UNITED STATES
SECURITIES AND EXCHANGE COMMISSION
Washington, D.C. 20549
FORM N-CSR
CERTIFIED SHAREHOLDER REPORT OF REGISTERED
MANAGEMENT INVESTMENT COMPANIES
Investment Company Act file number 811-08614
Brandes Investment Trust
(Exact name of registrant as specified in charter)
11988 El Camino Real, Suite 600
San Diego, CA 92130
(Address of principal executive offices) (Zip code)
Michael Glazer
Morgan, Lewis & Bockius LLP
355 South Grand Ave., Suite 4400
Los Angeles, CA 90071-3106
(Name and address of agent for service)
800-331-2979
Registrant’s telephone number, including area code
Date of fiscal year end: September 30, 2016
Date of reporting period: March 31, 2016
Item 1. Reports to Stockholders.

| 2 | ||||
| 6 | ||||
| 67 | ||||
| 102 | ||||
| 104 | ||||
| 106 | ||||
| 110 | ||||
| 120 | ||||
| 143 | ||||
| 147 |
1
Brandes International Equity Fund
Dear Fellow Investor,
After moving generally higher in the fourth quarter of 2015, equity markets worldwide gave up some of their gains in the first quarter of 2016 to close the period with mixed performance. Optimism over the U.S. economy’s resilience took a back seat to worries over slowing growth elsewhere in the world, falling oil prices, as well as the ramifications of negative interest rates in some parts of Europe and Japan. Adding to the list were uncertainties surrounding the U.S. presidential election cycle.
Monetary policy outside the United States remained accommodative. The European Central Bank announced more interest-rate cuts, bond purchases and a potential lender subsidy to combat the threat of deflation and jump start growth. In Japan, the government is expected to announce additional stimulus measures to help counter the effects of sluggish consumption and China’s economic slowdown.
Following a volatile period, emerging markets recorded gains, with Brazilian equities among the top performers even as the country remained mired in political instability amid President Dilma Rousseff’s potential impeachment. Additionally, oil-price stabilization toward the end of the first quarter of 2016 helped equities of oil exporters such as Russia.
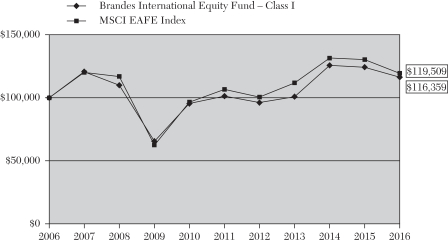
Against this backdrop, the net asset value of the Brandes International Equity Fund (Class I Shares) advanced 3.30% in the six months ended March 31, 2016. For the same period, the MSCI EAFE Index rose 1.56%.
The Fund
During the period, the Fund benefited from investments across a diverse set of countries, sectors and industries.
Allocations to health care, energy and materials helped performance, as did positions in Brazil and South Korea. The Brazilian real was one of the best-performing currencies in emerging markets in the first quarter of 2016 and its appreciation vs. the U.S. dollar aided returns.
On an individual security basis, top contributors included Japanese pharmaceutical firms Taisho Pharmaceutical and Daiichi Sankyo, South Korean steel manufacturer POSCO and Brazilian water utility Companhia de Saneamento Basico do Estado de Sao Paulo (SABESP). The shares of U.K.-based grocer Wm. Morrison Supermarkets also increased in the period as the market seemed to appreciate the company’s improved sales trajectory.
On the contrary, allocation to the industrials sector overall weighed on relative performance, along with a lack of exposure to Australia and positions in Switzerland. At the company level, major detractors included a number of financial holdings, namely Switzerland-based Credit Suisse and UBS Group, U.K.-based Barclays, as well as Japan’s Sumitomo Mitsui Trust Holdings and Mitsubishi UFJ Financial Group.
2
Brandes International Equity Fund
Barclays declined in the period as it announced a dividend cut and a rationalization of some of its businesses in efforts to focus on its core U.K. and U.S. markets and improve its capital position. Trading at 50% of tangible book value as of March 31, Barclays continues to offer, in our opinion, an attractive risk/reward tradeoff as we believe it should see the benefits of its restructuring over the next couple of years.
Credit Suisse saw its shares fall as the market remained concerned about the company’s restructuring and the possible negative effect on financial results over the next year. Nonetheless, we continue to believe Credit Suisse has an economically attractive business model and is significantly discounted at its valuation of 0.7x tangible book value as of March 31.
Fund activity was relatively light during the period. The International Large-Cap Investment Committee divested investment in Netherlands-based retailer Koninklijke Ahold, while initiating a position in French advertising (ad) agency Publicis Groupe.
Publicis is the world’s third-largest global ad agency holding company, with many valuable agency brands such as Saatchi & Saatchi, Leo Burnett, Razorfish, ZenithOptimedia, and Starcom MediaVest. Publicis has historically been a well-run company with a sound balance sheet and industry-leading margins.
In our view, the business model of ad agencies has attractive economics given their variable cost structure, industry consolidation, and exposure to long-term ad spending and global gross domestic product growth. While the industry as a whole appears to be valued somewhat fully by the market, Publicis has been the recent exception due to concerns over slowing organic growth, a handful of recent account losses and its acquisition of Sapient (its largest acquisition to date), which was seen as expensive.
We believe that excessive short-term pessimism centered on these recent missteps have created an attractive entry point in Publicis’ shares for long-term focused investors. Over the long term, Publicis management has displayed, in our opinion, an admirable track record of profitability, earnings growth, operational execution and mergers & acquisitions integration. We do not view recent client losses and the potential overpayment for Sapient as evidence of permanent structural changes in the business, and we believe Publicis is well positioned to return to levels of growth in line with its peers. Given its strong free-cash-flow generation, we also expect the company will quickly de-lever its balance sheet.
As of March 31, the Fund maintained a significant overweight vs. the benchmark to the energy sector, with holdings in developed European countries, Russia, and Brazil. Other key areas of exposure included U.K.-based food & staples retailers, Japanese automobile companies, and telecommunication services providers domiciled in Europe and select emerging markets. Key underweights included the industrials sector, as well as allocations to Germany and Australia.
3
Brandes International Equity Fund
Outlook
Looking ahead, we are excited about the prospects for the Brandes International Equity Fund as we believe volatile markets present opportunities for diligent stock pickers and where our bottom-up Graham-and-Dodd value approach should work well. In the 40-plus years since Brandes Investment Partners was founded, our ultimate goal has always been the same: Pursue above-market gains to help you move closer to your long-term investment objectives.
Thank you for your business and continued trust.
Sincerely yours,
The Brandes International Large-Cap Investment Committee
Brandes Investment Trust
Past performance does not guarantee future results.
Market conditions may impact performance. The performance results presented were achieved in particular market conditions which may not be repeated. Moreover, the current market volatility and uncertain regulatory environment may have a negative impact on future performance.
The Fund invests in foreign securities, which involve greater volatility and political, economic and currency risks and differences in accounting methods than domestic securities. Emerging country markets involve greater risk and volatility than more developed markets. Some emerging markets countries may have fixed or managed currencies that are not free-floating against the U.S. dollar. Certain of these currencies have experienced, and may experience in the future, substantial fluctuations or a steady devaluation relative to the U.S. dollar. The values of the Fund’s convertible securities are also affected by interest rates; if rates rise, the values of convertible securities may fall. Investments in small and medium capitalization companies tend to have limited liquidity and greater price volatility than investments in large capitalization companies. The Fund may invest in ETFs which are subject to additional risks that do not apply to conventional mutual funds, including the risks that the market price of an ETF’s shares may trade at a discount to its net asset value, an active secondary trading market may not develop or be maintained, or trading may be halted by the exchange on which they trade, which may impact the Fund’s ability to sell its shares.
Diversification does not guarantee a profit or protect from loss in a declining market.
Current and future portfolio holdings are subject to risk.
Free Cash Flow: Total cash flow from operations less capital expenditures.
Tangible Book Value: Book value minus intangible assets (e.g., goodwill).
4
Brandes International Equity Fund
Please refer to the Schedule of Investments in the report for complete holdings information. Fund holdings, geographic allocations and/or sector allocations are subject to change at any time and are not considered a recommendation to buy or sell any security.
The foregoing reflects the thoughts and opinions of Brandes Investment Partners® exclusively and is subject to change without notice.
Brandes Investment Partners® is a registered trademark of Brandes Investment Partners, L.P. in the United States and Canada.
Must be preceded or accompanied by a prospectus.
Index Guide
The MSCI EAFE (Europe, Australasia, Far East) Index with net dividends measures the equity market performance of developed markets in Europe, Australasia, and the Far East.
The MSCI Europe Index with net dividends measures equity market performance of developed markets in Europe.
The MSCI Brazil Index is designed to measure the performance of the large and mid cap segments of the Brazilian market. With 67 constituents, the index covers about 85% of the Brazilian equity universe.
The MSCI Japan Index is designed to measure the performance of the large and mid cap segments of the Japanese market. With 318 constituents, the index covers approximately 85% of the free float-adjusted market capitalization in Japan.
MSCI has not approved, reviewed or produced this report, makes no express or implied warranties or representations and is not liable whatsoever for any data in the report. You may not redistribute the MSCI data or use it as a basis for other indices or investment products.
The Brandes International Equity Fund is distributed by ALPS Distributors, LLC.
5
Brandes International Equity Fund
The following chart compares the value of a hypothetical $100,000 investment in the Brandes International Equity Fund – Class I from March 31, 2006 to March 31, 2016 and in the Morgan Stanley Capital International EAFE Index for the same period.
Value of $100,000 Investment vs Morgan Stanley Capital International EAFE (Europe, Australasia and Far East) Index (Unaudited)
| Average Annual Total Return Periods Ended March 31, 2016 | ||||||||||||||||
| One Year | Five Years | Ten Years | Since Inception(1) | |||||||||||||
Brandes International Equity Fund | ||||||||||||||||
Class A* | -6.55 | % | 2.62 | % | 1.33 | % | 7.60 | % | ||||||||
Class A* (with maximum sales charge) | -11.93 | % | 1.42 | % | 0.74 | % | 7.27 | % | ||||||||
Class C* | -7.30 | % | 1.83 | % | 0.54 | % | 6.78 | % | ||||||||
Class E* | -6.57 | % | 2.60 | % | 1.35 | % | 7.61 | % | ||||||||
Class I | -6.41 | % | 2.80 | % | 1.53 | % | 7.83 | % | ||||||||
Class R6* | -6.36 | % | 2.85 | % | 1.58 | % | 7.89 | % | ||||||||
Morgan Stanley Capital International EAFE Index | -8.27 | % | 2.29 | % | 1.80 | % | 4.12 | % | ||||||||
| (1) | The inception date is January 2, 1997. |
| * | Performance shown prior to January 31, 2011 for Class A shares reflects the performance of Class I shares adjusted to reflect Class A expenses. Performance shown prior to January 31, 2013 for Class C shares reflects the performance of Class I shares adjusted to reflect Class C expenses. Performance shown prior to October 6, 2008 for Class E shares reflects the performance of Class I shares adjusted to reflect Class E expenses. Performance shown prior to February 1, 2016 for Class R6 shares reflects the performance of Class I shares adjusted to reflect Class R6 expenses. |
6
Brandes International Equity Fund
Performance data quoted represents past performance; past performance does not indicate future results. The investment return and principal value of an investment will fluctuate so that an investor’s shares, when redeemed, may be worth more or less than their original cost. Current performance of the Fund may be lower or higher than the performance quoted. Performance data current to the most recent month end may be obtained by calling 800-331-2979.
The returns shown do not reflect the deduction of taxes that a shareholder would pay on Fund distributions or the redemption of Fund shares. The Advisor has a fee waiver arrangement in place to limit the Fund’s annual operating expenses.
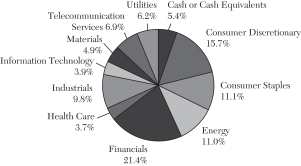
Sector Allocation as a Percentage of Total Investments as of
March 31, 2016 (Unaudited)
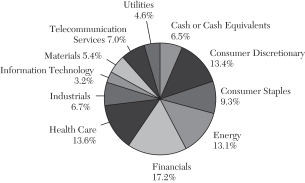
The sector classifications represented in the graph above and industry classifications represented in the Schedule of Investments are in accordance with Global Industry Classification Standard (GICS®), which was developed by and/or is the exclusive property of MSCI, Inc. and Standard & Poor Financial Services LLC.
7
Brandes Global Equity Fund
Dear Fellow Investor,
After moving generally higher in the fourth quarter of 2015, equity markets worldwide gave up some of their gains in the first quarter of 2016 to close the period with mixed performance. Optimism over the U.S. economy’s resilience took a back seat to worries over slowing growth elsewhere in the world, falling oil prices, as well as the ramifications of negative interest rates in some parts of Europe and Japan. Adding to the list were uncertainties surrounding the U.S. presidential election cycle.
As widely expected, the Federal Reserve raised its benchmark federal funds rate in December for the first time in seven years, signaling an end to its massive bond-buying program designed to stimulate growth. Fed officials gave upbeat assessments of the economy while scaling back the number of rate increases expected this year, citing risks posed by global economic and financial developments.
Outside the United States, monetary policy remained accommodative. The European Central Bank announced more interest-rate cuts, bond purchases and a potential lender subsidy to combat the threat of deflation and jump start growth. In Japan, the government is expected to announce additional stimulus measures to help counter the effects of sluggish consumption and China’s economic slowdown.
Following a volatile period, emerging markets recorded gains, with Brazilian equities among the top performers even as the country remained mired in political instability amid President Dilma Rousseff’s potential impeachment and former President Lula da Silva’s return to the limelight. Additionally, oil-price stabilization helped equities of oil exporters such as Russia.
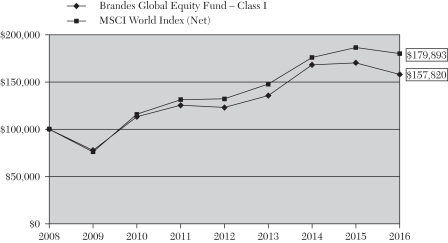
Against this backdrop, the net asset value of the Brandes Global Equity Fund (Class I Shares) rose 0.62% in the six months ended March 31, 2016. For the same period, the MSCI World Index advanced 5.40%.
The Fund
The Fund’s financial holdings, primarily in banks and companies with capital markets exposure were the most significant performance detractors. In our opinion, the market became indiscriminately concerned about some of these companies’ exposure to the energy sector, as well as about expectations of prolonged low interest rates in the United States and negative interest rates internationally.
Switzerland-based Credit Suisse, U.K.-based Barclays Plc. and U.S.-based Citigroup hurt returns in the period.
Credit Suisse declined over 30% in the last six months as the market remained concerned about the company’s restructuring/turnaround and the possible negative effect on financial results over the next year. Nonetheless, we continue to believe Credit Suisse has an economically attractive business model and is significantly
8
Brandes Global Equity Fund
discounted at its current valuation of 0.7x tangible book value (as of March 31). Accordingly, we increased our allocation during the period.
Citigroup has energy-loan exposure of less than 4% of total loans, and is, in our view, positioned to benefit from an eventual increase in interest rates. At its current valuation (as of March 31) of just 60% of book value and 7.7x earnings on depressed net interest margins, we believe the stock offers a compelling investment opportunity.
Energy holdings, most significantly oil & gas firms Chesapeake Energy (United States) and Petrobras (Brazil) hurt Fund performance. We divested these positions, as discussed below.
Other return detractors included Western Digital, Sanofi and Express Scripts.
Express Scripts declined in the period due to a dispute with its largest client, health insurer Anthem (which accounts for 15% to 20% of Express Scripts’ sales), as Anthem believes that Express Scripts needs to pass on larger drug cost savings to its customers. Under the existing contract, Anthem is entitled to a good-faith repricing of the contract terms, the deadline for which was December 15, 2015. As the deadline passed and Express Scripts still has not provided Anthem with an offer that Anthem deems acceptable, Anthem has recently decided to take legal action against Express Scripts. Express Scripts’ Chief Executive Officer stated the company intends to resolve the dispute and keep Anthem as a customer.
We believe the market has over-reacted to the dispute as the current valuation prices in more than a complete loss of the Anthem contract. While there are multiple possibilities, we believe the most likely outcome is a renegotiation to extend the contract, likely at a lower margin but with increased volumes due to Anthem’s acquisition of Cigna. There is a risk that Anthem switches to another vendor or brings the business in-house, although it lacks scale relative to peers. Given that the market seemed to have priced in the worst-case outcome, we continue to believe that Express Scripts offers an attractive margin of safety.
Meanwhile, a number of U.S.-based holdings bolstered performance in the period, including technology firms Microsoft and Corning, as well as utility firm Exelon and electrical equipment manufacturer Emerson Electric. Japan-based pharmaceutical firm Daiichi Sankyo also helped returns.
One of the Fund’s largest holdings, Microsoft has outperformed the market (as measured by the MSCI World Index) over the past year as investors have finally shown appreciation for its strong enterprise business, and how well it has managed to migrate its businesses toward the cloud-computing era.
Our investment in Microsoft serves as a great reminder that focusing on the long term — and on the actual value drivers of a business — can generate rewards for patient investors. Just a few years ago, media reports focused on Microsoft’s
9
Brandes Global Equity Fund
consumer business failings and how investing in the stock was “dead money” after it had previously been flat for nearly a decade. And while Microsoft may be one of the most followed stocks on Wall Street, we felt that the value drivers of its business (its enterprise division) were largely underappreciated by the market. As a result, we found significant margin of safety in our investment.
Although the market has started to catch up to our view of the company, we continue to think that Microsoft represents an attractive investment today. We believe the company is well positioned for the cloud-computing future as it adeptly navigates the ever-changing technology landscape. In addition, the company has a very strong balance sheet, and has shown its willingness to return cash to shareholders through dividends, which it has raised every year for the past six years.
Volatile markets created potential mispricing opportunities among companies which, based on our analysis, have attractive valuations relative to their intrinsic value estimates. The Global Large-Cap Investment Committee initiated a position in French oil & gas firm Total and added to existing position in Credit Suisse, as discussed above.
Following thorough deliberations, the committee decided to divest the Fund’s positions in Chesapeake Energy and Petrobras.
The primary uncertainty with Chesapeake is (and has been) the natural gas price. We believe that supply and demand warrant a much higher price than the current sub-$2 per mmBtu level (currently even lower in Pennsylvania where Chesapeake has a significant percentage of its acreage), likely in the $4 to $6 range in the medium to long term. At the current natural gas price, producers are cutting capital expenditure (capex) significantly, which could ultimately impact the supply of natural gas. The path of natural gas prices is uncertain with a lag between capex cuts and changes to production levels. At higher long-term price levels we believe that Chesapeake’s enterprise value would be substantially more than what was valued by the market.
However, as Chesapeake built out its acreage, it utilized a significant amount of debt, making it one of the more leveraged oil and natural gas companies today. As a result, while we think it likely has access to liquidity to survive the depressed natural- gas price environment for the next year or two, we cannot rule out that the management and board will choose to preemptively file for reorganization under the bankruptcy code in order to restructure the company and reduce the substantial debt burden.
Therefore, the investment committee decided to sell Chesapeake equity, which bears the brunt of this bankruptcy timing risk and allocate where possible to Chesapeake debt, which we believed offers a more attractive risk/reward tradeoff as it traded at 15 cents to 35 cents on the dollar. At these levels, the yield to maturity was north of 30%, offers the potential for equity-like returns and provides
10
Brandes Global Equity Fund
some downside protection because debt holders have a higher claim on assets than do equity shareholders if the company decides to file for reorganization.
It is not typical for the Global Equity Strategy to hold securities other than common equity. Exceptions have been made when the securities within a company’s capital structure offered potential investment returns that rivaled those of common equity. This happened with the preferred equity securities of U.S. banks during the financial crisis, for instance. In this particular case, Chesapeake endured an extremely difficult commodity-price environment which resulted in the market value of its common equity, preferred equity and debt falling significantly. The investment committee believes that the potential return from investing in Chesapeake debt surpasses that of many other common equity investments.
If the company files for reorganization and emerges having restructured its debt, it is highly likely that some/all of the debt will be converted to equity, allowing the strategy to potentially participate in the upside of the company’s enterprise value. The restructured company would allow for further potential recovery in value should natural-gas prices eventually rise to economically viable levels during or after the reorganization process.
The investment committee also decided to sell Petrobras, believing that other integrated oil majors offered a more attractive risk/reward tradeoff. As the Fund has a wide large-cap opportunity set in which to seek attractively valued companies, the Fund could benefit substantially from a recovery in oil prices by investing in other large integrated oil companies, in our opinion. These opportunities included recently purchased Total and Spain-based Repsol, as well as in U.K.-based BP, Russia’s Lukoil and Italy’s Eni where we increased allocations during the period.
Other positions sold were Netherlands-based retailer Koninklijke Ahold, Germany-based Deutsche Boerse and Japan-based Mitsubishi UFJ Financial Group.
As of March 31, the Fund’s fundamentals remained more attractive than those of the benchmark, exhibiting significantly lower valuations such as price-to-book, price-to-earnings and price-to-cash-flow ratios. It also offered a higher dividend yield than the MSCI World Index.
The Fund’s largest overweight positions versus the index were in the United Kingdom, as well as in pharmaceuticals, capital markets, automobiles and in oil, gas & consumable fuels. The Fund also had an off-index allocation of over 18% in emerging-market companies.
Meanwhile, the Fund maintained its largest underweight position in the United States. On the sector level, it had below-benchmark weightings in industrials and materials.
As always, the Fund’s investment allocations are based on bottom-up security selection, unaffected by benchmark weightings and primarily driven by
11
Brandes Global Equity Fund
opportunities in places where we can uncover what we believe are the most attractive values.
Outlook
Macroeconomic and geopolitical headlines over the last six months, which contributed to heightened market volatility, may have tested the mettle of many investors. However, it is important to note that despite market swings, over the long term, global equities have helped investors grow their capital. Consider that in the last 30 years, world equities as measured by the MSCI World Index appreciated more than investment-grade U.S. bonds and gold.*
Global value investors should also note that the underperformance of value stocks versus growth stocks in the last several years has led to valuation disparities that we believe portend a market environment that has the potential to generate opportunity for value going forward.**
In the 40-plus years since Brandes Investment Partners was founded, our ultimate goal has always been the same: Pursue above-market gains to help you move closer to your long-term investment objectives.
Thank you for your business and continued trust.
Sincerely yours,
The Brandes Global Large-Cap Investment Committee
Brandes Investment Trust
Past performance does not guarantee future results.
Because the values of the Fund’s investments will fluctuate with market conditions, so will the value of your investment in the Fund. You could lose money on your investment in the Fund, or the Fund could underperform other investments. The values of the Fund’s investments fluctuate in response to the activities of individual companies and general stock market and economic conditions. In addition, the performance of foreign securities depends on the political and economic environments and other overall economic conditions in the countries where the Fund invests. Emerging country markets involve greater risk and volatility than more developed markets. Some emerging markets countries may have fixed or managed currencies that are not free-floating against the U.S. dollar. Certain of these currencies have experienced, and may experience in the future, substantial fluctuations or a steady devaluation relative to the U.S. dollar.
| * | Source: Brandes Investment Partners and FactSet; as of 12/31/2015; Bonds as measured by the Barclays U.S. Aggregate Bond Index. Gold as measured by the S&P GSCI® Gold Index. |
| ** | MSCI World Value Index and MSCI World Growth Index (developed markets); MSCI All Country World Index (ACWI) Value and MSCI ACWI Growth (includes developed and emerging markets) |
12
Brandes Global Equity Fund
Current and future portfolio holdings are subject to risk.
Book Value: Assets minus liabilities. Also known as shareholders’ equity.
Federal Funds Rate: The interest rate at which a depository institution lends funds maintained at the Federal Reserve to another depository institution overnight.
Free Cash Flow: Total cash flow from operations less capital expenditures.
Intrinsic Value: The actual value of a company or an asset based on an underlying perception of its true value.
Margin of Safety: The margin of safety for any security is defined as the discount of its market price to what the firm believes is the intrinsic value of that security.
Net Interest Margin: Interest income generated by a financial institution minus the amount of interest paid to its lenders, divided by average earning assets.
Price/Book: Price per share divided by book value per share.
Price/Cash Flow: Price per share divided by cash flow per share.
Price/Earnings: Price per share divided by earnings per share.
Return on Capital: Net income minus dividends divided by total capital; used to assess a company’s efficiency at allocating the capital under its control to profitable investments.
Tangible Book Value: Book value minus intangible assets (e.g., goodwill).
Yield: Annual income from the investment (dividend, interest, etc.) divided by the current market price of the investment.
Yield to Maturity: The total return anticipated on a bond if the bond is held until the end of its lifetime.
The MSCI ACWI Growth Index captures large and midcap securities exhibiting overall growth style characteristics across 23 Developed Markets (DM) countries and 23 Emerging Markets (EM) countries.
The MSCI ACWI Value Index captures large and midcap securities exhibiting overall value style characteristics across 23 Developed Markets (DM) countries and 23 Emerging Markets (EM) countries.
The MSCI World Growth Index with net dividends measures equity market performance of developed markets. The attributes for growth index construction are long-term forward earnings per share (EPS) growth rate, short-term forward EPS growth rate, current internal growth rate, long-term historical EPS growth trend, and long-term historical sales per share growth trend.
The MSCI World Value Index with net dividends measures equity market performance of developed markets. The attributes for value index construction are book value-to-price ratio, 12-months forward earnings-to-price ratio, and dividend yield.
13
Brandes Global Equity Fund
The MSCI World Index with net dividends measures equity market performance of developed markets.
MSCI has not approved, reviewed or produced this report, makes no express or implied warranties or representations and is not liable whatsoever for any data in the report. You may not redistribute the MSCI data or use it as a basis for other indices or investment products.
Barclays U.S. Aggregate Bond Index: The Barclays U.S. Aggregate Bond Index is a broad-based benchmark that measures the investment-grade, U.S. dollar-denominated, fixed-rate taxable bond market. This index is a total return index which reflects the price changes and interest of each bond in the index.
S&P GSCI Gold Index: A sub-index of the S&P GSCI, provides investors with a reliable and publicly available benchmark tracking the COMEX gold future. The index is designed to be tradable, readily accessible to market participants, and cost efficient to implement.
The Brandes Global Equity Fund is distributed by ALPS Distributors, LLC.
14
Brandes Global Equity Fund
The following chart compares the value of a hypothetical $100,000 investment in the Brandes Global Equity Fund – Class I from its inception (October 6, 2008) to March 31, 2016 and in the Morgan Stanley Capital International World Index for the same period.
Value of $100,000 Investment vs Morgan Stanley Capital International World Index (Unaudited)
| Average Annual Total Return Periods Ended March 31, 2016 | ||||||||||||||||
| One Year | Three Years | Five Years | Since Inception(1) | |||||||||||||
Brandes Global Equity Fund | ||||||||||||||||
Class A* | -7.55 | % | 4.94 | % | 4.48 | % | 6.06 | % | ||||||||
Class A* (with maximum sales charge) | -12.85 | % | 2.89 | % | 3.26 | % | 5.22 | % | ||||||||
Class C* | -8.19 | % | 4.19 | % | 3.72 | % | 5.24 | % | ||||||||
Class E | -7.48 | % | 4.96 | % | 4.48 | % | 6.07 | % | ||||||||
Class I | -7.27 | % | 5.22 | % | 4.75 | % | 6.29 | % | ||||||||
Morgan Stanley Capital International World Index | -3.45 | % | 6.82 | % | 6.51 | % | 8.16 | % | ||||||||
| (1) | The inception date is October 6, 2008. |
| * | Performance shown prior to January 31, 2011 for Class A shares reflects the performance of Class I shares adjusted to reflect Class A expenses. Performance shown prior to January 31, 2013 for Class C shares reflects the performance of Class I shares adjusted to reflect Class C expenses. |
15
Brandes Global Equity Fund
Performance data quoted represents past performance; past performance does not indicate future results. The investment return and principal value of an investment will fluctuate so that an investor’s shares, when redeemed, may be worth more or less than their original cost. Current performance of the Fund may be lower or higher than the performance quoted. Performance data current to the most recent month end may be obtained by calling 800-331-2979.
The returns shown do not reflect the deduction of taxes that a shareholder would pay on fund distributions or the redemption of fund shares. The Advisor has a fee waiver arrangement in place to limit the Fund’s annual operating expenses.
Sector Allocation as a Percentage of Total Investments as of
March 31, 2016 (Unaudited)
The sector classifications represented in the graph above and industry classifications represented in the Schedule of Investments are in accordance with Global Industry Classification Standard (GICS®), which was developed by and/or is the exclusive property of MSCI, Inc. and Standard & Poor Financial Services LLC.
16
Brandes Global Equity Income Fund
Dear Fellow Investor,
After moving generally higher in the fourth quarter of 2015, equity markets worldwide gave up some of their gains in the first quarter of 2016 to close the period with mixed performance. Optimism over the U.S. economy’s resilience took a back seat to worries over slowing growth elsewhere in the world, falling oil prices, as well as the ramifications of negative interest rates in some parts of Europe and Japan. Adding to the list were uncertainties surrounding the U.S. presidential election cycle.
As widely expected, the Federal Reserve raised its benchmark federal funds rate in December for the first time in seven years, signaling an end to its massive bond-buying program designed to help stimulate growth. Fed officials gave upbeat assessments of the economy while scaling back the number of rate increases expected this year, citing risks posed by global economic and financial developments.
Outside the United States, monetary policy remained accommodative. The European Central Bank announced more interest-rate cuts, bond purchases and a potential lender subsidy to combat the threat of deflation and jump start growth. In Japan, the government is expected to announce additional stimulus measures to help counter the effects of sluggish consumption and China’s economic slowdown.
Following a volatile period, emerging markets recorded gains, with Brazilian equities among the top performers even as the country remained mired in political instability amid President Dilma Rousseff’s potential impeachment and former President Lula da Silva’s return to the limelight. Additionally, oil-price stabilization helped equities of oil exporters such as Russia.
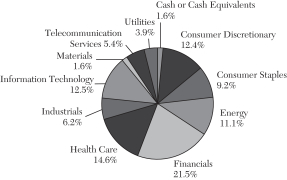
Against this backdrop, the net asset value of the Brandes Global Equity Income Fund (Class I Shares) advanced 8.88% in the six months ended March 31, 2016. For the same period, the MSCI World Index rose 5.13%.
The Fund
The Fund’s outperformance was powered by investments across a diverse set of countries, sectors and industries.
From a sector standpoint, holdings in healthcare, utilities and consumer staples were the most noteworthy contributors.
Pharmaceutical firms Daiichi Sankyo (Japan), Johnson & Johnson (United States) and GlaxoSmithKline (United Kingdom), as well as healthcare equipment and supplies firm Baxter International (United States) benefited performance, as did insurers Old Republic International (United States) and Swiss Re (Switzerland).
Holdings in Brazil, namely water utility Companhia de Saneamento Basico do Estado de Sao Paolo (SABESP) and telecommunications provider Telefonica Brasil, also helped performance. The Brazilian real was one of the best-performing
17
Brandes Global Equity Income Fund
currencies in emerging markets in the first quarter of 2016 and its appreciation vs. the U.S. dollar aided returns.
Other holdings that boosted returns included U.S.-based Microsoft and Emerson Electric.
One of the Fund’s largest holdings, Microsoft has outperformed the market (as measured by the MSCI World Index) over the past year as investors have finally shown appreciation for its strong enterprise business, and how well it has managed to migrate its businesses toward the cloud-computing era.
Our investment in Microsoft serves as a great reminder that focusing on the long term — and on the actual value drivers of a business — can generate rewards for patient investors. Just a few years ago, media reports focused on Microsoft’s consumer business failings and how investing in the stock was “dead money” after it had previously been flat for nearly a decade. And while Microsoft may be one of the most followed stocks on Wall Street, we felt that the value drivers of its business (its enterprise division) were largely underappreciated by the market. As a result, we found significant margin of safety in our investment.
Although the market has started to catch up to our view of the company, we continue to think that Microsoft represents an attractive investment today. We believe the company is well positioned for the cloud-computing future as it adeptly navigates the ever-changing technology landscape. In addition, the company has a very strong balance sheet, and has shown its willingness to return cash to shareholders through dividends, which it has raised every year for the past six years.
The Fund’s performance detractors during the period included U.S.-based technology firm Western Digital, French pharmaceutical firm Sanofi and U.K.-based retailer Marks & Spencer.
Volatile markets during the period created potential mispricing opportunities, and the Fund’s investment committee initiated positions in companies which, based on our analysis, exhibited attractive valuations relative to their intrinsic value estimates.
New additions included U.S.-based bank BB&T Corporation, with a dividend yield of 3.3% as of March 31, and South Korea-based Samsung Electronics. Although Samsung’s yield was just 1.6% as of March 31, it recently announced its intention to increase capital return to shareholders to 30%-50% of free cash flow over the long term.
BB&T is a higher quality bank trading near book value, has a history of generating above-peer-average net interest margins and very low energy-sector loan exposure (1% of total loans as of March 31). Moreover, the company has a strong operating history and traded at low multiples of normalized earnings, creating what we considered a good buying opportunity.
18
Brandes Global Equity Income Fund
The investment committee also divested the Fund’s positions in a number of companies that moved closer to our estimates of their true worth in order to make room for companies with more attractive valuations and margins of safety. We sold our positions in U.S.-based Philip Morris International, Outfront Media and Old Republic International, as well as in Germany-based Deutsche Boerse and Netherlands-based Koninklijke Ahold.
We first purchased retailer Ahold when several concerns weighed on the shares, including slowing revenue growth after years of acquisitions, historical accounting concerns and the resignation of the company’s Chief Executive Officer and Chief Financial Officer.
New management focused on improving shareholder returns. It divested non-core businesses at attractive prices, significantly reduced debt, and returned capital to shareholders via share repurchases and dividends. The shares were subsequently pressured again given concerns that a weak consumer environment would persist, increased competition would compress margins and the management would potentially not make wise use of proceeds from a recent divestiture. Throughout these challenges, we believed Ahold remained a well-positioned business with strong market share in structurally attractive markets. We also appreciated the company’s solid cash-flow generation, strong balance sheet and importantly, its appealing valuation.
We saw our investment thesis for Ahold materialize as the company continued to execute its operations well, leading its shares to increase toward our estimate of intrinsic value. Consequently, we decided to fully exit our investment.
As of March 31, the valuation levels and dividend yield of the Global Equity Income Fund remained more attractive than the benchmark. The dividend yield of the Fund was 4.2% vs. 2.7% for the MSCI World Index as of March 31.
On the industry and sector levels, the Fund had overweight positions versus the benchmark in pharmaceuticals, food & staples retailing, energy, electrical equipment, capital markets and utilities. From a country standpoint, the Fund had overweight allocations to the United Kingdom and France, as well as off-index allocations to emerging-market countries. The Fund had lower allocations versus the index in the United States and Japan, as well as in consumer discretionary, industrials and materials.
As always, Fund allocations are based on a Graham-and-Dodd, bottom-up investment approach, focused on what we believe are appealing company valuations relative to their fundamentals. Index weightings are not factored into investment decisions.
Outlook
Macroeconomic and geopolitical headlines over the last six months, which contributed to heightened market volatility, may have tested the mettle of many
19
Brandes Global Equity Income Fund
investors. However, it is important to note that despite market swings, over the long term, global equities have helped investors grow their capital. Consider that in the last 30 years, world equities as measured by the MSCI World Index appreciated more than investment-grade U.S. bonds and gold.*
Global value investors should also note that the underperformance of value stocks versus growth stocks in the last several years has led to valuation disparities that we believe portend a market environment that has the potential to generate opportunity for value going forward.**
In the 40-plus years since Brandes Investment Partners was founded, our ultimate goal has always been the same: Pursue above-market gains to help you move closer to your long-term investment objectives.
Thank you for your business and continued trust.
Sincerely yours,
The Brandes Global Large-Cap Investment Committee
Brandes Investment Trust
Past performance does not guarantee future results.
Because the values of the Fund’s investments will fluctuate with market conditions, so will the value of your investment in the Fund. You could lose money on your investment in the Fund, or the Fund could underperform other investments. The values of the Fund’s investments fluctuate in response to the activities of individual companies and general stock market and economic conditions. In addition, the performance of foreign securities depends on the political and economic environments and other overall economic conditions in the countries where the Fund invests. Emerging country markets involve greater risk and volatility than more developed markets. Some emerging markets countries may have fixed or managed currencies that are not free-floating against the U.S. dollar. Certain of these currencies have experienced, and may experience in the future, substantial fluctuations or a steady devaluation relative to the U.S. dollar.
Diversification does not assure a profit or protect against loss in a declining market.
Current and future portfolio holdings are subject to risk.
Book Value: Assets minus liabilities. Also known as shareholders’ equity.
| * | Source: Brandes Investment Partners and FactSet; as of 12/31/2015; Bonds as measured by the Barclays U.S. Aggregate Bond Index. Gold as measured by the S&P GSCI® Gold Index. |
| ** | MSCI World Value Index and MSCI World Growth Index (developed markets); MSCI All Country World Index (ACWI) Value and MSCI ACWI Growth (includes developed and emerging markets) |
20
Brandes Global Equity Income Fund
Free Cash Flow: Total cash flow from operations less capital expenditures.
Graham-and-Dodd Investment Approach: A method described by Benjamin Graham and David Dodd in their 1934 book Security Analysis that uses fundamental analysis to identify securities which may be underpriced relative to the value of their underlying assets.
Intrinsic Value: The actual value of a company or an asset based on an underlying perception of its true value.
Margin of Safety: The discount of a security’s market price to what the firm believes is the intrinsic value of that security.
Net Interest Margin: Interest income generated by a financial institution minus the amount of interest paid to its lenders, divided by average earning assets.
Price/Book: Price per share divided by book value per share.
Price/Earnings: Price per share divided by earnings per share.
Tangible Book Value: Book value minus intangible assets (e.g., goodwill).
Return on Capital: Net income minus dividends divided by total capital; used to assess a company’s efficiency at allocating the capital under its control to profitable investments.
Yield: Annual income from the investment (dividend, interest, etc.) divided by the current market price of the investment.
Yield to Maturity: The total return anticipated on a bond if the bond is held until the end of its lifetime.
Please refer to the Schedule of Investments in the report for complete holdings information. Fund holdings, geographic allocations and/or sector allocations are subject to change at any time and are not considered a recommendation to buy or sell any security.
The foregoing reflects the thoughts and opinions of Brandes Investment Partners® exclusively and is subject to change without notice.
Brandes Investment Partners® is a registered trademark of Brandes Investment Partners, L.P. in the United States and Canada.
Must be preceded or accompanied by a prospectus.
Index Guide
Barclays U.S. Aggregate Bond Index: The Barclays U.S. Aggregate Bond Index is a broad-based benchmark that measures the investment-grade, U.S. dollar-denominated, fixed-rate taxable bond market. This index is a total return index which reflects the price changes and interest of each bond in the index.
21
Brandes Global Equity Income Fund
The MSCI ACWI Growth Index captures large and mid-cap securities exhibiting overall growth style characteristics across 23 Developed Markets (DM) countries and 23 Emerging Markets (EM) countries.
The MSCI ACWI Value Index captures large and mid-cap securities exhibiting overall value style characteristics across 23 Developed Markets (DM) countries and 23 Emerging Markets (EM) countries.
The MSCI World Index with net dividends measures equity market performance of developed markets.
The MSCI World Growth Index with net dividends measures equity market performance of developed markets. The attributes for growth index construction are long-term forward earnings per share (EPS) growth rate, short-term forward EPS growth rate, current internal growth rate, long-term historical EPS growth trend, and long-term historical sales per share growth trend.
The MSCI World Value Index with net dividends measures equity market performance of developed markets. The attributes for value index construction are book value-to-price ratio, 12-months forward earnings-to-price ratio, and dividend yield.
MSCI has not approved, reviewed or produced this report, makes no express or implied warranties or representations and is not liable whatsoever for any data in the report. You may not redistribute the MSCI data or use it as a basis for other indices or investment products.
S&P GSCI Gold Index: A sub-index of the S&P GSCI, provides investors with a reliable and publicly available benchmark tracking the COMEX gold future. The index is designed to be tradable, readily accessible to market participants, and cost efficient to implement.
The Brandes Global Equity Income Fund is distributed by ALPS Distributors, LLC.
22
Brandes Global Equity Income Fund
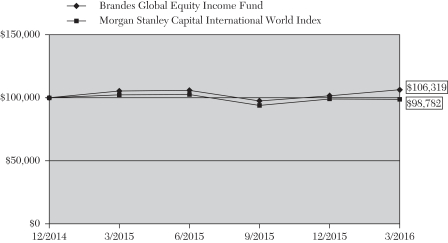
The following chart compares the value of a hypothetical $100,000 investment in the Brandes Global Equity Income Fund – Class I from its inception (December 31, 2014) to March 31, 2016 and in the Morgan Stanley Capital International World Index for the same period.
Value of $100,000 Investment vs Morgan Stanley Capital International World Index (Unaudited)
| Average Annual Total Return Periods Ended March 31, 2016 | ||||||||
| One Year | Since Inception(1) | |||||||
Brandes Global Equity Income Fund | ||||||||
Class A | 0.69 | % | 5.02 | % | ||||
Class A (with maximum sales charge) | -5.09 | % | 0.15 | % | ||||
Class C | -0.40 | % | 4.11 | % | ||||
Class I | 0.91 | % | 5.04 | % | ||||
Morgan Stanley Capital International | -3.45 | % | -0.98 | % | ||||
| (1) | The inception date is December 31, 2014. |
Performance data quoted represents past performance; past performance does not indicate future results. The investment return and principal value of an investment will fluctuate so that an investor’s shares, when redeemed, may be worth more or less than their original cost. Current performance of the Fund may be lower or higher than the performance quoted. Performance data current to the most recent month end may be obtained by calling 800-331-2979.
23
Brandes Global Equity Income Fund
The returns shown do not reflect the deduction of taxes that a shareholder would pay on fund distributions or the redemption of fund shares. The Advisor has a fee waiver arrangement in place to limit the Fund’s annual operating expenses.
Sector Allocation as a Percentage of Total Investments as of March 31, 2016 (Unaudited)
The sector classifications represented in the graph above and industry classifications represented in the Schedule of Investments are in accordance with Global Industry Classification Standard (GICS®), which was developed by and/or is the exclusive property of MSCI, Inc. and Standard & Poor Financial Services LLC.
24
Brandes Global Opportunities Value Fund
Dear Fellow Investor,
After moving generally higher in the fourth quarter of 2015, equity markets worldwide gave up some of their gains in the first quarter of 2016 to close the period with mixed performance. Optimism over the U.S. economy’s resilience took a back seat to worries over slowing growth elsewhere in the world, falling oil prices, as well as the ramifications of negative interest rates in some parts of Europe and Japan. Adding to the list were uncertainties surrounding the U.S. presidential election cycle.
As widely expected, the Federal Reserve raised its benchmark federal funds rate in December for the first time in seven years, signaling an end to its massive bond-buying program designed to stimulate growth. Fed officials gave upbeat assessments of the economy while scaling back the number of rate increases expected this year, citing risks posed by global economic and financial developments.
Outside the United States, monetary policy remained accommodative. The European Central Bank announced more interest-rate cuts, bond purchases and a potential lender subsidy to combat the threat of deflation and jump start growth. In Japan, the government is expected to announce additional stimulus measures to help counter the effects of sluggish consumption and China’s economic slowdown.
Following a volatile period, emerging markets recorded gains, with Brazilian equities among the top performers even as the country remained mired in political instability amid President Dilma Rousseff’s potential impeachment and former President Lula da Silva’s return to the limelight. Additionally, oil-price stabilization helped equities of oil exporters such as Russia.
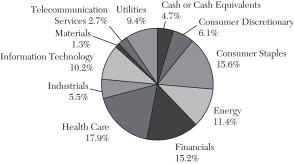
Against this backdrop, the net asset value of the Brandes Global Opportunities Value Fund (Class I Shares) rose 5.85% in the six months ended March 31, 2016. For the same period, the MSCI ACWI (All Country World) Index advanced 5.28%.
The Fund
During the period, the Fund benefited from investments across a diverse set of countries, sectors and industries.
Major positive contributors were allocations to the utilities and health care sectors, as well as to Brazil and the United Kingdom. The Brazilian real was one of the best-performing currencies in emerging markets in the first quarter of 2016 and its appreciation vs. the U.S. dollar aided returns.
At the company level, top performers included Brazilian water utility Companhia de Saneamento Basico do Estado de Sao Paulo (SABESP) and telecommunication services firm Telefonica Brasil, U.K.-based temporary power provider APR Energy, U.S.-based machinery company Briggs & Stratton and Indian conglomerate Reliance Infrastructure. The shares of U.K.-based grocer Wm. Morrison
25
Brandes Global Opportunities Value Fund
Supermarkets also increased in the period as the market seemed to appreciate the company’s improved sales trajectory.
Meanwhile, allocation to information technology hurt performance, along with a number of positions in the United States. Significant detractors included U.S. based technology company Western Digital and oil firm Chesapeake Energy.
Additionally, several holdings in financials weighed on returns, including Switzerland-based Credit Suisse, U.K.-based Barclays and U.S.-based Citigroup. The market became indiscriminately concerned about their exposure to the energy sector, in our opinion, as well as about expectations of prolonged low interest rates in the United States and negative interest rates internationally.
Credit Suisse declined over 30% in the last six months as the market remained concerned about the company’s restructuring/turnaround and the possible negative effect on financial results over the next year. Nonetheless, we continue to believe Credit Suisse has an economically attractive business model and is significantly discounted at its valuation of 0.7x tangible book value as of March 31.
Citigroup has energy-loan exposure of less than 4% of total loans, and is, in our view, positioned to benefit from an eventual increase in interest rates. At its valuation of just 60% of book value and 7.7x earnings on depressed net interest margins as of March 31, we believe the stock offers a compelling investment opportunity.
The All-Cap Investment Committee divested a number of positions over the last six months, including British household products company McBride, Spanish real-estate investment trust Merlin Properties, Irish construction materials provider CRH and Japanese pharmaceutical firm Daiichi Sankyo Company. The investment committee also exited the Fund’s position in U.K.-based APR Energy, whose acquisition by a group of private equity firms was completed in February.
The Fund also had several new purchases in the period, including U.K.-based banknotes printing company De La Rue, U.S.-based financial holding firm Leucadia National, Brazilian food & staples retailer Companhia Brasileira de Distribuicao and Israeli medical products company Syneron Medical. Additionally, the investment committee initiated a position in Draegerwerk, a small-cap German company operating in the health care equipment & supplies industry.
Draegerwerk applies its expertise in airflow dynamics and pressure regulation to two main segments: medical and safety. The medical division provides anesthesia workstations, ventilation equipment, patient monitoring systems and neonatal care products. Meanwhile, the company’s safety portfolio includes respiratory protection equipment, gas detection systems and professional diving equipment, as well as alcohol and drug impairment detection devices.
Several factors appear to have weighed on Draegerwerk’s shares. Earnings have been hurt due to the strength of the euro against the Japanese yen and also
26
Brandes Global Opportunities Value Fund
currencies in emerging markets, which account for approximately 25% of the company’s revenues. Poor cost management, weak demand in Europe and the United States, and higher research and development investments create further pressure on the company’s profitability. Operating margins in its medical business seem depressed despite the company’s relatively strong competitive position, and much of the company’s recent growth has come from emerging markets, which have shown signs of slowing. Moreover, the company has a somewhat complex capital structure.
Amid these challenges, our analysis suggests that Draegerwerk’s shares are undervalued. We like that the company enjoys a strong competitive position in most areas of its medical segment — a business with relatively high barriers to entry — and that a portion of its revenues are recurring in nature, which has contributed to stable cash-flow generation. With regard to the headwinds in emerging markets, we believe they are temporary, as health care infrastructure demand in the region has much room to grow. Ultimately, we believe the investment risks are more than accounted for in the share price.
As of March 31, the Fund had a large allocation of approximately 39% in emerging markets, a third of which to companies based in Brazil. The Fund also maintained a significant overweight vs. the benchmark to the United Kingdom and a major underweight to the United States. About half of our allocation in the United Kingdom was to grocers, while a third was to multinational names not directly impacted by the country’s macroeconomic situation. From a sector perspective, the Fund had a higher allocation than the benchmark to telecommunication services and a lower weighting to information technology.
Our Outlook
Looking ahead, we are excited about the prospects for the Brandes Global Opportunities Value Fund as we believe volatile markets present opportunities for diligent stock pickers and where our bottom-up Graham-and-Dodd value approach should work well. In the 40-plus years since Brandes Investment Partners was founded, our ultimate goal has always been the same: Pursue above-market gains to help you move closer to your long-term investment objectives.
27
Brandes Global Opportunities Value Fund
Thank you for your business and continued trust.
Sincerely yours,
The Brandes All-Cap Investment Committee
Brandes Investment Trust
Past performance does not guarantee future results.
Market conditions may impact performance. The performance results presented were achieved in particular market conditions which may not be repeated. Moreover, the current market volatility and uncertain regulatory environment may have a negative impact on future performance.
The Fund invests in foreign securities, which involve greater volatility and political, economic and currency risks and differences in accounting methods than domestic securities. Emerging country markets involve greater risk and volatility than more developed markets. Some emerging markets countries may have fixed or managed currencies that are not free-floating against the U.S. dollar. Certain of these currencies have experienced, and may experience in the future, substantial fluctuations or a steady devaluation relative to the U.S. dollar. The values of the Fund’s convertible securities are also affected by interest rates; if rates rise, the values of convertible securities may fall. Investments in small and medium capitalization companies tend to have limited liquidity and greater price volatility than investments in large capitalization companies. The Fund may invest in ETFs which are subject to additional risks that do not apply to conventional mutual funds, including the risks that the market price of an ETF’s shares may trade at a discount to its net asset value, an active secondary trading market may not develop or be maintained, or trading may be halted by the exchange on which they trade, which may impact the Fund’s ability to sell its shares.
Diversification does not guarantee a profit or protect from loss in a declining market.
Current and future portfolio holdings are subject to risk.
Graham-and-Dodd Investment Approach: A method described by Benjamin Graham and David Dodd in their 1934 book Security Analysis that uses fundamental analysis to identify securities which may be underpriced relative to the value of their underlying assets.
Price/Book: Price per share divided by book value per share.
Price/Earnings: Price per share divided by earnings per share.
Book Value: Assets minus liabilities. Also known as shareholders’ equity.
28
Brandes Global Opportunities Value Fund
Cash Flow: The amount of cash generated minus the amount of cash used by a company in a given period.
Net Interest Margin: Interest income generated by a financial institution minus the amount of interest paid to its lenders, divided by average earning assets.
Operating Margin: Operating income divided by net sales; used to measure a company’s operating efficiency.
Tangible Book Value: Book value minus intangible assets (e.g., goodwill).
Please refer to the Schedule of Investments in the report for complete holdings information. Fund holdings, geographic allocations and/or sector allocations are subject to change at any time and are not considered a recommendation to buy or sell any security.
The foregoing reflects the thoughts and opinions of Brandes Investment Partners® exclusively and is subject to change without notice.
Brandes Investment Partners® is a registered trademark of Brandes Investment Partners, L.P. in the United States and Canada.
Must be preceded or accompanied by a prospectus.
Index Guide
The MSCI All Country World Index with net dividends measures equity market performance of developed and emerging markets.
MSCI has not approved, reviewed or produced this report, makes no express or implied warranties or representations and is not liable whatsoever for any data in the report. You may not redistribute the MSCI data or use it as a basis for other indices or investment products.
The Brandes Global Opportunities Value Fund is distributed by ALPS Distributors, LLC.
29
Brandes Global Opportunities Value Fund
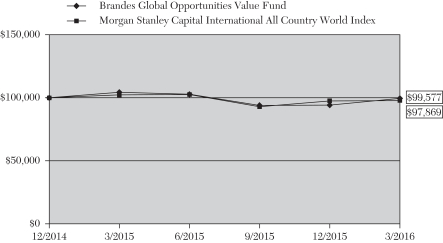
The following chart compares the value of a hypothetical $100,000 investment in the Brandes Global Opportunities Value Fund – Class I from its inception (December 31, 2014) to March 31, 2016 and in the Morgan Stanley Capital International All Country World Index for the same period.
Value of $100,000 Investment vs Morgan Stanley Capital International All Country World Index (Unaudited)
| Average Annual Total Return Periods Ended March 31, 2016 | ||||||||
| One Year | Since Inception(1) | |||||||
Brandes Global Opportunities Value Fund | ||||||||
Class A | -4.75 | % | -0.25 | % | ||||
Class A (with maximum sales charge) | -10.24 | % | -4.88 | % | ||||
Class C | -5.40 | % | -1.03 | % | ||||
Class I | -4.57 | % | -0.34 | % | ||||
Morgan Stanley Capital International All Country World Index | -4.34 | % | -1.71 | % | ||||
| (1) | The inception date is December 31, 2014. |
Performance data quoted represents past performance; past performance does not indicate future results. The investment return and principal value of an investment will fluctuate so that an investor’s shares, when redeemed, may be worth more or less than their original cost. Current performance of the Fund may be lower or higher than the performance quoted. Performance data current to the most recent month end may be obtained by calling 800-331-2979.
30
Brandes Global Opportunities Value Fund
The returns shown do not reflect the deduction of taxes that a shareholder would pay on fund distributions or the redemption of fund shares. The Advisor has a fee waiver arrangement in place to limit the Fund’s annual operating expenses.
Sector Allocation as a Percentage of Total Investments as of March 31, 2016 (Unaudited)
The sector classifications represented in the graph above and industry classifications represented in the Schedule of Investments are in accordance with Global Industry Classification Standard (GICS®), which was developed by and/or is the exclusive property of MSCI, Inc. and Standard & Poor Financial Services LLC.
31
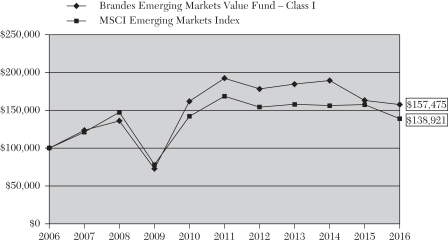
Brandes Emerging Markets Value Fund
Dear Fellow Investor,
Emerging markets ended the six-month period ended March 31, 2016 with a positive note despite concerns mainly fueled by China’s economic slowdown and its implications for the global economy. It was not a smooth ride, however, as the MSCI Emerging Markets Index reached its five-year low in January before reversing course.
Apart from China’s economic trajectory, oil prices also influenced investor sentiment. After a multi-year decline, oil price stabilized during the first months of 2016. The rebound helped emerging-market equities move higher, especially in oil-exporting countries such as Russia.
Brazil came out as one of the period’s strongest performers, even as the country remained mired in political instability amid President Dilma Rousseff’s potential impeachment and former President Lula da Silva’s return to the limelight. Brazilian equities, as measured by the MSCI Brazil Index, gained over 23% in U.S. dollar terms over the last six months.
In this environment, the net asset value of the Brandes Emerging Markets Value Fund (Class I shares) gained 16.97% in the six months ended March 31, 2016. For the same period, the Fund’s benchmark, the MSCI Emerging Markets Index, returned 6.53%.
The Fund
Holdings in Brazil, which have collectively accounted for the Fund’s largest weighting over the last 18 months, contributed positively to performance. The Brazilian real was one of the best-performing currencies in emerging markets in the first quarter of 2016 and its appreciation vs. the U.S. dollar aided returns. Notable contributors included water utility provider Companhia de Saneamento Basico do Estado de Sao Paulo (SABESP), private education company Kroton Educacional, bank Banco do Brasil and telecommunication services provider Telefonica Brasil.
Allocation to India, where conglomerate Reliance Infrastructure was the Fund’s only holding, also helped performance. Furthermore, the Fund’s significant underweight to China enhanced relative returns. As of March 31, the Fund allocated approximately 7% to companies in China, compared to the near 24% weighting in the MSCI Emerging Markets Index.
From a sector perspective, allocations to utilities, financials and telecommunication services boosted performance. Other strong contributors included Panamanian airline Copa Holdings, as well as steelmakers Luxembourg-domiciled Ternium and South Korean POSCO.
Performance detractors included holdings in Hong Kong, mainly retailers Chow Tai Fook Jewellery Group, Lifestyle International Holdings and Luk Fook
32
Brandes Emerging Markets Value Fund
Holdings. The Fund’s significant underweight to Taiwan also hurt relative returns, along with allocation to South Korea.
Additionally, U.K.-based Standard Chartered Bank weighed on performance. While domiciled in the United Kingdom, Standard Chartered has meaningful risk exposure to Asia and Africa, as well as to commodities, weighing on returns in the near term. However, we believe the risk/reward tradeoff warrants a modest allocation as the company traded at 50% of tangible book value as of March 31.
On a sector basis, allocation to information technology delivered positive absolute return but detracted from relative performance.
Fund activity was relatively light during the period. New purchases included Greece-based Hellenic Telecommunications Organization and Taiwanese semiconductor company MediaTek.
MediaTek is the world’s second-largest supplier of mobile phone-related semiconductors. The company has benefited significantly over the past few years due in large part to its strong relationships with smartphone vendors in China, where growth has been significant.
MediaTek competes in a difficult market environment, with relatively low barriers to entry and low customer stickiness. In addition, it is unlikely that MediaTek’s core end market (i.e. Chinese smartphones) can sustain the growth it has delivered in recent years, potentially keeping future returns from being as strong as they have been.
2015 was a challenging period for MediaTek as increased competition and various macroeconomic issues dampened the market’s prior unrealistic enthusiasm and expectations. Nevertheless, we believe the market overreacted to MediaTek’s issues and provided us with a good entry point for investment. As one of the main longstanding players in mobile phone-related semiconductors, MediaTek has generated attractive financial returns historically despite the industry’s tough competitive dynamics. While we expect an even more competitive environment, which may lead to margin compression, we take comfort in the company’s strong balance sheet and believe the shares offer an attractive risk/reward tradeoff.
Positions sold during the period included Czech Ceska Telekomunikacni Infrastruktura (CETIN), Hong Kong-headquartered footwear manufacturer Yue Yuen Industrial, and Turkish gas company Aygaz and health care provider Selcuk Ezra.
CETIN’s acquisition by investment group PPF, which had already owned 90% of the company, was completed in the first quarter of 2016, ending its short run as an independent firm. CETIN was created in June 2015 as O2 Czech Republic decided to spin off its infrastructure assets. Shortly thereafter, PPF, which was already O2’s majority owner, announced its plan to acquire the then-new company.
33
Brandes Emerging Markets Value Fund
As of March 31, the Fund held its largest country overweight in Brazil, with about 20% allocation vs. less than 7% in the benchmark. On the contrary, India and Taiwan continued to represent areas where we have not uncovered much value potential.
Outlook
The objective of the Brandes Emerging Markets Value Fund is to seek capital appreciation over the long term. Although the last year or so has been difficult for value investors in emerging markets, we have started to see our conviction and discipline bear fruit. This focus enables us to pursue potentially undervalued opportunities, just as it equips us to avoid potentially overvalued areas. For example, we have long been skeptical about the valuation levels and what we considered lofty market expectations for many Chinese companies. As such, we have found relatively less value in China, resulting in a significant underweight relative to the benchmark. In recent quarters, this underweight has contributed positively to our relative performance.
Unsurprising in a time where fear drives investor sentiment, emerging-market equities continue to appear attractive, with the MSCI Emerging Markets Index trading at 1.4x price-to-book ratio as of March 31 — a level we’ve observed few times in the last two decades. However, as undervalued as we believe the asset class remains as a whole, it is important to note that not all areas are appealing. With the diversity of emerging-market companies and their varying fundamental strengths, “simply being there” is not the best way to access opportunities within the asset class. Rather, it is our view that investors can be best served by applying a selective, flexible investment approach that an actively managed strategy, such as the Brandes Emerging Markets Value Fund, offers.
Thank you for your continued trust.
Sincerely yours,
The Brandes Emerging Markets Investment Committee
Brandes Investment Trust
34
Brandes Emerging Markets Value Fund
Past performance does not guarantee future results.
Market conditions may impact performance. The performance results presented were achieved in particular market conditions which may not be repeated. Moreover, the current market volatility and uncertain regulatory environment may have a negative impact on future performance.
The Fund invests in foreign securities, which involve greater volatility and political, economic and currency risks and differences in accounting methods than domestic securities. Emerging country markets involve greater risk and volatility than more developed markets. Some emerging markets countries may have fixed or managed currencies that are not free-floating against the U.S. dollar. Certain of these currencies have experienced, and may experience in the future, substantial fluctuations or a steady devaluation relative to the U.S. dollar. The values of the Fund’s convertible securities are also affected by interest rates; if rates rise, the values of convertible securities may fall. Investments in small and medium capitalization companies tend to have limited liquidity and greater price volatility than investments in large capitalization companies. The Fund may invest in ETFs which are subject to additional risks that do not apply to conventional mutual funds, including the risks that the market price of an ETF’s shares may trade at a discount to its net asset value, an active secondary trading market may not develop or be maintained, or trading may be halted by the exchange on which they trade, which may impact the Fund’s ability to sell its shares.
Diversification does not guarantee a profit or protect from loss in a declining market.
Current and future portfolio holdings are subject to risk.
Margin Compression: A decrease in a company’s operating margin (operating margin = operating income divided by sales).
Price/Book: Price per share divided by book value per share.
Tangible Book Value: Book value minus intangible assets (e.g., goodwill).
Please refer to the Schedule of Investments in the report for complete holdings information. Fund holdings, geographic allocations and/or sector allocations are subject to change at any time and are not considered a recommendation to buy or sell any security.
The foregoing reflects the thoughts and opinions of Brandes Investment Partners® exclusively and is subject to change without notice.
Brandes Investment Partners® is a registered trademark of Brandes Investment Partners, L.P. in the United States and Canada.
35
Brandes Emerging Markets Value Fund
Must be preceded or accompanied by a prospectus.
Index Guide
The MSCI Brazil Index is designed to measure the performance of the large and mid cap segments of the Brazilian market. With 67 constituents, the index covers about 85% of the Brazilian equity universe.
The MSCI Emerging Markets Index with gross dividends measures equity market performance of emerging markets.
MSCI has not approved, reviewed or produced this report, makes no express or implied warranties or representations and is not liable whatsoever for any data in the report. You may not redistribute the MSCI data or use it as a basis for other indices or investment products.
The Brandes Emerging Markets Value Fund is distributed by ALPS Distributors, LLC.
36
Brandes Emerging Markets Value Fund
The following chart compares the value of a hypothetical $100,000 investment in the Brandes Emerging Markets Value Fund – Class I from March 31, 2006 to March 31, 2016 and in the Morgan Stanley Emerging Markets Index for the same period.
Value of $100,000 Investment vs Morgan Stanley Capital Emerging Markets Index (Unaudited)
| Average Annual Total Return Periods Ended March 31, 2016** | ||||||||||||||||
| One Year | Five Years | Ten Years | Since Inception(1) | |||||||||||||
Brandes Emerging Markets Value Fund | ||||||||||||||||
Class A | -3.83 | % | -4.19 | % | 4.39 | % | 6.85 | % | ||||||||
Class A (with maximum sales charge) | -9.36 | % | -5.32 | % | 3.78 | % | 6.53 | % | ||||||||
Class C* | -4.48 | % | -4.86 | % | 3.62 | % | 6.06 | % | ||||||||
Class I | -3.50 | % | -3.93 | % | 4.65 | % | 7.12 | % | ||||||||
Morgan Stanley Capital International Emerging Markets Index | -11.70 | % | -3.80 | % | 3.34 | % | 5.70 | % | ||||||||
| (1) | The inception date is August 20, 1996. |
| * | Performance shown prior to January 31, 2013 for Class C shares reflects the performance of Class I shares adjusted to reflect Class C expenses. |
| ** | Prior to January 31, 2011, the Advisor managed a private investment fund with an investment objective, investment policies and strategies that were, in all material respects, equivalent to those of the Brandes Emerging Markets Value Fund. The performance information shown for the Class I shares for periods before January 31, 2011 is that of the private investment fund and reflects the net expenses of the private investment fund. The performance of the private investment fund prior to January 31, 2011 is based on a calculation method that is different from the standardized calculation method prescribed by the SEC. The performance information shown for the Class A shares has been adjusted to reflect the differences in the net expense ratios between the Class I and A shares. The private investment fund was not registered under the Investment Company Act of 1940 (“1940 Act”) and was not subject to certain investment limitations, diversification requirements, and other restrictions imposed by the 1940 Act and the Internal Revenue Code of 1986, which, if applicable, may have adversely affected its performance. |
37
Brandes Emerging Markets Value Fund
Performance data quoted represents past performance; past performance does not indicate future results. The investment return and principal value of an investment will fluctuate so that an investor’s shares, when redeemed, may be worth more or less than their original cost. Current performance of the Fund may be lower or higher than the performance quoted. Performance data current to the most recent month end may be obtained by calling 800-331-2979.
The returns shown do not reflect the deduction of taxes that a shareholder would pay on fund distributions or the redemption of fund shares. The Advisor has a fee waiver arrangement in place to limit the Fund’s annual operating expenses.
Sector Allocation as a Percentage of Total Investments as of
March 31, 2016 (Unaudited)
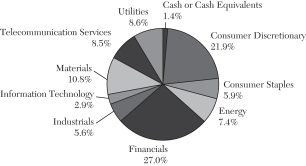
The sector classifications represented in the graph above and industry classifications represented in the Schedule of Investments are in accordance with Global Industry Classification Standard (GICS®), which was developed by and/or is the exclusive property of MSCI, Inc. and Standard & Poor Financial Services LLC.
38
Brandes International Small Cap Equity Fund
Dear Fellow Investor,
After moving generally higher in the fourth quarter of 2015, equity markets worldwide gave up some of their gains in the first quarter of 2016 to close the period with mixed performance. Optimism over the U.S. economy’s resilience took a back seat to worries over slowing growth elsewhere in the world, falling oil prices, as well as the ramifications of negative interest rates in some parts of Europe and Japan. Adding to the list were uncertainties surrounding the U.S. presidential election cycle.
Monetary policy outside the United States remained accommodative. The European Central Bank announced more interest-rate cuts, bond purchases and a potential lender subsidy to combat the threat of deflation and jump start growth. In Japan, the government is expected to announce additional stimulus measures to help counter the effects of sluggish consumption and China’s economic slowdown.
Following a volatile period, emerging markets recorded gains, with Brazilian equities among the top performers even as the country remained mired in political instability amid President Dilma Rousseff’s potential impeachment and former President Lula da Silva’s return to the limelight. Additionally, oil-price stabilization helped equities of oil exporters such as Russia.
Against this backdrop, the net asset value of the Brandes International Small Cap Equity Fund (Class I Shares) advanced 7.91% in the six months ended March 31, 2016. For the same period, the S&P Developed Ex-U.S. SmallCap Index rose 5.76%.
The Fund
During the period, the Fund benefited from investments across a diverse set of countries, sectors and industries.
Allocation to utilities, information technology and consumer staples were noteworthy positive contributors, along with positions in the United Kingdom, India and Brazil. The Brazilian real was one of the best-performing currencies in emerging markets in the first quarter of 2016 and its appreciation vs. the U.S. dollar aided returns.
On an individual security basis, Indian conglomerate Reliance Infrastructure, Canadian wood-based products company Norbord, Brazilian water utility Companhia de Saneamento Básico do Estado de São Paulo (SABESP) and Swiss Micronas Semiconductor helped performance significantly. In December 2015, TDK Corporation, a Japanese multinational electronics company, announced an all-cash public tender offer for Micronas that was priced at a 60% premium to its publicly traded market value. We accepted the cash offer as it approximated our estimate of the company’s intrinsic value.
Meanwhile, allocations to financials, health care and industrials weighed on relative performance, as did a lack of exposure to Australia. Holdings that detracted from
39
Brandes International Small Cap Equity Fund
returns included U.K.-based banknotes printing company De la Rue and real-estate services provider LSL Property Services, as well as Japanese Hyakugo Bank.
The Small-Cap Investment Committee exited a number of positions in the period. In addition to the aforementioned Micronas Semiconductor, holdings divested included Danish pharmaceutical firm H. Lundbeck, Italian utility Iren and British marketing services company Chime Communications. The investment committee also sold the Fund’s position in U.K.-based temporary power provider APR Energy, whose acquisition by a group of private equity firms was completed in February.
Additionally, the investment committee took advantage of volatile markets to initiate positions in companies which, based on our analysis, exhibited attractive prices relative to their intrinsic value estimates. New purchases included Japanese leisure products company Sega Sammy Holdings, Hachijuni Bank and consumer electronics company Funai Electric.
Some investors may associate the Sega Sammy name with the Sega home video game console, which peaked in popularity in the 1990s. While the video-game business remains a part of Sega Sammy, the company’s largest segment is the manufacturing and sale of pachinko (pinball) and pachislot (slot) machines in Japan. Pachinko and pachislot parlors can be found all over Japan and are the largest platform for gambling as these parlors are structured in a way to get around the country’s anti-gambling laws. The first commercial pachinko parlor opened in 1948 and Sega Sammy estimated equipment sales in Japan to be about $9.7 billion in 2014.
Sega Sammy has been facing operational issues, which we believe have been more than accounted for in its market price. Recent earnings have been lower than the last several years. This is partly due to lower hardware sales in the pachinko segment, as well as restructuring and investment in the entertainment segment (e.g., video games). We believe both of these issues are temporary in nature and not necessarily indicative of the prospects for the company. Moreover, Sega Sammy has invested significant capital in two resorts in Korea, which have yet to contribute to earnings.
We appreciate that more than half of Sega Sammy’s market capitalization consists of cash and investments, providing a solid floor to company valuation, in our opinion. Adjusting for the excess cash and investments, the company’s operations traded at less than 13x depressed earnings as of March 31 — a level that we considered attractive. Weighing the company’s strengths against its challenges, we believe Sega Sammy provides an appealing risk/reward proposition to long-term investors.
As of March 31, holdings in Japan, the United Kingdom and emerging-market countries accounted for the Fund’s largest weightings from a regional perspective.
40
Brandes International Small Cap Equity Fund
From a sector standpoint, the Fund held its key overweights vs. the benchmark in consumer staples and utilities, and its key underweights in financials and materials. Additionally, the Fund had no allocation to the energy sector as of March 31.
Outlook
We like to say that international small-cap equities represent a big pond with a lot of “fish” and yet few “fishermen” — in our opinion an ideal environment for active stock pickers. Launched in 1996, the Brandes International Small Cap Equity Fund is one of only 13 actively managed international small-cap value funds with a track record over 10 years.* We are highly familiar with the investing dynamics of the international small-cap space and with the business model of each of our holdings.
Although we cannot predict how the international small-cap equity market will move over the coming years, we remain committed to our style of patient, long-term investing. Over the past year or so, the Fund’s cash level has drifted up. Our mandate is to generally be fully invested, although we do have some flexibility as market conditions warrant. We believe now is one of those times to remain selective and patient as we await new value opportunities.
Looking ahead, we are excited about the prospects of the Fund. As always, thank you for your continued trust.
Sincerely yours,
The Brandes Small-Cap Investment Committee
Brandes Investment Trust
Past performance does not guarantee future results.
Market conditions may impact performance. The performance results presented were achieved in particular market conditions which may not be repeated. Moreover, the current market volatility and uncertain regulatory environment may have a negative impact on future performance.
The Fund invests in foreign securities, which involve greater volatility and political, economic and currency risks and differences in accounting methods than domestic securities. Emerging country markets involve greater risk and volatility than more developed markets. Some emerging markets countries may have fixed or managed currencies that are not free-floating against the U.S. dollar. Certain of these currencies have experienced, and may experience in the future, substantial fluctuations or a steady devaluation relative to the U.S. dollar. The values of the Fund’s convertible securities are also affected by interest rates; if rates rise, the values of convertible securities may fall. Investments in small and medium capitalization companies tend to have limited liquidity and greater price
| * | Source: Morningstar as of 12/31/2015; excludes Index Funds. |
41
Brandes International Small Cap Equity Fund
volatility than investments in large capitalization companies. The Fund may invest in ETFs which are subject to additional risks that do not apply to conventional mutual funds, including the risks that the market price of an ETF’s shares may trade at a discount to its net asset value, an active secondary trading market may not develop or be maintained, or trading may be halted by the exchange on which they trade, which may impact the Fund’s ability to sell its shares.
Diversification does not guarantee a profit or protect from loss in a declining market.
Current and future portfolio holdings are subject to risk.
Margin Compression: A decrease in a company’s operating margin (operating margin = operating income divided by sales).
Please refer to the Schedule of Investments in the report for complete holdings information. Fund holdings, geographic allocations and/or sector allocations are subject to change at any time and are not considered a recommendation to buy or sell any security.
The foregoing reflects the thoughts and opinions of Brandes Investment Partners® exclusively and is subject to change without notice.
Brandes Investment Partners® is a registered trademark of Brandes Investment Partners, L.P. in the United States and Canada.
Must be preceded or accompanied by a prospectus.
Index Guide
The S&P Developed Ex-U.S. SmallCap Index with gross dividends measures the equity performance of small capitalization companies from developed markets around the world, excluding the United States.
The MSCI Brazil Index is designed to measure the performance of the large and mid cap segments of the Brazilian market. With 67 constituents, the index covers about 85% of the Brazilian equity universe.
The MSCI Europe Index with net dividends measures equity market performance of developed markets in Europe.
The MSCI Japan Index is designed to measure the performance of the large and mid cap segments of the Japanese market. With 318 constituents, the index covers approximately 85% of the free float-adjusted market capitalization in Japan.
MSCI has not approved, reviewed or produced this report, makes no express or implied warranties or representations and is not liable whatsoever for any data in the report. You may not redistribute the MSCI data or use it as a basis for other indices or investment products.
One cannot invest directly in an index.
The Brandes International Small Cap Equity Fund is distributed by ALPS Distributors, LLC.
42
Brandes International Small Cap Equity Fund
The following chart compares the value of a hypothetical $100,000 investment in the Brandes International Small Cap Fund – Class I from March 31, 2006 to March 31, 2016 and in the S&P Developed Small Cap – Excluding U.S. Index for the same period.
Value of $100,000 Investment vs S&P Developed
Small Cap – Ex. U.S. Index (Unaudited)
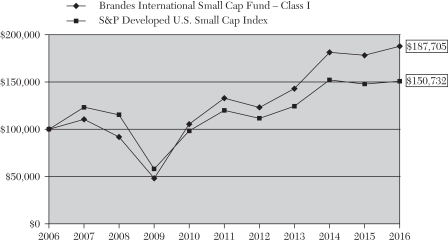
| Average Annual Total Return Periods Ended March 31, 2016** | ||||||||||||||||
| One Year | Five Years | Ten Years | Since Inception(1) | |||||||||||||
Brandes International Small Cap Fund | ||||||||||||||||
Class A | 5.23 | % | 6.94 | % | 6.25 | % | 10.04 | % | ||||||||
Class A (with maximum sales charge) | -0.82 | % | 5.68 | % | 5.62 | % | 9.71 | % | ||||||||
Class C* | 4.48 | % | 6.16 | % | 5.46 | % | 9.22 | % | ||||||||
Class I | 5.44 | % | 7.18 | % | 6.50 | % | 10.31 | % | ||||||||
S&P Developed Small Cap Ex. U.S. Index | 1.96 | % | 4.69 | % | 4.19 | % | 6.72 | % | ||||||||
| (1) | The inception date is August 19, 1996. |
| * | Performance shown prior to January 31, 2013 for Class C shares reflects the performance of Class I shares adjusted to reflect Class C expenses. |
| ** | Prior to February 1, 2012, the Advisor managed a private investment fund with an investment objective, investment policies and strategies that were, in all material respects, equivalent to those of the Brandes International Small Cap Fund. The performance information shown for the Class I shares for periods before February 1, 2012 is that of the private investment fund and reflects the net expenses of the private investment fund. The performance of the private investment fund prior to February 1, 2012 is based on a calculation method that is different from the standardized calculation method prescribed by the SEC. The performance information shown for the Class A shares has been adjusted to reflect the differences in the net expense ratios between the Class I and A shares. The private investment fund was not registered under the Investment Company Act of 1940 (“1940 Act”) and was not subject to certain investment limitations, diversification requirements, and other restrictions imposed by the 1940 Act and the Internal Revenue Code of 1986, which, if applicable, may have adversely affected its performance. |
43
Brandes International Small Cap Equity Fund
Performance data quoted represents past performance; past performance does not indicate future results. The investment return and principal value of an investment will fluctuate so that an investor’s shares, when redeemed, may be worth more or less than their original cost. Current performance of the Fund may be lower or higher than the performance quoted. Performance data current to the most recent month end may be obtained by calling 800-331-2979.
The returns shown do not reflect the deduction of taxes that a shareholder would pay on fund distributions or the redemption of fund shares. The Advisor has a fee waiver arrangement in place to limit the Fund’s annual operating expenses.
Sector Allocation as a Percentage of Total Investments as of
March 31, 2016 (Unaudited)
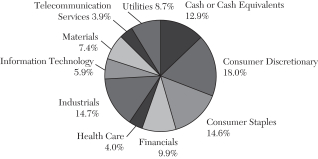
The sector classifications represented in the graph above and industry classifications represented in the Schedule of Investments are in accordance with Global Industry Classification Standard (GICS®), which was developed by and/or is the exclusive property of MSCI, Inc. and Standard & Poor Financial Services LLC.
44
Brandes Core Plus Fixed Income Fund
Dear Fellow Investor,
Amid an assortment of concerns that influenced the U.S. fixed-income market in the six months ended March 31, 2016, three main themes stood out: 1) implications and breadth of the Federal Reserve’s interest-rate policy; 2) heightened volatility amid rising risk aversion; and 3) scarce market liquidity.
After seven years of a near-zero interest-rate policy, the Fed raised the federal funds rate by 0.25% in December. The increase was the first in nine years, and signaled the beginning of what the Fed hopes to be a normalization of policy after years of emergency and historically unprecedented measures. Fed guidance, however, suggested that the rate hike, which marked the sixth tightening cycle since 1979, will be slow and gradual. The markets appeared to have priced in two rate hikes over the course of 2016.
Investors also grappled with the specter of a potential U.S. recession, slowing growth in China and falling commodity prices. Central banks around the world were out in force attempting to stimulate an anemic global economy. The Bank of China lowered its reserve requirement ratio to free up capital for lending. The Bank of Japan and European Central Bank (ECB) lowered interest rates to negative territory. The ECB also announced it would begin to purchase nonbank investment-grade corporate bonds as part of its monthly asset purchase plan. Meanwhile, the Fed took a pass at raising rates twice, at both its January and March meetings.
In this environment, we saw credit spreads start to move wider in late 2015 following a relatively long stretch of benign volatility. This trend accelerated in early 2016.
Another big story was the liquidity squeeze in the bond market, as demonstrated by the sharp selloff in high-yield securities in the fourth quarter of 2015, when investors sold bonds with the lowest credit quality. The weakness in the lowest-quality tier of the market eventually spread to the broader high-yield and investment-grade sectors. Sharp high-yield fund outflows combined with poor liquidity resulted in many large gap-downs in bond pricing. The redemption freeze at two distressed credit funds toward yearend 2015 brought out comparisons to Bear Stearns closing two mortgage-backed security (MBS) funds in 2007.1
The risk-off sentiment for the most part of the six-month period permeated the fixed-income markets and propelled investors to seek safety in U.S. Treasury securities, sending interest rates toward multi-year lows.
| 1 | Bloomberg 12/15/15: Third Avenue, Stone Lion Capital Spark Memories of ’08: Analysis ‘Contagion’ is back on the worry list. |
45
Brandes Core Plus Fixed Income Fund
The Fund
The Brandes Core Plus Fixed Income Fund (Class I Shares) gained 1.15% during the six months ended March 31, 2016, while its benchmark, the Barclays U.S. Aggregate Bond Index, returned 2.44%.
The largest negative contributors were holdings in the energy sector. The largest individual detractor was our holding in Chesapeake Energy.
Chesapeake is the second-largest natural gas producer in North America. The company replaced its free-spending CEO, Aubrey McClendon, in June 2013 with an accomplished executive from Anadarko Petroleum, Doug Lawler. The new CEO has made it a priority to emphasize corporate discipline with an eye toward improving the company’s stretched balance sheet. The early results were positive with the company able to reduce debt, keep spending levels within budget and reduce headcount.
Oil and natural gas prices dropped sharply during the quarter due to an oversupplied market, the unseasonably warm start to the winter season and the continued global economic malaise. Additionally, oil and gas companies such as Chesapeake effectively have to mark their reserves to market (through PV-10 calculation; see explanation on page 4) based on current oil and natural gas prices. The drop in prices has resulted in a large re-calculation of the company’s asset value to below the value of its outstanding debt. Bond prices reacted swiftly to the new asset coverage.
After a significant drop in bond prices, Chesapeake commenced an exchange offer in an effort to bolster liquidity and reduce outstanding long-term debt. The company was able to place a new second-lien security through a tender offer for existing unsecured notes which resulted in a debt reduction of approximately $1.5 billion.
Chesapeake appears to have a visible liquidity runway until late 2017/early 2018 at current natural gas and oil prices. The company needs a recovery in energy prices or execution of some asset sales in the next two years to avoid becoming a likely bankruptcy candidate. The company has survived a number of near-collapses in the late 1990s, 2008 and 2012 in part due to creative financing and ability to execute asset sales. Prior asset sales have generally been above book value due in large part to the quality of the acreage positions, as Chesapeake has been involved in almost every U.S. major resource play. The company also has a large amount of “unproven reserves.” The market currently assigns a value of zero to this land based on current energy prices and an oversupplied market, but if we see an upward move in energy prices, this land could have meaningful value.
46
Brandes Core Plus Fixed Income Fund
Industry capital expenditures (capex) were meaningfully lower in 2015 and Moody’s forecasts 2016 capex to be down an additional 20% to 25% in 20162 as a result of lower prices, which should eventually have an impact on the oversupply.
In summary, there is a wide range of outcomes for Chesapeake bonds. If there is no recovery in energy prices over the next two years, the company likely becomes a bankruptcy candidate and recoveries on unsecured bonds could be close to current market prices, in our view. A modest recovery in energy prices or a few well-executed asset sales should yield positive cash flow and bonds that mature at par. Based on likely supply cuts in 2016 and Chesapeake’s historically valuable and severable acreage holdings, we believe the risk/return tradeoff is now in the bondholder’s favor and we added to our position in Chesapeake in the period.
During the fourth quarter of 2015 and into the first quarter of 2016 we initiated positions in several companies in the energy sector, which in our view have meaningful coverage of their outstanding debt through their tangible assets. Essentially, we believe these companies have the balance sheet strength to weather a protracted downturn in energy prices.
Many of these bonds contributed to the Fund’s underperformance toward the end of 2015, as we were early, in retrospect, to initiate positions. However, the continued credit-spread widening in the early part of 2016 enabled us to build larger positions in what we view as strong, mispriced credits, such as ExxonMobil, British Petroleum and Occidental Petroleum.
Duration was set toward the lower end of our duration controlled band. This positioning modestly detracted from relative performance as interest rates not only remained stubbornly low, but fell further to multi-year lows during the period.
The Fund received positive contributions from holdings in electric utilities and credits in the building products and paper industries.
During the period, we took advantage of the widening of credit spreads to increase weightings in a number of securities at what we considered attractive prices and yields. As mentioned earlier, we added to a few positions in the energy sector. In addition, we added to our existing holdings in ADT Corp. and Tesco Plc.
We took advantage of the relative weakness of agency mortgage backed securities (MBS) in early 2016 to increase our allocation. We have been underweight agency MBS for the past several years due to what we believe was a large supply-demand imbalance in this sector, with the Fed purchasing an enormous amount of supply either through outright purchases or, more recently, continued reinvestment coupons and principal repayments. The agency MBS sector lagged the
| 2 | Oil and Gas Journal 1/4/16: Moody’s: Firms to see constrained spending, heightened risk in 2016 http://www.ogj.com/articles/2016/01/moody-s-firms-to-see-constrained-spending-heightened-risk-in-2016.html |
47
Brandes Core Plus Fixed Income Fund
performance of virtually every taxable fixed-income sector during the first quarter. While we added agency MBS to the fund during the quarter, we remain underweight relative to the benchmark.
We also initiated positions in homebuilders Toll Brothers Corp (4.875% coupon rate, maturing November 2025 and rated Ba1/BB+) and PulteGroup Inc. (5.50% coupon rate, maturing March 2026 and rated Ba1/BB+). We had owned bonds from Toll Brothers and Pulte in the past. In fact, we first purchased bonds from both Toll Brothers and Pulte in the 2007/2008 period. We held our Toll Brothers bond until it matured in November 2015, while our Pulte security purchased during that time frame is set to mature in early May.
Finally, we purchased Sprint Communications (9.00% coupon rate, maturing November 2018 and rated B1/BB). This particular issue from Sprint is a senior unsecured note, but is guaranteed by all of its subsidiaries; it is one of two such notes in the company’s debt complex and is the nearest maturity guaranteed note. Therefore, it is effectively structurally senior to other Sprint senior unsecured notes. Sprint is also 80% owned by Softbank, a Japanese telecommunications company. Sprint is one of the largest issuers in the high-yield market. The company’s bond price declined in the quarter, and based on our observations during the latest bout of market illiquidity and resulting volatility, many investors sell what they can rather than what they want. We believe this $3-billion issue of Sprint provides a good example of the current trading environment. In our view, this security has good asset coverage based on Sprint’s wireless spectrum holdings and good support from Softbank, which is a higher-rated credit. Therefore, we believe that we were able to establish a position in Sprint at an attractive yield relative to the underlying credit fundamentals.
Outlook
On balance, we are positioned defensively, but have started to find more opportunities that we believe can deliver long-term value. We maintain a strong preference for asset-rich credits.
For the remainder of 2016, we would not be surprised to see the market operate in fits and starts. Each bout of volatility has appeared to bring an outsized reaction relative to past behavior. We believe a good deal of this is attributable to the market’s liquidity challenges. In this environment, the Brandes fixed-income team will continue to adhere to a measured and deliberate approach to security selection, while selectively looking to add mispriced yield. We are positioned with ample dry powder to pursue potential mispricing opportunities, ready to act if company fundamentals disengage from their market price.
48
Brandes Core Plus Fixed Income Fund
We believe that a careful path remains the most prudent approach for protecting capital and adding value to client portfolios over the coming years.
Sincerely yours,
The Brandes Fixed-Income Investment Committee
Brandes Investment Trust
Past performance does not guarantee future results.
Because the values of the Fund’s investments will fluctuate with market conditions, so will the value of your investment in the Fund. You could lose money on your investment in the Fund, or the Fund could underperform other investments. As with most fixed income funds, the income on and value of your shares in the Fund will fluctuate along with interest rates. When interest rates rise, the market prices of the debt securities the Fund owns usually decline. When interest rates fall, the prices of these securities usually increase. Generally, the longer the Fund’s average portfolio maturity and the lower the average quality of its portfolio, the greater the price fluctuation. The price of any security owned by the Fund may also fall in response to events affecting the issuer of the security, such as its ability to continue to make principal and interest payments or its credit rating. Below investment grade debt securities are speculative and involve a greater risk of default and price change due to changes in the issuer’s creditworthiness. The market prices of these debt securities may fluctuate more than the market prices of investment grade debt securities and may decline significantly in periods of general economic difficulty.
Investing in foreign securities poses additional risks. The performance of foreign securities can be adversely affected by the different political, regulatory and economic environments and other overall economic conditions in the countries where the Fund invests. Emerging country markets involve greater risk and volatility than more developed markets. Some emerging markets countries may have fixed or managed currencies that are not free-floating against the U.S. dollar. Certain of these currencies may experience substantial fluctuations or steady devaluation relative to the U.S. dollar. Mortgage-related securities are subject to certain additional risks. Rising interest rates tend to extend the duration of mortgage-related securities, making them more sensitive to changes in interest rates. As a result, when holding mortgage-related securities in a period of rising interest rates, the Fund may exhibit additional volatility. In addition, mortgage-related securities are subject to prepayment risk. When interest rates decline, borrowers may pay off their mortgages sooner than expected. This can reduce the returns of the Fund because it will have to reinvest that money at the lower prevailing interest rates.
49
Brandes Core Plus Fixed Income Fund
Asset coverage: A company’s ability to cover debt obligations with its assets after all liabilities have been satisfied. Source: Investopedia.com
Dry powder: Securities considered to be dry powder could be Treasuries, or other fixed income investments, and can be liquidated on short notice, in order to provide emergency operational funding or allow an investor to purchase assets.
Duration: The weighted maturity of a fixed-income investment’s cash flows, used in the estimation of the price sensitivity of fixed-income securities for a given change in interest rates.
Federal funds rate: The interest rate at which a depository institution lends funds maintained at the Federal Reserve to another depository institution overnight.
Gap down: A situation in which a security’s opening price is lower than the previous day’s closing price.
Margin of safety: The discount of a security’s market price to what the firm believes is the intrinsic value of that security.
PV 10: Present value of estimated future oil and gas revenues, net of estimated direct expenses, discounted at an annual discount rate of 10%. This nomenclature is most commonly used in the energy industry, and is used to estimate the present value of a company’s proved oil and gas reserves. Source: Investopedia.com
Risk off: Refers to an investment setting in which price behavior responds to, and is driven by, changes in investor risk tolerance. During periods when risk is perceived as low, risk-on risk-off theory states that investors tend to engage in higher-risk investments. Source: Investopedia.com
Yield: annual income from the investment (dividend, interest, etc.) divided by the current market price of the investment.
There is no assurance that a forecast will be accurate. Because of the many variables involved, an investor should not rely on forecasts without realizing their limitations.
Bond ratings are grades given to bonds that indicate their credit quality as determined by a private independent rating service such as Standard & Poor’s or Moody’s. The service evaluates a bond issuer’s financial strength, or its ability to pay a bond’s principal and interest in a timely fashion. Ratings are expressed as letters ranging from ‘AAA’, which is the highest grade, to ‘D’, which is the lowest grade. In limited situations when the rating agency has not issued a formal rating, the Advisor will classify the security as nonrated.
Please refer to the Schedule of Investments in the report for complete holdings information. Fund holdings, geographic allocations and/or sector allocations are subject to change at any time and are not a recommendation to buy or sell any security.
50
Brandes Core Plus Fixed Income Fund
Investment performance reflects fee waivers and/or reimbursement of expenses. In the absence of such waivers/reimbursements, total return would be reduced.
The foregoing reflects the thoughts and opinions of Brandes Investment Partners® exclusively and is subject to change without notice.
Brandes Investment Partners® is a registered trademark of Brandes Investment Partners, L.P. in the United States and Canada.
Must be preceded or accompanied by a prospectus.
Index Guide
The Barclays U.S. Aggregate Bond Index is a broad-based benchmark that measures the investment grade, U.S. dollar-denominated, fixed-rate taxable bond market. This index is a total return index which reflects the price changes and interest of each bond in the index.
Please note that all indices are unmanaged are not available for direct investment.
The Brandes Core Plus Fixed Income Fund is distributed by ALPS Distributors, LLC.
51
Brandes Core Plus Fixed Income Fund
The following chart compares the value of a hypothetical $100,000 investment in the Brandes Core Plus Fixed Income Fund – Class I from its inception (December 28, 2007) to March 31, 2016 and in the Barclays Capital U.S. Aggregate Index for the same period.
Value of $100,000 Investment vs Barclays Capital U.S. Aggregate Index (Unaudited)
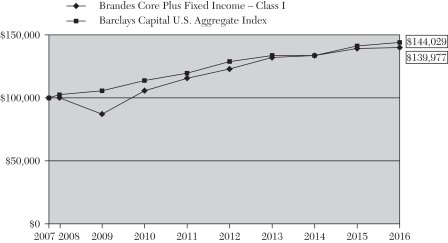
| Average Annual Total Return Periods Ended March 31, 2016 | ||||||||||||||||
| One Year | Three Years | Five Years | Since Inception(1) | |||||||||||||
Brandes Core Plus Fixed Income Fund | ||||||||||||||||
Class A* | 0.32 | % | 1.65 | % | 3.53 | % | 3.86 | % | ||||||||
Class A* (with maximum sales charge) | -3.41 | % | 0.35 | % | 2.74 | % | 3.38 | % | ||||||||
Class E* | 0.34 | % | 1.77 | % | 3.73 | % | 3.97 | % | ||||||||
Class I | 0.57 | % | 1.97 | % | 3.89 | % | 4.16 | % | ||||||||
Barclays Capital U.S. Aggregate Index | 1.96 | % | 2.50 | % | 3.78 | % | 4.52 | % | ||||||||
| (1) | The inception date is December 28, 2007. |
| * | Performance shown prior to January 31, 2013 for Class A shares reflects the performance of Class I shares adjusted to reflect Class A expenses. Performance shown prior to May 28, 2008 for Class E shares reflects the performance of Class I shares adjusted to reflect Class E expenses. |
52
Brandes Core Plus Fixed Income Fund
Performance data quoted represents past performance; past performance does not indicate future results. The investment return and principal value of an investment will fluctuate so that an investor’s shares, when redeemed, may be worth more or less than their original cost. Current performance of the Fund may be lower or higher than the performance quoted. Performance data current to the most recent month end may be obtained by calling 800-331-2979.
The returns shown do not reflect the deduction of taxes that a shareholder would pay on fund distributions or the redemption of Fund shares. The Advisor has a fee waiver arrangement in place to limit the Fund’s annual operating expenses.
Sector Allocation as a Percentage of Total Investments as of
March 31, 2016 (Unaudited)
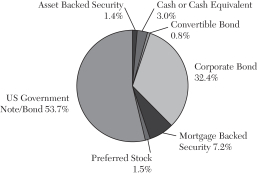
53
Brandes Credit Focus Yield Fund
Dear Fellow Investor,
Amid an assortment of concerns that influenced the U.S. fixed-income market in the six months ended March 31, 2016, three main themes stood out: 1) implications and breadth of the Federal Reserve’s interest-rate policy; 2) heightened volatility amid rising risk aversion; and 3) scarce market liquidity.
After seven years of a near-zero interest-rate policy, the Fed raised the federal funds rate by 0.25% in December. The increase was the first in nine years, and signaled the beginning of what the Fed hopes to be a normalization of policy after years of emergency and historically unprecedented measures. Fed guidance, however, suggested that the rate hike, which marked the sixth tightening cycle since 1979, will be slow and gradual. The markets appeared to have priced in two rate hikes over the course of 2016.
Investors also grappled with the specter of a potential U.S. recession, slowing growth in China and falling commodity prices. Central banks around the world were out in force attempting to stimulate an anemic global economy. The Bank of China lowered its reserve requirement ratio to free up capital for lending. The Bank of Japan and European Central Bank (ECB) lowered interest rates to negative territory. The ECB also announced it would begin to purchase nonbank investment-grade corporate bonds as part of its monthly asset purchase plan. Meanwhile, the Fed took a pass at raising rates twice, at both its January and March meetings.
In this environment, we saw credit spreads start to move wider in late 2015 following a relatively long stretch of benign volatility. This trend accelerated in early 2016.
Another big story was the liquidity squeeze in the bond market, as demonstrated by the sharp selloff in high-yield securities in the fourth quarter of 2015, when investors sold bonds with the lowest credit quality. The weakness in the lowest-quality tier of the market eventually spread to the broader high-yield and investment-grade sectors. Sharp high-yield fund outflows combined with poor liquidity resulted in many large gap-downs in bond pricing. The redemption freeze at two distressed credit funds toward yearend 2015 brought out comparisons to Bear Stearns closing two mortgage-backed security (MBS) funds in 2007.1
The risk-off sentiment for the most part of the six-month period permeated the fixed-income markets and propelled investors to seek safety in U.S. Treasury securities, sending interest rates toward multi-year lows.
| 1 | Bloomberg 12/15/15: Third Avenue, Stone Lion Capital Spark Memories of ’08: Analysis ‘Contagion’ is back on the worry list. |
54
Brandes Credit Focus Yield Fund
The Fund
The Brandes Credit Focus Yield Fund (Class I Shares) gained 0.29% during the six months ended March 31, 2016, while its benchmark, the Barclays U.S. Intermediate Credit Bond Index, returned 2.23%.
The largest negative contributors were holdings in the energy sector. The largest individual detractor was our holding in Chesapeake Energy.
Chesapeake is the second-largest natural gas producer in North America. The company replaced its free-spending CEO, Aubrey McClendon, in June 2013 with an accomplished executive from Anadarko Petroleum, Doug Lawler. The new CEO has made it a priority to emphasize corporate discipline with an eye toward improving the company’s stretched balance sheet. The early results were positive with the company able to reduce debt, keep spending levels within budget and reduce headcount.
Oil and natural gas prices dropped sharply during the quarter due to an oversupplied market, the unseasonably warm start to the winter season and the continued global economic malaise. Additionally, oil and gas companies such as Chesapeake effectively have to mark their reserves to market (through PV-10 calculation; see explanation on page 4) based on current oil and natural gas prices. The drop in prices has resulted in a large re-calculation of the company’s asset value to below the value of its outstanding debt. Bond prices reacted swiftly to the new asset coverage.
After a significant drop in bond prices, Chesapeake commenced an exchange offer in an effort to bolster liquidity and reduce outstanding long-term debt. The company was able to place a new second-lien security through a tender offer for existing unsecured notes which resulted in a debt reduction of approximately $1.5 billion.
Chesapeake appears to have a visible liquidity runway until late 2017/early 2018 at current natural gas and oil prices. The company needs a recovery in energy prices or execution of some asset sales in the next two years to avoid becoming a likely bankruptcy candidate. The company has survived a number of near-collapses in the late 1990s, 2008 and 2012 in part due to creative financing and ability to execute asset sales. Prior asset sales have generally been above book value due in large part to the quality of the acreage positions, as Chesapeake has been involved in almost every U.S. major resource play. The company also has a large amount of “unproven reserves.” The market currently assigns a value of zero to this land based on current energy prices and an oversupplied market, but if we see an upward move in energy prices, this land could have meaningful value.
55
Brandes Credit Focus Yield Fund
Industry capital expenditures (capex) were meaningfully lower in 2015 and Moody’s forecasts 2016 capex to be down an additional 20% to 25% in 20162 as a result of lower prices, which should eventually have an impact on the oversupply.
In summary, there is a wide range of outcomes for Chesapeake bonds. If there is no recovery in energy prices over the next two years, the company likely becomes a bankruptcy candidate and recoveries on unsecured bonds could be close to current market prices, in our view. A modest recovery in energy prices or a few well-executed asset sales should yield positive cash flow and bonds that mature at par. Based on likely supply cuts in 2016 and Chesapeake’s historically valuable and severable acreage holdings, we believe the risk/return tradeoff is now in the bondholder’s favor and we added to our position in Chesapeake in the period.
During the fourth quarter of 2015 and into the first quarter of 2016 we initiated positions in several companies in the energy sector, which in our view have meaningful coverage of their outstanding debt through their tangible assets. Essentially, we believe these companies have the balance sheet strength to weather a protracted downturn in energy prices.
Many of these bonds contributed to the Fund’s underperformance toward the end of 2015, as we were early, in retrospect, to initiate positions. However, the continued credit-spread widening in the early part of 2016 enabled us to build larger positions in what we view as strong, mispriced credits, such as ExxonMobil, British Petroleum and Occidental Petroleum.
Duration was set toward the lower end of our duration controlled band. This positioning modestly detracted from relative performance as interest rates not only remained stubbornly low, but fell further to multi-year lows during the period.
The Fund received positive contributions from holdings in electric utilities and credits in the building products and paper industries.
During the period, we took advantage of the widening of credit spreads to increase weightings in a number of securities at what we considered attractive prices and yields. As mentioned earlier, we added to a few positions in the energy sector. In addition, we added to our existing holdings in ADT Corp. and Tesco Plc.
We also initiated positions in homebuilders Toll Brothers Corp (4.875% coupon rate, maturing November 2025 and rated Ba1/BB+) and PulteGroup Inc. (5.50% coupon rate, maturing March 2026 and rated Ba1/BB+). We had owned bonds from Toll Brothers and Pulte in the past. In fact, we first purchased bonds from both Toll Brothers and Pulte in the 2007/2008 period. We held our Toll Brothers
| 2 | Oil and Gas Journal 1/4/16: Moody’s: Firms to see constrained spending, heightened risk in 2016 http://www.ogj.com/articles/2016/01/moody-s-firms-to-see-constrained-spending-heightened-risk-in-2016.html |
56
Brandes Credit Focus Yield Fund
bond until it matured in November 2015, while our Pulte security purchased during that time frame is set to mature in early May.
Finally, we purchased Sprint Communications (9.00% coupon rate, maturing November 2018 and rated B1/BB). This particular issue from Sprint is a senior unsecured note, but is guaranteed by all of its subsidiaries; it is one of two such notes in the company’s debt complex and is the nearest maturity guaranteed note. Therefore, it is effectively structurally senior to other Sprint senior unsecured notes. Sprint is also 80% owned by Softbank, a Japanese telecommunications company. Sprint is one of the largest issuers in the high-yield market. The company’s bond price declined in the quarter, and based on our observations during the latest bout of market illiquidity and resulting volatility, many investors sell what they can rather than what they want. We believe this $3-billion issue of Sprint provides a good example of the current trading environment. In our view, this security has good asset coverage based on Sprint’s wireless spectrum holdings and good support from Softbank, which is a higher-rated credit. Therefore, we believe that we were able to establish a position in Sprint at an attractive yield relative to the underlying credit fundamentals.
Outlook
On balance, we are positioned defensively, but have started to find more opportunities that we believe can deliver long-term value. We maintain a strong preference for asset-rich credits.
For the remainder of 2016, we would not be surprised to see the market operate in fits and starts. Each bout of volatility has appeared to bring an outsized reaction relative to past behavior. We believe a good deal of this is attributable to the market’s liquidity challenges. In this environment, the Brandes fixed-income team will continue to adhere to a measured and deliberate approach to security selection, while selectively looking to add mispriced yield. We are positioned with ample dry powder to pursue potential mispricing opportunities, ready to act if company fundamentals disengage from their market price.
57
Brandes Credit Focus Yield Fund
We believe that a careful path remains the most prudent approach for protecting capital and adding value to client portfolios over the coming years.
Sincerely yours,
The Brandes Fixed-Income Investment Committee
Brandes Investment Trust
Past performance does not guarantee future results.
Because the values of the Fund’s investments will fluctuate with market conditions, so will the value of your investment in the Fund. You could lose money on your investment in the Fund, or the Fund could underperform other investments. As with most fixed income funds, the income on and value of your shares in the Fund will fluctuate along with interest rates. When interest rates rise, the market prices of the debt securities the Fund owns usually decline. When interest rates fall, the prices of these securities usually increase. Generally, the longer the Fund’s average portfolio maturity and the lower the average quality of its portfolio, the greater the price fluctuation. The price of any security owned by the Fund may also fall in response to events affecting the issuer of the security, such as its ability to continue to make principal and interest payments or its credit rating. Below investment grade debt securities are speculative and involve a greater risk of default and price change due to changes in the issuer’s creditworthiness. The market prices of these debt securities may fluctuate more than the market prices of investment grade debt securities and may decline significantly in periods of general economic difficulty.
Investing in foreign securities poses additional risks. The performance of foreign securities can be adversely affected by the different political, regulatory and economic environments and other overall economic conditions in the countries where the Fund invests. Emerging country markets involve greater risk and volatility than more developed markets. Some emerging markets countries may have fixed or managed currencies that are not free-floating against the U.S. dollar. Certain of these currencies may experience substantial fluctuations or steady devaluation relative to the U.S. dollar. Mortgage-related securities are subject to certain additional risks. Rising interest rates tend to extend the duration of mortgage-related securities, making them more sensitive to changes in interest rates. As a result, when holding mortgage-related securities in a period of rising interest rates, the Fund may exhibit additional volatility. In addition, mortgage-related securities are subject to prepayment risk. When interest rates decline, borrowers may pay off their mortgages sooner than expected. This can reduce the returns of the Fund because it will have to reinvest that money at the lower prevailing interest rates.
58
Brandes Credit Focus Yield Fund
Asset coverage: A company’s ability to cover debt obligations with its assets after all liabilities have been satisfied. Source: Investopedia.com
Dry powder: Securities considered to be dry powder could be Treasuries, or other fixed income investments, and can be liquidated on short notice, in order to provide emergency operational funding or allow an investor to purchase assets.
Duration: The weighted maturity of a fixed-income investment’s cash flows, used in the estimation of the price sensitivity of fixed-income securities for a given change in interest rates.
Federal funds rate: The interest rate at which a depository institution lends funds maintained at the Federal Reserve to another depository institution overnight.
Gap down: A situation in which a security’s opening price is lower than the previous day’s closing price.
Margin of safety: The discount of a security’s market price to what the firm believes is the intrinsic value of that security.
PV 10: Present value of estimated future oil and gas revenues, net of estimated direct expenses, discounted at an annual discount rate of 10%. This nomenclature is most commonly used in the energy industry, and is used to estimate the present value of a company’s proved oil and gas reserves. Source: Investopedia.com
Risk off: Refers to an investment setting in which price behavior responds to, and is driven by, changes in investor risk tolerance. During periods when risk is perceived as low, risk-on risk-off theory states that investors tend to engage in higher-risk investments. Source: Investopedia.com
Yield: annual income from the investment (dividend, interest, etc.) divided by the current market price of the investment.
There is no assurance that a forecast will be accurate. Because of the many variables involved, an investor should not rely on forecasts without realizing their limitations.
Bond ratings are grades given to bonds that indicate their credit quality as determined by a private independent rating service such as Standard & Poor’s or Moody’s. The service evaluates a bond issuer’s financial strength, or its ability to pay a bond’s principal and interest in a timely fashion. Ratings are expressed as letters ranging from ‘AAA’, which is the highest grade, to ‘D’, which is the lowest grade. In limited situations when the rating agency has not issued a formal rating, the Advisor will classify the security as nonrated.
Please refer to the Schedule of Investments in the report for complete holdings information. Fund holdings, geographic allocations and/or sector allocations are subject to change at any time and are not a recommendation to buy or sell any security.
59
Brandes Credit Focus Yield Fund
Investment performance reflects fee waivers and/or reimbursement of expenses. In the absence of such waivers/reimbursements, total return would be reduced.
The foregoing reflects the thoughts and opinions of Brandes Investment Partners® exclusively and is subject to change without notice.
Brandes Investment Partners® is a registered trademark of Brandes Investment Partners, L.P. in the United States and Canada.
Must be preceded or accompanied by a prospectus.
Index Guide
The Barclays U.S. Intermediate Credit Bond Index measures performance of U.S. dollar-denominated U.S. Treasuries, government-related and investment-grade U.S. corporate securities that have remaining maturities of greater than one year and less than ten years. This index is a total return index which reflects the price changes and interest of each bond in the index.
Please note that all indices are unmanaged and are not available for direct investment.
The Brandes Credit Focus Yield Fund is distributed by ALPS Distributors, LLC.
60
Brandes Credit Focus Yield Fund
The following chart compares the value of a hypothetical $100,000 investment in the Brandes Credit Focus Yield Fund – Class I from March 31, 2006 to March 31, 2016 as compared with the Barclays Capital U.S. Intermediate Credit Index for the same period.
Value of $100,000 Investment vs Barclays Capital U.S. Intermediate Credit Index (Unaudited)

| Average Annual Total Return Periods Ended March 31, 2016** | ||||||||||||||||
| One Year | Five Years | Ten Years | Since Inception(1) | |||||||||||||
Brandes Credit Focus Yield Fund | ||||||||||||||||
Class A* | -1.50 | % | 2.90 | % | 3.84 | % | 5.38 | % | ||||||||
Class A* (with maximum sales charge) | -5.18 | % | 2.11 | % | 3.44 | % | 5.12 | % | ||||||||
Class I | -1.35 | % | 3.18 | % | 4.12 | % | 5.65 | % | ||||||||
Barclays Capital U.S. Intermediate Credit Index | 1.82 | % | 3.98 | % | 5.16 | % | 5.70 | % | ||||||||
| (1) | The inception date is June 29, 2000. |
| * | Performance shown prior to March 1, 2012 for Class A shares reflects the performance of Class I shares adjusted to reflect Class A expenses. |
| ** | Prior to February 1, 2012, the Advisor managed a private investment fund with an investment objective, investment policies and strategies that were, in all material respects, equivalent to those of the Brandes Credit Focus Yield Fund. The performance information shown for the Class I shares for periods before February 1, 2012 is that of the private investment fund and reflects the net expenses of the private investment fund. The performance of the private investment fund prior to February 1, 2012 is based on a calculation method that is different from the standardized calculation method prescribed by the SEC. The performance information shown for the Class A shares has been adjusted to reflect the differences in the net expense ratios between the Class I and A shares. The private investment fund was not registered under the Investment Company Act of 1940 (“1940 Act”) and was not subject to certain investment limitations, diversification requirements, and other restrictions imposed by the 1940 Act and the Internal Revenue Code of 1986, which, if applicable, may have adversely affected its performance. |
61
Brandes Credit Focus Yield Fund
Performance data quoted represents past performance; past performance does not indicate future results. The investment return and principal value of an investment will fluctuate so that an investor’s shares, when redeemed, may be worth more or less than their original cost. Current performance of the Fund may be lower or higher than the performance quoted. Performance data current to the most recent month end may be obtained by calling 800-331-2979.
The returns shown do not reflect the deduction of taxes that a shareholder would pay on Fund distributions or the redemption of Fund shares. The Advisor has a fee waiver arrangement in place to limit the Fund’s annual operating expenses.
Sector Allocation as a Percentage of Total Investments as of
March 31, 2016 (Unaudited)

62
Brandes Investment Trust
Expense Example (Unaudited)
As a shareholder of a Fund, you incur ongoing costs, including investment advisory and administrative fees and other fund expenses. The examples below are intended to help you understand your ongoing costs (in dollars) of investing in the Funds and to compare these costs with ongoing costs of investing in other mutual funds.
The examples are based on an investment of $1,000 invested at the beginning of the period and held for the entire period from October 1, 2015 to March 31, 2016 (the “Period”).
Actual Expenses
This section provides information about actual account values and actual expenses. The “Ending Account Value” shown is derived from each Fund’s actual return. You may use the information in this section, together with the amount you invested, to estimate the expenses that you paid over the period. Simply divide your account value by $1,000 (for example, an $8,600 account value divided by $1,000 = 8.6), then multiply the result by the number given for the Fund under the heading “Expenses Paid During Period” to estimate the expenses you paid on your account during this period.
| Class A | ||||||||||||||||
Fund | Beginning Account Value | Ending Account Value | Annual Expense Ratio | Expenses Paid During the Period* | ||||||||||||
International Equity Fund | $ | 1,000.00 | $ | 1,032.00 | 1.19% | $ | 6.05 | |||||||||
Global Equity Fund | $ | 1,000.00 | $ | 997.80 | 1.25% | $ | 6.24 | |||||||||
Global Equity Income Fund | $ | 1,000.00 | $ | 1,089.60 | 1.25% | $ | 6.53 | |||||||||
Global Opportunities Value Fund | $ | 1,000.00 | $ | 1,056.70 | 1.40% | $ | 7.20 | |||||||||
Emerging Markets Value Fund | $ | 1,000.00 | $ | 1,167.50 | 1.37% | $ | 7.42 | |||||||||
International Small Cap Fund | $ | 1,000.00 | $ | 1,078.80 | 1.31% | $ | 6.81 | |||||||||
Core Plus Fixed Income Fund | $ | 1,000.00 | $ | 1,011.30 | 0.70% | $ | 3.52 | |||||||||
Credit Focus Yield Fund** | $ | 1,000.00 | $ | 1,002.70 | 0.92% | $ | 4.61 | |||||||||
| Class C | ||||||||||||||||
Fund | Beginning Account Value | Ending Account Value | Annual Expense Ratio | Expenses Paid During the Period* | ||||||||||||
International Equity Fund | $ | 1,000.00 | $ | 1,028.00 | 1.94% | $ | 9.84 | |||||||||
Global Equity Fund | $ | 1,000.00 | $ | 994.10 | 2.00% | $ | 9.97 | |||||||||
Global Equity Income Fund | $ | 1,000.00 | $ | 1,083.80 | 2.00% | $ | 10.42 | |||||||||
Global Opportunities Value Fund | $ | 1,000.00 | $ | 1,054.00 | 2.15% | $ | 11.04 | |||||||||
Emerging Markets Value Fund | $ | 1,000.00 | $ | 1,162.60 | 2.12% | $ | 11.46 | |||||||||
International Small Cap Fund | $ | 1,000.00 | $ | 1,074.60 | 2.06% | $ | 10.68 | |||||||||
63
Brandes Investment Trust
| Class E | ||||||||||||||||
Fund | Beginning Account Value | Ending Account Value | Annual Expense Ratio | Expenses Paid During the Period* | ||||||||||||
International Equity Fund | $ | 1,000.00 | $ | 1,031.80 | 1.18% | $ | 5.99 | |||||||||
Global Equity Fund | $ | 1,000.00 | $ | 998.30 | 1.25% | $ | 6.24 | |||||||||
Core Plus Fixed Income Fund | $ | 1,000.00 | $ | 1,011.40 | 0.70% | $ | 3.52 | |||||||||
| Class I | ||||||||||||||||
Fund | Beginning Account Value | Ending Account Value | Annual Expense Ratio | Expenses Paid During the Period* | ||||||||||||
International Equity Fund | $ | 1,000.00 | $ | 1,033.00 | 1.00% | $ | 5.08 | |||||||||
Global Equity Fund | $ | 1,000.00 | $ | 999.50 | 1.00% | $ | 5.00 | |||||||||
Global Equity Income Fund | $ | 1,000.00 | $ | 1,088.80 | 1.00% | $ | 5.22 | |||||||||
Global Opportunities Value Fund | $ | 1,000.00 | $ | 1,058.50 | 1.15% | $ | 5.92 | |||||||||
Emerging Markets Value Fund | $ | 1,000.00 | $ | 1,169.70 | 1.12% | $ | 6.08 | |||||||||
International Small Cap Fund | $ | 1,000.00 | $ | 1,079.10 | 1.15% | $ | 5.98 | |||||||||
Core Plus Fixed Income Fund | $ | 1,000.00 | $ | 1,011.50 | 0.50% | $ | 2.51 | |||||||||
Credit Focus Yield Fund** | $ | 1,000.00 | $ | 1,002.90 | 0.67% | $ | 3.35 | |||||||||
| Class R6 | ||||||||||||||||
Fund | Beginning Account Value | Ending Account Value | Annual Expense Ratio | Expenses Paid During the Period* | ||||||||||||
International Equity Fund | $ | 1,000.00 | $ | 1,064.80 | 0.82% | $ | 1.34 | |||||||||
Hypothetical Example for Comparison Purposes
This section provides information about hypothetical account values and hypothetical expenses based on the Funds’ actual expense ratios and an assumed rate of return of 5% per year before expenses, which are not the Fund’s actual returns. The hypothetical account values and expenses may not be used to estimate the actual ending account balance or expenses you paid for the period. You may use this information to compare the ongoing costs of investing in the Funds and other mutual funds. To do so, compare this 5% hypothetical example with the 5% hypothetical examples that appear in the shareholder reports of the other mutual funds.
Please note that the expenses shown in the table are meant to highlight your ongoing costs only and do not reflect any transaction costs, such as sales charges (loads), redemption fees, or exchange fees. Therefore, the last column of the table is useful in comparing ongoing costs only, and will not help you determine the relative total costs of owning different funds. In addition, if these transactional costs were included, your costs would have been higher.
64
Brandes Investment Fund
| Class A | ||||||||||||||||
Fund | Beginning Account Value | Ending Account Value | Annual Expense Ratio | Expenses Paid During the Period* | ||||||||||||
International Equity Fund | $ | 1,000.00 | $ | 1,019.05 | 1.19% | $ | 6.01 | |||||||||
Global Equity Fund | $ | 1,000.00 | $ | 1,018.75 | 1.25% | $ | 6.31 | |||||||||
Global Equity Income Fund | $ | 1,000.00 | $ | 1,018.75 | 1.25% | $ | 6.31 | |||||||||
Global Opportunities Value Fund | $ | 1,000.00 | $ | 1,018.00 | 1.40% | $ | 7.06 | |||||||||
Emerging Markets Value Fund | $ | 1,000.00 | $ | 1,018.15 | 1.37% | $ | 6.91 | |||||||||
International Small Cap Fund | $ | 1,000.00 | $ | 1,018.45 | 1.31% | $ | 6.61 | |||||||||
Core Plus Fixed Income Fund | $ | 1,000.00 | $ | 1,021.50 | 0.70% | $ | 3.54 | |||||||||
Credit Focus Yield Fund** | $ | 1,000.00 | $ | 1,020.75 | 0.92% | $ | 4.65 | |||||||||
| Class C | ||||||||||||||||
Fund | Beginning Account Value | Ending Account Value | Annual Expense Ratio | Expenses Paid During the Period* | ||||||||||||
International Equity Fund | $ | 1,000.00 | $ | 1,015.30 | 1.94% | $ | 9.77 | |||||||||
Global Equity Fund | $ | 1,000.00 | $ | 1,015.00 | 2.00% | $ | 10.08 | |||||||||
Global Equity Income Fund | $ | 1,000.00 | $ | 1,015.00 | 2.00% | $ | 10.08 | |||||||||
Global Opportunities Value Fund | $ | 1,000.00 | $ | 1,014.25 | 2.15% | $ | 10.83 | |||||||||
Emerging Markets Value Fund | $ | 1,000.00 | $ | 1,014.40 | 2.12% | $ | 10.68 | |||||||||
International Small Cap Fund | $ | 1,000.00 | $ | 1,014.70 | 2.06% | $ | 10.38 | |||||||||
| Class E | ||||||||||||||||
Fund | Beginning Account Value | Ending Account Value | Annual Expense Ratio | Expenses Paid During the Period* | ||||||||||||
International Equity Fund | $ | 1,000.00 | $ | 1,019.10 | 1.18% | $ | 5.96 | |||||||||
Global Equity Fund | $ | 1,000.00 | $ | 1,018.75 | 1.25% | $ | 6.31 | |||||||||
Core Plus Fixed Income Fund | $ | 1,000.00 | $ | 1,021.50 | 0.70% | $ | 3.54 | |||||||||
| Class I | ||||||||||||||||
Fund | Beginning Account Value | Ending Account Value | Annual Expense Ratio | Expenses Paid During the Period* | ||||||||||||
International Equity Fund | $ | 1,000.00 | $ | 1,020.00 | 1.00% | $ | 5.05 | |||||||||
Global Equity Fund | $ | 1,000.00 | $ | 1,020.00 | 1.00% | $ | 5.05 | |||||||||
Global Equity Income Fund | $ | 1,000.00 | $ | 1,020.00 | 1.00% | $ | 5.05 | |||||||||
Global Opportunities Value Fund | $ | 1,000.00 | $ | 1,019.25 | 1.15% | $ | 5.81 | |||||||||
Emerging Markets Value Fund | $ | 1,000.00 | $ | 1,019.40 | 1.12% | $ | 5.65 | |||||||||
International Small Cap Fund | $ | 1,000.00 | $ | 1,019.25 | 1.15% | $ | 5.81 | |||||||||
Core Plus Fixed Income Fund | $ | 1,000.00 | $ | 1,022.50 | 0.50% | $ | 2.53 | |||||||||
Credit Focus Yield Fund** | $ | 1,000.00 | $ | 1,022.00 | 0.67% | $ | 3.39 | |||||||||
65
Brandes Investment Fund
| Class R6 | ||||||||||||||||
Fund | Beginning Account Value | Ending Account Value | Annual Expense Ratio | Expenses Paid During the Period* | ||||||||||||
International Equity Fund | $ | 1,000.00 | $ | 1,023.70 | 0.82% | $ | 4.15 | |||||||||
| * | Expenses are equal to the Funds’ expense ratio for the period, multiplied by the average account value over the period, multiplied by 183/366 (to reflect the one-half year period). The R6 share class of the International Equity Fund commenced operations on February 1, 2016. Actual expenses for this share class are equal to the Fund’s expense ratio for the period multiplied by the average account value over the period, multiplied by 60/366. |
| ** | Effective February 1, 2016, the Credit Focus Yield Fund reduced the expense cap on Classes A and I by 0.10%. |
66
Brandes International Equity Fund
SCHEDULE OF INVESTMENTS — March 31, 2016 (Unaudited)
| Shares | Value | |||||||
| COMMON STOCKS – 88.70% | ||||||||
| Austria – 1.22% | ||||||||
| 274,442 | Erste Group Bank AG(a) | $ | 7,702,792 | |||||
|
| |||||||
| Brazil – 4.98% | ||||||||
| 151,748 | Banco Santander Brasil SA – ADR | 705,628 | ||||||
| 1,266,600 | Centrais Electricas Brasileiras(a) | 2,328,432 | ||||||
| 1,223,030 | Centrais Electricas Brasileiras Sponsored – ADR(a) | 2,176,993 | ||||||
| 734,211 | Companhia de Saneamento Basico | 4,872,074 | ||||||
| 361,080 | Embraer SA – ADR | 9,518,069 | ||||||
| 2,580,800 | Petrol Brasileiros(a) | 5,914,311 | ||||||
| 379,600 | Tim Participacoes | 839,298 | ||||||
| 460,334 | Tim Participacoes SA – ADR | 5,091,294 | ||||||
|
| |||||||
| 31,446,099 | ||||||||
|
| |||||||
| China – 1.02% | ||||||||
| 580,500 | China Mobile Ltd. | 6,429,020 | ||||||
|
| |||||||
| France – 13.94% | ||||||||
| 408,888 | Carrefour SA | 11,233,470 | ||||||
| 228,506 | Compagnie De Saint – Gobain | 10,036,969 | ||||||
| 1,213,357 | Engie | 18,799,325 | ||||||
| 603,619 | Orange SA | 10,540,970 | ||||||
| 71,048 | Publicis Groupe SA | 4,981,972 | ||||||
| 45,970 | Renault SA | 4,568,396 | ||||||
| 217,091 | Sanofi | 17,453,245 | ||||||
| 165,508 | Schneider Electric | 10,430,418 | ||||||
|
| |||||||
| 88,044,765 | ||||||||
|
| |||||||
| Hong Kong – 1.42% | ||||||||
| 12,046,000 | First Pacific Co. Ltd. | 8,994,240 | ||||||
|
| |||||||
| Ireland – 2.71% | ||||||||
| 265,723 | CRH Plc | 7,496,997 | ||||||
| 81,325 | Willis Towers Watson | | 9,650,025 | | ||||
|
| |||||||
| 17,147,022 | ||||||||
|
| |||||||
| Italy – 4.54% | ||||||||
| 1,070,115 | ENI SpA | 16,161,655 | ||||||
| 237,275 | Italcementi Fabbriche Riunite Cemento SpA | 2,780,957 | ||||||
| Shares | Value | |||||||
| 8,304,250 | Telecom Italia SpA | $ | 7,267,610 | |||||
| 2,281,374 | Telecom Italia SpA(a) | 2,458,916 | ||||||
|
| |||||||
| 28,669,138 | ||||||||
|
| |||||||
| Japan – 17.25% | ||||||||
| 322,600 | Canon, Inc. | 9,620,885 | ||||||
| 484,400 | Dai Nippon Printing Co. Ltd. | 4,298,618 | ||||||
| 611,202 | Daiichi Sankyo Co. Ltd. | 13,565,715 | ||||||
| 504,500 | Honda Motor Co. Ltd. | 13,793,584 | ||||||
| 485,900 | Mitsubishi Tanabe Pharma Corp. | 8,442,825 | ||||||
| 1,486,100 | Mitsubishi UFJ Financial Group, Inc. | 6,886,001 | ||||||
| 347,899 | MS&AD Insurance Group Holdings | 9,696,385 | ||||||
| 1,595,100 | Nissan Motor Co. Ltd. | 14,747,092 | ||||||
| 2,447,000 | Sumitomo Mitsui Trust Holdings, Inc. | 7,163,546 | ||||||
| 156,800 | Taisho Pharmaceutical Co. Ltd. | 12,427,205 | ||||||
| 182,900 | Takeda Pharmaceutical Co. Ltd. | 8,338,515 | ||||||
|
| |||||||
| 108,980,371 | ||||||||
|
| |||||||
| Mexico – 1.93% | ||||||||
| 1,673,240 | Cemex SAB de CV – ADR(a) | 12,181,187 | ||||||
|
| |||||||
| Netherlands – 1.72% | ||||||||
| 1,980,260 | Aegon NV | 10,883,115 | ||||||
|
| |||||||
| Russia – 3.39% | ||||||||
| 2,433,900 | Gazprom OAO | 5,348,914 | ||||||
| 232,913 | Lukoil Oil Company | 9,082,103 | ||||||
| 181,503 | Lukoil Oil Company – ADR | 7,015,091 | ||||||
|
| |||||||
| 21,446,108 | ||||||||
|
| |||||||
| South Korea – 5.84% | ||||||||
| 407,418 | Hana Financial Group, Inc. | 8,839,666 | ||||||
| 75,540 | Hyundai Mobis Co. Ltd. | 16,458,486 | ||||||
| 60,746 | POSCO | 11,587,790 | ||||||
|
| |||||||
| 36,885,942 | ||||||||
|
| |||||||
The accompanying notes are an integral part of these Schedule of Investments.
67
Brandes International Equity Fund
SCHEDULE OF INVESTMENTS — March 31, 2016 (Unaudited) (continued)
| Shares | Value | |||||||
| Spain – 1.55% | ||||||||
| 870,239 | Repsol SA | $ | 9,784,939 | |||||
|
| |||||||
| Sweden – 1.68% | ||||||||
| 1,059,104 | LM Ericsson Telefon AB – Class B | 10,604,497 | ||||||
|
| |||||||
| | Switzerland – 5.14% | |||||||
| 743,778 | Credit Suisse Group | 10,503,599 | ||||||
| 62,955 | Swatch Group | 4,236,166 | ||||||
| 15,159 | Swatch Group Ltd. Bearer | 5,229,988 | ||||||
| 43,542 | Swiss Resources AG | 4,020,654 | ||||||
| 528,137 | UBS Group AG | 8,495,631 | ||||||
|
| |||||||
| 32,486,038 | ||||||||
|
| |||||||
| United Kingdom – 20.37% | ||||||||
| 3,005,093 | Barclays Plc | 6,450,712 | ||||||
| 3,061,806 | BP Plc | 15,319,281 | ||||||
| 2,866,862 | G4S Plc | 7,822,964 | ||||||
| 1,227,004 | GlaxoSmithKline Plc | 24,838,478 | ||||||
| 1,248,636 | HSBC Holdings Plc | 7,765,197 | ||||||
| 2,623,100 | J. Sainsbury Plc | 10,394,500 | ||||||
| 1,710,302 | Kingfisher Plc | 9,224,643 | ||||||
| Shares | Value | |||||||
| 1,817,505 | Marks & Spencer Group Plc | $ | 10,591,197 | |||||
| 5,840,981 | Tesco Plc(a) | 16,042,119 | ||||||
| 7,117,891 | WM. Morrison Supermarkets Plc | 20,270,788 | ||||||
|
| |||||||
| 128,719,879 | ||||||||
|
| |||||||
| TOTAL COMMON STOCKS | $ | 560,405,152 | |||||
|
| |||||||
| PREFERRED STOCKS – 3.83% | ||||||||
| Brazil – 2.60% | ||||||||
| 1,171,744 | Petroleo Brasileiro Sponsored – ADR(a) | $ | 5,308,000 | |||||
| 626,500 | Telefonica Brasil SA | 7,840,724 | ||||||
| 262,163 | Telefonica Brasil SA Sponsored – ADR | 3,274,416 | ||||||
|
| |||||||
| 16,423,140 | ||||||||
|
| |||||||
| Russia – 1.23% | ||||||||
| 11,646,070 | Surgutneftegaz OJSC | 7,789,742 | ||||||
|
| |||||||
| TOTAL PREFERRED STOCKS | $ | 24,212,882 | |||||
|
| |||||||
| Principal Amount | Value | |||||||
| REPURCHASE AGREEMENTS – 6.43% | ||||||||
State Street Bank and Trust Repurchase Agreement, | $ | 40,603,736 | $ | 40,603,736 | ||||
|
| |||||||
TOTAL REPURCHASE AGREEMENTS | $ | 40,603,736 | ||||||
|
| |||||||
Total Investments (Cost $715,923,031) – 98.96% | $ | 625,221,770 | ||||||
Other Assets in Excess of Liabilities – 1.04% | 6,571,611 | |||||||
|
| |||||||
TOTAL NET ASSETS – 100.00% | $ | 631,793,381 | ||||||
|
| |||||||
Percentages are stated as a percent of net assets.
ADR American Depository Receipt
| (a) | Non-income producing security. |
The accompanying notes are an integral part of these Schedule of Investments.
68
Brandes International Equity Fund
SCHEDULE OF INVESTMENTS BY INDUSTRY — March 31, 2016 (Unaudited)
COMMON STOCKS | ||||
Aerospace & Defense | 1.51 | % | ||
Auto Components | 2.61 | % | ||
Automobiles | 5.24 | % | ||
Banks | 7.20 | % | ||
Building Products | 1.59 | % | ||
Capital Markets | 3.01 | % | ||
Commercial Services & Supplies | 1.92 | % | ||
Communications Equipment | 1.68 | % | ||
Construction Materials | 3.55 | % | ||
Diversified Financial Services | 1.42 | % | ||
Diversified Telecommunication Services | 3.21 | % | ||
Electric Utilities | 0.71 | % | ||
Electrical Equipment | 1.65 | % | ||
Food & Staples Retailing | 9.17 | % | ||
Insurance | 5.42 | % | ||
Media | 0.79 | % | ||
Metals & Mining | 1.83 | % | ||
Multiline Retail | 1.68 | % | ||
Multi-Utilities | 2.98 | % | ||
Oil, Gas & Consumable Fuels | 10.86 | % | ||
Pharmaceuticals | 13.46 | % | ||
Specialty Retail | 1.46 | % | ||
Technology Hardware, Storage & Peripherals | 1.52 | % | ||
Textiles, Apparel & Luxury Goods | 1.50 | % | ||
Water Utilities | 0.77 | % | ||
Wireless Telecommunication Services | 1.96 | % | ||
|
| |||
TOTAL COMMON STOCKS | 88.70 | % | ||
|
| |||
PREFERRED STOCKS | ||||
Diversified Telecommunication Services | 1.76 | % | ||
Oil, Gas & Consumable Fuels | 2.07 | % | ||
|
| |||
TOTAL PREFERRED STOCKS | 3.83 | % | ||
|
| |||
REPURCHASE AGREEMENTS | 6.43 | % | ||
|
| |||
TOTAL INVESTMENTS | 98.96 | % | ||
Other Assets in Excess of Liabilities | 1.04 | % | ||
|
| |||
TOTAL NET ASSETS | 100.00 | % | ||
|
| |||
The industry classifications represented in the Schedule of Investments are in accordance with Global Industry Classification Standards (GICS ), which was developed by and/or is the exclusive property of MSCI, Inc. and Standard & Poor Financial Services LLC.
The accompanying notes are an integral part of these Schedule of Investments.
69
Brandes Global Equity Fund
SCHEDULE OF INVESTMENTS — March 31, 2016 (Unaudited)
| Shares | Value | |||||||
| COMMON STOCKS – 96.90% | ||||||||
| Aerospace & Defense – 2.08% | ||||||||
| 150,020 | Embraer SA | $ | 990,078 | |||||
|
| |||||||
| Auto Components – 2.34% | ||||||||
| 5,110 | Hyundai Mobis Co. Ltd. | 1,113,355 | ||||||
|
| |||||||
| Automobiles – 7.03% | ||||||||
| 28,700 | Honda Motor Co. Ltd. | 784,690 | ||||||
| 9,981 | Hyundai Motor Co. | 1,332,029 | ||||||
| 132,300 | Nissan Motor Co. Ltd. | 1,223,146 | ||||||
|
| |||||||
| 3,339,865 | ||||||||
|
| |||||||
| Banks – 10.66% | ||||||||
| 58,097 | Bank of America Corp. | 785,472 | ||||||
| 189,421 | Barclays Plc | 406,610 | ||||||
| 29,636 | Citigroup, Inc. | 1,237,303 | ||||||
| 23,760 | Erste Group Bank AG(a) | 666,874 | ||||||
| 70,073 | HSBC Holdings Plc | 435,780 | ||||||
| 9,560 | PNC Financial Services Group, Inc. | 808,489 | ||||||
| 14,986 | Wells Fargo & Co. | 724,723 | ||||||
|
| |||||||
| 5,065,251 | ||||||||
|
| |||||||
| Beverages – 1.01% | ||||||||
| 4,668 | PepsiCo, Inc. | 478,377 | ||||||
|
| |||||||
| Capital Markets – 7.17% | ||||||||
| 26,440 | Bank of New York Mellon Corp. | 973,785 | ||||||
| 51,870 | Credit Suisse Group | 732,506 | ||||||
| 16,478 | State Street Corp. | 964,293 | ||||||
| 45,788 | UBS Group AG | 736,547 | ||||||
|
| |||||||
| 3,407,131 | ||||||||
|
| |||||||
| Communications Equipment – 1.70% | ||||||||
| 80,500 | LM Ericsson Telefon AB – Class B | 806,023 | ||||||
|
| |||||||
| Construction Materials – 1.58% | ||||||||
| 26,632 | CRH Plc | 751,384 | ||||||
|
| |||||||
| Diversified Financial Services – 0.95% | ||||||||
| 27,894 | Leucadia National Corp. | 451,046 | ||||||
|
| |||||||
| Diversified Telecommunication Services –1.03% | ||||||||
| 560,444 | Telecom Italia SpA | 490,483 | ||||||
|
| |||||||
| Electric Utilities – 1.81% | ||||||||
| 23,930 | Exelon Corp. | 858,130 | ||||||
|
| |||||||
| Shares | Value | |||||||
| Electrical Equipment – 4.07% | ||||||||
| 14,867 | Emerson Electric Co. | $ | 808,467 | |||||
| 17,834 | Schneider Electric | 1,123,910 | ||||||
|
| |||||||
| 1,932,377 | ||||||||
|
| |||||||
| | Electronic Equipment, Instruments & Components – 2.08% | | ||||||
| 47,263 | Corning, Inc. | 987,324 | ||||||
|
| |||||||
| Food & Staples Retailing – 6.82% | ||||||||
| 18,585 | Carrefour SA | 510,590 | ||||||
| 219,500 | J. Sainsbury Plc | 869,808 | ||||||
| 331,776 | Tesco Plc(a) | 911,215 | ||||||
| 332,380 | WM. Morrison Supermarkets Plc | 946,573 | ||||||
|
| |||||||
| 3,238,186 | ||||||||
|
| |||||||
| Health Care Providers & Services – 1.65% | ||||||||
| 11,388 | Express Scripts Holding Co.(a) | 782,242 | ||||||
|
| |||||||
| Hotels, Restaurants & Leisure – 1.96% | ||||||||
| 798,600 | Genting Malaysia Berhad | 929,100 | ||||||
|
| |||||||
| Insurance – 2.58% | ||||||||
| 14,230 | American International Group, Inc. | 769,132 | ||||||
| 4,929 | Swiss Resources AG | 455,142 | ||||||
|
| |||||||
| 1,224,274 | ||||||||
|
| |||||||
| Multiline Retail – 0.97% | ||||||||
| 78,900 | Marks & Spencer Group Plc | 459,776 | ||||||
|
| |||||||
| Multi-Utilities – 2.02% | ||||||||
| 11,100 | Engie Registered Shares(a)(c) | 172,283 | ||||||
| 50,984 | Engie | 789,928 | ||||||
|
| |||||||
| 962,211 | ||||||||
|
| |||||||
| Oil, Gas & Consumable Fuels – 10.37% | �� | |||||||
| 11,099 | Apache Corp. | 541,742 | ||||||
| 251,604 | BP Plc | 1,258,862 | ||||||
| 51,677 | ENI SpA | 780,464 | ||||||
| 169,770 | Gazprom OAO | 373,099 | ||||||
| 20,962 | Lukoil Oil Company –ADR | 810,181 | ||||||
| 44,860 | Repsol SA | 504,404 | ||||||
| 14,517 | Total SA | 660,545 | ||||||
|
| |||||||
| 4,929,297 | ||||||||
|
| |||||||
The accompanying notes are an integral part of these Schedule of Investments.
70
Brandes Global Equity Fund
SCHEDULE OF INVESTMENTS — March 31, 2016 (Unaudited) (continued)
| Shares | Value | |||||||
| Pharmaceuticals – 12.80% | ||||||||
| 42,200 | Daiichi Sankyo Co. Ltd. | $ | 936,635 | |||||
| 94,000 | GlaxoSmithKline Plc | 1,902,860 | ||||||
| 21,071 | Merck & Co., Inc. | 1,114,867 | ||||||
| 33,554 | Pfizer, Inc. | 994,540 | ||||||
| 14,096 | Sanofi | 1,133,262 | ||||||
|
| |||||||
| 6,082,164 | ||||||||
|
| |||||||
| | Semiconductors & Semiconductor Equipment – 0.99% | | ||||||
| 9,940 | Xilinx, Inc. | 471,454 | ||||||
|
| |||||||
| Software – 2.74% | ||||||||
| 23,575 | Microsoft Corp. | 1,302,047 | ||||||
|
| |||||||
| | Technology Hardware, Storage & Peripherals – 4.89% | | ||||||
| 17,700 | Canon, Inc. | 527,866 | ||||||
| 983 | Samsung Electronics Co. Ltd. | 1,128,098 | ||||||
| Shares | Value | |||||||
| 14,130 | Western Digital Corp. | $ | 667,501 | |||||
|
| |||||||
| 2,323,465 | ||||||||
|
| |||||||
| Tobacco – 1.32% | ||||||||
| 11,349 | Imperial Tobacco Group Plc | 628,361 | ||||||
|
| |||||||
| Wireless Telecommunication Services – 4.28% | ||||||||
| 37,898 | America Movil SAB de CV – ADR | 588,556 | ||||||
| 73,500 | China Mobile Ltd. | 814,010 | ||||||
| 57,130 | Tim Participacoes SA – ADR | 631,858 | ||||||
|
| |||||||
| 2,034,424 | ||||||||
|
| |||||||
| TOTAL COMMON STOCKS | $ | 46,037,825 | |||||
|
| |||||||
| Principal Amount | Value | |||||||
| CORPORATE BONDS – 0.65% | ||||||||
| Oil, Gas & Consumable Fuels – 0.65% | ||||||||
| Chesapeake Energy Corp. 8.000%, 12/15/2022 (Acquired 2/2/16, Cost $239,749)(b) | $ | 626,000 | $ | 306,740 | ||||
|
| |||||||
TOTAL CORPORATE BONDS | $ | 306,740 | ||||||
|
| |||||||
| REPURCHASE AGREEMENTS – 1.61% | ||||||||
State Street Bank and Trust Repurchase Agreement, | $ | 765,361 | $ | 765,361 | ||||
|
| |||||||
TOTAL REPURCHASE AGREEMENTS | $ | 765,361 | ||||||
|
| |||||||
Total Investments (Cost $47,649,158) – 99.16% | $ | 47,109,926 | ||||||
Other Assets in Excess of Liabilities – 0.84% | 400,836 | |||||||
|
| |||||||
TOTAL NET ASSETS – 100.00% | $ | 47,510,762 | ||||||
|
| |||||||
Percentages are stated as a percent of net assets.
ADR American Depository Receipt
| (a) | Non-income producing security. |
| (b) | Security was purchased exempt from registration in the U.S. pursuant to Rule 144A of the Securities Act of 1933 (the “Act”) or was acquired in a private placement, and, unless registered under the Act, may only be sold to “qualified institutional buyers” (as defined in the Act) or pursuant to another exemption from registration. The market value of this security totals $306,740 which represents 0.65% of the Fund’s total net assets. |
| (c) | The price for this security was derived from an estimate of fair market value using methods approved by the Fund’s Board of Trustees. This security represents $172,283 or 0.36% of the Fund’s net assets and is classified as a Level 2 security. See Note 2 in the Notes to Financial Statements. |
The accompanying notes are an integral part of these Schedule of Investments.
71
Brandes Global Equity Fund
SCHEDULE OF INVESTMENTS BY COUNTRY — March 31, 2016 (Unaudited)
COMMON STOCKS | ||||
Austria | 1.40 | % | ||
Brazil | 3.41 | % | ||
China | 1.71 | % | ||
France | 9.24 | % | ||
Ireland | 1.58 | % | ||
Italy | 2.68 | % | ||
Japan | 7.31 | % | ||
Malaysia | 1.96 | % | ||
Mexico | 1.24 | % | ||
Russia | 2.49 | % | ||
South Korea | 7.52 | % | ||
Spain | 1.06 | % | ||
Sweden | 1.70 | % | ||
Switzerland | 4.05 | % | ||
United Kingdom | 16.46 | % | ||
United States | 33.09 | % | ||
|
| |||
TOTAL COMMON STOCKS | 96.90 | % | ||
|
| |||
CORPORATE BONDS | ||||
United States | 0.65 | % | ||
|
| |||
TOTAL CORPORATE BONDS | 0.65 | % | ||
|
| |||
REPURCHASE AGREEMENTS | 1.61 | % | ||
|
| |||
TOTAL INVESTMENTS | 99.16 | % | ||
Other Assets in Excess of Liabilities | 0.84 | % | ||
|
| |||
TOTAL NET ASSETS | 100.00 | % | ||
|
| |||
The industry classifications represented in the Schedule of Investments are in accordance with Global Industry Classification Standards (GICS), which was developed by and/or is the exclusive property of MSCI, Inc. and Standard & Poor Financial Services LLC.
The accompanying notes are an integral part of these Schedule of Investments.
72
Brandes Global Equity Income Fund
SCHEDULE OF INVESTMENTS — March 31, 2016 (Unaudited)
| Shares | Value | |||||||
| COMMON STOCKS – 88.16% | ||||||||
| Automobiles – 2.08% | ||||||||
| 500 | Honda Motor Co. Ltd. | $ | 13,671 | |||||
|
| |||||||
| Banks – 3.09% | ||||||||
| 1,630 | HSBC Holdings Plc | 10,137 | ||||||
| 120 | PNC Financial Services Group, Inc. | 10,148 | ||||||
|
| |||||||
| 20,285 | ||||||||
|
| |||||||
| Beverages – 2.95% | ||||||||
| 490 | Diageo Plc | 13,212 | ||||||
| 60 | PepsiCo, Inc. | 6,149 | ||||||
|
| |||||||
| 19,361 | ||||||||
|
| |||||||
| Capital Markets – 2.06% | ||||||||
| 843 | UBS Group AG | 13,561 | ||||||
|
| |||||||
| Commercial Banks – 1.01% | ||||||||
| 200 | BB&T Corp. | 6,654 | ||||||
|
| |||||||
| Communications Equipment – 2.21% | ||||||||
| 1,451 | LM Ericsson Telefon AB – Class B | 14,528 | ||||||
|
| |||||||
| Construction Materials – 1.37% | ||||||||
| 320 | CRH Plc | 9,028 | ||||||
|
| |||||||
| | Diversified Telecommunication Services – 2.79% | | ||||||
| 1,690 | Telefonica Brasil SA | 18,321 | ||||||
|
| |||||||
| Electric Utilities – 5.23% | ||||||||
| 3,600 | Companhia Paranaense de Energia | 18,472 | ||||||
| 443 | Exelon Corp. | 15,886 | ||||||
|
| |||||||
| 34,358 | ||||||||
|
| |||||||
| Electrical Equipment – 5.65% | ||||||||
| 348 | Emerson Electric Co. | 18,924 | ||||||
| 289 | Schneider Electric | 18,213 | ||||||
|
| |||||||
| 37,137 | ||||||||
|
| |||||||
| Food & Staples Retailing – 7.31% | ||||||||
| 2,740 | J. Sainsbury Plc | 10,858 | ||||||
| 4,419 | Tesco Plc(a) | 12,137 | ||||||
| 178 | Wal-Mart Stores, Inc. | 12,191 | ||||||
| 4,522 | WM. Morrison Supermarkets Plc | 12,878 | ||||||
|
| |||||||
| 48,064 | ||||||||
|
| |||||||
| Shares | Value | |||||||
| Health Care Equipment & Supplies – 1.58% | ||||||||
| 252 | Baxter International, Inc. | $ | 10,352 | |||||
|
| |||||||
| Household Products – 1.44% | ||||||||
| 115 | Procter & Gamble Co. | 9,466 | ||||||
|
| |||||||
| Insurance – 1.35% | ||||||||
| 96 | Swiss Resources AG | 8,865 | ||||||
|
| |||||||
| Multiline Retail – 1.15% | ||||||||
| 1,300 | Marks & Spencer Group Plc | 7,576 | ||||||
|
| |||||||
| Multi-Utilities – 2.54% | ||||||||
| 400 | Engie Registered Shares(a)(b) | 6,208 | ||||||
| 676 | Engie | 10,474 | ||||||
|
| |||||||
| 16,682 | ||||||||
|
| |||||||
| Oil, Gas & Consumable Fuels – 11.71% | ||||||||
| 3,236 | BP Plc | 16,191 | ||||||
| 170 | Chevron Corp. | 16,218 | ||||||
| 1,184 | ENI SpA | 17,881 | ||||||
| 575 | Royal Dutch Shell Plc | 13,884 | ||||||
| 281 | Total SA | 12,786 | ||||||
|
| |||||||
| 76,960 | ||||||||
|
| |||||||
| Pharmaceuticals – 16.84% | ||||||||
| 500 | Daiichi Sankyo Co. Ltd. | 11,098 | ||||||
| 1,190 | GlaxoSmithKline Plc | 24,089 | ||||||
| 180 | Johnson & Johnson | 19,476 | ||||||
| 345 | Merck & Co., Inc. | 18,254 | ||||||
| 568 | Pfizer, Inc. | 16,835 | ||||||
| 260 | Sanofi | 20,903 | ||||||
|
| |||||||
| 110,655 | ||||||||
|
| |||||||
| | Semiconductors & Semiconductor Equipment – 2.16% | | ||||||
| 300 | Xilinx, Inc. | 14,229 | ||||||
|
| |||||||
| Software – 3.09% | ||||||||
| 368 | Microsoft Corp. | 20,325 | ||||||
|
| |||||||
| �� | Specialty Retail – 1.44% | |||||||
| 1,750 | Kingfisher Plc | 9,439 | ||||||
|
| |||||||
| | Technology Hardware, Storage & Peripherals – 1.29% | | ||||||
| 180 | Western Digital Corp. | 8,503 | ||||||
|
| |||||||
| Textiles, Apparel & Luxury Goods – 1.59% | ||||||||
| 61 | LVMH Moet Hennessy Louis Vuitton SE | 10,424 | ||||||
|
| |||||||
The accompanying notes are an integral part of these Schedule of Investments.
73
Brandes Global Equity Income Fund
SCHEDULE OF INVESTMENTS — March 31, 2016 (Unaudited) (continued)
| Shares | Value | |||||||
| Tobacco – 4.41% | ||||||||
| 250 | British American Tobacco Plc | $ | 14,619 | |||||
| 260 | Imperial Tobacco Group Plc | 14,395 | ||||||
|
| |||||||
| 29,014 | ||||||||
|
| |||||||
| Water Utilities – 1.82% | ||||||||
| 1,800 | Companhia de Saneamento Basico | 11,944 | ||||||
|
| |||||||
| TOTAL COMMON STOCKS | $ | 579,402 | |||||
|
| |||||||
| PREFERRED STOCKS – 9.95% | ||||||||
| Banks – 2.73% | ||||||||
| 840 | Bank of America Corp., 4.000% | $ | 17,960 | |||||
|
| |||||||
| Shares | Value | |||||||
| Capital Markets – 5.45% | ||||||||
| 908 | Goldman Sachs Group, Inc., 3.750% | $ | 18,006 | |||||
| 877 | Morgan Stanley, 4.000% | 17,785 | ||||||
|
| |||||||
| 35,791 | ||||||||
|
| |||||||
| | Semiconductors & Semiconductor Equipment – 1.77% | | ||||||
| 12 | Samsung Electronic | 11,618 | ||||||
|
| |||||||
| TOTAL PREFERRED STOCKS | $ | 65,369 | |||||
|
| |||||||
| Principal Amount | Value | |||||||
| REPURCHASE AGREEMENTS – 4.87% | ||||||||
State Street Bank and Trust Repurchase Agreement, | $ | 32,032 | $ | 32,032 | ||||
|
| |||||||
TOTAL REPURCHASE AGREEMENTS | $ | 32,032 | ||||||
|
| |||||||
Total Investments (Cost $683,398) – 102.98% | $ | 676,803 | ||||||
Liabilities in Excess of Other Assets – (2.98%) | (19,593 | ) | ||||||
|
| |||||||
TOTAL NET ASSETS – 100.00% | $ | 657,210 | ||||||
|
| |||||||
Percentages are stated as a percent of net assets.
| (a) | Non-income producing security. |
| (b) | The price for this security was derived from an estimate of fair market value using methods approved by the Fund’s Board of Trustees. This security represents $6,208 or 0.94% of the Fund’s net assets and is classified as a Level 2 security. See Note 2 in the Notes to Financial Statements. |
The accompanying notes are an integral part of these Schedule of Investments.
74
Brandes Global Equity Income Fund
SCHEDULE OF INVESTMENTS BY COUNTRY — March 31, 2016 (Unaudited)
COMMON STOCKS | ||||
Brazil | 7.42 | % | ||
France | 12.02 | % | ||
Ireland | 1.37 | % | ||
Italy | 2.72 | % | ||
Japan | 3.77 | % | ||
Sweeden | 2.21 | % | ||
Switzerland | 3.41 | % | ||
United Kingdom | 24.26 | % | ||
United States | 30.98 | % | ||
|
| |||
TOTAL COMMON STOCKS | 88.16 | % | ||
|
| |||
PREFERRED STOCKS | ||||
South Korea | 1.77 | % | ||
United States | 8.18 | % | ||
|
| |||
TOTAL PREFERRED STOCKS | 9.95 | % | ||
|
| |||
REPURCHASE AGREEMENTS | 4.87 | % | ||
|
| |||
TOTAL INVESTMENTS | 102.98 | % | ||
Liabilities in Excess of Other Assets | (2.98) | % | ||
|
| |||
TOTAL NET ASSETS | 100.00 | % | ||
|
| |||
The industry classifications represented in the Schedule of Investments are in accordance with Global Industry Classification Standards (GICS ), which was developed by and/or is the exclusive property of MSCI, Inc. and Standard & Poor Financial Services LLC.
The accompanying notes are an integral part of these Schedule of Investments.
75
Brandes Global Opportunities Value Fund
SCHEDULE OF INVESTMENTS — March 31, 2016 (Unaudited)
| Shares | Value | |||||||
| COMMON STOCKS – 83.19% | ||||||||
| Aerospace & Defense – 1.67% | ||||||||
| 4,798 | Embraer SA – ADR | $ | 126,475 | |||||
|
| |||||||
| Auto Components – 3.00% | ||||||||
| 641 | Hyundai Mobis Co. Ltd. | 139,660 | ||||||
| 6,000 | Tachi-s Co. Ltd. | 87,340 | ||||||
|
| |||||||
| 227,000 | ||||||||
|
| |||||||
| Automobiles – 2.87% | ||||||||
| 3,800 | Honda Motor Co. Ltd. | 103,896 | ||||||
| 12,300 | Nissan Motor Co. Ltd. | 113,717 | ||||||
|
| |||||||
| 217,613 | ||||||||
|
| |||||||
| Banks – 7.89% | ||||||||
| 8,190 | Bank of America Corp. | 110,729 | ||||||
| 31,671 | Barclays Plc | 67,985 | ||||||
| 3,186 | Citigroup, Inc. | 133,015 | ||||||
| 4,667 | Erste Group Bank AG(a) | 130,989 | ||||||
| 2,783 | KB Financial Group, Inc. | 77,276 | ||||||
| 47,636 | Sberbank Of Russia | 77,834 | ||||||
|
| |||||||
| 597,828 | ||||||||
|
| |||||||
| Capital Markets – 2.40% | ||||||||
| 7,592 | Credit Suisse Group | 107,214 | ||||||
| 1,280 | State Street Corp. | 74,905 | ||||||
|
| |||||||
| 182,119 | ||||||||
|
| |||||||
| Commercial Services & Supplies – 1.48% | ||||||||
| 17,470 | De La Rue Plc | 112,006 | ||||||
|
| |||||||
| Construction & Engineering – 1.37% | ||||||||
| 10,140 | Balfour Beatty Plc(a) | 37,095 | ||||||
| 8,300 | Sanki Engineering Co. Ltd. | 66,386 | ||||||
|
| |||||||
| 103,481 | ||||||||
|
| |||||||
| Construction Materials – 2.34% | ||||||||
| 14,338 | Cemex SAB de CV – ADR(a) | 104,380 | ||||||
| 2,333 | Italmobiliare SpA RNC | 72,554 | ||||||
|
| |||||||
| 176,934 | ||||||||
|
| |||||||
| Distributors – 1.52% | ||||||||
| 2,739 | D’Ieteren SA | 115,154 | ||||||
|
| |||||||
| Diversified Financial Services – 4.13% | ||||||||
| 183,340 | First Pacific Co. Ltd. | 136,892 | ||||||
| 28,675 | Haci Omer Sabanci Holding AS | 99,214 | ||||||
| 4,748 | Leucadia National Corp. | 76,775 | ||||||
|
| |||||||
| 312,881 | ||||||||
|
| |||||||
| Shares | Value | |||||||
| | Diversified Telecommunication Services – 4.84% | | ||||||
| 70,050 | APT Satellite Holdings Ltd. | $ | 55,486 | |||||
| 45,652 | Magyar Telekom Telecommunications Plc(a) | 75,450 | ||||||
| 81,751 | Telecom Italia SpA | 71,546 | ||||||
| 15,100 | Telefonica Brasil SA | 163,697 | ||||||
|
| |||||||
| 366,179 | ||||||||
|
| |||||||
| Electric Utilities – 3.19% | ||||||||
| 17,400 | Companhia Paranaense de Energia | 89,283 | ||||||
| 6,306 | Reliance Infrastructure Ltd. – GDR | 152,435 | ||||||
|
| |||||||
| 241,718 | ||||||||
|
| |||||||
| Electrical Equipment – 2.80% | ||||||||
| 5,800 | Futaba Corp. | 82,034 | ||||||
| 2,066 | Schneider Electric | 130,200 | ||||||
|
| |||||||
| 212,234 | ||||||||
|
| |||||||
| Food & Staples Retailing – 7.75% | ||||||||
| 2,391 | Carrefour SA | 65,689 | ||||||
| 41,074 | J. Sainsbury Plc | 162,763 | ||||||
| 53,525 | Tesco Plc(a) | 147,005 | ||||||
| 74,129 | WM. Morrison Supermarkets Plc | 211,109 | ||||||
|
| |||||||
| 586,566 | ||||||||
|
| |||||||
| Food Products – 2.31% | ||||||||
| 61,500 | Marfrig Global Foods SA(a) | 111,689 | ||||||
| 957 | Savencia SA | 63,444 | ||||||
|
| |||||||
| 175,133 | ||||||||
|
| |||||||
| Health Care Equipment & Supplies – 0.69% | ||||||||
| 7,162 | Syneron Medical Ltd.(a) | 52,354 | ||||||
|
| |||||||
| Household Durables – 4.05% | ||||||||
| 328,385 | Consorcio ARA SAB de CV | 122,975 | ||||||
| 4,898 | Dorel Industries, Inc.(a) | 109,745 | ||||||
| 2,941 | MDC Holdings, Inc. | 73,701 | ||||||
|
| |||||||
| 306,421 | ||||||||
|
| |||||||
| Insurance – 0.94% | ||||||||
| 598 | Willis Towers Watson | 70,959 | ||||||
|
| |||||||
The accompanying notes are an integral part of these Schedule of Investments.
76
Brandes Global Opportunities Value Fund
SCHEDULE OF INVESTMENTS — March 31, 2016 (Unaudited) (continued)
| Shares | Value | |||||||
| Machinery – 2.45% | ||||||||
| 6,285 | Briggs & Stratton Corp. | $ | 150,337 | |||||
| 3,565 | China Yuchai International Ltd. | 35,115 | ||||||
|
| |||||||
| 185,452 | ||||||||
|
| |||||||
| Metals & Mining – 1.42% | ||||||||
| 564 | POSCO | 107,588 | ||||||
|
| |||||||
| Multiline Retail – 1.10% | ||||||||
| 77,330 | Debenhams Plc | 83,437 | ||||||
|
| |||||||
| Multi-Utilities – 1.78% | ||||||||
| 4,400 | Engie Registered Shares(a)(c) | 68,292 | ||||||
| 4,272 | Engie | 66,189 | ||||||
|
| |||||||
| 134,481 | ||||||||
|
| |||||||
| Oil, Gas & Consumable Fuels – 7.80% | ||||||||
| 23,553 | BP Plc | 117,844 | ||||||
| 15,318 | Chesapeake Energy Corp. | 63,110 | ||||||
| 7,826 | ENI SpA | 118,194 | ||||||
| 24,560 | Gazprom OAO – ADR | 105,854 | ||||||
| 25,040 | Petrol Brasileiros(a) | 57,383 | ||||||
| 3,309 | Lukoil Oil Company – ADR | 127,893 | ||||||
|
| |||||||
| 590,278 | ||||||||
|
| |||||||
| Paper & Forest Products – 1.14% | ||||||||
| 4,330 | Norbord, Inc. | 86,150 | ||||||
|
| |||||||
| Pharmaceuticals – 2.31% | ||||||||
| 8,626 | GlaxoSmithKline Plc | 174,618 | ||||||
|
| |||||||
| | Real Estate Management & Development – 1.97% | | ||||||
| 16,950 | LSL Property Services Plc | 69,990 | ||||||
| 4,605 | St Joe Co.(a) | 78,976 | ||||||
|
| |||||||
| 148,966 | ||||||||
|
| |||||||
| | Semiconductors & Semiconductor Equipment – 0.99% | | ||||||
| 1,700 | Nuflare Technology, Inc. | 75,350 | ||||||
|
| |||||||
| | Technology Hardware, Storage & Peripherals – 2.89% | | ||||||
| 111 | Samsung Electronics Co. Ltd. | 127,385 | ||||||
| 1,930 | Western Digital Corp. | 91,173 | ||||||
|
| |||||||
| 218,558 | ||||||||
|
| |||||||
| Shares | Value | |||||||
| Textiles, Apparel & Luxury Goods – 0.80% | ||||||||
| 9,100 | TSI Holdings Co. Ltd. | $ | 60,574 | |||||
|
| |||||||
| Water Utilities – 1.28% | ||||||||
| 14,600 | Companhia de Saneamento Basico | 96,883 | ||||||
|
| |||||||
| Wireless Telecommunication Services – 2.02% | ||||||||
| 245,261 | Sistema JSFC | 63,867 | ||||||
| 8,052 | Tim Participacoes SA – ADR | 89,055 | ||||||
|
| |||||||
| 152,922 | ||||||||
|
| |||||||
| TOTAL COMMON STOCKS | $ | 6,298,312 | |||||
|
| |||||||
| PREFERRED STOCKS – 6.98% | ||||||||
| Automobiles – 2.34% | ||||||||
| 1,946 | Hyundai Motor Co. | $ | 176,829 | |||||
|
| |||||||
| Banks – 1.29% | ||||||||
| 43,462 | Itausa – Investimentos Itau SA | 97,908 | ||||||
|
| |||||||
| Food & Staples Retailing – 0.97% | ||||||||
| 5,300 | Companhia Brasileira de Distribuicao | 73,627 | ||||||
|
| |||||||
| Health Care Equipment & Supplies – 0.68% | ||||||||
| 758 | Draegerwerk AG & Co. KGaA | 51,380 | ||||||
|
| |||||||
| Oil, Gas & Consumable Fuels – 1.70% | ||||||||
| 9,970 | Petroleo Brasileiro Sponsored – ADR(a) | 45,164 | ||||||
| 125,187 | Surgutneftegaz OJSC | 83,734 | ||||||
|
| |||||||
| 128,898 | ||||||||
|
| |||||||
| TOTAL PREFERRED STOCKS | $ | 528,642 | |||||
|
| |||||||
| | REAL ESTATE INVESTMENT TRUSTS – 2.66% | | ||||||
| 9,469 | Grivalia Properties Real Estate Investment Co. SA | $ | 79,410 | |||||
| 90,500 | Macquarie Mexico Real Estate Management SA de CV | 122,311 | ||||||
|
| |||||||
| TOTAL REAL ESTATE | $ | 201,721 | |||||
|
| |||||||
The accompanying notes are an integral part of these Schedule of Investments.
77
Brandes Global Opportunities Value Fund
SCHEDULE OF INVESTMENTS — March 31, 2016 (Unaudited) (continued)
| Principal Amount | Value | |||||||
| CORPORATE BONDS – 1.44% | ||||||||
| Oil, Gas & Consumable Fuels – 1.44% | ||||||||
Chesapeake Energy Corp. | ||||||||
6.625%, 8/15/2020 | $ | 166,000 | $ | 64,740 | ||||
8.000%, 12/15/2022 (Acquired 2/8/16, Cost $36,643)(b) | 90,000 | 44,100 | ||||||
|
| |||||||
TOTAL CORPORATE BONDS | $ | 108,840 | ||||||
|
| |||||||
| REPURCHASE AGREEMENTS – 5.41% | ||||||||
State Street Bank and Trust Repurchase Agreement, | $ | 409,689 | $ | 409,689 | ||||
|
| |||||||
TOTAL REPURCHASE AGREEMENTS | $ | 409,689 | ||||||
|
| |||||||
Total Investments (Cost $7,814,555) – 99.68% | $ | 7,547,204 | ||||||
Other Assets in Excess of Liabilities – 0.32% | 23,849 | |||||||
|
| |||||||
TOTAL NET ASSETS – 100.00% | $ | 7,571,053 | ||||||
|
| |||||||
Percentages are stated as a percent of net assets.
ADR American Depository Receipt
GDR Global Despository Receipt
| (a) | Non-income producing security. |
| (b) | Security was purchased exempt from registration in the U.S. pursuant to Rule 144A of the Securities Act of 1933 (the “Act”) or was acquired in a private placement, and, unless registered under the Act, may only be sold to “qualified institutional buyers” (as defined in the Act) or pursuant to another exemption from registration. The market value of this security totals $44,100 which represents 0.58% of the Fund’s total net assets. |
| (c) | The price for this security was derived from an estimate of fair market value using methods approved by the Fund’s Board of Trustees. This security represents $68,292 or 0.90% of the Fund’s net assets and is classified as a Level 2 security. See Note 2 in the Notes to Financial Statements. |
The accompanying notes are an integral part of these Schedule of Investments.
78
Brandes Global Opportunities Value Fund
SCHEDULE OF INVESTMENTS BY COUNTRY — March 31, 2016 (Unaudited)
COMMON STOCKS | ||||
Austria | 1.73 | % | ||
Belgium | 1.52 | % | ||
Brazil | 9.70 | % | ||
Canada | 2.59 | % | ||
China | 0.46 | % | ||
France | 5.20 | % | ||
Hong Kong | 2.54 | % | ||
Hungary | 1.00 | % | ||
India | 2.01 | % | ||
Ireland | 0.94 | % | ||
Israel | 0.69 | % | ||
Italy | 3.49 | % | ||
Japan | 7.78 | % | ||
Mexico | 3.00 | % | ||
Russia | 4.96 | % | ||
South Korea | 5.97 | % | ||
Switzerland | 1.42 | % | ||
Turkey | 1.31 | % | ||
United Kingdom | 15.63 | % | ||
United States | 11.25 | % | ||
|
| |||
TOTAL COMMON STOCKS | 83.19 | % | ||
|
| |||
PREFERRED STOCKS | ||||
Brazil | 2.86 | % | ||
Germany | 0.68 | % | ||
Russia | 1.11 | % | ||
South Korea | 2.33 | % | ||
|
| |||
TOTAL PREFERRED STOCKS STOCKS | 6.98 | % | ||
|
| |||
REAL ESTATE INVESTMENT TRUSTS | ||||
Greece | 1.05 | % | ||
Mexico | 1.61 | % | ||
|
| |||
TOTAL REAL ESTATE INVESTMENT TRUSTS | 2.66 | % | ||
|
| |||
CORPORATE BONDS | ||||
United States | 1.44 | % | ||
|
| |||
TOTAL CORPORATE BONDS | 1.44 | % | ||
|
| |||
REPURCHASE AGREEMENTS | 5.41 | % | ||
|
| |||
TOTAL INVESTMENTS | 99.68 | % | ||
Other Assets in Excess of Liabilities | 0.32 | % | ||
|
| |||
TOTAL NET ASSETS | 100.00 | % | ||
|
| |||
The industry classifications represented in the Schedule of Investments are in accordance with Global Industry Classification Standards (GICS ), which was developed by and/or is the exclusive property of MSCI, Inc. and Standard & Poor Financial Services LLC.
The accompanying notes are an integral part of these Schedule of Investments.
79
Brandes Emerging Markets Value Fund
SCHEDULE OF INVESTMENTS — March 31, 2016 (Unaudited)
| Shares | Value | |||||||
| COMMON STOCKS – 78.64% | ||||||||
| Argentina – 1.25% | ||||||||
| 3,480,073 | Arcos Dorados Holdings, Inc.(a) | $ | 13,050,274 | |||||
|
| |||||||
| Austria – 2.00% | ||||||||
| 743,665 | Erste Group Bank AG(a) | 20,872,521 | ||||||
|
| |||||||
| Brazil – 12.27% | ||||||||
| 400,956 | Banco Bradesco SA | 3,373,220 | ||||||
| 2,501,450 | Banco do Brasil SA | 13,579,827 | ||||||
| 1,158,029 | Banco Santander Brasil SA – ADR | 5,384,835 | ||||||
| 3,300,939 | Centrais Electricas Brasileiras Sponsored – ADR(a) | 5,875,671 | ||||||
| 3,233,200 | Companhia de Saneamento Basico | 21,454,856 | ||||||
| 768,910 | Companhia Paranaense de Energia | 3,945,431 | ||||||
| 699,729 | Embraer SA – ADR | 18,444,856 | ||||||
| 3,130,500 | Estacio Participacoes SA | 10,221,259 | ||||||
| 4,000,100 | Kroton Educacional | 12,771,306 | ||||||
| 11,310,611 | Marfrig Global Foods SA(a) | 20,541,012 | ||||||
| 1,105,206 | Tim Participacoes SA – ADR | 12,223,578 | ||||||
| 1,419,243 | Viver Incorporadora e Construtora SA(a) | 11,841 | ||||||
|
| |||||||
| 127,827,692 | ||||||||
|
| |||||||
| Chile – 3.39% | ||||||||
| 1,282,570 | Enersis SA – ADR | 17,827,723 | ||||||
| 849,340 | Sociedad Quimica Minera De Chile SA Series B – ADR | 17,453,937 | ||||||
|
| |||||||
| 35,281,660 | ||||||||
|
| |||||||
| China – 7.06% | ||||||||
| 167,238,000 | Bosideng International Holdings Ltd. | 13,382,705 | ||||||
| 1,777,400 | China Mobile Ltd. | 19,684,650 | ||||||
| 159,770 | China Yuchai International Ltd. | 1,573,735 | ||||||
| 16,277,000 | Dongfeng Motor Group Co. Ltd. | 20,355,928 | ||||||
| Shares | Value | |||||||
| 11,976,377 | Weiqiao Textile Co. | $ | 8,644,459 | |||||
| 25,983,500 | Yingde Gases Group Co. Ltd. | 9,975,753 | ||||||
|
| |||||||
| 73,617,230 | ||||||||
|
| |||||||
| Colombia – 1.52% | ||||||||
| 2,052,876 | Grupo Aval Acciones y Valores – ADR | 15,868,731 | ||||||
|
| |||||||
| Cyprus – 1.19% | ||||||||
| 2,875,926 | Globaltrans Investment – GDR(a) | 12,438,380 | ||||||
|
| |||||||
| Czech Republic – 0.94% | ||||||||
| 934,049 | Telefonica Czech Republic AS | 9,843,428 | ||||||
|
| |||||||
| Greece – 0.21% | ||||||||
| 240,188 | Hellenic Telecommunications Organization SA | 2,161,836 | ||||||
|
| |||||||
| Hong Kong – 6.43% | ||||||||
| 23,256,600 | Chow Tai Fook Jewellery Group Ltd. | 14,536,110 | ||||||
| 23,497,899 | First Pacific Co. Ltd. | 17,544,890 | ||||||
| 15,085,500 | Lifestyle International Holdings Ltd. | 20,316,481 | ||||||
| 6,444,000 | Luk Fook Holdings International Ltd. | 14,630,054 | ||||||
|
| |||||||
| 67,027,535 | ||||||||
|
| |||||||
| India – 2.22% | ||||||||
| 2,879,087 | Reliance Infrastructure Ltd. | 23,176,914 | ||||||
|
| |||||||
| Indonesia – 1.46% | ||||||||
| 50,542,740 | PT XL Axiata Tbk(a) | 15,237,850 | ||||||
|
| |||||||
| Luxembourg – 3.56% | ||||||||
| 585,363 | Adecoagro SA(a) | 6,760,943 | ||||||
| 1,685,420 | Ternium SA – ADR | 30,303,852 | ||||||
|
| |||||||
| 37,064,795 | ||||||||
|
| |||||||
| Malaysia – 0.68% | ||||||||
| 6,062,600 | Genting Malaysia Berhad | 7,053,292 | ||||||
|
| |||||||
The accompanying notes are an integral part of these Schedule of Investments.
80
Brandes Emerging Markets Value Fund
SCHEDULE OF INVESTMENTS — March 31, 2016 (Unaudited) (continued)
| Shares | Value | |||||||
| Mexico – 2.69% | ||||||||
| 3,841,043 | Cemex SAB de CV – ADR(a) | $ | 27,962,793 | |||||
| 13,687,865 | Urbi Desarrollos Urbanos SA de CV(a)(b)(d) | 36,444 | ||||||
|
| |||||||
| 27,999,237 | ||||||||
|
| |||||||
| Pakistan – 0.90% | ||||||||
| 10,247,760 | Nishat Mills Ltd. | 9,373,462 | ||||||
|
| |||||||
| Panama – 2.45% | ||||||||
| 376,885 | Copa Holdings SA | 25,533,959 | ||||||
|
| |||||||
| Russia – 7.47% | ||||||||
| 3,765,133 | Gazprom OAO – ADR | 16,227,723 | ||||||
| 4,582,250 | Mobile Telesystems | 16,359,659 | ||||||
| 686,085 | Lukoil Oil Company – ADR | 26,517,185 | ||||||
| 2,699,294 | Sberbank of Russia – ADR | 18,733,100 | ||||||
|
| |||||||
| 77,837,667 | ||||||||
|
| |||||||
| South Korea – 13.46% | ||||||||
| 1,029,680 | Hana Financial Group, Inc. | 22,340,759 | ||||||
| 121,635 | Hyundai Mobis Co. Ltd. | 26,501,562 | ||||||
| 502,470 | KB Financial Group, Inc. | 13,952,197 | ||||||
| 407,443 | KIA Motors Corp. | 17,210,811 | ||||||
| 131,547 | POSCO | 25,093,652 | ||||||
| 18,002 | Samsung Electronics Co. Ltd. | 20,659,223 | ||||||
| 412,290 | Shinhan Financial Group Co. Ltd. | 14,512,539 | ||||||
|
| |||||||
| 140,270,743 | ||||||||
|
| |||||||
| Taiwan, Province of China – 0.93% | ||||||||
| 1,263,000 | Mediatek, Inc. | 9,688,310 | ||||||
|
| |||||||
| Turkey – 5.00% | ||||||||
| 4,340,472 | Akbank | 12,363,350 | ||||||
| 4,263,531 | Turkiye Garanti Bankasi AS | 12,473,848 | ||||||
| 16,283,123 | Turkiye Vakiflar Bankasi Tao | 27,236,734 | ||||||
|
| |||||||
| 52,073,932 | ||||||||
|
| |||||||
| Shares | Value | |||||||
| United Kingdom – 1.56% | ||||||||
| 5,541,410 | ITE Group Plc | $ | 11,699,470 | |||||
| 674,213 | Standard Chartered Plc | 4,559,694 | ||||||
|
| |||||||
| 16,259,164 | ||||||||
|
| |||||||
| TOTAL COMMON STOCKS | $ | 819,558,612 | |||||
|
| |||||||
| PREFERRED STOCKS – 12.63% | ||||||||
| Brazil – 8.02% | ||||||||
| 1,510,236 | Banco Bradesco SA | $ | 11,323,672 | |||||
| 1,679,500 | Companhia Brasileira de Distribuicao | 23,331,255 | ||||||
| 709,810 | Companhia Brasileira de Distribuicao – ADR | 9,873,457 | ||||||
| 1,325,010 | Companhia Paranaense de Energia – ADR | 10,494,079 | ||||||
| 638,300 | Companhia Paranaense de Energia | 5,050,446 | ||||||
| 2,457,146 | Petroleo Brasileiro Sponsored – ADR(a) | 11,130,871 | ||||||
| 987,576 | Telefonica Brasil SA Sponsored – ADR | 12,334,824 | ||||||
|
| |||||||
| 83,538,604 | ||||||||
|
| |||||||
| Russia – 2.19% | ||||||||
| 2,304,816 | Surgutneftegas OJSC – ADR | 15,442,267 | ||||||
| 11,019,015 | Surgutneftegaz OJSC | 7,370,322 | ||||||
|
| |||||||
| 22,812,589 | ||||||||
|
| |||||||
| South Korea – 2.42% | ||||||||
| 277,826 | Hyundai Motor Co. | 25,245,518 | ||||||
|
| |||||||
| TOTAL PREFERRED | $ | 131,596,711 | |||||
|
| |||||||
| | REAL ESTATE INVESTMENT TRUSTS – 6.08% | | ||||||
| Mexico – 3.04% | ||||||||
| 5,938,934 | Fideicomiso PLA Administradora S. de R.L. de CV | $ | 11,041,090 | |||||
The accompanying notes are an integral part of these Schedule of Investments.
81
Brandes Emerging Markets Value Fund
SCHEDULE OF INVESTMENTS — March 31, 2016 (Unaudited) (continued)
| Shares | Value | |||||||
| 15,231,262 | Macquarie Mexico Real Estate Management SA de CV | $ | 20,584,990 | |||||
|
| |||||||
| 31,626,080 | ||||||||
|
| |||||||
| Thailand – 0.90% | ||||||||
| 40,048,500 | Jasmine Broadband | 9,388,188 | ||||||
|
| |||||||
| Shares | Value | |||||||
| Turkey – 2.14% | ||||||||
| 21,934,591 | Emlak Konut Gyo | $ | 22,323,409 | |||||
|
| |||||||
| TOTAL REAL ESTATE | $ | 63,337,677 | |||||
|
| |||||||
Principal Amount | Value | |||||||
| CONVERTIBLE BONDS – 0.01% | ||||||||
| Brazil – 0.01% | ||||||||
Viver Incorporadora e Construtora SA | BRL 3,299,971 | $ | 110,132 | |||||
|
| |||||||
TOTAL CONVERTIBLE BONDS | $ | 110,132 | ||||||
|
| |||||||
| REPURCHASE AGREEMENTS – 1.42% | ||||||||
State Street Bank and Trust Repurchase Agreement, | $ | 14,787,706 | $ | 14,787,706 | ||||
|
| |||||||
TOTAL REPURCHASE AGREEMENTS | $ | 14,787,706 | ||||||
|
| |||||||
Total Investments (Cost $1,278,680,662) – 98.78% | $ | 1,029,390,838 | ||||||
Other Assets in Excess of Liabilities – 1.22% | 12,716,758 | |||||||
|
| |||||||
TOTAL NET ASSETS – 100.00% | $ | 1,042,107,596 | ||||||
|
| |||||||
Percentages are stated as a percent of net assets.
ADR American Depository Receipt
GDR Global Depository Receipt
| (a) | Non-income producing security. |
| (b) | The prices for these securities were derived from an estimate of fair market value using methods approved by the Fund’s Board of Trustees. These securities represent $146,576 or 0.01% of the Fund’s net assets and, with the exception of Urbi Desarrollos Urbanos SA de CV, are classified as Level 2 securities. Urbi Desarrollos SA de CV is considered to be a Level 3 security. |
| (c) | Security was purchased exempt from registration in the U.S. pursuant to Rule 144A of the Securities Act of 1933 (the “Act”) or was acquired in a private placement, and, unless registered under the Act, may only be sold to “qualified institutional buyers” (as defined in the Act) or pursuant to another exemption from registration. The market value of this security totals $110,132 which represents 0.01% of the Fund’s total net assets. |
| (d) | This security has limited liquidity and represents $36,444 or 0.00% of the Fund’s net assets and is classified as a Level 3 security. See Note 2 in the Notes to Financial Statements. |
The accompanying notes are an integral part of these Schedule of Investments.
82
Brandes Emerging Markets Value Fund
SCHEDULE OF INVESTMENTS BY INDUSTRY — March 31, 2016 (Unaudited)
COMMON STOCKS | ||||
Aerospace & Defense | 1.77 | % | ||
Airlines | 2.45 | % | ||
Auto Components | 2.54 | % | ||
Automobiles | 3.60 | % | ||
Banks | 17.78 | % | ||
Chemicals | 2.63 | % | ||
Construction Materials | 2.68 | % | ||
Diversified Consumer Services | 2.21 | % | ||
Diversified Financial Services | 1.68 | % | ||
Diversified Telecommunication Services | 2.61 | % | ||
Electric Utilities | 4.88 | % | ||
Food Products | 2.62 | % | ||
Hotels, Restaurants & Leisure | 1.93 | % | ||
Machinery | 0.15 | % | ||
Media | 1.12 | % | ||
Metals & Mining | 5.32 | % | ||
Multiline Retail | 1.95 | % | ||
Oil, Gas & Consumable Fuels | 4.10 | % | ||
Road & Rail | 1.19 | % | ||
Semiconductors & Semiconductor Equipment | 0.93 | % | ||
Specialty Retail | 2.80 | % | ||
Technology Hardware, Storage & Peripherals | 1.98 | % | ||
Textiles, Apparel & Luxury Goods | 3.01 | % | ||
Water Utilities | 2.07 | % | ||
Wireless Telecommunication Services | 4.64 | % | ||
|
| |||
TOTAL COMMON STOCKS | 78.64 | % | ||
|
| |||
PREFERRED STOCKS | ||||
Automobiles | 2.42 | % | ||
Banks | 1.09 | % | ||
Diversified Telecommunication Services | 1.18 | % | ||
Electric Utilities | 1.49 | % | ||
Food & Staples Retailing | 3.19 | % | ||
Oil, Gas & Consumable Fuels | 3.26 | % | ||
|
| |||
TOTAL PREFERRED STOCKS | 12.63 | % | ||
|
| |||
REAL ESTATE INVESTMENT TRUSTS | 6.08 | % | ||
|
| |||
CONVERTIBLE BONDS | ||||
Household Durables | 0.01 | % | ||
|
| |||
TOTAL CONVERTIBLE BONDS | 0.01 | % | ||
|
| |||
REPURCHASE AGREEMENTS | 1.42 | % | ||
|
| |||
TOTAL INVESTMENTS | 98.78 | % | ||
Other Assets in Excess of Liabilities | 1.22 | % | ||
|
| |||
TOTAL NET ASSETS | 100.00 | % | ||
|
| |||
The industry classifications represented in the Schedule of Investments are in accordance with Global Industry Classification Standards (GICS ), which was developed by and/or is the exclusive property of MSCI, Inc. and Standard & Poor Financial Services LLC.
The accompanying notes are an integral part of these Schedule of Investments.
83
Brandes International Small Cap Fund
SCHEDULE OF INVESTMENTS — March 31, 2016 (Unaudited)
| Shares | Value | |||||||
| COMMON STOCKS – 80.65% | ||||||||
| Belgium – 3.11% | ||||||||
| 891,560 | D’Ieteren SA | $ | 37,483,158 | |||||
|
| |||||||
| Brazil – 5.22% | ||||||||
| 1,891,400 | Companhia de Saneamento Basico | 12,550,945 | ||||||
| 1,468,720 | Companhia Paranaense de Energia | 7,536,296 | ||||||
| 4,279,400 | Embraer SA | 28,242,505 | ||||||
| 7,997,024 | Marfrig Global Foods SA(a) | 14,523,262 | ||||||
| 1,815,154 | Viver Incorporadora e Construtora SA(a) | 15,144 | ||||||
|
| |||||||
| 62,868,152 | ||||||||
|
| |||||||
| Canada – 5.75% | ||||||||
| 1,499,183 | Dorel Industries, Inc.(a)(f) | 33,590,934 | ||||||
| 12,114 | E-L Financial Corp. Ltd.(a) | 6,302,498 | ||||||
| 1,478,813 | Norbord, Inc.(g) | 29,422,543 | ||||||
|
| |||||||
| 69,315,975 | ||||||||
|
| |||||||
| China – 1.14% | ||||||||
| 44,899 | China Yuchai International Ltd. | 442,255 | ||||||
| 18,429,000 | Weiqiao Textile Co. | 13,301,914 | ||||||
|
| |||||||
| 13,744,169 | ||||||||
|
| |||||||
| France – 1.06% | ||||||||
| 191,944 | Savencia SA | 12,724,773 | ||||||
|
| |||||||
| Germany – 0.73% | ||||||||
| 149,133 | Draegerwerk AG & Co. KGaA | 8,836,561 | ||||||
|
| |||||||
| Greece – 0.79% | ||||||||
| 1,005,596 | Sarantis SA | 9,520,327 | ||||||
|
| |||||||
| Hong Kong – 1.74% | ||||||||
| 14,746,250 | APT Satellite Holdings Ltd. | 11,680,341 | ||||||
| 10,889,500 | Dickson Concepts International Ltd. | 3,158,472 | ||||||
| 247,090,000 | Emperor Watch & Jewellery Ltd. | 6,077,465 | ||||||
| 532,000 | Sinotrans Shipping | 89,105 | ||||||
|
| |||||||
| 21,005,383 | ||||||||
|
| |||||||
| Shares | Value | |||||||
| Hungary – 2.10% | ||||||||
| 15,336,018 | Magyar Telekom Telecommunications Plc(a) | $ | 25,346,229 | |||||
|
| |||||||
| India – 4.04% | ||||||||
| 165,852 | Nava Bharat Ventures Ltd. | 403,970 | ||||||
| 1,971,461 | NIIT Technologies Ltd. | 14,780,672 | ||||||
| 4,164,040 | Reliance Infrastructure Ltd. | 33,520,903 | ||||||
|
| |||||||
| 48,705,545 | ||||||||
|
| |||||||
| Ireland – 3.31% | ||||||||
| 8,843,235 | C&C Group Plc | 39,898,465 | ||||||
|
| |||||||
| Israel – 1.92% | ||||||||
| 7,670,156 | Israel Discount Bank Ltd. – Class A(a) | 12,992,047 | ||||||
| 1,382,682 | Syneron Medical Ltd.(a) | 10,107,405 | ||||||
|
| |||||||
| 23,099,452 | ||||||||
|
| |||||||
| Italy – 4.18% | ||||||||
| 1,012,844 | Buzzi Unicem SpA | 10,659,712 | ||||||
| 988,642 | Italcementi Fabbriche Riunite Cemento SpA | 11,587,274 | ||||||
| 155,200 | Italmobiliare SpA | 6,947,541 | ||||||
| 678,454 | Italmobiliare SpA RNC | 21,099,154 | ||||||
|
| |||||||
| 50,293,681 | ||||||||
|
| |||||||
| Japan – 22.47% | ||||||||
| 2,138,000 | Bank of Nagoya, Ltd. | 7,021,805 | ||||||
| 2,086,000 | Denki Kogyo Co. Ltd. | 9,731,953 | ||||||
| 635,600 | Fuji Machine Manufacturing Co. Ltd. | 6,478,733 | ||||||
| 1,332,200 | Funai Electric Co. | 11,677,223 | ||||||
| 916,600 | Futaba Corp. | 12,964,179 | ||||||
| 3,520,000 | Hachijuni Bank | 15,164,437 | ||||||
| 445,700 | Hibiya Engineering Ltd. | 6,231,474 | ||||||
| 2,454,400 | Hitachi Koki Co. Ltd. | 16,215,139 | ||||||
The accompanying notes are an integral part of these Schedule of Investments.
84
Brandes International Small Cap Fund
SCHEDULE OF INVESTMENTS — March 31, 2016 (Unaudited) (continued)
| Shares | Value | |||||||
| 2,200,050 | Hosiden Corp. | $ | 13,147,486 | |||||
| 3,535,000 | Hyakugo Bank Ltd. | 13,242,205 | ||||||
| 798,500 | Kato Sangyo Co. | 19,740,538 | ||||||
| 1,553,900 | Komori Corp. | 18,073,871 | ||||||
| 1,660,900 | Noritsu Koki Co. Ltd. | 10,248,384 | ||||||
| 311,700 | Nuflare Technology, Inc. | 13,815,704 | ||||||
| 1,653,700 | Sanki Engineering Co. Ltd. | 13,226,803 | ||||||
| 1,105,300 | Sega Sammy Holdings | 12,042,447 | ||||||
| 1,027,700 | Sintokogio Ltd. | 9,081,900 | ||||||
| 1,272,700 | Tachi-s Co. Ltd. | 18,526,277 | ||||||
| 327,200 | The Okinawa Electric Power Co., Inc. | 8,803,421 | ||||||
| 565,100 | Torii Pharmaceutical Co. Ltd. | 12,986,222 | ||||||
| 1,296,800 | TSI Holdings Co. Ltd. | 8,632,184 | ||||||
| 283,700 | Tsutsumi Jewelry Co. Ltd. | 6,010,022 | ||||||
| 362,900 | Yodogawa Steel Works Ltd. | 7,699,110 | ||||||
|
| |||||||
| 270,761,517 | ||||||||
|
| |||||||
| Mexico – 1.35% | ||||||||
| 43,348,757 | Consorcio ARA SAB de CV | 16,233,375 | ||||||
| 6,089,400 | Urbi Desarrollos Urbanos SA de CV(a)(b)(e) | 16,213 | ||||||
|
| |||||||
| 16,249,588 | ||||||||
|
| |||||||
| Philippines – 0.62% | ||||||||
| 5,229,000 | First Philippine Holdings Corp. | 7,498,278 | ||||||
|
| |||||||
| Russia – 0.76% | ||||||||
| 35,058,761 | Sistema JSFC | 9,129,361 | ||||||
|
| |||||||
| South Korea – 2.01% | ||||||||
| 2,249 | Lotte Confectionery Co. Ltd. | 5,050,220 | ||||||
| 208,685 | Samchully Co. Ltd.(f) | 19,171,553 | ||||||
|
| |||||||
| 24,221,773 | ||||||||
|
| |||||||
| Shares | Value | |||||||
| Spain – 0.65% | ||||||||
| 547,410 | Hispania Activos Inmobiliarios SA(a) | $ | 7,775,172 | |||||
|
| |||||||
| Turkey – 0.58% | ||||||||
| 7,724,677 | Selcuk Ecza Deposu Ticaret ve Sanayi AS | 7,026,005 | ||||||
|
| |||||||
| United Kingdom – 17.12% | ||||||||
| 4,893,560 | Balfour Beatty Plc(a) | 17,902,237 | ||||||
| 372,763 | Clarkson Plc | 11,849,506 | ||||||
| 846,831 | Countrywide | 4,689,886 | ||||||
| 5,094,273 | De La Rue Plc(f) | 32,661,017 | ||||||
| 19,435,337 | Debenhams Plc | 20,970,099 | ||||||
| 6,474,782 | ITE Group Plc | 13,670,080 | ||||||
| 3,545,526 | LSL Property Services Plc | 14,640,202 | ||||||
| 6,365,290 | McBride Plc(a) | 14,855,939 | ||||||
| 13,874,444 | Premier Foods Plc(a) | 11,340,554 | ||||||
| 14,481,089 | Spirent Communications Plc | 18,302,586 | ||||||
| 15,928,736 | WM. Morrison Supermarkets Plc | 45,362,879 | ||||||
|
| |||||||
| 206,244,985 | ||||||||
|
| |||||||
| TOTAL COMMON STOCKS | $ | 971,748,549 | |||||
|
| |||||||
| PREFERRED STOCKS – 1.93% | ||||||||
| Brazil – 1.22% | ||||||||
| 1,866,100 | Companhia Paranaense de Energia | $ | 14,765,215 | |||||
|
| |||||||
| Germany – 0.71% | ||||||||
| 125,539 | Draegerwerk AG & Co. KGaA | 8,509,447 | ||||||
|
| |||||||
| TOTAL PREFERRED | $ | 23,274,662 | |||||
|
| |||||||
| | REAL ESTATE INVESTMENT TRUSTS – 2.93% | | ||||||
| Greece – 1.45% | ||||||||
| 2,080,177 | Grivalia Properties Real Estate Investment Co. SA | $ | 17,445,073 | |||||
|
| |||||||
The accompanying notes are an integral part of these Schedule of Investments.
85
Brandes International Small Cap Fund
SCHEDULE OF INVESTMENTS — March 31, 2016 (Unaudited) (continued)
| Shares | Value | |||||||
| Mexico – 0.56% | ||||||||
| 4,986,650 | Macquarie Mexico Real Estate Management SA de CV | $ | 6,739,438 | |||||
|
| |||||||
| Shares | Value | |||||||
| Spain – 0.92% | ||||||||
| 959,128 | Merlin Properties SOCIMI SA | $ | 11,116,590 | |||||
|
| |||||||
| TOTAL REAL ESTATE | $ | 35,301,101 | |||||
|
| |||||||
Principal Amount | Value | |||||||
| CONVERTIBLE BONDS – 0.00% | ||||||||
| Brazil – 0.00% | ||||||||
Viver Incorporadora e Construtora SA 2.000%, 8/6/2016 | BRL 1,136,056 | $ | 37,914 | |||||
|
| |||||||
TOTAL CONVERTIBLE BONDS | $ | 37,914 | ||||||
|
| |||||||
| CORPORATE BONDS & NOTES- 0.13% | ||||||||
| Mexico – 0.13% | ||||||||
Desarrolladora Homex SA de CV | $ | 17,981,000 | $ | 89,905 | ||||
Desarrolladora Homex SA de CV | 149,312 | 1,377,787 | ||||||
Urbi Desarrollos Urbanos SA de CV | 8,014,000 | 40,070 | ||||||
|
| |||||||
TOTAL CORPORATE BONDS & NOTES | $ | 1,507,762 | ||||||
|
| |||||||
| REPURCHASE AGREEMENTS – 12.72% | ||||||||
State Street Bank and Trust Repurchase Agreement, | $ | 153,251,323 | $ | 153,251,323 | ||||
|
| |||||||
TOTAL REPURCHASE AGREEMENTS | $ | 153,251,323 | ||||||
|
| |||||||
Total Investments (Cost $1,173,816,500) – 98.36% | $ | 1,185,121,311 | ||||||
Other Assets in Excess of Liabilities – 1.64% | 19,818,036 | |||||||
|
| |||||||
TOTAL NET ASSETS – 100.00% | $ | 1,204,939,347 | ||||||
|
| |||||||
Percentages are stated as a percent of net assets.
| (a) | Non-income producing security. |
| (b) | The prices for these securities were derived from an estimate of fair market value using methods approved by the Fund’s Board of Trustees. These securities represent $1,431,914 or 0.12% of the Fund’s net assets and, with the exception of Viver Incorporadora e Construtora SA convertible bond (“Viver”), are classified as Level 3 securities. Viver is considered a Level 2 security. See Note 2 in the Notes to Financial Statements. |
The accompanying notes are an integral part of these Schedule of Investments.
86
Brandes International Small Cap Fund
SCHEDULE OF INVESTMENTS — March 31, 2016 (Unaudited) (continued)
| (c) | Security was purchased exempt from registration in the U.S. pursuant to Rule 144A of the Securities Act of 1933 (the “Act”) or was acquired in a private placement, and, unless registered under the Act, may only be sold to “qualified institutional buyers” (as defined in the Act) or pursuant to another exemption from registration. The market values of these securities total $1,415,701 which represents 0.12% of the Fund’s total net assets. |
| (d) | In default. |
| (e) | These securities have limited liquidity and represent $1,523,975 or 0.13% of the Fund’s net assets and, with the exception of Urbi Desarrollos Urbanos SA de CV (“Urbi”) and Desarrolladora Homex SA de CV Promissory Note (“Homex Note”), are classified as Level 2 securities. Urbi and the Homex Note are classified as Level 3 securities. See Note 2 in the Notes to Financial Statements. |
| (f) | Affiliated issuer. See Note 8 in the Notes to Financial Statements. |
| (g) | All or a portion of this security is on loan. See Note 2 in the Notes to Financial Statements. |
The accompanying notes are an integral part of these Schedule of Investments.
87
Brandes International Small Cap Fund
SCHEDULE OF INVESTMENTS BY INDUSTRY — March 31, 2016 (Unaudited)
COMMON STOCKS | ||||
Aerospace & Defense | 2.34 | % | ||
Auto Components | 1.54 | % | ||
Banks | 4.02 | % | ||
Beverages | 3.31 | % | ||
Commercial Services & Supplies | 2.71 | % | ||
Communications Equipment | 2.33 | % | ||
Construction & Engineering | 3.10 | % | ||
Construction Materials | 4.17 | % | ||
Distributors | 3.11 | % | ||
Diversified Telecommunication Services | 3.07 | % | ||
Electric Utilities | 4.76 | % | ||
Electrical Equipment | 1.08 | % | ||
Electronic Equipment, Instruments & Components | 1.09 | % | ||
Food & Staples Retailing | 5.40 | % | ||
Food Products | 3.62 | % | ||
Gas Utilities | 1.59 | % | ||
Health Care Equipment & Supplies | 1.57 | % | ||
Health Care Providers & Services | 0.58 | % | ||
Household Durables | 5.11 | % | ||
Household Products | 1.23 | % | ||
Industrial Conglomerates | 0.03 | % | ||
Insurance | 0.52 | % | ||
Leisure Products | 1.00 | % | ||
Machinery | 4.17 | % | ||
Marine | 0.99 | % | ||
Media | 1.13 | % | ||
Metals & Mining | 0.64 | % | ||
Multiline Retail | 1.74 | % | ||
Paper & Forest Products | 2.44 | % | ||
Personal Products | 0.79 | % | ||
Pharmaceuticals | 1.08 | % | ||
Real Estate Management & Development | 2.25 | % | ||
Semiconductors & Semiconductor Equipment | 1.15 | % | ||
Software | 1.23 | % | ||
Specialty Retail | 1.27 | % | ||
Technology Hardware, Storage & Peripherals | 0.85 | % | ||
Textiles, Apparel & Luxury Goods | 1.82 | % | ||
Water Utilities | 1.05 | % | ||
Wireless Telecommunication Services | 0.77 | % | ||
|
| |||
TOTAL COMMON STOCKS | 80.65 | % | ||
|
| |||
PREFERRED STOCKS | ||||
Electric Utilities | 1.22 | % | ||
Health Care Equipment & Supplies | 0.71 | % | ||
|
| |||
TOTAL PREFERRED STOCKS | 1.93 | % | ||
|
| |||
REAL ESTATE INVESTMENT TRUSTS | 2.93 | % | ||
|
| |||
The accompanying notes are an integral part of these Schedule of Investments.
88
Brandes International Small Cap Fund
SCHEDULE OF INVESTMENTS BY INDUSTRY — March 31, 2016 (Unaudited) (continued)
CORPORATE BONDS & NOTES | ||||
Household Durables | 0.13 | % | ||
|
| |||
TOTAL CORPORATE BONDS & NOTES | 0.13 | % | ||
|
| |||
REPURCHASE AGREEMENTS | 12.72 | % | ||
|
| |||
TOTAL INVESTMENTS | 98.36 | % | ||
Other Assets in Excess of Liabilities | 1.64 | % | ||
|
| |||
TOTAL NET ASSETS | 100.00 | % | ||
|
| |||
The industry classifications represented in the Schedule of Investments are in accordance with Global Industry Classification Standards (GICS ), which was developed by and/or is the exclusive property of MSCI, Inc. and Standard & Poor Financial Services LLC.
The accompanying notes are an integral part of these Schedule of Investments.
89
Brandes Core Plus Fixed Income Fund
SCHEDULE OF INVESTMENTS — March 31, 2016 (Unaudited)
| Principal Amount | Value | |||||||
| FEDERAL AND FEDERALLY SPONSORED CREDITS – 6.99% | ||||||||
| Federal Home Loan Mortgage Corporation – 3.77% | ||||||||
Pool G1-8578, 3.000%, 12/1/2030 | $ | 2,540,705 | $ | 2,658,091 | ||||
Pool G0-6018, 6.500%, 4/1/2039 | 46,428 | 52,853 | ||||||
Pool A9-3505, 4.500%, 8/1/2040 | 229,605 | 250,186 | ||||||
|
| |||||||
| 2,961,130 | ||||||||
|
| |||||||
| Federal National Mortgage Association – 3.22% | ||||||||
Pool MA0918, 4.000%, 12/1/2041 | 484,158 | 518,847 | ||||||
Pool AS6201, 3.500%, 11/1/2045 | 1,785,997 | 1,873,449 | ||||||
Pool 934124, 5.500%, 7/1/2038 | 63,108 | 70,725 | ||||||
Pool 634757, 5.500%, 3/1/2017 | 766 | 776 | ||||||
Pool 254631, 5.000%, 2/1/2018 | 61,452 | 63,462 | ||||||
|
| |||||||
| 2,527,259 | ||||||||
|
| |||||||
TOTAL FEDERAL AND FEDERALLY SPONSORED CREDITS | $ | 5,488,389 | ||||||
|
| |||||||
| OTHER MORTGAGE RELATED SECURITIES – 0.21% | ||||||||
| Collateralized Mortgage Obligations – 0.00% | ||||||||
Wells Fargo Mortgage Backed Securities Trust | $ | 2,677 | $ | 2,561 | ||||
|
| |||||||
| Near Prime Mortgage – 0.21% | ||||||||
Bear Stearns Alt-A Trust | 171,268 | 165,642 | ||||||
|
| |||||||
TOTAL OTHER MORTGAGE RELATED SECURITIES | $ | 168,203 | ||||||
|
| |||||||
| US GOVERNMENTS – 53.72% | ||||||||
| Sovereign – 53.72% | ||||||||
United States Treasury Bond | $ | 475,000 | $ | 672,181 | ||||
United States Treasury Note | ||||||||
3.375%, 11/15/2019 | 12,065,000 | 13,081,102 | ||||||
2.000%, 11/15/2021 | 16,471,000 | 17,034,621 | ||||||
2.000%, 2/15/2023 | 8,540,000 | 8,798,865 | ||||||
2.375%, 8/15/2024 | 2,450,000 | 2,580,156 | ||||||
|
| |||||||
| 41,494,744 | ||||||||
|
| |||||||
TOTAL US GOVERNMENTS | $ | 42,166,925 | ||||||
|
| |||||||
The accompanying notes are an integral part of these Schedule of Investments.
90
Brandes Core Plus Fixed Income Fund
SCHEDULE OF INVESTMENTS — March 31, 2016 (Unaudited) (continued)
| Shares | Value | |||||||
| PREFERRED STOCKS – 1.53% | ||||||||
| Consumer Finance – 0.25% | ||||||||
Ally Financial, Inc., 8.500% | 7,800 | $ | 198,588 | |||||
|
| |||||||
| Technology Hardware – 1.28% | ||||||||
Pitney Bowes International Holdings, Inc., | 960 | 1,001,100 | ||||||
|
| |||||||
TOTAL PREFERRED STOCKS | $ | 1,199,688 | ||||||
|
| |||||||
| Principal Amount | Value | |||||||
| ASSET BACKED SECURITIES – 1.44% | ||||||||
| Equipment – 0.05% | ||||||||
Continental Airlines 2007-1 Class A Pass Through Trust | ||||||||
Series 2007-1, 5.983%, 10/19/2023 | $ | 31,615 | $ | 34,935 | ||||
|
| |||||||
| Student Loan – 1.39% | ||||||||
SLM Private Credit Student Loan Trust | ||||||||
Series 2004-B, 1.064%, 9/15/2033 | 300,000 | 248,309 | ||||||
Series 2005-A, 0.944%, 12/15/2038 | 400,000 | 320,575 | ||||||
Series 2006-A, 0.924%, 6/15/2039 | 275,000 | 230,266 | ||||||
Series 2007-A, 0.874%, 12/15/2041 | 350,000 | 291,892 | ||||||
|
| |||||||
| 1,091,042 | ||||||||
|
| |||||||
TOTAL ASSET BACKED SECURITIES | $ | 1,125,977 | ||||||
|
| |||||||
| CONVERTIBLE BONDS – 0.76% | ||||||||
| Metals & Mining – 0.76% | ||||||||
Royal Gold, Inc. | $ | 625,000 | $ | 597,656 | ||||
|
| |||||||
TOTAL CONVERTIBLE BONDS | $ | 597,656 | ||||||
|
| |||||||
| CORPORATE BONDS – 32.44% | ||||||||
| Banks – 1.53% | ||||||||
Citigroup, Inc. | $ | 885,000 | $ | 944,081 | ||||
Fifth Third Bancorp | 175,000 | 254,970 | ||||||
|
| |||||||
| 1,199,051 | ||||||||
|
| |||||||
| Banks & Thrifts – 3.38% | ||||||||
JP Morgan Chase & Co. | 1,585,000 | 1,585,000 | ||||||
The Goldman Sachs Group, Inc. | 445,000 | 512,578 | ||||||
USB Capital IX | 750,000 | 555,000 | ||||||
|
| |||||||
| 2,652,578 | ||||||||
|
| |||||||
The accompanying notes are an integral part of these Schedule of Investments.
91
Brandes Core Plus Fixed Income Fund
SCHEDULE OF INVESTMENTS — March 31, 2016 (Unaudited) (continued)
| Principal Amount | Value | |||||||
| Building Materials – 1.74% | ||||||||
Masco Corp. | $ | 1,105,000 | $ | 1,131,796 | ||||
USG Corp. | 230,000 | 235,750 | ||||||
|
| |||||||
| 1,367,546 | ||||||||
|
| |||||||
| Building Products – 0.01% | ||||||||
Owens Corning | 5,000 | 5,107 | ||||||
|
| |||||||
| Commercial Services & Supplies – 1.44% | ||||||||
The ADT Corp. | 1,310,000 | 1,133,150 | ||||||
|
| |||||||
| Diversified Financial Services – 0.98% | ||||||||
Bank of America Corp. | 395,000 | 397,880 | ||||||
Voya Financial, Inc. | 335,000 | 374,720 | ||||||
|
| |||||||
| 772,600 | ||||||||
|
| |||||||
| Electric Utilities – 4.35% | ||||||||
Arizona Public Service Co. | 340,000 | 403,178 | ||||||
Commonwealth Edison Co. | 175,000 | 219,014 | ||||||
Series 104, 5.950%, 8/15/2016 | 50,000 | 50,912 | ||||||
DPL, Inc. | 455,000 | 472,918 | ||||||
FirstEnergy Corp. | 1,165,000 | 1,414,970 | ||||||
Israel Electric Corp. Ltd. | 420,000 | 464,719 | ||||||
Oncor Electric Delivery Co., LLC | 315,000 | 389,968 | ||||||
|
| |||||||
| 3,415,679 | ||||||||
|
| |||||||
| Energy – 0.26% | ||||||||
Valero Energy Corp. | 170,000 | 202,713 | ||||||
|
| |||||||
| Food & Staples Retailing – 1.30% | ||||||||
Tesco Plc | 980,000 | 1,019,519 | ||||||
|
| |||||||
| Food, Beverage & Tobacco – 0.34% | ||||||||
Tyson Foods, Inc. | 270,000 | 270,000 | ||||||
|
| |||||||
The accompanying notes are an integral part of these Schedule of Investments.
92
Brandes Core Plus Fixed Income Fund
SCHEDULE OF INVESTMENTS — March 31, 2016 (Unaudited) (continued)
| Principal Amount | Value | |||||||
| Forest Products & Paper – 1.31% | ||||||||
Sappi Papier Holding GmbH | $ | 995,000 | $ | 1,028,999 | ||||
|
| |||||||
| Health Care Providers & Services – 0.63% | ||||||||
Laboratory Corp. of America Holdings | 165,000 | 170,351 | ||||||
Tenet Healthcare Corp. | 315,000 | 324,056 | ||||||
|
| |||||||
| 494,407 | ||||||||
|
| |||||||
| Homebuilders – 0.49% | ||||||||
Centex Corp. | 130,000 | 130,000 | ||||||
Toll Brothers Finance Corp. | 245,000 | 242,550 | ||||||
Urbi Desarrollos Urbanos SA | 1,640,000 | 8,200 | ||||||
|
| |||||||
| 380,750 | ||||||||
|
| |||||||
| Household Durables – 0.49% | ||||||||
Pulte Group, Inc. | 370,000 | 380,638 | ||||||
|
| |||||||
| Independent Power and Renewable Electricity Producers – 0.32% | ||||||||
PPL Energy Supply, LLC | 255,000 | 247,350 | ||||||
|
| |||||||
| Insurance – 2.04% | ||||||||
American International Group, Inc. | 800,000 | 929,622 | ||||||
CNA Financial Corp. | ||||||||
7.350%, 11/15/2019 | 160,000 | 184,692 | ||||||
5.875%, 8/15/2020 | 135,000 | 150,679 | ||||||
Genworth Financial, Inc. | 385,000 | 339,763 | ||||||
|
| |||||||
| 1,604,756 | ||||||||
|
| |||||||
| Media – 0.38% | ||||||||
McGraw Hill Financial, Inc. | 280,000 | 298,651 | ||||||
|
| |||||||
| Metals & Mining – 1.99% | ||||||||
ArcelorMittal SA | 435,000 | 428,475 | ||||||
Thompson Creek Metals Co., Inc. | 1,205,000 | 1,129,688 | ||||||
|
| |||||||
| 1,558,163 | ||||||||
|
| |||||||
The accompanying notes are an integral part of these Schedule of Investments.
93
Brandes Core Plus Fixed Income Fund
SCHEDULE OF INVESTMENTS — March 31, 2016 (Unaudited) (continued)
| Principal Amount | Value | |||||||
| Oil, Gas & Consumable Fuels – 6.93% | ||||||||
Anadarko Petroleum Corp. | $ | 435,000 | $ | 442,552 | ||||
BP Capital Markets Plc | 810,000 | 822,271 | ||||||
Chesapeake Energy Corp. | 1,560,000 | 608,400 | ||||||
6.125%, 2/15/2021 | 925,000 | 356,125 | ||||||
Cloud Peak Energy, Inc. | 545,000 | 174,400 | ||||||
Exxon Mobil Corp. | 745,000 | 754,649 | ||||||
Kinder Morgan, Inc. | ||||||||
7.000%, 6/15/2017 | 195,000 | 204,588 | ||||||
4.300%, 6/1/2025 | 904,000 | 859,871 | ||||||
Occidental Petroleum Corp. | 800,000 | 819,289 | ||||||
Range Resources Corp. | 470,000 | 398,325 | ||||||
|
| |||||||
| 5,440,470 | ||||||||
|
| |||||||
| Pharmaceutical – 1.09% | ||||||||
Valeant Pharmaceuticals International | 945,000 | 857,588 | ||||||
|
| |||||||
| Retail – 0.43% | ||||||||
Marks & Spencer Plc | 285,000 | 336,632 | ||||||
|
| |||||||
| Telecommunications – 0.31% | ||||||||
Telecom Italia Capital SA | 85,000 | 92,438 | ||||||
Telefonica Emisiones SAU | 135,000 | 153,367 | ||||||
|
| |||||||
| 245,805 | ||||||||
|
| |||||||
| Wireless Telecommunication Services – 0.70% | ||||||||
Sprint Nextel Corp. | 525,000 | 549,938 | ||||||
|
| |||||||
TOTAL CORPORATE BONDS | $ | 25,462,090 | ||||||
|
| |||||||
The accompanying notes are an integral part of these Schedule of Investments.
94
Brandes Core Plus Fixed Income Fund
SCHEDULE OF INVESTMENTS — March 31, 2016 (Unaudited) (continued)
| Principal Amount | Value | |||||||
| REPURCHASE AGREEMENTS – 2.97% | ||||||||
State Street Bank and Trust Repurchase Agreement, | $ | 2,334,068 | $ | 2,334,068 | ||||
|
| |||||||
TOTAL REPURCHASE AGREEMENTS | $ | 2,334,068 | ||||||
|
| |||||||
Total Investments (Cost $78,123,218) – 100.06% | $ | 78,542,996 | ||||||
Liabilities in Excess of Other Assets – (0.06%) | (46,804 | ) | ||||||
|
| |||||||
TOTAL NET ASSETS – 100.00% | $ | 78,496,192 | ||||||
|
| |||||||
Percentages are stated as a percent of net assets.
| (a) | Security was purchased exempt from registration in the U.S. pursuant to Rule 144A of the Securities Act of 1933 (the “Act”) or was acquired in a private placement, and, unless registered under the Act, may only be sold to “qualified institutional buyers” (as defined in the Act) or pursuant to another exemption from registration. The market values of these securities total $5,266,695 which represents 6.71% of total net assets. |
| (b) | In default. |
| (c) | These securities have limited liquidity and represent $1,011,861 or 1.29% of the Fund’s net assets and are classified as Level 2 securities. See Note 2 in the Notes to Schedule of Investments. |
| (d) | Non-income producing security. |
The industry classifications represented in the Schedule of Investments are in accordance with Global Industry Classification Standards (GICS ), which was developed by and/or is the exclusive property of MSCI, Inc. and Standard & Poor Financial Services LLC.
The accompanying notes are an integral part of these Schedule of Investments.
95
Brandes Credit Focus Yield Fund
SCHEDULE OF INVESTMENTS — March 31, 2016 (Unaudited)
| Principal Amount | Value | |||||||
| US GOVERNMENTS – 30.07% | ||||||||
| Sovereign – 30.07% | ||||||||
United States Treasury Note | ||||||||
3.375%, 11/15/2019 | $ | 4,835,000 | $ | 5,242,199 | ||||
2.000%, 11/15/2021 | 2,190,000 | 2,264,940 | ||||||
2.000%, 2/15/2023 | 1,225,000 | 1,262,132 | ||||||
|
| |||||||
| TOTAL US GOVERNMENTS (Cost $8,534,934) | $ | 8,769,271 | ||||||
|
| |||||||
| Shares | Value | |||||||
| PREFERRED STOCKS – 3.19% | ||||||||
| Consumer Finance – 1.03% | ||||||||
Ally Financial, Inc., 8.500% | 11,800 | $ | 300,428 | |||||
|
| |||||||
| Technology Hardware – 2.16% | ||||||||
Pitney Bowes International Holdings, Inc., | 605 | 630,901 | ||||||
|
| |||||||
TOTAL PREFERRED STOCKS | $ | 931,329 | ||||||
|
| |||||||
| Principal Amount | Value | |||||||
| ASSET BACKED SECURITIES – 1.16% | ||||||||
| Equipment – 0.30% | ||||||||
Continental Airlines 2007-1 Class A Pass Through Trust | $ | 79,038 | $ | 87,337 | ||||
|
| |||||||
| Student Loan – 0.86% | ||||||||
SLM Private Credit Student Loan Trust | 300,000 | 250,194 | ||||||
|
| |||||||
TOTAL ASSET BACKED SECURITIES | $ | 337,531 | ||||||
|
| |||||||
| CONVERTIBLE BONDS – 1.20% | ||||||||
| Metals & Mining – 1.20% | ||||||||
Royal Gold, Inc. | $ | 365,000 | $ | 349,031 | ||||
|
| |||||||
TOTAL CONVERTIBLE BONDS | $ | 349,031 | ||||||
|
| |||||||
| CORPORATE BONDS – 59.56% | ||||||||
| Banks – 2.15% | ||||||||
Citigroup, Inc. | $ | 500,000 | $ | 533,379 | ||||
Fifth Third Bancorp | 65,000 | 94,703 | ||||||
|
| |||||||
| 628,082 | ||||||||
|
| |||||||
The accompanying notes are an integral part of these Schedule of Investments.
96
Brandes Credit Focus Yield Fund
SCHEDULE OF INVESTMENTS — March 31, 2016 (Unaudited) (continued)
| Principal Amount | Value | |||||||
| Banks & Thrifts – 6.06% | ||||||||
JP Morgan Chase & Co. | $ | 1,140,000 | $ | 1,140,000 | ||||
The Goldman Sachs Group, Inc. | 320,000 | 368,596 | ||||||
USB Capital IX | 350,000 | 259,000 | ||||||
|
| |||||||
| 1,767,596 | ||||||||
|
| |||||||
| Building Materials – 3.04% | ||||||||
Masco Corp. | 720,000 | 737,460 | ||||||
Owens Corning | 6,000 | 6,129 | ||||||
USG Corp. | 140,000 | 143,500 | ||||||
|
| |||||||
| 887,089 | ||||||||
|
| |||||||
| Commercial Services & Supplies – 2.21% | ||||||||
The ADT Corp. | 745,000 | 644,425 | ||||||
|
| |||||||
| Computers & Peripherals – 2.59% | ||||||||
Apple, Inc. | 750,000 | 754,561 | ||||||
|
| |||||||
| Diversified Financial Services – 3.06% | ||||||||
Bank of America Corp. | 490,000 | 493,573 | ||||||
Voya Financial, Inc. | 355,000 | 397,091 | ||||||
|
| |||||||
| 890,664 | ||||||||
|
| |||||||
| Electric Utilities – 7.43% | ||||||||
Arizona Public Service Co. | 435,000 | 515,830 | ||||||
Commonwealth Edison Co. | 110,000 | 112,006 | ||||||
DPL, Inc. | 355,000 | 368,980 | ||||||
FirstEnergy Corp. | 380,000 | 461,536 | ||||||
Israel Electric Corp. Ltd. | 505,000 | 558,769 | ||||||
Oncor Electric Delivery Co., LLC | 120,000 | 148,559 | ||||||
|
| |||||||
| 2,165,680 | ||||||||
|
| |||||||
The accompanying notes are an integral part of these Schedule of Investments.
97
Brandes Credit Focus Yield Fund
SCHEDULE OF INVESTMENTS — March 31, 2016 (Unaudited) (continued)
| Principal Amount | Value | |||||||
| Energy – 0.84% | ||||||||
Valero Energy Corp. | $ | 205,000 | $ | 244,448 | ||||
|
| |||||||
| Food & Staples Retailing – 1.98% | ||||||||
Tesco Plc | 555,000 | 577,381 | ||||||
|
| |||||||
| Food, Beverage & Tobacco – 0.69% | ||||||||
Tyson Foods, Inc. | 200,000 | 200,000 | ||||||
|
| |||||||
| Forest Products & Paper – 2.00% | ||||||||
Sappi Papier Holding GmbH | 565,000 | 584,306 | ||||||
|
| |||||||
| Health Care Providers & Services – 1.57% | ||||||||
Laboratory Corp. of America Holdings | 240,000 | 247,783 | ||||||
Tenet Healthcare Corp. | 205,000 | 210,894 | ||||||
|
| |||||||
| 458,677 | ||||||||
|
| |||||||
| Homebuilders – 1.01% | ||||||||
Centex Corp. | 155,000 | 155,000 | ||||||
Toll Brothers Finance Corp. | 135,000 | 133,650 | ||||||
Urbi Desarrollos Urbanos SA | 1,225,000 | 6,125 | ||||||
|
| |||||||
| 294,775 | ||||||||
|
| |||||||
| Household Durables – 0.72% | ||||||||
Pulte Group, Inc. | 205,000 | 210,894 | ||||||
|
| |||||||
| Independent Power & Renewable Electricity Producers – 0.73% | ||||||||
PPL Energy Supply, LLC | 220,000 | 213,400 | ||||||
|
| |||||||
| Insurance – 3.98% | ||||||||
American International Group, Inc. | 485,000 | 563,584 | ||||||
CNA Financial Corp. | ||||||||
7.350%, 11/15/2019 | 125,000 | 144,291 | ||||||
5.875%, 8/15/2020 | 235,000 | 262,293 | ||||||
Genworth Financial, Inc. | 215,000 | 189,737 | ||||||
|
| |||||||
| 1,159,905 | ||||||||
|
| |||||||
The accompanying notes are an integral part of these Schedule of Investments.
98
Brandes Credit Focus Yield Fund
SCHEDULE OF INVESTMENTS — March 31, 2016 (Unaudited) (continued)
| Principal Amount | Value | |||||||
| Media – 0.97% | ||||||||
McGraw Hill Financial, Inc. | $ | 265,000 | $ | 282,652 | ||||
|
| |||||||
| Metals & Mining – 3.31% | ||||||||
ArcelorMittal SA | 280,000 | 275,800 | ||||||
Thompson Creek Metals Co., Inc. | 735,000 | 689,063 | ||||||
|
| |||||||
| 964,863 | ||||||||
|
| |||||||
| Oil, Gas & Consumable Fuels – 11.67% | ||||||||
Anadarko Petroleum Corp. | 510,000 | 518,855 | ||||||
BP Capital Markets Plc | 445,000 | 451,741 | ||||||
Chesapeake Energy Corp. | ||||||||
6.625%, 8/15/2020 | 1,010,000 | 393,900 | ||||||
6.125%, 2/15/2021 | 375,000 | 144,375 | ||||||
Cloud Peak Energy, Inc. | 375,000 | 120,000 | ||||||
Exxon Mobil Corp. | 435,000 | 440,634 | ||||||
Kinder Morgan, Inc. | ||||||||
7.000%, 6/15/2017 | 270,000 | 283,276 | ||||||
4.300%, 6/1/2025 | 353,000 | 335,768 | ||||||
Occidental Petroleum Corp. | 445,000 | 455,729 | ||||||
Range Resources Corp. | 305,000 | 258,487 | ||||||
|
| |||||||
| 3,402,765 | ||||||||
|
| |||||||
| Pharmaceutical – 1.68% | ||||||||
Valeant Pharmaceuticals International | 540,000 | 490,050 | ||||||
|
| |||||||
| Telecommunications – 0.83% | ||||||||
Telecom Italia Capital SA | 140,000 | 152,250 | ||||||
Telefonica Emisiones SAU | 80,000 | 90,884 | ||||||
|
| |||||||
| 243,134 | ||||||||
|
| |||||||
The accompanying notes are an integral part of these Schedule of Investments.
99
Brandes Credit Focus Yield Fund
SCHEDULE OF INVESTMENTS — March 31, 2016 (Unaudited) (continued)
| Principal Amount | Value | |||||||
| Wireless Telecommunication Services – 1.04% | ||||||||
Sprint Nextel Corp. | $ | 290,000 | $ | 303,775 | ||||
|
| |||||||
TOTAL CORPORATE BONDS | $ | 17,369,122 | ||||||
|
| |||||||
| REPURCHASE AGREEMENTS – 3.64% | ||||||||
State Street Bank and Trust Repurchase Agreement, | $ | 1,060,705 | $ | 1,060,705 | ||||
|
| |||||||
TOTAL REPURCHASE AGREEMENTS | $ | 1,060,705 | ||||||
|
| |||||||
Total Investments (Cost $29,530,527) – 98.82% | $ | 28,816,989 | ||||||
Other Assets in Excess of Liabilities – 1.18% | 345,495 | |||||||
|
| |||||||
TOTAL NET ASSETS – 100.00% | $ | 29,162,484 | ||||||
|
| |||||||
Percentages are stated as a percent of net assets.
| (a) | Security was purchased exempt from registration in the U.S. pursuant to Rule 144A of the Securities Act of 1933 (the “Act”) or was acquired in a private placement, and, unless registered under the Act, may only be sold to “qualified institutional buyers” (as defined in the Act) or pursuant to another exemption from registration. The market values of these securities total $3,151,307 which represents 10.81% of total net assets. |
| (b) | In default. |
| (c) | These securities have limited liquidity and represent $637,026 or 2.18% of the Fund’s net assets and are classified as Level 2 securities. See Note 2 in the Notes to Schedule of Investments. |
| (d) | Non-income producing security. |
The industry classifications represented in the Schedule of Investments are in accordance with Global Industry Classification Standards (GICS ), which was developed by and/or is the exclusive property of MSCI, Inc. and Standard & Poor Financial Services LLC.
The accompanying notes are an integral part of these Schedule of Investments.
100
(This Page Intentionally Left Blank.)
101
Brandes Investment Trust
STATEMENTS OF ASSETS AND LIABILITIES — March 31, 2016 (Unaudited)
| Brandes International Equity Fund | Brandes Global Equity Fund | |||||||
ASSETS | ||||||||
Investment in securities, at value(1) | ||||||||
Unaffiliated issuers | $ | 625,221,770 | $ | 47,109,926 | ||||
Affiliated issuers | — | — | ||||||
Cash | — | — | ||||||
Foreign Currency(1) | 193,484 | 20,167 | ||||||
Receivables: | ||||||||
Securities sold | 3,902,107 | 264,044 | ||||||
Fund shares sold | 1,384,506 | 14,233 | ||||||
Dividends and interest | 3,637,338 | 239,297 | ||||||
Foreign currency spot trade | 3,406 | — | ||||||
Tax reclaims | 456,620 | 21,224 | ||||||
Due from Advisor | — | — | ||||||
Prepaid expenses and other assets | 91,366 | 32,209 | ||||||
|
|
|
| |||||
Total Assets | 634,890,597 | 47,701,100 | ||||||
|
|
|
| |||||
LIABILITIES | ||||||||
Payables: | ||||||||
Securities purchased | 710,823 | — | ||||||
Fund shares redeemed | 1,256,594 | 84,165 | ||||||
Due to Advisor | 422,240 | 16,002 | ||||||
12b-1 Fee | 11,556 | 2,274 | ||||||
Trustee Fees | 22,887 | 4,446 | ||||||
Dividends payable | 77,781 | 1,354 | ||||||
Foreign tax witholding | 420,478 | 24,192 | ||||||
Foreign currency spot trade payable | — | — | ||||||
Accrued expenses | 174,857 | 57,905 | ||||||
|
|
|
| |||||
Total Liabilities | 3,097,216 | 190,338 | ||||||
|
|
|
| |||||
NET ASSETS | $ | 631,793,381 | $ | 47,510,762 | ||||
|
|
|
| |||||
COMPONENTS OF NET ASSETS | ||||||||
Paid-in capital | $ | 787,232,930 | $ | 49,259,385 | ||||
Undistributed net investment income (loss) | (1,414,634 | ) | (48,673 | ) | ||||
Accumulated net realized gain (loss) on investments and foreign currency | (63,331,149 | ) | (1,161,638 | ) | ||||
Net unrealized appreciation (depreciation) on: | ||||||||
Investments | (90,701,261 | ) | (539,232 | ) | ||||
Foreign currency | 7,495 | 920 | ||||||
|
|
|
| |||||
Total Net Assets | $ | 631,793,381 | $ | 47,510,762 | ||||
|
|
|
| |||||
Net asset value, offering price and redemption proceeds per share | ||||||||
Class A Shares | ||||||||
Net Assets | $ | 13,891,333 | $ | 4,678,899 | ||||
Shares outstanding (unlimited shares authorized without par value) | 909,782 | 229,213 | ||||||
Offering and redemption price | $ | 15.27 | $ | 20.41 | ||||
|
|
|
| |||||
Maximum offering price per share* | $ | 16.20 | $ | 21.66 | ||||
|
|
|
| |||||
Class C Shares | ||||||||
Net Assets | $ | 13,940,560 | $ | 1,927,090 | ||||
Shares outstanding (unlimited shares authorized without par value) | 920,032 | 94,942 | ||||||
Offering and redemption price | $ | 15.15 | $ | 20.30 | ||||
|
|
|
| |||||
Class E Shares | ||||||||
Net Assets | $ | 660,957 | $ | 59,710 | ||||
Shares outstanding (unlimited shares authorized without par value) | 43,313 | 2,971 | ||||||
Offering and redemption price | $ | 15.26 | $ | 20.10 | ||||
|
|
|
| |||||
Class I Shares | ||||||||
Net Assets | $ | 603,300,424 | $ | 40,845,063 | ||||
Shares outstanding (unlimited shares authorized without par value) | 39,445,651 | 1,989,887 | ||||||
Offering and redemption price | $ | 15.29 | $ | 20.53 | ||||
|
|
|
| |||||
Class R6 Shares | ||||||||
Net Assets | $ | 107 | N/A | |||||
Shares outstanding (unlimited shares authorized without par value) | 7 | N/A | ||||||
Offering and redemption price | $ | 15.29 | N/A | |||||
|
|
|
| |||||
(1) Cost of : | ||||||||
Investments in securities | ||||||||
Unaffiliated issuers | $ | 715,923,031 | $ | 47,649,158 | ||||
Affiliated issuers | — | — | ||||||
Foreign currency | 193,313 | 20,172 | ||||||
| * | Includes a sales load of 5.75% for the International, Global, Global Equity Income, Global Opportunities Value, Emerging Markets Value, and International Small Cap Funds and 3.75% for the Core Plus Fixed Income and Credit Focus Yield Funds. (see Note 7 of the Notes to Financial Statements) |
The accompanying notes to financial statements are an integral part of this statement.
102
Brandes Investment Trust
STATEMENTS OF ASSETS AND LIABILITIES — March 31, 2016 (Unaudited) (continued)
Brandes | Brandes | Brandes | Brandes | Brandes | Brandes | |||||||||||||||||
| $ | 676,803 | $ | 7,547,204 | $ | 1,029,390,838 | $ | 1,099,697,807 | $ | 78,542,996 | $ | 28,816,989 | |||||||||||
| — | — | — | 85,423,504 | — | — | |||||||||||||||||
| — | — | — | 459,969 | — | — | |||||||||||||||||
| 184 | — | 108,666 | 15,256,428 | — | — | |||||||||||||||||
| 4,476 | — | 10,003,459 | 3,533,421 | — | — | |||||||||||||||||
| — | 4,500 | 1,877,446 | 4,612,727 | 338,988 | — | |||||||||||||||||
| 3,338 | 37,804 | 4,348,924 | 4,052,442 | 760,029 | 366,523 | |||||||||||||||||
| — | — | 33,698 | 1,761 | — | — | |||||||||||||||||
| 76 | 3,785 | 240,277 | 316,385 | — | — | |||||||||||||||||
| 14,039 | 15,398 | — | — | — | 142 | |||||||||||||||||
| 7,570 | 15,926 | 132,685 | 94,372 | 34,228 | 26,577 | |||||||||||||||||
|
|
|
|
|
|
|
|
|
|
|
| |||||||||||
| 706,486 | 7,624,617 | 1,046,135,993 | 1,213,448,816 | 79,676,241 | 29,210,231 | |||||||||||||||||
|
|
|
|
|
|
|
|
|
|
|
| |||||||||||
| 3,700 | — | — | 5,524,453 | 1,057,376 | — | |||||||||||||||||
| — | 2 | 1,788,609 | 1,260,330 | 50,757 | 62 | |||||||||||||||||
| — | — | 737,046 | 972,324 | 7,358 | — | |||||||||||||||||
| 1 | 70 | 72,902 | 27,519 | 637 | 549 | |||||||||||||||||
| 6,063 | 5,933 | 40,441 | 34,000 | 5,130 | 3,578 | |||||||||||||||||
| 126 | 57 | 206,556 | — | 3,372 | 2,444 | |||||||||||||||||
| 292 | 4,398 | 734,177 | 458,268 | — | — | |||||||||||||||||
| 27 | — | — | — | — | — | |||||||||||||||||
| 39,067 | 43,104 | 448,666 | 232,575 | 55,419 | 41,114 | |||||||||||||||||
|
|
|
|
|
|
|
|
|
|
|
| |||||||||||
| 49,276 | 53,564 | 4,028,397 | 8,509,469 | 1,180,049 | 47,747 | |||||||||||||||||
|
|
|
|
|
|
|
|
|
|
|
| |||||||||||
| $ | 657,210 | $ | 7,571,053 | $ | 1,042,107,596 | $ | 1,204,939,347 | $ | 78,496,192 | $ | 29,162,484 | |||||||||||
|
|
|
|
|
|
|
|
|
|
|
| |||||||||||
| $ | 654,033 | $ | 7,868,168 | $ | 1,433,783,850 | $ | 1,202,457,409 | $ | 78,039,489 | $ | 29,533,711 | |||||||||||
| 137 | (6,033 | ) | (3,426,499 | ) | (12,351,526 | ) | (18,027 | ) | (7,861 | ) | ||||||||||||
| 9,651 | (24,199 | ) | (139,080,237 | ) | 2,982,973 | 54,952 | 350,172 | |||||||||||||||
| (6,595 | ) | (267,351 | ) | (249,289,824 | ) | 11,304,811 | 419,778 | (713,538 | ) | |||||||||||||
| (16 | ) | 468 | 120,306 | 545,680 | — | — | ||||||||||||||||
|
|
|
|
|
|
|
|
|
|
|
| |||||||||||
| $ | 657,210 | $ | 7,571,053 | $ | 1,042,107,596 | $ | 1,204,939,347 | $ | 78,496,192 | $ | 29,162,484 | |||||||||||
|
|
|
|
|
|
|
|
|
|
|
| |||||||||||
| $ | 100 | $ | 243,395 | $ | 296,408,612 | $ | 77,719,313 | $ | 2,672,306 | $ | 1,944,324 | |||||||||||
| 10 | 24,979 | 41,088,099 | 5,911,269 | 293,156 | 196,457 | |||||||||||||||||
| $ | 10.17 | $ | 9.74 | $ | 7.21 | $ | 13.15 | $ | 9.12 | $ | 9.90 | |||||||||||
|
|
|
|
|
|
|
|
|
|
|
| |||||||||||
| $ | 10.79 | $ | 10.34 | $ | 7.65 | $ | 13.95 | $ | 9.47 | $ | 10.28 | |||||||||||
|
|
|
|
|
|
|
|
|
|
|
| |||||||||||
| $ | 105 | $ | 32,561 | $ | 19,412,741 | $ | 18,520,776 | N/A | N/A | |||||||||||||
| 10 | 3,356 | 2,713,077 | 1,429,597 | — | — | |||||||||||||||||
| $ | 10.13 | $ | 9.70 | $ | 7.16 | �� | $ | 12.96 | N/A | N/A | ||||||||||||
|
|
|
|
|
|
|
|
|
|
|
| |||||||||||
| N/A | N/A | N/A | N/A | $ | 343,742 | N/A | ||||||||||||||||
| — | — | — | — | 37,381 | — | |||||||||||||||||
| N/A | N/A | N/A | N/A | $ | 9.20 | N/A | ||||||||||||||||
|
|
|
|
|
|
|
|
|
|
|
| |||||||||||
| $ | 657,005 | $ | 7,295,097 | $ | 726,286,243 | $ | 1,108,699,258 | $ | 75,480,144 | $ | 27,218,160 | |||||||||||
| 65,082 | 750,465 | 100,339,540 | 84,065,413 | 8,231,125 | 2,750,831 | |||||||||||||||||
| $ | 10.10 | $ | 9.72 | $ | 7.24 | $ | 13.19 | $ | 9.17 | $ | 9.89 | |||||||||||
|
|
|
|
|
|
|
|
|
|
|
| |||||||||||
| N/A | N/A | N/A | N/A | N/A | N/A | |||||||||||||||||
| N/A | N/A | N/A | N/A | N/A | N/A | |||||||||||||||||
| N/A | N/A | N/A | N/A | N/A | N/A | |||||||||||||||||
|
|
|
|
|
|
|
|
|
|
|
| |||||||||||
| $ | 683,398 | $ | 7,814,555 | $ | 1,278,680,662 | $ | 1,069,957,127 | $ | 78,123,218 | $ | 29,530,527 | |||||||||||
| — | — | — | 103,859,373 | — | — | |||||||||||||||||
| 185 | — | 107,655 | 14,742,603 | — | — | |||||||||||||||||
The accompanying notes to financial statements are an integral part of this statement.
103
Brandes Investment Trust
STATEMENTS OF OPERATIONS — For the Six Months Ended March 31, 2016 (Unaudited)
| Brandes International Equity Fund | Brandes Global Equity Fund | |||||||
INVESTMENT INCOME | ||||||||
Income | ||||||||
Dividend income | ||||||||
Unaffiliated issuers | $ | 7,528,940 | $ | 672,874 | ||||
Affiliated issuers | — | — | ||||||
Less: foreign taxes withheld | (905,863 | ) | (53,585 | ) | ||||
Interest income | 406 | 6,336 | ||||||
Less: Foreign taxes withheld | — | — | ||||||
Income from securities lending | 65,971 | 19,213 | ||||||
Miscellaneous Income | — | — | ||||||
|
|
|
| |||||
Total Income | 6,689,454 | 644,838 | ||||||
|
|
|
| |||||
Expenses | ||||||||
Advisory fees (Note 3) | 2,441,821 | 197,454 | ||||||
Custody fees | 85,125 | 6,395 | ||||||
Administration fees (Note 3) | 73,949 | 7,032 | ||||||
Insurance expense | 2,819 | 175 | ||||||
Legal fees | 13,943 | 1,894 | ||||||
Printing fees | 22,585 | 2,973 | ||||||
Miscellaneous | 10,635 | 2,164 | ||||||
Registration expense | 42,540 | 26,967 | ||||||
Trustee fees | 40,061 | 3,644 | ||||||
Transfer agent fees | 63,950 | 32,362 | ||||||
12b-1 Fees – Class A | 17,205 | 3,689 | ||||||
12b-1 Fees – Class C | 49,497 | 8,624 | ||||||
Shareholder Service Fees – Class C | 16,499 | 2,875 | ||||||
Shareholder Service Fees – Class E | 1,421 | — | ||||||
Sub-Transfer Agency Fees – Class I | 145,589 | 10,994 | ||||||
Accounting fees | 37,913 | 32,260 | ||||||
Auditing fees | 19,695 | 17,738 | ||||||
Organizational costs | — | — | ||||||
|
|
|
| |||||
Total expenses | 3,085,247 | 357,240 | ||||||
Expense recoupment (reimbursement / waiver) | 42,703 | (95,071 | ) | |||||
|
|
|
| |||||
Total expenses net of recoupment / reimbursement / waiver | 3,127,950 | 262,169 | ||||||
|
|
|
| |||||
Net investment income | 3,561,504 | 382,669 | ||||||
|
|
|
| |||||
REALIZED AND UNREALIZED GAIN (LOSS) ON INVESTMENTS | ||||||||
Net realized gain (loss) on: | ||||||||
Unaffiliated investments | (6,508,529 | ) | (876,587 | ) | ||||
Foreign currency transactions | 13,782 | (10,141 | ) | |||||
|
|
|
| |||||
Net realized gain (loss) | (6,494,747 | ) | (886,728 | ) | ||||
|
|
|
| |||||
Net change in unrealized appreciation (depreciation) on: | ||||||||
Investments | 20,963,163 | 457,431 | ||||||
Foreign currency transactions | 61,254 | 3,474 | ||||||
|
|
|
| |||||
Net unrealized appreciation (depreciation) | 21,024,417 | 460,905 | ||||||
|
|
|
| |||||
Net realized and unrealized gain (loss) on investments and foreign currency transactions | 14,529,670 | (425,823 | ) | |||||
|
|
|
| |||||
Net Increase (Decrease) in net assets resulting from operations | $ | 18,091,174 | $ | (43,154 | ) | |||
|
|
|
| |||||
The accompanying notes to financial statements are an integral part of this statement.
104
Brandes Investment Trust
STATEMENTS OF OPERATIONS — For the Six Months Ended March 31, 2016 (Unaudited) (continued)
Brandes | Brandes Global Opportunities Value Fund | Brandes Emerging Markets Value Fund | Brandes International Small Cap Fund | Brandes Core Plus Fixed Income Fund | Brandes Credit Focus Yield Fund | |||||||||||||||||
| $ | 10,708 | $ | 78,874 | $ | 10,886,403 | $ | 6,758,385 | $ | 37,687 | $ | 31,066 | |||||||||||
| — | — | — | 1,678,926 | — | — | |||||||||||||||||
| (571 | ) | (8,150 | ) | (1,148,802 | ) | (828,114 | ) | — | — | |||||||||||||
| — | 8,230 | 8,816 | 12,804 | 1,181,085 | 522,558 | |||||||||||||||||
| — | — | (1,280 | ) | (1,179 | ) | — | — | |||||||||||||||
| — | — | — | 19,769 | — | — | |||||||||||||||||
| — | — | — | — | 4,813 | 2,688 | |||||||||||||||||
|
|
|
|
|
|
|
|
|
|
|
| |||||||||||
| 10,137 | 78,954 | 9,745,137 | 7,640,591 | 1,223,585 | 556,312 | |||||||||||||||||
|
|
|
|
|
|
|
|
|
|
|
| |||||||||||
| 2,512 | 34,101 | 4,624,703 | 4,962,552 | 132,698 | 71,901 | |||||||||||||||||
| 2,417 | 4,307 | 337,743 | 108,291 | 5,992 | 3,163 | |||||||||||||||||
| 368 | 1,034 | 130,530 | 118,424 | 9,164 | 3,659 | |||||||||||||||||
| 84 | 84 | 7,705 | 3,649 | 359 | 172 | |||||||||||||||||
| 5,378 | 5,480 | 23,207 | 21,774 | 2,361 | 1,345 | |||||||||||||||||
| 337 | 716 | 77,424 | 39,347 | 3,990 | 1,003 | |||||||||||||||||
| 916 | 1,014 | 20,815 | 16,159 | 1,930 | 1,000 | |||||||||||||||||
| 7,071 | 36,780 | 75,436 | 48,543 | 25,920 | 17,638 | |||||||||||||||||
| 84 | 168 | 67,811 | 63,517 | 5,128 | 2,114 | |||||||||||||||||
| 22,510 | 22,677 | 257,226 | 95,409 | 26,058 | 16,089 | |||||||||||||||||
| — | 402 | 355,861 | 101,031 | 2,957 | 2,472 | |||||||||||||||||
| — | 109 | 67,276 | 63,305 | N/A | N/A | |||||||||||||||||
| — | 37 | 22,426 | 21,102 | N/A | N/A | |||||||||||||||||
| N/A | N/A | N/A | N/A | 1,188 | N/A | |||||||||||||||||
| 157 | 1,707 | 167,748 | 236,760 | 18,128 | — | |||||||||||||||||
| 27,251 | 29,828 | 37,361 | 38,689 | 29,342 | 23,307 | |||||||||||||||||
| 15,876 | 16,877 | 18,736 | 17,538 | 18,946 | 18,147 | |||||||||||||||||
| 4,094 | 4,094 | — | — | — | — | |||||||||||||||||
|
|
|
|
|
|
|
|
|
|
|
| |||||||||||
| 89,055 | 159,415 | 6,292,008 | 5,956,090 | 284,161 | 162,010 | |||||||||||||||||
| (85,914 | ) | (117,588 | ) | (394,163 | ) | 191,748 | (91,302 | ) | (63,792 | ) | ||||||||||||
|
|
|
|
|
|
|
|
|
|
|
| |||||||||||
| 3,141 | 41,827 | 5,897,845 | 6,147,838 | 192,859 | 98,218 | |||||||||||||||||
|
|
|
|
|
|
|
|
|
|
|
| |||||||||||
| 6,996 | 37,127 | 3,847,292 | 1,492,753 | 1,030,726 | 458,094 | |||||||||||||||||
|
|
|
|
|
|
|
|
|
|
|
| |||||||||||
| 13,172 | (5,620 | ) | (102,330,311 | ) | 8,854,925 | 122,309 | 14,945 | |||||||||||||||
| (194 | ) | (5,986 | ) | (937,142 | ) | (927,829 | ) | — | — | |||||||||||||
|
|
|
|
|
|
|
|
|
|
|
| |||||||||||
| 12,978 | (11,606 | ) | (103,267,453 | ) | 7,927,096 | 122,309 | 14,945 | |||||||||||||||
|
|
|
|
|
|
|
|
|
|
|
| |||||||||||
| 33,233 | 150,792 | 258,858,980 | 77,286,029 | (293,130 | ) | (376,306 | ) | |||||||||||||||
| 69 | 562 | 137,257 | 559,000 | — | — | |||||||||||||||||
|
|
|
|
|
|
|
|
|
|
|
| |||||||||||
| 33,302 | 151,354 | 258,996,237 | 77,845,029 | (293,130 | ) | (376,306 | ) | |||||||||||||||
|
|
|
|
|
|
|
|
|
|
|
| |||||||||||
| | 46,280 | | 139,748 | 155,728,784 | 85,772,125 | (170,821 | ) | (361,361 | ) | |||||||||||||
|
|
|
|
|
|
|
|
|
|
|
| |||||||||||
| $ | 53,276 | $ | 176,875 | $ | 159,576,076 | $ | 87,264,878 | $ | 859,905 | $ | 96,733 | |||||||||||
|
|
|
|
|
|
|
|
|
|
|
| |||||||||||
The accompanying notes to financial statements are an integral part of this statement.
105
Brandes Investment Trust
STATEMENTS OF CHANGES IN NET ASSETS
| Brandes International Equity Fund | Brandes Global Equity Fund | |||||||||||||||
| Six Months Ended March 31, 2016 | Year Ended September 30, 2015 | Six Months Ended March 31, 2016 | Year Ended September 30, 2015 | |||||||||||||
| (Unaudited) | (Unaudited) | |||||||||||||||
INCREASE (DECREASE) IN NET ASSETS FROM: | ||||||||||||||||
OPERATIONS | ||||||||||||||||
Net investment income | $ | 3,561,504 | $ | 11,788,240 | $ | 382,669 | $ | 816,216 | ||||||||
Net realized gain (loss) on: | ||||||||||||||||
Investments | (6,508,529 | ) | 30,830,886 | (876,587 | ) | 2,652,631 | ||||||||||
Foreign currency transactions | 13,782 | (339,603 | ) | (10,141 | ) | (6,526 | ) | |||||||||
Net unrealized appreciation (depreciation) on: | ||||||||||||||||
Investments | 20,963,163 | (102,057,414 | ) | 457,431 | (7,122,486 | ) | ||||||||||
Foreign currency transactions | 61,254 | (59,332 | ) | 3,474 | (334 | ) | ||||||||||
|
|
|
|
|
|
|
| |||||||||
Net increase (decrease) in net assets resulting from operations | 18,091,174 | (59,837,223 | ) | (43,154 | ) | (3,660,499 | ) | |||||||||
|
|
|
|
|
|
|
| |||||||||
DISTRIBUTIONS TO SHAREHOLDERS | ||||||||||||||||
From net investment income | ||||||||||||||||
Class A | (96,623 | ) | (252,436 | ) | (26,250 | ) | (27,075 | ) | ||||||||
Class C | (50,120 | ) | (147,039 | ) | (8,509 | ) | (17,646 | ) | ||||||||
Class E | (6,982 | ) | (32,004 | ) | (612 | ) | (4,102 | ) | ||||||||
Class I | (4,868,972 | ) | (11,055,569 | ) | (379,685 | ) | (755,709 | ) | ||||||||
Class R6 | (1 | ) | N/A | N/A | N/A | |||||||||||
From net realized gains | ||||||||||||||||
Class A | — | — | (117,360 | ) | (138,191 | ) | ||||||||||
Class C | — | — | (144,639 | ) | (95,408 | ) | ||||||||||
Class E | — | — | (13,647 | ) | (17,354 | ) | ||||||||||
Class I | — | — | (2,617,644 | ) | (3,049,426 | ) | ||||||||||
Class R6 | — | N/A | N/A | N/A | ||||||||||||
|
|
|
|
|
|
|
| |||||||||
Decrease in net assets from distributions | (5,022,698 | ) | (11,487,048 | ) | (3,308,346 | ) | (4,104,911 | ) | ||||||||
|
|
|
|
|
|
|
| |||||||||
CAPITAL SHARE TRANSACTIONS | ||||||||||||||||
Proceeds from shares sold | 149,891,383 | 297,808,360 | 5,584,527 | 17,889,572 | ||||||||||||
Net asset value of shares issued on reinvestment of distributions | 4,845,315 | 10,943,349 | 3,271,715 | 4,042,087 | ||||||||||||
Cost of shares redeemed | (125,304,887 | ) | (195,676,939 | ) | (8,497,974 | ) | (12,125,187 | ) | ||||||||
|
|
|
|
|
|
|
| |||||||||
Net increase in net assets from capital share transactions | 29,431,811 | 113,074,770 | 358,268 | 9,806,472 | ||||||||||||
|
|
|
|
|
|
|
| |||||||||
Total increase (decrease) in net assets | 42,500,287 | 41,750,499 | (2,993,232 | ) | 2,041,062 | |||||||||||
|
|
|
|
|
|
|
| |||||||||
NET ASSETS | ||||||||||||||||
Beginning of the Period | 589,293,094 | 547,542,595 | 50,503,994 | 48,462,932 | ||||||||||||
|
|
|
|
|
|
|
| |||||||||
End of the Period | $ | 631,793,381 | $ | 589,293,094 | $ | 47,510,762 | $ | 50,503,994 | ||||||||
|
|
|
|
|
|
|
| |||||||||
Undistributed net investment income (loss) | $ | (1,414,634 | ) | $ | 46,560 | $ | (48,673 | ) | $ | (16,286 | ) | |||||
|
|
|
|
|
|
|
| |||||||||
The accompanying notes to financial statements are an integral part of this statement.
106
Brandes Investment Trust
STATEMENTS OF CHANGES IN NET ASSETS (continued)
| Brandes Global Equity Income Fund | Brandes Global Opportunities Value Fund | Brandes Emerging Markets Value Fund | ||||||||||||||||||||||
| Six Months Ended March 31, 2016 | Period Ended September 30, 2015* | Six Months Ended March 31, 2016 | Period Ended September 30, 2015* | Six Months Ended March 31, 2016 | Year Ended September 30, 2015 | |||||||||||||||||||
| (Unaudited) | (Unaudited) | (Unaudited) | ||||||||||||||||||||||
INCREASE (DECREASE) IN NET ASSETS FROM: | ||||||||||||||||||||||||
OPERATIONS | ||||||||||||||||||||||||
Net investment income | $ | 6,996 | $ | 13,809 | $ | 37,127 | $ | 31,468 | $ | 3,847,292 | $ | 19,080,666 | ||||||||||||
Net realized gain (loss) on: | ||||||||||||||||||||||||
Investments | 13,172 | 9,317 | (5,620 | ) | 67,349 | (102,330,311 | ) | (33,870,174 | ) | |||||||||||||||
Foreign currency transactions | (194 | ) | (882 | ) | (5,986 | ) | (3,635 | ) | (937,142 | ) | (1,133,847 | ) | ||||||||||||
Net unrealized appreciation (depreciation) on: | ||||||||||||||||||||||||
Investments | 33,233 | (39,828 | ) | 150,792 | (418,143 | ) | 258,858,980 | (468,102,778 | ) | |||||||||||||||
Foreign currency transactions | 69 | (85 | ) | 562 | (94 | ) | 137,257 | (39,521 | ) | |||||||||||||||
|
|
|
|
|
|
|
|
|
|
|
| |||||||||||||
Net increase (decrease) in net assets resulting from operations | 53,276 | (17,669 | ) | 176,875 | (323,055 | ) | 159,576,076 | (484,065,654 | ) | |||||||||||||||
|
|
|
|
|
|
|
|
|
|
|
| |||||||||||||
DISTRIBUTIONS TO SHAREHOLDERS | ||||||||||||||||||||||||
From net investment income | ||||||||||||||||||||||||
Class A | (1 | ) | (1 | ) | (2,219 | ) | (1,909 | ) | (680,855 | ) | (5,101,168 | ) | ||||||||||||
Class C | (1 | ) | (1 | ) | (130 | ) | (90 | ) | — | (239,742 | ) | |||||||||||||
Class E | N/A | N/A | N/A | N/A | N/A | N/A | ||||||||||||||||||
Class I | (7,286 | ) | (12,859 | ) | (47,116 | ) | (25,605 | ) | (2,253,405 | ) | (16,727,079 | ) | ||||||||||||
From net realized gains | ||||||||||||||||||||||||
Class A | (2 | ) | — | (3,623 | ) | — | — | (6,331,579 | ) | |||||||||||||||
Class C | (2 | ) | — | (304 | ) | — | — | (637,122 | ) | |||||||||||||||
Class E | N/A | N/A | N/A | N/A | N/A | N/A | ||||||||||||||||||
Class I | (12,640 | ) | — | (70,302 | ) | — | — | (29,027,390 | ) | |||||||||||||||
|
|
|
|
|
|
|
|
|
|
|
| |||||||||||||
Decrease in net assets from distributions | (19,932 | ) | (12,861 | ) | (123,694 | ) | (27,604 | ) | (2,934,260 | ) | (58,064,080 | ) | ||||||||||||
|
|
|
|
|
|
|
|
|
|
|
| |||||||||||||
CAPITAL SHARE TRANSACTIONS | ||||||||||||||||||||||||
Proceeds from shares sold | — | 622,809 | 5,345,676 | 3,665,181 | 276,739,539 | 972,112,934 | ||||||||||||||||||
Net asset value of shares issued on reinvestment of distributions | 19,205 | 12,382 | 65,020 | 27,160 | 2,558,739 | 48,481,410 | ||||||||||||||||||
Cost of shares redeemed | — | — | (1,234,506 | ) | — | (432,972,962 | ) | (875,791,522 | ) | |||||||||||||||
|
|
|
|
|
|
|
|
|
|
|
| |||||||||||||
Net increase (decrease) in net assets from capital share transactions | 19,205 | 635,191 | 4,176,190 | 3,692,341 | (153,674,684 | ) | 144,802,822 | |||||||||||||||||
|
|
|
|
|
|
|
|
|
|
|
| |||||||||||||
Total increase (decrease) in net assets | 52,549 | 604,661 | 4,229,371 | 3,341,682 | 2,967,132 | (397,326,912 | ) | |||||||||||||||||
|
|
|
|
|
|
|
|
|
|
|
| |||||||||||||
NET ASSETS | ||||||||||||||||||||||||
Beginning of the Period | 604,661 | — | 3,341,682 | — | 1,039,140,464 | 1,436,467,376 | ||||||||||||||||||
|
|
|
|
|
|
|
|
|
|
|
| |||||||||||||
End of the Period | $ | 657,210 | $ | 604,661 | $ | 7,571,053 | $ | 3,341,682 | $ | 1,042,107,596 | $ | 1,039,140,464 | ||||||||||||
|
|
|
|
|
|
|
|
|
|
|
| |||||||||||||
Undistributed net investment income (loss) | $ | 137 | $ | 429 | $ | (6,033 | ) | $ | 6,305 | $ | (3,426,499 | ) | $ | (4,339,531 | ) | |||||||||
|
|
|
|
|
|
|
|
|
|
|
| |||||||||||||
| * | Commenced operations on December 31, 2014. |
The accompanying notes to financial statements are an integral part of this statement.
107
Brandes Investment Trust
STATEMENTS OF CHANGES IN NET ASSETS (continued)
| Brandes International Small Cap Fund | Brandes Core Plus Fixed Income Fund | Brandes Credit Focus Yield Fund | ||||||||||||||||||||||
| Six Months Ended March 31, 2016 | Year Ended September 30, 2015 | Six Months Ended March 31, 2016 | Year Ended September 30, 2015 | Six Months Ended March 31, 2016 | Year Ended September 30, 2015 | |||||||||||||||||||
| (Unaudited) | (Unaudited) | (Unaudited) | ||||||||||||||||||||||
INCREASE (DECREASE) IN NET ASSETS FROM: | ||||||||||||||||||||||||
OPERATIONS | ||||||||||||||||||||||||
Net investment income | $ | 1,492,753 | $ | 4,208,745 | $ | 1,030,726 | $ | 1,447,080 | $ | 458,094 | $ | 740,223 | ||||||||||||
Net realized gain (loss) on: | ||||||||||||||||||||||||
Investments | 8,854,925 | 24,636,722 | 122,309 | 57,956 | 14,945 | (17,869 | ) | |||||||||||||||||
Foreign currency transactions | (927,829 | ) | (237,021 | ) | — | — | — | — | ||||||||||||||||
Net unrealized appreciation (depreciation) on: | ||||||||||||||||||||||||
Investments | 77,286,029 | (60,332,960 | ) | (293,130 | ) | (459,241 | ) | (376,306 | ) | (583,671 | ) | |||||||||||||
Foreign currency transactions | 559,000 | 8,916 | — | — | — | — | ||||||||||||||||||
|
|
|
|
|
|
|
|
|
|
|
| |||||||||||||
Net increase (decrease) in net assets resulting from operations | 87,264,878 | (31,715,598 | ) | 859,905 | 1,045,795 | 96,733 | 138,683 | |||||||||||||||||
|
|
|
|
|
|
|
|
|
|
|
| |||||||||||||
DISTRIBUTIONS TO SHAREHOLDERS | ||||||||||||||||||||||||
From net investment income | ||||||||||||||||||||||||
Class A | (1,362,106 | ) | (701,245 | ) | (30,001 | ) | (47,510 | ) | (29,161 | ) | (47,030 | ) | ||||||||||||
Class C | (237,168 | ) | (141,085 | ) | N/A | N/A | N/A | N/A | ||||||||||||||||
Class E | N/A | N/A | (11,587 | ) | (40,927 | ) | N/A | N/A | ||||||||||||||||
Class I | (14,700,410 | ) | (9,854,648 | ) | (1,007,165 | ) | (1,406,481 | ) | (428,795 | ) | (708,709 | ) | ||||||||||||
From net realized gains | ||||||||||||||||||||||||
Class A | (1,347,940 | ) | (1,474,067 | ) | (1,614 | ) | (11,199 | ) | — | (1,320 | ) | |||||||||||||
Class C | (268,103 | ) | (411,606 | ) | N/A | N/A | N/A | N/A | ||||||||||||||||
Class E | N/A | N/A | (1,430 | ) | (9,854 | ) | N/A | N/A | ||||||||||||||||
Class I | (14,618,967 | ) | (17,794,096 | ) | (64,613 | ) | (268,927 | ) | — | (17,275 | ) | |||||||||||||
|
|
|
|
|
|
|
|
|
|
|
| |||||||||||||
Decrease in net assets from distributions | (32,534,694 | ) | (30,376,747 | ) | (1,116,410 | ) | (1,784,898 | ) | (457,956 | ) | (774,334 | ) | ||||||||||||
|
|
|
|
|
|
|
|
|
|
|
| |||||||||||||
CAPITAL SHARE TRANSACTIONS | ||||||||||||||||||||||||
Proceeds from shares sold | 317,750,463 | 676,989,096 | 14,303,690 | 42,844,221 | 92,904 | 535,825 | ||||||||||||||||||
Net asset value of shares issued on reinvestment of distributions | 31,781,573 | 29,204,882 | 1,094,924 | 1,757,928 | 442,984 | 754,855 | ||||||||||||||||||
Cost of shares redeemed | (171,165,633 | ) | (302,592,645 | ) | (12,742,153 | ) | (15,036,102 | ) | (388,058 | ) | (335,206 | ) | ||||||||||||
|
|
|
|
|
|
|
|
|
|
|
| |||||||||||||
Net increase in net assets from capital share transactions | 178,366,403 | 403,601,333 | 2,656,461 | 29,566,047 | 147,830 | 955,474 | ||||||||||||||||||
|
|
|
|
|
|
|
|
|
|
|
| |||||||||||||
Total increase (decrease) in net assets | 233,096,587 | �� | 341,508,988 | 2,399,956 | 28,826,944 | (213,393 | ) | 319,823 | ||||||||||||||||
|
|
|
|
|
|
|
|
|
|
|
| |||||||||||||
NET ASSETS | ||||||||||||||||||||||||
Beginning of the Period | 971,842,760 | 630,333,772 | 76,096,236 | 47,269,292 | 29,375,877 | 29,056,054 | ||||||||||||||||||
|
|
|
|
|
|
|
|
|
|
|
| |||||||||||||
End of the Period | $ | 1,204,939,347 | $ | 971,842,760 | $ | 78,496,192 | $ | 76,096,236 | $ | 29,162,484 | $ | 29,375,877 | ||||||||||||
|
|
|
|
|
|
|
|
|
|
|
| |||||||||||||
Undistributed net investment income (loss) | $ | (12,351,526 | ) | $ | 2,455,405 | $ | (18,027 | ) | $ | — | $ | (7,861 | ) | $ | (7,999 | ) | ||||||||
|
|
|
|
|
|
|
|
|
|
|
| |||||||||||||
The accompanying notes to financial statements are an integral part of this statement.
108
(This Page Intentionally Left Blank.)
109
Brandes Investment Trust
| Net asset value, beginning of period | Net investment income(5) | Net realized and unrealized gain/(loss) on investments | Total from investment operations | Dividends from net investment income | Dividends from net realized gains | |||||||||||||||||||
Brandes International Equity Fund |
| |||||||||||||||||||||||
Class A(8) | ||||||||||||||||||||||||
3/31/2016 (Unaudited) | $ | 14.90 | 0.08 | 0.40 | 0.48 | (0.11 | ) | — | ||||||||||||||||
9/30/2015 | $ | 16.58 | 0.35 | (1.73 | ) | (1.38 | ) | (0.30 | ) | — | ||||||||||||||
9/30/2014 | $ | 16.03 | 0.33 | 0.56 | 0.89 | (0.34 | ) | — | ||||||||||||||||
9/30/2013 | $ | 13.50 | 0.34 | 3.02 | 3.36 | (0.83 | ) | — | ||||||||||||||||
9/30/2012 | $ | 13.00 | 0.38 | 0.76 | 1.14 | (0.64 | ) | — | ||||||||||||||||
1/31/2011(3) – 9/30/2011 | $ | 15.74 | 0.26 | (3.00 | ) | (2.74 | ) | — | — | |||||||||||||||
Class C | ||||||||||||||||||||||||
3/31/2016 (Unaudited) | $ | 14.79 | 0.02 | 0.39 | 0.41 | (0.05 | ) | — | ||||||||||||||||
9/30/2015 | $ | 16.48 | 0.24 | (1.73 | ) | (1.49 | ) | (0.20 | ) | — | ||||||||||||||
9/30/2014 | $ | 15.98 | 0.20 | 0.55 | 0.75 | (0.25 | ) | — | ||||||||||||||||
1/31/2013(3) – 9/30/2013 | $ | 14.30 | 0.15 | 1.84 | 1.99 | (0.31 | ) | — | ||||||||||||||||
Class E | ||||||||||||||||||||||||
3/31/2016 (Unaudited) | $ | 14.89 | 0.08 | 0.39 | 0.47 | (0.10 | ) | — | ||||||||||||||||
9/30/2015 | $ | 16.56 | 0.18 | (1.58 | ) | (1.40 | ) | (0.27 | ) | — | ||||||||||||||
9/30/2014 | $ | 16.01 | 0.33 | 0.54 | 0.87 | (0.32 | ) | — | ||||||||||||||||
9/30/2013 | $ | 13.48 | 0.33 | 3.03 | 3.36 | (0.84 | ) | — | ||||||||||||||||
9/30/2012 | $ | 12.97 | 0.41 | 0.74 | 1.15 | (0.64 | ) | — | ||||||||||||||||
9/30/2011 | $ | 14.91 | 0.37 | (1.96 | ) | (1.59 | ) | (0.35 | ) | — | ||||||||||||||
Class I | ||||||||||||||||||||||||
3/31/2016 (Unaudited) | $ | 14.92 | 0.09 | 0.40 | 0.49 | (0.12 | ) | — | ||||||||||||||||
9/30/2015 | $ | 16.60 | 0.35 | (1.70 | ) | (1.35 | ) | (0.33 | ) | — | ||||||||||||||
9/30/2014 | $ | 16.05 | 0.36 | 0.56 | 0.92 | (0.37 | ) | — | ||||||||||||||||
9/30/2013 | $ | 13.50 | 0.35 | 3.04 | 3.39 | (0.84 | ) | — | ||||||||||||||||
9/30/2012 | $ | 12.99 | 0.41 | 0.76 | 1.17 | (0.66 | ) | — | ||||||||||||||||
9/30/2011 | $ | 14.92 | 0.40 | (1.98 | ) | (1.58 | ) | (0.35 | ) | — | ||||||||||||||
Class R6 | ||||||||||||||||||||||||
2/1/2016(3) – 3/31/2016 (Unaudited) | $ | 14.41 | 0.09 | 0.84 | 0.93 | (0.05 | ) | — | ||||||||||||||||
| (1) | Not annualized. |
| (2) | Annualized. |
| (3) | Commencement of operations. |
| (4) | After fees waived and expenses absorbed or recouped by the Advisor, where applicable. |
| (5) | Net investment income (loss) per share has been calculated based on average shares outstanding during the period. |
| (6) | The Total return calculation does not reflect the sales loads that may be imposed on Class A or C shares (see Note 7 of the Notes to Financial Statements). |
| (7) | The Total return figure is the since inception return for the class which commenced operations on January 31, 2013. |
| (8) | Prior to January 31, 2013, Class A shares were known as Class S shares. |
| (9) | The Total return figure is the since inception return for the class which commenced operations on February 1, 2016. |
The accompanying notes to financial statements are an integral part of this statement.
110
Brandes Investment Trust
FINANCIAL HIGHLIGHTS
| Net asset value, end of period | Total return(6) | Net assets, end of period (millions) | Ratio of net expenses to average net assets(4) | Ratio of net investment income to average net assets(4) | Ratio of expenses (prior to reimburse- ments) to average net assets | Ratio of net investment income (prior to reimburse- ments) to average net assets | Portfolio turnover rate | |||||||||||||||||||||||
| $ | 15.27 | 3.20 | %(1) | $ | 13.9 | 1.19 | %(2) | 1.01 | %(2) | 1.19 | %(2) | 1.01 | %(2) | 8.23 | %(1) | |||||||||||||||
| $ | 14.90 | (8.47 | )% | $ | 13.1 | 1.18 | % | 2.08 | % | 1.18 | % | 2.08 | % | 27.50 | % | |||||||||||||||
| $ | 16.58 | 5.47 | % | $ | 9.0 | 1.19 | % | 1.92 | % | 1.18 | % | 1.93 | % | 39.53 | % | |||||||||||||||
| $ | 16.03 | 26.06 | % | $ | 0.7 | 1.23 | % | 2.25 | % | 1.31 | % | 2.17 | % | 19.43 | % | |||||||||||||||
| $ | 13.50 | 8.94 | % | $ | — | 1.40 | % | 2.86 | % | 1.45 | % | 2.81 | % | 13.47 | % | |||||||||||||||
| $ | 13.00 | (17.41 | )%(1) | $ | — | 1.30 | %(2) | 2.54 | %(2) | 1.30 | %(2) | 2.54 | %(2) | 4.99 | %(1) | |||||||||||||||
| $ | 15.15 | 2.80 | %(1) | $ | 13.9 | 1.94 | %(2) | 0.26 | %(2) | 1.94 | %(2) | 0.26 | %(2) | 8.23 | %(1) | |||||||||||||||
| $ | 14.79 | (9.14 | )% | $ | 12.0 | 1.93 | % | 1.43 | % | 1.93 | % | 1.43 | % | 27.50 | % | |||||||||||||||
| $ | 16.48 | 4.64 | % | $ | 4.3 | 1.93 | % | 1.19 | % | 1.93 | % | 1.19 | % | 39.53 | % | |||||||||||||||
| $ | 15.98 | 14.17 | %(7) | $ | 0.1 | 1.95 | %(2) | 1.53 | %(2) | 1.97 | %(2) | 1.51 | %(2) | 19.43 | %(1) | |||||||||||||||
| $ | 15.26 | 3.18 | %(1) | $ | 0.7 | 1.18 | %(2) | 1.01 | %(2) | 1.18 | %(2) | 1.01 | %(2) | 8.23 | %(1) | |||||||||||||||
| $ | 14.89 | (8.59 | )% | $ | 1.7 | 1.18 | % | 1.13 | % | 1.18 | % | 1.13 | % | 27.50 | % | |||||||||||||||
| $ | 16.56 | 5.38 | % | $ | 12.3 | 1.19 | % | 1.93 | % | 1.18 | % | 1.94 | % | 39.53 | % | |||||||||||||||
| $ | 16.01 | 26.15 | % | $ | 22.0 | 1.22 | % | 2.26 | % | 1.23 | % | 2.25 | % | 19.43 | % | |||||||||||||||
| $ | 13.48 | 9.05 | % | $ | 6.6 | 1.18 | % | 3.09 | % | 1.23 | % | 3.04 | % | 13.47 | % | |||||||||||||||
| $ | 12.97 | (11.04 | )% | $ | 4.4 | 1.32 | % | 2.40 | % | 1.32 | % | 2.40 | % | 4.99 | % | |||||||||||||||
| $ | 15.29 | 3.30 | %(1) | $ | 603.3 | 1.00 | %(2) | 1.20 | %(2) | 0.99 | %(2) | 1.21 | %(2) | 8.23 | %(1) | |||||||||||||||
| $ | 14.92 | (8.30 | )% | $ | 562.5 | 1.00 | % | 2.10 | % | 0.98 | % | 2.12 | % | 27.50 | % | |||||||||||||||
| $ | 16.60 | 5.61 | % | $ | 521.9 | 1.00 | % | 2.12 | % | 0.99 | % | 2.13 | % | 39.53 | % | |||||||||||||||
| $ | 16.05 | 26.43 | % | $ | 404.4 | 1.03 | % | 2.45 | % | 1.15 | % | 2.33 | % | 19.43 | % | |||||||||||||||
| $ | 13.50 | 9.09 | % | $ | 352.7 | 1.16 | % | 3.11 | % | 1.21 | % | 3.06 | % | 13.47 | % | |||||||||||||||
| $ | 12.99 | (10.95 | )% | $ | 454.7 | 1.14 | % | 2.58 | % | 1.14 | % | 2.58 | % | 4.99 | % | |||||||||||||||
| $ | 15.29 | 6.48 | %(9) | $ | — | 0.82 | %(2) | 1.38 | %(2) | 0.94 | %(2) | 1.26 | %(2) | 8.23 | %(1) | |||||||||||||||
The accompanying notes to financial statements are an integral part of this statement.
111
Brandes Investment Trust
FINANCIAL HIGHLIGHTS
| Net asset value, beginning of period | Net investment income(5) | Net | Total from investment operations | Dividends from net investment income | Dividends from net realized gains | |||||||||||||||||||
Brandes Global Equity Fund | ||||||||||||||||||||||||
Class A(8) | ||||||||||||||||||||||||
3/31/2016 (Unaudited) | $ | 21.85 | 0.14 | (0.12 | ) | 0.02 | (0.17 | ) | (1.29 | ) | ||||||||||||||
9/30/2015 | $ | 25.43 | 0.27 | (1.90 | ) | (1.63 | ) | (0.33 | ) | (1.62 | ) | |||||||||||||
9/30/2014 | $ | 24.20 | 0.43 | 2.00 | 2.43 | (0.44 | ) | (0.76 | ) | |||||||||||||||
9/30/2013 | $ | 20.27 | 0.38 | 4.80 | 5.18 | (0.91 | ) | (0.34 | ) | |||||||||||||||
9/30/2012 | $ | 19.19 | 0.43 | 2.22 | 2.65 | (0.44 | ) | (1.13 | ) | |||||||||||||||
1/31/2011(3) – 9/30/2011 | $ | 22.34 | 0.29 | (3.44 | ) | (3.15 | ) | — | — | |||||||||||||||
Class C | ||||||||||||||||||||||||
3/31/2016 (Unaudited) | $ | 21.73 | 0.06 | (0.12 | ) | (0.06 | ) | (0.08 | ) | (1.29 | ) | |||||||||||||
9/30/2015 | $ | 25.31 | 0.16 | (1.92 | ) | (1.76 | ) | (0.20 | ) | (1.62 | ) | |||||||||||||
9/30/2014 | $ | 24.14 | 0.24 | 1.99 | 2.23 | (0.30 | ) | (0.76 | ) | |||||||||||||||
1/31/2013(3) – 9/30/2013 | $ | 21.21 | 0.15 | 3.12 | 3.27 | (0.34 | ) | — | ||||||||||||||||
Class E | ||||||||||||||||||||||||
3/31/2016 (Unaudited) | $ | 21.55 | 0.15 | (0.12 | ) | 0.03 | (0.19 | ) | (1.29 | ) | ||||||||||||||
9/30/2015 | $ | 25.16 | 0.32 | (1.93 | ) | (1.61 | ) | (0.38 | ) | (1.62 | ) | |||||||||||||
9/30/2014 | $ | 24.00 | 0.43 | 1.99 | 2.42 | (0.50 | ) | (0.76 | ) | |||||||||||||||
9/30/2013 | $ | 20.17 | 0.37 | 4.77 | 5.14 | (0.97 | ) | (0.34 | ) | |||||||||||||||
9/30/2012 | $ | 19.13 | 0.44 | 2.20 | 2.64 | (0.47 | ) | (1.13 | ) | |||||||||||||||
9/30/2011 | $ | 21.73 | 0.51 | (1.59 | ) | (1.08 | ) | (0.44 | ) | (1.08 | ) | |||||||||||||
Class I | ||||||||||||||||||||||||
3/31/2016 (Unaudited) | $ | 21.95 | 0.17 | (0.12 | ) | 0.05 | (0.18 | ) | (1.29 | ) | ||||||||||||||
9/30/2015 | $ | 25.52 | 0.39 | (1.97 | ) | (1.58 | ) | (0.37 | ) | (1.62 | ) | |||||||||||||
9/30/2014 | $ | 24.26 | 0.50 | 2.00 | 2.50 | (0.48 | ) | (0.76 | ) | |||||||||||||||
9/30/2013 | $ | 20.33 | 0.43 | 4.81 | 5.24 | (0.98 | ) | (0.34 | ) | |||||||||||||||
9/30/2012 | $ | 19.22 | 0.49 | 2.22 | 2.71 | (0.47 | ) | (1.13 | ) | |||||||||||||||
9/30/2011 | $ | 21.76 | 0.51 | (1.53 | ) | (1.02 | ) | (0.44 | ) | (1.08 | ) | |||||||||||||
| (1) | Not annualized. |
| (2) | Annualized. |
| (3) | Commencement of operations. |
| (4) | After fees waived and expenses absorbed or recouped by the Advisor, where applicable. |
| (5) | Net investment income (loss) per share has been calculated based on average shares outstanding during the period. |
| (6) | The Total return calculation does not reflect the sales loads that may be imposed on Class A or C shares (see Note 7 of the Notes to Financial Statements). |
| (7) | The Total return figure is the since inception return for the class which commenced operations on January 31, 2013. |
| (8) | Prior to January 31, 2013, Class A shares were known as Class S shares. |
The accompanying notes to financial statements are an integral part of this statement.
112
Brandes Investment Trust
FINANCIAL HIGHLIGHTS
| Net asset value, end of period | Total return(6) | Net assets, end of period (millions) | Ratio of net expenses to average net assets(4) | Ratio of net investment income to average net assets(4) | Ratio of expenses (prior to reimburse- ments) to average net assets | Ratio of net investment income (prior to reimburse- ments) to average net assets | Portfolio turnover rate | |||||||||||||||||||||||
| $ | 20.41 | (0.22 | )%(1) | $ | 4.7 | 1.25 | %(2) | 1.37 | %(2) | 1.61 | %(2) | 1.01 | %(2) | 8.67 | %(1) | |||||||||||||||
| $ | 21.85 | (6.99 | )% | $ | 1.8 | 1.25 | % | 1.15 | % | 1.66 | % | 0.74 | % | 25.06 | % | |||||||||||||||
| $ | 25.43 | 10.18 | % | $ | 1.2 | 1.25 | % | 1.67 | % | 1.71 | % | 1.21 | % | 30.33 | % | |||||||||||||||
| $ | 24.20 | 26.81 | % | $ | 0.3 | 1.25 | % | 1.72 | % | 1.97 | % | 1.00 | % | 24.37 | % | |||||||||||||||
| $ | 20.27 | 14.38 | % | $ | 0.1 | 1.25 | % | 2.23 | % | 2.00 | % | 1.47 | % | 18.00 | % | |||||||||||||||
| $ | 19.19 | (14.10 | )%(1) | $ | — | 1.25 | %(2) | 2.05 | %(2) | 1.74 | %(2) | 1.56 | %(2) | 23.94 | %(1) | |||||||||||||||
| $ | 20.30 | (0.59 | )%(1) | $ | 1.9 | 2.00 | %(2) | 0.61 | %(2) | 2.33 | %(2) | 0.28 | %(2) | 8.67 | %(1) | |||||||||||||||
| $ | 21.73 | (7.62 | )% | $ | 2.4 | 2.00 | % | 0.66 | % | 2.42 | % | 0.24 | % | 25.06 | % | |||||||||||||||
| $ | 25.31 | 9.34 | % | $ | 1.1 | 2.00 | % | 0.92 | % | 2.46 | % | 0.46 | % | 30.33 | % | |||||||||||||||
| $ | 24.14 | 15.50 | %(7) | $ | 0.1 | 2.00 | %(2) | 0.97 | %(2) | 2.71 | %(2) | 0.26 | %(2) | 24.37 | % | |||||||||||||||
| $ | 20.10 | (0.17 | )%(1) | $ | 0.1 | 1.25 | %(2) | 1.36 | %(2) | 1.32 | %(2) | 1.29 | %(2) | 8.67 | %(1) | |||||||||||||||
| $ | 21.55 | (6.97 | )% | $ | 0.3 | 1.25 | % | 1.33 | % | 1.42 | % | 1.16 | % | 25.06 | % | |||||||||||||||
| $ | 25.16 | 10.20 | % | $ | 0.3 | 1.25 | % | 1.68 | % | 1.48 | % | 1.45 | % | 30.33 | % | |||||||||||||||
| $ | 24.00 | 26.80 | % | $ | 0.2 | 1.25 | % | 1.71 | % | 1.76 | % | 1.20 | % | 24.37 | % | |||||||||||||||
| $ | 20.17 | 14.35 | % | $ | 0.2 | 1.25 | % | 2.23 | % | 1.69 | % | 1.78 | % | 18.00 | % | |||||||||||||||
| $ | 19.13 | (5.80 | )% | $ | 0.2 | 1.25 | % | 2.05 | % | 1.69 | % | 1.62 | % | 23.94 | % | |||||||||||||||
| $ | 20.53 | (0.05 | )%(1) | $ | 40.8 | 1.00 | %(2) | 1.61 | %(2) | 1.39 | %(2) | 1.22 | %(2) | 8.67 | %(1) | |||||||||||||||
| $ | 21.95 | (6.75 | )% | $ | 46.0 | 1.00 | % | 1.61 | % | 1.47 | % | 1.14 | % | 25.06 | % | |||||||||||||||
| $ | 25.52 | 10.46 | % | $ | 45.9 | 1.00 | % | 1.93 | % | 1.53 | % | 1.40 | % | 30.33 | % | |||||||||||||||
| $ | 24.26 | 27.12 | % | $ | 39.4 | 1.00 | % | 1.96 | % | 1.75 | % | 1.21 | % | 24.37 | % | |||||||||||||||
| $ | 20.33 | 14.67 | % | $ | 30.1 | 1.00 | % | 2.47 | % | 1.68 | % | 1.79 | % | 18.00 | % | |||||||||||||||
| $ | 19.22 | (5.51 | )% | $ | 36.4 | 1.00 | % | 2.30 | % | 1.44 | % | 1.86 | % | 23.94 | % | |||||||||||||||
The accompanying notes to financial statements are an integral part of this statement.
113
Brandes Investment Trust
FINANCIAL HIGHLIGHTS
| Net asset value, beginning of period | Net investment income(5) | Net | Total from investment operations | Dividends from net investment income | Dividends from net realized gains | |||||||||||||||||||
Brandes Global Equity Income Fund |
| |||||||||||||||||||||||
Class A | ||||||||||||||||||||||||
3/31/2016 (Unaudited) | $ | 9.62 | 0.10 | 0.75 | 0.85 | (0.10 | ) | (0.20 | ) | |||||||||||||||
12/31/2014(3) – 9/30/2015 | $ | 10.00 | 0.23 | (0.46 | ) | (0.23 | ) | (0.15 | ) | — | ||||||||||||||
Class C | ||||||||||||||||||||||||
3/31/2016 (Unaudited) | $ | 9.60 | 0.07 | 0.73 | 0.80 | (0.07 | ) | (0.20 | ) | |||||||||||||||
12/31/2014(3) – 9/30/2015 | $ | 10.00 | 0.23 | (0.52 | ) | (0.29 | ) | (0.11 | ) | — | ||||||||||||||
Class I | ||||||||||||||||||||||||
3/31/2016 (Unaudited) | $ | 9.57 | 0.11 | 0.73 | 0.84 | (0.11 | ) | (0.20 | ) | |||||||||||||||
12/31/2014(3) – 9/30/2015 | $ | 10.00 | 0.23 | (0.45 | ) | (0.22 | ) | (0.21 | ) | — | ||||||||||||||
Brandes Global Opportunities Value Fund |
| |||||||||||||||||||||||
Class A | ||||||||||||||||||||||||
3/31/2016 (Unaudited) | $ | 9.36 | 0.04 | 0.48 | 0.52 | (0.05 | ) | (0.09 | ) | |||||||||||||||
12/31/2014(3) – 9/30/2015 | $ | 10.00 | 0.12 | (0.68 | ) | (0.56 | ) | (0.08 | ) | — | ||||||||||||||
Class C | ||||||||||||||||||||||||
3/31/2016 (Unaudited) | $ | 9.33 | 0.00 | 0.50 | 0.50 | (0.04 | ) | (0.09 | ) | |||||||||||||||
12/31/2014(3) – 9/30/2015 | $ | 10.00 | 0.12 | (0.75 | ) | (0.63 | ) | (0.04 | ) | — | ||||||||||||||
Class I | ||||||||||||||||||||||||
3/31/2016 (Unaudited) | $ | 9.33 | 0.05 | 0.49 | 0.54 | (0.06 | ) | (0.09 | ) | |||||||||||||||
12/31/2014(3) – 9/30/2015 | $ | 10.00 | 0.12 | (0.71 | ) | (0.59 | ) | (0.08 | ) | — | ||||||||||||||
| (1) | Not annualized. |
| (2) | Annualized. |
| (3) | Commencement of operations. |
| (4) | After fees waived and expenses absorbed or recouped by the Advisor, where applicable. |
| (5) | Net investment income (loss) per share has been calculated based on average shares outstanding during the period. |
| (6) | The Total return calculation does not reflect the sales loads that may be imposed on Class A or C shares (see Note 7 of the Notes to Financial Statements). |
| (7) | The Total return figure is the since inception return for the class which commenced operations on December 31, 2014. |
The accompanying notes to financial statements are an integral part of this statement.
114
Brandes Investment Trust
FINANCIAL HIGHLIGHTS
| Net asset value, end of period | Total return(6) | Net assets, end of period (millions) | Ratio of net expenses to average net assets(2)(4) | Ratio of net investment income to average net assets(2)(4) | Ratio of expenses (prior to reimburse- ments) to average net assets(2) | Ratio of net investment income (prior to reimburse- ments) to average net assets(2) | Portfolio turnover rate(1) | |||||||||||||||||||||||
| $ | 10.17 | 8.96 | %(1) | $ | — | 1.25 | % | 1.98 | % | 28.56 | % | (25.33 | )% | 11.27 | % | |||||||||||||||
| $ | 9.62 | (2.44 | )%(7) | $ | — | 1.25 | % | 2.90 | % | 570.42 | % | (566.27 | )% | 16.78 | % | |||||||||||||||
| $ | 10.13 | 8.38 | %(1) | $ | — | 2.00 | % | 1.23 | % | 29.31 | % | (26.08 | )% | 11.27 | % | |||||||||||||||
| $ | 9.60 | (2.99 | )%(7) | $ | — | 2.00 | % | 2.90 | % | 572.75 | % | (567.85 | )% | 16.78 | % | |||||||||||||||
| $ | 10.10 | 8.88 | %(1) | $ | 0.7 | 1.00 | % | 2.23 | % | 28.36 | % | (25.13 | )% | 11.27 | % | |||||||||||||||
| $ | 9.57 | (2.36 | )%(7) | $ | 0.6 | 1.00 | % | 2.90 | % | 37.61 | % | (33.71 | )% | 16.78 | % | |||||||||||||||
| $ | 9.74 | 5.67 | %(1) | $ | 0.3 | 1.40 | % | 0.80 | % | 4.64 | % | (2.44 | )% | 13.20 | % | |||||||||||||||
| $ | 9.36 | (5.66 | )%(7) | $ | 0.3 | 1.40 | % | 1.29 | % | 9.85 | % | (7.16 | )% | 15.12 | % | |||||||||||||||
| $ | 9.70 | 5.40 | %(1) | $ | — | 2.15 | % | 0.05 | % | 5.43 | % | (3.23 | )% | 13.20 | % | |||||||||||||||
| $ | 9.33 | (6.33 | )%(7) | $ | — | 2.15 | % | 1.86 | % | 13.79 | % | (9.78 | )% | 15.12 | % | |||||||||||||||
| $ | 9.72 | 5.85 | %(1) | $ | 7.3 | 1.15 | % | 1.05 | % | 4.43 | % | (2.23 | )% | 13.20 | % | |||||||||||||||
| $ | 9.33 | (5.92 | )%(7) | $ | 3.0 | 1.15 | % | 1.55 | % | 11.77 | % | (9.07 | )% | 15.12 | % | |||||||||||||||
The accompanying notes to financial statements are an integral part of this statement.
115
Brandes Investment Trust
FINANCIAL HIGHLIGHTS
| Net asset value, beginning of period | Net investment income(5) | Net realized and unrealized gain/(loss) on investments | Net increase from payments by affiliates | Total from investment operations | Dividends from net investment income | Dividends from net realized gains | ||||||||||||||||||||||
Brandes Emerging Markets Value Fund |
| |||||||||||||||||||||||||||
Class A(8) | ||||||||||||||||||||||||||||
3/31/2016 (Unaudited) | $ | 6.19 | 0.02 | 1.02 | — | 1.04 | (0.02 | ) | — | |||||||||||||||||||
9/30/2015 | $ | 9.56 | 0.11 | (3.12 | ) | — | (3.01 | ) | (0.13 | ) | (0.23 | ) | ||||||||||||||||
9/30/2014 | $ | 9.23 | 0.11 | 0.53 | — | 0.64 | (0.10 | ) | (0.21 | ) | ||||||||||||||||||
9/30/2013 | $ | 8.96 | 0.11 | 0.59 | — | 0.70 | (0.22 | ) | (0.21 | ) | ||||||||||||||||||
9/30/2012 | $ | 7.85 | 0.17 | 1.10 | — | 1.27 | (0.08 | ) | (0.08 | ) | ||||||||||||||||||
1/31/2011(3) – 9/30/2011 | $ | 10.00 | 0.14 | (2.29 | ) | — | (9) | (2.15 | ) | — | — | |||||||||||||||||
Class C | ||||||||||||||||||||||||||||
3/31/2016 (Unaudited) | $ | 6.15 | 0.00 | 1.01 | — | 1.01 | — | — | ||||||||||||||||||||
9/30/2015 | $ | 9.51 | 0.05 | (3.10 | ) | — | (3.05 | ) | (0.08 | ) | (0.23 | ) | ||||||||||||||||
9/30/2014 | $ | 9.19 | 0.03 | 0.54 | — | 0.57 | (0.04 | ) | (0.21 | ) | ||||||||||||||||||
1/31/2013(3) – 9/30/2013 | $ | 9.54 | 0.02 | (0.30 | ) | — | (0.28 | ) | (0.07 | ) | — | |||||||||||||||||
Class I | ||||||||||||||||||||||||||||
3/31/2016 (Unaudited) | $ | 6.21 | 0.03 | 1.02 | — | 1.05 | (0.02 | ) | — | |||||||||||||||||||
9/30/2015 | $ | 9.58 | 0.13 | (3.12 | ) | — | (2.99 | ) | (0.15 | ) | (0.23 | ) | ||||||||||||||||
9/30/2014 | $ | 9.24 | 0.13 | 0.54 | — | 0.67 | (0.12 | ) | (0.21 | ) | ||||||||||||||||||
9/30/2013 | $ | 8.99 | 0.13 | 0.56 | — | 0.69 | (0.23 | ) | (0.21 | ) | ||||||||||||||||||
9/30/2012 | $ | 7.86 | 0.20 | 1.10 | — | 1.30 | (0.09 | ) | (0.08 | ) | ||||||||||||||||||
1/31/2011(3) – 9/30/2011 | $ | 10.00 | 0.15 | (2.29 | ) | — | (9) | (2.14 | ) | — | — | |||||||||||||||||
Brandes International Small Cap Fund |
| |||||||||||||||||||||||||||
Class A(8) | ||||||||||||||||||||||||||||
3/31/2016 (Unaudited) | $ | 12.58 | 0.01 | 0.95 | — | 0.96 | (0.19 | ) | (0.20 | ) | ||||||||||||||||||
9/30/2015 | $ | 13.55 | 0.04 | (0.43 | ) | — | (0.39 | ) | (0.17 | ) | (0.41 | ) | ||||||||||||||||
9/30/2014 | $ | 13.72 | 0.06 | 1.02 | — | 1.08 | (0.36 | ) | (0.89 | ) | ||||||||||||||||||
9/30/2013 | $ | 10.56 | 0.06 | 3.36 | — | 3.42 | (0.14 | ) | (0.12 | ) | ||||||||||||||||||
1/31/2012(3) – 9/30/2012 | $ | 10.00 | 0.10 | 0.46 | — | 0.56 | — | — | ||||||||||||||||||||
Class C | ||||||||||||||||||||||||||||
3/31/2016 (Unaudited) | $ | 12.42 | (0.04 | ) | 0.95 | — | 0.91 | (0.17 | ) | (0.20 | ) | |||||||||||||||||
9/30/2015 | $ | 13.45 | (0.04 | ) | (0.44 | ) | — | (0.48 | ) | (0.14 | ) | (0.41 | ) | |||||||||||||||
9/30/2014 | $ | 13.68 | (0.04 | ) | 1.02 | — | 0.98 | (0.32 | ) | (0.89 | ) | |||||||||||||||||
1/31/2013(3) – 9/30/2013 | $ | 11.90 | (0.02 | ) | 1.83 | — | 1.81 | (0.03 | ) | — | ||||||||||||||||||
Class I | ||||||||||||||||||||||||||||
3/31/2016 (Unaudited) | $ | 12.61 | 0.02 | 0.96 | — | 0.98 | (0.20 | ) | (0.20 | ) | ||||||||||||||||||
9/30/2015 | $ | 13.58 | 0.08 | (0.44 | ) | — | (0.36 | ) | (0.20 | ) | (0.41 | ) | ||||||||||||||||
9/30/2014 | $ | 13.74 | 0.09 | 1.03 | — | 1.12 | (0.39 | ) | (0.89 | ) | ||||||||||||||||||
9/30/2013 | $ | 10.56 | 0.09 | 3.37 | — | 3.46 | (0.16 | ) | (0.12 | ) | ||||||||||||||||||
1/31/2012(3) – 9/30/2012 | $ | 10.00 | 0.10 | 0.46 | — | 0.56 | — | — | ||||||||||||||||||||
| (1) | Not annualized. |
| (2) | Annualized. |
| (3) | Commencement of operations. |
| (4) | After fees waived and expenses absorbed or recouped by the Advisor, where applicable. |
| (5) | Net investment income (loss) per share has been calculated based on average shares outstanding during the period. |
| (6) | The Total return calculation does not reflect the sales loads that may be imposed on Class A or C shares (see Note 7 of the Notes to Financial Statements). |
| (7) | The Total return figure is the since inception return for the class which commenced operations on January 31, 2013. |
| (8) | Prior to January 31, 2013, Class A shares were known as Class S shares. |
| (9) | Amount is less than $0.01 per share. |
The accompanying notes to financial statements are an integral part of this statement.
116
Brandes Investment Trust
FINANCIAL HIGHLIGHTS
| Net asset value, end of period | Total return(6) | Net assets, end of period (millions) | Ratio of net expenses to average net assets(4) | Ratio of net investment income to average net assets(4) | Ratio of expenses (prior to reimburse- ments) to average net assets | Ratio of net investment income (prior to reimburse- ments) to average net assets | Portfolio turnover rate | |||||||||||||||||||||||
| $ | 7.21 | 16.75 | %(1) | $ | 296.4 | 1.37 | %(2) | 0.63 | %(2) | 1.42 | %(2) | 0.58 | %(2) | 7.79 | %(1) | |||||||||||||||
| $ | 6.19 | (32.32 | )% | $ | 295.6 | 1.37 | % | 1.46 | % | 1.40 | % | 1.43 | % | 35.02 | % | |||||||||||||||
| $ | 9.56 | 7.09 | % | $ | 266.9 | 1.37 | % | 1.10 | % | 1.37 | % | 1.10 | % | 22.54 | % | |||||||||||||||
| $ | 9.23 | 8.09 | % | $ | 131.7 | 1.37 | % | 1.16 | % | 1.46 | % | 1.07 | % | 21.74 | % | |||||||||||||||
| $ | 8.96 | 16.40 | % | $ | 68.1 | 1.37 | % | 2.03 | % | 1.60 | % | 1.79 | % | 28.59 | % | |||||||||||||||
| $ | 7.85 | (21.50 | )%(1) | $ | 38.4 | 1.37 | %(2) | 2.12 | %(2) | 1.64 | %(2) | 1.85 | %(2) | 94.70 | %(1) | |||||||||||||||
| $ | 7.16 | 16.42 | %(1) | $ | 19.4 | 2.12 | %(2) | (0.12 | )%(2) | 2.17 | %(2) | (0.17 | )%(2) | 7.79 | %(1) | |||||||||||||||
| $ | 6.15 | (32.83 | )% | $ | 18.4 | 2.12 | % | 0.62 | % | 2.14 | % | 0.60 | % | 35.02 | % | |||||||||||||||
| $ | 9.51 | 6.38 | % | $ | 25.3 | 2.12 | % | 0.35 | % | 2.13 | % | 0.34 | % | 22.54 | % | |||||||||||||||
| $ | 9.19 | (2.84 | )%(7) | $ | 5.3 | 2.12 | %(2) | 0.42 | %(2) | 2.20 | %(2) | 0.34 | %(2) | 21.74 | %(1) | |||||||||||||||
| $ | 7.24 | 16.97 | %(1) | $ | 726.3 | 1.12 | %(2) | 0.88 | %(2) | 1.22 | %(2) | 0.78 | %(2) | 7.79 | %(1) | |||||||||||||||
| $ | 6.21 | (32.13 | )% | $ | 725.1 | 1.12 | % | 1.58 | % | 1.19 | % | 1.51 | % | 35.02 | % | |||||||||||||||
| $ | 9.58 | 7.41 | % | $ | 1,144.3 | 1.12 | % | 1.34 | % | 1.18 | % | 1.28 | % | 22.54 | % | |||||||||||||||
| $ | 9.24 | 8.20 | % | $ | 287.7 | 1.12 | % | 1.41 | % | 1.26 | % | 1.27 | % | 21.74 | % | |||||||||||||||
| $ | 8.99 | 16.79 | % | $ | 134.5 | 1.12 | % | 2.26 | % | 1.35 | % | 2.03 | % | 28.59 | % | |||||||||||||||
| $ | 7.86 | (21.40 | )%(1) | $ | 71.9 | 1.11 | %(2) | 2.38 | %(2) | 1.35 | %(2) | 2.14 | %(2) | 94.70 | %(1) | |||||||||||||||
| $ | 13.15 | 7.88 | %(1) | $ | 77.7 | 1.31 | %(2) | 0.15 | %(2) | 1.31 | %(2) | 0.15 | %(2) | 8.98 | %(1) | |||||||||||||||
| $ | 12.58 | (2.76 | )% | $ | 79.1 | 1.40 | % | 0.35 | % | 1.32 | % | 0.43 | % | 24.82 | % | |||||||||||||||
| $ | 13.55 | 8.36 | % | $ | 50.1 | 1.40 | % | 0.42 | % | 1.39 | % | 0.43 | % | 24.30 | % | |||||||||||||||
| $ | 13.72 | 32.98 | % | $ | 31.2 | 1.40 | % | 0.49 | % | 1.68 | % | 0.21 | % | 24.45 | % | |||||||||||||||
| $ | 10.56 | 5.60 | %(1) | $ | 38.4 | 1.40 | %(2) | 1.19 | %(2) | 2.16 | %(2) | 0.43 | %(2) | 13.55 | %(1) | |||||||||||||||
| $ | 12.96 | 7.46 | %(1) | $ | 18.5 | 2.06 | %(2) | (0.60 | )%(2) | 2.06 | %(2) | (0.60 | )%(2) | 8.98 | %(1) | |||||||||||||||
| $ | 12.42 | (3.49 | )% | $ | 15.1 | 2.07 | % | (0.34 | )% | 2.07 | % | (0.34 | )% | 24.82 | % | |||||||||||||||
| $ | 13.45 | 7.60 | % | $ | 12.3 | 2.14 | % | (0.32 | )% | 2.14 | % | (0.32 | )% | 24.30 | % | |||||||||||||||
| $ | 13.68 | 15.23 | %(7) | $ | 1.5 | 2.15 | %(2) | (0.25 | )%(2) | 2.40 | %(2) | (0.50 | )%(2) | 24.45 | %(1) | |||||||||||||||
| $ | 13.19 | 7.91 | %(1) | $ | 1,108.7 | 1.15 | %(2) | 0.31 | %(2) | 1.11 | %(2) | 0.35 | %(2) | 8.98 | %(1) | |||||||||||||||
| $ | 12.61 | (2.58 | )% | $ | 877.6 | 1.15 | % | 0.59 | % | 1.12 | % | 0.62 | % | 24.82 | % | |||||||||||||||
| $ | 13.58 | 8.67 | % | $ | 567.9 | 1.15 | % | 0.67 | % | 1.18 | % | 0.64 | % | 24.30 | % | |||||||||||||||
| $ | 13.74 | 33.41 | % | $ | 81.5 | 1.15 | % | 0.74 | % | 1.48 | % | 0.31 | % | 24.45 | % | |||||||||||||||
| $ | 10.56 | 5.60 | %(1) | $ | 38.4 | 1.15 | %(2) | 1.44 | %(2) | 1.91 | %(2) | 0.68 | %(2) | 13.55 | %(1) | |||||||||||||||
The accompanying notes to financial statements are an integral part of this statement.
117
Brandes Investment Trust
FINANCIAL HIGHLIGHTS
| Net asset value, beginning of period | Net investment income(5) | Net | Total from investment operations | Dividends from net investment income | Dividends from net realized gains | |||||||||||||||||||
Brandes Core Plus Fixed Income Fund |
| |||||||||||||||||||||||
Class A | ||||||||||||||||||||||||
3/31/2016 (Unaudited) | $ | 9.14 | 0.11 | (0.01 | ) | 0.10 | (0.11 | ) | (0.01 | ) | ||||||||||||||
9/30/2015 | $ | 9.22 | 0.19 | (0.02 | ) | 0.17 | (0.20 | ) | (0.05 | ) | ||||||||||||||
9/30/2014 | $ | 9.16 | 0.25 | 0.06 | 0.31 | (0.24 | ) | (0.01 | ) | |||||||||||||||
1/31/2013(3) – 9/30/2013 | $ | 9.43 | 0.20 | (0.28 | ) | (0.08 | ) | (0.19 | ) | — | ||||||||||||||
Class E | ||||||||||||||||||||||||
3/31/2016 (Unaudited) | $ | 9.22 | 0.11 | (0.01 | ) | 0.10 | (0.11 | ) | (0.01 | ) | ||||||||||||||
9/30/2015 | $ | 9.30 | 0.19 | (0.02 | ) | 0.17 | (0.20 | ) | (0.05 | ) | ||||||||||||||
9/30/2014 | $ | 9.21 | 0.25 | 0.10 | 0.35 | (0.25 | ) | (0.01 | ) | |||||||||||||||
9/30/2013 | $ | 9.61 | 0.30 | �� | (0.22 | ) | 0.08 | (0.36 | ) | (0.12 | ) | |||||||||||||
9/30/2012 | $ | 9.36 | 0.38 | 0.50 | 0.88 | (0.44 | ) | (0.19 | ) | |||||||||||||||
9/30/2011 | $ | 9.66 | 0.47 | (0.12 | ) | 0.35 | (0.48 | ) | (0.17 | ) | ||||||||||||||
Class I | ||||||||||||||||||||||||
3/31/2016 (Unaudited) | $ | 9.20 | 0.12 | (0.01 | ) | 0.11 | (0.13 | ) | (0.01 | ) | ||||||||||||||
9/30/2015 | $ | 9.28 | 0.21 | (0.02 | ) | 0.19 | (0.22 | ) | (0.05 | ) | ||||||||||||||
9/30/2014 | $ | 9.19 | 0.27 | 0.10 | 0.37 | (0.27 | ) | (0.01 | ) | |||||||||||||||
9/30/2013 | $ | 9.60 | 0.32 | (0.23 | ) | 0.09 | (0.38 | ) | (0.12 | ) | ||||||||||||||
9/30/2012 | $ | 9.35 | 0.40 | 0.50 | 0.90 | (0.46 | ) | (0.19 | ) | |||||||||||||||
9/30/2011 | $ | 9.65 | 0.49 | (0.12 | ) | 0.37 | (0.50 | ) | (0.17 | ) | ||||||||||||||
Brandes Credit Focus Yield Fund |
| |||||||||||||||||||||||
Class A(8) | ||||||||||||||||||||||||
3/31/2016 (Unaudited) | $ | 10.02 | 0.14 | (0.12 | ) | 0.02 | (0.14 | ) | — | |||||||||||||||
9/30/2015 | $ | 10.23 | 0.23 | (0.20 | ) | 0.03 | (0.23 | ) | (0.01 | ) | ||||||||||||||
9/30/2014 | $ | 10.15 | 0.21 | 0.09 | 0.30 | (0.21 | ) | (0.01 | ) | |||||||||||||||
9/30/2013 | $ | 10.39 | 0.19 | (0.17 | ) | 0.02 | (0.20 | ) | (0.06 | ) | ||||||||||||||
3/2/2012(3) – 9/30/2012 | $ | 10.10 | 0.16 | 0.29 | 0.45 | (0.16 | ) | — | ||||||||||||||||
Class I | ||||||||||||||||||||||||
3/31/2016 (Unaudited) | $ | 10.02 | 0.16 | (0.13 | ) | 0.03 | (0.16 | ) | — | |||||||||||||||
9/30/2015 | $ | 10.23 | 0.26 | (0.20 | ) | 0.06 | (0.26 | ) | (0.01 | ) | ||||||||||||||
9/30/2014 | $ | 10.15 | 0.23 | 0.09 | 0.32 | (0.23 | ) | (0.01 | ) | |||||||||||||||
9/30/2013 | $ | 10.39 | 0.22 | (0.18 | ) | 0.04 | (0.22 | ) | (0.06 | ) | ||||||||||||||
1/31/2012(3) –9/30/2012 | $ | 10.00 | 0.23 | 0.38 | 0.61 | (0.22 | ) | — | ||||||||||||||||
| (1) | Not annualized. |
| (2) | Annualized. |
| (3) | Commencement of operations. |
| (4) | After fees waived and expenses absorbed or recouped by the Advisor, where applicable. |
| (5) | Net investment income (loss) per share has been calculated based on average shares outstanding during the period. |
| (6) | The Total return calculation does not reflect the sales loads that may be imposed on Class A or C shares (see Note 7 of the Notes to Financial Statements). |
| (7) | The Total return figure is the since inception return for the class which commenced operations on January 31, 2013. |
| (8) | Prior to January 31, 2013, Class A shares were known as Class S shares. |
The accompanying notes to financial statements are an integral part of this statement.
118
Brandes Investment Trust
FINANCIAL HIGHLIGHTS
| Net asset value, end of period | Total return(6) | Net assets, end of period (millions) | Ratio of net expenses to average net assets(4) | Ratio of net investment income to average net assets(4) | Ratio of expenses (prior to reimburse- ments) to average net assets | Ratio of net investment income (prior to reimburse- ments) to average net assets | Portfolio turnover rate | |||||||||||||||||||||||
| $ | 9.12 | 1.13 | %(1) | $ | 2.7 | 0.70 | %(2) | 2.54 | %(2) | 0.94 | %(2) | 2.30 | %(2) | 19.42 | %(1) | |||||||||||||||
| $ | 9.14 | 1.78 | % | $ | 2.1 | 0.70 | % | 2.07 | % | 1.06 | % | 1.71 | % | 11.24 | % | |||||||||||||||
| $ | 9.22 | 3.52 | % | $ | 2.1 | 0.70 | % | 2.68 | % | 1.33 | % | 2.05 | % | 18.63 | % | |||||||||||||||
| $ | 9.16 | (0.88 | )%(7) | $ | 1.4 | 0.70 | %(2) | 3.23 | %(2) | 1.45 | %(2) | 2.48 | %(2) | 33.91 | %(1) | |||||||||||||||
| $ | 9.20 | 1.14 | %(1) | $ | 0.3 | 0.70 | %(2) | 2.53 | %(2) | 0.93 | %(2) | 2.30 | %(2) | 19.42 | %(1) | |||||||||||||||
| $ | 9.22 | 1.78 | % | $ | 1.9 | 0.70 | % | 2.07 | % | 1.06 | % | 1.71 | % | 11.24 | % | |||||||||||||||
| $ | 9.30 | 3.86 | % | $ | 1.9 | 0.70 | % | 2.68 | % | 1.39 | % | 1.99 | % | 18.63 | % | |||||||||||||||
| $ | 9.21 | 0.79 | % | $ | 1.2 | 0.70 | % | 3.22 | % | 1.40 | % | 2.52 | % | 33.91 | % | |||||||||||||||
| $ | 9.61 | 9.85 | % | $ | 6.9 | 0.70 | % | 4.06 | % | 1.45 | % | 3.33 | % | 31.59 | % | |||||||||||||||
| $ | 9.36 | 3.72 | % | $ | 3.8 | 0.70 | % | 4.90 | % | 1.48 | % | 4.13 | % | 91.18 | % | |||||||||||||||
| $ | 9.17 | 1.15 | %(1) | $ | 75.5 | 0.50 | %(2) | 2.74 | %(2) | 0.74 | %(2) | 2.50 | %(2) | 19.42 | %(1) | |||||||||||||||
| $ | 9.20 | 2.02 | % | $ | 72.1 | 0.50 | % | 2.26 | % | 0.86 | % | 1.90 | % | 11.24 | % | |||||||||||||||
| $ | 9.28 | 4.10 | % | $ | 43.3 | 0.50 | % | 2.88 | % | 1.20 | % | 2.18 | % | 18.63 | % | |||||||||||||||
| $ | 9.19 | 0.89 | % | $ | 29.7 | 0.50 | % | 3.43 | % | 1.23 | % | 2.70 | % | 33.91 | % | |||||||||||||||
| $ | 9.60 | 10.06 | % | $ | 25.3 | 0.50 | % | 4.28 | % | 1.23 | % | 3.55 | % | 31.59 | % | |||||||||||||||
| $ | 9.35 | 3.94 | % | $ | 23.2 | 0.50 | % | 5.11 | % | 1.25 | % | 4.36 | % | 91.18 | % | |||||||||||||||
| $ | 9.90 | 0.27 | %(1) | $ | 2.0 | 0.92 | %(2) | 2.95 | %(2) | 1.36 | %(2) | 2.51 | %(2) | 12.37 | %(1) | |||||||||||||||
| $ | 10.02 | 0.26 | % | $ | 2.1 | 0.95 | % | 2.28 | % | 1.53 | % | 1.70 | % | 25.50 | % | |||||||||||||||
| $ | 10.23 | 2.94 | % | $ | 2.0 | 0.95 | % | 2.02 | % | 1.50 | % | 1.47 | % | 26.17 | % | |||||||||||||||
| $ | 10.15 | 0.13 | % | $ | 4.2 | 0.95 | % | 1.84 | % | 1.61 | % | 1.18 | % | 23.05 | % | |||||||||||||||
| $ | 10.39 | 4.51 | %(1) | — | 0.95 | %(2) | 2.69 | %(2) | 1.05 | %(2) | 2.06 | %(2) | 162.73 | %(1) | ||||||||||||||||
| $ | 9.89 | 0.29 | %(1) | $ | 27.2 | 0.67 | %(2) | 3.20 | %(2) | 1.11 | %(2) | 2.76 | %(2) | 12.37 | %(1) | |||||||||||||||
| $ | 10.02 | 0.58 | % | $ | 27.3 | 0.70 | % | 2.53 | % | 1.28 | % | 1.95 | % | 25.50 | % | |||||||||||||||
| $ | 10.23 | 3.20 | % | $ | 27.1 | 0.70 | % | 2.26 | % | 1.26 | % | 1.70 | % | 26.17 | % | |||||||||||||||
| $ | 10.15 | 0.40 | % | $ | 25.2 | 0.70 | % | 2.09 | % | 1.42 | % | 1.37 | % | 23.05 | % | |||||||||||||||
| $ | 10.39 | 6.23 | %(1) | $ | 19.3 | 0.70 | %(2) | 3.39 | %(2) | 2.35 | %(2) | 1.74 | %(2) | 162.73 | %(1) | |||||||||||||||
The accompanying notes to financial statements are an integral part of this statement.
119
Brandes Investment Trust
NOTES TO FINANCIAL STATEMENTS — (Unaudited)
NOTE 1 – ORGANIZATION
The Brandes International Equity Fund (the “International Fund”), the Brandes Global Equity Fund (the “Global Fund”), the Brandes Global Equity Income Fund (the “Global Income Fund”), the Brandes Global Opportunities Value Fund (the “Global Opportunities Fund”), the Brandes Emerging Markets Value Fund (the “Emerging Markets Fund”), the Brandes International Small Cap Equity Fund (the “International Small Cap Fund”), the Brandes Core Plus Fixed Income Fund (the “Core Plus Fund”) and the Brandes Credit Focus Yield Fund (the “Credit Focus Yield Fund”) (each a “Fund” and collectively the “Funds”) are series of Brandes Investment Trust (the “Trust”). The Trust is registered under the Investment Company Act of 1940 (the “1940 Act”) as a diversified, open-end management investment company.
The International Fund, Global Fund, Global Income Fund, Global Opportunities Fund, Emerging Markets Fund, Core Plus Fund, Credit Focus Yield Fund and International Small Cap Fund began operations on January 2, 1997, October 6, 2008, December 31, 2014, December 31, 2014, January 31, 2011, December 28, 2007, January 31, 2012 and January 31, 2012, respectively. Prior to January 31, 2011 for the Emerging Markets Fund and January 31, 2012 for the International Small Cap and Credit Focus Yield Funds, these Funds’ portfolios were managed as private investment funds with investment objectives, investment policies and strategies that were, in all material respects, equivalent to those of the Emerging Markets Fund, International Small Cap Fund and Credit Focus Yield Fund, respectively.
The International Fund has five classes of shares: Class A, Class C, Class E, Class I and Class R6. The Global Fund has four classes of shares: Class A, Class C, Class E and Class I. The Emerging Markets Fund, Global Income Fund, Global Opportunities Fund and International Small Cap Fund have three classes of shares: Class A, Class C and Class I. The Core Plus Fund has three classes of shares: Class A, Class E and Class I. The Credit Focus Yield Fund has two classes of shares: Class A and Class I. Prior to January 31, 2013, Class A shares were known as Class S shares for the International, Global, Emerging Markets, International Small Cap and Credit Focus Yield Funds (Class A shares have the same operating expenses as Class S shares).
The International Fund and Global Fund invest their assets primarily in equity securities of issuers with market capitalizations greater than $1 billion. The International, International Small Cap and Emerging Markets Funds invest their assets in securities of foreign companies, while the Global Fund, Global Income Fund and Global Opportunities Fund invests its assets in securities of foreign and domestic companies. The Core Plus Fund and Credit Focus Yield Fund invest predominantly in debt securities issued by U.S. and foreign companies and debt obligations issued or guaranteed by the U.S. Government and foreign governments and their agencies and instrumentalities.
120
Brandes Investment Trust
NOTES TO FINANCIAL STATEMENTS — (Unaudited) (continued)
NOTE 2 – SIGNIFICANT ACCOUNTING POLICIES
The following is a summary of significant accounting policies consistently followed by the Funds. These policies are in conformity with accounting principles (“GAAP”) generally accepted in the United States of America.
| A. | Repurchase Agreements. Each Fund may enter into repurchase agreements with government securities dealers recognized by the Federal Reserve Board, with member banks of the Federal Reserve System or with other brokers or dealers that meet the credit guidelines established by the Board of Trustees. Each Fund will always receive and maintain, as collateral, U.S. Government securities whose market value, including accrued interest (which is recorded in the Schedules of Investments), will be at least equal to 100% of the dollar amount invested by the Fund in each agreement, and the Fund will make payment for such securities only upon physical delivery or upon evidence of book entry transfer to the account of the Fund’s custodian. To the extent that the term of any repurchase transaction exceeds one business day, the value of the collateral is marked-to-market on a daily basis to ensure the adequacy of the collateral. Before causing a Fund to enter into a repurchase agreement with any other party, the investment advisor will determine that such party does not have any apparent risk of becoming involved in bankruptcy proceedings within the time frame contemplated by the repurchase agreement. If the seller defaults and the value of the collateral declines, or if bankruptcy proceedings are commenced with respect to the seller of the security, realization of the collateral by the Fund may be delayed or limited. At March 31, 2016, the Funds’ ongoing exposure to the economic return on repurchase agreements is shown on the Schedule of Investments. |
| B. | Foreign Currency Translation and Transactions. Values of investments denominated in foreign currencies are converted into U.S. dollars using the spot market rates of exchange at the time of valuation. Purchases and sales of investments and dividend and interest income are translated into U.S. dollars using the spot market rates of exchange prevailing on the respective dates of such translations. The gain or loss resulting from changes in foreign exchange rates is included with net realized and unrealized gain or loss from investments, as appropriate. Foreign securities and currency transactions may involve certain considerations and risks not typically associated with those of domestic origin. |
Foreign securities are recorded in the financial statements after translation to U.S. dollars based on the applicable exchange rate at the end of the period. The Funds report certain foreign currency-related transactions as components of realized gains or losses for financial reporting purposes, whereas such components are treated as ordinary income for federal income tax purposes.
121
Brandes Investment Trust
NOTES TO FINANCIAL STATEMENTS — (Unaudited) (continued)
| C. | Delayed Delivery Securities. The Funds may purchase securities on a when issued or delayed delivery basis. “When-issued” or delayed delivery refers to securities whose terms are available and for which a market exists, but that have not been issued. For a when-issued or delayed delivery transaction, no payment is made until delivery date, which is typically longer than the normal course of settlement. When a Fund enters into an agreement to purchase securities on a when-issued or delayed delivery basis, the Fund segregates cash or liquid securities, of any type or maturity, equal in value to the Fund’s commitment. Losses may arise if the market value of the underlying securities change, if the counterparty does not perform under the contract, or if the issuer does not issue the securities due to political, economic, or other factors. The Funds did not have any open commitments on delayed delivery securities as of March 31, 2016. |
| D. | Participatory Notes. The International, Global, Global Income, Global Opportunities, Emerging Markets and International Small Cap Funds may invest in participatory notes. Participatory notes are derivative securities which are designed to provide synthetic exposure to one or more underlying securities, subject to the credit risk of the issuing financial institution. |
Investments in participatory notes involve risks normally associated with a direct investment in the underlying securities. In addition, participatory notes are subject to counterparty risk, which is the risk that the broker-dealer or bank that issues the notes will not fulfill its contractual obligation to complete the transaction with the Trust. Participatory notes constitute general unsecured, unsubordinated contractual obligations of the banks or broker-dealers that issue them and generally are issued as an actual note from the financial intermediary or an equity linked warrant (commonly known as a low exercise price option). The Trust is relying on the creditworthiness of such banks or broker-dealers and has no rights under a participatory note against the issuer of the securities underlying such participatory note. The investment advisor has established guidelines for monitoring participatory note exposure for the Funds. Prior to investment in a participatory note, the investment advisor will complete an analysis of the prospective counterparties and once purchased, will continue to monitor creditworthiness on a quarterly basis. The investment advisor requires a minimum credit rating for such counterparties (as determined by rating agencies such as Moody’s, Fitch and S&P) of A.
The Funds record counterparty credit risk valuation adjustments, if material, on the participatory notes in order to appropriately reflect the credit quality of the counterparty. During the period ended March 31, 2016, the Funds did not make any counterparty credit risk valuation adjustments.
122
Brandes Investment Trust
NOTES TO FINANCIAL STATEMENTS — (Unaudited) (continued)
The International, Global, Global Income, Global Opportunities, Emerging Markets and International Small Cap Funds did not invest in any participatory notes at March 31, 2016.
| E. | Security Transactions, Dividends and Distributions. Security transactions are accounted for on the trade dates. Realized gains and losses are evaluated on the basis of identified costs. Dividend income and distributions to shareholders are recorded on the ex-dividend dates. Interest is recorded on an accrual basis. Withholding taxes on foreign dividends and capital gains, which are included as a component of net investment income and realized gain (loss) on investments, respectively, have been provided for in accordance with the Trust’s understanding of the applicable country’s tax rules and rates. Each Fund’s investment income, expenses, other than class specific expenses, and realized and unrealized gains and losses are allocated daily to each class of the Fund’s shares based upon the relative net asset values of outstanding shares of each class of shares at the beginning of the day (after adjusting for the current capital shares activity of the respective class). Expenses common to the Funds’ portfolios are allocated among the Funds based upon their relative net asset values or other appropriate allocation methods. The Funds amortize premiums and accrete discounts using the constant yield method. |
| F. | Concentration of Risk. As of March 31, 2016, the International, Global, Global Income, Global Opportunities, Emerging Markets and International Small Cap Funds held significant portions of their assets in foreign securities. Certain price and foreign exchange fluctuations as well as economic and political situations in the foreign jurisdictions could have an impact on the International, Global, Global Income, Global Opportunities, Emerging Markets and International Small Cap Funds’ net assets. The investment advisor monitors these off-balance sheet risks. |
| G. | Use of Estimates. The preparation of financial statements in conformity with accounting principles generally accepted in the United States of America requires management to make estimates and assumptions that affect the reported amounts of assets and liabilities and revenue and expenses and disclosure of contingent assets and liabilities and revenue and expenses at the date of the financial statements. Actual results could differ from those estimates. |
| H. | Securities Lending. The Funds may lend their portfolio securities to banks, brokers and dealers. Lending Fund securities exposes the Fund to risks such as the following: (i) the borrower may fail to return the loaned securities, (ii) the borrower may not be able to provide additional collateral, or (iii) the Fund may experience delays in recovery of the loaned securities or loss of rights in the collateral if the borrower fails financially. |
123
Brandes Investment Trust
NOTES TO FINANCIAL STATEMENTS — (Unaudited) (continued)
To minimize these risks, the borrower must agree to maintain collateral with the Fund’s custodian, marked to market daily, in the form of cash and/or U.S. Government obligations, in an amount at least equal to 102% (105% in the case of loans of foreign securities not denominated in U.S. dollars) of the market value of the loaned securities. As of March 31, 2016, the International Equity Fund, Global Fund, Global Income Fund, Global Opportunities Fund, Emerging Markets Fund, Core Plus Fund and Credit Focus Yield Fund did not have any securities on loan. The International Small Cap Fund had one security on loan with a market value of $2,873,767 and received non-cash collateral for the loan of $3,001,440. Non-cash collateral received by the Funds may not be sold or re-pledged except to satisfy a borrower default. Therefore, non-cash collateral is not included on the Funds’ Schedule of Investments or Statement of Assets and Liabilities.
| I. | Indemnification Obligations. Under the Trust’s organizational documents, its current and former officers and trustees are indemnified against certain liabilities arising out of the performance of their duties to the Trust. The Trust has indemnified its trustees against any expenses actually and reasonably incurred by the trustees in any proceeding arising out of or in connection with the trustees’ service to the Trust. In addition, in the normal course of business, the Trust enters into contracts that contain a variety of representations and warranties and provide general indemnifications. The Funds’ maximum exposure under these arrangements is unknown as this would involve future claims that may be made against the Funds that have not yet occurred or that would be covered by other parties. |
| J. | Accounting for Uncertainty in Income Taxes. Each Fund has elected to be taxed as a “regulated investment company” and intends to distribute substantially all taxable income to its shareholders and otherwise comply with the provisions of the Internal Revenue Code applicable to regulated investment companies. The Funds may be subject to a nondeductible excise tax calculated as a percentage of certain undistributed amounts of net investment income and net capital gains. The Funds intend to distribute their net investment income and capital gains as necessary to avoid this excise tax. Therefore, no provision for federal income taxes or excise taxes has been made. |
The Trust has adopted financial reporting rules that require the Funds to analyze all open tax years, as defined by the applicable statute of limitations, for all major jurisdictions. Open tax years for the Funds, with the exception of the Global Income Fund and Global Opportunities Fund, are those that are open for exam by taxing authorities (2012 through 2015). As of March 31, 2016 the Trust has no examinations in progress.
124
Brandes Investment Trust
NOTES TO FINANCIAL STATEMENTS — (Unaudited) (continued)
Management has analyzed the Trust’s tax positions, and has concluded that no liability should be recorded related to uncertain tax positions expected to be taken on the tax return for the fiscal year-end September 30, 2015.
The Trust identifies its major tax jurisdictions as the U.S. Government and the State of California. The Funds are not aware of any tax positions for which it is reasonably possible that the total amounts of unrecognized tax benefits will significantly change in the next twelve months.
| K. | Payment by Affiliate. During the fiscal year ended September 30, 2011, Brandes Investment Partners, L.P. voluntarily reimbursed the Emerging Markets Fund $5,862 relating to commissions paid by the Emerging Markets Fund to brokers for execution of certain securities transactions in relation to a redemption in kind during that period. These reimbursements have been classified on the Financial Highlights as “Net increase from payments by affiliates”. |
| L. | Fair Value Measurements. The Trust has adopted GAAP accounting principles related to fair value accounting standards which establish a definition of fair value and set out a hierarchy for measuring fair value. These standards require additional disclosures about the various inputs and valuation techniques used to develop the measurements of fair value and a discussion of changes in valuation techniques and related inputs during the period. These inputs are summarized in the three broad levels listed below: |
Level 1 — Quoted unadjusted prices for identical instruments in active markets to which the Trust has access at the date of measurement.
Level 2 — Other significant observable market inputs including quoted prices for similar instruments in active markets; quoted adjusted prices in active markets; quoted prices for identical or similar instruments in markets that are not active; and model-derived valuations in which all significant inputs and significant value drivers are observable in active markets. Level 2 inputs are those in markets for which there are few transactions, the prices are not current, little public information exists or instances where prices vary substantially over time or among broker market makers.
Level 3 — Significant unobservable inputs including model derived valuations in which one or more significant inputs or significant value drivers are unobservable. Unobservable inputs are those inputs that reflect the Trust’s own assumptions about factors market participants would use to price the asset or liability based on the best available information.
| M. | Security Valuation. Common and preferred stocks, exchange-traded funds and financial derivative instruments, such as futures contracts and options contracts that are traded on a national securities or commodities exchange, |
125
Brandes Investment Trust
NOTES TO FINANCIAL STATEMENTS — (Unaudited) (continued)
| are valued at the last reported sales price at the close of regular trading on each day the exchange is open for trading, in the case of common stocks and exchange-traded funds, or, in the case of futures contracts or options contracts, the settlement price determined by the relevant exchange. Securities listed on the NASDAQ National Market System for which market quotations are readily available are valued using the NASDAQ Official Closing Price. To the extent these securities are actively traded and valuation adjustments are not applied, they are categorized as Level 1 of the fair value hierarchy. |
Equity securities traded on an exchange for which there have been no sales on the valuation date are generally valued at the mean between last bid and ask price on such day and are categorized as Level 2 of the fair value hierarchy, or are fair valued by the Valuation Committee.
Investments in registered open-end management investment companies will be valued based upon the Net Asset Values (“NAVs”) of such investments and are categorized as Level 1 of the fair value hierarchy.
Valuation adjustments may be applied to certain common and preferred stocks that are solely traded on a foreign exchange to account for the market movement between the close of the foreign market and the close of the New York Stock Exchange (“NYSE”). These securities are generally valued using pricing service providers that consider the correlation of the trading patterns of the foreign securities to the intraday trading in the U.S. markets for investments. Securities using these valuation adjustments are categorized as Level 2 of the fair value hierarchy. As of March 31, 2016, the International Fund, Global Fund, Global Income Fund, Global Opportunities Fund, Emerging Markets Fund and International Small Cap Fund had securities with market values of $505,121,535, $27,123,935, $332,463, $3,780,927, $504,226,678 and $695,740,785, that represent 79.95%, 57.09%, 50.59%, 49.94%, 48.39% and 57.74% of each Fund’s net assets, respectively, that were fair valued using these valuation adjustments.
Fixed income securities (other than repurchase agreements and demand notes) including corporate, convertible and municipal bonds and notes, U.S. government agencies, U.S. Treasury obligations, sovereign issues, bank loans, convertible preferred securities, fixed income securities purchased on a delayed delivery basis and non-U.S. bonds are normally valued on the basis of quotes obtained from brokers and dealers or independent pricing services or sources. Independent pricing services typically use information provided by market makers or estimates of market values obtained from yield data relating to investments or securities with similar characteristics. The service providers’ internal models use inputs that are observable such as, among other things, issuer
126
Brandes Investment Trust
NOTES TO FINANCIAL STATEMENTS — (Unaudited) (continued)
details, interest rates, yield curves, prepayment speeds, credit risks/spreads, default rates and quoted prices for similar assets. Securities that use similar valuation techniques and inputs as described above are categorized as Level 2 of the fair value hierarchy.
Rights that are traded on a national securities exchange are valued at the last reported sales price at the close of regular trading on each day the exchange is open. A right is a privilege offered by a corporation to its shareholders pro rata to subscribe to a certain security at a specified price, often for a short period. Rights may or may not be transferable.
The Funds may enter into mortgage dollar roll transactions in which the Funds sell a mortgage-backed security to a counterparty and simultaneously enter into an agreement with the same counterparty to buy back a similar security on a specific future date at a predetermined price. Risks may arise due to the delayed payment date and the potential inability of counterparties to complete the transaction. Mortgage dollar rolls are accounted for as purchase and sale transactions, which may increase a Fund’s portfolio turnover rate.
Mortgage and asset-backed securities are usually issued as separate tranches, or classes, of securities within each package of underlying securities. These securities are also normally valued by pricing service providers that use broker dealer quotations or valuation estimates from their internal pricing models. The pricing models for these securities usually consider tranche level attributes, estimated cash flows and market-based yield spreads for each tranche, and current market data and incorporate packaged, collateral performance, as available. Mortgage and asset-backed securities that use such valuation techniques and inputs are categorized as Level 2 of the fair value hierarchy.
Repurchase agreements and demand notes, for which neither vendor pricing nor market maker prices are available, are valued at amortized cost on the day of valuation, unless the Advisor determines that the use of amortized cost valuation on such day is not appropriate (in which case such instrument is fair valued in accordance with the fair value procedures of the Trust).
Certain securities may be fair valued in accordance with the fair valuation procedures approved by the Board of Trustees. The Valuation Committee is generally responsible for overseeing the day-to-day valuation processes and reports periodically to the Board. The Valuation Committee is authorized to make all necessary determinations of the fair value of portfolio securities and other assets for which market quotations are not readily available or if it is deemed that the prices obtained from brokers and dealers or independent pricing services are unreliable. Valuation methodologies used to fair value such securities in the Funds’ portfolios as
127
Brandes Investment Trust
NOTES TO FINANCIAL STATEMENTS — (Unaudited) (continued)
of March 31, 2016 include conversion value, correlation to similar securities and financial statement analysis. The securities fair valued by the Valuation Committee are indicated in the Schedules of Investments and are categorized as Level 2 or Level 3 of the fair value hierarchy. Certain vendor priced securities may also be considered Level 3 if significant unobservable inputs are used by the vendors.
In using fair value pricing, each Fund attempts to establish the price that it might reasonably have expected to receive upon a sale of the security at 4:00 p.m. Eastern time. Valuing securities at fair value involves greater reliance on judgment than valuation of securities based on readily available market quotations. A Fund using fair value to price securities may value those securities higher or lower than another fund using market quotations or fair value to price the same securities. Further, there can be no assurance that the Fund could obtain the fair value assigned to a security if it were to sell the security at approximately the time at which the Fund determines its net asset value.
The following is a summary of the level inputs used, as of March 31, 2016, involving the Funds’ assets carried at fair value. The inputs used for valuing securities may not be an indication of the risk associated with investing in those securities.
Description | Level 1 | Level 2 | Level 3 | Total | ||||||||||||
Investments in Securities | ||||||||||||||||
International Fund | ||||||||||||||||
Equities | ||||||||||||||||
Consumer Discretionary | $ | — | $ | 83,831,525 | $ | — | $ | 83,831,525 | ||||||||
Consumer Staples | — | 57,940,877 | — | 57,940,877 | ||||||||||||
Energy | 12,929,402 | 55,696,892 | — | 68,626,294 | ||||||||||||
Financials | 10,355,653 | 97,401,539 | — | 107,757,192 | ||||||||||||
Health Care | — | 85,065,982 | — | 85,065,982 | ||||||||||||
Industrials | 9,518,069 | 32,588,969 | — | 42,107,038 | ||||||||||||
Information Technology | — | 20,225,382 | — | 20,225,382 | ||||||||||||
Materials | 14,962,144 | 19,084,787 | 34,046,931 | |||||||||||||
Telecommunication Services | 5,930,592 | 26,696,515 | — | 32,627,107 | ||||||||||||
Utilities | 9,377,499 | 18,799,325 | — | 28,176,824 | ||||||||||||
|
|
|
|
|
|
|
| |||||||||
Total Equities | 63,073,359 | 497,331,793 | — | 560,405,152 | ||||||||||||
|
|
|
|
|
|
|
| |||||||||
Preferred Stocks | ||||||||||||||||
Energy | 5,308,000 | 7,789,742 | — | 13,097,742 | ||||||||||||
Telecommunication Services | 11,115,140 | — | — | 11,115,140 | ||||||||||||
|
|
|
|
|
|
|
| |||||||||
Total Preferred Stocks | 16,423,140 | 7,789,742 | — | 24,212,882 | ||||||||||||
|
|
|
|
|
|
|
| |||||||||
Repurchase Agreements | — | 40,603,736 | — | 40,603,736 | ||||||||||||
|
|
|
|
|
|
|
| |||||||||
Total Investments in Securities | $ | 79,496,499 | $545,725,271 | $ | — | $625,221,770 | ||||||||||
|
|
|
|
|
|
|
| |||||||||
128
Brandes Investment Trust
NOTES TO FINANCIAL STATEMENTS — (Unaudited) (continued)
Description | Level 1 | Level 2 | Level 3 | Total | ||||||||||||
Global Fund | ||||||||||||||||
Equities | ||||||||||||||||
Consumer Discretionary | $ | — | $ | 5,842,096 | $ | — | $ | 5,842,096 | ||||||||
Consumer Staples | 478,377 | 3,866,547 | — | 4,344,924 | ||||||||||||
Energy | 1,351,923 | 3,577,374 | — | 4,929,297 | ||||||||||||
Financials | 6,714,242 | 3,433,460 | — | 10,147,702 | ||||||||||||
Health Care | 2,891,649 | 3,972,757 | — | 6,864,406 | ||||||||||||
Industrials | 1,798,546 | 1,123,910 | — | 2,922,456 | ||||||||||||
Information Technology | 3,428,327 | 2,461,987 | — | 5,890,314 | ||||||||||||
Materials | — | 751,384 | — | 751,384 | ||||||||||||
Telecommunication Services | 1,220,414 | 1,304,492 | — | 2,524,906 | ||||||||||||
Utilities | 858,129 | 962,211 | — | 1,820,340 | ||||||||||||
|
|
|
|
|
|
|
| |||||||||
Total Equities | 18,741,607 | 27,296,218 | — | 46,037,825 | ||||||||||||
|
|
|
|
|
|
|
| |||||||||
Corporate Bonds | — | 306,740 | — | 306,740 | ||||||||||||
|
|
|
|
|
|
|
| |||||||||
Repurchase Agreements | — | 765,361 | — | 765,361 | ||||||||||||
|
|
|
|
|
|
|
| |||||||||
Total Investments in Securities | $ | 18,741,607 | $ | 28,368,319 | $ | — | $ | 47,109,926 | ||||||||
|
|
|
|
|
|
|
| |||||||||
Global Equity Income | ||||||||||||||||
Equities | ||||||||||||||||
Consumer Discretionary | $ | — | $ | 41,108 | $ | — | $ | 41,108 | ||||||||
Consumer Staples | 27,806 | 78,099 | — | 105,905 | ||||||||||||
Energy | 16,218 | 60,742 | — | 76,960 | ||||||||||||
Financials | 16,802 | 32,562 | — | 49,364 | ||||||||||||
Health Care | 64,918 | 56,090 | — | 121,008 | ||||||||||||
Industrials | 18,924 | 18,213 | — | 37,137 | ||||||||||||
Information Technology | 43,057 | 14,528 | — | 57,585 | ||||||||||||
Materials | — | 9,028 | — | 9,028 | ||||||||||||
Telecommunication Services | 18,321 | — | — | 18,321 | ||||||||||||
Utilities | 46,303 | 16,683 | — | 62,986 | ||||||||||||
|
|
|
|
|
|
|
| |||||||||
Total Equities | 252,349 | 327,053 | — | 579,402 | ||||||||||||
|
|
|
|
|
|
|
| |||||||||
Preferred Stocks | ||||||||||||||||
Financials | 53,751 | 11,618 | — | 65,369 | ||||||||||||
|
|
|
|
|
|
|
| |||||||||
Total Preferred Stocks | 53,751 | 11,618 | — | 65,369 | ||||||||||||
|
|
|
|
|
|
|
| |||||||||
Repurchase Agreements | — | 32,032 | — | 32,032 | ||||||||||||
|
|
|
|
|
|
|
| |||||||||
Total Investments in Securities | $ | 306,100 | $ | 370,703 | $ | — | $ | 676,803 | ||||||||
|
|
|
|
|
|
|
| |||||||||
129
Brandes Investment Trust
NOTES TO FINANCIAL STATEMENTS — (Unaudited) (continued)
Description | Level 1 | Level 2 | Level 3 | Total | ||||||||||||
Global Opportunities Value | ||||||||||||||||
Equities | ||||||||||||||||
Consumer Discretionary | $ | 306,421 | $ | 703,777 | $ | — | $ | 1,010,198 | ||||||||
Consumer Staples | 175,133 | 586,566 | — | 761,699 | ||||||||||||
Energy | 354,240 | 236,038 | — | 590,278 | ||||||||||||
Financials | 615,350 | 697,404 | — | 1,312,754 | ||||||||||||
Health Care | 52,354 | 174,618 | — | 226,972 | ||||||||||||
Industrials | 311,928 | 427,722 | — | 739,650 | ||||||||||||
Information Technology | 91,173 | 202,735 | — | 293,908 | ||||||||||||
Materials | 263,084 | 107,588 | — | 370,672 | ||||||||||||
Telecommunication Services | 252,752 | 266,347 | — | 519,099 | ||||||||||||
Utilities | 186,166 | 286,916 | — | 473,082 | ||||||||||||
|
|
|
|
|
|
|
| |||||||||
Total Equities | 2,608,601 | 3,689,711 | — | 6,298,312 | ||||||||||||
|
|
|
|
|
|
|
| |||||||||
Preferred Stocks | ||||||||||||||||
Consumer Discretionary | — | 176,829 | — | 176,829 | ||||||||||||
Consumer Staples | 73,627 | — | — | 73,627 | ||||||||||||
Energy | 45,164 | 83,734 | — | 128,898 | ||||||||||||
Financials | 97,908 | — | — | 97,908 | ||||||||||||
Health Care | — | 51,380 | — | 51,380 | ||||||||||||
|
|
|
|
|
|
|
| |||||||||
Total Preferred Stocks | 216,699 | 311,943 | — | 528,642 | ||||||||||||
|
|
|
|
|
|
|
| |||||||||
Real Estate Investment Trusts | 201,721 | — | — | 201,721 | ||||||||||||
|
|
|
|
|
|
|
| |||||||||
Corporate Bonds | — | 108,840 | — | 108,840 | ||||||||||||
|
|
|
|
|
|
|
| |||||||||
Repurchase Agreements | — | 409,689 | — | 409,689 | ||||||||||||
|
|
|
|
|
|
|
| |||||||||
Total Investments in Securities | $ | 3,027,021 | $ | 4,520,183 | $ | — | $ | 7,547,204 | ||||||||
|
|
|
|
|
|
|
| |||||||||
Emerging Markets Fund | ||||||||||||||||
Equities | ||||||||||||||||
Consumer Discretionary | $ | 47,754,150 | $ | 152,004,864 | $ | 36,444 | $ | 199,795,458 | ||||||||
Consumer Staples | 27,301,955 | — | — | 27,301,955 | ||||||||||||
Energy | 42,744,908 | — | — | 42,744,908 | ||||||||||||
Financials | 56,939,714 | 145,856,532 | — | 202,796,246 | ||||||||||||
Industrials | 57,990,930 | — | — | 57,990,930 | ||||||||||||
Information Technology | — | 30,347,533 | — | 30,347,533 | ||||||||||||
Materials | 75,720,582 | 35,069,405 | — | 110,789,987 | ||||||||||||
Telecommunication Services | 22,067,007 | 53,443,994 | — | 75,511,001 | ||||||||||||
Utilities | 49,103,681 | 23,176,913 | — | 72,280,594 | ||||||||||||
|
|
|
|
|
|
|
| |||||||||
Total Equities | 379,622,927 | 439,899,241 | 36,444 | 819,558,612 | ||||||||||||
|
|
|
|
|
|
|
| |||||||||
Preferred Stocks | ||||||||||||||||
Consumer Discretionary | — | 25,245,518 | — | 25,245,518 | ||||||||||||
Consumer Staples | 33,204,712 | — | — | 33,204,712 | ||||||||||||
Energy | 26,573,139 | 7,370,322 | — | 33,943,461 | ||||||||||||
Financials | 11,323,672 | — | — | 11,323,672 | ||||||||||||
Telecommunication Services | 12,334,823 | — | — | 12,334,823 | ||||||||||||
Utilities | 15,544,525 | — | — | 15,544,525 | ||||||||||||
|
|
|
|
|
|
|
| |||||||||
Total Preferred Stocks | 98,980,871 | 32,615,840 | — | 131,596,711 | ||||||||||||
|
|
|
|
|
|
|
| |||||||||
Real Estate Investment Trusts | 31,626,080 | 31,711,597 | — | 63,337,677 | ||||||||||||
|
|
|
|
|
|
|
| |||||||||
Convertible Bonds | — | 110,132 | — | 110,132 | ||||||||||||
|
|
|
|
|
|
|
| |||||||||
Repurchase Agreements | — | 14,787,706 | — | 14,787,706 | ||||||||||||
|
|
|
|
|
|
|
| |||||||||
Total Investments in Securities | $ | 510,229,878 | $ | 519,124,516 | $ | 36,444 | $ | 1,029,390,838 | ||||||||
|
|
|
|
|
|
|
| |||||||||
130
Brandes Investment Trust
NOTES TO FINANCIAL STATEMENTS — (Unaudited) (continued)
Description | Level 1 | Level 2 | Level 3 | Total | ||||||||||||
International Small Cap Fund | ||||||||||||||||
Equities | ||||||||||||||||
Consumer Discretionary | $ | 66,668,005 | $ | 144,969,173 | $ | 16,213 | $211,653,391 | |||||||||
Consumer Staples | 56,674,521 | 116,342,435 | — | 173,016,956 | ||||||||||||
Financials | 19,330,089 | 62,498,165 | — | 81,828,254 | ||||||||||||
Health Care | 10,107,405 | 28,848,787 | — | 38,956,192 | ||||||||||||
Industrials | 29,088,730 | 144,773,964 | — | 173,862,694 | ||||||||||||
Information Technology | 18,302,586 | 51,475,814 | — | 69,778,400 | ||||||||||||
Materials | 69,056,512 | 18,358,821 | — | 87,415,333 | ||||||||||||
Telecommunication Services | — | 46,155,932 | — | 46,155,932 | ||||||||||||
Utilities | 20,087,241 | 68,994,156 | — | 89,081,397 | ||||||||||||
|
|
|
|
|
|
|
| |||||||||
Total Equities | 289,315,089 | 682,417,247 | 16,213 | 971,748,549 | ||||||||||||
|
|
|
|
|
|
|
| |||||||||
Preferred Stocks | ||||||||||||||||
Health Care | — | 8,509,447 | — | 8,509,447 | ||||||||||||
Utilities | 14,765,215 | — | — | 14,765,215 | ||||||||||||
|
|
|
|
|
|
|
| |||||||||
Total Preferred Stocks | 14,765,215 | 8,509,447 | — | 23,274,662 | ||||||||||||
|
|
|
|
|
|
|
| |||||||||
Real Estate Investment Trusts | 24,184,511 | 11,116,590 | — | 35,301,101 | ||||||||||||
|
|
|
|
|
|
|
| |||||||||
Convertible Bonds | — | 37,914 | — | 37,914 | ||||||||||||
|
|
|
|
|
|
|
| |||||||||
Corporate Bonds & Notes | — | 129,975 | 1,377,787 | 1,507,762 | ||||||||||||
|
|
|
|
|
|
|
| |||||||||
Repurchase Agreements | — | 153,251,323 | — | 153,251,323 | ||||||||||||
|
|
|
|
|
|
|
| |||||||||
Total Investments in Securities | $ | 328,264,815 | $ | 855,462,496 | $ | 1,394,000 | $ | 1,185,121,311 | ||||||||
|
|
|
|
|
|
|
| |||||||||
Core Plus Fund | ||||||||||||||||
Preferred Stocks | $ | 198,588 | $ | 1,001,100 | $ | — | $ | 1,199,688 | ||||||||
Asset Backed Securities | — | 1,125,977 | — | 1,125,977 | ||||||||||||
Convertible Bonds | — | 597,656 | — | 597,656 | ||||||||||||
Corporate Bonds | — | 25,462,090 | — | 25,462,090 | ||||||||||||
Government Securities | — | 42,166,925 | — | 42,166,925 | ||||||||||||
Mortgage Backed Securities | — | 5,656,592 | — | 5,656,592 | ||||||||||||
Repurchase Agreements | — | 2,334,068 | — | 2,334,068 | ||||||||||||
|
|
|
|
|
|
|
| |||||||||
Total Investments in Securities | $ | 198,588 | $ | 78,344,408 | $ | — | $ | 78,542,996 | ||||||||
|
|
|
|
|
|
|
| |||||||||
Credit Focus Yield Fund | ||||||||||||||||
Preferred Stocks | $ | 300,428 | $ | 630,901 | $ | — | $ | 931,329 | ||||||||
Asset Backed Securities | — | 337,531 | — | 337,531 | ||||||||||||
Convertible Bonds | — | 349,031 | — | 349,031 | ||||||||||||
Corporate Bonds | — | 17,369,122 | — | 17,369,122 | ||||||||||||
Government Securities | — | 8,769,271 | — | 8,769,271 | ||||||||||||
Repurchase Agreements | — | 1,060,705 | — | 1,060,705 | ||||||||||||
|
|
|
|
|
|
|
| |||||||||
Total Investments in Securities | $ | 300,428 | $ | 28,516,561 | $ | — | $ | 28,816,989 | ||||||||
|
|
|
|
|
|
|
| |||||||||
131
Brandes Investment Trust
NOTES TO FINANCIAL STATEMENTS — (Unaudited) (continued)
Below are the transfers into or out of Levels 1 and 2 for the Funds using market values measured at the end of the reporting periods:
| International Fund | Global Fund | Global Income Fund | Global Opportunities Value Fund | |||||||||||||
Transfers into Level 1 | $ | 2,780,957 | $ | — | $ | — | $ | 63,444 | ||||||||
Transfers out of Level 1 | — | — | — | — | ||||||||||||
|
|
|
|
|
|
|
| |||||||||
Net Transfers into Level 1 | $ | 2,780,957 | $ | — | $ | — | $ | 63,444 | ||||||||
|
|
|
|
|
|
|
| |||||||||
Transfers into Level 2 | $ | — | $ | — | $ | — | $ | — | ||||||||
Transfers out of Level 2 | 2,780,957 | — | — | 63,444 | ||||||||||||
|
|
|
|
|
|
|
| |||||||||
Net Transfers out of Level 2 | $ | (2,780,957 | ) | $ | — | $ | — | $ | (63,444 | ) | ||||||
|
|
|
|
|
|
|
| |||||||||
| Emerging Markets Fund | International Small Cap Fund | Core Plus Fund | Credit Focus Yield Fund | |||||||||||||
Transfers into Level 1 | $ | 12,438,380 | $ | 29,362,267 | $ | — | $ | — | ||||||||
Transfers out of Level 1 | 18,761,650 | 36,990,835 | — | — | ||||||||||||
|
|
|
|
|
|
|
| |||||||||
Net Transfers out of Level 1 | $ | (6,323,270 | ) | $ | (7,628,568 | ) | $ | — | $ | — | ||||||
|
|
|
|
|
|
|
| |||||||||
Transfers into Level 2 | $ | 18,761,650 | $ | 36,990,835 | $ | — | $ | — | ||||||||
Transfers out of Level 2 | 12,438,380 | 29,362,267 | — | — | ||||||||||||
|
|
|
|
|
|
|
| |||||||||
Net Transfers into Level 2 | $ | 6,323,270 | $ | 7,628,568 | $ | — | $ | — | ||||||||
|
|
|
|
|
|
|
| |||||||||
The transfers from Level 1 to Level 2 are due to the securities being fair valued as a result of market movements following the close of local trading and/or due to the lack of trading volume on March 31, 2016. The transfers from Level 2 to Level 1 are due to the securities no longer being fair valued as a result of trading on a stock exchange on March 31, 2016.
There were no Level 3 securities in the International Equity, Global Equity, Global Income, Global Opportunities, Core Plus and Credit Focus Funds at the beginning or during the periods presented.
Below is a reconciliation that details the activity of securities in Level 3 in the Emerging Markets and International Small Cap Funds during the period ended March 31, 2016:
| Emerging Markets Fund | International Small Cap Fund | |||||||
Beginning Balance – October 1, 2015 | $ | 202,424 | $ | 90,054 | ||||
Purchases | — | 896,228 | ||||||
Sales | — | — | ||||||
Transfers in to level 3 | — | — | ||||||
Transfers out of level 3 | — | — | ||||||
Realized gains (losses), net | — | — | ||||||
Change in unrealized gains (losses) | (165,980 | ) | 407,718 | |||||
|
|
|
| |||||
Ending Balance – March 31, 2016 | $ | 36,444 | $ | 1,394,000 | ||||
|
|
|
| |||||
132
Brandes Investment Trust
NOTES TO FINANCIAL STATEMENTS — (Unaudited) (continued)
The realized and unrealized gains and losses from Level 3 transactions are included with the net realized gains and losses on investments on the Statement of Assets and Liabilities. As of March 31, 2016 the Emerging Markets Fund and International Small Cap Fund had $5,130,602 and $1,466,976 of unrealized losses from Level 3 securities, respectively.
The following table presents information about unobservable inputs related to the Trust’s categories of Level 3 investments as of March 31, 2016.
Emerging Markets Fund
Investment Type | Fair Value | Valuation | Unobservable Inputs | Input Value/Range | ||||
Common Stock | $36,444 | Valuation based on financial information from company | Financial statement analysis Restructuring plan | N/A |
International Small Cap Fund
Investment Type | Fair Value | Valuation | Unobservable Inputs | Input Value/Range | ||||
Common Stock | $16,213 | Valuation based on financial information from company | Financial statement analysis Restructuring plan | N/A | ||||
Promissory Note | 1,377,787 | Intrinsic Value | Coversion feature | N/A | ||||
The following provides a general description of the impact of a change in an unobservable input on the fair value measurement and the interrelationship of unobservable inputs, where relevant and significant. Interrelationships may also exist between observable and unobservable inputs (for example, as interest rates rise, prepayment rates decline).
Common Stock
At regular intervals the above unobservable inputs are reviewed and compared to updated issuer information. The factors that were considered in determining the fair value of this security included consideration of the following: balance sheet figures (which include the most recent estimate of assets and liabilities), restructuring framework presented by the issuer and its dilutive impact on common equity, general market conditions and other information and analysis. If the financial condition of this company were to deteriorate the value of this common stock would be lower.
Promissory Note
At regular intervals the above unobservable inputs are reviewed and compared to updated issuer information. The factors that were considered in determining the fair value of this security included consideration of the following: issuer’s ordinary share stock price, promissory note’s embedded convertibility feature, general market conditions and other information and analysis.
133
Brandes Investment Trust
NOTES TO FINANCIAL STATEMENTS — (Unaudited) (continued)
NOTE 3 – INVESTMENT ADVISORY FEE AND OTHER TRANSACTIONS WITH AFFILIATES
| A. | Advisor Fee. Brandes Investment Partners, L.P. (the “Advisor”) provides the Funds with investment management services under an Investment Advisory Agreement. The Advisor furnishes all investment advice, office space and certain administrative services, and provides certain personnel, needed by the Funds. As compensation for its services, the Advisor is entitled to a monthly fee. The Advisor received a monthly fee at the annual rate of 0.80% of the first $5 billion of average daily net assets, and 0.70% of the amount of average daily net assets greater than $5 billion, of the International Fund. The Advisor received a monthly fee at the annual rate of 0.95% of the first $2.5 billion of average daily net assets, 0.90% on average daily net assets from $2.5 billion to $5.0 billion, and 0.85% of the amount of average daily net assets greater than $5.0 billion, of the Emerging Markets Fund. The Global Fund, Global Income Fund, Global Opportunities Fund, International Small Cap Fund, Core Plus Fund and Credit Focus Yield Fund incurred a monthly fee at the annual rate of 0.80%, 0.80%, 0.95%, 0.95%, 0.35% and 0.50% based upon their average daily net assets, respectively. For the period ended March 31, 2016, the International Fund, the Global Fund, the Global Income Fund, the Global Opportunities Fund, the Emerging Markets Fund, the International Small Cap Fund, the Core Plus Fund and the Credit Focus Yield Fund incurred $2,441,821, $197,454, $2,512, $34,101, $4,624,703, $4,962,552, $132,698 and $71,901 in advisory fees, respectively. |
Certain officers and trustees of the Trust are also officers of the Advisor.
The Funds are responsible for their own operating expenses. The Advisor has contractually agreed to limit each Fund’s annual operating expenses, including repayment of previous waivers, to the following percentages of the Fund’s average daily net assets attributable to the specific classes through January 31, 2017 (the “Expense Cap Agreement”):
Fund | Class A | Class C | Class E | Class I | ||||||||||||
International Fund | 1.20 | % | 1.95 | % | 1.20 | % | 1.00 | % | ||||||||
Global Fund | 1.25 | % | 2.00 | % | 1.25 | % | 1.00 | % | ||||||||
Global Income Fund | 1.25 | % | 2.00 | % | N/A | 1.00 | % | |||||||||
Global Opportunities Fund | 1.40 | % | 2.15 | % | N/A | 1.15 | % | |||||||||
Emerging Markets Fund | 1.37 | % | 2.12 | % | N/A | 1.12 | % | |||||||||
International Small Cap Fund | 1.40 | % | 2.15 | % | N/A | 1.15 | % | |||||||||
Core Plus Fund | 0.70 | % | N/A | 0.70 | % | 0.50 | % | |||||||||
Credit Focus Yield Fund | 0.85 | % | N/A | N/A | 0.60 | % | ||||||||||
Any reimbursements or fee waivers made by the Advisor to a Fund are subject to repayment by the Fund, to the extent that the Fund is able to make the repayment within its Expense Cap Agreement. Under the Expense Cap Agreement, any such repayment must be made before the end of the third full fiscal year after the fiscal year in which the related reimbursement or waiver
134
Brandes Investment Trust
NOTES TO FINANCIAL STATEMENTS — (Unaudited) (continued)
occurred. For the period ended March 31, 2016, the Advisor waived expenses and/or reimbursed the Funds $0, $95,071, $85,914, $117,588, $394,163, $0, $91,302 and $63,792 for the International Fund, Global Fund, Global Income Fund, Global Opportunities Fund, Emerging Markets Fund, International Small Cap Fund, Core Plus Fund and Credit Focus Yield Fund, respectively. Repayment rights expire as follows:
Fund | Potential Recovery Expiring September 30, 2016 | Potential Recovery Expiring September 30, 2017 | Potential Recovery Expiring September 30, 2018 | |||||||||
International Fund | $ | 416,224 | $ | — | $ | — | ||||||
Global Fund | 255,029 | 243,183 | 244,583 | |||||||||
Global Income Fund | N/A | N/A | 174,992 | |||||||||
Global Opportunities Fund | N/A | N/A | 215,095 | |||||||||
Emerging Markets Fund | 334,348 | 390,817 | 728,917 | |||||||||
International Small Cap Fund | — | 12,122 | — | |||||||||
Core Plus Fund | 237,047 | 259,463 | 230,245 | |||||||||
Credit Focus Yield Fund | 198,558 | 170,772 | 170,112 | |||||||||
The Advisor did not recoup any fees previously waived or reimbursed for the Global Fund, Global Income Fund, Global Opportunities Fund, Emerging Markets Fund, Core Plus Fund and Credit Focus Yield Fund. For the period ended March 31, 2016, the Advisor recouped fees previously waived or reimbursed in the amounts of:
Fund | Class I | |||
International Fund | $ | 42,703 | ||
International Small Cap Fund | $ | 191,748 | ||
| B. | Administration Fee. U.S. Bancorp Fund Services, LLC (the “Administrator”) acts as administrator for the Funds. The Administrator prepares various federal and state regulatory filings; prepares reports and materials to be supplied to the Trustees; monitors the activities of the Funds’ custodian, transfer agent and accountant; coordinates the preparation and payment of Fund expenses; and reviews the Funds’ expense accruals. For these services, the Funds shall pay the administrator monthly, a fee accrued daily and based on average daily net assets. The Funds may also reimburse the Administrator for such out-of-pocket expenses as incurred by the Administrator in the performance of its duties. The amounts paid directly to the Administrator by the Funds for administrative services are included in the Administration fees in the Statement of Operations. |
| C. | Distribution and Servicing Fees. ALPS Distributors, LLC (the “Distributor”), a registered broker-dealer, acts as the Funds’ principal underwriter in a continuous public offering of the Funds’ shares. A portion of the Funds’ distribution fees is paid by the Advisor. |
135
Brandes Investment Trust
NOTES TO FINANCIAL STATEMENTS — (Unaudited) (continued)
The Trust has adopted a Distribution Plan (the “Plan”) pursuant to Rule 12b-1 under the Investment Company Act of 1940 for the Funds’ Class A and C shares. The Plan is designed to reimburse the Distributor or dealers for certain promotional and other sales related costs associated with sales of such Fund shares. Unreimbursed amounts may be carried forward and paid in a subsequent year, to the extent that total expenses under the Plan do not exceed 0.25% and 0.75% of the average daily net assets of each Fund’s Class A and C shares, respectively. During the period ended March 31, 2016, the Funds paid to the Distributor and each dealer a monthly fee at the annual rate of 0.25% of the average daily net assets of Class A shares and 0.75% of the average daily net assets of Class C shares beneficially owned by the Distributor’s and each dealer’s existing brokerage clients. The 12b-1 Agreement may be continued in effect from year to year if such continuance is approved annually by the Board of Trustees of the Trust, including the vote of a majority of the Independent Trustees. For the period ended March 31, 2016, the following Funds incurred expenses pursuant to the Plan:
Fund | Class A | Class C | ||||||
International Fund | $ | 17,205 | $ | 49,497 | ||||
Global Fund | 3,689 | 8,624 | ||||||
Global Income Fund | — | — | ||||||
Global Opportunities Fund | 402 | 109 | ||||||
Emerging Markets Fund | 355,861 | 67,276 | ||||||
International Small Cap Fund | 101,031 | 63,305 | ||||||
Core Plus Fund | 2,957 | N/A | ||||||
Credit Focus Yield Fund | 2,472 | N/A | ||||||
The Funds have adopted a Shareholder Service Plan for classes C and E, and have authorized sub-transfer agency fee payments for Class I, to pay to securities broker-dealers, retirement plan sponsors and administrators, banks and their affiliates, and other institutions and service professionals as shareholder servicing agent of the Funds, an annual fee for non-distribution sub-transfer agent and/or subaccounting services up to 0.25%, 0.25% and 0.05% of annual net assets attributable to Class C, Class E and Class I, respectively (the “Service Fees”). For the period ended March 31, 2016, the Funds incurred the following Service Fees:
Fund | Class C | Class E | Class I | |||||||||
International Fund | $ | 16,499 | $ | 1,421 | $ | 145,589 | ||||||
Global Fund | 2,875 | — | 10,994 | |||||||||
Global Income Fund | — | N/A | 157 | |||||||||
Global Opportunities Fund | 37 | N/A | 1,707 | |||||||||
Emerging Markets Fund | 22,426 | N/A | 167,748 | |||||||||
International Small Cap Fund | 21,102 | N/A | 236,760 | |||||||||
Core Plus Fund | N/A | 1,188 | 18,128 | |||||||||
Credit Focus Yield Fund | N/A | N/A | — | |||||||||
136
Brandes Investment Trust
NOTES TO FINANCIAL STATEMENTS — (Unaudited) (continued)
NOTE 4 – PURCHASES AND SALES OF SECURITIES
The cost of purchases and the proceeds from sales of securities, excluding short term investments, were as follows for the period ended March 31, 2016:
| U.S. Government | Other | |||||||||||||||
Fund | Purchases | Sales | Purchases | Sales | ||||||||||||
International Fund | $ | — | $ | — | $ | 75,615,675 | $ | 46,844,294 | ||||||||
Global Fund | $ | — | $ | — | $ | 4,813,355 | $ | 4,035,409 | ||||||||
Global Income Fund | $ | — | $ | — | $ | 72,062 | $ | 101,514 | ||||||||
Global Opportunities Fund | $ | — | $ | — | $ | 4,814,683 | $ | 839,059 | ||||||||
Emerging Markets Fund | $ | — | $ | — | $ | 75,042,793 | $ | 211,075,667 | ||||||||
International Small Cap Fund | $ | — | $ | — | $ | 234,771,667 | $ | 81,207,253 | ||||||||
Core Plus Fund | $ | 6,355,506 | $ | 12,804,033 | $ | 11,324,685 | $ | 1,448,328 | ||||||||
Credit Focus Yield Fund | $ | 859,509 | $ | 2,713,248 | $ | 2,884,073 | $ | 687,504 | ||||||||
NOTE 5 – CAPITAL STOCK TRANSACTIONS
Capital stock activity for each class of shares was as follows (shares and dollar amounts in thousands):
| International Fund | Global Fund | |||||||||||||||||||||||||||||||
| Period Ended 3/31/2016 | Year Ended 9/30/2015 | Period Ended 3/31/2016 | Year Ended 9/30/2015 | |||||||||||||||||||||||||||||
| Shares | Amount | Shares | Amount | Shares | Amount | Shares | Amount | |||||||||||||||||||||||||
Shares Sold | ||||||||||||||||||||||||||||||||
Class A | 194 | $ | 2,932 | 599 | $ | 10,044 | 157 | $ | 3,125 | 182 | $ | 4,338 | ||||||||||||||||||||
Class C | 295 | 4,478 | 677 | 11,360 | 22 | 459 | 86 | 2,070 | ||||||||||||||||||||||||
Class E | — | — | 199 | 3,186 | — | — | — | — | ||||||||||||||||||||||||
Class I | 9,537 | 142,481 | 16,433 | 273,218 | 95 | 2,001 | 474 | 11,481 | ||||||||||||||||||||||||
Class R6 | — | * | — | * | N/A | N/A | N/A | N/A | N/A | N/A | ||||||||||||||||||||||
Issued on Reinvestment of Distributions | ||||||||||||||||||||||||||||||||
Class A | 6 | 94 | 15 | 251 | 6 | 136 | 7 | 157 | ||||||||||||||||||||||||
Class C | 4 | 49 | 9 | 144 | 7 | 153 | 5 | 111 | ||||||||||||||||||||||||
Class E | — | 6 | 2 | 29 | 1 | 12 | 1 | 16 | ||||||||||||||||||||||||
Class I | 309 | 4,696 | 649 | 10,520 | 137 | 2,971 | 157 | 3,757 | ||||||||||||||||||||||||
Class R6 | — | — | N/A | N/A | N/A | N/A | N/A | N/A | ||||||||||||||||||||||||
Shares Redeemed | ||||||||||||||||||||||||||||||||
Class A | (168 | ) | (2,515 | ) | (277 | ) | (4,555 | ) | (17 | ) | (350 | ) | (153 | ) | (3,689 | ) | ||||||||||||||||
Class C | (192 | ) | (2,871 | ) | (135 | ) | (2,177 | ) | (46 | ) | (936 | ) | (24 | ) | (555 | ) | ||||||||||||||||
Class E | (70 | ) | (1,039 | ) | (831 | ) | (13,518 | ) | (8 | ) | (174 | ) | (1 | ) | (22 | ) | ||||||||||||||||
Class I | (8,091 | ) | (118,879 | ) | (10,827 | ) | (175,427 | ) | (339 | ) | (7,039 | ) | (330 | ) | (7,858 | ) | ||||||||||||||||
Class R6 | — | — | N/A | N/A | N/A | N/A | N/A | N/A | ||||||||||||||||||||||||
|
|
|
|
|
|
|
|
|
|
|
|
|
|
|
| |||||||||||||||||
Net Increase Resulting from Fund Share Transactions | 1,824 | $ | 29,432 | 6,513 | $ | 113,075 | 15 | $ | 358 | 404 | $ | 9,806 | ||||||||||||||||||||
|
|
|
|
|
|
|
|
|
|
|
|
|
|
|
| |||||||||||||||||
| * | Value calculated is less than 500 shares/dollars. |
137
Brandes Investment Trust
NOTES TO FINANCIAL STATEMENTS — (Unaudited) (continued)
| Global Income Fund | Global Opportunities Fund | |||||||||||||||||||||||||||||||
| Period Ended 3/31/2016 | Period Ended 9/30/2015 | Period Ended 3/31/2016 | Period Ended 9/30/2015 | |||||||||||||||||||||||||||||
| Shares | Amount | Shares | Amount | Shares | Amount | Shares | Amount | |||||||||||||||||||||||||
Shares Sold | ||||||||||||||||||||||||||||||||
Class A | — | $ | — | — | $ | — | 11 | $ | 111 | 31 | $ | 324 | ||||||||||||||||||||
Class C | — | — | — | — | 1 | 5 | 3 | 26 | ||||||||||||||||||||||||
Class E | N/A | N/A | N/A | N/A | N/A | N/A | N/A | N/A | ||||||||||||||||||||||||
Class I | — | — | 62 | 623 | 544 | 5,230 | 322 | 3,315 | ||||||||||||||||||||||||
Issued on Reinvestment of Distributions | ||||||||||||||||||||||||||||||||
Class A | — | — | — | — | 1 | 6 | — | 2 | ||||||||||||||||||||||||
Class C | — | — | — | — | — | — | — | — | ||||||||||||||||||||||||
Class E | N/A | N/A | N/A | N/A | N/A | N/A | N/A | N/A | ||||||||||||||||||||||||
Class I | 2 | 19 | 1 | 12 | 6 | 59 | 3 | 25 | ||||||||||||||||||||||||
Shares Redeemed | ||||||||||||||||||||||||||||||||
Class A | — | — | — | — | (18 | ) | (154 | ) | — | — | ||||||||||||||||||||||
Class C | — | — | — | — | — | — | — | — | ||||||||||||||||||||||||
Class E | N/A | N/A | N/A | N/A | N/A | N/A | N/A | N/A | ||||||||||||||||||||||||
Class I | — | — | — | — | (124 | ) | (1,081 | ) | — | — | ||||||||||||||||||||||
|
|
|
|
|
|
|
|
|
|
|
|
|
|
|
| |||||||||||||||||
Net Increase Resulting from Fund Share Transactions | 2 | $ | 19 | 63 | $ | 635 | 421 | $ | 4,176 | 359 | $ | 3,692 | ||||||||||||||||||||
|
|
|
|
|
|
|
|
|
|
|
|
|
|
|
| |||||||||||||||||
| Emerging Markets Fund | International Small Cap Fund | |||||||||||||||||||||||||||||||
| Period Ended 3/31/2016 | Year Ended 9/30/2015 | Period Ended 3/31/2016 | Year Ended 9/30/2015 | |||||||||||||||||||||||||||||
| Shares | Amount | Shares | Amount | Shares | Amount | Shares | Amount | |||||||||||||||||||||||||
Shares Sold | ||||||||||||||||||||||||||||||||
Class A | 4,416 | $ | 28,538 | 33,787 | $ | 270,303 | 2,630 | $ | 32,772 | 4,545 | $ | 58,826 | ||||||||||||||||||||
Class C | 363 | 2,313 | 1,128 | 8,986 | 300 | 3,771 | 481 | 6,211 | ||||||||||||||||||||||||
Class E | N/A | N/A | N/A | N/A | N/A | N/A | N/A | N/A | ||||||||||||||||||||||||
Class I | 38,094 | 245,889 | 88,423 | 692,825 | 22,589 | 281,207 | 47,012 | 611,952 | ||||||||||||||||||||||||
Issued on Reinvestment of Distributions | ||||||||||||||||||||||||||||||||
Class A | 75 | 512 | 1,210 | 9,685 | 188 | 2,416 | 152 | 1,901 | ||||||||||||||||||||||||
Class C | — | — | 106 | 863 | 39 | 497 | 44 | 539 | ||||||||||||||||||||||||
Class E | N/A | N/A | N/A | N/A | N/A | N/A | N/A | N/A | ||||||||||||||||||||||||
Class I | 298 | 2,047 | 4,682 | 37,933 | 2,236 | 28,869 | 2,134 | 26,765 | ||||||||||||||||||||||||
Shares Redeemed | ||||||||||||||||||||||||||||||||
Class A | (11,127 | ) | (71,858 | ) | (15,192 | ) | (121,508 | ) | (3,195 | ) | (38,806 | ) | (2,109 | ) | (26,963 | ) | ||||||||||||||||
Class C | (639 | ) | (4,107 | ) | (910 | ) | (7,031 | ) | (134 | ) | (1,667 | ) | (213 | ) | (2,659 | ) | ||||||||||||||||
Class E | N/A | N/A | N/A | N/A | N/A | N/A | N/A | N/A | ||||||||||||||||||||||||
Class I | (54,775 | ) | (357,009 | ) | (95,812 | ) | (747,253 | ) | (10,351 | ) | (130,693 | ) | (21,388 | ) | (272,971 | ) | ||||||||||||||||
|
|
|
|
|
|
|
|
|
|
|
|
|
|
|
| |||||||||||||||||
Net Increase/Decrease Resulting from Fund Share Transactions | (23,295 | ) | $ | (153,675 | ) | 17,422 | $ | 144,803 | 14,302 | $ | 178,366 | 30,658 | $ | 403,601 | ||||||||||||||||||
|
|
|
|
|
|
|
|
|
|
|
|
|
|
|
| |||||||||||||||||
138
Brandes Investment Trust
NOTES TO FINANCIAL STATEMENTS — (Unaudited) (continued)
| Core Plus Fund | Credit Focus Yield Fund | |||||||||||||||||||||||||||||||
| Period Ended 3/31/2016 | Year Ended 9/30/2015 | Period Ended 3/31/2016 | Year Ended 9/30/2015 | |||||||||||||||||||||||||||||
| Shares | Amount | Shares | Amount | Shares | Amount | Shares | Amount | |||||||||||||||||||||||||
Shares Sold | ||||||||||||||||||||||||||||||||
Class A | 100 | $ | 895 | 350 | $ | 3,236 | 6 | $ | 55 | 15 | $ | 154 | ||||||||||||||||||||
Class E | — | — | 29 | 269 | N/A | N/A | N/A | N/A | ||||||||||||||||||||||||
Class I | 1,479 | 13,409 | 4,235 | 39,340 | 4 | 38 | 37 | 381 | ||||||||||||||||||||||||
Issued on Reinvestment of Distributions | ||||||||||||||||||||||||||||||||
Class A | 4 | 32 | 6 | 58 | 3 | 29 | 5 | 48 | ||||||||||||||||||||||||
Class E | 1 | 12 | 5 | 48 | N/A | N/A | N/A | N/A | ||||||||||||||||||||||||
Class I | 116 | 1,050 | 178 | 1,651 | 42 | 414 | 69 | 707 | ||||||||||||||||||||||||
Shares Redeemed | ||||||||||||||||||||||||||||||||
Class A | (42 | ) | (375 | ) | (350 | ) | (3,234 | ) | (17 | ) | (164 | ) | (7 | ) | (75 | ) | ||||||||||||||||
Class E | (169 | ) | (1,528 | ) | (38 | ) | (354 | ) | N/A | N/A | N/A | N/A | ||||||||||||||||||||
Class I | (1,204 | ) | (10,839 | ) | (1,235 | ) | (11,448 | ) | (23 | ) | (224 | ) | (25 | ) | (260 | ) | ||||||||||||||||
|
|
|
|
|
|
|
|
|
|
|
|
|
|
|
| |||||||||||||||||
Net Increase Resulting from Fund Share Transactions | 285 | $ | 2,656 | 3,180 | $ | 29,566 | 15 | $ | 148 | 94 | $ | 955 | ||||||||||||||||||||
|
|
|
|
|
|
|
|
|
|
|
|
|
|
|
| |||||||||||||||||
NOTE 6 – FEDERAL INCOME TAX MATTERS
As of September 30, 2015, the components of distributable earnings on a tax basis were as follows:
| International Fund | Global Fund | Global Income Fund | Global Opportunities Fund | |||||||||||||
Cost of investments for tax purposes | $ | 694,392,984 | $ | 51,608,508 | $ | 678,517 | $ | 3,797,401 | ||||||||
|
|
|
|
|
|
|
| |||||||||
Gross tax unrealized appreciation | 22,470,030 | 5,839,353 | 19,204 | 130,386 | ||||||||||||
Gross tax unrealized depreciation | (136,426,573 | ) | (6,913,747 | ) | (59,035 | ) | (560,428 | ) | ||||||||
|
|
|
|
|
|
|
| |||||||||
Net unrealized appreciation (depreciation) on investments and foreign currency | (113,956,543 | ) | (1,074,394 | ) | (39,831 | ) | (430,042 | ) | ||||||||
Distributable ordinary income | 1,437,916 | 629,257 | 9,750 | 79,838 | ||||||||||||
Distributable long-term capital gains | — | 2,069,637 | — | — | ||||||||||||
|
|
|
|
|
|
|
| |||||||||
Total distributable earnings | 1,437,916 | 2,698,894 | 9,750 | 79,838 | ||||||||||||
|
|
|
|
|
|
|
| |||||||||
Other accumulated gains/(losses) | (55,989,398 | ) | (21,623 | ) | (86 | ) | (92 | ) | ||||||||
|
|
|
|
|
|
|
| |||||||||
Total accumulated earnings | $ | (168,508,025 | ) | $ | 1,602,877 | $ | (30,167 | ) | $ | (350,296 | ) | |||||
|
|
|
|
|
|
|
| |||||||||
139
Brandes Investment Trust
NOTES TO FINANCIAL STATEMENTS — (Unaudited) (continued)
| Emerging Markets Fund | International Small Cap Fund | Core Plus Fund | Credit Focus Yield Fund | |||||||||||||
Cost of investments for tax purposes | $ | 1,521,174,619 | $ | 1,047,248,423 | $ | 75,201,664 | $ | 29,234,592 | ||||||||
|
|
|
|
|
|
|
| |||||||||
Gross tax unrealized appreciation | 27,046,530 | 56,704,416 | 1,918,323 | 949,085 | ||||||||||||
Gross tax unrealized depreciation | (536,026,549 | ) | (132,801,470 | ) | (1,237,865 | ) | (908,285 | ) | ||||||||
|
|
|
|
|
|
|
| |||||||||
Net unrealized appreciation (depreciation) on investments and foreign currency | (508,980,019 | ) | (76,097,054 | ) | 680,458 | 40,800 | ||||||||||
Distributable ordinary income | — | 17,791,674 | — | — | ||||||||||||
Distributable long-term capital gains | — | 6,126,546 | 32,749 | — | ||||||||||||
|
|
|
|
|
|
|
| |||||||||
Total distributable earnings | — | 23,918,220 | 32,749 | — | ||||||||||||
|
|
|
|
|
|
|
| |||||||||
Other accumulated gains/(losses) | (39,338,051 | ) | (69,412 | ) | 1 | (50,804 | ) | |||||||||
|
|
|
|
|
|
|
| |||||||||
Total accumulated earnings | $ | (548,318,070 | ) | $ | (52,248,246 | ) | $ | 713,208 | $ | (10,004 | ) | |||||
|
|
|
|
|
|
|
| |||||||||
The differences between book and tax basis distributable earnings are primarily related to foreign currency adjustments and the differences in classification of paydown gains and losses for tax purposes compared to book purposes. These differences are temporary.
The tax composition of dividends for the periods ended September 30, 2015 and September 30, 2014 for the Funds, were as follows:
| Ordinary Income | Long Term Capital Gains | |||||||||||||||
Fund | 2015 | 2014 | 2015 | 2014 | ||||||||||||
International Fund | $ | 11,487,048 | $ | 10,891,932 | $ | — | $ | — | ||||||||
Global Fund | $ | 1,308,335 | $ | 1,036,532 | $ | 2,796,576 | $ | 1,113,245 | ||||||||
Global Income Fund | $ | 12,861 | N/A | $ | — | N/A | ||||||||||
Global Opportunities Fund | $ | 27,604 | N/A | $ | — | N/A | ||||||||||
Emerging Markets Fund | $ | 41,702,727 | $ | 14,025,400 | $ | 16,361,353 | $ | 9,555,433 | ||||||||
International Small Cap Fund | $ | 18,479,717 | $ | 9,125,302 | $ | 11,897,030 | $ | 5,701,907 | ||||||||
Core Plus Fund | $ | 1,476,137 | $ | 1,057,596 | $ | 308,761 | $ | 49,808 | ||||||||
Credit Focus Yield Fund | $ | 757,646 | $ | 677,304 | $ | 16,688 | $ | 35,214 | ||||||||
At September 30, 2015 the Funds had capital losses expiring and capital loss carryforwards utilized as indicated below:
Fund | 2018 | Indefinite | Utilized | |||||||||
International Fund | $ | 29,067,216 | $ | 26,868,432 | $ | 56,792,472 | ||||||
Global Fund | — | — | — | |||||||||
Global Income Fund | — | — | — | |||||||||
Global Opportunities Fund | — | — | — | |||||||||
Emerging Markets Fund | — | $ | 82,520 | — | ||||||||
International Small Cap Fund | — | — | — | |||||||||
Core Plus Fund | — | — | — | |||||||||
Credit Focus Yield Fund | — | — | — | |||||||||
At September 30, 2015, the Emerging Markets Fund and the Credit Focus Yield Fund had net Post-October realized capital losses of $35,587,944 and
140
Brandes Investment Trust
NOTES TO FINANCIAL STATEMENTS — (Unaudited) (continued)
$42,804, respectively, and late year ordinary losses of $3,496,548 and $0, respectively, from transactions between November 1, 2014 and September 30, 2015.
Reclassification of Capital Accounts. Accounting principles generally accepted in the United States of America require that certain components of net assets be reclassified between financial and tax reporting. These reclassifications have no effect on net assets or net asset value per share. For the periods ended September 30, 2015, the International Fund decreased undistributed net investment income/loss by $339,607 and increased accumulated net realized gain/loss by $339,607. The Global Fund decreased undistributed net investment income/loss by $6,527 and increased accumulated net realized gain/loss by $6,527. The Global Income Fund decreased undistributed net investment income/loss by $519, decreased paid in capital by $363 and increased accumulated net realized gain/loss by $882. The Global Opportunities Fund increased undistributed net investment income/loss by $2,441, decreased paid in capital by $363 and decreased accumulated net realized gain/loss by $2,078. The Emerging Markets Fund increased undistributed net investment income/loss by $14,709 and decreased accumulated net realized gain/loss by $14,709. The International Small Cap Fund increased undistributed net investment income/loss by $12,931,899 and decreased accumulated net realized gain/loss by $12,931,899. The Core Plus Fund increased undistributed net investment income/loss by $24,140 and decreased accumulated net realized gain/loss by $24,140. The Credit Focus Yield Fund increased undistributed net investment income/loss by $9,516 and decreased accumulated net realized gain/loss by $9,516. The permanent book and tax differences are primarily due to reclassification of foreign currency transactions, passive foreign investment companies (PFICs) and paydown gains and losses.
NOTE 7 – OFFERING PRICE PER SHARE
The public offering price for Class A shares is the net asset value per share plus a sales charge, which varies in accordance with the amount of the purchase up to a maximum of 5.75% for the International, Global, Global Income, Global Opportunities, Emerging Markets and International Small Cap Funds, and 3.75% for the Core Plus and Credit Focus Yield Funds. A contingent deferred sales charge (“CDSC”) of 1.00% will be deducted with respect to Class A Shares purchased without a sales load and redeemed within 12 months of purchase, unless waived, as discussed in the Prospectus. Any applicable CDSC will be 1.00% of the lesser of the original purchase price or the redemption value of the Class A Shares redeemed. Class C Shares include a 1.00% CDSC paid by redeeming shareholders within 12 months of purchase. As a result the redemption price may differ from the net asset value per share. The public offering prices for Class E and I shares are the respective net asset values. Sales charges are not an expense of the Funds and are not reflected in the financial statements of the Funds.
141
Brandes Investment Trust
NOTES TO FINANCIAL STATEMENTS — (Unaudited) (continued)
NOTE 8 – TRANSACTIONS WITH AFFILIATES
The following issuers were affiliated with the International Small Cap Fund as defined in Section (2)(a)(3) of the 1940 Act, as the International Small Cap Fund held 5% or more of the outstanding voting securities of the issuers during the period October 1, 2015 through March 31, 2016:
| Issuer Name | Share Balance At October 1, 2015 | Additions | Reductions | Share Balance At March 31, 2016 | Dividend Income | Value At March 31, 2016 | ||||||||||||||||||
De La Rue Plc | 2,846,805 | 2,247,468 | — | 5,094,273 | $ | 440,759 | $ | 32,661,017 | ||||||||||||||||
Dorel Industries, Inc. | 1,126,790 | 372,393 | — | 1,499,183 | 792,106 | 33,590,934 | ||||||||||||||||||
Micronas Semiconductor Holding AG(1) | 1,895,559 | — | 1,895,559 | — | — | — | ||||||||||||||||||
Samchully Co. Ltd. | 208,685 | — | — | 208,685 | 446,061 | 19,171,553 | ||||||||||||||||||
|
|
|
| |||||||||||||||||||||
| $ | 1,678,926 | $ | 85,423,504 | |||||||||||||||||||||
|
|
|
| |||||||||||||||||||||
| (1) | Issuer was not an affiliate as of March 31, 2016. |
NOTE 9 – OWNERSHIP BY AFFILIATED PARTIES
As of March 31, 2016, the Advisor, Trustees or affiliates of the Advisor beneficially owned more than 5% of shares of the Funds as follows:
| International Fund | ||||||||
Class R6 | ||||||||
Shares | 7 | |||||||
% of Total Outstanding Shares | 100% | |||||||
| Global Fund | ||||||||
Class I | ||||||||
Shares | 1,042,339 | |||||||
% of Total Outstanding Shares | 52.52% | |||||||
| Global Income Fund | Global Opportunities Fund | |||||||
Class A | Class C | Class I | Class I | |||||
Shares | 10 | 10 | 64,746 | 224,963 | ||||
% of Total Outstanding Shares | 100% | 100% | 100% | 29.99% | ||||
| Core Plus Fund | Credit Focus Yield Fund | |||||||
Class I | Class I | |||||||
Shares | 1,339,638 | 2,610,948 | ||||||
% of Total Outstanding Shares | 16.33% | 95.18% | ||||||
NOTE 10 – SUBSEQUENT EVENTS
In preparing these financial statements, the Trust has evaluated events and transactions for potential recognition or disclosure through the date the financial statements were available to be issued. The Trust has concluded that there are no subsequent events to note.
142
Brandes Investment Trust
ADDITIONAL INFORMATION — (Unaudited)
BOARD CONSIDERATION AND CONTINUATION OF INVESTMENT ADVISORY AGREEMENT — EXISTING FUNDS
In November 2015, the Board of Trustees of the Trust, including the independent Trustees, unanimously approved renewal of the Investment Advisory Agreement (the “Agreement”) between the Trust and Brandes Investment Partners, L.P. (the “Advisor”) for an additional one-year term with respect to the Brandes International Equity Fund (the “International Fund”), the Brandes Global Equity Fund (the “Global Fund”), the Brandes Emerging Markets Value Fund (the “Emerging Markets Fund”), the Brandes International Small Cap Fund (the “Small Cap Fund”), the Brandes Core Plus Fixed Income Fund (the “Core Plus Fund”) and the Brandes Credit Focus Yield Fund (the “Credit Focus Fund”). Each of the International Fund, Global Fund, Emerging Markets Fund, Small Cap Fund, Core Plus Fund and Credit Focus Fund is referred to below as a “Fund” and they are collectively referred to below as the “Funds.”
Information Reviewed
During the course of each year, Board members review a wide variety of materials relating to the nature, extent and quality of the services provided by the Advisor to the Funds, including reports on each Fund’s investment results, portfolio composition, portfolio trading practices, and other matters. In addition, in connection with its annual review of the Agreement with respect to the Funds, the Board requested and reviewed supplementary information that included materials regarding the Funds’ investment results, advisory fees and expense comparisons for peer groups and categories of similar funds identified by Morningstar Associates (“Morningstar”); financial and profitability information regarding the Advisor; descriptions of various functions performed by the Advisor such as compliance monitoring and portfolio trading practices; and information about the personnel providing investment management and administrative services to the Funds.
In connection with its reviews, the Board received assistance and advice regarding legal and industry standards from counsel to the Trust and the independent Trustees. The independent Trustees discussed the approval of the Agreement with respect to each Fund with representatives of the Advisor at two Board meetings and in private sessions with counsel at which no representatives of the Advisor were present. In deciding to recommend approval of the Agreement with respect to each Fund, the Board and the independent Trustees did not identify any single or particular piece of information that, in isolation, was the controlling factor, and each Trustee did not necessarily attribute the same weight to each factor. This summary describes the most important, but not all, of the factors considered by the Board and the independent Trustees.
143
Brandes Investment Trust
ADDITIONAL INFORMATION — (Unaudited) (continued)
Nature, Extent and Quality of Services
With respect to the nature, extent and quality of services provided by the Advisor to the Funds, the Trustees reviewed among other things the quality and depth of the Advisor’s investment management staff, its regulatory compliance procedures, the day-to-day administrative services provided by the Advisor to the Funds, and the investment results of the Funds.
With respect to each Fund’s investment results, the Trustees reviewed detailed information regarding a peer group of similarly managed funds selected by Morningstar Associates, all of the funds in the larger Morningstar category of funds managed with the same general style, and the Fund’s benchmark indices. The Trustees also discussed with representatives of Morningstar the principles used in determining the Funds’ peer groups and categories, and differences in those groups from those presented by Morningstar in connection with the Trustees’ 2014 review of the Agreement. In addition, they reviewed the results of certain Funds considered by the Advisor to be the most direct competitors to the Funds in the Funds’ marketing channels.
The independent Trustees noted that the investment results of the I Class shares of all of the Funds were in the first or second quartiles of their respective peer groups for most of the one-year, three-year, five-year and ten-year periods ended September 30, 2015. The Emerging Markets Fund’s investment results were the highest of the funds in its performance peer group for the ten-year period and considerably in excess of its benchmark index for the period, were in the third quartile of the funds in its peer group for the five-year period and close to its benchmark index for that period, and were in the bottom quartile of its peer group and below its benchmark index for the one-year and three-year periods. The independent Trustees noted the Advisor’s fundamental commitment to the Graham and Dodd value strategy of investment management and that the Advisor has had little style drift compared with other value managers; considered that it is not unusual for the performance of funds managed with the long-term Graham and Dodd value strategy to fall below the performance of measurement indices for some periods, and that the investment returns from value stocks were out of favor in the markets for a number of years during the ten-year periods (an unprecedentedly long period since 1977); and further noted that the Funds investment approach is fully described in its prospectus and the Funds shareholders likely were willing to accept the long-term outlook associated with the Advisor’s approach. The Credit Focus Fund’s investment results were in the second quartile of the funds in its peer group for the five-year period and in excess of its benchmark index for the period, were in the bottom quartile of the funds in its peer group for the ten-year period but close to its benchmark index for that period, and were in the bottom quartile of the funds in its peer group for the one-year and three-year periods and below its benchmark index for those periods. The
144
Brandes Investment Trust
ADDITIONAL INFORMATION — (Unaudited) (continued)
Board noted the Advisor’s view that the Fund’s defensive positioning detracted from its relative one-year and three-year results. They also noted that the investment results of the I Class shares of all of the Funds were close to or above those of their respective benchmark indices for most periods except as indicated above.
Based on these discussions and reviews, the Trustees determined that under all the circumstances the investment results of the Funds were satisfactory.
Advisory Fees, Total Expenses, Profitability and Ancillary Benefits
With respect to advisory fees and total expenses of the Funds, the independent Trustees noted that:
| • | The management fees for all of the Funds other than the Credit Focus Fund were below the median fees in their respective Morningstar peer groups. The total expenses for all of the Funds other than the Credit Focus Fund, after waivers by the Advisor of expenses above stated expense caps, were at or below the median expenses of the funds in their respective Morningstar peer groups. However, the Advisor indicated that it would be increasing its waiver of investment advisory fees for the Credit Focus Fund, effective February 1, 2016, so that the Fund’s total expenses after waivers would be slightly below the median expenses of the funds in its Morningstar peer group. The independent Trustees also noted that the Advisor continues to waive any expenses over stated expense caps for the Funds. |
| • | Although the Advisor’s management fee is higher for the Funds than for its similar institutional separate accounts and, in the case of the International Fund, for other mutual funds to which the Advisor provides sub-advisory services, the Trustees noted information provided by the Advisor regarding the additional responsibilities and expenses that the Advisor incurs in sponsoring and operating the Funds. |
| • | The independent Trustees noted that although the Advisor’s fees for the Funds other than the International Fund and the Emerging Markets Fund do not have breakpoints as those Funds’ assets increase, the Advisor believes that it is premature to discuss economies of scale when it is subsidizing the Funds’ expenses. The independent Trustees also noted that the Advisor had agreed to review the nature and extent of any economies of scale that it may realize as the Funds’ assets increase in the future and how such economies would be shared with the Funds’ shareholders. |
In addition, the independent Trustees reviewed an analysis of the profitability to the Advisor of its relationship with the Funds and information regarding the Advisor’s financial capability to continue to provide services to the Funds in the future. They also reviewed the methods used by the Advisor to evaluate and compensate its professional investment personnel. Finally, they considered
145
Brandes Investment Trust
ADDITIONAL INFORMATION — (Unaudited) (continued)
ancillary benefits to the Advisor as a result of its relationships with the Funds. They noted that these were primarily related to the benefit of proprietary and third-party research provided by broker-dealers executing portfolio transactions on behalf of the Funds.
Conclusions
Based on their review, including consideration of each of the factors referred to above, the Board and the independent Trustees concluded that the Agreement is fair and reasonable to the Funds and their respective shareholders, that each of the factors discussed above supported renewal of the Agreement with respect to each of the Funds, and that renewal of the Agreement was in the best interests of each Fund and its shareholders.
PROXY VOTING PROCEDURES
The Advisor votes proxies relating to the Funds’ portfolio securities in accordance with procedures adopted by the Advisor. You may obtain a description of these procedures, free of charge, by calling toll-free 1-800-331-2979. This information is also available through the Securities and Exchange Commission’s website at http://www.sec.gov.
Information regarding how the Trust voted proxies relating to portfolio securities during the most recent 12-month period ended June 30 is available without charge, upon request, by calling 1-800-331-2979. This information is also available through the Securities and Exchange Commission’s website at http://www.sec.gov.
FORM N-Q DISCLOSURE
The Trust files the Fund’s complete schedule of portfolio holdings with the Securities and Exchange Commission for the first and third quarters of each fiscal year on Form N-Q. The Trust’s Form N-Q filings are available on the Securities and Exchange Commission’s website at http://www.sec.gov. The Trust’s Form N-Q filings may be reviewed and copied at the Commission’s Public Reference Room in Washington, D.C., and information on the operation of the Public Reference Room may be obtained by calling 1-800-SEC-0330. Information regarding the Trust’s Form N-Q filings is also available, without charge, by calling toll-free, 1-800-331-2979.
146
Brandes Investment Trust
TRUSTEES AND OFFICERS INFORMATION — (Unaudited)
The Board of Trustees is responsible for the overall management of the Trust’s business. The Board approves all significant agreements between the Trust and persons or companies furnishing services to the Trust, including the Trust’s agreements with the Advisor, Administrator, Custodian, Distributor and Transfer Agent. The Board of Trustees delegates the day-to-day operations of the Trust to its officers, subject to the Fund’s investment objective and policies and to general supervision by the Board. The Trust’s Statement of Additional Information includes additional information about the Trustees and is available, without charge, by calling 1-800-331-2979 or visiting www.brandes.com.
The Trustees and officers of the Trust, their business addresses and principal occupations during the past five years are:
Name, Address | Position(s) | Term of | Principal | Number | Other Trusteeships | |||||
Independent Trustees(2) | ||||||||||
J. Michael Gaffney, CFA 11988 El Camino Real, Suite 600 San Diego, CA 92130 (Age 74) | Trustee | Since June 2004 | Retired. Independent Consultant, NATIXIS Global Asset Management, North America from 2004 to 2011. | 9 | None | |||||
Jean E. Carter 11988 El Camino Real, Suite 600 San Diego, CA 92130 (Age 58) | Trustee and Chairman | Since April 2008 | Retired since 2005. | 9 | Bridge Builder Trust | |||||
Robert M. Fitzgerald, CPA (inactive) 11988 El Camino Real, Suite 600 San Diego, CA 92130 (Age 64) | Trustee | Since April 2008 | Retired. | 9 | Hotchkis and Wiley Mutual Funds | |||||
Craig Wainscott, CFA 11988 El Camino Real, Suite 600 San Diego, CA 92130 (Age 54) | Trustee | Since February 2012 | Partner with The Paradigm Project and advisor to early-stage companies. | 9 | None | |||||
147
Brandes Investment Trust
TRUSTEES AND OFFICERS INFORMATION — (Unaudited) (continued)
Name, Address | Position(s) | Term of | Principal | Number | Other Trusteeships | |||||
“Interested” Trustees(3) | ||||||||||
Oliver Murray 11988 El Camino Real, Suite 600 San Diego, CA 92130 (Age 53) | Trustee | Since February 2012 | Chief Executive Officer, Brandes Investment Partners & Co.; Managing Director – PMCS of Brandes Investment Partners, L.P., the investment advisor to the Funds (the “Advisor”). | 9 | None | |||||
Jeff Busby, CFA 11988 El Camino Real, Suite 600 San Diego, CA 92130 (Age 55) | Trustee and President | Since July 2006 | Executive Director of the Advisor. | 9 | None | |||||
Officers of the Trust | ||||||||||
Thomas M. Quinlan 11988 El Camino Real, Suite 600 San Diego, CA 92130 (Age 45) | Secretary | Since June 2003 | Associate General Counsel of the Advisor. | N/A | N/A | |||||
Gary Iwamura, CPA 11988 El Camino Real, Suite 600 San Diego, CA 92130 (Age 59) | Treasurer | Since September 1997 | Finance Director of the Advisor. | N/A | N/A | |||||
Roberta Loubier 11988 El Camino Real, Suite 600 San Diego, CA 92130 (Age 44) | Chief Compliance Officer | Since September 2015 | Global Head of Compliance, Brandes Investment Partners, L.P. | N/A | N/A | |||||
| (1) | Trustees and officers of the Fund serve until their resignation, removal or retirement. |
| (2) | Not “interested persons” of the Trust as defined in the 1940 Act. |
| (3) | “Interested persons” of the Trust as defined in the 1940 Act by virtue of their positions with the Advisor. |
148
Brandes Investment Trust
PRIVACY NOTICE
Brandes Investment Partners, L.P. and the Brandes Investment Trust collect nonpublic information about you from the following sources:
| • | Information we receive about you on applications or other forms; |
| • | Information you give us orally; and |
| • | Information about your transactions with us or others. |
We do not disclose any nonpublic personal information about our customers or former customers without the customer’s authorization, except as permitted by law or in response to inquires from governmental authorities.
We restrict access to your personal and account information to those personnel who need to know that information to provide products and services to you. We also may disclose that information to unaffiliated third parties (such as to brokers or custodians) only as permitted by law and only as needed for us to provide agreed services to you. We maintain physical, electronic and procedural safeguards to guard your nonpublic personal information.
149


| 2 | ||||
| 9 | ||||
| 13 | ||||
| 18 | ||||
| 19 | ||||
| 20 | ||||
| 21 | ||||
| 22 | ||||
| 32 | ||||
| 35 |
1
Brandes Separately Managed Account Reserve Trust
Dear Fellow Investor,
Amid an assortment of concerns that influenced the U.S. fixed-income market in the six months ended March 31, 2016, three main themes stood out: 1) implications and breadth of the Federal Reserve’s interest-rate policy; 2) heightened volatility amid rising risk aversion; and 3) scarce market liquidity.
After seven years of a near-zero interest-rate policy, the Fed raised the federal funds rate by 0.25% in December. The increase was the first in nine years, and signaled the beginning of what the Fed hopes to be a normalization of policy after years of emergency and historically unprecedented measures. Fed guidance, however, suggested that the rate hike, which marked the sixth tightening cycle since 1979, will be slow and gradual. The markets appeared to have priced in two rate hikes over the course of 2016.
Investors also grappled with the specter of a potential U.S. recession, slowing growth in China and falling commodity prices. Central banks around the world were out in force attempting to stimulate an anemic global economy. The Bank of China lowered its reserve requirement ratio to free up capital for lending. The Bank of Japan and European Central Bank (ECB) lowered interest rates to negative territory. The ECB also announced it would begin to purchase nonbank investment-grade corporate bonds as part of its monthly asset purchase plan. Meanwhile, the Fed took a pass at raising rates twice, at both its January and March meetings.
In this environment, we saw credit spreads start to move wider in late 2015 following a relatively long stretch of benign volatility. This trend accelerated in early 2016.
Another big story was the liquidity squeeze in the bond market, as demonstrated by the sharp selloff in high-yield securities in the fourth quarter of 2015, when investors sold bonds with the lowest credit quality. The weakness in the lowest-quality tier of the market eventually spread to the broader high-yield and investment-grade sectors. Sharp high-yield fund outflows combined with poor liquidity resulted in many large gap-downs in bond pricing. The redemption freeze at two distressed credit funds toward yearend 2015 brought out comparisons to Bear Stearns closing two mortgage-backed security (MBS) funds in 2007.1
The risk-off sentiment for the most part of the six-month period permeated the fixed-income markets and propelled investors to seek safety in U.S. Treasury securities, sending interest rates toward multi-year lows.
The Fund
The Brandes Separately Managed Account Reserve Trust (SMART) (Class I Shares) gained 0.16% during the six months ended March 31, 2016.
| 1 | Bloomberg 12/15/15: Third Avenue, Stone Lion Capital Spark Memories of ’08: Analysis ‘Contagion’ is back on the worry list. |
2
Brandes Separately Managed Account Reserve Trust
The largest negative contributors were holdings in the energy sector. The largest individual detractor was our holding in Chesapeake Energy.
Chesapeake is the second-largest natural gas producer in North America. The company replaced its free-spending CEO, Aubrey McClendon, in June 2013 with an accomplished executive from Anadarko Petroleum, Doug Lawler. The new CEO has made it a priority to emphasize corporate discipline with an eye toward improving the company’s stretched balance sheet. The early results were positive with the company able to reduce debt, keep spending levels within budget and reduce headcount.
Oil and natural gas prices dropped sharply during the quarter due to an oversupplied market, the unseasonably warm start to the winter season and the continued global economic malaise. Additionally, oil and gas companies such as Chesapeake effectively have to mark their reserves to market (through PV-10 calculation; see explanation on page 4) based on current oil and natural gas prices. The drop in prices has resulted in a large re-calculation of the company’s asset value to below the value of its outstanding debt. Bond prices reacted swiftly to the new asset coverage.
After a significant drop in bond prices, Chesapeake commenced an exchange offer in an effort to bolster liquidity and reduce outstanding long-term debt. The company was able to place a new second-lien security through a tender offer for existing unsecured notes which resulted in a debt reduction of approximately $1.5 billion.
Chesapeake appears to have a visible liquidity runway until late 2017/early 2018 at current natural gas and oil prices. The company needs a recovery in energy prices or execution of some asset sales in the next two years to avoid becoming a likely bankruptcy candidate. The company has survived a number of near-collapses in the late 1990s, 2008 and 2012 in part due to creative financing and ability to execute asset sales. Prior asset sales have generally been above book value due in large part to the quality of the acreage positions, as Chesapeake has been involved in almost every U.S. major resource play. The company also has a large amount of “unproven reserves.” The market currently assigns a value of zero to this land based on current energy prices and an oversupplied market, but if we see an upward move in energy prices, this land could have meaningful value.
Industry capital expenditures (capex) were meaningfully lower in 2015 and Moody’s forecasts 2016 capex to be down an additional 20% to 25% in 20162 as a result of lower prices, which should eventually have an impact on the oversupply.
In summary, there is a wide range of outcomes for Chesapeake bonds. If there is no recovery in energy prices over the next two years, the company likely becomes a
| 2 | Oil and Gas Journal 1/4/16: Moody’s: Firms to see constrained spending, heightened risk in 2016 http://www.ogj.com/articles/2016/01/moody-s-firms-to-see-constrained-spending-heightened-risk-in-2016.html |
3
Brandes Separately Managed Account Reserve Trust
bankruptcy candidate and recoveries on unsecured bonds could be close to current market prices, in our view. A modest recovery in energy prices or a few well-executed asset sales should yield positive cash flow and bonds that mature at par. Based on likely supply cuts in 2016 and Chesapeake’s historically valuable and severable acreage holdings, we believe the risk/return tradeoff is now in the bondholder’s favor and we added to our position in Chesapeake in the period.
During the fourth quarter of 2015 and into the first quarter of 2016 we initiated positions in several companies in the energy sector, which in our view have meaningful coverage of their outstanding debt through their tangible assets. Essentially, we believe these companies have the balance sheet strength to weather a protracted downturn in energy prices.
Many of these bonds contributed to the Fund’s underperformance toward the end of 2015, as we were early, in retrospect, to initiate positions. However, the continued credit-spread widening in the early part of 2016 enabled us to build larger positions in what we view as strong, mispriced credits, such as ExxonMobil, British Petroleum and Occidental Petroleum.
Duration was set toward the lower end of our duration controlled band. This positioning modestly detracted from relative performance as interest rates not only remained stubbornly low, but fell further to multi-year lows during the period.
The Fund received positive contributions from holdings in electric utilities and credits in the building products and paper industries.
During the period, we took advantage of the widening of credit spreads to increase weightings in a number of securities at what we considered attractive prices and yields. As mentioned earlier, we added to a few positions in the energy sector. In addition, we added to our existing holdings in ADT Corp. and Tesco Plc.
We took advantage of the relative weakness of agency mortgage backed securities (MBS) in early 2016 to increase our allocation. We have been underweight agency MBS for the past several years due to what we believe was a large supply-demand imbalance in this sector, with the Fed purchasing an enormous amount of supply either through outright purchases or, more recently, continued reinvestment coupons and principal repayments. The agency MBS sector lagged the performance of virtually every taxable fixed-income sector during the first quarter. While we added agency MBS to the fund during the quarter, we remain underweight relative to the benchmark.
We also initiated positions in homebuilders Toll Brothers Corp (4.875% coupon rate, maturing November 2025 and rated Ba1/BB+) and PulteGroup Inc. (5.50% coupon rate, maturing March 2026 and rated Ba1/BB+). We had owned bonds from Toll Brothers and Pulte in the past. In fact, we first purchased bonds from both Toll Brothers and Pulte in the 2007/2008 period. We held our Toll Brothers
4
Brandes Separately Managed Account Reserve Trust
bond until it matured in November 2015, while our Pulte security purchased during that time frame is set to mature in early May.
Finally, we purchased Sprint Communications (9.00% coupon rate, maturing November 2018 and rated B1/BB). This particular issue from Sprint is a senior unsecured note, but is guaranteed by all of its subsidiaries; it is one of two such notes in the company’s debt complex and is the nearest maturity guaranteed note. Therefore, it is effectively structurally senior to other Sprint senior unsecured notes. Sprint is also 80% owned by Softbank, a Japanese telecommunications company. Sprint is one of the largest issuers in the high-yield market. The company’s bond price declined in the quarter, and based on our observations during the latest bout of market illiquidity and resulting volatility, many investors sell what they can rather than what they want. We believe this $3-billion issue of Sprint provides a good example of the current trading environment. In our view, this security has good asset coverage based on Sprint’s wireless spectrum holdings and good support from Softbank, which is a higher-rated credit. Therefore, we believe that we were able to establish a position in Sprint at an attractive yield relative to the underlying credit fundamentals.
Outlook
On balance, we are positioned defensively, but have started to find more opportunities that we believe can deliver long-term value. We maintain a strong preference for asset-rich credits.
For the remainder of 2016, we would not be surprised to see the market operate in fits and starts. Each bout of volatility has appeared to bring an outsized reaction relative to past behavior. We believe a good deal of this is attributable to the market’s liquidity challenges. In this environment, the Brandes fixed-income team will continue to adhere to a measured and deliberate approach to security selection, while selectively looking to add mispriced yield. We are positioned with ample dry powder to pursue potential mispricing opportunities, ready to act if company fundamentals disengage from their market price.
We believe that a careful path remains the most prudent approach for protecting capital and adding value to client portfolios over the coming years.
Sincerely yours,
The Brandes Fixed-Income Investment Committee
Brandes Investment Trust
Past performance does not guarantee future results.
Because the values of the Fund’s investments will fluctuate with market conditions, so will the value of your investment in the Fund. You could lose money on your investment in the Fund, or the Fund could underperform other investments. As with most fixed income funds, the income on and
5
Brandes Separately Managed Account Reserve Trust
value of your shares in the Fund will fluctuate along with interest rates. When interest rates rise, the market prices of the debt securities the Fund owns usually decline. When interest rates fall, the prices of these securities usually increase. Generally, the longer the Fund’s average portfolio maturity and the lower the average quality of its portfolio, the greater the price fluctuation. The price of any security owned by the Fund may also fall in response to events affecting the issuer of the security, such as its ability to continue to make principal and interest payments or its credit rating. Below investment grade debt securities are speculative and involve a greater risk of default and price change due to changes in the issuer’s creditworthiness. The market prices of these debt securities may fluctuate more than the market prices of investment grade debt securities and may decline significantly in periods of general economic difficulty.
Investing in foreign securities poses additional risks. The performance of foreign securities can be adversely affected by the different political, regulatory and economic environments and other overall economic conditions in the countries where the Fund invests. Emerging country markets involve greater risk and volatility than more developed markets. Some emerging markets countries may have fixed or managed currencies that are not free-floating against the U.S. dollar. Certain of these currencies may experience substantial fluctuations or steady devaluation relative to the U.S. dollar. Mortgage-related securities are subject to certain additional risks. Rising interest rates tend to extend the duration of mortgage-related securities, making them more sensitive to changes in interest rates. As a result, when holding mortgage-related securities in a period of rising interest rates, the Fund may exhibit additional volatility. In addition, mortgage-related securities are subject to prepayment risk. When interest rates decline, borrowers may pay off their mortgages sooner than expected. This can reduce the returns of the Fund because it will have to reinvest that money at the lower prevailing interest rates.
Asset coverage: A company’s ability to cover debt obligations with its assets after all liabilities have been satisfied. Source: Investopedia.com
Dry powder: Securities considered to be dry powder could be Treasuries, or other fixed income investments, and can be liquidated on short notice, in order to provide emergency operational funding or allow an investor to purchase assets.
Duration: The weighted maturity of a fixed-income investment’s cash flows, used in the estimation of the price sensitivity of fixed-income securities for a given change in interest rates.
Federal funds rate: The interest rate at which a depository institution lends funds maintained at the Federal Reserve to another depository institution overnight.
6
Brandes Separately Managed Account Reserve Trust
Gap down: A situation in which a security’s opening price is lower than the previous day’s closing price.
Margin of safety: The discount of a security’s market price to what the firm believes is the intrinsic value of that security.
PV 10: Present value of estimated future oil and gas revenues, net of estimated direct expenses, discounted at an annual discount rate of 10%. This nomenclature is most commonly used in the energy industry, and is used to estimate the present value of a company’s proved oil and gas reserves. Source: Investopedia.com
Risk off: Refers to an investment setting in which price behavior responds to, and is driven by, changes in investor risk tolerance. During periods when risk is perceived as low, risk-on risk-off theory states that investors tend to engage in higher-risk investments. Source: Investopedia.com
Yield: annual income from the investment (dividend, interest, etc.) divided by the current market price of the investment.
There is no assurance that a forecast will be accurate. Because of the many variables involved, an investor should not rely on forecasts without realizing their limitations.
Bond ratings are grades given to bonds that indicate their credit quality as determined by a private independent rating service such as Standard & Poor’s or Moody’s. The service evaluates a bond issuer’s financial strength, or its ability to pay a bond’s principal and interest in a timely fashion. Ratings are expressed as letters ranging from ‘AAA’, which is the highest grade, to ‘D’, which is the lowest grade. In limited situations when the rating agency has not issued a formal rating, the Advisor will classify the security as nonrated.
Please refer to the Schedule of Investments in the report for complete holdings information. Fund holdings, geographic allocations and/or sector allocations are subject to change at any time and are not a recommendation to buy or sell any security.
Investment performance reflects fee waivers and/or reimbursement of expenses. In the absence of such waivers/reimbursements, total return would be reduced.
The foregoing reflects the thoughts and opinions of Brandes Investment Partners® exclusively and is subject to change without notice.
Brandes Investment Partners® is a registered trademark of Brandes Investment Partners, L.P. in the United States and Canada.
Must be preceded or accompanied by a prospectus.
Index Guide
The Barclays U.S. Aggregate Bond Index is a broad-based benchmark that measures the investment grade, U.S. dollar-denominated, fixed-rate taxable bond
7
Brandes Separately Managed Account Reserve Trust
market. This index is a total return index which reflects the price changes and interest of each bond in the index.
The Barclays U.S. Intermediate Credit Bond Index measures performance of U.S. dollar-denominated U.S. Treasuries, government-related and investment-grade U.S. corporate securities that have remaining maturities of greater than one year and less than ten years. This index is a total return index which reflects the price changes and interest of each bond in the index.
Please note that all indices are unmanaged and are not available for direct investment.
The Brandes Separately Managed Account Reserve Trust is distributed by ALPS Distributors, LLC.
8
Brandes Separately Managed Account Reserve Trust
The following chart compares the value of a hypothetical $10,000 investment in the Separately Managed Account Reserve Trust from March 31, 2006 to March 31, 2016 as compared with the Barclays Capital U.S. Aggregate Index and Barclays Capital U.S. Intermediate Credit Index for the same period.
Cumulative Performance of $10,000 Investment
Since Inception (Unaudited)
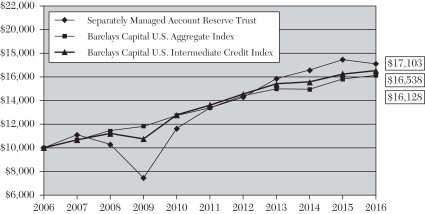
| Average Annual Total Return Periods Ended March 31, 2016 | ||||||||||||||||
| One Year | Five Years | Ten Years | Since Inception (10/3/05) | |||||||||||||
Separately Managed Account | ||||||||||||||||
Reserve Trust | -1.92 | % | 5.01 | % | 5.51 | % | 5.36 | % | ||||||||
Barclays Capital | ||||||||||||||||
U.S. Aggregate Index | 1.96 | % | 3.78 | % | 4.90 | % | 4.68 | % | ||||||||
Barclays Capital | ||||||||||||||||
U.S. Intermediate Credit Index | 1.82 | % | 3.98 | % | 5.16 | % | 4.92 | % | ||||||||
Performance data quoted represents past performance; past performance does not guarantee future results. The investment return and principal value of an investment will fluctuate so that an investor’s shares, when redeemed, may be worth more or less than their original cost. Current performance of the Fund may be lower or higher than the performance quoted. Performance data current to the most recent month end may be obtained by calling 800-331-2979.
9
Brandes Separately Managed Account Reserve Trust
The returns shown do not reflect the deduction of taxes that a shareholder would pay on fund distributions or the redemption of fund shares. The Advisor has a fee waiver arrangement in place to limit the Fund’s annual operating expenses.
Sector Allocation as a Percentage of Total Investments as of
March 31, 2016 (Unaudited)

The sector classifications represented in the graph above and industry classifications represented in the Schedule of Investments are in accordance with Global Industry Classification Standard (GICS®), which was developed by and/or is the exclusive property of MSCI, Inc. and Standard & Poor Financial Services LLC.
10
Brandes Separately Managed Account Reserve Trust
Expense Example (Unaudited)
As a shareholder of the Fund, you incur ongoing costs, including investment advisory and administrative fees and other Fund expenses. The examples below are intended to help you understand your ongoing costs (in dollars) of investing in the Fund and to compare these costs with the ongoing costs of investing in other mutual funds.
The examples are based on an investment of $1,000 invested at the beginning of the period and held for the entire period from October 1, 2015 to March 31, 2016 (the “Period”).
Actual Expenses
This section provides information about actual account values and actual expenses. The “Ending Account Value” shown is derived from the Fund’s actual returns. You may use the information in this section, together with the amount you invested, to estimate the expenses that you paid over the period. Simply divide your account value by $1,000 (for example, an $8,600 account value divided by $1,000 = 8.6), then multiply the result by the number given for the Fund under the heading “Expenses Paid During Period” to estimate the expenses you paid on your account during this period.
Fund | Beginning Account Value | Ending Account Value | Annual Expense Ratio | Expenses Paid During the Period* | ||||||||||||
Separately Managed Account Reserve Trust** | $ | 1,000.00 | $ | 1,001.60 | 0.00% | $ | 0.00 | |||||||||
Hypothetical Example for Comparison Purposes
This section provides information about hypothetical account values and hypothetical expenses based on the Fund’s actual expense ratio and an assumed rate of return of 5% per year before expenses, which is not the Fund’s actual return. The hypothetical account values and expenses may not be used to estimate the actual ending account balance or expenses you paid for the period. You may use this information to compare the ongoing costs of investing in the Fund and other mutual funds. To do so, compare this 5% hypothetical example with the 5% hypothetical examples that appear in the shareholder reports of the other mutual funds.
Please note that the expenses shown in the table are meant to highlight your ongoing costs only and do not reflect any transaction costs, such as sales charges (loads), redemption fees, or exchange fees. Therefore, the last column of the table is useful in comparing ongoing costs only, and will not help you determine the relative total costs of owning different funds. In addition, if these transactional costs were included, your costs would have been higher.
11
Brandes Separately Managed Account Reserve Trust
Fund | Beginning Account Value | Ending Account Value | Annual Expense Ratio | Expenses Paid During the Period* | ||||||||||||
Separately Managed Account Reserve Trust** | $ | 1,000.00 | $ | 1,025.00 | 0.00% | $ | 0.00 | |||||||||
| * | The Fund’s expenses are equal to the Fund’s expense ratio for the period, multiplied by the average account value over the period, multiplied by 183/366 (to reflect the one half-year period). |
| ** | No expenses have been charged to the SMART Fund over the period, as the SMART Fund participates in a wrap-fee program sponsored by investment advisors unaffiliated with the SMART Fund. See Note 3 to the Financial Statements. |
12
Brandes Separately Managed Account Reserve Trust
SCHEDULE OF INVESTMENTS — March 31, 2016 (Unaudited)
Principal | Value | |||||||
| FEDERAL AND FEDERALLY SPONSORED CREDITS – 4.01% | ||||||||
| Federal Home Loan Mortgage Corporation – 2.28% | ||||||||
Pool G1-8578, 3.000%, 12/1/2030 | $ | 3,440,027 | $ | 3,598,963 | ||||
|
| |||||||
| Federal National Mortgage Association – 1.73% | ||||||||
Pool AS6201, 3.500%, 11/1/2045 | 2,599,565 | 2,726,853 | ||||||
|
| |||||||
TOTAL FEDERAL AND FEDERALLY SPONSORED CREDITS | $ | 6,325,816 | ||||||
|
| |||||||
| OTHER MORTGAGE RELATED SECURITIES – 0.01% | ||||||||
| Collateralized Mortgage Obligations – 0.01% | ||||||||
Wells Fargo Mortgage Backed Securities Trust | $ | 9,310 | $ | 8,907 | ||||
|
| |||||||
TOTAL OTHER MORTGAGE RELATED SECURITIES | $ | 8,907 | ||||||
|
| |||||||
| US GOVERNMENTS – 16.39% | ||||||||
| Sovereign – 16.39% | ||||||||
United States Treasury Bond | $ | 1,535,000 | $ | 2,172,204 | ||||
United States Treasury Note | ||||||||
2.000%, 2/15/2023 | 9,415,000 | 9,700,388 | ||||||
2.375%, 8/15/2024 | 13,250,000 | 13,953,906 | ||||||
|
| |||||||
| 23,654,294 | ||||||||
|
| |||||||
TOTAL US GOVERNMENTS | $ | 25,826,498 | ||||||
|
| |||||||
| Shares | Value | |||||||
| PREFERRED STOCKS – 5.33% | ||||||||
| Consumer Finance – 2.04% | ||||||||
Ally Financial, Inc., 8.000% | 126,200 | $ | 3,213,052 | |||||
|
| |||||||
| Technology Hardware – 3.29% | ||||||||
Pitney Bowes International Holdings, Inc., 6.125% (Acquired 10/24/12 through 2/10/15, Cost $5,074,793)(a)(c) | 4,969 | 5,181,735 | ||||||
|
| |||||||
TOTAL PREFERRED STOCKS | $ | 8,394,787 | ||||||
|
| |||||||
Principal | Value | |||||||
| ASSET BACKED SECURITIES – 2.91% | ||||||||
| Student Loan – 2.91% | ||||||||
SLM Private Credit Student Loan Trust | ||||||||
Series 2004-B, 1.064%, 9/15/2033 | $ | 1,500,000 | $ | 1,241,544 | ||||
Series 2005-A, 0.944%, 12/15/2038 | 1,865,000 | 1,494,681 | ||||||
Series 2006-A, 0.924%, 6/15/2039 | 2,200,000 | 1,842,132 | ||||||
|
| |||||||
TOTAL ASSET BACKED SECURITIES | $ | 4,578,357 | ||||||
|
| |||||||
The accompanying notes are an integral part of these Schedules of Investments.
13
Brandes Separately Managed Account Reserve Trust
SCHEDULE OF INVESTMENTS — March 31, 2016 (Unaudited) (continued)
Principal | Value | |||||||
| CONVERTIBLE BONDS – 1.75% | ||||||||
| Metals & Mining – 1.75% | ||||||||
Royal Gold, Inc. | $ | 2,890,000 | $ | 2,763,563 | ||||
|
| |||||||
TOTAL CONVERTIBLE BONDS | $ | 2,763,563 | ||||||
|
| |||||||
| CORPORATE BONDS – 68.07% | ||||||||
| Banks & Thrifts – 6.62% | ||||||||
JP Morgan Chase & Co. | $ | 6,305,000 | $ | 6,305,000 | ||||
The Goldman Sachs Group, Inc. | 1,500,000 | 1,727,792 | ||||||
USB Capital IX | 3,250,000 | 2,405,000 | ||||||
|
| |||||||
| 10,437,792 | ||||||||
|
| |||||||
| Building Materials – 5.10% | ||||||||
Masco Corp. | 5,005,000 | 5,126,371 | ||||||
Owens Corning | 44,000 | 44,945 | ||||||
USG Corp. | 2,790,000 | 2,859,750 | ||||||
|
| |||||||
| 8,031,066 | ||||||||
|
| |||||||
| Commercial Services & Supplies – 3.22% | ||||||||
The ADT Corp. | 5,865,000 | 5,073,225 | ||||||
|
| |||||||
| Diversified Financial Services – 1.58% | ||||||||
Voya Financial, Inc. | 2,220,000 | 2,483,217 | ||||||
|
| |||||||
| Electric Utilities – 6.73% | ||||||||
DPL, Inc. | 2,100,000 | 2,182,698 | ||||||
FirstEnergy Corp. | 3,950,000 | 4,797,540 | ||||||
Israel Electric Corp. Ltd. | 3,275,000 | 3,623,702 | ||||||
|
| |||||||
| 10,603,940 | ||||||||
|
| |||||||
| Energy – 1.01% | ||||||||
Valero Energy Corp. | 1,340,000 | 1,597,854 | ||||||
|
| |||||||
The accompanying notes are an integral part of these Schedules of Investments.
14
Brandes Separately Managed Account Reserve Trust
SCHEDULE OF INVESTMENTS — March 31, 2016 (Unaudited) (continued)
Principal | Value | |||||||
| Food & Staples Retailing – 2.88% | ||||||||
Tesco Plc | $ | 4,365,000 | $ | 4,541,023 | ||||
|
| |||||||
| Food, Beverage & Tobacco – 2.93% | ||||||||
Tyson Foods, Inc. | 4,615,000 | 4,615,000 | ||||||
|
| |||||||
| Forest Products & Paper – 2.91% | ||||||||
Sappi Papier Holding GmbH | 4,435,000 | 4,586,544 | ||||||
|
| |||||||
| Health Care Providers & Services – 1.87% | ||||||||
Laboratory Corp. of America Holdings | 1,250,000 | 1,290,537 | ||||||
Tenet Healthcare Corp. | 1,605,000 | 1,651,144 | ||||||
|
| |||||||
| 2,941,681 | ||||||||
|
| |||||||
| Homebuilders – 2.39% | ||||||||
Centex Corp. | 2,695,000 | 2,695,000 | ||||||
Toll Brothers Finance Corp. | 1,040,000 | 1,029,600 | ||||||
Urbi Desarrollos Urbanos SA | 9,235,000 | 46,175 | ||||||
|
| |||||||
| 3,770,775 | ||||||||
|
| |||||||
| Household Durables – 1.05% | ||||||||
Pulte Group, Inc. | 1,615,000 | 1,661,431 | ||||||
|
| |||||||
| Insurance – 5.14% | ||||||||
American International Group, Inc. | 2,785,000 | 3,236,248 | ||||||
CNA Financial Corp. | ||||||||
7.350%, 11/15/2019 | 1,700,000 | 1,962,356 | ||||||
5.875%, 8/15/2020 | 1,250,000 | 1,395,175 | ||||||
Genworth Financial, Inc. | 1,700,000 | 1,500,250 | ||||||
|
| |||||||
| 8,094,029 | ||||||||
|
| |||||||
| Media – 1.03% | ||||||||
McGraw Hill Financial, Inc. | 1,525,000 | 1,626,583 | ||||||
|
| |||||||
The accompanying notes are an integral part of these Schedule of Investments.
15
Brandes Separately Managed Account Reserve Trust
SCHEDULE OF INVESTMENTS — March 31, 2016 (Unaudited) (continued)
Principal | Value | |||||||
| Metals & Mining – 4.81% | ||||||||
ArcelorMittal SA | $ | 2,220,000 | $ | 2,186,700 | ||||
Thompson Creek Metals Co., Inc. | 5,760,000 | 5,400,000 | ||||||
|
| |||||||
| 7,586,700 | ||||||||
|
| |||||||
| Oil, Gas & Consumable Fuels – 11.03% | ||||||||
BP Capital Markets Plc | 3,375,000 | 3,426,128 | ||||||
Chesapeake Energy Corp. | ||||||||
6.625%, 8/15/2020 | 7,860,000 | 3,065,400 | ||||||
6.125%, 2/15/2021 | 2,555,000 | 983,675 | ||||||
Cloud Peak Energy, Inc. | 2,902,000 | 928,640 | ||||||
Kinder Morgan, Inc. | ||||||||
7.000%, 6/15/2017 | 1,610,000 | 1,689,162 | ||||||
4.300%, 6/1/2025 | 1,921,000 | 1,827,226 | ||||||
Occidental Petroleum Corp. | 3,350,000 | 3,430,772 | ||||||
Range Resources Corp. | 2,400,000 | 2,034,000 | ||||||
|
| |||||||
| 17,385,003 | ||||||||
|
| |||||||
| Pharmaceutical – 2.44% | ||||||||
Valeant Pharmaceuticals International | 4,235,000 | 3,843,263 | ||||||
|
| |||||||
| Retail – 2.23% | ||||||||
Marks & Spencer Plc | 2,975,000 | 3,513,966 | ||||||
|
| |||||||
| Telecommunications – 1.58% | ||||||||
Telecom Italia Capital SA | 840,000 | 913,500 | ||||||
Telefonica Emisiones SAU | 1,390,000 | 1,579,116 | ||||||
|
| |||||||
| 2,492,616 | ||||||||
|
| |||||||
| Wireless Telecommunication Services – 1.52% | ||||||||
Sprint Nextel Corp. | $ | 2,290,000 | $ | 2,398,775 | ||||
|
| |||||||
TOTAL CORPORATE BONDS | $ | 107,284,483 | ||||||
|
| |||||||
The accompanying notes are an integral part of these Schedule of Investments.
16
Brandes Separately Managed Account Reserve Trust
SCHEDULE OF INVESTMENTS — March 31, 2016 (Unaudited) (continued)
Principal | Value | |||||||
| REPURCHASE AGREEMENTS – 0.56% | ||||||||
State Street Bank and Trust Repurchase Agreement, | $ | 889,325 | $ | 889,325 | ||||
|
| |||||||
TOTAL REPURCHASE AGREEMENTS | $ | 889,325 | ||||||
|
| |||||||
Total Investments (Cost $158,804,372) – 99.03% | $ | 156,071,736 | ||||||
Other Assets in Excess of Liabilities – 0.97% | 1,523,568 | |||||||
|
| |||||||
TOTAL NET ASSETS – 100.00% | $ | 157,595,304 | ||||||
|
| |||||||
Percentages are stated as a percent of net assets.
| (a) | Security was purchased exempt from registration in the U.S. pursuant to Rule 144A of the Securities Act of 1933 (the “Act”) or was acquired in a private placement, and, unless registered under the Act, may only be sold to “qualified institutional buyers” (as defined in the Act) or pursuant to another exemption from registration. The market values of these securities total $27,735,183 which represents 17.60% of total net assets. |
| (b) | In default. |
| (c) | These securities have limited liquidity and represent $5,236,817 or 3.32% of the Fund’s net assets and are classified as Level 2 securities. See Note 2 in the Notes to Schedule of Investments. |
| (d) | Non-income producing security. |
The industry classifications represented in the Schedule of Investments are in accordance with Global Industry Classification Standards (GICS ), which was developed by and/or is the exclusive property of MSCI, Inc. and Standard & Poor Financial Services LLC.
The accompanying notes are an integral part of these Schedule of Investments.
17
Brandes Separately Managed Account Reserve Trust
STATEMENT OF ASSETS AND LIABILITIES — March 31, 2016 (Unaudited)
ASSETS | ||||
Investments in securities, at cost | $ | 158,804,372 | ||
|
| |||
Investment in securities, at value | $ | 156,071,736 | ||
Receivables: | ||||
Fund shares sold | 114,392 | |||
Dividends and interest | 2,103,829 | |||
|
| |||
Total Assets | 158,289,957 | |||
|
| |||
LIABILITIES | ||||
Payables: | ||||
Fund shares redeemed | 688,782 | |||
Dividends payable | 5,871 | |||
|
| |||
Total Liabilities | 694,653 | |||
|
| |||
NET ASSETS | $ | 157,595,304 | ||
|
| |||
COMPONENTS OF NET ASSETS | ||||
Paid-in capital | $ | 189,269,097 | ||
Undistributed net investment income | 5,608 | |||
Accumulated net realized loss on investments | (28,946,765 | ) | ||
Net unrealized depreciation on investments | (2,732,636 | ) | ||
|
| |||
Total Net Assets | $ | 157,595,304 | ||
|
| |||
Net asset value, offering price and redemption proceeds per share | ||||
Net Assets | $ | 157,595,304 | ||
Shares outstanding (unlimited shares authorized without par value) | 18,612,445 | |||
Offering and redemption price | $ | 8.47 | ||
|
|
The accompanying notes to financial statements are an integral part of this statement.
18
Brandes Separately Managed Account Reserve Trust
STATEMENT OF OPERATIONS — For the Six Months Ended March 31, 2016 (Unaudited)
INVESTMENT INCOME | ||||
Income | ||||
Dividend income | $ | 286,263 | ||
Interest income | 3,868,812 | |||
Miscellaneous income | 21,250 | |||
|
| |||
Total Income | 4,176,325 | |||
|
| |||
Expenses (Note 3) | ||||
Total expenses | — | |||
|
| |||
Less reimbursement / waiver | — | |||
|
| |||
Total expenses net of reimbursement / waiver | — | |||
|
| |||
Net investment income | 4,176,325 | |||
|
| |||
REALIZED AND UNREALIZED GAIN (LOSS) ON INVESTMENTS: | ||||
Net realized gain on investments | 1,075,592 | |||
Net change in unrealized depreciation on investments | (4,956,397 | ) | ||
|
| |||
Net realized gain and unrealized depreciation on investments | (3,880,805 | ) | ||
|
| |||
Net Increase in net assets resulting from operations | $ | 295,520 | ||
|
|
The accompanying notes to financial statements are an integral part of this statement.
19
Brandes Separately Managed Account Reserve Trust
STATEMENT OF CHANGES IN NET ASSETS
| Six Months Ended March 31, 2016 | Year Ended September 30, 2015 | |||||||
| (Unaudited) | ||||||||
INCREASE IN NET ASSETS FROM: | ||||||||
OPERATIONS | ||||||||
Net investment income | $ | 4,176,325 | $ | 7,439,942 | ||||
Net realized gain (loss) on investments | 1,075,592 | (2,661,682 | ) | |||||
Net change in unrealized depreciation on investments | (4,956,397 | ) | (3,521,339 | ) | ||||
|
|
|
| |||||
Net increase in net assets resulting from operations | 295,520 | 1,256,921 | ||||||
|
|
|
| |||||
DISTRIBUTIONS TO SHAREHOLDERS | ||||||||
From net investment income | (4,175,824 | ) | (7,435,078 | ) | ||||
|
|
|
| |||||
Decrease in net assets from distributions | (4,175,824 | ) | (7,435,078 | ) | ||||
|
|
|
| |||||
CAPITAL SHARE TRANSACTIONS | ||||||||
Proceeds from shares sold | 17,832,657 | 50,987,410 | ||||||
Net asset value of shares issued on reinvestment of distributions | 4,147,786 | 7,390,029 | ||||||
Cost of shares redeemed | (20,270,998 | ) | (30,723,456 | ) | ||||
|
|
|
| |||||
Net increase in net assets from capital share transactions | 1,709,445 | 27,653,983 | ||||||
|
|
|
| |||||
Total increase (decrease) in net assets | (2,170,859 | ) | 21,475,826 | |||||
|
|
|
| |||||
NET ASSETS | ||||||||
Beginning of the Year | 159,766,163 | 138,290,337 | ||||||
|
|
|
| |||||
End of the Year | 157,595,304 | 159,766,163 | ||||||
|
|
|
| |||||
Undistributed net investment income | $ | 5,608 | $ | 5,107 | ||||
|
|
|
| |||||
The accompanying notes to financial statements are an integral part of this statement.
20
Brandes Separately Managed Account Reserve Trust
| Six Months Ended March 31, 2016 | Year Ended September 30 | |||||||||||||||||||||||
| 2015 | 2014 | 2013 | 2012 | 2011 | ||||||||||||||||||||
| (Unaudited) | ||||||||||||||||||||||||
Net asset value, beginning of period | $ | 8.69 | $ | 9.03 | $ | 8.89 | $ | 9.01 | $ | 8.32 | $ | 8.46 | ||||||||||||
|
|
|
|
|
|
|
|
|
|
|
| |||||||||||||
Income (Loss) from investment operations: | ||||||||||||||||||||||||
Net investment income(2) | 0.23 | 0.43 | 0.46 | 0.51 | 0.49 | 0.52 | ||||||||||||||||||
Net realized and unrealized gain/(loss) on investments | (0.22 | ) | (0.34 | ) | 0.16 | (0.12 | ) | 0.73 | (0.12 | ) | ||||||||||||||
|
|
|
|
|
|
|
|
|
|
|
| |||||||||||||
Total from investment operations | 0.01 | 0.09 | 0.62 | 0.39 | 1.22 | 0.40 | ||||||||||||||||||
|
|
|
|
|
|
|
|
|
|
|
| |||||||||||||
Less dividends and distributions: | ||||||||||||||||||||||||
Dividends from net investment income | (0.23 | ) | (0.43 | ) | (0.48 | ) | (0.51 | ) | (0.53 | ) | (0.54 | ) | ||||||||||||
|
|
|
|
|
|
|
|
|
|
|
| |||||||||||||
Total dividends and distributions | (0.23 | ) | (0.43 | ) | (0.48 | ) | (0.51 | ) | (0.53 | ) | (0.54 | ) | ||||||||||||
|
|
|
|
|
|
|
|
|
|
|
| |||||||||||||
Net asset value, end of period | $ | 8.47 | $ | 8.69 | $ | 9.03 | $ | 8.89 | $ | 9.01 | $ | 8.32 | ||||||||||||
|
|
|
|
|
|
|
|
|
|
|
| |||||||||||||
Total return | 0.16 | %(3) | 0.93 | % | 7.13 | % | 4.42 | % | 15.13 | % | 4.61 | % | ||||||||||||
Net assets, end of period (millions) | $ | 157.6 | $ | 159.8 | $ | 138.3 | $ | 126.3 | $ | 141.6 | $ | 142.4 | ||||||||||||
Ratio of expenses to average net assets(1) | 0.00 | %(4) | 0.00 | % | 0.00 | % | 0.00 | % | 0.00 | % | 0.00 | % | ||||||||||||
Ratio of net investment income to average net assets(1) | 5.45 | %(4) | 4.77 | % | 5.12 | % | 5.61 | % | 5.66 | % | 5.98 | % | ||||||||||||
Portfolio turnover rate | 24.41 | %(3) | 32.78 | % | 21.61 | % | 28.88 | % | 27.44 | % | 56.16 | % | ||||||||||||
| (1) | Reflects the fact that no fees or expenses are incurred by the Fund. The Fund is an integral part of “wrap-fee” programs sponsored by investment advisers and/or broker-dealers unaffiliated with the Fund or the Advisor. Participants in these programs pay a “wrap” fee to the sponsor of the program. |
| (2) | Net investment income per share has been calculated based on average shares outstanding during the period. |
| (3) | Not annualized. |
| (4) | Annualized. |
The accompanying notes to financial statements are an integral part of this statement.
21
Brandes Separately Managed Account Reserve Trust
NOTE 1 – ORGANIZATION
The Separately Managed Account Reserve Trust (the “Fund”) is a series of Brandes Investment Trust (the “Trust”). The Trust is registered under the Investment Company Act of 1940, as amended (the “1940 Act”), as a diversified, open-end management investment company. The Fund began operations on October 3, 2005. The Fund invests its assets primarily in debt securities and seeks to maximize total return.
NOTE 2 – SIGNIFICANT ACCOUNTING POLICIES
The following is a summary of significant accounting policies consistently followed by the Fund. These policies are in conformity with accounting principles (“GAAP”) generally accepted in the United States of America.
| A. | Repurchase Agreements. The Fund may enter into repurchase agreements with government securities dealers recognized by the Federal Reserve Board, with member banks of the Federal Reserve System or with other brokers or dealers that meet the credit guidelines established by the Board of Trustees. The Fund will always receive and maintain, as collateral, securities whose market value, including accrued interest (which is recorded in the Schedule of Investments), will be at least equal to 100% of the dollar amount invested by the Fund in each agreement, and the Fund will make payment for such securities only upon physical delivery or upon evidence of book entry transfer to the account of the Fund’s custodian. To the extent that the term of any repurchase transaction exceeds one business day, the value of the Fund’s collateral is marked-to-market on a daily basis to ensure the adequacy of the collateral. Before causing the Fund to enter into a repurchase agreement with any other party, the investment advisor will determine that such party does not have any apparent risk of becoming involved in bankruptcy proceedings within the time frame contemplated by the repurchase agreement. If the seller defaults and the value of the collateral declines, or if bankruptcy proceedings are commenced with respect to the seller of the security, realization of the collateral by the Fund may be delayed or limited. At March 31, 2016, the Fund’s ongoing exposure to the economic return on repurchase agreements is shown on the Schedule of Investments. |
| B. | Foreign Currency Translation and Transactions. Values of investments denominated in foreign currencies are converted into U.S. dollars using the spot market rates of exchange at the time of valuation. Purchases and sales of investments and dividend and interest income are translated into U.S. dollars using the spot market rates of exchange prevailing on the respective dates of such translations. The gain or loss resulting from changes in foreign exchange rates is included with net realized and unrealized gain or loss from investments, as appropriate. Foreign securities and currency transactions |
22
Brandes Separately Managed Account Reserve Trust
NOTES TO FINANCIAL STATEMENTS — (continued)
| may involve certain considerations and risks not typically associated with those of domestic origin. |
Foreign securities are recorded in the financial statements after translation to U.S. dollars based on the applicable exchange rate at the end of the period. The Fund reports certain foreign currency-related transactions as components of realized gains or losses for financial reporting purposes, whereas such components are treated as ordinary income for federal income tax purposes.
| C. | Delayed Delivery Securities. The Fund may purchase securities on a when-issued or delayed delivery basis. “When-issued” or delayed delivery refers to securities whose terms are available and for which a market exists, but that have not been issued. For a when-issued or delayed delivery transaction, no payment is made until delivery date, which is typically longer than the normal course of settlement. When the Fund enters into an agreement to purchase securities on a when-issued or delayed delivery basis, the Fund segregates cash or liquid securities, of any type or maturity, equal in value to the Fund’s commitment. Losses may arise if the market values of the underlying securities change, if the counterparty does not perform under the contract, or if the issuer does not issue the securities due to political, economic or other factors. The Fund did not have any open commitments on delayed delivery securities as of March 31, 2016. |
| D. | Security Transactions, Dividends and Distributions. Security transactions are accounted for on the trade dates. Realized gains and losses are evaluated on the bases of identified costs. Distributions from net investment income are declared daily and paid monthly. Distributions of net realized gains, if any, are declared at least annually. Dividend income and distributions to shareholders are recorded on the ex-dividend dates. Interest is recorded on an accrual basis. The Fund amortizes premiums and accretes discounts using the constant yield method. |
| E. | Use of Estimates. The preparation of financial statements in conformity with accounting principles generally accepted in the United States of America requires management to make estimates and assumptions that affect the reported amounts of assets and liabilities and revenue and expenses and disclosure of contingent assets and liabilities and revenue and expenses at the date of the financial statements. Actual results could differ from those estimates. |
| F. | Indemnification Obligations. Under the Trust’s organizational documents, its current and former officers and trustees are indemnified against certain liabilities arising out of the performance of their duties to the Trust. The Trust has indemnified its trustees against any expenses actually and reasonably incurred by the trustees in any proceeding arising out of or in |
23
Brandes Separately Managed Account Reserve Trust
NOTES TO FINANCIAL STATEMENTS — (continued)
| connection with the trustees’ service to the Trust. In addition, in the normal course of business, the Trust enters into contracts that contain a variety of representations and warranties and provide general indemnifications. The Fund’s maximum exposure under these arrangements is unknown as this would involve future claims that may be made against the Fund that have not yet occurred or that would be covered by other parties. |
| G. | Accounting for Uncertainty in Income Taxes. The Fund has elected to be taxed as a “regulated investment company” and intends to distribute substantially all taxable income to its shareholders and otherwise comply with the provisions of the Internal Revenue Code applicable to regulated investment companies. The Fund may be subject to a nondeductible excise tax calculated as a percentage of certain undistributed amounts of net investment income and net capital gains. The Fund intends to distribute its net investment income and capital gains as necessary to avoid this excise tax. Therefore, no provision for federal income taxes or excise taxes has been made. |
The Trust has adopted financial reporting rules that require the Trust to analyze all open tax years, as defined by the applicable statute of limitations, for all major jurisdictions. Open tax years for the Fund are those that are open for exam by taxing authorities (2012 through 2015). As of March 31, 2016, the Trust has no examinations in progress.
Management has analyzed the Trust’s tax positions, and has concluded that no liability should be recorded related to uncertain tax positions expected to be taken on the tax return for the fiscal year-end September 30, 2015. The Trust identifies its major tax jurisdictions as the U.S. Government and the State of California. The Trust is not aware of any tax positions for which it is reasonably possible that the total amounts of unrecognized tax benefits will significantly change in the next twelve months.
| H. | Fair Value Measurements. The Trust has adopted GAAP accounting principles related to fair value accounting standards which establish a definition of fair value and set out a hierarchy for measuring fair value. These standards require additional disclosures about the various inputs and valuation techniques used to develop the measurements of fair value and a discussion of changes in valuation techniques and related inputs during the period. These inputs are summarized in the three broad levels listed below: |
Level 1 — Quoted unadjusted prices for identical instruments in active markets to which the Trust has access at the date of measurement.
Level 2 — Other significant observable market inputs including quoted prices for similar instruments in active markets; quoted adjusted prices in
24
Brandes Separately Managed Account Reserve Trust
NOTES TO FINANCIAL STATEMENTS — (continued)
active markets; quoted prices for identical or similar instruments in markets that are not active; and model-derived valuations in which all significant inputs and significant value drivers are observable in active markets. Level 2 inputs are those in markets for which there are few transactions, the prices are not current, little public information exists or instances where prices vary substantially over time or among broker market makers.
Level 3 — Significant unobservable inputs including model derived valuations in which one or more significant inputs or significant value drivers are unobservable. Unobservable inputs are those inputs that reflect the Trust’s own assumptions that market participants would use to price the asset or liability based on the best available information.
| I. | Security Valuation. Bonds and other fixed-income securities (other than repurchase agreements and demand notes) are valued using the bid price on the day of the valuation provided by an independent pricing service. |
Securities traded on a national securities exchange are valued at the last reported sale price at the close of regular trading on each day the exchange is open for trading. Securities listed on the NASDAQ National Market System for which market quotations are readily available are valued using the NASDAQ Official Closing Price. Securities traded on an exchange for which there have been no sales are valued at the mean between last bid and ask price on such day. Securities for which quotations are not readily available are valued at their respective fair values as determined in good faith pursuant to procedures adopted by the Board of Trustees.
Repurchase agreements and demand notes, for which neither vendor pricing nor market maker prices are available, are valued at amortized cost on the day of valuation, unless the Advisor determines that the use of amortized cost valuation on such day is not appropriate (in which case such instrument is fair valued in accordance with the fair value procedures of the Trust).
The Trust has adopted valuation procedures that allow for fair value pricing for use in appropriate circumstances. For example, such circumstances may arise when trading in a security has been halted or suspended or a security has been delisted from a national exchange, a security has not been traded for an extended period of time, or a significant event with respect to a security occurs after the close of the market or exchange on which the security principally trades and before the time the Fund calculates its own share price. If no price, or in the Advisor’s determination no price representing fair value, is provided for a security held by the Fund by an independent pricing agent, then the security will be fair valued. Thinly traded securities and certain foreign
25
Brandes Separately Managed Account Reserve Trust
NOTES TO FINANCIAL STATEMENTS — (continued)
securities may be impacted more by the use of fair valuations than other securities.
In using fair value pricing, the Fund attempts to establish the price that it might reasonably have expected to receive upon a sale of the security at 4:00 p.m. Eastern time. Valuing securities at fair value involves greater reliance on judgment than valuation of securities based on readily available market quotations. When using fair value to price securities, the Fund may value those securities higher or lower than another fund using market quotations or fair value to price the same securities. Further, there can be no assurance that the Fund could obtain the fair value assigned to a security if it were to sell the security at approximately the time at which the Fund determines its net asset value.
Foreign securities are recorded in the financial statements after translation to U.S. dollars based on the applicable exchange rate at the end of the period. The Fund reports certain foreign currency-related transactions as components of realized gains or losses for financial reporting purposes, whereas such components are treated as ordinary income for federal income tax purposes.
Fixed income securities including corporate, convertible and municipal bonds and notes, U.S. government agencies, U.S. Treasury obligations, sovereign issues, bank loans, convertible preferred securities and non-U.S. bonds are normally valued on the basis of quotes obtained from brokers and dealers or independent pricing services or sources. Independent pricing services typically use information provided by market makers or estimates of market values obtained from yield data relating to investments or securities with similar characteristics. The service providers’ internal models use inputs that are observable such as, among other things, issuer details, interest rates, yield curves, prepayment speeds, credit risks/spreads, default rates and quoted prices for similar assets. Securities that use similar valuation techniques and inputs as described above are categorized as Level 2 of the fair value hierarchy.
Fixed income securities purchased on a delayed-delivery basis are typically marked to market daily until settlement at the forward settlement date.
The Fund may enter into mortgage dollar roll transactions in which the Fund sells a mortgage-backed security to a counterparty and simultaneously enters into an agreement with the same counterparty to buy back a similar security on a specific future date at a predetermined price. Risks may arise due to the delayed payment date and the potential inability of counterparties to complete the transaction. Mortgage dollar rolls are accounted for as purchase and sale transactions, which may increase the Fund’s portfolio turnover rate.
26
Brandes Separately Managed Account Reserve Trust
NOTES TO FINANCIAL STATEMENTS — (continued)
Mortgage and asset-backed securities are usually issued as separate tranches, or classes, of securities within each package of underlying securities. These securities are also normally valued by pricing service providers that use broker dealer quotations or valuation estimates from their internal pricing models. The pricing models for these securities usually consider tranche level attributes, estimated cash flows and market-based yield spreads for each tranche, current market data and packaged collateral performance, as available. Mortgage and asset-backed securities that use such valuation techniques and inputs are categorized as Level 2 of the fair value hierarchy only if there are significant observable inputs used.
Common stocks, exchange-traded fund shares and financial derivative instruments, such as futures contracts or options contracts that are traded on a national securities or commodities exchange, are valued at the last reported sales price, in the case of common stocks and exchange-traded fund shares, or, in the case of futures contracts or options contracts, the settlement price determined by the relevant exchange. To the extent these securities are actively traded and valuation adjustments are not applied, they are categorized as Level 1 of the fair value hierarchy.
Valuation adjustments may be applied to certain securities that are solely traded on a foreign exchange to account for the market movement between the close of the foreign market and the close of the New York Stock Exchange (“NYSE”). These securities are generally valued using pricing service providers that consider the correlation of the trading patterns of the foreign security to the intraday trading in the U.S. markets for investments. Securities using these valuation adjustments are categorized as Level 2 of the fair value hierarchy. None of the Fund’s securities were fair valued utilizing this method as of March 31, 2016.
Investments in registered open-end management investment companies are valued based upon the Net Asset Values (“NAVs”) of such investments and are categorized as Level 1 of the fair value hierarchy. If, on a particular day, a share price of an investment company is not readily available, such securities are fair valued in accordance with the fair value procedures of the Trust.
Certain securities may be fair valued in accordance with the fair valuation procedures approved by the Board of Trustees. The Valuation Committee is generally responsible for overseeing the day to day valuation processes and reports periodically to the Board. The Valuation Committee is authorized to make all necessary determinations of the fair value of portfolio securities and other assets for which market quotations are not readily available or if it is deemed that the prices obtained from brokers and dealers or independent pricing services are unreliable.
27
Brandes Separately Managed Account Reserve Trust
NOTES TO FINANCIAL STATEMENTS — (continued)
The following is a summary of the inputs used, as of March 31, 2016, involving the Fund’s assets carried at value. The inputs of methodology used for valuing securities may not be an indication of the risk associated with investing in those securities.
Description | Level 1 | Level 2 | Level 3 | Total | ||||||||||||
Seperately Managed Account Reserve Trust | ||||||||||||||||
Preferred Stocks | $ | 3,213,052 | $ | 5,181,735 | $ | — | $ | 8,394,787 | ||||||||
Asset Backed Securities | — | 4,578,357 | — | 4,578,357 | ||||||||||||
Convertible Bonds | — | 2,763,563 | — | 2,763,563 | ||||||||||||
Corporate Bonds | — | 107,284,483 | — | 107,284,483 | ||||||||||||
Government Securities | — | 25,826,498 | — | 25,826,498 | ||||||||||||
Mortgage Backed Securities | — | 6,334,723 | — | 6,334,723 | ||||||||||||
Repurchase Agreements | — | 889,325 | — | 889,325 | ||||||||||||
|
|
|
|
|
|
|
| |||||||||
Total Investments in Securities | $ | 3,213,052 | $ | 152,858,684 | $ | — | $ | 156,071,736 | ||||||||
|
|
|
|
|
|
|
| |||||||||
There were no transfers into or out of Levels 1 and 2 for the Fund during the reporting period.
There were no Level 3 securities in the Fund at the beginning or the end of the six month period ended March 31, 2016.
NOTE 3 – INVESTMENT ADVISORY FEE AND OTHER TRANSACTIONS WITH AFFILIATES
| A. | Advisor Fee. Brandes Investment Partners, L.P. (the “Advisor”) provides the Fund with investment management services under an Investment Advisory Agreement. The Advisor receives no advisory fee or other fee from the Fund. The financial statements of the Fund reflect the fact that no fees or expenses are incurred by the Fund. It should be understood, however, that the Fund is an integral part of “wrap-fee” programs sponsored by investment advisors unaffiliated with the Fund and the Advisor. Typically, participants in these programs pay a “wrap-fee” to their investment advisors. Although the Fund does not compensate the Advisor directly for its service under the Investment Advisory Agreement, the Advisor benefits from its relationships with the sponsors of wrap-fee programs for which the Fund is an investment option. Certain officers and Trustees of the Trust are also officers of the Advisor. |
| B. | Administration Fee. U.S. Bancorp Fund Services, LLC (the “Administrator”) acts as administrator for the Fund. The Administrator prepares various federal and state regulatory filings; prepares reports and materials to be supplied to the Trustees; monitors the activities of the Fund’s custodian, transfer agent and accountant; coordinates the preparation and payment of Fund expenses; and prepares several Fund reports. For these services, the Funds shall pay the administrator monthly, a fee accrued daily and based on average daily net assets. The Funds may also |
28
Brandes Separately Managed Account Reserve Trust
NOTES TO FINANCIAL STATEMENTS — (continued)
| reimburse the Administrator for such out-of-pocket expenses as incurred by the Administrator in the performance of its duties. The amounts paid directly to the Administrator by the Funds for administrative services are included in the Administration fees in the Statement of Operations. The Advisor compensates the Administrator on behalf of the Fund for the services the Administrator performs for the Fund. |
| C. | Distribution and Service Fees. ALPS Distributors, Inc. (the “Distributor”), a registered broker-dealer, acts as the Fund’s principal underwriter in a continuous public offering of the Fund’s shares. All of the Fund’s distribution fees are paid by the Advisor. |
NOTE 4 – PURCHASES AND SALES OF SECURITIES
The cost of purchases and the proceeds from sales of securities of the Fund, excluding short-term investments, were as follows for the six months ended March 31, 2016:
| U.S. Government | Other | |||||||||||||
| Purchases | Sales | Purchases | Sales | |||||||||||
| $ | 10,427,078 | $ | 25,763,421 | $ | 30,903,447 | $ | 10,785,504 | |||||||
NOTE 5 – CAPITAL STOCK TRANSACTIONS
The Fund’s capital stock activity in shares and dollars during the six months ended March 31, 2016, and the year ended September 30, 2015, was as follows (shares and dollar amounts in thousands):
| Six Months Ended 3/31/16 | Year Ended 9/30/15 | |||||||||||||||
| Shares | Amount | Shares | Amount | |||||||||||||
Shares Sold | 2,149 | $ | 17,832 | 5,660 | $ | 50,987 | ||||||||||
Issued on Reinvestment of Distributions | 495 | 4,148 | 823 | 7,390 | ||||||||||||
Shares Redeemed | (2,415 | ) | (20,271 | ) | (3,422 | ) | (30,723 | ) | ||||||||
|
|
|
|
|
|
|
| |||||||||
Net Increase Resulting from Fund | 229 | $ | 1,709 | 3,061 | $ | 27,654 | ||||||||||
|
|
|
|
|
|
|
| |||||||||
29
Brandes Separately Managed Account Reserve Trust
NOTES TO FINANCIAL STATEMENTS — (continued)
NOTE 6 – FEDERAL INCOME TAX MATTERS
As of September 30, 2015, the Fund’s components of distributable earnings on a tax basis were as follows:
Cost of investments for tax purposes | $ | 156,643,123 | ||
|
| |||
Gross tax unrealized appreciation | 8,099,527 | |||
|
| |||
Gross tax unrealized depreciation | (5,958,967 | ) | ||
|
| |||
Net unrealized appreciation on investments | 2,140,560 | |||
|
| |||
Distributable ordinary income | 5,107 | |||
|
| |||
Distributable long-term capital gains | — | |||
|
| |||
Total distributable earnings | 5,107 | |||
|
| |||
Other accumulated losses | (29,939,156 | ) | ||
|
| |||
Total accumulated losses | $ | (27,793,489 | ) | |
|
|
The differences between book and tax basis distributable earnings are primarily related to the differences in classification of paydown gains and losses for tax purposes compared to book purposes. The difference between book and tax basis unrealized depreciation on investments is due primarily to timing differences resulting from wash sale transactions. These differences are temporary.
As of September 30, 2015, the Fund had capital losses expiring on September 30, 2017, 2018 and 2019 in the amounts of $12,139,741, $6,084,748 and $6,501,831, respectively. As of September 30, 2015, the Fund had a capital loss with an indefinite expiration in the amount of $5,212,835.
The tax composition of dividends for the periods ended September 30, 2015 and September 30, 2014 for the Fund were as follows:
| Ordinary Income | Return of Capital | |||||||||||||
| 2015 | 2014 | 2015 | 2014 | |||||||||||
| $ | 7,435,078 | $ | 6,936,413 | $ | — | $ | 52,442 | |||||||
Reclassification of Capital Accounts. Accounting principles generally accepted in the United States of America require that certain components of net assets be reclassified between financial and tax reporting. These reclassifications have no effect on net assets or net asset value per share. For the year ended September 30, 2015, as a result of its reclassifications the Fund’s undistributed net investment income was increased by $243, and accumulated net realized loss was decreased by $243.
30
Brandes Separately Managed Account Reserve Trust
NOTES TO FINANCIAL STATEMENTS — (continued)
NOTE 7 – SUBSEQUENT EVENTS
In preparing these financial statements, the Trust has evaluated events and transactions for potential recognition or disclosure through the date the financial statements were available to be issued. The Trust has concluded that there are no subsequent events to note.
31
Brandes Separately Managed Account Reserve Trust
ADDITIONAL INFORMATION — (Unaudited)
BOARD CONSIDERATION AND CONTINUATION OF INVESTMENT ADVISORY AGREEMENT
In November 2015 the Board of Trustees of the Trust, including the independent Trustees, unanimously approved renewal of the Investment Advisory Agreement (the “Agreement”) between the Trust and Brandes Investment Partners, L.P. (the “Advisor”) with respect to the SMART Fund (the “Fund”) for an additional one-year term.
Information Reviewed
During the course of each year, Board members review a wide variety of materials relating to the nature, extent and quality of the services provided to the Fund by the Advisor, including reports on the Fund’s investment results, portfolio composition, portfolio trading practices, and other matters. In addition, in connection with its annual review of the Agreement with respect to the Fund, the Board requested and reviewed supplementary information that included materials regarding the Fund’s investment results, advisory fee and expense comparisons, financial and profitability information regarding the Advisor, descriptions of various functions such as compliance monitoring and portfolio trading practices, and information about the personnel providing investment management and administrative services to the Fund.
In connection with its reviews, the Board received assistance and advice regarding legal and industry standards from counsel to the Trust and the independent Trustees. The independent Trustees discussed the approval of the Agreement with respect to the Fund with representatives of the Advisor and in private sessions with counsel at which no representatives of the Advisor were present. In deciding to recommend approval of the Agreement with respect to the Fund, the Board and the independent Trustees did not identify any single or particular piece of information that, in isolation, was the controlling factor, and each Trustee did not necessarily attribute the same weight to each factor. This summary describes the most important, but not all, of the factors considered by the Board and the independent Trustees.
Nature, Extent and Quality of Services
With respect to the nature, extent and quality of services provided by the Advisor to the Fund, the Trustees reviewed among other things the quality and depth of the Advisor’s investment management staff, its regulatory compliance procedures, the day-to-day administrative services provided by the Advisor to the Fund and the investment results of the Fund.
The Trustees noted that the Fund’s investment results gross of fees (which are paid by the Advisor) were in the first quartile of the results of a peer group of funds identified by Morningstar Associates (“Morningstar”) for the three-year and five-
32
Brandes Separately Managed Account Reserve Trust
ADDITIONAL INFORMATION — (Unaudited) (continued)
year periods ended September 30, 2015; were in the first quartile of the larger group of funds in its Morningstar Intermediate-Term Bond Fund category for each of those periods; were above its benchmark indices (the Barclays Capital U.S. Aggregate Index and Barclays Capital U.S. Intermediate Credit Index) for the three-year, five-year and since-inception periods ended September 30, 2015; and were in the third or fourth quartile and below the indices for the one-year period. They concluded that the Fund’s performance was satisfactory.
Advisory Fees, Total Expenses, Profitability and Ancillary Benefits
The Trustees noted that the Fund does not incur any advisory fees or other expenses, all of which are paid by the Advisor, and as a result the Advisor’s relationship with the Fund alone is not profitable. The Board also considered ancillary benefits to the Advisor as a result of its relationship with the Fund. They noted that these were primarily related to the Advisor’s receipt of wrap account fees from Fund shareholders through various broker-dealer sponsors that are not affiliated with either the Fund or the Advisor, and the benefit of proprietary and third-party research provided by broker-dealers executing portfolio transactions on behalf of the Fund.
Conclusions
Based on their review, including consideration of each of the factors referred to above, the Board and the independent Trustees concluded that the Agreement is fair and reasonable to the Fund and its shareholders, that each of the factors discussed above supported renewal of the Agreement, and that renewal of the Agreement was in the best interests of the Fund and its shareholders.
PROXY VOTING PROCEDURES
The Advisor votes proxies relating to the Funds’ portfolio securities in accordance with procedures adopted by the Advisor. You may obtain a description of these procedures, free of charge, by calling toll-free 1-800-331-2979. This information is also available through the Securities and Exchange Commission’s website at http:// www.sec.gov.
Information regarding how the Trust voted proxies relating to portfolio securities during the most recent 12-month period ended June 30 is available without charge, upon request, by calling 1-800-331-2979. This information is also available through the Securities and Exchange Commission’s website at http://www.sec.gov.
33
Brandes Separately Managed Account Reserve Trust
ADDITIONAL INFORMATION — (Unaudited) (continued)
FORM N-Q DISCLOSURE
The Trust files the Fund’s complete schedule of portfolio holdings with the Securities and Exchange Commission for the first and third quarters of each fiscal year on Form N-Q. The Trust’s Form N-Q filings are available on the Securities and Exchange Commission’s website at http://www.sec.gov. The Trust’s Form N-Q filings may be reviewed and copied at the Commission’s Public Reference Room in Washington, D.C., and information on the operation of the Public Reference Room may be obtained by calling 1-800-SEC-0330. Information regarding the Trust’s Form N-Q filings is also available, without charge, by calling toll-free, 1-800-331-2979.
34
Brandes Separately Managed Account Reserve Trust
TRUSTEES AND OFFICERS INFORMATION — (Unaudited)
The Board of Trustees is responsible for the overall management of the Trust’s business. The Board approves all significant agreements between the Trust and persons or companies furnishing services to the Trust, including the Trust’s agreements with the Advisor, Administrator, Custodian, Distributor and Transfer Agent. The Board of Trustees delegates the day-to-day operations of the Trust to its officers, subject to the Fund’s investment objective and policies and to general supervision by the Board. The Trust’s Statement of Additional Information includes additional information about the Trustees and is available, without charge, by calling 1-800-331-2979 or visiting www.brandes.com.
The Trustees and officers of the Trust, their business addresses and principal occupations during the past five years are:
Name, Address | Position(s) | Term of | Principal | Number | Other Trusteeships | |||||
Independent Trustees(2) | ||||||||||
J. Michael Gaffney, CFA 11988 El Camino Real, Suite 600 San Diego, CA 92130 (Age 74) | Trustee | Since June 2004 | Retired. Independent Consultant, NATIXIS Global Asset Management, North America from 2004 to 2011. | 9 | None | |||||
Jean E. Carter 11988 El Camino Real, Suite 600 San Diego, CA 92130 (Age 58) | Trustee and Chairman | Since April 2008 | Retired since 2005. | 9 | Bridge Builder Trust | |||||
Robert M. Fitzgerald, CPA (inactive) 11988 El Camino Real, Suite 600 San Diego, CA 92130 (Age 64) | Trustee | Since April 2008 | Retired. | 9 | Hotchkis and Wiley Mutual Funds | |||||
Craig Wainscott, CFA 11988 El Camino Real, Suite 600 San Diego, CA 92130 (Age 54) | Trustee | Since February 2012 | Partner with The Paradigm Project and advisor to early-stage companies. | 9 | None | |||||
35
Brandes Separately Managed Account Reserve Trust
TRUSTEES AND OFFICERS INFORMATION — (Unaudited) (continued)
Name, Address | Position(s) | Term of | Principal | Number | Other Trusteeships | |||||
“Interested” Trustees(3) | ||||||||||
Oliver Murray 11988 El Camino Real, Suite 600 San Diego, CA 92130 (Age 53) | Trustee | Since February 2012 | Chief Executive Officer, Brandes Investment Partners & Co.; Managing Director – PMCS of Brandes Investment Partners, L.P., the investment advisor to the Funds (the “Advisor”). | 9 | None | |||||
Jeff Busby, CFA 11988 El Camino Real, Suite 600 San Diego, CA 92130 (Age 55) | Trustee and President | Since July 2006 | Executive Director of the Advisor. | 9 | None | |||||
Officers of the Trust | ||||||||||
Thomas M. Quinlan 11988 El Camino Real, Suite 600 San Diego, CA 92130 (Age 45) | Secretary | Since June 2003 | Associate General Counsel of the Advisor. | N/A | N/A | |||||
Gary Iwamura, CPA 11988 El Camino Real, Suite 600 San Diego, CA 92130 (Age 59) | Treasurer | Since September 1997 | Finance Director of the Advisor. | N/A | N/A | |||||
Roberta Loubier 11988 El Camino Real, Suite 600 San Diego, CA 92130 (Age 44) | Chief Compliance Officer | Since September 2015 | Global Head of Compliance, Brandes Investment Partners, L.P. | N/A | N/A | |||||
| (1) | Trustees and officers of the Fund serve until their resignation, removal or retirement. |
| (2) | Not “interested persons” of the Trust as defined in the 1940 Act. |
| (3) | “Interested persons” of the Trust as defined in the 1940 Act by virtue of their positions with the Advisor. |
36
Brandes Separately Managed Account Reserve Trust
PRIVACY NOTICE
Brandes Investment Partners, L.P. and the Brandes Investment Trust collect nonpublic information about you from the following sources:
| • | Information we receive about you on applications or other forms; |
| • | Information you give us orally; and |
| • | Information about your transactions with us or others. |
We do not disclose any nonpublic personal information about our customers or former customers without the customer’s authorization, except as permitted by law or in response to inquires from governmental authorities.
We restrict access to your personal and account information to those personnel who need to know that information to provide products and services to you. We also may disclose that information to unaffiliated third parties (such as to brokers or custodians) only as permitted by law and only as needed for us to provide agreed services to you. We maintain physical, electronic and procedural safeguards to guard your nonpublic personal information.
37

Item 2. Code of Ethics.
Not applicable for semi-annual reports.
Item 3. Audit Committee Financial Expert.
Not applicable for semi-annual reports.
Item 4. Principal Accountant Fees and Services.
Not applicable for semi-annual reports.
Item 5. Audit Committee of Listed Registrants.
Not applicable to registrants who are not listed issuers (as defined in Rule 10A-3 under the Securities Exchange Act of 1934).
Item 6. Investments.
| (a) | Schedule of Investments is included as part of the report to shareholders filed under Item 1 of this Form. |
| (b) | Not Applicable |
Item 7. Disclosure of Proxy Voting Policies and Procedures for Closed-End Management Investment Companies.
Not applicable to open-end investment companies.
Item 8. Portfolio Managers of Closed-End Management Investment Companies.
Not applicable to open-end investment companies.
Item 9. Purchases of Equity Securities by Closed-End Management Investment Company and Affiliated Purchasers.
Not applicable to open-end investment companies.
Item 10. Submission of Matters to a Vote of Security Holders.
There have been no material changes to the procedures by which shareholders may recommend nominees to the registrant’s board of trustees.
Item 11. Controls and Procedures.
| (a) | The registrant’s President and Treasurer have reviewed the Registrant’s disclosure controls and procedures (as defined in Rule 30a-3(c) under the Investment Company Act of 1940 (the “Act”)) as of a date within 90 days of the filing of this report, as required by Rule 30a-3(b) under the Act and Rules 13a-15(b) or 15d-15(b) under the Securities Exchange Act of 1934. Based on their review, such officers have concluded that the disclosure controls and procedures are effective in ensuring that information required to be disclosed in this report is appropriately recorded, processed, summarized and reported and made known to them by others within the Registrant and by the Registrant’s service provider. |
| (b) | No changes in the registrant’s internal control over financial reporting (as defined in Rule 30a-3(d) under the Act) occurred during the second fiscal quarter of the period covered by this report that materially affected, or are reasonably likely to materially affect, the registrant’s internal control over financial reporting. |
Item 12. Exhibits.
| (a) | (1) Any code of ethics or amendment thereto, that is the subject of the disclosure required by Item 2, to the extent that the registrant intends to satisfy Item 2 requirements through filing an exhibit. 1) Incorporated by reference to the registrant’s Form N-CSR filed January 7, 2005. |
(2) A separate certification for each principal executive and principal financial officer pursuant to Section 302 of the Sarbanes-Oxley Act of 2002. Filed herewith.
(3) Any written solicitation to purchase securities under Rule 23c-1 under the Act sent or given during the period covered by the report by or on behalf of the registrant to 10 or more persons. Not applicable to open-end investment companies.
| (b) | Certifications pursuant to Section 906 of the Sarbanes-Oxley Act of 2002. Furnished herewith. |
SIGNATURES
Pursuant to the requirements of the Securities Exchange Act of 1934 and the Investment Company Act of 1940, the registrant has duly caused this report to be signed on its behalf by the undersigned, thereunto duly authorized.
(Registrant) Brandes Investment Trust
By (Signature and Title)* | /s/ Jeff Busby | |
| Jeff Busby, President |
Date June 3, 2016
Pursuant to the requirements of the Securities Exchange Act of 1934 and the Investment Company Act of 1940, this report has been signed below by the following persons on behalf of the registrant and in the capacities and on the dates indicated.
By (Signature and Title)* | /s/ Jeff Busby | |
| Jeff Busby, President |
Date June 3, 2016
By (Signature and Title)* | /s/ Gary Iwamura | |
Gary Iwamura, Treasurer/ Principal Financial Officer |
Date June 3, 2016
| * | Print the name and title of each signing officer under his or her signature. |