UNITED STATES
SECURITIES AND EXCHANGE COMMISSION
Washington, D.C. 20549
FORM N-CSR
CERTIFIED SHAREHOLDER REPORT OF REGISTERED
MANAGEMENT INVESTMENT COMPANIES
Investment Company Act file number 811-08614
Brandes Investment Trust
(Exact name of registrant as specified in charter)
11988 El Camino Real, Suite 600
San Diego, CA 92130
(Address of principal executive offices) (Zip code)
Michael Glazer
Morgan, Lewis & Bockius LLP
355 South Grand Ave., Suite 4400
Los Angeles, CA 90071-3106
(Name and address of agent for service)
800-331-2979
Registrant’s telephone number, including area code
Date of fiscal year end: September 30, 2017
Date of reporting period: March 31, 2017
Item 1. Reports to Stockholders.
SEMI-ANNUAL REPORT INTERNATIONAL EQUITY FUND GLOBAL EQUITY FUND GLOBAL EQUITY INCOME FUND GLOBAL OPPORTUNITIES VALUE FUND EMERGING MARKETS VALUE FUND INTERNATIONAL SMALL CAP EQUITY FUND CORE PLUS FIXED INCOME FUND CREDIT FOCUS YIELD FUND For the six months ended March 31, 2017

| 2 | ||||
| 6 | ||||
| 56 | ||||
| 90 | ||||
| 92 | ||||
| 94 | ||||
| 98 | ||||
| 108 | ||||
| 132 | ||||
| 136 |
1
Brandes International Equity Fund
Dear Fellow Investor,
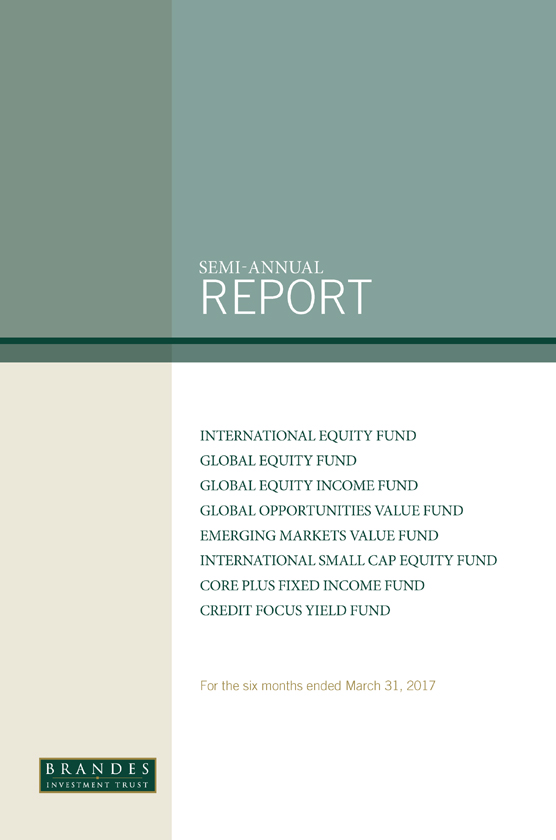
The net asset value of the Brandes International Equity Fund (Class I Shares) rose 7.38% in the six months ended March 31, 2017. For the same period, the MSCI EAFE Index increased 6.48%.
Major positive contributors included holdings in energy, industrials and financials. From a country standpoint, allocations to companies in emerging markets, especially Brazil and South Korea, as well as those in Switzerland and Japan, helped performance.
Top-performing holdings included Dutch insurer Aegon, South Korea-based Hana Financial Group and steelmaker POSCO, U.K.-based bank Barclays and Brazilian jet manufacturer Embraer.
Hana saw its share price appreciate as the market seemed to start anticipating a potential recovery in the bank’s net interest margins. Meanwhile, POSCO’s shares benefited from an improving steel market.
Other contributors included France-based pharmaceutical firm Sanofi, Italian oil & gas firm ENI and British security services provider G4S. In addition to its strong 2016 results, the market seemed to appreciate G4S’s growth in North America and Europe, which was more robust than expected, as well as the improvement in its operating margin and financial leverage.
Holdings in consumer discretionary and information technology detracted from relative returns. From a regional perspective, a lack of allocation to Germany hurt relative performance, along with positions in Sweden and China.
Primary return detractors included South Korean auto component manufacturer Hyundai Mobis, retailers Kingfisher (United Kingdom) and Carrefour (France), as well as French utility Engie.
Engie’s shares fell amid weak earnings guidance from the company due to low natural gas prices and nuclear outages in Belgium and France. Meanwhile, for Hyundai Mobis, the stock-price decline could be attributed to poor near-term results following a series of labor strikes over the summer, which led to lower utilization rates and higher fixed costs. There is also fear that the ensuing production loss may cause a shortage in certain models in the coming months.
In a relatively light period for Fund activity, the International Large-Cap Investment Committee purchased shares of U.K.-based pharmaceutical firm AstraZeneca, Italian bank Intesa Sanpaolo and Mexico-based real estate firm Fibra Uno.
A Fibra (Fideicomiso de Infraestructura y Bienes Raíces) is an investment vehicle in Mexico that has similarities to a REIT (real estate investment trust) in the United States.
2
Brandes International Equity Fund
Fibra Uno (FUNO) is a Mexican trust formed primarily to acquire, own, develop and operate a broad range of commercial real estate in Mexico, including industrial, retail and office properties. FUNO has selectively assembled a diversified portfolio of high-quality, well-located, income-producing commercial properties. The trust began trading on the Mexican stock exchange in 2011 and is the first — also currently the largest — publicly listed Fibra.
Over the past few years, FUNO’s shares have been under pressure, mainly due to the peso depreciation, which negatively affected the company’s real estate value and peso-denominated rental revenues. FUNO has more U.S. dollar-denominated debt than revenues; however, from a debt servicing perspective, it has what we consider solid revenue coverage of interest expense in U.S. dollars. Moreover, FUNO has predominantly long-term debt with a fixed interest rate. Hence, we believe FUNO should be relatively resilient against rising rates.
Most recently, the selloff in FUNO’s shares was magnified by the election of Donald Trump as U.S. President, creating what we considered a good entry point for investment. In our view, FUNO’s positive attributes include:
| • | Strong earnings growth prospects through a sizeable development pipeline |
| • | A solid balance sheet and a seasoned management team |
| • | An income stream which is “inflation protected” as rents are contractually tied to inflation |
| • | Attractive dividend yield |
During the period, we were able to purchase FUNO at a very compelling price, in our opinion, as the company traded not only below our conservative estimate of its net assets value, but also less than its original IPO (initial public offering) price in U.S. dollar terms. Additionally, we believe FUNO is now better diversified than it was in the past, while having limited direct exposure to major exporters to the United States and continuing to demonstrate strong capital allocation.
Other activity included the divestment of Ireland-based CRH, one of the world’s largest building materials companies.
We initially bought CRH following the downturn in construction materials that began during the financial crisis and continued on to the European sovereign debt crisis in 2011. Given its strong market share, improved balance sheet and solid cash generation, the business was well positioned to benefit from a rebound in its cyclically depressed end markets, in our view.
We also believed the company had significant opportunity to cut costs considering its acquisition history. We appreciated the fact that the company’s distribution business, where it channels building materials to contractors and direct to consumers, was more resilient to the cyclical downturn than were its building products due to its reliance on repair and maintenance demand as opposed to new infrastructure building.
3
Brandes International Equity Fund
Throughout 2016, the market started to show appreciation for the company’s improved cost and competitive position, and anticipated a recovery in the construction market. Consequently, CRH’s share price reached our estimate of its intrinsic value and we divested our position.
Outlook
As of March 31, 2017, the Fund held its largest overweight positions in emerging markets and France. From an industry standpoint, key overweights were in oil, gas & consumable fuels, food & staples retailing, pharmaceuticals and diversified telecommunication services.
The Fund continued to have no allocations to companies based in Germany and Australia, while maintaining its underweights to the industrials, materials and consumer staples sectors.
As always, we base our allocation decisions on a fundamental, bottom-up investment approach focused on seeking the most attractive value in all corners of the globe. Our focus remains long term as we seek to take advantage of indiscriminate mispricing by pursuing potentially undervalued opportunities, while avoiding areas that may be overheated. We believe this price-matters approach is the best way we can pursue alpha for Fund shareholders.
Thank you for your business and continued trust.
Sincerely yours,
The Brandes International Large-Cap Investment Committee
Brandes Investment Trust
Because the values of the Fund’s investments will fluctuate with market conditions, so will the value of your investment in the Fund. You could lose money on your investment in the Fund, or the Fund could underperform other investments. The values of the Fund’s investments fluctuate in response to the activities of individual companies and general stock market and economic conditions. In addition, the performance of foreign securities depends on the political and economic environments and other overall economic conditions in the countries where the Fund invests. Emerging country markets involve greater risk and volatility than more developed markets. Some emerging markets countries may have fixed or managed currencies that are not free-floating against the U.S. dollar. Certain of these currencies have experienced, and may experience in the future, substantial fluctuations or a steady devaluation relative to the U.S. dollar. Investments in small and medium capitalization companies tend to have limited liquidity and greater price volatility than large capitalization companies.
4
Brandes International Equity Fund
Diversification does not guarantee a profit or protect from loss in a declining market.
Alpha: A measure of performance based on the excess return of an investment relative to the return of a benchmark index.
Interest Coverage Ratio: Used to determine a company’s ability to pay interest on outstanding debt with available earnings.
Operating Margin: Operating income divided by net sales; used to measure a company’s operating efficiency.
Yield: Annual income from the investment (dividend, interest, etc.) divided by the current market price of the investment.
The declaration and payment of shareholder dividends are solely at the discretion of the issuer and are subject to change at any time.
Please refer to the Schedule of Investments in the report for complete holdings information. Fund holdings, geographic allocations and/or sector allocations are subject to change at any time and are not considered a recommendation to buy or sell any security.
The foregoing reflects the thoughts and opinions of Brandes Investment Partners® exclusively and is subject to change without notice.
Brandes Investment Partners® is a registered trademark of Brandes Investment Partners, L.P. in the United States and Canada.
Must be preceded or accompanied by a prospectus.
Index Guide
The MSCI EAFE (Europe, Australasia, Far East) Index with net dividends measures equity market performance of developed markets in Europe, Australasia, and the Far East.
MSCI has not approved, reviewed or produced this report, makes no express or implied warranties or representations and is not liable whatsoever for any data in the report. You may not redistribute the MSCI data or use it as a basis for other indices or investment products.
One cannot invest directly in an index.
The Brandes International Equity Fund is distributed by ALPS Distributors, LLC.
5
Brandes International Equity Fund
The following chart compares the value of a hypothetical $100,000 investment in the Brandes International Equity Fund – Class I from March 31, 2007 to March 31, 2017 with the value of such an investment in the MSCI EAFE (Europe, Australasia and Far East) Index for the same period.
Value of $100,000 Investment vs MSCI EAFE (Europe, Australasia and Far East) Index (Unaudited)
| Average Annual Total Return Periods Ended March 31, 2017 | ||||||||||||||||
| One Year | Five Years | Ten Years | Since Inception(1) | |||||||||||||
Brandes International Equity Fund | ||||||||||||||||
Class A* | 12.17 | % | 6.15 | % | 0.61 | % | 7.82 | % | ||||||||
Class A* (with maximum sales charge) | 5.73 | % | 4.91 | % | 0.02 | % | 7.51 | % | ||||||||
Class C* | 11.36 | % | 5.35 | % | -0.17 | % | 7.00 | % | ||||||||
Class I | 12.38 | % | 6.34 | % | 0.80 | % | 8.05 | % | ||||||||
Class R6* | 12.68 | % | 6.44 | % | 0.87 | % | 8.12 | % | ||||||||
MSCI EAFE (Europe, Australasia, and Far East) Index | 11.67 | % | 5.83 | % | 1.05 | % | 4.48 | % | ||||||||
| (1) | The inception date is January 2, 1997. |
| * | Performance shown prior to January 31, 2011 for Class A shares reflects the performance of Class I shares adjusted to reflect Class A expenses. Performance shown prior to January 31, 2013 for Class C shares reflects the performance of Class I shares adjusted to reflect Class C expenses. Performance shown prior to February 1, 2016 for Class R6 shares reflects the performance of Class I shares adjusted to reflect Class R6 expenses. |
Performance data quoted represents past performance; past performance does not indicate future results. The investment return and principal value of an investment will fluctuate so that an investor’s shares, when redeemed, may be worth more or
6
Brandes International Equity Fund
less than their original cost. Current performance of the Fund may be lower or higher than the performance quoted. Performance data current to the most recent month end may be obtained by calling 800-331-2979.
The returns shown do not reflect the deduction of taxes that a shareholder would pay on Fund distributions or the redemption of Fund shares. The Advisor has a fee waiver arrangement in place to limit the Fund’s annual operating expenses.
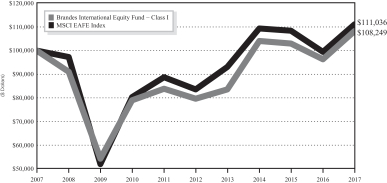
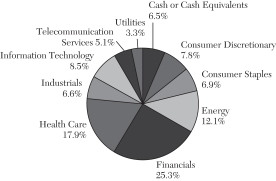
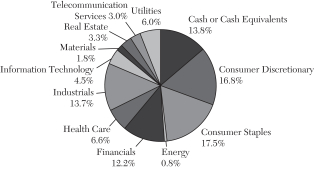
Sector Allocation as a Percentage of Total Investments as of
March 31, 2017 (Unaudited)
The sector classifications represented in the graph above and industry classifications represented in the Schedule of Investments are in accordance with Global Industry Classification Standard (GICS®), which was developed by and/or is the exclusive property of MSCI, Inc. and Standard & Poor Financial Services LLC.
7
Brandes Global Equity Fund
Dear Fellow Investor,
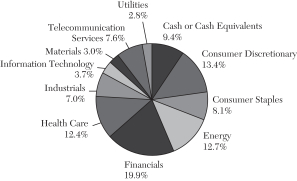
The net asset value of the Brandes Global Equity Fund (Class I Shares) rose 9.75% in the six months ended March 31, 2017. For the same period, the MSCI World Index increased 8.35%.
Allocations to a number of U.S.-based banks significantly boosted performance. Notable contributors included Bank of America, Citigroup, Wells Fargo, PNC Financial Services and Bank of New York Mellon.
After posting negative returns in the first half of 2016, these banks regained lost ground in the year’s second half as the market began to anticipate a generally better operating environment in the years ahead.
We believe despite their significant recent rally, our U.S. bank holdings continue to present attractive investment opportunities. As of March 31, they traded at low multiples of forward earnings and book value. Additionally, they have offered more attractive yields than areas of the market that investors have traditionally flocked to as yield plays, such as those in the consumer staples sector. Unlike many other yield plays, several U.S. banks have grown earnings in the last five years and have had a higher total shareholder yield (buybacks and dividends) with, in our opinion, a better opportunity to sustain and grow their payouts.
Additionally, the Fund’s emerging market holdings aided returns, including South Korean technology company Samsung Electronics and auto maker Hyundai Motor, as well as Brazil-based jet manufacturer Embraer and telecommunications firm TIM Participacoes. These companies enjoyed double-digit gains as emerging markets’ strong 2016 performance extended into the first quarter of 2017.
TIM Participacoes’ share price increased after the company announced solid financial results for the fourth quarter of 2016. The company’s revenue has improved, with growth mainly coming from contract subscribers and price increases. Moreover, its cost-cutting initiatives have been advancing at a good pace.
Other positive contributors included U.S.-based computer data storage company Western Digital and holding company Leucadia National Corp., as well as France-based pharmaceutical firm Sanofi, the Fund’s largest holding.
The Fund’s most significant return detractors were South Korea-based auto components manufacturer Hyundai Mobis, Sweden-based telecommunications equipment company Ericsson and China-based telecommunications firm China Mobile.
Ericsson declined on the back of weaker earnings guidance due to a lull in demand for wireless network equipment from carriers, its primary customers. However, the company has been working on cutting costs to improve margins. We believe despite the currently weak carrier spending environment, Ericsson should see its profitability pick up when spending starts to eventually recover from the 2016/2017 decline. Moreover, we hold the view that the company is well positioned to benefit from the industry consolidation that has occurred over the last several years.
8
Brandes Global Equity Fund
The investment team initiated positions in France-based advertising agency Publicis, South Korea-based KT&G (formerly known as Korea Tobacco & Ginseng) and U.S. drug distributor McKesson.
As the world’s third-largest global ad agency holding company, Publicis is the owner of many of the industry’s most valuable brands such as Saatchi & Saatchi, Leo Burnett, Razorfish, ZenithOptimedia and Starcom MediaVest. Publicis has historically been a well-run company with a sound balance sheet and industry-leading margins.
In our view, the business model of ad agencies has attractive economics given their variable cost structure, as well as exposure to long-term ad spending and global gross domestic product growth. While the industry as a whole appears to be valued somewhat fully by the market, Publicis has been the recent exception due to concerns over slowing organic growth, a handful of recent account losses and its acquisition of Sapient (its largest acquisition to date), which was seen as expensive.
In our view, excessive short-term pessimism centered on these recent missteps has created an attractive entry point in Publicis’ shares for long-term focused investors. Historically, Publicis management has displayed, in our opinion, an admirable track record of profitability, earnings growth, operational execution and successful acquisition integration. We do not view recent client losses and the potential overpayment for Sapient as evidence of permanent structural changes in the business, and we believe Publicis is well positioned to return to levels of growth in line with its peers. Given its strong free-cash-flow generation, we also expect the company will quickly de-lever its balance sheet.
The investment team decided to divest the Fund’s position in U.S.-based Corning, the world’s largest manufacturer of LCD glass, after its share price appreciated to our estimate of intrinsic value following the company’s strong 2016 performance.
We initially purchased Corning several years ago after its price declined on a variety of market concerns, including pricing pressure in the LCD TV glass market, concerns about currency fluctuation in the value of the yen as LCD glass is priced in yen, and overall growth prospects for Corning’s business.
Despite these concerns, we believed the shares offered an attractive discount to our estimate of its long-term intrinsic value for a number of reasons:
| • | The company’s strong technological know-how |
| • | History of innovation |
| • | Solid competitive position |
| • | A healthy balance sheet |
| • | Attractive capital return plan |
Over the past several years, Corning has returned half of its free cash flow to shareholders, reflecting its commitment to increase shareholder value. Additionally, the company has benefited from growth in its Gorilla Glass business,
9
Brandes Global Equity Fund
which produces thin sheet glass used as a protective cover providing scratch resistance and durability. Finally, the LCD-TV glass market has moved from a cyclically depressed environment to a cyclically elevated one. As a result of these factors and after the company increased its capital return to shareholders, Corning’s stock price appreciated to our estimate of intrinsic value and we sold our position.
Outlook
As of March 31, the Fund’s valuation metrics remained more appealing than those of the benchmark, as measured by price-to-book, price-to-earnings and price-to-cash-flow ratios. It also offered a higher dividend yield than the MSCI World Index.
Allocations to emerging markets, the United Kingdom and France represented the Fund’s largest relative overweight positions (calculated as a percentage of benchmark weights). From an industry standpoint, key areas of exposure were in banks, pharmaceuticals, oil, gas & consumable fuels, capital markets and automobiles. The Fund maintained its largest underweight position in the United States.
Information technology, which in past years represented a large overweight for the Fund (largely in what we called “boring” or mature technology companies mostly based in the United States), is currently the largest underweight to the index. Several companies from this group have had strong share-price appreciation, moving closer to or exceeding our intrinsic value estimates. Consequently, the investment committee decided to pare or sell several of our tech holdings over the past year.
The investment team’s allocation decisions are based on a fundamental, bottom-up investment approach focused on seeking the most attractive value in all corners of the globe.
While markets, economies and investor sentiment constantly change, our long-term focus is the same. We seek to take advantage of indiscriminate mispricing to uncover potentially undervalued opportunities, while avoiding areas that may be overheated. We are confident that our unwavering commitment to value investing will provide for attractive long-term returns for the Fund.
Sincerely yours,
The Brandes Global Large-Cap Investment Committee
Brandes Investment Trust
Because the values of the Fund’s investments will fluctuate with market conditions, so will the value of your investment in the Fund. You could lose money on your investment in the Fund, or the Fund could underperform other investments. The values of the Fund’s investments fluctuate in response to the activities of individual companies and general stock market
10
Brandes Global Equity Fund
and economic conditions. In addition, the performance of foreign securities depends on the political and economic environments and other overall economic conditions in the countries where the Fund invests. Emerging country markets involve greater risk and volatility than more developed markets. Some emerging markets countries may have fixed or managed currencies that are not free-floating against the U.S. dollar. Certain of these currencies have experienced, and may experience in the future, substantial fluctuations or a steady devaluation relative to the U.S. dollar.
Diversification does not guarantee a profit or protect from loss in a declining market.
Book Value: Assets minus liabilities. Also known as shareholders’ equity.
Free Cash Flow: Total cash flow from operations less capital expenditures.
Forward Earnings: Sell-side analysts’ consensus earnings estimates for the next fiscal year
Intrinsic Value: The actual value of a company or an asset based on an underlying perception of its true value.
Price/Book: Price per share divided by book value per share.
Price/Cash Flow: Price per share divided by cash flow per share.
Price/Earnings: Price per share divided by earnings per share.
Yield: Annual income from the investment (dividend, interest, etc.) divided by the current market price of the investment.
Please refer to the Schedule of Investments in the report for complete holdings information. Fund holdings, geographic allocations and/or sector allocations are subject to change at any time and are not considered a recommendation to buy or sell any security.
The foregoing reflects the thoughts and opinions of Brandes Investment Partners® exclusively and is subject to change without notice.
Brandes Investment Partners® is a registered trademark of Brandes Investment Partners, L.P. in the United States and Canada.
Must be preceded or accompanied by a prospectus.
Index Guide
The MSCI World Index with net dividends measures equity market performance of developed markets.
MSCI has not approved, reviewed or produced this report, makes no express or implied warranties or representations and is not liable whatsoever for any data in the report. You may not redistribute the MSCI data or use it as a basis for other indices or investment products.
The Brandes Global Equity Fund is distributed by ALPS Distributors, LLC.
11
Brandes Global Equity Fund
The following chart compares the value of a hypothetical $100,000 investment in the Brandes Global Equity Fund – Class I from its inception (October 6, 2008) to March 31, 2017 with the value of such an investment in the MSCI World Index for the same period.
Value of $100,000 Investment vs MSCI World Index (Unaudited)
| Average Annual Total Return Periods Ended March 31, 2017 | ||||||||||||||||
| One Year | Three Years | Five Years | Since Inception(1) | |||||||||||||
Brandes Global Equity Fund | ||||||||||||||||
Class A* | 15.35 | % | 2.54 | % | 7.96 | % | 7.11 | % | ||||||||
Class A* (with maximum sales charge) | 8.70 | % | 0.53 | % | 6.69 | % | 6.37 | % | ||||||||
Class C* | 14.46 | % | 1.78 | % | 7.18 | % | 6.29 | % | ||||||||
Class I | 15.58 | % | 2.79 | % | 8.24 | % | 7.34 | % | ||||||||
MSCI World Index | 14.77 | % | 5.52 | % | 9.37 | % | 8.92 | % | ||||||||
| (1) | The inception date is October 6, 2008. |
| * | Performance shown prior to January 31, 2011 for Class A shares reflects the performance of Class I shares adjusted to reflect Class A expenses. Performance shown prior to January 31, 2013 for Class C shares reflects the performance of Class I shares adjusted to reflect Class C expenses. |
Performance data quoted represents past performance; past performance does not indicate future results. The investment return and principal value of an investment will fluctuate so that an investor’s shares, when redeemed, may be worth more or less than their original cost. Current performance of the Fund may be lower or higher than the performance quoted. Performance data current to the most recent month end may be obtained by calling 800-331-2979.
12
Brandes Global Equity Fund
The returns shown do not reflect the deduction of taxes that a shareholder would pay on fund distributions or the redemption of fund shares. The Advisor has a fee waiver arrangement in place to limit the Fund’s annual operating expenses.
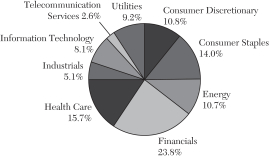
Sector Allocation as a Percentage of Total Investments as of
March 31, 2017 (Unaudited)
The sector classifications represented in the graph above and industry classifications represented in the Schedule of Investments are in accordance with Global Industry Classification Standard (GICS®), which was developed by and/or is the exclusive property of MSCI, Inc. and Standard & Poor Financial Services LLC.
13
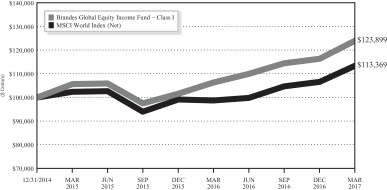
Brandes Global Equity Income Fund
Dear Fellow Investor,
The net asset value of the Brandes Global Equity Income Fund (Class I Shares) rose 8.46% in the six months ended March 31, 2017. For the same period, the MSCI World Index increased 8.35%.
The Fund’s most significant positive contributors included a diverse set of holdings in the United States, France, Switzerland and emerging markets.
U.S.-based banks PNC Financial Services, Wells Fargo and BB&T advanced strongly in the fourth quarter of 2016 following their negative performance in last year’s first half. The market seemed to begin anticipating a generally better operating environment for banks in the years ahead.
We believe despite their share-price appreciation, the Fund’s U.S. bank holdings continue to present attractive investment opportunities. As of March 31, they traded at low multiples of forward earnings and book value. Additionally, U.S. banks have offered more attractive yields than other areas of the market that investors have traditionally flocked to for yield, such as consumer staples. Unlike many other yield plays, several U.S. banks have grown earnings in the last five years and have had a higher total shareholder yield (buybacks and dividends) with, in our opinion, a better opportunity to sustain and grow their payouts.
U.S.-based computer data storage firm Western Digital also boosted Fund performance. The market seemed to have become more optimistic on the prospects for Western Digital’s NAND flash business (the storage business it acquired in its SanDisk acquisition in 2015) and appreciated the company’s improved results for its hard drive storage business.
Other notable contributors included France-based pharmaceutical firm Sanofi and luxury goods firm LVMH, Switzerland-based bank UBS and luxury goods firm Richemont, Brazil-based electric utility Companhia Paranaense de Energia (Copel), and South-Korea based technology company Samsung Electronics.
The Fund’s most significant performance detractors were U.K.-based retailer Kingfisher and pharmaceutical firm GlaxoSmithKline, communications equipment firms Ericsson (Sweden) and Nokia (Finland), Japanese pharmaceutical firm Daiichi Sankyo, as well as Brazilian telecommunications company Telefonica Brasil.
Ericsson and Nokia declined on the back of weaker earnings guidance due to a lull in demand for wireless network equipment from carriers, their primary customers. However, both companies have been working on cutting costs to improve margins. We believe despite the currently weak carrier spending environment, Ericsson and Nokia should see profitability pick up when spending starts to eventually recover from its current decline. Moreover, we hold the view that these companies are well positioned to benefit from the consolidation in the industry that has occurred over the last several years.
14
Brandes Global Equity Income Fund
During the period, the investment team initiated positions in companies exhibiting appealing valuations relative to our intrinsic value estimates and those with attractive dividend yield.
New additions included South Korea-based KT&G (formerly known as Korea Tobacco & Ginseng, with a dividend yield of 3.4% as of March 31), Mexico-based real estate firm Fibra Uno (div. yield: 6.2%) and France-based advertising agency Publicis (div. yield: 2.8%).
A Fibra (Fideicomiso de Infraestructura y Bienes Raíces) is an investment vehicle in Mexico that has similarities to a REIT (real estate investment trust) in the United States.
Fibra Uno (FUNO) is a Mexican trust formed primarily to acquire, own, develop and operate a broad range of commercial real estate in Mexico, including industrial, retail and office properties. FUNO has selectively assembled a diversified portfolio of high-quality, well-located, income-producing commercial properties. The trust began trading on the Mexican stock exchange in 2011 and is the first — also currently the largest — publicly listed Fibra.
Over the past few years, FUNO’s shares have been under pressure, mainly due to the peso depreciation, which affected the company’s real estate value and peso-denominated rental revenues. FUNO has more U.S. dollar-denominated debt than revenues; however, from a debt servicing perspective, it has what we consider solid revenue coverage of interest expense in U.S. dollars.
We were able to purchase FUNO at a very compelling price, in our opinion, as the company traded not only below our conservative estimate of its net asset value, but also for less than its initial public offering price in U.S. dollar terms. The company also has a very attractive dividend yield that we believe is sustainable given the support of the income stream derived from the properties in which it owns. Moreover, while the market is focused on U.S. policy concerns, we appreciate that the company’s property portfolio has limited direct exposure to major exporters to the United States, and that management continues to demonstrate strong capital allocation with a conservative balance sheet, which should enable the company to be opportunistic if market conditions weaken further in Mexico.
The Fund divested its position in Richemont as the company’s share price rose toward our intrinsic value estimate, with the price appreciation also lowering the yield to 2.2%.
We also sold U.S. semiconductor firm Xilinx (dividend yield of 2.2% as of 12/31/2016).
We initially purchased Xilinx, the world’s largest field-programmable gate array (FPGA) company, nearly two years ago after its share price declined on market concerns of a near-term semiconductor downturn and weakened spending in one of Xilinx’s key end markets. Despite these concerns, we believed the company offered a number of positive attributes.
15
Brandes Global Equity Income Fund
In the last two years, Xilinx generated strong returns on capital, while its main competitor was acquired by Intel at a significant premium to Xilinx’s valuation. As a result, Xilinx’s stock price appreciated as speculation increased about a potential takeover given: 1) Xilinx’s strong market share in products (FPGAs) that will be increasingly used in various computer acceleration applications, namely in the data center, artificial intelligence and automotive end markets; and 2) a highly active mergers and acquisitions environment in the semiconductor market. As a result, the company’s share price appreciated above our estimate of intrinsic value and we divested our position.
Outlook
As of March 31, the Brandes Global Equity Income Fund exhibited more appealing valuations than the benchmark, as measured by price-to-book, price-to-earnings and price-to-cash flow ratios. It also offered a higher dividend yield of 3.8% versus the MSCI World Index’s 2.4%.
The Fund’s largest overweight positions were in emerging markets, France and the United Kingdom, while its largest underweight positions were in the United States and Japan. From an industry standpoint, the Fund’s most significant weightings were in pharmaceuticals, U.K. food & staples retail, and oil, gas & consumable fuels.
The investment team’s allocation decisions are based on a fundamental, bottom-up investment approach centered on seeking companies around the world that are 1) potentially undervalued, and 2) offering attractive, higher-than-benchmark dividend yields. In our view, focusing on valuations and the sustainability of a company’s dividend enables us to select what we consider the best combination of value opportunities with attractive yield characteristics that are worthy of inclusion in the Fund.
Thank you for your business and continued trust.
Sincerely yours,
The Brandes Global Large-Cap Investment Committee
Brandes Investment Trust
Because the values of the Fund’s investments will fluctuate with market conditions, so will the value of your investment in the Fund. You could lose money on your investment in the Fund, or the Fund could underperform other investments. The values of the Fund’s investments fluctuate in response to the activities of individual companies and general stock market and economic conditions. In addition, the performance of foreign securities depends on the political and economic environments and other overall economic conditions in the countries where the Fund invests. Emerging country markets involve greater risk and volatility than more developed markets. Some emerging markets countries may have fixed or managed
16
Brandes Global Equity Income Fund
currencies that are not free-floating against the U.S. dollar. Certain of these currencies have experienced, and may experience in the future, substantial fluctuations or a steady devaluation relative to the U.S. dollar. Growth stocks typically are more volatile than value stocks; however, value stocks have a lower expected growth rate in earnings and sales.
Diversification does not assure a profit or protect against loss in a declining market.
Book Value: Assets minus liabilities. Also known as shareholders’ equity.
Free Cash Flow: Total cash flow from operations less capital expenditures.
Forward Earnings: Sell-side analysts’ consensus earnings estimates for the next fiscal year
Intrinsic Value: The actual value of a company or an asset based on an underlying perception of its true value.
Price/Book: Price per share divided by book value per share.
Price/Cash Flow: Price per share divided by cash flow per share.
Price/Earnings: Price per share divided by earnings per share.
Return on Capital: Net income minus dividends divided by total capital; used to assess a company’s efficiency at allocating the capital under its control to profitable investments.
Yield: Annual income from the investment (dividend, interest, etc.) divided by the current market price of the investment.
SEC 30-Day Yield (Class I Shares): 2.51% (subsidized) -12.33% (unsubsidized) This calculation is based on a 30-day period ending on the last day of the month shown. It is computed by dividing the net investment income per share earned during the period by the maximum offering price per share on the last day of the period. The yield figure reflects the dividends and interest earned during the period, after the deduction of the fund expenses. A subsidized yield takes into consideration the expenses paid by the advisor.
Please refer to the Schedule of Investments in the report for complete holdings information. Fund holdings, geographic allocations and/or sector allocations are subject to change at any time and are not considered a recommendation to buy or sell any security.
The foregoing reflects the thoughts and opinions of Brandes Investment Partners® exclusively and is subject to change without notice.
Brandes Investment Partners® is a registered trademark of Brandes Investment Partners, L.P. in the United States and Canada.
Must be preceded or accompanied by a prospectus.
17
Brandes Global Equity Income Fund
Index Guide
The MSCI World Index with net dividends measures equity market performance of developed markets.
MSCI has not approved, reviewed or produced this report, makes no express or implied warranties or representations and is not liable whatsoever for any data in the report. You may not redistribute the MSCI data or use it as a basis for other indices or investment products.
The Brandes Global Equity Income Fund is distributed by ALPS Distributors, LLC.
18
Brandes Global Equity Income Fund
The following chart compares the value of a hypothetical $100,000 investment in the Brandes Global Equity Income Fund – Class I from its inception (December 31, 2014) to March 31, 2017 with the value of such an investment in the MSCI World Index for the same period.
Value of $100,000 Investment vs MSCI World Index (Unaudited)
| Average Annual Total Return Periods Ended March 31, 2017 | ||||||||
| One Year | Since Inception(1) | |||||||
Brandes Global Equity Income Fund | ||||||||
Class A | 18.82 | % | 10.95 | % | ||||
Class A (with maximum sales charge) | 11.99 | % | 8.07 | % | ||||
Class C | 15.43 | % | 9.00 | % | ||||
Class I | 16.53 | % | 10.01 | % | ||||
MSCI World Index | 14.77 | % | 5.74 | % | ||||
| (1) | The inception date is December 31, 2014. |
19
Brandes Global Equity Income Fund
Performance data quoted represents past performance; past performance does not indicate future results. The investment return and principal value of an investment will fluctuate so that an investor’s shares, when redeemed, may be worth more or less than their original cost. Current performance of the Fund may be lower or higher than the performance quoted. Performance data current to the most recent month end may be obtained by calling 800-331-2979.
The returns shown do not reflect the deduction of taxes that a shareholder would pay on fund distributions or the redemption of fund shares. The Advisor has a fee waiver arrangement in place to limit the Fund’s annual operating expenses.
Sector Allocation as a Percentage of Total Investments as of March 31, 2017 (Unaudited)
The sector classifications represented in the graph above and industry classifications represented in the Schedule of Investments are in accordance with Global Industry Classification Standard (GICS®), which was developed by and/or is the exclusive property of MSCI, Inc. and Standard & Poor Financial Services LLC.
20
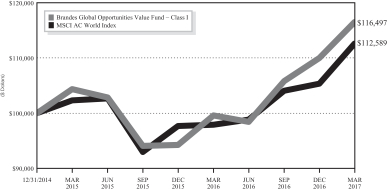
Brandes Global Opportunities Value Fund
Dear Fellow Investor,
The net asset value of the Brandes Global Opportunities Value Fund (Class I Shares) rose 10.12% in the six months ended March 31, 2017. For the same period, the MSCI All Country World Index increased 8.18%.
Allocations to companies in health care, consumer staples and industrials significantly helped relative performance, as did positions in the United States and Brazil.
At the company level, a number of financial holdings boosted returns, led by U.S.-based Bank of America, Citigroup and Leucadia National Corporation. Other major positive contributors included Brazilian regional jet manufacturer Embraer, as well as U.S.-based engine manufacturer Briggs & Stratton and computer data storage company Western Digital.
Embraer rebounded in the period after performing poorly in the first nine months of 2016. The company’s core regional and business jet markets have been at cyclical lows, but we believe they are mean-reverting over the long term. Recently, the market seemed to have become more optimistic about Embraer’s production schedule and budget for its new aircraft. Amid the resulting share-price appreciation, we continue to see value in Embraer as it is well managed, holds competitive positions across its end markets, and has a strong balance sheet, even after years of aggressive product development.
Holdings in consumer discretionary generated positive absolute returns overall but detracted from relative performance. Additionally, the Fund’s real estate positions weighed on returns.
Notable detractors from a country standpoint included allocations to companies in the United Kingdom and Mexico. At the company level, U.K.-based real estate firm Countrywide, South Korean auto component manufacturer Hyundai Mobis and French utility Engie hurt returns.
Countrywide continued to struggle with uncertainties surrounding Brexit (the United Kingdom’s decision to leave the European Union), which have led to fewer buyers and sellers in the housing market. Despite the continued slowdown in housing sales, we believe Countrywide is well positioned to adapt its business mix, as its rental business provides somewhat of a hedge in this challenging environment.
In a relatively light period for activity, the All-Cap Investment Committee initiated positions in China Mobile, U.S.-based health care firms McKesson Corporation and Express Scripts, South Korean tobacco company KT&G and Mexico-based Fibra Uno.
A Fibra (Fideicomiso de Infraestructura y Bienes Raíces) is an investment vehicle in Mexico that has similarities to a REIT (real estate investment trust) in the United States.
21
Brandes Global Opportunities Value Fund
Fibra Uno (FUNO) is a Mexican trust formed primarily to acquire, own, develop and operate a broad range of commercial real estate in Mexico, including industrial, retail and office properties. FUNO has selectively assembled a diversified portfolio of high-quality, well-located, income-producing commercial properties. The trust began trading on the Mexican stock exchange in 2011 and is the first — also currently the largest — publicly listed Fibra.
Over the past few years, FUNO’s shares have been under pressure, mainly due to the peso depreciation, which affected the company’s real estate value and peso-denominated rental revenues. FUNO has more U.S. dollar-denominated debt than revenues; however, from a debt servicing perspective, it has what we consider solid revenue coverage of interest expense in U.S. dollars.
We were able to purchase FUNO at a very compelling price, in our opinion, as the company traded not only below our conservative estimate of its net asset value, but also for less than its initial public offering price in U.S. dollar terms. The company also has a very attractive dividend yield that we believe is sustainable given the support of the income stream derived from the properties in which it owns. Moreover, while the market is focused on U.S. policy concerns, we appreciate that the company’s property portfolio has limited direct exposure to major exporters to the United States, and that management continues to demonstrate strong capital allocation with a conservative balance sheet, which should enable the company to be opportunistic if market conditions weaken further in Mexico.
The only position sold from the Fund was TIM Participacoes (TSU), the fourth-largest telecommunication firm by sales in Brazil and the second largest in terms of wireless subscribers.
Over the last year, TSU’s operations have improved, enabling the company to grow its revenue. Additionally, positive industry developments and rumors of a possible acquisition renewed investor interest in TSU. As the company appeared fully valued, we exited our position.
Outlook
We have been finding many value opportunities in emerging markets, with over a third of the Fund allocated to companies in this region as of March 31, 2017. From a country perspective, Brazil and South Korea continued to represent major overweights, while the United States remained a significant underweight position. From a sector standpoint, the Fund held its key overweights in real estate and telecommunication services.
At Brandes, our investment process focuses on a bottom-up analysis. As such, the Fund’s country and industry weightings are the result of our research-driven stock selection and reflect our convictions.
Our focus remains long term as we seek to take advantage of indiscriminate mispricing by pursuing potentially undervalued opportunities while avoiding areas
22
Brandes Global Opportunities Value Fund
that may be overheated. We believe this price-matters approach is the best way we can pursue attractive long-term returns for Fund shareholders.
As always, thank you for your continued trust.
Sincerely yours,
The Brandes All-Cap Investment Committee
Brandes Investment Trust
Because the values of the Fund’s investments will fluctuate with market conditions, so will the value of your investment in the Fund. You could lose money on your investment in the Fund, or the Fund could underperform other investments. The values of the Fund’s investments fluctuate in response to the activities of individual companies and general stock market and economic conditions. In addition, the performance of foreign securities depends on the political and economic environments and other overall economic conditions in the countries where the Fund invests. Emerging country markets involve greater risk and volatility than more developed markets. Some emerging markets countries may have fixed or managed currencies that are not free-floating against the U.S. dollar. Certain of these currencies have experienced, and may experience in the future, substantial fluctuations or a steady devaluation relative to the U.S. dollar. Investments in small and medium capitalization companies tend to have limited liquidity and greater price volatility than large capitalization companies.
Diversification does not guarantee a profit or protect from loss in a declining market.
Interest Coverage Ratio: Used to determine a company’s ability to pay interest on outstanding debt with available earnings.
Yield: Annual income from the investment (dividend, interest, etc.) divided by the current market price of the investment.
The declaration and payment of shareholder dividends are solely at the discretion of the issuer and are subject to change at any time.
Please refer to the Schedule of Investments in the report for complete holdings information. Fund holdings, geographic allocations and/or sector allocations are subject to change at any time and are not considered a recommendation to buy or sell any security.
The foregoing reflects the thoughts and opinions of Brandes Investment Partners® exclusively and is subject to change without notice.
Brandes Investment Partners® is a registered trademark of Brandes Investment Partners, L.P. in the United States and Canada.
Must be preceded or accompanied by a prospectus.
23
Brandes Global Opportunities Value Fund
Index Guide
The MSCI All Country World Index with net dividends measures equity market performance of developed and emerging markets.
MSCI has not approved, reviewed or produced this report, makes no express or implied warranties or representations and is not liable whatsoever for any data in the report. You may not redistribute the MSCI data or use it as a basis for other indices or investment products.
One cannot invest directly in an index.
The Brandes Global Opportunities Value Fund is distributed by ALPS Distributors, LLC.
24
Brandes Global Opportunities Value Fund
The following chart compares the value of a hypothetical $100,000 investment in the Brandes Global Opportunities Value Fund – Class I from its inception (December 31, 2014) to March 31, 2017 with the value of such an investment in the MSCI All Country World Index for the same period.
Value of $100,000 Investment vs MSCI All Country World Index (Unaudited)
| Average Annual Total Return Periods Ended March 31, 2017 | ||||||||
| One Year | Since Inception(1) | |||||||
Brandes Global Opportunities Value Fund | ||||||||
Class A | 16.63 | % | 6.94 | % | ||||
Class A (with maximum sales charge) | 9.97 | % | 4.16 | % | ||||
Class C | 15.85 | % | 6.16 | % | ||||
Class I | 16.99 | % | 7.03 | % | ||||
MSCI All Country World Index | 15.04 | % | 5.42 | % | ||||
| (1) | The inception date is December 31, 2014. |
Performance data quoted represents past performance; past performance does not indicate future results. The investment return and principal value of an investment will fluctuate so that an investor’s shares, when redeemed, may be worth more or less than their original cost. Current performance of the Fund may be lower or higher than the performance quoted. Performance data current to the most recent month end may be obtained by calling 800-331-2979.
25
Brandes Global Opportunities Value Fund
The returns shown do not reflect the deduction of taxes that a shareholder would pay on fund distributions or the redemption of fund shares. The Advisor has a fee waiver arrangement in place to limit the Fund’s annual operating expenses.
Sector Allocation as a Percentage of Total Investments as of March 31, 2017 (Unaudited)
The sector classifications represented in the graph above and industry classifications represented in the Schedule of Investments are in accordance with Global Industry Classification Standard (GICS®), which was developed by and/or is the exclusive property of MSCI, Inc. and Standard & Poor Financial Services LLC.
26
Brandes Emerging Markets Value Fund
Dear Fellow Investor,
The net asset value of the Brandes Emerging Markets Value Fund (Class I Shares) rose 10.11% in the six months ended March 31, 2017. For the same period, the MSCI Emerging Markets Index increased 6.80%.
Noteworthy positive contributors included holdings in industrials, telecommunication services and consumer staples. From a country perspective, the Fund benefited from positions in Brazil, Russia and Hong Kong.
On an individual security basis, Russian wireless telecommunication services provider Mobile TeleSystems, Brazilian jet manufacturer Embraer and Hong Kong-based specialty retailer Chow Tai Fook Jewellery helped performance significantly. Additionally, the Fund’s holding in McDonald’s franchisee Arcos Dorados aided returns.
Domiciled in Argentina, Arcos’ largest market is Brazil. In the first quarter of 2017, the company announced a new restaurant opening and reinvestment plan for the period 2017-2019, which was well received by the market. Under its agreement with McDonalds, Arcos Dorados expects to open at least 180 new restaurants and reinvest $292 million in its existing restaurants. Furthermore, as its balance sheet leverage has improved over the past year, Arcos Dorados decided not to pursue further asset monetization deals.
The Fund’s positions in real estate and its significant underweight to information technology (IT) hurt performance. Regionally, holdings in Turkey and South Korea weighed on relative returns, along with a lack of allocation to Taiwan.
Meanwhile, at the company level, primary detractors included Turkish real estate firm Emlak Konut, as well as South Korean auto companies Hyundai Mobis and KIA Motors.
New buys during the period included South Korean tobacco company KT&G and Indian IT services providers Infosys and Tech Mahindra (TechM).
Originally created as a joint venture between Indian Mahindra & Mahindra and British BT Group, TechM provides IT services, networking technology solutions and business process outsourcing primarily to the telecommunications sector.
TechM has grown its business through a number of acquisitions over the years. Lately, the company has been experiencing integration issues, resulting in depressed operating margins. It has also been slightly behind its competitors, such as Infosys and TCS, in the automation space, which has further contributed to margin compression. Nonetheless, in addition to its strong presence in the telecommunications sector, TechM has been able to successfully penetrate other industry markets because of its strong network management capabilities. These capabilities have allowed TechM to become a preferred partner for many cutting-edge IoT (internet of things) platform providers such as GE, Bosch and IBM.
27
Brandes Emerging Markets Value Fund
TechM’s investment thesis hinges upon its ability to enhance margins and operational efficiency. After its failed integration of U.S.-based Lightbridge Communications (LCC), which the company acquired in 2014, the market questioned TechM’s competence to increase margins and execute its growth strategy effectively. However, we have observed signs of a turnaround. While a disruption by cloud computing may present a headwind for TechM, we believe the company should be among the least negatively affected Indian IT services players because it is focused primarily on network management (more a facilitator of the cloud technology than a victim of it).
Finally, TechM, along with other Indian IT services providers, has recently seen its stock price fall on the specter of proposed protectionist policies in the United States. This provided us with a good opportunity to invest in the company, as we believe TechM and other offshore providers will be able to adjust their pricing and service model to minimize the impact of such policies on their earnings. Considering its strengths and the challenges it currently faces, we believe TechM offers an attractive risk/reward tradeoff over the long term.
Other activity included the divestments of Panamanian airline Copa Holdings and Turkish airport operator TAV Havalimanlari Holding.
Outlook
As always, we anchor our allocation decisions on a fundamental, bottom-up investment approach seeking the most attractive value in emerging markets.
Brazil continued to represent the Fund’s largest country weighting at quarter end, even after we sold or trimmed a number of our positions there. While our composition of Brazilian holdings remains well diversified, in our opinion, the companies we now own are mostly domestic oriented, with the exception of export-focused Embraer.
Meanwhile, we continued to struggle to find attractive value potential in China and the country remained our largest underweight position. Moreover, even with the additions of Tech Mahindra and Infosys in the period, our allocations to the information technology sector and to India were still well below those of the index as of March 31, 2017.
At Brandes, our focus remains long term as we seek to take advantage of indiscriminate mispricing by pursuing potentially undervalued opportunities, while avoiding areas that may be overheated. We believe this price-matters approach is the best way we can pursue alpha for client portfolios.
Sincerely yours,
The Brandes Emerging Markets Investment Committee
Brandes Investment Trust
28
Brandes Emerging Markets Value Fund
Because the values of the Fund’s investments will fluctuate with market conditions, so will the value of your investment in the Fund. You could lose money on your investment in the Fund, or the Fund could underperform other investments. The values of the Fund’s investments fluctuate in response to the activities of individual companies and general stock market and economic conditions. In addition, the performance of foreign securities depends on the political and economic environments and other overall economic conditions in the countries where the Fund invests. Emerging country markets involve greater risk and volatility than more developed markets. Some emerging markets countries may have fixed or managed currencies that are not free-floating against the U.S. dollar. Certain of these currencies have experienced, and may experience in the future, substantial fluctuations or a steady devaluation relative to the U.S. dollar. Investments in small and medium capitalization companies tend to have limited liquidity and greater price volatility than large capitalization companies.
Diversification does not guarantee a profit or protect from loss in a declining market.
Alpha: A measure of performance based on the excess return of an investment relative to the return of a benchmark index.
‘Please refer to the Schedule of Investments in the report for complete holdings information. Fund holdings, geographic allocations and/or sector allocations are subject to change at any time and are not considered a recommendation to buy or sell any security.
The foregoing reflects the thoughts and opinions of Brandes Investment Partners® exclusively and is subject to change without notice.
Brandes Investment Partners® is a registered trademark of Brandes Investment Partners, L.P. in the United States and Canada.
Must be preceded or accompanied by a prospectus.
Index Guide
The MSCI Emerging Markets Index with net dividends measures equity market performance of emerging markets. Data prior to 2001 is gross dividend and linked to the net dividend returns.
MSCI has not approved, reviewed or produced this report, makes no express or implied warranties or representations and is not liable whatsoever for any data in the report. You may not redistribute the MSCI data or use it as a basis for other indices or investment products.
One cannot invest directly in an index.
29
Brandes Emerging Markets Value Fund
The Brandes Emerging Markets Value Fund is distributed by ALPS Distributors, LLC.
30
Brandes Emerging Markets Value Fund
The following chart compares the value of a hypothetical $100,000 investment in the Brandes Emerging Markets Value Fund – Class I from March 31, 2007 to March 31, 2017 with the value of such an investment in the MSCI Emerging Markets Index for the same period.
Value of $100,000 Investment vs MSCI Emerging Markets Index (Unaudited)
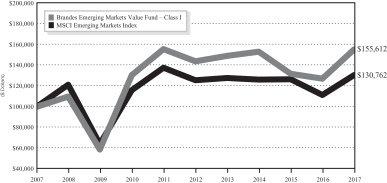
| Average Annual Total Return Periods Ended March 31, 2017** | ||||||||||||||||
| One Year | Five Years | Ten Years | Since Inception(1) | |||||||||||||
Brandes Emerging Markets Value Fund | ||||||||||||||||
Class A | 21.86 | % | 1.28 | % | 4.27 | % | 7.53 | % | ||||||||
Class A (with maximum sales charge) | 14.86 | % | 0.09 | % | 3.66 | % | 7.22 | % | ||||||||
Class C* | 20.97 | % | 0.55 | % | 3.49 | % | 6.73 | % | ||||||||
Class I | 22.10 | % | 1.55 | % | 4.52 | % | 7.80 | % | ||||||||
Class R6* | 22.28 | % | 1.62 | % | 4.58 | % | 7.86 | % | ||||||||
MSCI Emerging Markets Index | 17.22 | % | 0.81 | % | 2.72 | % | 5.99 | % | ||||||||
| (1) | The inception date is August 20, 1996. |
| * | Performance shown prior to January 31, 2013 for Class C shares reflects the performance of Class I shares adjusted to reflect Class C expenses. Performance shown prior to July 11, 2016 for Class R6 shares reflects the performance of Class I shares adjusted to reflect Class R6 expenses. |
31
Brandes Emerging Markets Value Fund
| ** | Prior to January 31, 2011, the Advisor managed a private investment fund with an investment objective, investment policies and strategies that were, in all material respects, equivalent to those of the Brandes Emerging Markets Value Fund. The performance information shown for the Class I shares for periods before January 31, 2011 is that of the private investment fund and reflects the net expenses of the private investment fund. The performance of the private investment fund prior to January 31, 2011 is based on a calculation method that is different from the standardized calculation method prescribed by the SEC. The performance information shown for the Class A shares has been adjusted to reflect the differences in the net expense ratios between the Class I and A shares. The private investment fund was not registered under the Investment Company Act of 1940 (“1940 Act”) and was not subject to certain investment limitations, diversification requirements, and other restrictions imposed by the 1940 Act and the Internal Revenue Code of 1986, which, if applicable, may have adversely affected its performance. |
Performance data quoted represents past performance; past performance does not indicate future results. The investment return and principal value of an investment will fluctuate so that an investor’s shares, when redeemed, may be worth more or less than their original cost. Current performance of the Fund may be lower or higher than the performance quoted. Performance data current to the most recent month end may be obtained by calling 800-331-2979.
The returns shown do not reflect the deduction of taxes that a shareholder would pay on fund distributions or the redemption of fund shares. The Advisor has a fee waiver arrangement in place to limit the Fund’s annual operating expenses.
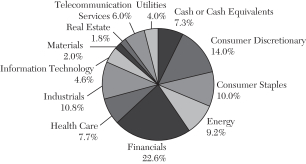
Sector Allocation as a Percentage of Total Investments as of
March 31, 2017 (Unaudited)
The sector classifications represented in the graph above and industry classifications represented in the Schedule of Investments are in accordance with Global Industry Classification Standard (GICS®), which was developed by and/or is the exclusive property of MSCI, Inc. and Standard & Poor Financial Services LLC.
32
Brandes International Small Cap Equity Fund
Dear Fellow Investor,
The net asset value of the Brandes International Small Cap Equity Fund (Class I Shares) advanced 7.61% in the six months ended March 31, 2017. For the same period, the S&P Developed Ex-U.S. SmallCap Index rose 4.27%.
Our stock selection in industrials, health care and information technology helped performance significantly. From a country standpoint, positions in Japan, Brazil and South Korea represented major positive contributors.
Top-performing holdings included Japanese power tool manufacturer Hitachi Koki and Brazilian regional jet maker Embraer, as well as medical equipment companies Draegerwerk (Germany) and Syneron Medical (Israel).
Over the last year, we took advantage of the market’s focus on short-term concerns to continue to build our position in Embraer at an attractive price, in our opinion. The company’s core regional and business jet markets have been at cyclical lows, but we believe they are mean-reverting over the long term. Recently, the market seemed to have become more optimistic about Embraer’s production schedule and budget for its new aircraft. Amid the resulting share-price appreciation, we continue to see value in Embraer as the company is well managed, holds competitive positions across its end markets, and has a strong balance sheet, even after years of aggressive product development.
The Fund’s underweight position to financials hurt relative returns, as did positions in the United Kingdom, Ireland and Italy. Meanwhile, primary detractors at the company level included U.K.-based real estate firm Countrywide and food product company Premier Foods, and Hong Kong-based satellite operator APT Satellite Holdings.
Countrywide continued to struggle with market uncertainties surrounding Brexit (the United Kingdom’s decision to leave the European Union), which have led to fewer buyers and sellers in the housing market. Despite the continued slowdown in housing sales, we believe Countrywide is well positioned to adapt its business mix, given its rental business provides a hedge in this challenging environment, in our opinion.
New buys in the period included Mexico-based real estate investment trust Fibra Uno and Canadian uranium producer Cameco. Additionally, the Small-Cap Investment Committee initiated several positions in Japan, namely Sankyo, Oita Bank, Toyo Susan Kaisha and Wacoal Holdings.
Meanwhile, divested holdings included Italian construction material companies Buzzi Unicem and Italcementi. Additionally, the investment committee exited a number of positions in Japan, namely Hibiya Engineering, Sega Sammy Holdings, Toshiba Machine, Hitachi Koki, Wakita & Co and Hosiden Corporation.
33
Brandes International Small Cap Equity Fund
Hosiden is an electronic components and devices manufacturer whose main business segments include:
| • | Building components for amusement applications, a vast majority of which is related to Nintendo’s hardware platforms |
| • | Mobile telecom, mainly switch components |
| • | Auto-related components |
In recent years, Hosiden saw its revenue from Nintendo deteriorate as the video game console industry faced declining sales due to increased competition from mobile gaming platforms. The company was also negatively affected by heightened competition in the mobile telecom component space and a slowing growth in the smartphone market.
Despite the challenging environment in its building-component and mobile-telecom segments, we saw an appealing value proposition in Hosiden’s auto-related segment, specifically in its hands-free microphone business. Hosiden sells voice-recognition modules directly to auto parts OEMs (original equipment manufacturers), optimized for the specific car platform. Hosiden’s auto-related segment represents not only its highest-margin business, but also an area with increasing growth as voice-recognition technology has become increasingly popular in new auto designs.
Additionally, Hosiden had a strong balance sheet, with its net cash position accounting for a large portion of our estimate of the company’s intrinsic value. We were also very attracted to the purchase price, as the stock represented what we call a net-net (i.e., the company traded for less than its current assets minus all liabilities).
Over the last year, Hosiden continued to allocate more resources toward its auto-related business and has made it a primary focus for the company, a move which seems to have been appreciated by the market. Moreover, as one of its component suppliers, Hosiden has benefited from the positive reception of the latest Nintendo Switch console release. We sold our position as the shares reached our intrinsic value estimate.
Outlook
As of March 31, 2017, holdings in Japan and the United Kingdom remained the Fund’s largest country weightings. We also continued to see tremendous value opportunities in emerging markets, which accounted for over 22% of the Fund.
Meanwhile, we remained underweight in Australia, Switzerland and France.
From a sector standpoint, the Fund held its key overweights in consumer staples and utilities, and its key underweights in industrials and materials.
As always, we anchor our allocation decisions on a fundamental, bottom-up investment approach focused on seeking the most attractive value in all corners of the globe.
34
Brandes International Small Cap Equity Fund
At Brandes, our focus remains long term as we seek to take advantage of indiscriminate mispricing by pursuing potentially undervalued opportunities, while avoiding areas that may be overheated. We believe this price-matters approach is the best way we can pursue alpha for client portfolios.
Sincerely yours,
The Brandes Small-Cap Investment Committee
Brandes Investment Trust
Because the values of the Fund’s investments will fluctuate with market conditions, so will the value of your investment in the Fund. You could lose money on your investment in the Fund, or the Fund could underperform other investments. The values of the Fund’s investments fluctuate in response to the activities of individual companies and general stock market and economic conditions. In addition, the performance of foreign securities depends on the political and economic environments and other overall economic conditions in the countries where the Fund invests. Emerging country markets involve greater risk and volatility than more developed markets. Some emerging markets countries may have fixed or managed currencies that are not free-floating against the U.S. dollar. Certain of these currencies have experienced, and may experience in the future, substantial fluctuations or a steady devaluation relative to the U.S. dollar. Investments in small and medium capitalization companies tend to have limited liquidity and greater price volatility than large capitalization companies.
Diversification does not guarantee a profit or protect from loss in a declining market.
Alpha: A measure of performance based on the excess return of an investment relative to the return of a benchmark index.
Net Cash: Total cash minus total debt.
Please refer to the Schedule of Investments in the report for complete holdings information. Fund holdings, geographic allocations and/or sector allocations are subject to change at any time and are not considered a recommendation to buy or sell any security.
The foregoing reflects the thoughts and opinions of Brandes Investment Partners® exclusively and is subject to change without notice.
Brandes Investment Partners® is a registered trademark of Brandes Investment Partners, L.P. in the United States and Canada.
Must be preceded or accompanied by a prospectus.
35
Brandes International Small Cap Equity Fund
Index Guide
The S&P Developed Ex-U.S. SmallCap Index with net dividends measures the equity performance of small-capitalization companies from developed markets excluding the United States. Data prior to 2001 is gross dividend and linked to the net dividend returns.
One cannot invest directly in an index.
The Brandes International Small Cap Equity Fund is distributed by ALPS Distributors, LLC.
36
Brandes International Small Cap Equity Fund
The following chart compares the value of a hypothetical $100,000 investment in the Brandes International Small Cap Fund – Class I from March 31, 2007 to March 31, 2017 with the value of such an investment in the S&P Developed Ex-U.S. SmallCap Index for the same period.
Value of $100,000 Investment vs S&P Developed
Ex-U.S. SmallCap Index (Unaudited)
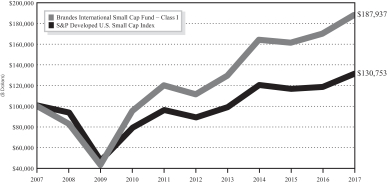
| Average Annual Total Return Periods Ended March 31, 2017** | ||||||||||||||||
| One Year | Five Years | Ten Years | Since Inception(1) | |||||||||||||
Brandes International Small Cap Fund | ||||||||||||||||
Class A | 10.34 | % | 10.76 | % | 6.27 | % | 10.06 | % | ||||||||
Class A (with maximum sales charge) | 3.99 | % | 9.45 | % | 5.64 | % | 9.74 | % | ||||||||
Class C* | 9.50 | % | 9.97 | % | 5.48 | % | 9.24 | % | ||||||||
Class I | 10.54 | % | 11.02 | % | 6.51 | % | 10.32 | % | ||||||||
Class R6* | 10.70 | % | 11.09 | % | 6.58 | % | 10.38 | % | ||||||||
S&P Developed Ex-U.S. Small Cap Index | 10.80 | % | 8.08 | % | 2.72 | % | 6.62 | % | ||||||||
| (1) | The inception date is August 19, 1996. |
| * | Performance shown prior to January 31, 2013 for Class C shares reflects the performance of Class I shares adjusted to reflect Class C expenses. Performance shown prior to June 27, 2016 for Class R6 shares reflects the performance of Class I shares adjusted to reflect Class R6 expenses. |
| ** | Prior to February 1, 2012, the Advisor managed a private investment fund with an investment objective, investment policies and strategies that were, in all material respects, equivalent to those of the Brandes International Small Cap Fund. The performance information shown for the Class I shares for periods before February 1, 2012 is that of the private investment fund and reflects the net expenses of the private investment fund. The performance of the private investment fund prior to February 1, 2012 is based on a calculation method that is different from the standardized calculation method prescribed by the SEC. The performance information shown for the Class A shares has been adjusted to reflect the differences in the net expense ratios between the Class I and A shares. The private investment fund was not registered under the Investment Company Act of 1940 (“1940 Act”) and was not subject to certain investment limitations, diversification requirements, and other restrictions imposed by the 1940 Act and the Internal Revenue Code of 1986, which, if applicable, may have adversely affected its performance. |
37
Brandes International Small Cap Equity Fund
Performance data quoted represents past performance; past performance does not indicate future results. The investment return and principal value of an investment will fluctuate so that an investor’s shares, when redeemed, may be worth more or less than their original cost. Current performance of the Fund may be lower or higher than the performance quoted. Performance data current to the most recent month end may be obtained by calling 800-331-2979.
The returns shown do not reflect the deduction of taxes that a shareholder would pay on fund distributions or the redemption of fund shares. The Advisor has a fee waiver arrangement in place to limit the Fund’s annual operating expenses.
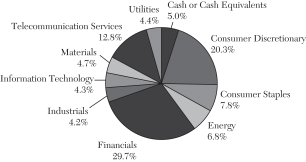
Sector Allocation as a Percentage of Total Investments as of
March 31, 2017 (Unaudited)
The sector classifications represented in the graph above and industry classifications represented in the Schedule of Investments are in accordance with Global Industry Classification Standard (GICS®), which was developed by and/or is the exclusive property of MSCI, Inc. and Standard & Poor Financial Services LLC.
38
Brandes Core Plus Fixed Income Fund
Dear Fellow Investor,
The Brandes Core Plus Fixed Income Fund (Class I Shares) declined 1.17% during the six months ended March 31, 2017, while its benchmark, the Bloomberg Barclays U.S. Aggregate Bond Index, declined 2.18%.
The most notable positive contributors were corporate holdings in banking, energy, utilities and commodity resources. The Fund also benefited from holdings in private student loan asset backed securities (ABS) and an underweight to agency mortgage backed securities (MBS).
Within the banking industry, the Fund received strong contributions from junior subordinated securities from U.S. Bank, JPMorgan and Wells Fargo. The U.S. Bank holding is a floating rate note while the JPMorgan and Wells Fargo holdings are currently fixed-rate securities, but will convert to floating rate notes in a year if they are not called. Bank credit profiles continue to improve, especially with short rates trending higher, and these securities also benefit from the possibility that they can convert to floating rate instruments.
Metals & mining companies Cloud Peak Energy and Royal Gold helped performance, as these companies benefited from higher commodity prices.
Cloud Peak is a coal miner operating in the Powder River Basin (Western United States). The company operates some of the industry’s lowest-cost mines in the country. During the fourth quarter of 2016 the company took steps to ease refinancing concerns by issuing a tender offer for its nearest term maturity (December 2019) and issuing second-lien notes maturing in 2021. The result of the tender was that Cloud Peak was able to reduce its debt maturing in 2019 from $200 million to $56 million. The company also benefited, post-U.S. presidential election, from the perception that the incoming administration will take a more favorable regulatory approach toward the coal industry.
In the first quarter of 2017, the Fund’s holdings in private student loan floating rate note ABS added to returns. We own securities backed by pools of loans issued from 2004 to 2007. We see improving credit trends with delinquencies declining, recovery rates increasing, and the credit enhancement feature of the bonds improving as the students in our pools are largely now in the workforce and thus better equipped to meet payment terms. Additionally, one feature common to private student loans is that most require a co-borrower. Therefore, in the event of bankruptcy the bond holder has recourse not only to the student, but typically the student’s parent or guardian as well. Furthermore, student loan debt is not dischargeable during bankruptcy, making the probability for an ultimate recovery high but the timing uncertain. These are floating rate notes that have begun to see their coupon rates reset higher as the Federal Reserve has begun to normalize interest rates.
39
Brandes Core Plus Fixed Income Fund
The Fund’s underweight position in U.S. agency MBS aided relative performance. The agency MBS market underperformed other taxable fixed-income sectors during the six-month period. MBS prices are typically sensitive to interest-rate volatility, and the sharp rise in interest rates during the fourth quarter, strong demand for corporate bonds and the anticipation that the Fed will begin to reduce MBS held on its balance sheet at some point this year caused agency MBS to underperform.
The Fund added Frontier Communications (6.25% coupon rate, maturing September 2021 and rated B1/B+). Frontier is a telecommunications company offering services in mostly rural areas and is the dominant provider in areas that it serves. The company is facing industry headwinds as landline operations appear to be experiencing a secular decline. We believe Frontier’s primarily rural markets should be more insulated from secular changes initially, making this issue (with four years until maturity) attractive.
We also took advantage of the weakness in the energy sector in the first quarter of 2017 to increase our weighting in Range Resources.
After the U.S. presidential election, the Fund increased its weighting in a number of financials, including Bank of America, Goldman Sachs and Wells Fargo, as the incoming administration has suggested that it will examine and potentially roll back some of the onerous regulations that have been placed on the financial industry since the Global Financial Crisis. The Fund also purchased a few industrial credits, namely AT&T, Tenet Healthcare and Transocean. The common theme with both the increased weighting in financials and industrial purchases is our continued preference for shorter maturities, with all of the bonds above scheduled to mature between 2017 and 2022.
Other activity included the sale of securities of Laboratory Corp. and Genworth Financial, which reached our estimates of intrinsic value.
Agency MBS Value
Over the last several years, the Fund’s largest underweight position has been agency MBS. As a byproduct of this underweight, we have had a larger allocation to U.S. Treasury securities than at any time in the Fund’s history.
The agency MBS market, in our view, has been supported by massive, and unprecedented, purchases by the Fed. In late 2008, the Fed began buying agency MBS to hold on its balance sheet in an effort to help alleviate the fallout from the financial crisis and stimulate lending in the U.S. housing market. Prior to that, the Fed did not hold any agency MBS on its balance sheet. Today, however, the Fed owns $1.7 trillion in agency MBS. In our opinion, the Fed’s increased involvement in the MBS market over the last several years has contributed to a considerable supply/demand imbalance, which in turn has made it difficult for us to find value in the sector.
40
Brandes Core Plus Fixed Income Fund
To illustrate how tight yield spreads have been, the average yield spread over U.S. Treasuries on the Bloomberg Barclays MBS Index over the past three years has been 0.23% (23 basis points). In comparison, for the 10-year period ended 12/31/2007, the average yield spread was 0.60% (60 basis points).
One mechanism to evaluate the relative values of agency MBS value and U.S. Treasury securities is the concept of breakeven spread analysis. The calculation is relatively straightforward. If one takes the yield spread divided by the duration, the result is how much the yield spread can widen before the returns are equivalent between similar maturity agency MBS and U.S. Treasuries. The current yield spread on the Bloomberg Barclays MBS Index is 0.27% and the duration is 4.95 years. Therefore, the current breakeven spread is 0.05%. If MBS yield spreads widen by more than 5 basis points, agency MBS will underperform similar maturity U.S. Treasury securities.
With yield spreads on agency MBS hovering near multi-decade lows, there is not much of a yield cushion in the event yield spreads widen. Additionally, the Fed is expected to eventually begin to unwind its massive agency MBS holdings. In their March meeting, Fed officials suggested that the move may come as early as this year. Given that we are almost 10 years into the Fed’s explicit support for the agency MBS market, we believe that the bank’s gradual exit may not be as smooth as most market participants hope. Consider what the market experienced in 2010 when the Fed made an initial attempt to slow its purchase activity. Yield spreads significantly widened, leading the Fed to launch another round of outright purchases. Even with an expected slowdown in mortgage origination due to higher interest rates, there is an enormous MBS supply that the market will need to absorb once the Fed slows and eventually ceases its purchase activity.
Agency MBS yield spreads have drifted wider over the last few months causing underperformance versus U.S. Treasury securities. Accordingly, our underweight to the agency MBS sector and overweight to U.S. Treasuries have benefited the Fund. We will continue to monitor developments and reassess our allocation when we believe there is value in owning additional agency MBS.
Outlook
As of March 31, the U.S. fixed-income market continued to operate in a low-volatility environment. This has caused a great deal of complacency among investors.
What could possibly go wrong with equities hitting all-time highs and yield spreads hovering near historic lows? In our view, this environment has driven investors to stretch their risk boundaries in an effort to pick up additional yield.
Against this backdrop, the Fed appeared to start the process of withdrawing its unprecedented monetary policy accommodation. Does this mean we could begin to see volatility rise toward its historical mean and valuations become guided by fundamentals? We certainly hope so. Until that happens, we believe it is best to remain patient, especially if you’re a long-term investor.
41
Brandes Core Plus Fixed Income Fund
At the close of the six-month period, the Brandes Core Plus Fixed Income Fund remained defensively positioned across a number of metrics. We favor short-maturity corporate bonds and those exhibiting strong, tangible asset coverage based on our analysis. We are underweight agency MBS and are managing duration toward the shorter end of our range. We have a high allocation to U.S. Treasuries that we will look to redeploy thoughtfully and efficiently — if and when market uncertainty and volatility cause credit fundamentals to become mispriced based on our intrinsic value estimates.
Sincerely yours,
The Brandes Fixed-Income Investment Committee
Brandes Investment Trust
Because the values of the Fund’s investments will fluctuate with market conditions, so will the value of your investment in the Fund. You could lose money on your investment in the Fund, or the Fund could underperform other investments. The values of the Fund’s investments fluctuate in response to the activities of individual companies and general stock market and economic conditions. In addition, the performance of foreign securities depends on the political and economic environments and other overall economic conditions in the countries where the Fund invests. Emerging country markets involve greater risk and volatility than more developed markets. Some emerging markets countries may have fixed or managed currencies that are not free-floating against the U.S. dollar. Certain of these currencies have experienced, and may experience in the future, substantial fluctuations or a steady devaluation relative to the U.S. dollar. It is not possible to invest directly in an index.
As with most fixed income funds, the income on and value of your shares in the Fund will fluctuate along with interest rates. When interest rates rise, the market prices of the debt securities the Fund owns usually decline. When interest rates fall, the prices of these securities usually increase. Generally, the longer the Fund’s average portfolio maturity and the lower the average quality of its portfolio, the greater the price fluctuation. The price of any security owned by the Fund may also fall in response to events affecting the issuer of the security, such as its ability to continue to make principal and interest payments or its credit rating. Below investment grade debt securities are speculative and involve a greater risk of default and price change due to changes in the issuer’s creditworthiness. The market prices of these debt securities may fluctuate more than the market prices of investment grade debt securities and may decline significantly in periods of general economic difficulty.
Asset coverage: Assets available to cover debt obligations after all other liabilities have been satisfied.
Basis Point: 1/100 of 1%.
42
Brandes Core Plus Fixed Income Fund
Duration: The weighted maturity of a fixed-income investment’s cash flows, used in the estimation of the price sensitivity of fixed-income securities for a given change in interest rates.
Intrinsic Value: The actual value of a company or an asset based on an underlying perception of its true value.
Yield Spread: The difference in yield between two comparable securities.
Yield: Annual income from the investment (dividend, interest, etc.) divided by the current market price of the investment.
There is no assurance that a forecast will be accurate. Because of the many variables involved, an investor should not rely on forecasts without realizing their limitations.
Bond ratings are grades given to bonds that indicate their credit quality as determined by a private independent rating service such as Standard & Poor’s or Moody’s. The service evaluates a bond issuer’s financial strength, or its ability to pay a bond’s principal and interest in a timely fashion. Ratings are expressed as letters ranging from ‘AAA’, which is the highest grade, to ‘D’, which is the lowest grade. In limited situations when the rating agency has not issued a formal rating, the Advisor will classify the security as nonrated.
Please refer to the Schedule of Investments in the report for complete holdings information. Fund holdings, geographic allocations and/or sector allocations are subject to change at any time and are not a recommendation to buy or sell any security.
The foregoing reflects the thoughts and opinions of Brandes Investment Partners® exclusively and is subject to change without notice.
Brandes Investment Partners® is a registered trademark of Brandes Investment Partners, L.P. in the United States and Canada.
Must be preceded or accompanied by a prospectus.
Index Guide
The Bloomberg Barclays U.S. Aggregate Bond Index is a broad-based benchmark that measures the investment grade, U.S. dollar-denominated, fixed-rate taxable bond market. This index is a total return index which reflects the price changes and interest of each bond in the index.
The Bloomberg Barclays U.S. Mortgage-Backed Securities Index is an unmanaged index consisting of mortgage-backed pass-through securities of Ginnie Mae (GNMA), Fannie Mae (FNMA), and Freddie Mac (FHLMC). The index is a total return index which reflects the price changes and interest of each bond in the index.
The Brandes Core Plus Fixed Income Fund is distributed by ALPS Distributors, Inc.
43
Brandes Core Plus Fixed Income Fund
The following chart compares the value of a hypothetical $100,000 investment in the Brandes Core Plus Fixed Income Fund – Class I from its inception (December 28, 2007) to March 31, 2017 with the value of such an investment in the Bloomberg Barclays U.S. Aggregate Bond Index for the same period.
Value of $100,000 Investment vs Bloomberg Barclays U.S. Aggregate Bond Index (Unaudited)
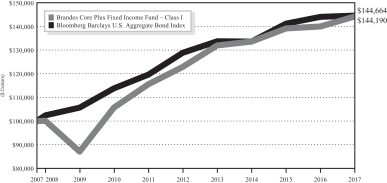
| Average Annual Total Return Periods Ended March 31, 2017 | ||||||||||||||||
| One Year | Three Years | Five Years | Since Inception(1) | |||||||||||||
Brandes Core Plus Fixed Income Fund | ||||||||||||||||
Class A* | 2.81 | % | 2.34 | % | 2.88 | % | 3.74 | % | ||||||||
Class A* (with maximum sales charge) | -1.10 | % | 1.04 | % | 2.10 | % | 3.32 | % | ||||||||
Class I | 3.01 | % | 2.57 | % | 3.23 | % | 4.03 | % | ||||||||
Bloomberg Barclays U.S. Aggregate Bond Index | 0.44 | % | 2.68 | % | 2.34 | % | 4.07 | % | ||||||||
| (1) | The inception date is December 28, 2007. |
| * | Performance shown prior to January 31, 2013 for Class A shares reflects the performance of Class I shares adjusted to reflect Class A expenses. |
Performance data quoted represents past performance; past performance does not indicate future results. The investment return and principal value of an investment will fluctuate so that an investor’s shares, when redeemed, may be worth more or less than their original cost. Current performance of the Fund may be lower or higher than the performance quoted. Performance data current to the most recent month end may be obtained by calling 800-331-2979.
The returns shown do not reflect the deduction of taxes that a shareholder would pay on fund distributions or the redemption of Fund shares. The Advisor has a fee waiver arrangement in place to limit the Fund’s annual operating expenses.
44
Brandes Core Plus Fixed Income Fund
Asset Allocation as a Percentage of Total Investments as of
March 31, 2017 (Unaudited)
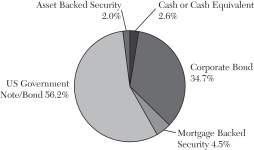
45
Brandes Credit Focus Yield Fund
Dear Fellow Investor,
The Brandes Credit Focus Yield Fund (Class I Shares) advanced 0.33% during the six months ended March 31, 2017, while its benchmark, the Bloomberg Barclays U.S. Intermediate Credit Bond Index, returned -0.78%.
The most notable positive contributors were corporate holdings in banking, energy, utilities and commodity resources. The Fund also benefited from holdings in private student loan asset backed securities (ABS).
Within the banking industry, the Fund received strong contributions from junior subordinated securities of U.S. Bank, JPMorgan and Wells Fargo. The U.S. Bank holding is a floating rate note while the JPMorgan and Wells Fargo holdings are currently fixed-rate securities, but will convert to floating rate notes in a year if they are not called. Bank credit profiles continue to improve, especially with short rates trending higher, and these securities also benefit from the possibility that they can convert to floating rate instruments.
Metals & mining companies Cloud Peak Energy and Royal Gold helped performance, as these companies benefited from higher commodity prices.
Cloud Peak is a coal miner operating in the Powder River Basin (Western United States). The company operates some of the industry’s lowest-cost mines in the country. During the fourth quarter of 2016 the company took steps to ease refinancing concerns by issuing a tender offer for its nearest term maturity (December 2019) and issuing second-lien notes maturing in 2021. The result of the tender was that Cloud Peak was able to reduce its debt maturing in 2019 from $200 million to $56 million. The company also benefited, post-U.S. presidential election, from the perception that the incoming administration will take a more favorable regulatory approach toward the coal industry.
In the first quarter of 2017, the Fund’s holdings in private student loan floating rate note ABS added to returns. We own securities backed by pools of loans issued from 2004 to 2007. We see improving credit trends with delinquencies declining, recovery rates increasing, and the credit enhancement feature of the bonds improving as the students in our pools are largely now in the workforce and thus better equipped to meet payment terms. Additionally, one feature common to private student loans is that most require a co-borrower. Therefore, in the event of bankruptcy the bond holder has recourse not only to the student, but typically the student’s parent or guardian as well. Furthermore, student loan debt is not dischargeable during bankruptcy, making the probability for an ultimate recovery high but the timing uncertain. These are floating rate notes that have begun to see their coupon rates reset higher as the Federal Reserve has begun to normalize interest rates.
Given tight yield spreads and low volatility, Fund activity was light.
46
Brandes Credit Focus Yield Fund
We added Frontier Communications (6.25% coupon rate, maturing September 2021 and rated B1/B+). Frontier is a telecommunications company offering services in mostly rural areas and is the dominant provider in areas that it serves. Frontier is facing industry headwinds as landline operations appear to be experiencing a secular decline. We believe Frontier’s primarily rural markets should be more insulated from secular changes initially, making this issue (with four years until maturity) attractive.
We also took advantage of the weakness in the energy sector in the first quarter of 2017 to increase our weighting in Range Resources.
After the U.S. presidential election, the Fund increased its weighting in a number of financials, including Bank of America, Goldman Sachs and Wells Fargo, as the incoming administration has suggested that it will examine and potentially roll back some of the onerous regulations that have been placed on the financial industry since the Global Financial Crisis. The Fund also purchased a few industrial credits, namely AT&T, Tenet Healthcare and Transocean. The common theme with both the increased weighting in financials and industrial purchases is our continued preference for shorter maturities, with all of the bonds scheduled to mature between 2017 and 2022.
Other activity included the sale of securities of Laboratory Corp. and Genworth Financial, which reached our estimates of intrinsic value.
Outlook
As of March 31, the U.S. fixed-income market continued to operate in a low-volatility environment. This has caused a great deal of complacency among investors.
What could possibly go wrong with equities hitting all-time highs and yield spreads hovering near historic lows? In our view, this environment has driven investors to stretch their risk boundaries in an effort to pick up additional yield.
Against this backdrop, the Fed appeared to start the process of withdrawing its unprecedented monetary policy accommodation. Does this mean we could begin to see volatility rise toward its historical mean and valuations become guided by fundamentals? We certainly hope so. Until that happens, we believe it is best to remain patient, especially if you’re a long-term investor.
At the close of the six-month period, the Brandes Credit Focus Yield Fund remained defensively positioned across a number of metrics. We favor short-maturity corporate bonds and those exhibiting strong, tangible asset coverage based on our analysis. We are underweight agency MBS and are managing duration toward the shorter end of our range. We have a high allocation to U.S. Treasuries that we will look to redeploy thoughtfully and efficiently — if and when market uncertainty and volatility cause credit fundamentals to become mispriced based on our intrinsic value estimates.
47
Brandes Credit Focus Yield Fund
Sincerely yours,
The Brandes Fixed-Income Investment Committee
Brandes Investment Trust
Because the values of the Fund’s investments will fluctuate with market conditions, so will the value of your investment in the Fund. You could lose money on your investment in the Fund, or the Fund could underperform other investments. The values of the Fund’s investments fluctuate in response to the activities of individual companies and general stock market and economic conditions. In addition, the performance of foreign securities depends on the political and economic environments and other overall economic conditions in the countries where the Fund invests. Emerging country markets involve greater risk and volatility than more developed markets. Some emerging markets countries may have fixed or managed currencies that are not free-floating against the U.S. dollar. Certain of these currencies have experienced, and may experience in the future, substantial fluctuations or a steady devaluation relative to the U.S. dollar. It is not possible to invest directly in an index.
As with most fixed income funds, the income on and value of your shares in the Fund will fluctuate along with interest rates. When interest rates rise, the market prices of the debt securities the Fund owns usually decline. When interest rates fall, the prices of these securities usually increase. Generally, the longer the Fund’s average portfolio maturity and the lower the average quality of its portfolio, the greater the price fluctuation. The price of any security owned by the Fund may also fall in response to events affecting the issuer of the security, such as its ability to continue to make principal and interest payments or its credit rating. Below investment grade debt securities are speculative and involve a greater risk of default and price change due to changes in the issuer’s creditworthiness. The market prices of these debt securities may fluctuate more than the market prices of investment grade debt securities and may decline significantly in periods of general economic difficulty.
Asset coverage: Assets available to cover debt obligations after all other liabilities have been satisfied.
Duration: The weighted maturity of a fixed-income investment’s cash flows, used in the estimation of the price sensitivity of fixed-income securities for a given change in interest rates.
Intrinsic Value: The actual value of a company or an asset based on an underlying perception of its true value.
Yield Spread: The difference in yield between two comparable securities.
48
Brandes Credit Focus Yield Fund
Yield: Annual income from the investment (dividend, interest, etc.) divided by the current market price of the investment.
There is no assurance that a forecast will be accurate. Because of the many variables involved, an investor should not rely on forecasts without realizing their limitations.
Bond ratings are grades given to bonds that indicate their credit quality as determined by a private independent rating service such as Standard & Poor’s or Moody’s. The service evaluates a bond issuer’s financial strength, or its ability to pay a bond’s principal and interest in a timely fashion. Ratings are expressed as letters ranging from ‘AAA’, which is the highest grade, to ‘D’, which is the lowest grade. In limited situations when the rating agency has not issued a formal rating, the Advisor will classify the security as nonrated.
Please refer to the Schedule of Investments in the report for complete holdings information. Fund holdings, geographic allocations and/or sector allocations are subject to change at any time and are not a recommendation to buy or sell any security.
The foregoing reflects the thoughts and opinions of Brandes Investment Partners® exclusively and is subject to change without notice.
Brandes Investment Partners® is a registered trademark of Brandes Investment Partners, L.P. in the United States and Canada.
Must be preceded or accompanied by a prospectus.
Index Guide
The Bloomberg Barclays U.S. Intermediate Credit Bond Index measures performance of U.S. Treasuries and government-related and investment-grade U.S. corporate securities that have remaining maturities of greater than one year and less than ten years. This index is a total return index which reflects the price changes and interest of each bond in the index.
The Brandes Credit Focus Yield Fund is distributed by ALPS Distributors, Inc.
49
Brandes Credit Focus Yield Fund
The following chart compares the value of a hypothetical $100,000 investment in the Brandes Credit Focus Yield Fund – Class I from March 31, 2007 to March 31, 2017 with the value of such an investment in the Bloomberg Barclays U.S. Intermediate Credit Bond Index for the same period.
Value of $100,000 Investment vs Bloomberg Barclays U.S. Intermediate Credit Bond Index (Unaudited)
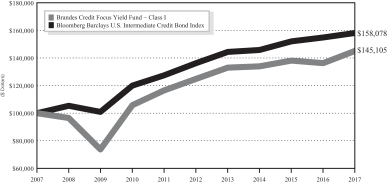
| Average Annual Total Return Periods Ended March 31, 2017** | ||||||||||||||||
| One Year | Five Years | Ten Years | Since Inception(1) | |||||||||||||
Brandes Credit Focus Yield Fund | ||||||||||||||||
Class A* | 6.16 | % | 2.76 | % | 3.51 | % | 5.42 | % | ||||||||
Class A* (with maximum sales charge) | 2.14 | % | 1.98 | % | 3.11 | % | 5.18 | % | ||||||||
Class I | 6.53 | % | 3.05 | % | 3.79 | % | 5.70 | % | ||||||||
Bloomberg Barclays U.S. Intermediate Credit Bond Index | 2.11 | % | 3.02 | % | 4.69 | % | 5.49 | % | ||||||||
| (1) | The inception date is June 29, 2000. |
| * | Performance shown prior to March 1, 2012 for Class A shares reflects the performance of Class I shares adjusted to reflect Class A expenses. |
| ** | Prior to February 1, 2012, the Advisor managed a private investment fund with an investment objective, investment policies and strategies that were, in all material respects, equivalent to those of the Brandes Credit Focus Yield Fund. The performance information shown for the Class I shares for periods before February 1, 2012 is that of the private investment fund and reflects the net expenses of the private investment fund. The performance of the private investment fund prior to February 1, 2012 is based on a calculation method that is different from the standardized calculation method prescribed by the SEC. The performance information shown for the Class A shares has been adjusted to reflect the differences in the net expense ratios between the Class I and A shares. The private investment fund was not registered under the Investment Company Act of 1940 (“1940 Act”) and was not subject to certain investment limitations, diversification requirements, and other restrictions imposed by the 1940 Act and the Internal Revenue Code of 1986, which, if applicable, may have adversely affected its performance. |
50
Brandes Credit Focus Yield Fund
Performance data quoted represents past performance; past performance does not indicate future results. The investment return and principal value of an investment will fluctuate so that an investor’s shares, when redeemed, may be worth more or less than their original cost. Current performance of the Fund may be lower or higher than the performance quoted. Performance data current to the most recent month end may be obtained by calling 800-331-2979.
The returns shown do not reflect the deduction of taxes that a shareholder would pay on Fund distributions or the redemption of Fund shares. The Advisor has a fee waiver arrangement in place to limit the Fund’s annual operating expenses.
Asset Allocation as a Percentage of Total Investments as of
March 31, 2017 (Unaudited)
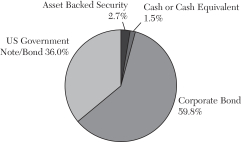
51
Brandes Investment Trust
Expense Example (Unaudited)
As a shareholder of a Fund, you incur ongoing costs, including investment advisory and administrative fees and other fund expenses. The examples below are intended to help you understand your ongoing costs (in dollars) of investing in the Funds and to compare these costs with ongoing costs of investing in other mutual funds.
The examples are based on an investment of $1,000 invested at the beginning of the period and held for the entire period from October 1, 2016 to March 31, 2017 (the “Period”).
Actual Expenses
This section provides information about actual account values and actual expenses. The “Ending Account Value” shown is derived from each Fund’s actual return. You may use the information in this section, together with the amount you invested, to estimate the expenses that you paid over the period. Simply divide your account value by $1,000 (for example, an $8,600 account value divided by $1,000 = 8.6), then multiply the result by the number given for the Fund under the heading “Expenses Paid During Period” to estimate the expenses you paid on your account during this period.
| Class A | ||||||||||||||||
Fund | Beginning Account Value | Ending Account Value | Annual Expense Ratio | Expenses Paid During the Period* | ||||||||||||
International Equity Fund | $ | 1,000.00 | $ | 1,072.90 | 1.18% | $ | 6.10 | |||||||||
Global Equity Fund | $ | 1,000.00 | $ | 1,096.10 | 1.25% | $ | 6.53 | |||||||||
Global Equity Income Fund | $ | 1,000.00 | $ | 1,103.30 | 1.25% | $ | 6.55 | |||||||||
Global Opportunities Value Fund | $ | 1,000.00 | $ | 1,099.10 | 1.40% | $ | 7.33 | |||||||||
Emerging Markets Value Fund | $ | 1,000.00 | $ | 1,099.70 | 1.37% | $ | 7.17 | |||||||||
International Small Cap Fund | $ | 1,000.00 | $ | 1,075.30 | 1.29% | $ | 6.67 | |||||||||
Core Plus Fixed Income Fund | $ | 1,000.00 | $ | 987.20 | 0.70% | $ | 3.47 | |||||||||
Credit Focus Yield Fund | $ | 1,000.00 | $ | 1,001.10 | 0.85% | $ | 4.24 | |||||||||
| Class C | ||||||||||||||||
Fund | Beginning Account Value | Ending Account Value | Annual Expense Ratio | Expenses Paid During the Period* | ||||||||||||
International Equity Fund | $ | 1,000.00 | $ | 1,068.90 | 1.93% | $ | 9.96 | |||||||||
Global Equity Fund | $ | 1,000.00 | $ | 1,091.90 | 2.00% | $ | 10.43 | |||||||||
Global Equity Income Fund | $ | 1,000.00 | $ | 1,095.80 | 2.00% | $ | 10.36 | |||||||||
Global Opportunities Value Fund | $ | 1,000.00 | $ | 1,095.80 | 2.15% | $ | 11.23 | |||||||||
Emerging Markets Value Fund | $ | 1,000.00 | $ | 1,095.50 | 2.12% | $ | 11.08 | |||||||||
International Small Cap Fund | $ | 1,000.00 | $ | 1,071.80 | 2.04% | $ | 10.54 | |||||||||
52
Brandes Investment Trust
| Class I | ||||||||||||||||
Fund | Beginning Account Value | Ending Account Value | Annual Expense Ratio | Expenses Paid During the Period* | ||||||||||||
International Equity Fund | $ | 1,000.00 | $ | 1,073.80 | 0.98% | $ | 5.07 | |||||||||
Global Equity Fund | $ | 1,000.00 | $ | 1,097.50 | 1.00% | $ | 5.23 | |||||||||
Global Equity Income Fund | $ | 1,000.00 | $ | 1,084.60 | 1.00% | $ | 5.20 | |||||||||
Global Opportunities Value Fund | $ | 1,000.00 | $ | 1,101.20 | 1.15% | $ | 6.02 | |||||||||
Emerging Markets Value Fund | $ | 1,000.00 | $ | 1,101.10 | 1.12% | $ | 5.87 | |||||||||
International Small Cap Fund | $ | 1,000.00 | $ | 1,076.10 | 1.09% | $ | 5.64 | |||||||||
Core Plus Fixed Income Fund | $ | 1,000.00 | $ | 988.30 | 0.50% | $ | 2.48 | |||||||||
Credit Focus Yield Fund | $ | 1,000.00 | $ | 1,003.30 | 0.60% | $ | 3.00 | |||||||||
| Class R6 | ||||||||||||||||
Fund | Beginning Account Value | Ending Account Value | Annual Expense Ratio | Expenses Paid During the Period* | ||||||||||||
International Equity Fund | $ | 1,000.00 | $ | 1,075.20 | 0.82% | $ | 4.24 | |||||||||
Emerging Markets Value Fund | $ | 1,000.00 | $ | 1,103.90 | 0.97% | $ | 5.09 | |||||||||
International Small Cap Fund | $ | 1,000.00 | $ | 1,077.10 | 1.00% | $ | 5.18 | |||||||||
Hypothetical Example for Comparison Purposes
This section provides information about hypothetical account values and hypothetical expenses based on the Funds’ actual expense ratios and an assumed rate of return of 5% per year before expenses, which are not the Fund’s actual returns. The hypothetical account values and expenses may not be used to estimate the actual ending account balance or expenses you paid for the period. You may use this information to compare the ongoing costs of investing in the Funds and other mutual funds. To do so, compare this 5% hypothetical example with the 5% hypothetical examples that appear in the shareholder reports of the other mutual funds.
Please note that the expenses shown in the table are meant to highlight your ongoing costs only and do not reflect any transaction costs, such as sales charges (loads), redemption fees, or exchange fees. Therefore, the last column of the table is useful in comparing ongoing costs only, and will not help you determine the relative total costs of owning different funds. In addition, if these transactional costs were included, your costs would have been higher.
53
Brandes Investment Trust
| Class A | ||||||||||||||||
Fund | Beginning Account Value | Ending Account Value | Annual Expense Ratio | Expenses Paid During the Period* | ||||||||||||
International Equity Fund | $ | 1,000.00 | $ | 1,019.05 | 1.18% | $ | 5.94 | |||||||||
Global Equity Fund | $ | 1,000.00 | $ | 1,018.70 | 1.25% | $ | 6.29 | |||||||||
Global Equity Income Fund | $ | 1,000.00 | $ | 1,018.70 | 1.25% | $ | 6.29 | |||||||||
Global Opportunities Value Fund | $ | 1,000.00 | $ | 1,017.95 | 1.40% | $ | 7.04 | |||||||||
Emerging Markets Value Fund | $ | 1,000.00 | $ | 1,018.10 | 1.37% | $ | 6.89 | |||||||||
International Small Cap Fund | $ | 1,000.00 | $ | 1,018.50 | 1.29% | $ | 6.49 | |||||||||
Core Plus Fixed Income Fund | $ | 1,000.00 | $ | 1,021.44 | 0.70% | $ | 3.53 | |||||||||
Credit Focus Yield Fund | $ | 1,000.00 | $ | 1,020.69 | 0.85% | $ | 4.28 | |||||||||
| Class C | ||||||||||||||||
Fund | Beginning Account Value | Ending Account Value | Annual Expense Ratio | Expenses Paid During the Period* | ||||||||||||
International Equity Fund | $ | 1,000.00 | $ | 1,015.31 | 1.93% | $ | 9.70 | |||||||||
Global Equity Fund | $ | 1,000.00 | $ | 1,014.96 | 2.00% | $ | 10.05 | |||||||||
Global Equity Income Fund | $ | 1,000.00 | $ | 1,014.96 | 2.00% | $ | 10.05 | |||||||||
Global Opportunities Value Fund | $ | 1,000.00 | $ | 1,014.21 | 2.15% | $ | 10.80 | |||||||||
Emerging Markets Value Fund | $ | 1,000.00 | $ | 1,014.36 | 2.12% | $ | 10.65 | |||||||||
International Small Cap Fund | $ | 1,000.00 | $ | 1,014.76 | 2.04% | $ | 10.25 | |||||||||
| Class I | ||||||||||||||||
Fund | Beginning Account Value | Ending Account Value | Annual Expense Ratio | Expenses Paid During the Period* | ||||||||||||
International Equity Fund | $ | 1,000.00 | $ | 1,020.04 | 0.98% | $ | 4.94 | |||||||||
Global Equity Fund | $ | 1,000.00 | $ | 1,019.95 | 1.00% | $ | 5.04 | |||||||||
Global Equity Income Fund | $ | 1,000.00 | $ | 1,019.95 | 1.00% | $ | 5.04 | |||||||||
Global Opportunities Value Fund | $ | 1,000.00 | $ | 1,019.20 | 1.15% | $ | 5.79 | |||||||||
Emerging Markets Value Fund | $ | 1,000.00 | $ | 1,019.35 | 1.12% | $ | 5.64 | |||||||||
International Small Cap Fund | $ | 1,000.00 | $ | 1,019.50 | 1.09% | $ | 5.49 | |||||||||
Core Plus Fixed Income Fund | $ | 1,000.00 | $ | 1,022.44 | 0.50% | $ | 2.52 | |||||||||
Credit Focus Yield Fund | $ | 1,000.00 | $ | 1,021.94 | 0.60% | $ | 3.02 | |||||||||
54
Brandes Investment Trust
| Class R6 | ||||||||||||||||
Fund | Beginning Account Value | Ending Account Value | Annual Expense Ratio | Expenses Paid During the Period* | ||||||||||||
International Equity Fund | $ | 1,000.00 | $ | 1,020.84 | 0.82% | $ | 4.13 | |||||||||
Emerging Markets Value Fund | $ | 1,000.00 | $ | 1,020.16 | 0.97% | $ | 4.89 | |||||||||
International Small Cap Fund | $ | 1,000.00 | $ | 1,020.01 | 1.00% | $ | 5.04 | |||||||||
| * | Expenses are equal to the Fund’s expense ratio for the period, multiplied by the average account value over the period, multiplied by 182/365 (to reflect the one-half year period). |
55
Brandes International Equity Fund
SCHEDULE OF INVESTMENTS — March 31, 2017 (Unaudited)
| Shares | Value | |||||||
| COMMON STOCKS – 88.06% | ||||||||
| Austria – 1.42% | ||||||||
| 221,089 | Erste Group Bank AG | $ | 7,199,097 | |||||
|
| |||||||
| Brazil – 3.73% | ||||||||
| 376,596 | Embraer SA Sponsored – ADR | 8,315,240 | ||||||
| 1,434,000 | Petroleo Brasileiro SA(a) | 6,673,922 | ||||||
| 204,600 | TIM Participacoes SA | 656,163 | ||||||
| 208,017 | TIM Participacoes SA Sponsored – ADR | 3,324,111 | ||||||
|
| |||||||
| 18,969,436 | ||||||||
|
| |||||||
| China – 1.47% | ||||||||
| 678,500 | China Mobile Ltd. | 7,461,806 | ||||||
|
| |||||||
| Finland – 1.35% | ||||||||
| 1,271,356 | Nokia OYJ | 6,833,360 | ||||||
|
| |||||||
| France – 15.48% | ||||||||
| 496,041 | Carrefour SA | 11,687,337 | ||||||
| 148,084 | Compagnie De Saint-Gobain SA | 7,597,745 | ||||||
| 1,014,349 | Engie SA | 14,334,442 | ||||||
| 651,120 | Orange SA | 10,109,047 | ||||||
| 107,414 | Publicis Groupe SA | 7,499,692 | ||||||
| 64,077 | Renault SA | 5,566,533 | ||||||
| 152,205 | Sanofi | 13,758,656 | ||||||
| 110,349 | Schneider Electric SE | 8,107,228 | ||||||
|
| |||||||
| 78,660,680 | ||||||||
|
| |||||||
| Hong Kong – 1.03% | ||||||||
| 7,208,000 | First Pacific Co. Ltd. | 5,239,084 | ||||||
|
| |||||||
| Ireland – 0.96% | ||||||||
| 37,407 | Willis Towers Watson Plc | 4,896,202 | ||||||
|
| |||||||
| Italy – 5.70% | ||||||||
| 886,545 | Eni SpA | 14,515,704 | ||||||
| 1,885,373 | Intesa Sanpaolo SpA | 5,128,429 | ||||||
| 11,040,253 | Telecom Italia Rsp | 8,060,310 | ||||||
| 1,365,052 | Telecom Italia SpA(a) | 1,228,805 | ||||||
|
| |||||||
| 28,933,248 | ||||||||
|
| |||||||
| Shares | Value | |||||||
| Japan – 15.95% | ||||||||
| 143,800 | Canon, Inc. | $ | 4,490,681 | |||||
| 498,400 | Dai Nippon Printing Co. Ltd. | 5,393,374 | ||||||
| 324,102 | Daiichi Sankyo Co. Ltd. | 7,312,092 | ||||||
| 328,100 | Honda Motor Co. Ltd. | 9,905,025 | ||||||
| 227,700 | Mitsubishi Tanabe Pharma Corp. | 4,754,159 | ||||||
| 1,280,000 | Mitsubishi UFJ Financial Group, Inc. | 8,062,935 | ||||||
| 229,999 | MS&AD Insurance Group Holdings, Inc. | 7,346,307 | ||||||
| 702,500 | Nissan Motor Co. Ltd. | 6,773,775 | ||||||
| 226,200 | Sumitomo Mitsui Trust Holdings, Inc. | 7,838,263 | ||||||
| 90,900 | Taisho Pharmaceutical Holdings Co. Ltd. | 7,401,407 | ||||||
| 250,100 | Takeda Pharmaceutical Co. Ltd. | 11,773,993 | ||||||
|
| |||||||
| 81,052,011 | ||||||||
|
| |||||||
| Mexico – 2.36% | ||||||||
| 838,272 | Cemex SAB de CV Sponsored ADR – ADR(a) | 7,603,127 | ||||||
| 2,553,982 | Fibra Uno Administracion SA de CV | 4,366,621 | ||||||
|
| |||||||
| 11,969,748 | ||||||||
|
| |||||||
| Netherlands – 1.72% | ||||||||
| 1,714,506 | AEGON NV | 8,733,465 | ||||||
|
| |||||||
| Russia – 2.99% | ||||||||
| 139,363 | Oil Company LUKOIL PJSC | 7,382,010 | ||||||
| 84,652 | Oil Company LUKOIL PJSC Sponsored – ADR | 4,491,635 | ||||||
| 1,456,315 | Public Join-Stock Co. Gazprom | 3,309,719 | ||||||
|
| |||||||
| 15,183,364 | ||||||||
|
| |||||||
The accompanying notes are an integral part of these Schedules of Investments.
56
Brandes International Equity Fund
SCHEDULE OF INVESTMENTS — March 31, 2017 (Unaudited) (continued)
| Shares | Value | |||||||
| South Korea – 5.25% | ||||||||
| 221,975 | Hana Financial Group, Inc. | $ | 7,324,736 | |||||
| 41,267 | Hyundai Mobis Co. Ltd. | 8,877,239 | ||||||
| 20,520 | Hyundai Motor Co. | 2,891,921 | ||||||
| 29,246 | POSCO | 7,595,946 | ||||||
|
| |||||||
| 26,689,842 | ||||||||
|
| |||||||
| Spain – 1.63% | ||||||||
| 534,406 | Repsol SA | 8,279,526 | ||||||
|
| |||||||
| Sweden – 1.50% | ||||||||
| 1,139,674 | LM Ericsson Telefon AB – Class B(b) | 7,608,884 | ||||||
|
| |||||||
| Switzerland – 5.72% | ||||||||
| 600,322 | Credit Suisse Group AG | 8,931,965 | ||||||
| 16,049 | Swatch Group Ltd. Bearer | 5,745,988 | ||||||
| 37,669 | Swatch Group Ltd. Registered | 2,624,965 | ||||||
| 26,053 | Swiss Resources AG | 2,339,979 | ||||||
| 588,653 | UBS Group AG | 9,409,391 | ||||||
|
| |||||||
| 29,052,288 | ||||||||
|
| |||||||
| United Kingdom – 19.80% | ||||||||
| 86,832 | AstraZeneca Plc | 5,339,031 | ||||||
| Shares | Value | |||||||
| 2,554,364 | Barclays Plc | $ | 7,210,395 | |||||
| 2,295,925 | BP Plc | 13,215,585 | ||||||
| 1,658,328 | G4S Plc | 6,321,728 | ||||||
| 620,684 | GlaxoSmithKline Plc | 12,905,818 | ||||||
| 919,294 | HSBC Holdings Plc | 7,498,526 | ||||||
| 2,629,364 | J Sainsbury Plc | 8,708,916 | ||||||
| 1,821,726 | Kingfisher Plc | 7,453,748 | ||||||
| 2,587,222 | Marks & Spencer Group Plc | 10,928,080 | ||||||
| 4,460,190 | Tesco Plc(a) | 10,380,460 | ||||||
| 3,535,297 | Wm Morrison Supermarkets Plc | 10,638,677 | ||||||
|
| |||||||
| 100,600,964 | ||||||||
|
| |||||||
| | TOTAL COMMON STOCKS | $ | 447,363,005 | |||||
|
| |||||||
| PREFERRED STOCKS – 2.73% | ||||||||
| Brazil – 1.45% | ||||||||
| 376,900 | Telefonica Brasil SA | 5,605,463 | ||||||
| 120,102 | Telefonica Brasil SA Sponsored – ADR | 1,783,515 | ||||||
|
| |||||||
| 7,388,978 | ||||||||
|
| |||||||
| Russia – 1.28% | ||||||||
| 11,340,603 | Surgutneftegas OJSC | 6,486,677 | ||||||
|
| |||||||
| | TOTAL PREFERRED STOCKS | $ | 13,875,655 | |||||
|
| |||||||
| Principal Amount | Value | |||||||
| REPURCHASE AGREEMENTS – 9.45% | ||||||||
State Street Bank and Trust Repurchase Agreement, | $ | 48,023,378 | $ | 48,023,378 | ||||
|
| |||||||
TOTAL REPURCHASE AGREEMENTS | $ | 48,023,378 | ||||||
|
| |||||||
Total Investments (Cost $571,772,612) – 100.24% | $ | 509,262,038 | ||||||
Liabilities in Excess of Other Assets – (0.24)% | (1,208,317 | ) | ||||||
|
| |||||||
TOTAL NET ASSETS – 100.00% | $ | 508,053,721 | ||||||
|
| |||||||
Percentages are stated as a percent of net assets.
ADR American Depositary Receipt
| (a) | Non-income producing security. |
| (b) | All or a portion of this security is on loan. See Note 2 in the Notes to Financial Statements. |
The accompanying notes are an integral part of these Schedules of Investments.
57
Brandes International Equity Fund
SCHEDULE OF INVESTMENTS BY INDUSTRY — March 31, 2017 (Unaudited)
COMMON STOCKS | ||||
Aerospace & Defense | 1.64 | % | ||
Auto Components | 1.75 | % | ||
Automobiles | 4.95 | % | ||
Banks | 9.89 | % | ||
Building Products | 1.50 | % | ||
Capital Markets | 3.61 | % | ||
Commercial Services & Supplies | 2.31 | % | ||
Communications Equipment | 2.84 | % | ||
Construction Materials | 1.50 | % | ||
Diversified Financial Services | 1.03 | % | ||
Diversified Telecommunication Services | 3.82 | % | ||
Electrical Equipment | 1.60 | % | ||
Food & Staples Retailing | 8.15 | % | ||
Insurance | 4.59 | % | ||
Media | 1.48 | % | ||
Metals & Mining | 1.50 | % | ||
Multiline Retail | 2.15 | % | ||
Multi-Utilities | 2.82 | % | ||
Oil, Gas & Consumable Fuels | 11.39 | % | ||
Pharmaceuticals | 12.45 | % | ||
Real Estate Investment Trust | 0.86 | % | ||
Specialty Retail | 1.47 | % | ||
Technology Hardware, Storage & Peripherals | 0.88 | % | ||
Textiles, Apparel & Luxury Goods | 1.65 | % | ||
Wireless Telecommunication Services | 2.23 | % | ||
|
| |||
TOTAL COMMON STOCKS | 88.06 | % | ||
|
| |||
PREFERRED STOCKS | ||||
Diversified Telecommunication Services | 1.45 | % | ||
Oil, Gas & Consumable Fuels | 1.28 | % | ||
|
| |||
TOTAL PREFERRED STOCKS | 2.73 | % | ||
|
| |||
REPURCHASE AGREEMENTS | 9.45 | % | ||
|
| |||
TOTAL INVESTMENTS | 100.24 | % | ||
Liabilities in Excess of Other Assets | (0.24 | )% | ||
|
| |||
TOTAL NET ASSETS | 100.00 | % | ||
|
| |||
The industry classifications represented in the Schedule of Investments are in accordance with Global Industry Classification Standards (GICS®), which was developed by and/or is the exclusive property of MSCI, Inc. and Standard & Poor Financial Services LLC. This information is unaudited.
The accompanying notes are an integral part of these Schedules of Investments.
58
Brandes Global Equity Fund
SCHEDULE OF INVESTMENTS — March 31, 2017 (Unaudited)
| Shares | Value | |||||||
| COMMON STOCKS – 92.63% | ||||||||
| Aerospace & Defense – 2.31% | ||||||||
| 250,820 | Embraer SA | $ | 1,390,062 | |||||
| 7,378 | Embraer SA Sponsored – ADR | 162,906 | ||||||
|
| |||||||
| 1,552,968 | ||||||||
|
| |||||||
| Auto Components – 1.58% | ||||||||
| 4,950 | Hyundai Mobis Co. Ltd. | 1,064,830 | ||||||
|
| |||||||
| Automobiles – 5.86% | ||||||||
| 35,100 | Honda Motor Co. Ltd. | 1,059,635 | ||||||
| 11,771 | Hyundai Motor Co. | 1,658,908 | ||||||
| 127,000 | Nissan Motor Co. Ltd. | 1,224,583 | ||||||
|
| |||||||
| 3,943,126 | ||||||||
|
| |||||||
| Banks – 12.56% | ||||||||
| 58,097 | Bank of America Corp. | 1,370,508 | ||||||
| 228,395 | Barclays Plc | 644,708 | ||||||
| 35,722 | Citigroup, Inc. | 2,136,890 | ||||||
| 25,975 | Erste Group Bank AG | 845,797 | ||||||
| 87,902 | HSBC Holdings Plc | 717,002 | ||||||
| 9,560 | PNC Financial Services Group, Inc. | 1,149,494 | ||||||
| 28,404 | Wells Fargo & Co. | 1,580,967 | ||||||
|
| |||||||
| 8,445,366 | ||||||||
|
| |||||||
| Beverages – 0.78% | ||||||||
| 4,668 | PepsiCo, Inc. | 522,162 | ||||||
|
| |||||||
| Capital Markets – 7.87% | ||||||||
| 26,440 | Bank of New York Mellon Corp. | 1,248,761 | ||||||
| 81,067 | Credit Suisse Group AG | 1,206,166 | ||||||
| 17,458 | State Street Corp. | 1,389,831 | ||||||
| 90,575 | UBS Group AG | 1,447,806 | ||||||
|
| |||||||
| 5,292,564 | ||||||||
|
| |||||||
| Communications Equipment – 2.57% | ||||||||
| 148,782 | LM Ericsson Telefon AB – Class B(c) | 993,324 | ||||||
| 137,193 | Nokia OYJ | 737,393 | ||||||
|
| |||||||
| 1,730,717 | ||||||||
|
| |||||||
| Diversified Financial Services – 1.41% | ||||||||
| 36,368 | Leucadia National Corp. | 945,568 | ||||||
|
| |||||||
| Shares | Value | |||||||
| | Diversified Telecommunication Services – 1.13% | | ||||||
| 1,045,481 | Telecom Italia Rsp | $ | 763,289 | |||||
|
| |||||||
| Electric Utilities – 0.81% | ||||||||
| 15,092 | Exelon Corp. | 543,010 | ||||||
|
| |||||||
| Electrical Equipment – 3.97% | ||||||||
| 17,086 | Emerson Electric Co. | 1,022,768 | ||||||
| 22,403 | Schneider Electric SE | 1,645,925 | ||||||
|
| |||||||
| 2,668,693 | ||||||||
|
| |||||||
| Food & Staples Retailing – 4.78% | ||||||||
| 26,418 | Carrefour SA | 622,441 | ||||||
| 297,726 | J Sainsbury Plc | 986,121 | ||||||
| 416,038 | Tesco Plc(a) | 968,269 | ||||||
| 212,603 | Wm Morrison Supermarkets Plc | 639,781 | ||||||
|
| |||||||
| 3,216,612 | ||||||||
|
| |||||||
| Health Care Providers & Services – 4.26% | ||||||||
| 21,065 | Express Scripts Holding Co.(a) | 1,388,394 | ||||||
| 9,960 | McKesson Corp. | 1,476,670 | ||||||
|
| |||||||
| 2,865,064 | ||||||||
|
| |||||||
| Hotels, Restaurants & Leisure – 1.84% | ||||||||
| 1,004,500 | Genting Malaysia Bhd. | 1,236,853 | ||||||
|
| |||||||
| Insurance – 2.34% | ||||||||
| 15,211 | American International Group, Inc. | 949,622 | ||||||
| 6,929 | Swiss Resources AG | 622,336 | ||||||
|
| |||||||
| 1,571,958 | ||||||||
|
| |||||||
| Media – 1.03% | ||||||||
| 9,950 | Publicis Groupe SA | 694,713 | ||||||
|
| |||||||
| Multiline Retail – 1.56% | ||||||||
| 248,544 | Marks & Spencer Group Plc | 1,049,817 | ||||||
|
| |||||||
| Multi-Utilities – 2.32% | ||||||||
| 79,376 | Engie SA | 1,121,715 | ||||||
| 20,100 | Engie SA Registered Shares (Prime De Fidelite 2017) | 284,046 | ||||||
| 11,100 | Engie SA Registered Shares (Prime De Fidelite 2018) | 156,862 | ||||||
|
| |||||||
| 1,562,623 | ||||||||
|
| |||||||
The accompanying notes are an integral part of these Schedules of Investments.
59
Brandes Global Equity Fund
SCHEDULE OF INVESTMENTS — March 31, 2017 (Unaudited) (continued)
| Shares | Value | |||||||
| Oil, Gas & Consumable Fuels – 10.56% | ||||||||
| 8,374 | Apache Corp. | $ | 430,340 | |||||
| 314,242 | BP Plc | 1,808,810 | ||||||
| 71,529 | Eni SpA | 1,171,169 | ||||||
| 24,494 | Oil Company LUKOIL PJSC Sponsored – ADR | 1,299,652 | ||||||
| 220,760 | Public Join-Stock Co. Gazprom | 501,714 | ||||||
| 55,737 | Repsol SA | 863,530 | ||||||
| 20,323 | Total SA | 1,027,603 | ||||||
|
| |||||||
| 7,102,818 | ||||||||
|
| |||||||
| Pharmaceuticals – 12.85% | ||||||||
| 47,000 | Daiichi Sankyo Co. Ltd. | 1,060,371 | ||||||
| 105,356 | GlaxoSmithKline Plc | 2,190,656 | ||||||
| 21,071 | Merck & Co., Inc. | 1,338,851 | ||||||
| 52,336 | Pfizer, Inc. | 1,790,415 | ||||||
| 25,066 | Sanofi | 2,265,855 | ||||||
|
| |||||||
| 8,646,148 | ||||||||
|
| |||||||
| Software – 2.17% | ||||||||
| 22,158 | Microsoft Corp. | 1,459,326 | ||||||
|
| |||||||
| Shares | Value | |||||||
| | Technology Hardware, Storage & Peripherals – 3.37% | | ||||||
| 865 | Samsung Electronics Co. Ltd. | $ | 1,591,959 | |||||
| 8,197 | Western Digital Corp. | 676,499 | ||||||
|
| |||||||
| 2,268,458 | ||||||||
|
| |||||||
| Tobacco – 1.01% | ||||||||
| 7,830 | KT&G Corp. | 682,666 | ||||||
|
| |||||||
| Wireless Telecommunication Services – 3.69% | ||||||||
| 48,696 | America Movil SAB de CV Sponsored – Class L – ADR | 690,023 | ||||||
| 99,000 | China Mobile Ltd. | 1,088,753 | ||||||
| 43,936 | TIM Participacoes SA Sponsored – ADR | 702,097 | ||||||
|
| |||||||
| 2,480,873 | ||||||||
|
| |||||||
| | TOTAL COMMON STOCKS | $ | 62,310,222 | |||||
|
| |||||||
| Principal Amount | Value | |||||||
| CORPORATE BONDS – 0.98% | ||||||||
| Oil, Gas & Consumable Fuels – 0.98% | ||||||||
Chesapeake Energy Corp. | $ | 626,000 | $ | 655,735 | ||||
|
| |||||||
TOTAL CORPORATE BONDS | $ | 655,735 | ||||||
|
| |||||||
| REPURCHASE AGREEMENTS – 6.23% | ||||||||
State Street Bank and Trust Repurchase Agreement, | $ | 4,192,777 | $ | 4,192,777 | ||||
|
| |||||||
TOTAL REPURCHASE AGREEMENTS | $ | 4,192,777 | ||||||
|
| |||||||
Total Investments (Cost $61,147,770) – 99.84% | $ | 67,158,734 | ||||||
Other Assets in Excess of Liabilities – 0.16% | 106,219 | |||||||
|
| |||||||
TOTAL NET ASSETS – 100.00% | $ | 67,264,953 | ||||||
|
| |||||||
Percentages are stated as a percent of net assets.
The accompanying notes are an integral part of these Schedules of Investments.
60
Brandes Global Equity Fund
SCHEDULE OF INVESTMENTS — March 31, 2017 (Unaudited) (continued)
ADR American Depositary Receipt
| (a) | Non-income producing security. |
| (b) | Security was purchased exempt from registration in the U.S. pursuant to Rule 144A of the Securities Act of 1933 (the “Act”) or were acquired in a private placement, and, unless registered under the Act, may only be sold to “qualified institutional buyers” (as defined in the Act) or pursuant to another exemption from registration. The market value of this security totals $655,735 which represents 0.98% of the Fund’s net assets. |
| (c) | All or a portion of this security is on loan. See Note 2 in the Notes to Financial Statements. |
The accompanying notes are an integral part of these Schedules of Investments.
61
Brandes Global Equity Fund
SCHEDULE OF INVESTMENTS BY COUNTRY — March 31, 2017 (Unaudited)
COMMON STOCKS | ||||
Austria | 1.26 | % | ||
Brazil | 3.35 | % | ||
China | 1.62 | % | ||
Finland | 1.10 | % | ||
France | 11.62 | % | ||
Italy | 2.88 | % | ||
Japan | 4.97 | % | ||
Malaysia | 1.84 | % | ||
Mexico | 1.03 | % | ||
Russia | 2.68 | % | ||
South Korea | 7.43 | % | ||
Spain | 1.28 | % | ||
Sweden | 1.48 | % | ||
Switzerland | 4.87 | % | ||
United Kingdom | 13.39 | % | ||
United States | 31.83 | % | ||
|
| |||
TOTAL COMMON STOCKS | 92.63 | % | ||
|
| |||
CORPORATE BONDS | ||||
United States | 0.98 | % | ||
|
| |||
TOTAL CORPORATE BONDS | 0.98 | % | ||
|
| |||
REPURCHASE AGREEMENTS | 6.23 | % | ||
|
| |||
TOTAL INVESTMENTS | 99.84 | % | ||
Other Assets in Excess of Liabilities | 0.16 | % | ||
|
| |||
TOTAL NET ASSETS | 100.00 | % | ||
|
| |||
The industry classifications represented in the Schedule of Investments are in accordance with Global Industry Classification Standards (GICS®), which was developed by and/or is the exclusive property of MSCI, Inc. and Standard & Poor Financial Services LLC. This information is unaudited.
The accompanying notes are an integral part of these Schedules of Investments.
62
Brandes Global Equity Income Fund
SCHEDULE OF INVESTMENTS — March 31, 2017 (Unaudited)
| Shares | Value | |||||||
| COMMON STOCKS – 87.29% | ||||||||
| Automobiles – 2.18% | ||||||||
| 700 | Honda Motor Co. Ltd. | $ | 21,132 | |||||
|
| |||||||
| Banks – 7.90% | ||||||||
| 377 | BB&T Corp. | 16,852 | ||||||
| 2,038 | HSBC Holdings Plc | 16,623 | ||||||
| 176 | PNC Financial Services Group, Inc. | 21,162 | ||||||
| 395 | Wells Fargo & Co. | 21,986 | ||||||
|
| |||||||
| 76,623 | ||||||||
|
| |||||||
| Beverages – 2.37% | ||||||||
| 567 | Diageo Plc | 16,236 | ||||||
| 60 | PepsiCo, Inc. | 6,712 | ||||||
|
| |||||||
| 22,948 | ||||||||
|
| |||||||
| Capital Markets – 4.16% | ||||||||
| 280 | Bank of New York Mellon Corp. | 13,224 | ||||||
| 1,695 | UBS Group AG | 27,094 | ||||||
|
| |||||||
| 40,318 | ||||||||
|
| |||||||
| Communications Equipment – 2.76% | ||||||||
| 2,502 | LM Ericsson Telefon AB – Class B | 16,704 | ||||||
| 1,875 | Nokia OYJ | 10,078 | ||||||
|
| |||||||
| 26,782 | ||||||||
|
| |||||||
| | Diversified Telecommunication Services – 2.53% | | ||||||
| 2,190 | Telefonica Brasil SA | 24,498 | ||||||
|
| |||||||
| Electric Utilities – 5.91% | ||||||||
| 3,200 | Companhia Paranaense de Energia | 26,321 | ||||||
| 152,328 | Enersis Chile SA | 16,861 | ||||||
| 392 | Exelon Corp. | 14,104 | ||||||
|
| |||||||
| 57,286 | ||||||||
|
| |||||||
| Electrical Equipment – 4.93% | ||||||||
| 305 | Emerson Electric Co. | 18,257 | ||||||
| 403 | Schneider Electric SE | 29,608 | ||||||
|
| |||||||
| 47,865 | ||||||||
|
| |||||||
| Food & Staples Retailing – 5.67% | ||||||||
| 4,381 | J Sainsbury Plc | 14,511 | ||||||
| 6,533 | Tesco Plc(a) | 15,205 | ||||||
| 219 | Wal-Mart Stores, Inc. | 15,785 | ||||||
| Shares | Value | |||||||
| 3,159 | Wm Morrison Supermarkets Plc | $ | 9,506 | |||||
|
| |||||||
| 55,007 | ||||||||
|
| |||||||
| Household Products – 1.06% | ||||||||
| 115 | Procter & Gamble Co. | 10,333 | ||||||
|
| |||||||
| Insurance – 1.48% | ||||||||
| 160 | Swiss Resources AG | 14,371 | ||||||
|
| |||||||
| Media – 1.60% | ||||||||
| 222 | Publicis Groupe SA | 15,500 | ||||||
|
| |||||||
| Multiline Retail – 1.54% | ||||||||
| 3,545 | Marks & Spencer Group Plc | 14,974 | ||||||
|
| |||||||
| Multi-Utilities – 2.98% | ||||||||
| 1,648 | Engie SA | 23,289 | ||||||
| 400 | Engie SA Registered Shares (Prime De Fidelite 2018) | 5,653 | ||||||
|
| |||||||
| 28,942 | ||||||||
|
| |||||||
| Oil, Gas & Consumable Fuels – 10.42% | ||||||||
| 4,367 | BP Plc | 25,137 | ||||||
| 77 | Chevron Corp. | 8,267 | ||||||
| 1,585 | Eni SpA | 25,952 | ||||||
| 776 | Royal Dutch Shell Plc – Class A | 20,454 | ||||||
| 420 | Total SA | 21,237 | ||||||
|
| |||||||
| 101,047 | ||||||||
|
| |||||||
| Pharmaceuticals – 15.18% | ||||||||
| 600 | Daiichi Sankyo Co. Ltd. | 13,537 | ||||||
| 1,512 | GlaxoSmithKline Plc | 31,439 | ||||||
| 180 | Johnson & Johnson | 22,419 | ||||||
| 345 | Merck & Co., Inc. | 21,921 | ||||||
| 747 | Pfizer, Inc. | 25,555 | ||||||
| 358 | Sanofi | 32,361 | ||||||
|
| |||||||
| 147,232 | ||||||||
|
| |||||||
| Real Estate Investment Trusts – 1.84% | ||||||||
| 10,415 | Fibra Uno Administracion SA de CV | 17,807 | ||||||
|
| |||||||
| Software – 2.16% | ||||||||
| 318 | Microsoft Corp. | 20,943 | ||||||
|
| |||||||
| Specialty Retail – 1.53% | ||||||||
| 3,620 | Kingfisher Plc | 14,811 | ||||||
|
| |||||||
| | Technology Hardware, Storage & Peripherals – 1.00% | | ||||||
| 118 | Western Digital Corp. | 9,739 | ||||||
|
| |||||||
The accompanying notes are an integral part of these Schedules of Investments.
63
Brandes Global Equity Income Fund
SCHEDULE OF INVESTMENTS — March 31, 2017 (Unaudited) (continued)
| Shares | Value | |||||||
| Textiles, Apparel & Luxury Goods – 3.64% | ||||||||
| 810 | Burberry Group Plc | $ | 17,481 | |||||
| 81 | LVMH Moet Hennessy Louis Vuitton SE | 17,803 | ||||||
|
| |||||||
| 35,284 | ||||||||
|
| |||||||
| Tobacco – 4.45% | ||||||||
| 196 | British American Tobacco Plc | 13,004 | ||||||
| 312 | Imperial Tobacco Group Plc | 15,121 | ||||||
| 173 | KT&G Corp. | 15,083 | ||||||
|
| |||||||
| 43,208 | ||||||||
|
| |||||||
| | TOTAL COMMON STOCKS | $ | 846,650 | |||||
|
| |||||||
| PREFERRED STOCKS – 9.59% | ||||||||
| Banks – 2.56% | ||||||||
| 1,067 | Bank of America Corp., 4.000% | 24,829 | ||||||
|
| |||||||
| Shares | Value | |||||||
| Capital Markets – 5.11% | ||||||||
| 1,031 | Goldman Sachs Group, Inc., 3.750% | $ | 24,445 | |||||
| 1,063 | Morgan Stanley, 4.000% | 25,097 | ||||||
|
| |||||||
| 49,542 | ||||||||
|
| |||||||
| | Technology Hardware, Storage & Peripherals – 1.92% | | ||||||
| 13 | Samsung Electronics Co. Ltd. | 18,621 | ||||||
|
| |||||||
| | TOTAL PREFERRED STOCKS | $ | 92,992 | |||||
|
| |||||||
| | Total Investments | $ | 939,642 | |||||
| | Other Assets in Excess of | 30,259 | ||||||
|
| |||||||
TOTAL NET ASSETS – 100.00% | $ | 969,901 | ||||||
|
| |||||||
Percentages are stated as a percent of net assets.
| (a) | Non-income producing security. |
The accompanying notes are an integral part of these Schedules of Investments.
64
Brandes Global Equity Income Fund
SCHEDULE OF INVESTMENTS BY COUNTRY — March 31, 2017 (Unaudited)
COMMON STOCKS | ||||
Brazil | 5.24 | % | ||
Chile | 1.74 | % | ||
Finland | 1.04 | % | ||
France | 15.00 | % | ||
Italy | 2.68 | % | ||
Japan | 3.57 | % | ||
Mexico | 1.84 | % | ||
South Korea | 1.56 | % | ||
Sweden | 1.72 | % | ||
Switzerland | 4.28 | % | ||
United Kingdom | 23.15 | % | ||
United States | 25.47 | % | ||
|
| |||
TOTAL COMMON STOCKS | 87.29 | % | ||
|
| |||
PREFERRED STOCKS | ||||
South Korea | 1.92 | % | ||
United States | 7.67 | % | ||
|
| |||
TOTAL PREFERRED STOCKS | 9.59 | % | ||
|
| |||
TOTAL INVESTMENTS | 96.88 | % | ||
Other Assets in Excess of Liabilities | 3.12 | % | ||
|
| |||
TOTAL NET ASSETS | 100.00 | % | ||
|
| |||
The industry classifications represented in the Schedule of Investments are in accordance with Global Industry Classification Standards (GICS®), which was developed by and/or is the exclusive property of MSCI, Inc. and Standard & Poor Financial Services LLC. This information is unaudited.
The accompanying notes are an integral part of these Schedules of Investments.
65
Brandes Global Opportunities Value Fund
SCHEDULE OF INVESTMENTS — March 31, 2017 (Unaudited)
| Shares | Value | |||||||
| COMMON STOCKS – 85.78% | ||||||||
| Aerospace & Defense – 2.58% | ||||||||
| 27,509 | Embraer SA Sponsored – ADR | $ | 607,399 | |||||
|
| |||||||
| Auto Components – 2.57% | ||||||||
| 1,608 | Hyundai Mobis Co. Ltd. | 345,908 | ||||||
| 12,900 | Tachi-S Co. Ltd. | 257,304 | ||||||
|
| |||||||
| 603,212 | ||||||||
|
| |||||||
| Automobiles – 2.86% | ||||||||
| 11,300 | Honda Motor Co. Ltd. | 341,136 | ||||||
| 34,300 | Nissan Motor Co. Ltd. | 330,734 | ||||||
|
| |||||||
| 671,870 | ||||||||
|
| |||||||
| Banks – 7.24% | ||||||||
| 9,327 | Bank of America Corp. | 220,024 | ||||||
| 75,862 | Barclays Plc | 214,141 | ||||||
| 8,000 | Citigroup, Inc. | 478,560 | ||||||
| 10,146 | Erste Group Bank AG | 330,374 | ||||||
| 5,095 | KB Financial Group, Inc. | 223,296 | ||||||
| 83,468 | Sberbank of Russia OJSC | 237,008 | ||||||
|
| |||||||
| 1,703,403 | ||||||||
|
| |||||||
| Capital Markets – 4.41% | ||||||||
| 22,793 | Credit Suisse Group AG | 339,129 | ||||||
| 4,202 | State Street Corp. | 334,521 | ||||||
| 22,729 | UBS Group AG | 363,314 | ||||||
|
| |||||||
| 1,036,964 | ||||||||
|
| |||||||
| Commercial Services & Supplies – 2.78% | ||||||||
| 42,897 | De La Rue Plc | 331,072 | ||||||
| 116,406 | Mitie Group Plc | 323,630 | ||||||
|
| |||||||
| 654,702 | ||||||||
|
| |||||||
| Communications Equipment – 1.63% | ||||||||
| 57,383 | LM Ericsson Telefon AB – Class B | 383,110 | ||||||
|
| |||||||
| Construction & Engineering – 0.69% | ||||||||
| 18,700 | Sanki Engineering Co. Ltd. | 161,367 | ||||||
|
| |||||||
| Construction Materials – 0.97% | ||||||||
| 25,224 | Cemex SAB de CV Sponsored – ADR(a) | 228,782 | ||||||
|
| |||||||
| Shares | Value | |||||||
| Diversified Financial Services – 3.23% | ||||||||
| 397,340 | First Pacific Co. Ltd. | $ | 288,804 | |||||
| 87,172 | Haci Omer Sabanci Holding AS | 239,843 | ||||||
| 8,920 | Leucadia National Corp. | 231,920 | ||||||
|
| |||||||
| 760,567 | ||||||||
|
| |||||||
| | Diversified Telecommunication Services – 4.16% | | ||||||
| 72,050 | APT Satellite Holdings Ltd. | 38,526 | ||||||
| 117,693 | Magyar Telekom Telecommunications Plc | 195,200 | ||||||
| 487,782 | Telecom Italia Rsp | 356,121 | ||||||
| 34,800 | Telefonica Brasil SA | 389,285 | ||||||
|
| |||||||
| 979,132 | ||||||||
|
| |||||||
| Electric Utilities – 2.23% | ||||||||
| 28,200 | Companhia Paranaense de Energia | 231,952 | ||||||
| 11,165 | Reliance Infrastructure Ltd. – GDR | 293,324 | ||||||
|
| |||||||
| 525,276 | ||||||||
|
| |||||||
| Electrical Equipment – 1.91% | ||||||||
| 13,500 | Futaba Corp. | 239,324 | ||||||
| 2,868 | Schneider Electric SE | 210,709 | ||||||
|
| |||||||
| 450,033 | ||||||||
|
| |||||||
| Food & Staples Retailing – 6.56% | ||||||||
| 10,703 | Carrefour SA | 252,176 | ||||||
| 143,607 | J Sainsbury Plc | 475,652 | ||||||
| 146,693 | Tesco Plc(a) | 341,407 | ||||||
| 157,480 | Wm Morrison Supermarkets Plc | 473,900 | ||||||
|
| |||||||
| 1,543,135 | ||||||||
|
| |||||||
| Food Products – 1.26% | ||||||||
| 133,700 | Marfrig Global Foods SA(a) | 247,276 | ||||||
| 590 | Savencia SA | 49,120 | ||||||
|
| |||||||
| 296,396 | ||||||||
|
| |||||||
| Health Care Equipment & Supplies – 0.84% | ||||||||
| 18,810 | Syneron Medical Ltd.(a) | 198,446 | ||||||
|
| |||||||
| Health Care Providers & Services – 2.61% | ||||||||
| 4,176 | Express Scripts Holding Co.(a) | 275,240 | ||||||
The accompanying notes are an integral part of these Schedules of Investments.
66
Brandes Global Opportunities Value Fund
SCHEDULE OF INVESTMENTS — March 31, 2017 (Unaudited) (continued)
| Shares | Value | |||||||
| 2,285 | McKesson Corp. | $ | 338,774 | |||||
|
| |||||||
| 614,014 | ||||||||
|
| |||||||
| Household Durables – 2.50% | ||||||||
| 1,133,079 | Consorcio ARA SAB de CV | 358,281 | ||||||
| 7,626 | MDC Holdings, Inc. | 229,161 | ||||||
|
| |||||||
| 587,442 | ||||||||
|
| |||||||
| Insurance – 0.95% | ||||||||
| 1,699 | Willis Towers Watson Plc | 222,382 | ||||||
|
| |||||||
| Machinery – 2.72% | ||||||||
| 22,258 | Briggs & Stratton Corp. | 499,692 | ||||||
| 7,610 | China Yuchai International Ltd. | 140,861 | ||||||
|
| |||||||
| 640,553 | ||||||||
|
| |||||||
| Metals & Mining – 0.98% | ||||||||
| 885 | POSCO | 229,858 | ||||||
|
| |||||||
| Multiline Retail – 2.66% | ||||||||
| 268,022 | Debenhams Plc | 182,678 | ||||||
| 104,827 | Marks & Spencer Group Plc | 442,775 | ||||||
|
| |||||||
| 625,453 | ||||||||
|
| |||||||
| Multi-Utilities – 1.87% | ||||||||
| 26,627 | Engie SA | 376,284 | ||||||
| 4,400 | Engie SA Registered Shares (Prime De Fidelite 2018) | 62,179 | ||||||
|
| |||||||
| 438,463 | ||||||||
|
| |||||||
| Oil, Gas & Consumable Fuels – 7.54% | ||||||||
| 61,719 | BP Plc | 355,261 | ||||||
| 33,407 | Chesapeake Energy Corp.(a) | 198,437 | ||||||
| 23,917 | Eni SpA | 391,601 | ||||||
| 6,446 | Oil Company LUKOIL PJSC Sponsored – ADR | 342,025 | ||||||
| 43,540 | Petroleo Brasileiro SA(a) | 202,638 | ||||||
| 62,719 | Public Joint-Stock Co. Gazprom Sponsored – ADR | 281,922 | ||||||
|
| |||||||
| 1,771,884 | ||||||||
|
| |||||||
| Pharmaceuticals – 3.43% | ||||||||
| 21,829 | GlaxoSmithKline Plc | 453,888 | ||||||
| Shares | Value | |||||||
| 3,911 | Sanofi | $ | 353,537 | |||||
|
| |||||||
| 807,425 | ||||||||
|
| |||||||
| Real Estate Investment Trusts – 3.71% | ||||||||
| 230,344 | Fibra Uno Administracion SA de CV | 393,826 | ||||||
| 27,539 | Grivalia Properties Real Estate Investment Co. SA | 240,905 | ||||||
| 211,505 | Macquarie Mexico Real Estate Management SA de CV | 237,237 | ||||||
|
| |||||||
| 871,968 | ||||||||
|
| |||||||
| | Real Estate Management & Development – 3.74% | | ||||||
| 218,712 | Countrywide Plc | 426,327 | ||||||
| 70,749 | LSL Property Services Plc | 185,260 | ||||||
| 15,741 | St Joe Co.(a) | 268,384 | ||||||
|
| |||||||
| 879,971 | ||||||||
|
| |||||||
| | Semiconductors & Semiconductor Equipment – 1.01% | | ||||||
| 3,900 | NuFlare Technology, Inc. | 237,410 | ||||||
|
| |||||||
| | Technology Hardware, Storage & Peripherals – 1.97% | | ||||||
| 184 | Samsung Electronics Co. Ltd. | 338,636 | ||||||
| 1,494 | Western Digital Corp. | 123,300 | ||||||
|
| |||||||
| 461,936 | ||||||||
|
| |||||||
| Textiles, Apparel & Luxury Goods – 1.34% | ||||||||
| 43,700 | TSI Holdings Co. Ltd. | 315,202 | ||||||
|
| |||||||
| Tobacco – 1.00% | ||||||||
| 2,689 | KT&G Corp. | 234,443 | ||||||
|
| |||||||
| Wireless Telecommunication Services – 1.83% | ||||||||
| 27,500 | China Mobile Ltd. | 302,431 | ||||||
| 326,647 | Sistema JSFC | 129,028 | ||||||
|
| |||||||
| 431,459 | ||||||||
|
| |||||||
| | TOTAL COMMON STOCKS | $ | 20,173,657 | |||||
|
| |||||||
The accompanying notes are an integral part of these Schedules of Investments.
67
Brandes Global Opportunities Value Fund
SCHEDULE OF INVESTMENTS — March 31, 2017 (Unaudited) (continued)
| Shares | Value | |||||||
| PREFERRED STOCKS – 5.81% | ||||||||
| Automobiles – 2.00% | ||||||||
| 5,284 | Hyundai Motor Co. | $ | 469,195 | |||||
|
| |||||||
| Banks – 1.01% | ||||||||
| 78,108 | Itausa – Investimentos Itau SA | 238,271 | ||||||
|
| |||||||
| Food & Staples Retailing – 1.04% | ||||||||
| 12,700 | Companhia Brasileira de Distribuicao | 244,540 | ||||||
|
| |||||||
| Shares | Value | |||||||
| Health Care Equipment & Supplies – 0.77% | ||||||||
| 1,769 | Draegerwerk AG & Co. KGaA | $ | 181,782 | |||||
|
| |||||||
| Oil, Gas & Consumable Fuels – 0.99% | ||||||||
| 405,050 | Surgutneftegas OJSC | 231,683 | ||||||
|
| |||||||
| | TOTAL PREFERRED STOCKS | $ | 1,365,471 | |||||
|
| |||||||
| Principal Amount | Value | |||||||
| CORPORATE BONDS – 0.61% | ||||||||
| Oil, Gas & Consumable Fuels – 0.61% | ||||||||
Chesapeake Energy Corp. | $ | 86,000 | $ | 85,893 | ||||
8.000%, 12/15/2022 (Acquired 02/08/16, Cost $24,003)(b) | 54,000 | 56,565 | ||||||
|
| |||||||
TOTAL CORPORATE BONDS | $ | 142,458 | ||||||
|
| |||||||
| REPURCHASE AGREEMENTS – 7.27% | ||||||||
State Street Bank and Trust Repurchase Agreement, | $ | 1,709,130 | $ | 1,709,130 | ||||
|
| |||||||
TOTAL REPURCHASE AGREEMENTS | $ | 1,709,130 | ||||||
|
| |||||||
Total Investments (Cost $21,956,121) – 99.47% | $ | 23,390,716 | ||||||
Other Assets in Excess of Liabilities – 0.53% | 124,458 | |||||||
|
| |||||||
TOTAL NET ASSETS – 100.00% | $ | 23,515,174 | ||||||
|
| |||||||
Percentages are stated as a percent of net assets.
ADR American Depositary Receipt
GDR Global Depositary Receipt
| (a) | Non-income producing security. |
| (b) | Security was purchased exempt from registration in the U.S. pursuant to Rule 144A of the Securities Act of 1933 (the “Act”) or was acquired in a private placement, and, unless registered under the Act, may only be sold to “qualified institutional buyers” (as defined in the Act) or pursuant to another exemption from registration. The market value of this security totals $56,565 which represents 0.24% of the Fund’s net assets. |
The accompanying notes are an integral part of these Schedules of Investments.
68
Brandes Global Opportunities Value Fund
SCHEDULE OF INVESTMENTS BY COUNTRY — March 31, 2017 (Unaudited)
COMMON STOCKS | ||||
Austria | 1.40 | % | ||
Brazil | 7.14 | % | ||
China | 1.89 | % | ||
France | 5.55 | % | ||
Greece | 1.02 | % | ||
Hong Kong | 1.39 | % | ||
Hungary | 0.83 | % | ||
India | 1.25 | % | ||
Israel | 0.84 | % | ||
Italy | 3.18 | % | ||
Japan | 8.01 | % | ||
Mexico | 5.18 | % | ||
Russia | 4.21 | % | ||
South Korea | 5.84 | % | ||
Sweden | 1.63 | % | ||
Switzerland | 2.99 | % | ||
Turkey | 1.02 | % | ||
United Kingdom | 17.89 | % | ||
United States | 14.52 | % | ||
|
| |||
TOTAL COMMON STOCKS | 85.78 | % | ||
|
| |||
PREFERRED STOCKS | ||||
Brazil | 2.05 | % | ||
Germany | 0.77 | % | ||
Russia | 0.99 | % | ||
South Korea | 2.00 | % | ||
|
| |||
TOTAL PREFERRED STOCKS | 5.81 | % | ||
|
| |||
CORPORATE BONDS | ||||
United States | 0.61 | % | ||
|
| |||
TOTAL CORPORATE BONDS | 0.61 | % | ||
|
| |||
REPURCHASE AGREEMENTS | 7.27 | % | ||
|
| |||
TOTAL INVESTMENTS | 99.47 | % | ||
Other Assets in Excess of Liabilities | 0.53 | % | ||
|
| |||
TOTAL NET ASSETS | 100.00 | % | ||
|
| |||
The industry classifications represented in the Schedule of Investments are in accordance with Global Industry Classification Standards (GICS®), which was developed by and/or is the exclusive property of MSCI, Inc. and Standard & Poor Financial Services LLC. This information is unaudited.
The accompanying notes are an integral part of these Schedules of Investments.
69
Brandes Emerging Markets Value Fund
SCHEDULE OF INVESTMENTS — March 31, 2017 (Unaudited)
| Shares | Value | |||||||
| COMMON STOCKS – 84.12% | ||||||||
| Argentina – 1.27% | ||||||||
| 2,289,635 | Arcos Dorados Holdings, Inc. – Class A(a) | $ | 18,431,562 | |||||
|
| |||||||
| Austria – 2.38% | ||||||||
| 1,066,750 | Erste Group Bank AG | 34,735,499 | ||||||
|
| |||||||
| Brazil – 9.94% | ||||||||
| 1,390,315 | Banco do Brasil SA | 14,970,778 | ||||||
| 800,010 | Companhia Paranaense de Energia | 6,580,291 | ||||||
| 1,767,385 | Embraer SA Sponsored – ADR | 39,023,861 | ||||||
| 3,767,200 | Estacio Participacoes SA | 18,988,825 | ||||||
| 4,153,000 | Kroton Educacional SA | 17,603,753 | ||||||
| 11,717,111 | Marfrig Global Foods SA(a) | 21,670,630 | ||||||
| 2,598,900 | Petroleo Brasileiro SA(a) | 12,095,436 | ||||||
| 862,644 | TIM Participacoes SA Sponsored – ADR | 13,785,051 | ||||||
|
| |||||||
| 144,718,625 | ||||||||
|
| |||||||
| Chile – 3.54% | ||||||||
| 2,108,192 | Empresa Nacional de Telecomunicaciones SA(a) | 25,482,646 | ||||||
| 51,051,761 | Enersis Chile SA | 5,650,798 | ||||||
| 3,724,374 | Enersis Chile SA Sponsored – ADR | 20,484,057 | ||||||
|
| |||||||
| 51,617,501 | ||||||||
|
| |||||||
| China – 6.02% | ||||||||
| 174,645,000 | Bosideng International Holdings Ltd. | 15,065,808 | ||||||
| 3,251,400 | China Mobile Ltd. | 35,757,284 | ||||||
| 173,073 | China Yuchai International Ltd. | 3,203,581 | ||||||
| Shares | Value | |||||||
| 22,125,000 | Dongfeng Motor Group Co. Ltd. – Class H | $ | 24,870,681 | |||||
| 12,307,077 | Weiqiao Textile Co. – Class H(b)(f) | 8,836,581 | ||||||
|
| |||||||
| 87,733,935 | ||||||||
|
| |||||||
| Colombia – 1.19% | ||||||||
| 2,127,094 | Grupo Aval Acciones y Valores Grupo Sponsored – ADR | 17,378,358 | ||||||
|
| |||||||
| Cyprus – 0.33% | ||||||||
| 669,837 | Globaltrans Investment Plc Sponsored RegS – GDR | 4,822,826 | ||||||
|
| |||||||
| Czech Republic – 0.75% | ||||||||
| 981,490 | O2 Czech Republic AS | 10,965,741 | ||||||
|
| |||||||
| Greece – 1.48% | ||||||||
| 2,300,930 | Hellenic Telecommunications Organization SA | 21,617,625 | ||||||
|
| |||||||
| Hong Kong – 6.56% | ||||||||
| 24,990,600 | Chow Tai Fook Jewellery Group Ltd. | 24,274,704 | ||||||
| 28,461,920 | First Pacific Co. Ltd. | 20,687,346 | ||||||
| 15,778,500 | Lifestyle China Group Ltd.(a) | 4,732,476 | ||||||
| 15,676,500 | Lifestyle International Holdings Ltd. | 21,273,423 | ||||||
| 7,754,000 | Luk Fook Holdings International Ltd. | 24,648,707 | ||||||
|
| |||||||
| 95,616,656 | ||||||||
|
| |||||||
| India – 4.04% | ||||||||
| 913,009 | Infosys Ltd. | 14,393,689 | ||||||
| 1,077,359 | PC Jeweller Ltd. | 6,935,810 | ||||||
| 34,348 | Reliance Infrastructure Ltd. – GDR | 902,380 | ||||||
The accompanying notes are an integral part of these Schedules of Investments.
70
Brandes Emerging Markets Value Fund
SCHEDULE OF INVESTMENTS — March 31, 2017 (Unaudited) (continued)
| Shares | Value | |||||||
| 2,515,599 | Reliance Infrastructure Ltd. | $ | 22,033,799 | |||||
| 2,062,248 | Tech Mahindra Ltd. | 14,584,778 | ||||||
|
| |||||||
| 58,850,456 | ||||||||
|
| |||||||
| Indonesia – 2.06% | ||||||||
| 130,976,015 | PT XL Axiata Tbk(a) | 30,075,520 | ||||||
|
| |||||||
| Luxembourg – 1.55% | ||||||||
| 604,688 | Adecoagro SA(a) | 6,929,724 | ||||||
| 600,885 | Ternium SA Sponsored – ADR | 15,695,116 | ||||||
|
| |||||||
| 22,624,840 | ||||||||
|
| |||||||
| Mexico – 8.41% | ||||||||
| 4,136,586 | Cemex SAB de CV Sponsored – ADR(a) | 37,518,836 | ||||||
| 14,231,206 | Fibra Uno Administracion SA de CV | 24,331,526 | ||||||
| 21,413,582 | Fideicomiso PLA Administradora Industrial S de RL de CV | 34,941,576 | ||||||
| 20,533,014 | Macquarie Mexico Real Estate Management SA de CV | 23,031,062 | ||||||
| 10,242,449 | Urbi Desarrollos Urbanos SA de CV(a)(e) | 2,735,368 | ||||||
|
| |||||||
| 122,558,368 | ||||||||
|
| |||||||
| Pakistan – 0.83% | ||||||||
| 7,646,760 | Nishat Mills Ltd. | 12,050,413 | ||||||
|
| |||||||
| Panama – 1.48% | ||||||||
| 778,859 | Banco Latinoamericano de Comercio Exterior SA – Class E | 21,605,549 | ||||||
|
| |||||||
| Russia – 8.69% | ||||||||
| 6,767,787 | Mobile TeleSystems PJSC | 32,782,172 | ||||||
| Shares | Value | |||||||
| 54,717 | Mobile TeleSystems PJSC Sponsored – ADR | $ | 603,529 | |||||
| 630,096 | Oil Company LUKOIL PJSC Sponsored – ADR | 33,432,895 | ||||||
| 1,673,728 | Public Joint-Stock Co. Gazprom | 3,803,826 | ||||||
| 3,939,534 | Public Joint-Stock Co. Gazprom Sponsored – ADR | 17,708,205 | ||||||
| 3,302,987 | Sberbank of Russia OJSC Sponsored – ADR | 38,083,440 | ||||||
|
| |||||||
| 126,414,067 | ||||||||
|
| |||||||
| South Korea – 12.49% | ||||||||
| 443,333 | Hana Financial Group, Inc. | 14,629,112 | ||||||
| 131,987 | Hyundai Mobis Co. Ltd. | 28,392,665 | ||||||
| 340,531 | KB Financial Group, Inc. | 14,924,271 | ||||||
| 648,389 | KIA Motors Corp. | 21,489,352 | ||||||
| 418,544 | KT&G Corp. | 36,491,138 | ||||||
| 57,604 | POSCO | 14,961,256 | ||||||
| 17,987 | Samsung Electronics Co. Ltd. | 33,103,552 | ||||||
| 427,503 | Shinhan Financial Group Co. Ltd. | 17,812,803 | ||||||
|
| |||||||
| 181,804,149 | ||||||||
|
| |||||||
| Spain – 0.98% | ||||||||
| 6,246,765 | Prosegur Cash SA (Acquired 03/16/17, Cost $13,454,302)(a)(c) | 14,261,108 | ||||||
|
| |||||||
| Thailand – 3.47% | ||||||||
| 4,162,000 | Bangkok Bank Plc – NVDR | 21,984,607 | ||||||
| 43,883,700 | Jasmine Broadband Internet Infrastructure | 14,813,261 | ||||||
| 2,511,600 | Kasikornbank Plc – NVDR | 13,821,168 | ||||||
|
| |||||||
| 50,619,036 | ||||||||
|
| |||||||
The accompanying notes are an integral part of these Schedules of Investments.
71
Brandes Emerging Markets Value Fund
SCHEDULE OF INVESTMENTS — March 31, 2017 (Unaudited) (continued)
| Shares | Value | |||||||
| Turkey – 5.67% | ||||||||
| 6,190,065 | Akbank TAS | $ | 14,533,246 | |||||
| 37,130,599 | Emlak Konut Gayrimenkul Yatirim Ortakligi AG | 29,627,929 | ||||||
| 6,223,640 | Turkiye Garanti Bankasi Anonim Sirketi | 15,177,037 | ||||||
| 15,747,168 | Turkiye Vakiflar Bankasi Turk Anonim Ortakligi | 23,234,630 | ||||||
|
| |||||||
| 82,572,842 | ||||||||
|
| |||||||
| United Kingdom – 0.99% | ||||||||
| 7,130,076 | ITE Group Plc | 14,382,538 | ||||||
|
| |||||||
| | TOTAL COMMON STOCKS | $ | 1,225,457,214 | |||||
|
| |||||||
| PREFERRED STOCKS – 10.66% | ||||||||
| Brazil – 6.69% | ||||||||
| 1,524,489 | Banco Bradesco SA | 15,719,193 | ||||||
| 1,755,200 | Companhia Brasileira de Distribuicao | 33,796,542 | ||||||
| 709,810 | Companhia Brasileira de Distribuicao Sponsored – Class A – ADR | 13,628,352 | ||||||
| 857,150 | Companhia Paranaense de Energia – COPEL B | 8,876,510 | ||||||
| 2,760 | Companhia Paranaense de Energia Sponsored – Class B – ADR | 28,456 | ||||||
| Shares | Value | |||||||
| 1,123,832 | Petroleo Brasileiro Sponsored – ADR(a) | $ | 10,361,731 | |||||
| 13,500 | Telefonica Brasil SA | 200,779 | ||||||
| 1,004,568 | Telefonica Brasil SA Sponsored – ADR | 14,917,835 | ||||||
|
| |||||||
| 97,529,398 | ||||||||
|
| |||||||
| Colombia – 0.37% | ||||||||
| 13,282,093 | Grupo Aval Acciones y Valores SA | 5,405,272 | ||||||
|
| |||||||
| Russia – 1.52% | ||||||||
| 16,137,141 | Surgutneftegas OJSC | 9,230,235 | ||||||
| 2,304,816 | Surgutneftegas OJSC Sponsored – ADR | 12,906,970 | ||||||
|
| |||||||
| 22,137,205 | ||||||||
|
| |||||||
| South Korea – 2.08% | ||||||||
| 340,966 | Hyundai Motor Co. | 30,276,244 | ||||||
|
| |||||||
| | TOTAL PREFERRED | $ | 155,348,119 | |||||
|
| |||||||
| PARTICIPATORY NOTES – 0.00% | ||||||||
| Saudi Arabia – 0.00% | ||||||||
| 7,093 | Banque Saudi Fransi (Acquired 03/28/17, Cost $45,064)(a)(b)(c)(d) | 48,971 | ||||||
|
| |||||||
| | TOTAL PARTICIPATORY | $ | 48,971 | |||||
|
| |||||||
The accompanying notes are an integral part of these Schedules of Investments.
72
Brandes Emerging Markets Value Fund
SCHEDULE OF INVESTMENTS — March 31, 2017 (Unaudited) (continued)
| Principal Amount | Value | |||||||
| REPURCHASE AGREEMENTS – 4.95% | ||||||||
State Street Bank and Trust Repurchase Agreement, | $ | 72,158,547 | $ | 72,158,547 | ||||
|
| |||||||
TOTAL REPURCHASE AGREEMENTS | $ | 72,158,547 | ||||||
|
| |||||||
Total Investments (Cost $1,440,820,886) – 99.73% | $ | 1,453,012,851 | ||||||
Other Assets in Excess of Liabilities – 0.27% | 3,864,270 | |||||||
|
| |||||||
TOTAL NET ASSETS – 100.00% | $ | 1,456,877,121 | ||||||
|
| |||||||
Percentages are stated as a percent of net assets.
ADR American Depositary Receipt
GDR Global Depositary Receipt
NVDR Non-Voting Depositary Receipt
| (a) | Non-income producing security. |
| (b) | The prices for these securities were derived from an estimate of fair market value using methods approved by the Fund’s Board of Trustees. These securities represent $8,885,552 or 0.61% of the Fund’s net assets and are classified as Level 2 securities. See Note 2 in the Notes to Financial Statements. |
| (c) | Securities were purchased exempt from registration in the U.S. pursuant to Rule 144A of the Securities Act of 1933 (the “Act”) or were acquired in a private placement, and, unless registered under the Act, may only be sold to “qualified institutional buyers” (as defined in the Act) or pursuant to another exemption from registration. The market value of these securities total $14,310,079 which represents 0.98% of the Fund’s net assets. |
| (d) | Represents the underlying security of a participatory note with HSBC Bank Plc. Banque Saudi Fransi has a maturity date of March 24, 2020. See Note 2 in the Notes to Financial Statements. |
| (e) | Affiliated issuer. See Note 8 in the Notes to Financial Statements. |
| (f) | This security has limited liquidity and represents $8,836,581 or 0.61% of the Fund’s net assets and is classified as a Level 2 security. See Note 2 in the Notes to Financial Statements. |
The accompanying notes are an integral part of these Schedules of Investments.
73
Brandes Emerging Markets Value Fund
SCHEDULE OF INVESTMENTS BY INDUSTRY — March 31, 2017 (Unaudited)
COMMON STOCKS | ||||
Aerospace & Defense | 2.68 | % | ||
Auto Components | 1.95 | % | ||
Automobiles | 3.18 | % | ||
Banks | 18.04 | % | ||
Construction Materials | 2.58 | % | ||
Consumer Finance | 0.98 | % | ||
Diversified Consumer Services | 2.51 | % | ||
Diversified Financial Services | 1.42 | % | ||
Diversified Telecommunication Services | 2.24 | % | ||
Electric Utilities | 3.82 | % | ||
Food Products | 1.96 | % | ||
Hotels, Restaurants & Leisure | 1.27 | % | ||
Household Durables | 0.19 | % | ||
IT Services | 1.99 | % | ||
Machinery | 0.22 | % | ||
Media | 0.99 | % | ||
Metals & Mining | 2.10 | % | ||
Multiline Retail | 1.79 | % | ||
Oil, Gas & Consumable Fuels | 4.60 | % | ||
Real Estate Investment Trusts | 8.70 | % | ||
Road & Rail | 0.33 | % | ||
Specialty Retail | 3.83 | % | ||
Technology Hardware, Storage & Peripherals | 2.27 | % | ||
Textiles, Apparel & Luxury Goods | 2.47 | % | ||
Tobacco | 2.50 | % | ||
Wireless Telecommunication Services | 9.51 | % | ||
|
| |||
TOTAL COMMON STOCKS | 84.12 | % | ||
|
| |||
PREFERRED STOCKS | ||||
Automobiles | 2.08 | % | ||
Banks | 1.45 | % | ||
Diversified Telecommunication Services | 1.04 | % | ||
Electric Utilities | 0.61 | % | ||
Food & Staples Retailing | 3.26 | % | ||
Oil, Gas & Consumable Fuels | 2.22 | % | ||
|
| |||
TOTAL PREFERRED STOCKS | 10.66 | % | ||
|
| |||
PARTICIPATORY NOTE | ||||
Banks | 0.00 | % | ||
|
| |||
TOTAL PARTICIPATORY NOTE | 0.00 | % | ||
|
| |||
REPURCHASE AGREEMENTS | 4.95 | % | ||
|
| |||
TOTAL INVESTMENTS | 99.73 | % | ||
Other Assets in Excess of Liabilities | 0.27 | % | ||
|
| |||
TOTAL NET ASSETS | 100.00 | % | ||
|
| |||
The industry classifications represented in the Schedule of Investments are in accordance with Global Industry Classification Standards (GICS®), which was developed by and/or is the exclusive property of MSCI, Inc. and Standard & Poor Financial Services LLC. This information is unaudited.
The accompanying notes are an integral part of these Schedules of Investments.
74
Brandes International Small Cap Fund
SCHEDULE OF INVESTMENTS — March 31, 2017 (Unaudited)
| Shares | Value | |||||||
| COMMON STOCKS – 82.24% | ||||||||
| Belgium – 1.47% | ||||||||
| 521,144 | D’Ieteren SA | $ | 24,384,631 | |||||
|
| |||||||
| Brazil – 4.96% | ||||||||
| 1,468,720 | Companhia Paranaense de Energia | 12,080,604 | ||||||
| 9,060,600 | Embraer SA | 50,214,467 | ||||||
| 10,886,724 | Marfrig Global Foods SA(a) | 20,134,841 | ||||||
|
| |||||||
| 82,429,912 | ||||||||
|
| |||||||
| Canada – 5.09% | ||||||||
| 1,202,524 | Cameco Corp. | 13,311,941 | ||||||
| 1,302,257 | Dorel Industries, Inc. – Class B(a) | 31,061,843 | ||||||
| 16,404 | E-L Financial Corp. Ltd.(a) | 10,102,550 | ||||||
| 1,057,021 | Norbord, Inc. | 30,084,780 | ||||||
|
| |||||||
| 84,561,114 | ||||||||
|
| |||||||
| China – 1.49% | ||||||||
| 47,744,500 | Sinotrans Shipping Ltd. | 11,558,457 | ||||||
| 18,429,000 | Weiqiao Textile Co. – Class H(b)(d) | 13,232,172 | ||||||
|
| |||||||
| 24,790,629 | ||||||||
|
| |||||||
| France – 0.96% | ||||||||
| 191,944 | Savencia SA | 15,979,976 | ||||||
|
| |||||||
| Germany – 0.74% | ||||||||
| 156,726 | Draegerwerk AG & Co. KGaA | 12,210,769 | ||||||
|
| |||||||
| Greece – 1.87% | ||||||||
| 1,005,596 | GR Sarantis SA | 12,411,984 | ||||||
| 2,136,124 | Grivalia Properties Real Estate Investment Co. SA | 18,686,357 | ||||||
|
| |||||||
| 31,098,341 | ||||||||
|
| |||||||
| Hong Kong – 1.56% | ||||||||
| 14,961,750 | APT Satellite Holdings Ltd. | 8,000,180 | ||||||
| 10,889,500 | Dickson Concepts International Ltd. | 3,881,350 | ||||||
| Shares | Value | |||||||
| 316,040,000 | Emperor Watch & Jewellery Ltd.(a) | $ | 14,041,790 | |||||
|
| |||||||
| 25,923,320 | ||||||||
|
| |||||||
| Hungary – 1.53% | ||||||||
| 15,336,018 | Magyar Telekom Telecommunications Plc | 25,435,559 | ||||||
|
| |||||||
| India – 3.40% | ||||||||
| 2,988,135 | NIIT Technologies Ltd. | 20,048,562 | ||||||
| 4,164,040 | Reliance Infrastructure Ltd. | 36,472,276 | ||||||
|
| |||||||
| 56,520,838 | ||||||||
|
| |||||||
| Ireland – 2.92% | ||||||||
| 12,518,280 | C&C Group Plc | 48,543,758 | ||||||
|
| |||||||
| Israel – 2.23% | ||||||||
| 7,952,280 | Israel Discount Bank Ltd. – Class A(a) | 18,676,539 | ||||||
| 1,748,885 | Syneron Medical Ltd.(a) | 18,450,737 | ||||||
|
| |||||||
| 37,127,276 | ||||||||
|
| |||||||
| Japan – 24.40% | ||||||||
| 273,300 | Bank of Nagoya Ltd. | 9,846,324 | ||||||
| 2,654,000 | Denki Kogyo Co. Ltd. | 13,424,842 | ||||||
| 561,400 | Fuji Machine Manufacturing Co. Ltd. | 7,379,271 | ||||||
| 1,765,800 | Fuji Media Holdings, Inc. | 24,470,122 | ||||||
| 1,632,700 | Funai Electric Co. Ltd. | 13,892,289 | ||||||
| 961,100 | Futaba Corp. | 17,038,081 | ||||||
| 4,588,700 | Hachijuni Bank Ltd. | 25,892,336 | ||||||
| 4,845,000 | Hyakugo Bank Ltd. | 19,344,233 | ||||||
| 1,119,700 | Kato Sangyo Co. Ltd. | 28,838,766 | ||||||
| 1,101,200 | Kissei Pharmaceutical Co. Ltd. | 28,930,313 | ||||||
The accompanying notes are an integral part of these Schedules of Investments.
75
Brandes International Small Cap Fund
SCHEDULE OF INVESTMENTS — March 31, 2017 (Unaudited) (continued)
| Shares | Value | |||||||
| 2,145,600 | Komori Corp. | $ | 27,592,689 | |||||
| 419,000 | Nippon Seiki Co. Ltd. | 9,028,068 | ||||||
| 999,900 | Noritsu Koki Co. Ltd. | 8,073,423 | ||||||
| 311,700 | NuFlare Technology, Inc. | 18,974,526 | ||||||
| 2,037,000 | Oita Bank Ltd. | 7,960,768 | ||||||
| 1,653,700 | Sanki Engineering Co. Ltd. | 14,270,187 | ||||||
| 513,700 | Sankyo Co. Ltd. | 17,206,320 | ||||||
| 1,994,800 | Sintokogio Ltd. | 17,392,766 | ||||||
| 1,272,700 | Tachi-S Co. Ltd. | 25,385,323 | ||||||
| 605,300 | Torii Pharmaceutical Co. Ltd. | 15,666,292 | ||||||
| 638,300 | Toyo Suisan Kaisha Ltd | 23,813,264 | ||||||
| 1,908,400 | TSI Holdings Co. Ltd. | 13,765,044 | ||||||
| 283,700 | Tsutsumi Jewelry Co. Ltd. | 5,313,048 | ||||||
| 973,000 | Wacoal Holdings Corp. | 12,020,214 | ||||||
|
| |||||||
| 405,518,509 | ||||||||
|
| |||||||
| Mexico – 3.34% | ||||||||
| 43,348,757 | Consorcio ARA SAB de CV | 13,706,934 | ||||||
| 2,517,107 | Desarrolladora Homex SAB de CV(a) | 112,396 | ||||||
| 13,695,224 | Fibra Uno Administracion SA de CV | 23,415,141 | ||||||
| 13,203,697 | Macquarie Mexico Real Estate Management SA de CV | 14,810,059 | ||||||
| 12,714,355 | Urbi Desarrollos Urbanos SA de CV(a)(e) | 3,395,520 | ||||||
|
| |||||||
| 55,440,050 | ||||||||
|
| |||||||
| Philippines – 0.58% | ||||||||
| 6,701,510 | First Philippine Holdings Corp. | 9,589,804 | ||||||
|
| |||||||
| Shares | Value | |||||||
| Russia – 1.00% | ||||||||
| 42,262,804 | Sistema JSFC | $ | 16,694,103 | |||||
|
| |||||||
| South Korea – 3.71% | ||||||||
| 243,745 | Binggrae Co. Ltd. | 14,930,280 | ||||||
| 2,983 | Lotte Chilsung Beverage Co. Ltd. | 3,774,298 | ||||||
| 133,938 | Lotte Confectionery Co. Ltd. | 23,039,783 | ||||||
| 208,685 | Samchully Co. Ltd.(e) | 19,967,178 | ||||||
|
| |||||||
| 61,711,539 | ||||||||
|
| |||||||
| Spain – 3.41% | ||||||||
| 10,932,902 | Banco Popular Espanol SA(a) | 10,601,654 | ||||||
| 1,418,942 | Hispania Activos Inmobiliarios SOCIMI SA | 20,360,137 | ||||||
| 2,333,732 | Lar Espana Real Estate SOCIMI SA | 17,975,149 | ||||||
| 687,144 | Merlin Properties SOCIMI SA | 7,676,876 | ||||||
|
| |||||||
| 56,613,816 | ||||||||
|
| |||||||
| United Kingdom – 17.58% | ||||||||
| 5,001,259 | Balfour Beatty Plc | 16,867,655 | ||||||
| 18,744,516 | Countrywide Plc(e) | 36,537,962 | ||||||
| 3,828,362 | De La Rue Plc | 29,546,714 | ||||||
| 40,881,841 | Debenhams Plc | 27,864,088 | ||||||
| 7,262,710 | ITE Group Plc | 14,650,082 | ||||||
| 10,390,076 | J Sainsbury Plc | 34,413,757 | ||||||
| 5,321,367 | LSL Property Services Plc(e) | 13,934,294 | ||||||
| 12,427,717 | Mitie Group Plc | 34,551,280 | ||||||
| 19,714,556 | Premier Foods Plc(a) | 10,868,139 | ||||||
| 14,481,089 | Spirent Communications Plc | 21,635,906 | ||||||
| 17,015,273 | Wm Morrison Supermarkets Plc | 51,203,618 | ||||||
|
| |||||||
| 292,073,495 | ||||||||
|
| |||||||
| | TOTAL COMMON STOCKS | $ | 1,366,647,439 | |||||
|
| |||||||
The accompanying notes are an integral part of these Schedules of Investments.
76
Brandes International Small Cap Fund
SCHEDULE OF INVESTMENTS — March 31, 2017 (Unaudited) (continued)
| Shares | Value | |||||||
| PREFERRED STOCKS – 3.10% | ||||||||
| Brazil – 1.15% | ||||||||
| 1,845,600 | Companhia Paranaense de Energia – COPEL B | $ | 19,112,742 | |||||
|
| |||||||
| Germany – 1.95% | ||||||||
| 315,507 | Draegerwerk AG & Co. KGaA | 32,421,396 | ||||||
|
| |||||||
| | TOTAL PREFERRED | $ | 51,534,138 | |||||
|
| |||||||
| Principal Amount | Value | |||||||
| CORPORATE BONDS & NOTES – 0.12% | ||||||||
| Mexico – 0.12% | ||||||||
Desarrolladora Homex SA de CV Promissory Note | $ | 1,057,347 | $ | 1,996,671 | ||||
Urbi Desarrollos Urbanos SA de CV | 8,014,000 | 20,035 | ||||||
|
| |||||||
TOTAL CORPORATE BONDS & NOTES | $ | 2,016,706 | ||||||
|
| |||||||
| REPURCHASE AGREEMENTS – 13.72% | ||||||||
State Street Bank and Trust Repurchase Agreement, | $ | 30,687,573 | $ | 30,687,573 | ||||
State Street Bank and Trust Repurchase Agreement, | 35,102,318 | 35,102,318 | ||||||
State Street Bank and Trust Repurchase Agreement, | 162,287,897 | 162,287,897 | ||||||
|
| |||||||
TOTAL REPURCHASE AGREEMENTS | $ | 228,077,788 | ||||||
|
| |||||||
Total Investments (Cost $1,569,172,518) – 99.18% | $ | 1,648,276,071 | ||||||
Other Assets in Excess of Liabilities – 0.82% | 13,602,463 | |||||||
|
| |||||||
TOTAL NET ASSETS – 100.00% | $ | 1,661,878,534 | ||||||
|
| |||||||
Percentages are stated as a percent of net assets.
The accompanying notes are an integral part of these Schedules of Investments.
77
Brandes International Small Cap Fund
SCHEDULE OF INVESTMENTS — March 31, 2017 (Unaudited) (continued)
| (a) | Non-income producing security. |
| (b) | The prices for these securities were derived from an estimate of fair market value using methods approved by the Fund’s Board of Trustees. These securities represent $15,228,843 or 0.92% of the Fund’s net assets and are classified as Level 2 securities. See Note 2 in the Notes to Financial Statements. |
| (c) | Security was purchased exempt from registration in the U.S. pursuant to Rule 144A of the Securities Act of 1933 (the “Act”) or were acquired in a private placement, and, unless registered under the Act, may only be sold to “qualified institutional buyers” (as defined in the Act) or pursuant to another exemption from registration. The market value of this security totals $1,996,671 which represents 0.12% of the Fund’s net assets. |
| (d) | These securities have limited liquidity and represent $15,248,878 or 0.92% of the Fund’s net assets and are classified as Level 2 securities. See Note 2 in the Notes to Financial Statements. |
| (e) | Affiliated issuer. See Note 8 in the Notes to Financial Statements. |
| (f) | In default. |
The accompanying notes are an integral part of these Schedules of Investments.
78
Brandes International Small Cap Fund
SCHEDULE OF INVESTMENTS BY INDUSTRY — March 31, 2017 (Unaudited)
COMMON STOCKS | ||||
Aerospace & Defense | 3.02 | % | ||
Auto Components | 2.07 | % | ||
Banks | 5.56 | % | ||
Beverages | 3.15 | % | ||
Commercial Services & Supplies | 3.86 | % | ||
Communications Equipment | 2.11 | % | ||
Construction & Engineering | 1.87 | % | ||
Distributors | 1.47 | % | ||
Diversified Telecommunication Services | 2.01 | % | ||
Electric Utilities | 3.50 | % | ||
Electrical Equipment | 1.03 | % | ||
Food & Staples Retailing | 6.89 | % | ||
Food Products | 6.54 | % | ||
Gas Utilities | 1.20 | % | ||
Health Care Equipment & Supplies | 1.84 | % | ||
Household Durables | 3.74 | % | ||
Insurance | 0.61 | % | ||
Leisure Products | 1.04 | % | ||
Machinery | 3.15 | % | ||
Marine | 0.70 | % | ||
Media | 2.35 | % | ||
Multiline Retail | 1.68 | % | ||
Oil, Gas & Consumable Fuels | 0.80 | % | ||
Paper & Forest Products | 1.81 | % | ||
Personal Products | 0.75 | % | ||
Pharmaceuticals | 2.68 | % | ||
Real Estate Investment Trusts | 6.19 | % | ||
Real Estate Management & Development | 3.04 | % | ||
Semiconductors & Semiconductor Equipment | 1.14 | % | ||
Software | 1.21 | % | ||
Specialty Retail | 1.08 | % | ||
Technology Hardware, Storage & Peripherals | 0.49 | % | ||
Textiles, Apparel & Luxury Goods | 2.67 | % | ||
Wireless Telecommunication Services | 0.99 | % | ||
|
| |||
TOTAL COMMON STOCKS | 82.24 | % | ||
|
| |||
PREFERRED STOCKS | ||||
Electric Utilities | 1.15 | % | ||
Health Care Equipment & Supplies | 1.95 | % | ||
|
| |||
TOTAL PREFERRED STOCKS | 3.10 | % | ||
|
| |||
The accompanying notes are an integral part of these Schedules of Investments.
79
Brandes International Small Cap Fund
SCHEDULE OF INVESTMENTS BY INDUSTRY — March 31, 2017 (Unaudited) (continued)
CORPORATE BONDS & NOTES | ||||
Household Durables | 0.12 | % | ||
|
| |||
TOTAL CORPORATE BONDS & NOTES | 0.12 | % | ||
|
| |||
REPURCHASE AGREEMENTS | 13.72 | % | ||
|
| |||
TOTAL INVESTMENTS | 99.18 | % | ||
Other Assets in Excess of Liabilities | 0.82 | % | ||
|
| |||
TOTAL NET ASSETS | 100.00 | % | ||
|
| |||
The industry classifications represented in the Schedule of Investments are in accordance with Global Industry Classification Standards (GICS®), which was developed by and/or is the exclusive property of MSCI, Inc. and Standard & Poor Financial Services LLC. This information is unaudited.
The accompanying notes are an integral part of these Schedules of Investments.
80
Brandes Core Plus Fixed Income Fund
SCHEDULE OF INVESTMENTS — March 31, 2017 (Unaudited)
| Principal Amount | Value | |||||||
| FEDERAL AND FEDERALLY SPONSORED CREDITS – 4.36% | ||||||||
| Federal Home Loan Mortgage Corporation – 2.42% | ||||||||
Pool G1-8578, 3.000%, 12/1/2030 | $ | 2,148,869 | $ | 2,205,968 | ||||
Pool A9-3505, 4.500%, 8/1/2040 | 168,499 | 181,467 | ||||||
Pool G0-6018, 6.500%, 4/1/2039 | 37,960 | 44,310 | ||||||
|
| |||||||
| 2,431,745 | ||||||||
|
| |||||||
| Federal National Mortgage Association – 1.94% | ||||||||
Pool AS6201, 3.500%, 11/1/2045 | 1,450,893 | 1,484,975 | ||||||
Pool MA0918, 4.000%, 12/1/2041 | 372,504 | 392,187 | ||||||
Pool 254631, 5.000%, 2/1/2018 | 19,088 | 19,617 | ||||||
Pool 934124, 5.500%, 7/1/2038 | 51,487 | 57,426 | ||||||
|
| |||||||
| 1,954,205 | ||||||||
|
| |||||||
TOTAL FEDERAL AND FEDERALLY SPONSORED CREDITS (Cost $4,393,430) | $ | 4,385,950 | ||||||
|
| |||||||
| OTHER MORTGAGE RELATED SECURITIES – 0.11% | ||||||||
| Collateralized Mortgage Obligations – 0.00% | ||||||||
Wells Fargo Mortgage Backed Securities 2006-AR14 Trust | $ | 2,103 | $ | 1,961 | ||||
|
| |||||||
| Near Prime Mortgage – 0.11% | ||||||||
Bear Stearns ALT-A Trust 2004-11 | 115,556 | 112,997 | ||||||
|
| |||||||
TOTAL OTHER MORTGAGE RELATED SECURITIES | $ | 114,958 | ||||||
|
| |||||||
| US GOVERNMENTS – 55.57% | ||||||||
| Sovereign – 55.57% | ||||||||
United States Treasury Bond | $ | 1,925,000 | $ | 2,513,403 | ||||
United States Treasury Note | ||||||||
2.000%, 11/15/2021 | 13,811,000 | 13,874,655 | ||||||
2.000%, 2/15/2023 | 15,390,000 | 15,310,649 | ||||||
2.375%, 8/15/2024 | 24,055,000 | 24,247,632 | ||||||
|
| |||||||
TOTAL US GOVERNMENTS | $ | 55,946,339 | ||||||
|
| |||||||
| ASSET BACKED SECURITIES – 1.94% | ||||||||
| Equipment – 0.03% | ||||||||
Continental Airlines 2007-1 Class A Pass Through Trust | $ | 30,178 | $ | 33,196 | ||||
|
| |||||||
| Student Loan – 1.91% | ||||||||
SLM Private Credit Student Loan Trust 2004-B | 300,000 | 271,690 | ||||||
The accompanying notes are an integral part of these Schedules of Investments.
81
Brandes Core Plus Fixed Income Fund
SCHEDULE OF INVESTMENTS — March 31, 2017 (Unaudited) (continued)
| Principal Amount | Value | |||||||
SLM Private Credit Student Loan Trust 2005-A | $ | 400,000 | $ | 366,220 | ||||
SLM Private Credit Student Loan Trust 2006-A | 1,025,000 | 962,885 | ||||||
SLM Private Credit Student Loan Trust 2007-A | 350,000 | 318,145 | ||||||
|
| |||||||
| 1,918,940 | ||||||||
|
| |||||||
TOTAL ASSET BACKED SECURITIES | $ | 1,952,136 | ||||||
|
| |||||||
| CORPORATE BONDS – 34.34% | ||||||||
| Banks & Thrifts – 8.44% | ||||||||
Bank of America Corp. | $ | 1,475,000 | $ | 1,588,301 | ||||
Citigroup, Inc. | 885,000 | 910,111 | ||||||
Fifth Third Bancorp | 175,000 | 249,294 | ||||||
Goldman Sachs Group, Inc. | 1,025,000 | 1,124,897 | ||||||
JPMorgan Chase & Co. | 2,085,000 | 2,160,581 | ||||||
USB Capital IX | 750,000 | 637,500 | ||||||
Wells Fargo & Co. | 625,000 | 624,686 | ||||||
7.980%, Perpetual | 1,150,000 | 1,201,750 | ||||||
|
| |||||||
| 8,497,120 | ||||||||
|
| |||||||
| Commercial Services & Supplies – 1.44% | ||||||||
ADT Corp. | 1,510,000 | 1,445,825 | ||||||
|
| |||||||
| Diversified Telecommunication Services – 0.37% | ||||||||
Frontier Communications Corp. | 400,000 | 372,000 | ||||||
|
| |||||||
| Electric Utilities – 3.32% | ||||||||
Arizona Public Service Co. | 340,000 | 383,110 | ||||||
Commonwealth Edison Co. | 175,000 | 215,520 | ||||||
FirstEnergy Corp. | 1,465,000 | 1,909,400 | ||||||
Israel Electric Corp. Ltd. | 420,000 | 454,633 | ||||||
The accompanying notes are an integral part of these Schedules of Investments.
82
Brandes Core Plus Fixed Income Fund
SCHEDULE OF INVESTMENTS — March 31, 2017 (Unaudited) (continued)
| Principal Amount | Value | |||||||
Oncor Electric Delivery Co., LLC | $ | 315,000 | $ | 380,002 | ||||
|
| |||||||
| 3,342,665 | ||||||||
|
| |||||||
| Energy Equipment & Services – 1.01% | ||||||||
Transocean, Inc. | 1,010,000 | 1,015,050 | ||||||
|
| |||||||
| Food, Beverage & Tobacco – 0.99% | ||||||||
Tesco Plc 5.500%, 11/15/2017 (Acquired 03/12/15 through 02/24/16, Cost $995,726)(b) | 980,000 | 998,558 | ||||||
|
| |||||||
| Forest Products & Paper – 1.38% | ||||||||
Sappi Papier Holding GmbH | 1,390,000 | 1,392,919 | ||||||
|
| |||||||
| Health Care Providers & Services – 1.52% | ||||||||
Tenet Healthcare Corp. | 1,505,000 | 1,529,456 | ||||||
|
| |||||||
| Homebuilders – 0.88% | ||||||||
PulteGroup, Inc. | 370,000 | 382,950 | ||||||
Toll Brothers Finance Corp. | 495,000 | 498,713 | ||||||
Urbi Desarrollos Urbanos SAB de CV | 1,640,000 | 4,100 | ||||||
|
| |||||||
| 885,763 | ||||||||
|
| |||||||
| Independent Power and Renewable Electricity Producers – 0.26% | ||||||||
Talen Energy Supply, LLC | 255,000 | 263,287 | ||||||
|
| |||||||
| Insurance – 2.29% | ||||||||
American International Group, Inc. | 800,000 | 905,480 | ||||||
CNA Financial Corp. | ||||||||
7.350%, 11/15/2019 | 785,000 | 885,404 | ||||||
5.875%, 8/15/2020 | 135,000 | 149,754 | ||||||
Voya Financial, Inc. | 335,000 | 369,203 | ||||||
|
| |||||||
| 2,309,841 | ||||||||
|
| |||||||
| Metals & Mining – 1.76% | ||||||||
Cloud Peak Energy Resources, LLC / Cloud Peak Energy Finance Corp. 12.000%, 11/1/2021 | 1,030,000 | 1,109,825 | ||||||
The accompanying notes are an integral part of these Schedules of Investments.
83
Brandes Core Plus Fixed Income Fund
SCHEDULE OF INVESTMENTS — March 31, 2017 (Unaudited) (continued)
| Principal Amount | Value | |||||||
Royal Gold, Inc. | $ | 625,000 | $ | 660,156 | ||||
|
| |||||||
| 1,769,981 | ||||||||
|
| |||||||
| Oil, Gas & Consumable Fuels – 7.10% | ||||||||
BP Capital Markets Plc | ||||||||
2.241%, 9/26/2018 | 1,115,000 | 1,122,855 | ||||||
3.506%, 3/17/2025 | 810,000 | 815,009 | ||||||
Chesapeake Energy Corp. | 1,925,000 | 1,867,250 | ||||||
Exxon Mobil Corp. | 745,000 | 745,136 | ||||||
Kinder Morgan, Inc. | ||||||||
7.000%, 6/15/2017 | 195,000 | 197,090 | ||||||
4.300%, 6/1/2025 | 904,000 | 923,534 | ||||||
Occidental Petroleum Corp. | 405,000 | 408,987 | ||||||
Range Resources Corp. | 890,000 | 876,650 | ||||||
Valero Energy Corp. | 170,000 | 193,292 | ||||||
|
| |||||||
| 7,149,803 | ||||||||
|
| |||||||
| Telecommunications – 3.58% | ||||||||
AT&T, Inc. | 1,480,000 | 1,472,297 | ||||||
Sprint Communications, Inc. | 1,175,000 | 1,279,281 | ||||||
Telecom Italia Capital SA | 85,000 | 89,356 | ||||||
Telefonica Emisiones SAU | ||||||||
6.221%, 7/3/2017 | 610,000 | 616,710 | ||||||
5.462%, 2/16/2021 | 135,000 | 148,193 | ||||||
|
| |||||||
| 3,605,837 | ||||||||
|
| |||||||
TOTAL CORPORATE BONDS | $ | 34,578,105 | ||||||
|
| |||||||
The accompanying notes are an integral part of these Schedules of Investments.
84
Brandes Core Plus Fixed Income Fund
SCHEDULE OF INVESTMENTS — March 31, 2017 (Unaudited) (continued)
| Principal Amount | Value | |||||||
| REPURCHASE AGREEMENTS – 2.58% | ||||||||
State Street Bank and Trust Repurchase Agreement, | $ | 2,601,793 | $ | 2,601,793 | ||||
|
| |||||||
TOTAL REPURCHASE AGREEMENTS | $ | 2,601,793 | ||||||
|
| |||||||
Total Investments (Cost $99,141,031) – 98.90% | $ | 99,579,281 | ||||||
Other Assets in Excess of Liabilities – 1.10% | 1,105,347 | |||||||
|
| |||||||
TOTAL NET ASSETS – 100.00% | $ | 100,684,628 | ||||||
|
| |||||||
Percentages are stated as a percent of net assets.
| (a) | Non-income producing security. |
| (b) | Securities were purchased exempt from registration in the U.S. pursuant to Rule 144A of the Securities Act of 1933 (the “Act”) or were acquired in a private placement, and, unless registered under the Act, may only be sold to “qualified institutional buyers” (as defined in the Act) or pursuant to another exemption from registration. The market values of these securities total $5,006,141 which represents 4.97% of the Fund’s net assets. |
| (c) | These securities have limited liquidity and represent $119,058 or 0.12% of the Fund’s net assets and are classified as Level 2 securities. See Note 2 in the Notes to Financial Statements. |
| (d) | In default. |
The industry classifications represented in the Schedule of Investments are in accordance with Global Industry Classification Standards (GICS®), which was developed by and/or is the exclusive property of MSCI, Inc. and Standard & Poor Financial Services LLC. This information is unaudited.
The accompanying notes are an integral part of these Schedules of Investments.
85
Brandes Credit Focus Yield Fund
SCHEDULE OF INVESTMENTS — March 31, 2017 (Unaudited)
| Principal Amount | Value | |||||||
| US GOVERNMENTS – 35.59% | ||||||||
| Sovereign – 35.59% | ||||||||
United States Treasury Note | ||||||||
3.375%, 11/15/2019 | $ | 3,380,000 | $ | 3,551,244 | ||||
2.000%, 11/15/2021 | 2,815,000 | 2,827,974 | ||||||
2.000%, 2/15/2023 | 1,655,000 | 1,646,467 | ||||||
2.375%, 8/15/2024 | 3,100,000 | 3,124,825 | ||||||
|
| |||||||
TOTAL US GOVERNMENTS | $ | 11,150,510 | ||||||
|
| |||||||
| ASSET BACKED SECURITIES – 2.65% | ||||||||
| Equipment – 0.27% | ||||||||
Continental Airlines 2007-1 Class A Pass Through Trust | $ | 75,445 | $ | 82,990 | ||||
|
| |||||||
| Student Loan – 2.38% | ||||||||
SLM Private Credit Student Loan Trust 2006-A | 505,000 | 474,397 | ||||||
SLM Private Credit Student Loan Trust 2007-A | 300,000 | 272,695 | ||||||
|
| |||||||
| 747,092 | ||||||||
|
| |||||||
TOTAL ASSET BACKED SECURITIES | $ | 830,082 | ||||||
|
| |||||||
| CORPORATE BONDS – 59.23% | ||||||||
| Banks & Thrifts – 13.50% | ||||||||
Bank of America Corp. | $ | 700,000 | $ | 753,770 | ||||
Citigroup, Inc. | 500,000 | 514,187 | ||||||
Fifth Third Bancorp | 65,000 | 92,595 | ||||||
Goldman Sachs Group, Inc. | 490,000 | 537,755 | ||||||
JPMorgan Chase & Co. | 1,140,000 | 1,181,325 | ||||||
USB Capital IX | 350,000 | 297,500 | ||||||
Wells Fargo & Co. | 350,000 | 349,824 | ||||||
7.980%, Perpetual | 480,000 | 501,600 | ||||||
|
| |||||||
| 4,228,556 | ||||||||
|
| |||||||
| Commercial Services & Supplies – 2.28% | ||||||||
ADT Corp. | 745,000 | 713,337 | ||||||
|
| |||||||
The accompanying notes are an integral part of these Schedules of Investments.
86
Brandes Credit Focus Yield Fund
SCHEDULE OF INVESTMENTS — March 31, 2017 (Unaudited) (continued)
| Principal Amount | Value | |||||||
| Computers & Peripherals – 2.35% | ||||||||
Apple, Inc. | $ | 750,000 | $ | 737,461 | ||||
|
| |||||||
| Diversified Financial Services – 1.25% | ||||||||
Voya Financial, Inc. | 355,000 | 391,245 | ||||||
|
| |||||||
| Diversified Telecommunication Services – 0.53% | ||||||||
Frontier Communications Corp. | 180,000 | 167,400 | ||||||
|
| |||||||
| Electric Utilities – 5.35% | ||||||||
Arizona Public Service Co. | 435,000 | 490,156 | ||||||
FirstEnergy Corp. | 380,000 | 495,271 | ||||||
Israel Electric Corp. Ltd. | 505,000 | 546,642 | ||||||
Oncor Electric Delivery Co., LLC | 120,000 | 144,763 | ||||||
|
| |||||||
| 1,676,832 | ||||||||
|
| |||||||
| Energy Equipment & Services – 1.54% | ||||||||
Transocean, Inc. | 480,000 | 482,400 | ||||||
|
| |||||||
| Food, Beverage & Tobacco – 1.81% | ||||||||
Tesco Plc | 555,000 | 565,510 | ||||||
|
| |||||||
| Forest Products & Paper – 2.11% | ||||||||
Sappi Papier Holding GmbH | 660,000 | 661,386 | ||||||
|
| |||||||
| Health Care Providers & Services – 2.29% | ||||||||
Tenet Healthcare Corp. | 705,000 | 716,456 | ||||||
|
| |||||||
| Homebuilders – 1.41% | ||||||||
PulteGroup, Inc. | 205,000 | 212,175 | ||||||
Toll Brothers Finance Corp. | 225,000 | 226,687 | ||||||
Urbi Desarrollos Urbanos SAB de CV | 1,225,000 | 3,063 | ||||||
|
| |||||||
| 441,925 | ||||||||
|
| |||||||
The accompanying notes are an integral part of these Schedules of Investments.
87
Brandes Credit Focus Yield Fund
SCHEDULE OF INVESTMENTS — March 31, 2017 (Unaudited) (continued)
| Principal Amount | Value | |||||||
| Independent Power & Renewable Electricity Producers – 0.73% | ||||||||
Talen Energy Supply, LLC | $ | 220,000 | $ | 227,150 | ||||
|
| |||||||
| Insurance – 3.03% | ||||||||
American International Group, Inc. | 485,000 | 548,947 | ||||||
CNA Financial Corp. | 125,000 | 140,988 | ||||||
5.875%, 8/15/2020 | 235,000 | 260,684 | ||||||
|
| |||||||
| 950,619 | ||||||||
|
| |||||||
| Metals & Mining – 2.85% | ||||||||
Cloud Peak Energy Resources, LLC / Cloud Peak Energy Finance Corp. | 470,000 | 506,425 | ||||||
Royal Gold, Inc. | 365,000 | 385,531 | ||||||
|
| |||||||
| 891,956 | ||||||||
|
| |||||||
| Oil, Gas & Consumable Fuels – 12.25% | ||||||||
BP Capital Markets Plc | 475,000 | 478,346 | ||||||
3.506%, 3/17/2025 | 445,000 | 447,752 | ||||||
Chesapeake Energy Corp. | 1,010,000 | 979,700 | ||||||
Exxon Mobil Corp. | 435,000 | 435,079 | ||||||
Kinder Morgan, Inc. | 270,000 | 272,894 | ||||||
4.300%, 6/1/2025 | 353,000 | 360,628 | ||||||
Occidental Petroleum Corp. | 220,000 | 222,166 | ||||||
Range Resources Corp. | 415,000 | 408,775 | ||||||
Valero Energy Corp. | 205,000 | 233,088 | ||||||
|
| |||||||
| 3,838,428 | ||||||||
|
| |||||||
| Telecommunications – 5.95% | ||||||||
AT&T, Inc. | 710,000 | 706,305 | ||||||
Sprint Communications, Inc. | 535,000 | 582,481 | ||||||
Telecom Italia Capital SA | 140,000 | 147,175 | ||||||
The accompanying notes are an integral part of these Schedules of Investments.
88
Brandes Credit Focus Yield Fund
SCHEDULE OF INVESTMENTS — March 31, 2017 (Unaudited) (continued)
| Principal Amount | Value | |||||||
Telefonica Emisiones SAU | $ | 335,000 | $ | 338,685 | ||||
5.462%, 2/16/2021 | 80,000 | 87,818 | ||||||
|
| |||||||
| 1,862,464 | ||||||||
|
| |||||||
TOTAL CORPORATE BONDS | $ | 18,553,125 | ||||||
|
| |||||||
| REPURCHASE AGREEMENTS – 1.50% | ||||||||
State Street Bank and Trust Repurchase Agreement, | $ | 470,881 | $ | 470,881 | ||||
|
| |||||||
TOTAL REPURCHASE AGREEMENTS | $ | 470,881 | ||||||
|
| |||||||
Total Investments (Cost $30,711,430) – 98.97% | $ | 31,004,598 | ||||||
Other Assets in Excess of Liabilities – 1.03% | 323,179 | |||||||
|
| |||||||
TOTAL NET ASSETS – 100.00% | $ | 31,327,777 | ||||||
|
| |||||||
Percentages are stated as a percent of net assets.
| (a) | Non-income producing security. |
| (b) | Securities were purchased exempt from registration in the U.S. pursuant to Rule 144A of the Securities Act of 1933 (the “Act”) or were acquired in a private placement, and, unless registered under the Act, may only be sold to “qualified institutional buyers” (as defined in the Act) or pursuant to another exemption from registration. The market values of these securities total $2,767,857 which represents 8.84% of the Fund’s net assets. |
| (c) | This security has limited liquidity and represents $3,063 or 0.01% of the Fund’s net assets and is classified as a Level 2 security. See Note 2 in the Notes to Financial Statements. |
| (d) | In default. |
The industry classifications represented in the Schedule of Investments are in accordance with Global Industry Classification Standards (GICS®), which was developed by and/or is the exclusive property of MSCI, Inc. and Standard & Poor Financial Services LLC. This information is unaudited.
The accompanying notes are an integral part of these Schedules of Investments.
89
Brandes Investment Trust
STATEMENTS OF ASSETS AND LIABILITIES — March 31, 2017 (Unaudited)
| Brandes International Equity Fund | Brandes Global Equity Fund | |||||||
ASSETS | ||||||||
Investment in securities, at value(1) | ||||||||
Unaffiliated issuers | $ | 509,262,038 | $ | 67,158,734 | ||||
Affiliated issuers | — | — | ||||||
Cash | — | — | ||||||
Restricted Cash | — | — | ||||||
Foreign Currency(1) | 250,627 | 16,575 | ||||||
Receivables: | ||||||||
Securities sold | — | — | ||||||
Fund shares sold | 1,107,799 | 18,445 | ||||||
Dividends and interest | 2,323,738 | 240,216 | ||||||
Foreign currency spot trade | — | — | ||||||
Tax reclaims | 317,113 | 20,165 | ||||||
Due from Advisor | — | — | ||||||
Prepaid expenses and other assets | 50,400 | 35,778 | ||||||
|
|
|
| |||||
Total Assets | 513,311,715 | 67,489,913 | ||||||
|
|
|
| |||||
LIABILITIES | ||||||||
Payables: | ||||||||
Securities purchased | 3,158,167 | — | ||||||
Fund shares redeemed | 1,147,531 | 87,114 | ||||||
Due to Advisor | 345,406 | 31,651 | ||||||
12b-1 Fee | 12,872 | 2,855 | ||||||
Trustee Fees | 16,932 | 2,900 | ||||||
Dividends payable | 141,184 | 1,006 | ||||||
Foreign tax witholding | 252,196 | 22,468 | ||||||
Foreign currency spot trade payable | 2,806 | — | ||||||
Accrued expenses | 180,900 | 76,966 | ||||||
|
|
|
| |||||
Total Liabilities | 5,257,994 | 224,960 | ||||||
|
|
|
| |||||
NET ASSETS | $ | 508,053,721 | $ | 67,264,953 | ||||
|
|
|
| |||||
COMPONENTS OF NET ASSETS | ||||||||
Paid-in capital | $ | 625,649,313 | $ | 61,770,785 | ||||
Undistributed net investment income (loss) | (3,836,382 | ) | (235,808 | ) | ||||
Accumulated net realized gain (loss) on investments and foreign currency | (51,262,965 | ) | (284,527 | ) | ||||
Net unrealized appreciation (depreciation) on: | ||||||||
Investments | (62,510,574 | ) | 6,010,964 | |||||
Foreign currency | 14,329 | 3,539 | ||||||
|
|
|
| |||||
Total Net Assets | $ | 508,053,721 | $ | 67,264,953 | ||||
|
|
|
| |||||
Net asset value, offering price and redemption proceeds per share | ||||||||
Class A Shares | ||||||||
Net Assets | $ | 22,369,451 | $ | 7,603,862 | ||||
Shares outstanding (unlimited shares authorized without par value) | 1,354,316 | 329,520 | ||||||
Offering and redemption price | $ | 16.52 | $ | 23.08 | ||||
|
|
|
| |||||
Maximum offering price per share* | $ | 17.52 | $ | 24.48 | ||||
|
|
|
| |||||
Class C Shares | ||||||||
Net Assets | $ | 13,816,588 | $ | 1,889,120 | ||||
Shares outstanding (unlimited shares authorized without par value) | 844,679 | 82,332 | ||||||
Offering and redemption price | $ | 16.36 | $ | 22.95 | ||||
|
|
|
| |||||
Class I Shares | ||||||||
Net Assets | $ | 439,842,777 | $ | 57,771,971 | ||||
Shares outstanding (unlimited shares authorized without par value) | 26,571,055 | 2,488,144 | ||||||
Offering and redemption price | $ | 16.55 | $ | 23.22 | ||||
|
|
|
| |||||
Class R6 Shares | ||||||||
Net Assets | $ | 32,024,905 | N/A | |||||
Shares outstanding (unlimited shares authorized without par value) | 1,930,791 | N/A | ||||||
Offering and redemption price | $ | 16.59 | N/A | |||||
|
|
|
| |||||
(1) Cost of: | ||||||||
Investments in securities | ||||||||
Unaffiliated issuers | $ | 571,772,612 | $ | 61,147,770 | ||||
Affiliated issuers | — | — | ||||||
Foreign currency | 250,271 | 16,629 | ||||||
| * | Includes a sales load of 5.75% for the International, Global, Global Equity Income, Global Opportunities Value, Emerging Markets Value, and International Small Cap Funds and 3.75% for the Core Plus Fixed Income and Credit Focus Yield Funds. (See Note 7 of the Notes to Financial Statements) |
The accompanying notes to financial statements are an integral part of this statement.
90
Brandes Investment Trust
STATEMENTS OF ASSETS AND LIABILITIES — March 31, 2017 (Unaudited) (continued)
Brandes | Brandes Global Opportunities Value Fund | Brandes Emerging Markets Value Fund | Brandes International Small Cap Equity Fund | Brandes Core Plus Fixed Income Fund | Brandes Credit Focus Yield Fund | |||||||||||||||||
| $ | 939,642 | $ | 23,390,716 | $ | 1,450,277,483 | $ | 1,574,441,117 | $ | 99,579,281 | $ | 31,004,598 | |||||||||||
| — | — | 2,735,368 | 73,834,954 | — | — | |||||||||||||||||
| 48,203 | — | — | — | — | — | |||||||||||||||||
| — | — | — | 1,857,541 | — | — | |||||||||||||||||
| 137 | 1,379 | 160,420 | 17,147,454 | — | — | |||||||||||||||||
| — | 61,849 | 3,688,989 | 3,130,536 | — | — | |||||||||||||||||
| — | 84,713 | 2,728,934 | 4,241,236 | 489,487 | — | |||||||||||||||||
| 4,030 | 89,285 | 4,912,987 | 6,639,032 | 760,492 | 348,309 | |||||||||||||||||
| — | 6,008 | 840,242 | 1,847,913 | — | — | |||||||||||||||||
| 240 | 6,735 | 249,816 | 405,173 | — | — | |||||||||||||||||
| 12,016 | — | — | — | — | — | |||||||||||||||||
| 5,105 | 34,003 | 102,946 | 81,986 | 36,587 | 24,852 | |||||||||||||||||
|
|
|
|
|
|
|
|
|
|
|
| |||||||||||
| 1,009,373 | 23,674,688 | 1,465,697,185 | 1,683,626,942 | 100,865,847 | 31,377,759 | |||||||||||||||||
|
|
|
|
|
|
|
|
|
|
|
| |||||||||||
| — | 99,723 | 3,815,929 | 15,248,274 | — | — | |||||||||||||||||
| — | 994 | 2,595,024 | 3,872,146 | 85,087 | 107 | |||||||||||||||||
| — | 4,172 | 1,090,987 | 1,318,809 | 16,043 | 256 | |||||||||||||||||
| 10 | 620 | 86,743 | 51,043 | 443 | 639 | |||||||||||||||||
| 3,146 | 2,868 | 42,281 | 43,533 | 5,513 | 2,400 | |||||||||||||||||
| 116 | 412 | — | 227,529 | 2,331 | 2,894 | |||||||||||||||||
| 290 | 8,843 | 802,059 | 690,290 | — | — | |||||||||||||||||
| — | — | — | — | — | — | |||||||||||||||||
| 35,910 | 41,882 | 387,041 | 296,784 | 71,802 | 43,686 | |||||||||||||||||
|
|
|
|
|
|
|
|
|
|
|
| |||||||||||
| 39,472 | 159,514 | 8,820,064 | 21,748,408 | 181,219 | 49,982 | |||||||||||||||||
|
|
|
|
|
|
|
|
|
|
|
| |||||||||||
| $ | 969,901 | $ | 23,515,174 | $ | 1,456,877,121 | $ | 1,661,878,534 | $ | 100,684,628 | $ | 31,327,777 | |||||||||||
|
|
|
|
|
|
|
|
|
|
|
| |||||||||||
| $ | 878,837 | $ | 22,503,771 | $ | 1,634,649,699 | $ | 1,577,617,457 | $ | 100,408,281 | $ | 30,811,932 | |||||||||||
| (20 | ) | (28,446 | ) | (7,691,421 | ) | (28,321,141 | ) | (14,690 | ) | (7,292 | ) | |||||||||||
| 9,941 | (395,912 | ) | (182,521,040 | ) | 33,462,014 | (147,213 | ) | 229,969 | ||||||||||||||
| 81,087 | 1,434,595 | 12,191,965 | 79,103,553 | 438,250 | 293,168 | |||||||||||||||||
| 56 | 1,166 | 247,918 | 16,651 | — | — | |||||||||||||||||
|
|
|
|
|
|
|
|
|
|
|
| |||||||||||
| $ | 969,901 | $ | 23,515,174 | $ | 1,456,877,121 | $ | 1,661,878,534 | $ | 100,684,628 | $ | 31,327,777 | |||||||||||
|
|
|
|
|
|
|
|
|
|
|
| |||||||||||
| $ | 119 | $ | 2,654,854 | $ | 347,924,095 | $ | 174,312,821 | $ | 1,663,752 | $ | 2,362,027 | |||||||||||
| 10 | 238,889 | 40,374,429 | 12,562,099 | 182,092 | 231,625 | |||||||||||||||||
| $ | 11.57 | $ | 11.11 | $ | 8.62 | $ | 13.88 | $ | 9.14 | $ | 10.20 | |||||||||||
|
|
|
|
|
|
|
|
|
|
|
| |||||||||||
| $ | 12.27 | $ | 11.79 | $ | 9.14 | $ | 14.72 | $ | 9.49 | $ | 10.59 | |||||||||||
|
|
|
|
|
|
|
|
|
|
|
| |||||||||||
| $ | 11,913 | $ | 102,538 | $ | 24,134,216 | $ | 24,425,928 | N/A | N/A | |||||||||||||
| 1,060 | 9,265 | 2,823,524 | 1,792,489 | — | — | |||||||||||||||||
| $ | 11.23 | $ | 11.07 | $ | 8.55 | $ | 13.63 | N/A | N/A | |||||||||||||
|
|
|
|
|
|
|
|
|
|
|
| |||||||||||
| $ | 957,869 | $ | 20,757,782 | $ | 1,012,314,886 | $ | 1,404,851,459 | $ | 99,020,876 | $ | 28,965,750 | |||||||||||
| 85,542 | 1,870,755 | 116,956,714 | 100,926,874 | 10,775,666 | 2,840,922 | |||||||||||||||||
| $ | 11.20 | $ | 11.10 | $ | 8.66 | $ | 13.92 | $ | 9.19 | $ | 10.20 | |||||||||||
|
|
|
|
|
|
|
|
|
|
|
| |||||||||||
| N/A | N/A | $ | 72,503,924 | $ | 58,288,326 | N/A | N/A | |||||||||||||||
| N/A | N/A | 8,364,195 | 4,185,734 | N/A | N/A | |||||||||||||||||
| N/A | N/A | $ | 8.67 | $ | 13.93 | N/A | N/A | |||||||||||||||
|
|
|
|
|
|
|
|
|
|
|
| |||||||||||
| $ | 858,555 | $ | 21,956,121 | $ | 1,428,618,721 | $ | 1,455,593,971 | $ | 99,141,031 | $ | 30,711,430 | |||||||||||
| — | — | 12,202,165 | 113,578,547 | — | — | |||||||||||||||||
| 139 | 7,194 | 163,271 | 19,024,682 | — | — | |||||||||||||||||
The accompanying notes to financial statements are an integral part of this statement.
91
Brandes Investment Trust
STATEMENTS OF OPERATIONS — For the Six Months Ended March 31, 2017 (Unaudited)
| Brandes International Equity Fund | Brandes Global Equity Fund | |||||||
INVESTMENT INCOME | ||||||||
Income | ||||||||
Dividend income | ||||||||
Unaffiliated issuers | $ | 5,329,761 | $ | 659,807 | ||||
Affiliated issuers | — | — | ||||||
Less: foreign taxes withheld | (444,516 | ) | (36,417 | ) | ||||
Interest income | 2,602 | 37,414 | ||||||
Less: Foreign taxes withheld | — | — | ||||||
Income from securities lending | 57,284 | 1,877 | ||||||
Miscellaneous Income | — | — | ||||||
|
|
|
| |||||
Total Income | 4,945,131 | 662,681 | ||||||
|
|
|
| |||||
Expenses | ||||||||
Advisory fees (Note 3) | 2,177,747 | 245,729 | ||||||
Custody fees | 27,273 | 3,182 | ||||||
Administration fees (Note 3) | 60,425 | 7,100 | ||||||
Insurance expense | 9,899 | 790 | ||||||
Legal fees | 10,652 | 2,041 | ||||||
Printing fees | 18,588 | 2,998 | ||||||
Miscellaneous | 19,410 | 2,367 | ||||||
Registration expense | 47,253 | 28,542 | ||||||
Trustee fees | 27,528 | 4,536 | ||||||
Transfer agent fees | 70,346 | 31,872 | ||||||
12b-1 Fees – Class A | 20,139 | 8,324 | ||||||
12b-1 Fees – Class C | 48,568 | 7,369 | ||||||
Shareholder Service Fees – Class C | 16,189 | 2,457 | ||||||
Shareholder Service Fees – Class E* | 225 | — | ||||||
Sub-Transfer Agency Fees – Class I | 122,774 | 13,197 | ||||||
Accounting fees | 37,686 | 31,676 | ||||||
Auditing fees | 20,106 | 19,209 | ||||||
Proxy expense | 49,384 | 4,138 | ||||||
|
|
|
| |||||
Total expenses | 2,784,192 | 415,527 | ||||||
Expense recoupment (reimbursement / waiver) | (13,705 | ) | (86,054 | ) | ||||
|
|
|
| |||||
Total expenses net of recoupment / reimbursement / waiver | 2,770,487 | 329,473 | ||||||
|
|
|
| |||||
Net investment income | 2,174,644 | 333,208 | ||||||
|
|
|
| |||||
REALIZED AND UNREALIZED GAIN (LOSS) ON INVESTMENTS | ||||||||
Net realized gain (loss) on: | ||||||||
Unaffiliated investments | 3,791,366 | 225,845 | ||||||
Redemption in-kind | 9,879,819 | — | ||||||
Foreign currency transactions | (493,145 | ) | (5,135 | ) | ||||
|
|
|
| |||||
Net realized gain (loss) | 13,178,040 | 220,710 | ||||||
|
|
|
| |||||
Net change in unrealized appreciation (depreciation) on: | ||||||||
Investments | 12,209,297 | 5,109,484 | ||||||
Foreign currency transactions | 17,391 | 4,707 | ||||||
|
|
|
| |||||
Net unrealized appreciation (depreciation) | 12,226,688 | 5,114,191 | ||||||
|
|
|
| |||||
Net realized and unrealized gain (loss) on investments and foreign currency transactions | 25,404,728 | 5,334,901 | ||||||
|
|
|
| |||||
Net Increase (decrease) in net assets resulting from operations | $ | 27,579,372 | $ | 5,668,109 | ||||
|
|
|
| |||||
| * | Class E shares were eliminated effective November 30, 2016 and are no longer offered for sale. |
The accompanying notes to financial statements are an integral part of this statement.
92
Brandes Investment Trust
STATEMENTS OF OPERATIONS — For the Six Months Ended March 31, 2017 (Unaudited) (continued)
Brandes | Brandes Global Opportunities Value Fund | Brandes Emerging Markets Value Fund | Brandes International Small Cap Equity Fund | Brandes Core Plus Fixed Income Fund | Brandes Credit Focus Yield Fund | |||||||||||||||||
| $ | 12,900 | $ | 131,735 | $ | 12,912,217 | $ | 18,823,129 | $ | 29,890 | $ | 18,837 | |||||||||||
| — | — | — | 849,035 | — | — | |||||||||||||||||
| (456 | ) | (10,323 | ) | (1,266,121 | ) | (1,720,291 | ) | — | — | |||||||||||||
| — | 9,549 | — | 120,153 | 1,376,257 | 534,353 | |||||||||||||||||
| — | — | — | (4,874 | ) | — | — | ||||||||||||||||
| — | — | — | 7,570 | — | — | |||||||||||||||||
| — | — | 1,497 | 43,195 | 21,465 | ||||||||||||||||||
|
|
|
|
|
|
|
|
|
|
|
| |||||||||||
| 12,444 | 130,961 | 11,647,593 | 18,074,722 | 1,449,342 | 574,655 | |||||||||||||||||
|
|
|
|
|
|
|
|
|
|
|
| |||||||||||
| 3,573 | 60,967 | 5,889,120 | 7,076,060 | 169,955 | 77,592 | |||||||||||||||||
| 731 | 1,560 | 221,684 | 90,213 | 6,184 | 2,361 | |||||||||||||||||
| 633 | 1,737 | 133,336 | 165,436 | 11,471 | 3,821 | |||||||||||||||||
| — | 94 | 17,066 | 17,847 | 1,275 | 486 | |||||||||||||||||
| 1,121 | 1,216 | 22,401 | 26,175 | 2,858 | 1,589 | |||||||||||||||||
| 1,179 | 1,082 | 57,809 | 51,128 | 4,544 | 1,722 | |||||||||||||||||
| 1,273 | 1,275 | 113,972 | 23,865 | 2,548 | 1,362 | |||||||||||||||||
| 4,817 | 21,746 | 59,740 | 48,831 | 22,934 | 17,513 | |||||||||||||||||
| 275 | 842 | 61,776 | 73,022 | 4,153 | 2,963 | |||||||||||||||||
| 22,567 | 22,847 | 219,607 | 119,334 | 26,116 | 15,914 | |||||||||||||||||
| 7 | 2,557 | 391,019 | 182,702 | 2,554 | 2,912 | |||||||||||||||||
| 42 | 351 | 82,291 | 77,398 | N/A | N/A | |||||||||||||||||
| 14 | 117 | 27,431 | 25,799 | N/A | N/A | |||||||||||||||||
| N/A | N/A | N/A | N/A | 124 | N/A | |||||||||||||||||
| 219 | 2,674 | 218,653 | 320,234 | 23,744 | — | |||||||||||||||||
| 26,803 | 29,274 | 40,613 | 43,371 | 29,167 | 23,110 | |||||||||||||||||
| 16,459 | 17,551 | 19,402 | 19,544 | 19,655 | 18,960 | |||||||||||||||||
| 44 | 585 | 147,917 | 144,069 | 8,990 | 1,401 | |||||||||||||||||
|
|
|
|
|
|
|
|
|
|
|
| |||||||||||
| 79,757 | 166,475 | 7,723,837 | 8,505,028 | 336,272 | 171,706 | |||||||||||||||||
| (75,184 | ) | (89,038 | ) | (138,884 | ) | (9,552 | ) | (82,350 | ) | (74,282 | ) | |||||||||||
|
|
|
|
|
|
|
|
|
|
|
| |||||||||||
| 4,573 | 77,437 | 7,584,953 | 8,495,476 | 253,922 | 97,424 | |||||||||||||||||
|
|
|
|
|
|
|
|
|
|
|
| |||||||||||
| 7,871 | 53,524 | 4,062,640 | 9,579,246 | 1,195,420 | 477,231 | |||||||||||||||||
|
|
|
|
|
|
|
|
|
|
|
| |||||||||||
| 10,117 | 45,112 | (20,286,267 | ) | 44,410,695 | (63,699 | ) | 19,925 | |||||||||||||||
| — | — | — | — | — | — | |||||||||||||||||
| (167 | ) | (14,907 | ) | (815,739 | ) | (915,359 | ) | — | — | |||||||||||||
|
|
|
|
|
|
|
|
|
|
|
| |||||||||||
| 9,950 | 30,205 | (21,102,006 | ) | 43,495,336 | (63,699 | ) | 19,925 | |||||||||||||||
|
|
|
|
|
|
|
|
|
|
|
| |||||||||||
| 56,251 | 1,172,278 | 139,571,143 | 60,100,234 | (2,370,579 | ) | (423,059 | ) | |||||||||||||||
| (12 | ) | 724 | 252,454 | 212,644 | — | — | ||||||||||||||||
|
|
|
|
|
|
|
|
|
|
|
| |||||||||||
| 56,239 | 1,173,002 | 139,823,597 | 60,312,878 | (2,370,579 | ) | (423,059 | ) | |||||||||||||||
|
|
|
|
|
|
|
|
|
|
|
| |||||||||||
| | 66,189 | 1,203,207 | 118,721,591 | 103,808,214 | (2,434,278 | ) | (403,134 | ) | ||||||||||||||
|
|
|
|
|
|
|
|
|
|
|
| |||||||||||
| $ | 74,060 | $ | 1,256,731 | $ | 122,784,231 | $ | 113,387,460 | $ | (1,238,858 | ) | $ | 74,097 | ||||||||||
|
|
|
|
|
|
|
|
|
|
|
| |||||||||||
The accompanying notes to financial statements are an integral part of this statement.
93
Brandes Investment Trust
STATEMENT OF CHANGES IN NET ASSETS
| Brandes International Equity Fund | Brandes Global Equity Fund | |||||||||||||||
| Six Months Ended March 31, 2017 | Year Ended September 30, 2016 | Six Months Ended March 31, 2017 | Year Ended September 30, 2016 | |||||||||||||
| (Unaudited) | (Unaudited) | |||||||||||||||
INCREASE (DECREASE) IN NET ASSETS FROM: | ||||||||||||||||
OPERATIONS | ||||||||||||||||
Net investment income | $ | 2,174,644 | $ | 15,585,402 | $ | 333,208 | $ | 1,078,861 | ||||||||
Net realized gain (loss) on: | ||||||||||||||||
Investments | 13,671,185 | (3,759,302 | ) | 225,845 | (224,516 | ) | ||||||||||
Foreign currency transactions | (493,145 | ) | (98,428 | ) | (5,135 | ) | (20,745 | ) | ||||||||
Net unrealized appreciation on: |
| |||||||||||||||
Investments | 12,209,297 | 36,944,553 | 5,109,484 | 1,898,143 | ||||||||||||
Foreign currency transactions | 17,391 | 50,697 | 4,707 | 1,386 | ||||||||||||
|
|
|
|
|
|
|
| |||||||||
Net increase in net assets resulting from operations | 27,579,372 | 48,722,922 | 5,668,109 | 2,733,129 | ||||||||||||
|
|
|
|
|
|
|
| |||||||||
DISTRIBUTIONS TO SHAREHOLDERS | ||||||||||||||||
From net investment income | ||||||||||||||||
Class A | (324,942 | ) | (326,735 | ) | (55,597 | ) | (83,326 | ) | ||||||||
Class C | (228,741 | ) | (217,328 | ) | (6,978 | ) | (25,407 | ) | ||||||||
Class E | N/A | (16,845 | ) | N/A | (1,382 | ) | ||||||||||
Class I | (7,997,807 | ) | (15,332,614 | ) | (452,016 | ) | (991,951 | ) | ||||||||
Class R6 | (486,156 | ) | (458,693 | ) | N/A | N/A | ||||||||||
From net realized gains | ||||||||||||||||
Class A | — | — | — | (117,360 | ) | |||||||||||
Class C | — | — | — | (144,639 | ) | |||||||||||
Class E | N/A | — | N/A | (13,647 | ) | |||||||||||
Class I | — | — | — | (2,617,644 | ) | |||||||||||
Class R6 | — | — | N/A | N/A | ||||||||||||
|
|
|
|
|
|
|
| |||||||||
Decrease in net assets from distributions | (9,037,646 | ) | (16,352,215 | ) | (514,591 | ) | (3,995,356 | ) | ||||||||
|
|
|
|
|
|
|
| |||||||||
CAPITAL SHARE TRANSACTIONS | ||||||||||||||||
Proceeds from shares sold | 124,051,761 | 278,842,419 | 11,526,259 | 12,290,688 | ||||||||||||
Net asset value of shares issued on reinvestment of distributions | 8,448,623 | 15,725,407 | 511,381 | 3,952,436 | ||||||||||||
Cost of shares redeemed | (115,722,899 | ) | (212,318,638 | ) | (3,860,581 | ) | (11,550,515 | ) | ||||||||
Cost of shares redeemed from Redemption in-kind (Note 10) | (231,178,479 | ) | — | — | — | |||||||||||
|
|
|
|
|
|
|
| |||||||||
Net increase (decrease) in net assets from capital share transactions | (214,400,994 | ) | 82,249,188 | 8,177,059 | 4,692,609 | |||||||||||
|
|
|
|
|
|
|
| |||||||||
Total increase (decrease) in net assets | (195,859,268 | ) | 114,619,895 | 13,330,577 | 3,430,382 | |||||||||||
|
|
|
|
|
|
|
| |||||||||
NET ASSETS | ||||||||||||||||
Beginning of the Period | 703,912,989 | 589,293,094 | 53,934,376 | 50,503,994 | ||||||||||||
|
|
|
|
|
|
|
| |||||||||
End of the Period | $ | 508,053,721 | $ | 703,912,989 | $ | 67,264,953 | $ | 53,934,376 | ||||||||
|
|
|
|
|
|
|
| |||||||||
Undistributed net investment income (loss) | $ | (3,836,382 | ) | $ | 3,026,620 | $ | (235,808 | ) | $ | (54,425 | ) | |||||
|
|
|
|
|
|
|
| |||||||||
The accompanying notes to financial statements are an integral part of this statement.
94
Brandes Investment Trust
STATEMENT OF CHANGES IN NET ASSETS (continued)
| Brandes Global Equity Income Fund | Brandes Global Opportunities Value Fund | |||||||||||||||
| Six Months Ended March 31, 2017 | Year Ended September 30, 2016 | Six Months Ended March 31, 2017 | Year Ended September 30, 2016 | |||||||||||||
| (Unaudited) | (Unaudited) | |||||||||||||||
INCREASE (DECREASE) IN NET ASSETS FROM: | ||||||||||||||||
OPERATIONS | ||||||||||||||||
Net investment income | $ | 7,871 | $ | 20,269 | $ | 53,524 | $ | 120,380 | ||||||||
Net realized gain (loss) on: | ||||||||||||||||
Investments | 10,117 | 24,436 | 45,112 | (399,349 | ) | |||||||||||
Foreign currency transactions | (167 | ) | (291 | ) | (14,907 | ) | (2,745 | ) | ||||||||
Net unrealized appreciation (depreciation) on: | ||||||||||||||||
Investments | 56,251 | 64,664 | 1,172,278 | 680,460 | ||||||||||||
Foreign currency transactions | (12 | ) | 153 | 724 | 536 | |||||||||||
|
|
|
|
|
|
|
| |||||||||
Net increase in net assets resulting from operations | 74,060 | 109,231 | 1,256,731 | 399,282 | ||||||||||||
|
|
|
|
|
|
|
| |||||||||
DISTRIBUTIONS TO SHAREHOLDERS | ||||||||||||||||
From net investment income | ||||||||||||||||
Class A | (19 | ) | (76 | ) | (13,472 | ) | (10,894 | ) | ||||||||
Class C | (46 | ) | (122 | ) | (792 | ) | (463 | ) | ||||||||
Class I | (7,826 | ) | (20,233 | ) | (69,785 | ) | (124,679 | ) | ||||||||
Class R6 | N/A | N/A | N/A | N/A | ||||||||||||
From net realized gains | ||||||||||||||||
Class A | (124 | ) | (2 | ) | — | (3,623 | ) | |||||||||
Class C | (269 | ) | (2 | ) | — | (304 | ) | |||||||||
Class I | (20,701 | ) | (12,640 | ) | — | (70,302 | ) | |||||||||
Class R6 | N/A | N/A | N/A | N/A | ||||||||||||
|
|
|
|
|
|
|
| |||||||||
Decrease in net assets from distributions | (28,985 | ) | (33,075 | ) | (84,049 | ) | (210,265 | ) | ||||||||
|
|
|
|
|
|
|
| |||||||||
CAPITAL SHARE TRANSACTIONS | ||||||||||||||||
Proceeds from shares sold | 39,089 | 150,238 | 16,944,978 | 6,590,086 | ||||||||||||
Net asset value of shares issued on reinvestment of distributions | 28,163 | 31,963 | 82,432 | 149,850 | ||||||||||||
Cost of shares redeemed | (5,444 | ) | — | (384,114 | ) | (4,571,439 | ) | |||||||||
|
|
|
|
|
|
|
| |||||||||
Net increase in net assets from capital share transactions | 61,808 | 182,201 | 16,643,296 | 2,168,497 | ||||||||||||
|
|
|
|
|
|
|
| |||||||||
Total increase in net assets | 106,883 | 258,357 | 17,815,978 | 2,357,514 | ||||||||||||
|
|
|
|
|
|
|
| |||||||||
NET ASSETS | ||||||||||||||||
Beginning of the Period | 863,018 | 604,661 | 5,699,196 | 3,341,682 | ||||||||||||
|
|
|
|
|
|
|
| |||||||||
End of the Period | $ | 969,901 | $ | 863,018 | $ | 23,515,174 | $ | 5,699,196 | ||||||||
|
|
|
|
|
|
|
| |||||||||
Undistributed net investment income (loss) | $ | (20 | ) | $ | — | $ | (28,446 | ) | $ | 2,079 | ||||||
|
|
|
|
|
|
|
| |||||||||
The accompanying notes to financial statements are an integral part of this statement.
95
Brandes Investment Trust
STATEMENT OF CHANGES IN NET ASSETS (continued)
| Brandes Emerging Markets Value Fund | Brandes International Small Cap Equity Fund | |||||||||||||||
| Six Months Ended March 31, 2017 | Year Ended September 30, 2016 | Six Months Ended March 31, 2017 | Year Ended September 30, 2016 | |||||||||||||
| (Unaudited) | (Unaudited) | |||||||||||||||
INCREASE (DECREASE) IN NET ASSETS FROM: | ||||||||||||||||
OPERATIONS | ||||||||||||||||
Net investment income | $ | 4,062,640 | $ | 19,655,749 | $ | 9,579,246 | $ | 10,157,426 | ||||||||
Net realized gain (loss) on: | ||||||||||||||||
Investments | (20,286,267 | ) | (125,575,989 | ) | 44,410,695 | 27,969,963 | ||||||||||
Foreign currency transactions | (815,739 | ) | (1,608,216 | ) | (915,359 | ) | (772,696 | ) | ||||||||
Net unrealized appreciation (depreciation) on: | ||||||||||||||||
Investments | 139,571,143 | 380,769,626 | 60,100,234 | 84,984,537 | ||||||||||||
Foreign currency transactions | 252,454 | 12,415 | 212,644 | (182,673 | ) | |||||||||||
|
|
|
|
|
|
|
| |||||||||
Net increase in net assets resulting from operations | 122,784,231 | 273,253,585 | 113,387,460 | 122,156,557 | ||||||||||||
|
|
|
|
|
|
|
| |||||||||
DISTRIBUTIONS TO SHAREHOLDERS | ||||||||||||||||
From net investment income | ||||||||||||||||
Class A | (2,708,288 | ) | (3,653,585 | ) | (3,132,973 | ) | (1,623,052 | ) | ||||||||
Class C | (144,547 | ) | (95,247 | ) | (376,041 | ) | (237,168 | ) | ||||||||
Class I | (7,781,416 | ) | (10,871,960 | ) | (27,937,640 | ) | (18,992,579 | ) | ||||||||
Class R6 | (237,281 | ) | — | (936,034 | ) | (26,169 | ) | |||||||||
From net realized gains | ||||||||||||||||
Class A | — | — | (2,808,067 | ) | (1,347,940 | ) | ||||||||||
Class C | — | — | (411,540 | ) | (268,103 | ) | ||||||||||
Class I | — | — | (25,524,016 | ) | (14,618,967 | ) | ||||||||||
Class R6 | — | — | (794,405 | ) | — | |||||||||||
|
|
|
|
|
|
|
| |||||||||
Decrease in net assets from distributions | (10,871,532 | ) | (14,620,792 | ) | (61,920,716 | ) | (37,113,978 | ) | ||||||||
|
|
|
|
|
|
|
| |||||||||
CAPITAL SHARE TRANSACTIONS | ||||||||||||||||
Proceeds from shares sold | 366,705,707 | 465,356,191 | 395,619,725 | 620,532,710 | ||||||||||||
Net asset value of shares issued on reinvestment of distributions | 9,550,092 | 12,848,337 | 60,221,079 | 36,267,289 | ||||||||||||
Cost of shares redeemed | (187,649,411 | ) | (619,619,751 | ) | (215,270,824 | ) | (343,843,528 | ) | ||||||||
|
|
|
|
|
|
|
| |||||||||
Net increase (decrease) in net assets from capital share transactions | 188,606,388 | (141,415,223 | ) | 240,569,980 | 312,956,471 | |||||||||||
|
|
|
|
|
|
|
| |||||||||
Total increase in net assets | 300,519,087 | 117,217,570 | 292,036,724 | 397,999,050 | ||||||||||||
|
|
|
|
|
|
|
| |||||||||
NET ASSETS | ||||||||||||||||
Beginning of the Period | 1,156,358,034 | 1,039,140,464 | 1,369,841,810 | 971,842,760 | ||||||||||||
|
|
|
|
|
|
|
| |||||||||
End of the Period | $ | 1,456,877,121 | $ | 1,156,358,034 | $ | 1,661,878,534 | $ | 1,369,841,810 | ||||||||
|
|
|
|
|
|
|
| |||||||||
Undistributed net investment loss | $ | (7,691,421 | ) | $ | (882,529 | ) | $ | (28,321,141 | ) | $ | (5,517,699 | ) | ||||
|
|
|
|
|
|
|
| |||||||||
The accompanying notes to financial statements are an integral part of this statement.
96
Brandes Investment Trust
STATEMENT OF CHANGES IN NET ASSETS (continued)
| Brandes Core Plus Fixed Income Fund | Brandes Credit Focus Yield Fund | |||||||||||||||
| Six Months Ended March 31, 2017 | Year Ended September 30, 2016 | Six Months Ended March 31, 2017 | Year Ended September 30, 2016 | |||||||||||||
| (Unaudited) | (Unaudited) | |||||||||||||||
INCREASE (DECREASE) IN NET ASSETS FROM: | ||||||||||||||||
OPERATIONS | ||||||||||||||||
Net investment income | $ | 1,195,420 | $ | 2,115,182 | $ | 477,231 | $ | 925,834 | ||||||||
Net realized gain (loss) on: | ||||||||||||||||
Investments | (63,699 | ) | 275,403 | 19,925 | (76,678 | ) | ||||||||||
Foreign currency transactions | — | — | — | — | ||||||||||||
Net unrealized appreciation (depreciation) on: |
| |||||||||||||||
Investments | (2,370,579 | ) | 2,095,921 | (423,059 | ) | 1,053,459 | ||||||||||
Foreign currency transactions | — | — | — | — | ||||||||||||
|
|
|
|
|
|
|
| |||||||||
Net increase (decrease) in net assets resulting from operations | (1,238,858 | ) | 4,486,506 | 74,097 | 1,902,615 | |||||||||||
|
|
|
|
|
|
|
| |||||||||
DISTRIBUTIONS TO SHAREHOLDERS | ||||||||||||||||
From net investment income | ||||||||||||||||
Class A | (23,696 | ) | (55,764 | ) | (33,126 | ) | (59,334 | ) | ||||||||
Class E | (1,222 | ) | (15,343 | ) | N/A | N/A | ||||||||||
Class I | (1,185,192 | ) | (2,076,681 | ) | (444,104 | ) | (866,362 | ) | ||||||||
Class R6 | N/A | N/A | N/A | N/A | ||||||||||||
From net realized gains | ||||||||||||||||
Class A | (5,530 | ) | (1,614 | ) | (3,593 | ) | — | |||||||||
Class E | N/A | (1,430 | ) | N/A | N/A | |||||||||||
Class I | (253,423 | ) | (64,614 | ) | (44,344 | ) | — | |||||||||
Class R6 | N/A | N/A | N/A | N/A | ||||||||||||
|
|
|
|
|
|
|
| |||||||||
Decrease in net assets from distributions | (1,469,063 | ) | (2,215,446 | ) | (525,167 | ) | (925,696 | ) | ||||||||
|
|
|
|
|
|
|
| |||||||||
CAPITAL SHARE TRANSACTIONS | ||||||||||||||||
Proceeds from shares sold | 20,101,219 | 38,192,598 | 11,025 | 520,078 | ||||||||||||
Net asset value of shares issued on reinvestment of distributions | 1,446,467 | 2,175,810 | 505,899 | 894,878 | ||||||||||||
Cost of shares redeemed | (17,697,785 | ) | (19,193,056 | ) | (86,090 | ) | (419,739 | ) | ||||||||
|
|
|
|
|
|
|
| |||||||||
Net increase in net assets from capital share transactions | 3,849,901 | 21,175,352 | 430,834 | 995,217 | ||||||||||||
|
|
|
|
|
|
|
| |||||||||
Total increase (decrease) in net assets | 1,141,980 | 23,446,412 | (20,236 | ) | 1,972,136 | |||||||||||
|
|
|
|
|
|
|
| |||||||||
NET ASSETS | ||||||||||||||||
Beginning of the Period | 99,542,648 | 76,096,236 | 31,348,013 | 29,375,877 | ||||||||||||
|
|
|
|
|
|
|
| |||||||||
End of the Period | $ | 100,684,628 | $ | 99,542,648 | $ | 31,327,777 | $ | 31,348,013 | ||||||||
|
|
|
|
|
|
|
| |||||||||
Undistributed net investment income (loss) | $ | (14,690 | ) | $ | — | $ | (7,292 | ) | $ | (7,293 | ) | |||||
|
|
|
|
|
|
|
| |||||||||
The accompanying notes to financial statements are an integral part of this statement.
97
Brandes Investment Trust
FINANCIAL HIGHLIGHTS For a capital share outstanding for the period ended:
| Net asset value, beginning of period | Net investment income(5) | Net realized and unrealized gain/(loss) on investments | Total from investment operations | Dividends from net investment income | ||||||||||||||||
Brandes International Equity Fund | ||||||||||||||||||||
Class A(8) | ||||||||||||||||||||
3/31/2017 (Unaudited) | $ | 15.70 | 0.05 | 1.08 | 1.13 | (0.31 | ) | |||||||||||||
9/30/2016 | $ | 14.90 | 0.35 | 0.81 | 1.16 | (0.36 | ) | |||||||||||||
9/30/2015 | $ | 16.58 | 0.35 | (1.73 | ) | (1.38 | ) | (0.30 | ) | |||||||||||
9/30/2014 | $ | 16.03 | 0.33 | 0.56 | 0.89 | (0.34 | ) | |||||||||||||
9/30/2013 | $ | 13.50 | 0.34 | 3.02 | 3.36 | (0.83 | ) | |||||||||||||
9/30/2012 | $ | 13.00 | 0.38 | 0.76 | 1.14 | (0.64 | ) | |||||||||||||
Class C | ||||||||||||||||||||
3/31/2017 (Unaudited) | $ | 15.58 | (0.01 | ) | 1.07 | 1.06 | (0.28 | ) | ||||||||||||
9/30/2016 | $ | 14.79 | 0.23 | 0.81 | 1.04 | (0.25 | ) | |||||||||||||
9/30/2015 | $ | 16.48 | 0.24 | (1.73 | ) | (1.49 | ) | (0.20 | ) | |||||||||||
9/30/2014 | $ | 15.98 | 0.20 | 0.55 | 0.75 | (0.25 | ) | |||||||||||||
1/31/2013(3) – 9/30/2013 | $ | 14.30 | 0.15 | 1.84 | 1.99 | (0.31 | ) | |||||||||||||
Class I | ||||||||||||||||||||
3/31/2017 (Unaudited) | $ | 15.72 | 0.07 | 1.08 | 1.15 | (0.32 | ) | |||||||||||||
9/30/2016 | $ | 14.92 | 0.38 | 0.81 | 1.19 | (0.39 | ) | |||||||||||||
9/30/2015 | $ | 16.60 | 0.35 | (1.70 | ) | (1.35 | ) | (0.33 | ) | |||||||||||
9/30/2014 | $ | 16.05 | 0.36 | 0.56 | 0.92 | (0.37 | ) | |||||||||||||
9/30/2013 | $ | 13.50 | 0.35 | 3.04 | 3.39 | (0.84 | ) | |||||||||||||
9/30/2012 | $ | 12.99 | 0.41 | 0.76 | 1.17 | (0.66 | ) | |||||||||||||
Class R6 | ||||||||||||||||||||
3/31/2017 (Unaudited) | $ | 15.74 | 0.08 | 1.09 | 1.17 | (0.32 | ) | |||||||||||||
2/1/2016(3) – 9/30/2016 | $ | 14.41 | 0.27 | 1.39 | 1.66 | (0.33 | ) | |||||||||||||
| (1) | Not annualized. |
| (2) | Annualized. |
| (3) | Commencement of operations. |
| (4) | After fees waived and expenses absorbed or recouped by the Advisor, where applicable. |
| (5) | Net investment income (loss) per share has been calculated based on average shares outstanding during the period. |
| (6) | The total return calculation does not reflect the sales loads that may be imposed on Class A or C shares (see Note 7 of the Notes to Financial Statements). |
| (7) | The total return figure is the since inception return for the class. |
| (8) | Prior to January 31, 2013, Class A shares were known as Class S shares. |
| (9) | Amount is less than $50,000. |
| (10) | Includes proxy expenses not covered by the Trust’s expense limitation agreement. |
The accompanying notes to financial statements are an integral part of this statement.
98
Brandes Investment Trust
FINANCIAL HIGHLIGHTS For a capital share outstanding for the period ended:
| Net asset value, end of period | Total return(6) | Net assets, end of period (millions) | Ratio of net expenses to average net assets(4) | Ratio of net investment income to average net assets(4) | Ratio of expenses (prior to reimburse- ments) to average net assets | Ratio of net investment income (prior to reimburse- ments) to average net assets | Portfolio turnover rate | |||||||||||||||||||||||
| $ | 16.52 | 7.29 | %(1) | $ | 22.4 | 1.20 | %(2)(10) | 0.62 | %(2) | 1.20 | %(2)(10) | 0.62 | %(2) | 14.31 | %(1) | |||||||||||||||
| $ | 15.70 | 7.90 | % | $ | 14.3 | 1.18 | % | 2.30 | % | 1.18 | % | 2.30 | % | 17.60 | % | |||||||||||||||
| $ | 14.90 | (8.47 | )% | $ | 13.1 | 1.18 | % | 2.08 | % | 1.18 | % | 2.08 | % | 27.50 | % | |||||||||||||||
| $ | 16.58 | 5.47 | % | $ | 9.0 | 1.19 | % | 1.92 | % | 1.18 | % | 1.93 | % | 39.53 | % | |||||||||||||||
| $ | 16.03 | 26.06 | % | $ | 0.7 | 1.23 | % | 2.25 | % | 1.31 | % | 2.17 | % | 19.43 | % | |||||||||||||||
| $ | 13.50 | 8.94 | % | $ | — | (9) | 1.40 | % | 2.86 | % | 1.45 | % | 2.81 | % | 13.47 | % | ||||||||||||||
| $ | 16.36 | 6.89 | %(1) | $ | 13.8 | 1.95 | %(2)(10) | (0.13 | )%(2) | 1.95 | %(2)(10) | (0.13 | )%(2) | 14.31 | %(1) | |||||||||||||||
| $ | 15.58 | 7.10 | % | $ | 13.1 | 1.93 | % | 1.55 | % | 1.93 | % | 1.55 | % | 17.60 | % | |||||||||||||||
| $ | 14.79 | (9.14 | )% | $ | 12.0 | 1.93 | % | 1.43 | % | 1.93 | % | 1.43 | % | 27.50 | % | |||||||||||||||
| $ | 16.48 | 4.64 | % | $ | 4.3 | 1.93 | % | 1.19 | % | 1.93 | % | 1.19 | % | 39.53 | % | |||||||||||||||
| $ | 15.98 | 14.17 | %(7) | $ | 0.1 | 1.95 | %(2) | 1.53 | %(2) | 1.97 | %(2) | 1.51 | %(2) | 19.43 | %(1) | |||||||||||||||
| $ | 16.55 | 7.38 | %(1) | $ | 439.8 | 1.00 | %(2)(10) | 0.82 | %(2) | 1.00 | %(2)(10) | 0.82 | %(2) | 14.31 | %(1) | |||||||||||||||
| $ | 15.72 | 8.10 | % | $ | 648.3 | 1.00 | % | 2.48 | % | 0.98 | % | 2.50 | % | 17.60 | % | |||||||||||||||
| $ | 14.92 | (8.30 | )% | $ | 562.5 | 1.00 | % | 2.10 | % | 0.98 | % | 2.12 | % | 27.50 | % | |||||||||||||||
| $ | 16.60 | 5.61 | % | $ | 521.9 | 1.00 | % | 2.12 | % | 0.99 | % | 2.13 | % | 39.53 | % | |||||||||||||||
| $ | 16.05 | 26.43 | % | $ | 404.4 | 1.03 | % | 2.45 | % | 1.15 | % | 2.33 | % | 19.43 | % | |||||||||||||||
| $ | 13.50 | 9.09 | % | $ | 352.7 | 1.16 | % | 3.11 | % | 1.21 | % | 3.06 | % | 13.47 | % | |||||||||||||||
| $ | 16.59 | 7.52 | %(1) | $ | 32.0 | 0.84 | %(2)(10) | 0.98 | %(2) | 0.95 | %(2)(10) | 0.87 | %(2) | 14.31 | %(1) | |||||||||||||||
| $ | 15.74 | 11.60 | %(7) | $ | 27.7 | 0.82 | %(2) | 2.67 | %(2) | 0.93 | %(2) | 2.56 | %(2) | 17.60 | %(1) | |||||||||||||||
The accompanying notes to financial statements are an integral part of this statement.
99
Brandes Investment Trust
FINANCIAL HIGHLIGHTS For a capital share outstanding for the period ended:
| Net asset value, beginning of period | Net investment income(5) | Net realized and unrealized gain/(loss) on investments | Total from investment operations | Dividends from net investment income | Dividends from net realized gains | |||||||||||||||||||
Brandes Global Equity Fund | ||||||||||||||||||||||||
Class A(8) | ||||||||||||||||||||||||
3/31/2017 (Unaudited) | $ | 21.21 | 0.10 | 1.93 | 2.03 | (0.16 | ) | — | ||||||||||||||||
9/30/2016 | $ | 21.85 | 0.40 | 0.67 | 1.07 | (0.42 | ) | (1.29 | ) | |||||||||||||||
9/30/2015 | $ | 25.43 | 0.27 | (1.90 | ) | (1.63 | ) | (0.33 | ) | (1.62 | ) | |||||||||||||
9/30/2014 | $ | 24.20 | 0.43 | 2.00 | 2.43 | (0.44 | ) | (0.76 | ) | |||||||||||||||
9/30/2013 | $ | 20.27 | 0.38 | 4.80 | 5.18 | (0.91 | ) | (0.34 | ) | |||||||||||||||
9/30/2012 | $ | 19.19 | 0.43 | 2.22 | 2.65 | (0.44 | ) | (1.13 | ) | |||||||||||||||
Class C | ||||||||||||||||||||||||
3/31/2017 (Unaudited) | $ | 21.09 | 0.02 | 1.92 | 1.94 | (0.08 | ) | — | ||||||||||||||||
9/30/2016 | $ | 21.73 | 0.25 | 0.66 | 0.91 | (0.26 | ) | (1.29 | ) | |||||||||||||||
9/30/2015 | $ | 25.31 | 0.16 | (1.92 | ) | (1.76 | ) | (0.20 | ) | (1.62 | ) | |||||||||||||
9/30/2014 | $ | 24.14 | 0.24 | 1.99 | 2.23 | (0.30 | ) | (0.76 | ) | |||||||||||||||
1/31/2013(3) – 9/30/2013 | $ | 21.21 | 0.15 | 3.12 | 3.27 | (0.34 | ) | — | ||||||||||||||||
Class I | ||||||||||||||||||||||||
3/31/2017 (Unaudited) | $ | 21.33 | 0.13 | 1.95 | 2.08 | (0.19 | ) | — | ||||||||||||||||
9/30/2016 | $ | 21.95 | 0.46 | 0.67 | 1.13 | (0.46 | ) | (1.29 | ) | |||||||||||||||
9/30/2015 | $ | 25.52 | 0.39 | (1.97 | ) | (1.58 | ) | (0.37 | ) | (1.62 | ) | |||||||||||||
9/30/2014 | $ | 24.26 | 0.50 | 2.00 | 2.50 | (0.48 | ) | (0.76 | ) | |||||||||||||||
9/30/2013 | $ | 20.33 | 0.43 | 4.81 | 5.24 | (0.98 | ) | (0.34 | ) | |||||||||||||||
9/30/2012 | $ | 19.22 | 0.49 | 2.22 | 2.71 | (0.47 | ) | (1.13 | ) | |||||||||||||||
| (1) | Not annualized. |
| (2) | Annualized. |
| (3) | Commencement of operations. |
| (4) | After fees waived and expenses absorbed or recouped by the Advisor, where applicable. |
| (5) | Net investment income (loss) per share has been calculated based on average shares outstanding during the period. |
| (6) | The total return calculation does not reflect the sales loads that may be imposed on Class A or C shares (see Note 7 of the Notes to Financial Statements). |
| (7) | The total return figure is the since inception return for the class which commenced operations on January 31, 2013. |
| (8) | Prior to January 31, 2013, Class A shares were known as Class S shares. |
| (9) | Includes proxy expenses not covered by the Trust’s expense limitation agreement. |
The accompanying notes to financial statements are an integral part of this statement.
100
Brandes Investment Trust
FINANCIAL HIGHLIGHTS For a capital share outstanding for the period ended:
| Net asset value, end of period | Total return(6) | Net assets, end of period (millions) | Ratio of net expenses to average net assets(4) | Ratio of net investment income to average net assets(4) | Ratio of expenses (prior to reimburse- ments) to average net assets | Ratio of net investment income (prior to reimburse- ments) to average net assets | Portfolio turnover rate | |||||||||||||||||||||||
| $ | 23.08 | 9.61 | %(1) | $ | 7.6 | 1.26 | %(2)(9) | 0.91 | %(2) | 1.49 | %(2)(9) | 0.68 | %(2) | 6.78 | %(1) | |||||||||||||||
| $ | 21.21 | 5.01 | % | $ | 4.6 | 1.25 | % | 1.95 | % | 1.58 | % | 1.62 | % | 15.68 | % | |||||||||||||||
| $ | 21.85 | (6.99 | )% | $ | 1.8 | 1.25 | % | 1.15 | % | 1.66 | % | 0.74 | % | 25.06 | % | |||||||||||||||
| $ | 25.43 | 10.18 | % | $ | 1.2 | 1.25 | % | 1.67 | % | 1.71 | % | 1.21 | % | 30.33 | % | |||||||||||||||
| $ | 24.20 | 26.81 | % | $ | 0.3 | 1.25 | % | 1.72 | % | 1.97 | % | 1.00 | % | 24.37 | % | |||||||||||||||
| $ | 20.27 | 14.38 | % | $ | 0.1 | 1.25 | % | 2.23 | % | 2.00 | % | 1.47 | % | 18.00 | % | |||||||||||||||
| $ | 22.95 | 9.19 | %(1) | $ | 1.9 | 2.01 | %(2)(9) | 0.14 | %(2) | 2.25 | %(2)(9) | (0.10 | )%(2) | 6.78 | %(1) | |||||||||||||||
| $ | 21.09 | 4.20 | % | $ | 2.0 | 2.00 | % | 1.20 | % | 2.32 | % | 0.88 | % | 15.68 | % | |||||||||||||||
| $ | 21.73 | (7.62 | )% | $ | 2.4 | 2.00 | % | 0.66 | % | 2.42 | % | 0.24 | % | 25.06 | % | |||||||||||||||
| $ | 25.31 | 9.34 | % | $ | 1.1 | 2.00 | % | 0.92 | % | 2.46 | % | 0.46 | % | 30.33 | % | |||||||||||||||
| $ | 24.14 | 15.50 | %(7) | $ | 0.1 | 2.00 | %(2) | 0.97 | %(2) | 2.71 | %(2) | 0.26 | %(2) | 24.37 | %(1) | |||||||||||||||
| $ | 23.22 | 9.75 | %(1) | $ | 57.8 | (1) | 1.01 | %(2)(9) | 1.15 | %(2) | 1.30 | %(2)(9) | 0.86 | %(2) | 6.78 | %(1) | ||||||||||||||
| $ | 21.33 | 5.26 | % | $ | 47.3 | 1.00 | % | 2.20 | % | 1.38 | % | 1.82 | % | 15.68 | % | |||||||||||||||
| $ | 21.95 | (6.75 | )% | $ | 46.0 | 1.00 | % | 1.61 | % | 1.47 | % | 1.14 | % | 25.06 | % | |||||||||||||||
| $ | 25.52 | 10.46 | % | $ | 45.9 | 1.00 | % | 1.93 | % | 1.53 | % | 1.40 | % | 30.33 | % | |||||||||||||||
| $ | 24.26 | 27.12 | % | $ | 39.4 | 1.00 | % | 1.96 | % | 1.75 | % | 1.21 | % | 24.37 | % | |||||||||||||||
| $ | 20.33 | 14.67 | % | $ | 30.1 | 1.00 | % | 2.47 | % | 1.68 | % | 1.79 | % | 18.00 | % | |||||||||||||||
The accompanying notes to financial statements are an integral part of this statement.
101
Brandes Investment Trust
FINANCIAL HIGHLIGHTS For a capital share outstanding for the period ended:
| Net asset value, beginning of period | Net investment income(5) | Net realized and unrealized gain/(loss) on investments | Total from investment operations | Dividends from net investment income | Dividends from net realized gains | |||||||||||||||||||
Brandes Global Equity Income Fund |
| |||||||||||||||||||||||
Class A | ||||||||||||||||||||||||
3/31/2017 (Unaudited) | $ | 10.79 | 0.08 | 1.00 | 1.08 | (0.04 | ) | (0.26 | ) | |||||||||||||||
9/30/2016 | $ | 9.62 | 0.28 | 1.35 | 1.63 | (0.26 | ) | (0.20 | ) | |||||||||||||||
12/31/2014(3) – 9/30/2015 | $ | 10.00 | 0.23 | (0.46 | ) | (0.23 | ) | (0.15 | ) | — | ||||||||||||||
Class C | ||||||||||||||||||||||||
3/31/2017 (Unaudited) | $ | 10.72 | 0.04 | 0.77 | 0.81 | (0.04 | ) | (0.26 | ) | |||||||||||||||
9/30/2016 | $ | 9.60 | 0.20 | 1.31 | 1.51 | (0.19 | ) | (0.20 | ) | |||||||||||||||
12/31/2014(3) – 9/30/2015 | $ | 10.00 | 0.23 | (0.52 | ) | (0.29 | ) | (0.11 | ) | — | ||||||||||||||
Class I | ||||||||||||||||||||||||
3/31/2017 (Unaudited) | $ | 10.68 | 0.10 | 0.78 | 0.88 | (0.10 | ) | (0.26 | ) | |||||||||||||||
9/30/2016 | $ | 9.57 | 0.29 | 1.30 | 1.59 | (0.28 | ) | (0.20 | ) | |||||||||||||||
12/31/2014(3) – 9/30/2015 | $ | 10.00 | 0.23 | (0.45 | ) | (0.22 | ) | (0.21 | ) | — | ||||||||||||||
Brandes Global Opportunities Value Fund |
| |||||||||||||||||||||||
Class A | ||||||||||||||||||||||||
3/31/2017 (Unaudited) | $ | 10.17 | 0.03 | 0.97 | 1.00 | (0.06 | ) | — | ||||||||||||||||
9/30/2016 | $ | 9.36 | 0.15 | 0.96 | 1.11 | (0.21 | ) | (0.09 | ) | |||||||||||||||
12/31/2014(3) – 9/30/2015 | $ | 10.00 | 0.12 | (0.68 | ) | (0.56 | ) | (0.08 | ) | — | ||||||||||||||
Class C | ||||||||||||||||||||||||
3/31/2017 (Unaudited) | $ | 10.15 | (0.01 | ) | 0.98 | 0.97 | (0.05 | ) | — | |||||||||||||||
9/30/2016 | $ | 9.33 | 0.07 | 0.98 | 1.05 | (0.14 | ) | (0.09 | ) | |||||||||||||||
12/31/2014(3) – 9/30/2015 | $ | 10.00 | 0.12 | (0.75 | ) | (0.63 | ) | (0.04 | ) | — | ||||||||||||||
Class I | ||||||||||||||||||||||||
3/31/2017 (Unaudited) | $ | 10.15 | 0.05 | 0.97 | 1.02 | (0.07 | ) | — | ||||||||||||||||
9/30/2016 | $ | 9.33 | 0.17 | 0.97 | 1.14 | (0.23 | ) | (0.09 | ) | |||||||||||||||
12/31/2014(3) – 9/30/2015 | $ | 10.00 | 0.12 | (0.71 | ) | (0.59 | ) | (0.08 | ) | — | ||||||||||||||
| (1) | Not annualized. |
| (2) | Annualized. |
| (3) | Commencement of operations. |
| (4) | After fees waived and expenses absorbed or recouped by the Advisor, where applicable. |
| (5) | Net investment income (loss) per share has been calculated based on average shares outstanding during the period. |
| (6) | The total return calculation does not reflect the sales loads that may be imposed on Class A or C shares (see Note 7 of the Notes to Financial Statements). |
| (7) | The total return figure is the since inception return for the class which commenced operations on December 31, 2014. |
| (8) | Amount is less than $50,000. |
| (9) | Includes proxy expenses not covered by the Trust’s expense limitation agreement. |
The accompanying notes to financial statements are an integral part of this statement.
102
Brandes Investment Trust
FINANCIAL HIGHLIGHTS For a capital share outstanding for the period ended:
| Net asset value, end of period | Total return(6) | Net assets, end of period (millions) | Ratio of net expenses to average net assets(4) | Ratio of net investment income to average net assets(4) | Ratio of expenses (prior to reimburse- ments) to average net assets | Ratio of net investment income (prior to reimburse- ments) to average net assets | Portfolio turnover rate | |||||||||||||||||||||||
| $ | 11.57 | 10.33 | %(1) | $ | — | (8) | 1.26 | %(2)(9) | 1.50 | %(2) | 18.05 | %(2)(9) | (15.29 | )%(2) | 7.89 | %(1) | ||||||||||||||
| $ | 10.79 | 17.35 | % | $ | — | (8) | 1.25 | % | 2.67 | % | 20.41 | % | (16.49 | )% | 22.38 | % | ||||||||||||||
| $ | 9.62 | (2.44 | )%(7) | $ | — | (8) | 1.25 | %(2) | 2.90 | %(2) | 570.42 | %(2) | (566.27 | )%(2) | 16.78 | %(1) | ||||||||||||||
| $ | 11.23 | 7.85 | %(1) | $ | — | (8) | 2.01 | %(2)(9) | 0.78 | %(2) | 18.81 | %(2)(9) | (16.02 | )%(2) | 7.89 | %(1) | ||||||||||||||
| $ | 10.72 | 16.01 | % | $ | — | (8) | 2.00 | % | 1.91 | % | 21.51 | % | (17.60 | )% | 22.38 | % | ||||||||||||||
| $ | 9.60 | (2.99 | )%(7) | $ | — | (8) | 2.00 | %(2) | 2.90 | %(2) | 572.75 | %(2) | (567.85 | )%(2) | 16.78 | %(1) | ||||||||||||||
| $ | 11.20 | 8.46 | %(1) | $ | 1.0 | 1.01 | %(2)(9) | 1.78 | %(2) | 17.85 | %(2)(9) | (15.06 | )%(2) | 7.89 | %(1) | |||||||||||||||
| $ | 10.68 | 16.98 | % | $ | 0.9 | 1.00 | % | 2.91 | % | 24.04 | % | (20.13 | )% | 22.38 | % | |||||||||||||||
| $ | 9.57 | (2.36 | )%(7) | $ | 0.6 | 1.00 | %(2) | 2.90 | %(2) | 37.61 | %(2) | (33.71 | )%(2) | 16.78 | %(1) | |||||||||||||||
| $ | 11.11 | 9.91 | %(1) | $ | 2.6 | 1.41 | %(2)(9) | 0.63 | %(2) | 2.94 | %(2)(9) | (0.90 | )%(2) | 2.50 | %(1) | |||||||||||||||
| $ | 10.17 | 12.13 | % | $ | 0.6 | 1.40 | % | 1.53 | % | 4.57 | % | (1.64 | )% | 71.20 | % | |||||||||||||||
| $ | 9.36 | (5.66 | )%(7) | $ | 0.3 | 1.40 | %(2) | 1.29 | %(2) | 9.85 | %(2) | (7.16 | )%(2) | 15.12 | %(1) | |||||||||||||||
| $ | 11.07 | 9.58 | %(1) | $ | 0.1 | 2.16 | %(2)(9) | (0.12 | )%(2) | 3.71 | %(2)(9) | (1.67 | )%(2) | 2.50 | %(1) | |||||||||||||||
| $ | 10.15 | 11.42 | % | $ | — | (8) | 2.15 | % | 0.78 | % | 5.32 | % | (2.39 | )% | 71.20 | % | ||||||||||||||
| $ | 9.33 | (6.33 | )%(7) | $ | — | (8) | 2.15 | %(2) | 1.86 | %(2) | 13.79 | %(2) | (9.78 | )%(2) | 15.12 | %(1) | ||||||||||||||
| $ | 11.10 | 10.12 | %(1) | $ | 20.8 | 1.16 | %(2)(9) | 0.88 | %(2) | 2.52 | %(2)(9) | (0.48 | )%(2) | 2.50 | %(1) | |||||||||||||||
| $ | 10.15 | 12.45 | % | $ | 5.1 | 1.15 | % | 1.78 | % | 4.25 | % | (1.32 | )% | 71.20 | % | |||||||||||||||
| $ | 9.33 | (5.92 | )%(7) | $ | 3.0 | 1.15 | %(2) | 1.55 | %(2) | 11.77 | %(2) | (9.07 | )%(2) | 15.12 | %(1) | |||||||||||||||
The accompanying notes to financial statements are an integral part of this statement.
103
Brandes Investment Trust
FINANCIAL HIGHLIGHTS For a capital share outstanding for the period ended:
| Net asset value, beginning of period | Net investment income(5) | Net | Total from investment operations | Dividends from net investment income | Dividends from net realized gains | |||||||||||||||||||
Brandes Emerging Markets Value Fund |
| |||||||||||||||||||||||
Class A(8) | ||||||||||||||||||||||||
3/31/2017 (Unaudited) | $ | 7.91 | 0.02 | 0.76 | 0.78 | (0.07 | ) | — | ||||||||||||||||
9/30/2016 | $ | 6.19 | 0.12 | 1.69 | 1.81 | (0.09 | ) | — | ||||||||||||||||
9/30/2015 | $ | 9.56 | 0.11 | (3.12 | ) | (3.01 | ) | (0.13 | ) | (0.23 | ) | |||||||||||||
9/30/2014 | $ | 9.23 | 0.11 | 0.53 | 0.64 | (0.10 | ) | (0.21 | ) | |||||||||||||||
9/30/2013 | $ | 8.96 | 0.11 | 0.59 | 0.70 | (0.22 | ) | (0.21 | ) | |||||||||||||||
9/30/2012 | $ | 7.85 | 0.17 | 1.10 | 1.27 | (0.08 | ) | (0.08 | ) | |||||||||||||||
Class C | ||||||||||||||||||||||||
3/31/2017 (Unaudited) | $ | 7.86 | (0.01 | ) | 0.76 | 0.75 | (0.06 | ) | — | |||||||||||||||
9/30/2016 | $ | 6.15 | 0.07 | 1.67 | 1.74 | (0.03 | ) | — | ||||||||||||||||
9/30/2015 | $ | 9.51 | 0.05 | (3.10 | ) | (3.05 | ) | (0.08 | ) | (0.23 | ) | |||||||||||||
9/30/2014 | $ | 9.19 | 0.03 | 0.54 | 0.57 | (0.04 | ) | (0.21 | ) | |||||||||||||||
1/31/2013(3) – 9/30/2013 | $ | 9.54 | 0.02 | (0.30 | ) | (0.28 | ) | (0.07 | ) | — | ||||||||||||||
Class I | ||||||||||||||||||||||||
3/31/2017 (Unaudited) | $ | 7.94 | 0.03 | 0.77 | 0.80 | (0.08 | ) | — | ||||||||||||||||
9/30/2016 | $ | 6.21 | 0.14 | 1.70 | 1.84 | (0.11 | ) | — | ||||||||||||||||
9/30/2015 | $ | 9.58 | 0.13 | (3.12 | ) | (2.99 | ) | (0.15 | ) | (0.23 | ) | |||||||||||||
9/30/2014 | $ | 9.24 | 0.13 | 0.54 | 0.67 | (0.12 | ) | (0.21 | ) | |||||||||||||||
9/30/2013 | $ | 8.99 | 0.13 | 0.56 | 0.69 | (0.23 | ) | (0.21 | ) | |||||||||||||||
9/30/2012 | $ | 7.86 | 0.20 | 1.10 | 1.30 | (0.09 | ) | (0.08 | ) | |||||||||||||||
Class R6 | ||||||||||||||||||||||||
3/31/2017 (Unaudited) | $ | 7.93 | 0.04 | 0.78 | 0.82 | (0.08 | ) | — | ||||||||||||||||
7/11/2016(3) – 9/30/2016 | $ | 7.54 | 0.04 | 0.38 | 0.42 | (0.03 | ) | — | ||||||||||||||||
Brandes International Small Cap Fund |
| |||||||||||||||||||||||
Class A(8) | ||||||||||||||||||||||||
3/31/2017 (Unaudited) | $ | 13.46 | 0.08 | 0.90 | 0.98 | (0.28 | ) | (0.28 | ) | |||||||||||||||
9/30/2016 | $ | 12.58 | 0.09 | 1.22 | 1.31 | (0.23 | ) | (0.20 | ) | |||||||||||||||
9/30/2015 | $ | 13.55 | 0.04 | (0.43 | ) | (0.39 | ) | (0.17 | ) | (0.41 | ) | |||||||||||||
9/30/2014 | $ | 13.72 | 0.06 | 1.02 | 1.08 | (0.36 | ) | (0.89 | ) | |||||||||||||||
9/30/2013 | $ | 10.56 | 0.06 | 3.36 | 3.42 | (0.14 | ) | (0.12 | ) | |||||||||||||||
1/31/2012(3) – 9/30/2012 | $ | 10.00 | 0.10 | 0.46 | 0.56 | — | — | |||||||||||||||||
Class C | ||||||||||||||||||||||||
3/31/2017 (Unaudited) | $ | 13.24 | 0.02 | 0.89 | 0.91 | (0.24 | ) | (0.28 | ) | |||||||||||||||
9/30/2016 | $ | 12.42 | 0.00 | 1.19 | 1.19 | (0.17 | ) | (0.20 | ) | |||||||||||||||
9/30/2015 | $ | 13.45 | (0.04 | ) | (0.44 | ) | (0.48 | ) | (0.14 | ) | (0.41 | ) | ||||||||||||
9/30/2014 | $ | 13.68 | (0.04 | ) | 1.02 | 0.98 | (0.32 | ) | (0.89 | ) | ||||||||||||||
1/31/2013(3) – 9/30/2013 | $ | 11.90 | (0.02 | ) | 1.83 | 1.81 | (0.03 | ) | — | |||||||||||||||
Class I | ||||||||||||||||||||||||
3/31/2017 (Unaudited) | $ | 13.50 | 0.09 | 0.90 | 0.99 | (0.29 | ) | (0.28 | ) | |||||||||||||||
9/30/2016 | $ | 12.61 | 0.12 | 1.22 | 1.34 | (0.25 | ) | (0.20 | ) | |||||||||||||||
9/30/2015 | $ | 13.58 | 0.08 | (0.44 | ) | (0.36 | ) | (0.20 | ) | (0.41 | ) | |||||||||||||
9/30/2014 | $ | 13.74 | 0.09 | 1.03 | 1.12 | (0.39 | ) | (0.89 | ) | |||||||||||||||
9/30/2013 | $ | 10.56 | 0.09 | 3.37 | 3.46 | (0.16 | ) | (0.12 | ) | |||||||||||||||
1/31/2012(3) – 9/30/2012 | $ | 10.00 | 0.10 | 0.46 | 0.56 | — | — | |||||||||||||||||
Class R6 | ||||||||||||||||||||||||
3/31/2017 (Unaudited) | $ | 13.50 | 0.10 | 0.90 | 1.00 | (0.29 | ) | (0.28 | ) | |||||||||||||||
6/27/2016(3) – 9/30/2016 | $ | 12.68 | 0.04 | 0.83 | 0.87 | (0.05 | ) | — | ||||||||||||||||
| (1) | Not annualized. |
| (2) | Annualized. |
| (3) | Commencement of operations. |
| (4) | After fees waived and expenses absorbed or recouped by the Advisor, where applicable. |
| (5) | Net investment income (loss) per share has been calculated based on average shares outstanding during the period. |
| (6) | The total return calculation does not reflect the sales loads that may be imposed on Class A or C shares (see Note 7 of the Notes to Financial Statements). |
| (7) | The total return figure is the since inception return for the class. |
| (8) | Prior to January 31, 2013, Class A shares were known as Class S shares. |
| (9) | Amount is less than $50,000. |
| (10) | Includes proxy expenses not covered by the Trust’s expense limitation agreement. |
The accompanying notes to financial statements are an integral part of this statement.
104
Brandes Investment Trust
FINANCIAL HIGHLIGHTS For a capital share outstanding for the period ended:
| Net asset value, end of period | Total return(6) | Net assets, end of period (millions) | Ratio of net expenses to average net assets(4) | Ratio of net investment income to average net assets(4) | Ratio of expenses (prior to reimburse- ments) to average net assets | Ratio of net investment income (prior to reimburse- ments) to average net assets | Portfolio turnover rate | |||||||||||||||||||||||
| $ | 8.62 | 9.97 | %(1) | $ | 347.9 | 1.39 | %(2)(10) | 0.48 | %(2) | 1.37 | %(2)(10) | 0.50 | %(2) | 11.96 | %(1) | |||||||||||||||
| $ | 7.91 | 29.38 | % | $ | 305.0 | 1.37 | % | 1.74 | % | 1.39 | % | 1.72 | % | 26.48 | % | |||||||||||||||
| $ | 6.19 | (32.32 | )% | $ | 295.6 | 1.37 | % | 1.46 | % | 1.40 | % | 1.43 | % | 35.02 | % | |||||||||||||||
| $ | 9.56 | 7.09 | % | $ | 266.9 | 1.37 | % | 1.10 | % | 1.37 | % | 1.10 | % | 22.54 | % | |||||||||||||||
| $ | 9.23 | 8.09 | % | $ | 131.7 | 1.37 | % | 1.16 | % | 1.46 | % | 1.07 | % | 21.74 | % | |||||||||||||||
| $ | 8.96 | 16.40 | % | $ | 68.1 | 1.37 | % | 2.03 | % | 1.60 | % | 1.79 | % | 28.59 | % | |||||||||||||||
| $ | 8.55 | 9.55 | %(1) | $ | 24.2 | 2.14 | %(2)(10) | (0.27 | )%(2) | 2.13 | %(2)(10) | (0.26 | )%(2) | 11.96 | %(1) | |||||||||||||||
| $ | 7.86 | 28.38 | % | $ | 22.4 | 2.12 | % | 0.99 | % | 2.14 | % | 0.97 | % | 26.48 | % | |||||||||||||||
| $ | 6.15 | (32.83 | )% | $ | 18.4 | 2.12 | % | 0.62 | % | 2.14 | % | 0.60 | % | 35.02 | % | |||||||||||||||
| $ | 9.51 | 6.38 | % | $ | 25.3 | 2.12 | % | 0.35 | % | 2.13 | % | 0.34 | % | 22.54 | % | |||||||||||||||
| $ | 9.19 | (2.84 | )%(7) | $ | 5.3 | 2.12 | %(2) | 0.42 | %(2) | 2.20 | %(2) | 0.34 | %(2) | 21.74 | %(1) | |||||||||||||||
| $ | 8.66 | 10.11 | %(1) | $ | 1,012.3 | 1.14 | %(2)(10) | 0.73 | %(2) | 1.17 | %(2)(10) | 0.70 | %(2) | 11.96 | %(1) | |||||||||||||||
| $ | 7.94 | 29.70 | % | $ | 829.0 | 1.12 | % | 1.99 | % | 1.19 | % | 1.92 | % | 26.48 | % | |||||||||||||||
| $ | 6.21 | (32.13 | )% | $ | 725.1 | 1.12 | % | 1.58 | % | 1.19 | % | 1.51 | % | 35.02 | % | |||||||||||||||
| $ | 9.58 | 7.41 | % | $ | 1,144.3 | 1.12 | % | 1.34 | % | 1.18 | % | 1.28 | % | 22.54 | % | |||||||||||||||
| $ | 9.24 | 8.20 | % | $ | 287.7 | 1.12 | % | 1.41 | % | 1.26 | % | 1.27 | % | 21.74 | % | |||||||||||||||
| $ | 8.99 | 16.79 | % | $ | 134.5 | 1.12 | % | 2.26 | % | 1.35 | % | 2.03 | % | 28.59 | % | |||||||||||||||
| $ | 8.67 | 10.39 | %(1) | $ | 72.5 | 0.99 | %(2)(10) | 0.89 | %(2) | 1.13 | %(2)(10) | 0.75 | %(2) | 11.96 | %(1) | |||||||||||||||
| $ | 7.93 | 5.59 | %(7) | $ | — | (9) | 0.97 | %(2) | 2.14 | %(2) | 1.14 | %(2) | 1.97 | %(2) | 26.48 | %(1) | ||||||||||||||
| $ | 13.88 | 7.53 | %(1) | $ | 174.3 | 1.31 | %(2)(10) | 1.12 | %(2) | 1.31 | %(2)(10) | 1.12 | %(2) | 11.75 | %(1) | |||||||||||||||
| $ | 13.46 | 10.60 | % | $ | 121.2 | 1.32 | % | 0.71 | % | 1.31 | % | 0.72 | % | 21.00 | % | |||||||||||||||
| $ | 12.58 | (2.76 | )% | $ | 79.1 | 1.40 | % | 0.35 | % | 1.32 | % | 0.43 | % | 24.82 | % | |||||||||||||||
| $ | 13.55 | 8.36 | % | $ | 50.1 | 1.40 | % | 0.42 | % | 1.39 | % | 0.43 | % | 24.30 | % | |||||||||||||||
| $ | 13.72 | 32.98 | % | $ | 31.2 | 1.40 | % | 0.49 | % | 1.68 | % | 0.21 | % | 24.45 | % | |||||||||||||||
| $ | 10.56 | 5.60 | %(1) | $ | 38.4 | 1.40 | %(2) | 1.19 | %(2) | 2.16 | %(2) | 0.43 | %(2) | 13.55 | %(1) | |||||||||||||||
| $ | 13.63 | 7.18 | %(1) | $ | 24.4 | 2.06 | %(2)(10) | 0.37 | %(2) | 2.06 | %(2)(10) | 0.37 | %(2) | 11.75 | %(1) | |||||||||||||||
| $ | 13.24 | 9.78 | % | $ | 19.8 | 2.06 | % | (0.03 | )% | 2.06 | % | (0.03 | )% | 21.00 | % | |||||||||||||||
| $ | 12.42 | (3.49 | )% | $ | 15.1 | 2.07 | % | (0.34 | )% | 2.07 | % | (0.34 | )% | 24.82 | % | |||||||||||||||
| $ | 13.45 | 7.60 | % | $ | 12.3 | 2.14 | % | (0.32 | )% | 2.14 | % | (0.32 | )% | 24.30 | % | |||||||||||||||
| $ | 13.68 | 15.23 | %(7) | $ | 1.5 | 2.15 | %(2) | (0.25 | )%(2) | 2.40 | %(2) | (0.50 | )%(2) | 24.45 | %(1) | |||||||||||||||
| $ | 13.92 | 7.61 | %(1) | $ | 1,404.9 | 1.11 | %(2)(10) | 1.32 | %(2) | 1.11 | %(2)(10) | 1.32 | %(2) | 11.75 | %(1) | |||||||||||||||
| $ | 13.50 | 10.85 | % | $ | 1,212.4 | 1.13 | % | 0.90 | % | 1.11 | % | 0.92 | % | 21.00 | % | |||||||||||||||
| $ | 12.61 | (2.58 | )% | $ | 877.6 | 1.15 | % | 0.59 | % | 1.12 | % | 0.62 | % | 24.82 | % | |||||||||||||||
| $ | 13.58 | 8.67 | % | $ | 567.9 | 1.15 | % | 0.67 | % | 1.18 | % | 0.64 | % | 24.30 | % | |||||||||||||||
| $ | 13.74 | 33.41 | % | $ | 81.5 | 1.15 | % | 0.74 | % | 1.48 | % | 0.31 | % | 24.45 | % | |||||||||||||||
| $ | 10.56 | 5.60 | %(1) | $ | 38.4 | 1.15 | %(2) | 1.44 | %(2) | 1.91 | %(2) | 0.68 | %(2) | 13.55 | %(1) | |||||||||||||||
| $ | 13.93 | 7.71 | %(1) | $ | 58.3 | 1.02 | %(2)(10) | 1.41 | %(2) | 1.06 | %(2)(10) | 1.37 | %(2) | 11.75 | %(1) | |||||||||||||||
| $ | 13.50 | 9.49 | %(7) | $ | 16.5 | 1.00 | %(2) | 1.03 | %(2) | 1.06 | %(2) | 0.97 | %(2) | 21.00 | %(1) | |||||||||||||||
The accompanying notes to financial statements are an integral part of this statement.
105
Brandes Investment Trust
FINANCIAL HIGHLIGHTS For a capital share outstanding for the period ended:
| Net asset value, beginning of period | Net investment income(5) | Net | Total from investment operations | Dividends from net investment income | Dividends from net realized gains | |||||||||||||||||||
Brandes Core Plus Fixed Income Fund |
| |||||||||||||||||||||||
Class A | ||||||||||||||||||||||||
3/31/2017 (Unaudited) | $ | 9.39 | 0.10 | (0.23 | ) | (0.13 | ) | (0.10 | ) | (0.02 | ) | |||||||||||||
9/30/2016 | $ | 9.14 | 0.22 | 0.26 | 0.48 | (0.22 | ) | (0.01 | ) | |||||||||||||||
9/30/2015 | $ | 9.22 | 0.19 | (0.02 | ) | 0.17 | (0.20 | ) | (0.05 | ) | ||||||||||||||
9/30/2014 | $ | 9.16 | 0.25 | 0.06 | 0.31 | (0.24 | ) | (0.01 | ) | |||||||||||||||
1/31/2013(3) – 9/30/2013 | $ | 9.43 | 0.20 | (0.28 | ) | (0.08 | ) | (0.19 | ) | — | ||||||||||||||
Class I | ||||||||||||||||||||||||
3/31/2017 (Unaudited) | $ | 9.44 | 0.11 | (0.23 | ) | (0.12 | ) | (0.11 | ) | (0.02 | ) | |||||||||||||
9/30/2016 | $ | 9.20 | 0.24 | 0.25 | 0.49 | (0.24 | ) | (0.01 | ) | |||||||||||||||
9/30/2015 | $ | 9.28 | 0.21 | (0.02 | ) | 0.19 | (0.22 | ) | (0.05 | ) | ||||||||||||||
9/30/2014 | $ | 9.19 | 0.27 | 0.10 | 0.37 | (0.27 | ) | (0.01 | ) | |||||||||||||||
9/30/2013 | $ | 9.60 | 0.32 | (0.23 | ) | 0.09 | (0.38 | ) | (0.12 | ) | ||||||||||||||
9/30/2012 | $ | 9.35 | 0.40 | 0.50 | 0.90 | (0.46 | ) | (0.19 | ) | |||||||||||||||
Brandes Credit Focus Yield Fund |
| |||||||||||||||||||||||
Class A(8) | ||||||||||||||||||||||||
3/31/2017 (Unaudited) | $ | 10.35 | 0.14 | (0.13 | ) | 0.01 | (0.14 | ) | (0.02 | ) | ||||||||||||||
9/30/2016 | $ | 10.02 | 0.29 | 0.33 | 0.62 | (0.29 | ) | — | ||||||||||||||||
9/30/2015 | $ | 10.23 | 0.23 | (0.20 | ) | 0.03 | (0.23 | ) | (0.01 | ) | ||||||||||||||
9/30/2014 | $ | 10.15 | 0.21 | 0.09 | 0.30 | (0.21 | ) | (0.01 | ) | |||||||||||||||
9/30/2013 | $ | 10.39 | 0.19 | (0.17 | ) | 0.02 | (0.20 | ) | (0.06 | ) | ||||||||||||||
3/2/2012(3) – 9/30/2012 | $ | 10.10 | 0.16 | 0.29 | 0.45 | (0.16 | ) | — | ||||||||||||||||
Class I | ||||||||||||||||||||||||
3/31/2017 (Unaudited) | $ | 10.34 | 0.16 | (0.12 | ) | 0.04 | (0.16 | ) | (0.02 | ) | ||||||||||||||
9/30/2016 | $ | 10.02 | 0.31 | 0.32 | 0.63 | (0.31 | ) | — | ||||||||||||||||
9/30/2015 | $ | 10.23 | 0.26 | (0.20 | ) | 0.06 | (0.26 | ) | (0.01 | ) | ||||||||||||||
9/30/2014 | $ | 10.15 | 0.23 | 0.09 | 0.32 | (0.23 | ) | (0.01 | ) | |||||||||||||||
9/30/2013 | $ | 10.39 | 0.22 | (0.18 | ) | 0.04 | (0.22 | ) | (0.06 | ) | ||||||||||||||
1/31/2012(3) – 9/30/2012 | $ | 10.00 | 0.23 | 0.38 | 0.61 | (0.22 | ) | — | ||||||||||||||||
| (1) | Not annualized. |
| (2) | Annualized. |
| (3) | Commencement of operations. |
| (4) | After fees waived and expenses absorbed or recouped by the Advisor, where applicable. |
| (5) | Net investment income (loss) per share has been calculated based on average shares outstanding during the period. |
| (6) | The total return calculation does not reflect the sales loads that may be imposed on Class A or C shares (see Note 7 of the Notes to Financial Statements). |
| (7) | The total return figure is the since inception return for the class. |
| (8) | Prior to January 31, 2013, Class A shares were know as Class S shares. |
| (9) | Effective February 1, 2016, the contractual operating expense limit was reduced from 0.95% to 0.85% for Class A and 0.70% to 0.60% for Class I. |
| (10) | Amount is less than $50,000. |
| (11) | Includes proxy expenses not covered by the Trust’s expense limitation agreement. |
The accompanying notes to financial statements are an integral part of this statement.
106
Brandes Investment Trust
FINANCIAL HIGHLIGHTS For a capital share outstanding for the period ended:
| Net asset value, end of period | Total return(6) | Net assets, end of period (millions) | Ratio of net expenses to average net assets(4) | Ratio of net investment income to average net assets(4) | Ratio of expenses (prior to reimburse- ments) to average net assets | Ratio of net investment income (prior to reimburse- ments) to average net assets | Portfolio turnover rate | |||||||||||||||||||||||
| $ | 9.14 | (1.28 | )%(1) | $ | 1.7 | 0.72 | %(2)(11) | 2.28 | %(2) | 0.90 | %(2)(11) | 2.10 | %(2) | 22.10 | %(1) | |||||||||||||||
| $ | 9.39 | 5.32 | % | $ | 2.0 | 0.70 | % | 2.38 | % | 0.93 | % | 2.15 | % | 35.88 | % | |||||||||||||||
| $ | 9.14 | 1.78 | % | $ | 2.1 | 0.70 | % | 2.07 | % | 1.06 | % | 1.71 | % | 11.24 | % | |||||||||||||||
| $ | 9.22 | 3.52 | % | $ | 2.1 | 0.70 | % | 2.68 | % | 1.33 | % | 2.05 | % | 18.63 | % | |||||||||||||||
| $ | 9.16 | (0.88 | )%(7) | $ | 1.4 | 0.70 | %(2) | 3.23 | %(2) | 1.45 | %(2) | 2.48 | %(2) | 33.91 | %(1) | |||||||||||||||
| $ | 9.19 | (1.17 | )%(1) | $ | 99.0 | 0.52 | %(2)(11) | 2.48 | %(2) | 0.69 | %(2)(11) | 2.31 | %(2) | 22.10 | %(1) | |||||||||||||||
| $ | 9.44 | 5.43 | % | $ | 97.2 | 0.50 | % | 2.58 | % | 0.72 | % | 2.36 | % | 35.88 | % | |||||||||||||||
| $ | 9.20 | 2.02 | % | $ | 72.1 | 0.50 | % | 2.26 | % | 0.86 | % | 1.90 | % | 11.24 | % | |||||||||||||||
| $ | 9.28 | 4.10 | % | $ | 43.3 | 0.50 | % | 2.88 | % | 1.20 | % | 2.18 | % | 18.63 | % | |||||||||||||||
| $ | 9.19 | 0.89 | % | $ | 29.7 | 0.50 | % | 3.43 | % | 1.23 | % | 2.70 | % | 33.91 | % | |||||||||||||||
| $ | 9.60 | 10.06 | % | $ | 25.3 | 0.50 | % | 4.28 | % | 1.23 | % | 3.55 | % | 31.59 | % | |||||||||||||||
| $ | 10.20 | 0.11 | %(1) | $ | 2.4 | 0.86 | %(2)(11) | 2.85 | %(2) | 1.34 | %(2)(11) | 2.37 | %(2) | 19.76 | %(1) | |||||||||||||||
| $ | 10.35 | 6.33 | % | $ | 2.3 | 0.88 | %(9) | 2.90 | % | 1.35 | % | 2.43 | % | 34.14 | % | |||||||||||||||
| $ | 10.02 | 0.26 | % | $ | 2.1 | 0.95 | % | 2.28 | % | 1.53 | % | 1.70 | % | 25.50 | % | |||||||||||||||
| $ | 10.23 | 2.94 | % | $ | 2.0 | 0.95 | % | 2.02 | % | 1.50 | % | 1.47 | % | 26.17 | % | |||||||||||||||
| $ | 10.15 | 0.13 | % | $ | 4.2 | 0.95 | % | 1.84 | % | 1.61 | % | 1.18 | % | 23.05 | % | |||||||||||||||
| $ | 10.39 | 4.51 | %(7) | — | (10) | 0.95 | %(2) | 2.69 | %(2) | 1.05 | %(2) | 2.06 | %(2) | 162.73 | %(1) | |||||||||||||||
| $ | 10.20 | 0.33 | %(1) | $ | 29.0 | 0.61 | %(2)(11) | 3.10 | %(2) | 1.09 | %(2)(11) | 2.62 | %(2) | 19.76 | %(1) | |||||||||||||||
| $ | 10.34 | 6.49 | % | $ | 29.0 | 0.63 | %(9) | 3.15 | % | 1.10 | % | 2.68 | % | 34.14 | % | |||||||||||||||
| $ | 10.02 | 0.58 | % | $ | 27.3 | 0.70 | % | 2.53 | % | 1.28 | % | 1.95 | % | 25.50 | % | |||||||||||||||
| $ | 10.23 | 3.20 | % | $ | 27.1 | 0.70 | % | 2.26 | % | 1.26 | % | 1.70 | % | 26.17 | % | |||||||||||||||
| $ | 10.15 | 0.40 | % | $ | 25.2 | 0.70 | % | 2.09 | % | 1.42 | % | 1.37 | % | 23.05 | % | |||||||||||||||
| $ | 10.39 | 6.23 | %(7) | $ | 19.3 | 0.70 | %(2) | 3.39 | %(2) | 2.35 | %(2) | 1.74 | %(2) | 162.73 | %(1) | |||||||||||||||
The accompanying notes to financial statements are an integral part of this statement.
107
Brandes Investment Trust
NOTES TO FINANCIAL STATEMENTS — (Unaudited)
NOTE 1 – ORGANIZATION
The Brandes International Equity Fund (the “International Fund”), the Brandes Global Equity Fund (the “Global Fund”), the Brandes Global Equity Income Fund (the “Global Income Fund”), the Brandes Global Opportunities Value Fund (the “Global Opportunities Fund”), the Brandes Emerging Markets Value Fund (the “Emerging Markets Fund”), the Brandes International Small Cap Equity Fund (the “International Small Cap Fund”), the Brandes Core Plus Fixed Income Fund (the “Core Plus Fund”) and the Brandes Credit Focus Yield Fund (the “Credit Focus Yield Fund”) (each a “Fund” and collectively the “Funds”) are series of Brandes Investment Trust (the “Trust”). The Trust is registered under the Investment Company Act of 1940 (the “1940 Act”) as a diversified, open-end management investment company.
The International Fund, Global Fund, Global Income Fund, Global Opportunities Fund, Emerging Markets Fund, Core Plus Fund, Credit Focus Yield Fund and International Small Cap Fund began operations on January 2, 1997, October 6, 2008, December 31, 2014, December 31, 2014, January 31, 2011, December 28, 2007, January 31, 2012 and January 31, 2012, respectively. Prior to January 31, 2011 for the Emerging Markets Fund and January 31, 2012 for the International Small Cap and Credit Focus Yield Funds, these Funds’ portfolios were managed as private investment funds with investment objectives, investment policies and strategies that were, in all material respects, equivalent to those of the Emerging Markets Fund, International Small Cap Fund and Credit Focus Yield Fund, respectively.
The International Fund has four classes of shares: Class A, Class C, Class I and Class R6. The Global Fund has three classes of shares: Class A, Class C, and Class I. The Global Income Fund and Global Opportunities Fund have three classes of shares: Class A, Class C and Class I. The Emerging Markets Fund and International Small Cap Fund have four classes of shares: Class A, Class C, Class I and Class R6. The Core Plus Fund has two classes of shares: Class A, and Class I. The Credit Focus Yield Fund has two classes of shares: Class A and Class I. Prior to January 31, 2013, Class A shares were known as Class S shares for the International, Global, Emerging Markets, International Small Cap and Credit Focus Yield Funds (Class A shares have the same operating expenses as Class S shares).
The International Fund and Global Fund invest their assets primarily in equity securities of issuers with market capitalizations greater than $1 billion. The International, International Small Cap and Emerging Markets Funds invest their assets in securities of foreign companies, while the Global Fund, Global Income Fund and Global Opportunities Fund invests its assets in securities of foreign and domestic companies. The Core Plus Fund and Credit Focus Yield Fund invest predominantly in debt securities issued by U.S. and foreign companies and debt
108
Brandes Investment Trust
NOTES TO FINANCIAL STATEMENTS — (Unaudited) (continued)
obligations issued or guaranteed by the U.S. Government and foreign governments and their agencies and instrumentalities.
NOTE 2 – SIGNIFICANT ACCOUNTING POLICIES
The following is a summary of significant accounting policies consistently followed by the Funds. These policies are in conformity with generally accepted accounting principles (“GAAP”) in the United States of America.
| A. | Repurchase Agreements. Each Fund may enter into repurchase agreements with government securities dealers recognized by the Federal Reserve Board, with member banks of the Federal Reserve System or with other brokers or dealers that meet the credit guidelines established by the Board of Trustees. Each Fund will always receive and maintain, as collateral, U.S. Government securities whose market value, including accrued interest (which is recorded in the Schedules of Investments), will be at least equal to 100% of the dollar amount invested by the Fund in each agreement, and the Fund will make payment for such securities only upon physical delivery or upon evidence of book entry transfer to the account of the Fund’s custodian. To the extent that the term of any repurchase transaction exceeds one business day, the value of the collateral is marked-to-market on a daily basis to ensure the adequacy of the collateral. Before causing a Fund to enter into a repurchase agreement with any other party, the investment advisor will determine that such party does not have any apparent risk of becoming involved in bankruptcy proceedings within the time frame contemplated by the repurchase agreement. If the seller defaults and the value of the collateral declines, or if bankruptcy proceedings are commenced with respect to the seller of the security, realization of the collateral by the Fund may be delayed or limited. At March 31, 2017, the Funds’ ongoing exposure to the economic return on repurchase agreements is shown on the Schedule of Investments. |
| B. | Foreign Currency Translation and Transactions. Values of investments denominated in foreign currencies are converted into U.S. dollars using the spot market rates of exchange at the time of valuation. Purchases and sales of investments and dividend and interest income are translated into U.S. dollars using the spot market rates of exchange prevailing on the respective dates of such translations. The gain or loss resulting from changes in foreign exchange rates is included with net realized and unrealized gain or loss from investments, as appropriate. Foreign securities and currency transactions may involve certain considerations and risks not typically associated with those of domestic origin. |
Foreign securities are recorded in the financial statements after translation to U.S. dollars based on the applicable exchange rate at the end of the period. The Funds report certain foreign currency-related transactions as
109
Brandes Investment Trust
NOTES TO FINANCIAL STATEMENTS — (Unaudited) (continued)
components of realized gains or losses for financial reporting purposes, whereas such components are treated as ordinary income for federal income tax purposes.
| C. | Delayed Delivery Securities. The Funds may purchase securities on a when issued or delayed delivery basis. “When-issued” or delayed delivery refers to securities whose terms are available and for which a market exists, but that have not been issued. For a when-issued or delayed delivery transaction, no payment is made until delivery date, which is typically longer than the normal course of settlement. When a Fund enters into an agreement to purchase securities on a when-issued or delayed delivery basis, the Fund segregates cash or liquid securities, of any type or maturity, equal in value to the Fund’s commitment. Losses may arise if the market value of the underlying securities change, if the counterparty does not perform under the contract, or if the issuer does not issue the securities due to political, economic, or other factors. The Funds did not have any open commitments on delayed delivery securities as of March 31, 2017. |
| D. | Participatory Notes. The International, Global, Global Income, Global Opportunities, Emerging Markets and International Small Cap Funds may invest in participatory notes. Participatory notes are derivative securities which are designed to provide synthetic exposure to one or more underlying securities, subject to the credit risk of the issuing financial institution. |
Investments in participatory notes involve risks normally associated with a direct investment in the underlying securities. In addition, participatory notes are subject to counterparty risk, which is the risk that the broker-dealer or bank that issues the notes will not fulfill its contractual obligation to complete the transaction with the Trust. Participatory notes constitute general unsecured, unsubordinated contractual obligations of the banks or broker-dealers that issue them and generally are issued as an actual note from the financial intermediary or an equity linked warrant (commonly known as a low exercise price option). The Trust is relying on the creditworthiness of such banks or broker-dealers and has no rights under a participatory note against the issuer of the securities underlying such participatory note. The investment advisor has established guidelines for monitoring participatory note exposure for the Funds. Prior to investment in a participatory note, the investment advisor will complete an analysis of the prospective counterparties and once purchased, will continue to monitor creditworthiness on a quarterly basis. The investment advisor requires a minimum credit rating for such counterparties (as determined by rating agencies such as Moody’s, Fitch and S&P) of A.
The Funds record counterparty credit risk valuation adjustments, if material, on the participatory notes in order to appropriately reflect the credit quality of
110
Brandes Investment Trust
NOTES TO FINANCIAL STATEMENTS — (Unaudited) (continued)
the counterparty. During the six months ended March 31, 2017, the Funds did not make any counterparty credit risk valuation adjustments.
The International, Global, Global Income, Global Opportunities, and International Small Cap Funds did not invest in any participatory notes at March 31, 2017. The Emerging Markets Fund invested in one participatory note with HSBC Bank Plc in which HSBC Bank Plc is an investment vehicle used to gain exposure to the underlying security of Banque Saudi Fransi. Banque Saudi Fransi was purchased on March 28, 2017 and held through the end of the period. As of March 31, 2017, the market value and realized gain on this position was $48,971 and $3,907, respectively.
| E. | Investment Transactions, Dividends and Distributions. Investment transactions are accounted for on the trade dates. Realized gains and losses are evaluated on the basis of identified costs. Dividend income and distributions to shareholders are recorded on the ex-dividend dates. Interest is recorded on an accrual basis. Withholding taxes on foreign dividends and capital gains, which are included as a component of net investment income and realized gain (loss) on investments, respectively, have been provided for in accordance with the Trust’s understanding of the applicable country’s tax rules and rates. Each Fund’s investment income, expenses, other than class specific expenses, and realized and unrealized gains and losses are allocated daily to each class of the Fund’s shares based upon the relative net asset values of outstanding shares of each class of shares at the beginning of the day (after adjusting for the current capital shares activity of the respective class). Expenses common to the Funds’ portfolios are allocated among the Funds based upon their relative net asset values or other appropriate allocation methods. The Funds amortize premiums and accrete discounts using the constant yield method. |
| F. | Concentration of Risk. As of March 31, 2017, the International, Global, Global Income, Global Opportunities, Emerging Markets and International Small Cap Funds held significant portions of their assets in foreign securities. Certain price and foreign exchange fluctuations as well as economic and political situations in the foreign jurisdictions could have an impact on the International, Global, Global Income, Global Opportunities, Emerging Markets and International Small Cap Funds’ net assets. The investment advisor monitors these off-balance sheet risks. |
| G. | Use of Estimates. The preparation of financial statements in conformity with GAAP requires management to make estimates and assumptions that affect the reported amounts of assets and liabilities at the date of the financial statements and the reported amounts of revenues and expenses during the reporting period. Actual results could differ from those estimates and assumptions. |
111
Brandes Investment Trust
NOTES TO FINANCIAL STATEMENTS — (Unaudited) (continued)
| H. | Securities Lending. The Funds may lend their portfolio securities to banks, brokers and dealers. Lending Fund securities exposes the Fund to risks such as the following: (i) the borrower may fail to return the loaned securities, (ii) the borrower may not be able to provide additional collateral, or (iii) the Fund may experience delays in recovery of the loaned securities or loss of rights in the collateral if the borrower fails financially. |
To minimize these risks, the borrower must agree to maintain collateral with the Fund’s custodian, marked to market daily, in the form of cash and/or U.S. Government obligations, in an amount at least equal to 102% (105% in the case of loans of foreign securities not denominated in U.S. dollars) of the market value of the loaned securities. As of March 31, 2017, the Global Income Fund, Global Opportunities Fund, Emerging Markets Fund, International Small Cap Fund, Core Plus Fund and Credit Focus Fund did not have any securities on loan. The International Fund and Global Fund had market values of securities loaned of $7,208,745 and $944,598 and received non-cash collateral for the loans of $7,447,740 and $975,260, respectively. Non-cash collateral received by the Funds may not be sold or re-pledged except to satisfy a borrower default. Therefore, non-cash collateral is not included on the Funds’ Schedule of Investments or Statement of Assets and Liabilities.
| I. | Indemnification Obligations. Under the Trust’s organizational documents, its current and former officers and trustees are indemnified against certain liabilities arising out of the performance of their duties to the Trust. The Trust has indemnified its trustees against any expenses actually and reasonably incurred by the trustees in any proceeding arising out of or in connection with the trustees’ service to the Trust. In addition, in the normal course of business, the Trust enters into contracts that contain a variety of representations and warranties and provide general indemnifications. The Funds’ maximum exposure under these arrangements is unknown as this would involve future claims that may be made against the Funds that have not yet occurred or that would be covered by other parties. |
| J. | Accounting for Uncertainty in Income Taxes. Each Fund has elected to be taxed as a “regulated investment company” and intends to distribute substantially all taxable income to its shareholders and otherwise comply with the provisions of the Internal Revenue Code applicable to regulated investment companies. The Funds may be subject to a nondeductible excise tax calculated as a percentage of certain undistributed amounts of net investment income and net capital gains. The Funds intend to distribute their net investment income and capital gains as necessary to avoid this excise tax. Therefore, no provision for federal income taxes or excise taxes has been made. |
112
Brandes Investment Trust
NOTES TO FINANCIAL STATEMENTS — (Unaudited) (continued)
The Trust has adopted financial reporting rules that require the Funds to analyze all open tax years, as defined by the applicable statute of limitations, for all major jurisdictions. Open tax years for the Funds are those that are open for exam by taxing authorities (2013 through 2016). As of March 31, 2017 the Trust has no examinations in progress.
Management has analyzed the Trust’s tax positions, and has concluded that no liability should be recorded related to uncertain tax positions expected to be taken on the tax return for the fiscal year-ended September 30, 2016.
The Trust identifies its major tax jurisdictions as the U.S. Government and the State of California. The Funds are not aware of any tax positions for which it is reasonably possible that the total amounts of unrecognized tax benefits will significantly change in the next twelve months.
| K. | Fair Value Measurements. The Trust has adopted GAAP accounting principles related to fair value accounting standards which establish a definition of fair value and set out a hierarchy for measuring fair value. These standards require additional disclosures about the various inputs and valuation techniques used to develop the measurements of fair value and a discussion of changes in valuation techniques and related inputs during the period. These inputs are summarized in the three broad levels listed below: |
Level 1 — Fair value measurement within Level 1 should be based on an unadjusted quoted price in an active market that the Funds have the ability to access for the asset or liability at the measurement date. Because a quoted price alone forms the basis for the measurement, the access requirement within Level 1 limits discretion in pricing the asset or liability, including in situations in which there are multiple markets for the asset or liability with different prices and no single market represents a principal market for the asset or liability. Importantly, the Financial Accounting Standards Board has indicated that when a quoted price in an active market for a security is available, that price should be used to measure fair value without regard to an entity’s intent to transact at that price.
Level 2 — Fair value measurement within Level 2 should be based on all inputs other than unadjusted quoted prices included within Level 1 that are observable for the asset or liability. Other significant observable market inputs include quoted prices for similar instruments in active markets, quoted adjusted prices in active markets, quoted prices for identical or similar instruments in markets that are not active, and model-derived valuations in which the majority of significant inputs and significant value drivers are observable in active markets.
Level 3 — Fair value measurement within Level 3 should be based on unobservable inputs in such cases where markets do not exist or are illiquid.
113
Brandes Investment Trust
NOTES TO FINANCIAL STATEMENTS — (Unaudited) (continued)
Significant unobservable inputs include model derived valuations in which the majority of significant inputs or significant value drivers are unobservable. Unobservable inputs are those inputs that reflect the Fund’s own assumptions that market participants would use to price the asset or liability based on the best available information.
| L. | Security Valuation. Common and preferred stocks, exchange-traded funds and financial derivative instruments, such as futures contracts and options contracts that are traded on a national securities or commodities exchange, are valued at the last reported sales price at the close of regular trading on each day the exchange is open for trading, in the case of common stocks and exchange-traded funds, or, in the case of futures contracts or options contracts, the settlement price determined by the relevant exchange. Securities listed on the NASDAQ National Market System for which market quotations are readily available are valued using the NASDAQ Official Closing Price. To the extent these securities are actively traded and valuation adjustments are not applied, they are categorized as Level 1 of the fair value hierarchy. |
Equity securities traded on an exchange for which there have been no sales on the valuation date are generally valued at the mean between last bid and ask price on such day and are categorized as Level 2 of the fair value hierarchy, or are fair valued by the Valuation Committee.
Investments in registered open-end management investment companies will be valued based upon the Net Asset Values (“NAVs”) of such investments and are categorized as Level 1 of the fair value hierarchy.
Valuation adjustments may be applied to certain common and preferred stocks that are solely traded on a foreign exchange to account for the market movement between the close of the foreign market and the close of the New York Stock Exchange (“NYSE”). These securities are generally valued using pricing service providers that consider the correlation of the trading patterns of the foreign securities to the intraday trading in the U.S. markets for investments. Securities using these valuation adjustments are categorized as Level 2 of the fair value hierarchy. As of March 31, 2017, the International Fund, Global Fund, Global Income Fund, Global Opportunities Fund, Emerging Markets Fund and International Small Cap Fund had securities with market values of $393,719,289, $35,461,027, $517,441, $10,868,648, $594,192,039, and $813,244,408, that represent 77.50%, 52.72%, 53.35%, 46.22%, 40.79%, and 48.94% of each Fund’s net assets, respectively, that were fair valued using these valuation adjustments.
Fixed income securities (other than repurchase agreements and demand notes) including corporate, convertible and municipal bonds and notes, U.S. government agencies, U.S. Treasury obligations, sovereign issues, bank loans, convertible preferred securities, fixed income securities
114
Brandes Investment Trust
NOTES TO FINANCIAL STATEMENTS — (Unaudited) (continued)
purchased on a delayed delivery basis and non-U.S. bonds are normally valued on the basis of quotes obtained from brokers and dealers or independent pricing services or sources. Independent pricing services typically use information provided by market makers or estimates of market values obtained from yield data relating to investments or securities with similar characteristics. The service providers’ internal models use inputs that are observable such as, among other things, issuer details, interest rates, yield curves, prepayment speeds, credit risks/spreads, default rates and quoted prices for similar assets. Securities that use similar valuation techniques and inputs as described above are categorized as Level 2 of the fair value hierarchy.
Rights that are traded on a national securities exchange are valued at the last reported sales price at the close of regular trading on each day the exchange is open. A right is a privilege offered by a corporation to its shareholders pro rata to subscribe to a certain security at a specified price, often for a short period. Rights may or may not be transferable.
The Funds may enter into mortgage dollar roll transactions in which the Funds sell a mortgage-backed security to a counterparty and simultaneously enter into an agreement with the same counterparty to buy back a similar security on a specific future date at a predetermined price. Risks may arise due to the delayed payment date and the potential inability of counterparties to complete the transaction. Mortgage dollar rolls are accounted for as purchase and sale transactions, which may increase a Fund’s portfolio turnover rate.
Mortgage and asset-backed securities are usually issued as separate tranches, or classes, of securities within each package of underlying securities. These securities are also normally valued by pricing service providers that use broker dealer quotations or valuation estimates from their internal pricing models. The pricing models for these securities usually consider tranche level attributes, estimated cash flows and market-based yield spreads for each tranche, and current market data and incorporate packaged collateral performance, as available. Mortgage and asset-backed securities that use such valuation techniques and inputs are categorized as Level 2 of the fair value hierarchy.
Repurchase agreements and demand notes, for which neither vendor pricing nor market maker prices are available, are valued at amortized cost on the day of valuation, unless the Advisor determines that the use of amortized cost valuation on such day is not appropriate (in which case such instrument is fair valued in accordance with the fair value procedures of the Trust).
Certain securities may be fair valued in accordance with the fair valuation procedures approved by the Board of Trustees. The Valuation Committee
115
Brandes Investment Trust
NOTES TO FINANCIAL STATEMENTS — (Unaudited) (continued)
is generally responsible for overseeing the day-to-day valuation processes and reports periodically to the Board. The Valuation Committee is authorized to make all necessary determinations of the fair value of portfolio securities and other assets for which market quotations are not readily available or if it is deemed that the prices obtained from brokers and dealers or independent pricing services are unreliable. The securities fair valued by the Valuation Committee are indicated in the Schedules of Investments and are categorized as Level 2 or Level 3 of the fair value hierarchy. Certain vendor priced securities may also be considered Level 3 if significant unobservable inputs are used by the vendors.
In using fair value pricing, each Fund attempts to establish the price that it might reasonably have expected to receive upon a sale of the security at 4:00 p.m. Eastern time. Valuing securities at fair value involves greater reliance on judgment than valuation of securities based on readily available market quotations. A Fund using fair value to price securities may value those securities higher or lower than another fund using market quotations or fair value to price the same securities. Further, there can be no assurance that the Fund could obtain the fair value assigned to a security if it were to sell the security at approximately the time at which the Fund determines its net asset value.
The following is a summary of the level inputs used, as of March 31, 2017, involving the Funds’ assets carried at fair value. The inputs used for valuing securities may not be an indication of the risk associated with investing in those securities.
Description | Level 1 | Level 2 | Level 3 | Total | ||||||||||||
Investments in Securities | ||||||||||||||||
International Fund | ||||||||||||||||
Common Stocks | ||||||||||||||||
Consumer Discretionary | $ | 2,624,965 | $ | 65,642,000 | $ | — | $ | 68,266,965 | ||||||||
Consumer Staples | — | 41,415,389 | — | 41,415,389 | ||||||||||||
Energy | 11,165,557 | 46,702,544 | — | 57,868,101 | ||||||||||||
Financials | 9,262,823 | 92,262,573 | — | 101,525,396 | ||||||||||||
Health Care | — | 63,245,157 | — | 63,245,157 | ||||||||||||
Industrials | 8,315,239 | 27,420,074 | — | 35,735,313 | ||||||||||||
Information Technology | — | 18,932,924 | — | 18,932,924 | ||||||||||||
Materials | 7,603,127 | 7,595,947 | 15,199,074 | |||||||||||||
Telecommunication Services | 3,980,275 | 26,859,969 | — | 30,840,244 | ||||||||||||
Utilities | — | 14,334,442 | — | 14,334,442 | ||||||||||||
|
|
|
|
|
|
|
| |||||||||
Total Common Stocks | 42,951,986 | 404,411,019 | — | 447,363,005 | ||||||||||||
|
|
|
|
|
|
|
| |||||||||
Preferred Stocks | ||||||||||||||||
Energy | — | 6,486,677 | — | 6,486,677 | ||||||||||||
Telecommunication Services | 7,388,978 | — | — | 7,388,978 | ||||||||||||
|
|
|
|
|
|
|
| |||||||||
Total Preferred Stocks | 7,388,978 | 6,486,677 | — | 13,875,655 | ||||||||||||
|
|
|
|
|
|
|
| |||||||||
Repurchase Agreements | — | 48,023,378 | — | 48,023,378 | ||||||||||||
|
|
|
|
|
|
|
| |||||||||
Total Investments in Securities | $ | 50,340,964 | $ | 458,921,074 | $ | — | $ | 509,262,038 | ||||||||
|
|
|
|
|
|
|
| |||||||||
116
Brandes Investment Trust
NOTES TO FINANCIAL STATEMENTS — (Unaudited) (continued)
Description | Level 1 | Level 2 | Level 3 | Total | ||||||||||||
Global Fund | ||||||||||||||||
Common Stocks | ||||||||||||||||
Consumer Discretionary | $ | — | $ | 7,989,339 | $ | — | $ | 7,989,339 | ||||||||
Consumer Staples | 1,204,828 | 3,216,612 | — | 4,421,440 | ||||||||||||
Energy | 1,729,991 | 5,372,826 | — | 7,102,817 | ||||||||||||
Financials | 10,771,643 | 5,483,815 | — | 16,255,458 | ||||||||||||
Health Care | 5,994,330 | 5,516,882 | — | 11,511,212 | ||||||||||||
Industrials | 2,575,736 | 1,645,925 | — | 4,221,661 | ||||||||||||
Information Technology | 2,135,824 | 3,322,676 | — | 5,458,500 | ||||||||||||
Telecommunication Services | 1,392,120 | 1,852,042 | — | 3,244,162 | ||||||||||||
Utilities | 543,010 | 1,562,623 | — | 2,105,633 | ||||||||||||
|
|
|
|
|
|
|
| |||||||||
Total Common Stocks | 26,347,482 | 35,962,740 | — | 62,310,222 | ||||||||||||
|
|
|
|
|
|
|
| |||||||||
Corporate Bonds | ||||||||||||||||
Energy | — | 655,735 | — | 655,735 | ||||||||||||
|
|
|
|
|
|
|
| |||||||||
Total Corporate Bonds | — | 655,735 | — | 655,735 | ||||||||||||
|
|
|
|
|
|
|
| |||||||||
Repurchase Agreements | — | 4,192,777 | — | 4,192,777 | ||||||||||||
|
|
|
|
|
|
|
| |||||||||
Total Investments in Securities | $ | 26,347,482 | $ | 40,811,252 | $ | — | $ | 67,158,734 | ||||||||
|
|
|
|
|
|
|
| |||||||||
Global Equity Income | ||||||||||||||||
Common Stocks | ||||||||||||||||
Consumer Discretionary | $ | — | $ | 101,701 | $ | — | $ | 101,701 | ||||||||
Consumer Staples | 47,913 | 83,582 | — | 131,495 | ||||||||||||
Energy | 8,268 | 92,780 | — | 101,048 | ||||||||||||
Financials | 91,031 | 58,088 | — | 149,119 | ||||||||||||
Health Care | 69,895 | 77,337 | — | 147,232 | ||||||||||||
Industrials | 18,257 | 29,608 | — | 47,865 | ||||||||||||
Information Technology | 30,682 | 26,782 | — | 57,464 | ||||||||||||
Telecommunication Services | 24,498 | — | — | 24,498 | ||||||||||||
Utilities | 57,286 | 28,942 | — | 86,228 | ||||||||||||
|
|
|
|
|
|
|
| |||||||||
Total Common Stocks | 347,830 | 498,820 | — | 846,650 | ||||||||||||
|
|
|
|
|
|
|
| |||||||||
Preferred Stocks | ||||||||||||||||
Financials | 74,371 | — | — | 74,371 | ||||||||||||
Information Technology | — | 18,621 | — | 18,621 | ||||||||||||
|
|
|
|
|
|
|
| |||||||||
Total Preferred Stocks | 74,371 | 18,621 | — | 92,992 | ||||||||||||
|
|
|
|
|
|
|
| |||||||||
Total Investments in Securities | $ | 422,201 | $ | 517,441 | $ | — | $ | 939,642 | ||||||||
|
|
|
|
|
|
|
| |||||||||
117
Brandes Investment Trust
NOTES TO FINANCIAL STATEMENTS — (Unaudited) (continued)
Description | Level 1 | Level 2 | Level 3 | Total | ||||||||||||
Global Opportunities Value | ||||||||||||||||
Common Stocks | ||||||||||||||||
Consumer Discretionary | $ | 770,120 | $ | 2,033,060 | $ | — | $ | 2,803,180 | ||||||||
Consumer Staples | 530,838 | 1,543,135 | — | 2,073,973 | ||||||||||||
Energy | 1,025,022 | 746,862 | — | 1,771,884 | ||||||||||||
Financials | 2,813,020 | 2,235,908 | — | 5,048,928 | ||||||||||||
Health Care | 812,460 | 807,425 | — | 1,619,885 | ||||||||||||
Industrials | 1,902,654 | 611,400 | — | 2,514,054 | ||||||||||||
Information Technology | 123,300 | 959,156 | — | 1,082,456 | ||||||||||||
Materials | 228,782 | 229,857 | — | 458,639 | ||||||||||||
Real Estate | — | 426,327 | — | 426,327 | ||||||||||||
Telecommunication Services | 389,285 | 1,021,307 | — | 1,410,592 | ||||||||||||
Utilities | 231,952 | 731,787 | — | 963,739 | ||||||||||||
|
|
|
|
|
|
|
| |||||||||
Total Common Stocks | 8,827,433 | 11,346,224 | — | 20,173,657 | ||||||||||||
|
|
|
|
|
|
|
| |||||||||
Preferred Stocks | ||||||||||||||||
Consumer Discretionary | 469,195 | — | — | 469,195 | ||||||||||||
Consumer Staples | 244,540 | — | — | 244,540 | ||||||||||||
Energy | — | 231,683 | — | 231,683 | ||||||||||||
Financials | 238,271 | — | — | 238,271 | ||||||||||||
Health Care | — | 181,782 | — | 181,782 | ||||||||||||
|
|
|
|
|
|
|
| |||||||||
Total Preferred Stocks | 952,006 | 413,465 | — | 1,365,471 | ||||||||||||
|
|
|
|
|
|
|
| |||||||||
Corporate Bonds | ||||||||||||||||
Energy | — | 142,458 | — | 142,458 | ||||||||||||
|
|
|
|
|
|
|
| |||||||||
Total Corporate Bonds | — | 142,458 | — | 142,458 | ||||||||||||
|
|
|
|
|
|
|
| |||||||||
Repurchase Agreements | — | 1,709,130 | — | 1,709,130 | ||||||||||||
|
|
|
|
|
|
|
| |||||||||
Total Investments in Securities | $ | 9,779,439 | $ | 13,611,277 | $ | — | $ | 23,390,716 | ||||||||
|
|
|
|
|
|
|
| |||||||||
118
Brandes Investment Trust
NOTES TO FINANCIAL STATEMENTS — (Unaudited) (continued)
Description | Level 1 | Level 2 | Level 3 | Total | ||||||||||||
Emerging Markets Fund | ||||||||||||||||
Common Stocks | ||||||||||||||||
Consumer Discretionary | $ | 84,192,459 | $ | 180,520,208 | $ | — | $ | 264,712,667 | ||||||||
Consumer Staples | 65,091,492 | — | — | 65,091,492 | ||||||||||||
Energy | 63,236,535 | 3,803,826 | — | 67,040,361 | ||||||||||||
Financials | 174,342,289 | 235,980,910 | — | 410,323,199 | ||||||||||||
Industrials | 61,311,376 | — | — | 61,311,376 | ||||||||||||
Information Technology | — | 62,082,019 | — | 62,082,019 | ||||||||||||
Materials | 53,213,951 | 14,961,256 | — | 68,175,207 | ||||||||||||
Telecommunication Services | 50,836,967 | 120,232,601 | — | 171,069,568 | ||||||||||||
Utilities | 32,715,146 | 22,936,179 | — | 55,651,325 | ||||||||||||
|
|
|
|
|
|
|
| |||||||||
Total Common Stocks | 584,940,215 | 640,516,999 | — | 1,225,457,214 | ||||||||||||
|
|
|
|
|
|
|
| |||||||||
Preferred Stocks | ||||||||||||||||
Consumer Discretionary | 30,276,244 | — | — | 30,276,244 | ||||||||||||
Consumer Staples | 47,424,894 | — | — | 47,424,894 | ||||||||||||
Energy | 23,268,701 | 9,230,235 | — | 32,498,936 | ||||||||||||
Financials | 21,124,465 | — | — | 21,124,465 | ||||||||||||
Telecommunication Services | 15,118,614 | — | — | 15,118,614 | ||||||||||||
Utilities | 8,904,966 | — | — | 8,904,966 | ||||||||||||
|
|
|
|
|
|
|
| |||||||||
Total Preferred Stocks | 146,117,884 | 9,230,235 | — | 155,348,119 | ||||||||||||
|
|
|
|
|
|
|
| |||||||||
Participatory Notes | ||||||||||||||||
Financials | — | 48,971 | — | 48,971 | ||||||||||||
|
|
|
|
|
|
|
| |||||||||
Total Participatory Notes | — | 48,971 | — | 48,971 | ||||||||||||
|
|
|
|
|
|
|
| |||||||||
Repurchase Agreements | — | 72,158,547 | — | 72,158,547 | ||||||||||||
|
|
|
|
|
|
|
| |||||||||
Total Investments in Securities | $ | 731,058,099 | $ | 721,954,752 | $ | — | $ | 1,453,012,851 | ||||||||
|
|
|
|
|
|
|
| |||||||||
119
Brandes Investment Trust
NOTES TO FINANCIAL STATEMENTS — (Unaudited) (continued)
Description | Level 1 | Level 2 | Level 3 | Total | ||||||||||||
International Small Cap Fund | ||||||||||||||||
Common Stocks | ||||||||||||||||
Consumer Discretionary | $ | 94,672,213 | $ | 180,812,443 | $ | — | $ | 275,484,656 | ||||||||
Consumer Staples | 122,868,977 | 165,083,485 | — | 287,952,462 | ||||||||||||
Energy | 13,311,941 | — | — | 13,311,941 | ||||||||||||
Financials | 80,948,401 | 120,358,867 | — | 201,307,268 | ||||||||||||
Health Care | 18,450,737 | 56,807,374 | — | 75,258,111 | ||||||||||||
Industrials | 114,312,461 | 112,099,107 | — | 226,411,568 | ||||||||||||
Information Technology | 21,635,906 | 52,447,931 | — | 74,083,837 | ||||||||||||
Materials | 30,084,780 | — | — | 30,084,780 | ||||||||||||
Real Estate | 17,975,149 | 36,537,962 | 54,513,111 | |||||||||||||
Telecommunication Services | — | 50,129,843 | — | 50,129,843 | ||||||||||||
Utilities | 41,637,586 | 36,472,276 | — | 78,109,862 | ||||||||||||
|
|
|
|
|
|
|
| |||||||||
Total Common Stocks | 555,898,151 | 810,749,288 | — | 1,366,647,439 | ||||||||||||
|
|
|
|
|
|
|
| |||||||||
Preferred Stocks | ||||||||||||||||
Health Care | — | 32,421,396 | — | 32,421,396 | ||||||||||||
Utilities | 19,112,742 | — | — | 19,112,742 | ||||||||||||
|
|
|
|
|
|
|
| |||||||||
Total Preferred Stocks | 19,112,742 | 32,421,396 | — | 51,534,138 | ||||||||||||
|
|
|
|
|
|
|
| |||||||||
Corporate Bonds & Notes | ||||||||||||||||
Consumer Discretionary | — | 2,016,706 | — | 2,016,706 | ||||||||||||
|
|
|
|
|
|
|
| |||||||||
Total Corporate Bonds & Notes | — | 2,016,706 | — | 2,016,706 | ||||||||||||
|
|
|
|
|
|
|
| |||||||||
Repurchase Agreements | — | 228,077,788 | — | 228,077,788 | ||||||||||||
|
|
|
|
|
|
|
| |||||||||
Total Investments in Securities | $ | 575,010,893 | $ | 1,073,265,178 | $ | — | $ | 1,648,276,071 | ||||||||
|
|
|
|
|
|
|
| |||||||||
Core Plus Fund | ||||||||||||||||
Asset Backed Securities | $ | — | $ | 1,952,136 | $ | — | $ | 1,952,136 | ||||||||
Corporate Bonds | — | 34,578,105 | — | 34,578,105 | ||||||||||||
Government Securities | — | 55,946,339 | — | 55,946,339 | ||||||||||||
Mortgage Backed Securities | — | 4,500,908 | — | 4,500,908 | ||||||||||||
Repurchase Agreements | — | 2,601,793 | — | 2,601,793 | ||||||||||||
|
|
|
|
|
|
|
| |||||||||
Total Investments in Securities | $ | — | $ | 99,579,281 | $ | — | $ | 99,579,281 | ||||||||
|
|
|
|
|
|
|
| |||||||||
Credit Focus Yield Fund | ||||||||||||||||
Asset Backed Securities | $ | — | $ | 830,082 | $ | — | $ | 830,082 | ||||||||
Corporate Bonds | — | 18,553,125 | — | 18,553,125 | ||||||||||||
Government Securities | — | 11,150,510 | — | 11,150,510 | ||||||||||||
Repurchase Agreements | — | 470,881 | — | 470,881 | ||||||||||||
|
|
|
|
|
|
|
| |||||||||
Total Investments in Securities | $ | — | $ | 31,004,598 | $ | — | $ | 31,004,598 | ||||||||
|
|
|
|
|
|
|
| |||||||||
120
Brandes Investment Trust
NOTES TO FINANCIAL STATEMENTS — (Unaudited) (continued)
Below are the transfers into or out of Levels 1 and 2 for the Funds using market values measured at the end of the reporting period:
| International Equity Fund | Global Fund | Emerging Markets Fund | International Small Cap Fund | |||||||||||||
Transfers into Level 1 | $ | 2,624,965 | $ | 975,502 | $ | 56,709,194 | $ | 111,962,907 | ||||||||
Transfers out of Level 1 | — | (195,200 | ) | (4,732,476 | ) | (25,435,559 | ) | |||||||||
|
|
|
|
|
|
|
| |||||||||
Net Transfers into (out of) Level 1 | $ | 2,624,965 | $ | 780,302 | $ | 51,976,718 | $ | 86,527,348 | ||||||||
|
|
|
|
|
|
|
| |||||||||
Transfers into Level 2 | $ | — | $ | 195,200 | $ | 4,732,476 | $ | 25,435,559 | ||||||||
Transfers out of Level 2 | (2,624,965 | ) | (975,502 | ) | (56,709,194 | ) | (111,962,907 | ) | ||||||||
|
|
|
|
|
|
|
| |||||||||
Net Transfers into (out of) Level 2 | $ | (2,624,965 | ) | $ | (780,302 | ) | $ | (51,976,718 | ) | $ | (86,527,348 | ) | ||||
|
|
|
|
|
|
|
| |||||||||
There were no transfers into or out of Levels 1 or 2 during the six months ended March 31, 2017 for the Global, Global Income, Core Plus and Credit Focus Yield Funds.
The transfers from Level 1 to Level 2 are due to the securities being fair valued as a result of market movements following the close of local trading and/or due to the lack of trading volume on March 31, 2017. The transfers from Level 2 to Level 1 are due to the securities no longer being fair valued as a result of trading on a stock exchange on March 31, 2017.
There were no Level 3 securities in the International, Global, Global Income, Global Opportunities, Core Plus and Credit Focus Yield Funds at the beginning or during the periods presented.
Below is a reconciliation that details the activity of securities in Level 3 in the Emerging Markets and International Small Cap Funds during the six months ended March 31, 2017:
| Emerging Markets Fund | International Small Cap Fund | |||||||
Beginning Balance – October 1, 2016 | $ | 7,087,594 | $ | 9,238,517 | ||||
Purchases | — | — | ||||||
Sales | — | — | ||||||
Transfers in to level 3 | — | — | ||||||
Transfers out of level 3 | (7,087,594 | ) | (9,238,517 | ) | ||||
Realized gains (losses), net | — | — | ||||||
Change in unrealized gains (losses) | — | — | ||||||
|
|
|
| |||||
Ending Balance – March 31, 2017 | $ | — | $ | — | ||||
|
|
|
| |||||
NOTE 3 – INVESTMENT ADVISORY FEE AND OTHER TRANSACTIONS WITH AFFILIATES
| A. | Advisor Fee. Brandes Investment Partners, L.P. (the “Advisor”) provides the Funds with investment management services under an Investment Advisory Agreement. The Advisor furnishes all investment advice, office space and certain administrative services, and provides certain personnel, |
121
Brandes Investment Trust
NOTES TO FINANCIAL STATEMENTS — (Unaudited) (continued)
| needed by the Funds. As compensation for its services, the Advisor is entitled to a monthly fee. The Advisor received a monthly fee at the annual rate of 0.80% of the first $2.5 billion of average daily net assets, 0.75% on average daily net assets from $2.5 billion to $5.0 billion, and 0.70% of the average daily net assets greater than $5.0 billion, of the International Fund. The Advisor received a monthly fee at the annual rate of 0.95% of the first $2.5 billion of average daily net assets, 0.90% on average daily net assets from $2.5 billion to $5.0 billion, and 0.85% of the amount of average daily net assets greater than $5.0 billion, of the Emerging Markets Fund. The Global Fund, Global Income Fund, Global Opportunities Fund, International Small Cap Fund, Core Plus Fund and Credit Focus Yield Fund incurred a monthly fee at the annual rate of 0.80%, 0.80%, 0.95%, 0.95%, 0.35% and 0.50% based upon their average daily net assets, respectively. For the six months ended March 31, 2017, the International Fund, the Global Fund, the Global Income Fund, the Global Opportunities Fund, the Emerging Markets Fund, the International Small Cap Fund, the Core Plus Fund and the Credit Focus Yield Fund incurred $2,177,747, $245,729, $3,573, $60,967, $5,889,120, $7,076,060, $169,955, and $77,592 in advisory fees, respectively. |
Certain officers and trustees of the Trust are also officers of the Advisor.
The Funds are responsible for their own operating expenses. The Advisor has contractually agreed to limit each Fund’s annual operating expenses, including repayment of previous waivers, to the following percentages of the Fund’s average daily net assets attributable to the specific classes through January 31, 2018 (the “Expense Cap Agreement”):
Fund | Class A | Class C | Class I | Class R6 | ||||||||||||
International Fund | 1.20 | % | 1.95 | % | 1.00 | % | 0.82 | % | ||||||||
Global Fund | 1.25 | % | 2.00 | % | 1.00 | % | N/A | |||||||||
Global Income Fund | 1.25 | % | 2.00 | % | 1.00 | % | N/A | |||||||||
Global Opportunities Fund | 1.40 | % | 2.15 | % | 1.15 | % | N/A | |||||||||
Emerging Markets Fund | 1.37 | % | 2.12 | % | 1.12 | % | 0.97 | % | ||||||||
International Small Cap Fund | 1.40 | % | 2.15 | % | 1.15 | % | 1.00 | % | ||||||||
Core Plus Fund | 0.70 | % | N/A | 0.50 | % | N/A | ||||||||||
Credit Focus Yield Fund | 0.85 | % | N/A | 0.60 | % | N/A | ||||||||||
Any reimbursements or fee waivers made by the Advisor to a Fund are subject to repayment by the Fund, to the extent that the Fund is able to make the repayment within its Expense Cap Agreement. Under the Expense Cap Agreement, any such repayment must be made before the end of the third full fiscal year after the fiscal year in which the related reimbursement or waiver occurred. For the six months ended March 31, 2017, the Advisor waived expenses and/or reimbursed the Funds $13,705, $86,054, $75,184, $89,038, $138,884, $9,552, $82,350, and $74,282 for the
122
Brandes Investment Trust
NOTES TO FINANCIAL STATEMENTS — (Unaudited) (continued)
International Fund, Global Fund, Global Income Fund, Global Opportunities Fund, Emerging Markets Fund, International Small Cap Fund, Core Plus Fund and Credit Focus Yield Fund, respectively. Repayment rights expire as follows:
Fund | Potential Recovery Expiring September 30, 2017 | Potential Recovery Expiring September 30, 2018 | Potential Recovery Expiring September 30, 2019 | |||||||||
International Fund | $ | — | $ | — | $ | 7,467 | ||||||
Global Fund | 243,183 | 244,584 | 186,480 | |||||||||
Global Income Fund | N/A | 174,992 | 160,670 | |||||||||
Global Opportunities Fund | �� | N/A | 215,095 | 212,240 | ||||||||
Emerging Markets Fund | 390,817 | 728,917 | 535,375 | |||||||||
International Small Cap Fund | — | — | 1,527 | |||||||||
Core Plus Fund | 259,463 | 230,245 | 181,891 | |||||||||
Credit Focus Yield Fund | 170,772 | 170,112 | 138,659 | |||||||||
The Advisor did not recoup any fees previously waived or reimbursed for the International Fund, Global Fund, Global Income Fund, Global Opportunities Fund, International Small Cap Fund, Core Plus Fund and Credit Focus Yield Fund. For the six months ended March 31, 2017, the Advisor recouped fees previously waived or reimbursed in the amounts of:
Fund | Class A | Class C | ||||||
Emerging Markets Fund | $ | 42,945 | $ | 3,039 | ||||
| B. | Administration Fee. U.S. Bancorp Fund Services, LLC (the “Administrator”) acts as administrator for the Funds. The Administrator prepares various federal and state regulatory filings; prepares reports and materials to be supplied to the Trustees; monitors the activities of the Funds’ custodian, transfer agent and accountant; coordinates the preparation and payment of Fund expenses; and reviews the Funds’ expense accruals. For these services, the Funds pay the administrator monthly, a fee accrued daily and based on average daily net assets. The Funds may also reimburse the Administrator for such out-of-pocket expenses as incurred by the Administrator in the performance of its duties. The amounts paid directly to the Administrator by the Funds for administrative services are included in the Administration fees in the Statement of Operations. |
| C. | Distribution and Servicing Fees. ALPS Distributors, LLC (the “Distributor”), a registered broker-dealer, acts as the Funds’ principal underwriter in a continuous public offering of the Funds’ shares. A portion of the Funds’ distribution fees is paid by the Advisor. |
The Trust has adopted a Distribution Plan (the “Plan”) pursuant to Rule 12b-1 under the Investment Company Act of 1940 for the Funds’ Class A and C shares. The Plan is designed to reimburse the Distributor or dealers
123
Brandes Investment Trust
NOTES TO FINANCIAL STATEMENTS — (Unaudited) (continued)
for certain promotional and other sales related costs associated with sales of such Fund shares. Unreimbursed amounts may be carried forward and paid in a subsequent year, to the extent that total expenses under the Plan do not exceed 0.25% and 0.75% of the average daily net assets of each Fund’s Class A and C shares, respectively. During the six months ended March 31, 2017, the Funds paid to the Distributor and each dealer a monthly fee at the annual rate of 0.25% of the average daily net assets of Class A shares and 0.75% of the average daily net assets of Class C shares beneficially owned by the Distributor’s and each dealer’s existing brokerage clients. The 12b-1 Agreement may be continued in effect from year to year if such continuance is approved annually by the Board of Trustees of the Trust, including the vote of a majority of the Independent Trustees. For the six months ended March 31, 2017, the following Funds incurred expenses pursuant to the Plan:
Fund | Class A | Class C | ||||||
International Fund | $ | 20,139 | $ | 48,568 | ||||
Global Fund | 8,324 | 7,369 | ||||||
Global Income Fund | 7 | 42 | ||||||
Global Opportunities Fund | 2,557 | 351 | ||||||
Emerging Markets Fund | 391,019 | 82,291 | ||||||
International Small Cap Fund | 182,702 | 77,398 | ||||||
Core Plus Fund | 2,554 | N/A | ||||||
Credit Focus Yield Fund | 2,912 | N/A | ||||||
The Funds have adopted a Shareholder Service Plan for class C, and have authorized sub-transfer agency fee payments for Class I, to pay to securities broker-dealers, retirement plan sponsors and administrators, banks and their affiliates, and other institutions and service professionals as shareholder servicing agent of the Funds, an annual fee for non-distribution sub-transfer agent and/or subaccounting services up to 0.25% and 0.05% of annual net assets attributable to Class C and Class I, respectively (the “Service Fees”). From October 1, 2016 until November 30, 2016, the Funds had a Shareholder Service Plan for Class E in which an annual fee of 0.25% of annual net assets were charged. For the six months ended March 31, 2017, the Funds incurred the following Service Fees:
Fund | Class C | Class E* | Class I | |||||||||
International Fund | $ | 16,189 | $ | 225 | $ | 122,774 | ||||||
Global Fund | 2,457 | — | 13,197 | |||||||||
Global Income Fund | 14 | N/A | 219 | |||||||||
Global Opportunities Fund | 117 | N/A | 2,674 | |||||||||
Emerging Markets Fund | 27,431 | N/A | 218,653 | |||||||||
International Small Cap Fund | 25,799 | N/A | 320,234 | |||||||||
Core Plus Fund | N/A | 124 | 23,744 | |||||||||
Credit Focus Yield Fund | N/A | N/A | — | |||||||||
| * | Class E shares were eliminated effective November 30, 2016 and are no longer offered for sale. |
124
Brandes Investment Trust
NOTES TO FINANCIAL STATEMENTS — (Unaudited) (continued)
NOTE 4 – PURCHASES AND SALES OF SECURITIES
The cost of purchases and the proceeds from sales of securities, excluding short term investments, were as follows for the six months ended March 31, 2107:
| U.S. Government | Other | |||||||||||||||
Fund | Purchases | Sales | Purchases | Sales | ||||||||||||
International Fund | $ | — | $ | — | $ | 69,493,100 | $ | 282,183,826 | * | |||||||
Global Fund | $ | — | $ | — | $ | 10,631,646 | $ | 3,874,953 | ||||||||
Global Income Fund | $ | — | $ | — | $ | 92,167 | $ | 69,057 | ||||||||
Global Opportunities Fund | $ | — | $ | — | $ | 15,645,717 | $ | 286,382 | ||||||||
Emerging Markets Fund | $ | — | $ | — | $ | 276,929,019 | $ | 142,420,720 | ||||||||
International Small Cap Fund | $ | — | $ | — | $ | 287,904,779 | $ | 150,461,924 | ||||||||
Core Plus Fund | $ | 13,462,535 | $ | 13,978,969 | $ | 10,548,564 | $ | 6,750,957 | ||||||||
Credit Focus Yield Fund | $ | 1,909,281 | $ | 1,927,001 | $ | 4,781,898 | $ | 3,945,826 | ||||||||
| * | Includes $231,178,479 from the November 30, 2016 Redemption in kind. See Note 10 for more information. |
NOTE 5 – CAPITAL STOCK TRANSACTIONS
Capital stock activity for each class of shares was as follows (shares and dollar amounts in thousands):
| International Fund | Global Fund | |||||||||||||||||||||||||||||||
| Six Months Ended 3/31/2017 | Year Ended 9/30/2016 | Six Months Ended 3/31/2017 | Year Ended 9/30/2016 | |||||||||||||||||||||||||||||
| Shares | Amount | Shares | Amount | Shares | Amount | Shares | Amount | |||||||||||||||||||||||||
Shares Sold | ||||||||||||||||||||||||||||||||
Class A | 618 | $ | 10,048 | 353 | $ | 5,375 | 161 | $ | 3,469 | 172 | $ | 3,418 | ||||||||||||||||||||
Class C | 132 | 2,105 | 372 | 5,640 | 7 | 149 | 33 | 680 | ||||||||||||||||||||||||
Class E | — | * | — | * | — | * | 1 | — | — | — | — | |||||||||||||||||||||
Class I | 6,219 | 99,924 | 16,033 | 242,045 | 352 | 7,908 | 397 | 8,194 | ||||||||||||||||||||||||
Class R6 | 737 | 11,975 | 1,734 | 25,782 | N/A | N/A | N/A | N/A | ||||||||||||||||||||||||
Issued on Reinvestment of Distributions | ||||||||||||||||||||||||||||||||
Class A | 19 | 303 | 21 | 314 | 2 | 55 | 9 | 192 | ||||||||||||||||||||||||
Class C | 14 | 225 | 14 | 214 | — | * | 7 | 8 | 169 | |||||||||||||||||||||||
Class E | — | — | 1 | 13 | — | — | 1 | 12 | ||||||||||||||||||||||||
Class I | 466 | 7,434 | 976 | 14,725 | 20 | 449 | 167 | 3,579 | ||||||||||||||||||||||||
Class R6 | 31 | 486 | 30 | 459 | N/A | N/A | N/A | N/A | ||||||||||||||||||||||||
Shares Redeemed | ||||||||||||||||||||||||||||||||
Class A | (196 | ) | (3,151 | ) | (339 | ) | (5,128 | ) | (52 | ) | (1,156 | ) | (45 | ) | (923 | ) | ||||||||||||||||
Class C | (141 | ) | (2,229 | ) | (360 | ) | (5,418 | ) | (18 | ) | (405 | ) | (59 | ) | (1,204 | ) | ||||||||||||||||
Class E | (35 | ) | (546 | ) | (78 | ) | (1,170 | ) | (3 | ) | (58 | ) | (9 | ) | (180 | ) | ||||||||||||||||
Class I | (21,346 | ) | (331,737 | ) | (13,467 | ) | (200,479 | ) | (100 | ) | (2,241 | ) | (445 | ) | (9,244 | ) | ||||||||||||||||
Class R6 | (594 | ) | (9,238 | ) | (8 | ) | (124 | ) | N/A | N/A | N/A | N/A | ||||||||||||||||||||
|
|
|
|
|
|
|
|
|
|
|
|
|
|
|
| |||||||||||||||||
Net Increase/(Decrease) Resulting from Fund Share Transactions | (14,076 | ) | $ | (214,401 | ) | 5,282 | $ | 82,249 | 369 | $ | 8,177 | 229 | $ | 4,693 | ||||||||||||||||||
|
|
|
|
|
|
|
|
|
|
|
|
|
|
|
| |||||||||||||||||
| * | Value calculated is less than 500 shares/dollars. |
125
Brandes Investment Trust
NOTES TO FINANCIAL STATEMENTS — (Unaudited) (continued)
| Global Income Fund | Global Opportunities Fund | |||||||||||||||||||||||||||||||
| Six Months Ended 3/31/2017 | Year Ended 9/30/2016 | Six Months Ended 3/31/2017 | Year Ended 9/30/2016 | |||||||||||||||||||||||||||||
| Shares | Amount | Shares | Amount | Shares | Amount | Shares | Amount | |||||||||||||||||||||||||
Shares Sold | ||||||||||||||||||||||||||||||||
Class A | — | $ | — | — | * | $ | 5 | 188 | $ | 1,946 | 63 | $ | 631 | |||||||||||||||||||
Class C | — | — | 1 | 10 | 18 | 184 | 1 | 5 | ||||||||||||||||||||||||
Class I | 3 | 39 | 13 | 135 | 1,380 | 14,815 | 616 | 5,953 | ||||||||||||||||||||||||
Issued on Reinvestment of Distributions | ||||||||||||||||||||||||||||||||
Class A | — | * | — | * | — | * | — | * | 1 | 13 | 2 | 15 | ||||||||||||||||||||
Class C | — | * | — | * | — | * | — | * | — | * | 1 | — | * | — | * | |||||||||||||||||
Class I | 3 | 28 | 3 | 32 | 6 | 68 | 14 | 135 | ||||||||||||||||||||||||
Shares Redeemed | ||||||||||||||||||||||||||||||||
Class A | — | * | (5 | ) | — | — | (7 | ) | (71 | ) | (40 | ) | (373 | ) | ||||||||||||||||||
Class C | — | — | — | — | (12 | ) | (126 | ) | — | — | ||||||||||||||||||||||
Class I | — | — | — | — | (17 | ) | (187 | ) | (453 | ) | (4,198 | ) | ||||||||||||||||||||
|
|
|
|
|
|
|
|
|
|
|
|
|
|
|
| |||||||||||||||||
Net Increase Resulting from Fund Share Transactions | 6 | $ | 62 | 17 | $ | 182 | 1,557 | $ | 16,643 | 203 | $ | 2,168 | ||||||||||||||||||||
|
|
|
|
|
|
|
|
|
|
|
|
|
|
|
| |||||||||||||||||
| * | Value calculated is less than 500 shares/dollars. |
| Emerging Markets Fund | International Small Cap Fund | |||||||||||||||||||||||||||||||
| Six Months Ended 3/31/2017 | Year Ended 9/30/2016 | Six Months Ended 3/31/2017 | Year Ended 9/30/2016 | |||||||||||||||||||||||||||||
| Shares | Amount | Shares | Amount | Shares | Amount | Shares | Amount | |||||||||||||||||||||||||
Shares Sold | ||||||||||||||||||||||||||||||||
Class A | 6,523 | $ | 53,379 | 8,735 | $ | 61,198 | 5,060 | $ | 68,023 | 6,424 | $ | 82,919 | ||||||||||||||||||||
Class C | 421 | 3,451 | 789 | 5,491 | 462 | 6,171 | 538 | 6,869 | ||||||||||||||||||||||||
Class I | 29,019 | 238,173 | 58,323 | 398,668 | 20,929 | 282,692 | 40,210 | 514,468 | ||||||||||||||||||||||||
Class R6 | 8,666 | 71,702 | — | * | — | * | 2,864 | 38,734 | 1,219 | 16,277 | ||||||||||||||||||||||
Issued on Reinvestment of Distributions | ||||||||||||||||||||||||||||||||
Class A | 278 | 2,163 | 380 | 2,816 | 424 | 5,579 | 207 | 2,664 | ||||||||||||||||||||||||
Class C | 18 | 137 | 12 | 90 | 61 | 778 | 39 | 497 | ||||||||||||||||||||||||
Class I | 897 | 7,013 | 1,338 | 9,942 | 3,954 | 52,133 | 2,558 | 33,082 | ||||||||||||||||||||||||
Class R6 | 30 | 237 | — | * | — | * | 131 | 1,730 | 1 | 24 | ||||||||||||||||||||||
Shares Redeemed | ||||||||||||||||||||||||||||||||
Class A | (4,966 | ) | (40,215 | ) | (18,300 | ) | (125,947 | ) | (1,922 | ) | (25,815 | ) | (3,920 | ) | (48,345 | ) | ||||||||||||||||
Class C | (465 | ) | (3,701 | ) | (941 | ) | (6,387 | ) | (223 | ) | (2,952 | ) | (308 | ) | (3,930 | ) | ||||||||||||||||
Class I | (17,342 | ) | (140,937 | ) | (72,001 | ) | (487,286 | ) | (13,798 | ) | (186,095 | ) | (22,518 | ) | (291,569 | ) | ||||||||||||||||
Class R6 | (332 | ) | (2,796 | ) | — | — | (30 | ) | (408 | ) | — | — | ||||||||||||||||||||
|
|
|
|
|
|
|
|
|
|
|
|
|
|
|
| |||||||||||||||||
Net Increase/(Decrease) Resulting from Fund Share Transactions | 22,747 | $ | 188,606 | (21,665 | ) | $ | (141,415 | ) | 17,912 | $ | 240,570 | 24,450 | $ | 312,956 | ||||||||||||||||||
|
|
|
|
|
|
|
|
|
|
|
|
|
|
|
| |||||||||||||||||
| * | Value calculated is less than 500 shares/dollars. |
126
Brandes Investment Trust
NOTES TO FINANCIAL STATEMENTS — (Unaudited) (continued)
| Core Plus Fund | Credit Focus Yield Fund | |||||||||||||||||||||||||||||||
| Six Months Ended 3/31/2017 | Year Ended 9/30/2016 | Six Months Ended 3/31/2017 | Year Ended 9/30/2016 | |||||||||||||||||||||||||||||
| Shares | Amount | Shares | Amount | Shares | Amount | Shares | Amount | |||||||||||||||||||||||||
Shares Sold | ||||||||||||||||||||||||||||||||
Class A | 341 | $ | 3,137 | 133 | $ | 1,202 | 1 | $ | 12 | 34 | $ | 347 | ||||||||||||||||||||
Class E | — | — | — | * | 3 | N/A | N/A | N/A | N/A | |||||||||||||||||||||||
Class I | 1,845 | 16,964 | 4,004 | 36,987 | — | — | 17 | 173 | ||||||||||||||||||||||||
Issued on Reinvestment of Distributions | ||||||||||||||||||||||||||||||||
Class A | 3 | 29 | 6 | 57 | 3 | 34 | 6 | 58 | ||||||||||||||||||||||||
Class E | — | * | 1 | 2 | 17 | N/A | N/A | N/A | N/A | |||||||||||||||||||||||
Class I | 154 | 1,417 | 228 | 2,102 | 46 | 472 | 84 | 837 | ||||||||||||||||||||||||
Shares Redeemed | ||||||||||||||||||||||||||||||||
Class A | (380 | ) | (3,469 | ) | (153 | ) | (1,402 | ) | — | * | (1 | ) | (17 | ) | (170 | ) | ||||||||||||||||
Class E | (34 | ) | (316 | ) | (173 | ) | (1,564 | ) | N/A | N/A | N/A | N/A | ||||||||||||||||||||
Class I | (1,514 | ) | (13,913 | ) | (1,782 | ) | (16,227 | ) | (8 | ) | (86 | ) | (26 | ) | (250 | ) | ||||||||||||||||
|
|
|
|
|
|
|
|
|
|
|
|
|
|
|
| |||||||||||||||||
Net Increase Resulting from Fund Share Transactions | 415 | $ | 3,850 | 2,265 | $ | 21,175 | 42 | $ | 431 | 98 | $ | 995 | ||||||||||||||||||||
|
|
|
|
|
|
|
|
|
|
|
|
|
|
|
| |||||||||||||||||
NOTE 6 – FEDERAL INCOME TAX MATTERS
GAAP requires that certain components of net assets be reclassified between financial and tax reporting. Temporary differences do not require reclassification. Temporary and permanent differences have no effect on net assets or net asset value per share. For the year ended September 30, 2016, the Funds made the following permanent book-to-tax reclassifications primarily related to the treatment of foreign currency transactions, passive foreign investment companies, paydowns and difference between book and tax accretion methods for market premium:
| Undistributed Net Investment Income/(Loss) | Accumulated Net Realized Gain/(Loss) | Paid-In Capital | ||||||||||
International Fund | $ | 3,746,873 | $ | (3,746,873 | ) | $ | — | |||||
Global Fund | (14,934 | ) | 14,934 | — | ||||||||
Global Income Fund | (267 | ) | 267 | — | ||||||||
Global Opportunities Fund | 11,430 | (11,430 | ) | — | ||||||||
Emerging Markets Fund | (1,577,955 | ) | 1,577,955 | — | ||||||||
International Small Cap Fund | 2,748,438 | (2,748,438 | ) | — | ||||||||
Core Plus Fund | 32,606 | (32,606 | ) | — | ||||||||
Credit Focus Yield Fund | 568 | (568 | ) | — | ||||||||
127
Brandes Investment Trust
NOTES TO FINANCIAL STATEMENTS — (Unaudited) (continued)
As of September 30, 2016, the components of distributable earnings on a tax basis were as follows:
| International Fund | Global Fund | Global Income Fund | Global Opportunities Fund | |||||||||||||
Cost of investments for tax purposes | $ | 768,882,855 | $ | 53,397,997 | $ | 824,049 | $ | 5,542,090 | ||||||||
|
|
|
|
|
|
|
| |||||||||
Gross tax unrealized appreciation | 45,387,426 | 6,969,531 | 70,421 | 567,629 | ||||||||||||
Gross tax unrealized depreciation | (124,836,285 | ) | (6,305,488 | ) | (45,594 | ) | (395,321 | ) | ||||||||
|
|
|
|
|
|
|
| |||||||||
Net unrealized appreciation (depreciation) on investments and foreign currency | (79,448,859 | ) | 664,043 | 24,827 | 172,308 | |||||||||||
Distributable ordinary income | 6,854,857 | 180,835 | 4,467 | 29,912 | ||||||||||||
Distributable long-term capital gains | — | — | 16,627 | — | ||||||||||||
|
|
|
|
|
|
|
| |||||||||
Total distributable earnings | 6,854,857 | 180,835 | 21,094 | 29,912 | ||||||||||||
|
|
|
|
|
|
|
| |||||||||
Other accumulated gains/(losses) | (63,543,316 | ) | (504,228 | ) | 68 | (363,499 | ) | |||||||||
|
|
|
|
|
|
|
| |||||||||
Total accumulated earnings | $ | (136,137,318 | ) | $ | 340,650 | $ | 45,989 | $ | (161,279 | ) | ||||||
|
|
|
|
|
|
|
| |||||||||
| Emerging Markets Fund | International Small Cap Fund | Core Plus Fund | Credit Focus Yield Fund | |||||||||||||
Cost of investments for tax purposes | $ | 1,287,969,827 | $ | 1,370,072,137 | $ | 97,465,507 | $ | 30,129,326 | ||||||||
|
|
|
|
|
|
|
| |||||||||
Gross tax unrealized appreciation | 88,919,068 | 87,797,857 | 3,393,990 | 1,370,224 | ||||||||||||
Gross tax unrealized depreciation | (223,160,694 | ) | (97,149,468 | ) | (588,952 | ) | (443,947 | ) | ||||||||
|
|
|
|
|
|
|
| |||||||||
Net unrealized appreciation (depreciation) on investments and foreign currency | (134,241,626 | ) | (9,351,611 | ) | 2,805,038 | 926,277 | ||||||||||
Distributable ordinary income | 5,936,151 | 33,565,252 | 258,867 | 47,931 | ||||||||||||
Distributable long-term capital gains | — | 8,818,527 | — | — | ||||||||||||
|
|
|
|
|
|
|
| |||||||||
Total distributable earnings | 5,936,151 | 42,383,779 | 258,867 | 47,931 | ||||||||||||
|
|
|
|
|
|
|
| |||||||||
Other accumulated gains/(losses) | (161,379,802 | ) | (237,835 | ) | (79,637 | ) | (7,293 | ) | ||||||||
|
|
|
|
|
|
|
| |||||||||
Total accumulated earnings | $ | (289,685,277 | ) | $ | 32,794,333 | $ | 2,984,268 | $ | 966,915 | |||||||
|
|
|
|
|
|
|
| |||||||||
The differences between book and tax basis distributable earnings are primarily related to foreign currency adjustments and the differences in classification of paydown gains and losses for tax purposes compared to book purposes. These differences are temporary.
128
Brandes Investment Trust
NOTES TO FINANCIAL STATEMENTS — (Unaudited) (continued)
The tax composition of dividends for the periods ended September 30, 2016 and September 30, 2015 for the Funds, were as follows:
| Ordinary Income | Long Term Capital Gains | |||||||||||||||
Fund | 2016 | 2015 | 2016 | 2015 | ||||||||||||
International Fund | $ | 16,352,215 | $ | 11,487,048 | $ | — | $ | — | ||||||||
Global Fund | 1,719,172 | 1,308,335 | 2,276,184 | 2,796,576 | ||||||||||||
Global Income Fund | 33,075 | 12,861 | — | — | ||||||||||||
Global Opportunities Fund | 210,265 | 27,604 | — | — | ||||||||||||
Emerging Markets Fund | 14,620,792 | 41,702,727 | — | 16,361,353 | ||||||||||||
International Small Cap Fund | 29,288,452 | 18,479,717 | 7,825,526 | 11,897,030 | ||||||||||||
Core Plus Fund | 2,147,788 | 1,476,137 | 67,658 | 308,761 | ||||||||||||
Credit Focus Yield Fund | 925,696 | 757,646 | — | 16,688 | ||||||||||||
At September 30, 2016 the Funds had capital losses expiring and capital loss carryforwards utilized as indicated below:
Fund | 2018 | Indefinite | Utilized | |||||||||
International Fund | $ | 29,067,216 | $ | 34,473,038 | $ | — | ||||||
Global Fund | — | — | — | |||||||||
Global Income Fund | — | — | — | |||||||||
Global Opportunities Fund | — | — | — | |||||||||
Emerging Markets Fund | — | 161,233,300 | — | |||||||||
International Small Cap Fund | — | — | — | |||||||||
Core Plus Fund | — | — | — | |||||||||
Credit Focus Yield Fund | — | — | — | |||||||||
At September 30, 2016, the Global Fund, the Global Opportunities Fund and the Core Plus Fund had net Post-October realized capital losses of $486,383, $363,941 and $79,637, respectively.
NOTE 7 – OFFERING PRICE PER SHARE
The public offering price for Class A shares is the net asset value per share plus a sales charge, which varies in accordance with the amount of the purchase up to a maximum of 5.75% for the International, Global, Global Income, Global Opportunities, Emerging Markets and International Small Cap Funds, and 3.75% for the Core Plus and Credit Focus Yield Funds. A contingent deferred sales charge (“CDSC”) of 1.00% will be deducted with respect to Class A Shares purchased without a sales load and redeemed within 12 months of purchase, unless waived, as discussed in the Prospectus. Any applicable CDSC will be 1.00% of the lesser of the original purchase price or the redemption value of the Class A Shares redeemed. Class C Shares include a 1.00% CDSC paid by redeeming shareholders within 12 months of purchase. As a result the redemption price may differ from the net asset value per share. The public offering prices for Class E and I shares are the respective net asset values. Sales charges are not an expense of the Funds and are not reflected in the financial statements of the Funds.
129
Brandes Investment Trust
NOTES TO FINANCIAL STATEMENTS — (Unaudited) (continued)
NOTE 8 – TRANSACTIONS WITH AFFILIATES
The following issuers were affiliated with the Emerging Markets Fund and International Small Cap Fund as defined in Section (2)(a)(3) of the 1940 Act, as these held 5% or more of the outstanding voting securities of the issuers during the six months from October 1, 2016 through March 31, 2017:
Emerging Markets Fund
| Issuer Name | Share October 1, | Additions | Reductions | Share Balance At March 31, 2017 | Dividend Income | Value At March 31, | ||||||||||||||||||
Urbi Desarrollos Urbanos SA de CV | 13,688 | 10,228,761 | — | 10,242,449 | $ | — | $ | 2,735,368 | ||||||||||||||||
|
|
|
| |||||||||||||||||||||
| $ | — | $ | 2,735,368 | |||||||||||||||||||||
|
|
|
| |||||||||||||||||||||
International Small Cap Fund
| Issuer Name | Share October 1, | Additions | Reductions | Share Balance At March 31, 2017 | Dividend Income | Value At March 31, | ||||||||||||||||||
Countrywide Plc | 9,110,030 | 9,634,486 | — | 18,744,516 | $ | — | $ | 36,537,962 | ||||||||||||||||
LSL Property Services Plc | 4,151,341 | 1,170,026 | — | 5,321,367 | 417,082 | 13,934,294 | ||||||||||||||||||
Samchully Co. Ltd. | 208,685 | — | — | 208,685 | 431,953 | 19,967,178 | ||||||||||||||||||
Syneron Medical Ltd.(1) | 1,748,885 | — | — | 1,748,885 | — | 18,450,737 | ||||||||||||||||||
Urbi Desarrollos Urbanos SA de CV | 6,089 | 12,708,266 | — | 12,714,355 | — | 3,395,520 | ||||||||||||||||||
|
|
|
| |||||||||||||||||||||
| $ | 849,035 | $ | 92,285,691 | |||||||||||||||||||||
|
|
|
| |||||||||||||||||||||
| (1) | Issuer was not an affiliate as of March 31, 2017. |
NOTE 9 – OWNERSHIP BY AFFILIATED PARTIES
As of March 31, 2017, the Advisor, Trustees or affiliates of the Advisor beneficially owned more than 5% of shares of the Funds as follows:
| Global Fund | Global Income Fund | Global Opportunities Fund | International Small Cap Fund | Core Plus Fund | Credit Focus Yield Fund | |||||||||||||||||||||||
Class I | Class A | Class I | Class I | Class I | Class I | Class I | ||||||||||||||||||||||
Shares | 915,718 | 10 | 66,441 | 1,154,014 | 6,896,713 | 1,388,107 | 2,705,117 | |||||||||||||||||||||
% of Total Outstanding Shares | 36.86 | % | 100.00 | % | 78.01 | % | 61.95 | % | 6.85 | % | 12.94 | % | 95.45 | % | ||||||||||||||
NOTE 10 – REDEMPTION IN-KIND
Effective November 30, 2016, the International Fund had a shareholder who redeemed assets through an in-kind redemption. In this transaction, the Fund transferred securities with a value of $231,178,479 to the redeeming shareholder which is shown on the Statement of Changes. The Fund recognized a net realized gain in the amount of $9,879,819, which is reflected on the Statement of Operations.
130
Brandes Investment Trust
NOTES TO FINANCIAL STATEMENTS — (Unaudited) (continued)
NOTE 11 – SUBSEQUENT EVENTS
In preparing these financial statements, the Trust has evaluated events and transactions for potential recognition or disclosure through the date the financial statements were available to be issued. The Trust has concluded that there are no subsequent events to note.
131
Brandes Investment Trust
ADDITIONAL INFORMATION — (Unaudited)
BOARD CONSIDERATION AND CONTINUATION OF INVESTMENT ADVISORY AGREEMENT
In November 2016, the Board of Trustees of the Trust, including the independent Trustees, unanimously approved renewal of the Investment Advisory Agreement (the “Agreement”) between the Trust and Brandes Investment Partners, L.P. (the “Advisor”) for an additional one-year term with respect to the Brandes International Equity Fund, the Brandes Global Equity Fund, the Brandes Global Equity Income Fund, the Brandes Global Opportunities Value Fund, the Brandes Emerging Markets Value Fund, the Brandes International Small Cap Fund, the Brandes Core Plus Fixed Income Fund and the Brandes Credit Focus Yield Fund. Each of these is referred to below as a “Fund” and they are collectively referred to below as the “Funds.”
Information Reviewed
During the course of each year, Board members review a wide variety of materials relating to the nature, extent and quality of the services provided by the Advisor to the Funds, including reports on each Fund’s investment results, portfolio composition, portfolio trading practices, and other matters. In addition, in connection with its annual review of the Agreement with respect to the Funds, the Board requested and reviewed supplementary information that included materials regarding the Funds’ investment results, advisory fees and expense comparisons for peer groups and categories of similar funds identified by Morningstar Associates (“Morningstar”); financial and profitability information regarding the Advisor; descriptions of various functions performed by the Advisor such as compliance monitoring and portfolio trading practices; and information about the personnel providing investment management and administrative services to the Funds.
In connection with its reviews, the Board received assistance and advice regarding legal and industry standards from counsel to the Trust and the independent Trustees. The independent Trustees discussed the approval of the Agreement with respect to each Fund with representatives of the Advisor at two Board meetings and in private sessions with counsel at which no representatives of the Advisor were present. In deciding to recommend approval of the Agreement with respect to each Fund, the Board and the independent Trustees did not identify any single or particular piece of information that, in isolation, was the controlling factor, and each Trustee did not necessarily attribute the same weight to each factor. This summary describes the most important, but not all, of the factors considered by the Board and the independent Trustees.
Nature, Extent and Quality of Services
With respect to the nature, extent and quality of services provided by the Advisor to the Funds, the Trustees reviewed among other things the quality and depth of the Advisor’s investment management staff, its regulatory compliance
132
Brandes Investment Trust
ADDITIONAL INFORMATION — (Unaudited) (continued)
procedures, its business continuity and cyber-security programs, the day-to-day administrative services provided by the Advisor to the Funds, and the investment results of the Funds.
With respect to each Fund’s investment results, the Trustees reviewed detailed information regarding a peer group of similarly managed funds selected by Morningstar Associates, all of the funds in the larger Morningstar category of funds managed with the same general style, and the Fund’s benchmark indices. The Trustees also discussed with representatives of Morningstar the principles used in determining the Funds’ peer groups and categories, and differences in those groups from those presented by Morningstar in connection with the Trustees’ 2015 review of the Agreement. In addition, they reviewed the results of certain Funds considered by the Advisor to be the most direct competitors to the Funds in the Funds’ marketing channels.
The independent Trustees noted that the investment results of the I Class shares of all of the Funds were in the first or second quartiles of their respective peer groups for most of the one-year, three-year, five-year and ten-year periods ended September 30, 2016, except as follows:
| • | The Global Equity Fund’s investment results were in the third or fourth quartile of the funds in its Morningstar World Stock Fund peer group and below its benchmark index (the MSCI World Index) for the one-year, three-year and five-year periods. The independent Trustees noted the Advisor’s observations that many of the funds comprising the Morningstar peer group evidence considerable style dispersion and had greater exposure to the U.S. market compared to the Fund, which had little style drift. They also noted the Advisor’s fundamental commitment to the Graham and Dodd value strategy of investment management; considered that it is not unusual for the performance of funds managed with the long-term Graham and Dodd value strategy to fall below the performance of measurement indices for some periods; and further noted that the Fund’s investment approach is fully described in its prospectus and the Fund’s shareholders likely were willing to accept the long-term outlook associated with the Advisor’s approach. |
| • | The Core Plus Fund’s investment results were mixed – in the second quartile of its Morningstar Intermediate Investment Grade Bond Fund peer group for the five-year period, and close to or above its benchmark index (the Barclays Capital U.S. Aggregate Index) for the one-year, three-year and five-year periods, but in the third peer group quartile for the one-year period and the fourth peer group quartile for the three-year period. The independent Trustees noted the Advisor’s observation that the Fund’s defensive positioning detracted from its relative results. |
133
Brandes Investment Trust
ADDITIONAL INFORMATION — (Unaudited) (continued)
| • | The Credit Focus Fund’s investment results were also mixed – in the first quartile of the funds in its Morningstar Intermediate Investment Grade Bond Fund peer group for the one-year and five-year periods; in excess of its benchmark index (the Barclays Capital U.S. Intermediate Credit Index) for the one-year and five-year periods; but in the fourth quartile of the funds in its peer group and below its benchmark index for the three-year and ten-year periods. The independent Trustees noted the Advisor’s view that the Fund’s defensive positioning detracted from its relative results. |
The Independent Trustees also noted that the investment results of the I Class shares of all of the Funds were close to or above those of their respective benchmark indices for most periods except as indicated above.
Based on these discussions and reviews, the Trustees determined that under all the circumstances the investment results of the Funds were satisfactory.
Advisory Fees, Total Expenses, Profitability and Ancillary Benefits
With respect to advisory fees and total expenses of the Funds, the independent Trustees noted that:
| • | The management fees for all of the Funds other than the Global Opportunities Fund and the Credit Focus Fund were below the median fees in their respective Morningstar peer groups. The total expenses for all of the Funds other than the Global Opportunities Fund and the Credit Focus Fund, after waivers by the Advisor of expenses above stated expense caps, were at or below the median expenses of the funds in their respective Morningstar peer groups. The independent Trustees noted that the Advisor continues to waive any expenses over stated expense caps for the Funds. |
| • | Although the Advisor’s management fee is higher for the Funds than for its similar institutional separate accounts and, in the case of the International Fund, for other mutual funds to which the Advisor provides sub-advisory services, the Trustees noted information provided by the Advisor regarding the additional responsibilities and expenses that the Advisor incurs in sponsoring and operating the Funds. |
| • | The independent Trustees noted that although the Advisor’s fees for the Funds other than the International Fund and the Emerging Markets Fund do not have breakpoints as those Funds’ assets increase, the Advisor believes that it is premature to discuss economies of scale when it is subsidizing the Funds’ expenses. The independent Trustees also noted that the Advisor had agreed to review the nature and extent of any economies of scale that it may realize as the Funds’ assets increase in the future and how such economies would be shared with the Funds’ shareholders. |
134
Brandes Investment Trust
ADDITIONAL INFORMATION — (Unaudited) (continued)
In addition, the independent Trustees reviewed an analysis of the profitability to the Advisor of its relationship with the Funds and information regarding the Advisor’s financial capability to continue to provide services to the Funds in the future. They also reviewed the methods used by the Advisor to evaluate and compensate its professional investment personnel. Finally, they considered ancillary benefits to the Advisor as a result of its relationships with the Funds. They noted that these were primarily related to the benefit of proprietary and third-party research provided by broker-dealers executing portfolio transactions on behalf of the Funds.
Conclusions
Based on their review, including consideration of each of the factors referred to above, the Board and the independent Trustees concluded that the Agreement is fair and reasonable to the Funds and their respective shareholders, that each of the factors discussed above supported renewal of the Agreement with respect to each of the Funds, and that renewal of the Agreement was in the best interests of each Fund and its shareholders.
PROXY VOTING PROCEDURES
The Advisor votes proxies relating to the Funds’ portfolio securities in accordance with procedures adopted by the Advisor. You may obtain a description of these procedures, free of charge, by calling toll-free 1-800-331-2979. This information is also available through the Securities and Exchange Commission’s website at http://www.sec.gov.
Information regarding how the Trust voted proxies relating to portfolio securities during the most recent 12-month period ended June 30 is available without charge, upon request, by calling 1-800-331-2979. This information is also available through the Securities and Exchange Commission’s website at http://www.sec.gov.
FORM N-Q DISCLOSURE
The Trust files the Fund’s complete schedule of portfolio holdings with the Securities and Exchange Commission for the first and third quarters of each fiscal year on Form N-Q. The Trust’s Form N-Q filings are available on the Securities and Exchange Commission’s website at http://www.sec.gov. The Trust’s Form N-Q filings may be reviewed and copied at the Commission’s Public Reference Room in Washington, D.C., and information on the operation of the Public Reference Room may be obtained by calling 1-800-SEC-0330. Information regarding the Trust’s Form N-Q filings is also available, without charge, by calling toll-free, 1-800-331-2979.
135
Brandes Investment Trust
TRUSTEES AND OFFICERS INFORMATION — (Unaudited)
The Board of Trustees is responsible for the overall management of the Trust’s business. The Board approves all significant agreements between the Trust and persons or companies furnishing services to the Trust, including the Trust’s agreements with the Advisor, Administrator, Custodian, Distributor and Transfer Agent. The Board of Trustees delegates the day-to-day operations of the Trust to its officers and service providers, subject to the Fund’s investment objective and policies and to general supervision by the Board. The Trust’s Statement of Additional Information includes additional information about the Trustees and is available, without charge, by calling 1-800-331-2979 or visiting www.brandes.com.
The Trustees and officers of the Trust, their business addresses and principal occupations during the past five years are:
Name, Address | Position(s) | Term of | Principal | Number | Other Trusteeships | |||||
Independent Trustees(2) | ||||||||||
Jean E. Carter 11988 El Camino Real, Suite 600 San Diego, CA 92130 (Age 59) | Trustee and Chairman | Since April 2008 | Retired. | 9 | Bridge Builder Trust | |||||
Robert M. Fitzgerald, CPA (inactive) 11988 El Camino Real, Suite 600 San Diego, CA 92130 (Age 65) | Trustee | Since April 2008 | Retired. | 9 | Hotchkis and Wiley Mutual Funds | |||||
Craig Wainscott, CFA 11988 El Camino Real, Suite 600 San Diego, CA 92130 (Age 55) | Trustee | Since February 2012 | Partner with The Paradigm Project and advisor to early-stage companies. | 9 | None | |||||
Gregory Bishop, CFA 11988 El Camino Real, Suite 600 San Diego, CA 92130 (Age: 54) | Trustee | Since January 2017 | Retired. Previously Executive Vice President and Head of Retail Business, PIMCO Investments, from 1997 to 2014 | 9 | None | |||||
136
Brandes Investment Trust
TRUSTEES AND OFFICERS INFORMATION — (Unaudited) (continued)
Name, Address | Position(s) | Term of | Principal | Number | Other Trusteeships | |||||
“Interested” Trustees(3) | ||||||||||
Oliver Murray 11988 El Camino Real, Suite 600 San Diego, CA 92130 (Age 54) | Trustee | Since February 2012 | Chief Executive Officer, Brandes Investment Partners & Co.; Managing Director – PMCS of Brandes Investment Partners, L.P., the investment advisor to the Funds (the “Advisor”). | 9 | None | |||||
Jeff Busby, CFA 11988 El Camino Real, Suite 600 San Diego, CA 92130 (Age 56) | Trustee and President | Since July 2006 | Executive Director of the Advisor. | 9 | None | |||||
Officers of the Trust | ||||||||||
Thomas M. Quinlan 11988 El Camino Real, Suite 600 San Diego, CA 92130 (Age 46) | Secretary | Since June 2003 | Associate General Counsel of the Advisor. | N/A | N/A | |||||
Gary Iwamura, CPA 11988 El Camino Real, Suite 600 San Diego, CA 92130 (Age 60) | Treasurer | Since September 1997 | Finance Director of the Advisor. | N/A | N/A | |||||
Roberta Loubier 11988 El Camino Real, Suite 600 San Diego, CA 92130 (Age 46) | Chief Compliance Officer | Since September 2015 | Global Head of Compliance, Brandes Investment Partners, L.P. | N/A | N/A | |||||
| (1) | Trustees and officers of the Fund serve until their resignation, removal or retirement. |
| (2) | Not “interested persons” of the Trust as defined in the 1940 Act. |
| (3) | “Interested persons” of the Trust as defined in the 1940 Act by virtue of their positions with the Advisor. |
137

ADVISOR Brandes Investment Partners, L.P. 11988 El Camino Real, Suite 600 San Diego, CA 92130 800.331.2979 DISTRIBUTOR ALPS Distributors, Inc. 1290 Broadway, #1100 Denver, CO 80203 TRANSFER AGENT U.S. Bancorp Fund Services, LLC 615 E. Michigan Street, 3rd Floor Milwaukee, WI 53202 INDEPENDENT REGISTERED PUBLIC ACCOUNTING FIRM PricewaterhouseCoopers LLP 601 South Figueroa Street Los Angeles, CA 90017 LEGAL COUNSEL Morgan, Lewis & Bockius LLP 300 S. Grand Avenue, 22nd Floor Los Angeles, CA 90071 This report is intended for shareholders of the Brandes International Equity Fund, the Brandes Global Equity Fund, the Brandes Global Equity Income Fund, the Brandes Global Opportunities Value Fund, the Brandes Emerging Markets Value Fund, the Brandes International Small Cap Equity Fund, the Brandes Core Plus Fixed Income Fund and the Brandes Credit Focus Yield Fund and may not be used as sales literature unless preceded or accompanied by a current prospectus. Statements and other information herein are dated and are subject to change.
SEMI-ANNUAL REPORT SEPARATELY MANAGED ACCOUNT RESERVETR UST For the six months ended March 31, 2017

| 2 | ||||
| 8 | ||||
| 12 | ||||
| 16 | ||||
| 17 | ||||
| 18 | ||||
| 19 | ||||
| 20 | ||||
| 29 | ||||
| 32 |
1
Brandes Separately Managed Account Reserve Trust
Dear Fellow Investor,
The Brandes Separately Managed Account Reserve Trust (SMART) (Class I Shares) advanced 0.64% during the six months ended March 31, 2017.
The most notable positive contributors were corporate holdings in banking, energy, utilities and commodity resources. The Fund also benefited from holdings in private student loan asset backed securities (ABS) and an underweight to agency mortgage backed securities (MBS).1
Within the banking industry, the Fund received strong contributions from junior subordinated securities of U.S. Bank, JPMorgan and Wells Fargo. The U.S. Bank holding is a floating rate note while the JPMorgan and Wells Fargo holdings are currently fixed-rate securities, but will convert to floating rate notes in a year if they are not called. Bank credit profiles continue to improve, especially with short rates trending higher, and these securities also benefit from the possibility that they can convert to floating rate instruments.
Metals & mining companies Cloud Peak Energy and Royal Gold helped performance, as these companies benefited from higher commodity prices.
Cloud Peak is a coal miner operating in the Powder River Basin (Western United States). The company operates some of the industry’s lowest-cost mines in the country. During the fourth quarter of 2016 the company took steps to ease refinancing concerns by issuing a tender offer for its nearest term maturity (December 2019) and issuing second-lien notes maturing in 2021. The result of the tender was that Cloud Peak was able to reduce its debt maturing in 2019 from $200 million to $56 million. The company also benefited, post-U.S. presidential election, from the perception that the incoming administration will take a more favorable regulatory approach toward the coal industry.
In the first quarter of 2017, the Fund’s holdings in private student loan floating rate note ABS added to returns. We own securities backed by pools of loans issued from 2004 to 2007. We see improving credit trends with delinquencies declining, recovery rates increasing, and the credit enhancement feature of the bonds improving as the students in our pools are largely now in the workforce and thus better equipped to meet payment terms. Additionally, one feature common to private student loans is that most require a co-borrower. Therefore, in the event of bankruptcy the bond holder has recourse not only to the student, but typically the student’s parent or guardian as well. Furthermore, student loan debt is not dischargeable during bankruptcy, making the probability for an ultimate recovery high but the timing uncertain. These are floating rate notes that have begun to see their coupon rates reset higher as the Federal Reserve has begun to normalize interest rates.
| 1 | Underweight versus the Fund’s benchmark, the Bloomberg Barclays U.S. Aggregate Bond Index |
2
Brandes Separately Managed Account Reserve Trust
The Fund’s underweight position in U.S. agency MBS aided relative performance. The agency MBS market underperformed other taxable fixed-income sectors during the six-month period. MBS prices are typically sensitive to interest-rate volatility, and the sharp rise in interest rates during the fourth quarter, strong demand for corporate bonds, and the anticipation that the Fed will begin to reduce MBS held on its balance sheet at some point this year caused agency MBS to underperform.
We added Frontier Communications (6.25% coupon rate, maturing September 2021 and rated B1/B+). Frontier is a telecommunications company offering services in mostly rural areas and is the dominant provider in areas that it serves. Frontier is facing industry headwinds as landline operations appear to be experiencing a secular decline. We believe Frontier’s primarily rural markets should be more insulated from secular changes initially, making this issue (with four years until maturity) attractive.
We also took advantage of the weakness in the energy sector in the first quarter of 2017 to increase our weighting in Range Resources.
After the U.S. presidential election, the Fund increased its weighting in a number of financials, including Bank of America, Goldman Sachs and Wells Fargo, as the incoming administration has suggested that it will examine and potentially roll back some of the onerous regulations that have been placed on the financial industry since the Global Financial Crisis. The Fund also purchased a few industrial credits, namely AT&T, Tenet Healthcare and Transocean. The common theme with both the increased weighting in financials and industrial purchases is our continued preference for shorter maturities, with all of the bonds scheduled to mature between 2017 and 2022.
Other activity included the sale of securities of Laboratory Corp. and Genworth Financial, which reached our estimates of intrinsic value.
Agency MBS Value
Over the last several years, the Fund’s largest underweight position has been agency MBS. As a byproduct of this underweight, we have had a larger allocation to U.S. Treasury securities than at any time in our history.
The agency MBS market, in our view, has been supported by massive, and unprecedented, purchases by the Fed. In late 2008, the Fed began buying agency MBS to hold on its balance sheet in an effort to help alleviate the fallout from the financial crisis and stimulate lending in the U.S. housing market. Prior to that, the Fed did not hold any agency MBS on its balance sheet. Today, however, the Fed owns $1.7 trillion in agency MBS. In our opinion, the Fed’s increased involvement in the MBS market over the last several years has contributed to a considerable supply/demand imbalance, which in turn has made it difficult for us to find value in the sector.
3
Brandes Separately Managed Account Reserve Trust
To illustrate how tight yield spreads have been, the average yield spread over U.S. Treasuries on the Bloomberg Barclays MBS Index over the past three years has been 0.23% (23 basis points). In comparison, for the 10-year period ended 12/31/2007, the average yield spread was 0.60% (60 basis points).
One mechanism to evaluate the relative values of agency MBS value and U.S. Treasury securities is the concept of breakeven spread analysis. The calculation is relatively straightforward. If one takes the yield spread divided by the duration, the result is how much the yield spread can widen before the returns are equivalent between similar maturity agency MBS and U.S. Treasuries. The current yield spread on the Bloomberg Barclays MBS Index is 0.27% and the duration is 4.95 years. Therefore, the current breakeven spread is 0.05%. If MBS yield spreads widen by more than 5 basis points, agency MBS will underperform similar maturity U.S. Treasury securities.
With yield spreads on agency MBS hovering near multi-decade lows, there is not much of a yield cushion in the event yield spreads widen. Additionally, the Fed is expected to eventually begin to unwind its massive agency MBS holdings. In their March meeting, Fed officials suggested that the move may come as early as this year. Given that we are almost 10 years into the Fed’s explicit support for the agency MBS market, we believe that the bank’s gradual exit may not be as smooth as most market participants hope. Consider what the market experienced in 2010 when the Fed made an initial attempt to slow its purchase activity. Yield spreads significantly widened, leading the Fed to launch another round of outright purchases. Even with an expected slowdown in mortgage origination due to higher interest rates, there is an enormous MBS supply that the market will need to absorb once the Fed slows and eventually ceases its purchase activity.
Agency MBS yield spreads have drifted wider over the last few months causing underperformance versus U.S. Treasury securities. Accordingly, our underweight to the agency MBS sector and overweight to U.S. Treasuries have benefited the Fund. We will continue to monitor developments and reassess our allocation when we believe there is value in owning additional agency MBS.
Outlook
As of March 31, the U.S. fixed-income market continued to operate in a low-volatility environment. This has caused a great deal of complacency among investors.
What could possibly go wrong with equities hitting all-time highs and yield spreads hovering near historic lows? In our view, this environment has driven investors to stretch their risk boundaries in an effort to pick up additional yield.
Against this backdrop, the Fed appeared to start the process of withdrawing its unprecedented monetary policy accommodation. Does this mean we could begin to see volatility rise toward its historical mean and valuations become guided by fundamentals? We certainly hope so. Until that happens, we believe it is best to remain patient, especially if you’re a long-term investor.
4
Brandes Separately Managed Account Reserve Trust
At the close of the six-month period, the Brandes Separately Managed Account Reserve Trust remained defensively positioned across a number of metrics. We favor short-maturity corporate bonds and those exhibiting strong, tangible asset coverage based on our analysis. We are underweight agency MBS and are managing duration toward the shorter end of our range. We have a high allocation to U.S. Treasuries that we will look to redeploy thoughtfully and efficiently — if and when market uncertainty and volatility cause credit fundamentals to become mispriced based on our intrinsic value estimates.
Sincerely yours,
The Brandes Fixed-Income Investment Committee
Brandes Investment Trust
Because the values of the Fund’s investments will fluctuate with market conditions, so will the value of your investment in the Fund. You could lose money on your investment in the Fund, or the Fund could underperform other investments. As with most fixed income funds, the income on and value of your shares in the Fund will fluctuate along with interest rates. When interest rates rise, the market prices of the debt securities the Fund owns usually decline. When interest rates fall, the prices of these securities usually increase. Generally, the longer the Fund’s average portfolio maturity and the lower the average quality of its portfolio, the greater the price fluctuation. The price of any security owned by the Fund may also fall in response to events affecting the issuer of the security, such as its ability to continue to make principal and interest payments or its credit rating. Below investment grade debt securities are speculative and involve a greater risk of default and price change due to changes in the issuer’s creditworthiness. The market prices of these debt securities may fluctuate more than the market prices of investment grade debt securities and may decline significantly in periods of general economic difficulty.
Investing in foreign securities poses additional risks. The performance of foreign securities can be adversely affected by the different political, regulatory and economic environments and other overall economic conditions in the countries where the Fund invests. Emerging country markets involve greater risk and volatility than more developed markets. Some emerging markets countries may have fixed or managed currencies that are not free-floating against the U.S. dollar. Certain of these currencies may experience substantial fluctuations or steady devaluation relative to the U.S. dollar. Mortgage-related securities are subject to certain additional risks. Rising interest rates tend to extend the duration of mortgage-related securities, making them more sensitive to changes in interest rates. As a result, when holding mortgage-related securities in a period of rising interest rates, the Fund may exhibit additional volatility. In addition, mortgage-related securities are subject to prepayment risk. When interest
5
Brandes Separately Managed Account Reserve Trust
rates decline, borrowers may pay off their mortgages sooner than expected. This can reduce the returns of the Fund because it will have to reinvest that money at the lower prevailing interest rates.
Asset coverage: Assets available to cover debt obligations after all other liabilities have been satisfied.
Basis Point: 1/100 of 1%.
Duration: The weighted maturity of a fixed-income investment’s cash flows, used in the estimation of the price sensitivity of fixed-income securities for a given change in interest rates.
Intrinsic Value: The actual value of a company or an asset based on an underlying perception of its true value.
Yield: Annual income from the investment (dividend, interest, etc.) divided by the current market price of the investment.
Yield Spread: The difference in yield between two comparable securities.
There is no assurance that a forecast will be accurate. Because of the many variables involved, an investor should not rely on forecasts without realizing their limitations.
Bond ratings are grades given to bonds that indicate their credit quality as determined by a private independent rating service such as Standard & Poor’s or Moody’s. The service evaluates a bond issuer’s financial strength, or its ability to pay a bond’s principal and interest in a timely fashion. Ratings are expressed as letters ranging from ‘AAA’, which is the highest grade, to ‘D’, which is the lowest grade. In limited situations when the rating agency has not issued a formal rating, the Advisor will classify the security as nonrated.
Please refer to the Schedule of Investments in the report for complete holdings information. Fund holdings, geographic allocations and/or sector allocations are subject to change at any time and are not a recommendation to buy or sell any security.
The foregoing reflects the thoughts and opinions of Brandes Investment Partners® exclusively and is subject to change without notice.
Brandes Investment Partners® is a registered trademark of Brandes Investment Partners, L.P. in the United States and Canada.
Must be preceded or accompanied by a prospectus.
Index Guide
The Bloomberg Barclays U.S. Aggregate Bond Index is a broad-based benchmark that measures the investment grade, U.S. dollar-denominated, fixed-rate taxable bond market. This index is a total return index which reflects the price changes and interest of each bond in the index.
The Bloomberg Barclays U.S. Mortgage-Backed Securities Index is an unmanaged index consisting of mortgage-backed pass-through securities of Ginnie Mae
6
Brandes Separately Managed Account Reserve Trust
(GNMA), Fannie Mae (FNMA), and Freddie Mac (FHLMC). The index is a total return index which reflects the price changes and interest of each bond in the index.
Please note that all indices are unmanaged and are not available for direct investment.
The Brandes Separately Managed Account Reserve Trust is distributed by ALPS Distributors, Inc.
7
Brandes Separately Managed Account Reserve Trust
The following chart compares the value of a hypothetical $10,000 investment in the Separately Managed Account Reserve Trust from March 31, 2007 to March 31, 2017 with the value of such an investment in the Bloomberg Barclays U.S. Aggregate Bond Index and Bloomberg Barclays U.S. Intermediate Credit Bond Index for the same period.
Value of $10,000 Investment vs Bloomberg Barclays U.S. Aggregate Bond Index & Bloomberg Barclays U.S. Intermediate Credit Bond Index (Unaudited)

| Average Annual Total Return Periods Ended March 31, 2017 | ||||||||||||||||
| One Year | Five Years | Ten Years | Since Inception (10/3/05) | |||||||||||||
Separately Managed Account | ||||||||||||||||
Reserve Trust | 9.77 | % | 5.62 | % | 5.38 | % | 5.74 | % | ||||||||
Bloomberg Barclays | 0.44 | % | 2.34 | % | 4.27 | % | 4.30 | % | ||||||||
Bloomberg Barclays | 2.11 | % | 3.02 | % | 4.69 | % | 4.67 | % | ||||||||
Performance data quoted represents past performance; past performance does not guarantee future results. The investment return and principal value of an investment will fluctuate so that an investor’s shares, when redeemed, may be worth more or less than their original cost. Current performance of the Fund may be lower or higher than the performance quoted. Performance data current to the most recent month end may be obtained by calling 800-331-2979.
8
Brandes Separately Managed Account Reserve Trust
The returns shown do not reflect the deduction of taxes that a shareholder would pay on fund distributions or the redemption of fund shares. The Advisor has a fee waiver arrangement in place to limit the Fund’s annual operating expenses.
Asset Allocation as a Percentage of Total Investments as of
March 31, 2017 (Unaudited)
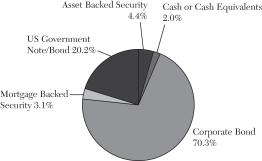
9
Brandes Separately Managed Account Reserve Trust
Expense Example (Unaudited)
As a shareholder of the Fund, you incur ongoing costs, including investment advisory and administrative fees and other Fund expenses. The examples below are intended to help you understand your ongoing costs (in dollars) of investing in the Fund and to compare these costs with the ongoing costs of investing in other mutual funds.
The examples are based on an investment of $1,000 invested at the beginning of the period and held for the entire period from October 1, 2016 to March 31, 2017 (the “Period”).
Actual Expenses
This section provides information about actual account values and actual expenses. The “Ending Account Value” shown is derived from the Fund’s actual returns. You may use the information in this section, together with the amount you invested, to estimate the expenses that you paid over the period. Simply divide your account value by $1,000 (for example, an $8,600 account value divided by $1,000 = 8.6), then multiply the result by the number given for the Fund under the heading “Expenses Paid During Period” to estimate the expenses you paid on your account during this period.
Fund | Beginning Account Value | Ending Account Value | Annual Expense Ratio | Expenses Paid During the Period* | ||||||||||||
Separately Managed Account Reserve Trust** | $ | 1,000.00 | $ | 1,006.40 | 0.00% | $ | 0.00 | |||||||||
Hypothetical Example for Comparison Purposes
This section provides information about hypothetical account values and hypothetical expenses based on the Fund’s actual expense ratio and an assumed rate of return of 5% per year before expenses, which is not the Fund’s actual return. The hypothetical account values and expenses may not be used to estimate the actual ending account balance or expenses you paid for the period. You may use this information to compare the ongoing costs of investing in the Fund and other mutual funds. To do so, compare this 5% hypothetical example with the 5% hypothetical examples that appear in the shareholder reports of the other mutual funds.
Please note that the expenses shown in the table are meant to highlight your ongoing costs only and do not reflect any transaction costs, such as sales charges (loads), redemption fees, or exchange fees. Therefore, the last column of the table is useful in comparing ongoing costs only, and will not help you determine the relative total costs of owning different funds. In addition, if these transactional costs were included, your costs would have been higher.
10
Brandes Separately Managed Account Reserve Trust
Fund | Beginning Account Value | Ending Account Value | Annual Expense Ratio | Expenses Paid During the Period* | ||||||||||||
Separately Managed Account Reserve Trust** | $ | 1,000.00 | $ | 1,024.93 | 0.00% | $ | 0.00 | |||||||||
| * | The Fund’s expenses are equal to the Fund’s expense ratio for the period, multiplied by the average account value over the period, multiplied by 182/365 (to reflect the one half-year period). |
| ** | No expenses have been charged to the Brandes Separately Managed Account Reserve Trust (“SMART Fund”) over the period, as the SMART Fund participates in a wrap-fee program sponsored by investment advisors unaffiliated with the SMART Fund. See Note 3 to the Financial Statements. |
11
Brandes Separately Managed Account Reserve Trust
SCHEDULE OF INVESTMENTS — March 31, 2017 (Unaudited)
| Principal Amount | Value | |||||||
| FEDERAL AND FEDERALLY SPONSORED CREDITS – 3.13% | ||||||||
| Federal Home Loan Mortgage Corporation – 1.82% | ||||||||
Pool G1-8578, 3.000%, 12/1/2030 | $ | 2,909,493 | $ | 2,986,804 | ||||
|
| |||||||
| Federal National Mortgage Association – 1.31% | ||||||||
Pool AS6201, 3.500%, 11/1/2045 | 2,111,813 | 2,161,419 | ||||||
|
| |||||||
TOTAL FEDERAL AND FEDERALLY SPONSORED CREDITS | $ | 5,148,223 | ||||||
|
| |||||||
| OTHER MORTGAGE RELATED SECURITIES – 0.00% | ||||||||
| Collateralized Mortgage Obligations – 0.00% | ||||||||
Wells Fargo Mortgage Backed Securities 2006-AR14 Trust Series 2006-AR14, 3.066%, 10/25/2036(c) | $ | 7,314 | $ | 6,820 | ||||
|
| |||||||
TOTAL OTHER MORTGAGE RELATED SECURITIES | $ | 6,820 | ||||||
|
| |||||||
| US GOVERNMENTS – 20.14% | ||||||||
| Sovereign – 20.14% | ||||||||
United States Treasury Bond | ||||||||
4.750%, 2/15/2037 | $ | 10,535,000 | $ | 13,755,170 | ||||
United States Treasury Note | ||||||||
2.375%, 8/15/2024 | 19,250,000 | 19,404,154 | ||||||
|
| |||||||
TOTAL US GOVERNMENTS | $ | 33,159,324 | ||||||
|
| |||||||
| ASSET BACKED SECURITIES – 4.38% | ||||||||
| Student Loan – 4.38% | ||||||||
SLM Private Credit Student Loan Trust 2004-B | $ | 1,500,000 | $ | 1,358,450 | ||||
SLM Private Credit Student Loan Trust 2005-A | 1,865,000 | 1,707,504 | ||||||
SLM Private Credit Student Loan Trust 2006-A | 4,420,000 | 4,152,147 | ||||||
|
| |||||||
TOTAL ASSET BACKED SECURITIES | $ | 7,218,101 | ||||||
|
| |||||||
| CORPORATE BONDS – 70.01% | ||||||||
| Banks & Thrifts – 15.28% | ||||||||
Bank of America Corp. | $ | 5,270,000 | $ | 5,674,810 | ||||
Goldman Sachs Group, Inc. | 3,700,000 | 4,060,602 | ||||||
JPMorgan Chase & Co. | 6,305,000 | 6,533,556 | ||||||
USB Capital IX | 3,250,000 | 2,762,500 | ||||||
The accompanying notes are an integral part of this Schedule of Investments.
12
Brandes Separately Managed Account Reserve Trust
SCHEDULE OF INVESTMENTS — March 31, 2017 (Unaudited) (continued)
| Principal Amount | Value | |||||||
Wells Fargo & Co. | ||||||||
1.400%, 9/8/2017 | $ | 2,600,000 | $ | 2,598,692 | ||||
7.980%, Perpetual | 3,380,000 | 3,532,100 | ||||||
|
| |||||||
| 25,162,260 | ||||||||
|
| |||||||
| Commercial Services & Supplies – 3.41% | ||||||||
ADT Corp. | 5,865,000 | 5,615,737 | ||||||
|
| |||||||
| Diversified Financial Services – 1.49% | ||||||||
Voya Financial, Inc. | 2,220,000 | 2,446,658 | ||||||
|
| |||||||
| Diversified Telecommunication Services – 0.77% | ||||||||
Frontier Communications Corp. | 1,355,000 | 1,260,150 | ||||||
|
| |||||||
| Electric Utilities – 5.28% | ||||||||
FirstEnergy Corp. | 3,950,000 | 5,148,213 | ||||||
Israel Electric Corp. Ltd. | 3,275,000 | 3,545,056 | ||||||
|
| |||||||
| 8,693,269 | ||||||||
|
| |||||||
| Energy Equipment & Services – 2.20% | ||||||||
Transocean, Inc. | 3,605,000 | 3,623,025 | ||||||
|
| |||||||
| Food, Beverage & Tobacco – 2.70% | ||||||||
Tesco Plc | 4,365,000 | 4,447,660 | ||||||
|
| |||||||
| Forest Products & Paper – 3.04% | ||||||||
Sappi Papier Holding GmbH | 5,000,000 | 5,010,500 | ||||||
|
| |||||||
| Health Care Providers & Services – 3.29% | ||||||||
Tenet Healthcare Corp. | 5,325,000 | 5,411,531 | ||||||
|
| |||||||
| Homebuilders – 2.08% | ||||||||
PulteGroup, Inc. | 1,615,000 | 1,671,525 | ||||||
Toll Brothers Finance Corp. | 1,710,000 | 1,722,825 | ||||||
Urbi Desarrollos Urbanos SAB de CV | 9,235,000 | 23,088 | ||||||
|
| |||||||
| 3,417,438 | ||||||||
|
| |||||||
The accompanying notes are an integral part of this Schedule of Investments.
13
Brandes Separately Managed Account Reserve Trust
SCHEDULE OF INVESTMENTS — March 31, 2017 (Unaudited) (continued)
| Principal Amount | Value | |||||||
| Insurance – 3.92% | ||||||||
American International Group, Inc. | $ | 2,785,000 | $ | 3,152,202 | ||||
CNA Financial Corp. | ||||||||
7.350%, 11/15/2019 | 1,700,000 | 1,917,435 | ||||||
5.875%, 8/15/2020 | 1,250,000 | 1,386,614 | ||||||
|
| |||||||
| 6,456,251 | ||||||||
|
| |||||||
| Metals & Mining – 4.19% | ||||||||
Cloud Peak Energy Resources, LLC / Cloud Peak Energy Finance Corp. | 3,570,000 | 3,846,675 | ||||||
Royal Gold, Inc. | 2,890,000 | 3,052,563 | ||||||
|
| |||||||
| 6,899,238 | ||||||||
|
| |||||||
| Oil, Gas & Consumable Fuels – 14.69% | ||||||||
BP Capital Markets Plc | ||||||||
2.241%, 9/26/2018 | 3,235,000 | 3,257,791 | ||||||
3.506%, 3/17/2025 | 3,375,000 | 3,395,871 | ||||||
Chesapeake Energy Corp. | 7,860,000 | 7,624,200 | ||||||
Kinder Morgan, Inc. | ||||||||
7.000%, 6/15/2017 | 1,610,000 | 1,627,259 | ||||||
4.300%, 6/1/2025 | 1,921,000 | 1,962,509 | ||||||
Occidental Petroleum Corp. | 1,705,000 | 1,721,784 | ||||||
Range Resources Corp. | 3,120,000 | 3,073,200 | ||||||
Valero Energy Corp. | 1,340,000 | 1,523,596 | ||||||
|
| |||||||
| 24,186,210 | ||||||||
|
| |||||||
| Telecommunications – 7.67% | ||||||||
AT&T, Inc. | 5,235,000 | 5,207,752 | ||||||
Sprint Communications, Inc. | 4,060,000 | 4,420,325 | ||||||
Telecom Italia Capital SA | 840,000 | 883,050 | ||||||
Telefonica Emisiones SAU | ||||||||
6.221%, 7/3/2017 | 575,000 | 581,325 | ||||||
5.462%, 2/16/2021 | 1,390,000 | 1,525,839 | ||||||
|
| |||||||
| 12,618,291 | ||||||||
|
| |||||||
TOTAL CORPORATE BONDS | $ | 115,248,218 | ||||||
|
| |||||||
The accompanying notes are an integral part of this Schedule of Investments.
14
Brandes Separately Managed Account Reserve Trust
SCHEDULE OF INVESTMENTS — March 31, 2017 (Unaudited) (continued)
| Principal Amount | Value | |||||||
| REPURCHASE AGREEMENTS – 1.94% | ||||||||
State Street Bank and Trust Repurchase Agreement, | $ | 3,189,777 | $ | 3,189,777 | ||||
|
| |||||||
TOTAL REPURCHASE AGREEMENTS | $ | 3,189,777 | ||||||
|
| |||||||
Total Investments (Cost $159,415,512) – 99.60% | $ | 163,970,463 | ||||||
Other Assets in Excess of Liabilities – 0.40% | 663,582 | |||||||
|
| |||||||
TOTAL NET ASSETS – 100.00% | $ | 164,634,045 | ||||||
|
| |||||||
Percentages are stated as a percent of net assets.
| (a) | Non-income producing security. |
| (b) | Securities were purchased exempt from registration in the U.S. pursuant to Rule 144A of the Securities Act of 1933 (the “Act”) or were acquired in a private placement, and, unless registered under the Act, may only be sold to “qualified institutional buyers” (as defined in the Act) or pursuant to another exemption from registration. The market values of these securities total $20,519,829 which represents 12.46% of the Fund’s net assets. |
| (c) | These securities have limited liquidity and represent $29,908 or 0.02% of the Fund’s net assets and are classified as Level 2 securities. See Note 2 in the Notes to Schedule of Investments. |
| (d) | In default. |
The industry classifications represented in the Schedule of Investments are in accordance with Global Industry Classification Standards (GICS®), which was developed by and/or is the exclusive property of MSCI, Inc. and Standard & Poor Financial Services LLC. This information is unaudited.
The accompanying notes are an integral part of this Schedule of Investments.
15
Brandes Separately Managed Account Reserve Trust
STATEMENT OF ASSETS AND LIABILITIES — March 31, 2017 (Unaudited)
ASSETS | ||||
Investments in securities, at cost | $ | 159,415,512 | ||
|
| |||
Investment in securities, at value | $ | 163,970,463 | ||
Receivables: | ||||
Fund shares sold | 243,290 | |||
Interest | 1,842,541 | |||
|
| |||
Total Assets | 166,056,294 | |||
|
| |||
LIABILITIES | ||||
Payables: | ||||
Fund shares redeemed | 1,408,754 | |||
Dividends payable | 13,495 | |||
|
| |||
Total Liabilities | 1,422,249 | |||
|
| |||
NET ASSETS | $ | 164,634,045 | ||
|
| |||
COMPONENTS OF NET ASSETS | ||||
Paid-in capital | $ | 188,925,444 | ||
Undistributed net investment loss | (14,630 | ) | ||
Accumulated net realized loss on investments | (28,831,720 | ) | ||
Net unrealized appreciation on investments | 4,554,951 | |||
|
| |||
Total Net Assets | $ | 164,634,045 | ||
|
| |||
Net asset value, offering price and redemption proceeds per share | ||||
Net Assets | $ | 164,634,045 | ||
Shares outstanding (unlimited shares authorized without par value) | 18,561,866 | |||
Offering and redemption price | $ | 8.87 | ||
|
|
The accompanying notes to financial statements are an integral part of this statement.
16
Brandes Separately Managed Account Reserve Trust
STATEMENT OF OPERATIONS — For the Six Months Ended March 31, 2017 (Unaudited)
INVESTMENT INCOME | ||||
Income | ||||
Dividend income | $ | 154,712 | ||
Interest income | 3,427,068 | |||
Miscellaneous income | 164,141 | |||
|
| |||
Total Income | 3,745,921 | |||
|
| |||
Expenses (Note 3) | ||||
Total expenses | — | |||
|
| |||
Less reimbursement / waiver | — | |||
|
| |||
Total expenses net of reimbursement / waiver | — | |||
|
| |||
Net investment income | 3,745,921 | |||
|
| |||
REALIZED AND UNREALIZED GAIN ON INVESTMENTS: | ||||
Net realized gain on investments | 1,817 | |||
Net change in unrealized depreciation on investments | (2,791,378 | ) | ||
|
| |||
Net realized gain and unrealized depreciation on investments | (2,789,561 | ) | ||
|
| |||
Net Increase in net assets resulting from operations | $ | 956,360 | ||
|
|
The accompanying notes to financial statements are an integral part of this statement.
17
Brandes Separately Managed Account Reserve Trust
STATEMENT OF CHANGES IN NET ASSETS
| Six Months Ended March 31, 2017 | Year Ended September 30, 2016 | |||||||
| (Unaudited) | ||||||||
INCREASE IN NET ASSETS FROM: | ||||||||
OPERATIONS | ||||||||
Net investment income | $ | 3,745,921 | $ | 8,022,463 | ||||
Net realized gain on investments | 1,817 | 1,211,845 | ||||||
Net change in unrealized appreciation (depreciation) on investments | (2,791,378 | ) | 5,122,568 | |||||
|
|
|
| |||||
Net increase in net assets resulting from operations | 956,360 | 14,356,876 | ||||||
|
|
|
| |||||
DISTRIBUTIONS TO SHAREHOLDERS | ||||||||
From net investment income | (3,766,323 | ) | (8,044,823 | ) | ||||
|
|
|
| |||||
Decrease in net assets from distributions | (3,766,323 | ) | (8,044,823 | ) | ||||
|
|
|
| |||||
CAPITAL SHARE TRANSACTIONS | ||||||||
Proceeds from shares sold | 18,672,899 | 28,073,579 | ||||||
Net asset value of shares issued on reinvestment of distributions | 3,693,074 | 7,967,120 | ||||||
Cost of shares redeemed | (18,774,509 | ) | (38,266,371 | ) | ||||
|
|
|
| |||||
Net increase/(decrease) in net assets from capital share transactions | 3,591,464 | (2,225,672 | ) | |||||
|
|
|
| |||||
Total increase in net assets | 781,501 | 4,086,381 | ||||||
|
|
|
| |||||
NET ASSETS | ||||||||
Beginning of the Year | 163,852,544 | 159,766,163 | ||||||
|
|
|
| |||||
End of the Year | 164,634,045 | 163,852,544 | ||||||
|
|
|
| |||||
Undistributed net investment income (loss) | $ | (14,630 | ) | $ | 5,772 | |||
|
|
|
| |||||
The accompanying notes to financial statements are an integral part of this statement.
18
Brandes Separately Managed Account Reserve Trust
| Six Months Ended March 31, 2017 | Year Ended September 30, | |||||||||||||||||||||||
| 2016 | 2015 | 2014 | 2013 | 2012 | ||||||||||||||||||||
| (Unaudited) | ||||||||||||||||||||||||
Net asset value, beginning of period | $ | 9.02 | $ | 8.69 | $ | 9.03 | $ | 8.89 | $ | 9.01 | $ | 8.32 | ||||||||||||
|
|
|
|
|
|
|
|
|
|
|
| |||||||||||||
Total from investment operations: | ||||||||||||||||||||||||
Net investment income(2) | 0.20 | 0.44 | 0.43 | 0.46 | 0.51 | 0.49 | ||||||||||||||||||
Net realized and unrealized gain/(loss) on investments | (0.15 | ) | 0.33 | (0.34 | ) | 0.16 | (0.12 | ) | 0.73 | |||||||||||||||
|
|
|
|
|
|
|
|
|
|
|
| |||||||||||||
Total from investment operations | 0.05 | 0.77 | 0.09 | 0.62 | 0.39 | 1.22 | ||||||||||||||||||
|
|
|
|
|
|
|
|
|
|
|
| |||||||||||||
Less dividends and distributions: | ||||||||||||||||||||||||
Dividends from net investment income | (0.20 | ) | (0.44 | ) | (0.43 | ) | (0.48 | ) | (0.51 | ) | (0.53 | ) | ||||||||||||
|
|
|
|
|
|
|
|
|
|
|
| |||||||||||||
Total dividends and distributions | (0.20 | ) | (0.44 | ) | (0.43 | ) | (0.48 | ) | (0.51 | ) | (0.53 | ) | ||||||||||||
|
|
|
|
|
|
|
|
|
|
|
| |||||||||||||
Net asset value, end of period | $ | 8.87 | $ | 9.02 | $ | 8.69 | $ | 9.03 | $ | 8.89 | $ | 9.01 | ||||||||||||
|
|
|
|
|
|
|
|
|
|
|
| |||||||||||||
Total return | 0.64 | %(3) | 9.24 | % | 0.93 | % | 7.13 | % | 4.42 | % | 15.13 | % | ||||||||||||
Net assets, end of period (millions) | $ | 164.6 | $ | 163.9 | $ | 159.8 | $ | 138.3 | $ | 126.3 | $ | 141.6 | ||||||||||||
Ratio of expenses to average net assets(1) | 0.00 | %(4) | 0.00 | % | 0.00 | % | 0.00 | % | 0.00 | % | 0.00 | % | ||||||||||||
Ratio of net investment income to average net assets(1) | 4.64 | %(4) | 5.12 | % | 4.77 | % | 5.12 | % | 5.61 | % | 5.66 | % | ||||||||||||
Portfolio turnover rate | 28.38 | %(3) | 53.60 | % | 32.78 | % | 21.61 | % | 28.88 | % | 27.44 | % | ||||||||||||
| (1) | Reflects the fact that no fees or expenses are incurred by the Fund. The Fund is an integral part of “wrap-fee” programs sponsored by investment advisers and/or broker-dealers unaffiliated with the Fund or the Advisor. Participants in these programs pay a “wrap” fee to the sponsor of the program. |
| (2) | Net investment income per share has been calculated based on average shares outstanding during the period. |
| (3) | Not annualized. |
| (4) | Annualized. |
The accompanying notes to financial statements are an integral part of this statement.
19
Brandes Separately Managed Account Reserve Trust
NOTES TO FINANCIAL STATEMENTS — (Unaudited)
NOTE 1 – ORGANIZATION
The Separately Managed Account Reserve Trust (the “Fund”) is a series of Brandes Investment Trust (the “Trust”). The Trust is registered under the Investment Company Act of 1940, as amended (the “1940 Act”), as a diversified, open-end management investment company. The Fund began operations on October 3, 2005. The Fund invests its assets primarily in debt securities and seeks to maximize total return.
NOTE 2 – SIGNIFICANT ACCOUNTING POLICIES
The following is a summary of significant accounting policies consistently followed by the Fund. These policies are in conformity with accounting principles (“GAAP”) generally accepted in the United States of America.
| A. | Repurchase Agreements. The Fund may enter into repurchase agreements with government securities dealers recognized by the Federal Reserve Board, with member banks of the Federal Reserve System or with other brokers or dealers that meet the credit guidelines established by the Board of Trustees. The Fund will always receive and maintain, as collateral, securities whose market value, including accrued interest (which is recorded in the Schedule of Investments), will be at least equal to 100% of the dollar amount invested by the Fund in each agreement, and the Fund will make payment for such securities only upon physical delivery or upon evidence of book entry transfer to the account of the Fund’s custodian. To the extent that the term of any repurchase transaction exceeds one business day, the value of the Fund’s collateral is marked-to-market on a daily basis to ensure the adequacy of the collateral. Before causing the Fund to enter into a repurchase agreement with any other party, the investment advisor will determine that such party does not have any apparent risk of becoming involved in bankruptcy proceedings within the time frame contemplated by the repurchase agreement. If the seller defaults and the value of the collateral declines, or if bankruptcy proceedings are commenced with respect to the seller of the security, realization of the collateral by the Fund may be delayed or limited. At March 31, 2017, the Fund’s ongoing exposure to the economic return on repurchase agreements is shown on the Schedule of Investments. |
| B. | Foreign Currency Translation and Transactions. Values of investments denominated in foreign currencies are converted into U.S. dollars using the spot market rates of exchange at the time of valuation. Purchases and sales of investments and dividend and interest income are translated into U.S. dollars using the spot market rates of exchange prevailing on the respective dates of such translations. The gain or loss resulting from changes in foreign exchange rates is included with net realized and unrealized gain or loss from investments, as appropriate. Foreign securities and currency |
20
Brandes Separately Managed Account Reserve Trust
NOTES TO FINANCIAL STATEMENTS — (Unaudited) (continued)
| transactions may involve certain considerations and risks not typically associated with those of domestic origin. |
Foreign securities are recorded in the financial statements after translation to U.S. dollars based on the applicable exchange rate at the end of the period. The Fund reports certain foreign currency-related transactions as components of realized gains or losses for financial reporting purposes, whereas such components are treated as ordinary income for federal income tax purposes.
| C. | Delayed Delivery Securities. The Fund may purchase securities on a when-issued or delayed delivery basis. “When-issued” or delayed delivery refers to securities whose terms are available and for which a market exists, but that have not been issued. For a when-issued or delayed delivery transaction, no payment is made until delivery date, which is typically longer than the normal course of settlement. When the Fund enters into an agreement to purchase securities on a when-issued or delayed delivery basis, the Fund segregates cash or liquid securities, of any type or maturity, equal in value to the Fund’s commitment. Losses may arise if the market values of the underlying securities change, if the counterparty does not perform under the contract, or if the issuer does not issue the securities due to political, economic or other factors. The Fund did not have any open commitments on delayed delivery securities as of March 31, 2017. |
| D. | Security Transactions, Dividends and Distributions. Security transactions are accounted for on the trade dates. Realized gains and losses are evaluated on the basis of identified costs. Distributions from net investment income are declared daily and paid monthly. Distributions of net realized gains, if any, are declared at least annually. Dividend income and distributions to shareholders are recorded on the ex-dividend dates. Interest is recorded on an accrual basis. The Fund amortizes premiums and accretes discounts using the constant yield method. |
| E. | Use of Estimates. The preparation of financial statements in conformity with accounting principles generally accepted in the United States of America requires management to make estimates and assumptions that affect the reported amounts of assets and liabilities and revenue and expenses and disclosure of contingent assets and liabilities and revenue and expenses at the date of the financial statements. Actual results could differ from those estimates. |
| F. | Indemnification Obligations. Under the Trust’s organizational documents, its current and former officers and trustees are indemnified against certain liabilities arising out of the performance of their duties to the Trust. The Trust has indemnified its trustees against any expenses actually and reasonably incurred by the trustees in any proceeding arising out of or in |
21
Brandes Separately Managed Account Reserve Trust
NOTES TO FINANCIAL STATEMENTS — (Unaudited) (continued)
| connection with the trustees’ service to the Trust. In addition, in the normal course of business, the Trust enters into contracts that contain a variety of representations and warranties and provide general indemnifications. The Fund’s maximum exposure under these arrangements is unknown as this would involve future claims that may be made against the Fund that have not yet occurred or that would be covered by other parties. |
| G. | Accounting for Uncertainty in Income Taxes. The Fund has elected to be taxed as a “regulated investment company” and intends to distribute substantially all taxable income to its shareholders and otherwise comply with the provisions of the Internal Revenue Code applicable to regulated investment companies. The Fund may be subject to a nondeductible excise tax calculated as a percentage of certain undistributed amounts of net investment income and net capital gains. The Fund intends to distribute its net investment income and capital gains as necessary to avoid this excise tax. Therefore, no provision for federal income taxes or excise taxes has been made. |
The Trust has adopted financial reporting rules that require the Trust to analyze all open tax years, as defined by the applicable statute of limitations, for all major jurisdictions. Open tax years for the Fund are those that are open for exam by taxing authorities (2013 through 2016). As of March 31, 2017, the Trust has no examinations in progress.
Management has analyzed the Trust’s tax positions, and has concluded that no liability should be recorded related to uncertain tax positions expected to be taken on the tax return for the fiscal year-end September 30, 2016. The Trust identifies its major tax jurisdictions as the U.S. Government and the State of California. The Trust is not aware of any tax positions for which it is reasonably possible that the total amounts of unrecognized tax benefits will significantly change in the next twelve months.
| H. | Fair Value Measurements. The Trust has adopted GAAP accounting principles related to fair value accounting standards which establish a definition of fair value and set out a hierarchy for measuring fair value. These standards require additional disclosures about the various inputs and valuation techniques used to develop the measurements of fair value and a discussion of changes in valuation techniques and related inputs during the period. These inputs are summarized in the three broad levels listed below: |
Level 1 — Fair value measurement within Level 1 should be based on an unadjusted quoted price in an active market that the Funds have the ability to access for the asset or liability at the measurement date. Because a quoted price alone forms the basis for the measurement, the access requirement within Level 1 limits discretion in pricing the asset or liability,
22
Brandes Separately Managed Account Reserve Trust
NOTES TO FINANCIAL STATEMENTS — (Unaudited) (continued)
including in situations in which there are multiple markets for the asset or liability with different prices and no single market represents a principal market for the asset or liability. Importantly, the Financial Accounting Standards Board has indicated that when a quoted price in an active market for a security is available, that price should be used to measure fair value without regard to an entity’s intent to transact at that price.
Level 2 — Fair value measurement within Level 2 should be based on all inputs other than unadjusted quoted prices included within Level 1 that are observable for the asset or liability. Other significant observable market inputs include quoted prices for similar instruments in active markets, quoted adjusted prices in active markets, quoted prices for identical or similar instruments in markets that are not active, and model-derived valuations in which the majority of significant inputs and significant value drivers are observable in active markets.
Level 3 — Fair value measurement within Level 3 should be based on unobservable inputs in such cases where markets do not exist or are illiquid. Significant unobservable inputs include model derived valuations in which the majority of significant inputs or significant value drivers are unobservable. Unobservable inputs are those inputs that reflect the Fund’s own assumptions that market participants would use to price the asset or liability based on the best available information.
| I. | Security Valuation. Bonds and other fixed-income securities (other than repurchase agreements and demand notes) are valued using the bid price on the day of the valuation provided by an independent pricing service. |
Securities traded on a national securities exchange are valued at the last reported sale price at the close of regular trading on each day the exchange is open for trading. Securities listed on the NASDAQ National Market System for which market quotations are readily available are valued using the NASDAQ Official Closing Price. Securities traded on an exchange for which there has been no sales are valued at the mean between last bid and ask price on such day. Securities for which quotations are not readily available are valued at their respective fair values as determined in good faith pursuant to procedures adopted by the Board of Trustees.
Repurchase agreements and demand notes, for which neither vendor pricing nor market maker prices are available, are valued at amortized cost on the day of valuation, unless the Advisor determines that the use of amortized cost valuation on such day is not appropriate (in which case such instrument is fair valued in accordance with the fair value procedures of the Trust).
23
Brandes Separately Managed Account Reserve Trust
NOTES TO FINANCIAL STATEMENTS — (Unaudited) (continued)
The Trust has adopted valuation procedures that allow for fair value pricing for use in appropriate circumstances. For example, such circumstances may arise when trading in a security has been halted or suspended or a security has been delisted from a national exchange, a security has not been traded for an extended period of time, or a significant event with respect to a security occurs after the close of the market or exchange on which the security principally trades and before the time the Fund calculates its own share price. If no price, or in the Advisor’s determination no price representing fair value, is provided for a security held by the Fund by an independent pricing agent, then the security will be fair valued. Thinly traded securities and certain foreign securities may be impacted more by the use of fair valuations than other securities.
In using fair value pricing, the Fund attempts to establish the price that it might reasonably have expected to receive upon a sale of the security at 4:00 p.m. Eastern time. Valuing securities at fair value involves greater reliance on judgment than valuation of securities based on readily available market quotations. When using fair value to price securities, the Fund may value those securities higher or lower than another fund using market quotations or fair value to price the same securities. Further, there can be no assurance that the Fund could obtain the fair value assigned to a security if it were to sell the security at approximately the time at which the Fund determines its net asset value.
Foreign securities are recorded in the financial statements after translation to U.S. dollars based on the applicable exchange rate at the end of the period. The Fund reports certain foreign currency-related transactions as components of realized gains or losses for financial reporting purposes, whereas such components are treated as ordinary income for federal income tax purposes.
Fixed income securities including corporate, convertible and municipal bonds and notes, U.S. government agencies, U.S. Treasury obligations, sovereign issues, bank loans, convertible preferred securities and non-U.S. bonds are normally valued on the basis of quotes obtained from brokers and dealers or independent pricing services or sources. Independent pricing services typically use information provided by market makers or estimates of market values obtained from yield data relating to investments or securities with similar characteristics. The service providers’ internal models use inputs that are observable such as, among other things, issuer details, interest rates, yield curves, prepayment speeds, credit risks/spreads, default rates and quoted prices for similar assets. Securities that use similar valuation techniques and inputs as described above are categorized as Level 2 of the fair value hierarchy.
24
Brandes Separately Managed Account Reserve Trust
NOTES TO FINANCIAL STATEMENTS — (Unaudited) (continued)
Fixed income securities purchased on a delayed-delivery basis are typically marked to market daily until settlement at the forward settlement date.
The Fund may enter into mortgage dollar roll transactions in which the Fund sells a mortgage-backed security to a counterparty and simultaneously enters into an agreement with the same counterparty to buy back a similar security on a specific future date at a predetermined price. Risks may arise due to the delayed payment date and the potential inability of counterparties to complete the transaction. Mortgage dollar rolls are accounted for as purchase and sale transactions, which may increase the Fund’s portfolio turnover rate.
Mortgage and asset-backed securities are usually issued as separate tranches, or classes, of securities within each package of underlying securities. These securities are also normally valued by pricing service providers that use broker dealer quotations or valuation estimates from their internal pricing models. The pricing models for these securities usually consider tranche level attributes, estimated cash flows and market-based yield spreads for each tranche, current market data and packaged collateral performance, as available. Mortgage and asset-backed securities that use such valuation techniques and inputs are categorized as Level 2 of the fair value hierarchy only if there are significant observable inputs used.
Common stocks, exchange-traded fund shares and financial derivative instruments, such as futures contracts or options contracts that are traded on a national securities or commodities exchange, are valued at the last reported sales price, in the case of common stocks and exchange-traded fund shares, or, in the case of futures contracts or options contracts, the settlement price determined by the relevant exchange. To the extent these securities are actively traded and valuation adjustments are not applied, they are categorized as Level 1 of the fair value hierarchy.
Valuation adjustments may be applied to certain securities that are solely traded on a foreign exchange to account for the market movement between the close of the foreign market and the close of the New York Stock Exchange (“NYSE”). These securities are generally valued using pricing service providers that consider the correlation of the trading patterns of the foreign security to the intraday trading in the U.S. markets for investments. Securities using these valuation adjustments are categorized as Level 2 of the fair value hierarchy. None of the Fund’s securities were fair valued utilizing this method as of March 31, 2017.
Investments in registered open-end management investment companies are valued based upon the Net Asset Values (“NAVs”) of such investments and are categorized as Level 1 of the fair value hierarchy. If, on a particular day, a share price of an investment company is not readily
25
Brandes Separately Managed Account Reserve Trust
NOTES TO FINANCIAL STATEMENTS — (Unaudited) (continued)
available, such securities are fair valued in accordance with the fair value procedures of the Trust.
Certain securities may be fair valued in accordance with the fair valuation procedures approved by the Board of Trustees. The Valuation Committee is generally responsible for overseeing the day to day valuation processes and reports periodically to the Board. The Valuation Committee is authorized to make all necessary determinations of the fair value of portfolio securities and other assets for which market quotations are not readily available or if it is deemed that the prices obtained from brokers and dealers or independent pricing services are unreliable.
The following is a summary of the inputs used, as of March 31, 2017, involving the Fund’s assets carried at value. The inputs of methodology used for valuing securities may not be an indication of the risk associated with investing in those securities.
Description | Level 1 | Level 2 | Level 3 | Total | ||||||||||||
Separately Managed Account Reserve Trust | ||||||||||||||||
Asset Backed Securities | $ | — | $ | 7,218,101 | $ | — | $ | 7,218,101 | ||||||||
Corporate Bonds | — | 115,248,218 | — | 115,248,218 | ||||||||||||
Government Securities | — | 33,159,324 | — | 33,159,324 | ||||||||||||
Mortgage Backed Securities | — | 5,155,043 | — | 5,155,043 | ||||||||||||
Repurchase Agreements | — | 3,189,777 | — | 3,189,777 | ||||||||||||
|
|
|
|
|
|
|
| |||||||||
Total Investments in Securities | $ | — | $ | 163,970,463 | $ | — | $ | 163,970,463 | ||||||||
|
|
|
|
|
|
|
| |||||||||
There were no transfers into or out of Levels 1 and 2 for the Fund during the reporting period.
There were no Level 3 securities in the Fund at the beginning or the end of the six months ended March 31, 2017.
NOTE 3 – INVESTMENT ADVISORY FEE AND OTHER TRANSACTIONS WITH AFFILIATES
| A. | Advisor Fee. Brandes Investment Partners, L.P. (the “Advisor”) provides the Fund with investment management services under an Investment Advisory Agreement. The Advisor receives no advisory fee or other fee from the Fund. The financial statements of the Fund reflect the fact that no fees or expenses are incurred by the Fund. It should be understood, however, that the Fund is an integral part of “wrap-fee” programs sponsored by investment advisors unaffiliated with the Fund and the Advisor. Typically, participants in these programs pay a “wrap-fee” to their investment advisors. Although the Fund does not compensate the Advisor directly for its service under the Investment Advisory Agreement, the Advisor benefits from its relationships with the |
26
Brandes Separately Managed Account Reserve Trust
NOTES TO FINANCIAL STATEMENTS — (Unaudited) (continued)
| sponsors of wrap-fee programs for which the Fund is an investment option. Certain officers and Trustees of the Trust are also officers of the Advisor. |
| B. | Administration Fee. U.S. Bancorp Fund Services, LLC (the “Administrator”) acts as administrator for the Fund. The Administrator prepares various federal and state regulatory filings; prepares reports and materials to be supplied to the Trustees; monitors the activities of the Fund’s custodian, transfer agent and accountant; coordinates the preparation and payment of Fund expenses; and prepares several Fund reports. The Advisor compensates the Administrator on behalf of the Fund for the services the Administrator performs for the Fund. |
| C. | Distribution and Service Fees. ALPS Distributors, Inc. (the “Distributor”), a registered broker-dealer, acts as the Fund’s principal underwriter in a continuous public offering of the Fund’s shares. All of the Fund’s distribution fees are paid by the Advisor. |
NOTE 4 – PURCHASES AND SALES OF SECURITIES
The cost of purchases and the proceeds from sales of securities of the Fund, excluding short-term investments, were as follows for the six months ended March 31, 2017:
| U.S. Government | Other | |||||||||||||
| Purchases | Sales | Purchases | Sales | |||||||||||
| $ | 10,302,871 | $ | 13,032,575 | $ | 36,374,269 | $ | 30,862,526 | |||||||
NOTE 5 – CAPITAL STOCK TRANSACTIONS
The Fund’s capital stock activity in shares and dollars during the six months ended March 31, 2017, and the year ended September 30, 2016, was as follows (shares and dollar amounts in thousands):
| Six Months Ended 3/31/17 | Year Ended 9/30/16 | |||||||||||||||
| Shares | Amount | Shares | Amount | |||||||||||||
Shares Sold | 2,107 | $ | 18,673 | 3,316 | $ | 28,074 | ||||||||||
Issued on Reinvestment | ||||||||||||||||
of Distributions | 416 | 3,693 | 927 | 7,967 | ||||||||||||
Shares Redeemed | (2,119 | ) | (18,775 | ) | (4,470 | ) | (38,266 | ) | ||||||||
|
|
|
|
|
|
|
| |||||||||
Net Increase/(Decrease) Resulting from Fund Share Transactions | 404 | $ | 3,591 | (227 | ) | $ | (2,225 | ) | ||||||||
|
|
|
|
|
|
|
| |||||||||
NOTE 6 – FEDERAL INCOME TAX MATTERS
GAAP requires that certain components of net assets be reclassified between financial and tax reporting. Temporary differences do not require reclassification. Temporary and permanent differences have no effect on net assets or net asset value per share. For the year ended September 30, 2016, the Fund made the
27
Brandes Separately Managed Account Reserve Trust
NOTES TO FINANCIAL STATEMENTS — (Unaudited) (continued)
following permanent book-to-tax reclassifications primarily related to the treatment of paydowns and the difference between book and tax accretion methods for market premium:
| Undistributed Net Investment Income | Accumulated Net Realized Loss | Paid-In Capital | ||||||||
| $ | 23,025 | $ | (23,025 | ) | $ | — | ||||
As of September 30, 2016, the Fund’s components of distributable earnings on a tax basis were as follows:
Cost of investments for tax purposes | $ | 155,440,484 | ||
|
| |||
Gross tax unrealized appreciation | 9,957,617 | |||
Gross tax unrealized depreciation | (2,627,167 | ) | ||
|
| |||
Net unrealized appreciation on investments | 7,330,450 | |||
|
| |||
Distributable ordinary income | 5,772 | |||
Distributable long-term capital gains | — | |||
|
| |||
Total distributable earnings | 5,772 | |||
|
| |||
Other accumulated losses | (28,817,658 | ) | ||
|
| |||
Total accumulated losses | $ | (21,481,436 | ) | |
|
|
The differences between book and tax basis distributable earnings are primarily related to the differences in classification of paydown gains and losses for tax purposes compared to book purposes. The difference between book and tax basis unrealized depreciation on investments is due primarily to timing differences resulting from wash sale transactions. These differences are temporary.
As of September 30, 2016, the Fund had capital losses expiring on September 30, 2017, 2018 and 2019 in the amounts of $12,139,741, $6,084,748 and $6,501,831, respectively. As of September 30, 2016, the Fund had a capital loss with an indefinite expiration in the amount of $4,091,338. At September 30, 2016, the Fund utilized $1,121,497 of capital loss carryforwards.
The tax compositions of dividends for the years ended September 30, 2016 and September 30, 2015 for the Fund were as follows:
| Ordinary Income | Long Term Capital Gains | |||||||||||||||||
| 2016 | 2015 | 2016 | 2015 | |||||||||||||||
| $ | 8,044,823 | $ | 7,435,078 | $ | — | $ | — | |||||||||||
NOTE 7 – SUBSEQUENT EVENTS
In preparing these financial statements, the Trust has evaluated events and transactions for potential recognition or disclosure through the date the financial statements were available to be issued. The Trust has concluded that there are no subsequent events to note.
28
Brandes Separately Managed Account Reserve Trust
ADDITIONAL INFORMATION — (Unaudited)
BOARD CONSIDERATION AND CONTINUATION OF INVESTMENT ADVISORY AGREEMENT
In November 2016 the Board of Trustees of the Trust, including the independent Trustees, unanimously approved renewal of the Investment Advisory Agreement (the “Agreement”) between the Trust and Brandes Investment Partners, L.P. (the “Advisor”) with respect to the SMART Fund (the “Fund”) for an additional one-year term.
Information Reviewed
During the course of each year, Board members review a wide variety of materials relating to the nature, extent and quality of the services provided to the Fund by the Advisor, including reports on the Fund’s investment results, portfolio composition, portfolio trading practices, and other matters. In addition, in connection with its annual review of the Agreement with respect to the Fund, the Board requested and reviewed supplementary information that included materials regarding the Fund’s investment results, advisory fee and expense comparisons, financial and profitability information regarding the Advisor, descriptions of various functions such as compliance monitoring and portfolio trading practices, and information about the personnel providing investment management and administrative services to the Fund.
In connection with its reviews, the Board received assistance and advice regarding legal and industry standards from counsel to the Trust and the independent Trustees. The independent Trustees discussed the approval of the Agreement with respect to the Fund with representatives of the Advisor and in private sessions with counsel at which no representatives of the Advisor were present. In deciding to recommend approval of the Agreement with respect to the Fund, the Board and the independent Trustees did not identify any single or particular piece of information that, in isolation, was the controlling factor, and each Trustee did not necessarily attribute the same weight to each factor. This summary describes the most important, but not all, of the factors considered by the Board and the independent Trustees.
Nature, Extent and Quality of Services
With respect to the nature, extent and quality of services provided by the Advisor to the Fund, the Trustees reviewed among other things the quality and depth of the Advisor’s investment management staff, its regulatory compliance procedures, the day-to-day administrative services provided by the Advisor to the Fund and the investment results of the Fund.
The Trustees noted that the Fund’s investment results gross of fees (which are paid by the Advisor) were in the first quartile of the results of a peer group of funds identified by Morningstar Associates (“Morningstar”) for the one-year, three-year
29
Brandes Separately Managed Account Reserve Trust
ADDITIONAL INFORMATION — (Unaudited) (continued)
and five- year periods ended September 30, 2016; were in the second quartile of the peer group for the 10-year period; were in the same quartiles of the larger group of funds in its Morningstar MultisectorBond Fund category for each of those periods; and were above its benchmark indices (the Barclays Capital U.S. Aggregate Index and Barclays Capital U.S. Intermediate Credit Index) for all such periods. They concluded that the Fund’s performance was satisfactory.
Advisory Fees, Total Expenses, Profitability and Ancillary Benefits
The Trustees noted that the Fund does not incur any advisory fees or other expenses, all of which are paid by the Advisor, and as a result the Advisor’s relationship with the Fund alone is not profitable. The Board also considered ancillary benefits to the Advisor as a result of its relationship with the Fund. They noted that these were primarily related to the Advisor’s receipt of wrap account fees from Fund shareholders through various broker-dealer sponsors that are not affiliated with either the Fund or the Advisor, and the benefit of proprietary and third-party research provided by broker-dealers executing portfolio transactions on behalf of the Fund.
Conclusions
Based on their review, including consideration of each of the factors referred to above, the Board and the independent Trustees concluded that the Agreement is fair and reasonable to the Fund and its shareholders, that each of the factors discussed above supported renewal of the Agreement, and that renewal of the Agreement was in the best interests of the Fund and its shareholders.
PROXY VOTING PROCEDURES
The Advisor votes proxies relating to the Funds’ portfolio securities in accordance with procedures adopted by the Advisor. You may obtain a description of these procedures, free of charge, by calling toll-free 1-800-331-2979. This information is also available through the Securities and Exchange Commission’s website at http:// www.sec.gov.
Information regarding how the Trust voted proxies relating to portfolio securities during the most recent 12-month period ended June 30 is available without charge, upon request, by calling 1-800-331-2979. This information is also available through the Securities and Exchange Commission’s website at http://www.sec.gov.
FORM N-Q DISCLOSURE
The Trust files the Fund’s complete schedule of portfolio holdings with the Securities and Exchange Commission for the first and third quarters of each fiscal year on Form N-Q. The Trust’s Form N-Q filings are available on the Securities and Exchange Commission’s website at http://www.sec.gov. The Trust’s Form N-Q
30
Brandes Separately Managed Account Reserve Trust
ADDITIONAL INFORMATION — (Unaudited) (continued)
filings may be reviewed and copied at the Commission’s Public Reference Room in Washington, D.C., and information on the operation of the Public Reference Room may be obtained by calling 1-800-SEC-0330. Information regarding the Trust’s Form N-Q filings is also available, without charge, by calling toll-free, 1-800-331-2979.
31
Brandes Separately Managed Account Reserve Trust
TRUSTEES AND OFFICERS INFORMATION — (Unaudited)
The Board of Trustees is responsible for the overall management of the Trust’s business. The Board approves all significant agreements between the Trust and persons or companies furnishing services to the Trust, including the Trust’s agreements with the Advisor, Administrator, Custodian, Distributor and Transfer Agent. The Board of Trustees delegates the day-to-day operations of the Trust to its officers and service providers, subject to the Fund’s investment objective and policies and to general supervision by the Board. The Trust’s Statement of Additional Information includes additional information about the Trustees and is available, without charge, by calling 1-800-331-2979 or visiting www.brandes.com.
The Trustees and officers of the Trust, their business addresses and principal occupations during the past five years are:
Name, Address | Position(s) | Term of | Principal | Number | Other Trusteeships | |||||
Independent Trustees(2) | ||||||||||
Jean E. Carter 11988 El Camino Real, Suite 600 San Diego, CA 92130 (Age 59) | Trustee and Chairman | Since April 2008 | Retired. | 9 | Bridge Builder Trust | |||||
Robert M. Fitzgerald, CPA (inactive) 11988 El Camino Real, Suite 600 San Diego, CA 92130 (Age 65) | Trustee | Since April 2008 | Retired. | 9 | Hotchkis and Wiley Mutual Funds | |||||
Craig Wainscott, CFA 11988 El Camino Real, Suite 600 San Diego, CA 92130 (Age 55) | Trustee | Since February 2012 | Partner with The Paradigm Project and advisor to early-stage companies. | 9 | None | |||||
Gregory Bishop, CFA 11988 El Camino Real, Suite 600 San Diego, CA 92130 (Age: 54) | Trustee | Since January 2017 | Retired. Previously Executive Vice President and Head of Retail Business, PIMCO Investments , from 1997 to 2014 | 9 | None | |||||
32
Brandes Separately Managed Account Reserve Trust
TRUSTEES AND OFFICERS INFORMATION — (Unaudited) (continued)
Name, Address | Position(s) | Term of | Principal | Number | Other Trusteeships | |||||
“Interested” Trustees(3) | ||||||||||
Oliver Murray 11988 El Camino Real, Suite 600 San Diego, CA 92130 (Age 54) | Trustee | Since February 2012 | Chief Executive Officer, Brandes Investment Partners & Co.; Managing Director – PMCS of Brandes Investment Partners, L.P., the investment advisor to the Funds (the “Advisor”). | 9 | None | |||||
Jeff Busby, CFA 11988 El Camino Real, Suite 600 San Diego, CA 92130 (Age 56) | Trustee and President | Since July 2006 | Executive Director of the Advisor. | 9 | None | |||||
Officers of the Trust | ||||||||||
Thomas M. Quinlan 11988 El Camino Real, Suite 600 San Diego, CA 92130 (Age 46) | Secretary | Since June 2003 | Associate General Counsel of the Advisor. | N/A | N/A | |||||
Gary Iwamura, CPA 11988 El Camino Real, Suite 600 San Diego, CA 92130 (Age 60) | Treasurer | Since September 1997 | Finance Director of the Advisor. | N/A | N/A | |||||
Roberta Loubier 11988 El Camino Real, Suite 600 San Diego, CA 92130 (Age 46) | Chief Compliance Officer | Since September 2015 | Global Head of Compliance, Brandes Investment Partners, L.P. | N/A | N/A | |||||
| (1) | Trustees and officers of the Fund serve until their resignation, removal or retirement. |
| (2) | Not “interested persons” of the Trust as defined in the 1940 Act. |
| (3) | “Interested persons” of the Trust as defined in the 1940 Act by virtue of their positions with the Advisor. |
33

ADVISOR Brandes Investment Partners, L.P. 11988 El Camino Real, Suite 600 San Diego, CA 92130 800.331.2979 DISTRIBUTOR ALPS Distributors, Inc. 1290 Broadway, #1100 Denver, CO 80203 TRANSFER AGENT U.S. Bancorp Fund Services, LLC 615 E. Michigan Street, 3rd Floor Milwaukee, WI 53202 INDEPENDENT REGISTERED PUBLIC ACCOUNTING FIRM PricewaterhouseCoopers LLP 601 South Figueroa Street Los Angeles, CA 90017 LEGAL COUNSEL Morgan, Lewis & Bockius LLP 300 S. Grand Avenue, 22nd Floor Los Angeles, CA 90071 This report is intended for shareholders of the Brandes Separately Managed Account Reserve Trust and may not be used as sales literature unless preceded or accompanied by a current prospectus. Statements and other information herein are dated and are subject to change.
Item 2. Code of Ethics.
Not applicable for semi-annual reports.
Item 3. Audit Committee Financial Expert.
Not applicable for semi-annual reports.
Item 4. Principal Accountant Fees and Services.
Not applicable for semi-annual reports.
Item 5. Audit Committee of Listed Registrants.
Not applicable to registrants who are not listed issuers (as defined in Rule 10A-3 under the Securities Exchange Act of 1934).
Item 6. Investments.
| (a) | Schedule of Investments is included as part of the report to shareholders filed under Item 1 of this Form. |
| (b) | Not Applicable |
Item 7. Disclosure of Proxy Voting Policies and Procedures for Closed-End Management Investment Companies.
Not applicable to open-end investment companies.
Item 8. Portfolio Managers of Closed-End Management Investment Companies.
Not applicable to open-end investment companies.
Item 9. Purchases of Equity Securities by Closed-End Management Investment Company and Affiliated Purchasers.
Not applicable to open-end investment companies.
Item 10. Submission of Matters to a Vote of Security Holders.
There have been no material changes to the procedures by which shareholders may recommend nominees to the registrant’s board of trustees.
Item 11. Controls and Procedures.
| (a) | The registrant’s President and Treasurer have reviewed the Registrant’s disclosure controls and procedures (as defined in Rule 30a-3(c) under the Investment Company Act of 1940 (the “Act”)) as of a date within 90 days of the filing of this report, as required by Rule 30a-3(b) under the Act and Rules 13a-15(b) or 15d-15(b) under the Securities Exchange Act of 1934. Based on their review, such officers have concluded that the disclosure controls and procedures are effective in ensuring that information required to be disclosed in this report is appropriately recorded, processed, summarized and reported and made known to them by others within the Registrant and by the Registrant’s service provider. |
| (b) | No changes in the registrant’s internal control over financial reporting (as defined in Rule 30a-3(d) under the Act) occurred during the second fiscal quarter of the period covered by this report that materially affected, or are reasonably likely to materially affect, the registrant’s internal control over financial reporting. |
Item 12. Exhibits.
| (a) | (1) Any code of ethics or amendment thereto, that is the subject of the disclosure required by Item 2, to the extent that the registrant intends to satisfy Item 2 requirements through filing an exhibit. 1) Incorporated by reference to the registrant’s Form N-CSR filed January 7, 2005. |
(2) A separate certification for each principal executive and principal financial officer pursuant to Section 302 of the Sarbanes-Oxley Act of 2002. Filed herewith.
(3) Any written solicitation to purchase securities under Rule 23c-1 under the Act sent or given during the period covered by the report by or on behalf of the registrant to 10 or more persons. Not applicable to open-end investment companies.
| (b) | Certifications pursuant to Section 906 of the Sarbanes-Oxley Act of 2002. Furnished herewith. |
SIGNATURES
Pursuant to the requirements of the Securities Exchange Act of 1934 and the Investment Company Act of 1940, the registrant has duly caused this report to be signed on its behalf by the undersigned, thereunto duly authorized.
| (Registrant) Brandes Investment Trust | ||||
| By (Signature and Title)* | /s/ Jeff Busby | |||
| Jeff Busby, President | ||||
| Date 6/2/17 | ||||
Pursuant to the requirements of the Securities Exchange Act of 1934 and the Investment Company Act of 1940, this report has been signed below by the following persons on behalf of the registrant and in the capacities and on the dates indicated.
By (Signature and Title)* | /s/ Jeff Busby | |||
| Jeff Busby, President | ||||
Date 6/2/17 | ||||
| By (Signature and Title)* | /s/ Gary Iwamura | |||
| Gary Iwamura, Treasurer/Principal Financial Officer | ||||
| Date 6/2/17 | ||||
| * | Print the name and title of each signing officer under his or her signature. |