UNITED STATES
SECURITIES AND EXCHANGE COMMISSION
Washington, D.C. 20549
FORMN-CSR
CERTIFIED SHAREHOLDER REPORT OF REGISTERED
MANAGEMENT INVESTMENT COMPANIES
Investment Company Act file number811-08614
Brandes Investment Trust
(Exact name of registrant as specified in charter)
11988 El Camino Real, Suite 600
San Diego, CA 92130
(Address of principal executive offices) (Zip code)
Lea Anne Copenhefer
Morgan, Lewis & Bockius LLP
One Federal Street
Boston, MA 02110-1726
(Name and address of agent for service)
800-331-2979
Registrant’s telephone number, including area code
Date of fiscal year end:September 30, 2019
Date of reporting period:September 30, 2019
Item 1. Reports to Stockholders.
ANNUAL REPORT INTERNATIONAL EQUITY FUND GLOBAL EQUITY FUND GLOBAL EQUITY INCOME FUND EMERGING MARKETS VALUE FUND INTERNATIONAL SMALL CAP EQUITY FUND SMALL CAP VALUE FUND CORE PLUS FIXED INCOME FUND For the year ended September 30, 2019 Beginning in January 2021, as permitted by regulations adopted by the U.S. Securities and Exchange Commission, paper copies of the Funds’ annual and semi-annual shareholder reports will no longer be sent by mail, unless you specifically request paper copies of the reports. Instead, the reports will be made available on the Funds’ website (http://www.brandesfunds.com/literature.html), and you will be notified by mail each time a report is posted and provided with a website link to access the report. If you already elected to receive shareholder reports electronically, you will not be affected by this change and you need not take any action. You may elect to receive shareholder reports and other communications from the Funds electronically anytime by contacting your financial intermediary (such as a broker-dealer or a bank) or, if you are a direct investor, by calling1-800-395-3807, sending ane-mail request to info@brandesfunds.com, or by enrolling at http://www.brandesfunds.com/literature.html. You may elect to receive all future reports in paper free of charge. If you invest through a financial intermediary, you can contact your financial intermediary to request that you continue to receive paper copies of your shareholder reports. If you invest directly with the Funds, you can call1-800-395-3807 or send an email request to info@brandesfunds.com to let the Funds know you wish to continue receiving paper copies of your shareholder reports. Your election to receive reports in paper will apply to all Funds held in your account with that intermediary if you invest through your financial intermediary or all Funds held with the fund complex if you invest directly with the Funds. [Graphic Appears Here]

| 2 | ||||
| 2 | ||||
| 5 | ||||
| 9 | ||||
| 13 | ||||
| 17 | ||||
| 21 | ||||
| 25 | ||||
| 29 | ||||
| 35 | ||||
| 38 | ||||
| 38 | ||||
| 41 | ||||
| 44 | ||||
| 47 | ||||
| 53 | ||||
| 58 | ||||
| 62 | ||||
| 68 | ||||
| 70 | ||||
| 72 | ||||
| 76 | ||||
| 88 | ||||
| 110 | ||||
| 112 | ||||
| 116 |
1
Introductory Letter to Shareholders
Dear Shareholders,
Sir John Templeton famously warned in the eleventh of his “16 Rules for Investment Success” that the investor who saysthis time is different has uttered “the four most costly words in the annals of investing.”1 The legendary growth fund manager was making the point that one needs to be careful of rationalizing why the current environment will end better than a similar one did previously.
Why do we bring up Templeton’s quote from more than 25 years ago? Today, the pace of innovation is changing our lives so dramatically that it can be tempting to think that surely thebusiness landscape is no longer what it once was. And in the past, investors have falsely believed that sharp advances in security prices would continue because of some new development. Even Templeton reportedly conceded that the investor who says this time is different has a 20% chance of being correct.2
Disruptive technologies have indeed threatened a variety of industries, causing some investors to question the idea ofmean reversion and whether certain companies or entire sectors can return to prior levels of growth.
We consider it our job as an active value manager to differentiate between those industries whose fundamentals are being disrupted from those who are only experiencing stock price disruption. Opportunities can arise if the market overreacts to the threat of disruption and underappreciates a seemingly threatened company’s moat or durability.
Indeed, we think active value management is the most logical approach to investing when disruptive technologies roil the market. Obviously, passive or index strategies pay little heed to secular changes, and smart-beta factors that rely onprice-to-book orprice-to-earnings multiples to drive stock selection may miss company- or industry-specific nuances.
Our approach to value investing seeks to determine whether a company is simply “cheap” or whether it is undervalued. With a cheap company, the price has fallen but is unlikely to recover because the company is vulnerable to structural issues. On the other hand, anundervaluedcompany has mean-reverting capabilities, meaning its price has fallen for reasons that may not be long-lasting.
A key tenet of the value approach is to develop a solid understanding of not only the company but its industry and main competitors. This naturally leads us to investigate the specific role technology plays in the company as well as the industry. In each case we ask, is this company and/or industry vulnerable to disruption? Or is there a widespread misperception that may be creating an asymmetric opportunity?
| 1 | “16 Rules for Investment Success” by Sir John Templeton, Franklin Templeton Investments, 2017. Reprinted fromWorld Monitor: The Christian Science Monitor Monthly,1993. |
| 2 | Memo to Oaktree Clients, Howard Marks, Oaktree Capital Management, June 12, 2019 |
2
For example, our research teams are wary of the competitive threat that online retailers pose to traditionalbrick-and-mortar retailers, and we have limited our exposure accordingly. However, not all industries may be exposed to these threats equally. We have found opportunities in a few grocers, especially in the United Kingdom, because online and home delivery companies have not been able to easily disrupt these established businesses.
Likewise, we are overweight financials, especially in the United States, despite threats from financial technology (fintech) firms. Fintechs largely affect personal loans, money exchange and payments, while we’ve found value in some of the larger money center banks that also derive a large portion of their value from the more defensible areas of trade finance, foreign exchange and payments. In addition, many of these institutions not only have the resources to compete with the fintechs, but should also benefit from their technology investments that improve efficiencies and fundamentals. We believe such fundamental improvements will eventually be reflected in higher share prices.
Foroil-related companies, secular competition — e.g., from electric cars and solar energy — appears to be growing. But these innovations might not have a truly major effect for years to come. While some investors may look at oil as a dying industry, global oil demand and production are each expected to continue growing, (thanks in part to emerging markets), although they may be volatile in the shorter term due to cyclical, economic and political factors.3 Our company-specific analysis has led us to opportunities in integrated oil companies (with operations in nearly all facets of energy production and distribution) with strong balance sheets and diverse exposure to the value chain, rather than the more levered companies focusing only on exploration and production.
Disruption from technological innovation has been part of investing at least since the appearance of the automobile threatened theso-called “buggy whip” companies in the late 19th century. Today, the pace of disruption might appear more amplified than ever before. But our task has been the same since Brandes began operating 45 years ago. We strive to determine if a business that has fallen out of favor has the ability to adapt and survive, or will go the way of the buggy whip makers.
Todayis different from the past in many ways. But theprinciples guiding our active value investing approach haven’t changed. And the disruption we’ve witnessed recently only strengthens our belief in the need for investors to distinguish potentially undervalued businesses from cheap companies that may only get cheaper.
Thank you for your business and continued trust.
| 3 | U.S. Energy Information Administration, July 2019 |
3
Price/Book: Price per share divided by book value per share.
Price/Earnings: Price per share divided by earnings per share.
Smart Beta: An investment strategy that is based on a passive approach but seeks to adjust portfolio weights to manage risk variables such as volatility, quality, liquidity, etc.
Mutual fund investing involves risk. Principal loss is possible.
A mutual fund’s investment objectives, risks, charges and expenses must be considered carefully before investing. The statutory and summary prospectuses contain this and other important information about the investment company, and may be obtained by calling 1.800.395.3807 or visiting brandesfunds.com. Read carefully before investing.
The foregoing reflects the thoughts and opinions of Brandes Investment Partners® exclusively and is subject to change without notice. Brandes Investment Partners® is a registered trademark of Brandes Investment Partners, L.P. in the United States and Canada.
The Brandes Funds are distributed by ALPS Distributors, Inc.
4
Brandes International Equity Fund
The net asset value of the Brandes International Equity Fund (Class I Shares) declined 5.82% in the year ending September 30, 2019. For the same period, the MSCI EAFE Index fell 1.34%.
Portfolio holdings in the Diversified Telecommunication Services, Equity Real Estate Investment Trusts (REITs) and Multi-Utilities industries were contributors to performance, while holdings in Food & Staples Retailing, Capital Markets and Banks detracted from returns.
Holdings in Russia, Brazil and France contributed to performance, while results were hampered by holdings in United Kingdom, Japan and Switzerland.
Three of the largest individual contributors to performance were Fibra Uno Admin. SA de C.V. (Mexico — Equity Real Estate Investment Trusts (REITs)), Engie SA (France — Multi-Utilities) and Telefonica Brasil S.A. (Brazil — Diversified Telecom Services). Cemex SA (Mexico — Construction Materials), Marks & Spencer Group Plc (United Kingdom — Multiline Retail) and Mitsubishi Tanabe Pharma (Japan — Pharmaceuticals) were three of the largest detractors from performance.
At the close of the period, the Fund’s largest country weights were in United Kingdom and France, and the Fund’s largest industry weights were in Pharmaceuticals and Oil, Gas & Consumable Fuels. Please note that while macro conditions are considered when we determine valuation estimates for individual companies, our country and industry weightings are aby-product ofbottom-up stock selection, not the result oftop-down observations.
After nearly a half-century of professional investing, Brandes Investment Partners remains fixed on its original goal. We pursue above-market returns to help you fulfill your long-term investment objectives. Our approach remains deeply rooted in the value philosophy and seeks to identify worthy but potentially underpriced companies. Thank you for your confidence in our approach.
Thank you for your business and continued trust.
Sincerely yours,
The Brandes InternationalLarge-Cap Investment Committee
Brandes Investment Trust
Because the values of the fund’s investments will fluctuate with market conditions, so will the value of your investment in the fund. You could lose money on your investment in the fund, or the fund could underperform other investments. The values of the fund’s investments fluctuate in response to the activities of individual companies and general stock market and economic conditions. In addition, the performance of foreign securities depends on the political and economic environments and other overall
5
Brandes International Equity Fund
economic conditions in the countries where the fund invests. Emerging country markets involve greater risk and volatility than more developed markets. Some emerging markets countries may have fixed or managed currencies that are not free-floating against the U.S. dollar. Certain of these currencies have experienced, and may experience in the future, substantial fluctuations or a steady devaluation relative to the U.S. dollar. Value stocks typically are less volatile than growth stocks; however, issues of value stocks typically have a lower expected growth rate in earnings and sales than issues of growth stocks.
Past performance is not a guarantee of future results.
Please refer to the Schedule of Investments in the report for complete holdings information. Fund holdings, geographic allocations and/or sector allocations are subject to change at any time and are not considered a recommendation to buy or sell any security.
The foregoing reflects the thoughts and opinions of Brandes Investment Partners® exclusively and is subject to change without notice.
Brandes Investment Partners® is a registered trademark of Brandes Investment Partners, L.P. in the United States and Canada.
Must be preceded or accompanied by a prospectus.
Index Guide
The MSCI EAFE Index with net dividends captures large and mid cap representation of developed market countries excluding the U.S. and Canada.
MSCI has not approved, reviewed or produced this report, makes no express or implied warranties or representations and is not liable whatsoever for any data in the report. You may not redistribute the MSCI data or use it as a basis for other indices or investment products.
One cannot invest directly in an index.
The Brandes International Equity Fund is distributed by ALPS Distributors, Inc.
6
Brandes International Equity Fund
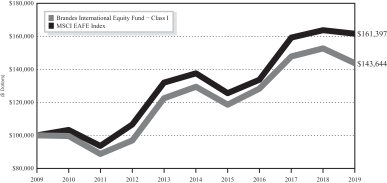
The following chart compares the value of a hypothetical $100,000 investment in the Brandes International Equity Fund – Class I from September 30, 2009 to September 30, 2019 with the value of such an investment in the MSCI EAFE (Europe, Australasia and Far East) Index for the same period.
Value of $100,000 Investment vs MSCI EAFE (Europe, Australasia and Far East) Index (Unaudited)
| Average Annual Total Return Periods Ended September 30, 2019 | ||||||||||||||||
| One Year | Five Years | Ten Years | Since Inception(1) | |||||||||||||
Brandes International Equity Fund | ||||||||||||||||
Class A* | -5.98 | % | 1.92 | % | 3.51 | % | 7.11 | % | ||||||||
Class A* (with maximum sales charge) | -11.39 | % | 0.73 | % | 2.90 | % | 6.83 | % | ||||||||
Class C* | -6.73 | % | 1.15 | % | 2.70 | % | 6.30 | % | ||||||||
Class C* (with maximum sales charge) | -7.63 | % | 1.15 | % | 2.70 | % | 6.30 | % | ||||||||
Class I | -5.82 | % | 2.11 | % | 3.69 | % | 7.34 | % | ||||||||
Class R6* | -5.69 | % | 2.26 | % | 3.79 | % | 7.42 | % | ||||||||
MSCI EAFE (Europe, Australasia, and Far East) Index | -1.34 | % | 3.27 | % | 4.90 | % | 4.55 | % | ||||||||
| (1) | The inception date is January 2, 1997. |
| * | Performance shown prior to January 31, 2011 for Class A shares reflects the performance of Class I shares adjusted to reflect Class A expenses. Performance shown prior to January 31, 2013 for Class C shares reflects the performance of Class I shares adjusted to reflect Class C expenses. Performance shown prior to February 1, 2016 for Class R6 shares reflects the performance of Class I shares adjusted to reflect Class R6 expenses. |
Performance data quoted represents past performance; past performance does not indicate future results. The investment return and principal value of an investment will fluctuate so that an investor’s shares, when redeemed, may be worth more or less than their original cost. Current performance of the Fund may be lower or
7
Brandes International Equity Fund
higher than the performance quoted. Performance data current to the most recent month end may be obtained by calling 800-331-2979.
The returns shown do not reflect the deduction of taxes that a shareholder would pay on Fund distributions or the redemption of Fund shares. The Advisor has a fee waiver arrangement in place to limit the Fund’s annual operating expenses.
Sector Allocation as a Percentage of Total Investments as of
September 30, 2019 (Unaudited)
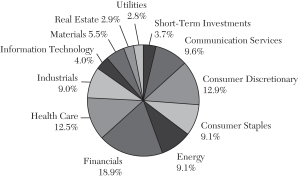
The sector classifications represented in the graph above are in accordance with Global Industry Classification Standard (GICS®), which was developed by and/or is the exclusive property of MSCI, Inc. and Standard & Poor Financial Services LLC.
8
Dear Fellow Investor,
The net asset value of the Brandes Global Equity Fund (Class I Shares) declined 4.98% in the year ending September 30, 2019. For the same period, the MSCI World Index rose 1.83%.
Portfolio holdings in the Pharmaceuticals, Equity Real Estate Investment Trusts (REITs) and Multi-Utilities industries were contributors to performance, while holdings in Capital Markets, Oil, Gas & Consumable Fuels and Food & Staples Retailing detracted from returns.
Holdings in Mexico, France and Russia contributed to performance, while results were hampered by holdings in United Kingdom, United States and Switzerland.
Three of the largest individual contributors to performance were Fibra Uno Admin. SA de C.V. (Mexico — Equity Real Estate Investment Trusts (REITs)), Engie SA (France — Multi-Utilities) and Merck & Co. (United States — Pharmaceuticals). Imperial Brands PLC (United Kingdom — Tobacco), UBS Group AG (Switzerland — Capital Markets) and Nissan Motor Co., Ltd. (Japan — Automobiles) were three of the largest detractors from performance.
At the close of the period, the Fund’s largest country weights were in United States and United Kingdom, and the Fund’s largest industry weights were in Banks and Pharmaceuticals. Please note that while macro conditions are considered when we determine valuation estimates for individual companies, our country and industry weightings are aby-product ofbottom-up stock selection, not the result oftop-down observations.
Brandes Investment Partners has had the same goal since we started 45 years ago: Realize above-market gains to help you pursue your long-term investment objectives. We aim to do so by staying true to our value approach, which seeks fundamentally sound but potentially undervalued companies for the Fund. Thank you for investing with us.
Thank you for your business and continued trust.
Sincerely yours,
The Brandes GlobalLarge-Cap Investment Committee
Brandes Investment Trust
Because the values of the fund’s investments will fluctuate with market conditions, so will the value of your investment in the fund. You could lose money on your investment in the fund, or the fund could underperform other investments. The values of the fund’s investments fluctuate in response to the activities of individual companies and general stock market and economic conditions. In addition, the performance of foreign securities depends on the political and economic environments and other overall economic conditions in the countries where the fund invests. Emerging
9
Brandes Global Equity Fund
country markets involve greater risk and volatility than more developed markets. Some emerging markets countries may have fixed or managed currencies that are not free-floating against the U.S. dollar. Certain of these currencies have experienced, and may experience in the future, substantial fluctuations or a steady devaluation relative to the U.S. dollar. Value stocks typically are less volatile than growth stocks; however, issues of value stocks typically have a lower expected growth rate in earnings and sales than issues of growth stocks.
Past performance is not a guarantee of future results.
Please refer to the Schedule of Investments in the report for complete holdings information. Fund holdings, geographic allocations and/or sector allocations are subject to change at any time and are not considered a recommendation to buy or sell any security.
The foregoing reflects the thoughts and opinions of Brandes Investment Partners® exclusively and is subject to change without notice.
Brandes Investment Partners® is a registered trademark of Brandes Investment Partners, L.P. in the United States and Canada.
Must be preceded or accompanied by a prospectus.
Index Guide
The MSCI World Index with net dividends captures large and mid cap representation of developed markets.
MSCI has not approved, reviewed or produced this report, makes no express or implied warranties or representations and is not liable whatsoever for any data in the report. You may not redistribute the MSCI data or use it as a basis for other indices or investment products.
One cannot invest directly in an index.
The Brandes Global Equity Fund is distributed by ALPS Distributors, Inc.
10
Brandes Global Equity Fund
The following chart compares the value of a hypothetical $100,000 investment in the Brandes Global Equity Fund – Class I from September 30, 2009 to September 30, 2019 with the value of such an investment in the MSCI World Index for the same period.
Value of $100,000 Investment vs MSCI World Index (Unaudited)

| Average Annual Total Return Periods Ended September 30, 2019 | ||||||||||||||||
| One Year | Five Years | Ten Years | Since Inception(1) | |||||||||||||
Brandes Global Equity Fund | ||||||||||||||||
Class A* | -5.22 | % | 2.58 | % | 5.96 | % | 6.02 | % | ||||||||
Class A* (with maximum sales charge) | -10.66 | % | 1.37 | % | 5.34 | % | 5.45 | % | ||||||||
Class C* | -5.91 | % | 1.82 | % | 5.15 | % | 5.21 | % | ||||||||
Class C* (with maximum sales charge) | -6.80 | % | 1.82 | % | 5.15 | % | 5.21 | % | ||||||||
Class I | -4.98 | % | 2.83 | % | 6.20 | % | 6.26 | % | ||||||||
MSCI World Index | 1.83 | % | 7.18 | % | 9.01 | % | 8.90 | % | ||||||||
| (1) | The inception date is October 6, 2008. |
| * | Performance shown prior to January 31, 2011 for Class A shares reflects the performance of Class I shares adjusted to reflect Class A expenses. Performance shown prior to January 31, 2013 for Class C shares reflects the performance of Class I shares adjusted to reflect Class C expenses. |
Performance data quoted represents past performance; past performance does not indicate future results. The investment return and principal value of an investment will fluctuate so that an investor’s shares, when redeemed, may be worth more or less than their original cost. Current performance of the Fund may be lower or higher than the performance quoted. Performance data current to the most recent month end may be obtained by calling 800-331-2979.
11
Brandes Global Equity Fund
The returns shown do not reflect the deduction of taxes that a shareholder would pay on fund distributions or the redemption of fund shares. The Advisor has a fee waiver arrangement in place to limit the Fund’s annual operating expenses.
Sector Allocation as a Percentage of Total Investments as of
September 30, 2019 (Unaudited)
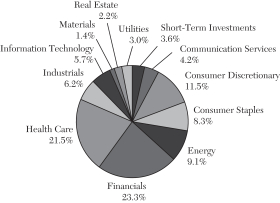
The sector classifications represented in the graph above are in accordance with Global Industry Classification Standard (GICS®), which was developed by and/or is the exclusive property of MSCI, Inc. and Standard & Poor Financial Services LLC.
12
Brandes Global Equity Income Fund
Dear Fellow Investor,
The net asset value of the Brandes Global Equity Income Fund (Class I Shares) fell 2.09% in the year ending September 30, 2019. For the same period, the MSCI World Index advanced 1.83%.
Portfolio holdings in the Electric Utilities, Diversified Telecommunication Services and Pharmaceuticals industries were contributors to performance, while holdings in Oil, Gas & Consumable Fuels, Capital Markets and Tobacco detracted from returns.
Holdings in Brazil, Mexico and France contributed to performance, while results were hampered by holdings in United Kingdom, Switzerland and Italy.
Three of the largest individual contributors to performance were CIA Paranaense de Energia (Brazil — Electric Utilities), Telefonica Brasil S.A. (Brazil — Diversified Telecom Svcs.) and Fibra Uno Admin. SA de C.V. (Mexico — Equity Real Estate Investment Trusts (REITs)). Imperial Brands PLC (United Kingdom — Tobacco), UBS Group AG (Switzerland — Capital Markets) and Kingfisher Plc (United Kingdom — Specialty Retail) were three of the largest detractors from performance.
At the close of the period, the Fund’s largest country weights were in United States and United Kingdom, and the Fund’s largest industry weights were in Pharmaceuticals and Capital Markets. Please note that while macro conditions are considered when we determine valuation estimates for individual companies, our country and industry weightings are aby-product ofbottom-up stock selection, not the result oftop-down observations.
Brandes Investment Partners has had the same goal since we started 45 years ago: Realize above-market gains to help you pursue your long-term investment objectives. We aim to do so by staying true to our value approach, which seeks fundamentally sound but potentially undervalued companies for the Fund.
Thank you for your business and continued trust.
Sincerely yours,
The Brandes GlobalLarge-Cap Investment Committee
Brandes Investment Trust
Because the values of the fund’s investments will fluctuate with market conditions, so will the value of your investment in the fund. You could lose money on your investment in the fund, or the fund could underperform other investments. The values of the fund’s investments fluctuate in response to the activities of individual companies and general stock market and economic conditions. In addition, the performance of foreign securities depends on the political and economic environments and other overall economic conditions in the countries where the fund invests. Emerging
13
Brandes Global Equity Income Fund
country markets involve greater risk and volatility than more developed markets. Some emerging markets countries may have fixed or managed currencies that are not free-floating against the U.S. dollar. Certain of these currencies have experienced, and may experience in the future, substantial fluctuations or a steady devaluation relative to the U.S. dollar. Value stocks typically are less volatile than growth stocks; however, issues of value stocks typically have a lower expected growth rate in earnings and sales than issues of growth stocks.
Past performance is not a guarantee of future results.
Please refer to the Schedule of Investments in the report for complete holdings information. Fund holdings, geographic allocations and/or sector allocations are subject to change at any time and are not considered a recommendation to buy or sell any security.
The foregoing reflects the thoughts and opinions of Brandes Investment Partners® exclusively and is subject to change without notice.
Brandes Investment Partners® is a registered trademark of Brandes Investment Partners, L.P. in the United States and Canada.
Must be preceded or accompanied by a prospectus.
Index Guide
The MSCI World Index with net dividends captures large and mid cap representation of developed markets.
MSCI has not approved, reviewed or produced this report, makes no express or implied warranties or representations and is not liable whatsoever for any data in the report. You may not redistribute the MSCI data or use it as a basis for other indices or investment products.
One cannot invest directly in an index.
The Brandes Global Equity Income Fund is distributed by ALPS Distributors, Inc.
14
Brandes Global Equity Income Fund
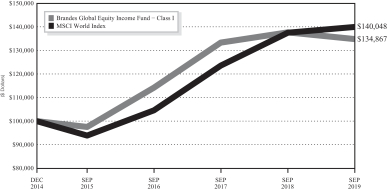
The following chart compares the value of a hypothetical $100,000 investment in the Brandes Global Equity Income Fund – Class I from its inception (December 31, 2014) to September 30, 2019 with the value of such an investment in the MSCI World Index for the same period.
Value of $100,000 Investment vs MSCI World Index (Unaudited)
| Average Annual Total Return Periods Ended September 30, 2019 | ||||||||||||
| One Year | Three Years | Since Inception(1) | ||||||||||
Brandes Global Equity Income Fund | ||||||||||||
Class A | -2.29 | % | 6.02 | % | 6.76 | % | ||||||
Class A (with maximum sales charge) | -7.91 | % | 3.95 | % | 5.44 | % | ||||||
Class C | -2.91 | % | 4.95 | % | 5.70 | % | ||||||
Class C (with maximum sales charge) | -3.83 | % | 4.95 | % | 5.70 | % | ||||||
Class I | -2.09 | % | 5.69 | % | 6.50 | % | ||||||
MSCI World Index | 1.83 | % | 10.21 | % | 7.35 | % | ||||||
| (1) | The inception date is December 31, 2014. |
Performance data quoted represents past performance; past performance does not indicate future results. The investment return and principal value of an investment will fluctuate so that an investor’s shares, when redeemed, may be worth more or less than their original cost. Current performance of the Fund may be lower or higher than the performance quoted. Performance data current to the most recent month end may be obtained by calling 800-331-2979.
15
Brandes Global Equity Income Fund
The returns shown do not reflect the deduction of taxes that a shareholder would pay on fund distributions or the redemption of fund shares. The Advisor has a fee waiver arrangement in place to limit the Fund’s annual operating expenses.
Sector Allocation as a Percentage of Total Investments as of September 30, 2019 (Unaudited)
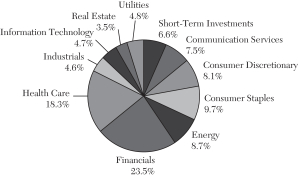
The sector classifications represented in the graph above are in accordance with Global Industry Classification Standard (GICS®), which was developed by and/or is the exclusive property of MSCI, Inc. and Standard & Poor Financial Services LLC.
16
Brandes Emerging Markets Value Fund
Dear Fellow Investor,
The net asset value of the Brandes Emerging Markets Value Fund (Class I Shares) increased 3.41% in the year ending September 30, 2019. For the same period, the MSCI Emerging Markets Index fell 2.02%.
Portfolio holdings in the Banks, Diversified Consumer Services and Oil, Gas & Consumable Fuels industries were contributors to performance, while holdings in Construction Materials, Hotels, Restaurants & Leisure and Multiline Retail detracted from returns.
Holdings in Brazil, Russia and Indonesia contributed to performance, while results were hampered by holdings in Argentina, Mexico and Hong Kong.
Three of the largest individual contributors to performance were Marfrig Alimentos SA (Brazil — Food Products), X5 Retail Group NV (Russia — Food & Staples Retailing) and PT BANK RAKYAT INDONESIA (Indonesia — Banks). Cemex SA (Mexico — Construction Materials), YPF Sociedad Anonima (Argentina — Oil, Gas & Consumable Fuels) and Genting Bhd (Malaysia — Hotels, Restaurants & Leisure) were three of the largest detractors from performance.
At the close of the period, the Fund’s largest country weights were in China and South Korea, and the Fund’s largest industry weights were in Banks and Wireless Telecommunication Services. Please note that while macro conditions are considered when we determine valuation estimates for individual companies, our country and industry weightings are aby-product ofbottom-up stock selection, not the result oftop-down observations.
In the45-plus years since Brandes Investment Partners was founded, our goal has remained the same: pursue above-market gains to help you move closer to your long-term investment objectives. We believe that our unwavering commitment to value investing will lead us to attractively priced, fundamentally sound companies worthy of inclusion in the fund.
Thank you for your business and continued trust.
Sincerely yours,
The Brandes Emerging Markets Investment Committee
Brandes Investment Trust
Because the values of the fund’s investments will fluctuate with market conditions, so will the value of your investment in the fund. You could lose money on your investment in the fund, or the fund could underperform other investments. The values of the fund’s investments fluctuate in response to the activities of individual companies and general stock market and economic conditions. In addition, the performance of foreign securities depends on the political and economic environments and other overall
17
Brandes Emerging Markets Value Fund
economic conditions in the countries where the fund invests. Emerging country markets involve greater risk and volatility than more developed markets. Some emerging markets countries may have fixed or managed currencies that are not free-floating against the U.S. dollar. Certain of these currencies have experienced, and may experience in the future, substantial fluctuations or a steady devaluation relative to the U.S. dollar. Investments in small and medium capitalization companies tend to have limited liquidity and greater price volatility than investments in larger capitalization companies. Value stocks typically are less volatile than growth stocks; however, issues of value stocks typically have a lower expected growth rate in earnings and sales than issues of growth stocks.
Past performance is not a guarantee of future results.
Please refer to the Schedule of Investments in the report for complete holdings information. Fund holdings, geographic allocations and/or sector allocations are subject to change at any time and are not considered a recommendation to buy or sell any security.
The foregoing reflects the thoughts and opinions of Brandes Investment Partners® exclusively and is subject to change without notice.
Brandes Investment Partners® is a registered trademark of Brandes Investment Partners, L.P. in the United States and Canada.
Must be preceded or accompanied by a prospectus.
Index Guide
The MSCI Emerging Markets Index with net dividends captures large and mid cap representation of emerging market countries.
MSCI has not approved, reviewed or produced this report, makes no express or implied warranties or representations and is not liable whatsoever for any data in the report. You may not redistribute the MSCI data or use it as a basis for other indices or investment products.
One cannot invest directly in an index.
The Brandes Emerging Markets Value Fund is distributed by ALPS Distributors, Inc.
18
Brandes Emerging Markets Value Fund
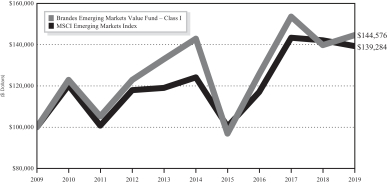
The following chart compares the value of a hypothetical $100,000 investment in the Brandes Emerging Markets Value Fund – Class I from September 30, 2009 to September 30, 2019 with the value of such an investment in the MSCI Emerging Markets Index for the same period.
Value of $100,000 Investment vs MSCI Emerging Markets Index (Unaudited)
| Average Annual Total Return Periods Ended September 30, 2019** | ||||||||||||||||
| One Year | Five Years | Ten Years | Since Inception(1) | |||||||||||||
Brandes Emerging Markets Value Fund | ||||||||||||||||
Class A | 3.10 | % | -0.02 | % | 3.50 | % | 6.89 | % | ||||||||
Class A (with maximum sales charge) | -2.83 | % | -1.20 | % | 2.89 | % | 6.62 | % | ||||||||
Class C* | 2.27 | % | -0.77 | % | 2.73 | % | 6.06 | % | ||||||||
Class C* (with maximum sales charge) | 1.27 | % | -0.77 | % | 2.73 | % | 6.06 | % | ||||||||
Class I | 3.41 | % | 0.24 | % | 3.76 | % | 7.13 | % | ||||||||
Class R6* | 3.45 | % | 0.36 | % | 3.84 | % | 7.20 | % | ||||||||
MSCI Emerging Markets Index | -2.02 | % | 2.33 | % | 3.37 | % | 5.82 | % | ||||||||
| (1) | The inception date is August 20, 1996. |
| * | Performance shown prior to January 31, 2013 for Class C shares reflects the performance of Class I shares adjusted to reflect Class C expenses. Performance shown prior to July 11, 2016 for Class R6 shares reflects the performance of Class I shares adjusted to reflect Class R6 expenses. |
| ** | Prior to January 31, 2011, the Advisor managed a private investment fund with an investment objective, investment policies and strategies that were, in all material respects, equivalent to those of the Brandes Emerging Markets Value Fund. The performance information shown for the Class I shares for periods before January 31, 2011 is that of the private investment fund and reflects the net expenses of the private investment fund. The performance of the private investment fund prior to January 31, 2011 is based on a calculation method that is different from the standardized calculation method prescribed by the SEC. The performance information shown for the Class A shares has been adjusted to reflect the differences in the net expense ratios between the Class I and A shares. The private investment fund was not registered under the Investment Company Act of 1940 (“1940 Act”) and was not subject to certain |
19
Brandes Emerging Markets Value Fund
| investment limitations, diversification requirements, and other restrictions imposed by the 1940 Act and the Internal Revenue Code of 1986, which, if applicable, may have adversely affected its performance. |
Performance data quoted represents past performance; past performance does not indicate future results. The investment return and principal value of an investment will fluctuate so that an investor’s shares, when redeemed, may be worth more or less than their original cost. Current performance of the Fund may be lower or higher than the performance quoted. Performance data current to the most recent month end may be obtained by calling 800-331-2979.
The returns shown do not reflect the deduction of taxes that a shareholder would pay on fund distributions or the redemption of fund shares. The Advisor has a fee waiver arrangement in place to limit the Fund’s annual operating expenses.
Sector Allocation as a Percentage of Total Investments as of
September 30, 2019 (Unaudited)
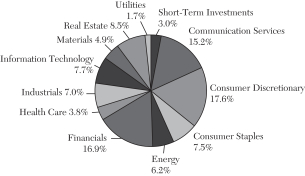
The sector classifications represented in the graph above are in accordance with Global Industry Classification Standard (GICS®), which was developed by and/or is the exclusive property of MSCI, Inc. and Standard & Poor Financial Services LLC.
20
Brandes International Small Cap Equity Fund
Dear Fellow Investor,
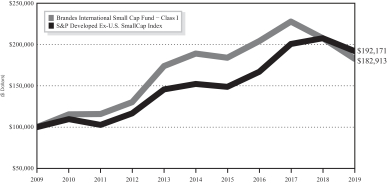
The net asset value of the Brandes International Small Cap Equity Fund (Class I Shares) fell 11.93% in the year ending September 30, 2019. For the same period, the S&P DevelopedEx-U.S. SmallCap Index declined 7.35%.
Portfolio holdings in the Electric Utilities, Equity Real Estate Investment Trusts (REITs) and Trading Cos. & Distributors industries were contributors to performance, while holdings in Household Durables, Food & Staples Retailing and Real Estate Management & Development detracted from returns.
Holdings in Brazil, Ireland and Italy contributed to performance, while results were hampered by holdings in United Kingdom, Canada and South Korea.
Three of the largest individual contributors to performance were CIA Paranaense de Energia (Brazil — Electric Utilities), C&C Group PLC (Ireland — Beverages) and Fibra Uno Admin. SA de C.V. (Mexico — Equity Real Estate Investment Trusts (REITs)). Dorel Industries Inc. (Canada — Household Durables), De La Rue Plc (United Kingdom — Commercial Services & Supplies) and Countrywide PLC (United Kingdom — Real Estate Management & Development) were three of the largest detractors from performance.
At the close of the period, the Fund’s largest country weights were in Japan and United Kingdom, and the Fund’s largest industry weights were in Food & Staples Retailing and Banks. Please note that while macro conditions are considered when we determine valuation estimates for individual companies, our country and industry weightings are aby-product ofbottom-up stock selection, not the result oftop-down observations.
After nearly a half-century of professional investing, Brandes Investment Partners remains fixed on its original goal. We pursue above-market returns to help you fulfill your long-term investment objectives. Our approach remains deeply rooted in the value philosophy and seeks to identify worthy but potentially underpriced companies. Thank you for your confidence in our approach.
Thank you for your business and continued trust.
Sincerely yours,
The BrandesSmall-Cap Investment Committee
Brandes Investment Trust
Because the values of the fund’s investments will fluctuate with market conditions, so will the value of your investment in the fund. You could lose money on your investment in the fund, or the fund could underperform other investments. The values of the fund’s investments fluctuate in response to the activities of individual companies and general stock market and economic conditions. In addition, the performance of foreign securities depends on the political and economic environments and other overall
21
Brandes International Small Cap Equity Fund
economic conditions in the countries where the fund invests. Emerging country markets involve greater risk and volatility than more developed markets. Some emerging markets countries may have fixed or managed currencies that are not free-floating against the U.S. dollar. Certain of these currencies have experienced, and may experience in the future, substantial fluctuations or a steady devaluation relative to the U.S. dollar. Investments in small and medium capitalization companies tend to have limited liquidity and greater price volatility than investments in larger capitalization companies. Value stocks typically are less volatile than growth stocks; however, issues of value stocks typically have a lower expected growth rate in earnings and sales than issues of growth stocks.
Past performance is not a guarantee of future results.
Please refer to the Schedule of Investments in the report for complete holdings information. Fund holdings, geographic allocations and/or sector allocations are subject to change at any time and are not considered a recommendation to buy or sell any security.
The foregoing reflects the thoughts and opinions of Brandes Investment Partners® exclusively and is subject to change without notice.
Brandes Investment Partners® is a registered trademark of Brandes Investment Partners, L.P. in the United States and Canada.
Must be preceded or accompanied by a prospectus.
Index Guide
The S&P DevelopedEx-U.S. SmallCap Index with net dividends measures the equity performance of small-capitalization companies from developed markets excluding the United States.
One cannot invest directly in an index.
The Brandes International Equity Small Cap Equity Fund is distributed by ALPS Distributors, Inc.
22
Brandes International Small Cap Equity Fund
The following chart compares the value of a hypothetical $100,000 investment in the Brandes International Small Cap Fund – Class I from September 30, 2009 to September 30, 2019 with the value of such an investment in the S&P DevelopedEx-U.S. SmallCap Index for the same period.
Value of $100,000 Investment vs S&P Developed
Ex-U.S. SmallCap Index (Unaudited)
| Average Annual Total Return Periods Ended September 30, 2019** | ||||||||||||||||
| One Year | Five Years | Ten Years | Since Inception(1) | |||||||||||||
Brandes International Small Cap Fund | ||||||||||||||||
Class A | -12.04 | % | -0.83 | % | 6.00 | % | 8.04 | % | ||||||||
Class A (with maximum sales charge) | -17.10 | % | -2.00 | % | 5.37 | % | 7.77 | % | ||||||||
Class C* | -12.69 | % | -1.55 | % | 5.21 | % | 7.24 | % | ||||||||
Class C* (with maximum sales charge) | -13.53 | % | -1.55 | % | 5.21 | % | 7.24 | % | ||||||||
Class I | -11.93 | % | -0.64 | % | 6.22 | % | 8.30 | % | ||||||||
Class R6* | -11.80 | % | -0.55 | % | 6.30 | % | 8.36 | % | ||||||||
S&P Developed Ex-U.S. SmallCap Index | -7.35 | % | 4.80 | % | 6.75 | % | 6.35 | % | ||||||||
| (1) | The inception date is August 19, 1996. |
| * | Performance shown prior to January 31, 2013 for Class C shares reflects the performance of Class I shares adjusted to reflect Class C expenses. Performance shown prior to June 27, 2016 for Class R6 shares reflects the performance of Class I shares adjusted to reflect Class R6 expenses. |
| ** | Prior to February 1, 2012, the Advisor managed a private investment fund with an investment objective, investment policies and strategies that were, in all material respects, equivalent to those of the Brandes International Small Cap Fund. The performance information shown for the Class I shares for periods before February 1, 2012 is that of the private investment fund and reflects the net expenses of the private investment fund. The performance of the private investment fund prior to February 1, 2012 is based on a calculation method that is different from the standardized calculation method prescribed by the SEC. The performance information shown for the Class A shares has been adjusted to reflect the differences in the net expense ratios between the Class I and A shares. The private investment fund was not registered under the Investment Company Act of 1940 (“1940 Act”) and was not subject to certain investment limitations, diversification requirements, and other restrictions imposed by the 1940 Act and the Internal Revenue Code of 1986, which, if applicable, may have adversely affected its performance. |
23
Brandes International Small Cap Equity Fund
Performance data quoted represents past performance; past performance does not indicate future results. The investment return and principal value of an investment will fluctuate so that an investor’s shares, when redeemed, may be worth more or less than their original cost. Current performance of the Fund may be lower or higher than the performance quoted. Performance data current to the most recent month end may be obtained by calling 800-331-2979.
The returns shown do not reflect the deduction of taxes that a shareholder would pay on fund distributions or the redemption of fund shares. The Advisor has a fee waiver arrangement in place to limit the Fund’s annual operating expenses.
Sector Allocation as a Percentage of Total Investments as of
September 30, 2019 (Unaudited)
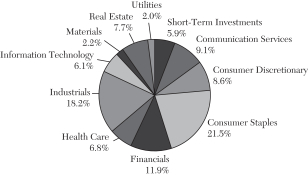
The sector classifications represented in the graph above are in accordance with Global Industry Classification Standard (GICS®), which was developed by and/or is the exclusive property of MSCI, Inc. and Standard & Poor Financial Services LLC.
24
Dear Fellow Investor,
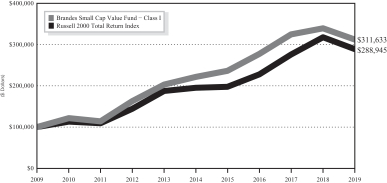
The net asset value of the Brandes Small Cap Value Fund (Class I Shares) declined 8.13% in the year ending September 30, 2019. For the same period, the Russell 2000 Index fell 8.89% while the Russell 2000 Value Index dropped 8.24%.
Portfolio holdings in the Specialty Retail, Capital Markets and Biotechnology industries were contributors to performance, while holdings in Machinery, Health Care Providers & Services and Communications Equipment detracted from returns.
Three of the largest individual contributors to performance were Taylor Morrison Home Corp (Household Durables),Rent-A-Center Inc (Specialty Retail) and World Fuel Services Corp (Oil, Gas & Consumable Fuels). Briggs & Stratton Corp (Machinery), Edgewell Personal Care (Personal Products) and CSS Industries Inc (Household Durables) were three of the largest detractors from performance.
At the close of the period, the Fund’s largest industry weights were in Household Durables and Biotechnology. Please note that while macro conditions are considered when we determine valuation estimates for individual companies, our industry weightings are aby-product ofbottom-up stock selection, not the result oftop-down observations.
For 45 years, Brandes Investment Partners has had the same goal: Seek better-than-market returns to help you pursue your long-term investment goals. We believe steadfast adherence to our value investing approach can help us achieve this aim because it compels us to invest in companies we view as strong yet appealingly priced. We thank you for your confidence and for investing with us.
Thank you for your business and continued trust.
Sincerely yours,
The BrandesSmall-Cap Investment Committee
Brandes Investment Trust
Because the values of the fund’s investments will fluctuate with market conditions, so will the value of your investment in the fund. You could lose money on your investment in the fund, or the fund could underperform other investments. The values of the fund’s investments fluctuate in response to the activities of individual companies and general stock market and economic conditions. Investments in small and medium capitalization companies tend to have limited liquidity and greater price volatility than investments in larger capitalization companies. Value stocks typically are less volatile than growth stocks; however, issues of value stocks typically have a lower expected growth rate in earnings and sales than issues of growth stocks.
25
Brandes Small Cap Value Fund
Past performance is not a guarantee of future results.
Please refer to the Schedule of Investments in the report for complete holdings information. Fund holdings, geographic allocations and/or sector allocations are subject to change at any time and are not considered a recommendation to buy or sell any security.
The foregoing reflects the thoughts and opinions of Brandes Investment Partners® exclusively and is subject to change without notice.
Brandes Investment Partners® is a registered trademark of Brandes Investment Partners, L.P. in the United States and Canada.
Must be preceded or accompanied by a prospectus.
Index Guide
The Russell 2000 Index with gross dividends measures the performance of the small cap segment of the U.S. equity universe.
The Russell 2000 Value Index with gross dividends measures performance of the small cap value segment of the U.S. equity universe. Securities are categorized as growth or value based on their relativebook-to-price ratios, historical sales growth, and expected earnings growth.
One cannot invest directly in an index.
The Brandes Small Cap Value Fund is distributed by ALPS Distributors, Inc.
26
Brandes Small Cap Value Fund
The following chart compares the value of a hypothetical $100,000 investment in the Brandes Small Cap Value Fund – Class I from September 30, 2009 to September 30, 2019 with the value of such an investment in the Russell 2000 Total Return Index for the same period.
Value of $100,000 Investment vs Russell 2000 Total Return Index (Unaudited)
| Average Annual Total Return Periods Ended September 30, 2019* | ||||||||||||||||
| One Year | Five Years | Ten Years | Since Inception(1) | |||||||||||||
Brandes Small Cap Value Fund | ||||||||||||||||
Class A | -8.53 | % | 6.76 | % | 11.74 | % | 6.30 | % | ||||||||
Class A (with maximum sales charge) | -13.82 | % | -5.50 | % | 11.80 | % | 6.01 | % | ||||||||
Class I | -8.13 | % | 7.06 | % | 12.04 | % | 6.57 | % | ||||||||
Class R6 | -15.36 | % | 5.43 | % | 11.18 | % | 6.20 | % | ||||||||
Russell 2000 Total Return Index | -8.89 | % | 8.19 | % | 11.19 | % | 7.06 | % | ||||||||
| (1) | The inception date is September 30, 1997. |
| * | Prior to January 2, 2018, the Advisor managed a private investment fund with an investment objective, investment policies and strategies that were, in all material respects, equivalent to those of the Brandes Small Cap Value Fund. The performance information shown for the Class I shares for periods before January 2, 2018 is that of the private investment fund and reflects the net expenses of the private investment fund. The performance of the private investment fund prior to January 2, 2018 is based on a calculation method that is different from the standardized calculation method prescribed by the SEC. The performance information shown for the Class A shares has been adjusted to reflect the differences in the net expense ratios between the Class I and A shares. Performance shown prior to January 2, 2018 for Class R6 shares reflects the performance of Class I shares. The private investment fund was not registered under the Investment Company Act of 1940 (“1940 Act”) and was not subject to certain investment limitations, diversification requirements, and other restrictions imposed by the 1940 Act and the Internal Revenue Code of 1986, which, if applicable, may have adversely affected its performance. |
27
Brandes Small Cap Value Fund
Performance data quoted represents past performance; past performance does not indicate future results. The investment return and principal value of an investment will fluctuate so that an investor’s shares, when redeemed, may be worth more or less than their original cost. Current performance of the Fund may be lower or higher than the performance quoted. Performance data current to the most recent month end may be obtained by calling 800-331-2979.
The returns shown do not reflect the deduction of taxes that a shareholder would pay on Fund distributions or the redemption of Fund shares. The Advisor has a fee waiver arrangement in place to limit the Fund’s annual operating expenses.
Sector Allocation as a Percentage of Total Investments as of
September 30, 2019 (Unaudited)
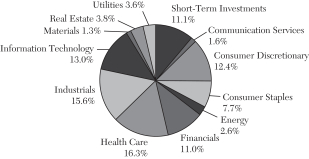
The sector classifications represented in the graph above are in accordance with Global Industry Classification Standard (GICS®), which was developed by and/or is the exclusive property of MSCI, Inc. and Standard & Poor Financial Services LLC.
28
Brandes Core Plus Fixed Income Fund
Dear Fellow Investor,
The net asset value of the Brandes Core Plus Fixed Income Fund (Class I Shares) gained 6.85% in the year ending September 30, 2019. For the same period, the Bloomberg Barclays Aggregate Bond Index increased 10.30%.
Relative performance was hurt by corporate bond investments in energy and telecommunications.
Within energy, unease about a global slowdown and an oversupply of oil and natural gas has caused underperformance throughout the sector. More specifically, bonds from Chesapeake Energy and Range Resources detracted from returns as the market expressed its concerns about debt levels from energy companies operating in the high-yield space.
The short-term sentiment, particularly regarding natural gas, has been decidedly negative, primarily as a result of abundant supply. However, the longer-term fundamentals are more positive. Based on our analysis, natural gas is capturing 70% of energy needs from coal plant retirements versus 30% for renewables. Export capacity is increasing: liquefied natural gas export terminals are coming online, and a new pipeline recently placed into service will increase export capacity to Mexico. Finally, investor demands for more capital discipline should serve to restrain volume growth.
During the third quarter 2019, Chesapeake engaged in two transactions that saw debt holders voluntarily swap $733 million in debt for common equity. During the past few years, Chesapeake has opportunistically extended debt maturities to lengthen their runway during a downturn; it has now turned its focus on debt reduction through equity swaps and possible asset sales. Chesapeake has been shifting their product mix toward higher margin oil, which should aid cash flow going forward.
In the telecommunications sector, Frontier Communications detracted from returns. Earlier this year, the company took positive steps to address balance sheet returns, including buying $56 million of its debt in the open market below par value and issuing $1.65 billion first-lien bonds maturing in 2027. Proceeds from the issuance were used to refinance a term loan set to mature in 2021. Frontier also announced an asset sale for $1.35 billion, with proceeds earmarked for additional debt reduction when the transaction closes.
Frontier continues to generate positive free cash flow and with the transactions highlighted above, has a visible path to paying down its maturities for the next three years (we own bonds with a scheduled maturity in 2021). However, its bond prices, continued to move lower in the quarter because a number of investors who own longer-maturity Frontier debt began agitating for the company to undertake a more comprehensive debt restructuring as the path to repay debt maturing in 2023 and beyond is far less certain.
29
Brandes Core Plus Fixed Income Fund
Given the sharp decline in interest rates, the Fund’s duration positioning toward the lower end of our duration-controlled band also detracted from returns.
Finally, the Fund’s defensive positioning in corporate bonds hurt relative performance. We have been favoring shorter maturity corporate bonds — the duration of our corporate bond exposure is under three years — with credit spreads at or near the tightest levels relative to U.S. Treasuries in decades. During the period, Intermediate maturity corporate bonds outperformed shorter maturity corporates.Year-to-date, the outperformance is quite stark as7- to10-year maturities delivered over 350bps more in return versus U.S. Treasury securities than corporate bonds with1- to3-year maturities.
The Fund received positive contributions more recently from Tenet Healthcare, which was subject to an early call at a premium, Pilgrim’s Pride Corp, and select holdings in banking (JPMorgan and U.S. Bank).
We increased our weight in agency mortgage-backed securities (MBS), as their performance lagged the broader market. The increase in overall market volatility and continued runoff of the Fed’s balance sheet agency MBS holdings, at about $200 billion over the past 12 months, caused yield spreads in the agency MBS market to widen to their highest levels in more than five years recently.
While we remain underweight agency MBS, we will consider additional purchases if recent weakness persists.
Toward the close of the period ending September 30, 2019, U.S. economic data reports were mixed. Economic reports about consumer spending — which represents abouttwo-thirds of the economy — have been largely positive. Manufacturing reports, however, have begun to show more weakness — understandable against the uncertainty of the ongoing trade war.
In this environment, the Brandes Core Plus Fixed Income Fund favors shorter maturity corporate bonds and those that, in our view, exhibit strong, tangible asset coverage. Although we added to our position during the period, we remain underweight agency MBS and we’ve been managing duration toward the shorter end of our duration-controlled range. We have a higher allocation to U.S. Treasuries that we will look to redeploy thoughtfully and efficiently — if and when market uncertainty and volatility cause credit fundamentals to become mispriced from our estimates of intrinsic value.
As always, thank you for your business and continued trust.
Sincerely yours,
The Brandes Fixed Income Investment Committee
Brandes Investment Trust
Because the values of the fund’s investments will fluctuate with market conditions, so will the value of your investment in the fund. You could lose
30
Brandes Core Plus Fixed Income Fund
money on your investment in the fund, or the fund could underperform other investments. The values of the fund’s investments fluctuate in response to the activities of individual companies and general bond market and economic conditions. Investments in small and medium capitalization companies tend to have limited liquidity and greater price volatility than large capitalization companies.
As with most fixed income funds, the income on and value of your shares in the fund will fluctuate along with interest rates. When interest rates rise, the market prices of the debt securities the fund owns usually decline. When interest rates fall, the prices of these securities usually increase. Generally, the longer the fund’s average portfolio maturity and the lower the average quality of its portfolio, the greater the price fluctuation. The price of any security owned by the fund may also fall in response to events affecting the issuer of the security, such as its ability to continue to make principal and interest payments or its credit rating. Below investment grade debt securities are speculative and involve a greater risk of default and price change due to changes in the issuer’s creditworthiness than higher grade debt. The market prices of these debt securities may fluctuate more than the market prices of investment grade debt securities and may decline significantly in periods of general economic difficulty.
Past performance is not a guarantee of future results.
Short-term debt refers to fixed income securities set to mature more 1 to 5 years from the issue or purchase date. Long-term debt refers to fixed income securities set to mature more than 10 years from the issue or purchase date.
Asset Coverage: A company’s ability to cover debt obligations with its assets after all liabilities have been satisfied. Source: Investopedia.com
Basis Point: 1/100 of 1%.
Duration: The weighted maturity of a fixed-income investment’s cash flows, used in the estimation of the price sensitivity of fixed-income securities for a given change in interest rates.
Free Cash Flow: Total cash flow from operations less capital expenditures.
Yield: Annual income from the investment (dividend, interest, etc.) divided by the current market price of the investment.
Yield Spread: The difference in yield from a Treasury security and another debt security of the same maturity.
Please refer to the Schedule of Investments in the report for complete holdings information. Fund holdings, geographic allocations and/or sector allocations are subject to change at any time and are not considered a recommendation to buy or sell any security.
31
Brandes Core Plus Fixed Income Fund
The foregoing reflects the thoughts and opinions of Brandes Investment Partners® exclusively and is subject to change without notice.
Brandes Investment Partners® is a registered trademark of Brandes Investment Partners, L.P. in the United States and Canada.
Must be preceded or accompanied by a prospectus.
Index Guide
The Bloomberg Barclays U.S. Aggregate Bond Index is a broad-based benchmark that measures the investment grade, U.S. dollar-denominated, fixed-rate taxable bond market. This index is a total return index which reflects the price changes and interest of each bond in the index.
One cannot invest directly in an index.
The Brandes Core Plus Fixed Income Fund is distributed by ALPS Distributors, LLC.
32
Brandes Core Plus Fixed Income Fund
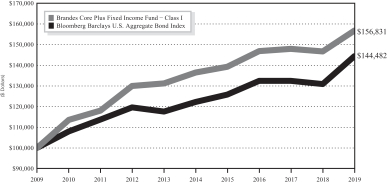
The following chart compares the value of a hypothetical $100,000 investment in the Brandes Core Plus Fixed Income Fund – Class I from September 30, 2009 to September 30, 2019 with the value of such an investment in the Bloomberg Barclays U.S. Aggregate Bond Index for the same period.
Value of $100,000 Investment vs Bloomberg Barclays U.S. Aggregate Bond Index (Unaudited)
| Average Annual Total Return Periods Ended September 30, 2019 | ||||||||||||||||
| One Year | Five Years | Ten Years | Since Inception(1) | |||||||||||||
Brandes Core Plus Fixed Income Fund | ||||||||||||||||
Class A* | 6.56 | % | 2.53 | % | 4.29 | % | 3.54 | % | ||||||||
Class A* (with maximum sales charge) | 2.61 | % | 1.75 | % | 3.89 | % | 3.20 | % | ||||||||
Class I | 6.85 | % | 2.79 | % | 4.60 | % | 3.83 | % | ||||||||
Class R6* | 7.40 | % | 3.13 | % | 4.80 | % | 4.01 | % | ||||||||
Bloomberg Barclays U.S. Aggregate Bond Index | 10.30 | % | 3.38 | % | 3.75 | % | 4.15 | % | ||||||||
| (1) | The inception date is December 28, 2007. |
| * | Performance shown prior to January 31, 2013 for Class A shares reflects the performance of Class I shares adjusted to reflect Class A expenses. Performance shown prior to October 10, 2017 for Class R6 shares reflects the performance of Class I shares adjusted to reflect Class R6 expenses. |
Performance data quoted represents past performance; past performance does not indicate future results. The investment return and principal value of an investment will fluctuate so that an investor’s shares, when redeemed, may be worth more or less than their original cost. Current performance of the Fund may be lower or higher than the performance quoted. Performance data current to the most recent month end may be obtained by calling 800-331-2979.
33
Brandes Core Plus Fixed Income Fund
The returns shown do not reflect the deduction of taxes that a shareholder would pay on fund distributions or the redemption of Fund shares. The Advisor has a fee waiver arrangement in place to limit the Fund’s annual operating expenses.
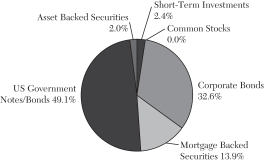
Asset Allocation as a Percentage of Total Investments as of
September 30, 2019 (Unaudited)
34
Brandes Investment Trust
As a shareholder of a Fund, you incur ongoing costs, including investment advisory and administrative fees and other fund expenses. The examples below are intended to help you understand your ongoing costs (in dollars) of investing in the Funds and to compare these costs with ongoing costs of investing in other mutual funds.
The examples are based on an investment of $1,000 invested at the beginning of the period and held for the entire period from April 1, 2019 to September 30, 2019 (the “Period”).
Actual Expenses
This section provides information about actual account values and actual expenses. The “Ending Account Value” shown is derived from each Fund’s actual return. You may use the information in this section, together with the amount you invested, to estimate the expenses that you paid over the period. Simply divide your account value by $1,000 (for example, an $8,600 account value divided by $1,000 = 8.6), then multiply the result by the number given for the Fund under the heading “Expenses Paid During Period” to estimate the expenses you paid on your account during this period.
| Class A | ||||||||||||||||
Fund | Beginning Account Value | Ending Account Value | Annualized Expense Ratio | Expenses Paid During the Period* | ||||||||||||
International Equity Fund | $ | 1,000.00 | $ | 990.60 | 1.16% | $ | 5.79 | |||||||||
Global Equity Fund | $ | 1,000.00 | $ | 1,001.40 | 1.25% | $ | 6.27 | |||||||||
Global Equity Income Fund | $ | 1,000.00 | $ | 997.40 | 1.25% | $ | 6.26 | |||||||||
Emerging Markets Value Fund | $ | 1,000.00 | $ | 1,007.60 | 1.35% | $ | 6.79 | |||||||||
International Small Cap Fund | $ | 1,000.00 | $ | 956.20 | 1.33% | $ | 6.52 | |||||||||
Small Cap Value Fund | $ | 1,000.00 | $ | 997.40 | 1.15% | $ | 5.76 | |||||||||
Core Plus Fixed Income Fund | $ | 1,000.00 | $ | 1,033.20 | 0.70% | $ | 3.57 | |||||||||
| Class C | ||||||||||||||||
Fund | Beginning Account Value | Ending Account Value | Annualized Expense Ratio | Expenses Paid During the Period* | ||||||||||||
International Equity Fund | $ | 1,000.00 | $ | 987.10 | 1.91% | $ | 9.51 | |||||||||
Global Equity Fund | $ | 1,000.00 | $ | 997.50 | 2.00% | $ | 10.01 | |||||||||
Global Equity Income Fund | $ | 1,000.00 | $ | 994.50 | 2.00% | $ | 10.00 | |||||||||
Emerging Markets Value Fund | $ | 1,000.00 | $ | 1,003.70 | 2.09% | $ | 10.50 | |||||||||
International Small Cap Fund | $ | 1,000.00 | $ | 953.00 | 2.09% | $ | 10.23 | |||||||||
35
Brandes Investment Trust
| Class I | ||||||||||||||||
Fund | Beginning Account Value | Ending Account Value | Annualized Expense Ratio | Expenses Paid During the Period* | ||||||||||||
International Equity Fund | $ | 1,000.00 | $ | 991.70 | 0.90% | $ | 4.49 | |||||||||
Global Equity Fund | $ | 1,000.00 | $ | 1,002.40 | 1.00% | $ | 5.02 | |||||||||
Global Equity Income Fund | $ | 1,000.00 | $ | 998.30 | 1.00% | $ | 5.01 | |||||||||
Emerging Markets Value Fund | $ | 1,000.00 | $ | 1,008.50 | 1.12% | $ | 5.64 | |||||||||
International Small Cap Fund | $ | 1,000.00 | $ | 956.50 | 1.15% | $ | 5.64 | |||||||||
Small Cap Value Fund | $ | 1,000.00 | $ | 1,000.00 | 0.90% | $ | 4.51 | |||||||||
Core Plus Fixed Income Fund | $ | 1,000.00 | $ | 1,034.00 | 0.50% | $ | 2.55 | |||||||||
| Class R6 | ||||||||||||||||
Fund | Beginning Account Value | Ending Account Value | Annualized Expense Ratio | Expenses Paid During the Period* | ||||||||||||
International Equity Fund | $ | 1,000.00 | $ | 992.60 | 0.78% | $ | 3.90 | |||||||||
Emerging Markets Value Fund | $ | 1,000.00 | $ | 1,009.90 | 0.97% | $ | 4.89 | |||||||||
International Small Cap Fund | $ | 1,000.00 | $ | 956.50 | 1.00% | $ | 4.91 | |||||||||
Small Cap Value Fund | $ | 1,000.00 | $ | 920.80 | 0.72% | $ | 3.47 | |||||||||
Core Plus Fixed Income Fund | $ | 1,000.00 | $ | 1,036.30 | 0.35% | $ | 1.79 | |||||||||
| * | Expenses are equal to the Fund’s expense ratio for the period, multiplied by the average account value over the period, multiplied by 183/365 (to reflect the one-half year period). |
Hypothetical Example for Comparison Purposes
This section provides information about hypothetical account values and hypothetical expenses based on the Funds’ actual expense ratios and an assumed rate of return of 5% per year before expenses, which are not the Funds’ actual returns. The hypothetical account values and expenses may not be used to estimate the actual ending account balance or expenses you paid for the period. You may use this information to compare the ongoing costs of investing in the Funds and other mutual funds. To do so, compare this 5% hypothetical example with the 5% hypothetical examples that appear in the shareholder reports of the other mutual funds.
Please note that the expenses shown in the table are meant to highlight your ongoing costs only and do not reflect any transaction costs, such as brokerage commissions on purchase and sales of Fund shares. Therefore, the last column of the table is useful in comparing ongoing costs only, and will not help you determine the relative total costs of owning different funds. In addition, if these transactional costs were included, your costs would have been higher.
36
Brandes Investment Trust
| Class A | ||||||||||||||||
Fund | Beginning Account Value | Ending Account Value | Annualized Expense Ratio | Expenses Paid During the Period* | ||||||||||||
International Equity Fund | $ | 1,000.00 | $ | 1,019.25 | 1.16% | $ | 5.87 | |||||||||
Global Equity Fund | $ | 1,000.00 | $ | 1,018.80 | 1.25% | $ | 6.33 | |||||||||
Global Equity Income Fund | $ | 1,000.00 | $ | 1,018.80 | 1.25% | $ | 6.33 | |||||||||
Emerging Markets Value Fund | $ | 1,000.00 | $ | 1,018.30 | 1.35% | $ | 6.83 | |||||||||
International Small Cap Fund | $ | 1,000.00 | $ | 1,018.40 | 1.33% | $ | 6.73 | |||||||||
Small Cap Value Fund | $ | 1,000.00 | $ | 1,019.30 | 1.15% | $ | 5.82 | |||||||||
Core Plus Fixed Income Fund | $ | 1,000.00 | $ | 1,021.56 | 0.70% | $ | 3.55 | |||||||||
| Class C | ||||||||||||||||
Fund | Beginning Account Value | Ending Account Value | Annualized Expense Ratio | Expenses Paid During the Period* | ||||||||||||
International Equity Fund | $ | 1,000.00 | $ | 1,015.49 | 1.91% | $ | 9.65 | |||||||||
Global Equity Fund | $ | 1,000.00 | $ | 1,015.04 | 2.00% | $ | 10.10 | |||||||||
Global Equity Income Fund | $ | 1,000.00 | $ | 1,015.04 | 2.00% | $ | 10.10 | |||||||||
Emerging Markets Value Fund | $ | 1,000.00 | $ | 1,014.59 | 2.09% | $ | 10.56 | |||||||||
International Small Cap Fund | $ | 1,000.00 | $ | 1,014.59 | 2.09% | $ | 10.56 | |||||||||
| Class I | ||||||||||||||||
Fund | Beginning Account Value | Ending Account Value | Annualized Expense Ratio | Expenses Paid During the Period* | ||||||||||||
International Equity Fund | $ | 1,000.00 | $ | 1,020.56 | 0.90% | $ | 4.56 | |||||||||
Global Equity Fund | $ | 1,000.00 | $ | 1,020.05 | 1.00% | $ | 5.06 | |||||||||
Global Equity Income Fund | $ | 1,000.00 | $ | 1,020.05 | 1.00% | $ | 5.06 | |||||||||
Emerging Markets Value Fund | $ | 1,000.00 | $ | 1,019.45 | 1.12% | $ | 5.67 | |||||||||
International Small Cap Fund | $ | 1,000.00 | $ | 1,019.30 | 1.15% | $ | 5.82 | |||||||||
Small Cap Value Fund | $ | 1,000.00 | $ | 1,020.56 | 0.90% | $ | 4.56 | |||||||||
Core Plus Fixed Income Fund | $ | 1,000.00 | $ | 1,022.56 | 0.50% | $ | 2.54 | |||||||||
| Class R6 | ||||||||||||||||
Fund | Beginning Account Value | Ending Account Value | Annualized Expense Ratio | Expenses Paid During the Period* | ||||||||||||
International Equity Fund | $ | 1,000.00 | $ | 1,021.16 | 0.78% | $ | 3.95 | |||||||||
Emerging Markets Value Fund | $ | 1,000.00 | $ | 1,020.21 | 0.97% | $ | 4.91 | |||||||||
International Small Cap Fund | $ | 1,000.00 | $ | 1,020.05 | 1.00% | $ | 5.06 | |||||||||
Small Cap Value Fund | $ | 1,000.00 | $ | 1,021.46 | 0.72% | $ | 3.65 | |||||||||
Core Plus Fixed Income Fund | $ | 1,000.00 | $ | 1,023.31 | 0.35% | $ | 1.78 | |||||||||
| * | Expenses are equal to the Fund’s expense ratio for the period, multiplied by the average account value over the period, multiplied by 183/365 (to reflect the one-half year period). |
37
Brandes International Equity Fund
SCHEDULE OF INVESTMENTS — September 30, 2019
| Shares | Value | |||||||
| COMMON STOCKS – 92.87% | ||||||||
| Brazil – 1.84% | ||||||||
| 750,182 | Embraer SA Sponsored – ADR | $ | 12,940,640 | |||||
|
| |||||||
| China – 1.46% | ||||||||
| 1,241,000 | China Mobile Ltd. | 10,280,136 | ||||||
|
| |||||||
| Finland – 1.62% | ||||||||
| 2,255,736 | Nokia OYJ | 11,392,193 | ||||||
|
| |||||||
| France – 18.24% | ||||||||
| 1,001,334 | Carrefour SA | 17,515,666 | ||||||
| 360,304 | Compagnie de Saint-Gobain SA | 14,121,344 | ||||||
| 1,220,263 | Engie SA | 19,917,406 | ||||||
| 701,975 | Orange SA | 10,987,312 | ||||||
| 298,091 | Publicis Groupe SA | 14,667,691 | ||||||
| 119,629 | Renault SA | 6,865,904 | ||||||
| 308,608 | Sanofi | 28,587,325 | ||||||
| 102,505 | Schneider Electric SE | 8,963,284 | ||||||
| 46,177 | Societe BIC SA | 3,100,377 | ||||||
| 68,054 | Total SA | 3,543,362 | ||||||
|
| |||||||
| 128,269,671 | ||||||||
|
| |||||||
| Germany – 1.57% | ||||||||
| 158,377 | BASF SE | 11,073,453 | ||||||
|
| |||||||
| Hong Kong – 0.65% | ||||||||
| 11,842,000 | First Pacific Co. Ltd. | 4,533,422 | ||||||
|
| |||||||
| Ireland – 1.87% | ||||||||
| 384,232 | CRH Plc | 13,175,313 | ||||||
|
| |||||||
| Italy – 6.40% | ||||||||
| 968,468 | Eni SpA | 14,802,860 | ||||||
| 5,328,543 | Intesa Sanpaolo SpA(a) | 12,622,404 | ||||||
| 30,748,839 | Telecom Italia Rsp | 16,819,646 | ||||||
| 1,365,052 | Telecom Italia SpA | 779,429 | ||||||
|
| |||||||
| 45,024,339 | ||||||||
|
| |||||||
| Japan – 14.90% | ||||||||
| 542,400 | Dai Nippon Printing Co. Ltd. | 14,070,386 | ||||||
| 456,200 | Honda Motor Co. Ltd. | 11,945,344 | ||||||
| 1,103,700 | Mitsubishi Tanabe Pharma Corp. | 12,163,123 | ||||||
| 2,734,800 | Mitsubishi UFJ Financial Group, Inc. | 13,927,959 | ||||||
| 471,999 | MS&AD Insurance Group Holdings, Inc. | 15,341,930 | ||||||
| Shares | Value | |||||||
| 760,700 | Nissan Motor Co. Ltd. | $ | 4,749,321 | |||||
| 364,800 | Sumitomo Mitsui Trust Holdings, Inc. | 13,210,102 | ||||||
| 72,000 | Taisho Pharmaceutical Holdings Co. Ltd. | 5,264,657 | ||||||
| 410,683 | Takeda Pharmaceutical Co. Ltd. | 14,092,867 | ||||||
|
| |||||||
| 104,765,689 | ||||||||
|
| |||||||
| Mexico – 4.37% | ||||||||
| 2,620,613 | Cemex SAB de CV Sponsored – ADR(a) | 10,272,803 | ||||||
| 13,986,944 | Fibra Uno Administracion SA de CV | 20,490,653 | ||||||
|
| |||||||
| 30,763,456 | ||||||||
|
| |||||||
| Netherlands – 2.25% | ||||||||
| 2,056,796 | Aegon NV(a) | 8,542,167 | ||||||
| 66,690 | NXP Semiconductors NV | 7,277,213 | ||||||
|
| |||||||
| 15,819,380 | ||||||||
|
| |||||||
| Russia – 1.37% | ||||||||
| 1,556,496 | Mobile TeleSystems PJSC | 6,359,902 | ||||||
| 934,737 | Public Joint-Stock Co. Gazprom | 3,255,833 | ||||||
|
| |||||||
| 9,615,735 | ||||||||
|
| |||||||
| South Korea – 5.21% | ||||||||
| 181,653 | Hana Financial Group, Inc. | 5,347,315 | ||||||
| 66,213 | Hyundai Mobis Co. Ltd. | 13,934,065 | ||||||
| 60,185 | Hyundai Motor Co. | 6,738,609 | ||||||
| 78,870 | KT&G Corp. | 6,958,333 | ||||||
| 19,278 | POSCO | 3,654,297 | ||||||
|
| |||||||
| 36,632,619 | ||||||||
|
| |||||||
| Spain – 1.90% | ||||||||
| 855,737 | Repsol SA | 13,346,107 | ||||||
|
| |||||||
| Switzerland – 7.23% | ||||||||
| 1,322,764 | Credit Suisse Group AG | 16,181,525 | ||||||
| 20,996 | Swatch Group Ltd. Bearer | 5,574,466 | ||||||
The accompanying notes to financial statements are an integral part of these Schedule of Investments.
38
Brandes International Equity Fund
SCHEDULE OF INVESTMENTS — September 30, 2019 (continued)
| Shares | Value | |||||||
| 79,685 | Swatch Group Ltd. Registered | $ | 4,004,541 | |||||
| 90,598 | Swiss Resources AG | 9,453,340 | ||||||
| 1,377,705 | UBS Group AG | 15,643,070 | ||||||
|
| |||||||
| 50,856,942 | ||||||||
|
| |||||||
| Taiwan – 1.36% | ||||||||
| 1,436,000 | Asustek Computer, Inc. | 9,556,349 | ||||||
|
| |||||||
| United Kingdom – 20.63% | ||||||||
| 5,919,246 | Barclays Plc(a) | 10,906,162 | ||||||
| 1,792,930 | BP Plc | 11,350,558 | ||||||
| 4,333,899 | G4S Plc | 10,093,331 | ||||||
| 1,275,152 | GlaxoSmithKline Plc | 27,332,245 | ||||||
| 915,298 | HSBC Holdings Plc | 7,013,215 | ||||||
| 273,504 | Imperial Brands Plc | 6,141,825 | ||||||
| 4,945,983 | J Sainsbury Plc | 13,346,163 | ||||||
| 4,889,136 | Kingfisher Plc | 12,425,118 | ||||||
| 4,179,971 | Marks & Spencer Group Plc | 9,467,464 | ||||||
| Shares | Value | |||||||
| 3,632,234 | Tesco Plc | $ | 10,738,543 | |||||
| 3,807,408 | Wm Morrison Supermarkets Plc | 9,374,652 | ||||||
| 1,353,138 | WPP Plc | 16,943,048 | ||||||
|
| |||||||
| 145,132,324 | ||||||||
|
| |||||||
| | TOTAL COMMON STOCKS | $ | 653,177,768 | |||||
|
| |||||||
| PREFERRED STOCKS – 3.26% | ||||||||
| Brazil – 1.69% | ||||||||
| 1,028,300 | Petroleo Brasileiro SA | $ | 6,808,393 | |||||
| 386,200 | Telefonica Brasil SA | 5,102,921 | ||||||
|
| |||||||
| 11,911,314 | ||||||||
|
| |||||||
| Russia – 1.57% | ||||||||
| 19,087,950 | Surgutneftegas PJSC | 11,025,123 | ||||||
|
| |||||||
| | TOTAL PREFERRED STOCKS | $ | 22,936,437 | |||||
|
| |||||||
| Shares | Value | |||||||
| SHORT-TERM INVESTMENTS – 3.70% |
| |||||||
| Money Market Funds – 3.70% | ||||||||
BlackRock Liquidity Funds T-Fund – Institutional Class, 1.834%(b) | 26,029,138 | $ | 26,029,138 | |||||
|
| |||||||
TOTAL SHORT–TERM INVESTMENTS | $ | 26,029,138 | ||||||
|
| |||||||
Total Investments (Cost $825,638,340) – 99.83% | $ | 702,143,343 | ||||||
Other Assets in Excess of Liabilities – 0.17% | 1,221,133 | |||||||
|
| |||||||
TOTAL NET ASSETS – 100.00% | $ | 703,364,476 | ||||||
|
| |||||||
Percentages are stated as a percent of net assets.
ADR American Depository Receipt
| (a) | Non–income producing security. |
| (b) | The rate shown is the annualized seven day yield as of September 30, 2019. |
The accompanying notes to financial statements are an integral part of these Schedule of Investments.
39
Brandes International Equity Fund
SCHEDULE OF INVESTMENTS BY INDUSTRY — September 30, 2019
COMMON STOCKS | ||||
Aerospace & Defense | 1.84 | % | ||
Auto Components | 1.98 | % | ||
Automobiles | 4.31 | % | ||
Banks | 8.97 | % | ||
Building Products | 2.01 | % | ||
Capital Markets | 4.52 | % | ||
Chemicals | 1.57 | % | ||
Commercial Services & Supplies | 3.88 | % | ||
Communications Equipment | 1.62 | % | ||
Construction Materials | 3.33 | % | ||
Diversified Financial Services | 0.64 | % | ||
Diversified Telecommunication Services | 4.06 | % | ||
Electrical Equipment | 1.27 | % | ||
Equity Real Estate Investment Trusts | 2.91 | % | ||
Food & Staples Retailing | 7.26 | % | ||
Insurance | 4.74 | % | ||
Media | 4.49 | % | ||
Metals & Mining | 0.52 | % | ||
Multiline Retail | 1.35 | % | ||
Multi-Utilities | 2.83 | % | ||
Oil, Gas & Consumable Fuels | 6.58 | % | ||
Pharmaceuticals | 12.44 | % | ||
Semiconductors & Semiconductor Equipment | 1.03 | % | ||
Specialty Retail | 1.77 | % | ||
Technology Hardware, Storage & Peripherals | 1.36 | % | ||
Textiles, Apparel & Luxury Goods | 1.36 | % | ||
Tobacco | 1.86 | % | ||
Wireless Telecommunication Services | 2.37 | % | ||
|
| |||
TOTAL COMMON STOCKS | 92.87 | % | ||
|
| |||
PREFERRED STOCKS | ||||
Diversified Telecommunication Services | 0.73 | % | ||
Oil, Gas & Consumable Fuels | 2.53 | % | ||
|
| |||
TOTAL PREFERRED STOCKS | 3.26 | % | ||
|
| |||
SHORT-TERM INVESTMENTS | 3.70 | % | ||
|
| |||
TOTAL INVESTMENTS | 99.83 | % | ||
Other Assets in Excess of Liabilities | 0.17 | % | ||
|
| |||
TOTAL NET ASSETS | 100.00 | % | ||
|
| |||
The industry classifications represented in the Schedule of Investments are in accordance with Global Industry Classification Standards (GICS®), which was developed by and/or is the exclusive property of MSCI, Inc. and Standard & Poor Financial Services LLC or were otherwise determined by the Adviser to be appropriate. This information is unaudited.
The accompanying notes to financial statements are an integral part of these Schedule of Investments.
40
SCHEDULE OF INVESTMENTS — September 30, 2019
| Shares | Value | |||||||
| COMMON STOCKS – 96.50% | ||||||||
| Austria – 1.42% | ||||||||
| 15,451 | Erste Group Bank AG | $ | 510,651 | |||||
|
| |||||||
| Brazil – 2.18% | ||||||||
| 168,920 | Embraer SA | 730,979 | ||||||
| 3,247 | Embraer SA Sponsored – ADR | 56,011 | ||||||
|
| |||||||
| 786,990 | ||||||||
|
| |||||||
| China – 1.24% | ||||||||
| 54,000 | China Mobile Ltd. | 447,323 | ||||||
|
| |||||||
| Finland – 1.81% | ||||||||
| 129,201 | Nokia OYJ | 652,507 | ||||||
|
| |||||||
| France – 14.02% | ||||||||
| 19,278 | Carrefour SA | 337,217 | ||||||
| 34,611 | Engie SA | 564,929 | ||||||
| 31,200 | Engie SA Registered Shares (Prime Fidelite 2019) | 509,253 | ||||||
| 11,504 | Publicis Groupe SA | 566,059 | ||||||
| 15,242 | Sanofi | 1,411,914 | ||||||
| 11,535 | Schneider Electric SE | 1,008,648 | ||||||
| 12,667 | Total SA | 659,532 | ||||||
|
| |||||||
| 5,057,552 | ||||||||
|
| |||||||
| Ireland – 1.38% | ||||||||
| 14,480 | CRH Plc | 496,519 | ||||||
|
| |||||||
| Italy – 2.64% | ||||||||
| 39,071 | Eni SpA | 597,193 | ||||||
| 653,887 | Telecom Italia Rsp | 357,677 | ||||||
|
| |||||||
| 954,870 | ||||||||
|
| |||||||
| Japan – 2.98% | ||||||||
| 22,700 | Honda Motor Co. Ltd. | 594,387 | ||||||
| 77,100 | Nissan Motor Co. Ltd. | 481,363 | ||||||
|
| |||||||
| 1,075,750 | ||||||||
|
| |||||||
| Malaysia – 1.50% | ||||||||
| 394,700 | Genting Berhad | 541,339 | ||||||
|
| |||||||
| Mexico – 2.22% | ||||||||
| 547,053 | Fibra Uno Administracion SA de CV | 801,424 | ||||||
|
| |||||||
| Shares | Value | |||||||
| Netherlands – 1.47% | ||||||||
| 4,857 | NXP Semiconductors NV | $ | 529,996 | |||||
|
| |||||||
| Russia – 0.80% | ||||||||
| 82,434 | Public Joint-Stock Co. Gazprom | 287,130 | ||||||
|
| |||||||
| South Korea – 5.84% | ||||||||
| 2,944 | Hyundai Mobis Co. Ltd. | 619,544 | ||||||
| 5,486 | Hyundai Motor Co. | 614,239 | ||||||
| 4,364 | KT&G Corp. | 385,015 | ||||||
| 11,877 | Samsung Electronics Co. Ltd. | 486,293 | ||||||
|
| |||||||
| 2,105,091 | ||||||||
|
| |||||||
| Spain – 1.36% | ||||||||
| 31,540 | Repsol SA | 491,899 | ||||||
|
| |||||||
| Switzerland – 4.57% | ||||||||
| 57,619 | Credit Suisse Group AG | 704,860 | ||||||
| 2,612 | Swiss Resources AG | 272,546 | ||||||
| 59,244 | UBS Group AG | 672,682 | ||||||
|
| |||||||
| 1,650,088 | ||||||||
|
| |||||||
| United Kingdom – 17.63% | ||||||||
| 143,033 | Barclays Plc(a) | 263,537 | ||||||
| 130,274 | BP Plc | 824,730 | ||||||
| 64,998 | GlaxoSmithKline Plc | 1,393,199 | ||||||
| 44,512 | HSBC Holdings Plc | 341,061 | ||||||
| 29,628 | Imperial Brands Plc | 665,329 | ||||||
| 177,095 | J Sainsbury Plc | 477,870 | ||||||
| 196,456 | Kingfisher Plc | 499,268 | ||||||
| 105,291 | Marks & Spencer Group Plc | 238,480 | ||||||
| 235,094 | Tesco Plc | 695,045 | ||||||
| 105,820 | Wm Morrison Supermarkets Plc | 260,552 | ||||||
| 55,999 | WPP Plc | 701,180 | ||||||
|
| |||||||
| 6,360,251 | ||||||||
|
| |||||||
The accompanying notes to financial statements are an integral part of these Schedule of Investments.
41
Brandes Global Equity Fund
SCHEDULE OF INVESTMENTS — September 30, 2019 (continued)
| Shares | Value | |||||||
| United States – 33.44% | ||||||||
| 12,966 | American International Group, Inc.(a) | $ | 722,206 | |||||
| 25,685 | Bank of America Corp. | 749,231 | ||||||
| 14,465 | Bank of New York Mellon Corp. | 653,963 | ||||||
| 17,061 | Cardinal Health, Inc. | 805,109 | ||||||
| 2,736 | Cigna Corp. | 415,297 | ||||||
| 19,528 | Citigroup, Inc. | 1,348,994 | ||||||
| 6,852 | CVS Health Corp. | 432,156 | ||||||
| 6,778 | Emerson Electric Co. | 453,177 | ||||||
| 24,045 | Halliburton Co. | 453,248 | ||||||
| 3,253 | HCA Healthcare, Inc. | 391,726 | ||||||
| 18,783 | Jefferies Financial Group, Inc. | 345,607 | ||||||
| 2,867 | Laboratory Corp. of America Holdings(a) | 481,656 | ||||||
| Shares | Value | |||||||
| 6,942 | McKesson Corp. | $ | 948,694 | |||||
| 9,194 | Merck & Co., Inc. | 773,951 | ||||||
| 1,973 | Microsoft Corp. | 274,306 | ||||||
| 1,391 | PepsiCo, Inc. | 190,706 | ||||||
| 20,873 | Pfizer, Inc. | 749,967 | ||||||
| 3,436 | PNC Financial Services Group, Inc. | 481,590 | ||||||
| 8,814 | State Street Corp. | 521,701 | ||||||
| 17,240 | Wells Fargo & Co. | 869,586 | ||||||
|
| |||||||
| 12,062,871 | ||||||||
|
| |||||||
| | TOTAL COMMON STOCKS | $ | 34,812,251 | |||||
|
| |||||||
PREFERRED STOCKS – 0.36% | ||||||||
| South Korea – 0.36% | ||||||||
| 3,912 | Samsung Electronics Co. Ltd. | $ | 129,131 | |||||
|
| |||||||
| | TOTAL PREFERRED | $ | 129,131 | |||||
|
| |||||||
| Shares | Value | |||||||
| SHORT–TERM INVESTMENTS – 3.57% |
| |||||||
| Money Market Funds – 3.57% | ||||||||
BlackRock Liquidity Funds T-Fund – Institutional Class, 1.834%(b) | 1,288,678 | $ | 1,288,678 | |||||
|
| |||||||
TOTAL SHORT-TERM INVESTMENTS | $ | 1,288,678 | ||||||
|
| |||||||
Total Investments (Cost $32,651,804) – 100.43% | $ | 36,230,060 | ||||||
Liabilites in Escess of Other Assets – (0.43)% | (158,251 | ) | ||||||
|
| |||||||
TOTAL NET ASSETS – 100.00% | $ | 36,071,809 | ||||||
|
| |||||||
Percentages are stated as a percent of net assets.
ADR American Depository Receipt
| (a) | Non-income producing security. |
| (b) | The rate shown is the annualized seven day yield as of September 30, 2019. |
The accompanying notes to financial statements are an integral part of these Schedule of Investments.
42
Brandes Global Equity Fund
SCHEDULE OF INVESTMENTS BY INDUSTRY — September 30, 2019
COMMON STOCKS | ||||
Aerospace & Defense | 2.18 | % | ||
Auto Components | 1.72 | % | ||
Automobiles | 4.68 | % | ||
Banks | 12.65 | % | ||
Beverages | 0.53 | % | ||
Capital Markets | 7.08 | % | ||
Communications Equipment | 1.81 | % | ||
Construction Materials | 1.38 | % | ||
Diversified Financial Services | 0.96 | % | ||
Diversified Telecommunication Services | 0.99 | % | ||
Electrical Equipment | 4.05 | % | ||
Energy Equipment & Services | 1.26 | % | ||
Equity Real Estate Investment Trusts | 2.22 | % | ||
Food & Staples Retailing | 4.91 | % | ||
Health Care Providers & Services | 9.63 | % | ||
Hotels, Restaurants & Leisure | 1.50 | % | ||
Insurance | 2.76 | % | ||
Media | 3.51 | % | ||
Multiline Retail | 0.66 | % | ||
Multi-Utilities | 2.98 | % | ||
Oil, Gas & Consumable Fuels | 7.93 | % | ||
Pharmaceuticals | 12.00 | % | ||
Semiconductors & Semiconductor Equipment | 1.47 | % | ||
Software | 0.76 | % | ||
Specialty Retail | 1.38 | % | ||
Technology Hardware, Storage & Peripherals | 1.35 | % | ||
Tobacco | 2.91 | % | ||
Wireless Telecommunication Services | 1.24 | % | ||
|
| |||
TOTAL COMMON STOCKS | 96.50 | % | ||
|
| |||
PREFERRED STOCKS | ||||
Technology Hardware, Storage & Peripherals | 0.36 | % | ||
|
| |||
TOTAL PREFERRED STOCKS | 0.36 | % | ||
|
| |||
SHORT-TERM INVESTMENTS | 3.57 | % | ||
|
| |||
TOTAL INVESTMENTS | 100.43 | % | ||
Liabilities in Excess of Other Assets | (0.43 | )% | ||
|
| |||
TOTAL NET ASSETS | 100.00 | % | ||
|
| |||
The industry classifications represented in the Schedule of Investments are in accordance with Global Industry Classification Standards (GICS®), which was developed by and/or is the exclusive property of MSCI, Inc. and Standard & Poor Financial Services LLC or were otherwise determined by the Adviser to be appropriate. This information is unaudited.
The accompanying notes to financial statements are an integral part of these Schedule of Investments.
43
Brandes Global Equity Income Fund
SCHEDULE OF INVESTMENTS — September 30, 2019
| Shares | Value | |||||||
| COMMON STOCKS – 86.18% | ||||||||
| Brazil – 3.07% | ||||||||
| 3,990 | Telefonica Brasil SA | $ | 43,127 | |||||
|
| |||||||
| Chile – 1.47% | ||||||||
| 239,437 | Enel Chile SA | 20,691 | ||||||
|
| |||||||
| China – 1.77% | ||||||||
| 3,000 | China Mobile Ltd. | 24,851 | ||||||
|
| |||||||
| Finland – 1.62% | ||||||||
| 4,519 | Nokia OYJ | 22,822 | ||||||
|
| |||||||
| France – 14.73% | ||||||||
| 1,491 | Engie SA | 24,337 | ||||||
| 400 | Engie SA Registered Shares (Prime Fidelite 2019) | 6,529 | ||||||
| 1,092 | Engie SA Registered Shares (Prime Fidelite 2021) | 17,824 | ||||||
| 590 | Publicis Groupe SA | 29,031 | ||||||
| 568 | Sanofi | 52,615 | ||||||
| 528 | Schneider Electric SE | 46,170 | ||||||
| 590 | Total SA | 30,719 | ||||||
|
| |||||||
| 207,225 | ||||||||
|
| |||||||
| Italy – 2.43% | ||||||||
| 2,241 | Eni SpA | 34,253 | ||||||
|
| |||||||
| Japan – 1.86% | ||||||||
| 1,000 | Honda Motor Co. Ltd. | 26,184 | ||||||
|
| |||||||
| Malaysia – 1.38% | ||||||||
| 14,200 | Genting Berhad | 19,476 | ||||||
|
| |||||||
| Mexico – 3.60% | ||||||||
| 34,606 | Fibra Uno Administracion SA de CV | 50,697 | ||||||
|
| |||||||
| South Korea – 1.63% | ||||||||
| 260 | KT&G Corp. | 22,939 | ||||||
|
| |||||||
| Switzerland – 5.31% | ||||||||
| 1,738 | Credit Suisse Group AG | 21,261 | ||||||
| 240 | Swiss Resources AG | 25,043 | ||||||
| 2,498 | UBS Group AG | 28,363 | ||||||
|
| |||||||
| 74,667 | ||||||||
|
| |||||||
| United Kingdom – 22.38% | ||||||||
| 5,875 | BP Plc | 37,194 | ||||||
| 403 | British American Tobacco Plc | 14,883 | ||||||
| 2,390 | GlaxoSmithKline Plc | 51,227 | ||||||
| 2,475 | HSBC Holdings Plc | 18,964 | ||||||
| Shares | Value | |||||||
| 1,447 | Imperial Brands Plc | $ | 32,493 | |||||
| 6,646 | J Sainsbury Plc | 17,933 | ||||||
| 12,240 | Kingfisher Plc | 31,107 | ||||||
| 4,816 | Marks & Spencer Group Plc | 10,908 | ||||||
| 814 | Royal Dutch Shell Plc – Class A | 23,873 | ||||||
| 8,470 | Tesco Plc | 25,042 | ||||||
| 4,210 | Wm Morrison Supermarkets Plc | 10,366 | ||||||
| 3,261 | WPP Plc | 40,832 | ||||||
|
| |||||||
| 314,822 | ||||||||
|
| |||||||
| United States – 24.93% | ||||||||
| 312 | Bank of New York Mellon Corp. | 14,106 | ||||||
| 270 | BB&T Corp. | 14,410 | ||||||
| 947 | Cardinal Health, Inc. | 44,689 | ||||||
| 486 | Citigroup, Inc. | 33,573 | ||||||
| 337 | CVS Health Corp. | 21,255 | ||||||
| 305 | Emerson Electric Co. | 20,392 | ||||||
| 166 | Johnson & Johnson | 21,477 | ||||||
| 475 | Merck & Co., Inc. | 39,986 | ||||||
| 129 | Microsoft Corp. | 17,935 | ||||||
| 118 | PepsiCo, Inc. | 16,178 | ||||||
| 934 | Pfizer, Inc. | 33,559 | ||||||
| 85 | PNC Financial Services Group, Inc. | 11,914 | ||||||
| 370 | State Street Corp. | 21,900 | ||||||
| 781 | Wells Fargo & Co. | 39,393 | ||||||
|
| |||||||
| 350,767 | ||||||||
|
| |||||||
| | TOTAL COMMON STOCKS | $ | 1,212,521 | |||||
|
| |||||||
| PREFERRED STOCKS – 9.90% | ||||||||
| South Korea – 1.94% | ||||||||
| 828 | Samsung Electronics Co. Ltd. | $ | 27,332 | |||||
|
| |||||||
| United States – 7.96% | ||||||||
| 1,632 | Bank of America Corp. 4.000% (3M LIBOR + 0.500%, minimum of 4.000%)(b) | 36,508 | ||||||
| 1,867 | Goldman Sachs Group, Inc. 3.750% (3M LIBOR + 0.750%, minimum of 3.750%)(b) | 39,020 | ||||||
The accompanying notes to financial statements are an integral part of these Schedule of Investments.
44
Brandes Global Equity Income Fund
SCHEDULE OF INVESTMENTS — September 30, 2019 (continued)
| Shares | Value | |||||||
| 1,668 | Morgan Stanley 4.000% (3M LIBOR + 0.700%, minimum of 4.000%)(b) | $ | 36,462 | |||||
|
| |||||||
| 111,990 | ||||||||
|
| |||||||
| | TOTAL PREFERRED STOCKS | $ | 139,322 | |||||
|
| |||||||
| Shares | Value | |||||||
| SHORT-TERM INVESTMENTS – 6.85% |
| |||||||
| Money Market Funds – 6.85% | ||||||||
BlackRock Liquidity Funds T-Fund – Institutional Class, 1.834%(a) | 96,343 | $ | 96,343 | |||||
|
| |||||||
TOTAL SHORT-TERM INVESTMENTS | $ | 96,343 | ||||||
|
| |||||||
Total Investments (Cost $1,463,537) – 102.93% | $ | 1,448,186 | ||||||
Liabilities in Excess of Other Assets – (2.93)% | (41,247 | ) | ||||||
|
| |||||||
TOTAL NET ASSETS – 100.00% | $ | 1,406,939 | ||||||
|
| |||||||
Percentages are stated as a percent of net assets.
LIBOR London Inter-bank Offered Rate
| (a) | The rate shown is the annualized seven day yield as of September 30, 2019. |
| (b) | Variable rate security. This coupon is based on a reference index and spread. |
The accompanying notes to financial statements are an integral part of these Schedule of Investments.
45
Brandes Global Equity Income Fund
SCHEDULE OF INVESTMENTS BY INDUSTRY — September 30, 2019
COMMON STOCKS | ||||
Automobiles | 1.86 | % | ||
Banks | 8.41 | % | ||
Beverages | 1.15 | % | ||
Capital Markets | 6.09 | % | ||
Communications Equipment | 1.62 | % | ||
Diversified Telecommunication Services | 3.07 | % | ||
Electric Utilities | 1.47 | % | ||
Electrical Equipment | 4.73 | % | ||
Equity Real Estate Investment Trusts | 3.60 | % | ||
Food & Staples Retailing | 3.79 | % | ||
Health Care Providers & Services | 4.69 | % | ||
Hotels, Restaurants & Leisure | 1.38 | % | ||
Insurance | 1.78 | % | ||
Media | 4.97 | % | ||
Multiline Retail | 0.78 | % | ||
Multi-Utilities | 3.46 | % | ||
Oil, Gas & Consumable Fuels | 8.96 | % | ||
Pharmaceuticals | 14.12 | % | ||
Software | 1.27 | % | ||
Specialty Retail | 2.21 | % | ||
Tobacco | 5.00 | % | ||
Wireless Telecommunication Services | 1.77 | % | ||
|
| |||
TOTAL COMMON STOCKS | 86.18 | % | ||
|
| |||
PREFERRED STOCKS | ||||
Banks | 2.59 | % | ||
Capital Markets | 5.37 | % | ||
Technology Hardware, Storage & Peripherals | 1.94 | % | ||
|
| |||
TOTAL PREFERRED STOCKS | 9.90 | % | ||
|
| |||
SHORT-TERM INVESTMENTS | 6.85 | % | ||
|
| |||
TOTAL INVESTMENTS | 102.93 | % | ||
Liabilities in Excess of Other Assets | (2.93 | )% | ||
|
| |||
TOTAL NET ASSETS | 100.00 | % | ||
|
| |||
The industry classifications represented in the Schedule of Investments are in accordance with Global Industry Classification Standards (GICS®), which was developed by and/or is the exclusive property of MSCI, Inc. and Standard & Poor Financial Services LLC or were otherwise determined by the Adviser to be appropriate. This information is unaudited.
The accompanying notes to financial statements are an integral part of these Schedule of Investments.
46
Brandes Emerging Markets Value Fund
SCHEDULE OF INVESTMENTS — September 30, 2019
| Shares | Value | |||||||
| COMMON STOCKS – 87.60% | ||||||||
| Argentina – 2.19% | ||||||||
| 1,176,931 | Adecoagro SA(a) | $ | 6,861,508 | |||||
| 2,625,116 | YPF SA Sponsored – Class D – ADR | 24,282,323 | ||||||
|
| |||||||
| 31,143,831 | ||||||||
|
| |||||||
| Austria – 0.98% | ||||||||
| 421,414 | Erste Group Bank AG | 13,927,607 | ||||||
|
| |||||||
| Brazil – 10.33% | ||||||||
| 330,118 | AES Tiete Energia SA | 964,544 | ||||||
| 5,180,100 | Cielo SA | 9,973,838 | ||||||
| 2,748,762 | Embraer SA Sponsored – ADR | 47,416,145 | ||||||
| 1,377,400 | Hapvida Participacoes e Investimentos SA(c) | 18,020,786 | ||||||
| 5,600,500 | Kroton Educacional SA | 15,110,075 | ||||||
| 9,098,615 | Marfrig Global Foods SA(a) | 24,066,181 | ||||||
| 3,594,793 | YDUQS Part(a) | 31,077,381 | ||||||
|
| |||||||
| 146,628,950 | ||||||||
|
| |||||||
| Chile – 1.18% | ||||||||
| 1,189,718 | Empresa Nacional de Telecomunicaciones SA | 10,427,755 | ||||||
| 1,509,388 | Enel Chile SA Sponsored – ADR | 6,354,523 | ||||||
|
| |||||||
| 16,782,278 | ||||||||
|
| |||||||
| China – 14.03% | ||||||||
| 29,314,000 | China Construction Bank Corp. – Class H | 22,336,073 | ||||||
| 6,243,900 | China Mobile Ltd. | 51,722,919 | ||||||
| 20,227,100 | China Railway Signal & Communication Corp. Ltd.(c) | 12,513,570 | ||||||
| 173,073 | China Yuchai International Ltd. | 2,241,295 | ||||||
| Shares | Value | |||||||
| 34,409,000 | Dongfeng Motor Group Co. Ltd. – Class H | $ | 32,692,423 | |||||
| 21,333,500 | Genertec Universal Medical Group Co. Ltd.(c) | 14,315,952 | ||||||
| 27,200,000 | PetroChina Co. Ltd. | 13,952,298 | ||||||
| 11,814,800 | Shanghai Pharmaceuticals Holding Co. Ltd. – Class H | 21,398,473 | ||||||
| 2,982,000 | TravelSky Technology Ltd. | 6,192,293 | ||||||
| 6,967,200 | Wynn Macau Ltd. | 13,576,785 | ||||||
| 380,528 | ZTO Express Cayman, Inc. – ADR | 8,116,662 | ||||||
|
| |||||||
| 199,058,743 | ||||||||
|
| |||||||
| Colombia – 1.12% | ||||||||
| 2,127,094 | Grupo Aval Acciones y Valores Grupo Sponsored – ADR | 15,868,121 | ||||||
|
| |||||||
| Czech Republic – 0.40% | ||||||||
| 626,829 | O2 Czech Republic AS | 5,668,717 | ||||||
|
| |||||||
| Greece – 0.54% | ||||||||
| 552,285 | Hellenic Telecommunications Organization SA | 7,609,040 | ||||||
|
| |||||||
| Hong Kong – 2.50% | ||||||||
| 28,461,920 | First Pacific Co. Ltd. | 10,895,954 | ||||||
| 10,597,500 | Lifestyle International Holdings Ltd. | 11,042,037 | ||||||
| 5,364,000 | Luk Fook Holdings International Ltd. | 13,475,914 | ||||||
|
| |||||||
| 35,413,905 | ||||||||
|
| |||||||
| India – 1.17% | ||||||||
| 5,904,971 | Power Grid Corp of India Ltd. | 16,585,359 | ||||||
|
| |||||||
The accompanying notes to financial statements are an integral part of these Schedule of Investments.
47
Brandes Emerging Markets Value Fund
SCHEDULE OF INVESTMENTS — September 30, 2019 (continued)
| Shares | Value | |||||||
| Indonesia – 4.15% | ||||||||
| 97,044,300 | Bank Rakyat Indonesia Persero Tbk PT | $ | 28,178,260 | |||||
| 126,877,915 | PT XL Axiata Tbk(a) | 30,744,773 | ||||||
|
| |||||||
| 58,923,033 | ||||||||
|
| |||||||
| Luxembourg – 0.01% | ||||||||
| 3,928 | Ternium SA Sponsored – ADR(a) | 75,378 | ||||||
|
| |||||||
| Malaysia – 2.03% | ||||||||
| 21,040,900 | Genting Berhad | 28,857,999 | ||||||
|
| |||||||
| Mexico – 10.87% | ||||||||
| 30,167,817 | America Movil SAB de CV | 22,411,077 | ||||||
| 10,054,422 | Cemex SAB de CV Sponsored – ADR(a) | 39,413,334 | ||||||
| 32,196,641 | Fibra Uno Administracion SA de CV | 47,167,574 | ||||||
| 17,287,809 | Fideicomiso PLA Administradora Industrial S de RL de CV | 26,579,108 | ||||||
| 14,203,330 | Macquarie Mexico Real Estate Management SA de CV(c) | 17,921,502 | ||||||
| 10,242,449 | Urbi Desarrollos Urbanos SA de CV(a)(f) | 778,538 | ||||||
|
| |||||||
| 154,271,133 | ||||||||
|
| |||||||
| Pakistan – 0.29% | ||||||||
| 7,646,760 | Nishat Mills Ltd. | 4,108,926 | ||||||
|
| |||||||
| Panama – 1.83% | ||||||||
| 644,836 | Banco Latinoamericano de Comercio Exterior SA – Class E | 12,858,030 | ||||||
| Shares | Value | |||||||
| 132,245 | Copa Holdings SA – Class A | $ | 13,059,194 | |||||
|
| |||||||
| 25,917,224 | ||||||||
|
| |||||||
| Russia – 5.57% | ||||||||
| 6,017,014 | Mobile TeleSystems PJSC | 24,585,748 | ||||||
| 8,476,466 | Sberbank of Russia OJSC | 29,761,407 | ||||||
| 2,684,906 | Sistema JSFC Sponsored – GDR | 10,369,118 | ||||||
| 410,848 | X5 Retail Group NV – GDR | 14,366,130 | ||||||
|
| |||||||
| 79,082,403 | ||||||||
|
| |||||||
| Singapore – 1.45% | ||||||||
| 1,963,128 | Flex Ltd.(a) | 20,544,135 | ||||||
|
| |||||||
| South Africa – 1.49% | ||||||||
| 2,098,660 | ABSA GROUP Ltd. | 21,196,242 | ||||||
|
| |||||||
| South Korea – 12.94% | ||||||||
| 133,964 | Hyundai Mobis Co. Ltd. | 28,191,791 | ||||||
| 752,977 | KIA Motors Corp.(a) | 28,708,859 | ||||||
| 431,744 | KT&G Corp. | 38,090,762 | ||||||
| 158,366 | POSCO | 30,019,529 | ||||||
| 157,189 | S-1 Corp. | 12,891,561 | ||||||
| 610,691 | Samsung Electronics Co. Ltd. | 25,004,166 | ||||||
| 592,275 | Shinhan Financial Group Co. Ltd.(a) | 20,695,863 | ||||||
|
| |||||||
| 183,602,531 | ||||||||
|
| |||||||
| Spain – 1.17% | ||||||||
| 11,548,879 | Prosegur Cash SA(c) | 16,595,130 | ||||||
|
| |||||||
| Taiwan – 2.47% | ||||||||
| 3,216,000 | Asustek Computer, Inc. | 21,401,963 | ||||||
| 1,534,000 | Taiwan Semiconductor Manufacturing Co Ltd. | 13,624,274 | ||||||
|
| |||||||
| 35,026,237 | ||||||||
|
| |||||||
The accompanying notes to financial statements are an integral part of these Schedule of Investments.
48
Brandes Emerging Markets Value Fund
SCHEDULE OF INVESTMENTS — September 30, 2019 (continued)
| Shares | Value | |||||||
| Thailand – 3.38% | ||||||||
| 1,984,500 | Bangkok Bank Plc – NVDR | $ | 11,256,892 | |||||
| 43,617,600 | Jasmine Broadband Internet Infrastructure – Class F | 15,687,219 | ||||||
| 5,464,600 | Siam Commercial Bank PCL – Class F | 21,090,658 | ||||||
|
| |||||||
| 48,034,769 | ||||||||
|
| |||||||
| Turkey – 2.76% | ||||||||
| 10,120,663 | Akbank T.A.S.(a) | 14,523,424 | ||||||
| 54,766,538 | Emlak Konut Gayrimenkul Yatirim Ortakligi AG | 13,462,094 | ||||||
| 6,223,640 | Turkiye Garanti Bankasi Anonim Sirketis(a) | 11,237,233 | ||||||
|
| |||||||
| 39,222,751 | ||||||||
|
| |||||||
| United Kingdom – 2.75% | ||||||||
| 22,007,865 | Hyve Group Plc | 23,081,862 | ||||||
| 10,376,419 | Vivo Energy Plc(c) | 15,947,823 | ||||||
|
| |||||||
| 39,029,685 | ||||||||
|
| |||||||
| | TOTAL COMMON STOCKS | $ | 1,243,174,127 | |||||
|
| |||||||
| PARTICIPATORY NOTES – 0.95% | ||||||||
| China – 0.95% | ||||||||
| 7,936,516 | China South Publishing & Media Group Co. Ltd.(a)(b)(c)(d) | $ | 13,443,815 | |||||
|
| |||||||
| | TOTAL PARTICIPATORY | $ | 13,443,815 | |||||
|
| |||||||
| Shares | Value | |||||||
| PREFERRED STOCKS – 8.70% | ||||||||
| Brazil – 4.37% | ||||||||
| 1,166,900 | Companhia Brasileira de Distribuicao | $ | 22,476,084 | |||||
| 3,315,000 | Petroleo Brasileiro SA | 21,948,676 | ||||||
| 498,300 | Telefonica Brasil SA | 6,584,115 | ||||||
| 846,683 | Telefonica Brasil SA Sponsored – ADR | 11,150,815 | ||||||
|
| |||||||
| 62,159,690 | ||||||||
|
| |||||||
| Colombia – 0.53% | ||||||||
| 20,018,115 | Grupo Aval Acciones y Valores SA | 7,506,793 | ||||||
|
| |||||||
| Russia – 1.94% | ||||||||
| 32,081,832 | Surgutneftegas PJSC | 18,530,338 | ||||||
| 1,570,389 | Surgutneftegas PJSC Sponsored – ADR | 8,919,810 | ||||||
|
| |||||||
| 27,450,148 | ||||||||
|
| |||||||
| South Korea – 1.86% | ||||||||
| 413,848 | Hyundai Motor Co. Ltd. | 26,414,322 | ||||||
|
| |||||||
| | TOTAL PREFERRED | $ | 123,530,953 | |||||
|
| |||||||
The accompanying notes to financial statements are an integral part of these Schedule of Investments.
49
Brandes Emerging Markets Value Fund
SCHEDULE OF INVESTMENTS — September 30, 2019 (continued)
| Shares | Value | |||||||
| SHORT–TERM INVESTMENTS – 3.02% | ||||||||
| Money Market Funds – 3.02% | ||||||||
BlackRock Liquidity Funds T–Fund – Institutional Class, 1.834%(e) | 42,839,683 | $ | 42,839,683 | |||||
|
| |||||||
TOTAL SHORT–TERM INVESTMENTS | $ | 42,839,683 | ||||||
|
| |||||||
Total Investments (Cost $1,607,294,087) – 100.27% | $ | 1,422,988,578 | ||||||
Liabilities in Excess of Other Assets – (0.27)% | (3,793,370 | ) | ||||||
|
| |||||||
TOTAL NET ASSETS – 100.00% | $ | 1,419,195,208 | ||||||
|
| |||||||
Percentages are stated as a percent of net assets.
ADR American Depositary Receipt
GDR Global Depositary Receipt
NVDR Non-Voting Depositary Receipt
| (a) | Non-income producing security. |
| (b) | The price for this security was derived from an estimate of fair market value using methods approved by the Fund’s Board of Trustees. This security represents $13,443,815 or 0.95% of the Fund’s net assets and is classified as a Level 2 security. See Note 2 in the Notes to Financial Statements. |
| (c) | Acquired in a transaction exempt from registration under Rule 144A or Section 4(a)(2) of the Securities Act of 1933. May be resold in the U.S. in transactions exempt from registration, normally to qualified institutional buyers. The total value of all such securities was $108,758,578, which represented 7.66% of the net assets of the Fund. |
| (d) | Represents the underlying security of a participatory note with HSBC Bank Plc. China South Publishing & Media Group Co. Ltd. has a maturity date of November 23, 2021. See Note 2 in the Notes to Schedule of Investments. |
| (e) | The rate shown is the annualized seven day yield as of September 30, 2019. |
| (f) | Affiliated issuer. See Note 8 in the Notes to the Financial Statements. |
The accompanying notes to financial statements are an integral part of these Schedule of Investments.
50
Brandes Emerging Markets Value Fund
SCHEDULE OF INVESTMENTS BY INDUSTRY — September 30, 2019
COMMON STOCKS | ||||
Aerospace & Defense | 3.34 | % | ||
Air Freight & Logistics | 0.57 | % | ||
Airlines | 0.92 | % | ||
Auto Components | 1.99 | % | ||
Automobiles | 4.33 | % | ||
Banks | 14.80 | % | ||
Commercial Services & Supplies | 2.08 | % | ||
Construction Materials | 2.78 | % | ||
Diversified Consumer Services | 3.25 | % | ||
Diversified Financial Services | 1.67 | % | ||
Diversified Telecommunication Services | 0.94 | % | ||
Electric Utilities | 1.62 | % | ||
Electronic Equipment, Instruments & Components | 2.33 | % | ||
Equity Real Estate Investment Trusts | 8.51 | % | ||
Food & Staples Retailing | 1.01 | % | ||
Food Products | 2.18 | % | ||
Health Care Providers & Services | 3.79 | % | ||
Hotels, Restaurants & Leisure | 2.99 | % | ||
Household Durables | 0.05 | % | ||
Independent Power & Renewable Electricity Producers | 0.07 | % | ||
IT Services | 1.14 | % | ||
Machinery | 0.16 | % | ||
Media | 1.63 | % | ||
Metals & Mining | 2.12 | % | ||
Multiline Retail | 0.78 | % | ||
Oil, Gas & Consumable Fuels | 2.69 | % | ||
Semiconductors & Semiconductor Equipment | 0.96 | % | ||
Specialty Retail | 2.07 | % | ||
Technology Hardware, Storage & Peripherals | 3.27 | % | ||
Textiles, Apparel & Luxury Goods | 0.29 | % | ||
Tobacco | 2.68 | % | ||
Wireless Telecommunication Services | 10.59 | % | ||
|
| |||
TOTAL COMMON STOCKS | 87.60 | % | ||
|
| |||
PARTICIPATORY NOTES | ||||
Media | 0.95 | % | ||
|
| |||
TOTAL PARTICIPATORY NOTES | 0.95 | % | ||
|
| |||
PREFERRED STOCKS | ||||
Automobiles | 1.86 | % | ||
Banks | 0.53 | % | ||
Diversified Telecommunication Services | 1.25 | % | ||
Food & Staples Retailing | 1.58 | % | ||
Oil, Gas & Consumable Fuels | 3.48 | % | ||
|
| |||
TOTAL PREFERRED STOCKS | 8.70 | % | ||
|
| |||
The accompanying notes to financial statements are an integral part of these Schedule of Investments.
51
Brandes Emerging Markets Value Fund
SCHEDULE OF INVESTMENTS BY INDUSTRY — September 30, 2019 (continued)
SHORT-TERM INVESTMENTS | 3.02 | % | ||
|
| |||
TOTAL INVESTMENTS | 100.27 | % | ||
Liabilities in Excess of Other Assets | (0.27 | )% | ||
|
| |||
TOTAL NET ASSETS | 100.00 | % | ||
|
| |||
The industry classifications represented in the Schedule of Investments are in accordance with Global Industry Classification Standards (GICS®), which was developed by and/or is the exclusive property of MSCI, Inc. and Standard & Poor Financial Services LLC or were otherwise determined by the Adviser to be appropriate. This information is unaudited.
The accompanying notes to financial statements are an integral part of these Schedule of Investments.
52
Brandes International Small Cap Equity Fund
SCHEDULE OF INVESTMENTS — September 30, 2019
| Shares | Value | |||||||
| COMMON STOCKS – 95.29% | ||||||||
| Argentina – 0.52% | ||||||||
| 429,593 | Adecoagro SA(a) | $ | 2,504,527 | |||||
|
| |||||||
| Austria – 0.91% | ||||||||
| 237,124 | Addiko Bank AG(a) | 4,419,567 | ||||||
|
| |||||||
| Brazil – 5.13% | ||||||||
| 4,982,147 | Embraer SA | 21,559,586 | ||||||
| 2,026,400 | Mills Estruturas e Servicos de Engenharia SA(a) | 3,360,304 | ||||||
|
| |||||||
| 24,919,890 | ||||||||
|
| |||||||
| Canada – 5.29% | ||||||||
| 1,034,245 | Celestica, Inc.(a) | 7,415,537 | ||||||
| 855,918 | Dorel Industries, Inc. – Class B(a) | 5,872,585 | ||||||
| 1,162,476 | Sierra Wireless, Inc.(a) | 12,415,772 | ||||||
|
| |||||||
| 25,703,894 | ||||||||
|
| |||||||
| China – 2.02% | ||||||||
| 15,644,900 | Boyaa Interactive International Ltd. | 2,349,579 | ||||||
| 283,869 | China Yuchai International Ltd. | 3,676,104 | ||||||
| 14,229,500 | Weiqiao Textile Co. Ltd. – Class H | 3,762,743 | ||||||
|
| |||||||
| 9,788,426 | ||||||||
|
| |||||||
| France – 2.32% | ||||||||
| 86,398 | Savencia SA | 6,064,538 | ||||||
| 77,502 | Societe BIC SA | 5,203,574 | ||||||
|
| |||||||
| 11,268,112 | ||||||||
|
| |||||||
| Germany – 1.74% | ||||||||
| 111,228 | Draegerwerk AG & Co. KGaA | 3,921,900 | ||||||
| 203,294 | Rhoen-Klinikum AG | 4,553,492 | ||||||
|
| |||||||
| 8,475,392 | ||||||||
|
| |||||||
| Greece – 0.60% | ||||||||
| 328,625 | GR Sarantis SA | 2,901,307 | ||||||
|
| |||||||
| Hong Kong – 4.45% | ||||||||
| 7,832,050 | APT Satellite Holdings Ltd. | 3,167,715 | ||||||
| 3,581,000 | Dickson Concepts International Ltd. | 1,971,315 | ||||||
| 86,140,000 | Emperor Watch & Jewellery Ltd. | 1,869,215 | ||||||
| Shares | Value | |||||||
| 22,694,000 | First Pacific Co. Ltd. | $ | 8,687,847 | |||||
| 13,184,000 | PAX Global Technology Ltd. | 5,931,898 | ||||||
|
| |||||||
| 21,627,990 | ||||||||
|
| |||||||
| Hungary – 2.22% | ||||||||
| 7,532,169 | Magyar Telekom Telecommunications Plc | 10,785,829 | ||||||
|
| |||||||
| Ireland – 3.56% | ||||||||
| 1,235,959 | Avadel Pharmaceuticals Plc Sponsored – ADR(a) | 5,141,589 | ||||||
| 2,682,781 | C&C Group Plc | 12,135,047 | ||||||
|
| |||||||
| 17,276,636 | ||||||||
|
| |||||||
| Italy – 1.78% | ||||||||
| 240,192 | Buzzi Unicem SpA | 3,476,542 | ||||||
| 5,008,687 | Safilo Group SpA(a) | 5,153,520 | ||||||
|
| |||||||
| 8,630,062 | ||||||||
|
| |||||||
| Japan – 21.95% | ||||||||
| 58,300 | Bank of Nagoya Ltd. | 1,721,695 | ||||||
| 663,400 | Concordia Financial Group Ltd. | 2,556,592 | ||||||
| 615,200 | Fuji Media Holdings, Inc. | 7,948,691 | ||||||
| 709,900 | Funai Electric Co. Ltd. | 3,931,586 | ||||||
| 204,000 | Futaba Corp. | 2,505,691 | ||||||
| 1,992,500 | Hachijuni Bank Ltd. | 8,162,960 | ||||||
| 2,382,200 | Hyakugo Bank Ltd. | 7,643,851 | ||||||
| 294,200 | Kato Sangyo Co. Ltd. | 9,182,424 | ||||||
| 357,300 | Kissei Pharmaceutical Co. Ltd. | 8,641,000 | ||||||
| 1,069,900 | Komori Corp. | 11,329,338 | ||||||
| 1,927,300 | Kyushu Financial Group, Inc. | 7,886,465 | ||||||
| 210,000 | Mitsubishi Shokuhin Co. Ltd. | 5,279,951 | ||||||
| 154,700 | Nippon Seiki Co. Ltd. | 2,375,791 | ||||||
| 88,200 | Oita Bank Ltd. | 2,377,515 | ||||||
| 395,200 | Tachi-S Co. Ltd. | 4,815,810 | ||||||
| 97,600 | Torii Pharmaceutical Co. Ltd. | 2,606,404 | ||||||
| 179,200 | Toyo Suisan Kaisha Ltd. | 7,196,083 | ||||||
The accompanying notes to financial statements are an integral part of these Schedule of Investments.
53
Brandes International Small Cap Equity Fund
SCHEDULE OF INVESTMENTS — September 30, 2019 (continued)
| Shares | Value | |||||||
| 457,200 | TSI Holdings Co. Ltd. | $ | 2,544,093 | |||||
| 132,900 | Tsutsumi Jewelry Co. Ltd. | 2,565,239 | ||||||
| 283,200 | Yodogawa Steel Works Ltd. | 5,311,920 | ||||||
|
| |||||||
| 106,583,099 | ||||||||
|
| |||||||
| Mexico – 7.35% | ||||||||
| 637,250 | Cemex SAB de CV Sponsored – ADR(a) | 2,498,020 | ||||||
| 27,919,538 | Consorcio ARA SAB de CV(a) | 5,843,098 | ||||||
| 279,501,983 | Desarrolladora Homex SAB de CV(a)(c) | 1,118,914 | ||||||
| 11,986,453 | Fibra Uno Administracion SA de CV | 17,559,965 | ||||||
| 5,896,622 | Macquarie Mexico Real Estate Management SA de CV(b) | 7,440,250 | ||||||
| 16,033,402 | Urbi Desarrollos Urbanos SA de CV(a)(c) | 1,218,714 | ||||||
|
| |||||||
| 35,678,961 | ||||||||
|
| |||||||
| Panama – 0.57% | ||||||||
| 139,056 | Banco Latinoamericano de Comercio Exterior SA – Class E | 2,772,777 | ||||||
|
| |||||||
| Philippines – 1.01% | ||||||||
| 3,173,212 | First Philippine Holdings Corp. | 4,916,244 | ||||||
|
| |||||||
| Russia – 0.96% | ||||||||
| 23,851,962 | Sistema PJSFC | 4,663,369 | ||||||
|
| |||||||
| Slovenia – 1.74% | ||||||||
| 712,555 | Nova Ljubljanska Banka – GDR(b) | 8,434,442 | ||||||
|
| |||||||
| South Korea – 7.32% | ||||||||
| 93,464 | Binggrae Co. Ltd. | 4,555,408 | ||||||
| 729,184 | Korean Reinsurance Co. | 4,881,893 | ||||||
| 52,050 | Lotte Chilsung Beverage Co. Ltd. | 6,019,337 | ||||||
| Shares | Value | |||||||
| 45,558 | Lotte Confectionery Co. Ltd. | $ | 5,599,628 | |||||
| 223,640 | Lotte Corp.(a) | 6,771,113 | ||||||
| 6,052 | Namyang Dairy Products Co. Ltd. | 2,486,777 | ||||||
| 74,175 | Samchully Co. Ltd. | 5,234,500 | ||||||
|
| |||||||
| 35,548,656 | ||||||||
|
| |||||||
| Spain – 2.71% | ||||||||
| 1,952,922 | Atresmedia Corp de Medios de Comunicacion SA | 7,522,863 | ||||||
| 671,850 | Lar Espana Real Estate Socimi SA | 5,645,922 | ||||||
|
| |||||||
| 13,168,785 | ||||||||
|
| |||||||
| United Kingdom – 21.14% | ||||||||
| 1,928,535 | Balfour Beatty Plc | 5,259,226 | ||||||
| 3,821,170 | Chemring Group Plc | 9,246,244 | ||||||
| 56,238,231 | Countrywide Plc(a) | 2,748,607 | ||||||
| 3,497,383 | De La Rue Plc | 9,610,912 | ||||||
| 20,071,416 | Debenhams Plc(a)(d) | — | ||||||
| 3,485,439 | G4S Plc | 8,117,330 | ||||||
| 8,840,985 | Hyve Group Plc | 9,272,430 | ||||||
| 6,419,205 | J Sainsbury Plc | 17,321,482 | ||||||
| 1,918,582 | LSL Property Services Plc | 5,071,807 | ||||||
| 6,271,043 | Mitie Group Plc | 11,288,201 | ||||||
| 8,873,233 | Premier Foods Plc(a) | 3,534,848 | ||||||
| 2,447,969 | Telit Communications Plc(a) | 4,960,289 | ||||||
| 6,589,724 | Wm Morrison Supermarkets Plc | 16,225,309 | ||||||
|
| |||||||
| 102,656,685 | ||||||||
|
| |||||||
| | TOTAL COMMON STOCKS | $ | 462,724,650 | |||||
|
| |||||||
| PREFERRED STOCKS – 1.86% | ||||||||
| Germany – 1.86% | ||||||||
| 202,891 | Draegerwerk AG & Co. KGaA | $ | 9,004,896 | |||||
|
| |||||||
| | TOTAL PREFERRED | $ | 9,004,896 | |||||
|
| |||||||
The accompanying notes to financial statements are an integral part of these Schedule of Investments.
54
Brandes International Small Cap Equity Fund
SCHEDULE OF INVESTMENTS — September 30, 2019 (continued)
| Shares | Value | |||||||
| SHORT-TERM INVESTMENTS – 6.14% | ||||||||
| Money Market Funds – 6.14% | ||||||||
BlackRock Liquidity FundsT-Fund – Institutional Class, 1.834%(e) | 29,835,284 | $ | 29,835,284 | |||||
|
| |||||||
TOTAL SHORT-TERM INVESTMENTS | $ | 29,835,284 | ||||||
|
| |||||||
Total Investments (Cost $615,523,450) – 103.29% | $ | 501,564,830 | ||||||
Liabilities in Excess of Other Assets – (3.29)% | (15,967,928 | ) | ||||||
|
| |||||||
TOTAL NET ASSETS – 100.00% | $ | 485,596,902 | ||||||
|
| |||||||
Percentages are stated as a percent of net assets.
ADR American Depository Receipt
GDR Global Depositary Receipt
| (a) | Non-income producing security. |
| (b) | Acquired in a transaction exempt from registration under Rule 144A or Section 4(a)(2) of the Securities Act of 1933. May be resold in the U.S. in transactions exempt from registration, normally to qualified institutional buyers. The total value of all such securities was $15,874,692, which represented 3.27% of the net assets of the Fund. |
| (c) | Affiliated issuer. See Note 8 in the Notes to the Financial Statements. |
| (d) | The price for this security was derived from an estimate of fair market value using methods approved by the Fund’s Board of Trustees. This security represents $0 or 0.00% of the Fund’s net assets and is classified as a Level 2 security. See Note 2 in the Notes to Financial Statements. |
| (e) | The rate shown is the annualized seven day yield as of September 30, 2019. |
The accompanying notes to financial statements are an integral part of these Schedule of Investments.
55
Brandes International Small Cap Equity Fund
SCHEDULE OF INVESTMENTS BY INDUSTRY — September 30, 2019
COMMON STOCKS | ||||
Aerospace & Defense | 6.34 | % | ||
Auto Components | 1.48 | % | ||
Banks | 8.90 | % | ||
Beverages | 3.74 | % | ||
Commercial Services & Supplies | 7.05 | % | ||
Communications Equipment | 3.58 | % | ||
Construction & Engineering | 1.08 | % | ||
Construction Materials | 1.23 | % | ||
Diversified Financial Services | 2.36 | % | ||
Diversified Telecommunication Services | 2.87 | % | ||
Electric Utilities | 1.01 | % | ||
Electrical Equipment | 0.52 | % | ||
Electronic Equipment, Instruments & Components | 2.75 | % | ||
Entertainment | 0.48 | % | ||
Equity Real Estate Investment Trusts | 6.31 | % | ||
Food & Staples Retailing | 9.88 | % | ||
Food Products | 6.58 | % | ||
Gas Utilities | 1.08 | % | ||
Health Care Equipment & Supplies | 0.81 | % | ||
Health Care Providers & Services | 0.94 | % | ||
Household Durables | 3.70 | % | ||
Industrial Conglomerate | 1.39 | % | ||
Insurance | 1.01 | % | ||
Machinery | 3.09 | % | ||
Media | 5.10 | % | ||
Metals & Mining | 1.09 | % | ||
Multiline Retail | — | % | ||
Personal Products | 0.60 | % | ||
Pharmaceuticals | 3.38 | % | ||
Real Estate Management & Development | 1.61 | % | ||
Specialty Retail | 0.79 | % | ||
Textiles, Apparel & Luxury Goods | 2.89 | % | ||
Trading Companies & Distributors | 0.69 | % | ||
Wireless Telecommunication Services | 0.96 | % | ||
|
| |||
TOTAL COMMON STOCKS | 95.29 | % | ||
|
| |||
PREFERRED STOCKS | ||||
Health Care Equipment & Supplies | 1.86 | % | ||
|
| |||
TOTAL PREFERRED STOCKS | 1.86 | % | ||
|
| |||
SHORT-TERM INVESTMENTS | 6.14 | % | ||
|
| |||
TOTAL INVESTMENTS | 103.29 | % | ||
Liabilities in Excess of Other Assets | (3.29 | )% | ||
|
| |||
TOTAL NET ASSETS | 100.00 | % | ||
|
| |||
The accompanying notes to financial statements are an integral part of these Schedule of Investments.
56
Brandes International Small Cap Equity Fund
SCHEDULE OF INVESTMENTS BY INDUSTRY — September 30, 2019 (continued)
The industry classifications represented in the Schedule of Investments are in accordance with Global Industry Classification Standards (GICS®), which was developed by and/or is the exclusive property of MSCI, Inc. and Standard & Poor Financial Services LLC or were otherwise determined by the Adviser to be appropriate. This information is unaudited.
The accompanying notes to financial statements are an integral part of these Schedule of Investments.
57
SCHEDULE OF INVESTMENTS — September 30, 2019
| Shares | Value | |||||||
| COMMON STOCKS – 87.63% | ||||||||
| Aerospace & Defense – 3.88% | ||||||||
| 482 | Embraer SA Sponsored – ADR | $ | 8,315 | |||||
| 116 | National Presto Industries, Inc. | 10,334 | ||||||
|
| |||||||
| 18,649 | ||||||||
|
| |||||||
| Auto Components – 1.09% | ||||||||
| 201 | Cooper Tire & Rubber Co. | 5,250 | ||||||
|
| |||||||
| Banks – 4.85% | ||||||||
| 385 | Eagle Bancorp Montana, Inc. | 6,737 | ||||||
| 206 | National Bankshares, Inc. | 8,250 | ||||||
| 210 | Northrim BanCorp, Inc. | 8,331 | ||||||
|
| |||||||
| 23,318 | ||||||||
|
| |||||||
| Biotechnology – 8.82% | ||||||||
| 255 | AMAG Pharmaceuticals, Inc.(a) | 2,945 | ||||||
| 171 | Eagle Pharmaceuticals, Inc.(a) | 9,673 | ||||||
| 7,076 | PDL BioPharma, Inc. | 15,284 | ||||||
| 182 | United Therapeutics Corp.(a) | 14,515 | ||||||
|
| |||||||
| 42,417 | ||||||||
|
| |||||||
| Chemicals – 1.34% | ||||||||
| 94 | Sensient Technologies Corp. | 6,453 | ||||||
|
| |||||||
| Communications Equipment – 8.12% | ||||||||
| 656 | Digi International, Inc.(a) | 8,935 | ||||||
| 648 | NETGEAR, Inc.(a) | 20,878 | ||||||
| 863 | Sierra Wireless, Inc.(a) | 9,234 | ||||||
|
| |||||||
| 39,047 | ||||||||
|
| |||||||
| Construction & Engineering – 1.28% | ||||||||
| 1,370 | Orion Group Holdings, Inc.(a) | 6,165 | ||||||
|
| |||||||
| | Electronic Equipment, Instruments & Components – 3.05% | | ||||||
| 341 | Arlo Technologies, Inc.(a) | 1,163 | ||||||
| 304 | Avnet, Inc.(a) | 13,523 | ||||||
|
| |||||||
| 14,686 | ||||||||
|
| |||||||
| | Equity Real Estate Investment Trusts – 0.79% | | ||||||
| 155 | Alexander & Baldwin, Inc. | 3,799 | ||||||
|
| |||||||
| Shares | Value | |||||||
| Food Products – 3.59% | ||||||||
| 108 | Cal-Maine Foods, Inc. | $ | 4,315 | |||||
| 415 | Seneca Foods Corp. – Class A(a) | 12,940 | ||||||
|
| |||||||
| 17,255 | ||||||||
|
| |||||||
| Health Care Equipment & Supplies – 0.76% | ||||||||
| 489 | Invacare Corp. | 3,668 | ||||||
|
| |||||||
| Health Care Providers & Services – 3.48% | ||||||||
| 299 | Patterson Companies, Inc.(a) | 5,328 | ||||||
| 853 | Triple-S Management Corp. – Class B(a) | 11,430 | ||||||
|
| |||||||
| 16,758 | ||||||||
|
| |||||||
| Hotels, Restaurants & Leisure – 1.11% | ||||||||
| 119 | International Speedway Corp. – Class A | 5,356 | ||||||
|
| |||||||
| Household Durables – 7.16% | ||||||||
| 812 | CSS Industries, Inc. | 3,224 | ||||||
| 707 | Dorel Industries, Inc. – Class B(a) | 4,851 | ||||||
| 134 | M.D.C. Holdings, Inc. | 5,775 | ||||||
| 511 | Taylor Morrison Home Corp. – Class A(a) | 13,255 | ||||||
| 179 | Toll Brothers, Inc.(a) | 7,348 | ||||||
|
| |||||||
| 34,453 | ||||||||
|
| |||||||
| Insurance – 5.64% | ||||||||
| 64 | American National Insurance Co. | 7,919 | ||||||
| 51 | National Western Life Group, Inc. | 13,687 | ||||||
| 234 | Old Republic International Corp. | 5,515 | ||||||
|
| |||||||
| 27,121 | ||||||||
|
| |||||||
| Machinery – 6.70% | ||||||||
| 2,186 | Briggs & Stratton Corp. | 13,247 | ||||||
| 239 | Hurco Companies, Inc.(a) | 7,689 | ||||||
| 376 | The Greenbrier Companies, Inc. | 11,325 | ||||||
|
| |||||||
| 32,261 | ||||||||
|
| |||||||
| Media – 1.76% | ||||||||
| 224 | Scholastic Corp. | 8,458 | ||||||
|
| |||||||
| Multi-Utilities – 1.25% | ||||||||
| 124 | Avista Corp. | 6,007 | ||||||
|
| |||||||
The accompanying notes to financial statements are an integral part of these Schedule of Investments.
58
Brandes Small Cap Value Fund
SCHEDULE OF INVESTMENTS — September 30, 2019 (continued)
| Shares | Value | |||||||
| Oil, Gas & Consumable Fuels – 1.45% | ||||||||
| 1,362 | Chesapeake Energy Corp. | $ | 1,921 | |||||
| 127 | World Fuel Services Corp. | 5,072 | ||||||
|
| |||||||
| 6,993 | ||||||||
|
| |||||||
| Personal Products – 4.61% | ||||||||
| 683 | Edgewell Personal Care Co.(a) | 22,191 | ||||||
|
| |||||||
| Pharmaceuticals – 4.35% | ||||||||
| 2,656 | Avadel Pharmaceuticals Plc Sponsored – ADR(a) | 11,049 | ||||||
| 463 | Phibro Animal Health Corp. | 9,876 | ||||||
|
| |||||||
| 20,925 | ||||||||
|
| |||||||
| Professional Services – 2.01% | ||||||||
| 568 | Resources Connection, Inc.(a) | 9,650 | ||||||
|
| |||||||
| | Real Estate Management & Development – 3.26% | | ||||||
| 917 | The St. Joe Co.(a) | 15,708 | ||||||
|
| |||||||
| Software – 2.96% | ||||||||
| 96 | MicroStrategy, Inc. – Class A(a) | 14,244 | ||||||
|
| |||||||
| Shares | Value | |||||||
| Specialty Retail – 0.69% | ||||||||
| 128 | Rent-A-Center, Inc.(a) | $ | 3,301 | |||||
|
| |||||||
| Textiles, Apparel & Luxury Goods – 1.10% | ||||||||
| 213 | Movado Group, Inc. | 5,295 | ||||||
|
| |||||||
| Thrifts & Mortgage Finance – 1.35% | ||||||||
| 227 | Territorial Bancorp, Inc. | 6,488 | ||||||
|
| |||||||
| Trading Companies & Distributors – 1.18% | ||||||||
| 1,205 | Houston Wire & Cable Co. | 5,688 | ||||||
|
| |||||||
| | TOTAL COMMON STOCKS | $ | 421,604 | |||||
|
| |||||||
| PREFERRED STOCKS – 1.27% | ||||||||
| Oil, Gas & Consumable Fuels – 1.27% | ||||||||
| 16 | Chesapeake Energy Corp., 5.750% | $ | 6,112 | |||||
|
| |||||||
| | TOTAL PREFERRED STOCKS | $ | 6,112 | |||||
|
| |||||||
| Principal Amount | Value | |||||||
| CORPORATE BONDS – 6.32% | ||||||||
| Electric Utilities – 2.52% | ||||||||
PNM Resources, Inc. | $ | 12,000 | $ | 12,113 | ||||
|
| |||||||
| Household Durables – 2.10% | ||||||||
MDC Holdings, Inc. | 10,000 | 10,088 | ||||||
|
| |||||||
| Machinery – 1.70% | ||||||||
Kennametal, Inc. | 8,000 | 8,207 | ||||||
|
| |||||||
TOTAL CORPORATE BONDS (Cost $30,271) | $ | 30,408 | ||||||
|
| |||||||
| Shares | Value | |||||||
| SHORT-TERM INVESTMENTS – 11.91% | ||||||||
| Money Market Funds – 11.91% | ||||||||
BlackRock Liquidity FundsT-Fund – Institutional Class, 1.834%(b) | 57,290 | $ | 57,290 | |||||
|
| |||||||
TOTAL SHORT-TERM INVESTMENTS(Cost $57,290) | $ | 57,290 | ||||||
|
| |||||||
Total Investments (Cost $522,811) – 107.13% | $ | 515,414 | ||||||
Liabilities in Excess of Other Assets – (7.13)% | (34,285 | ) | ||||||
|
| |||||||
TOTAL NET ASSETS – 100.00% | $ | 481,129 | ||||||
|
| |||||||
The accompanying notes to financial statements are an integral part of these Schedule of Investments.
59
Brandes Small Cap Value Fund
SCHEDULE OF INVESTMENTS — September 30, 2019 (continued)
Percentages are stated as a percent of net assets.
ADR American Depository Receipt
(a)Non-income producing security.
(b) The rate shown is the annualized seven day yield as of September 30, 2019.
The accompanying notes to financial statements are an integral part of these Schedule of Investments.
60
Brandes Small Cap Value Fund
SCHEDULE OF INVESTMENTS BY COUNTRY — September 30, 2019
COMMON STOCKS | ||||
Brazil | 1.73 | % | ||
Canada | 2.93 | % | ||
Ireland | 2.30 | % | ||
United States | 80.67 | % | ||
|
| |||
TOTAL COMMON STOCKS | 87.63 | % | ||
|
| |||
PREFERRED STOCKS | ||||
United States | 1.27 | % | ||
|
| |||
TOTAL PREFERRED STOCKS | 1.27 | % | ||
|
| |||
CORPORATE BONDS | ||||
United States | 6.32 | % | ||
|
| |||
TOTAL CORPORATE BONDS | 6.32 | % | ||
|
| |||
SHORT-TERM INVESTMENTS | 11.91 | % | ||
|
| |||
TOTAL INVESTMENTS | 107.13 | % | ||
Liabilities in Excess of Other Assets | (7.13 | )% | ||
|
| |||
TOTAL NET ASSETS | 100.00 | % | ||
|
| |||
The industry classifications represented in the Schedule of Investments are in accordance with Global Industry Classification Standards (GICS®), which was developed by and/or is the exclusive property of MSCI, Inc. and Standard & Poor Financial Services LLC or were otherwise determined by the Adviser to be appropriate. This information is unaudited.
The accompanying notes to financial statements are an integral part of these Schedule of Investments.
61
Brandes Core Plus Fixed Income Fund
SCHEDULE OF INVESTMENTS — September 30, 2019
| Shares | Value | |||||||
| COMMON STOCKS – 0.00% | ||||||||
| Household Durables – 0.00% | ||||||||
Urbi Desarrollos Urbanos SA de CV(a) | 31,277 | $ | 2,377 | |||||
|
| |||||||
TOTAL COMMON STOCKS | $ | 2,377 | ||||||
|
| |||||||
| Principal Amount | Value | |||||||
| FEDERAL AND FEDERALLY SPONSORED CREDITS – 13.85% |
| |||||||
| Federal Home Loan Mortgage Corporation – 4.82% | ||||||||
Pool G1-8578, 3.000%, 12/1/2030 | $ | 1,378,954 | $ | 1,416,920 | ||||
Pool G0-6018, 6.500%, 4/1/2039 | 22,301 | 25,607 | ||||||
Pool A9-3505, 4.500%, 8/1/2040 | 107,359 | 116,369 | ||||||
Pool SD-8001, 3.500%, 7/1/2049 | 1,249,937 | 1,282,389 | ||||||
Pool SD-8003, 4.000%, 7/1/2049 | 1,284,118 | 1,333,232 | ||||||
|
| |||||||
| 4,174,517 | ||||||||
|
| |||||||
| Federal National Mortgage Association – 9.03% | ||||||||
Pool CA1624, 3.000%, 4/1/2033 | 1,036,957 | 1,064,280 | ||||||
Pool 934124, 5.500%, 7/1/2038 | 40,441 | 45,524 | ||||||
Pool MA0918, 4.000%, 12/1/2041 | 250,341 | 267,429 | ||||||
Pool AS6201, 3.500%, 11/1/2045 | 989,996 | 1,031,289 | ||||||
Pool AL9865, 3.000%, 2/1/2047 | 1,756,710 | 1,799,275 | ||||||
Pool BJ2553, 3.500%, 12/1/2047 | 673,736 | 696,740 | ||||||
Pool BN6683, 3.500%, 6/1/2049 | 1,855,335 | 1,908,466 | ||||||
Pool MA3687, 4.000%, 6/1/2049 | 960,565 | 997,212 | ||||||
|
| |||||||
| 7,810,215 | ||||||||
|
| |||||||
TOTAL FEDERAL AND FEDERALLY SPONSORED CREDITS | $ | 11,984,732 | ||||||
|
| |||||||
| OTHER MORTGAGE RELATED SECURITIES – 0.00% | ||||||||
| Collateralized Mortgage Obligations – 0.00% | ||||||||
Wells Fargo Mortgage Backed Securities 2006-AR14 Trust | $ | 975 | $ | 953 | ||||
|
| |||||||
TOTAL OTHER MORTGAGE RELATED SECURITIES | $ | 953 | ||||||
|
| |||||||
| US GOVERNMENTS – 49.00% | ||||||||
| Sovereign – 49.00% | ||||||||
United States Treasury Note | ||||||||
2.000%, 11/15/2021 | $ | 211,000 | $ | 212,591 | ||||
2.000%, 2/15/2023 | 3,140,000 | 3,182,684 | ||||||
2.375%, 8/15/2024 | 10,405,000 | 10,792,749 | ||||||
2.250%, 2/15/2027 | 16,850,000 | 17,579,947 | ||||||
2.375%, 5/15/2029 | 3,500,000 | 3,716,836 | ||||||
4.750%, 2/15/2037 | 4,835,000 | 6,928,970 | ||||||
|
| |||||||
TOTAL US GOVERNMENTS | $ | 42,413,777 | ||||||
|
| |||||||
The accompanying notes to financial statements are an integral part of these Schedule of Investments.
62
Brandes Core Plus Fixed Income Fund
SCHEDULE OF INVESTMENTS — September 30, 2019 (continued)
| Principal Amount | Value | |||||||
| ASSET BACKED SECURITIES – 2.02% | ||||||||
| Equipment – 0.03% | ||||||||
Continental Airlines 2007-1 Class A Pass Through Trust | $ | 26,660 | $ | 28,134 | ||||
|
| |||||||
| Student Loan – 1.99% | ||||||||
SLM Private Credit Student Loan Trust 2004-B | 300,000 | 289,712 | ||||||
SLM Private Credit Student Loan Trust 2005-A | 400,000 | 390,146 | ||||||
SLM Private Credit Student Loan Trust 2006-A | 752,412 | 736,277 | ||||||
SLM Private Credit Student Loan Trust 2007-A | 308,573 | 300,679 | ||||||
|
| |||||||
| 1,716,814 | ||||||||
|
| |||||||
TOTAL ASSET BACKED SECURITIES | $ | 1,744,948 | ||||||
|
| |||||||
| CORPORATE BONDS – 32.46% | ||||||||
| Automobiles – 2.07% | ||||||||
Ford Motor Credit Co. LLC | 780,000 | $ | 792,897 | |||||
General Motors Financial Co., Inc. | 1,000,000 | 1,001,322 | ||||||
|
| |||||||
| 1,794,219 | ||||||||
|
| |||||||
| Banks – 7.00% | ||||||||
Citibank NA | 1,650,000 | 1,650,524 | ||||||
Fifth Third Bancorp | 175,000 | 269,239 | ||||||
Goldman Sachs Group, Inc. | 780,000 | 788,479 | ||||||
JPMorgan Chase & Co. | 1,639,000 | 1,646,682 | ||||||
USB Capital IX | 1,265,000 | 1,078,413 | ||||||
Wells Fargo & Co. | 618,000 | 625,725 | ||||||
|
| |||||||
| 6,059,062 | ||||||||
|
| |||||||
| Commercial Services & Supplies – 2.61% | ||||||||
ADT Corp. | 1,830,000 | 1,836,863 | ||||||
Iron Mountain, Inc. | 410,000 | 419,299 | ||||||
|
| |||||||
| 2,256,162 | ||||||||
|
| |||||||
The accompanying notes to financial statements are an integral part of these Schedule of Investments.
63
Brandes Core Plus Fixed Income Fund
SCHEDULE OF INVESTMENTS — September 30, 2019 (continued)
| Principal Amount | Value | |||||||
| Consumer Products – 1.71% | ||||||||
Avon International Operations, Inc. | $ | 925,000 | $ | 962,897 | ||||
Wyndham Destinations, Inc. | 510,000 | 517,650 | ||||||
|
| |||||||
| 1,480,547 | ||||||||
|
| |||||||
| Electric Utilities – 0.28% | ||||||||
Commonwealth Edison Co. | 175,000 | 238,251 | ||||||
|
| |||||||
| Food, Beverage & Tobacco – 1.76% | ||||||||
Mead Johnson Nutrition Co. | 775,000 | 776,642 | ||||||
Pilgrim’s Pride Corp. | 725,000 | 750,375 | ||||||
|
| |||||||
| 1,527,017 | ||||||||
|
| |||||||
| Homebuilders – 2.16% | ||||||||
PulteGroup, Inc. | 980,000 | 1,070,650 | ||||||
Toll Brothers Finance Corp. | 745,000 | 797,150 | ||||||
|
| |||||||
| 1,867,800 | ||||||||
|
| |||||||
| Insurance – 0.97% | ||||||||
American International Group, Inc. | 800,000 | 840,662 | ||||||
|
| |||||||
| Media – 0.50% | ||||||||
Netflix, Inc. | 420,000 | 432,600 | ||||||
|
| |||||||
| Metals & Mining – 0.14% | ||||||||
Cloud Peak Energy | 480,000 | 120,000 | ||||||
|
| |||||||
| Oil, Gas & Consumable Fuels – 8.15% | ||||||||
BP Capital Markets Plc | 810,000 | 859,537 | ||||||
Chesapeake Energy Corp. | 1,245,000 | 899,513 | ||||||
Chevron Corp. | 1,150,000 | 1,154,440 | ||||||
Exxon Mobil Corp. | 945,000 | 959,407 | ||||||
Kinder Morgan, Inc. | 1,054,000 | 1,139,503 | ||||||
Occidental Petroleum Corp. | 555,000 | 570,602 | ||||||
The accompanying notes to financial statements are an integral part of these Schedule of Investments.
64
Brandes Core Plus Fixed Income Fund
SCHEDULE OF INVESTMENTS — September 30, 2019 (continued)
| Principal Amount | Value | |||||||
Range Resources Corp. | $ | 1,680,000 | $ | 1,470,000 | ||||
|
| |||||||
| 7,053,002 | ||||||||
|
| |||||||
| Technology – 2.35% | ||||||||
Microsoft Corp. | 1,000,000 | 1,013,962 | ||||||
VMware, Inc. | 995,000 | 1,023,334 | ||||||
|
| |||||||
| 2,037,296 | ||||||||
|
| |||||||
| Telecommunications – 2.76% | ||||||||
AT&T, Inc. | 1,630,000 | 1,663,782 | ||||||
Frontier Communications Corp. | 1,320,000 | 587,400 | ||||||
Telefonica Emisiones SA | 135,000 | 140,924 | ||||||
|
| |||||||
| 2,392,106 | ||||||||
|
| |||||||
TOTAL CORPORATE BONDS | $ | 28,098,724 | ||||||
|
| |||||||
| Shares | Value | |||||||
| SHORT-TERM INVESTMENTS – 2.43% | ||||||||
| Money Market Funds – 2.43% | ||||||||
BlackRock Liquidity Funds T-Fund – Institutional Class, 1.834%(f) | 2,098,876 | $ | 2,098,876 | |||||
|
| |||||||
TOTAL SHORT-TERM INVESTMENTS | $ | 2,098,876 | ||||||
|
| |||||||
Total Investments (Cost $84,339,730) – 99.76% | $ | 86,344,387 | ||||||
Liabilities in Excess of Other Assets – 0.24% | 206,639 | |||||||
|
| |||||||
TOTAL NET ASSETS – 100.00% | $ | 86,551,026 | ||||||
|
| |||||||
Percentages are stated as a percent of net assets.
LIBOR London Inter-bank Offered Rate
| (a) | Non-income producing security. |
| (b) | Acquired in a transaction exempt from registration under Rule 144A or Section 4(a)(2) of the Securities Act of 1933. May be resold in the U.S. in transactions exempt from registration, normally to qualified institutional buyers. The total value of all such securities was $2,132,571, which represented 2.46% of the net assets of the Fund. |
| (c) | Variable rate security. The coupon is based on an underlying pool of loans. |
| (d) | Variable rate security. The coupon is based on a reference index and spread index. |
| (e) | Issuer filed for bankruptcy and is in default of interest payments. |
| (f) | The rate shown is the annualized seven day yield as of September 30, 2019. |
The accompanying notes to financial statements are an integral part of these Schedule of Investments.
65
Brandes Core Plus Fixed Income Fund
SCHEDULE OF INVESTMENTS — September 30, 2019 (continued)
The industry classifications represented in the Schedule of Investments are in accordance with Global Industry Classification Standards (GICS®), which was developed by and/or is the exclusive property of MSCI, Inc. and Standard & Poor Financial Services LLC or were otherwise determined by the Adviser to be appropriate. This information is unaudited.
The accompanying notes to financial statements are an integral part of these Schedule of Investments.
66
(This Page Intentionally Left Blank.)
67
Brandes Investment Trust
STATEMENTS OF ASSETS AND LIABILITIES — September 30, 2019
| Brandes International Equity Fund | Brandes Global Equity Fund | |||||||
ASSETS | ||||||||
Investment in securities, at value(1) | ||||||||
Unaffiliated issuers | $ | 702,143,343 | $ | 36,230,060 | ||||
Affiliated issuers | — | — | ||||||
Foreign Currency(1) | 105,240 | 11,836 | ||||||
Receivables: | ||||||||
Securities sold | — | — | ||||||
Fund shares sold | 1,788,867 | — | ||||||
Dividends and interest | 3,208,217 | 86,155 | ||||||
Foreign currency spot trade | — | — | ||||||
Tax reclaims | 947,410 | 44,154 | ||||||
Securities lending | 27,804 | — | ||||||
Due from Advisor | — | — | ||||||
Prepaid expenses and other assets | 55,361 | 15,274 | ||||||
|
|
|
| |||||
Total Assets | 708,276,242 | 36,387,479 | ||||||
|
|
|
| |||||
LIABILITIES | ||||||||
Payables: | ||||||||
Fund shares redeemed | 3,468,182 | 170,104 | ||||||
Due to Advisor | 365,675 | 8,280 | ||||||
12b-1 Fee | 14,806 | 1,054 | ||||||
Trustee Fees | 22,985 | 1,270 | ||||||
Custodian Fee Payable | 12,941 | 921 | ||||||
Dividends payable | 359,984 | 2,478 | ||||||
Foreign tax withholding | 266,330 | 3,009 | ||||||
Foreign currency spot trade payable | 346 | 39 | ||||||
Accrued expenses | 400,517 | 128,515 | ||||||
|
|
|
| |||||
Total Liabilities | 4,911,766 | 315,670 | ||||||
|
|
|
| |||||
NET ASSETS | $ | 703,364,476 | $ | 36,071,809 | ||||
|
|
|
| |||||
COMPONENTS OF NET ASSETS | ||||||||
Paid in Capital | $ | 834,714,110 | $ | 33,575,673 | ||||
Total distributable earnings (loss) | (131,349,634 | ) | 2,496,136 | |||||
|
|
|
| |||||
Total Net Assets | $ | 703,364,476 | $ | 36,071,809 | ||||
|
|
|
| |||||
Net asset value, offering price and redemption proceeds per share | ||||||||
Class A Shares | ||||||||
Net Assets | $ | 32,019,257 | $ | 1,487,607 | ||||
Shares outstanding (unlimited shares authorized without par value) | 1,999,135 | 68,402 | ||||||
Offering and redemption price | $ | 16.02 | $ | 21.75 | ||||
|
|
|
| |||||
Maximum offering price per share* | $ | 16.99 | $ | 23.08 | ||||
|
|
|
| |||||
Class C Shares | ||||||||
Net Assets | $ | 13,059,248 | $ | 1,193,477 | ||||
Shares outstanding (unlimited shares authorized without par value) | 828,768 | 55,253 | ||||||
Offering and redemption price | $ | 15.76 | $ | 21.60 | ||||
|
|
|
| |||||
Class I Shares | ||||||||
Net Assets | $ | 622,414,368 | $ | 33,390,725 | ||||
Shares outstanding (unlimited shares authorized without par value) | 38,722,403 | 1,523,832 | ||||||
Offering and redemption price | $ | 16.07 | $ | 21.91 | ||||
|
|
|
| |||||
Class R6 Shares | ||||||||
Net Assets | $ | 35,871,603 | N/A | |||||
Shares outstanding (unlimited shares authorized without par value) | 2,221,551 | N/A | ||||||
Offering and redemption price | $ | 16.15 | N/A | |||||
|
|
|
| |||||
(1)Costof: | ||||||||
Investments in securities | ||||||||
Unaffiliated issuers | $ | 825,638,340 | $ | 32,651,804 | ||||
Affiliated issuers | — | — | ||||||
Foreign currency | 105,237 | 11,836 | ||||||
| * | Includes a sales load of 5.75% for the International, Global, Global Equity Income, Emerging Markets Value, International Small Cap, and Small Cap Value Funds and 3.75% for the Core Plus Fixed Income Fund. (see Note 7 of the Notes to Financial Statements) |
The accompanying notes to financial statements are an integral part of these statements.
68
Brandes Investment Trust
STATEMENTS OF ASSETS AND LIABILITIES — September 30, 2019 (continued)
Brandes | Brandes Emerging Markets Value Fund | Brandes International Small Cap Equity Fund | Brandes Small Cap Value Fund | Brandes Core Plus Fixed Income Fund | ||||||||||||||
| $ | 1,448,186 | $ | 1,422,210,040 | $ | 499,227,202 | $ | 515,414 | $ | 86,344,387 | |||||||||
| — | 778,538 | 2,337,628 | — | — | ||||||||||||||
| 530 | — | 29,146 | — | — | ||||||||||||||
| — | — | 42,985 | — | — | ||||||||||||||
| — | 2,055,657 | 3,283,407 | — | — | ||||||||||||||
| 6,431 | 3,021,666 | 1,830,805 | 556 | 428,656 | ||||||||||||||
| — | — | — | — | — | ||||||||||||||
| 1,562 | 79,591 | 362,929 | 11 | — | ||||||||||||||
| — | — | — | — | — | ||||||||||||||
| 15,732 | — | — | 17,923 | — | ||||||||||||||
| 3,115 | 40,545 | 20,086 | 15,014 | 13,915 | ||||||||||||||
|
|
|
|
|
|
|
|
|
| |||||||||
| 1,475,556 | 1,428,186,037 | 507,134,188 | 548,918 | 86,786,958 | ||||||||||||||
|
|
|
|
|
|
|
|
|
| |||||||||
| 151 | 5,398,478 | 20,437,324 | — | 86,668 | ||||||||||||||
| — | 990,378 | 434,438 | — | 6,159 | ||||||||||||||
| 11 | 59,786 | 13,397 | 3 | 742 | ||||||||||||||
| 40 | 46,519 | 19,556 | 173 | 2,754 | ||||||||||||||
| 337 | 106,934 | 27,792 | 205 | 1,988 | ||||||||||||||
| 141 | 1,386,444 | 75,275 | — | 3,305 | ||||||||||||||
| 433 | 350,862 | 140,496 | 16 | — | ||||||||||||||
| 2 | — | 10 | — | — | ||||||||||||||
| 67,502 | 651,428 | 388,998 | 67,392 | 134,316 | ||||||||||||||
|
|
|
|
|
|
|
|
|
| |||||||||
| 68,617 | 8,990,829 | 21,537,286 | 67,789 | 235,932 | ||||||||||||||
|
|
|
|
|
|
|
|
|
| |||||||||
| $ | 1,406,939 | $ | 1,419,195,208 | $ | 485,596,902 | $ | 481,129 | $ | 86,551,026 | |||||||||
|
|
|
|
|
|
|
|
|
| |||||||||
| $ | 1,400,491 | $ | 1,627,207,779 | $ | 735,430,876 | $ | 683,383 | $ | 86,372,482 | |||||||||
| 6,448 | (208,012,571 | ) | (249,833,974 | ) | (202,254 | ) | 178,544 | |||||||||||
|
|
|
|
|
|
|
|
|
| |||||||||
| $ | 1,406,939 | $ | 1,419,195,208 | $ | 485,596,902 | $ | 481,129 | $ | 86,551,026 | |||||||||
|
|
|
|
|
|
|
|
|
| |||||||||
| $ | 30,153 | $ | 235,872,973 | $ | 43,459,402 | $ | 7,497 | $ | 3,224,627 | |||||||||
| 2,708 | 27,508,096 | 4,252,420 | 873 | 351,138 | ||||||||||||||
| $ | 11.13 | $ | 8.57 | $ | 10.22 | $ | 8.58 | $ | 9.18 | |||||||||
|
|
|
|
|
|
|
|
|
| |||||||||
| $ | 11.81 | $ | 9.10 | $ | 10.84 | $ | 9.11 | $ | 9.54 | |||||||||
|
|
|
|
|
|
|
|
|
| |||||||||
| $ | 4,974 | $ | 18,045,263 | $ | 6,878,228 | N/A | N/A | |||||||||||
| 464 | 2,114,934 | 692,187 | N/A | N/A | ||||||||||||||
| $ | 10.71 | $ | 8.53 | $ | 9.94 | N/A | N/A | |||||||||||
|
|
|
|
|
|
|
|
|
| |||||||||
| $ | 1,371,812 | $ | 1,117,688,152 | $ | 414,815,896 | $ | 473,544 | $ | 83,326,292 | |||||||||
| 129,480 | 129,698,133 | 40,452,353 | 54,944 | 9,000,810 | ||||||||||||||
| $ | 10.59 | $ | 8.62 | $ | 10.25 | $ | 8.62 | $ | 9.26 | |||||||||
|
|
|
|
|
|
|
|
|
| |||||||||
| N/A | $ | 47,588,820 | $ | 20,443,376 | 88 | 107 | ||||||||||||
| N/A | 5,501,942 | 1,989,837 | 11 | 12 | ||||||||||||||
| N/A | $ | 8.65 | $ | 10.27 | $ | 7.97 | $ | 9.26 | ||||||||||
|
|
|
|
|
|
|
|
|
| |||||||||
| $ | 1,463,537 | $ | 1,595,091,922 | $ | 584,642,484 | $ | 522,811 | $ | 84,339,730 | |||||||||
| — | 12,202,165 | 30,880,966 | — | — | ||||||||||||||
| 530 | — | 29,523 | — | — | ||||||||||||||
The accompanying notes to financial statements are an integral part of these statements.
69
Brandes Investment Trust
STATEMENTS OF OPERATIONS — For the Year Ended September 30, 2019
| Brandes International Equity Fund | Brandes Global Equity Fund | |||||||
INVESTMENT INCOME | ||||||||
Income | ||||||||
Dividend income | ||||||||
Unaffiliated issuers | $ | 35,073,224 | $ | 1,710,601 | ||||
Affiliated issuers | — | — | ||||||
Less: Foreign taxes withheld | (3,692,775 | ) | (116,080 | ) | ||||
Interest income | 281,665 | 7,109 | ||||||
Income from securities lending | 392,073 | 9,863 | ||||||
Miscellaneous Income | — | — | ||||||
|
|
|
| |||||
Total Income | 32,054,187 | 1,611,493 | ||||||
|
|
|
| |||||
Expenses | ||||||||
Advisory fees (Note 3) | 5,780,755 | 382,961 | ||||||
Custody fees | 76,780 | 6,512 | ||||||
Administration fees (Note 3) | 192,500 | 25,084 | ||||||
Insurance expense | 15,325 | 1,456 | ||||||
Legal fees | 35,879 | 2,445 | ||||||
Printing fees | 59,818 | 4,774 | ||||||
Miscellaneous | 40,978 | 5,926 | ||||||
Registration expense | 112,417 | 45,795 | ||||||
Trustee fees | 95,498 | 6,831 | ||||||
Transfer agent fees | 159,107 | 48,453 | ||||||
12b-1 Fees - Class A | 85,885 | 5,202 | ||||||
12b-1 Fees - Class C | 119,460 | 10,268 | ||||||
Shareholder Service Fees - Class C | 39,820 | 3,423 | ||||||
Sub-Transfer Agency Fees - Class I | 326,473 | 22,210 | ||||||
Accounting fees | 80,467 | 59,176 | ||||||
Auditing fees | 42,736 | 38,458 | ||||||
Offering Costs | — | — | ||||||
|
|
|
| |||||
Total expenses | 7,263,898 | 668,974 | ||||||
Expenses waived | (202,211 | ) | (171,380 | ) | ||||
Expenses recouped | — | — | ||||||
|
|
|
| |||||
Total net expenses | 7,061,687 | 497,594 | ||||||
|
|
|
| |||||
Net investment income | 24,992,500 | 1,113,899 | ||||||
|
|
|
| |||||
REALIZED AND UNREALIZED GAIN (LOSS) ON INVESTMENTS | ||||||||
Net realized gain (loss) on: | ||||||||
Unaffiliated investments | (2,065,397 | ) | (1,072,737 | ) | ||||
Affiliated investments | — | — | ||||||
Redemption in-kind (Note 10) | — | 91,756 | ||||||
Foreign currency transactions | (312,368 | ) | (34,297 | ) | ||||
|
|
|
| |||||
Net realized gain (loss) | (2,377,765 | ) | (1,015,278 | ) | ||||
|
|
|
| |||||
Net change in unrealized appreciation (depreciation) on: | ||||||||
Investments | (69,944,066 | ) | (3,780,920 | ) | ||||
Foreign currency transactions | (28,967 | ) | (200 | ) | ||||
|
|
|
| |||||
Net change in unrealized appreciation (depreciation) | (69,973,033 | ) | (3,781,120 | ) | ||||
|
|
|
| |||||
Net realized and unrealized gain (loss) on investments and foreign currency transactions | (72,350,798 | ) | (4,796,398 | ) | ||||
|
|
|
| |||||
Net increase (decrease) in net assets resulting from operations | $ | (47,358,298) | $ | (3,682,499) | ||||
|
|
|
| |||||
The accompanying notes to financial statements are an integral part of these statements.
70
Brandes Investment Trust
STATEMENTS OF OPERATIONS — For the Year Ended September 30, 2019 (continued)
Brandes | Brandes Emerging Markets Value Fund | Brandes International Small Cap Equity Fund | Brandes Small Cap Value Fund | Brandes Core Plus Fixed Income Fund | ||||||||||||||
| $ | 61,166 | $ | 58,837,092 | $ | 19,752,049 | $ | 98,807 | $ | 18,328 | |||||||||
| — | — | 160,701 | — | — | ||||||||||||||
| (4,672 | ) | (7,566,790 | ) | (1,715,837 | ) | (2,947 | ) | — | ||||||||||
| 8 | 169,265 | 271,770 | 19,925 | 2,850,648 | ||||||||||||||
| 1 | — | 81,580 | — | — | ||||||||||||||
| — | — | 29,429 | 1,257 | — | ||||||||||||||
|
|
|
|
|
|
|
|
|
| |||||||||
| 56,503 | 51,439,567 | 18,579,692 | 117,042 | 2,868,976 | ||||||||||||||
|
|
|
|
|
|
|
|
|
| |||||||||
| 10,645 | 13,666,520 | 6,569,287 | 47,956 | 294,429 | ||||||||||||||
| 1,921 | 680,663 | 195,158 | 1,618 | 11,801 | ||||||||||||||
| 13,580 | 359,223 | 177,052 | 13,413 | 33,456 | ||||||||||||||
| 4 | 31,756 | 25,436 | 180 | 2,002 | ||||||||||||||
| 63 | 67,740 | 32,835 | 385 | 3,985 | ||||||||||||||
| 1,841 | 98,838 | 39,823 | 2,998 | 6,039 | ||||||||||||||
| 2,957 | 115,473 | 70,061 | 2,570 | 5,810 | ||||||||||||||
| 7,769 | 105,070 | 77,230 | 36,363 | 53,692 | ||||||||||||||
| 914 | 178,565 | 81,810 | 2,798 | 11,496 | ||||||||||||||
| 45,129 | 337,944 | 188,548 | 44,673 | 51,693 | ||||||||||||||
| 76 | 617,880 | 151,496 | 42 | 5,437 | ||||||||||||||
| 37 | 152,134 | 73,459 | N/A | N/A | ||||||||||||||
| 12 | 50,711 | 24,486 | N/A | N/A | ||||||||||||||
| 648 | 566,316 | 280,696 | 1,821 | 40,974 | ||||||||||||||
| 56,572 | 90,631 | 83,064 | 48,825 | 58,520 | ||||||||||||||
| 33,294 | 41,150 | 39,306 | 35,128 | 38,599 | ||||||||||||||
| — | — | — | 15,691 | — | ||||||||||||||
|
|
|
|
|
|
|
|
|
| |||||||||
| 175,462 | 17,160,614 | 8,109,747 | 254,461 | 617,933 | ||||||||||||||
| (162,031 | ) | (352,747 | ) | (58,771 | ) | (198,545 | ) | (192,970 | ) | |||||||||
| — | 20,458 | — | — | — | ||||||||||||||
|
|
|
|
|
|
|
|
|
| |||||||||
| 13,431 | 16,828,325 | 8,050,976 | 55,916 | 424,963 | ||||||||||||||
|
|
|
|
|
|
|
|
|
| |||||||||
| 43,072 | 34,611,242 | 10,528,716 | 61,126 | 2,444,013 | ||||||||||||||
|
|
|
|
|
|
|
|
|
| |||||||||
| 21,541 | 20,752,214 | (68,904,313 | ) | (245,372 | ) | (950,890 | ) | |||||||||||
| — | — | (47,603,149 | ) | — | — | |||||||||||||
| — | — | — | (959,099 | ) | — | |||||||||||||
| (64 | ) | 313,477 | (42,701 | ) | (52 | ) | — | |||||||||||
|
|
|
|
|
|
|
|
|
| |||||||||
| 21,477 | 21,065,691 | (116,550,163 | ) | (1,204,523 | ) | (950,890 | ) | |||||||||||
|
|
|
|
|
|
|
|
|
| |||||||||
| (93,988 | ) | (16,858,102 | ) | (6,809,821 | ) | 83,063 | 3,872,912 | |||||||||||
| (109 | ) | (50,755 | ) | 13,121 | — | — | ||||||||||||
|
|
|
|
|
|
|
|
|
| |||||||||
| (94,097 | ) | (16,908,857 | ) | (6,796,700 | ) | 83,063 | 3,872,912 | |||||||||||
|
|
|
|
|
|
|
|
|
| |||||||||
| (72,620 | ) | 4,156,834 | (123,346,863 | ) | (1,121,460 | ) | 2,922,022 | ||||||||||
|
|
|
|
|
|
|
|
|
| |||||||||
| $ | (29,548 | ) | $ | 38,768,076 | $ | (112,818,147 | ) | $ | (1,060,334 | ) | $ | 5,366,035 | ||||||
|
|
|
|
|
|
|
|
|
| |||||||||
The accompanying notes to financial statements are an integral part of these statements.
71
Brandes Investment Trust
STATEMENT OF CHANGES IN NET ASSETS
| Brandes International Equity Fund | Brandes Global Equity Fund | |||||||||||||||
| Year ended September 30, 2019 | Year ended September 30, 2018(1) | Year ended September 30, 2019 | Year ended September 30, 2018(2) | |||||||||||||
INCREASE (DECREASE) IN NET ASSETS FROM: | ||||||||||||||||
OPERATIONS | ||||||||||||||||
Net investment income | $ | 24,992,500 | $ | 14,011,486 | $ | 1,113,899 | $ | 1,348,817 | ||||||||
Net realized gain (loss) on: | ||||||||||||||||
Investments | (2,065,397 | ) | 25,391,080 | (1,072,737 | ) | 2,874,455 | ||||||||||
Redemption in-kind | — | — | 91,756 | — | ||||||||||||
Foreign currency transactions | (312,368 | ) | (210,171 | ) | (34,297 | ) | (10,426 | ) | ||||||||
Net unrealized appreciation (depreciation) on: | ||||||||||||||||
Investments | (69,944,066 | ) | (17,141,192 | ) | (3,780,920 | ) | (732,898 | ) | ||||||||
Foreign currency transactions | (28,967 | ) | (41,489 | ) | (200 | ) | (281 | ) | ||||||||
|
|
|
|
|
|
|
| |||||||||
Net increase (decrease) in net assets resulting from operations | (47,358,298 | ) | 22,009,714 | (3,682,499 | ) | 3,479,667 | ||||||||||
|
|
|
|
|
|
|
| |||||||||
DISTRIBUTIONS TO SHAREHOLDERS | ||||||||||||||||
Distributions to shareholders | ||||||||||||||||
Class A | (1,307,402 | ) | (569,062 | ) | (174,666 | ) | (195,704 | ) | ||||||||
Class C | (502,763 | ) | (240,746 | ) | (90,070 | ) | (48,710 | ) | ||||||||
Class I | (25,706,405 | ) | (10,567,066 | ) | (3,614,095 | ) | (2,487,609 | ) | ||||||||
Class R6 | (1,310,485 | ) | (440,184 | ) | N/A | N/A | ||||||||||
|
|
|
|
|
|
|
| |||||||||
Decrease in net assets from distributions | (28,827,055 | ) | (11,817,058 | ) | (3,878,831 | ) | (2,732,023 | ) | ||||||||
|
|
|
|
|
|
|
| |||||||||
CAPITAL SHARE TRANSACTIONS | ||||||||||||||||
Proceeds from shares sold | 352,119,388 | 280,183,460 | 5,549,682 | 5,255,435 | ||||||||||||
Net asset value of shares issued on reinvestment of distributions | 27,122,568 | 11,008,451 | 3,840,206 | 2,710,260 | ||||||||||||
Cost of shares redeemed | (342,230,968 | ) | (169,897,059 | ) | (31,256,592 | ) | (10,290,630 | ) | ||||||||
Cost of shares redeemed from redemption in-kind (Note 10) | — | — | (2,112,940 | ) | — | |||||||||||
|
|
|
|
|
|
|
| |||||||||
Net increase (decrease) in net assets from capital share transactions | 37,010,988 | 121,294,852 | (23,979,644 | ) | (2,324,935 | ) | ||||||||||
|
|
|
|
|
|
|
| |||||||||
Total increase (decrease) in net assets | (39,174,365 | ) | 131,487,508 | (31,540,974 | ) | (1,577,291 | ) | |||||||||
|
|
|
|
|
|
|
| |||||||||
NET ASSETS | ||||||||||||||||
Beginning of the Period | 742,538,841 | 611,051,333 | 67,612,783 | 69,190,074 | ||||||||||||
|
|
|
|
|
|
|
| |||||||||
End of the Period | $ | 703,364,476 | $ | 742,538,841 | $ | 36,071,809 | $ | 67,612,783 | ||||||||
|
|
|
|
|
|
|
| |||||||||
| (1) | Distributions to shareholders includes net investment income distributions of $569,062, $240,746, $10,567,066 and $440,184 for the A, C, I and R6 classes, respectively. End of period net assets includes accumulated undistributed net investment income of $1,537,706. |
| (2) | Distributions to shareholders includes net investment income distributions of $72,745, $15,982 and $1,223,998, and net realized gains distributions of $122,959, $32,728 and $1,263,611 for the A, C and I classes, respectively. End of period net assets includes accumulated undistributed net investment loss of $62,335. |
The accompanying notes to financial statements are an integral part of these statements.
72
Brandes Investment Trust
STATEMENT OF CHANGES IN NET ASSETS (continued)
| Brandes Global Equity Income Fund | Brandes Emerging Markets Value Fund | |||||||||||||||
| Year ended September 30, 2019 | Year ended September 30, 2018(1) | Year ended September 30, 2019 | Year ended September 30, 2018(2) | |||||||||||||
INCREASE (DECREASE) IN NET ASSETS FROM: | ||||||||||||||||
OPERATIONS | ||||||||||||||||
Net investment income | $ | 43,072 | $ | 31,967 | $ | 34,611,242 | $ | 31,671,556 | ||||||||
Net realized gain (loss) on: | ||||||||||||||||
Investments | 21,541 | 53,581 | 20,752,214 | 101,866,689 | ||||||||||||
Foreign currency transactions | (64 | ) | (260 | ) | 313,477 | (2,992,329 | ) | |||||||||
Net unrealized appreciation (depreciation) on: | ||||||||||||||||
Investments | (93,988 | ) | (48,419 | ) | (16,858,102 | ) | (297,507,481 | ) | ||||||||
Foreign currency transactions | (109 | ) | (171 | ) | (50,755 | ) | 31,294 | |||||||||
|
|
|
|
|
|
|
| |||||||||
Net increase (decrease) in net assets resulting from operations | (29,548 | ) | 36,698 | 38,768,076 | (166,930,271 | ) | ||||||||||
|
|
|
|
|
|
|
| |||||||||
DISTRIBUTIONS TO SHAREHOLDERS | ||||||||||||||||
Distributions to shareholders | ||||||||||||||||
Class A | (1,865 | ) | (685 | ) | (4,270,926 | ) | (4,492,509 | ) | ||||||||
Class C | (272 | ) | (21 | ) | (219,104 | ) | (224,759 | ) | ||||||||
Class I | (83,638 | ) | (64,304 | ) | (22,135,574 | ) | (23,654,042 | ) | ||||||||
Class R6 | N/A | N/A | (859,192 | ) | (1,345,870 | ) | ||||||||||
|
|
|
|
|
|
|
| |||||||||
Decrease in net assets from distributions | (85,775 | ) | (65,010 | ) | (27,484,796 | ) | (29,717,180 | ) | ||||||||
|
|
|
|
|
|
|
| |||||||||
CAPITAL SHARE TRANSACTIONS | ||||||||||||||||
Proceeds from shares sold | 98,095 | 339,640 | 469,166,542 | 532,236,709 | ||||||||||||
Net asset value of shares issued on reinvestment of distributions | 83,916 | 62,888 | 24,989,132 | 26,393,702 | ||||||||||||
Cost of shares redeemed | (47,982 | ) | (28,697 | ) | (563,551,771 | ) | (640,989,583 | ) | ||||||||
|
|
|
|
|
|
|
| |||||||||
Net increase (decrease) in net assets from capital share transactions | 134,029 | 373,831 | (69,396,097 | ) | (82,359,172 | ) | ||||||||||
|
|
|
|
|
|
|
| |||||||||
Total increase (decrease) in net assets | 18,706 | 345,519 | (58,112,817 | ) | (279,006,623 | ) | ||||||||||
|
|
|
|
|
|
|
| |||||||||
NET ASSETS | ||||||||||||||||
Beginning of the Period | 1,388,233 | 1,042,714 | 1,477,308,025 | 1,756,314,648 | ||||||||||||
|
|
|
|
|
|
|
| |||||||||
End of the Period | $ | 1,406,939 | $ | 1,388,233 | $ | 1,419,195,208 | $ | 1,477,308,025 | ||||||||
|
|
|
|
|
|
|
| |||||||||
| (1) | Distributions to shareholders includes net investment income distributions of $681, $17 and $30,179, and net realized gains distributions of $4, $4 and $34,125 for the A, C and I classes, respectively. End of period net assets includes accumulated undistributed net investment income of $935. |
| (2) | Distributions to shareholders includes net investment income distributions of $4,492,509, $224,759, $23,654,042 and $1,345,870 for the A, C, I and R6 classes, respectively. End of period net assets includes accumulated undistributed net investment loss of $10,547,353. |
The accompanying notes to financial statements are an integral part of these statements.
73
Brandes Investment Trust
STATEMENT OF CHANGES IN NET ASSETS (continued)
| Brandes International Small Cap Equity Fund | Brandes Small Cap Value Fund | |||||||||||||||
| Year ended September 30, 2019 | Year ended September 30, 2018(1) | Year ended September 30, 2019 | Period ended September 30, 2018(2)(3) | |||||||||||||
INCREASE (DECREASE) IN NET ASSETS FROM: | ||||||||||||||||
OPERATIONS | ||||||||||||||||
Net investment income | $ | 10,528,716 | $ | 18,413,109 | $ | 61,126 | $ | 39,189 | ||||||||
Net realized gain (loss) on: | ||||||||||||||||
Investments | (116,507,462 | ) | 76,959,441 | (245,372 | ) | 500,680 | ||||||||||
Redemption in-kind | — | — | (959,099 | ) | — | |||||||||||
Foreign currency transactions | (42,701 | ) | (807,207 | ) | (52 | ) | — | |||||||||
Net unrealized appreciation (depreciation) on: | ||||||||||||||||
Investments | (6,809,821 | ) | (212,419,367 | ) | 83,063 | (90,460 | ) | |||||||||
Foreign currency transactions | 13,121 | 166,032 | — | — | ||||||||||||
|
|
|
|
|
|
|
| |||||||||
Net increase (decrease) in net assets resulting from operations | (112,818,147 | ) | (117,687,992 | ) | (1,060,334 | ) | 449,409 | |||||||||
|
|
|
|
|
|
|
| |||||||||
DISTRIBUTIONS TO SHAREHOLDERS | ||||||||||||||||
Distributions to shareholders | ||||||||||||||||
Class A | (2,579,162 | ) | (11,119,388 | ) | (1,892 | ) | (166 | ) | ||||||||
Class C | (381,674 | ) | (1,848,988 | ) | N/A | N/A | ||||||||||
Class I | (22,475,604 | ) | (109,207,423 | ) | (396,607 | ) | (20,004 | ) | ||||||||
Class R6 | (2,449,141 | ) | (5,700,213 | ) | (347,896 | ) | (19,482 | ) | ||||||||
|
|
|
|
|
|
|
| |||||||||
Decrease in net assets from distributions | (27,885,581 | ) | (127,876,012 | ) | (746,395 | ) | (39,652 | ) | ||||||||
|
|
|
|
|
|
|
| |||||||||
CAPITAL SHARE TRANSACTIONS | �� | |||||||||||||||
Proceeds from shares sold | 193,681,212 | 400,890,576 | 5,000 | 1,813,264 | ||||||||||||
Proceeds from Transfer in-kind (Note 10) | — | — | — | 8,132,782 | ||||||||||||
Net asset value of shares issued on reinvestment of distributions | 26,544,230 | 123,508,821 | 746,395 | 39,652 | ||||||||||||
Cost of shares redeemed | (725,653,118 | ) | (971,216,787 | ) | (5,184,173 | ) | (65,620 | ) | ||||||||
Cost of shares redeemed from redemption in-kind (Note 10) | — | — | (3,609,199 | ) | — | |||||||||||
|
|
|
|
|
|
|
| |||||||||
Net increase (decrease) in net assets from capital share transactions | (505,427,676 | ) | (446,817,390 | ) | (8,041,977 | ) | 9,920,078 | |||||||||
|
|
|
|
|
|
|
| |||||||||
Total increase (decrease) in net assets | (646,131,404 | ) | (692,381,394 | ) | (9,848,706 | ) | 10,329,835 | |||||||||
|
|
|
|
|
|
|
| |||||||||
NET ASSETS | ||||||||||||||||
Beginning of the Period | 1,131,728,306 | 1,824,109,700 | 10,329,835 | — | ||||||||||||
|
|
|
|
|
|
|
| |||||||||
End of the Period | $ | 485,596,902 | $ | 1,131,728,306 | $ | 481,129 | $ | 10,329,835 | ||||||||
|
|
|
|
|
|
|
| |||||||||
| (1) | Distributions to shareholders includes net investment income distributions of $5,950,910, $957,993, $60,072,418 and $3,193,839, and net realized gains distributions of $5,168,478, $890,995, $49,135,005 and $2,506,374 for the A, C, I and R6 classes, respectively. End of period net assets includes accumulated undistributed net investment loss of $11,039,962. |
| (2) | Distributions to shareholders includes net investment income distributions of $166, $20,004 and $19,482 for the A, I and R6 classes, respectively. End of period net assets includes accumulated undistributed net investment income of $2,480. |
| (3) | Commenced operations on January 2, 2018. |
The accompanying notes to financial statements are an integral part of these statements.
74
Brandes Investment Trust
STATEMENT OF CHANGES IN NET ASSETS (continued)
| Brandes Core Plus Fixed Income Fund | ||||||||
| Year ended September 30, 2019 | Year ended September 30, 2018(1) | |||||||
INCREASE (DECREASE) IN NET ASSETS FROM: | ||||||||
OPERATIONS | ||||||||
Net investment income | $ | 2,444,013 | $ | 2,720,051 | ||||
Net realized gain (loss) on: | ||||||||
Investments | (950,890 | ) | (734,191 | ) | ||||
Foreign currency transactions | — | — | ||||||
Net unrealized appreciation (depreciation) on: | ||||||||
Investments | 3,872,912 | (2,975,754 | ) | |||||
Foreign currency transactions | — | — | ||||||
|
|
|
| |||||
Net increase (decrease) in net assets resulting from operations | 5,366,035 | (989,894 | ) | |||||
|
|
|
| |||||
DISTRIBUTIONS TO SHAREHOLDERS | ||||||||
Distributions to shareholders | ||||||||
Class A | (58,426 | ) | (64,040 | ) | ||||
Class I | (2,372,519 | ) | (2,657,099 | ) | ||||
Class R6 | (4 | ) | (4 | ) | ||||
|
|
|
| |||||
Decrease in net assets from distributions | (2,430,949 | ) | (2,721,143 | ) | ||||
|
|
|
| |||||
CAPITAL SHARE TRANSACTIONS | ||||||||
Proceeds from shares sold | 15,713,889 | 34,243,797 | ||||||
Net asset value of shares issued on reinvestment of distributions | 2,391,447 | 2,679,959 | ||||||
Cost of shares redeemed | (25,992,319 | ) | (42,896,480 | ) | ||||
|
|
|
| |||||
Net increase (decrease) in net assets from capital share transactions | (7,886,983 | ) | (5,972,724 | ) | ||||
|
|
|
| |||||
Total increase (decrease) in net assets | (4,951,897 | ) | (9,683,761 | ) | ||||
|
|
|
| |||||
NET ASSETS | ||||||||
Beginning of the Period | 91,502,923 | 101,186,684 | ||||||
|
|
|
| |||||
End of the Period | $ | 86,551,026 | $ | 91,502,923 | ||||
|
|
|
| |||||
| (1) | Distributions to shareholders includes net investment income distributions of $64,040, $2,657,099 and $4 for the A, I and R6 classes, respectively. End of period net assets includes accumulated undistributed net investment income of $19,107. |
The accompanying notes to financial statements are an integral part of these statements.
75
Brandes Investment Trust
FINANCIAL HIGHLIGHTS For a capital share outstanding for the period ended:
| Net asset value, beginning of period | Net investment income(5) | Net realized and unrealized gain (loss) on investments | Total from investment operations | Dividends from net investment income | ||||||||||||||||
Brandes International Equity Fund | ||||||||||||||||||||
Class A | ||||||||||||||||||||
9/30/2019 | $ | 17.71 | 0.53 | (1.59 | ) | (1.06 | ) | (0.63 | ) | |||||||||||
9/30/2018 | $ | 17.48 | 0.36 | 0.17 | 0.53 | (0.30 | ) | |||||||||||||
9/30/2017 | $ | 15.70 | 0.29 | 2.03 | 2.32 | (0.54 | ) | |||||||||||||
9/30/2016 | $ | 14.90 | 0.35 | 0.81 | 1.16 | (0.36 | ) | |||||||||||||
9/30/2015 | $ | 16.58 | 0.35 | (1.73 | ) | (1.38 | ) | (0.30 | ) | |||||||||||
Class C | ||||||||||||||||||||
9/30/2019 | $ | 17.47 | 0.40 | (1.58 | ) | (1.18 | ) | (0.53 | ) | |||||||||||
9/30/2018 | $ | 17.30 | 0.22 | 0.18 | 0.40 | (0.23 | ) | |||||||||||||
9/30/2017 | $ | 15.58 | 0.17 | 2.00 | 2.17 | (0.45 | ) | |||||||||||||
9/30/2016 | $ | 14.79 | 0.23 | 0.81 | 1.04 | (0.25 | ) | |||||||||||||
9/30/2015 | $ | 16.48 | 0.24 | (1.73 | ) | (1.49 | ) | (0.20 | ) | |||||||||||
Class I | ||||||||||||||||||||
9/30/2019 | $ | 17.76 | 0.56 | (1.60 | ) | (1.04 | ) | (0.65 | ) | |||||||||||
9/30/2018 | $ | 17.52 | 0.40 | 0.16 | 0.56 | (0.32 | ) | |||||||||||||
9/30/2017 | $ | 15.72 | 0.33 | 2.04 | 2.37 | (0.57 | ) | |||||||||||||
9/30/2016 | $ | 14.92 | 0.38 | 0.81 | 1.19 | (0.39 | ) | |||||||||||||
9/30/2015 | $ | 16.60 | 0.35 | (1.70 | ) | (1.35 | ) | (0.33 | ) | |||||||||||
Class R6 | ||||||||||||||||||||
9/30/2019 | $ | 17.83 | 0.59 | (1.61 | ) | (1.02 | ) | (0.66 | ) | |||||||||||
9/30/2018 | $ | 17.56 | 0.42 | 0.18 | 0.60 | (0.33 | ) | |||||||||||||
9/30/2017 | $ | 15.74 | 0.35 | 2.04 | 2.39 | (0.57 | ) | |||||||||||||
2/1/2016(3) – 9/30/2016 | $ | 14.41 | 0.27 | 1.39 | 1.66 | (0.33 | ) | |||||||||||||
| (1) | Not annualized. |
| (2) | Annualized. |
| (3) | Commencement of operations. |
| (4) | After fees waived and expenses absorbed or recouped by the Advisor, where applicable. |
| (5) | Net investment income per share has been calculated based on average shares outstanding during the period. |
| (6) | The total return calculation does not reflect the sales loads that may be imposed on Class A or C shares (see Note 7 of the Notes to Financial Statements). |
| (7) | The total return figure is the since inception return for the class. |
| (8) | Includes expenses not covered by the Trust’s expense limitation agreement. See Note 3 for more information. |
| (9) | As of June 30, 2019, the expense cap for the class changed from 1.00% to 0.85%. |
| (10) | As of June 30, 2019, the expense cap for the class changed from 0.82% to 0.75%. |
The accompanying notes to financial statements are an integral part of these statements.
76
Brandes Investment Trust
FINANCIAL HIGHLIGHTS For a capital share outstanding for the period ended:
| Net asset value, end of period | Total return(6) | Net assets, end of period (millions) | Ratio of net expenses to average net assets(4) | Ratio of net investment income to average net assets(4) | Ratio of expenses (prior to reimburse- ments) to average net assets | Ratio of net investment income (prior to reimburse- ments) to average net assets | Portfolio turnover rate | |||||||||||||||||||||||
| $ | 16.02 | -5.98 | % | $ | 32.0 | 1.16 | % | 3.21 | % | 1.16 | % | 3.21 | % | 14.43 | % | |||||||||||||||
| $ | 17.71 | 3.02 | % | $ | 34.9 | 1.16 | % | 2.00 | % | 1.16 | % | 2.00 | % | 20.37 | % | |||||||||||||||
| $ | 17.48 | 15.07 | % | $ | 31.5 | 1.18 | %(8) | 1.77 | % | 1.18 | %(8) | 1.77 | % | 33.82 | % | |||||||||||||||
| $ | 15.70 | 7.90 | % | $ | 14.3 | 1.18 | % | 2.30 | % | 1.18 | % | 2.30 | % | 17.60 | % | |||||||||||||||
| $ | 14.90 | -8.47 | % | $ | 13.1 | 1.18 | % | 2.08 | % | 1.18 | % | 2.08 | % | 27.50 | % | |||||||||||||||
| $ | 15.76 | -6.73 | % | $ | 13.1 | 1.91 | % | 2.46 | % | 1.91 | % | 2.46 | % | 14.43 | % | |||||||||||||||
| $ | 17.47 | 2.31 | % | $ | 18.3 | 1.91 | % | 1.25 | % | 1.91 | % | 1.25 | % | 20.37 | % | |||||||||||||||
| $ | 17.30 | 14.19 | % | $ | 17.9 | 1.93 | %(8) | 1.01 | % | 1.93 | %(8) | 1.01 | % | 33.82 | % | |||||||||||||||
| $ | 15.58 | 7.10 | % | $ | 13.1 | 1.93 | % | 1.55 | % | 1.93 | % | 1.55 | % | 17.60 | % | |||||||||||||||
| $ | 14.79 | -9.14 | % | $ | 12.0 | 1.93 | % | 1.43 | % | 1.93 | % | 1.43 | % | 27.50 | % | |||||||||||||||
| $ | 16.07 | -5.82 | % | $ | 622.4 | 0.94 | %(9) | 3.43 | % | 0.96 | %(9) | 3.41 | % | 14.43 | % | |||||||||||||||
| $ | 17.76 | 3.23 | % | $ | 664.7 | 0.96 | % | 2.20 | % | 0.96 | % | 2.20 | % | 20.37 | % | |||||||||||||||
| $ | 17.52 | 15.33 | % | $ | 523.1 | 0.98 | %(8) | 1.96 | % | 0.98 | %(8) | 1.96 | % | 33.82 | % | |||||||||||||||
| $ | 15.72 | 8.10 | % | $ | 648.3 | 1.00 | % | 2.48 | % | 0.98 | % | 2.50 | % | 17.60 | % | |||||||||||||||
| $ | 14.92 | -8.30 | % | $ | 562.5 | 1.00 | % | 2.10 | % | 0.98 | % | 2.12 | % | 27.50 | % | |||||||||||||||
| $ | 16.15 | -5.69 | % | $ | 35.9 | 0.80 | %(10) | 3.57 | % | 0.91 | %(10) | 3.46 | % | 14.43 | % | |||||||||||||||
| $ | 17.83 | 3.44 | % | $ | 24.6 | 0.82 | % | 2.34 | % | 0.91 | % | 2.25 | % | 20.37 | % | |||||||||||||||
| $ | 17.56 | 15.48 | % | $ | 38.5 | 0.83 | %(8) | 2.12 | % | 0.93 | %(8) | 2.02 | % | 33.82 | % | |||||||||||||||
| $ | 15.74 | 11.60 | %(7) | $ | 27.7 | 0.82 | %(2) | 2.67 | %(2) | 0.93 | %(2) | 2.56 | %(2) | 17.60 | %(1) | |||||||||||||||
The accompanying notes to financial statements are an integral part of these statements.
77
Brandes Investment Trust
FINANCIAL HIGHLIGHTS For a capital share outstanding for the period ended:
| Net asset value, beginning of period | Net investment income(2) | Net realized and unrealized gain (loss) on investments | Total from investment operations | Dividends from net investment income | Dividends from net realized gains | |||||||||||||||||||
Brandes Global Equity Fund |
| |||||||||||||||||||||||
Class A | ||||||||||||||||||||||||
9/30/2019 | $ | 24.61 | 0.47 | (1.80 | ) | (1.33 | ) | (0.48 | ) | (1.05 | ) | |||||||||||||
9/30/2018 | $ | 24.42 | 0.43 | 0.69 | 1.12 | (0.42 | ) | (0.51 | ) | |||||||||||||||
9/30/2017 | $ | 21.21 | 0.34 | 3.28 | 3.62 | (0.41 | ) | — | ||||||||||||||||
9/30/2016 | $ | 21.85 | 0.40 | 0.67 | 1.07 | (0.42 | ) | (1.29 | ) | |||||||||||||||
9/30/2015 | $ | 25.43 | 0.27 | (1.90 | ) | (1.63 | ) | (0.33 | ) | (1.62 | ) | |||||||||||||
Class C | ||||||||||||||||||||||||
9/30/2019 | $ | 24.45 | 0.30 | (1.78 | ) | (1.48 | ) | (0.32 | ) | (1.05 | ) | |||||||||||||
9/30/2018 | $ | 24.28 | 0.24 | 0.69 | 0.93 | (0.25 | ) | (0.51 | ) | |||||||||||||||
9/30/2017 | $ | 21.09 | 0.18 | 3.25 | 3.43 | (0.24 | ) | — | ||||||||||||||||
9/30/2016 | $ | 21.73 | 0.25 | 0.66 | 0.91 | (0.26 | ) | (1.29 | ) | |||||||||||||||
9/30/2015 | $ | 25.31 | 0.16 | (1.92 | ) | (1.76 | ) | (0.20 | ) | (1.62 | ) | |||||||||||||
Class I | ||||||||||||||||||||||||
9/30/2019 | $ | 24.77 | 0.53 | (1.81 | ) | (1.28 | ) | (0.53 | ) | (1.05 | ) | |||||||||||||
9/30/2018 | $ | 24.57 | 0.49 | 0.70 | 1.19 | (0.48 | ) | (0.51 | ) | |||||||||||||||
9/30/2017 | $ | 21.33 | 0.41 | 3.30 | 3.71 | (0.47 | ) | — | ||||||||||||||||
9/30/2016 | $ | 21.95 | 0.46 | 0.67 | 1.13 | (0.46 | ) | (1.29 | ) | |||||||||||||||
9/30/2015 | $ | 25.52 | 0.39 | (1.97 | ) | (1.58 | ) | (0.37 | ) | (1.62 | ) | |||||||||||||
| (1) | After fees waived and expenses absorbed or recouped by the Advisor, where applicable. |
| (2) | Net investment income per share has been calculated based on average shares outstanding during the period. |
| (3) | The total return calculation does not reflect the sales loads that may be imposed on Class A or C shares (see Note 7 of the Notes to Financial Statements). |
| (4) | Includes expenses not covered by the Trust’s expense limitation agreement. See Note 3 for more information. |
The accompanying notes to financial statements are an integral part of these statements.
78
Brandes Investment Trust
FINANCIAL HIGHLIGHTS For a capital share outstanding for the period ended:
| Net asset value, end of period | Total return(3) | Net assets, end of period (millions) | Ratio of net expenses to average net assets(1) | Ratio of net investment income to average net assets(1) | Ratio of expenses (prior to reimburse- ments) to average net assets | Ratio of net investment income (prior to reimburse- ments) to average net assets | Portfolio turnover rate | |||||||||||||||||||||||
| $ | 21.75 | -5.22 | % | $ | 1.5 | 1.25 | % | 2.11 | % | 1.56 | % | 1.81 | % | 12.11 | % | |||||||||||||||
| $ | 24.61 | 4.68 | % | $ | 3.4 | 1.25 | % | 1.72 | % | 1.40 | % | 1.57 | % | 8.89 | % | |||||||||||||||
| $ | 24.42 | 17.20 | % | $ | 5.8 | 1.26 | %(4) | 1.52 | % | 1.45 | %(4) | 1.33 | % | 17.42 | % | |||||||||||||||
| $ | 21.21 | 5.01 | % | $ | 4.6 | 1.25 | % | 1.95 | % | 1.58 | % | 1.62 | % | 15.68 | % | |||||||||||||||
| $ | 21.85 | -6.99 | % | $ | 1.8 | 1.25 | % | 1.15 | % | 1.66 | % | 0.74 | % | 25.06 | % | |||||||||||||||
| $ | 21.60 | -5.91 | % | $ | 1.2 | 2.00 | % | 1.37 | % | 2.32 | % | 1.05 | % | 12.11 | % | |||||||||||||||
| $ | 24.45 | 3.88 | % | $ | 1.6 | 2.00 | % | 0.97 | % | 2.15 | % | 0.82 | % | 8.89 | % | |||||||||||||||
| $ | 24.28 | 16.31 | % | $ | 1.7 | 2.01 | %(4) | 0.77 | % | 2.21 | %(4) | 0.57 | % | 17.42 | % | |||||||||||||||
| $ | 21.09 | 4.20 | % | $ | 2.0 | 2.00 | % | 1.20 | % | 2.32 | % | 0.88 | % | 15.68 | % | |||||||||||||||
| $ | 21.73 | -7.62 | % | $ | 2.4 | 2.00 | % | 0.66 | % | 2.42 | % | 0.24 | % | 25.06 | % | |||||||||||||||
| $ | 21.91 | -4.98 | % | $ | 33.4 | 1.00 | % | 2.37 | % | 1.36 | % | 2.00 | % | 12.11 | % | |||||||||||||||
| $ | 24.77 | 4.95 | % | $ | 62.6 | 1.00 | % | 1.97 | % | 1.20 | % | 1.77 | % | 8.89 | % | |||||||||||||||
| $ | 24.57 | 17.48 | % | $ | 61.7 | 1.01 | %(4) | 1.77 | % | 1.26 | %(4) | 1.52 | % | 17.42 | % | |||||||||||||||
| $ | 21.33 | 5.26 | % | $ | 47.3 | 1.00 | % | 2.20 | % | 1.38 | % | 1.82 | % | 15.68 | % | |||||||||||||||
| $ | 21.95 | -6.75 | % | $ | 46.0 | 1.00 | % | 1.61 | % | 1.47 | % | 1.14 | % | 25.06 | % | |||||||||||||||
The accompanying notes to financial statements are an integral part of these statements.
79
Brandes Investment Trust
FINANCIAL HIGHLIGHTS For a capital share outstanding for the period ended:
| Net asset value, beginning of period | Net investment income(5) | Net realized and unrealized gain (loss) on investments | Total from investment operations | Dividends from net investment income | Dividends from net realized gains | |||||||||||||||||||
Brandes Global Equity Income Fund |
| |||||||||||||||||||||||
Class A | ||||||||||||||||||||||||
9/30/2019 | $ | 12.12 | 0.34 | (0.64 | ) | (0.30 | ) | (0.33 | ) | (0.36 | ) | |||||||||||||
9/30/2018 | $ | 12.46 | 0.30 | 0.02 | 0.32 | (0.26 | ) | (0.40 | ) | |||||||||||||||
9/30/2017 | $ | 10.79 | 0.24 | 1.73 | 1.97 | (0.04 | ) | (0.26 | ) | |||||||||||||||
9/30/2016 | $ | 9.62 | 0.28 | 1.35 | 1.63 | (0.26 | ) | (0.20 | ) | |||||||||||||||
12/31/2014(3) – 9/30/2015 | $ | 10.00 | 0.23 | (0.46 | ) | (0.23 | ) | (0.15 | ) | — | ||||||||||||||
Class C | ||||||||||||||||||||||||
9/30/2019 | $ | 11.69 | 0.24 | (0.61 | ) | (0.37 | ) | (0.25 | ) | (0.36 | ) | |||||||||||||
9/30/2018 | $ | 11.97 | 0.20 | 0.11 | 0.31 | (0.19 | ) | (0.40 | ) | |||||||||||||||
9/30/2017 | $ | 10.72 | 0.16 | 1.50 | 1.66 | (0.15 | ) | (0.26 | ) | |||||||||||||||
9/30/2016 | $ | 9.60 | 0.20 | 1.31 | 1.51 | (0.19 | ) | (0.20 | ) | |||||||||||||||
12/31/2014(3) – 9/30/2015 | $ | 10.00 | 0.23 | (0.52 | ) | (0.29 | ) | (0.11 | ) | — | ||||||||||||||
Class I | ||||||||||||||||||||||||
9/30/2019 | $ | 11.57 | 0.35 | (0.62 | ) | (0.27 | ) | (0.35 | ) | (0.36 | ) | |||||||||||||
9/30/2018 | $ | 11.87 | 0.32 | 0.06 | 0.38 | (0.28 | ) | (0.40 | ) | |||||||||||||||
9/30/2017 | $ | 10.68 | 0.27 | 1.45 | 1.72 | (0.27 | ) | (0.26 | ) | |||||||||||||||
9/30/2016 | $ | 9.57 | 0.29 | 1.30 | 1.59 | (0.28 | ) | (0.20 | ) | |||||||||||||||
12/31/2014(3) – 9/30/2015 | $ | 10.00 | 0.23 | (0.45 | ) | (0.22 | ) | (0.21 | ) | — | ||||||||||||||
| (1) | Not annualized. |
| (2) | Annualized. |
| (3) | Commencement of operations. |
| (4) | After fees waived and expenses absorbed or recouped by the Advisor, where applicable. |
| (5) | Net investment income per share has been calculated based on average shares outstanding during the period. |
| (6) | The total return calculation does not reflect the sales loads that may be imposed on Class A or C shares (see Note 7 of the Notes to Financial Statements). |
| (7) | The total return figure is the since inception return for the class. |
| (8) | Amount is less than $50,000. |
| (9) | Includes expenses not covered by the Trust’s expense limitation agreement. See Note 3 for more information. |
The accompanying notes to financial statements are an integral part of these statements.
80
Brandes Investment Trust
FINANCIAL HIGHLIGHTS For a capital share outstanding for the period ended:
| Net asset value, end of period | Total return(6) | Net assets, end of period (millions) | Ratio of net expenses to average net assets(4) | Ratio of net investment income to average net assets(4) | Ratio of expenses (prior to reimburse- ments) to average net assets | Ratio of net investment income (prior to reimburse- ments) to average net assets | Portfolio turnover rate | |||||||||||||||||||||||
| $ | 11.13 | -2.29 | % | $ | — | (8) | 1.25 | % | 3.00 | % | 13.38 | % | (9.13 | )% | 7.52 | % | ||||||||||||||
| $ | 12.12 | 2.66 | % | $ | — | (8) | 1.25 | % | 2.47 | % | 13.81 | % | (10.09 | )% | 16.42 | % | ||||||||||||||
| $ | 12.46 | 18.81 | % | $ | — | (8) | 1.27 | %(9) | 2.17 | % | 18.00 | %(9) | (14.56 | )% | 12.97 | % | ||||||||||||||
| $ | 10.79 | 17.35 | % | $ | — | (8) | 1.25 | % | 2.67 | % | 20.41 | % | (16.49 | )% | 22.38 | % | ||||||||||||||
| $ | 9.62 | -2.44 | %(7) | $ | — | (8) | 1.25 | %(2) | 2.90 | %(2) | 570.42 | %(2) | (566.27 | )%(2) | 16.78 | %(1) | ||||||||||||||
| $ | 10.71 | -2.91 | % | $ | — | (8) | 2.00 | % | 2.25 | % | 14.12 | % | (9.87 | )% | 7.52 | % | ||||||||||||||
| $ | 11.69 | 2.64 | % | $ | — | (8) | 2.00 | % | 1.68 | % | 15.76 | % | (12.08 | )% | 16.42 | % | ||||||||||||||
| $ | 11.97 | 16.01 | % | $ | — | (8) | 2.00 | %(9) | 1.44 | % | 17.88 | %(9) | (14.44 | )% | 12.97 | % | ||||||||||||||
| $ | 10.72 | 16.01 | % | $ | — | (8) | 2.00 | % | 1.91 | % | 21.51 | % | (17.60 | )% | 22.38 | % | ||||||||||||||
| $ | 9.60 | -2.99 | %(7) | $ | — | (8) | 2.00 | %(2) | 2.90 | %(2) | 572.75 | %(2) | (567.85 | )%(2) | 16.78 | %(1) | ||||||||||||||
| $ | 10.59 | -2.09 | % | $ | 1.4 | 1.00 | % | 3.25 | % | 13.18 | % | (8.93 | )% | 7.52 | % | |||||||||||||||
| $ | 11.57 | 3.33 | % | $ | 1.4 | 1.00 | % | 2.70 | % | 14.47 | % | (10.77 | )% | 16.42 | % | |||||||||||||||
| $ | 11.87 | 16.71 | % | $ | 1.0 | 1.00 | %(9) | 2.45 | % | 16.88 | %(9) | (13.43 | )% | 12.97 | % | |||||||||||||||
| $ | 10.68 | 16.98 | % | $ | 0.9 | 1.00 | % | 2.91 | % | 24.04 | % | (20.13 | )% | 22.38 | % | |||||||||||||||
| $ | 9.57 | -2.36 | %(7) | $ | 0.6 | 1.00 | %(2) | 2.90 | %(2) | 37.61 | %(2) | (33.71 | )%(2) | 16.78 | %(1) | |||||||||||||||
The accompanying notes to financial statements are an integral part of these statements.
81
Brandes Investment Trust
FINANCIAL HIGHLIGHTS For a capital share outstanding for the period ended:
| Net asset value, beginning of period | Net investment income(5) | Net realized and unrealized gain (loss) on investments | Total from investment operations | Dividends from net investment income | Dividends from net realized gains | |||||||||||||||||||
Brandes Emerging Markets Value Fund |
| |||||||||||||||||||||||
Class A | ||||||||||||||||||||||||
9/30/2019 | $ | 8.46 | 0.19 | 0.07 | 0.26 | (0.15 | ) | — | ||||||||||||||||
9/30/2018 | $ | 9.47 | 0.15 | (1.01 | ) | (0.86 | ) | (0.15 | ) | — | ||||||||||||||
9/30/2017 | $ | 7.91 | 0.10 | 1.60 | 1.70 | (0.14 | ) | — | ||||||||||||||||
9/30/2016 | $ | 6.19 | 0.12 | 1.69 | 1.81 | (0.09 | ) | — | ||||||||||||||||
9/30/2015 | $ | 9.56 | 0.11 | (3.12 | ) | (3.01 | ) | (0.13 | ) | (0.23 | ) | |||||||||||||
Class C | ||||||||||||||||||||||||
9/30/2019 | $ | 8.44 | 0.13 | 0.06 | 0.19 | (0.10 | ) | — | ||||||||||||||||
9/30/2018 | $ | 9.43 | 0.08 | (0.99 | ) | (0.91 | ) | (0.08 | ) | — | ||||||||||||||
9/30/2017 | $ | 7.86 | 0.05 | 1.58 | 1.63 | (0.06 | ) | — | ||||||||||||||||
9/30/2016 | $ | 6.15 | 0.07 | 1.67 | 1.74 | (0.03 | ) | — | ||||||||||||||||
9/30/2015 | $ | 9.51 | 0.05 | (3.10 | ) | (3.05 | ) | (0.08 | ) | (0.23 | ) | |||||||||||||
Class I | ||||||||||||||||||||||||
9/30/2019 | $ | 8.50 | 0.21 | 0.08 | 0.29 | (0.17 | ) | — | ||||||||||||||||
9/30/2018 | $ | 9.51 | 0.17 | (1.01 | ) | (0.84 | ) | (0.17 | ) | — | ||||||||||||||
9/30/2017 | $ | 7.94 | 0.13 | 1.60 | 1.73 | (0.16 | ) | — | ||||||||||||||||
9/30/2016 | $ | 6.21 | 0.14 | 1.70 | 1.84 | (0.11 | ) | — | ||||||||||||||||
9/30/2015 | $ | 9.58 | 0.13 | (3.12 | ) | (2.99 | ) | (0.15 | ) | (0.23 | ) | |||||||||||||
Class R6 | ||||||||||||||||||||||||
9/30/2019 | $ | 8.53 | 0.23 | 0.07 | 0.30 | (0.18 | ) | — | ||||||||||||||||
9/30/2018 | $ | 9.53 | 0.19 | (1.02 | ) | (0.83 | ) | (0.17 | ) | — | ||||||||||||||
9/30/2017 | $ | 7.93 | 0.15 | 1.62 | 1.77 | (0.17 | ) | — | ||||||||||||||||
7/11/2016(3) – 9/30/2016 | $ | 7.54 | 0.04 | 0.38 | 0.42 | (0.03 | ) | — | ||||||||||||||||
| (1) | Not annualized. |
| (2) | Annualized. |
| (3) | Commencement of operations. |
| (4) | After fees waived and expenses absorbed or recouped by the Advisor, where applicable. |
| (5) | Net investment income per share has been calculated based on average shares outstanding during the period. |
| (6) | The total return calculation does not reflect the sales loads that may be imposed on Class A or C shares (see Note 7 of the Notes to Financial Statements). |
| (7) | The total return figure is the since inception return for the class. |
| (8) | Amount is less than $50,000. |
| (9) | Includes expenses not covered by the Trust’s expense limitation agreement. See Note 3 for more information. |
The accompanying notes to financial statements are an integral part of these statements.
82
Brandes Investment Trust
FINANCIAL HIGHLIGHTS For a capital share outstanding for the period ended:
| Net asset value, end of period | Total return(6) | Net assets, end of period (millions) | Ratio of net expenses to average net assets(4) | Ratio of net investment income to average net assets(4) | Ratio of expenses (prior to reimburse- ments) to average net assets | Ratio of net investment income (prior to reimburse- ments) to average net assets | Portfolio turnover rate | |||||||||||||||||||||||
| $ | 8.57 | 3.10 | % | $ | 235.9 | 1.35 | % | 2.23 | % | 1.35 | % | 2.23 | % | 22.09 | % | |||||||||||||||
| $ | 8.46 | -9.14 | % | $ | 258.8 | 1.37 | % | 1.62 | % | 1.34 | % | 1.65 | % | 37.66 | % | |||||||||||||||
| $ | 9.47 | 21.78 | % | $ | 319.2 | 1.42 | %(9) | 1.27 | % | 1.40 | %(9) | 1.29 | % | 23.67 | % | |||||||||||||||
| $ | 7.91 | 29.38 | % | $ | 305.0 | 1.37 | % | 1.74 | % | 1.39 | % | 1.72 | % | 26.48 | % | |||||||||||||||
| $ | 6.19 | -32.32 | % | $ | 295.6 | 1.37 | % | 1.46 | % | 1.40 | % | 1.43 | % | 35.02 | % | |||||||||||||||
| $ | 8.53 | 2.27 | % | $ | 18.0 | 2.10 | % | 1.48 | % | 2.10 | % | 1.48 | % | 22.09 | % | |||||||||||||||
| $ | 8.44 | -9.70 | % | $ | 22.8 | 2.10 | % | 0.89 | % | 2.09 | % | 0.90 | % | 37.66 | % | |||||||||||||||
| $ | 9.43 | 20.83 | % | $ | 28.2 | 2.17 | %(9) | 0.52 | % | 2.14 | %(9) | 0.55 | % | 23.67 | % | |||||||||||||||
| $ | 7.86 | 28.38 | % | $ | 22.4 | 2.12 | % | 0.99 | % | 2.14 | % | 0.97 | % | 26.48 | % | |||||||||||||||
| $ | 6.15 | -32.83 | % | $ | 18.4 | 2.12 | % | 0.62 | % | 2.14 | % | 0.60 | % | 35.02 | % | |||||||||||||||
| $ | 8.62 | 3.41 | % | $ | 1,117.7 | 1.12 | % | 2.46 | % | 1.15 | % | 2.43 | % | 22.09 | % | |||||||||||||||
| $ | 8.50 | -8.91 | % | $ | 1,162.1 | 1.12 | % | 1.88 | % | 1.14 | % | 1.86 | % | 37.66 | % | |||||||||||||||
| $ | 9.51 | 22.07 | % | $ | 1,311.5 | 1.17 | %(9) | 1.51 | % | 1.20 | %(9) | 1.48 | % | 23.67 | % | |||||||||||||||
| $ | 7.94 | 29.70 | % | $ | 829.0 | 1.12 | % | 1.99 | % | 1.19 | % | 1.92 | % | 26.48 | % | |||||||||||||||
| $ | 6.21 | -32.13 | % | $ | 725.1 | 1.12 | % | 1.58 | % | 1.19 | % | 1.51 | % | 35.02 | % | |||||||||||||||
| $ | 8.65 | 3.45 | % | $ | 47.6 | 0.97 | % | 2.61 | % | 1.10 | % | 2.48 | % | 22.09 | % | |||||||||||||||
| $ | 8.53 | -8.74 | % | $ | 33.6 | 0.97 | % | 2.02 | % | 1.08 | % | 1.91 | % | 37.66 | % | |||||||||||||||
| $ | 9.53 | 22.53 | % | $ | 97.4 | 1.02 | %(9) | 1.68 | % | 1.17 | %(9) | 1.53 | % | 23.67 | % | |||||||||||||||
| $ | 7.93 | 5.59 | %(7) | $ | — | (8) | 0.97 | %(2) | 2.14 | %(2) | 1.14 | %(2) | 1.97 | %(2) | 26.48 | %(1) | ||||||||||||||
The accompanying notes to financial statements are an integral part of these statements.
83
Brandes Investment Trust
FINANCIAL HIGHLIGHTS For a capital share outstanding for the period ended:
| Net asset value, beginning of period | Net investment income (loss)(5) | Net realized and unrealized gain (loss) on investments | Total from investment operations | Dividends from net investment income | Dividends from net realized gains | |||||||||||||||||||
Brandes International Small Cap Equity Fund |
| |||||||||||||||||||||||
Class A | ||||||||||||||||||||||||
9/30/2019 | $ | 12.10 | 0.15 | (1.60 | ) | (1.45 | ) | (0.30 | ) | (0.13 | ) | |||||||||||||
9/30/2018 | $ | 14.30 | 0.14 | (1.32 | ) | (1.18 | ) | (0.54 | ) | (0.48 | ) | |||||||||||||
9/30/2017 | $ | 13.46 | 0.14 | 1.32 | 1.46 | (0.34 | ) | (0.28 | ) | |||||||||||||||
9/30/2016 | $ | 12.58 | 0.09 | 1.22 | 1.31 | (0.23 | ) | (0.20 | ) | |||||||||||||||
9/30/2015 | $ | 13.55 | 0.04 | (0.43 | ) | (0.39 | ) | (0.17 | ) | (0.41 | ) | |||||||||||||
Class C | ||||||||||||||||||||||||
9/30/2019 | $ | 11.81 | 0.06 | (1.55 | ) | (1.49 | ) | (0.25 | ) | (0.13 | ) | |||||||||||||
9/30/2018 | $ | 14.03 | 0.04 | (1.28 | ) | (1.24 | ) | (0.50 | ) | (0.48 | ) | |||||||||||||
9/30/2017 | $ | 13.24 | 0.04 | 1.30 | 1.34 | (0.27 | ) | (0.28 | ) | |||||||||||||||
9/30/2016 | $ | 12.42 | 0.00 | (9) | 1.19 | 1.19 | (0.17 | ) | (0.20 | ) | ||||||||||||||
9/30/2015 | $ | 13.45 | (0.04 | ) | (0.44 | ) | (0.48 | ) | (0.14 | ) | (0.41 | ) | ||||||||||||
Class I | ||||||||||||||||||||||||
9/30/2019 | $ | 12.14 | 0.17 | (1.61 | ) | (1.44 | ) | (0.32 | ) | (0.13 | ) | |||||||||||||
9/30/2018 | $ | 14.35 | 0.17 | (1.32 | ) | (1.15 | ) | (0.58 | ) | (0.48 | ) | |||||||||||||
9/30/2017 | $ | 13.50 | 0.17 | 1.32 | 1.49 | (0.36 | ) | (0.28 | ) | |||||||||||||||
9/30/2016 | $ | 12.61 | 0.12 | 1.22 | 1.34 | (0.25 | ) | (0.20 | ) | |||||||||||||||
9/30/2015 | $ | 13.58 | 0.08 | (0.44 | ) | (0.36 | ) | (0.20 | ) | (0.41 | ) | |||||||||||||
Class R6 | ||||||||||||||||||||||||
9/30/2019 | $ | 12.15 | 0.18 | (1.61 | ) | (1.43 | ) | (0.32 | ) | (0.13 | ) | |||||||||||||
9/30/2018 | $ | 14.36 | 0.18 | (1.33 | ) | (1.15 | ) | (0.58 | ) | (0.48 | ) | |||||||||||||
9/30/2017 | $ | 13.50 | 0.18 | 1.33 | 1.51 | (0.37 | ) | (0.28 | ) | |||||||||||||||
6/27/2016(3) – 9/30/2016 | $ | 12.38 | 0.04 | 1.13 | 1.17 | (0.05 | ) | — | ||||||||||||||||
| (1) | Not annualized. |
| (2) | Annualized. |
| (3) | Commencement of operations. |
| (4) | After fees waived and expenses absorbed or recouped by the Advisor, where applicable. |
| (5) | Net investment income per share has been calculated based on average shares outstanding during the period. |
| (6) | The total return calculation does not reflect the sales loads that may be imposed on Class A or C shares (see Note 7 of the Notes to Financial Statements). |
| (7) | The total return figure is the since inception return for the class. |
| (8) | Includes expenses not covered by the Trust’s expense limitation agreement. See Note 3 for more information. |
| (9) | Amount is less than $0.01 per share. |
The accompanying notes to financial statements are an integral part of these statements.
84
Brandes Investment Trust
FINANCIAL HIGHLIGHTS For a capital share outstanding for the period ended:
| Net asset value, end of period | Total return(6) | Net assets, end of period (millions) | Ratio of net expenses to average net assets(4) | Ratio of net investment income to average net assets(4) | Ratio of expenses (prior to reimburse- ments) to average net assets | Ratio of net investment income (prior to reimburse- ments) to average net assets | Portfolio turnover rate | |||||||||||||||||||||||
| $ | 10.22 | -12.04 | % | $ | 43.5 | 1.35 | % | 1.34 | % | 1.35 | % | 1.34 | % | 22.52 | % | |||||||||||||||
| $ | 12.10 | -8.88 | % | $ | 80.9 | 1.30 | % | 1.05 | % | 1.30 | % | 1.05 | % | 21.97 | % | |||||||||||||||
| $ | 14.30 | 11.29 | % | $ | 176.9 | 1.30 | %(8) | 1.04 | % | 1.30 | %(8) | 1.04 | % | 21.37 | % | |||||||||||||||
| $ | 13.46 | 10.60 | % | $ | 121.1 | 1.32 | % | 0.71 | % | 1.31 | % | 0.72 | % | 21.00 | % | |||||||||||||||
| $ | 12.58 | -2.76 | % | $ | 79.1 | 1.40 | % | 0.35 | % | 1.32 | % | 0.43 | % | 24.82 | % | |||||||||||||||
| $ | 9.94 | -12.69 | % | $ | 6.9 | 2.10 | % | 0.59 | % | 2.10 | % | 0.59 | % | 22.52 | % | |||||||||||||||
| $ | 11.81 | -9.55 | % | $ | 14.5 | 2.05 | % | 0.30 | % | 2.05 | % | 0.30 | % | 21.97 | % | |||||||||||||||
| $ | 14.03 | 10.52 | % | $ | 27.2 | 2.05 | %(8) | 0.29 | % | 2.05 | %(8) | 0.29 | % | 21.37 | % | |||||||||||||||
| $ | 13.24 | 9.78 | % | $ | 19.8 | 2.06 | % | (0.03 | )% | 2.06 | % | (0.03 | )% | 21.00 | % | |||||||||||||||
| $ | 12.42 | -3.49 | % | $ | 15.1 | 2.07 | % | (0.34 | )% | 2.07 | % | (0.34 | )% | 24.82 | % | |||||||||||||||
| $ | 10.25 | -11.93 | % | $ | 414.8 | 1.15 | % | 1.54 | % | 1.15 | % | 1.54 | % | 22.52 | % | |||||||||||||||
| $ | 12.14 | -8.70 | % | $ | 963.8 | 1.10 | % | 1.25 | % | 1.10 | % | 1.25 | % | 21.97 | % | |||||||||||||||
| $ | 14.35 | 11.54 | % | $ | 1,543.9 | 1.10 | %(8) | 1.24 | % | 1.10 | %(8) | 1.24 | % | 21.37 | % | |||||||||||||||
| $ | 13.50 | 10.85 | % | $ | 1,212.4 | 1.13 | % | 0.90 | % | 1.11 | % | 0.92 | % | 21.00 | % | |||||||||||||||
| $ | 12.61 | -2.58 | % | $ | 877.6 | 1.15 | % | 0.59 | % | 1.12 | % | 0.62 | % | 24.82 | % | |||||||||||||||
| $ | 10.27 | -11.80 | % | $ | 20.4 | 1.00 | % | 1.69 | % | 1.10 | % | 1.59 | % | 22.52 | % | |||||||||||||||
| $ | 12.15 | -8.64 | % | $ | 72.5 | 1.00 | % | 1.35 | % | 1.05 | % | 1.30 | % | 21.97 | % | |||||||||||||||
| $ | 14.36 | 11.67 | % | $ | 76.1 | 1.01 | %(8) | 1.33 | % | 1.05 | %(8) | 1.29 | % | 21.37 | % | |||||||||||||||
| $ | 13.50 | 9.49 | %(7) | $ | 16.5 | 1.00 | %(2) | 1.03 | %(2) | 1.06 | %(2) | 0.97 | %(2) | 21.00 | %(1) | |||||||||||||||
The accompanying notes to financial statements are an integral part of these statements.
85
Brandes Investment Trust
FINANCIAL HIGHLIGHTS For a capital share outstanding for the period ended:
| Net asset value, beginning of period | Net investment income(5) | Net realized and unrealized gain (loss) on investments | Total from investment operations | Dividends from net investment income | Dividends from net realized gains | |||||||||||||||||||
Brandes Small Cap Value Fund |
| |||||||||||||||||||||||
Class A | ||||||||||||||||||||||||
9/30/2019 | $ | 10.27 | 0.05 | (0.95 | ) | (0.90 | ) | (0.10 | ) | (0.69 | ) | |||||||||||||
1/2/2018(3) – 9/30/2018 | $ | 10.00 | 0.02 | 0.27 | 0.29 | (0.02 | ) | — | ||||||||||||||||
Class I | ||||||||||||||||||||||||
9/30/2019 | $ | 10.27 | 0.07 | (0.92 | ) | (0.85 | ) | (0.11 | ) | (0.69 | ) | |||||||||||||
1/2/2018(3) – 9/30/2018 | $ | 10.00 | 0.04 | 0.27 | 0.31 | (0.04 | ) | — | ||||||||||||||||
Class R6 | ||||||||||||||||||||||||
9/30/2019 | $ | 10.32 | 0.09 | (1.63 | ) | (1.54 | ) | (0.12 | ) | (0.69 | ) | |||||||||||||
1/2/2018(3) – 9/30/2018 | $ | 10.00 | 0.05 | 0.31 | 0.36 | (0.04 | ) | — | ||||||||||||||||
Brandes Core Plus Fixed Income Fund |
| |||||||||||||||||||||||
Class A | ||||||||||||||||||||||||
9/30/2019 | $ | 8.85 | 0.24 | 0.33 | 0.57 | (0.24 | ) | — | ||||||||||||||||
9/30/2018 | $ | 9.18 | 0.23 | (0.33 | ) | (0.10 | ) | (0.23 | ) | — | ||||||||||||||
9/30/2017 | $ | 9.39 | 0.20 | (0.18 | ) | 0.02 | (0.21 | ) | (0.02 | ) | ||||||||||||||
9/30/2016 | $ | 9.14 | 0.22 | 0.26 | 0.48 | (0.22 | ) | (0.01 | ) | |||||||||||||||
9/30/2015 | $ | 9.22 | 0.19 | (0.02 | ) | 0.17 | (0.20 | ) | (0.05 | ) | ||||||||||||||
Class I | ||||||||||||||||||||||||
9/30/2019 | $ | 8.92 | 0.26 | 0.34 | 0.60 | (0.26 | ) | — | ||||||||||||||||
9/30/2018 | $ | 9.25 | 0.25 | (0.33 | ) | (0.08 | ) | (0.25 | ) | — | ||||||||||||||
9/30/2017 | $ | 9.44 | 0.22 | (0.16 | ) | 0.06 | (0.23 | ) | (0.02 | ) | ||||||||||||||
9/30/2016 | $ | 9.20 | 0.24 | 0.25 | 0.49 | (0.24 | ) | (0.01 | ) | |||||||||||||||
9/30/2015 | $ | 9.28 | 0.21 | (0.02 | ) | 0.19 | (0.22 | ) | (0.05 | ) | ||||||||||||||
Class R6 | ||||||||||||||||||||||||
9/30/2019 | $ | 8.93 | 0.09 | 0.56 | 0.65 | (0.32 | ) | — | ||||||||||||||||
10/10/2017(3) – 9/30/2018 | $ | 9.25 | 0.06 | (0.06 | ) | — | (0.32 | ) | — | |||||||||||||||
| (1) | Not annualized. |
| (2) | Annualized. |
| (3) | Commencement of operations. |
| (4) | After fees waived and expenses absorbed or recouped by the Advisor, where applicable. |
| (5) | Net investment income per share has been calculated based on average shares outstanding during the period. |
| (6) | The total return calculation does not reflect the sales loads that may be imposed on Class A shares (see Note 7 of the Notes to Financial Statements). |
| (7) | The total return figure is the since inception return for the class. |
| (8) | Includes expenses not covered by the Trust’s expense limitation agreement. See Note 3 for more information. |
| (9) | Amount is less than $50,000. |
The accompanying notes to financial statements are an integral part of these statements.
86
Brandes Investment Trust
FINANCIAL HIGHLIGHTS For a capital share outstanding for the period ended:
| Net asset value, end of period | Total return(6) | Net assets, end of period (millions) | Ratio of net expenses to average net assets(4) | Ratio of net investment income to average net assets(4) | Ratio of expenses (prior to reimburse- ments) to average net assets | Ratio of net investment income (prior to reimburse- ments) to average net assets | Portfolio turnover rate | |||||||||||||||||||||||
| $ | 8.58 | -8.53 | % | $ | — | (9) | 1.15 | % | 0.55 | % | 7.18 | % | (5.48 | )% | 54.30 | % | ||||||||||||||
| $ | 10.27 | 2.92 | %(7) | $ | 0.1 | 1.15 | %(2) | 0.28 | %(2) | 3.21 | %(2) | (1.78 | )%(2) | 41.02 | %(1) | |||||||||||||||
| $ | 8.62 | -8.13 | % | $ | 0.5 | 0.90 | % | 0.81 | % | 4.18 | % | (2.47 | )% | 54.30 | % | |||||||||||||||
| $ | 10.27 | 3.09 | %(7) | $ | 5.4 | 0.90 | %(2) | 0.53 | %(2) | 3.67 | %(2) | (2.24 | )%(2) | 41.02 | %(1) | |||||||||||||||
| $ | 7.97 | -15.36 | % | $ | — | (9) | 0.72 | % | 0.98 | % | 3.16 | % | (1.46 | )% | 54.30 | % | ||||||||||||||
| $ | 10.32 | 3.63 | %(7) | $ | 4.8 | 0.72 | %(2) | 0.71 | %(2) | 2.99 | %(2) | (1.56 | )%(2) | 41.02 | %(1) | |||||||||||||||
| $ | 9.18 | 6.56 | % | $ | 3.2 | 0.70 | % | 2.72 | % | 0.93 | % | 2.49 | % | 18.54 | % | |||||||||||||||
| $ | 8.85 | -1.08 | % | $ | 1.8 | 0.70 | % | 2.57 | % | 0.87 | % | 2.40 | % | 47.73 | % | |||||||||||||||
| $ | 9.18 | 0.28 | % | $ | 3.3 | 0.71 | %(8) | 2.25 | % | 0.85 | %(8) | 2.11 | % | 35.10 | % | |||||||||||||||
| $ | 9.39 | 5.32 | % | $ | 2.0 | 0.70 | % | 2.38 | % | 0.93 | % | 2.15 | % | 35.88 | % | |||||||||||||||
| $ | 9.14 | 1.78 | % | $ | 2.1 | 0.70 | % | 2.07 | % | 1.06 | % | 1.71 | % | 11.24 | % | |||||||||||||||
| $ | 9.26 | 6.85 | % | $ | 83.4 | 0.50 | % | 2.91 | % | 0.73 | % | 2.68 | % | 18.54 | % | |||||||||||||||
| $ | 8.92 | -0.85 | % | $ | 89.7 | 0.50 | % | 2.78 | % | 0.68 | % | 2.60 | % | 47.73 | % | |||||||||||||||
| $ | 9.25 | 0.71 | % | $ | 97.9 | 0.51 | %(8) | 2.45 | % | 0.66 | %(8) | 2.30 | % | 35.10 | % | |||||||||||||||
| $ | 9.44 | 5.43 | % | $ | 97.2 | 0.50 | % | 2.58 | % | 0.72 | % | 2.36 | % | 35.88 | % | |||||||||||||||
| $ | 9.20 | 2.02 | % | $ | 72.1 | 0.50 | % | 2.26 | % | 0.86 | % | 1.90 | % | 11.24 | % | |||||||||||||||
| $ | 9.26 | 7.40 | % | $ | — | (9) | 0.35 | % | 0.97 | % | 0.35 | % | 0.97 | % | 18.54 | % | ||||||||||||||
| $ | 8.93 | 0.04 | %(7) | $ | — | (9) | 0.35 | %(2) | 0.69 | %(2) | 0.35 | %(2) | 0.69 | %(2) | 47.73 | %(1) | ||||||||||||||
The accompanying notes to financial statements are an integral part of these statements.
87
Brandes Investment Trust
NOTE 1 – ORGANIZATION
The Brandes International Equity Fund (the “International Fund”), the Brandes Global Equity Fund (the “Global Fund”), the Brandes Global Equity Income Fund (the “Global Income Fund”), the Brandes Emerging Markets Value Fund (the “Emerging Markets Fund”), the Brandes International Small Cap Equity Fund (the “International Small Cap Fund”), the Brandes Small Cap Value Fund (the “Small Cap Value Fund”) and the Brandes Core Plus Fixed Income Fund (the “Core Plus Fund”) (each a “Fund” and collectively the “Funds”) are series of Brandes Investment Trust (the “Trust”). The Trust is registered under the Investment Company Act of 1940 (the “1940 Act”) as a diversified, open-end management investment company.
The International Fund, Global Fund, Global Income Fund, Emerging Markets Fund, International Small Cap Fund, Small Cap Value Fund and Core Plus Fund began operations on January 2, 1997, October 6, 2008, December 31, 2014, January 31, 2011, February 1, 2012, January 2, 2018 and December 28, 2007, respectively. Prior to January 31, 2011 for the Emerging Markets Fund, February 1, 2012 for the International Small Cap and January 2, 2018 for the Small Cap Value Fund, these Funds’ portfolios were managed as private investment funds with investment objectives, investment policies and strategies that were, in all material respects, equivalent to those of the Emerging Markets Fund, International Small Cap Fund and Small Cap Value Fund, respectively.
The International Fund has four classes of shares: Class A, Class C, Class I and Class R6. The Global Fund and the Global Income Fund have three classes of shares: Class A, Class C and Class I. The Emerging Markets Fund and International Small Cap Fund have four classes of shares: Class A, Class C, Class I and Class R6. The Small Cap Value Fund and Core Plus Fund have three classes of shares: Class A, Class I and Class R6.
The International Fund and Global Fund invest their assets primarily in equity securities of issuers with market capitalizations greater than $1 billion. The International, International Small Cap and Emerging Markets Funds invest their assets in securities of foreign companies, while the Global Fund, and Global Income Fund invest their assets in securities of foreign and domestic companies. The Small Cap Value Fund invests primarily in U.S. equity securities of issuers with market capitalizations less than $5 billion. The Core Plus Fund invests predominantly in debt securities issued by U.S. and foreign companies and debt obligations issued or guaranteed by the U.S. Government and foreign governments and their agencies and instrumentalities.
88
Brandes Investment Trust
NOTES TO FINANCIAL STATEMENTS — (continued)
NOTE 2 – SIGNIFICANT ACCOUNTING POLICIES
Each Fund is an investment company that applies the accounting and reporting guidance issued in Topic 946, “Financial Services-Investment Companies”, by the Financial Accounting Standards Board (“FASB”). The following is a summary of significant accounting policies consistently followed by the Funds. These policies are in conformity with generally accepted accounting principles (“GAAP”) in the United States of America.
| A. | Repurchase Agreements. Each Fund may enter into repurchase agreements with government securities dealers recognized by the Federal Reserve Board, with member banks of the Federal Reserve System or with other brokers or dealers that meet the credit guidelines established by the Board of Trustees. Each Fund will always receive and maintain, as collateral, U.S. Government securities whose market value, including accrued interest (which is recorded in the Schedules of Investments), will be at least equal to 100% of the dollar amount invested by the Fund in each agreement, and the Fund will make payment for such securities only upon physical delivery or upon evidence of book entry transfer to the account of the Fund’s custodian. If the term of any repurchase transaction exceeds one business day, the value of the collateral is marked-to-market on a daily basis to ensure the adequacy of the collateral. Before causing a Fund to enter into a repurchase agreement with any other party, the investment advisor will determine that such party does not have any apparent risk of becoming involved in bankruptcy proceedings within the time frame contemplated by the repurchase agreement. If the seller defaults and the value of the collateral declines, or if bankruptcy proceedings are commenced with respect to the seller of the security, realization of the collateral by the Fund may be delayed or limited. At September 30, 2019, the Funds did not invest in repurchase agreements. |
| B. | Foreign Currency Translation and Transactions. Values of investments denominated in foreign currencies are converted into U.S. dollars using the spot market rates of exchange at the time of valuation. Purchases and sales of investments and dividend and interest income are translated into U.S. dollars using the spot market rates of exchange prevailing on the respective dates of such translations. The gain or loss resulting from changes in foreign exchange rates is included with net realized and unrealized gain or loss from investments, as appropriate. Foreign securities and currency transactions may involve certain considerations and risks not typically associated with those of domestic origin. |
Foreign securities are recorded in the financial statements after translation to U.S. dollars based on the applicable exchange rate at the end of the period. The Funds report certain foreign currency-related transactions as
89
Brandes Investment Trust
NOTES TO FINANCIAL STATEMENTS — (continued)
components of realized gains or losses for financial reporting purposes, whereas such components are treated as ordinary income for federal income tax purposes.
| C. | Delayed Delivery Securities. The Funds may purchase securities on a when issued or delayed delivery basis. “When-issued” or delayed delivery refers to securities whose terms are available and for which a market exists, but that have not been issued. For a when-issued or delayed delivery transaction, no payment is made until delivery date, which is typically longer than the normal course of settlement. When a Fund enters into an agreement to purchase securities on a when-issued or delayed delivery basis, the Fund segregates cash or liquid securities, of any type or maturity, equal in value to the Fund’s commitment. Losses may arise if the market value of the underlying securities change, if the counterparty does not perform under the contract, or if the issuer does not issue the securities due to political, economic, or other factors. The Funds did not have any open commitments on delayed delivery securities as of September 30, 2019. |
| D. | Participatory Notes. The International, Global, Global Income, Emerging Markets, International Small Cap and Small Cap Value Funds may invest in participatory notes. Participatory notes are derivative securities which are designed to provide synthetic exposure to one or more underlying securities, subject to the credit risk of the issuing financial institution. |
Investments in participatory notes involve risks normally associated with a direct investment in the underlying securities. In addition, participatory notes are subject to counterparty risk, which is the risk that the broker-dealer or bank that issues the notes will not fulfill its contractual obligation to complete the transaction with the Trust. Participatory notes constitute general unsecured, unsubordinated contractual obligations of the banks or broker-dealers that issue them and generally are issued as an actual note from the financial intermediary or an equity linked warrant (commonly known as a low exercise price option). The Trust is relying on the creditworthiness of such banks or broker-dealers and has no rights under a participatory note against the issuer of the securities underlying such participatory note. The investment advisor has established guidelines for monitoring participatory note exposure for the Funds. Prior to investment in a participatory note, the investment advisor will complete an analysis of the prospective counterparties and once purchased, will continue to monitor creditworthiness on a quarterly basis. The investment advisor requires a minimum credit rating for such counterparties (as determined by rating agencies such as Moody’s, Fitch and S&P) of A.
90
Brandes Investment Trust
NOTES TO FINANCIAL STATEMENTS — (continued)
The Funds record counterparty credit risk valuation adjustments, if material, on the participatory notes in order to appropriately reflect the credit quality of the counterparty.
The International, Global, Global Income, International Small Cap and Small Cap Value Funds did not invest in any participatory notes at September 30, 2019. The Emerging Markets Fund invested in one participatory note with HSBC Bank Plc in which HSBC Bank Plc is an investment vehicle used to gain exposure to the underlying security of China South Publishing & Media Group Co. Ltd. China South Publishing & Media Group Co. Ltd. was held from the beginning of the fiscal year through the end of the year. The average monthly market value of this security was $14,447,582 during the year. There was no realized gain or loss in participatory notes recognized in the Emerging Markets Fund for the year ended September 30, 2019. The market value of China South Publishing & Media Group Co. Ltd. on September 30, 2019 was $13,443,815 and can be found in the Emerging Market Fund’s Schedule of Investments.
| E. | Investment Transactions, Dividends and Distributions. Investment transactions are accounted for on the trade dates. Realized gains and losses are evaluated on the basis of identified costs. Dividend income and distributions to shareholders are recorded on the ex-dividend dates. Interest is recorded on an accrual basis. Withholding taxes on foreign dividends and capital gains, which are included as a component of net investment income and realized gain (loss) on investments, respectively, have been provided for in accordance with the Trust’s understanding of the applicable country’s tax rules and rates. Each Fund’s investment income, expenses, other than class specific expenses, and realized and unrealized gains and losses are allocated daily to each class of the Fund’s shares based upon the relative net asset values of outstanding shares of each class of shares at the beginning of the day (after adjusting for the current capital shares activity of the respective class). Expenses common to the Funds’ portfolios are allocated among the Funds based upon their relative net asset values or other appropriate allocation methods. The Funds amortize premiums and accrete discounts using the constant yield method. |
| F. | Concentration of Risk. As of September 30, 2019, the International, Global, Global Income, Emerging Markets and International Small Cap Funds held significant portions of their assets in foreign securities. Certain price and foreign exchange fluctuations as well as economic and political situations in the foreign jurisdictions could have an impact on the International, Global, Global Income, Emerging Markets and International Small Cap Funds’ net assets. The investment advisor monitors these off-balance sheet risks. |
91
Brandes Investment Trust
NOTES TO FINANCIAL STATEMENTS — (continued)
| G. | Use of Estimates. The preparation of financial statements in conformity with GAAP requires management to make estimates and assumptions that affect the reported amounts of assets and liabilities at the date of the financial statements and reported amounts of income and expenses during the reporting period. Actual results could differ from those estimates and assumptions. |
| H. | Securities Lending. The Funds may lend their portfolio securities to banks, brokers and dealers. Lending Fund securities exposes the Fund to risks such as the following: (i) the borrower may fail to return the loaned securities, (ii) the borrower may not be able to provide additional collateral, or (iii) the Funds may experience delays in recovery of the loaned securities or loss of rights in the collateral if the borrower fails financially. |
To minimize these risks, the borrower must agree to maintain collateral with the Fund’s custodian, marked to market daily, in the form of U.S. Government obligations, in an amount at least equal to 102% (105% in the case of loans of foreign securities not denominated in U.S. dollars) of the market value of the loaned securities. As of September 30, 2019, the International Fund, Global Fund, Global Income Fund, Emerging Markets Fund, International Small Cap Fund, Small Cap Value Fund and Core Plus Fund did not have any securities on loan. Non-cash collateral received by the Fund may not be sold or re-pledged except to satisfy a borrower default. Therefore, non-cash collateral is not included on the Fund’s Schedules of Investments or Statements of Assets and Liabilities.
| I. | Indemnification Obligations. Under the Trust’s organizational documents, its current and former officers and trustees are indemnified against certain liabilities arising out of the performance of their duties to the Trust. The Trust has indemnified its trustees against any expenses actually and reasonably incurred by the trustees in any proceeding arising out of or in connection with the trustees’ service to the Trust. In addition, in the normal course of business, the Trust enters into contracts that contain a variety of representations and warranties and provide general indemnifications. The Funds’ maximum exposure under these arrangements is unknown as this would involve future claims that may be made against the Funds that have not yet occurred or that would be covered by other parties. |
| J. | Accounting for Uncertainty in Income Taxes. Each Fund has elected to be taxed as a “regulated investment company” and intends to distribute substantially all its taxable income to its shareholders and otherwise comply with the provisions of the Internal Revenue Code applicable to regulated investment companies. The Funds may be subject to a nondeductible excise tax calculated as a percentage of certain undistributed amounts of net investment income and net capital gains. The Funds intend to distribute |
92
Brandes Investment Trust
NOTES TO FINANCIAL STATEMENTS — (continued)
| their net investment income and capital gains as necessary to avoid this excise tax. Therefore, no provision for federal income taxes or excise taxes has been made. |
The Trust analyzes all open tax years, as defined by the applicable statute of limitations, for all major jurisdictions. Open tax years for the Funds are those that are open for exam by taxing authorities (2016 through 2019). As of September 30, 2019, the Trust has no examinations in progress.
Management has analyzed the Trust’s tax positions, and has concluded that no liability should be recorded related to uncertain tax positions expected to be taken on the tax return for the fiscal year-ended September 30, 2019.
The Trust identifies its major tax jurisdictions as the U.S. Government and the State of California. The Funds are not aware of any tax positions for which it is reasonably possible that the total amounts of unrecognized tax benefits will significantly change in the next twelve months.
| K. | Fair Value Measurements. The Trust has adopted GAAP accounting principles related to fair value accounting standards which establish a definition of fair value and set out a hierarchy for measuring fair value. These standards require additional disclosures about the various inputs and valuation techniques used to develop the measurements of fair value and a discussion of changes in valuation techniques and related inputs during the period. These inputs are summarized in the three broad levels listed below: |
Level 1 — Fair value measurement within Level 1 should be based on an unadjusted quoted price in an active market that the Funds have the ability to access for the asset or liability at the measurement date. Because a quoted price alone forms the basis for the measurement, the access requirement within Level 1 limits discretion in pricing the asset or liability, including in situations in which there are multiple markets for the asset or liability with different prices and no single market represents a principal market for the asset or liability. Importantly, the Financial Accounting Standards Board has indicated that when a quoted price in an active market for a security is available, that price should be used to measure fair value without regard to an entity’s intent to transact at that price.
Level 2 — Fair value measurement within Level 2 should be based on all inputs other than unadjusted quoted prices included within Level 1 that are observable for the asset or liability. Other significant observable market inputs include quoted prices for similar instruments in active markets, quoted adjusted prices in active markets, quoted prices for identical or similar instruments in markets that are not active, and model-derived valuations in which the majority of significant inputs and significant value drivers are observable in active markets.
93
Brandes Investment Trust
NOTES TO FINANCIAL STATEMENTS — (continued)
Level 3 — Fair value measurement within Level 3 should be based on unobservable inputs in such cases where markets do not exist or are illiquid. Significant unobservable inputs include model derived valuations in which the majority of significant inputs or significant value drivers are unobservable. Unobservable inputs are those inputs that reflect the Fund’s own assumptions that market participants would use to price the asset or liability based on the best available information.
| L. | Security Valuation. Common and preferred stocks, exchange-traded funds and financial derivative instruments, such as futures contracts and options contracts that are traded on a national securities or commodities exchange, are valued at the last reported sales price at the close of regular trading on each day the exchange is open for trading, in the case of common stocks and exchange-traded funds, or, in the case of futures contracts or options contracts, the settlement price determined by the relevant exchange. Securities listed on the NASDAQ National Market System for which market quotations are readily available are valued using the NASDAQ Official Closing Price. To the extent these securities are actively traded and valuation adjustments are not applied, they are categorized as Level 1 of the fair value hierarchy. |
Equity securities traded on an exchange for which there have been no sales on the valuation date are generally valued at the mean between last bid and ask price on such day and are categorized as Level 2 of the fair value hierarchy, or are fair valued by the Valuation Committee.
Investments in registered open-end management investment companies are valued based upon the Net Asset Values (“NAVs”) of such investments and are categorized as Level 1 of the fair value hierarchy.
Valuation adjustments may be applied to certain common and preferred stocks that are solely traded on a foreign exchange to account for the market movement between the close of the foreign market and the close of the New York Stock Exchange (“NYSE”). These securities are generally valued using pricing service providers that consider the correlation of the trading patterns of the foreign securities to the intraday trading in the U.S. markets for investments. Securities using these valuation adjustments are categorized as Level 2 of the fair value hierarchy. As of September 30, 2019, the International Fund, Global Fund, Global Income Fund, Emerging Markets Fund and International Small Cap Fund had securities with market values of$589,480,347, $20,472,971, $795,263, $710,108,576, and $228,370,749 that represent 83.81%, 56.76%, 56.52%, 50.04%, and 47.03% of each Fund’s net assets, respectively, that were fair valued using these valuation adjustments.
94
Brandes Investment Trust
NOTES TO FINANCIAL STATEMENTS — (continued)
Fixed income securities (other than repurchase agreements and demand notes) including corporate, convertible and municipal bonds and notes, U.S. government agencies, U.S. Treasury obligations, sovereign issues, bank loans, convertible preferred securities, fixed income securities purchased on a delayed delivery basis and non-U.S. bonds are normally valued on the basis of quotes obtained from brokers and dealers or independent pricing services or sources. Independent pricing services typically use information provided by market makers or estimates of market values obtained from yield data relating to investments or securities with similar characteristics. The service providers’ internal models use inputs that are observable such as, among other things, issuer details, interest rates, yield curves, prepayment speeds, credit risks/spreads, default rates and quoted prices for similar assets. Securities that use similar valuation techniques and inputs as described above are categorized as Level 2 of the fair value hierarchy.
Rights that are traded on a national securities exchange are valued at the last reported sales price at the close of regular trading on each day the exchange is open. A right is a privilege offered by a corporation to its shareholders pro rata to subscribe to a certain security at a specified price, often for a short period. Rights may or may not be transferable.
Mortgage and asset-backed securities are usually issued as separate tranches, or classes, of securities within each package of underlying securities. These securities are also normally valued by pricing service providers that use broker-dealer quotations or valuation estimates from their internal pricing models. The pricing models for these securities usually consider tranche level attributes, estimated cash flows and market-based yield spreads for each tranche, and current market data and incorporate packaged collateral performance, as available. Mortgage and asset-backed securities that use such valuation techniques and inputs are categorized as Level 2 of the fair value hierarchy.
Repurchase agreements and demand notes, for which neither vendor pricing nor market maker prices are available, are valued at amortized cost on the day of valuation, unless Brandes Investment Partners, L.P. (the “Advisor”) determines that the use of amortized cost valuation on such day is not appropriate (in which case such instrument is fair valued in accordance with the fair value procedures of the Trust).
Certain securities may be fair valued in accordance with the fair valuation procedures approved by the Board of Trustees. The Valuation Committee is generally responsible for overseeing the day-to-day valuation processes and reports periodically to the Board. The Valuation Committee is authorized to make all necessary determinations of the fair value of
95
Brandes Investment Trust
NOTES TO FINANCIAL STATEMENTS — (continued)
portfolio securities and other assets for which market quotations are not readily available or if it is deemed that the prices obtained from brokers and dealers or independent pricing services are unreliable. The securities fair valued by the Valuation Committee are indicated in the Schedules of Investments and are categorized as Level 2 or Level 3 of the fair value hierarchy. Certain vendor priced securities may also be considered Level 3 if significant unobservable inputs are used by the vendors.
In using fair value pricing, each Fund attempts to establish the price that it might reasonably have expected to receive upon a sale of the security at 4:00 p.m. Eastern time. Valuing securities at fair value involves greater reliance on judgment than valuation of securities based on readily available market quotations. A Fund using fair value to price securities may value those securities higher or lower than another fund using market quotations or fair value to price the same securities. Further, there can be no assurance that the Fund could obtain the fair value assigned to a security if it were to sell the security at approximately the time at which the Fund determines its net asset value.
The following is a summary of the level inputs used, as of September 30, 2019, involving the Funds’ assets carried at fair value. The inputs used for valuing securities may not be an indication of the risk associated with investing in those securities.
Description | Level 1 | Level 2 | Level 3 | Total | ||||||||||||
Investments in Securities | ||||||||||||||||
International Fund | ||||||||||||||||
Common Stocks | ||||||||||||||||
Communication Services | $ | — | $ | 62,169,473 | $ | — | $ | 62,169,473 | ||||||||
Consumer Discretionary | — | 90,372,523 | — | 90,372,523 | ||||||||||||
Consumer Staples | — | 64,075,182 | — | 64,075,182 | ||||||||||||
Energy | — | 46,298,720 | — | 46,298,720 | ||||||||||||
Financials | — | 132,722,611 | — | 132,722,611 | ||||||||||||
Health Care | — | 87,440,217 | — | 87,440,217 | ||||||||||||
Industrials | 16,041,017 | 47,248,345 | — | 63,289,362 | ||||||||||||
Information Technology | 7,277,213 | 20,948,542 | — | 28,225,755 | ||||||||||||
Materials | 10,272,803 | 27,903,063 | — | 38,175,866 | ||||||||||||
Real Estate | 20,490,653 | — | — | 20,490,653 | ||||||||||||
Utilities | — | 19,917,406 | — | 19,917,406 | ||||||||||||
|
|
|
|
|
|
|
| |||||||||
Total Common Stocks | 54,081,686 | 599,096,082 | — | 653,177,768 | ||||||||||||
|
|
|
|
|
|
|
| |||||||||
Preferred Stocks | ||||||||||||||||
Communication Services | 5,102,921 | — | — | 5,102,921 | ||||||||||||
Energy | 6,808,393 | 11,025,123 | — | 17,833,516 | ||||||||||||
|
|
|
|
|
|
|
| |||||||||
Total Preferred Stocks | 11,911,314 | 11,025,123 | — | 22,936,437 | ||||||||||||
|
|
|
|
|
|
|
| |||||||||
Short-Term Investments | 26,029,138 | — | 26,029,138 | |||||||||||||
|
|
|
|
|
|
|
| |||||||||
Total Investments in Securities | $ | 92,022,138 | $ | 610,121,205 | $ | — | $ | 702,143,343 | ||||||||
|
|
|
|
|
|
|
| |||||||||
96
Brandes Investment Trust
NOTES TO FINANCIAL STATEMENTS — (continued)
Description | Level 1 | Level 2 | Level 3 | Total | ||||||||||||
Global Fund | ||||||||||||||||
Common Stocks | ||||||||||||||||
Communication Services | $ | — | $ | 1,506,180 | $ | — | $ | 1,506,180 | ||||||||
Consumer Discretionary | — | 4,154,679 | — | 4,154,679 | ||||||||||||
Consumer Staples | 190,706 | 2,821,028 | — | 3,011,734 | ||||||||||||
Energy | 453,248 | 2,860,484 | — | 3,313,732 | ||||||||||||
Financials | 5,692,879 | 2,765,337 | — | 8,458,216 | ||||||||||||
Health Care | 4,998,555 | 2,805,114 | — | 7,803,669 | ||||||||||||
Industrials | 1,240,167 | 1,008,648 | — | 2,248,815 | ||||||||||||
Information Technology | 804,302 | 1,138,799 | — | 1,943,101 | ||||||||||||
Materials | — | 496,519 | — | 496,519 | ||||||||||||
Real Estate | 801,424 | — | — | 801,424 | ||||||||||||
Utilities | — | 1,074,182 | — | 1,074,182 | ||||||||||||
|
|
|
|
|
|
|
| |||||||||
Total Common Stocks | 14,181,281 | 20,630,970 | — | 34,812,251 | ||||||||||||
|
|
|
|
|
|
|
| |||||||||
Preferred Stocks | ||||||||||||||||
Information Technology | — | 129,131 | — | 129,131 | ||||||||||||
|
|
|
|
|
|
|
| |||||||||
Total Preferred Stocks | — | 129,131 | — | 129,131 | ||||||||||||
|
|
|
|
|
|
|
| |||||||||
Short-Term Investments | 1,288,678 | — | — | 1,288,678 | ||||||||||||
|
|
|
|
|
|
|
| |||||||||
Total Investments in Securities | $ | 15,469,959 | $ | 20,760,101 | $ | — | $ | 36,230,060 | ||||||||
|
|
|
|
|
|
|
| |||||||||
Global Equity Income | ||||||||||||||||
Common Stocks | ||||||||||||||||
Communication Services | $ | 43,127 | $ | 65,683 | $ | — | 108,810 | |||||||||
Consumer Discretionary | — | 116,706 | — | 116,706 | ||||||||||||
Consumer Staples | 16,178 | 123,656 | — | 139,834 | ||||||||||||
Energy | — | 126,038 | — | 126,038 | ||||||||||||
Financials | 135,296 | 93,631 | — | 228,927 | ||||||||||||
Health Care | 160,965 | 103,844 | — | 264,809 | ||||||||||||
Industrials | 20,392 | 46,170 | — | 66,562 | ||||||||||||
Information Technology | 17,935 | 22,822 | — | 40,757 | ||||||||||||
Real Estate | 50,697 | — | — | 50,697 | ||||||||||||
Utilities | — | 69,381 | — | 69,381 | ||||||||||||
|
|
|
|
|
|
|
| |||||||||
Total Common Stocks | 444,590 | 767,931 | — | 1,212,521 | ||||||||||||
|
|
|
|
|
|
|
| |||||||||
Preferred Stocks | ||||||||||||||||
Financials | 111,990 | — | — | 111,990 | ||||||||||||
Information Technology | — | 27,332 | — | 27,332 | ||||||||||||
|
|
|
|
|
|
|
| |||||||||
Total Preferred Stocks | 111,990 | 27,332 | — | 139,322 | ||||||||||||
|
|
|
|
|
|
|
| |||||||||
Short-Term Investments | 96,343 | — | — | 96,343 | ||||||||||||
|
|
|
|
|
|
|
| |||||||||
Total Investments in Securities | $ | 652,923 | $ | 795,263 | $ | — | $ | 1,448,186 | ||||||||
|
|
|
|
|
|
|
| |||||||||
97
Brandes Investment Trust
NOTES TO FINANCIAL STATEMENTS — (continued)
Description | Level 1 | Level 2 | Level 3 | Total | ||||||||||||
Emerging Markets Fund | ||||||||||||||||
Common Stocks | ||||||||||||||||
Communication Services | $ | 51,161,656 | $ | 135,459,353 | $ | — | $ | 186,621,009 | ||||||||
Consumer Discretionary | 67,022,743 | 156,545,807 | — | 223,568,550 | ||||||||||||
Consumer Staples | 30,927,689 | 52,456,892 | — | 83,384,581 | ||||||||||||
Energy | 24,282,323 | 13,952,298 | — | 38,234,621 | ||||||||||||
Financials | 28,726,151 | 205,099,613 | — | 233,825,764 | ||||||||||||
Health Care | 18,020,786 | 35,714,425 | — | 53,735,211 | ||||||||||||
Industrials | 83,724,857 | 16,595,130 | — | 100,319,987 | ||||||||||||
Information Technology | 30,517,973 | 78,736,266 | — | 109,254,239 | ||||||||||||
Materials | 39,488,713 | 30,019,529 | — | 69,508,242 | ||||||||||||
Real Estate | 107,355,403 | 13,462,094 | — | 120,817,497 | ||||||||||||
Utilities | 23,904,426 | — | — | 23,904,426 | ||||||||||||
|
|
|
|
|
|
|
| |||||||||
Total Common Stocks | 505,132,720 | 738,041,407 | — | 1,243,174,127 | ||||||||||||
|
|
|
|
|
|
|
| |||||||||
Participatory Note | ||||||||||||||||
Communication Services | — | 13,443,815 | — | 13,443,815 | ||||||||||||
|
|
|
|
|
|
|
| |||||||||
Total Participatory Note | — | 13,443,815 | — | 13,443,815 | ||||||||||||
|
|
|
|
|
|
|
| |||||||||
Preferred Stocks | ||||||||||||||||
Communication Services | 17,734,930 | — | — | 17,734,930 | ||||||||||||
Consumer Discretionary | — | 26,414,322 | — | 26,414,322 | ||||||||||||
Consumer Staples | 22,476,084 | — | — | 22,476,084 | ||||||||||||
Energy | 30,868,486 | 18,530,338 | — | 49,398,824 | ||||||||||||
Financials | 7,506,793 | — | — | 7,506,793 | ||||||||||||
|
|
|
|
|
|
|
| |||||||||
Total Preferred Stocks | 78,586,293 | 44,944,660 | — | 123,530,953 | ||||||||||||
|
|
|
|
|
|
|
| |||||||||
Short-Term Investments | 42,839,683 | — | — | 42,839,683 | ||||||||||||
|
|
|
|
|
|
|
| |||||||||
Total Investments in Securities | $ | 626,558,696 | $ | 796,429,882 | $ | — | $ | 1,422,988,578 | ||||||||
|
|
|
|
|
|
|
| |||||||||
International Small Cap Fund |
| |||||||||||||||
Common Stocks | ||||||||||||||||
Communication Services | $ | 12,440,145 | $ | 33,270,331 | $ | — | 45,710,476 | |||||||||
Consumer Discretionary | 19,206,832 | 23,835,792 | — | 43,042,624 | ||||||||||||
Consumer Staples | 34,182,452 | 73,595,327 | — | 107,777,779 | ||||||||||||
Financials | 7,192,344 | 52,353,259 | — | 59,545,603 | ||||||||||||
Health Care | 13,616,981 | 11,247,404 | — | 24,864,385 | ||||||||||||
Industrials | 63,944,925 | 27,211,585 | — | 91,156,510 | ||||||||||||
Information Technology | 24,791,598 | 5,931,898 | — | 30,723,496 | ||||||||||||
Materials | 2,498,020 | 8,788,462 | — | 11,286,482 | ||||||||||||
Real Estate | 38,466,551 | — | — | 38,466,551 | ||||||||||||
Utilities | 4,916,244 | 5,234,500 | — | 10,150,744 | ||||||||||||
|
|
|
|
|
|
|
| |||||||||
Total Common Stocks | 221,256,092 | 241,468,558 | — | 462,724,650 | ||||||||||||
|
|
|
|
|
|
|
| |||||||||
Preferred Stocks | ||||||||||||||||
Health Care | 9,004,896 | — | — | 9,004,896 | ||||||||||||
|
|
|
|
|
|
|
| |||||||||
Total Preferred Stocks | 9,004,896 | — | — | 9,004,896 | ||||||||||||
|
|
|
|
|
|
|
| |||||||||
Short-Term Investments | 29,835,284 | — | — | 29,835,284 | ||||||||||||
|
|
|
|
|
|
|
| |||||||||
Total Investments in Securities | $ | 260,096,272 | $ | 241,468,558 | $ | — | $ | 501,564,830 | ||||||||
|
|
|
|
|
|
|
| |||||||||
98
Brandes Investment Trust
NOTES TO FINANCIAL STATEMENTS — (continued)
Description | Level 1 | Level 2 | Level 3 | Total | ||||||||||||
Small Cap Value Fund |
| |||||||||||||||
Common Stocks | ||||||||||||||||
Communication Services | $ | 8,458 | $ | — | $ | — | $ | 8,458 | ||||||||
Consumer Discretionary | 53,656 | — | — | 53,656 | ||||||||||||
Consumer Staples | 39,446 | — | — | 39,446 | ||||||||||||
Energy | 6,993 | — | — | 6,993 | ||||||||||||
Financials | 56,927 | — | — | 56,927 | ||||||||||||
Health Care | 83,767 | — | — | 83,767 | ||||||||||||
Industrials | 72,413 | — | — | 72,413 | ||||||||||||
Information Technology | 67,977 | — | — | 67,977 | ||||||||||||
Materials | 6,453 | — | — | 6,453 | ||||||||||||
Real Estate | 19,507 | — | — | 19,507 | ||||||||||||
Utilities | 6,007 | — | — | 6,007 | ||||||||||||
|
|
|
|
|
|
|
| |||||||||
Total Common Stocks | 421,604 | — | — | 421,604 | ||||||||||||
|
|
|
|
|
|
|
| |||||||||
Preferred Stocks | ||||||||||||||||
Energy | 6,112 | — | — | 6,112 | ||||||||||||
|
|
|
|
|
|
|
| |||||||||
Total Preferred Stocks | 6,112 | — | — | 6,112 | ||||||||||||
|
|
|
|
|
|
|
| |||||||||
Corporate Bonds | ||||||||||||||||
Consumer Discretionary | — | 10,088 | — | 10,088 | ||||||||||||
Industrials | — | 8,207 | — | 8,207 | ||||||||||||
Utilities | — | 12,113 | — | 12,113 | ||||||||||||
|
|
|
|
|
|
|
| |||||||||
Total Corporate Bonds | — | 30,408 | — | 30,408 | ||||||||||||
|
|
|
|
|
|
|
| |||||||||
Short-Term Investments | 57,290 | — | — | 57,290 | ||||||||||||
|
|
|
|
|
|
|
| |||||||||
Total Investments in Securities | $ | 485,006 | $ | 30,408 | $ | — | $ | 515,414 | ||||||||
|
|
|
|
|
|
|
| |||||||||
Core Plus Fund | ||||||||||||||||
Common Stock | $ | 2,377 | $ | — | $ | — | $ | 2,377 | ||||||||
Mortgage Backed Securities | — | 11,985,685 | — | 11,985,685 | ||||||||||||
Government Securities | — | 42,413,777 | — | 42,413,777 | ||||||||||||
Asset Backed Securities | — | 1,744,948 | — | 1,744,948 | ||||||||||||
Corporate Bonds | — | 28,098,724 | — | 28,098,724 | ||||||||||||
Short-Term Investments | 2,098,876 | — | — | 2,098,876 | ||||||||||||
|
|
|
|
|
|
|
| |||||||||
Total Investments in Securities | $ | 2,101,253 | $ | 84,243,134 | $ | — | $ | 86,344,387 | ||||||||
|
|
|
|
|
|
|
| |||||||||
There were no Level 3 securities in the International, Global, Global Income, Emerging Markets, International Small Cap, Small Cap Value and Core Plus Funds at the beginning or during the periods presented.
NOTE 3 – INVESTMENT ADVISORY FEE AND OTHER TRANSACTIONS WITH AFFILIATES
| A. | Advisor Fee. The Advisor provides the Funds with investment management services under an Investment Advisory Agreement. The Advisor furnishes all investment advice, office space and certain administrative services, and provides certain personnel, needed by the Funds. As compensation for its services, the Advisor is entitled to a monthly fee. The Advisor received a |
99
Brandes Investment Trust
NOTES TO FINANCIAL STATEMENTS — (continued)
| monthly fee at the annual rate of 0.75% of the first $2.5 billion of average daily net assets, 0.70% on average daily net assets from $2.5 billion to $5.0 billion, and 0.67% of the average daily net assets greater than $5.0 billion, of the International Fund. The Advisor received a monthly fee at the annual rate of 0.95% of the first $2.5 billion of average daily net assets, 0.90% on average daily net assets from $2.5 billion to $5.0 billion, and 0.85% of the amount of average daily net assets greater than $5.0 billion, of the Emerging Markets Fund. The Advisor received a monthly fee at the annual rate of 0.95% of the first $1.0 billion of average daily net assets, and 0.90% of the average daily net assets greater than $1.0 billion, of the International Small Cap Fund. The Global Fund, Global Income Fund, Small Cap Value Fund and Core Plus Fund incurred a monthly fee at the annual rate of 0.80%, 0.80%, 0.70% and 0.35% based upon their average daily net assets, respectively. For the year ended September 30, 2019, the International Fund, the Global Fund, the Global Income Fund, the Emerging Markets Fund, the International Small Cap Fund, the Small Cap Value Fund and the Core Plus Fund incurred $5,780,755, $382,961, $10,645, $13,666,520, $6,569,287, $47,956, and $294,429 in advisory fees, respectively. |
Certain officers and trustees of the Trust are also officers of the Advisor.
The Funds are responsible for their own operating expenses. The Advisor has contractually agreed to limit each Fund’s annual operating expenses, including repayment of previous waivers, to the following percentages of the Fund’s average daily net assets attributable to the specific classes through January 31, 2021 (the “Expense Cap Agreement”):
Fund | Class A | Class C | Class I | Class R6 | ||||||||||||
International Fund | 1.20 | % | 1.95 | % | 0.85 | % | 0.75 | % | ||||||||
Global Fund | 1.25 | % | 2.00 | % | 1.00 | % | 0.82 | %* | ||||||||
Global Income Fund | 1.25 | % | 2.00 | % | 1.00 | % | 0.82 | %* | ||||||||
Emerging Markets Fund | 1.37 | % | 2.12 | % | 1.12 | % | 0.97 | % | ||||||||
International Small Cap Fund | 1.40 | % | 2.15 | % | 1.15 | % | 1.00 | % | ||||||||
Small Cap Value Fund | 1.15 | % | N/A | 0.90 | % | 0.72 | % | |||||||||
Core Plus Fund | 0.70 | % | N/A | 0.50 | % | 0.35 | % | |||||||||
| * | These classes are not active |
The Funds may incur additional expenses not covered under the Expense Cap Agreement. These expenses include acquired fund fees and expenses, taxes, interest, broker commissions, and proxy expenses or other extraordinary expenses.
Any reimbursements of fee waivers made by the Advisor to a Fund are subject to repayment by the Fund, to the extent that the Fund is able to make the repayment within the expense limit specified in its Expense Cap Agreement. Under the Expense Cap Agreement that was in place during
100
Brandes Investment Trust
NOTES TO FINANCIAL STATEMENTS — (continued)
the period covered by this report, any such repayment must be made before the end of the thirty-six months after the month in which the related reimbursement or waiver occurred. The Trust has agreed to repay the expense reimbursement to the Adviser. However, the repayment of previously waived expenses is limited to amounts that do not cause the aggregate operating expenses of the Fund to exceed the current expense cap or the expense cap in place at the time the waiver was generated. For the year ended September 30, 2019, the Advisor waived expenses and/or reimbursed the Funds $202,211, $171,380, $162,031, $352,747, $58,771, $198,545, and $192,970 for the International Fund, Global Fund, Global Income Fund, Emerging Markets Fund, International Small Cap Fund, Small Cap Value Fund and Core Plus Fund, respectively. Potential recovery amounts expire through the following periods:
Fund | Year Ended September 30, 2020 | Year Ended September 30, 2021 | Year Ended September 30, 2022 | |||||||||
International Fund | $ | 30,969 | $ | 22,758 | $ | 202,211 | ||||||
Global Fund | 157,094 | 136,624 | 171,380 | |||||||||
Global Income Fund | 150,841 | 159,007 | 162,031 | |||||||||
Emerging Markets Fund | 353,314 | 295,177 | 352,747 | |||||||||
International Small Cap Fund | 24,530 | 40,989 | 58,771 | |||||||||
Small Cap Value Fund | N/A | 167,436 | 198,545 | |||||||||
Core Plus Fund | 145,644 | 172,990 | 192,970 | |||||||||
The Advisor did not recoup any fees previously waived or reimbursed for the International Fund, Global Fund, Global Income Fund, International Small Cap Fund, Small Cap Value Fund and Core Plus Fund. For the year ended September 30, 2019, the Advisor recouped fees previously waived or reimbursed in the following amounts:
Fund | Class A | Class I | ||||||
Emerging Markets Fund | $ | 17,391 | $ | 3,067 | ||||
| B. | Administration Fee. U.S. Bancorp Fund Services, LLC, doing business as U.S. Bank Global Fund Services, (the “Administrator”) acts as administrator for the Funds. The Administrator prepares various federal and state regulatory filings; prepares reports and materials to be supplied to the Trustees; monitors the activities of the Funds’ custodian, transfer agent and accountant; coordinates the preparation and payment of Fund expenses; and reviews the Funds’ expense accruals. For these services, each Fund pays the administrator monthly a fee accrued daily and based on the Fund’s average daily net assets. The Funds may also reimburse the Administrator for out-of-pocket expenses incurred by the Administrator in the performance of its duties. The amounts paid directly to the Administrator by the Funds for administrative services are included in the Administration fees in the Statements of Operations. |
101
Brandes Investment Trust
NOTES TO FINANCIAL STATEMENTS — (continued)
| C. | Distribution and Servicing Fees. ALPS Distributors, LLC (the “Distributor”), a registered broker-dealer, acts as the Funds’ principal underwriter in a continuous public offering of the Funds’ shares. A portion of the Funds’ distribution expenses is paid by the Advisor. |
The Funds have adopted a Distribution Plan (the “Plan”) pursuant to Rule 12b-1 under the Investment Company Act of 1940 for the Funds’ Class A and C shares. The Plan is designed to reimburse the Distributor or dealers for certain promotional and other sales related costs associated with sales of such Fund shares. Unreimbursed amounts may be carried forward and paid in a subsequent year, to the extent that total expenses under the Plan do not exceed 0.25% and 0.75% of the average daily net assets of each Fund’s Class A and C shares, respectively. During the year ended September 30, 2019, the Funds paid to the Distributor and each dealer a monthly fee at the annual rate of 0.25% of the average daily net assets of Class A shares and 0.75% of the average daily net assets of Class C shares beneficially owned by the Distributor’s and each dealer’s existing brokerage clients. The Plan may be continued in effect from year to year if such continuance is approved annually by the Board of Trustees of the Trust, including the vote of a majority of the Independent Trustees. For the year ended September 30, 2019, the following Funds incurred expenses pursuant to the Plan:
Fund | Class A | Class C | ||||||
International Fund | $ | 85,885 | $ | 119,460 | ||||
Global Fund | 5,202 | 10,268 | ||||||
Global Income Fund | 76 | 37 | ||||||
Emerging Markets Fund | 617,880 | 152,134 | ||||||
International Small Cap Fund | 151,496 | | 73,459 | | ||||
Small Cap Value Fund | 42 | N/A | ||||||
Core Plus Fund | 5,437 | N/A | ||||||
The Funds have adopted a Shareholder Service Plan for Class C, and have authorized sub-transfer agency fee payments for Class I, to pay to securities broker-dealers, retirement plan sponsors and administrators, banks and their affiliates, and other institutions and service professionals, as shareholder servicing agents of the Funds, an annual fee for non-distribution sub-transfer agent and/or subaccounting services up to 0.25% and 0.05% of annual net assets attributable to Class C and Class I, respectively (the “Service Fees”). For the year ended September 30, 2019, the Funds incurred the following Service Fees:
Fund | Class C | Class I | ||||||
International Fund | $ | 39,820 | $ | 326,473 | ||||
Global Fund | 3,423 | 22,210 | ||||||
Global Income Fund | 12 | 648 | ||||||
Emerging Markets Fund | 50,711 | 566,316 | ||||||
International Small Cap Fund | 24,486 | 280,696 | ||||||
Small Cap Value Fund | N/A | 1,821 | ||||||
Core Plus Fund | N/A | 40,974 | ||||||
102
Brandes Investment Trust
NOTES TO FINANCIAL STATEMENTS — (continued)
NOTE 4 – PURCHASES AND SALES OF SECURITIES
The cost of purchases and the proceeds from sales of securities, excluding short term investments, were as follows for the year ended September 30, 2019:
| U.S. Government | Other | |||||||||||||||
Fund | Purchases | Sales | Purchases | Sales | ||||||||||||
International Fund | $ | — | $ | — | $ | 178,870,195 | $ | 99,579,265 | ||||||||
Global Fund | $ | — | $ | — | $ | 5,692,669 | $ | 30,876,147 | * | |||||||
Global Income Fund | $ | — | $ | — | $ | 194,569 | $ | 97,442 | ||||||||
Emerging Markets Fund | $ | — | $ | — | $ | 310,814,423 | $ | 385,407,043 | ||||||||
International Small Cap Fund | $ | — | $ | — | $ | 145,669,031 | $ | 575,696,705 | ||||||||
Small Cap Value Fund | $ | — | $ | — | $ | 3,102,469 | $ | 10,046,387 | ** | |||||||
Core Plus Fund | $ | 6,775,863 | $ | 13,720,164 | $ | 8,348,543 | $ | 11,250,669 | ||||||||
| * | Includes redemptions in-kind of $2,112,940. See Note 10 for more information. |
| ** | Includes redemptions in-kind of $3,609,199. See Note 10 for more information. |
NOTE 5 – CAPITAL STOCK TRANSACTIONS
Capital stock activity for each class of shares was as follows (shares and dollar amounts in thousands):
| International Fund | Global Fund | |||||||||||||||||||||||||||||||
| Year Ended 9/30/2019 | Year Ended 9/30/2018 | Year Ended 9/30/2019 | Year Ended 9/30/2018 | |||||||||||||||||||||||||||||
| Shares | Amount | Shares | Amount | Shares | Amount | Shares | Amount | |||||||||||||||||||||||||
Shares Sold | ||||||||||||||||||||||||||||||||
Class A | 1,227 | $ | 20,241 | 702 | $ | 12,531 | 7 | $ | 154 | 19 | $ | 490 | ||||||||||||||||||||
Class C | 142 | 2,300 | 171 | 3,063 | 12 | 275 | 17 | 410 | ||||||||||||||||||||||||
Class I | 18,718 | 309,545 | 13,918 | 248,548 | 221 | 5,121 | 178 | 4,356 | ||||||||||||||||||||||||
Class R6 | 1,198 | 20,033 | 885 | 16,042 | N/A | N/A | N/A | N/A | ||||||||||||||||||||||||
Issued on Reinvestment of Distributions | ||||||||||||||||||||||||||||||||
Class A | 75 | 1,203 | 25 | 447 | 8 | 169 | 8 | 192 | ||||||||||||||||||||||||
Class C | 31 | 495 | 14 | 237 | 4 | 89 | 2 | 48 | ||||||||||||||||||||||||
Class I | 1,489 | 24,116 | 556 | 9,884 | 166 | 3,582 | 101 | 2,470 | ||||||||||||||||||||||||
Class R6 | 80 | 1,309 | 25 | 440 | N/A | N/A | N/A | N/A | ||||||||||||||||||||||||
Shares Redeemed | ||||||||||||||||||||||||||||||||
Class A | (1,273 | ) | (21,080 | ) | (558 | ) | (10,034 | ) | (83 | ) | (1,842 | ) | (131 | ) | (3,312 | ) | ||||||||||||||||
Class C | (390 | ) | (6,228 | ) | (174 | ) | (3,085 | ) | (27 | ) | (604 | ) | (22 | ) | (541 | ) | ||||||||||||||||
Class I | (18,906 | ) | (307,610 | ) | (6,918 | ) | (125,341 | ) | (1,391 | ) | (30,924 | ) | (259 | ) | (6,438 | ) | ||||||||||||||||
Class R6 | (440 | ) | (7,313 | ) | (1,720 | ) | (31,437 | ) | N/A | N/A | N/A | N/A | ||||||||||||||||||||
|
|
|
|
|
|
|
|
|
|
|
|
|
|
|
| |||||||||||||||||
Net Increase/(Decrease) Resulting from Fund Share Transactions | 1,951 | $ | 37,011 | 6,926 | $ | 121,295 | (1,083 | ) | $ | (23,980 | ) | (87 | ) | $ | (2,325 | ) | ||||||||||||||||
| �� |
|
|
|
|
|
|
|
|
|
|
|
|
|
| |||||||||||||||||
103
Brandes Investment Trust
NOTES TO FINANCIAL STATEMENTS — (continued)
| Global Income Fund | Emerging Markets Fund | |||||||||||||||||||||||||||||||
| Year Ended 9/30/2019 | Year Ended 9/30/2018 | Year Ended 9/30/2019 | Year Ended 9/30/2018 | |||||||||||||||||||||||||||||
| Shares | Amount | Shares | Amount | Shares | Amount | Shares | Amount | |||||||||||||||||||||||||
Shares Sold | ||||||||||||||||||||||||||||||||
Class A | — | $ | — | 4 | $ | 43 | 6,734 | $ | 59,122 | 7,847 | $ | 73,159 | ||||||||||||||||||||
Class C | — | — | — | * | 5 | 232 | 1,966 | 455 | 4,253 | |||||||||||||||||||||||
Class I | 9 | 98 | 25 | 292 | 45,448 | 388,107 | 46,535 | 439,948 | ||||||||||||||||||||||||
Class R6 | N/A | N/A | N/A | N/A | 2,256 | 19,972 | 1,602 | 14,878 | ||||||||||||||||||||||||
Issued on Reinvestment of Distributions | ||||||||||||||||||||||||||||||||
Class A | — | * | — | * | — | * | — | * | 408 | 3,543 | 417 | 3,687 | ||||||||||||||||||||
Class C | — | * | — | * | — | * | — | * | 24 | 211 | 24 | 216 | ||||||||||||||||||||
Class I | 8 | 84 | 5 | 63 | 2,340 | 20,376 | 2,416 | 21,497 | ||||||||||||||||||||||||
Class R6 | N/A | N/A | N/A | N/A | 99 | 859 | 108 | 993 | ||||||||||||||||||||||||
Shares Redeemed | ||||||||||||||||||||||||||||||||
Class A | — | — | (1 | ) | (10 | ) | (10,208 | ) | (87,615 | ) | (11,397 | ) | (105,987 | ) | ||||||||||||||||||
Class C | — | — | — | — | (848 | ) | (7,178 | ) | (760 | ) | (7,003 | ) | ||||||||||||||||||||
Class I | (4 | ) | (48 | ) | (1 | ) | (19 | ) | (54,752 | ) | (461,901 | ) | (50,197 | ) | (455,961 | ) | ||||||||||||||||
Class R6 | N/A | N/A | N/A | N/A | (798 | ) | (6,858 | ) | (7,983 | ) | (72,039 | ) | ||||||||||||||||||||
|
|
|
|
|
|
|
|
|
|
|
|
|
|
|
| |||||||||||||||||
Net Increase/(Decrease) Resulting from Fund Share Transactions | 13 | $ | 134 | 32 | $ | 374 | (9,065 | ) | $ | (69,396 | ) | (10,933 | ) | $ | (82,359 | ) | ||||||||||||||||
|
|
|
|
|
|
|
|
|
|
|
|
|
|
|
| |||||||||||||||||
| * | Value calculated is less than 500 shares/dollars. |
| International Small Cap Fund | Small Cap Value Fund | |||||||||||||||||||||||||||||||
| Year Ended 9/30/2019 | Year Ended 9/30/2018 | Year Ended 9/30/2019 | Period Ended 9/30/2018 | |||||||||||||||||||||||||||||
| Shares | Amount | Shares | Amount | Shares | Amount | Shares | Amount | |||||||||||||||||||||||||
Shares Sold | ||||||||||||||||||||||||||||||||
Class A | 1,128 | $ | 12,277 | 2,538 | $ | 33,671 | 1 | $ | 5 | 11 | $ | 112 | ||||||||||||||||||||
Class C | 57 | 582 | 127 | 1,704 | N/A | N/A | N/A | N/A | ||||||||||||||||||||||||
Class I | 16,280 | 176,550 | 26,887 | 356,547 | — | — | 527 | 5,268 | ||||||||||||||||||||||||
Class R6 | 391 | 4,272 | 689 | 8,969 | — | — | 468 | 4,566 | ||||||||||||||||||||||||
Issued on Reinvestment of Distributions | ||||||||||||||||||||||||||||||||
Class A | 237 | 2,508 | 782 | 10,584 | — | * | 2 | — | * | — | * | |||||||||||||||||||||
Class C | 37 | 377 | 138 | 1,836 | N/A | N/A | N/A | N/A | ||||||||||||||||||||||||
Class I | 1,995 | 21,210 | 7,773 | 105,388 | 46 | 396 | 2 | 20 | ||||||||||||||||||||||||
Class R6 | 231 | 2,449 | 421 | 5,700 | 40 | 348 | 2 | 20 | ||||||||||||||||||||||||
Shares Redeemed | ||||||||||||||||||||||||||||||||
Class A | (3,800 | ) | (40,560 | ) | (9,006 | ) | (120,281 | ) | (5 | ) | (46 | ) | (6 | ) | (66 | ) | ||||||||||||||||
Class C | (626 | ) | (6,600 | ) | (983 | ) | (12,440 | ) | N/A | N/A | N/A | N/A | ||||||||||||||||||||
Class I | (57,249 | ) | (630,056 | ) | (62,848 | ) | (832,664 | ) | (520 | ) | (4,349 | ) | — | — | ||||||||||||||||||
Class R6 | (4,601 | ) | (48,437 | ) | �� | (437 | ) | (5,831 | ) | (510 | ) | (4,398 | ) | — | — | |||||||||||||||||
|
|
|
|
|
|
|
|
|
|
|
|
|
|
|
| |||||||||||||||||
Net Increase/(Decrease) Resulting from Fund Share Transactions | (45,920 | ) | $ | (505,428 | ) | (33,919 | ) | $ | (446,817 | ) | (948 | ) | $ | (8,042 | ) | 1,004 | $ | 9,920 | ||||||||||||||
|
|
|
|
|
|
|
|
|
|
|
|
|
|
|
| |||||||||||||||||
| * | Value calculated is less than 500 shares/dollars. |
104
Brandes Investment Trust
NOTES TO FINANCIAL STATEMENTS — (continued)
| Core Plus Fund | ||||||||||||||||
| Year Ended 9/30/2019 | Year Ended 9/30/2018 | |||||||||||||||
| Shares | Amount | Shares | Amount | |||||||||||||
Shares Sold | ||||||||||||||||
Class A | 210 | $ | 1,901 | 136 | $ | 1,215 | ||||||||||
Class I | 1,524 | 13,813 | 3,622 | 33,029 | ||||||||||||
Class R6 | — | — | — | * | — | * | ||||||||||
Issued on Reinvestment of Distributions | ||||||||||||||||
Class A | 6 | 51 | 7 | 63 | ||||||||||||
Class I | 259 | 2,340 | 290 | 2,617 | ||||||||||||
Class R6 | — | * | — | * | — | * | — | * | ||||||||
Shares Redeemed | ||||||||||||||||
Class A | (63 | ) | (564 | ) | (306 | ) | (2,754 | ) | ||||||||
Class I | (2,842 | ) | (25,428 | ) | (4,431 | ) | (40,143 | ) | ||||||||
Class R6 | — | — | — | — | ||||||||||||
|
|
|
|
|
|
|
| |||||||||
Net Increase/(Decrease) Resulting from Fund Share Transactions | (906 | ) | $ | (7,887 | ) | (682 | ) | $ | (5,973 | ) | ||||||
|
|
|
|
|
|
|
| |||||||||
| * | Value calculated is less than 500 shares/dollars. |
NOTE 6 – FEDERAL INCOME TAX MATTERS
GAAP requires that certain components of net assets be reclassified between financial and tax reporting. Temporary differences do not require reclassification. Temporary and permanent differences have no effect on net assets or net asset value per share. For the year ended September 30, 2019, the Funds made the following permanent book-to-tax reclassifications primarily related to the treatment of foreign currency transactions, passive foreign investment companies, paydowns, corporate actions and redemptions in-kind:
| Undistributed Net Investment Income/(Loss) | Accumulated Net Realized Gain/(Loss) | Paid-In Capital | ||||||||||
International Fund | $ | 4,533,625 | $ | (4,533,625 | ) | $ | — | |||||
Global Fund | (23,386 | ) | (68,330 | ) | 91,716 | |||||||
Global Income Fund | (24 | ) | 24 | — | ||||||||
Emerging Markets Fund | (1,379,766 | ) | 1,379,766 | — | ||||||||
International Small Cap Fund | 15,177,355 | (15,177,355 | ) | — | ||||||||
Small Cap Value Fund | (58 | ) | 817,951 | (817,893 | ) | |||||||
Core Plus Fund | 45,239 | (45,239 | ) | — | ||||||||
105
Brandes Investment Trust
NOTES TO FINANCIAL STATEMENTS — (continued)
As of September 30, 2019, the components of distributable earnings on a tax basis were as follows:
| International Fund | Global Fund | Global Income Fund | ||||||||||
Cost of investments for tax purposes | $ | 828,791,614 | $ | 32,878,255 | $ | 1,463,546 | ||||||
|
|
|
|
|
| |||||||
Gross tax unrealized appreciation | 32,038,453 | 6,804,229 | 126,191 | |||||||||
Gross tax unrealized depreciation | (158,686,724 | ) | (3,452,424 | ) | (141,551 | ) | ||||||
|
|
|
|
|
| |||||||
Net unrealized appreciation (depreciation) on investments and foreign currency | (126,648,271 | ) | 3,351,805 | (15,360 | ) | |||||||
Distributable ordinary income | 4,596,644 | 106,117 | 5,372 | |||||||||
Distributable long-term capital gains | — | — | 16,685 | |||||||||
|
|
|
|
|
| |||||||
Total distributable earnings | 4,596,644 | 106,117 | 22,057 | |||||||||
|
|
|
|
|
| |||||||
Other accumulated gains/(losses) | (9,298,007 | ) | (961,786 | ) | (249 | ) | ||||||
|
|
|
|
|
| |||||||
Total accumulated earnings | $ | (131,349,634 | ) | $ | 2,496,136 | $ | 6,448 | |||||
|
|
|
|
|
| |||||||
| Emerging Markets Fund | International Small Cap Fund | Small Cap Value Fund | Core Plus Fund | |||||||||||||
Cost of investments for tax purposes | $ | 1,618,681,577 | $ | 624,367,204 | $ | 521,227 | $ | 84,394,191 | ||||||||
|
|
|
|
|
|
|
| |||||||||
Gross tax unrealized appreciation | 119,412,401 | 22,458,602 | 52,860 | 3,749,277 | ||||||||||||
Gross tax unrealized depreciation | (315,105,400 | ) | (145,260,976 | ) | (58,673 | ) | (1,799,081 | ) | ||||||||
|
|
|
|
|
|
|
| |||||||||
Net unrealized appreciation (depreciation) on investments and foreign currency | (195,692,999 | ) | (122,802,374 | ) | (5,813 | ) | 1,950,196 | |||||||||
Distributable ordinary income | 6,619,964 | 770,347 | — | 77,410 | ||||||||||||
Distributable long-term capital gains | — | — | — | — | ||||||||||||
|
|
|
|
|
|
|
| |||||||||
Total distributable earnings | 6,619,964 | 770,347 | — | 77,410 | ||||||||||||
|
|
|
|
|
|
|
| |||||||||
Other accumulated gains/(losses) | (18,939,536 | ) | (127,801,947 | ) | (196,441 | ) | (1,849,062 | ) | ||||||||
|
|
|
|
|
|
|
| |||||||||
Total accumulated earnings | $ | (208,012,571 | ) | $ | (249,833,974 | ) | $ | (202,254 | ) | $ | 178,544 | |||||
|
|
|
|
|
|
|
| |||||||||
The differences between book and tax basis distributable earnings are primarily related to foreign currency adjustments and the differences in classification of paydown gains and losses for tax purposes compared to book purposes. These differences are permanent.
The tax composition of dividends for the years ended September 30, 2019 and September 30, 2018 for the Funds, were as follows:
| Ordinary Income | Long Term Capital Gains | |||||||||||||||
| 2019 | 2018 | 2019 | 2018 | |||||||||||||
International Fund | $ | 28,827,055 | $ | 11,817,058 | $ | — | $ | — | ||||||||
Global Fund | 1,021,928 | 1,314,875 | 2,856,903 | 1,417,148 | ||||||||||||
Global Income Fund | 45,084 | 36,763 | 40,691 | 28,247 | ||||||||||||
Emerging Markets Fund | 27,484,796 | 29,717,180 | — | — | ||||||||||||
International Small Cap Fund | 18,353,209 | 77,837,530 | 9,532,372 | 50,038,482 | ||||||||||||
Small Cap Value Fund | 581,016 | 39,652 | 165,379 | — | ||||||||||||
Core Plus Fund | 2,430,949 | 2,721,143 | — | — | ||||||||||||
106
Brandes Investment Trust
NOTES TO FINANCIAL STATEMENTS — (continued)
At September 30, 2019, the Funds had capital losses expiring and capital loss carryforwards utilized as indicated below:
| Indefinite | Utilized | |||||||
International Fund | $ | (9,226,797 | ) | $ | — | |||
Global Fund | (950,950 | ) | — | |||||
Global Income Fund | — | — | ||||||
Emerging Markets Fund | (18,799,153 | ) | (22,428,395 | ) | ||||
International Small Cap Fund | (127,759,352 | ) | — | |||||
Small Cap Value Fund | (192,103 | ) | — | |||||
Core Plus Fund | (1,849,062 | ) | — | |||||
NOTE 7 – OFFERING PRICE PER SHARE
The public offering price for Class A shares is the net asset value per share plus a sales charge, which varies in accordance with the amount of the purchase up to a maximum of 5.75% for the International, Global, Global Income, Emerging Markets, International Small Cap and Small Cap Value Funds, and 3.75% for the Core Plus Fund. A contingent deferred sales charge (“CDSC”) of 1.00% will be deducted with respect to Class A shares purchased without a sales load and redeemed within 12 months of purchase, unless waived, as discussed in the Prospectus. Any applicable CDSC will be 1.00% of the lesser of the original purchase price or the redemption value of the Class A shares redeemed. Class C shares include a 1.00% CDSC paid by redeeming shareholders within 12 months of purchase. As a result the redemption price may differ from the net asset value per share. The public offering prices for I shares are the respective net asset values. Sales charges are not an expense of the Funds and are not reflected in the financial statements of the Funds.
NOTE 8 – TRANSACTIONS WITH AFFILIATES
The following issuers were affiliated with the Emerging Markets Fund and International Small Cap Fund as defined in Section (2)(a)(3) of the 1940 Act, as these Funds held 5% or more of the outstanding voting securities of the following issuers during the year ended September 30, 2019:
Emerging Markets Fund
| Issuer Name | Share Balance At October 1, 2018 | Additions | Reductions | Share Balance At September 30, 2019 | Dividend Income | Unrealized Appreciation/ (Depreciation) | Realized Gain/(Loss) | Value At September 30, 2019 | ||||||||||||||||||||||||
Urbi Desarrollos Urbanos SA de CV | 10,242,449 | — | — | 10,242,449 | $ | — | $ | (1,191,795 | ) | $ | — | $ | 778,538 | |||||||||||||||||||
|
|
|
|
|
|
|
| |||||||||||||||||||||||||
| $ | — | $ | (1,191,795 | ) | $ | — | $ | 778,538 | ||||||||||||||||||||||||
|
|
|
|
|
|
|
| |||||||||||||||||||||||||
107
Brandes Investment Trust
NOTES TO FINANCIAL STATEMENTS — (continued)
International Small Cap Fund
| Issuer Name | Share Balance At October 1, 2018 | Additions | Reductions | Share Balance At | Dividend Income | Unrealized Appreciation/ (Depreciation) | Realized Gain/(Loss) | Value At September 30, 2019 | ||||||||||||||||||||||||
Avadel Pharmaceuticals Plc(1) | 1,924,883 | 138,526 | (827,450 | ) | 1,235,959 | $ | — | $ | 3,422,601 | $ | (5,372,072 | ) | $ | 5,141,589 | ||||||||||||||||||
Countrywide Plc(1) | 114,155,464 | — | (57,917,233 | ) | 56,238,231 | — | 32,653,702 | (41,409,694 | ) | 2,748,607 | ||||||||||||||||||||||
Desarrolladora Homex SAB de CV | 279,501,983 | — | — | 279,501,983 | — | (3,331,849 | ) | — | 1,118,914 | |||||||||||||||||||||||
Lotte Chilsung Bev(1) | 9,596 | 53,604 | (11,150 | ) | 52,050 | 160,701 | 242,601 | (559,087 | ) | 6,019,337 | ||||||||||||||||||||||
Mills Estruturas e Servicos de Engenharia SA(1) | 8,911,000 | — | (6,884,600 | ) | 2,026,400 | — | 6,785,296 | (439,723 | ) | 3,360,304 | ||||||||||||||||||||||
Safilo Group(1) | — | 6,018,587 | (1,009,900 | ) | 5,008,687 | — | 1,088,849 | 177,427 | 5,153,520 | |||||||||||||||||||||||
Urbi Desarrollos Urbanos SA de CV | 12,867,533 | 3,165,869 | — | 16,033,402 | — | (1,422,751 | ) | — | 1,218,714 | |||||||||||||||||||||||
|
|
|
|
|
|
|
| |||||||||||||||||||||||||
| $ | 160,701 | $ | 39,438,449 | $ | (47,603,149 | ) | $ | 24,760,985 | ||||||||||||||||||||||||
|
|
|
|
|
|
|
| |||||||||||||||||||||||||
| (1) | Issuer was not an affiliate as of September 30, 2019. |
NOTE 9 – OWNERSHIP BY AFFILIATED PARTIES
As of September 30, 2019, the Advisor, Trustees or affiliates of the Advisor beneficially owned more than 5% of shares in each class of the Funds as follows:
| Global Equity Fund | Global Income Fund | Small Cap Value Fund | ||||||
Class I | Class I | Class I | Class R6 | |||||
Shares | 176,468 | 80,215 | 12,317 | 11 | ||||
% of Total Outstanding Shares | 11.58% | 61.95% | 22.42% | 100.00% | ||||
| Core Plus Fund | ||||||||
Class I | Class R6 |
|
| |||||
Shares | 1,180,781 | 12 | ||||||
% of Total Outstanding Shares | 13.12% | 100.00% | ||||||
NOTE 10 –IN-KIND TRANSACTIONS
Affiliated Transactions
On January 2, 2018, the Advisor transferred all securities, through a reorganization, from an affiliated private investment fund to create the Small Cap Value Fund. The Fund received securities with a value of $4,432,969. Prior to January 2, 2018, the Advisor managed the affiliated private investment fund which had an investment objective and investment policies and strategies that were, in all material respects, equivalent to those of the Small Cap Value Fund. Through this transfer, the affiliated private investment fund was closed.
108
Brandes Investment Trust
NOTES TO FINANCIAL STATEMENTS — (continued)
On March 15, 2018, a shareholder transferred securities from an affiliated separately managed account into the Small Cap Value Fund through anin-kind purchase. The Fund received securities with a value of $3,699,813.
The total value of these two transactions was $8,132,782, which is shown on the Statement of Changes in Net Assets. Of the $8,132,782 transferred, $8,051,136 were considered long-term purchases.
Unaffiliated Transactions
On June 12, 2019, a shareholder of the Global Equity Fund redeemed assets through an in-kind redemption. In this transaction, the Fund transferred securities with a value of $2,112,940 to the redeeming shareholder which is shown in the Statement of Changes in Net Assets. The Fund recognized a net realized gain in the amount of $91,756, which is reflected on the Statement of Operations.
On June 12, 2019, a shareholder of the Small Cap Value Fund redeemed assets through anin-kind redemption. In this transaction, the Fund transferred securities with a value of $3,609,199 to the redeeming shareholder which is shown in the Statement of Changes in Net Assets. The Fund recognized a net realized loss in the amount of $959,099, which is reflected on the Statement of Operations.
NOTE 11 – NEW ACCOUNTING PRONOUNCEMENTS
In March 2017, the FASB issued Accounting Standards Update (ASU) No. 2017-08, Receivables – Nonrefundable Fees and Other Costs (Subtopic 310-20): Premium Amortization on Purchased Callable Debt Securities. The amendments in the ASU shorten the amortization period for certain callable debt securities acquired at a premium, to be amortized to the earliest call date. The ASU does not require an accounting change for securities acquired at a discount, which continues to be amortized to maturity. The ASU is effective for fiscal years and interim periods within those fiscal years beginning after December 15, 2018. Management is currently evaluating the impact of this guidance to the Funds.
NOTE 12 – SUBSEQUENT EVENTS
In preparing these financial statements, the Trust has evaluated events and transactions for potential recognition or disclosure through the date the financial statements were available to be issued. The Trust has concluded that there are no subsequent events to note.
109
Brandes Investment Trust
REPORT OF INDEPENDENT REGISTERED PUBLIC ACCOUNTING FIRM
Tothe Board of Trustees of Brandes Investment Trust and Shareholders of Brandes International Equity Fund, Brandes Global Equity Fund, Brandes Global Equity Income Fund, Brandes Emerging Markets Value Fund, Brandes International Small Cap Equity Fund, Brandes Small Cap Value Fund and Brandes Core Plus Fixed Income Fund
Opinions on the Financial Statements
We have audited the accompanying statements of assets and liabilities, including the schedules of investments, of Brandes International Equity Fund, Brandes Global Equity Fund, Brandes Global Equity Income Fund, Brandes Emerging Markets Value Fund, Brandes International Small Cap Equity Fund, Brandes Small Cap Value Fund and Brandes Core Plus Fixed Income Fund (seven of the funds constituting Brandes Investment Trust, hereafter collectively referred to as the “Funds”) as of September 30, 2019, the related statements of operations for the year ended September 30, 2019, the statements of changes in net assets for each of the periods listed in the table below,including the related notes, and the financial highlights for each of the periods indicated therein (collectively referred to as the “financial statements”). In our opinion, the financial statements present fairly, in all material respects, the financial position of each of the Funds as of September 30, 2019, the results of each of their operations for the year then ended, and the changes in each of their net assets for the periods listed in the table below and each of the financial highlights for each of the periods indicated therein in conformity with accounting principles generally accepted in the United States of America.
Fund
Brandes International Equity Fund(1)
Brandes Global Equity Fund(1)
Brandes Global Equity Income Fund(1)
Brandes Emerging Markets Value Fund(1)
Brandes International Small Cap Equity Fund(1)
Brandes Small Cap Value Fund(2)
Brandes Core Plus Fixed Income Fund(1)
| (1) | Statement of changes in net assets for the years ended September 30, 2019 and 2018 |
| (2) | Statement of changes in net assets for the year ended September 30, 2019 and for the period January 2, 2018 (commencement of operations) through September 30, 2018 |
Basis for Opinions
These financial statements are the responsibility of the Funds’ management. Our responsibility is to express an opinion on the Funds’ financial statements based on our audits. We are a public accounting firm registered with the Public Company Accounting Oversight Board (United States) (PCAOB) and are required to be independent with respect to the Funds in accordance with the
110
Brandes Investment Trust
REPORT OF INDEPENDENT REGISTERED PUBLIC ACCOUNTING FIRM — (continued)
U.S. federal securities laws and the applicable rules and regulations of the Securities and Exchange Commission and the PCAOB.
We conducted our audits of these financial statements in accordance with the standards of the PCAOB. Those standards require that we plan and perform the audit to obtain reasonable assurance about whether the financial statements are free of material misstatement, whether due to error or fraud.
Our audits included performing procedures to assess the risks of material misstatement of the financial statements, whether due to error or fraud, and performing procedures that respond to those risks. Such procedures included examining, on a test basis, evidence regarding the amounts and disclosures in the financial statements. Our audits also included evaluating the accounting principles used and significant estimates made by management, as well as evaluating the overall presentation of the financial statements. Our procedures included confirmation of securities owned as of September 30, 2019 by correspondence with the custodian and brokers; when replies were not received from brokers, we performed other auditing procedures. We believe that our audits provide a reasonable basis for our opinions.
/s/ PricewaterhouseCoopers LLP
Los Angeles, California
November 25, 2019
We have served as the auditor of one or more investment companies in Brandes Investment Partners LP Investment Company Complex since 2011.
111
Brandes Investment Trust
ADDITIONAL INFORMATION — (Unaudited)
PROXY VOTING PROCEDURES
The Advisor votes proxies relating to the Funds’ portfolio securities in accordance with procedures adopted by the Advisor. You may obtain a description of these procedures, free of charge, by calling toll-free 1-800-331-2979. This information is also available through the Securities and Exchange Commission’s website athttp://www.sec.gov.
Information regarding how the Trust voted proxies relating to portfolio securities during the most recent 12-month period ended June 30 is available without charge, upon request, by calling 1-800-331-2979. This information is also available through the Securities and Exchange Commission’s website athttp://www.sec.gov.
PORTFOLIO HOLDINGS DISCLOSURE
The Trust files the Funds’ complete schedules of portfolio holdings with the Securities and Exchange Commission for the first and third quarters of each fiscal year on Form N-Q or Part F of Form N-PORT (beginning with filings after March 31, 2019). The Trust’s Form N-Q or Part F of Form N-PORT filings are available on the Securities and Exchange Commission’s website at http://www.sec.gov. The Trust’s Form N-Q or Part F of Form N-PORT filings may be reviewed and copied at the Commission’s Public Reference Room in Washington, D.C., and information on the operation of the Public Reference Room may be obtained by calling 1-800-SEC-0330. Information regarding the Trust’s Form N-Q or Part F of Form N-PORT filings is also available, without charge, by callingtoll-free, 1-800-331-2979.
TAX NOTICE
For the fiscal year ended September 30, 2019, the percentage of taxable ordinary income distributions that are designated as interest related dividends under the Internal Revenue Code Section 87(k)(1)(c) for each Fund were as follows:
| PERCENTAGE | ||||
International Fund | 1.03 | % | ||
Global Fund | 0.86 | % | ||
Global Income Fund | 1.12 | % | ||
Emerging Markets Fund | 0.66 | % | ||
International Small Cap Fund | 2.37 | % | ||
Small Cap Value Fund | 5.76 | % | ||
Core Plus Fund | 100.00 | % | ||
112
Brandes Investment Trust
ADDITIONAL INFORMATION — (Unaudited) (continued)
The percentage of ordinary distributions designated as short-term gain distributions under the Internal Revenue Code Section 871(k)(2)(c) for the fiscal year ended September 30, 2019 were as follows:
| PERCENTAGE | ||||
International Fund | 0.00 | % | ||
Global Fund | 1.51 | % | ||
Global Income Fund | 3.68 | % | ||
Emerging Markets Fund | 0.00 | % | ||
International Small Cap Fund | 0.00 | % | ||
Small Cap Value Fund | 88.32 | % | ||
Core Plus Fund | 0.00 | % | ||
The distributions designated as long-term capital gain distributions for the fiscal year ended September 30, 2019 were as follows:
| DISTRIBUTION | ||||
International Fund | $ | — | ||
Global Fund | $ | 2,856,903 | ||
Global Income Fund | $ | 40,691 | ||
Emerging Markets Fund | $ | — | ||
International Small Cap Fund | $ | 9,532,372 | ||
Small Cap Value Fund | $ | 165,379 | ||
Core Plus Fund | $ | — | ||
The percentage of dividend income distributed for the fiscal year ended September 30, 2019, which is designated as qualified dividend income under the Jobs and Growth Tax relief Reconciliation Act of 2003 is as follows:
| PERCENTAGE | ||||
International Fund | 100.00 | % | ||
Global Fund | 100.00 | % | ||
Global Income Fund | 99.55 | % | ||
Emerging Markets Fund | 96.66 | % | ||
International Small Cap Fund | 89.71 | % | ||
Small Cap Value Fund | 23.59 | % | ||
Core Plus Fund | 0.00 | % | ||
The percentage of dividends paid during the fiscal year ended September 30, 2019 that qualify for the corporate dividends received deduction are as follows:
| PERCENTAGE | ||||
International Fund | 0.00 | % | ||
Global Fund | 34.37 | % | ||
Global Income Fund | 32.38 | % | ||
Emerging Markets Fund | 3.43 | % | ||
International Small Cap Fund | 0.00 | % | ||
Small Cap Value Fund | 22.23 | % | ||
Core Plus Fund | 0.00 | % | ||
113
Brandes Investment Trust
ADDITIONAL INFORMATION — (Unaudited) (continued)
For the year ended September 30, 2019, the International Fund, Global Fund, Global Income Fund, Emerging Markets Fund and International Small Cap Fund earned foreign source income and paid foreign taxes, as noted below, which it intends to pass through to its shareholders pursuant to Section 853 of the Internal Revenue Code, with the exception to the foreign taxes paid in the United Kingdom. The United Kingdom foreign taxes paid by the Fund do not qualify to be passed through to the Fund’s shareholders.
| Gross Foreign Income | ||||||||||||||||||||
| International Fund | Global Fund | Global Income Fund | Emerging Markets Fund | International Small Cap Fund | ||||||||||||||||
Argentina | $ | — | $ | — | $ | — | $ | 574,034 | $ | — | ||||||||||
Belgium | — | — | — | — | 89,010 | |||||||||||||||
Bermuda | — | — | — | 147,112 | 333,982 | |||||||||||||||
Brazil | 951,316 | 734 | 4,587 | 6,912,200 | 371,763 | |||||||||||||||
Canada | — | — | — | — | 860,740 | |||||||||||||||
Cayman Islands | — | — | — | 1,480,508 | — | |||||||||||||||
Chile | — | — | 1,127 | 374,774 | — | |||||||||||||||
China | 2,192,409 | 90,507 | 3,311 | 2,249,818 | — | |||||||||||||||
Colombia | — | — | — | 1,057,493 | — | |||||||||||||||
Czech Republic | — | — | — | 460,716 | — | |||||||||||||||
Finland | 251,350 | 15,588 | 504 | — | — | |||||||||||||||
France | 6,415,144 | 294,205 | 9,818 | — | 282,791 | |||||||||||||||
Germany | 431,122 | — | — | — | 149,512 | |||||||||||||||
Greece | — | — | — | 326,569 | 56,385 | |||||||||||||||
Hong Kong | 643,027 | 21,620 | 1,027 | 6,848,492 | 1,669,815 | |||||||||||||||
Hungary | — | — | — | — | 750,067 | |||||||||||||||
India | — | — | — | 771,609 | — | |||||||||||||||
Indonesia | — | — | — | 891,211 | — | |||||||||||||||
Ireland | 329,864 | 13,994 | — | — | 1,185,444 | |||||||||||||||
Italy | 3,456,050 | 59,934 | 2,003 | — | 45,215 | |||||||||||||||
Japan | 3,989,836 | 53,490 | 1,037 | — | 2,975,703 | |||||||||||||||
Jersey | 1,135,143 | 46,875 | 2,117 | — | — | |||||||||||||||
Malaysia | — | 13,962 | — | 555,370 | — | |||||||||||||||
Mexico | 1,151,747 | 44,959 | 2,250 | 5,795,308 | 1,577,421 | |||||||||||||||
Netherlands | 774,211 | 6,713 | — | — | — | |||||||||||||||
Pakistan | — | — | — | 271,770 | — | |||||||||||||||
Panama | — | — | — | 1,573,781 | 26,250 | |||||||||||||||
Philippines | — | — | — | — | 184,102 | |||||||||||||||
Republic of Korea | 1,332,807 | 103,786 | 1,746 | 7,477,982 | 1,185,088 | |||||||||||||||
Russia | 3,223,628 | 36,832 | — | 10,608,713 | 43,294 | |||||||||||||||
Slovenia | — | — | — | — | 1,405,177 | |||||||||||||||
South Africa | — | — | — | 1,647,042 | — | |||||||||||||||
Spain | 843,116 | 41,921 | — | 883,631 | 1,839,975 | |||||||||||||||
Switzerland | — | — | — | — | — | |||||||||||||||
Taiwan | 692,615 | — | — | 2,044,477 | — | |||||||||||||||
Thailand | — | — | — | 2,525,314 | — | |||||||||||||||
Turkey | — | — | — | 304,128 | — | |||||||||||||||
United Kingdom | — | 443,991 | 15,564 | 1,480,297 | 4,598,128 | |||||||||||||||
|
|
|
|
|
|
|
|
|
| |||||||||||
| $ | 27,813,385 | $ | 1,289,111 | $ | 45,091 | $ | 57,262,349 | $ | 19,629,862 | |||||||||||
|
|
|
|
|
|
|
|
|
| |||||||||||
114
Brandes Investment Trust
ADDITIONAL INFORMATION — (Unaudited) (continued)
| Foreign Tax Paid | ||||||||||||||||||||
| International Fund | Global Fund | Global Income Fund | Emerging Markets Fund | International Small Cap Fund | ||||||||||||||||
Belgium | $ | — | $ | — | $ | — | $ | — | $ | 13,352 | ||||||||||
Brazil | 106,641 | — | 475 | 399,045 | 28,944 | |||||||||||||||
Canada | — | — | — | — | 129,111 | |||||||||||||||
Chile | — | — | 354 | 52,436 | — | |||||||||||||||
China | 212,322 | — | 198 | 224,982 | — | |||||||||||||||
Colombia | — | — | — | 14,104 | — | |||||||||||||||
Czech Republic | — | — | — | 69,107 | — | |||||||||||||||
Finland | 37,703 | 2,338 | 76 | — | — | |||||||||||||||
France | 962,271 | 48,869 | 1,776 | — | 42,419 | |||||||||||||||
Germany | 64,668 | — | — | — | 22,427 | |||||||||||||||
Greece | — | — | — | 32,657 | 5,638 | |||||||||||||||
Hong Kong | 46,144 | 2,162 | 103 | 502,266 | 27,530 | |||||||||||||||
India | — | — | — | 133,682 | — | |||||||||||||||
Italy | 460,242 | 8,990 | 300 | — | 6,782 | |||||||||||||||
Japan | 398,984 | 5,349 | 104 | — | 297,570 | |||||||||||||||
Mexico | 306,301 | 13,488 | 675 | 1,513,083 | 345,179 | |||||||||||||||
Netherlands | 116,132 | 1,007 | — | — | — | |||||||||||||||
Pakistan | — | — | — | 40,766 | — | |||||||||||||||
Philippines | — | — | — | — | 55,264 | |||||||||||||||
Republic of Korea | 291,369 | 22,783 | 382 | 1,625,640 | 259,067 | |||||||||||||||
Russia | 483,544 | 4,813 | — | 1,584,978 | 6,494 | |||||||||||||||
Slovenia | — | — | — | — | 210,776 | |||||||||||||||
South Africa | — | — | — | 247,056 | — | |||||||||||||||
Spain | 58,410 | 1,853 | — | 132,544 | 265,284 | |||||||||||||||
Switzerland | — | 4,176 | — | — | — | |||||||||||||||
Taiwan | 145,449 | — | — | 429,340 | — | |||||||||||||||
Thailand | — | — | — | 154,692 | — | |||||||||||||||
|
|
|
|
|
|
|
|
|
| |||||||||||
| $ | 3,690,180 | $ | 115,828 | $ | 4,443 | $ | 7,156,378 | $ | 1,715,837 | |||||||||||
|
|
|
|
|
|
|
|
|
| |||||||||||
115
Brandes Investment Trust
TRUSTEES AND OFFICERS INFORMATION — (Unaudited)
The Board of Trustees is responsible for the overall management of the Trust’s business. The Board approves all significant agreements between the Trust and persons or companies furnishing services to the Trust, including the Trust’s agreements with the Advisor, Administrator, Custodian, Distributor and Transfer Agent. The Board of Trustees delegates the day-to-day operations of the Trust to its officers and service providers, subject to the Funds’ investment objectives and policies and to general supervision by the Board. The Trust’s Statement of Additional Information includes additional information about the Trustees and is available, without charge, bycalling 1-800-331-2979 or visiting www.brandes.com.
The Trustees and officers of the Trust, their business addresses and principal occupations during the past five years are:
Name, Address | Position(s) | Term of | Principal | Number | Other Trusteeships | |||||
Independent Trustees(2) | ||||||||||
Gregory Bishop, CFA 11988 El Camino Real, Suite 600 San Diego, CA 92130 (Born: 1961) | Trustee | Since January 2017 | Retired. Previously Executive Vice President and Head of Retail Business, PIMCO Investments, from 1997 to 2014 | 10 | None | |||||
Jean E. Carter 11988 El Camino Real, Suite 600 San Diego, CA 92130 (Born: 1957) | Trustee | Since April 2008 | Retired. | 10 | Bridge Builder Trust | |||||
Robert M. Fitzgerald, CPA (inactive) 11988 El Camino Real, Suite 600 San Diego, CA 92130 (Born: 1952) | Trustee | Since April 2008 | Retired. | 10 | Hotchkis and Wiley Mutual Funds | |||||
Craig Wainscott, CFA 11988 El Camino Real, Suite 600 San Diego, CA 92130 (Born: 1961) | Trustee and Chairman | Since February 2012 | Partner with The Paradigm Project and advisor to early-stage companies. | 10 | None | |||||
116
Brandes Investment Trust
TRUSTEES AND OFFICERS INFORMATION — (Unaudited) (continued)
Name, Address | Position(s) | Term of | Principal | Number | Other Trusteeships | |||||
“Interested” Trustees(3) | ||||||||||
Oliver Murray 11988 El Camino Real, Suite 600 San Diego, CA 92130 (Born: 1962) | Trustee | Since February 2012 | Chief Executive Officer, Brandes Investment Partners & Co.; Managing Director – PMCS of Brandes Investment Partners, L.P., the investment advisor to the Funds (the “Advisor”). | 10 | None | |||||
Jeff Busby, CFA 11988 El Camino Real, Suite 600 San Diego, CA 92130 (Born: 1961) | Trustee and President | Since July 2006 | Executive Director of the Advisor. | 10 | None | |||||
Officers of the Trust | ||||||||||
Thomas M. Quinlan 11988 El Camino Real, Suite 600 San Diego, CA 92130 (Born: 1970) | Secretary | Since June 2003 | Associate General Counsel of the Advisor. | N/A | N/A | |||||
Gary Iwamura, CPA 11988 El Camino Real, Suite 600 San Diego, CA 92130 (Born: 1956) | Treasurer | Since September 1997 | Finance Director of the Advisor. | N/A | N/A | |||||
Roberta Loubier 11988 El Camino Real, Suite 600 San Diego, CA 92130 (Born: 1971) | Chief Compliance Officer | Since September 2015 | Global Head of Compliance, Brandes Investment Partners, L.P. | N/A | N/A | |||||
| (1) | Trustees and officers of the Fund serve until their resignation, removal or retirement. |
| (2) | Not “interested persons” of the Trust as defined in the 1940 Act. |
| (3) | “Interested persons” of the Trust as defined in the 1940 Act by virtue of their positions with the Advisor. |
117
Brandes Investment Trust
Brandes Investment Trust and Brandes Investment Partners, L.P. may collect non-public information about you from the following sources:
| • | Information we receive about you on applications or other forms; |
| • | Information you give us orally; and |
| • | Information about your transactions with us. |
We do not disclose any non-public personal information about any shareholder or former shareholder of the Fund without the shareholder’s authorization, except as required by law or in response to inquiries from governmental authorities. We restrict access to your personal and account information to those employees who need to know that information to provide products and services to you. We also may disclose that information to unaffiliated third parties (such as to brokers or custodians) only as permitted by law and only as needed for us to provide agreed services to you. We maintain physical, electronic and procedural safeguards to guard your non-public personal information.
If you hold shares of the Fund through a financial intermediary, such as a broker-dealer, bank, or trust company, the privacy policy of your financial intermediary governs how your non-public personal information would be shared with nonaffiliated third parties.

ADVISOR Brandes Investment Partners, L.P. 11988 El Camino Real, Suite 600 San Diego, CA 92130 800.331.2979 DISTRIBUTOR ALPS Distributors, Inc. 1290 Broadway, #1100 Denver, CO 80203 TRANSFER AGENT U.S. Bancorp Fund Services, LLC 615 E. Michigan Street, 3rd Floor Milwaukee, WI 53202 INDEPENDENT REGISTERED PUBLIC ACCOUNTING FIRM PricewaterhouseCoopers LLP 601 South Figueroa Street Los Angeles, CA 90017 LEGAL COUNSEL Morgan, Lewis & Bockius LLP One Federal Street Boston, MA 02110 This report is intended for shareholders of the Brandes International Equity Fund, the Brandes Global Equity Fund, the Brandes Global Equity Income Fund, the Brandes Emerging Markets Value Fund, the Brandes International Small Cap Equity Fund, the Brandes Small Cap Value Fund and the Brandes Core Plus Fixed Income Fund and may not be used as sales literature unless preceded or accompanied by a current prospectus. Statements and other information herein are dated and are subject to change. [Graphic Appears Here]
ANNUAL REPORT SEPARATELY MANAGED ACCOUNT RESERVETR UST For the year ended September 30, 2019 Beginning in January 2021, as permitted by regulations adopted by the U.S. Securities and Exchange Commission, paper copies of the Funds’ annual and semi-annual shareholder reports will no longer be sent by mail, unless you specifically request paper copies of the reports. Instead, the reports will be made available on the Funds’ website (http://www.brandesfunds.com/literature.html), and you will be notified by mail each time a report is posted and provided with a website link to access the report. If you already elected to receive shareholder reports electronically, you will not be affected by this change and you need not take any action. You may elect to receive shareholder reports and other communications from the Funds electronically anytime by contacting your financial intermediary (such as a broker-dealer or a bank) or, if you are a direct investor, by calling1-800-395-3807, sending ane-mail request to info@brandesfunds.com, or by enrolling at http://www.brandesfunds.com/literature.html. You may elect to receive all future reports in paper free of charge. If you invest through a financial intermediary, you can contact your financial intermediary to request that you continue to receive paper copies of your shareholder reports. If you invest directly with the Funds, you can call1-800-395-3807 or send an email request to info@brandesfunds.com to let the Funds know you wish to continue receiving paper copies of your shareholder reports. Your election to receive reports in paper will apply to all Funds held in your account with that intermediary if you invest through your financial intermediary or all Funds held with the fund complex if you invest directly with the Funds. [Graphic Appears Here]

| 2 | ||||
| 8 | ||||
| 10 | ||||
| 14 | ||||
| 15 | ||||
| 16 | ||||
| 17 | ||||
| 18 | ||||
| 27 | ||||
| 28 | ||||
| 29 |
1
Brandes Separately Managed Account Reserve Trust
Dear Fellow Investor,
The net asset value of the Brandes Separately Managed Account Reserve Trust Fund gained 5.29% in the year ending September 30, 2019. For the same period, the Bloomberg Barclays Aggregate Bond Index increased 10.30%.
Relative performance was hurt by corporate bond investments in energy and telecommunications.
Within energy, unease about a global slowdown and an oversupply of oil and natural gas has caused underperformance throughout the sector. More specifically, bonds from Chesapeake Energy and Range Resources detracted from returns as the market expressed its concerns about debt levels from energy companies operating in the high-yield space.
The short-term sentiment, particularly regarding natural gas, has been decidedly negative, primarily as a result of abundant supply. However, the longer-term fundamentals are more positive. Based on our analysis, natural gas is capturing 70% of energy needs from coal plant retirements versus 30% for renewables. Export capacity is increasing: liquefied natural gas export terminals are coming online, and a new pipeline recently placed into service will increase export capacity to Mexico. Finally, investor demands for more capital discipline should serve to restrain volume growth.
During the third quarter 2019, Chesapeake engaged in two transactions that saw debt holders voluntarily swap $733 million in debt for common equity. During the past few years, Chesapeake has opportunistically extended debt maturities to lengthen their runway during a downturn; it has now turned its focus on debt reduction through equity swaps and possible asset sales. Chesapeake has been shifting their product mix toward higher margin oil, which should aid cash flow going forward.
In the telecommunications sector, Frontier Communications detracted from returns. Earlier this year, the company took positive steps to address balance sheet returns, including buying $56 million of its debt in the open market below par value and issuing $1.65 billion first-lien bonds maturing in 2027. Proceeds from the issuance were used to refinance a term loan set to mature in 2021. Frontier also announced an asset sale for $1.35 billion, with proceeds earmarked for additional debt reduction when the transaction closes.
Frontier continues to generate positive free cash flow and with the transactions highlighted above, has a visible path to paying down its maturities for the next three years (we own bonds with a scheduled maturity in 2021). However, its bond prices, continued to move lower in the quarter because a number of investors who own longer-maturity Frontier debt began agitating for the company to undertake a more comprehensive debt restructuring as the path to repay debt maturing in 2023 and beyond is far less certain.
2
Brandes Separately Managed Account Reserve Trust
Given the sharp decline in interest rates, the Fund’s duration positioning toward the lower end of our duration-controlled band also detracted from returns.
Finally, the Fund’s defensive positioning in corporate bonds hurt relative performance. We have been favoring shorter maturity corporate bonds — the duration of our corporate bond exposure is under three years — with credit spreads at or near the tightest levels relative to U.S. Treasuries in decades. During the period, Intermediate maturity corporate bonds outperformed shorter maturity corporates.Year-to-date, the outperformance is quite stark as7- to10-year maturities delivered over 350bps more in return versus U.S. Treasury securities than corporate bonds with1- to3-year maturities.
The Fund received positive contributions more recently from Tenet Healthcare, which was subject to an early call at a premium, Pilgrim’s Pride Corp, and select holdings in banking (JPMorgan and U.S. Bank).
We increased our weight in agency mortgage-backed securities (MBS), as their performance lagged the broader market. The increase in overall market volatility and continued runoff of the Fed’s balance sheet agency MBS holdings, at about $200 billion over the past 12 months, caused yield spreads in the agency MBS market to widen to their highest levels in more than five years recently.
While we remain underweight agency MBS, we will consider additional purchases if recent weakness persists.
Toward the close of the period ending September 30, 2019, U.S. economic data reports were mixed. Economic reports about consumer spending — which represents abouttwo-thirds of the economy — have been largely positive. Manufacturing reports, however, have begun to show more weakness — understandable against the uncertainty of the ongoing trade war.
In this environment, the Brandes Separately Managed Account Reserve Trust Fund favors shorter maturity corporate bonds and those that, in our view, exhibit strong, tangible asset coverage. Although we added to our position during the period, we remain underweight agency MBS and we’ve been managing duration toward the shorter end of our duration-controlled range. We have a higher allocation to U.S. Treasuries that we will look to redeploy thoughtfully and efficiently — if and when market uncertainty and volatility cause credit fundamentals to become mispriced from our estimates of intrinsic value.
As always, thank you for your business and continued trust.
Sincerely yours,
The Brandes Fixed Income Investment Committee
Brandes Investment Trust
Because the values of the fund’s investments will fluctuate with market conditions, so will the value of your investment in the fund. You could lose
3
Brandes Separately Managed Account Reserve Trust
money on your investment in the fund, or the fund could underperform other investments. The values of the fund’s investments fluctuate in response to the activities of individual companies and general bond market and economic conditions. Investments in small and medium capitalization companies tend to have limited liquidity and greater price volatility than large capitalization companies.
As with most fixed income funds, the income on and value of your shares in the fund will fluctuate along with interest rates. When interest rates rise, the market prices of the debt securities the fund owns usually decline. When interest rates fall, the prices of these securities usually increase. Generally, the longer the fund’s average portfolio maturity and the lower the average quality of its portfolio, the greater the price fluctuation. The price of any security owned by the fund may also fall in response to events affecting the issuer of the security, such as its ability to continue to make principal and interest payments or its credit rating. Below investment grade debt securities are speculative and involve a greater risk of default and price change due to changes in the issuer’s creditworthiness than higher grade debt. The market prices of these debt securities may fluctuate more than the market prices of investment grade debt securities and may decline significantly in periods of general economic difficulty.
Past performance is not a guarantee of future results.
Short-term debt refers to fixed income securities set to mature more 1 to 5 years from the issue or purchase date. Long-term debt refers to fixed income securities set to mature more than 10 years from the issue or purchase date.
Asset Coverage: A company’s ability to cover debt obligations with its assets after all liabilities have been satisfied. Source: Investopedia.com
Basis Point: 1/100 of 1%.
Duration: The weighted maturity of a fixed-income investment’s cash flows, used in the estimation of the price sensitivity of fixed-income securities for a given change in interest rates.
Free Cash Flow: Total cash flow from operations less capital expenditures.
Yield: Annual income from the investment (dividend, interest, etc.) divided by the current market price of the investment.
Yield Spread: The difference in yield from a Treasury security and another debt security of the same maturity.
Please refer to the Schedule of Investments in the report for complete holdings information. Fund holdings, geographic allocations and/or sector allocations are subject to change at any time and are not considered a recommendation to buy or sell any security.
4
Brandes Separately Managed Account Reserve Trust
The foregoing reflects the thoughts and opinions of Brandes Investment Partners® exclusively and is subject to change without notice.
Brandes Investment Partners® is a registered trademark of Brandes Investment Partners, L.P. in the United States and Canada.
Must be preceded or accompanied by a prospectus.
Index Guide
The Bloomberg Barclays U.S. Aggregate Bond Index is a broad-based benchmark that measures the investment grade, U.S. dollar-denominated, fixed-rate taxable bond market. This index is a total return index which reflects the price changes and interest of each bond in the index.
One cannot invest directly in an index.
The Brandes Separately Managed Account Reserve Trust is distributed by ALPS Distributors, LLC.
5
Brandes Separately Managed Account Reserve Trust
The following chart compares the value of a hypothetical $10,000 investment in the Separately Managed Account Reserve Trust from September 30, 2009 to September 30, 2019 with the value of such an investment in the Bloomberg Barclays U.S. Aggregate Bond Index and Bloomberg Barclays U.S. Intermediate Credit Bond Index for the same period.
Value of $10,000 Investment vs Bloomberg Barclays U.S. Aggregate Bond Index & Bloomberg Barclays U.S. Intermediate Credit Bond Index (Unaudited)
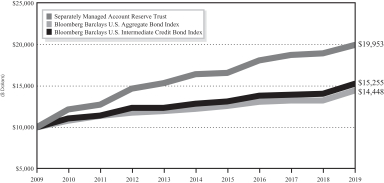
| Average Annual Total Return Periods Ended September 30, 2019 | ||||||||||||||||
| One Year | Five Years | Ten Years | Since Inception(1) | |||||||||||||
Separately Managed Account | ||||||||||||||||
Reserve Trust | 5.29 | % | 3.99 | % | 7.15 | % | 5.38 | % | ||||||||
Bloomberg Barclays U.S. Aggregate Bond Index | 10.30 | % | 3.38 | % | 3.75 | % | 4.33 | % | ||||||||
Bloomberg Barclays U.S. Intermediate Credit Bond Index | 9.27 | % | 3.47 | % | 4.31 | % | 4.61 | % | ||||||||
| (1) | The inception date is October 3, 2005. |
Performance data quoted represents past performance; past performance does not guarantee future results. The investment return and principal value of an investment will fluctuate so that an investor’s shares, when redeemed, may be worth more or less than their original cost. Current performance of the Fund may be lower or higher than the performance quoted. Performance data current to the most recent month end may be obtained by calling 800-331-2979.
6
Brandes Separately Managed Account Reserve Trust
The returns shown do not reflect the deduction of taxes that a shareholder would pay on fund distributions or the redemption of fund shares.
Asset Allocation as a Percentage of Total Investments as of
September 30, 2019 (Unaudited)
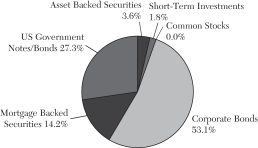
7
Brandes Separately Managed Account Reserve Trust
As a shareholder of the Fund, you incur ongoing costs, including investment advisory and administrative fees and other Fund expenses. The example below is intended to help you understand your ongoing costs (in dollars) of investing in the Fund and to compare these costs with the ongoing costs of investing in other mutual funds. Note that for this Fund, which is used in wrap-fee programs, fees and expenses are paid at the wrap account level rather than the Fund level.
The example is based on an investment of $1,000 invested at the beginning of the period and held for the entire period from April 1, 2019 to September 30, 2019 (the “Period”).
Actual Expenses
This section provides information about actual account values and actual expenses. The “Ending Account Value” shown is derived from the Fund’s actual returns. You may use the information in this section, together with the amount you invested, to estimate the expenses that you paid over the period. Simply divide your account value by $1,000 (for example, an $8,600 account value divided by $1,000 = 8.6), then multiply the result by the number given for the Fund under the heading “Expenses Paid During Period” to estimate the expenses you paid on your account during this period.
Fund | Beginning Account Value | Ending Account Value | Annualized Expense Ratio | Expenses Paid During the Period* | ||||||||||||
Separately Managed Account Reserve Trust** | $ | 1,000.00 | $ | 1,029.60 | 0.00% | $ | 0.00 | |||||||||
| * | The Fund’s expenses are equal to the Fund’s expense ratio for the period, multiplied by the average account value over the period, multiplied by 183/365 (to reflect the one half-year period). |
| ** | No expenses have been charged to the Brandes Separately Managed Account Reserve Trust (“SMART Fund”) over the period, as the SMART Fund participates in a wrap-fee program sponsored by investment advisors unaffiliated with the SMART Fund. See Note 3 to the Financial Statements. Fees and expenses are charged at the wrap account level. |
Hypothetical Example for Comparison Purposes
This section provides information about hypothetical account values and hypothetical expenses based on the Fund’s actual expense ratio and an assumed rate of return of 5% per year before expenses, which is not the Fund’s actual return. The hypothetical account values and expenses may not be used to estimate the actual ending account balance or expenses you paid for the period. You may use this information to compare the ongoing costs of investing in the Fund and other mutual funds. To do so, compare this 5% hypothetical example with the 5% hypothetical examples that appear in the shareholder reports of the other mutual funds.
8
Brandes Separately Managed Account Reserve Trust
Please note that the expenses shown in the table are meant to highlight your ongoing costs only and do not reflect any transaction costs, such as brokerage commissions on purchase and sales of Fund shares. Therefore, the last column of the table is useful in comparing ongoing costs only, and will not help you determine the relative total costs of owning different funds. In addition, if these transactional costs were included, your costs would have been higher.
Fund | Beginning Account Value | Ending Account Value | Annualized Expense Ratio | Expenses Paid During the Period* | ||||||||||||
Separately Managed Account Reserve Trust** | $ | 1,000.00 | $ | 1,025.07 | 0.00% | $ | 0.00 | |||||||||
| * | The Fund’s expenses are equal to the Fund’s expense ratio for the period, multiplied by the average account value over the period, multiplied by 183/365 (to reflect the one half-year period). |
| ** | No expenses have been charged to the Brandes Separately Managed Account Reserve Trust (“SMART Fund”) over the period, as the SMART Fund participates in a wrap-fee program sponsored by investment advisors unaffiliated with the SMART Fund. See Note 3 to the Financial Statements. Fees and expenses are charged at the wrap account level. |
9
Brandes Separately Managed Account Reserve Trust
SCHEDULE OF INVESTMENTS — September 30, 2019
| Shares | Value | |||||||
| COMMON STOCKS – 0.01% |
| |||||||
| Household Durables – 0.01% |
| |||||||
Urbi Desarrollos Urbanos SA de CV(a) | 176,124 | $ | 13,387 | |||||
|
| |||||||
TOTAL COMMON STOCKS | $ | 13,387 | ||||||
|
| |||||||
| Principal Amount | Value | |||||||
| ASSET BACKED SECURITIES – 3.64% |
| |||||||
| Student Loan – 3.64% |
| |||||||
SLM Private Credit Student Loan Trust2004-B | $ | 1,500,000 | $ | 1,448,559 | ||||
SLM Private Credit Student Loan Trust2005-A | 1,865,000 | 1,819,054 | ||||||
SLM Private Credit Student Loan Trust2006-A | 3,244,549 | 3,174,972 | ||||||
|
| |||||||
TOTAL ASSET BACKED SECURITIES | $ | 6,442,585 | ||||||
|
| |||||||
| CORPORATE BONDS – 52.88% |
| |||||||
| Automobiles – 3.92% |
| |||||||
Ford Motor Credit Co. LLC | $ | 3,405,000 | $ | 3,461,303 | ||||
General Motors Financial Co., Inc. | 3,460,000 | 3,464,575 | ||||||
|
| |||||||
| 6,925,878 | ||||||||
|
| |||||||
| Banks – 9.98% |
| |||||||
Citibank NA | 3,092,000 | 3,092,983 | ||||||
Goldman Sachs Group, Inc. | 3,405,000 | 3,442,012 | ||||||
JPMorgan Chase & Co. | 4,523,000 | 4,544,199 | ||||||
USB Capital IX | 5,575,000 | 4,752,687 | ||||||
Wells Fargo & Co. | 1,817,000 | 1,839,713 | ||||||
|
| |||||||
| 17,671,594 | ||||||||
|
| |||||||
| Commercial Services & Supplies – 5.07% |
| |||||||
ADT Corp. | 7,270,000 | 7,297,262 | ||||||
Iron Mountain, Inc. | 1,640,000 | 1,677,195 | ||||||
|
| |||||||
| 8,974,457 | ||||||||
|
| |||||||
The accompanying notes to financial statements are an integral part of this Schedule of Investments.
10
Brandes Separately Managed Account Reserve Trust
SCHEDULE OF INVESTMENTS — September 30, 2019 (continued)
| Principal Amount | Value | |||||||
| Consumer Products – 3.34% |
| |||||||
Avon International Operations, Inc.(b) | $ | 3,695,000 | $ | 3,846,384 | ||||
Wyndham Destinations, Inc. | 2,035,000 | 2,065,525 | ||||||
|
| |||||||
| 5,911,909 | ||||||||
|
| |||||||
| Food, Beverage & Tobacco – 3.17% | ||||||||
Mead Johnson Nutrition Co. | 2,850,000 | 2,856,038 | ||||||
Pilgrim’s Pride Corp. | 2,665,000 | 2,758,275 | ||||||
|
| |||||||
| 5,614,313 | ||||||||
|
| |||||||
| Homebuilders – 3.45% | ||||||||
PulteGroup, Inc. | 3,920,000 | 4,282,600 | ||||||
Toll Brothers Finance Corp. | 1,710,000 | 1,829,700 | ||||||
|
| |||||||
| 6,112,300 | ||||||||
|
| |||||||
| Insurance – 1.65% | ||||||||
American International Group, Inc. | 2,785,000 | 2,926,556 | ||||||
|
| |||||||
| Media – 1.06% | ||||||||
Netflix, Inc. | 1,815,000 | 1,869,450 | ||||||
|
| |||||||
| Metals & Mining – 0.29% | ||||||||
Cloud Peak Energy | 2,055,000 | 513,750 | ||||||
|
| |||||||
| Oil, Gas & Consumable Fuels – 11.29% | ||||||||
BP Capital Markets Plc | 3,375,000 | 3,581,402 | ||||||
Chesapeake Energy Corp. | 5,105,000 | 3,688,363 | ||||||
Chevron Corp. | 3,460,000 | 3,473,359 | ||||||
Kinder Morgan, Inc. | 1,921,000 | 2,076,836 | ||||||
Occidental Petroleum Corp. | 1,705,000 | 1,752,931 | ||||||
Range Resources Corp. | 6,195,000 | 5,420,625 | ||||||
|
| |||||||
| 19,993,516 | ||||||||
|
| |||||||
The accompanying notes to financial statements are an integral part of this Schedule of Investments.
11
Brandes Separately Managed Account Reserve Trust
SCHEDULE OF INVESTMENTS — September 30, 2019 (continued)
| Principal Amount | Value | |||||||
| Technology – 4.41% | ||||||||
Microsoft Corp. | $ | 3,460,000 | $ | 3,508,310 | ||||
VMware, Inc. | 4,176,000 | 4,294,917 | ||||||
|
| |||||||
| 7,803,227 | ||||||||
|
| |||||||
| Telecommunications – 5.25% | ||||||||
AT&T, Inc. | 5,235,000 | 5,343,496 | ||||||
Frontier Communications Corp. | 5,640,000 | 2,509,800 | ||||||
Telefonica Emisiones SA | 1,390,000 | 1,450,998 | ||||||
|
| |||||||
| 9,304,294 | ||||||||
|
| |||||||
TOTAL CORPORATE BONDS | $ | 93,621,244 | ||||||
|
| |||||||
| FEDERAL AND FEDERALLY SPONSORED CREDITS – 14.12% |
| |||||||
| Federal Home Loan Mortgage Corporation – 5.76% | ||||||||
PoolG1-8578, 3.000%, 12/1/2030 | $ | 1,867,056 | $ | 1,918,460 | ||||
PoolSD-8001, 3.500%, 7/1/2049 | 5,529,134 | 5,672,684 | ||||||
PoolSD-8003, 4.000%, 7/1/2049 | 2,519,778 | 2,616,154 | ||||||
|
| |||||||
| 10,207,298 | ||||||||
|
| |||||||
| Federal National Mortgage Association – 8.36% | ||||||||
Pool CA1624, 3.000%, 4/1/2033 | 2,488,696 | 2,554,272 | ||||||
Pool AS6201, 3.500%, 11/1/2045 | 1,440,964 | 1,501,068 | ||||||
Pool AL9865, 3.000%, 2/1/2047 | 1,634,149 | 1,673,745 | ||||||
Pool BN6683, 3.500%, 6/1/2049 | 3,417,723 | 3,515,594 | ||||||
Pool MA3687, 4.000%, 6/1/2049 | 5,345,541 | 5,549,484 | ||||||
|
| |||||||
| 14,794,163 | ||||||||
|
| |||||||
TOTAL FEDERAL AND FEDERALLY SPONSORED CREDITS | $ | 25,001,461 | ||||||
|
| |||||||
| OTHER MORTGAGE RELATED SECURITIES – 0.00% | ||||||||
| Collateralized Mortgage Obligations – 0.00% | ||||||||
Wells Fargo Mortgage Backed Securities 2006-AR14 Trust | $ | 3,391 | $ | 3,313 | ||||
|
| |||||||
TOTAL OTHER MORTGAGE RELATED SECURITIES | $ | 3,313 | ||||||
|
| |||||||
| US GOVERNMENTS – 27.24% | ||||||||
| Sovereign – 27.24% | ||||||||
United States Treasury Note/Bond | ||||||||
2.375%, 8/15/2024 | $ | 4,500,000 | $ | 4,667,695 | ||||
The accompanying notes to financial statements are an integral part of this Schedule of Investments.
12
Brandes Separately Managed Account Reserve Trust
SCHEDULE OF INVESTMENTS — September 30, 2019 (continued)
| Principal Amount | Value | |||||||
2.250%, 2/15/2027 | $ | 2,575,000 | $ | 2,686,550 | ||||
2.375%, 5/15/2029 | 2,000,000 | 2,123,906 | ||||||
4.750%, 2/15/2037 | 27,035,000 | 38,743,479 | ||||||
|
| |||||||
TOTAL US GOVERNMENTS | $ | 48,221,630 | ||||||
|
| |||||||
| Shares | Value | |||||||
| SHORT-TERM INVESTMENTS – 1.78% | ||||||||
| Money Market Funds – 1.78% | ||||||||
BlackRock Liquidity FundsT-Fund – Institutional Class, 1.834%(f) | 3,144,188 | $ | 3,144,188 | |||||
|
| |||||||
TOTAL SHORT-TERM INVESTMENTS | $ | 3,144,188 | ||||||
|
| |||||||
Total Investments (Cost $175,641,755) – 99.67% | $ | 176,447,808 | ||||||
Other Assets in Excess of Liabilities – 0.33% | 584,667 | |||||||
|
| |||||||
TOTAL NET ASSETS – 100.00% | $ | 177,032,475 | ||||||
|
| |||||||
Percentages are stated as a percent of net assets.
LIBOR London Inter-bank Offered Rate
| (a) | Non-income producing security. |
| (b) | Acquired in a transaction exempt from registration under Rule 144A or Section 4(a)(2) of the Securities Act of 1933. May be resold in the U.S. in transactions exempt from registration, normally to qualified institutional buyers. The total value of all such securities was $8,281,854, which represented 4.68% of the net assets of the Fund. |
| (c) | Variable rate security. The coupon is based on an underlying pool of loans. |
| (d) | Variable rate security. The coupon is based on a reference index and spread index. |
| (e) | Issuer is in default of interest payments. |
| (f) | The rate shown is the annualized seven day yield as of September 30, 2019. |
The industry classifications represented in the Schedule of Investments are in accordance with Global Industry Classification Standards (GICS®), which was developed by and/or is the exclusive property of MSCI, Inc. and Standard & Poor Financial Services LLC. This information is unaudited.
The accompanying notes to financial statements are an integral part of this Schedule of Investments.
13
Brandes Separately Managed Account Reserve Trust
STATEMENT OF ASSETS AND LIABILITIES — September 30, 2019
ASSETS | ||||
Investments in securities, at cost | $ | 175,641,755 | ||
|
| |||
Investment in securities, at value | $ | 176,447,808 | ||
Receivables: | ||||
Fund shares sold | 64,999 | |||
Interest | 1,100,678 | |||
|
| |||
Total Assets | 177,613,485 | |||
|
| |||
LIABILITIES | ||||
Payables: | ||||
Fund shares redeemed | 541,529 | |||
Dividends payable | 39,481 | |||
|
| |||
Total Liabilities | 581,010 | |||
|
| |||
NET ASSETS | $ | 177,032,475 | ||
|
| |||
COMPONENTS OF NET ASSETS | ||||
Paid-in Capital | $ | 179,539,756 | ||
Total distributable earnings (loss) | (2,507,281 | ) | ||
|
| |||
Total Net Assets | $ | 177,032,475 | ||
|
| |||
Net asset value, offering price and redemption proceeds per share | ||||
Net Assets | $ | 177,032,475 | ||
Shares outstanding (unlimited shares authorized without par value) | 20,287,184 | |||
Offering and redemption price | $ | 8.73 | ||
|
|
The accompanying notes to financial statements are an integral part of this statement.
14
Brandes Separately Managed Account Reserve Trust
STATEMENT OF OPERATIONS — For the Year Ended September 30, 2019
INVESTMENT INCOME | ||||
Income | ||||
Dividend income | $ | 24,107 | ||
Interest income | 7,388,535 | |||
|
| |||
Total Income | 7,412,642 | |||
|
| |||
Expenses (Note 3) | ||||
Total expenses | — | |||
|
| |||
Total net expenses | — | |||
|
| |||
Net investment income | 7,412,642 | |||
|
| |||
REALIZED AND UNREALIZED GAIN (LOSS) ON INVESTMENTS: | ||||
Net realized gain (loss) on investments | (974,165 | ) | ||
Net change in unrealized appreciation (depreciation) on investments | 2,335,798 | |||
|
| |||
Net realized and unrealized gain on investments | 1,361,633 | |||
|
| |||
Net Increase in net assets resulting from operations | $ | 8,774,275 | ||
|
|
The accompanying notes to financial statements are an integral part of this statement.
15
Brandes Separately Managed Account Reserve Trust
STATEMENT OF CHANGES IN NET ASSETS
| Year Ended September 30, 2019 | Year Ended September 30, 2018(1) | |||||||
INCREASE IN NET ASSETS FROM: | ||||||||
OPERATIONS | ||||||||
Net investment income | $ | 7,412,642 | $ | 7,887,915 | ||||
Net realized gain (loss) on investments | (974,165 | ) | 1,068,915 | |||||
Net change in unrealized appreciation (depreciation) on investments | 2,335,798 | (6,901,291 | ) | |||||
|
|
|
| |||||
Net increase in net assets resulting from operations | 8,774,275 | 2,055,539 | ||||||
|
|
|
| |||||
DISTRIBUTIONS TO SHAREHOLDERS | ||||||||
Distributions to Shareholders | (7,370,934 | ) | (7,860,061 | ) | ||||
|
|
|
| |||||
Decrease in net assets from distributions | (7,370,934 | ) | (7,860,061 | ) | ||||
|
|
|
| |||||
CAPITAL SHARE TRANSACTIONS | ||||||||
Proceeds from shares sold | 40,330,186 | 32,406,816 | ||||||
Net asset value of shares issued on reinvestment of distributions | 6,971,775 | 7,523,525 | ||||||
Cost of shares redeemed | (48,308,152 | ) | (34,163,795 | ) | ||||
|
|
|
| |||||
Net increase (decrease) in net assets from capital share transactions | (1,006,191 | ) | 5,766,546 | |||||
|
|
|
| |||||
Total increase (decrease) in net assets | 397,150 | (37,976 | ) | |||||
|
|
|
| |||||
NET ASSETS | ||||||||
Beginning of the Period | 176,635,325 | 176,673,301 | ||||||
|
|
|
| |||||
End of the Period | $ | 177,032,475 | $ | 176,635,325 | ||||
|
|
|
| |||||
| (1) | Distributions to shareholders includes net investment income distributions of $7,860,061. End of period net assets includes accumulated undistributed net investment income of $50,508. |
The accompanying notes to financial statements are an integral part of this statement.
16
Brandes Separately Managed Account Reserve Trust
| Year Ended September 30, | ||||||||||||||||||||
| 2019 | 2018 | 2017 | 2016 | 2015 | ||||||||||||||||
Net asset value, beginning of period | $ | 8.65 | $ | 8.94 | $ | 9.02 | $ | 8.69 | $ | 9.03 | ||||||||||
|
|
|
|
|
|
|
|
|
| |||||||||||
Total from investment operations: | ||||||||||||||||||||
Net investment income(2) | 0.36 | 0.39 | 0.39 | 0.44 | 0.43 | |||||||||||||||
Net realized and unrealized gain/(loss) on investments | 0.08 | (0.29 | ) | (0.08 | ) | 0.33 | (0.34 | ) | ||||||||||||
|
|
|
|
|
|
|
|
|
| |||||||||||
Total from investment operations | 0.44 | 0.10 | 0.31 | 0.77 | 0.09 | |||||||||||||||
|
|
|
|
|
|
|
|
|
| |||||||||||
Less dividends and distributions: | ||||||||||||||||||||
Dividends from net investment income | (0.36 | ) | (0.39 | ) | (0.39 | ) | (0.44 | ) | (0.43 | ) | ||||||||||
|
|
|
|
|
|
|
|
|
| |||||||||||
Total dividends and distributions | (0.36 | ) | (0.39 | ) | (0.39 | ) | (0.44 | ) | (0.43 | ) | ||||||||||
|
|
|
|
|
|
|
|
|
| |||||||||||
Net asset value, end of period | $ | 8.73 | $ | 8.65 | $ | 8.94 | $ | 9.02 | $ | 8.69 | ||||||||||
|
|
|
|
|
|
|
|
|
| |||||||||||
Total return | 5.29 | % | 1.12 | % | 3.57 | % | 9.24 | % | 0.93 | % | ||||||||||
Net assets, end of period (millions) | $ | 177.0 | $ | 176.6 | $ | 176.7 | $ | 163.9 | $ | 159.8 | ||||||||||
Ratio of expenses to average net assets(1) | 0.00 | % | 0.00 | % | 0.00 | % | 0.00 | % | 0.00 | % | ||||||||||
Ratio of net investment income to average net assets(1) | 4.27 | % | 4.43 | % | 4.39 | % | 5.12 | % | 4.77 | % | ||||||||||
Portfolio turnover rate | 35.99 | % | 42.90 | % | 39.74 | % | 53.60 | % | 32.78 | % | ||||||||||
| (1) | Reflects the fact that no fees or expenses are incurred by the Fund. The Fund is an integral part of“wrap-fee” programs sponsored by investment advisers and/or broker-dealers unaffiliated with the Fund or the Advisor. Participants in these programs pay a “wrap” fee to the sponsor of the program. |
| (2) | Net investment income per share has been calculated based on average shares outstanding during the period. |
The accompanying notes to financial statements are an integral part of this statement.
17
Brandes Separately Managed Account Reserve Trust
NOTE 1 – ORGANIZATION
The Separately Managed Account Reserve Trust (the “Fund”) is a series of Brandes Investment Trust (the “Trust”). The Trust is registered under the Investment Company Act of 1940, as amended (the “1940 Act”), as a diversified, open-end management investment company. The Fund began operations on October 3, 2005. The Fund invests its assets primarily in debt securities and seeks to maximize total return.
NOTE 2 – SIGNIFICANT ACCOUNTING POLICIES
The Fund is an investment company that applies the accounting and reporting guidance issued in Topic 946, “Financial Services-Investment Companies”, by the Financial Accounting Standards Board (“FASB”). The following is a summary of significant accounting policies consistently followed by the Fund. These policies are in conformity with accounting principles (“GAAP”) generally accepted in the United States of America.
| A. | Repurchase Agreements. The Fund may enter into repurchase agreements with government securities dealers recognized by the Federal Reserve Board, with member banks of the Federal Reserve System or with other brokers or dealers that meet the credit guidelines established by the Board of Trustees. The Fund will always receive and maintain, as collateral, securities whose market value, including accrued interest (which is recorded in the Schedule of Investments), will be at least equal to 100% of the dollar amount invested by the Fund in each agreement, and the Fund will make payment for such securities only upon physical delivery or upon evidence of book entry transfer to the account of the Fund’s custodian. If the term of any repurchase transaction exceeds one business day, the value of the Fund’s collateral is marked-to-market on a daily basis to ensure the adequacy of the collateral. Before causing the Fund to enter into a repurchase agreement with any other party, the investment advisor will determine that such party does not have any apparent risk of becoming involved in bankruptcy proceedings within the time frame contemplated by the repurchase agreement. If the seller defaults and the value of the collateral declines, or if bankruptcy proceedings are commenced with respect to the seller of the security, realization of the collateral by the Fund may be delayed or limited. As of September 30, 2019, the Fund did not invest in a repurchase agreement. |
| B. | Foreign Currency Translation and Transactions. Values of investments denominated in foreign currencies are converted into U.S. dollars using the spot market rates of exchange at the time of valuation. Purchases and sales of investments and dividend and interest income are translated into U.S. dollars using the spot market rates of exchange prevailing on the |
18
Brandes Separately Managed Account Reserve Trust
NOTES TO FINANCIAL STATEMENTS (continued)
| respective dates of such translations. The gain or loss resulting from changes in foreign exchange rates is included with net realized and unrealized gain or loss from investments, as appropriate. Foreign securities and currency transactions may involve certain considerations and risks not typically associated with those of domestic origin. |
Foreign securities are recorded in the financial statements after translation to U.S. dollars based on the applicable exchange rate at the end of the period. The Fund reports certain foreign currency-related transactions as components of realized gains or losses for financial reporting purposes, whereas such components are treated as ordinary income for federal income tax purposes.
| C. | Delayed Delivery Securities. The Fund may purchase securities on a when-issued or delayed delivery basis. “When-issued” or delayed delivery refers to securities whose terms are available and for which a market exists, but that have not been issued. For a when-issued or delayed delivery transaction, no payment is made until delivery date, which is typically longer than the normal course of settlement. When the Fund enters into an agreement to purchase securities on a when-issued or delayed delivery basis, the Fund segregates cash or liquid securities, of any type or maturity, equal in value to the Fund’s commitment. Losses may arise if the market values of the underlying securities change, if the counterparty does not perform under the contract, or if the issuer does not issue the securities due to political, economic or other factors. The Fund did not have any open commitments on delayed delivery securities as of September 30, 2019. |
| D. | Security Transactions, Dividends and Distributions. Security transactions are accounted for on the trade dates. Realized gains and losses are evaluated on the basis of security costs. Distributions from net investment income are declared daily and paid monthly. Distributions of net realized gains, if any, are declared at least annually. Dividend income and distributions to shareholders are recorded on the ex-dividend dates. Interest is recorded on an accrual basis. The Fund amortizes premiums and accretes discounts using the constant yield method. |
| E. | Use of Estimates. The preparation of financial statements in conformity with accounting principles generally accepted in the United States of America requires management to make estimates and assumptions that affect the reported amounts of assets and liabilities at the date of the financial statements and reported amounts of income and expenses during the reporting period. Actual results could differ from those estimates. |
| F. | Indemnification Obligations. Under the Trust’s organizational documents, its current and former officers and trustees are indemnified against certain liabilities arising out of the performance of their duties to the Trust. The |
19
Brandes Separately Managed Account Reserve Trust
NOTES TO FINANCIAL STATEMENTS (continued)
| Trust has indemnified its trustees against any expenses actually and reasonably incurred by the trustees in any proceeding arising out of or in connection with the trustees’ service to the Trust. In addition, in the normal course of business, the Trust enters into contracts that contain a variety of representations and warranties and provide general indemnifications. The Fund’s maximum exposure under these arrangements is unknown as this would involve future claims that may be made against the Fund that have not yet occurred or that would be covered by other parties. |
| G. | Accounting for Uncertainty in Income Taxes. The Fund has elected to be taxed as a “regulated investment company” and intends to distribute substantially all its taxable income to its shareholders and otherwise comply with the provisions of the Internal Revenue Code applicable to regulated investment companies. The Fund may be subject to a nondeductible excise tax calculated as a percentage of certain undistributed amounts of net investment income and net capital gains. The Fund intends to distribute its net investment income and capital gains as necessary to avoid this excise tax. Therefore, no provision for federal income taxes or excise taxes has been made. |
The Trust analyzes all open tax years, as defined by the applicable statute of limitations, for all major jurisdictions. Open tax years for the Fund are those that are open for exam by taxing authorities (2016 through 2019). As of September 30, 2019, the Trust has no examinations in progress.
Management has analyzed the Trust’s tax positions, and has concluded that no liability should be recorded related to uncertain tax positions expected to be taken on the tax return for the fiscal year-end September 30, 2019.
The Trust identifies its major tax jurisdictions as the U.S. Government and the State of California. The Trust is not aware of any tax positions for which it is reasonably possible that the total amounts of unrecognized tax benefits will significantly change in the next twelve months.
| H. | Fair Value Measurements. The Trust has adopted GAAP accounting principles related to fair value accounting standards which establish a definition of fair value and set out a hierarchy for measuring fair value. These standards require additional disclosures about the various inputs and valuation techniques used to develop the measurements of fair value and a discussion of changes in valuation techniques and related inputs during the period. These inputs are summarized in the three broad levels listed below: |
Level 1 — Fair value measurement within Level 1 should be based on an unadjusted quoted price in an active market that the Fund has the ability to access for the asset or liability at the measurement date. Because a quoted price alone forms the basis for the measurement, the access
20
Brandes Separately Managed Account Reserve Trust
NOTES TO FINANCIAL STATEMENTS (continued)
requirement within Level 1 limits discretion in pricing the asset or liability, including in situations in which there are multiple markets for the asset or liability with different prices and no single market represents a principal market for the asset or liability. Importantly, the Financial Accounting Standards Board has indicated that when a quoted price in an active market for a security is available, that price should be used to measure fair value without regard to an entity’s intent to transact at that price.
Level 2 — Fair value measurement within Level 2 should be based on all inputs other than unadjusted quoted prices included within Level 1 that are observable for the asset or liability. Other significant observable market inputs include quoted prices for similar instruments in active markets, quoted adjusted prices in active markets, quoted prices for identical or similar instruments in markets that are not active, and model-derived valuations in which the majority of significant inputs and significant value drivers are observable in active markets.
Level 3 — Fair value measurement within Level 3 should be based on unobservable inputs in such cases where markets do not exist or are illiquid. Significant unobservable inputs include model derived valuations in which the majority of significant inputs or significant value drivers are unobservable. Unobservable inputs are those inputs that reflect the Fund’s own assumptions that market participants would use to price the asset or liability based on the best available information.
| I. | Security Valuation. Securities traded on a national securities exchange are valued at the last reported sale price at the close of regular trading on each day the exchange is open for trading. Securities listed on the NASDAQ National Market System for which market quotations are readily available are valued using the NASDAQ Official Closing Price. Securities traded on an exchange for which there has been no sales on the valuation date are valued at the mean between last bid and ask price on such day. Securities for which quotations are not readily available are valued at their respective fair values as determined in good faith pursuant to procedures adopted by the Board of Trustees. |
Repurchase agreements and demand notes, for which neither vendor pricing nor market maker prices are available, are valued at amortized cost on the day of valuation, unless Brandes Investment Partners, L.P. (the “Advisor”) determines that the use of amortized cost valuation on such day is not appropriate (in which case such instrument is fair valued in accordance with the fair value procedures of the Trust).
The Trust has adopted valuation procedures that allow for fair value pricing for use in appropriate circumstances. For example, such circumstances may
21
Brandes Separately Managed Account Reserve Trust
NOTES TO FINANCIAL STATEMENTS (continued)
arise when trading in a security has been halted or suspended or a security has been delisted from a national exchange, a security has not been traded for an extended period of time, or a significant event with respect to a security occurs after the close of the market or exchange on which the security principally trades and before the time the Fund calculates its own share price. If no price, or in the Advisor’s determination no price representing fair value, is provided for a security held by the Fund by an independent pricing agent, then the security will be fair valued. Thinly traded securities and certain foreign securities may be impacted more by the use of fair valuations than other securities.
In using fair value pricing, the Fund attempts to establish the price that it might reasonably have expected to receive upon a sale of the security at 4:00 p.m. Eastern time. Valuing securities at fair value involves greater reliance on judgment than valuation of securities based on readily available market quotations. When using fair value to price securities, the Fund may value those securities higher or lower than another fund using market quotations or fair value to price the same securities. Further, there can be no assurance that the Fund could obtain the fair value assigned to a security if it were to sell the security at approximately the time at which the Fund determines its net asset value.
Foreign securities are recorded in the financial statements after translation to U.S. dollars based on the applicable exchange rate at the end of the period. The Fund reports certain foreign currency-related transactions as components of realized gains or losses for financial reporting purposes, whereas such components are treated as ordinary income for federal income tax purposes.
Fixed income securities including corporate, convertible and municipal bonds and notes, U.S. government agencies, U.S. Treasury obligations, sovereign issues, bank loans, convertible preferred securities and non-U.S. bonds are normally valued on the basis of quotes obtained from brokers and dealers or independent pricing services or sources. Independent pricing services typically use information provided by market makers or estimates of market values obtained from yield data relating to investments or securities with similar characteristics. The service providers’ internal models use inputs that are observable such as, among other things, issuer details, interest rates, yield curves, prepayment speeds, credit risks/spreads, default rates and quoted prices for similar assets. Securities that use similar valuation techniques and inputs as described above are categorized as Level 2 of the fair value hierarchy.
Fixed income securities purchased on a delayed-delivery basis are typically marked to market daily until settlement at the forward settlement date.
22
Brandes Separately Managed Account Reserve Trust
NOTES TO FINANCIAL STATEMENTS (continued)
Mortgage and asset-backed securities are usually issued as separate tranches, or classes, of securities within each package of underlying securities. These securities are also normally valued by pricing service providers that use broker-dealer quotations or valuation estimates from their internal pricing models. The pricing models for these securities usually consider tranche level attributes, estimated cash flows and market-based yield spreads for each tranche, current market data and packaged collateral performance, as available. Mortgage and asset-backed securities that use such valuation techniques and inputs are categorized as Level 2 of the fair value hierarchy only if there are significant observable inputs used.
Common stocks, are valued at the last reported sales price, in the case of common stocks and exchange-traded fund shares, or, in the case of futures contracts or options contracts, the settlement price determined by the relevant exchange. To the extent these securities are actively traded and valuation adjustments are not applied, they are categorized as Level 1 of the fair value hierarchy.
Valuation adjustments may be applied to certain securities that are solely traded on a foreign exchange to account for the market movement between the close of the foreign market and the close of the New York Stock Exchange (“NYSE”). These securities are generally valued using pricing service providers that consider the correlation of the trading patterns of the foreign security to the intraday trading in the U.S. markets for investments. Securities using these valuation adjustments are categorized as Level 2 of the fair value hierarchy. None of the Fund’s securities were fair valued utilizing this method as of September 30, 2019.
Investments in registered open-end management investment companies are valued based upon the Net Asset Values (“NAVs”) of such investments and are categorized as Level 1 of the fair value hierarchy. If, on a particular day, a share price of an investment company is not readily available, such securities are fair valued in accordance with the fair value procedures of the Trust.
Certain securities may be fair valued in accordance with the fair valuation procedures approved by the Board of Trustees. The Valuation Committee is generally responsible for overseeing the day to day valuation processes and reports periodically to the Board. The Valuation Committee is authorized to make all necessary determinations of the fair value of portfolio securities and other assets for which market quotations are not readily available or if it is deemed that the prices obtained from brokers and dealers or independent pricing services are unreliable.
23
Brandes Separately Managed Account Reserve Trust
NOTES TO FINANCIAL STATEMENTS (continued)
The following is a summary of the inputs used, as of September 30, 2019, involving the Fund’s assets carried at fair value. The inputs of methodology used for valuing securities may not be an indication of the risk associated with investing in those securities.
Description | Level 1 | Level 2 | Level 3 | Total | ||||||||||||
Seperately Managed Account | ||||||||||||||||
Common Stocks | $ | 13,387 | $ | — | $ | — | $ | 13,387 | ||||||||
Asset Backed Securities | — | 6,442,585 | — | 6,442,585 | ||||||||||||
Corporate Bonds | — | 93,621,244 | — | 93,621,244 | ||||||||||||
Mortgage Backed Securities | — | 25,004,774 | — | 25,004,774 | ||||||||||||
Government Securities | — | 48,221,630 | — | 48,221,630 | ||||||||||||
Short-Term Investments | 3,144,188 | — | — | 3,144,188 | ||||||||||||
|
|
|
|
|
|
|
| |||||||||
Total Investments in Securities | $ | 3,157,575 | $ | 173,290,233 | $ | — | $ | 176,447,808 | ||||||||
|
|
|
|
|
|
|
| |||||||||
There were no Level 3 securities in the Fund at the beginning or the end of the year ended September 30, 2019.
NOTE 3 – INVESTMENT ADVISORY FEE AND OTHER TRANSACTIONS WITH AFFILIATES
| A. | Advisor Fee. The Advisor provides the Fund with investment management services under an Investment Advisory Agreement. The Advisor receives no advisory fee or other fee from the Fund. The financial statements of the Fund reflect the fact that no fees or expenses are incurred by the Fund. It should be understood, however, that the Fund is an integral part of “wrap-fee” programs sponsored by investment advisors unaffiliated with the Fund and the Advisor. Typically, participants in these programs pay a “wrap-fee” to their investment advisors. Although the Fund does not compensate the Advisor directly for its service under the Investment Advisory Agreement, the Advisor benefits from its relationships with the sponsors of wrap-fee programs for which the Fund is an investment option. Certain officers and Trustees of the Trust are also officers of the Advisor. |
| B. | Administration Fee. U.S. Bancorp Fund Services, LLC, doing business as U.S. Bank Global Fund Services, (the “Administrator”) acts as administrator for the Fund. The Administrator prepares various federal and state regulatory filings; prepares reports and materials to be supplied to the Trustees; monitors the activities of the Fund’s custodian, transfer agent and accountant; coordinates the preparation and payment of Fund expenses; and prepares several Fund reports. The Advisor compensates the Administrator on behalf of the Fund for the services the Administrator performs for the Fund. |
| C. | Distribution Fees. ALPS Distributors, Inc. (the “Distributor”), a registered broker-dealer, acts as the Fund’s principal underwriter in a continuous public offering of the Fund’s shares. All of the Fund’s distribution fees are paid by the Advisor. |
24
Brandes Separately Managed Account Reserve Trust
NOTES TO FINANCIAL STATEMENTS (continued)
NOTE 4 – PURCHASES AND SALES OF SECURITIES
The cost of purchases and the proceeds from sales of securities of the Fund, excluding short-term investments, were as follows for the year ended September 30, 2019:
| U.S. Government | Other | |||||||||||||
| Purchases | Sales | Purchases | Sales | |||||||||||
| $ | 28,889,500 | $ | 25,348,421 | $ | 30,976,351 | $ | 39,899,616 | |||||||
NOTE 5 – CAPITAL STOCK TRANSACTIONS
The Fund’s capital stock activity in shares and dollars during the years ended September 30, 2019 and September 30, 2018, was as follows (shares and dollar amounts in thousands):
| Year Ended 9/30/2019 | Year Ended 9/30/2018 | |||||||||||||||
| Shares | Amount | Shares | Amount | |||||||||||||
Shares Sold | 4,695 | $ | 40,330 | 3,693 | $ | 32,407 | ||||||||||
Issued on Reinvestment of Distributions | 811 | 6,972 | 859 | 7,524 | ||||||||||||
Shares Redeemed | (5,632 | ) | (48,308 | ) | (3,902 | ) | (34,164 | ) | ||||||||
|
|
|
|
|
|
|
| |||||||||
Net Increase/(Decrease) Resulting from Fund Share Transactions | (126 | ) | $ | (1,006 | ) | 650 | $ | 5,767 | ||||||||
|
|
|
|
|
|
|
| |||||||||
NOTE 6 – FEDERAL INCOME TAX MATTERS
GAAP requires that certain components of net assets be reclassified between financial and tax reporting. Temporary differences do not require reclassification. Temporary and permanent differences have no effect on net assets or net asset value per share. For the year ended September 30, 2019, the Fund made the following permanent book-to-tax reclassifications primarily related to the treatment of paydowns and the expiration of capital loss carryforwards:
| Undistributed Net Investment Income | Accumulated Net Realized Gain | Paid-In Capital | ||||||||
| $ | 156,974 | $ | 6,344,857 | $ | (6,501,831 | ) | ||||
As of September 30, 2019, the Fund’s components of distributable earnings on a tax basis were as follows:
Cost of investments for tax purposes | $ | 175,771,086 | ||
|
| |||
Gross tax unrealized appreciation | 8,795,139 | |||
Gross tax unrealized depreciation | (8,118,417 | ) | ||
|
| |||
Net unrealized appreciation on investments | 676,722 | |||
Distributable ordinary income | 249,190 | |||
Distributable long-term capital gains | — | |||
|
| |||
Total distributable earnings | 249,190 | |||
|
| |||
Other accumulated losses | (3,433,193 | ) | ||
|
| |||
Total accumulated losses | $ | (2,507,281 | ) | |
|
|
25
Brandes Separately Managed Account Reserve Trust
NOTES TO FINANCIAL STATEMENTS (continued)
The differences between book and tax basis distributable earnings are primarily related to the differences in classification of paydown gains and losses for tax purposes compared to book purposes. The difference between book and tax basis unrealized depreciation on investments is due primarily to timing differences resulting from wash sale transactions. These differences are temporary.
As of September 30, 2019, the Fund had a capital loss with an indefinite expiration in the amount of $3,433,193. At September 30, 2019, the Fund utilized $149,153 of capital loss carryforwards. At September 30, 2019, the Fund had $6,501,831 of capital loss carryforwards expire.
The tax compositions of dividends for the years ended September 30, 2019 and September 30, 2018 for the Fund were as follows:
| Ordinary Income | Long Term Capital Gains | |||||||||||
| 2019 | 2018 | 2019 | 2018 | |||||||||
| $7,370,935 | $ | 7,860,061 | $ | — | $ | — | ||||||
NOTE 7 – NEW ACCOUNTING PRONOUNCEMENTS
In March 2017, the FASB issued Accounting Standards Update (ASU) No. 2017-08, Receivables – Nonrefundable Fees and Other Costs (Subtopic 310-20): Premium Amortization on Purchased Callable Debt Securities. The amendments in the ASU shorten the amortization period for certain callable debt securities acquired at a premium, to be amortized to the earliest call date. The ASU does not require an accounting change for securities acquired at a discount, which continues to be amortized to maturity. The ASU is effective for fiscal years and interim periods within those fiscal years beginning after December 15, 2018. Management is currently evaluating the impact of this guidance to the Fund.
NOTE 8 – SUBSEQUENT EVENTS
In preparing these financial statements, the Trust has evaluated events and transactions for potential recognition or disclosure through the date the financial statements were available to be issued. The Trust has concluded that there are no subsequent events to note.
26
Brandes Separately Managed Account Reserve Trust
REPORT OF INDEPENDENT REGISTERED PUBLIC ACCOUNTING FIRM
Tothe Board of Trustees of Brandes Investment Trust and Shareholders of Brandes Separately Managed Account Reserve Trust
Opinion on the Financial Statements
We have audited the accompanying statement of assets and liabilities, including the schedule of investments, of Brandes Separately Managed Account Reserve Trust (one of the funds constituting Brandes Investment Trust, hereafter referred to as the “Fund”) as of September 30, 2019, the related statement of operationsfor the year ended September 30, 2019, the statement of changes in net assets for each of the two years in the period ended September 30, 2019, including the related notes,and the financial highlights for each of the five years in the period ended September 30, 2019 (collectively referred to as the “financial statements”). In our opinion, the financial statements present fairly, in all material respects, the financial position of the Fund as of September 30, 2019, the results of its operations for the year then ended, the changes in its net assets for each of the two years in the period ended September 30, 2019 and the financial highlights for each of the five years in the period ended September 30, 2019 in conformity with accounting principles generally accepted in the United States of America.
Basis for Opinion
These financial statements are the responsibility of the Fund’s management. Our responsibility is to express an opinion on the Fund’s financial statements based on our audits. We are a public accounting firm registered with the Public Company Accounting Oversight Board (United States) (“PCAOB”) and are required to be independent with respect to the Fund in accordance with the U.S. federal securities laws and the applicable rules and regulations of the Securities and Exchange Commission and the PCAOB.
We conducted our audits of these financial statements in accordance with the standards of the PCAOB. Those standards require that we plan and perform the audit to obtain reasonable assurance about whether the financial statements are free of material misstatement, whether due to error or fraud.
Our audits included performing procedures to assess the risks of material misstatement of the financial statements, whether due to error or fraud, and performing procedures that respond to those risks. Such procedures included examining, on a test basis, evidence regarding the amounts and disclosures in the financial statements. Our audits also included evaluating the accounting principles used and significant estimates made by management, as well as evaluating the overall presentation of the financial statements. Our procedures included confirmation of securities owned as of September 30, 2019 by correspondence with the custodian and brokers; when replies were not received from brokers, we performed other auditing procedures. We believe that our audits provide a reasonable basis for our opinion.
/s/ PricewaterhouseCoopers LLP
Los Angeles, California
November 25, 2019
We have served as the auditor of one or more investment companies in the Brandes Investment Partners LP Investment Company Complex since 2011.
27
Brandes Separately Managed Account Reserve Trust
ADDITIONAL INFORMATION — (Unaudited)
PROXY VOTING PROCEDURES
The Advisor votes proxies relating to the Fund’s portfolio securities in accordance with procedures adopted by the Advisor. You may obtain a description of these procedures, free of charge, by calling toll-free 1-800-331-2979. This information is also available through the Securities and Exchange Commission’s website athttp://www.sec.gov.
Information regarding how the Trust voted proxies relating to portfolio securities during the most recent 12-month period ended June 30 is available without charge, upon request, by calling 1-800-331-2979. This information is also available through the Securities and Exchange Commission’s website athttp://www.sec.gov.
PORTFOLIO HOLDINGS DISCLOSURE
The Trust files the Funds’ complete schedules of portfolio holdings with the Securities and Exchange Commission for the first and third quarters of each fiscal year on FormN-Q or Part F of FormN-PORT (beginning with filings after March 31, 2019). The Trust’s FormN-Q or Part F of FormN-PORT filings are available on the Securities and Exchange Commission’s website at http://www.sec.gov. The Trust’s FormN-Q or Part F of FormN-PORT filings may be reviewed and copied at the Commission’s Public Reference Room in Washington, D.C., and information on the operation of the Public Reference Room may be obtained by calling1-800-SEC-0330. Information regarding the Trust’s FormN-Q or Part F of FormN-PORT filings is also available, without charge, by calling toll-free,1-800-331-2979.
TAX NOTICE
For the fiscal year ended September 30, 2019, 100.00% of the ordinary distributions paid by the SMART Fund qualify as interest related dividends under Internal Revenue Code Section 87(k)(1)(c). For the fiscal year ended September 30, 2019, none of the ordinary distributions paid by SMART Fund, were designated as short-term gain distributions under Internal Revenue Code Section 871(k)(2)(c). Under Section 852(b)(3)(c) of the Revenue Code, the SMART Fund designated $0 as long-term capital gain dividends for the fiscal year ended September 30, 2019.
None of the dividend income distributed for the fiscal year ended September 30, 2019, were designated as qualified dividend income under the Jobs and Growth Tax Relief Reconciliation Act of 2003 for the SMART Fund. Of the dividends paid by the SMART Fund, none qualify for the corporate dividends received deduction.
28
Brandes Separately Managed Account Reserve Trust
TRUSTEES AND OFFICERS INFORMATION — (Unaudited)
The Board of Trustees is responsible for the overall management of the Trust’s business. The Board approves all significant agreements between the Trust and persons or companies furnishing services to the Trust, including the Trust’s agreements with the Advisor, Administrator, Custodian, Distributor and Transfer Agent. The Board of Trustees delegates the day-to-day operations of the Trust to its officers and service providers, subject to the Fund investment objectives and policies and to general supervision by the Board. The Trust’s Statement of Additional Information includes additional information about the Trustees and is available, without charge, bycalling 1-800-331-2979 or visiting www.brandes.com.
The Trustees and officers of the Trust, their business addresses and principal occupations during the past five years are:
Name, Address and Age | Position(s) | Term of | Principal | Number | Other Trusteeships | |||||
Independent Trustees(2) | ||||||||||
Gregory Bishop, CFA 11988 El Camino Real, Suite 600 San Diego, CA 92130 (Born: 1961) | Trustee | Since January 2017 | Retired. Previously Executive Vice President and Head of Retail Business, PIMCO Investments , from 1997 to 2014 | 10 | None | |||||
Jean E. Carter 11988 El Camino Real, Suite 600 San Diego, CA 92130 (Born: 1957) | Trustee | Since April 2008 | Retired. | 10 | Bridge Builder Trust | |||||
Robert M. Fitzgerald, CPA (inactive) 11988 El Camino Real, Suite 600 San Diego, CA 92130 (Born: 1952) | Trustee | Since April 2008 | Retired. | 10 | Hotchkis and Wiley Mutual Funds | |||||
Craig Wainscott, CFA 11988 El Camino Real, Suite 600 San Diego, CA 92130 (Born: 1961) | Trustee and Chairman | Since February 2012 | Partner with The Paradigm Project and advisor to early-stage companies. | 10 | None | |||||
29
Brandes Separately Managed Account Reserve Trust
TRUSTEES AND OFFICERS INFORMATION — (Unaudited) (continued)
Name, Address and Age | Position(s) | Term of | Principal | Number | Other Trusteeships | |||||
“Interested” Trustees(3) | ||||||||||
Oliver Murray 11988 El Camino Real, Suite 600 San Diego, CA 92130 (Born: 1962) | Trustee | Since February 2012 | Chief Executive Officer, Brandes Investment Partners & Co.; Managing Director – PMCS of Brandes Investment Partners, L.P., the investment advisor to the Funds (the “Advisor”). | 10 | None | |||||
Jeff Busby, CFA 11988 El Camino Real, Suite 600 San Diego, CA 92130 (Born: 1961) | Trustee and President | Since July 2006 | Executive Director of the Advisor. | 10 | None | |||||
Officers of the Trust | ||||||||||
Thomas M. Quinlan 11988 El Camino Real, Suite 600 San Diego, CA 92130 (Born: 1970) | Secretary | Since June 2003 | Associate General Counsel of the Advisor. | N/A | N/A | |||||
Gary Iwamura, CPA 11988 El Camino Real, Suite 600 San Diego, CA 92130 (Born: 1956) | Treasurer | Since September 1997 | Finance Director of the Advisor. | N/A | N/A | |||||
Roberta Loubier 11988 El Camino Real, Suite 600 San Diego, CA 92130 (Born: 1971) | Chief Compliance Officer | Since September 2015 | Global Head of Compliance, Brandes Investment Partners, L.P. | N/A | N/A | |||||
| (1) | Trustees and officers of the Fund serve until their resignation, removal or retirement. |
| (2) | Not “interested persons” of the Trust as defined in the 1940 Act. |
| (3) | “Interested persons” of the Trust as defined in the 1940 Act by virtue of their positions with the Advisor. |
30
Brandes Separately Managed Account Reserve Trust
Brandes Investment Trust and Brandes Investment Partners, L.P. may collect non-public information about you from the following sources:
| • | Information we receive about you on applications or other forms; |
| • | Information you give us orally; and |
| • | Information about your transactions with us. |
We do not disclose any non-public personal information about any shareholder or former shareholder of the Fund without the shareholder’s authorization, except as required by law or in response to inquiries from governmental authorities. We restrict access to your personal and account information to those employees who need to know that information to provide products and services to you. We also may disclose that information to unaffiliated third parties (such as to brokers or custodians) only as permitted by law and only as needed for us to provide agreed services to you. We maintain physical, electronic and procedural safeguards to guard your non-public personal information.
If you hold shares of the Fund through a financial intermediary, such as a broker-dealer, bank, or trust company, the privacy policy of your financial intermediary governs how your non-public personal information would be shared with nonaffiliated third parties.

ADVISOR Brandes Investment Partners, L.P. 11988 El Camino Real, Suite 600 San Diego, CA 92130 800.331.2979 DISTRIBUTOR ALPS Distributors, Inc. 1290 Broadway, #1100 Denver, CO 80203 TRANSFER AGENT U.S. Bancorp Fund Services, LLC 615 E. Michigan Street, 3rd Floor Milwaukee, WI 53202 INDEPENDENT REGISTERED PUBLIC ACCOUNTING FIRM PricewaterhouseCoopers LLP 601 South Figueroa Street Los Angeles, CA 90017 LEGAL COUNSEL Morgan, Lewis & Bockius LLP One Federal Street Boston, MA 02110 This report is intended for shareholders of the Brandes Separately Managed Account Reserve Trust and may not be used as sales literature unless preceded or accompanied by a current prospectus. Statements and other information herein are dated and are subject to change. [Graphic Appears Here]
Item 2. Code of Ethics.
The registrant has adopted a code of ethics that applies to the registrant’s principal executive officer and principal financial officer. The registrant has not made any amendments to its code of ethics during the period covered by this report. The registrant has not granted any waivers from any provisions of the code of ethics during the period covered by this report. The registrant undertakes to provide to any person without charge, upon request, a copy of such code of ethics by mail when they call the registrant at1-800-331-2979.
Item 3. Audit Committee Financial Expert.
The registrant’s board of trustees has determined that there is at least one audit committee financial expert serving on its audit committee. Robert Fitzgerald is the “audit committee financial expert” and is considered to be “independent” as each term is defined in Item 3 ofForm N-CSR.
Item 4. Principal Accountant Fees and Services.
The registrant has engaged its principal accountant to perform audit services, audit-related services, tax services and other services during the past two fiscal years. “Audit services” refers to performing an audit of the registrant’s annual financial statements or services that are normally provided by the accountant in connection with statutory and regulatory filings or engagements for those fiscal years. “Audit-related services” refers to the assurance and related services by the principal accountant that are reasonably related to the performance of the audit. “Tax services” refers to professional services rendered by the principal accountant for tax compliance, tax advice, and tax planning. The following table details the aggregate fees billed or expected to be billed for each of the last two fiscal years for audit services, audit-related services, tax services and other services by the principal accountant.
| FYE 9/30/2019 | FYE 9/30/2018 | |||
| Audit Fees | $341,090 | $303,055 | ||
| Audit-Related Fees | None | None | ||
| Tax Fees | $84,020 | $87,121 | ||
| All Other Fees | None | None |
The registrant’s audit committee has adoptedpre-approval policies and procedures that require the audit committee topre-approve all audit andnon-audit services of the registrant, including services provided to any entity affiliated with the registrant.
All of the principal accountant’s hours spent on auditing the registrant’s financial statements were attributed to work performed byfull-time permanent employees of the principal accountant. The following table indicates thenon-audit fees billedor expected to be billed by the registrant’s accountant for services to the registrant and to the registrant’s investment adviser (and any
entity controlling, controlled by, or under common control with the investment adviser for the last two years.
| Non-Audit Related Fees | FYE 9/30/2018 | FYE 9/30/2017 | ||
| Registrant | None | None | ||
| Registrant’s Investment Adviser | None | None |
Item 5. Audit Committee of Listed Registrants.
Not applicable to registrants who are not listed issuers (as defined in Rule10A-3 under the Securities Exchange Act of 1934).
Item 6. Investments.
| (a) | Schedule of Investments is included as part of the report to shareholders filed under Item 1 of this Form. |
| (b) | Not applicable. |
Item 7. Disclosure of Proxy Voting Policies and Procedures forClosed-End Management Investment Companies.
Not applicable toopen-end investment companies.
Item 8. Portfolio Managers ofClosed-End Management Investment Companies.
Not applicable toopen-end investment companies.
Item 9. Purchases of Equity Securities byClosed-End Management Investment Company and Affiliated Purchasers.
Not applicable toopen-end investment companies.
Item 10. Submission of Matters to a Vote of Security Holders.
There have been no material changes to the procedures by which shareholders may recommend nominees to the registrant’s board of trustees.
Item 11. Controls and Procedures.
| (a) | The registrant’s President and Treasurer have reviewed the Registrant’s disclosure controls and procedures (as defined in Rule30a-3(c) under the Investment Company Act of 1940 (the “Act”)) as of a date within 90 days of the filing of this report, as required by Rule30a-3(b) under the Act and Rules13a-15(b) or15d-15(b) under the Securities Exchange Act of 1934. Based on their review, such officers have concluded that the disclosure controls and procedures are effective in ensuring that information required to be disclosed in this report is appropriately recorded, processed, summarized and reported and made known to them by others within the Registrant and by the Registrant’s service provider. |
| (b) | No changes in the registrant’s internal control over financial reporting (as defined in Rule30a-3(d) under the Act) occurred during the second fiscal quarter of the period covered by this report that materially affected, or are reasonably likely to materially affect, the registrant’s internal control over financial reporting. |
Item 12. Disclosure of Securities Lending Activities for Closed-End Management Investment Companies.
Not applicable to open-end investment companies.
Item 13. Exhibits.
| (a) | (1)Any code of ethics or amendment thereto, that is the subject of the disclosure required by Item 2, to the extent that the registrant intends to satisfy Item 2 requirements through filing an exhibit.1) Incorporated by reference to the registrant’s FormN-CSR filed January 7, 2005. |
(2)A separate certification for each principal executive and principal financial officer pursuant to Section 302 of the Sarbanes-Oxley Act of 2002.Filed herewith.
(3)Any written solicitation to purchase securities under Rule 23c-1 under the Act sent or given during the period covered by the report by or on behalf of the registrant to 10 or more persons.Not applicable toopen-end investment companies.
(4)There was no change in the registrant’s independent public accountant for the period covered in this report.
| (b) | Certifications pursuant to Section 906 of the Sarbanes-Oxley Act of 2002. Furnished herewith. |
SIGNATURES
Pursuant to the requirements of the Securities Exchange Act of 1934 and the Investment Company Act of 1940, the registrant has duly caused this report to be signed on its behalf by the undersigned, thereunto duly authorized.
| (Registrant)Brandes Investment Trust | ||
| By (Signature and Title)*/s/ Jeff Busby | ||
| Jeff Busby, President and Principal Executive Officer | ||
| Date 12/4/19 | ||
Pursuant to the requirements of the Securities Exchange Act of 1934 and the Investment Company Act of 1940, this report has been signed below by the following persons on behalf of the registrant and in the capacities and on the dates indicated.
| By (Signature and Title)* /s/ Jeff Busby | ||
| Jeff Busby, President and Principal Executive Officer | ||
| Date 12/4/19 | ||
| By (Signature and Title)* /s/ Gary Iwamura | ||
| Gary Iwamura, Treasurer and Principal Financial Officer | ||
| Date 12/4/19 | ||
* Print the name and title of each signing officer under his or her signature.