UNITED STATES
SECURITIES AND EXCHANGE COMMISSION
Washington, D.C. 20549
FORM N-CSR
CERTIFIED SHAREHOLDER REPORT OF REGISTERED
MANAGEMENT INVESTMENT COMPANIES
Investment Company Act File Number 811-08614
Brandes Investment Trust
(Exact name of registrant as specified in charter)
4275 Executive Square, Suite 500
La Jolla, California 92037
(Address of principal executive offices) (Zip code)
Lea Anne Copenhefer
Morgan, Lewis & Bockius LLP
One Federal Street
Boston, MA 02110-1726
(Name and address of agent for service)
(858) 755-0239
Registrant’s telephone number, including area code
Date of fiscal year end: September 30
Date of reporting period: September 30, 2022
Item 1. Reports to Stockholders.
(a) The following are copies of the reports transmitted to shareholders pursuant to Rule 30e-1 under the Investment Company Act of 1940 (the “Act”) (17 CFR 270.30e-1):
1

| Letter to Shareholders and Performance Graphs | 2 | |||
| 2 | ||||
| 7 | ||||
| 14 | ||||
| 21 | ||||
| 28 | ||||
| 36 | ||||
| 42 | ||||
| 49 | ||||
| Expense Example | 57 | |||
| Schedule of Investments | 60 | |||
| 60 | ||||
| 63 | ||||
| 66 | ||||
| 70 | ||||
| 75 | ||||
| 78 | ||||
| 81 | ||||
| Statements of Assets and Liabilities | 86 | |||
| Statements of Operations | 88 | |||
| Statements of Changes in Net Assets | 90 | |||
| Financial Highlights | 94 | |||
| Notes to Financial Statements | 108 | |||
| Report of Independent Registered Public Accounting Firm | 134 | |||
| Additional Information | 136 | |||
| Trustees and Officers Information | 142 |
1
From our beginnings, Brandes has been a reflective investment manager, constantly renewing our bond with our founding principles and periodically reviewing our past communications with the dual goals of staying focused and thinking forward.
Recently, we’ve taken stock of Brandes Letters from the past several years, the messages affirming our core principles woven throughout them, and the client reactions to them. We think our championing of value investing has passed the twin tests of critical scrutiny and time.
In our experience, it takes commitment to invest consistently through a repeatable process. Brandes has upheld its value investing convictions and has consistently delivered exposure to what we consider value portfolios. In our opinion, being purpose-built for value is what makes us distinctive. It’s the reason why our investment decisions are not driven by the composition of the benchmarks. We have not diluted our approach, though it’s more adaptable than often perceived, nor have we renounced what we stand for to ourselves or to our clients.
Key value investing principles can get lost in translation. While value principles are straightforward in concept, they can be difficult to execute. In this Letter, we will elaborate on why we endeavor not to deviate from a value approach. We will also offer insights into behavioral biases that can undermine disciplined, long-term investing and will discuss in depth the changing market/economic factors that we interpret as favorable to investing with a genuine value orientation. And, finally, we will explain why this could be an ideal time to review your allocation to value investing.
Staying True to Our “Constitution”
Let us begin with the origins of Brandes as an investing organization and how and why we have committed ourselves to the search for value.
Our “constitution” as a firm is Benjamin Graham and David Dodd’s 1934 classic, Security Analysis, as well as Graham’s 1949 follow-on, The Intelligent Investor. Graham and Dodd insisted that there is a profound difference between deliberate investing based on careful analysis of business fundamentals and mere speculation. For us, this remains a bedrock truth, and the books established the mindset we regard as the most trustworthy approach to investing.
In our opinion, Security Analysis and The Intelligent Investor are among those rare texts that continue to speak to audiences long after their publication because they have withstood the challenge of change. Our founder, Charles Brandes, was convinced by the clarity of the arguments about the importance of examining long-term fundamentals and having a “margin of safety” (the discount of a security’s market price to an estimate of the security’s intrinsic value) especially after he met with the “brilliant…gracious …very formal” author in the early 1970s. At Graham’s California home, they conversed about their mutual understanding of what really counts (no pun
2
intended) in investing. Graham later sent a congratulatory letter to Charles on his starting the firm in 1974.
As a value manager, Brandes undertakes analytical examination of the companies we buy and concentrates on identifying solid financial fundamentals that markets may overlook or ignore. Value investing is not—and has never been—about a search only for low price-to-book stocks to us. It’s not about being a contrarian for the sake of being a contrarian. It is about avoiding competing priorities that can distort sound stock selection.
Around the time Brandes began operating, the “Nifty Fifty” (50 NYSE-listed large-cap stocks dominant in the ’60s and ’70s) captured the imagination of institutional investors—a situation strikingly similar to the so-called FAANGs (i.e., the large American technology companies Meta [formerly Facebook], Amazon, Apple, Netflix and Alphabet [formerly Google] over the past several years). Applying value principles, Charles Brandes rejected buying the Nifty Fifty, and today we continue to rebuff what we consider overpriced market offerings.
We acknowledge that some of these can be great companies, but we will not pay more for them than we think they are worth. In a similar and related way, we’re also vigilant for and strive to overcome the psychological and behavioral biases that inhibit discerning investing and will discuss them in depth in the next section.
Given that value investing has been out of favor during most of the past decade, the pressure and temptation to ‘flex’ the definition of value has been intense. However, we have worked hard to embed our self-defining standards into our culture and have committed training resources to impart them to the newcomers and future leaders of our firm. This includes, for example, periodically offering a “Graham Course” to all members of our firm in order to share the wisdom conveyed by Ben Graham in The Intelligent Investor and its application by Charles Brandes. We do this to ensure that the style fidelity we seek to preserve lives long into the future and want existing and future clients to have full confidence in Brandes’ commitment to being a true value manager.
Seeking to Understand Investor Psychology, Behavior
We are convinced that understanding investor psychology and behavior are important—maybe the most important—elements in successful long-term investing. This applies to our own self-awareness in our selection and decision-making processes, as well as to the direction of educational content we create for our clients. We therefore work to counter emotion-centered biases that might creep into investment decisions, as well as other errors in judgment that can erode rational investing.
Behavioral finance expert and MarketPsych co-founder, Dr. Frank Murtha, with whom the Brandes Institute has worked on various educational initiatives, described other known biases in a March 2019 paper for the Institute: Five Wealth-Destroying Biases: Where They Strike in the Investment Process and How to Address Them. These include anchoring, availability, framing, extrapolation (which fits under Prospect Theory) and planning fallacy. It’s beyond the scope or focus of this Letter to explore each, let alone others in detail, but we trust you can appreciate that bias can interfere with making an accurate assessment of an investment’s inherent worth and a valid case for acquisition or divestment. An important step to dealing with biases is to recognize
3
them. At Brandes and the Brandes Institute, we’ve done a lot of work studying biases and thinking about how to mitigate them.
In our view, investing based on innate but potentially misleading cognitive biases is an adversary of patient, discipline value investing. Without the diligent process of undertaking fundamental analysis and searching for intrinsic value, it will be hard, in our opinion, to remain committed to the long term when excessive optimism (or “irrational exuberance” as former Federal Reserve Chair Alan Greenspan called it in 1996), heightened uncertainty or unconscious predispositions dominate the markets—as they have many times in the past. Accordingly, we will continue to remind ourselves and our clients about the potential consequences that emotions and biases can bring to any investment approach.
What hasn’t Changed? What has? Why does it Matter?
Fundamental, bottom-up investing based on time-tested principles typically does not materially differ from one period to another. Brandes has not departed from them or sought to water down how we apply them. However, our approach is not absolutely rigid: we have adapted our understanding and application of our value-seeking process by deploying intelligent flexibility, as we think Graham would advise.
For example, we have seen a meaningful shift in how value is created over the past 20-plus years, where capital invested in intangible assets, like intellectual property, brands or research and development, has become more prominent. Intangible assets may not always be accurately captured on the balance sheet under current generally accepted accounting principles, and therefore, possibly not reflected in the stated book value of a company.
In today’s global economy, stated book value’s efficacy as a measure of value has become less useful, especially for a large subset of the investible universe. It is not a metric that we have abandoned completely, but one that is more relevant for our analysis of capital-intensive industries.
For knowledge-intensive industries, we either have to make thoughtful adjustments to book value to reflect economic reality or rely on other metrics that are more indicative of value in those industries.
Technological and competitive disruption has always been a part of value investing, but there is a legitimate argument that the speed and intensity of disruption has increased. The internet has facilitated competitive transparency, the cloud has reduced some start-up costs and moats, and network effects have changed the competitive landscape of a number of industries.
So, no, it’s not different this time as far as our emphasis on seeking out undervalued companies offering a margin of safety is concerned. However, the circumstances in which that occurs can change—and have evolved. Accordingly, we can and will evolve our approach.
In recent years, we’ve seen a significant rise of passive or index-replicating funds. Passive investing does not necessarily align allocations with business fundamentals: sometimes capital will flow toward certain companies merely because of their weight in an index. To us, this disconnect from fundamentals can increase the potential for financial bubbles. Most significantly, from our perspective, index investing
4
does not focus on the margin of safety that is at the heart of value investing. We argue that index-weighted passive investing effectively decouples investing from purposeful choice—money flows to a company not because of fundamentals. We further argue that in such situations, money is “directed” as opposed to “invested.” Directed investing can result in speculation and we are very mindful that Ben Graham dedicated the first chapter of The Intelligent Investor to a discussion on the difference between speculation and investing.
Passive investing alone does not account for the sky-high valuations of recent years. Following the Great Financial Crisis, Quantitative Easing (QE) led to record low interest rates being offered as a stimulus to revive economic activity. The sustained low interest rates have helped skew perceptions about risk, reshape financial conduct and reset expectations.
More recently, a global pandemic caused central banks to keep the money taps open to help economies function. However, COVID-19 followed by the Russian invasion of Ukraine, have also reintroduced an awareness of risk, prompting genuine fears and a renewed interest in downside protection. Ubiquitous global supply challenges stemming from the pandemic and aggravated by the prolonged conflict in Eastern Europe have contributed to inflation levels not seen in most national economies in decades and has also resulted in a resurgence in stock market volatility. Some pundits are talking about “stagflation,” a condition in which prices rise but employment and gross domestic product growth decline.
As the headline of our August 2019 Letter stated: Interest Rates—Lower for Longer Not Lower Forever. At the time, we observed that the record-low rates were likely unsustainable. And now with central banks weighing higher interest rates to help cool down inflation, pervasive geopolitical and economic unease, and accelerating anxieties about the effects of climate change, it’s clear to many investors that risks abound. The rise in inflation, specifically, may require a readjustment in thinking because it effectively touches everyone. When you stand in a grocery line expecting to pay much more to keep your family fed or fill your gas tank and shudder, the price-to-value relationship is starkly obvious. It forces you to look for the best deals, i.e., to search for authentic value.
The situation today and for the foreseeable future may inspire some investors to rethink where they place their investible assets. We would argue for investing with a long-term perspective, one that regards sound fundamentals and a margin of safety as essential today as they have ever been.
Owning “Companies for All Seasons”
In a particularly volatile period of turbulent change and unpleasant disruption, we believe investors may benefit from owning a portfolio of “companies for all seasons,” i.e., those that demonstrate enduring value under a variety of economic and market conditions. And that they should consider avoiding the pricey performers that generate headlines and whose value appears fully recognized (and then some) by the markets. Rather, it is times like we are experiencing when companies the market has seemingly discounted for a variety of reasons may deserve a closer look.
In presenting this line of argument, we make no predictions about future results because forecasts of this nature cannot be made with certainty. At the same time, we
5
cannot ignore recent macroeconomic data that speaks to us loudly and fairly clearly. Nobody knows the future direction of the markets, especially given current circumstances, but that is all the more reason for a value investing style—with its emphasis on identifying underestimated resilience and hidden potential in individual companies. It is why the search for value has defined Brandes from its beginnings: as we’ve said, we’re purpose-built for it.
Our responsibility—and our pledge to our clients—therefore, is to stay the course in our detailed, bottom-up research practices and style fidelity, even when it is not “trendy” to do so.
Your opportunity—toward pursuing your long-term financial goals—is to re-explore value in light of the economic/financial conditions we’ve described in this Letter. Is your allocation to value—that is, to true value—where you want it to be?
Ultimately, we ask you to reconsider the value-seeking journey. The conditions are promising because we expect the external drivers described in this letter—high inflation and the potential for higher interest rates to combat it—will likely persist for some time. The indicators are robust and compelling.
Thank you,
Brandes Investment Partners

Price/Book: Price per share divided by book value per share.
Price/Earnings: Price per share divided by earnings per share.
Past performance is not a guarantee of future results. One cannot invest directly in an index.
This material is intended for informational purposes only. The information provided in this material should not be considered a recommendation to purchase or sell any particular security.
It should not be assumed that any security transactions, holdings or sectors discussed were or will be profitable, or that the investment recommendations or decisions we make in the future will be profitable or will equal the investment performance discussed herein. Strategies discussed are subject to change at any time by the investment manager in its discretion due to market conditions or opportunities. Market conditions may impact performance. The performance results presented were achieved in particular market conditions which may not be repeated. Moreover, the current market volatility and uncertain regulatory environment may have a negative impact on future performance. The Brandes investment approach tends to result in portfolios that are materially different than their benchmarks with regard to characteristics such as risk, volatility, diversification, and concentration. Diversification does not assure a profit or protect against a loss in a declining market. International and emerging markets investing is subject to certain risks such as currency fluctuation and social and political changes; such risks may result in greater share price volatility.
The foregoing reflects the thoughts and opinions of Brandes Investment Partners® exclusively and is subject to change without notice.
Brandes Investment Partners® is a registered trademark of Brandes Investment Partners, L.P. in the United States and Canada.
6
Brandes International Equity Fund
Dear Fellow Investor,
The net asset value of the Brandes International Equity Fund (Class I Shares) declined 24.83% in the year ended September 30, 2022. During the same period, the MSCI EAFE Index declined 25.13%.
From a country perspective, holdings in Brazil and Canada helped performance. Energy firms Petrobras (Brazil) and Cameco Corporation (Canada) were top performers in the Fund, both experiencing meaningful share price appreciation over the trailing twelve-month period. U.K.-based energy equipment & services company TechnipFMC also contributed materially, while certain other U.K. holdings held up well in the declining market environment (e.g., tobacco firm Imperial Brands and household products business Reckitt Benckiser Group).
From an industry perspective, Fund holdings in commercial services & supplies (e.g., Societe BIC) and chemicals (e.g., BASF) aided returns. Other contributors included Brazil-based beverage company Ambev and diversified telecommunication services firm Telefonica Brasil, as well as Spanish oil & gas firm Repsol.
The most significant detractors were holdings in Russia (Mobile TeleSystems and Surgutneftegas). Our thoughts continue to be with the people of Ukraine, as well as those in Russia that are advocating for peace. Other performance detractors included Japanese automaker Honda Motor, Spanish biotechnology firm Grifols, and German health care company Fresenius.
Select Portfolio Activity
The investment committee initiated positions in several companies over the year, including Germany-based software company SAP, Dutch health care equipment company Philips, Austria-domiciled bank Erste Group, and U.K.-based industrial company Rolls-Royce. Other major activity included the full sales of Spain-based oil firm Repsol and U.K. household products company Reckitt Benckiser. Both holdings appreciated to our estimates of intrinsic value, and we decided to reallocate the capital to what we consider better investment opportunities.
SAP is a leader in enterprise resource planning (ERP) software, which includes applications for payroll, procurement, finance, manufacturing, and operations. We believe enterprise software is an attractive industry with high switching cost, low capital intensity and robust returns on equity. SAP has historically traded at a premium relative to the broad market, largely due to its dominant position in an appealing growth industry, and the scarcity of technology-related investment opportunities in Europe relative to the United States. However, because SAP’s ERP software was heavily customized and difficult to upgrade, its growth rate lagged that of many of its peers, leading the company to turn to acquisitions for growth.
Past performance is not a guarantee of future results.
7
Brandes International Equity Fund
SAP has delivered disappointing earnings as it tried to balance integrating its acquisitions with moving its applications to the cloud, both of which have proven challenging for the company. As a result, its share price has dropped near a five-year low, making the company more attractive to us.
Although SAP may continue to deliver subdued financial results in the short term, we believe its business strategy, combined with its recent record of execution, positions it well for the long term, which is the investment horizon for us. Its strong focus on cloud migration corresponds well with enterprise customers’ urgent need to improve the flexibility and agility of their enterprise application software as they grappled with the pandemic-triggered disruptions and uncertainties over the past two years. SAP’s effort to offer a fully integrated technology solution should serve well as the foundation for both its organically developed software and its acquired software. This, in turn, should enable SAP to revive its organic growth rate as it will be easier for customers to buy and implement additional software modules, which was not the case with on-premise software. Even though its short-term financial results may be depressed due to frontloaded expenses associated with both efforts (integration and cloud migration), we believe these projects will help SAP achieve organic growth that should benefit its operating leverage and profitability over the longer term. We have seen this happen with other enterprise software firms that have gone through a similar multi-year transitional period. As such, at its current valuation, SAP represents a compelling long-term risk/reward tradeoff to us.
Rolls-Royce is a U.K.-based conglomerate with a focus on the aerospace and defense industry. The company primarily designs, manufactures and services engines and turbines used in aircraft, ships, and power generators.
Rolls-Royce has struggled for several years, despite what has been a robust civilian aviation market pre-pandemic. The company appears to have made a strategic misstep in exiting the narrow-body engine market in 2012, a market that proved to be more stable and better growing than the wide-body market it strategically focused on. Additionally, Rolls-Royce’s newly designed Trent 1000 engine experienced premature wear, forcing the company to spend significant capital to fix the issue in 2017.
Rolls-Royce seemed to have overcome these challenges in 2019 when its revenue and profitability improved. However, the impact of COVID-19 the following year severely hit Rolls-Royce’s business. Lower utilization of aircraft weighed on demand and uncharacteristically caused a steep fall in the company’s maintenance business, which tended to be more profitable than its manufacturing business. Cash-flow burn in 2020 forced Roll-Royce to issue over $2 billion in equity and divest some non-core businesses. More recently, lingering pandemic concerns, high fuel prices and the risk of a recession in major economies have further hurt investor sentiment. The combination of strategic missteps, the unfortunate timing of a pandemic-triggered moratorium on travel and a potentially weak economic environment led Roll-Royce’s share price to drop to less than one-tenth of its 2019-high.
8
Brandes International Equity Fund
While we acknowledge the near-term future appears bleak for Rolls-Royce, we believe there are reasons for longer-term optimism. In our opinion, cash-flow characteristics in the next downturn should be better as the company can release working capital to cushion any slowdown in orders. We also think that the service business should continue to recover as pandemic restrictions ease and aircraft utilization increases. Even a recessionary level of activity in the service business would be an improvement over the past couple of years. When activity potentially picks up again, Rolls-Royce is poised, in our view, to resume its duopoly position in an industry with high barriers to entry and should benefit from the next aerospace cycle. Overall, Rolls-Royce’s current market valuations are attractive enough for us to take the near-term cyclical risk and initiate a measured allocation to the company.
Looking Forward
As of September 30, 2022, the Brandes International Equity Fund held its key overweights to communication services, health care and consumer staples, while maintaining significantly lower allocations to technology and industrials than the benchmark. Geographically, we continued to have overweight positions in France and emerging markets, and underweight positions in Australia and Japan. We believe the differences between the Fund’s portfolio and the benchmark continue to make it an attractive complement to index-tracking or growth-oriented alternatives.
A variety of headwinds face international stocks today, ranging from elevated inflation, slowing economic growth and recession concerns to energy risk and political as well as regulatory uncertainties. While our overall positioning is driven by a bottom-up stock selection with a focus on the long term, we do consider many of these concerns when we analyze an investment opportunity, determining how they can impact the fundamentals of a business and comparing our intrinsic value estimate against what is currently being priced in by the market. We believe the Fund’s current positioning offers an attractive opportunity for long-term investors. Compared to the benchmark, the Fund generally has less cyclical or what we consider expensive growth exposure, as seen through our underweights to technology, industrials, and materials. In contrast, the Fund provides more defensive exposure, as highlighted by our overweights to consumer staples and health care. Additionally, our allocation to companies in the energy and financials sectors, in which we also hold overweight positions, may benefit from rising energy prices and interest rates.
As of September 30, 2022, the overall international equity market (MSCI EAFE) traded among its largest discount ever relative to the U.S. market (MSCI USA) based on valuation metrics such as price/cash flow, forward price/earnings and EV/sales, while offering exposure to many well positioned global and domestic oriented companies. Although the strong U.S. dollar has been a headwind for international stocks for the last decade, and particularly so this past year or two, it is reaching levels only seen twice in the last 50 years. Both times boded well for the subsequent returns of international
9
Brandes International Equity Fund
stocks as companies operating in cheaper currencies were better positioned with a lower cost basis and an eventual recovery in growth.
In addition to international stocks trading at historically large discounts to U.S. stocks, international value stocks are trading at even more attractive levels. MSCI EAFE Value continues to trade at near record level discounts to MSCI EAFE Growth on a variety of valuation metrics. Large discount levels, such as the ones we see today, have historically portended attractive returns over a long-term time horizon for value stocks, and the Fund has tended to do well when value stocks did well. Moreover, the current margin of safety exhibited by the Fund’s portfolio is among the highest we have observed in the last 15 or so years, outside of the peaks seen during the most dramatic crises.
We remain optimistic about the prospects of the Brandes International Equity Fund and appreciate your continued trust.
Sincerely yours,
The Brandes International Large-Cap Investment Committee
Brandes Investment Trust
Cash Flow: The amount of cash generated minus the amount of cash used by a company in a given period.
EV/Sales: Compares the enterprise value of a company to its annual sales.
Forward Price/Earnings: Price per share divided by expected earnings per share.
Price/Book: Price per share divided by book value per share.
Price/Cash Flow: Price per share divided by cash flow per share.
Margin of Safety: The discount of a security’s market price to what the firm believes is the intrinsic value of that security.
Working Capital: Current assets minus current liabilities; a measure of a company’s efficiency and short-term financial health.
Past performance is not a guarantee of future results.
Diversification does not assure a profit or protect against a loss.
Because the values of the Fund’s investments will fluctuate with market conditions, so will the value of your investment in the Fund. You could lose money on your investment in the Fund, or the Fund could underperform other investments. The values of the Fund’s investments fluctuate in response to the activities of individual companies and general stock market and economic conditions. In addition, the performance of foreign securities depends on the political and economic environments and other overall economic conditions in the countries where the Fund invests. Emerging country markets involve greater risk and volatility than more developed markets. Some emerging markets countries may have fixed or managed currencies that are not free-floating against the U.S. dollar. Certain of these currencies have experienced, and may experience in the future, substantial fluctuations or a steady devaluation relative to
10
Brandes International Equity Fund
the U.S. dollar. Value stocks typically are less volatile than growth stocks; however, issues of value stocks typically have a lower expected growth rate in earnings and sales than issues of growth stocks.
Please refer to the Schedule of Investments in the report for complete holdings information. Fund holdings, geographic allocations and/or sector allocations are subject to change at any time and are not considered a recommendation to buy or sell any security.
The foregoing reflects the thoughts and opinions of Brandes Investment Partners® exclusively and is subject to change without notice.
Brandes Investment Partners® is a registered trademark of Brandes Investment Partners, L.P. in the United States and Canada.
Must be preceded or accompanied by a prospectus.
Index Guide
The MSCI EAFE Index with net dividends captures large and mid cap representation of developed market countries excluding the U.S. and Canada.
The MSCI EAFE Value Index with net dividends captures large and mid cap securities across developed market countries, excluding the United States and Canada, exhibiting value style characteristics, defined using book value to price, 12-month forward earnings to price, and dividend yield.
The MSCI EAFE Growth Index with net dividends captures large and mid cap securities across developed market countries, excluding the United States and Canada, exhibiting growth style characteristics, defined using long-term forward earnings per share (EPS) growth rate, short-term forward EPS growth rate, current internal growth rate, long-term historical EPS growth trend, and long-term historical sales per share growth trend.
The MSCI USA Index with gross dividends measures the performance of the large and mid cap segments of the U.S. equity market.
MSCI has not approved, reviewed or produced this report, makes no express or implied warranties or representations and is not liable whatsoever for any data in the report. You may not redistribute the MSCI data or use it as a basis for other indices or investment products.
One cannot invest directly in an index.
The Brandes International Equity Fund is distributed by ALPS Distributors, Inc.
11
Brandes International Equity Fund
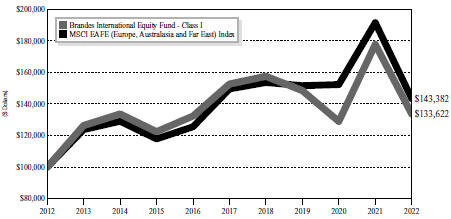
The following chart compares the value of a hypothetical $100,000 investment in the Brandes International Equity Fund – Class I from September 30, 2012 to September 30, 2022 with the value of such an investment in the MSCI EAFE (Europe, Australasia and Far East) Index for the same period.
Value of $100,000 Investment vs MSCI
EAFE (Europe, Australasia and Far East) Index (Unaudited)
| Average Annual Total Return Periods Ended September 30, 2022 | ||||||||||||||||||||
| One Year | Three Years | Five Years | Ten Years | Since Inception(1) | ||||||||||||||||
Brandes International Equity Fund | ||||||||||||||||||||
Class A(2) | -25.05 | % | -3.72 | % | -2.87 | % | 2.71 | % | 5.79% | |||||||||||
Class A (2) (with maximum sales charge) | -29.37 | % | -5.60 | % | -4.02 | % | 2.10 | % | 5.55% | |||||||||||
Class C(3) | -25.64 | % | -4.36 | % | -3.55 | % | 2.11 | % | N/A | |||||||||||
Class C (3) (with maximum sales charge) | -26.36 | % | -4.36 | % | -3.55 | % | 2.11 | % | N/A | |||||||||||
Class I | -24.83 | % | -3.44 | % | -2.63 | % | 2.94 | % | 6.03% | |||||||||||
Class R6(4) | -24.76 | % | -3.36 | % | -2.51 | % | 3.05 | % | 6.10% | |||||||||||
MSCI EAFE (Europe, Australasia and Far East) Index | -25.13 | % | -1.83 | % | -0.84 | % | 3.67 | % | 3.83% | |||||||||||
| (1) | The inception date is January 2, 1997. |
| (2) | Performance shown prior to January 31, 2011 for Class A shares reflects the performance of Class I shares adjusted to reflect Class A expenses. |
| (3) | Performance shown prior to January 31, 2013 for Class C shares reflects the performance of Class I shares adjusted to reflect Class C expenses. The Class C shares’ average annual total return for the 10-year period assumes that Class C shares automatically converted to Class A shares 8 years after the start of the period. |
12
Brandes International Equity Fund
The Class C shares’ average annual total return for the since inception period cannot be calculated as the Class A shares did not yet exist 8 years after the Fund’s inception date.
| (4) | Performance shown prior to February 1, 2016 for Class R6 shares reflects the performance of Class I shares adjusted to reflect Class R6 expenses. |
Performance data quoted represents past performance; past performance does not indicate future results. The investment return and principal value of an investment will fluctuate so that an investor’s shares, when redeemed, may be worth more or less than their original cost. Current performance of the Fund may be lower or higher than the performance quoted. Performance data current to the most recent month end may be obtained by calling 800-331-2979.
The returns shown do not reflect the deduction of taxes that a shareholder would pay on Fund distributions or the redemption of Fund shares. Brandes Investment Partners, L.P., the Advisor, has a fee waiver arrangement in place to limit the Fund’s annual operating expenses.
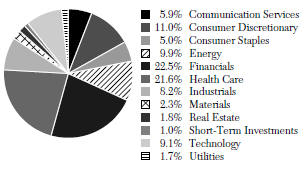
Sector Allocation as a Percentage of Total Investments as of
September 30, 2022 (Unaudited)
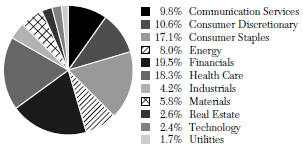
The sector classifications represented in the graph above are in accordance with Global Industry Classification Standard (GICS®), which was developed by and/or is the exclusive property of MSCI, Inc. and Standard & Poor’s Financial Services LLC.
13
Dear Fellow Investor,
The net asset value of the Brandes Global Equity Fund (Class I Shares) declined 18.08% in the twelve months ended September 30, 2022. During the same period, the MSCI World Index declined 19.63%.
The Fund’s performance was helped by solid contributions from holdings in health care providers and services (e.g., McKesson, Cigna, Cardinal Health) and pharmaceuticals (e.g., Merck, Pfizer, Euroapi). Additionally, a continued rise in energy prices benefited our oil-related holdings, such as Shell, BP, and Total Energies. Other contributors included U.K. based tobacco manufacturer Imperial Brands, U.S. food products company Ingredion, and energy equipment & services giant Halliburton, which all held up well during the declining market environment.
A variety of concerns led to market declines in the period, from geopolitical risks to inflation, as well as concerns around future economic growth. As a result, certain cyclically oriented companies were some of the weakest performers, along with technology-related companies, which continued to see their valuations compress amid rising interest rates.
The Fund’s most significant detractors were holdings in banks (e.g., Erste Group Bank, Citigroup, Bank of America) and media (e.g., Comcast, WPP, Publicis Groupe), along with Brazilian regional jet manufacturer Embraer and South Korean technology company Samsung Electronics. China-based internet company Alibaba was also a notable detractor. The company continued to deal with market concerns about China’s regulatory environment and the extension of the country’s zero-tolerance COVID policy, which has dampened consumer demand.
Lastly, Spain-based blood plasma company Grifols saw its shares decline after announcing weaker-than-expected short-term earnings as it continues to deal with effects from COVID-19 on its recovery. Grifols has been materially affected by COVID-19 as initial shelter-in place orders and government financial support led to a significant drop in plasma collection in 2020 and 2021. While plasma collections have recovered, the resulting impact in Grifols’ financial results won’t likely be seen until next year because plasma-derived products require a six-month quarantine. Additionally, in anticipation of an increase in long-term demand for blood plasma-derived products, Grifols has been ramping up its spending to build more collection centers, which has hurt its short-term results and increased its balance sheet leverage. Longer-term, we believe Grifols offers an attractive opportunity given the likelihood of blood-plasma supply recovery and the potential improvement of the company’s margins and earnings from today’s depressed levels.
Past performance is not a guarantee of future results.
14
Brandes Global Equity Fund
Select Portfolio Activity
The global large-cap investment committee initiated positions in several companies, including software company SAP and semiconductor equipment company Applied Materials, as well as industrial company Rolls-Royce.
SAP is a leader in enterprise resource planning (ERP) software, which includes applications for payroll, procurement, finance, manufacturing, and operations. We believe enterprise software is an attractive industry with high switching cost, low capital intensity and robust returns on equity. SAP has historically traded at a premium relative to the broad market, largely due to its dominant position in an appealing growth industry, and the scarcity of technology-related investment opportunities in Europe relative to the United States. However, because SAP’s ERP software was heavily customized and difficult to upgrade, its growth rate lagged that of many of its peers, leading the company to turn to acquisitions for growth. SAP has delivered disappointing earnings as it tried to balance integrating its acquisitions with moving its applications to the cloud, both of which have proven challenging for the company. As a result, its share price recently dropped near a five-year low, making the company more attractive to us.
Although SAP may still deliver subdued financial results in the short term, we believe its business strategy, combined with its recent record of execution, positions it well for the long term, which is the investment horizon for us.Its strong focus on cloud migration corresponds well with enterprise customers’ urgent need to improve the flexibility and agility of their enterprise application software as they grappled with the pandemic-triggered disruptions and uncertainties over the past two years. Its effort to offer a fully integrated technology solution should serve well as the foundation for both SAP’s organically developed software and acquired software. This, in turn, should enable SAP to revive its organic growth rate as it will be easier for customers to buy and implement additional software modules, which was the not the case with on-premise software. Even though its short-term financial results may be depressed due to frontloaded expenses associated with both efforts (integration and cloud migration), we believe these projects will help SAP achieve organic growth that should benefit its operating leverage and profitability over the longer term. We have seen this happen with other enterprise software firms that have gone through similar multi-year transitional periods. As such, at its current valuation, SAP represents a compelling long-term risk/reward tradeoff to us.
Rolls-Royce is a U.K.-based conglomerate with a focus on the aerospace and defense industry. The company primarily designs, manufactures and services engines and turbines used in aircraft, ships, and power generators.
Rolls-Royce has struggled for several years, despite what has been a robust civilian aviation market pre-pandemic. The company appears to have made a strategic misstep in exiting the narrow-body engine market in 2012, a market that proved to be more
15
Brandes Global Equity Fund
stable and better growing than the wide-body market it strategically focused on. Additionally, Rolls-Royce’s newly designed Trent 1000 engine experienced premature wear, forcing the company to spend significant capital to fix the issue in 2017.
Rolls-Royce seemed to have overcome these challenges in 2019 when its revenue and profitability improved. However, the impact of COVID-19 the following year severely hit Rolls-Royce’s business. Lower utilization of aircraft weighed on demand and uncharacteristically caused a steep fall in the company’s maintenance business, which tended to be more profitable than its manufacturing business. Cash-flow burn in 2020 forced Roll-Royce to issue over $2 billion in equity and divest some non-core businesses. More recently, lingering pandemic concerns, high fuel prices and the risk of a recession in major economies have further hurt investor sentiment. The combination of strategic missteps, the unfortunate timing of a pandemic-triggered moratorium on travel and a potentially weak economic environment led Roll-Royce’s share price to drop to less than one-tenth of its 2019-high.
While we acknowledge the near-term future appears bleak for Rolls-Royce, we believe there are reasons for longer-term optimism. In our opinion, cash-flow characteristics in the next downturn should be better as the company can release working capital to cushion any slowdown in orders. We also think that the service business should continue to recover as pandemic restrictions ease and aircraft utilization increases. Even a recessionary level of activity in the service business would be an improvement over the past couple of years. When activity potentially picks up again, Rolls-Royce is poised, in our view, to resume its duopoly position in an industry with high barriers to entry and should benefit from the next aerospace cycle. Overall, Rolls-Royce’s current market valuations are attractive enough for us to take the near-term cyclical risk and initiate a measured allocation to the company.
Beyond these new purchases, other major fund activity included the full sales of Mexico-based Fomento Economico Mexicano (FEMSA) and American food products company Ingredion.
The investment committee bought Ingredion during the market downturn of early 2020. The company’s share price came under pressure due to concerns around global trade, as well as the risk of a significant recession as COVID-19 began to spread globally. However, we thought Ingredion offered an attractive long-term opportunity as it had exposure to the growing specialty ingredients market and at its valuation, it also offered a significant margin of safety. Over our holding period, the company has executed well and its share price climbed significantly. When it reached our estimate of its intrinsic value, we divested.
Looking Forward
As of September 30, 2022, the Brandes Global Equity Fund held its key positions in the economically sensitive financials and energy sectors, and the more defensive health care sector. Our overall weight to the health care sector hasn’t changed materially this
16
Brandes Global Equity Fund
year. However, our relative overweight decreased as our holdings performed well, and we pared some of our exposure, even while health care became a larger part of the benchmark. Our energy overweight also did well, and while we have slightly reduced our exposure to some oil and gas companies, our relative overweight has also narrowed given the sector’s strong performance in the benchmark. Financials haven’t performed well overall but remain our largest overweight as we believe our holdings are well capitalized, trade at attractive valuation levels and should benefit from a rising interest rate environment.
Our most significant underweight remains in the technology sector. However, that gap has narrowed somewhat as we have added to a number of our holdings and initiated a position in SAP as mentioned above, while the underperformance of the sector has led to it being a smaller part of the index. The decline in market valuations globally has helped expand our opportunity set as some companies within the technology sector or other cyclically oriented areas are starting to look more attractive.
Geographically, we remained overweight in the United Kingdom, France and emerging markets, while underweight in the United States and Japan. We believe the differences between our portfolio and the broader market continue to make the Fund an intelligent complement to index-tracking or growth-oriented alternatives.
Looking ahead, we remain optimistic about the prospects for the Global Equity Fund given the current valuation discounts of value stocks to the market in general and the Fund’s history of outperforming the MSCI World Value Index during periods of strong value performance.
Thank you for the trust you have placed in us.
Sincerely yours, The Brandes Global Large-Cap Investment Committee
Brandes Investment Trust
Cyclically Oriented Companies: Those following the cycles of an economy through expansion, peak, recession and recovery, including companies that sell items that consumers buy more during a booming economy but spend less on during a recession.
Intrinsic Value: The actual value of a company or an asset based on an underlying perception of its true value by the investment committee.
Margin of Safety: The discount of a security’s market price to what the firm believes is the intrinsic value of that security.
Working Capital: Current assets minus current liabilities; a measure of a company’s efficiency and short-term financial health.
Past performance is not a guarantee of future results.
Diversification does not assure a profit or protect against a loss.
Because the values of the Fund’s investments will fluctuate with market conditions, so will the value of your investment in the Fund. You could lose money on your investment
17
Brandes Global Equity Fund
in the Fund, or the Fund could underperform other investments. The values of the Fund’s investments fluctuate in response to the activities of individual companies and general stock market and economic conditions. In addition, the performance of foreign securities depends on the political and economic environments and other overall economic conditions in the countries where the Fund invests. Emerging country markets involve greater risk and volatility than more developed markets. Some emerging markets countries may have fixed or managed currencies that are not free-floating against the U.S. dollar. Certain of these currencies have experienced, and may experience in the future, substantial fluctuations or a steady devaluation relative to the U.S. dollar. Value stocks typically are less volatile than growth stocks; however, issues of value stocks typically have a lower expected growth rate in earnings and sales than issues of growth stocks.
Please refer to the Schedule of Investments in the report for complete holdings information. Fund holdings, geographic allocations and/or sector allocations are subject to change at any time and are not considered a recommendation to buy or sell any security.
The foregoing reflects the thoughts and opinions of Brandes Investment Partners® exclusively and is subject to change without notice.
Brandes Investment Partners® is a registered trademark of Brandes Investment Partners, L.P. in the United States and Canada.
Must be preceded or accompanied by a prospectus.
Index Guide
The MSCI World Index with net dividends captures large and mid cap representation of developed markets.
The MSCI World Value Index with net dividends captures large and mid cap securities across developed market countries exhibiting value style characteristics, defined using book value to price, 12-month forward earnings to price, and dividend yield.
MSCI has not approved, reviewed or produced this report, makes no express or implied warranties or representations and is not liable whatsoever for any data in the report. You may not redistribute the MSCI data or use it as a basis for other indices or investment products.
One cannot invest directly in an index.
The Brandes Global Equity Fund is distributed by ALPS Distributors, Inc.
18
Brandes Global Equity Fund
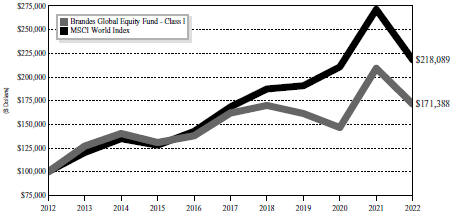
The following chart compares the value of a hypothetical $100,000 investment in the Brandes Global Equity Fund – Class I from September 30, 2012 to September 30, 2022 with the value of such an investment in the MSCI World Index for the same period.
Value of $100,000 Investment vs MSCI
World Index (Unaudited)
| Average Annual Total Return Periods Ended September 30, 2022 | ||||||||||||||||||||
| One Year | Three Years | Five Years | Ten Years | Since Inception(1) | ||||||||||||||||
Brandes Global Equity Fund | ||||||||||||||||||||
Class A(2) | -18.30 | % | 1.74 | % | 0.88 | % | 5.27 | % | 5.09% | |||||||||||
Class A (2) (with maximum sales charge) | -23.00 | % | -0.25 | % | -0.30 | % | 4.65 | % | 4.64% | |||||||||||
Class C(3) | -18.91 | % | 0.98 | % | 0.13 | % | 4.65 | % | 4.62% | |||||||||||
Class C (3) (with maximum sales charge) | -19.67 | % | 0.98 | % | 0.13 | % | 4.65 | % | 4.62% | |||||||||||
Class I | -18.08 | % | 2.01 | % | 1.14 | % | 5.54 | % | 5.33% | |||||||||||
MSCI World Index | -19.63 | % | 4.56 | % | 5.30 | % | 8.11 | % | 7.95% | |||||||||||
| (1) | The inception date is October 6, 2008. |
| (2) | Performance shown prior to January 31, 2011 for Class A shares reflects the performance of Class I shares adjusted to reflect Class A expenses. |
| (3) | Performance shown prior to January 31, 2013 for Class C shares reflects the performance of Class I shares adjusted to reflect Class C expenses. The Class C shares’ average annual total return for the 10-year and since inception periods assumes that Class C shares automatically converted to Class A shares 8 years after the start of the period. |
Performance data quoted represents past performance; past performance does not indicate future results. The investment return and principal value of an investment will fluctuate so that an investor’s shares, when redeemed, may be worth more or less than
19
Brandes Global Equity Fund
their original cost. Current performance of the Fund may be lower or higher than the performance quoted. Performance data current to the most recent month end may be obtained by calling 800-331-2979.
The returns shown do not reflect the deduction of taxes that a shareholder would pay on fund distributions or the redemption of fund shares. Brandes Investment Partners, L.P., the Advisor, has a fee waiver arrangement in place to limit the Fund’s annual operating expenses.
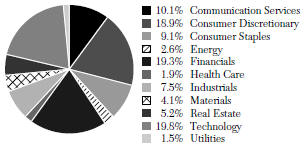
Sector Allocation as a Percentage of Total Investments as of
September 30, 2022 (Unaudited)
The sector classifications represented in the graph above are in accordance with Global Industry Classification Standard (GICS®), which was developed by and/or is the exclusive property of MSCI, Inc. and Standard & Poor’s Financial Services LLC.
20
Brandes Emerging Markets Value Fund
Dear Fellow Investor,
The net asset value of the Brandes Emerging Markets Value Fund (Class I Shares) declined 28.79% in the year ended September 30, 2022. During the same period, the MSCI Emerging Markets Index declined 28.11%.
A variety of headwinds face emerging market stocks today, ranging from elevated inflation, slowing economic growth/recession concerns and COVID lockdowns to energy risk and political as well as regulatory uncertainties. Within the Brandes Emerging Markets Value Fund, holdings in Russia were the most significant detractors over the trailing twelve-month (TTM) period. Our thoughts continue to be with the people of Ukraine, as well as those in Russia that are advocating for peace.
Meanwhile, select holdings in China also declined, although our underweight and stock selection in the country helped returns relative to the benchmark.
Engines manufacturer Weichai Power issued a warning in September 2022 that its subsidiary KION, an automated logistics solutions provider, would record a material loss from ongoing inefficiencies due to supply issues and rising input costs. This, coupled with a continued downcycle in its heavy-duty truck segment, has contributed to the company’s share price decline.
Internet company Alibaba hurt returns as market concerns persisted around the regulatory environment in China and the uncertain future of its listing in the U.S., as well as the continuation of China’s zero-Covid policy and its effect on consumer demand.
Besides Weichai and Alibaba, Chinasoft International, China Education Group and Ping An Insurance also weighed on performance.
Our underweights to India and Saudi Arabia detracted from relative returns. From an industry perspective, several technology-related holdings weighed on performance, notably Samsung Electronics, Taiwan Semiconductor Manufacturing Company, and SK Hynix.
Strong performers in the Fund included select Brazilian holdings such as oil and gas firm Petrobras and diversified telecommunications company Telefonica Brasil. Additionally, China’s Wens Foodstuffs Group and Galaxy Entertainment Group Limited, as well as U.K.-based Vivo Energy saw their share prices rise. The Fund’s positions in Greece (e.g., Hellenic Telecommunications) and Czech Republic (e.g., O2 Czech Republic) also held up relatively well in a declining market.
Select Portfolio Activity
During the period, the emerging markets investment committee initiated positions in several businesses including Kimberly-Clark de Mexico, IndusInd Bank, Millicom International Cellular, and LG Household & Healthcare.
Past performance is not a guarantee of future results.
21
Brandes Emerging Markets Value Fund
Kimberly-Clark de Mexico (KCM) is the leading producer of tissue and fiber-based personal care products in Mexico, where it holds 60% market share. The company derives over 90% of its revenue from baby diapers and tissue products, with feminine care products making up the rest. Historically, KCM has boasted solid operating margins of more than 20% due to its strong position in Mexico’s brand-conscious consumer products market. However, despite the high margins, KCM’s profitability has recently fluctuated as the company has had trouble passing inflationary raw material costs on to end consumers. Approximately two-thirds of KCM’s manufacturing costs (paper and pulp products and oil derivatives) are in U.S. dollars, so inflation and currency fluctuations present challenges, especially considering that the Mexican consumer sector is not particularly strong. In the past year as a result of these dynamics, KCM’s EBITDA margin declined to its lowest level since 2005. Management has been pushing through price increases, resulting in lost market share as its competitors were slower to react. We believe the market has overly punished KCM due to the near-term margin pressure, creating a buying opportunity. This is not the first time KCM has dealt with raw material cost headwinds, and the company has a history of overcoming such challenges over time as pricing and volumes eventually offset short-term cost pressures. Furthermore, pulp is a raw material for which pricing has been elevated lately and tends to be cyclical. With new capacity coming to market over the next few years, we expect pulp input costs to fall.
Founded in 1994, Mumbai-based IndusInd Bank (IIB) is the fifth-largest private bank in India by market share (based on assets). Over the past several years, IIB has faced a variety of internal and external issues. Between 2018 and 2020, the bank came under pressure following the defaults of several corporate and infrastructure finance companies it had exposure to. During the pandemic, IIB struggled to manage its vehicle and microfinance loans, which require more high-touch, in-person access to customers. Additionally, the company experienced some government deposit outflows driven by risk aversion toward mid-sized private sector banks.
We believe IndusInd is now on an underappreciated recovery path, having taken the following actions:
Weighing its recovery potential in a credit growth cycle against its past challenges, we believe IIB represents an attractive investment opportunity.
Headquartered in Luxembourg, Millicom provides wireless and fixed-line services to 49 million customers across nine countries in Latin America (LatAm). Millicom differs from its LatAm peers in its focus on smaller countries, either by early entry or by acquisition, a strategy that has helped it gain top market share positions in most of the countries in which it operates. Given the low adoption rates of wireless data services across a population of nearly 120 million, meaningful growth opportunities persist across Millicom’s geographic markets.
22
Brandes Emerging Markets Value Fund
Although we have followed Millicom for more than 15 years, this was the first time we purchased its shares. The company underwent a large rights offering that increased its shares outstanding by 70%. This, combined with general market malaise, has put Millicom’s shares under significant pressure.
In our view, Millicom is among the most attractively valued LatAm telecommunications services providers. Its operations are concentrated in countries that have relatively low competition (many are duopolies), lenient regulation and manageable foreign-exchange risk, while offering a favorable macroeconomic outlook. There are several potential catalysts that can unlock the value we see in Millicom, including:
We believe Millicom’s positive attributes outweigh the potential risks, and the share-price decline has created a compelling entry point for an investment in a company with a strong market position and appealing growth opportunity.
LG Household & Health Care (LGHH) is a diversified consumer goods company based in South Korea. The company has enjoyed consistent growth, with revenues growing at a 10-year compounded rate of 13% annually (pre-pandemic) and operating profit at 18%, leading it to become South Korea’s top player in all three of its divisions: Beauty (cosmetic products), Health (health care and household products) and Refreshment (beverages). LGHH’s flagship luxury cosmetics brand, The History of Whoo, has steadily been gaining share in the Chinese beauty market (its main market) as it benefited from the shift in consumer preferences from value to premium products, a trend that is expected to continue in the foreseeable future. However, sales have slowed, mainly due to the strict lockdowns in China and the related decline in the duty-free sales channel. We believe the market is applying an overly harsh scenario of permanently slower sales growth of LGHH’s cosmetic products, providing us with an opportunity to invest in a company with a solid market presence at appealing valuations. In our opinion, LGHH remains well positioned to benefit from the premiumization of China’s beauty market and from a rebound in sales as mobility restrictions ease in its main markets.
During the period, the investment committee sold various positions from the Fund including China-based Wens Foodstuffs, Argentina’s YPF and O2 Czech Republic, as well as Greece’s Hellenic Telecommunications. We exited these positions as the shares appreciated toward our estimates of their intrinsic values.
Looking Forward
As of September 30, 2022, the Fund continued to have its largest sector overweights in consumer discretionary and real estate (note that we do not own any real estate holdings in China), while maintaining key underweights in materials, financials, and energy. Mexico and Indonesia were the largest overweights from a country perspective, while India, Taiwan, Saudi Arabia, and China represented our key underweight positions.
We believe the Brandes Emerging Markets Value Fund continues to offer a diversified portfolio with exposure to post-COVID economic reopening (e.g., through holdings in
23
Brandes Emerging Markets Value Fund
air travel, casino, luxury retail), inflation (e.g., holdings in financials may benefit from a rising interest rate environment), and long-term growth drivers in emerging markets (e.g., consumer-related holdings such as e-commerce, food products, apparel, appliances, education). Furthermore, even though the Fund’s portfolio has always stayed true to its value investing style, our value exposure is different than that of a quantitative or factor approach. Emerging markets value stocks (MSCI EM Value) have performed relatively well compared to the broad market (MSCI EM), partly due to classic cyclicals in the energy and materials sectors that benefited from higher commodity prices. We believe valuations in these sectors were already indicative of above mid-cycle profitability prior to the invasion of Ukraine, and they have become even more elevated since then. In our opinion, economically sensitive sectors levered to a potential post-pandemic rebound, such as consumer discretionary (where we hold an overweight relative to the benchmark and the value index), represent a more appealing opportunity today than classic cyclical sectors such as energy and materials.
We believe the Fund’s positioning, combined with its overall attractive valuation levels, bodes well for its returns in the long term. As always, we appreciate your continued trust and remain optimistic about the long-term prospects of the Brandes Emerging Markets Value Fund.
Sincerely yours,
The Brandes Emerging Markets Investment Committee
Brandes Investment Trust
EBITDA: Earnings before interest, taxes, depreciation and amortization.
EBITDA Margin: EBITDA divided by total sales.
Free Cash Flow: Total cash flow from operations less capital expenditures.
Operating Profit: Earnings before interests and taxes.
Operating Margin: Operating income divided by net sales; used to measure a company’s operating efficiency.
Rights Offering: A company’s offer to its existing shareholders to purchase additional shares in proportion to their existing stakes.
Share Buyback: A company’s re-acquisition of its own stock.
Past performance is not a guarantee of future results.
Diversification does not assure a profit or protect against a loss.
Because the values of the Fund’s investments will fluctuate with market conditions, so will the value of your investment in the Fund. You could lose money on your investment in the Fund, or the Fund could underperform other investments. The values of the Fund’s investments fluctuate in response to the activities of individual companies and general stock market and economic conditions. In addition, the performance of foreign securities depends on the political and economic environments and other overall
24
Brandes Emerging Markets Value Fund
economic conditions in the countries where the Fund invests. Emerging markets involve greater risk and volatility than more developed markets. Some emerging markets may have fixed or managed currencies that are not free-floating against the U.S. dollar. Certain of these currencies have experienced, and may experience in the future, substantial fluctuations or a steady devaluation relative to the U.S. dollar. Investments in small and medium capitalization companies tend to have limited liquidity and greater price volatility than investments in larger capitalization companies. Value stocks typically are less volatile than growth stocks; however, issues of value stocks typically have a lower expected growth rate in earnings and sales than issues of growth stocks.
Please refer to the Schedule of Investments in the report for complete holdings information. Fund holdings, geographic allocations and/or sector allocations are subject to change at any time and are not considered a recommendation to buy or sell any security.
The foregoing reflects the thoughts and opinions of Brandes Investment Partners® exclusively and is subject to change without notice.
Brandes Investment Partners® is a registered trademark of Brandes Investment Partners, L.P. in the United States and Canada.
Must be preceded or accompanied by a prospectus.
Index Guide
The MSCI Emerging Markets Index with net dividends captures large and mid cap representation of emerging market countries.
The MSCI Emerging Markets Value Index with net dividends captures large and mid cap securities exhibiting value style characteristics, defined using book value to price, 12-month forward earnings to price, and dividend yield.
MSCI has not approved, reviewed or produced this report, makes no express or implied warranties or representations and is not liable whatsoever for any data in the report. You may not redistribute the MSCI data or use it as a basis for other indices or investment products.
One cannot invest directly in an index.
The Brandes Emerging Markets Value Fund is distributed by ALPS Distributors, Inc.
25
Brandes Emerging Markets Value Fund
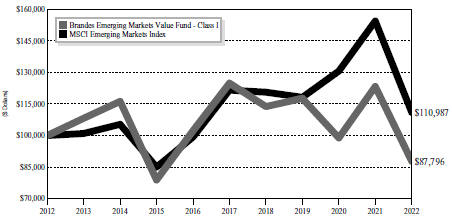
The following chart compares the value of a hypothetical $100,000 investment in the Brandes Emerging Markets Value Fund – Class I from September 30, 2012 to September 30, 2022 with the value of such an investment in the MSCI Emerging Markets Index for the same period.
Value of $100,000 Investment vs MSCI
Emerging Markets Index (Unaudited)
| Average Annual Total Return Periods Ended September 30, 2022(1) | ||||||||||||||||||||
| One Year | Three Years | Five Years | Ten Years | Since Inception(2) | ||||||||||||||||
Brandes Emerging Markets Value Fund | ||||||||||||||||||||
Class A | -28.99 | % | -9.50 | % | -7.02 | % | -1.52 | % | 4.87% | |||||||||||
Class A (with maximum sales charge) | -33.08 | % | -11.27 | % | -8.11 | % | -2.10 | % | 4.64% | |||||||||||
Class C(3) | -29.54 | % | -10.03 | % | -7.62 | % | -2.11 | % | N/A | |||||||||||
Class C (3) (with maximum sales charge) | -30.22 | % | -10.03 | % | -7.62 | % | -2.11 | % | N/A | |||||||||||
Class I | -28.79 | % | -9.29 | % | -6.81 | % | -1.29 | % | 5.10% | |||||||||||
Class R6(4) | -28.75 | % | -9.19 | % | -6.70 | % | -1.19 | % | 5.18% | |||||||||||
MSCI Emerging Markets Index | -28.11 | % | -2.07 | % | -1.81 | % | 1.05 | % | 4.83% | |||||||||||
| (1) | Prior to January 31, 2011, the Advisor managed a private investment fund with an investment objective, investment policies and strategies that were, in all material respects, equivalent to those of the Brandes Emerging Markets Value Fund. The performance information shown for the Class I shares for periods before January 31, 2011 is that of the private investment fund and reflects the net expenses of the private investment fund. The performance of the private investment fund prior to January 31, 2011 is based on a calculation method that is different from the standardized calculation method prescribed by the SEC. The performance information shown for the Class A shares has been adjusted to reflect the differences in |
26
Brandes Emerging Markets Value Fund
the net expense ratios between the Class I and A shares. The private investment fund was not registered under the Investment Company Act of 1940 (“1940 Act”) and was not subject to certain investment limitations, diversification requirements, and other restrictions imposed by the 1940 Act and the Internal Revenue Code of 1986, which, if applicable, may have adversely affected its performance.
| (2) | The inception date is August 20, 1996. |
| (3) | Performance shown prior to January 31, 2013 for Class C shares reflects the performance of Class I shares adjusted to reflect Class C expenses. The Class C shares’ average annual total return for the 10-year period assumes that Class C shares automatically converted to Class A shares 8 years after the start of the period. The Class C shares’ average annual total return for the since inception period cannot be calculated as the Class A shares did not yet exist 8 years after the Fund’s inception date. |
| (4) | Performance shown prior to July 11, 2016 for Class R6 shares reflects the performance of Class I shares adjusted to reflect Class R6 expenses. |
Performance data quoted represents past performance; past performance does not indicate future results. The investment return and principal value of an investment will fluctuate so that an investor’s shares, when redeemed, may be worth more or less than their original cost. Current performance of the Fund may be lower or higher than the performance quoted. Performance data current to the most recent month end may be obtained by calling 800-331-2979.
The returns shown do not reflect the deduction of taxes that a shareholder would pay on fund distributions or the redemption of fund shares. Brandes Investment Partners, L.P., the Advisor, has a fee waiver arrangement in place to limit the Fund’s annual operating expenses.
Sector Allocation as a Percentage of Total Investments as of
September 30, 2022 (Unaudited)
The sector classifications represented in the graph above are in accordance with Global Industry Classification Standard (GICS®), which was developed by and/or is the exclusive property of MSCI, Inc. and Standard & Poor’s Financial Services LLC.
27
Brandes International Small Cap Equity Fund
Dear Fellow Investor,
The net asset value of the Brandes International Small Cap Equity Fund (Class I Shares) declined 28.04% in the year ended September 30, 2022. During the same period, the S&P Developed Ex-U.S. SmallCap Index declined 33.01%.
A variety of headwinds face international stocks today, ranging from elevated inflation, slowing economic growth and recession concerns to energy risk and political as well as regulatory uncertainties. While our overall positioning in the Fund is driven by bottom-up stock selection with a focus on the long term, we do consider many of these concerns when we analyze an investment opportunity, determining how they can impact the fundamentals of a business and comparing our intrinsic value estimate against what is currently being priced in by the market. Compared to the benchmark, the Brandes International Small Cap Equity Fund generally has less cyclical (or what we currently consider more expensive growth) exposure, as seen through our underweights to technology and materials. In contrast, the Fund provides more defensive exposure, as evidenced by our overweights to the consumer staples and communication services sectors. Additionally, our allocation to companies in the financials sector, in which we also have an overweight position, may benefit from a rising interest rate environment.
Against this backdrop, the Fund’s trailing twelve-month (TTM) performance was helped by holdings in energy equipment & services (e.g., TechnipFMC) and oil gas & consumable fuels (e.g., Cameco Corporation). TechnipFMC’s share price appreciated significantly as oil prices rose and the market has generally become more optimistic about a recovery in oil services activities. Canada-based Cameco, one of the largest uranium producers globally, has recently benefited from a surge in commodity prices. Additionally, Fund returns were helped by allocations to Italian aerospace & defense company Leonardo and Canadian communications equipment firm Sierra Wireless.
Performance detractors in the TTM period included holdings in consumer staples, notably U.K. retailers Marks and Spencer and J Sainsbury, food products companies Greencore Group (Ireland) and Binggrae (South Korea), and Ireland-based beverage firm C&C Group. The weak macroeconomic outlook, particularly in Europe, was a headwind to these companies. However, we believe market sentiment is overly negative, especially given the defensive nature of these businesses.
Other detractors included Brazilian aerospace & defense manufacturer Embraer and German-based health care equipment & supplies company Draegerwerk.
Select Portfolio Activity
The small-cap investment committee initiated a variety of positions during the period, including Ireland-based food products company Greencore Group, Japanese
Past performance is not a guarantee of future results.
28
Brandes International Small Cap Equity Fund
entertainment business DeNA, U.K.-domiciled energy equipment company TechnipFMC and defense technology firm QinetiQ, as well as Hong Kong-based Yue Yuen.
Founded in 1988, Yue Yuen is the world’s largest manufacturer of branded athletic and casual footwear, producing nearly 250 million pairs of shoes in the fiscal year 2020 as an original equipment manufacturer for major brands such as Nike and Adidas, which together account for almost two-thirds of Yue Yuen’s sales, as well as Reebok, Asics, New Balance, and Puma. The company also has a majority stake in sportswear (athletic shoes and apparel) retailer Pou Sheng.
We see significant value potential in Yue Yuen. While volume growth has been muted in recent years as key customers have been working to reduce inventories and demanding shorter lead times, Yue Yuen has maintained a strong pricing power which is attributable to increased popularity of athletic shoes and a style shift toward more complex designs. Provided COVID-related conditions continue to improve, the industry is expected to grow at mid-single digits. Furthermore, we believe Yue Yuen is well positioned to expand its operating margins, which have been negatively affected by forced factory closures and occupancy reductions (for social distancing). Although the timing of the recovery is impossible to predict, it is our opinion that Yue Yuen’s current share price is overly discounted, providing us with what we consider a compelling entry point for an investment.
Based in Ireland, Greencore Group is the leading provider of private-label fresh prepared foods in the United Kingdom, selling fresh sandwiches, salads, sushi and other ready-to-eat meals. Greencore works with grocery retailers to develop their private-label offerings, with nearly half of its revenues coming from strategic partnerships with the U.K.’s Big Four (Tesco, J Sainsbury, Asda and Wm Morrison). The company also caters to what we consider better-growing channels, such as convenience stores.
Prior to COVID-19, the U.K. food-to-go market was growing above global GDP (gross domestic product) amid many structural changes in consumer behavior and expectations by supermarkets. While the pandemic has altered the trajectory of the industry, Greencore has navigated the environment better than expected. Revenue growth and profitability in 2021 exceeded expectations, and the near-term and medium-term outlook for the company is favorable. However, this progress has not been reflected in the company’s share price. New COVID-19 variants and consumer mobility restrictions have weighed on investor sentiment, along with supply-chain and labor challenges, as well as the recent departure of Greencore’s chief executive officer. We believe the market has overreacted to these concerns, creating a buying opportunity in a company with improving fundamentals, a positive growth outlook and an undemanding valuation.
29
Brandes International Small Cap Equity Fund
TechnipFMC (FTI) is the product of a 2016 merger between Technip, a leading engineering, procurement and construction company (EPC), and FMC, a leading provider of subsea production and processing equipment. The rationale of the merger was to combine equipment manufacturing with engineering and construction of subsea oilfields. More recently, the company completed a long-planned separation of its onshore EPC business, making it purely focused on offshore oilfield exploration and development.
With an over 40% market share, FTI is the industry leader in subsea systems, highly engineered capital goods that reside on the seabed producing and processing hydrocarbons. The subsea industry has been in a multi-year slump following a decade of high oil prices. Capital expenditures (capex) among upstream oil and gas companies (FTI’s customer base) reached highs in 2014 and were estimated to be less than half of the peak levels in 2021. In addition to the collapse in capex, there has been a shift of investment to unconventional opportunities on land. The overall effect has been a sustained period of low manufacturing utilization, high price competition and distressed profitability for the subsea industry.
While a return to peak capex is unlikely, we believe a gradual increase in offshore activity is in the cards given two main factors: 1) global demand growth has been stable or growing; and 2) poor returns from onshore unconventional production over the past decade may be an indication that more capital should flow elsewhere (or oil prices need to be substantially higher). In our view, FTI is well positioned to benefit from the potentially improved offshore activity considering its industry-leading position in subsea equipment and engineering, as well as its fully integrated business model. Furthermore, we appreciate that FTI has made several investments to capitalize on its offshore development expertise and seek to benefit from a global energy transition, including subsea carbon transportation and storage, floating renewable power generation (offshore wind) and hydrogen production, storage and re-electrification.
Sales in the period included Japan-based office supply company Nichiban and health care testing services business H.U. Group (formerly Miraca Holdings), France-based Societe BIC, South Korean Namyang Dairy Products, and Cameco. The investment committee also divested from Spain-based Atresmedia and Bankinter.
Canada-based Cameco is one of the largest uranium producers globally, providing about 17% of the world’s production from its mines in Canada, the United States and Kazakhstan. Owner of several of the largest high-grade mines in the world, Cameco enjoys economies of scale and is prominently positioned near the bottom of the cost curves. When we added Cameco to the Fund’s portfolio during the early period of the pandemic in first quarter 2020, we believed that uranium prices were well below what the industry required to invest in incremental capacity and that demand was well supported by planned nuclear power plants in emerging markets. Since most of Cameco’s sales are to nuclear power plants supplying base load electricity, and these relationships are covered under contracts with specific volume and price terms, we
30
Brandes International Small Cap Equity Fund
believed the business should be somewhat insulated from the economic downturn. We also appreciated that the company had a strong balance sheet as it ended 2019 with a net-cash position.
Cameco, along with its uranium peers, has recently benefited from a surge in commodity prices. As its share price appreciated beyond our estimate of the company’s intrinsic value, we decided to deploy the capital to other opportunities offering higher margins of safety.
Looking Forward
As of September 30, 2022, the Brandes International Small Cap Equity Fund held its key overweights to consumer staples, communication services, and financials, while maintaining significantly lower allocations to technology and materials than the benchmark. Geographically, we continued to have overweight positions in Ireland, the U.K., Hong Kong, and emerging markets, and underweight positions in Canada and Japan.
Although the strong U.S. dollar has been a headwind for international stocks in general for the last decade, and particularly so this past year or two, we believe it is producing attractive opportunities across our opportunity set as companies operating in cheaper currencies may be better positioned with a lower cost basis.
Within the international small cap space, even after their recent outperformance, value stocks (S&P Developed ex-U.S. SmallCap Value) continue to trade at large discounts to growth stocks (S&P Developed ex-U.S. SmallCap Growth) on various valuation metrics such as price/cash flow, forward price/earnings and EV/sales, which historically boded well for value stocks’ returns relative to growth. This, combined with the current margin of safety exhibited by the Fund’s portfolio, which is among the highest we have seen over the last two decades, drives our optimism about the prospects of the Brandes International Small Cap Equity Fund.
Brandes Investment Partners remains true to our value approach by seeking fundamentally sound but potentially undervalued companies for the Fund. We appreciate your continued trust.
Sincerely yours,
The Brandes Small-Cap Investment Committee
Brandes Investment Trust
EV/Sales: Compares the enterprise value of a company to its annual sales.
Forward Price/Earnings: Price per share divided by expected earnings per share.
Margin of Safety: The discount of a security’s market price to what the firm believes is the intrinsic value of that security.
Operating Margin: Operating income divided by net sales; used to measure a company’s operating efficiency.
31
Brandes International Small Cap Equity Fund
Price/Cash Flow: Price per share divided by cash flow per share.
Past performance is not a guarantee of future results.
Diversification does not assure a profit or protect against a loss.
Because the values of the Fund’s investments will fluctuate with market conditions, so will the value of your investment in the Fund. You could lose money on your investment in the Fund, or the Fund could underperform other investments. The values of the Fund’s investments fluctuate in response to the activities of individual companies and general stock market and economic conditions. In addition, the performance of foreign securities depends on the political and economic environments and other overall economic conditions in the countries where the Fund invests. Emerging country markets involve greater risk and volatility than more developed markets. Some emerging markets countries may have fixed or managed currencies that are not free-floating against the U.S. dollar. Certain of these currencies have experienced, and may experience in the future, substantial fluctuations or a steady devaluation relative to the U.S. dollar. Investments in small and medium capitalization companies tend to have limited liquidity and greater price volatility than investments in larger capitalization companies. Value stocks typically are less volatile than growth stocks; however, issues of value stocks typically have a lower expected growth rate in earnings and sales than issues of growth stocks.
Please refer to the Schedule of Investments in the report for complete holdings information. Fund holdings, geographic allocations and/or sector allocations are subject to change at any time and are not considered a recommendation to buy or sell any security.
The foregoing reflects the thoughts and opinions of Brandes Investment Partners® exclusively and is subject to change without notice.
Brandes Investment Partners® is a registered trademark of Brandes Investment Partners, L.P. in the United States and Canada.
Must be preceded or accompanied by a prospectus.
Index Guide
The S&P Developed Ex-U.S. SmallCap Index with net dividends measures the equity performance of small-capitalization companies from developed markets excluding the United States.
The S&P Developed Ex U.S. SmallCap Value Index with net dividends measures the equity performance of small cap companies in developed markets excluding the United States, which are classified as value stocks by book value-to-price, sales-to-price, cash flow-to-price, and dividend yield.
The S&P Developed Ex-U.S. SmallCap Growth Index with net dividends measures the equity performance of small cap companies in developed markets excluding the
32
Brandes International Small Cap Equity Fund
United States, which are classified as growth stocks by 5-year historical earnings per share growth, 5-year historical sales per share growth, and 5-year average annual internal growth rate.
One cannot invest directly in an index.
The Brandes International Equity Small Cap Equity Fund is distributed by ALPS Distributors, Inc.
33
Brandes International Small Cap Equity Fund
The following chart compares the value of a hypothetical $100,000 investment in the Brandes International Small Cap Fund – Class I from September 30, 2012 to September 30, 2022 with the value of such an investment in the S&P Developed Ex-U.S. SmallCap Index for the same period.
Value of $100,000 Investment vs S&P Developed
Ex-U.S. SmallCap Index (Unaudited)

| Average Annual Total Return Periods Ended September 30, 2022(1) | ||||||||||||||||||||
| One Year | Three Years | Five Years | Ten Years | Since Inception(2) | ||||||||||||||||
Brandes International Small Cap Equity Fund | ||||||||||||||||||||
Class A | -28.26 | % | 0.11 | % | -4.27 | % | 3.32 | % | 7.10% | |||||||||||
Class A (with maximum sales charge) | -32.38 | % | -1.85 | % | -5.40 | % | 2.71 | % | 6.86% | |||||||||||
Class C(3) | -28.71 | % | -0.44 | % | -4.86 | % | 2.73 | % | N/A | |||||||||||
Class C (3) (with maximum sales charge) | -29.38 | % | -0.44 | % | -4.86 | % | 2.73 | % | N/A | |||||||||||
Class I | -28.04 | % | 0.36 | % | -4.06 | % | 3.56 | % | 7.35% | |||||||||||
Class R6(4) | -28.00 | % | 0.41 | % | -3.97 | % | 3.65 | % | 7.42% | |||||||||||
S&P Developed Ex-U.S. SmallCap Index | -33.01 | % | -2.29 | % | -2.21 | % | 4.40 | % | 5.32% | |||||||||||
| (1) | Prior to February 1, 2012, the Advisor managed a private investment fund with an investment objective, investment policies and strategies that were, in all material respects, equivalent to those of the Brandes International Small Cap Fund. The performance information shown for the Class I shares for periods before February 1, 2012 is that of the private investment fund and reflects the net expenses of the private investment fund. The performance of the private investment fund prior to February 1, 2012 is based on a calculation method that is different from the standardized calculation method prescribed by the SEC. |
34
Brandes International Small Cap Equity Fund
The performance information shown for the Class A shares has been adjusted to reflect the differences in the net expense ratios between the Class I and A shares. The private investment fund was not registered under the Investment Company Act of 1940 (“1940 Act”) and was not subject to certain investment limitations, diversification requirements, and other restrictions imposed by the 1940 Act and the Internal Revenue Code of 1986, which, if applicable, may have adversely affected its performance. |
| (2) | The inception date is August 19, 1996. |
| (3) | Performance shown prior to January 31, 2013 for Class C shares reflects the performance of Class I shares adjusted to reflect Class C expenses. The Class C shares’ average annual total return for the 10-year period assumes that Class C shares automatically converted to Class A shares 8 years after the start of the period. The Class C shares’ average annual total return for the since inception period cannot be calculated as the Class A shares did not yet exist 8 years after the Fund’s inception date. |
| (4) | Performance shown prior to June 27, 2016 for Class R6 shares reflects the performance of Class I shares adjusted to reflect Class R6 expenses. |
Performance data quoted represents past performance; past performance does not indicate future results. The investment return and principal value of an investment will fluctuate so that an investor’s shares, when redeemed, may be worth more or less than their original cost. Current performance of the Fund may be lower or higher than the performance quoted. Performance data current to the most recent month end may be obtained by calling 800-331-2979.
The returns shown do not reflect the deduction of taxes that a shareholder would pay on fund distributions or the redemption of fund shares. Brandes Investment Partners, L.P., the Advisor, has a fee waiver arrangement in place to limit the Fund’s annual operating expenses.
Sector Allocation as a Percentage of Total Investments as of
September 30, 2022 (Unaudited)
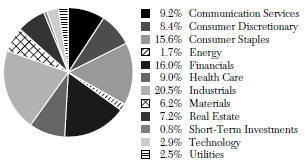
The sector classifications represented in the graph above are in accordance with Global Industry Classification Standard (GICS®), which was developed by and/or is the exclusive property of MSCI, Inc. and Standard & Poor’s Financial Services LLC.
35
Dear Fellow Investor,
The net asset value of the Brandes Small Cap Value Fund (Class I Shares) declined 16.66% in the year ended September 30, 2022. During the same period, the Russell 2000 Index declined 23.50%.
Markets have declined amid unease about inflation and a slowdown in economic growth. As interest rates have risen, technology-related companies have been among the worst performers in the Russell 2000 Index, along with some cyclically oriented companies based on increasing anxieties about future economic growth. Conversely, more defensive and commodity-oriented companies have performed relatively well, while value stocks have also fared reasonably well in a down market.
Our relative outperformance versus the broad U.S. small-cap market (Russell 2000 Index) was due to value exposure, as well as select energy and professional services companies. At the individual security level, key drivers of our outperformance over the last year were energy investments Helmerich & Payne, Chesapeake Energy, and Halliburton, as well as health care equipment & supplies producer Utah Medical Products.
Other contributors included professional services firm Resources Connection, communications equipment company Sierra Wireless, and food retailer Ingles Markets.
Key detractors for the Fund included holdings in machinery (e.g., L. B. Foster Company, Graham Corporation), aerospace & defense (e.g., Embraer) and communications equipment (e.g., NETGEAR).
Additionally, biotechnology firm Eagle Pharmaceuticals and construction & engineering business Orion Group Holdings performed poorly over the year.
Select Activity
Amid the market volatility, portfolio activity was higher than normal as the small-cap investment committee added a number of new positions to the Fund, including tow truck and towing equipment manufacturer Miller Industries, clothes company Hanesbrands, commercial services provider Healthcare Services Group, lawn and garden care products manufacturer Scotts Miracle-Gro Company, cement company Buzzi Unicem, and machinery firm Kennametal.
Kennametal (KMT) manufactures tungsten-based metal cutting components, wear-resistant cutting tools and metallurgical powders. KMT’s products address the needs of customers in cyclical industries, serving the general engineering, aerospace, energy, earthworks, and transportation markets. In our opinion, KMT boasts an attractive business model and benefits from a favorable industry structure. Eighty percent of KMT’s products are classified as consumables, which can drive recurring revenue because products such as cutting tools (e.g., drill heads or drill blades) wear
Past performance is not a guarantee of future results.
36
Brandes Small Cap Value Fund
out. Additionally, these tools tend to be highly engineered, specialty items that are critical to customers’ manufacturing productivity.
KMT is a cyclical business that has been highly sensitive to changes in the industrial production outlook. During “good” times, its stock has tended to benefit from a positive revenue and free cash flow (FCF) trajectory. When the industrial production outlook softens, the stock price has tended to retrench due to KMT’s weakening revenue and FCF outlook. Unsurprisingly, recent recession fears, combined with market scrutiny on the sustainability of KMT’s long-term margin, have hit KMT’s stock hard. As the market was focused on KMT’s depressed short-term margin outlook, the share price fell almost 50% from its 52-week high, creating a buying opportunity for long-term-oriented and price-sensitive investors such as Brandes.
We appreciate KMT’s solid balance sheet and extended debt maturity profile, its history of resilient FCF generation and healthy returns of capital, as well as its leading position in a niche industry with significant barriers to entry. Furthermore, there is upside potential to be had if KMT manages to improve its margin toward peer levels. Weighing its positive attributes against its challenges, we believe KMT offers an appealing risk/reward tradeoff.
Scotts Miracle-Gro Company (SMG) is the leading manufacturer and marketer of branded consumer lawn and garden products in North America and the exclusive agent of Monsanto for the marketing and distribution of Roundup-branded consumer products in the U.S. and certain other countries. In the mid-1900s, the company became widely known for developing quality lawn fertilizers and grass seeds that led to the creation of a new industry: consumer lawn care. In the 1990s, SMG significantly expanded its product offering by merging with Stern’s Miracle-Gro, a leader in water-soluble garden plant foods, by buying the Ortho brand, and by securing the rights to market Monsanto’s Roundup brand. Since 2015, the company has made a series of investments to establish a leadership position in hydroponic gardening.
The opportunity to invest in SMG came as the company was updating its fiscal 2022 guidance based on weaker sales outlook and rising input costs. The deterioration in company fundamentals was well known. SMG had already downgraded its original fiscal 2022 earnings per share (EPS) guidance from $8.5-9.0 to $8.0; it subsequently reported that the $8.0 target was likely unattainable. The magnitude of the updated guidance, however, was greater than the market had anticipated, and the new fiscal 2022 EPS target of $4.5-5.0 drove the company’s share price lower.
We believe the stock price now reflects the bad news and we think that most of the company’s struggles are likely to prove temporary. As of June 30, SMG offered a double-digit earnings yield and a dividend yield of more than 3%, while maintaining market leadership in its industry. That said, our level of conviction and allocation is tempered by the prevailing view that strong demand for lawn and garden products is
37
Brandes Small Cap Value Fund
not mean-reverting and, to a lesser extent, by SMG’s high financial leverage-although we believe it is manageable.
During the past year, we exited our positions in Kelly Services, N-able, Avnet, and American National Group. We also divested ALLETE, Avista, Resources Connection, and Eagle Bancorp Montana.
Looking Forward
As of September 30, 2022, the Fund’s largest sector allocations were to industrials and health care. Our allocation to industrials meaningfully increased over the past year, as we added Miller Industries and Kennametal to the Fund, and bought additional shares of Graham Corporation and Embraer.
Our most significant underweights were in financials, real estate, consumer discretionary, and information technology, which appear generally expensive to us relative to their risks, other than a few specific opportunities. Given concerns around inflation and a weakening economic environment, we have remained careful about our exposure to companies that could be hurt by continued inflation or those with significant balance sheet leverage.
In our opinion, the differences between the Brandes Small Cap Value Fund and the broader U.S. small-cap market continue to make the Fund an attractive complement to other small-cap offerings. The Fund exhibits lower valuations than the Russell 2000 Index while also offering exposure to companies we view as having strong balance sheets, compelling growth prospects and a history of durable free-cash-flow generation. Compared with the Russell 2000 Value Index, we have significantly less exposure to financials and real estate.
We remain optimistic about the prospects of the Brandes Small Cap Value Fund and its potential for patient, long-term investors.
Sincerely yours,
The Brandes Small-Cap Investment Committee
Brandes Investment Trust
Cyclically Oriented Companies: Those following the cycles of an economy through expansion, peak, recession and recovery, including companies that sell items that consumers buy more during a booming economy but spend less on during recession.
Dividend Yield: Dividends per share divided by price per share.
Earnings per share (EPS): The portion of a company’s profit allocated to each share of common stock. EPS serves as an indicator of a company’s profitability.
Free Cash Flow: Total cash flow from operations less capital expenditures.
Past performance is not a guarantee of future results.
Diversification does not assure a profit or protect against a loss.
38
Brandes Small Cap Value Fund
Because the values of the Fund’s investments will fluctuate with market conditions, so will the value of your investment in the Fund. You could lose money on your investment in the Fund, or the Fund could underperform other investments. The values of the Fund’s investments fluctuate in response to the activities of individual companies and general stock market and economic conditions. Investments in small and medium capitalization companies tend to have limited liquidity and greater price volatility than investments in larger capitalization companies. Value stocks typically are less volatile than growth stocks; however, issues of value stocks typically have a lower expected growth rate in earnings and sales than issues of growth stocks.
Please refer to the Schedule of Investments in the report for complete holdings information. Fund holdings, geographic allocations and/or sector allocations are subject to change at any time and are not considered a recommendation to buy or sell any security.
The foregoing reflects the thoughts and opinions of Brandes Investment Partners® exclusively and is subject to change without notice.
Brandes Investment Partners® is a registered trademark of Brandes Investment Partners, L.P. in the United States and Canada.
Must be preceded or accompanied by a prospectus.
Index Guide
The Russell 2000 Index with gross dividends measures the performance of the small cap segment of the U.S. equity universe.
The Russell 2000 Value Index with gross dividends measures performance of the small cap value segment of the U.S. equity universe. Securities are categorized as growth or value based on their relative book-to-price ratios, historical sales growth, and expected earnings growth.
One cannot invest directly in an index.
The Brandes Small Cap Value Fund is distributed by ALPS Distributors, Inc.
39
Brandes Small Cap Value Fund
The following chart compares the value of a hypothetical $100,000 investment in the Brandes Small Cap Value Fund – Class I from September 30, 2012 to September 30, 2022 with the value of such an investment in the Russell 2000 Total Return Index and Russell 2000 Value Total Return Index for the same period.
Value of $100,000 Investment vs Russell 2000 Total
Return Index & Russell 2000 Value Total
Return Index (Unaudited)
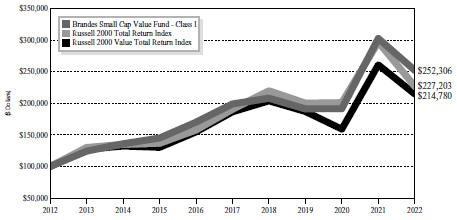
| Average Annual Total Return Periods Ended September 30, 2022(2) | ||||||||||||||||||||
| One Year | Three Years | Five Years | Ten Years | Since Inception(1) | ||||||||||||||||
Brandes Small Cap Value Fund | ||||||||||||||||||||
Class A | -16.84 | % | 9.42 | % | 4.55 | % | 9.41 | % | 6.66% | |||||||||||
Class A (with maximum sales charge) | -21.64 | % | 7.29 | % | 3.33 | % | 8.76 | % | 6.40% | |||||||||||
Class I | -16.66 | % | 9.66 | % | 4.86 | % | 9.70 | % | 6.93% | |||||||||||
Class R6(3) | -16.50 | % | 10.37 | % | 3.67 | % | 9.07 | % | 6.68% | |||||||||||
Russell 2000 Total Return Index | -23.50 | % | 4.29 | % | 3.55 | % | 8.55 | % | 6.73% | |||||||||||
Russell 2000 Value Total Return Index | -17.69 | % | 4.72 | % | 2.87 | % | 7.94 | % | 7.43% | |||||||||||
| (1) | The inception date is September 30, 1997. |
| (2) | Prior to January 2, 2018, the Advisor managed a private investment fund with an investment objective, investment policies and strategies that were, in all material respects, equivalent to those of the Brandes Small Cap Value Fund. The performance information shown for the Class I shares for periods before January 2, 2018 is that of the private investment fund and reflects the net expenses of the private investment fund. The performance of the private investment fund prior to January 2, 2018 is based on a calculation method that is different from the standardized calculation method prescribed by the SEC. |
40
Brandes Small Cap Value Fund
The performance information shown for the Class A shares has been adjusted to reflect the differences in the net expense ratios between the Class I and A shares.
| (3) | Performance shown prior to January 2, 2018 for Class R6 shares reflects the performance of Class I shares. The private investment fund was not registered under the Investment Company Act of 1940 (“1940 Act”) and was not subject to certain investment limitations, diversification requirements, and other restrictions imposed by the 1940 Act and the Internal Revenue Code of 1986, which, if applicable, may have adversely affected its performance. |
Performance data quoted represents past performance; past performance does not indicate future results. The investment return and principal value of an investment will fluctuate so that an investor’s shares, when redeemed, may be worth more or less than their original cost. Current performance of the Fund may be lower or higher than the performance quoted. Performance data current to the most recent month end may be obtained by calling 800-331-2979.
The returns shown do not reflect the deduction of taxes that a shareholder would pay on Fund distributions or the redemption of Fund shares. Brandes Investment Partners, L.P., the Advisor, has a fee waiver arrangement in place to limit the Fund’s annual operating expenses.
Sector Allocation as a Percentage of Total Investments as of
September 30, 2022 (Unaudited)
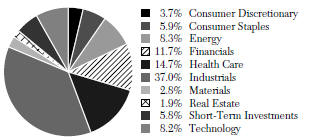
The sector classifications represented in the graph above are in accordance with Global Industry Classification Standard (GICS®), which was developed by and/or is the exclusive property of MSCI, Inc. and Standard & Poor’s Financial Services LLC.
41
Dear Fellow Investor,
The net asset value of the Brandes U.S. Value Fund (Class I Shares) declined 11.44% in the twelve months ended September 30, 2022. During the same period its benchmark, the Russell 1000 Value Index, declined 12.46%.
Over the last twelve months, a variety of health care services companies, including Cardinal Health, Cigna, McKesson, and CVS Health were the most significant contributors to performance. The industry held up better than the declining overall market, and the Fund’s holdings performed better than the industry with several reporting strong earnings results. Positions in the pharmaceuticals (e.g., Merk, Pfizer, Johnson & Johnson) and health care technology (e.g., Change Healthcare) industries also performed strongly.
Our stock selection was strong in the chemicals industry (e.g. Corteva, Westlake) as Fund holdings performed significantly better than those in the index as they appreciated in an overall declining market. Select energy positions also aided returns such as oil gas & consumable fuels company Chevron and energy equipment & services firm Halliburton.
The largest detractors from returns were our holdings and overweight in financials. Consumer finance company OneMain Holdings, as well as trust banks State Street and Bank of New York Mellon declined more than the overall market. The steepest performance declines came from traditional bank holdings such as JPMorgan Chase, Bank of America, and Citigroup.
Other economically sensitive companies, such as flooring business Mohawk and media company Comcast also saw their share prices decline.
Select Portfolio Activity
During the period, the investment committee initiated positions in semiconductor firm Qorvo, insurance broker and benefits firm Willis Towers Watson (WTW), and software company Open Text.
Qorvo was formed in 2015 via the merger of TriQuint Semiconductor and RF Micro Devices. The company is now the second-largest independent radio frequency (RF) front-end component supplier and offers products that are critical for transmitting radio signals to, and receiving them from, a smartphone’s cellular modem.
Most of Qorvo’s revenue comes from the smartphone market. It has a strong competitive position and should continue to benefit from the transition to 5G-enabled phones, which include significantly more RF components per phone (3G phones average $8 of RF components versus 5G at $25). Additionally, the company earns almost one-third of its revenue outside of smartphone end-markets, and will likely derive a benefit from the growing Internet of Things (IoT) applications for internet-connected appliances and devices.
Past performance is not a guarantee of future results.
42
Brandes U.S. Value Fund
Qorvo’s shares have declined due to concerns about supply chain constraints and a slowdown in the smartphone market, especially in China which accounts for the largest share of Qorvo’s revenue. Over the longer term, we believe that Qorvo’s supply chain constraints will be resolved and that it offers an appealing way to benefit from the growth of RF content per 5G phone, as well as the proliferation of internet-connected devices globally. At a current valuation of less than 10x our estimate of normalized earnings, we feel the company offers a desirable risk/reward tradeoff.
Willis Towers Watson (WTW) is the third-largest retail insurance broker in the United States offering insurance brokerage, actuarial support, consulting, pension plan design, risk broking and benefits outsourcing. WTW’s share price declined when an intended acquisition by Aon fell through for anti-trust reasons. WTW is now working to turn around its standalone business, with a new management team and a reconstituted board of directors.
Overall, we believe WTW is an appealing business with good cash flow generation and a strong balance sheet that trades at an attractive valuation level, especially as it works on raising its margins closer to those of its insurance broker peers. Additionally, several activist investors have bought WTW shares to push for its turnaround, and WTW has announced it will be returning a significant amount of excess cash to shareholders over the next 18 months, equal to about 15% of its market cap.
Open Text is a software company that, while based in Canada, trades in the U.S. and generates the majority of its revenue from the U.S. market. Open Text has a complex product portfolio of mostly slower-growing software applications focused on content management (includes products such as document management, signature, and analytics) and business networks (includes products used for invoicing, purchase orders, and tracking). The company has a strong track record of executing acquisitions to build its portfolio. Its software business offers attractive economics as it is largely based on recurring revenue which generates attractive cash flow. With a strong installed base of enterprise customers, including nearly all of the 100 largest companies in the U.S., and strong partnerships with the largest cloud and software providers, Open Text is positioned well to continue growing its largely recurring revenue stream as it migrates customers to the cloud.
Full sales from the Fund in the period included biotechnology firm Gilead Sciences and real estate investment trust Mid-America Apartment Communities (MAA). Real estate markets and rents have continued to see strong price appreciation, which has significantly benefitted MAA, and its shares have performed well. Additional divestments included chemical company Westlake after it reached our estimate of intrinsic value, as well as Change Healthcare, Allete, and Avnet.
Change Healthcare’s acquisition by UnitedHealth was approved, leading to its share price appreciating and we divested our position.
43
Brandes U.S. Value Fund
Allete, an electric utility, and Avnet, a semiconductor distributor, were also divested as their stock prices had held up better than the overall market during the year and the investment committee decided to deploy capital to more attractively priced opportunities amid the market volatility.
Looking Forward
As of September 30, 2022, from a sector standpoint, the Fund’s largest relative overweight positions remained in the economically sensitive financials sector, the more defensive health care sector, and various areas within the technology sector that are exposed to secular growth at what we consider to be reasonable valuations.
Our financials overweight has not performed well overall the past year, but we believe our holdings are well capitalized, trade at attractive valuation levels, and should benefit from a rising interest rate environment. Our allocation to technology stocks has increased this year as the sector has meaningfully underperformed the broader market (Russell 1000), helping create new investment opportunities as well as opportunities to add to some of our existing holdings.
Our most significant underweights are in consumer staples, utilities, and real estate, which generally appear expensive as, from our perspective, investors are overpaying for perceived defensiveness amidst an expected economic downturn. We continue to be careful with our exposure to companies that may be hurt by elevated inflation or those with balance sheet leverage. Instead, we find value in the traditionally defensive health care sector.
We believe the differences between the Brandes U.S. Value Fund and the broader U.S. market continue to make the Fund an attractive complement to more index-like or growth-oriented alternatives.
Despite their strong relative performance this year, U.S. value stocks (MSCI USA Value) continue to trade at their cheapest decile relative to growth stocks (MSCI USA Growth) across a variety of valuation metrics (e.g., price/earnings, price/cash flow, EV/sales). Historically, discounts similar to today’s levels have often portended attractive returns over a long-term time horizon for U.S. value stocks.
While a variety of headwinds face stocks today (e.g., elevated inflation, slowing economic growth and recession concerns, energy risk, and political and regulatory risks just to name a few), we believe that at today’s valuations, value stocks and the Fund in particular offer an attractive long-term opportunity. It’s important to remember that our overall positioning is driven from the bottom up, on a company-by-company basis, with a focus on the long term. We take into account many of the economic concerns noted above when we are evaluating a potential investment, determining the impact they may have on the investment’s intrinsic value. But given the heightened volatility and extremes that exist in the market today, we believe the Fund’s overall positioning offers an attractive opportunity for long-term investors.
44
Brandes U.S. Value Fund
Sincerely yours,
The Brandes Global Large-Cap Investment Committee
Brandes Investment Trust
Cash Flow: The amount of cash generated minus the amount of cash used by a company in a given period.
EV/Sales: Compares the enterprise value of a company to its annual sales.
Market Capitalization (Cap): The number of common shares outstanding multiplied by the current market price per common share.
Normalized Earnings: Earnings adjusted based on economic cycles.
Price/Cash Flow: Price per share divided by cash flow per share.
Price/Earnings: Price per share divided by earnings per share.
Past performance is not a guarantee of future results.
Diversification does not assure a profit or protect against a loss.
Because the values of the Fund’s investments will fluctuate with market conditions, so will the value of your investment in the Fund. You could lose money on your investment in the Fund, or the Fund could underperform other investments. The values of the Fund’s investments fluctuate in response to the activities of individual companies and general stock market and economic conditions. Value stocks typically are less volatile than growth stocks; however, issues of value stocks typically have a lower expected growth rate in earnings and sales than issues of growth stocks.
Please refer to the Schedule of Investments in the report for complete holdings information. Fund holdings, geographic allocations and/or sector allocations are subject to change at any time and are not considered a recommendation to buy or sell any security.
The foregoing reflects the thoughts and opinions of Brandes Investment Partners® exclusively and is subject to change without notice.
Brandes Investment Partners® is a registered trademark of Brandes Investment Partners, L.P. in the United States and Canada.
Must be preceded or accompanied by a prospectus.
Index Guide
The Russell 1000 Value Index with gross dividends measures performance of the large cap segment of the U.S. equity universe. Securities are categorized as growth or value based on their relative book-to-price ratios, historical sales growth, and expected earnings growth.
The Russell 1000 Index with gross dividends measures performance of the large cap segment of the U.S. equity universe.
45
Brandes U.S. Value Fund
The MSCI USA Value Index with gross dividends captures large and mid cap US securities exhibiting overall value style characteristics. The value investment style characteristics for index construction are defined using book value to price, 12-month forward earnings to price and dividend yield.
The MSCI USA Growth Index with gross dividends captures large and mid cap US securities exhibiting overall growth style characteristics. The growth investment style characteristics include long-term forward EPS growth rate, short-term forward EPS growth rate, current internal growth rate, long-term historical EPS growth trend and long-term historical sales per share growth trend.
MSCI has not approved, reviewed or produced this report, makes no express or implied warranties or representations and is not liable whatsoever for any data in the report. You may not redistribute the MSCI data or use it as a basis for other indices or investment products.
One cannot invest directly in an index.
The Brandes U.S. Value Fund is distributed by ALPS Distributors, Inc.
46
Brandes U.S. Value Fund
The following chart compares the value of a hypothetical $100,000 investment in the Brandes U.S. Value Fund – Class I from October 1, 2021 to September 30, 2022 with the value of such an investment in the Russell 1000 Total Return Index and Russell 1000 Value Total Return Index for the same period.
Value of $100,000 Investment vs Russell 1000 Total
Return Index & Russell 1000 Value Total
Return Index (Unaudited)
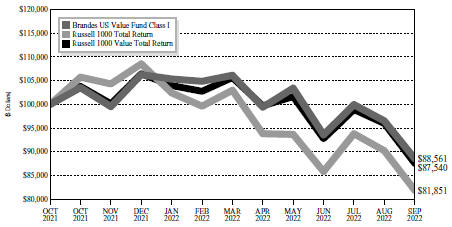
| Since Inception | |||||
Brandes U.S. Value Fund | |||||
Class A | -11.39% | ||||
Class A (with maximum sales charge) | -16.49% | ||||
Class I | -11.44% | ||||
Class R6 | -11.39% | ||||
Russell 1000 Total Return | -18.15% | ||||
Russell 1000 Value Total Return | -12.46% | ||||
Performance data quoted represents past performance; past performance does not indicate future results. The investment return and principal value of an investment will fluctuate so that an investor’s shares, when redeemed, may be worth more or less than their original cost. Current performance of the Fund may be lower or higher than the performance quoted. Performance data current to the most recent month end may be obtained by calling 800-331-2979.
The returns shown do not reflect the deduction of taxes that a shareholder would pay on Fund distributions or the redemption of Fund shares. Brandes Investment Partners, L.P., the Advisor, has a fee waiver arrangement in place to limit the Fund’s annual operating expenses.
47
Brandes U.S. Value Fund
Sector Allocation as a Percentage of Total Investments as of
September 30, 2022 (Unaudited)
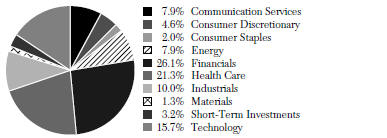
The sector classifications represented in the graph above are in accordance with Global Industry Classification Standard (GICS®), which was developed by and/or is the exclusive property of MSCI, Inc. and Standard & Poor’s Financial Services LLC.
48
Brandes Core Plus Fixed Income Fund
Dear Fellow Investor,
The net asset value of the Brandes Core Plus Fixed Income Fund (Class I Shares) declined 12.25% in the year ended September 30, 2022. During the same period, the Bloomberg U.S. Aggregate Bond Index declined by 14.60%.
By some accounts, this year’s bond market performance was the worst bond market performance since ’88 – that is 1788. Interest rates continued to march higher, equity markets continued to move lower, and inflation readings hit levels not seen since the 1970s.
Over the past year, fixed income markets appear to be undergoing a cyclical and perhaps secular change from a long period of low interest rates coupled with low inflation. Inflation readings over the past year have hit levels not seen since the late-1970s and interest rates have moved upwards to levels not seen in over a decade.
As a result, the fixed income market has had to grapple with increasing yields and widening yield spreads. Returns on all major fixed income asset classes and sectors have been negative over the trailing 12-months as the low overall level of yields offered in the market have provided little cushion to insulate bond prices from the effects of rapidly rising interest rates.
In 1975, REO Speedwagon released an album titled: This Time We Mean It. Those words appear to be an apt description of the Fed’s messaging to the market during the past year regarding its resolve to tame rampant inflation.
While the Federal Reserve (Fed) adopted a more hawkish stance throughout the earlier part of the year and backed up their rhetoric with the fastest rate hikes since the summer of 1980, up until the third quarter there appeared to be a lack of market belief in the Fed’s conviction to fully commit to bringing inflation under control if it meant causing elevated market volatility. The Fed has talked tough, but during the first half of this year, the market seemed to be continually expecting a pivot in policy, back to a more accommodative stance.
The last fifteen years of Fed policy are analogous to a long car trip with temperamental children in the back seat. To make the ride smoother and more tolerable you give the kids a bit of sugar, and for a while they’re all happy and well behaved. Eventually, however, the sugar rush wears off. As a parent, in the back of your mind you know that the right thing to do is cut off the sugar and deal with the consequences; but it’s been such a lovely ride, you wonder what’s the harm in keeping the rush going? The problem is that the longer you prolong the inevitable normalization the higher the behavioral volatility will likely be.
The Fed made a change to its messaging during the third quarter. It effectively told the markets that it is not supplying any more sugar. Not unlike the antics of temperamental
Past performance is not a guarantee of future results.
49
Brandes Core Plus Fixed Income Fund
children, we saw a dramatic sell-off in equites and bonds. Both the S&P 500 and the Bloomberg U.S. Aggregate Index declined by nearly 5% during the most recent quarter end.
Earlier in the year the Fed’s message was focused on guiding the economy to a soft landing, which evolved into a “softish landing”, and then to more recent rhetoric that there will likely be some economic pain in the efforts to bring down inflation. The Fed has a dual mandate to maintain price stability and full employment. Chair Powell indicated that the Fed’s priority is now keenly focused on price stability.
The open question as we enter the fourth quarter 2022 is whether the Fed will stick to its newfound conviction. It’s relatively easy to talk tough when the unemployment rate is the lowest in nearly 50 years. It’s another thing to stay on track if the economy starts shedding jobs or heads into a recession.
The silver lining around the rapid rise in fixed income yields however, is that overall yields are at levels last reached over a decade ago. It seems like a novel idea – tongue firmly in cheek – but by the end of the third quarter, and for the first time in a long time, fixed income securities actually provided an income component.
Specific to the Brandes Core Plus Fund, the trailing 12-month performance has been negative on an absolute basis, but meaningfully positive on a relative basis versus the benchmark Bloomberg U.S. Aggregate Index as well as broader Core Plus peers.
Strong relative returns can be traced to a number of factors:
New purchases into the Fund during the twelve-month period included; Coty Inc. secured debt (5.00% coupon, maturing 4/15/26, rated B1/B+), Range Resources (9.25% coupon, maturing 2/1/26, callable 2/1/22, rated B1/BB-) American Transmission System (2.65% coupon, maturing 1/15/32, rated A3/BBB), Mauser Packaging (7.25% coupon, maturing 4/15/25, rated Caa3/CCC), Charles Schwab Inc. (5.375% coupon, perpetual, callable 6/1/25, rated Baa2/BBB), Citigroup Inc. (4.40% coupon, maturing 6/10/25, rated Baa2/BBB), Methanex Corp (5.125% coupon, maturing 10/15/27, rated Ba1/BB, Ford Motor Credit (2.70% coupon, maturing 8/10/26, rated Ba2/BB+), Bank of America (4.45% coupon, maturing 3/3/26, rated Baa1/BBB+), and Hess Midstream LP (4.25% coupon, maturing 2/15/30, rated Ba2/BB+).
Coty Inc. is a world leader in beauty with 75 brands and is home to well-known brands such as CoverGirl, Clairol and Max Factor. The company experienced a revolving door in the chief executive officer’s (CEO’s) chair with four different CEOs in 2020. Additionally, the pandemic affected revenues as beauty sales suffered in a world dominated by Zoom calls.
However, Coty is in the early stages of an operational turnaround centered on three key initiatives: 1) shifting the mix toward prestige brands with a focus on clean and green—i.e., CoverGirl Clean Fresh vegan makeup; 2) stabilizing its mass market beauty
50
Brandes Core Plus Fixed Income Fund
portfolio; and 3) reducing leverage through applying strong operational cash flows to paying down debt and divesting non-core brands.
As the pandemic recedes and more people can return to the office, travel, and engage in leisure activities, we believe Coty is well positioned to benefit from positive industry trends, as well as specific steps the company has taken to strengthen its balance sheet and product portfolio.
We believe that theCharles Schwab bond that we purchased is a good example of a situation where the distinctive structure of the security presents an attractive value opportunity. This bond is a junior subordinated security – it ranks lower in the company’s capital structure. It pays a fixed-rate coupon until June 2025. If the bond is not called in June 2025, it will become a perpetual security, and its coupon will revert to a floating rate based on the 5-year U.S. Treasury rate plus 4.97% - with a quarterly reset. The reset rate will be at a yield spread that is similar to where low-quality high yield bonds generally trade.
The distinctive feature of this bond is that if Charles Schwab chooses not to call the security in June 2025, the company does not have the option to call it again for an additional five years. At today’s interest rates the coupon would reset to nearly 7%. Given the relatively high cost of a coupon reset and the limited flexibility offered to the company for future calls, we believe that this bond is best treated as a bullet security with a 3-year maturity.
Charles Schwab issued this bond in April 2020 during the early stages of the pandemic, which we believe is the likely explanation of why the bond’s structure is not representative of the strong underlying credit quality of the company. As a result, this represents an attractive value opportunity to us.
During the period, the Fund exited full positions in Occidental Petroleum (3.50% coupon, maturing 6/15/25, rated Ba1/BB+) and Allison Transmission Inc. (4.75% coupon, maturing 10/1/27, rated Ba2/NR). Moreover, the Fund experienced a full call in Range Resources (9.25% coupon, maturing 2/1/26, rated B1/BB-), in Avon Products Inc. (6.50% coupon, maturing 3/15/23, rated Ba3/BB-) and in British Petroleum (3.50% coupon, maturing 3.506%, rated A2/A-), and saw maturities in Microsoft Corp., ExxonMobil, and AT&T Inc.
Overall, while we are starting to see more value come into the corporate bond market, credit yield spreads have not been as volatile as they were in previous episodes of market instability such as 2002 (Enron and WorldCom bankruptcies), 2008 (Global Financial Crisis), and 2020 (COVID pandemic). Most of the widening in corporate bonds yields has been attributable to the rise in U.S Treasury rates rather than outright weakness in corporate bonds. This reinforces our view that the most prudent approach is to continue to seek value in a measured and deliberate manner.
Markets now appear to be exiting a period where valuations were largely artificially propped up by huge injections of liquidity and easy policy by the Fed - not to mention
51
Brandes Core Plus Fixed Income Fund
extraordinary stimulus from the federal government. This transition has been painful for virtually every financial asset class over the short-term. In our view, over the last several years fundamentals like cash flow generation, margins, and balance sheet positioning have taken a back seat to technical factors like momentum and investor enthusiasm.
As the market continues to adapt to what appears to be a post-pandemic financial reckoning, we’ve started to see signs of a rise in idiosyncratic risk. For example, one of the first casualties has been a telecommunications company named Avaya. As recently as June, Avaya was able to raise new debt, despite being highly leveraged. The price of those bonds has fallen nearly 40% since issuance after Avaya cut earnings forecasts and disclosed “substantial doubt” about its ability to keep operating. (We did not invest in these bonds).
As we move forward, we believe that understanding how inflation and higher interest rates affect individual companies’ revenue, costs, and ability to refinance has taken on much more importance than it did in a zero-rateworld. There are an increasing number of bonds that we believe offer attractive yields, but there are also companies facing margin pressures that may have trouble refinancing at higher rates.
Interest rates are higher and yields on bonds are more attractive than they have been in quite some time. We believe, however, that careful security selection rooted in fundamental value principles is the key to successfully guiding the Fund through this uncertain and volatile landscape.
For a considerable period now, we have attempted to tilt the Brandes Core Plus Fixed Income Fund into what we believe is a defensive posture in order to mitigate some of the potential detrimental impact of rising interest rates and widening yield spreads. The Fund continues to favor shorter-maturity corporate bonds and those that we believe exhibit strong, tangible asset coverage, while remaining underweight agency MBS. We are managing duration toward the shorter end of our duration-controlled range. We have a meaningful allocation to U.S. Treasuries and if recent market uncertainty and volatility continue to cause credit fundamentals to become mispricedrelative to our estimates of intrinsic value, then we will look to redeploy some of those Treasury holdings thoughtfully and effectively to take advantage of opportunities.
As we move forward, we believe prudence dictates that we continue our search for value in a measured and deliberate manner while continuing to tilt the Fund to what we believe is a relatively defensive posture.
We remain optimistic about the prospects for the Brandes Core Plus Fixed Income Fund.
Sincerely yours,
The Brandes Fixed Income Investment Committee
Brandes Investment Trust
52
Brandes Core Plus Fixed Income Fund
Agency mortgage-backed securities (MBS): An MBS issued by one of three quasi-governmental agencies: The Government National Mortgage Association (GNMA or Ginnie Mae), the Federal National Mortgage Association (FNMA or Fannie Mae), and the Federal Home Loan Mortgage Corporation (Freddie Mac). A MBS is an investment similar to a bond that is made up of a bundle of home loans bought from the banks that issued them.
Asset Coverage: Measures how well a company can repay its debts by selling or liquidating its assets.
Cash Flow: The amount of cash generated minus the amount of cash used by a company in a given period.
Coupon: The annual interest rate paid on a bond, expressed as a percentage of the face value and paid from issue date until maturity.
Duration: The weighted maturity of a fixed-income investment’s cash flows, used in the estimation of the price sensitivity of fixed-income securities for a given change in interest rates.
Floating Rate: A debt instrument that does not have a fixed rate of interest over the life of the instrument.
Idiosyncratic Risk: The risk that is endemic to a particular asset and not a whole investment portfolio.
Yield: Annual income from the investment (dividend, interest, etc.) divided by the current market price of the investment.
Yield Curve: A graphical comparison of the relationship between interest rates for loans of various maturities with similar credit quality. A typical yield curve slopes upward to reflect higher interest rates for longer maturities.
Yield Spread: The net difference between two interest-bearing instruments of varying maturities, credit ratings, issuer or risk level.
Past Performance is not a guarantee of future results.
Diversification does not assure a profit or protect against a loss in a declining market.
Because the values of the fund’s investments will fluctuate with market conditions, so will the value of your investment in the fund. You could lose money on your investment in the fund, or the fund could underperform other investments. The values of the fund’s investments fluctuate in response to the activities of individual companies and general bond market and economic conditions. Investments in small and medium capitalization companies tend to have limited liquidity and greater price volatility than large capitalization companies.
As with most fixed income funds, the income on and value of your shares in the fund will fluctuate along with interest rates. When interest rates rise, the market prices of the debt securities the fund owns usually decline. When interest rates fall, the prices of these
53
Brandes Core Plus Fixed Income Fund
securities usually increase. Generally, the longer the fund’s average portfolio maturity and the lower the average quality of its portfolio, the greater the price fluctuation. The price of any security owned by the fund may also fall in response to events affecting the issuer of the security, such as its ability to continue to make principal and interest payments or its credit rating. Below investment grade debt securities are speculative and involve a greater risk of default and price change due to changes in the issuer’s creditworthiness than higher grade debt. The market prices of these debt securities may fluctuate more than the market prices of investment grade debt securities and may decline significantly in periods of general economic difficulty.
Bond credit ratings are grades given to bonds that indicate their credit quality as determined by a private independent rating service. The firm evaluates a bond issuer’s financial strength, or its ability to pay a bond’s principal and interest in a timely fashion. Credit ratings are measured on a scale that generally ranges from AAA (highest) to D (lowest). All Fund securities except for those labeled “Not Rated” and “Other” have been rated by Moody’s, S&P or Fitch, which are each a Nationally Recognized Statistical Rating Organization. All Index securities except for those labeled “Not Rated” have been rated by Moody’s or S&P. Credit ratings are subject to change.
Index securities except for those labeled “Not Rated” have been rated by Moody’s or S&P. Credit ratings are subject to change.
Please refer to the Schedule of Investments in the report for complete holdings information. Fund holdings, geographic allocations and/or sector allocations are subject to change at any time and are not considered a recommendation to buy or sell any security.
The foregoing reflects the thoughts and opinions of Brandes Investment Partners® exclusively and is subject to change without notice.
Brandes Investment Partners® is a registered trademark of Brandes Investment Partners, L.P. in the United States and Canada.
Must be preceded or accompanied by a prospectus.
Index Guide
The Bloomberg Barclays U.S. Aggregate Bond Index is a broad-based benchmark that measures the investment grade, U.S. dollar-denominated, fixed-rate taxable bond market. This index is a total return index which reflects the price changes and interest of each bond in the index.
The S&P 500 Index with gross dividends measures equity performance of 500 of the top companies in leading industries of the U.S. economy.
One cannot invest directly in an index.
The Brandes Core Plus Fixed Income Fund is distributed by ALPS Distributors, Inc.
54
Brandes Core Plus Fixed Income Fund
The following chart compares the value of a hypothetical $100,000 investment in the Brandes Core Plus Fixed Income Fund – Class I from September 30, 2012 to September 30, 2022 with the value of such an investment in the Bloomberg U.S. Aggregate Bond Index for the same period.
Value of $100,000 Investment vs Bloomberg
U.S. Aggregate Bond Index (Unaudited)
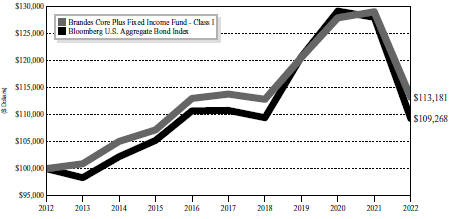
| Average Annual Total Return Periods Ended September 30, 2022 | ||||||||||||||||||||
| One | Three | Five | Ten | Since | ||||||||||||||||
| Year | Years | Years | Years | Inception(1) | ||||||||||||||||
Brandes Core Plus Fixed Income Fund | ||||||||||||||||||||
Class A(2) | -12.55 | % | -2.31 | % | -0.35 | % | 0.92 | % | 2.30% | |||||||||||
Class A (2) (with maximum sales charge) | -15.80 | % | -3.56 | % | -1.11 | % | 0.54 | % | 2.04% | |||||||||||
Class I | -12.25 | % | -2.08 | % | -0.10 | % | 1.25 | % | 2.61% | |||||||||||
Class R6(2) | -11.26 | % | -1.02 | % | 0.84 | % | 1.75 | % | 2.96% | |||||||||||
Bloomberg Barclays U.S. Aggregate Bond Index | -14.60 | % | -3.26 | % | -0.27 | % | 0.89 | % | 2.60% | |||||||||||
| (1) | The inception date is December 28, 2007. |
| (2) | Performance shown prior to January 31, 2013 for Class A shares reflects the performance of Class I shares adjusted to reflect Class A expenses. Performance shown prior to October 10, 2017 for Class R6 shares reflects the performance of Class I shares adjusted to reflect Class R6 expenses. |
Performance data quoted represents past performance; past performance does not indicate future results. The investment return and principal value of an investment will fluctuate so that an investor’s shares, when redeemed, may be worth more or less than their original cost. Current performance of the Fund may be lower or higher than the
55
Brandes Core Plus Fixed Income Fund
performance quoted. Performance data current to the most recent month end may be obtained by calling 800-331-2979.
The returns shown do not reflect the deduction of taxes that a shareholder would pay on fund distributions or the redemption of Fund shares. Brandes Investment Partners, L.P., the Advisor, has a fee waiver arrangement in place to limit the Fund’s annual operating expenses.
Asset Allocation as a Percentage of Total Investments as of
September 30, 2022 (Unaudited)
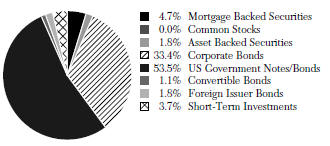
56
Expense Example (Unaudited)
As a shareholder of a Fund, you incur ongoing costs, including investment advisory and administrative fees and other fund expenses. The examples below are intended to help you understand your ongoing costs (in dollars) of investing in the Funds and to compare these costs with ongoing costs of investing in other mutual funds.
The examples are based on an investment of $1,000 invested at the beginning of the period and held for the entire period from April 1, 2022 to September 30, 2022 (the “Period”).
Actual Expenses
This section provides information about actual account values and actual expenses. The “Ending Account Value” shown is derived from each Fund’s actual return. You may use the information in this section, together with the amount you invested, to estimate the expenses that you paid over the period. Simply divide your account value by $1,000 (for example, an $8,600 account value divided by $1,000 = 8.6), then multiply the result by the number given for the Fund under the heading “Expenses Paid During Period” to estimate the expenses you paid on your account during this period.
| Class A | ||||||||||||||||||||
| Expenses | ||||||||||||||||||||
| Beginning | Ending | Annualized | Paid | |||||||||||||||||
| Account | Account | Expense | During | |||||||||||||||||
Fund | Value | Value | Ratio | the Period | ||||||||||||||||
International Equity Fund | $ | 1,000.00 | $ | 777.00 | 1.13 | % | $ | 5.03 | * | |||||||||||
Global Equity Fund | $ | 1,000.00 | $ | 810.90 | 1.25 | % | $ | 5.67 | * | |||||||||||
Emerging Markets Value Fund | $ | 1,000.00 | $ | 800.20 | 1.35 | % | $ | 6.09 | * | |||||||||||
International Small Cap Fund | $ | 1,000.00 | $ | 799.40 | 1.37 | % | $ | 6.18 | * | |||||||||||
Small Cap Value Fund | $ | 1,000.00 | $ | 811.70 | 1.15 | % | $ | 5.22 | * | |||||||||||
U.S. Value Fund | $ | 1,000.00 | $ | 833.10 | 0.95 | % | $ | 4.37 | ||||||||||||
Core Plus Fixed Income Fund | $ | 1,000.00 | $ | 924.50 | 0.50 | % | $ | 2.41 | * | |||||||||||
| Class C | ||||||||||||||||||||
| Expenses | ||||||||||||||||||||
| Beginning | Ending | Annualized | Paid | |||||||||||||||||
| Account | Account | Expense | During | |||||||||||||||||
Fund | Value | Value | Ratio | the Period | ||||||||||||||||
International Equity Fund | $ | 1,000.00 | $ | 773.80 | 1.88 | % | $ | 8.36 | * | |||||||||||
Global Equity Fund | $ | 1,000.00 | $ | 808.00 | 2.00 | % | $ | 9.06 | * | |||||||||||
Emerging Markets Value Fund | $ | 1,000.00 | $ | 797.20 | 2.10 | % | $ | 9.46 | * | |||||||||||
International Small Cap Fund | $ | 1,000.00 | $ | 797.60 | 2.12 | % | $ | 9.55 | * | |||||||||||
57
Brandes Investment Trust
| Class I | ||||||||||||||||||||
| Expenses | ||||||||||||||||||||
| Beginning | Ending | Annualized | Paid | |||||||||||||||||
| Account | Account | Expense | During | |||||||||||||||||
Fund | Value | Value | Ratio | the Period | ||||||||||||||||
International Equity Fund | $ | 1,000.00 | $ | 778.10 | 0.85 | % | $ | 3.79 | * | |||||||||||
Global Equity Fund | $ | 1,000.00 | $ | 812.20 | 1.00 | % | $ | 4.54 | * | |||||||||||
Emerging Markets Value Fund | $ | 1,000.00 | $ | 802.10 | 1.12 | % | $ | 5.06 | * | |||||||||||
International Small Cap Fund | $ | 1,000.00 | $ | 801.40 | 1.15 | % | $ | 5.19 | * | |||||||||||
Small Cap Value Fund | $ | 1,000.00 | $ | 812.40 | 0.90 | % | $ | 4.09 | * | |||||||||||
U.S. Value Fund | $ | 1,000.00 | $ | 834.30 | 0.70 | % | $ | 3.22 | ||||||||||||
Core Plus Fixed Income Fund | $ | 1,000.00 | $ | 926.30 | 0.30 | % | $ | 1.45 | * | |||||||||||
| Class R6 | ||||||||||||||||||||
| Expenses | ||||||||||||||||||||
| Beginning | Ending | Annualized | Paid | |||||||||||||||||
| Account | Account | Expense | During | |||||||||||||||||
Fund | Value | Value | Ratio | the Period | ||||||||||||||||
International Equity Fund | $ | 1,000.00 | $ | 778.70 | 0.75 | % | $ | 3.34 | * | |||||||||||
Emerging Markets Value Fund | $ | 1,000.00 | $ | 801.30 | 0.97 | % | $ | 4.38 | * | |||||||||||
International Small Cap Fund | $ | 1,000.00 | $ | 801.40 | 1.00 | % | $ | 4.52 | * | |||||||||||
Small Cap Value Fund | $ | 1,000.00 | $ | 812.50 | 0.72 | % | $ | 3.27 | * | |||||||||||
U.S. Value Fund | $ | 1,000.00 | $ | 834.70 | 0.60 | % | $ | 2.76 | ||||||||||||
Core Plus Fixed Income Fund | $ | 1,000.00 | $ | 930.70 | 0.30 | % | $ | 1.45 | * | |||||||||||
| * | The Fund’s expenses are equal to the Fund’s expense ratio for the period, multiplied by the average account value over the period, multiplied by 183/365 (to reflect the one half-year period). |
Hypothetical Example for Comparison Purposes
This section provides information about hypothetical account values and hypothetical expenses based on the Funds’ actual expense ratios and an assumed rate of return of 5% per year before expenses, which are not the Funds’ actual returns. The hypothetical account values and expenses may not be used to estimate the actual ending account balance or expenses you paid for the period. You may use this information to compare the ongoing costs of investing in the Funds and other mutual funds. To do so, compare this 5% hypothetical example with the 5% hypothetical examples that appear in the shareholder reports of the other mutual funds.
Please note that the expenses shown in the table are meant to highlight your ongoing costs only and do not reflect any transaction costs, such as brokerage commissions on purchase and sales of Fund shares. Therefore, the last column of the table is useful in comparing ongoing costs only, and will not help you determine the relative total costs of owning different funds. In addition, if these transactional costs were included, your costs would have been higher.
58
Brandes Investment Trust
| Class A | ||||||||||||||||||||
| Expenses | ||||||||||||||||||||
| Beginning | Ending | Annualized | Paid | |||||||||||||||||
| Account | Account | Expense | During | |||||||||||||||||
Fund | Value | Value | Ratio | the Period | ||||||||||||||||
International Equity Fund | $ | 1,000.00 | $ | 1,019.40 | 1.13 | % | $ | 5.72 | * | |||||||||||
Global Equity Fund | $ | 1,000.00 | $ | 1,018.80 | 1.25 | % | $ | 6.33 | * | |||||||||||
Emerging Markets Value Fund | $ | 1,000.00 | $ | 1,018.30 | 1.35 | % | $ | 6.83 | * | |||||||||||
International Small Cap Fund | $ | 1,000.00 | $ | 1,018.20 | 1.37 | % | $ | 6.93 | * | |||||||||||
Small Cap Value Fund | $ | 1,000.00 | $ | 1,019.30 | 1.15 | % | $ | 5.82 | * | |||||||||||
U.S. Value Fund | $ | 1,000.00 | $ | 1,020.31 | 0.95 | % | $ | 4.81 | ||||||||||||
Core Plus Fixed Income Fund | $ | 1,000.00 | $ | 1,022.56 | 0.50 | % | $ | 2.54 | * | |||||||||||
| Class C | ||||||||||||||||||||
| Expenses | ||||||||||||||||||||
| Beginning | Ending | Annualized | Paid | |||||||||||||||||
| Account | Account | Expense | During | |||||||||||||||||
Fund | Value | Value | Ratio | the Period | ||||||||||||||||
International Equity Fund | $ | 1,000.00 | $ | 1,015.64 | 1.88 | % | $ | 9.50 | * | |||||||||||
Global Equity Fund | $ | 1,000.00 | $ | 1,015.04 | 2.00 | % | $ | 10.10 | * | |||||||||||
Emerging Markets Value Fund | $ | 1,000.00 | $ | 1,014.54 | 2.10 | % | $ | 10.61 | * | |||||||||||
International Small Cap Fund | $ | 1,000.00 | $ | 1,014.44 | 2.12 | % | $ | 10.71 | * | |||||||||||
| Class I | ||||||||||||||||||||
| Expenses | ||||||||||||||||||||
| Beginning | Ending | Annualized | Paid | |||||||||||||||||
| Account | Account | Expense | During | |||||||||||||||||
Fund | Value | Value | Ratio | the Period | ||||||||||||||||
International Equity Fund | $ | 1,000.00 | $ | 1,020.81 | 0.85 | % | $ | 4.31 | * | |||||||||||
Global Equity Fund | $ | 1,000.00 | $ | 1,020.05 | 1.00 | % | $ | 5.06 | * | |||||||||||
Emerging Markets Value Fund | $ | 1,000.00 | $ | 1,019.45 | 1.12 | % | $ | 5.67 | * | |||||||||||
International Small Cap Fund | $ | 1,000.00 | $ | 1,019.30 | 1.15 | % | $ | 5.82 | * | |||||||||||
Small Cap Value Fund | $ | 1,000.00 | $ | 1,020.56 | 0.90 | % | $ | 4.56 | * | |||||||||||
U.S. Value Fund | $ | 1,000.00 | $ | 1,021.56 | 0.70 | % | $ | 3.55 | ||||||||||||
Core Plus Fixed Income Fund | $ | 1,000.00 | $ | 1,023.56 | 0.30 | % | $ | 1.52 | * | |||||||||||
| Class R6 | ||||||||||||||||||||
| Expenses | ||||||||||||||||||||
| Beginning | Ending | Annualized | Paid | |||||||||||||||||
| Account | Account | Expense | During | |||||||||||||||||
Fund | Value | Value | Ratio | the Period | ||||||||||||||||
International Equity Fund | $ | 1,000.00 | $ | 1,021.31 | 0.75 | % | $ | 3.80 | * | |||||||||||
Emerging Markets Value Fund | $ | 1,000.00 | $ | 1,020.21 | 0.97 | % | $ | 4.91 | * | |||||||||||
International Small Cap Fund | $ | 1,000.00 | $ | 1,020.05 | 1.00 | % | $ | 5.06 | * | |||||||||||
Small Cap Value Fund | $ | 1,000.00 | $ | 1,021.46 | 0.72 | % | $ | 3.65 | * | |||||||||||
U.S. Value Fund | $ | 1,000.00 | $ | 1,022.06 | 0.60 | % | $ | 3.04 | ||||||||||||
Core Plus Fixed Income Fund | $ | 1,000.00 | $ | 1,023.56 | 0.30 | % | $ | 1.52 | * | |||||||||||
| * | The Fund’s expenses are equal to the Fund’s expense ratio for the period, multiplied by the average account value over the period, multiplied by 183/365 (to reflect the one half-year period). |
59
Brandes International Equity Fund
SCHEDULE OF INVESTMENTS — September 30, 2022
| Shares | Value | |||||||
COMMON STOCKS – 95.28% | ||||||||
Austria – 1.42% | ||||||||
| 299,418 | Erste Group Bank AG | $ | 6,563,893 | |||||
|
| |||||||
| Belgium – 1.44% | ||||||||
| 146,320 | Anheuser-Busch InBev SA/NV | 6,627,804 | ||||||
|
| |||||||
| Brazil – 4.57% | ||||||||
| 2,395,800 | Ambev SA | 6,901,801 | ||||||
| 980,458 | Embraer SA Sponsored – ADR(a) | 8,431,939 | ||||||
| 767,100 | Telefonica Brasil SA | 5,757,854 | ||||||
|
| |||||||
| 21,091,594 | ||||||||
|
| |||||||
| China – 2.46% | ||||||||
| 1,136,500 | Alibaba Group Holding Ltd.(a) | 11,341,518 | ||||||
|
| |||||||
| France – 17.43% | ||||||||
| 179,584 | BNP Paribas SA | 7,585,495 | ||||||
| 674,375 | Carrefour SA | 9,352,969 | ||||||
| 148,757 | Danone SA | 7,034,024 | ||||||
| 695,698 | Engie SA | 8,007,407 | ||||||
| 1,059,194 | Orange SA | 9,579,921 | ||||||
| 237,254 | Publicis Groupe SA | 11,241,734 | ||||||
| 124,687 | Renault SA(a) | 3,373,535 | ||||||
| 150,516 | Sanofi | 11,461,269 | ||||||
| 67,829 | Societe BIC SA | 4,302,442 | ||||||
| 180,484 | TotalEnergies SE(b) | 8,467,332 | ||||||
|
| |||||||
| 80,406,128 | ||||||||
|
| |||||||
| Germany – 8.43% | ||||||||
| 327,121 | Fresenius & Co. KGaA | 6,972,651 | ||||||
| 236,894 | HeidelbergCement AG | 9,358,299 | ||||||
| 203,349 | Henkel AG & Co. KGaA | 11,524,440 | ||||||
| 135,521 | SAP SE | 11,044,307 | ||||||
|
| |||||||
| 38,899,697 | ||||||||
|
| |||||||
| Hong Kong – 0.78% | ||||||||
| 11,842,000 | First Pacific Co. Ltd. | 3,600,674 | ||||||
|
| |||||||
| Italy – 5.68% | ||||||||
| 434,979 | Buzzi Unicem SpA | 6,153,244 | ||||||
| 788,080 | Eni SpA | 8,376,265 | ||||||
| 5,281,728 | Intesa Sanpaolo SpA | 8,730,782 | ||||||
| 16,264,983 | Telecom Italia SpA(a) | 2,929,726 | ||||||
|
| |||||||
| 26,190,017 | ||||||||
|
| |||||||
| Shares | Value | |||||||
Japan – 15.07% | ||||||||
| 333,700 | Honda Motor Co. Ltd. | $ | 7,243,222 | |||||
| 1,973,500 | Mitsubishi UFJ Financial Group, Inc. | 8,940,207 | ||||||
| 330,199 | MS&AD Insurance Group Holdings, Inc. | 8,744,569 | ||||||
| 1,129,700 | Nissan Motor Co. Ltd. | 3,640,608 | ||||||
| 156,900 | SoftBank Group Corp. | 5,317,515 | ||||||
| 278,000 | Sumitomo Mitsui Trust Holdings, Inc. | 7,906,236 | ||||||
| 186,400 | Taisho Pharmaceutical Holdings Co. Ltd. | 6,826,137 | ||||||
| 803,683 | Takeda Pharmaceutical Co. Ltd. | 20,869,884 | ||||||
|
| |||||||
| 69,488,378 | ||||||||
|
| |||||||
| Mexico – 4.20% | ||||||||
| 2,151,753 | Cemex SAB de CV Sponsored – ADR(a) | 7,380,513 | ||||||
| 11,641,842 | Fibra Uno Administracion SA de CV | 11,983,186 | ||||||
|
| |||||||
| 19,363,699 | ||||||||
|
| |||||||
| Netherlands – 2.50% | ||||||||
| 1,210,971 | Aegon NV | 4,813,610 | ||||||
| 435,025 | Koninklijke Philips NV | 6,697,864 | ||||||
|
| |||||||
| 11,511,474 | ||||||||
|
| |||||||
| Russia – 0.07% | ||||||||
| 1,013,133 | Mobile TeleSystems PJSC(c) | 317,960 | ||||||
|
| |||||||
| South Korea – 4.42% | ||||||||
| 142,237 | Hana Financial Group, Inc. | 3,492,628 | ||||||
| 44,690 | Hyundai Mobis Co. Ltd. | 5,899,237 | ||||||
| 125,123 | KT&G Corp. | 7,554,927 | ||||||
| 23,433 | POSCO Holdings, Inc. | 3,418,118 | ||||||
|
| |||||||
| 20,364,910 | ||||||||
|
| |||||||
| Switzerland – 11.02% | ||||||||
| 2,156,830 | Credit Suisse Group AG Registered | 8,531,523 | ||||||
| 156,628 | Novartis AG Registered | 11,940,847 | ||||||
The accompanying notes to financial statements are an integral part of this Schedule of Investments.
60
Brandes International Equity Fund
SCHEDULE OF INVESTMENTS — September 30, 2022 (continued)
| Shares | Value | |||||||
| 13,909 | Swatch Group AG Bearer | $ | 3,123,940 | |||||
| 186,895 | Swatch Group AG Registered | 7,829,576 | ||||||
| 101,685 | Swiss Re AG | 7,499,675 | ||||||
| 821,901 | UBS Group AG Registered | 11,924,111 | ||||||
|
| |||||||
| 50,849,672 | ||||||||
|
| |||||||
| United Kingdom – 15.79% | ||||||||
| 3,289,545 | Barclays Plc | 5,234,112 | ||||||
| 746,072 | GSK Plc | 10,775,301 | ||||||
| 1,262,670 | Haleon Plc(a) | 3,936,962 | ||||||
| 227,615 | Imperial Brands Plc | 4,680,419 | ||||||
| 3,947,729 | J Sainsbury Plc | 7,645,107 | ||||||
| 2,457,439 | Kingfisher Plc | 5,981,942 | ||||||
| 3,588,578 | Marks & Spencer Group Plc(a) | 3,914,465 | ||||||
| 9,020,750 | Rolls-Royce Holdings Plc(a) | 6,908,563 | ||||||
| Shares | Value | |||||||
| 343,175 | Shell Plc | $ | 8,513,463 | |||||
| 2,565,438 | Tesco Plc | 5,887,866 | ||||||
| 1,132,320 | WPP Plc | 9,347,522 | ||||||
|
| |||||||
| 72,825,722 | ||||||||
|
| |||||||
| | TOTAL COMMON STOCKS | $ | 439,443,140 | |||||
|
| |||||||
PREFERRED STOCKS – 4.16% | ||||||||
| Brazil – 2.20% | ||||||||
| 1,835,900 | Petroleo Brasileiro SA, 39.45%(d) | $ | 10,142,060 | |||||
|
| |||||||
| Russia – 0.17% | ||||||||
| 21,512,699 | Surgutneftegas PJSC, 21.77%(c),(d) | 777,985 | ||||||
|
| |||||||
| Spain – 1.79% | ||||||||
| 1,325,719 | Grifols SA – Class B(a) | 8,272,648 | ||||||
|
| |||||||
| | TOTAL PREFERRED STOCKS | $ | 19,192,693 | |||||
|
| |||||||
Total Investments | $ | 458,635,833 | ||
Other Assets in Excess of Liabilities – 0.56% | 2,583,093 | |||
|
| |||
TOTAL NET ASSETS – 100.00%. | $ | 461,218,926 | ||
|
| |||
Percentages are stated as a percent of net assets.
ADR American Depositary Receipt
| (a) | Non-income producing security. |
| (b) | All or a portion of this security is on loan. See Note 2 in the Notes to Financial Statements. |
| (c) | Level 3 asset. |
| (d) | Current yield is disclosed. Dividends are calculated based on a percentage of the issuer’s net income. |
The accompanying notes to financial statements are an integral part of this Schedule of Investments.
61
Brandes International Equity Fund
SCHEDULE OF INVESTMENTS BY INDUSTRY — September 30, 2022
COMMON STOCKS | ||||
Aerospace & Defense | 3.33 | % | ||
Auto Components | 1.28 | % | ||
Automobiles | 3.09 | % | ||
Banks | 10.49 | % | ||
Beverages | 2.93 | % | ||
Capital Markets | 4.43 | % | ||
Commercial Services & Supplies | 0.93 | % | ||
Construction Materials | 4.96 | % | ||
Diversified Telecommunication Services | 3.97 | % | ||
Equity Real Estate Investment Trusts | 2.60 | % | ||
Food & Staples Retailing | 5.82 | % | ||
Food Products | 2.30 | % | ||
Health Care Equipment & Supplies | 1.45 | % | ||
Health Care Providers & Services | 1.51 | % | ||
Household Products | 2.50 | % | ||
Insurance | 4.57 | % | ||
Internet & Direct Marketing Retail | 2.46 | % | ||
Media | 4.47 | % | ||
Metals & Mining | 0.74 | % | ||
Multi-Utilities | 1.74 | % | ||
Oil, Gas & Consumable Fuels | 5.50 | % | ||
Personal Products | 0.85 | % | ||
Pharmaceuticals | 13.42 | % | ||
Software | 2.39 | % | ||
Specialty Retail | 1.30 | % | ||
Textiles, Apparel & Luxury Goods | 2.38 | % | ||
Tobacco | 2.65 | % | ||
Wireless Telecommunication Services | 1.22 | % | ||
|
| |||
TOTAL COMMON STOCKS | 95.28 | % | ||
|
| |||
PREFERRED STOCKS | ||||
Biotechnology | 1.79 | % | ||
Oil, Gas & Consumable Fuels | 2.37 | % | ||
|
| |||
TOTAL PREFERRED STOCKS | 4.16 | % | ||
|
| |||
TOTAL INVESTMENTS | 99.44 | % | ||
Other Assets in Excess of Liabilities | 0.56 | % | ||
|
| |||
TOTAL NET ASSETS | 100.00 | % | ||
|
| |||
The industry classifications represented in the Schedule of Investments are in accordance with Global Industry Classification Standards (GICS®), which was developed by and/or is the exclusive property of MSCI, Inc. and Standard & Poor’s Financial Services LLC or were otherwise determined by the Advisor to be appropriate. This information is unaudited.
The accompanying notes to financial statements are an integral part of this Schedule of Investments.
62
SCHEDULE OF INVESTMENTS — September 30, 2022
| Shares | Value | |||||||
COMMON STOCKS – 98.51% | ||||||||
Austria – 1.96% | ||||||||
| 32,652 | Erste Group Bank AG | $ | 715,803 | |||||
|
| |||||||
| Brazil – 1.26% | ||||||||
| 168,020 | Embraer SA(a) | 362,867 | ||||||
| 11,308 | Embraer SA Sponsored – ADR(a) | 97,249 | ||||||
|
| |||||||
| 460,116 | ||||||||
|
| |||||||
| China – 4.42% | ||||||||
| 73,000 | Alibaba Group Holding Ltd.(a) | 728,491 | ||||||
| 101,698 | Gree Electric Appliances, Inc. of Zhuhai – Class A | 461,036 | ||||||
| 604,000 | Topsports International Holdings Ltd. | 422,218 | ||||||
|
| |||||||
| 1,611,745 | ||||||||
|
| |||||||
| France – 10.55% | ||||||||
| 29,021 | Carrefour SA | 402,495 | ||||||
| 23,716 | Engie SA | 272,968 | ||||||
| 31,200 | Engie SA Registered Shares (Prime Fidelite 2019)(a) | 359,109 | ||||||
| 14,597 | Publicis Groupe SA | 691,645 | ||||||
| 12,720 | Sanofi | 968,584 | ||||||
| 2,573 | Schneider Electric SE | 290,622 | ||||||
| 18,460 | TotalEnergies SE(b) | 866,043 | ||||||
|
| |||||||
| 3,851,466 | ||||||||
|
| |||||||
| Germany – 2.77% | ||||||||
| 13,297 | HeidelbergCement AG | 525,287 | ||||||
| 5,980 | SAP SE | 487,341 | ||||||
|
| |||||||
| 1,012,628 | ||||||||
|
| |||||||
| Ireland – 0.82% | ||||||||
| 9,289 | CRH Plc | 297,960 | ||||||
|
| |||||||
| Italy – 1.17% | ||||||||
| 40,041 | Eni SpA | 425,584 | ||||||
|
| |||||||
| Japan – 1.03% | ||||||||
| 17,400 | Honda Motor Co. Ltd. | 377,681 | ||||||
|
| |||||||
| Malaysia – 1.54% | ||||||||
| 582,600 | Genting Berhad | 560,643 | ||||||
|
| |||||||
| Mexico – 1.83% | ||||||||
| 649,177 | Fibra Uno Administracion SA de CV | 668,211 | ||||||
|
| |||||||
| Shares | Value | |||||||
South Korea – 5.28% | ||||||||
| 2,362 | Hyundai Mobis Co. Ltd. | $ | 311,792 | |||||
| 3,446 | Hyundai Motor Co. | 420,545 | ||||||
| 4,260 | KT&G Corp. | 257,219 | ||||||
| 15,353 | Samsung Electronics Co. Ltd. | 563,751 | ||||||
| 6,518 | SK Hynix, Inc. | 372,831 | ||||||
|
| |||||||
| 1,926,138 | ||||||||
|
| |||||||
| Spain – 0.88% | ||||||||
| 27,833 | Repsol SA | 319,808 | ||||||
|
| |||||||
| Switzerland – 2.82% | ||||||||
| 70,841 | UBS Group AG Registered | 1,027,759 | ||||||
|
| |||||||
| United Kingdom – 14.05% | ||||||||
| 166,172 | BP Plc | 794,035 | ||||||
| 52,499 | GSK Plc | 758,228 | ||||||
| 39,284 | Imperial Brands Plc | 807,792 | ||||||
| 47,291 | J Sainsbury Plc | 91,583 | ||||||
| 187,936 | Kingfisher Plc | 457,477 | ||||||
| 149,316 | NatWest Group Plc | 371,905 | ||||||
| 410,780 | Rolls-Royce Holdings Plc(a) | 314,597 | ||||||
| 14,388 | Shell Plc – ADR | 715,947 | ||||||
| 123,243 | Tesco Plc | 282,851 | ||||||
| 64,638 | WPP Plc | 533,599 | ||||||
|
| |||||||
| 5,128,014 | ||||||||
|
| |||||||
| United States – 48.13% | ||||||||
| 2,791 | Alphabet, Inc. - Class A(a) | 266,959 | ||||||
| 7,838 | Amdocs Ltd. | 622,729 | ||||||
| 13,610 | American International Group, Inc. | 646,203 | ||||||
| 4,344 | Applied Materials, Inc. | 355,904 | ||||||
| 27,801 | Bank of America Corp. | 839,590 | ||||||
| 9,138 | Bank of New York Mellon Corp. | 351,996 | ||||||
| 11,616 | Cardinal Health, Inc. | 774,555 | ||||||
| 3,925 | Cigna Corp. | 1,089,070 | ||||||
| 19,374 | Citigroup, Inc. | 807,315 | ||||||
| 21,920 | Comcast Corp. – Class A | 642,914 | ||||||
| 7,425 | CVS Health Corp. | 708,122 | ||||||
| 4,667 | Emerson Electric Co. | 341,718 | ||||||
| 3,066 | FedEx Corp. | 455,209 | ||||||
| 9,204 | Fiserv, Inc.(a) | 861,218 | ||||||
| 3,020 | General Dynamics Corp. | 640,753 | ||||||
| 19,876 | Halliburton Co. | 489,347 | ||||||
| 2,552 | HCA Healthcare, Inc. | 469,032 | ||||||
The accompanying notes to financial statements are an integral part of this Schedule of Investments.
63
Brandes Global Equity Fund
SCHEDULE OF INVESTMENTS — September 30, 2022 (continued)
| Shares | Value | |||||||
| 3,144 | JPMorgan Chase & Co. | $ | 328,548 | |||||
| 1,620 | Laboratory Corp. of America Holdings | 331,792 | ||||||
| 2,320 | McKesson Corp. | 788,498 | ||||||
| 10,308 | Merck & Co., Inc. | 887,725 | ||||||
| 3,220 | Mohawk Industries, Inc.(a) | 293,632 | ||||||
| 18,080 | Old Republic International Corp. | 378,414 | ||||||
| 13,571 | OneMain Holdings, Inc. | 400,616 | ||||||
| 19,758 | Pfizer, Inc. | 864,610 | ||||||
| 3,556 | PNC Financial Services Group, Inc. | 531,338 | ||||||
| 7,061 | State Street Corp. | 429,379 | ||||||
| 9,080 | Textron, Inc. | 529,001 | ||||||
| 10,296 | Truist Financial Corp. | 448,288 | ||||||
| 24,540 | Wells Fargo & Co. | 986,999 | ||||||
|
| |||||||
| 17,561,474 | ||||||||
|
| |||||||
| | TOTAL COMMON STOCKS | $ | 35,945,030 | |||||
|
| |||||||
| Shares | Value | |||||||
PREFERRED STOCKS – 0.88% | ||||||||
South Korea – 0.22% | ||||||||
| 2,497 | Samsung Electronics Co. Ltd., 3.081%(c) | $ | 81,110 | |||||
|
| |||||||
Spain – 0.66% | ||||||||
| 38,733 | Grifols SA – ADR(a) | 238,595 | ||||||
|
| |||||||
| | TOTAL PREFERRED STOCKS | $ | 319,705 | |||||
|
| |||||||
| Shares | Value | |||||||
SHORT-TERM INVESTMENTS – 1.06% | ||||||||
| Money Market Funds — 1.06% | ||||||||
Northern Institutional Funds - Treasury Portfolio (Premier), 2.38%(d) | 387,203 | $ | 387,203 | |||||
|
| |||||||
TOTAL SHORT-TERM INVESTMENTS | $ | 387,203 | ||||||
|
| |||||||
Total Investments | $ | 36,651,938 | ||||||
Liabilities in Excess of Other Assets – (0.45)% | (162,812 | ) | ||||||
|
| |||||||
TOTAL NET ASSETS – 100.00% | $ | 36,489,126 | ||||||
|
| |||||||
Percentages are stated as a percent of net assets.
ADR American Depositary Receipt
| (a) | Non-income producing security. |
| (b) | All or a portion of this security is on loan. See Note 2 in the Notes to Financial Statements. |
| (c) | Current yield is disclosed. Dividends are calculated based on a percentage of the issuer’s net income. |
| (d) | The rate shown is the annualized seven day yield as of September 30, 2022. |
The accompanying notes to financial statements are an integral part of this Schedule of Investments.
64
Brandes Global Equity Fund
SCHEDULE OF INVESTMENTS BY INDUSTRY — September 30, 2022
COMMON STOCKS | ||||
Aerospace & Defense | 5.33 | % | ||
Air Freight & Logistics | 1.25 | % | ||
Auto Components | 0.85 | % | ||
Automobiles | 2.18 | % | ||
Banks | 13.78 | % | ||
Capital Markets | 4.96 | % | ||
Construction Materials | 2.26 | % | ||
Consumer Finance | 1.10 | % | ||
Electrical Equipment | 1.74 | % | ||
Energy Equipment & Services | 1.34 | % | ||
Equity Real Estate Investment Trusts | 1.83 | % | ||
Food & Staples Retailing | 2.13 | % | ||
Health Care Providers & Services | 11.40 | % | ||
Hotels, Restaurants & Leisure | 1.54 | % | ||
Household Durables | 2.06 | % | ||
Insurance | 2.81 | % | ||
Interactive Media & Services | 0.73 | % | ||
Internet & Direct Marketing Retail | 2.00 | % | ||
IT Services | 4.07 | % | ||
Media | 5.12 | % | ||
Multi-Utilities | 1.73 | % | ||
Oil, Gas & Consumable Fuels | 8.56 | % | ||
Pharmaceuticals | 9.53 | % | ||
Semiconductors & Semiconductor Equipment | 2.00 | % | ||
Software | 1.33 | % | ||
Specialty Retail | 2.41 | % | ||
Technology Hardware, Storage & Peripherals | 1.55 | % | ||
Tobacco | 2.92 | % | ||
|
| |||
TOTAL COMMON STOCKS | 98.51 | % | ||
|
| |||
PREFERRED STOCKS | ||||
Biotechnology | 0.66 | % | ||
Technology Hardware, Storage & Peripherals | 0.22 | % | ||
|
| |||
TOTAL PREFERRED STOCKS | 0.88 | % | ||
|
| |||
SHORT-TERM INVESTMENTS | 1.06 | % | ||
|
| |||
TOTAL INVESTMENTS | 100.45 | % | ||
Liabilities in Excess of Other Assets | (0.45 | )% | ||
|
| |||
TOTAL NET ASSETS | 100.00 | % | ||
|
| |||
The industry classifications represented in the Schedule of Investments are in accordance with Global Industry Classification Standards (GICS®), which was developed by and/or is the exclusive property of MSCI, Inc. and Standard & Poor’s Financial Services LLC or were otherwise determined by the Advisor to be appropriate. This information is unaudited.
The accompanying notes to financial statements are an integral part of this Schedule of Investments.
65
Brandes Emerging Markets Value Fund
SCHEDULE OF INVESTMENTS — September 30, 2022
| Shares | Value | |||||||
COMMON STOCKS – 97.35% | ||||||||
Austria – 2.00% | ||||||||
| 567,101 | Erste Group Bank AG | $ | 12,432,086 | |||||
|
| |||||||
| Brazil – 6.61% | ||||||||
| 2,113,695 | Embraer SA Sponsored – ADR(a) | 18,177,777 | ||||||
| 2,897,200 | Sendas Distribuidora SA | 9,425,762 | ||||||
| 382,900 | Telefonica Brasil SA | 2,874,048 | ||||||
| 4,693,000 | TIM SA(a) | 10,509,411 | ||||||
|
| |||||||
| 40,986,998 | ||||||||
|
| |||||||
| Chile – 2.53% | ||||||||
| 2,229,571 | Empresa Nacional de Telecomunicaciones SA | 6,317,130 | ||||||
| 271,596,160 | Enel Chile SA | 7,838,508 | ||||||
| 1,119,948 | Enel Chile SA Sponsored – ADR | 1,545,528 | ||||||
|
| |||||||
| 15,701,166 | ||||||||
|
| |||||||
| China – 26.36% | ||||||||
| 2,594,500 | Alibaba Group Holding Ltd.(a) | 25,891,395 | ||||||
| 15,062,000 | China Education Group Holdings Ltd. | 11,086,088 | ||||||
| 15,658,000 | Chinasoft International Ltd. | 9,564,519 | ||||||
| 3,135,000 | Galaxy Entertainment Group Ltd.(a) | 18,427,193 | ||||||
| 1,986,000 | Genertec Universal Medical Group Co. Ltd.(b) | 1,014,826 | ||||||
| 2,655,476 | Gree Electric Appliances, Inc. of Zhuhai – Class A | 12,038,286 | ||||||
| 1,494,446 | Midea Group Co. Ltd. – Class A | 10,289,951 | ||||||
| 2,789,000 | Ping An Insurance Group Co. of China Ltd. – Class H | 13,913,749 | ||||||
| 8,717,500 | Shanghai Pharmaceuticals Holding Co. Ltd. – Class H | 12,022,177 | ||||||
| Shares | Value | |||||||
| 17,600,000 | Topsports International Holdings Ltd. | $ | 12,303,033 | |||||
| 11,295,000 | TravelSky Technology Ltd. – Class H | 17,287,838 | ||||||
| 5,780,000 | Weichai Power Co. Ltd. – Class H | 5,475,737 | ||||||
| 7,880,200 | Wynn Macau Ltd.(a) | 5,022,801 | ||||||
| 386,086 | ZTO Express Cayman, Inc. – ADR | 9,277,647 | ||||||
|
| |||||||
| 163,615,240 | ||||||||
|
| |||||||
Hong Kong – 2.85% | ||||||||
| 993,200 | AIA Group Ltd. | 8,269,291 | ||||||
| 8,687,920 | First Pacific Co. Ltd. | 2,641,645 | ||||||
| 2,854,200 | Luk Fook Holdings International Ltd. | 6,736,617 | ||||||
|
| |||||||
| 17,647,553 | ||||||||
|
| |||||||
India – 5.88% | ||||||||
| 825,661 | HDFC Bank Ltd. | 14,304,988 | ||||||
| 6,136,795 | Indus Towers Ltd. | 14,813,584 | ||||||
| 511,265 | IndusInd Bank Ltd. | 7,388,641 | ||||||
|
| |||||||
| 36,507,213 | ||||||||
|
| |||||||
Indonesia – 6.72% | ||||||||
| 57,742,011 | Bank Rakyat Indonesia Persero Tbk PT | 16,899,508 | ||||||
| 4,867,412 | Gudang Garam Tbk PT | 7,325,718 | ||||||
| 26,403,800 | Indofood Sukses Makmur Tbk PT | 10,432,704 | ||||||
| 43,917,015 | XL Axiata Tbk PT | 7,064,215 | ||||||
|
| |||||||
| 41,722,145 | ||||||||
|
| |||||||
Luxembourg – 1.00% | ||||||||
| 541,682 | Millicom International Cellular SA – SDR(a) | 6,221,328 | ||||||
|
| |||||||
Malaysia – 2.24% | ||||||||
| 14,411,200 | Genting Berhad | 13,868,065 | ||||||
|
| |||||||
Mexico – 8.16% | ||||||||
| 3,773,776 | Cemex SAB de CV Sponsored – ADR(a) | 12,944,052 | ||||||
| 20,674,607 | Fibra Uno Administracion SA de CV | 21,280,797 | ||||||
The accompanying notes to financial statements are an integral part of this Schedule of Investments.
66
Brandes Emerging Markets Value Fund
SCHEDULE OF INVESTMENTS — September 30, 2022 (continued)
| Shares | Value | |||||||
| 4,224,150 | Kimberly-Clark de Mexico SAB de CV - Class A | $ | 5,644,225 | |||||
| 7,997,455 | PLA Administradora Industrial S de RL de CV | 10,614,562 | ||||||
| 512,122 | Urbi Desarrollos Urbanos SAB de CV(a) | 164,015 | ||||||
|
| |||||||
| 50,647,651 | ||||||||
|
| |||||||
| Panama – 2.86% | ||||||||
| 511,469 | Banco Latinoamericano de Comercio Exterior SA – Class E | 6,679,785 | ||||||
| 165,150 | Copa Holdings SA – Class A(a) | 11,066,702 | ||||||
|
| |||||||
| 17,746,487 | ||||||||
|
| |||||||
| Philippines – 1.97% | ||||||||
| 8,031,934 | Bank of the Philippine Islands | 12,233,740 | ||||||
|
| |||||||
Russia – 0.78% | ||||||||
| 11,121,093 | Detsky Mir PJSC(c) | 1,209,363 | ||||||
| 236,429 | LUKOIL PJSC(c) | 1,540,998 | ||||||
| 4,858,073 | Mobile TeleSystems PJSC(c) | 1,524,648 | ||||||
| 7,919,891 | Sberbank of Russia PJSC(a),(c) | 19,800 | ||||||
| 31,423,480 | Sistema PJSFC(a),(c) | 548,748 | ||||||
|
| |||||||
| 4,843,557 | ||||||||
|
| |||||||
| South Korea – 12.89% | ||||||||
| 182,397 | KT&G Corp. | 11,013,131 | ||||||
| 23,001 | LG H&H Co. Ltd. | 10,081,773 | ||||||
| 86,033 | POSCO Holdings, Inc. | 12,549,437 | ||||||
| 639,035 | Samsung Electronics Co. Ltd. | 23,464,888 | ||||||
| 507,337 | Shinhan Financial Group Co. Ltd. | 11,785,007 | ||||||
| 194,547 | SK Hynix, Inc. | 11,128,131 | ||||||
|
| |||||||
| 80,022,367 | ||||||||
|
| |||||||
| Shares | Value | |||||||
Spain – 0.40% | ||||||||
| 4,019,017 | Prosegur Cash SA(b) | $ | 2,501,162 | |||||
|
| |||||||
| Taiwan – 10.07% | ||||||||
| 1,819,000 | Accton Technology Corp. | 15,515,160 | ||||||
| 196,000 | Chailease Holding Co. Ltd. | 1,119,574 | ||||||
| 54,000 | Largan Precision Co. Ltd. | 2,830,731 | ||||||
| 2,043,000 | Taiwan Semiconductor Manufacturng Co. Ltd. | 27,080,767 | ||||||
| 631,000 | Wiwynn Corp. | 15,945,527 | ||||||
|
| |||||||
| 62,491,759 | ||||||||
|
| |||||||
| Thailand – 4.03% | ||||||||
| 1,389,200 | Bangkok Bank PCL – Class F | 5,006,604 | ||||||
| 59,087,081 | Jasmine Broadband Internet Infrastructure Fund - Class F | 12,766,694 | ||||||
| 1,901,500 | Kasikornbank PCL – Class F | 7,225,425 | ||||||
|
| |||||||
| 24,998,723 | ||||||||
|
| |||||||
| | TOTAL COMMON STOCKS | $ | 604,187,240 | |||||
|
| |||||||
PREFERRED STOCKS – 2.30% | ||||||||
| Brazil – 2.30% | ||||||||
| 2,581,400 | Petroleo Brasileiro SA, 39.448%(d) | $ | 14,260,424 | |||||
|
| |||||||
| | TOTAL PREFERRED STOCKS | $ | 14,260,424 | |||||
|
| |||||||
The accompanying notes to financial statements are an integral part of this Schedule of Investments.
67
Brandes Emerging Markets Value Fund
SCHEDULE OF INVESTMENTS — September 30, 2022 (continued)
Total Investments | $ | 618,447,664 | ||
Other Assets in Excess of Liabilities – 0.35% | 2,200,519 | |||
|
| |||
TOTAL NET ASSETS – 100.00% | $ | 620,648,183 | ||
|
| |||
Percentages are stated as a percent of net assets.
ADR American Depositary Receipt
| (a) | Non-income producing security. |
| (b) | Acquired in a transaction exempt from registration under Rule 144A or Section 4(a)(2) of the Securities Act of 1933. May be resold in the U.S. in transactions exempt from registration, normally to qualified institutional buyers. The total value of all such securities was $15,819,021 which represented 2.55% of the net assets of the Fund. |
| (c) | Level 3 asset. |
| (d) | Current yield is disclosed. Dividends are calculated based on a percentage of the issuer’s net income. |
The accompanying notes to financial statements are an integral part of this Schedule of Investments.
68
Brandes Emerging Markets Value Fund
SCHEDULE OF INVESTMENTS BY INDUSTRY — September 30, 2022
COMMON STOCKS | ||||
Aerospace & Defense | 2.93 | % | ||
Air Freight & Logistics | 1.49 | % | ||
Airlines | 1.78 | % | ||
Banks | 14.05 | % | ||
Commercial Services & Supplies | 0.40 | % | ||
Communications Equipment | 2.50 | % | ||
Construction Materials | 2.08 | % | ||
Diversified Consumer Services | 1.79 | % | ||
Diversified Financial Services | 1.42 | % | ||
Diversified Telecommunication Services | 4.91 | % | ||
Electric Utilities | 1.51 | % | ||
Electronic Equipment, Instruments & Components | 0.46 | % | ||
Equity Real Estate Investment Trusts | 5.14 | % | ||
Food & Staples Retailing | 1.52 | % | ||
Food Products | 2.11 | % | ||
Health Care Providers & Services | 1.94 | % | ||
Hotels, Restaurants & Leisure | 6.02 | % | ||
Household Durables | 3.63 | % | ||
Household Products | 0.91 | % | ||
Insurance | 3.57 | % | ||
Internet & Direct Marketing Retail | 4.17 | % | ||
IT Services | 4.33 | % | ||
Machinery | 0.88 | % | ||
Metals & Mining | 2.02 | % | ||
Oil, Gas & Consumable Fuels | 0.25 | % | ||
Personal Products | 1.62 | % | ||
Semiconductors & Semiconductor Equipment | 6.15 | % | ||
Specialty Retail | 3.26 | % | ||
Technology Hardware, Storage & Peripherals | 6.35 | % | ||
Tobacco | 2.96 | % | ||
Wireless Telecommunication Services | 5.20 | % | ||
|
| |||
TOTAL COMMON STOCKS | 97.35 | % | ||
|
| |||
PREFERRED STOCKS | ||||
Oil, Gas & Consumable Fuels | 2.30 | % | ||
|
| |||
TOTAL PREFERRED STOCKS | 2.30 | % | ||
|
| |||
TOTAL INVESTMENTS | 99.65 | % | ||
Other Assets in Excess of Liabilities | 0.35 | % | ||
|
| |||
TOTAL NET ASSETS | 100.00 | % | ||
|
| |||
The industry classifications represented in the Schedule of Investments are in accordance with Global Industry Classification Standards (GICS®), which was developed by and/or is the exclusive property of MSCI, Inc. and Standard & Poor’s Financial Services LLC or were otherwise determined by the Advisor to be appropriate. This information is unaudited.
The accompanying notes to financial statements are an integral part of this Schedule of Investments.
69
Brandes International Small Cap Equity Fund
SCHEDULE OF INVESTMENTS — September 30, 2022
| Shares | Value | |||||||
COMMON STOCKS – 95.20% | ||||||||
Austria – 1.03% | ||||||||
| 236,257 | Addiko Bank AG | $ | 2,442,786 | |||||
|
| |||||||
Belgium – 0.92% | ||||||||
| 406,574 | Ontex Group NV(a) | 2,183,443 | ||||||
|
| |||||||
Brazil – 5.21% | ||||||||
| 5,729,740 | Embraer SA(a) | 12,374,331 | ||||||
|
| |||||||
Canada – 2.21% | ||||||||
| 860,709 | Dorel Industries, Inc. – Class B | 2,959,690 | ||||||
| 259,206 | Heroux-Devtek, Inc.(a) | 2,298,674 | ||||||
|
| |||||||
| 5,258,364 | ||||||||
|
| |||||||
Chile – 2.49% | ||||||||
| 205,245,731 | Enel Chile SA | 5,923,575 | ||||||
|
| |||||||
China – 1.43% | ||||||||
| 12,512,900 | Boyaa Interactive International Ltd.(a) | 597,777 | ||||||
| 216,052 | China Yuchai International Ltd. | 1,575,019 | ||||||
| 8,172,000 | Weiqiao Textile Co. – Class H | 1,228,457 | ||||||
|
| |||||||
| 3,401,253 | ||||||||
|
| |||||||
France – 2.58% | ||||||||
| 560,456 | Elior Group SA(a),(b) | 1,021,614 | ||||||
| 98,958 | LISI | 1,731,112 | ||||||
| 7,812 | Savencia SA | 390,464 | ||||||
| 132,693 | Vicat SA | 2,980,012 | ||||||
|
| |||||||
| 6,123,202 | ||||||||
|
| |||||||
Germany – 0.67% | ||||||||
| 42,881 | Draegerwerk AG & Co. KGaA | 1,582,261 | ||||||
|
| |||||||
Greece – 0.86% | ||||||||
| 341,206 | Sarantis SA | 2,036,489 | ||||||
|
| |||||||
Hong Kong – 8.85% | ||||||||
| 2,396,450 | APT Satellite Holdings Ltd. | 600,150 | ||||||
| 2,059,500 | Dickson Concepts International Ltd. | 923,537 | ||||||
| 65,170,000 | Emperor Watch & Jewellery Ltd. | 1,066,793 | ||||||
| 15,553,000 | First Pacific Co. Ltd. | 4,729,039 | ||||||
| 8,863,020 | PAX Global Technology Ltd. | 6,707,728 | ||||||
| Shares | Value | |||||||
| 22,918,000 | Pico Far East Holdings Ltd. | $ | 3,116,745 | |||||
| 3,035,500 | Yue Yuen Industrial Holdings Ltd. | 3,871,622 | ||||||
|
| |||||||
| 21,015,614 | ||||||||
|
| |||||||
Hungary – 1.46% | ||||||||
| 5,073,435 | Magyar Telekom Telecommunications Plc | 3,469,334 | ||||||
|
| |||||||
| Ireland – 6.67% | ||||||||
| 2,425,584 | AIB Group Plc | 5,902,901 | ||||||
| 341,796 | Avadel Pharmaceuticals Plc – ADR(a) | 1,712,398 | ||||||
| 2,948,132 | C&C Group Plc(a) | 4,902,733 | ||||||
| 4,142,265 | Greencore Group Plc(a) | 3,339,283 | ||||||
|
| |||||||
| 15,857,315 | ||||||||
|
| |||||||
Israel – 1.11% | ||||||||
| 88,259 | Taro Pharmaceutical Industries Ltd.(a) | 2,646,005 | ||||||
|
| |||||||
Italy – 2.49% | ||||||||
| 292,543 | Buzzi Unicem SpA | 4,138,334 | ||||||
| 315,529 | Credito Emiliano SpA | 1,779,602 | ||||||
|
| |||||||
| 5,917,936 | ||||||||
|
| |||||||
Japan – 18.17% | ||||||||
| 751,000 | Concordia Financial Group Ltd. | 2,330,656 | ||||||
| 230,000 | DeNa Co. Ltd. | 2,914,253 | ||||||
| 397,900 | Fuji Media Holdings, Inc. | 2,922,345 | ||||||
| 33,600 | Fukuda Denshi Co. Ltd. | 1,662,511 | ||||||
| 293,900 | Futaba Corp. | 1,244,541 | ||||||
| 1,075,300 | Hachijuni Bank Ltd. | 3,572,900 | ||||||
| 1,068,500 | Hyakugo Bank Ltd. | 2,346,549 | ||||||
| 91,500 | Kaken Pharmaceutical Co. Ltd. | 2,410,441 | ||||||
| 171,300 | Kissei Pharmaceutical Co. Ltd. | 3,043,051 | ||||||
| 407,500 | Koatsu Gas Kogyo Co. Ltd. | 1,756,954 | ||||||
| 967,444 | Komori Corp. | 4,709,444 | ||||||
The accompanying notes to financial statements are an integral part of this Schedule of Investments.
70
Brandes International Small Cap Equity Fund
SCHEDULE OF INVESTMENTS — September 30, 2022 (continued)
| Shares | Value | |||||||
| 503,900 | Kyushu Financial Group, Inc. | $ | 1,334,959 | |||||
| 104,800 | Mitsubishi Shokuhin Co. Ltd. | 2,360,458 | ||||||
| 274,800 | Nihon Parkerizing Co. Ltd. | 1,770,637 | ||||||
| 181,800 | Oita Bank Ltd. | 2,283,613 | ||||||
| 146,300 | Tachi-S Co. Ltd. | 1,083,224 | ||||||
| 83,800 | Taisho Pharmaceutical Holdings Co. Ltd. | 3,068,832 | ||||||
| 143,500 | Yodogawa Steel Works Ltd. | 2,355,979 | ||||||
|
| |||||||
| 43,171,347 | ||||||||
|
| |||||||
Luxembourg – 1.98% | ||||||||
| 411,961 | Millicom International Cellular SA(a) | 4,700,475 | ||||||
|
| |||||||
Malaysia – 1.43% | ||||||||
| 3,518,100 | Genting Berhad | 3,385,509 | ||||||
|
| |||||||
Mexico – 6.77% | ||||||||
| 343,868 | Cemex SAB de CV Sponsored – ADR(a) | 1,179,467 | ||||||
| 23,997,426 | Consorcio ARA SAB de CV | 3,801,077 | ||||||
| 279,501,983 | Desarrolladora Homex SAB de CV(a),(c) | 388,592 | ||||||
| 2,421,478 | FIBRA Macquarie Mexico(b) | 2,918,110 | ||||||
| 7,315,041 | Fibra Uno Administracion SA de CV | 7,529,522 | ||||||
| 806,929 | Urbi Desarrollos Urbanos SAB de CV(a),(c) | 258,432 | ||||||
|
| |||||||
| 16,075,200 | ||||||||
|
| |||||||
Panama – 2.07% | ||||||||
| 376,511 | Banco Latinoamericano de Comercio Exterior SA – Class E | 4,917,234 | ||||||
|
| |||||||
| Shares | Value | |||||
Slovenia – 1.98% | ||||||
| 426,357 | Nova Ljubljanska Banka – GDR(b) | $ | 4,345,652 | |||
| 35,035 | Nova Ljubljanska Banka – GDR | 357,095 | ||||
|
| |||||
| 4,702,747 | ||||||
|
| |||||
South Korea – 2.31% | ||||||
| 84,861 | Binggrae Co. Ltd. | 2,332,917 | ||||
| 78,451 | S-1 Corp. | 3,159,937 | ||||
|
| |||||
| 5,492,854 | ||||||
|
| |||||
Spain – 3.86% | ||||||
| 1,175,707 | Lar Espana Real Estate Socimi SA | 4,983,488 | ||||
| 4,432,315 | Linea Directa Aseguradora SA Cia de Seguros y Reaseguros | 4,179,528 | ||||
|
| |||||
| 9,163,016 | ||||||
|
| |||||
Switzerland – 1.24% | ||||||
| 51,281 | Sulzer AG Registered | 2,950,053 | ||||
|
| |||||
Turkey – 1.45% | ||||||
| 3,113,296 | Ulker Biskuvi Sanayi AS(a) | 3,444,471 | ||||
|
| |||||
United Kingdom – 15.96% | ||||||
| 1,044,718 | Balfour Beatty Plc | 3,574,095 | ||||
| 2,783,831 | De La Rue Plc(a) | 2,682,452 | ||||
| 5,382,949 | ITV Plc | 3,396,956 | ||||
| 3,654,986 | J Sainsbury Plc | 7,078,186 | ||||
| 590,743 | LSL Property Services Plc | 1,728,137 | ||||
| 3,445,693 | Marks & Spencer Group Plc(a) | 3,758,604 | ||||
| 7,731,948 | Mitie Group Plc | 5,404,325 | ||||
| 2,563,104 | Rolls-Royce Holdings Plc(a) | 1,962,959 | ||||
| 457,427 | TechnipFMC Plc(a) | 3,869,832 | ||||
| 1,001,087 | Yellow Cake Plc(a),(b) | 4,467,440 | ||||
|
| |||||
| 37,922,986 | ||||||
|
| |||||
TOTAL COMMON STOCKS | $ | 226,157,800 | ||||
|
| |||||
The accompanying notes to financial statements are an integral part of this Schedule of Investments.
71
Brandes International Small Cap Equity Fund
SCHEDULE OF INVESTMENTS — September 30, 2022 (continued)
| Shares | Value | |||||
PREFERRED STOCKS – 2.06% |
| |||||
Germany – 2.06% |
| |||||
| 117,368 | Draegerwerk AG & Co. KGaA, 0.448%(d) | $ | 4,908,674 | |||
|
| |||||
TOTAL PREFERRED STOCKS | $ | 4,908,674 | ||||
|
| |||||
INVESTMENT COMPANIES – 0.78% |
| |||||
Canada – 0.78% |
| |||||
| 156,911 | Sprott Physical Uranium Trust(a) | $ | 1,852,694 | |||
|
| |||||
TOTAL INVESTMENT COMPANIES | $ | 1,852,694 | ||||
|
| |||||
| Shares | Value | |||||||
SHORT-TERM INVESTMENTS – 0.77% | ||||||||
Money Market Funds — 0.77% | ||||||||
Northern Institutional Funds - Treasury Portfolio (Premier), 2.31%(e) | 1,825,168 | $ | 1,825,168 | |||||
|
| |||||||
TOTAL SHORT-TERM INVESTMENTS | $ | 1,825,168 | ||||||
|
| |||||||
Total Investments | $ | 234,744,336 | ||||||
Other Assets in Excess of Liabilities – 1.19% | 2,823,352 | |||||||
|
| |||||||
TOTAL NET ASSETS – 100.00% | $ | 237,567,688 | ||||||
|
| |||||||
Percentages are stated as a percent of net assets.
ADR American Depositary Receipt
GDR Global Depositary Receipt
| (a) | Non-income producing security. |
| (b) | Acquired in a transaction exempt from registration under Rule 144A or Section 4(a)(2) of the Securities Act of 1933. May be resold in the U.S. in transactions exempt from registration, normally to qualified institutional buyers. The total value of all such securities was $12,752,816 which represented 5.37% of the net assets of the Fund. |
| (c) | Affiliated issuer. See Note 8in the Notes to Financial Statements. |
| (d) | Current yield is disclosed. Dividends are calculated based on a percentage of the issuer’s net income. |
| (e) | The rate shown is the annualized seven day yield as of September 30, 2022. |
The accompanying notes to financial statements are an integral part of this Schedule of Investments.
72
Brandes International Small Cap Equity Fund
SCHEDULE OF INVESTMENTS BY INDUSTRY — September 30, 2022
COMMON STOCKS | ||||
Aerospace & Defense | 7.74 | % | ||
Auto Components | 0.46 | % | ||
Banks | 11.23 | % | ||
Beverages | 2.06 | % | ||
Chemicals | 1.49 | % | ||
Commercial Services & Supplies | 4.73 | % | ||
Construction & Engineering | 1.50 | % | ||
Construction Materials | 3.50 | % | ||
Diversified Financial Services | 2.07 | % | ||
Diversified Telecommunication Services | 1.71 | % | ||
Electric Utilities | 2.49 | % | ||
Electrical Equipment | 0.52 | % | ||
Electronic Equipment, Instruments & Components | 2.83 | % | ||
Energy Equipment & Services | 1.63 | % | ||
Entertainment | 1.48 | % | ||
Equity Real Estate Investment Trusts | 6.50 | % | ||
Food & Staples Retailing | 5.55 | % | ||
Food Products | 5.99 | % | ||
Health Care Equipment & Supplies | 1.37 | % | ||
Hotels, Restaurants & Leisure | 1.86 | % | ||
Household Durables | 3.11 | % | ||
Insurance | 1.76 | % | ||
Machinery | 3.88 | % | ||
Media | 3.97 | % | ||
Metals & Mining | 0.99 | % | ||
Personal Products | 1.78 | % | ||
Pharmaceuticals | 5.42 | % | ||
Real Estate Management & Development | 0.73 | % | ||
Specialty Retail | 0.84 | % | ||
Textiles, Apparel & Luxury Goods | 2.15 | % | ||
Trading Companies & Distributors | 1.88 | % | ||
Wireless Telecommunication Services | 1.98 | % | ||
|
| |||
TOTAL COMMON STOCKS | 95.20 | % | ||
|
| |||
PREFERRED STOCKS | ||||
Health Care Equipment & Supplies | 2.06 | % | ||
|
| |||
TOTAL PREFERRED STOCKS | 2.06 | % | ||
|
| |||
INVESTMENT COMPANIES | ||||
Trading Companies & Distributors | 0.78 | % | ||
|
| |||
TOTAL INVESTMENT COMPANIES | 0.78 | % | ||
|
| |||
SHORT-TERM INVESTMENTS | 0.77 | % | ||
|
| |||
TOTAL INVESTMENTS | 98.81 | % | ||
Other Assets in Excess of Liabilities | 1.19 | % | ||
|
| |||
TOTAL NET ASSETS | 100.00 | % | ||
|
| |||
The accompanying notes to financial statements are an integral part of this Schedule of Investments.
73
Brandes International Small Cap Equity Fund
SCHEDULE OF INVESTMENTS BY INDUSTRY — September 30, 2022 (continued)
The industry classifications represented in the Schedule of Investments are in accordance with Global Industry Classification Standards (GICS®), which was developed by and/or is the exclusive property of MSCI, Inc. and Standard & Poor’s Financial Services LLC or were otherwise determined by the Advisor to be appropriate. This information is unaudited.
The accompanying notes to financial statements are an integral part of this Schedule of Investments.
74
SCHEDULE OF INVESTMENTS — September 30, 2022
| Shares | Value | |||||||
COMMON STOCKS – 92.98% | ||||||||
Aerospace & Defense – 14.74% | ||||||||
| 16,731 | Embraer SA Sponsored – ADR(a) | $ | 143,887 | |||||
| 2,093 | Moog, Inc. – Class A | 147,243 | ||||||
| 1,636 | National Presto Industries, Inc. | 106,422 | ||||||
| 15,787 | Park Aerospace Corp. | 174,288 | ||||||
|
| |||||||
| 571,840 | ||||||||
|
| |||||||
Banks – 3.95% | ||||||||
| 1,272 | ACNB Corp. | 38,211 | ||||||
| 3,407 | National Bankshares, Inc. | 115,020 | ||||||
|
| |||||||
| 153,231 | ||||||||
|
| |||||||
Biotechnology – 4.71% | ||||||||
| 3,530 | Eagle Pharmaceuticals, Inc.(a) | 93,262 | ||||||
| 11,508 | PDL BioPharma, Inc.(a),(b) | 16,917 | ||||||
| 347 | United Therapeutics Corp.(a) | 72,655 | ||||||
|
| |||||||
| 182,834 | ||||||||
|
| |||||||
Chemicals – 1.30% | ||||||||
| 1,179 | Scotts Miracle-Gro Co. | 50,402 | ||||||
|
| |||||||
Commercial Services & Supplies – 2.00% | ||||||||
| 2,274 | Healthcare Services Group, Inc. | 27,493 | ||||||
| 4,528 | Kimball International, Inc. – Class B | 28,481 | ||||||
| 3,312 | Steelcase, Inc. – Class A | 21,594 | ||||||
|
| |||||||
| 77,568 | ||||||||
|
| |||||||
Communications Equipment – 5.57% | ||||||||
| 8,741 | NETGEAR, Inc.(a) | 175,170 | ||||||
| 18,404 | Ribbon Communications, Inc.(a) | 40,857 | ||||||
|
| |||||||
| 216,027 | ||||||||
|
| |||||||
Construction & Engineering – 2.55% | ||||||||
| 37,428 | Orion Group Holdings, Inc.(a) | 98,810 | ||||||
|
| |||||||
Construction Materials – 1.47% | ||||||||
| 8,011 | Buzzi Unicem SpA – ADR | 57,231 | ||||||
|
| |||||||
Electronic Equipment, Instruments & Components – 1.42% | ||||||||
| 11,839 | Arlo Technologies, Inc.(a) | 54,933 | ||||||
|
| |||||||
| Shares | Value | |||||||
Energy Equipment & Services – 4.03% | ||||||||
| 8,020 | Dril-Quip, Inc.(a) | $ | 156,550 | |||||
|
| |||||||
Equity Real Estate Investment Trusts – 1.92% | ||||||||
| 3,056 | Equity Commonwealth | 74,444 | ||||||
|
| |||||||
Food & Staples Retailing – 1.26% | ||||||||
| 616 | Ingles Markets, Inc. – Class A | 48,793 | ||||||
|
| |||||||
Health Care Equipment & Supplies – 1.65% | ||||||||
| 1,354 | Invacare Corp.(a) | 1,057 | ||||||
| 4,499 | LENSAR, Inc.(a) | 24,969 | ||||||
| 444 | Utah Medical Products, Inc. | 37,878 | ||||||
|
| |||||||
| 63,904 | ||||||||
|
| |||||||
Health Care Providers & Services – 2.63% | ||||||||
| 3,734 | Pediatrix Medical Group, Inc.(a) | 61,648 | ||||||
| 1,192 | Premier, Inc. – Class A | 40,457 | ||||||
|
| |||||||
| 102,105 | ||||||||
|
| |||||||
Household Durables – 2.84% | ||||||||
| 12,666 | Dorel Industries, Inc. – Class B | 43,554 | ||||||
| 1,018 | MDC Holdings, Inc. | 27,914 | ||||||
| 1,660 | Taylor Morrison Home Corp.(a) | 38,711 | ||||||
|
| |||||||
| 110,179 | ||||||||
|
| |||||||
Insurance – 5.81% | ||||||||
| 14,762 | Crawford & Co. – Class A | 84,734 | ||||||
| 823 | National Western Life Group, Inc. – Class A | 140,568 | ||||||
|
| |||||||
| 225,302 | ||||||||
|
| |||||||
IT Services – 1.27% | ||||||||
| 6,385 | SolarWinds Corp.(a) | 49,484 | ||||||
|
| |||||||
Machinery – 17.03% | ||||||||
| 4,808 | Flowserve Corp. | 116,835 | ||||||
| 19,525 | Graham Corp. | 171,625 | ||||||
| 5,586 | Hurco Companies, Inc. | 125,573 | ||||||
| 4,735 | Kennametal, Inc. | 97,446 | ||||||
| 9,199 | L.B. Foster Co. – Class A(a) | 89,782 | ||||||
| 2,790 | Miller Industries, Inc. | 59,399 | ||||||
|
| |||||||
| 660,660 | ||||||||
|
| |||||||
Oil, Gas & Consumable Fuels – 4.36% | ||||||||
| 795 | Chesapeake Energy Corp. | 74,897 | ||||||
| 4,023 | World Fuel Services Corp. | 94,299 | ||||||
|
| |||||||
| 169,196 | ||||||||
|
| |||||||
The accompanying notes to financial statements are an integral part of this Schedule of Investments.
75
Brandes Small Cap Value Fund
SCHEDULE OF INVESTMENTS — September 30, 2022 (continued)
| Shares | Value | |||||||
Personal Products – 4.70% | ||||||||
| 4,881 | Edgewell Personal Care Co. | $ | 182,549 | |||||
|
| |||||||
Pharmaceuticals – 5.86% | ||||||||
| 5,365 | Avadel Pharmaceuticals Plc | |||||||
| – ADR(a) | 26,879 | |||||||
| 7,547 | Phibro Animal Health Corp. | |||||||
| – Class A | 100,300 | |||||||
| 2,009 | Prestige Consumer Healthcare, Inc.(a) | 100,108 | ||||||
|
| |||||||
| 227,287 | ||||||||
|
| |||||||
Professional Services – 1.00% | ||||||||
| 441 | Science Applications International Corp. | 38,998 | ||||||
|
| |||||||
| Shares | Value | |||||||
Textiles, Apparel & Luxury Goods – 0.91% | ||||||||
| 5,069 | Hanesbrands, Inc. | $ | 35,280 | |||||
|
| |||||||
| | TOTAL COMMON STOCKS | $ | 3,607,607 | |||||
|
| |||||||
INVESTMENT COMPANIES – 2.14% | ||||||||
Trading Companies & Distributors – 2.14% | ||||||||
| 7,034 | Sprott Physical Uranium Trust(a) | $ | 83,053 | |||||
|
| |||||||
| | TOTAL INVESTMENT COMPANIES | $ | 83,053 | |||||
|
| |||||||
| Shares | Value | |||||||
SHORT-TERM INVESTMENTS – 5.81% | ||||||||
Northern Institutional Funds - Treasury Portfolio (Premier), 2.38%, (c) | 225,682 | $ | 225,682 | |||||
|
| |||||||
TOTAL SHORT-TERM INVESTMENTS | $ | 225,682 | ||||||
|
| |||||||
Total Investments (Cost $4,258,235) – 100.93% | $ | 3,916,342 | ||||||
Liabilities in Excess of Other Assets – (0.93)% | (36,230 | ) | ||||||
|
| |||||||
TOTAL NET ASSETS – 100.00% | $ | 3,880,112 | ||||||
|
| |||||||
Percentages are stated as a percent of net assets.
ADR American Depositary Receipt
| (a) | Non-income producing security. |
| (b) | Level 3 asset. |
| (c) | The rate shown is the annualized seven day yield as of September 30, 2022. |
The industry classifications represented in the Schedule of Investments are in accordance with Global Industry Classification Standards (GICS®), which was developed by and/or is the exclusive property of MSCI, Inc. and Standard & Poor’s Financial Services LLC or were otherwise determined by the Advisor to be appropriate.
The accompanying notes to financial statements are an integral part of this Schedule of Investments.
76
Brandes Small Cap Value Fund
SCHEDULE OF INVESTMENTS BY COUNTRY — September 30, 2022
COMMON STOCKS | ||||
Brazil | 3.71 | % | ||
Canada | 1.12 | % | ||
Ireland | 0.69 | % | ||
Italy | 1.47 | % | ||
United States | 85.99 | % | ||
|
| |||
TOTAL COMMON STOCKS | 92.98 | % | ||
|
| |||
INVESTMENT COMPANIES | ||||
Canada | 2.14 | % | ||
|
| |||
TOTAL INVESTMENT COMPANIES | 2.14 | % | ||
|
| |||
SHORT-TERM INVESTMENTS | 5.81 | % | ||
|
| |||
TOTAL INVESTMENTS | 100.93 | % | ||
Liabilities in Excess of Other Assets | (0.93 | )% | ||
|
| |||
TOTAL NET ASSETS | 100.00 | % | ||
|
| |||
The accompanying notes to financial statements are an integral part of this Schedule of Investments.
77
SCHEDULE OF INVESTMENTS — September 30, 2022
| Shares | Value | |||||||
COMMON STOCKS – 96.57% | ||||||||
Aerospace & Defense – 4.19% | ||||||||
| 514 | General Dynamics Corp. | $ | 109,056 | |||||
| 1,451 | Textron, Inc. | 84,535 | ||||||
|
| |||||||
| 193,591 | ||||||||
|
| |||||||
Air Freight & Logistics – 1.90% | ||||||||
| 590 | FedEx Corp. | 87,597 | ||||||
|
| |||||||
Banks – 13.85% | ||||||||
| 3,934 | Bank of America Corp. | 118,807 | ||||||
| 2,610 | Citigroup, Inc. | 108,759 | ||||||
| 763 | JPMorgan Chase & Co. | 79,733 | ||||||
| 698 | PNC Financial Services Group, Inc. | 104,295 | ||||||
| 2,351 | Truist Financial Corp. | 102,362 | ||||||
| 3,121 | Wells Fargo & Co. | 125,527 | ||||||
|
| |||||||
| 639,483 | ||||||||
|
| |||||||
Building Products – 1.05% | ||||||||
| 984 | Johnson Controls International Plc | 48,433 | ||||||
|
| |||||||
Capital Markets – 2.72% | ||||||||
| 1,486 | Bank of New York Mellon Corp. | 57,241 | ||||||
| 1,126 | State Street Corp. | 68,472 | ||||||
|
| |||||||
| 125,713 | ||||||||
|
| |||||||
Chemicals – 1.26% | ||||||||
| 1,021 | Corteva, Inc. | 58,350 | ||||||
|
| |||||||
Communications Equipment – 1.00% | ||||||||
| 1,151 | Cisco Systems, Inc. | 46,040 | ||||||
|
| |||||||
Consumer Finance – 1.36% | ||||||||
| 2,123 | OneMain Holdings, Inc. | 62,671 | ||||||
|
| |||||||
Diversified Financial Services – 1.51% | ||||||||
| 262 | Berkshire Hathaway, Inc. – Class B(a) | 69,959 | ||||||
|
| |||||||
Electrical Equipment – 1.97% | ||||||||
| 1,244 | Emerson Electric Co. | 91,086 | ||||||
|
| |||||||
Electronic Equipment, Instruments & Components – 1.69% | ||||||||
| 4,697 | Flex Ltd.(a) | 78,252 | ||||||
|
| |||||||
Energy Equipment & Services – 2.27% | ||||||||
| 4,262 | Halliburton Co. | 104,930 | ||||||
|
| |||||||
Food Products – 1.96% | ||||||||
| 1,126 | Ingredion, Inc. | 90,666 | ||||||
|
| |||||||
| Shares | Value | |||||||
Health Care Providers & Services – 14.31% | ||||||||
| 1,476 | Cardinal Health, Inc. | $ | 98,419 | |||||
| 594 | Cigna Corp. | 164,817 | ||||||
| 1,251 | CVS Health Corp. | 119,308 | ||||||
| 434 | HCA Healthcare, Inc. | 79,765 | ||||||
| 327 | Laboratory Corp. of America Holdings | 66,973 | ||||||
| 387 | McKesson Corp. | 131,530 | ||||||
|
| |||||||
| 660,812 | ||||||||
|
| |||||||
Household Durables – 2.86% | ||||||||
| 755 | Mohawk Industries, Inc.(a) | 68,848 | ||||||
| 2,708 | Taylor Morrison Home Corp.(a) | 63,151 | ||||||
|
| |||||||
| 131,999 | ||||||||
|
| |||||||
Insurance – 6.54% | ||||||||
| 2,137 | American International Group, Inc. | 101,465 | ||||||
| 895 | Loews Corp. | 44,607 | ||||||
| 3,052 | Old Republic International Corp. | 63,878 | ||||||
| 458 | Willis Towers Watson Plc | 92,030 | ||||||
|
| |||||||
| 301,980 | ||||||||
|
| |||||||
Interactive Media & Services – 1.90% | ||||||||
| 913 | Alphabet, Inc. – Class C(a) | 87,785 | ||||||
|
| |||||||
IT Services – 7.59% | ||||||||
| 1,724 | Amdocs Ltd. | 136,972 | ||||||
| 1,557 | Cognizant Technology Solutions Corp. – Class A | 89,434 | ||||||
| 1,329 | Fiserv, Inc.(a) | 124,354 | ||||||
|
| |||||||
| 350,760 | ||||||||
|
| |||||||
Machinery – 0.87% | ||||||||
| 4,098 | Gates Industrial Corp. Plc(a) | 39,996 | ||||||
|
| |||||||
Media – 6.06% | ||||||||
| 3,845 | Comcast Corp. – Class A | 112,774 | ||||||
| 2,608 | Fox Corp. – Class B | 74,328 | ||||||
| 1,474 | Omnicom Group, Inc. | 92,995 | ||||||
|
| |||||||
| 280,097 | ||||||||
|
| |||||||
Oil, Gas & Consumable Fuels – 5.56% | ||||||||
| 1,222 | Chevron Corp. | 175,565 | ||||||
| 3,468 | World Fuel Services Corp. | 81,290 | ||||||
|
| |||||||
| 256,855 | ||||||||
|
| |||||||
Pharmaceuticals – 7.14% | ||||||||
| 571 | Johnson & Johnson | 93,278 | ||||||
The accompanying notes to financial statements are an integral part of this Schedule of Investments.
78
Brandes U.S. Value Fund
SCHEDULE OF INVESTMENTS — September 30, 2022 (continued)
| Shares | Value | |||||||
| 1,414 | Merck & Co., Inc. | $ | 121,774 | |||||
| 2,617 | Pfizer, Inc. | 114,520 | ||||||
|
| |||||||
| 329,572 | ||||||||
|
| |||||||
Semiconductors & Semiconductor Equipment –3.65% | ||||||||
| 838 | Applied Materials, Inc. | 68,657 | ||||||
| 1,117 | Micron Technology, Inc. | 55,962 | ||||||
| 554 | Qorvo, Inc.(a) | 43,993 | ||||||
|
| |||||||
| 168,612 | ||||||||
|
| |||||||
Software – 1.69% | ||||||||
| 92 | Microsoft Corp. | 21,427 | ||||||
| Shares | Value | |||||||
| 1,344 | Open Text Corp. | $ | 35,535 | |||||
| 346 | Oracle Corp. | 21,130 | ||||||
|
| |||||||
| 78,092 | ||||||||
|
| |||||||
Specialty Retail – 1.67% | ||||||||
| 36 | AutoZone, Inc.(a) | 77,110 | ||||||
|
| |||||||
| | TOTAL COMMON STOCKS | $ | 4,460,441 | |||||
|
| |||||||
| Shares | Value | |||||||
SHORT-TERM INVESTMENTS – 3.17% | ||||||||
Northern Institutional Funds - Treasury Portfolio (Premier), 2.38%, (b) | 146,287 | $ | 146,287 | |||||
|
| |||||||
TOTAL SHORT-TERM INVESTMENTS | $ | 146,287 | ||||||
|
| |||||||
Total Investments (Cost $5,676,455) – 99.74% | $ | 4,606,728 | ||||||
Other Assets in Excess of Liabilities – 0.26% | 11,984 | |||||||
|
| |||||||
TOTAL NET ASSETS – 100.00% | $ | 4,618,712 | ||||||
|
| |||||||
Percentages are stated as a percent of net assets.
| (a) | Non-income producing security. |
| (b) | The rate shown is the annualized seven day yield as of September 30, 2022. |
The industry classifications represented in the Schedule of Investments are in accordance with Global Industry Classification Standards (GICS®), which was developed by and/or is the exclusive property of MSCI, Inc. and Standard & Poor’s Financial Services LLC or were otherwise determined by the Advisor to be appropriate.
The accompanying notes to financial statements are an integral part of this Schedule of Investments.
79
Brandes U.S. Value Fund
SCHEDULE OF INVESTMENTS BY COUNTRY — September 30, 2022
COMMON STOCKS | ||||
Canada | 0.77 | % | ||
Ireland | 3.04 | % | ||
Singapore | 1.69 | % | ||
United Kingdom | 0.87 | % | ||
United States | 90.20 | % | ||
|
| |||
TOTAL COMMON STOCKS | 96.57 | % | ||
|
| |||
SHORT-TERM INVESTMENTS | 3.17 | % | ||
|
| |||
TOTAL INVESTMENTS | 99.74 | % | ||
Other Assets in Excess of Liabilities | 0.26 | % | ||
|
| |||
TOTAL NET ASSETS | 100.00 | % | ||
|
| |||
The accompanying notes to financial statements are an integral part of this Schedule of Investments.
80
Brandes Core Plus Fixed Income Fund
SCHEDULE OF INVESTMENTS — September 30, 2022
| Shares | Value | |||||||
COMMON STOCKS – 0.00% | ||||||||
| Home Construction – 0.00% | ||||||||
Urbi Desarrollos Urbanos SAB de CV (a) | 1,564 | $ | 501 | |||||
|
| |||||||
TOTAL COMMON STOCKS | $ | 501 | ||||||
|
| |||||||
| Principal Amount | Value | |||||||
FEDERAL AND FEDERALLY SPONSORED CREDITS – 4.65% | ||||||||
| Federal Home Loan Mortgage Corporation – 1.47% | ||||||||
Pool A9-3505 4.500%, 8/1/2040 | $ | 40,326 | $ | 39,552 | ||||
Pool G0-6018 6.500%, 4/1/2039 | 12,713 | 13,171 | ||||||
Pool G1-8578 3.000%, 12/1/2030 | 529,129 | 498,975 | ||||||
Pool SD-8001 3.500%, 7/1/2049. | 171,259 | 155,791 | ||||||
Pool SD-8003 4.000%, 7/1/2049. | 199,478 | 187,864 | ||||||
|
| |||||||
| 895,353 | ||||||||
|
| |||||||
Federal National Mortgage Association – 3.18% | ||||||||
Pool 934124 5.500%, 7/1/2038 | 30,928 | 31,948 | ||||||
Pool AL9865 3.000%, 2/1/2047 | 660,753 | 587,382 | ||||||
Pool AS6201 3.500%, 11/1/2045 | 230,523 | 211,901 | ||||||
Pool BJ2553 3.500%, 12/1/2047 | 191,193 | 174,748 | ||||||
Pool BN6683 3.500%, 6/1/2049 | 345,085 | 313,756 | ||||||
Pool CA1624 3.000%, 4/1/2033 | 426,382 | 397,325 | ||||||
Pool MA0918 4.000%, 12/1/2041 | 85,923 | 81,903 | ||||||
Pool MA3687 4.000%, 6/1/2049 | 138,448 | 130,584 | ||||||
|
| |||||||
| 1,929,547 | ||||||||
|
| |||||||
TOTAL FEDERAL AND FEDERALLY SPONSORED CREDITS | $ | 2,824,900 | ||||||
|
| |||||||
OTHER MORTGAGE RELATED SECURITIES – 0.00% | ||||||||
Collateralized Mortgage Obligations – 0.00% | ||||||||
Wells Fargo Mortgage Backed Securities Trust Series 2006-AR14 4.433%, 10/25/2036(b) | $ | 337 | $ | 303 | ||||
|
| |||||||
TOTAL OTHER MORTGAGE RELATED SECURITIES | $ | 303 | ||||||
|
| |||||||
US GOVERNMENTS – 53.26% | ||||||||
| Sovereign Government – 53.26% | ||||||||
United States Treasury Note | ||||||||
2.375%, 8/15/2024 | $ | 5,260,000 | $ | 5,079,393 | ||||
2.250%, 2/15/2027 | 9,875,000 | 9,127,432 | ||||||
2.375%, 5/15/2029 | 9,275,000 | 8,393,150 | ||||||
United States Treasury Bond | ||||||||
4.750%, 2/15/2037 | 5,775,000 | 6,401,001 | ||||||
3.500%, 2/15/2039 | 1,750,000 | 1,666,123 | ||||||
3.000%, 5/15/2047 | 2,000,000 | 1,674,141 | ||||||
The accompanying notes to financial statements are an integral part of this Schedule of Investments.
81
Brandes Core Plus Fixed Income Fund
SCHEDULE OF INVESTMENTS — September 30, 2022 (continued)
| Principal Amount | Value | |||||||
|
| |||||||
TOTAL US GOVERNMENTS | $ | 32,341,240 | ||||||
|
| |||||||
CONVERTIBLE BONDS – 1.13% | ||||||||
| Software – 1.13% | ||||||||
MicroStrategy, Inc. | $ | 1,540,000 | $ | 686,840 | ||||
|
| |||||||
TOTAL CONVERTIBLE BONDS | $ | 686,840 | ||||||
|
| |||||||
CORPORATE BONDS – 33.20% | ||||||||
| Asset Management – 1.19% | ||||||||
Charles Schwab Corp. | $ | 745,000 | $ | 724,513 | ||||
|
| |||||||
Automotive – 1.88% | ||||||||
Ford Motor Credit Co. LLC | ||||||||
3.350%, 11/1/2022 | 370,000 | 369,478 | ||||||
3.375%, 11/13/2025 | 350,000 | 309,227 | ||||||
2.700%, 8/10/2026 | 555,000 | 460,312 | ||||||
|
| |||||||
| 1,139,017 | ||||||||
|
| |||||||
Banking – 7.05% | ||||||||
Bank of America Corp. | 685,000 | 660,071 | ||||||
Citigroup, Inc. | 730,000 | 709,507 | ||||||
Fifth Third Bancorp | 175,000 | 207,212 | ||||||
JPMorgan Chase & Co. | 1,317,000 | 1,316,981 | ||||||
USB Capital IX | 1,830,000 | 1,389,061 | ||||||
|
| |||||||
| 4,282,832 | ||||||||
|
| |||||||
Cable & Satellite – 0.47% | ||||||||
Charter Communications Operating LLC | 295,000 | 287,672 | ||||||
|
| |||||||
Commercial Support Services – 2.39% | ||||||||
Prime Security Services Borrower LLC | ||||||||
5.750%, 4/15/2026(e) | 715,000 | 672,772 | ||||||
6.250%, 1/15/2028(e) | 915,000 | 780,835 | ||||||
|
| |||||||
| 1,453,607 | ||||||||
|
| |||||||
The accompanying notes to financial statements are an integral part of this Schedule of Investments.
82
Brandes Core Plus Fixed Income Fund
SCHEDULE OF INVESTMENTS — September 30, 2022 (continued)
| Principal Amount | Value | |||||||
Containers & Packaging – 1.06% | ||||||||
Mauser Packaging Solutions Holding Co. | $ | 310,000 | $ | 272,698 | ||||
Sealed Air Corp. | 430,000 | 372,100 | ||||||
|
| |||||||
| 644,798 | ||||||||
|
| |||||||
Electric Utilities – 1.81% | ||||||||
American Transmission Systems, Inc. | 600,000 | 471,017 | ||||||
Commonwealth Edison Co. | 175,000 | 179,435 | ||||||
FirstEnergy Corp. | 410,000 | 450,508 | ||||||
|
| |||||||
| 1,100,960 | ||||||||
|
| |||||||
Food – 1.16% | ||||||||
Pilgrim’s Pride Corp. | ||||||||
5.875%, 9/30/2027(e) | 210,000 | 204,225 | ||||||
4.250%, 4/15/2031(e) | 625,000 | 498,919 | ||||||
|
| |||||||
| 703,144 | ||||||||
|
| |||||||
Health Care Facilities & Services – 1.58% | ||||||||
Tenet Healthcare Corp. | 1,030,000 | 957,148 | ||||||
|
| |||||||
Home Construction – 2.77% | ||||||||
PulteGroup, Inc. | 980,000 | 966,728 | ||||||
Toll Brothers Finance Corp. | 745,000 | 717,554 | ||||||
|
| |||||||
| 1,684,282 | ||||||||
|
| |||||||
Household Products – 1.23% | ||||||||
Coty, Inc. | 821,000 | 747,480 | ||||||
|
| |||||||
Institutional Financial Services – 0.75% | ||||||||
Goldman Sachs Group, Inc. | 585,000 | 453,280 | ||||||
|
| |||||||
Internet Media & Services – 1.82% | ||||||||
Expedia Group, Inc. | 130,000 | 115,451 | ||||||
Netflix, Inc. | 1,050,000 | 991,237 | ||||||
|
| |||||||
| 1,106,688 | ||||||||
|
| |||||||
Leisure Facilities & Services – 1.21% | ||||||||
Travel + Leisure Co. | 785,000 | 735,342 | ||||||
|
| |||||||
The accompanying notes to financial statements are an integral part of this Schedule of Investments.
83
Brandes Core Plus Fixed Income Fund
SCHEDULE OF INVESTMENTS — September 30, 2022 (continued)
| Principal Amount | Value | |||||||
| Oil & Gas Producers – 2.88% | ||||||||
Continental Resources, Inc. | ||||||||
4.500%, 4/15/2023 | $ | 355,000 | $ | 353,221 | ||||
4.375%, 1/15/2028 | 215,000 | 192,957 | ||||||
Hess Midstream Operations LP | 365,000 | 294,738 | ||||||
Range Resources Corp. | 960,000 | 904,877 | ||||||
|
| |||||||
| 1,745,793 | ||||||||
|
| |||||||
REIT – 0.95% | ||||||||
Iron Mountain, Inc. | 645,000 | 577,685 | ||||||
|
| |||||||
Software – 1.86% | ||||||||
VMware, Inc. | ||||||||
4.500%, 5/15/2025 | 215,000 | 209,978 | ||||||
3.900%, 8/21/2027 | 995,000 | 916,632 | ||||||
|
| |||||||
| 1,126,610 | ||||||||
|
| |||||||
Telecommunications – 1.14% | ||||||||
Sprint Spectrum Co. LLC | 415,000 | 406,112 | ||||||
T-Mobile USA, Inc. | 300,000 | 283,203 | ||||||
|
| |||||||
| 689,315 | ||||||||
|
| |||||||
TOTAL CORPORATE BONDS | $ | 20,160,166 | ||||||
|
| |||||||
FOREIGN ISSUER BONDS – 1.81% | ||||||||
| Chemicals – 0.61% | ||||||||
Methanex Corp. | ||||||||
5.125%, 10/15/2027 | $ | 250,000 | $ | 210,000 | ||||
5.250%, 12/15/2029 | 200,000 | 158,981 | ||||||
|
| |||||||
| 368,981 | ||||||||
|
| |||||||
Telecommunications – 1.20% | ||||||||
SoftBank Group Corp. | 200,000 | 187,500 | ||||||
Telecom Italia Capital SA | 695,000 | 540,314 | ||||||
|
| |||||||
| 727,814 | ||||||||
|
| |||||||
TOTAL FOREIGN ISSUER BONDS | $ | 1,096,795 | ||||||
|
| |||||||
ASSET BACKED SECURITIES – 1.82% | ||||||||
| Specialty Finance – 1.82% | ||||||||
SLM Private Credit Student Loan Trust Series 2007-A, 3.533%, (3M LIBOR + 0.240%), 12/16/2041(d) | $ | 159,274 | $ | 153,679 | ||||
The accompanying notes to financial statements are an integral part of this Schedule of Investments.
84
Brandes Core Plus Fixed Income Fund
SCHEDULE OF INVESTMENTS — September 30, 2022 (continued)
| Principal Amount | Value | |||||||
SLM Private Credit Student Loan Trust Series 2004-B, 3.723%, (3M LIBOR + 0.430%), 9/15/2033(d) | $ | 300,000 | $ | 287,955 | ||||
SLM Private Credit Student Loan Trust Series 2005-A, 3.603%, (3M LIBOR + 0.310%), 12/15/2038(d) | 262,861 | 253,924 | ||||||
SLM Private Credit Student Loan Trust Series 2006-A, 3.583%, (3M LIBOR + 0.290%), 6/15/2039(d) | 437,862 | 411,318 | ||||||
|
| |||||||
TOTAL ASSET BACKED SECURITIES | $ | 1,106,876 | ||||||
|
| |||||||
| Shares | Value | |||||||
SHORT-TERM INVESTMENTS – 3.66% | ||||||||
| Money Market Funds – 3.66% | ||||||||
Northern Institutional Funds - Treasury Portfolio (Premier), 2.38%(f) | 2,220,282 | $ | 2,220,282 | |||||
|
| |||||||
TOTAL SHORT-TERM INVESTMENTS | $ | 2,220,282 | ||||||
|
| |||||||
Total Investments (Cost $67,216,988) – 99.53% | $ | 60,437,903 | ||||||
Other Assets in Excess of Liabilities – 0.47% | 283,281 | |||||||
|
| |||||||
Total Net Assets – 100.00% | $ | 60,721,184 | ||||||
|
| |||||||
Percentages are stated as a percent of net assets.
LIBOR London Interbank Offered Rate
LP Limited Partnership
REIT Real Estate Investment Trust
| (a) | Non-income producing security. |
| (b) | Variable rate security. The coupon is based on an underlying pool of loans. |
| (c) | Zero coupon bond. |
| (d) | Variable rate security. The coupon is based on a reference index and spread index. |
| (e) | Acquired in a transaction exempt from registration under Rule 144A or Section 4(a)(2) of the Securities Act of 1933. May be resold in the U.S. in transactions exempt from registration, normally to qualified institutional buyers. The total value of all such securities was $6,991,071 which represented 11.51% of the net assets of the Fund. |
| (f) | The rate shown is the annualized seven day yield as of September 30, 2022. |
The industry classifications represented in the Schedule of Investments are in accordance with Bloomberg Industry Classification Standards (BICS) or were otherwise determined by the Advisor to be appropriate. This information is unaudited.
The accompanying notes to financial statements are an integral part of this Schedule of Investments.
85
Brandes Investment Trust
STATEMENTS OF ASSETS AND LIABILITIES — September 30, 2022
| Brandes International Equity Fund | Brandes Global Equity Fund | |||||||
ASSETS | ||||||||
Investment in securities, at value(1), (2) | ||||||||
Unaffiliated issuers | $ | 458,635,833 | $ | 36,651,938 | ||||
Affiliated issuers | — | — | ||||||
Foreign Currency(1) | 73,795 | 9,330 | ||||||
Receivables: | ||||||||
Securities sold | 547,930 | 7 | ||||||
Fund shares sold | 333,260 | 2,274 | ||||||
Dividends and interest | 2,247,467 | 63,900 | ||||||
Tax reclaims | 1,904,152 | 65,292 | ||||||
Securities lending | 903 | 87 | ||||||
Prepaid expenses and other assets | 30,588 | 33,684 | ||||||
Due from Advisor | — | — | ||||||
|
|
|
|
| ||||
Total Assets | 463,773,928 | 36,826,512 | ||||||
|
|
|
|
| ||||
LIABILITIES | ||||||||
Payables: | ||||||||
Securities purchased | — | 74,055 | ||||||
Fund shares redeemed | 1,524,005 | 145,032 | ||||||
Overdraft payable | 482,936 | — | ||||||
12b-1 Fee | 10,694 | 550 | ||||||
Trustee Fees | 22,642 | 1,732 | ||||||
Custodian Fee | 13,389 | 1,117 | ||||||
Foreign capital gains taxes | — | — | ||||||
Dividends payable | 68,750 | 1,686 | ||||||
Accrued expenses | 165,978 | 87,220 | ||||||
Due to Advisor. | 266,608 | 25,994 | ||||||
|
|
|
|
| ||||
Total Liabilities | 2,555,002 | 337,386 | ||||||
|
|
|
|
| ||||
NET ASSETS | $ | 461,218,926 | $ | 36,489,126 | ||||
|
|
|
|
| ||||
COMPONENTS OF NET ASSETS | ||||||||
Paid in Capital | $ | 742,250,246 | $ | 37,704,061 | ||||
Total distributable earnings (loss) | (281,031,320 | ) | (1,214,935 | ) | ||||
|
|
|
|
| ||||
Total Net Assets. | $ | 461,218,926 | $ | 36,489,126 | ||||
|
|
|
|
| ||||
Net asset value, offering price and redemption proceeds per share | ||||||||
Class A Shares | ||||||||
Net Assets | $ | 27,885,790 | $ | 767,955 | ||||
Shares outstanding (unlimited shares authorized without par value) | 2,149,943 | 37,599 | ||||||
Offering and redemption price. | $ | 12.97 | $ | 20.42 | ||||
|
|
|
|
| ||||
Maximum offering price per share* | $ | 13.76 | $ | 21.67 | ||||
|
|
|
|
| ||||
Class C Shares | ||||||||
Net Assets | $ | 5,906,371 | $ | 562,322 | ||||
Shares outstanding (unlimited shares authorized without par value) | 464,193 | 27,875 | ||||||
Offering and redemption price. | $ | 12.72 | $ | 20.17 | ||||
|
|
|
|
| ||||
Class I Shares | ||||||||
Net Assets | $ | 387,354,243 | $ | 35,158,849 | ||||
Shares outstanding (unlimited shares authorized without par value) | 29,616,026 | 1,701,697 | ||||||
Offering and redemption price. | $ | 13.08 | $ | 20.66 | ||||
|
|
|
|
| ||||
Class R6 Shares | ||||||||
Net Assets | $ | 40,072,522 | $ | N/A | ||||
Shares outstanding (unlimited shares authorized without par value) | 3,040,750 | N/A | ||||||
Offering and redemption price. | $ | 13.18 | $ | N/A | ||||
|
|
|
|
| ||||
(1) Cost of: | ||||||||
Investments in securities | ||||||||
Unaffiliated issuers | $ | 657,364,820 | $ | 38,160,606 | ||||
Affiliated issuers | — | — | ||||||
Foreign currency. | 73,795 | 9,330 | ||||||
(2) Market value of securities loaned of: | $ | 7,978,499 | $ | 864,272 | ||||
| * | Includes a sales load of 5.75% for the International, Global, Emerging Markets, International Small Cap, Small Cap Value, and U.S. Value Funds and 3.75% for the Core Plus Fund. (see Note 7 of the Notes to Financial Statements) |
The accompanying notes to financial statements are an integral part of this statement.
86
Brandes Investment Trust
STATEMENTS OF ASSETS AND LIABILITIES — September 30, 2022 (continued)
| Brandes Emerging Markets Value Fund | Brandes International Small Cap Equity Fund | Brandes Small Cap Value Fund | Brandes U.S. Value Fund | Brandes Core Plus Fixed Income Fund | ||||||||||||||
| $ | 618,447,664 | $ | 234,097,312 | $ | 3,916,342 | $ | 4,606,728 | $ | 60,437,903 | |||||||||
| — | 647,024 | — | — | — | ||||||||||||||
| 716,056 | 396,459 | — | — | — | ||||||||||||||
| 3,840,709 | 1,963,130 | — | — | — | ||||||||||||||
| 2,055,422 | 2,010,404 | — | — | 22,270 | ||||||||||||||
| 2,134,720 | 1,076,506 | 9,564 | 6,290 | 476,349 | ||||||||||||||
| 176,091 | 461,316 | — | 213 | — | ||||||||||||||
| — | — | — | — | — | ||||||||||||||
| 35,776 | 27,904 | 26,477 | 47,555 | 39,970 | ||||||||||||||
| — | — | — | 8,168 | — | ||||||||||||||
|
|
|
|
|
|
|
|
|
|
|
| |||||||
| 627,406,438 | 240,680,055 | 3,952,383 | 4,668,954 | 60,976,492 | ||||||||||||||
|
|
|
|
|
|
|
|
|
|
|
| |||||||
| — | 2,509,139 | 18,298 | 11,888 | — | ||||||||||||||
| 2,308,070 | 206,584 | 2,290 | 471 | 106,373 | ||||||||||||||
| 2,093,711 | — | — | — | — | ||||||||||||||
| 33,799 | 10,587 | 167 | 8 | 160 | ||||||||||||||
| 29,550 | 11,758 | 283 | 215 | 2,244 | ||||||||||||||
| 34,316 | 11,363 | 803 | 365 | 517 | ||||||||||||||
| 339,416 | — | — | — | — | ||||||||||||||
| 1,144,647 | 1,078 | 13 | — | — | ||||||||||||||
| 271,165 | 163,071 | 46,996 | 37,295 | 128,497 | ||||||||||||||
| 503,581 | 198,787 | 3,421 | — | 17,517 | ||||||||||||||
|
|
|
|
|
|
|
|
|
|
|
| |||||||
| 6,758,255 | 3,112,367 | 72,271 | 50,242 | 255,308 | ||||||||||||||
|
|
|
|
|
|
|
|
|
|
|
| |||||||
| $ | 620,648,183 | $ | 237,567,688 | $ | 3,880,112 | $ | 4,618,712 | $ | 60,721,184 | |||||||||
|
|
|
|
|
|
|
|
|
|
|
| |||||||
| $ | 1,209,267,827 | $ | 488,451,125 | $ | 4,820,842 | $ | 5,657,561 | $ | 69,743,665 | |||||||||
| (588,619,644 | ) | (250,883,437 | ) | (940,730 | ) | (1,038,849 | ) | (9,022,481 | ) | |||||||||
|
|
|
|
|
|
|
|
|
|
|
| |||||||
| $ | 620,648,183 | $ | 237,567,688 | $ | 3,880,112 | $ | 4,618,712 | $ | 60,721,184 | |||||||||
|
|
|
|
|
|
|
|
|
|
|
| |||||||
| $ | 137,529,501 | $ | 37,833,435 | $ | 741,029 | $ | 35,778 | $ | 760,614 | |||||||||
| 23,234,369 | 4,002,836 | 71,228 | 4,095 | 95,285 | ||||||||||||||
| $ | 5.92 | $ | 9.45 | $ | 10.40 | $ | 8.74 | $ | 7.98 | |||||||||
|
|
|
|
|
|
|
|
|
|
|
| |||||||
| $ | 6.28 | $ | 10.03 | $ | 11.03 | $ | 9.27 | $ | 8.29 | |||||||||
|
|
|
|
|
|
|
|
|
|
|
| |||||||
| $ | 5,102,345 | $ | 3,170,616 | $ | N/A | $ | N/A | $ | N/A | |||||||||
| 870,265 | 348,673 | N/A | N/A | N/A | ||||||||||||||
| $ | 5.86 | $ | 9.09 | $ | N/A | $ | N/A | $ | N/A | |||||||||
|
|
|
|
|
|
|
|
|
|
|
| |||||||
| $ | 456,976,893 | $ | 196,240,029 | $ | 3,056,787 | $ | 4,582,845 | $ | 59,960,479 | |||||||||
| 76,716,067 | 20,646,880 | 290,485 | 525,047 | 7,438,287 | ||||||||||||||
| $ | 5.96 | $ | 9.50 | $ | 10.52 | $ | 8.73 | $ | 8.06 | |||||||||
|
|
|
|
|
|
|
|
|
|
|
| |||||||
| $ | 21,039,444 | $ | 323,608 | $ | 82,296 | $ | 89 | $ | 91 | |||||||||
| 3,505,479 | 33,911 | 8,333 | 10 | 11 | ||||||||||||||
| $ | 6.00 | $ | 9.54 | $ | 9.88 | $ | 8.75 | $ | 8.06 | |||||||||
|
|
|
|
|
|
|
|
|
|
|
| |||||||
| $ | 931,543,031 | $ | 298,757,827 | $ | 4,258,235 | $ | 5,676,455 | $ | 67,216,988 | |||||||||
| — | 30,882,874 | — | — | — | ||||||||||||||
| 716,055 | 396,459 | — | — | — | ||||||||||||||
| $ | — | $ | — | $ | — | $ | — | $ | — | |||||||||
The accompanying notes to financial statements are an integral part of this statement.
87
Brandes Investment Trust
STATEMENTS OF OPERATIONS — For the Year Ended September 30, 2022
| Brandes International Equity Fund | Brandes Global Equity Fund | |||||||
INVESTMENT INCOME | ||||||||
Income | ||||||||
Dividend income | ||||||||
Unaffiliated issuers | $ | 29,957,355 | $ | 1,519,265 | ||||
Less: Foreign taxes withheld | (1,951,846 | ) | (77,328 | ) | ||||
Interest income | — | 249 | ||||||
Income from securities lending | 161,072 | 3,188 | ||||||
|
|
|
| |||||
Total Income | 28,166,581 | 1,445,374 | ||||||
|
|
|
| |||||
Expenses | ||||||||
Advisory fees (Note 3) | 4,680,487 | 364,405 | ||||||
Custody fees | 80,069 | 5,319 | ||||||
Administration fees (Note 3) | 144,459 | 21,653 | ||||||
Insurance expense | 22,064 | 1,622 | ||||||
Legal fees | 94,436 | 6,917 | ||||||
Printing fees | 9,997 | 1,829 | ||||||
Miscellaneous. | 78,581 | 11,303 | ||||||
Registration expense | 84,258 | 56,502 | ||||||
Trustees fees | 85,682 | 6,279 | ||||||
Transfer agent fees | 132,151 | 9,378 | ||||||
12b-1 Fees – Class A | 97,782 | 2,105 | ||||||
12b-1 Fees – Class C | 59,743 | 6,039 | ||||||
Shareholder Service Fees – Class C | 19,906 | 2,013 | ||||||
Sub-Transfer Agency Fees – Class I | 262,272 | 21,952 | ||||||
Auditing fees. | 51,447 | 46,062 | ||||||
Organizational Costs | — | — | ||||||
Expenses recouped | — | — | ||||||
|
|
|
| |||||
Total expenses | 5,903,334 | 563,378 | ||||||
Expenses waived by Advisor | (440,163 | ) | (96,460 | ) | ||||
Expenses waived by Service Providers | (23,528 | ) | (1,255 | ) | ||||
|
|
|
| |||||
Total net expenses | 5,439,643 | 465,663 | ||||||
|
|
|
| |||||
Net investment income | 22,726,938 | 979,711 | ||||||
|
|
|
| |||||
REALIZED AND UNREALIZED GAIN (LOSS) ON INVESTMENTS | ||||||||
Net realized gain (loss) on: | ||||||||
Unaffiliated investments | (7,063,815 | ) | 827,801 | |||||
Foreign currency transactions | (700,900 | ) | (15,285 | ) | ||||
|
|
|
| |||||
Net realized gain (loss) | (7,764,715 | ) | 812,516 | |||||
|
|
|
| |||||
Net change in unrealized appreciation (depreciation) on: | ||||||||
Unaffiliated investments (net of decrease in estimated foreign capital gains taxes of $3,621,330 for the Emerging Markets Fund) | (175,999,556 | ) | (9,975,356 | ) | ||||
Affiliated investments | — | — | ||||||
Foreign currency transactions | (241,080 | ) | (8,435 | ) | ||||
|
|
|
| |||||
Net change in unrealized appreciation (depreciation) | (176,240,636 | ) | (9,983,791 | ) | ||||
|
|
|
| |||||
Net realized and unrealized gain (loss) on investments and foreign currency transactions | (184,005,351 | ) | (9,171,275 | ) | ||||
|
|
|
| |||||
Net increase (decrease) in net assets resulting from operations | $ | (161,278,413 | ) | $ | (8,191,564 | ) | ||
|
|
|
| |||||
The accompanying notes to financial statements are an integral part of this statement.
88
Brandes Investment Trust
STATEMENTS OF OPERATIONS — For the Year Ended September 30, 2022 (continued)
Brandes | Brandes International Small Cap Equity Fund | Brandes Small Cap Value Fund | Brandes U.S. Value Fund | Brandes Core Plus Fixed Income Fund | ||||||||||||||
| $ | 49,630,273 | $ | 18,805,920 | $ | 104,018 | $ | 74,183 | $ | 7,690 | |||||||||
| (6,628,422 | ) | (2,278,191 | ) | (6,806) | (49 | ) | — | |||||||||||
| 2 | — | 25 | — | 1,993,036 | ||||||||||||||
| — | 136,643 | — | — | — | ||||||||||||||
|
|
|
|
|
|
|
|
|
|
| ||||||||
| 43,001,853 | 16,664,372 | 97,237 | 74,134 | 2,000,726 | ||||||||||||||
|
|
|
|
|
|
|
|
|
|
| ||||||||
| 9,724,487 | 3,151,100 | 27,436 | 18,171 | 242,426 | ||||||||||||||
| 205,368 | 71,865 | 6,796 | 2,517 | 3,317 | ||||||||||||||
| 234,808 | 82,327 | 25,975 | 36,877 | 27,025 | ||||||||||||||
| 44,126 | 13,224 | 85 | 8 | 2,779 | ||||||||||||||
| 158,814 | 51,684 | 610 | 390 | 10,448 | ||||||||||||||
| 31,034 | 2,662 | 4,524 | 2,257 | 1,042 | ||||||||||||||
| 154,370 | 62,153 | 4,574 | 3,412 | 11,684 | ||||||||||||||
| 98,902 | 81,518 | 52,409 | 7,091 | 53,512 | ||||||||||||||
| 137,036 | 45,334 | 622 | 519 | 9,226 | ||||||||||||||
| 222,534 | 69,333 | 756 | 624 | 14,750 | ||||||||||||||
| 457,670 | 139,848 | 1,941 | 146 | 3,218 | ||||||||||||||
| 59,763 | 32,825 | — | — | — | ||||||||||||||
| 19,911 | 10,934 | — | — | — | ||||||||||||||
| 392,847 | 131,846 | 1,567 | 1,470 | 33,990 | ||||||||||||||
| 54,751 | 48,974 | 42,852 | 44,411 | 45,510 | ||||||||||||||
| — | — | — | 18,641 | — | ||||||||||||||
| 36,235 | — | — | — | — | ||||||||||||||
|
|
|
|
|
|
|
|
|
|
| ||||||||
| 12,032,656 | 3,995,627 | 170,147 | 136,534 | 458,927 | ||||||||||||||
| (141,386 | ) | (25,089 | ) | (132,843) | (89,215 | ) | (211,363 | ) | ||||||||||
| (47,208 | ) | (12,077 | ) | (28) | (23,943 | ) | (37,258 | ) | ||||||||||
|
|
|
|
|
|
|
|
|
|
| ||||||||
| 11,844,062 | 3,958,461 | 37,276 | 23,376 | 210,306 | ||||||||||||||
|
|
|
|
|
|
|
|
|
|
| ||||||||
| 31,157,791 | 12,705,911 | 59,961 | 50,758 | 1,790,420 | ||||||||||||||
|
|
|
|
|
|
|
|
|
|
| ||||||||
| (147,485,351 | ) | 10,322,771 | (528,735) | 28,969 | (715,460 | ) | ||||||||||||
| (1,097,201 | ) | (356,356 | ) | 454 | — | — | ||||||||||||
|
|
|
|
|
|
|
|
|
|
| ||||||||
| (148,582,552 | ) | 9,966,415 | (528,281) | 28,969 | (715,460 | ) | ||||||||||||
|
|
|
|
|
|
|
|
|
|
| ||||||||
| (199,723,228) | (125,679,428 | ) | (612,750) | (1,069,727 | ) | (10,087,293 | ) | |||||||||||
| — | (648,896 | ) | — | — | — | |||||||||||||
| (31,431 | ) | (81,548 | ) | 15 | — | — | ||||||||||||
|
|
|
|
|
|
|
|
|
|
| ||||||||
| (199,754,659 | ) | (126,409,872 | ) | (612,735) | (1,069,727 | ) | (10,087,293 | ) | ||||||||||
|
|
|
|
|
|
|
|
|
|
| ||||||||
| (348,337,211 | ) | (116,443,457 | ) | (1,141,016) | (1,040,758 | ) | (10,802,753 | ) | ||||||||||
|
|
|
|
|
|
|
|
|
|
| ||||||||
| $(317,179,420 | ) | $ | (103,737,546 | ) | $ | (1,081,055) | $ | (990,000 | ) | $ | (9,012,333 | ) | ||||||
|
|
|
|
|
|
|
|
|
|
| ||||||||
The accompanying notes to financial statements are an integral part of this statement.
89
Brandes Investment Trust
STATEMENT OF CHANGES IN NET ASSETS
| Brandes International Equity Fund | Brandes Global Equity Fund | |||||||||||||||
| Year Ended September 30, 2022 | Year Ended September 30, 2021 | Year Ended September 30, 2022 | Year Ended September 30, 2021 | |||||||||||||
INCREASE (DECREASE) IN NET ASSETS FROM: | ||||||||||||||||
OPERATIONS | ||||||||||||||||
Net investment income | $ | 22,726,938 | $ | 19,498,943 | $ | 979,711 | $ | 1,021,630 | ||||||||
Net realized gain (loss) on: | ||||||||||||||||
Investments | (7,063,815 | ) | (474,713 | ) | 827,801 | 1,871,263 | ||||||||||
Foreign currency transactions | (700,900 | ) | (131,250 | ) | (15,285 | ) | (4,557 | ) | ||||||||
Net unrealized appreciation (depreciation) on: | ||||||||||||||||
Investments | (175,999,556 | ) | 154,701,750 | (9,975,356 | ) | 9,678,417 | ||||||||||
Foreign currency transactions | (241,080 | ) | (29,853 | ) | (8,435 | ) | (3,044 | ) | ||||||||
|
|
|
|
|
|
|
|
|
|
|
| |||||
Net increase (decrease) in net assets resulting from operations | (161,278,413 | ) | 173,564,877 | (8,191,564 | ) | 12,563,709 | ||||||||||
|
|
|
|
|
|
|
|
|
|
|
| |||||
DISTRIBUTIONS TO SHAREHOLDERS | ||||||||||||||||
Distributions to shareholders | ||||||||||||||||
Class A | (1,652,905 | ) | (867,045 | ) | (48,584 | ) | (24,398 | ) | ||||||||
Class C | (283,709 | ) | (203,047 | ) | (44,233 | ) | (26,196 | ) | ||||||||
Class I | (21,959,633 | ) | (14,614,616 | ) | (2,627,232 | ) | (1,407,084 | ) | ||||||||
Class R6 | (2,164,915 | ) | (1,576,599 | ) | N/A | N/A | ||||||||||
Return of Capital | ||||||||||||||||
Class A | — | — | — | — | ||||||||||||
Class C | — | — | — | — | ||||||||||||
Class I | — | — | — | — | ||||||||||||
Class R6 | — | — | — | — | ||||||||||||
|
|
|
|
|
|
|
|
|
|
|
| |||||
Decrease in net assets from distributions | (26,061,162 | ) | (17,261,307 | ) | (2,720,049 | ) | (1,457,678 | ) | ||||||||
|
|
|
|
|
|
|
|
|
|
|
| |||||
CAPITAL SHARE TRANSACTIONS | ||||||||||||||||
Proceeds from shares sold | 155,549,525 | 181,449,754 | 4,123,658 | 9,162,908 | ||||||||||||
Net asset value of shares issued on reinvestment of distributions | 25,539,391 | 16,741,706 | 2,702,811 | 1,446,229 | ||||||||||||
Cost of shares redeemed | (190,614,438 | ) | (175,603,810 | ) | (6,640,211 | ) | (4,707,060 | ) | ||||||||
|
|
|
|
|
|
|
|
|
|
|
| |||||
Net increase (decrease) in net assets from capital share transactions | (9,525,522 | ) | 22,587,650 | 186,258 | 5,902,077 | |||||||||||
|
|
|
|
|
|
|
|
|
|
|
| |||||
Total increase (decrease) in net assets | (196,865,097 | ) | 178,891,220 | (10,725,355 | ) | 17,008,108 | ||||||||||
|
|
|
|
|
|
|
|
|
|
|
| |||||
NET ASSETS | ||||||||||||||||
Beginning of the Period | 658,084,023 | 479,192,803 | 47,214,481 | 30,206,373 | ||||||||||||
|
|
|
|
|
|
|
|
|
|
|
| |||||
End of the Period | $ | 461,218,926 | $ | 658,084,023 | $ | 36,489,126 | $ | 47,214,481 | ||||||||
|
|
|
|
|
|
|
|
|
|
|
| |||||
The accompanying notes to financial statements are an integral part of this statement.
90
Brandes Investment Trust
STATEMENT OF CHANGES IN NET ASSETS (continued)
| Brandes Emerging Markets Value Fund | Brandes International Small Cap Equity Fund | |||||||||||||||
| Year Ended September 30, 2022 | Year Ended September 30, 2021 | Year Ended September 30, 2022 | Year Ended September 30, 2021 | |||||||||||||
INCREASE (DECREASE) IN NET ASSETS FROM: | ||||||||||||||||
OPERATIONS | ||||||||||||||||
Net investment income | $ | 31,157,791 | $ | 28,600,598 | $ | 12,705,911 | $ | 4,725,118 | ||||||||
Net realized gain (loss) on: | ||||||||||||||||
Investments | (147,485,351 | ) | 3,896,861 | 10,322,771 | 23,489,024 | |||||||||||
Foreign currency transactions | (1,097,201 | ) | (265,591 | ) | (356,356 | ) | (86,203 | ) | ||||||||
Net unrealized appreciation (depreciation) on: | ||||||||||||||||
Investments | (199,723,228 | ) | 224,737,828 | (126,328,324 | ) | 130,209,934 | ||||||||||
Foreign currency transactions | (31,431 | ) | 73,348 | (81,548 | ) | (27,266 | ) | |||||||||
|
|
|
|
|
|
|
|
|
|
|
| |||||
Net increase (decrease) in net assets resulting from operations | (317,179,420 | ) | 257,043,044 | (103,737,546 | ) | 158,310,607 | ||||||||||
|
|
|
|
|
|
|
|
|
|
|
| |||||
DISTRIBUTIONS TO SHAREHOLDERS | ||||||||||||||||
Distributions to shareholders | ||||||||||||||||
Class A | (6,347,674 | ) | (2,477,613 | ) | (3,489,657 | ) | (775,482 | ) | ||||||||
Class C | (230,284 | ) | (132,067 | ) | (243,386 | ) | (75,830 | ) | ||||||||
Class I | (27,374,946 | ) | (12,653,014 | ) | (16,390,870 | ) | (3,791,449 | ) | ||||||||
Class R6 | (1,596,820 | ) | (871,639 | ) | (592,142 | ) | (159,657 | ) | ||||||||
Return of Capital | ||||||||||||||||
Class A | (131,028 | ) | — | — | — | |||||||||||
Class C | (3,375 | ) | — | — | — | |||||||||||
Class I | (463,081 | ) | — | — | — | |||||||||||
Class R6 | (21,696 | ) | — | — | — | |||||||||||
|
|
|
|
|
|
|
|
|
|
|
| |||||
Decrease in net assets from distributions | (36,168,904 | ) | (16,134,333 | ) | (20,716,055 | ) | (4,802,418 | ) | ||||||||
|
|
|
|
|
|
|
|
|
|
|
| |||||
CAPITAL SHARE TRANSACTIONS | ||||||||||||||||
Proceeds from shares sold | 306,487,134 | 362,787,961 | 41,558,199 | 66,727,719 | ||||||||||||
Net asset value of shares issued on reinvestment of distributions | 29,062,823 | 15,194,734 | 20,677,171 | 4,783,873 | ||||||||||||
Cost of shares redeemed | (660,047,927 | ) | (379,551,076 | ) | (105,048,010 | ) | (131,748,892 | ) | ||||||||
|
|
|
|
|
|
|
|
|
|
|
| |||||
Net increase (decrease) in net assets from capital share transactions | (324,497,970 | ) | (1,568,381 | ) | (42,812,640 | ) | (60,237,300 | ) | ||||||||
|
|
|
|
|
|
|
|
|
|
|
| |||||
Total increase (decrease) in net assets | (677,846,294 | ) | 239,340,330 | (167,266,241 | ) | 93,270,889 | ||||||||||
|
|
|
|
|
|
|
|
|
|
|
| |||||
NET ASSETS | ||||||||||||||||
Beginning of the Period | 1,298,494,477 | 1,059,154,147 | 404,833,929 | 311,563,040 | ||||||||||||
|
|
|
|
|
|
|
|
|
|
|
| |||||
End of the Period | $ | 620,648,183 | $ | 1,298,494,477 | $ | 237,567,688 | $ | 404,833,929 | ||||||||
|
|
|
|
|
|
|
|
|
|
|
| |||||
The accompanying notes to financial statements are an integral part of this statement.
91
Brandes Investment Trust
STATEMENT OF CHANGES IN NET ASSETS (continued)
| Brandes Small Cap Value Fund | Brandes U.S. Value Fund | |||||||||||
| Year Ended September 30, 2022 | Year Ended September 30, 2021 | Year Ended September 30, 2022 | ||||||||||
INCREASE (DECREASE) IN NET ASSETS FROM: | ||||||||||||
OPERATIONS | ||||||||||||
Net investment income. | $ | 59,961 | $ | 11,005 | $ | 50,758 | ||||||
Net realized gain (loss) on: | ||||||||||||
Investments | (528,735 | ) | 217,309 | 28,969 | ||||||||
Foreign currency transactions | 454 | (305 | ) | — | ||||||||
Net unrealized appreciation (depreciation) on: | ||||||||||||
Investments | (612,750 | ) | 300,796 | (1,069,727 | ) | |||||||
Foreign currency transactions | 15 | (15 | ) | — | ||||||||
|
|
|
|
|
|
|
|
| ||||
Net increase (decrease) in net assets resulting from operations | (1,081,055 | ) | 528,790 | (990,000 | ) | |||||||
|
|
|
|
|
|
|
|
| ||||
DISTRIBUTIONS TO SHAREHOLDERS | ||||||||||||
Distributions to shareholders | ||||||||||||
Class A | (39,140 | ) | (1,309 | ) | (649 | ) | ||||||
Class C | N/A | N/A | N/A | |||||||||
Class I. | (130,366 | ) | (19,384 | ) | (48,199 | ) | ||||||
Class R6 | (109 | ) | (2 | ) | (1 | ) | ||||||
Return of Capital | ||||||||||||
Class A | — | — | — | |||||||||
Class C | — | — | — | |||||||||
Class I | — | — | — | |||||||||
Class R6 | — | — | — | |||||||||
|
|
|
|
|
|
|
|
| ||||
Decrease in net assets from distributions | (169,615 | ) | (20,695 | ) | (48,849 | ) | ||||||
|
|
|
|
|
|
|
|
| ||||
CAPITAL SHARE TRANSACTIONS | ||||||||||||
Proceeds from shares sold | 8,335,910 | 2,067,659 | 5,878,995 | |||||||||
Net asset value of shares issued on reinvestment of distributions | 169,533 | 20,693 | 48,849 | |||||||||
Cost of shares redeemed | (5,504,192 | ) | (1,016,511 | ) | (270,283 | ) | ||||||
|
|
|
|
|
|
|
|
| ||||
Net increase (decrease) in net assets from capital share transactions | 3,001,251 | 1,071,841 | 5,657,561 | |||||||||
|
|
|
|
|
|
|
|
| ||||
Total increase (decrease) in net assets | 1,750,581 | 1,579,936 | 4,618,712 | |||||||||
|
|
|
|
|
|
|
|
| ||||
NET ASSETS | ||||||||||||
Beginning of the Period | 2,129,531 | 549,595 | — | (1) | ||||||||
|
|
|
|
|
|
|
|
| ||||
End of the Period | $ | 3,880,112 | $ | 2,129,531 | $ | 4,618,712 | ||||||
|
|
|
|
|
|
|
|
| ||||
| (1) | Commencement of operations on October 1, 2021. |
The accompanying notes to financial statements are an integral part of this statement.
92
Brandes Investment Trust
STATEMENT OF CHANGES IN NET ASSETS (continued)
| Brandes Core Plus Fixed Income Fund | ||||||||
| Year Ended September 30, 2022 | Year Ended September 30, 2021 | |||||||
INCREASE (DECREASE) IN NET ASSETS FROM: | ||||||||
OPERATIONS | ||||||||
Net investment income | $ | 1,790,420 | $ | 1,794,678 | ||||
Net realized gain (loss) on: | ||||||||
Investments | (715,460 | ) | 2,224,588 | |||||
Foreign currency transactions | — | — | ||||||
Net unrealized appreciation (depreciation) on: | ||||||||
Investments | (10,087,293 | ) | (3,279,513 | ) | ||||
Foreign currency transactions | — | — | ||||||
|
|
|
|
|
| |||
Net increase (decrease) in net assets resulting from operations | (9,012,333 | ) | 739,753 | |||||
|
|
|
|
|
| |||
DISTRIBUTIONS TO SHAREHOLDERS | ||||||||
Distributions to shareholders | ||||||||
Class A | (29,564 | ) | (29,720 | ) | ||||
Class C | N/A | N/A | ||||||
Class I | (1,755,824 | ) | (2,138,336 | ) | ||||
Class R6 | (4 | ) | (4 | ) | ||||
Return of Capital | ||||||||
Class A | — | — | ||||||
Class C | — | — | ||||||
Class I | — | — | ||||||
Class R6 | — | — | ||||||
|
|
|
|
|
| |||
Decrease in net assets from distributions | (1,785,392 | ) | (2,168,060 | ) | ||||
|
|
|
|
|
| |||
CAPITAL SHARE TRANSACTIONS | ||||||||
Proceeds from shares sold | 19,856,759 | 19,386,128 | ||||||
Net asset value of shares issued on reinvestment of distributions | 1,763,157 | 2,121,069 | ||||||
Cost of shares redeemed. | (29,217,438 | ) | (27,773,634 | ) | ||||
|
|
|
|
|
| |||
Net increase (decrease) in net assets from capital share transactions | (7,597,522 | ) | (6,266,437 | ) | ||||
|
|
|
|
|
| |||
Total increase (decrease) in net assets | (18,395,247 | ) | (7,694,744 | ) | ||||
|
|
|
|
|
| |||
NET ASSETS | ||||||||
Beginning of the Period | 79,116,431 | 86,811,175 | ||||||
|
|
|
|
|
| |||
End of the Period | $ | 60,721,184 | $ | 79,116,431 | ||||
|
|
|
|
|
| |||
The accompanying notes to financial statements are an integral part of this statement.
93
Brandes Investment Trust
FINANCIAL HIGHLIGHTS For a capital share outstanding for the period ended:
| Net asset value, beginning of period | Net investment income(1) |
Net | Total from investment operations | Dividends from net investment income | Net asset value, end of period | |||||||||||||||||||||||||
Brandes International Equity Fund | ||||||||||||||||||||||||||||||
Class A | ||||||||||||||||||||||||||||||
9/30/2022 | $ | 18.12 | 0.60 | (5.02) | (4.42) | (0.73) | $ | 12.97 | ||||||||||||||||||||||
9/30/2021 | $ | 13.51 | 0.53 | 4.54 | 5.07 | (0.46) | $ | 18.12 | ||||||||||||||||||||||
9/30/2020 | $ | 16.02 | 0.26 | (2.40) | (2.14) | (0.37) | $ | 13.51 | ||||||||||||||||||||||
9/30/2019 | $ | 17.71 | 0.53 | (1.59) | (1.06) | (0.63) | $ | 16.02 | ||||||||||||||||||||||
9/30/2018 | $ | 17.48 | 0.36 | 0.17 | 0.53 | (0.30) | $ | 17.71 | ||||||||||||||||||||||
Class C | ||||||||||||||||||||||||||||||
9/30/2022 | $ | 17.78 | 0.43 | (4.89) | (4.46) | (0.60) | $ | 12.72 | ||||||||||||||||||||||
9/30/2021 | $ | 13.27 | 0.43 | 4.47 | 4.90 | (0.39) | $ | 17.78 | ||||||||||||||||||||||
9/30/2020 | $ | 15.76 | 0.13 | (2.33) | (2.20) | (0.29) | $ | 13.27 | ||||||||||||||||||||||
9/30/2019 | $ | 17.47 | 0.40 | (1.58) | (1.18) | (0.53) | $ | 15.76 | ||||||||||||||||||||||
9/30/2018 | $ | 17.30 | 0.22 | 0.18 | 0.40 | (0.23) | $ | 17.47 | ||||||||||||||||||||||
Class I | ||||||||||||||||||||||||||||||
9/30/2022 | $ | 18.21 | 0.62 | (5.03) | (4.41) | (0.72) | $ | 13.08 | ||||||||||||||||||||||
9/30/2021 | $ | 13.57 | 0.57 | 4.57 | 5.14 | (0.50) | $ | 18.21 | ||||||||||||||||||||||
9/30/2020 | $ | 16.07 | 0.27 | (2.37) | (2.10) | (0.40) | $ | 13.57 | ||||||||||||||||||||||
9/30/2019 | $ | 17.76 | 0.56 | (1.60) | (1.04) | (0.65) | $ | 16.07 | ||||||||||||||||||||||
9/30/2018 | $ | 17.52 | 0.40 | 0.16 | 0.56 | (0.32) | $ | 17.76 | ||||||||||||||||||||||
Class R6 | ||||||||||||||||||||||||||||||
9/30/2022 | $ | 18.32 | 0.63 | (5.06) | (4.43) | (0.71) | $ | 13.18 | ||||||||||||||||||||||
9/30/2021 | $ | 13.64 | 0.57 | 4.62 | 5.19 | (0.51) | $ | 18.32 | ||||||||||||||||||||||
9/30/2020 | $ | 16.15 | 0.36 | (2.47) | (2.11) | (0.40) | $ | 13.64 | ||||||||||||||||||||||
9/30/2019 | $ | 17.83 | 0.59 | (1.61) | (1.02) | (0.66) | $ | 16.15 | ||||||||||||||||||||||
9/30/2018 | $ | 17.56 | 0.42 | 0.18 | 0.60 | (0.33) | $ | 17.83 | ||||||||||||||||||||||
| (1) | Net investment income per share has been calculated based on average shares outstanding during the period. |
| (2) | The total return calculation does not reflect the sales loads that may be imposed on Class A or C shares (see Note 7 of the Notes to Financial Statements). |
| (3) | After fees waived and expenses absorbed or recouped by the Advisor, where applicable. |
| (4) | As of June 30, 2019, the expense cap for the class changed from 1.00% to 0.85%. |
| (5) | As of June 30, 2019, the expense cap for the class changed from 0.82% to 0.75%. |
The accompanying notes to financial statements are an integral part of this statement.
94
Brandes Investment Trust
FINANCIAL HIGHLIGHTS For a capital share outstanding for the period ended:
Total return(2) | Net assets, end of period (millions) | Ratio of net expenses to average net assets(3) | Ratio of net investment income to average net assets(3) | Ratio of expenses (prior to reimburse- ments) to average net assets | Ratio of net investment income (prior to reimburse- ments) to average net assets | Portfolio turnover rate | |||||||||||||||||||||||||||
| (25.05)% | $ | 27.9 | 1.12 | % | 3.57 | % | 1.13 | % | 3.56 | % | 28.67% | ||||||||||||||||||||||
| 37.55% | $ | 38.2 | 1.10 | % | 3.03 | % | 1.11 | % | 3.02 | % | 30.41% | ||||||||||||||||||||||
| (13.42)% | $ | 22.1 | 1.13 | % | 1.80 | % | 1.14 | % | 1.79 | % | 23.20% | ||||||||||||||||||||||
| (5.98)% | $ | 32.0 | 1.16 | % | 3.21 | % | 1.16 | % | 3.21 | % | 14.43% | ||||||||||||||||||||||
| 3.02% | $ | 34.9 | 1.16 | % | 2.00 | % | 1.16 | % | 2.00 | % | 20.37% | ||||||||||||||||||||||
| (25.64)% | $ | 5.9 | 1.87 | % | 2.58 | % | 1.88 | % | 2.57 | % | 28.67% | ||||||||||||||||||||||
| 36.90% | $ | 8.8 | 1.54 | % | 2.51 | % | 1.56 | % | 2.49 | % | 30.41% | ||||||||||||||||||||||
| (14.06)% | $ | 7.6 | 1.88 | % | 1.01 | % | 1.89 | % | 1.00 | % | 23.20% | ||||||||||||||||||||||
| (6.73)% | $ | 13.1 | 1.91 | % | 2.46 | % | 1.91 | % | 2.46 | % | 14.43% | ||||||||||||||||||||||
| 2.31% | $ | 18.3 | 1.91 | % | 1.25 | % | 1.91 | % | 1.25 | % | 20.37% | ||||||||||||||||||||||
| (24.83)% | $ | 387.4 | 0.85 | % | 3.66 | % | 0.93 | % | 3.58 | % | 28.67% | ||||||||||||||||||||||
| 37.87% | $ | 552.2 | 0.85 | % | 3.25 | % | 0.91 | % | 3.19 | % | 30.41% | ||||||||||||||||||||||
| (13.13)% | $ | 401.7 | 0.85 | % | 2.03 | % | 0.94 | % | 1.94 | % | 23.20% | ||||||||||||||||||||||
| (5.82)% | $ | 622.4 | 0.94 | %(4) | 3.43 | % | 0.96 | %(4) | 3.41 | % | 14.43% | ||||||||||||||||||||||
| 3.23% | $ | 664.7 | 0.96 | % | 2.20 | % | 0.96 | % | 2.20 | % | 20.37% | ||||||||||||||||||||||
| (24.76)% | $ | 40.1 | 0.75 | % | 3.69 | % | 0.88 | % | 3.56 | % | 28.67% | ||||||||||||||||||||||
| 38.03% | $ | 58.8 | 0.75 | % | 3.28 | % | 0.86 | % | 3.17 | % | 30.41% | ||||||||||||||||||||||
| (13.08)% | $ | 47.8 | 0.75 | % | 2.35 | % | 0.89 | % | 2.21 | % | 23.20% | ||||||||||||||||||||||
| (5.69)% | $ | 35.9 | 0.80 | %(5) | 3.57 | % | 0.91 | %(5) | 3.46 | % | 14.43% | ||||||||||||||||||||||
| 3.44% | $ | 24.6 | 0.82 | % | 2.34 | % | 0.91 | % | 2.25 | % | 20.37% | ||||||||||||||||||||||
The accompanying notes to financial statements are an integral part of this statement.
95
Brandes Investment Trust
FINANCIAL HIGHLIGHTS For a capital share outstanding for the period ended:
| Net asset value, beginning of period | Net investment income(1) |
Net | Total from investment operations | Dividends from net investment income | Dividends from net realized gains | |||||||||||||||||||||||||
Brandes Global Equity Fund | ||||||||||||||||||||||||||||||
Class A | ||||||||||||||||||||||||||||||
9/30/2022 | $ | 26.53 | 0.49 | (5.09) | (4.60) | (0.61) | (0.90) | |||||||||||||||||||||||
9/30/2021 | $ | 19.30 | 0.55 | 7.54 | 8.09 | (0.56) | (0.30) | |||||||||||||||||||||||
9/30/2020 | $ | 21.75 | 0.28 | (2.33) | (2.05) | (0.40) | — | |||||||||||||||||||||||
9/30/2019 | $ | 24.61 | 0.47 | (1.80) | (1.33) | (0.48) | (1.05) | |||||||||||||||||||||||
9/30/2018 | $ | 24.42 | 0.43 | 0.69 | 1.12 | (0.42) | (0.51) | |||||||||||||||||||||||
Class C | ||||||||||||||||||||||||||||||
9/30/2022 | $ | 26.25 | 0.29 | (5.01) | (4.72) | (0.46) | (0.90) | |||||||||||||||||||||||
9/30/2021 | $ | 19.16 | 0.37 | 7.47 | 7.84 | (0.45) | (0.30) | |||||||||||||||||||||||
9/30/2020 | $ | 21.60 | 0.17 | (2.35) | (2.18) | (0.26) | — | |||||||||||||||||||||||
9/30/2019 | $ | 24.45 | 0.30 | (1.78) | (1.48) | (0.32) | (1.05) | |||||||||||||||||||||||
9/30/2018 | $ | 24.28 | 0.24 | 0.69 | 0.93 | (0.25) | (0.51) | |||||||||||||||||||||||
Class I | ||||||||||||||||||||||||||||||
9/30/2022 | $ | 26.78 | 0.55 | (5.14) | (4.59) | (0.63) | (0.90) | |||||||||||||||||||||||
9/30/2021 | $ | 19.46 | 0.64 | 7.59 | 8.23 | (0.61) | (0.30) | |||||||||||||||||||||||
9/30/2020 | $ | 21.91 | 0.38 | (2.39) | (2.01) | (0.44) | — | |||||||||||||||||||||||
9/30/2019 | $ | 24.77 | 0.53 | (1.81) | (1.28) | (0.53) | (1.05) | |||||||||||||||||||||||
9/30/2018 | $ | 24.57 | 0.49 | 0.70 | 1.19 | (0.48) | (0.51) | |||||||||||||||||||||||
| (1) | Net investment income per share has been calculated based on average shares outstanding during the period. |
| (2) | The total return calculation does not reflect the sales loads that may be imposed on Class A or C shares (see Note 7 of the Notes to Financial Statements). |
| (3) | After fees waived and expenses absorbed or recouped by the Advisor, where applicable. |
The accompanying notes to financial statements are an integral part of this statement.
96
Brandes Investment Trust
FINANCIAL HIGHLIGHTS For a capital share outstanding for the period ended:
| Net asset value, end of period | Total return(2) | Net assets, end of period (millions) | Ratio of net expenses to average net assets(3) | Ratio of net investment income to average net assets(3) | Ratio of expenses (prior to reimburse- ments) to average net assets | Ratio of net investment income (prior to reimburse- ments) to average net assets | Portfolio turnover rate | |||||||||||||||||||||||||||||||
| $20.42 | (18.30 | )% | $ | 0.8 | 1.25% | 1.95% | 1.42% | 1.78% | 14.57% | |||||||||||||||||||||||||||||
| $26.53 | 42.30 | % | $ | 0.8 | 1.25% | 2.21% | 1.41% | 2.05% | 20.46% | |||||||||||||||||||||||||||||
| $19.30 | (9.41 | )% | $ | 0.9 | 1.25% | 1.56% | 1.58% | 1.23% | 17.16% | |||||||||||||||||||||||||||||
| $21.75 | (5.22 | )% | $ | 1.5 | 1.25% | 2.11% | 1.56% | 1.81% | 12.11% | |||||||||||||||||||||||||||||
| $24.61 | 4.68 | % | $ | 3.4 | 1.25% | 1.72% | 1.40% | 1.57% | 8.89% | |||||||||||||||||||||||||||||
| $20.17 | (18.91 | )% | $ | 0.6 | 2.00% | 1.17% | 2.17% | 1.00% | 14.57% | |||||||||||||||||||||||||||||
| $26.25 | 41.21 | % | $ | 0.9 | 2.00% | 1.50% | 1.78% | 1.72% | 20.46% | |||||||||||||||||||||||||||||
| $19.16 | (10.08 | )% | $ | 0.7 | 2.00% | 0.84% | 2.32% | 0.52% | 17.16% | |||||||||||||||||||||||||||||
| $21.60 | (5.91 | )% | $ | 1.2 | 2.00% | 1.37% | 2.32% | 1.05% | 12.11% | |||||||||||||||||||||||||||||
| $24.45 | 3.88 | % | $ | 1.6 | 2.00% | 0.97% | 2.15% | 0.82% | 8.89% | |||||||||||||||||||||||||||||
| $20.66 | (18.08 | )% | $ | 35.2 | 1.00% | 2.18% | 1.22% | 1.96% | 14.57% | |||||||||||||||||||||||||||||
| $26.78 | 42.67 | % | $ | 45.5 | 1.00% | 2.52% | 1.20% | 2.32% | 20.46% | |||||||||||||||||||||||||||||
| $19.46 | (9.18 | )% | $ | 28.6 | 1.00% | 1.83% | 1.36% | 1.47% | 17.16% | |||||||||||||||||||||||||||||
| $21.91 | (4.98 | )% | $ | 33.4 | 1.00% | 2.37% | 1.36% | 2.00% | 12.11% | |||||||||||||||||||||||||||||
| $24.77 | 4.95 | % | $ | 62.6 | 1.00% | 1.97% | 1.20% | 1.77% | 8.89% | |||||||||||||||||||||||||||||
The accompanying notes to financial statements are an integral part of this statement.
97
Brandes Investment Trust
FINANCIAL HIGHLIGHTS For a capital share outstanding for the period ended:
| Net asset value, beginning of period | Net investment income(1) |
Net | Total from investment operations | Dividends from net investment income | Return of capital | |||||||||||||||||||||||||
Brandes Emerging Markets Value Fund |
| |||||||||||||||||||||||||||||
Class A | ||||||||||||||||||||||||||||||
9/30/2022 | $ | 8.66 | 0.28 | (2.75) | (2.47) | (0.27) | — | (4) | ||||||||||||||||||||||
9/30/2021 | $ | 7.04 | 0.18 | 1.54 | 1.72 | (0.10) | — | |||||||||||||||||||||||
9/30/2020 | $ | 8.57 | 0.13 | (1.49) | (1.36) | (0.17) | — | |||||||||||||||||||||||
9/30/2019 | $ | 8.46 | 0.19 | 0.07 | 0.26 | (0.15) | — | |||||||||||||||||||||||
9/30/2018 | $ | 9.47 | 0.15 | (1.01) | (0.86) | (0.15) | — | |||||||||||||||||||||||
Class C | ||||||||||||||||||||||||||||||
9/30/2022 | $ | 8.59 | 0.22 | (2.72) | (2.50) | (0.23) | — | (4) | ||||||||||||||||||||||
9/30/2021 | $ | 7.01 | 0.14 | 1.55 | 1.69 | (0.11) | — | |||||||||||||||||||||||
9/30/2020 | $ | 8.53 | 0.07 | (1.48) | (1.41) | (0.11) | — | |||||||||||||||||||||||
9/30/2019 | $ | 8.44 | 0.13 | 0.06 | 0.19 | (0.10) | — | |||||||||||||||||||||||
9/30/2018 | $ | 9.43 | 0.08 | (0.99) | (0.91) | (0.08) | — | |||||||||||||||||||||||
Class I | ||||||||||||||||||||||||||||||
9/30/2022 | $ | 8.71 | 0.24 | (2.70) | (2.46) | (0.28) | (0.01 | ) | ||||||||||||||||||||||
9/30/2021 | $ | 7.07 | 0.20 | 1.55 | 1.75 | (0.11) | — | |||||||||||||||||||||||
9/30/2020 | $ | 8.62 | 0.14 | (1.50) | (1.36) | (0.19) | — | |||||||||||||||||||||||
9/30/2019 | $ | 8.50 | 0.21 | 0.08 | 0.29 | (0.17) | — | |||||||||||||||||||||||
9/30/2018 | $ | 9.51 | 0.17 | (1.01) | (0.84) | (0.17) | — | |||||||||||||||||||||||
Class R6 | ||||||||||||||||||||||||||||||
9/30/2022 | $ | 8.76 | 0.28 | (2.75) | (2.47) | (0.28) | (0.01 | ) | ||||||||||||||||||||||
9/30/2021 | $ | 7.11 | 0.20 | 1.56 | 1.76 | (0.11) | — | |||||||||||||||||||||||
9/30/2020 | $ | 8.65 | 0.16 | (1.51) | (1.35) | (0.19) | — | |||||||||||||||||||||||
9/30/2019 | $ | 8.53 | 0.23 | 0.07 | 0.30 | (0.18) | — | |||||||||||||||||||||||
9/30/2018 | $ | 9.53 | 0.19 | (1.02) | (0.83) | (0.17) | — | |||||||||||||||||||||||
| (1) | Net investment income per share has been calculated based on average shares outstanding during the period. |
| (2) | The total return calculation does not reflect the sales loads that may be imposed on Class A or C shares (see Note 7 of the Notes to Financial Statements). |
| (3) | After fees waived and expenses absorbed or recouped by the Advisor, where applicable. |
| (4) | Amount is less than $0.01 per share. |
The accompanying notes to financial statements are an integral part of this statement.
98
Brandes Investment Trust
FINANCIAL HIGHLIGHTS For a capital share outstanding for the period ended:
Net asset value, end of period | Total return(2) | Net assets, end of period (millions) | Ratio of net expenses to average net assets(3) | Ratio of net investment income to average net assets(3) | Ratio of expenses (prior to reimburse- ments) to average net assets | Ratio of net investment income (prior to reimburse- ments) to average net assets | Portfolio turnover rate | |||||||||||||||||||||||||||||||
| $5.92 | (28.99 | )% | $ | 137.5 | 1.33 | % | 2.90 | % | 1.33 | % | 2.90 | % | 23.04% | |||||||||||||||||||||||||
| $8.66 | 24.41 | % | $ | 216.2 | 1.30 | % | 2.02 | % | 1.31 | % | 2.01 | % | 34.97% | |||||||||||||||||||||||||
| $7.04 | (16.10 | )% | $ | 174.2 | 1.33 | % | 1.75 | % | 1.34 | % | 1.74 | % | 34.39% | |||||||||||||||||||||||||
| $8.57 | 3.10 | % | $ | 235.9 | 1.35 | % | 2.23 | % | 1.35 | % | 2.23 | % | 22.09% | |||||||||||||||||||||||||
| $8.46 | (9.14 | )% | $ | 258.8 | 1.37 | % | 1.62 | % | 1.34 | % | 1.65 | % | 37.66% | |||||||||||||||||||||||||
| $5.86 | (29.54 | )% | $ | 5.1 | 2.08 | % | 2.14 | % | 2.08 | % | 2.14 | % | 23.04% | |||||||||||||||||||||||||
| $8.59 | 24.01 | % | $ | 10.3 | 1.59 | % | 1.66 | % | 1.60 | % | 1.65 | % | 34.97% | |||||||||||||||||||||||||
| $7.01 | (16.63 | )% | $ | 11.1 | 2.08 | % | 0.90 | % | 2.09 | % | 0.89 | % | 34.39% | |||||||||||||||||||||||||
| $8.53 | 2.27 | % | $ | 18.0 | 2.10 | % | 1.48 | % | 2.10 | % | 1.48 | % | 22.09% | |||||||||||||||||||||||||
| $8.44 | (9.70 | )% | $ | 22.8 | 2.10 | % | 0.89 | % | 2.09 | % | 0.90 | % | 37.66% | |||||||||||||||||||||||||
| $5.96 | (28.79 | )% | $ | 457.0 | 1.12 | % | 3.10 | % | 1.14 | % | 3.08 | % | 23.04% | |||||||||||||||||||||||||
| $8.71 | 24.71 | % | $ | 1,003.8 | 1.12 | % | 2.24 | % | 1.11 | % | 2.25 | % | 34.97% | |||||||||||||||||||||||||
| $7.07 | (15.96 | )% | $ | 834.8 | 1.12 | % | 1.88 | % | 1.14 | % | 1.86 | % | 34.39% | |||||||||||||||||||||||||
| $8.62 | 3.41 | % | $ | 1,117.7 | 1.12 | % | 2.46 | % | 1.15 | % | 2.43 | % | 22.09% | |||||||||||||||||||||||||
| $8.50 | (8.91 | )% | $ | 1,162.1 | 1.12 | % | 1.88 | % | 0.14 | % | 1.86 | % | 37.66% | |||||||||||||||||||||||||
| $6.00 | (28.75 | )% | $ | 21.0 | 0.97 | % | 2.95 | % | 1.08 | % | 2.84 | % | 23.04% | |||||||||||||||||||||||||
| $8.76 | 24.74 | % | $ | 68.1 | 0.97 | % | 2.32 | % | 1.06 | % | 2.23 | % | 34.97% | |||||||||||||||||||||||||
| $7.11 | (15.74 | )% | $ | 39.1 | 0.97 | % | 2.07 | % | 1.09 | % | 1.95 | % | 34.39% | |||||||||||||||||||||||||
| $8.65 | 3.45 | % | $ | 47.6 | 0.97 | % | 2.61 | % | 1.10 | % | 2.48 | % | 22.09% | |||||||||||||||||||||||||
| $8.53 | (8.74 | )% | $ | 33.6 | 0.97 | % | 2.02 | % | 1.08 | % | 1.91 | % | 37.66% | |||||||||||||||||||||||||
The accompanying notes to financial statements are an integral part of this statement.
99
Brandes Investment Trust
FINANCIAL HIGHLIGHTS For a capital share outstanding for the period ended:
| Net asset value, beginning of period | Net investment income (loss)(1) | Net realized and unrealized gain (loss) on investments | Total from investment operations | Dividends from net investment income | Dividends from net realized gains | |||||||||||||||||||||||||
Brandes International Small Cap Equity Fund |
| |||||||||||||||||||||||||||||
Class A | ||||||||||||||||||||||||||||||
9/30/2022 | $ | 14.01 | 0.45 | (4.27) | (3.82) | (0.74) | — | |||||||||||||||||||||||
9/30/2021 | $ | 9.33 | 0.14 | 4.69 | 4.83 | (0.15) | — | |||||||||||||||||||||||
9/30/2020 | $ | 10.22 | 0.07 | (0.88) | (0.81) | (0.08) | — | |||||||||||||||||||||||
9/30/2019 | $ | 12.10 | 0.15 | (1.60) | (1.45) | (0.30) | (0.13 | ) | ||||||||||||||||||||||
9/30/2018 | $ | 14.30 | 0.14 | (1.32) | (1.18) | (0.54) | (0.48 | ) | ||||||||||||||||||||||
Class C | ||||||||||||||||||||||||||||||
9/30/2022 | $ | 13.49 | 0.33 | (4.08) | (3.75) | (0.65) | — | |||||||||||||||||||||||
9/30/2021 | $ | 9.03 | 0.10 | 4.54 | 4.64 | (0.18) | — | |||||||||||||||||||||||
9/30/2020 | $ | 9.94 | (0.01 | ) | (0.85) | (0.86) | (0.05) | — | ||||||||||||||||||||||
9/30/2019 | $ | 11.81 | 0.06 | (1.55) | (1.49) | (0.25) | (0.13 | ) | ||||||||||||||||||||||
9/30/2018 | $ | 14.03 | 0.04 | (1.28) | (1.24) | (0.50) | (0.48 | ) | ||||||||||||||||||||||
Class I | ||||||||||||||||||||||||||||||
9/30/2022 | $ | 14.09 | 0.47 | (4.29) | (3.82) | (0.77) | — | |||||||||||||||||||||||
9/30/2021 | $ | 9.37 | 0.15 | 4.73 | 4.88 | (0.16) | — | |||||||||||||||||||||||
9/30/2020 | $ | 10.25 | 0.09 | (0.88) | (0.79) | (0.09) | — | |||||||||||||||||||||||
9/30/2019 | $ | 12.14 | 0.17 | (1.61) | (1.44) | (0.32) | (0.13 | ) | ||||||||||||||||||||||
9/30/2018 | $ | 14.35 | 0.17 | (1.32) | (1.15) | (0.58) | (0.48 | ) | ||||||||||||||||||||||
Class R6 | ||||||||||||||||||||||||||||||
9/30/2022 | $ | 14.14 | 0.59 | (4.40) | (3.81) | (0.79) | — | |||||||||||||||||||||||
9/30/2021 | $ | 9.39 | 0.17 | 4.74 | 4.91 | (0.16) | — | |||||||||||||||||||||||
9/30/2020 | $ | 10.27 | 0.07 | (0.86) | (0.79) | (0.09) | — | |||||||||||||||||||||||
9/30/2019 | $ | 12.15 | 0.18 | (1.61) | (1.43) | (0.32) | (0.13 | ) | ||||||||||||||||||||||
9/30/2018 | $ | 14.36 | 0.18 | (1.33) | (1.15) | (0.58) | (0.48 | ) | ||||||||||||||||||||||
| (1) | Net investment income per share has been calculated based on average shares outstanding during the period. |
| (2) | The total return calculation does not reflect the sales loads that may be imposed on Class A or C shares (see Note 7 of the Notes to Financial Statements). |
| (3) | After fees waived and expenses absorbed or recouped by the Advisor, where applicable. |
The accompanying notes to financial statements are an integral part of this statement.
100
Brandes Investment Trust
FINANCIAL HIGHLIGHTS For a capital share outstanding for the period ended:
| Net asset value, end of period | Total return(2) | Net assets, end of period (millions) | Ratio of net expenses to average net assets(3) | Ratio of net investment income to average net assets(3) | Ratio of expenses (prior to reimburse- ments) to average net assets | Ratio of net net assets | Portfolio turnover rate | |||||||
| $ 9.45 | (28.26)% | $ 37.8 | 1.36% | 3.73% | 1.36% | 3.73% | 38.17% | |||||||
| $14.01 | 51.91% | $ 68.0 | 1.32% | 1.10% | 1.33% | 1.09% | 26.16% | |||||||
| $ 9.33 | (7.95)% | $ 35.8 | 1.35% | 0.77% | 1.36% | 0.76% | 39.28% | |||||||
| $10.22 | (12.04)% | $ 43.5 | 1.35% | 1.34% | 1.35% | 1.34% | 22.52% | |||||||
| $12.10 | (8.88)% | $ 80.9 | 1.30% | 1.05% | 1.30% | 1.05% | 21.97% | |||||||
| $ 9.09 | (28.71)% | $ 3.2 | 2.11% | 2.88% | 2.11% | 2.88% | 38.17% | |||||||
| $13.49 | 51.52% | $ 5.3 | 1.49% | 0.86% | 1.50% | 0.85% | 26.16% | |||||||
| $ 9.03 | (8.64)% | $ 4.5 | 2.11% | (0.06)% | 2.12% | (0.07)% | 39.28% | |||||||
| $ 9.94 | (12.69)% | $ 6.9 | 2.10% | 0.59% | 2.10% | 0.59% | 22.52% | |||||||
| $11.81 | (9.55)% | $ 14.5 | 2.05% | 0.30% | 2.05% | 0.30% | 21.97% | |||||||
| $ 9.50 | (28.04)% | $196.2 | 1.15% | 3.85% | 1.16% | 3.84% | 38.17% | |||||||
| $14.09 | 52.15% | $318.0 | 1.12% | 1.23% | 1.13% | 1.22% | 26.16% | |||||||
| $ 9.37 | (7.69)% | $260.8 | 1.15% | 0.93% | 1.16% | 0.92% | 39.28% | |||||||
| $10.25 | (11.93)% | $414.8 | 1.15% | 1.54% | 1.15% | 1.54% | 22.52% | |||||||
| $12.14 | (8.70)% | $963.8 | 1.10% | 1.25% | 1.10% | 1.25% | 21.97% | |||||||
| $ 9.54 | (28.00)% | $ 0.3 | 1.00% | 4.53% | 1.10% | 4.43% | 38.17% | |||||||
| $14.14 | 52.39% | $ 13.5 | 1.00% | 1.37% | 1.08% | 1.29% | 26.16% | |||||||
| $ 9.39 | (7.72)% | $ 10.5 | 1.00% | 0.83% | 1.12% | 0.71% | 39.28% | |||||||
| $10.27 | (11.80)% | $ 20.4 | 1.00% | 1.69% | 1.10% | 1.59% | 22.52% | |||||||
| $12.15 | (8.64)% | $ 72.5 | 1.00% | 1.35% | 1.05% | 1.30% | 21.97% |
The accompanying notes to financial statements are an integral part of this statement.
101
Brandes Investment Trust
FINANCIAL HIGHLIGHTS For a capital share outstanding for the period ended:
| Net asset value, beginning of period | Net investment income(1) | Net realized and unrealized gain (loss) on investments | Total from investment operations | Dividends from net investment income | Dividends from net realized gains | |||||||||||||||||||||||||
Brandes Small Cap Value Fund | ||||||||||||||||||||||||||||||
Class A | ||||||||||||||||||||||||||||||
9/30/2022 | $ | 13.22 | 0.20 | (2.30) | (2.10) | (0.21) | (0.51) | |||||||||||||||||||||||
9/30/2021 | $ | 8.52 | 0.02 | 4.51 | 4.53 | 0.17 | — | |||||||||||||||||||||||
9/30/2020 | $ | 8.58 | 0.15 | (0.16) | (0.01) | (0.05) | — | |||||||||||||||||||||||
9/30/2019 | $ | 10.27 | 0.05 | (0.95) | (0.90) | (0.10) | (0.69) | |||||||||||||||||||||||
1/2/2018(5) – 9/30/2018 | $ | 10.00 | 0.02 | 0.27 | 0.29 | (0.02) | — | |||||||||||||||||||||||
Class I | ||||||||||||||||||||||||||||||
9/30/2022 | $ | 13.34 | 0.19 | (2.28) | (2.09) | (0.22) | (0.51) | |||||||||||||||||||||||
9/30/2021 | $ | 8.58 | 0.09 | 4.50 | 4.59 | 0.17 | — | |||||||||||||||||||||||
9/30/2020 | $ | 8.62 | 0.14 | (0.13) | 0.01 | (0.05) | — | |||||||||||||||||||||||
9/30/2019 | $ | 10.27 | 0.07 | (0.92) | (0.85) | (0.11) | (0.69) | |||||||||||||||||||||||
1/2/2018(5) – 9/30/2018 | $ | 10.00 | 0.04 | 0.27 | 0.31 | (0.04) | — | |||||||||||||||||||||||
Class R6 | ||||||||||||||||||||||||||||||
9/30/2022 | $ | 12.53 | 0.20 | (2.13) | (1.93) | (0.21) | (0.51) | |||||||||||||||||||||||
9/30/2021 | $ | 8.00 | 0.18 | 4.18 | 4.36 | 0.17 | — | |||||||||||||||||||||||
9/30/2020 | $ | 7.97 | 0.26 | (0.18) | 0.08 | (0.05) | — | |||||||||||||||||||||||
9/30/2019 | $ | 10.32 | 0.09 | (1.63) | (1.54) | (0.12) | (0.69) | |||||||||||||||||||||||
1/2/2018(5) – 9/30/2018 | $ | 10.00 | 0.05 | 0.31 | 0.36 | (0.04) | — | |||||||||||||||||||||||
| (1) | Net investment income per share has been calculated based on average shares outstanding during the period. |
| (2) | The total return calculation does not reflect the sales loads that may be imposed on Class A shares (see Note 7 of the Notes to Financial Statements). |
| (3) | After fees waived and expenses absorbed or recouped by the Advisor, where applicable. |
| (4) | Amount is less than $50,000. |
| (5) | Commencement of operations. |
| (6) | The total return figure is the since inception return for the class. |
| (7) | Annualized. |
| (8) | Not annualized. |
The accompanying notes to financial statements are an integral part of this statement.
102
Brandes Investment Trust
FINANCIAL HIGHLIGHTS For a capital share outstanding for the period ended:
Net asset value, end of period | Total return(2) | Net assets, end of period (millions) | Ratio of net expenses to average net assets(3) | Ratio of net income to average net assets(3) | Ratio of ments) to average net assets | Ratio of net ments) to average net assets | Portfolio turnover rate | |||||||
| $10.40 | (16.84)% | $0.7 | 1.15% | 1.64% | 4.66% | (1.87)% | 160.46% | |||||||
| $13.22 | 57.55% | $0.5 | 1.15% | 0.19% | 5.78% | (4.44)% | 90.71% | |||||||
| $ 8.52 | (0.02)% | $—(4) | 1.15% | 1.06% | 27.37% | (25.16)% | 80.65% | |||||||
| $ 8.58 | (8.53)% | $—(4) | 1.15% | 0.55% | 7.18% | (5.48)% | 54.30% | |||||||
| $10.27 | 2.92%(6) | $0.1 | 1.15%(7) | 0.28%(7) | 3.21%(7) | (1.78)%(7) | 41.02%(8) | |||||||
| $10.52 | (16.66)% | $3.1 | 0.90% | 1.50% | 4.25% | (1.85)% | 160.46% | |||||||
| $13.34 | 58.09% | $1.6 | 0.90% | 0.70% | 6.66% | (5.06)% | 90.71% | |||||||
| $ 8.58 | 0.10% | $0.5 | 0.90% | 1.65% | 30.12% | (27.57)% | 80.65% | |||||||
| $ 8.62 | (8.13)% | $0.5 | 0.90% | 0.81% | 4.18% | (2.47)% | 54.30% | |||||||
| $10.27 | 3.09%(6) | $5.4 | 0.90%(7) | 0.53%(7) | 3.67%(7) | (2.24)%(7) | 41.02%(8) | |||||||
| $ 9.88 | (16.50)% | $0.1 | 0.72% | 1.86% | 3.58% | (1.00)% | 160.46% | |||||||
| $12.53 | 59.25% | $—(4) | 0.72% | 0.86% | 6.62% | (5.04)% | 90.71% | |||||||
| $ 8.00 | 1.11% | $—(4) | 0.72% | 0.87% | 29.17% | (27.58)% | 80.65% | |||||||
| $ 7.97 | (15.36)% | $—(4) | 0.72% | 0.98% | 3.16% | (1.46)% | 54.30% | |||||||
| $10.32 | 3.63%(6) | $4.8 | 0.72%(7) | 0.71%(7) | 2.99%(7) | (1.56)%(7) | 41.02%(8) |
The accompanying notes to financial statements are an integral part of this statement.
103
Brandes Investment Trust
FINANCIAL HIGHLIGHTS For a capital share outstanding for the period ended:
| Net asset value, beginning of period | Net investment income(1) | Net realized and unrealized gain (loss) on investments | Total from investment operations | Dividends from net investment income | Dividends from net realized gains | |||||||||||||||||||||||||
Brandes U.S. Value Fund | ||||||||||||||||||||||||||||||
Class A | ||||||||||||||||||||||||||||||
10/1/2021(4) – 9/30/2022 | $ | 10.00 | 0.12 | (1.25 | ) | (1.13 | ) | (0.12 | ) | (0.01 | ) | |||||||||||||||||||
Class I | ||||||||||||||||||||||||||||||
10/1/2021(4) – 9/30/2022 | $ | 10.00 | 0.15 | (1.29 | ) | (1.14 | ) | (0.12 | ) | (0.01 | ) | |||||||||||||||||||
Class R6 | ||||||||||||||||||||||||||||||
10/1/2021(4) – 9/30/2022 | $ | 10.00 | 0.14 | (1.27 | ) | (1.13 | ) | (0.11 | ) | (0.01 | ) | |||||||||||||||||||
| (1) | Net investment income per share has been calculated based on average shares outstanding during the period. |
| (2) | The total return calculation does not reflect the sales loads that may be imposed on Class A shares (see Note 7 of the Notes to Financial Statements). |
| (3) | After fees waived and expenses absorbed or recouped by the Advisor, where applicable. |
| (4) | Commencement of operations. |
| (5) | The total return figure is the since inception return for the class. |
| (6) | Amount is less than $50,000. |
The accompanying notes to financial statements are an integral part of this statement.
104
Brandes Investment Trust
FINANCIAL HIGHLIGHTS For a capital share outstanding for the period ended:
| Net asset value, end of period | Total return(2) | Net assets, end of period (millions) | Ratio of net expenses to average net assets(3) | Ratio of net investment income to average net assets(3) | Ratio of expenses (prior to reimburse- ments) to average net assets | Ratio of net investment | Portfolio turnover rate | |||||||||||||||||||||
| $8.74 | (11.39)%(5) | $—(6) | 0.95% | 1.20% | 3.34% | (1.19)% | 14.62% | |||||||||||||||||||||
| $8.73 | (11.44)%(5) | $4.6 | 0.70% | 1.53% | 4.12% | (1.89)% | 14.62% | |||||||||||||||||||||
| $8.75 | (11.39)%(5) | $—(6) | 0.60% | 1.40% | 12.14% | (10.14)% | 14.62% | |||||||||||||||||||||
The accompanying notes to financial statements are an integral part of this statement.
105
Brandes Investment Trust
FINANCIAL HIGHLIGHTS For a capital share outstanding for the period ended:
| Net asset value, beginning of period | Net investment income(1) | Net | Total from investment operations | Dividends from net investment income | Net asset value, end of period | |||||||||||||||||||||||||
Brandes Core Plus Fixed Income Fund |
| |||||||||||||||||||||||||||||
Class A | ||||||||||||||||||||||||||||||
9/30/2022 | $ | 9.35 | 0.20 | (1.36 | ) | (1.16 | ) | (0.21 | ) | $ | 7.98 | |||||||||||||||||||
9/30/2021 | $ | 9.52 | 0.18 | (0.12 | ) | 0.06 | (0.23 | ) | $ | 9.35 | ||||||||||||||||||||
9/30/2020 | $ | 9.18 | 0.19 | 0.34 | 0.53 | (0.19 | ) | $ | 9.52 | |||||||||||||||||||||
9/30/2019 | $ | 8.85 | 0.24 | 0.33 | 0.57 | (0.24 | ) | $ | 9.18 | |||||||||||||||||||||
9/30/2018 | $ | 9.18 | 0.23 | (0.33 | ) | (0.10 | ) | (0.23 | ) | $ | 8.85 | |||||||||||||||||||
Class I | ||||||||||||||||||||||||||||||
9/30/2022 | $ | 9.43 | 0.23 | (1.37 | ) | (1.14 | ) | (0.23 | ) | $ | 8.06 | |||||||||||||||||||
9/30/2021 | $ | 9.60 | 0.21 | (0.13 | ) | 0.08 | (0.25 | ) | $ | 9.43 | ||||||||||||||||||||
9/30/2020 | $ | 9.26 | 0.22 | 0.33 | 0.55 | (0.21 | ) | $ | 9.60 | |||||||||||||||||||||
9/30/2019 | $ | 8.92 | 0.26 | 0.34 | 0.60 | (0.26 | ) | $ | 9.26 | |||||||||||||||||||||
9/30/2018 | $ | 9.25 | 0.25 | (0.33 | ) | (0.08 | ) | (0.25 | ) | $ | 8.92 | |||||||||||||||||||
Class R6 | ||||||||||||||||||||||||||||||
9/30/2022 | $ | 9.43 | 0.33 | (1.37 | ) | (1.04 | ) | (0.33 | ) | $ | 8.06 | |||||||||||||||||||
9/30/2021 | $ | 9.60 | 0.34 | (0.13 | ) | 0.21 | (0.38 | ) | $ | 9.43 | ||||||||||||||||||||
9/30/2020 | $ | 9.26 | 0.29 | 0.34 | 0.63 | (0.29 | ) | $ | 9.60 | |||||||||||||||||||||
9/30/2019 | $ | 8.93 | 0.09 | 0.56 | 0.65 | (0.32 | ) | $ | 9.26 | |||||||||||||||||||||
10/10/2017(8) – 9/30/2018 | $ | 9.25 | 0.06 | (0.06 | ) | — | (0.32 | ) | $ | 8.93 | ||||||||||||||||||||
| (1) | Net investment income per share has been calculated based on average shares outstanding during the period. |
| (2) | The total return calculation does not reflect the sales loads that may be imposed on Class A shares (see Note 7 of the Notes to Financial Statements). |
| (3) | After fees waived and expenses absorbed or recouped by the Advisor, where applicable. |
| (4) | As of August 24, 2020, the expense cap for the class changed from 0.70% to 0.50%. |
| (5) | As of August 24, 2020, the expense cap for the class changed from 0.50% to 0.30%. |
| (6) | Amount is less than $50,000. |
| (7) | As of August 24, 2020, the expense cap for the class changed from 0.35% to 0.30%. |
| (8) | Commencement of operations. |
| (9) | The total return figure is the since inception return for the class. |
| (10) | Annualized. |
| (11) | Not annualized. |
The accompanying notes to financial statements are an integral part of this statement.
106
Brandes Investment Trust
FINANCIAL HIGHLIGHTS For a capital share outstanding for the period ended:
| Total return(2) | Net assets, end of period (millions) | Ratio of net expenses to average net assets(3) | Ratio of net investment income to average net assets(3) | Ratio of expenses (prior to reimburse- ments) to average net assets | Ratio of net investment income (prior | Portfolio turnover rate | ||||||||||||||||||
| (12.55)% | $ 0.8 | 0.50% | 2.30% | 0.86% | 1.94% | 25.44% | ||||||||||||||||||
| 0.67% | $ 1.0 | 0.50% | 1.95% | 0.83% | 1.62% | 27.13% | ||||||||||||||||||
| 5.89% | $ 1.2 | 0.68%(4) | 2.30% | 0.86% | 2.12% | 20.59% | ||||||||||||||||||
| 6.56% | $ 3.2 | 0.70% | 2.72% | 0.93% | 2.49% | 18.54% | ||||||||||||||||||
| (1.08)% | $ 1.8 | 0.70% | 2.57% | 0.87% | 2.40% | 47.73% | ||||||||||||||||||
| (12.25)% | $60.0 | 0.30% | 2.59% | 0.66% | 2.23% | 25.44% | ||||||||||||||||||
| 0.89% | $78.1 | 0.30% | 2.23% | 0.63% | 1.90% | 27.13% | ||||||||||||||||||
| 6.07% | $85.6 | 0.48%(5) | 2.41% | 0.65% | 2.24% | 20.59% | ||||||||||||||||||
| 6.85% | $83.4 | 0.50% | 2.91% | 0.73% | 2.68% | 18.54% | ||||||||||||||||||
| (0.85)% | $89.7 | 0.50% | 2.78% | 0.68% | 2.60% | 47.73% | ||||||||||||||||||
| (11.26)% | $ —(6) | 0.30% | 3.73% | 0.30% | 3.73% | 25.44% | ||||||||||||||||||
| 2.23% | $ —(6) | 0.30% | 3.54% | 0.30% | 3.54% | 27.13% | ||||||||||||||||||
| 6.89% | $ —(6) | 0.30%(7) | 3.19% | 0.30% | 3.19% | 20.59% | ||||||||||||||||||
| 7.40% | $ —(6) | 0.35% | 0.97% | 0.35% | 0.97% | 18.54% | ||||||||||||||||||
| 0.04%(9) | $ —(6) | 0.35%(10) | 0.69%(10) | 0.35%(10) | 0.69%(10) | 47.73%(11) | ||||||||||||||||||
The accompanying notes to financial statements are an integral part of this statement.
107
Brandes Investment Trust
NOTE 1 – ORGANIZATION
The Brandes International Equity Fund (the “International Fund”), the Brandes Global Equity Fund (the “Global Fund”), the Brandes Emerging Markets Value Fund (the “Emerging Markets Fund”), the Brandes International Small Cap Equity Fund (the “International Small Cap Fund”), the Brandes Small Cap Value Fund (the “Small Cap Value Fund”), the Brandes U.S. Value Fund (the “U.S. Value Fund”) and the Brandes Core Plus Fixed Income Fund (the “Core Plus Fund”) (each a “Fund” and collectively the “Funds”) are series of Brandes Investment Trust (the “Trust”). The Trust is registered under the Investment Company Act of 1940, as amended (the “1940 Act”), as a diversified, open-end management investment company.
The International Fund, Global Fund, Emerging Markets Fund, International Small Cap Fund, Small Cap Value Fund, U.S. Value Fund and Core Plus Fund began operations on January 2, 1997, October 6, 2008, January 31, 2011, February 1, 2012, January 2, 2018, October 1, 2021 and December 28, 2007, respectively. Prior to January 31, 2011 for the Emerging Markets Fund, February 1, 2012 for the International Small Cap and January 2, 2018 for the Small Cap Value Fund, these Funds’ portfolios were managed as private investment funds with investment objectives, investment policies and strategies that were, in all material respects, equivalent to those of the Emerging Markets Fund, International Small Cap Fund and Small Cap Value Fund, respectively.
The International Fund, Emerging Markets Fund and International Small Cap Fund have four classes of shares: Class A, Class C, Class I and Class R6. The Global Fund has three classes of shares: Class A, Class C and Class I. The Small Cap Value Fund, U.S. Value Fund and Core Plus Fund have three classes of shares: Class A, Class I and Class R6.
The International Fund and Global Fund invest their assets primarily in equity securities of issuers with market capitalizations greater than $5 billion. The International, International Small Cap and Emerging Markets Funds invest their assets in securities of foreign companies, while the Global Fund invests its assets in securities of foreign and domestic companies. The Small Cap Value Fund invests primarily in U.S. equity securities of issuers with market capitalizations less than $5 billion. The U.S. Value Fund invests primarily in U.S. equity securities of issuers with market capitalizations greater than $5 billion. The Core Plus Fund invests predominantly in debt securities issued by U.S. and foreign companies and debt obligations issued or guaranteed by the U.S. Government and foreign governments and their agencies and instrumentalities.
108
Brandes Investment Trust
NOTES TO FINANCIAL STATEMENTS — (continued)
NOTE 2 – SIGNIFICANT ACCOUNTING POLICIES
Each Fund is an investment company that applies the accounting and reporting guidance issued in Topic 946, “Financial Services-Investment Companies”, by the Financial Accounting Standards Board (“FASB”). The following is a summary of significant accounting policies consistently followed by the Funds. These policies are in conformity with generally accepted accounting principles (“GAAP”) in the United States of America.
| A. | Repurchase Agreements. Each Fund may enter into repurchase agreements with government securities dealers recognized by the Federal Reserve Board, with member banks of the Federal Reserve System or with other brokers or dealers that meet the credit guidelines established by the Board of Trustees. Each Fund will always receive and maintain, as collateral, U.S. Government securities whose market value, including accrued interest (which is recorded in the Schedules of Investments), will be at least equal to 100% of the dollar amount invested by the Fund in each agreement, and the Fund will make payment for such securities only upon physical delivery or upon evidence of book entry transfer to the account of the Fund’s custodian. If the term of any repurchase transaction exceeds one business day, the value of the collateral is marked-to-market on a daily basis to ensure the adequacy of the collateral. Before causing a Fund to enter into a repurchase agreement with any other party, the investment advisor will determine that such party does not have any apparent risk of becoming involved in bankruptcy proceedings within the time frame contemplated by the repurchase agreement. If the seller defaults and the value of the collateral declines, or if bankruptcy proceedings are commenced with respect to the seller of the security, realization of the collateral by the Fund may be delayed or limited. At September 30, 2022, the Funds did not invest in repurchase agreements. |
| B. | Foreign Currency Translation and Transactions. Values of investments denominated in foreign currencies are converted into U.S. dollars using the spot market rates of exchange at the time of valuation. Purchases and sales of investments and dividend and interest income are translated into U.S. dollars using the spot market rates of exchange prevailing on the respective dates of such translations. The gain or loss resulting from changes in foreign exchange rates is included with net realized and unrealized gain or loss from investments, as appropriate. Foreign securities and currency transactions may involve certain considerations and risks not typically associated with those of domestic origin. |
Foreign securities are recorded in the financial statements after translation to U.S. dollars based on the applicable exchange rate at the end of the period. The Funds report certain foreign currency-related transactions as
109
Brandes Investment Trust
NOTES TO FINANCIAL STATEMENTS — (continued)
components of realized gains or losses for financial reporting purposes, whereas such components are treated as ordinary income for federal income tax purposes. |
| C. | Delayed Delivery Securities. The Funds may purchase securities on a when issued or delayed delivery basis. “When-issued” or delayed delivery refers to securities whose terms are available and for which a market exists, but that have not been issued. For a when-issued or delayed delivery transaction, no payment is made until delivery date, which is typically longer than the normal course of settlement. When a Fund enters into an agreement to purchase securities on a when-issued or delayed delivery basis, the Fund segregates cash or liquid securities, of any type or maturity, equal in value to the Fund’s commitment. Losses may arise if the market value of the underlying securities changes, if the counterparty does not perform under the contract, or if the issuer does not issue the securities due to political, economic, or other factors. |
The Funds did not have any open commitments on delayed delivery securities as of September 30, 2022.
| D. | Zero Coupon Bonds. The Funds may invest without limit in so-called zero coupon bonds. Zero coupon bonds are issued at a significant discount from their principal amount in lieu of paying interest periodically. Because zero coupon bonds do not pay current interest in cash, their value is subject to greater fluctuation in response to changes in market interest rates than bonds that pay interest currently. Zero coupon bonds allow an issuer to avoid the need to generate cash to meet current interest payments. Accordingly, such bonds may involve greater credit risks than bonds paying interest currently in cash. A Fund is required to accrue interest income on such investments and to distribute such amounts at least annually to shareholders even though the investments do not make any current interest payments. The daily market quotations of the original bonds may include the accrued interest (referred to as a dirty price) and require a pro rata adjustment, if any, from the unrealized appreciation (depreciation) on investments to interest receivable on the Statements of Assets and Liabilities. |
| E. | Participatory Notes. The International, Global, Emerging Markets, International Small Cap, Small Cap Value and U.S. Value Funds may invest in participatory notes. Participatory notes are derivative securities which are designed to provide synthetic exposure to one or more underlying securities, subject to the credit risk of the issuing financial institution. |
Investments in participatory notes involve risks normally associated with a direct investment in the underlying securities. In addition, participatory notes are subject to counterparty risk, which is the risk that the broker-dealer or bank that issues the notes will not fulfill its contractual obligation to complete the transaction with the Trust. Participatory notes constitute general
110
Brandes Investment Trust
NOTES TO FINANCIAL STATEMENTS — (continued)
unsecured, unsubordinated contractual obligations of the banks or broker-dealers that issue them and generally are issued as an actual note from the financial intermediary or an equity linked warrant (commonly known as a low exercise price option). The Trust is relying on the creditworthiness of such banks or broker-dealers and has no rights under a participatory note against the issuer of the securities underlying such participatory note. The investment advisor has established guidelines for monitoring participatory note exposure for the Funds. Prior to investment in a participatory note, the investment advisor will complete an analysis of the prospective counterparties and once purchased, will continue to monitor creditworthiness on a quarterly basis. The investment advisor requires a minimum credit rating for such counterparties (as determined by rating agencies such as Moody’s, Fitch and S&P) of A. |
The Funds record counterparty credit risk valuation adjustments, if material, on the participatory notes in order to appropriately reflect the credit quality of the counterparty.
The International, Global, Emerging Markets, International Small Cap, Small Cap Value and U.S. Value Funds did not invest in any participatory notes at September 30, 2022.
| F. | Investment Transactions, Dividends and Distributions. Investment transactions are accounted for on the trade dates. Realized gains and losses are evaluated on the basis of identified cost. Dividend income and distributions to shareholders are recorded on the ex-dividend dates. Interest is recorded on an accrual basis. Other non-cash dividends are recognized as investment income at the fair value of the investment received. Withholding taxes on foreign dividends and capital gains, which are included as a component of net investment income and realized gain (loss) on investments, respectively, have been provided for in accordance with the Trust’s understanding of the applicable country’s tax rules and rates. Each Fund’s investment income, expenses, other than class specific expenses, and realized and unrealized gains and losses are allocated daily to each class of the Fund’s shares based upon the relative net asset values of outstanding shares of each class of shares at the beginning of the day (after adjusting for the current capital shares activity of the respective class). Expenses common to the Funds’ portfolios are allocated among the Funds based upon their relative net asset values or other appropriate allocation methods. The Funds amortize premiums and accrete discounts using the constant yield method. |
| G. | Concentration of Risk. As of September 30, 2022, the International, Global, Emerging Markets and International Small Cap Funds held significant portions of their assets in foreign securities. Certain price and foreign exchange fluctuations as well as economic and political situations in the |
111
Brandes Investment Trust
NOTES TO FINANCIAL STATEMENTS — (continued)
foreign jurisdictions could have an impact on the International, Global, Emerging Markets and International Small Cap Funds’ net assets. The investment advisor monitors these off-balance sheet risks. |
| H. | Use of Estimates. The preparation of financial statements in conformity with GAAP requires management to make estimates and assumptions that affect the reported amounts of assets and liabilities at the date of the financial statements and reported amounts of income and expenses during the reporting period. Actual results could differ from those estimates and assumptions. |
| I. | Securities Lending. The Funds may lend their portfolio securities to banks, brokers and dealers. Lending Fund securities exposes the Fund to risks such as the following: (i) the borrower may fail to return the loaned securities, (ii) the borrower may not be able to provide additional collateral, or (iii) the Funds may experience delays in recovery of the loaned securities or loss of rights in the collateral if the borrower fails financially. |
To minimize these risks, the borrower must agree to maintain collateral with the Fund’s custodian, marked to market daily, in the form of U.S. Government obligations, in an amount at least equal to 102% (105% in the case of loans of foreign securities not denominated in U.S. dollars) of the market value of the loaned securities. As of September 30, 2022, the Emerging Markets Fund, International Small Cap Fund, Small Cap Value Fund, U.S. Value Fund, and Core Plus Fund did not have any securities on loan. The International Fund and Global Fund had securities on loan as of September 30, 2022. The market value of securities loaned is $7,978,499 and $864,272, respectively. The Funds received non-cash collateral for the loans in the amounts of $8,329,083 and $885,748, respectively. Non-cash collateral received by a Fund may not be sold or re-pledged except to satisfy a borrower default. Therefore, non-cash collateral is not included on the Funds’ Schedules of Investments or Statements of Assets and Liabilities.
| J. | Indemnification Obligations. Under the Trust’s organizational documents, its current and former officers and trustees are indemnified against certain liabilities arising out of the performance of their duties to the Trust. The Trust has indemnified its trustees against any expenses actually and reasonably incurred by the trustees in any proceeding arising out of or in connection with the trustees’ service to the Trust. In addition, in the normal course of business, the Trust enters into contracts that contain a variety of representations and warranties and provide general indemnifications. The Funds’ maximum exposure under these arrangements is unknown as this would involve future claims that may be made against the Funds that have not yet occurred or that would be covered by other parties. |
112
Brandes Investment Trust
NOTES TO FINANCIAL STATEMENTS — (continued)
| K. | Accounting for Uncertainty in Income Taxes. Each Fund has elected to be taxed as a “regulated investment company” and intends to distribute substantially all its taxable income to its shareholders and otherwise comply with the provisions of the Internal Revenue Code applicable to regulated investment companies. The Funds may be subject to a nondeductible excise tax calculated as a percentage of certain undistributed amounts of net investment income and net capital gains. The Funds intend to distribute their net investment income and capital gains as necessary to avoid this excise tax. Therefore, no provision for federal income taxes or excise taxes has been made. |
The Trust analyzes all open tax years, as defined by the applicable statute of limitations, for all major jurisdictions. Open tax years for the Funds are those that are open for exam by taxing authorities (2019 through 2022). As of September 30, 2022 the Trust has no examinations in progress.
Management has analyzed the Trust’s tax positions, and has concluded that no liability should be recorded related to uncertain tax positions expected to be taken on the tax return for the fiscal year ended September 30, 2022.
The Trust identifies its major tax jurisdictions as the U.S. Government and the State of California. The Funds are not aware of any tax positions for which it is reasonably possible that the total amounts of unrecognized tax benefits will significantly change in the next twelve months.
| L. | Fair Value Measurements. The Trust has adopted GAAP accounting principles related to fair value accounting standards which establish a definition of fair value and set out a hierarchy for measuring fair value. These standards require additional disclosures about the various inputs and valuation techniques used to develop the measurements of fair value and a discussion of changes in valuation techniques and related inputs during the period. These inputs are summarized in the three broad levels listed below: |
Level 1—Fair value measurement within Level 1 should be based on an unadjusted quoted price in an active market that the Funds have the ability to access for the asset or liability at the measurement date. Because a quoted price alone forms the basis for the measurement, the access requirement within Level 1 limits discretion in pricing the asset or liability, including in situations in which there are multiple markets for the asset or liability with different prices and no single market represents a principal market for the asset or liability. Importantly, the FASB has indicated that when a quoted price in an active market for a security is available, that price should be used to measure fair value without regard to an entity’s intent to transact at that price.
113
Brandes Investment Trust
NOTES TO FINANCIAL STATEMENTS — (continued)
Level 2—Fair value measurement within Level 2 should be based on all inputs other than unadjusted quoted prices included within Level 1 that are observable for the asset or liability. Other significant observable market inputs include quoted prices for similar instruments in active markets, quoted adjusted prices in active markets, quoted prices for identical or similar instruments in markets that are not active, and model derived valuations in which the majority of significant inputs and significant value drivers are observable in active markets.
Level 3—Fair value measurement within Level 3 should be based on unobservable inputs in such cases where markets do not exist or are illiquid. Significant unobservable inputs include model derived valuations in which the majority of significant inputs or significant value drivers are unobservable. Unobservable inputs are those inputs that reflect the Fund’s own assumptions that market participants would use to price the asset or liability based on the best available information.
| M. | Security Valuation. Common and preferred stocks, exchange-traded funds and financial derivative instruments, such as futures contracts and options contracts that are traded on a national securities or commodities exchange, are valued at the last reported sales price at the close of regular trading on each day the exchange is open for trading, in the case of common stocks and exchange-traded funds, or, in the case of futures contracts or options contracts, the settlement price determined by the relevant exchange. Securities listed on the NASDAQ National Market System for which market quotations are readily available are valued using the NASDAQ Official Closing Price. To the extent these securities are actively traded and valuation adjustments are not applied, they are categorized as Level 1 of the fair value hierarchy. |
Equity securities traded on an exchange for which there have been no sales on the valuation date are generally valued at the mean between last bid and ask price on such day and are categorized as Level 2 of the fair value hierarchy, or are fair valued by the Advisor.
Investments in registered open-end management investment companies are valued based upon the Net Asset Values (“NAVs”) of such investments and are categorized as Level 1 of the fair value hierarchy.
Valuation adjustments may be applied to certain common and preferred stocks that are solely traded on a foreign exchange to account for the market movement between the close of the foreign market and the close of the New York Stock Exchange (“NYSE”). These securities are generally valued using pricing service providers that consider the correlation of the trading patterns of the foreign securities to the intraday trading in the U.S. markets for
114
Brandes Investment Trust
NOTES TO FINANCIAL STATEMENTS — (continued)
investments. Securities using these valuation adjustments are categorized as Level 2 of the fair value hierarchy. As of September 30, 2022, the International Fund, Global Fund, Emerging Markets Fund and International Small Cap Fund had securities with market values of $403,005,573, $16,620,392, $457,554,386 and $142,321,319 that represent 87.38%, 45.55%, 73.72%, and 59.91% of each Fund’s net assets, respectively, that were fair valued using these valuation adjustments.
Fixed income securities (other than repurchase agreements and demand notes) including corporate, convertible and municipal bonds and notes, U.S. government agencies, U.S. Treasury obligations, sovereign issues, bank loans, convertible preferred securities, fixed income securities purchased on a delayed delivery basis and non-U.S. bonds are normally valued on the basis of quotes obtained from brokers and dealers or independent pricing services or sources. Independent pricing services typically use information provided by market makers or estimates of market values obtained from yield data relating to investments or securities with similar characteristics. The service providers’ internal models use inputs that are observable such as, among other things, issuer details, interest rates, yield curves, prepayment speeds, credit risks/ spreads, default rates and quoted prices for similar assets. Securities that use similar valuation techniques and inputs as described above are categorized as Level 2 of the fair value hierarchy.
Rights that are traded on a national securities exchange are valued at the last reported sales price at the close of regular trading on each day the exchange is open. A right is a privilege offered by a corporation to its shareholders pro rata to subscribe to a certain security at a specified price, often for a short period. Rights may or may not be transferable. Rights that use such valuation techniques and inputs are categorized as Level 2 of the fair value hierarchy.
Mortgage and asset-backed securities are usually issued as separate tranches, or classes, of securities within each package of underlying securities. These securities are also normally valued by pricing service providers that use broker-dealer quotations or valuation estimates from their internal pricing models. The pricing models for these securities usually consider tranche level attributes, estimated cash flows and market based yield spreads for each tranche, and current market data and incorporate packaged collateral performance, as available. Mortgage and asset-backed securities that use such valuation techniques and inputs are categorized as Level 2 of the fair value hierarchy.
Repurchase agreements and demand notes, for which neither vendor pricing nor market maker prices are available, are valued at amortized cost on the day of valuation, unless Brandes Investment Partners, L.P. (the “Advisor”) determines that the use of amortized cost valuation on such day is not
115
Brandes Investment Trust
NOTES TO FINANCIAL STATEMENTS — (continued)
appropriate (in which case such instrument is fair valued in accordance with the fair value procedures of the Trust). Repurchase agreements and demand notes that use such valuation techniques and inputs are categorized as Level 2 of the fair value hierarchy.
The Board of Trustees has designated the Advisor as the valuation designee pursuant to Rule 2a-5 under the 1940 Act to perform fair value determinations relating to any or all Fund investments. Certain securities may be fair valued in accordance with the fair valuation procedures approved by the Board of Trustees. The Advisor is generally responsible for overseeing the day-to-day valuation processes and the Board of Trustees oversees the Advisor in its role as valuation designee in accordance with the requirements of Rule 2a-5 under the 1940 Act. The Advisor is authorized to make all necessary determinations of the fair value of portfolio securities and other assets for which market quotations are not readily available or if it is deemed that the prices obtained from brokers and dealers or independent pricing services are unreliable. The securities fair valued by the Advisor are indicated in the Schedules of Investments and are categorized as Level 2 or Level 3 of the fair value hierarchy. Certain vendor priced securities may also be considered Level 3 if significant unobservable inputs are used by the vendors.
In using fair value pricing, each Fund attempts to establish the price that it might reasonably have expected to receive upon a sale of the security at 4:00 p.m. Eastern time. Valuing securities at fair value involves greater reliance on judgment than valuation of securities based on readily available market quotations. A Fund using fair value to price securities may value those securities higher or lower than another fund using market quotations or fair value to price the same securities. Further, there can be no assurance that the Fund could obtain the fair value assigned to a security if it were to sell the security at approximately the time at which the Fund determines its net asset value.
116
Brandes Investment Trust
NOTES TO FINANCIAL STATEMENTS — (continued)
The following is a summary of the level inputs used, as of September 30, 2022, involving the Funds’ assets carried at fair value. The inputs used for valuing securities may not be an indication of the risk associated with investing in those securities.
Description | Level 1 | Level 2 | Level 3 | Total | ||||||||||||
Investments in Securities | ||||||||||||||||
International Fund | ||||||||||||||||
Common Stocks | ||||||||||||||||
Communication Services | $ | 5,757,854 | $ | 38,416,418 | $ | 317,960 | $ | 44,492,232 | ||||||||
Consumer Discretionary | — | 48,433,578 | — | 48,433,578 | ||||||||||||
Consumer Staples | 10,838,763 | 67,822,695 | — | 78,661,458 | ||||||||||||
Energy | — | 25,357,060 | — | 25,357,060 | ||||||||||||
Financials | — | 89,966,841 | — | 89,966,841 | ||||||||||||
Health Care | — | 75,543,953 | — | 75,543,953 | ||||||||||||
Industrials | 8,431,939 | 11,211,005 | — | 19,642,944 | ||||||||||||
Materials | 7,380,513 | 18,929,661 | — | 26,310,174 | ||||||||||||
Real Estate | 11,983,186 | — | — | 11,983,186 | ||||||||||||
Technology | — | 11,044,307 | — | 11,044,307 | ||||||||||||
Utilities | — | 8,007,407 | — | 8,007,407 | ||||||||||||
|
|
|
|
|
|
|
| |||||||||
Total Common Stocks | 44,392,255 | 394,732,925 | 317,960 | 439,443,140 | ||||||||||||
|
|
|
|
|
|
|
| |||||||||
Preferred Stocks | ||||||||||||||||
Energy | 10,142,060 | — | 777,985 | 10,920,045 | ||||||||||||
Health Care | — | 8,272,648 | — | 8,272,648 | ||||||||||||
|
|
|
|
|
|
|
| |||||||||
Total Preferred Stocks | 10,142,060 | 8,272,648 | 777,985 | 19,192,693 | ||||||||||||
|
|
|
|
|
|
|
| |||||||||
Total Investments in Securities | $ | 54,534,315 | $ | 403,005,573 | $ | 1,095,945 | $ | 458,635,833 | ||||||||
|
|
|
|
|
|
|
| |||||||||
Global Fund | ||||||||||||||||
Common Stocks | ||||||||||||||||
Communication Services | $ | 909,873 | $ | 1,225,244 | $ | — | $ | 2,135,117 | ||||||||
Consumer Discretionary | 293,632 | 3,739,883 | — | 4,033,515 | ||||||||||||
Consumer Staples | — | 1,841,940 | — | 1,841,940 | ||||||||||||
Energy | 1,205,294 | 2,405,470 | — | 3,610,764 | ||||||||||||
Financials | 6,148,686 | 2,115,467 | — | 8,264,153 | ||||||||||||
Health Care | 5,913,404 | 1,726,812 | — | 7,640,216 | ||||||||||||
Industrials | 2,426,797 | 605,219 | — | 3,032,016 | ||||||||||||
Materials | — | 823,247 | — | 823,247 | ||||||||||||
Real Estate | 668,211 | — | — | 668,211 | ||||||||||||
Technology | 1,839,851 | 1,423,923 | — | 3,263,774 | ||||||||||||
Utilities | — | 632,077 | — | 632,077 | ||||||||||||
|
|
|
|
|
|
|
| |||||||||
Total Common Stocks | 19,405,748 | 16,539,282 | — | 35,945,030 | ||||||||||||
|
|
|
|
|
|
|
| |||||||||
Preferred Stocks | ||||||||||||||||
Health Care | 238,595 | — | — | 238,595 | ||||||||||||
Technology | — | 81,110 | — | 81,110 | ||||||||||||
|
|
|
|
|
|
|
| |||||||||
Total Preferred Stocks | 238,595 | 81,110 | — | 319,705 | ||||||||||||
|
|
|
|
|
|
|
| |||||||||
Short-Term Investments | 387,203 | — | — | 387,203 | ||||||||||||
|
|
|
|
|
|
|
| |||||||||
Total Investments in Securities | $ | 20,031,546 | $ | 16,620,392 | $ | — | $ | 36,651,938 | ||||||||
|
|
|
|
|
|
|
| |||||||||
117
Brandes Investment Trust
NOTES TO FINANCIAL STATEMENTS — (continued)
Description | Level 1 | Level 2 | Level 3 | Total | ||||||||||||
Emerging Markets Fund | ||||||||||||||||
Common Stocks | ||||||||||||||||
Communication Services | $ | 19,700,589 | $ | 40,865,821 | $ | 2,073,396 | $ | 62,639,806 | ||||||||
Consumer Discretionary | 164,015 | 115,663,429 | 1,209,363 | 117,036,807 | ||||||||||||
Consumer Staples | 15,069,987 | 41,494,971 | — | 56,564,958 | ||||||||||||
Energy | — | — | 1,540,998 | 1,540,998 | ||||||||||||
Financials | 6,679,785 | 111,593,439 | 19,800 | 118,293,024 | ||||||||||||
Health Care | — | 12,022,177 | — | 12,022,177 | ||||||||||||
Industrials | 41,023,288 | 5,475,737 | — | 46,499,025 | ||||||||||||
Materials | 12,944,052 | 12,549,437 | — | 25,493,489 | ||||||||||||
Real Estate | 31,895,359 | — | — | 31,895,359 | ||||||||||||
Technology | — | 122,817,561 | — | 122,817,561 | ||||||||||||
Utilities | 1,545,528 | 7,838,508 | — | 9,384,036 | ||||||||||||
|
|
|
|
|
|
|
| |||||||||
Total Common Stocks | 129,022,603 | 470,321,080 | 4,843,557 | 604,187,240 | ||||||||||||
|
|
|
|
|
|
|
| |||||||||
Preferred Stocks | ||||||||||||||||
Energy | 14,260,424 | — | — | 14,260,424 | ||||||||||||
|
|
|
|
|
|
|
| |||||||||
Total Investments in Securities | $ | 143,283,027 | $ | 470,321,080 | $ | 4,843,557 | $ | 618,447,664 | ||||||||
|
|
|
|
|
|
|
| |||||||||
International Small Cap Fund | ||||||||||||||||
Common Stocks | ||||||||||||||||
Communication Services | $ | 5,298,252 | $ | 16,419,783 | $ | — | $ | 21,718,035 | ||||||||
Consumer Discretionary | 9,559,785 | 10,428,762 | — | 19,988,547 | ||||||||||||
Consumer Staples | 5,766,236 | 30,789,851 | — | 36,556,087 | ||||||||||||
Energy | 3,869,832 | — | — | 3,869,832 | ||||||||||||
Financials | 7,717,115 | 28,076,360 | — | 35,793,475 | ||||||||||||
Health Care | 5,940,664 | 10,184,835 | — | 16,125,499 | ||||||||||||
Industrials | 27,908,896 | 20,225,486 | — | 48,134,382 | ||||||||||||
Materials | 1,179,467 | 13,001,916 | — | 14,181,383 | ||||||||||||
Real Estate | 17,159,257 | — | — | 17,159,257 | ||||||||||||
Technology | — | 6,707,728 | — | 6,707,728 | ||||||||||||
Utilities | — | 5,923,575 | — | 5,923,575 | ||||||||||||
|
|
|
|
|
|
|
| |||||||||
Total Common Stocks | 84,399,504 | 141,758,296 | — | 226,157,800 | ||||||||||||
|
|
|
|
|
|
|
| |||||||||
Preferred Stocks | ||||||||||||||||
Health Care | — | 4,908,674 | — | 4,908,674 | ||||||||||||
Investment Companies | ||||||||||||||||
Financials | 1,852,694 | — | — | 1,852,694 | ||||||||||||
Short-Term Investments | 1,825,168 | — | — | 1,825,168 | ||||||||||||
|
|
|
|
|
|
|
| |||||||||
Total Investments in Securities | $ | 88,077,366 | $ | 146,666,970 | $ | — | $ | 234,744,336 | ||||||||
|
|
|
|
|
|
|
| |||||||||
118
Brandes Investment Trust
NOTES TO FINANCIAL STATEMENTS — (continued)
Description | Level 1 | Level 2 | Level 3 | Total | ||||||||||||
Small Cap Value Fund | ||||||||||||||||
Common Stocks | ||||||||||||||||
Consumer Discretionary | $ | 145,459 | $ | — | $ | — | $ | 145,459 | ||||||||
Consumer Staples | 231,342 | — | — | 231,342 | ||||||||||||
Energy | 325,746 | — | — | 325,746 | ||||||||||||
Financials | 378,533 | — | — | 378,533 | ||||||||||||
Health Care | 559,213 | — | 16,917 | 576,130 | ||||||||||||
Industrials | 1,447,876 | — | — | 1,447,876 | ||||||||||||
Materials | 50,402 | 57,231 | — | 107,633 | ||||||||||||
Real Estate | 74,444 | — | — | 74,444 | ||||||||||||
Technology | 320,444 | — | — | 320,444 | ||||||||||||
|
|
|
|
|
|
|
| |||||||||
Total Common Stocks | 3,533,459 | 57,231 | 16,917 | 3,607,607 | ||||||||||||
|
|
|
|
|
|
|
| |||||||||
Investment Companies | ||||||||||||||||
Financials | 83,053 | — | — | 83,053 | ||||||||||||
Short-Term Investments | 225,682 | — | — | 225,682 | ||||||||||||
|
|
|
|
|
|
|
| |||||||||
Total Investments in Securities | $ | 3,842,194 | $ | 57,231 | $ | 16,917 | $ | 3,916,342 | ||||||||
|
|
|
|
|
|
|
| |||||||||
U.S. Value Fund | ||||||||||||||||
Common Stocks | ||||||||||||||||
Communication Services | $ | 367,882 | $ | — | $ | — | $ | 367,882 | ||||||||
Consumer Discretionary | 209,108 | — | — | 209,108 | ||||||||||||
Consumer Staples | 90,665 | — | — | 90,665 | ||||||||||||
Energy | 361,785 | — | — | 361,785 | ||||||||||||
Financials | 1,199,808 | — | — | 1,199,808 | ||||||||||||
Health Care | 990,386 | — | — | 990,386 | ||||||||||||
Industrials | 460,701 | — | — | 460,701 | ||||||||||||
Materials | 58,350 | — | — | 58,350 | ||||||||||||
Technology | 721,756 | — | — | 721,756 | ||||||||||||
|
|
|
|
|
|
|
| |||||||||
Total Common Stocks | 4,460,441 | — | — | 4,460,441 | ||||||||||||
|
|
|
|
|
|
|
| |||||||||
Short-Term Investments | 146,287 | — | — | 146,287 | ||||||||||||
|
|
|
|
|
|
|
| |||||||||
Total Investments in Securities | $ | 4,606,728 | $ | — | $ | — | $ | 4,606,728 | ||||||||
|
|
|
|
|
|
|
| |||||||||
119
Brandes Investment Trust
NOTES TO FINANCIAL STATEMENTS — (continued)
Description | Level 1 | Level 2 | Level 3 | Total | ||||||||||||
Core Plus Fund | ||||||||||||||||
Common Stocks | ||||||||||||||||
Consumer Discretionary | $ | 501 | $ | — | $ | — | $ | 501 | ||||||||
Asset Backed Securities | — | 1,106,876 | — | 1,106,876 | ||||||||||||
Corporate Bonds | — | 20,160,166 | — | 20,160,166 | ||||||||||||
Government Securities | — | 32,341,240 | — | 32,341,240 | ||||||||||||
Convertible Bonds | ||||||||||||||||
Technology | — | 686,840 | — | 686,840 | ||||||||||||
Foreign Issuer Bonds | ||||||||||||||||
Materials | — | 368,981 | — | 368,981 | ||||||||||||
Telecommunications | — | 727,814 | — | 727,814 | ||||||||||||
|
|
|
|
|
|
|
| |||||||||
Total Foreign Issuer Bonds | — | 1,096,795 | — | 1,096,795 | ||||||||||||
|
|
|
|
|
|
|
| |||||||||
Mortgage Backed Securities | — | 2,825,203 | — | 2,825,203 | ||||||||||||
Short-Term Investments | 2,220,282 | — | — | 2,220,282 | ||||||||||||
|
|
|
|
|
|
|
| |||||||||
Total Investments in Securities | $ | 2,220,783 | $ | 58,217,120 | $ | — | $ | 60,437,903 | ||||||||
|
|
|
|
|
|
|
| |||||||||
There were no Level 3 securities in the Global, International Small Cap, U.S. Value and Core Plus Funds at the beginning or during the period presented.
The following is a reconciliation of investments in which significant unobservable inputs (Level 3) were used in determining fair value in the International Fund:
| Balance As Of 9/30/21 | Realized Gain (Loss) | Change In Unrealized Appreciation (Depreciation) | Purchases | Sales | Transfers Into Level 3 | Transfers Out Of Level 3 | Balance As Of 9/30/22 | |||||||||||||||||||||||||
Preferred stocks | ||||||||||||||||||||||||||||||||
Russia | $— | $— | $— | $— | $— | $ | 777,985 | $— | $ | 777,985 | ||||||||||||||||||||||
Common Stocks | ||||||||||||||||||||||||||||||||
Russia | — | — | — | — | — | 317,960 | — | 317,960 | ||||||||||||||||||||||||
|
|
|
|
|
|
|
|
|
|
|
|
|
|
|
|
| ||||||||||||||||
Total | $— | $— | $— | $— | $— | $ | 1,095,945 | $— | $ | 1,095,945 | ||||||||||||||||||||||
The International fund held two level 3 securities with a fair value of $1,095,945 at 9/30/2022 that were valued using prices provided by the Fund’s investment advisor.
| Fair Value at 9/30/22 | Valuation Techniques | Unobservable Inputs | Range (Weighted Average) | |||||||||||||||||
Preferred stocks | ||||||||||||||||||||
Russia | 777,985 | | Market Approach | | Market DiscountRate | 90% | ||||||||||||||
Common Stocks | ||||||||||||||||||||
Russia | 317,960 | | Market Approach | | Market DiscountRate | 90% | ||||||||||||||
The significant unobservable inputs that can be used in the fair value measurement are; Market Discount Rate. Significant decreases (increase) in Market Discount Rate would have resulted in a significantly higher (lower) fair value measurement.
The following is a reconciliation of investments in which significant unobservable inputs (Level 3) were used in determining fair value in the Emerging Markets Fund:
120
Brandes Investment Trust
NOTES TO FINANCIAL STATEMENTS — (continued)
| Balance As Of 9/30/21 | Realized Gain (Loss) | Change In Unrealized Appreciation (Depreciation) | Purchases | Sales | Transfers Into Level 3 | Transfers Out Of Level 3 | Balance As Of 9/30/22 | |||||||||||||||||||||||||||||||||
Common Stocks | ||||||||||||||||||||||||||||||||||||||||
Russia | $— | $— | $— | $— | $— | $ | 4,843,557 | $— | $ | 4,843,557 | ||||||||||||||||||||||||||||||
|
|
|
|
|
|
|
|
|
|
|
|
|
|
|
|
| ||||||||||||||||||||||||
Total | $— | $— | $— | $— | $— | $ | 4,843,557 | $— | $ | 4,843,557 | ||||||||||||||||||||||||||||||
The Emerging Market Value fund held five level 3 securities with a fair value of $4,843,557 at 9/30/2022 that were valued using prices provided by the Fund’s investment advisor.
| Fair Value at 9/30/22 | Valuation Techniques | Unobservable Inputs | Range (Weighted Average) | |||||||||||||||||
Common Stocks | ||||||||||||||||||||
Russia | 4,843,557 | | Market Approach | | Market DiscountRate | 90%-99.9% | ||||||||||||||
The significant unobservable inputs that can be used in the fair value measurement are; Market Discount Rate. Significant decreases (increase) in Market Discount Rate would have resulted in a significantly higher (lower) fair value measurement.
The following is a reconciliation of investments in which significant unobservable inputs (Level 3) were used in determining fair value in the Small Cap Value Fund:
| Balance As Of 9/30/21 | Realized Gain (Loss) | Change In Unrealized Appreciation (Depreciation) | Purchases | Sales | Transfers Into Level 3 | Transfers Out Of Level 3 | Balance As Of 9/30/22 | |||||||||||||||||||||||||||||||||
Common Stocks | ||||||||||||||||||||||||||||||||||||||||
United States | $ | 28,425 | $— | $— | $— | $ | (11,508 | ) | $— | $— | $ | 16,917 | ||||||||||||||||||||||||||||
Total | $ | 28,425 | $— | $— | $— | $ | (11,508 | ) | $— | $— | $ | 16,917 | ||||||||||||||||||||||||||||
The Small Cap Value Fund held one level 3 security with a fair value of $16,917 at 9/30/2022. The valuation technique used for this security was the last observable price and the unobservable input used was management’s estimate of net liquidation value.
NOTE 3 – INVESTMENT ADVISORY FEE AND OTHER TRANSACTIONS WITH AFFILIATES
| A. | Advisor Fee. The Advisor provides the Funds with investment management services under an Investment Advisory Agreement. The Advisor furnishes all investment advice, office space and certain administrative services, and provides certain personnel, needed by the Funds. As compensation for its services, the Advisor is entitled to a monthly fee. The Advisor received a monthly fee at the annual rate of 0.75% of the first $2.5 billion of average daily net assets, 0.70% on average daily net assets from $2.5 billion to $5.0 billion, and 0.67% of the average daily net assets greater than $5.0 billion, of the International Fund. The Advisor received a monthly fee at the annual rate of 0.95% of the first $2.5 billion of average daily net assets, 0.90% on average daily net assets from $2.5 billion to $5.0 billion, and 0.85% of the amount of average daily net assets greater than $5.0 billion, of the Emerging Markets |
121
Brandes Investment Trust
NOTES TO FINANCIAL STATEMENTS — (continued)
Fund. The Advisor received a monthly fee at the annual rate of 0.95% of the first $1.0 billion of average daily net assets, and 0.90% of the average daily net assets greater than $1.0 billion, of the International Small Cap Fund. The Global Fund, Small Cap Value Fund, U.S. Value Fund, and Core Plus Fund incurred a monthly fee at the annual rate of 0.80%, 0.70%, 0.55%, and 0.35% based upon their average daily net assets, respectively. The Advisor has contractually agreed to limit the Management Fee of each share class of the Core Plus Fund to 0.30% pursuant to an Investment Advisory Fee Waiver Agreement in effect until January 28, 2023. For the year ended September 30, 2022, the International Fund, the Global Fund, the Emerging Markets Fund, the International Small Cap Fund, the Small Cap Value Fund, the U.S. Value Fund and the Core Plus Fund incurred $4,680,487, $364,405, $9,724,487, $3,151,100, $27,436, $18,171, and $242,426 in advisory fees, respectively. |
Certain officers and trustees of the Trust are also officers of the Advisor and receive no compensation directly from the Funds for serving in their role.
The Funds are responsible for their own operating expenses. The Advisor contractually agreed to limit each Fund’s annual operating expenses, including repayment of previous waivers, to the following percentages of the Fund’s average daily net assets attributable to the specific classes through January 28, 2023 (the “Expense Cap Agreement”):
Fund | Class A | Class C | Class I | Class R6 | ||||||||||||||||
International Fund | 1.20 | % | 1.95 | % | 0.85 | % | 0.75 | % | ||||||||||||
Global Fund | 1.25 | % | 2.00 | % | 1.00 | % | 0.82 | %* | ||||||||||||
Emerging Markets Fund | 1.37 | % | 2.12 | % | 1.12 | % | 0.97 | % | ||||||||||||
International Small Cap Fund | 1.40 | % | 2.15 | % | 1.15 | % | 1.00 | % | ||||||||||||
Small Cap Value Fund | 1.15 | % | N/A | 0.90 | % | 0.72 | % | |||||||||||||
U.S. Value Fund | 0.95 | % | N/A | 0.70 | % | 0.60 | % | |||||||||||||
Core Plus Fund | 0.50 | % | N/A | 0.30 | % | 0.30 | % | |||||||||||||
* This class is not active.
The Funds may incur additional expenses not covered under the Expense Cap Agreement. These expenses include acquired fund fees and expenses, taxes, interest, broker commissions, and proxy expenses or other extraordinary expenses.
Any reimbursements of fee waivers made by the Advisor to a Fund are subject to repayment by the Fund, to the extent that the Fund is able to make the repayment within the expense limit specified in its Expense Cap Agreement. Under the Expense Cap Agreement that was in place during the period covered by this report, any such repayment must be made before the end of the thirty-six months after the month in which the related reimbursement or waiver occurred. The Trust has agreed to repay the expense reimbursement to the Advisor. However, the repayment of previously waived expenses is limited
122
Brandes Investment Trust
NOTES TO FINANCIAL STATEMENTS — (continued)
to amounts that do not cause the aggregate operating expenses of the Fund to exceed the current expense cap or the expense cap in place at the time the waiver was generated. For the year ended September 30, 2022, the Advisor waived expenses and/or reimbursed the Funds $440,163, $96,460, $141,386, $25,089, $132,843, $89,215, and $211,363 for the International Fund, Global Fund, Emerging Markets Fund, International Small Cap Fund, Small Cap Value Fund, U.S. Value Fund and Core Plus Fund, respectively. Repayment rights expire as follows:
Fund | Year Ended September 30, 2023 | Year Ended September 30, 2024 | Year Ended September 30, 2025 | ||||||||||||
International Fund | $ | 464,613 | $ | 311,474 | $ | 440,163 | |||||||||
Global Fund | 112,731 | 78,902 | 96,460 | ||||||||||||
Emerging Markets Fund | 310,558 | 56,334 | 141,383 | ||||||||||||
International Small Cap Fund | 11,110 | 8,859 | 25,090 | ||||||||||||
Small Cap Value Fund | 148,291 | 100,743 | 132,842 | ||||||||||||
U.S. Value Fund | — | — | 89,215 | ||||||||||||
Core Plus Fund | 136,785 | 216,372 | 211,363 | ||||||||||||
The Advisor did not recoup any fees previously waived or reimbursed for the International Fund, Global Fund, International Small Cap Fund, Small Cap Value Fund, U.S. Value Fund and Core Plus Fund. For the year ended September 30, 2022, the Advisor recouped fees previously waived or reimbursed in the following amounts:
Fund | Class I | |||
Emerging Markets Fund | $ | 36,235 | ||
| B. | Administration Fee. The Northern Trust Company (the “Administrator”) acts as administrator for the Funds. The Administrator prepares various federal and state regulatory filings; prepares reports and materials to be supplied to the Trustees; monitors the activities of the Funds’ custodian, transfer agent and accountant; coordinates the preparation and payment of Fund expenses; and reviews the Funds’ expense accruals. For these services, each Fund pays the administrator monthly a fee accrued daily and based on the Fund’s average daily net assets. The Funds may also reimburse the Administrator for out-of-pocket expenses incurred by the Administrator in the performance of its duties. The amounts paid directly to the Administrator by the Funds for administrative services are included in the Administration fees in the Statements of Operations. |
The Administrator waived a portion of their administration and custody fees for the Funds from February 1, 2020 through January 31, 2022. The amounts waived are included in Receivable from Service Providers in the Statements of Assets and Liabilities and Expenses reduced by Service Providers in the Statements of Operations. These amounts are not subject to recoupment.
123
Brandes Investment Trust
NOTES TO FINANCIAL STATEMENTS — (continued)
| C. | Distribution and Servicing Fees. ALPS Distributors, Inc. (the “Distributor”), a registered broker-dealer, acts as the Funds’ principal underwriter in a continuous public offering of the Funds’ shares. A portion of the Funds’ distribution expenses is paid by the Advisor. |
The Funds have adopted a Distribution Plan (the “Plan”) pursuant to Rule 12b-1 under the 1940 Act for the Funds’ Class A and C shares. The Plan is designed to reimburse the Distributor or dealers for certain promotional and other sales related costs associated with sales of such Fund shares. Unreimbursed amounts may be carried forward and paid in a subsequent year, to the extent that total expenses under the Plan do not exceed 0.25% and 0.75% of the average daily net assets of each Fund’s Class A and C shares, respectively. During the year ended September 30, 2022, the Funds paid to the Distributor and each dealer a monthly fee at the annual rate of 0.25% of the average daily net assets of Class A shares and 0.75% of the average daily net assets of Class C shares beneficially owned by the Distributor’s and each dealer’s existing brokerage clients. The Plan may be continued in effect from year to year if such continuance is approved annually by the Board of Trustees of the Trust, including the vote of a majority of the Independent Trustees. For the year ended September 30, 2022, the following Funds incurred expenses pursuant to the Plan:
Fund | Class A | Class C | ||||||||
International Fund | $ | 97,782 | $ | 59,743 | ||||||
Global Fund | 2,105 | 6,039 | ||||||||
Emerging Markets Fund | 457,670 | 59,763 | ||||||||
International Small Cap Fund | 139,848 | 32,825 | ||||||||
Small Cap Value Fund | 1,941 | N/A | ||||||||
U.S. Value Fund | 146 | N/A | ||||||||
Core Plus Fund | 3,218 | N/A | ||||||||
The Funds have adopted a Shareholder Service Plan for Class C, and have authorized sub-transfer agency fee payments for Class I, to pay to securities broker-dealers, retirement plan sponsors and administrators, banks and their affiliates, and other institutions and service professionals, as shareholder servicing agents of the Funds, an annual fee for non-distribution sub-transfer agent and/or subaccounting services up to 0.25% and 0.05% of annual net assets attributable to Class C and Class I, respectively (the “Service Fees”). For the year ended September 30, 2022, the Funds incurred the following Service Fees:
124
Brandes Investment Trust
NOTES TO FINANCIAL STATEMENTS — (continued)
Fund | Class C | Class I | ||||||||
International Fund | $ | 19,906 | $ | 262,272 | ||||||
Global Fund | 2,013 | 21,952 | ||||||||
Emerging Markets Fund | 19,911 | 392,847 | ||||||||
International Small Cap Fund | 10,934 | 131,846 | ||||||||
Small Cap Value Fund | N/A | 1,567 | ||||||||
U.S. Value Fund | N/A | 1,470 | ||||||||
Core Plus Fund | N/A | 33,990 | ||||||||
NOTE 4 – PURCHASES AND SALES OF SECURITIES
The cost of purchases and the proceeds from sales of securities, excluding short term investments, were as follows for the year ended September 30, 2022:
| U.S. Government | Other | |||||||||||||||
Fund | Purchases | Sales | Purchases | Sales | ||||||||||||
International Fund | $ | — | $ | — | $ | 174,112,429 | $ | 172,334,197 | ||||||||
Global Fund | $ | — | $ | — | $ | 6,456,929 | $ | 7,288,870 | ||||||||
Emerging Markets Fund | $ | — | $ | — | $ | 230,686,494 | $ | 545,590,388 | ||||||||
International Small Cap Fund | $ | — | $ | — | $ | 123,866,860 | $ | 171,840,625 | ||||||||
Small Cap Value Fund | $ | — | $ | — | $ | 8,423,037 | $ | 5,547,851 | ||||||||
U.S. Value Fund | $ | — | $ | — | $ | 5,992,621 | $ | 491,421 | ||||||||
Core Plus Fund | $ | 9,576,396 | $ | 15,612,232 | $ | 7,713,383 | $ | 9,630,234 | ||||||||
125
Brandes Investment Trust
NOTES TO FINANCIAL STATEMENTS — (continued)
NOTE 5 – CAPITAL STOCK TRANSACTIONS
Capital stock activity for each class of shares was as follows (shares and dollar amounts in thousands):
| International Fund | Global Fund | |||||||||||||||||||||||||||||||||||||||
| Year Ended 9/30/2022 | Year Ended 9/30/2021 | Year Ended 9/30/2022 | Year Ended 9/30/2021 | |||||||||||||||||||||||||||||||||||||
| Shares | Amount | Shares | Amount | Shares | Amount | Shares | Amount | |||||||||||||||||||||||||||||||||
Shares Sold | ||||||||||||||||||||||||||||||||||||||||
Class A | 973 | $ | 16,741 | 999 | $ | 18,421 | 8 | $ | 207 | 8 | $ | 215 | ||||||||||||||||||||||||||||
Class C | 36 | 619 | 56 | 969 | 2 | 39 | — | — | ||||||||||||||||||||||||||||||||
Class I | 7,451 | 127,473 | 8,627 | 149,853 | 150 | 3,878 | 353 | 8,948 | ||||||||||||||||||||||||||||||||
Class R6 | 624 | 10,716 | 683 | 12,207 | N/A | N/A | N/A | N/A | ||||||||||||||||||||||||||||||||
Issued on Reinvestment of Distributions | ||||||||||||||||||||||||||||||||||||||||
Class A | 105 | 1,651 | 46 | 845 | 2 | 49 | 1 | 24 | ||||||||||||||||||||||||||||||||
Class C | 18 | 283 | 11 | 202 | 2 | 43 | 1 | 25 | ||||||||||||||||||||||||||||||||
Class I | 1,359 | 21,440 | 771 | 14,118 | 103 | 2,611 | 55 | 1,397 | ||||||||||||||||||||||||||||||||
Class R6 | 137 | 2,165 | 86 | 1,577 | N/A | N/A | N/A | N/A | ||||||||||||||||||||||||||||||||
Shares Redeemed | ||||||||||||||||||||||||||||||||||||||||
Class A | (1,038 | ) | (16,508 | ) | (569 | ) | (10,133 | ) | (4 | ) | (88 | ) | (25 | ) | (541 | ) | ||||||||||||||||||||||||
Class C | (86 | ) | (1,440 | ) | (142 | ) | (2,439 | ) | (10 | ) | (244 | ) | (4 | ) | (97 | ) | ||||||||||||||||||||||||
Class I | (9,510 | ) | (156,577 | ) | (8,682 | ) | (144,853 | ) | (250 | ) | (6,308 | ) | (177 | ) | (4,069 | ) | ||||||||||||||||||||||||
Class R6 | (931 | ) | (16,089 | ) | (1,060 | ) | (18,179 | ) | N/A | N/A | N/A | N/A | ||||||||||||||||||||||||||||
|
|
|
|
|
|
|
|
|
|
|
|
|
|
|
| |||||||||||||||||||||||||
Net Increase/(Decrease) Resulting from Fund Share Transactions | (862 | ) | $ | (9,526 | ) | 826 | $ | 22,588 | 3 | $ | 187 | 212 | $ | 5,902 | ||||||||||||||||||||||||||
|
|
|
|
|
|
|
|
|
|
|
|
|
|
|
| |||||||||||||||||||||||||
126
Brandes Investment Trust
NOTES TO FINANCIAL STATEMENTS — (continued)
| Emerging Markets Fund | International Small Cap Fund | |||||||||||||||||||||||||||||||||||||||
| Year Ended 9/30/2022 | Year Ended 9/30/2021 | Year Ended 9/30/2022 | Year Ended 9/30/2021 | |||||||||||||||||||||||||||||||||||||
| Shares | Amount | Shares | Amount | Shares | Amount | Shares | Amount | |||||||||||||||||||||||||||||||||
Shares Sold | ||||||||||||||||||||||||||||||||||||||||
Class A | 2,494 | $ | 19,089 | 2,366 | $ | 20,691 | 212 | $ | 2,623 | 1,960 | $ | 19,289 | ||||||||||||||||||||||||||||
Class C | 68 | 531 | 140 | 1,239 | 6 | 71 | 22 | 277 | ||||||||||||||||||||||||||||||||
Class I | 36,376 | 275,797 | 35,019 | 305,038 | 3,065 | 37,310 | 3,659 | 45,709 | ||||||||||||||||||||||||||||||||
Class R6 | 1,341 | 11,070 | 4,660 | 35,820 | 119 | 1,554 | 118 | 1,453 | ||||||||||||||||||||||||||||||||
Issued on Reinvestment of Distributions | ||||||||||||||||||||||||||||||||||||||||
Class A | 210 | 1,527 | 267 | 2,361 | 290 | 3,485 | 58 | 771 | ||||||||||||||||||||||||||||||||
Class C | 32 | 233 | 15 | 131 | 21 | 243 | 6 | 75 | ||||||||||||||||||||||||||||||||
Class I | 3,640 | 26,704 | 1,373 | 12,238 | 1,368 | 16,367 | 286 | 3,778 | ||||||||||||||||||||||||||||||||
Class R6 | 73 | 599 | 51 | 465 | 46 | 582 | 12 | 160 | ||||||||||||||||||||||||||||||||
Shares Redeemed | ||||||||||||||||||||||||||||||||||||||||
Class A | (4,450 | ) | (34,006 | ) | (2,410 | ) | (20,925 | ) | (1,353 | ) | (15,415 | ) | (1,001 | ) | (12,091 | ) | ||||||||||||||||||||||||
Class C | (433 | ) | (3,257 | ) | (541 | ) | (4,694 | ) | (73 | ) | (827 | ) | (136 | ) | (1,579 | ) | ||||||||||||||||||||||||
Class I | (78,555 | ) | (578,967 | ) | (39,158 | ) | (332,504 | ) | (6,351 | ) | (76,257 | ) | (9,214 | ) | (114,487 | ) | ||||||||||||||||||||||||
Class R6 | (5,681 | ) | (43,818 | ) | (2,439 | ) | (21,428 | ) | (1,086 | ) | (12,549 | ) | (290 | ) | (3,592 | ) | ||||||||||||||||||||||||
|
|
|
|
|
|
|
|
|
|
|
|
|
|
|
| |||||||||||||||||||||||||
Net Increase/(Decrease) Resulting from Fund Share Transactions | (44,885 | ) | $ | (324,498 | ) | (657 | ) | $ | (1,568 | ) | (3,736 | ) | $ | (42,813 | ) | (4,520 | ) | $ | (60,237 | ) | ||||||||||||||||||||
|
|
|
|
|
|
|
|
|
|
|
|
|
|
|
| |||||||||||||||||||||||||
| Small Cap Value Fund | U.S. Value Fund | |||||||||||||||||||||||||||||||||||||||
| Year Ended 9/30/2022 | Year Ended 9/30/2021 | Since Inception 9/30/2022 | ||||||||||||||||||||||||||||||||||||||
| Shares | Amount | Shares | Amount | Shares | Amount | |||||||||||||||||||||||||||||||||||
Shares Sold | ||||||||||||||||||||||||||||||||||||||||
Class A | 84 | $ | 1,102 | 66 | $ | 843 | 10 | $ | 108 | |||||||||||||||||||||||||||||||
Class C | N/A | N/A | N/A | N/A | N/A | N/A | ||||||||||||||||||||||||||||||||||
Class I | 563 | 7,135 | 107 | 1,225 | 541 | 5,771 | ||||||||||||||||||||||||||||||||||
Class R6 | 8 | 99 | — | — | — | * | — | * | ||||||||||||||||||||||||||||||||
Issued on Reinvestment of Distributions | ||||||||||||||||||||||||||||||||||||||||
Class A | 3 | 39 | — | * | 2 | — | * | 1 | ||||||||||||||||||||||||||||||||
Class C | N/A | N/A | N/A | N/A | N/A | N/A | ||||||||||||||||||||||||||||||||||
Class I | 10 | 130 | 2 | 19 | 5 | 48 | ||||||||||||||||||||||||||||||||||
Class R6 | — | * | — | * | — | * | — | * | — | * | — | * | ||||||||||||||||||||||||||||
Shares Redeemed | ||||||||||||||||||||||||||||||||||||||||
Class A | (55 | ) | (703 | ) | (31 | ) | (402 | ) | (6 | ) | (58 | ) | ||||||||||||||||||||||||||||
Class C | N/A | N/A | N/A | N/A | N/A | N/A | ||||||||||||||||||||||||||||||||||
Class I | (404 | ) | (4,801 | ) | (47 | ) | (615 | ) | (21 | ) | (212 | ) | ||||||||||||||||||||||||||||
Class R6 | — | * | — | * | — | — | — | — | ||||||||||||||||||||||||||||||||
|
|
|
|
|
|
|
|
|
|
|
| |||||||||||||||||||||||||||||
Net Increase/(Decrease) Resulting from Fund Share Transactions | 209 | $ | 3,001 | 97 | $ | 1,072 | 529 | $ | 5,658 | |||||||||||||||||||||||||||||||
|
|
|
|
|
|
|
|
|
|
|
| |||||||||||||||||||||||||||||
* Value calculated is less than 500 shares/dollars.
127
Brandes Investment Trust
NOTES TO FINANCIAL STATEMENTS — (continued)
| Core Plus Fund | ||||||||||||||||||||
| Year Ended 9/30/2022 | Year Ended 9/30/2021 | |||||||||||||||||||
| Shares | Amount | Shares | Amount | |||||||||||||||||
Shares Sold | ||||||||||||||||||||
Class A | 205 | $ | 1,899 | 50 | $ | 473 | ||||||||||||||
Class C | N/A | N/A | N/A | N/A | ||||||||||||||||
Class I | 2,085 | 17,958 | 1,990 | 18,913 | ||||||||||||||||
Class R6 | — | — | — | — | ||||||||||||||||
Issued on Reinvestment of Distributions | ||||||||||||||||||||
Class A | 3 | 29 | 2 | 24 | ||||||||||||||||
Class C | N/A | N/A | N/A | N/A | ||||||||||||||||
Class I | 198 | 1,734 | 221 | 2,097 | ||||||||||||||||
Class R6 | — | * | — | * | — | — | ||||||||||||||
Shares Redeemed | ||||||||||||||||||||
Class A | (220 | ) | (1,970 | ) | (75 | ) | (707 | ) | ||||||||||||
Class C | N/A | N/A | N/A | N/A | ||||||||||||||||
Class I | (3,129 | ) | (27,247 | ) | (2,840 | ) | (27,067 | ) | ||||||||||||
Class R6 | — | — | — | — | ||||||||||||||||
|
|
|
|
|
|
|
| |||||||||||||
Net Increase/(Decrease) Resulting from Fund Share Transactions | (858 | ) | $ | (7,597 | ) | (652 | ) | $ | (6,267 | ) | ||||||||||
|
|
|
|
|
|
|
| |||||||||||||
* Value calculated is less than 500 shares/dollars.
NOTE 6 – FEDERAL INCOME TAX MATTERS
The Funds may be subject to taxes imposed by countries in which they invest. Such taxes are generally based on income and/or capital gains earned. Taxes are accrued based on net investment income, net realized gains and net unrealized appreciation as such income and/or gains are recorded. Taxes accrued on unrealized gains are reflected as a liability on the Statements of Assets and Liabilities under the caption “Foreign capital gains taxes”. When assets subject to capital gains tax are sold, accrued taxes are relieved, and the actual amount of the taxes paid is reflected on the Statements of Operations as a reduction in “Net realized gain (loss) on Investments”.
GAAP requires that certain components of net assets be reclassified between financial and tax reporting. Temporary differences do not require reclassification. Temporary and permanent differences have no effect on net assets or net asset value per share. For the year ended September 30, 2022, the Funds made the following permanent book-to-tax reclassifications primarily related to the treatment of foreign currency transactions, passive foreign investment companies, paydowns, corporate actions, distributions treated as return of capital and difference between book and tax accretion methods for market premium:
128
Brandes Investment Trust
NOTES TO FINANCIAL STATEMENTS — (continued)
| Undistributed Net Investment Income/(Loss) | Accumulated Net Realized Gain/(Loss) | Paid-In Capital | |||||||||||||
International Fund | $ | (14,731 | ) | $ | 14,731 | $ | — | ||||||||
Global Fund | (56,080 | ) | 56,080 | — | |||||||||||
Emerging Markets Fund | (586,504 | ) | 1,205,684 | (619,180 | ) | ||||||||||
International Small Cap Fund | 2,753,348 | (2,753,348 | ) | — | |||||||||||
Small Cap Value Fund | 24,602 | (24,602 | ) | — | |||||||||||
U.S. Value Fund | (14 | ) | 14 | — | |||||||||||
Core Plus Fund | 17,522 | (17,522 | ) | — | |||||||||||
As of September 30, 2022, the components of distributable earnings on a tax basis were as follows:
| International Fund | Global Fund | |||||||
Cost of investments for tax purposes | $ | 659,725,467 | $ | 38,336,993 | ||||
Gross tax unrealized appreciation | 9,774,366 | 5,252,036 | ||||||
|
|
|
| |||||
Gross tax unrealized depreciation | (211,075,795 | ) | (6,945,117 | ) | ||||
|
|
|
| |||||
Net unrealized appreciation (depreciation) on investments and foreign currency | (201,301,429 | ) | (1,693,081 | ) | ||||
Distributable ordinary income | — | — | ||||||
Distributable long-term capital gains | — | 570,731 | ||||||
|
|
|
| |||||
Total distributable earnings | — | 570,731 | ||||||
|
|
|
| |||||
Other accumulated gains/(losses) | (79,729,891 | ) | (92,585 | ) | ||||
|
|
|
| |||||
Total accumulated earnings | $ | (281,031,320 | ) | $ | (1,214,935 | ) | ||
|
|
|
| |||||
129
Brandes Investment Trust
NOTES TO FINANCIAL STATEMENTS — (continued)
| Emerging Markets Fund | International Small Cap Fund | Small Cap Value Fund | U.S. Value Fund | Core Plus Fund | ||||||||||||||||
Cost of investments for tax purposes | $ | 940,631,688 | $ | 346,747,561 | $ | 4,852,704 | $ | 5,678,045 | $ | 67,251,097 | ||||||||||
|
|
|
|
|
|
|
|
|
| |||||||||||
Gross tax unrealized appreciation | 37,683,530 | 16,397,974 | 153,923 | 110,371 | 154,724 | |||||||||||||||
Gross tax unrealized depreciation | (360,198,690 | ) | (128,488,524 | ) | (1,090,287 | ) | (1,181,689 | ) | (6,967,918 | ) | ||||||||||
|
|
|
|
|
|
|
|
|
| |||||||||||
Net unrealized appreciation | ||||||||||||||||||||
(depreciation) on investments and foreign currency | (322,515,160 | ) | (112,090,550 | ) | (936,364 | ) | (1,071,318 | ) | (6,813,194 | ) | ||||||||||
Distributable ordinary income | — | — | 48,638 | 32,455 | 24,181 | |||||||||||||||
Distributable long-term capital gains | — | — | — | 14 | — | |||||||||||||||
|
|
|
|
|
|
|
|
|
| |||||||||||
Total distributable earnings | — | — | 48,638 | 32,469 | 24,181 | |||||||||||||||
|
|
|
|
|
|
|
|
|
| |||||||||||
Other accumulated gains/(losses) | (266,104,484 | ) | (138,792,887 | ) | (53,004 | ) | — | (2,233,468 | ) | |||||||||||
|
|
|
|
|
|
|
|
|
| |||||||||||
Total accumulated earnings | $ | (588,619,644 | ) | $ | (250,883,437 | ) | $ | (940,730 | ) | $ | (1,038,849 | ) | $ | (9,022,481 | ) | |||||
|
|
|
|
|
|
|
|
|
| |||||||||||
The differences between book and tax basis distributable earnings are primarily related to foreign currency adjustments and the differences in classification of paydown gains and losses for tax purposes compared to book purposes. These differences are permanent.
The tax composition of dividends for the years ended September 30, 2022 and September 30, 2021 for the Funds, were as follows:
| Ordinary Income | Long Term Capital Gains | Return of Capital | ||||||||||||||||||||||
| 2022 | 2021 | 2022 | 2021 | 2022 | 2021 | |||||||||||||||||||
International Fund | $ | 26,061,162 | $ | 17,261,308 | $ | — | $— | $ | — | $— | ||||||||||||||
Global Fund | 1,162,638 | 1,457,678 | 1,557,411 | — | — | — | ||||||||||||||||||
Emerging Markets Fund | 35,549,724 | 16,134,333 | — | — | 619,180 | — | ||||||||||||||||||
International Small Cap Fund | 20,716,055 | 4,802,418 | — | — | — | — | ||||||||||||||||||
Small Cap Value Fund | 148,814 | 20,695 | 20,801 | — | — | — | ||||||||||||||||||
U.S. Value Fund | 48,849 | — | — | — | — | — | ||||||||||||||||||
Core Plus Fund | 1,785,392 | 2,168,060 | — | — | — | — | ||||||||||||||||||
130
Brandes Investment Trust
NOTES TO FINANCIAL STATEMENTS — (continued)
For the period subsequent to October 31, 2021, through the fiscal year ended September 30, 2022, The International Fund, Global Fund, Emerging Markets Fund, International Small Cap Fund and Small Cap Value Fund incurred $734,820, $90,206, $3,467,236, $127,405 and $49,663 respectively, of net capital losses and/or late year ordinary losses for which the Funds intend to treat as having occurred in the following fiscal year.
At September 30, 2022 the Funds had capital loss carryforwards and capital loss carryforwards utilized as indicated below:
| Indefinite | Utilized | |||||||
International Fund | $ | (78,995,071 | ) | $ | — | |||
Global Fund | — | — | ||||||
Emerging Markets Fund | (262,586,548 | ) | — | |||||
International Small Cap Fund | (138,647,931 | ) | (6,908,509 | ) | ||||
Small Cap Value Fund | — | — | ||||||
U.S. Value Fund | — | — | ||||||
Core Plus Fund | (2,233,468 | ) | — | |||||
NOTE 7 – OFFERING PRICE PER SHARE
The public offering price for Class A shares is the net asset value per share plus a sales charge, which varies in accordance with the amount of the purchase up to a maximum of 5.75% for the International, Global, Emerging Markets, International Small Cap, Small Cap Value, and U.S. Value Funds, and 3.75% for the Core Plus Fund. A contingent deferred sales charge (“CDSC”) of 1.00% will be deducted with respect to Class A shares purchased without a sales load and redeemed within 12 months of purchase, unless waived, as discussed in the Prospectus. Any applicable CDSC will be 1.00% of the lesser of the original purchase price or the redemption value of the Class A shares redeemed. Class C shares include a 1.00% CDSC paid by redeeming shareholders within 12 months of purchase. As a result the redemption price may differ from the net asset value per share. The public offering prices for I shares are the respective net asset values. Sales charges are not an expense of the Funds and are not reflected in the financial statements of the Funds.
131
Brandes Investment Trust
NOTES TO FINANCIAL STATEMENTS — (continued)
NOTE 8 – TRANSACTIONS WITH AFFILIATES
The following issuers were affiliated with the International Small Cap Fund as defined in Section (2)(a)(3) of the 1940 Act, as these Funds held 5% or more of the outstanding voting securities of the following issuers during the year ended September 30, 2022:
International Small Cap Fund
Issuer Name | Value At October 1, 2021 | Purchases | Sales Proceeds | Realized Gain/(Loss) | Unrealized Appreciation/ | Value At | Dividend Income | ||||||||||||||||||||||
Desarrolladora Homex SAB de CV | $ | 934,314 | $— | $— | $— | $(545,722) | $388,592 | $— | |||||||||||||||||||||
Urbi Desarrollos Urbanos SAB de CV | 361,606 | — | — | — | (103,174) | 258,432 | — | ||||||||||||||||||||||
|
|
|
|
|
|
|
|
|
|
|
| ||||||||||||||||||
| $ | 1,295,920 | $— | $— | $— | $(648,896) | $647,024 | $— | ||||||||||||||||||||||
|
|
|
|
|
|
|
|
|
|
|
| ||||||||||||||||||
NOTE 9 – OWNERSHIP BY AFFILIATED PARTIES
As of September 30, 2022, the Advisor, Trustees or affiliates of the Advisor beneficially owned more than 5% of shares in each class of the Funds as follows:
| Global Fund | ||||
| Class I | ||||
Shares | 348,389 | |||
% of Total Outstanding Shares | 20.39% | |||
| Small Cap Value Fund | Core Plus Fund | ||||||||||||||
| Class I | Class I | Class R6 | |||||||||||||
Shares | 49,755 | 2,149,124 | 11 | ||||||||||||
% of Total Outstanding Shares | 17.12% | 28.85% | 100.00% | ||||||||||||
NOTE 10 – RISK FACTORS
The respiratory illness COVID-19 caused by a novel coronavirus has resulted in a global pandemic and caused major disruptions to economies and markets around the world. The impact of this pandemic, and other global health crises that may arise in the future, could affect the economies of many nations, individual companies, and the market in general, in ways that cannot necessarily be foreseen at the present time. This pandemic may result in substantial market volatility and may adversely impact the prices and liquidity of a fund’s investments. Although vaccines have been developed, the duration of this pandemic and its effects cannot be determined with certainty.
Recent events relating to the armed conflict in Ukraine and the global economic sanctions that have resulted may adversely impact global economic and market activity, and contribute to significant volatility in financial markets. The impact of the conflict has been rapidly evolving, and the ultimate economic fallout and long-term impact on economies, markets, industries, and individual companies, are not known.
132
Brandes Investment Trust
NOTES TO FINANCIAL STATEMENTS — (continued)
NOTE 11 – SUBSEQUENT EVENTS
In preparing these financial statements, the Trust has evaluated events and transactions for potential recognition or disclosure through the date the financial statements were available to be issued. The Trust has concluded that there are no subsequent events to note.
133
Brandes Investment Trust
REPORT OF INDEPENDENT REGISTERED PUBLIC ACCOUNTING FIRM
To the Board of Trustees of Brandes Investment Trust and Shareholders of Brandes International Equity Fund, Brandes Global Equity Fund, Brandes Emerging Markets Value Fund, Brandes International Small Cap Equity Fund, Brandes Small Cap Value Fund, Brandes U.S. Value Fund and Brandes Core Plus Fixed Income Fund
Opinions on the Financial Statements
We have audited the accompanying statements of assets and liabilities, including the schedules of investments, of Brandes International Equity Fund, Brandes Global Equity Fund, Brandes Emerging Markets Value Fund, Brandes International Small Cap Equity Fund, Brandes Small Cap Value Fund, Brandes U.S. Value Fund and Brandes Core Plus Fixed Income Fund (seven of the funds constituting Brandes Investment Trust, hereafter collectively referred to as the “Funds”) as of September 30, 2022, the related statements of operations for the year ended September 30, 2022, the statements of changes in net assets for each of the two years in the period ended September 30, 2022 (or for Brandes U.S. Value Fund, for the period October 1, 2021 (commencement of operations) through September 30, 2022), including the related notes, and the financial highlights for each of the periods indicated therein (collectively referred to as the “financial statements”). In our opinion, the financial statements present fairly, in all material respects, the financial position of each of the Funds as of September 30, 2022, the results of each of their operations for the year then ended, the changes in each of their net assets for each of the two years in the period ended September 30, 2022 (or for Brandes U.S. Value Fund, for the period October 1, 2021 (commencement of operations) through September 30, 2022) and each of the financial highlights for each of the periods indicated therein in conformity with accounting principles generally accepted in the United States of America.
Basis for Opinions
These financial statements are the responsibility of the Funds’ management. Our responsibility is to express an opinion on the Funds’ financial statements based on our audits. We are a public accounting firm registered with the Public Company Accounting Oversight Board (United States) (PCAOB) and are required to be independent with respect to the Funds in accordance with the U.S. federal securities laws and the applicable rules and regulations of the Securities and Exchange Commission and the PCAOB.
We conducted our audits of these financial statements in accordance with the standards of the PCAOB. Those standards require that we plan and perform the audit to obtain reasonable assurance about whether the financial statements are free of material misstatement, whether due to error or fraud.
Our audits included performing procedures to assess the risks of material misstatement of the financial statements, whether due to error or fraud, and performing procedures that respond to those risks. Such procedures included examining, on a test basis, evidence regarding the amounts and disclosures in the financial statements. Our audits
134
Brandes Investment Trust
REPORT OF INDEPENDENT REGISTERED PUBLIC ACCOUNTING FIRM — (continued)
also included evaluating the accounting principles used and significant estimates made by management, as well as evaluating the overall presentation of the financial statements. Our procedures included confirmation of securities owned as of September 30, 2022 by correspondence with the custodian and brokers; when replies were not received from brokers, we performed other auditing procedures. We believe that our audits provide a reasonable basis for our opinions.
/s/ PricewaterhouseCoopers LLP
Los Angeles, California
November 29, 2022
We have served as the auditor of one or more investment companies in the Brandes Investment Partners LP Investment Company Complex since 2011.
135
Brandes Investment Trust
ADDITIONAL INFORMATION — (Unaudited)
BOARD REVIEW OF LIQUIDITY RISK MANAGEMENT PROGRAM
To promote effective liquidity risk management throughout the fund industry and to enhance disclosure regarding fund liquidity and redemption practices, the Securities and Exchange Commission (the “Commission”) adopted Rule 22e-4 under the 1940 Act. This Rule requires every registered open-end management investment company to establish a liquidity risk management program (the “LRMP”) that, among other things, provides for the assessment, management and review of liquidity risk, the classification of a fund’s portfolio investments into one of four liquidity buckets based upon the number of days that such investments may reasonably be expected to be converted into cash or otherwise disposed of without significantly impacting their price, the establishment of a highly liquid investment minimum where required, and the establishment of a 15% limitation on illiquid investments. Additionally, the Commission adopted Rule 30b1-10 under the 1940 Act and Form N-LIQUID, which generally require funds to notify the Commission when certain liquidity-related events occur.
The Trust’s Board of Trustees approved the appointment of the Advisor’s Liquidity Risk Review Committee as the administrator of the LRMP for the Funds on August 9, 2018, and the Funds’ LRMP on May 9, 2019. Pursuant to the LRMP, the Advisor manages liquidity risks associated with the Funds’ investments by monitoring cash and cash equivalents, the concentration of investments and the appropriateness of portfolio strategies for open-end funds, and by classifying the portfolio holdings of each of the Funds as either highly liquid, moderately liquid, less liquid or illiquid on at least a monthly basis. To assist with the classification of Fund investments, the Advisor utilizes a third-party provider of liquidity monitoring services.
At the Board’s regular meeting on August 11, 2022, the Trust’s Chief Compliance Officer provided a report to the Board on the operation and effectiveness of the LRMP for the period from July 1, 2021 through June 30, 2022 (the “Reporting Period”), noting that the Funds’ LRMP was adequate and effectively implemented during the Reporting Period. No significant liquidity events impacting the Funds were noted in the report, and there were no material changes to the LRMP during the Reporting Period.
PROXY VOTING PROCEDURES
The Advisor votes proxies relating to the Funds’ portfolio securities in accordance with procedures adopted by the Advisor. You may obtain a description of these procedures, free of charge, by calling toll-free 1-800-331-2979. This information is also available through the Commission’s website at http://www.sec.gov.
Information regarding how the Trust voted proxies relating to portfolio securities during the most recent 12-month period ended June 30 is available without charge, upon request, by calling 1-800-331-2979. This information is also available through the Commission’s website at http://www.sec.gov.
136
Brandes Investment Trust
ADDITIONAL INFORMATION — (Unaudited) (continued)
PORTFOLIO HOLDINGS DISCLOSURE
The Trust files the Funds’ complete schedules of portfolio holdings with the Commission for the first and third quarters of each fiscal year on Form N-PORT. The Trust’s Form N-PORT filings are available on the Commission’s website at http://www.sec.gov. Information regarding the Trust’s Form N-PORT filings is also available, without charge, by calling toll-free, 1-800-331-2979.
TAX NOTICE
For the fiscal year ended September 30, 2022, the percentage of taxable ordinary income distributions that are designated as interest related dividends under the Internal Revenue Code Section 871(k)(1)(c) for each Fund were as follows:
PERCENTAGE | |||||
International Fund | 0.08 | % | |||
Global Fund | 0.13 | % | |||
Emerging Markets Fund | 0.05 | % | |||
International Small Cap Fund | 0.04 | % | |||
Small Cap Value Fund | 3.69 | % | |||
U.S. Value Fund | 0.54 | % | |||
Core Plus Fund | 95.30 | % | |||
The percentage of ordinary distributions designated as short-term gain distributions under the Internal Revenue Code Section 871(k)(2)(c) for the fiscal year ended September 30, 2022 were as follows:
PERCENTAGE | |||||
International Fund | 0.00 | % | |||
Global Fund | 0.00 | % | |||
Emerging Markets Fund | 0.00 | % | |||
International Small Cap Fund | 0.00 | % | |||
Small Cap Value Fund | 0.00 | % | |||
U.S. Value Fund | 0.00 | % | |||
Core Plus Fund | 0.00 | % | |||
The distributions designated as long-term capital gain distributions for the fiscal year ended September 30, 2022 were as follows:
DISTRIBUTION | |||||
International Fund | $ | — | |||
Global Fund | $ | 1,557,411 | |||
Emerging Markets Fund | $ | — | |||
International Small Cap Fund | $ | — | |||
Small Cap Value Fund | $ | 20,801 | |||
U.S. Value Fund | $ | — | |||
Core Plus Fund | $ | — | |||
The percentage of dividend income distributed for the fiscal year ended September 30, 2022, which is designated as qualified dividend income under the Jobs and Growth Tax relief Reconciliation Act of 2003 is as follows:
137
Brandes Investment Trust
ADDITIONAL INFORMATION — (Unaudited) (continued)
| QUALIFIED | |||||
| DIVIDEND | |||||
INCOME | |||||
International Fund | 70.69 | % | |||
Global Fund | 100.00 | % | |||
Emerging Markets Fund | 75.62 | % | |||
International Small Cap Fund | 66.95 | % | |||
Small Cap Value Fund | 43.87 | % | |||
U.S. Value Fund | 89.50 | % | |||
Core Plus Fund | 0.00 | % | |||
The percentage of dividends paid during the fiscal year ended September 30, 2022 that qualify for the corporate dividends received deduction are as follows:
PERCENTAGE | |||||
International Fund | 0.00 | % | |||
Global Fund | 45.81 | % | |||
Emerging Markets Fund | 0.00 | % | |||
International Small Cap Fund | 0.00 | % | |||
Small Cap Value Fund | 22.92 | % | |||
U.S. Value Fund | 84.44 | % | |||
Core Plus Fund | 0.00 | % | |||
For the year ended September 30, 2022, the International Fund, Global Fund, Emerging Markets Fund and International Small Cap Fund earned foreign source income and paid foreign taxes, as noted below, which it intends to pass through to its shareholders pursuant to Section 853 of the Internal Revenue Code, with the exception to the foreign taxes paid in the United Kingdom. The United Kingdom foreign taxes paid by the Fund do not qualify to be passed through to the Fund’s shareholders.
138
Brandes Investment Trust
ADDITIONAL INFORMATION — (Unaudited) (continued)
| Gross Foreign Income | ||||||||||||||||||||
| Emerging | International | |||||||||||||||||||
| International | Global | Markets | Small Cap | |||||||||||||||||
| Fund | Fund | Fund | Fund | |||||||||||||||||
Austria | $ | 243,527 | $ | 89,229 | $ | 739,817 | $ | 544,067 | ||||||||||||
Belgium | 86,487 | - | - | - | ||||||||||||||||
Bermuda | 309,266 | - | 806,554 | 1,297,715 | ||||||||||||||||
Brazil | 8,354,017 | - | 12,307,541 | - | ||||||||||||||||
Canada | - | - | - | 7,890,274 | ||||||||||||||||
Cayman Islands | - | 34,963 | 1,672,488 | 161,184 | ||||||||||||||||
Chile | - | 3,399 | 5,959,661 | 92,050 | ||||||||||||||||
China | - | 46,498 | 3,829,664 | 226,318 | ||||||||||||||||
Colombia | - | - | - | - | ||||||||||||||||
Czech Republic | - | - | - | - | ||||||||||||||||
France | 4,856,183 | 197,242 | - | 426,421 | ||||||||||||||||
Germany | 1,365,285 | 33,194 | - | 29,594 | ||||||||||||||||
Greece | - | - | 233,396 | 32,656 | ||||||||||||||||
Guernsey | - | 11,608 | - | - | ||||||||||||||||
Hong Kong | - | - | 1,369,058 | 60,612 | ||||||||||||||||
Hungary | - | - | - | 228,948 | ||||||||||||||||
India | - | - | 1,197,172 | - | ||||||||||||||||
Indonesia | - | - | 2,499,379 | - | ||||||||||||||||
Ireland | (88 | ) | 12,054 | - | 156,640 | |||||||||||||||
Italy | 1,878,488 | 27,232 | - | 263,340 | ||||||||||||||||
Japan | 3,155,876 | 18,461 | - | 2,318,656 | ||||||||||||||||
Jersey | 445,430 | 26,475 | - | - | ||||||||||||||||
Malaysia | - | 24,751 | 783,553 | 176,594 | ||||||||||||||||
Mexico | 1,443,502 | 67,097 | 4,174,750 | 1,688,065 | ||||||||||||||||
Netherlands | 217,398 | - | - | - | ||||||||||||||||
Pakistan | - | - | - | - | ||||||||||||||||
Panama | - | - | 598,833 | 364,499 | ||||||||||||||||
Philippines | - | - | 396,229 | 28,740 | ||||||||||||||||
Republic of Korea | 1,309,590 | 74,818 | 5,970,070 | 242,328 | ||||||||||||||||
Russia | - | - | 2,134,243 | - | ||||||||||||||||
Slovenia | - | - | - | 661,580 | ||||||||||||||||
South Africa | - | - | - | - | ||||||||||||||||
Spain | 205,794 | 21,163 | 264,837 | 733,700 | ||||||||||||||||
Switzerland | 2,229,151 | 38,692 | - | - | ||||||||||||||||
Taiwan | - | - | 2,178,673 | - | ||||||||||||||||
Thailand | - | - | 2,513,328 | - | ||||||||||||||||
United Arab Emirates | - | - | - | - | ||||||||||||||||
United Kingdom | 3,833,107 | 309,780 | - | 1,172,443 | ||||||||||||||||
|
|
|
|
|
|
|
|
|
| |||||||||||
| $ | 29,933,013 | $ | 1,036,656 | $ | 49,629,246 | $ | 18,796,424 | |||||||||||||
|
|
|
|
|
|
|
|
|
| |||||||||||
139
Brandes Investment Trust
ADDITIONAL INFORMATION — (Unaudited) (continued)
| Foreign Tax Paid | ||||||||||||||||||||
| Emerging | International | |||||||||||||||||||
| International | Global | Markets | Small Cap | |||||||||||||||||
| Fund | Fund | Fund | Fund | |||||||||||||||||
Austria | $ | 36,529 | $ | 13,384 | $ | 110,972 | $ | - | ||||||||||||
Belgium | 12,973 | - | - | - | ||||||||||||||||
Brazil | - | - | - | - | ||||||||||||||||
Canada | - | - | - | 292,683 | ||||||||||||||||
Chile | - | 687 | 1,572,951 | 25,155 | ||||||||||||||||
China | - | 4,650 | 382,966 | 22,632 | ||||||||||||||||
Colombia | - | - | - | - | ||||||||||||||||
Czech Republic | - | - | - | - | ||||||||||||||||
France | 26,382 | 9,590 | - | 63,450 | ||||||||||||||||
Germany | 204,603 | 4,993 | - | 4,439 | ||||||||||||||||
Greece | - | - | 11,670 | 1,633 | ||||||||||||||||
India | - | - | 286,364 | - | ||||||||||||||||
Indonesia | - | - | 423,849 | - | ||||||||||||||||
Ireland | (51 | ) | - | - | - | |||||||||||||||
Italy | 105,064 | 4,043 | - | 39,501 | ||||||||||||||||
Japan | 293,030 | 1,846 | - | 229,495 | ||||||||||||||||
Mexico | 418,266 | 19,512 | 1,125,466 | 401,483 | ||||||||||||||||
Netherlands | 4 | - | - | - | ||||||||||||||||
Pakistan | - | - | - | - | ||||||||||||||||
Philippines | - | - | 98,789 | 7,185 | ||||||||||||||||
Republic of Korea | 269,600 | 15,513 | 1,238,138 | 52,744 | ||||||||||||||||
Russia | - | - | 262,277 | - | ||||||||||||||||
Slovenia | - | - | - | 176,317 | ||||||||||||||||
South Africa | - | - | - | - | ||||||||||||||||
Spain | 5 | - | 39,726 | 75,958 | ||||||||||||||||
Switzerland | 276,547 | 2,902 | - | - | ||||||||||||||||
Taiwan | - | - | 457,521 | - | ||||||||||||||||
Thailand | - | - | 251,333 | - | ||||||||||||||||
|
|
|
|
|
|
|
|
|
| |||||||||||
| $ | 1,642,952 | $ | 77,120 | $ | 6,262,022 | $ | 1,392,675 | |||||||||||||
|
|
|
|
|
|
|
|
|
| |||||||||||
DISTRIBUTION INFORMATION
For purposes of Section 19 of the 1940 Act, the Funds estimated the periodic sources of any dividends paid during the period covered by this report in accordance with good accounting practice. The Emerging Markets Value Fund did not issue a Section 19(a) notice because at the time the Fund did not believe that such a notice was necessary. Pursuant to Rule 19a-1(e) under the 1940 Act, the information in the table below includes the sources of the Emerging Markets Value Fund distributions paid during the year ended September 30, 2022.
Please note that the information in the table below is for financial accounting purposes only. Form 1099-DIV received by shareholders for the calendar year specifies how shareholders should characterize and report distributions paid by the Fund during the year for U.S. federal income tax purposes.
140
Brandes Investment Trust
ADDITIONAL INFORMATION — (Unaudited) (continued)
The Fund’s distributions during the year ended September 30, 2022, were paid from:
Record Date | Ordinary Income | Return of Capital | |||||||||||||
Emerging Markets Value Fund | 9/29/2022 | 0.037498 | 0.005648 | ||||||||||||
Emerging Markets Value Fund | 9/29/2022 | 0.025858 | 0.003895 | ||||||||||||
Emerging Markets Value Fund | 9/29/2022 | 0.040351 | 0.006077 | ||||||||||||
Emerging Markets Value Fund | 9/29/2022 | 0.041108 | 0.006191 | ||||||||||||
141
TRUSTEES AND OFFICERS INFORMATION — (Unaudited)
The Board is responsible for the overall management of the Trust’s business. The Board approves all significant agreements between the Trust and persons or companies furnishing services to it, including the agreements with the Advisor, Administrator, the Trust’s Custodian, Distributor and Transfer Agent. The Board delegates the day-to-day operations of the Trust to its officers, subject to each Fund’s investment objective and policies and to general supervision by the Board. The Trust’s Statement of Additional Information includes additional information about the Trustees and is available, without charge, by calling 1-800-331-2979 or visiting www.brandes.com.
The Trustees and officers of the Trust, their business addresses and principal occupations during the past five years are:
Name, Address and Age | Position(s) Held with Trust | Term of Office and Length of Time Served(1) | Principal Occupation During Past 5 Years | Number of Trust Series Overseen by Trustee | Other Directorships/ Trusteeships Held by Trustee | |||||
Independent Trustees(2) | ||||||||||
Gregory Bishop, CFA 4275 Executive Square, 5th Floor La Jolla, CA 92037 (1961) | Trustee | Since January 2017 | Retired. Previously Executive Vice President and Head of Retail Business, PIMCO Investments, from 1997 to 2014 | 8 | None | |||||
Robert M. Fitzgerald 4275 Executive Square, 5th Floor La Jolla, CA 92037 (1952) | Trustee | Since April 2008 | Retired from 2002- 2005 and since 2007; Chief Financial Officer of National Retirement Partners from 2005 to 2007. | 8 | Hotchkis and Wiley Funds (10 portfolios). | |||||
Craig Wainscott, CFA 4275 Executive Square, 5th Floor La Jolla, CA 92037 (1961) | Trustee and (beginning January 2018) Chairman of the Board | Since February 2012 | Retired from Russell Investments, Managing Director, US Mutual Funds; Currently Partner with The Paradigm Project and advisor to early-stage companies. | 8 | None | |||||
142
Brandes Investment Trust
TRUSTEES AND OFFICERS INFORMATION — (Unaudited) (continued)
Name, Address and Age | Position(s) Held with Trust | Term of Office and Length of Time Served(1) | Principal Occupation During Past 5 Years | Number of Trust Series Overseen by Trustee | Other Directorships/ Trusteeships Held by Trustee | |||||
“Interested” Trustees(3) | ||||||||||
Jeff Busby, CFA 4275 Executive Square, 5th Floor La Jolla, CA 92037 (1961) | Trustee and President | Since July 2006 Since February 2012 | Executive Director of the Advisor since January 2004. | 8 | None | |||||
Oliver Murray 4275 Executive Square, 5th Floor La Jolla, CA 92037 (1961) | Trustee | Since February 2012 | CEO, Brandes Investment Partners & Co. since 2002; Managing Director - PCPM of the Advisor since 2011. | 8 | None | |||||
Officers of the Trust | ||||||||||
Thomas M. Quinlan 4275 Executive Square, 5th Floor La Jolla, CA 92037 (1970) | Secretary | Since June 2003 | Associate General Counsel of the Advisor since January 2006. | N/A | N/A | |||||
Gary Iwamura, CPA 4275 Executive Square, 5th Floor La Jolla, CA 92037 (1956) | Treasurer | Since September 1997 | Consultant to the Advisor since January 2022; Finance Director of the Advisor from 1997 to 2021. | N/A | N/A | |||||
Roberta Loubier 4275 Executive Square, 5th Floor La Jolla, CA 92037 (1971) | Chief Compliance Officer and Anti-Money Laundering Officer | Since September 2015 | Global Head of Compliance of the Advisor. | N/A | N/A | |||||
| (1) | Trustees and officers of the Fund serve until their resignation, removal or retirement. |
| (2) | Not “interested persons” of the Trust as defined in the 1940 Act. |
| (3) | “Interested persons” of the Trust as defined in the 1940 Act. Jeff Busby is an interested person of the Trust because he is the President of the Trust and the Executive Director of the Advisor. Oliver Murray is an interested person of the Trust, because he is the Managing Director of the Advisor. |
143
Brandes Investment Trust
PRIVACY NOTICE
Brandes Investment Trust and Brandes Investment Partners, L.P. may collect non-public information about you from the following sources:
| • | Information we receive about you on applications or other forms; |
| • | Information you give us orally; and |
| • | Information about your transactions with us. |
We do not disclose any non-public personal information about any shareholder or former shareholder of the Fund without the shareholder’s authorization, except as required by law or in response to inquiries from governmental authorities. We restrict access to your personal and account information to those employees who need to know that information to provide products and services to you. We also may disclose that information to unaffiliated third parties (such as to brokers or custodians) only as permitted by law and only as needed for us to provide agreed services to you. We maintain physical, electronic and procedural safeguards to guard your non-public personal information.
If you hold shares of the Fund through a financial intermediary, such as a broker-dealer, bank, or trust company, the privacy policy of your financial intermediary governs how your non-public personal information would be shared with nonaffiliated third parties.
144

ADVISOR Brandes Investment Partners, L.P. 4275 Executive Square, 5th Floor La Jolla, CA 92037 800.331.2979 DISTRIBUTOR ALPS Distributors, Inc. 1290 Broadway, #1100 Denver, CO 80203 TRANSFER AGENT The Northern Trust Company 333 South Wabash Avenue, W-38 Chicago, IL 60604 INDEPENDENT REGISTERED PUBLIC ACCOUNTING FIRM PricewaterhouseCoopers LLP 601 South Figueroa Street Los Angeles, CA 90017 LEGAL COUNSEL Morgan, Lewis & Bockius LLP One Federal Street Boston, MA 02110 This report is intended for shareholders of the Brandes International Equity Fund, the Brandes Global Equity Fund, the Brandes Emerging Markets Value Fund, the Brandes International Small Cap Equity Fund, the Brandes Small Cap Value Fund, the Brandes U.S. Value Fund and the Brandes Core Plus Fixed Income Fund and may not be used as sales literature unless preceded or accompanied by a current prospectus. Statements and other information herein are dated and are subject to change. BIT 09/30

| 2 | ||||
| 10 | ||||
| 12 | ||||
| 17 | ||||
| 18 | ||||
| 19 | ||||
| 20 | ||||
| 21 | ||||
| 30 | ||||
| 31 | ||||
| 33 |
1
Brandes Separately Managed Account Reserve Trust
The net asset value of the Brandes Separately Managed Account Reserve Trust declined 13.30% in the year ended September 30, 2022. During the same period, the Bloomberg U.S. Aggregate Bond Index declined by 14.60%.
By some accounts, this year’s bond market performance was the worst bond market performance since ’88 – that is 1788. Interest rates continued to march higher, equity markets continued to move lower, and inflation readings hit levels not seen since the 1970s.
Over the past year, fixed income markets appear to be undergoing a cyclical and perhaps secular change from a long period of low interest rates coupled with low inflation. Inflation readings over the past year have hit levels not seen since the late-1970s and interest rates have moved upwards to levels not seen in over a decade.
As a result, the fixed income market has had to grapple with increasing yields and widening yield spreads. Returns on all major fixed income asset classes and sectors have been negative over the trailing 12-months as the low overall level of yields offered in the market have provided little cushion to insulate bond prices from the effects of rapidly rising interest rates.
In 1975, REO Speedwagon released an album titled: This Time We Mean It. Those words appear to be an apt description of the Fed’s messaging to the market during the past year regarding its resolve to tame rampant inflation.
While the Federal Reserve (Fed) adopted a more hawkish stance throughout the earlier part of the year and backed up their rhetoric with the fastest rate hikes since the summer of 1980, up until the third quarter there appeared to be a lack of market belief in the Fed’s conviction to fully commit to bringing inflation under control if it meant causing elevated market volatility. The Fed has talked tough, but during the first half of this year, the market seemed to be continually expecting a pivot in policy, back to a more accommodative stance.
The last fifteen years of Fed policy are analogous to a long car trip with temperamental children in the back seat. To make the ride smoother and more tolerable you give the kids a bit of sugar, and for a while they’re all happy and well behaved. Eventually, however, the sugar rush wears off. As a parent, in the back of your mind you know that the right thing to do is cut off the sugar and deal with the consequences; but it’s been such a lovely ride, you wonder what’s the harm in keeping the rush going? The problem is that the longer you prolong the inevitable normalization the higher the behavioral volatility will likely be.
The Fed made a change to its messaging during the third quarter. It effectively told the markets that it is not supplying any more sugar. Not unlike the antics of temperamental
Past performance is not a guarantee of future results.
2
Brandes Separately Managed Account Reserve Trust
children, we saw a dramatic sell-off in equites and bonds. Both the S&P 500 and the Bloomberg U.S. Aggregate Index declined by nearly 5% during the most recent quarter end.
Earlier in the year the Fed’s message was focused on guiding the economy to a soft landing, which evolved into a “softish landing”, and then to more recent rhetoric that there will likely be some economic pain in the efforts to bring down inflation. The Fed has a dual mandate to maintain price stability and full employment. Chair Powell indicated that the Fed’s priority is now keenly focused on price stability.
The open question as we enter the fourth quarter 2022 is whether the Fed will stick to its newfound conviction. It’s relatively easy to talk tough when the unemployment rate is the lowest in nearly 50 years. It’s another thing to stay on track if the economy starts shedding jobs or heads into a recession.
The silver lining around the rapid rise in fixed income yields however, is that overall yields are at levels last reached over a decade ago. It seems like a novel idea – tongue firmly in cheek – but by the end of the third quarter, and for the first time in a long time, fixed income securities actually provided an income component.
Specific to the Brandes Separately Managed Account Reserve Trust Fund, the trailing 12-month performance has been negative on an absolute basis, but meaningfully positive on a relative basis versus the benchmark Bloomberg U.S. Aggregate Index.
Strong relative returns can be traced to a number of factors:
New purchases into the Fund during the twelve-month period included; Coty Inc. secured debt (5.00% coupon, maturing 4/15/26, rated B1/B+), Range Resources (9.25% coupon, maturing 2/1/26, callable 2/1/22, rated B1/BB-) American Transmission System (2.65% coupon, maturing 1/15/32, rated A3/BBB), Mauser Packaging (7.25% coupon, maturing 4/15/25, rated Caa3/CCC), Charles Schwab Inc. (5.375% coupon, perpetual, callable 6/1/25, rated Baa2/BBB), Citigroup Inc. (4.40% coupon, maturing 6/10/25, rated Baa2/BBB), Methanex Corp (5.125% coupon, maturing 10/15/27, rated Ba1/BB), Ford Motor Credit (2.70% coupon, maturing 8/10/26, rated Ba2/BB+), Bank of America (4.45% coupon, maturing 3/3/26, rated Baa1/BBB+), and Hess Midstream LP (4.25% coupon, maturing 2/15/30, rated Ba2/BB+).
Coty Inc. is a world leader in beauty with 75 brands and is home to well-known brands such as CoverGirl, Clairol and Max Factor. The company experienced a revolving door in the chief executive officer’s (CEO’s) chair with four different CEOs in 2020. Additionally, the pandemic affected revenues as beauty sales suffered in a world dominated by Zoom calls.
However, Coty is in the early stages of an operational turnaround centered on three key initiatives: 1) shifting the mix toward prestige brands with a focus on clean and green—i.e., CoverGirl Clean Fresh vegan makeup; 2) stabilizing its mass market beauty
3
Brandes Separately Managed Account Reserve Trust
portfolio; and 3) reducing leverage through applying strong operational cash flows to paying down debt and divesting non-core brands.
As the pandemic recedes and more people can return to the office, travel, and engage in leisure activities, we believe Coty is well positioned to benefit from positive industry trends, as well as specific steps the company has taken to strengthen its balance sheet and product portfolio.
We believe that the Charles Schwab bond that we purchased is a good example of a situation where the distinctive structure of the security presents an attractive value opportunity. This bond is a junior subordinated security – it ranks lower in the company’s capital structure. It pays a fixed-rate coupon until June 2025. If the bond is not called in June 2025, it will become a perpetual security, and its coupon will revert to a floating rate based on the 5-year U.S. Treasury rate plus 4.97% - with a quarterly reset. The reset rate will be at a yield spread that is similar to where low-quality high yield bonds generally trade.
The distinctive feature of this bond is that if Charles Schwab chooses not to call the security in June 2025, the company does not have the option to call it again for an additional five years. At today’s interest rates the coupon would reset to nearly 7%. Given the relatively high cost of a coupon reset and the limited flexibility offered to the company for future calls, we believe that this bond is best treated as a bullet security with a 3-year maturity.
Charles Schwab issued this bond in April 2020 during the early stages of the pandemic, which we believe is the likely explanation of why the bond’s structure is not representative of the strong underlying credit quality of the company. As a result, this represents an attractive value opportunity to us.
During the period, the Fund exited full positions in Occidental Petroleum (3.50% coupon, maturing 6/15/25, rated Ba1/BB+) and Allison Transmission Inc. (4.75% coupon, maturing 10/1/27, rated Ba2/NR). Moreover, the Fund experienced a full call in Range Resources (9.25% coupon, maturing 2/1/26, rated B1/BB-), in Avon Products Inc. (6.50% coupon, maturing 3/15/23, rated Ba3/BB-) and in British Petroleum (3.50% coupon, maturing 3.506%, rated A2/A-), and saw maturities in Microsoft Corp., ExxonMobil, and AT&T Inc.
Overall, while we are starting to see more value come into the corporate bond market, credit yield spreads have not been as volatile as they were in previous episodes of market instability such as 2002 (Enron and WorldCom bankruptcies), 2008 (Global Financial Crisis), and 2020 (COVID pandemic). Most of the widening in corporate bonds yields has been attributable to the rise in U.S Treasury rates rather than outright weakness in corporate bonds. This reinforces our view that the most prudent approach is to continue to seek value in a measured and deliberate manner.
Markets now appear to be exiting a period where valuations were largely artificially propped up by huge injections of liquidity and easy policy by the Fed - not to mention
4
Brandes Separately Managed Account Reserve Trust
extraordinary stimulus from the federal government. This transition has been painful for virtually every financial asset class over the short-term. In our view, over the last several years fundamentals like cash flow generation, margins, and balance sheet positioning have taken a back seat to technical factors like momentum and investor enthusiasm.
As the market continues to adapt to what appears to be a post-pandemic financial reckoning, we’ve started to see signs of a rise in idiosyncratic risk. For example, one of the first casualties has been a telecommunications company named Avaya. As recently as June, Avaya was able to raise new debt, despite being highly leveraged. The price of those bonds has fallen nearly 40% since issuance after Avaya cut earnings forecasts and disclosed “substantial doubt” about its ability to keep operating. (We did not invest in these bonds).
As we move forward, we believe that understanding how inflation and higher interest rates affect individual companies’ revenue, costs, and ability to refinance has taken on much more importance than it did in a zero-rateworld. There are an increasing number of bonds that we believe offer attractive yields, but there are also companies facing margin pressures that may have trouble refinancing at higher rates.
Interest rates are higher and yields on bonds are more attractive than they have been in quite some time. We believe, however, that careful security selection rooted in fundamental value principles is the key to successfully guiding the Fund through this uncertain and volatile landscape.
For a considerable period now, we have attempted to tilt the Brandes Separately Managed Account Reserve Trust Fund into what we believe is a defensive posture in order to mitigate some of the potential detrimental impact of rising interest rates and widening yield spreads. The Fund continues to favor shorter-maturity corporate bonds and those that we believe exhibit strong, tangible asset coverage, while remaining underweight agency MBS. We are managing duration toward the shorter end of our duration-controlled range. We have a meaningful allocation to U.S. Treasuries and if recent market uncertainty and volatility continue to cause credit fundamentals to become mispricedrelative to our estimates of intrinsic value, then we will look to redeploy some of those Treasury holdings thoughtfully and effectively to take advantage of opportunities.
As we move forward, we believe prudence dictates that we continue our search for value in a measured and deliberate manner while continuing to tilt the Fund to what we believe is a relatively defensive posture.
We remain optimistic about the prospects for the Brandes Separately Managed Account Reserve Trust Fund.
Sincerely yours,
The Brandes Fixed Income Investment Committee
Brandes Investment Trust
5
Brandes Separately Managed Account Reserve Trust
Agency mortgage-backed securities (MBS): An MBS issued by one of three quasi-governmental agencies: The Government National Mortgage Association (GNMA or Ginnie Mae), the Federal National Mortgage Association (FNMA or Fannie Mae), and the Federal Home Loan Mortgage Corporation (Freddie Mac). A MBS is an investment similar to a bond that is made up of a bundle of home loans bought from the banks that issued them.
Asset Coverage: Measures how well a company can repay its debts by selling or liquidating its assets.
Cash Flow: The amount of cash generated minus the amount of cash used by a company in a given period.
Coupon: The annual interest rate paid on a bond, expressed as a percentage of the face value and paid from issue date until maturity.
Duration: The weighted maturity of a fixed-income investment’s cash flows, used in the estimation of the price sensitivity of fixed-income securities for a given change in interest rates.
Floating Rate: A debt instrument that does not have a fixed rate of interest over the life of the instrument.
Idiosyncratic Risk: The risk that is endemic to a particular asset and not a whole investment portfolio.
Yield: Annual income from the investment (dividend, interest, etc.) divided by the current market price of the investment.
Yield Curve: A graphical comparison of the relationship between interest rates for loans of various maturities with similar credit quality. A typical yield curve slopes upward to reflect higher interest rates for longer maturities.
Yield Spread: The net difference between two interest-bearing instruments of varying maturities, credit ratings, issuer or risk level.
Past Performance is not a guarantee of future results.
Diversification does not assure a profit or protect against a loss in a declining market.
Because the values of the fund’s investments will fluctuate with market conditions, so will the value of your investment in the fund. You could lose money on your investment in the fund, or the fund could underperform other investments. The values of the fund’s investments fluctuate in response to the activities of individual companies and general bond market and economic conditions. Investments in small and medium capitalization companies tend to have limited liquidity and greater price volatility than large capitalization companies.
As with most fixed income funds, the income on and value of your shares in the fund will fluctuate along with interest rates. When interest rates rise, the market prices of the debt securities the fund owns usually decline. When interest rates fall, the prices of these
6
Brandes Separately Managed Account Reserve Trust
securities usually increase. Generally, the longer the fund’s average portfolio maturity and the lower the average quality of its portfolio, the greater the price fluctuation. The price of any security owned by the fund may also fall in response to events affecting the issuer of the security, such as its ability to continue to make principal and interest payments or its credit rating. Below investment grade debt securities are speculative and involve a greater risk of default and price change due to changes in the issuer’s creditworthiness than higher grade debt. The market prices of these debt securities may fluctuate more than the market prices of investment grade debt securities and may decline significantly in periods of general economic difficulty.
Bond credit ratings are grades given to bonds that indicate their credit quality as determined by a private independent rating service. The firm evaluates a bond issuer’s financial strength, or its ability to pay a bond’s principal and interest in a timely fashion. Credit ratings are measured on a scale that generally ranges from AAA (highest) to D (lowest). All Fund securities except for those labeled “Not Rated” and “Other” have been rated by Moody’s, S&P or Fitch, which are each a Nationally Recognized Statistical Rating Organization. All Index securities except for those labeled “Not Rated” have been rated by Moody’s or S&P. Credit ratings are subject to change.
Index securities except for those labeled “Not Rated” have been rated by Moody’s or S&P. Credit ratings are subject to change.
Please refer to the Schedule of Investments in the report for complete holdings information. Fund holdings, geographic allocations and/or sector allocations are subject to change at any time and are not considered a recommendation to buy or sell any security.
The foregoing reflects the thoughts and opinions of Brandes Investment Partners® exclusively and is subject to change without notice.
Brandes Investment Partners® is a registered trademark of Brandes Investment Partners, L.P. in the United States and Canada.
Must be preceded or accompanied by a prospectus.
Index Guide
The Bloomberg Barclays U.S. Aggregate Bond Index is a broad-based benchmark that measures the investment grade, U.S. dollar-denominated, fixed-rate taxable bond market. This index is a total return index which reflects the price changes and interest of each bond in the index.
The S&P 500 Index with gross dividends measures equity performance of 500 of the top companies in leading industries of the U.S. economy.
One cannot invest directly in an index.
The Brandes Separately Managed Account Reserve Trust Fund is distributed by ALPS Distributors, Inc.
7
Brandes Separately Managed Account Reserve Trust
The following chart compares the value of a hypothetical $100,000 investment in the Separately Managed Account Reserve Trust from September 30, 2012 to September 30, 2022 with the value of such an investment in the Bloomberg U.S. Aggregate Bond Index and Bloomberg U.S. Intermediate Credit Bond Index for the same period.
Value of $100,000 Investment vs Bloomberg U.S. Aggregate Bond
Index & Bloomberg U.S. Intermediate Credit Bond Index (Unaudited)
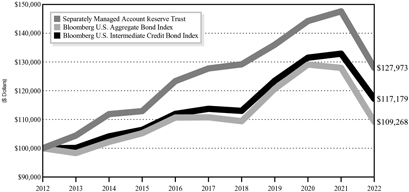
| Average Annual Total Return Periods Ended September 30, 2022 | ||||||||||||||||
| One Year | Five Years | Ten Years | Since Inception(1) | |||||||||||||
Brandes Separately Managed Account | ||||||||||||||||
Reserve Trust | (13.30 | )% | 0.04 | % | 2.50 | % | 4.03 | % | ||||||||
Bloomberg Barclays U.S. Aggregate Bond Index | (14.60 | )% | (0.27 | )% | 0.89 | % | 2.95 | % | ||||||||
Bloomberg Barclays U.S. Intermediate Credit Bond Index | (11.82 | )% | 0.60 | % | 1.60 | % | 3.46 | % | ||||||||
(1) The inception date is October 3, 2005.
Performance data quoted represents past performance; past performance does not guarantee future results. The investment return and principal value of an investment will fluctuate so that an investor’s shares, when redeemed, may be worth more or less than their original cost. Current performance of the Fund may be lower or higher than the performance quoted. Performance data current to the most recent month end may be obtained by calling 800-331-2979.
8
Brandes Separately Managed Account Reserve Trust
The returns shown do not reflect the deduction of taxes that a shareholder
would pay on fund distributions or the redemption of fund shares.
Asset Allocation as a Percentage of Total Investments as of
September 30, 2022 (Unaudited)
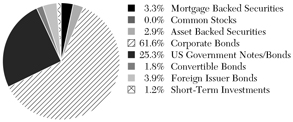
9
Brandes Separately Managed Account Reserve Trust
As a shareholder of the Fund, you incur ongoing costs, including investment advisory and administrative fees and other Fund expenses. The example below is intended to help you understand your ongoing costs (in dollars) of investing in the Fund and to compare these costs with the ongoing costs of investing in other mutual funds. Note that for this Fund, which is used in wrap-fee programs, fees and expenses are paid at the wrap account level rather than the Fund level.
The example is based on an investment of $1,000 invested at the beginning of the period and held for the entire period from April 1, 2022 to September 30, 2022 (the “Period”).
Actual Expenses
This section provides information about actual account values and actual expenses. The “Ending Account Value” shown is derived from the Fund’s actual returns. You may use the information in this section, together with the amount you invested, to estimate the expenses that you paid over the period. Simply divide your account value by $1,000 (for example, an $8,600 account value divided by $1,000 = 8.6), then multiply the result by the number given for the Fund under the heading “Expenses Paid During Period” to estimate the expenses you paid on your account during this period.
Fund | Beginning Account Value | Ending Account Value | Annualized Expense Ratio | Expenses Paid During the Period* | ||||||||||||
Seperately Managed Account Reserve Trust** | $ | 1,000.00 | $ | 912.90 | 0.00% | $ | 0.00 | |||||||||
| * | The Fund’s expenses are equal to the Fund’s expense ratio for the period, multiplied by the average account value over the period, multiplied by 183/365 (to reflect the one half-year period). |
| ** | No expenses have been charged to the Brandes Separately Managed Account Reserve Trust (“SMART Fund”) over the period, as the SMART Fund participates in a wrap-fee program sponsored by investment advisors unaffiliated with the SMART Fund. See Note 3 to the Financial Statements. Fees and expenses are charged at the wrap account level. |
Hypothetical Example for Comparison Purposes
This section provides information about hypothetical account values and hypothetical expenses based on the Fund’s actual expense ratio and an assumed rate of return of 5% per year before expenses, which is not the Fund’s actual return. The hypothetical account values and expenses may not be used to estimate the actual ending account balance or expenses you paid for the period. You may use this information to compare the ongoing costs of investing in the Fund and other mutual funds. To do so, compare this 5% hypothetical example with the 5% hypothetical examples that appear in the shareholder reports of the other mutual funds.
10
Brandes Separately Managed Account Reserve Trust
Please note that the expenses shown in the table are meant to highlight your ongoing costs only and do not reflect any transaction costs, such as brokerage commissions on purchase and sales of Fund shares. Therefore, the last column of the table is useful in comparing ongoing costs only, and will not help you determine the relative total costs of owning different funds. In addition, if these transactional costs were included, your costs would have been higher.
Fund | Beginning Account Value | Ending Account Value | Annualized Expense Ratio | Expenses Paid During the Period* | ||||||||||||
Seperately Managed Account Reserve Trust** | $ | 1,000.00 | $ | 1,025.07 | 0.00% | $ | 0.00 | |||||||||
| * | The Fund’s expenses are equal to the Fund’s expense ratio for the period, multiplied by the average account value over the period, multiplied by 183/365 (to reflect the one half-year period). |
| ** | No expenses have been charged to the Brandes Separately Managed Account Reserve Trust (“SMART Fund”) over the period, as the SMART Fund participates in a wrap-fee program sponsored by investment advisors unaffiliated with the SMART Fund. See Note 3 to the Financial Statements. Fees and expenses are charged at the wrap account level. |
11
Brandes Separately Managed Account Reserve Trust
SCHEDULE OF INVESTMENTS — September 30, 2022
| Shares | Value | |||||||
| COMMON STOCKS – 0.00% | ||||||||
| Home Construction – 0.00% | ||||||||
Urbi Desarrollos Urbanos SAB de CV (a) | 8,806 | $ | 2,820 | |||||
|
| |||||||
TOTAL COMMON STOCKS | $ | 2,820 | ||||||
|
| |||||||
| Principal Amount | Value | |||||||
| FEDERAL AND FEDERALLY SPONSORED CREDITS – 3.23% | ||||||||
| Federal Home Loan Mortgage Corporation – 1.15% | ||||||||
Pool G1-8578 3.000%, 12/1/2030 | $ | 716,422 | $ | 675,594 | ||||
Pool SD-8001 3.500%, 7/1/2049 | 757,568 | 689,148 | ||||||
Pool SD-8003 4.000%, 7/1/2049 | 391,430 | 368,638 | ||||||
|
| |||||||
| 1,733,380 | ||||||||
|
| |||||||
| Federal National Mortgage Association – 2.08% | ||||||||
Pool AL9865 3.000%, 2/1/2047 | 614,654 | 546,402 | ||||||
Pool AS6201 3.500%, 11/1/2045 | 335,532 | 308,427 | ||||||
Pool BN6683 3.500%, 6/1/2049 | 635,682 | 577,971 | ||||||
Pool CA1624 3.000%, 4/1/2033 | 1,023,316 | 953,581 | ||||||
Pool MA3687 4.000%, 6/1/2049 | 770,466 | 726,699 | ||||||
|
| |||||||
| 3,113,080 | ||||||||
|
| |||||||
TOTAL FEDERAL AND FEDERALLY SPONSORED CREDITS | $ | 4,846,460 | ||||||
|
| |||||||
| OTHER MORTGAGE RELATED SECURITIES – 0.00% | ||||||||
| Collateralized Mortgage Obligations – 0.00% | ||||||||
Wells Fargo Mortgage Backed Securities Trust Series 2006-AR14 4.433%, 10/25/2036(b) | $ | 1,171 | $ | 1,055 | ||||
|
| |||||||
TOTAL OTHER MORTGAGE RELATED SECURITIES | $ | 1,055 | ||||||
|
| |||||||
| US GOVERNMENTS – 25.09% | ||||||||
| Sovereign Government – 25.09% | ||||||||
United States Treasury Bond | ||||||||
4.750%, 2/15/2037 | $ | 13,035,000 | $ | 14,447,974 | ||||
3.500%, 2/15/2039 | 19,250,000 | 18,327,353 | ||||||
3.000%, 5/15/2047 | 5,750,000 | 4,813,154 | ||||||
|
| |||||||
TOTAL US GOVERNMENTS | $ | 37,588,481 | ||||||
|
| |||||||
| CONVERTIBLE BONDS – 1.80% | ||||||||
| Software – 1.80% | ||||||||
MicroStrategy, Inc. | $ | 6,045,000 | $ | 2,696,070 | ||||
|
| |||||||
TOTAL CONVERTIBLE BONDS | $ | 2,696,070 | ||||||
|
| |||||||
The accompanying notes to financial statements are an integral part of this Schedule of Investments.
12
Brandes Separately Managed Account Reserve Trust
SCHEDULE OF INVESTMENTS — September 30, 2022 (continued)
| Principal Amount | Value | |||||||
| CORPORATE BONDS – 61.17% | ||||||||
| Asset Management – 2.64% | ||||||||
Charles Schwab Corp. | $ | 4,070,000 | $ | 3,958,075 | ||||
|
| |||||||
| Automotive – 2.53% | ||||||||
Ford Motor Credit Co. LLC | ||||||||
3.375%, 11/13/2025 | 1,625,000 | 1,435,698 | ||||||
2.700%, 8/10/2026 | 2,845,000 | 2,359,615 | ||||||
|
| |||||||
| 3,795,313 | ||||||||
|
| |||||||
| Banking – 13.18% | ||||||||
Bank of America Corp. | 3,795,000 | 3,656,889 | ||||||
Citigroup, Inc. | 3,640,000 | 3,537,815 | ||||||
JPMorgan Chase & Co. | 6,083,000 | 6,082,912 | ||||||
USB Capital IX | 8,525,000 | 6,470,902 | ||||||
|
| |||||||
| 19,748,518 | ||||||||
|
| |||||||
| Cable & Satellite – 0.86% | ||||||||
Charter Communications Operating LLC | 1,325,000 | 1,292,086 | ||||||
|
| |||||||
| Commercial Support Services – 5.13% | ||||||||
Prime Security Services Borrower LLC | ||||||||
5.750%, 4/15/2026(d) | 4,870,000 | 4,582,378 | ||||||
6.250%, 1/15/2028(d) | 3,635,000 | 3,102,005 | ||||||
|
| |||||||
| 7,684,383 | ||||||||
|
| |||||||
| Containers & Packaging – 2.05% | ||||||||
Mauser Packaging Solutions Holding Co. | 1,540,000 | 1,354,692 | ||||||
Sealed Air Corp. | 1,990,000 | 1,722,046 | ||||||
|
| |||||||
| 3,076,738 | ||||||||
|
| |||||||
| Electric Utilities – 3.43% | ||||||||
American Transmission Systems, Inc. | 2,930,000 | 2,300,134 | ||||||
FirstEnergy Corp. | 2,580,000 | 2,834,904 | ||||||
|
| |||||||
| 5,135,038 | ||||||||
|
| |||||||
The accompanying notes to financial statements are an integral part of this Schedule of Investments.
13
Brandes Separately Managed Account Reserve Trust
SCHEDULE OF INVESTMENTS — September 30, 2022 (continued)
| Principal Amount | Value | |||||||
| Food – 2.02% | ||||||||
| Pilgrim’s Pride Corp. 5.875%, 9/30/2027(d) | $ | 720,000 | $ | 700,200 | ||||
4.250%, 4/15/2031(d) | 2,905,000 | 2,318,974 | ||||||
|
| |||||||
| 3,019,174 | ||||||||
|
| |||||||
| Health Care Facilities & Services – 2.97% | ||||||||
Tenet Healthcare Corp. | 4,780,000 | 4,441,911 | ||||||
|
| |||||||
| Home Construction – 3.68% | ||||||||
PulteGroup, Inc. | 3,920,000 | 3,866,913 | ||||||
Toll Brothers Finance Corp. | 1,710,000 | 1,647,004 | ||||||
|
| |||||||
| 5,513,917 | ||||||||
|
| |||||||
| Household Products – 2.15% | ||||||||
Coty, Inc. | 3,534,000 | 3,217,534 | ||||||
|
| |||||||
| Institutional Financial Services – 1.50% | ||||||||
Goldman Sachs Group, Inc. | 2,900,000 | 2,247,031 | ||||||
|
| |||||||
| Internet Media & Services – 3.85% | ||||||||
Expedia Group, Inc. | 810,000 | 719,350 | ||||||
Netflix, Inc. | 5,340,000 | 5,041,147 | ||||||
|
| |||||||
| 5,760,497 | ||||||||
|
| |||||||
| Leisure Facilities & Services – 2.92% | ||||||||
Travel + Leisure Co. | 4,675,000 | 4,379,266 | ||||||
|
| |||||||
| Oil & Gas Producers – 4.81% | ||||||||
Continental Resources, Inc. | 1,105,000 | 991,710 | ||||||
Hess Midstream Operations LP | 1,940,000 | 1,566,550 | ||||||
Range Resources Corp. | 4,925,000 | 4,642,207 | ||||||
|
| |||||||
| 7,200,467 | ||||||||
|
| |||||||
| REIT – 1.75% | ||||||||
Iron Mountain, Inc. | 2,925,000 | 2,619,732 | ||||||
|
| |||||||
The accompanying notes to financial statements are an integral part of this Schedule of Investments.
14
Brandes Separately Managed Account Reserve Trust
SCHEDULE OF INVESTMENTS — September 30, 2022 (continued)
| Principal Amount | Value | |||||||
| Software – 3.50% | ||||||||
| VMware, Inc. 4.500%, 5/15/2025 | $ | 1,430,000 | $ | 1,396,597 | ||||
3.900%, 8/21/2027 | 4,176,000 | 3,847,091 | ||||||
|
| |||||||
| 5,243,688 | ||||||||
|
| |||||||
| Telecommunications – 2.20% | ||||||||
Sprint Spectrum Co. LLC | 1,988,000 | 1,945,424 | ||||||
T-Mobile USA, Inc. | 1,435,000 | 1,354,654 | ||||||
|
| |||||||
| 3,300,078 | ||||||||
|
| |||||||
TOTAL CORPORATE BONDS | $ | 91,633,446 | ||||||
|
| |||||||
| FOREIGN ISSUER BONDS – 3.86% | ||||||||
| Chemicals – 1.36% | ||||||||
| Methanex Corp. 5.125%, 10/15/2027 | $ | 1,249,000 | $ | 1,049,160 | ||||
5.250%, 12/15/2029 | 1,245,000 | 989,657 | ||||||
|
| |||||||
| 2,038,817 | ||||||||
|
| |||||||
| Telecommunications – 2.50% | ||||||||
SoftBank Group Corp. | 980,000 | 918,750 | ||||||
Telecom Italia Capital SA | 3,626,000 | 2,818,961 | ||||||
|
| |||||||
| 3,737,711 | ||||||||
|
| |||||||
TOTAL FOREIGN ISSUER BONDS | $ | 5,776,528 | ||||||
|
| |||||||
| ASSET BACKED SECURITIES – 2.94% | ||||||||
| Specialty Finance – 2.94% | ||||||||
SLM Private Credit Student Loan Trust Series 2004-B, 3.723%, (3M | $ | 1,500,000 | $ | 1,439,776 | ||||
SLM Private Credit Student Loan Trust Series 2005-A, 3.603%, (3M | 1,225,588 | 1,183,922 | ||||||
SLM Private Credit Student Loan Trust Series 2006-A, 3.583%, (3M | 1,888,148 | 1,773,682 | ||||||
|
| |||||||
TOTAL ASSET BACKED SECURITIES | $ | 4,397,380 | ||||||
|
| |||||||
The accompanying notes to financial statements are an integral part of this Schedule of Investments.
15
Brandes Separately Managed Account Reserve Trust
SCHEDULE OF INVESTMENTS — September 30, 2022 (continued)
| Shares | Value | |||||||
| SHORT-TERM INVESTMENTS – 1.16% | ||||||||
| Money Market Funds – 1.16% | ||||||||
Northern Institutional Funds - Treasury Portfolio (Premier), 2.38%(e) | 1,732,406 | $ | 1,732,406 | |||||
|
| |||||||
TOTAL SHORT-TERM INVESTMENTS | $ | 1,732,406 | ||||||
|
| |||||||
Total Investments (Cost $169,862,726) – 99.25%. | $ | 148,674,646 | ||||||
Other Assets in Excess of Liabilities – 0.75% | 1,121,582 | |||||||
|
| |||||||
Total Net Assets – 100.00% | $ | 149,796,228 | ||||||
|
| |||||||
Percentages are stated as a percent of net assets.
LIBOR London Interbank Offered Rate
LP Limited Partnership
REIT Real Estate Investment Trust
| (a) | Non-income producing security. |
| (b) | Variable rate security. The coupon is based on an underlying pool of loans. |
| (c) | Variable rate security. The coupon is based on a reference index and spread index. |
| (d) | Acquired in a transaction exempt from registration under Rule 144A or Section 4(a)(2) of the Securities Act of 1933. May be resold in the U.S. in transactions exempt from registration, normally to qualified institutional buyers. The total value of all such securities was $34,250,846 which represented 22.86% of the net assets of the Fund. |
| (e) | The rate shown is the annualized seven day yield as of September 30, 2022. |
The industry classifications represented in the Schedule of Investments are in accordance with Bloomberg Industry Classification Standards (BICS) or were otherwise determined by the Advisor to be appropriate. This information is unaudited.
The accompanying notes to financial statements are an integral part of this Schedule of Investments.
16
Brandes Separately Managed Account Reserve Trust
STATEMENT OF ASSETS AND LIABILITIES — September 30, 2022
ASSETS | ||||
Investment in securities, at cost. | $ | 169,862,726 | ||
|
| |||
Investment in securities, at value | $ | 148,674,646 | ||
Receivables: | ||||
Fund shares sold. | 124,335 | |||
Interest | 1,487,696 | |||
|
| |||
Total Assets | 150,286,677 | |||
|
| |||
LIABILITIES | ||||
Payables: | ||||
Fund shares redeemed | 490,449 | |||
|
| |||
Total Liabilities | 490,449 | |||
|
| |||
NET ASSETS | $ | 149,796,228 | ||
|
| |||
COMPONENTS OF NET ASSETS | ||||
Paid-in Capital | $ | 180,064,862 | ||
Total distributable earnings (loss) | (30,268,634 | ) | ||
|
| |||
Total Net Assets | $ | 149,796,228 | ||
|
| |||
Net asset value, offering price and redemption proceeds per share | ||||
Net Assets | $ | 149,796,228 | ||
Shares outstanding (unlimited shares authorized without par value) | 20,305,364 | |||
Offering and redemption price | $ | 7.38 | ||
|
|
The accompanying notes to financial statements are an integral part of this statement.
17
Brandes Separately Managed Account Reserve Trust
STATEMENT OF OPERATIONS — For the Year Ended September 30, 2022
INVESTMENT INCOME | ||||
Income | ||||
Dividend income | $ | 11,585 | ||
Interest income | 6,144,312 | |||
|
| |||
Total Income | 6,155,897 | |||
|
| |||
Expenses (Note 3) | ||||
Total expenses | — | |||
|
| |||
Total net expenses | — | |||
|
| |||
Net investment income | 6,155,897 | |||
|
| |||
REALIZED AND UNREALIZED GAIN (LOSS) ON INVESTMENTS: | ||||
Net realized gain (loss) on investments | (112,643 | ) | ||
Net change in unrealized appreciation (depreciation) on investments | (29,818,705 | ) | ||
|
| |||
Net realized and unrealized loss on investments | (29,931,348 | ) | ||
|
| |||
Net decrease in net assets resulting from operations | $ | (23,775,451 | ) | |
|
|
The accompanying notes to financial statements are an integral part of this statement.
18
Brandes Separately Managed Account Reserve Trust
STATEMENT OF CHANGES IN NET ASSETS
| Year Ended September 30, 2022 | Year Ended September 30, 2021 | |||||||
INCREASE IN NET ASSETS FROM: | ||||||||
OPERATIONS | ||||||||
Net investment income | $ | 6,155,897 | $ | 5,611,074 | ||||
Net realized gain (loss) on investments | (112,643 | ) | 3,030,095 | |||||
Net change in unrealized appreciation (depreciation) on investments | (29,818,705 | ) | (4,302,975 | ) | ||||
|
|
|
| |||||
Net increase (decrease) in net assets resulting from operations | (23,775,451 | ) | 4,338,194 | |||||
|
|
|
| |||||
DISTRIBUTIONS TO SHAREHOLDERS | ||||||||
Distributions to Shareholders | (6,148,231 | ) | (6,546,146 | ) | ||||
|
|
|
| |||||
Decrease in net assets from distributions | (6,148,231 | ) | (6,546,146 | ) | ||||
|
|
|
| |||||
CAPITAL SHARE TRANSACTIONS | ||||||||
Proceeds from shares sold | 22,721,171 | 34,103,567 | ||||||
Net asset value of shares issued on reinvestment of distributions . | 5,632,534 | 6,013,966 | ||||||
Cost of shares redeemed | (35,093,784 | ) | (32,674,142 | ) | ||||
|
|
|
| |||||
Net increase (decrease) in net assets from capital share transactions | (6,740,079 | ) | 7,443,391 | |||||
|
|
|
| |||||
Total increase (decrease) in net assets | (36,663,761 | ) | 5,235,439 | |||||
|
|
|
| |||||
NET ASSETS | ||||||||
Beginning of the Period | 186,459,989 | 181,224,550 | ||||||
|
|
|
| |||||
End of the Period | $ | 149,796,228 | $ | 186,459,989 | ||||
|
|
|
| |||||
The accompanying notes to financial statements are an integral part of this statement.
19
Brandes Separately Managed Account Reserve Trust
| Year Ended September 30, | ||||||||||||||||||||
| 2022 | 2021 | 2020 | 2019 | 2018 | ||||||||||||||||
Net asset value, beginning of period | $ | 8.83 | $ | 8.94 | $ | 8.73 | $ | 8.65 | $ | 8.94 | ||||||||||
|
|
|
|
|
|
|
|
|
| |||||||||||
Total from investment operations: | ||||||||||||||||||||
Net investment income(1) | 0.30 | 0.27 | 0.31 | 0.36 | 0.39 | |||||||||||||||
Net realized and unrealized gain/(loss) on investments | (1.45 | ) | (0.07 | ) | 0.21 | 0.08 | (0.29 | ) | ||||||||||||
|
|
|
|
|
|
|
|
|
| |||||||||||
Total from investment operations | (1.15 | ) | 0.20 | 0.52 | 0.44 | 0.10 | ||||||||||||||
|
|
|
|
|
|
|
|
|
| |||||||||||
Less dividends and distributions: | ||||||||||||||||||||
Dividends from net investment income | (0.30 | ) | (0.31 | ) | (0.31 | ) | (0.36 | ) | (0.39 | ) | ||||||||||
|
|
|
|
|
|
|
|
|
| |||||||||||
Total dividends and distributions | (0.30 | ) | (0.31 | ) | (0.31 | ) | (0.36 | ) | (0.39 | ) | ||||||||||
|
|
|
|
|
|
|
|
|
| |||||||||||
Net asset value, end of period | $ | 7.38 | $ | 8.83 | $ | 8.94 | $ | 8.73 | $ | 8.65 | ||||||||||
|
|
|
|
|
|
|
|
|
| |||||||||||
Total return | (13.30 | %) | 2.33 | % | 6.05 | % | 5.29 | % | 1.12 | % | ||||||||||
Net assets, end of period (millions) | $ | 149.8 | $ | 186.5 | $ | 181.2 | $ | 177.0 | $ | 176.6 | ||||||||||
Ratio of expenses to average net assets(2) | 0.00 | % | 0.00 | % | 0.00 | % | 0.00 | % | 0.00 | % | ||||||||||
Ratio of net investment income to average net assets(2) | 3.63 | % | 3.04 | % | 3.52 | % | 4.27 | % | 4.43 | % | ||||||||||
Portfolio turnover rate | 28.94 | % | 36.89 | % | 32.24 | % | 35.99 | % | 42.90 | % | ||||||||||
| (1) | Net investment income per share has been calculated based on average shares outstanding during the period. |
| (2) | Reflects the fact that no fees or expenses are incurred by the Fund. The Fund is an integral part of “wrap-fee” programs sponsored by investment advisors and/or broker-dealers unaffiliated with the Fund or the Advisor. Participants in these programs pay a “wrap” fee to the sponsor of the program. |
The accompanying notes to financial statements are an integral part of this statement.
20
Brandes Separately Managed Account Reserve Trust
NOTE 1 – ORGANIZATION
The Brandes Separately Managed Account Reserve Trust (the “Fund”) is a series of Brandes Investment Trust (the “Trust”). The Trust is registered under the Investment Company Act of 1940, as amended (the “1940 Act”), as a diversified, open-end management investment company. The Fund began operations on October 3, 2005. The Fund invests its assets primarily in debt securities and seeks to maximize total return.
NOTE 2 – SIGNIFICANT ACCOUNTING POLICIES
The Fund is an investment company that applies the accounting and reporting guidance issued in Topic 946, “Financial Services-Investment Companies”, by the Financial Accounting Standards Board (“FASB”). The following is a summary of significant accounting policies consistently followed by the Fund. These policies are in conformity with generally accepted accounting principles (“GAAP”) in the United States of America.
| A. | Repurchase Agreements. The Fund may enter into repurchase agreements with government securities dealers recognized by the Federal Reserve Board, with member banks of the Federal Reserve System or with other brokers or dealers that meet the credit guidelines established by the Board of Trustees. Each Fund will always receive and maintain, as collateral, U.S. Government securities whose market value, including accrued interest (which is recorded in the Schedules of Investments), will be at least equal to 100% of the dollar amount invested by the Fund in each agreement, and the Fund will make payment for such securities only upon physical delivery or upon evidence of book entry transfer to the account of the Fund’s custodian. If the term of any repurchase transaction exceeds one business day, the value of the collateral is marked-to-market on a daily basis to ensure the adequacy of the collateral. Before causing the Fund to enter into a repurchase agreement with any other party, the investment advisor will determine that such party does not have any apparent risk of becoming involved in bankruptcy proceedings within the time frame contemplated by the repurchase agreement. If the seller defaults and the value of the collateral declines, or if bankruptcy proceedings are commenced with respect to the seller of the security, realization of the collateral by the Fund may be delayed or limited. At September 30, 2022, the Fund did not invest in repurchase agreements. |
| B. | Foreign Currency Translation and Transactions. Values of investments denominated in foreign currencies are converted into U.S. dollars using the spot market rates of exchange at the time of valuation. Purchases and sales of investments and dividend and interest income are translated into U.S. dollars using the spot market rates of exchange prevailing on the respective dates of such translations. The gain or loss resulting from changes in foreign exchange |
21
Brandes Separately Managed Account Reserve Trust
NOTES TO FINANCIAL STATEMENTS — (continued)
rates is included with net realized and unrealized gain or loss from investments, as appropriate. Foreign securities and currency transactions may involve certain considerations and risks not typically associated with those of domestic origin. |
Foreign securities are recorded in the financial statements after translation to U.S. dollars based on the applicable exchange rate at the end of the period. The Fund reports certain foreign currency-related transactions as components of realized gains or losses for financial reporting purposes, whereas such components are treated as ordinary income for federal income tax purposes.
| C. | Delayed Delivery Securities. The Fund may purchase securities on a when issued or delayed delivery basis. “When-issued” or delayed delivery refers to securities whose terms are available and for which a market exists, but that have not been issued. For a when-issued or delayed delivery transaction, no payment is made until delivery date, which is typically longer than the normal course of settlement. When the Fund enters into an agreement to purchase securities on a when-issued or delayed delivery basis, the Fund segregates cash or liquid securities, of any type or maturity, equal in value to the Fund’s commitment. Losses may arise if the market value of the underlying securities change, if the counterparty does not perform under the contract, or if the issuer does not issue the securities due to political, economic, or other factors. The Fund did not have any open commitments on delayed delivery securities as of September 30, 2022. |
| D. | Security Transactions, Dividends and Distributions. Security transactions are accounted for on the trade dates. Realized gains and losses are evaluated on the basis of identified cost. Distributions from net investment income are declared daily and paid monthly. Distributions of net realized gains, if any, are declared at least annually. Dividend income and distributions to shareholders are recorded on the ex-dividend dates. Interest is recorded on an accrual basis. The Fund amortizes premiums and accretes discounts using the constant yield method. |
| E. | Use of Estimates. The preparation of financial statements in conformity with GAAP requires management to make estimates and assumptions that affect the reported amounts of assets and liabilities at the date of the financial statements and reported amounts of income and expenses during the reporting period. Actual results could differ from those estimates and assumptions. |
| F. | Indemnification Obligations. Under the Trust’s organizational documents, its current and former officers and trustees are indemnified against certain liabilities arising out of the performance of their duties to the Trust. The Trust |
22
Brandes Separately Managed Account Reserve Trust
NOTES TO FINANCIAL STATEMENTS — (continued)
has indemnified its trustees against any expenses actually and reasonably incurred by the trustees in any proceeding arising out of or in connection with the trustees’ service to the Trust. In addition, in the normal course of business, the Trust enters into contracts that contain a variety of representations and warranties and provide general indemnifications. The Fund’s maximum exposure under these arrangements is unknown as this would involve future claims that may be made against the Fund that have not yet occurred or that would be covered by other parties. |
| G. | Accounting for Uncertainty in Income Taxes. The Fund has elected to be taxed as a “regulated investment company” and intends to distribute substantially all its taxable income to its shareholders and otherwise comply with the provisions of the Internal Revenue Code applicable to regulated investment companies. The Fund may be subject to a nondeductible excise tax calculated as a percentage of certain undistributed amounts of net investment income and net capital gains. The Fund intends to distribute its net investment income and capital gains as necessary to avoid this excise tax. Therefore, no provision for federal income taxes or excise taxes has been made. |
The Trust analyzes all open tax years, as defined by the applicable statute of limitations, for all major jurisdictions. Open tax years for the Fund are those that are open for exam by taxing authorities (2019 through 2022). As of September 30, 2022 the Trust has no examinations in progress.
Management has analyzed the Trust’s tax positions, and has concluded that no liability should be recorded related to uncertain tax positions expected to be taken on the tax return for the fiscal year ended September 30, 2022.
The Trust identifies its major tax jurisdictions as the U.S. Government and the State of California. The Fund is not aware of any tax positions for which it is reasonably possible that the total amounts of unrecognized tax benefits will significantly change in the next twelve months.
| H. | Fair Value Measurements. The Trust has adopted GAAP accounting principles related to fair value accounting standards which establish a definition of fair value and set out a hierarchy for measuring fair value. These standards require additional disclosures about the various inputs and valuation techniques used to develop the measurements of fair value and a discussion of changes in valuation techniques and related inputs during the period. These inputs are summarized in the three broad levels listed below: |
Level 1—Fair value measurement within Level 1 should be based on an unadjusted quoted price in an active market that the Fund has the ability to access for the asset or liability at the measurement date. Because a quoted price alone forms the basis for the measurement, the access requirement
23
Brandes Separately Managed Account Reserve Trust
NOTES TO FINANCIAL STATEMENTS — (continued)
within Level 1 limits discretion in pricing the asset or liability, including in situations in which there are multiple markets for the asset or liability with different prices and no single market represents a principal market for the asset or liability. Importantly, the FASB has indicated that when a quoted price in an active market for a security is available, that price should be used to measure fair value without regard to an entity’s intent to transact at that price.
Level 2—Fair value measurement within Level 2 should be based on all inputs other than unadjusted quoted prices included within Level 1 that are observable for the asset or liability. Other significant observable market inputs include quoted prices for similar instruments in active markets, quoted adjusted prices in active markets, quoted prices for identical or similar instruments in markets that are not active, and model derived valuations in which the majority of significant inputs and significant value drivers are observable in active markets.
Level 3—Fair value measurement within Level 3 should be based on unobservable inputs in such cases where markets do not exist or are illiquid. Significant unobservable inputs include model derived valuations in which the majority of significant inputs or significant value drivers are unobservable. Unobservable inputs are those inputs that reflect the Fund’s own assumptions that market participants would use to price the asset or liability based on the best available information.
| I. | Security Valuation. Fixed income securities including corporate, convertible and municipal bonds and notes, U.S. government agencies, U.S. Treasury obligations, sovereign issues, bank loans, convertible preferred securities and non-U.S. bonds are normally valued on the basis of quotes obtained from brokers and dealers or independent pricing services or sources. Independent pricing services typically use information provided by market makers or estimates of market values obtained from yield data relating to investments or securities with similar characteristics. The service providers’ internal models use inputs that are observable such as, among other things, issuer details, interest rates, yield curves, prepayment speeds, credit risks/ spreads, default rates and quoted prices for similar assets. Securities that use similar valuation techniques and inputs as described above are categorized as Level 2 of the fair value hierarchy. |
Fixed income securities purchased on a delayed-delivery basis are typically marked to market daily until settlement at the forward settlement date.
Repurchase agreements and demand notes, for which neither vendor pricing nor market maker prices are available, are valued at amortized cost on the day of valuation, unless Brandes Investment Partners, L.P. (the “Advisor”)
24
Brandes Separately Managed Account Reserve Trust
NOTES TO FINANCIAL STATEMENTS — (continued)
determines that the use of amortized cost valuation on such day is not appropriate (in which case such instrument is fair valued in accordance with the fair value procedures of the Trust).
Mortgage and asset-backed securities are usually issued as separate tranches, or classes, of securities within each package of underlying securities. These securities are also normally valued by pricing service providers that use broker-dealer quotations or valuation estimates from their internal pricing models. The pricing models for these securities usually consider tranche level attributes, estimated cash flows and market based yield spreads for each tranche, current market data and packaged collateral performance, as available. Mortgage and asset-backed securities that use such valuation techniques and inputs are categorized as Level 2 of the fair value hierarchy only if there are significant observable inputs used.
Common stocks, exchange-traded fund shares and financial derivative instruments, such as futures contracts or options contracts that are traded on a national securities or commodities exchange, are valued at the last reported sales price, in the case of common stocks and exchange-traded fund shares, or, in the case of futures contracts or options contracts, the settlement price determined by the relevant exchange. Securities listed on the NASDAQ National Market System for which market quotations are readily available are valued using the NASDAQ Official Closing Price. To the extent these securities are actively traded and valuation adjustments are not applied, they are categorized as Level 1 of the fair value hierarchy.
Valuation adjustments may be applied to certain securities that are solely traded on a foreign exchange to account for the market movement between the close of the foreign market and the close of the New York Stock Exchange (“NYSE”). These securities are generally valued using pricing service providers that consider the correlation of the trading patterns of the foreign security to the intraday trading in the U.S. markets for investments. Securities using these valuation adjustments are categorized as Level 2 of the fair value hierarchy. None of the Fund’s securities were fair valued utilizing this method as of September 30, 2022.
Investments in registered open-end management investment companies are valued based upon the Net Asset Values (“NAVs”) of such investments and are categorized as Level 1 of the fair value hierarchy. If, on a particular day, a share price of an investment company is not readily available, such securities are fair valued in accordance with the fair value procedures of the Trust.
Certain securities may be fair valued in accordance with the fair valuation procedures approved by the Board of Trustees. The Fair Valuation Committee is generally responsible for overseeing the day to day valuation
25
Brandes Separately Managed Account Reserve Trust
NOTES TO FINANCIAL STATEMENTS — (continued)
processes and reports periodically to the Board. The Fair Valuation Committee is authorized to make all necessary determinations of the fair value of portfolio securities and other assets for which market quotations are not readily available or if it is deemed that the prices obtained from brokers and dealers or independent pricing services are unreliable.
In using fair value pricing, the Fund attempts to establish the price that it might reasonably have expected to receive upon a sale of the security at 4:00 p.m. Eastern time. Valuing securities at fair value involves greater reliance on judgment than valuation of securities based on readily available market quotations. When using fair value to price securities, the Fund may value those securities higher or lower than another fund using market quotations or fair value to price the same securities. Further, there can be no assurance that the Fund could obtain the fair value assigned to a security if it were to sell the security at approximately the time at which the Fund determines its net asset value.
The following is a summary of the level inputs used, as of September 30, 2022, involving the Fund’s assets carried at fair value. The inputs used for valuing securities may not be an indication of the risk associated with investing in those securities.
Description | Level 1 | Level 2 | Level 3 | Total | ||||||||||||
Seperately Managed Account | ||||||||||||||||
Common Stocks | $ | 2,820 | $ | — | $— | $ | 2,820 | |||||||||
Asset Backed Securities | — | 4,397,380 | — | 4,397,380 | ||||||||||||
Corporate Bonds | — | 91,633,446 | — | 91,633,446 | ||||||||||||
Government Securities. | — | 37,588,481 | — | 37,588,481 | ||||||||||||
Convertible Bonds | — | 2,696,070 | — | 2,696,070 | ||||||||||||
Foreign Issuer Bonds | — | 5,776,528 | — | 5,776,528 | ||||||||||||
Mortgage Backed Securities | — | 4,847,515 | — | 4,847,515 | ||||||||||||
Short-Term Investments | 1,732,406 | — | — | 1,732,406 | ||||||||||||
|
|
|
|
|
|
|
| |||||||||
Total Investments in Securities | $ | 1,735,226 | $ | 146,939,420 | $— | $ | 148,674,646 | |||||||||
|
|
|
|
|
|
|
| |||||||||
There were no Level 3 securities in the Fund at the beginning or the end of the year ended September 30, 2022.
NOTE 3 – INVESTMENT ADVISORY FEE AND OTHER TRANSACTIONS WITH AFFILIATES
| A. | Advisor Fee. The Advisor provides the Fund with investment management services under an Investment Advisory Agreement. The Advisor receives no advisory fee or other fee from the Fund. The financial statements of the Fund reflect the fact that no fees or expenses are incurred by the Fund. It should be understood, however, that the Fund is an integral part of “wrap-fee” programs sponsored by investment advisors unaffiliated with the Fund and the Advisor. |
26
Brandes Separately Managed Account Reserve Trust
NOTES TO FINANCIAL STATEMENTS — (continued)
Typically, participants in these programs pay a “wrap-fee” to their investment advisors. Although the Fund does not compensate the Advisor directly for its service under the Investment Advisory Agreement, the Advisor benefits from its relationships with the sponsors of wrap-fee programs for which the Fund is an investment option. Certain officers and Trustees of the Trust are also officers of the Advisor. |
| B. | Administration Fee. The Northern Trust Company (the “Administrator”) acts as the administrator for the Fund. The Administrator prepares various federal and state regulatory filings; prepares reports and materials to be supplied to the Trustees; monitors the activities of the Fund’s custodian, transfer agent and accountant; coordinates the preparation and payment of Fund expenses; and prepares several Fund reports. The Advisor compensates the Administrator on behalf of the Fund for the services the Administrator performs for the Fund. |
| C. | Distribution Fees. ALPS Distributors, Inc. (the “Distributor”), a registered broker-dealer, acts as the Fund’s principal underwriter in a continuous public offering of the Fund’s shares. All of the Fund’s distribution fees are paid by the Advisor. |
NOTE 4 – PURCHASES AND SALES OF SECURITIES
The cost of purchases and the proceeds from sales of securities of the Fund, excluding short-term investments, were as follows for the period ended September 30, 2022:
| U.S. Government | Other | |||||||||||||
| Purchases | Sales | Purchases | Sales | |||||||||||
| $7,391,904 | $23,726,596 | $40,731,811 | $28,102,952 | |||||||||||
NOTE 5 – CAPITAL STOCK TRANSACTIONS
The Fund’s capital stock activity in shares and dollars during the years ended September 30, 2022 and September 30, 2021, was as follows (shares and dollar amounts in thousands):
| Year Ended 9/30/2022 | Year Ended 9/30/2021 | |||||||||||||||
| Shares | Amount | Shares | Amount | |||||||||||||
Shares Sold | 2,761 | $ | 22,721 | 3,846 | $ | 34,103 | ||||||||||
Issued on Reinvestment of Distributions. | 694 | 5,633 | 679 | 6,014 | ||||||||||||
Shares Redeemed | (4,262 | ) | (35,094 | ) | (3,689 | ) | (32,674 | ) | ||||||||
|
|
|
|
|
|
|
| |||||||||
Net Increase/(Decrease) Resulting from Fund Share Transactions | (807 | ) | $ | (6,740 | ) | 836 | $ | 7,443 | ||||||||
|
|
|
|
|
|
|
| |||||||||
27
Brandes Separately Managed Account Reserve Trust
NOTES TO FINANCIAL STATEMENTS — (continued)
NOTE 6 – FEDERAL INCOME TAX MATTERS
GAAP requires that certain components of net assets be reclassified between financial and tax reporting. Temporary differences do not require reclassification. Temporary and permanent differences have no effect on net assets or net asset value per share. For the year ended September 30, 2022, the Fund made the following permanent book-to-tax reclassifications primarily related to the treatment of paydowns, and the difference between book and tax accretion methods for market premium:
| Undistributed Net Investment Income | Accumulated Net Realized Loss | Paid-In Capital | ||
| $44,678 | $(44,678) | $— |
As of September 30, 2022, the Fund’s components of distributable earnings on a tax basis were as follows:
Cost of investments for tax purposes | $ | 169,862,726 | ||
|
| |||
Gross tax unrealized appreciation | 202,599 | |||
Gross tax unrealized depreciation | (21,390,679 | ) | ||
|
| |||
Net unrealized appreciation (depreciation) | (21,188,080 | ) | ||
Distributable ordinary income | 52,344 | |||
Distributable long-term capital gains | — | |||
|
| |||
Total distributable earnings | 52,344 | |||
|
| |||
Other accumulated losses | (9,132,898 | ) | ||
|
| |||
Total accumulated losses | $ | (30,268,634 | ) | |
|
|
The differences between book and tax basis distributable earnings are primarily related to the differences in classification of paydown gains and losses for tax purposes compared to book purposes. These differences are temporary.
As of September 30, 2022, the Fund had a capital loss carryforward with an indefinite expiration in the amount of $9,132,898. During the tax year ended September 30, 2022, the Fund utilized $0 in capital loss carryforwards.
The tax compositions of dividends for the years ended September 30, 2022 and September 30, 2021 for the Fund were as follows:
| Ordinary Income | Long Term Capital Gains | |||||||||
| 2022 | 2021 | 2022 | 2021 | |||||||
| $6,148,231 | $6,546,146 | $— | $— | |||||||
NOTE 7 – RISK FACTORS
The respiratory illness COVID-19 caused by a novel coronavirus has resulted in a global pandemic and caused major disruptions to economies and markets around the world. The impact of this pandemic, and other global health crises that may arise in the future, could affect the economies of many nations, individual companies, and the
28
Brandes Separately Managed Account Reserve Trust
NOTES TO FINANCIAL STATEMENTS — (continued)
market in general, in ways that cannot necessarily be foreseen at the present time. This pandemic may result in substantial market volatility and may adversely impact the prices and liquidity of a fund’s investments. Although vaccines have been developed, the duration of this pandemic and its effects cannot be determined with certainty.
Recent events relating to the armed conflict in Ukraine and the global economic sanctions that have resulted may adversely impact global economic and market activity, and contribute to significant volatility in financial markets. The impact of the conflict has been rapidly evolving, and the ultimate economic fallout and long-term impact on economies, markets, industries, and individual companies, are not known.
NOTE 8 – SUBSEQUENT EVENTS
In preparing these financial statements, the Trust has evaluated events and transactions for potential recognition or disclosure through the date the financial statements were available to be issued. The Trust has concluded that there are no subsequent events to note.
29
Brandes Separately Managed Account Reserve Trust
REPORT OF INDEPENDENT REGISTERED PUBLIC ACCOUNTING FIRM
To the Board of Trustees of Brandes Investment Trust and Shareholders of Brandes Separately Managed Account Reserve Trust
Opinion on the Financial Statements
We have audited the accompanying statement of assets and liabilities, including the schedule of investments, of Brandes Separately Managed Account Reserve Trust (one of the funds constituting Brandes Investment Trust, hereafter referred to as the “Fund”) as of September 30, 2022, the related statement of operations for the year ended September 30, 2022, the statement of changes in net assets for each of the two years in the period ended September 30, 2022, including the related notes,and the financial highlights for each of the five years in the period ended September 30, 2022 (collectively referred to as the “financial statements”). In our opinion, the financial statements present fairly, in all material respects, the financial position of the Fund as of September 30, 2022, the results of its operations for the year then ended, the changes in its net assets for each of the two years in the period ended September 30, 2022 and the financial highlights for each of the five years in the period ended September 30, 2022 in conformity with accounting principles generally accepted in the United States of America.
Basis for Opinion
These financial statements are the responsibility of the Fund’s management. Our responsibility is to express an opinion on the Fund’s financial statements based on our audits. We are a public accounting firm registered with the Public Company Accounting Oversight Board (United States) (PCAOB) and are required to be independent with respect to the Fund in accordance with the U.S. federal securities laws and the applicable rules and regulations of the Securities and Exchange Commission and the PCAOB.
We conducted our audits of these financial statements in accordance with the standards of the PCAOB. Those standards require that we plan and perform the audit to obtain reasonable assurance about whether the financial statements are free of material misstatement, whether due to error or fraud.
Our audits included performing procedures to assess the risks of material misstatement of the financial statements, whether due to error or fraud, and performing procedures that respond to those risks. Such procedures included examining, on a test basis, evidence regarding the amounts and disclosures in the financial statements. Our audits also included evaluating the accounting principles used and significant estimates made by management, as well as evaluating the overall presentation of the financial statements. Our procedures included confirmation of securities owned as of September 30, 2022 by correspondence with the custodian. We believe that our audits provide a reasonable basis for our opinion.
/s/ PricewaterhouseCoopers LLP
|
Los Angeles, California
|
November 29, 2022 |
We have served as the auditor of one or more investment companies in the Brandes Investment Partners LP Investment Company Complex since 2011.
30
Brandes Separately Managed Account Reserve Trust
ADDITIONAL INFORMATION — (Unaudited)
BOARD REVIEW OF LIQUIDITY RISK MANAGEMENT PROGRAM
To promote effective liquidity risk management throughout the fund industry and to enhance disclosure regarding fund liquidity and redemption practices, the Securities and Exchange Commission (the “Commission”) adopted Rule 22e-4 under the 1940 Act. This Rule requires every registered open-end management investment company to establish a liquidity risk management program (the “LRMP”) that, among other things, provides for the assessment, management and review of liquidity risk, the classification of a fund’s portfolio investments into one of four liquidity buckets based upon the number of days that such investments may reasonably be expected to be converted into cash or otherwise disposed of without significantly impacting their price, the establishment of a highly liquid investment minimum where required, and the establishment of a 15% limitation on illiquid investments. Additionally, the Commission adopted Rule 30b1-10 under the 1940 Act and Form N-LIQUID, which generally require funds to notify the Commission when certain liquidity-related events occur.
The Trust’s Board of Trustees approved the appointment of the Advisor’s Liquidity Risk Review Committee as the administrator of the LRMP for the Funds on August 9, 2018, and the Funds’ LRMP on May 9, 2019. Pursuant to the LRMP, the Advisor manages liquidity risks associated with the Funds’ investments by monitoring cash and cash equivalents, the concentration of investments and the appropriateness of portfolio strategies for open-end funds, and by classifying the portfolio holdings of each of the Funds as either highly liquid, moderately liquid, less liquid or illiquid on at least a monthly basis. To assist with the classification of Fund investments, the Advisor utilizes a third-party provider of liquidity monitoring services.
At the Board’s regular meeting on August 11, 2022, the Trust’s Chief Compliance Officer provided a report to the Board on the operation and effectiveness of the LRMP for the period from July 1, 2021 through June 30, 2022 (the “Reporting Period”), noting that the Funds’ LRMP was adequate and effectively implemented during the Reporting Period. No significant liquidity events impacting the Funds were noted in the report, and there were no material changes to the LRMP during the Reporting Period.
PROXY VOTING PROCEDURES
The Advisor votes proxies relating to the Fund’s portfolio securities in accordance with procedures adopted by the Advisor. You may obtain a description of these procedures, free of charge, by calling toll-free 1-800-331-2979. This information is also available through the Commission’s website at http://www.sec.gov.
Information regarding how the Trust voted proxies relating to portfolio securities during the most recent 12-month period ended June 30 is available without charge, upon request, by calling 1-800-331-2979. This information is also available through the Commission’s website at http://www.sec.gov.
31
Brandes Separately Managed Account Reserve Trust
ADDITIONAL INFORMATION — (Unaudited) (continued)
PORTFOLIO HOLDINGS DISCLOSURE
The Trust files the Fund’s complete schedule of portfolio holdings with the Commission for the first and third quarters of each fiscal year on Form N-PORT. The Trust’s Form N-PORT filings are available on the Commission’s website at http://www.sec.gov. Information regarding the Trust’s Form N-PORT filings is also available, without charge, by calling toll-free, 1-800-331-2979.
TAX NOTICE
For the fiscal year ended September 30, 2022, the percentage of taxable ordinary income distributions that are designated as interest related dividends under the Internal Revenue Code Section 871(k)(1)(c) for each Fund were as follows:
| PERCENTAGE | ||||
Seperately Managed Account | ||||
Reserve Trust. | 93.78% | |||
32
Brandes Separately Managed Account Reserve Trust
TRUSTEES AND OFFICERS INFORMATION — (Unaudited)
The Board is responsible for the overall management of the Trust’s business. The Board approves all significant agreements between the Trust and persons or companies furnishing services to it, including the agreements with the Advisor, Administrator, the Trust’s Custodian, Distributor and Transfer Agent. The Board delegates the day-to-day operations of the Trust to its officers, subject to the Fund’s investment objective and policies and to general supervision by the Board. The Trust’s Statement of Additional Information includes additional information about the Trustees and is available, without charge, by calling 1-800-331-2979 or visiting www.brandes.com.
The Trustees and officers of the Trust, their business addresses and principal occupations during the past five years are:
Name, Address and Age | Position(s) | Term of | Principal | Number | Other | |||||
Independent Trustees(2) | ||||||||||
Gregory Bishop, CFA 4275 Executive Square, 5th Floor La Jolla, CA 92037 (1961) | Trustee | Since January 2017 | Retired. Previously Executive Vice President and Head of Retail Business, PIMCO Investments, from 1997 to 2014 | 8 | None | |||||
Robert M. Fitzgerald 4275 Executive Square, 5th Floor La Jolla, CA 92037 (1952) | Trustee | Since April 2008 | Retired from 2002- 2005 and since 2007; Chief Financial Officer of National Retirement Partners from 2005 to 2007. | 8 | Hotchkis and Wiley Funds (10 portfolios). | |||||
Craig Wainscott, CFA 4275 Executive Square, 5th Floor La Jolla, CA 92037 (1961) | Trustee and (beginning January 2018) Chairman of the Board | Since February 2012 | Retired from Russell Investments, Managing Director, US Mutual Funds; Currently Partner with The Paradigm Project and advisor to early-stage companies. | 8 | None | |||||
33
Brandes Separately Managed Account Reserve Trust
TRUSTEES AND OFFICERS INFORMATION — (Unaudited) (continued)
Name, Address and Age | Position(s) | Term of | Principal | Number | Other | |||||
“Interested” Trustees(3) | ||||||||||
Jeff Busby, CFA 4275 Executive Square, 5th Floor La Jolla, CA 92037 (1961) | Trustee and President | Since July 2006 Since February 2012 | Executive Director of the Advisor since January 2004. | 8 | None | |||||
Oliver Murray 4275 Executive Square, 5th Floor La Jolla, CA 92037 (1961) | Trustee | Since February 2012 | CEO, Brandes Investment Partners & Co. since 2002; Managing Director - PCPM of the Advisor since 2011. | 8 | None | |||||
Officers of the Trust | ||||||||||
Thomas M. Quinlan 4275 Executive Square, 5th Floor La Jolla, CA 92037 (1970) | Secretary | Since June 2003 | Associate General Counsel of the Advisor since January 2006. | N/A | N/A | |||||
Gary Iwamura, CPA 4275 Executive Square, 5th Floor La Jolla, CA 92037 (1956) | Treasurer | Since September 1997 | Consultant to the Advisor since January 2022; Finance Director of the Advisor from 1997 to 2021. | N/A | N/A | |||||
Roberta Loubier 4275 Executive Square, 5th Floor La Jolla, CA 92037 (1971) | Chief Compliance Officer and Anti-Money Laundering Officer | Since September 2015 | Global Head of Compliance of the Advisor. | N/A | N/A | |||||
| (1) | Trustees and officers of the Fund serve until their resignation, removal or retirement. |
| (2) | Not “interested persons” of the Trust as defined in the 1940 Act. |
| (3) | “Interested persons” of the Trust as defined in the 1940 Act. Jeff Busby is an interested person of the Trust because he is the President of the Trust and the Executive Director of the Advisor. Oliver Murray is an interested person of the Trust, because he is the Managing Director of the Advisor. |
34
Brandes Separately Managed Account Reserve Trust
PRIVACY NOTICE
Brandes Investment Trust and Brandes Investment Partners, L.P. may collect non-public information about you from the following sources:
| ● | Information we receive about you on applications or other forms; |
| ● | Information you give us orally; and |
| ● | Information about your transactions with us. |
We do not disclose any non-public personal information about any shareholder or former shareholder of the Fund without the shareholder’s authorization, except as required by law or in response to inquiries from governmental authorities. We restrict access to your personal and account information to those employees who need to know that information to provide products and services to you. We also may disclose that information to unaffiliated third parties (such as to brokers or custodians) only as permitted by law and only as needed for us to provide agreed services to you. We maintain physical, electronic and procedural safeguards to guard your non-public personal information.
If you hold shares of the Fund through a financial intermediary, such as a broker-dealer, bank, or trust company, the privacy policy of your financial intermediary governs how your non-public personal information would be shared with nonaffiliated third parties.
35

(b) Not applicable.
2
Item 2. Code of Ethics.
As of the end of the period covered by this report, the registrant has adopted a code of ethics that applies to the registrant’s principal executive officer and principal financial officer, or persons performing similar functions.
The registrant has not made any amendments to its code of ethics during the period covered by this report.
The registrant has not granted any waivers from any provisions of the code of ethics during the period covered by this report.
The registrant undertakes to provide to any person without charge, upon request, a copy of such code of ethics by mail when they call the registrant at 1-800-331-2979.
Item 3. Audit Committee Financial Expert.
| (a) | (1) The registrant’s board of directors has determined that the registrant has at least one audit committee financial expert serving on its audit committee. |
| (a) | (2) The audit committee financial expert is Robert Fitzgerald, who is “independent” for purposes of this Item 3 of Form N-CSR. |
Item 4. Principal Accountant Fees and Services.
The registrant has engaged its principal accountant to perform audit services, audit-related services, tax services and other services during the past two fiscal years. “Audit services” refers to performing an audit of the registrant’s annual financial statements or services that are normally provided by the accountant in connection with statutory and regulatory filings or engagements for those fiscal years. “Audit-related services” refers to the assurance and related services by the principal accountant that are reasonably related to the performance of the audit. “Tax services” refers to professional services rendered by the principal accountant for tax compliance, tax advice, and tax planning. The following table details the aggregate fees billed or expected to be billed for each of the last two fiscal years for audit services, audit-related services, tax services and other services by the principal accountant.
| FYE 09/30/2022 | FYE 09/30/2021 | |||||||
Audit Fees | $ | 298,215 | $ | 252,420 | ||||
Audit-Related Fees | None | None | ||||||
Tax Fees | $ | 79,147 | $ | 65,070 | ||||
All Other Fees | $ | 4,210 | $ | 4,188 | ||||
3
The registrant’s audit committee has adopted pre-approval policies and procedures that require the audit committee to pre-approve all audit and non-audit services of the registrant, including services provided to any entity affiliated with the registrant.
All of the principal accountant’s hours spent on auditing the registrant’s financial statements were attributed to work performed by full-time permanent employees of the principal accountant. The following table indicates the non-audit fees billed or expected to be billed by the registrant’s accountant for services to the registrant and to the registrant’s investment adviser (and any entity controlling, controlled by, or under common control with the investment adviser for the last two years).
Non-Audit Related Fees | FYE 09/30/2022 | FYE 09/30/2021 | ||
Registrant | None | None | ||
Registrant’s Investment Adviser | None | None |
The registrant has not been identified by the U.S. Securities and Exchange Commission as having filed an annual report issued by a registered public accounting firm branch or office that is located in a foreign jurisdiction where the Public Company Accounting Oversight Board is unable to inspect or completely investigate because of a position taken by an authority in that jurisdiction. The registrant is not a foreign issuer.
Item 5. Audit Committee of Listed Registrants.
Not applicable to registrants who are not listed issuers (as defined in Rule 10A-3 under the Securities Exchange Act of 1934).
Item 6. Schedule of Investments.
| (a) | Schedule of Investments are included as part of the reports to shareholders filed under Item 1 of this Form. |
| (b) | Not applicable. |
Item 7. Disclosure of Proxy Voting Policies and Procedures for Closed-End Management Investment Companies.
Not applicable to open-end investment companies.
Item 8. Portfolio Managers of Closed-End Management Investment Companies.
Not applicable to open-end investment companies.
Item 9. Purchases of Equity Securities by Closed-End Management Investment Company and Affiliated Purchasers.
Not applicable to open-end investment companies.
Item 10. Submission of Matters to a Vote of Security Holders.
There have been no material changes to the procedures by which shareholders may recommend nominees to the registrant’s Board of Trustees.
4
Item 11. Controls and Procedures.
| (a) | The registrant’s President and Treasurer have reviewed the Registrant’s disclosure controls and procedures (as defined in Rule 30a-3(c) of the Investment Company Act of 1940 (“the Act”)) as of a date within 90 days of the filing date of this report, as required by 30a-3(b) under the Act and Rules 13a-15(b) or 15d-15(b) under the Securities Exchange Act of 1934. Based on their review, such officers have concluded that the disclosure controls and procedures are effective in ensuring that information required to be disclosed in this report is appropriately recorded, processed, summarized and reported and made known to them by others within the Registrant and by the Registrant’s service provider. |
| (b) | No changes in the registrant’s internal control over financial reporting (as defined in Rule 30a-3(d) under the Act) occurred during the period covered by this report that materially affected or are reasonably likely to materially affect, the registrant’s internal control over financial reporting. |
Item 12. Disclosure of Securities Lending Activities for Closed-End Management Investment Companies.
Not applicable to open-end investment companies.
Item 13. Exhibits.
(a)(3) Not applicable to open-end investment companies.
(a)(4) There has been no change to the registrant’s independent public accountant.
(b) Certifications pursuant to Section 906 of the Sarbanes-Oxley Act of 2002. Filed herewith.
5
SIGNATURES
Pursuant to the requirements of the Securities Exchange Act of 1934 and the Investment Company Act of 1940, the registrant has duly caused this report to be signed on its behalf by the undersigned, thereunto duly authorized.
| Brandes Investment Trust | ||
| By: | /s/ Jeff Busby | |
| Jeff Busby | ||
| President and Principal Executive Officer | ||
Date: December 6, 2022
Pursuant to the requirements of the Securities Exchange Act of 1934 and the Investment Company Act of 1940, this report has been signed below by the following persons on behalf of the registrant and in the capacities and on the dates indicated.
| By: | /s/ Jeff Busby | |
| Jeff Busby | ||
| President and Principal Executive Officer | ||
| Date: December 6, 2022 | ||
| By: | /s/ Gary Iwamura | |
| Gary Iwamura | ||
| Treasurer and Principal Financial Officer | ||
| Date: December 6, 2022 | ||
6