UNITED STATES
SECURITIES AND EXCHANGE COMMISSION
Washington, D.C. 20549
FORM N-CSR
CERTIFIED SHAREHOLDER REPORT OF REGISTERED MANAGEMENT INVESTMENT COMPANIES
Investment Company Act file number 811-01743
The Alger Funds II
(Exact name of registrant as specified in charter)
360 Park Avenue South New York, New York 10010
(Address of principal executive offices) (Zip code)
Mr. Hal Liebes
Fred Alger Management, LLC
360 Park Avenue South
New York, New York 10010
(Name and address of agent for service)
Registrant's telephone number, including area code: 212-806-8800
Date of fiscal year end: October 31
Date of reporting period: April 30, 2021
Form N-CSR is to be used by management investment companies to file reports with the Commission, not later than 10 days after the transmission to Stockholders of any report to be transmitted to Stockholders under Rule 30e-1 under the Investment Company Act of 1940 (17 CFR 270.30e1). The Commission may use the information provided on Form N-CSR in its regulatory, disclosure review, inspection, and policymaking roles.
A registrant is required to disclose the information specified by Form N-CSR, and the Commission will make this information public. A registrant is not required to respond to the collection of information contained in Form N-CSR unless the Form displays a currently valid Office of Management and Budget ("OMB") control number. Please direct comments concerning the accuracy of the information collection burden estimate and any suggestions for reducing the burden to the Secretary, Securities and Exchange Commission, 450 Fifth Street, NW, Washington, DC 20549-0609. The OMB has reviewed this collection of information under the clearance requirements of 44 U.S.C. § 3507.
| ITEM 1. | REPORT(S) TO STOCKHOLDERS. |


The Alger Funds II
| 1 | |
| 13 | |
| 21 | |
| 22 | |
| 45 | |
| 48 | |
| 52 | |
| 56 | |
| 72 | |
| 97 |
Dear Shareholders,
Recent Market Performance Masks the Appeal of Industry Disrupters
In our opinion, unprecedented amounts of fiscal and monetary stimulus, anticipation of a grand re-opening of the economy and the widespread digitization of business models has resulted in investors assessing two possible approaches to pursuing investments that can benefit from a growing economy. One approach involves conducting in-depth fundamental research to find companies with strong earnings that are using innovation to create secular growth, including in industries such as leisure and restaurants, that benefit from economic expansion. The other approach relies on, what we believe, is a flawed shortcut of investing in businesses classified as value companies to gain exposure to cyclical opportunities, or businesses that may have weak fundamentals but have potential to benefit from economic growth.
While equities of secular growth leaders underperformed value stocks during the six-month period ended April 30, 2021, we believe they have potential to generate attractive long-term performance. Therefore, we are continuing to seek companies with strong fundamentals that we believe are benefiting from developing innovative products and services.
Optimism Supports Markets
In the U.S., the S&P 500 Index generated a 28.85% return for the aforementioned six-month reporting period. Value indices outperformed the broad market, with the Russell 3000 Value Index gaining 37.84% and small cap value leading, as indicated by the 59.17% return of the Russell 2000 Value Index, as investors pursued cyclical companies. Nevertheless, the Russell 1000 Growth Index, which trailed other U.S. equity benchmarks, generated a 24.31% return. During the six-month reporting period, cyclical sectors such as Energy, Materials and Industrials outperformed the broad market, while higher interest rates supported the performance of the Financials sector. Broadly speaking, investors sold shares of companies that had led markets for most of 2020, including companies that experienced increased demand for technology that enables social distancing, such as e-commerce and remote working.
During the reporting period, the rapid development of Covid-19 vaccines and progress toward inoculating individuals supported investor optimism that economic shutdowns and other measures to contain the pandemic will be curtailed or eliminated. Simultaneously, analysts upgraded their outlook for 2021 earnings growth, while the prospect of additional fiscal stimulus was also a tailwind as Joe Biden captured the presidency. President Biden eventually succeeded in gaining approval of a $1.9 trillion coronavirus relief package that includes $1,400 checks for eligible individuals. President Biden also signaled his commitment to further prime the economy with a proposed $2.3 trillion infrastructure program.
Inflation and Valuations Spark Volatility
Optimism was occasionally dampened by fears that strong economic growth and stimulus spending could spark inflation, even though the Federal Reserve has maintained that inflationary pressures may be transitory and signaled that it is unlikely to curtail monetary stimulus prematurely. After dipping into negative territory during portions of 2020, inflation crept up to approximately 2% during the reporting period, the same benign level that existed in 2019. Valuations also sparked concern among some investors, with the S&P 500 forward price-to-earnings ratio climbing from 13.1 times in late March of 2020 to 21.7 times earnings as of April 30 of this year compared to the 20-year average of 15.4 times.
We believe, however, that other valuation metrics, such as free cash flow and the equity risk premium, are encouraging. Due to what we believe are outdated accounting standards, corporations’ growing investments in intangible assets, such as software, marketing algorithms, research and patents are expensed rather than capitalized, causing earnings to decline relative to free cash flow, which is the amount of cash remaining after expenditures for operations and the maintenance of capital assets. Free cash flow as a percentage of net income during the past three years has been 111% and has increased substantially since the 1990’s when it was typically 75%, which depicts stocks as more attractively valued compared to the P/E metric. The equity risk premium, which measures investors’ required rate of return above the prevailing risk-free interest rate, furthermore, was only 4.8% for the S&P 500 as of April 30, 2021, which we believe is attractive from a historical perspective.
International Markets Also Advance
International markets were also strong during the reporting period with the MSCI ACWI ex USA Index, the MSCI ACWI Index and the MSCI Emerging Markets Index returning 27.66%, 28.56% and 23.09%, respectively. Optimism about a global economic recovery combined with increasing supplies of the Covid-19 vaccines supported markets, while rising commodity prices were an additional tailwind for certain emerging market countries. The price of West Texas Intermediate crude oil, for example, increased from $35 a barrel to
$63.50 a barrel during the reporting period.
Choosing the Path Forward
We believe the post-pandemic economic recovery is benefiting from not only scaling back or eliminating social distancing requirements, but also from the strength of the U.S. consumer. The strong performance of equities and increasing home values during the past year have helped household net worth climb to $130 trillion, a sizeable amount that as of April 30, 2021, was expected to have increased by approximately 20%, or $25 trillion, in the first quarter of this year. If Americans spend 2% of that increased wealth, approximately
$500 billion would surge through the economy, boosting GDP by 2.5%. At the same time, stimulus checks are only now starting to work their way through the economy.
As estimates for GDP growth climb and U.S. personal savings grow, it may be tempting to embrace cyclical stocks typically classified as value stocks in anticipation of strong economic expansion. At Alger, however, we are continuing to take a long-term approach that involves seeking growth companies with strong fundamentals that are using innovation to disrupt their specific industries.
First, value market rallies have historically been short-lived, which illustrates the difficulty of successfully timing value trades.
| • | The Trump election in the fall of 2016 resulted in the Russell 3000 Val- ue Index rising 6% relative to the Russell 3000 Growth Index, as investors priced in lower corporate tax rates which benefit more domestically oriented companies like banks and retailers. Approximately half of the rally was con- centrated in the two weeks after the election. |
| • | When worries about the longevity of the European Union subsided in the spring of 2012, the Russell 3000 Value Index rallied over 8% relative to the growth benchmark through mid-2013. More than half of that move oc- curred in late 2012 and early 2013. |
| • | After the Global Financial Crisis, the Russell 3000 Value Index rose over 4% relative to the Russell 3000 Growth Index in the summer of 2009, but most of the rally took place over only one month. |
Importantly, these value rallies occurred within a long structural downward period for value underperformance, with the Russell 3000 Value Index generating an annualized return of 11.04% for the 10-year period ended April 30, 2021, compared to the 16.7% annualized return of the Russell 3000 Growth Index. Additionally, we maintain that broader structural issues, including what we believe is the outdated practice of not fully valuing intangible assets, has made the common practice of using price-to-book ratios in classifying stocks as value equities obsolete.
Finally, growth companies are often leaders in innovation and can potentially benefit from corporations increasingly digitizing their business models, which over the years has become a competitive necessity. Indeed, during earnings calls, businesses are emphasizing the need to digitize rather than increase their exposure to more discretionary services or products within their respective industries. We believe that the intersection of digital innovation and certain end markets that may benefit from economic growth may be attractive for investors. These may include travel and leisure stocks, restaurant stocks, retailers or even certain commercial real estate and energy companies.
Portfolio Matters
Alger Spectra Fund
The Alger Spectra Fund returned 19.12% for the fiscal six-month period ended April 30, 2021, compared to the 25.08% return of the Russell 3000 Growth Index. Effective February 11, 2021, Alger Chief Executive Officer and Portfolio Manager Daniel C. Chung, CFA, joined the portfolio management team of the Fund.
During the reporting period, the largest sector weightings were Information Technology and Consumer Discretionary. The largest sector overweight was Consumer Discretionary and the largest underweight was Consumer Staples. For the reporting period, the Fund’s average portfolio allocation to long positions, which was increased by leverage, was 107.92%. The Fund had a -8.09% allocation to short positions and a 0.18% allocation to cash.
Contributors to Performance
The Utilities and Energy sectors provided neutral contributions to relative performance while other sectors detracted from results.
Regarding individual long positions, Alphabet, Inc., Cl. C; Microsoft Corp.; Apple, Inc.; Visa, Inc., Cl. A; and Amazon.com, Inc. were among the top contributors to absolute performance. We believe Microsoft is a “Positive Dynamic Change” beneficiary of corporate America’s transformative digitization. Microsoft’s enterprise cloud product, Azure, is rapidly growing and accruing market share. Recently, Microsoft reported that Azure grew 50% during the fourth quarter of 2020. This high unit volume growth is a primary driver of the company’s higher share price, but Microsoft’s operating execution has enabled notable margin expansion that has also helped to increase forward earnings estimates. Microsoft’s subscription-based software offerings and cloud computing services have not been entirely immune to the pandemic-related economic slowdown but are resilient because they enhance customers’ growth initiatives and help them to reduce costs. Additionally, investors appreciate Microsoft’s strong free cash flow generation and its return of cash to shareholders in the form of dividends and share repurchases.
Short exposure to a 3D printing company also supported performance. While 3D printing, or additive manufacturing, is a revolutionary concept, it has only seen its primary adoption for manufacturing prototypes and test parts, not high-volume end-use parts. Additive manufacturing has continued to attract capital and dozens of new entrants have emerged with new technologies targeting specific applications. In addition to increased competition, the short position performance reflects that the 3D company has seen key patents expire and has lost market share to new competition. More specifically the 3D printing company experienced year-over-year revenue contraction, a talent exodus, and no significant progress on developing new opportunities in promising additive verticals like metal and dental.
Detractors from Performance
The Information Technology and Healthcare sectors were among the sectors that detracted from absolute performance. Regarding individual positions, Alibaba Group Holding Ltd. Sponsored ADR; Penn National Gaming, Inc.; Magnite, Inc.; Discovery, Inc., Cl. A; and BigCommerce Holdings, Inc. were among the top detractors from absolute performance. Magnite is an advertising technology company serving as a supply side platform for publishers. The platform helps publishers such as network television stations or cable news providers automate the sale of digital advertising inventory across different formats and channels, like desktop, mobile, video, audio, connected TV and over-the-top TV. Publishers monetize their digital advertising inventory by using Magnite’s platform to access a global market of ad buyers, including advertising agencies that use supply side platforms. Magnite also helps sellers decrease costs and protect their brands and user experience. Magnite receives ad inventory from sellers and optimizes publishers’ revenue yields by processing the highest buyer bids. Currently, Magnite keeps approximately 14% of ad spend as revenue (i.e. take rate) and passes on the remainder of the ad spend to publishers. Magnite’s clients include many of the world’s leading publishers of websites and mobile applications and the company believes that its platform reaches approximately 1 billion individuals globally. Shares of Magnite outperformed due to stronger-than-expected fourth quarter results driven by a rapid recovery in digital advertising. Additionally, the company acquired SpotX, its largest competitor in connected TV. The combination makes Magnite the industry’s largest independent supply side platform and a much larger connected TV player. We believe connected TV is the most exciting part of the digital ad market and is in the early days of growth, including capturing market share from linear TV.
Short exposure to a designer and manufacturer of semiconductors for the computing and communications industries also detracted from performance. Alger believes the company’s proprietary intellectual strength and manufacturing prowess versus the competition is deteriorating, which is causing the company to lose market share and profit opportunities. The short position detracted from portfolio returns as the share price reacted positively to the announcement of a change in senior management and stronger-than-anticipated quarterly earnings report driven by unusually robust PC sales. The company also unveiled an initiative to help improve manufacturing and spur innovation.
Alger Dynamic Opportunities Fund
The Alger Dynamic Opportunities Fund returned 19.91% for the fiscal six-month period ended April 30, 2021, compared to the 28.85% return of the Fund’s benchmark, the S&P 500 Index.
During the reporting period, the average allocation to long positions was 89.70% and the average allocation to short positions was -33.52%. The Fund’s average cash allocation, which was a residual of long position sales and short sale proceeds, was 43.83%.
Based on the combined allocations of long and short positions, the Healthcare and Information Technology sectors were the largest sector weightings for the reporting period. Healthcare was the largest sector overweighting and the Information Technology sector was the largest underweighting.
Contributors to Performance
Long positions, in aggregate, contributed to both absolute and relative performance. Short exposure, however, detracted from both absolute and relative performance. Based on the net exposure of long and short positions, the Healthcare and Consumer Discretionary sectors provided the largest contributions to relative performance.
Regarding long positions, Progyny, Inc.; Signature Bank; Upstart Holdings, Inc.; Natera, Inc.; and Chegg, Inc. were among the top contributors to absolute performance. Chegg provides online textbook rentals and other internet-delivered services, such as homework help, tutoring and assistance with obtaining scholarships and finding internships. The company has been acquiring customers at a low cost, in part because it is a leader in providing supplementary educational services to college students. The Covid-19 pandemic saw college students across the country leave campuses and complete the spring semester remotely. Chegg shares have performed strongly in large part due to the company generating strong subscriber growth. Alger believes that Chegg’s encouraging results underscore the company’s strong fundamentals.
Short exposure to a company that provides remote patient monitoring to detect cardiac arrhythmias also contributed to performance. News of less favorable insurance reimbursement rates for the company’s products caused the company’s share price to decline, resulting in the short exposure contributing to performance.
Detractors from Performance
Based on the combined exposure of short and long positions, the Real Estate sector was the most significant detractor from relative performance. Regarding individual long positions, Enphase Energy, Inc.; Discovery, Inc., Cl. A; Quidel Corp.; BigCommerce Holdings, Inc.; and ACADIA Pharmaceuticals, Inc. were among the most significant detractors from performance. Quidel develops, manufactures and markets rapid point-of-care diagnostic solutions worldwide that are used for infectious disease, cardiac and toxicology testing. Quidel’s solutions are mainly used at point-of-care locations, such as physicians’ offices, hospitals, urgent care clinics, pharmacies, wellness screening clinics and clinical laboratories when quality, highly sensitive, low cost, easy-to-use and fast diagnosis is particularly important. Shares of the company underperformed due to general concern that Covid-19 vaccines will result in decreased demand for Quidel’s Covid-19 testing products. We believe potential exists for demand to decrease in 2022, but Covid-19 testing is still experiencing strong utilization while vaccines are being distributed, a process that can last throughout 2021, in our view. In addition, we believe the need for testing can potentially last longer than the market is currently assuming. Quidel has a significantly enhanced position in rapid point-of-care infectious disease testing, with a significant number of new instrument customers as a result of the pandemic. Quidel also has a robust product pipeline outside of Covid-19, including the expected launch of its Savanna instrument by mid-2021 to offer rapid molecular testing with a panel of up to 8-12 tests at a time from a single patient sample. Additionally, Covid-19 testing has allowed Quidel to build a sizable cash position, which it can potentially deploy on accretive mergers and acquisitions.
Short exposure to a company that designs, manufactures and distributes a range of industrial products and systems worldwide also detracted from performance. The company’s products include branded hydraulic and mechanical tools as well as services and tool rentals to industrial, maintenance, infrastructure, oil and gas, energy and other markets. The company’s results are correlated closely to industrial activity. Even though the company has missed its estimates during recent quarters, its stock performance strengthened after the company provided evidence that its end markets are improving, which resulted in the short exposure detracting from performance.
Alger Emerging Markets Fund
The Alger Emerging Markets Fund returned 20.84% for the fiscal six-month period ended April 30, 2021, compared to the 23.09% return of its benchmark, the MSCI Emerging Markets Index.
Contributors to Performance
During the reporting period, the largest portfolio sector weightings were Consumer Discretionary and Information Technology. The largest sector overweight was Consumer Discretionary and the largest sector underweight was Financials. The Consumer Discretionary and Industrials sectors were the largest contributors to relative performance. Among countries, China, South Korea, Greece and Hong Kong were some of the top contributors to relative performance.
Regarding individual positions, Taiwan Semiconductor Manufacturing Co., Ltd.; Geely Automobile Holdings Ltd.; Samsung Electronics Co., Ltd.; Kakao Corp.; and Sany Heavy Industry Co., Ltd., Cl. A. were among the top contributors to absolute performance. Geely Automotive is one of China’s leading auto manufacturers. With sales continuing to recover with the reopening of the economy during the second quarter of 2020 and breaking into positive territory in year-over-year (YOY) terms, Geely performed strongly during the final three months of 2020. Geely recorded important milestones in the fourth quarter of 2020, including selling nearly 23,000 units of the company’s high-end nameplate, Lynk & Co., a more than 61% YOY increase.
The auto manufacturer also introduced two new vehicles under the Lynk brand and Xingrui, its first sedan to use the company’s Compact Modular Architecture, a state-of-the-art platform jointly developed with Volvo. The Xingrui is the beginning of a new product pipeline that includes plans for debuting several electric vehicles utilizing the company’s internally developed Sustainable Experience Architecture in 2021 and 2022. Geely is developing the cars to have industry-leading battery performance, 50% reduction in non-engine vehicle energy consumption and state-of-the-art power trains.
Detractors from Performance
The Financials and Materials sectors detracted from results while South Africa, Brazil, South Africa and Taiwan were among countries that detracted from performance.
Regarding individual positions, Yatsen Holding Ltd. ADR Cl. A; Alibaba Group Holding Ltd. Sponsored ADR; Vinci Partners Investments Ltd., Cl. A; Akbank TAS; and InPost S.A. were among the most significant detractors from performance. Alibaba is the dominant e-commerce platform in the Chinese economy where e-commerce remains underpenetrated and fast growing. It is also a leading player in China’s cloud computing, big data analytics, digital media and entertainment markets. The Fund owns Alibaba shares because of the large addressable market opportunities in e-commerce and cloud computing, as well as Alibaba’s potential for exploiting those opportunities due to state-enacted barriers that block meaningful foreign competitors. Unfortunately, the Chinese communist party has exhibited increased regulatory oversight of Alibaba, which precluded the company from consummating a value-creating IPO of ANT Financial, its formidable fintech platform. As a result of this near-term regulatory uncertainty, the Alibaba investment detracted from portfolio performance.
Alger Responsible Investing Fund
The Alger Responsible Investing Fund returned 23.06% for the fiscal six-month period ended April 30, 2021, compared to the 24.31% return of the Russell 1000 Growth Index.
During the reporting period, the largest sector weightings were Information Technology and Consumer Discretionary. The largest sector overweight was Financials and the largest underweight was Healthcare.
Contributors to Performance
The Information Technology and Financials sectors provided the greatest contributions to relative performance during the reporting period.
Regarding individual positions, Microsoft Corp.; Lam Research Corp.; Apple, Inc.; Visa, Inc., Cl. A; and Alphabet, Inc., Cl. A were among the top contributors to absolute performance. Shares of Microsoft performed strongly in response to developments identified in the Alger Spectra Fund discussion.
Detractors from Performance
The Consumer Discretionary and Healthcare sectors were among the sectors that detracted from results. Regarding individual positions, Tesla, Inc.; Sarepta Therapeutics, Inc.; SolarEdge Technologies, Inc.; salesforce, inc.; and Guardant Health, Inc. were among the top detractors from performance. Salesforce is a leading software as a service company. It provides turnkey salesforce productivity and customer relationship management applications as well as a cloud-based development environment.
Salesforce is a high unit volume growth beneficiary of the increased spending associated with corporate America’s “digitization.” Alger believes customers can potentially experience high return on investment on salesforce deployments because the technology makes enterprises more productive and more profitable while fostering growth. The company has announced plans to acquire Slack Technologies at a significant premium to the industry’s historic deal multiples. Slack Technologies provides businesses with real-time messaging, file sharing capabilities, archiving and other services.
Additionally, during the fourth quarter of 2020, salesforce announced achieving significant earnings growth, but its revenues fell slightly short of expectations and the company’s revenue guidance called into question the timing of the Slack acquisition, which hurt the performance of salesforce shares. Finally, the company’s Chief Financial Officer and President Mark Hawkins announced that he is retiring and is being replaced by Chief Legal Counsel Amy Weaver. This development was a continuation of a trend of senior management departures.
I thank you for putting your trust in Alger.
Sincerely,
Daniel C. Chung, CFA
Chief Executive Officer
Fred Alger Management, LLC
Investors cannot invest directly in an index. Index performance does not reflect the deduction for fees, expenses, or taxes.
This report and the financial statements contained herein are submitted for the general information of shareholders of the funds. This report is not authorized for distribution to prospective investors in a fund unless preceded or accompanied by an effective prospectus for the fund. Fund performance returns represent the six-month period return of Class A shares prior to the deduction of any sales charges and include the reinvestment of any dividends or distributions.
The performance data quoted represents past performance, which is not an indication or guarantee of future results.
Standardized performance results can be found on the following pages. The investment return and principal value of an investment in a fund will fluctuate so that an investor’s shares, when redeemed, may be worth more or less than their original cost. Current performance may be lower or higher than the performance quoted. For performance data current to the most recent month-end, visit us at www.alger.com or call us at (800) 992-3863.
The views and opinions of the funds’ management in this report are as of the date of the Shareholders’ Letter and are subject to change at any time subsequent to this date. There is no guarantee that any of the assumptions that formed the basis for the opinions stated herein are accurate or that they will materialize. Moreover, the information forming the basis for such assumptions is from sources believed to be reliable; however, there is no guarantee that such information is accurate. Any securities mentioned, whether owned in a fund or otherwise, are considered in the context of the construction of an overall portfolio of securities and therefore reference to them should not be construed as a recommendation or offer to purchase or sell any such security. Inclusion of such securities in a fund and transactions in such securities, if any, may be for a variety of reasons, including, without limitation, in response to cash flows, inclusion in a benchmark, and risk control. The reference to a specific security should also be understood in such context and not viewed as a statement that the security is a significant holding in a fund. Please refer to the Schedule of Investments for each fund which is included in this report for a complete list of fund holdings as of April 30, 2021. Securities mentioned in the Shareholders’ Letter, if not found in the Schedule of Investments, may have been held by the funds during the six-month fiscal period ended April 30, 2021.
Risk Disclosures Alger Spectra Fund
Investing in the stock market involves risks, including the potential loss of principal. Growth stocks may be more volatile than other stocks as their prices tend to be higher in relation to their companies’ earnings and may be more sensitive to market, political, and economic developments. A significant portion of assets will be invested in technology and healthcare companies, which may be significantly affected by competition, innovation, regulation, and product obsolescence, and may be more volatile than the securities of other companies. Investments in the Consumer Discretionary Sector may be affected by domestic and international economies, consumers’ disposable income, consumer preferences and social trends. Foreign securities involve special risks including currency fluctuations, inefficient trading, political and economic instability, and increased volatility. Short sales could increase market exposure, magnifying losses and increasing volatility. Leverage increases volatility in both up and down markets and its costs may exceed the returns of borrowed securities.
Alger Dynamic Opportunities Fund
Investing in the stock market involves risks, including the potential loss of principal. Growth stocks may be more volatile than other stocks as their prices tend to be higher in relation to their companies’ earnings and may be more sensitive to market, political, and economic developments. A significant portion of assets will be invested in technology companies, which may be significantly affected by competition, innovation, regulation, and product obsolescence, and may be more volatile than the securities of other companies. Cash positions may underperform relative to equity and fixed-income securities. Options and short sales could increase market exposure, magnifying losses and increasing volatility. Issuers of convertible securities may be more sensitive to economic changes. Investing in companies of small capitalizations involve the risk that such issuers may have limited product lines or financial resources, lack management depth, or have limited liquidity. Leverage increases volatility in both up and down markets and its costs may exceed the returns of borrowed securities. Foreign securities involve special risks including currency fluctuations, inefficient trading, political and economic instability, and increased volatility. Active trading may increase transaction costs, brokerage commissions, and taxes, which can lower the return on investment.
Alger Emerging Markets Fund
Investing in the stock market involves risks, including the potential loss of principal. Growth stocks may be more volatile than other stocks as their prices tend to be higher in relation to their companies’ earnings and may be more sensitive to market, political, and economic developments. Foreign securities, frontier markets, and emerging markets involve special risks including currency fluctuations, inefficient trading, political and economic instability, and increased volatility. Assets may be focused in a small number of holdings, making them susceptible to risks associated with a single economic, political or regulatory event than a more diversified portfolio. Investing in companies of small capitalizations involves the risk that such issuers may have limited product lines or financial resources, lack management depth, or have limited liquidity. Active trading may increase transaction costs, brokerage commissions, and taxes, which can lower the return on investment.
Alger Responsible Investing Fund
Investing in the stock market involves risks, including the potential loss of principal. Growth stocks may be more volatile than other stocks as their prices tend to be higher in relation to their companies’ earnings and may be more sensitive to market, political, and economic developments. The environmental, social and governance investment criteria may limit the number of investment opportunities available, and as a result, returns may be lower than vehicles not subject to such considerations. A significant portion of assets will be invested in technology companies, which may be significantly affected by competition, innovation, regulation, and product obsolescence, and may be more volatile than the securities of other companies. Investments in the Consumer Discretionary sector may be affected by domestic and international economies, consumer’s disposable income, consumer preferences and social trends.
For a more detailed discussion of the risks associated with a fund, please see the Prospectus.
Before investing, carefully consider a fund’s investment objective, risks, charges, and expenses.
For a prospectus and summary prospectus containing this and other information or for the Alger Funds II’ most recent month-end performance data, visit www.alger. com, call (800) 992-3863 or consult your financial advisor. Read the prospectus and summary prospectus carefully before investing.
Distributor: Fred Alger & Company, LLC.
NOT FDIC INSURED. NOT BANK GUARANTEED. MAY LOSE VALUE.
Definitions:
| • | The S&P 500 Index: An index of large company stocks considered to be representative of the U.S. stock market. |
| • | The Russell 2000 Value Index measures the performance of small-cap value segment of the U.S. equity universe. It includes those Russell 2000 companies with lower price-to-book ratios and lower forecasted growth values |
| • | The MSCI ACWI ex USA Index (gross) captures large and mid cap represen- tation across 22 of 23 Developed Markets (DM) countries (excluding the US) and 26 Emerging Markets (EM) countries. The index covers approximately 85% of the global equity opportunity set outside the US. |
| • | The Morgan Stanley Capital International (MSCI) Emerging Markets Index (gross) is a free float-adjusted market capitalization index that is designed to measure equity market performance in the global emerging markets. |
| • | The MSCI ACWI Index (gross) is a free float-adjusted market capitalization weighted index that is designed to measure the equity market performance of developed and emerging markets. The MSCI ACWI captures large and mid cap representation across 23 Developed Markets (DM) and 26 Emerging Markets (EM) countries. |
| • | The Russell 1000 Growth Index measures the performance of the large-cap growth segment of the U.S. equity universe. It includes those Russell 1000 companies with higher growth earning potential as defined by Russell's lead- ing style methodology. The Russell 1000 Growth Index is constructed to provide a comprehensive and unbiased barometer for the large-cap growth segment. |
| • | The Russell 3000 Growth Index is constructed to provide a comprehensive, unbiased and stable barometer of the broad growth market. The index is completely reconstituted annually to ensure new and growing equities are included and that the represented companies continue to reflect growth char- acteristics. |
| • | The Russell 3000 Value Index measures the performance of the broad value segment of the US equity value universe. It includes those Russell 3000 com- panies with lower price-to-book ratios and lower forecasted growth values. The Russell 3000 Value Index is constructed to provide a comprehensive, unbiased and stable barometer of the broad value market. |
FUND PERFORMANCE AS OF 3/31/21 (Unaudited) | ||||||||||||
| AVERAGE ANNUAL TOTAL RETURNS | ||||||||||||
| 1 YEAR | 5 YEARS | 10 YEARS | ||||||||||
Alger Spectra Class A (Inception 7/28/69) | 54.48 | % | 19.01 | % | 15.19 | % | ||||||
Alger Spectra Class C (Inception 9/24/08) | 60.78 | % | 19.40 | % | 14.94 | % | ||||||
Alger Spectra Class I (Inception 9/24/08) | 63.04 | % | 20.31 | % | 15.83 | % | ||||||
Alger Spectra Class Z (Inception 12/29/10) | 63.51 | % | 20.68 | % | 16.17 | % | ||||||
1 YEAR | 5 YEARS | SINCE INCEPTION | ||||||||||
Alger Spectra Class Y (Inception 12/03/18) | 63.56 | % | n/a | 25.50 | % | |||||||
FUND PERFORMANCE AS OF 3/31/21 (Unaudited) | ||||||||||||||||
| AVERAGE ANNUAL TOTAL RETURNS | ||||||||||||||||
| 1 YEAR | 5 YEARS | 10 YEARS | SINCE INCEPTION | |||||||||||||
Alger Dynamic Opportunities Class A (Inception 11/2/09) | 42.13 | % | 13.75 | % | 8.57 | % | 8.86 | % | ||||||||
Alger Dynamic Opportunities Class C (Inception 12/29/10)‡ | 47.90 | % | 14.10 | % | 8.32 | % | 8.54 | % | ||||||||
Alger Dynamic Opportunities Class Z (Inception 12/29/10) | 50.36 | % | 15.30 | % | 9.45 | % | 9.79 | % | ||||||||
Alger Emerging Markets Class A (Inception 12/29/10) | 64.16 | % | 12.24 | % | 4.19 | 4.01 | % | |||||||||
Alger Emerging Markets Class C (Inception 12/29/10) | 70.89 | % | 12.62 | % | 3.96 | 3.72 | % | |||||||||
Alger Emerging Markets Class I (Inception 12/29/10) | 73.31 | % | 13.51 | % | 4.77 | 4.52 | % | |||||||||
Alger Emerging Markets Class Z (Inception 2/28/14) | 74.04 | % | 13.98 | % | n/a | 7.97 | % | |||||||||
Alger Responsible Investing Class A (Inception 12/4/00) | 49.76 | % | 17.80 | % | 13.03 | % | 5.53 | % | ||||||||
Alger Responsible Investing Class C (Inception 9/24/08)* | 55.82 | % | 18.14 | % | 12.73 | % | 11.18 | % | ||||||||
Alger Responsible Investing Class I (Inception 9/24/08)† | 57.97 | % | 19.05 | % | 13.63 | % | 12.04 | % | ||||||||
Alger Responsible Investing Class Z (Inception 10/14/16) | 58.52 | % | n/a | n/a | 21.72 | % | ||||||||||
Prior to December 29, 2016, the Alger Responsible Investing Fund followed different investment strategies under the name “Alger Green Fund,” and was managed by different portfolio management teams. Performance during that period does not reflect the Fund’s current investment strategies.
Prior to September 24, 2019, Alger Emerging Markets Fund followed different investment strategies and was managed by different portfolio managers. Performance prior to this date reflects these prior management styles and does not reflect the Alger Emerging Markets Fund's current investment strategies and investment personnel.
* | Since inception performance is calculated since the inception of the Class A shares. Historical performance prior to September 24, 2008, inception of the class, is that of the Fund’s Class A shares, reduced to reflect the current maximum sales charge and the higher operating expenses of Class C shares. |
† | Since inception performance is calculated since the inception of the Class A shares. Historical performance prior to September 24, 2008, inception of the class, is that of the Fund’s Class A shares, which has been adjusted to remove the front-end sales charge imposed by Class A shares. |
‡ | Since inception performance is calculated since the inception of the Class A shares. Historical performance prior to December 29, 2010, inception of the class, is that of the Fund’s Class A shares, reduced to reflect the current maximum sales charge and the higher operating expenses of Class C shares. |
The performance data quoted represents past performance, which is not an indication or a guarantee of future results. The Funds’ average annual total returns include changes in share price and reinvestment of dividends and capital gains.
HYPOTHETICAL $10,000 INVESTMENT IN CLASS A SHARES
— 10 years ended 4/30/21

The chart above illustrates the change in value of a hypothetical $10,000 investment made in the Alger Spectra Fund Class A shares, with an initial 5.25% maximum sales charge, and the Russell 3000 Growth Index (an unmanaged index of common stocks) for the ten years ended April 30, 2021. Figures for the Alger Spectra Fund Class A and the Russell 3000 Growth Index include reinvestment of dividends. Figures for the Alger Spectra Fund Class A shares also include reinvestment of capital gains. Performance for the Alger Spectra Fund Class C, Class I, Class Y and Class Z shares will vary from the results shown above due to the operating expenses and the current maximum sales charge of each share class. Investors cannot invest directly in any index. Index performance does not reflect deduction for fees, expenses, or taxes.
ALGER SPECTRA FUND Fund Highlights Through April 30, 2021 (Unaudited) (Continued) |
| PERFORMANCE COMPARISON AS OF 4/30/21 | ||||||||||||||||
| AVERAGE ANNUAL TOTAL RETURNS | ||||||||||||||||
1 YEAR | 5 YEARS | 10 YEARS | Since 12/31/1974 | |||||||||||||
| Class A (Inception 7/28/69) | 42.35 | % | 20.70 | % | 15.39 | % | 16.21 | % | ||||||||
| Class C (Inception 9/24/08)* | 48.07 | % | 21.10 | % | 15.13 | % | 15.48 | % | ||||||||
| Class I (Inception 9/24/08)† | 50.19 | % | 22.03 | % | 16.02 | % | 16.36 | % | ||||||||
Russell 3000 Growth Index | 52.41 | % | 22.59 | % | 16.70 | % | n/a | |||||||||
1 YEAR | 5 YEARS | 10 YEARS | Since 12/3/2018 | |||||||||||||
| Class Y (Inception 12/3/18) | 50.71 | % | n/a | n/a | 27.56 | % | ||||||||||
Russell 3000 Growth Index | 52.41 | % | n/a | n/a | 28.24 | % | ||||||||||
1 YEAR | 5 YEARS | 10 YEARS | Since 12/29/2010 | |||||||||||||
| Class Z (Inception 12/29/10) | 50.67 | % | 22.40 | % | 16.36 | % | 17.02 | % | ||||||||
Russell 3000 Growth Index | 52.41 | % | 22.59 | % | 16.70 | % | 17.14 | % | ||||||||
The performance data quoted represents past performance, which is not an indication or a guarantee of future results. The Fund’s average annual total returns include changes in share price and reinvestment of dividends and capital gains. Class A returns reflect the maximum initial sales charge and Class C returns reflect the applicable contingent deferred sales charge. Class A, C, and I historical performance is calculated from December 31, 1974, the first full calendar year that Fred Alger Management, LLC was the Fund's investment adviser. The Fund operated as a closed-end fund from August 23, 1978 to February 12, 1996, during which time the calculation of total return assumed dividends were reinvested at market value. Had dividends not been reinvested, performance would have been lower. The chart and table above do not reflect the deduction of taxes that a shareholder would have paid on Fund distributions or on the redemption of Fund shares. Investment return and principal will fluctuate and the Fund’s shares, when redeemed, may be worth more or less than their original cost. Current performance may be higher or lower than the performance quoted. For updated performance, visit us at www.alger.com or call us at (800) 992-3863.
| * | Since inception performance is calculated since the inception of the Class A shares. Historical performance prior to September 24, 2008, inception of the class, is that of the Fund's Class A shares, reduced to reflect the current maximum sales charge and the higher operating expenses of Class C shares. |
| † | Since inception performance is calculated since the inception of the Class A shares. Historical performance prior to September 24, 2008, inception of the class, is that of the Fund's Class A shares, which has been adjusted to remove the front-end sales charge imposed by Class A shares. |
ALGER DYNAMIC OPPORTUNITIES FUND Fund Highlights Through April 30, 2021 (Unaudited) |
HYPOTHETICAL $10,000 INVESTMENT IN CLASS A SHARES
— 10 years ended 4/30/21

The chart above illustrates the change in value of a hypothetical $10,000 investment made in Alger Dynamic Opportunities Fund Class A shares, with an initial 5.25% maximum sales charge, the S&P 500 Index (an unmanaged Index of Common Stocks) and the HFRI Equity Hedge (Total) Index (an unmanaged index of hedge funds) for the ten years ended April 30, 2021. Effective March 1, 2017, Weatherbie Capital, LLC, an indirect, wholly-owned subsidiary of Alger Group Holdings, LLC, the parent company of Fred Alger Management, LLC, began providing investment sub-advisory services for a portion of the assets of the Alger Dynamic Opportunities Fund. Figures for the Alger Dynamic Opportunities Fund Class A, the S&P 500 Index and the HFRI Equity Hedge (Total) Index include reinvestment of dividends. Figures for the Alger Dynamic Opportunities Fund Class A shares also include reinvestment of capital gains. Performance for the Alger Dynamic Opportunities Fund Class C and Class Z shares will vary from the results shown above due to the operating expenses and the current maximum sales charge of each share class. Investors cannot invest directly in any index. Index performance does not reflect deduction for fees, expenses, or taxes.
ALGER DYNAMIC OPPORTUNITIES FUND Fund Highlights Through April 30, 2021 (Unaudited) (Continued) |
| PERFORMANCE COMPARISON AS OF 4/30/21 | ||||||||||||||||
| AVERAGE ANNUAL TOTAL RETURNS | ||||||||||||||||
1 YEAR | 5 YEARS | 10 YEARS | Since 11/2/2009 | |||||||||||||
| Class A (Inception 11/2/09) | 38.50 | % | 15.20 | % | 8.83 | % | 9.30 | % | ||||||||
| Class C (Inception 12/29/10)* | 44.07 | % | 15.54 | % | 8.60 | % | 8.98 | % | ||||||||
S&P 500 Index | 45.98 | % | 17.42 | % | 14.17 | % | 15.17 | % | ||||||||
HFRI Equity Hedge (Total) Index | 42.17 | % | 10.53 | % | 6.02 | % | 6.79 | % | ||||||||
1 YEAR | 5 YEARS | 10 YEARS | Since 12/29/2010 | |||||||||||||
| Class Z (Inception 12/29/10) | 46.46 | % | 16.76 | % | 9.73 | % | 10.28 | % | ||||||||
S&P 500 Index | 45.98 | % | 17.42 | % | 14.17 | % | 14.62 | % | ||||||||
HFRI Equity Hedge (Total) Index | 41.45 | % | 10.42 | % | 5.96 | % | 6.13 | % | ||||||||
The performance data quoted represents past performance, which is not an indication or a guarantee of future results. The Fund’s average annual total returns include changes in share price and reinvestment of dividends and capital gains. Class A returns reflect the maximum initial sales charge and Class C returns reflect the applicable contingent deferred sales charge. The chart and table above do not reflect the deduction of taxes that a shareholder would have paid on Fund distributions or on the redemption of Fund shares. Investment return and principal will fluctuate and the Fund’s shares, when redeemed, may be worth more or less than their original cost. Current performance may be higher or lower than the performance quoted. For updated performance, visit us at www.alger.com or call us at (800) 992-3863.
| * | Since inception performance is calculated since the inception of the Class A shares. Historical performance prior to December 29, 2010, inception of the class, is that of the Fund’s Class A shares, reduced to reflect the current maximum sales charge and the higher operating expenses of Class C shares. |
ALGER EMERGING MARKETS FUND Fund Highlights Through April 30, 2021 (Unaudited) |
HYPOTHETICAL $10,000 INVESTMENT IN CLASS A SHARES
— 10 years ended 4/30/21

The chart above illustrates the change in value of a hypothetical $10,000 investment made in Alger Emerging Markets Fund Class A shares, with an initial 5.25% maximum sales charge, and the MSCI Emerging Markets Index (an unmanaged index of common stocks) for the ten years ended April 30, 2021. Prior to September 24, 2019, Alger Emerging Markets Fund followed different investment strategies and was managed by different portfolio managers. Performance prior to this date reflects these prior management styles and does not reflect the Alger Emerging Markets Fund's current investment strategies and investment personnel. Figures for the Alger Emerging Markets Fund Class A and the MSCI Emerging Markets Index include reinvestment of dividends. Figures for the Alger Emerging Markets Fund Class A shares also include reinvestment of capital gains. Performance for the Alger Emerging Markets Fund Class C, Class I and Class Z shares will vary from the results shown above due to the operating expenses and current maximum sales charge of each share class. Investors cannot invest directly in any index. Index performance does not reflect deduction for fees, expenses, or taxes.
ALGER EMERGING MARKETS FUND Fund Highlights Through April 30, 2021 (Unaudited) (Continued) |
| PERFORMANCE COMPARISON AS OF 4/30/21 | ||||||||||||||||
| AVERAGE ANNUAL TOTAL RETURNS | ||||||||||||||||
1 YEAR | 5 YEARS | 10 YEARS | Since 12/29/2010 | |||||||||||||
| Class A (Inception 12/29/10) | 48.95 | % | 12.42 | % | 3.99 | % | 4.10 | % | ||||||||
| Class C (Inception 12/29/10) | 54.98 | % | 12.78 | % | 3.77 | % | 3.81 | % | ||||||||
| Class I (Inception 12/29/10) | 57.24 | % | 13.69 | % | 4.57 | % | 4.61 | % | ||||||||
MSCI Emerging Markets Index | 49.21 | % | 12.91 | % | 3.96 | % | 4.48 | % | ||||||||
1 YEAR | 5 YEARS | 10 YEARS | Since 2/28/2014 | |||||||||||||
| Class Z (Inception 2/28/14) | 58.03 | % | 14.15 | % | n/a | 8.08 | % | |||||||||
MSCI Emerging Markets Index | 49.21 | % | 12.91 | % | n/a | 7.63 | % | |||||||||
The performance data quoted represents past performance, which is not an indication or a guarantee of future results. The Fund’s average annual total returns include changes in share price and reinvestment of dividends and capital gains. Prior to September 24, 2019, Alger Emerging Markets Fund followed different investment strategies and was managed by different portfolio managers. Performance prior to this date reflects these prior management styles and does not reflect the Alger Emerging Markets Fund's current investment strategies and investment personnel. Class A returns reflect the maximum initial sales charge and Class C returns reflect the applicable contingent deferred sales charge. The chart and table above do not reflect the deduction of taxes that a shareholder would have paid on Fund distri- butions or on the redemption of Fund shares. Investment return and principal will fluctuate and the Fund’s shares, when redeemed, may be worth more or less than their original cost. Current performance may be higher or lower than the performance quoted. For updated performance, visit us at www.alger.com or call us at (800) 992-3863.
HYPOTHETICAL $10,000 INVESTMENT IN CLASS A SHARES
— 10 years ended 4/30/21
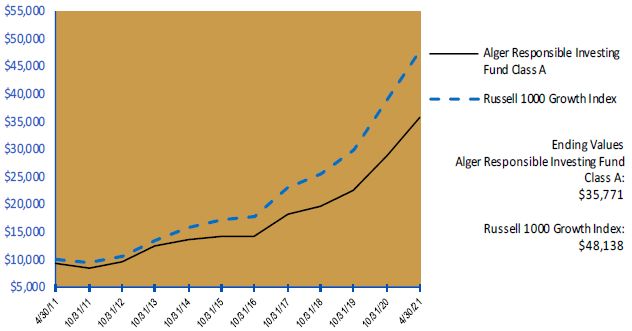
The chart above illustrates the change in value of a hypothetical $10,000 investment made in the Alger Responsible Investing Fund Class A shares, with an initial 5.25% maximum sales charge, the Russell 1000 Growth Index (an unmanaged index of common stocks) for the ten years ended April 30, 2021. Prior to December 29, 2016, the Alger Responsible Investing Fund followed different investment strategies under the name “Alger Green Fund,” and was managed by different portfolio management teams. Performance during that period does not reflect the Fund’s current investment strategies. Figures for the Alger Responsible Investing Fund Class A and the Russell 1000 Growth Index include reinvestment of dividends. Figures for the Alger Responsible Investing Fund Class A shares also include reinvestment of capital gains. Performance for the Alger Responsible Investing Fund Class C, Class I and Class Z shares will vary from the results shown above due to the operating expenses and the current maximum sales charge of each share class. Investors cannot invest directly in any index. Index performance does not reflect deduction for fees, expenses, or taxes.
| PERFORMANCE COMPARISON AS OF 4/30/21 | ||||||||||||||||
| AVERAGE ANNUAL TOTAL RETURNS | ||||||||||||||||
1 YEAR | 5 YEARS | 10 YEARS | Since 12/4/2000 | |||||||||||||
| Class A (Inception 12/4/00) | 40.53 | % | 19.73 | % | 13.59 | % | 5.84 | % | ||||||||
Russell 1000 Growth Index | 51.41 | % | 22.88 | % | 17.02 | % | 8.28 | % | ||||||||
| PERFORMANCE COMPARISON AS OF 4/30/21 | ||||||||||||||||
| AVERAGE ANNUAL TOTAL RETURNS | ||||||||||||||||
1 YEAR | 5 YEARS | 10 YEARS | Since 9/24/2008 | |||||||||||||
| Class C (Inception 9/24/08) | 46.38 | % | 20.07 | % | 13.32 | % | 11.67 | % | ||||||||
| Class I (Inception 9/24/08) | 48.51 | % | 21.01 | % | 14.22 | % | 12.54 | % | ||||||||
Russell 1000 Growth Index | 51.41 | % | 22.88 | % | 17.02 | % | 15.80 | % | ||||||||
1 YEAR | 5 YEARS | 10 YEARS | Since 10/14/2016 | |||||||||||||
| Class Z (Inception 10/14/16) | 49.03 | % | n/a | n/a | 23.05 | % | ||||||||||
Russell 1000 Growth Index | 51.41 | % | n/a | n/a | 24.33 | % | ||||||||||
The performance data quoted represents past performance, which is not an indication or a guarantee of future results. The Fund’s average annual total returns include changes in share price and reinvestment of dividends and capital gains. Class A returns reflect the maximum initial sales charge and Class C returns reflect the applicable contingent deferred sales charge. Performance figures prior to January 12, 2007, are those of the Alger Green Institutional Fund and performance prior to October 19, 2006, represents the performance of the Alger Socially Responsible Growth Institutional Fund Class I, the predecessor fund to the Alger Green Institutional Fund. The predecessor fund followed different investment strategies and had a different portfolio manager. As of January 12, 2007, the Alger Green Institutional Fund became the Alger Green Fund. The chart and table above do not reflect the deduction of taxes that a shareholder would have paid on Fund distributions or on the redemption of Fund shares. Investment return and principal will fluctuate and the Fund’s shares, when redeemed, may be worth more or less than their original cost. Current performance may be higher or lower than the performance quoted. For updated performance, visit us at www.alger.com or call us at (800) 992-3863.
COUNTRY | Alger Emerging Markets Fund | |||
Brazil | 7.0 | % | ||
Canada | 1.8 | |||
China | 29.7 | |||
Greece | 2.2 | |||
Hong Kong | 3.0 | |||
Hungary | 2.7 | |||
India | 10.1 | |||
Indonesia | 1.5 | |||
South Africa | 2.0 | |||
South Korea | 17.5 | |||
Taiwan | 14.2 | |||
United States | 2.6 | |||
Vietnam | 1.6 | |||
Cash and Net Other Assets | 4.1 | |||
| 100.0 | % | |||
* Includes short sales as a reduction of sector exposure.
† Based on net assets for each Fund.
ALGER SPECTRA FUND | |
| Schedule of Investments April 30, 2021 (Unaudited) |
| COMMON STOCKS—107.5% | SHARES | VALUE | ||||||
| AEROSPACE & DEFENSE—2.5% | ||||||||
HEICO Corp., Cl. A+ | 1,115,751 | $ | 140,897,036 | |||||
| Teledyne Technologies, Inc.* | 132,500 | 59,326,875 | ||||||
| 200,223,911 | ||||||||
| AIR FREIGHT & LOGISTICS—0.9% | ||||||||
| XPO Logistics, Inc.* | 532,111 | 74,027,282 | ||||||
| APPAREL ACCESSORIES & LUXURY GOODS—1.8% | ||||||||
| Capri Holdings Ltd.* | 1,065,703 | 58,698,921 | ||||||
| LVMH Moet Hennessy Louis Vuitton SE | 114,912 | 86,576,213 | ||||||
| 145,275,134 | ||||||||
| APPAREL RETAIL—0.8% | ||||||||
| The TJX Cos., Inc. | 877,114 | 62,275,094 | ||||||
| APPLICATION SOFTWARE—9.3% | ||||||||
Adobe, Inc.*,+ | 390,589 | 198,552,012 | ||||||
| Anaplan, Inc.* | 288,427 | 17,204,671 | ||||||
| Autodesk, Inc.* | 92,951 | 27,133,326 | ||||||
| Avalara, Inc.* | 402,775 | 57,077,245 | ||||||
| Bill.com Holdings, Inc.* | 259,498 | 40,126,176 | ||||||
| Cadence Design Systems, Inc.* | 452,818 | 59,667,828 | ||||||
| Coupa Software, Inc.* | 92,445 | 24,871,403 | ||||||
| Datadog, Inc., Cl. A* | 453,541 | 38,900,212 | ||||||
| Fair Isaac Corp.* | 44,115 | 23,002,002 | ||||||
| Five9, Inc.* | 465,618 | 87,522,215 | ||||||
| HubSpot, Inc.* | 79,956 | 42,092,836 | ||||||
| Intuit, Inc. | 227,139 | 93,617,610 | ||||||
| RingCentral, Inc., Cl. A* | 155,901 | 49,724,624 | ||||||
| 759,492,160 | ||||||||
| AUTOMOBILE MANUFACTURERS—2.6% | ||||||||
| General Motors Co.* | 306,015 | 17,510,178 | ||||||
| Tesla, Inc.* | 279,375 | 198,199,800 | ||||||
| 215,709,978 | ||||||||
| BIOTECHNOLOGY—0.6% | ||||||||
| Natera, Inc.* | 474,492 | 52,203,610 | ||||||
| BROADCASTING—1.5% | ||||||||
| Discovery, Inc., Cl. A* | 3,330,844 | 125,439,585 | ||||||
| CASINOS & GAMING—3.2% | ||||||||
| DraftKings, Inc., Cl. A* | 1,373,549 | 77,825,286 | ||||||
| MGM Resorts International | 2,972,134 | 121,025,296 | ||||||
| Penn National Gaming, Inc.* | 713,805 | 63,614,302 | ||||||
| 262,464,884 | ||||||||
| DATA PROCESSING & OUTSOURCED SERVICES—9.6% | ||||||||
PayPal Holdings, Inc.*,+ | 963,537 | 252,726,120 | ||||||
| Square, Inc., Cl. A* | 598,332 | 146,483,640 | ||||||
Visa, Inc., Cl. A+ | 1,620,805 | 378,555,216 | ||||||
| 777,764,976 | ||||||||
| DIVERSIFIED BANKS—0.3% | ||||||||
| Wells Fargo & Co. | 499,751 | 22,513,782 | ||||||
| DIVERSIFIED SUPPORT SERVICES—1.5% | ||||||||
Cintas Corp.+ | 221,949 | 76,603,478 | ||||||
THE ALGER FUNDS II ALGER SPECTRA FUND |
| Schedule of Investments April 30, 2021 (Unaudited) (Continued) |
| COMMON STOCKS—107.5% (CONT.) | SHARES | VALUE | ||||||
| DIVERSIFIED SUPPORT SERVICES—1.5% (CONT.) | ||||||||
Copart, Inc.* | 346,925 | $ | 43,195,632 | |||||
| 119,799,110 | ||||||||
| ELECTRICAL COMPONENTS & EQUIPMENT—0.5% | ||||||||
AMETEK, Inc. | 159,082 | 21,464,934 | ||||||
Generac Holdings, Inc.* | 60,285 | 19,529,326 | ||||||
| 40,994,260 | ||||||||
| ELECTRONIC MANUFACTURING SERVICES—0.4% | ||||||||
Flex Ltd.* | 1,792,839 | 31,195,399 | ||||||
| FINANCIAL EXCHANGES & DATA—1.4% | ||||||||
CME Group, Inc., Cl. A | 160,421 | 32,403,438 | ||||||
Coinbase Global, Inc., Cl. A* | 59,127 | 17,598,560 | ||||||
S&P Global, Inc. | 159,366 | 62,214,893 | ||||||
| 112,216,891 | ||||||||
| FOOD DISTRIBUTORS—0.9% | ||||||||
US Foods Holding Corp.* | 1,789,949 | 74,211,285 | ||||||
| FOOTWEAR—0.5% | ||||||||
| NIKE, Inc., Cl. B+ | 315,560 | 41,849,567 | ||||||
| HEALTHCARE EQUIPMENT—5.5% | ||||||||
Danaher Corp.+ | 553,721 | 140,611,911 | ||||||
Dexcom, Inc.* | 203,388 | 78,528,107 | ||||||
Insulet Corp.* | 76,497 | 22,583,444 | ||||||
Intuitive Surgical, Inc.* | 211,771 | 183,181,915 | ||||||
Masimo Corp.* | 85,564 | 19,908,176 | ||||||
| 444,813,553 | ||||||||
| HEALTHCARE SERVICES—0.9% | ||||||||
Guardant Health, Inc.* | 470,798 | 74,847,466 | ||||||
| HEALTHCARE SUPPLIES—0.8% | ||||||||
Align Technology, Inc.* | 111,489 | 66,395,044 | ||||||
| HEALTHCARE TECHNOLOGY—1.1% | ||||||||
Veeva Systems, Inc., Cl. A* | 309,986 | 87,555,546 | ||||||
| HOME IMPROVEMENT RETAIL—0.8% | ||||||||
Lowe's Cos., Inc. | 312,270 | 61,282,987 | ||||||
| HOTELS RESORTS & CRUISE LINES—0.8% | ||||||||
Expedia Group, Inc.* | 383,442 | 67,573,984 | ||||||
| HUMAN RESOURCE & EMPLOYMENT SERVICES—0.6% | ||||||||
Upwork, Inc.* | 991,761 | 45,680,512 | ||||||
| INTERACTIVE MEDIA & SERVICES—10.1% | ||||||||
Alphabet, Inc., Cl. C*,+ | 230,042 | 554,428,825 | ||||||
Facebook, Inc., Cl. A*,+ | 144,297 | 46,908,069 | ||||||
Genius Sports Ltd.* | 1,768,608 | 37,317,629 | ||||||
Pinterest, Inc., Cl. A*,+ | 1,888,421 | 125,334,502 | ||||||
Snap, Inc., Cl. A* | 944,841 | 58,410,070 | ||||||
| 822,399,095 | ||||||||
| INTERNET & DIRECT MARKETING RETAIL—9.5% | ||||||||
Altaba, Inc.*,@,(a) ,+ | 606,454 | 7,222,867 | ||||||
Amazon.com, Inc.*,+ | 185,482 | 643,143,997 | ||||||
Magnite, Inc.* | 1,339,216 | 53,635,601 | ||||||
THE ALGER FUNDS II ALGER SPECTRA FUND |
| Schedule of Investments April 30, 2021 (Unaudited) (Continued) |
| COMMON STOCKS—107.5% (CONT.) | SHARES | VALUE | ||||||
| INTERNET & DIRECT MARKETING RETAIL—9.5% (CONT.) | ||||||||
MercadoLibre, Inc.* | 44,480 | $ | 69,877,190 | |||||
| 773,879,655 | ||||||||
| INTERNET SERVICES & INFRASTRUCTURE—3.7% | ||||||||
BigCommerce Holdings, Inc.* | 1,464,139 | 87,760,491 | ||||||
Shopify, Inc., Cl. A* | 85,935 | 101,618,997 | ||||||
Snowflake, Inc., Cl. A* | 173,013 | 40,068,081 | ||||||
Twilio, Inc., Cl. A* | 190,620 | 70,110,036 | ||||||
| 299,557,605 | ||||||||
| LEISURE FACILITIES—0.4% | ||||||||
Vail Resorts, Inc.* | 106,912 | 34,763,506 | ||||||
| MANAGED HEALTHCARE—1.5% | ||||||||
UnitedHealth Group, Inc.+ | 303,566 | 121,062,121 | ||||||
| METAL & GLASS CONTAINERS—0.6% | ||||||||
Ball Corp. | 542,746 | 50,822,735 | ||||||
| MOVIES & ENTERTAINMENT—1.4% | ||||||||
Live Nation Entertainment, Inc.* | 149,494 | 12,240,569 | ||||||
Netflix, Inc.* | 82,440 | 42,330,467 | ||||||
Roku, Inc., Cl. A* | 173,091 | 59,365,020 | ||||||
| 113,936,056 | ||||||||
| PHARMACEUTICALS—0.2% | ||||||||
Green Thumb Industries, Inc.* | 595,160 | 18,912,260 | ||||||
| RAILROADS—0.7% | ||||||||
Union Pacific Corp. | 244,918 | 54,393,839 | ||||||
| RESEARCH & CONSULTING SERVICES—2.0% | ||||||||
CoStar Group, Inc.*,+ | 162,800 | 139,101,204 | ||||||
TransUnion | 254,021 | 26,568,056 | ||||||
| 165,669,260 | ||||||||
| RESTAURANTS—3.1% | ||||||||
Chipotle Mexican Grill, Inc., Cl. A* | 57,915 | 86,410,918 | ||||||
Shake Shack, Inc., Cl. A*,+ | 988,528 | 107,502,420 | ||||||
Starbucks Corp. | 524,937 | 60,100,037 | ||||||
| 254,013,375 | ||||||||
| SEMICONDUCTOR EQUIPMENT—4.3% | ||||||||
Applied Materials, Inc. | 838,022 | 111,213,900 | ||||||
Enphase Energy, Inc.* | 365,235 | 50,858,974 | ||||||
Lam Research Corp.+ | 218,883 | 135,805,957 | ||||||
SolarEdge Technologies, Inc.* | 206,774 | 54,493,220 | ||||||
| 352,372,051 | ||||||||
| SEMICONDUCTORS—6.6% | ||||||||
Advanced Micro Devices, Inc.*,+ | 622,670 | 50,822,325 | ||||||
Micron Technology, Inc.* | 559,750 | 48,177,683 | ||||||
NVIDIA Corp.+ | 269,653 | 161,894,268 | ||||||
NXP Semiconductors NV | 492,400 | 94,791,924 | ||||||
QUALCOMM, Inc.+ | 298,393 | 41,416,948 | ||||||
Taiwan Semiconductor Manufacturing Co., Ltd.# | 1,008,051 | 117,679,874 | ||||||
Universal Display Corp. | 92,782 | 20,754,406 | ||||||
| 535,537,428 | ||||||||
THE ALGER FUNDS II ALGER SPECTRA FUND |
| Schedule of Investments April 30, 2021 (Unaudited) (Continued) |
| COMMON STOCKS—107.5% (CONT.) | SHARES | VALUE | ||||||
| SPECIALTY CHEMICALS—0.2% | ||||||||
The Sherwin-Williams Co.+ | 63,588 | $ | 17,414,846 | |||||
| SYSTEMS SOFTWARE—8.9% | ||||||||
Crowdstrike Holdings, Inc., Cl. A* | 185,713 | 38,723,017 | ||||||
Microsoft Corp.+ | 2,715,338 | 684,753,937 | ||||||
| 723,476,954 | ||||||||
| TECHNOLOGY HARDWARE STORAGE & PERIPHERALS—4.9% | ||||||||
Apple, Inc.+ | 3,005,440 | 395,095,142 | ||||||
| TRUCKING—0.6% | ||||||||
Lyft, Inc., Cl. A* | 823,492 | 45,835,565 | ||||||
| TOTAL COMMON STOCKS | ||||||||
| (Cost $5,270,544,192) | 8,744,947,493 | |||||||
| PREFERRED STOCKS—0.0% | SHARES | VALUE | ||||||
| BIOTECHNOLOGY—0.0% | ||||||||
| Prosetta Biosciences, Inc., Series D*,@,(a),(b) | 2,912,012 | 436,802 | ||||||
| (Cost $13,104,054) | 436,802 | |||||||
| REAL ESTATE INVESTMENT TRUST—0.6% | SHARES | VALUE | ||||||
| RETAIL—0.6% | ||||||||
Simon Property Group, Inc. | 388,371 | 47,280,285 | ||||||
| (Cost $35,974,713) | 47,280,285 | |||||||
| SPECIAL PURPOSE VEHICLE—0.1% | SHARES | VALUE | ||||||
| DATA PROCESSING & OUTSOURCED SERVICES—0.1% | ||||||||
| Crosslink Ventures Capital LLC, Cl. A*,@,(a),(b) | 294 | 7,350,000 | ||||||
| Crosslink Ventures Capital LLC, Cl. B*,@,(a),(b) | 183 | 4,575,000 | ||||||
| 11,925,000 | ||||||||
TOTAL SPECIAL PURPOSE VEHICLE | ||||||||
| (Cost $11,925,000) | 11,925,000 | |||||||
| Total Investments | ||||||||
| (Cost $5,331,547,959) | 108.2 | % | $ | 8,804,589,580 | ||||
| Affiliated Securities (Cost $25,029,054) | 12,361,802 | |||||||
| Unaffiliated Securities (Cost $5,306,518,905) | 8,792,227,778 | |||||||
Securities Sold Short (Proceeds $686,061,881) | (8.7 | )% | (709,116,954 | ) | ||||
Other Assets in Excess of Liabilities | 0.5 | % | 40,126,334 | |||||
| NET ASSETS | 100.0 | % | $ | 8,135,598,960 | ||||
THE ALGER FUNDS II ALGER SPECTRA FUND |
| Schedule of Investments April 30, 2021 (Unaudited) (Continued) |
+ | All or a portion of this security is held as collateral for securities sold short. |
| # | American Depositary Receipts. |
| (a) | Security is valued in good faith at fair value determined using significant unobservable inputs pursuant to procedures established by the Board. |
| (b) | Deemed an affiliate of the Fund in accordance with Section 2(a)(3) of the Investment Company Act of 1940. See Note 11 - Affiliated Securities. |
| * | Non-income producing security. |
| @ | Restricted security - Investment in security not registered under the Securities Act of 1933. Sales or transfers of the investment may be restricted only to qualified buyers. |
Security | Acquisition Date(s) | Acquisition Cost | % of net assets (Acquisition Date) | Market Value | % of net assets as of 4/30/2021 | ||||||||||||
| Altaba, Inc. | 10/24/18 | $ | 1,704,939 | 0.03 | % | $ | 1,155,068 | 0.01 | % | ||||||||
| Altaba, Inc. | 10/25/18 | 2,562,470 | 0.04 | % | 1,727,807 | 0.02 | % | ||||||||||
| Altaba, Inc. | 10/29/18 | 2,492,386 | 0.04 | % | 1,749,948 | 0.02 | % | ||||||||||
| Altaba, Inc. | 10/30/18 | 1,640,707 | 0.03 | % | 1,173,659 | 0.02 | % | ||||||||||
| Altaba, Inc. | 10/31/18 | 591,342 | 0.01 | % | 402,677 | 0.01 | % | ||||||||||
| Altaba, Inc. | 11/6/18 | 2,386,078 | 0.04 | % | 1,013,708 | 0.01 | % | ||||||||||
| Crosslink Ventures Capital LLC, Cl. A | 10/2/20 | 7,350,000 | 0.10 | % | 7,350,000 | 0.09 | % | ||||||||||
| Crosslink Ventures Capital LLC, Cl. B | 12/16/20 | 4,575,000 | 0.06 | % | 4,575,000 | 0.05 | % | ||||||||||
| Prosetta Biosciences, Inc., Series D | 2/6/15 | 13,104,054 | 0.28 | % | 436,802 | 0.01 | % | ||||||||||
| Total | $ | 19,584,669 | 0.24 | % | |||||||||||||
See Notes to Financial Statements.
THE ALGER FUNDS II ALGER SPECTRA FUND |
| Schedule of Investments - Securities Sold Short April 30, 2021 (Unaudited) |
| COMMON STOCKS—(8.5)% | SHARES | VALUE | ||||||
| AEROSPACE & DEFENSE—(0.4)% | ||||||||
Northrop Grumman Corp. | (84,264 | ) | $ | (29,866,532 | ) | |||
| APPLICATION SOFTWARE—(0.3)% | ||||||||
SAP SE# | (191,515 | ) | (26,800,609 | ) | ||||
| AUTO PARTS & EQUIPMENT—(0.7)% | ||||||||
BorgWarner, Inc. | (193,991 | ) | (9,424,083 | ) | ||||
Luminar Technologies, Inc. | (319,871 | ) | (7,277,065 | ) | ||||
QuantumScape Corp., Cl. A | (1,076,181 | ) | (39,323,654 | ) | ||||
| (56,024,802 | ) | |||||||
| BIOTECHNOLOGY—(0.2)% | ||||||||
Regeneron Pharmaceuticals, Inc. | (34,696 | ) | (16,699,185 | ) | ||||
| DIVERSIFIED FINANCIALS—(0.7)% | ||||||||
iShares 20+ Year Treasury Bond ETF | (399,875 | ) | (55,438,670 | ) | ||||
| FOOD RETAIL—(0.3)% | ||||||||
The Kroger Co. | (761,661 | ) | (27,831,093 | ) | ||||
| HOMEBUILDING—(0.2)% | ||||||||
iShares U.S. Home Construction ETF | (222,470 | ) | (16,289,253 | ) | ||||
| HOUSEHOLD PRODUCTS—(1.3)% | ||||||||
Church & Dwight Co., Inc. | (378,236 | ) | (32,429,955 | ) | ||||
Energizer Holdings, Inc. | (176,835 | ) | (8,717,965 | ) | ||||
The Clorox Co. | (365,461 | ) | (66,696,632 | ) | ||||
| (107,844,552 | ) | |||||||
| INDUSTRIAL CONGLOMERATES—(0.4)% | ||||||||
3M Co. | (145,148 | ) | (28,614,477 | ) | ||||
| INTERNET SERVICES & INFRASTRUCTURE—(0.2)% | ||||||||
Fastly, Inc., Cl. A | (232,829 | ) | (14,870,788 | ) | ||||
| IT CONSULTING & OTHER SERVICES—(0.5)% | ||||||||
International Business Machines Corp. | (304,712 | ) | (43,232,538 | ) | ||||
| LEISURE PRODUCTS—(0.3)% | ||||||||
YETI Holdings, Inc. | (280,536 | ) | (23,963,385 | ) | ||||
| LIFE SCIENCES TOOLS & SERVICES—(0.2)% | ||||||||
Illumina, Inc. | (41,115 | ) | (16,151,617 | ) | ||||
| METAL & GLASS CONTAINERS—(0.1)% | ||||||||
Silgan Holdings, Inc. | (209,423 | ) | (8,831,368 | ) | ||||
| MULTI UTILITIES—(0.5)% | ||||||||
Utilities Select Sector SPDR Fund | (561,083 | ) | (37,435,458 | ) | ||||
| PACKAGED FOODS & MEATS—(1.1)% | ||||||||
Campbell Soup Co. | (899,653 | ) | (42,958,431 | ) | ||||
General Mills, Inc. | (802,421 | ) | (48,835,342 | ) | ||||
| (91,793,773 | ) | |||||||
| PUBLISHING—(0.4)% | ||||||||
News Corp., Cl. A | (1,072,789 | ) | (28,101,708 | ) | ||||
| SEMICONDUCTORS—(0.2)% | ||||||||
Intel Corp. | (323,300 | ) | (18,599,449 | ) | ||||
| SYSTEMS SOFTWARE—(0.4)% | ||||||||
SolarWinds Corp. | (464,545 | ) | (7,832,229 | ) | ||||
THE ALGER FUNDS II ALGER SPECTRA FUND |
| Schedule of Investments - Securities Sold Short April 30, 2021 (Unaudited) (Continued) |
| COMMON STOCKS—(8.5)% (CONT.) | SHARES | VALUE | ||||||
| SYSTEMS SOFTWARE—(0.4)% (CONT.) | ||||||||
Teradata Corp. | (487,883 | ) | $ | (24,135,572 | ) | |||
| (31,967,801 | ) | |||||||
| TRUCKING—(0.1)% | ||||||||
Werner Enterprises, Inc. | (203,895 | ) | (9,426,066 | ) | ||||
| TOTAL COMMON STOCKS | ||||||||
(Proceeds $667,456,321) | $ | (689,783,124 | ) | |||||
| REAL ESTATE INVESTMENT TRUST—(0.2)% | SHARES | VALUE | ||||||
| HEALTHCARE—(0.2)% | ||||||||
Omega Healthcare Investors, Inc. | (508,785 | ) | (19,333,830 | ) | ||||
(Proceeds $18,605,560) | $ | (19,333,830 | ) | |||||
| Total Securities Sold Short | ||||||||
(Proceeds $686,061,881) | $ | (709,116,954 | ) | |||||
| # | American Depositary Receipts. |
See Notes to Financial Statements.
THE ALGER FUNDS II ALGER DYNAMIC OPPORTUNITIES FUND |
| Schedule of Investments April 30, 2021 (Unaudited) |
| COMMON STOCKS—92.1% | SHARES | VALUE | ||||||
| ADVERTISING—0.4% | ||||||||
Cardlytics, Inc.* | 20,873 | $ | 2,870,664 | |||||
| AEROSPACE & DEFENSE—4.9% | ||||||||
HEICO Corp.+ | 58,437 | 8,227,930 | ||||||
HEICO Corp., Cl. A+ | 84,615 | 10,685,182 | ||||||
Kratos Defense & Security Solutions, Inc.*,+ | 65,998 | 1,764,787 | ||||||
TransDigm Group, Inc.*,+ | 25,183 | 15,455,814 | ||||||
| 36,133,713 | ||||||||
| AIR FREIGHT & LOGISTICS—0.7% | ||||||||
XPO Logistics, Inc.* | 37,542 | 5,222,843 | ||||||
| APPAREL ACCESSORIES & LUXURY GOODS—0.2% | ||||||||
Capri Holdings Ltd.* | 26,828 | 1,477,686 | ||||||
| APPAREL RETAIL—0.5% | ||||||||
MYT Netherlands Parent BV#,* | 124,890 | 3,742,953 | ||||||
| APPLICATION SOFTWARE—9.8% | ||||||||
Adobe, Inc.* | 13,350 | 6,786,339 | ||||||
Altair Engineering, Inc., Cl. A*,+ | 6,405 | 416,325 | ||||||
Avalara, Inc.* | 18,087 | 2,563,109 | ||||||
Bill.com Holdings, Inc.* | 12,871 | 1,990,243 | ||||||
Cerence, Inc.* | 62,283 | 6,004,704 | ||||||
Coupa Software, Inc.* | 2,261 | 608,299 | ||||||
Digital Turbine, Inc.* | 24,830 | 1,872,927 | ||||||
Dynatrace, Inc.* | 103,168 | 5,368,863 | ||||||
Ebix, Inc.+ | 114,686 | 3,453,196 | ||||||
Everbridge, Inc.*,+ | 27,859 | 3,697,168 | ||||||
Five9, Inc.* | 31,505 | 5,921,995 | ||||||
HubSpot, Inc.* | 7,656 | 4,030,501 | ||||||
LivePerson, Inc.* | 24,979 | 1,365,102 | ||||||
Olo, Inc., Cl. A* | 197 | 5,685 | ||||||
Paylocity Holding Corp.*,+ | 83,841 | 16,201,435 | ||||||
SEMrush Holdings, Inc., Cl. A* | 75,606 | 1,243,719 | ||||||
Sprout Social, Inc., Cl. A* | 28,625 | 1,897,551 | ||||||
SPS Commerce, Inc.*,+ | 25,677 | 2,630,352 | ||||||
The Trade Desk, Inc., Cl. A*,+ | 529 | 385,805 | ||||||
Vertex, Inc., Cl. A* | 128,747 | 2,630,301 | ||||||
Voyager Digital Ltd.* | 123,520 | 2,779,200 | ||||||
| 71,852,819 | ||||||||
| ASSET MANAGEMENT & CUSTODY BANKS—2.0% | ||||||||
Hamilton Lane, Inc., Cl. A+ | 73,831 | 6,678,014 | ||||||
Silver Spike Acquisition Corp., Cl. A* | 64,504 | 1,128,820 | ||||||
StepStone Group, Inc., Cl. A+ | 204,804 | 6,819,973 | ||||||
| 14,626,807 | ||||||||
| AUTOMOBILE MANUFACTURERS—0.1% | ||||||||
Tesla, Inc.*,+ | 1,288 | 913,759 | ||||||
| AUTOMOTIVE RETAIL—0.5% | ||||||||
Carvana Co., Cl. A* | 12,243 | 3,492,438 | ||||||
| BIOTECHNOLOGY—5.4% | ||||||||
ACADIA Pharmaceuticals, Inc.*,+ | 270,593 | 5,563,392 | ||||||
BioMarin Pharmaceutical, Inc.* | 24,226 | 1,887,690 | ||||||
THE ALGER FUNDS II ALGER DYNAMIC OPPORTUNITIES FUND |
| Schedule of Investments April 30, 2021 (Unaudited) (Continued) |
| COMMON STOCKS—92.1% (CONT.) | SHARES | VALUE | ||||||
| BIOTECHNOLOGY—5.4% (CONT.) | ||||||||
Forte Biosciences, Inc.* | 94,485 | $ | 3,419,412 | |||||
Natera, Inc.*,+ | 212,824 | 23,414,896 | ||||||
Puma Biotechnology, Inc.* | 362,473 | 3,573,984 | ||||||
Ultragenyx Pharmaceutical, Inc.* | 14,590 | 1,628,828 | ||||||
| 39,488,202 | ||||||||
| BROADCASTING—1.3% | ||||||||
Discovery, Inc., Cl. A* | 245,322 | 9,238,826 | ||||||
| CASINOS & GAMING—2.4% | ||||||||
DraftKings, Inc., Cl. A*,+ | 30,740 | 1,741,728 | ||||||
Evolution Gaming Group AB | 5,299 | 1,046,081 | ||||||
Flutter Entertainment PLC* | 13,110 | 2,672,829 | ||||||
MGM Resorts International | 240,766 | 9,803,992 | ||||||
Penn National Gaming, Inc.* | 26,426 | 2,355,085 | ||||||
| 17,619,715 | ||||||||
| CONSTRUCTION & ENGINEERING—0.2% | ||||||||
Ameresco, Inc., Cl. A* | 23,024 | 1,215,437 | ||||||
| CONSUMER FINANCE—2.8% | ||||||||
LendingTree, Inc.* | 13,323 | 2,751,066 | ||||||
Upstart Holdings, Inc.*,+ | 163,201 | 17,792,173 | ||||||
| 20,543,239 | ||||||||
| DATA PROCESSING & OUTSOURCED SERVICES—3.0% | ||||||||
PayPal Holdings, Inc.*,+ | 24,646 | 6,464,399 | ||||||
Square, Inc., Cl. A* | 30,547 | 7,478,517 | ||||||
Visa, Inc., Cl. A+ | 34,852 | 8,140,033 | ||||||
| 22,082,949 | ||||||||
| DEPARTMENT STORES—0.2% | ||||||||
Kohl's Corp. | 31,427 | 1,843,508 | ||||||
| DIVERSIFIED BANKS—0.7% | ||||||||
Wells Fargo & Co. | 112,355 | 5,061,593 | ||||||
| DIVERSIFIED SUPPORT SERVICES—0.6% | ||||||||
UniFirst Corp. | 19,721 | 4,421,251 | ||||||
| EDUCATION SERVICES—4.1% | ||||||||
Chegg, Inc.*,+ | 332,083 | 29,997,057 | ||||||
| ELECTRICAL COMPONENTS & EQUIPMENT—0.8% | ||||||||
AMETEK, Inc. | 38,796 | 5,234,744 | ||||||
Generac Holdings, Inc.* | 1,097 | 355,373 | ||||||
| 5,590,117 | ||||||||
| ELECTRONIC EQUIPMENT & INSTRUMENTS—0.2% | ||||||||
Trimble, Inc.* | 17,839 | 1,462,798 | ||||||
| ENVIRONMENTAL & FACILITIES SERVICES—2.4% | ||||||||
Casella Waste Systems, Inc., Cl. A*,+ | 68,324 | 4,585,224 | ||||||
Montrose Environmental Group, Inc.* | 109,725 | 5,948,192 | ||||||
Waste Connections, Inc.+ | 56,971 | 6,785,816 | ||||||
| 17,319,232 | ||||||||
| FINANCIAL EXCHANGES & DATA—0.4% | ||||||||
Coinbase Global, Inc., Cl. A* | 10,920 | 3,250,229 | ||||||
| FOOD DISTRIBUTORS—1.0% | ||||||||
US Foods Holding Corp.*,+ | 183,765 | 7,618,897 | ||||||
THE ALGER FUNDS II ALGER DYNAMIC OPPORTUNITIES FUND |
| Schedule of Investments April 30, 2021 (Unaudited) (Continued) |
| COMMON STOCKS—92.1% (CONT.) | SHARES | VALUE | ||||||
| GENERAL MERCHANDISE STORES—1.4% | ||||||||
Ollie's Bargain Outlet Holdings, Inc.*,+ | 108,073 | $ | 9,971,896 | |||||
| HEALTHCARE DISTRIBUTORS—1.2% | ||||||||
Apria, Inc.* | 197,673 | 5,920,306 | ||||||
PetIQ, Inc., Cl. A* | 67,134 | 2,859,909 | ||||||
| 8,780,215 | ||||||||
| HEALTHCARE EQUIPMENT—6.5% | ||||||||
CryoPort, Inc.* | 67,304 | 3,807,387 | ||||||
Eargo, Inc.* | 68,998 | 3,949,446 | ||||||
Glaukos Corp.*,+ | 63,923 | 6,018,990 | ||||||
Insulet Corp.*,+ | 23,679 | 6,990,514 | ||||||
Intuitive Surgical, Inc.*,+ | 9,379 | 8,112,835 | ||||||
Nevro Corp.*,+ | 108,799 | 18,801,555 | ||||||
| 47,680,727 | ||||||||
| HEALTHCARE FACILITIES—0.4% | ||||||||
The Joint Corp.* | 48,520 | 2,691,890 | ||||||
| HEALTHCARE SERVICES—0.5% | ||||||||
| Guardant Health, Inc.*,+ | 24,921 | 3,961,941 | ||||||
| HEALTHCARE SUPPLIES—0.5% | ||||||||
Align Technology, Inc.* | 6,182 | 3,681,566 | ||||||
| HEALTHCARE TECHNOLOGY—1.5% | ||||||||
Inspire Medical Systems, Inc.* | 8,955 | 2,120,723 | ||||||
Tabula Rasa HealthCare, Inc.* | 60,212 | 2,863,683 | ||||||
Veeva Systems, Inc., Cl. A* | 20,666 | 5,837,111 | ||||||
| 10,821,517 | ||||||||
| HOTELS RESORTS & CRUISE LINES—0.8% | ||||||||
Expedia Group, Inc.* | 29,073 | 5,123,535 | ||||||
Travel + Leisure Co. | 11,342 | 731,899 | ||||||
| 5,855,434 | ||||||||
| HUMAN RESOURCE & EMPLOYMENT SERVICES—0.5% | ||||||||
Upwork, Inc.* | 82,701 | 3,809,208 | ||||||
| INDUSTRIAL CONGLOMERATES—0.4% | ||||||||
General Electric Co. | 246,462 | 3,233,581 | ||||||
| INSURANCE BROKERS—0.1% | ||||||||
Goosehead Insurance, Inc., Cl. A | 6,755 | 742,645 | ||||||
| INTERACTIVE MEDIA & SERVICES—4.0% | ||||||||
Alphabet, Inc., Cl. C*,+ | 3,335 | 8,037,750 | ||||||
Genius Sports Ltd.*,+ | 443,574 | 9,359,411 | ||||||
Pinterest, Inc., Cl. A* | 96,207 | 6,385,259 | ||||||
Snap, Inc., Cl. A* | 90,180 | 5,574,928 | ||||||
| 29,357,348 | ||||||||
| INTERNET & DIRECT MARKETING RETAIL—3.4% | ||||||||
Amazon.com, Inc.*,+ | 2,529 | 8,769,105 | ||||||
Chewy, Inc., Cl. A* | 20,400 | 1,626,288 | ||||||
Magnite, Inc.*,+ | 67,772 | 2,714,269 | ||||||
Quotient Technology, Inc.* | 223,164 | 3,646,500 | ||||||
The RealReal, Inc.* | 73,384 | 1,817,722 | ||||||
Wayfair, Inc., Cl. A*,+ | 22,057 | 6,519,387 | ||||||
| 25,093,271 | ||||||||
THE ALGER FUNDS II ALGER DYNAMIC OPPORTUNITIES FUND |
| Schedule of Investments April 30, 2021 (Unaudited) (Continued) |
| COMMON STOCKS—92.1% (CONT.) | SHARES | VALUE | ||||||
| INTERNET SERVICES & INFRASTRUCTURE—1.8% | ||||||||
BigCommerce Holdings, Inc.* | 114,488 | $ | 6,862,411 | |||||
Shopify, Inc., Cl. A*,+ | 5,204 | 6,153,782 | ||||||
| 13,016,193 | ||||||||
| IT CONSULTING & OTHER SERVICES—0.5% | ||||||||
EPAM Systems, Inc.*,+ | 6,063 | 2,775,338 | ||||||
Globant SA* | 3,911 | 896,323 | ||||||
| 3,671,661 | ||||||||
| LEISURE FACILITIES—0.3% | ||||||||
Planet Fitness, Inc., Cl. A* | 26,154 | 2,196,674 | ||||||
| LEISURE PRODUCTS—0.0% | ||||||||
Latham Group, Inc.* | 12,340 | 320,840 | ||||||
| LIFE SCIENCES TOOLS & SERVICES—2.0% | ||||||||
10X Genomics, Inc., Cl. A* | 15,181 | 3,002,802 | ||||||
Bio-Techne Corp. | 9,299 | 3,975,230 | ||||||
NeoGenomics, Inc.*,+ | 161,473 | 7,910,562 | ||||||
| 14,888,594 | ||||||||
| MANAGED HEALTHCARE—2.9% | ||||||||
Progyny, Inc.*,+ | 377,480 | 21,482,387 | ||||||
| MOVIES & ENTERTAINMENT—0.5% | ||||||||
Roku, Inc., Cl. A* | 10,189 | 3,494,521 | ||||||
| OIL & GAS EQUIPMENT & SERVICES—1.0% | ||||||||
Core Laboratories NV+ | 252,436 | 7,113,646 | ||||||
| PHARMACEUTICALS—1.4% | ||||||||
Aerie Pharmaceuticals, Inc.* | 121,896 | 2,088,079 | ||||||
Catalent, Inc.* | 33,724 | 3,792,938 | ||||||
Green Thumb Industries, Inc.* | 134,235 | 4,265,554 | ||||||
| 10,146,571 | ||||||||
| REAL ESTATE SERVICES—2.1% | ||||||||
FirstService Corp.+ | 97,092 | 15,753,177 | ||||||
| REGIONAL BANKS—2.9% | ||||||||
Signature Bank+ | 85,560 | 21,519,196 | ||||||
| RESEARCH & CONSULTING SERVICES—1.0% | ||||||||
CoStar Group, Inc.*,+ | 8,180 | 6,989,237 | ||||||
| RESTAURANTS—1.3% | ||||||||
Shake Shack, Inc., Cl. A* | 58,835 | 6,398,306 | ||||||
The Cheesecake Factory, Inc.* | 14,690 | 919,447 | ||||||
Wingstop, Inc. | 14,186 | 2,247,205 | ||||||
| 9,564,958 | ||||||||
| SEMICONDUCTOR EQUIPMENT—3.2% | ||||||||
Applied Materials, Inc.+ | 51,216 | 6,796,875 | ||||||
Enphase Energy, Inc.* | 35,800 | 4,985,150 | ||||||
Lam Research Corp. | 10,811 | 6,707,685 | ||||||
MKS Instruments, Inc. | 17,713 | 3,172,576 | ||||||
SolarEdge Technologies, Inc.* | 5,809 | 1,530,904 | ||||||
| 23,193,190 | ||||||||
| SEMICONDUCTORS—0.7% | ||||||||
Impinj, Inc.* | 60,603 | 2,876,218 | ||||||
THE ALGER FUNDS II ALGER DYNAMIC OPPORTUNITIES FUND |
| Schedule of Investments April 30, 2021 (Unaudited) (Continued) |
| COMMON STOCKS—92.1% (CONT.) | SHARES | VALUE | ||||||
| SEMICONDUCTORS—0.7% (CONT.) | ||||||||
QUALCOMM, Inc.+ | 16,742 | $ | 2,323,790 | |||||
| 5,200,008 | ||||||||
| SYSTEMS SOFTWARE—2.5% | ||||||||
| Crowdstrike Holdings, Inc., Cl. A* | 21,934 | 4,573,458 | ||||||
Microsoft Corp.+ | 50,135 | 12,643,044 | ||||||
| Rapid7, Inc.* | 14,239 | 1,156,919 | ||||||
| 18,373,421 | ||||||||
| TECHNOLOGY HARDWARE STORAGE & PERIPHERALS—1.5% | ||||||||
Apple, Inc.+ | 83,606 | 10,990,845 | ||||||
| THRIFTS & MORTGAGE FINANCE—0.1% | ||||||||
Axos Financial, Inc.*,+ | 16,699 | 753,960 | ||||||
| TRADING COMPANIES & DISTRIBUTORS—0.2% | ||||||||
| SiteOne Landscape Supply, Inc.* | 9,314 | 1,670,745 | ||||||
| TRUCKING—0.4% | ||||||||
| Lyft, Inc., Cl. A* | 55,413 | 3,084,288 | ||||||
| TOTAL COMMON STOCKS | ||||||||
| (Cost $560,057,215) | 676,192,083 | |||||||
| PREFERRED STOCKS—0.0% | SHARES | VALUE | ||||||
| BIOTECHNOLOGY—0.0% | ||||||||
| Prosetta Biosciences, Inc., Series D*,@,(a),(b) | 41,418 | 6,213 | ||||||
| (Cost $186,381) | 6,213 | |||||||
| WARRANTS—0.2% | SHARES | VALUE | ||||||
| BIOTECHNOLOGY—0.2% | ||||||||
| Forte Biosciences, Inc., 6/30/21*,@ | 61,681 | 1,580,637 | ||||||
| (Cost $0) | 1,580,637 | |||||||
| RIGHTS—0.0% | SHARES | VALUE | ||||||
| BIOTECHNOLOGY—0.0% | ||||||||
| Adolor Corp., CPR*,@,(a),(c) | 49,870 | – | ||||||
| Tolero CDR*,@,(a),(d) | 126,108 | 105,098 | ||||||
| 105,098 | ||||||||
| TOTAL RIGHTS | ||||||||
| (Cost $67,638) | 105,098 | |||||||
| REAL ESTATE INVESTMENT TRUST—1.4% | SHARES | VALUE | ||||||
| RETAIL—1.4% | ||||||||
| Simon Property Group, Inc. | 38,125 | 4,641,338 | ||||||
| Tanger Factory Outlet Centers, Inc. | 334,878 | 5,843,621 | ||||||
| 10,484,959 | ||||||||
| TOTAL REAL ESTATE INVESTMENT TRUST | ||||||||
| (Cost $7,224,127) | 10,484,959 | |||||||
| SPECIAL PURPOSE VEHICLE—0.2% | SHARES | VALUE | ||||||
| DATA PROCESSING & OUTSOURCED SERVICES—0.2% | ||||||||
| Crosslink Ventures Capital LLC, Cl. A*,@,(a),(b) | 37 | 925,000 | ||||||
| Crosslink Ventures Capital LLC, Cl. B*,@,(a),(b) | 22 | 550,000 | ||||||
| 1,475,000 | ||||||||
| TOTAL SPECIAL PURPOSE VEHICLE | ||||||||
| (Cost $1,475,000) | 1,475,000 | |||||||
THE ALGER FUNDS II ALGER DYNAMIC OPPORTUNITIES FUND |
| Schedule of Investments April 30, 2021 (Unaudited) (Continued) |
PURCHASED OPTIONS—0.3% SECURITY NAME/ EXPIRATION DATE/ STRIKE PRICE | NOTIONAL AMOUNTS | COUNTERPARTY | NUMBER OF CONTRACTS | VALUE | |||||||||
| PUT OPTIONS—0.3% | |||||||||||||
| iRhythm Technologies, Inc., 05/21/2021, 115.00* | $ | 4,718,316 | BNP Paribas | 606 | $ | 2,260,380 | |||||||
| Lemonade, Inc., | |||||||||||||
| 12/17/21, 100.00* | 45,200 | BNP Paribas | 5 | 12,350 | |||||||||
| (Cost $531,069) | 2,272,730 | ||||||||||||
| TOTAL PURCHASED OPTIONS | |||||||||||||
| (Cost $531,069) | 2,272,730 | ||||||||||||
| Total Investments | |||||||||||||
| (Cost $569,541,430) | 94.2 | % | $ | 692,116,720 | |||||||||
| Affiliated Securities (Cost $1,661,381) | 1,481,213 | ||||||||||||
| Unaffiliated Securities (Cost $567,880,049) | 690,635,507 | ||||||||||||
| Securities Sold Short (Proceeds $220,386,203) | (30.2 | )% | (221,610,543 | ) | |||||||||
| Swaps | (0.1 | )% | (582,898 | ) | |||||||||
| Other Assets in Excess of Liabilities | 36.1 | % | 264,717,619 | ||||||||||
| NET ASSETS | 100.0 | % | $ | 734,640,898 | |||||||||
+ | All or a portion of this security is held as collateral for securities sold short. |
# | American Depositary Receipts. |
(a) | Security is valued in good faith at fair value determined using significant unobservable inputs pursuant to procedures established by the Board. |
(b) | Deemed an affiliate of the Fund in accordance with Section 2(a)(3) of the Investment Company Act of 1940. See Note 11 - Affiliated Securities. |
(c) | Right - Contingent Payment Right granted December 13, 2011 and may not be sold. Right is deemed to be illiquid and represents 0.0% of the net assets of the Fund. |
(d) | Contingent Deferred Rights. |
* | Non-income producing security. |
@ | Restricted security - Investment in security not registered under the Securities Act of 1933. Sales or transfers of the investment may be restricted only to qualified buyers. |
Security | Acquisition Date(s) | Acquisition Cost | % of net assets (Acquisition Date) | Market Value | % of net assets as of 4/30/2021 | ||||||||||||
| Adolor Corp., CPR | 10/24/11 | $ | 0 | 0.00 | % | $ | 0 | 0.00 | % | ||||||||
| Crosslink Ventures Capital LLC, Cl. A | 10/2/20 | 925,000 | 0.24 | % | 925,000 | 0.13 | % | ||||||||||
| Crosslink Ventures Capital LLC, Cl. B | 12/16/20 | 550,000 | 0.11 | % | 550,000 | 0.07 | % | ||||||||||
| Forte Biosciences, Inc., Warrants | 2/19/20 | 0 | 0.00 | % | 1,580,637 | 0.22 | % | ||||||||||
| Prosetta Biosciences, Inc., Series D | 2/6/15 | 186,381 | 0.25 | % | 6,213 | 0.00 | % | ||||||||||
| Tolero CDR | 2/6/17 | 67,638 | 0.09 | % | 105,098 | 0.01 | % | ||||||||||
| Total | $ | 3,166,948 | 0.43 | % | |||||||||||||
THE ALGER FUNDS II ALGER DYNAMIC OPPORTUNITIES FUND |
| Schedule of Investments April 30, 2021 (Unaudited) (Continued) |
| Swaps outstanding as of April, 2021: | ||||||||||||||||||||
| Centrally cleared swaps - Contracts for difference | ||||||||||||||||||||
Contract Amount | Counterparty | Reference Company | Market Value | Unrealized Appreciation | Unrealized (Depreciation) | Net Unrealized Appreciation/ (Depreciation) | ||||||||||||||
$ | 3,422,181 | Goldman Sachs | Church & Dwight Co., Inc | $ | (183,127 | ) | $ | – | $ | (126,391 | ) | $ | (126,391 | ) | ||||||
| 1,636,772 | Goldman Sachs | Intel Corp. | 45,283 | 45,283 | – | 45,283 | ||||||||||||||
| 2,379,319 | Goldman Sachs | Omnicom Group, Inc. | (523,125 | ) | – | (523,126 | ) | (523,126 | ) | |||||||||||
| 3,572,046 | Goldman Sachs | The Clorox Co. | 96,865 | 96,866 | – | 96,866 | ||||||||||||||
| 837,436 | Goldman Sachs | The Kroger Co. | (18,794 | ) | – | (18,794 | ) | (18,794 | ) | |||||||||||
| Total | $ | (582,898 | ) | $ | 142,149 | $ | (668,311 | ) | $ | (526,162 | ) | |||||||||
See Notes to Financial Statements.
THE ALGER FUNDS II ALGER DYNAMIC OPPORTUNITIES FUND |
| Schedule of Investments - Securities Sold Short April 30, 2021 (Unaudited) |
| COMMON STOCKS—(26.4)% | SHARES | VALUE | ||||||
| APPLICATION SOFTWARE—(1.4)% | ||||||||
| 2U, Inc. | (26,226 | ) | $ | (1,029,370 | ) | |||
| AppLovin Corp., Cl. A | (15,217 | ) | (882,738 | ) | ||||
| Elastic NV | (15,067 | ) | (1,817,381 | ) | ||||
| SAP SE# | (32,622 | ) | (4,565,123 | ) | ||||
| ShotSpotter, Inc. | (64,315 | ) | (2,247,166 | ) | ||||
| (10,541,778 | ) | |||||||
| ASSET MANAGEMENT & CUSTODY BANKS—(0.1)% | ||||||||
| Main Street Capital Corp. | (11,885 | ) | (506,182 | ) | ||||
| AUTO PARTS & EQUIPMENT—(0.3)% | ||||||||
| Luminar Technologies, Inc. | (43,821 | ) | (996,928 | ) | ||||
| QuantumScape Corp., Cl. A | (47,899 | ) | (1,750,229 | ) | ||||
| (2,747,157 | ) | |||||||
| AUTOMOBILE MANUFACTURERS—(0.1)% | ||||||||
| ElectraMeccanica Vehicles Corp. | (180,501 | ) | (749,079 | ) | ||||
| BIOTECHNOLOGY—(0.7)% | ||||||||
| Apellis Pharmaceuticals, Inc. | (34,237 | ) | (1,734,789 | ) | ||||
| Flexion Therapeutics, Inc. | (268,917 | ) | (2,086,796 | ) | ||||
| Regeneron Pharmaceuticals, Inc. | (3,567 | ) | (1,716,797 | ) | ||||
| (5,538,382 | ) | |||||||
| BREWERS—(0.3)% | ||||||||
| Molson Coors Beverage Co., Cl. B | (34,567 | ) | (1,899,457 | ) | ||||
| BUILDING PRODUCTS—(0.1)% | ||||||||
| Lennox International, Inc. | (2,255 | ) | (756,192 | ) | ||||
| CABLE & SATELLITE—(0.2)% | ||||||||
| Sirius XM Holdings, Inc. | (177,517 | ) | (1,082,854 | ) | ||||
| CONSTRUCTION MACHINERY & HEAVY TRUCKS—(0.2)% | ||||||||
| Nikola Corp. | (101,504 | ) | (1,174,401 | ) | ||||
| DATA PROCESSING & OUTSOURCED SERVICES—(0.2)% | ||||||||
| MAXIMUS, Inc. | (15,920 | ) | (1,458,909 | ) | ||||
| DEPARTMENT STORES—(0.2)% | ||||||||
| Nordstrom, Inc. | (35,612 | ) | (1,306,248 | ) | ||||
| DIVERSIFIED SUPPORT SERVICES—(0.4)% | ||||||||
| Healthcare Services Group, Inc. | (85,236 | ) | (2,552,818 | ) | ||||
| Viad Corp. | (2,770 | ) | (115,398 | ) | ||||
| (2,668,216 | ) | |||||||
| DIVERSIFIED FINANCIALS—(0.7)% | ||||||||
| iRhythm Technologies, Inc. | (39,279 | ) | (3,058,263 | ) | ||||
| EDUCATION SERVICES—(0.2)% | ||||||||
| Bright Horizons Family Solutions, Inc. | (11,245 | ) | (1,628,613 | ) | ||||
| ELECTRICAL COMPONENTS & EQUIPMENT—(0.1)% | ||||||||
| FuelCell Energy, Inc. | (38,728 | ) | (376,049 | ) | ||||
| FOOD RETAIL—(0.4)% | ||||||||
| Grocery Outlet Holding Corp. | (70,817 | ) | (2,860,299 | ) | ||||
| HEALTHCARE EQUIPMENT—(0.5)% | ||||||||
| iRhythm Technologies, Inc. | (39,279 | ) | (3,058,263 | ) | ||||
THE ALGER FUNDS II ALGER DYNAMIC OPPORTUNITIES FUND |
| Schedule of Investments - Securities Sold Short April 30, 2021 (Unaudited) (Continued) |
| COMMON STOCKS—(26.4)% (CONT.) | SHARES | VALUE | ||||||
| HEALTHCARE EQUIPMENT—(0.5)% (CONT.) | ||||||||
| Penumbra, Inc. | (3,330 | ) | $ | (1,018,947 | ) | |||
| (4,077,210 | ) | |||||||
| HEALTHCARE TECHNOLOGY—0.0% | ||||||||
| Castlight Health, Inc., Cl. B | (7,950 | ) | (15,105 | ) | ||||
| HOME FURNISHINGS—(0.1)% | ||||||||
| Leggett & Platt, Inc. | (18,313 | ) | (909,607 | ) | ||||
| INDUSTRIAL MACHINERY—(0.3)% | ||||||||
| Proto Labs, Inc. | (17,577 | ) | (1,969,679 | ) | ||||
| INTERACTIVE HOME ENTERTAINMENT—(0.1)% | ||||||||
| Playtika Holding Corp. | (30,845 | ) | (856,874 | ) | ||||
| INTERACTIVE MEDIA & SERVICES—(0.1)% | ||||||||
| Twitter, Inc. | (12,961 | ) | (715,706 | ) | ||||
| INTERNET & DIRECT MARKETING RETAIL—(0.7)% | ||||||||
| DoorDash, Inc., Cl. A | (6,467 | ) | (925,880 | ) | ||||
| JD.com, Inc.# | (32,265 | ) | (2,496,020 | ) | ||||
| Just Eat Takeaway.com NV | (12,377 | ) | (1,278,940 | ) | ||||
| ThredUp, Inc., Cl. A | (11,065 | ) | (189,986 | ) | ||||
| (4,890,826 | ) | |||||||
| INTERNET SERVICES & INFRASTRUCTURE—(1.5)% | ||||||||
| Akamai Technologies, Inc. | (22,773 | ) | (2,475,425 | ) | ||||
| Fastly, Inc., Cl. A | (22,924 | ) | (1,464,156 | ) | ||||
| GTT Communications, Inc. | (128,460 | ) | (206,821 | ) | ||||
| Rackspace Technology, Inc. | (91,025 | ) | (2,263,792 | ) | ||||
| Snowflake, Inc., Cl. A | (20,418 | ) | (4,728,605 | ) | ||||
| (11,138,799 | ) | |||||||
| IT CONSULTING & OTHER SERVICES—(0.5)% | ||||||||
| International Business Machines Corp. | (26,868 | ) | (3,812,032 | ) | ||||
| LEISURE PRODUCTS—(0.3)% | ||||||||
| YETI Holdings, Inc. | (22,821 | ) | (1,949,370 | ) | ||||
| LIFE SCIENCES TOOLS & SERVICES—(0.2)% | ||||||||
| Illumina, Inc. | (4,516 | ) | (1,774,065 | ) | ||||
| MARKET INDICES—(13.1)% | ||||||||
| iShares Russell 2000 Growth ETF | (260,351 | ) | (79,826,220 | ) | ||||
| iShares Russell Mid-Capital Growth ETF | (150,089 | ) | (16,155,580 | ) | ||||
| (95,981,800 | ) | |||||||
| MOVIES & ENTERTAINMENT—(0.3)% | ||||||||
| Spotify Technology SA | (10,079 | ) | (2,541,117 | ) | ||||
| PACKAGED FOODS & MEATS—(0.7)% | ||||||||
| Beyond Meat, Inc. | (20,145 | ) | (2,652,694 | ) | ||||
| General Mills, Inc. | (42,304 | ) | (2,574,621 | ) | ||||
| (5,227,315 | ) | |||||||
| PROPERTY & CASUALTY INSURANCE—(1.4)% | ||||||||
| Kinsale Capital Group, Inc. | (17,146 | ) | (2,983,576 | ) | ||||
| Lemonade, Inc. | (35,769 | ) | (3,233,518 | ) | ||||
| Palomar Holdings, Inc. | (64,139 | ) | (4,512,820 | ) | ||||
THE ALGER FUNDS II ALGER DYNAMIC OPPORTUNITIES FUND |
| Schedule of Investments - Securities Sold Short April 30, 2021 (Unaudited) (Continued) |
| COMMON STOCKS—(26.4)% (CONT.) | SHARES | VALUE | ||||||
| PROPERTY & CASUALTY INSURANCE—(1.4)% (CONT.) | ||||||||
| Universal Insurance Holdings, Inc. | (2,323 | ) | $ | (32,406 | ) | |||
| (10,762,320 | ) | |||||||
| PUBLISHING—(0.2)% | ||||||||
| News Corp., Cl. A | (64,595 | ) | (1,692,066 | ) | ||||
| REGIONAL BANKS—(0.2)% | ||||||||
| Great Western Bancorp, Inc. | (41,261 | ) | (1,363,676 | ) | ||||
| RESTAURANTS—(0.2)% | ||||||||
| Domino's Pizza, Inc. | (3,483 | ) | (1,471,010 | ) | ||||
| SPECIALTY STORES—(0.1)% | ||||||||
| Petco Health & Wellness Co., Inc., Cl. A | (36,848 | ) | (870,350 | ) | ||||
| SYSTEMS SOFTWARE—(0.3)% | ||||||||
| Check Point Software Technologies Ltd. | (15,684 | ) | (1,832,048 | ) | ||||
| TOTAL COMMON STOCKS | ||||||||
| (Proceeds $195,110,123) | $ | (193,914,562 | ) | |||||
| REAL ESTATE INVESTMENT TRUST—(3.8)% | SHARES | VALUE | ||||||
| DIVERSIFIED—(0.4)% | ||||||||
| Empire State Realty Trust, Inc., Cl. A | (234,279 | ) | (2,668,438 | ) | ||||
| HEALTHCARE—(1.7)% | ||||||||
| Omega Healthcare Investors, Inc. | (329,962 | ) | (12,538,556 | ) | ||||
| OFFICE—(1.2)% | ||||||||
| Boston Properties, Inc. | (6,559 | ) | (717,227 | ) | ||||
| Hudson Pacific Properties, Inc. | (34,490 | ) | (969,514 | ) | ||||
| Paramount Group, Inc. | (305,058 | ) | (3,236,665 | ) | ||||
| SL Green Realty Corp. | (23,474 | ) | (1,737,311 | ) | ||||
| Vornado Realty Trust | (54,119 | ) | (2,475,944 | ) | ||||
| (9,136,661 | ) | |||||||
| RETAIL—(0.5)% | ||||||||
| CBL & Associates Properties, Inc. | (13,748 | ) | (1,732 | ) | ||||
| Pennsylvania Real Estate Investment Trust | (6,036 | ) | (11,468 | ) | ||||
| Seritage Growth Properties, Cl. A | (193,950 | ) | (3,335,940 | ) | ||||
| Washington Prime Group, Inc. | (1,295 | ) | (3,186 | ) | ||||
| (3,352,326 | ) | |||||||
| TOTAL REAL ESTATE INVESTMENT TRUST | ||||||||
| (Proceeds $25,276,080) | $ | (27,695,981 | ) | |||||
| Total Securities Sold Short | ||||||||
| (Proceeds $220,386,203) | $ | (221,610,543 | ) | |||||
# | American Depositary Receipts. |
See Notes to Financial Statements.
THE ALGER FUNDS II ALGER EMERGING MARKETS FUND |
| Schedule of Investments April 30, 2021 (Unaudited) |
| COMMON STOCKS—95.9% | SHARES | VALUE | ||||||
| BRAZIL—7.0% | ||||||||
| ASSET MANAGEMENT & CUSTODY BANKS—1.4% | ||||||||
| Vinci Partners Investments Ltd., Cl. A* | 48,170 | $ | 534,687 | |||||
| DATA PROCESSING & OUTSOURCED SERVICES—1.8% | ||||||||
| StoneCo Ltd., Cl. A* | 10,400 | 672,256 | ||||||
| HEALTHCARE SERVICES—2.0% | ||||||||
| Diagnosticos da America SA | 71,500 | 759,581 | ||||||
| HEAVY ELECTRICAL EQUIPMENT—1.8% | ||||||||
| Aeris Industria E Comercio de Equipamentos Para Geracao de Energia SA* | 401,000 | 664,476 | ||||||
| TOTAL BRAZIL | ||||||||
| (Cost $2,806,673) | 2,631,000 | |||||||
| CANADA—1.8% | ||||||||
| GOLD—1.8% | ||||||||
| Endeavour Mining Corp. | 31,500 | 655,780 | ||||||
| (Cost $768,547) | ||||||||
| CHINA—29.7% | ||||||||
| APPAREL ACCESSORIES & LUXURY GOODS—1.5% | ||||||||
| Li Ning Co., Ltd. | 67,000 | 543,744 | ||||||
| AUTOMOBILE MANUFACTURERS—2.7% | ||||||||
| Geely Automobile Holdings Ltd. | 382,000 | 994,979 | ||||||
| CONSTRUCTION MACHINERY & HEAVY TRUCKS—0.9% | ||||||||
| Sany Heavy Industry Co., Ltd., Cl. A | 73,997 | 351,261 | ||||||
| EDUCATION SERVICES—2.0% | ||||||||
| New Oriental Education & Technology Group, Inc.#,* | 50,000 | 763,000 | ||||||
| INTERACTIVE MEDIA & SERVICES—5.6% | ||||||||
| Tencent Holdings Ltd. | 26,007 | 2,074,605 | ||||||
| INTERNET & DIRECT MARKETING RETAIL—9.0% | ||||||||
| Alibaba Group Holding Ltd.#,* | 1,308 | 302,083 | ||||||
| JD.com, Inc.#,* | 14,000 | 1,083,040 | ||||||
| Meituan, Cl. B* | 19,133 | 732,293 | ||||||
| Trip.com Group Ltd.#,* | 31,600 | 1,234,928 | ||||||
| 3,352,344 | ||||||||
| PACKAGED FOODS & MEATS—2.5% | ||||||||
| China Feihe Ltd. | 332,000 | 943,335 | ||||||
| PERSONAL PRODUCTS—2.0% | ||||||||
| Yatsen Holding Ltd.#,* | 73,502 | 765,891 | ||||||
| SEMICONDUCTORS—3.5% | ||||||||
| LONGi Green Energy Technology Co., Ltd., Cl. A | 84,904 | 1,294,632 | ||||||
| TOTAL CHINA | ||||||||
| (Cost $9,935,285) | 11,083,791 | |||||||
| GREECE—2.2% | ||||||||
| SPECIALTY STORES—2.2% | ||||||||
| JUMBO SA | 45,000 | 840,753 | ||||||
| (Cost $831,758) | ||||||||
THE ALGER FUNDS II ALGER EMERGING MARKETS FUND |
| Schedule of Investments April 30, 2021 (Unaudited) (Continued) |
| COMMON STOCKS—95.9% (CONT.) | SHARES | VALUE | ||||||
| HONG KONG—3.0% | ||||||||
| ADVERTISING—1.6% | ||||||||
| iClick Interactive Asia Group Ltd.#,* | 46,800 | $ | 603,720 | |||||
| FINANCIAL EXCHANGES & DATA—1.4% | ||||||||
| Hong Kong Exchanges & Clearing Ltd. | 8,476 | 511,190 | ||||||
| TOTAL HONG KONG | ||||||||
| (Cost $942,963) | 1,114,910 | |||||||
| HUNGARY—2.7% | ||||||||
| AIRLINES—2.7% | ||||||||
| Wizz Air Holdings PLC* | 14,686 | 994,178 | ||||||
| (Cost $889,698) | ||||||||
| INDIA—10.1% | ||||||||
| APPAREL ACCESSORIES & LUXURY GOODS—1.1% | ||||||||
| Titan Co., Ltd. | 20,000 | 402,126 | ||||||
| APPLICATION SOFTWARE—1.2% | ||||||||
| Route Mobile Ltd.* | 20,500 | 453,540 | ||||||
| CONSUMER FINANCE—2.8% | ||||||||
| Manappuram Finance Ltd. | 397,000 | 796,673 | ||||||
| Paisalo Digital Ltd. | 29,000 | 236,592 | ||||||
| 1,033,265 | ||||||||
| ELECTRICAL COMPONENTS & EQUIPMENT—1.7% | ||||||||
| Polycab India Ltd.* | 33,000 | 652,516 | ||||||
| HEALTHCARE SERVICES—1.5% | ||||||||
| Metropolis Healthcare Ltd. | 17,000 | 549,285 | ||||||
| HOUSEHOLD APPLIANCES—1.8% | ||||||||
| Amber Enterprises India Ltd.* | 16,000 | 668,078 | ||||||
| TOTAL INDIA | ||||||||
| (Cost $3,290,978) | 3,758,810 | |||||||
| INDONESIA—1.5% | ||||||||
| REGIONAL BANKS—1.5% | ||||||||
| Bank BTPN Syariah Tbk PT | 2,408,570 | 544,027 | ||||||
| (Cost $510,743) | ||||||||
| SOUTH AFRICA—2.0% | ||||||||
| APPAREL RETAIL—2.0% | ||||||||
| Mr Price Group Ltd. | 61,000 | 763,156 | ||||||
| (Cost $703,369) | ||||||||
| SOUTH KOREA—17.5% | ||||||||
| HEALTHCARE EQUIPMENT—2.7% | ||||||||
| Ray Co., Ltd.* | 21,600 | 996,274 | ||||||
| INTERACTIVE MEDIA & SERVICES—3.4% | ||||||||
| Kakao Corp. | 12,600 | 1,276,004 | ||||||
| SEMICONDUCTORS—2.6% | ||||||||
| LEENO Industrial, Inc. | 6,639 | 962,424 | ||||||
| SPECIALTY CHEMICALS—2.6% | ||||||||
| Chunbo Co., Ltd. | 6,123 | 987,212 | ||||||
THE ALGER FUNDS II ALGER EMERGING MARKETS FUND |
| Schedule of Investments April 30, 2021 (Unaudited) (Continued) |
| COMMON STOCKS—95.9% (CONT.) | SHARES | VALUE | ||||||
| SOUTH KOREA—17.5% (CONT.) | ||||||||
| TECHNOLOGY HARDWARE STORAGE & PERIPHERALS—6.2% | ||||||||
| Samsung Electronics Co., Ltd. | 31,713 | $ | 2,298,780 | |||||
| TOTAL SOUTH KOREA | ||||||||
| (Cost $4,467,671) | 6,520,694 | |||||||
| TAIWAN—14.2% | ||||||||
| ELECTRONIC EQUIPMENT & INSTRUMENTS—2.4% | ||||||||
| Chroma ATE, Inc. | 130,000 | 897,792 | ||||||
INTERNET & DIRECT MARKETING RETAIL—2.0% momo.com, Inc. | 21,000 | 767,967 | ||||||
| SEMICONDUCTORS—9.8% | ||||||||
| Realtek Semiconductor Corp. | 62,000 | 1,168,914 | ||||||
| Taiwan Semiconductor Manufacturing Co., Ltd. | 118,000 | 2,483,524 | ||||||
| 3,652,438 | ||||||||
| TOTAL TAIWAN | ||||||||
| (Cost $4,162,252) | 5,318,197 | |||||||
| UNITED STATES—2.6% | ||||||||
| IT CONSULTING & OTHER SERVICES—2.6% | ||||||||
| EPAM Systems, Inc.* | 2,100 | 961,275 | ||||||
| (Cost $546,310) | ||||||||
| VIETNAM—1.6% | ||||||||
| REAL ESTATE DEVELOPMENT—1.6% | ||||||||
| Vinhomes JSC* | 140,000 | 601,470 | ||||||
| (Cost $611,271) | ||||||||
| TOTAL COMMON STOCKS | ||||||||
| (Cost $30,467,518) | 35,788,041 | |||||||
| Total Investments | ||||||||
| (Cost $30,467,518) | 95.9 | % | $ | 35,788,041 | ||||
| Unaffiliated Securities (Cost $30,467,518) | 35,788,041 | |||||||
Other Assets in Excess of Liabilities | 4.1 | % | 1,544,501 | |||||
| NET ASSETS | 100.0 | % | $ | 37,332,542 |
| # | American Depositary Receipts. |
* | Non-income producing security. |
See Notes to Financial Statements.
THE ALGER FUNDS II ALGER RESPONSIBLE INVESTING FUND |
| Schedule of Investments April 30, 2021 (Unaudited) |
| COMMON STOCKS—96.1% | SHARES | VALUE | ||||||
| APPAREL ACCESSORIES & LUXURY GOODS—1.7% | ||||||||
| Levi Strauss & Co., Cl. A | 23,983 | $ | 692,149 | |||||
| Lululemon Athletica, Inc.* | 2,388 | 800,625 | ||||||
| 1,492,774 | ||||||||
| APPLICATION SOFTWARE—9.9% | ||||||||
| Adobe, Inc.* | 6,785 | 3,449,087 | ||||||
| Autodesk, Inc.* | 4,433 | 1,294,037 | ||||||
| Intuit, Inc. | 1,076 | 443,484 | ||||||
| Paycom Software, Inc.* | 947 | 364,036 | ||||||
| salesforce.com, Inc.* | 12,073 | 2,780,654 | ||||||
| Workday, Inc., Cl. A* | 1,906 | 470,782 | ||||||
| 8,802,080 | ||||||||
| AUTO PARTS & EQUIPMENT—0.9% | ||||||||
| Aptiv PLC* | 5,666 | 815,281 | ||||||
| AUTOMOBILE MANUFACTURERS—0.8% | ||||||||
| Tesla, Inc.* | 967 | 686,028 | ||||||
| BIOTECHNOLOGY—1.0% | ||||||||
| Vertex Pharmaceuticals, Inc.* | 3,980 | 868,436 | ||||||
| BUILDING PRODUCTS—0.6% | ||||||||
| Allegion PLC | 3,668 | 492,906 | ||||||
| COMMUNICATIONS EQUIPMENT—0.5% | ||||||||
| Cisco Systems, Inc. | 9,310 | 473,972 | ||||||
| DATA PROCESSING & OUTSOURCED SERVICES—7.7% | ||||||||
| PayPal Holdings, Inc.* | 10,184 | 2,671,161 | ||||||
| Visa, Inc., Cl. A | 17,582 | 4,106,452 | ||||||
| 6,777,613 | ||||||||
| DISTRIBUTORS—0.5% | ||||||||
| Pool Corp. | 1,157 | 488,856 | ||||||
| DIVERSIFIED BANKS—0.5% | ||||||||
| JPMorgan Chase & Co. | 2,658 | 408,827 | ||||||
| ELECTRIC UTILITIES—0.5% | ||||||||
| NextEra Energy, Inc. | 5,908 | 457,929 | ||||||
| ELECTRICAL COMPONENTS & EQUIPMENT—0.5% | ||||||||
| Rockwell Automation, Inc. | 1,599 | 422,552 | ||||||
| ELECTRONIC EQUIPMENT & INSTRUMENTS—1.4% | ||||||||
| Cognex Corp. | 5,696 | 490,539 | ||||||
| Trimble, Inc.* | 9,100 | 746,200 | ||||||
| 1,236,739 | ||||||||
| ELECTRONIC MANUFACTURING SERVICES—0.8% | ||||||||
| Flex Ltd.* | 38,294 | 666,316 | ||||||
| ENVIRONMENTAL & FACILITIES SERVICES—0.5% | ||||||||
| Tetra Tech, Inc. | 3,729 | 475,932 | ||||||
| FINANCIAL EXCHANGES & DATA—2.1% | ||||||||
| CME Group, Inc., Cl. A | 2,074 | 418,927 | ||||||
| S&P Global, Inc. | 3,601 | 1,405,795 | ||||||
| 1,824,722 | ||||||||
| FOOD DISTRIBUTORS—0.7% | ||||||||
| Sysco Corp. | 7,189 | 609,124 | ||||||
THE ALGER FUNDS II ALGER RESPONSIBLE INVESTING FUND |
| Schedule of Investments April 30, 2021 (Unaudited) (Continued) |
| COMMON STOCKS—96.1% (CONT.) | SHARES | VALUE | ||||||
| FOOTWEAR—1.4% | ||||||||
| NIKE, Inc., Cl. B | 9,691 | $ | 1,285,220 | |||||
| HEALTHCARE EQUIPMENT—0.8% | ||||||||
| Dexcom, Inc.* | 675 | 260,617 | ||||||
| Edwards Lifesciences Corp.* | 4,755 | 454,198 | ||||||
| 714,815 | ||||||||
| HEALTHCARE SERVICES—1.7% | ||||||||
| Cigna Corp. | 4,158 | 1,035,383 | ||||||
| Guardant Health, Inc.* | 3,065 | 487,274 | ||||||
| 1,522,657 | ||||||||
| HEALTHCARE SUPPLIES—0.8% | ||||||||
| Align Technology, Inc.* | 1,128 | 671,758 | ||||||
| HOME IMPROVEMENT RETAIL—2.8% | ||||||||
| The Home Depot, Inc. | 7,586 | 2,455,361 | ||||||
| HOUSEHOLD PRODUCTS—1.1% | ||||||||
| The Procter & Gamble Co. | 7,270 | 969,963 | ||||||
| INDUSTRIAL CONGLOMERATES—1.1% | ||||||||
| Honeywell International, Inc. | 4,177 | 931,638 | ||||||
| INDUSTRIAL GASES—1.4% | ||||||||
| Air Products & Chemicals, Inc. | 4,187 | 1,207,866 | ||||||
| INDUSTRIAL MACHINERY—0.7% | ||||||||
| Xylem, Inc. | 5,737 | 634,799 | ||||||
| INTERACTIVE HOME ENTERTAINMENT—0.6% | ||||||||
| Electronic Arts, Inc. | 3,981 | 565,620 | ||||||
| INTERACTIVE MEDIA & SERVICES—8.6% | ||||||||
| Alphabet, Inc., Cl. A* | 1,102 | 2,593,557 | ||||||
| Alphabet, Inc., Cl. C* | 927 | 2,234,181 | ||||||
| Facebook, Inc., Cl. A* | 8,550 | 2,779,434 | ||||||
| 7,607,172 | ||||||||
| INTERNET & DIRECT MARKETING RETAIL—7.6% | ||||||||
| Amazon.com, Inc.* | 1,797 | 6,230,954 | ||||||
| Etsy, Inc.* | 2,715 | 539,715 | ||||||
| 6,770,669 | ||||||||
| INVESTMENT BANKING & BROKERAGE—1.4% | ||||||||
| Morgan Stanley | 15,491 | 1,278,782 | ||||||
| IT CONSULTING & OTHER SERVICES—0.9% | ||||||||
| Accenture PLC, Cl. A | 2,605 | 755,372 | ||||||
| LEISURE FACILITIES—0.6% | ||||||||
| Vail Resorts, Inc.* | 1,567 | 509,526 | ||||||
| LIFE SCIENCES TOOLS & SERVICES—0.7% | ||||||||
| Agilent Technologies, Inc. | 4,610 | 616,080 | ||||||
| MANAGED HEALTHCARE—1.0% | ||||||||
| Humana, Inc. | 1,990 | 886,028 | ||||||
| METAL & GLASS CONTAINERS—1.0% | ||||||||
| Ball Corp. | 9,682 | 906,622 | ||||||
| MOVIES & ENTERTAINMENT—1.0% | ||||||||
| Live Nation Entertainment, Inc.* | 4,766 | 390,240 | ||||||
| The Walt Disney Co.* | 2,512 | 467,282 | ||||||
| 857,522 | ||||||||
THE ALGER FUNDS II ALGER RESPONSIBLE INVESTING FUND |
| Schedule of Investments April 30, 2021 (Unaudited) (Continued) |
| COMMON STOCKS—96.1% (CONT.) | SHARES | VALUE | ||||||
| PHARMACEUTICALS—2.7% | ||||||||
| Bristol-Myers Squibb Co. | 11,377 | $ | 710,152 | |||||
| Merck & Co., Inc. | 10,929 | 814,211 | ||||||
| Zoetis, Inc., Cl. A | 4,902 | 848,193 | ||||||
| 2,372,556 | ||||||||
| RAILROADS—0.5% | ||||||||
| Union Pacific Corp. | 2,098 | 465,945 | ||||||
| RESTAURANTS—0.8% | ||||||||
| Starbucks Corp. | 5,977 | 684,307 | ||||||
| SEMICONDUCTOR EQUIPMENT—4.5% | ||||||||
| ASML Holding NV | 1,580 | 1,023,998 | ||||||
| Lam Research Corp. | 4,234 | 2,626,985 | ||||||
| SolarEdge Technologies, Inc.* | 1,363 | 359,205 | ||||||
| 4,010,188 | ||||||||
| SEMICONDUCTORS—3.9% | ||||||||
| NVIDIA Corp. | 3,519 | 2,112,737 | ||||||
| Taiwan Semiconductor Manufacturing Co., Ltd.# | 11,145 | 1,301,068 | ||||||
| 3,413,805 | ||||||||
| SOFT DRINKS—1.1% | ||||||||
| PepsiCo, Inc. | 6,849 | 987,352 | ||||||
| SYSTEMS SOFTWARE—9.4% | ||||||||
| Microsoft Corp. | 33,051 | 8,334,801 | ||||||
| TECHNOLOGY HARDWARE STORAGE & PERIPHERALS—7.4% | ||||||||
| Apple, Inc. | 50,046 | 6,579,047 | ||||||
| TOTAL COMMON STOCKS | ||||||||
| (Cost $30,369,368) | 84,995,558 | |||||||
| REAL ESTATE INVESTMENT TRUST—2.7% | SHARES | VALUE | ||||||
| INDUSTRIAL—1.0% | ||||||||
| Prologis, Inc. | 7,288 | 849,271 | ||||||
| SPECIALIZED—1.7% | ||||||||
| Equinix, Inc. | 1,564 | 1,127,269 | ||||||
| SBA Communications Corp., Cl. A | 1,356 | 406,420 | ||||||
| 1,533,689 | ||||||||
| TOTAL REAL ESTATE INVESTMENT TRUST | ||||||||
| (Cost $1,467,994) | 2,382,960 | |||||||
| Total Investments | ||||||||
| (Cost $31,837,362) | 98.8 | % | $ | 87,378,518 | ||||
| Unaffiliated Securities (Cost $31,837,362) | 87,378,518 | |||||||
| Other Assets in Excess of Liabilities | 1.2 | % | 1,095,438 | |||||
| NET ASSETS | 100.0 | % | $ | 88,473,956 | ||||
| # | American Depositary Receipts. |
| * | Non-income producing security. |
See Notes to Financial Statements.
Alger Spectra Fund | Alger Dynamic Opportunities Fund | |||||||
| ASSETS: | ||||||||
| Investments in unaffiliated securities, at value (Identified cost below)* see accompanying schedules of investments | $ | 8,792,227,778 | $ | 690,635,507 | ||||
| Investments in affiliated securities, at value (Identified cost below)** see accompanying schedules of investments | 12,361,802 | 1,481,213 | ||||||
| Cash and cash equivalents | 398,380 | 64,433,806 | ||||||
| Collateral held for short sales | 150,766,599 | 188,353,648 | ||||||
| Receivable for investment securities sold | — | 25,618,977 | ||||||
| Receivable for shares of beneficial interest sold | 3,632,947 | 1,270,234 | ||||||
| Dividends and interest receivable | 1,104,874 | 134,877 | ||||||
| Receivable from Investment Manager | — | 272,743 | ||||||
| Security litigation receivable | 7,093 | — | ||||||
| Prepaid expenses | 320,581 | 66,178 | ||||||
| Total Assets | 8,960,820,054 | 972,267,183 | ||||||
| LIABILITIES: | ||||||||
| Securities sold short, at value ‡ | 709,116,954 | 221,610,543 | ||||||
| Swaps, at value | — | 582,898 | ||||||
| Interest payable | 638,636 | 182,188 | ||||||
| Payable for investment securities purchased | 1,295,715 | 13,652,856 | ||||||
| Payable for shares of beneficial interest redeemed | 7,336,193 | 391,487 | ||||||
| Due to broker | 97,081,039 | — | ||||||
| Bank overdraft | 406,238 | — | ||||||
| Due to investment advisor | 2,228 | — | ||||||
| Accrued investment advisory fees | 4,729,548 | 699,975 | ||||||
| Accrued distribution fees | 985,904 | 29,832 | ||||||
| Accrued shareholder administrative fees | 79,762 | 6,365 | ||||||
| Accrued administrative fees | 183,667 | 16,041 | ||||||
| Accrued custodian fees | 39,393 | 21,694 | ||||||
| Accrued transfer agent fees | 990,106 | 30,059 | ||||||
| Accrued printing fees | 127,199 | 15,486 | ||||||
| Accrued professional fees | 50,719 | 1,197 | ||||||
| Accrued registration fees | 80,000 | 3,000 | ||||||
| Accrued trustee fees | 16,067 | 33,568 | ||||||
| Accrued fund accounting fees | 189,950 | 342,223 | ||||||
| Accrued tax payable | 460 | 539 | ||||||
| Dividends payable | 1,862,221 | 4,451 | ||||||
| Accrued other expenses | 9,095 | 1,883 | ||||||
| Total Liabilities | 825,221,094 | 237,626,285 | ||||||
| NET ASSETS | $ | 8,135,598,960 | $ | 734,640,898 | ||||
See Notes to Financial Statements.
THE ALGER FUNDS II
Statements of Assets and Liabilities April 30, 2021 (Unaudited) (Continued)
Alger Spectra Fund | Alger Dynamic Opportunities Fund | |||||||
| NET ASSETS CONSIST OF: | ||||||||
| Paid in capital (par value of $.001 per share) | 3,620,808,363 | 588,699,289 | ||||||
| Distributable earnings | 4,514,790,597 | 145,941,609 | ||||||
| NET ASSETS | $ | 8,135,598,960 | $ | 734,640,898 | ||||
| * Identified cost | $ | 5,306,518,905 | (a) | $ | 567,880,049 | (b) | ||
| ** Identified cost | $ | 25,029,054 | (a) | $ | 1,661,381 | (b) | ||
| ‡ Proceeds received on short sales | $ | 686,061,881 | $ | 220,386,203 | ||||
| NET ASSETS BY CLASS: | ||||||||
| Class A | $ | 1,757,081,549 | $ | 87,625,835 | ||||
| Class C | $ | 659,257,933 | $ | 15,939,115 | ||||
| Class I | $ | 371,794,956 | $ | — | ||||
| Class Y | $ | 187,958,556 | $ | — | ||||
| Class Z | $ | 5,159,505,966 | $ | 631,075,948 | ||||
SHARES OF BENEFICIAL INTEREST OUTSTANDING — NOTE 6: | ||||||||
| Class A | 57,073,465 | 4,191,444 | ||||||
| Class C | 24,649,828 | 840,027 | ||||||
| Class I | 11,918,047 | — | ||||||
| Class Y | 5,844,213 | — | ||||||
| Class Z | 160,619,179 | 29,171,099 | ||||||
| NET ASSET VALUE PER SHARE: | ||||||||
| Class A — Net Asset Value Per Share Class A | $ | 30.79 | $ | 20.91 | ||||
| Class A — Offering Price Per Share (includes a 5.25% sales charge) | $ | 32.49 | $ | 22.06 | ||||
| Class C — Net Asset Value Per Share Class C | $ | 26.74 | $ | 18.97 | ||||
| Class I — Net Asset Value Per Share Class I | $ | 31.20 | $ | — | ||||
| Class Y — Net Asset Value Per Share Class Y | $ | 32.16 | $ | — | ||||
| Class Z — Net Asset Value Per Share Class Z | $ | 32.12 | $ | 21.63 | ||||
See Notes to Financial Statements.
a) At April 30, 2021, the net unrealized appreciation on investments, based on cost for federal income tax purposes of $4,728,279,915, amounted to $3,367,192,711 which consisted of aggregate gross unrealized appreciation of $3,617,382,055 and aggregate gross unrealized depreciation of $250,189,344.
(b) At April 30, 2021, the net unrealized appreciation on investments, based on cost for federal income tax purposes of $354,006,296, amounted to $116,499,881 which consisted of aggregate gross unrealized appreciation of $148,982,627 and aggregate gross unrealized depreciation of $32,482,746.
THE ALGER FUNDS II
Statements of Assets and Liabilities April 30, 2021 (Unaudited) (Continued)
Alger Emerging Markets Fund | Alger Responsible Investing Fund | |||||||
| ASSETS: | ||||||||
| Investments in unaffiliated securities, at value (Identified cost below)* see accompanying schedules of investments | $ | 35,788,041 | $ | 87,378,518 | ||||
| Cash and cash equivalents | 1,147,130 | 1,038,319 | ||||||
| Foreign cash † | 408,315 | — | ||||||
| Receivable for shares of beneficial interest sold | 46,367 | 85,305 | ||||||
| Dividends and interest receivable | 13,210 | 33,265 | ||||||
| Receivable from Investment Manager | 6,219 | — | ||||||
| Security litigation receivable | — | 109 | ||||||
| Prepaid expenses | 77,448 | 72,905 | ||||||
| Total Assets | 37,486,730 | 88,608,421 | ||||||
| LIABILITIES: | ||||||||
| Payable for shares of beneficial interest redeemed | — | 349 | ||||||
| Foreign capital gain tax payable | 55,372 | — | ||||||
| Due to investment advisor | — | 227 | ||||||
| Accrued investment advisory fees | 22,917 | 50,914 | ||||||
| Accrued distribution fees | 4,124 | 14,899 | ||||||
| Accrued shareholder administrative fees | 352 | 988 | ||||||
| Accrued administrative fees | 840 | 1,972 | ||||||
| Accrued custodian fees | 6,580 | 1,333 | ||||||
| Accrued transfer agent fees | 4,917 | 21,522 | ||||||
| Accrued printing fees | 2,549 | 4,525 | ||||||
| Accrued professional fees | 33,944 | 22,055 | ||||||
| Accrued registration fees | — | 83 | ||||||
| Accrued trustee fees | 67 | 164 | ||||||
| Accrued fund accounting fees | 9,735 | 11,585 | ||||||
| Accrued tax payable | 11,700 | 831 | ||||||
| Accrued other expenses | 1,091 | 3,018 | ||||||
| Total Liabilities | 154,188 | 134,465 | ||||||
| NET ASSETS | $ | 37,332,542 | $ | 88,473,956 | ||||
| NET ASSETS CONSIST OF: | ||||||||
| Paid in capital (par value of $.001 per share) | 32,024,294 | 30,440,453 | ||||||
| Distributable earnings | 5,308,248 | 58,033,503 | ||||||
| NET ASSETS | $ | 37,332,542 | $ | 88,473,956 | ||||
| * Identified cost | $ | 30,467,518(a | ) | $ | 31,837,362(b | ) | ||
| † Cost of foreign cash | $ | 406,774 | $ | — | ||||
See Notes to Financial Statements.
Alger Emerging Markets Fund | Alger Responsible Investing Fund | |||||||
| NET ASSETS BY CLASS: | ||||||||
| Class A | $ | 5,633,556 | $ | 46,292,593 | ||||
| Class C | $ | 3,112,424 | $ | 5,054,183 | ||||
| Class I | $ | 1,925,719 | $ | 6,737,235 | ||||
| Class Z | $ | 26,660,843 | $ | 30,389,945 | ||||
SHARES OF BENEFICIAL INTEREST OUTSTANDING — NOTE 6: | ||||||||
| Class A | 398,004 | 2,968,468 | ||||||
| Class C | 231,699 | 373,943 | ||||||
| Class I | 137,434 | 433,070 | ||||||
| Class Z | 1,868,178 | 1,904,539 | ||||||
| NET ASSET VALUE PER SHARE: | ||||||||
| Class A — Net Asset Value Per Share Class A | $ | 14.15 | $ | 15.59 | ||||
| Class A — Offering Price Per Share (includes a 5.25% sales charge) | $ | 14.94 | $ | 16.46 | ||||
| Class C — Net Asset Value Per Share Class C | $ | 13.43 | $ | 13.52 | ||||
| Class I — Net Asset Value Per Share Class I | $ | 14.01 | $ | 15.56 | ||||
| Class Z — Net Asset Value Per Share Class Z | $ | 14.27 | $ | 15.96 |
See Notes to Financial Statements.
a) At April 30, 2021, the net unrealized appreciation on investments, based on cost for federal income tax purposes of $30,547,743, amounted to $5,240,298 which consisted of aggregate gross unrealized appreciation of $6,596,783 and aggregate gross unrealized depreciation of $1,356,485.
(b) At April 31, 2021, the net unrealized appreciation on investments, based on cost for federal income tax purposes of $31,911,167, amounted to $55,467,351 which consisted of aggregate gross unrealized appreciation of $55,740,327 and aggregate gross unrealized depreciation of $272,976.
THE ALGER FUNDS II
Statements of Operations for the six months ended April 30, 2021 (Unaudited)
Alger Spectra Fund | Alger Dynamic Opportunities Fund | |||||||
| INCOME: | ||||||||
| Dividends (net of foreign withholding taxes*) | $ | 20,422,825 | $ | 695,926 | ||||
| Interest | — | 3,395 | ||||||
| Total Income | 20,422,825 | 699,321 | ||||||
| EXPENSES: | ||||||||
| Investment advisory fees — Note 3(a) | 28,065,712 | 3,507,849 | ||||||
| Distribution fees — Note 3(c) | ||||||||
| Class A | 2,154,896 | 95,046 | ||||||
| Class C | 3,394,641 | 67,525 | ||||||
| Class I | 504,237 | — | ||||||
| Shareholder administrative fees — Note 3(f) | 471,855 | 32,142 | ||||||
| Administration fees — Note 3(b) | 1,082,849 | 80,388 | ||||||
| Dividends on securities sold short | 6,234,661 | 1,134,366 | ||||||
| Interest expenses | 6,879 | — | ||||||
| Borrowing fees on short sales | 5,272,579 | 1,543,691 | ||||||
| Transfer agent fees — Note 3(f) | 1,075,466 | 37,998 | ||||||
| Fund accounting fees | 529,645 | 60,916 | ||||||
| Professional fees | 144,527 | 26,259 | ||||||
| Custodian fees | 133,594 | 22,333 | ||||||
| Printing fees | 98,783 | 23,540 | ||||||
| Trustee fees — Note 3(g) | 96,469 | 6,990 | ||||||
| Registration fees | 69,287 | 38,160 | ||||||
| Accrued taxes | 297 | — | ||||||
| Other expenses | 185,000 | 13,619 | ||||||
| Total Expenses | 49,521,377 | 6,690,822 | ||||||
| Less, expense reimbursements/waivers — Note 3(a) | (4,629 | ) | (1,477,970 | ) | ||||
| Net Expenses | 49,516,748 | 5,212,852 | ||||||
| NET INVESTMENT LOSS | (29,093,923 | ) | (4,513,531 | ) | ||||
THE ALGER FUNDS II
Statements of Operations for the six months ended April 30, 2021 (Unaudited) (Continued)
Alger Spectra Fund | Alger Dynamic Opportunities Fund | |||||||
| REALIZED AND UNREALIZED GAIN (LOSS) ON INVESTMENTS, OPTIONS, SWAPS AND FOREIGN CURRENCY: | ||||||||
| Net realized gain on unaffiliated investments and purchased options | 1,303,642,957 | 63,465,498 | ||||||
| Net realized gain (loss) on foreign currency transactions | (28,282 | ) | 12,084 | |||||
| Net realized (loss) on short sales | (89,977,274 | ) | (27,574,910 | ) | ||||
| Net realized (loss) on swaps | — | (1,570,209 | ) | |||||
| Net change in unrealized appreciation on unaffiliated investments, purchased options | 206,250,262 | 77,675,975 | ||||||
| Net change in unrealized appreciation (depreciation) on foreign currency | 1,171 | (4,394 | ) | |||||
| Net change in unrealized (depreciation) on short sales | (34,928,333 | ) | (9,851,751 | ) | ||||
| Net change in unrealized (depreciation) on swaps | — | (526,162 | ) | |||||
| Net realized and unrealized gain on investments, purchased options, swaps and foreign currency | 1,384,960,501 | 101,626,131 | ||||||
| NET INCREASE IN NET ASSETS RESULTING FROM OPERATIONS | $ | 1,355,866,578 | $ | 97,112,600 | ||||
| * Foreign withholding taxes | $ | 421,344 | $ | 15,128 | ||||
See Notes to Financial Statements.
THE ALGER FUNDS II
Statements of Operations for the six months ended April 30, 2021 (Unaudited) (Continued)
Alger Emerging Markets Fund | Alger Responsible Investing Fund | |||||||
| INCOME: | ||||||||
| Dividends (net of foreign withholding taxes*) | $ | 107,894 | $ | 337,878 | ||||
| Interest | 74 | 26 | ||||||
| Total Income | 107,968 | 337,904 | ||||||
| EXPENSES: | ||||||||
| Investment advisory fees — Note 3(a) | 116,382 | 290,141 | ||||||
| Distribution fees — Note 3(c) | ||||||||
| Class A | 5,925 | 53,367 | ||||||
| Class C | 15,385 | 24,830 | ||||||
| Class I | 3,528 | 8,620 | ||||||
| Shareholder administrative fees — Note 3(f) | 1,806 | 5,635 | ||||||
| Administration fees — Note 3(b) | 4,267 | 11,238 | ||||||
| Interest expenses | — | 30 | ||||||
| Transfer agent fees — Note 3(f) | 4,441 | 20,889 | ||||||
| Fund accounting fees | 23,842 | 24,662 | ||||||
| Professional fees | 22,272 | 17,829 | ||||||
| Custodian fees | 26,164 | 10,169 | ||||||
| Printing fees | 733 | 2,623 | ||||||
| Trustee fees — Note 3(g) | 376 | 977 | ||||||
| Registration fees | 12,555 | 20,000 | ||||||
| Accrued taxes | 3,620 | — | ||||||
| Other expenses | 4,459 | 3,752 | ||||||
| Total Expenses | 245,755 | 494,762 | ||||||
| Less, expense reimbursements/waivers — Note 3(a) | (54,340 | ) | (1,635 | ) | ||||
| Net Expenses | 191,415 | 493,127 | ||||||
| NET INVESTMENT LOSS | (83,447 | ) | (155,223 | ) | ||||
REALIZED AND UNREALIZED GAIN (LOSS) ON INVESTMENTS AND FOREIGN CURRENCY: | ||||||||
| Net realized gain on unaffiliated investments | 3,040,863 | 2,975,747 | ||||||
| Net realized (loss) on foreign currency transactions | (13,901 | ) | — | |||||
| Net change in unrealized appreciation on unaffiliated investments | 1,342,341 | 14,014,994 | ||||||
| Net change in unrealized appreciation on foreign currency | 863 | — | ||||||
| Net realized and unrealized gain on investments and foreign currency | 4,370,166 | 16,990,741 | ||||||
| NET INCREASE IN NET ASSETS RESULTING FROM OPERATIONS | $ | 4,286,719 | $ | 16,835,518 | ||||
| * Foreign withholding taxes | $ | 21,777 | $ | 2,264 | ||||
See Notes to Financial Statements.
| Alger Spectra Fund | ||||||||
For the Six Months Ended April 30, 2021 | For the Year Ended October 31, 2020 | |||||||
| Net investment loss | $ | (29,093,923 | ) | $ | (35,741,533 | ) | ||
| Net realized gain on investments and foreign currency | 1,213,637,401 | 651,739,914 | ||||||
| Net change in unrealized appreciation on investments and foreign currency | 171,323,100 | 1,320,308,961 | ||||||
| Net increase in net assets resulting from operations | 1,355,866,578 | 1,936,307,342 | ||||||
| Dividends and distributions to shareholders: | ||||||||
| Class A | (149,713,974 | ) | (86,391,404 | ) | ||||
| Class C | (68,859,702 | ) | (53,304,257 | ) | ||||
| Class I | (35,078,329 | ) | (46,365,085 | ) | ||||
| Class Y | (11,306,560 | ) | (3,233,744 | ) | ||||
| Class Z | (406,820,187 | ) | (238,139,189 | ) | ||||
| Total dividends and distributions to shareholders | (671,778,752 | ) | (427,433,679 | ) | ||||
Increase (decrease) from shares of beneficial interest transactions: | ||||||||
| Class A | 42,594,566 | 33,801,403 | ||||||
| Class C | (41,129,460 | ) | (173,737,429 | ) | ||||
| Class I | (87,255,652 | ) | (385,287,951 | ) | ||||
| Class Y | 51,094,376 | 57,180,926 | ||||||
| Class Z | 345,504,882 | 12,458,926 | ||||||
| Net increase (decrease) from shares of beneficial interest transactions — Note 6 | 310,808,712 | (455,584,125 | ) | |||||
| Total increase | 994,896,538 | 1,053,289,538 | ||||||
| Net Assets: | ||||||||
| Beginning of period | 7,140,702,422 | 6,087,412,884 | ||||||
| END OF PERIOD | $ | 8,135,598,960 | $ | 7,140,702,422 | ||||
See Notes to Financial Statements.
THE ALGER FUNDS II
Statements of Changes in Net Assets (Unaudited) (Continued)
| Alger Dynamic Opportunities Fund | ||||||||
For the Six Months Ended April 30, 2021 | For the Year Ended October 31, 2020 | |||||||
| Net investment loss | $ | (4,513,531 | ) | $ | (2,789,540 | ) | ||
| Net realized gain on investments, purchased options, swaps and foreign currency | 34,332,463 | 23,735,791 | ||||||
| Net change in unrealized appreciation on investments, purchased options, swaps and foreign currency | 67,293,668 | 41,708,622 | ||||||
| Net increase in net assets resulting from operations | 97,112,600 | 62,654,873 | ||||||
| Dividends and distributions to shareholders: | ||||||||
| Class A | (3,410,651 | ) | (1,099,438 | ) | ||||
| Class C | (670,569 | ) | (275,687 | ) | ||||
| Class Z | (19,608,559 | ) | (2,800,411 | ) | ||||
| Total dividends and distributions to shareholders | (23,689,779 | ) | (4,175,536 | ) | ||||
Increase (decrease) from shares of beneficial interest transactions: | ||||||||
| Class A | 17,520,535 | 15,068,082 | ||||||
| Class C | 3,855,174 | 1,295,879 | ||||||
| Class Z | 216,181,087 | 224,552,045 | ||||||
| Net increase from shares of beneficial interest transactions — Note 6 | 237,556,796 | 240,916,006 | ||||||
| Total increase | 310,979,617 | 299,395,343 | ||||||
| Net Assets: | ||||||||
| Beginning of period | 423,661,281 | 124,265,938 | ||||||
| END OF PERIOD | $ | 734,640,898 | $ | 423,661,281 | ||||
See Notes to Financial Statements.
THE ALGER FUNDS II
Statements of Changes in Net Assets (Unaudited) (Continued)
| Alger Emerging Markets Fund | ||||||||
For the Six Months Ended April 30, 2021 | For the Year Ended October 31, 2020 | |||||||
| Net investment loss | $ | (83,447 | ) | $ | (75,745 | ) | ||
| Net realized gain on investments and foreign currency | 3,026,962 | 5,410,855 | ||||||
| Net change in unrealized appreciation (depreciation) on investments and foreign currency | 1,343,204 | (1,066,731 | ) | |||||
| Net increase in net assets resulting from operations | 4,286,719 | 4,268,379 | ||||||
| Dividends and distributions to shareholders: | ||||||||
| Class A | — | (186,353 | ) | |||||
| Class C | — | (110,469 | ) | |||||
| Class I | — | (150,420 | ) | |||||
| Class Z | — | (728,473 | ) | |||||
| Total dividends and distributions to shareholders | — | (1,175,715 | ) | |||||
Increase (decrease) from shares of beneficial interest transactions: | ||||||||
| Class A | 1,635,516 | (1,053,978 | ) | |||||
| Class C | (88,243 | ) | (562,407 | ) | ||||
| Class I | (1,270,256 | ) | (335,135 | ) | ||||
| Class Y | — | (3,146 | ) | |||||
| Class Z | 11,145,322 | (2,967,804 | ) | |||||
| Net increase (decrease) from shares of beneficial interest transactions — Note 6 | 11,422,339 | (4,922,470 | ) | |||||
| Total increase (decrease) | 15,709,058 | (1,829,806 | ) | |||||
| Net Assets: | ||||||||
| Beginning of period | 21,623,484 | 23,453,290 | ||||||
| END OF PERIOD | $ | 37,332,542 | $ | 21,623,484 | ||||
See Notes to Financial Statements.
THE ALGER FUNDS II
Statements of Changes in Net Assets (Unaudited) (Continued)
| Alger Responsible Investing Fund | ||||||||
For the Six Months Ended April 30, 2021 | For the Year Ended October 31, 2020 | |||||||
Net investment loss | $ | (155,223 | ) | $ | (263,033 | ) | ||
Net realized gain on investments and foreign currency | 2,975,747 | 5,586,523 | ||||||
| Net change in unrealized appreciation on investments and foreign currency | 14,014,994 | 11,650,967 | ||||||
Net increase in net assets resulting from operations | 16,835,518 | 16,974,457 | ||||||
Dividends and distributions to shareholders: | ||||||||
| Class A | (2,887,364 | ) | (2,236,304 | ) | ||||
| Class C | (391,085 | ) | (439,961 | ) | ||||
| Class I | (510,643 | ) | (767,212 | ) | ||||
| Class Z | (1,797,133 | ) | (1,159,920 | ) | ||||
Total dividends and distributions to shareholders | (5,586,225 | ) | (4,603,397 | ) | ||||
Increase (decrease) from shares of beneficial interest transactions: | ||||||||
| Class A | 2,309,483 | 2,221,923 | ||||||
| Class C | (999,117 | ) | (908,158 | ) | ||||
| Class I | (2,434,153 | ) | (3,992,707 | ) | ||||
| Class Z | 4,010,589 | 3,376,122 | ||||||
Net increase from shares of beneficial interest transactions — Note 6 | 2,886,802 | 697,180 | ||||||
Total increase | 14,136,095 | 13,068,240 | ||||||
Net Assets: | ||||||||
| Beginning of period | 74,337,861 | 61,269,621 | ||||||
| END OF PERIOD | $ | 88,473,956 | $ | 74,337,861 | ||||
See Notes to Financial Statements.
| Alger Spectra Fund | Class A | |||||||||||||||||||||||
| Six months ended 4/30/2021(i) | Year ended 10/31/2020 | Year ended 10/31/2019 | Year ended 10/31/2018 | Year ended 10/31/2017 | Year ended 10/31/2016 | |||||||||||||||||||
| Net asset value, beginning of period | $ | 28.24 | $ | 22.51 | $ | 21.94 | $ | 21.41 | $ | 16.91 | $ | 18.45 | ||||||||||||
| INCOME FROM INVESTMENT OPERATIONS: | ||||||||||||||||||||||||
| Net investment loss(ii) | (0.13 | ) | (0.16 | ) | (0.07 | ) | (0.06 | ) | (0.02 | ) | (0.01 | ) | ||||||||||||
| Net realized and unrealized gain (loss) on investments | 5.39 | 7.51 | 2.84 | 1.85 | 4.86 | (0.03 | ) | |||||||||||||||||
| Total from investment operations | 5.26 | 7.35 | 2.77 | 1.79 | 4.84 | (0.04 | ) | |||||||||||||||||
| Distributions from net realized gains | (2.71 | ) | (1.62 | ) | (2.20 | ) | (1.26 | ) | (0.34 | ) | (1.50 | ) | ||||||||||||
| Net asset value, end of period | $ | 30.79 | $ | 28.24 | $ | 22.51 | $ | 21.94 | $ | 21.41 | $ | 16.91 | ||||||||||||
| Total return(iii) | 19.12 | % | 34.65 | % | 14.82 | % | 8.75 | % | 29.19 | % | (0.36 | )% | ||||||||||||
| RATIOS/SUPPLEMENTAL DATA: | ||||||||||||||||||||||||
| Net assets, end of period (000's omitted) | $ | 1,757,082 | $ | 1,568,743 | $ | 1,222,285 | $ | 1,208,421 | $ | 1,662,441 | $ | 1,635,495 | ||||||||||||
| Ratio of gross expenses to average net assets | 1.39 | %(iv) | 1.40 | %(v) | 1.31 | %(vi) | 1.27 | %(vii) | 1.28 | %(viii) | 1.31 | %(ix) | ||||||||||||
| Ratio of net expenses to average net assets | 1.39 | % | 1.40 | % | 1.31 | % | 1.27 | % | 1.28 | % | 1.31 | % | ||||||||||||
| Ratio of net investment loss to average net assets | (0.87 | )% | (0.66 | )% | (0.35 | )% | (0.29 | )% | (0.13 | )% | (0.05 | )% | ||||||||||||
| Portfolio turnover rate | 49.21 | % | 71.81 | % | 86.54 | % | 74.19 | % | 80.08 | % | 108.51 | % | ||||||||||||
See Notes to Financial Statements.
(i) | Ratios have been annualized; total return and portfolio turnover rate have not been annualized. |
(ii) | Amount was computed based on average shares outstanding during the period. |
(iii) | Does not reflect the effect of sales charges, if applicable. |
(iv) | Includes 0.29% related to dividend expense on short positions and interest expense for the period ended 4/30/21. |
(v) | Includes 0.25% related to dividend expense on short positions and interest expense for the period ended 10/31/20. |
(vi) | Includes 0.12% related to dividend expense on short positions and interest expense for the period ended 10/31/19. |
(vii) | Includes 0.08% related to dividend expense on short positions and interest expense for the period ended 10/31/18. |
(viii) | Includes 0.07% related to dividend expense on short positions and interest expense for the period ended 10/31/17. |
(ix) | Includes 0.10% related to dividend expense on short positions and interest expense for the period ended 10/31/16. |
THE ALGER FUNDS II
Financial Highlights for a share outstanding throughout the period (Unaudited)
| Alger Spectra Fund | Class C | |||||||||||||||||||||||
| Six months ended 4/30/2021(i) | Year ended 10/31/2020 | Year ended 10/31/2019 | Year ended 10/31/2018 | Year ended 10/31/2017 | Year ended 10/31/2016 | |||||||||||||||||||
| Net asset value, beginning of period | $ | 24.94 | $ | 20.20 | $ | 20.06 | $ | 19.82 | $ | 15.80 | $ | 17.46 | ||||||||||||
| INCOME FROM INVESTMENT OPERATIONS: | ||||||||||||||||||||||||
| Net investment loss(ii) | (0.21 | ) | (0.30 | ) | (0.21 | ) | (0.21 | ) | (0.15 | ) | (0.13 | ) | ||||||||||||
| Net realized and unrealized gain (loss) on investments | 4.72 | 6.66 | 2.55 | 1.71 | 4.51 | (0.03 | ) | |||||||||||||||||
| Total from investment operations | 4.51 | 6.36 | 2.34 | 1.50 | 4.36 | (0.16 | ) | |||||||||||||||||
| Distributions from net realized gains | (2.71 | ) | (1.62 | ) | (2.20 | ) | (1.26 | ) | (0.34 | ) | (1.50 | ) | ||||||||||||
| Net asset value, end of period | $ | 26.74 | $ | 24.94 | $ | 20.20 | $ | 20.06 | $ | 19.82 | $ | 15.80 | ||||||||||||
| Total return(iii) | 18.70 | % | 33.60 | % | 13.97 | % | 7.95 | % | 28.18 | % | (1.12 | )% | ||||||||||||
| RATIOS/SUPPLEMENTAL DATA: | ||||||||||||||||||||||||
| Net assets, end of period (000's omitted) | $ | 659,258 | $ | 651,194 | $ | 681,792 | $ | 727,681 | $ | 765,136 | $ | 815,694 | ||||||||||||
| Ratio of gross expenses to average net assets | 2.15 | %(iv) | 2.15 | %(v) | 2.07 | %(vi) | 2.01 | %(vii) | 2.04 | %(viii) | 2.07 | %(ix) | ||||||||||||
| Ratio of net expenses to average net assets | 2.15 | % | 2.15 | % | 2.07 | % | 2.01 | % | 2.04 | % | 2.07 | % | ||||||||||||
| Ratio of net investment loss to average net assets | (1.63 | )% | (1.39 | )% | (1.10 | )% | (1.04 | )% | (0.89 | )% | (0.82 | )% | ||||||||||||
| Portfolio turnover rate | 49.21 | % | 71.81 | % | 86.54 | % | 74.19 | % | 80.08 | % | 108.51 | % | ||||||||||||
See Notes to Financial Statements.
| (i) | Ratios have been annualized; total return and portfolio turnover rate have not been annualized. |
| (ii) | Amount was computed based on average shares outstanding during the period. |
| (iii) | Does not reflect the effect of sales charges, if applicable. |
| (iv) | Includes 0.29% related to dividend expense on short positions and interest expense for the period ended 4/30/21. |
| (v) | Includes 0.25% related to dividend expense on short positions and interest expense for the period ended 10/31/20. |
| (vi) | Includes 0.12% related to dividend expense on short positions and interest expense for the period ended 10/31/19. |
| (vii) | Includes 0.08% related to dividend expense on short positions and interest expense for the period ended 10/31/18. |
| (viii) | Includes 0.07% related to dividend expense on short positions and interest expense for the period ended 10/31/17. |
| (ix) | Includes 0.10% related to dividend expense on short positions and interest expense for the period ended 10/31/16. |
THE ALGER FUNDS II
Financial Highlights for a share outstanding throughout the period (Unaudited)
| Alger Spectra Fund | Class I | |||||||||||||||||||||||
| Six months ended 4/30/2021(i) | Year ended 10/31/2020 | Year ended 10/31/2019 | Year ended 10/31/2018 | Year ended 10/31/2017 | Year ended 10/31/2016 | |||||||||||||||||||
| Net asset value, beginning of period | $ | 28.59 | $ | 22.77 | $ | 22.16 | $ | 21.61 | $ | 17.06 | $ | 18.60 | ||||||||||||
| INCOME FROM INVESTMENT OPERATIONS: | ||||||||||||||||||||||||
| Net investment loss(ii) | (0.13 | ) | (0.15 | ) | (0.07 | ) | (0.06 | ) | (0.02 | ) | (0.01 | ) | ||||||||||||
| Net realized and unrealized gain (loss) on investments | 5.45 | 7.59 | 2.88 | 1.87 | 4.91 | (0.03 | ) | |||||||||||||||||
| Total from investment operations | 5.32 | 7.44 | 2.81 | 1.81 | 4.89 | (0.04 | ) | |||||||||||||||||
| Distributions from net realized gains | (2.71 | ) | (1.62 | ) | (2.20 | ) | (1.26 | ) | (0.34 | ) | (1.50 | ) | ||||||||||||
| Net asset value, end of period | $ | 31.20 | $ | 28.59 | $ | 22.77 | $ | 22.16 | $ | 21.61 | $ | 17.06 | ||||||||||||
| Total return(iii) | 19.14 | % | 34.61 | % | 14.85 | % | 8.76 | % | 29.23 | % | (0.35 | )% | ||||||||||||
| RATIOS/SUPPLEMENTAL DATA: | ||||||||||||||||||||||||
| Net assets, end of period (000's omitted) | $ | 371,795 | $ | 422,807 | $ | 656,990 | $ | 776,443 | $ | 791,060 | $ | 1,222,783 | ||||||||||||
| Ratio of gross expenses to average net assets | 1.40 | %(iv) | 1.39 | %(v) | 1.30 | %(vi) | 1.25 | %(vii) | 1.27 | %(viii) | 1.29 | %(ix) | ||||||||||||
| Ratio of net expenses to average net assets | 1.40 | % | 1.39 | % | 1.30 | % | 1.25 | % | 1.27 | % | 1.29 | % | ||||||||||||
| Ratio of net investment loss to average net assets | (0.87 | )% | (0.61 | )% | (0.33 | )% | (0.28 | )% | (0.09 | )% | (0.05 | )% | ||||||||||||
| Portfolio turnover rate | 49.21 | % | 71.81 | % | 86.54 | % | 74.19 | % | 80.08 | % | 108.51 | % | ||||||||||||
See Notes to Financial Statements.
(i) | Ratios have been annualized; total return and portfolio turnover rate have not been annualized. |
(ii) | Amount was computed based on average shares outstanding during the period. |
(iii) | Does not reflect the effect of sales charges, if applicable. |
(iv) | Includes 0.29% related to dividend expense on short positions and interest expense for the period ended 4/30/21. |
(v) | Includes 0.25% related to dividend expense on short positions and interest expense for the period ended 10/31/20. |
(vi) | Includes 0.12% related to dividend expense on short positions and interest expense for the period ended 10/31/19. |
(vii) | Includes 0.08% related to dividend expense on short positions and interest expense for the period ended 10/31/18. |
(viii) | Includes 0.07% related to dividend expense on short positions and interest expense for the period ended 10/31/17. |
(ix) | Includes 0.10% related to dividend expense on short positions and interest expense for the period ended 10/31/16. |
THE ALGER FUNDS II
Financial Highlights for a share outstanding throughout the period (Unaudited)
| Alger Spectra Fund | Class Y | |||||||||||
| Six months ended 4/30/2021(i) | Year ended 10/31/2020 | From 12/3/2018 (commencement of operations) to 10/31/2019(ii) | ||||||||||
| Net asset value, beginning of period | $ | 29.36 | $ | 23.26 | $ | 23.29 | ||||||
| INCOME FROM INVESTMENT OPERATIONS: | ||||||||||||
| Net investment loss(iii) | (0.09 | ) | (0.11 | ) | (0.03 | ) | ||||||
| Net realized and unrealized gain on investments | 5.60 | 7.83 | 2.20 | |||||||||
| Total from investment operations | 5.51 | 7.72 | 2.17 | |||||||||
| Distributions from net realized gains | (2.71 | ) | (1.62 | ) | (2.20 | ) | ||||||
| Net asset value, end of period | $ | 32.16 | $ | 29.36 | $ | 23.26 | ||||||
| Total return(iv) | 19.30 | % | 35.11 | % | 11.43 | % | ||||||
| RATIOS/SUPPLEMENTAL DATA: | ||||||||||||
| Net assets, end of period (000's omitted) | $ | 187,959 | $ | 121,397 | $ | 43,750 | ||||||
| Ratio of gross expenses to average net assets | 1.09 | %(v) | 1.09 | %(vi) | 1.03 | %(vii) | ||||||
| Ratio of expense reimbursements to average net assets | (0.01 | )% | (0.04 | )% | (0.09 | )% | ||||||
| Ratio of net expenses to average net assets | 1.08 | % | 1.05 | % | 0.94 | % | ||||||
| Ratio of net investment loss to average net assets | (0.58 | )% | (0.40 | )% | (0.14 | )% | ||||||
| Portfolio turnover rate | 49.21 | % | 71.81 | % | 86.54 | % | ||||||
See Notes to Financial Statements.
(i) | Ratios have been annualized; total return and portfolio turnover rate have not been annualized. |
(ii) | Ratios have been annualized; total return has not been annualized; portfolio turnover is for the twelve months then ended. |
(iii) | Amount was computed based on average shares outstanding during the period. |
(iv) | Does not reflect the effect of sales charges, if applicable. |
(v) | Includes 0.30% related to dividend expense on short positions and interest expense for the period ended 4/30/21. |
(vi) | Includes 0.26% related to dividend expense on short positions and interest expense for the period ended 10/31/20. |
(vii) | Includes 0.17% related to dividend expense on short positions and interest expense for the period ended 10/31/19. |
THE ALGER FUNDS II
Financial Highlights for a share outstanding throughout the period (Unaudited)
| Alger Spectra Fund | Class Z | |||||||||||||||||||||||
| Six months ended 4/30/2021(i) | Year ended 10/31/2020 | Year ended 10/31/2019 | Year ended 10/31/2018 | Year ended 10/31/2017 | Year ended 10/31/2016 | |||||||||||||||||||
| Net asset value, beginning of period | $ | 29.32 | $ | 23.24 | $ | 22.51 | $ | 21.87 | $ | 17.21 | $ | 18.70 | ||||||||||||
| INCOME FROM INVESTMENT OPERATIONS: | ||||||||||||||||||||||||
Net investment income (loss)(ii) | (0.09 | ) | (0.09 | ) | (0.01 | ) | – | (iii) | 0.03 | 0.04 | ||||||||||||||
| Net realized and unrealized gain (loss) on investments | 5.60 | 7.79 | 2.94 | 1.90 | 4.97 | (0.03 | ) | |||||||||||||||||
| Total from investment operations | 5.51 | 7.70 | 2.93 | 1.90 | 5.00 | 0.01 | ||||||||||||||||||
| Distributions from net realized gains | (2.71 | ) | (1.62 | ) | (2.20 | ) | (1.26 | ) | (0.34 | ) | (1.50 | ) | ||||||||||||
| Net asset value, end of period | $ | 32.12 | $ | 29.32 | $ | 23.24 | $ | 22.51 | $ | 21.87 | $ | 17.21 | ||||||||||||
Total return(iv) | 19.28 | % | 35.10 | % | 15.18 | % | 9.09 | % | 29.62 | % | (0.06 | )% | ||||||||||||
| RATIOS/SUPPLEMENTAL DATA: | ||||||||||||||||||||||||
| Net assets, end of period (000's omitted) | $ | 5,159,506 | $ | 4,376,561 | $ | 3,482,596 | $ | 3,241,767 | $ | 2,646,438 | $ | 1,502,388 | ||||||||||||
| Ratio of gross expenses to average net assets | 1.08 | %(v) | 1.09 | %(vi) | 0.99 | %(vii) | 0.94 | %(viii) | 0.96 | %(ix) | 0.99 | %(x) | ||||||||||||
| Ratio of net expenses to average net assets | 1.08 | % | 1.09 | % | 0.99 | % | 0.94 | % | 0.96 | % | 0.99 | % | ||||||||||||
| Ratio of net investment income (loss) to average net assets | (0.56 | )% | (0.35 | )% | (0.03 | )% | 0.02 | % | 0.17 | % | 0.26 | % | ||||||||||||
| Portfolio turnover rate | 49.21 | % | 71.81 | % | 86.54 | % | 74.19 | % | 80.08 | % | 108.51 | % | ||||||||||||
See Notes to Financial Statements.
(i) | Ratios have been annualized; total return and portfolio turnover rate have not been annualized. |
(ii) | Amount was computed based on average shares outstanding during the period. |
(iii) | Amount was less than $0.005 per share. |
(iv) | Does not reflect the effect of sales charges, if applicable. |
(v) | Includes 0.29% related to dividend expense on short positions and interest expense for the period ended 4/30/21. |
(vi) | Includes 0.25% related to dividend expense on short positions and interest expense for the period ended 10/31/20. |
(vii) | Includes 0.12% related to dividend expense on short positions and interest expense for the period ended 10/31/19. |
(viii) | Includes 0.08% related to dividend expense on short positions and interest expense for the period ended 10/31/18. |
(ix) | Includes 0.07% related to dividend expense on short positions and interest expense for the period ended 10/31/17. |
(x) | Includes 0.10% related to dividend expense on short positions and interest expense for the period ended 10/31/16. |
THE ALGER FUNDS II
Financial Highlights for a share outstanding throughout the period (Unaudited)
| Alger Dynamic Opportunities Fund | Class A | |||||||||||||||||||||||
| Six months ended 4/30/2021(i) | Year ended 10/31/2020 | Year ended 10/31/2019 | Year ended 10/31/2018 | Year ended 10/31/2017 | Year ended 10/31/2016 | |||||||||||||||||||
| Net asset value, beginning of period | $ | 18.32 | $ | 13.91 | $ | 13.73 | $ | 14.10 | $ | 11.63 | $ | 12.48 | ||||||||||||
| INCOME FROM INVESTMENT OPERATIONS: | ||||||||||||||||||||||||
| Net investment loss(ii) | (0.17 | ) | (0.22 | ) | (0.16 | ) | (0.28 | ) | (0.21 | ) | (0.17 | ) | ||||||||||||
| Net realized and unrealized gain (loss) on investments | 3.71 | 5.15 | 0.58 | 0.80 | 2.72 | (0.34 | ) | |||||||||||||||||
| Total from investment operations | 3.54 | 4.93 | 0.42 | 0.52 | 2.51 | (0.51 | ) | |||||||||||||||||
| Distributions from net realized gains | (0.95 | ) | (0.52 | ) | (0.24 | ) | (0.89 | ) | (0.04 | ) | (0.34 | ) | ||||||||||||
| Net asset value, end of period | $ | 20.91 | $ | 18.32 | $ | 13.91 | $ | 13.73 | $ | 14.10 | $ | 11.63 | ||||||||||||
| Total return(iii) | 19.91 | % | 36.67 | % | 3.26 | % | 3.99 | % | 21.63 | % | (4.22 | )% | ||||||||||||
| RATIOS/SUPPLEMENTAL DATA: | ||||||||||||||||||||||||
| Net assets, end of period (000's omitted) | $ | 87,626 | $ | 60,793 | $ | 32,011 | $ | 29,620 | $ | 28,833 | $ | 30,031 | ||||||||||||
| Ratio of gross expenses to average net assets | 2.55 | %(iv) | 2.81 | %(v) | 2.49 | %(vi) | 2.63 | %(vii) | 2.51 | %(viii) | 2.38 | %(ix) | ||||||||||||
| Ratio of expense reimbursements to average net assets | (0.57 | )% | (0.80 | )% | (0.32 | )% | – | – | – | |||||||||||||||
| Ratio of net expenses to average net assets | 1.98 | % | 2.01 | % | 2.17 | % | 2.63 | % | 2.51 | % | 2.38 | % | ||||||||||||
Ratio of net investment loss to average net assets | (1.74 | )% | (1.41 | )% | (1.12 | )% | (2.02 | )% | (1.62 | )% | (1.43 | )% | ||||||||||||
| Portfolio turnover rate | 91.64 | % | 249.71 | % | 264.04 | % | 181.92 | % | 216.81 | % | 146.73 | % | ||||||||||||
See Notes to Financial Statements.
(i) | Ratios have been annualized; total return and portfolio turnover rate have not been annualized. |
(ii) | Amount was computed based on average shares outstanding during the period. |
(iii) | Does not reflect the effect of sales charges, if applicable. |
(iv) | Includes 0.93% related to dividend expense on short positions and interest expense for the period ended 4/30/21. |
(v) | Includes 1.09% related to dividend expense on short positions and interest expense for the period ended 10/31/20. |
(vi) | Includes 0.59% related to dividend expense on short positions and interest expense for the period ended 10/31/19. |
(vii) | Includes 0.81% related to dividend expense on short positions and interest expense for the period ended 10/31/18. |
(viii) | Includes 0.62% related to dividend expense on short positions and interest expense for the period ended 10/31/17. |
(ix) | Includes 0.58% related to dividend expense on short positions and interest expense for the period ended 10/31/16. |
THE ALGER FUNDS II
Financial Highlights for a share outstanding throughout the period (Unaudited)
| Alger Dynamic Opportunities Fund | Class C | |||||||||||||||||||||||
| Six months ended 4/30/2021(i) | Year ended 10/31/2020 | Year ended 10/31/2019 | Year ended 10/31/2018 | Year ended 10/31/2017 | Year ended 10/31/2016 | |||||||||||||||||||
| Net asset value, beginning of period | $ | 16.77 | $ | 12.87 | $ | 12.81 | $ | 13.32 | $ | 11.07 | $ | 11.98 | ||||||||||||
| INCOME FROM INVESTMENT OPERATIONS: | ||||||||||||||||||||||||
| Net investment loss(ii) | (0.22 | ) | (0.30 | ) | (0.25 | ) | (0.36 | ) | (0.29 | ) | (0.25 | ) | ||||||||||||
| Net realized and unrealized gain (loss) on investments | 3.37 | 4.72 | 0.55 | 0.74 | 2.58 | (0.32 | ) | |||||||||||||||||
| Total from investment operations | 3.15 | 4.42 | 0.30 | 0.38 | 2.29 | (0.57 | ) | |||||||||||||||||
| Distributions from net realized gains | (0.95 | ) | (0.52 | ) | (0.24 | ) | (0.89 | ) | (0.04 | ) | (0.34 | ) | ||||||||||||
| Net asset value, end of period | $ | 18.97 | $ | 16.77 | $ | 12.87 | $ | 12.81 | $ | 13.32 | $ | 11.07 | ||||||||||||
| Total return(iii) | 19.46 | % | 35.64 | % | 2.55 | % | 3.12 | % | 20.73 | % | (5.00 | )% | ||||||||||||
| RATIOS/SUPPLEMENTAL DATA: | ||||||||||||||||||||||||
| Net assets, end of period (000's omitted) | $ | 15,939 | $ | 10,472 | $ | 7,071 | $ | 6,790 | $ | 6,472 | $ | 7,120 | ||||||||||||
| Ratio of gross expenses to average net assets | 3.30 | %(iv) | 3.55 | %(v) | 3.25 | %(vi) | 3.41 | %(vii) | 3.29 | %(viii) | 3.14 | %(ix) | ||||||||||||
| Ratio of expense reimbursements to average net assets | (0.58 | )% | (0.80 | )% | (0.32 | )% | – | – | – | |||||||||||||||
| Ratio of net expenses to average net assets | 2.72 | % | 2.75 | % | 2.93 | % | 3.41 | % | 3.29 | % | 3.14 | % | ||||||||||||
Ratio of net investment loss to average net assets | (2.48 | )% | (2.07 | )% | (1.88 | )% | (2.79 | )% | (2.42 | )% | (2.19 | )% | ||||||||||||
| Portfolio turnover rate | 91.64 | % | 249.71 | % | 264.04 | % | 181.92 | % | 216.81 | % | 146.73 | % | ||||||||||||
See Notes to Financial Statements.
(i) | Ratios have been annualized; total return and portfolio turnover rate have not been annualized. |
(ii) | Amount was computed based on average shares outstanding during the period. |
(iii) | Does not reflect the effect of sales charges, if applicable. |
(iv) | Includes 0.93% related to dividend expense on short positions and interest expense for the period ended 4/30/21. |
(v) | Includes 1.07% related to dividend expense on short positions and interest expense for the period ended 10/31/20. |
(vi) | Includes 0.60% related to dividend expense on short positions and interest expense for the period ended 10/31/19. |
(vii) | Includes 0.81% related to dividend expense on short positions and interest expense for the period ended 10/31/18. |
(viii) | Includes 0.61% related to dividend expense on short positions and interest expense for the period ended 10/31/17. |
(ix) | Includes 0.59% related to dividend expense on short positions and interest expense for the period ended 10/31/16. |
THE ALGER FUNDS II
Financial Highlights for a share outstanding throughout the period (Unaudited)
| Alger Dynamic Opportunities Fund | Class Z | |||||||||||||||||||||||
| Six months ended 4/30/2021(i) | Year ended 10/31/2020 | Year ended 10/31/2019 | Year ended 10/31/2018 | Year ended 10/31/2017 | Year ended 10/31/2016 | |||||||||||||||||||
| Net asset value, beginning of period | $ | 18.91 | $ | 14.30 | $ | 14.07 | $ | 14.39 | $ | 11.83 | $ | 12.64 | ||||||||||||
| INCOME FROM INVESTMENT OPERATIONS: | ||||||||||||||||||||||||
| Net investment loss(ii) | (0.15 | ) | (0.22 | ) | (0.12 | ) | (0.25 | ) | (0.18 | ) | (0.14 | ) | ||||||||||||
| Net realized and unrealized gain (loss) on investments | 3.82 | 5.35 | 0.59 | 0.82 | 2.78 | (0.33 | ) | |||||||||||||||||
| Total from investment operations | 3.67 | 5.13 | 0.47 | 0.57 | 2.60 | (0.47 | ) | |||||||||||||||||
| Distributions from net realized gains | (0.95 | ) | (0.52 | ) | (0.24 | ) | (0.89 | ) | (0.04 | ) | (0.34 | ) | ||||||||||||
| Net asset value, end of period | $ | 21.63 | $ | 18.91 | $ | 14.30 | $ | 14.07 | $ | 14.39 | $ | 11.83 | ||||||||||||
| Total return(iii) | 19.97 | % | 37.08 | % | 3.54 | % | 4.27 | % | 22.02 | % | (3.92 | )% | ||||||||||||
| RATIOS/SUPPLEMENTAL DATA: | ||||||||||||||||||||||||
| Net assets, end of period (000's omitted) | $ | 631,076 | $ | 352,396 | $ | 85,184 | $ | 69,002 | $ | 48,660 | $ | 44,947 | ||||||||||||
| Ratio of gross expenses to average net assets | 2.22 | %(iv) | 2.47 | %(v) | 2.15 | %(vi) | 2.33 | %(vii) | 2.21 | %(viii) | 2.07 | %(ix) | ||||||||||||
| Ratio of expense reimbursements to average net assets | (0.49 | )% | (0.70 | )% | (0.29 | )% | – | – | – | |||||||||||||||
| Ratio of net expenses to average net assets | 1.73 | % | 1.77 | % | 1.86 | % | 2.33 | % | 2.21 | % | 2.07 | % | ||||||||||||
| Ratio of net investment loss to average net assets | (1.49 | )% | (1.30 | )% | (0.82 | )% | (1.72 | )% | (1.34 | )% | (1.13 | )% | ||||||||||||
| Portfolio turnover rate | 91.64 | % | 249.71 | % | 264.04 | % | 181.92 | % | 216.81 | % | 146.73 | % | ||||||||||||
See Notes to Financial Statements.
(i) | Ratios have been annualized; total return and portfolio turnover rate have not been annualized. |
(ii) | Amount was computed based on average shares outstanding during the period. |
(iii) | Does not reflect the effect of sales charges, if applicable. |
(iv) | Includes 0.91% related to dividend expense on short positions and interest expense for the period ended 4/30/21. |
(v) | Includes 1.09% related to dividend expense on short positions and interest expense for the period ended 10/31/20. |
(vi) | Includes 0.58% related to dividend expense on short positions and interest expense for the period ended 10/31/19. |
(vii) | Includes 0.81% related to dividend expense on short positions and interest expense for the period ended 10/31/18. |
(viii) | Includes 0.61% related to dividend expense on short positions and interest expense for the period ended 10/31/17. |
(ix) | Includes 0.58% related to dividend expense on short positions and interest expense for the period ended 10/31/16. |
THE ALGER FUNDS II
Financial Highlights for a share outstanding throughout the period (Unaudited)
| Alger Emerging Markets Fund | Class A | |||||||||||||||||||||||
Six months ended 4/30/2021(i) | Year ended 10/31/2020 | Year ended 10/31/2019 | Year ended 10/31/2018 | Year ended 10/31/2017 | Year ended 10/31/2016 | |||||||||||||||||||
| Net asset value, beginning of period | $ | 11.71 | $ | 9.80 | $ | 8.77 | $ | 11.29 | $ | 9.09 | $ | 8.55 | ||||||||||||
| INCOME FROM INVESTMENT OPERATIONS: | ||||||||||||||||||||||||
Net investment income (loss)(ii) | (0.06 | ) | (0.06 | ) | 0.03 | – | (iii) | – | (0.01 | ) | ||||||||||||||
| Net realized and unrealized gain (loss) on investments | 2.50 | 2.45 | 1.18 | (2.12 | ) | 2.20 | 0.56 | |||||||||||||||||
| Total from investment operations | 2.44 | 2.39 | 1.21 | (2.12 | ) | 2.20 | 0.55 | |||||||||||||||||
| Dividends from net investment income | – | (0.48 | ) | (0.18 | ) | (0.40 | ) | – | (0.01 | ) | ||||||||||||||
| Net asset value, end of period | $ | 14.15 | $ | 11.71 | $ | 9.80 | $ | 8.77 | $ | 11.29 | $ | 9.09 | ||||||||||||
| Total return(iv) | 20.84 | % | 25.15 | % | 14.13 | % | (19.46 | )% | 24.20 | % | 6.41 | % | ||||||||||||
| RATIOS/SUPPLEMENTAL DATA: | ||||||||||||||||||||||||
| Net assets, end of period (000's omitted) | $ | 5,634 | $ | 3,320 | $ | 3,942 | $ | 4,397 | $ | 7,141 | $ | 5,931 | ||||||||||||
| Ratio of gross expenses to average net assets | 1.72 | % | 2.25 | % | 2.22 | % | 1.77 | % | 2.05 | % | 2.43 | % | ||||||||||||
| Ratio of expense reimbursements to average net assets | (0.19 | )% | (0.72 | )% | (0.69 | )% | (0.21 | )% | (0.50 | )% | (0.83 | )% | ||||||||||||
| Ratio of net expenses to average net assets | 1.53 | % | 1.53 | % | 1.53 | % | 1.56 | % | 1.55 | % | 1.60 | % | ||||||||||||
| Ratio of net investment income (loss) to average net assets | (0.83 | )% | (0.61 | )% | 0.35 | % | (0.01 | )% | 0.05 | % | (0.10 | )% | ||||||||||||
| Portfolio turnover rate | 46.19 | % | 184.74 | % | 80.33 | % | 105.23 | % | 71.95 | % | 65.84 | % | ||||||||||||
See Notes to Financial Statements.
(i) | Ratios have been annualized; total return and portfolio turnover rate have not been annualized. |
(ii) | Amount was computed based on average shares outstanding during the period. |
(iii) | Amount was less than $0.005 per share. |
(iv) | Does not reflect the effect of sales charges, if applicable. |
THE ALGER FUNDS II
Financial Highlights for a share outstanding throughout the period (Unaudited)
| Alger Emerging Markets Fund | Class C | |||||||||||||||||||||||
| Six months ended 4/30/2021(i) | Year ended 10/31/2020 | Year ended 10/31/2019 | Year ended 10/31/2018 | Year ended 10/31/2017 | Year ended 10/31/2016 | |||||||||||||||||||
| Net asset value, beginning of period | $ | 11.16 | $ | 9.35 | $ | 8.36 | $ | 10.80 | $ | 8.76 | $ | 8.30 | ||||||||||||
| INCOME FROM INVESTMENT OPERATIONS: | ||||||||||||||||||||||||
Net investment loss(ii) | (0.10 | ) | (0.13 | ) | (0.03 | ) | (0.08 | ) | (0.06 | ) | (0.06 | ) | ||||||||||||
| Net realized and unrealized gain (loss) on investments | 2.37 | 2.33 | 1.13 | (2.02 | ) | 2.10 | 0.52 | |||||||||||||||||
| Total from investment operations | 2.27 | 2.20 | 1.10 | (2.10 | ) | 2.04 | 0.46 | |||||||||||||||||
| Dividends from net investment income | – | (0.39 | ) | (0.11 | ) | (0.34 | ) | – | – | |||||||||||||||
| Net asset value, end of period | $ | 13.43 | $ | 11.16 | $ | 9.35 | $ | 8.36 | $ | 10.80 | $ | 8.76 | ||||||||||||
| Total return(iii) | 20.34 | % | 24.19 | % | 13.34 | % | (20.11 | )% | 23.29 | % | 5.54 | % | ||||||||||||
| RATIOS/SUPPLEMENTAL DATA: | ||||||||||||||||||||||||
| Net assets, end of period (000's omitted) | $ | 3,112 | $ | 2,658 | $ | 2,782 | $ | 2,973 | $ | 3,602 | $ | 2,849 | ||||||||||||
| Ratio of gross expenses to average net assets | 2.51 | % | 3.02 | % | 2.98 | % | 2.54 | % | 2.82 | % | 3.21 | % | ||||||||||||
| Ratio of expense reimbursements to average net assets | (0.24 | )% | (0.72 | )% | (0.70 | )% | (0.23 | )% | (0.52 | )% | (0.86 | )% | ||||||||||||
| Ratio of net expenses to average net assets | 2.27 | % | 2.30 | % | 2.28 | % | 2.31 | % | 2.30 | % | 2.35 | % | ||||||||||||
| Ratio of net investment loss to average net assets | (1.55 | )% | (1.36 | )% | (0.35 | )% | (0.75 | )% | (0.68 | )% | (0.80 | )% | ||||||||||||
| Portfolio turnover rate | 46.19 | % | 184.74 | % | 80.33 | % | 105.23 | % | 71.95 | % | 65.84 | % | ||||||||||||
See Notes to Financial Statements.
(i) | Ratios have been annualized; total return and portfolio turnover rate have not been annualized. |
(ii) | Amount was computed based on average shares outstanding during the period. |
(iii) | Does not reflect the effect of sales charges, if applicable. |
THE ALGER FUNDS II
Financial Highlights for a share outstanding throughout the period (Unaudited)
| Alger Emerging Markets Fund | Class I | |||||||||||||||||||||||
| Six months ended 4/30/2021(i) | Year ended 10/31/2020 | Year ended 10/31/2019 | Year ended 10/31/2018 | Year ended 10/31/2017 | Year ended 10/31/2016 | |||||||||||||||||||
| Net asset value, beginning of period | $ | 11.59 | $ | 9.73 | $ | 8.72 | $ | 11.22 | $ | 9.04 | $ | 8.50 | ||||||||||||
| INCOME FROM INVESTMENT OPERATIONS: | ||||||||||||||||||||||||
| Net investment income (loss)(ii) | (0.05 | ) | (0.05 | ) | 0.02 | 0.01 | – | (0.01 | ) | |||||||||||||||
| Net realized and unrealized gain (loss) on investments | 2.47 | 2.42 | 1.19 | (2.11 | ) | 2.18 | 0.55 | |||||||||||||||||
| Total from investment operations | 2.42 | 2.37 | 1.21 | (2.10 | ) | 2.18 | 0.54 | |||||||||||||||||
| Dividends from net investment income | – | (0.51 | ) | (0.20 | ) | (0.40 | ) | – | – | (iii) | ||||||||||||||
| Net asset value, end of period | $ | 14.01 | $ | 11.59 | $ | 9.73 | $ | 8.72 | $ | 11.22 | $ | 9.04 | ||||||||||||
| Total return(iv) | 20.88 | % | 25.19 | % | 14.22 | % | (19.40 | )% | 24.12 | % | 6.39 | % | ||||||||||||
| RATIOS/SUPPLEMENTAL DATA: | ||||||||||||||||||||||||
| Net assets, end of period (000's omitted) | $ | 1,926 | $ | 2,617 | $ | 2,636 | $ | 14,516 | $ | 22,848 | $ | 14,006 | ||||||||||||
| Ratio of gross expenses to average net assets | 1.73 | % | 2.14 | % | 2.07 | % | 1.71 | % | 1.96 | % | 2.32 | % | ||||||||||||
| Ratio of expense reimbursements to average net assets | (0.30 | )% | (0.69 | )% | (0.65 | )% | (0.24 | )% | (0.41 | )% | (0.72 | )% | ||||||||||||
| Ratio of net expenses to average net assets | 1.43 | % | 1.45 | % | 1.42 | % | 1.47 | % | 1.55 | % | 1.60 | % | ||||||||||||
| Ratio of net investment income (loss) to average net assets | (0.68 | )% | (0.52 | )% | 0.17 | % | 0.06 | % | 0.03 | % | (0.06 | )% | ||||||||||||
| Portfolio turnover rate | 46.19 | % | 184.74 | % | 80.33 | % | 105.23 | % | 71.95 | % | 65.84 | % | ||||||||||||
See Notes to Financial Statements.
(i) | Ratios have been annualized; total return and portfolio turnover rate have not been annualized. |
(ii) | Amount was computed based on average shares outstanding during the period. |
(iii) | Amount was less than $0.005 per share. |
(iv) | Does not reflect the effect of sales charges, if applicable. |
THE ALGER FUNDS II
Financial Highlights for a share outstanding throughout the period (Unaudited)
| Alger Emerging Markets Fund | Class Z | |||||||||||||||||||||||
Six months ended 4/30/2021(i) | Year ended 10/31/2020 | Year ended 10/31/2019 | Year ended 10/31/2018 | Year ended 10/31/2017 | Year ended 10/31/2016 | |||||||||||||||||||
| Net asset value, beginning of period | $ | 11.78 | $ | 9.87 | $ | 8.85 | $ | 11.36 | $ | 9.12 | $ | 8.56 | ||||||||||||
| INCOME FROM INVESTMENT OPERATIONS: | ||||||||||||||||||||||||
Net investment income (loss)(ii) | (0.02 | ) | (0.01 | ) | 0.09 | 0.04 | 0.04 | 0.02 | ||||||||||||||||
| Net realized and unrealized gain (loss) on investments | 2.51 | 2.46 | 1.18 | (2.12 | ) | 2.20 | 0.56 | |||||||||||||||||
| Total from investment operations | 2.49 | 2.45 | 1.27 | (2.08 | ) | 2.24 | 0.58 | |||||||||||||||||
| Dividends from net investment income | – | (0.54 | ) | (0.25 | ) | (0.43 | ) | – | (0.02 | ) | ||||||||||||||
| Net asset value, end of period | $ | 14.27 | $ | 11.78 | $ | 9.87 | $ | 8.85 | $ | 11.36 | $ | 9.12 | ||||||||||||
Total return(iii) | 21.14 | % | 25.76 | % | 14.83 | % | (19.07 | )% | 24.56 | % | 6.78 | % | ||||||||||||
| RATIOS/SUPPLEMENTAL DATA: | ||||||||||||||||||||||||
| Net assets, end of period (000's omitted) | $ | 26,661 | $ | 13,028 | $ | 14,090 | $ | 19,236 | $ | 27,944 | $ | 17,568 | ||||||||||||
| Ratio of gross expenses to average net assets | 1.40 | % | 1.89 | % | 1.85 | % | 1.43 | % | 1.71 | % | 2.07 | % | ||||||||||||
| Ratio of expense reimbursements to average net assets | (0.41 | )% | (0.90 | )% | (0.90 | )% | (0.39 | )% | (0.46 | )% | (0.82 | )% | ||||||||||||
| Ratio of net expenses to average net assets | 0.99 | % | 0.99 | % | 0.95 | % | 1.04 | % | 1.25 | % | 1.25 | % | ||||||||||||
| Ratio of net investment income (loss) to average net assets | (0.30 | )% | (0.06 | )% | 0.95 | % | 0.39 | % | 0.38 | % | 0.29 | % | ||||||||||||
| Portfolio turnover rate | 46.19 | % | 184.74 | % | 80.33 | % | 105.23 | % | 71.95 | % | 65.84 | % | ||||||||||||
See Notes to Financial Statements.
(i) | Ratios have been annualized; total return and portfolio turnover rate have not been annualized. |
(ii) | Amount was computed based on average shares outstanding during the period. |
(iii) | Does not reflect the effect of sales charges, if applicable. |
THE ALGER FUNDS II
Financial Highlights for a share outstanding throughout the period (Unaudited)
| Alger Responsible Investing Fund | Class A | |||||||||||||||||||||||
Six months ended 4/30/2021(i) | Year ended 10/31/2020 | Year ended 10/31/2019 | Year ended 10/31/2018 | Year ended 10/31/2017 | Year ended 10/31/2016 | |||||||||||||||||||
| Net asset value, beginning of period | $ | 13.60 | $ | 11.38 | $ | 10.60 | $ | 11.32 | $ | 9.14 | $ | 9.36 | ||||||||||||
| INCOME FROM INVESTMENT OPERATIONS: | ||||||||||||||||||||||||
Net investment income (loss)(ii) | (0.03 | ) | (0.05 | ) | (0.01 | ) | (0.02 | ) | – | 0.01 | ||||||||||||||
| Net realized and unrealized gain (loss) on investments | 3.06 | 3.13 | 1.43 | 0.84 | 2.55 | (0.10 | ) | |||||||||||||||||
| Total from investment operations | 3.03 | 3.08 | 1.42 | 0.82 | 2.55 | (0.09 | ) | |||||||||||||||||
| Distributions from net realized gains | (1.04 | ) | (0.86 | ) | (0.64 | ) | (1.54 | ) | (0.37 | ) | (0.13 | ) | ||||||||||||
| Net asset value, end of period | $ | 15.59 | $ | 13.60 | $ | 11.38 | $ | 10.60 | $ | 11.32 | $ | 9.14 | ||||||||||||
Total return(iii) | 23.06 | % | 28.64 | % | 14.81 | % | 8.05 | % | 28.84 | % | (1.03 | )% | ||||||||||||
| RATIOS/SUPPLEMENTAL DATA: | ||||||||||||||||||||||||
| Net assets, end of period (000's omitted) | $ | 46,293 | $ | 38,192 | $ | 29,932 | $ | 29,662 | $ | 33,828 | $ | 31,321 | ||||||||||||
| Ratio of gross expenses to average net assets | 1.27 | % | 1.36 | % | 1.40 | % | 1.41 | % | 1.42 | % | 1.31 | % | ||||||||||||
| Ratio of expense reimbursements to average net assets | – | (0.02 | )% | (0.05 | )% | (0.06 | )% | (0.07 | )% | – | ||||||||||||||
| Ratio of net expenses to average net assets | 1.27 | % | 1.34 | % | 1.35 | % | 1.35 | % | 1.35 | % | 1.31 | % | ||||||||||||
| Ratio of net investment income (loss) to average net assets | (0.44 | )% | (0.43 | )% | (0.12 | )% | (0.16 | )% | (0.02 | )% | 0.14 | % | ||||||||||||
| Portfolio turnover rate | 4.89 | % | 11.73 | % | 14.64 | % | 20.20 | % | 30.70 | % | 19.84 | % | ||||||||||||
See Notes to Financial Statements.
(i) | Ratios have been annualized; total return and portfolio turnover rate have not been annualized. |
(ii) | Amount was computed based on average shares outstanding during the period. |
(iii) | Does not reflect the effect of sales charges, if applicable. |
THE ALGER FUNDS II
Financial Highlights for a share outstanding throughout the period (Unaudited)
| Alger Responsible Investing Fund | Class C | |||||||||||||||||||||||
Six months ended 4/30/2021(i) | Year ended 10/31/2020 | Year ended 10/31/2019 | Year ended 10/31/2018 | Year ended 10/31/2017 | Year ended 10/31/2016 | |||||||||||||||||||
| Net asset value, beginning of period | $ | 11.95 | $ | 10.18 | $ | 9.62 | $ | 10.49 | $ | 8.56 | $ | 8.84 | ||||||||||||
| INCOME FROM INVESTMENT OPERATIONS: | ||||||||||||||||||||||||
Net investment loss(ii) | (0.08 | ) | (0.13 | ) | (0.09 | ) | (0.09 | ) | (0.08 | ) | (0.05 | ) | ||||||||||||
| Net realized and unrealized gain (loss) on investments | 2.69 | 2.76 | 1.29 | 0.76 | 2.38 | (0.10 | ) | |||||||||||||||||
| Total from investment operations | 2.61 | 2.63 | 1.20 | 0.67 | 2.30 | (0.15 | ) | |||||||||||||||||
| Distributions from net realized gains | (1.04 | ) | (0.86 | ) | (0.64 | ) | (1.54 | ) | (0.37 | ) | (0.13 | ) | ||||||||||||
| Net asset value, end of period | $ | 13.52 | $ | 11.95 | $ | 10.18 | $ | 9.62 | $ | 10.49 | $ | 8.56 | ||||||||||||
Total return(iii) | 22.71 | % | 27.53 | % | 13.97 | % | 7.14 | % | 27.83 | % | (1.77 | )% | ||||||||||||
| RATIOS/SUPPLEMENTAL DATA: | ||||||||||||||||||||||||
| Net assets, end of period (000's omitted) | $ | 5,054 | $ | 5,368 | $ | 5,369 | $ | 6,124 | $ | 6,205 | $ | 5,581 | ||||||||||||
| Ratio of gross expenses to average net assets | 2.03 | % | 2.11 | % | 2.16 | % | 2.14 | % | 2.19 | % | 2.09 | % | ||||||||||||
| Ratio of net expenses to average net assets | 2.03 | % | 2.11 | % | 2.16 | % | 2.14 | % | 2.19 | % | 2.09 | % | ||||||||||||
| Ratio of net investment loss to average net assets | (1.19 | )% | (1.19 | )% | (0.92 | )% | (0.95 | )% | (0.86 | )% | (0.63 | )% | ||||||||||||
| Portfolio turnover rate | 4.89 | % | 11.73 | % | 14.64 | % | 20.20 | % | 30.70 | % | 19.84 | % | ||||||||||||
See Notes to Financial Statements.
(i) | Ratios have been annualized; total return and portfolio turnover rate have not been annualized. |
(ii) | Amount was computed based on average shares outstanding during the period. |
(iii) | Does not reflect the effect of sales charges, if applicable. |
THE ALGER FUNDS II
Financial Highlights for a share outstanding throughout the period (Unaudited)
| Alger Responsible Investing Fund | Class I | |||||||||||||||||||||||
Six months ended 4/30/2021(i) | Year ended 10/31/2020 | Year ended 10/31/2019 | Year ended 10/31/2018 | Year ended 10/31/2017 | Year ended 10/31/2016 | |||||||||||||||||||
| Net asset value, beginning of period | $ | 13.57 | $ | 11.36 | $ | 10.58 | $ | 11.31 | $ | 9.13 | $ | 9.35 | ||||||||||||
| INCOME FROM INVESTMENT OPERATIONS: | ||||||||||||||||||||||||
Net investment income (loss)(ii) | (0.03 | ) | (0.05 | ) | (0.01 | ) | (0.02 | ) | 0.01 | 0.01 | ||||||||||||||
| Net realized and unrealized gain (loss) on investments | 3.06 | 3.12 | 1.43 | 0.83 | 2.54 | (0.10 | ) | |||||||||||||||||
| Total from investment operations | 3.03 | 3.07 | 1.42 | 0.81 | 2.55 | (0.09 | ) | |||||||||||||||||
| Distributions from net realized gains | (1.04 | ) | (0.86 | ) | (0.64 | ) | (1.54 | ) | (0.37 | ) | (0.13 | ) | ||||||||||||
| Net asset value, end of period | $ | 15.56 | $ | 13.57 | $ | 11.36 | $ | 10.58 | $ | 11.31 | $ | 9.13 | ||||||||||||
Total return(iii) | 23.12 | % | 28.60 | % | 14.83 | % | 7.95 | % | 28.88 | % | (1.03 | )% | ||||||||||||
| RATIOS/SUPPLEMENTAL DATA: | ||||||||||||||||||||||||
| Net assets, end of period (000's omitted) | $ | 6,737 | $ | 8,131 | $ | 10,213 | $ | 12,258 | $ | 13,128 | $ | 28,461 | ||||||||||||
| Ratio of gross expenses to average net assets | 1.28 | % | 1.35 | % | 1.39 | % | 1.37 | % | 1.37 | % | 1.28 | % | ||||||||||||
| Ratio of expense reimbursements to average net assets | – | – | (0.02 | )% | (0.02 | )% | (0.02 | )% | – | |||||||||||||||
| Ratio of net expenses to average net assets | 1.28 | % | 1.35 | % | 1.37 | % | 1.35 | % | 1.35 | % | 1.28 | % | ||||||||||||
| Ratio of net investment income (loss) to average net assets | (0.44 | )% | (0.42 | )% | (0.12 | )% | (0.17 | )% | 0.08 | % | 0.16 | % | ||||||||||||
| Portfolio turnover rate | 4.89 | % | 11.73 | % | 14.64 | % | 20.20 | % | 30.70 | % | 19.84 | % | ||||||||||||
See Notes to Financial Statements.
(i) | Ratios have been annualized; total return and portfolio turnover rate have not been annualized. |
(ii) | Amount was computed based on average shares outstanding during the period. |
(iii) | Does not reflect the effect of sales charges, if applicable. |
THE ALGER FUNDS II
Financial Highlights for a share outstanding throughout the period (Unaudited)
| Alger Responsible Investing Fund | Class Z | |||||||||||||||||||||||
Six months ended 4/30/2021(i) | Year ended 10/31/2020 | Year ended 10/31/2019 | Year ended 10/31/2018 | Year ended 10/31/2017 | From 10/14/2016 (commencement of operations) to 10/31/2016(ii) | |||||||||||||||||||
| Net asset value, beginning of period | $ | 13.87 | $ | 11.55 | $ | 10.70 | $ | 11.37 | $ | 9.14 | $ | 9.20 | ||||||||||||
| INCOME FROM INVESTMENT OPERATIONS: | ||||||||||||||||||||||||
Net investment income (loss)(iii) | (0.01 | ) | (0.01 | ) | 0.03 | 0.03 | 0.03 | 0.01 | ||||||||||||||||
| Net realized and unrealized gain (loss) on investments | 3.14 | 3.19 | 1.46 | 0.84 | 2.57 | (0.07 | ) | |||||||||||||||||
| Total from investment operations | 3.13 | 3.18 | 1.49 | 0.87 | 2.60 | (0.06 | ) | |||||||||||||||||
| Distributions from net realized gains | (1.04 | ) | (0.86 | ) | (0.64 | ) | (1.54 | ) | (0.37 | ) | – | |||||||||||||
| Net asset value, end of period | $ | 15.96 | $ | 13.87 | $ | 11.55 | $ | 10.70 | $ | 11.37 | $ | 9.14 | ||||||||||||
Total return(iv) | 23.35 | % | 29.11 | % | 15.34 | % | 8.50 | % | 29.41 | % | (0.65 | )% | ||||||||||||
| RATIOS/SUPPLEMENTAL DATA: | ||||||||||||||||||||||||
| Net assets, end of period (000's omitted) | $ | 30,390 | $ | 22,646 | $ | 15,755 | $ | 13,262 | $ | 9,050 | $ | 99 | ||||||||||||
| Ratio of gross expenses to average net assets | 0.95 | % | 1.04 | % | 1.12 | % | 1.13 | % | 1.31 | % | 33.46 | % | ||||||||||||
| Ratio of expense reimbursements to average net assets | (0.01 | )% | (0.09 | )% | (0.18 | )% | (0.23 | )% | (0.41 | )% | (32.56 | )% | ||||||||||||
| Ratio of net expenses to average net assets | 0.94 | % | 0.95 | % | 0.94 | % | 0.90 | % | 0.90 | % | 0.90 | % | ||||||||||||
| Ratio of net investment income (loss) to average net assets | (0.12 | )% | (0.05 | )% | 0.29 | % | 0.27 | % | 0.32 | % | 2.38 | % | ||||||||||||
| Portfolio turnover rate | 4.89 | % | 11.73 | % | 14.64 | % | 20.20 | % | 30.70 | % | 19.84 | % | ||||||||||||
See Notes to Financial Statements.
(i) | Ratios have been annualized; total return and portfolio turnover rate have not been annualized. |
(ii) | Ratios have been annualized; total return has not been annualized; portfolio turnover is for the twelve months then ended. |
(iii) | Amount was computed based on average shares outstanding during the period. |
(iv) | Does not reflect the effect of sales charges, if applicable. |
NOTE 1 — General:
The Alger Funds II (the “Trust”) is an open-end registered investment company organized as a business trust under the laws of the Commonwealth of Massachusetts. The Trust qualifies as an investment company as defined in Financial Accounting Standards Board (“FASB”) Accounting Standards Codification 946-Financial Services – Investment Companies. The Trust operates as a series company currently offering an unlimited number of shares of beneficial interest in four series — Alger Spectra Fund, Alger Dynamic Opportunities Fund, Alger Emerging Markets Fund and Alger Responsible Investing Fund (collectively, the “Funds” or individually, each a “Fund”). The Funds normally invest primarily in equity securities and each has an investment objective of long-term capital appreciation.
Each Fund offers one or more of the following share classes: Class A shares, Class C shares, Class I shares, Class Y shares and Class Z shares. Class A shares are generally subject to an initial sales charge while Class C shares are generally subject to a deferred sales charge. Class C shares will automatically convert to Class A shares on the fifth business day of the month following the eighth anniversary of the purchase date of a shareholder’s Class C shares, without the imposition of any sales load, fee or other charge. Class C shares held at certain dealers may not convert to Class A shares or may be converted on a different schedule. At conversion, a proportionate amount of shares representing reinvested dividends and distributions will also be converted into Class A shares. Effective August 27, 2019, Class C shares were closed to direct shareholders and are only available for purchase through certain financial intermediaries and group retirement plan recordkeeping platforms, Class I shares and Class Y shares are sold to institutional investors without an initial or deferred sales charge and Class Z Shares are generally subject to a minimum initial investment of $500,000. Each class has identical rights to assets and earnings, except that each share class bears the pro rata allocation of a Fund’s expenses other than a class expense (not including advisory or custodial fees or other expenses related to the management of the Fund’s assets).
NOTE 2 — Significant Accounting Policies:
(a) Investment Valuation: The Funds value their financial instruments at fair value using independent dealers or pricing services under policies approved by the Trust’s Board of Trustees (the “Board”). Investments held by the Funds are valued on each day the New York Stock Exchange (the “NYSE”) is open, as of the close of the NYSE (normally 4:00 p.m. Eastern Time).
Investments in money market funds and short-term securities held by the Funds having a remaining maturity of sixty days or less are valued at amortized cost which approximates market value.
Equity securities, including traded rights, warrants and option contracts for which valuation information is readily available, are valued at the last quoted sales price or official closing price on the primary market or exchange on which they are traded as reported by an independent pricing service. In the absence of quoted sales, such securities are valued at the bid price or, in the absence of a recent bid price, the equivalent as obtained from one or more of the major market makers for the securities to be valued.
THE ALGER FUNDS II
NOTES TO FINANCIAL STATEMENTS (Unaudited) (Continued)
Debt securities generally trade in the over-the-counter market. Debt securities with remaining maturities of more than sixty days at the time of acquisition are valued on the basis of the last available bid prices or current market quotations provided by dealers or pricing services. In determining the value of a particular investment, pricing services may use certain information with respect to transactions in such investments, quotations from dealers, pricing matrixes, market transactions in comparable investments, various relationships observed in the market between investments and calculated yield measures based on valuation technology commonly employed in the market for such investments. Asset-backed and mortgage-backed securities are valued by independent pricing services using models that consider estimated cash flows of each tranche of the security, establish a benchmark yield and develop an estimated tranche-specific spread to the benchmark yield based on the unique attributes of the tranche. Debt securities with a remaining maturity of sixty days or less are valued at amortized cost which approximates market value.
Securities for which market quotations are not readily available are valued at fair value, as determined in good faith pursuant to procedures established by the Board and described further herein.
Securities in which the Funds invest may be traded in foreign markets that close before the close of the NYSE. Developments that occur between the close of the foreign markets and the close of the NYSE may result in adjustments to the closing foreign prices to reflect what the Trust’s investment adviser, pursuant to policies established by the Board, believes to be the fair value of these securities as of the close of the NYSE. The Funds may also fair value securities in other situations, for example, when a particular foreign market is closed but the Funds are open.
FASB Accounting Standards Codification 820 – Fair Value Measurements and Disclosures (“ASC 820”) defines fair value as the price that the Funds would receive upon selling an investment in a timely transaction to an independent buyer in the principal or most advantageous market of the investment. ASC 820 established a three-tier hierarchy to maximize the use of observable market data and minimize the use of unobservable inputs and to establish classification of fair value measurements for disclosure purposes. Inputs refer broadly to the assumptions that market participants would use in pricing the asset or liability and may be observable or unobservable. Observable inputs are based on market data obtained from sources independent of the Funds. Unobservable inputs are inputs that reflect the Funds’ own assumptions based on the best information available in the circumstances. The three-tier hierarchy of inputs is summarized in the three broad Levels listed below.
| • | Level 1 – quoted prices in active markets for identical investments |
| • | Level 2 – significant other observable inputs (including quoted prices for similar investments, interest rates, prepayment speeds, credit risk, etc.) |
| • | Level 3 – significant unobservable inputs (including the Funds’ own assumptions in determining the fair value of investments) |
THE ALGER FUNDS II
NOTES TO FINANCIAL STATEMENTS (Unaudited) (Continued)The Funds’ valuation techniques are generally consistent with either the market or the income approach to fair value. The market approach considers prices and other relevant information generated by market transactions involving identical or comparable assets to measure fair value. The income approach converts future amounts to a current, or discounted, single amount. These fair value measurements are determined on the basis of the value indicated by current market expectations about such future events. Inputs for Level 1 include exchange-listed prices and broker quotes in an active market. Inputs for Level 2 include the last trade price in the case of a halted security, an exchange-listed price which has been adjusted for fair value factors, and prices of closely related securities. Additional Level 2 inputs include an evaluated price which is based upon a compilation of observable market information such as spreads for fixed income and preferred securities. Inputs for Level 3 include, but are not limited to, revenue multiples, earnings before interest, taxes, depreciation and amortization (“EBITDA”) multiples, discount rates, time to exit and the probabilities of success of certain outcomes. Such unobservable market information may be obtained from a company’s financial statements and from industry studies, market data, and market indicators such as benchmarks and indexes. Because of the inherent uncertainty and often limited markets for restricted securities, the valuations assigned to such securities by the Funds may significantly differ from the valuations that would have been assigned by the Funds had there been an active market for such securities.
Valuation processes are determined by a Valuation Committee (“Committee”) authorized by the Board and comprised of representatives of the Trust’s investment adviser and officers of the Trust. The Committee reports its fair valuation determinations and related valuation information to the Board. The Board is responsible for approving the valuation policy and procedures.
While the Committee meets on an as-needed basis, the Committee generally meets quarterly to review and evaluate the effectiveness of the procedures for making fair value determinations. The Committee considers, among other things, the results of quarterly back testing of the fair value model for foreign securities, pricing comparisons between primary and secondary price sources, the outcome of price challenges put to the Funds’ pricing vendor, and variances between transactional prices and the previous day’s price.
(b) Cash and Cash Equivalents: Cash and cash equivalents include U.S. dollars, foreign cash and overnight time deposits.
(c) Securities Transactions and Investment Income: Securities transactions are recorded on a trade date basis. Realized gains and losses from securities transactions are recorded on the identified cost basis. Dividend income is recognized on the ex-dividend date and interest income is recognized on the accrual basis.
Premiums and discounts on debt securities purchased are amortized or accreted over the lives of the respective securities.
(d) Foreign Currency Transactions: The books and records of the Funds are maintained in U.S. dollars. Foreign currencies, investments and other assets and liabilities are translated into U.S. dollars at the prevailing rates of exchange on the valuation date. Purchases and sales of investment securities and income and expenses are translated into U.S. dollars at the prevailing exchange rates on the respective dates of such transactions.
THE ALGER FUNDS II
NOTES TO FINANCIAL STATEMENTS (Unaudited) (Continued)Net realized gains and losses on foreign currency transactions represent net gains and losses from the disposition of foreign currencies, currency gains and losses realized between the trade dates and settlement dates of security transactions, and the difference between the amount of net investment income accrued and the U.S. dollar amount actually received. The effects of changes in foreign currency exchange rates on investments in securities are included in realized and unrealized gain or loss on investments in the accompanying Statements of Operations.
(e) Forward Foreign Exchange Contracts: Certain Funds may enter into forward foreign currency contracts to hedge against foreign currency exchange rate risk on their non-U.S. dollar denominated securities or to facilitate settlement of foreign currency denominated portfolio transactions. A forward foreign currency contract is an agreement between two parties to buy and sell a currency at a set price on a future date. The contract is marked-to-market daily and the change in value is recorded by a Fund as an unrealized gain or loss. Realized gains or losses equal to the difference between the value of the contract at the time it was opened and the value at the time it was closed are recorded upon delivery or receipt of the currency.
These contracts may involve market risk in excess of the unrealized gain or loss reflected on the Statements of Assets and Liabilities. In addition, the Funds could be exposed to risk if the counterparties are unable to meet the terms of the contracts or if the value of the currency changes unfavorably to the base currency.
(f) Short Sales: Securities sold short represent an obligation to deliver the securities at a future date. A Fund may sell a security it does not own in anticipation of a decline in the value of that security before the delivery date. When a Fund sells a security short, it must borrow the security sold short and deliver it to the broker-dealer through which it made the short sale. Net dividends paid on securities sold short are disclosed as an expense on the Statements of Operations. Net dividends received on securities sold short are disclosed as income on the Statements of Operations. A gain, limited to the price at which the Fund sold the security short, or a loss, unlimited in size, will be recognized upon the termination of a short sale.
To secure its obligation to deliver to the broker-dealer the securities sold short, the Fund must segregate an amount of cash or liquid securities with its custodian equal to any excess of the current market value of the securities sold short over any cash or liquid securities deposited as collateral with the broker in connection with the short sale (not including the proceeds of the short sale). As a result of that requirement, the Fund will not gain any leverage merely by selling short, except to the extent that it earns interest or other income or gains on the segregated cash or liquid securities while also being subject to gain or loss from the securities sold short.
(g) Swaps: Each Fund may engage in swap transactions, including currency swaps, index swaps and interest rate swaps. A Fund may enter into swaps for both hedging purposes and to seek to increase total return. A Fund also may enter into options on swap agreements, sometimes called “swaptions.”
THE ALGER FUNDS II
NOTES TO FINANCIAL STATEMENTS (Unaudited) (Continued)(h) Option Contracts: When a Fund writes an option, an amount equal to the premium received by the Fund is recorded as a liability and is subsequently adjusted to reflect the current fair value of the option written. Premiums received from writing options that expire unexercised are treated by the Fund on the expiration date as realized gains from investments. The difference between the premium and the amount paid on effecting a closing purchase transaction, including brokerage commissions, is also treated as a realized gain, or, if the premium is less than the amount paid for the closing purchase transaction, as a realized loss. If a call option is exercised, the premium is added to the proceeds from the sale of the underlying security in determining whether the Fund has realized a gain or loss. If a put option is exercised, the premium reduces the cost basis of the securities purchased by the Fund. The Fund, as writer of an option, bears the market risk of an unfavorable change in the price of the security underlying the written option.
Certain Funds may also purchase put and call options. Such Funds pay a premium which is included in each Fund’s accompanying Statement of Assets and Liabilities as an investment and subsequently marked to market to reflect the current value of the option. Premiums paid for purchasing options which expire unexercised are treated as realized losses. The risk associated with purchasing put and call options is limited to the premium paid. Premiums paid for purchasing options which are exercised or closed are added to the amounts paid or offset against the proceeds on the underlying security to determine the realized gain or loss.
(i) Dividends to Shareholders: Dividends and distributions payable to shareholders are recorded by the Funds on the ex-dividend date. Dividends from net investment income, if available, and distributions from net realized gains, offset by any loss carryforward, are declared and paid annually after the end of the fiscal year in which earned.
Each share class is treated separately in determining the amounts of dividends from net investment income payable to holders of its shares.
The characterization of distributions to shareholders for financial reporting purposes is determined in accordance with federal income tax rules. Therefore, the source of a Fund’s distributions may be shown in the accompanying financial statements as either from, or in excess of, net investment income, net realized gain on investment transactions, or return of capital, depending on the type of book/tax differences that may exist. Capital accounts within the financial statements are adjusted for permanent book/tax differences. Reclassifications result primarily from the differences in tax treatment of net operating losses, passive foreign investment companies, and foreign currency transactions. The reclassifications are done annually at year-end and have no impact on the net asset values of the Funds and are designed to present each Fund’s capital accounts on a tax basis.
(j) Federal Income Taxes: It is each Fund’s policy to comply with the requirements of the Internal Revenue Code Subchapter M applicable to regulated investment companies and to distribute all of its taxable income to its shareholders. Provided that the Funds maintain such compliance, no federal income tax provision is required. Each Fund is treated as a separate entity for the purpose of determining such compliance.
THE ALGER FUNDS II
NOTES TO FINANCIAL STATEMENTS (Unaudited) (Continued)FASB Accounting Standards Codification 740 – Income Taxes (“ASC 740”) requires the Funds to measure and recognize in their financial statements the benefit of a tax position taken (or expected to be taken) on an income tax return if such position will more likely than not be sustained upon examination based on the technical merits of the position. No tax years are currently under investigation. The Funds file income tax returns in the U.S. Federal jurisdiction, as well as the New York State and New York City jurisdictions. The statute of limitations on the Funds’ tax returns remains open for the tax years 2017-2020. Management does not believe there are any uncertain tax positions that require recognition of a tax liability.
(k) Allocation Methods: The Trust accounts separately for the assets, liabilities and operations of each Fund. Expenses directly attributable to each Fund are charged to that Fund’s operations; expenses which are applicable to all Funds are allocated among them based on net assets. Income, realized and unrealized gains and losses, and expenses of each Fund are allocated among the Fund’s classes based on relative net assets, with the exception of distribution fees, transfer agency fees, and shareholder servicing and related fees.
(l) Estimates: These financial statements have been prepared in accordance with accounting principles generally accepted in the United States of America, which require using estimates and assumptions that affect the reported amounts therein. These unaudited interim financial statements reflect all adjustments that are, in the opinion of management, necessary to present a fair statement of results for the interim period. Actual results may differ from those estimates. All such estimates are of a normal recurring nature.
NOTE 3 — Investment Advisory Fees and Other Transactions with Affiliates:
(a) Investment Advisory Fees: Fees incurred by each Fund, pursuant to the provisions of the Trust's Investment Advisory Agreement with Fred Alger Management, LLC (“Alger Management” or the “Investment Manager”), are payable monthly and computed based on the following rates. The actual rate paid as a percentage of average daily net assets, for the six months ended April 30, 2021, is set forth below under the heading “Actual Rate”:
| Tier 1 | Tier 2 | Tier 3 | Tier 4 | Tier 5 | Actual Rate | |||||||||||||||||||
Alger Spectra Fund(a) | 0.90 | % | 0.75 | % | 0.65 | % | 0.55 | % | 0.45 | % | 0.71 | % | ||||||||||||
Alger Dynamic Opportunities Fund(b) | 1.20 | 1.00 | – | – | – | 1.20 | ||||||||||||||||||
Alger Emerging Markets Fund(c) | 0.75 | – | – | – | – | 0.75 | ||||||||||||||||||
Alger Responsible Investing Fund(b) | 0.71 | 0.65 | – | – | – | 0.71 | ||||||||||||||||||
(a) Tier 1 rate is paid on assets up to $2 billion, Tier 2 rate is paid on assets between $2 billion and $4 billion, Tier 3 rate is paid on assets between $4 billion and $6 billion, Tier 4 rate is paid on assets between $6 billion and $8 billion, and Tier 5 rate is paid on assets in excess of $8 billion.
THE ALGER FUNDS II
NOTES TO FINANCIAL STATEMENTS (Unaudited) (Continued)(b) Tier 1 rate is paid on assets up to $1 billion and Tier 2 rate is paid on assets in excess of $1 billion.
(c) Tier 1 rate is paid on all assets.
The sub-advisor to the Alger Dynamic Opportunities Fund, Weatherbie Capital, LLC (“Weatherbie” or the “Sub-Advisor”), an affiliate of Alger Management, is paid a fee, out of the management fee that Alger Management receives at no additional cost to the Alger Dynamic Opportunities Fund. The sub-advisory fee is equal to 70% of the net management fee paid by the Alger Dynamic Opportunities Fund to Alger Management with respect to the sub-advised assets. For the six months ended April 30, 2021, Alger Management paid a sub-advisory fee of $706,123 to Weatherbie.
Alger Management has contractually agreed to waive fees or to reimburse Fund expenses (excluding acquired fund fees and expenses, interest, taxes, brokerage and extraordinary expenses , and, for all Funds other than Alger Dynamic Opportunities Fund, dividend expense on short sales and borrowing costs) through February 28, 2023 to the extent necessary to limit the total annual fund operating expenses exceed the rates, based on average daily net assets, listed in the table below:
CLASS | FEES WAIVED / REIMBURSED FOR SIX MONTHS ENDED | |||||||||||||||||||||||
| A | C | I | Y | Z | APRIL 30, 2021 | |||||||||||||||||||
Alger Spectra Fund | – | – | – | 0.79 | % | 0.99 | %(a) | $ | 4,629 | |||||||||||||||
Alger Dynamic Opportunities Fund | 2.00 | % | 2.75 | % | – | – | 1.75 | 1,477,970 | ||||||||||||||||
Alger Emerging Markets Fund | 1.55 | 2.30 | 1.45 | % | – | 0.99 | 54,340 | |||||||||||||||||
Alger Responsible Investing Fund | – | (b) | – | – | – | 0.95 | 1,635 | |||||||||||||||||
| (a) | Prior to March 1, 2021, Alger Spectra Fund Class Z shares had no expense cap. |
| (b) | Prior to March 1, 2021, the expense cap for Alger Responsible Investing Fund Class A shares was 1.35%. |
Alger Management may, during the term of the contract, recoup any fees waived or expenses reimbursed pursuant to the contract to the extent that such recoupment would not cause the expense ratio to exceed the stated limitation in effect at the time of (i) the waiver or reimbursement and (ii) the recoupment by Alger Management, after repayment of the recoupment is taken into account. For the period ended April 30, 2021, the recoupments made by the Funds to the Investment Manager for Alger Spectra Fund and Alger Responsible Investing Fund to the Investment Manager were $2,228 and $227, respectively.
(b) Administration Fees: Fees incurred by each Fund, pursuant to the provisions of the Trust's Fund Administration Agreement with Alger Management, are payable monthly and computed based on the average daily net assets of each Fund at the annual rate of 0.0275%.
(c) Distribution Fees: The Trust has adopted distribution plans for Class A, Class C and Class I shares of the Funds pursuant to which Class A shares, Class C shares and Class I shares of each Fund pay Fred Alger & Company, LLC, the Funds’ distributor and an affiliate of the Investment Manager (the “Distributor” or “Alger LLC”), a fee at the annual rate listed below of the respective average daily net assets of the share class of the designated Fund to compensate Alger LLC for its activities and expenses incurred in distributing the share class and/or shareholder servicing. Fees paid may be more or less than the expenses incurred by Alger LLC.
THE ALGER FUNDS II
NOTES TO FINANCIAL STATEMENTS (Unaudited) (Continued)| SHARE CLASS | FEE RATE |
| A | 0.25% |
| C | 1.00 |
| I | 0.25 |
(d) Sales Charges: Sales of shares of the Funds may be subject to contingent deferred sales charges. The contingent deferred sales charges are used by Alger LLC to offset distribution expenses previously incurred. Sales charges do not represent expenses of the Trust. For the six months ended April 30, 2021, contingent deferred sales charges imposed, all of which were retained by Alger LLC, were as follows:
CONTINGENT DEFERRED SALES CHARGES | ||||
Alger Spectra Fund | $ | 21,916 | ||
Alger Dynamic Opportunities Fund | 155 | |||
Alger Emerging Markets Fund | 186 | |||
Alger Responsible Investing Fund | 805 | |||
(e) Brokerage Commissions: During the six months ended April 30, 2021, Alger Spectra Fund and Alger Responsible Investing Fund paid Alger LLC, $701,931 and $1,047, respectively, in connection with securities transactions.
(f) Shareholder Administrative Fees: The Trust has entered into a Shareholder Administrative Services Agreement with Alger Management to compensate Alger Management for liaising with, and providing administrative oversight of, the Trust’s transfer agent, and for other related services. The Funds compensate Alger Management at the annual rate of 0.0165% of their respective average daily net assets for the Class A and Class C shares and 0.01% of their respective average daily net assets of the Class I shares, Class Y shares and Class Z shares for these services.
Alger Management makes payments to intermediaries that provide sub-accounting services to omnibus accounts invested in the Funds. A portion of the fees paid by Alger Management to intermediaries that provide sub-accounting services are charged back to the appropriate Fund, subject to certain limitations, as approved by the Board. For the six months ended April 30, 2021, Alger Management charged back to Alger Spectra Fund, Alger Dynamic Opportunities Fund, Alger Emerging Markets Fund and Alger Responsible Investing Fund, $704,600, $19,724, $2,810 and $15,440, respectively, for these services, which are included in transfer agent fees in the accompanying Statements of Operations.
(g) Trustee Fees: Each trustee who is not an “interested person” of the Trust, as defined in the Investment Company Act of 1940, as amended (“Independent Trustee”) receives a fee of $142,000 per annum, paid pro rata based on net assets by each fund in the Alger Fund Complex, plus travel expenses incurred for attending board meetings. The term “Alger Fund Complex” refers to the Trust, The Alger Institutional Funds, The Alger Funds, The Alger Portfolios, Alger Global Focus Fund and The Alger ETF Trust, each of which is a registered investment company managed by Alger Management. The Independent Trustee appointed as Chairman of the Board receives additional compensation of $20,000 per annum paid pro rata based on net assets by each fund in the Alger Fund Complex. Additionally, each member of the Audit Committee receives a fee of $13,000 per annum, paid pro rata based on net assets by each fund in the Alger Fund Complex.
THE ALGER FUNDS II
NOTES TO FINANCIAL STATEMENTS (Unaudited) (Continued)Prior to January 1, 2021, each Independent Trustee received a fee of $134,000 per annum, paid pro rata based on net assets by each fund in the Alger Fund Complex, plus travel expenses incurred for attending board meetings. The Independent Trustee appointed as Chairman of the Board received additional compensation of $20,000 per annum paid pro rata based on net assets by each fund in the Alger Fund Complex. Additionally, each member of the Audit Committee received a fee of $13,000 per annum, paid pro rata based on net assets by each fund in the Alger Fund Complex.
(h) Interfund Trades: The Funds may engage in purchase and sale transactions with other funds advised by Alger Management or Weatherbie. For the six months ended April 30, 2021, these purchases and sales were as follows:
| PURCHASES | SALES | REALIZED GAIN | ||||||||||
| Alger Spectra Fund | $ | – | $ | 170,917 | $ | 89,528 | ||||||
(i) Interfund Loans: The Funds, along with other funds in the Alger Fund Complex, may borrow money from and lend money to each other for temporary or emergency purposes. To the extent permitted under its investment restrictions, each Fund may lend uninvested cash in an amount up to 15% of its net assets to other funds in the Alger Fund Complex. If a Fund has borrowed from other funds in the Alger Fund Complex and has aggregate borrowings from all sources that exceed 10% of the Fund’s total assets, such Fund will secure all of its loans from other funds in the Alger Fund Complex. The interest rate charged on interfund loans is equal to the average of the overnight time deposit rate and bank loan rate available to the Funds. There were no interfund loans outstanding as of April 30, 2021.
During the six months ended April 30, 2021, Alger Spectra Fund and Alger Responsible Investing Fund incurred interfund loan interest expenses of $470 and $30, respectively, which are included in interest in the accompanying Statements of Operations.
(j) Other Transactions with Affiliates: Certain officers and one Trustee of the Trust are directors and/or officers of Alger Management, the Distributor, or their affiliates. At April 30, 2021, Alger Management and its affiliated entities owned the following:
| SHARE CLASS | ||||||||||||||||||||
| A | C | I | Y | Z | ||||||||||||||||
| Alger Spectra Fund | 1,808,788 | –18,848 | 4,791 | 124,084 | ||||||||||||||||
| Alger Dynamic Opportunities Fund | 108 | –– | – | 2,134,999 | ||||||||||||||||
| Alger Responsible Investing Fund | – | –– | – | 231,211 | ||||||||||||||||
THE ALGER FUNDS II
NOTES TO FINANCIAL STATEMENTS (Unaudited) (Continued)NOTE 4 — Securities Transactions:
The following summarizes the securities transactions by each Fund, other than U.S. Government securities, short-term securities, purchased options, swaps, forward foreign currency contracts and short sales, for the six months ended April 30, 2021:
| PURCHASES | SALES | |||||||
| Alger Spectra Fund | $ | 4,150,356,929 | $ | 4,557,969,079 | ||||
| Alger Dynamic Opportunities Fund | 711,443,612 | 472,433,355 | ||||||
| Alger Emerging Markets Fund | 24,521,102 | 13,600,771 | ||||||
| Alger Responsible Investing Fund | 3,936,673 | 6,978,218 | ||||||
NOTE 5 — Borrowing:
The Funds may borrow from Brown Brothers Harriman & Co., the Funds’ Custodian (the “Custodian”), on an uncommitted basis. Each Fund pays the Custodian a market rate of interest, generally based upon a rate of return with respect to each respective currency borrowed taking into consideration relevant overnight and short-term reference rates, the range of distribution between and among the interest rates paid on deposits to other institutions, less applicable commissions, if any. The Funds may also borrow from other funds in the Alger Fund Complex, as discussed in Note 3(i). For the six months ended April 30, 2021, the Funds had the following borrowings from the Custodian and other funds in the Alger Fund Complex:
AVERAGE DAILY BORROWING | WEIGHTED AVERAGE INTEREST RATE | |||||||
| Alger Spectra Fund | $ | 650,221 | 2.01 | % | ||||
| Alger Responsible Investing Fund | 5,567 | 1.08 | ||||||
The highest amount borrowed from the Custodian and other funds during the six months ended April 30, 2021 by each Fund was as follows:
| HIGHEST BORROWING | ||||
Alger Spectra Fund | $ | 18,362,133 | ||
Alger Responsible Investing Fund | 350,000 | |||
NOTE 6 — Share Capital:
The Trust has an unlimited number of authorized shares of beneficial interest of $.001 par value which are presently divided into four series. Each series is divided into separate classes. During the period ended April 30, 2021 and the year ended October 31, 2020, transactions of shares of beneficial interest were as follows:
THE ALGER FUNDS II
NOTES TO FINANCIAL STATEMENTS (Unaudited) (Continued)FOR THE SIX MONTHS ENDED APRIL 30, 2021 | FOR THE YEAR ENDED OCTOBER 31, 2020 | |||||||||||||||
| SHARES | AMOUNT | SHARES | AMOUNT | |||||||||||||
| Alger Spectra Fund | ||||||||||||||||
| Class A: | ||||||||||||||||
| Shares sold | 4,604,618 | $ | 138,358,760 | 10,715,039 | $ | 265,018,157 | ||||||||||
| Shares converted from Class C | 487,608 | 15,042,309 | 66,519 | 1,564,433 | ||||||||||||
| Dividends reinvested | 4,255,947 | 124,060,855 | 3,352,811 | 74,298,292 | ||||||||||||
| Shares redeemed | (7,815,626 | ) | (234,867,358 | ) | (12,890,128 | ) | (307,079,479 | ) | ||||||||
| Net increase | 1,532,547 | $ | 42,594,566 | 1,244,241 | $ | 33,801,403 | ||||||||||
| Class C: | ||||||||||||||||
| Shares sold | 820,879 | $ | 21,468,832 | 2,488,771 | $ | 51,798,205 | ||||||||||
| Shares converted to Class A | (560,145 | ) | (15,042,309 | ) | (74,893 | ) | (1,564,433 | ) | ||||||||
| Dividends reinvested | 2,526,887 | 64,157,661 | 2,276,639 | 44,827,010 | ||||||||||||
| Shares redeemed | (4,247,829 | ) | (111,713,644 | ) | (12,334,054 | ) | (268,798,211 | ) | ||||||||
| Net decrease | (1,460,208 | ) | $ | (41,129,460 | ) | (7,643,537 | ) | $ | (173,737,429 | ) | ||||||
| Class I: | ||||||||||||||||
| Shares sold | 1,241,284 | $ | 38,050,346 | 4,404,578 | $ | 103,344,108 | ||||||||||
| Dividends reinvested | 1,126,398 | 33,273,802 | 2,005,734 | 44,988,618 | ||||||||||||
| Shares redeemed | (5,237,487 | ) | (158,579,800 | ) | (20,477,840 | ) | (533,620,677 | ) | ||||||||
| Net decrease | (2,869,805 | ) | $ | (87,255,652 | ) | (14,067,528 | ) | $ | (385,287,951 | ) | ||||||
| Class Y: | ||||||||||||||||
| Shares sold | 1,712,765 | $ | 51,577,593 | 2,580,000 | $ | 66,474,771 | ||||||||||
| Dividends reinvested | 371,377 | 11,293,579 | 140,505 | 3,225,999 | ||||||||||||
| Shares redeemed | (375,343 | ) | (11,776,796 | ) | (466,211 | ) | (12,519,844 | ) | ||||||||
| Net increase | 1,708,799 | $ | 51,094,376 | 2,254,294 | $ | 57,180,926 | ||||||||||
| Class Z: | ||||||||||||||||
| Shares sold | 17,784,144 | $ | 554,014,048 | 36,350,314 | $ | 935,480,385 | ||||||||||
| Dividends reinvested | 11,824,154 | 359,217,814 | 8,953,293 | 205,388,527 | ||||||||||||
| Shares redeemed | (18,238,253 | ) | (567,726,980 | ) | (45,879,132 | ) | (1,128,409,986 | ) | ||||||||
| Net increase (decrease) | 11,370,045 | $ | 345,504,882 | (575,525 | ) | $ | 12,458,926 | |||||||||
THE ALGER FUNDS II
NOTES TO FINANCIAL STATEMENTS (Unaudited) (Continued)FOR THE SIX MONTHS ENDED APRIL 30, 2021 | FOR THE YEAR ENDED OCTOBER 31, 2020 | |||||||||||||||
| SHARES | AMOUNT | SHARES | AMOUNT | |||||||||||||
| Alger Dynamic Opportunities Fund | ||||||||||||||||
| Class A: | ||||||||||||||||
| Shares sold | 1,826,032 | $ | 36,293,893 | 3,624,168 | $ | 59,212,893 | ||||||||||
| Shares converted from Class C | 2,592 | 52,701 | 3,062 | 48,201 | ||||||||||||
| Dividends reinvested | 178,146 | 3,354,483 | 79,652 | 1,088,046 | ||||||||||||
| Shares redeemed | (1,133,190 | ) | (22,180,542 | ) | (2,690,591 | ) | (45,281,058 | ) | ||||||||
| Net increase | 873,580 | $ | 17,520,535 | 1,016,291 | $ | 15,068,082 | ||||||||||
| Class C: | ||||||||||||||||
| Shares sold | 246,683 | $ | 4,451,978 | 244,074 | $ | 3,703,525 | ||||||||||
| Shares converted to Class A | (2,851 | ) | (52,701 | ) | (3,333 | ) | (48,201 | ) | ||||||||
| Dividends reinvested | 39,061 | 669,499 | 21,810 | 274,591 | ||||||||||||
| Shares redeemed | (67,304 | ) | (1,213,602 | ) | (187,592 | ) | (2,634,036 | ) | ||||||||
| Net increase | 215,589 | $ | 3,855,174 | 74,959 | $ | 1,295,879 | ||||||||||
| Class Z: | ||||||||||||||||
| Shares sold | 12,874,372 | $ | 265,175,148 | 15,151,731 | $ | 264,199,101 | ||||||||||
| Dividends reinvested | 970,640 | 18,898,368 | 172,664 | 2,429,386 | ||||||||||||
| Shares redeemed | (3,312,099 | ) | (67,892,429 | ) | (2,641,916 | ) | (42,076,442 | ) | ||||||||
| Net increase | 10,532,913 | $ | 216,181,087 | 12,682,479 | $ | 224,552,045 | ||||||||||
| Alger Emerging Markets Fund | ||||||||||||||||
| Class A: | ||||||||||||||||
| Shares sold | 161,034 | $ | 2,306,597 | 55,253 | $ | 572,472 | ||||||||||
| Dividends reinvested | — | — | 18,173 | 182,825 | ||||||||||||
| Shares redeemed | (46,464 | ) | (671,081 | ) | (192,275 | ) | (1,809,275 | ) | ||||||||
| Net increase (decrease) | 114,570 | $ | 1,635,516 | (118,849 | ) | $ | (1,053,978 | ) | ||||||||
| Class C: | ||||||||||||||||
| Shares sold | 14,898 | $ | 204,154 | 6,443 | $ | 64,232 | ||||||||||
| Dividends reinvested | — | — | 11,207 | 108,145 | ||||||||||||
| Shares redeemed | (21,459 | ) | (292,397 | ) | (76,931 | ) | (734,784 | ) | ||||||||
| Net decrease | (6,561 | ) | $ | (88,243 | ) | (59,281 | ) | $ | (562,407 | ) | ||||||
| Class I: | ||||||||||||||||
| Shares sold | 42,433 | $ | 605,348 | 158,903 | $ | 1,754,767 | ||||||||||
| Dividends reinvested | — | — | 14,926 | 148,512 | ||||||||||||
| Shares redeemed | (130,760 | ) | (1,875,604 | ) | (218,921 | ) | (2,238,414 | ) | ||||||||
| Net decrease | (88,327 | ) | $ | (1,270,256 | ) | (45,092 | ) | $ | (335,135 | ) | ||||||
| Class Y: | ||||||||||||||||
| Shares redeemed | — | — | (309 | ) | (3,146 | ) | ||||||||||
| Net decrease | — | $ | — | (309 | ) | $ | (3,146 | ) | ||||||||
| Class Z: | ||||||||||||||||
| Shares sold | 884,510 | $ | 12,898,115 | 206,651 | $ | 2,171,086 | ||||||||||
| Dividends reinvested | — | — | 72,341 | 728,473 | ||||||||||||
| Shares redeemed | (121,984 | ) | (1,752,793 | ) | (600,809 | ) | (5,867,363 | ) | ||||||||
| Net increase (decrease) | 762,526 | $ | 11,145,322 | (321,817 | ) | $ | (2,967,804 | ) | ||||||||
THE ALGER FUNDS II
NOTES TO FINANCIAL STATEMENTS (Unaudited) (Continued)FOR THE SIX MONTHS ENDED APRIL 30, 2021 | FOR THE YEAR ENDED OCTOBER 31, 2020 | |||||||||||||||
| SHARES | AMOUNT | SHARES | AMOUNT | |||||||||||||
| Alger Responsible Investing Fund | ||||||||||||||||
| Class A: | ||||||||||||||||
| Shares sold | 354,007 | $ | 5,216,304 | 564,468 | $ | 6,985,965 | ||||||||||
| Shares converted from Class C | 1,090 | 16,200 | 1,268 | 15,028 | ||||||||||||
| Dividends reinvested | 187,967 | 2,657,847 | 184,700 | 2,070,483 | ||||||||||||
| Shares redeemed | (383,791 | ) | (5,580,868 | ) | (570,922 | ) | (6,849,553 | ) | ||||||||
| Net increase | 159,273 | $ | 2,309,483 | 179,514 | $ | 2,221,923 | ||||||||||
| Class C: | ||||||||||||||||
| Shares sold | 17,893 | $ | 225,991 | 57,681 | $ | 625,278 | ||||||||||
| Shares converted to Class A | (1,256 | ) | (16,200 | ) | (1,434 | ) | (15,028 | ) | ||||||||
| Dividends reinvested | 31,136 | 382,658 | 39,555 | 392,389 | ||||||||||||
| Shares redeemed | (123,079 | ) | (1,591,566 | ) | (174,134 | ) | (1,910,797 | ) | ||||||||
| Net decrease | (75,306 | ) | $ | (999,117 | ) | (78,332 | ) | $ | (908,158 | ) | ||||||
| Class I: | ||||||||||||||||
| Shares sold | 5,504 | $ | 79,464 | 136,979 | $ | 1,586,755 | ||||||||||
| Dividends reinvested | 35,640 | 502,521 | 67,189 | 751,841 | ||||||||||||
| Shares redeemed | (207,430 | ) | (3,016,138 | ) | (503,817 | ) | (6,331,303 | ) | ||||||||
| Net decrease | (166,286 | ) | $ | (2,434,153 | ) | (299,649 | ) | $ | (3,992,707 | ) | ||||||
| Class Z: | ||||||||||||||||
| Shares sold | 362,313 | $ | 5,386,212 | 637,550 | $ | 8,091,217 | ||||||||||
| Dividends reinvested | 106,785 | 1,543,037 | 83,450 | 951,326 | ||||||||||||
| Shares redeemed | (197,594 | ) | (2,918,660 | ) | (451,900 | ) | (5,666,421 | ) | ||||||||
| Net increase | 271,504 | $ | 4,010,589 | 269,100 | $ | 3,376,122 | ||||||||||
NOTE 7 — Income Tax Information:
At October 31, 2020, the Funds, for federal income tax purposes, had no capital loss carryforwards and no capital loss carryforwards were utilized in 2021.
Under the Regulated Investment Company Modernization Act of 2010, capital losses incurred by the Funds will not be subject to expiration.
The difference between book-basis and tax-basis unrealized appreciation (depreciation) is determined annually and is attributable primarily to the tax deferral of losses on wash sales,
U.S. Internal Revenue Code Section 988 currency transactions, nondeductible expenses on dividends sold short, the tax treatment of partnership investments, the realization of unrealized appreciation of passive foreign investment companies, and return of capital from real estate investment trust investments.
NOTE 8 — Fair Value Measurements:
The following is a summary of the inputs used as of April 30, 2021 in valuing the Funds’ investments carried at fair value on a recurring basis. Based upon the nature, characteristics, and risks associated with their investments, the Funds have determined that presenting them by security type and sector is appropriate.
THE ALGER FUNDS II
NOTES TO FINANCIAL STATEMENTS (Unaudited) (Continued)| Alger Spectra Fund | TOTAL | LEVEL 1 | LEVEL 2 | LEVEL 3 | ||||||||||||
| COMMON STOCKS | ||||||||||||||||
| Communication Services | $ | 1,061,774,736 | $ | 1,061,774,736 | $ | — | $ | — | ||||||||
| Consumer Discretionary | 1,919,088,164 | 1,825,289,084 | 86,576,213 | 7,222,867 | ||||||||||||
| Consumer Staples | 74,211,285 | 74,211,285 | — | — | ||||||||||||
| Financials | 134,730,673 | 134,730,673 | — | — | ||||||||||||
| Healthcare | 865,789,600 | 865,789,600 | — | — | ||||||||||||
| Industrials | 746,623,739 | 746,623,739 | — | — | ||||||||||||
| Information Technology | 3,874,491,715 | 3,874,491,715 | — | — | ||||||||||||
| Materials | 68,237,581 | 68,237,581 | — | — | ||||||||||||
| TOTAL COMMON STOCKS | $ | 8,744,947,493 | $ | 8,651,148,413 | $ | 86,576,213 | $ | 7,222,867 | ||||||||
| PREFERRED STOCKS | ||||||||||||||||
| Healthcare | 436,802 | — | — | 436,802 | ||||||||||||
| REAL ESTATE INVESTMENT TRUST | ||||||||||||||||
| Real Estate | 47,280,285 | 47,280,285 | — | — | ||||||||||||
| SPECIAL PURPOSE VEHICLE | ||||||||||||||||
| Information Technology | 11,925,000 | — | — | 11,925,000 | ||||||||||||
| TOTAL INVESTMENTS IN SECURITIES | $ | 8,804,589,580 | $ | 8,698,428,698 | $ | 86,576,213 | $ | 19,584,669 | ||||||||
| SECURITIES SOLD SHORT | ||||||||||||||||
| COMMON STOCKS | ||||||||||||||||
| Communication Services | 28,101,708 | 28,101,708 | — | — | ||||||||||||
| Consumer Discretionary | 96,277,440 | 96,277,440 | — | — | ||||||||||||
| Consumer Staples | 227,469,418 | 227,469,418 | — | — | ||||||||||||
| Exchange Traded Funds | 37,435,458 | 37,435,458 | — | — | ||||||||||||
| Healthcare | 88,289,472 | 88,289,472 | — | — | ||||||||||||
| Industrials | 67,907,075 | 67,907,075 | — | — | ||||||||||||
| Information Technology | 135,471,185 | 135,471,185 | — | — | ||||||||||||
| Materials | 8,831,368 | 8,831,368 | — | — | ||||||||||||
| TOTAL COMMON STOCKS | $ | 689,783,124 | $ | 689,783,124 | $ | — | $ | — | ||||||||
| REAL ESTATE INVESTMENT TRUST | ||||||||||||||||
| Real Estate | 19,333,830 | 19,333,830 | — | — | ||||||||||||
| TOTAL SECURITIES SOLD SHORT | $ | 709,116,954 | $ | 709,116,954 | $ | — | $ | — | ||||||||
| Alger Dynamic Opportunities Fund | TOTAL | LEVEL 1 | LEVEL 2 | LEVEL 3 | ||||||||||||
| COMMON STOCKS | ||||||||||||||||
| Communication Services | $ | 44,961,359 | $ | 44,961,359 | $ | — | $ | — | ||||||||
| Consumer Discretionary | 112,090,189 | 108,371,279 | 3,718,910 | — | ||||||||||||
| Consumer Staples | 7,618,897 | 7,618,897 | — | — | ||||||||||||
| Energy | 7,113,646 | 7,113,646 | — | — | ||||||||||||
| Financials | 66,497,669 | 66,497,669 | — | — | ||||||||||||
| Healthcare | 163,623,610 | 163,623,610 | — | — | ||||||||||||
| Industrials | 88,689,652 | 88,689,652 | — | — | ||||||||||||
| Information Technology | 169,843,884 | 169,843,884 | — | — | ||||||||||||
| Real Estate | 15,753,177 | 15,753,177 | — | — | ||||||||||||
| TOTAL COMMON STOCKS | $ | 676,192,083 | $ | 672,473,173 | $ | 3,718,910 | $ | — | ||||||||
THE ALGER FUNDS II
NOTES TO FINANCIAL STATEMENTS (Unaudited) (Continued)| Alger Dynamic Opportunities Fund | TOTAL | LEVEL 1 | LEVEL 2 | LEVEL 3 | ||||||||||||
| PREFERRED STOCKS | ||||||||||||||||
| Healthcare | $ | 6,213 | $ | — | $ | — | $ | 6,213 | ||||||||
| WARRANTS | ||||||||||||||||
| Healthcare | 1,580,637 | — | 1,580,637 | — | ||||||||||||
| RIGHTS | ||||||||||||||||
| Healthcare | 105,098 | — | — | 105,098 | * | |||||||||||
| REAL ESTATE INVESTMENT TRUST | ||||||||||||||||
| Real Estate | 10,484,959 | 10,484,959 | — | — | ||||||||||||
| SPECIAL PURPOSE VEHICLE | ||||||||||||||||
| Information Technology | 1,475,000 | — | — | 1,475,000 | ||||||||||||
| PURCHASED OPTIONS | ||||||||||||||||
| Financials | 12,350 | — | 12,350 | — | ||||||||||||
| Healthcare | 2,260,380 | — | 2,260,380 | — | ||||||||||||
| TOTAL INVESTMENTS IN SECURITIES | $ | 692,116,720 | $ | 682,958,132 | $ | 7,572,277 | $ | 1,586,311 | ||||||||
| SECURITIES SOLD SHORT | ||||||||||||||||
| COMMON STOCKS | ||||||||||||||||
| Communication Services | 6,888,617 | 6,888,617 | — | — | ||||||||||||
| Consumer Discretionary | 16,522,260 | 15,243,320 | 1,278,940 | — | ||||||||||||
| Consumer Staples | 9,987,071 | 9,987,071 | — | — | ||||||||||||
| Financials | 12,632,178 | 12,632,178 | — | — | ||||||||||||
| Healthcare | 16,174,533 | 16,174,533 | — | — | ||||||||||||
| Industrials | 6,944,537 | 6,944,537 | — | — | ||||||||||||
| Information Technology | 28,783,566 | 28,783,566 | — | — | ||||||||||||
| Market Indices | 95,981,800 | 95,981,800 | — | — | ||||||||||||
| TOTAL COMMON STOCKS | $ | 193,914,562 | $ | 192,635,622 | $ | 1,278,940 | $ | — | ||||||||
| REAL ESTATE INVESTMENT TRUST | ||||||||||||||||
| Real Estate | 27,695,981 | 27,695,981 | — | — | ||||||||||||
| TOTAL SECURITIES SOLD SHORT | $ | 221,610,543 | $ | 220,331,603 | $ | 1,278,940 | $ | — | ||||||||
| FINANCIAL DERIVATIVE INSTRUMENTS - LIABILITIES | ||||||||||||||||
| Swaps - Contracts for difference | (582,898 | ) | — | (582,898 | ) | — | ||||||||||
| Alger Emerging Markets Fund | TOTAL | LEVEL 1 | LEVEL 2 | LEVEL 3 | ||||||||||||
| COMMON STOCKS | ||||||||||||||||
| Communication Services | 3,954,329 | 603,720 | 3,350,609 | — | ||||||||||||
| Consumer Discretionary | 9,096,147 | 3,383,051 | 5,713,096 | — | ||||||||||||
| Consumer Staples | 1,709,226 | 765,891 | 943,335 | — | ||||||||||||
| Financials | 2,623,169 | 534,687 | 2,088,482 | — | ||||||||||||
| Healthcare | 2,305,140 | 759,581 | 1,545,559 | — | ||||||||||||
| Industrials | 2,662,431 | 664,476 | 1,997,955 | — | ||||||||||||
| Information Technology | 11,193,137 | 1,633,531 | 9,559,606 | — | ||||||||||||
| Materials | 1,642,992 | 655,780 | 987,212 | — | ||||||||||||
| Real Estate | 601,470 | — | 601,470 | — | ||||||||||||
| TOTAL COMMON STOCKS | $ | 35,788,041 | $ | 9,000,717 | $ | 26,787,324 | $ | — | ||||||||
| TOTAL INVESTMENTS IN SECURITIES | $ | 35,788,041 | $ | 9,000,717 | $ | 26,787,324 | $ | — | ||||||||
THE ALGER FUNDS II
NOTES TO FINANCIAL STATEMENTS (Unaudited) (Continued)| Alger Responsible Investing Fund | TOTAL | LEVEL 1 | LEVEL 2 | LEVEL 3 | ||||||||||||
| COMMON STOCKS | ||||||||||||||||
| Communication Services | $ | 9,030,314 | $ | 9,030,314 | $ | — | $ | — | ||||||||
| Consumer Discretionary | 15,188,022 | 15,188,022 | — | — | ||||||||||||
| Consumer Staples | 2,566,439 | 2,566,439 | — | — | ||||||||||||
| Financials | 3,512,331 | 3,512,331 | — | — | ||||||||||||
| Healthcare | 7,652,330 | 7,652,330 | — | — | ||||||||||||
| Industrials | 3,423,772 | 3,423,772 | — | — | ||||||||||||
| Information Technology | 41,049,933 | 41,049,933 | — | — | ||||||||||||
| Materials | 2,114,488 | 2,114,488 | — | — | ||||||||||||
| Utilities | 457,929 | 457,929 | — | — | ||||||||||||
| TOTAL COMMON STOCKS | $ | 84,995,558 | $ | 84,995,558 | $ | — | $ | — | ||||||||
| REAL ESTATE INVESTMENT TRUST | ||||||||||||||||
| Real Estate | 2,382,960 | 2,382,960 | — | — | ||||||||||||
| TOTAL INVESTMENTS IN SECURITIES | $ | 87,378,518 | $ | 87,378,518 | $ | — | $ | — | ||||||||
*Alger Dynamic Opportunities Fund’s holdings of Adolor Corp.’s rights are classified as a Level 3 investment and fair valued at zero as of April 30, 2021.
FAIR VALUE MEASUREMENTS USING SIGNIFICANT UNOBSERVABLE INPUTS (LEVEL 3) | ||||
| Alger Spectra Fund | Common Stocks | |||
| Opening balance at November 1, 2020 | $ | 13,384,440 | ||
| Transfers into Level 3 | — | |||
| Transfers out of Level 3 | — | |||
| Total gains or losses | ||||
| Included in net realized gain (loss) on investments | — | |||
| Included in net change in unrealized appreciation (depreciation) on investments | (6,161,573 | ) | ||
| Purchases and sales | ||||
| Purchases | — | |||
| Sales | — | |||
| Closing balance at April 30, 2021 | 7,222,867 | |||
| Net change in unrealized appreciation (depreciation) attributable to investments still held at April 30, 2021** | (6,161,573 | ) | ||
| Alger Spectra Fund | Preferred Stocks | |||
| Opening balance at November 1, 2020 | $ | 436,802 | ||
| Transfers into Level 3 | — | |||
| Transfers out of Level 3 | — | |||
| Total gains or losses | ||||
| Included in net realized gain (loss) on investments | — | |||
| Included in net change in unrealized appreciation (depreciation) on investments | — | |||
| Purchases and sales | ||||
| Purchases | — | |||
| Sales | — | |||
| Closing balance at April 30, 2021 | 436,802 | |||
| Net change in unrealized appreciation (depreciation) attributable to investments still held at April 30, 2021** | — | |||
THE ALGER FUNDS II
NOTES TO FINANCIAL STATEMENTS (Unaudited) (Continued)FAIR VALUE MEASUREMENTS USING SIGNIFICANT UNOBSERVABLE INPUTS (LEVEL 3) | ||||
| Alger Spectra Fund | Special Purpose Vehicle | |||
| Opening balance at November 1, 2020 | $ | 7,350,000 | ||
| Transfers into Level 3 | — | |||
| Transfers out of Level 3 | — | |||
| Total gains or losses | ||||
| Included in net realized gain (loss) on investments | — | |||
| Included in net change in unrealized appreciation (depreciation) on investments | — | |||
| Purchases and sales | ||||
| Purchases | 4,575,000 | |||
| Sales | — | |||
| Closing balance at April 30, 2021 | 11,925,000 | |||
| Net change in unrealized appreciation (depreciation) attributable to investments still held at April 30, 2021** | — | |||
FAIR VALUE MEASUREMENTS USING SIGNIFICANT UNOBSERVABLE INPUTS (LEVEL 3) | ||||
| Alger Dynamic Opportunities Fund | Preferred Stocks | |||
| Opening balance at November 1, 2020 | $ | 6,213 | ||
| Transfers into Level 3 | — | |||
| Transfers out of Level 3 | — | |||
| Total gains or losses | ||||
| Included in net realized gain (loss) on investments | — | |||
| Included in net change in unrealized appreciation (depreciation) on investments | — | |||
| Purchases and sales | ||||
| Purchases | — | |||
| Sales | — | |||
| Closing balance at April 30, 2021 | 6,213 | |||
| Net change in unrealized appreciation (depreciation) attributable to investments still held at April 30, 2021** | — | |||
THE ALGER FUNDS II
NOTES TO FINANCIAL STATEMENTS (Unaudited) (Continued)FAIR VALUE MEASUREMENTS USING SIGNIFICANT UNOBSERVABLE INPUTS (LEVEL 3) | ||||
| Alger Dynamic Opportunities Fund | Rights | |||
| Opening balance at November 1, 2020 | $ | 87,015 | * | |
| Transfers into Level 3 | — | |||
| Transfers out of Level 3 | — | |||
| Total gains or losses | ||||
| Included in net realized gain (loss) on investments | — | |||
| Included in net change in unrealized appreciation (depreciation) on investments | 18,083 | |||
| Purchases and sales | ||||
| Purchases | — | |||
| Sales | — | |||
| Closing balance at April 30, 2021 | 105,098 | * | ||
| Net change in unrealized appreciation (depreciation) attributable to investments still held at April 30, 2021** | 18,083 | |||
Alger Dynamic Opportunities Fund | Special Purpose Vehicle | |||
| Opening balance at November 1, 2020 | $ | 925,000 | ||
| Transfers into Level 3 | — | |||
| Transfers out of Level 3 | — | |||
| Total gains or losses | ||||
| Included in net realized gain (loss) on investments | — | |||
| Included in net change in unrealized appreciation (depreciation) on investments | — | |||
| Purchases and sales | ||||
| Purchases | 550,000 | |||
| Sales | — | |||
| Closing balance at April 30, 2021 | 1,475,000 | |||
| Net change in unrealized appreciation (depreciation) attributable to investments still held at April 30, 2021** | — | |||
* Includes securities that are fair valued at zero.
** Net change in unrealized appreciation (depreciation) is included in net change in unrealized appreciation (depreciation) on investments in the accompanying statement of operations.
The following table provides quantitative information about each Fund's Level 3 fair value measurements of the Funds' investments as of April 30, 2021. The table below is not intended to be all-inclusive, but rather provides information on the Level 3 inputs as they relate to the Funds' fair value measurements.
Fair Value April 30, 2021 | Valuation Methodology | Unobservable Input | Input/Range | Weighted Average Inputs | ||||||||||
| Alger Spectra Fund | ||||||||||||||
| Common Stocks | $ | 7,222,867 | Income Approach | Discount Rate | 1.00%-3.40 | % | N/A | |||||||
| Preferred Stocks | 436,802 | Income Approach | Discount Rate | 72.50%-77.50 | % | N/A | ||||||||
THE ALGER FUNDS II
NOTES TO FINANCIAL STATEMENTS (Unaudited) (Continued)Fair Value April 30, 2021 | Valuation Methodology | Unobservable Input | Input/Range | Weighted Average Inputs | ||||||||||
| Alger Spectra Fund | ||||||||||||||
| Special Purpose Vehicle | $ | 11,925,000 | Cost Approach | Priced at Cost | N/A | N/A | ||||||||
Alger Dynamic Opportunities Fund | ||||||||||||||
| Preferred Stocks | 6,213 | Income Approach | Discount Rate | 72.50%-77.50 | % | N/A | ||||||||
| Rights | — | Income Approach | Probability of Success | 0 | % | N/A | ||||||||
| Rights | 105,098 | Income Approach | Discount Rate | 3.40%-5.12 | % | N/A | ||||||||
| Special Purpose Vehicle | 1,475,000 | Cost Approach | Priced at Cost | N/A | N/A | |||||||||
The significant unobservable inputs used in the fair value measurement of the Fund's securities are revenue and EBITDA multiples, discount rates, and the probabilities of success of certain outcomes. Significant increases and decreases in these inputs in isolation and interrelationships between these inputs would have resulted in significantly higher or lower fair value measurements than those noted in the table above. Generally, all other things being equal, increases in revenue and EBITDA multiples, decreases in discount rates, and increases in the probabilities of success result in higher fair value measurements, whereas decreases in revenues and EBITDA multiples, increases in discount rates, and decreases in the probabilities of success result in lower fair value measurements.
Certain of the Funds’ assets and liabilities are held at carrying amount or face value, which approximates fair value for financial statements purposes. As of April 30, 2021, such assets were categorized within the ASC 820 disclosure hierarchy as follows:
| TOTAL | LEVEL 1 | LEVEL 2 | LEVEL 3 | |||||||||||||
| Cash, foreign cash and cash equivalents: | ||||||||||||||||
| Alger Spectra Fund | $ | 398,380 | $ | – | $ | 398,380 | $ | – | ||||||||
Collateral held for short sales(a) | 150,766,599 | 150,766,599 | – | – | ||||||||||||
Due to broker(b) | (97,081,039 | ) | (97,081,039 | ) | – | – | ||||||||||
| Alger Dynamic Opportunities Fund | 64,433,806 | 2,515,387 | 61,918,419 | – | ||||||||||||
Collateral held for short sales(a) | 188,353,648 | 188,353,648 | – | – | ||||||||||||
| Alger Emerging Markets Fund | 1,555,445 | 408,315 | 1,147,130 | – | ||||||||||||
| Alger Responsible Investing Fund | 1,038,319 | – | 1,038,319 | – | ||||||||||||
(a) The collateral held for short sales balance represents restricted cash held at prime brokers as of April 30, 2021.
(b) The due to broker balance represents a margin payable related to short sales due to prime brokers as of April 30, 2021.
NOTE 9 — Derivatives:
FASB Accounting Standards Codification 815 – Derivatives and Hedging (“ASC 815”) requires qualitative disclosures about objectives and strategies for using derivatives, quantitative disclosures about fair value amounts of and gains and losses on derivative instruments, and disclosures about credit-risk-related contingent features in derivative agreements.
THE ALGER FUNDS II
NOTES TO FINANCIAL STATEMENTS (Unaudited) (Continued)Options — The Funds seek to capture the majority of the returns associated with equity market investments. To meet this investment goal, the Funds invest in a broadly diversified portfolio of common stocks, the Funds may also buy and sell call and put options on equities and equity indexes. The Funds may also purchase call options to increase their exposure to the stock market and also provide diversification of risk. The Funds may also purchase put options in order to protect from significant market declines that may occur over a short period of time. The Funds may also write covered call and cash secured put options to generate cash flows while reducing the volatility of the Funds’ portfolios. The cash flows may be an important source of the Funds’ returns, although written call options may reduce the Funds’ ability to profit from increases in the value of the underlying security or equity portfolio. The value of a call option generally increases as the price of the underlying stock increases and decreases as the stock decreases in price. Conversely, the value of a put option generally increases as the price of the underlying stock decreases and decreases as the stock increases in price. The combination of the diversified stock portfolio and the purchase and sale of options is intended to provide the Funds with the majority of the returns associated with equity market investments but with reduced volatility and returns that are augmented with the cash flows from the sale of options. During the six months ended April 30, 2021, options were used in accordance with these objectives.
The Funds’ option contracts were not subject to any rights of offset with any counterparty. All of the Funds’ options were exchange traded which utilize a clearinghouse that acts as an intermediary between buyer and seller, receiving initial and maintenance margin from both, and guaranteeing performance of the option contract. The purchased options included on the Statement of Assets and Liabilities are exchange traded and not subject to offsetting.
Forward foreign currency contracts — In connection with portfolio purchases and sales of securities denominated in foreign currencies, the Funds may enter into forward foreign currency contracts. Additionally, the Funds may enter into such contracts to economically hedge certain other foreign currency denominated investments. These contracts are valued at the current cost of covering or offsetting such contracts and the related realized and unrealized foreign exchange gains and losses are included in the Statement of Operations. In the event that counterparties fail to settle these currency contracts or the related foreign security trades, the Funds could be exposed to foreign currency fluctuation.
| ASSET DERIVATIVES 2021 | LIABILITY DERIVATIVES 2021 | |||||||||||||
Alger Dynamic Opportunities Fund | ||||||||||||||
Derivatives not accounted for as hedging instruments | Balance Sheet Location | Fair Value | Balance Sheet Location | Fair Value | ||||||||||
Purchased Put Options | Investments in Securities, at value | $ | 2,272,730 | N/A | $ | – | ||||||||
Total | $ | 2,272,730 | $ | – | ||||||||||
For the six months ended April 30, 2021, Alger Dynamic Opportunities Fund had option purchases of $501,907. The average volume of contracts for purchased options for the six months ended April 30, 2021 was $21,871 based on market value. The effect of derivative instruments on the accompanying Statement of Operations for the six months ended April 30, 2021 was as follows:
THE ALGER FUNDS II
NOTES TO FINANCIAL STATEMENTS (Unaudited) (Continued)NET REALIZED (LOSS) ON DERIVATIVES | ||||
Alger Dynamic Opportunities Fund | ||||
Derivatives not accounted for as hedging instruments | Options | |||
Purchased Options | $ | (197,546 | ) | |
Total | $ | (197,546 | ) | |
NET CHANGE IN UNREALIZED DEPRECIATION ON OPTIONS | ||||
| Alger Dynamic Opportunities Fund | ||||
Derivatives not accounted for as hedging instruments | Options | |||
Purchased Options | $ | 1,742,973 | ||
Total | $ | 1,742,973 | ||
Swaps—Certain Funds may engage in swap transactions, including currency swaps, index swaps and interest rate swaps. A Fund may enter into swaps for both hedging purposes and to seek to increase total return. A Fund also may enter into options on swap agreements, sometimes called “swaptions.”
Swap agreements are two-party contracts entered into primarily by institutional investors for periods ranging from a few weeks to more than one year. In a standard “swap” transaction, two parties agree to exchange the returns (or differentials in rates of return) earned or realized on particular predetermined investments or instruments. The gross returns to be exchanged or “swapped” between the parties are generally calculated with respect to a “notional amount,” i.e., the return on or increase in value of a particular dollar amount invested at a particular interest rate, in a particular foreign currency, or in a “basket” of swaps or securities representing a particular index. The “notional amount” of the swap agreement is only used as a basis upon which to calculate the obligations that the parties to a swap agreement have agreed to exchange.
The use of swap agreements is a highly specialized activity which involves strategies and risks different from those associated with ordinary portfolio security transactions. If Alger Management is incorrect in its forecasts of applicable market factors, or a counterparty defaults, the investment performance of the Fund would diminish compared with what it would have been if these techniques were not used. In addition, it is possible that developments in the swap market, including potential government regulation, could adversely affect the Fund’s ability to terminate existing swap agreements or to realize amounts to be received under such agreements.
| ASSET DERIVATIVES 2021 | LIABILITY DERIVATIVES 2021 | ||||||||||
Alger Dynamic Opportunities Fund | |||||||||||
Centrally cleared swaps - Contracts for difference | Assets Fair Value | $ | 142,148 | Liabilities Fair Value | $ | (725,046 | ) | ||||
Total | $ | 142,148 | $ | (725,046 | ) | ||||||
THE ALGER FUNDS II
NOTES TO FINANCIAL STATEMENTS (Unaudited) (Continued)For the six months ended April 30, 2021, the average monthly notional amount of swap contracts for Alger Dynamic Opportunities Fund was $8,245,513. Swaps contracts were held during 3 months of the period. The effect of swap instruments on the accompanying Statement of Operations for the six months ended April 30, 2021 was as follows:
| NET REALIZED (LOSS) ON SWAPS | ||||
| Alger Dynamic Opportunities Fund | ||||
| Centrally cleared swaps - Contracts for difference | $ | (1,570,209 | ) | |
| Total | $ | (1,507,209 | ) | |
| NET CHANGE IN UNREALIZED DEPRECIATION ON SWAPS | ||||
| Alger Dynamic Opportunities Fund | ||||
| Centrally cleared swaps - Contracts for difference | $ | (526,162 | ) | |
| Total | $ | (526,162 | ) | |
NOTE 10 — Principal Risks:
Alger Spectra Fund - Investing in the stock market involves risks, including the potential loss of principal. Your investment in Fund shares represents an indirect investment in the securities owned by the Fund. The value of these securities, like other investments, may move up or down, sometimes rapidly and unpredictably. Your Fund shares at any point in time may be worth less than what you invested, even after taking into account the reinvestment of Fund dividends and distributions. Local, regional or global events such as war, acts of terrorism, the spread of infectious illness such as COVID-19 or other public health issues, recessions, or other events could have a significant impact on the Fund and its investments. Growth stocks may be more volatile than other stocks as their prices tend to be higher in relation to their companies’ earnings and may be more sensitive to market, political, and economic developments. A significant portion of assets may be invested in securities of companies in related sectors, and may be similarly affected by economic, political, or market events and conditions and may be more vulnerable to unfavorable sector developments. Foreign securities involve special risks including currency fluctuations, inefficient trading, political and economic instability, and increased volatility. Short sales could increase market exposure, magnifying losses and increasing volatility. Leverage increases volatility in both up and down markets and its costs may exceed the returns of borrowed securities.
Alger Dynamic Opportunities Fund - Investing in the stock market involves risks, including the potential loss of principal. Your investment in Fund shares represents an indirect investment in the securities owned by the Fund. The value of these securities, like other investments, may move up or down, sometimes rapidly and unpredictably. Your Fund shares at any point in time may be worth less than what you invested, even after taking into account the reinvestment of Fund dividends and distributions. Local, regional or global events such as war, acts of terrorism, the spread of infectious illness such as COVID-19 or other public health issues, recessions, or other events could have a significant impact on the Fund and its investments. Growth stocks may be more volatile than other stocks as their prices tend to be higher in relation to their companies’ earnings and may be more sensitive to market, political, and economic developments. A significant portion of assets may be invested in securities of companies in related sectors, and may be similarly affected by economic, political, or market events and conditions and may be more vulnerable to unfavorable sector developments. Cash positions may underperform relative to equity and fixed-income securities. Options and Short sales could increase market exposure, magnifying losses and increasing volatility. Assets may be invested in Financial Derivatives Instruments (FDIs) such as Total Return Swaps (TRS) or options, which involve risks including possible counterparty default, illiquidity, and the risk of losses greater than if they had not been used. Issuers of convertible securities may be more sensitive to economic changes. Investing in companies of small capitalizations involve the risk that such issuers may have limited product lines or financial resources, lack management depth, or have limited liquidity. Leverage increases volatility in both up and down markets and its costs may exceed the returns of borrowed securities. Foreign securities involve special risks including currency fluctuations, inefficient trading, political and economic instability, and increased volatility. Active trading may increase transaction costs, brokerage commissions, and taxes, which can lower the return on investment.
THE ALGER FUNDS II
NOTES TO FINANCIAL STATEMENTS (Unaudited) (Continued)Alger Emerging Markets Fund - Investing in the stock market involves risks, including the potential loss of principal. Your investment in Fund shares represents an indirect investment in the securities owned by the Fund. The value of these securities, like other investments, may move up or down, sometimes rapidly and unpredictably. Your Fund shares at any point in time may be worth less than what you invested, even after taking into account the reinvestment of Fund dividends and distributions. Local, regional or global events such as war, acts of terrorism, the spread of infectious illness such as COVID-19 or other public health issues, recessions, or other events could have a significant impact on the Fund and its investments. Growth stocks may be more volatile than other stocks as their prices tend to be higher in relation to their companies’ earnings and may be more sensitive to market, political, and economic developments. A significant portion of assets may be invested in securities of companies in related sectors, and may be similarly affected by economic, political, or market events and conditions and may be more vulnerable to unfavorable sector developments. Foreign securities, Frontier Markets, and Emerging Markets involve special risks including currency fluctuations, inefficient trading, political and economic instability, and increased volatility. Assets may be focused in a small number of holdings, making them susceptible to risks associated with a single economic, political or regulatory event than a more diversified portfolio. Investing in companies of small capitalizations involve the risk that such issuers may have limited product lines or financial resources, lack management depth, or have limited liquidity. Active trading may increase transaction costs, brokerage commissions, and taxes, which can lower the return on investment.
Alger Responsible Investing Fund - Investing in the stock market involves risks, including the potential loss of principal. Your investment in Fund shares represents an indirect investment in the securities owned by the Fund. The value of these securities, like other investments, may move up or down, sometimes rapidly and unpredictably. Your Fund shares at any point in time may be worth less than what you invested, even after taking into account the reinvestment of Fund dividends and distributions. Local, regional or global events such as war, acts of terrorism, the spread of infectious illness such as COVID-19 or other public health issues, recessions, or other events could have a significant impact on the Fund and its investments. Growth stocks may be more volatile than other stocks as their prices tend to be higher in relation to their companies’ earnings and may be more sensitive to market, political, and economic developments. The environmental, social and governance investment criteria may limit the number of investment opportunities available, and as a result, returns may be lower than vehicles not subject to such considerations. A significant portion of assets may be invested in securities of companies in related sectors, and may be similarly affected by economic, political, or market events and conditions and may be more vulnerable to unfavorable sector developments.
THE ALGER FUNDS II
NOTES TO FINANCIAL STATEMENTS (Unaudited) (Continued)Transactions in foreign securities may involve certain considerations and risks not typically associated with those of U.S. companies because of, among other factors, the level of governmental supervision and regulation of foreign security markets, and the possibility of political or economic instability. Additional risks associated with investing in emerging markets include increased volatility, limited liquidity, and less stringent regulatory and legal systems.
NOTE 11 — Affiliated Securities:
The issuers of the securities listed below are deemed to be affiliates of the Funds because the Funds or their affiliates owned 5% or more of the issuer’s voting securities during all or part of the period ended April 30, 2021. Information regarding the Funds’ holdings of such securities is set forth in the following table:
Security | Value at October 31, 2020 | Purchases/ Conversion | Sales/ Conversion | Dividend/ Interest Income | Realized Gain (Loss) | Net Change in Unrealized App(Dep) | Value at April 30, 2021 | |||||||||||||||||||||
Alger Spectra Fund | ||||||||||||||||||||||||||||
Preferred Stocks | ||||||||||||||||||||||||||||
Prosetta Biosciences, Inc., Series D | $ | 436,802 | $ | – | $ | – | $ | – | $ | – | $ | – | $ | 436,802 | ||||||||||||||
Special Purpose Vehicle | ||||||||||||||||||||||||||||
Crosslink Ventures Capital LLC, Cl. A | $ | 7,350,000 | $ | – | $ | – | $ | – | $ | – | $ | – | $ | 7,350,000 | ||||||||||||||
Crosslink Ventures Capital LLC, Cl. B | – | 4,575,000 | – | – | – | – | 4,575,000 | |||||||||||||||||||||
Total | $ | 7,786,802 | $ | 4,575,000 | $ | – | $ | – | $ | – | $ | – | $ | 12,361,802 | ||||||||||||||
Security | Value at October 31, 2020 | Purchases/ Conversion | Sales/ Conversion | Dividend/ Interest Income | Realized Gain (Loss) | Net Change in Unrealized App(Dep) | Value at April 30, 2021 | |||||||||||||||||||||
| Alger Dynamic Opportunities Fund | ||||||||||||||||||||||||||||
| Preferred Stocks | ||||||||||||||||||||||||||||
| Prosetta Biosciences, Inc., Series D | $ | 6,213 | $ | – | $ | – | $ | – | $ | – | $ | – | $ | 6,213 | ||||||||||||||
| Special Purpose Vehicle | ||||||||||||||||||||||||||||
| Crosslink Ventures Capital LLC, Cl. A | $ | 925,000 | $ | – | $ | – | $ | – | $ | – | $ | – | $ | 925,000 | ||||||||||||||
| Crosslink Ventures Capital LLC, Cl. B | – | 550,000 | – | – | – | – | 550,000 | |||||||||||||||||||||
| Total | $ | 931,213 | $ | 550,000 | $ | – | $ | – | $ | – | $ | – | $ | 1,481,213 | ||||||||||||||
THE ALGER FUNDS II
NOTES TO FINANCIAL STATEMENTS (Unaudited) (Continued)NOTE 12 — Subsequent Events:
Management of each Fund has evaluated events that have occurred subsequent to April 30, 2021, through the issuance date of the Financial Statements. No such events have been identified which require recognition and/or disclosure.
Shareholder Expense Example
As a shareholder of the Fund, you incur two types of costs: transaction costs, if applicable, including sales charges (loads) and redemption fees; and ongoing costs, including management fees, distribution (12b-1) fees, if applicable, and other fund expenses. This example is intended to help you understand your ongoing costs (in dollars) of investing in the Fund and to compare these costs with the ongoing costs of investing in other mutual funds.
The example below is based on an investment of $1,000 invested at the beginning of the six-month period starting November 1, 2020 and ending April 30, 2021 and held for the entire period.
Actual Expenses
The first line for each class of shares in the table below provides information about actual account values and actual expenses. You may use the information in this line, together with the amount you invested, to estimate the expenses that you paid over the period. Simply divide your account value by $1,000 (for example, an $8,600 account value divided by $1,000 = 8.6), then multiply the result by the number in the first line under the heading entitled “Expenses Paid During the Six Months Ended April 30, 2021” to estimate the expenses you paid on your account during this period.
Hypothetical Example for Comparison Purposes
The second line for each class of shares in the table below provides information about hypothetical account values and hypothetical expenses based on the actual expense ratio for each class of the Fund’s shares and an assumed rate of return of 5% per year before expenses, which is not the Fund’s actual return. The hypothetical account values and expenses may not be used to estimate the actual ending account balance or expenses you paid for the period. You may use this information to compare the ongoing costs of investing in the Fund and other funds. To do so, compare this 5% hypothetical example with the 5% hypothetical examples that appear in the shareholder reports of other funds.
Please note that the expenses shown in the table are meant to highlight your ongoing costs only and do not reflect any transaction costs, such as sales charges (loads) and redemption fees. Therefore, the second line under each class of shares in the table is useful in comparing ongoing costs only, and will not help you determine the relative total costs of owning different funds. In addition, if these transactional costs were included, your costs would have been higher.
THE ALGER FUNDS II
ADDITIONAL INFORMATION (Unaudited) (Continued)
Beginning Account Value November 1, 2020 | Ending Account Value April 30, 2021 | Expenses Paid During the Six Months Ended April 30, 2021(a) | Annualized Expense Ratio For the Six Months Ended April 30, 2021(b) | ||||||||||||||
| Alger Spectra Fund | |||||||||||||||||
| Class A | Actual | $ | 1,000.00 | $ | 1,128.50 | $ | 7.34 | 1.39 | % | ||||||||
| Hypothetical(c) | 1,000.00 | 1,017.90 | 6.95 | 1.39 | |||||||||||||
| Class C | Actual | 1,000.00 | 1,177.00 | 11.61 | 2.15 | ||||||||||||
| Hypothetical(c) | 1,000.00 | 1,014.13 | 10.74 | 2.15 | |||||||||||||
| Class I | Actual | 1,000.00 | 1,191.40 | 7.61 | 1.40 | ||||||||||||
| Hypothetical(c) | 1,000.00 | 1,017.85 | 7.00 | 1.40 | |||||||||||||
| Class Y | Actual | 1,000.00 | 1,193.00 | 5.87 | 1.08 | ||||||||||||
| Hypothetical(c) | 1,000.00 | 1,019.44 | 5.41 | 1.08 | |||||||||||||
| Class Z | Actual | 1,000.00 | 1,192.80 | 5.87 | 1.08 | ||||||||||||
| Hypothetical(c) | 1,000.00 | 1,019.44 | 5.41 | 1.08 | |||||||||||||
Alger Dynamic Opportunities Fund | |||||||||||||||||
| Class A | Actual | $ | 1,000.00 | $ | 1,135.80 | $ | 10.49 | 1.98 | % | ||||||||
| Hypothetical(c) | 1,000.00 | 1,014.98 | 9.89 | 1.98 | |||||||||||||
| Class C | Actual | 1,000.00 | 1,184.60 | 14.73 | 2.72 | ||||||||||||
| Hypothetical(c) | 1,000.00 | 1,011.31 | 13.56 | 2.72 | |||||||||||||
| Class Z | Actual | 1,000.00 | 1,199.70 | 9.44 | 1.73 | ||||||||||||
| Hypothetical(c) | 1,000.00 | 1,016.22 | 8.65 | 1.73 | |||||||||||||
Alger Emerging Markets Fund | |||||||||||||||||
| Class A | Actual | $ | 1,000.00 | $ | 1,144.80 | $ | 8.14 | 1.53 | % | ||||||||
| Hypothetical(c) | 1,000.00 | 1,017.21 | 7.65 | 1.53 | |||||||||||||
| Class C | Actual | 1,000.00 | 1,193.40 | 12.35 | 2.27 | ||||||||||||
| Hypothetical(c) | 1,000.00 | 1,013.54 | 11.33 | 2.27 | |||||||||||||
| Class I | Actual | 1,000.00 | 1,208.80 | 7.83 | 1.43 | ||||||||||||
| Hypothetical(c) | 1,000.00 | 1,017.70 | 7.15 | 1.43 | |||||||||||||
| Class Z | Actual | 1,000.00 | 1,211.40 | 5.43 | 0.99 | ||||||||||||
| Hypothetical(c) | 1,000.00 | 1,019.89 | 4.96 | 0.99 | |||||||||||||
THE ALGER FUNDS II
ADDITIONAL INFORMATION (Unaudited) (Continued)
Beginning Account Value November 1, 2020 | Ending Account Value April 30, 2021 | Expenses Paid During the Six Months Ended April 30, 2021(a) | Annualized Expense Ratio For the Six Months Ended April 30, 2021(b) | ||||||||||||||
| Alger Responsible Investing Fund | |||||||||||||||||
| Class A | Actual | $ | 1,000.00 | $ | 1,166.30 | $ | 6.82 | 1.27 | % | ||||||||
| Hypothetical(c) | 1,000.00 | 1,018.50 | 6.36 | 1.27 | |||||||||||||
| Class C | Actual | 1,000.00 | 1,217.10 | 11.16 | 2.03 | ||||||||||||
| Hypothetical(c) | 1,000.00 | 1,014.73 | 10.14 | 2.03 | |||||||||||||
| Class I | Actual | 1,000.00 | 1,231.20 | 7.08 | 1.28 | ||||||||||||
| Hypothetical(c) | 1,000.00 | 1,018.45 | 6.41 | 1.28 | |||||||||||||
| Class Z | Actual | 1,000.00 | 1,233.50 | 5.21 | 0.94 | ||||||||||||
| Hypothetical(c) | 1,000.00 | 1,020.13 | 4.71 | 0.94 | |||||||||||||
| (a) | Expenses are equal to the annualized expense ratio of the respective share class, multiplied by the average account value over the period, multiplied by 181/365 (to reflect the one-half year period). |
| (b) | Annualized. |
| (c) | 5% annual return before expenses. |
THE ALGER FUNDS II
ADDITIONAL INFORMATION (Unaudited) (Continued)
Privacy Policy
| U.S. Consumer Privacy Notice | Rev. 6/22/21 | ||
| FACTS | WHAT DOES ALGER DO WITH YOUR PERSONAL INFORMATION? | ||
| Why? | Financial companies choose how they share your personal information. Federal law gives consumers the right to limit some but not all sharing. Federal law also requires us to tell you how we collect, share, and protect your personal information. Please read this notice carefully to understand what we do. | ||
| What? | The types of personal information we collect and share depend on the product or service you have with us. This information can include: • Social Security number and • Account balances and • Transaction history and • Purchase history and • Assets When you are no longer our customer, we continue to share your information as described in this notice. | ||
| How? | All financial companies need to share personal information to run their everyday business. In the section below, we list the reasons financial companies can share personal information; the reasons Alger chooses to share; and whether you can limit this sharing. | ||
| Reasons we can share your personal information | Does Alger share? | Can you limit this sharing? | |||
For our everyday business purposes — such as to process your transactions, maintain your account(s), respond to court orders and legal investigations, or report to credit bureaus | Yes | No | |||
For our marketing purposes —to offer our products and services to you | Yes | No | |||
For joint marketing with other financial companies | No | We don’t share | |||
For our affiliates’ everyday business purposes — information about your transactions and experiences | Yes | No | |||
For our affiliates’ everyday business purposes — information about your creditworthiness | No | We don’t share | |||
| For nonaffiliates to market to you | No | We don’t share | |||
| Questions? Call 1-800-223-3810 |
THE ALGER FUNDS II
ADDITIONAL INFORMATION (Unaudited) (Continued)
| Who we are | |||
| Who is providing this notice? | Alger includes Fred Alger Management, LLC and Fred Alger & Company, LLC as well as the following funds: The Alger Funds, The Alger Funds II, The Alger Institutional Funds, The Alger Portfolios, Alger Global Focus Fund, and the Alger ETF Trust. |
| What we do | |||
| How does Alger protect my personal information? | To protect your personal information from unauthorized access and use, we use security measures that comply with federal law. These measures include computer safeguards and secured files and buildings. | ||
| How does Alger collect my personal information? | We collect your personal information, for example, when you: • Open an account or • Make deposits or withdrawals from your account or • Give us your contact information or • Provide account information or • Pay us by check. | ||
| Why can’t I limit all sharing? | Federal law gives you the right to limit some but not all sharing related to: • sharing for affiliates’ everyday business purposes ─ information about your credit worthiness • affiliates from using your information to market to you • sharing for nonaffiliates to market to you State laws and individual companies may give you additional rights to limit sharing. |
| Definitions | |||
| Affiliates | Companies related by common ownership or control. They can be financial and nonfinancial companies. • Our affiliates include Fred Alger Management, LLC, Weatherbie Capital, LLC and Fred Alger & Company, LLC as well as the following funds: The Alger Funds, The Alger Funds II, The Alger Institutional Funds, The Alger Portfolios, Alger Global Focus Fund and the Alger ETF Trust. | ||
| Nonaffiliates | Companies not related by common ownership or control. They can be financial and nonfinancial companies. | ||
| Joint marketing | A formal agreement between nonaffiliated financial companies that together market financial products or services to you. |
THE ALGER FUNDS II
ADDITIONAL INFORMATION (Unaudited) (Continued)
Proxy Voting Policies
A description of the policies and procedures the Funds use to determine how to vote proxies relating to portfolio securities and the proxy voting record is available, without charge, by calling (800) 992-3863 or online on the Funds’ website at http://www.alger.com or on the SEC’s website at http://www.sec.gov.
Fund Holdings
The Board has adopted policies and procedures relating to disclosure of the Funds’ portfolio securities. These policies and procedures recognize that there may be legitimate business reasons for holdings to be disclosed and seek to balance those interests to protect the proprietary nature of the trading strategies and implementation thereof by the Funds.
Generally, the policies prohibit the release of information concerning portfolio holdings, which have not previously been made public, to individual investors, institutional investors, intermediaries that distribute the Funds’ shares and other parties which are not employed by the Investment Manager or its affiliates except when the legitimate business purposes for selective disclosure and other conditions (designed to protect the Funds) are acceptable.
The Funds file their complete schedules of portfolio holdings with the SEC semi-annually in shareholder reports on Form N-CSR and after the first and third fiscal quarters as an exhibit to their reports on Form N-PORT. The Funds’ Forms N-CSR and N-PORT are available online on the SEC’s website at www.sec.gov.
In addition, the Funds make publicly available their month-end top 10 holdings with a 10 day lag and their month-end full portfolios with a 60 day lag on their website www.alger.com and through other marketing communications (including printed advertising/sales literature and/or shareholder telephone customer service centers). No compensation or other consideration is received for the non-public disclosure of portfolio holdings information.
In accordance with the foregoing, the Funds provide portfolio holdings information to third parties including financial intermediaries and service providers who need access to this information in the performance of their services and are subject to duties of confidentiality
(1) imposed by law, including a duty not to trade on non-public information, and/or (2) pursuant to an agreement that confidential information is not to be disclosed or used (including trading on such information) other than as required by law. From time to time, the Funds will communicate with these third parties to confirm that they understand the Funds’ policies and procedures regarding such disclosure. This agreement must be approved by the Trust’s Chief Compliance Officer.
The Board periodically reviews a report disclosing the third parties to whom each Fund’s holdings information has been disclosed and the purpose for such disclosure, and it considers whether or not the release of information to such third parties is in the best interest of the Fund and its shareholders.
In addition to material the Funds routinely provide to shareholders, the Investment Manager may make additional statistical information available regarding the Alger Family of Funds.
THE ALGER FUNDS II
ADDITIONAL INFORMATION (Unaudited) (Continued)
Such information may include, but not be limited to, relative weightings and characteristics of the Fund versus an index (such as P/E ratio, alpha, beta, capture ratio, maximum drawdown, standard deviation, EPS forecasts, Sharpe ratio, information ratio, R-squared, and market cap analysis), security specific impact on overall portfolio performance, month- end top ten contributors to and detractors from performance, portfolio turnover, and other similar information. Shareholders should visit www.alger.com or may also contact the Funds at (800) 992-3863 to obtain such information.
Liquidity Risk Management Program
In accordance with Rule 22e-4 under the Investment Company Act of 1940, as amended (the “Rule”), the Trust established a liquidity risk management program (the “LRMP”) in December 2018 and the Board, including a majority of the Independent Trustees, appointed the Investment Manager as the administrator of the LRMP. The Board, including a majority of the Independent Trustees, formally approved the LRMP in May of 2019. The Investment Manager administers the LRMP through a Liquidity Risk Committee (the “Committee”) that is chaired by the Investment Manager’s Chief Compliance Officer, who also serves as the Trust’s Chief Compliance Officer. The Board also approved an agreement with Intercontinental Exchange (“ICE”), a third-party vendor that assists the Funds with liquidity classifications required by the Rule. The Committee is responsible for assessing the liquidity risk of the Funds, subject to the oversight of the Investment Manager. The Committee reviews daily investment classification reports, and meets quarterly to continuously monitor the Funds’ liquidity risk and the liquidity of the Funds’ underlying holdings. The Committee also performs stress testing on the Funds’ portfolios periodically throughout the year, and reports the results at the next Committee meeting.
The Board met on December 18, 2020 to review the LRMP pursuant to the Rule and at such meeting the Trust’s Chief Compliance Officer, on behalf of the Investment Manager as the administrator of the LRMP, provided the Board with a report that addressed the operation of the LRMP and assessed its adequacy and effectiveness during the past year (the “Report”). The Report covered the period from December 1, 2019 through November 30, 2020 (the “Review Period”).
The Report stated that the Committee assessed each Fund’s liquidity risk by considering qualitative factors such as the Fund’s investment strategy, holdings, diversification of investments, redemption policies, cash flows, cash levels, shareholder concentration, and access to borrowings, among others, in conjunction with the quantitative classifications generated by ICE. In addition, in connection with the review of the Funds’ liquidity risks and the operation of the LRMP and the adequacy and effectiveness of its implementation, the Committee also evaluated the levels at which to set the reasonably anticipated trade size and market price impact. The Report described the process for determining that each Fund primarily holds investments that are highly liquid (i.e. greater than 50% of the Fund’s portfolio is invested in highly liquid securities) under the Rule. The Report also stated that the Committee concluded that, when evaluating the effects of the COVID-19 pandemic, and given the nature of the Funds’ underlying investments as well as each Fund’s historical redemption rate, each Fund’s reasonably anticipated trade size (RATS) percentage and market price impact remained appropriate.
The Report concluded that, during the Review Period, the Trust’s LRMP operated effectively, is adequate and effectively implemented, that no material changes to the LRMP were made during the Review Period, and none were being recommended.
THE ALGER FUNDS II
360 Park Avenue South
New York, NY 10010
(800) 992-3863
www.alger.com
Investment Manager
Fred Alger Management, LLC
360 Park Avenue South
New York, NY 10010
Distributor
Fred Alger & Company, LLC
360 Park Avenue South
New York, NY 10010
Transfer Agent and Dividend Disbursing Agent
UMB Fund Services, Inc.
235 W. Galena Street Milwaukee,
WI 53212
Custodian
Brown Brothers Harriman & Company
50 Post Office Square
Boston, MA 02110
Independent Registered Public Accounting Firm
Deloitte & Touche LLP
30 Rockefeller Plaza
New York, NY 10112
This report is submitted for the general information of the shareholders of The Alger Funds II. It is not authorized for distribution to prospective investors unless accompanied by an effective Prospectus for the Trust, which contains information concerning the Trust’s investment policies, fees and expenses as well as other pertinent information.
(This page has been intentionally left blank.)
(This page has been intentionally left blank.)
(This page has been intentionally left blank.)
(This page has been intentionally left blank.)

| ITEM 2. | CODE OF ETHICS. |
Not applicable.
| ITEM 3. | AUDIT COMMITTEE FINANCIAL EXPERT. |
Not applicable.
| ITEM 4. | PRINCIPAL ACCOUNTANT FEES AND SERVICES. |
Not applicable.
| ITEM 5. | AUDIT COMMITTEE OF LISTED REGISTRANTS. |
Not applicable.
| ITEM 6. | INVESTMENTS. |
Not applicable.
| ITEM 7. | DISCLOSURE OF PROXY VOTING POLICIES AND PROCEDURES FOR CLOSED-END MANAGEMENT INVESTMENT COMPANIES. |
Not applicable.
| ITEM 8. | PORTFOLIO MANAGERS OF CLOSED-END MANAGEMENT INVESTMENT COMPANIES. |
Not applicable.
| ITEM 9. | PURCHASES OF EQUITY SECURITIES BY CLOSED-END MANAGEMENT INVESTMENT COMPANY AND AFFILIATED PURCHASERS. |
Not applicable.
| ITEM 10. | SUBMISSION OF MATTERS TO A VOTE OF SECURITY HOLDERS. |
Not applicable.
| ITEM 11. | CONTROLS AND PROCEDURES. |
(a) The Registrant’s principal executive officer and principal financial officer have concluded that the Registrant’s disclosure controls and procedures (as defined in Rule 30a-3(c) under the Investment Company Act of 1940, as amended) are effective based on their evaluation of the disclosure controls and procedures as of a date within 90 days of the filing date of this document.
(b) No changes in the Registrant’s internal control over financial reporting occurred during the Registrant’s second fiscal quarter of the period covered by this report that materially affected, or are reasonably likely to materially affect, the Registrant’s internal control over financial reporting.
| ITEM 12. | Disclosure of Securities Lending Activities for Closed-End Management Investment Companies. |
Not applicable.
| ITEM 13. | EXHIBITS. |
(a) (1) Not applicable
(a) (3) Not applicable
(a) (4) Not applicable
SIGNATURES
Pursuant to the requirements of the Securities Exchange Act of 1934 and the Investment Company Act of 1940, the registrant has duly caused this report to be signed on its behalf by the undersigned, thereunto duly authorized.
The Alger Funds II
By: | /s/Hal Liebes | |
Hal Liebes | ||
President |
Date: June 21, 2021
Pursuant to the requirements of the Securities Exchange Act of 1934 and the Investment Company Act of 1940, this report has been signed below by the following persons on behalf of the registrant and in the capacities and on the dates indicated.
By: | /s/Hal Liebes | |
Hal Liebes | ||
President |
Date: June 21, 2021
By: | /s/Michael D. Martins | |
Michael D. Martins | ||
Treasurer |
Date: June 21, 2021