UNITED STATES
SECURITIES AND EXCHANGE COMMISSION
Washington, D.C. 20549
FORM N-CSR
CERTIFIED SHAREHOLDER REPORT OF REGISTERED
MANAGEMENT INVESTMENT COMPANIES
Investment Company Act file number 811-01743
The Alger Funds II
(Exact name of registrant as specified in charter)
100 Pearl Street New York, New York 10004
(Address of principal executive offices) (Zip code)
Mr. Hal Liebes
Fred Alger Management, LLC
100 Pearl Street
New York, New York 10004
(Name and address of agent for service)
Registrant's telephone number, including area code: 212-806-8800
Date of fiscal year end: October 31
Date of reporting period: October 31, 2021
Form N-CSR is to be used by management investment companies to file reports with the Commission, not later than 10 days after the transmission to Stockholders of any report to be transmitted to Stockholders under Rule 30e-1 under the Investment Company Act of 1940 (17 CFR 270.30e1). The Commission may use the information provided on Form N-CSR in its regulatory, disclosure review, inspection, and policymaking roles.
A registrant is required to disclose the information specified by Form N-CSR, and the Commission will make this information public. A registrant is not required to respond to the collection of information contained in Form N-CSR unless the Form displays a currently valid Office of Management and Budget ("OMB") control number. Please direct comments concerning the accuracy of the information collection burden estimate and any suggestions for reducing the burden to the Secretary, Securities and Exchange Commission, 450 Fifth Street, NW, Washington, DC 20549-0609. The OMB has reviewed this collection of information under the clearance requirements of 44 U.S.C. § 3507.
| ITEM 1. | REPORTS TO STOCKHOLDERS. |

Table of Contents
The Alger Funds II
| 1 | |
| 14 | |
| 22 | |
| 23 | |
| 48 | |
| 53 | |
| 55 | |
| 59 | |
| 75 | |
| 105 | |
| 107 |
Dear Shareholders,
Instant Gratification Gives Way to Fundamentals
Pity poor Ralph. After an evening of gluttony, he suffered from major digestive issues while repeating, “I can’t believe I ate the whole thing.” Ralph appeared in a 1970s commercial, during which Alka-Seltzer miraculously cured his stomach woes. One can hardly blame Ralph: Overeating is common and one of many examples of instant gratification, such as conspicuous consumption, gambling and a wide range of other vices. Indeed, researchers say instant gratification floods our brains with short-term mood-enhancing blasts of dopamine, yet like Ralph’s stomach issues, comes at a high cost.
We believe the fiscal 12-month period ended October 31, 2021, illustrates many investors’ preference for short-term gratification. Despite growth equities exhibiting strong and durable fundamentals, investors favored lower-quality cyclical “value” stocks in the past year based on the reopening of the U.S. and other economies post the peak of the COVID-19 pandemic that occurred in late 2020. These kinds of companies benefited disproportionately during the reporting period from the “easy” growth occurring after they experienced massive revenue and earnings declines triggered by forced closures as the COVID-19 pandemic struck in 2020. In our view, the current high growth in revenues and profits reported by many cyclicals that dominate value indices is deceptive. As societies worldwide return to “normal” life as COVID-19 recedes – thanks to the amazing medical advances in vaccines and treatment we’ve seen these past nearly two years—we believe that these companies, and value stocks generally, will be faced with the reality that their long-term, “true” growth and fundamentals are, in many cases, quite poor and deteriorating. As that happens, we believe the longer-term fundamental outperformance of growth companies, innovative leaders in many sectors, will re-assert themselves, and that growth stocks will outperform value stocks again.
Investors Flock to Lower-Quality Cyclicals
Value equities rallied for most of the reporting period. Yet a strong rotation into growth equities that started in early June resulted in the 44.97% return of the Russell 3000 Value Index only modestly outperforming the 42.81% return of the Russell 3000 Growth Index during the fiscal 12-month period. Within the broad Russell 3000 Index, Energy led as investors anticipated that economic growth would support demand for oil, natural gas and other energy commodities, while Financials was the second-best performing sector, a result of increasing interest rates. The Real Estate sector also outperformed with particular strength in cyclical residential real estate investment trusts (REITs) and specialty REITs, such as timber and billboard companies. One interesting fact: small cap growth underperformed small cap value by a very large amount in the past year. In addition, small cap stocks generally are cheap on a historical basis relative to large cap stocks. We think this presents an interesting starting point for small cap growth stocks to potentially outperform in future periods.
Economic Outlook Becomes Less Clear
As the reporting period progressed, investors watched for signs of inflation due to deficit spending, strong labor demand, rising input costs and accelerating economic growth. These concerns appeared to be realized when the May Consumer Price Index climbed 5% year over year, its highest reading since August 2008. The Federal Reserve also helped dampen enthusiasm in June when it adopted a less dovish approach to inflation, signaling that it may raise interest rates in 2023 and discussing tapering its bond buying. Supply chain issues, including a shortage of semiconductors, also surfaced, with AutoForecast Solutions estimating that the problem caused Ford to cut production by some 566,000 vehicles. A muddled view of Washington negotiations on President Biden’s proposed $3.5 trillion stimulus plan also weighed upon sentiment.
We believe the reporting period illustrates that outperformance of value equities can be short lived and occurs within longer periods of growth equities outperforming. Even with the strong performance of value equities prior to June, the Russell 3000 Growth Index has generated an annualized return of 19.09%, outpacing the 12.79% return of the Russell 3000 Value Index during the 10-year period ended October 31, 2021.
Market Rally Extends Beyond the U.S.
Global markets as measured by the MSCI ACWI Index were also strong during the reporting period, with the index generating a 37.86% return, while the MSCI Emerging Markets Index generated a 17.33% return. Within the global benchmark, France, Hong Kong, Germany, the United States, the Netherlands and Switzerland were among the top performing countries.
The Appeal of Growth Equity Fundamentals
The aforementioned rotation to value equities occurred despite growth equities exhibiting the following characteristics at the start of the reporting period and to a similar degree throughout the 12 months:
| • | Long-term earnings per share growth based on consensus estimates for the Russell 1000 Growth Index was approximately 17.6% at the start of the reporting period compared to only 7.8% for the Russell 1000 Value Index. |
| • | Return on equity, or the ratio of net income to shareholders' equity, for the Russell 1000 Growth Index was approximately 29.7% compared to only 8.7% for the Russell 1000 Value Index. |
| • | Risk as determined by the ratio of net debt to earnings before interest, taxes, depreciation and amortization (EBITDA) for the Russell 1000 Growth Index was only 0.7X compared to a substantially higher rate of 2.9X for the Russell 1000 Value Index. |
The rotation into value equities, furthermore, appears to have overlooked another metric— the price to earnings growth ratio (PEG), which measures the cost per unit of future earnings growth. At the start of the reporting period, the S&P 500 Growth Index PEG ratio was 1.76 compared to the 2.6 ratio of the S&P 500 Value Index.
Comparing Drivers of Performance
The drivers of cyclical companies’ performance in the Energy and Financials sectors illustrate why rotations to value equities can be short lived unlike the potential for long-term gains of secular growth leaders with durable fundamentals.
| • | Energy: During the second quarter of calendar year 2021, S&P 500 Energy sector earnings soared to $13.9 billion as commodity prices climbed, while during the same period last year the sector recorded a loss of $10.6 billion as the recession dramatically curtailed demand. We believe the long-term fu- ture performance of traditional oil and gas companies, however, faces many challenges. With the accelerated adoption of electric vehicles, as well as solar, wind and other renewable energy sources, we think the long-term outlook for oil and gas presents a difficult environment for these companies’ stocks to outperform. In comparison, companies that are squarely involved with the growth opportunities in electric vehicles, renewable power, battery storage and technology, etc. will be, we believe, much better opportunities for long- term appreciation for investors. Tesla, of course, is the leading example of both a company and stock that has benefitted from its innovation and leader- ship, and handsomely rewarded its long-term shareholders. |
| • | Financials: This sector is one of the most traditional and conservative, and thus lacking in innovation within its dominant companies (in terms of current size and brand). However, the major banks, credit card companies and other financial institutions are all, we believe, now faced with challenges from innovative, technology enabled, “fintech” companies that are upsetting the long-held status quo. Upstart Holdings, for example, has developed big data techniques, powered by artificial intelligence (AI), to advance credit scoring of loans. Banking companies using their technology can offer loans at much lower interest rates but make the same returns (or better) because of the ability to better price credit risk and reduce loan losses. Loans are a com- modity – as are most financial services in the banking world – so Upstart has seen rapid and massive growth through the adoption of its technology by its banking customers. Similarly, other fintech companies like PayPal and Square are offering merchants and consumers better point-of-sale systems, integrated with financial and cash management systems for businesses or, for consumers, in better electronic wallets and cash “apps” for managing personal finances. The competitive pressures in this sector are enormous, and thus there are also traditional banks that have responded by innovating and developing solutions for emerging new customer profiles. For example, Signature Bank is growing well above the rate of growth of the traditional brick and mortar banking industry with its branchless banking services and apps that, in our view, are superior to most and also by targeting high growth customer segments within the cryptocurrency marketplaces. |
Going Forward
At Alger, we will continue to focus on secular growth leaders that we believe have strong long-term fundamentals. We are in a highly innovative period in our society and in the world. The numerous initial public offerings of a new generation of growth companies have attracted tremendous attention. Many, if not most, are disruptors in their industries: changing how we purchase everything and anything, how it is delivered to us, changing what we drive and how we power and live in our homes, changing how we travel and how we engage with both friends and colleagues. Businesses of all sizes are realizing efficiency benefits from “digitizing” their internal processes – from marketing, to contract negotiation, to billing and expense payment. We intend to continue to use our time-tested fundamental research to understand these changes and innovations in business and our society and to find the companies that we think offer strong potential for attractive long-term performance for our portfolios and clients.
Portfolio Matters
Alger Spectra Fund
The Alger Spectra Fund returned 36.80% for the fiscal 12-month period ended October 31, 2021, compared to the 42.81% return of the Russell 3000 Growth Index.
During the reporting period, the largest sector weightings were Information Technology and Consumer Discretionary. The largest sector overweight was Consumer Discretionary and the largest underweight was Consumer Staples.
For the reporting period, the Fund’s average portfolio allocation to long positions, which was increased by leverage, was 107.88%. The Fund had a -8.15% allocation to short positions and a 0.27% allocation to cash.
Contributors to Performance
The Financials and Industrials sectors provided the greatest contributions to relative performance. Regarding individual long positions, Microsoft Corp.; Alphabet, Inc., Cl. C; Upstart Holdings, Inc.; Tesla, Inc.; and Apple, Inc. were among the top contributors to absolute performance.
We believe Microsoft is a Positive Dynamic Change beneficiary of corporate America’s transformative digitization. Microsoft’s enterprise cloud product, Azure, is rapidly growing and accruing market share. This high unit volume growth is a primary driver of the company’s higher share price, but Microsoft’s operating execution has enabled notable margin expansion that has also helped to increase forward earnings estimates. Additionally, investors appreciate Microsoft’s strong free cash flow generation and its return of cash to shareholders in the form of dividends and share repurchases.
Short exposure to a 3D printing company also supported performance. While 3D printing, or additive manufacturing, is a revolutionary concept, it has only seen its primary adoption for manufacturing prototypes and test parts, not high-volume end-use parts. Additive manufacturing has continued to attract capital and dozens of new entrants have emerged with new technologies targeting specific applications. In addition to increased competition, the short position performance reflects that the 3D company has seen key patents expire and has lost market share to new competition.
Detractors from Performance
The Consumer Discretionary and Communication Services sectors were among the sectors that detracted from relative performance. Regarding individual positions, Alibaba Group Holding Ltd.; Magnite, Inc.; Penn National Gaming, Inc.; Discovery, Inc., Cl. A; and Shake Shack, Inc., Cl. A were among the top detractors from absolute performance.
Shake Shack is a modern day "roadside" burger stand serving a classic American menu of premium burgers, hot dogs, crinkle-cut fries, shakes, frozen custard, beer and wine. Shares of Shake Shack underperformed due to a slower-than-expected recovery in urban locations and a lower-than-expected margin outlook. We believe a delay in return to work has caused a temporary stalling in the company’s margin recovery, but this could potentially improve as urban mobility increases and tourism from foreigners normalizes. Short exposure to a designer and manufacturer of semiconductors for the computing and communications industries also detracted from performance. Alger believes the company’s proprietary intellectual strength and manufacturing prowess versus the competition is deteriorating, which is causing the company to lose market share and profit opportunities. The short position detracted from portfolio returns as the share price reacted positively to the announcement of a change in senior management and a stronger-than-anticipated quarterly earnings report driven by unusually robust PC sales.
Alger Dynamic Opportunities Fund
The Alger Dynamic Opportunities Fund returned 27.82% for the fiscal 12-month period ended October 31, 2021, compared to the 42.91% return of the Fund’s benchmark, the S&P 500 Index.
During the reporting period, the average allocation to long positions was 91.71% and the average allocation to short positions was -35.31%. The Fund’s average cash allocation, which was a residual of long position sales and short sale proceeds, was 43.60%.
Based on the combined allocations of long and short positions, the Healthcare and Information Technology sectors were the largest sector weightings for the reporting period. Healthcare was the largest sector overweighting and the Information Technology sector was the largest underweighting.
Contributors to Performance
Long positions, in aggregate, contributed to absolute performance but detracted from relative performance. Based on the net exposure of long and short positions, the Financials and Healthcare sectors were the most significant contributors to relative performance.
Regarding long positions, Upstart Holdings, Inc.; Progyny, Inc.; Signature Bank; Natera, Inc. and Paylocity Holding Corp. were among the top contributors to absolute performance. Upstart Holdings provides an online marketplace lending platform that is powered by artificial intelligence. The platform facilitates the origination of prime and near prime unsecured consumer loans by acting as an intermediary between consumers and lending institutions, which is a capital-light model.
Shares of Upstart outperformed after the company said it delivered strong results for the second quarter of 2021 and raised its full-year 2021 guidance. The results showed that volume growth in the core personal loan business is extremely strong as Upstart’s marketing funnel is gaining scale benefits while EBITDA margins are expanding and tracking well ahead of guidance.
Short exposure to a company that provides remote patient monitoring to detect cardiac arrhythmias also contributed to performance. News of less favorable insurance reimbursement rates for the company’s products caused the company’s share price to decline, resulting in the short exposure contributing to performance.
Detractors from Performance
Short exposure detracted from both absolute and relative performance. Based on the combined exposure of short and long positions, the Consumer Discretionary and Communication Services sectors were the most significant detractors from relative performance. Regarding individual long positions, Eargo, Inc.; Chegg, Inc.; BigCommerce Holdings, Inc.; Nevro Corp. and ACADIA Pharmaceuticals, Inc. were among the most significant detractors from absolute performance. Nevro provides spinal cord stimulation (SCS) devices in the U.S. and internationally for patients suffering from chronic pain. The global SCS market exceeds $2 billion and has been growing as a result of increased investment by the industry. The company released second quarter 2021 results that were in-line with its prior guidance but provided new guidance that was disappointing, including a sequential decline in revenues for the third quarter driven largely by COVID-19-related factors. We believe these factors are beyond management’s control. However, Nevro has a near monopoly in the high frequency SCS market, strong clinical data and new product offerings underway. Additionally, the company’s initial launch of a product targeting Painful Diabetic Neuropathy (PDN) has been encouraging.
Alger Emerging Markets Fund
The Alger Emerging Markets Fund returned 20.67% for the fiscal 12-month period ended October 31, 2021, compared to the 17.33% return of its benchmark, the MSCI Emerging Markets Index.
Contributors to Performance
During the reporting period, the largest portfolio sector weightings were Consumer Discretionary and Information Technology. The largest sector overweight was Consumer Discretionary and the largest sector underweight was Financials. The Consumer Discretionary and Information Technology sectors were the largest contributors to relative performance. Among countries, China, South Korea, Taiwan and India were some of the top contributors to relative performance.
Regarding individual positions, Geely Automobile Holdings Ltd.; Momo.com, Inc.; Taiwan Semiconductor Manufacturing Co., Ltd.; Kakao Corp.; and Chunbo Co. Ltd. were among the top contributors to absolute performance. Geely Automobile is one of China’s leading automobile manufacturers. With sales continuing to recover with the reopening of the economy and breaking into positive territory year-over-year (YOY), Geely shares performed strongly. Geely also recorded important milestones for the fourth quarter of 2020, including selling nearly 23,000 units of the company’s high-end nameplate, Lynk & Co., a more than 61% YOY increase.
Detractors from Performance
The Financials and Energy sectors detracted from relative performance, while Brazil, Russia, Hong Kong and Turkey were among countries that detracted from performance.
Regarding individual positions, Yatsen Holding Ltd.; iClick Interactive Asia Group Ltd.; Alibaba Group Holding Ltd.; Tencent Holdings Ltd.; and New Oriental Education & Technology Group, Inc. were among the most significant detractors from absolute performance.
The Fund owns Alibaba shares because of the large addressable market opportunities in e-commerce and cloud computing, as well as the company’s potential for capitalizing on those opportunities due to state-enacted barriers that block meaningful foreign competitors. Unfortunately, the Chinese communist party has exhibited increased regulatory oversight of Alibaba, which precluded the company from consummating a value-creating initial public offering of ANT Financial, its formidable fintech platform. As a result of this near-term regulatory uncertainty, the Alibaba investment detracted from portfolio performance.
Alger Responsible Investing Fund
The Alger Responsible Investing Fund returned 39.80% for the fiscal 12-month period ended October 31, 2021, compared to the 43.21% return of the Russell 1000 Growth Index.
During the reporting period, the largest sector weightings were Information Technology and Consumer Discretionary. The largest sector overweight was Financials and the largest underweight was Healthcare.
Contributors to Performance
The Industrials and Financials sectors provided the greatest contributions to relative performance during the reporting period.
Regarding individual positions, Microsoft Corp.; Apple, Inc.; NVIDIA Corp.; Alphabet, Inc., Cl. A; and Adobe, Inc. were among the top contributors to absolute performance. Shares of Microsoft performed strongly in response to developments identified in the Alger Spectra Fund discussion.
Detractors from Performance
The Consumer Discretionary and Healthcare sectors were among the sectors that detracted from relative performance. Regarding individual positions, Guardant Health, Inc.; Snap, Inc., Cl. A; Sarepta Therapeutics, Inc.; Universal Display Corp.; and Vertex Pharmaceuticals, Inc. were among the top detractors from absolute performance.
Guardant Health is a pioneer in liquid biopsy testing. The company established itself as a leader in the large and underpenetrated blood-based oncology testing market with its comprehensive genomic profiling test, Guardant360. Guardant Health has also leveraged its extensive research and development as well as its commercial infrastructure to develop and sell additional tests. In February, the company launched its minimal residual disease/ recurrence monitoring test, Guardant Reveal. The company also plans to launch a blood-based early cancer detection test called LUNAR-2.
The company generated solid but unexciting results for the first quarter of this year, which included only modestly beating expectations. Given the company’s premium valuation, the results were not strong enough to support its share price. Additionally, Guardant Health outperformed high growth Tools & Diagnostics companies in the first quarter and there was likely a mean reversion dynamic at play in the most recent quarter.
I thank you for putting your trust in Alger. Sincerely,

Daniel C. Chung, CFA
Chief Executive Officer
Fred Alger Management, LLC
Investors cannot invest directly in an index. Index performance does not reflect the deduction for fees, expenses, or taxes.
This report and the financial statements contained herein are submitted for the general information of shareholders of the funds. This report is not authorized for distribution to prospective investors in a fund unless preceded or accompanied by an effective prospectus for the fund. Fund performance returns represent the 12-month period return of Class A shares prior to the deduction of any sales charges and include the reinvestment of any dividends or distributions.
The performance data quoted represents past performance, which is not an indication or guarantee of future results.
Standardized performance results can be found on the following pages. The investment return and principal value of an investment in a fund will fluctuate so that an investor’s shares, when redeemed, may be worth more or less than their original cost. Current performance may be lower or higher than the performance quoted. For performance data current to the most recent month-end, visit us at www.alger.com or call us at (800) 992-3863.
The views and opinions of the funds’ management in this report are as of the date of the Shareholders’ Letter and are subject to change at any time subsequent to this date. There is no guarantee that any of the assumptions that formed the basis for the opinions stated herein are accurate or that they will materialize. Moreover, the information forming the basis for such assumptions is from sources believed to be reliable; however, there is no guarantee that such information is accurate. Any securities mentioned, whether owned in a fund or otherwise, are considered in the context of the construction of an overall portfolio of securities and therefore reference to them should not be construed as a recommendation or offer to purchase or sell any such security. Inclusion of such securities in a fund and transactions in such securities, if any, may be for a variety of reasons, including, without limitation, in response to cash flows, inclusion in a benchmark, and risk control. The reference to a specific security should also be understood in such context and not viewed as a statement that the security is a significant holding in a fund. Please refer to the Schedule of Investments for each fund which is included in this report for a complete list of fund holdings as of October 31, 2021. Securities mentioned in the Shareholders’ Letter, if not found in the Schedule of Investments, may have been held by the funds during the 12-month fiscal period ended October 31, 2021.
Risk Disclosures
Alger Spectra Fund
Investing in the stock market involves risks, including the potential loss of principal. Growth stocks may be more volatile than other stocks as their prices tend to be higher in relation to their companies’ earnings and may be more sensitive to market, political, and economic developments. Local, regional or global events such as war, acts of terrorism, the spread of infectious illness such as COVID-19 or other public health issues, recessions, or other events could have a significant impact on investments. A significant portion of assets may be invested in securities of companies in related sectors, and may be similarly affected by economic, political, or market events and conditions and may be more vulnerable to unfavorable sector developments. Foreign securities involve special risks including currency fluctuations, inefficient trading, political and economic instability, and increased volatility. Short sales could increase market exposure, magnifying losses and increasing volatility. Leverage increases volatility in both up and down markets and its costs may exceed the returns of borrowed securities.
Alger Dynamic Opportunities Fund
Investing in the stock market involves risks, including the potential loss of principal. Growth stocks may be more volatile than other stocks as their prices tend to be higher in relation to their companies’ earnings and may be more sensitive to market, political, and economic developments. Local, regional or global events such as war, acts of terrorism, the spread of infectious illness such as COVID-19 or other public health issues, recessions, or other events could have a significant impact on investments. A significant portion of assets may be invested in securities of companies in related sectors, and may be similarly affected by economic, political, or market events and conditions and may be more vulnerable to unfavorable sector developments. Cash positions may underperform relative to equity and fixed-income securities. Options and short sales could increase market exposure, magnifying losses and increasing volatility. Assets may be invested in Financial Derivatives Instruments (FDIs) such as Total Return Swaps (TRS) or options, which involve risks including possible counterparty default, illiquidity, and the risk of losses greater than if they had not been used. Issuers of convertible securities may be more sensitive to economic changes. Investing in companies of small capitalizations involves the risk that such issuers may have limited product lines or financial resources, lack management depth, or have limited liquidity. Leverage increases volatility in both up and down markets and its costs may exceed the returns of borrowed securities. Foreign securities involve special risks including currency fluctuations, inefficient trading, political and economic instability, and increased volatility. Active trading may increase transaction costs, brokerage commissions, and taxes, which can lower the return on investment.
Alger Emerging Markets Fund
Investing in the stock market involves risks, including the potential loss of principal. Growth stocks may be more volatile than other stocks as their prices tend to be higher in relation to their companies’ earnings and may be more sensitive to market, political, and economic developments. Local, regional or global events such as war, acts of terrorism, the spread of infectious illness such as COVID-19 or other public health issues, recessions, or other events could have a significant impact on investments. A significant portion of assets may be invested in securities of companies in related sectors, and may be similarly affected by economic, political, or market events and conditions and may be more vulnerable to unfavorable sector developments. Foreign securities, frontier markets, and emerging markets involve special risks including currency fluctuations, inefficient trading, political and economic instability, and increased volatility. Assets may be focused in a small number of holdings, making them susceptible to risks associated with a single economic, political or regulatory event than a more diversified portfolio. Investing in companies of small capitalizations involve the risk that such issuers may have limited product lines or financial resources, lack management depth, or have limited liquidity. Active trading may increase transaction costs, brokerage commissions, and taxes, which can lower the return on investment.
Alger Responsible Investing Fund
Investing in the stock market involves risks, including the potential loss of principal. Growth stocks may be more volatile than other stocks as their prices tend to be higher in relation to their companies’ earnings and may be more sensitive to market, political, and economic developments. Local, regional or global events such as war, acts of terrorism, the spread of infectious illness such as COVID-19 or other public health issues, recessions, or other events could have a significant impact on investments. The environmental, social and governance investment criteria may limit the number of investment opportunities available, and as a result, returns may be lower than vehicles not subject to such considerations. A significant portion of assets may be invested in securities of companies in related sectors, and may be similarly affected by economic, political, or market events and conditions and may be more vulnerable to unfavorable sector developments.
For a more detailed discussion of the risks associated with a fund, please see the prospectus.
Before investing, carefully consider a fund’s investment objective, risks, charges, and expenses.
For a prospectus and summary prospectus containing this and other information or for the Alger Funds II’ most recent month-end performance data, visit www.alger. com, call (800) 992-3863 or consult your financial advisor.
Read the prospectus and summary prospectus carefully before investing. Distributor: Fred Alger & Company, LLC.
NOT FDIC INSURED. NOT BANK GUARANTEED. MAY LOSE VALUE.
Definitions:
| • | The Consumer Price Index (CPI) is a measure of the average change over time in the prices paid by urban consumers for a market basket of consumer goods and services. |
| • | The Russell 3000 Growth Index combines the large-cap Russell 1000 Growth, the small-cap Russell 2000 Growth and the Russell Microcap Growth Index. It includes companies that are considered more growth oriented relative to the overall market as defined by Russell's leading style methodology. The Russell 3000 Growth Index is constructed to provide a comprehensive, un- biased, and stable barometer of the growth opportunities within the broad market. |
| • | The Russell 3000 Value Index measures the performance of the broad value segment of the US equity value universe. It includes those Russell 3000 com- panies with lower price-to-book ratios and lower forecasted growth values. The Russell 3000 Value Index is constructed to provide a comprehensive, unbiased and stable barometer of the broad value market. |
| • | The Russell 3000 Index is a market-capitalization-weighted equity index maintained by FTSE Russell that provides exposure to the entire U.S. stock market. The index tracks the performance of the 3,000 largest U.S.-traded stocks, which represent about 98% of all U.S.-incorporated equity securities. The Russell 3000 Index is constructed to provide a comprehensive, unbiased and stable barometer of the broad market |
| • | The MSCI ACWI Index (gross) is a free float-adjusted market capitalization weighted index that is designed to measure the equity market performance of developed and emerging markets. The MSCI ACWI captures large and mid cap representation across 23 Developed Markets (DM) and 26 Emerging Markets (EM) countries. |
| • | The Morgan Stanley Capital International (MSCI) Emerging Markets Index (gross) is a free float-adjusted market capitalization index that is designed to measure equity market performance in the global emerging markets. MSCI Index (gross) Index performance does not reflect deductions for fees or expenses. |
| • | The Russell 1000 Growth Index measures the performance of the large-cap growth segment of the U.S. equity universe. It includes those Russell 1000 companies with higher growth earning potential as defined by Russell's lead- ing style methodology. The Russell 1000 Growth Index is constructed to provide a comprehensive and unbiased barometer for the large-cap growth segment. |
| • | The Russell 1000 Value Index measures the performance of the large cap val- ue segment of the U.S. equity universe. It includes those Russell 1000 com- panies with lower price-to-book ratios and lower forecasted growth values. The Russell 1000 Value Index is constructed to provide a comprehensive and unbiased barometer for the large-cap growth segment. |
| • | The S&P 500 Growth Index is an unmanaged index considered representative of large-cap growth stocks. |
| • | The S&P 500 Value Index is an unmanaged index considered representative of large-cap value stocks. |
| • | The S&P 500 Index is an index of large company stocks considered to be representative of the U.S. stock market. |
FUND PERFORMANCE AS OF 9/30/21 (Unaudited) | ||||||||||||
| AVERAGE ANNUAL TOTAL RETURNS | ||||||||||||
| 1 YEAR | 5 YEARS | 10 YEARS | ||||||||||
Alger Spectra Class A (Inception 7/28/69) | 16.47 | % | 20.39 | % | 18.50 | % | ||||||
Alger Spectra Class C (Inception 9/24/08) | 20.99 | % | 20.77 | % | 18.24 | % | ||||||
Alger Spectra Class I (Inception 9/24/08) | 22.89 | % | 21.71 | % | 19.15 | % | ||||||
Alger Spectra Class Z (Inception 12/29/10) | 23.29 | % | 22.08 | % | 19.50 | % | ||||||
1 YEAR | 5 YEARS | SINCE INCEPTION | ||||||||||
Alger Spectra Class Y (Inception 12/03/18) | 23.33 | % | n/a | 25.64 | % | |||||||
FUND PERFORMANCE AS OF 9/30/21 (Unaudited) | ||||||||||||||||
| AVERAGE ANNUAL TOTAL RETURNS | ||||||||||||||||
1 YEAR | 5 YEARS | 10 YEARS | SINCE INCEPTION | |||||||||||||
Alger Dynamic Opportunities Class A (Inception 11/2/09) | 17.65 | % | 15.05 | % | 10.93 | % | 9.24 | % | ||||||||
Alger Dynamic Opportunities Class C (Inception 12/29/10)‡ | 22.30 | % | 15.41 | % | 10.69 | % | 8.90 | % | ||||||||
Alger Dynamic Opportunities Class Z (Inception 12/29/10) | 24.49 | % | 16.64 | % | 11.85 | % | 10.20 | % | ||||||||
Alger Emerging Markets Class A (Inception 12/29/10) | 14.74 | % | 9.93 | % | 7.32 | % | 3.85 | % | ||||||||
Alger Emerging Markets Class C (Inception 12/29/10) | 19.13 | % | 10.26 | % | 7.08 | % | 3.53 | % | ||||||||
Alger Emerging Markets Class I (Inception 12/29/10) | 21.14 | % | 11.16 | % | 7.91 | % | 4.33 | % | ||||||||
Alger Emerging Markets Class Z (Inception 2/28/14) | 21.65 | % | 11.65 | % | n/a | 7.51 | % | |||||||||
Alger Responsible Investing Class A (Inception 12/4/00) | 17.82 | % | 19.64 | % | 16.33 | % | 5.95 | % | ||||||||
Alger Responsible Investing Class C (Inception 9/24/08)* | 22.33 | % | 19.96 | % | 16.01 | % | 11.63 | % | ||||||||
Alger Responsible Investing Class I (Inception 9/24/08)† | 24.32 | % | 20.93 | % | 16.95 | % | 12.50 | % | ||||||||
Alger Responsible Investing Class Z (Inception 10/14/16) | 24.71 | % | n/a | n/a | 22.06 | % | ||||||||||
Prior to December 29, 2016, the Alger Responsible Investing Fund followed different investment strategies under the name “Alger Green Fund,” and was managed by different portfolio management teams. Performance during that period does not reflect the Fund’s current investment strategies.
Prior to September 24, 2019, Alger Emerging Markets Fund followed different investment strategies and was managed by different portfolio managers. Performance prior to this date reflects these prior management styles and does not reflect the Alger Emerging Markets Fund's current investment strategies and investment personnel.
| * | Since inception performance is calculated since the inception of the Class A shares. Historical performance prior to September 24, 2008, inception of the class, is that of the Fund’s Class A shares, reduced to reflect the current maximum sales charge and the higher operating expenses of Class C shares. |
| † | Since inception performance is calculated since the inception of the Class A shares. Historical performance prior to September 24, 2008, inception of the class, is that of the Fund’s Class A shares, which has been adjusted to remove the front-end sales charge imposed by Class A shares. |
| ‡ | Since inception performance is calculated since the inception of the Class A shares. Historical performance prior to December 29, 2010, inception of the class, is that of the Fund’s Class A shares, reduced to reflect the current maximum sales charge and the higher operating expenses of Class C shares. |
The performance data quoted represents past performance, which is not an indication or a guarantee of future results. The Funds’ average annual total returns include changes in share price and reinvestment of dividends and capital gains.
HYPOTHETICAL $10,000 INVESTMENT IN CLASS A SHARES
— 10 years ended 10/31/21

The chart above illustrates the change in value of a hypothetical $10,000 investment made in the Alger Spectra Fund Class A shares, with an initial 5.25% maximum sales charge, and the Russell 3000 Growth Index (an unmanaged index of common stocks) for the ten years ended October 31, 2021. Figures for the Alger Spectra Fund Class A and the Russell 3000 Growth Index include reinvestment of dividends. Figures for the Alger Spectra Fund Class A shares also include reinvestment of capital gains. Performance for the Alger Spectra Fund Class C, Class I, Class Y and Class Z shares will vary from the results shown above due to the operating expenses and the current maximum sales charge of each share class. Investors cannot invest directly in any index. Index performance does not reflect deduction for fees, expenses, or taxes.
ALGER SPECTRA FUND |
| Fund Highlights Through October 31, 2021 (Unaudited) (Continued) |
| PERFORMANCE COMPARISON AS OF 10/31/21 | ||||||||||||||||
| AVERAGE ANNUAL TOTAL RETURNS | ||||||||||||||||
1 YEAR | 5 YEARS | 10 YEARS | Since 12/31/1974 | |||||||||||||
| Class A (Inception 12/31/74) | 29.60 | % | 23.00 | % | 18.12 | % | 16.37 | % | ||||||||
| Class C (Inception 9/24/08)* | 34.79 | % | 23.40 | % | 17.86 | % | 15.63 | % | ||||||||
| Class I (Inception 9/24/08)† | 36.82 | % | 24.35 | % | 18.77 | % | 16.52 | % | ||||||||
| Russell 3000 Growth Index | 42.81 | % | 24.96 | % | 19.08 | % | 16.11 | % | ||||||||
1 YEAR | 5 YEARS | 10 YEARS | Since 12/3/2018 | |||||||||||||
| Class Y (Inception 12/3/18) | 37.21 | % | n/a | n/a | 28.32 | % | ||||||||||
| Russell 3000 Growth Index | 42.81 | % | n/a | n/a | 28.55 | % | ||||||||||
1 YEAR | 5 YEARS | 10 YEARS | Since 12/29/2010 | |||||||||||||
| Class Z (Inception 12/29/10) | 37.22 | % | 24.73 | % | 19.12 | % | 17.68 | % | ||||||||
| Russell 3000 Growth Index | 42.81 | % | 24.96 | % | 19.08 | % | 17.72 | % | ||||||||
The performance data quoted represents past performance, which is not an indication or a guarantee of future results. The Fund’s average annual total returns include changes in share price and reinvestment of dividends and capital gains. Class A returns reflect the maximum initial sales charge and Class C returns reflect the applicable contingent deferred sales charge. Class A, C, and I historical performance is calculated from December 31, 1974, the first full calendar year that Fred Alger Management, LLC was the Fund's investment adviser. The Fund operated as a closed-end fund from August 23, 1978 to February 12, 1996, during which time the calculation of total return assumed dividends were reinvested at market value. Had dividends not been reinvested, performance would have been lower. The chart and table above do not reflect the deduction of taxes that a shareholder would have paid on Fund distributions or on the redemption of Fund shares. Investment return and principal will fluctuate and the Fund’s shares, when redeemed, may be worth more or less than their original cost. Current performance may be higher or lower than the performance quoted. For updated performance, visit us at www.alger.com or call us at (800) 992-3863.
| * | Since inception performance is calculated since the inception of the Class A shares. Historical performance prior to September 24, 2008, inception of the class, is that of the Fund's Class A shares, reduced to reflect the current maximum sales charge and the higher operating expenses of Class C shares. |
| † | Since inception performance is calculated since the inception of the Class A shares. Historical performance prior to September 24, 2008, inception of the class, is that of the Fund's Class A shares, which has been adjusted to remove the front-end sales charge imposed by Class A shares. |
ALGER DYNAMIC OPPORTUNITIES FUND |
Fund Highlights Through October 31, 2021 (Unaudited) |
HYPOTHETICAL $10,000 INVESTMENT IN CLASS A SHARES
—10 years ended 10/31/21
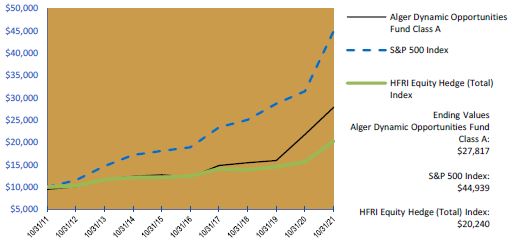
The chart above illustrates the change in value of a hypothetical $10,000 investment made in Alger Dynamic Opportunities Fund Class A shares, with an initial 5.25% maximum sales charge, the S&P 500 Index (an unmanaged Index of Common Stocks) and the HFRI Equity Hedge (Total) Index (an unmanaged index of hedge funds) for the ten years ended October 31, 2021. Effective March 1, 2017, Weatherbie Capital, LLC, an indirect, wholly-owned subsidiary of Alger Group Holdings, LLC, the parent company of Fred Alger Management, LLC, began providing investment sub-advisory services for a portion of the assets of the Alger Dynamic Opportunities Fund. Figures for the Alger Dynamic Opportunities Fund Class A, the S&P 500 Index and the HFRI Equity Hedge (Total) Index include reinvestment of dividends. Figures for the Alger Dynamic Opportunities Fund Class A shares also include reinvestment of capital gains. Performance for the Alger Dynamic Opportunities Fund Class C and Class Z shares will vary from the results shown above due to the operating expenses and the current maximum sales charge of each share class. Investors cannot invest directly in any index. Index performance does not reflect deduction for fees, expenses, or taxes.
ALGER SPECTRA FUND |
| Fund Highlights Through October 31, 2021 (Unaudited) (Continued) |
| PERFORMANCE COMPARISON AS OF 10/31/21 | ||||||||||||||||
| AVERAGE ANNUAL TOTAL RETURNS | ||||||||||||||||
1 YEAR | 5 YEARS | 10 YEARS | Since 11/2/2009 | |||||||||||||
| Class A (Inception 11/2/09) | 21.08 | % | 16.68 | % | 10.77 | % | 9.47 | % | ||||||||
| Class C (Inception 12/29/10)* | 25.83 | % | 17.04 | % | 10.53 | % | 9.13 | % | ||||||||
| S&P 500 Index | 42.91 | % | 18.93 | % | 16.21 | % | 15.49 | % | ||||||||
| HFRI Equity Hedge (Total) Index | 29.73 | % | 10.27 | % | 7.31 | % | 6.74 | % | ||||||||
1 YEAR | 5 YEARS | 10 YEARS | Since 12/29/2010 | |||||||||||||
| Class Z (Inception 12/29/10) | 28.07 | % | 18.26 | % | 11.68 | % | 10.44 | % | ||||||||
| S&P 500 Index | 42.91 | % | 18.93 | % | 16.21 | % | 14.99 | % | ||||||||
| HFRI Equity Hedge (Total) Index | 20.06 | % | 10.18 | % | 8.54 | % | 7.95 | % | ||||||||
The performance data quoted represents past performance, which is not an indication or a guarantee of future results. The Fund’s average annual total returns include changes in share price and reinvestment of dividends and capital gains. Class A returns reflect the maximum initial sales charge and Class C returns reflect the applicable contingent deferred sales charge. The chart and table above do not reflect the deduction of taxes that a shareholder would have paid on Fund distributions or on the redemption of Fund shares. Investment return and principal will fluctuate and the Fund’s shares, when redeemed, may be worth more or less than their original cost. Current performance may be higher or lower than the performance quoted. For updated performance, visit us at www.alger.com or call us at (800) 992-3863.
| * | Since inception performance is calculated since the inception of the Class A shares. Historical performance prior to December 29, 2010, inception of the class, is that of the Fund’s Class A shares, reduced to reflect the current maximum sales charge and the higher operating expenses of Class C shares. |
ALGER EMERGING MARKETS FUND |
Fund Highlights Through October 31, 2021 (Unaudited) |
HYPOTHETICAL $10,000 INVESTMENT IN CLASS A SHARES
— 10 years ended 10/31/21

The chart above illustrates the change in value of a hypothetical $10,000 investment made in Alger Emerging Markets Fund Class A shares, with an initial 5.25% maximum sales charge, and the MSCI Emerging Markets Index (an unmanaged index of common stocks) for the ten years ended October 31, 2021. Prior to September 24, 2019, Alger Emerging Markets Fund followed different investment strategies and was managed by different portfolio managers. Performance prior to this date reflects these prior management styles and does not reflect the Alger Emerging Markets Fund's current investment strategies and investment personnel. Figures for the Alger Emerging Markets Fund Class A and the MSCI Emerging Markets Index include reinvestment of dividends. Figures for the Alger Emerging Markets Fund Class A shares also include reinvestment of capital gains. Performance for the Alger Emerging Markets Fund Class C, Class I and Class Z shares will vary from the results shown above due to the operating expenses and current maximum sales charge of each share class. Investors cannot invest directly in any index. Index performance does not reflect deduction for fees, expenses, or taxes.
ALGER EMERGING MARKETS FUND |
Fund Highlights Through October 31, 2021 (Unaudited) (Continued) |
| PERFORMANCE COMPARISON AS OF 10/31/21 | ||||||||||||||||
| AVERAGE ANNUAL TOTAL RETURNS | ||||||||||||||||
1 YEAR | 5 YEARS | 10 YEARS | Since 12/29/2010 | |||||||||||||
| Class A (Inception 12/29/10) | 14.32 | % | 10.32 | % | 6.16 | % | 3.90 | % | ||||||||
| Class C (Inception 12/29/10) | 18.71 | % | 10.66 | % | 5.93 | % | 3.58 | % | ||||||||
| Class I (Inception 12/29/10) | 20.79 | % | 11.56 | % | 6.76 | % | 4.38 | % | ||||||||
| MSCI Emerging Markets Index | 17.33 | % | 9.79 | % | 5.25 | % | 3.80 | % | ||||||||
1 YEAR | 5 YEARS | 10 YEARS | Since 2/28/2014 | |||||||||||||
| Class Z (Inception 2/28/14) | 21.31 | % | 12.05 | % | n/a | 7.55 | % | |||||||||
| MSCI Emerging Markets Index | 17.33 | % | 9.79 | % | n/a | 6.44 | % | |||||||||
The performance data quoted represents past performance, which is not an indication or a guarantee of future results. The Fund’s average annual total returns include changes in share price and reinvestment of dividends and capital gains. Prior to September 24, 2019, Alger Emerging Markets Fund followed different investment strategies and was managed by different portfolio managers. Performance prior to this date reflects these prior management styles and does not reflect the Alger Emerging Markets Fund's current investment strategies and investment personnel. Class A returns reflect the maximum initial sales charge and Class C returns reflect the applicable contingent deferred sales charge. The chart and table above do not reflect the deduction of taxes that a shareholder would have paid on Fund distri- butions or on the redemption of Fund shares. Investment return and principal will fluctuate and the Fund’s shares, when redeemed, may be worth more or less than their original cost. Current performance may be higher or lower than the performance quoted. For updated performance, visit us at www.alger.com or call us at (800) 992-3863.
ALGER RESPONSIBLE INVESTING FUND |
Fund Highlights Through October 31, 2021 (Unaudited) |
HYPOTHETICAL $10,000 INVESTMENT IN CLASS A SHARES
— 10 years ended 10/31/21

The chart above illustrates the change in value of a hypothetical $10,000 investment made in the Alger Responsible Investing Fund Class A shares, with an initial 5.25% maximum sales charge, the Russell 1000 Growth Index (an unmanaged index of common stocks) for the ten years ended October 31, 2021. Prior to December 29, 2016, the Alger Responsible Investing Fund followed different investment strategies under the name “Alger Green Fund” and was managed by different portfolio management teams. Performance during that period does not reflect the Fund’s current investment strategies. Figures for the Alger Responsible Investing Fund Class A and the Russell 1000 Growth Index include reinvestment of dividends. Figures for the Alger Responsible Investing Fund Class A shares also include reinvestment of capital gains. Performance for the Alger Responsible Investing Fund Class C, Class I and Class Z shares will vary from the results shown above due to the operating expenses and the current maximum sales charge of each share class. Investors cannot invest directly in any index. Index performance does not reflect deduction for fees, expenses, or taxes.
ALGER RESPONSIBLE INVESTING FUND |
Fund Highlights Through October 31, 2021 (Unaudited) (Continued) |
| PERFORMANCE COMPARISON AS OF 10/31/21 | ||||||||||||||||
AVERAGE ANNUAL TOTAL RETURNS | ||||||||||||||||
1 YEAR | 5 YEARS | 10 YEARS | Since 12/4/2000 | |||||||||||||
| Class A (Inception 12/4/00) | 32.49 | % | 22.18 | % | 16.20 | % | 6.34 | % | ||||||||
| Russell 1000 Growth Index | 43.21 | % | 25.49 | % | 19.42 | % | 8.81 | % | ||||||||
| PERFORMANCE COMPARISON AS OF 10/31/21 | ||||||||||||||||
| AVERAGE ANNUAL TOTAL RETURNS | ||||||||||||||||
1 YEAR | 5 YEARS | 10 YEARS | Since 9/24/2008 | |||||||||||||
| Class C (Inception 9/24/08) | 37.87 | % | 22.55 | % | 15.88 | % | 12.25 | % | ||||||||
| Class I (Inception 9/24/08) | 39.82 | % | 23.50 | % | 16.80 | % | 13.12 | % | ||||||||
| Russell 1000 Growth Index | 43.21 | % | 25.49 | % | 19.42 | % | 16.39 | % | ||||||||
1 YEAR | 5 YEARS | 10 YEARS | Since 10/14/2016 | |||||||||||||
| Class Z (Inception 10/14/16) | 40.35 | % | 24.03 | % | n/a | 23.65 | % | |||||||||
| Russell 1000 Growth Index | 43.21 | % | 25.49 | % | n/a | 25.11 | % | |||||||||
The performance data quoted represents past performance, which is not an indication or a guarantee of future results. The Fund’s average annual total returns include changes in share price and reinvestment of dividends and capital gains. Class A returns reflect the maximum initial sales charge and Class C returns reflect the applicable contingent deferred sales charge. Performance figures prior to January 12, 2007, are those of the Alger Green Institutional Fund and performance prior to October 19, 2006, represents the performance of the Alger Socially Responsible Growth Institutional Fund Class I, the predecessor fund to the Alger Green Institutional Fund. The predecessor fund followed different investment strategies and had a different portfolio manager. As of January 12, 2007, the Alger Green Institutional Fund became the Alger Green Fund. The chart and table above do not reflect the deduction of taxes that a shareholder would have paid on Fund distributions or on the redemption of Fund shares. Investment return and principal will fluctuate and the Fund’s shares, when redeemed, may be worth more or less than their original cost. Current performance may be higher or lower than the performance quoted. For updated performance, visit us at www.alger.com or call us at (800) 992-3863.
SECTORS | Alger Spectra Fund* | Alger Dynamic Opportunities Fund* | Alger Responsible Investing Fund | |||||||||
| Communication Services | 11.7 | % | 7.1 | % | 9.5 | % | ||||||
| Consumer Discretionary | 18.7 | 11.4 | 18.0 | |||||||||
| Consumer Staples | (0.9 | ) | (0.2 | ) | 2.7 | |||||||
| Energy | 0.0 | 1.7 | 0.0 | |||||||||
| Financials | 5.8 | 9.2 | 3.8 | |||||||||
| Healthcare | 13.5 | 17.2 | 8.6 | |||||||||
| Industrials | 7.1 | 9.9 | 4.0 | |||||||||
| Information Technology | 47.2 | 23.2 | 46.8 | |||||||||
| Market Indices | (3.5 | ) | (12.8 | ) | 0.0 | |||||||
| Materials | 0.0 | (1.3 | ) | 1.8 | ||||||||
| Real Estate | 0.4 | (0.3 | ) | 2.8 | ||||||||
| Utilities | 0.0 | 0.0 | 0.5 | |||||||||
| Short-Term Investments and Net Other Assets | 0.0 | 34.9 | 1.5 | |||||||||
| 100.0 | % | 100.0 | % | 100.0 | % | |||||||
| COUNTRY | Alger Emerging Markets Fund | |||
| Argentina | 1.9 | % | ||
| Brazil | 6.7 | |||
| Canada | 1.7 | |||
| China | 28.2 | |||
| Cyprus | 1.6 | |||
| Greece | 1.1 | |||
| Hong Kong | 1.4 | |||
| Hungary | 2.1 | |||
| India | 19.5 | |||
| Indonesia | 1.5 | |||
| Russia | 1.6 | |||
| Singapore | 3.6 | |||
| South Korea | 12.6 | |||
| Taiwan | 11.1 | |||
| United States | 2.0 | |||
| Vietnam | 2.1 | |||
| Cash and Net Other Assets | 1.3 | |||
| 100.0 | % | |||
| * | Includes short sales as a reduction of sector exposure. |
| † | Based on net assets for each Fund. |
THE ALGER FUNDS II ALGER SPECTRA FUND |
| COMMON STOCKS—109.1% | SHARES | VALUE | ||||||
| AEROSPACE & DEFENSE—2.8% | ||||||||
HEICO Corp., Cl. A+ | 1,049,336 | $ | 131,880,548 | |||||
| Textron, Inc. | 288,443 | 21,301,516 | ||||||
| TransDigm Group, Inc.* | 153,568 | 95,798,790 | ||||||
| 248,980,854 | ||||||||
| AIR FREIGHT & LOGISTICS—0.4% | ||||||||
| GXO Logistics, Inc.* | 434,669 | 38,598,607 | ||||||
| APPLICATION SOFTWARE—12.5% | ||||||||
Adobe, Inc.*,+ | 384,737 | 250,217,555 | ||||||
| Atlassian Corp., PLC, Cl. A* | 103,126 | 47,245,114 | ||||||
| Avalara, Inc.* | 294,060 | 52,824,938 | ||||||
| Bill.com Holdings, Inc.* | 413,959 | 121,832,273 | ||||||
| Cadence Design Systems, Inc.* | 186,331 | 32,255,760 | ||||||
| Coupa Software, Inc.* | 260,687 | 59,358,430 | ||||||
| Datadog, Inc., Cl. A* | 766,271 | 128,005,571 | ||||||
| HubSpot, Inc.* | 124,648 | 100,993,549 | ||||||
| Intuit, Inc. | 179,108 | 112,119,817 | ||||||
| Paylocity Holding Corp.* | 410,594 | 125,288,653 | ||||||
| The Trade Desk, Inc., Cl. A* | 521,717 | 39,081,821 | ||||||
| Unity Software, Inc.* | 342,571 | 51,834,418 | ||||||
| 1,121,057,899 | ||||||||
| AUTOMOBILE MANUFACTURERS—4.9% | ||||||||
| General Motors Co.* | 926,068 | 50,405,881 | ||||||
| Tesla, Inc.* | 349,661 | 389,522,354 | ||||||
| 439,928,235 | ||||||||
| AUTOMOTIVE RETAIL—0.8% | ||||||||
| Carvana Co., Cl. A* | 228,873 | 69,389,716 | ||||||
| BIOTECHNOLOGY—1.2% | ||||||||
| Natera, Inc.* | 948,079 | 108,621,411 | ||||||
| CASINOS & GAMING—2.0% | ||||||||
| Flutter Entertainment PLC* | 113,841 | 21,549,920 | ||||||
| MGM Resorts International | 3,333,891 | 157,226,300 | ||||||
| 178,776,220 | ||||||||
| CONSUMER FINANCE—3.5% | ||||||||
| Upstart Holdings, Inc.* | 985,584 | 317,397,471 | ||||||
| DATA PROCESSING & OUTSOURCED SERVICES—8.5% | ||||||||
| Affirm Holdings, Inc., Cl. A* | 586,912 | 95,373,200 | ||||||
| Dlocal Ltd., Cl. A* | 1,244,198 | 60,356,045 | ||||||
| Marqeta, Inc., Cl. A* | 1,921,687 | 58,803,622 | ||||||
PayPal Holdings, Inc.*,+ | 934,684 | 217,398,152 | ||||||
| Square, Inc., Cl. A* | 602,783 | 153,408,273 | ||||||
Visa, Inc., Cl. A+ | 841,170 | 178,134,571 | ||||||
| 763,473,863 | ||||||||
| DIVERSIFIED BANKS—0.4% | ||||||||
| Wells Fargo & Co. | 651,687 | 33,340,307 | ||||||
| DIVERSIFIED SUPPORT SERVICES—1.0% | ||||||||
Cintas Corp.+ | 105,040 | 45,492,824 | ||||||
| Copart, Inc.* | 260,709 | 40,485,501 | ||||||
| 85,978,325 | ||||||||
THE ALGER FUNDS II ALGER SPECTRA FUND |
Schedule of Investments October 31, 2021 (Continued) |
| COMMON STOCKS—109.1% (CONT.) | SHARES | VALUE | ||||||
| ELECTRICAL COMPONENTS & EQUIPMENT—0.4% | ||||||||
| Generac Holdings, Inc.* | 67,839 | $ | 33,821,812 | |||||
| ELECTRONIC EQUIPMENT & INSTRUMENTS—0.9% | ||||||||
| Teledyne Technologies, Inc.* | 176,646 | 79,352,916 | ||||||
| FINANCIAL EXCHANGES & DATA—1.8% | ||||||||
| Coinbase Global, Inc., Cl. A* | 136,379 | 43,562,180 | ||||||
| S&P Global, Inc. | 254,109 | 120,488,324 | ||||||
| 164,050,504 | ||||||||
| FOOTWEAR—0.8% | ||||||||
NIKE, Inc., Cl. B+ | 406,003 | 67,920,242 | ||||||
| HEALTHCARE EQUIPMENT—5.3% | ||||||||
Danaher Corp.+ | 335,719 | 104,667,113 | ||||||
| Dexcom, Inc.* | 156,701 | 97,657,630 | ||||||
| IDEXX Laboratories, Inc.* | 67,498 | 44,963,118 | ||||||
| Insulet Corp.* | 376,520 | 116,728,730 | ||||||
| Intuitive Surgical, Inc.* | 313,512 | 113,218,589 | ||||||
| 477,235,180 | ||||||||
| HEALTHCARE SERVICES—0.7% | ||||||||
| Guardant Health, Inc.* | 577,082 | 67,397,407 | ||||||
| HEALTHCARE SUPPLIES—0.4% | ||||||||
| Align Technology, Inc.* | 60,218 | 37,598,313 | ||||||
| HEALTHCARE TECHNOLOGY—1.7% | ||||||||
| Doximity, Inc., Cl. A* | 341,332 | 23,715,747 | ||||||
| Veeva Systems, Inc., Cl. A* | 414,097 | 131,272,890 | ||||||
| 154,988,637 | ||||||||
| HOME IMPROVEMENT RETAIL—0.7% | ||||||||
| Lowe's Cos., Inc. | 262,604 | 61,402,067 | ||||||
| HOTELS RESORTS & CRUISE LINES—0.7% | ||||||||
| Airbnb, Inc., Cl. A* | 262,241 | 44,754,049 | ||||||
| Expedia Group, Inc.* | 136,939 | 22,514,141 | ||||||
| 67,268,190 | ||||||||
| HUMAN RESOURCE & EMPLOYMENT SERVICES—0.2% | ||||||||
| Upwork, Inc.* | 468,253 | 22,064,081 | ||||||
| INTERACTIVE HOME ENTERTAINMENT—2.3% | ||||||||
| ROBLOX Corp., Cl. A* | 520,571 | 43,738,375 | ||||||
| Sea Ltd.#,* | 251,485 | 86,402,702 | ||||||
| Take-Two Interactive Software, Inc.* | 423,185 | 76,596,485 | ||||||
| 206,737,562 | ||||||||
| INTERACTIVE MEDIA & SERVICES—6.9% | ||||||||
Alphabet, Inc., Cl. C*,+ | 154,646 | 458,588,795 | ||||||
| Genius Sports Ltd.* | 3,560,058 | 66,003,475 | ||||||
Pinterest, Inc., Cl. A*,+ | 1,488,920 | 66,465,389 | ||||||
| Snap, Inc., Cl. A* | 512,004 | 26,921,170 | ||||||
| 617,978,829 | ||||||||
| INTERNET & DIRECT MARKETING RETAIL—8.6% | ||||||||
Altaba, Inc.*,@,(a) | 606,454 | 2,371,235 | ||||||
Amazon.com, Inc.*,+ | 211,541 | 713,407,215 | ||||||
| MercadoLibre, Inc.* | 40,161 | 59,479,244 | ||||||
| 775,257,694 | ||||||||
THE ALGER FUNDS II ALGER SPECTRA FUND |
Schedule of Investments October 31, 2021 (Continued) |
| COMMON STOCKS—109.1% (CONT.) | SHARES | VALUE | ||||||
| INTERNET SERVICES & INFRASTRUCTURE—1.7% | ||||||||
| Shopify, Inc., Cl. A* | 78,112 | $ | 114,569,214 | |||||
| Snowflake, Inc., Cl. A* | 111,994 | 39,627,957 | ||||||
| 154,197,171 | ||||||||
| INVESTMENT BANKING & BROKERAGE—0.5% | ||||||||
| The Goldman Sachs Group, Inc. | 115,330 | 47,671,656 | ||||||
| LIFE SCIENCES TOOLS & SERVICES—2.1% | ||||||||
| Bio-Techne Corp. | 260,278 | 136,294,575 | ||||||
| Repligen Corp.* | 183,247 | 53,233,253 | ||||||
| 189,527,828 | ||||||||
| MANAGED HEALTHCARE—1.3% | ||||||||
| Progyny, Inc.* | 357,424 | 21,956,556 | ||||||
UnitedHealth Group, Inc.+ | 215,057 | 99,027,297 | ||||||
| 120,983,853 | ||||||||
| MOVIES & ENTERTAINMENT—3.0% | ||||||||
| Live Nation Entertainment, Inc.* | 878,849 | 88,895,576 | ||||||
| Netflix, Inc.* | 66,076 | 45,612,924 | ||||||
| Roku, Inc., Cl. A* | 458,543 | 139,809,761 | ||||||
| 274,318,261 | ||||||||
| PHARMACEUTICALS—1.0% | ||||||||
| Catalent, Inc.* | 636,562 | 87,756,437 | ||||||
| RAILROADS—0.4% | ||||||||
| Union Pacific Corp. | 136,336 | 32,911,511 | ||||||
| REAL ESTATE SERVICES—0.5% | ||||||||
| FirstService Corp. | 215,012 | 42,985,199 | ||||||
| REGIONAL BANKS—0.8% | ||||||||
| Signature Bank | 239,516 | 71,332,655 | ||||||
| RESEARCH & CONSULTING SERVICES—0.8% | ||||||||
CoStar Group, Inc.*,+ | 851,681 | 73,287,150 | ||||||
| RESTAURANTS—1.7% | ||||||||
| Chipotle Mexican Grill, Inc., Cl. A* | 36,581 | 65,078,696 | ||||||
Shake Shack, Inc., Cl. A*,+ | 1,270,946 | 87,911,335 | ||||||
| 152,990,031 | ||||||||
| SEMICONDUCTOR EQUIPMENT—5.2% | ||||||||
| Applied Materials, Inc. | 996,535 | 136,176,508 | ||||||
| ASML Holding NV | 28,133 | 22,868,753 | ||||||
| Enphase Energy, Inc.* | 164,449 | 38,091,322 | ||||||
Lam Research Corp.+ | 183,978 | 103,684,481 | ||||||
| SolarEdge Technologies, Inc.* | 466,618 | 165,500,072 | ||||||
| 466,321,136 | ||||||||
| SEMICONDUCTORS—4.8% | ||||||||
Advanced Micro Devices, Inc.*,+ | 1,075,708 | 129,332,373 | ||||||
NVIDIA Corp.+ | 788,421 | 201,575,597 | ||||||
QUALCOMM, Inc.+ | 428,346 | 56,987,152 | ||||||
| Xilinx, Inc. | 258,926 | 46,606,680 | ||||||
| 434,501,802 | ||||||||
THE ALGER FUNDS II ALGER SPECTRA FUND |
Schedule of Investments October 31, 2021 (Continued) |
| COMMON STOCKS—109.1% (CONT.) | SHARES | VALUE | ||||||
| SYSTEMS SOFTWARE—9.7% | ||||||||
| Crowdstrike Holdings, Inc., Cl. A* | 305,609 | $ | 86,120,616 | |||||
Microsoft Corp.+ | 2,365,300 | 784,380,786 | ||||||
| 870,501,402 | ||||||||
| TECHNOLOGY HARDWARE STORAGE & PERIPHERALS—3.9% | ||||||||
Apple, Inc.+ | 2,370,520 | 355,103,896 | ||||||
| TRADING COMPANIES & DISTRIBUTORS—0.7% | ||||||||
| Herc Holdings, Inc. | 176,923 | 32,207,063 | ||||||
| SiteOne Landscape Supply, Inc.* | 112,189 | 26,359,927 | ||||||
| 58,566,990 | ||||||||
| TRUCKING—1.6% | ||||||||
| Uber Technologies, Inc.* | 1,344,158 | 58,901,003 | ||||||
| XPO Logistics, Inc.* | 974,111 | 83,578,724 | ||||||
| 142,479,727 | ||||||||
| TOTAL COMMON STOCKS | ||||||||
| (Cost $6,201,416,017) | 9,814,053,047 | |||||||
| PREFERRED STOCKS—0.2% | SHARES | VALUE | ||||||
| BIOTECHNOLOGY—0.0% | ||||||||
| Prosetta Biosciences, Inc., Series D*,@,(a),(b) | 2,912,012 | – | ||||||
| DATA PROCESSING & OUTSOURCED SERVICES—0.2% | ||||||||
| Chime Financial, Inc., Series G*,@,(a) | 188,583 | 13,025,390 | ||||||
| 13,025,390 | ||||||||
| TOTAL PREFFERED STOCKS | ||||||||
| (Cost $26,129,444) | 13,025,390 | |||||||
| SPECIAL PURPOSE VEHICLE—0.2% | SHARES | VALUE | ||||||
| DATA PROCESSING & OUTSOURCED SERVICES—0.2% | ||||||||
| Crosslink Ventures Capital LLC, Cl. A*,@,(a),(b) | 294 | 11,768,232 | ||||||
| Crosslink Ventures Capital LLC, Cl. B*,@,(a),(b) | 183 | 7,718,391 | ||||||
| 19,486,623 | ||||||||
| TOTAL SPECIAL PURPOSE VEHICLE | ||||||||
| (Cost $11,925,000) | 19,486,623 | |||||||
| Total Investments | ||||||||
| (Cost $6,239,470,461) | 109.5 | % | $ | 9,846,565,060 | ||||
| Affiliated Securities (Cost $25,029,054) | 19,486,623 | |||||||
| Unaffiliated Securities (Cost $6,214,441,407) | 9,827,078,437 | |||||||
| Securities Sold Short (Proceeds $880,053,931) | (9.5 | )% | (853,697,999 | ) | ||||
| Other Assets in Excess of Liabilities | 0.0 | % | 2,650,559 | |||||
| NET ASSETS | 100.0 | % | $ | 8,995,517,620 | ||||
| + | All or a portion of this security is held as collateral for securities sold short. |
| # | American Depositary Receipts. |
| (a) | Security is valued in good faith at fair value determined using significant unobservable inputs pursuant to procedures established by the Board. |
| (b) | Deemed an affiliate of the Fund in accordance with Section 2(a)(3) of the Investment Company Act of 1940. See Note 11 -Affiliated Securities. |
| * | Non-income producing security. |
THE ALGER FUNDS II ALGER SPECTRA FUND |
Schedule of Investments October 31, 2021 (Continued) |
| @ | Restricted security - Investment in security not registered under the Securities Act of 1933. Sales or transfers of the investment may be restricted only to qualified buyers. |
Security | Acquisition Date(s) | Acquisition Cost | % of net assets (Acquisition Date) | Market Value | % of net assets as of 10/31/2021 | ||||||||||||
| Altaba, Inc. | 10/24/18 | $ | 1,110,174 | 0.02 | % | $ | 379,204 | 0.00 | % | ||||||||
| Altaba, Inc. | 10/25/18 | 1,702,274 | 0.03 | % | 567,231 | 0.01 | % | ||||||||||
| Altaba, Inc. | 10/29/18 | 1,371,189 | 0.02 | % | 574,500 | 0.01 | % | ||||||||||
| Altaba, Inc. | 10/30/18 | 813,707 | 0.01 | % | 385,307 | 0.00 | % | ||||||||||
| Altaba, Inc. | 10/31/18 | 376,636 | 0.01 | % | 132,197 | 0.00 | % | ||||||||||
| Altaba, Inc. | 11/6/18 | 1,093,434 | 0.02 | % | 332,796 | 0.00 | % | ||||||||||
| Chime Financial, Inc., Series G | 8/24/21 | 13,025,390 | 0.15 | % | 13,025,390 | 0.15 | % | ||||||||||
| Crosslink Ventures Capital LLC, Cl. A | 10/2/20 | 7,350,000 | 0.10 | % | 11,768,232 | 0.13 | % | ||||||||||
| Crosslink Ventures Capital LLC, Cl. B | 12/16/20 | 4,575,000 | 0.06 | % | 7,718,391 | 0.09 | % | ||||||||||
| Prosetta Biosciences, Inc., Series D | 2/6/15 | 13,104,054 | 0.28 | % | 0 | 0.00 | % | ||||||||||
| Total | $ | 34,883,248 | 0.39 | % | |||||||||||||
See Notes to Financial Statements.
THE ALGER FUNDS II ALGER SPECTRA FUND |
Schedule of Investments - Securities Sold Short October 31, 2021 |
| COMMON STOCKS—(9.4)% | SHARES | VALUE | ||||||
| AEROSPACE & DEFENSE—(0.1)% | ||||||||
| Virgin Galactic Holdings, Inc. | (331,808 | ) | $ | (6,221,400 | ) | |||
| AUTO PARTS & EQUIPMENT—(0.2)% | ||||||||
| Luminar Technologies, Inc., Cl. A | (319,871 | ) | (5,242,686 | ) | ||||
| QuantumScape Corp., Cl. A | (274,596 | ) | (7,946,808 | ) | ||||
| (13,189,494 | ) | |||||||
| DEPARTMENT STORES—(0.2)% | ||||||||
| Nordstrom, Inc. | (666,613 | ) | (19,151,792 | ) | ||||
| ENVIRONMENTAL & FACILITIES SERVICES—(0.1)% | ||||||||
| Rollins, Inc. | (247,561 | ) | (8,721,574 | ) | ||||
| FOOD RETAIL—(0.1)% | ||||||||
| The Kroger Co. | (311,306 | ) | (12,458,466 | ) | ||||
| HOUSEHOLD PRODUCTS—(0.6)% | ||||||||
| Church & Dwight Co., Inc. | (610,392 | ) | (53,323,845 | ) | ||||
| INDUSTRIAL CONGLOMERATES—(0.7)% | ||||||||
| 3M Co. | (367,743 | ) | (65,708,319 | ) | ||||
| INTERACTIVE MEDIA & SERVICES—(0.2)% | ||||||||
| Twitter, Inc. | (347,637 | ) | (18,612,485 | ) | ||||
| INTERNET & DIRECT MARKETING RETAIL—(1.1)% | ||||||||
| Wayfair, Inc., Cl. A | (383,946 | ) | (95,640,949 | ) | ||||
| INTERNET SERVICES & INFRASTRUCTURE—(0.1)% | ||||||||
| SolarWinds Corp. | (232,272 | ) | (3,739,579 | ) | ||||
| MARKET INDICES—(3.5)% | ||||||||
| Invesco QQQ Trust Series 1 | (702,873 | ) | (271,386,294 | ) | ||||
| iShares Russell Mid-Cap Growth ETF | (374,274 | ) | (44,939,079 | ) | ||||
| (316,325,373 | ) | |||||||
| OTHER DIVERSIFIED FINANCIAL SERVICES—(1.2)% | ||||||||
| iShares 20+ Year Treasury Bond ETF | (747,989 | ) | (110,470,495 | ) | ||||
| PACKAGED FOODS & MEATS—(0.2)% | ||||||||
| Campbell Soup Co. | (530,515 | ) | (21,194,074 | ) | ||||
| PHARMACEUTICALS—(0.2)% | ||||||||
| Elanco Animal Health, Inc. | (658,217 | ) | (21,642,175 | ) | ||||
| PUBLISHING—(0.3)% | ||||||||
| News Corp., Cl. A | (1,072,789 | ) | (24,566,868 | ) | ||||
| SEMICONDUCTORS—(0.1)% | ||||||||
| Intel Corp. | (157,574 | ) | (7,721,126 | ) | ||||
TECHNOLOGY HARDWARE STORAGE & PERIPHERALS—(0.2)% | ||||||||
| Logitech International SA | (178,264 | ) | (14,801,260 | ) | ||||
| TRADING COMPANIES & DISTRIBUTORS—(0.3)% | ||||||||
| Fastenal Co. | (488,003 | ) | (27,855,211 | ) | ||||
| TOTAL COMMON STOCKS | ||||||||
| (Proceeds $864,660,457) | $ | (841,344,485 | ) | |||||
THE ALGER FUNDS II ALGER SPECTRA FUND |
Schedule of Investments - Securities Sold Short October 31, 2021 (Continued) |
| REAL ESTATE INVESTMENT TRUST—(0.1)% | SHARES | VALUE | ||||||
| HEALTHCARE—(0.1)% | ||||||||
| Omega Healthcare Investors, Inc. | (420,760 | ) | $ | (12,353,514 | ) | |||
| (Proceeds $15,393,474) | $ | (12,353,514 | ) | |||||
| Total Securities Sold Short | ||||||||
| (Proceeds $880,053,931) | $ | (853,697,999 | ) | |||||
See Notes to Financial Statements.
THE ALGER FUNDS II ALGER DYNAMIC OPPORTUNITIES FUND |
Schedule of Investments October 31, 2021 |
| COMMON STOCKS—97.0% | SHARES | VALUE | ||||||
| AEROSPACE & DEFENSE—5.0% | ||||||||
HEICO Corp.+ | 70,761 | $ | 9,863,376 | |||||
HEICO Corp., Cl. A+ | 65,053 | 8,175,861 | ||||||
Kratos Defense & Security Solutions, Inc.*,+ | 83,671 | 1,789,723 | ||||||
TransDigm Group, Inc.*,+ | 46,788 | 29,187,290 | ||||||
| 49,016,250 | ||||||||
| APPAREL RETAIL—0.7% | ||||||||
| MYT Netherlands Parent BV#,* | 254,498 | 6,718,747 | ||||||
| APPLICATION SOFTWARE—11.7% | ||||||||
| Adobe, Inc.* | 7,348 | 4,778,845 | ||||||
| Altair Engineering, Inc., Cl. A* | 2,802 | 217,968 | ||||||
| Avalara, Inc.* | 22,580 | 4,056,271 | ||||||
| Bill.com Holdings, Inc.* | 24,850 | 7,313,603 | ||||||
| Cerence, Inc.* | 59,852 | 6,292,241 | ||||||
| Confluent, Inc., Cl. A* | 32,144 | 2,184,185 | ||||||
| Coupa Software, Inc.* | 27,877 | 6,347,593 | ||||||
Ebix, Inc.+ | 61,674 | 2,023,524 | ||||||
Everbridge, Inc.*,+ | 18,036 | 2,873,315 | ||||||
| HubSpot, Inc.* | 8,947 | 7,249,128 | ||||||
| LivePerson, Inc.* | 31,668 | 1,631,219 | ||||||
Manhattan Associates, Inc.*,+ | 52,891 | 9,601,832 | ||||||
Paylocity Holding Corp.*,+ | 104,815 | 31,983,249 | ||||||
| SEMrush Holdings, Inc., Cl. A* | 55,577 | 1,355,523 | ||||||
Sprout Social, Inc., Cl. A*,+ | 47,353 | 6,046,031 | ||||||
SPS Commerce, Inc.*,+ | 51,635 | 7,886,213 | ||||||
The Trade Desk, Inc., Cl. A*,+ | 6,625 | 496,279 | ||||||
| Unity Software, Inc.* | 15,721 | 2,378,744 | ||||||
| Vertex, Inc., Cl. A* | 434,619 | 9,048,768 | ||||||
| 113,764,531 | ||||||||
| ASSET MANAGEMENT & CUSTODY BANKS—2.5% | ||||||||
Hamilton Lane, Inc., Cl. A+ | 99,753 | 10,425,186 | ||||||
StepStone Group, Inc., Cl. A+ | 293,403 | 13,784,073 | ||||||
| 24,209,259 | ||||||||
| AUTOMOBILE MANUFACTURERS—1.0% | ||||||||
| Tesla, Inc.* | 8,474 | 9,440,036 | ||||||
| AUTOMOTIVE RETAIL—1.2% | ||||||||
| Advance Auto Parts, Inc. | 8,625 | 1,945,110 | ||||||
| Carvana Co., Cl. A* | 30,505 | 9,248,506 | ||||||
| 11,193,616 | ||||||||
| BIOTECHNOLOGY—5.0% | ||||||||
ACADIA Pharmaceuticals, Inc.*,+ | 294,254 | 5,281,859 | ||||||
| BioMarin Pharmaceutical, Inc.* | 31,783 | 2,518,167 | ||||||
| Celldex Therapeutics, Inc.* | 87,202 | 3,709,573 | ||||||
| DermTech, Inc.* | 108,698 | 2,972,890 | ||||||
Natera, Inc.*,+ | 265,617 | 30,431,740 | ||||||
| Puma Biotechnology, Inc.* | 209,688 | 1,069,409 | ||||||
| Ultragenyx Pharmaceutical, Inc.* | 29,288 | 2,457,849 | ||||||
| 48,441,487 | ||||||||
THE ALGER FUNDS II ALGER DYNAMIC OPPORTUNITIES FUND |
Schedule of Investments October 31, 2021 (Continued) |
| COMMON STOCKS—97.0% (CONT.) | SHARES | VALUE | ||||||
| CASINOS & GAMING—1.7% | ||||||||
| Evolution AB | 38,927 | $ | 6,319,152 | |||||
| Flutter Entertainment PLC* | 15,378 | 2,911,031 | ||||||
MGM Resorts International+ | 159,805 | 7,536,404 | ||||||
| 16,766,587 | ||||||||
| CONSTRUCTION & ENGINEERING—0.7% | ||||||||
| Ameresco, Inc., Cl. A* | 80,511 | 6,612,368 | ||||||
| CONSUMER FINANCE—5.2% | ||||||||
| LendingTree, Inc.* | 17,321 | 2,795,436 | ||||||
Upstart Holdings, Inc.*,+ | 148,286 | 47,754,024 | ||||||
| 50,549,460 | ||||||||
| DATA PROCESSING & OUTSOURCED SERVICES—3.6% | ||||||||
| Affirm Holdings, Inc., Cl. A* | 45,670 | 7,421,375 | ||||||
| Dlocal Ltd., Cl. A* | 121,395 | 5,888,871 | ||||||
| Marqeta, Inc., Cl. A* | 279,681 | 8,558,239 | ||||||
PayPal Holdings, Inc.*,+ | 38,253 | 8,897,265 | ||||||
| Square, Inc., Cl. A* | 15,868 | 4,038,406 | ||||||
| 34,804,156 | ||||||||
| EDUCATION SERVICES—3.9% | ||||||||
Chegg, Inc.*,+ | 642,688 | 38,201,375 | ||||||
| Duolingo, Inc., Cl. A* | 179 | 31,090 | ||||||
| 38,232,465 | ||||||||
| ELECTRONIC EQUIPMENT & INSTRUMENTS—0.7% | ||||||||
| 908 Devices, Inc.* | 121,541 | 3,998,699 | ||||||
| Novanta, Inc.* | 14,909 | 2,572,697 | ||||||
| 6,571,396 | ||||||||
| ENVIRONMENTAL & FACILITIES SERVICES—3.0% | ||||||||
Casella Waste Systems, Inc., Cl. A*,+ | 82,943 | 7,192,817 | ||||||
Montrose Environmental Group, Inc.*,+ | 200,312 | 13,731,388 | ||||||
Waste Connections, Inc.+ | 63,520 | 8,639,355 | ||||||
| 29,563,560 | ||||||||
| GENERAL MERCHANDISE STORES—1.8% | ||||||||
Ollie's Bargain Outlet Holdings, Inc.*,+ | 260,998 | 17,659,125 | ||||||
| HEALTHCARE DISTRIBUTORS—1.6% | ||||||||
Apria, Inc.*,+ | 378,588 | 14,170,549 | ||||||
| PetIQ, Inc., Cl. A* | 57,274 | 1,434,713 | ||||||
| 15,605,262 | ||||||||
| HEALTHCARE EQUIPMENT—5.2% | ||||||||
| CryoPort, Inc.* | 67,304 | 5,487,968 | ||||||
| Eargo, Inc.* | 131,922 | 1,160,914 | ||||||
Glaukos Corp.*,+ | 69,273 | 3,166,469 | ||||||
| Inmode Ltd.* | 53,004 | 5,021,599 | ||||||
Insulet Corp.*,+ | 37,522 | 11,632,570 | ||||||
Intuitive Surgical, Inc.*,+ | 19,918 | 7,192,987 | ||||||
Nevro Corp.*,+ | 145,840 | 16,587,842 | ||||||
| 50,250,349 | ||||||||
| HEALTHCARE FACILITIES—0.5% | ||||||||
| The Joint Corp.* | 56,274 | 4,922,849 | ||||||
THE ALGER FUNDS II ALGER DYNAMIC OPPORTUNITIES FUND |
Schedule of Investments October 31, 2021 (Continued) |
| COMMON STOCKS—97.0% (CONT.) | SHARES | VALUE | ||||||
| HEALTHCARE SERVICES—0.2% | ||||||||
Guardant Health, Inc.*,+ | 17,270 | $ | 2,016,963 | |||||
| HEALTHCARE SUPPLIES—0.2% | ||||||||
| Align Technology, Inc.* | 3,132 | 1,955,527 | ||||||
| HEALTHCARE TECHNOLOGY—1.8% | ||||||||
| Definitive Healthcare Corp., Cl. A* | 361 | 14,491 | ||||||
| Doximity, Inc., Cl. A* | 104,820 | 7,282,894 | ||||||
| Inspire Medical Systems, Inc.* | 8,788 | 2,369,069 | ||||||
| Tabula Rasa HealthCare, Inc.* | 91,968 | 2,496,931 | ||||||
Veeva Systems, Inc., Cl. A*,+ | 17,938 | 5,686,525 | ||||||
| 17,849,910 | ||||||||
| HOTELS RESORTS & CRUISE LINES—0.5% | ||||||||
| Airbnb, Inc., Cl. A* | 27,142 | 4,632,054 | ||||||
| INSURANCE BROKERS—0.1% | ||||||||
| Goosehead Insurance, Inc., Cl. A | 7,939 | 1,145,598 | ||||||
| INTERACTIVE HOME ENTERTAINMENT—2.2% | ||||||||
| ROBLOX Corp., Cl. A* | 28,690 | 2,410,534 | ||||||
Sea Ltd.#,*,+ | 29,797 | 10,237,355 | ||||||
| Take-Two Interactive Software, Inc.* | 50,941 | 9,220,321 | ||||||
| 21,868,210 | ||||||||
| INTERACTIVE MEDIA & SERVICES—4.0% | ||||||||
Alphabet, Inc., Cl. C*,+ | 8,303 | 24,621,799 | ||||||
| Genius Sports Ltd.* | 391,434 | 7,257,186 | ||||||
| Pinterest, Inc., Cl. A* | 149,001 | 6,651,405 | ||||||
| 38,530,390 | ||||||||
| INTERNET & DIRECT MARKETING RETAIL—2.7% | ||||||||
Amazon.com, Inc.*,+ | 6,810 | 22,966,248 | ||||||
| Etsy, Inc.* | 14,795 | 3,708,959 | ||||||
| 26,675,207 | ||||||||
| INTERNET SERVICES & INFRASTRUCTURE—1.1% | ||||||||
| BigCommerce Holdings, Inc.* | 70,531 | 3,259,237 | ||||||
Shopify, Inc., Cl. A*,+ | 4,801 | 7,041,771 | ||||||
| 10,301,008 | ||||||||
| INVESTMENT BANKING & BROKERAGE—0.4% | ||||||||
The Goldman Sachs Group, Inc.+ | 10,479 | 4,331,495 | ||||||
| IT CONSULTING & OTHER SERVICES—0.7% | ||||||||
EPAM Systems, Inc.*,+ | 7,709 | 5,190,007 | ||||||
| Globant SA* | 3,655 | 1,166,640 | ||||||
| 6,356,647 | ||||||||
| LEISURE PRODUCTS—0.2% | ||||||||
| Latham Group, Inc.* | 126,391 | 1,946,421 | ||||||
| LIFE SCIENCES TOOLS & SERVICES—1.4% | ||||||||
| 10X Genomics, Inc., Cl. A* | 17,021 | 2,744,977 | ||||||
Bio-Techne Corp.+ | 17,882 | 9,363,909 | ||||||
NeoGenomics, Inc.*,+ | 25,143 | 1,156,578 | ||||||
| 13,265,464 | ||||||||
| MANAGED HEALTHCARE—2.3% | ||||||||
Progyny, Inc.*,+ | 371,978 | 22,850,609 | ||||||
THE ALGER FUNDS II ALGER DYNAMIC OPPORTUNITIES FUND |
Schedule of Investments October 31, 2021 (Continued) |
| COMMON STOCKS—97.0% (CONT.) | SHARES | VALUE | ||||||
| MOVIES & ENTERTAINMENT—2.1% | ||||||||
| Live Nation Entertainment, Inc.* | 91,335 | $ | 9,238,535 | |||||
| Netflix, Inc.* | 7,127 | 4,919,839 | ||||||
| Roku, Inc., Cl. A* | 19,825 | 6,044,643 | ||||||
| 20,203,017 | ||||||||
| OIL & GAS EQUIPMENT & SERVICES—0.9% | ||||||||
| Core Laboratories NV | 342,083 | 8,897,579 | ||||||
| OIL & GAS EXPLORATION & PRODUCTION—0.9% | ||||||||
| Diamondback Energy, Inc. | 41,199 | 4,416,121 | ||||||
| EOG Resources, Inc. | 48,893 | 4,520,647 | ||||||
| 8,936,768 | ||||||||
| PHARMACEUTICALS—1.4% | ||||||||
| Aerie Pharmaceuticals, Inc.* | 95,392 | 1,014,017 | ||||||
| Catalent, Inc.* | 71,736 | 9,889,525 | ||||||
| Green Thumb Industries, Inc.* | 124,829 | 2,556,896 | ||||||
| 13,460,438 | ||||||||
| REAL ESTATE SERVICES—2.4% | ||||||||
FirstService Corp.+ | 116,784 | 23,347,457 | ||||||
| REGIONAL BANKS—2.9% | ||||||||
Signature Bank+ | 94,213 | 28,058,516 | ||||||
| RESTAURANTS—0.7% | ||||||||
Shake Shack, Inc., Cl. A*,+ | 74,380 | 5,144,865 | ||||||
| Wingstop, Inc. | 12,285 | 2,118,794 | ||||||
| 7,263,659 | ||||||||
| SEMICONDUCTOR EQUIPMENT—3.4% | ||||||||
Applied Materials, Inc.+ | 70,448 | 9,626,719 | ||||||
| ASML Holding NV | 5,879 | 4,778,921 | ||||||
| Brooks Automation, Inc. | 64,726 | 7,537,343 | ||||||
| SolarEdge Technologies, Inc.*,+ | 32,195 | 11,418,923 | ||||||
| 33,361,906 | ||||||||
| SEMICONDUCTORS—1.9% | ||||||||
Advanced Micro Devices, Inc.*,+ | 83,835 | 10,079,482 | ||||||
| Impinj, Inc.* | 55,560 | 3,873,643 | ||||||
| Xilinx, Inc. | 26,986 | 4,857,480 | ||||||
| 18,810,605 | ||||||||
| SYSTEMS SOFTWARE—4.1% | ||||||||
| Crowdstrike Holdings, Inc., Cl. A* | 19,187 | 5,406,897 | ||||||
Microsoft Corp.+ | 99,817 | 33,101,314 | ||||||
| Rapid7, Inc.* | 7,182 | 924,682 | ||||||
| 39,432,893 | ||||||||
| TECHNOLOGY HARDWARE STORAGE & PERIPHERALS—0.3% | ||||||||
Apple, Inc.+ | 21,869 | 3,275,976 | ||||||
| THRIFTS & MORTGAGE FINANCE—0.1% | ||||||||
Axos Financial, Inc.*,+ | 20,810 | 1,102,930 | ||||||
| TRADING COMPANIES & DISTRIBUTORS—1.1% | ||||||||
| SiteOne Landscape Supply, Inc.* | 46,541 | 10,935,273 | ||||||
THE ALGER FUNDS II ALGER DYNAMIC OPPORTUNITIES FUND |
Schedule of Investments October 31, 2021 (Continued) |
| COMMON STOCKS—97.0% (CONT.) | SHARES | VALUE | ||||||
| TRUCKING—2.0% | ||||||||
| Uber Technologies, Inc.* | 201,787 | $ | 8,842,306 | |||||
| XPO Logistics, Inc.* | 122,708 | 10,528,347 | ||||||
| 19,370,653 | ||||||||
| TOTAL COMMON STOCKS | ||||||||
| (Cost $788,449,862) | 944,504,676 | |||||||
| PREFERRED STOCKS—0.0% | SHARES | VALUE | ||||||
| BIOTECHNOLOGY—0.0% | ||||||||
Prosetta Biosciences, Inc., Series D*,@,(a),(b) | 41,418 | – | ||||||
| (Cost $186,381) | – | |||||||
| RIGHTS—0.0% | SHARES | VALUE | ||||||
| BIOTECHNOLOGY—0.0% | ||||||||
Tolero CDR*,@,(a),(c) | 126,108 | �� | 94,581 | |||||
| (Cost $67,638) | 94,581 | |||||||
| REAL ESTATE INVESTMENT TRUST—0.9% | SHARES | VALUE | ||||||
| INDUSTRIAL—0.5% | ||||||||
| Prologis, Inc. | 30,677 | 4,446,938 | ||||||
| RESIDENTIAL—0.2% | ||||||||
| AvalonBay Communities, Inc. | 9,701 | 2,296,033 | ||||||
| RETAIL—0.2% | ||||||||
| Simon Property Group, Inc. | 16,209 | 2,375,915 | ||||||
| TOTAL REAL ESTATE INVESTMENT TRUST | ||||||||
| (Cost $7,460,909) | 9,118,886 | |||||||
| SPECIAL PURPOSE VEHICLE—0.3% | SHARES | VALUE | ||||||
| DATA PROCESSING & OUTSOURCED SERVICES—0.3% | ||||||||
Crosslink Ventures Capital LLC, Cl. A*,@,(a),(b) | 37 | 1,481,036 | ||||||
Crosslink Ventures Capital LLC, Cl. B*,@,(a),(b) | 22 | 927,894 | ||||||
| 2,408,930 | ||||||||
| TOTAL SPECIAL PURPOSE VEHICLE | ||||||||
| (Cost $1,475,000) | 2,408,930 | |||||||
PURCHASED OPTIONS—0.0% SECURITY NAME/ EXPIRATION DATE/ STRIKE PRICE | NOTIONAL AMOUNTS | COUNTERPARTY | NUMBER OF CONTRACTS | VALUE | |||||||||
| PUT OPTIONS—0.0% | |||||||||||||
| Lemonade, Inc., 12/17/21, 100.00* | $ | 31,080 | BNP Paribas | 5 | $ | 19,050 | |||||||
| (Cost $29,161) | 19,050 | ||||||||||||
| TOTAL PURCHASED OPTIONS | |||||||||||||
| (Cost $29,161) | 19,050 | ||||||||||||
| Total Investments | |||||||||||||
| (Cost $797,668,951) | 98.2 | % | $ | 956,146,123 | |||||||||
| Affiliated Securities (Cost $1,661,381) | 2,408,930 | ||||||||||||
| Unaffiliated Securities (Cost $796,007,570) | 953,737,193 | ||||||||||||
| Securities Sold Short (Proceeds $331,906,270) | (33.1 | )% | (322,831,710 | ) | |||||||||
| Swaps | (0.1 | )% | (467,257 | ) | |||||||||
| Other Assets in Excess of Liabilities | 35.0 | % | 341,221,828 | ||||||||||
| NET ASSETS | 100.0 | % | $ | 974,068,984 | |||||||||
THE ALGER FUNDS II ALGER DYNAMIC OPPORTUNITIES FUND |
Schedule of Investments October 31, 2021 (Continued) |
| + | All or a portion of this security is held as collateral for securities sold short. |
| # | American Depositary Receipts. |
| (a) | Security is valued in good faith at fair value determined using significant unobservable inputs pursuant to procedures established by the Board. |
| (b) | Deemed an affiliate of the Fund in accordance with Section 2(a)(3) of the Investment Company Act of 1940. See Note 11 - Affiliated Securities. |
| (c) | Contingent Deferred Rights. |
| * | Non-income producing security. |
| @ | Restricted security - Investment in security not registered under the Securities Act of 1933. Sales or transfers of the investment may be restricted only to qualified buyers. |
Security | Acquisition Date(s) | Acquisition Cost | % of net assets (Acquisition Date) | Market Value | % of net assets as of 10/31/2021 | ||||||||||||
| Crosslink Ventures Capital LLC, Cl. A | 10/2/20 | $ | 925,000 | 0.24 | % | $ | 1,481,036 | 0.15 | % | ||||||||
| Crosslink Ventures Capital LLC, Cl. B | 12/16/20 | 550,000 | 0.11 | % | 927,894 | 0.10 | % | ||||||||||
| Prosetta Biosciences, Inc., Series D | 2/6/15 | 186,381 | 0.25 | % | 0 | 0.00 | % | ||||||||||
| Tolero CDR | 2/6/17 | 67,638 | 0.09 | % | 94,581 | 0.01 | % | ||||||||||
| Total | $ | 2,503,511 | 0.26 | % | |||||||||||||
| Swaps outstanding as of October 31, 2021: |
Centrally cleared swaps - Contracts for difference |
| Contract Amount | Counterparty | Reference Company | Market Value | Unrealized Appreciation | Unrealized (Depreciation) | Net Unrealized Appreciation/ (Depreciation) | ||||||||||||||
3,435,656 | Goldman Sachs | 3M Co. | $ | 316,660 | $ | 316,660 | $ | – | $ | 316,660 | ||||||||||
4,770,975 | Goldman Sachs | Church & Dwight Co., Inc. | (237,992 | ) | – | (208,499 | ) | (208,499 | ) | |||||||||||
2,424,949 | Goldman Sachs | Omnicom Group, Inc. | 220,803 | 220,803 | – | 220,803 | ||||||||||||||
4,246,544 | Goldman Sachs | Rollins, Inc. | 198,538 | 198,538 | – | 198,538 | ||||||||||||||
2,313,404 | BNP Paribas | SL Green Realty Corp. | 71,113 | 71,113 | – | 71,113 | ||||||||||||||
4,630,744 | Goldman Sachs | The Clorox Co. | (87,480 | ) | – | (87,480 | ) | (87,480 | ) | |||||||||||
| Total | $ | 481,642 | $ | 807,114 | $ | (295,979 | ) | $ | 511,135 | |||||||||||
Over the counter swaps - Contracts for difference
| Contract Amount | Counterparty | Reference Company | Market Value | Unrealized Appreciation | Unrealized (Depreciation) | Net Unrealized Appreciation/ (Depreciation) | ||||||||||||||
40,320,608 | Goldman Sachs | Russell 2500 Growth Index | (948,899 | ) | – | (948,899 | ) | (948,899 | ) | |||||||||||
| Total | $ | (948,899 | ) | $ | – | $ | (948,899 | ) | $ | (948,899 | ) | |||||||||
See Notes to Financial Statements.
THE ALGER FUNDS II ALGER DYNAMIC OPPORTUNITIES FUND |
Schedule of Investments - Securities Sold Short October 31, 2021 |
| COMMON STOCKS—(29.9)% | SHARES | VALUE | ||||||
| AEROSPACE & DEFENSE—(0.2)% | ||||||||
| Virgin Galactic Holdings, Inc. | (93,702 | ) | $ | (1,756,912 | ) | |||
| APPAREL RETAIL—(0.2)% | ||||||||
| Ross Stores, Inc. | (21,159 | ) | (2,395,199 | ) | ||||
| APPLICATION SOFTWARE—(1.3)% | ||||||||
| DoubleVerify Holdings, Inc. | (18,282 | ) | (722,687 | ) | ||||
| Latch, Inc. | (938,198 | ) | (8,340,580 | ) | ||||
| Procore Technologies, Inc. | (6,907 | ) | (631,645 | ) | ||||
| Sumo Logic, Inc. | (94,300 | ) | (1,628,561 | ) | ||||
| (11,323,473 | ) | |||||||
| ASSET MANAGEMENT & CUSTODY BANKS—0.0% | ||||||||
| Main Street Capital Corp. | (6,784 | ) | (297,275 | ) | ||||
| BIOTECHNOLOGY—(0.1)% | ||||||||
| Flexion Therapeutics, Inc. | (160,052 | ) | (1,480,481 | ) | ||||
| COMMODITY CHEMICALS—(1.3)% | ||||||||
| PureCycle Technologies, Inc. | (952,148 | ) | (12,749,262 | ) | ||||
| Zymergen, Inc.* | (48,433 | ) | (513,390 | ) | ||||
| (13,262,652 | ) | |||||||
| DEPARTMENT STORES—(0.2)% | ||||||||
| Nordstrom, Inc. | (61,015 | ) | (1,752,961 | ) | ||||
| DIVERSIFIED SUPPORT SERVICES—(0.7)% | ||||||||
| Healthcare Services Group, Inc. | (208,214 | ) | (3,995,627 | ) | ||||
| KAR Auction Services, Inc. | (191,037 | ) | (2,802,513 | ) | ||||
| (6,798,140 | ) | |||||||
| EDUCATION SERVICES—(0.1)% | ||||||||
| 2U, Inc. | (26,226 | ) | (774,716 | ) | ||||
| ELECTRICAL COMPONENTS & EQUIPMENT—(0.5)% | ||||||||
| FREYR Battery SA | (504,038 | ) | (5,105,905 | ) | ||||
| ELECTRONIC EQUIPMENT & INSTRUMENTS—(0.2)% | ||||||||
| MicroVision, Inc. | (262,491 | ) | (1,997,557 | ) | ||||
| HEALTHCARE EQUIPMENT—(0.8)% | ||||||||
| Inari Medical, Inc. | (25,998 | ) | (2,353,339 | ) | ||||
| iRhythm Technologies, Inc. | (63,729 | ) | (4,469,952 | ) | ||||
| NuVasive, Inc. | (17,321 | ) | (924,249 | ) | ||||
| (7,747,540 | ) | |||||||
| HEALTHCARE SERVICES—(0.7)% | ||||||||
| Agiliti, Inc. | (29,503 | ) | (665,293 | ) | ||||
| Aveanna Healthcare Holdings, Inc. | (77,761 | ) | (600,315 | ) | ||||
| Hims & Hers Health, Inc. | (310,510 | ) | (2,421,978 | ) | ||||
| RadNet, Inc. | (107,055 | ) | (3,328,340 | ) | ||||
| (7,015,926 | ) | |||||||
| HEALTHCARE TECHNOLOGY—(0.3)% | ||||||||
| American Well Corp., Cl. A | (343,005 | ) | (3,087,045 | ) | ||||
| Castlight Health, Inc., Cl. B | (7,950 | ) | (14,310 | ) | ||||
| (3,101,355 | ) | |||||||
THE ALGER FUNDS II ALGER DYNAMIC OPPORTUNITIES FUND |
Schedule of Investments - Securities Sold Short October 31, 2021 (Continued) |
| COMMON STOCKS—(29.9)% (CONT.) | SHARES | VALUE | ||||||
| HOUSEHOLD APPLIANCES—(0.2)% | ||||||||
| iRobot Corp. | (22,146 | ) | $ | (1,847,419 | ) | |||
| INDUSTRIAL MACHINERY—(0.1)% | ||||||||
| Proto Labs, Inc. | (12,693 | ) | (759,168 | ) | ||||
| INTERACTIVE MEDIA & SERVICES—(0.7)% | ||||||||
| fuboTV, Inc. | (32,566 | ) | (970,792 | ) | ||||
| Twitter, Inc. | (75,507 | ) | (4,042,645 | ) | ||||
| ZipRecruiter, Inc., Cl. A | (81,585 | ) | (2,266,431 | ) | ||||
| (7,279,868 | ) | |||||||
| INTERNET & DIRECT MARKETING RETAIL—(2.3)% | ||||||||
| 1stdibs.com, Inc. | (27,827 | ) | (476,955 | ) | ||||
| JD.com, Inc.# | (16,625 | ) | (1,301,405 | ) | ||||
| Porch Group, Inc. | (324,573 | ) | (6,825,770 | ) | ||||
| Poshmark, Inc., Cl. A | (189,068 | ) | (4,600,024 | ) | ||||
| The Original BARK Co. | (526,375 | ) | (3,874,120 | ) | ||||
| ThredUp, Inc., Cl. A | (43,567 | ) | (942,790 | ) | ||||
| Wayfair, Inc., Cl. A | (19,463 | ) | (4,848,233 | ) | ||||
| (22,869,297 | ) | |||||||
| INTERNET SERVICES & INFRASTRUCTURE—(1.8)% | ||||||||
| Akamai Technologies, Inc. | (6,356 | ) | (670,304 | ) | ||||
| GTT Communications, Inc. | (87,552 | ) | (4,815 | ) | ||||
| Rackspace Technology, Inc.* | (107,440 | ) | (1,427,878 | ) | ||||
| Snowflake, Inc., Cl. A | (40,458 | ) | (14,315,659 | ) | ||||
| Wix.com Ltd. | (3,038 | ) | (564,946 | ) | ||||
| (16,983,602 | ) | |||||||
| IT CONSULTING & OTHER SERVICES—(0.4)% | ||||||||
| Cognizant Technology Solutions Corp., Cl. A | (50,544 | ) | (3,946,981 | ) | ||||
| MARKET INDICES—(12.8)% | ||||||||
| iShares Russell 1000 Growth ETF | (111,628 | ) | (33,265,144 | ) | ||||
| iShares Russell 2000 Growth ETF | (298,056 | ) | (91,628,376 | ) | ||||
| (124,893,520 | ) | |||||||
| MOVIES & ENTERTAINMENT—(0.5)% | ||||||||
| AMC Entertainment Holdings, Inc., Cl. A | (102,932 | ) | (3,640,705 | ) | ||||
| Endeavor Group Holdings, Inc., Cl. A | (24,928 | ) | (670,065 | ) | ||||
| (4,310,770 | ) | |||||||
| OIL & GAS DRILLING—(0.1)% | ||||||||
| Transocean Ltd. | (217,158 | ) | (766,568 | ) | ||||
| OTHER DIVERSIFIED FINANCIAL SERVICES—(0.5)% | ||||||||
| iShares 20+ Year Treasury Bond ETF | (34,352 | ) | (5,073,447 | ) | ||||
| PACKAGED FOODS & MEATS—(0.1)% | ||||||||
| Oatly Group AB# | (48,136 | ) | (620,473 | ) | ||||
| PERSONAL PRODUCTS—(0.1)% | ||||||||
| The Honest Co., Inc. | (60,988 | ) | (558,040 | ) | ||||
| PHARMACEUTICALS—(0.5)% | ||||||||
| Elanco Animal Health, Inc. | (138,258 | ) | (4,545,923 | ) | ||||
THE ALGER FUNDS II ALGER DYNAMIC OPPORTUNITIES FUND |
Schedule of Investments - Securities Sold Short October 31, 2021 (Continued) |
| COMMON STOCKS—(29.9)% (CONT.) | SHARES | VALUE | ||||||
| PROPERTY & CASUALTY INSURANCE—(1.5)% | ||||||||
| Kinsale Capital Group, Inc. | (10,700 | ) | $ | (2,002,505 | ) | |||
| Lemonade, Inc. | (135,935 | ) | (8,449,720 | ) | ||||
| Palomar Holdings, Inc. | (43,834 | ) | (4,008,619 | ) | ||||
| (14,460,844 | ) | |||||||
| REAL ESTATE SERVICES—(0.4)% | ||||||||
| Opendoor Technologies, Inc. | (165,824 | ) | (3,931,687 | ) | ||||
| SECURITY & ALARM SERVICES—(0.2)% | ||||||||
| The Brink's Co. | (25,875 | ) | (1,782,270 | ) | ||||
| SEMICONDUCTORS—(0.2)% | ||||||||
| SkyWater Technology, Inc. | (43,870 | ) | (1,502,109 | ) | ||||
| SYSTEMS SOFTWARE—(0.5)% | ||||||||
| Check Point Software Technologies Ltd. | (7,194 | ) | (860,402 | ) | ||||
| Monday.com Ltd. | (6,590 | ) | (2,450,360 | ) | ||||
| UiPath, Inc., Cl. A | (43,349 | ) | (2,178,287 | ) | ||||
| (5,489,049 | ) | |||||||
TECHNOLOGY HARDWARE STORAGE & PERIPHERALS—(0.2)% | ||||||||
| Logitech International SA | (24,502 | ) | (2,034,401 | ) | ||||
| TRUCKING—(0.2)% | ||||||||
| Avis Budget Group, Inc. | (13,453 | ) | (2,331,539 | ) | ||||
| TOTAL COMMON STOCKS | ||||||||
| (Proceeds $296,699,155) | $ | (290,797,067 | ) | |||||
| REAL ESTATE INVESTMENT TRUST—(3.2)% | SHARES | VALUE | ||||||
| DIVERSIFIED—(0.3)% | ||||||||
| Empire State Realty Trust, Inc., Cl. A | (295,463 | ) | (2,860,082 | ) | ||||
| HEALTHCARE—(1.6)% | ||||||||
| Omega Healthcare Investors, Inc. | (530,811 | ) | (15,584,611 | ) | ||||
| OFFICE—(0.8)% | ||||||||
| Boston Properties, Inc. | (29,385 | ) | (3,339,311 | ) | ||||
| Paramount Group, Inc. | (378,752 | ) | (3,211,817 | ) | ||||
| Vornado Realty Trust | (52,527 | ) | (2,239,226 | ) | ||||
| (8,790,354 | ) | |||||||
| RETAIL—(0.5)% | ||||||||
| CBL & Associates Properties, Inc. | (13,748 | ) | (2,337 | ) | ||||
| Pennsylvania Real Estate Investment Trust | (6,036 | ) | (10,261 | ) | ||||
| Seritage Growth Properties, Cl. A | (310,844 | ) | (4,786,998 | ) | ||||
| (4,799,596 | ) | |||||||
| TOTAL REAL ESTATE INVESTMENT TRUST | ||||||||
| (Proceeds $35,207,115) | $ | (32,034,643 | ) | |||||
THE ALGER FUNDS II ALGER DYNAMIC OPPORTUNITIES FUND |
Schedule of Investments - Securities Sold Short October 31, 2021 (Continued) |
| VALUE | ||||
Total Securities Sold Short | ||||
(Proceeds $331,906,270) | $ | (322,831,710 | ) | |
| * | Non-income producing security. |
| # | American Depositary Receipts. |
See Notes to Financial Statements.
THE ALGER FUNDS II ALGER EMERGING MARKETS FUND |
Schedule of Investments October 31, 2021 |
| COMMON STOCKS—98.7% | SHARES | VALUE | ||||||
| ARGENTINA—1.9% | ||||||||
| INTERNET & DIRECT MARKETING RETAIL—1.9% | ||||||||
| MercadoLibre, Inc.* | 590 | $ | 873,802 | |||||
| (Cost $989,616) | ||||||||
| BRAZIL—6.7% | ||||||||
| ASSET MANAGEMENT & CUSTODY BANKS—1.2% | ||||||||
| Vinci Partners Investments Ltd., Cl. A | 46,922 | 576,671 | ||||||
| EDUCATION SERVICES—1.3% | ||||||||
| Afya Ltd., Cl. A* | 34,900 | 609,005 | ||||||
| HEALTHCARE SERVICES—0.9% | ||||||||
| Diagnosticos da America SA | 65,500 | 406,546 | ||||||
| HEAVY ELECTRICAL EQUIPMENT—1.2% | ||||||||
| Aeris Industria E Comercio de Equipamentos Para Geracao de Energia SA* | 411,000 | 573,848 | ||||||
| INTERACTIVE MEDIA & SERVICES—0.9% | ||||||||
| Infracommerce CXAAS SA* | 184,000 | 425,458 | ||||||
| RESEARCH & CONSULTING SERVICES—1.2% | ||||||||
| Boa Vista Servicos SA | 344,000 | 556,490 | ||||||
| TOTAL BRAZIL | ||||||||
| (Cost $4,308,783) | 3,148,018 | |||||||
| CANADA—1.7% | ||||||||
| GOLD—1.7% | ||||||||
| Endeavour Mining PLC | 30,500 | 774,822 | ||||||
| (Cost $760,552) | ||||||||
| CHINA—28.2% | ||||||||
| APPAREL ACCESSORIES & LUXURY GOODS—1.5% | ||||||||
| Li Ning Co., Ltd. | 63,000 | 695,209 | ||||||
| APPLICATION SOFTWARE—1.7% | ||||||||
| Glodon Co., Ltd., Cl. A | 68,000 | 788,336 | ||||||
| AUTOMOBILE MANUFACTURERS—6.9% | ||||||||
| BYD Co., Ltd., Cl. H | 54,000 | 2,065,370 | ||||||
| Geely Automobile Holdings Ltd. | 332,000 | 1,152,253 | ||||||
| 3,217,623 | ||||||||
| FOOTWEAR—2.1% | ||||||||
| ANTA Sports Products Ltd. | 64,000 | 991,598 | ||||||
| INTERACTIVE MEDIA & SERVICES—2.3% | ||||||||
| Tencent Holdings Ltd. | 18,007 | 1,095,362 | ||||||
| INTERNET & DIRECT MARKETING RETAIL—9.5% | ||||||||
| JD Health International, Inc.* | 168,000 | 1,474,780 | ||||||
| JD.com, Inc.#,* | 21,440 | 1,678,323 | ||||||
| Meituan, Cl. B* | 38,000 | 1,293,088 | ||||||
| 4,446,191 | ||||||||
| PERSONAL PRODUCTS—0.2% | ||||||||
| Yatsen Holding Ltd.#,* | 32,502 | 91,006 | ||||||
THE ALGER FUNDS II ALGER EMERGING MARKETS FUND |
Schedule of Investments October 31, 2021 (Continued) |
| COMMON STOCKS—98.7% (CONT.) | SHARES | VALUE | ||||||
| CHINA—28.2% (CONT.) | ||||||||
| SEMICONDUCTORS—4.0% | ||||||||
| LONGi Green Energy Technology Co., Ltd., Cl. A | 121,865 | $ | 1,855,623 | |||||
| TOTAL CHINA | ||||||||
| (Cost $12,362,823) | 13,180,948 | |||||||
| CYPRUS—1.6% | ||||||||
| IT CONSULTING & OTHER SERVICES—1.6% | ||||||||
Softline Holding PLC*,(a) | 100,000 | 730,000 | ||||||
| (Cost $750,000) | ||||||||
| GREECE—1.1% | ||||||||
| SPECIALTY STORES—1.1% | ||||||||
| JUMBO SA | 34,000 | 506,046 | ||||||
| (Cost $657,515) | ||||||||
| HONG KONG—1.4% | ||||||||
| FINANCIAL EXCHANGES & DATA—1.4% | ||||||||
| Hong Kong Exchanges & Clearing Ltd. | 10,476 | 631,092 | ||||||
| (Cost $424,131) | ||||||||
| HUNGARY—2.1% | ||||||||
| AIRLINES—2.1% | ||||||||
| Wizz Air Holdings PLC* | 15,186 | 960,374 | ||||||
| (Cost $923,514) | ||||||||
| INDIA—19.5% | ||||||||
| APPAREL ACCESSORIES & LUXURY GOODS—1.1% | ||||||||
| Titan Co., Ltd. | 16,000 | 510,015 | ||||||
| APPLICATION SOFTWARE—2.1% | ||||||||
| Route Mobile Ltd. | 39,000 | 979,915 | ||||||
| CONSUMER FINANCE—3.8% | ||||||||
| Manappuram Finance Ltd. | 447,000 | 1,242,901 | ||||||
| Paisalo Digital Ltd. | 42,527 | 535,223 | ||||||
| 1,778,124 | ||||||||
| DIVERSIFIED BANKS—2.5% | ||||||||
| HDFC Bank Ltd. | 55,000 | 1,163,965 | ||||||
| ELECTRICAL COMPONENTS & EQUIPMENT—0.9% | ||||||||
| Polycab India Ltd. | 14,000 | 423,119 | ||||||
| HEALTHCARE FACILITIES—1.1% | ||||||||
| Krishna Institute of Medical Sciences Ltd.* | 33,000 | 491,820 | ||||||
| HEALTHCARE SERVICES—1.7% | ||||||||
| Metropolis Healthcare Ltd. | 20,000 | 792,267 | ||||||
| HOUSEHOLD APPLIANCES—2.5% | ||||||||
| Amber Enterprises India Ltd.* | 27,000 | 1,191,463 | ||||||
| LIFE SCIENCES TOOLS & SERVICES—2.2% | ||||||||
| Syngene International Ltd.* | 144,000 | 1,040,326 | ||||||
| RESTAURANTS—1.6% | ||||||||
| Barbeque Nation Hospitality Ltd.* | 44,000 | 732,952 | ||||||
| TOTAL INDIA | ||||||||
| (Cost $7,722,529) | 9,103,966 | |||||||
THE ALGER FUNDS II ALGER EMERGING MARKETS FUND |
Schedule of Investments October 31, 2021 (Continued) |
| COMMON STOCKS—98.7% (CONT.) | SHARES | VALUE | ||||||
| INDONESIA—1.5% | ||||||||
| REGIONAL BANKS—1.5% | ||||||||
| Bank BTPN Syariah Tbk PT | 2,508,570 | $ | 674,642 | |||||
| (Cost $571,023) | ||||||||
| RUSSIA—1.6% | ||||||||
| APPAREL RETAIL—1.6% | ||||||||
| Detsky Mir PJSC | 391,940 | 757,595 | ||||||
| (Cost $799,741) | ||||||||
| SINGAPORE—3.6% | ||||||||
| INTERACTIVE HOME ENTERTAINMENT—3.6% | ||||||||
| Sea Ltd.#,* | 4,880 | 1,676,622 | ||||||
| (Cost $1,403,172) | ||||||||
| SOUTH KOREA—12.6% | ||||||||
| HEALTHCARE EQUIPMENT—2.6% | ||||||||
| Ray Co., Ltd.* | 49,700 | 1,225,197 | ||||||
| INTERACTIVE MEDIA & SERVICES—1.9% | ||||||||
| Kakao Corp. | 8,100 | 866,968 | ||||||
| SEMICONDUCTORS—2.4% | ||||||||
| LEENO Industrial, Inc. | 7,639 | 1,113,869 | ||||||
| SPECIALTY CHEMICALS—3.6% | ||||||||
| Chunbo Co., Ltd. | 7,023 | 1,698,890 | ||||||
| TECHNOLOGY HARDWARE STORAGE & PERIPHERALS—2.1% | ||||||||
| Samsung Electronics Co., Ltd. | 16,713 | 995,531 | ||||||
| TOTAL SOUTH KOREA | ||||||||
| (Cost $4,282,001) | 5,900,455 | |||||||
| TAIWAN—11.1% | ||||||||
| ELECTRONIC EQUIPMENT & INSTRUMENTS—2.2% | ||||||||
| Chroma ATE, Inc. | 154,000 | 1,004,359 | ||||||
| INTERNET & DIRECT MARKETING RETAIL—2.7% | ||||||||
| momo.com, Inc. | 19,800 | 1,274,245 | ||||||
| SEMICONDUCTORS—6.2% | ||||||||
| Realtek Semiconductor Corp. | 81,000 | 1,455,090 | ||||||
| Taiwan Semiconductor Manufacturing Co., Ltd. | 69,000 | 1,462,282 | ||||||
| 2,917,372 | ||||||||
| TOTAL TAIWAN | ||||||||
| (Cost $3,827,803) | 5,195,976 | |||||||
| UNITED STATES—2.0% | ||||||||
| IT CONSULTING & OTHER SERVICES—2.0% | ||||||||
| EPAM Systems, Inc.* | 1,400 | 942,536 | ||||||
| (Cost $407,461) | ||||||||
THE ALGER FUNDS II ALGER EMERGING MARKETS FUND |
Schedule of Investments October 31, 2021 (Continued) |
| COMMON STOCKS—98.7% (CONT.) | SHARES | VALUE | ||||||
| VIETNAM—2.1% | ||||||||
| REAL ESTATE DEVELOPMENT—2.1% | ||||||||
| Vinhomes JSC | 266,500 | $ | 1,000,295 | |||||
| (Cost $923,854) | ||||||||
| TOTAL COMMON STOCKS | ||||||||
| (Cost $41,114,518) | 46,057,189 | |||||||
| Total Investments | ||||||||
| (Cost $41,114,518) | 98.7 | % | $ | 46,057,189 | ||||
| Unaffiliated Securities (Cost $41,114,518) | 46,057,189 | |||||||
| Other Assets in Excess of Liabilities | 1.3 | % | 614,550 | |||||
| NET ASSETS | 100.0 | % | $ | 46,671,739 | ||||
| # | American Depositary Receipts. |
| (a) | Global Depositary Receipts. |
| * | Non-income producing security. |
See Notes to Financial Statements.
THE ALGER FUNDS II ALGER RESPONSIBLE INVESTING FUND |
Schedule of Investments October 31, 2021 |
| COMMON STOCKS—95.7% | SHARES | VALUE | ||||||
| APPAREL ACCESSORIES & LUXURY GOODS—1.6% | ||||||||
| Levi Strauss & Co., Cl. A | 18,358 | $ | 480,612 | |||||
| Lululemon Athletica, Inc.* | 2,388 | 1,112,832 | ||||||
| 1,593,444 | ||||||||
| APPLICATION SOFTWARE—11.4% | ||||||||
| Adobe, Inc.* | 6,785 | 4,412,693 | ||||||
| Autodesk, Inc.* | 4,433 | 1,407,965 | ||||||
| Intuit, Inc. | 1,417 | 887,028 | ||||||
| Paycom Software, Inc.* | 947 | 518,814 | ||||||
| salesforce.com, Inc.* | 12,073 | 3,618,157 | ||||||
| Workday, Inc., Cl. A* | 1,906 | 552,702 | ||||||
| 11,397,359 | ||||||||
| AUTO PARTS & EQUIPMENT—1.0% | ||||||||
| Aptiv PLC* | 5,666 | 979,595 | ||||||
| AUTOMOBILE MANUFACTURERS—2.7% | ||||||||
| Tesla, Inc.* | 2,389 | 2,661,346 | ||||||
| BIOTECHNOLOGY—0.5% | ||||||||
| Vertex Pharmaceuticals, Inc.* | 2,680 | 495,612 | ||||||
| BUILDING PRODUCTS—0.5% | ||||||||
| Allegion PLC | 3,668 | 470,604 | ||||||
| DATA PROCESSING & OUTSOURCED SERVICES—6.1% | ||||||||
| PayPal Holdings, Inc.* | 10,184 | 2,368,697 | ||||||
| Visa, Inc., Cl. A | 17,582 | 3,723,340 | ||||||
| 6,092,037 | ||||||||
| DISTRIBUTORS—0.6% | ||||||||
| Pool Corp. | 1,157 | 596,040 | ||||||
| ELECTRIC UTILITIES—0.5% | ||||||||
| NextEra Energy, Inc. | 5,908 | 504,130 | ||||||
| ELECTRICAL COMPONENTS & EQUIPMENT—0.5% | ||||||||
| Rockwell Automation, Inc. | 1,599 | 510,721 | ||||||
| ELECTRONIC EQUIPMENT & INSTRUMENTS—1.3% | ||||||||
| Cognex Corp. | 5,696 | 498,913 | ||||||
| Trimble, Inc.* | 9,100 | 795,067 | ||||||
| 1,293,980 | ||||||||
| ELECTRONIC MANUFACTURING SERVICES—1.0% | ||||||||
| Flex Ltd.* | 56,652 | 957,419 | ||||||
| ENVIRONMENTAL & FACILITIES SERVICES—0.7% | ||||||||
| Tetra Tech, Inc. | 3,729 | 655,036 | ||||||
| FINANCIAL EXCHANGES & DATA—2.2% | ||||||||
| CME Group, Inc., Cl. A | 2,074 | 457,421 | ||||||
| S&P Global, Inc. | 3,601 | 1,707,450 | ||||||
| 2,164,871 | ||||||||
| FOOD DISTRIBUTORS—0.6% | ||||||||
| Sysco Corp. | 7,189 | 552,834 | ||||||
| FOOTWEAR—1.4% | ||||||||
| NIKE, Inc., Cl. B | 8,142 | 1,362,075 | ||||||
THE ALGER FUNDS II ALGER RESPONSIBLE INVESTING FUND |
Schedule of Investments October 31, 2021 (Continued) |
| COMMON STOCKS—95.7% (CONT.) | SHARES | VALUE | ||||||
| HEALTHCARE EQUIPMENT—2.1% | ||||||||
| Danaher Corp. | 3,428 | $ | 1,068,747 | |||||
| Dexcom, Inc.* | 675 | 420,667 | ||||||
| Edwards Lifesciences Corp.* | 4,755 | 569,744 | ||||||
| 2,059,158 | ||||||||
| HEALTHCARE SERVICES—1.2% | ||||||||
| Cigna Corp. | 4,158 | 888,191 | ||||||
| Guardant Health, Inc.* | 3,065 | 357,961 | ||||||
| 1,246,152 | ||||||||
| HEALTHCARE SUPPLIES—0.7% | ||||||||
| Align Technology, Inc.* | 1,128 | 704,289 | ||||||
| HOME IMPROVEMENT RETAIL—2.6% | ||||||||
| The Home Depot, Inc. | 6,953 | 2,584,708 | ||||||
| HOUSEHOLD PRODUCTS—1.0% | ||||||||
| The Procter & Gamble Co. | 7,270 | 1,039,537 | ||||||
| INDUSTRIAL CONGLOMERATES—0.9% | ||||||||
| Honeywell International, Inc. | 4,177 | 913,176 | ||||||
| INDUSTRIAL GASES—0.9% | ||||||||
| Air Products & Chemicals, Inc. | 2,905 | 870,948 | ||||||
| INDUSTRIAL MACHINERY—0.7% | ||||||||
| Xylem, Inc. | 5,737 | 749,195 | ||||||
| INTERACTIVE HOME ENTERTAINMENT—0.6% | ||||||||
| Take-Two Interactive Software, Inc.* | 3,247 | 587,707 | ||||||
| INTERACTIVE MEDIA & SERVICES—7.7% | ||||||||
| Alphabet, Inc., Cl. A* | 1,102 | 3,262,934 | ||||||
| Alphabet, Inc., Cl. C* | 927 | 2,748,935 | ||||||
| Meta Platforms, Inc., Cl. A* | 4,276 | 1,383,585 | ||||||
| Snap, Inc., Cl. A* | 6,374 | 335,145 | ||||||
| 7,730,599 | ||||||||
| INTERNET & DIRECT MARKETING RETAIL—6.8% | ||||||||
| Amazon.com, Inc.* | 1,797 | 6,060,257 | ||||||
| Etsy, Inc.* | 2,715 | 680,623 | ||||||
| 6,740,880 | ||||||||
| INTERNET SERVICES & INFRASTRUCTURE—0.5% | ||||||||
| Shopify, Inc., Cl. A* | 319 | 467,887 | ||||||
| INVESTMENT BANKING & BROKERAGE—1.6% | ||||||||
| Morgan Stanley | 15,491 | 1,592,165 | ||||||
| IT CONSULTING & OTHER SERVICES—0.9% | ||||||||
| Accenture PLC, Cl. A | 2,605 | 934,648 | ||||||
| LEISURE FACILITIES—0.5% | ||||||||
| Vail Resorts, Inc. | 1,567 | 540,161 | ||||||
| LIFE SCIENCES TOOLS & SERVICES—0.7% | ||||||||
| Agilent Technologies, Inc. | 4,610 | 726,029 | ||||||
| MANAGED HEALTHCARE—0.9% | ||||||||
| Humana, Inc. | 1,990 | 921,688 | ||||||
| METAL & GLASS CONTAINERS—0.9% | ||||||||
| Ball Corp. | 9,682 | 885,709 | ||||||
THE ALGER FUNDS II ALGER RESPONSIBLE INVESTING FUND |
Schedule of Investments October 31, 2021 (Continued) |
| COMMON STOCKS—95.7% (CONT.) | SHARES | VALUE | ||||||
| MOVIES & ENTERTAINMENT—1.2% | ||||||||
Live Nation Entertainment, Inc.* | 8,120 | $ | 821,338 | |||||
The Walt Disney Co.* | 2,512 | 424,704 | ||||||
| 1,246,042 | ||||||||
| PHARMACEUTICALS—2.5% | ||||||||
Bristol-Myers Squibb Co. | 11,377 | 664,417 | ||||||
Merck & Co., Inc. | 8,311 | 731,784 | ||||||
Zoetis, Inc., Cl. A | 4,902 | 1,059,812 | ||||||
| 2,456,013 | ||||||||
| RAILROADS—0.7% | ||||||||
Union Pacific Corp. | 2,735 | 660,229 | ||||||
| RESTAURANTS—0.8% | ||||||||
Starbucks Corp. | 7,708 | 817,588 | ||||||
| SEMICONDUCTOR EQUIPMENT—4.5% | ||||||||
ASML Holding NV | 1,580 | 1,284,351 | ||||||
Lam Research Corp. | 4,234 | 2,386,155 | ||||||
SolarEdge Technologies, Inc.* | 2,452 | 869,675 | ||||||
| 4,540,181 | ||||||||
| SEMICONDUCTORS—5.2% | ||||||||
| NVIDIA Corp. | 12,729 | 3,254,423 | ||||||
| Taiwan Semiconductor Manufacturing Co., Ltd.# | 11,145 | 1,267,186 | ||||||
| Universal Display Corp. | 3,508 | 642,666 | ||||||
| 5,164,275 | ||||||||
| SOFT DRINKS—1.1% | ||||||||
| PepsiCo, Inc. | 6,849 | 1,106,798 | ||||||
| SYSTEMS SOFTWARE—11.0% | ||||||||
| Microsoft Corp. | 33,051 | 10,960,373 | ||||||
| TECHNOLOGY HARDWARE STORAGE & PERIPHERALS—4.9% | ||||||||
| Apple, Inc. | 32,436 | 4,858,913 | ||||||
| TOTAL COMMON STOCKS | ||||||||
| (Cost $33,804,995) | 95,392,151 | |||||||
| REAL ESTATE INVESTMENT TRUST—2.8% | SHARES | VALUE | ||||||
| INDUSTRIAL—1.0% | ||||||||
Prologis, Inc. | 7,288 | 1,056,468 | ||||||
| SPECIALIZED—1.8% | ||||||||
Equinix, Inc. | 1,564 | 1,309,178 | ||||||
SBA Communications Corp., Cl. A | 1,356 | 468,267 | ||||||
| 1,777,445 | ||||||||
| TOTAL REAL ESTATE INVESTMENT TRUST | ||||||||
| (Cost $1,467,993) | 2,833,913 | |||||||
THE ALGER FUNDS II ALGER RESPONSIBLE INVESTING FUND |
Schedule of Investments October 31, 2021 (Continued) |
| VALUE | ||||||||
| Total Investments | ||||||||
| (Cost $35,272,988) | 98.5 | % | $ | 98,226,064 | ||||
| Unaffiliated Securities (Cost $35,272,988) | 98,226,064 | |||||||
| Other Assets in Excess of Liabilities | 1.5 | % | 1,495,537 | |||||
| NET ASSETS | 100.0 | % | $ | 99,721,601 | ||||
| # | American Depositary Receipts. |
| * | Non-income producing security. |
See Notes to Financial Statements.
Alger Spectra Fund | Alger Dynamic Opportunities Fund | |||||||
| ASSETS: | ||||||||
| Investments in unaffiliated securities and purchased options, at value (Identified cost below)* see accompanying schedules of investments | $ | 9,827,078,437 | $ | 953,737,193 | ||||
| Investments in affiliated securities, at value (Identified cost below)** see accompanying schedules of investments | 19,486,623 | 2,408,930 | ||||||
| Cash and cash equivalents | 34,970,953 | 46,942,356 | ||||||
| Collateral held for short sales | 418,211,526 | 303,574,347 | ||||||
| Variation margin for centrally cleared swap contracts | — | 400,992 | ||||||
| Receivable for investment securities sold | 153,937,646 | 1,684,411 | ||||||
| Receivable for shares of beneficial interest sold | 3,477,984 | 4,218,744 | ||||||
| Dividends and interest receivable | 943,631 | 58,434 | ||||||
| Receivable from Investment Manager | — | 23,262 | ||||||
| Prepaid expenses | 278,502 | 86,555 | ||||||
| Total Assets | 10,458,385,302 | 1,313,135,224 | ||||||
| LIABILITIES: | ||||||||
| Securities sold short, at value ‡ | 853,697,999 | 322,831,710 | ||||||
| OTC swaps, at value | — | 948,899 | ||||||
| Collateral pledged for OTC swap contracts | — | 2,045,010 | ||||||
| Bank overdraft | 2,710 | — | ||||||
| Interest payable | 674,329 | 221,389 | ||||||
| Payable for investment securities purchased | 95,053,331 | 11,240,460 | ||||||
| Payable for shares of beneficial interest redeemed | 7,102,656 | 599,176 | ||||||
| Due to broker | 497,779,936 | — | ||||||
| Due to investment advisor | 3,020 | — | ||||||
| Accrued investment advisory fees | 5,094,633 | 946,198 | ||||||
| Accrued distribution fees | 1,021,906 | 35,814 | ||||||
| Accrued shareholder administrative fees | 87,608 | 8,528 | ||||||
| Accrued administrative fees | 202,343 | 21,684 | ||||||
| Accrued custodian fees | 41,784 | 7,931 | ||||||
| Accrued transfer agent fees | 1,245,025 | 49,373 | ||||||
| Accrued printing fees | 176,579 | 19,758 | ||||||
| Accrued professional fees | 44,068 | 28,685 | ||||||
| Accrued registration fees | 80,000 | 3,000 | ||||||
| Accrued trustee fees | 16,602 | 1,237 | ||||||
| Accrued fund accounting fees | 201,982 | 27,658 | ||||||
| Dividends on securities sold short payable | 332,931 | 26,130 | ||||||
| Accrued other expenses | 8,240 | 3,600 | ||||||
| Total Liabilities | 1,462,867,682 | 339,066,240 | ||||||
| NET ASSETS | $ | $ 8,995,517,620 | $ | 974,068,984 | ||||
See Notes to Financial Statements.
| THE ALGER FUNDS II |
Statements of Assets and Liabilities October 31, 2021 (Continued) |
Alger Spectra Fund | Alger Dynamic Opportunities Fund | |||||||
| NET ASSETS CONSIST OF: | ||||||||
| Paid in capital (par value of $.001 per share) | 3,409,864,293 | 770,715,033 | ||||||
| Distributable earnings | 5,585,653,327 | 203,353,951 | ||||||
| NET ASSETS | $ | 8,995,517,620 | $ | 974,068,984 | ||||
| * Identified cost | $ | 6,214,441,407 | (a) | $ | 796,007,570 | (b) | ||
| ** Identified cost | $ | 25,029,054 | (a) | $ | 1,661,381 | (b) | ||
| ‡ Proceeds received on short sales | $ | 880,053,931 | $ | 331,906,270 | ||||
| NET ASSETS BY CLASS: | ||||||||
| Class A | $ | 1,985,099,315 | $ | 103,683,507 | ||||
| Class C | $ | 656,003,551 | $ | 17,997,999 | ||||
| Class I | $ | 378,367,390 | $ | — | ||||
| Class Y | $ | 252,167,103 | $ | — | ||||
| Class Z | $ | 5,723,880,261 | $ | 852,387,478 | ||||
SHARES OF BENEFICIAL INTEREST OUTSTANDING — NOTE 6: | ||||||||
| Class A | 56,144,639 | 4,651,988 | ||||||
| Class C | 21,439,931 | 893,084 | ||||||
| Class I | 10,560,206 | — | ||||||
| Class Y | 6,816,783 | — | ||||||
| Class Z | 154,917,021 | 36,911,273 | ||||||
| NET ASSET VALUE PER SHARE: | ||||||||
| Class A — Net Asset Value Per Share Class A | $ | 35.36 | $ | 22.29 | ||||
| Class A — Offering Price Per Share (includes a 5.25% sales charge) | $ | 37.32 | $ | 23.52 | ||||
| Class C — Net Asset Value Per Share Class C | $ | 30.60 | $ | 20.15 | ||||
| Class I — Net Asset Value Per Share Class I | $ | 35.83 | $ | — | ||||
| Class Y — Net Asset Value Per Share Class Y | $ | 36.99 | $ | — | ||||
| Class Z — Net Asset Value Per Share Class Z | $ | 36.95 | $ | 23.09 | ||||
See Notes to Financial Statements.
a) At October 31, 2021, the net unrealized appreciation on investments, based on cost for federal income tax purposes of $5,464,168,951, amounted to $3,528,698,110 which consisted of aggregate gross unrealized appreciation of $3,710,146,247 and aggregate gross unrealized depreciation of $181,448,137.
(b) At October 31, 2021, the net unrealized appreciation on investments, based on cost for federal income tax purposes of $476,429,784, amounted to $156,865,579 which consisted of aggregate gross unrealized appreciation of $227,432,750 and aggregate gross unrealized depreciation of $70,567,171.
| THE ALGER FUNDS II |
Statements of Assets and Liabilities October 31, 2021 (Continued) |
Alger Emerging Markets Fund | Alger Responsible Investing Fund | |||||||
| ASSETS: | ||||||||
| Investments in unaffiliated securities, at value (Identified cost below)* see accompanying schedules of investments | $ | 46,057,189 | $ | 98,226,064 | ||||
| Cash and cash equivalents | 1,272,920 | 1,604,206 | ||||||
| Foreign cash † | 51,046 | — | ||||||
| Receivable for investment securities sold | 344,164 | — | ||||||
| Receivable for shares of beneficial interest sold | 53,375 | 63,201 | ||||||
| Dividends and interest receivable | 9,312 | 38,467 | ||||||
| Receivable from Investment Manager | 7,809 | — | ||||||
| Prepaid expenses | 101,181 | 79,298 | ||||||
| Total Assets | 47,896,996 | 100,011,236 | ||||||
| LIABILITIES: | ||||||||
| Payable for investment securities purchased | 750,000 | 87,888 | ||||||
| Payable for shares of beneficial interest redeemed | 221,492 | 53,946 | ||||||
| Foreign capital gain tax payable | 156,141 | — | ||||||
| Due to investment advisor | — | 165 | ||||||
| Accrued investment advisory fees | 29,535 | 57,465 | ||||||
| Accrued distribution fees | 4,311 | 16,101 | ||||||
| Accrued shareholder administrative fees | 445 | 1,109 | ||||||
| Accrued administrative fees | 1,083 | 2,226 | ||||||
| Accrued custodian fees | 5,475 | 994 | ||||||
| Accrued transfer agent fees | 6,244 | 26,993 | ||||||
| Accrued printing fees | 2,592 | 4,436 | ||||||
| Accrued professional fees | 27,614 | 21,411 | ||||||
| Accrued registration fees | — | 83 | ||||||
| Accrued trustee fees | 69 | 170 | ||||||
| Accrued fund accounting fees | 11,255 | 10,996 | ||||||
| Accrued other expenses | 9,001 | 5,652 | ||||||
| Total Liabilities | 1,225,257 | 289,635 | ||||||
| NET ASSETS | $ | 46,671,739 | $ | 99,721,601 | ||||
| NET ASSETS CONSIST OF: | ||||||||
| Paid in capital (par value of $.001 per share) | 41,646,916 | 29,462,045 | ||||||
| Distributable earnings | 5,024,823 | 70,259,556 | ||||||
| NET ASSETS | $ | 46,671,739 | $ | 99,721,601 | ||||
| * Identified cost | $ | 41,114,518 | (a) | $ | 35,272,988 | (b) | ||
| † Cost of foreign cash | $ | 50,944 | $ | — | ||||
See Notes to Financial Statements.
| THE ALGER FUNDS II |
Statements of Assets and Liabilities October 31, 2021 (Continued) |
Alger Emerging Markets Fund | Alger Responsible Investing Fund | |||||||
| NET ASSETS BY CLASS: | ||||||||
| Class A | $ | 6,331,028 | $ | 51,633,942 | ||||
| Class C | $ | 3,015,944 | $ | 5,150,344 | ||||
| Class I | $ | 1,967,959 | $ | 6,884,288 | ||||
| Class Z | $ | 35,356,808 | $ | 36,053,027 | ||||
SHARES OF BENEFICIAL INTEREST OUTSTANDING — NOTE 6: | ||||||||
| Class A | 447,960 | 2,914,731 | ||||||
| Class C | 225,709 | 336,728 | ||||||
| Class I | 140,594 | 389,556 | ||||||
| Class Z | 2,474,205 | 1,985,826 | ||||||
| NET ASSET VALUE PER SHARE: | ||||||||
| Class A — Net Asset Value Per Share Class A | $ | 14.13 | $ | 17.71 | ||||
| Class A — Offering Price Per Share (includes a 5.25% sales charge) | $ | 14.92 | $ | 18.70 | ||||
| Class C — Net Asset Value Per Share Class C | $ | 13.36 | $ | 15.30 | ||||
| Class I — Net Asset Value Per Share Class I | $ | 14.00 | $ | 17.67 | ||||
| Class Z — Net Asset Value Per Share Class Z | $ | 14.29 | $ | 18.16 | ||||
See Notes to Financial Statements.
a) At October 31, 2021, the net unrealized appreciation on investments, based on cost for federal income tax purposes of $42,012,772, amounted to $4,044,417 which consisted of aggregate gross unrealized appreciation of $7,801,025 and aggregate gross unrealized depreciation of $3,756,608.
(b) At October 31, 2021, the net unrealized appreciation on investments, based on cost for federal income tax purposes of $35,346,771, amounted to $62,879,293 which consisted of aggregate gross unrealized appreciation of $63,304,807 and aggregate gross unrealized depreciation of $425,514.
| THE ALGER FUNDS II |
Statements of Assets and Liabilities October 31, 2021 (Continued) |
Alger Spectra Fund | Alger Dynamic Opportunities Fund | |||||||
| INCOME: | ||||||||
| Dividends (net of foreign withholding taxes*) | $ | 33,959,826 | $ | 1,526,584 | ||||
| Interest | — | 23,654 | ||||||
| Total Income | 33,959,826 | 1,550,238 | ||||||
| EXPENSES: | ||||||||
| Investment advisory fees — Note 3(a) | 57,637,716 | 8,435,901 | ||||||
| Distribution fees — Note 3(c) | ||||||||
| Class A | 4,449,054 | 209,922 | ||||||
| Class C | 6,638,855 | 149,054 | ||||||
| Class I | 962,178 | — | ||||||
| Shareholder administrative fees — Note 3(f) | 975,079 | 76,726 | ||||||
| Administration fees — Note 3(b) | 2,244,692 | 193,323 | ||||||
| Dividends on securities sold short | 12,443,524 | 1,963,325 | ||||||
| Custodian fees | 264,878 | 48,560 | ||||||
| Interest expenses | 11,558 | 1,042 | ||||||
| Borrowing fees on short sales | 12,352,514 | 4,065,077 | ||||||
| Transfer agent fees — Note 3(f) | 2,020,872 | 93,906 | ||||||
| Printing fees | 451,734 | 61,156 | ||||||
| Professional fees | 225,987 | 54,845 | ||||||
| Registration fees | 142,474 | 77,975 | ||||||
| Trustee fees — Note 3(g) | 196,175 | 16,131 | ||||||
| Fund accounting fees | 1,097,778 | 146,373 | ||||||
| Other expenses | 384,594 | 31,167 | ||||||
| Total Expenses | 102,499,662 | 15,624,483 | ||||||
| Less, expense reimbursements/waivers — Note 3(a) | — | (3,026,870 | ) | |||||
| Net Expenses | 102,499,662 | 12,597,613 | ||||||
| NET INVESTMENT LOSS | (68,539,836 | ) | (11,047,375 | ) | ||||
See Notes to Financial Statements.
THE ALGER FUNDS II
See Notes to Financial Statements.

NOTE 9 — Derivatives:
The following table presents the Funds’ gross and net amounts of assets and liabilities, by derivative type, available for offset under a master netting agreement, or similar agreement as of October 31, 2021:
Alger Spectra Fund | Alger Dynamic Opportunities Fund | |||||||
| REALIZED AND UNREALIZED GAIN (LOSS) ON INVESTMENTS, OPTIONS, SWAPS AND FOREIGN CURRENCY: | ||||||||
| Net realized gain on unaffiliated investments and purchased options | 2,387,258,107 | 92,163,022 | ||||||
| Net realized gain (loss) on foreign currency transactions | (78,644 | ) | 2,815 | |||||
| Net realized (loss) on short sales | (132,359,456 | ) | (37,987,832 | ) | ||||
| Net realized (loss) on swaps | — | (2,036,492 | ) | |||||
| Net change in unrealized appreciation on unaffiliated investments and purchased options | 333,178,419 | 112,650,140 | ||||||
| Net change in unrealized appreciation on affiliated investments | 7,124,821 | 927,717 | ||||||
| Net change in unrealized appreciation (depreciation) on foreign currency | (4,440 | ) | 3,418 | |||||
| Net change in unrealized appreciation on short sales | 14,482,672 | 447,149 | ||||||
| Net change in unrealized (depreciation) on swaps | — | (437,764 | ) | |||||
| Net realized and unrealized gain on investments, purchased options, swaps and foreign currency | 2,609,601,479 | 165,732,173 | ||||||
| NET INCREASE IN NET ASSETS RESULTING FROM OPERATIONS | $ | 2,541,061,643 | $ | 154,684,798 | ||||
| * Foreign withholding taxes | $ | 553,805 | $ | 29,683 | ||||
See Notes to Financial Statements.
THE ALGER FUNDS II
Statements of Operations for the six months ended October 31, 2021 (Continued)
Alger Emerging Markets Fund | Alger Responsible Investing Fund | |||||||
| INCOME: | ||||||||
| Dividends (net of foreign withholding taxes*) | $ | 341,773 | $ | 654,161 | ||||
| Interest | 109 | 55 | ||||||
| Total Income | 341,882 | 654,216 | ||||||
| EXPENSES: | ||||||||
Investment advisory fees — Note 3(a) | 273,861 | 623,194 | ||||||
Distribution fees — Note 3(c) | ||||||||
| Class A | 13,530 | 114,087 | ||||||
| Class C | 31,121 | 50,116 | ||||||
| Class I | 5,988 | 17,266 | ||||||
Shareholder administrative fees — Note 3(f) | 4,206 | 12,069 | ||||||
Administration fees — Note 3(b) | 10,042 | 24,138 | ||||||
| Custodian fees | 47,714 | 14,041 | ||||||
| Interest expenses | 5 | 30 | ||||||
Transfer agent fees — Note 3(f) | 9,857 | 39,582 | ||||||
| Printing fees | 4,191 | 7,107 | ||||||
| Professional fees | 42,778 | 37,553 | ||||||
| Registration fees | 32,096 | 52,295 | ||||||
Trustee fees — Note 3(g) | 848 | 2,071 | ||||||
| Fund accounting fees | 57,689 | 56,842 | ||||||
| Other expenses | 12,241 | 7,636 | ||||||
| Total Expenses | 546,167 | 1,058,027 | ||||||
Less, expense reimbursements/waivers — Note 3(a) | (104,236 | ) | (3,496 | ) | ||||
| Net Expenses | 441,931 | 1,054,531 | ||||||
| NET INVESTMENT LOSS | (100,049 | ) | (400,315 | ) | ||||
REALIZED AND UNREALIZED GAIN (LOSS) ON INVESTMENTS AND FOREIGN CURRENCY: | ||||||||
| Net realized gain on unaffiliated investments | 3,258,508 | 7,773,882 | ||||||
| Net realized (loss) on foreign currency transactions | (17,564 | ) | — | |||||
| Net change in unrealized appreciation on unaffiliated investments | 863,720 | 21,426,914 | ||||||
| Net change in unrealized (depreciation) on foreign currency | (1,321 | ) | — | |||||
| Net realized and unrealized gain on investments and foreign currency | 4,103,343 | 29,200,796 | ||||||
| NET INCREASE IN NET ASSETS RESULTING FROM OPERATIONS | $ | 4,003,294 | $ | 28,800,481 | ||||
| * Foreign withholding taxes | $ | 54,429 | $ | 4,899 | ||||
See Notes to Financial Statements.
| Alger Spectra Fund | ||||||||
For the Year Ended October 31, 2021 | For the Year Ended October 31, 2020 | |||||||
| Net investment loss | $ | (68,539,836 | ) | $ | (35,741,533 | ) | ||
| Net realized gain on investments and foreign currency | 2,254,820,007 | 651,739,914 | ||||||
| Net change in unrealized appreciation on investments and foreign currency | 354,781,472 | 1,320,308,961 | ||||||
| Net increase in net assets resulting from operations | 2,541,061,643 | 1,936,307,342 | ||||||
| Dividends and distributions to shareholders: | ||||||||
| Class A | (149,713,973 | ) | (86,391,404 | ) | ||||
| Class C | (68,859,702 | ) | (53,304,257 | ) | ||||
| Class I | (35,078,329 | ) | (46,365,085 | ) | ||||
| Class Y | (11,306,560 | ) | (3,233,744 | ) | ||||
| Class Z | (406,820,186 | ) | (238,139,189 | ) | ||||
| Total dividends and distributions to shareholders | (671,778,750 | ) | (427,433,679 | ) | ||||
Increase (decrease) from shares of beneficial interest transactions: | ||||||||
| Class A | 13,596,270 | 33,801,403 | ||||||
| Class C | (130,391,600 | ) | (173,737,429 | ) | ||||
| Class I | (130,424,751 | ) | (385,287,951 | ) | ||||
| Class Y | 79,882,154 | 57,180,926 | ||||||
| Class Z | 152,870,232 | 12,458,926 | ||||||
| Net decrease from shares of beneficial interest transactions — Note 6 | (14,467,695 | ) | (455,584,125 | ) | ||||
| Total increase | 1,854,815,198 | 1,053,289,538 | ||||||
| Net Assets: | ||||||||
| Beginning of period | 7,140,702,422 | 6,087,412,884 | ||||||
| END OF PERIOD | $ | 8,995,517,620 | $ | 7,140,702,422 | ||||
See Notes to Financial Statements.
THE ALGER FUNDS II
Statements of Changes in Net Assets (Continued)
| Alger Dynamic Opportunities Fund | ||||||||
For the Year Ended October 31, 2021 | For the Year Ended October 31, 2020 | |||||||
| Net investment loss | $ | (11,047,375 | ) | $ | (2,789,540 | ) | ||
| Net realized gain on investments, purchased options, swaps and foreign currency | 52,141,513 | 23,735,791 | ||||||
| Net change in unrealized appreciation on investments, purchased options, swaps and foreign currency | 113,590,660 | 41,708,622 | ||||||
| Net increase in net assets resulting from operations | 154,684,798 | 62,654,873 | ||||||
| Dividends and distributions to shareholders: | ||||||||
| Class A | (3,410,651 | ) | (1,099,438 | ) | ||||
| Class C | (670,569 | ) | (275,687 | ) | ||||
| Class Z | (19,608,559 | ) | (2,800,411 | ) | ||||
| Total dividends and distributions to shareholders | (23,689,779 | ) | (4,175,536 | ) | ||||
Increase (decrease) from shares of beneficial interest transactions: | ||||||||
| Class A | 27,495,067 | 15,068,082 | ||||||
| Class C | 4,923,080 | 1,295,879 | ||||||
| Class Z | 386,994,537 | 224,552,045 | ||||||
| Net increase from shares of beneficial interest transactions — Note 6 | 419,412,684 | 240,916,006 | ||||||
| Total increase | 550,407,703 | 299,395,343 | ||||||
| Net Assets: | ||||||||
| Beginning of period | 423,661,281 | 124,265,938 | ||||||
| END OF PERIOD | $ | 974,068,984 | $ | 423,661,281 | ||||
See Notes to Financial Statements.
THE ALGER FUNDS II
Statements of Changes in Net Assets (Continued)
| Alger Emerging Markets Fund | ||||||||
For the Year Ended October 31, 2021 | For the Year Ended October 31, 2020 | |||||||
| Net investment loss | $ | (100,049 | ) | $ | (75,745 | ) | ||
| Net realized gain on investments and foreign currency | 3,240,944 | 5,410,855 | ||||||
| Net change in unrealized appreciation (depreciation) on investments and foreign currency | 862,399 | (1,066,731 | ) | |||||
| Net increase in net assets resulting from operations | 4,003,294 | 4,268,379 | ||||||
| Dividends and distributions to shareholders: | ||||||||
| Class A | — | (186,353 | ) | |||||
| Class C | — | (110,469 | ) | |||||
| Class I | — | (150,420 | ) | |||||
| Class Z | — | (728,473 | ) | |||||
| Total dividends and distributions to shareholders | — | (1,175,715 | ) | |||||
Increase (decrease) from shares of beneficial interest transactions: | ||||||||
| Class A | 2,358,575 | (1,053,978 | ) | |||||
| Class C | (170,224 | ) | (562,407 | ) | ||||
| Class I | (1,229,611 | ) | (335,135 | ) | ||||
| Class Y | — | (3,146 | ) | |||||
| Class Z | 20,086,221 | (2,967,804 | ) | |||||
| Net increase (decrease) from shares of beneficial interest transactions — Note 6 | 21,044,961 | (4,922,470 | ) | |||||
| Total increase (decrease) | 25,048,255 | (1,829,806 | ) | |||||
| Net Assets: | ||||||||
| Beginning of period | 21,623,484 | 23,453,290 | ||||||
| END OF PERIOD | $ | 46,671,739 | $ | 21,623,484 | ||||
See Notes to Financial Statements.
THE ALGER FUNDS II
Statements of Changes in Net Assets (Continued)
| Alger Responsible Investing Fund | ||||||||
For the Year Ended October 31, 2021 | For the Year Ended October 31, 2020 | |||||||
| Net investment loss | $ | (400,315 | ) | $ | (263,033 | ) | ||
Net realized gain on investments and foreign currency | 7,773,882 | 5,586,523 | ||||||
Net change in unrealized appreciation on investments and foreign currency | 21,426,914 | 11,650,967 | ||||||
Net increase in net assets resulting from operations | 28,800,481 | 16,974,457 | ||||||
| Dividends and distributions to shareholders: | ||||||||
| Class A | (2,887,365 | ) | (2,236,304 | ) | ||||
| Class C | (391,085 | ) | (439,961 | ) | ||||
| Class I | (510,643 | ) | (767,212 | ) | ||||
| Class Z | (1,797,133 | ) | (1,159,920 | ) | ||||
Total dividends and distributions to shareholders | (5,586,226 | ) | (4,603,397 | ) | ||||
Increase (decrease) from shares of beneficial interest transactions: | ||||||||
| Class A | 1,492,713 | 2,221,923 | ||||||
| Class C | (1,517,797 | ) | (908,158 | ) | ||||
| Class I | (3,173,490 | ) | (3,992,707 | ) | ||||
| Class Z | 5,368,059 | 3,376,122 | ||||||
| Net increase from shares of beneficial interest transactions — Note 6 | 2,169,485 | 697,180 | ||||||
Total increase | 25,383,740 | 13,068,240 | ||||||
| Net Assets: | ||||||||
| Beginning of period | 74,337,861 | 61,269,621 | ||||||
| END OF PERIOD | $ | 99,721,601 | $ | 74,337,861 | ||||
| Alger Spectra Fund | Class A | |||||||||||||||||||
Year ended 10/31/2021 | Year ended 10/31/2020 | Year ended 10/31/2019 | Year ended 10/31/2018 | Year ended 10/31/2017 | ||||||||||||||||
| Net asset value, beginning of period | $ | 28.24 | $ | 22.51 | $ | 21.94 | $ | 21.41 | $ | 16.91 | ||||||||||
| INCOME FROM INVESTMENT OPERATIONS: | ||||||||||||||||||||
Net investment loss(i) | (0.31 | ) | (0.16 | ) | (0.07 | ) | (0.06 | ) | (0.02 | ) | ||||||||||
| Net realized and unrealized gain on investments | 10.14 | 7.51 | 2.84 | 1.85 | 4.86 | |||||||||||||||
| Total from investment operations | 9.83 | 7.35 | 2.77 | 1.79 | 4.84 | |||||||||||||||
| Distributions from net realized gains | (2.71 | ) | (1.62 | ) | (2.20 | ) | (1.26 | ) | (0.34 | ) | ||||||||||
| Net asset value, end of period | $ | 35.36 | $ | 28.24 | $ | 22.51 | $ | 21.94 | $ | 21.41 | ||||||||||
Total return(ii) | 36.80 | % | 34.65 | % | 14.82 | % | 8.75 | % | 29.19 | % | ||||||||||
| RATIOS/SUPPLEMENTAL DATA: | ||||||||||||||||||||
| Net assets, end of period (000's omitted) | $ | 1,985,099 | $ | 1,568,743 | $ | 1,222,285 | $ | 1,208,421 | $ | 1,662,441 | ||||||||||
| Ratio of gross expenses to average net assets | 1.39 | %(iii) | 1.40 | %(iv) | 1.31 | %(v) | 1.27 | %(vi) | 1.28 | %(vii) | ||||||||||
| Ratio of net expenses to average net assets | 1.39 | % | 1.40 | % | 1.31 | % | 1.27 | % | 1.28 | % | ||||||||||
| Ratio of net investment loss to average net assets | (0.98 | )% | (0.66 | )% | (0.35 | )% | (0.29 | )% | (0.13 | )% | ||||||||||
| Portfolio turnover rate | 108.48 | % | 71.81 | % | 86.54 | % | 74.19 | % | 80.08 | % | ||||||||||
See Notes to Financial Statements.
| (i) | Amount was computed based on average shares outstanding during the period. |
| (ii) | Does not reflect the effect of sales charges, if applicable. |
| (iii) | Includes 0.30% related to dividend expense on short positions and interest expense for the period ended 10/31/21. |
| (iv) | Includes 0.25% related to dividend expense on short positions and interest expense for the period ended 10/31/20. |
| (v) | Includes 0.12% related to dividend expense on short positions and interest expense for the period ended 10/31/19. |
| (vi) | Includes 0.08% related to dividend expense on short positions and interest expense for the period ended 10/31/18. |
| (vii) | Includes 0.07% related to dividend expense on short positions and interest expense for the period ended 10/31/17. |
THE ALGER FUNDS II
Financial Highlights for a share outstanding throughout the period
| Alger Spectra Fund | Class C | |||||||||||||||||||
Year ended 10/31/2021 | Year ended 10/31/2020 | Year ended 10/31/2019 | Year ended 10/31/2018 | Year ended 10/31/2017 | ||||||||||||||||
Net asset value, beginning of period | $ | 24.94 | $ | 20.20 | $ | 20.06 | $ | 19.82 | $ | 15.80 | ||||||||||
INCOME FROM INVESTMENT OPERATIONS: | ||||||||||||||||||||
Net investment loss(i) | (0.47 | ) | (0.30 | ) | (0.21 | ) | (0.21 | ) | (0.15 | ) | ||||||||||
Net realized and unrealized gain on investments | 8.84 | 6.66 | 2.55 | 1.71 | 4.51 | |||||||||||||||
Total from investment operations | 8.37 | 6.36 | 2.34 | 1.50 | 4.36 | |||||||||||||||
Distributions from net realized gains | (2.71 | ) | (1.62 | ) | (2.20 | ) | (1.26 | ) | (0.34 | ) | ||||||||||
Net asset value, end of period | $ | 30.60 | $ | 24.94 | $ | 20.20 | $ | 20.06 | $ | 19.82 | ||||||||||
Total return(ii) | 35.79 | % | 33.60 | % | 13.97 | % | 7.95 | % | 28.18 | % | ||||||||||
RATIOS/SUPPLEMENTAL DATA: | ||||||||||||||||||||
Net assets, end of period (000's omitted) | $ | 656,004 | $ | 651,194 | $ | 681,792 | $ | 727,681 | $ | 765,136 | ||||||||||
Ratio of gross expenses to average net assets | 2.16 | %(iii) | 2.15 | %(iv) | 2.07 | %(v) | 2.01 | %(vi) | 2.04 | %(vii) | ||||||||||
Ratio of net expenses to average net assets | 2.16 | % | 2.15 | % | 2.07 | % | 2.01 | % | 2.04 | % | ||||||||||
Ratio of net investment loss to average net assets | (1.73 | )% | (1.39 | )% | (1.10 | )% | (1.04 | )% | (0.89 | )% | ||||||||||
Portfolio turnover rate | 108.48 | % | 71.81 | % | 86.54 | % | 74.19 | % | 80.08 | % | ||||||||||
See Notes to Financial Statements.
| (i) | Amount was computed based on average shares outstanding during the period. |
| (ii) | Does not reflect the effect of sales charges, if applicable. |
| (iii) | Includes 0.30% related to dividend expense on short positions and interest expense for the period ended 10/31/21. |
| (iv) | Includes 0.25% related to dividend expense on short positions and interest expense for the period ended 10/31/20. |
| (v) | Includes 0.12% related to dividend expense on short positions and interest expense for the period ended 10/31/19. |
| (vi) | Includes 0.08% related to dividend expense on short positions and interest expense for the period ended 10/31/18. |
| (vii) | Includes 0.07% related to dividend expense on short positions and interest expense for the period ended 10/31/17. |
THE ALGER FUNDS II
Financial Highlights for a share outstanding throughout the period
| Alger Spectra Fund | Class I | |||||||||||||||||||
Year ended 10/31/2021 | Year ended 10/31/2020 | Year ended 10/31/2019 | Year ended 10/31/2018 | Year ended 10/31/2017 | ||||||||||||||||
Net asset value, beginning of period | $ | 28.59 | $ | 22.77 | $ | 22.16 | $ | 21.61 | $ | 17.06 | ||||||||||
INCOME FROM INVESTMENT OPERATIONS: | ||||||||||||||||||||
Net investment loss(i) | (0.30 | ) | (0.15 | ) | (0.07 | ) | (0.06 | ) | (0.02 | ) | ||||||||||
Net realized and unrealized gain on investments | 10.25 | 7.59 | 2.88 | 1.87 | 4.91 | |||||||||||||||
Total from investment operations | 9.95 | 7.44 | 2.81 | 1.81 | 4.89 | |||||||||||||||
Distributions from net realized gains | (2.71 | ) | (1.62 | ) | (2.20 | ) | (1.26 | ) | (0.34 | ) | ||||||||||
Net asset value, end of period | $ | 35.83 | $ | 28.59 | $ | 22.77 | $ | 22.16 | $ | 21.61 | ||||||||||
Total return(ii) | 36.82 | % | 34.61 | % | 14.85 | % | 8.76 | % | 29.23 | % | ||||||||||
RATIOS/SUPPLEMENTAL DATA: | ||||||||||||||||||||
Net assets, end of period (000's omitted) | $ | 378,367 | $ | 422,807 | $ | 656,990 | $ | 776,443 | $ | 791,060 | ||||||||||
Ratio of gross expenses to average net assets | 1.40 | %(iii) | 1.39 | %(iv) | 1.30 | %(v) | 1.25 | %(vi) | 1.27 | %(vii) | ||||||||||
Ratio of net expenses to average net assets | 1.40 | % | 1.39 | % | 1.30 | % | 1.25 | % | 1.27 | % | ||||||||||
Ratio of net investment loss to average net assets | (0.96 | )% | (0.61 | )% | (0.33 | )% | (0.28 | )% | (0.09 | )% | ||||||||||
Portfolio turnover rate | 108.48 | % | 71.81 | % | 86.54 | % | 74.19 | % | 80.08 | % | ||||||||||
See Notes to Financial Statements.
| (i) | Amount was computed based on average shares outstanding during the period. |
| (ii) | Does not reflect the effect of sales charges, if applicable. |
| (iii) | Includes 0.30% related to dividend expense on short positions and interest expense for the period ended 10/31/21. |
| (iv) | Includes 0.25% related to dividend expense on short positions and interest expense for the period ended 10/31/20. |
| (v) | Includes 0.12% related to dividend expense on short positions and interest expense for the period ended 10/31/19. |
| (vi) | Includes 0.08% related to dividend expense on short positions and interest expense for the period ended 10/31/18. |
| (vii) | Includes 0.07% related to dividend expense on short positions and interest expense for the period ended 10/31/17. |
THE ALGER FUNDS II
Financial Highlights for a share outstanding throughout the period
| Alger Spectra Fund | Class Y | |||||||||||
Year ended 10/31/2021 | Year ended 10/31/2020 | From 12/3/2018 (commencement of operations) to 10/31/2019(i) | ||||||||||
Net asset value, beginning of period | $ | 29.36 | $ | 23.26 | $ | 23.29 | ||||||
INCOME FROM INVESTMENT OPERATIONS: | ||||||||||||
Net investment loss(ii) | (0.23 | ) | (0.11 | ) | (0.03 | ) | ||||||
Net realized and unrealized gain on investments | 10.57 | 7.83 | 2.20 | |||||||||
Total from investment operations | 10.34 | 7.72 | 2.17 | |||||||||
Distributions from net realized gains | (2.71 | ) | (1.62 | ) | (2.20 | ) | ||||||
Net asset value, end of period | $ | 36.99 | $ | 29.36 | $ | 23.26 | ||||||
Total return(iii) | 37.21 | % | 35.11 | % | 11.43 | % | ||||||
RATIOS/SUPPLEMENTAL DATA: | ||||||||||||
Net assets, end of period (000's omitted) | $ | 252,167 | $ | 121,397 | $ | 43,750 | ||||||
Ratio of gross expenses to average net assets | 1.09 | %(iv) | 1.09 | %(v) | 1.03 | %(vi) | ||||||
Ratio of expense reimbursements to average net assets | – | (0.04 | )% | (0.09 | )% | |||||||
Ratio of net expenses to average net assets | 1.09 | % | 1.05 | % | 0.94 | % | ||||||
Ratio of net investment loss to average net assets | (0.70 | )% | (0.40 | )% | (0.14 | )% | ||||||
Portfolio turnover rate | 108.48 | % | 71.81 | % | 86.54 | % | ||||||
See Notes to Financial Statements.
| (i) | Ratios have been annualized; total return has not been annualized; portfolio turnover is for the twelve months then ended. |
| (ii) | Amount was computed based on average shares outstanding during the period. |
| (iii) | Does not reflect the effect of sales charges, if applicable. |
| (iv) | Includes 0.31% related to dividend expense on short positions and interest expense for the period ended 10/31/21. |
| (v) | Includes 0.26% related to dividend expense on short positions and interest expense for the period ended 10/31/20. |
| (vi) | Includes 0.17% related to dividend expense on short positions and interest expense for the period ended 10/31/19. |
THE ALGER FUNDS II
Financial Highlights for a share outstanding throughout the period
| Alger Spectra Fund | Class Z | |||||||||||||||||||
Year ended 10/31/2021 | Year ended 10/31/2020 | Year ended 10/31/2019 | Year ended 10/31/2018 | Year ended 10/31/2017 | ||||||||||||||||
Net asset value, beginning of period | $ | 29.32 | $ | 23.24 | $ | 22.51 | $ | 21.87 | $ | 17.21 | ||||||||||
INCOME FROM INVESTMENT OPERATIONS: | ||||||||||||||||||||
Net investment income (loss)(i) | (0.22 | ) | (0.09 | ) | (0.01 | ) | –(ii) | 0.03 | ||||||||||||
Net realized and unrealized gain on investments | 10.56 | 7.79 | 2.94 | 1.90 | 4.97 | |||||||||||||||
Total from investment operations | 10.34 | 7.70 | 2.93 | 1.90 | 5.00 | |||||||||||||||
Distributions from net realized gains | (2.71 | ) | (1.62 | ) | (2.20 | ) | (1.26 | ) | (0.34 | ) | ||||||||||
Net asset value, end of period | $ | 36.95 | $ | 29.32 | $ | 23.24 | $ | 22.51 | $ | 21.87 | ||||||||||
| Total return(iii) | 37.22 | % | 35.10 | % | 15.18 | % | 9.09 | % | 29.62 | % | ||||||||||
RATIOS/SUPPLEMENTAL DATA: | ||||||||||||||||||||
Net assets, end of period (000's omitted) | $ | 5,723,880 | $ | 4,376,561 | $ | 3,482,596 | $ | 3,241,767 | $ | 2,646,438 | ||||||||||
Ratio of gross expenses to average net assets | 1.09 | %(iv) | 1.09 | %(v) | 0.99 | %(vi) | 0.94 | %(vii) | 0.96 | %(viii) | ||||||||||
Ratio of net expenses to average net assets | 1.09 | % | 1.09 | % | 0.99 | % | 0.94 | % | 0.96 | % | ||||||||||
Ratio of net investment income (loss) to average net assets | (0.67 | )% | (0.35 | )% | (0.03 | )% | 0.02 | % | 0.17 | % | ||||||||||
Portfolio turnover rate | 108.48 | % | 71.81 | % | 86.54 | % | 74.19 | % | 80.08 | % | ||||||||||
See Notes to Financial Statements.
| (i) | Amount was computed based on average shares outstanding during the period. |
| (ii) | Amount was less than $0.005 per share. |
| (iii) | Does not reflect the effect of sales charges, if applicable. |
| (iv) | Includes 0.31% related to dividend expense on short positions and interest expense for the period ended 10/31/21. |
| (v) | Includes 0.25% related to dividend expense on short positions and interest expense for the period ended 10/31/20. |
| (vi) | Includes 0.12% related to dividend expense on short positions and interest expense for the period ended 10/31/19. |
| (vii) | Includes 0.08% related to dividend expense on short positions and interest expense for the period ended 10/31/18. |
| (viii) | Includes 0.07% related to dividend expense on short positions and interest expense for the period ended 10/31/17. |
THE ALGER FUNDS II
Financial Highlights for a share outstanding throughout the period
| Alger Dynamic Opportunities Fund | Class A | |||||||||||||||||||
| Year ended 10/31/2021 | Year ended 10/31/2020 | Year ended 10/31/2019 | Year ended 10/31/2018 | Year ended 10/31/2017 | ||||||||||||||||
Net asset value, beginning of period | $ | 18.32 | $ | 13.91 | $ | 13.73 | $ | 14.10 | $ | 11.63 | ||||||||||
INCOME FROM INVESTMENT OPERATIONS: | ||||||||||||||||||||
Net investment loss(i) | (0.36 | ) | (0.22 | ) | (0.16 | ) | (0.28 | ) | (0.21 | ) | ||||||||||
Net realized and unrealized gain on investments | 5.28 | 5.15 | 0.58 | 0.80 | 2.72 | |||||||||||||||
Total from investment operations | 4.92 | 4.93 | 0.42 | 0.52 | 2.51 | |||||||||||||||
Distributions from net realized gains | (0.95 | ) | (0.52 | ) | (0.24 | ) | (0.89 | ) | (0.04 | ) | ||||||||||
Net asset value, end of period | $ | 22.29 | $ | 18.32 | $ | 13.91 | $ | 13.73 | $ | 14.10 | ||||||||||
Total return(ii) | 27.82 | % | 36.67 | % | 3.26 | % | 3.99 | % | 21.63 | % | ||||||||||
RATIOS/SUPPLEMENTAL DATA: | ||||||||||||||||||||
Net assets, end of period (000's omitted) | $ | 103,684 | $ | 60,793 | $ | 32,011 | $ | 29,620 | $ | 28,833 | ||||||||||
Ratio of gross expenses to average net assets | 2.52 | %(iii) | 2.81 | %(iv) | 2.49 | %(v) | 2.63 | %(vi) | 2.51 | %(vii) | ||||||||||
Ratio of expense reimbursements to average net assets | (0.52 | )% | (0.80 | )% | (0.32 | )% | – | – | ||||||||||||
Ratio of net expenses to average net assets | 2.00 | % | 2.01 | % | 2.17 | % | 2.63 | % | 2.51 | % | ||||||||||
Ratio of net investment loss to average net assets | (1.77 | )% | (1.41 | )% | (1.12 | )% | (2.02 | )% | (1.62 | )% | ||||||||||
Portfolio turnover rate | 161.76 | % | 249.71 | % | 264.04 | % | 181.92 | % | 216.81 | % | ||||||||||
See Notes to Financial Statements.
| (i) | Amount was computed based on average shares outstanding during the period. |
| (ii) | Does not reflect the effect of sales charges, if applicable. |
| (iii) | Includes 0.89% related to dividend expense on short positions and interest expense for the period ended 10/31/21. |
| (iv) | Includes 1.09% related to dividend expense on short positions and interest expense for the period ended 10/31/20. |
| (v) | Includes 0.59% related to dividend expense on short positions and interest expense for the period ended 10/31/19. |
| (vi) | Includes 0.81% related to dividend expense on short positions and interest expense for the period ended 10/31/18. |
| (vii) | Includes 0.62% related to dividend expense on short positions and interest expense for the period ended 10/31/17. |
THE ALGER FUNDS II
Financial Highlights for a share outstanding throughout the period
| Alger Dynamic Opportunities Fund | Class C | |||||||||||||||||||
Year ended 10/31/2021 | Year ended 10/31/2020 | Year ended 10/31/2019 | Year ended 10/31/2018 | Year ended 10/31/2017 | ||||||||||||||||
Net asset value, beginning of period | $ | 16.77 | $ | 12.87 | $ | 12.81 | $ | 13.32 | $ | 11.07 | ||||||||||
INCOME FROM INVESTMENT OPERATIONS: | ||||||||||||||||||||
Net investment loss(i) | (0.47 | ) | (0.30 | ) | (0.25 | ) | (0.36 | ) | (0.29 | ) | ||||||||||
Net realized and unrealized gain on investments | 4.80 | 4.72 | 0.55 | 0.74 | 2.58 | |||||||||||||||
Total from investment operations | 4.33 | 4.42 | 0.30 | 0.38 | 2.29 | |||||||||||||||
Distributions from net realized gains | (0.95 | ) | (0.52 | ) | (0.24 | ) | (0.89 | ) | (0.04 | ) | ||||||||||
Net asset value, end of period | $ | 20.15 | $ | 16.77 | $ | 12.87 | $ | 12.81 | $ | 13.32 | ||||||||||
Total return(ii) | 26.83 | % | 35.64 | % | 2.55 | % | 3.12 | % | 20.73 | % | ||||||||||
RATIOS/SUPPLEMENTAL DATA: | ||||||||||||||||||||
Net assets, end of period (000's omitted) | $ | 17,998 | $ | 10,472 | $ | 7,071 | $ | 6,790 | $ | 6,472 | ||||||||||
Ratio of gross expenses to average net assets | 3.27 | %(iii) | 3.55 | %(iv) | 3.25 | %(v) | 3.41 | %(vi) | 3.29 | %(vii) | ||||||||||
Ratio of expense reimbursements to average net assets | (0.52 | )% | (0.80 | )% | (0.32 | )% | – | – | ||||||||||||
Ratio of net expenses to average net assets | 2.75 | % | 2.75 | % | 2.93 | % | 3.41 | % | 3.29 | % | ||||||||||
Ratio of net investment loss to average net assets | (2.52 | )% | (2.07 | )% | (1.88 | )% | (2.79 | )% | (2.42 | )% | ||||||||||
Portfolio turnover rate | 161.76 | % | 249.71 | % | 264.04 | % | 181.92 | % | 216.81 | % | ||||||||||
See Notes to Financial Statements.
| (i) | Amount was computed based on average shares outstanding during the period. |
| (ii) | Does not reflect the effect of sales charges, if applicable. |
| (iii) | Includes 0.89% related to dividend expense on short positions and interest expense for the period ended 10/31/21. |
| (iv) | Includes 1.07% related to dividend expense on short positions and interest expense for the period ended 10/31/20. |
| (v) | Includes 0.60% related to dividend expense on short positions and interest expense for the period ended 10/31/19. |
| (vi) | Includes 0.81% related to dividend expense on short positions and interest expense for the period ended 10/31/18. |
| (vii) | Includes 0.61% related to dividend expense on short positions and interest expense for the period ended 10/31/17. |
THE ALGER FUNDS II
Financial Highlights for a share outstanding throughout the period
| Alger Dynamic Opportunities Fund | Class Z | |||||||||||||||||||
| Year ended 10/31/2021 | Year ended 10/31/2020 | Year ended 10/31/2019 | Year ended 10/31/2018 | Year ended 10/31/2017 | ||||||||||||||||
Net asset value, beginning of period | $ | 18.91 | $ | 14.30 | $ | 14.07 | $ | 14.39 | $ | 11.83 | ||||||||||
INCOME FROM INVESTMENT OPERATIONS: | ||||||||||||||||||||
Net investment loss(i) | (0.33 | ) | (0.22 | ) | (0.12 | ) | (0.25 | ) | (0.18 | ) | ||||||||||
Net realized and unrealized gain on investments | 5.46 | 5.35 | 0.59 | 0.82 | 2.78 | |||||||||||||||
Total from investment operations | 5.13 | 5.13 | 0.47 | 0.57 | 2.60 | |||||||||||||||
Distributions from net realized gains | (0.95 | ) | (0.52 | ) | (0.24 | ) | (0.89 | ) | (0.04 | ) | ||||||||||
Net asset value, end of period | $ | 23.09 | $ | 18.91 | $ | 14.30 | $ | 14.07 | $ | 14.39 | ||||||||||
Total return(ii) | 28.07 | % | 37.08 | % | 3.54 | % | 4.27 | % | 22.02 | % | ||||||||||
RATIOS/SUPPLEMENTAL DATA: | ||||||||||||||||||||
Net assets, end of period (000's omitted) | $ | 852,387 | $ | 352,396 | $ | 85,184 | $ | 69,002 | $ | 48,660 | ||||||||||
Ratio of gross expenses to average net assets | 2.20 | %(iii) | 2.47 | %(iv) | 2.15 | %(v) | 2.33 | %(vi) | 2.21 | %(vii) | ||||||||||
Ratio of expense reimbursements to average net assets | (0.45 | )% | (0.70 | )% | (0.29 | )% | – | – | ||||||||||||
Ratio of net expenses to average net assets | 1.75 | % | 1.77 | % | 1.86 | % | 2.33 | % | 2.21 | % | ||||||||||
Ratio of net investment loss to average net assets | (1.52 | )% | (1.30 | )% | (0.82 | )% | (1.72 | )% | (1.34 | )% | ||||||||||
Portfolio turnover rate | 161.76 | % | 249.71 | % | 264.04 | % | 181.92 | % | 216.81 | % | ||||||||||
See Notes to Financial Statements.
| (i) | Amount was computed based on average shares outstanding during the period. |
| (ii) | Does not reflect the effect of sales charges, if applicable. |
| (iii) | Includes 0.88% related to dividend expense on short positions and interest expense for the period ended 10/31/21. |
| (iv) | Includes 1.09% related to dividend expense on short positions and interest expense for the period ended 10/31/20. |
| (v) | Includes 0.58% related to dividend expense on short positions and interest expense for the period ended 10/31/19. |
| (vi) | Includes 0.81% related to dividend expense on short positions and interest expense for the period ended 10/31/18. |
| (vii) | Includes 0.61% related to dividend expense on short positions and interest expense for the period ended 10/31/17. |
THE ALGER FUNDS II
Financial Highlights for a share outstanding throughout the period
| Alger Emerging Markets Fund | Class A | |||||||||||||||||||
Year ended 10/31/2021 | Year ended 10/31/2020 | Year ended 10/31/2019 | Year ended 10/31/2018 | Year ended 10/31/2017 | ||||||||||||||||
Net asset value, beginning of period | $ | 11.71 | $ | 9.80 | $ | 8.77 | $ | 11.29 | $ | 9.09 | ||||||||||
INCOME FROM INVESTMENT OPERATIONS: | ||||||||||||||||||||
Net investment income (loss)(i) | (0.09 | ) | (0.06 | ) | 0.03 | –(ii) | – | |||||||||||||
Net realized and unrealized gain (loss) on investments | 2.51 | 2.45 | 1.18 | (2.12 | ) | 2.20 | ||||||||||||||
Total from investment operations | 2.42 | 2.39 | 1.21 | (2.12 | ) | 2.20 | ||||||||||||||
Dividends from net investment income | – | (0.48 | ) | (0.18 | ) | (0.40 | ) | – | ||||||||||||
Net asset value, end of period | $ | 14.13 | $ | 11.71 | $ | 9.80 | $ | 8.77 | $ | 11.29 | ||||||||||
| Total return(iii) | 20.67 | % | 25.15 | % | 14.13 | % | (19.46 | )% | 24.20 | % | ||||||||||
RATIOS/SUPPLEMENTAL DATA: | ||||||||||||||||||||
Net assets, end of period (000's omitted) | $ | 6,331 | $ | 3,320 | $ | 3,942 | $ | 4,397 | $ | 7,141 | ||||||||||
Ratio of gross expenses to average net assets | 1.65 | % | 2.25 | % | 2.22 | % | 1.77 | % | 2.05 | % | ||||||||||
Ratio of expense reimbursements to average net assets | (0.10 | )% | (0.72 | )% | (0.69 | )% | (0.21 | )% | (0.50 | )% | ||||||||||
Ratio of net expenses to average net assets | 1.55 | % | 1.53 | % | 1.53 | % | 1.56 | % | 1.55 | % | ||||||||||
Ratio of net investment income (loss) to average net assets | (0.60 | )% | (0.61 | )% | 0.35 | % | (0.01 | )% | 0.05 | % | ||||||||||
Portfolio turnover rate | 83.30 | % | 184.74 | % | 80.33 | % | 105.23 | % | 71.95 | % | ||||||||||
See Notes to Financial Statements.
| (i) | Amount was computed based on average shares outstanding during the period. |
| (ii) | Amount was less than $0.005 per share. |
| (iii) | Does not reflect the effect of sales charges, if applicable. |
THE ALGER FUNDS II
Financial Highlights for a share outstanding throughout the period
| Alger Emerging Markets Fund | Class C | |||||||||||||||||||
Year ended 10/31/2021 | Year ended 10/31/2020 | Year ended 10/31/2019 | Year ended 10/31/2018 | Year ended 10/31/2017 | ||||||||||||||||
Net asset value, beginning of period | $ | 11.16 | $ | 9.35 | $ | 8.36 | $ | 10.80 | $ | 8.76 | ||||||||||
INCOME FROM INVESTMENT OPERATIONS: | ||||||||||||||||||||
Net investment loss(i) | (0.18 | ) | (0.13 | ) | (0.03 | ) | (0.08 | ) | (0.06 | ) | ||||||||||
Net realized and unrealized gain (loss) on investments | 2.38 | 2.33 | 1.13 | (2.02 | ) | 2.10 | ||||||||||||||
Total from investment operations | 2.20 | 2.20 | 1.10 | (2.10 | ) | 2.04 | ||||||||||||||
Dividends from net investment income | – | (0.39 | ) | (0.11 | ) | (0.34 | ) | – | ||||||||||||
Net asset value, end of period | $ | 13.36 | $ | 11.16 | $ | 9.35 | $ | 8.36 | $ | 10.80 | ||||||||||
Total return(ii) | 19.71 | % | 24.19 | % | 13.34 | % | (20.11 | )% | 23.29 | % | ||||||||||
RATIOS/SUPPLEMENTAL DATA: | ||||||||||||||||||||
Net assets, end of period (000's omitted) | $ | 3,016 | $ | 2,658 | $ | 2,782 | $ | 2,973 | $ | 3,602 | ||||||||||
Ratio of gross expenses to average net assets | 2.45 | % | 3.02 | % | 2.98 | % | 2.54 | % | 2.82 | % | ||||||||||
Ratio of expense reimbursements to average net assets | (0.15 | )% | (0.72 | )% | (0.70 | )% | (0.23 | )% | (0.52 | )% | ||||||||||
Ratio of net expenses to average net assets | 2.30 | % | 2.30 | % | 2.28 | % | 2.31 | % | 2.30 | % | ||||||||||
Ratio of net investment loss to average net assets | (1.35 | )% | (1.36 | )% | (0.35 | )% | (0.75 | )% | (0.68 | )% | ||||||||||
Portfolio turnover rate | 83.30 | % | 184.74 | % | 80.33 | % | 105.23 | % | 71.95 | % | ||||||||||
See Notes to Financial Statements.
| (i) | Amount was computed based on average shares outstanding during the period. |
| (ii) | Does not reflect the effect of sales charges, if applicable. |
THE ALGER FUNDS II
Financial Highlights for a share outstanding throughout the period
| Alger Emerging Markets Fund | Class I | |||||||||||||||||||
| Year ended 10/31/2021 | Year ended 10/31/2020 | Year ended 10/31/2019 | Year ended 10/31/2018 | Year ended 10/31/2017 | ||||||||||||||||
Net asset value, beginning of period | $ | 11.59 | $ | 9.73 | $ | 8.72 | $ | 11.22 | $ | 9.04 | ||||||||||
INCOME FROM INVESTMENT OPERATIONS: | ||||||||||||||||||||
Net investment income (loss)(i) | (0.07 | ) | (0.05 | ) | 0.02 | 0.01 | – | |||||||||||||
Net realized and unrealized gain (loss) on investments | 2.48 | 2.42 | 1.19 | (2.11 | ) | 2.18 | ||||||||||||||
Total from investment operations | 2.41 | 2.37 | 1.21 | (2.10 | ) | 2.18 | ||||||||||||||
Dividends from net investment income | – | (0.51 | ) | (0.20 | ) | (0.40 | ) | – | ||||||||||||
Net asset value, end of period | $ | 14.00 | $ | 11.59 | $ | 9.73 | $ | 8.72 | $ | 11.22 | ||||||||||
Total return(ii) | 20.79 | % | 25.19 | % | 14.22 | % | (19.40 | )% | 24.12 | % | ||||||||||
RATIOS/SUPPLEMENTAL DATA: | ||||||||||||||||||||
Net assets, end of period (000's omitted) | $ | 1,968 | $ | 2,617 | $ | 2,636 | $ | 14,516 | $ | 22,848 | ||||||||||
Ratio of gross expenses to average net assets | 1.66 | % | 2.14 | % | 2.07 | % | 1.71 | % | 1.96 | % | ||||||||||
Ratio of expense reimbursements to average net assets | (0.22 | )% | (0.69 | )% | (0.65 | )% | (0.24 | )% | (0.41 | )% | ||||||||||
Ratio of net expenses to average net assets | 1.44 | % | 1.45 | % | 1.42 | % | 1.47 | % | 1.55 | % | ||||||||||
Ratio of net investment income (loss) to average net assets | (0.53 | )% | (0.52 | )% | 0.17 | % | 0.06 | % | 0.03 | % | ||||||||||
Portfolio turnover rate | 83.30 | % | 184.74 | % | 80.33 | % | 105.23 | % | 71.95 | % | ||||||||||
See Notes to Financial Statements.
| (i) | Amount was computed based on average shares outstanding during the period. |
| (ii) | Does not reflect the effect of sales charges, if applicable. |
THE ALGER FUNDS II
Financial Highlights for a share outstanding throughout the period
| Alger Emerging Markets Fund | Class Z | |||||||||||||||||||
Year ended 10/31/2021 | Year ended 10/31/2020 | Year ended 10/31/2019 | Year ended 10/31/2018 | Year ended 10/31/2017 | ||||||||||||||||
Net asset value, beginning of period | $ | 11.78 | $ | 9.87 | $ | 8.85 | $ | 11.36 | $ | 9.12 | ||||||||||
INCOME FROM INVESTMENT OPERATIONS: | ||||||||||||||||||||
Net investment income (loss)(i) | (0.01 | ) | (0.01 | ) | 0.09 | 0.04 | 0.04 | |||||||||||||
Net realized and unrealized gain (loss) on investments | 2.52 | 2.46 | 1.18 | (2.12 | ) | 2.20 | ||||||||||||||
Total from investment operations | 2.51 | 2.45 | 1.27 | (2.08 | ) | 2.24 | ||||||||||||||
Dividends from net investment income | – | (0.54 | ) | (0.25 | ) | (0.43 | ) | – | ||||||||||||
Net asset value, end of period | $ | 14.29 | $ | 11.78 | $ | 9.87 | $ | 8.85 | $ | 11.36 | ||||||||||
Total return(ii) | 21.31 | % | 25.76 | % | 14.83 | % | (19.07 | )% | 24.56 | % | ||||||||||
RATIOS/SUPPLEMENTAL DATA: | ||||||||||||||||||||
Net assets, end of period (000's omitted) | $ | 35,357 | $ | 13,028 | $ | 14,090 | $ | 19,236 | $ | 27,944 | ||||||||||
Ratio of gross expenses to average net assets | 1.34 | % | 1.89 | % | 1.85 | % | 1.43 | % | 1.71 | % | ||||||||||
Ratio of expense reimbursements to average net assets | (0.35 | )% | (0.90 | )% | (0.90 | )% | (0.39 | )% | (0.46 | )% | ||||||||||
Ratio of net expenses to average net assets | 0.99 | % | 0.99 | % | 0.95 | % | 1.04 | % | 1.25 | % | ||||||||||
Ratio of net investment income (loss) to average net assets | (0.05 | )% | (0.06 | )% | 0.95 | % | 0.39 | % | 0.38 | % | ||||||||||
Portfolio turnover rate | 83.30 | % | 184.74 | % | 80.33 | % | 105.23 | % | 71.95 | % | ||||||||||
See Notes to Financial Statements.
| (i) | Amount was computed based on average shares outstanding during the period. |
| (ii) | Does not reflect the effect of sales charges, if applicable. |
THE ALGER FUNDS II
Financial Highlights for a share outstanding throughout the period
| Alger Responsible Investing Fund | Class A | |||||||||||||||||||
Year ended 10/31/2021 | Year ended 10/31/2020 | Year ended 10/31/2019 | Year ended 10/31/2018 | Year ended 10/31/2017 | ||||||||||||||||
Net asset value, beginning of period | $ | 13.60 | $ | 11.38 | $ | 10.60 | $ | 11.32 | $ | 9.14 | ||||||||||
INCOME FROM INVESTMENT OPERATIONS: | ||||||||||||||||||||
Net investment loss(i) | (0.08 | ) | (0.05 | ) | (0.01 | ) | (0.02 | ) | – | |||||||||||
Net realized and unrealized gain on investments | 5.23 | 3.13 | 1.43 | 0.84 | 2.55 | |||||||||||||||
Total from investment operations | 5.15 | 3.08 | 1.42 | 0.82 | 2.55 | |||||||||||||||
Distributions from net realized gains | (1.04 | ) | (0.86 | ) | (0.64 | ) | (1.54 | ) | (0.37 | ) | ||||||||||
Net asset value, end of period | $ | 17.71 | $ | 13.60 | $ | 11.38 | $ | 10.60 | $ | 11.32 | ||||||||||
Total return(ii) | 39.80 | % | 28.64 | % | 14.81 | % | 8.05 | % | 28.84 | % | ||||||||||
RATIOS/SUPPLEMENTAL DATA: | ||||||||||||||||||||
Net assets, end of period (000's omitted) | $ | 51,634 | $ | 38,192 | $ | 29,932 | $ | 29,662 | $ | 33,828 | ||||||||||
Ratio of gross expenses to average net assets | 1.27 | % | 1.36 | % | 1.40 | % | 1.41 | % | 1.42 | % | ||||||||||
Ratio of expense reimbursements to average net assets | – | (0.02 | )% | (0.05 | )% | (0.06 | )% | (0.07 | )% | |||||||||||
Ratio of net expenses to average net assets | 1.27 | % | 1.34 | % | 1.35 | % | 1.35 | % | 1.35 | % | ||||||||||
Ratio of net investment loss to average net assets | (0.52 | )% | (0.43 | )% | (0.12 | )% | (0.16 | )% | (0.02 | )% | ||||||||||
Portfolio turnover rate | 11.07 | % | 11.73 | % | 14.64 | % | 20.20 | % | 30.70 | % | ||||||||||
See Notes to Financial Statements.
| (i) | Amount was computed based on average shares outstanding during the period. |
| (ii) | Does not reflect the effect of sales charges, if applicable. |
THE ALGER FUNDS II
Financial Highlights for a share outstanding throughout the period
| Alger Responsible Investing Fund | Class C | |||||||||||||||||||
Year ended 10/31/2021 | Year ended 10/31/2020 | Year ended 10/31/2019 | Year ended 10/31/2018 | Year ended 10/31/2017 | ||||||||||||||||
Net asset value, beginning of period | $ | 11.95 | $ | 10.18 | $ | 9.62 | $ | 10.49 | $ | 8.56 | ||||||||||
INCOME FROM INVESTMENT OPERATIONS: | ||||||||||||||||||||
Net investment loss(i) | (0.17 | ) | (0.13 | ) | (0.09 | ) | (0.09 | ) | (0.08 | ) | ||||||||||
Net realized and unrealized gain on investments | 4.56 | 2.76 | 1.29 | 0.76 | 2.38 | |||||||||||||||
Total from investment operations | 4.39 | 2.63 | 1.20 | 0.67 | 2.30 | |||||||||||||||
Distributions from net realized gains | (1.04 | ) | (0.86 | ) | (0.64 | ) | (1.54 | ) | (0.37 | ) | ||||||||||
Net asset value, end of period | $ | 15.30 | $ | 11.95 | $ | 10.18 | $ | 9.62 | $ | 10.49 | ||||||||||
Total return(ii) | 38.87 | % | 27.53 | % | 13.97 | % | 7.14 | % | 27.83 | % | ||||||||||
RATIOS/SUPPLEMENTAL DATA: | ||||||||||||||||||||
Net assets, end of period (000's omitted) | $ | 5,150 | $ | 5,368 | $ | 5,369 | $ | 6,124 | $ | 6,205 | ||||||||||
Ratio of gross expenses to average net assets | 2.03 | % | 2.11 | % | 2.16 | % | 2.14 | % | 2.19 | % | ||||||||||
Ratio of net expenses to average net assets | 2.03 | % | 2.11 | % | 2.16 | % | 2.14 | % | 2.19 | % | ||||||||||
Ratio of net investment loss to average net assets | (1.27 | )% | (1.19 | )% | (0.92 | )% | (0.95 | )% | (0.86 | )% | ||||||||||
Portfolio turnover rate | 11.07 | % | 11.73 | % | 14.64 | % | 20.20 | % | 30.70 | % | ||||||||||
See Notes to Financial Statements.
| (i) | Amount was computed based on average shares outstanding during the period. |
| (ii) | Does not reflect the effect of sales charges, if applicable. |
THE ALGER FUNDS II
Financial Highlights for a share outstanding throughout the period
| Alger Responsible Investing Fund | Class I | |||||||||||||||||||
Year ended 10/31/2021 | Year ended 10/31/2020 | Year ended 10/31/2019 | Year ended 10/31/2018 | Year ended 10/31/2017 | ||||||||||||||||
Net asset value, beginning of period | $ | 13.57 | $ | 11.36 | $ | 10.58 | $ | 11.31 | $ | 9.13 | ||||||||||
INCOME FROM INVESTMENT OPERATIONS: | ||||||||||||||||||||
Net investment income (loss)(i) | (0.08 | ) | (0.05 | ) | (0.01 | ) | (0.02 | ) | 0.01 | |||||||||||
Net realized and unrealized gain on investments | 5.22 | 3.12 | 1.43 | 0.83 | 2.54 | |||||||||||||||
Total from investment operations | 5.14 | 3.07 | 1.42 | 0.81 | 2.55 | |||||||||||||||
Distributions from net realized gains | (1.04 | ) | (0.86 | ) | (0.64 | ) | (1.54 | ) | (0.37 | ) | ||||||||||
Net asset value, end of period | $ | 17.67 | $ | 13.57 | $ | 11.36 | $ | 10.58 | $ | 11.31 | ||||||||||
Total return(ii) | 39.82 | % | 28.60 | % | 14.83 | % | 7.95 | % | 28.88 | % | ||||||||||
RATIOS/SUPPLEMENTAL DATA: | ||||||||||||||||||||
Net assets, end of period (000's omitted) | $ | 6,884 | $ | 8,131 | $ | 10,213 | $ | 12,258 | $ | 13,128 | ||||||||||
Ratio of gross expenses to average net assets | 1.28 | % | 1.35 | % | 1.39 | % | 1.37 | % | 1.37 | % | ||||||||||
Ratio of expense reimbursements to average net assets | – | – | (0.02 | )% | (0.02 | )% | (0.02 | )% | ||||||||||||
Ratio of net expenses to average net assets | 1.28 | % | 1.35 | % | 1.37 | % | 1.35 | % | 1.35 | % | ||||||||||
Ratio of net investment income (loss) to average net assets | (0.52 | )% | (0.42 | )% | (0.12 | )% | (0.17 | )% | 0.08 | % | ||||||||||
Portfolio turnover rate | 11.07 | % | 11.73 | % | 14.64 | % | 20.20 | % | 30.70 | % | ||||||||||
See Notes to Financial Statements.
| (i) | Amount was computed based on average shares outstanding during the period. |
| (ii) | Does not reflect the effect of sales charges, if applicable. |
THE ALGER FUNDS II
Financial Highlights for a share outstanding throughout the period
| Alger Responsible Investing Fund | Class Z | |||||||||||||||||||
| Year ended 10/31/2021 | Year ended 10/31/2020 | Year ended 10/31/2019 | Year ended 10/31/2018 | Year ended 10/31/2017 | ||||||||||||||||
Net asset value, beginning of period | $ | 13.87 | $ | 11.55 | $ | 10.70 | $ | 11.37 | $ | 9.14 | ||||||||||
INCOME FROM INVESTMENT OPERATIONS: | ||||||||||||||||||||
Net investment income (loss)(i) | (0.03 | ) | (0.01 | ) | 0.03 | 0.03 | 0.03 | |||||||||||||
Net realized and unrealized gain on investments | 5.36 | 3.19 | 1.46 | 0.84 | 2.57 | |||||||||||||||
Total from investment operations | 5.33 | 3.18 | 1.49 | 0.87 | 2.60 | |||||||||||||||
Distributions from net realized gains | (1.04 | ) | (0.86 | ) | (0.64 | ) | (1.54 | ) | (0.37 | ) | ||||||||||
Net asset value, end of period | $ | 18.16 | $ | 13.87 | $ | 11.55 | $ | 10.70 | $ | 11.37 | ||||||||||
Total return(ii) | 40.35 | % | 29.11 | % | 15.34 | % | 8.50 | % | 29.41 | % | ||||||||||
RATIOS/SUPPLEMENTAL DATA: | ||||||||||||||||||||
Net assets, end of period (000's omitted) | $ | 36,053 | $ | 22,646 | $ | 15,755 | $ | 13,262 | $ | 9,050 | ||||||||||
Ratio of gross expenses to average net assets | 0.96 | % | 1.04 | % | 1.12 | % | 1.13 | % | 1.31 | % | ||||||||||
Ratio of expense reimbursements to average net assets | (0.02 | )% | (0.09 | )% | (0.18 | )% | (0.23 | )% | (0.41 | )% | ||||||||||
Ratio of net expenses to average net assets | 0.94 | % | 0.95 | % | 0.94 | % | 0.90 | % | 0.90 | % | ||||||||||
Ratio of net investment income (loss) to average net assets | (0.20 | )% | (0.05 | )% | 0.29 | % | 0.27 | % | 0.32 | % | ||||||||||
Portfolio turnover rate | 11.07 | % | 11.73 | % | 14.64 | % | 20.20 | % | 30.70 | % | ||||||||||
See Notes to Financial Statements.
| (i) | Amount was computed based on average shares outstanding during the period. |
| (ii) | Does not reflect the effect of sales charges, if applicable. |
NOTE 1 — General:
The Alger Funds II (the “Trust”) is an open-end registered investment company organized as a business trust under the laws of the Commonwealth of Massachusetts. The Trust qualifies as an investment company as defined in Financial Accounting Standards Board (“FASB”) Accounting Standards Codification 946 – Financial Services – Investment Companies. The Trust operates as a series company currently offering an unlimited number of shares of beneficial interest in four series – Alger Spectra Fund, Alger Dynamic Opportunities Fund, Alger Emerging Markets Fund and Alger Responsible Investing Fund (collectively, the “Funds” or individually, each a “Fund”). The Funds normally invest primarily in equity securities and each has an investment objective of long-term capital appreciation.
Each Fund offers one or more of the following share classes: Class A shares, Class C shares, Class I shares, Class Y shares and Class Z shares. Class A shares are generally subject to an initial sales charge while Class C shares are generally subject to a deferred sales charge. Class C shares will automatically convert to Class A shares on the fifth business day of the month following the eighth anniversary of the purchase date of a shareholder’s Class C shares, without the imposition of any sales load, fee or other charge. Class C shares held at certain dealers may not convert to Class A shares or may be converted on a different schedule. At conversion, a proportionate amount of shares representing reinvested dividends and distributions will also be converted into Class A shares. Effective August 27, 2019, Class C shares were closed to direct shareholders and are only available for purchase through certain financial intermediaries and group retirement plan recordkeeping platforms, Class I shares, Class Z shares and Class Y shares are sold to institutional investors without an initial or deferred sales charge and Class Z shares and Class Y shares are generally subject to a minimum initial investment of $500,000. Each class has identical rights to assets and earnings, except that each share class bears the pro rata allocation of the Fund’s expenses other than a class expense (not including advisory or custodial fees or other expenses related to the management of the Fund’s assets).
NOTE 2 — Significant Accounting Policies:
(a) Investment Valuation: The Funds value their financial instruments at fair value using independent dealers or pricing services under policies approved by the Trust’s Board of Trustees (the “Board”). Investments held by the Funds are valued on each day the New York Stock Exchange (the “NYSE”) is open, as of the close of the NYSE (normally 4:00 p.m. Eastern Time).
Investments in money market funds and short-term securities held by the Funds having a remaining maturity of sixty days or less are valued at amortized cost which approximates market value.
Equity securities, including traded rights, warrants and option contracts for which valuation information is readily available, are valued at the last quoted sales price or official closing price on the primary market or exchange on which they are traded as reported by an independent pricing service. In the absence of quoted sales, such securities are valued at the bid price or, in the absence of a recent bid price, the equivalent as obtained from one or more of the major market makers for the securities to be valued.
THE ALGER FUNDS II
NOTES TO FINANCIAL STATEMENTS (Continued)
Debt securities generally trade in the over-the-counter market. Debt securities with remaining maturities of more than sixty days at the time of acquisition are valued on the basis of the last available bid prices or current market quotations provided by dealers or pricing services. In determining the value of a particular investment, pricing services may use certain information with respect to transactions in such investments, quotations from dealers, pricing matrixes, market transactions in comparable investments, various relationships observed in the market between investments and calculated yield measures based on valuation technology commonly employed in the market for such investments. Asset-backed and mortgage-backed securities are valued by independent pricing services using models that consider estimated cash flows of each tranche of the security, establish a benchmark yield and develop an estimated tranche-specific spread to the benchmark yield based on the unique attributes of the tranche. Debt securities with a remaining maturity of sixty days or less are valued at amortized cost which approximates market value.
Swap contracts are privately negotiated in the over-the-counter market (“OTC Swaps”) or may be executed in a multilateral or other trade facility platform, such as a registered commodities exchange (“Centrally Cleared Swaps”). Centrally cleared swaps are valued at the last reported sale on the clearing exchange.
Securities for which market quotations are not readily available are valued at fair value, as determined in good faith pursuant to procedures established by the Board and described further herein.
Securities in which the Funds invest may be traded in foreign markets that close before the close of the NYSE. Developments that occur between the close of the foreign markets and the close of the NYSE may result in adjustments to the closing foreign prices to reflect what the Trust’s investment adviser, pursuant to policies established by the Board, believes to be the fair value of these securities as of the close of the NYSE. The Funds may also fair value securities in other situations, for example, when a particular foreign market is closed but the Funds are open.
FASB Accounting Standards Codification 820 – Fair Value Measurements and Disclosures (“ASC 820”) defines fair value as the price that the Funds would receive upon selling an investment in a timely transaction to an independent buyer in the principal or most advantageous market of the investment. ASC 820 established a three-tier hierarchy to maximize the use of observable market data and minimize the use of unobservable inputs and to establish classification of fair value measurements for disclosure purposes. Inputs refer broadly to the assumptions that market participants would use in pricing the asset or liability and may be observable or unobservable. Observable inputs are based on market data obtained from sources independent of the Funds. Unobservable inputs are inputs that reflect the Funds’ own assumptions based on the best information available in the circumstances. The three-tier hierarchy of inputs is summarized in the three broad Levels listed below.
THE ALGER FUNDS II
NOTES TO FINANCIAL STATEMENTS (Continued)
| • | Level 1 – quoted prices in active markets for identical investments |
| • | Level 2 – significant other observable inputs (including quoted prices for similar investments, interest rates, prepayment speeds, credit risk, etc.) |
| • | Level 3 – significant unobservable inputs (including the Funds’ own assumptions in determining the fair value of investments) |
The Funds’ valuation techniques are generally consistent with either the market or the income approach to fair value. The market approach considers prices and other relevant information generated by market transactions involving identical or comparable assets to measure fair value. The income approach converts future amounts to a current, or discounted, single amount. These fair value measurements are determined on the basis of the value indicated by current market expectations about such future events. Inputs for Level 1 include exchange-listed prices and broker quotes in an active market. Inputs for Level 2 include the last trade price in the case of a halted security, an exchange-listed price which has been adjusted for fair value factors, and prices of closely related securities. Additional Level 2 inputs include an evaluated price which is based upon a compilation of observable market information such as spreads for fixed income and preferred securities. Inputs for Level 3 include, but are not limited to, revenue multiples, earnings before interest, taxes, depreciation and amortization (“EBITDA”) multiples, discount rates, time to exit and the probabilities of success of certain outcomes. Such unobservable market information may be obtained from a company’s financial statements and from industry studies, market data, and market indicators such as benchmarks and indexes. Because of the inherent uncertainty and often limited markets for restricted securities, the valuations assigned to such securities by the Funds may significantly differ from the valuations that would have been assigned by the Funds had there been an active market for such securities.
Valuation processes are determined by a Valuation Committee (“Committee”) authorized by the Board and comprised of representatives of the Trust’s investment adviser and officers of the Trust. The Committee reports its fair valuation determinations and related valuation information to the Board. The Board is responsible for approving the valuation policy and procedures.
While the meetings are held on an as-needed basis, the Committee generally meets quarterly to review and evaluate the effectiveness of the procedures for making fair value determinations. The Committee considers, among other things, the results of quarterly back testing of the fair value model for foreign securities, pricing comparisons between primary and secondary price sources, the outcome of price challenges put to the Funds’ pricing vendor, and variances between transactional prices and the previous day’s price.
(b) Cash and Cash Equivalents: Cash and cash equivalents include U.S. dollars, foreign cash and overnight time deposits.
(c) Securities Transactions and Investment Income: Securities transactions are recorded on a trade date basis. Realized gains and losses from securities transactions are recorded on the identified cost basis. Dividend income is recognized on the ex-dividend date and interest income is recognized on the accrual basis.
THE ALGER FUNDS II
NOTES TO FINANCIAL STATEMENTS (Continued)
Premiums and discounts on debt securities purchased are amortized or accreted over the lives of the respective securities.
(d) Foreign Currency Transactions: The books and records of the Funds are maintained in U.S. dollars. Foreign currencies, investments and other assets and liabilities are translated into U.S. dollars at the prevailing rates of exchange on the valuation date. Purchases and sales of investment securities and income and expenses are translated into U.S. dollars at the prevailing exchange rates on the respective dates of such transactions.
Net realized gains and losses on foreign currency transactions represent net gains and losses from the disposition of foreign currencies, currency gains and losses realized between the trade dates and settlement dates of security transactions, and the difference between the amount of net investment income accrued and the U.S. dollar amount actually received. The effects of changes in foreign currency exchange rates on investments in securities are included in realized and unrealized gain or loss on investments in the accompanying Statements of Operations.
(e) Forward Foreign Exchange Contracts: Certain Funds may enter into forward foreign currency contracts to hedge against foreign currency exchange rate risk on their non-U.S. dollar denominated securities or to facilitate settlement of foreign currency denominated portfolio transactions. A forward foreign currency contract is an agreement between two parties to buy and sell a currency at a set price on a future date. The contract is marked-to-market daily and the change in value is recorded by a Fund as an unrealized gain or loss. Realized gains or losses equal to the difference between the value of the contract at the time it was opened and the value at the time it was closed are recorded upon delivery or receipt of the currency.
These contracts may involve market risk in excess of the unrealized gain or loss reflected on the Statements of Assets and Liabilities. In addition, the Funds could be exposed to risk if the counterparties are unable to meet the terms of the contracts or if the value of the currency changes unfavorably to the base currency.
(f) Short Sales: Securities sold short represent an obligation to deliver the securities at a future date. A Fund may sell a security it does not own in anticipation of a decline in the value of that security before the delivery date. When a Fund sells a security short, it must borrow the security sold short and deliver it to the broker-dealer through which it made the short sale. Net dividends paid on securities sold short are disclosed as an expense on the Statements of Operations. Net dividends received on securities sold short are disclosed as income on the Statements of Operations. A gain, limited to the price at which the Fund sold the security short, or a loss, unlimited in size, will be recognized upon the termination of a short sale.
To secure its obligation to deliver to the broker-dealer the securities sold short, the Fund must segregate an amount of cash or liquid securities with its custodian equal to any excess of the current market value of the securities sold short over any cash or liquid securities deposited as collateral with the broker in connection with the short sale (not including the proceeds of the short sale). As a result of that requirement, the Fund will not gain any leverage merely by selling short, except to the extent that it earns interest or other income or gains on the segregated cash or liquid securities while also being subject to gain or loss from the securities sold short.
THE ALGER FUNDS II
NOTES TO FINANCIAL STATEMENTS (Continued)
(g) Swaps: Each Fund may engage in swap transactions, including currency swaps, index swaps and interest rate swaps. A Fund may enter into swaps for both hedging purposes and to seek to increase total return. A Fund also may enter into options on swap agreements, sometimes called “swaptions.”
(h) Option Contracts: When a Fund writes an option, an amount equal to the premium received by the Fund is recorded as a liability and is subsequently adjusted to reflect the current fair value of the option written. Premiums received from writing options that expire unexercised are treated by the Fund on the expiration date as realized gains from investments. The difference between the premium and the amount paid on effecting a closing purchase transaction, including brokerage commissions, is also treated as a realized gain, or, if the premium is less than the amount paid for the closing purchase transaction, as a realized loss. If a call option is exercised, the premium is added to the proceeds from the sale of the underlying security in determining whether the Fund has realized a gain or loss. If a put option is exercised, the premium reduces the cost basis of the securities purchased by the Fund. The Fund, as writer of an option, bears the market risk of an unfavorable change in the price of the security underlying the written option.
Certain Funds may also purchase put and call options. Such Funds pay a premium which is included in each Fund’s accompanying Statement of Assets and Liabilities as an investment and subsequently marked to market to reflect the current value of the option. Premiums paid for purchasing options which expire unexercised are treated as realized losses. The risk associated with purchasing put and call options is limited to the premium paid. Premiums paid for purchasing options which are exercised or closed are added to the amounts paid or offset against the proceeds on the underlying security to determine the realized gain or loss.
(i) Dividends to Shareholders: Dividends and distributions payable to shareholders are recorded by the Funds on the ex-dividend date. Dividends from net investment income, if available, and distributions from net realized gains, offset by any loss carryforward, are declared and paid annually after the end of the fiscal year in which earned.
Each share class is treated separately in determining the amounts of dividends from net investment income payable to holders of its shares.
The characterization of distributions to shareholders for financial reporting purposes is determined in accordance with federal income tax rules. Therefore, the source of a Fund’s distributions may be shown in the accompanying financial statements as either from, or in excess of, net investment income, net realized gain on investment transactions, or return of capital, depending on the type of book/tax differences that may exist. Capital accounts within the financial statements are adjusted for permanent book/tax differences. Reclassifications result primarily from the differences in tax treatment of net operating losses, passive foreign investment companies, and foreign currency transactions. The reclassifications are done annually at year-end and have no impact on the net asset values of the Funds and are designed to present each Fund’s capital accounts on a tax basis.
THE ALGER FUNDS II
NOTES TO FINANCIAL STATEMENTS (Continued)
(j) Federal Income Taxes: It is each Fund’s policy to comply with the requirements of the Internal Revenue Code Subchapter M applicable to regulated investment companies and to distribute all of its taxable income to its shareholders. Provided that the Funds maintain such compliance, no federal income tax provision is required. Each Fund is treated as a separate entity for the purpose of determining such compliance.
FASB Accounting Standards Codification 740 – Income Taxes (“ASC 740”) requires the Funds to measure and recognize in their financial statements the benefit of a tax position taken (or expected to be taken) on an income tax return if such position will more likely than not be sustained upon examination based on the technical merits of the position. No tax years are currently under investigation. The Funds file income tax returns in the U.S. Federal jurisdiction, as well as the New York State and New York City jurisdictions. The statute of limitations on the Funds’ tax returns remains open for the tax years 2017-2020. Management does not believe there are any uncertain tax positions that require recognition of a tax liability.
(k) Allocation Methods: The Trust accounts separately for the assets, liabilities and operations of each Fund. Expenses directly attributable to each Fund are charged to that Fund’s operations; expenses which are applicable to all Funds are allocated among them based on net assets. Income, realized and unrealized gains and losses, and expenses of each Fund are allocated among the Fund’s classes based on relative net assets, with the exception of distribution fees, transfer agency fees, and shareholder servicing and related fees.
(l) Estimates: These financial statements have been prepared in accordance with accounting principles generally accepted in the United States of America, which require using estimates and assumptions that affect the reported amounts therein. Actual results may differ from those estimates. All such estimates are of a normal recurring nature.
NOTE 3 — Investment Advisory Fees and Other Transactions with Affiliates:
(a) Investment Advisory Fees: Fees incurred by each Fund, pursuant to the provisions of the Trust’s Investment Advisory Agreement with Fred Alger Management, LLC (“Alger Management” or the “Investment Manager”), are payable monthly and computed based on the following rates. The actual rate paid as a percentage of average daily net assets, for the year ended October 31, 2021, is set forth below under the heading “Actual Rate”:
THE ALGER FUNDS II
NOTES TO FINANCIAL STATEMENTS (Continued)
| Tier 1 | Tier 2 | Tier 3 | Tier 4 | Tier 5 | Actual Rate | |||||||||||||||||||
Alger Spectra Fund(a) | 0.90 | % | 0.75 | % | 0.65 | % | 0.55 | % | 0.45 | % | 0.71 | % | ||||||||||||
Alger Dynamic Opportunities Fund(b) | 1.20 | 1.00 | – | – | – | 1.20 | ||||||||||||||||||
Alger Emerging Markets Fund(c) | 0.75 | – | – | – | – | 0.75 | ||||||||||||||||||
Alger Responsible Investing Fund(b) | 0.71 | 0.65 | – | – | – | 0.71 | ||||||||||||||||||
(a) Tier 1 rate is paid on assets up to $2 billion, Tier 2 rate is paid on assets between $2 billion and $4 billion, Tier 3 rate is paid on assets between $4 billion and $6 billion, Tier 4 rate is paid on assets between $6 billion and $8 billion, and Tier 5 rate is paid on assets in excess of $8 billion.
(b) Tier 1 rate is paid on assets up to $1 billion and Tier 2 rate is paid on assets in excess of $1 billion.
(c) Tier 1 rate is paid on all assets.
The sub-advisor to the Alger Dynamic Opportunities Fund, Weatherbie Capital, LLC (“Weatherbie” or the “Sub-Advisor”), an affiliate of Alger Management, is paid a fee, out of the advisory fee that Alger Management receives at no additional cost to the Alger Dynamic Opportunities Fund. The sub-advisory fee is equal to 70% of the net management fee paid by the Alger Dynamic Opportunities Fund to Alger Management with respect to the sub- advised assets. For the year ended October 31, 2021, Alger Management paid a sub-advisory fee of $1,869,175 to Weatherbie.
Alger Management has contractually agreed to waive fees or to reimburse Fund expenses (excluding acquired fund fees and expenses, interest, taxes, brokerage and extraordinary expenses and, for all Funds other than Alger Dynamic Opportunities Fund, dividend expense on short sales and borrowing costs) through February 28, 2023 to the extent necessary to limit the total annual fund operating expenses exceed the rates, based on average daily net assets, listed in the table below:
CLASS | FEES WAIVED / REIMBURSED FOR YEAR ENDED | |||||||||||||||||||||||
| A | C | I | Y | Z | OCTOBER 31, 2021 | |||||||||||||||||||
Alger Spectra Fund | – | – | – | 0.79 | % | 0.99 | %(a) | $ | – | |||||||||||||||
Alger Dynamic Opportunities Fund | 2.00 | % | 2.75 | % | – | – | 1.75 | 3,026,870 | ||||||||||||||||
Alger Emerging Markets Fund | 1.55 | 2.30 | 1.45 | % | – | 0.99 | 104,236 | |||||||||||||||||
Alger Responsible Investing Fund | – | (b) | – | – | – | 0.95 | 3,496 | |||||||||||||||||
| (a) | Prior to March 1, 2021, Alger Spectra Fund Class Z shares had no expense cap. |
| (b) | Prior to March 1, 2021, the expense cap for Alger Responsible Investing Fund Class A shares was 1.35%. |
Alger Management may, during the term of the contract, recoup any fees waived or expenses reimbursed pursuant to the contract to the extent that such recoupment would not cause the expense ratio to exceed the stated limitation in effect at the time of (i) the waiver or reimbursement and (ii) the recoupment by Alger Management, after repayment of the recoupment is taken into account. For the year ended October 31, 2021, the recoupments made by the Funds to the Investment Manager for Alger Spectra Fund and Alger Responsible Investing Fund to the Investment Manager were $9,086 and $458, respectively.
THE ALGER FUNDS II
NOTES TO FINANCIAL STATEMENTS (Continued)
(b) Administration Fees: Fees incurred by each Fund, pursuant to the provisions of the Trust's Fund Administration Agreement with Alger Management, are payable monthly and computed based on the average daily net assets of each Fund at the annual rate of 0.0275%.
(c) Distribution Fees: The Trust has adopted distribution plans for Class A, Class C and Class I shares of the Funds pursuant to which Class A shares, Class C shares and Class I shares of each Fund pay Fred Alger & Company, LLC, the Funds’ distributor and an affiliate of the Investment Manager (the “Distributor” or “Alger LLC”), a fee at the annual rate listed below of the respective average daily net assets of the share class of the designated Fund to compensate Alger LLC for its activities and expenses incurred in distributing and/or administering the share class and/or shareholder servicing. The fees paid may be more or less than the expenses incurred by Alger LLC.
SHARE CLASS | FEE RATE |
| A | 0.25% |
| C | 1.00 |
| I | 0.25 |
(d) Sales Charges: Sales of shares of the Funds may be subject to contingent deferred sales charges. The contingent deferred sales charges are used by Alger LLC to offset distribution expenses previously incurred. Sales charges do not represent expenses of the Trust. For the year ended October 31, 2021, contingent deferred sales charges imposed, all of which were retained by Alger LLC, were as follows:
CONTINGENT DEFERRED SALES CHARGES | ||||
Alger Spectra Fund | $ | 32,440 | ||
Alger Dynamic Opportunities Fund | 4,029 | |||
Alger Emerging Markets Fund | 198 | |||
Alger Responsible Investing Fund | 971 | |||
(e) Brokerage Commissions: During the year ended October 31, 2021, Alger Spectra Fund, Alger Dynamic Opportunities Fund and Alger Responsible Investing Fund paid Alger LLC,
$1,483,981, $270,020 and $3,552, respectively, in connection with securities transactions.
(f) Shareholder Administrative Fees: The Trust has entered into a Shareholder Administrative Services Agreement with Alger Management to compensate Alger Management for liaising with, and providing administrative oversight of, the Trust’s transfer agent, and for other related services. The Funds compensate Alger Management at the annual rate of 0.0165% of their respective average daily net assets for the Class A and Class C shares and 0.01% of their respective average daily net assets of the Class I shares, Class Y shares and Class Z shares for these services.
THE ALGER FUNDS II
NOTES TO FINANCIAL STATEMENTS (Continued)
Alger Management makes payments to intermediaries that provide sub-accounting services to omnibus accounts invested in the Funds. A portion of the fees paid by Alger Management to intermediaries that provide sub-accounting services are charged back to the appropriate Fund, subject to certain limitations, as approved by the Board. For the year ended October 31, 2021, Alger Management charged back to Alger Spectra Fund, Alger Dynamic Opportunities Fund, Alger Emerging Markets Fund and Alger Responsible Investing Fund, $1,294,632, $44,072, $5,460 and $30,484, respectively, for these services, which are included in transfer agent fees in the accompanying Statements of Operations.
(g) Trustee Fees: Each trustee who is not an “interested person” of the Trust, as defined in the Investment Company Act of 1940, as amended (“Independent Trustee”) receives a fee of $142,000 per annum, paid pro rata based on net assets by each fund in the Alger Fund Complex, plus travel expenses incurred for attending board meetings. The term “Alger Fund Complex” refers to the Trust, The Alger Institutional Funds, The Alger Funds, The Alger Portfolios, Alger Global Focus Fund and The Alger ETF Trust, each of which is a registered investment company managed by Alger Management. The Independent Trustee appointed as Chairman of the Board receives additional compensation of $20,000 per annum paid pro rata based on net assets by each fund in the Alger Fund Complex. Additionally, each member of the Audit Committee receives a fee of $13,000 per annum, paid pro rata based on net assets by each fund in the Alger Fund Complex.
Prior to January 1, 2021, each Independent Trustee received a fee of $134,000 per annum, paid pro rata based on net assets by each fund in the Alger Fund Complex, plus travel expenses incurred for attending board meetings. The Independent Trustee appointed as Chairman of the Board received additional compensation of $20,000 per annum paid pro rata based on net assets by each fund in the Alger Fund Complex. Additionally, each member of the Audit Committee received a fee of $13,000 per annum, paid pro rata based on net assets by each fund in the Alger Fund Complex.
(h) Interfund Trades: The Funds may engage in purchase and sale transactions with other funds advised by Alger Management or Weatherbie Capital, LLC, an affiliate of Alger Management. For the year ended October 31, 2021, these purchases and sales were as follows.
| PURCHASES | SALES | REALIZED GAIN | ||||||||||
Alger Spectra Fund | $ | – | $ | 170,917 | $ | 89,528 | ||||||
(i) Interfund Loans: The Funds, along with other funds in the Alger Fund Complex, may borrow money from and lend money to each other for temporary or emergency purposes. To the extent permitted under its investment restrictions, each Fund may lend uninvested cash in an amount up to 15% of its net assets to other funds in the Alger Fund Complex. If a Fund has borrowed from other funds in the Alger Fund Complex and has aggregate borrowings from all sources that exceed 10% of the Fund’s total assets, such Fund will secure all of its loans from other funds in the Alger Fund Complex. The interest rate charged on interfund loans is equal to the average of the overnight time deposit rate and bank loan rate available to the Funds. There were no interfund loans outstanding as of October 31, 2021.
THE ALGER FUNDS II
NOTES TO FINANCIAL STATEMENTS (Continued)
During the year ended October 31, 2021, Alger Spectra Fund, Alger Emerging Markets Fund and Alger Responsible Investing Fund incurred interfund loan interest expenses of $470, $5 and $30, respectively, and Alger Dynamic Opportunities Fund earned interfund loan interest income of $18,444, which is included in interest in the accompanying Statements of Operations.
(j) Other Transactions with Affiliates: Certain officers and one Trustee of the Trust are directors and/or officers of Alger Management, the Distributor, or their affiliates. At October 31, 2021, Alger Management and its affiliated entities owned the following shares:
| SHARE CLASS | ||||||||||||||||||||
| A | C | I | Y | Z | ||||||||||||||||
Alger Spectra Fund | 1,808,788 | – | 18,848 | 4,790 | 124,084 | |||||||||||||||
Alger Dynamic Opportunities Fund | 108 | – | – | – | 2,134,999 | |||||||||||||||
Alger Responsible Investing Fund | – | – | – | – | 231,211 | |||||||||||||||
NOTE 4 — Securities Transactions:
The following summarizes the securities transactions by each Fund, other than U.S. Government securities, short-term securities, purchased options, swaps, forward foreign currency contracts and short sales, for the year ended October 31, 2021:
| PURCHASES | SALES | |||||||
Alger Spectra Fund | $ | 9,520,235,361 | $ | 10,098,534,917 | ||||
Alger Dynamic Opportunities Fund | 1,481,238,647 | 1,041,192,174 | ||||||
Alger Emerging Markets Fund | 50,388,027 | 29,037,853 | ||||||
Alger Responsible Investing Fund | 9,541,377 | 13,944,965 | ||||||
NOTE 5 — Borrowing:
The Funds may borrow from Brown Brothers Harriman & Co., the Funds’ Custodian (the “Custodian”), on an uncommitted basis. Each Fund pays the Custodian a market rate of interest, generally based upon a rate of return with respect to each respective currency borrowed taking into consideration relevant overnight and short-term reference rates, the range of distribution between and among the interest rates paid on deposits to other institutions, less applicable commissions, if any. Borrowings from the Custodian are included in Bank overdrafts in the Statement of Assets and Liabilities. The Funds may also borrow from other funds in the Alger Fund Complex, as discussed in Note 3(i). For the year ended October 31, 2021, the Funds had the following borrowings from the Custodian and other funds in the Alger Fund Complex:
AVERAGE DAILY BORROWING | WEIGHTED AVERAGE INTEREST RATE | |||||||
Alger Spectra Fund | $ | 561,691 | 2.05 | % | ||||
Alger Emerging Markets Fund | 522 | 1.10 | ||||||
Alger Responsible Investing Fund | 2,775 | 1.08 | ||||||
The highest amount borrowed from the Custodian and other funds during the year ended October 31, 2021 by each Fund was as follows:
THE ALGER FUNDS II
NOTES TO FINANCIAL STATEMENTS (Continued)
| HIGHEST BORROWING | ||||
Alger Spectra Fund | $ | 34,859,131 | ||
Alger Emerging Markets Fund | 182,000 | |||
Alger Responsible Investing Fund | 350,000 | |||
NOTE 6 — Share Capital:
The Trust has an unlimited number of authorized shares of beneficial interest of $.001 par value which are presently divided into four series. Each series is divided into separate classes. The transactions of shares of beneficial interest were as follows:
FOR THE YEAR ENDED OCTOBER 31, 2021 | FOR THE YEAR ENDED OCTOBER 31, 2020 | |||||||||||||||
| SHARES | AMOUNT | SHARES | AMOUNT | |||||||||||||
| Alger Spectra Fund | ||||||||||||||||
| Class A: | ||||||||||||||||
| Shares sold | 7,700,343 | $ | 237,751,000 | 10,715,039 | $ | 265,018,157 | ||||||||||
| Shares converted from Class C | 607,731 | 18,905,165 | 66,519 | 1,564,433 | ||||||||||||
| Dividends reinvested | 4,255,947 | 124,060,855 | 3,352,811 | 74,298,292 | ||||||||||||
| Shares redeemed | (11,960,300 | ) | (367,120,750 | ) | (12,890,128 | ) | (307,079,479 | ) | ||||||||
| Net increase | 603,721 | $ | 13,596,270 | 1,244,241 | $ | 33,801,403 | ||||||||||
| Class C: | ||||||||||||||||
| Shares sold | 1,258,944 | $ | 33,669,143 | 2,488,771 | $ | 51,798,205 | ||||||||||
| Shares converted to Class A | (698,641 | ) | (18,905,165 | ) | (74,893 | ) | (1,564,433 | ) | ||||||||
| Dividends reinvested | 2,526,887 | 64,157,661 | 2,276,639 | 44,827,010 | ||||||||||||
| Shares redeemed | (7,757,295 | ) | (209,313,239 | ) | (12,334,054 | ) | (268,798,211 | ) | ||||||||
| Net decrease | (4,670,105 | ) | $ | (130,391,600 | ) | (7,643,537 | ) | $ | (173,737,429 | ) | ||||||
| Class I: | ||||||||||||||||
| Shares sold | 1,641,178 | $ | 51,043,309 | 4,404,578 | $ | 103,344,108 | ||||||||||
| Dividends reinvested | 1,126,398 | 33,273,802 | 2,005,734 | 44,988,618 | ||||||||||||
| Shares redeemed | (6,995,222 | ) | (214,741,862 | ) | (20,477,840 | ) | (533,620,677 | ) | ||||||||
| Net decrease | (4,227,646 | ) | $ | (130,424,751 | ) | (14,067,528 | ) | $ | (385,287,951 | ) | ||||||
| Class Y: | ||||||||||||||||
| Shares sold | 3,070,135 | $ | 93,265,394 | 2,580,000 | $ | 66,474,771 | ||||||||||
| Dividends reinvested | 371,377 | 11,293,579 | 140,505 | 3,225,999 | ||||||||||||
| Shares redeemed | (760,143 | ) | (24,676,819 | ) | (466,211 | ) | (12,519,844 | ) | ||||||||
| Net increase | 2,681,369 | $ | 79,882,154 | 2,254,294 | $ | 57,180,926 | ||||||||||
| Class Z: | ||||||||||||||||
| Shares sold | 26,539,344 | $ | 845,279,756 | 36,350,314 | $ | 935,480,385 | ||||||||||
| Dividends reinvested | 11,824,154 | 359,217,814 | 8,953,293 | 205,388,527 | ||||||||||||
| Shares redeemed | (32,695,611 | ) | (1,051,627,338 | ) | (45,879,132 | ) | (1,128,409,986 | ) | ||||||||
| Net increase (decrease) | 5,667,887 | $ | 152,870,232 | (575,525 | ) | $ | 12,458,926 | |||||||||
THE ALGER FUNDS II
NOTES TO FINANCIAL STATEMENTS (Continued)
FOR THE YEAR ENDED OCTOBER 31, 2021 | FOR THE YEAR ENDED OCTOBER 31, 2020 | |||||||||||||||
| SHARES | AMOUNT | SHARES | AMOUNT | |||||||||||||
| Alger Dynamic Opportunities Fund | ||||||||||||||||
| Class A: | ||||||||||||||||
| Shares sold | 3,305,242 | $ | 67,888,013 | 3,624,168 | $ | 59,212,893 | ||||||||||
| Shares converted from Class C | 2,592 | 52,701 | 3,062 | 48,201 | ||||||||||||
| Dividends reinvested | 178,145 | 3,354,483 | 79,652 | 1,088,046 | ||||||||||||
| Shares redeemed | (2,151,855 | ) | (43,800,130 | ) | (2,690,591 | ) | (45,281,058 | ) | ||||||||
| Net increase | 1,334,124 | $ | 27,495,067 | 1,016,291 | $ | 15,068,082 | ||||||||||
| Class C: | ||||||||||||||||
| Shares sold | 423,631 | $ | 7,857,459 | 244,074 | $ | 3,703,525 | ||||||||||
| Shares converted to Class A | (2,851 | ) | (52,701 | ) | (3,333 | ) | (48,201 | ) | ||||||||
| Dividends reinvested | 39,061 | 669,499 | 21,810 | 274,591 | ||||||||||||
| Shares redeemed | (191,195 | ) | (3,551,177 | ) | (187,592 | ) | (2,634,036 | ) | ||||||||
| Net increase | 268,646 | $ | 4,923,080 | 74,959 | $ | 1,295,879 | ||||||||||
| Class Z: | ||||||||||||||||
| Shares sold | 23,899,862 | $ | 507,438,516 | 15,151,731 | $ | 264,199,101 | ||||||||||
| Dividends reinvested | 970,640 | 18,898,368 | 172,664 | 2,429,386 | ||||||||||||
| Shares redeemed | (6,597,415 | ) | (139,342,347 | ) | (2,641,916 | ) | (42,076,442 | ) | ||||||||
| Net increase | 18,273,087 | $ | 386,994,537 | 12,682,479 | $ | 224,552,045 | ||||||||||
| Alger Emerging Markets Fund | ||||||||||||||||
| Class A: | ||||||||||||||||
| Shares sold | 242,387 | $ | 3,485,202 | 55,253 | $ | 572,472 | ||||||||||
| Dividends reinvested | — | — | 18,173 | 182,825 | ||||||||||||
| Shares redeemed | (77,861 | ) | (1,126,627 | ) | (192,275 | ) | (1,809,275 | ) | ||||||||
| Net increase (decrease) | 164,526 | $ | 2,358,575 | (118,849 | ) | $ | (1,053,978 | ) | ||||||||
| Class C: | ||||||||||||||||
| Shares sold | 23,261 | $ | 320,530 | 6,443 | $ | 64,232 | ||||||||||
| Dividends reinvested | — | — | 11,207 | 108,145 | ||||||||||||
| Shares redeemed | (35,812 | ) | (490,754 | ) | (76,931 | ) | (734,784 | ) | ||||||||
| Net decrease | (12,551 | ) | $ | (170,224 | ) | (59,281 | ) | $ | (562,407 | ) | ||||||
| Class I: | ||||||||||||||||
| Shares sold | 69,673 | $ | 993,269 | 158,903 | $ | 1,754,767 | ||||||||||
| Dividends reinvested | — | — | 14,926 | 148,512 | ||||||||||||
| Shares redeemed | (154,840 | ) | (2,222,880 | ) | (218,921 | ) | (2,238,414 | ) | ||||||||
| Net decrease | (85,167 | ) | $ | (1,229,611 | ) | (45,092 | ) | $ | (335,135 | ) | ||||||
| Class Y: | ||||||||||||||||
| Shares redeemed | — | — | (309 | ) | (3,146 | ) | ||||||||||
| Net decrease | — | $ | — | (309 | ) | $ | (3,146 | ) | ||||||||
| Class Z: | ||||||||||||||||
| Shares sold | 1,784,420 | $ | 26,131,363 | 206,651 | $ | 2,171,086 | ||||||||||
| Dividends reinvested | — | — | 72,341 | 728,473 | ||||||||||||
| Shares redeemed | (415,867 | ) | (6,045,142 | ) | (600,809 | ) | (5,867,363 | ) | ||||||||
| Net increase (decrease) | 1,368,553 | $ | 20,086,221 | (321,817 | ) | $ | (2,967,804 | ) | ||||||||
THE ALGER FUNDS II
NOTES TO FINANCIAL STATEMENTS (Continued)
FOR THE YEAR ENDED OCTOBER 31, 2021 | FOR THE YEAR ENDED OCTOBER 31, 2020 | |||||||||||||||
| SHARES | AMOUNT | SHARES | AMOUNT | |||||||||||||
| Alger Responsible Investing Fund | ||||||||||||||||
| Class A: | ||||||||||||||||
| Shares sold | 545,740 | $ | 8,378,057 | 564,468 | $ | 6,985,965 | ||||||||||
| Shares converted from Class C | 1,090 | 16,200 | 1,268 | 15,028 | ||||||||||||
| Dividends reinvested | 187,966 | 2,657,847 | 184,700 | 2,070,483 | ||||||||||||
| Shares redeemed | (629,260 | ) | (9,559,391 | ) | (570,922 | ) | (6,849,553 | ) | ||||||||
| Net increase | 105,536 | $ | 1,492,713 | 179,514 | $ | 2,221,923 | ||||||||||
| Class C: | ||||||||||||||||
| Shares sold | 34,210 | $ | 458,326 | 57,681 | $ | 625,278 | ||||||||||
| Shares converted to Class A | (1,256 | ) | (16,200 | ) | (1,434 | ) | (15,028 | ) | ||||||||
| Dividends reinvested | 31,136 | 382,658 | 39,555 | 392,389 | ||||||||||||
| Shares redeemed | (176,611 | ) | (2,342,581 | ) | (174,134 | ) | (1,910,797 | ) | ||||||||
| Net decrease | (112,521 | ) | $ | (1,517,797 | ) | (78,332 | ) | $ | (908,158 | ) | ||||||
| Class I: | ||||||||||||||||
| Shares sold | 13,905 | $ | 213,947 | 136,979 | $ | 1,586,755 | ||||||||||
| Dividends reinvested | 35,640 | 502,521 | 67,189 | 751,841 | ||||||||||||
| Shares redeemed | (259,345 | ) | (3,889,958 | ) | (503,817 | ) | (6,331,303 | ) | ||||||||
| Net decrease | (209,800 | ) | $ | (3,173,490 | ) | (299,649 | ) | $ | (3,992,707 | ) | ||||||
| Class Z: | ||||||||||||||||
| Shares sold | 543,990 | $ | 8,449,590 | 637,550 | $ | 8,091,217 | ||||||||||
| Dividends reinvested | 106,784 | 1,543,037 | 83,450 | 951,326 | ||||||||||||
| Shares redeemed | (297,983 | ) | (4,624,568 | ) | (451,900 | ) | (5,666,421 | ) | ||||||||
| Net increase | 352,791 | $ | 5,368,059 | 269,100 | $ | 3,376,122 | ||||||||||
NOTE 7 — Income Tax Information:
The tax character of distributions paid during the year ended October 31, 2021 and the year ended October 31, 2020 was as follows:
FOR THE YEAR ENDED OCTOBER 31, 2021 | FOR THE YEAR ENDED OCTOBER 31, 2020 | |||||||
| Alger Spectra Fund | ||||||||
Distributions paid from: | ||||||||
| Ordinary Income | $ | — | $ | — | ||||
| Long-term capital gain | 671,778,750 | 427,433,679 | ||||||
| Total distributions paid | $ | 671,778,750 | $ | 427,433,679 | ||||
| Alger Dynamic Opportunities Fund | ||||||||
Distributions paid from: | ||||||||
| Ordinary Income | $ | 9,925,509 | $ | — | ||||
| Long-term capital gain | 13,764,270 | 4,175,536 | ||||||
| Total distributions paid | $ | 23,689,779 | $ | 4,175,536 |
THE ALGER FUNDS II
NOTES TO FINANCIAL STATEMENTS (Continued)
FOR THE YEAR ENDED OCTOBER 31, 2021 | FOR THE YEAR ENDED OCTOBER 31, 2020 | |||||||
| Alger Emerging Markets Fund | ||||||||
Distributions paid from: | ||||||||
| Ordinary Income | $ | — | $ | 1,175,715 | ||||
| Long-term capital gain | — | — | ||||||
| Total distributions paid | $ | — | $ | 1,175,715 | ||||
| Alger Responsible Investing Fund | ||||||||
Distributions paid from: | ||||||||
| Ordinary Income | $ | — | $ | — | ||||
| Long-term capital gain | 5,586,226 | 4,603,397 | ||||||
| Total distributions paid | $ | 5,586,226 | $ | 4,603,397 | ||||
As of October 31, 2021, the components of accumulated gains (losses) on a tax basis were as follows:
| Alger Spectra Fund | ||||
| Undistributed ordinary income | $ | — | ||
| Undistributed long-term gains | 2,121,027,391 | |||
| Net accumulated earnings | 2,121,027,391 | |||
| Capital loss carryforwards | — | |||
| Late year ordinary income losses | (63,966,782 | ) | ||
| Net unrealized appreciation | 3,528,592,718 | |||
| Total accumulated earnings | $ | 5,585,653,327 | ||
| Alger Dynamic Opportunities Fund | ||||
| Undistributed ordinary income | $ | 280,571 | ||
| Undistributed long-term gains | 46,658,036 | |||
| Net accumulated earnings | 46,938,607 | |||
| Capital loss carryforwards | — | |||
| Late year ordinary income losses | — | |||
| Net unrealized appreciation | 156,415,344 | |||
| Total accumulated earnings | $ | 203,353,951 | ||
| Alger Emerging Markets Fund | ||||
| Undistributed ordinary income | $ | 157,231 | ||
| Undistributed long-term gains | 979,900 | |||
| Net accumulated earnings | 1,137,131 | |||
| Capital loss carryforwards | — | |||
| Late year ordinary income losses | — | |||
| Net unrealized appreciation | 3,887,692 | |||
| Total accumulated losses | $ | 5,024,823 | ||
THE ALGER FUNDS II
NOTES TO FINANCIAL STATEMENTS (Continued)
| Alger Responsible Investing Fund | ||||
| Undistributed ordinary income | $ | — | ||
| Undistributed long-term gains | 7,752,116 | |||
| Net accumulated earnings | 7,752,116 | |||
| Capital loss carryforwards | — | |||
| Late year ordinary income losses | (370,586 | ) | ||
| Net unrealized appreciation | 62,878,026 | |||
| Total accumulated earnings | $ | 70,259,556 | ||
During the year ended October 31, 2021, the Funds had no capital loss carryforwards utilized for federal income tax purposes.
The difference between book-basis and tax-basis unrealized appreciation (depreciation) is determined annually and is attributable primarily to the tax deferral of losses on wash sales, U.S. Internal Revenue Code Section 988 currency transactions, nondeductible expenses on dividends sold short, the tax treatment of partnership investments, the realization of unrealized appreciation of passive foreign investment companies, and the return of capital from real estate investment trust investments.
The Funds accrue tax on unrealized gains in foreign jurisdictions that impose a foreign capital tax.
Permanent differences, primarily from net operating losses and real estate investment trusts and partnership investments sold by the Funds, resulted in the following reclassifications among the Fund’s components of net assets at October 31, 2021:
| Alger Spectra Fund | ||||
| Distributable earnings | $ | (114,332,337 | ) | |
| Paid-in Capital | $ | 114,332,337 | ||
| Alger Dynamic Opportunities Fund | ||||
| Distributable earnings | $ | (159,856 | ) | |
| Paid-in Capital | $ | 159,856 | ||
| Alger Responsible Investing Fund | ||||
| Distributable earnings | $ | 261,091 | ||
| Paid-in Capital | $ | (261,091 | ) | |
NOTE 8 — Fair Value Measurements:
The following is a summary of the inputs used as of October 31, 2021 in valuing the Funds’ investments carried at fair value on a recurring basis. Based upon the nature, characteristics, and risks associated with their investments, the Funds have determined that presenting them by security type and sector is appropriate.
THE ALGER FUNDS II
NOTES TO FINANCIAL STATEMENTS (Continued)
| Alger Spectra Fund | TOTAL | LEVEL 1 | LEVEL 2 | LEVEL 3 | ||||||||||||
| COMMON STOCKS | ||||||||||||||||
| Communication Services | $ | 1,099,034,652 | $ | 1,099,034,652 | $ | — | $ | — | ||||||||
| Consumer Discretionary | 1,812,932,395 | 1,789,011,240 | 21,549,920 | 2,371,235 | ||||||||||||
| Financials | 633,792,593 | 633,792,593 | — | — | ||||||||||||
| Healthcare | 1,244,109,066 | 1,244,109,066 | — | — | ||||||||||||
| Industrials | 736,689,057 | 736,689,057 | — | — | ||||||||||||
| Information Technology | 4,244,510,085 | 4,244,510,085 | — | — | ||||||||||||
| Real Estate | 42,985,199 | 42,985,199 | — | — | ||||||||||||
| TOTAL COMMON STOCKS | $ | 9,814,053,047 | $ | 9,790,131,892 | $ | 21,549,920 | $ | 2,371,235 | ||||||||
| PREFERRED STOCKS | ||||||||||||||||
| Healthcare | — | * | — | — | — | * | ||||||||||
| Information Technology | 13,025,390 | — | — | 13,025,390 | ||||||||||||
| TOTAL PREFERRED STOCKS | $ | 13,025,390 | * | $ | — | $ | — | $ | 13,025,390 | * | ||||||
| SPECIAL PURPOSE VEHICLE | ||||||||||||||||
| Information Technology | 19,486,623 | — | — | 19,486,623 | ||||||||||||
| TOTAL INVESTMENTS IN SECURITIES | $ | 9,846,565,060 | $ | 9,790,131,892 | $ | 21,549,920 | $ | 34,883,248 | ||||||||
| SECURITIES SOLD SHORT | ||||||||||||||||
| COMMON STOCKS | ||||||||||||||||
| Communication Services | 43,179,353 | 43,179,353 | — | — | ||||||||||||
| Consumer Discretionary | 127,982,235 | 127,982,235 | — | — | ||||||||||||
| Consumer Staples | 86,976,385 | 86,976,385 | — | — | ||||||||||||
| Financials | 110,470,495 | 110,470,495 | — | — | ||||||||||||
| Healthcare | 21,642,175 | 21,642,175 | — | — | ||||||||||||
| Industrials | 108,506,504 | 108,506,504 | — | — | ||||||||||||
| Information Technology | 26,261,965 | 26,261,965 | — | — | ||||||||||||
| Market Indices | 316,325,373 | 316,325,373 | — | — | ||||||||||||
| TOTAL COMMON STOCKS | $ | 841,344,485 | $ | 841,344,485 | $ | — | $ | — | ||||||||
| REAL ESTATE INVESTMENT TRUST | ||||||||||||||||
| Real Estate | 12,353,514 | 12,353,514 | — | — | ||||||||||||
| TOTAL SECURITIES SOLD SHORT | $ | 853,697,999 | $ | 853,697,999 | $ | — | $ | — | ||||||||
| Alger Dynamic Opportunities Fund | TOTAL | LEVEL 1 | LEVEL 2 | LEVEL 3 | ||||||||||||
| COMMON STOCKS | ||||||||||||||||
| Communication Services | $ | 80,601,617 | $ | 80,601,617 | $ | — | $ | — | ||||||||
| Consumer Discretionary | 140,527,917 | 131,297,734 | 9,230,183 | — | ||||||||||||
| Energy | 17,834,347 | 17,834,347 | — | — | ||||||||||||
| Financials | 109,397,258 | 109,397,258 | — | — | ||||||||||||
| Healthcare | 190,618,858 | 190,618,858 | — | — | ||||||||||||
| Industrials | 115,498,104 | 115,498,104 | — | — | ||||||||||||
| Information Technology | 266,679,118 | 266,679,118 | — | — | ||||||||||||
| Real Estate | 23,347,457 | 23,347,457 | — | — | ||||||||||||
| TOTAL COMMON STOCKS | $ | 944,504,676 | $ | 935,274,493 | $ | 9,230,183 | $ | — | ||||||||
THE ALGER FUNDS II
NOTES TO FINANCIAL STATEMENTS (Continued)
| Alger Dynamic Opportunities Fund | TOTAL | LEVEL 1 | LEVEL 2 | LEVEL 3 | ||||||||||||
| PREFERRED STOCKS | ||||||||||||||||
| Healthcare | $ | — | * | $ | — | $ | — | $ | — | * | ||||||
| RIGHTS | ||||||||||||||||
| Healthcare | 94,581 | — | — | 94,581 | ||||||||||||
| REAL ESTATE INVESTMENT TRUST | ||||||||||||||||
| Real Estate | 9,118,886 | 9,118,886 | — | — | ||||||||||||
| SPECIAL PURPOSE VEHICLE | ||||||||||||||||
| Information Technology | 2,408,930 | — | — | 2,408,930 | ||||||||||||
| PURCHASED OPTIONS | ||||||||||||||||
| Financials | 19,050 | 19,050 | — | — | ||||||||||||
| TOTAL INVESTMENTS IN SECURITIES | $ | 956,146,123 | $ | 944,412,429 | $ | 9,230,183 | $ | 2,503,511 | ||||||||
| SECURITIES SOLD SHORT | ||||||||||||||||
| COMMON STOCKS | ||||||||||||||||
| Communication Services | 11,590,638 | 11,590,638 | — | — | ||||||||||||
| Consumer Discretionary | 29,639,592 | 29,639,592 | — | — | ||||||||||||
| Consumer Staples | 1,178,513 | 1,178,513 | — | — | ||||||||||||
| Energy | 766,568 | 766,568 | — | — | ||||||||||||
| Financials | 19,831,566 | 19,831,566 | — | — | ||||||||||||
| Healthcare | 23,891,225 | 23,891,225 | — | — | ||||||||||||
| Industrials | 18,533,934 | 18,533,934 | — | — | ||||||||||||
| Information Technology | 43,277,172 | 43,277,172 | — | — | ||||||||||||
| Market Indices | 124,893,520 | 124,893,520 | — | — | ||||||||||||
| Materials | 13,262,652 | 13,262,652 | — | — | ||||||||||||
| Real Estate | 3,931,687 | 3,931,687 | — | — | ||||||||||||
| TOTAL COMMON STOCKS | $ | 290,797,067 | $ | 290,797,067 | $ | — | $ | — | ||||||||
| REAL ESTATE INVESTMENT TRUST | ||||||||||||||||
| Real Estate | 32,034,643 | 32,034,643 | — | — | ||||||||||||
| TOTAL SECURITIES SOLD SHORT | $ | 322,831,710 | $ | 322,831,710 | $ | — | $ | — | ||||||||
| FINANCIAL DERIVATIVE INSTRUMENTS - LIABILITIES | ||||||||||||||||
| Swaps - Contracts for difference | $ | (467,257 | ) | $ | — | $ | (467,257 | ) | $ | — | ||||||
| Alger Emerging Markets Fund | TOTAL | LEVEL 1 | LEVEL 2 | LEVEL 3 | ||||||||||||
| COMMON STOCKS | ||||||||||||||||
| Communication Services | 4,064,410 | 2,102,080 | 1,962,330 | — | ||||||||||||
| Consumer Discretionary | 15,805,744 | 3,894,082 | 11,911,662 | — | ||||||||||||
| Consumer Staples | 91,006 | 91,006 | — | — | ||||||||||||
| Financials | 4,824,494 | 576,671 | 4,247,823 | — | ||||||||||||
| Healthcare | 3,956,156 | 406,546 | 3,549,610 | — | ||||||||||||
| Industrials | 2,513,831 | 1,130,338 | 1,383,493 | — | ||||||||||||
| Information Technology | 11,327,541 | 1,672,536 | 9,655,005 | — | ||||||||||||
| Materials | 2,473,712 | 774,822 | 1,698,890 | — | ||||||||||||
| Real Estate | 1,000,295 | — | 1,000,295 | — | ||||||||||||
| TOTAL COMMON STOCKS | $ | 46,057,189 | $ | 10,648,081 | $ | 35,409,108 | $ | — | ||||||||
| TOTAL INVESTMENTS IN SECURITIES | $ | 46,057,189 | $ | 10,648,081 | $ | 35,409,108 | $ | — | ||||||||
THE ALGER FUNDS II
NOTES TO FINANCIAL STATEMENTS (Continued)
| Alger Responsible Investing Fund | TOTAL | LEVEL 1 | LEVEL 2 | LEVEL 3 | ||||||||||||
| COMMON STOCKS | ||||||||||||||||
| Communication Services | $ | 9,564,348 | $ | 9,564,348 | $ | — | $ | — | ||||||||
| Consumer Discretionary | 17,875,837 | 17,875,837 | — | — | ||||||||||||
| Consumer Staples | 2,699,169 | 2,699,169 | — | — | ||||||||||||
| Financials | 3,757,036 | 3,757,036 | — | — | ||||||||||||
| Healthcare | 8,608,941 | 8,608,941 | — | — | ||||||||||||
| Industrials | 3,958,961 | 3,958,961 | — | — | ||||||||||||
| Information Technology | 46,667,072 | 46,667,072 | — | — | ||||||||||||
| Materials | 1,756,657 | 1,756,657 | — | — | ||||||||||||
| Utilities | 504,130 | 504,130 | — | — | ||||||||||||
| TOTAL COMMON STOCKS | $ | 95,392,151 | $ | 95,392,151 | $ | — | $ | — | ||||||||
| REAL ESTATE INVESTMENT TRUST | ||||||||||||||||
| Real Estate | 2,833,913 | 2,833,913 | — | — | ||||||||||||
| TOTAL INVESTMENTS IN SECURITIES | $ | 98,226,064 | $ | 98,226,064 | $ | — | $ | — | ||||||||
* Alger Spectra Fund’s and Alger Dynamic Opportunities Fund’s holdings of Prosetta Biosciences, Inc., Series D shares are classified as a Level 3 investment and are fair valued at zero as of October 31, 2021.
FAIR VALUE MEASUREMENTS USING SIGNIFICANT UNOBSERVABLE INPUTS (LEVEL 3) | ||||
| Alger Spectra Fund | Common Stocks | |||
Opening balance at November 1, 2020 | $ | 13,384,440 | ||
| Transfers into Level 3 | — | |||
| Transfers out of Level 3 | — | |||
| Total gains or losses | ||||
| Included in net realized gain (loss) on investments | 5,005,015 | |||
| Included in net change in unrealized appreciation (depreciation) on investments | (6,102,697 | ) | ||
| Purchases and sales | ||||
| Purchases/Conversions | — | |||
| Sales | (9,915,523 | ) | ||
Closing balance at October 31, 2021 | 2,371,235 | |||
| Net change in unrealized appreciation (depreciation) attributable to investments still held at October 31, 2021** | $ | (6,102,697 | ) | |
THE ALGER FUNDS II
NOTES TO FINANCIAL STATEMENTS (Continued)
FAIR VALUE MEASUREMENTS USING SIGNIFICANT UNOBSERVABLE INPUTS (LEVEL 3) | ||||
| Alger Spectra Fund | Preferred Stocks | |||
Opening balance at November 1, 2020 | $ | 436,802 | ||
| Transfers into Level 3 | — | |||
| Transfers out of Level 3 | — | |||
| Total gains or losses | ||||
| Included in net realized gain (loss) on investments | — | |||
| Included in net change in unrealized appreciation (depreciation) on investments | (436,802 | ) | ||
| Purchases and sales | ||||
| Purchases | 13,025,390 | |||
| Sales/Conversions | — | |||
Closing balance at October 31, 2021 | 13,025,390 | * | ||
| Net change in unrealized appreciation (depreciation) attributable to investments still held at October 31, 2021** | $ | (436,802 | ) | |
Alger Spectra Fund | Special Purpose Vehicle | |||
Opening balance at November 1, 2020 | $ | 7,350,000 | ||
| Transfers into Level 3 | — | |||
| Transfers out of Level 3 | — | |||
| Total gains or losses | ||||
| Included in net realized gain (loss) on investments | — | |||
| Included in net change in unrealized appreciation (depreciation) on investments | 7,561,623 | |||
| Purchases and sales | ||||
| Purchases | 4,575,000 | |||
| Sales | — | |||
Closing balance at October 31, 2021 | 19,486,623 | |||
| Net change in unrealized appreciation (depreciation) attributable to investments still held at October 31, 2021** | $ | 7,561,623 | ||
THE ALGER FUNDS II
NOTES TO FINANCIAL STATEMENTS (Continued)
FAIR VALUE MEASUREMENTS USING SIGNIFICANT UNOBSERVABLE INPUTS (LEVEL 3) | ||||
| Alger Dynamic Opportunities Fund | Preferred Stocks | |||
Opening balance at November 1, 2020 | $ | 6,213 | ||
| Transfers into Level 3 | — | |||
| Transfers out of Level 3 | — | |||
| Total gains or losses | ||||
| Included in net realized gain (loss) on investments | — | |||
| Included in net change in unrealized appreciation (depreciation) on investments | (6,213 | ) | ||
| Purchases and sales | ||||
| Purchases | — | |||
| Sales/Conversions | — | |||
Closing balance at October 31, 2021 | — | * | ||
| Net change in unrealized appreciation (depreciation) attributable to investments still held at October 31, 2021** | $ | (6,213 | ) | |
| Alger Dynamic Opportunities Fund | Rights | |||
Opening balance at November 1, 2020 | $ | 87,015 | * | |
| Transfers into Level 3 | — | |||
| Transfers out of Level 3 | — | |||
| Total gains or losses | ||||
| Included in net realized gain (loss) on investments | — | |||
| Included in net change in unrealized appreciation (depreciation) on investments | 7,566 | |||
| Purchases and sales | ||||
| Purchases | — | |||
| Sales | — | |||
Closing balance at October 31, 2021 | 94,581 | |||
| Net change in unrealized appreciation (depreciation) attributable to investments still held at October 31, 2021** | $ | 7,566 | ||
THE ALGER FUNDS II
NOTES TO FINANCIAL STATEMENTS (Continued)
FAIR VALUE MEASUREMENTS USING SIGNIFICANT UNOBSERVABLE INPUTS (LEVEL 3) | ||||
| Alger Dynamic Opportunities Fund | Special Purpose Vehicle | |||
Opening balance at November 1, 2020 | $ | 925,000 | ||
| Transfers into Level 3 | — | |||
| Transfers out of Level 3 | — | |||
| Total gains or losses | ||||
| Included in net realized gain (loss) on investments | — | |||
| Included in net change in unrealized appreciation (depreciation) on investments | 933,930 | |||
| Purchases and sales | ||||
| Purchases | 550,000 | |||
| Sales | — | |||
Closing balance at October 31, 2021 | 2,408,930 | |||
| Net change in unrealized appreciation (depreciation) attributable to investments still held at October 31, 2021** | $ | 933,930 | ||
* Includes securities that are fair valued at zero.
** Net change in unrealized appreciation (depreciation) is included in net change in unrealized appreciation (depreciation) on investments in the accompanying statement of operations.
The following table provides quantitative information about each Fund’s Level 3 fair value measurements of the Funds’ investments as of October 31, 2021. The table below is not intended to be all-inclusive, but rather provides information on the Level 3 inputs as they relate to the Funds’ fair value measurements.
Fair Value October 31, 2021 | Valuation Methodology | Unobservable Input | Input/Range | Weighted Average Inputs | |||||||||
Alger Spectra Fund | |||||||||||||
| Common Stocks | 2,371,235 | Income Approach | Discount Rate Probability of Success | 3.28% 15.00%-50.00 | % | N/A N/A | |||||||
| Preferred Stocks | – | * | Income Approach | Discount Rate | 100.00 | % | N/A | ||||||
| Preferred Stocks | 13,025,390 | Cost Approach | Priced at cost | N/A | N/A | ||||||||
| Special Purpose Vehicle | 19,486,623 | Market Approach | Transaction price Revenue Multiple | N/A 28.5x-29.5 | x | N/A N/A | |||||||
THE ALGER FUNDS II
NOTES TO FINANCIAL STATEMENTS (Continued)
Fair Value October 31, 2021 | Valuation Methodology | Unobservable Input | Input/Range | Weighted Average Inputs | |||||||||
Alger Dynamic Opportunities Fund | |||||||||||||
| Preferred Stocks | – | * | Income Approach | Discount Rate | 100.00 | % | N/A | ||||||
| Rights | 94,581 | Income Approach | Discount Rate Probability of Success | 3.58%-5.07% 0.00%-100.00 | % | N/A N/A | |||||||
| Special Purpose Vehicle | 2,408,930 | Market Approach | Transaction price Revenue Multiple | N/A 28.5x-29.5 | x | N/A N/A | |||||||
| * | Prosetta Biosciences, Inc., Series D shares are classified as a Level 3 investment and are fair valued at zero as of October 31, 2021. |
The significant unobservable inputs used in the fair value measurement of each Fund’s securities are revenue and EBITDA multiples, discount rates, and the probabilities of success of certain outcomes. Significant increases and decreases in these inputs in isolation and interrelationships between these inputs would have resulted in significantly higher or lower fair value measurements than those noted in the table above. Generally, all other things being equal, increases in revenue and EBITDA multiples, decreases in discount rates, and increases in the probabilities of success result in higher fair value measurements, whereas decreases in revenues and EBITDA multiples, increases in discount rates, and decreases in the probabilities of success result in lower fair value measurements.
Certain of the Funds’ assets and liabilities are held at carrying amount or face value, which approximates fair value for financial statements purposes. As of October 31, 2021, such assets were categorized within the ASC 820 disclosure hierarchy as follows:
| TOTAL | LEVEL 1 | LEVEL 2 | LEVEL 3 | |||||||||||||
| Cash, foreign cash and cash equivalents: | ||||||||||||||||
Alger Spectra Fund | $ | 34,968,243 | $ | (2,710 | ) | $ | 34,970,953 | $ | – | |||||||
Collateral held for short sales(a) | 418,211,526 | 418,211,526 | – | – | ||||||||||||
Due to broker(b) | (497,779,936 | ) | (497,779,936 | ) | – | – | ||||||||||
Alger Dynamic Opportunities Fund | 46,942,356 | – | 46,942,356 | – | ||||||||||||
Collateral held for short sales(a) | 303,574,347 | 303,574,347 | – | – | ||||||||||||
Collateral pledged for OTC swaps(c) | (2,045,010 | ) | (2,045,010 | ) | – | – | ||||||||||
Alger Emerging Markets Fund | 1,323,966 | 51,046 | 1,272,920 | – | ||||||||||||
Alger Responsible Investing Fund | 1,604,206 | – | 1,604,206 | – | ||||||||||||
(a) The collateral held for short sales balance represents restricted cash held at prime brokers as of October 31, 2021.
(b) The due to broker balance represents a margin payable related to short sales due to prime brokers as of October 31, 2021.
(c) The collateral held for OTC swaps balance represents restricted cash held at prime brokers as of October 31, 2021.
THE ALGER FUNDS II
NOTES TO FINANCIAL STATEMENTS (Continued)
FASB Accounting Standards Codification 815 – Derivatives and Hedging (“ASC 815”) requires qualitative disclosures about objectives and strategies for using derivatives, quantitative disclosures about fair value amounts of and gains and losses on derivative instruments, and disclosures about credit-risk-related contingent features in derivative agreements.
Options — The Funds seek to capture the majority of the returns associated with equity market investments. To meet this investment goal, the Funds invest in a broadly diversified portfolio of common stocks, the Funds may also buy and sell call and put options on equities and equity indexes. The Funds may also purchase call options to increase their exposure to the stock market and also provide diversification of risk. The Funds may also purchase put options in order to protect from significant market declines that may occur over a short period of time. The Funds may also write covered call and cash secured put options to generate cash flows while reducing the volatility of the Funds’ portfolios. The cash flows may be an important source of the Funds’ returns, although written call options may reduce the Funds’ ability to profit from increases in the value of the underlying security or equity portfolio. The value of a call option generally increases as the price of the underlying stock increases and decreases as the stock decreases in price. Conversely, the value of a put option generally increases as the price of the underlying stock decreases and decreases as the stock increases in price. The combination of the diversified stock portfolio and the purchase and sale of options is intended to provide the Funds with the majority of the returns associated with equity market investments but with reduced volatility and returns that are augmented with the cash flows from the sale of options. During the year ended October 31, 2021, options were used in accordance with these objectives.
The Funds’ option contracts were not subject to any rights of offset with any counterparty. All of the Funds’ options were exchange traded which utilize a clearinghouse that acts as an intermediary between buyer and seller, receiving initial and maintenance margin from both, and guaranteeing performance of the option contract. The purchased options included on the Statement of Assets and Liabilities are exchange traded and not subject to offsetting.
Forward foreign currency contracts — In connection with portfolio purchases and sales of securities denominated in foreign currencies, the Funds may enter into forward foreign currency contracts. Additionally, the Funds may enter into such contracts to economically hedge certain other foreign currency denominated investments. These contracts are valued at the current cost of covering or offsetting such contracts and the related realized and unrealized foreign exchange gains and losses are included in the Statement of Operations. In the event that counterparties fail to settle these currency contracts or the related foreign security trades, the Funds could be exposed to foreign currency fluctuation.
THE ALGER FUNDS II
NOTES TO FINANCIAL STATEMENTS (Continued)
| ASSET DERIVATIVES 2021 | LIABILITY DERIVATIVES 2021 | ||||||||||
| Alger Dynamic Opportunities Fund | |||||||||||
Derivatives not accounted for as hedging instruments | Statements of Assets and Liabilities Location | Fair Value | Statements of Assets and Liabilities Location | Fair Value | |||||||
Purchased Put Options | Investments in Unaffiliated Securities, at value | $ | 19,050 | N/A | $ | – | |||||
Total | $ | 19,050 | $ | – | |||||||
For the year ended October 31, 2021, Alger Dynamic Opportunities Fund had option purchases of $501,907 and option sales of $1,521,892. The average volume of contracts for purchased options for the year ended October 31, 2021 was $12,008 based on market value. The effect of derivative instruments on the accompanying Statement of Operations for the year ended October 31, 2021 was as follows:
| NET REALIZED GAIN/(LOSS) ON DERIVATIVES | ||||
| Alger Dynamic Opportunities Fund | ||||
Derivatives not accounted for as hedging instruments | ||||
Purchased Options | $ | (1,019,985 | ) | |
Total | $ | (1,019,985 | ) | |
| NET CHANGE IN UNREALIZED DEPRECIATION ON OPTIONS | ||||
| Alger Dynamic Opportunities Fund | ||||
Derivatives not accounted for as hedging instruments | Options | |||
Purchased Options | $ | (8,800 | ) | |
Total | $ | (8,800 | ) | |
Swaps — Swap agreements are two-party contracts entered into primarily by institutional investors for periods ranging from a few weeks to more than one year. In a standard “swap” transaction, two parties agree to exchange the returns (or differentials in rates of return) earned or realized on particular predetermined investments or instruments. The gross returns to be exchanged or “swapped” between the parties are generally calculated with respect to a “notional amount,” i.e., the return on or increase in value of a particular dollar amount invested at a particular interest rate, in a particular foreign currency, or in a “basket” of swaps or securities representing a particular index. The “notional amount” of the swap agreement is only used as a basis upon which to calculate the obligations that the parties to a swap agreement have agreed to exchange.
THE ALGER FUNDS II
NOTES TO FINANCIAL STATEMENTS (Continued)
Contracts for Differences — The Fund may enter into Contracts for Differences (“CFDs”). CFDs are leveraged derivative instruments that allow a Fund to take a position on the change in the market price of an underlying asset, such as a stock, or the value of an index or currency exchange rate. With a short CFD, a Fund is seeking to profit from falls in the market price of the asset. CFDs are subject to liquidity risk because the liquidity of CFDs is based on the liquidity of the underlying instrument, and are subject to counterparty risk, i.e., the risk that the counterparty to the CFD transaction may be unable or unwilling to make payments or to otherwise honor its financial obligations under the terms of the contract. It is also possible that the market price of the CFD will move between the time the order is placed by a Fund and when it is executed by the issuer, which can result in the trade being executed at a less favorable price. CFDs, like many other derivative instruments, involve the risk that, if the derivative security declines in value, additional margin would be required to maintain the margin level. The seller may require a Fund to deposit additional sums to cover this decline in value, and the margin call may be at short notice. If additional margin is not provided in time, the seller may liquidate the positions at a loss for which a Fund is liable. The potential for margin calls and large losses are much greater in CFDs than in other leveraged products. Most CFDs are traded OTC. CFDs are not registered with the SEC or any U.S. regulator, and are not subject to U.S. regulation. In a short position, a Fund will receive or pay an amount based upon the amount, if any, by which the notional amount of the CFD would have decreased or increased in value had it sold the particular stocks short, less the dividends that would have been paid on those stocks, plus a floating rate of interest on the notional amount of the CFD. All of these components are reflected in the market value of the CFD.
The use of swap agreements is a highly specialized activity which involves strategies and risks different from those associated with ordinary portfolio security transactions. If Alger Management is incorrect in its forecasts of applicable market factors, or a counterparty defaults, the investment performance of the Fund would diminish compared with what it would have been if these techniques were not used. In addition, it is possible that developments in the swap market, including potential government regulation, could adversely affect the Fund’s ability to terminate existing swap agreements or to realize amounts to be received under such agreements.
| ASSET DERIVATIVES 2021 | LIABILITY DERIVATIVES 2021 | ||||||||||
| Alger Dynamic Opportunities Fund | |||||||||||
Centrally cleared swaps – Contracts for difference*,+ | Assets Fair Value | $ | 807,114 | Liabilities Fair Value | $ | (295,979 | ) | ||||
| Over the counter swaps – Contracts for difference+ | Assets Fair Value | $ | – | Liabilities Fair Value | $ | (948,899 | ) | ||||
Total | $ | 807,114 | $ | (1,244,878 | ) | ||||||
* Includes cumulative appreciation (depreciation) of centrally cleared swaps contracts as reported in the Schedule of Investments. Only current day’s variation margin is reported within the Statement of Assets and Liabilities.
+ Equity contracts.
For the year ended October 31, 2021, the average monthly notional amount of swap contracts for Alger Dynamic Opportunities Fund was $15,467,060. Swaps contracts were held during 3 months of the period. The effect of swap instruments on the accompanying Statement of Operations for the year ended October 31, 2021 was as follows:
THE ALGER FUNDS II
NOTES TO FINANCIAL STATEMENTS (Continued)
| NET REALIZED LOSS ON SWAPS | ||||
| Alger Dynamic Opportunities Fund | ||||
| Contracts for difference+ | $ | (2,036,492 | ) | |
Total | $ | (2,036,492 | ) | |
| NET CHANGE IN UNREALIZED DEPRECIATION ON SWAPS | ||||
| Alger Dynamic Opportunities Fund | ||||
| Contracts for difference+ | $ | (437,764 | ) | |
Total | $ | (437,764 | ) | |
+ Equity contracts.
Disclosure about Offsetting Assets and Liabilities — in order to better define contractual rights under derivative contracts and to secure rights that will help the Funds mitigate their counterparty risk, a Fred Alger Management, LLC may, on behalf of the Funds, enter into an International Swaps and Derivatives Association, Inc. Master Agreement (“ISDA Master Agreement”) or similar agreement with its derivative contract counterparties. An ISDA Master Agreement is a bilateral agreement between a Funds and a counterparty that governs OTC derivatives contracts and typically contains, among other things, collateral posting terms and netting provisions in the event of a default and/or termination event. The ISDA Master Agreement may give a Fund the right, upon an event of default by the applicable counterparty or a termination of the agreement, to close out all transactions traded under such agreement and to net amounts owed under each transaction to one net amount payable by one party to the other. Absent an event of default by the counterparty or a termination of the agreement, the ISDA Master Agreement does not result in an offset of reported amounts of assets and liabilities in the Statements of Assets and Liabilities across the transactions between the Funds and the applicable counterparty . The right to offset and net payments across all transactions traded under the ISDA Master Agreement could result in a reduction of the Funds’ credit risk to such counterparty equal to any amounts payable by the Funds under the applicable transactions, if any. The enforceability of the right to offset may vary by jurisdiction.
Cash collateral that has been received or pledged to cover obligations under derivative contracts, if any, will be reported separately in the Statements of Assets and Liabilities. Generally, the amount of collateral due from or to a counterparty is subject to a minimum transfer threshold amount before a transfer is required, which may vary by counterparty. Collateral pledged for the benefit of the Fund and/or counterparty is held in segregated accounts by the Fund’s custodian and cannot be sold, re-pledged, assigned or otherwise used while pledged. The portion of such collateral representing cash, if any, is reflected as deposits with counterparties and, in the case of cash pledged by a counterparty for the benefit of the Fund, a corresponding liability in the Statements of Assets and Liabilities. Securities pledged by the Fund as collateral, if any, are identified as such in the Schedule of Investments. The carrying amount of such deposits due to brokers at October 31, 2021 approximated their fair value. If measured at fair value, such deposits would have been considered as Level 2 in the fair value hierarchy.
THE ALGER FUNDS II
NOTES TO FINANCIAL STATEMENTS (Continued)
| Alger Dynamic Opportunities Fund | ||||||||
| Assets | Liabilities | |||||||
Gross Amounts of Recognized Assets Presented in the Statements of Assets and Liabilities | Gross Amounts of Recognized Liabilities Presented in the Statements of Assets and Liabilities | |||||||
| Contracts for difference+ | $ | – | $ | 948,899 | ||||
Total | $ | – | $ | 948,899 | ||||
+ Equity contracts.
The following table presents the Funds’ derivative assets and liabilities by counterparty net of amounts available for offset under master netting or similar agreements, and net of related collateral received or pledged as of October 31, 2021:
| Alger Dynamic Opportunities Fund | ||||||||||||||||
Counterparty | Gross Amounts of Recognized Liabilities Presented in the Statements of Assets and Liabilities(a) | Financial Instruments Available for Offset | Collateral Pledged(b) | Net Amount(c) (Not Less than $0) | ||||||||||||
Goldman Sachs | $ | 948,899 | $ | – | $ | (948,899 | ) | $ | – | |||||||
Total | $ | 948,899 | $ | – | $ | (948,899 | ) | $ | – | |||||||
(a) Represents the amount of assets that could be offset by liabilities with the same counterparty under master netting or similar agreements that are not offset on the Statements of Assets and Liabilities.
(b) In some instances, the actual collateral received and/or pledged may be more than the amount shown here due to overcollateralization.
(c) Net amount represents the net amount payable to the counterparty in the event of default.
NOTE 10 — Principal Risks:
Alger Spectra Fund - Investing in the stock market involves risks, including the potential loss of principal. Your investment in Fund shares represents an indirect investment in the securities owned by the Fund. The value of these securities, like other investments, may move up or down, sometimes rapidly and unpredictably. Your Fund shares at any point in time may be worth less than what you invested, even after taking into account the reinvestment of Fund dividends and distributions. Local, regional or global events such as war, acts of terrorism, the spread of infectious illness such as COVID-19 or other public health issues, recessions, or other events could have a significant impact on the Fund and its investments. Growth stocks may be more volatile than other stocks as their prices tend to be higher in relation to their companies’ earnings and may be more sensitive to market, political, and economic developments. A significant portion of assets may be invested in securities of companies in related sectors, and may be similarly affected by economic, political, or market events and conditions and may be more vulnerable to unfavorable sector developments. Foreign securities involve special risks including currency fluctuations, inefficient trading, political and economic instability, and increased volatility. Short sales could increase market exposure, magnifying losses and increasing volatility. Leverage increases volatility in both up and down markets and its costs may exceed the returns of borrowed securities.
THE ALGER FUNDS II
NOTES TO FINANCIAL STATEMENTS (Continued)
Alger Dynamic Opportunities Fund - Investing in the stock market involves risks, including the potential loss of principal. Your investment in Fund shares represents an indirect investment in the securities owned by the Fund. The value of these securities, like other investments, may move up or down, sometimes rapidly and unpredictably. Your Fund shares at any point in time may be worth less than what you invested, even after taking into account the reinvestment of Fund dividends and distributions. Local, regional or global events such as war, acts of terrorism, the spread of infectious illness such as COVID-19 or other public health issues, recessions, or other events could have a significant impact on the Fund and its investments. Growth stocks may be more volatile than other stocks as their prices tend to be higher in relation to their companies’ earnings and may be more sensitive to market, political, and economic developments. A significant portion of assets may be invested in securities of companies in related sectors, and may be similarly affected by economic, political, or market events and conditions and may be more vulnerable to unfavorable sector developments. Cash positions may underperform relative to equity and fixed-income securities. Options and Short sales could increase market exposure, magnifying losses and increasing volatility. Assets may be invested in Financial Derivatives Instruments (FDIs) such as CFDs or options, which involve risks including possible counterparty default, illiquidity, and the risk of losses greater than if they had not been used. Issuers of convertible securities may be more sensitive to economic changes. Investing in companies of small capitalizations involves the risk that such issuers may have limited product lines or financial resources, lack management depth, or have limited liquidity. Leverage increases volatility in both up and down markets and its costs may exceed the returns of borrowed securities. Foreign securities involve special risks including currency fluctuations, inefficient trading, political and economic instability, and increased volatility. Active trading may increase transaction costs, brokerage commissions, and taxes, which can lower the return on investment.
Alger Emerging Markets Fund - Investing in the stock market involves risks, including the potential loss of principal. Your investment in Fund shares represents an indirect investment in the securities owned by the Fund. The value of these securities, like other investments, may move up or down, sometimes rapidly and unpredictably. Your Fund shares at any point in time may be worth less than what you invested, even after taking into account the reinvestment of Fund dividends and distributions. Local, regional or global events such as war, acts of terrorism, the spread of infectious illness such as COVID-19 or other public health issues, recessions, or other events could have a significant impact on the Fund and its investments. Growth stocks may be more volatile than other stocks as their prices tend to be higher in relation to their companies’ earnings and may be more sensitive to market, political, and economic developments. A significant portion of assets may be invested in securities of companies in related sectors, and may be similarly affected by economic, political, or market events and conditions and may be more vulnerable to unfavorable sector developments. Foreign securities, Frontier Markets, and emerging markets involve special risks including currency fluctuations, inefficient trading, political and economic instability, and increased volatility. Assets may be focused in a small number of holdings, making them susceptible to risks associated with a single economic, political or regulatory event than a more diversified portfolio. Investing in companies of small capitalizations involves the risk that such issuers may have limited product lines or financial resources, lack management depth, or have limited liquidity. Active trading may increase transaction costs, brokerage commissions, and taxes, which can lower the return on investment.
THE ALGER FUNDS II
NOTES TO FINANCIAL STATEMENTS (Continued)
Alger Responsible Investing Fund - Investing in the stock market involves risks, including the potential loss of principal. Your investment in Fund shares represents an indirect investment in the securities owned by the Fund. The value of these securities, like other investments, may move up or down, sometimes rapidly and unpredictably. Your Fund shares at any point in time may be worth less than what you invested, even after taking into account the reinvestment of Fund dividends and distributions. Local, regional or global events such as war, acts of terrorism, the spread of infectious illness such as COVID-19 or other public health issues, recessions, or other events could have a significant impact on the Fund and its investments. Growth stocks may be more volatile than other stocks as their prices tend to be higher in relation to their companies’ earnings and may be more sensitive to market, political, and economic developments. The environmental, social and governance investment criteria may limit the number of investment opportunities available, and as a result, returns may be lower than vehicles not subject to such considerations. A significant portion of assets may be invested in securities of companies in related sectors, and may be similarly affected by economic, political, or market events and conditions and may be more vulnerable to unfavorable sector developments.
Transactions in foreign securities may involve certain considerations and risks not typically associated with those of U.S. companies because of, among other factors, the level of governmental supervision and regulation of foreign security markets, and the possibility of political or economic instability. Additional risks associated with investing in emerging markets include increased volatility, limited liquidity, and less stringent regulatory and legal systems.
NOTE 11 — Affiliated Securities:
The issuers of the securities listed below are deemed to be affiliates of the Funds because the Funds or their affiliates owned 5% or more of the issuer’s voting securities during all or part of the year ended October 31, 2021. Information regarding the Funds’ holdings of such securities is set forth in the following table:
THE ALGER FUNDS II
NOTES TO FINANCIAL STATEMENTS (Continued)
| Security | Value at October 31, 2020 | Purchases/ Conversion | Sales/ Conversion | Dividend/ Interest Income | Realized Gain (Loss) | Net Increase (Decrease) in Unrealized App(Dep) | Value at October 31, 2021 | |||||||||||||||||||||
| Alger Spectra Fund | ||||||||||||||||||||||||||||
| Preferred Stocks | ||||||||||||||||||||||||||||
| Prosetta Biosciences, Inc., Series D | $ | 436,802 | $ | – | $ | – | – | – | $ | (436,802 | ) | $ | – | |||||||||||||||
| Special Purpose Vehicle | ||||||||||||||||||||||||||||
| Crosslink Ventures Capital LLC, Cl. A | $ | 7,350,000 | $ | – | $ | – | – | – | $ | 4,418,232 | $ | 11,768,232 | ||||||||||||||||
| Crosslink Ventures Capital LLC, Cl. B | $ | – | $ | 4,575,000 | $ | – | – | – | $ | 3,143,391 | $ | 7,718,391 | ||||||||||||||||
| Total | $ | 7,786,802 | $ | 4,575,000 | $ | – | – | – | $ | 7,124,821 | $ | 19,486,623 | ||||||||||||||||
| Security | Value at October 31, 2020 | Purchases/ Conversion | Sales/ Conversion | Dividend/ Interest Income | Realized Gain (Loss) | Net Increase (Decrease) inUnrealized App(Dep) | Value at October 31, 2021 | |||||||||||||||||||||
| Alger Dynamic Opportunities Fund | ||||||||||||||||||||||||||||
| Preferred Stocks | ||||||||||||||||||||||||||||
| Prosetta Biosciences, Inc., Series D | $ | 6,213 | $ | – | $ | – | – | – | $ | (6,213 | ) | $ | – | |||||||||||||||
| Special Purpose Vehicle | ||||||||||||||||||||||||||||
| Crosslink Ventures Capital LLC, Cl. A | $ | 925,000 | $ | – | $ | – | – | – | $ | 556,036 | $ | 1,481,036 | ||||||||||||||||
| Crosslink Ventures Capital LLC, Cl. B | $ | – | $ | 550,000 | $ | – | – | – | $ | 377,894 | $ | 927,894 | ||||||||||||||||
| Total | $ | 931,213 | $ | 550,000 | $ | – | – | – | $ | 927,717 | $ | 2,408,930 | ||||||||||||||||
NOTE 12 — Subsequent Events:
Management of each Fund has evaluated events that have occurred subsequent to October 31, 2021, through the issuance date of the Financial Statements. The following items were noted which require recognition and/or disclosure:
On September 7, 2021, Brown Brothers Harriman & Co. (“BBH”), the Funds' custodian, announced that it had entered into an agreement with State Street Bank and Trust Company (“State Street”) to sell BBH's Investor Services business to State Street (the “Transaction”). The Transaction is subject to certain closing conditions, including regulatory and customary approvals, and it is expected to be consummated during the first calendar quarter of year 2022 (the “Closing Date”). Consequently, as a result of the Transaction, it is expected that State Street will replace BBH as the Funds' custodian effective as of the Closing Date.
To the Shareholders and the Board of Trustees of The Alger Funds II:
Opinion on the Financial Statements and Financial Highlights
We have audited the accompanying statements of assets and liabilities of The Alger Funds II comprised of Alger Spectra Fund, Alger Dynamic Opportunities Fund, Alger Emerging Markets Fund, and Alger Responsible Investing Fund (collectively, the “Funds”), including the schedules of investments, as of October 31, 2021, the related statements of operations for the year then ended, the statements of changes in net assets for each of the two years in the period then ended, the financial highlights for each of the five years in the period then ended, and the related notes. In our opinion, the financial statements and financial highlights present fairly, in all material respects, the financial position of each of the funds constituting The Alger Funds II as of October 31, 2021, and the results of their operations for the year then ended, the changes in their net assets for each of the two years in the period then ended, and the financial highlights for each of the five years in the period then ended in conformity with accounting principles generally accepted in the United States of America.
Basis for Opinion
These financial statements and financial highlights are the responsibility of the Funds’ management. Our responsibility is to express an opinion on the Funds’ financial statements and financial highlights based on our audits. We are a public accounting firm registered with the Public Company Accounting Oversight Board (United States) (PCAOB) and are required to be independent with respect to the Funds in accordance with the U.S. federal securities laws and the applicable rules and regulations of the Securities and Exchange Commission and the PCAOB.
We conducted our audits in accordance with the standards of the PCAOB. Those standards require that we plan and perform the audit to obtain reasonable assurance about whether the financial statements and financial highlights are free of material misstatement, whether due to error or fraud. The Funds are not required to have, nor were we engaged to perform, an audit of their internal control over financial reporting. As part of our audits we are required to obtain an understanding of internal control over financial reporting but not for the purpose of expressing an opinion on the effectiveness of the Funds’ internal control over financial reporting. Accordingly, we express no such opinion.
Our audits included performing procedures to assess the risks of material misstatement of the financial statements and financial highlights, whether due to error or fraud, and performing procedures that respond to those risks. Such procedures included examining, on a test basis, evidence regarding the amounts and disclosures in the financial statements and financial highlights. Our audits also included evaluating the accounting principles used and significant estimates made by management, as well as evaluating the overall presentation of the financial statements and financial highlights. Our procedures included confirmation of securities owned as of October 31, 2021, by correspondence with the custodian and brokers; when replies were not received from brokers, we performed other auditing procedures. We believe that our audits provide a reasonable basis for our opinion.
REPORT OF INDEPENDENT REGISTERED PUBLIC ACCOUNTING FIRM
Deloitte & Touche LLP
New York, New York
December 21, 2021
We have served as the auditor of one or more investment companies within the Alger group of investment companies since 2009.
Shareholder Expense Example
As a shareholder of the Fund, you incur two types of costs: transaction costs, if applicable, including sales charges (loads) and redemption fees; and ongoing costs, including management fees, distribution (12b-1) fees, if applicable, and other fund expenses. This example is intended to help you understand your ongoing costs (in dollars) of investing in the Fund and to compare these costs with the ongoing costs of investing in other mutual funds.
The example below is based on an investment of $1,000 invested at the beginning of the six-month period starting May 1, 2021 and ending October 31, 2021 and held for the entire period.
Actual Expenses
The first line for each class of shares in the table below provides information about actual account values and actual expenses. You may use the information in this line, together with the amount you invested, to estimate the expenses that you paid over the period. Simply divide your account value by $1,000 (for example, an $8,600 account value divided by $1,000
= 8.6), then multiply the result by the number in the first line under the heading entitled “Expenses Paid During the Six Months Ended October 31, 2021” to estimate the expenses you paid on your account during this period.
Hypothetical Example for Comparison Purposes
The second line for each class of shares in the table below provides information about hypothetical account values and hypothetical expenses based on the actual expense ratio for each class of the Fund’s shares and an assumed rate of return of 5% per year before expenses, which is not the Fund’s actual return. The hypothetical account values and expenses may not be used to estimate the actual ending account balance or expenses you paid for the period. You may use this information to compare the ongoing costs of investing in the Fund and other funds. To do so, compare this 5% hypothetical example with the 5% hypothetical examples that appear in the shareholder reports of other funds.
Please note that the expenses shown in the table are meant to highlight your ongoing costs only and do not reflect any transaction costs, such as sales charges (loads) and redemption fees. Therefore, the second line under each class of shares in the table is useful in comparing ongoing costs only, and will not help you determine the relative total costs of owning different funds. In addition, if these transactional costs were included, your costs would have been higher.
THE ALGER FUNDS II
ADDITIONAL INFORMATION (Unaudited) (Continued)
Beginning Account Value May 1, 2021 | Ending Account Value October 31, 2021 | Expenses Paid During the Six Months Ended October 31, 2021(a) | Annualized Expense Ratio For the Six Months Ended October 31, 2021(b) | ||||||||||||||
| Alger Spectra Fund | |||||||||||||||||
| Class A | Actual | $ | 1,000.00 | $ | 1,088.00 | $ | 7.32 | 1.39 | % | ||||||||
Hypothetical(c) | 1,000.00 | 1,018.20 | 7.07 | 1.39 | |||||||||||||
| Class C | Actual | 1,000.00 | 1,133.90 | 11.62 | 2.16 | ||||||||||||
Hypothetical(c) | 1,000.00 | 1,014.32 | 10.97 | 2.16 | |||||||||||||
| Class I | Actual | 1,000.00 | 1,148.40 | 7.58 | 1.40 | ||||||||||||
Hypothetical(c) | 1,000.00 | 1,018.15 | 7.12 | 1.40 | |||||||||||||
| Class Y | Actual | 1,000.00 | 1,150.20 | 5.91 | 1.09 | ||||||||||||
Hypothetical(c) | 1,000.00 | 1,019.71 | 5.55 | 1.09 | |||||||||||||
| Class Z | Actual | 1,000.00 | 1,150.40 | 5.91 | 1.09 | ||||||||||||
Hypothetical(c) | 1,000.00 | 1,019.71 | 5.55 | 1.09 | |||||||||||||
Alger Dynamic Opportunities Fund | |||||||||||||||||
| Class A | Actual | $ | 1,000.00 | $ | 1,010.00 | $ | 10.13 | 2.00 | % | ||||||||
Hypothetical(c) | 1,000.00 | 1,015.12 | 10.16 | 2.00 | |||||||||||||
| Class C | Actual | 1,000.00 | 1,051.60 | 14.22 | 2.75 | ||||||||||||
Hypothetical(c) | 1,000.00 | 1,011.34 | 13.94 | 2.75 | |||||||||||||
| Class Z | Actual | 1,000.00 | 1,067.50 | 9.12 | 1.75 | ||||||||||||
Hypothetical(c) | 1,000.00 | 1,016.38 | 8.89 | 1.75 | |||||||||||||
Alger Emerging Markets Fund | |||||||||||||||||
| Class A | Actual | $ | 1,000.00 | $ | 946.40 | $ | 7.60 | 1.55 | % | ||||||||
Hypothetical(c) | 1,000.00 | 1,017.39 | 7.88 | 1.55 | |||||||||||||
| Class C | Actual | 1,000.00 | 984.80 | 11.51 | 2.30 | ||||||||||||
Hypothetical(c) | 1,000.00 | 1,013.61 | 11.67 | 2.30 | |||||||||||||
| Class I | Actual | 1,000.00 | 999.30 | 7.26 | 1.44 | ||||||||||||
Hypothetical(c) | 1,000.00 | 1,017.95 | 7.32 | 1.44 | |||||||||||||
| Class Z | Actual | 1,000.00 | 1,001.40 | 4.99 | 0.99 | ||||||||||||
Hypothetical(c) | 1,000.00 | 1,020.21 | 5.04 | 0.99 | |||||||||||||
THE ALGER FUNDS II
ADDITIONAL INFORMATION (Unaudited) (Continued)
Beginning Account Value May 1, 2021 | Ending Account Value October 31, 2021 | Expenses Paid During the Six Months Ended October 31, 2021(a) | Annualized Expense Ratio For the Six Months Ended October 31, 2021(b) | ||||||||||||||
| Alger Responsible Investing Fund | |||||||||||||||||
| Class A | Actual | $ | 1,000.00 | $ | 1,076.60 | $ | 6.65 | 1.27 | % | ||||||||
| Hypothetical(c) | 1,000.00 | 1,018.80 | 6.46 | 1.27 | |||||||||||||
| Class C | Actual | 1,000.00 | 1,121.70 | 10.86 | 2.03 | ||||||||||||
| Hypothetical(c) | 1,000.00 | 1,014.97 | 10.31 | 2.03 | |||||||||||||
| Class I | Actual | 1,000.00 | 1,135.60 | 6.89 | 1.28 | ||||||||||||
| Hypothetical(c) | 1,000.00 | 1,018.75 | 6.51 | 1.28 | |||||||||||||
| Class Z | Actual | 1,000.00 | 1,137.80 | 5.07 | 0.94 | ||||||||||||
| Hypothetical(c) | 1,000.00 | 1,020.47 | 4.79 | 0.94 | |||||||||||||
| (a) | Expenses are equal to the annualized expense ratio of the respective share class, multiplied by the average account value over the period, multiplied by 184/365 (to reflect the one-half year period). |
| (b) | Annualized. |
| (c) | 5% annual return before expenses. |
THE ALGER FUNDS II
ADDITIONAL INFORMATION (Unaudited) (Continued)
Tax information
Alger Spectra Fund, Alger Dynamic Opportunities Fund and Alger Responsible Investing Fund designate $671,778,750, $13,764,270 and $5,586,226, respectively, as approximate amounts of capital gain dividend for the purpose of dividends paid deduction.
In accordance with subchapter M of the Internal Revenue Code of 1986, as amended, for the year ended October 31, 2021, 2.67% of Alger Dynamic Opportunities Fund’s dividends qualified for the dividends deduction for corporations. For the year ended October 31, 2021, certain dividends paid by the Funds may be subject to a maximum rate of 15%, as provided by the Jobs and Growth Tax Relief Reconciliation Act of 2003. Of the distributions paid during the fiscal year, 3.21% of Alger Dynamic Opportunities Fund’s dividends may be considered qualified dividend income.
Shareholders should not use the above information to prepare their tax returns. Since the Fund's fiscal year is not the calendar year, another notification will be sent with respect to calendar year 2021. Such notification, which will reflect the amount to be used by tax payers on their federal income tax returns, will be made in conjunction with Form 1099 DIV and will be mailed in January 2022. Shareholders are advised to consult their own tax advisers with respect to the tax consequences of their investment in the Fund.
THE ALGER FUNDS II
ADDITIONAL INFORMATION (Unaudited) (Continued)
Trustees and Officers of the Trust
Information about the trustees and officers of the Trust is set forth below. In the table the term "Alger Fund Complex" refers to the Trust, The Alger Portfolios, The Alger Funds, The Alger Institutional Funds, Alger Global Focus Fund and The Alger ETF Trust, each of which is a registered investment company managed by Alger Management. Each Trustee serves until an event of termination, such as death or resignation, or until his or her successor is duly elected; each officer's term of office is one year. Unless otherwise noted, the address of each person named below is 100 Pearl Street, New York, NY 10004.
Additional information regarding the Trustees and Officers of the Trust is available in the Trust’s Statement of Additional Information.
THE ALGER FUNDS II
ADDITIONAL INFORMATION (Unaudited) (Continued)
Name (Year of Birth) and Address(1) | Position(s) Held with the Trust and Length of Time Served | Principal Occupation(s) During Past Five Years | Number of Funds in the Alger Fund Complex(3) which are Overseen by Trustee | Other Directorships Held by Trustee During Past Five Years |
Interested Trustee(2): | ||||
Hilary M. Alger (1961) | Trustee since 2003 | Non-Profit Fundraising Consultant since 2015, Schultz & Williams; Emeritus Trustee since 2020 and Trustee from 2013 to 2020, Pennsylvania Ballet; School Committee Member since 2017, Germantown Friends School. | 29 | Board of Directors, Alger Associates, Inc.; Trustee of Target Margin Theater |
| Non-Interested Trustees: | ||||
Charles F. Baird, Jr. (1953) | Trustee since 2000 | Managing Director since 1997, North Castle Partners (private equity securities group). | 29 | None |
Roger P. Cheever (1945) | Trustee since 2000 | Retired; Associate Vice President for Development Strategy from 2020 to 2021 and Associate Vice President Principal Gifts from 2008 to 2020, Harvard University. | 29 | Board of Directors, Alger SICAV Fund |
Stephen E. O’Neil (1932) | Trustee since 1986 | Retired. | 29 | None |
David Rosenberg (1962) | Trustee since 2007 | Associate Professor of Law since August 2000, Zicklin School of Business, Baruch College, City University of New York. | 29 | None |
Nathan E. Saint-Amand M.D. (1938) | Trustee since 1986 | Medical doctor in private practice since 1970; Member of the Board of the Manhattan Institute (non-profit policy research) since 1988. | 29 | None |
(1) The address of each Trustee is c/o Fred Alger Management, LLC, 100 Pearl Street, New York, NY 10004.
(2) Ms. Alger is an “interested person” (as defined in the Investment Company Act of 1940, as amended) of the Trust by virtue of her ownership control of Alger Associates, Inc., which indirectly controls Alger Management and its affiliates.
(3) “Alger Fund Complex” refers to the Fund and the five other registered investment companies managed by Alger Management, and the series therof. Each Trustee serves until an event of termination, such as death or resignation, or until his or her successor is duly elected. Each of the Trustees serves on the board of trustees of the other five registered investment companies in the Alger Fund Complex.
THE ALGER FUNDS II
ADDITIONAL INFORMATION (Unaudited) (Continued)
Name (Year of Birth), Position with Trust and Address(1) | Principal Occupations | Officer Since |
| Officers(2): | ||
Hal Liebes (1964) President, Principal Executive Officer | Executive Vice President, Chief Operating Officer (“COO”) and Secretary, Alger Management; COO and Secretary, Alger Associates, Inc. and Alger Alternative Holdings, LLC; Director, Alger SICAV, Alger International Holdings, and Alger Dynamic Return Offshore Fund; Vice President, COO, Member, and Secretary, Alger Capital, LLC and Alger Group Holdings, LLC; Executive Director and Chairman, Alger Management, Ltd.; Manager and Secretary, Weatherbie Capital, LLC and Alger Apple Real Estate LLC; Manager, Alger Partners Investors I, LLC and Alger Partners Investors KEIGF; Secretary, Alger-Weatherbie Holdings, LLC and Alger Boulder I LLC; and Director and Secretary, The Foundation for Alger Families. | 2005 |
Tina Payne (1974) Secretary, Chief Compliance Officer, Chief Legal Officer | Since 2017, Senior Vice President, General Counsel, and Chief Compliance Officer (“CCO”), Alger Management; Senior Vice President, General Counsel, and Secretary, Alger LLC; CCO, Alger Management, Ltd.; Assistant Secretary, Weatherbie Capital, LLC and Alger Alternative Holdings, LLC; and since 2019, Assistant Secretary, Alger-Weatherbie Holdings, LLC. Formerly, Senior Vice President and Associate General Counsel, Cohen & Steers Capital Management, from 2007 to 2017. | 2017 |
Michael D. Martins (1965) Treasurer, Principal Financial Officer | Senior Vice President of Alger Management. | 2005 |
Anthony S. Caputo (1955) Assistant Treasurer | Vice President of Alger Management. | 2007 |
Sergio M. Pavone (1961) Assistant Treasurer | Vice President of Alger Management. | 2007 |
Mia G. Pillinger (1989) Assistant Secretary | Associate Counsel of Alger Management. | 2020 |
Sushmita Sahu (1981) AML Compliance Officer | Vice President of Alger Management. | 2021 |
| (1) | The address of each officer is c/o Fred Alger Management, LLC, 100 Pearl Street, New York, NY 10004. |
| (2) | Each officer’s term of office is one year. Each officer serves in the same capacity for the other funds in the Alger Fund Complex. |
THE ALGER FUNDS II
Board Approval of Investment Advisory Agreements
ADDITIONAL INFORMATION (Unaudited) (Continued)
At a meeting held on September 22, 2021 (Meeting), the Board of Trustees (Board) of The Alger Funds II (Trust), including a majority of the trustees who are not “interested persons” (as defined in the Investment Company Act of 1940, as amended) of the Trust (Independent Trustees), reviewed and approved the continuance of the investment advisory agreement between Fred Alger Management, LLC (Fred Alger Management) and the Trust, on behalf of each Fund, and the investment sub-advisory agreement between Fred Alger Management and Weatherbie Capital, LLC (Sub-Adviser), an affiliate of Fred Alger Management, on behalf of Alger Dynamic Opportunities Fund (each, a Management Agreement), for an additional one-year period. Fred Alger Management and the Sub-Adviser are collectively referred to herein as the “Manager.”
In considering the continuation of each Management Agreement, the Board reviewed and considered information provided by the Manager and its representatives at the Meeting and throughout the year at meetings of the Board and its committees. The Board also reviewed and considered information the Manager provided in response to a detailed request for information Independent Trustee counsel submitted to the Manager on behalf of the Independent Trustees in connection with the Board’s annual contract consideration, as well as information provided in response to a supplemental request from Independent Trustee counsel on behalf of the Independent Trustees. The materials for the Meeting included a presentation and analysis of the Funds and the Manager by FUSE Research Network LLC (FUSE), an independent consulting firm. The Board also spoke directly with FUSE representatives at the Meeting and, among other things, received a description of the methodology FUSE used to select the mutual funds included in each Fund's Peer Universe and Peer Group (as described herein). The Board considered the information provided to it about the Funds together, and with respect to each Fund separately, as the Board deemed appropriate.
The Independent Trustees also received advice from, and met separately with, their Independent Trustee counsel in considering whether to approve the continuation of each Management Agreement. The Independent Trustees also received a memorandum from Independent Trustee counsel discussing their duties in considering the continuation of the Management Agreements. In addition, prior to the Meeting, the chair of the Board, on behalf of the other Independent Trustees, conferred with Independent Trustee counsel about the contract renewal process.
The Board reviewed the materials provided and considered all of the factors it deemed relevant in approving the continuance of each Management Agreement, including, but not limited to: (i) the nature, extent and quality of the services provided by the Manager; (ii) the investment performance of each Fund; (iii) the costs of the services the Manager provided and profits it realized; (iv) the extent to which economies of scale are realized as a Fund grows; and (v) whether fee levels reflect these economies of scale for the benefit of Fund shareholders. The Board did not identify any one factor as dispositive, and each Board member may have attributed different weights to the factors considered.
THE ALGER FUNDS II
In the discussions that follow, reference is made to the "median" in the Peer Group and Peer Universe categories. With respect to performance, below median performance represents performance that is worse relative to the median, and above median performance represents performance that is better relative to the median of the funds in the relevant Performance Universe. With respect to expenses, below median fees or expenses represent fees or expenses that are lower relative to the median, and above median fees or expenses represent fees or expenses that are higher relative to the median of the funds in the relevant Expense Group. FUSE information is calculated on a share class basis. References appearing below with regard to a Fund’s performance results and comparative fees and expenses generally relate to Class A shares of the Fund (each Fund’s oldest share class).
ADDITIONAL INFORMATION (Unaudited) (Continued)
In particular, in approving the continuance of each Management Agreement, the Board considered the following factors:
Nature, Extent and Quality of Services
The Board reviewed and considered information regarding the nature, extent and quality of investment management services provided by the Manager to the Funds. This information included, among other things, the qualifications, background and experience of the professional personnel who perform services for the Funds; the structure of investment professional compensation; oversight of third-party service providers; investment performance, fee information and related financial information for each Fund; fees and payments to intermediaries for fund administration, transfer agency and shareholder services; legal and compliance matters; risk controls; pricing and other services provided by the Manager; and the range of advisory fees charged by the Manager to other funds and accounts, including the Manager’s explanation of differences among accounts where relevant. The Board noted that it received information at regular meetings throughout the year regarding the services rendered by the Fred Alger Management concerning the management of each Fund’s affairs and the Fred Alger Management role in coordinating and overseeing providers of other services to the Funds.
The Board noted Fred Alger Management’s history and expertise in the “growth” style of investment management and management’s ongoing efforts to develop strategies and products, and adjust portfolios as necessary, as well as to address the changing investment landscape as evidenced, in part, by the recent launch of a suite of actively-managed non- transparent exchange-traded funds. With respect to the Alger Dynamic Opportunities Fund, the Board also considered the investment approach of Weatherbie, which takes a fundamental, bottom-up research approach to investing in growth equities, similar to that of Fred Alger Management. The Board noted the length of time the Manager had provided services as an investment adviser to each Fund and also noted FUSE’s analysis that Fred Alger Management’s successful flagship offerings support Fred Alger Management’s overall investment capabilities.
The Board considered information provided by the Manager with respect to its business continuity plans, including the continued effectiveness of those plans throughout the ongoing COVID-19 pandemic. The Board further noted the Manager’s ongoing engagement with key service providers with respect to their operations and personnel supporting the Funds during the COVID-19 pandemic.
THE ALGER FUNDS II
ADDITIONAL INFORMATION (Unaudited) (Continued)
The Board also reviewed and considered the benefits provided to Fund shareholders of investing in a Fund that is part of the Alger Family of Funds. The Board noted the strong financial position of the Manager and its commitment to the fund business as evidenced, in part, by a continued focus on offerings in focused strategies. The Board also noted that certain administrative, compliance, reporting and accounting services necessary for the conduct of the Funds’ affairs are provided separately under a Fund Administration Agreement and a Shareholder Administrative Services Agreement with Fred Alger Management.
Following consideration of such information, each Trustee was satisfied with the nature, extent and quality of services provided by the Manager to the Funds under the Management Agreements.
Fund Performance
The Board reviewed and considered the performance results of each Fund over various time periods. The Board considered the performance returns for each Fund in comparison to the performance returns of a universe of mutual funds deemed comparable to the Fund based on various investment, operational, and pricing characteristics (Peer Universe), and a group of mutual funds from within such Peer Universe deemed comparable to the Fund based primarily on investment strategy similarity (Peer Group), each as selected by FUSE, as well as the Fund’s benchmark index. The Board took into account that long-term performance could be impacted by one period of significant outperformance or underperformance.
The Board also reviewed and considered Fund performance reports provided by management and discussions that occurred with investment personnel and senior management at Board meetings throughout the year. As had been the practice at every quarterly meeting of the Board throughout the year, representatives of the Manager reviewed with the Trustees the recent and longer-term performance of each Fund and, where appropriate, the measures that the Manager was considering, or had implemented during the past year, to address any performance outliers.
The Trustees concluded that each Fund's performance was acceptable. Further discussion of the Board's considerations with respect to each Fund's performance is set forth below.
Alger Spectra Fund - The Board noted that the Fund’s annualized total return for the one-, three-, five- and 10-year periods underperformed the median of its Peer Group. The Board also noted that the Fund’s annualized total return for the three-, five- and 10- year periods was in the second quartile of its Peer Universe, and for the one-year period was in the third quartile of its Peer Universe. The Board further noted that the Fund had underperformed the Fund’s benchmark index for the one-, three-, five- and 10-year periods.
Alger Responsible Investing Fund - The Board noted that the Fund’s annualized total return for the five- and 10-year periods outperformed the median of its Peer Group, and for the one- and three-year periods underperformed the median of its Peer Group. The Board also noted that the Fund’s annualized total return for the three- and five-year periods was in the second quartile of its Peer Universe and for the one- and 10-year periods was in the third quartile of its Peer Universe. The Board further noted that the Fund had underperformed the Fund’s benchmark index for the one-, three-, five- and 10-year periods. The Board also noted that the Fund has a “high” Morningstar sustainability ranking.
THE ALGER FUNDS II
ADDITIONAL INFORMATION (Unaudited) (Continued)
Alger Dynamic Opportunities Fund – The Board noted that the Fund’s annualized total return for the one-, three-, five- and 10-year periods outperformed the median of its Peer Group. The Board also noted that Fund’s annualized total return for each of the one-, three-, five- and 10-year periods was in the first quartile of its Peer Universe. The Board further noted that the Fund had underperformed the Fund’s benchmark index for the one-, three-, five- and 10-year periods.
Alger Emerging Markets Fund – The Board noted that the Fund’s annualized total return for the three-, five- and 10-year periods outperformed the median of its Peer Group, and for the one-year period underperformed the median of its Peer Group. The Board also noted that the Fund’s annualized total return for the one-, three- and five-year periods was in the first quartile of its Peer Universe, and for the 10-year period was in the second quartile of its Peer Universe. The Board further noted that the Fund had outperformed the Fund’s benchmark index for the one-, three-, five- and 10-year periods.
Comparative Fees and Expenses
For each Fund, the Board reviewed and considered the contractual management fee (the "Contractual Management Fee") payable by the Fund to the Fred Alger Management in light of the nature, extent and quality of the services provided by the Fred Alger Management pursuant to the Management Agreement. The Board also reviewed and considered the fee waiver and/or expense reimbursement arrangements for each Fund (if any), including specific share classes thereof, and considered the actual fee rate (after taking any waivers and reimbursements into account) payable by the Fund (the "Actual Management Fee"). Additionally, the Board received and considered information comparing each Fund's Contractual Management Fee, Actual Management Fee and overall expenses, including administrative fees payable to Fred Alger Management, with those of the funds in the Peer Group provided by FUSE. For purposes of the comparisons below, the FUSE Contractual Management Fee includes administrative fees.
The Board discussed those factors that could contribute to each Fund’s Contractual Management Fee, Actual Management Fee or total expenses being above or below the median of the Fund’s Peer Group and concluded that the Contractual Management Fee charged to each Fund is reasonable. Further discussion of the Board's considerations with respect to each Fund's comparative fees and expenses is set forth below.
Alger Spectra Fund. The Board noted that the Contractual Management Fee and total expenses for the Fund were above the median and in the third quartile of its Peer Group. In this regard, the Board noted that the Fund’s strategy involved selling securities short and the resulting expenses associated with such short selling.
Alger Responsible Investing Fund. The Board noted that the Contractual Management Fee and total expenses for the Fund were above the median and in the third and fourth (most expensive) quartiles of its Peer Group, respectively.
THE ALGER FUNDS II
ADDITIONAL INFORMATION (Unaudited) (Continued)
Alger Dynamic Opportunities Fund. The Board noted that the Contractual Management Fee and total expenses for the Fund were below the median and in the first (least expensive) quartile of its Peer Group. The Board also noted that, with respect to the Fund, the Sub-Adviser is paid by Fred Alger Management out of the management fee Fred Alger Management receives from the Fund.
Alger Emerging Markets Fund. The Board noted that the Contractual Management Fee for the Fund was below the median and in the first (least expensive) quartile of its Peer Group, but that total expenses for the Fund were above the median and in the fourth (most expensive) quartile of its Peer Group.
In connection with its consideration of each Fund's fees payable under the Management Agreement, the Board also received information on the Fred Alger Management standard institutional account fees for accounts of a similar investment type to each of the Funds. The Board noted management's explanation that comparisons with such accounts may be of limited relevance given the different structures and regulatory requirements of mutual funds, such as the Funds, versus those accounts and the differences in the levels of services required by the Funds and those accounts. The Board also received information on fees charged to other funds managed by the Fred Alger Management.
Profitability
The Board reviewed and considered information regarding the profits realized by Fred Alger Management and its affiliates in connection with the operation of each Fund. In this respect, the Board considered overall profitability, including in comparison to certain investment advisory peers, as well as the profits, of Fred Alger Management, in providing investment management and other services to each Fund during the year ended June 30, 2021. The Board also reviewed the profitability methodology and any changes thereto, noting that management applies its methods consistently from year to year.
The Board noted that costs incurred in establishing and maintaining the infrastructure necessary for the mutual fund operations conducted by Fred Alger Management may not be fully reflected in the expenses allocated to each Fund in determining Fred Alger Management's profitability. The Board also noted that the scope of services provided by the Manager, and the related costs of providing those services, had expanded over time as a result of regulatory and other developments.
The Board also considered the extent to which the Manager might derive ancillary benefits from Fund operations, including, for example, through soft dollar arrangements. Based upon its consideration of all these factors, the Trustees concluded that the level of profits realized by Fred Alger Management from providing services to each Fund was not excessive in view of the nature, extent and quality of services provided to each Fund.
THE ALGER FUNDS II
ADDITIONAL INFORMATION (Unaudited) (Continued)
Economies of Scale
For each Fund, the Board reviewed and considered the extent to which the Manager may realize economies of scale, if any, as the Fund grows larger and whether the Fund’s management fee structure reflects any economies of scale for the benefit of Fund shareholders. The Board noted the existence of management fee breakpoints for Alger Spectra Fund, Alger Responsible Investing Fund, and Alger Dynamic Opportunities Fund, which operate to share economies of scale with a Fund’s shareholders by reducing the Fund’s effective management fees as the Fund grows in size. The Board considered the Manager’s view that the overall size of Fred Alger Management allows it to realize other economies of scale, such as with office space, purchases of technology, and other general business expenses, including with respect to Funds that did not have management fee breakpoints.
The Trustees concluded that for each Fund, to the extent economies of scale may be realized by Fred Alger Management and its affiliates, the benefits of such economies of scale would be shared with the Fund and its shareholders as the Fund grows, including through the management fee breakpoints in place for applicable Funds.
Conclusion
The Board's consideration of the Contractual Management Fee for each Fund also had the benefit of a number of years of reviews of the Management Agreement, during which lengthy discussions took place between the Board and representatives of the Manager. Certain aspects of the arrangements may receive greater scrutiny in some years than in others, and the Board's conclusions may be based, in part, on its consideration of the Fund's arrangements in prior years.
Based on its review, consideration and evaluation of all factors it believed relevant, including the above-described factors and conclusions, the Board, including the Independent Trustees voting separately, unanimously approved the continuation of each Management Agreement for an additional one-year period.
THE ALGER FUNDS II
ADDITIONAL INFORMATION (Unaudited) (Continued)
| U.S. Consumer Privacy Notice | Rev. 6/22/21 | ||
| FACTS | WHAT DOES ALGER DO WITH YOUR PERSONAL INFORMATION? | ||
Why? | Financial companies choose how they share your personal information. Federal law gives consumers the right to limit some but not all sharing. Federal law also requires us to tell you how we collect, share, and protect your personal information. Please read this notice carefully to understand what we do. | ||
What? | The types of personal information we collect and share depend on the product or service you have with us. This information can include: • Social Security number and • Account balances and • Transaction history and • Purchase history and • Assets When you are no longer our customer, we continue to share your information as described in this notice. | ||
How? | All financial companies need to share personal information to run their everyday business. In the section below, we list the reasons financial companies can share personal information; the reasons Alger chooses to share; and whether you can limit this sharing. | ||
Reasons we can share your personal information | Does Alger share? | Can you limit this sharing? | |||
For our everyday business purposes — such as to process your transactions, maintain your account(s), respond to court orders and legal investigations, or report to credit bureaus | Yes | No | |||
For our marketing purposes —to offer our products and services to you | Yes | No | |||
| For joint marketing with other financial companies | No | We don’t share | |||
For our affiliates’ everyday business purposes — information about your transactions and experiences | Yes | No | |||
For our affiliates’ everyday business purposes — information about your creditworthiness | No | We don’t share | |||
| For nonaffiliates to market to you | No | We don’t share | |||
| Questions? Call 1-800-223-3810 |
THE ALGER FUNDS II
ADDITIONAL INFORMATION (Unaudited) (Continued)
| Who we are | ||||
Who is providing this notice? | Alger includes Fred Alger Management, LLC. and Fred Alger & Company, LLC as well as the following funds: The Alger Funds, The Alger Funds II, The Alger Institutional Funds, The Alger Portfolios, Alger Global Focus Fund, and The Alger ETF Trust. |
| What we do | ||||
How does Alger protect my personal information? | To protect your personal information from unauthorized access and use, we use security measures that comply with federal law. These measures include computer safeguards and secured files and buildings. | |||
How does Alger collect my personal information? | We collect your personal information, for example, when you: • Open an account or • Make deposits or withdrawals from your account or • Give us your contact information or • Provide account information or • Pay us by check. | |||
Why can’t I limit all sharing? | Federal law gives you the right to limit some but not all sharing related to: • sharing for affiliates’ everyday business purposes ─ information about your credit worthiness • affiliates from using your information to market to you • sharing for nonaffiliates to market to you State laws and individual companies may give you additional rights to limit sharing. |
| Definitions | ||||
Affiliates | Companies related by common ownership or control. They can be financial and nonfinancial companies. • Our affiliates include Fred Alger Management, LLC, Weatherbie Capital, LLC and Fred Alger & Company, LLC as well as the following funds: The Alger Funds, The Alger Funds II, The Alger Institutional Funds, The Alger Portfolios, Alger Global Focus Fund, and The Alger ETF Trust. | |||
Nonaffiliates | Companies not related by common ownership or control. They can be financial and nonfinancial companies. | |||
Joint marketing | A formal agreement between nonaffiliated financial companies that together market financial products or services to you. |
THE ALGER FUNDS II
ADDITIONAL INFORMATION (Unaudited) (Continued)
A description of the policies and procedures the Funds use to determine how to vote proxies relating to portfolio securities and the proxy voting record is available, without charge, by calling (800) 992-3863 or online on the Funds’ website at http://www.alger.com or on the SEC’s website at http://www.sec.gov.
Fund Holdings
The Board has adopted policies and procedures relating to disclosure of the Funds’ portfolio securities. These policies and procedures recognize that there may be legitimate business reasons for holdings to be disclosed and seek to balance those interests to protect the proprietary nature of the trading strategies and implementation thereof by the Funds.
Generally, the policies prohibit the release of information concerning portfolio holdings, which have not previously been made public, to individual investors, institutional investors, intermediaries that distribute the Funds’ shares and other parties which are not employed by the Investment Manager or its affiliates except when the legitimate business purposes for selective disclosure and other conditions (designed to protect the Funds) are acceptable.
The Funds file their complete schedules of portfolio holdings with the SEC semi-annually in shareholder reports on Form N-CSR and after the first and third fiscal quarters as an exhibit to their reports on Form N-PORT. The Funds’ Forms N-CSR and N-PORT are available online on the SEC’s website at www.sec.gov.
In addition, the Funds make publicly available their month-end top 10 holdings with a 10 day lag and their month-end full portfolios with a 60 day lag on their website www.alger.com and through other marketing communications (including printed advertising/sales literature and/or shareholder telephone customer service centers). No compensation or other consideration is received for the non-public disclosure of portfolio holdings information.
In accordance with the foregoing, the Funds provide portfolio holdings information to third parties including financial intermediaries and service providers who need access to this information in the performance of their services and are subject to duties of confidentiality
(1) imposed by law, including a duty not to trade on non-public information, and/or (2) pursuant to an agreement that confidential information is not to be disclosed or used (including trading on such information) other than as required by law. From time to time, the Funds will communicate with these third parties to confirm that they understand the Funds’ policies and procedures regarding such disclosure. This agreement must be approved by the Trust’s Chief Compliance Officer.
The Board periodically reviews a report disclosing the third parties to whom each Fund’s holdings information has been disclosed and the purpose for such disclosure, and it considers whether or not the release of information to such third parties is in the best interest of the Fund and its shareholders.
THE ALGER FUNDS II
ADDITIONAL INFORMATION (Unaudited) (Continued)
In addition to material the Funds routinely provide to shareholders, the Investment Manager may make additional statistical information available regarding the Alger Family of Funds. Such information may include, but not be limited to, relative weightings and characteristics of the Fund versus an index (such as P/E ratio, alpha, beta, capture ratio, maximum drawdown, standard deviation, EPS forecasts, Sharpe ratio, information ratio, R-squared, and market cap analysis), security specific impact on overall portfolio performance, month- end top ten contributors to and detractors from performance, portfolio turnover, and other similar information. Shareholders should visit www.alger.com or may also contact the Funds at (800) 992-3863 to obtain such information.
THE ALGER FUNDS II
100 Pearl Street
New York, NY 10004
(800) 992-3863
www.alger.com
Investment Manager
Fred Alger Management, LLC
100 Pearl Street
New York, NY 10004
Distributor
Fred Alger & Company, LLC
100 Pearl Street
New York, NY 10004
Transfer Agent and Dividend Disbursing Agent
UMB Fund Services, Inc.
235 W. Galena Street
Milwaukee, WI 53212
Custodian
Brown Brothers Harriman & Company
50 Post Office Square
Boston, MA 02110
Independent Registered Public Accounting Firm
Deloitte & Touche LLP
30 Rockefeller Plaza
New York, NY 10112
30 Rockefeller Plaza
New York, NY 10112
This report is submitted for the general information of the shareholders of The Alger Funds II. It is not authorized for distribution to prospective investors unless accompanied by an effective Prospectus for the Trust, which contains information concerning the Trust’s investment policies, fees and expenses as well as other pertinent information.
| ITEM 2. | CODE OF ETHICS. |
| (a) | The Registrant has adopted a code of ethics (the "Code of Ethics") that applies to its principal executive officer, principal financial officer, principal accounting officer or controller, or persons performing similar functions. |
| (b) | Not applicable. |
| (c) | The Registrant has not amended its Code of Ethics during the period covered by the shareholder report presented in Item 1 hereto. |
| (d) | The Registrant has not granted a waiver or an implicit waiver from a provision of its Code of Ethics during the period covered by the shareholder report presented in Item 1 hereto. |
| (e) | Not applicable. |
| (f) | The Registrant's Code of Ethics is attached as an Exhibit hereto. |
| ITEM 3. | AUDIT COMMITTEE FINANCIAL EXPERT. |
The Board of Trustees of the Registrant determined that Stephen E. O’Neil is an audit committee financial expert (within the meaning of that phrase specified in the instructions to Form N-CSR) on the Registrant’s audit committee. Mr. O’Neil is an “independent” trustee – i.e., he is not an interested person of the Registrant as defined in the Investment Company Act of 1940, nor has he accepted directly or indirectly any consulting, advisory or other compensatory fee from the Registrant, other than in his capacity as Trustee.
| ITEM 4. | PRINCIPAL ACCOUNTANT FEES AND SERVICES. |
a) Audit Fees:
| October 31, 2021 | $ | 137,300 | ||
| October 31, 2020 | $ | 133,300 |
b) Audit-Related Fees: NONE
c) Tax Fees for tax advice, tax compliance and tax planning:
| October 31, 2021 | $ | 24,665 | ||
| October 31, 2020 | $ | 29,680 |
d) All Other Fees:
| October 31, 2021 | $ | 9,072 | ||
| October 31, 2020 | $ | 9,860 |
Other fees include a review and consent for Registrants registration statement filing and a review of the semi-annual financial statements.
e) 1) Audit Committee Pre-Approval Policies And Procedures:
Audit and non-audit services provided by the Registrant’s independent registered public accounting firm (the “Auditors”) on behalf the Registrant must be pre-approved by the Audit Committee. Non-audit services provided by the Auditors on behalf of the Registrant’s Investment Adviser or any entity controlling, controlled by, or under common control with the Investment Adviser must be pre-approved by the Audit Committee if such non-audit services directly relate to the operations or financial reporting of the Registrant.
2) All fees in item 4(b) through 4(d) above were approved by the Registrants’ Audit Committee.
f) Not Applicable
g) Non-Audit Fees:
| October 31, 2021 | $ | 228,972, | € | 91,934 | ||
| October 31, 2020 | $ | 232,670, | € | 72,885 |
h) The audit committee of the board of trustees has considered whether the provision of the non-audit services that were rendered to the registrant's investment adviser and any entity controlling, controlled by, or under common control, with the adviser that provides ongoing services to the registrant that were not approved pursuant to (c)(7)(ii) of Rule 2-01 of Regulation S-X is compatible with maintaining the principle accountant's independence.
| ITEM 5. | AUDIT COMMITTEE OF LISTED REGISTRANTS. |
Not applicable
| ITEM 6. | INVESTMENTS. |
a) A Schedule of Investments in securities of unaffiliated issuers is included as part of the report to shareholders filed under Item 1 of this Form N-CSR.
| ITEM 7. | DISCLOSURE OF PROXY VOTING POLICIES AND PROCEDURES FOR CLOSED-END MANAGEMENT INVESTMENT COMPANIES. |
Not applicable
| ITEM 8. | PORTFOLIO MANAGERS OF CLOSED-END MANAGEMENT INVESTMENT COMPANIES. |
Not applicable
| ITEM 9. | PURCHASES OF EQUITY SECURITIES BY CLOSED-END MANAGEMENT INVESTMENT COMPANY AND AFFILIATED PURCHASERS. |
Not applicable
| ITEM 10. | SUBMISSION OF MATTERS TO A VOTE OF SECURITY HOLDERS. |
None
| ITEM 11. | CONTROLS AND PROCEDURES. |
(a) The Registrant’s principal executive officer and principal financial officer have concluded that the Registrant’s disclosure controls and procedures (as defined in Rule 30a-3(c) under the Investment Company Act of 1940, as amended) are effective based on their evaluation of the disclosure controls and procedures as of a date within 90 days of the filing date of this document.
(b) No changes in the Registrant’s internal control over financial reporting occurred during the Registrant’s second fiscal half-year that materially affected, or are reasonably likely to materially affect, the Registrant’s internal control over financial reporting.
| ITEM 12. | Disclosure of Securities Lending Activities for Closed-End Management Investment Companies. |
Not applicable.
| ITEM 13. | EXHIBITS. |
(a) (3) Not applicable
(a) (4) Not applicable
SIGNATURES
Pursuant to the requirements of the Securities Exchange Act of 1934 and the Investment Company Act of 1940, the registrant has duly caused this report to be signed on its behalf by the undersigned, thereunto duly authorized.
| The Alger Funds II | |
| By: | /s/ Hal Liebes |
| Hal Liebes | |
| President | |
| Date: December 20, 2021 | |
Pursuant to the requirements of the Securities Exchange Act of 1934 and the Investment Company Act of 1940, this report has been signed below by the following persons on behalf of the registrant and in the capacities and on the dates indicated.
| By: | /s/ Hal Liebes |
| Hal Liebes | |
| President | |
| Date: December 20, 2021 | |
| By: | /s/ Michael D. Martins |
| Michael D. Martins | |
| Treasurer | |
| Date: December 20, 2021 | |