Exhibit 99.2
Appendix 4E
Sims Metal Management Limited
ABN 69 114 838 630
Preliminary Final Report
Results for announcement to the market
Year ended: 30 June 2012
Previous corresponding period: 30 June 2011
| Results | A$m | |||||||||||||
Revenue from ordinary activities | Up | 2.1% | to | 9,035.7 | ||||||||||
Loss from ordinary activities after tax attributable to members* | Down | 371.4 | % | to | (521.4 | ) | ||||||||
Net loss for the period attributable to members* | Down | 371.4 | % | to | (521.4 | ) | ||||||||
| *Includes A$593.7 million non-cash goodwill impairment charge | ||||||||||||||
| Dividends for the year ended 30 June 2012 | Cents per | % Franked per | ||||
| Security | Security | |||||
Interim dividend (1) | 10.0 | 0% | ||||
Final dividend (2) | 10.0 | 0% | ||||
Record date | 5 October 2012 | |||||
Payment date | 19 October 2012 | |||||
| (1) The entire portion of the interim dividend was declared to be nil conduit foreign income. Accordingly, the entire interim dividend payable to non-residents was subject to a 15% non-resident shareholders’ withholding tax. | ||||||
| (2) The entire portion of the final dividend is declared to be nil conduit foreign income. Accordingly, the entire final dividend payable to non-residents will be subject to a 15% non-resident shareholders’ withholding tax. | ||||||
| Net tangible assets | 30 June | 30 June | ||||||
| 2012 | 2011 | |||||||
Net tangible asset per security | 8.59 | 8.74 | ||||||
For further explanation of the above figures, please refer to the Directors’ Report, press release and market presentations filed with the Australian Securities Exchange Limited (“ASX”).
The remainder of the information required by Listing Rule 4.3A is contained in the attached additional information.
The consolidated financial statements are based on accounts that have been audited.
CONTENTS
| Page | ||||
Directors’ Report | 1 | |||
Auditor’s Independence Declaration | 32 | |||
Consolidated Income Statements | 33 | |||
Consolidated Statements of Comprehensive Income | 34 | |||
Consolidated Statements of Financial Position | 35 | |||
Consolidated Statements of Changes in Equity | 36 | |||
Consolidated Statements of Cash Flows | 37 | |||
Notes to the Consolidated Financial Statements | 38 | |||
Directors’ Declaration | 110 | |||
Independent Auditor’s Report | 111 | |||
Directors’ report
The directors present their report on the consolidated entity (the “Group”) consisting of Sims Metal Management Limited (the “Company”) and the entities it controlled at the end of, or during, the year ended 30 June 2012.
Names and particulars of directors
The names of the directors of the Company in office during the financial year and up to the date of this report together with their qualifications and experience are as follows:
Geoffrey N Brunsdon B Comm (age 54)
Chairperson and Independent non-executive director
Mr Brunsdon was appointed as a director in November 2009, appointed Deputy Chairperson in September 2011 and appointed Chairperson of the Company on 1 March 2012. He is the Chairperson of the Finance & Investment Committee and is a member of the Risk, Audit & Compliance Committee and the Remuneration Committee. Until June 2009, Mr Brunsdon was Managing Director and Head of Investment Banking of Merrill Lynch International (Australia) Limited. He is Chairman of ING Private Equity Access Limited (since 2004), a director of APN Funds Management Limited (since November 2009), a director of Macquarie University Hospital, Chairman of MetLife Insurance Limited (since April 2011) and a member of the Takeovers Panel. He was a member of the listing committee of the Australian Securities Exchange between 1993 and 1997 and was a director of Sims Group Limited between 1999 and 2007. He is a Fellow of the Institute of Chartered Accountants, a Fellow of the Financial Services Institute of Australia and a Fellow of the Institute of Company Directors. Mr Brunsdon is also a director of several non-profit organisations, including Redkite (supporting families who have children with cancer), the Wentworth Group of Concerned Scientists and Purves Environmental Custodians.
Daniel W Dienst JD (age 47)
Executive Director and Group Chief Executive Officer
Mr Dienst was appointed as an Executive Director and Group Chief Executive Officer in March 2008. He is a member of the Safety, Health, Environment & Community Committee, the Nomination/Governance Committee and the Finance & Investment Committee. Mr Dienst was formerly a director (since June 2001), Chairman (since April 2003), Chief Executive Officer (since January 2004) and President (since September 2004) of Metal Management, Inc which merged with the Company on 14 March 2008. From January 1999 to January 2004, Mr Dienst served in various capacities with CIBC World Markets Corp., lastly as Managing Director of the Corporate and Leveraged Finance Group. From 2002-2005, he was Chairman of the Board of Metals USA, Inc., a NASDAQ – listed steel service center company until its sale to a private entity. Mr Dienst is a director of other Sims Metal Management Limited subsidiaries and associated companies. He is a graduate of Washington University and received a Juris Doctorate from The Brooklyn Law School.
Norman R Bobins BS, MBA (age 69)
Independent non-executive director
Mr Bobins was appointed as a director in March 2008. He is Chairperson of the Nomination/Governance Committee and is a member of the Finance & Investment Committee. Mr Bobins was formerly a director of Metal Management, Inc (since 2006). He is the Chairman of Norman Bobins Consulting LLC (since 2008). From May 2007 until October 2007, Mr Bobins was the Chairman of the Board of LaSalle Bank Corporation. From 2002 to 2007, he was President and Chief Executive Officer of LaSalle Bank Corporation. From 2006-2007, he was President and Chief Executive Officer of ABN AMRO North America. From 2002-2007, Mr Bobins was Senior Executive Vice President at ABN AMRO Bank N.V., the Dutch parent of LaSalle Bank Corporation. He is the Non-Executive Chairman of The PrivateBank and Trust Company. Mr Bobins is also a director of AGL Resources, Inc. and AAR CORP. He earned his BS from the University of Wisconsin and his MBA from the University of Chicago.
1
John T DiLacqua MBA (age 60)
Independent non-executive director
Mr DiLacqua was appointed as a director on 1 September 2011. He is a member of the Risk, Audit & Compliance Committee and the Finance & Investment Committee. Mr DiLacqua was formerly a director of Metal Management, Inc (since June 2001), and was a director of Sims Metal Management Limited between March and November 2008. He was the Executive Chairman of Envirosource, Inc. from May 2004 to December 2004 and had served as President and Chief Executive Officer of Envirosource from January 1999 to May 2004. From October 1997 to December 1998, Mr DiLacqua served as President of the US Ferrous Operations of Philip Metals, Inc., and, prior to that, from May 1994, as the President of Luria Brothers. He is a graduate of Temple University and received an MBA from Carnegie Mellon University. Mr DiLacqua is a Certified Public Accountant.
J Michael Feeney B Comm (Marketing) (age 66)
Independent non-executive director
Mr Feeney was appointed as a director in September 1991. He is Chairperson of the Remuneration Committee and is a member of the Risk, Audit & Compliance Committee and the Nomination/Governance Committee. Mr Feeney was formerly an Executive Director of Collins Partners Corporate Advisory and prior to that Finance and Strategy Director for Philip Morris, Executive Director, Strategy & Corporate Affairs for Elders IXL and Executive Director, Corporate Strategy of Elders Resources NZFP.
Gerald E Morris BA (age 80)
Independent non-executive director
Mr Morris was appointed as a director in March 2008. He is Chairperson of the Risk, Audit & Compliance Committee and is a member of the Remuneration Committee and the Nomination/Governance Committee. Mr Morris was formerly a director (since January 2004) of Metal Management, Inc. He previously served as President and CEO of Intalite International N.V., as Chairman and director of Beacon Trust Company, and as a director of Metals USA, Inc., Rexel, Inc. and Tivoli Industries, Inc., and as trustee of the Blanchard Group of Funds. He earned his BA from the University of Connecticut. Mr Morris is a Certified Public Accountant.
Christopher J Renwick AM, FAIM, FAIE, FTSE - BA, LLB (age 69)
Independent non-executive director
Mr Renwick was appointed as a director in June 2007. He is Mitsui’s designated independent director. Mr Renwick is Chairperson of the Safety, Health, Environment & Community Committee and is a member of the Nomination/Governance Committee. Mr Renwick was employed with the Rio Tinto Group for over 35 years rising, in 1997, to Chief Executive, Rio Tinto Iron Ore, a position he held until his retirement in 2004. He has previously served as Chairman and director of Coal and Allied Industries Limited (2004 to 2011), Chairman of the Rio Tinto Aboriginal Fund (2004 to 2011) and director of Downer EDI Limited (2004 to 2010). Mr Renwick is a director of South East Regional Touring Opera Company Limited, a “not-for-profit” public company limited by guarantee, which operates as “Melbourne Opera”.
Heather Ridout BEc (Hons) (age 58)
Independent non-executive director
Mrs Ridout was appointed as a director on 1 September 2011. She is a member of the Safety, Health, Environment & Community Committee. Mrs Ridout was formerly the Chief Executive Officer of the Australian Industry Group from 2004 until her retirement in April 2012. She is a Member of the Board of the Reserve Bank of Australia (since December 2011), and is a director of the AustralianSuper Trustee Board, the largest industry fund in Australia. Mrs Ridout also serves on the Boards of Skills Australia, a Federal Government body established to shape Australia’s strategy on skills development, and the Climate Change Authority, an independent body established to provide advice on the Australian Government’s policies for reducing carbon pollution. She has an economics degree with honours from the University of Sydney.
2
M Paul Sukagawa BA (age 61)
Non-independent non-executive director
Mr Sukagawa was appointed as a director in November 2009. He is Mitsui’s designated representative director. Mr Sukagawa is a member of the Finance & Investment Committee, the Nomination/Governance Committee and the Safety, Health, Environment & Community Committee. He joined Mitsui & Co., Ltd in 1973 and has held various positions within that company, including President & Managing Director of Mitsui Iron Ore Development (2004–2007), President & CEO of PT. Mitsui Indonesia (2007–2009) and, most recently, since April 2009, Senior Adviser of Mitsui Iron Ore Development.
James T Thompson BS (age 62)
Independent non-executive director
Mr Thompson was appointed as a director in November 2009. He is a member of the Finance & Investment Committee and the Remuneration Committee. Mr Thompson was, from 2004 until his retirement in 2007, Executive Vice President–Commercial for The Mosaic Company, one of the world’s largest fertiliser companies, with sales of US$11 billion and some 8,000 employees, which is publicly traded on the New York Stock Exchange. Prior to that, he was engaged for 30 years in the steel industry from 1974–2004 in various roles at Cargill, Inc of Minnesota, United States, leading to the position of President of Cargill Steel Group from 1996–2004. During that period, Mr Thompson also served for a time as Co-Chairman of the North Star BlueScope Steel joint venture, and was a member of various industry boards including AISI (American Iron and Steel Institute), SMA (Steel Manufacturers Institute) and MSCI (Metals Service Center Institute). He is currently a director of Hawkins, Inc. and serves on the Board of Visitors of the University of Wisconsin School of Education. Mr Thompson has a BS from the University of Wisconsin–Madison.
Paul J Varello BCE (Civil Engineering) (age 68)
Independent non-executive director
Mr Varello was appointed as a director in November 2005. He served as Chairperson of the Company from August 2009 until 1 March 2012. Mr Varello is a member of the Remuneration Committee and the Nomination/Governance Committee. He is Chairman of Commonwealth Engineering and Construction (CEC), located in Houston, Texas. Prior to founding CEC in 2003, he was Chairman and CEO of American Ref-Fuel Company. Mr Varello is a registered professional engineer and a member of the American Society of Civil Engineers and the American Institute of Chemical Engineers.
Robert Lewon BS (age 69)
Former Independent non-executive director
Mr Lewon retired on 10 November 2011 having served as an independent non-executive director since March 2008.
Company secretaries
Frank Moratti B Comm, LLB, MBA (Executive)
Mr Moratti was appointed to the position of Company Secretary in 1997. Before joining the Company, he held positions of assistant company secretary/legal counsel in a number of publicly listed companies over a period of some 12 years and, prior to that, worked as a solicitor with a major legal practice.
Scott Miller BS, MS, JD, PE
Mr Miller was appointed to the position of Company Secretary in 2008. Since joining the Company in 1997, Mr Miller has held positions as legal counsel and manager for environmental affairs for North American operations. Before joining the Company, he held positions at an environmental mediation firm, as an attorney with a major legal practice and as a consulting engineer.
3
Directors’ meetings
The following table shows the actual board and committee meetings held during the financial year and the number of meetings attended by each director.
| Board of Directors | Risk, Audit & Compliance Committee | Safety, Health, Environment & Community Committee | Remuneration Committee | Finance & Investment Committee | Nomination/ Governance Committee | |||||||
Meetings held | 8 | 6 | 4 | 7 | 7 | 3 | ||||||
G Brunsdon1 | 8 | 6 | 5 | 7 | ||||||||
D Dienst | 8 | 2 | 6 | 2 | ||||||||
N Bobins2 | 7 | 6 | 2 | |||||||||
J DiLacqua3 | 6 | 5 | 5 | |||||||||
JM Feeney | 8 | 6 | 7 | 3 | ||||||||
R Lewon4 | 4 | 2 | 3 | 2 | ||||||||
G Morris | 8 | 6 | 7 | 3 | ||||||||
C Renwick5 | 8 | 4 | 2 | 2 | ||||||||
H Ridout6 | 5 | 3 | ||||||||||
M Sukagawa7 | 8 | 4 | 7 | 2 | ||||||||
J Thompson8 | 8 | 1 | 1 | 5 | 5 | |||||||
P Varello | 7 | 7 | 3 |
1Mr Brunsdon was appointed to the Remuneration Committee on 1 September 2011.
2Mr Bobins was appointed to the Nomination/Governance Committee on 1 September 2011.
3Mr DiLacqua was appointed to the Board of Directors and to the Finance & Investment Committee and Risk, Audit & Compliance Committee on 1 September 2011.
4Mr Lewon retired from the Board of Directors and the Safety, Health, Environment & Community Committee, Finance & Investment Committee and Nomination/Governance Committee on 10 November 2011.
5Mr Renwick vacated the Finance & Investment Committee, and was appointed to the Nomination/Governance Committee, on 1 September 2011.
6Mrs Ridout was appointed to the Board of Directors and to the Safety, Health, Environment & Community Committee on 1 September 2011.
7Mr Sukagawa was appointed to the Nomination/Governance Committee on 1 September 2011.
8Mr Thompson vacated the Safety, Health, Environment & Community Committee and Risk, Audit & Compliance Committee and was appointed to the Remuneration Committee and Finance & Investment Committee on 1 September 2011.
Directors’ interests
As at the date of this report, the interests of the directors in the shares, options, or performance rights of the Company are set forth below. Shares owned by each director are either in the form of ordinary shares or American Depositary Shares (“ADS”).
| Shares | Options over Shares | Performance Rights | ||||||||||
G Brunsdon | 4,057 | - | - | |||||||||
D Dienst (ADS) | 592,593 | 1,075,640 | 862,879 | |||||||||
N Bobins (ADS) | 54,600 | - | - | |||||||||
J DiLacqua | - | - | - | |||||||||
JM Feeney | 32,789 | - | - | |||||||||
G Morris (ADS) | 15,000 | 82,000 | - | |||||||||
C Renwick | 3,144 | - | - | |||||||||
H Ridout | - | - | - | |||||||||
M Sukagawa | 3,000 | - | - | |||||||||
J Thompson (ADS) | 12,000 | - | - | |||||||||
P Varello (ADS) | 97,625 | - | - | |||||||||
4
Review of operations
A review of the operations of the Group during the financial year and the results of those operations are set out in the Chairman’s and Group Chief Executive Officer’s Review in the annual report and in the press release announcing the results for the financial year as filed with the ASX.
Principal activities
The Group reports revenues by the following product groups:
| • | Ferrous secondary recycling - comprising the collection, processing and trading of iron and steel secondary raw material. |
| • | Non-ferrous secondary recycling - comprising the collection, processing and trading of other metal alloys and residues, principally aluminium, lead, copper, zinc and nickel bearing materials. |
| • | Recycling solutions - comprising the provision of environmentally responsible solutions for the disposal of post-consumer electronic products, including IT assets recycled for commercial customers. The Group offers fee-for-service business opportunities in the environmentally responsible recycling of negative value materials including refrigerators, electrical and electronic equipment. |
| • | Secondary processing and other services - comprising value-added processes involving the melting, refining and ingoting of certain non-ferrous metals and other service revenue. |
Dividends
The board determined a final dividend of 10.0 cents per share, unfranked, for the financial year to be paid on 19 October 2012. The interim dividend for the financial year was 10.0 cents per share, unfranked, and was paid on 10 April 2012.
Significant changes in the state of affairs
There were no significant changes in the state of affairs of the Group during the financial year not otherwise disclosed elsewhere in this report.
Significant events after the balance sheet date
The directors are not aware of any items, transactions or events of a material or unusual nature that have arisen since the end of the financial year which will significantly affect, or may significantly affect, the operations of the Group, the results of those operations or the state of affairs of the Group in subsequent financial years.
Likely developments
Information as to the likely developments in the operations of the Group is set out in the Chairman’s and Group Chief Executive Officer’s Review in the annual report.
Environmental regulation
The Group is subject to environmental regulations and reporting requirements in Australia and other countries in which it operates. The Group has licenses and consents in place at each of its operating sites as prescribed by environmental laws and regulations that apply in each respective location. Further information on the consolidated entity’s performance in relation to environmental regulation is set out in the annual report.
The Group’s Australian operations are subject to the reporting requirements of both theEnergy Efficiency Opportunities Act 2006and theNational Greenhouse and Energy Reporting Act 2007.The Group’s aluminium operation in Victoria also reports under that State’sEnvironment and Resource Efficiency Plan (EREP) as well as itsWater Management Action Plan (WaterMap).
5
TheEnergy Efficiency Opportunities Act 2006 requires the Group to assess the energy usage of its Australian operations, including the identification, investigation and evaluation of energy saving opportunities, and to report publicly on the assessments undertaken, including what action the Group intends to take as a result. The Group continues to meet its obligations under this Act.
TheNational Greenhouse and Energy Reporting Act 2007 requires the Group to report its annual greenhouse gas emissions and energy use of its Australian operations. The Group has implemented systems and processes for the collection and calculation of the data required to enable it to prepare and submit its report to the Greenhouse and Energy Data Officer by 31 October 2012.
EREP is a regulatory program in Victoria that requires the reporting of major energy, water and waste activities, with the aim of better management of those activities. WaterMap is a Victoria based initiative that aims to improve the utilisation of water sources.
There have been no significant known breaches of the Group’s license conditions or any environmental regulations to which it is subject.
Insurance and indemnification of officers
During the financial year, the Company had contracts in place insuring all directors and executives of the Company (and/or any subsidiary companies in which it holds greater than 50% of the voting shares), including directors in office at the date of this report and those who served on the board during the year, against liabilities that may arise from their positions within the Company and its controlled entities, except where the liabilities arise out of conduct involving a lack of good faith. The directors have not included details of the nature of the liabilities covered or the amount of the premium paid as such disclosure is prohibited under the terms of the contracts.
Share option and rights
Unissued shares
As of the date of this report, there are 5,191,263 share options outstanding and 3,483,123 rights outstanding in relation to the Company’s ordinary shares. Refer to Note 24 of the consolidated financial statements for further details of the options and rights outstanding as at 30 June 2012. Option and right holders do not have any right, by virtue of the option or right, to participate in any share issue of the Company.
Shares issued as a result of the exercise of options and vesting of rights
During the financial year, there were 181,654 ordinary shares issued upon the exercise of share options and 531,787 ordinary shares issued in connection with the vesting of rights. Refer to Note 24 of the consolidated financial statements for further details of shares issued pursuant to share-based awards. Subsequent to the end of the financial year and up to the date of this report, 13,251 ordinary shares were issued in connection with vesting of rights.
Non-audit services
The Company may decide to employ its external auditor (PricewaterhouseCoopers) on assignments additional to their statutory audit duties where the auditor’s expertise and experience with the Company and/or the Group are important.
Details of the amounts paid or payable to the auditor for audit and non-audit services provided during the financial year are set out in Note 26 of the consolidated financial statements.
The Board has considered the position and, in accordance with advice received from the Risk, Audit & Compliance Committee, is satisfied that the provision of the non-audit services is compatible with the general standard of independence for auditors imposed by theCorporations Act 2001. The directors are satisfied that the provision of non-audit services by the auditor, as set forth in Note 26 of the consolidated financial statements, did not compromise the auditor independence requirements of theCorporations Act 2001 for the following reasons:
6
| • | All non-audit services have been reviewed by the Risk, Audit & Compliance Committee to ensure they do not impact the impartiality and objectivity of the auditor; and |
| • | None of the services undermine the general principles relating to auditor independence as set out inAPES 110 Code of Ethics for Professional Accountants. |
A copy of the auditor’s independence declaration as required under section307C of the Corporations Act 2001 is set out on page 32.
Rounding of amounts
The Company is of a kind referred to in Class Order 98/100, issued by the Australian Securities and Investments Commission, relating to the “rounding off” of amounts in the financial statements. Amounts in the financial statements have been rounded off in accordance with that Class Order to the nearest tenth of a million dollars, unless otherwise indicated.
7
REMARKS BY THE CHAIRMAN OF THE REMUNERATION COMMITTEE
Dear Shareholder,
We are pleased to present your Company’s 2012 Remuneration Report and hope that you will find it to be clear, informative and easy to comprehend.
Our executive remuneration framework, including incentive plan design, has remained consistent between the 2011 and 2012 financial years. It reflects our global scale and consists of fixed remuneration, a short-term incentive plan (‘STI Plan’) that is subject to the achievement of challenging Company financial targets and personal performance goals and a long-term incentive plan (‘LTI Plan’) that is aligned to the creation of shareholder value.
Each year, we continue to strive to make our Remuneration Report more readable and relevant, and, in enhancing this year’s Report, we have:
| • | provided an ‘executive remuneration snapshot,’ which provides an overview of our remuneration approach; and |
| • | explained in further detail how actual remuneration outcomes are correlated to Company performance, as well as the difference between actual remuneration outcomes, targeted remuneration and the statutory remuneration table. |
With respect to the Company’s LTI Plan, the Committee commissioned its remuneration consultant, Mercer (US) Inc.(‘Mercer’), to review the Plan and recommend possible changes. These recommendations are being considered by management and the Committee and may lead to changes being put into effect for the LTI Plan in the 2014 financial year.
The negotiation of a new employment agreement for the Executive Director was postponed until the 2013 financial year. In exchange for an agreement to extend his existing contract through 30 June 2013, the Executive Director received a one-off payment of US$500,000. He also received an approximate five percent increase in base salary effective 1 July 2012 which was in line with our compensation philosophy and benchmarking against our compensation comparator group. In addition, effective 1 July 2012, the Executives received base salary increases ranging from zero to three percent. The average salary increase for all other global employees was approximately three percent.
We will keep our remuneration policy and practices under constant review as we continue to strive to achieve ‘best practice’ in the alignment of remuneration with corporate strategy and shareholder wealth.
We welcome and value your feedback as we continue to find ways to improve communications with our shareholders.
Yours sincerely,

Michael Feeney
Remuneration Committee Chair
RemCoChair@simsmm.com
REMUNERATION REPORT
The Directors of Sims Metal Management Limited present the Remuneration Report for the Company and the Group for the 2012 financial year. The information provided in this Remuneration Report has been audited.
The Remuneration Report is set out as follows:
Section
| Description
| Page #
| ||
| A | Executive Remuneration Snapshot | 9 | ||
| B | Our Remuneration Governance Framework | 12 | ||
| C | Executive Remuneration Policy | 13 | ||
| D | Executive Remuneration Framework | 14 | ||
| E | Remuneration Outcomes For Executives During The 2012 Financial Year, Including Discussion Of The Linkage Between ‘At-Risk’ Remuneration And Company Performance | 20 | ||
| F | Executive Contracts | 25 | ||
| G | Share-based Payment Disclosures | 26 | ||
| H | Non-Executive Director Remuneration | 30 | ||
8
A. EXECUTIVE REMUNERATION SNAPSHOT
Due to our global scale, our remuneration practices must take into account local market practice, particularly in our largest jurisdiction of the United States where we compete for much of our talent and business. Our executive remuneration framework consists of fixed remuneration, short-term incentives and long-term incentives.
The Company’s remuneration philosophy is designed to provide a remuneration program that:
| • | attracts, motivates and retains the best and brightest of its senior executive, leadership and staff positions; |
| • | drives the Company’s business strategy of continued growth and success as a major global corporation; and |
| • | aligns reward opportunities with shareholder interests. |
Sims Metal Management Limited and its joint ventures operate in more than 270 locations across five continents. Given our global scale, it is imperative that our remuneration practices take into account local market practice, particularly in our largest jurisdiction of the United States where we compete for much of our talent and business. Of the five members of your current senior management team, three are based in the United States, one is based in the United Kingdom, and one is based in Australia.
Fixed Remuneration
Our Executive fixed remuneration levels are benchmarked against a comparator group by Mercer (the Board’s external remuneration adviser). In light of our global operations, the comparator group includes industry-related companies of a relative size, footprint and complexity. Adjustments with respect to fixed remuneration were made in the 2012 financial year, factoring in appropriate benchmarks, role and Executive performance.
Variable Pay
Our variable pay plans use demanding financial and individual performance criteria focused on delivering short-term and long-term value to our shareholders. The Company endeavours to achieve simplicity and transparency in remuneration design, whilst also balancing competitive market practice in the United States, the United Kingdom and Australia.
Our STI Plan is a global plan and the 2012 financial year metrics were in alignment with the Company’s strategic plan and factored in its cost of capital. The STI Plan for the Executive Director and Executives is weighted 80% on financial measures and, in order to drive and reinforce desired individual behaviours and outcomes, 20% on individual measures. The STI Plan performance in respect of financial measures came in below threshold on a Group-wide basis and, as such, only ‘personal priority’ portions of the STI were earned by the Executive Director and Executives as measured against Group performance. However, some regions did achieve partial accomplishments against target. As such, bonuses were paid to those Executives in line with the respective performance of their region as applicable, in conjunction with their performance against their individual objectives.
Under our LTI Plan, performance rights and options are granted to select Company executives consistent with the framework of the awards made to the Executive Director, as approved by shareholders at the Company’s Annual General Meeting in November. These awards provide meaningful remuneration opportunities that are aligned with the Company’s share price performance and reflect the importance of retaining the Company’s world-class management team.
The performance rights are nil exercise price options and vest subject to relative total shareholder return (TSR) performance against an industry peer group over a three-to-five-year period. This is consistent with competitive market practice in Australia and the United Kingdom. The options have an exercise price which is equal to the average share price for the five days preceding the grant date. They vest in three equal instalments over a three-year period subject to continued service. The options reward executives for share price growth and only deliver value if the share price exceeds the exercise price subsequent to vesting. This is consistent with competitive market practice in the United States.
This LTI structure ensures that executives focus on shareholder value creation relative to companies within the Company’s industry, as well as the creation of absolute shareholder value. Under this structure, executives cannot receive their full LTI opportunity unless the Company’s share price has grown in absolute terms and its TSR is above the median against its industry peer group. This structure is more rigorous than other structures typically seen in the Australian market where, in difficult economic conditions, 100% of the LTI opportunity can still vest even if relative TSR performance is strong but no shareholder value has been created.
9
Non-Executive Directors and Executives covered in this report
The Remuneration Report is focused on the Company’s Key Management Personnel (‘KMP’) consisting of the below Non-Executive Directors and Executives.
| Name | Position | |
| Non-Executive Directors | ||
| Geoffrey N Brunsdon | Chairman and Independent Non-Executive Director | |
| Norman R Bobins | Independent Non-Executive Director | |
| John T DiLacqua | Independent Non-Executive Director (commenced on 1 September 2011) | |
| J Michael Feeney | Independent Non-Executive Director | |
| Robert Lewon | Independent Non-Executive Director (retired 10 November 2011) | |
| Gerald E Morris | Independent Non-Executive Director | |
| Chris J Renwick | Independent Non-Executive Director | |
| Heather Ridout | Independent Non-Executive Director (commenced on 1 September 2011) | |
| M Paul Sukagawa | Non-Independent Non-Executive Director | |
| James T Thompson | Independent Non-Executive Director | |
| Paul J Varello | Independent Non-Executive Director | |
| Executives | ||
| Daniel W Dienst | Executive Director and Group Chief Executive Officer | |
| Graham Davy | Chief Executive Officer – European Metals and Sims Recycling Solutions (SRS), Global Operations | |
| Robert Kelman | President – Commercial North America (1 July 2011 to 31 January 2012) | |
| President – North America Metals (effective 1 February 2012) | ||
| Robert C Larry | Group Chief Financial Officer | |
| Darron McGree | Managing Director Australia and New Zealand Metals | |
| Alan D Ratner1 | President – Operations North America (1 July 2011 to 31 January 2012) Group Executive Vice President – Operations & SHEC (Safety, Health, Environment & Community) (effective 1 February 2012) | |
| 1 | As at 1 February 2012, Mr Ratner, due to a change in responsibilities, is no longer considered to be a KMP. |
10
Actual Remuneration Outcomes
There is a strong correlation between incentive pay and Company performance, with cash bonuses being significantly lower than target and significantly lower than the prior year due to Company performance against ROCCE targets. No performance rights vested since the Company’s TSR performance was below the median when measured against its peer group.
In order to provide additional transparency, outlined below is the actual remuneration received by the Executives during the 2012 financial year. For comparative purposes, the targeted remuneration is also shown. Targeted remuneration is consistent with the Company’s remuneration philosophy and is supported by Mercer’s competitive benchmarking data.
The statutory remuneration tables, which are prepared consistent with Australian Accounting Standards and theCorporations Act 2001 (Cth), are outlined later in this report.
By providing this table below, the strong correlation between actual remuneration received and Company performance can be more clearly demonstrated. Actual cash bonuses were significantly lower than the previous financial year (as noted in the statutory remuneration table in Section E) as well as significantly lower than targeted incentives because the Return on Controlled Capital Employed (ROCCE) performance against target at the Group and business unit level was not met. Actual cash bonus figures reflect the figures in the statutory remuneration table.
In the 2008 financial year, there were three tranches of performance rights granted, with vesting subject to Relative TSR, EPS and EBITDA respectively. 43.8% of the performance rights subject to EBITDA vested during the 2012 financial year, meaning that 100% of this allocation has now vested. There was no vesting in relation to the 2008 performance rights that were subject to relative TSR and EPS. Accordingly, in the 2013 financial year, 40.4% of the 2008 performance rights subject to relative TSR will be forfeited (because the Company’s relative TSR performance was below the median against its peer group) and 100% of the 2008 performance rights subject to EPS will be forfeited (because the threshold EPS level was not achieved). There was also no vesting of the 2009 and 2010 financial year performance rights subject to relative TSR.
The actual value of LTI awards is different from the targeted LTI awards noted below, as well as the statutory remuneration table in Section E. This is because the actual LTI figures reflect the value of the LTI awards that actually vested on the vesting date (i.e., the actual amount that Executives received) whereas the value of the LTI figures in the statutory remuneration table reflects the amortised value of the entire LTI award (that may or may not vest) in accordance with accounting standards. By comparing the two tables, it can be seen that the actual remuneration of the Executives during the 2012 financial year was significantly lower than their targeted incentives, as well as the remuneration that is required to be disclosed in the statutory remuneration table.
Executives (A$) | Fixed remuneration1 | Actual cash bonus2 | Target cash bonus | Actual long-term incentives3 | Target long-term incentives | Total actual remuneration | Total target remuneration | |||||||||||||||||||||
D Dienst4 | 1,435,952 | 819,653 | 1,675,550 | 449,490 | 3,866,654 | 2,705,095 | 6,978,156 | |||||||||||||||||||||
G Davy4 | 583,821 | 244,274 | 526,691 | 43,867 | 526,691 | 871,962 | 1,637,203 | |||||||||||||||||||||
R Kelman4 | 790,754 | 133,686 | 668,669 | 109,306 | 668,669 | 1,033,746 | 2,128,092 | |||||||||||||||||||||
R Larry4 | 806,174 | 128,888 | 644,442 | 256,847 | 805,553 | 1,191,909 | 2,256,169 | |||||||||||||||||||||
D McGree | 732,692 | 244,923 | 621,557 | - | 621,557 | 977,615 | 1,975,806 | |||||||||||||||||||||
A Ratner4 | 713,522 | 128,888 | 644,442 | 109,306 | 644,442 | 951,716 | 2,002,406 | |||||||||||||||||||||
| 1. | Fixed remuneration includes cash salary, other benefits, pension and superannuation, and leave accruals in line with statutory remuneration disclosures. Effective 1 February 2012, commensurate with the assumption of his new role and expanded responsibilities, Mr Kelman received a nine percent increase to his base salary. |
| 2. | Actual cash bonus refers to the Executive’s total bonus that was earned in the 2012 financial year and will be paid to the Executive in September 2012 following the finalisation of the audited financial results. For Mr Dienst, the actual cash bonus also includes a one-off payment of US$500,000 in exchange for an agreement to extend his existing contract through 30 June 2013. |
| 3. | LTI refers to equity allocations granted in prior years that vested during the 2012 financial year. The value has been calculated using the closing share price of the Company’s shares on the vesting date (less any exercise price). It also includes amounts paid out under the deferred compensation plan. |
| 4. | Messrs Dienst, Kelman, Larry and Ratner receive their cash payments in United States dollars. Mr Davy receives his cash payments in pounds sterling. |
11
B: OUR REMUNERATION GOVERNANCE FRAMEWORK
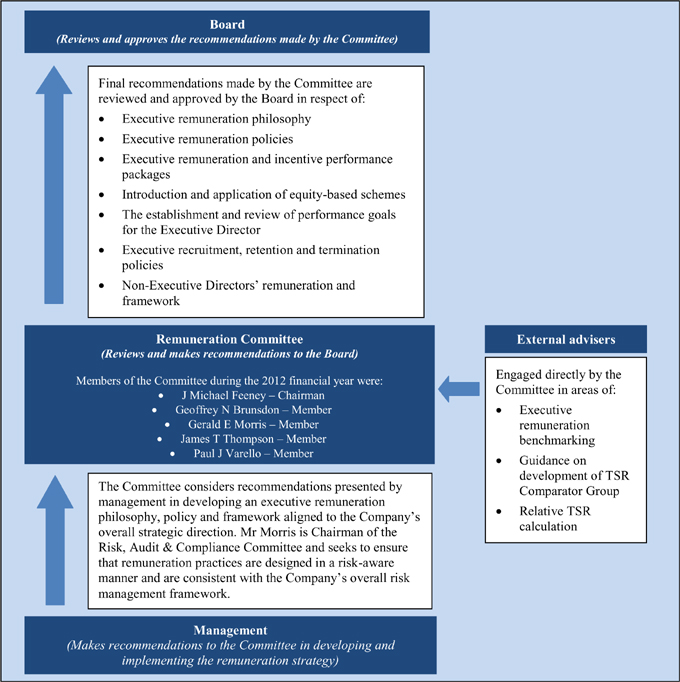
We have a strong remuneration governance framework, with the Board being ultimately responsible for the Company’s executive remuneration practices. The Remuneration Committee (Committee) supports the Board The in making remuneration decisions.
The primary role of the Committee is to support and advise the Board on the implementation and maintenance of coherent, fair and responsible remuneration policies and practices that are observed by the Company and enable it to attract and retain executives and directors who will create value for shareholders. The Committee’s charter, which is available on the Company’s website at www.simsmm.com, provides further information on the role of the Committee.
The diagram below illustrates the role of the Board, the Committee, management and external advisers (including remuneration consultants) in relation to remuneration.
In addition to the above, in recognition of the value and advantages of having a diversified workforce and consistent with the Company’s Workforce Diversity Policy (which has been posted on the Company’s website atwww.simsmm.com), the Committee is responsible for reviewing and approving the measureable objectives for achieving diversity as noted in the Company’s Corporate Governance Statement.
12
C: EXECUTIVE REMUNERATION POLICY
Our executive remuneration policy supports our vision and aligns executive incentive pay with the achievement of Company strategic and business priorities and the creation of shareholder value.
Executive remuneration policy
The executive remuneration policy recognises that the Company operates in a global environment and that the Company’s performance depends on the quality of its people.
The policy seeks to ensure alignment between the Company’s remuneration philosophy, its business strategy and the best interest of its shareholders.
The primary aim of the Company’s remuneration policy is to attract, motivate and retain high calibre executives. To do so, the Company provides executive remuneration packages that are competitive (referencing market data) and commensurate with employee responsibilities and accountabilities. The diagram below provides a snapshot of the Company’s remuneration principles and its components, and how they support the Company’s overall vision.

13
D: EXECUTIVE REMUNERATION FRAMEWORK
Our executive remuneration framework is heavily skewed towards variable pay, with 81% of the Executive Director’s target pay being at-risk, subject to challenging short-term and long-term hurdles.
The executive remuneration framework reflects the international nature of the Company and the fact that we employ executives based throughout the world.
The framework is continually reviewed by the Committee to ensure best practices are followed. The Company also undertakes an annual remuneration review to determine the total remuneration positioning of its executives against the market.
Use of External Remuneration Advisor
The Committee retains Mercer, a remuneration consultant, to serve as its external advisor. In its capacity as advisor to the Committee, Mercer performs competitive compensation research and provides guidance on executive remuneration issues. The activity includes providing guidance on appropriate comparator group companies, which includes industry-related companies of similar sized revenue and market capitalisation (i.e., from approximately half the Company’s size to twice the Company’s size) with similar geographic footprints and complexity. Mercer also assesses competitive executive base salary, annual incentive, and long-term incentive levels for the Committee’s consideration as it approves base salary adjustments and sets target incentive opportunities for Executives. During the 2012 financial year, Mercer also reviewed the Company’s LTI Plan and provided the Committee with potential alternatives, provided guidance on competitive practices with regard to executive contracts, provided valuations of awards under the LTI Plan and assessed the Company’s cumulative TSR against the comparator group. In addition, Mercer provided the Committee with a remuneration recommendation as defined under theCorporations Act 2001(Cth) during the 2012 financial year. Mercer has not provided any other advice to the Committee during the 2012 financial year.
The Mercer fees for the above remuneration recommendation approximated A$109,000. The Committee has implemented protocols around the appointment and use of remuneration consultants to ensure compliance with theCorporations Act 2001(Cth). Michael Feeney, Chairman of the Committee, directly engaged Mercer to perform the above work and Mercer did not provide their report to any member of Company management. The Committee also had direct access to Mercer during executive sessions (sans Company management) throughout the 2012 financial year. Mercer has declared to the Committee that their remuneration recommendations were not unduly influenced by any of the Company’s KMP throughout the course of their engagement. Based on the protocols followed, and Mercer’s declaration, the Board is satisfied that the remuneration recommendation from Mercer was made free from undue influence by any of the KMP.
Fixed and variable (‘at-risk’) remuneration mix
In line with the Company’s intent to ensure the executive remuneration framework is aligned to the Company’s performance, a significant portion of an Executive’s remuneration is ‘at-risk’. The following chart sets out the target remuneration mix; that is, fixed remuneration (salary/package), target short-term incentive, and long-term incentive for the Executives.
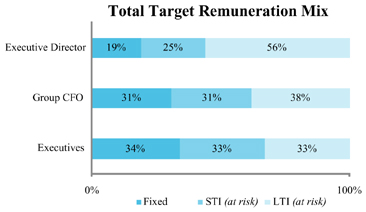
14
Fixed remuneration
Fixed remuneration comprises base salary and benefits.
| • | Base salary is determined on an individual basis, taking into consideration the individual’s capability, experience, responsibilities and accountability, as well as external market factors and benchmark data. |
| • | Benefits programs vary by market and may include health insurance, life and disability insurance, retirement programs (depending on national government and tax regulations) and automobile allowances. |
Remuneration packages (including fixed components of base salaries and benefits) are reviewed annually. In reviewing any changes to executive remuneration, the Committee references individual performance, as well as market-based comparable positions in public surveys and obtains advice from its external remuneration consultant where necessary.
There are no guaranteed increases to any components of fixed remuneration for any Executives.
‘At-risk’ remuneration
‘At-risk’ remuneration comprises both short-term and long-term incentives. ‘At-risk’ means an absence of certainty regarding the payment of a particular component of remuneration in the event agreed-upon performance hurdles or employment conditions are not met during the performance period. The remuneration of Executives is linked to performance through short- and long-term incentives. Details on each of these plans are outlined below.
Short-Term Incentive Plan (STI Plan)
The STI Plan is based 80% on financial performance (ROCCE) and 20% on individual goals that are critical to the overall success of the Company.
Executives are eligible to participate in the Company’s STI Plan. The table below summarises the key aspects of the STI Plan.
| Frequency, timing and form of award | - Executives have an opportunity to earn an annual cash-based incentive based on the achievement of pre-defined targets over the financial year. - Individual goals and targets are set on an annual basis. - Payment is made in September following the finalisation of the audited financial results. | |||||||||
| Target and maximum STI opportunities | - The STI target opportunity is 130% of fixed remuneration for the Executive Director and 100% of fixed remuneration for Executives. - The STI opportunity ranges from a minimum of nil payment to a maximum opportunity of 200% of the target opportunity for all Executives. | |||||||||
Performance measures for the Executive Director and Executives | ||||||||||
Financial measures |
Individual measures | |||||||||
| Weighting | • 80% | • 20% | ||||||||
| Metrics | • Based on ROCCE targets1,
• Group Executives–
• Regional Executives– | • Individual goals are set in several key performance areas which focus on individual initiatives that are critical to the overall success of the Company. They may include:
- Safety (i.e., reduction in certain safety metrics) - Implementation of certain aspects of the Company strategic plan - Talent Management - Sustainability - Shareholder and community relations
| ||||||||
1. ROCCE is computed as Profit Before Interest and Taxes (PBIT) divided by Average Controlled Capital Employed (CCE).
| ||||||||||
15
- The Company understands the desire for greater transparency of specific targets. However, given the Company’s size and position in the industry, we believe disclosing precise financial / individual performance targets would put us at a competitive disadvantage due to commercial sensitivity. Performance against the financial targets is set out in Section E. | ||
Rationale for performance measures | - ROCCE has been approved by the Committee as the appropriate financial measure as the Committee believes that ROCCE is a key performance driver of the Group. ROCCE focuses on the effective management of invested capital while encouraging maximisation of operating profits. - The Company has chosen relevant individual performance measures to drive and reinforce the desired individual behaviours and outcomes, even in difficult economic and financial times. | |
| Determination of performance measures | - The financial targets for Executives are recommended each year by the Executive Director and reviewed by the Committee for recommendation to the Board for approval. The financial targets for the Executive Director are recommended by the Committee and approved by the Board. The financial targets are determined by taking into consideration stretch performance targets in the context of the economic cycle. - Individual goals and targets for Executives are established on an annual basis by the Executive Director, taking into consideration the Executive’s required goals to support the Company’s strategic plan. The individual goals and targets for the Executive Director are recommended by the Committee for approval by the Board. | |
Assessment of performance against measures | - Threshold, target and maximum individual award opportunities have been established and vary by position. - A minimum ROCCE threshold and individual level of performance must be met for executives to be eligible for payment. Payment between threshold and maximum is then determined by reference to ROCCE and individual performance outcomes against pre-defined targets. Once the threshold hurdle is met, awards are linear in calculation until the maximum hurdle is reached. - At the end of the financial year, each executive’s individual performance is assessed based on appropriate ROCCE performance (e.g., overall Group performance or the relevant business unit) and a review of individual performance achievement against pre-defined key performance areas. - The individual’s performance is rated on a scale of 0 to 4. Participants must receive a weighted average rating of at least 2.0 (meets expectations) in order to receive target payment based on the individual performance component. A rating below 1.75 results in no award with regard to the individual performance component. - Executive performance is assessed by the Executive Director, and recommended payments are considered and, if appropriate, approved by the Committee. For the Executive Director, performance is assessed by the Committee and a recommended payment is approved by the Board. - Performance against the financial targets is set out in Section E. | |
| Termination provisions | - A voluntary termination or termination for cause prior to the last calendar day of the financial year will result in no STI being paid for the year unless the Committee determines otherwise. - Upon a qualifying cessation (i.e., termination due to death, disability or redundancy), STI performance for the relevant period will be assessed and paid. |
Long-Term Incentive Plan (LTI Plan)
The LTI Plan aligns executive rewards with the shareholder experience through the use of relative TSR and absolute share price.
The Committee believes that executive participation in equity-based incentive plans is a key element which aligns executive and shareholder objectives. The Company’s LTI Plan is the principal means of allowing executives the opportunity to be rewarded for the Company’s growth in share price and total shareholder return. The LTI Plan provides a direct link between the value created for shareholders, and the reward earned by executives. It also assists in the retention of executives.
The LTI Plan allows for grants of performance rights (rights), options and phantom options. The LTI Plan structure is designed to focus on two key aspects of future performance. First, rights recognise shareholder value
16
creation relative to companies either within the Company’s industry or of a similar nature, as measured by TSR. Second, options (and phantom options where applicable) reflect creation of absolute shareholder value, as recognised by absolute growth in the Company’s share price.
Performance Rights | - A right is a contractual right to acquire an ordinary share for nil consideration. United States participants have their rights settled in American Depositary Shares (ADSs). - Rights reward executives for relative performance as a relative total shareholder return (TSR) hurdle must be satisfied in order for the rights to vest. Accordingly, for participants to receive any value from the plan, the Company’s TSR performance must be above the median against the peer group. | |
| Options | - An option is a contract that gives the holder the right, but not the obligation, to acquire an ordinary share at a fixed price over a specified period of time. United States participants have their options settled in ADSs. - Options reward executives for absolute share price performance. This is because the options only have value if the share price exceeds the exercise price at the end of the vesting period. The options are also subject to a continuous service vesting condition. This reflects common market practice in the United States, where the Company competes for much of its talent and business. | |
| Phantom Options | - Phantom options operate in the same manner as options; however, they are cash-settled rather than equity-settled. Accordingly, rather than receiving one fully paid ordinary share in the Company upon exercise, the executive receives the value of one fully paid ordinary share in the Company in cash. - Phantom options (as opposed to equity-settled options) have been offered to participants in Australia and India from 1 July 2010 onwards because of the differing securities laws and taxation treatments in those jurisdictions. |
The Board believes that the combined rights / options structure provides an appropriate balance in terms of ensuring that rewards for executives are competitive, aligned to the Company’s global business and its shareholders, and reflect market practice in Australia, the United States and the United Kingdom. In addition, this structure is more rigorous than other structures commonly seen in the Australian market where, in difficult economic conditions, 100% of the LTI opportunity can vest if relative TSR performance is strong but no shareholder value has been created.
The following table summarises the LTI Plan as it relates to grants made in the 2012 financial year.
Options / Phantom Options | Rights | |||||
| Frequency and timing of awards | - The Company’s shareholders approved an LTI award for the Executive Director at the Company’s 2011 Annual General Meeting. In conjunction with that meeting, the Committee approved and granted LTI awards for the Executives. - Awards are typically made on an annual basis. | |||||
| Valuation of grants | - The fair value of rights and options is calculated by Mercer, the Company’s external valuation consultant, at their grant date using a Black-Scholes, Binomial or Monte Carlo simulation option pricing model as appropriate. See Note 24 of the financial report for assumptions used in determining the fair value. | |||||
| Treatment of dividends | - Holders of rights and options are not entitled to dividends over the term of the relevant vesting period (and in the case of options, until exercised). | |||||
| Performance conditions | Performance measure and rationale | - In order for options to deliver value to participants, the Company’s share price must increase above the exercise price. This aligns the award’s value to absolute growth in shareholder wealth, as measured by share price. | - In order for rights to vest, the Company’s TSR must be at the 51stpercentile or higher against a comparator group of companies. Above the 51st percentile,vesting is prorated, with full vesting occurring at the 75thpercentile. TSR aligns the vesting of executive awards to relative shareholder wealth creation. | |||
| Performance period | - Options generally vest in three equal instalments over a three-year period. This vesting schedule reflects common United States practice.1 - Options expire seven | - Performance is measured over an initial three-year period starting 1 July 2011 through 30 June 2014, with two potential annual re-tests at Year 4 (30 June 2015) and Year 5 (30 June 2016). - The potential tests at Year 4 and Year 5 will be measured over the extended four-year and five-year periods respectively. | ||||
17
Options / Phantom Options | Rights | |||||||||
years after the date of grant. | . | - Respectful of the feedback from shareholders and shareholder advisory groups, the Board and the Committee continue to maintain a firm belief that re-testing motivates executives to exert an extra level of effort in the years subsequent to the original performance period to bring performance above the median of (or higher than) the comparator group. Where executives receive value from the re-test, shareholders will also have experienced enhanced relative shareholder returns in those subsequent years. Accordingly, re-testing has been maintained for the 2012 financial year. - Any unvested rights outstanding at the end of Year 5 will immediately lapse. | ||||||||
Exercise price | - The exercise price of options is set at grant, and is equal to the average closing share price for the five days preceding the grant date2. | - Nil | ||||||||
Comparator group | - N/A | - The following companies comprise the current comparator group, chosen from comparable industry sectors: | ||||||||
Peer companies | ||||||||||
| AK Steel | Arrium (formerly OneSteel) | |||||||||
| Alcoa | Posco | |||||||||
| Allegheny Technologies | Reliance Steel | |||||||||
| ArcelorMittal | Schnitzer Steel | |||||||||
| BlueScope Steel | Steel Dynamics | |||||||||
| Commercial Metals | Tokyo Steel | |||||||||
| Gerdau | U.S. Steel | |||||||||
Nucor | ||||||||||
Vesting schedule | - N/A | The vesting schedule against the relative TSR hurdle is: | ||||||||
| TSR growth relative to the comparator group | Proportion of TSR grant vesting | |||||||||
| Less than 51stpercentile | 0% | |||||||||
| 51stpercentile | 50% | |||||||||
51stpercentile to 75thpercentile | Pro-rata straight line | |||||||||
| 75thpercentile or higher | 100% | |||||||||
| Treatment of awards on termination of employment | - Where participants resign, or are terminated for cause, awards are forfeited. - Where termination of employment is the result of a qualifying cessation (i.e., death, total or permanent disablement, or other circumstances at the discretion of the Board), participants will be entitled to unvested awards in accordance with the original vesting schedule. - Any unvested awards will continue to be held by eligible terminated participants and will be tested at the end of the initial performance period. However, no additional re-testing will be permitted. Any unvested awards lapse at the end of the initial performance period, subject to the Board’s discretion. | |||||||||
| Treatment of awards on change of control | - A change in control of the Company may trigger full vesting of awards, subject to Board discretion in certain circumstances. | |||||||||
| 1. | Each instalment vests following the date the Company announces its annual financial results to the Australian Securities Exchange (ASX) for its 2012, 2013 and 2014 financial years. |
| 2. | For United States executives, option awards are not Incentive Stock Options for the purposes of section 422 of the United States Internal Revenue Code. |
18
Guidelines for Group CEO approval of Discretionary Awards
In the 2011 financial year, the Committee implemented clearly defined Group CEO approval authority limits for individual discretionary cash awards and aggregate discretionary cash and/or equity awards.
With regard to individual awards, any individual discretionary cash award in excess of US$500,000 must be presented to the Committee for approval. With regard to aggregate awards, if the aggregate sum of the cash and/or equity award per occurrence is in excess of the Group CEO Discretionary Capital Expenditure authority (currently US$1,000,000), then it must be presented to the Committee for approval.
Securities Trading Policy
The trading of securities issued to participants pursuant to the Company’s LTI Plan is subject to, and conditional upon, compliance with the terms of the Company’s policy titledDealingsin SimsMetalManagementLimited Securities (a copy of which is available on the Company’s website atwww.simsmm.com). Executives are prohibited from entering into any hedging arrangements over unvested awards under the Company’s LTI Plan. The Company would consider a breach of the insider securities trading policy as serious misconduct, which may lead to disciplinary action up to and including dismissal.
19
E: REMUNERATION OUTCOMES FOR EXECUTIVES DURING THE 2012 FINANCIAL YEAR, INCLUDING DISCUSSION OF THE LINKAGE BETWEEN ‘AT-RISK’ REMUNERATION AND COMPANY PERFORMANCE
Overview of the link between remuneration and performance
In accounting for the Group’s performance and benefits for shareholder wealth, the Committee considers the following indices in respect of the current financial year and the previous four financial years.
| 20121 | 2011 | 2010 | 20091 | 2008 | ||||||||||||||||
(Loss)/Profit Before Interest and Tax (A$m)2 | (514.8) | 299.7 | 205.7 | (105.6) | 687.9 | |||||||||||||||
Diluted EPS (cents)3 | (253.3) | 93.3 | 64.5 | (82.5) | 306.3 | |||||||||||||||
Return on Shareholders’ Equity | (21.8)% | 6.6% | 3.9% | (5.3)% | 15.5% | |||||||||||||||
Total dividends (cents) | 20.0 | 47.0 | 33.0 | 38.0 | 130.0 | |||||||||||||||
Share price at 30 June A$ | 9.61 | 17.65 | 17.11 | 26.51 | 41.69 | |||||||||||||||
1 2012 and 2009 financial years reflect non-cash goodwill and other intangible impairment charges of A$615.1 million and A$191.1 million, respectively.
2Profit/(loss) before interest and tax for the 2008 to 2011 financial years have been adjusted to reflect a reclassification of income tax expense for equity accounted investments which were previously included within income tax expense. See Note 1(b) of the financial report.
3 Diluted EPS for the 2008 to 2010 financial years have been adjusted to reflect the shares issued in connection with the institutional placement and share purchase program in November and December 2009. See Note 4 of the financial report.
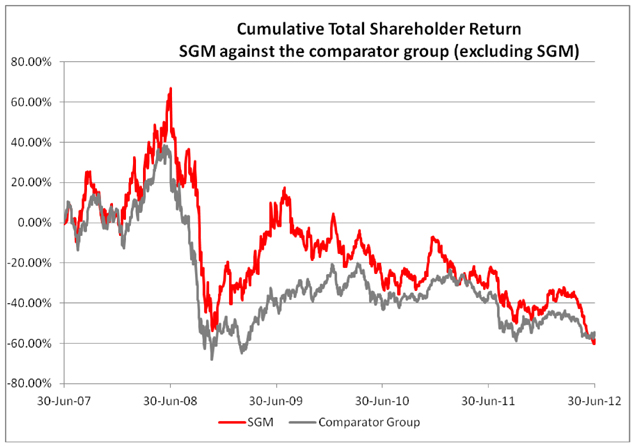
PBIT is used as one of the financial performance metrics in setting the STI Plan hurdles, as it is this figure divided by Average Controlled Capital Employed that determines ROCCE.
Dividends, share price and return on shareholders’ equity are included in the TSR calculation, which is the performance criteria assessed for the LTI Plan. The TSR graph below compares the Company (‘SGM’)’s TSR against the LTI comparator group (as referenced above) for the five-year period ending 30 June 2012. TSR is the return to shareholders provided by share price appreciation plus dividends (which are assumed to be reinvested in the Company’s shares) expressed as a percentage of the share price at the beginning of the measurement period, adjusted where appropriate for bonus issues, capital consolidation or equivalents.
20
Short-term incentives
As noted previously, STI Plan measures are based on financial performance (ROCCE) and individual performance measures. The table below outlines 2012 financial year Group and business unit performance against STI Plan ROCCE targets.
| Name | Business Unit | ROCCE Performance | ||||
D Dienst | Group | Below Threshold | ||||
G Davy | Global SRS (less United Kingdom SRS) | Above Threshold | ||||
G Davy | United Kingdom Metals/United Kingdom SRS | Below Threshold | ||||
R Kelman | North America Metals | Below Threshold | ||||
R Larry | Group | Below Threshold | ||||
D McGree | Australia Metals | Below Threshold | ||||
D McGree | New Zealand Metals | Above Threshold | ||||
A Ratner | Group | Below Threshold |
The following table outlines the proportion of the target STI that was earned and forfeited in relation to the 2012 financial year. Both ROCCE and individual performance influences individual STI payments.
| Name | Proportion of target STI earned during the 2011 financial year | Proportion of target STI the 2011 financial year | Proportion of target STI the 2012 financial year | Proportion of target STI the 2012 financial year | ||||
D Dienst | 95% | 5% | 20% | 80% | ||||
G Davy | 148% | 0% | 41% | 59% | ||||
R Kelman | 20% | 80% | 20% | 80% | ||||
R Larry | 95% | 5% | 20% | 80% | ||||
D McGree | 102% | 0% | 34% | 66% | ||||
A Ratner | 20% | 80% | 20% | 80% |
21
Long-term incentives
Actual vesting outcomes of the rights granted in the 2008, 2009 and 2010 financial years, as a result of the Company’s performance, are outlined in the table below.
| 2008 grant1 | ||||||||||||||||
| % of Rights | % of Rights | Additional % of | Total % of | Total % of | ||||||||||||
| that | that | Rights that will | Rights that | Rights that | ||||||||||||
| vested in 2011 | vested in 2012 | vest in 2013 | vested | will be | ||||||||||||
| (based on | (based on | (based on | forfeited | |||||||||||||
| performance | performance | performance | ||||||||||||||
| over initial | over extended | over extended | ||||||||||||||
| three-year | four-year period | five-year period | ||||||||||||||
| period to 30 | to 30 June 2011) | to 30 June 2012) | ||||||||||||||
June 2010)
| ||||||||||||||||
Relative TSR | 59.6%2 | 0%3 | 0%3 | 59.6% | 40.4%3 | |||||||||||
Earnings per | 0% | 0% | 0% | 0% | 100% | |||||||||||
share (EPS) | ||||||||||||||||
Earnings | 56.2% | 43.8% (i.e., the | n/a | 100% | 0% | |||||||||||
before | full 100% of | |||||||||||||||
interest, tax, | EBITDA rights | |||||||||||||||
depreciation | became vested) | |||||||||||||||
and amortisation | ||||||||||||||||
(EBITDA) | ||||||||||||||||
| 1. | The 2008 rights had an initial performance period from 1 July 2007 to 30 June 2010. They had re-tests on 30 June 2011 and 30 June 2012. Any rights that did not vest as of the end of the final performance period (30 June 2012) will be forfeited. |
| 2. | This equated to a TSR percentile rank of 55.6%. |
| 3. | No additional rights vested in the 2012 financial year or will vest in the 2013 financial year as the TSR performance ranks over the extended four-year and five-year periods were 54.2% and 45.8% respectively. These were below the initial performance rank of 55.6%. The remaining 40.4% of outstanding rights will be forfeited in August 2012. |
| 2009 grant1 | 2010 grant3 | |||||||||
| % of Rights that | Additional % of Rights | % of Rights that | ||||||||
| vested in 2012 | that will vest in 2013 | will vest in 2013 | ||||||||
| (based on performance | (based on performance | (based on performance | ||||||||
| over initial three-year | over extended four-year | over the initial three-year | ||||||||
period to 30 June 2011)
| period to 30 June 2012)
| period to 30 June 2012)
| ||||||||
Relative TSR | 0%2 | 0%2 | 0%4 | |||||||
| 1. | The 2009 rights had an initial performance period from 1 July 2008 to 30 June 2011. They had one re-test on 30 June 2012, and will have a final re-test on 30 June 2013. |
| 2. | No rights vested in the 2012 financial year, and no additional rights will vest in the 2013 financial year, as the Company’s TSR percentile ranks were 43.8% and 43.8% respectively. |
| 3. | The 2010 rights had an initial performance period from 1 July 2009 to 30 June 2012. They have two potential further test dates, one on 30 June 2013 and one on 30 June 2014. |
| 4. | No rights vested as the Company’s TSR percentile rank was 25%. |
22
Statutory Executive Remuneration Disclosures
Certain Executives (as disclosed below) are not residents of Australia. Their respective remuneration paid in foreign currency has been converted to Australian dollars at an average exchange rate for the year. Both the amount of any remuneration and any movement in comparison to the prior year may be influenced by changes in the respective currency exchange rates.
| Short-term benefits | Post- employment benefits | Other | Share- | |||||||||||||||||
| (A$) | Location | Year | Cash salary1 | Cash bonus2 | Other benefits3 | Pension and superannuation | long-term benefits4 | based payments5 | Total | |||||||||||
Executive Director | ||||||||||||||||||||
D Dienst6 | USA | 2012 | 1,288,885 | 819,653 | 109,473 | 37,594 | - | 4,281,770 | 6,537,375 | |||||||||||
| 2011 | 1,305,536 | 1,603,851 | 44,043 | 37,166 | - | 3,473,987 | 6,464,583 | |||||||||||||
Executives | ||||||||||||||||||||
G Davy6 | UK | 2012 | 526,691 | 244,274 | 32,107 | 25,023 | - | 701,230 | 1,529,325 | |||||||||||
| 2011 | 449,905 | 772,880 | 32,780 | 26,256 | - | 603,437 | 1,885,258 | |||||||||||||
R Kelman6 | USA | 2012 | 668,669 | 133,686 | 92,863 | 29,222 | 4,845 | 638,123 | 1,567,408 | |||||||||||
| 2011 | 652,768 | 130,554 | 36,972 | 29,482 | 5,060 | 661,570 | 1,516,406 | |||||||||||||
R Larry6 | USA | 2012 | 644,442 | 128,888 | 131,998 | 29,734 | 4,845 | 852,834 | 1,792,741 | |||||||||||
| 2011 | 652,768 | 616,866 | 36,100 | 31,731 | 5,060 | 959,237 | 2,301,762 | |||||||||||||
D McGree | Australia | 2012 | 621,557 | 244,923 | 2,362 | 108,773 | 19,430 | 393,231 | 1,390,276 | |||||||||||
| 2011 | 605,611 | 720,391 | 4,401 | 105,603 | 21,703 | 575,638 | 2,033,347 | |||||||||||||
A Ratner6,7 | USA | 2012 | 644,442 | 128,888 | 51,065 | 18,015 | - | 638,123 | 1,480,533 | |||||||||||
| 2011 | 652,768 | 130,554 | 22,221 | 18,236 | - | 714,755 | 1,538,534 | |||||||||||||
Total Executive Director & Executives | 2012 | 4,394,686 | 1,700,312 | 419,868 | 248,361 | 29,120 | 7,505,311 | 14,297,658 | ||||||||||||
| 2011 | 4,319,356 | 3,975,096 | 176,517 | 248,474 | 31,823 | 6,988,624 | 15,739,890 | |||||||||||||
1 Cash salary includes amounts sacrificed in lieu of other benefits at the discretion of the individual. Effective 1 February 2012, commensurate with the assumption of his new role and expanded responsibilities, Mr Kelman received a nine percent increase to his base salary.
2 Cash bonus amounts for 2012 and 2011 reflect the amounts accrued for all Executives under the 2012 and 2011 STI Plans respectively. The Company agreed to make a one-off payment to Mr Dienst of US$500,000 in exchange for an agreement to extend his existing contract through 30 June 2013.
3 Other short-term benefits include auto allowances, health and life insurance benefits, amounts accrued for annual leave during the period and personal security payments (for Mr Dienst). Effective for the 2011 financial year, the Company instituted a Paid Time Off policy for U.S. employees which included a carryover feature of up to two weeks. The amount for Mr Larry in 2012 also includes a one-time reimbursement (plus related gross-up) of expenses incurred arising from a medical injury that occurred while travelling internationally on Company business.
4 Other long-term benefits include amounts accrued for cash-based long-term incentive plans, long-service leave and deferred compensation plans.
5 Share-based payments represent the accounting expense (as computed pursuant to AASB 2 (IFRS 2), ‘Share-based Payments’) recognised by the Company for share-based awards.
6 Messrs Dienst, Larry, Ratner and Kelman receive their cash payments in United States dollars. Mr Davy receives his cash payments in pounds sterling.
7 Mr Ratner received an overpayment of his car allowance in prior years, which resulted in a repayment of A$14,169 in the 2011 financial year. The amounts reflected in the table above represent the actual amounts paid to Mr Ratner in the respective years. No adjustment has been made to reflect the related repayment. Mr Ratner’s 2012 remuneration disclosed above reflects his remuneration for the entire year. He ceased being classified as a KMP as of 31 January 2012.
23
Fixed and actual ‘at-risk’ remuneration for the 2012 financial year
Outlined below is the percentage of the Executives’ 2012 financial year remuneration that was fixed and ‘at-risk’ based upon the statutory remuneration table. The percentage of the value of their actual total remuneration that consisted of rights and options is also disclosed.
| Fixed Remuneration % | ‘At-Risk’ Remuneration % | Remuneration consisting of Rights % | Remuneration consisting of Options % | |||||||
Executives | ||||||||||
D Dienst | 22 | 78 | 46 | 19 | ||||||
G Davy | 38 | 62 | 27 | 18 | ||||||
R Kelman | 50 | 50 | 20 | 20 | ||||||
R Larry | 45 | 55 | 25 | 22 | ||||||
D McGree | 54 | 46 | 25 | 3 | ||||||
A Ratner | 48 | 52 | 21 | 22 | ||||||
24
F: EXECUTIVE CONTRACTS
Executive Director
The Executive Director’s contract with Metal Management, Inc. (MMI), entered into as of 26 July 2007, was amended as of 1 August 2009 and was due to expire on 30 June 2012. The Company and Executive Director have agreed that such contract will continue until 30 June 2013. The Company agreed to make a one-off payment to the Executive Director of US$500,000 in exchange for an agreement to extend the expiry / term of his existing contract through 30 June 2013.
Under the original agreement with MMI, if Mr Dienst is terminated involuntarily other than for cause, then the Company is required to continue to pay Mr Dienst his fixed remuneration and target bonus for 24 months following such termination. Also per the original agreement, and as previously disclosed in prior years, all unvested options, share grants, and any unvested long term incentive plan compensation, vest upon early involuntary termination. The Committee recognises that this termination benefit would be considered greater than general Australian investor expectations. The Committee further recognises that these original contractual provisions may be inconsistent with the LTI Plan rules in such regard. The Board is committed to structuring a new employment agreement with Mr Dienst in line with investor expectations pursuant to negotiations between Mr Dienst and the Company in respect of the renewal of his contract with effect from 1 July 2013.
Prior to the merger between MMI and the former Sims Group Limited, the MMI Board amended certain grants of restricted shares pursuant to Mr Dienst’s previous employment contract with MMI which caused vesting of such restricted shares upon a change of control.
The amended employment contract with the Company requires that Mr Dienst pay back up to US$3 million (Clawback Amount), amortising over a four-year period, should he resign or terminate his agreement other than for good reason, as defined by the agreement. The amortisation of the remaining Clawback Amount for the 2012 financial year was A$684,061 and has been included as part of Mr Dienst’s remuneration under the heading ‘Share-Based Payments’ in the remuneration table. As at 30 June 2012, the Clawback Amount has been fully amortised.
Executives
The details of executive contracts for the other Executives are summarised in the following table.
Contract term | - Messrs Davy and McGree have fixed term contracts with automatic renewal. - Mr Larry’s contract, which was due to expire on 30 June 2012, was allowed to automatically renew through until 30 June 2013 in accordance with the terms of such agreement. - Messrs Kelman and Ratner do not have employment contracts. | |
Notice period | - Contracts typically may not be terminated during the fixed term, other than for cause. - For Messrs Davy and McGree, after the expiration of their respective terms, the Company must typically provide 12 months prior written notice or payment in lieu of notice. The executive is typically required to provide three months prior written notice to terminate the agreement. | |
Termination provisions (other than for cause) | - Mr Larry is entitled to receive an amount equivalent to 12 months base salary and all unvested options, share grants and LTI Plan awards vest in accordance with their original vesting schedule. - Messrs Davy and McGree may have their contracts terminated by the Company provided they receive 12 months prior written notice of termination or payment in lieu of notice based on their respective remuneration packages. | |
Change of control | - Mr Larry is entitled to an amount equal to two times his fixed remuneration, and all unvested share awards will vest, if his employment is terminated within 12 months as a result of change in control. This clause is part of a legacy arrangement with MMI and will be addressed in any negotiations between Mr Larry and the Company in respect of the renewal of his contract with effect from 1 July 2013. - Mr McGree is entitled to a payment equivalent to six months total annual remuneration if he remains in the employ of the employer six months after a takeover of the Company (or if he is terminated within six months of such a takeover). | |
Redundancy | - In the event of redundancy, Messrs Davy and McGree are each entitled to the greater of 12 months’ notice or payment in lieu, or a benefit calculated by reference to the Sims Metal Management Redundancy Policy up to a maximum of 18 months’ remuneration depending upon years of service. |
25
G: SHARE-BASED PAYMENT DISCLOSURES
Options provided as remuneration
The following table summarises the terms of outstanding Option grants (and Phantom Option grants where applicable) for the Executives.
Name
| Grant date
| Number
| Exercise
| Fair value
| Date next
| Expiry date
| % of options that have vested | Maximum total
| ||||||||||||||
Ordinary Shares (A$) | ||||||||||||||||||||||
G Davy | 02 Apr 09 | 48,950 | $ | 17.79 | $ 5.82 | Fully vested | 02 Apr 16 | 100% | - | |||||||||||||
| 23 Nov 09 | 37,231 | $ | 21.95 | $ 6.84 | 23 Aug 12 | 23 Nov 16 | 66.7% | $ | 5,021 | |||||||||||||
| 30 Nov 10 | 42,472 | $ | 17.62 | $ 6.07 | 23 Aug 12 | 30 Nov 17 | 33.3% | $ | 47,989 | |||||||||||||
| 11 Nov 11 | 71,274 | $ | 13.07 | $ 4.08 | 23 Aug 12 | 11 Nov 18 | 0% | $
| 161,562
|
| ||||||||||||
D McGree | 02 Apr 09 | 47,534 | $ | 17.79 | $ 5.82 | Fully vested | 02 Apr 16 | 100% | - | |||||||||||||
| 23 Nov 09 | 46,908 | $ | 21.95 | $ 6.84 | 23 Aug 12 | 23 Nov 16 | 66.7% | $ | 6,326 | |||||||||||||
| 30 Nov 10 | 56,5622 | $ | 17.62 | $ 0.772 | 23 Aug 12 | 30 Nov 17 | 33.3% | $ | 7,768 | |||||||||||||
| 11 Nov 11 | 87,2602 | $ | 13.07 | $ 1.472 | 23 Aug 12 | 11 Nov 18 | 0% | $
| 71,125
|
| ||||||||||||
ADS (US$) | ||||||||||||||||||||||
D Dienst | 24 Nov 08 | 181,654 | $ | 8.39 | $ 2.59 | Fully vested | 24 Nov 15 | 100% | - | |||||||||||||
| 23 Nov 09 | 178,037 | $ | 20.57 | $ 6.97 | 23 Aug 12 | 23 Nov 16 | 66.7% | $ | 24,553 | |||||||||||||
| 22 Nov 10 | 203,908 | $ | 16.73 | $ 6.19 | 23 Aug 12 | 22 Nov 17 | 33.3% | $ | 232,650 | |||||||||||||
| 11 Nov 11 | 283,695 | $ | 13.37 | $ 4.52 | 23 Aug 12 | 11 Nov 18 | 0% | $
| 713,050
|
| ||||||||||||
R Kelman | 02 Apr 09 | 87,664 | $ | 12.19 | $ 4.73 | Fully vested | 02 Apr 16 | 100% | - | |||||||||||||
| 23 Nov 09 | 44,914 | $ | 20.57 | $ 6.97 | 23 Aug 12 | 23 Nov 16 | 66.7% | $ | 6,194 | |||||||||||||
| 30 Nov 10 | 50,977 | $ | 16.98 | $ 6.14 | 23 Aug 12 | 30 Nov 17 | 33.3% | $ | 58,305 | |||||||||||||
| 11 Nov 11 | 70,924 | $ | 13.37 | $ 4.52 | 23 Aug 12 | 11 Nov 18 | 0% | $
| 178,264
|
| ||||||||||||
R Larry | 02 Apr 09 | 109,580 | $ | 12.19 | $ 4.73 | Fully vested | 02 Apr 16 | 100% | - | |||||||||||||
| 23 Nov 09 | 56,142 | $ | 20.57 | $ 6.97 | 23 Aug 12 | 23 Nov 16 | 66.7% | $ | 7,743 | |||||||||||||
| 30 Nov 10 | 63,721 | $ | 16.98 | $ 6.14 | 23 Aug 12 | 30 Nov 17 | 33.3% | $ | 72,882 | |||||||||||||
| 11 Nov 11 | 88,655 | $ | 13.37 | $ 4.52 | 23 Aug 12 | 11 Nov 18 | 0% | $
| 222,827
|
| ||||||||||||
A Ratner | 02 Apr 09 | 87,664 | $ | 12.19 | $ 4.73 | Fully vested | 02 Apr 16 | 100% | - | |||||||||||||
| 23 Nov 09 | 44,914 | $ | 20.57 | $ 6.97 | 23 Aug 12 | 23 Nov 16 | 66.7% | $ | 6,194 | |||||||||||||
| 30 Nov 10 | 50,977 | $ | 16.98 | $ 6.14 | 23 Aug 12 | 30 Nov 17 | 33.3% | $ | 58,305 | |||||||||||||
| 11 Nov 11 | 70,924 | $ | 13.37 | $ 4.52 | 23 Aug 12 | 11 Nov 18 | 0% | $ | 178,264 | |||||||||||||
| 1. | No options will vest if the vesting conditions are not satisfied, hence the minimum value of unvested awards is nil. The maximum value of the unvested awards has been determined as the amount of the grant date fair value that is yet to be expensed. |
| 2. | Represents a cash-settled phantom option grant. In accordance with AASB 2 (IFRS 2), the fair value is as of the end of the reporting period. |
26
The following table summarises the Option holdings of the Executive Director and Executives for the 2012 financial year.
| Name | Number of options held at 1 July 2011 | Options granted during the financial year | Options the | Options lapsed during the financial year | Number of options held at 30 June 2012 | Number of options vested during the financial year | Number of vested options held at 30 June 2012 | Value of options granted during the financial year |
Value of | |||||||||||||||||||||||||||
Ordinary Shares (A$) |
| |||||||||||||||||||||||||||||||||||
G Davy | 128,653 | 71,274 | - | - | 199,927 | 42,885 | 87,928 | $ | 290,798 | - | ||||||||||||||||||||||||||
D McGree | 151,004 | 87,260 | 1 | - | - | 238,264 | 50,335 | 97,660 | $ | 128,272 |
| -
|
| |||||||||||||||||||||||
ADS (US$) | ||||||||||||||||||||||||||||||||||||
D Dienst | 973,599 | 2 | 283,695 | (181,654 | ) | - | 1,075,640 | 2 | 187,867 | 596,660 | $ | 1,282,301 | $ | 957,849 | 3 | |||||||||||||||||||||
R Kelman | 125,112 | 70,924 | - | - | 196,036 | 61,185 | 76,156 | $ | 320,577 | - | ||||||||||||||||||||||||||
R Larry | 229,443 | 88,655 | - | - | 318,098 | 76,481 | 168,248 | $ | 400,720 | - | ||||||||||||||||||||||||||
A Ratner | 183,555 | 70,924 | - | - | 254,479 | 61,185 | 134,599 | $ | 320,577 | - | ||||||||||||||||||||||||||
1 Represents a cash-settled option grant.
2 Balance includes 410,000 options which were assumed as a result of the merger with MMI.
3 The options that were exercised had an exercise price of $8.39. The options converted to ordinary shares on a 1:1 basis.
27
Rights provided as remuneration
The table below summarises the terms of outstanding rights affecting remuneration in the current or future reporting periods, as well as the percentage of the available grant that was vested and forfeited during the 2012 financial year for the Executives.
| Name | Grant date | Number granted | Fair value at grant date | Vested % | Forfeited % | Date next tranche vests | Expiry Date | Maximum of unvested | ||||||||||||||||||
Ordinary Shares (A$) | ||||||||||||||||||||||||||
G Davy | 25 Sep 07 | 6,550 | $ | 28.04 | - | - | 23 Aug 12 | 23 Aug 12 | - | |||||||||||||||||
| 25 Sep 07 | 6,550 | $ | 28.04 | 100.0 | - | - | - | - | ||||||||||||||||||
| 25 Sep 07 | 9,737 | $ | 24.03 | 59.6 | - | 23 Aug 12 | 23 Aug 12 | - | ||||||||||||||||||
| 02 Apr 09 | 18,312 | $ | 15.46 | - | - | 23 Aug 12 | 31 Aug 13 | - | ||||||||||||||||||
| 23 Nov 09 | 16,928 | $ | 15.97 | - | - | 23 Aug 12 | 31 Aug 14 | $ | 12,694 | |||||||||||||||||
| 30 Nov 10 | 18,410 | $ | 14.04 | - | - | 31 Aug 13 | 31 Aug 15 | $ | 95,310 | |||||||||||||||||
| 16 June 111 | 28,893 | $ | 14.60 | - | - | 16 June 14 | 16 June 14 | $ | 275,328 | |||||||||||||||||
| 11 Nov 11 | 28,733 | $ | 10.42 | - | - | 31 Aug 14 | 31 Aug 16 | $
| 204,769
|
| ||||||||||||||||
D McGree | 25 Sep 07 | 12,107 | $ | 28.04 | - | - | 23 Aug 12 | 23 Aug 12 | - | |||||||||||||||||
| 25 Sep 07 | 8,998 | $ | 24.03 | 59.6 | - | 23 Aug 12 | 23 Aug 12 | - | ||||||||||||||||||
| 02 Apr 09 | 16,313 | $ | 15.46 | - | - | 23 Aug 12 | 31 Aug 13 | - | ||||||||||||||||||
| 23 Nov 09 | 20,728 | $ | 15.97 | - | - | 23 Aug 12 | 31 Aug 14 | $ | 15,543 | |||||||||||||||||
| 30 Nov 10 | 24,517 | $ | 14.04 | - | - | 31 Aug 13 | 31 Aug 15 | $ | 126,926 | |||||||||||||||||
| 11 Nov 11 | 35,178 | $ | 10.42 | - | - | 31 Aug 14 | 31 Aug 16 | $
| 250,700
|
| ||||||||||||||||
ADS (US$) | ||||||||||||||||||||||||||
D Dienst | 24 Nov 08 | 61,092 | $ | 5.70 | - | - | 23 Aug 12 | 31 Aug 13 | - | |||||||||||||||||
| 23 Nov 09 | 197,006 | $ | 11.99 | - | - | 23 Aug 12 | 31 Aug 14 | $ | 110,916 | |||||||||||||||||
| 22 Nov 10 | 271,865 | $ | 9.09 | - | - | 31 Aug 13 | 31 Aug 15 | $ | 911,247 | |||||||||||||||||
| 11 Nov 11 | 332,916 | $ | 8.24 | - | - | 31 Aug 14 | 31 Aug 16 | $
| 1,876,197
|
| ||||||||||||||||
R Kelman | 25 Sep 07 | 14,137 | $ | 24.33 | - | - | 23 Aug 12 | 23 Aug 12 | - | |||||||||||||||||
| 25 Sep 07 | 10,507 | $ | 20.84 | 59.6 | - | 23 Aug 12 | 23 Aug 12 | - | ||||||||||||||||||
| 02 Apr 09 | 38,580 | $ | 10.32 | - | - | 23 Aug 12 | 31 Aug 13 | - | ||||||||||||||||||
| 23 Nov 09 | 25,531 | $ | 11.99 | - | - | 23 Aug 12 | 31 Aug 14 | $ | 14,374 | |||||||||||||||||
| 30 Nov 10 | 33,983 | $ | 9.29 | - | - | 31 Aug 13 | 31 Aug 15 | $ | 116,411 | |||||||||||||||||
| 11 Nov 11 | 41,615 | $ | 8.24 | - | - | 31 Aug 14 | 31 Aug 16 | $
| 234,527
|
| ||||||||||||||||
R Larry | 02 Apr 09 | 48,225 | $ | 10.32 | - | - | 23 Aug 12 | 31 Aug 13 | - | |||||||||||||||||
| 23 Nov 09 | 31,914 | $ | 11.99 | - | - | 23 Aug 12 | 31 Aug 14 | $ | 17,967 | |||||||||||||||||
| 18 Feb 10 | 5,261 | $ | 16.76 | 100.0 | - | - | - | - | ||||||||||||||||||
| 18 Feb 10 | 5,261 | $ | 16.11 | - | - | 28 Feb 13 | 28 Feb 13 | $ | 18,604 | |||||||||||||||||
| 30 Nov 10 | 42,479 | $ | 9.29 | - | - | 31 Aug 13 | 31 Aug 15 | $ | 145,515 | |||||||||||||||||
| 11 Nov 11 | 52,018 | $ | 8.24 | - | - | 31 Aug 14 | 31 Aug 16 | $
| 293,155
|
| ||||||||||||||||
A Ratner | 02 Apr 09 | 38,580 | $ | 10.32 | - | - | 23 Aug 12 | 31 Aug 13 | - | |||||||||||||||||
| 23 Nov 09 | 25,531 | $ | 11.99 | - | - | 23 Aug 12 | 31 Aug 14 | $ | 14,374 | |||||||||||||||||
| 30 Nov 10 | 33,983 | $ | 9.29 | - | - | 31 Aug 13 | 31 Aug 15 | $ | 116,411 | |||||||||||||||||
| 11 Nov 11 | 41,615 | $ | 8.24 | - | - | 31 Aug 14 | 31 Aug 16 | $
| 234,527
|
| ||||||||||||||||
| 1. | The Company made a one-time award to Mr Davy on 16 June 2011 as part of a special award. |
| 2. | No rights will vest if the vesting conditions are not satisfied, hence the minimum value of unvested awards is nil. The maximum value of the unvested rights has been determined as the amount of the grant date fair value that is yet to be expensed. |
28
The following table summarises the rights holdings of the Executives for the 2012 financial year.
| Name | Balance at 30 June 2011 | Granted | Vested | Forfeited | Balance at 30 June 2012 | |||||||||||||
Ordinary Shares (A$) | ||||||||||||||||||
G Davy | 95,896 | 28,733 | (2,869 | ) | - | 121,760 | ||||||||||||
D McGree | 77,300 | 35,178 | - | - | 112,478 | |||||||||||||
ADS (US$) | ||||||||||||||||||
D Dienst | 529,963 | 332,916 | - | - | 862,879 | |||||||||||||
R Kelman | 116,476 | 41,615 | - | - | 158,091 | |||||||||||||
R Larry | 133,140 | 52,018 | (5,261 | ) | - | 179,897 | ||||||||||||
A Ratner | 98,094 | 41,615 | - | - | 139,709 | |||||||||||||
29
H: NON-EXECUTIVE DIRECTOR REMUNERATION
NEDs receive a base fee and also further fees for chairmanship of a Board Committee. Consistent with their independent role, NEDs do not participate in any incentive plans.
Approach to determining Non-Executive Director (NED) fees
Remuneration for NEDs recognises the need to reward directors for their commitment to the corporate governance of the Company, their active participation in the affairs of the business and the contribution they make generally to the maximisation of shareholder value. The Company aims to provide a level of remuneration for NEDs taking into account, among other things, fees paid for similar roles in comparable companies, the time commitment, risk and responsibility accepted by NEDs, and recognition of their commercial expertise and experience.
Directors’ fees
Annual NED fees are determined within an aggregate Directors’ fee pool limit, which is periodically recommended for approval by shareholders. The current pool limit of A$3,000,000 was approved by shareholders at the Company’s 2009 AGM. The Committee believes that this limit continues to be appropriate at this time and therefore no increase to the limit will be sought at the Company’s 2012 AGM.
Under the current fee framework, NEDs receive a base fee and also receive further fees for chairmanship of a Board Committee. An increase in NED fees was approved by the Board for the 2012 financial year as outlined in the table below.
| Financial Year | ||||||||
| NED FEES IN A$ | 2012 | 2011 | ||||||
Base fee (Chairperson) | 450,528 | 433,200 | ||||||
Base fee (Non-Executive Director) | 203,424 | 195,600 | ||||||
Chairperson Risk, Audit & Compliance Committee | 65,000 | 60,000 | ||||||
Chairperson Safety, Health, Environment & Community Committee | 35,000 | 30,000 | ||||||
Chairperson Remuneration Committee | 35,000 | 30,000 | ||||||
Chairperson Finance & Investment Committee | 35,000 | 30,000 | ||||||
Chairperson Nomination/Governance Committee | 35,000 | 30,000 | ||||||
NEDs also receive reimbursement for reasonable travel, accommodation and other expenses incurred in travelling to or from meetings of the Board, or when otherwise engaged in the business of the Company in accordance with Board policy.
NEDs are not currently covered by any contract of employment; therefore, they have no contract duration, notice period for termination, or entitlement to termination payments other than as noted below under Retirement benefits.
NED equity arrangements
NEDs do not participate in any incentive (cash or equity-based) arrangements. Mr Morris holds options as a result of grants made by MMI prior to the merger with the former Sims Group Limited in March 2008.
Retirement benefits
The Company’s NEDs’ Retirement Allowance Scheme was discontinued effective 30 June 2006. The accrued amount for Mr Feeney, the sole remaining NED who had participated in the plan, was frozen and has been indexed at 5% per annum until payment. For Australian resident NEDs, superannuation is paid in addition to these fee rates. The Company pays superannuation at 9% for each Australian resident NED, as required by legislation. Superannuation is not paid for overseas directors.
30
Statutory NED remuneration disclosures
For NEDs who receive payments in foreign currencies, the table below reflects the Australian dollar equivalent of the fees paid to each such NED based on the exchange rate at the date of payment. Accordingly, both the amount of any remuneration and any movement in comparison to the prior year may be influenced by changes in the respective currency exchange rates.
| (A$) | Short- term benefits | Post-employment benefits | ||||||||||||||||||||
| Cash Fees | Superann | Retirement | ||||||||||||||||||||
| Name | Location | Year | uation6 | benefits | Total | |||||||||||||||||
N Bobins1,7 | USA | 2012 | 225,935 | - | - | 225,935 | ||||||||||||||||
| 2011 | 249,073 | - | - | 249,073 | ||||||||||||||||||
G Brunsdon2 | Australia | 2012 | 308,199 | 27,738 | - | 335,937 | ||||||||||||||||
| 2011 | 195,600 | 17,604 | - | 213,204 | ||||||||||||||||||
J DiLacqua1,3,7 | USA | 2012 | 162,939 | - | - | 162,939 | ||||||||||||||||
JM Feeney | Australia | 2012 | 238,424 | 21,458 | 24,421 | 284,303 | ||||||||||||||||
| 2011 | 225,600 | 20,304 | 23,258 | 269,162 | ||||||||||||||||||
R Lewon1,5,7 | USA | 2012 | 81,306 | - | - | 81,306 | ||||||||||||||||
| 2011 | 249,073 | - | - | 249,073 | ||||||||||||||||||
G Morris1,7 | USA | 2012 | 254,363 | - | - | 254,363 | ||||||||||||||||
| 2011 | 282,193 | - | - | 282,193 | ||||||||||||||||||
C Renwick | Australia | 2012 | 238,424 | 21,458 | - | 259,882 | ||||||||||||||||
| 2011 | 225,600 | 20,304 | - | 245,904 | ||||||||||||||||||
H Ridout3 | Australia | 2012 | 169,520 | 15,257 | - | 184,777 | ||||||||||||||||
P Sukagawa4 | Japan | 2012 | 203,424 | - | - | 203,424 | ||||||||||||||||
| 2011 | 195,600 | - | - | 195,600 | ||||||||||||||||||
J Thompson1,7 | USA | 2012 | 192,946 | - | - | 192,946 | ||||||||||||||||
| 2011 | 216,145 | - | - | 216,145 | ||||||||||||||||||
P Varello1,2,7 | USA | 2012 | 350,099 | - | - | 350,099 | ||||||||||||||||
| 2011 | 478,271 | - | - | 478,271 | ||||||||||||||||||
Total | 2012 | 2,425,579 | 85,911 | 24,421 | 2,535,911 | |||||||||||||||||
| 2011 | 2,317,155 | 58,212 | 23,258 | 2,398,625 | ||||||||||||||||||
1 Messrs Bobins, DiLacqua, Lewon, Morris, Thompson and Varello are residents of the United States and received their payments in United States dollars.
2 Mr Varello served as Chairman of the Company from August 2009 to 1 March 2012. Mr Brunsdon was appointed Chairman of the Company on 1 March 2012.
3 Mr DiLacqua and Mrs Ridout were appointed to the Board on 1 September 2011.
4 Mr Sukagawa is a representative Director of Mitsui. He is currently employed by a subsidiary of Mitsui and as a result his fees are paid to a Mitsui affiliate in Australia.
5 Mr Lewon retired from the Board on 10 November 2011.
6 Superannuation contributions are made on behalf of NEDs to satisfy the Company’s obligations under Superannuation Guarantee legislation.
7 Fees for the 2011 financial year that were paid in United States dollars were converted at a rate of A$1 to US$.9626 being the exchange rates set by the Board in July 2008. Fees for the 2012 financial year that were paid in United States dollars were converted at a rate of A$1 to US$1 as set by the Committee in July 2011.
This report is made in accordance with a resolution of the Board of Directors and is signed for and on behalf of the Board of Directors.
 |  | |
| G N Brunsdon | D W Dienst | |
| Chairman | Group Chief Executive Officer | |
| Sydney | New York | |
| 23 August 2012 | 22 August 2012 |
31

Auditor’s Independence Declaration
As lead auditor for the audit of Sims Metal Management Limited for the year ended 30 June 2012, I declare that to the best of my knowledge and belief, there have been:
| a) | no contraventions of the auditor independence requirements of theCorporations Act 2001in relation to the audit; and |
| b) | no contraventions of any applicable code of professional conduct in relation to the audit. |
This declaration is in respect of Sims Metal Management Limited and the entities it controlled during the period.
| ||
| Andrew J Parker | Sydney | |
| Partner | 23 August 2012 | |
| PricewaterhouseCoopers |
| ||||
| PricewaterhouseCoopers, ABN 52 780 433 757 | ||||
| Darling Park Tower 2, 201 Sussex Street, GPO BOX 2650, SYDNEY NSW 1171 | ||||
| DX 77 Sydney, Australia | ||||
| T +61 2 8266 0000, F +61 2 8266 9999, www.pwc.com.au | ||||
| Liability limited by a scheme approved under Professional Standards Legislation. | ||||
32
Sims Metal Management Limited
Consolidated Income Statements
For the year ended 30 June 2012
| Note | 2012 A$m | 2011 A$m | 2010 A$m | |||||||||||||
Revenue | 6 | 9,042.3 | 8,852.9 | 7,458.5 | ||||||||||||
Other income | 7 | 91.2 | 42.5 | 25.2 | ||||||||||||
Raw materials used and changes in inventories | (7,017.5 | ) | (6,693.2 | ) | (5,344.3 | ) | ||||||||||
Freight expense | (687.0 | ) | (715.1 | ) | (716.0 | ) | ||||||||||
Employee benefits expense | (483.9 | ) | (409.7 | ) | (433.0 | ) | ||||||||||
Depreciation and amortisation expense | 7 | (129.9 | ) | (130.6 | ) | (143.9 | ) | |||||||||
Repairs and maintenance expense | (127.2 | ) | (123.5 | ) | (111.7 | ) | ||||||||||
Other expenses | (576.0 | ) | (548.5 | ) | (537.5 | ) | ||||||||||
Impairment of goodwill and other intangibles | 7 | (557.6 | ) | - | (0.9 | ) | ||||||||||
Finance costs | 7 | (24.9 | ) | (27.1 | ) | (16.4 | ) | |||||||||
Impairment of goodwill in jointly controlled entity | 29 | (57.5 | ) | - | - | |||||||||||
Share of results of investments accounted for using the equity method | 29 | (8.0 | ) | 28.1 | 12.1 | |||||||||||
|
|
|
|
|
| |||||||||||
(Loss)/profit before income tax | (536.0 | ) | 275.8 | 192.1 | ||||||||||||
Income tax benefit/(expense) | 8 | 14.6 | (83.7 | ) | (65.4 | ) | ||||||||||
|
|
|
|
|
| |||||||||||
(Loss)/profit for the year | (521.4 | ) | 192.1 | 126.7 | ||||||||||||
|
|
|
|
|
| |||||||||||
| A¢ | A¢ | A¢ | ||||||||||||||
|
|
|
|
|
| |||||||||||
(Loss)/earnings per share: | ||||||||||||||||
Basic | 4 | (253.3 | ) | 93.9 | 64.9 | |||||||||||
Diluted | 4 | (253.3 | ) | 93.3 | 64.5 | |||||||||||
The consolidated income statements should be read in conjunction with the accompanying notes.
33
Sims Metal Management Limited
Consolidated Statements of Comprehensive Income
For the year ended 30 June 2012
| Note | 2012 A$m | 2011 A$m | 2010 A$m | |||||||||||||
(Loss)/profit for the year | (521.4 | ) | 192.1 | 126.7 | ||||||||||||
Other comprehensive income: | ||||||||||||||||
Changes in the fair value of available-for-sale financial assets, | 20 | - | 0.8 | (0.8 | ) | |||||||||||
Changes in the fair value of cash flow hedges, net of tax | 20 | 1.2 | 0.5 | (1.1 | ) | |||||||||||
Foreign exchange translation differences, net of tax | 20 | 87.8 | (523.9 | ) | (121.3 | ) | ||||||||||
Net actuarial (losses)/gains on defined benefit plans, net of tax | 18(e) | (11.3 | ) | 2.8 | (2.7 | ) | ||||||||||
Share of other comprehensive income of associates, net of tax | 29 | (0.4 | ) | - | - | |||||||||||
|
|
|
|
|
| |||||||||||
Other comprehensive income for the year, net of tax | 77.3 | (519.8 | ) | (125.9 | ) | |||||||||||
|
|
|
|
|
| |||||||||||
Total comprehensive (loss)/income for the year | (444.1 | ) | (327.7 | ) | 0.8 | |||||||||||
|
|
|
|
|
| |||||||||||
The consolidated statements of comprehensive income should be read in conjunction with the accompanying notes.
34
Sims Metal Management Limited
Consolidated Statements of Financial Position
As at 30 June 2012
| Note | 2012 A$m | 2011 A$m | ||||||||||
ASSETS | ||||||||||||
Current assets | ||||||||||||
Cash and cash equivalents | 32 | 51.4 | 165.5 | |||||||||
Trade and other receivables | 9 | 513.4 | 606.7 | |||||||||
Inventory | 10 | 890.0 | 978.5 | |||||||||
Other financial assets | 11 | 29.4 | 15.8 | |||||||||
|
|
|
| |||||||||
Total current assets | 1,484.2 | 1,766.5 | ||||||||||
|
|
|
| |||||||||
Non-current assets | ||||||||||||
Investments accounted for using the equity method | 29 | 351.1 | 310.3 | |||||||||
Other financial assets | 11 | 49.4 | 12.3 | |||||||||
Property, plant and equipment | 12 | 977.1 | 865.5 | |||||||||
Retirement benefit assets | 18 | - | 0.9 | |||||||||
Deferred tax assets | 8 | 124.2 | 99.4 | |||||||||
Goodwill | 13 | 507.4 | 988.7 | |||||||||
Other intangible assets | 14 | 126.6 | 136.2 | |||||||||
|
|
|
| |||||||||
Total non-current assets | 2,135.8 | 2,413.3 | ||||||||||
|
|
|
| |||||||||
Total assets | 3,620.0 | 4,179.8 | ||||||||||
|
|
|
| |||||||||
LIABILITIES | ||||||||||||
Current liabilities | ||||||||||||
Trade and other payables | 15 | 672.1 | 747.3 | |||||||||
Borrowings | 16 | 13.7 | 0.5 | |||||||||
Other financial liabilities | 11 | 2.1 | 5.8 | |||||||||
Current tax liabilities | 15.7 | 32.6 | ||||||||||
Provisions | 17 | 30.6 | 37.1 | |||||||||
|
|
|
| |||||||||
Total current liabilities | 734.2 | 823.3 | ||||||||||
|
|
|
| |||||||||
Non-current liabilities | ||||||||||||
Payables | 8.0 | 3.7 | ||||||||||
Borrowings | 16 | 329.9 | 291.2 | |||||||||
Deferred tax liabilities | 8 | 109.4 | 119.6 | |||||||||
Provisions | 17 | 29.5 | 18.6 | |||||||||
Retirement benefit obligations | 18 | 14.6 | 2.9 | |||||||||
|
|
|
| |||||||||
Total non-current liabilities | 491.4 | 436.0 | ||||||||||
|
|
|
| |||||||||
Total liabilities | 1,225.6 | 1,259.3 | ||||||||||
|
|
|
| |||||||||
Net assets | 2,394.4 | 2,920.5 | ||||||||||
|
|
|
| |||||||||
EQUITY | ||||||||||||
Contributed equity | 19 | 2,804.3 | 2,817.9 | |||||||||
Reserves | 20 | (333.4 | ) | (446.3 | ) | |||||||
Retained (deficit)/earnings | 20 | (76.5 | ) | 548.9 | ||||||||
|
|
|
| |||||||||
Total equity | 2,394.4 | 2,920.5 | ||||||||||
|
|
|
| |||||||||
The consolidated statements of financial position should be read in conjunction with the accompanying notes.
35
Sims Metal Management Limited
Consolidated Statements of Changes in Equity
For the year ended 30 June 2012
| Contrib- | ||||||||||||||||||||
| uted | Retained | Total | ||||||||||||||||||
| equity | Reserves | earnings | equity | |||||||||||||||||
| Note | A$m | A$m | A$m | A$m | ||||||||||||||||
Balance at 1 July 2009 | 2,352.9 | 166.0 | 340.1 | 2,859.0 | ||||||||||||||||
Profit for the year | - | - | 126.7 | 126.7 | ||||||||||||||||
Other comprehensive income | - | (123.2 | ) | (2.7 | ) | (125.9 | ) | |||||||||||||
|
|
|
|
|
|
|
| |||||||||||||
Total comprehensive income for the year | - | (123.2 | ) | 124.0 | 0.8 | |||||||||||||||
|
|
|
|
|
|
|
| |||||||||||||
Transactions with owners in their capacity as owners: | ||||||||||||||||||||
Dividends provided for or paid | 21 | - | - | (38.6 | ) | (38.6 | ) | |||||||||||||
Share-based payments | 0.5 | 15.3 | - | 15.8 | ||||||||||||||||
Issue of shares under institutional placement | 391.4 | - | - | 391.4 | ||||||||||||||||
Issue of shares under share purchase plan | 41.2 | - | - | 41.2 | ||||||||||||||||
Dividend reinvestment plan | 21 | 9.2 | - | - | 9.2 | |||||||||||||||
|
|
|
|
|
|
|
| |||||||||||||
| 442.3 | 15.3 | (38.6 | ) | 419.0 | ||||||||||||||||
|
|
|
|
|
|
|
| |||||||||||||
Balance at 30 June 2010 | 2,795.2 | 58.1 | 425.5 | 3,278.8 | ||||||||||||||||
|
| �� |
|
|
|
|
| |||||||||||||
Profit for the year | - | - | 192.1 | 192.1 | ||||||||||||||||
Other comprehensive income | - | (522.6 | ) | 2.8 | (519.8 | ) | ||||||||||||||
|
|
|
|
|
|
|
| |||||||||||||
Total comprehensive loss for the year | - | (522.6 | ) | 194.9 | (327.7 | ) | ||||||||||||||
|
|
|
|
|
|
|
| |||||||||||||
Transactions with owners in their capacity as owners: | ||||||||||||||||||||
Dividends provided for or paid | 21 | - | - | (71.5 | ) | (71.5 | ) | |||||||||||||
Share-based payments | 3.6 | 18.2 | - | 21.8 | ||||||||||||||||
Dividend reinvestment plan | 21 | 19.1 | - | - | 19.1 | |||||||||||||||
|
|
|
|
|
|
|
| |||||||||||||
| 22.7 | 18.2 | (71.5 | ) | (30.6 | ) | |||||||||||||||
|
|
|
|
|
|
|
| |||||||||||||
Balance at 30 June 2011 | 2,817.9 | (446.3 | ) | 548.9 | 2,920.5 | |||||||||||||||
|
|
|
|
|
|
|
| |||||||||||||
Loss for the year | - | - | (521.4 | ) | (521.4 | ) | ||||||||||||||
Other comprehensive income | - | 88.6 | (11.3 | ) | 77.3 | |||||||||||||||
|
|
|
|
|
|
|
| |||||||||||||
Total comprehensive loss for the year | - | 88.6 | (532.7 | ) | (444.1 | ) | ||||||||||||||
|
|
|
|
|
|
|
| |||||||||||||
Transactions with owners in their capacity as owners: | ||||||||||||||||||||
Dividends provided for or paid | 21 | - | - | (92.7 | ) | (92.7 | ) | |||||||||||||
Share-based payments | 1.5 | 24.3 | - | 25.8 | ||||||||||||||||
Buy-back of ordinary shares | 19 | (38.5 | ) | - | - | (38.5 | ) | |||||||||||||
Dividend reinvestment plan | 21 | 23.4 | - | - | 23.4 | |||||||||||||||
|
|
|
|
|
|
|
| |||||||||||||
| (13.6 | ) | 24.3 | (92.7 | ) | (82.0 | ) | ||||||||||||||
|
|
|
|
|
|
|
| |||||||||||||
Balance at 30 June 2012 | 2,804.3 | (333.4 | ) | (76.5 | ) | 2,394.4 | ||||||||||||||
|
|
|
|
|
|
|
| |||||||||||||
The consolidated statements of changes in equity should be read in conjunction with the accompanying notes.
36
Sims Metal Management Limited
Consolidated Statements of Cash Flows
For the year ended 30 June 2012
| Note | 2012 A$m | 2011 A$m | 2010 A$m | |||||||||||||
Cash flows from operating activities | ||||||||||||||||
Receipts from customers (inclusive of goods and services tax) | 9,323.9 | 8,776.0 | 7,230.3 | |||||||||||||
Payments to suppliers and employees (inclusive of goods and services tax) | (8,959.9 | ) | (8,564.2 | ) | (7,305.1 | ) | ||||||||||
Interest received | 2.6 | 3.2 | 2.8 | |||||||||||||
Interest paid | (22.6 | ) | (21.9 | ) | (16.2 | ) | ||||||||||
Dividends received from associates and jointly controlled entities | 29 | 5.1 | 15.8 | 19.6 | ||||||||||||
Insurance recoveries | 5.3 | 7.6 | 1.0 | |||||||||||||
Income taxes (paid)/refunded | (64.8 | ) | (57.9 | ) | 20.1 | |||||||||||
|
|
|
|
|
| |||||||||||
Net cash inflow/(outflow) from operating activities | 32 | 289.6 | 158.6 | (47.5 | ) | |||||||||||
|
|
|
|
|
| |||||||||||
Cash flows from investing activities | ||||||||||||||||
Payments for property, plant and equipment | 12 | (161.1 | ) | (142.8 | ) | (120.9 | ) | |||||||||
Proceeds from sale of property, plant and equipment | 6.6 | 3.9 | 8.1 | |||||||||||||
Payments for acquisition of subsidiaries, net of cash acquired | 27 | (82.2 | ) | (105.8 | ) | (113.4 | ) | |||||||||
Payment for an interest in an associate | 29 | (93.5 | ) | - | - | |||||||||||
Return of capital from associates and jointly controlled entities | 29 | 0.3 | - | 0.4 | ||||||||||||
Loan to an associate | (37.8 | ) | - | - | ||||||||||||
Payments for other financial assets | (1.5 | ) | (28.3 | ) | (22.8 | ) | ||||||||||
Proceeds from sale of other financial assets | 0.4 | 54.8 | - | |||||||||||||
Proceeds from sale of jointly controlled assets | 40.0 | - | - | |||||||||||||
Loan to third parties | (33.0 | ) | (10.2 | ) | - | |||||||||||
Proceeds from repayment on third party loans | 19.2 | 3.3 | - | |||||||||||||
|
|
|
|
|
| |||||||||||
Net cash outflow from investing activities | (342.6 | ) | (225.1 | ) | (248.6 | ) | ||||||||||
|
|
|
|
|
| |||||||||||
Cash flows from financing activities | ||||||||||||||||
Proceeds from borrowings | 2,557.3 | 3,177.7 | 3,009.9 | |||||||||||||
Repayment of borrowings | (2,514.3 | ) | (2,997.8 | ) | (3,051.1 | ) | ||||||||||
Fees paid for loan facilities | (2.1 | ) | (6.9 | ) | (3.2 | ) | ||||||||||
Proceeds from issue of shares | 1.5 | 3.6 | 441.9 | |||||||||||||
Transaction costs associated with issue of shares | - | - | (8.8 | ) | ||||||||||||
Payments for shares bought back | 19 | (38.5 | ) | - | - | |||||||||||
Dividends paid | 21 | (69.3 | ) | (52.4 | ) | (29.4 | ) | |||||||||
|
|
|
|
|
| |||||||||||
Net cash (outflow)/inflow from financing activities | (65.4 | ) | 124.2 | 359.3 | ||||||||||||
|
|
|
|
|
| |||||||||||
Net (decrease)/increase in cash and cash equivalents | (118.4 | ) | 57.7 | 63.2 | ||||||||||||
Cash and cash equivalents at the beginning of the financial year | 165.5 | 132.3 | 69.5 | |||||||||||||
Effects of exchange rate changes on cash and cash equivalents | 4.3 | (24.5 | ) | (0.4 | ) | |||||||||||
|
|
|
|
|
| |||||||||||
Cash and cash equivalents at the end of the financial year | 32 | 51.4 | 165.5 | 132.3 | ||||||||||||
|
|
|
|
|
| |||||||||||
The consolidated statements of cash flows should be read in conjunction with the accompanying notes.
37
Sims Metal Management Limited
Notes to the Consolidated Financial Statements
For the year ended 30 June 2012
| Page | ||||
1 | Summary of significant accounting policies | 39 | ||
2 | Financial risk management | 55 | ||
3 | Critical accounting estimates and judgements | 60 | ||
4 | Earnings per share | 61 | ||
5 | Segment information | 61 | ||
6 | Revenue | 65 | ||
7 | Other income and expenses | 65 | ||
8 | Income taxes | 67 | ||
9 | Trade and other receivables | 70 | ||
10 | Inventory | 71 | ||
11 | Other financial assets and liabilities | 71 | ||
12 | Property, plant and equipment | 75 | ||
13 | Goodwill | 76 | ||
14 | Other intangible assets | 78 | ||
15 | Trade and other payables | 79 | ||
16 | Borrowings | 79 | ||
17 | Provisions | 79 | ||
18 | Retirement benefit obligations | 80 | ||
19 | Contributed equity | 83 | ||
20 | Retained earnings and reserves | 84 | ||
21 | Dividends | 86 | ||
22 | Contingencies | 87 | ||
23 | Commitments | 88 | ||
24 | Share ownership plans | 88 | ||
25 | Key management personnel disclosures | 93 | ||
26 | Remuneration of auditors | 97 | ||
27 | Business acquisitions and disposals | 97 | ||
28 | Subsidiaries | 99 | ||
29 | Investments in associates and jointly controlled entities | 104 | ||
30 | Related party transactions | 106 | ||
31 | Parent entity financial information | 107 | ||
32 | Cash flow information | 108 | ||
38
Notes to the Consolidated Financial Statements
For the year ended 30 June 2012
Note 1 – Summary of significant accounting policies
The principal accounting policies adopted in the preparation of these consolidated financial statements are set out below. These policies have been consistently applied to all the years presented, unless otherwise stated.
(a) Reporting entity
Sims Metal Management Limited (the “Company”) is a company domiciled in Australia. The consolidated financial statements for the year ended 30 June 2012 comprise the Company and its subsidiaries (together referred to as the “Group”) and the Group’s interest in associates, jointly controlled entities and joint venture operations. The Group is a for-profit entity for the purpose of preparing the consolidated financial statements.
(b) Basis of preparation
The consolidated financial statements are general purpose financial statements, which have been prepared in accordance with the requirements of theCorporations Act 2001, Australian Accounting Standards, Urgent Issues Group Interpretations (“UIGI”) and other authoritative pronouncements of the Australian Accounting Standards Board (“AASB”).
Compliance with IFRS
The consolidated financial statements comply with International Financial Reporting Standards (“IFRS”) and interpretations as issued by the International Accounting Standards Board (“IASB”).
Historical cost convention
The consolidated financial statements have been prepared under the historical cost convention, except for certain financial assets and liabilities, and liabilities for cash-settled share based payments, which are measured at fair value.
Reclassifications
Certain reclassifications have been made to prior period amounts to conform to the current period financial statement presentation with no significant impact on the previously reported consolidated financial statements.
The Group reclassified its share of income tax expense for equity accounted investments of A$1.4 million and A$2.4 million, which were included within income tax expense for the years ended 30 June 2011 and 2010, respectively, to share of results of investments accounted for using the equity method.
The Group reclassified non-current receivables of A$9.6 million as at 30 June 2011 to non-current other financial assets to be consistent with the presentation as at 30 June 2012.
Rounding of amounts
The Company is of a kind referred to in the Australian Securities and Investments Commission (“ASIC”) Class Order No. 98/100 and, in accordance with this Class Order, amounts in the consolidated financial statements have been rounded off to the nearest tenth of a million dollars, unless otherwise stated.
(c) Critical accounting estimates
The preparation of the consolidated financial statements requires the use of certain critical accounting estimates. It also requires management to exercise its judgement in the process of applying the Group’s accounting policies. The areas involving a higher degree of judgement or complexity, or areas where assumptions and estimates are significant to the consolidated financial statements, are disclosed in Note 3.
39
Notes to the Consolidated Financial Statements
For the year ended 30 June 2012
Note 1 – Summary of significant accounting policies (continued)
(d) New accounting standards and interpretations
There are a number of new and amended accounting standards issued by the AASB and IASB, which are applicable for reporting periods beginning on or after 1 July 2011. The Group has adopted all the mandatory new and amended accounting standards issued that are relevant to its operations and effective for the current reporting period. There was no material impact on the consolidated financial statements for the year as a result of the new and amended accounting standards adopted.
A number of new accounting standards have been issued but are not yet mandatory for the year ended 30 June 2012. The Group has elected not to early adopt any of these new standards or amendments.
| Title | IFRS equivalent reference | Impact on the Group | Group Date | |||
| AASB 2011-9 Amendments to Australian Accounting Standards – Presentation of Items of Other Comprehensive Income | Revised IAS 1 | No material impact | 1 July 2012 | |||
| AASB 10 Consolidated Financial Statements | IFRS 10 | Not yet assessed | 1 July 2013 | |||
| AASB 11 Joint Arrangements | IFRS 11 | Not yet assessed | 1 July 2013 | |||
| AASB 12 Disclosure of Interests in Other Entities | IFRS 12 | Not yet assessed | 1 July 2013 | |||
| Revised AASB 127 Separate Financial Statements | Revised IAS 27 | Not yet assessed | 1 July 2013 | |||
| Revised AASB 128 Investments in Associates and Joint Ventures | Revised IAS 28 | Not yet assessed | 1 July 2013 | |||
| AASB 2011-7 Amendments to Australian Accounting Standards arising from the Consolidation and Joint Arrangements Standards | - | Not yet assessed | 1 July 2013 | |||
| AASB 13 Fair Value Measurement and AASB 2011-8 Amendments to Australian Accounting Standards arising from AASB 13 | IFRS 13 | Not yet assessed | 1 July 2013 | |||
| AASB 2011-4 Amendments to Australian Accounting Standards to Remove Individual Key Management Personnel Disclosures | - | No material impact | 1 July 2013 | |||
| Revised AASB 119 Employee Benefits1and AASB 2011-10 Amendments to Australian Accounting Standards arising from AASB 119 | Revised IAS 19 | Not yet assessed | 1 July 2013 | |||
| Revised AASB 7 Financial Instruments: Disclosures | IFRS 7 | Not yet assessed | 1 July 2013 | |||
| Revised AASB 132 Financial Instruments: Presentation –Offsetting Financial Assets and Financial Liabilities | Revised IAS 32 | Not yet assessed | 1 July 2014 | |||
| AASB 9 Financial Instruments2, AASB 2009-11 Amendments to Australian Accounting Standards arising from AASB 9, and AASB 2010-7 Amendments to Australian Accounting Standards arising from AASB 9 | IFRS 9 | Not yet assessed | 1 July 2015 |
1 While the Group has not yet assessed the impact of this standard, when adopted, this standard will lead to significant changes to the recognition and measurement of defined benefit pension expense and to the disclosures for all employee benefits.
2 While the Group has not yet assessed the impact of this standard, when adopted, this standard could change the classification and measurement of financial assets.
40
Notes to the Consolidated Financial Statements
For the year ended 30 June 2012
Note 1 – Summary of significant accounting policies (continued)
(e) Principles of consolidation
(i) Subsidiaries
Subsidiaries are all entities over which the Group has the power to govern the financial and operating policies, generally accompanying a shareholding of more than one-half of the voting rights. The existence and effect of potential voting rights that are currently exercisable or convertible are considered when assessing whether the Group controls another entity. Subsidiaries are fully consolidated from the date on which control is transferred to the Group. They are de-consolidated from the date that control ceases. Accounting policies of subsidiaries, associates and jointly controlled entities have been changed where necessary to ensure consistency with the policies adopted by the Group.
(ii) Investments in associates and jointly controlled entities (equity-accounted investees)
An associate is an entity over whose operating and financial policies the Group exercises significant influence, but not control. Significant influence is presumed to exist where the Group has between 20% and 50% of the voting rights, but can also arise where the Group holds less than 20% if it has the power to be actively involved and influential in policy decisions affecting the entity. Jointly controlled entities are those entities whose activities the Group has joint control, established by contractual agreement and requiring unanimous consent for strategic financial and operating decisions.
Investments in associates and jointly controlled entities are accounted for using the equity method of accounting. This involves recording the investment initially at cost, which therefore includes any goodwill and other intangibles on acquisition. The cost of the investment includes transaction costs.
The consolidated financial statements include the Group’s share of the profit or loss and other comprehensive income of equity-accounted investees, after adjustments to align the accounting policies with those of the Group, from the date that significant influence or joint control commences until the date that significant influence or joint control ceases.
(iii) Jointly controlled operations
A jointly controlled operation is a joint venture carried on by each venturer using its own assets in pursuit of the joint operations. A jointly controlled operation does not involve the establishment of a corporation, partnership or other entity. The consolidated financial statements include the assets that the Group controls and the liabilities that it incurs in the course of pursuing the joint operation, and the expenses that the Group incurs and its share of the income that it earns from the joint operation.
(iv) Transactions eliminated in consolidation
Intercompany transactions, balances and unrealised gains on transactions between Group companies are eliminated. Unrealised gains on transactions between the Group and its equity-accounted investees are eliminated to the extent of the Group’s interest in the investee. Unrealised losses are also eliminated unless the transaction provides evidence of an impairment of the asset transferred.
(v) Changes in ownership interests
When the Group ceases to have control, joint control or significant influence, any retained interest in the entity is remeasured to its fair value with the change in carrying amount recognised in profit or loss. The fair value is the initial carrying amount for the purposes of subsequently accounting for the retained interest as an associate or financial asset. In addition, any amounts previously recognised in other comprehensive income in respect of that entity are accounted for as if the Group had directly disposed of the related assets or liabilities. This may mean that amounts previously recognised in other comprehensive income are reclassified to profit or loss.
If the ownership interest in an equity-accounted investee is reduced but joint control or significant influence is retained, only a proportionate share of the amounts previously recognised in other comprehensive income are reclassified to profit or loss where appropriate.
41
Notes to the Consolidated Financial Statements
For the year ended 30 June 2012
Note 1 – Summary of significant accounting policies (continued)
(f) Business combinations
The acquisition method of accounting is used to account for all business combinations, regardless of whether equity instruments or other assets are acquired. The consideration transferred to the acquisition of a subsidiary comprises the fair values of the assets transferred, the liabilities incurred and the equity interests issued by the Group. The consideration transferred also includes the fair value of any contingent consideration arrangement and the fair value of any pre-existing equity interest in the subsidiary. Acquisition-related costs are expensed as incurred. Identifiable assets acquired and liabilities and contingent liabilities assumed in a business combination are, with limited exceptions, measured initially at their fair values at the acquisition date. On an acquisition-by-acquisition basis, the Group recognises any non-controlling interest in the acquiree either at fair value or at the non-controlling interest’s proportionate share of the acquiree’s net identifiable assets.
The excess of the consideration transferred and the amount of any non-controlling interest in the acquiree over the fair value of the net identifiable assets acquired is recorded as goodwill. If those amounts are less than the fair value of the net identifiable assets of the subsidiary acquired and the measurement of all amounts has been reviewed, the difference is recognised directly in profit or loss as a bargain purchase.
Where settlement of any part of cash consideration is deferred, the amounts payable in the future are discounted to their present value as at the date of the exchange. The discount rate used is the entity’s incremental borrowing rate, being the rate at which a similar borrowing could be obtained from an independent financier under comparable terms and conditions.
Contingent consideration is classified as either equity or a financial liability. Amounts classified as a financial liability are subsequently remeasured to fair value with changes in fair value recognised in profit or loss.
(g) Foreign currency translation
(i) Functional and presentation currency
Items included in the financial statements of each of the Group’s entities are measured using the currency of the primary economic environment in which the entity operates (the “functional currency”). The consolidated financial statements are presented in Australian dollars, which is the Company’s functional and presentation currency.
(ii) Transactions and balances
Foreign currency transactions are translated into the functional currency using the exchange rates prevailing at the dates of the transactions. Foreign exchange gains and losses resulting from the settlement of such transactions and from the translation at year end exchange rates of monetary assets and liabilities denominated in foreign currencies are recognised in profit or loss, except when deferred in equity as qualifying cash flow hedges and qualifying net investment hedges or are attributable to part of the net investment in a foreign operation.
Non-monetary items that are measured at fair value in a foreign currency are translated using the exchange rates at the date when the fair value was determined. Translation differences on assets and liabilities carried at fair value are reported as part of the fair value gain or loss. Translation differences on non-monetary financial assets and liabilities such as equities held at fair value through profit or loss are recognised in profit or loss as part of the fair value gain or loss and translation differences on non-monetary assets such as equities classified as available-for-sale financial assets are included in other comprehensive income.
42
Notes to the Consolidated Financial Statements
For the year ended 30 June 2012
Note 1 – Summary of significant accounting policies (continued)
(g) Foreign currency translation (continued)
(iii) Group companies
The results and financial position of foreign operations (none of which has the currency of a hyperinflationary economy) that have a functional currency different from the presentation currency are translated into the presentation currency as follows:
| • | assets and liabilities for each statement of financial position presented are translated at the closing rate at the date of that statement of financial position; |
| • | income and expenses for each income statement and statement of comprehensive income are translated at average exchange rates (unless this is not a reasonable approximation of the cumulative effect of the rates prevailing on the transaction dates, in which case they are translated at the date of the transaction); and |
| • | all resulting exchange differences are recognised in other comprehensive income. |
On consolidation, exchange differences arising from the translation of any net investment in foreign entities, borrowings and other financial instruments designated as hedges of such investments, or long-term intragroup borrowings which, in substance, form part of the Group’s net investment in an entity, are recognised in other comprehensive income. When a loss of control occurs over a foreign operation, a proportionate share of such exchange differences is reclassified to profit or loss as part of the gain or loss on disposal where applicable.
Goodwill and fair value adjustments arising on the acquisition of a foreign entity are treated as assets and liabilities of the foreign entity and translated at the closing rate.
(h) Revenue recognition
Revenue is measured at the fair value of the consideration received or receivable. Amounts disclosed as revenue are net of returns and trade allowances. Amounts billed to customers in respect of shipping and handling are classified as sales revenue where the Group is responsible for carriage, insurance and freight. All shipping and handling costs incurred by the Group are recognised as freight expense in the income statement.
The Group recognises revenue when the amount of revenue can be reliably measured, it is probable that future economic benefits will flow to the entity and specific criteria have been met for each of the Group’s activities as described below. The amount of revenue is not considered to be reliably measurable until all contingencies relating to the sale have been resolved.
Revenue is recognised for the major business activities as follows:
(i) Sale of goods
Revenue from the sale of goods is recognised when there is persuasive evidence, usually in the form of an executed sales agreement at the time of delivery of goods to the customer, indicating that there has been a transfer of risks and rewards to the customer, no further work or processing is required, the quantity and quality of the goods have been determined, the price is fixed and generally title has passed.
(ii) Service revenue
Service revenue principally represents revenue earned from the collection of end-of-life post-consumer products for the purpose of product recycling. Service revenue is recognised when the services have been provided. Service revenue received in advance of the service being rendered is deferred.
(iii) Interest income
Interest income is recognised on an accrual basis using the effective interest method.
(iv) Dividend income
Dividends are recognised when the right to receive payment is established.
43
Notes to the Consolidated Financial Statements
For the year ended 30 June 2012
Note 1 – Summary of significant accounting policies (continued)
(i) Government grants
Grants from the government are recognised at their fair value where there is a reasonable assurance that the grant will be received and the Group will comply with all attached conditions.
Government grants relating to costs are deferred and recognised in profit or loss over the period necessary to match them with the costs that they are intended to compensate.
Government grants relating to the purchase of property, plant and equipment are included in non-current liabilities as deferred income and are credited to other income in the income statement on a straight-line basis over the expected lives of the related assets.
(j) Income tax
The income tax expense or benefit for the period is the tax payable on the current period’s taxable income based on the applicable income tax rate for each jurisdiction adjusted by changes in deferred tax assets and liabilities attributable to temporary differences and unused tax losses.
The current income tax charge is calculated on the basis of the tax laws enacted or substantively enacted at the end of the reporting period in the countries where the Group’s subsidiaries and associates operate and generate taxable income. Management periodically evaluates provisions taken in tax returns with respect to situations in which applicable tax regulation is subject to interpretation. It establishes provisions where appropriate on the basis of amounts expected to be paid to the tax authorities.
Deferred income tax is provided in full, using the liability method, on temporary differences arising between the tax bases of assets and liabilities and their carrying amounts in the consolidated financial statements. However, the deferred income tax is not accounted for if it arises from initial recognition of an asset or liability in a transaction other than a business combination that at the time of the transaction affects neither accounting nor taxable profit or loss. Deferred income tax is determined using tax rates (and laws) that have been enacted or substantially enacted by the end of the reporting period and are expected to apply when the related deferred income tax asset is realised or the deferred income tax liability is settled.
Deferred tax assets are recognised for deductible temporary differences and unused tax losses only if it is probable that future taxable amounts will be available to utilise those temporary differences and losses.
Deferred tax liabilities and assets are not recognised for temporary differences between the carrying amount and tax bases of investments in controlled entities where the Company is able to control the timing of the reversal of the temporary differences and it is probable that the differences will not reverse in the foreseeable future.
Deferred tax assets and liabilities are offset when there is a legally enforceable right to offset current tax assets and liabilities and when the deferred tax balances relate to the same taxation authority. Current tax assets and tax liabilities are offset where the entity has a legally enforceable right to offset and intends either to settle on a net basis, or to realise the asset and settle the liability simultaneously.
Current and deferred tax is recognised in profit or loss, except to the extent that it relates to items recognised in other comprehensive income or directly in equity. In this case, the tax is also recognised in other comprehensive income or directly in equity, respectively.
44
Notes to the Consolidated Financial Statements
For the year ended 30 June 2012
Note 1 – Summary of significant accounting policies (continued)
(j) Income tax (continued)
(i) Tax consolidation legislation
Sims Metal Management Limited and its wholly-owned Australian controlled entities have implemented the tax consolidation legislation as of 31 October 2005. Sims Metal Management Limited is the head entity of the tax consolidated group. Members of the tax consolidated group have entered into a tax sharing and funding agreement that provides for the allocation of income tax liabilities between entities should the head entity default on its tax payment obligations. No amounts have been recognised in the consolidated financial statements in respect of this agreement on the basis that the probability of default is remote.
(ii) Investment allowances
Entities within the Group may be entitled to claim special tax deductions for investments in qualifying assets (investment allowances). The Group accounts for such allowances as tax credits, which means that the allowance reduces income tax payable and current tax expense. A deferred tax asset is recognised for unclaimed tax credits that are carried forward as deferred tax assets.
(k) Leases
Leases are classified at their inception as either finance or operating leases based on the economic substance of the arrangement so as to reflect the risks and benefits incidental to ownership. Finance leases are those that effectively transfer from the lessor to the lessee substantially all the risks and benefits incidental to ownership of the leased property. All other leases are classified as operating leases.
Assets held under finance leases are initially recognised at their fair value at the inception of the lease or, if lower, at the present value of the minimum lease payments. The corresponding liability to the lessor is included in the statement of financial position as a finance lease obligation. Lease payments are apportioned between finance expenses and reduction of the lease obligation so as to achieve a constant rate of interest on the remaining balance of the liability. The Group does not have any significant finance leases.
Operating lease payments are recognised as an expense on a straight-line basis over the lease term. In the event that lease incentives are received to enter into operating leases, such incentives are recognised as a liability. The aggregate benefit of incentives is recognised as a reduction of rental expense on a straight-line basis.
Lease income from operating leases where the Group is a lessor is recognised in income on a straight-line basis over the lease term. The respective leased assets are included in the statement of financial position based on their nature.
(l) Segment information
Operating segments are reported in a manner consistent with the internal reporting provided to the Group Chief Executive Officer (“CEO”), who is the chief operating decision maker. Details on the Group’s segments are set out in Note 5.
(m) Impairment of non-current assets
Goodwill and other intangible assets that have an indefinite useful life are not subject to amortisation and are tested annually for impairment, or more frequently if events or changes in circumstances indicate a potential for impairment. Other assets are tested for impairment whenever events or changes in circumstances indicate that the carrying amount may not be recoverable. An impairment loss is recognised for the amount by which the asset’s carrying amount exceeds its recoverable amount. The recoverable amount is the higher of an asset’s fair value less costs to sell and value-in-use. For the purposes of assessing impairment, assets are grouped at the lowest levels for which there are separately identifiable cash inflows, which are largely independent of the cash inflows from other assets or groups of assets (“CGUs”). Non-financial assets, other than goodwill, that suffered impairment are reviewed for possible reversal of the impairment at each reporting period.
45
Notes to the Consolidated Financial Statements
For the year ended 30 June 2012
Note 1 – Summary of significant accounting policies (continued)
(n) Cash and cash equivalents
For the purpose of presentation in the consolidated statement of cash flows, cash and cash equivalents includes cash on hand, deposits held at call with financial institutions and other short-term, highly liquid investments with original maturities of three months or less that are readily convertible to known amounts of cash and which are subject to an insignificant risk of changes in value.
(o) Trade and other receivables
Trade receivables are recognised initially at fair value and subsequently measured at amortised cost, less provision for impairment. Trade receivables are generally due for settlement within 30 to 60 days following shipment, except in the case of certain ferrous shipments made to export destinations, which are generally secured by letters of credit that are collected on negotiated terms but generally within 10 days of shipment.
Collectibility of trade receivables is reviewed on an ongoing basis. Individual debts that are known to be uncollectible are written-off by reducing the carrying amount directly. An allowance account (a provision for impairment of trade receivables) is used when there is objective evidence that the Group will not be able to collect all amounts due according to the original terms of the receivable. Indicators of impairment would include significant financial difficulties of the debtor, likelihood of the debtor’s insolvency, default or delinquency in payment, or a significant deterioration in creditworthiness. The amount of the impairment provision is recognised in profit or loss within other expenses.
When a trade receivable for which an impairment provision had been recognised becomes uncollectible in a subsequent period, it is written-off against the provision for impairment account. Subsequent recoveries of amounts previously written-off are credited against other expenses in profit or loss.
(p) Inventory
Inventories are stated at the lower of cost and net realisable value. Cost is based on weighted average and comprises direct materials, direct labour and an appropriate proportion of variable and fixed overhead expenditures, the latter being allocated on the basis of normal operating capacity. Net realisable value is the estimated selling price in the ordinary course of business less the estimated costs of completion and the estimated costs necessary to make the sale.
Stores consist of consumable and maintenance stores and are valued at the lower of cost and net realisable value. Cost is determined using weighted average costs.
(q) Non-current assets (or disposal groups) held for sale and discontinued operations
Non-current assets (or disposal groups) are classified as held for sale if their carrying amount will be recovered principally through a sale transaction rather than through continuing use and a sale is considered highly probable. They are measured at the lower of their carrying amount and fair value less costs to sell, except for assets such as deferred tax assets, assets arising from employee benefits and financial assets that are carried at fair value, which are specifically exempt from this requirement.
An impairment loss is recognised for any initial or subsequent write-down of the asset (or disposal group) to fair value less costs to sell. A gain is recognised for any subsequent increases in fair value less costs to sell of an asset (or disposal group), but not in excess of any cumulative impairment loss previously recognised. A gain or loss not previously recognised by the date of the sale of the non-current asset (or disposal group) is recognised at the date of derecognition.
46
Notes to the Consolidated Financial Statements
For the year ended 30 June 2012
Note 1 – Summary of significant accounting policies (continued)
(q) Non-current assets (or disposal groups) held for sale and discontinued operations (continued)
Non-current assets (including those that are part of a disposal group) are not depreciated or amortised while they are classified as held for sale. Interest and other expenses attributable to the liabilities of a disposal group classified as held for sale continue to be recognised.
Non-current assets classified as held for sale and the assets of a disposal group classified as held for sale are presented separately from the other assets in the statement of financial position. The liabilities of a disposal group classified as held for sale are presented separately from other liabilities in the statement of financial position.
A discontinued operation is a component of the entity that has been disposed of or is classified as held for sale and that represents a separate major line of business or geographical area of operations, is part of a single coordinated plan to dispose of such a line of business or area of operations, or is a subsidiary acquired exclusively with a view to resale. The results of discontinued operations are presented separately in profit or loss.
(r) Property, plant and equipment
Property, plant and equipment is recorded at historical cost less accumulated depreciation and accumulated impairment. Historical cost includes expenditures that are directly attributable to the acquisition and installation of the items. Cost may also include transfers from equity of any gain or loss on qualifying cash flow hedges of foreign currency purchases of property, plant and equipment.
Subsequent costs are included in the asset’s carrying amount or recognised as a separate asset, as appropriate, only when it is probable that future economic benefits associated with the item will flow to the Group and the cost of the item can be measured reliably. The carrying amount of any component accounted for as a separate asset is derecognised when replaced. All other repairs and maintenance are charged to profit or loss during the financial period in which they are incurred.
Land is not depreciated. Depreciation on other assets is calculated using the straight-line method to allocate their cost net of their residual values, over their estimated useful lives, as follows:
| • | Buildings – 25 to 40 years |
| • | Plant and equipment – 3 to 20 years |
| • | Leasehold improvements – lesser of life of asset or life of the lease |
The assets’ residual values and useful lives are reviewed, and adjusted if appropriate, at the end of each reporting period. An asset’s carrying amount is written-down immediately to its recoverable amount if the asset’s carrying amount is greater than its estimated recoverable amount as set out in Note 1(m). Gains and losses on disposals are determined by comparing proceeds with carrying amounts and recognised in profit or loss.
47
Notes to the Consolidated Financial Statements
For the year ended 30 June 2012
Note 1 – Summary of significant accounting policies (continued)
(s) Financial assets
Initial recognition and measurement
The Group classifies its financial assets in the following categories: financial assets at fair value through profit or loss, loans and receivables, or available-for-sale financial assets. The Group determines the classification of its financial assets at initial recognition.
All financial assets are recognised initially at fair value plus transaction costs, except in the case of financial assets recorded at fair value through profit or loss.
Purchases or sales of financial assets that require delivery of assets within a time frame established by regulation or convention in the market place (regular way trades) are recognised on the trade date - the date that the Group commits to purchase or sell the asset.
Subsequent measurement
The subsequent measurement of financial assets depends on their classification as described below:
Financial assets at fair value through profit or loss
Financial assets at fair value through profit or loss are financial assets held for trading. A financial asset is classified in this category if acquired principally for the purpose of selling in the short-term. Derivatives are classified as held for trading unless they are designated as effective hedging instruments. Gains or losses on financial assets held for trading are recognised in profit or loss and the related assets are classified in the statement of financial position based on their maturity.
The Group evaluates its financial assets held for trading, other than derivatives, to determine whether the intention to sell them in the near term is still appropriate. When in rare circumstances the Group is unable to trade these financial assets due to inactive markets and management’s intention to sell them in the foreseeable future significantly changes, the Group may elect to reclassify these financial assets. The reclassification to loans and receivables or available-for-sale depends on the nature of the asset. This evaluation does not affect any financial assets designated at fair value through profit or loss using the fair value option at designation, these instruments cannot be reclassified after initial recognition.
Derivatives embedded in host contracts are accounted for as separate derivatives and recorded at fair value if their economic characteristics and risks are not closely related to those of the host contracts and the host contracts are not held for trading or designated at fair value though profit or loss. These embedded derivatives are measured at fair value with changes in fair value recognised in profit or loss. Reassessment only occurs if there is a change in the terms of the contract that significantly modifies the cash flows that would otherwise be required.
Loans and receivables
Loans and receivables are non-derivative financial assets with fixed or determinable payments that are not quoted in an active market. After initial measurement, such financial assets are subsequently measured at amortised cost using the effective interest method, less impairment.
Convertible loans held by the Group are separately presented as a debt portion and conversion option embedded in convertible loans. On initial recognition, the debt portion represents the residual between the fair value of the convertible loan and the fair value of the embedded conversion option. The debt portion is classified as loans and receivables and is subsequently measured at amortised cost using the effective interest method.
48
Notes to the Consolidated Financial Statements
For the year ended 30 June 2012
Note 1 – Summary of significant accounting policies (continued)
(s) Financial assets (continued)
Subsequent measurement (continued)
Available-for-sale financial assets
Available-for-sale financial assets are non-derivative financial assets that are designated as available-for-sale or are not classified in any other category. They are included in non-current assets unless the investment matures or management intends to dispose of the investment within 12 months of the end of the reporting period. Investments are designated as available-for-sale if they do not have fixed maturities and fixed or determinable payments and management intends to hold them for the medium to long-term.
After initial measurement, available-for-sale financial investments are subsequently measured at fair value with unrealised gains or losses recognised as other comprehensive income in the available-for-sale investments reserve until the investment is derecognised, at which time the cumulative gain or loss is recognised in other operating income, or the investment is determined to be impaired, when the cumulative loss is reclassified from the available-for-sale investment reserve to profit or loss.
The Group evaluates whether the ability and intention to sell its available-for-sale financial assets in the near term is still appropriate. When, in rare circumstances, the Group is unable to trade these financial assets due to inactive markets and management’s intention to do so significantly changes in the foreseeable future, the Group may elect to reclassify these financial assets. Reclassification to loans and receivables is permitted when the financial assets meet the definition of loans and receivables and the Group has the intent and ability to hold these assets for the foreseeable future or until maturity.
For a financial asset reclassified from the available-for-sale category, the fair value carrying amount at the date of reclassification becomes its new amortised cost and any previous gain or loss on the asset that has been recognised in equity is amortised to profit or loss over the remaining life of the investment using the effective interest method. Any difference between the new amortised cost and the maturity amount is also amortised over the remaining life of the asset using the effective interest method. If the asset is subsequently determined to be impaired, then the amount recorded in equity is reclassified to profit or loss.
Offsetting financial instruments
Financial assets and liabilities are offset, and the net amount reported in the statement of financial position, when there is a legally enforceable right to offset the recognised amounts and there is an intention to settle on a net basis or realise the asset and settle the liability simultaneously.
Impairment
The Group assesses at the end of each reporting period whether there is objective evidence that a financial asset or group of financial assets is impaired. In the case of equity securities classified as available-for-sale, a significant or prolonged decline in the fair value of a security below its cost is considered as an indicator that the securities are impaired. If any such evidence exists for available-for-sale financial assets, the cumulative loss - measured as the difference between the acquisition cost and the current fair value, less any impairment loss on that financial asset previously recognised in profit or loss - is reclassified from equity and recognised in profit or loss as a reclassification adjustment. Impairment losses recognised in profit or loss on equity instruments classified as available-for-sale are not reversed through profit or loss.
If there is evidence of impairment for any of the Group’s financial assets carried at amortised cost, the loss is measured as the difference between the asset’s carrying amount and the present value of estimated future cash flows, excluding future credit losses that have not been incurred. The cash flows are discounted at the financial asset’s original effective interest rate. The loss is recognised in profit or loss.
49
Notes to the Consolidated Financial Statements
For the year ended 30 June 2012
Note 1 – Summary of significant accounting policies (continued)
(t) Derivatives and hedging activities
Derivatives are initially recognised at fair value on the date a derivative contract is entered into and are subsequently remeasured to their fair value at the end of each reporting period. The accounting for subsequent changes in fair value depends on whether the derivative is designated as a hedging instrument, and if so, the nature of the item being hedged. The Group designates certain derivatives as either: (i) hedges of the fair value of recognised assets or liabilities or a firm commitment (“fair value hedges”); or (ii) hedges of a particular risk associated with the cash flows of recognised assets and liabilities and highly probable forecast transactions (“cash flow hedges”).
Certain derivative instruments do not qualify for hedge accounting, despite being valid economic hedges of the relevant risks. Changes in the fair value of any derivative instrument that does not qualify for hedge accounting are recognised immediately in profit or loss and are included in other income or other expenses.
The Group documents at the inception of the hedging transaction the relationship between hedging instruments and hedged items, as well as its risk management objective and strategy for undertaking various hedge transactions. The Group also documents its assessment, both at hedge inception and on an ongoing basis, of whether the derivatives that are used in hedging transactions have been, and will continue to be, highly effective in offsetting changes in fair values or cash flows of hedged items.
The fair values of various derivative financial instruments used for hedging purposes are disclosed in Note 11. Movements in the hedging reserve in equity are shown in Note 20. The full fair value of a hedging derivative is classified as a non-current asset or liability when the remaining maturity of the hedged item is more than 12 months; it is classified as a current asset or liability when the remaining maturity is less than 12 months.
Options and warrants associated with listed equity securities and the conversion feature of convertible loans are classified as derivatives on the statement of financial position.
(i) Fair value hedge
Changes in the fair value of derivatives that are designated and qualify as fair value hedges are recorded in profit or loss, together with any changes in the fair value of the hedged asset or liability that are attributable to the hedged risk.
(ii) Cash flow hedge
The effective portion of changes in the fair value of derivatives that are designated and qualify as cash flow hedges are recognised in other comprehensive income and accumulated in the hedging reserve in equity. The gain or loss relating to the ineffective portion is recognised immediately in profit or loss. Amounts accumulated in equity are reclassified to profit or loss in the periods when the hedged item affects profit or loss (for instance when the forecast sale that is hedged takes place). The gain or loss relating to the effective portion of forward foreign exchange contracts hedging export sales is recognised in profit or loss within revenue.
Where the hedged item is the cost of a non-financial asset or liability, such as a forecast transaction for the purchase of property, plant and equipment, the amounts recognised within other comprehensive income are transferred to the initial carrying amount of the non-financial asset or liability.
When a hedging instrument expires or is sold or terminated, or when a hedge no longer meets the criteria for hedge accounting, any cumulative gain or loss existing in equity at that time remains in equity and is recognised when the forecast transaction is ultimately recognised in profit or loss. When a forecast transaction is no longer expected to occur, the cumulative gains or losses that were deferred in equity are immediately transferred to profit or loss.
50
Notes to the Consolidated Financial Statements
For the year ended 30 June 2012
Note 1 – Summary of significant accounting policies (continued)
(u) Goodwill and other intangible assets
(i) Goodwill
Goodwill is measured as described in Note 1(f). Goodwill is not amortised but it is tested for impairment annually or more frequently if events or changes in circumstances indicate that it might be impaired, and is carried at cost less accumulated impairment losses. Gains and losses on the disposal of an entity include the carrying amount of goodwill relating to the entity sold.
Goodwill is allocated to CGUs for the purpose of impairment testing. The allocation is made to those CGUs or groups of CGUs that are expected to benefit from the business combination in which the goodwill arose.
(ii) Trade name
Trade name relates principally to the “Metal Management” trading name. This intangible asset has a finite useful life and is carried at cost less accumulated amortisation. Amortisation is calculated using the straight-line method to allocate the cost of the trade name over its estimated useful life, which is 20 years.
(iii) Supplier relationships and contracts
Supplier relationships and contracts acquired as part of a business combination are recognised separately from goodwill. The supplier relationships and contracts are carried at their fair value at the date of acquisition less accumulated amortisation and impairment losses. Amortisation is calculated based on the timing of projected cash flows of the supplier relationships or straight-line method (as appropriate) over their estimated useful lives, which currently vary from 1 to 19 years.
(iv) Permits
Permits acquired as part of a business combination are recognised separately from goodwill. Permits are issued by state and local governments and are renewable at little or no cost and are thus considered to have an indefinite life. Permits are carried at their fair value at the date of acquisition and are not amortised. Instead, permits are tested for impairment annually or more frequently if events or changes in circumstances indicate that they might be impaired, and are carried at cost less accumulated impairment losses. Permits that relate to facilities that close or relocate are written-off to nil at the time the facility is closed or relocated.
(v) Trade and other payables
These amounts represent liabilities for goods and services provided to the Group prior to the end of a financial year, which are unpaid. The amounts are unsecured and are usually payable within 30 days of recognition.
(w) Borrowings
Borrowings are initially recognised at fair value, net of transaction costs incurred. Borrowings are subsequently measured at amortised cost. Any difference between the proceeds (net of transaction costs) and the redemption amount is recognised in profit or loss over the period of the borrowings using the effective interest method. Fees paid on the establishment of loan facilities, which are not an incremental cost relating to the actual draw-down of the facility, are recognised as prepayments and amortised to finance costs on a straight-line basis over the term of the loan facility.
Borrowings are removed from the statement of financial position when the obligation specified in the contract is discharged, cancelled or expired. The difference between the carrying amount of a financial liability that has been extinguished or transferred to another party and the consideration paid, including any non-cash assets transferred or liabilities assumed, is recognised in profit or loss as other income or finance costs.
Borrowings are classified as current liabilities unless the Group has the unconditional right to defer settlement of the liability for at least 12 months after the reporting period.
51
Notes to the Consolidated Financial Statements
For the year ended 30 June 2012
Note 1 – Summary of significant accounting policies (continued)
(x) Borrowing costs
Borrowing costs incurred for the construction of any qualifying asset are capitalised during the period of time required to complete and prepare the asset for its intended use. Other borrowing costs are recognised as expenses in the period in which they are incurred.
(y) Provisions
Provisions are recognised when the Group has a present legal or constructive obligation as a result of past events, it is probable that an outflow of resources will be required to settle the obligation, and the amount can be reliably estimated. Provisions are not recognised for future operating losses.
Where there are a number of similar obligations, the likelihood that an outflow will be required in settlement is determined by considering the class of obligations as a whole. A provision is recognised even if the likelihood of an outflow with respect to any one item included in the same class of obligations may be small.
Provisions are measured at the present value of management’s best estimate of the expenditure required to settle the present obligation at the end of the reporting period. The discount rate used to determine the present value is a pre-tax rate that reflects current market assessments of the time value of money and the risks specific to the liability. The increase in the provision due to the passage of time is recognised as interest expense.
(z) Employee benefits
(i) Salaries and annual leave
Liabilities for salaries and annual leave expected to be settled within 12 months of the end of the period in which employees render the related service are recognised in respect of employees’ services up to the end of the reporting period and are measured at the amounts expected to be paid when the liabilities are settled. The liability for annual leave is recognised in the provision for employee benefits and the liability for salaries is recognised in other payables.
(ii) Long service leave
The liability for long service leave is recognised in the provision for employee benefits and measured as the present value of expected future payments to be made in respect of services provided by employees up to the end of the reporting period in which the employees render the related service. Consideration is given to expected future wage and salary levels, experience of employee departures and periods of service. Expected future payments are discounted using market yields at the reporting date on national government bonds with terms to maturity and currency that match, as closely as possible, the estimated future cash outflows.
(iii) Superannuation, pensions and other post-retirement benefits
The Group operates or participates in a number of pension (including superannuation) schemes throughout the world. The funding of the schemes complies with local regulations. The assets of the schemes are generally held separately from those of the Group and are administered by trustees or management boards.
For defined contribution schemes or schemes operated on an industry-wide basis where it is not possible to identify assets attributable to the participation by the Group’s employees, the cost is calculated on the basis of contributions payable.
52
Notes to the Consolidated Financial Statements
For the year ended 30 June 2012
Note 1 – Summary of significant accounting policies (continued)
(z) Employee benefits (continued)
(iii) Superannuation, pensions and other post-retirement benefits (continued)
For defined benefit schemes, the cost of providing pensions is charged to profit or loss so as to recognise current and past service costs, interest cost on defined benefit obligations, and the effect of any curtailments or settlements, net of expected returns on plan assets. Actuarial gains and losses arising from experience adjustments and changes in actuarial assumptions are recognised in the period in which they occur, directly in other comprehensive income. An asset or liability is consequently recognised in the statement of financial position based on the present value of the defined benefit obligation at the end of the reporting period, less any unrecognised past service costs and the fair value of plan assets at that date.
The present value of the defined benefit obligation is calculated by independent actuaries by discounting expected future payments using market yields at the reporting date on high quality corporate bonds in countries that have developed corporate bond markets. However, where developed corporate bond markets do not exist, the discount rates are selected by reference to national government bonds. In both instances, the bonds are selected with terms to maturity and currency that match, as closely as possible, the estimated future cash flows. Consideration is given to expected future wage and salary levels, experience of employee departures and periods of service. Details relating to retirement benefit obligations are set out in Note 18.
(iv) Termination benefits
Termination benefits are payable when employment is terminated before the normal retirement date, or when an employee accepts voluntary redundancy in exchange for these benefits. The Group recognises termination benefits when it is demonstrably committed to either terminating the employment of current employees according to a detailed formal plan without possibility of withdrawal or providing termination benefits as a result of an offer made to encourage voluntary redundancy. Benefits due more than 12 months after the end of the reporting period are discounted to present value.
(v) Share-based payments
Share-based compensation benefits are provided to certain employees via the schemes set out in Note 24. For share-based arrangements, the fair value is measured at grant date and recognised as an employee benefit expense with a corresponding increase in equity. For cash-settled share-based arrangements, the fair value of the amount payable is recognised as an employee benefit expense with a corresponding increase to a liability. The liability is re-measured each reporting date and at settlement date. Any changes in the fair value of the liability are recognised as an employee benefit expense in profit or loss.
The fair value at grant date is independently determined using either a binomial model or a Monte-Carlo simulation model. The model takes into account the exercise price, the term, the share price at grant date and expected price volatility of the underlying share, the expected dividend yield, and the risk-free interest rate for the term of the grant. The fair value is adjusted to reflect market vesting conditions, but excludes the impact of any non-market vesting conditions (for example, earnings per share targets). Non-market vesting conditions are included in assumptions about the number of shares that are expected to become exercisable. At the end of each reporting period, the Group revises its estimate of the number of shares that are expected to become exercisable. The employee benefit expense recognised each period takes into account the most recent estimate. The impact of the revision to original estimates, if any, is recognised in profit or loss with a corresponding adjustment to equity.
(aa) Contributed equity
Ordinary shares are classified as equity. Incremental costs directly attributable to the issue of new shares are shown in equity as a deduction, net of tax, from the proceeds.
When the Company purchases any of its own equity instruments, for example, as a result of a share buy-back, the consideration paid, including any directly attributable incremental costs (net of income taxes) is deducted from contributed equity and any reacquired shares are cancelled upon their purchase.
53
Notes to the Consolidated Financial Statements
For the year ended 30 June 2012
Note 1 – Summary of significant accounting policies (continued)
(ab) Dividends
A provision is made for the amount of any dividends declared on or before the end of the reporting period, but not distributed at the end of the reporting period.
(ac) Earnings per share (“EPS”)
Basic earnings per share is calculated by dividing net profit by the weighted average number of ordinary shares outstanding during the financial year, adjusted for bonus elements in ordinary shares issued during the year.
Diluted earnings per share adjusts the figures used in the determination of basic earnings per share to take into account the after income tax effect of interest and other financing costs associated with dilutive potential ordinary shares, and the weighted average number of additional ordinary shares that would have been outstanding assuming the conversion of all dilutive potential ordinary shares.
(ad) Goods and services or other value-added taxes (“GST”)
Revenues, expenses and assets are recognised net of the amount of associated GST, unless the GST incurred is not recoverable from the taxation authority. In this case, it is recognised as part of the cost of acquisition of the asset or as part of the expense.
Receivables and payables are stated inclusive of the amount of GST receivable or payable. The net amount of GST recoverable from, or payable to, the taxation authority is included with other receivables or payables in the statement of financial position.
Cash flows are presented on a gross basis. The GST components of cash flows arising from investing or financing activities, which are recoverable from, or payable to, the taxation authority, are presented as operating cash flows.
(ae) Parent entity financial information
The financial information for the parent entity, Sims Metal Management Limited, disclosed in Note 31 has been prepared on the same basis as the consolidated financial statements, except as set out below.
(i) Investments in subsidiaries
Investments in subsidiaries are accounted for at cost in the financial statements of the Company. Dividends received from subsidiaries are recognised in the Company’s profit or loss, rather than being deducted from the carrying amount of the investments.
(ii) Tax consolidation legislation
The Company and its wholly-owned Australian controlled entities have implemented the tax consolidation legislation. The head entity, Sims Metal Management Limited, and the controlled entities in the tax consolidated group account for their own current and deferred tax amounts. These amounts are measured as if each entity in the tax consolidated group continues to be a stand-alone taxpayer in its own right.
In addition to its current and deferred tax amounts, the Company also recognises the current tax liabilities (or assets) and the deferred tax assets arising from unused tax losses and unused tax credits assumed from controlled entities in the tax consolidated group.
The entities have also entered into a tax funding agreement under which the wholly-owned entities fully compensate the Company for any current tax receivable and deferred tax assets relating to unused tax losses or unused tax credits that are transferred to the Company under the tax consolidation legislation. The funding amounts are determined by reference to the amounts recognised in the wholly-owned entities’ financial statements.
54
Notes to the Consolidated Financial Statements
For the year ended 30 June 2012
Note 1 – Summary of significant accounting policies (continued)
(ae) Parent entity financial information (continued)
(ii) Tax consolidation legislation (continued)
The amount receivable/payable under the tax funding agreement are due upon receipt of the funding advice from the head entity, which is issued as soon as practicable after the end of each financial year. The head entity may also require payment of interim funding amounts to assist with its obligations to pay tax installments.
Assets or liabilities arising under the tax funding agreements with the tax consolidated entities are recognised as current amounts receivable from or payable to other entities in the Group.
Any difference between the amounts assumed and amounts receivable or payable under the tax funding agreement are recognised as a contribution to (or distribution from) wholly-owned tax consolidated entities.
Note 2 – Financial risk management
The Group’s activities expose it to a variety of financial risks: market risk (including interest rate risk, foreign exchange risk, commodity price risk and equity securities price risk), credit risk and liquidity risk. The Group’s overall financial risk management strategy seeks to mitigate these risks to minimise potential adverse effects on the financial performance of the Group.
The Group uses derivative financial instruments in certain circumstances in accordance with Board of Directors (“Board”) approved policies to hedge exposure to fluctuations in foreign exchange rates or commodity prices. Derivative financial instruments are used for hedging purposes and not as trading or other speculative instruments. The Group uses different methods to measure different types of risk to which it is exposed. These methods include monitoring key movements in interest rates, key transactions affected by foreign exchange, commodity prices, equity prices, and ageing analysis for credit risk. Risk management is carried out by a limited number of employees as authorised by the Board. The Board provides written principles for overall risk management, as well as written policies covering specific areas, such as foreign exchange risk, interest rate risk, credit risk, use of derivative financial instruments and non-derivative financial instruments, and the investment of excess liquidity.
The Risk, Audit & Compliance Committee (“RAC”) of the Board oversees, on a quarterly basis, the monitoring of compliance by management with the Group’s risk management framework. The RAC is assisted in its oversight role by Internal Audit. Internal Audit undertakes both regular and ad hoc reviews of risk management controls and procedures, the results of which are also reported to the RAC.
The Group holds the following financial instruments:
| 2012 A$m | 2011 A$m | |||||||
Financial assets: | ||||||||
Cash and cash equivalents | 51.4 | 165.5 | ||||||
Trade and other receivables | 513.4 | 606.7 | ||||||
Other financial assets | 78.8 | 28.1 | ||||||
|
|
|
| |||||
Total financial assets | 643.6 | 800.3 | ||||||
|
|
|
| |||||
Financial liabilities: | ||||||||
Trade and other payables | 680.1 | 751.0 | ||||||
Borrowings | 343.6 | 291.7 | ||||||
Other financial liabilities | 2.1 | 5.8 | ||||||
|
|
|
| |||||
Total financial liabilities | 1,025.8 | 1,048.5 | ||||||
|
|
|
| |||||
55
Notes to the Consolidated Financial Statements
For the year ended 30 June 2012
Note 2 – Financial risk management (continued)
(a) Market risk
Market risk is the risk that the fair value or future cash flows of the Group’s financial instruments will fluctuate because of changes in market prices. The market risks to which the Group is exposed are discussed in further detail below.
(i) Interest rate risk
Interest rate risk arises from interest bearing financial assets and liabilities that the Group utilises. The Group’s main exposure to interest rate risk arises from borrowings at variable interest rates. The Group does not use any derivative financial instruments to manage its exposure to interest rate risk. Cash deposits, loans to third parties and associates, and borrowings issued at fixed rates expose the Group to fair value interest rate risk.
The Group’s borrowings are sourced primarily from domestic but also offshore markets. The Group’s borrowings consist primarily of foreign currency denominated borrowings and are managed in accordance with targeted currency, interest rate, liquidity and debt portfolio maturity profiles.
Specifically, interest rate risk is managed on the Group’s net debt portfolio by:
| • | providing access to diverse sources of funding; |
| • | reducing risks of refinancing by establishing and managing in accordance with target maturity profiles; and |
| • | negotiating interest rates with the Group’s banks based on a variable pricing matrix, which generally involve a LIBOR rate plus a margin. |
The Group’s weighted average interest rate on interest-bearing liabilities for the year ended 30 June 2012 was 2.5% (2011: 2.5%) . If interest rates had increased by 100 basis points as at the balance date with all other variables held constant, post-tax profit for the year ended 30 June 2012 would have been A$2.4 million lower (2011: A$2.0 million lower). A sensitivity of 100 basis points is deemed reasonable based on current and past market conditions. The calculations are based on interest-bearing financial instruments with variable interest rates at the end of the reporting period. A 100 basis points decrease in interest rates would have an equal and opposite effect.
(ii) Foreign exchange risk
The Group operates internationally and is exposed to foreign exchange risk, primarily with respect to transactions settled in US dollars. Foreign exchange risk arises when future commercial transactions and recognised assets and liabilities are denominated in a currency that is not the entity’s functional currency. Financial assets and liabilities denominated in currencies other than the functional currency of an entity are periodically restated to their functional currency, and the associated gain or loss is taken to profit or loss. The exposure of an entity to transaction risk is minimised by matching local currency income with local currency costs.
The Group seeks to denominate borrowings in the currencies of its principal assets and cash flows. These are primarily denominated in US dollars, British pounds, Euros and Australian dollars.
In accordance with Board approved policies, the Group enters into forward foreign exchange contracts to buy and sell specific amounts of various foreign currencies in the future at pre-determined exchange rates. The forward foreign exchange contracts are used to hedge transactions denominated in currencies that are not the functional currency of the relevant entity. These contracts are hedging highly probable forecasted transactions for the ensuing financial year. The contracts are timed to mature when monies from the forecasted sales are scheduled to be received or when payments for purchases are scheduled to be made. On a limited basis, the Group also utilises option contracts to hedge its foreign currency exposure. The Group does not hedge its exposure to recognised assets and liabilities.
56
Notes to the Consolidated Financial Statements
For the year ended 30 June 2012
Note 2 – Financial risk management (continued)
(a) Market risk (continued)
(ii) Foreign exchange risk (continued)
The Group’s exposure to foreign exchange risk at the end of the reporting period, expressed in Australian dollars, was as follows:
| Net financial assets/(liabilities) | ||||||||
| Currency: | 2012 A$m | 2011 A$m | ||||||
US dollar | 37.4 | 136.1 | ||||||
Euro | 31.8 | 52.4 | ||||||
British pound | - | (1.1 | ) | |||||
The table below shows the net impact of a 10% appreciation of the relevant currency against the Australian dollar for the balances above with all other variables held constant and the corresponding effect on the Group’s forward foreign exchange contracts with all other variables held constant. A sensitivity of 10% has been selected as this is considered reasonable, given the current level of exchange rates and the volatility observed both on a historical basis and on market expectations for future movements.
| US dollar | Euro | British pound | ||||||||||||||||||||||
| 2012 A$m | 2011 A$m | 2012 A$m | 2011 A$m | 2012 A$m | 2011 A$m | |||||||||||||||||||
Impact on post-tax profit – higher/(lower) | 1.0 | 4.1 | 0.8 | 0.2 | - | (0.1 | ) | |||||||||||||||||
Impact on equity | 14.7 | 14.3 | (0.7 | ) | (0.7 | ) | 9.3 | 15.2 | ||||||||||||||||
The impact on equity includes the effect from intragroup long-term borrowings which, in substance, form part of the Group’s investment in an entity. Exchange gains and losses on these balances are recorded in the foreign currency translation reserve.
A 10% depreciation of the relevant currency against the Australian dollar would have an equal and opposite effect.
Translation risk
The financial statements for each of the Group’s foreign operations are prepared in local currency, being their functional currency. For the purposes of preparing the Group’s consolidated financial information, each foreign operation’s financial statements are translated into Australian dollars using the applicable foreign exchange rates as at the balance date. A translation risk, therefore, exists on translating the financial statements of the Group’s foreign operations into Australian dollars for the purposes of reporting consolidated financial information. As a result, volatility in foreign exchange rates can impact the Group’s net assets, net profit and the foreign currency translation reserve and as a result can influence compliance with credit agreements.
(iii) Price risk
Commodity price risk
The Group is exposed to risks associated with fluctuations in the market price for ferrous and non-ferrous metals and precious metals, which are at times volatile. The Group seeks to mitigate commodity price risk by seeking to turn its inventories quickly, instead of holding inventories in anticipation of higher commodity prices. The ability of the Group to accomplish an adequate level of inventory turnover can be a function of demand and market conditions which are not always steady. The Group uses forward commodity contracts matched to purchases or sales of non-ferrous metals (primarily copper and aluminum) and precious metals.
57
Notes to the Consolidated Financial Statements
For the year ended 30 June 2012
Note 2 – Financial risk management (continued)
(a) Market risk (continued)
(iii) Price risk (continued)
Commodity price risk (continued)
The Group’s normal policy is to sell its products at prevailing market prices. Exceptions to this rule are subject to limits and policies approved by the Board and to systems of internal controls and compliance monitoring. The Group’s exposure to commodity prices is to an extent diversified by virtue of its broad commodity base.
At the end of the reporting period, none of the Group’s forward commodity contracts qualified for hedge accounting, despite being valid economic hedges of the relevant risk. Accordingly, any movement in commodity rates that impact the fair value of these forward commodity contracts are recorded in profit or loss. Note 11 shows the carrying amount of the Group’s forward commodity contracts at the end of the reporting period.
The following table shows the effect on post-tax profit from a 10% appreciation in commodity prices at the end of the reporting period based on the outstanding forward commodity contracts, with all other variables held constant. A 10% sensitivity has been selected as this is considered reasonable, given the current level of commodity prices and the volatility observed both on a historical basis and on market expectations for future movements.
| 2012 A$m | 2011 A$m | |||||||
Impact on post-tax profit – higher/(lower) | (9.2) | (10.6) | ||||||
A 10% depreciation of the stated commodity prices would have an equal and opposite effect.
Equity securities price risk
The Group is exposed to equity securities price risk through financial instruments classified as fair value through profit or loss, whose valuations are partially derived from equity prices of listed securities. These financial instruments relate to an investment in an associate that the Group considers strategic in nature. The Group does not attempt to manage the price risk related to these financial instruments.
The Group is also exposed to equity securities price risk through investments in marketable securities. These marketable securities are traded in major financial markets. The price risk for these investments is immaterial in terms of possible impact on profit or loss.
(b) Credit risk
Credit risk is the risk that a counterparty will not complete its obligations under a financial instrument and cause a financial loss to the Group. The Group has exposure to credit risk on all financial assets included in the Group’s statement of financial position.
The Group establishes credit limits for its customers. Trade and other receivables consist of a large number of customers, spread across the consumer, business and international sectors. The Group does not have any significant credit risk exposure to a single customer or groups of customers. Ongoing credit evaluation is performed on the financial condition of the Group’s customers and, where appropriate, an impairment provision is raised. For certain customers, the Group purchases credit insurance to protect itself against collection risks.
The Group is also exposed to credit risk arising from the Group’s transactions in derivative contracts. For credit purposes, there is only a credit risk where the counterparty is liable to pay the Group in the event of a closeout. The Group has policies that limit the amount of credit exposure to any financial institution. Derivative counterparties and cash transactions are limited to financial institutions that have a minimum credit rating of “A” by either Standard & Poor’s or Moody’s. Management also monitors the current credit exposure with each counterparty. Any changes to counterparties or their credit limits must be approved by the Group Chief Financial Officer.
58
Notes to the Consolidated Financial Statements
For the year ended 30 June 2012
Note 2 – Financial risk management (continued)
(c) Liquidity risk
Liquidity risk is associated with ensuring that there is sufficient cash and cash equivalents and the availability of funding through an adequate amount of committed credit facilities to meet the Group’s obligations when they come due and the ability to close out market positions.
The Group manages liquidity risk by monitoring forecast and actual cash flows and matching the maturity profiles of financial assets and liabilities. Due to the dynamic and volatile nature of the underlying businesses, the Group aims at maintaining flexibility in funding by keeping committed credit lines available with a variety of counterparties.
The Group has access to unsecured global multi-currency/multi-option loan facilities all of which are the subject to common terms. The loan facilities have maturities ranging from 23 June 2014 to 31 October 2015. The Group also has annual rights to extend the maturity by an additional year in certain circumstances. The Group had access to the following credit standby arrangements at the balance date. The amount of credit available is subject to limits from covenants as specified in the loan facilities.
| 2012 A$m | 2011 A$m | |||||||
Unsecured global multi-currency/multi-option loan facilities | 1,451.6 | 1,419.7 | ||||||
Amount of credit unused | 1,098.0 | 1,088.9 | ||||||
The contractual cash flows of the Group’s financial liabilities are shown in the table below. The contractual amounts represent the future undiscounted cash flows. The amounts for interest bearing liabilities also include interest cash flows and, therefore, do not equate to the carrying amount. The expected timing of cash outflows are set out below.
| 2012 A$m | 2011 A$m | |||||||||||||||||||||||
| Less than 1 year | Between 1 and 2 years | Between 2 and 5 years | Less than 1 year | Between 1 and 2 years | Between 2 and 5 years | |||||||||||||||||||
Non-derivatives: | ||||||||||||||||||||||||
Trade and other payables | 672.1 | - | - | 747.3 | - | - | ||||||||||||||||||
Payables – non-current | - | 2.9 | 5.1 | - | 0.9 | 2.8 | ||||||||||||||||||
Borrowings (including interest payments) | 18.3 | 18.2 | 349.7 | 18.6 | 18.6 | 309.3 | ||||||||||||||||||
|
|
|
|
|
|
|
|
|
|
|
| |||||||||||||
| 690.4 | 21.1 | 354.8 | 765.9 | 19.5 | 312.1 | |||||||||||||||||||
Financial guarantees1 | 41.6 | - | - | 64.5 | - | - | ||||||||||||||||||
|
|
|
|
|
|
|
|
|
|
|
| |||||||||||||
| 732.0 | 21.1 | 354.8 | 830.4 | 19.5 | 312.1 | |||||||||||||||||||
|
|
|
|
|
|
|
|
|
|
|
| |||||||||||||
Derivatives: | ||||||||||||||||||||||||
Net settled (forward commodity contracts) | 1.4 | - | - | 2.9 | - | - | ||||||||||||||||||
Gross settled (forward foreign exchange contracts): | ||||||||||||||||||||||||
- (inflow) | (149.3 | ) | - | - | (195.3 | ) | - | - | ||||||||||||||||
- outflow | 150.0 | - | - | 198.2 | - | - | ||||||||||||||||||
|
|
|
|
|
|
|
|
|
|
|
| |||||||||||||
| 2.1 | - | - | 5.8 | - | - | |||||||||||||||||||
|
|
|
|
|
|
|
|
|
|
|
| |||||||||||||
| 1 | Refer to Note 22(a) for details on financial guarantees. The amounts disclosed above are the maximum amounts allocated to the earliest period in which the guarantee could be called. However, the Group considers that it is more likely than not that such an amount will not be payable under the arrangement. |
59
Notes to the Consolidated Financial Statements
For the year ended 30 June 2012
Note 3 – Critical accounting estimates and judgements
Certain amounts included in the consolidated financial statements involve the use of estimation and/or judgement. Estimates and judgments used in preparation of the consolidated financial statements are continually evaluated and are based on historical experience and other factors, including the expectations of future events that may have a financial impact on the Group and that are believed to be reasonable under the circumstances. The resulting accounting estimates may differ from actual results.
The following are the critical judgements and estimations that have the most significant effect on the amounts recognised in the consolidated financial statements.
Impairment of goodwill
Goodwill is tested for impairment in accordance with the accounting policy stated in Note 1(u). For goodwill impairment testing, the recoverable amount of each CGU is determined based on the higher of its value-in-use or fair value less costs to sell. These calculations require the use of assumptions such as discount rates, exchange rates, growth rates, and other assumptions. As at 30 June 2012, the carrying amount of goodwill was A$507.4 million. Refer to Note 13 for details of these assumptions and the potential impact of changes to the assumptions.
Taxation
The Group is subject to income taxes in numerous jurisdictions. Significant judgement is required in determining the worldwide provision for income taxes due to the complexity of legislation. There are many transactions and calculations for which the ultimate tax determination is uncertain during the ordinary course of business. The Group recognises liabilities for anticipated tax audit issues based on estimates of whether additional taxes will be due. Where the final tax outcome of these matters is different from the amounts that were initially recorded, such differences will impact the income tax and deferred tax provisions in the period in which such determination is made.
The Group recognises the net future tax benefit related to deferred income tax assets to the extent that it is probable that the deductible temporary differences will reverse in the foreseeable future. Assessing the recoverability of deferred income tax assets requires the Group to make significant estimates related to expectations of future taxable income. Estimates of future taxable income are based on forecast cash flows from operations and the application of existing tax laws in each jurisdiction. To the extent that future cash flows and taxable income differ significantly from estimates, the ability of the Group to realise the net deferred tax assets recorded at the reporting date could be impacted. Additionally, future changes in tax laws in the jurisdictions in which the Group operates could limit the ability of the Group to obtain tax deductions in future periods. For more information see Note 8.
Valuation of inventories
The Group’s inventories primarily consist of ferrous and non-ferrous scrap metals. Quantities of inventories are determined using estimation techniques, including observation, weighing and other industry methods and are subject to periodic physical verification.
Inventories are stated at the lower of cost and net realisable value, with due allowance for excess, obsolete or slow moving items. Cost is determined by the weighted average method and comprises direct purchase costs, direct labor and an appropriate portion of fixed and variable overhead costs (refer to Note 1(p)). The Group reviews its inventory at the end of each reporting period to determine if it is properly stated at net realisable value. Net realisable value is based on current assessments of future demand and market conditions. The amount of write-downs of inventories to net realisable value is disclosed in Note 7. Given the significance of inventories to the consolidated statement of financial position, the determination of net realisable value is considered to be a critical accounting estimate. Impairment losses may be recognized on inventory within the next financial year if management needs to revise its estimates of net realisable value in response to changing market conditions.
60
Notes to the Consolidated Financial Statements
For the year ended 30 June 2012
Note 4 – Earnings per share
| 2012 | 2011 | 2010 | ||||||||||
(Loss)/earnings per share (in cents) | ||||||||||||
Basic | (253.3 | ) | 93.9 | 64.9 | ||||||||
Diluted | (253.3 | ) | 93.3 | 64.5 | ||||||||
Weighted average number of shares used in the denominator (’000) | ||||||||||||
Number of shares for basic earnings per share | 205,828 | 204,630 | 194,417 | |||||||||
Effect of equity issue1 | - | - | 929 | |||||||||
|
|
|
|
|
| |||||||
Basic shares | 205,828 | 204,630 | 195,346 | |||||||||
Dilutive effect of share-based awards | - | 1,330 | 1,129 | |||||||||
|
|
|
|
|
| |||||||
Diluted shares | 205,828 | 205,960 | 196,475 | |||||||||
|
|
|
|
|
| |||||||
1In accordance with AASB 133 (IAS 33)Earnings Per Share, an adjustment to shares issued is required in the calculation of earnings per share when shares are offered to existing shareholders at a discount to the market price. This gives rise to a retrospective restatement of the weighted average number of shares.
Due to the loss after tax in the year ended 30 June 2012, the dilutive effect of share-based awards, which was approximately 2.0 million shares, was not included as the result would have been anti-dilutive. For the years ended 30 June 2011 and 2010, share awards granted to employees are considered to be potential ordinary shares and have been included in the determination of diluted earnings per share to the extent they are dilutive. Details relating to share awards are set out in Note 24.
Note 5 – Segment information
(a) Description of segments
The Group is principally organised geographically and then by line of business. While the CEO evaluates results in a number of different ways, the geographical area of operation is the primary basis for which the allocations of resources and financial results are assessed. The major geographic areas of operations are as follows:
| • | North America - comprising the United States of America and Canada. |
| • | Australasia - comprising Australia, New Zealand, Papua New Guinea, India, Singapore, Hong Kong, Dubai and South Africa. |
| • | Europe - comprising the United Kingdom, Sweden, Belgium, the Netherlands, Germany, Poland, the Czech Republic, Hungary, Austria and Croatia. |
The Group reports revenues by the following product groups:
| • | Ferrous secondary recycling - comprising the collection, processing and trading of iron and steel secondary raw material. |
| • | Non-ferrous secondary recycling - comprising the collection, processing and trading of other metal alloys and residues, principally aluminium, lead, copper, zinc and nickel bearing materials. |
| • | Recycling solutions - comprising the provision of environmentally responsible solutions for the disposal of post-consumer electronic products, including IT assets recycled for commercial customers. The Group offers fee-for-service business opportunities in the environmentally responsible recycling of negative value materials, including refrigerators, electrical and electronic equipment. |
| • | Secondary processing and other services - comprising value-added processes involving the melting, refining and ingoting of certain non-ferrous metals and other service revenue. |
61
Notes to the Consolidated Financial Statements
For the year ended 30 June 2012
Note 5 – Segment information (continued)
(b) Information about reportable segments
There have been no changes to the basis of segmentation or the measurement basis for the segment profit before income tax since 30 June 2011.
| North America A$m | Austral- asia A$m | Europe A$m | A$m | |||||||||||||
2012 | ||||||||||||||||
Total sales revenue | 6,027.0 | 1,228.1 | 1,780.6 | 9,035.7 | ||||||||||||
Other revenue/income | 0.5 | 5.3 | 0.8 | 6.6 | ||||||||||||
|
|
|
|
|
|
|
| |||||||||
Total segment revenue | 6,027.5 | 1,233.4 | 1,781.4 | 9,042.3 | ||||||||||||
|
|
|
|
|
|
|
| |||||||||
Segment EBIT | (615.9 | ) | 93.3 | 7.8 | (514.8 | ) | ||||||||||
|
|
|
|
|
| |||||||||||
Interest income | 3.7 | |||||||||||||||
Finance costs | (24.9 | ) | ||||||||||||||
|
| |||||||||||||||
Loss before income tax | (536.0 | ) | ||||||||||||||
|
| |||||||||||||||
Segment total assets | 2,066.3 | 733.0 | 820.7 | 3,620.0 | ||||||||||||
Segment total liabilities | 608.6 | 190.6 | 426.4 | 1,225.6 | ||||||||||||
|
|
|
|
|
|
|
| |||||||||
Net assets | 1,457.7 | 542.4 | 394.3 | 2,394.4 | ||||||||||||
|
|
|
|
|
|
|
| |||||||||
Other items: | ||||||||||||||||
Depreciation and amortisation expense | 77.1 | 24.9 | 27.9 | 129.9 | ||||||||||||
Share of results of investments accounted for using the equity method | (11.9 | ) | 3.9 | - | (8.0 | ) | ||||||||||
Investments accounted for using the equity method | 230.9 | 120.2 | - | 351.1 | ||||||||||||
Acquisitions of property, plant and equipment | 79.0 | 39.5 | 42.6 | 161.1 | ||||||||||||
Impairment charge/(reversal): | ||||||||||||||||
Goodwill | 510.8 | 3.6 | 42.4 | 556.8 | ||||||||||||
Other intangible assets | 0.8 | - | - | 0.8 | ||||||||||||
Property, plant and equipment | 3.1 | 0.3 | (3.0 | ) | 0.4 | |||||||||||
62
Notes to the Consolidated Financial Statements
For the year ended 30 June 2012
Note 5 – Segment information (continued)
(b) Information about reportable segments (continued)
| North America A$m | Austral- asia A$m | Europe A$m | A$m | |||||||||||||
2011 | ||||||||||||||||
Total sales revenue | 5,993.0 | 1,369.2 | 1,484.6 | 8,846.8 | ||||||||||||
Other revenue/income | 1.0 | 4.8 | 0.3 | 6.1 | ||||||||||||
|
|
|
|
|
|
|
| |||||||||
Total segment revenue | 5,994.0 | 1,374.0 | 1,484.9 | 8,852.9 | ||||||||||||
|
|
|
|
|
|
|
| |||||||||
Segment EBIT | 120.5 | 79.0 | 100.2 | 299.7 | ||||||||||||
|
|
|
|
|
| |||||||||||
Interest income | 3.2 | |||||||||||||||
Finance costs | (27.1 | ) | ||||||||||||||
|
| |||||||||||||||
Profit before income tax | 275.8 | |||||||||||||||
|
| |||||||||||||||
Segment total assets | 2,656.0 | 633.0 | 890.8 | 4,179.8 | ||||||||||||
Segment total liabilities | 670.4 | 220.9 | 368.0 | 1,259.3 | ||||||||||||
|
|
|
|
|
|
|
| |||||||||
Net assets | 1,985.6 | 412.1 | 522.8 | 2,920.5 | ||||||||||||
|
|
|
|
|
|
|
| |||||||||
Other items: | ||||||||||||||||
Depreciation and amortisation expense | 82.7 | 21.7 | 26.2 | 130.6 | ||||||||||||
Share of results of investments accounted for using the equity method | 25.2 | 2.9 | - | 28.1 | ||||||||||||
Investments accounted for using the equity method | 288.8 | 21.5 | - | 310.3 | ||||||||||||
Acquisitions of property, plant and equipment | 69.2 | 29.4 | 44.2 | 142.8 | ||||||||||||
2010 | ||||||||||||||||
Total sales revenue | 5,040.0 | 1,221.3 | 1,191.3 | 7,452.6 | ||||||||||||
Other revenue/income | 1.8 | 3.8 | 0.3 | 5.9 | ||||||||||||
|
|
|
|
|
|
|
| |||||||||
Total segment revenue | 5,041.8 | 1,225.1 | 1,191.6 | 7,458.5 | ||||||||||||
|
|
|
|
|
|
|
| |||||||||
Segment EBIT | 79.2 | 59.9 | 66.6 | 205.7 | ||||||||||||
|
|
|
|
|
| |||||||||||
Interest income | 2.8 | |||||||||||||||
Finance costs | (16.4 | ) | ||||||||||||||
|
| |||||||||||||||
Profit before income tax | 192.1 | |||||||||||||||
|
| |||||||||||||||
Segment total assets | 3,032.3 | 562.8 | 644.6 | 4,239.7 | ||||||||||||
Segment total liabilities | 532.0 | 222.9 | 206.0 | 960.9 | ||||||||||||
|
|
|
|
|
|
|
| |||||||||
Net assets | 2,500.3 | 339.9 | 438.6 | 3,278.8 | ||||||||||||
|
|
|
|
|
|
|
| |||||||||
Other items: | ||||||||||||||||
Depreciation and amortisation expense | 97.4 | 21.2 | 25.3 | 143.9 | ||||||||||||
Share of results of investments accounted for using the equity method | 9.0 | 3.1 | - | 12.1 | ||||||||||||
Investments accounted for using the equity method | 348.9 | 20.6 | - | 369.5 | ||||||||||||
Acquisitions of property, plant and equipment | 67.6 | 21.7 | 31.6 | 120.9 | ||||||||||||
Impairment charge/(reversal): | ||||||||||||||||
Property, plant and equipment | 15.8 | (1.3 | ) | - | 14.5 | |||||||||||
Other intangible assets | 0.9 | - | - | 0.9 | ||||||||||||
63
Notes to the Consolidated Financial Statements
For the year ended 30 June 2012
Note 5 – Segment information (continued)
(c) Other segment information
(i) Intersegment sales
Segment revenues, expenses and results include transfers between segments. Such transfers are priced on an “arm’s-length” basis and are eliminated on consolidation.
(ii) Sales to external customers
| 2012 A$m | 2011 A$m | 2010 A$m | ||||||||||
Australia | 339.9 | 518.4 | 505.3 | |||||||||
China | 1,844.6 | 1,373.3 | 1,189.1 | |||||||||
USA | 1,925.3 | 1,739.6 | 1,966.4 | |||||||||
Turkey | 1,643.9 | 1,452.3 | 843.3 | |||||||||
South Korea | 432.7 | 525.7 | 660.5 | |||||||||
Other | 2,849.3 | 3,237.5 | 2,288.0 | |||||||||
|
|
|
|
|
| |||||||
| 9,035.7 | 8,846.8 | 7,452.6 | ||||||||||
|
|
|
|
|
| |||||||
No single customer contributed 10% or more to the Group revenue for all the periods presented.
(iii) Revenue by product
| 2012 A$m | 2011 A$m | 2010 A$m | ||||||||||
Ferrous secondary recycling | 6,258.6 | 6,143.6 | 5,071.2 | |||||||||
Non-ferrous secondary recycling | 1,656.5 | 1,724.0 | 1,525.5 | |||||||||
Recycling solutions | 1,011.8 | 786.4 | 657.4 | |||||||||
Secondary processing and other services | 108.8 | 192.8 | 198.5 | |||||||||
|
|
|
|
|
| |||||||
Total sales revenue | 9,035.7 | 8,846.8 | 7,452.6 | |||||||||
|
|
|
|
|
| |||||||
(iv) Non-current assets
Non-current assets (excluding financial assets and deferred tax assets) are held in the following countries:
| 2012 A$m | 2011 A$m | |||||||
Australia | 244.4 | 219.8 | ||||||
USA | 1,247.5 | 1,709.2 | ||||||
United Kingdom | 233.4 | 222.0 | ||||||
Other | 236.9 | 150.6 | ||||||
|
|
|
| |||||
| 1,962.2 | 2,301.6 | |||||||
|
|
|
| |||||
64
Notes to the Consolidated Financial Statements
For the year ended 30 June 2012
Note 6 – Revenue
| 2012 A$m | 2011 A$m | 2010 A$m | ||||||||||
Sales revenue | ||||||||||||
Sale of goods | 8,965.9 | 8,789.0 | 7,391.9 | |||||||||
Service revenue | 69.8 | 57.8 | 60.7 | |||||||||
|
|
|
|
|
| |||||||
| 9,035.7 | 8,846.8 | 7,452.6 | ||||||||||
|
|
|
|
|
| |||||||
Other revenue | ||||||||||||
Interest income | 3.7 | 3.2 | 2.8 | |||||||||
Rental income | 2.9 | 2.9 | 3.1 | |||||||||
|
|
|
|
|
| |||||||
| 6.6 | 6.1 | 5.9 | ||||||||||
|
|
|
|
|
| |||||||
| 9,042.3 | 8,852.9 | 7,458.5 | ||||||||||
|
|
|
|
|
| |||||||
Note 7 – Other income and expenses
(a) Other income
| 2012 A$m | 2011 A$m | 2010 A$m | ||||||||||
Gain on sale of jointly controlled assets1 | 35.7 | - | - | |||||||||
Commercial settlements | 1.4 | 15.4 | - | |||||||||
Gain on sale of other financial assets | - | 11.0 | - | |||||||||
Insurance recoveries | 5.3 | 7.6 | 1.0 | |||||||||
Net gain on revaluation of financial assets at fair value through profit or loss | - | 0.6 | 0.4 | |||||||||
Government grants | 0.5 | 0.7 | 0.7 | |||||||||
Net foreign exchange gain | - | 1.0 | - | |||||||||
Net gain on disposal of property, plant and equipment | 2.8 | 1.3 | 3.0 | |||||||||
Remeasurement at fair value of interest in Port Albany Ventures LLC (“Port Albany”)2 | - | - | 8.7 | |||||||||
Net gain on currency derivatives | 4.1 | - | 7.0 | |||||||||
Net gain on held for trading commodity derivatives | 34.0 | - | - | |||||||||
Third party commissions | 4.2 | 3.5 | 2.9 | |||||||||
Other | 3.2 | 1.4 | 1.5 | |||||||||
|
|
|
|
|
| |||||||
| 91.2 | 42.5 | 25.2 | ||||||||||
|
|
|
|
|
| |||||||
| 1 | Represents the gain from the sale of the Group’s 50% ownership interest in the secondary lead producing facility in Sydney, Australia of Australian Refined Alloys |
| (see Note 27). |
| 2 | During 2010, the Group purchased the remaining 50% ownership interest in Port Albany, which was previously a jointly controlled entity. In accordance with the revised AASB 3 (IFRS 3) and AASB 127 (IAS 27), the Group was required to remeasure its previously held equity interest in Port Albany at its acquisition date fair value which resulted in the recognition of a gain. |
65
Notes to the Consolidated Financial Statements
For the year ended 30 June 2012
Note 7 – Other income and expenses (continued)
(b) Specific expenses recognised in (loss)/profit before income tax
| 2012 A$m | 2011 A$m | 2010 A$m | ||||||||||
Depreciation and amortisation: | ||||||||||||
Depreciation expense | 103.1 | 102.2 | 109.1 | |||||||||
Amortisation expense | 26.8 | 28.4 | 34.8 | |||||||||
|
|
|
|
|
| |||||||
| 129.9 | 130.6 | 143.9 | ||||||||||
|
|
|
|
|
| |||||||
Finance costs1 | 24.9 | 27.1 | 16.4 | |||||||||
Net loss on held for trading commodity derivatives | - | 30.9 | 15.4 | |||||||||
Net loss on currency derivatives | - | 0.6 | - | |||||||||
Net foreign exchange loss | 2.5 | - | 15.6 | |||||||||
Net loss on revaluation of financial assets at fair value through profit or loss | 2.0 | - | - | |||||||||
Equity-settled share-based payments expense2 | 24.3 | 15.7 | 16.9 | |||||||||
Cash-settled share-based payments expense | - | 0.4 | 0.1 | |||||||||
Defined contribution superannuation expense | 10.8 | 10.2 | 7.0 | |||||||||
Rental expenses relating to operating leases | 79.5 | 63.3 | 60.1 | |||||||||
| 1 | Finance costs include commitment fees paid on the Group’s loan facilities of A$7.0 million (2011: A$11.4 million; 2010: A$5.8 million). |
| 2 | 2012 amount includes A$7.9 million of long-term incentive expense associated with the final settlement of a business arrangement. |
(c) (Loss)/profit before income tax includes the following expenses, which are disclosed due to their size or nature
| 2012 A$m | 2011 A$m | 2010 A$m | ||||||||||
Impairment losses/(reversals): | ||||||||||||
Impairment of goodwill (Note 13) | 556.8 | - | - | |||||||||
Impairment of other intangible assets (Note 14) | 0.8 | - | 0.9 | |||||||||
|
|
|
|
|
| |||||||
| 557.6 | - | 0.9 | ||||||||||
Impairment of goodwill in jointly controlled entity (Note 29) | 57.5 | - | 5.7 | |||||||||
Impairment of trade receivables1 | 5.1 | 0.3 | 1.2 | |||||||||
Impairment of property, plant and equipment2 | 0.4 | - | 14.5 | |||||||||
Write-down of inventory to net realisable value | 21.3 | 2.0 | 18.5 | |||||||||
Natural disaster related expenses3 | 2.6 | 6.9 | - | |||||||||
Transaction costs related to business combinations | 2.5 | 3.1 | 0.4 | |||||||||
Redundancies4 | 9.9 | 1.6 | 5.7 | |||||||||
Withdrawal liability related to multi-employer pension plans | 3.0 | - | - | |||||||||
Provision recorded for a dispute with a third party (Note 22) | 12.8 | - | - | |||||||||
| 1 | 2012 amount includes A$4.4 million provision related to a receivable that was partially impaired as a result of a customer bankruptcy. |
| 2 | 2012 amount is comprised of impairments of A$3.4 million related to excess or under-utilised processing equipment offset by the reversal of a previously recognised impairment of A$3.0 million on land. 2010 amount is comprised of impairments of A$15.8 million related to processing equipment located in idled yards offset by the reversal of previously recognised impairments of A$1.3 million on processing equipment. |
| 3 | Amounts primarily represents costs associated with the floods in Queensland, Australia. These costs were reimbursed by the Group’s insurance carrier and the reimbursement is included in the “insurance recoveries” line in other income above. |
| 4 | 2012 amount primarily represents employee termination benefits associated with the Group’s cost reduction plans in the United States and United Kingdom. |
66
Notes to the Consolidated Financial Statements
For the year ended 30 June 2012
Note 8 – Income taxes
| 2012 A$m | 2011 A$m | 2010 A$m | ||||||||||
(a) Income tax (benefit)/expense | ||||||||||||
Current income tax charge | 35.2 | 73.3 | 69.7 | |||||||||
Adjustments for prior years | (6.6 | ) | 2.4 | 5.6 | ||||||||
Deferred income tax | (43.2 | ) | 8.0 | (9.9 | ) | |||||||
|
|
|
|
|
| |||||||
Income tax (benefit)/expense | (14.6 | ) | 83.7 | 65.4 | ||||||||
|
|
|
|
|
| |||||||
Deferred income tax expense included in income tax expense comprises: | ||||||||||||
(Increase) in deferred tax assets | (22.1 | ) | (6.5 | ) | (4.9 | ) | ||||||
(Decrease)/increase in deferred tax liabilities | (21.1 | ) | 14.5 | (5.0 | ) | |||||||
|
|
|
|
|
| |||||||
| (43.2 | ) | 8.0 | (9.9 | ) | ||||||||
|
|
|
|
|
| |||||||
(b) Reconciliation of income tax (benefit)/expense to prima facie tax payable | ||||||||||||
(Loss)/profit before income tax | (536.0 | ) | 275.8 | 192.1 | ||||||||
|
|
|
|
|
| |||||||
Tax at the standard Australian rate of 30% | (160.8 | ) | 82.7 | 57.6 | ||||||||
Effect of tax rates in other jurisdictions | (12.1 | ) | (3.9 | ) | 2.4 | |||||||
Equity accounted investees results reported net of tax | (1.6 | ) | (0.9 | ) | (1.6 | ) | ||||||
Non-deductible impairment of goodwill | 156.0 | - | - | |||||||||
Non-deductible impairment of goodwill in jointly controlled entity | 11.9 | - | - | |||||||||
Non-deductible expenses | 4.7 | 4.6 | 6.1 | |||||||||
Share-based payments | 6.5 | 2.1 | 2.8 | |||||||||
Non-assessable income | (2.5 | ) | (2.0 | ) | (2.5 | ) | ||||||
Adjustments for prior years | (6.3 | ) | 2.4 | 5.6 | ||||||||
Prior year tax loss not previously recognised | - | (1.1 | ) | (1.7 | ) | |||||||
Non-assessable gain on acquisition of a remaining interest in a jointly controlled entity | - | - | (2.6 | ) | ||||||||
Non-assessable gain on disposal of jointly controlled assets | (10.7 | ) | - | - | ||||||||
Other | 0.3 | (0.2 | ) | (0.7 | ) | |||||||
|
|
|
|
|
| |||||||
Income tax (benefit)/expense | (14.6 | ) | 83.7 | 65.4 | ||||||||
|
|
|
|
|
| |||||||
(c) Income tax charged/(credited) directly to equity | ||||||||||||
Share placement costs | - | - | (1.3 | ) | ||||||||
Share-based payments | 0.0 | (3.3 | ) | 1.6 | ||||||||
Exchange gain/(loss) on foreign denominated intercompany loans | 7.0 | (36.8 | ) | (4.6 | ) | |||||||
|
|
|
|
|
| |||||||
| 7.0 | (40.1 | ) | (4.3 | ) | ||||||||
|
|
|
|
|
| |||||||
(d) Tax (benefit)/expense relating to items of other comprehensive income | ||||||||||||
Cash flow hedges | 0.4 | 0.3 | (0.4 | ) | ||||||||
Available-for-sale financial assets | - | 0.6 | (0.6 | ) | ||||||||
Defined benefit plans | (4.9 | ) | 1.7 | (1.1 | ) | |||||||
|
|
|
|
|
| |||||||
| (4.5 | ) | 2.6 | (2.1 | ) | ||||||||
|
|
|
|
|
| |||||||
67
Notes to the Consolidated Financial Statements
For the year ended 30 June 2012
Note 8 – Income taxes (continued)
| 2012 A$m | 2011 A$m | |||||||
(e) Deferred tax assets and liabilities | ||||||||
Deferred tax assets | ||||||||
The balance comprises temporary difference attributable to: | ||||||||
(amounts recognised in profit or loss) | ||||||||
Provisions and other accruals | 20.2 | 16.3 | ||||||
Employee benefits | 11.3 | 6.1 | ||||||
Inventory and consumables | 7.6 | 4.2 | ||||||
Property, plant and equipment | 2.4 | 1.6 | ||||||
Jointly controlled entities and associates | 4.1 | - | ||||||
Tax loss carryforwards | 19.0 | 8.3 | ||||||
Share-based payments | 6.0 | 7.8 | ||||||
Other | 5.0 | 3.9 | ||||||
|
|
|
| |||||
| 75.6 | 48.2 | |||||||
|
|
|
| |||||
(amounts recognised directly in equity) | ||||||||
Share-based payments | 0.8 | 0.8 | ||||||
Defined benefit plans | 8.0 | 3.1 | ||||||
Share placement costs | 0.5 | 1.0 | ||||||
Exchange loss on foreign denominated intercompany loans | 39.3 | 46.3 | ||||||
|
|
|
| |||||
| 48.6 | 51.2 | |||||||
|
|
|
| |||||
Movements | ||||||||
Balance at 1 July | 99.4 | 74.1 | ||||||
Charged to income statement | 22.1 | 6.5 | ||||||
Adjustments for prior years | (6.1 | ) | 0.7 | |||||
Transfers from/(to) deferred tax liabilities | 7.5 | (11.2 | ) | |||||
Acquisitions | 2.7 | 0.1 | ||||||
Charged directly to equity and other comprehensive income | (3.6 | ) | 40.2 | |||||
Other | - | (0.3 | ) | |||||
Foreign exchange differences | 2.2 | (10.7 | ) | |||||
|
|
|
| |||||
Balance at 30 June | 124.2 | 99.4 | ||||||
|
|
|
| |||||
Deferred tax assets expected to be recovered within 12 months | 43.5 | 27.3 | ||||||
Deferred tax assets expected to be recovered after 12 months | 80.7 | 72.1 | ||||||
|
|
|
| |||||
| 124.2 | 99.4 | |||||||
|
|
|
| |||||
Deferred tax liabilities | ||||||||
The balance comprises temporary differences attributable to: | ||||||||
(amounts recognised in profit or loss) | ||||||||
Intangible assets | 26.6 | 37.9 | ||||||
Property, plant and equipment | 73.4 | 72.6 | ||||||
Inventory and consumables | 3.3 | 3.2 | ||||||
Jointly controlled entities and associates | 1.3 | 4.2 | ||||||
Other | 4.4 | 1.7 | ||||||
|
|
|
| |||||
| 109.0 | 119.6 | |||||||
|
|
|
| |||||
(amounts recognised directly in equity) | ||||||||
Cash flow hedges | 0.4 | - | ||||||
|
|
|
| |||||
68
Notes to the Consolidated Financial Statements
For the year ended 30 June 2012
Note 8 – Income taxes (continued)
(e) Deferred tax assets and liabilities (continued)
| 2012 A$m | 2011 A$m | |||||||
Deferred tax liabilities (continued) | ||||||||
Movements | ||||||||
Balance at 1 July | 119.6 | 133.7 | ||||||
Charged to income statement | (21.1 | ) | 14.5 | |||||
Adjustments for prior years | (4.2 | ) | 5.2 | |||||
Transfers to/(from) deferred tax assets | 7.5 | (11.2 | ) | |||||
Charged directly to equity and other comprehensive income | (1.1 | ) | 2.7 | |||||
Acquisitions | 3.1 | 0.9 | ||||||
Foreign exchange differences | 5.6 | (26.2 | ) | |||||
|
|
|
| |||||
Balance at 30 June | 109.4 | 119.6 | ||||||
|
|
|
| |||||
Deferred tax liabilities expected to be settled within 12 months | 4.8 | 4.9 | ||||||
Deferred tax liabilities expected to be settled after 12 months | 104.6 | 114.7 | ||||||
|
|
|
| |||||
| 109.4 | 119.6 | |||||||
|
|
|
| |||||
(f) Tax losses
Deferred tax assets are recognised for carried forward tax losses to the extent that realisation of the related tax benefit through future taxable profit is probable. As at 30 June 2012, the Group has unused tax losses of A$182.2 million (2011: A$107.7 million) available for offset against future profit. A deferred tax asset has been recognised in respect of A$95.2 million (2011: A$61.6 million) of such losses.
The benefit of tax losses will only be obtained if (i) the Group derives future assessable income of a nature and an amount sufficient to enable the benefit from the deductions for the losses to be realised; (ii) the Group continues to comply with the conditions for deductibility imposed by tax legislation; and (iii) no changes in tax legislation adversely affect the Group in realising the benefit from the deduction for the losses.
No deferred tax asset has been recognised in respect of the remaining unused tax losses of A$87.0 million (2011: A$46.1 million) due to the unpredictability of future profit streams in the relevant jurisdictions.
(g) Unrecognised temporary differences
As at 30 June 2012, there were no unrecognised temporary differences associated with the Group’s investments in subsidiaries, associates, or jointly controlled entities, as the Group has no liability for additional taxation should unremitted earnings be remitted.
69
Notes to the Consolidated Financial Statements
For the year ended 30 June 2012
Note 9 – Trade and other receivables
| 2012 A$m | 2011 A$m | |||||||
Trade receivables | 392.5 | 522.3 | ||||||
Provision for impairment of receivables | (8.3 | ) | (5.4 | ) | ||||
|
|
|
| |||||
| 384.2 | 516.9 | |||||||
|
|
|
| |||||
Other receivables and deferred expenses | 81.8 | 67.1 | ||||||
Tax receivable | 23.0 | 1.5 | ||||||
Prepayments | 24.4 | 21.2 | ||||||
|
|
|
| |||||
| 129.2 | 89.8 | |||||||
|
|
|
| |||||
| 513.4 | 606.7 | |||||||
|
|
|
| |||||
Occasionally, the Group will sell a portion of its trade receivables to third parties. All credit risk passes to the third party at the time of the assignment, such that the Group has no further exposure to default by the specific trade debtors. The amount of trade receivables sold to third parties was not significant in the periods presented. The third party is not obliged to accept offers of receivables and the Group is not obligated to make offers or pay commitment fees to the third party.
(a) Movements in provision for impairment of receivables
| 2012 A$m | 2011 A$m | 2010 A$m | ||||||||||
Balance at 1 July | 5.4 | 3.6 | 9.0 | |||||||||
Provision for impairment recognised during the year | 5.1 | 0.3 | 1.2 | |||||||||
Acquisitions | - | 2.8 | - | |||||||||
Write-offs | (2.4 | ) | (0.8 | ) | (5.9 | ) | ||||||
Foreign exchange differences | 0.2 | (0.5 | ) | (0.7 | ) | |||||||
|
|
|
|
|
| |||||||
Balance at 30 June | 8.3 | 5.4 | 3.6 | |||||||||
|
|
|
|
|
| |||||||
The creation and release of the provision for impaired receivables has been included in other expenses in profit or loss. Amounts charged to the allowance account are generally written-off when there is no expectation of recovering additional cash.
(b) Past due but not impaired
As at 30 June 2012, receivables of A$65.7 million (2011: A$106.3 million) were past due but not impaired and the Group does not hold any material collateral in relation to these receivables. These relate to a number of independent customers for whom there is no recent history of default. The ageing analyses of these receivables are as follows:
| Days overdue: | 2012 A$m | 2011 A$m | ||||||
1 – 30 days | 50.6 | 95.1 | ||||||
31 – 60 days | 4.0 | 7.3 | ||||||
Over 60 days | 11.1 | 3.9 | ||||||
|
|
|
| |||||
| 65.7 | 106.3 | |||||||
|
|
|
| |||||
(c) Other receivables and deferred expenses
Other receivable amounts generally arise from transactions outside the usual operating activities of the Group. Interest may be charged at commercial rates where the terms of repayment exceed six months. Collateral is not normally obtained.
70
Notes to the Consolidated Financial Statements
For the year ended 30 June 2012
Note 9 – Trade and other receivables (continued)
(d) Foreign exchange and interest rate risk
Information about the Group’s exposure to foreign exchange risk and interest rate risk in relation to trade and other receivables is provided in Note 2.
(e) Fair value and credit risk
Due to their short-term nature, the carrying value of current receivables approximates its fair value.
The maximum exposure to credit risk at the end of the reporting period is the carrying amount of each class of receivables mentioned above. The fair value of securities held for certain trade receivables is insignificant as is the fair value of any collateral sold or repledged. Refer to Note 2 for more information on the Group’s exposure to credit risk.
Note 10 – Inventory
| 2012 A$m | 2011 A$m | |||||||
Raw materials | 197.7 | 172.9 | ||||||
Stores and spare parts | 36.7 | 33.3 | ||||||
Finished goods | 655.6 | 772.3 | ||||||
|
|
|
| |||||
| 890.0 | 978.5 | |||||||
|
|
|
| |||||
The cost of inventories recognised as expense during the year ended 30 June 2012 amounted to A$7,161.1 million (2011: A$6,835.2 million). Write-downs of inventories to net realisable value are disclosed in Note 7.
Note 11 – Other financial assets and liabilities
| 2012 A$m | 2011 A$m | |||||||
Other financial assets – Current: | ||||||||
Financial assets at fair value through profit or loss: | ||||||||
Investments in marketable securities | 5.5 | 4.0 | ||||||
Loans to third parties carried at amortised cost | 18.1 | 3.8 | ||||||
Derivative financial instruments (c): | ||||||||
Forward foreign exchange contracts – cash flow hedges | 3.2 | 3.9 | ||||||
Forward commodity contracts – held for trading | 2.6 | 4.1 | ||||||
|
|
|
| |||||
| 29.4 | 15.8 | |||||||
|
|
|
| |||||
Other financial assets – Non-current: | ||||||||
Loans and other receivables: | ||||||||
Convertible loan to an associate carried at amortised cost (a) | 33.1 | - | ||||||
Loans to third parties carried at amortised cost | 2.4 | 2.7 | ||||||
Other receivables | 9.7 | 9.6 | ||||||
Financial assets at fair value through profit or loss: | ||||||||
Embedded conversion feature of convertible loan (a) | 2.7 | - | ||||||
Warrants (a) | 0.5 | - | ||||||
Options (b) | 1.0 | - | ||||||
|
|
|
| |||||
| 49.4 | 12.3 | |||||||
|
|
|
| |||||
71
Notes to the Consolidated Financial Statements
For the year ended 30 June 2012
Note 11 – Other financial assets and liabilities (continued)
| 2012 A$m | 2011 A$m | |||||||
Other financial liabilities – Current: | ||||||||
Derivative financial instruments (c): | ||||||||
Forward foreign exchange contracts – cash flow hedges | 0.7 | 2.9 | ||||||
Forward commodity contracts – held for trading | 1.4 | 2.9 | ||||||
|
|
|
| |||||
| 2.1 | 5.8 | |||||||
|
|
|
| |||||
(a) Convertible loan
On 1 March 2012, the Group subscribed for a HK$315.6 million (A$37.8 million) convertible loan from Chiho-Tiande Group Limited (“CTG”), an associate of the Group. The convertible loan carries an annual interest rate of 4% and is convertible at HK$6.00 per share. In connection with the subscription, CTG also issued to the Group warrants to purchase 12,638,441 shares of CTG at an exercise price of HK$6.00 per share. Both the convertible loan and warrants have a term of three years from the date of issue, but are not convertible or exercisable until two years from the date of the issue. In certain instances, the conversion period can be extended for a further two years.
The conversion feature of the convertible loan represents an embedded derivative, which, along with the warrants, are recorded as financial assets at fair value through profit or loss. The fair value of both of these financial assets at the issue date was independently calculated by a valuation firm and was recorded as a reduction to the convertible loan as follows:
| A$m | ||||
Fair value of conversion feature | 6.1 | |||
Fair value of warrants | 1.0 | |||
Amortised cost of convertible loan | 30.7 | |||
|
| |||
| 37.8 | ||||
|
| |||
Subsequent to their initial recognition, the conversion feature and warrants have been measured at fair value, with gains or losses being recognised in profit or loss. Subsequent to its initial recognition, the convertible loan is recorded at amortised cost using the effective interest method.
(b) Options
On 17 January 2012, the Group received options to purchase 20,837,095 shares of CTG as part of its investment in CTG (see Note 29). The options have an exercise price of HK$6.00 per share, are immediately exercisable and expire on 17 January 2015.
The options are recorded as financial assets at fair value through profit or loss. The fair value of the options at the issue date was A$1.1 million and was independently calculated by a valuation firm. Subsequent to its initial recognition, the options have been measured at fair value, with any gains or losses being recognised in profit or loss.
72
Notes to the Consolidated Financial Statements
For the year ended 30 June 2012
Note 11 – Other financial assets and liabilities (continued)
(c) Derivatives used by the Group
The Group is a party to derivative financial instruments in the normal course of business in order to hedge its exposure to currency fluctuations in foreign exchange rates and commodity prices in accordance with the Group’s financial risk management policies, which are set out in Note 2.
(i) Forward foreign exchange contracts – cash flow hedges
In order to protect against exchange rate movements in relation to material purchases and sales and underlying transactions between subsidiaries, the Group has entered into forward foreign exchange contracts to purchase foreign currencies for settlement of the related transaction. The Group’s primary exposure is to US dollars, Euros and British pounds as disclosed in Note 2.
The portion of the gain or loss on the hedging instrument that is determined to be an effective hedge is deferred and recognised in other comprehensive income to the extent that the hedge is effective. When the cash flows occur, the amount is released to profit or loss. Any ineffective portion is charged to profit or loss.
(ii) Forward commodity contracts – held for trading
The Group has entered into forward commodity contracts, which are economic hedges but do not satisfy the requirements for hedge accounting. These contracts protect against movements in the underlying commodity of the related material purchase or sale. The Group’s primary exposure is to non-ferrous and precious metal prices as disclosed in Note 2.
(d) Risk exposures
Information about the Group’s exposure to credit risk, foreign exchange, price and interest rate risk is provided in Note 2. The maximum exposure to credit risk at the end of the reporting period is the carrying amount of each class of financial instrument mentioned above.
(e) Fair value
The loans to third parties and the convertible loan to a listed entity, carried at amortised cost, accrue interest at a fixed rate. The fair value of these loans using current interest rates approximates their carrying value. The carrying value of other non-current receivables approximates their fair value.
Financial instruments carried at fair value are classified by valuation method using the following hierarchy:
| • | Level 1 – quoted prices (unadjusted) in active markets for identical assets or liabilities. |
| • | Level 2 – inputs other than quoted prices included within Level 1 that are observable for the asset or liability, either directly (as prices) or indirectly (derived from prices). |
| • | Level 3 – inputs for the asset or liability that are not based on observable market data (unobservable inputs). |
73
Notes to the Consolidated Financial Statements
For the year ended 30 June 2012
Note 11 – Other financial assets and liabilities (continued)
(e) Fair value (continued)
The following table presents the Group’s financial instruments measured at fair value by valuation method.
2012 | Level 1 A$m | Level 2 A$m | Level 3 A$m | Total A$m | ||||||||||||
Financial assets: | ||||||||||||||||
Financial assets at fair value through profit or loss: | ||||||||||||||||
Investments in marketable securities | 5.5 | - | - | 5.5 | ||||||||||||
Embedded conversion feature of convertible loan | - | - | 2.7 | 2.7 | ||||||||||||
Warrants | - | - | 0.5 | 0.5 | ||||||||||||
Options | - | - | 1.0 | 1.0 | ||||||||||||
Derivative financial instruments | 2.6 | 3.2 | - | 5.8 | ||||||||||||
|
|
|
|
|
|
|
| |||||||||
| 8.1 | 3.2 | 4.2 | 15.5 | |||||||||||||
|
|
|
|
|
|
|
| |||||||||
Financial liabilities: | ||||||||||||||||
Derivative financial instruments | 1.4 | 0.7 | - | 2.1 | ||||||||||||
|
|
|
|
|
|
|
| |||||||||
| 1.4 | 0.7 | - | 2.1 | |||||||||||||
|
|
|
|
|
|
|
| |||||||||
2011 | ||||||||||||||||
Financial assets: | ||||||||||||||||
Financial assets at fair value through profit or loss: | ||||||||||||||||
Investments in marketable securities | 4.0 | - | - | 4.0 | ||||||||||||
Derivative financial instruments | 4.1 | 3.9 | - | 8.0 | ||||||||||||
|
|
|
|
|
|
|
| |||||||||
| 8.1 | 3.9 | - | 12.0 | |||||||||||||
|
|
|
|
|
|
|
| |||||||||
Financial liabilities: | ||||||||||||||||
Derivative financial instruments | 2.9 | 2.9 | - | 5.8 | ||||||||||||
|
|
|
|
|
|
|
| |||||||||
| 2.9 | 2.9 | - | 5.8 | |||||||||||||
|
|
|
|
|
|
|
| |||||||||
The fair value of financial instruments traded on active markets (such as publicly traded derivatives and investments in marketable securities) is based on quoted market prices at the reporting date. The quoted market price used for financial assets held by the group is the current bid price. These instruments are included in level 1.
The fair value of financial instruments that are not traded in an active market (for example, forward foreign exchange contracts) is determined using forward exchange market rates at the end of the reporting period. These instruments are included in level 2.
If one or more of the significant inputs is not based on observable market data, the fair value of financial instruments is included in level 3. This is the case for the embedded conversion feature of the convertible loan and unlisted warrants and options. The following table presents the changes in level 3 instruments for the year ended 30 June 2012.
(A$m) | Warrants | Conversion feature | Options | Total | ||||||||||||
Opening balance | - | - | - | - | ||||||||||||
Additions | 1.0 | 6.1 | 1.1 | 8.2 | ||||||||||||
Revaluation loss recognised in profit or loss | (0.4 | ) | (1.5 | ) | (0.1 | ) | (2.0 | ) | ||||||||
Equity accounting elimination (Note 29) | (0.2 | ) | (2.3 | ) | - | (2.5 | ) | |||||||||
Foreign exchange differences | 0.1 | 0.4 | - | 0.5 | ||||||||||||
|
|
|
|
|
|
|
| |||||||||
Closing balance | 0.5 | 2.7 | 1.0 | 4.2 | ||||||||||||
|
|
|
|
|
|
|
| |||||||||
During the reporting period, there were no transfers between level 1 and level 2 fair value measurements, or no transfers into or out of level 3 fair value measurements.
74
Notes to the Consolidated Financial Statements
For the year ended 30 June 2012
Note 12 – Property, plant and equipment
| Land A$m | Buildings A$m | Leasehold improve- ments A$m | Plant & equip- ment A$m | Capital work in progress A$m | Total A$m | |||||||||||||||||||
At 30 June 2012 | ||||||||||||||||||||||||
Cost | 235.5 | 196.1 | 81.3 | 967.1 | 123.6 | 1,603.6 | ||||||||||||||||||
Accumulated depreciation | - | (66.4 | ) | (29.6 | ) | (530.5 | ) | - | (626.5 | ) | ||||||||||||||
|
|
|
|
|
|
|
|
|
|
|
| |||||||||||||
Net book amount | 235.5 | 129.7 | 51.7 | 436.6 | 123.6 | 977.1 | ||||||||||||||||||
|
|
|
|
|
|
|
|
|
|
|
| |||||||||||||
Year ended 30 June 2012 | ||||||||||||||||||||||||
Balance at 1 July | 211.3 | 118.2 | 47.4 | 414.6 | 74.0 | 865.5 | ||||||||||||||||||
Additions | 5.4 | 10.7 | 5.5 | 73.8 | 65.7 | 161.1 | ||||||||||||||||||
Disposals | (1.4 | ) | (1.2 | ) | (0.3 | ) | (2.1 | ) | - | (5.0 | ) | |||||||||||||
Transfers | 0.1 | 1.7 | 4.3 | 13.1 | (19.2 | ) | - | |||||||||||||||||
Reclassifications (Note 13) | - | - | - | - | (0.2 | ) | (0.2 | ) | ||||||||||||||||
Impairments | 3.0 | - | - | (3.4 | ) | - | (0.4 | ) | ||||||||||||||||
Depreciation expense | - | (12.7 | ) | (6.8 | ) | (83.6 | ) | - | (103.1 | ) | ||||||||||||||
Acquisition of subsidiaries (Note 27) | 11.0 | 10.7 | 0.1 | 14.1 | - | 35.9 | ||||||||||||||||||
Sale of jointly controlled assets (Note 27) | (2.1 | ) | (0.3 | ) | - | (1.3 | ) | (0.2 | ) | (3.9 | ) | |||||||||||||
Foreign exchange differences | 8.2 | 2.6 | 1.5 | 11.4 | 3.5 | 27.2 | ||||||||||||||||||
|
|
|
|
|
|
|
|
|
|
|
| |||||||||||||
Balance at 30 June | 235.5 | 129.7 | 51.7 | 436.6 | 123.6 | 977.1 | ||||||||||||||||||
|
|
|
|
|
|
|
|
|
|
|
| |||||||||||||
At 30 June 2011 | ||||||||||||||||||||||||
Cost | 211.3 | 172.1 | 70.8 | 896.3 | 74.0 | 1,424.5 | ||||||||||||||||||
Accumulated depreciation | - | (53.9 | ) | (23.4 | ) | (481.7 | ) | - | (559.0 | ) | ||||||||||||||
|
|
|
|
|
|
|
|
|
|
|
| |||||||||||||
Net book amount | 211.3 | 118.2 | 47.4 | 414.6 | 74.0 | 865.5 | ||||||||||||||||||
|
|
|
|
|
|
|
|
|
|
|
| |||||||||||||
Year ended 30 June 2011 | ||||||||||||||||||||||||
Balance at 1 July | 254.1 | 143.7 | 32.5 | 405.5 | 90.0 | 925.8 | ||||||||||||||||||
Additions | 1.8 | 5.4 | 15.9 | 86.3 | 33.4 | 142.8 | ||||||||||||||||||
Disposals | (6.0 | ) | (0.3 | ) | - | (2.0 | ) | - | (8.3 | ) | ||||||||||||||
Transfers | (2.8 | ) | 1.4 | 7.1 | 30.3 | (36.0 | ) | - | ||||||||||||||||
Depreciation expense | - | (14.4 | ) | (5.0 | ) | (82.8 | ) | - | (102.2 | ) | ||||||||||||||
Acquisition of subsidiaries | 9.4 | 2.0 | 3.2 | 44.3 | - | 58.9 | ||||||||||||||||||
Foreign exchange differences | (45.2 | ) | (19.6 | ) | (6.3 | ) | (67.0 | ) | (13.4 | ) | (151.5 | ) | ||||||||||||
|
|
|
|
|
|
|
|
|
|
|
| |||||||||||||
Balance at 30 June | 211.3 | 118.2 | 47.4 | 414.6 | 74.0 | 865.5 | ||||||||||||||||||
|
|
|
|
|
|
|
|
|
|
|
| |||||||||||||
75
Notes to the Consolidated Financial Statements
For the year ended 30 June 2012
Note 13 – Goodwill
(a) Movements in carrying amounts
| 2012 A$m | 2011 A$m | |||||||
Cost | 1,195.4 | 1,113.3 | ||||||
Accumulated impairment | (688.0 | ) | (124.6 | ) | ||||
|
|
|
| |||||
Net book amount | 507.4 | 988.7 | ||||||
|
|
|
| |||||
Balance at 1 July | 988.7 | 1,151.7 | ||||||
Acquisition of subsidiaries (Note 27) | 38.7 | 62.8 | ||||||
Impairment charge | (556.8 | ) | - | |||||
Reclassifications | (1.1 | ) | - | |||||
Contingent consideration on acquisitions prior to the adoption of AASB 3R (IFRS 3R) | - | (0.5 | ) | |||||
Foreign exchange differences | 37.9 | (225.3 | ) | |||||
|
|
|
| |||||
Balance at 30 June | 507.4 | 988.7 | ||||||
|
|
|
| |||||
Goodwill acquired through business combinations has been allocated to groups of CGUs that are expected to benefit from the acquisition. Goodwill is monitored and tested for impairment by management at the CGU level. The following CGUs have significant amounts of goodwill:
CGU | Segment | 2012 A$m | 2011 A$m | |||||||
North America Metals | North America | 267.1 | 731.7 | |||||||
Continental Europe Recycling Solutions | Europe | 53.4 | 61.1 | |||||||
United Kingdom Metals | Europe | 23.9 | 64.3 | |||||||
United States Recycling Solutions | North America | 52.5 | 49.9 | |||||||
Australia Recycling Solutions | Australia | - | 3.6 | |||||||
All other CGUs | 110.5 | 78.1 | ||||||||
|
|
|
| |||||||
Total | 507.4 | 988.7 | ||||||||
|
|
|
| |||||||
(b) Key assumptions used for goodwill impairment tests
The recoverable amount of each of the Group’s CGUs has been determined based on the higher of fair value less costs to sell or value-in-use calculations. The Group believes its methodology is the most meaningful method, in order to reflect the cyclicality of its business and the volatile nature of commodity markets that can impact its business.
The value-in-use calculations use a 5-year cash flow projection, which is based initially on the 2013 financial year budget (as approved by the Board) and a 4-year forecast prepared by management. The 4-year forecast is developed using historical averages derived from four years of historical results and the 2013 financial year budget. These 5-year projections also incorporate management estimates related to the inherent impact of future volatility in volumes, commodity prices and margins drawn from past experience and factor in current and expected future economic conditions and consider the potential benefits to arise from significant capital investments approved by the Board. A terminal value is determined from the final year of cash flow based on application of the Gordon Growth model.
The cash flows are discounted using rates that reflect management’s estimate of the time value of money and the risks specific to each CGU that are not already reflected in the cash flows. In determining appropriate discount rates for each CGU, consideration has been given to a weighted average cost of capital of the entity as a whole and adjusted for country and business risk specific to the CGU.
76
Notes to the Consolidated Financial Statements
For the year ended 30 June 2012
Note 13 – Goodwill (continued)
(b) Key assumptions used for goodwill impairment tests (continued)
The cash flow projections are based on management’s best estimates, with reference to historical results, to determine income, expenses, capital expenditures and cash flows for each CGU. Expected future cash flows used to determine the value in use of goodwill are inherently uncertain and could materially change over time. Should management’s estimate of the future not reflect actual events, further impairments may be identified.
The key assumptions used for the value-in-use calculations were as follows:
| Discount rate (pre-tax) | Growth rate | |||||||||||||||
CGU | 2012 % | 2011 % | 2012 % | 2011 % | ||||||||||||
North America Metals | 13.0 – 13.4 | 13.2 | 3.0 | 3.0 | ||||||||||||
Continental Europe Recycling Solutions | 14.3 – 14.8 | 14.6 | 1.5 – 2.5 | 1.5 – 2.5 | ||||||||||||
United Kingdom Metals | 13.4 – 13.8 | 13.4 | 2.5 | 2.5 | ||||||||||||
United States Recycling Solutions | 13.4 – 14.1 | 13.1 | 3.0 | 3.0 | ||||||||||||
Australia Recycling Solutions | 16.5 – 16.9 | 15.8 | 2.5 | 2.5 | ||||||||||||
All other CGUs | 12.2 – 17.3 | 12.6 –16.9 | 2.5 – 3.0 | 2.5 – 3.0 | ||||||||||||
(c) Impairment charges recognised
Due to the difficult economic conditions affecting the Group’s industry, changes to the Group’s operating results and forecasts, and a significant reduction in the Group’s market capitalisation, a goodwill impairment test was performed as at 31 December 2011 and resulted in the following impairment charges being recognised:
CGU | A$m | |||
North America Metals | 510.8 | |||
United Kingdom Metals | 42.4 | |||
Australia Recycling Solutions | 3.6 | |||
|
| |||
Total | 556.8 | |||
|
| |||
In the half year ended 31 December 2011, results for the North America Metals CGU and United Kingdom Metals CGU were impacted by weak volumes and margin pressure that was encountered during the last three months of the period. In October and November 2011, ferrous scrap prices rapidly declined as deep sea ferrous markets became illiquid as economic concerns for Europe and for slowing growth in China became pervasive. These factors adversely impacted the operating results for these CGUs during the half year ended 31 December 2011, which required a reassessment of the future cash flows of these CGUs. As a result, the carrying value of the goodwill for both CGUs was not fully recoverable resulting in the impairment charges for these CGUs.
The impairment charge related to the Australia Recycling Solutions CGU was due to continued operating losses for this CGU. As a result, the carrying value of goodwill for this CGU exceeded its recoverable amount. After the impairment charge, this CGU had no remaining goodwill.
The annual impairment test performed by the Group as at 30 June 2012 identified no additional impairment.
(d) Impact of possible changes in key assumptions
Other than as disclosed below, the valuations as at 30 June 2012 indicate sufficient headroom such that a reasonably possible change to key assumptions is unlikely to result in an impairment of the related goodwill.
77
Notes to the Consolidated Financial Statements
For the year ended 30 June 2012
Note 13 – Goodwill (continued)
(d) Impact of possible changes in key assumptions (continued)
The estimated recoverable amount for the North America Metals CGU and United Kingdom Metals CGU exceeded its carrying value by 2.0% and 6.3%, respectively. For these CGUs, the table below shows the amount by which each key assumption must change in isolation in order for the estimated recoverable amount to be equal to its carrying value.
| Discount rate (pre-tax) % | Growth rate % | |||
North America Metals | +0.2 | -0.2 | ||
United Kingdom Metals | +0.8 | -0.8 |
In isolation, if forecasted cash flows were to decrease by 20% for the North America Metals CGU and United Kingdom Metals CGU, an impairment charge of A$219.2 million and A$23.9 million, respectively, would be required.
Note 14 – Other intangible assets
| Supplier relation- ships A$m | Permits A$m | Licenses/ Contracts A$m | Trade- names A$m | Total A$m | ||||||||||||||||
At 30 June 2012 | ||||||||||||||||||||
Cost | 222.4 | 9.2 | 33.2 | 31.0 | 295.8 | |||||||||||||||
Accumulated impairment | (0.3 | ) | (1.3 | ) | - | - | (1.6 | ) | ||||||||||||
Accumulated amortisation | (134.5 | ) | - | (26.3 | ) | (6.8 | ) | (167.6 | ) | |||||||||||
|
|
|
|
|
|
|
|
|
| |||||||||||
Net book amount | 87.6 | 7.9 | 6.9 | 24.2 | 126.6 | |||||||||||||||
|
|
|
|
|
|
|
|
|
| |||||||||||
Year ended 30 June 2012 | ||||||||||||||||||||
Balance at 1 July | 100.3 | 7.1 | 4.8 | 24.0 | 136.2 | |||||||||||||||
Acquisitions (Note 27) | 5.2 | 1.0 | 3.2 | - | 9.4 | |||||||||||||||
Purchases | - | - | 1.0 | - | 1.0 | |||||||||||||||
Reclassifications (Note 13) | 1.0 | 0.1 | 0.2 | - | 1.3 | |||||||||||||||
Impairment1 | (0.3 | ) | (0.5 | ) | - | - | (0.8 | ) | ||||||||||||
Amortisation charge | (23.2 | ) | - | (2.5 | ) | (1.1 | ) | (26.8 | ) | |||||||||||
Foreign exchange differences | 4.6 | 0.2 | 0.2 | 1.3 | 6.3 | |||||||||||||||
|
|
|
|
|
|
|
|
|
| |||||||||||
Balance at 30 June | 87.6 | 7.9 | 6.9 | 24.2 | 126.6 | |||||||||||||||
|
|
|
|
|
|
|
|
|
| |||||||||||
At 30 June 2011 | ||||||||||||||||||||
Cost | 205.5 | 7.8 | 29.3 | 29.4 | 272.0 | |||||||||||||||
Accumulated impairment | - | (0.7 | ) | - | - | (0.7 | ) | |||||||||||||
Accumulated amortisation | (105.2 | ) | - | (24.5 | ) | (5.4 | ) | (135.1 | ) | |||||||||||
|
|
|
|
|
|
|
|
|
| |||||||||||
Net book amount | 100.3 | 7.1 | 4.8 | 24.0 | 136.2 | |||||||||||||||
|
|
|
|
|
|
|
|
|
| |||||||||||
Year ended 30 June 2011 | ||||||||||||||||||||
Balance at 1 July | 151.2 | 8.8 | 3.3 | 31.9 | 195.2 | |||||||||||||||
Acquisitions | 2.2 | - | 4.2 | 0.5 | 6.9 | |||||||||||||||
Amortisation charge | (24.6 | ) | - | (1.9 | ) | (1.9 | ) | (28.4 | ) | |||||||||||
Foreign exchange differences | (28.5 | ) | (1.7 | ) | (0.8 | ) | (6.5 | ) | (37.5 | ) | ||||||||||
|
|
|
|
|
|
|
|
|
| |||||||||||
Balance at 30 June | 100.3 | 7.1 | 4.8 | 24.0 | 136.2 | |||||||||||||||
|
|
|
|
|
|
|
|
|
| |||||||||||
| 1Impairments | recognised in connection with yards which were closed. |
78
Notes to the Consolidated Financial Statements
For the year ended 30 June 2012
Note 15 – Trade and other payables
| 2012 A$m | 2011 A$m | |||||||
Trade payables | 485.2 | 547.4 | ||||||
Other payables | 153.7 | 160.8 | ||||||
Deferred income | 33.2 | 39.1 | ||||||
|
|
|
| |||||
| 672.1 | 747.3 | |||||||
|
|
|
| |||||
The Group’s exposure to currency and liquidity risk related to trade and other payables is set out in Note 2. The fair value of the Group’s trade and other payables approximates its carrying value.
Note 16 – Borrowings
| 2012 A$m | 2011 A$m | |||||||
Current borrowings: | ||||||||
Bank loans | 13.5 | — | ||||||
Other borrowings | 0.2 | 0.5 | ||||||
|
|
|
| |||||
| 13.7 | 0.5 | |||||||
|
|
|
| |||||
Non-current borrowings: | ||||||||
Bank loans | 329.9 | 291.0 | ||||||
Other borrowings | — | 0.2 | ||||||
|
|
|
| |||||
| 329.9 | 291.2 | |||||||
|
|
|
| |||||
Bank loans are unsecured but are subject to various guarantees/cross guarantees, cross defaults and indemnities from the Company and certain of its subsidiaries.
(a) Risk exposures
The Group’s exposure to interest rate risk as well as information relating to the facility arrangements is set out in Note 2.
(b) Fair value
The Group’s borrowings approximate the carrying amount as the Group’s primary exposure is to floating rate bank loans. The Group has nominal exposure to fixed rates through other borrowings.
Note 17 – Provisions
| 2012 A$m | 2011 A$m | |||||||
Employee benefits | 40.1 | 32.6 | ||||||
Legal provisions | 13.1 | 10.1 | ||||||
Environmental compliance | 4.0 | 3.8 | ||||||
Other | 2.9 | 9.2 | ||||||
|
|
|
| |||||
| 60.1 | 55.7 | |||||||
|
|
|
| |||||
Current | 30.6 | 37.1 | ||||||
Non-current | 29.5 | 18.6 | ||||||
|
|
|
| |||||
| 60.1 | 55.7 | |||||||
|
|
|
| |||||
79
Notes to the Consolidated Financial Statements
For the year ended 30 June 2012
Note 17 – Provisions (continued)
Movements in each class of provision during the financial year, other than employee benefits, are set out below.
| Legal A$m | Environ- mental compliance A$m | Other A$m | ||||||||||
Balance at 1 July | 10.1 | 3.8 | 9.2 | |||||||||
Transfers/reclassifications | - | - | (6.2 | ) | ||||||||
Provisions recognised/(written-back) in profit or loss | 12.3 | - | (0.1 | ) | ||||||||
Payments | (9.9 | ) | - | - | ||||||||
Foreign exchange differences | 0.6 | 0.2 | - | |||||||||
|
|
|
|
|
| |||||||
Balance at 30 June | 13.1 | 4.0 | 2.9 | |||||||||
|
|
|
|
|
| |||||||
The Group is involved in legal and other disputes and, after taking legal advice, has established provisions taking into account the relevant facts of each dispute. The timing of cash outflows associated with legal claims cannot be reasonably determined. The environmental compliance provision is an estimate of costs for property remediation that will be required in the future.
Note 18 – Retirement benefit obligations
The Group operates a number of pension plans for the benefit of its employees throughout the world. The Group’s pension plans are provided through both defined benefit and defined contribution arrangements. Defined benefit schemes provide benefits based on years of service and/or final average salary. Defined contribution schemes offer employees individual funds that are converted into benefits at the time of retirement.
The following sets out details in respect of the defined benefit sections only. The expense recognised in relation to the defined contribution plans is disclosed in Note 7.
(a) Balances recognised in the statement of financial position
| 2012 A$m | 2011 A$m | |||||||
Present value of defined benefit obligation | 79.5 | 64.6 | ||||||
Fair value of defined benefit plan assets | (64.9 | ) | (62.6 | ) | ||||
|
|
|
| |||||
Net defined benefit liability | 14.6 | 2.0 | ||||||
|
|
|
| |||||
These amounts are disclosed as: | ||||||||
Retirement benefit assets | - | 0.9 | ||||||
Retirement benefit obligations | 14.6 | 2.9 | ||||||
|
|
|
| |||||
| 14.6 | 2.0 | |||||||
|
|
|
| |||||
The Group has no legal obligation to settle the liability with an immediate contribution or additional one-off contributions. The Group intends to continue to contribute to the defined benefit plans based on recommendations from its actuaries.
80
Notes to the Consolidated Financial Statements
For the year ended 30 June 2012
Note 18 – Retirement benefit obligations (continued)
(b) Expense recognised in profit or loss
| 2012 A$m | 2011 A$m | 2010 A$m | ||||||||||
Current service cost | 1.2 | 1.3 | 1.4 | |||||||||
Interest cost | 3.3 | 3.3 | 3.7 | |||||||||
Past service cost | 0.1 | - | - | |||||||||
Expected return on plan assets | (4.1 | ) | (3.6 | ) | (3.6 | ) | ||||||
|
|
|
|
|
| |||||||
| 0.5 | 1.0 | 1.5 | ||||||||||
|
|
|
|
|
| |||||||
Actual return on plan assets | (0.6 | ) | 7.4 | 8.2 | ||||||||
|
|
|
|
|
| |||||||
(c) Reconciliations
| 2012 A$m | 2011 A$m | |||||||
Movements in the defined benefit obligation: | ||||||||
Balance at 1 July | 64.6 | 72.9 | ||||||
Current service cost | 1.2 | 1.3 | ||||||
Interest cost | 3.3 | 3.3 | ||||||
Past service cost | 0.1 | - | ||||||
Actuarial loss/(gain) | 11.6 | (0.7 | ) | |||||
Benefits paid | (3.0 | ) | (3.8 | ) | ||||
Contributions paid by members | 0.3 | 0.4 | ||||||
Foreign exchange differences | 1.4 | (8.8 | ) | |||||
|
|
|
| |||||
Balance at 30 June | 79.5 | 64.6 | ||||||
|
|
|
| |||||
Reconciliation of the fair value of plan assets: | ||||||||
Balance at 1 July | 62.6 | 61.9 | ||||||
Expected return on plan assets | 4.1 | 3.6 | ||||||
Actuarial (loss)/gain | (4.6 | ) | 3.8 | |||||
Contributions by Group | 4.3 | 4.5 | ||||||
Contributions paid by members | 0.3 | 0.4 | ||||||
Benefits paid | (3.0 | ) | (3.8 | ) | ||||
Foreign exchange differences | 1.2 | (7.8 | ) | |||||
|
|
|
| |||||
Balance at 30 June | 64.9 | 62.6 | ||||||
|
|
|
| |||||
(d) Categories of plan assets
The major categories of plan assets are as follows:
| 2012 A$m | 2011 A$m | |||||||
Cash | 2.3 | 8.3 | ||||||
Equity instruments | 42.8 | 36.5 | ||||||
Debt instruments | 14.6 | 13.5 | ||||||
Property | 5.2 | 4.3 | ||||||
|
|
|
| |||||
Total plan assets | 64.9 | 62.6 | ||||||
|
|
|
| |||||
81
Notes to the Consolidated Financial Statements
For the year ended 30 June 2012
Note 18 – Retirement benefit obligations (continued)
(e) Amounts recognised in other comprehensive income
| 2012 A$m | 2011 A$m | 2010 A$m | ||||||||||
Actuarial (loss)/gain recognised during the financial year | (16.2 | ) | 4.5 | (3.8 | ) | |||||||
Income tax benefit/(expense) | 4.9 | (1.7 | ) | 1.1 | ||||||||
| �� |
|
|
|
| |||||||
Net actuarial (loss)/gain | (11.3 | ) | 2.8 | (2.7 | ) | |||||||
|
|
|
|
|
| |||||||
Cumulative amount at 30 June | (29.4 | ) | (13.2 | ) | (17.7 | ) | ||||||
|
|
|
|
|
| |||||||
(f) Principal actuarial assumptions | ||||||||||||
| 2012 % | 2011 % | 2010 % | ||||||||||
Australia | ||||||||||||
Discount rate | 2.2 | 4.3 | 4.2 | |||||||||
Expected rate of return on plan assets | 7.0 | 7.3 | 7.3 | |||||||||
Future salary increases | 4.0 | 3.5 | 4.0 | |||||||||
United Kingdom | ||||||||||||
Discount rate | 4.5 | 5.5 | 5.3 | |||||||||
Expected rate of return on plan assets | 5.4 | 5.6 | 5.4 | |||||||||
Future salary increases | 3.3 | 3.9 | 3.6 | |||||||||
United States | ||||||||||||
Discount rate | 4.0 | 5.5 | 5.5 | |||||||||
Expected rate of return on plan assets | 7.3 | 8.0 | 8.0 | |||||||||
Future salary increases | 3.5 | 3.5 | 3.5 | |||||||||
The expected rate of return on plan assets has been based on historical and future expectations of returns for each of the major categories of asset classes as well as the expected and actual allocation of plan assets to these major categories and considers recommendations from the Group’s actuaries. This resulted in the selection of the weighted average returns of plan assets for each of the defined benefit plans as set out above.
(g) Employer contributions
Employer contributions for defined benefit schemes are based on recommendations of actuarial advisors of the plans. Actuarial assessments are made at no more than one-year intervals, and the last such assessment was made as at 30 June 2012.
The objective of funding is to ensure that the benefit entitlements of members and other beneficiaries are fully funded by the time they become payable. To achieve this objective, the actuaries have adopted a method of funding benefits known as the aggregate funding method. This funding method seeks to have benefits funded by means of a total contribution, which is expected to be a constant percentage of members’ salaries over their working lifetimes.
Using the funding method described above and particular actuarial assumptions as to the plan’s future experience, the actuaries recommended, in their review as at 30 June 2012, a contribution amount that would be sufficient to meet the Group’s obligations to the defined benefit scheme. Total employer contributions expected to be paid by Group companies for the year ending 30 June 2013 is A$2.0 million for Australia, A$1.5 million for the United Kingdom, and A$0.8 million for the United States.
82
Notes to the Consolidated Financial Statements
For the year ended 30 June 2012
Note 18 – Retirement benefit obligations (continued)
(h) Historic summary
| 2012 A$m | 2011 A$m | 2010 A$m | 2009 A$m | 2008 A$m | ||||||||||||||||
Defined benefit plan obligation | 79.5 | 64.6 | 72.9 | 73.4 | 81.6 | |||||||||||||||
Plan assets | (64.9 | ) | (62.6 | ) | (61.9 | ) | (62.2 | ) | (76.8 | ) | ||||||||||
|
|
|
|
|
|
|
|
|
| |||||||||||
Deficit | 14.6 | 2.0 | 11.0 | 11.2 | 4.8 | |||||||||||||||
|
|
|
|
|
|
|
|
|
| |||||||||||
Experience adjustments arising on plan liabilities | 11.6 | (0.7 | ) | 8.4 | (8.7 | ) | (0.5 | ) | ||||||||||||
|
|
|
|
|
|
|
|
|
| |||||||||||
Experience adjustments arising on plan assets | 4.6 | (3.8 | ) | (4.6 | ) | 16.9 | 11.8 | |||||||||||||
|
|
|
|
|
|
|
|
|
| |||||||||||
Note 19 – Contributed equity
(a) Share capital
Ordinary shares, which have no par value, trade on the Australian Securities Exchange (“ASX”) and entitle the holder to participate in dividends and the proceeds on winding up of the Company in proportion to the number of shares held. Voting rights attaching to the ordinary shares are, on a show of hands, one vote for every person present as a member, proxy, attorney or representative thereof and, on a poll, one vote per share for every member present in person or by proxy, attorney or representative. The Company does not have a limited amount of authorised capital. The Company’s shares also trade on the New York Stock Exchange in the form of American Depositary Shares (“ADS”) with one ordinary share equaling one ADS. ADSs have the same rights as ordinary shares, including participation in dividends and voting rights.
Movements in the ordinary share balance were as follows:
| Number of shares | A$m | |||||||
Balance at 1 July 2010 | 203,834,443 | 2,795.2 | ||||||
Issued under long-term incentive plans | 363,177 | 3.3 | ||||||
Issued under the employee share scheme recognised as issued following | 23,205 | 0.3 | ||||||
Issued under the dividend reinvestment plan | 1,149,463 | 19.1 | ||||||
|
|
|
| |||||
Balance at 30 June 2011 | 205,370,288 | 2,817.9 | ||||||
Issued under long-term incentive plans | 713,441 | 1.5 | ||||||
Issued under the dividend reinvestment plan | 1,772,714 | 23.4 | ||||||
Share buy-back | (3,039,649 | ) | (38.5 | ) | ||||
|
|
|
| |||||
Balance at 30 June 2012 | 204,816,794 | 2,804.3 | ||||||
|
|
|
| |||||
(b) Share buy-back
On 7 October 2011, the Company announced an on-market share buy-back program, which will allow the buy-back of a maximum of 10% of issued capital (20,603,871 ordinary shares) over a 12-month period on the ASX. The buy-back commenced on 24 October 2011. The Company purchased 3,039,649 ordinary shares at an average price of A$12.67, with prices ranging from A$9.35 to A$13.96, under the share buy-back program during the year ended 30 June 2012. These re-acquired shares have been cancelled. The current on-market share buy-back program is ongoing through 23 October 2012.
83
Notes to the Consolidated Financial Statements
For the year ended 30 June 2012
Note 19 – Contributed equity (continued)
(c) Dividend reinvestment plan
The Company operated a Dividend Reinvestment Plan (“DRP”) under which holders of ordinary shares were able to elect to have all or part of their dividend entitlements satisfied by issue of new ordinary shares rather than by being paid cash. Shares issued under the DRP were at a 2.5% discount to the market price. On 17 February 2012, the Directors resolved to suspend the DRP.
(d) Capital risk management
The primary objective of managing the Group’s capital is to ensure that there is sufficient capital available to support the funding requirements of the Group, including capital expenditure, in a way that optimises the cost of capital, maximises shareholders’ returns and ensures that the Group remains in a sound financial position.
In order to manage the capital structure, the Group may periodically adjust dividends policy, return capital to shareholders, issue new shares or sell assets to reduce debt.
The Group monitors its capital structure primarily using the gearing ratio. This ratio is calculated as net debt divided by total capital. Net debt is calculated as total borrowings less cash and cash equivalents. Total capital is calculated as total equity as shown in the statement of financial position plus net debt. The Group seeks to maintain an optimum gearing ratio.
The Group’s gearing ratio is as follows:
| 2012 A$m | 2011 A$m | |||||||
Total borrowings | 343.6 | 291.7 | ||||||
Less: cash and cash equivalents | (51.4 | ) | (165.5 | ) | ||||
|
|
|
| |||||
Net debt | 292.2 | 126.2 | ||||||
Plus: total equity | 2,394.4 | 2,920.5 | ||||||
|
|
|
| |||||
Total capital | 2,686.6 | 3,046.7 | ||||||
|
|
|
| |||||
Gearing ratio | 10.9% | 4.1% | ||||||
There have been no breaches of external obligations such as regulatory obligations or bank covenants.
Note 20 – Retained earnings and reserves
(a) Retained earnings
| 2012 A$m | 2011 A$m | |||||||
Balance at 1 July | 548.9 | 425.5 | ||||||
(Loss)/profit after tax | (521.4 | ) | 192.1 | |||||
Dividends paid | (92.7 | ) | (71.5 | ) | ||||
Actuarial (loss)/gain on defined benefit plans, net of tax | (11.3 | ) | 2.8 | |||||
|
|
|
| |||||
Balance at 30 June | (76.5 | ) | 548.9 | |||||
|
|
|
| |||||
84
Notes to the Consolidated Financial Statements
For the year ended 30 June 2012
Note 20 – Retained earnings and reserves (continued)
(b) Reserves
| Share- based payments A$m | Available -for-sale investme nts A$m | Cash flow hedging A$m | Foreign currency translation A$m | Total A$m | ||||||||||||||||
Balance at 1 July 2010 | 53.7 | (0.8 | ) | (0.7 | ) | 5.9 | 58.1 | |||||||||||||
Equity-settled share-based payment expense | 15.7 | - | - | - | 15.7 | |||||||||||||||
Cash settlement | (0.8 | ) | - | - | - | (0.8 | ) | |||||||||||||
Revaluation – gross | - | - | (0.1 | ) | - | (0.1 | ) | |||||||||||||
Transfer to profit or loss – gross | - | 1.4 | 0.9 | - | 2.3 | |||||||||||||||
Foreign currency translation differences | - | - | - | (560.7 | ) | (560.7 | ) | |||||||||||||
Deferred tax | 3.3 | (0.6 | ) | (0.3 | ) | 36.8 | 39.2 | |||||||||||||
|
|
|
|
|
|
|
|
|
| |||||||||||
Balance at 30 June 2011 | 71.9 | - | (0.2 | ) | (518.0 | ) | (446.3 | ) | ||||||||||||
Equity-settled share-based payment expense | 24.3 | - | - | - | 24.3 | |||||||||||||||
Revaluation – gross | - | - | 1.3 | - | 1.3 | |||||||||||||||
Transfer to profit or loss – gross | - | - | 0.3 | - | 0.3 | |||||||||||||||
Foreign currency translation differences | - | - | - | 94.8 | 94.8 | |||||||||||||||
Associates | - | (0.1 | ) | - | (0.3 | ) | (0.4 | ) | ||||||||||||
Deferred tax | - | - | (0.4 | ) | (7.0 | ) | (7.4 | ) | ||||||||||||
|
|
|
|
|
|
|
|
|
| |||||||||||
Balance at 30 June 2012 | 96.2 | (0.1 | ) | 1.0 | (430.5 | ) | (333.4 | ) | ||||||||||||
|
|
|
|
|
|
|
|
|
| |||||||||||
(c) Nature and purpose of reserves
(i) Share-based payments reserve
The share-based payments reserve is used to recognise the fair value of share-based awards issued to employees.
(ii) Available-for-sale investments reserve
Changes in the fair value and exchange differences arising on translation of investments, such as equities classified as available-for-sale investments, are recognised in other comprehensive income as described in Note 1(s) and accumulated in a separate reserve within equity. Amounts are reclassified to profit or loss when the associated assets are sold or impaired.
(iii) Cash flow hedging reserve
The cash flow hedging reserve is used to record gains or losses on a hedging instrument in a cash flow hedge that are recognised in other comprehensive income, as described in Note 1(t). Amounts are recognised in profit or loss when the associated hedged transaction affects profit or loss.
(iv) Foreign currency translation reserve
Exchange differences arising on translation of foreign controlled entities are recognised in other comprehensive income, as described in Note 1(g) and accumulated in a separate reserve within equity. The cumulative amount is reclassified to profit or loss when the Group no longer controls the foreign operation.
85
Notes to the Consolidated Financial Statements
For the year ended 30 June 2012
Note 21 – Dividends
(a) Dividends declared and paid during the year
| Cents per share | Franked % | 2012 A$m | 2011 A$m | 2010 A$m | ||||||||||||||||
Interim 2012 | 10.0 | 0% | 20.6 | - | - | |||||||||||||||
Final 2011 | 35.0 | 43% | 72.1 | - | - | |||||||||||||||
Interim 2011 | 12.0 | 42% | - | 24.6 | - | |||||||||||||||
Final 2010 | 23.0 | 74% | - | 46.9 | - | |||||||||||||||
Interim 2010 | 10.0 | 100% | - | - | 20.4 | |||||||||||||||
Final 2009 | 10.0 | 100% | - | - | 18.2 | |||||||||||||||
|
|
|
|
|
| |||||||||||||||
Total dividends paid | 92.7 | 71.5 | 38.6 | |||||||||||||||||
Shares issued under the DRP | (23.4 | ) | (19.1 | ) | (9.2 | ) | ||||||||||||||
|
|
|
|
|
| |||||||||||||||
Total cash dividends paid | 69.3 | 52.4 | 29.4 | |||||||||||||||||
|
|
|
|
|
| |||||||||||||||
The franked components of all dividends paid or declared were franked based on a tax rate of 30%.
(b) Dividends not recognised at year end
Since the end of the year, the Directors have determined the payment of a final dividend of 10.0 cents per share, unfranked. The aggregate amount of the proposed dividend expected to be paid on 19 October 2012 out of consolidated retained earnings as at 30 June 2012, but not recognised as a liability at the end of the reporting period, is A$20.5 million (2011: A$71.9 million; 2010: A$46.9 million).
The entire final dividend is declared to be nil conduit foreign income. Accordingly the entire final dividend payable to non-residents will be subject to a 15% non-resident shareholders’ withholding tax.
(c) Franked dividends
| 2012 A$m | 2011 A$m | |||||||
Estimated franking credits available for the subsequent financial years based on tax | 17.1 | 14.0 | ||||||
|
|
|
| |||||
The above amounts represent the balance of the franking account as at the end of the reporting date, adjusted for:
| a) | franking credits that will arise from the payment of the amount of the provision for income tax and franking debits that will arise from refunds; |
| b) | franking debits that will arise from the payment of dividends recognised as a liability as at the reporting date; and |
| c) | franking credits that will arise from the receipt of dividends recognised as receivables as at the reporting date. |
The impact on the franking account of the dividend determined by the Directors since the end of the reporting period, but not recognised as a liability as at the end of the reporting date, will be a reduction in the franking account of nil (2011: A$13.3 million).
86
Notes to the Consolidated Financial Statements
For the year ended 30 June 2012
Note 22 – Contingencies
(a) Guarantees
The Group has given guarantees in respect of the performance of contracts entered into in the ordinary course of business. The amounts of these guarantees provided by the Group, for which no amounts are recognised in the consolidated financial statements, as at 30 June 2012 was A$41.6 million (2011: A$64.5 million).
See Note 31(b) for information related to guarantees provided by the Company.
(b) Tax audits
The Group files income tax returns in many jurisdictions throughout the world. Various tax authorities are currently reviewing or auditing the Group’s income tax returns. Tax returns contain matters that could be subject to differing interpretations of applicable tax laws and regulations. While it is difficult to predict the ultimate outcome in some cases, the Group does not anticipate that there will be any material impact on the Group’s consolidated financial statements from such audits or reviews.
(c) Environmental claims
The Group is subject to comprehensive environmental requirements relating to, among others, the acceptance, storage, treatment, handling and disposal of solid waste and hazardous waste; the discharge of materials and storm water into the environment; the management and treatment of wastewater and stormwater; and the remediation of soil and groundwater contamination. As a consequence, the Group has incurred and will continue to incur environmental costs and liabilities associated with site and facility operation, closure, remediation, monitoring and licensing. Provisions have been made in respect of estimated environmental liabilities where obligations are known to exist and can be reasonably measured. However, additional liabilities may emerge due to a number of factors, including changes in environmental laws and regulations in each of the jurisdictions in which the Group operates or has operated. The Group cannot predict the extent to which it may be affected in the future by any such changes in legislation or regulation.
(d) Legal claims
Various Group companies are parties to legal actions and claims that arise in the ordinary course of their business. While the outcome of such legal proceedings cannot be readily foreseen, the Group believes that they will be resolved without material effect on its financial statements. Provision has been made for known obligations where the existence of the liability is probable and can be reasonably estimated.
On 20 June 2011, the United States District Court Southern District of New York issued a summary judgement against Metal Management Inc. (a subsidiary of the Company) in a dispute involving a breach of contract. The breach of contract relates to the transaction fee that was payable to Metal Management Inc.’s financial advisers in connection with its merger with the Company. The amount of the summary judgement of A$9.8 million was paid during the current financial year.
In the year ended 30 June 2012, the Group recorded a provision of A$12.8 million related to a dispute with a third party.
87
Notes to the Consolidated Financial Statements
For the year ended 30 June 2012
Note 22 – Contingencies (continued)
(e) Subsidiaries
Under the terms of a Deed of Cross Guarantee (“DCG”) entered into in accordance with ASIC Class Order 98/1418 (as amended by Class Orders 98/2107, 00/0321, 01/1087, 02/0248 and 02/1017), the Company has undertaken to meet any shortfall that might arise on the winding up of controlled entities that are party to the deed, as described in Note 28. The controlled entities are not in liquidation and there is no indication that they will be wound up.
Note 23 – Commitments
(a) Capital commitments
Capital expenditures contracted for at the reporting date but not recognised as liabilities are as follows:
| 2012 A$m | 2011 A$m | |||||||
Property, plant and equipment | 69.2 | 41.2 | ||||||
|
|
|
| |||||
The capital commitments included above also include the Group’s share relating to joint venture operations and jointly controlled entities.
(b) Lease commitments
The Group has entered into various operating leases on property, plant and equipment. The leases have varying terms, escalation clauses and renewal rights. On renewal, the terms of the leases are renegotiated. Lease commitments for operating leases are as follows:
| 2012 A$m | 2011 A$m | |||||||
Not later than one-year | 68.9 | 61.1 | ||||||
Later than one-year, but not later than three-years | 92.4 | 89.3 | ||||||
Later than three-years, but not later than five-years | 48.4 | 44.7 | ||||||
Later than five-years | 124.6 | 95.0 | ||||||
|
|
|
| |||||
Total lease commitments not recognised as liabilities | 334.3 | 290.1 | ||||||
|
|
|
| |||||
The lease commitments included above also include the Group’s share relating to joint venture operations and jointly controlled entities.
Note 24 – Share ownership plans
The Company’s share ownership plans are designed to link the rewards of eligible employees to the long-term performance of the Company and the returns generated for shareholders. The maximum number of shares that can be outstanding at any time under the share ownership plans is limited to 5% of the Company’s issued capital. Grants under the share ownership plans can be in the form of options or share rights. Certain share ownership plans also provide for cash-settlement, which are determined by the Board.
An option is a contract that gives the holder the right, but not the obligation, to acquire the Company’s shares at a fixed or determinable price for a specified period of time. Options have an exercise price based on the weighted average market price of the Company’s ordinary shares (or ADSs) during the five trading days up to the date of the grant. Share rights are a contractual right to acquire the Company’s shares for nil consideration. Unless specified in the grants, holders of options and share rights are not entitled to dividends or voting rights.
88
Notes to the Consolidated Financial Statements
For the year ended 30 June 2012
Note 24 – Share ownership plans (continued)
(a) Effect of share-based payments on profit or loss
The expense recognised in the income statement in relation to share-based payments is disclosed in Note 7. The carrying amount of liabilities for cash-settled share-based arrangements as at 30 June 2012 was A$0.4 million (2011: A$0.5 million). Where share-based awards are issued to employees of subsidiaries within the Group, the subsidiaries compensate the Company for the fair value of these share-based awards.
(b) Long-Term Incentive Plan (“LTIP”)
In July 2003, the Company established a LTIP designed as a reward and retention tool for certain employees. Options and share rights granted under the LTIP may vest either based on continuous service or based on performance conditions. Share rights that contain performance conditions are referred to as performance rights whereas share rights which only contain a continuous service condition are referred to as restricted share units. Cash-settled option grants are also made under the LTIP to certain employees. Refer to the Remuneration Report for further information on the terms of the grants made in the year ended 30 June 2012 pursuant to the LTIP.
(i) Equity-settled options
The fair value of equity-settled options granted is independently determined using a Binomial method, which allows for the effects of an early exercise for vested options assuming the share price exceeds one and a half times the exercise price. The significant weighted assumptions used to determine the fair value were as follows:
| Ordinary shares | ADSs | |||||||||||||||
| 2012 | 2011 | 2012 | 2011 | |||||||||||||
Risk-free interest rate | 3.9% | 5.1% | 1.4% | 2.0% | ||||||||||||
Dividend yield | 3.0% | 3.0% | 3.0% | 3.0% | ||||||||||||
Volatility | 43.0% | 39.6% | 51.0% | 59.0% | ||||||||||||
Expected life (years) | 4.2 | 3.8 | 4.3 | 4.2 | ||||||||||||
Share price at grant date | A$13.27 | A$17.81 | US$13.66 | US$16.90 | ||||||||||||
Weighted average fair value | A$4.08 | A$5.04 | US$4.52 | US$6.15 | ||||||||||||
Volatility for the ordinary shares is based on historical share price. Due to the sparse trading of the ADSs and its limited listing (since March 2008), the volatility of the ADSs is based on the historical share price of the ordinary shares which have been translated to US dollars using daily exchange rates.
| Equity-settled options outstanding | Weighted | Weighted | ||||||||||||||
| Number of options 2012 | average exercise price $ 2012 | Number of options 2011 | average exercise price $ 2011 | |||||||||||||
Ordinary Shares: | ||||||||||||||||
Balance at 1 July | 825,223 | A$21.34 | 781,579 | A$21.11 | ||||||||||||
Granted | 247,823 | A$13.07 | 143,579 | A$17.62 | ||||||||||||
Forfeited | (11,300 | ) | A$23.87 | (9,645 | ) | A$24.12 | ||||||||||
Exercised | - | - | (90,290 | ) | A$13.11 | |||||||||||
|
|
|
| |||||||||||||
Balance at 30 June | 1,061,746 | A$19.38 | 825,223 | A$21.34 | ||||||||||||
|
|
|
| |||||||||||||
Exercisable at 30 June | 636,585 | A$21.78 | 338,032 | A$22.97 | ||||||||||||
|
|
|
| |||||||||||||
ADSs: | ||||||||||||||||
Balance at 1 July | 2,608,765 | US$17.80 | 1,802,588 | US$18.08 | ||||||||||||
Granted | 1,311,842 | US$13.37 | 911,868 | US$16.99 | ||||||||||||
Forfeited | (90,445 | ) | US$16.57 | (47,248 | ) | US$19.61 | ||||||||||
Exercised | (181,654 | ) | US$8.39 | (58,443 | ) | US$12.19 | ||||||||||
|
|
|
| |||||||||||||
Balance at 30 June | 3,648,508 | US$16.71 | 2,608,765 | US$17.80 | ||||||||||||
|
|
|
| |||||||||||||
Exercisable at 30 June | 1,581,353 | US$18.75 | 900,741 | US$17.78 | ||||||||||||
|
|
|
| |||||||||||||
89
Notes to the Consolidated Financial Statements
For the year ended 30 June 2012
Note 24 – Share ownership plans (continued)
(b) Long-Term Incentive Plan (“LTIP”) (continued)
(i) Equity-settled options (continued)
For equity-settled options exercised during the year ended 30 June 2012, the weighted average share price at the date of exercise was nil for ordinary shares (2011: A$17.05) and US$14.02 for ADSs (2011: US$20.20) .
Information about outstanding and exercisable equity-settled options as at 30 June 2012 is as follows:
| Outstanding | Exercisable | |||||||||||||||||||||||
Exercise price range | Number of options | Weighted average exercise price | Weighted average remaining contractual life (years) | Number of options | Weighted average exercise price | Weighted average remaining contractual life (years) | ||||||||||||||||||
Ordinary shares: | ||||||||||||||||||||||||
A$8 – A$15 | 292,968 | A$13.08 | 5.91 | 45,145 | A$13.11 | 3.40 | ||||||||||||||||||
A$15 – A$20 | 240,063 | A$17.69 | 4.75 | 144,344 | A$17.74 | 4.31 | ||||||||||||||||||
A$20 – A$30 | 528,715 | A$23.65 | 4.20 | 447,096 | A$23.96 | 4.15 | ||||||||||||||||||
|
|
|
| |||||||||||||||||||||
| 1,061,746 | A$19.38 | 4.80 | 636,585 | A$21.78 | 4.14 | |||||||||||||||||||
|
|
|
| |||||||||||||||||||||
ADSs: | ||||||||||||||||||||||||
US$8 – US$15 | 1,496,415 | US$13.19 | 5.97 | 226,465 | US$12.19 | 3.76 | ||||||||||||||||||
US$15 – US$20 | 863,775 | US$16.92 | 5.42 | 293,903 | US$16.92 | 5.42 | ||||||||||||||||||
US$20 – US$30 | 1,288,318 | US$20.65 | 4.23 | 1,060,985 | US$20.66 | 4.18 | ||||||||||||||||||
|
|
|
| |||||||||||||||||||||
| 3,648,508 | US$16.71 | 5.23 | 1,581,353 | US$18.75 | 4.35 | |||||||||||||||||||
|
|
|
| |||||||||||||||||||||
(ii) Cash-settled options
The fair value of cash-settled options is determined in the same manner as equity-settled options. The liability for cash-settled options is remeasured at each reporting date. The significant weighted assumptions used to remeasure the fair value at 30 June 2012 were as follows:
| Granted during year ended 30 June | 2012 | 2011 | ||||||
Risk-free interest rate | 2.7% | 2.6% | ||||||
Dividend yield | 3.0% | 3.0% | ||||||
Volatility | 34.0% | 34.0% | ||||||
Expected life (years) | 4.6 | 4.2 | ||||||
Share price at reporting date | A$9.61 | A$9.61 | ||||||
Weighted average fair value | A$1.47 | A$0.77 | ||||||
| Cash-settled options outstanding | Number of options 2012 | Weighted average exercise price $ 2012 | Number of options 2011 | Weighted average exercise price $ 2011 | ||||||||||||
Ordinary Shares: | ||||||||||||||||
Balance at 1 July | 238,722 | A$17.62 | - | - | ||||||||||||
Granted | 353,533 | A$13.07 | 241,329 | A$17.62 | ||||||||||||
Forfeited | (26,089 | ) | A$15.46 | (2,607 | ) | A$17.62 | ||||||||||
Exercised | - | - | - | - | ||||||||||||
|
|
|
| |||||||||||||
Balance at 30 June | 566,166 | A$14.88 | 238,722 | A$17.62 | ||||||||||||
|
|
|
| |||||||||||||
Exercisable at 30 June | 79,573 | A$17.62 | - | - | ||||||||||||
|
|
|
| |||||||||||||
90
Notes to the Consolidated Financial Statements
For the year ended 30 June 2012
Note 24 – Share ownership plans (continued)
(b) Long-Term Incentive Plan (“LTIP”) (continued)
(iii) Performance rights
Performance rights vest after a period of three to five years, but only if the performance hurdle has been met. Performance hurdles are either based on Total Shareholder Return (“TSR”) or on non-market based performance criteria. In the year ended 30 June 2012, 44,440 (2011: 104,677) share rights were forfeited as the performance conditions were not satisfied.
Performance-based share right grants made in the years ended 30 June 2012 and 2011 are measured using a TSR hurdle over a three year period (commencing at the beginning of the financial year) against a comparator group of companies. Full vesting of the performance share rights occurs when the Company’s TSR is at (or exceeds) the 75th percentile relative to the comparator group, scaling down to 50% vesting on a straight-line basis for median performance. Below median performance, no vesting occurs. Initial TSR performance is tested at the third anniversary of the commencement of the performance period, with subsequent performance testing possible at the fourth and fifth anniversaries of the commencement of the performance period.
The fair value of performance share rights granted is independently determined using a Black-Scholes method to produce a Monte-Carlo simulation model which allows for the incorporation for a TSR performance condition that must be met before the share rights vest. The significant weighted assumptions used to determine the fair value were as follows:
| Ordinary shares | ADSs | |||||||||||||||
| 2012 | 2011 | 2012 | 2011 | |||||||||||||
Dividend yield | 3.0% | 3.0% | 3.0% | 3.0% | ||||||||||||
Risk-free interest rate | 3.9% | 5.2% | 1.4% | 1.3% | ||||||||||||
Volatility | 43.0% | 49.0% | 51.0% | 59.0% | ||||||||||||
Share price at grant date | A$13.27 | A$17.81 | US$13.66 | US$16.90 | ||||||||||||
| Performance rights outstanding | Number of shares 2012 | Weighted average fair value at grant date $ 2012 | Number of shares 2011 | Weighted average fair value at grant date $ 2011 | ||||||||||||
Ordinary Shares: | ||||||||||||||||
Non-vested balance at 1 July | 544,846 | A$18.51 | 633,628 | A$22.61 | ||||||||||||
Granted | 242,432 | A$10.42 | 167,525 | A$14.04 | ||||||||||||
Forfeited/cancelled | (66,341 | ) | A$10.85 | (110,122 | ) | A$26.69 | ||||||||||
Vested1 | (13,990 | ) | A$28.04 | (146,185 | ) | A$24.97 | ||||||||||
|
|
|
| |||||||||||||
Non-vested balance at 30 June | 706,947 | A$16.27 | 544,846 | A$18.51 | ||||||||||||
|
|
|
| |||||||||||||
ADSs: | ||||||||||||||||
Balance at 1 July | 1,398,064 | US$10.08 | 674,990 | US$11.04 | ||||||||||||
Granted | 936,183 | US$8.24 | 741,883 | US$9.22 | ||||||||||||
Forfeited/cancelled | (55,412 | ) | US$9.40 | (18,809 | ) | US$10.56 | ||||||||||
Vested | - | - | - | - | ||||||||||||
|
|
|
| |||||||||||||
Non-vested balance at 30 June | 2,278,835 | US$9.34 | 1,398,064 | US$10.08 | ||||||||||||
|
|
|
| |||||||||||||
154,780 rights were settled in cash in 2011
91
Notes to the Consolidated Financial Statements
For the year ended 30 June 2012
Note 24 – Share ownership plans (continued)
(b) Long-Term Incentive Plan (“LTIP”) (continued)
(iv) Restricted share units
Restricted share units granted to employees typically vest over a period up to three years. The fair value of restricted share units is determined based on the market price of the Company’s shares on the date of grant and the Company’s dividend yield.
| Restricted share units outstanding | Number of shares 2012 | Weighted average fair value at grant date $ 2012 | Number of shares 2011 | Weighted average fair value at grant date $ 2011 | ||||||||||||
Ordinary Shares: | ||||||||||||||||
Non-vested balance at 1 July | 57,075 | A$16.46 | 19,042 | A$23.51 | ||||||||||||
Granted | - | - | 45,907 | A$14.86 | ||||||||||||
Forfeited/cancelled | (1,666 | ) | A$23.58 | - | - | |||||||||||
Vested | (8,873 | ) | A$22.96 | (7,874 | ) | A$24.17 | ||||||||||
|
|
|
| |||||||||||||
Non-vested balance at 30 June | 46,536 | A$14.96 | 57,075 | A$16.46 | ||||||||||||
|
|
|
| |||||||||||||
ADSs: | ||||||||||||||||
Balance at 1 July | 193,729 | US$18.49 | 80,210 | US$17.90 | ||||||||||||
Granted | 794,691 | US$11.94 | 149,720 | US$18.86 | ||||||||||||
Forfeited/cancelled | (7,733 | ) | US$19.13 | (12,036 | ) | US$19.06 | ||||||||||
Vested | (508,924 | ) | US$12.98 | (24,165 | ) | US$18.49 | ||||||||||
|
|
|
| |||||||||||||
Non-vested balance at 30 June | 471,763 | US$13.39 | 193,729 | US$18.49 | ||||||||||||
|
|
|
| |||||||||||||
(c) Former Executive Long-Term Incentive Plan (“LTI Share Plan”)
The LTI Share Plan was approved by shareholders in November 2004. Offers of shares under the LTI Share Plan were made to eligible Australian-based employees in the 2006 and 2007 financial years. At the beginning of the financial year, there were 23,626 shares outstanding under the LTI Share Plan. The performance conditions related to these shares were not met and as a result, the shares were all forfeited. There are no outstanding awards under the LTI Share Plan.
(d) Transition Incentive Share Plan related to the Metal Management merger
In accordance with the terms and conditions of the merger agreement with Metal Management Inc., the Sims Group Limited Transition Incentive Plan (“SGLTIP”) was established. The SGLTIP assumed the rights and obligations of Metal Management under its former plan (“MMI Plan”). No additional grants can be made under the SGLTIP.
The options assumed were held by the former directors of Metal Management Inc. who became directors of the Company on the merger date. Each outstanding share option under the MMI Plan was converted into 2.05 options of the Company. Each option represents the right to acquire one ADS. In addition, the exercise price of each outstanding option under the MMI Plan was converted at the same exchange ratio. All the options assumed were fully vested and therefore the fair value was recorded as a component of the purchase price for Metal Management Inc.
92
Notes to the Consolidated Financial Statements
For the year ended 30 June 2012
Note 24 – Share ownership plans (continued)
(d) Transition Incentive Share Plan related to the Metal Management merger (continued)
The following table sets out details of outstanding options under the SGLTIP:
| Number of options 2012 | Weighted average exercise price US$ 2012 | Number of options 2011 | Weighted average exercise price US$ 2011 | |||||||||||||
Balance at 1 July | 615,000 | $15.62 | 706,000 | $15.58 | ||||||||||||
Exercised | - | - | (91,000 | ) | $15.29 | |||||||||||
Forfeited/cancelled | (123,000 | ) | $22.55 | - | - | |||||||||||
|
|
|
| |||||||||||||
Balance at 30 June | 492,000 | $13.89 | 615,000 | $15.62 | ||||||||||||
|
|
|
| |||||||||||||
Exercisable at 30 June | 492,000 | $13.89 | 615,000 | $15.62 | ||||||||||||
|
|
|
| |||||||||||||
For options exercised during the year ended 30 June 2011, the weighted average share price at the date of exercise was US$20.39. The weighted average contractual life of options outstanding as at 30 June 2012 was 1.56 years (2011: 2.21 years).
Note 25 – Key management personnel disclosures
Key management personnel are those persons defined as having authority and responsibility for planning, directing and controlling the activities of the Group, either directly or indirectly, including any Director (Executive or Non-Executive). Please refer to the Directors’ Report for information regarding each key management person.
(a) Key management personnel compensation
| 2012 A$ | 2011 A$ | |||||||
Short-term benefits | 8,940,445 | 10,788,124 | ||||||
Long-term benefits | 29,120 | 31,823 | ||||||
Post-employment benefits | 358,693 | 329,944 | ||||||
Share-based payments | 7,505,311 | 6,988,624 | ||||||
|
|
|
| |||||
| 16,833,569 | 18,138,515 | |||||||
|
|
|
| |||||
The Group has taken advantage of the relief provided by ASIC Class Order 06/50 and has transferred the detailed remuneration disclosures to the Remuneration Report, which is presented in the Directors’ Report.
(b) Equity instrument disclosures relating to key management personnel
(i) Options provided as remuneration and shares issued on exercise of such options
Details of options provided as remuneration and shares issued on the exercise of such options, together with terms and conditions of the options, can be found in the Remuneration Report.
93
Notes to the Consolidated Financial Statements
For the year ended 30 June 2012
Note 25 – Key management personnel disclosures (continued)
(b) Equity instrument disclosures relating to key management personnel (continued)
(ii) Share holdings
The number of shares in the Company held during the financial year by each Director and other key management personnel, including their personally related parties, is set out below:
| 2012 | Received | Other | ||||||||||||||||||
| Balance at | on exercise | changes | Balance | |||||||||||||||||
| 1 July | of options | Purchases/ | during the | at 30 June | ||||||||||||||||
Name | 2011 | or rights | (sales) | year | 2012 | |||||||||||||||
Non-Executive Directors: | ||||||||||||||||||||
N Bobins (ADS) | 54,600 | - | - | - | 54,600 | |||||||||||||||
G Brunsdon1 | 3,952 | - | - | 105 | 4,057 | |||||||||||||||
M Feeney | 27,789 | - | 5,000 | - | 32,789 | |||||||||||||||
G Morris (ADS) | 30,000 | - | (15,000 | ) | - | 15,000 | ||||||||||||||
C Renwick | 3,144 | - | - | - | 3,144 | |||||||||||||||
M Sukagawa | - | - | 3,000 | - | 3,000 | |||||||||||||||
J Thompson (ADS) | 5,000 | - | 7,000 | - | 12,000 | |||||||||||||||
P Varello (ADS) | 74,925 | - | 22,700 | - | 97,625 | |||||||||||||||
Executive Director: | ||||||||||||||||||||
D Dienst (ADS)3 | 597,293 | 181,654 | (181,654 | ) | (4,700 | ) | 592,593 | |||||||||||||
Senior Executives: | ||||||||||||||||||||
G Davy | 67,170 | 2,869 | - | - | 70,039 | |||||||||||||||
R Kelman (ADS) | - | - | - | - | - | |||||||||||||||
R Larry (ADS) | 54,477 | 5,261 | (1,671 | ) | - | 58,067 | ||||||||||||||
D McGree | 47,462 | - | - | - | 47,462 | |||||||||||||||
A Ratner (ADS)4 | 75,718 | - | - | - | 75,718 | |||||||||||||||
| 2011 | Received | Other | ||||||||||||||||||
| Balance at | on exercise | changes | Balance | |||||||||||||||||
| 1 July | of options | Purchases/ | during the | at 30 June | ||||||||||||||||
Name | 2010 | or rights | (sales) | year | 2011 | |||||||||||||||
Non-Executive Directors: | ||||||||||||||||||||
N Bobins (ADS) | 54,600 | - | - | - | 54,600 | |||||||||||||||
G Brunsdon1 | 3,870 | - | - | 82 | 3,952 | |||||||||||||||
M Feeney | 27,789 | - | - | - | 27,789 | |||||||||||||||
R Lewon (ADS)2 | - | 29,500 | (29,500 | ) | - | - | ||||||||||||||
G Morris (ADS) | 25,000 | 61,500 | (56,500 | ) | - | 30,000 | ||||||||||||||
C Renwick | 3,144 | - | - | - | 3,144 | |||||||||||||||
J Thompson (ADS) | - | - | 5,000 | - | 5,000 | |||||||||||||||
P Varello (ADS) | 52,125 | - | 22,800 | - | 74,925 | |||||||||||||||
Executive Director: | ||||||||||||||||||||
D Dienst (ADS)3 | 603,293 | - | - | (6,000 | ) | 597,293 | ||||||||||||||
Senior Executives: | ||||||||||||||||||||
G Davy | 57,686 | 9,484 | - | - | 67,170 | |||||||||||||||
R Kelman (ADS) | 14,979 | 64,705 | (79,684 | ) | - | - | ||||||||||||||
R Larry (ADS) | 80,972 | 5,260 | (31,755 | ) | - | 54,477 | ||||||||||||||
D McGree | 42,099 | 5,363 | - | - | 47,462 | |||||||||||||||
A Ratner (ADS) | 87,959 | - | (12,241 | ) | - | 75,718 | ||||||||||||||
1Other changes for Mr Brunsdon represent shares issued under the dividend reinvestment plan.
2Mr Lewon retired from the Board of Directors on 10 November 2011.
3Other changes for Mr Dienst represent a charitable gift.
4Effective 1 February 2012, Mr Ratner is no longer a key management person.
94
Notes to the Consolidated Financial Statements
For the year ended 30 June 2012
Note 25 – Key management personnel disclosures (continued)
(b) Equity instrument disclosures relating to key management personnel (continued)
(iii) Option holdings
The number of options over ordinary shares or ADSs in the Company held during the financial year by each Director and other key management personnel, including their personally related parties, are set out below:
| 2012 | Balance | Balance | ||||||||||||||||||||||||||
| at 1 July | at 30 June | |||||||||||||||||||||||||||
Name | 2011 | Granted | Exercised | Forfeited | 2012 | Vested | Unvested | |||||||||||||||||||||
Non-Executive Directors: | ||||||||||||||||||||||||||||
R Lewon (ADS)1 | 61,500 | - | - | (61,500) | - | - | - | |||||||||||||||||||||
G Morris (ADS) | 143,500 | - | - | (61,500) | 82,000 | 82,000 | - | |||||||||||||||||||||
Executive Director: | ||||||||||||||||||||||||||||
D Dienst (ADS) | 973,599 | 283,695 | (181,654) | - | 1,075,640 | 596,660 | 478,980 | |||||||||||||||||||||
Senior Executives: | ||||||||||||||||||||||||||||
G Davy | 128,653 | 71,274 | - | - | 199,927 | 87,928 | 111,999 | |||||||||||||||||||||
R Kelman (ADS) | 125,112 | 70,924 | - | - | 196,036 | 76,156 | 119,880 | |||||||||||||||||||||
R Larry (ADS) | 229,443 | 88,655 | - | - | 318,098 | 168,248 | 149,850 | |||||||||||||||||||||
D McGree2 | 151,004 | 87,260 | - | - | 238,264 | 97,660 | 140,604 | |||||||||||||||||||||
A Ratner (ADS) | 183,555 | 70,924 | - | - | 254,479 | 134,599 | 119,880 | |||||||||||||||||||||
| 2011 | Balance | Balance | ||||||||||||||||||||||||||
| at 1 July | at 30 June | |||||||||||||||||||||||||||
Name | 2010 | Granted | Exercised | Forfeited | 2011 | Vested | Unvested | |||||||||||||||||||||
Non-Executive Directors: | ||||||||||||||||||||||||||||
R Lewon (ADS)1 | 91,000 | - | (29,500) | - | 61,500 | 61,500 | - | |||||||||||||||||||||
G Morris (ADS) | 205,000 | - | (61,500) | - | 143,500 | 143,500 | - | |||||||||||||||||||||
Executive Director: | ||||||||||||||||||||||||||||
D Dienst (ADS) | 769,691 | 203,908 | - | - | 973,599 | 590,447 | 383,152 | |||||||||||||||||||||
Senior Executives: | ||||||||||||||||||||||||||||
G Davy | 86,181 | 42,472 | - | - | 128,653 | 45,043 | 83,610 | |||||||||||||||||||||
R Kelman (ADS) | 132,578 | 50,977 | (58,443) | - | 125,112 | 14,971 | 110,141 | |||||||||||||||||||||
R Larry (ADS) | 165,722 | 63,721 | - | - | 229,443 | 91,767 | 137,676 | |||||||||||||||||||||
D McGree2 | 94,442 | 56,562 | - | - | 151,004 | 47,325 | 103,679 | |||||||||||||||||||||
A Ratner (ADS) | 132,578 | 50,977 | - | - | 183,555 | 73,414 | 110,141 | |||||||||||||||||||||
1Mr Lewon retired from the Board of Directors on 10 November 2011.
2Options granted to Mr McGree in the 2011 and 2012 financial years are phantom options, which are cash-settled.
95
Notes to the Consolidated Financial Statements
For the year ended 30 June 2012
Note 25 – Key management personnel disclosures (continued)
(b) Equity instrument disclosures relating to key management personnel (continued)
(iv) Rights and award holdings
The number of rights to ordinary shares or ADSs in the Company held during the financial year by each Executive Director and other key management personnel, including their personally related parties, are set out below:
| 2012 | Balance | Balance | ||||||||||||||||||
| at 1 July | at 30 June | |||||||||||||||||||
Name | 2011 | Granted | Vested | Forfeited | 2012 | |||||||||||||||
Executive Director: | ||||||||||||||||||||
D Dienst (ADS) | 529,963 | 332,916 | - | - | 862,879 | |||||||||||||||
Senior Executives: | ||||||||||||||||||||
G Davy | 95,896 | 28,733 | (2,869) | - | 121,760 | |||||||||||||||
R Kelman (ADS) | 116,476 | 41,615 | - | - | 158,091 | |||||||||||||||
R Larry (ADS) | 133,140 | 52,018 | (5,261) | - | 179,897 | |||||||||||||||
D McGree | 77,300 | 35,178 | - | - | 112,478 | |||||||||||||||
A Ratner (ADS) | 98,094 | 41,615 | - | - | 139,709 | |||||||||||||||
| 2011 | Balance | Balance | ||||||||||||||||||
| at 1 July | at 30 June | |||||||||||||||||||
Name | 2010 | Granted | Vested | Forfeited | 2011 | |||||||||||||||
Executive Director: | ||||||||||||||||||||
D Dienst (ADS) | 258,098 | 271,865 | - | - | 529,963 | |||||||||||||||
Senior Executives: | ||||||||||||||||||||
G Davy | 58,077 | 47,303 | (9,484) | - | 95,896 | |||||||||||||||
R Kelman (ADS) | 88,755 | 33,983 | (6,262) | - | 116,476 | |||||||||||||||
R Larry (ADS) | 95,921 | 42,479 | (5,260) | - | 133,140 | |||||||||||||||
D McGree | 58,146 | 24,517 | (5,363) | - | 77,300 | |||||||||||||||
A Ratner (ADS) | 72,653 | 33,983 | (8,542) | - | 98,094 | |||||||||||||||
(c) Other transactions with key management personnel
Transactions entered into with any Directors or other key management personnel of the Group, including their personally related parties, are at normal commercial terms.
During the year ended 30 June 2012, a company related to Mr Varello was paid US$13,432 for administrative services (2011: US$20,148).
Mr Sukagawa is the representative director for Mitsui & Co. As Mr Sukagawa is employed by Mitsui, his Director remuneration is paid directly to Mitsui. During the year ended 30 June 2012, the Group paid A$203,424 to Mitsui for Director remuneration for Mr Sukagawa (2011: A$195,600).
In February 2012, the Group entered into an agreement with Mr Lewon, who retired from the Board on 10 November 2011. Pursuant to the agreement, Mr Lewon is providing services with respect to certain business development activities in North America. Payments made under the agreement to Mr Lewon during the year ended 30 June 2012 were US$50,000.
96
Notes to the Consolidated Financial Statements
For the year ended 30 June 2012
Note 26 – Remuneration of auditors
It is the Group’s policy to employ PricewaterhouseCoopers on assignments additional to their statutory audit duties where PricewaterhouseCoopers’ expertise and experience with the Group are important. These assignments are principally for tax advice and due diligence on acquisitions, or where PricewaterhouseCoopers is awarded assignments on a competitive basis. All audit and non-audit services provided by PricewaterhouseCoopers are subject to pre-approval by the RAC of the Board in accordance with the Group Independence Policy.
The following fees were paid and payable for services provided by the auditor of the Group and its related practices:
| 2012 | 2011 | |||||||
| A$’000 | A$’000 | |||||||
PricewaterhouseCoopers Australia: | ||||||||
Audit and review of financial statements | 2,116 | 2,264 | ||||||
Audit-related fees1 | 170 | 55 | ||||||
Taxation services | 21 | 13 | ||||||
|
|
|
| |||||
| 2,307 | 2,332 | |||||||
|
|
|
| |||||
Network firms of PricewaterhouseCoopers Australia: | ||||||||
Audit and review of financial statements | 3,034 | 3,032 | ||||||
Taxation services | 5 | 294 | ||||||
Other | 2 | 11 | ||||||
|
|
|
| |||||
| 3,041 | 3,337 | |||||||
|
|
|
| |||||
Total remuneration for PricewaterhouseCoopers | 5,348 | 5,669 | ||||||
|
|
|
| |||||
1Audit-related fees include due diligence related to acquisitions, internal control reviews, accounting consultations and regulatory related matters.
Note 27 – Business acquisitions and disposals
During the year ended 30 June 2012, the Group acquired thirteen businesses. None of the acquisitions were significant in terms of purchase price. On a combined basis, had the acquisitions all occurred on 1 July 2011, there would not have been a significant change to the Group’s revenue and net profit. Additionally, revenue and net profit contribution by the businesses acquired to the Group post-acquisition was not significant.
(a) Purchase consideration and assets and liabilities acquired
Details of the aggregate purchase consideration and cash outflow are as follows:
| A$m | ||||
Cash paid for current year acquisitions | 87.5 | |||
Cash acquired | (5.3 | ) | ||
|
| |||
Cash outflow for acquisitions | 82.2 | |||
|
| |||
97
Notes to the Consolidated Financial Statements
For the year ended 30 June 2012
Note 27 – Business acquisitions and disposals (continued)
(a) Purchase consideration and assets and liabilities acquired (continued)
Assets and liabilities arising from current year acquisitions are as follows:
| Fair | ||||
| value | ||||
| A$m | ||||
Cash | 5.3 | |||
Trade and other receivables | 3.2 | |||
Inventories | 1.5 | |||
Property, plant and equipment (Note 12) | 35.9 | |||
Identified intangible assets (Note 14) | 9.4 | |||
Deferred tax assets | 2.7 | |||
Trade and other payables | (4.2 | ) | ||
Current tax liabilities | (0.1 | ) | ||
Non-current payables | (0.1 | ) | ||
Deferred tax liability | (3.1 | ) | ||
|
| |||
Net assets acquired | 50.5 | |||
|
| |||
Goodwill recognised from current year acquisitions are as follows:
| A$m | ||||
Total cash consideration | 87.5 | |||
Deferred cash consideration | 1.7 | |||
Less: net assets acquired | (50.5 | ) | ||
|
| |||
Goodwill on acquisition | 38.7 | |||
|
| |||
The initial accounting for some of the current year acquisitions has only been provisionally determined. The goodwill is attributable to several factors including, site locations, synergies existing in the operations acquired and the assembled workforce, which together contribute to the profitability of the acquired businesses. Some of the goodwill recognised is expected to be deductible for income tax purposes.
(c) Disposals
In February 2012, the Group sold its 50% ownership interest in the secondary lead producing facility in Sydney, Australia of Australian Refined Alloys to companies associated with Renewed Metal Technologies for total sales proceeds of A$40.0 million. The disposal transaction was an asset sale only comprising the sale of land, buildings, and plant and equipment. The gain on the disposal of the assets recorded in other income in the year ended 30 June 2012, was calculated as follows:
| A$m | ||||||||
Consideration received | 40.0 | |||||||
Net carrying value of disposed assets: | ||||||||
Land and buildings | (2.4 | ) | ||||||
Plant and equipment | (1.3 | ) | ||||||
Capital work-in-progress | (0.2 | ) | ||||||
|
| |||||||
| (3.9 | ) | |||||||
Disposal costs | (0.4 | ) | ||||||
|
| |||||||
| 35.7 | ||||||||
|
| |||||||
Following the sale, the Group continues to retain its 50% ownership in the secondary lead producing facility in Melbourne, Australia.
98
Notes to the Consolidated Financial Statements
For the year ended 30 June 2012
Note 28 – Subsidiaries
The consolidated financial statements incorporate the assets, liabilities and results of the following subsidiaries in accordance with the accounting policy described in Note 1.
| Country of | Equity holding % | |||||||||
Name of entity | Incorporation | 2012 | 2011 | |||||||
Sims Metal Management Limited | Australia | |||||||||
Sims Group Australia Holdings Limited (i) | Australia | 100% | 100% | |||||||
Sims Aluminium Pty Limited (i) | Australia | 100% | 100% | |||||||
Sims E-Recycling Pty Limited | Australia | 90% | 90% | |||||||
Simsmetal Holdings Pty Limited | Australia | 100% | 100% | |||||||
Simsmetal Properties QLD Pty Limited | Australia | 100% | 100% | |||||||
Sims Industrial Pty Limited | Australia | 100% | 100% | |||||||
Simsmetal Services Pty Limited (i) | Australia | 100% | 100% | |||||||
Simsmetal Properties NSW Pty Limited | Australia | 100% | 100% | |||||||
Sims Group Holdings 3 Pty Limited | Australia | 100% | 100% | |||||||
Universal Inspection and Testing Company Pty Limited | Australia | 100% | 100% | |||||||
Sims Group Holdings 1 Pty Ltd | Australia | 100% | 100% | |||||||
Sims Group Holdings 2 Pty Ltd | Australia | 100% | 100% | |||||||
Electronic Product Stewardship Australasia Pty Limited (ii) | Australia | 100% | 0% | |||||||
Sims Recycling Solutions Holding Austria GmbH | Austria | 100% | 100% | |||||||
Sims Recycling Solutions Anteilsverwaltung Austria GmbH | Austria | 100% | 100% | |||||||
Sims metrade GmbH | Austria | 100% | 100% | |||||||
Sims Recycling Solutions NV | Belgium | 100% | 100% | |||||||
Sims Group Recycling Solutions Canada Ltd | Canada | 100% | 100% | |||||||
Sims Group Canada Holdings Limited | Canada | 100% | 100% | |||||||
ErgoTrade d.o.o. | Croatia | 100% | 100% | |||||||
Sims Lifecycle Services s.r.o. | Czech Republic | 100% | 100% | |||||||
Sims Recycling Solutions FZE | Dubai | 100% | 0% | |||||||
Sims Recycling Solutions SARL | France | 100% | 100% | |||||||
Sims Group German Holdings GmbH | Germany | 100% | 100% | |||||||
Sims M+R GmbH | Germany | 100% | 100% | |||||||
Sims Lifecycle Services GmbH | Germany | 100% | 100% | |||||||
Sims Metal Management Asia Limited | Hong Kong | 100% | 100% | |||||||
Sims Metal Management China Holdings Limited | Hong Kong | 100% | 100% | |||||||
Sims Metal Management Dragon Holdings Limited (ii) | Hong Kong | 100% | 0% | |||||||
Sims Lifecycle Services Kft. | Hungary | 100% | 100% | |||||||
Trishyiraya Recycling India Private Limited | India | 100% | 100% | |||||||
Sims Recycling Solutions India Private Limited (formerly | India | 100% | 100% | |||||||
Sims Group Mauritius Limited | Mauritius | 100% | 100% | |||||||
Mirec BV | Netherlands | 100% | 100% | |||||||
Sims Recycling Solutions Coöperatief B.A. | Netherlands | 100% | 100% | |||||||
Sims Lifecycle Services BV | Netherlands | 100% | 100% | |||||||
Sims E-Recycling (NZ) Limited | New Zealand | 90% | 90% | |||||||
Simsmetal Industries Limited | New Zealand | 100% | 100% | |||||||
PNG Recycling Limited | Papua New Guinea | 100% | 100% | |||||||
Gaukara Company No. 2 Limited (ii) | Papua New Guinea | 100% | 0% | |||||||
Sims Recycling Solutions Sp. z.o.o. (formerly Device Polska Sp. z.o.o.) | Poland | 100% | 100% | |||||||
Sims Recycling Solutions Africa Pty Ltd | Republic of South Africa | 100% | 100% | |||||||
Sims Recycling Solutions Pte. Ltd. | Singapore | 100% | 100% | |||||||
99
Notes to the Consolidated Financial Statements
For the year ended 30 June 2012
Note 28 – Subsidiaries (continued)
| Country of | Equity holding % | |||||||||
Name of entity | Incorporation | 2012 | 2011 | |||||||
Sims Recycling Solutions AB | Sweden | 100% | 100% | |||||||
Sims Group UK Holdings Limited | UK | 100% | 100% | |||||||
Sims Group UK Intermediate Holdings Limited | UK | 100% | 100% | |||||||
Sims Group UK Limited | UK | 100% | 100% | |||||||
C Herring & Son Limited | UK | 100% | 100% | |||||||
Life Cycle Services Limited | UK | 100% | 100% | |||||||
All Metal Recovery Limited | UK | 100% | 100% | |||||||
All Metal Recovery Cradley Heath Limited | UK | 100% | 100% | |||||||
ER Coley (Steel) Limited | UK | 100% | 100% | |||||||
ER Coley (Cast) Limited | UK | 100% | 100% | |||||||
Evans & Mondon Limited | UK | 100% | 100% | |||||||
Sims Recycling Solutions UK Holdings Limited | UK | 100% | 100% | |||||||
Sims Recycling Solutions UK Group Limited | UK | 100% | 100% | |||||||
Sims Recycling Solutions UK Limited | UK | 100% | 100% | |||||||
United Castings Limited | UK | 100% | 100% | |||||||
Sims Group UK Pension Trustees Limited | UK | 100% | 100% | |||||||
Recommit Limited | UK | 100% | 100% | |||||||
Sims Cymru Limited | UK | 100% | 100% | |||||||
Cooper Metal Recycling Limited | UK | 100% | 100% | |||||||
Dunn Brothers (1995) Limited | UK | 100% | 100% | |||||||
Brook Street Metal Co. Limited (ii) | UK | 100% | 0% | |||||||
Deane Wood Export Limited (ii) | UK | 100% | 0% | |||||||
S3 Interactive Limited (ii) | UK | 100% | 0% | |||||||
Sims FE Mottram Limited (ii) | UK | 100% | 0% | |||||||
Sims Recycling Solutions Inc. | USA | 100% | 100% | |||||||
Sims Recycling Solutions Holdings Inc. | USA | 100% | 100% | |||||||
Global Investment Recovery, Incorporated (iii) | USA | 0% | 100% | |||||||
Sims Metal Management USA GP | USA | 100% | 100% | |||||||
Sims Group USA Holdings Corporation | USA | 100% | 100% | |||||||
SHN Co., LLC (iii) | USA | 0% | 100% | |||||||
HNW Recycling LLC (iii) | USA | 0% | 100% | |||||||
HNE Recycling LLC (iii) | USA | 0% | 100% | |||||||
Dover Barge Company | USA | 100% | 100% | |||||||
North Carolina Resource Conservation LLC (iii) | USA | 0% | 100% | |||||||
Simsmetal East LLC | USA | 100% | 100% | |||||||
Sims Municipal Recycling of New York LLC | USA | 100% | 100% | |||||||
Schiabo Larovo Corporation | USA | 100% | 100% | |||||||
Simsmetal West LLC | USA | 100% | 100% | |||||||
Sims Group Global Trade Corporation | USA | 100% | 100% | |||||||
Sims Group USA Corporation | USA | 100% | 100% | |||||||
Metal Management, Inc. | USA | 100% | 100% | |||||||
MM Metal Dynamics Holdings, Inc. (iii) | USA | 0% | 100% | |||||||
Metal Dynamics LLC (iii) | USA | 0% | 100% | |||||||
Metal Dynamics Detroit LLC | USA | 100% | 100% | |||||||
SMM Gulf Coast LLC (formerly: TH Properties LLC) | USA | 100% | 100% | |||||||
Metal Management Midwest, Inc. | USA | 100% | 100% | |||||||
CIM Trucking, Inc. | USA | 100% | 100% | |||||||
Metal Management Indiana, Inc. | USA | 100% | 100% | |||||||
Metal Management Memphis, L.L.C. | USA | 100% | 100% | |||||||
Metal Management Ohio, Inc. | USA | 100% | 100% | |||||||
SMM – North America Trade Corporation | USA | 100% | 100% | |||||||
100
Notes to the Consolidated Financial Statements
For the year ended 30 June 2012
Note 28 – Subsidiaries (continued)
| �� | ||||||||||
| Country of | Equity holding % | |||||||||
Name of entity | Incorporation | 2012 | 2011 | |||||||
Metal Management Pittsburgh, Inc. | USA | 100% | 100% | |||||||
Metal Management Aerospace, Inc. | USA | 100% | 100% | |||||||
Metal Management West Coast Holdings, Inc. (iii) | USA | 0% | 100% | |||||||
Metal Management West, Inc. (iii) | USA | 0% | 100% | |||||||
Metal Management Arizona, L.L.C. | USA | 100% | 100% | |||||||
Proler Southwest GP, Inc. (iii) | USA | 0% | 100% | |||||||
Metal Management Proler Southwest, Inc. (iii) | USA | 0% | 100% | |||||||
Proler Southwest Corporation (formerly: Proler Southwest LP) | USA | 100% | 100% | |||||||
SMM South Corporation (formerly: Metal Management Alabama, Inc.) | USA | 100% | 100% | |||||||
Metal Management Mississippi, Inc. (iii) | USA | 0% | 100% | |||||||
Naporano Iron & Metal, Inc. | USA | 100% | 100% | |||||||
Metal Management Northeast, Inc. | USA | 100% | 100% | |||||||
SMM New England Corporation | USA | 100% | 100% | |||||||
New York Recycling Ventures, Inc. | USA | 100% | 100% | |||||||
Metal Management New Haven, Inc. (iii) | USA | 0% | 100% | |||||||
Reserve Iron & Metal Limited Partnership | USA | 100% | 100% | |||||||
Port Albany Ventures, LLC | USA | 100% | 100% | |||||||
SMM Southeast LLC (ii) | USA | 100% | 0% | |||||||
(i) These subsidiaries and the Company are parties to a DCG under which each entity guarantees the debts of the others. The above entities represent a Closed Group and an Extended Closed Group for the purposes of the relevant Australian Securities and Investments Commission Class Order.
(ii) These subsidiaries were acquired or incorporated during the year.
(iii) These subsidiaries were de-registered during the year.
The voting power held in each subsidiary is proportionate to the equity holdings.
Deed of Cross Guarantee
Sims Metal Management Limited, Sims Group Australia Holdings Limited, Sims Aluminium Pty Limited and Simsmetal Services Pty Limited are parties to a DCG under which each Group guarantees the debts of the others. By entering into the DCG, the wholly-owned entities have been relieved from the requirements to prepare a financial report and directors report under Class Order 98/1418 (as amended) issued by ASIC.
The above companies represent a “Closed Group” for the purposes of the Class Order. As there are no other parties to the DCG that are controlled by Sims Metal Management Limited, they also represent the “Extended Closed Group”.
101
Notes to the Consolidated Financial Statements
For the year ended 30 June 2012
Note 28 – Subsidiaries (continued)
Deed of Cross Guarantee (continued)
Set out below is a condensed consolidated income statement, a consolidated statement of comprehensive income, a summary of movements in consolidated retained earnings and a consolidated statement of financial position for the Closed Group.
| 2012 A$m | 2011 A$m | |||||||
(i) Condensed consolidated income statement | ||||||||
(Loss)/profit before income tax1 | (554.4 | ) | 49.4 | |||||
Income tax expense | (15.3 | ) | (10.8 | ) | ||||
|
|
|
| |||||
(Loss)/profit after tax | (569.7 | ) | 38.6 | |||||
|
|
|
| |||||
12012 amount includes a non-cash impairment charge of A$640.0 million after tax against the parent entity’s investment in subsidiaries which are not part of the Closed Group.
| (ii) Consolidated statement of comprehensive income | ||||||||
(Loss)/profit after tax | (569.7 | ) | 38.6 | |||||
Other comprehensive income: | ||||||||
Changes in the fair value of derivatives held as cash flow hedges, net of tax | 0.4 | 1.7 | ||||||
Actuarial (loss)/gain on defined benefit plans, net of tax | (4.0 | ) | 0.9 | |||||
Share of other comprehensive income from associates | (0.1 | ) | - | |||||
|
|
|
| |||||
Other comprehensive income for the year, net of tax | (3.7 | ) | 2.6 | |||||
|
|
|
| |||||
Total comprehensive (loss)/income for the year | (573.4 | ) | 41.2 | |||||
|
|
|
|
| (iii) Summary of movements in consolidated retained earnings | ||||||||
Balance at 1 July | 122.5 | 154.5 | ||||||
(Loss)/profit for the year | (569.7 | ) | 38.6 | |||||
Actuarial (loss)/gain on defined benefit plan, net of tax | (4.0 | ) | 0.9 | |||||
Dividends provided for or paid | (92.7 | ) | (71.5 | ) | ||||
|
|
|
| |||||
Balance at 30 June | (543.9 | ) | 122.5 | |||||
|
|
|
|
102
Notes to the Consolidated Financial Statements
For the year ended 30 June 2012
Note 28 – Subsidiaries (continued)
| Deed of Cross Guarantee (continued) | 2012 A$m | 2011 A$m | ||||||
(iv) Consolidated statement of financial position | ||||||||
ASSETS | ||||||||
Current assets | ||||||||
Cash and cash equivalents | 1.9 | 16.9 | ||||||
Trade and other receivables | 651.0 | 455.6 | ||||||
Inventory | 147.0 | 136.3 | ||||||
Other financial assets | 3.2 | 3.5 | ||||||
|
|
|
| |||||
Total current assets | 803.1 | 612.3 | ||||||
|
|
|
| |||||
Non-current assets | ||||||||
Investments accounted for using the equity method | 22.6 | 21.2 | ||||||
Other financial assets | 1,873.9 | 2,515.4 | ||||||
Property, plant and equipment | 134.8 | 118.8 | ||||||
Deferred tax assets | 29.0 | 36.2 | ||||||
Goodwill | 35.6 | 24.7 | ||||||
Other intangible assets | 2.9 | 2.5 | ||||||
|
|
|
| |||||
Total non-current assets | 2,098.8 | 2,718.8 | ||||||
|
|
|
| |||||
Total assets | 2,901.9 | 3,331.1 | ||||||
|
|
|
| |||||
LIABILITIES | ||||||||
Current liabilities | ||||||||
Trade and other payables | 480.3 | 237.5 | ||||||
Borrowings | 13.6 | - | ||||||
Current tax liabilities | 5.8 | 15.2 | ||||||
Provisions | 17.3 | 16.0 | ||||||
|
|
|
| |||||
Total current liabilities | 517.0 | 268.7 | ||||||
|
|
|
| |||||
Non-current liabilities | ||||||||
Payables | 1.0 | - | ||||||
Borrowings | 10.5 | 28.0 | ||||||
Deferred tax liabilities | 9.5 | 18.0 | ||||||
Provisions | 1.6 | 2.4 | ||||||
Retirement benefit obligations | 4.6 | 0.9 | ||||||
|
|
|
| |||||
Total non-current liabilities | 27.2 | 49.3 | ||||||
|
|
|
| |||||
Total liabilities | 544.2 | 318.0 | ||||||
|
|
|
| |||||
Net assets | 2,357.7 | 3,013.1 | ||||||
|
|
|
| |||||
EQUITY | ||||||||
Contributed equity | 2,804.3 | 2,817.9 | ||||||
Reserves | 97.3 | 72.7 | ||||||
Retained (deficit)/earnings | (543.9 | ) | 122.5 | |||||
|
|
|
| |||||
Total equity | 2,357.7 | 3,013.1 | ||||||
|
|
|
| |||||
103
Notes to the Consolidated Financial Statements
For the year ended 30 June 2012
Note 29 – Investments in associates and jointly controlled entities
(a) Carrying amounts of associates and jointly controlled entities
Name of associate or jointly controlled entity | Country of incorporation | Ownership interest % | ||||||||
| 2012 | 2011 | |||||||||
SA Recycling LLC | USA | 50 | 50 | |||||||
Metal Management Nashville, LLC | USA | 50 | 50 | |||||||
Rondout Iron & Metal Company LLC | USA | 50 | 50 | |||||||
Richmond Steel Recycling Limited | Canada | 50 | 50 | |||||||
LMS Energy Pty Ltd (“LMS”) | Australia | 50 | 50 | |||||||
Australia Refined Alloys Pty Limited | Australia | - | 50 | |||||||
Simstar Alloys Pty Limited | Australia | 50 | - | |||||||
ITL Logistics GmbH | Germany | 34 | 34 | |||||||
Chiho-Tiande Group Limited (“CTG”) | Cayman Islands | 16 | - | |||||||
Extruded Metals (New Zealand) Limited | New Zealand | - | 33 | |||||||
Other than LMS, the principal activity of all other associates or jointly controlled entities is metal recycling. LMS is a specialist landfill gas and renewable energy company, which researches, installs and develops landfill gas extraction systems, renewable energy and power generation technologies.
(b) Movements in carrying amounts
| 2012 A$m | 2011 A$m | |||||||
Balance at 1 July | 310.3 | 369.5 | ||||||
Acquisitions (c) | 93.5 | - | ||||||
Share of results | (10.3 | ) | 25.7 | |||||
Share of other comprehensive income of associates | (0.4 | ) | - | |||||
Accretion of deferred gain to equity accounted profit | 2.3 | 2.4 | ||||||
Equity accounting elimination (Note 11) | 2.5 | - | ||||||
Dividends received | (5.1 | ) | (15.8 | ) | ||||
Return of capital | (0.3 | ) | - | |||||
Impairment of goodwill in jointly controlled entity (d) | (57.5 | ) | - | |||||
Foreign exchange differences | 16.1 | (71.5 | ) | |||||
|
|
|
| |||||
Balance at 30 June | 351.1 | 310.3 | ||||||
|
|
|
| |||||
(c) Acquisitions
On 17 January 2012, the Group acquired 16% of the existing shares of CTG, a Hong Kong listed metals and electronics recycler with operations in the People’s Republic of China and Hong Kong. The shares were acquired from founder Chairman Ankong Fang and Delco Participation B.V. (Delco), a Netherlands-based investment holding company, for total consideration of HK$750.1 million (A$93.1 million). The cost of the acquisition also includes transaction costs of A$0.4 million. In addition, Delco granted an option to the Group to acquire a further 2% of CTG (see Note 11).
The Group accounts for CTG as an associate although the Group holds less than 20% equity interest. This is because the Group exercises significant influence through its nominated director’s active participation on CTG’s board of directors as well as a significant trading relationship with CTG.
104
Notes to the Consolidated Financial Statements
For the year ended 30 June 2012
Note 29 – Investments in associates and jointly controlled entities (continued)
(d) Impairment of goodwill in jointly controlled entity
On a regular basis, investments in associates and jointly controlled entities are tested for impairment if the Group believes events or changes in circumstances indicate that the carrying value amount may not be recoverable. An impairment loss is recognised for the amount by which the carrying amount of the investment exceeds its recoverable amount. The recoverable amount is the higher of an investment’s fair value less costs to sell and value-in-use.
In the year ended 30 June 2012, SA Recycling LLC recognised an impairment on goodwill, of which the Group’s pre-tax share was A$57.5 million. This has been recognised in the income statement in the period. The impairment represents the portion of SA Recycling LLC’s goodwill attributable to the Group which was determined to be not recoverable based on the value in use of the business. Similar to the Group’s North America Metals CGU, SA Recycling LLC has been impacted by current economic conditions which have impacted its financial results and future forecasts.
(e) Summarised financial information of associates and jointly controlled entities
| Group’s share of assets and liabilities | 2012 A$m | 2011 A$m | ||||||
Current assets | 207.4 | 102.4 | ||||||
Non-current assets | 269.2 | 236.3 | ||||||
|
|
|
| |||||
Total assets | 476.6 | 338.7 | ||||||
|
|
|
| |||||
Current liabilities | 95.8 | 32.7 | ||||||
Non-current liabilities | 102.9 | 74.7 | ||||||
|
|
|
| |||||
Total liabilities | 198.7 | 107.4 | ||||||
|
|
|
| |||||
Net assets | 277.9 | 231.3 | ||||||
|
|
|
| |||||
| Group’s share of revenue, expenses and results | 2012 A$m | 2011 A$m | 2010 A$m | |||||||||
Revenues | 837.9 | 774.3 | 596.3 | |||||||||
Expenses | (845.7 | ) | (747.2 | ) | (578.8 | ) | ||||||
|
|
|
|
|
| |||||||
(Loss)/profit before income tax | (7.8 | ) | 27.1 | 17.5 | ||||||||
Tax expense | (2.5 | ) | (1.4 | ) | (2.4 | ) | ||||||
|
|
|
|
|
| |||||||
(Loss)/profit for the year | (10.3 | ) | 25.7 | 15.1 | ||||||||
|
|
|
|
|
| |||||||
(f) Fair value of listed investments in associates
As at 30 June 2012, the fair value of the Group’s interest in CTG, which is listed on the Hong Kong Stock Exchange, was A$86.0 million.
(g) Contingent liabilities and capital commitments
The Group’s share of the contingent liabilities of jointly controlled entities is disclosed in Note 22. The Group’s share of the capital commitments and other expenditure commitments of jointly controlled entities is disclosed in Note 23.
105
Notes to the Consolidated Financial Statements
For the year ended 30 June 2012
Note 29 – Investments in associates and jointly controlled entities (continued)
(h) Jointly controlled operations
The Group accounts for its 50% interest in Sims Pacific Metals (“SPM”) joint venture under the proportionate consolidation method. SPM is an unincorporated joint venture based in New Zealand and its principal activity is metal recycling. The Group’s interest in SPM is included in the statement of financial position under the classifications shown below:
| 2012 A$m | 2011 A$m | |||||||
Current assets | 14.2 | 16.6 | ||||||
Non-current assets | 7.3 | 6.9 | ||||||
|
|
|
| |||||
Total assets | 21.5 | 23.5 | ||||||
|
|
|
| |||||
Current liabilities | 15.5 | 17.4 | ||||||
Non-current liabilities | 0.2 | 0.2 | ||||||
|
|
|
| |||||
Total liabilities | 15.7 | 17.6 | ||||||
|
|
|
| |||||
Net assets | 5.8 | 5.9 | ||||||
|
|
|
| |||||
The Group’s share of SPM’s contingent liabilities and capital expenditure commitments is included in Notes 22 and 23, respectively.
Note 30 – Related party transactions
The Group’s related parties are its associates, jointly controlled entities, pension schemes and key management personnel. Group contributions to pension schemes are disclosed in Notes 7 and 18. Compensation paid to key management personnel are disclosed in Note 25.
Related party transactions with the Group’s associates and jointly controlled entities are as follows:
| 2012 A$m | 2011 A$m | |||||||
Sales of goods and services | 118.3 | 82.2 | ||||||
Purchases of goods and services | 890.9 | 980.6 | ||||||
Management fees and commissions | 3.1 | 2.7 | ||||||
Interest income | 1.2 | - | ||||||
Transactions with CTG reported above are only for the period from the date of investment through 30 June 2012.
Outstanding balances from the Group’s associates and jointly controlled entities are as follows:
| 2012 A$m | 2011 A$m | |||||||
Current receivables | 8.5 | 6.4 | ||||||
Current payables | 32.3 | 39.0 | ||||||
Loans to associates | 33.1 | - | ||||||
106
Notes to the Consolidated Financial Statements
For the year ended 30 June 2012
Note 31 – Parent entity financial information
The Company was incorporated on 20 June 2005. Under the terms of a scheme of arrangement entered into between Sims Metal Management Limited (formerly known as Sims Group Limited from 20 June 2005 to 21 November 2008) and Sims Group Australia Holdings Limited (“SGAHL”) (formerly known as Sims Group Limited prior to 20 June 2005) on 31 October 2005, the shareholders in SGAHL exchanged their shares in that entity for the shares in Sims Metal Management Limited. As required by AASB 3 (IFRS 3),Business Combinationsat the time, SGAHL was deemed to be the acquirer in this business combination. This transaction has therefore been accounted for as a reverse acquisition. Accordingly, the consolidated financial statements of Sims Metal Management Limited have been prepared as a continuation of the consolidated financial statements of SGAHL. SGAHL, as the deemed acquirer, has applied purchase accounting for its acquisition of Sims Metal Management Limited as at 31 October 2005.
(a) Summary financial information
| Statement of financial position: | 2012 A$m | 2011 A$m | ||||||
Current assets | 51.7 | 53.5 | ||||||
Total assets | 3,146.1 | 4,285.2 | ||||||
Current liabilities | 61.8 | 71.3 | ||||||
Total liabilities | 62.7 | 72.0 | ||||||
Shareholders’ equity: | ||||||||
Contributed equity | 4,125.0 | 4,138.6 | ||||||
Reserves | 96.2 | 71.9 | ||||||
Retained (deficit)/earnings | (1,137.8 | ) | 2.7 | |||||
|
|
|
| |||||
Total equity | 3,083.4 | 4,213.2 | ||||||
|
|
|
| |||||
(Loss)/profit for the year1 | (1,047.8 | ) | 67.6 | |||||
|
|
|
| |||||
Total comprehensive (loss)/income | (1,047.8 | ) | 67.6 | |||||
|
|
|
| |||||
1The parent entity’s loss for the year ended 30 June 2012 includes a non-cash impairment charge of A$1,137.0 million after tax against the parent entity’s investment in subsidiaries. In accordance with AASB 136 (IAS 36), the parent entity’s investment in subsidiary balance was compared to the higher of its value-in-use or fair market value less costs to sell, and the comparison identified an impairment in the carrying value of the parent entity’s investment in subsidiaries. This non-cash charge is reversed on consolidation and does not impact the consolidated financial statements of the Group.
The Company has current liabilities greater than current assets. The current liabilities primarily represent intercompany balances between entities, which are a party to a DCG to which the Parent is also a party. Refer to Note 28.
107
Notes to the Consolidated Financial Statements
For the year ended 30 June 2012
Note 31 – Parent entity financial information (continued)
(b)Guarantees entered into by the parent entity
The Company has not provided financial guarantees for which a liability has been recognised in the Company’s statement of financial position.
The Company and certain of its subsidiaries have given guarantees in respect of the performance of contracts entered into in the ordinary course of business. The amount of these guarantees provided by the Company as at 30 June 2012 was A$39.6 million (2011: A$60.1 million).
On 31 March 2011, the Company provided a guarantee for its proportional share of a lease obligation of a jointly controlled entity of the Group. The Company’s proportional amount of the lease obligation remaining as at 30 June 2012 was A$15.0 million (2011: A$16.1 million).
The Company is party to a number of financing facilities and a Deed of Cross Guarantee under which it guarantees the debts of a number of its subsidiaries. Refer to Notes 16 and 28 for details.
(c) Lease commitments
| 2012 A$m | 2011 A$m | |||||||
Not later than one-year | 1.8 | 1.7 | ||||||
Later than one-year, but not later than three-years | 3.7 | 3.4 | ||||||
Later than three-years, but not later than five-years | 3.9 | 3.6 | ||||||
Later than five-years | 39.0 | 38.8 | ||||||
|
|
|
| |||||
Total lease commitments not recognised as liabilities | 48.4 | 47.5 | ||||||
|
|
|
| |||||
On 29 May 2009, the Company entered into a lease agreement for property in the United States. The property is being sub-leased to a Group subsidiary in the United States.
Note 32 – Cash flow information
(a) Cash and cash equivalents
Cash at the end of the financial year as shown in the consolidated statements of cash flows is reconciled to the related items in the consolidated statements of financial position as follows:
| 2012 A$m | 2011 A$m | |||||||
Cash at bank and on hand | 51.4 | 165.5 | ||||||
|
|
|
| |||||
Cash and cash equivalents | 51.4 | 165.5 | ||||||
|
|
|
| |||||
108
Notes to the Consolidated Financial Statements
For the year ended 30 June 2012
Note 32 – Cash flow information (continued)
(b) Reconciliation of (loss)/profit for the year to net cash inflow/(outflow) from operating activities
| 2012 A$m | 2011 A$m | 2010 A$m | ||||||||||
(Loss)/profit for the year | (521.4 | ) | 192.1 | 126.7 | ||||||||
Depreciation and amortisation | 129.9 | 130.6 | 143.9 | |||||||||
Amortisation of deferred financing costs | 2.0 | 1.9 | 3.7 | |||||||||
Unrealised (gain)/loss on held for trading derivatives | (1.2 | ) | (1.2 | ) | (3.7 | ) | ||||||
Fair value loss on financial assets at fair value through profit or loss | 2.0 | - | - | |||||||||
Impairment of goodwill | 556.8 | - | - | |||||||||
Impairment of goodwill in jointly controlled entity | 57.5 | - | - | |||||||||
Impairment of property, plant and equipment | 0.4 | - | 14.5 | |||||||||
Impairment of intangible assets | 0.8 | - | 0.9 | |||||||||
Net gain on disposal of property, plant and equipment | (2.8 | ) | (1.3 | ) | (3.0 | ) | ||||||
Gain on sale of jointly controlled assets | (35.7 | ) | - | - | ||||||||
Share-based payments | 24.3 | 15.7 | 16.9 | |||||||||
Gain on sale of other financial assets | - | (11.0 | ) | - | ||||||||
Non-cash pension expense | 0.5 | 1.0 | 1.5 | |||||||||
Imputed portion of interest income on convertible loan | (0.7 | ) | - | - | ||||||||
Equity accounted profit net of dividends received | 13.1 | (12.3 | ) | 2.7 | ||||||||
Gain on acquisition of Port Albany Ventures LLC | - | - | (8.7 | ) | ||||||||
Other | - | 0.8 | (0.3 | ) | ||||||||
Change in operating assets and liabilities, excluding the effects of | ||||||||||||
Decrease/(increase) in trade and other receivables | 139.6 | (91.9 | ) | (240.7 | ) | |||||||
Decrease/(increase) in inventories | 113.0 | (322.7 | ) | (339.6 | ) | |||||||
(Increase) in prepayments | (22.1 | ) | (5.6 | ) | (6.5 | ) | ||||||
(Decrease)/increase in provisions | (15.8 | ) | 12.4 | (7.7 | ) | |||||||
(Decrease)/increase in income taxes | (17.4 | ) | 12.0 | 109.2 | ||||||||
(Decrease) in deferred taxes | (34.4 | ) | (22.4 | ) | (11.1 | ) | ||||||
(Decrease)/increase in trade and other payables | (98.8 | ) | 260.5 | 153.8 | ||||||||
|
|
|
|
|
| |||||||
Net cash inflow/(outflow) from operating activities | 289.6 | 158.6 | (47.5 | ) | ||||||||
|
|
|
|
|
| |||||||
(c) Non-cash investing and financing activities
(i) During the year ended 30 June 2012, dividends of A$23.4 million (2011: A$19.1 million; 2010: A$9.2 million) were paid via the issue of ordinary shares pursuant to the DRP. Refer to Note 21.
(ii) As at 30 June 2012, proceeds from the sale of land during the year ended 30 June 2011 of A$5.6 million had not been received in cash.
109
Directors’ Declaration
In the Directors’ opinion:
| a) | The financial statements and notes set out on pages 33 to 109 are in accordance with theCorporations Act 2001, including: |
| i) | complying with Accounting Standards, theCorporations Regulations 2001and other mandatory professional reporting requirements, and |
| ii) | giving a true and fair view of the consolidated entity’s financial position as at 30 June 2012 and of its performance for the financial year ended on that date, and |
| b) | there are reasonable grounds to believe that Sims Metal Management Limited will be able to pay its debts as and when they become due and payable, and |
| c) | at the date of this declaration, there are reasonable grounds to believe that the members of the Extended Closed Group identified in Note 28 will be able to meet any obligations or liabilities to which they are, or may become, subject by virtue of the Deed of Cross Guarantee described in Note 28. |
Note 1(b) confirms that the financial statements also comply with International Financial Reporting Standards as issued by the International Accounting Standards Board.
The directors have been given the declarations by the Group Chief Executive Officer and the Group Chief Financial Officer required by section 295A of theCorporations Act 2001.
The declaration is made in accordance with a resolution of the Directors.
 | | |
| G N Brunsdon | D W Dienst | |
| Chairman | Group Chief Executive Officer | |
| Sydney | New York | |
| 23 August 2012 | 22 August 2012 | |
110
Independent auditor’s report to the members of
Sims Metal Management Limited
Report on the financial report
We have audited the accompanying financial report of Sims Metal Management Limited (the company), which comprises the consolidated statement of financial position as at 30 June 2012, and the consolidated income statement, the consolidated statement of comprehensive income, consolidated statement of changes in equity and consolidated statement of cash flows for the year ended on that date, a summary of significant accounting policies, other explanatory notes and the directors’ declaration for the Sims Metal Management Group (the consolidated entity). The consolidated entity comprises the company and the entities it controlled at the year’s end or from time to time during the financial year.
Directors’ responsibility for the financial report
The directors of the company are responsible for the preparation of the financial report that gives a true and fair view in accordance with Australian Accounting Standards and theCorporations Act 2001and for such internal control as the directors determine is necessary to enable the preparation of the financial report that is free from material misstatement, whether due to fraud or error. In Note 1(b), the directors also state, in accordance with Accounting Standard AASB 101Presentation of Financial Statements, that the financial statements comply with International Financial Reporting Standards as issued by the International Accounting Standards Board.
Auditor’s responsibility
Our responsibility is to express an opinion on the financial report based on our audit. We conducted our audit in accordance with Australian Auditing Standards. These Auditing Standards require that we comply with relevant ethical requirements relating to audit engagements and plan and perform the audit to obtain reasonable assurance whether the financial report is free from material misstatement.
An audit involves performing procedures to obtain audit evidence about the amounts and disclosures in the financial report. The procedures selected depend on the auditor’s judgement, including the assessment of the risks of material misstatement of the financial report, whether due to fraud or error. In making those risk assessments, the auditor considers internal control relevant to the entity’s preparation and fair presentation of the financial report in order to design audit procedures that are appropriate in the circumstances, but not for the purpose of expressing an opinion on the effectiveness of the entity’s internal control. An audit also includes evaluating the appropriateness of accounting policies used and the reasonableness of accounting estimates made by the directors, as well as evaluating the overall presentation of the financial report.
Our procedures include reading the other information in the Annual Report to determine whether it contains any material inconsistencies with the financial report.
We believe that the audit evidence we have obtained is sufficient and appropriate to provide a basis for our audit opinion.
PricewaterhouseCoopers, ABN 52 780 433 757 | ||
Darling Park Tower 2, 201 Sussex Street, GPO BOX 2650, SYDNEY NSW 1171 DX 77 Sydney, Australia T +61 2 8266 0000, F +61 2 8266 9999,www.pwc.com.au | ||
| Liability limited bya scheme approved under Professional Standards Legislation. | ||
111
Independence
In conducting our audit, we have complied with the independence requirements of theCorporations Act 2001.
Auditor’s opinion
In our opinion:
| (a) | the financial report of Sims Metal Management Limited is in accordance with theCorporations Act 2001, including: |
| (i) | giving a true and fair view of the consolidated entity’s financial position as at 30 June 2012 and of its performance for the year ended on that date; and |
| (ii) | complying with Australian Accounting Standards (including the Australian Accounting Interpretations) and theCorporations Regulations 2001;and |
| (b) | the financial report and notes also comply with International Financial Reporting Standards as disclosed in Note 1(b) |
Report on the Remuneration Report
We have audited the remuneration report included in pages 9 to 31 of the directors’ report for the year ended 30 June 2012. The directors of the company are responsible for the preparation and presentation of the remuneration report in accordance with section 300A of theCorporations Act 2001. Our responsibility is to express an opinion on the remuneration report, based on our audit conducted in accordance with Australian Auditing Standards.
Auditor’s opinion
In our opinion, the remuneration report of Sims Metal Management Limited for the year ended 30 June 2012, complies with section 300A of theCorporations Act 2001.

PricewaterhouseCoopers

| Andrew J Parker | Sydney | |
| Partner | 23 August 2012 |
112
Annual Financial Report Extracts Presented in US Dollars
The audited financial statements of the Group presented in Australian dollars (“A$”) are included in pages 33 to 109. On pages 114 to 116, extracts from the audited financial statements are presented in US dollars (“US$”). This information does not form the part of the audited financial statements. The translation from A$ to US$ is included solely for the convenience of the reader. The financial statements as at and for the year ended 30 June 2012 have been translated into US$ at US$1.00 = A$0.9813 based on the closing exchange rate published by the Reserve Bank of Australia.
113
Sims Metal Management Limited
Consolidated US$ Income Statement
For the year ended 30 June 2012
| 2012 US$m | ||||
Revenue | 9,215.0 | |||
Other income | 92.9 | |||
Raw materials used and changes in inventories | (7,151.5 | ) | ||
Freight expense | (700.1 | ) | ||
Employee benefits expense | (493.1 | ) | ||
Depreciation and amortisation expense | (132.4 | ) | ||
Repairs and maintenance expense | (129.6 | ) | ||
Other expenses | (587.0 | ) | ||
Impairment of goodwill and other intangibles | (568.3 | ) | ||
Finance costs | (25.4 | ) | ||
Impairment of goodwill in jointly controlled entity | (58.6 | ) | ||
Share of results of investments accounted for using | (8.2 | ) | ||
|
| |||
Loss before income tax | (546.3 | ) | ||
Income tax benefit | 14.9 | |||
|
| |||
Loss for the year | (531.4 | ) | ||
|
| |||
| US¢ | ||||
Loss per share: | ||||
Basic | (258.1 | ) | ||
Diluted | (258.1 | ) | ||
114
Sims Metal Management Limited
Consolidated US$ Statement of Financial Position
As at 30 June 2012
| 2012 US$m | ||||
ASSETS | ||||
Current assets | ||||
Cash and cash equivalents | 52.4 | |||
Trade and other receivables | 523.2 | |||
Inventory | 907.0 | |||
Other financial assets | 30.0 | |||
|
| |||
Total current assets | 1,512.6 | |||
|
| |||
Non-current assets | ||||
Investments accounted for using the equity method | 357.8 | |||
Other financial assets | 50.4 | |||
Property, plant and equipment | 995.8 | |||
Deferred tax assets | 126.6 | |||
Goodwill | 517.1 | |||
Other intangible assets | 129.0 | |||
|
| |||
Total non-current assets | 2,176.7 | |||
|
| |||
Total assets | 3,689.3 | |||
|
| |||
LIABILITIES | ||||
Current liabilities | ||||
Trade and other payables | 684.9 | |||
Borrowings | 14.0 | |||
Other financial liabilities | 2.1 | |||
Current tax liabilities | 16.0 | |||
Provisions | 31.2 | |||
|
| |||
Total current liabilities | 748.2 | |||
|
| |||
Non-current liabilities | ||||
Payables | 8.2 | |||
Borrowings | 336.2 | |||
Deferred tax liabilities | 111.5 | |||
Provisions | 30.2 | |||
Retirement benefit obligations | 14.9 | |||
|
| |||
Total non-current liabilities | 501.0 | |||
|
| |||
Total liabilities | 1,249.2 | |||
|
| |||
Net assets | 2,440.1 | |||
|
| |||
EQUITY | ||||
Contributed equity | 2,857.9 | |||
Reserves | (339.8 | ) | ||
Retained deficit | (78.0 | ) | ||
|
| |||
Total equity | 2,440.1 | |||
|
| |||
115
Sims Metal Management Limited
Consolidated US$ Cash Flow Statement
For the year ended 30 June 2012
| 2012 US$m | ||||
Cash flows from operating activities | ||||
Receipts from customers (inclusive of goods and services tax) | 9,502.0 | |||
Payments to suppliers and employees (inclusive of goods and services tax) | (9,131.0 | ) | ||
Interest received | 2.6 | |||
Interest paid | (23.0 | ) | ||
Dividends received from associates and jointly controlled entities | 5.2 | |||
Insurance recoveries | 5.4 | |||
Income taxes paid | (66.0 | ) | ||
|
| |||
Net cash inflow from operating activities | 295.2 | |||
|
| |||
Cash flows from investing activities | ||||
Payments for property, plant and equipment | (164.2 | ) | ||
Proceeds from sale of property, plant and equipment | 6.7 | |||
Payments for acquisition of subsidiaries, net of cash acquired | (83.8 | ) | ||
Payment for an interest in an associate | (95.3 | ) | ||
Return of capital from associates and jointly controlled entities | 0.3 | |||
Loan to an associate | (38.5 | ) | ||
Payments for other financial assets | (1.5 | ) | ||
Proceeds from sale of other financial assets | 0.4 | |||
Proceeds from sale of jointly controlled assets | 40.8 | |||
Loan to third parties | (33.6 | ) | ||
Proceeds from repayment on third party loans | 19.6 | |||
|
| |||
Net cash outflow from investing activities | (349.1 | ) | ||
|
| |||
Cash flows from financing activities | ||||
Proceeds from borrowings | 2,606.1 | |||
Repayment of borrowings | �� | (2,562.3 | ) | |
Fees paid for loan facilities | (2.1 | ) | ||
Proceeds from issue of shares | 1.5 | |||
Payments for shares bought back | (39.2 | ) | ||
Dividends paid | (70.6 | ) | ||
|
| |||
Net cash outflow from financing activities | (66.6 | ) | ||
|
| |||
Net decrease in cash and cash equivalents | (120.5 | ) | ||
Cash and cash equivalents at the beginning of the financial year | 168.7 | |||
Effects of exchange rate changes on cash and cash equivalents | 4.2 | |||
|
| |||
Cash and cash equivalents at the end of the financial year | 52.4 | |||
|
| |||
116