SECURITIES AND EXCHANGE COMMISSION
WASHINGTON, D.C. 20549
FORM 10-K
ANNUAL REPORT PURSUANT TO SECTION 13 OR 15(d)
OF THE SECURITIES EXCHANGE ACT OF 1934
For the Fiscal Year Ended December 31, 2006
Commission File Number: 0-24866
MICROTEK MEDICAL HOLDINGS, INC.
(Exact Name of registrant as specified in its charter)
| | |
| GEORGIA | | 58-1746149 |
| (State or other Jurisdiction of incorporation or organization) | | (I.R.S. Employer Identification No.) |
| |
13000 Deerfield Parkway, Suite 300 ALPHARETTA, GEORGIA | | 30004 |
| (Address of principal executive offices) | | (Zip Code) |
(678) 896-4400
Registrant’s telephone number, including area code
| | |
| Securities registered pursuant to Section 12(b) of the Act: | | Name of each exchange on which registered: |
| Common stock, $.001 par value per share | | The Nasdaq Stock Market |
| Stock purchase rights | | The Nasdaq Stock Market |
Indicate by check mark if the registrant is a well-known seasoned issuer, as defined in Rule 405 of the Securities Act.
Yes ¨ No x
Indicate by check mark if the registrant is not required to file reports pursuant to Section 13 or Section 15(d) of the Exchange Act.
Yes ¨ No x
Indicate by check mark whether the registrant (1) has filed all reports required to be filed by Section 13 or 15(d) of the Securities Exchange Act of 1934 during the preceding 12 months (or for such shorter period that the registrant was required to file such reports), and (2) has been subject to such filing requirements for the past 90 days.
Yes x No ¨
Indicate by check mark if disclosure of delinquent filers pursuant to Item 405 of Regulation S-K is not contained herein, and will not be contained, to the best of registrant’s knowledge, in definitive proxy or information statements incorporated by reference in Part III of this Form 10-K or any amendment to this Form 10-K. x
Indicate by check mark whether the registrant is a large accelerated filer, an accelerated filer, or a non-accelerated filer. See definition of “accelerated filer and large accelerated filer” in Rule 12b-2 of the Exchange Act.
Large accelerated filer ¨ Accelerated filer x Non-accelerated filer¨
Indicate by check mark whether the registrant is a shell company (as defined in Rule 12b-2 of the Exchange Act).
Yes ¨ No x
The aggregate market value of voting and non-voting common equity held by nonaffiliates of the registrant based on the sale price at which the common equity was last sold as reported on The Nasdaq Stock Market as of June 30, 2006, was approximately $136.0 million. For purposes of this computation, all officers, directors and 5% beneficial owners of the registrant are deemed to be affiliates. Such determination should not be deemed an admission that such officers, directors or 5% beneficial owners are, in fact, affiliates of the registrant.
At March 9, 2007, there were outstanding 43,430,276 shares of the registrant’s common stock, $.001 par value per share.
Documents incorporated by reference: Portions of the Registrant’s proxy statement relating to the 2007 Annual Meeting of Shareholders are incorporated into Part III of this Form 10-K.
Note: The discussions in this Form 10-K contain forward-looking statements that involve risks and uncertainties. The actual results of Microtek Medical Holdings, Inc. and subsidiaries (the “Company”) could differ significantly from those set forth herein. Factors that could cause or contribute to such differences include, but are not limited to, those discussed in “Business”, particularly “Risk Factors”, and “Management’s Discussion and Analysis of Financial Condition and Results of Operations” as well as those discussed elsewhere in this Form 10-K. Statements contained in this Form 10-K that are not historical facts are forward-looking statements that are subject to the safe harbor created by the Private Securities Litigation Reform Act of 1995. A number of important factors could cause the Company’s actual results for 2007 and beyond to differ materially from those expressed or implied in any forward-looking statements made by, or on behalf of, the Company. These factors include, without limitation, those listed in “Risk Factors” in this Form 10-K.
PART I.
General
Microtek Medical Holdings, Inc. (the “Company”) was incorporated under the laws of the State of Georgia in 1987. Headquartered near Atlanta, Georgia and with operations worldwide, the Company specializes in the design, manufacture and marketing of an extensive range of surgical products for patient care, occupational safety and management of infectious and hazardous waste for the healthcare industry. The Company’s goal is to provide healthcare professionals with innovative product solutions that encompass a high-level of patient care and prevention of cross infection in operating rooms and ambulatory surgical centers. The Company’s extensive line of products, including sterile procedure equipment drapes and surgical patient drapes, are marketed to healthcare professionals through multiple channels, including direct sales, original equipment manufacturers (“OEM’s”) and private label arrangements.
The Company conducts substantially all of its operations through its healthcare subsidiary, Microtek Medical, Inc. (“Microtek”). OREX Technologies International (“OTI”), a division of the Company, was previously focused on the commercialization of the Company’s OREX degradable products and disposal technologies to the nuclear power generating industry until this business was licensed to a third party in September 2004.
Microtek, a market leading healthcare company within its area of focus, manufactures and markets its infection and fluid control products and other surgical products to healthcare professionals for use in environments such as operating rooms and ambulatory surgical centers. Traditionally a category leader in sterile procedure equipment drapes, surgical patient drapes and fluid control drapes, Microtek offers a diverse product line which has been designed to improve patient care and to address risk reduction and cross contamination concerns for virtually every medical specialty in a healthcare facility, from interventional radiology, cardiology and angiography to orthopedics, neurology, OB/GYN, urology and other clinical environments. Additionally, Microtek is also a prominent contract manufacturer for some of most technologically advanced healthcare equipment companies in the world.
Microtek has established a broad product selling system through multiple channels including distributors, directly through its own sales force, original equipment manufacturers, and private label customers. Additionally, Microtek has a strong presence as a branded component supplier to custom procedure tray companies.
Through its acquisition of certain businesses of International Medical Products, B.V. and affiliates (collectively, “IMP”) on May 28, 2004, Microtek added to its operations the development, manufacture, marketing and distribution in Europe of high quality dip-molded medical devices (primarily ultrasound probe covers), other equipment covers, cardiac thoracic drain systems, gynecological devices and wound care products. Microtek’s acquisition in March 2006 of the European manufacturing and distribution operations of Samco added additional European manufacturing capacity, primarily in Malta, and an expanded sales presence in Germany. In July 2006, Microtek acquired substantially all of the assets of Ceres Medical, a marketer of a small line of products sold primarily to cardiology and interventional radiology specialties within the United States. In October 2006, Microtek acquired all of the stock of Europlak, a France-based marketer of minimally invasive surgical products and devices primarily to urology, gastroenterology and related surgical specialties. In December 2006, Microtek acquired all of the stock of Eurobiopsy, a France-based company focused on the design, development, manufacture and commercialization of a line of endoscope biopsy forceps.
2
OTI’s most recent efforts have focused primarily on the commercialization of its OREX degradable products and technology for disposing of such products in the nuclear power generating industry. In September 2004, the Company granted to a third party a worldwide exclusive license to manufacture, use and sell the Company’s OREX materials and processing technology in the nuclear industry and the homeland security industry and for certain other industrial applications. Concurrently, the Company also entered into an exclusive three-year supply agreement under which the Company has agreed to provide certain sourcing and supply chain management services and to sell a total of approximately $4.8 million of inventory to its licensee. Except for activities under this licensing arrangement and the supply agreement, the Company is not actively engaged in any business development efforts associated with the Company’s OREX products and processing technologies.
The Company’s internet address is www. microtekmed.com. The Company makes available free of charge, through its web site, its annual report on Form 10-K, quarterly reports on Form 10-Q, current reports on Form 8-K, and amendments to those reports filed or furnished pursuant to Sections 13(a) or 15(d) of the Securities and Exchange Act of 1934, as amended, as soon as practicable after the Company electronically files such materials with or furnishes such materials to, the Securities and Exchange Commission. Information contained on the web site is not part of this report.
Business Strategy
The Company provides healthcare professionals with innovative product solutions that encompass a high level of patient care and prevention of cross infection. The Company intends to maintain this business by continually improving its existing capabilities and simultaneously developing and acquiring new business opportunities while maintaining its customer focus and providing the highest levels of customer support. The Company seeks to increase sales and earnings from its infection control business by completing strategic acquisitions, enhancing its worldwide marketing and distribution efforts, introducing new products, increasing direct sales representation, employing tele-sales agents for added sales coverage, and capitalizing on low-cost manufacturing opportunities in the Dominican Republic, Malta and China.
Since 2001, the Company’s acquisition strategy has resulted in the following transactions:
| | • | | In the first quarter of 2001, Microtek acquired the post-surgical clean-up product line and the patient and medical equipment drape product lines of Deka Medical, Inc., a manufacturer and marketer of specialty equipment and patient drapes for use in various surgical procedures to prevent infection; |
| | • | | In February 2001, the Company acquired the assets of MICROBasix LLC (“MICROBasix”) after developing a cooperative alliance relationship with MICROBasix in 2000 for the purpose of sharing technologies, products and services that provide significant volume reduction of low level radioactive waste for the nuclear industry; |
| | • | | In November 2002, Microtek acquired the surgical drape product line of Gyrus ENT, LLC; |
| | • | | In November 2003, Microtek acquired substantially all of the assets of Plasco, Inc., a manufacturer and marketer of multi-line disposable medical device products; |
| | • | | In March 2004, Microtek acquired substantially all of the assets of Ortho/Plast, Inc., a marketer of a small line of orthopedic products; |
| | • | | In May 2004, Microtek acquired certain assets related to certain businesses of International Medical Products, B.V. and affiliates (collectively, “IMP”) engaged in the development, manufacture, marketing and distribution in Europe of high quality dip-molded medical devices (primarily ultrasound probe covers), other equipment covers, cardiac thoracic drain systems, gynecological devices and wound care products; |
3
| | • | | In March 2006, Microtek acquired the European manufacturing and distribution operations of Samco which added additional European manufacturing capacity, primarily in Malta, and an expanded sales presence in Germany; |
| | • | | In July 2006, Microtek acquired substantially all of the assets of Ceres Medical, a marketer of a small line of products sold primarily to cardiology and interventional radiology specialties within the United States; |
| | • | | In October 2006, Microtek acquired all of the stock of Europlak, a France-based marketer of minimally invasive surgical products and devices primarily to urology, gastroenterology and related surgical specialties; |
| | • | | In December 2006, Microtek acquired all of the stock of Eurobiopsy, a France-based company focused on the design, development, manufacture and commercialization of a line of endoscope biopsy forceps. |
At the same time that the Company has pursued this acquisition strategy, the Company has generated internal growth by making product improvements and product line extensions to its existing product families. The Company has also made significant investments in all parts of its business, particularly in its domestic sales and marketing infrastructure and in its European operations, to increase market awareness of the Company’s branded product lines and to further position the Company as a worldwide market leader in the customized infection control market. The Company has also focused on efforts to expand and develop its relationships with its customers and other end users which include certain of the leading original equipment manufacturers (“OEM’s”) and supply service companies in the world. Historically, the majority of the Company’s operations have been conducted domestically in the United States and North America. In 2004, approximately 81.3 percent of the Company’s consolidated net revenues were considered domestic while the remaining 18.7 percent were generated internationally. In 2005 and 2006, approximately 24.4 percent and 26.6 percent, respectively, of the Company’s consolidated net revenues were generated internationally. Less than one percent of the Company’s sales in 2006 were related to its nuclear industry revenues.
The Company’s objective is to increase shareholder value by efficiently deploying its capital and management resources to grow its business, reduce its operating costs and build sustainable competitive positions and to complete acquisitions that generate attractive cash returns.
Marketing and Distribution
The Company believes that one of its key marketing strengths is its reputation for meeting the needs of its customers and solving problems in clinical settings with a consistent measure of innovation, physician preference and efficiency. Consistent with its niche market strategy, Microtek is actively engaged in the development of new products and the refinement of its existing products to appropriately respond to the needs of healthcare professionals and their patients and to the changing technology of the healthcare industry. Many of the Company’s product innovations have been generated from requests by the Company’s customers, equipment manufacturers and healthcare professionals for products to be custom designed to address specified problems in the operating room and ambulatory surgical center environments. The Company also monitors trends in the healthcare industry and performs market research in order to evaluate new product ideas.
Domestically and abroad, the Company markets its healthcare products through two channels or customer categories: branded and contract manufacturing (commonly referred to as OEM). The Company’s healthcare revenues (excluding its OTI division revenues) for 2006, 2005 and 2004 are as follows:
| | | | | | | | | |
| | | 2006 | | | 2005 | | | 2004 | |
Domestic: | | | | | | | | | |
Branded | | 48.4 | % | | 48.5 | % | | 53.0 | % |
OEM | | 24.8 | % | | 26.3 | % | | 27.1 | % |
| | | | | | | | | |
| | 73.2 | % | | 74.8 | % | | 80.1 | % |
International** | | 26.8 | % | | 25.2 | % | | 19.9 | % |
| | | | | | | | | |
TOTAL | | 100.0 | % | | 100.0 | % | | 100.0 | % |
| | | | | | | | | |
** | includes branded and OEM revenues sold in international markets |
4
Within the United States, the Company’s branded products are marketed to hospitals and other surgical settings through a combined sales and marketing effort which includes direct field sales representatives, independent sales representatives in selected regions and an inside tele-sales team. The Company believes that its unique blend of outside and inside sales cooperation and focus allow for maximized domestic market penetration and a more active defense against competition. The Company’s direct sales focus also allows the Company to establish and maintain direct contact with its customers and other end users. Additionally, the Company sells its branded and non-branded products to custom procedure tray companies (commonly known as kitpackers). On a non-branded, contract manufacturing basis, the Company’s products are marketed to equipment manufacturers and other medical device companies by the Company’s own contract manufacturing sales specialists.
As of December 31, 2006, the Company’s domestic marketing and sales force consisted of 46 sales representatives, 36 of whom are employed by the Company and ten of whom are independent representatives, eight field sales managers, four home office sales managers, 14 marketing managers, and 20 persons in customer support. All of these persons market and sell the Company’s infection control products and do not market or sell the Company’s OREX products and services.
As is customary in the healthcare industry, the Company also relies on large independent distributors to market and distribute its products. Because distribution of medical products is heavily dependent upon these large distributors, the Company anticipates that it will remain dependent upon these distributors and others for the distribution of its products. If the efforts of the Company’s distributors prove unsuccessful, or if such distributors abandon or limit their distribution of the Company’s products, the Company’s sales may be materially adversely affected until the Company could establish other means of delivery to its customers, including other distributors or through the Company’s direct sales force. The Company considers its customers to be the hospitals and medical professionals who use the Company’s products, rather than these distributors.
Distributor sales to Owens & Minor and Cardinal Healthcare, two of the Company’s largest diversified distributors, accounted for approximately 6.7 percent and 4.4 percent, respectively, of the Company’s consolidated net revenues in 2006. Distributor sales to Owens & Minor and Cardinal Healthcare were 6.8 percent and 3.1 percent of consolidated net revenues in 2005, respectively, and 8.2 percent and 2.7 percent of consolidated net revenues in 2004, respectively. The Company also sells its products to Cardinal Healthcare on a branded, private label and contract manufacturing basis. In 2006, non-distributor related sales to Cardinal Healthcare amounted 6.5 percent of the Company’s consolidated net revenues as compared to 9.3 percent and 9.9 percent in 2005 and 2004, respectively.
Outside the United States, the Company markets its products principally through a network of more than 100 different dealers and distributors and through its own international direct sales force. As of December 31, 2006, the Company had 20 sales representatives operating in international markets and 11 persons in international marketing and customer support. The Company is actively seeking to expand its international direct sales force. International sales during 2006, 2005 and 2004 totaled $37.7 million, $32.8 million and $23.7 million, respectively.
Products
Branded
The foundation of Microtek’s product portfolio is its sterile procedure drapes which are centered on infection and fluid control applications for risk reduction and protection in the operating room and beyond. The development of Microtek’s manufacturing capabilities and its market strategy through the growth of its infection control barrier technology has given Microtek a gateway to new product and procedural specialty platforms from which to serve the healthcare marketplace. New concepts such as Microtek’s CleanOp® system have changed operating room turnover between patient procedures; new product platforms in orthopedics and peripheral vascular expand Microtek’s presence into large, growth markets; and established markets for its traditional draping products, Deep Vein Thrombosis (DVT) prevention and liquid solidifiers continue to contribute to Microtek’s overall profitability.
5
Sterile Procedure Drapes. Sterile procedures occur in virtually every area of hospitals, outpatient surgical settings and other healthcare facilities. Operating Rooms, Cath Labs, Interventional Radiology and Endoscopy Centers are just some of the most noted locations. Sterile procedures have also become mobile throughout healthcare facilities, bringing diagnostic equipment and vascular access procedures out of the operating room and to the patient. Microtek’s product line consists of more than 1,500 specially designed drapes to protect the sterile surgical procedure area from the non-sterile equipment and patient.
Equipment Drapes.Microtek offers innovative design draping solutions to promote risk reduction and protection for practically every piece of equipment found in a clinical environment today. In addition to reducing the risk of cross-infection, Microtek’s equipment drapes increase operating room efficiency by reducing the need to sterilize equipment between procedures. These disposable sterile products are generally made from plastic film containing features designed for the operating room environment, such as low glare and anti-static properties. Equipment drapes, which generated approximately 29.6 percent of the Company’s consolidated revenues for 2006 and 2005 and approximately 27.1 percent of the Company’s consolidated revenues for 2004, consisted of the following product categories:
Neurosurgical Microscope. Microtek has custom designed a cover for virtually every model and brand of surgical microscope used today. Convenience-driven innovations, such as ClearLens which eliminates glare while maintaining the sterile field, enhance the product’s performance.
X-Ray Imaging C-Arm. Imaging technology is an increasingly vital part of many medical procedures. Microtek’s imaging equipment drapes not only protect the sterile field but also help ensure that valuable imaging equipment is not exposed to surgical fluids.
Ultrasound Probe. Microtek offers a full line of ultrasound and imaging solutions for diagnostic and biopsy procedures. Microtek’s ultrasound probe covers offer innovations such as Isosilk™, a latex-free material for imaging needs where disease and contamination control is a high priority. Microtek’s general and endocavity probe covers are also available in sterile or non-sterile packaging, are telescopically folded and contain other customized features to promote fit.
Endoscopic Camera. Microtek’s endoscopic camera drapes are specially designed to provide clear vision, extreme flexibility and patient comfort. Quick and easy to turnaround for increased procedures, Microtek’s endoscopic camera drapes provide advanced levels of performance beneficial to both physicians and patients.
Other Equipment Drapes. Microtek offers draping alternatives for a wide range of other commercial equipment, including slush machine/fluid warmers and sterile, single-use banded bags made with Microshield™ clear poly material for visual clarity. Microtek’s equipment draping line also offers other specialty options and performance innovations to address the rapidly evolving medical device technology in surgical procedures.
Surgical Patient Drapes.Microtek manufactures and sells specialty patient drapes, both non-woven and plastic varieties, which offer various enhancements, such as fluid collection pouches, incise and unique procedure-specific designs. Microtek’s surgical patient drapes accounted for approximately 12.7 percent, 11.9 percent, and 12.2 percent of the Company’s consolidated net revenues in 2006, 2005 and 2004. These drapes have been specially designed to provide advanced functionality and performance integrity for an extensive range of medical specialties, including:
Interventional Cardiology and Interventional Radiology. Interventional cardiology and radiology are rapidly expanding specialties with ever increasing numbers of procedures with a host of unique needs. Microtek’s most recent product offerings for these specialties include a specialty drape which offers protection during high-dose, fluoroscopically guided procedures by blocking and significantly reducing harmful scatter radiation at the source and minimizing the risks of exposure. Additionally, Microtek has recently introduced a line of drapes which improve clinical efficacy and promote speed, convenience, ease and risk reduction in closing surgical procedures. This product line features procedure-specific dressings which are affixed to the drape and thus eliminate the need to break the sterile field prior to application of the wound dressing.
6
Urology. Urology procedures typically require surgeons to work in confined sections of the anatomy where fluid control is essential. Microtek’s urology surgical patient drapes provide critical features to enhance visibility, instrument manipulation and fluid control.
Obstetrics-Gynecology. Microtek offers a wide spectrum of procedure-specific patient drapes with innovative designs to accommodate the unique surgical and fluid control requirements and the extensive range of needs of obstetricians and gynecologists. Microtek’s surgical patient drapes for OB/GYN procedures include see through panels and Microtek’s patented PerfectPouch™ for optimum fluid control and ease of access.
Orthopedic. Microtek’s orthopedic surgical patient drapes are designed for musculoskeletal procedures performed today, from minimally invasive arthroscopy to hip replacement surgery. Special features and innovations, such as fluid control with Microtek’s patented PerfectPouch™, promote physician ease and access while enhancing patient comfort throughout the procedure.
Neurosurgery. Neurological surgeries involving the spinal column, spinal cord, brain and peripheral nerves require every measure of precaution, especially in the area of protecting the sterile field from risk of infection for potentially extended periods of time. Microtek’s surgical patient drapes for neurosurgery ensure that conveniences are available to surgeon, from instrument pouches to self sealing channels. Equally critical are features to promote ease of access and filtered fluid collection.
Ophthalmic. Ophthalmic surgery requires extraordinary precision with delicate anatomy from optic nerves to the retina. Microtek’s ophthalmic surgical patient drapes, many of which were designed in collaboration with ophthalmic specialists, control fluids, protect the sterile field and offer a unique nature of access for surgeons.
ENT. The wide range of precision instruments used in ear, nose and throat procedures has created an ongoing need for innovation in surgical patient drapes for ENT. Microtek’s drapes offer the latest advances for ENT procedures, including special drainage ports for fluid release and easy access instrument pouches.
General Purpose Surgery. Microtek’s general purpose surgical patient drapes are impressive in performance, innovative design and sheer breadth of custom product diversity. Strategically placed clear view panels, convenient instrument pouches and innovative advances in fluid control distinguish the risk reduction and protection advantages of these drapes for the patient, surgeon and healthcare staff.
CleanOp® Room Turnover System. Microtek’s CleanOp® system consists of an entire line of products and supplies designed to efficiently and effectively clean a procedural room and prepare it for subsequent use. These pre-packaged, non-sterile systems combine all the necessary clean-up products into a convenient and easy-to-use pack. Enhanced with Microtek’s innovative new Mojave™ super absorbent linens, Microtek’s CleanOp system offers a higher degree of risk reduction combined with the supplies and training necessary to assure proper room turnover protocol.
Microtek’s CleanOp products have been a significant source of the increase in the Company’s branded revenues since 2001 due to increased market penetration and the absence of a significant competitor coupled with the Company’s focused selling and marketing activities. Revenues from CleanOp products generated 9.2 percent, 8.0 percent and 8.9 percent of the Company’s consolidated net revenues in 2006, 2005 and 2004, respectively.
DVT Compression Therapy. Compression therapy is recommended for surgeries lasting 45 minutes and longer to prevent DVT. Intermittent compression systems, such as Microtek’s Venodyne system, are noted as a leading choice to prevent DVT without the risk of post-operative bleeding often associated with drug therapies. DVT compression therapy revenues in 2006, 2005 and 2004 were less than five percent of the Company’s consolidated net revenues.
7
Medi-Plast Fluid Decanters.Microtek’s Medi-Plast system of decanting devices helps assure the aseptic dispensing of fluids from a diverse variety of containers. Medi-Plast bag, vial and bottle decanters, as well as container-to-container transfer devices, represent a complete and essential fluid transfer management system. Medi-Plast system revenues in 2006, 2005 and 2004 were less than five percent of the Company’s consolidated net revenues.
Liquid Medical Waste Solidifiers.Effective containment and management of fluids in the surgical environment is fundamental to risk reduction from the point of origin to the transport and disposal of liquid waste. Microtek offers industry-leading safety measures for bio-hazardous fluid encapsulation and conversion from liquid waste to solid, including ISOSORB® Solidifier and LTS-PLUS® Solidifier with disinfectant. ISOSORB® Solidifier eliminates the need to transport biohazardous fluids in liquid form by solidifying and encapsulating up to 40 times its own weight of blood, blood components and fluids with wide ranges of pH and electrolyte concentrations. LTS-PLUS® minimizes the chance for fluid contamination by solidifying and disinfecting infectious fluids collected in the operating room, whether from patients or from fluids used for irrigation. Liquid solidifier revenues in 2006, 2005 and 2004 were less than five percent of the Company’s consolidated net revenues.
MDI Emergency Medical. Microtek’s emergency medical solutions include a full spectrum of innovative emergency response products, including its industry-leading CPR Microshield, a patented barrier device to enhance performance of CPR while also offering maximum risk reduction and protection for the patient and the first responder. Microtek also offers its innovative EMS Immobile-Vac system, a unique splint technology used to immobilize the arm, leg, wrist, angle and full body via a vacuum form which is created around the injured anatomy using a contoured splint or temporary cast. MDI emergency medical revenues in 2006, 2005 and 2004 were less than five percent of the Company’s consolidated net revenues.
Other Specialty Medical Products.Microtek acquired and continues to develop two product categories which have enhanced the Company’s surgical offerings. First, the OrthoPrep™ line of orthopedic products consists of a host of devices for joint arthroplasty, including cement restrictors used in joint replacements and femoral bone prep trays, a pre-engineered single-tray system with every device necessary to prep the femoral canal for a cemented hip procedure. Other OrthoPrep offerings include Microtek’s Wound Evac system which promotes healing by providing safe, effective and portable wound drainage via a gentle negative pressure that actually removes harmful fluids and bacteria from the anatomy and the OrthoPrep™ Disposable Hood System which offers a convenient, ventilated barrier protection for the surgical team. Secondly, through its acquisition of substantially all of the assets of Ceres Medical in July 2006, Microtek acquired a group of non-drape related products focused on cardiology and interventional radiology procedures, including biopsy forceps and micro-introducer kits. These products are engineered with the precision, accuracy and dependability required for these applications. Although not a significant portion of the Company’s consolidated net revenues in 2006, the Company believes there are significant growth opportunities in the future for these higher-margin products.
OEM
Microtek is also focused on developing high concept designs that ultimately become valuable solutions for patients, healthcare professionals and medical equipment manufacturers. In this effort, Microtek contracts with premier brand names and collaborates with visionaries from various technology and industrial sectors. Microtek’s extensive manufacturing capabilities in numerous locations around the world, including the United States, the Dominican Republic, the Netherlands, Mexico, Malta and France, ensure that every product is produced to world-class standards. Microtek also provides assistance throughout the market evaluation and approval and regulatory processes which are critical in bringing a product to market. Microtek’s technical support helps ensure that its contract manufactured products are properly managed through each level of certification and approval including: ISO, FDA, CE Marking, GMP, UL Listing, or any other required regulatory or compliance standard. Microtek’s commitment to customer support and satisfaction and its focus on developing its OEM partner relationships have built worldwide trust in Microtek’s turnkey OEM capabilities. OEM revenues comprised 24.6 percent, 25.4 percent and 25.5 percent of the Company’s consolidated net revenues in 2006, 2005 and 2004, respectively.
8
OREX Degradables
During a portion of 2004, the Company’s OTI division was focused on commercializing its OREX Degradable products and processing technology primarily in nuclear power markets. OTI’s nuclear products consisted of protective clothing products such as coveralls, hoods and booties used in the nuclear power industry to help protect people from radioactive contamination, primarily in connection with periodic maintenance and re-fueling of nuclear power systems. After such use, these products are required to be treated as low-level radioactive materials and thereby become subject to regulations addressing the manner in which they are processed and disposed. OTI owns a processing system called MICROBasix which substantially reduces the volume of OREX products, separates radioactive contaminants and facilitates the disposal of processed by-product material.
Effective September 30, 2004, the Company granted to Eastern Technologies, Inc. (“ETI”) an exclusive license to manufacture, use and sell the Company’s OREX materials and processing technology in the nuclear industry and the homeland security industry, and for certain other industrial applications. The license extends for the duration of the Company’s patents for the OREX materials and processing technology. Through set royalties, management fees and proceeds from the sale of equipment and inventories, ETI is required to pay the Company certain fixed sums over the first three-year period of this arrangement, and thereafter is required to pay certain royalties based on the amount of ETI’s net revenues from the sale of OREX products and processing services. Except for these activities with ETI under this licensing arrangement, the Company is no longer actively engaged in any business development efforts associated with the Company’s OREX materials and processing technologies. Nuclear industry revenues amounted to less than one percent of the Company’s consolidated net revenues in 2006 and approximately three percent and six percent of the Company’s consolidated net revenues in 2005 and 2004, respectively.
Manufacturing and Supplies
The Company manufactures its products at its facilities in Columbus, Mississippi; Tyler, Texas; the Dominican Republic; Acuna, Mexico; Varsseveld, the Netherlands; Malta and near Toulon, France. The Company’s facilities in Columbus, Mississippi and Tyler, Texas also serve as distribution centers for certain of the Company’s products. The Company utilizes a facility in Jacksonville, Florida as its primary distribution point for the receipt and shipment of products and for light manufacturing. The Company’s European headquarters near Zutphen, the Netherlands serves as its primary distribution point for the majority of its European sales. Through the Company’s relationship with Global Resources, the Company sources certain of its infection control products from China when advantageous.
The Company maintains a variety of suppliers for its raw materials and other components necessary for the manufacture of its products. Based on its existing arrangements with suppliers and current and anticipated requirements, the Company believes that it has made adequate provisions for acquiring its raw materials and other components. The Company believes that its relationships with its suppliers are strong and that these relationships help to ensure the stability of the Company’s manufacturing processes. Historically, the Company has not been materially affected by interruptions with its suppliers; however, if a supplier of significant raw materials or component parts were to terminate its relationship with the Company or otherwise cease to supply the Company with required raw materials or components, the Company’s ability to meet its manufacturing requirements may be disrupted, which could materially impact the Company’s business and financial condition.
Research and Development
Microtek is continually focused on developing new innovative product solutions to solve its customers’ needs. Microtek is also receptive to new product opportunities, market trends and emerging needs. While Microtek has developed a number of its own products, most of its research and development efforts have historically been directed toward product improvement and enhancements of previously developed products. Primarily through its own internal engineering, manufacturing and marketing resources but also through direct collaboration with renowned healthcare professionals and medical equipment manufacturers, Microtek has created a product
9
development process which enables ideas and concepts to be quickly turned into prototypes that can be market tested and market released in an effective and efficient manner. The Company’s research and development expenses in 2006, 2005 and 2004 were $873,000, $810,000 and $1,048,000, respectively.
Order Backlog
At December 31, 2006, the Company’s order backlog totaled approximately $360 thousand, compared to approximately $800 thousand (in each case net of any cancellations) at December 31, 2005. All backlog orders at December 31, 2006 are expected to be filled during the first quarter of 2007. Microtek typically sells its products pursuant to written purchase orders which generally may be canceled without penalty prior to shipment of the product. Accordingly, the Company does not believe that the level of backlog orders at any date is material or indicative of future results. Because the Company strives to meet customer needs promptly and to provide the highest levels of customer support, typical shipment times range from one to three days which require that the Company maintain sufficient levels of inventories at all times.
Technology and Intellectual Property
The Company seeks to protect its proprietary technology, both in the United States and in international jurisdictions, by obtaining patents and filing patent applications for technology and products that it considers important to its business when it believes that such patent applications will be advantageous to the Company. Additionally, the Company relies upon registrations of various trademarks that the Company believes are recognized within their principal markets, trade secrets, confidentiality agreements, proprietary know-how, innovation and market penetration to develop and maintain its competitive position. The Company also operates under licenses from other owners of certain patents, patent applications, technology, trade secrets, or trademarks. While these are considered, in the aggregate, materially important to its business, the Company does not consider that any single patent, pending patent application, technology, trade secret or trademark, or any group of them, is essential to the Company’s success.
The Company holds several patents issued by the United States Patent and Trademark Office relating to various technologies for use in its infection control and fluid control products business as well as in its liquid medical waste solidifier business. The Company also holds numerous patents relating to several aspects of its OREX line of products, including several patents concerning methods of manufacture, methods of use, and methods of disposal, and patents covering several of the OREX products themselves. The Company’s current U.S. patent holdings will expire between the years 2007 and 2023.
Among the Company’s registered trademarks with the United States Patent and Trademark Office are: “MICROTEK”, “VERSA-DRAPE”, “ORTHOPREP”, “PERFECT POUCH”, “UNIVERSAL ANGIOGRAPHY DRAPE”, “SAF-T-SORB”, “NO-SPILL”, “ARMATEC”, “ISODRAPE” & DESIGN, “ISOLYSER”, “LTS PLUS”, “CLEARLENS”, “ISOSORB”, “MICROBASIX” & DESIGN, “EZÚSERT”, “ISOSILK”, “CLEANOP”, “C.P.R. MICROSHIELD”, “MDI”, “INNOVATION BY DESIGN”, “VENODYNE”, “WOUND EVAC”, “OREX” and “CERTIFIED SOLUBLE OREX MICROBASIX” & DESIGN. In addition, the Company holds certain international trademark registrations for those trademarks associated with and considered important to its international markets.
No assurance can be given that the various components of the Company’s technology protection arrangements utilized by the Company to protect its technologies will provide any significant competitive advantage or will be successful in preventing others from making products competitive with those offered by the Company or its licensees. Litigation may be necessary to protect the Company’s patent position. Such litigation may be costly and time-consuming, and no assurance can be given that the Company will be successful in such litigation. Since the Company also relies on trade secrets and proprietary know-how to maintain its competitive position, no assurance can be given that others may not independently develop similar or superior technologies or obtain access to the Company’s trade secrets, know-how or proprietary technology.
The medical device industry is increasingly competitive, and there has been substantial litigation regarding patent and intellectual rights. There are risks that the Company’s activities may require the Company to defend itself against claims and actions alleging infringement of the intellectual rights of others. This action could be costly and, if unsuccessful, could have a material adverse effect on the Company’s business.
10
Competition
The domestic and international markets in which the Company’s product lines compete are highly competitive. In general, the Company’s products compete with the products of numerous companies in the business of developing, manufacturing, distributing and marketing medical products. Some of these competitors have greater financial, technical, marketing and other resources than the Company.
The Company believes that each of its markets are characterized by competition on the basis of (i) quality, (ii) price, (iii) product design, development, function and innovation, (iv) distribution arrangements, (v) customer service and support, (vi) customer relationship, (vii) convenience and (viii) promptness of delivery. The Company believes that its products have achieved market acceptance due to the Company’s emphasis on overall value through a combination of competitive pricing, exceptional product quality and innovation and superior customer service and support. Additionally, in an effort to meet customer needs promptly, the Company maintains sufficient inventory levels to enable delivery of most of its products within one to three days of order.
Government Regulation
As a manufacturer and marketer of medical devices, the Company is subject to regulation by the U.S. Food and Drug Administration (“FDA”) as well as the corresponding regulatory agencies of the state, local and foreign governments in which the Company sells its products. These regulations govern the development, testing, packaging, labeling and marketing of medical devices and manufacturing procedures relating to these devices.
The Company’s traditional medical products (including, for example, equipment drapes) are regulated by the FDA under the medical device provisions of the Federal Food, Drug and Cosmetic Act (the “FDCA”). Pursuant to the FDCA, medical devices intended for human use are classified into one of three categories, Classes I, II and III, on the basis of the controls deemed necessary by the FDA to reasonably assure the safety and effectiveness of these devices. Each class involves an increasing degree of regulatory control. Medical devices in these categories are subject to regulations which require, among other things, pre-market notifications or approvals and adherence to good manufacturing practices, labeling, record-keeping and registration requirements. Devices which the Company currently markets are classified as Class I or Class II devices subject to existing 510(k) clearances which the Company believes satisfy FDA pre-market notification requirements. There can be no assurances as to when, or if, other such 510(k) clearances necessary for the Company to market products developed by it in the future will be issued by the FDA.
The Company is also required to register with the FDA as a device manufacturer and to comply with the FDA’s Quality System Regulations which require that the Company have a quality system for the design and production of its products intended for commercial distribution in the United States and satisfy recordkeeping requirements with respect to its manufacturing, testing and control activities. The Company’s manufacturing, quality control and quality assurance procedures and documents are subject to unscheduled inspection and evaluation by the FDA which has broad authority to order recalls of medical devices, issue stop sale orders, seize non-complying medical devices, enjoin violations, impose civil and criminal penalties and criminally prosecute violators. Failure to comply with applicable regulatory requirements, which may be ambiguous or unclear, can result in fines, civil and criminal penalties, stop sale orders, loss or denial of approvals and recalls or seizures of products.
Countries in the European Union require that certain products being sold within their jurisdictions obtain a “CE mark”, an international symbol of adherence to quality assurance standards, and be manufactured in compliance with certain requirements. The Company has CE mark approval to sell most of its medical device products and its safety products in Europe. One of the conditions to obtaining CE mark status involves the qualification of the Company’s manufacturing plants and corporate offices under certain certification processes. All of the Company’s manufacturing plants and administrative offices have obtained such certifications, except the Company’s manufacturing facilities located in Tyler, Texas and the Company’s executive offices in Alpharetta, Georgia which do not hold such certifications. To maintain CE mark approval, the Company has to satisfy continuing obligations including annual inspections by European notified bodies as well as satisfy record keeping, product qualification and other quality assurance requirements. The notified bodies have the authority to stop the Company’s use of the CE
11
mark if the Company fails to meet these standards. While the Company believes that its operations at these facilities are in compliance with requirements to maintain CE mark status, no assurances are provided that such certifications will be maintained or that other foreign regulatory requirements will not adversely affect the Company’s marketing efforts in foreign jurisdictions.
Under the Federal Insecticide, Fungicide, and Rodenticide Act (“FIFRA”), any product which claims to kill microorganisms through chemical action must be registered with the EPA. FIFRA affects primarily the Company’s fluid encapsulation and infectious waste treatment products including LTS-Plus, a product which provides treatment for encapsulation and disinfection of suction canister waste. LTS-Plus is registered with the EPA as a chemical device.
State and local regulations of the Company’s products and services are highly variable. Individual state registration of LTS-Plus is required for just over half of the states in the United States as a condition to landfill of treated suction canisters. In 1997, as a result of a review of an existing approval in California for the landfilling in California of waste treated by LTS, California authorities revoked such approval and have also not given approval for the use of LTS-Plus. While LTS offers benefits unrelated to landfilling, such action has adversely affected the Company’s ability to sell LTS-Plus. The Company is continuing the process of obtaining from the various states approval to landfill waste treated by LTS-Plus, and has obtained such approval from several states not including California. The rules for disinfecting infectious waste are being revised on a national standard. The outcome of the national standard will play a very important part in the life of LTS-Plus. No assurances can be provided that the prior regulatory actions or pending regulatory reviews will not continue to have an adverse effect upon the sales of the Company’s sanitizing liquid absorbent products.
Regulators at the Federal, state and local level have imposed, are currently considering and are expected to continue to impose regulations on medical and other waste. No prediction can be made of the potential effect of any such future regulations, and there can be no assurance that future legislation or regulations will not increase the costs of the Company’s products or prohibit the sale or use of the Company’s products, in either event having an adverse effect on the Company’s business.
Employees
As of December 31, 2006, the Company employed 1,829 full-time employees, 34 part-time employees and ten people as independent contractors. Of these, 123 were employed in marketing, sales and customer support, 1,496 in manufacturing, 14 in research and development, and 240 in administrative positions. The Company believes its relationship with its employees is good.
Insurance
The Company maintains commercial general liability insurance which provides coverage with respect to product liability claims. The manufacture and sale of the Company’s products entail an inherent risk of liability. The Company believes that its insurance is adequate in amount and coverage. There can be no assurance that any future claims will not exceed applicable insurance coverage. Furthermore, no assurance can be given that such liability insurance will be available at a reasonable cost or that the Company will be able to maintain adequate levels of liability insurance in the future. In the event that claims in excess of these coverage amounts are incurred, they could have a material adverse effect on the financial condition or results of operations of the Company.
Environmental Matters
The Company is not a party to any material environmental regulation proceedings alleging that the Company has unlawfully discharged materials into the environment. The Company does not anticipate the need for any material capital expenditures for environmental control facilities during the next 18 to 24 months.
12
Low barriers to entry for competitive products could cause the Company to reduce the prices for its products or lose customers.Most of the Company’s infection control products are not protected by patents, and some of such infection control products that are protected by patents are subject to competition from products which may be manufactured or used in a way which does not infringe upon the Company’s patents. In addition, other barriers to entry, such as manufacturing processes and regulatory approvals, may not prevent the introduction of products competitive with the Company’s infection control products. The introduction of competitive products or other competitive marketing strategies, including competitive marketing from companies outside the United States through the internet, could force the Company to lower its prices for its products or otherwise adversely affect the Company’s operating results.
Large purchasers of the Company’s products regularly negotiate for reductions in prices for the Company’s products, which may reduce the Company’s profits.While the Company has been able to substantially maintain Microtek’s gross margins during 2006, the large customers to which Microtek sells its products regularly negotiate for reductions in pricing of products which they purchase. This could require that the Company reduce the prices at which it sells its products or revise the manner in which the Company sells or distributes its products. These changes could reduce Microtek’s sales or gross margins, or both, and potentially have an adverse effect on the Company’s operating results.
Because a few distributors control much of the delivery of hospital supplies to hospitals, the Company relies significantly on these distributors in connection with the sale of the Company’s branded products.As is customary in the healthcare industry, the Company has historically relied to a significant extent on a few large distributors to market and distribute its branded products. Hospitals often prefer to purchase products from one or a few distributors to facilitate the delivery, control and management of the hospital’s inventory of supplies. Hospitals accordingly purchase most of their products from a few large distributors, and the Company anticipates that it will remain dependent upon these distributors and others for the distribution of its products. If the efforts of the Company’s distributors prove unsuccessful, or if such distributors abandon or limit their distribution of the Company’s products (such as could occur if a distributor is unable to obtain price adjustments which a distributor seeks from the Company), the Company’s sales may be materially adversely affected until the Company could establish other means of delivery to its customers, including other distributors or through the Company’s direct sales force.
The Company considers its customers to be the hospitals and medical professionals who use the Company’s products, rather than these distributors. Distributor sales to Owens & Minor and Cardinal Healthcare, two of the Company’s largest diversified distributors, accounted for approximately 6.7 percent and 4.4 percent, respectively, of the Company’s consolidated net revenues in 2006. Distributor sales to Owens & Minor and Cardinal Healthcare were 6.8 percent and 3.1 percent of consolidated net revenues in 2005, respectively, and 8.2 percent and 2.7 percent of consolidated net revenues in 2004, respectively. The Company also sells its products to Cardinal Healthcare on a branded, private label and contract manufacturing basis. In 2006, non-distributor related sales to Cardinal Healthcare amounted to 6.5 percent of the Company’s consolidated net revenues as compared to 9.3 percent and 9.9 percent in 2005 and 2004, respectively.
The Company’s relatively small sales and marketing force may place the Company at a competitive disadvantage to its competition.At December 31, 2006, the Company’s marketing and sales force consisted of 123 individuals, including 68 people in sales and 45 people in marketing and customer support. Additionally, the Company has ten independent contractors involved in its sales and marketing efforts. Included in the Company’s sales and marketing force are 20 sales representatives who operate in international markets. The Company is actively seeking to expand its direct sales force in its international markets. Other companies with which the Company competes have substantially larger sales forces and greater brand awareness, placing the Company at a competitive disadvantage. For example, the Company may not be able to reach certain potential customers due to the Company’s inability to have its products included within certain group purchasing organizations’ lists of approved products.
The Company’s contract manufacturing division relies upon a small number of customers, the loss of any of which could have a material adverse impact on the Company.Microtek’s contract manufacturing division, which accounted for 24.6 percent of the Company’s consolidated net revenues in 2006, has historically relied upon a relatively small number of customers for most its net revenues. The loss of any one or more of such customers, which may occur unexpectedly, could have a material and disproportionately adverse impact upon the Company’s net revenues and operating results.
13
The inability of the Company to complete acquisitions of businesses at an attractive cost could adversely affect the Company’s growth.Part of Microtek’s growth strategy involves completing strategic acquisitions. The Company’s ability to complete strategic acquisitions is subject to a number of variables outside the control of the Company including the Company’s ability to find attractive and complementary acquisition opportunities at an attractive cost which the Company can afford or can finance on acceptable terms. Failure to successfully complete strategic acquisitions on favorable terms may adversely affect the Company’s growth rate.
If the Company is successful in acquiring businesses, the failure to successfully integrate those businesses could adversely affect the Company.As the Company completes acquisitions, it encounters risks that it will not successfully integrate the acquired products or business operations into its business and thereby fail to achieve the benefits sought to be achieved through these acquisitions. In addition, the Company is generally required to invest in an acquired company’s financial and disclosure controls to improve on assurances that the Company will timely receive complete information to accurately fulfill its financial reporting and disclosure obligations. The failure to successfully integrate acquired businesses in the Company’s operations could adversely affect the Company’s operating results.
The Company’s growing international operations subject the Company’s operating results to numerous additional risks.Of the Company’s $141.6 million in consolidated net revenues for the year ended December 31, 2006, $37.7 million, or 26.6 percent, were generated from sales of products outside the United States. In addition, the Company maintains manufacturing facilities in the Dominican Republic, Mexico, the Netherlands, Malta and France which are important components of the Company’s manufacturing operations. International sales and operations are subject to risks including political, economic and other risks and uncertainties inherent in the countries in which the Company operates; fluctuations in currency exchange rates, in particular the relationship of the U.S. dollar to the functional currencies of the Company’s international subsidiaries which could result in currency translations that materially impact the Company’s revenues and earnings; unexpected changes in regulatory requirements and laws; difficulties in transferring earnings from foreign subsidiaries to the Company; burdens of complying with a wide variety of foreign laws and labor practices; export duties, quotas and embargoes; and business interruptions due to terrorist activities or acts of God such as hurricanes. Because the Company expects that a significant and growing proportion of its revenues will continue to come from international operations and because the Company expects to continue to rely upon off-shore manufacturing, the occurrence of any of the above events could materially and adversely affect the Company’s operating results.
Non-performance by the Company’s third-party licensee with respect to the development of the Company’s OREX materials and processing technology could adversely affect the Company.During 2004, the Company granted to ETI a worldwide exclusive license for the Company’s OREX materials and processing technology in the nuclear industry and the homeland security industry, and for certain other industrial applications. Except for these activities with ETI under the Company’s licensing arrangement, the Company is not actively engaged in any business development efforts associated with the Company’s OREX materials and processing technologies. The Company is accordingly entirely dependent upon the efforts of ETI with respect to the operating results generated by the Company’s OREX materials and processing technology. In the event ETI fails to perform its obligations under the Company’s licensing arrangements with ETI, or is unsuccessful in growing the OREX business, the Company may not achieve a continuing return on its investment in this business and technology.
The loss of any of the Company’s key personnel, particularly its President, could adversely affect the Company.The Company believes that its ability to succeed will depend to a significant extent upon the continued services of a limited number of key personnel, and the ability of the Company to attract and retain key personnel. The Company currently has three executive officers. The loss of any one of the Company’s executive officers could have a material adverse effect on the Company as the Company may not be able to attract and retain suitable replacements for its executive positions. The Company does not maintain key man life insurance on any of its executive officers other than a $1.5 million policy on Mr. Lee, the Company’s President and Chief Executive Officer.
Markets in which the Company competes are highly competitive, which may adversely affect the Company’s growth and operating results.There are many companies engaged in the development, manufacturing and marketing of products and technologies that are competitive with the Company’s products and technologies.
14
Many such competitors are large companies with significantly greater financial resources than the Company. For example, the Company seeks to sell its antimicrobial incise drapes to the healthcare industry, and the Company has a small market share in the sales of these products at this time. Therefore, the Company will be required to displace sales of competitive products in this industry to gain market presence. There can be no assurance that the Company’s competitors will not substantially increase the resources devoted to the development, manufacturing and marketing of products competitive with the Company’s products. The successful marketing of competing products by one or more of the Company’s competitors could have a material adverse effect on the Company.
The Company’s products entail risks of liability, which could result in claims against the Company.The manufacture and sale of the Company’s products entails an inherent risk of liability. Product liability claims may be asserted against the Company in the event that the use of the Company’s products or processing systems are alleged to have resulted in injury or other adverse events, and such claims may involve large amounts of alleged damages and significant defense costs. Although the Company currently maintains product liability insurance providing coverage for such claims, there can be no assurance that the liability limits or the scope of the Company’s insurance policy will be adequate to protect against such potential claims. In addition, the Company’s insurance policies must be renewed annually. While the Company has been able to obtain product liability insurance in the past, such insurance varies in cost, is difficult to obtain and may not be available on commercially reasonable terms in the future, if it is available at all. A successful claim against the Company in excess of its available insurance coverage could have a material adverse effect on the Company. In addition, the Company’s business reputation could be adversely affected by product liability claims, regardless of their merit or eventual outcome. See “Business - Insurance”.
The Company’s products are subject to extensive governmental regulations, compliance or non-compliance with which could adversely affect the Company.The development, manufacture and marketing of the Company’s products are subject to extensive government regulation in the United States by Federal, state and local agencies including the EPA and the FDA. Similar regulatory agencies exist in other countries with a wide variety of regulatory review processes and procedures. The process of obtaining and maintaining FDA and any other required regulatory clearances or approvals of the Company’s products is lengthy, expensive and uncertain, and regulatory authorities may delay or prevent product introductions or require additional tests prior to introduction. The FDA also requires healthcare companies to satisfy the quality system regulation. Failure to comply with applicable regulatory requirements, which may be ambiguous or unclear, can result in fines, civil and criminal penalties, stop sale orders, loss or denial of approvals and recalls or seizures of products. There can be no assurance that changes in existing regulations or the adoption of new regulations will not occur, which could prevent the Company from obtaining approval for (or delay the approval of) various products or could affect market demand for the Company’s products.
New products and technologies could cause the Company’s products to become less attractive or obsolete.Many companies are engaged in the development of products and technologies to address the need for safe and cost-effective prevention of infection in healthcare markets. There can be no assurance that superior products or technologies will not be developed or that alternative approaches will not prove superior to the Company’s infection control products. For example, some companies are attempting to develop technologies to sterilize equipment maintained in the operating room which would compete directly with the Company’s sterile procedure equipment drapes. Any such developments would have a material adverse effect on the Company’s operations and profitability.
The Company’s strategies to protect its proprietary assets may be ineffective, allowing increased competition with the Company.The Company holds various issued patents and has various patent applications pending relative to its products. See “Business – Technology and Intellectual Property.” There can be no assurance that any of the Company’s patents will prove to be valid and enforceable, that any patent will provide adequate protection for the technology, process or product it is intended to cover or that any patents will be issued as a result of pending or future applications. Failure to obtain patents pursuant to the Company’s patent applications could have a material adverse effect on the Company and its operations. It is also possible that competitors will be able to develop materials, processes or products, including other methods of disposing of contaminated waste, outside the patent protection the Company has or may obtain, or that such competitors may circumvent, or successfully challenge the validity of patents issued to the Company. Although there is a statutory presumption of a patent’s validity, the issuance of a patent is not conclusive as to its validity or as to the enforceable scope of the claims of the patent. In the event that another party infringes the Company’s patent or trade secret rights, the enforcement of such
15
right is generally at the option of the Company and can be a lengthy and costly process, with no guarantee of success. Further, no assurance can be given that the Company’s other protection strategies such as confidentiality agreements will be effective in protecting the Company’s technologies. Due to such factors, no assurance can be given that the various components of the Company’s technology protection arrangements utilized by the Company, including its patents, will be successful in preventing other companies from making products competitive with those offered by the Company or its licensees.
The Company may encounter claims for violating the intellectual property rights of others.There can be no assurance that claims alleging that the Company’s technology or products infringe upon the intellectual property rights of others will not be brought against the Company or its licensees, or that any such claims will not be successful. If such a claim were successful, the Company’s business could be materially adversely affected. In addition to any potential monetary liability for damages, the Company could be required to obtain a license in order to continue to manufacture or market the product or products in question or could be enjoined from making or selling such product or products if such a license were not made available on acceptable terms. If the Company or its licensees becomes involved in such litigation, it may require significant Company resources, which may materially adversely affect the Company. See “Business - Technology and Intellectual Property”.
The Company’s stock price may fluctuate and be volatile.The market prices for securities of companies with a very small market capitalization such as the Company can be highly volatile. Various factors, including factors that are not related to the Company’s operating performance, may cause significant volume and price fluctuations in the market, which may limit an investor’s liquidity in the Company’s common stock and could result in a loss in the value of such investment.
Accounting for income taxes makes it difficult to understand and compare the Company’s operating results from period to period.Accounting for income taxes has had a significant impact upon the Company’s earnings. At December 31, 2006, the Company had net deferred income tax assets, before consideration of any valuation allowances, of approximately $23.7 million, including operating loss carryforwards for Federal, state and foreign income tax purposes of approximately $23.4 million. The Company’s operating loss carryforwards, to the extent not covered by the valuation allowance, are expected to be used by the Company to offset future U.S. Federal, state and foreign income tax liabilities as they accrue. At December 31, 2006, the Company has recorded a valuation allowance of approximately $4.9 million against its deferred income tax assets resulting in net deferred income tax assets of approximately $18.8 million at December 31, 2006. Determining the amount of the valuation allowance against the Company’s deferred tax assets is highly sensitive to significant judgments about the Company’s ability to generate future taxable income. Adjustments in such judgments may result in significant changes to the tax provision in the Company’s results of operations and thereby significantly impact the Company’s profitability, although such adjustments have no impact on the Company’s cash position or cash flow. The effect of these adjustments on the Company’s financial statements, if any, may make it more difficult to compare the operating results of the Company from period to period or to compare the operating results of the Company with other companies. This could also adversely affect the market prices at which securities of the Company trade on public markets.
Fluctuations in the value of the dollar against foreign currencies have in the past and may in the future adversely affect the Company’s operating results.International sales by the Company during 2006 were $37.7 million. Approximately $7.6 million of the Company’s international sales in 2006 were billed and paid in currencies other than the functional currency of the Company’s international subsidiaries. Currency translations on international sales and other transactions that are denominated in currencies other than the functional currency of the Company’s subsidiaries could be adversely affected in the future by the relationship of the U.S. dollar to these functional currencies resulting in currency translation charges or benefits that may materially impact the Company’s revenues and earnings.
The volatility in the rate of exchange of the Dominican peso with the U.S. dollar and actions to compensate for this volatility could adversely affect the Company’s operating results. During late 2004 and most of 2005, the value of the Dominican peso substantially increased in relation to the U.S. dollar. As this occurs, the costs of the Company’s inventory increases because the Company manufactures a material portion of its inventory at its facilities located in the Dominican Republic. Increases in the value of the Dominican peso relative to the U.S. dollar in the future may similarly result in increased costs to the Company for its inventory, which would adversely affect
16
the Company’s operating results. The Company cannot mitigate this risk by hedging strategies based on forward contracts to purchase Dominican pesos because these contracts are not readily available for purchase in established markets. The Company pursues other strategies to mitigate this currency exchange risk, such as maintaining bank deposits in the Dominican Republic denominated in pesos. These bank deposits are generally not insured due to the unavailability of insurance on larger deposits in the Dominican Republic. This causes the Company to encounter risks of losses on deposits.
The Company’s expenses for raw materials and product distribution are adversely affected by increases in the price for petroleum.A significant portion of the raw materials required by Microtek to manufacture its products and a significant portion of the Company’s distribution expenses are highly dependent upon the price for petroleum. As the petroleum prices rise, the costs for these raw materials and amount of these distribution expenses also increase. Due to competitive pressures and other contractual limitations, Microtek may not readily pass these price increases on to its customers. While the Company has been successful in offsetting these pricing pressures with other manufacturing efficiencies and cost controls, continuing increases in prices of raw materials and distribution expenses may adversely affect the Company’s operating results.
The Company maintains a Rights Agreement which may discourage or make it more difficult for a person to obtain control of the Company.On December 20, 2006, the Company’s Board of Directors amended its shareholder protection rights agreement (the “Rights Agreement”). Under the Rights Agreement, a dividend of one right (“Right”) to purchase a fraction of a share of a newly created class of preferred stock was declared for each share of common stock outstanding at the close of business on December 31, 1996. The Rights, which expire on December 31, 2016, may be exercised only if certain conditions are met, such as the acquisition (or the announcement of a tender offer, the consummation of which would result in the acquisition) of beneficial ownership of 15% or more of the common stock (“15% Acquisition”) of the Company by a person or affiliated group. The Rights, if exercised, would cause substantial dilution to a person or group of persons that attempts to acquire the Company without the prior approval of the Board of Directors. The Board of Directors may cause the Company to redeem the rights for nominal consideration, subject to certain exceptions. The Rights Agreement may discourage or make more difficult any attempt by a person or a group of persons to obtain control of the Company.
ITEM 1B. | UNRESOLVED STAFF COMMENTS |
Not applicable.
The Company leases approximately 20,200 square feet of office space located in Alpharetta, Georgia under a lease which expires December 31, 2015. The Company uses this space as its principal executive offices.
The Company owns a 13,000 square foot building and a 20,000 square foot building in Columbus, Mississippi that are used for administrative offices and for warehousing and office space, respectively. The Company also leases approximately 1,300 square feet of office space in Sugarland, Texas under an operating lease which expires on November 30, 2009.
The Company currently conducts its equipment drape and fluid control manufacturing business from four locations. First, in Columbus, Mississippi, the Company owns a 48,400 square foot manufacturing building and leases approximately 30,600 square feet of additional warehouse and storage space on generally a month-to-month basis. Secondly, the Company leases five manufacturing facilities in the Dominican Republic totaling approximately 159,900 square feet under three operating leases. The first lease, which covers approximately 123,600 square feet, expires on October 1, 2010, with two renewal options for four years each. The second lease covers approximately 13,500 square feet and expires on May 1, 2007. The third lease covers approximately 22,800 square feet and expires on December 1, 2008. Thirdly, the Company leases a 62,700 square foot facility in Tyler, Texas where it manufactures materials for other drape converters under a lease which expires July 31, 2012. Finally, the Company’s facility in Acuna, Mexico houses 21,250 square feet of manufacturing and warehouse space under a lease that expires on July 31, 2007.
17
The Company also leases approximately 88,000 square feet of warehouse and distribution space in Jacksonville, Florida under a lease which expires on October 31, 2014. The Company uses this facility for distribution of finished products, distribution of materials to the Company’s Dominican Republic facility and light manufacturing.
The Company leases approximately 2,500 square feet of office space near Manchester, England under a lease which expires in October 2007.
The Company’s manufacturing and distribution operations in the Netherlands are currently conducted from a 41,000 square foot facility in Zutphen under a lease which expires on October 31, 2016, with a right to terminate the lease after five years, and a 17,000 square foot facility in Varsseveld under a lease which expires on April 30, 2008. At these facilities, the Company has approximately 17,000 square feet of manufacturing space, approximately 33,000 square feet of distribution, warehouse and storage space, and approximately 8,000 square feet of administrative office space. The lease for the Company’s facility in Zutphen provides for a first right of refusal for an additional 10,800 square feet of expansion capacity which would accommodate the potential consolidation of the operations currently conducted in the Varsseveld facility when its lease expires in 2008.
The Company’s manufacturing and distribution operations in Malta are currently conducted from a 72,600 square foot facility under a lease which expires on January 1, 2012. At this facility, the Company has approximately 65,400 square feet of manufacturing space, approximately 3,500 square feet of warehouse and storage space, and approximately 3,700 square feet of administrative office space.
The Company’s sales operations located near Munich, Germany are conducted from a 4,300 square foot facility under a lease which expires on February 28, 2011. This facility has a small warehouse area which totals approximately 3,000 square feet.
The Company’s operations in France which were acquired in the Europlak and Eurobiopsy acquisitions are conducted from a 14,500 square foot leased facility in La Garde, France and a 5,300 square foot leased facility in Quincie, France. These leases expire on February 28, 2015 and on March 14, 2011, respectively.
The Company believes that its present facilities are adequate for its current requirements and that leases expiring in 2007, specifically one of its operating leases in the Dominican Republic and its operating lease in Acuna, Mexico, can be extended on reasonable terms.
From time to time the Company is involved in litigation and legal proceedings in the ordinary course of business. The Company does not believe that the outcome of any existing claims will have a material adverse effect on its business.
ITEM 4. | SUBMISSION OF MATTERS TO A VOTE OF SECURITY HOLDERS |
There were no submissions of matters to a vote of the Company’s shareholders during the three months ended December 31, 2006.
ITEM 4A. | DIRECTORS AND EXECUTIVE OFFICERS |
The current directors and executive officers of the Company are as follows:
| | |
Name | | Position |
Dan R. Lee | | Chairman, President and Chief Executive Officer, Director |
Mark J. Alvarez | | Chief Operating Officer |
Roger G. Wilson | | Chief Financial Officer, Treasurer and Secretary |
Kenneth F. Davis | | Director |
Michael E. Glasscock, III | | Director |
Rosdon Hendrix | | Director |
Gene R. McGrevin | | Director |
Marc R. Sarni | | Director |
Ronald L. Smorada | | Director |
18
Dan R. Lee (age 59) was appointed Chairman of the Board of Directors effective July 1, 2002, and was appointed to serve as President and Chief Executive Officer of the Company in December 2000. Additionally, he continues his role as the President of Microtek, a subsidiary of the Company. He became an executive officer of the Company following the conclusion of the acquisition of Microtek in 1996, and became a director of the Company in December 1996. Prior to accepting such positions with the Company, Mr. Lee had served as the Vice President and Chief Operating and Financial Officer of Microtek since 1987. Previous to that time, he was engaged in the public accounting practice, including more than five years with KPMG LLP. Mr. Lee serves on the Board of NBC Capital Corp., a bank holding company traded on the American Stock Exchange.
Mark J. Alvarez(age 47) was appointed Chief Operating Officer of the Company in August 2005. Prior to joining the Company and since 2002, Mr. Alvarez served as the President of Recall North America, a document management solutions company with 2,000 employees across 150 facilities in the U.S., Canada and Mexico. Prior to joining Recall North America, Mr. Alvarez served in progressively more senior positions with General Electric Company from 1983 to 2002, initially with GE Medical Systems and thereafter in more senior leadership positions within General Electric’s Corporate Marketing and Sales group across all of the industrial and capital businesses of General Electric Company. Mr. Alvarez serves as an Advisory Board member for Nioxin Research Laboratories, Inc.
Roger G. “Jerry” Wilson (age 63) was appointed Chief Financial Officer of the Company in December 2000, in addition to serving since July 1998 in the position of Vice President and Chief Financial Officer of Microtek. Mr. Wilson served as Vice President of Finance for the White Knight Healthcare subsidiary after its acquisition by the Company in 1995. Prior to accepting such positions, Mr. Wilson had served as corporate controller of White Knight Healthcare, Inc. since 1987. Mr. Wilson was also employed by Akzo America, Inc. for twelve years in various accounting and income tax management positions. Prior to that, Mr. Wilson, who is a Certified Public Accountant, practiced public accounting for seven years.
Kenneth F. Davis (age 55) was elected a director of the Company in January 1996. Dr. Davis was a practicing surgeon on the staff of the Harbin Clinic and Redmond Regional Medical Center in Rome, Georgia from 1986 to 2000. Dr. Davis now serves as the Chief Executive Officer and President of the Harbin Clinic, the largest multi-specialty clinic in Georgia. In addition, Dr. Davis serves on the Board of Heritage First Bank, Adams Product Management, Hydro Dynamics, Inc. and the Georgia Land Trust. He also serves on the Board of Visitors for Berry College.
Michael E. Glasscock, III (age 73) was appointed a Director of the Company in December 2002. Dr. Glasscock, a physician, practiced otology and neurotology for 35 years and retired from the active practice of medicine in 1997. From 1997 to 1998, Dr. Glasscock served as Chairman of St. Cloud Medical, a physician practice management company; from 1998 to 2001, he served as Chairman of TrueSound, Inc., a hearing aid dispensing company; and since 2001, he has served as Chairman of Tympany, a start-up company that has developed an automated hearing test. He currently serves as Chairman of Otomed, a manufacturer of surgical products. Dr. Glasscock has published in excess of 250 scientific articles and founded the American Journal of Otology (now Otology & Neurotology) and the E.A.R. Foundation. He is the past president of the American Otologic Society and has been an active entrepreneur with several medical related companies.
Rosdon Hendrix (age 67) was elected a Director of the Company in December 1994. Until he retired in June 1992, Mr. Hendrix served for approximately 30 years in various financial positions for General Motors Corporation, including serving as Resident Comptroller from 1975 until his retirement. Since June 1992, Mr. Hendrix has engaged in efficiency consulting studies and other consulting services with various governmental authorities and businesses. In addition, since June 1997, Mr. Hendrix has performed information technology consulting services for Lockheed Martin. On December 1, 2003, Lockheed Martin’s commercial division was acquired by Affiliated Computer Services, Inc. (ACS), and Mr. Hendrix has been retained by ACS as a consultant.
19
Gene R. McGrevin (age 64) was appointed Chairman of the Board of Directors and acting President of the Company in April 1997, and currently serves as a Director of the Company. Mr. McGrevin served as chairman of P.E.T.Net Pharmaceutical Services, LLC, a manufacturer and distributor of radiopharmaceuticals, from May 1997 until January 2001. Mr. McGrevin previously served as Vice Chairman and Chief Executive Officer of Syncor International Corp., a public company in the nuclear medicine industry, with which Mr. McGrevin was associated since 1989. Prior to managing Syncor, Mr. McGrevin served in executive positions with various healthcare businesses including President of the Healthcare Products Group of Kimberly-Clark Corporation, founder and President of a consulting firm specializing in the healthcare industry and an executive officer of VHA Enterprises, Inc. Mr. McGrevin is currently chairman of the executive committee of Hydro Dynamics, Inc. and serves as chairman of the Board of Real Time Medical Data, LLC and Medivance, Inc. He is also chairman of the Director’s Circle at the Yerkes Primate Center-Emory University.
Marc R. Sarni (age 48) was elected a Director of the Company in May 2005. Mr. Sarni is a Principal at Cornerstone Investment LLC and a Managing Director of NEW Holdings, LLC, companies engaged in the investment, development, brokerage and property management of residential and commercial real estate. Mr. Sarni worked as an investment banker at A.G. Edwards and Sons, Inc. for 17 years, and from 1997 until 2003, was the Managing Director responsible for establishing and managing the Healthcare Industry Group within the corporate finance department’s Emerging Growth Sector. The Healthcare Industry Group of A.G. Edwards focused primarily on emerging growth medical technology, biotechnology, specialty pharmaceutical and healthcare services companies. Prior to joining A.G. Edwards, Mr. Sarni spent three years working as a Certified Public Accountant at PriceWaterhouse (now PricewaterhouseCoopers LLP). Mr. Sarni graduated from the University of Missouri at Columbia with a BSBA degree in accounting and received his MBA in finance from the University of Chicago. Mr. Sarni currently serves as a member of the Board of Managers for Ascension Health Ventures, the strategic health venture-investing subsidiary of Ascension Health, the nation’s largest Catholic and not-for-profit healthcare system. Mr. Sarni also serves on the Board of Directors of Cornerstone Investment, LLC, Hollis-Eden Pharmaceuticals, Inc., Howard Commercial Corp. and NEW Holdings, LLC.
Ronald L. Smorada (age 60) was elected a Director of the Company in May 1999. Dr. Smorada has long been an active participant in the global nonwovens industry. From 1995 to 1999, Dr. Smorada held senior management positions at Reemay, Fiberweb and BBA US Holdings, the latter being the parent of the former two with nonwoven sales in excess of $800 million. During this time, he worked in the development, acquisition and integration of new and existing businesses, both domestic and international. Since 2000, Dr. Smorada has been involved with establishing new businesses which develop novel nonwoven materials for entirely new uses. He is president of OnWay International, a consulting and technology transfer organization. His major focus is the application and conversion of science and technical concepts into meaningful businesses.
PART II
ITEM 5. | MARKET FOR REGISTRANT’S COMMON EQUITY AND RELATED STOCKHOLDER MATTERS AND ISSUER PURCHASES OF EQUITY SECURITIES |
Market Information
The common stock is traded and quoted on The Nasdaq Stock Market under the symbol “MTMD”. The following table shows the quarterly range of high and low sales prices of the common stock during the periods indicated since December 31, 2004.
| | | | | | |
| | | Common Stock |
| | | High | | Low |
2006 | | | | | | |
First Quarter | | $ | 3.67 | | $ | 3.37 |
Second Quarter | | $ | 3.93 | | $ | 3.38 |
Third Quarter | | $ | 4.11 | | $ | 3.35 |
Fourth Quarter | | $ | 4.69 | | $ | 3.35 |
2005 | | | | | | |
First Quarter | | $ | 4.17 | | $ | 3.25 |
Second Quarter | | $ | 3.96 | | $ | 3.30 |
Third Quarter | | $ | 4.11 | | $ | 3.25 |
Fourth Quarter | | $ | 3.92 | | $ | 3.31 |
20
Holders
On March 9, 2007, the closing sales price for the common stock as reported by The Nasdaq Stock Market was $4.36 per share. As of March 9, 2007, the Company had approximately 1,200 shareholders of record.
Dividends
The Company has never declared or paid any cash dividends on its common stock. The Company currently intends to retain any future earnings to finance the growth and development of its business and therefore does not anticipate paying any cash dividends in the foreseeable future. Moreover, the Company’s credit facility prohibits the Company from declaring or paying cash dividends without the prior written consent of its senior lender. See “Management’s Discussion and Analysis of Financial Condition and Results of Operations - Liquidity and Capital Resources”. Accordingly, the Company does not intend to pay cash dividends in the foreseeable future.
Issuer Purchases of Equity Securities
In February 2000, the Board of Directors authorized the repurchase of up to five percent (5%) of the Company’s outstanding common stock from time to time in open market or private transactions. As amended to date, the Company’s share repurchase program authorizes the repurchase of up to an aggregate of 4,000,000 shares over an indefinite period. As of December 31, 2006, the Company had repurchased 1,984,255 shares for an aggregate repurchase price of $5.0 million, at an average repurchase price of approximately $2.52 per share. The following table summarizes the Company’s share repurchases during the Company’s fourth quarter of 2006:
| | | | | | | | | |
Period | | Total Number of
Shares Purchased | | Average Price
Paid per Share | | Total Number of Shares
Purchased as Part of
Publicly Announced
Repurchase Plans | | Maximum Number of
Shares that May Yet
Be Purchased Under
the Repurchase Plans |
October 1 to 31, 2006 | | — | | $ | — | | — | | 2,068,245 |
November 1 to 30, 2006 | | 48,500 | | $ | 3.68 | | 48,500 | | 2,019,745 |
December 1 to 31, 2006 | | 4,000 | | $ | 3.94 | | 4,000 | | 2,015,745 |
| | | | | | | | | |
Total | | 52,500 | | $ | 3.70 | | 52,500 | | 2,015,745 |
| | | | | | | | | |
21
Stock Price Performance Graph
The graph below compares cumulative total returns (changes in stock price plus reinvested dividends) on a hypothetical investment of $100 in the common stock of the Company, the S&P 500 Index and the S&P Health Care Index, for the period commencing December 31, 2001 and ending December 31, 2006.
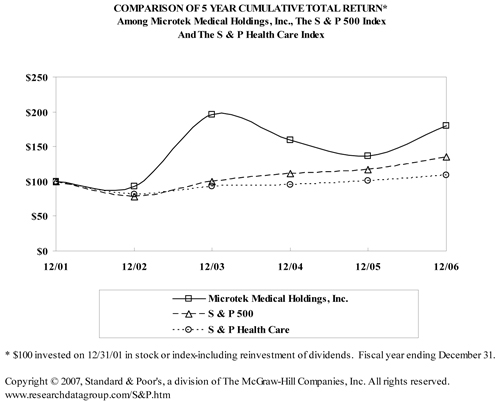
| | | | | | | | | | | | |
| | | 12/01 | | 12/02 | | 12/03 | | 12/04 | | 12/05 | | 12/06 |
Microtek Medical Holdings, Inc. | | 100.00 | | 93.33 | | 196.08 | | 159.22 | | 136.47 | | 180.39 |
S & P 500 | | 100.00 | | 77.90 | | 100.24 | | 111.15 | | 116.61 | | 135.03 |
S & P Health Care | | 100.00 | | 81.17 | | 93.40 | | 94.96 | | 101.10 | | 108.71 |
ITEM 6. | SELECTED FINANCIAL DATA |
In December 2006, Microtek acquired all of the stock of Eurobiopsy, a company focused on the design, development, manufacture and commercialization of a line of endoscope biopsy forceps. In October 2006, Microtek acquired all of the stock of Europlak, a marketer of minimally invasive surgical products and devices primarily to urology, gastroenterology and related surgical specialties. In July 2006, Microtek acquired substantially all of the assets of Ceres Medical, a marketer of a small line of products sold primarily to cardiology and interventional radiology specialties within the United States. In March 2006, Microtek acquired the European manufacturing and distribution operations of Samco which added additional European manufacturing capacity, primarily in Malta, and an expanded sales presence in Germany. In March 2004, the Company acquired a small line of orthopedic products. Effective May 28, 2004, the Company acquired certain businesses of International Medical Products, B.V. and affiliates (“IMP”) related to the development, manufacture, marketing and sale of medical device equipment covers, cardiac thoracic drain systems, gynecological devices and wound care products. Effective September 30, 2004, the Company completed a license to ETI to manufacture, use and sale the Company’s OREX materials and processing technology in the nuclear industry and homeland security industry and for certain other industrial applications, and the Company completed the associated sale to ETI of certain equipment and inventory. Effective November 1, 2003, the Company acquired substantially all of the assets of Plasco, Inc. Effective November 29, 2002, the Company acquired the surgical drape product line of Gyrus ENT.
22
The table below sets forth summary historical financial data for each of the five years in the period ended December 31, 2006. This summary historical financial data has been derived from the Company’s audited consolidated financial statements and should be read in conjunction with the historical consolidated financial statements of the Company and the related notes thereto, “Management’s Discussion and Analysis of Financial Condition and Results of Operations” and other financial data appearing elsewhere in this Form 10-K.
| | | | | | | | | | | | | | | | | | | |
| | | Year Ended December 31, |
| | | 2002 | | | 2003 | | | 2004 | | | 2005 | | | 2006 |
Statement of Operations Data:
(in thousands, except per share data) | | | | | | | | | | | | | | | | | | | |
Net sales | | $ | 85,228 | | | $ | 98,664 | | | $ | 126,581 | | | $ | 134,458 | | | $ | 141,577 |
Licensing revenues | | | 1,427 | | | | — | | | | — | | | | — | | | | — |
| | | | | | | | | | | | | | | | | | | |
Total revenues | | | 86,655 | | | | 98,664 | | | | 126,581 | | | | 134,458 | | | | 141,577 |
Cost of goods sold | | | 52,554 | | | | 59,448 | | | | 77,017 | | | | 81,932 | | | | 85,595 |
| | | | | | | | | | | | | | | | | | | |
Gross profit | | | 34,101 | | | | 39,216 | | | | 49,564 | | | | 52,526 | | | | 55,982 |
Operating expenses | | | | | | | | | | | | | | | | | | | |
Selling, general and administrative | | | 27,326 | | | | 31,261 | | | | 39,483 | | | | 40,526 | | | | 42,721 |
Amortization of intangibles | | | 456 | | | | 440 | | | | 809 | | | | 961 | | | | 1,109 |
Research and development | | | 736 | | | | 940 | | | | 1,048 | | | | 810 | | | | 873 |
| | | | | | | | | | | | | | | | | | | |
Total operating expenses | | | 28,518 | | | | 32,641 | | | | 41,340 | | | | 42,297 | | | | 44,703 |
| | | | | | | | | | | | | | | | | | | |
Gain (loss) on dispositions | | | — | | | | 982 | | | | 215 | | | | (139 | ) | | | — |
| | | | | | | | | | | | | | | | | | | |
Income from operations | | | 5,583 | | | | 7,557 | | | | 8,439 | | | | 10,090 | | | | 11,279 |
Net other (expense) income | | | (340 | ) | | | (44 | ) | | | 718 | | | | (244 | ) | | | 851 |
| | | | | | | | | | | | | | | | | | | |
Income before income taxes | | | 5,243 | | | | 7,513 | | | | 9,157 | | | | 9,846 | | | | 12,130 |
Income tax (benefit) expense | | | (3,171 | ) | | | (8,510 | ) | | | (764 | ) | | | (4,658 | ) | | | 4,215 |
| | | | | | | | | | | | | | | | | | | |
Net income | | $ | 8,414 | | | $ | 16,023 | | | $ | 9,921 | | | $ | 14,504 | | | $ | 7,915 |
| | | | | | | | | | | | | | | | | | | |
Net income per share – basic | | $ | 0.20 | | | $ | 0.38 | | | $ | 0.23 | | | $ | 0.33 | | | $ | 0.18 |
| | | | | | | | | | | | | | | | | | | |
Net income per share – diluted | | $ | 0.20 | | | $ | 0.37 | | | $ | 0.22 | | | $ | 0.33 | | | $ | 0.18 |
| | | | | | | | | | | | | | | | | | | |
Weighted average number of common and common equivalent shares outstanding – Basic | | | 42,125 | | | | 42,206 | | | | 43,005 | | | | 43,347 | | | | 43,498 |
| | | | | | | | | | | | | | | | | | | |
Weighted average number of common and common equivalent shares outstanding – Diluted | | | 42,789 | | | | 43,251 | | | | 44,500 | | | | 44,050 | | | | 44,506 |
| | | | | | | | | | | | | | | | | | | |
| |
| | | Year Ended December 31, |
| | | 2002 | | | 2003 | | | 2004 | | | 2005 | | | 2006 |
Balance Sheet Data
(in thousands) | | | | | | | | | | | | | | | | | | | |
Working capital | | $ | 42,950 | | | $ | 52,520 | | | $ | 48,819 | | | $ | 59,154 | | | $ | 58,873 |
Intangible assets, net | | | 29,392 | | | | 30,488 | | | | 38,951 | | | | 36,997 | | | | 47,007 |
Total assets | | | 96,696 | | | | 118,299 | | | | 131,069 | | | | 140,758 | | | | 156,166 |
Long-term debt | | | 7,367 | | | | 8,528 | | | | 5,479 | | | | 1,669 | | | | 894 |
Total shareholders’ equity | | | 78,886 | | | | 96,544 | | | | 108,643 | | | | 124,066 | | | | 132,236 |
23
ITEM 7. | MANAGEMENT’S DISCUSSION AND ANALYSIS OF FINANCIAL CONDITION AND RESULTS OF OPERATION |
The following discussion and analysis is intended to provide an understanding of the Company’s consolidated financial position and results of operations for the three year period ended December 31, 2006. The consolidated financial statements and the accompanying notes included elsewhere in the Company’s Annual Report contain detailed information that should be referred to in conjunction with the following discussion and analysis.
General
The Company conducts substantially all of its operations through its subsidiary, Microtek Medical, Inc. (“Microtek”). OREX Technologies International (“OTI”), a division of the Company, was previously focused on the commercialization of the Company’s OREX degradable products and disposal technologies to the nuclear power generating industry until this business was licensed to a third party in September 2004.
Microtek, a market leading healthcare company within its area of focus, manufactures and sells infection control products, fluid control products, safety products and other surgical products to healthcare professionals for use in environments such as operating rooms and ambulatory surgical centers. Traditionally a category leader in disposable equipment drapes, specialty patient drapes and fluid control drapes, Microtek offers a diverse product line which has been designed to improve patient care and to address risk reduction and cross contamination concerns for virtually every medical specialty in a healthcare facility, from interventional radiology, cardiology and angiography to orthopedics, neurology, OB/GYN, urology and other clinical environments. Additionally, Microtek is also a prominent contract manufacturer for some of the most technologically advanced healthcare equipment companies in the world.
Microtek has established a broad product selling system through multiple channels including distributors, directly through its own sales force, original equipment manufacturers, and private label customers. Additionally, Microtek has a strong presence as a branded component supplier to custom procedure tray companies.
Through its acquisition of certain businesses of International Medical Products, B.V. and affiliates (collectively, “IMP”) on May 28, 2004, Microtek added to its operations the development, manufacture, marketing and distribution in Europe of high quality dip-molded medical devices (primarily ultrasound probe covers), other equipment covers, cardiac thoracic drain systems, gynecological devices and wound care products. Microtek’s acquisition in March 2006 of the European manufacturing and distribution operations of Samco added additional European manufacturing capacity, primarily in Malta, and an expanded sales presence in Germany. In July 2006, Microtek acquired substantially all of the assets of Ceres Medical, a marketer of a small line of products sold primarily to cardiology and interventional radiology specialties within the U.S. In October 2006, Microtek acquired all of the stock of Europlak, a marketer of minimally invasive surgical products and devices primarily to urology, gastroenterology and related surgical specialties. In December 2006, Microtek acquired all of the stock of Eurobiopsy, a company focused on the design, development, manufacture and commercialization of a line of endoscope biopsy forceps.
In September 2004, the Company entered into an agreement (the “License Agreement”) with Eastern Technologies, Inc. (“ETI”) which grants to ETI a worldwide exclusive license to manufacture, use and sell the Company’s OREX materials and processing technology in the nuclear industry and the homeland security industry and for certain other industrial applications. Concurrent with the signing of the License Agreement, the Company also entered into an exclusive three-year supply agreement (the “Supply Agreement”) under which the Company has agreed to provide certain sourcing and supply chain management services and to sell a total of approximately $4.8 million of inventory to ETI over the term of the Supply Agreement. Except for activities under the License Agreement and the Supply Agreement, the Company is not actively engaged in any business development efforts associated with the Company’s OREX products and processing technologies.
24
The Company provides healthcare professionals with innovative product solutions that encompass a high level of patient care and prevention of cross infection. The Company intends to maintain this business by continually improving its existing capabilities and simultaneously developing and acquiring new business opportunities while maintaining its customer focus and providing the highest levels of customer support. The Company seeks to increase sales and earnings from its infection control business by completing strategic acquisitions, enhancing marketing and distribution efforts both domestically and internationally, introducing new products, increasing direct sales representation, employing tele-sales agents for added sales coverage, and capitalizing on low-cost manufacturing opportunities in the Dominican Republic, Malta and China.
Sales Growth
The Company has increased its consolidated net revenues from approximately $86.7 million in 2002 to $141.6 million in 2006. This growth has resulted from acquisitions and through double-digit internal growth. Since January 2002, the Company has completed eight acquisitions, including:
| | • | | the surgical drape product line of Gyrus ENT, LLC; |
| | • | | the multi-line disposable medical device products of Plasco, Inc.; |
| | • | | a small line of orthopedic products of Ortho/Plast, Inc.; |
| | • | | certain businesses of International Medical Products, B.V. and affiliates; |
| | • | | Samco’s European manufacturing and distribution operations located in Malta and Germany; |
| | • | | a small line of cardiology and interventional radiology products of Ceres Medical; |
| | • | | Europlak’s line of minimally invasive surgical products and devices for urology and gastroenterology; and |
| | • | | Eurobiopsy’s line of endoscope biopsy forceps. |
At the same time that the Company has pursued this acquisition strategy, the Company has generated internal growth by making product improvements and product line extensions to its existing product families. The Company has also made significant investments in all parts of its business, particularly in its domestic sales and marketing infrastructure and its European operations, to increase market awareness of the Company’s branded product lines and to further position the Company as a worldwide market leader in the customized infection control market. The Company has also focused its efforts on expanding and developing its relationships with its customers and other end users which include certain of the leading original equipment manufacturers (“OEM’s”) and supply service companies in the world.
While continued investment in promoting the Company’s brand has partially offset operating leverage from revenue growth in the short term, the Company believes that its branded sales and marketing infrastructure will aid the Company in maintaining and increasing revenues and thereby contribute to the Company’s operating income. The Company also believes that additional internal growth in net revenues can be achieved through increased focus on the design and release of new products, targeted sales efforts in key surgical procedures and departments within the hospital and outpatient surgical settings, continued relationship building with major OEM’s, and an increased international presence stemming from the Company’s European headquarters in the Netherlands and an increased direct branded presence in other parts of Europe. The Company also expects to continue to pursue acquisitions that are accretive to earnings and shareholder value over the long-term. In the absence of such acquisition opportunities, the Company will use its cash flow to reduce indebtedness and, when appropriate, to repurchase shares of the Company’s stock pursuant to its existing share repurchase program.
Operating Performance
The Company operates in an environment where it is necessary to realize cost reduction opportunities to offset continued competitive pricing and other margin pressures. In spite of raw material price increases, the relative value of the U.S. dollar as compared to the Dominican peso during the first three calendar quarters of 2005, price pressures related to certain of the Company’s OEM relationships and changes in the Company’s sales mix, the Company has been able to substantially maintain its gross margin at approximately 39 percent in 2006 and 2005. The Company has done so by leveraging its low-cost offshore manufacturing capabilities and its other sourcing capabilities and relationships in China where these capabilities and relationships are considered advantageous. The Company has also maintained its margins through targeted capital investment for productivity and efficiency
25
improvements and manufacturing cost reductions resulting from facility and plant rationalization and consolidation. For example, during 2004, the Company either consolidated into its Tyler, Texas facility or transferred offshore the operations of its former Athens, Texas facility. Additionally, during 2005, the Company consolidated its manufacturing operations acquired in the November 2003 Plasco transaction from Gurnee, Illinois to its facilities in the Dominican Republic. In 2006, the Company transitioned certain of its Netherlands manufacturing operations to its lower cost facility in Malta and relocated its administrative, warehouse and distribution operations to a new facility which is better able to accommodate the Company’s expanding European operations. These consolidations and facility rationalizations have resulted and are expected to result in substantial cost savings which mitigate pressures from increases in raw material prices, foreign currency pressures and impacts of other pricing pressures and sales mix changes. The Company continuously looks for continued savings from facility consolidations and other process improvements at each of its facilities.
Since 2004, the Company’s selling, general and administrative expenses as a percentage of consolidated net revenues have improved from approximately 31.2 percent in 2004 to approximately 30.1 percent in 2005 and 30.2 percent in 2006. The Company attributes this improvement since 2004 to increased leverage on higher revenues, inflationary increases in the Company’s fixed costs, and its general and administrative cost cutting and control efforts which have offset increases in distribution costs and sales and marketing expenses. In terms of absolute dollars, the Company attributes the increase in its total selling, general and administrative expenses from 2004 to 2006 primarily to higher variable selling and distribution costs resulting from increased revenues and to its investment during 2005 and 2006 in the selling, general and administrative infrastructure of its Netherlands operations and in its newly acquired operations in Germany, Malta and France. Since 2004, the Company has also made a considerable investment in its domestic sales and market infrastructure in an effort to promote the Company’s branded market presence in the United States. Additionally, the Company has experienced increases in distribution costs, particularly in 2005, as a result of increased freight and other expenses associated with rising petroleum prices.
The Company’s research and development expenses have been modest at one percent or less of consolidated net revenues in 2004, 2005 and 2006. A significant component of the Company’s future business plan focuses on internal growth, much of which is expected to be generated through new product development and product line extensions. The Company expects that its research and development expenses will increase in the future as the Company invests in additional internal research and development expertise and as it pursues expanded research and development activities.
The Company’s amortization of intangibles was $809 thousand and $961 thousand in 2004 and 2005, respectively, and increased to approximately $1.1 million in 2006 as a result of amortization expense related to intangibles acquired in the Company’s 2006 acquisitions. The Company expects that its amortization expense in 2007 will increase over 2006 as a result of amortizing its newly acquired intangibles. As previously incurred patent and other intangibles become fully amortized, they will be replaced by the Company’s future investments to seek patent and trademark protection for its proprietary products resulting from the Company’s expanded research and development efforts.
Cash Flows
Over the past three years, the Company has reduced its indebtedness from $8.5 million at December 31, 2003 to $894 thousand at December 31, 2006, while completing six different acquisition transactions, including the Company’s IMP acquisition in May 2004 for approximately $9.6 million and the Samco, Ceres Medical, Europlak and Eurobiopsy transactions in 2006 which collectively used $9.5 million. The Company attributes its improved cash flows in 2006 to its sound working capital management activities, primarily its receivables management, to relatively modest capital expenditures in 2006 of approximately $2.3 million, and the cash savings related to the Company’s net operating loss carryforwards which eliminate the payment of substantially all Federal income taxes on the Company’s earnings until these carryforwards are fully utilized. Absent the effect of any potential future acquisitions, capital expenditures in 2007 are expected to increase modestly over its 2006 capital expenditures of approximately $2.3 million as a result of the Company’s expanding worldwide operations. The Company anticipates future capital improvements to certain of its manufacturing facilities and an increase in capital expenditures related to the Company’s information technology infrastructure both domestically and abroad. As of March 9, 2007, the Company had repaid all outstanding borrowings under its revolving credit facility.
26
Year Ended December 31, 2006 Compared to Year Ended December 31, 2005
Overview.Consolidated net revenues were $141.6 million in 2006, representing a 5.3 percent increase as compared to 2005, primarily as a result of growth in the Company’s healthcare revenues of approximately 8.0 percent, including domestic branded growth of 7.9 percent, OEM revenue growth of 1.8 percent and international revenue growth of 14.8 percent resulting from organic growth of 2.1 percent and approximately $4.2 million in revenues attributable to the Company’s European acquisitions in 2006. OTI division revenues in 2006 decreased by approximately $3.3 million, or 72.8 percent, from 2005 as anticipated under the License Agreement with ETI. Gross margins in 2006 were 39.5 percent, versus 39.1 percent in 2005. Income from operations in 2006 increased by $1.2 million, or 11.8 percent, from 2005. Net income for 2006 was $7.9 million, including foreign currency exchange gains of $236 thousand and income tax expense of $4.2 million. By comparison, net income for 2005 was $14.5 million, or $0.33 per basic and diluted share. The Company’s cash flow from operations in 2006 was $14.5 million which, together with proceeds from sales of property and equipment and proceeds from common stock issuances and option exercises, financed more than $9.5 million in business acquisitions, funded capital expenditures of $2.3 million and paid down approximately $1.7 million of long-term debt during 2006. The Company’s cash and cash equivalents increased by $2.3 million during 2006 and totaled approximately $17.1 million at December 31, 2005.
Results of Operations.The following table sets forth certain income statement data, including amounts expressed as a percentage of net revenues, for the years ended December 31, 2006 and 2005 (in thousands):
| | | | | | | | | | | | | |
| | | Year ended December 31, 2006 | | | Year ended December 31, 2005 | |
| | | Amount | | % of Net
Revenues | | | Amount | | | % of Net
Revenues | |
Net revenues | | $ | 141,577 | | 100.0 | % | | $ | 134,458 | | | 100.0 | % |
Gross profit | | | 55,982 | | 39.5 | % | | | 52,526 | | | 39.1 | % |
Operating expenses | | | 44,703 | | 31.6 | % | | | 42,297 | | | 31.5 | % |
Income from operations | | | 11,279 | | 8.0 | % | | | 10,090 | | | 7.5 | % |
Other income (expense) | | | 851 | | 0.6 | % | | | (244 | ) | | (0.2 | )% |
Income tax expense (benefit) | | | 4,215 | | 3.0 | % | | | (4,658 | ) | | (3.5 | )% |
Net income | | | 7,915 | | 5.6 | % | | | 14,504 | | | 10.8 | % |
Net Revenues.Consolidated net revenues in 2006 were $141.6 million, an increase of $7.1 million, or 5.3 percent over the $134.5 million of net revenues reported in 2005.
For 2006, Microtek’s net revenues totaled $140.3 million, an increase of $10.4 million, or 8.0 percent, over net revenues of $129.9 million reported in 2005. Included in Microtek’s net revenues for 2006 are $4.2 million in revenues associated with the Company’s European acquisitions in 2006. The following table depicts Microtek’s domestic and international revenues and the relative percentage of each to Microtek’s total revenues in 2006 and 2005 (in millions):
| | | | | | | | | | | | |
| | | Year ended
December 31, 2006 | | | Year ended
December 31, 2005 | |
| | | Amount | | % of
Total | | | Amount | | % of
Total | |
Domestic | | $ | 102.6 | | 73.2 | % | | $ | 97.1 | | 74.8 | % |
International | | | 37.7 | | 26.8 | % | | | 32.8 | | 25.2 | % |
| | | | | | | | | | | | |
Total | | $ | 140.3 | | 100.0 | % | | $ | 129.9 | | 100.0 | % |
| | | | | | | | | | | | |
Microtek’s domestic revenues are generated through two primary channels or customer categories, branded and contract manufacturing (commonly referred to as OEM). Domestic branded revenues were 66.1 percent and OEM revenues were 33.9 percent of Microtek’s total domestic revenues in 2006 as compared to 64.8 percent and 35.2 percent, respectively, in 2005. Included in the Company’s OEM revenues are sales of product to “non-branded” or private label customers.
27
Microtek’s domestic branded revenues in 2006 improved over 2005 amounts by $4.9 million, or 7.9 percent. This increase is primarily the result of a $3.3 million, or 9.8 percent, increase in specialty product revenues (which includes Microtek’s CleanOp product sales and its specialty procedure patient drapes) and a $900 thousand, or 3.1 percent, increase in the Company’s core equipment draping revenues. Microtek’s OEM revenues in 2006 increased by $600 thousand, or 1.8 percent, to $34.8 million from $34.2 million in 2005. Increases in OEM revenues resulted primarily from growth of approximately $2.0 million, or 8.8 percent, in the Company’s private label revenues which was offset by lower trilaminate converting and woundcare revenues which declined as a result of customer decisions to move the manufacture of certain of these products in-house or to another offshore provider. OEM revenues can be volatile as they are heavily dependent on the buying patterns of the Company’s OEM partners.
Microtek’s international revenues, which accounted for 26.8 percent of Microtek’s 2006 net revenues, grew by $4.9 million, or 14.8 percent, over 2005 as a result of internal growth of approximately $700 thousand, or 2.1 percent, and approximately $4.2 million in revenues attributable to the Company’s Samco, Europlak and Eurobiopsy acquisitions completed in March, October and December 2006, respectively.
OTI’s net revenues were $1.2 million and $4.5 million in 2006 and 2005, respectively. As discussed above, in September 2004, the Company licensed its OREX degradable products and disposal technologies for nuclear and other specified applications to ETI and concurrently entered into an exclusive three-year Supply Agreement for certain sourcing and supply chain management services. Royalties under the License Agreement totaled $300 thousand in both 2006 and 2005. Sales of finished goods inventories to ETI under the Supply Agreement were approximately $900 thousand and $4.2 million in 2006 and 2005, respectively. The Company expects that OTI division revenues in 2007 will consist of sales of the remaining finished goods inventories on hand of approximately $300 thousand, plus an applicable margin, and license royalties totaling $75 thousand per quarter through September 2007. Thereafter, license royalties will be based on a percentage of certain of ETI’s net revenues, as defined in the License Agreement.
Gross Margins.Consolidated gross margins in 2006 were 39.5 percent, as compared with 39.1 percent for 2005. Microtek’s gross margins in 2006 and 2005 were consistent with the Company’s consolidated gross margin for the respective period. OTI’s gross margin in 2006 was 41.5 percent, as compared to 37.9 percent in 2005. The Company attributes its ability to improve its gross margins in 2006 to leverage from increased revenues and cost control and other manufacturing process improvements which have helped mitigate the impact of rising prices for fuel and other petroleum-based products which have resulted in increases in raw material and freight costs. Additionally, the stabilization of the Dominican peso versus the U.S. dollar in 2006 has eliminated significant cost pressures experienced in 2005 which increased certain expenses associated with the Company’s manufacturing operations in the Dominican Republic. Finally, changes in the Company’s sales mix, particularly the relative strength of the Company’s domestic branded revenues in the latter half of 2006, have also mitigated cost increases. OTI division revenues, consisting of sales of finished goods inventories, plus an applicable margin, and license royalties, are expected to generate gross margins of more than 40 percent and are therefore not expected to have a dilutive impact on the Company’s consolidated gross margins.
Operating Expenses. Consolidated operating expenses as a percentage of net revenues in 2006 were 31.6 percent, up slightly from 31.5 percent in 2005. Microtek’s operating expenses, which include corporate administrative expenses, as a percentage of net revenues, for 2006 were 31.7 percent versus 32.2 percent in 2005. In absolute dollar amounts, Microtek’s operating expenses increased in 2005 by $2.7 million to $44.5 million. OTI’s operating expenses in 2006 decreased by $325 thousand, or 64.2 percent, from 2005.
Consolidated selling, general and administrative (“SG&A”) expenses were $42.7 million, or 30.2 percent of net revenues, in 2006, versus $40.5 million, or 30.1 percent of net revenues, in 2005.
In 2006, Microtek’s SG&A expenses totaled approximately $42.7 million, or 30.4 percent of Microtek’s net revenues, as compared to $40.2 million, or 31.0 percent of Microtek’s net revenues, in 2005. In 2006, Microtek’s domestic SG&A expenses decreased approximately $487 thousand as a result of the second quarter 2005
28
closure of the Company’s Gurnee, Illinois facilities (which resulted in savings of approximately $854 thousand in 2006) and from the 2005 realignment of the Company’s domestic branded sales and marketing force, net of increased selling costs associated with the Company’s increased revenues (which resulted in a net decrease in sales and marketing expenses of approximately $685 thousand in 2006). Offsetting these sales and marketing expense savings were increases in distribution and general and administrative expenses (primarily variable distribution freight, general and administrative salaries and benefits and professional fees) of $101 thousand and $951 thousand, respectively.
In 2006, SG&A expenses of the Company’s Netherlands, Malta, Germany and France operations increased approximately $2.9 million, primarily as a result of additional investments in the Company’s sales, marketing and administrative infrastructure in the Netherlands, restructuring charges of approximately $750 thousand related to the Company’s transition of certain of its manufacturing operations from the Netherlands to Malta and to China, and SG&A expenses in 2006 of approximately $1.8 million related to the Samco, Europlak and Eurobiopsy businesses which were acquired in March, October and December 2006, respectively.
Following the ETI transaction in September 2004, the Company has substantially reduced the SG&A expenses of its OTI division for all future periods. During 2006 and 2005, SG&A expenses for the OTI division, consisting primarily of franchise taxes, miscellaneous administrative costs and in 2005 depreciation expense, totaled $44 thousand and $309 thousand, respectively.
Consolidated research and development expenses were $873 thousand and $810 thousand in 2006 and 2005, respectively. The net increase in research and development expenses is a result of a $130 thousand decrease in Microtek’s domestic research and development expenses and a $60 thousand decrease in OTI’s research and development expenses which were offset by approximately $253 thousand of research and development expenses associated with Europlak which was acquired in October 2006. The decline in Microtek’s domestic research and development expenses in 2006 is the continued result of a more focused research and development program which centers on new product development, as well as product enhancements and product line extensions. There are no new future research and development projects planned for the Company’s OTI division. The OTI division will continue to incur expenses related to maintenance and protection of OTI’s intellectual property.
Consolidated amortization of intangibles in 2006 of approximately $1.1 million increased by $148 thousand over 2005 as amortization expense associated with intangibles acquired in the Samco, Ceres Medical, Europlak and Eurobiopsy transactions was offset by the fact that certain of Microtek’s intangibles, primarily patent related expenses, are now fully amortized. As part of the licensing of the OREX technology in September 2004, the Company retained ownership of all of its intangible assets, including patent acquisition costs, related to its OREX products and processing technology. Consequently, this licensing agreement is not expected to have an impact on amortization of intangibles in future periods. OTI’s amortization expense totaled $117 thousand in both 2006 and 2005.
Income from Operations.Consolidated income from operations for 2006 was $11.3 million, versus $10.1 million in 2005, an increase in 11.8 percent. Microtek’s income from operations in 2006 of $10.9 million increased by approximately $2.1 million, or 23.4 percent, from income from operations in 2005 of $8.9 million. The Company’s OTI division reported income from operations in 2006 of $332 thousand versus $1.2 million in 2005.
Interest Expense and Interest Income.Consolidated interest expense was $69 thousand in 2006 as compared to $227 thousand in 2005. The decrease in consolidated interest expense in 2006 is attributable primarily to the Company’s elimination of its borrowings under its revolving credit facility in early 2006. Interest income of $435 thousand in 2006 increased by $298 thousand over 2005 as higher average cash and cash equivalent balances and higher applicable interest rates offset a $52 thousand decrease in interest income attributable to the promissory note from Global Resources related to the September 2004 sales of certain raw material inventories which was repaid in full in the third quarter of 2006.
Other Income/Expense, Net. Other income includes the Company’s equity in earnings of its investee, Global Resources, which totaled $249 thousand and $202 thousand in 2006 and 2005, respectively. Also included in other income and expense are foreign currency exchange gains and losses resulting from the translation of certain intercompany transactions of the Company’s Netherlands subsidiaries which are denominated in a currency other than the functional currency of those subsidiaries. In 2005, the Company’s recorded foreign currency exchange losses of $408 thousand, as compared to foreign currency exchange gains of approximately $236 thousand in 2006.
29
Income Taxes. The Company’s provision for income taxes in 2006 reflects income tax expense of $4.2 million, consisting of Federal alternative minimum tax (“AMT”), state and foreign income tax expense of $313 thousand for which the Company is currently liable and deferred income tax expense of $3.9 million. In 2005, the Company recorded a total net income tax benefit of $4.7 million consisting of a $5.3 million net deferred income tax benefit due primarily to the decrease in the Company’s valuation allowance for deferred tax assets in the third quarter of 2006, and the offsetting current Federal AMT, state and foreign income tax expense of $598 thousand.
Net Income. The resulting net income for 2006 was $7.9 million, or $0.18 per basic and diluted share. This compares to the net income of $14.5 million, or $0.33 per basic and diluted share reported for 2005.
Year Ended December 31, 2005 Compared to Year Ended December 31, 2004
Results of Operations.The following table sets forth certain income statement data, including amounts expressed as a percentage of net revenues, for the years ended December 31, 2005 and 2004 (in thousands):
| | | | | | | | | | | | | | |
| | | Year ended December 31, 2005 | | | Year ended December 31, 2004 | |
| | | Amount | | | % of Net
Revenues | | | Amount | | | % of Net
Revenues | |
Net revenues | | $ | 134,458 | | | 100.0 | % | | $ | 126,581 | | | 100.0 | % |
Gross profit | | | 52,526 | | | 39.1 | % | | | 49,564 | | | 39.2 | % |
Operating expenses | | | 42,297 | | | 31.5 | % | | | 41,340 | | | 32.7 | % |
Income from operations | | | 10,090 | | | 7.5 | % | | | 8,439 | | | 6.7 | % |
Other (expense) income | | | (244 | ) | | (0.2 | )% | | | 718 | | | 0.6 | % |
Income tax benefit | | | (4,658 | ) | | (3.5 | )% | | | (764 | ) | | (0.6 | )% |
Net income | | | 14,504 | | | 10.8 | % | | | 9,921 | | | 7.8 | % |
Overview.Consolidated net revenues were $134.5 million in 2005, representing a 6.2 percent increase as compared to 2004, primarily as a result of revenues of $14.0 million from the IMP acquisition which was completed on May 28, 2004, and internal growth in the Company’s healthcare revenues of approximately 4.2 percent. OTI division revenues in 2005 decreased by approximately $2.9 million, or 38.7 percent, from 2004. Gross margins in 2005 were 39.1 percent, versus 39.2 percent in 2004. Income from operations in 2005 increased by $1.7 million, or 19.6 percent, from 2004. Excluding losses and gains on dispositions of property and equipment in 2005 and 2004 of $139 thousand and $215 thousand, respectively, income from operations in 2005 increased by $2.0 million, or 24.4 percent, over 2004. Net income for 2005 was $14.5 million, including foreign currency exchange losses of $408 thousand and a net deferred income tax benefit of $4.7 million related primarily to the reduction in the Company’s valuation allowance for its deferred tax assets and the offsetting current Federal AMT, state and foreign income tax expense for 2005. The Company’s cash flow from operations in 2005 was $9.7 million which, together with proceeds from sales of property and equipment and proceeds from common stock issuances and option exercises, was used to fund capital expenditures of $1.1 million and to pay down approximately $3.8 million of long-term debt during 2005. The Company’s cash and cash equivalents increased by $5.8 million during 2005 and totaled approximately $14.8 million at December 31, 2005.
Net Revenues.Consolidated net revenues in 2005 were $134.5 million, an increase of $7.9 million or 6.2 percent over the $126.6 million of net revenues reported in 2004.
30
For 2005, Microtek’s net revenues totaled $129.9 million, an increase of $10.7 million, or 9.0 percent, over net revenues of $119.2 million reported in 2004. Included in Microtek’s net revenues for 2005 were $14.0 million in revenues associated with the IMP acquisition, as compared to $7.9 million in 2004. The following table depicts Microtek’s domestic and international revenues and the relative percentage of each to Microtek’s total revenues in 2005 and 2004 (in millions):
| | | | | | | | | | | | |
| | | Year ended December 31, 2005 | | | Year ended December 31, 2004 | |
| | | Amount | | % of
Total | | | Amount | | % of
Total | |
Domestic | | $ | 97.1 | | 74.8 | % | | $ | 95.5 | | 80.1 | % |
International | | | 32.8 | | 25.2 | % | | | 23.7 | | 19.9 | % |
| | | | | | | | | | | | |
Total | | $ | 129.9 | | 100.0 | % | | $ | 119.2 | | 100.0 | % |
| | | | | | | | | | | | |
Microtek’s domestic revenues are generated through two primary channels or customer categories: branded and contract manufacturing (commonly referred to as OEM). Domestic branded revenues were 64.8 percent and OEM revenues were 35.2 percent of Microtek’s total domestic revenues in 2005 as compared to 66.2 percent and 33.8 percent, respectively, in 2004. Included in the Company’s OEM revenues are sales of product to “non-branded” or private label customers.
Microtek’s 2005 domestic branded revenues were relatively consistent with 2004 amounts. The lack of growth in 2005 is the result of the consolidation of two large kit companies during 2004 and pricing and other competitive pressures experienced by the Company in 2005. Microtek’s OEM revenues in 2005 increased by $1.9 million, or 5.9 percent, to $34.2 million from $32.3 million in 2004. Increases in OEM revenues resulted primarily from growth in the Company’s private label revenues which was partially offset by lower trilaminate converting and woundcare revenues which declined as a result of customer decisions to move the manufacture of certain of these products in-house or to another offshore provider.
Microtek’s international revenues, which accounted for 25.2 percent of Microtek’s 2005 net revenues, grew by $9.1 million, or 38.6 percent, over 2004 as a result of internal growth of approximately $3.1 million, or 19.6 percent, and a $6.0 million increase in revenues from the IMP acquisition completed in May 2004.
OTI’s net revenues were $4.5 million in 2005 and consisted primarily of sales of finished goods inventories to ETI and royalties under the License Agreement of $300 thousand. OTI’s net revenues in 2004 were $7.4 million, including approximately $1.2 million in sales of certain OREX raw materials to a related party in September 2004 and royalties under the license agreement of $75 thousand.
Gross Margins.Consolidated gross margins in 2005 were 39.1 percent, as compared with 39.2 percent for 2004. Microtek’s gross margin was approximately 39.1 percent in 2005 versus 39.8 percent in 2004. OTI’s gross margin in 2005 was 37.9 percent, as compared to 28.4 percent in 2004. The Company attributes its ability to maintain consolidated gross margins of approximately 39 percent in 2005 to cost control and other manufacturing improvements designed to improve gross margins which substantially offset the impact of higher raw material costs resulting from rising petroleum prices and the weakening of the US dollar in relation to the Dominican peso.
Operating Expenses. Consolidated operating expenses as a percentage of net revenues in 2005 were 31.5 percent, as compared to 32.7 percent in 2004. In 2005, Microtek’s operating expenses, which include corporate administrative expenses, were 32.2 percent of net revenues versus 33.4 percent in 2004. In absolute dollar amounts, Microtek’s operating expenses increased in 2005 by $2.2 million to $41.8 million. OTI’s operating expenses in 2005 decreased by $1.1 million, or 68.0 percent, from 2004.
Consolidated selling, general and administrative (“SG&A”) expenses were $40.5 million or 30.1 percent of net revenues in 2005, versus $39.5 million or 31.2 percent of net revenues for 2004.
In 2005, Microtek’s SG&A expenses totaled approximately $40.2 million, or 31.0 percent of Microtek’s net revenues, as compared to $38.2 million, or 32.0 percent of net revenues, in 2004. Contributing to the overall increase in the absolute dollar amount of Microtek’s SG&A expenses was an increase SG&A expenses related to the IMP businesses of $2.0 million. Excluding expenses associated with the IMP businesses, Microtek’s total SG&A expenses increased by approximately $40 thousand principally as a result of a $548 thousand increase in distribution costs and a $387 thousand increase in sales and marketing expenses which were offset by an $895 thousand decrease in general and administrative expenses. The Company attributes the increases in its distribution and sales and marketing expenses in 2005 primarily to the variable nature of a significant portion of these costs and the related
31
increase in net revenues in 2005 and, with respect to distribution expenses, the impact of rising petroleum prices in 2005 on the Company’s freight and other similar distribution expenses. Microtek’s general and administrative expenses in 2005 declined from 2004 primarily as a result of various administrative cost control and cost elimination measures, including, most significantly, the closure of the Company’s Plasco manufacturing facilities in Gurnee, Illinois in the second quarter of 2005 which eliminated the related administrative cost infrastructure in the last six months of 2005.
During 2005, SG&A expenses for the OTI division consisted primarily of franchise taxes, depreciation expense and miscellaneous administrative costs and totaled $309 thousand. In 2004, the OTI division’s SG&A expenses, consisting primarily of sales commissions, warehousing and distribution expenses and other administrative costs, totaled approximately $1.3 million.
Consolidated research and development expenses were $810 thousand in 2005, as compared to $1.0 million in 2004. Research and development expenses for Microtek and OTI decreased by $173 thousand and $65 thousand, respectively, as a result of a more focused research and development program and the Company’s continued cost cutting efforts during 2005.
Consolidated amortization of intangibles in 2005 was $961 thousand and increased over amortization expense in 2004 of $809 thousand as a result of a full year of amortization expense related to the intangibles acquired in the IMP acquisition (increase over 2004 of $108 thousand) and a $44 thousand increase in Microtek’s amortization expense related primarily to patent and other intangible amortization.
Income from Operations.Consolidated income from operations for 2005 was $10.1 million, versus $8.4 million in 2004, an increase of 19.6 percent. Excluding disposition losses of $139 thousand in 2005 related to the closure of the Company’s manufacturing facilities in Gurnee, Illinois and the transition of those operations to the Dominican Republic and gains of $215 thousand in 2004 related to dispositions of property and equipment, the Company’s consolidated income from operations in 2005 increased by $2.0 million, or 24.4 percent, over 2004. Microtek’s income from operations in 2005 of $8.9 million increased by approximately $1.2 million or 15.2 percent, from income from operations in 2004 of $7.7 million. The Company’s OTI division reported income from operations in 2005 of $1.2 million, a 66.1 percent improvement over OTI’s income from operations of $732 thousand in 2004.
Interest Expense and Interest Income.Consolidated interest expense was $227 thousand in 2005, as compared to $322 thousand in 2004. The decrease in consolidated interest expense in 2005 resulted primarily from lower average borrowings under the Company’s Credit Agreement. Interest income of $189 thousand in 2005 increased from $57 thousand in 2004 as a result of higher interest rates applicable to the Company’s cash and cash equivalents and interest income attributable to the promissory note from Global Resources related to the September 2004 sales of certain raw material inventories.
Other Income/Expense, Net. Other income includes the Company’s equity in earnings of its investee, Global Resources, which totaled $202 thousand and $128 thousand in 2005 and 2004, respectively. Also included in other income and expense are foreign currency exchange gains and losses resulting from the translation of certain intercompany transactions of the Company’s Netherlands subsidiaries which are denominated in a currency other than the functional currency of those subsidiaries. In 2005, the Company’s recorded foreign currency exchange losses of $408 thousand, as compared to foreign currency exchange gains of approximately $850 thousand in 2004.
Income Taxes. The Company’s provision for income taxes in 2005 reflects a total net income tax benefit of $4.7 million, consisting of a $5.3 million net deferred income tax benefit due primarily to the decrease in the Company’s valuation allowance for deferred tax assets, and the offsetting current Federal AMT, state and foreign income tax expense of $598 thousand. In 2004, the Company’s provision for income taxes reflected a total net income tax benefit of $764 thousand, consisting of a $1.7 million net deferred income tax benefit due primarily to the decrease in the Company’s valuation allowance for deferred tax assets, and the offsetting current Federal AMT, state and foreign income tax expense of $926 thousand.
Net Income. The resulting net income for 2005 was $14.5 million, or $0.33 per basic and diluted share. This compares to the net income of $9.9 million, or $0.23 and $0.22 per basic and diluted share, respectively, reported for 2004.
32
Liquidity and Capital Resources
As of December 31, 2006, the Company’s cash and cash equivalents totaled $17.1 million compared to $14.8 million at December 31, 2005. The following are highlights of the Company’s cash flow activity in 2006 and 2005 (in thousands):
| | | | | | | | |
| | | Year ended December 31, | |
| | | 2006 | | | 2005 | |
Cash provided by operating activities | | $ | 14,518 | | | $ | 9,702 | |
Cash used in investing activities | | | (11,748 | ) | | | (897 | ) |
Cash used in financing activities | | | (820 | ) | | | (2,748 | ) |
During 2006, the Company utilized cash to fund its Samco, Ceres Medical and Europlak acquisitions, to repurchase Company stock, to purchase property and equipment, to repay all outstanding borrowings under its line of credit agreement, and to make scheduled debt payments related to previous acquisitions, capital leases and other debt obligations.
Cash provided by operating activities in 2006 totaled $14.5 million and resulted from improved profitability, net of depreciation and amortization, from the cash savings related to the Company’s net operating loss carryforwards which eliminate the payment of substantially all Federal income taxes on the Company’s earnings until these carryforwards are fully utilized, and from active receivables management which resulted in a decrease in receivables of approximately $1.7 million. Other sources of cash included increases in accounts payable, accrued compensation and other long-term liabilities. Offsetting these sources of cash were a $2.7 million increase in inventories, an increase in prepaid expenses and other assets and a decrease in other current liabilities. The increase in inventories in 2006 resulted from certain purchasing strategies employed by the Company to ensure a continuous supply of certain inventory items as the Company seeks to transfer additional manufacturing processes offshore to the Dominican Republic and to China.
During 2006, cash used in investing activities of $11.7 million included cash payments related to the Samco, Ceres Medical, and Europlak acquisitions of approximately $9.5 million and purchases of capital property and equipment of $2.3 million. Offsetting these payments were proceeds from the sales of property and equipment of $45 thousand. Capital additions in 2006 included machinery and equipment, computer equipment and building and leasehold improvements. Cash used in financing activities in 2006 was $820 thousand and resulted from repayments under the Company’s line of credit agreement of $1.2 million, repayments of notes payable, including capital lease obligations, of $448 thousand and treasury stock repurchases of $2.2 million which were offset by proceeds from the exercise of stock options and other issuances of common stock of $882 thousand. Additionally, in 2006, the Company’s bank overdraft increased by $2.2 million.
Cash provided by operating activities in 2005 totaled $9.7 million and resulted from improved profitability, sound working capital management, particularly inventories which decreased by $1.5 million, and the cash savings related to the Company’s net operating loss carryforwards. Uses of operating cash in 2005 included increases in accounts receivable, prepaid expenses and other assets and decreases in accounts payable, accrued compensation, and other accrued liabilities.
During 2005, cash used in investing activities of $897 thousand included purchases of capital property and equipment of approximately $1.1 million offset by $215 thousand in proceeds from the sales of property and equipment. Capital additions in 2005 included machinery and equipment and computer equipment. Cash used in financing activities in 2005 was $2.7 million and resulted from net repayments under the Company’s line of credit agreement of $3.3 million, repayments of notes payable, including capital lease obligations, of $491 thousand, and treasury stock repurchases of $147 thousand, which were offset by proceeds from the exercise of stock options and other issuances of common stock of approximately $1.1 million. Additionally, in 2005, the Company’s bank overdraft increased by $93 thousand.
33
The Company maintains a credit agreement (as amended to date, the “Credit Agreement”) with JP Morgan Chase Bank (the “Bank”), consisting of a $23.5 million revolving credit facility, maturing on June 30, 2008. Borrowing availability under the revolving credit facility is based on the lesser of (i) a percentage of eligible accounts receivable and inventory or (ii) $23.5 million, less any outstanding letters of credit issued under the Credit Agreement. There were no outstanding borrowings under the revolving credit facility at December 31, 2006. Outstanding borrowings under the revolving credit facility totaled $1.2 million at December 31, 2005. Borrowing availability under the revolving facility at December 31, 2006 totaled $17.4 million. As of March 9, 2007, the Company had no borrowings under the revolving credit facility and a total borrowing availability of approximately $16.7 million. Revolving credit borrowings bear interest at a floating rate approximating the Bank’s prime rate plus an interest margin (8.5 percent at December 31, 2006 and March 9, 2007). The Credit Agreement provides for the issuance of up to $1.0 million in letters of credit. There were no outstanding letters of credit at December 31, 2006 or 2005. The Credit Agreement provides for a fee of 0.375% per annum on the unused commitment, an annual collateral monitoring fee of $35 thousand, and an outstanding letter of credit fee of 2.0% per annum. Borrowings under the Credit Agreement are collateralized by the Company’s accounts receivable, inventory, equipment, the Company’s stock of its subsidiaries and certain of the Company’s plants and offices. The Credit Agreement contains certain restrictive covenants, including the maintenance of certain financial ratios and earnings, and limitations on acquisitions, dispositions, capital expenditures and additional indebtedness. The Company also is not permitted to pay any dividends.
Based on its current business plan, the Company currently expects that cash and cash equivalents and short term investments on hand, the Company’s existing credit facility and funds budgeted to be generated from operations will be adequate to meet its liquidity and capital requirements through 2007. However, currently unforeseen future developments, potential acquisitions and increased working capital requirements may require additional debt financing or issuances of common stock in 2007 and subsequent years.
Inflation.Inflation has not had a material effect on the Company’s operations in the past. Recently, rising petroleum prices have increased the Company’s costs of raw materials and distribution expenses included in the Company’s selling, general and administration expense. Where possible, the Company has attempted to pass a small portion of these increased costs to its customers by increasing prices but may not be able to continue to do so due to competitive pricing pressures. The Company also seeks to offset these increases costs in part through cost saving measures in other areas.
Foreign Currency Translation.The financial position and results of operations of the Company’s foreign subsidiaries in the United Kingdom, the Netherlands, Germany, Malta and France are measured using the foreign subsidiary’s local currency as the functional currency. Revenues and expenses of such subsidiaries are translated into U.S. dollars at average exchange rates prevailing during the period. Assets and liabilities are translated at the rates of exchange on the balance sheet date. The resulting translation gain and loss adjustments are recorded directly as a separate component of shareholders’ equity. Foreign currency translation adjustments, net of applicable taxes, resulted in gains of $1.6 million and $497 thousand in 2006 and 2004, respectively, and a loss of $1.5 million in 2005.
Transaction gains and losses that arise from exchange rate fluctuations on transactions denominated in a currency other than the subsidiary’s functional currency are included in the results of operations as incurred. The translation of certain transactions of the Company’s Netherlands subsidiaries which are denominated in a currency other than the functional currency of those subsidiaries resulted in foreign currency exchange gains for the years ended December 31, 2006 and 2004 of $236 thousand and $850 thousand, respectively. Foreign currency exchange losses for the year ended December 31, 2005 were approximately $408 thousand.
Currency translations and transactions that are billed and paid in foreign currencies could be adversely affected in the future by the relationship of the U.S. Dollar with foreign currencies.
34
Contractual Obligations.
Known contractual obligations of the Company existing as of December 31, 2006, including anticipated interest expense at approximate rates existing at December 31, 2006, and their respective estimated due dates are as follows (in thousands):
| | | | | | | | | | | | | | | |
| | | Total | | 2007 | | 2008-2010 | | 2011-2013 | | After 2013 |
Notes payable | | $ | 994 | | $ | 193 | | $ | 459 | | $ | 342 | | $ | — |
Capital leases | | $ | 19 | | $ | 15 | | $ | 4 | | $ | — | | $ | — |
Operating leases | | $ | 18,769 | | $ | 3,062 | | $ | 7,717 | | $ | 5,304 | | $ | 2,686 |
Purchase obligations | | $ | 9,413 | | $ | 9,413 | | $ | — | | $ | — | | $ | — |
Off-Balance Sheet Arrangements.
The Company does not have any off-balance sheets arrangements that have or are reasonably likely to have a current or future effect on the Company’s financial condition, changes in financial condition, revenues or expenses, results of operations, liquidity, capital expenditures or capital resources that are material to investors.
Transactions with Affiliated Company.
As part of the Company’s strategy to maintain and achieve manufacturing cost reductions for products which it manufactures, the Company owns a 19.5 percent interest in Global Resources. A non-executive member of the Company’s management owns a 30 percent interest in Global Resources. Global Resources provides material sourcing and manufacturing of various of the Company’s products where the supplier arrangements are advantageous to the Company based on favorable pricing and other considerations. During 2006, 2005 and 2004, the Company paid a total of $8.5 million, $5.5 million and $6.6 million, respectively, for product supplies, services rendered and expenses incurred by Global Resources for the benefit of the Company. The Company believes this relationship enhances the Company’s ability to provide favorable pricing to its customers and manage continued competitive pricing and other margin pressures which the Company encounters. The Company negotiates prices and other terms of its arrangements with Global Resources on an arm’s length basis.
Critical Accounting Policies.
While the listing below is not inclusive of all of the Company’s accounting policies, the Company’s management believes that the following policies are those which are most critical and embody the most significant management judgments and the uncertainties affecting their application and the likelihood that materially different amounts would be reported under different conditions or using different assumptions. These critical policies are:
Sales Returns and Other Allowances and Allowance for Doubtful Accounts.The preparation of financial statements requires management to make estimates and assumptions that affect the reported amount of assets and disclosure of contingent assets and liabilities at the date of the financial statements and the reported amounts of revenues and expenses during the reporting period. Specifically, management must make estimates of potential future product returns related to current period product revenues. The Company’s sales arrangements do not generally include acceptance provisions or clauses. Additionally, the Company does not typically grant its distributors or other customers price protection rights or rights to return products bought, other than normal and customary rights of return for defects in materials or workmanship, and is not obligated to accept product returns for any other reason. Actual returns have historically not been significant. Management analyzes historical returns, current economic trends and changes in customer demand when evaluating the adequacy of its sales returns and other allowances.
Similarly, the Company’s management must make estimates of the uncollectibility of its accounts receivables. Management specifically analyzes accounts receivable, historical bad debts, customer concentrations, customer credit worthiness, current economic trends and changes in its customers’ payment terms when evaluating the adequacy of its allowance for doubtful accounts. The Company’s accounts receivable at December 31, 2006 totaled $18.2 million, net of allowances of $1.6 million.
Inventory Valuation. The preparation of the Company’s financial statements requires careful determination of the appropriate dollar amount of the Company’s inventory balances. Such amount is presented as a current asset in the Company’s balance sheet and is a direct determinant of cost of goods sold in the statement of operations and therefore has a significant impact on the amount of net income reported in an accounting period. The basis of accounting for inventories is cost, which is the sum of expenditures and charges, both direct and indirect, incurred to bring the inventory quantities to their existing condition and location. The Company’s inventories are stated at the lower of cost or market, with cost determined using the first-in, first-out (“FIFO”) method, which assumes that
35
inventory quantities are sold in the order in which they are manufactured or purchased. The Company utilizes standard costs as a management tool. The Company’s standard cost valuation of its inventories is adjusted at regular intervals to reflect the approximate cost of the inventory under FIFO. The determination of the indirect charges and their allocation to the Company’s work-in-process and finished goods inventories is complex and requires significant management judgment and estimates. Material differences may result in the valuation of the Company’s inventories and in the amount and timing of the Company’s cost of goods sold and resulting net income for any period if management made different judgments or utilized different estimates.
On a periodic basis, management reviews its inventory quantities on hand for obsolescence, physical deterioration, changes in price levels and the existence of quantities on hand which may not reasonably be expected to be used or sold within the normal operating cycles of the Company’s operations. To the extent that any of these conditions are believed to exist or the utility of the inventory quantities in the ordinary course of business is no longer as great as their carrying value, the carrying value of the inventory is adjusted. To the extent that this adjustment is made during an accounting period, an expense is recorded in the Company’s statement of operations, generally in cost of goods sold. Significant management judgment is required in determining the amount of such an adjustment. In the event that actual results differ from management’s estimates or these estimates and judgments are revised in future periods, the Company may need to record additional adjustments to the carrying value of its inventory which could materially impact the Company’s financial position and results of operation. As of December 31, 2006, the Company’s inventories totaled $35.7 million. Management believes that the Company’s inventory is carried at the lower of cost or market.
Accounting for Income Taxes.In conjunction with preparing the Company’s consolidated financial statements, management is required to estimate the Company’s income tax liability in each of the jurisdictions in which the Company operates. This process involves estimating the Company’s actual current tax exposure together with assessing temporary differences resulting from differing treatment of items for tax and accounting purposes. These differences result in deferred tax assets or liabilities which are reflected in the Company’s consolidated balance sheet. Management must also assess the likelihood that the Company’s deferred tax assets will be used to offset income taxes otherwise payable as a result of the Company’s generation of taxable income in the future. To the extent that management believes that recovery is not likely, a valuation allowance must be established and reviewed in each accounting period. Increases in the valuation allowance in an accounting period require that the Company record an expense within its tax provision in its consolidated statement of operations, which results in a non-cash decrease in the Company’s earnings. Decreases in the valuation allowance in an accounting period require that the Company reverse previously recorded valuation allowances. Decreases in the valuation allowance result in a corresponding benefit within the tax provision and the Company’s consolidated statement of operations, which results in a non-cash increase in the Company’s earnings and masks the income tax expense the Company would otherwise record in its results of operations.
Significant management judgment is required in determining the Company’s provision for income taxes, its deferred tax assets and liabilities, the valuation allowance against its deferred tax assets and any periodic adjustment of the valuation allowance. At December 31, 2006, the Company has recorded a valuation allowance of $4.9 million, due to uncertainties related to the Company’s ability to utilize some of its deferred tax assets, primarily consisting of state net operating loss and capital loss carryforwards, before they expire. As a result of this valuation allowance, the Company’s net deferred tax assets at December 31, 2006 totaled $18.8 million, of which $3.4 million was included in current assets, $16.2 million was included in other long-term assets and $769 thousand was included in non-current liabilities in the Company’s consolidated balance sheet.
In connection with preparing its financial statements in 2004, 2005 and 2006, the Company assessed the future realizability of its deferred tax assets. As a result of this assessment in 2004 and 2005, the Company recorded reductions in the valuation allowance of $7.9 million in the fourth quarter of 2004 and a total of $9.6 million during the third and fourth quarters of 2005. The change in the Company’s valuation allowance in 2006 was not significant. In making these assessments, the Company considered, among other things, management’s risk-adjusted forecast of taxable income during the periods in which its net operating loss carryforwards can be utilized. Because changes in the Company’s valuation allowance are subject to significant judgments about unknown future events, future developments could have a significant effect on the amount of the Company’s valuation allowance and, consequently, the Company’s financial position and its results of operations.
36
Valuation of Long-Lived and Intangible Assets and Goodwill.The Company assesses the impairment of identifiable intangibles, long-lived assets and related goodwill whenever events or changes in circumstances indicate that the carrying value may not be recoverable based on estimates of future undiscounted cash flows. Factors that are considered by management in performing this assessment include, but are not limited to, the following:
| | • | | The Company’s performance relative to historical or projected future operating results; |
| | • | | The Company’s intended use of acquired assets or the Company’s strategy for its overall business; and |
| | • | | Industry or economic trends. |
In the event that the carrying value of intangibles, long-lived assets and related goodwill is determined to be impaired, such impairment is measured using a discount rate determined by management to be commensurate with the risk inherent in the Company’s current business model. Net intangible assets, long-lived assets and goodwill, including property and equipment, amounted to $55.0 million as of December 31, 2006.
Recently Issued Accounting Standards.
Stock-Based Compensation.Effective January 1, 2006, the Company adopted the provisions of Statement of Financial Accounting Standard (“SFAS”) No. 123(R),Share-Based Payment,and related interpretations (collectively, “SFAS No. 123(R)”) to account for stock-based compensation using the modified prospective transition method and therefore will not restate its prior period results. SFAS No. 123(R) supersedes Accounting Principles Board (“APB”) Opinion No. 25,Accounting for Stock Issued to Employees, and revises guidance in SFAS No. 123,Accounting for Stock-Based Compensation. SFAS No. 123(R) establishes accounting requirements for share-based compensation to employees and carries forward prior guidance on accounting for awards to non-employees. Specifically, SFAS No. 123(R) requires that compensation expense be recognized in the financial statements for share-based awards based on the grant date fair value of those awards. SFAS No. 123(R) also requires the benefits of tax deductions in excess of recognized compensation expense to be reported as a financing cash flow activity, rather than as an operating cash flow activity as previously required.
The Company’s initial adoption of SFAS No. 123(R)’s fair value method on January 1, 2006 did not have an impact on the Company’s results of operations or overall financial position. However, the future impact of the adoption of SFAS No. 123(R) on the Company’s results of operations cannot be predicted at this time because it will depend on levels of future grants of share-based payments.
Pursuant to SFAS No. 123(R)’s modified prospective transition method, the Company recognizes stock-based compensation expense based on the grant-date fair value of any new share-based awards granted subsequent to December 31, 2005 that are expected to vest. Compensation expense is recognized on a straight-line basis over the requisite service period, which is generally commensurate with the vesting term. Compensation expense is recognized immediately for share-based awards that are fully vested on the date of the grant. For the year ended December 31, 2006, compensation expense recognized in the Company’s financial statements related to share-based awards totaled approximately $19,000. For the year ended December 31, 2006, the Company did not record any excess tax benefits generated from stock option exercises because of the Company’s significant net operating loss carryforwards for Federal income tax purposes.
Prior to January 1, 2006, the Company accounted for its share-based payments to employees under the intrinsic value recognition and measurement principles of APB Opinion No. 25 and related interpretations, including Financial Accounting Standards Board (“FASB”) Interpretation No. 44,Accounting for Certain Transactions Involving Stock Compensation, an interpretation of APB Opinion No. 25. Accordingly, no stock-based employee compensation cost was reflected in the Company’s results of operations as all options granted under the Company’s stock options plans had an exercise price equal to the market value of the underlying common stock on the date of the grant. Prior to its adoption of SFAS 123(R), the Company followed the disclosure requirements of SFAS 148,Accounting for Stock-Based Compensation – Transition and Disclosure, an amendment of FASB Statement No. 123and accordingly provided pro forma disclosures of net income and net income per basic and diluted share as if the fair-value-based method had been applied to all outstanding and unvested awards for each period presented.
37
As permitted under SFAS No. 123(R), the Company uses the Black-Scholes option pricing model to determine the fair value of the Company’s share-based awards under SFAS No. 123(R), which is the same valuation technique previously used for pro forma disclosures under SFAS No. 123. The Black-Scholes option valuation model, like other option valuation models, requires the input of highly subjective assumptions including the expected stock price volatility. Because the Company’s employee stock options have characteristics significantly different from those of traded options, and because changes in the subjective input assumptions can materially affect the fair value estimate, in management’s opinion, the existing models do not necessarily provide a reliable single measure of the fair value of its employee stock options.
The guidance in SFAS No. 123(R) is relatively new and best practices are not well established. The application of these principles may be subject to further interpretation and refinement over time. There are significant differences among valuation models and there is a possibility that the Company will adopt different valuation models in the future. This may result in a lack of comparability with other companies that use different models, methods and assumptions and in a lack of consistency in future periods.
Accounting for Uncertainty in Income Taxes. In June 2006, the FASB issued Interpretation No. 48,Accounting for Uncertainty in Income Taxes – An interpretation of FASB Statement No. 109, or FIN 48, which clarifies the accounting and disclosure requirements for uncertainty in tax positions, as defined. The Company is currently evaluating the provisions of FIN 48, which is effective for fiscal years beginning after December 15, 2006.
Employer’s Accounting for Defined Benefit Pension and Other Postretirement Plans.In September 2006, the FASB issued SFAS No. 158, Employer’s Accounting for Defined Benefit Pension and Other Postretirement Plans– an amendment of FASB Statements No. 87, 88, 106, and 132(R)(“SFAS No. 158”). SFAS No. 158 requires companies to recognize the funded status of defined benefit pension and other postretirement plans as a net asset or liability in its statement of financial position and to recognize changes in that funded status in the year in which the changes occur through comprehensive income to the extent that those changes are not included in the net periodic cost. The funded status of a defined benefit pension plan is measured as the difference between the fair value of plan assets and the projected benefit obligation under the plan. Additionally, SFAS No. 158 requires companies to measure the funded status of a plan as of the company’s fiscal year-end, with limited exceptions, and expands financial statement disclosures. SFAS No. 158 is effective as of the end of fiscal years ending after December 15, 2006; however, the requirement to measure plan assets and benefit obligations as of the Company fiscal year-end is effective for fiscal years ending after December 15, 2008. The Company adopted all requirements of SFAS No. 158 with respect to its international defined benefit pension plan as of December 31, 2006, except for the funded status measurement date requirement which will be adopted on December 31, 2008, as allowed under SFAS No. 158. The adoption of SFAS No. 158 did not impact the Company’s compliance with its debt covenants or its cash position. The incremental effect of applying SFAS No. 158 on the Company’s consolidated financial position as of December 31, 2006 was as follows:
| | | | | | | | | | | |
| | | Before
application of
SFAS No. 158 | | Adjustments | | | After
application of
SFAS No. 158 | |
Liability for pension benefits – non-current portion | | $ | 405 | | $ | 32 | | | $ | 437 | |
Deferred income taxes – non-current | | | — | | | (8 | ) | | | (8 | ) |
| | | | | | | | | | | |
Total liabilities | | | 405 | | | 24 | | | | 429 | |
Accumulated other comprehensive income, net of income taxes | | | — | | | (24 | ) | | | (24 | ) |
| | | | | | | | | | | |
Total stockholders’ equity | | $ | — | | $ | (24 | ) | | $ | (24 | ) |
Considering the Effects of Prior Year Financial Statement Misstatements. In September 2006, the Securities and Exchange Commission issued Staff Accounting Bulletin (“SAB”) No. 108,Considering the Effects of Prior Year Misstatements when Quantifying Misstatements in Current Year Financial Statements (“SAB 108”), to address diversity in practice in quantifying financial statement misstatements. SAB 108 requires companies to quantify misstatements based on their impact on each of their financial statements and related disclosures. SAB 108 is effective as of the end of the Company’s 2006 fiscal year, allowing a one-time transitional cumulative effect
38
adjustment to retained earnings as of January 1, 2006 for errors that were not previously deemed material but are material under the guidance in SAB 108. The impact of the adoption of SAB 108 as of December 31, 2006 had no impact on the Company’s consolidated financial statements.
Fair Value Measurement. In September 2006, the FASB issued SFAS No. 157,Fair Value Measurement (“SFAS No. 157”). SFAS No. 157 defines fair value, establishes a framework for the measurement of fair value, and enhances disclosures about fair value measurements but does not require any new fair value measures. SFAS No. 157 is effective for fair value measure already required or permitted by other standards for fiscal years beginning after November 15, 2007. The Company is required to adopt SFAS No. 157 on January 1, 2008. SFAS No. 157 is required to be applied prospectively, except for certain financial instruments. Any transition adjustment will be recognized as an adjustment to opening retained earnings in the year of adoption. The Company is currently evaluating the impact of adopting SFAS No. 157 on its consolidated results of operations and financial position.
Forward Looking Statements.
Statements made in this Management’s Discussion and Analysis of Financial Condition and Results of Operations and elsewhere in this Annual Report on Form 10-K that state the Company’s or management’s intentions, hopes, beliefs, expectations or predictions of the future are forward looking statements within the meaning of the Private Securities Litigation Reform Act of 1995. Such forward looking statements include, without limitation, the Company’s ability to maintain its business by continually improving its existing capabilities and simultaneously developing and acquiring new business opportunities while maintaining its customer focus and providing the highest level of customer support; the Company’s ability to increase sales and earnings from its infection control business by completing strategic acquisitions, enhancing marketing and distribution efforts both domestically and internationally, introducing new products, increasing direct sales representation, employing tele-sales agents for added sales coverage, and capitalizing on low-cost manufacturing opportunities in the Dominican Republic, Malta and China; the Company’s ability to increase shareholder value by efficiently deploying its capital and management resources to grow its business, reduce its operating costs and build sustainable competitive positions and to complete acquisitions that generate attractive cash returns; the Company’s belief that certain of its higher margin products have significant growth opportunities; the Company’s belief that it has made adequate provisions for acquiring its raw materials and other components; the Company’s belief that its insurance is adequate in amount and coverage; the Company’s belief that it will not need to make any material capital expenditures for environmental control facilities during the next 18 to 24 months; the Company’s belief that its operating leases expiring in 2007 can be extended on reasonable terms; the Company’s belief that the outcome of any existing claims will not have a material adverse effect on the Company; the Company’s belief that its branded sales and marketing infrastructure will aid the Company in maintaining and increasing revenues and thereby contribute to the Company’s operating income; the Company’s belief that additional internal growth in net revenues can be achieved through increased focus on the design and release of new products, targeted sales efforts in key surgical procedures and departments within the hospital and outpatient surgical settings, continued relationship building with major OEM’s, and an increased international presence stemming from the Company’s new European manufacturing and distribution centers in the Netherlands and an increased direct branded presence in other parts of Europe; the Company’s ability to complete acquisitions that are accretive to earnings and shareholder value over the long-term; the Company’s plans, in the absence of acquisition opportunities, to use its cash flow to reduce indebtedness or, where appropriate, to repurchase shares of the Company’s stock; the ability of the Company to achieve continued savings from facility consolidations and other process improvements at its facilities; the Company’s belief that its research and development expenses will increase in the future; the Company’s belief that its amortization of intangibles will increase in 2007; the Company’s belief that its capital expenditures in 2007 are expected to increase over its 2006 capital expenditures and the anticipated purpose of these capital expenditures; the Company’s expectation about the composition and amount of revenues to be received by the Company’s OTI division; the Company’s expectation about the gross margin contribution of the Company’s OTI division; the Company’s expectation that it will eliminate substantially all of the OTI division’s selling, general and administrative expenses in future periods; the Company’s current expectation that cash equivalents and short term investments on hand, the Company’s existing credit facility and funds budgeted to be generated from operations will be adequate to meet its liquidity and capital requirements through 2007; the amount and estimated due dates of contractual obligations coming due in the future; judgments by management described under “Critical Accounting Policies” including, without limitation, the Company’s ability to collect accounts receivable due from customers, management’s belief that the Company’s net inventory valuation results in carrying inventory at the lower of cost or market, management’s estimates of taxable income and
39
recoverability of the Company’s deferred tax assets, and the effect of the Company’s valuation allowance for its deferred tax assets on its future operating results; the effect of the newly issued accounting standards on the Company’s consolidated financial statements described under “Recently Issued Accounting Standards”; the Company’s belief that its disclosure controls and procedures provided reasonable assurance that the information required to be disclosed in reports filed or submitted by the Company under the Securities and Exchange Act of 1934 is recorded, processed, summarized and reported within the requisite time periods; Company’s management conclusion that the Company’s internal control over financial reporting was effective as of December 31, 2006; and, anticipated events or trends, and similar expressions concerning matters that are not historical facts. It should be noted that the Company’s actual results could differ materially from those contained in such forward looking statements mentioned above due to adverse changes in any number of factors that affect the Company’s business including, without limitation, risks associated with low barriers to entry for competitive products, potential erosion of profit margins, risks of technological obsolescence, reliance upon distributors, regulatory risks, product liability and other risks described in this Annual Report on Form 10-K. See “Risk Factors”. The Company does not undertake to update its forward looking statements.
ITEM 7A. | QUANTITATIVE AND QUALITATIVE DISCLOSURES ABOUT MARKET RISK |
The Company’s operating results and cash flows are subject to fluctuations from changes in foreign currency exchange rates and interest rates.
The financial position and results of operations of the Company’s foreign subsidiaries in the United Kingdom, the Netherlands, Malta, Germany and France are measured using the foreign subsidiary’s local currency as the functional currency. Revenues and expenses of such subsidiaries are translated into U.S. dollars at average exchange rates prevailing during the period. Assets and liabilities are translated at the rates of exchange on the balance sheet date. The resulting translation gain and loss adjustments are recorded directly as a separate component of shareholders’ equity. Foreign currency translation adjustments, net of applicable taxes, resulted in gains of $1.6 million and $497 thousand in 2006 and 2004, respectively, and a loss of $1.5 million in 2005.
Transaction gains and losses that arise from exchange rate fluctuations on transactions denominated in a currency other than the subsidiary’s functional currency are included in the results of operations as incurred. The translation of certain transactions of the Company’s Netherlands subsidiaries which are denominated in a currency other than the functional currency of those subsidiaries resulted in foreign currency exchange gains for the years ended December 31, 2006 and 2004 of $236 thousand and $850 thousand, respectively. Foreign currency exchange losses for the year ended December 31, 2005 were approximately $408 thousand.
Currency translations and transactions that are billed and paid in foreign currencies could be adversely affected in the future by the relationship of the U.S. dollar and the functional currencies of the Company’s foreign subsidiaries with foreign currencies.
The Company is also subject to fluctuations in the value of the Dominican peso relative to the U.S. dollar. As the value of the Dominican peso increases with respect to the U.S. dollar, the costs of the Company’s inventory increase because the Company manufactures a material portion of its inventory at its facilities located in the Dominican Republic. The appreciation of the Dominican peso relative to the U.S. dollar in the future could adversely affect the Company’s operating results.
The Company’s cash and cash equivalents are short-term, highly liquid investments with original maturities of three months or less. As a result of the short-term nature of the Company’s cash and cash equivalents, a change of market interest rates does not materially impact interest income accruing on these investments or, consequently, the Company’s operating results or cash flow. The Company’s greatest sensitivity with respect to the general level of U.S. interest rates relates to the effect that changes in those rates have on the Company’s interest expense. At December 31, 2006, the Company had repaid all of its borrowings under its Credit Agreement which bear interest at a floating rate approximating the prime rate. An increase or decrease in the Company’s average interest rate of ten percent would have had an immaterial impact on the Company’s recorded interest expense during the year ended December 31, 2006.
40
The Company does not use derivative instruments for trading purposes or to hedge its market risks, and the use of such instruments would be subject to strict approvals by the Company’s senior officers. Therefore, the Company’s exposure related to such derivative instruments is not expected to be material to the Company’s financial position, results of operations or cash flows.
ITEM 8. | FINANCIAL STATEMENTS AND SUPPLEMENTARY DATA |
The consolidated financial statements and supplementary data are listed under Item 15(a) and filed as part of this report on the pages indicated.
ITEM 9. | CHANGES IN AND DISAGREEMENTS WITH ACCOUNTANTS ON ACCOUNTING AND FINANCIAL DISCLOSURE |
Not applicable.
ITEM 9A. | CONTROLS AND PROCEDURES |
Evaluation of disclosure controls and procedures.Under the supervision and with the participation of the Company’s management, including the Company’s President and Chief Executive Officer and its Chief Financial Officer, the Company carried out an evaluation (the “Evaluation”) of the effectiveness of the Company’s “disclosure controls and procedures” (as defined in the Securities Exchange Act of 1934 Rules 13a-15(e) and 15d-15(e)). Based upon the Evaluation, the Company’s President and Chief Executive Officer and its Chief Financial Officer have concluded that the Company’s disclosure controls and procedures are effective at the reasonable assurance level as of the end of the year for which this report is being filed to ensure that (i) information required to be disclosed by the Company in reports that it files or submits under the Securities Exchange Act of 1934 is recorded, processed, summarized and reported within the time periods specified in the SEC’s rules and forms and (ii) such information is accumulated and communicated to the Company’s management, including the Company’s President and Chief Executive Officer and its Chief Financial Officer, as appropriate, to allow timely decisions regarding required disclosure.
The Company is committed to a continuing process of identifying, evaluating and implementing improvements to the effectiveness of the Company’s disclosure and internal controls and procedures. The Company’s management, including its President and Chief Executive Officer and its Chief Financial Officer, does not expect that the Company’s controls and procedures will prevent all errors. A control system, no matter how well conceived and operated, can provide only reasonable, not absolute, assurance that the objectives of the control system are met. Because of the inherent limitations in all control systems, no evaluation of controls can provide absolute assurance that all control issues within the Company have been detected. These inherent limitations include the realities that judgments in decision-making can be faulty and that breakdowns can occur because of a simple error or mistake. Additionally, controls can be circumvented by the individual acts of some persons, by collusion of two or more people, or by management override of the control. The design of any system of controls is also based in part upon certain assumptions about the likelihood of future events, and there can be no assurance that any design will succeed in achieving its stated goals under all potential future conditions. Over time, controls may become inadequate because of changes in conditions, or the degree of compliance with the policies or procedures may deteriorate. Because of the inherent limitations in any control system, misstatements due to error or violations of law may occur and not be detected. The Company has, however, designed its disclosure controls and procedures to provide, and believes that such controls and procedures do provide, reasonable assurance that information required to be disclosed by the Company in reports that it files or submits under the Securities Exchange Act of 1934 is recorded, processed, summarized and reported within the time periods specified in the SEC’s rules and forms. The disclosure in this paragraph about inherent limitations of control systems does not modify the conclusions set forth in the immediately preceding paragraph of the Company’s President and Chief Executive Officer and its Chief Financial Officer concerning the effectiveness of the Company’s disclosure controls and procedures.
41
Management’s Report on Internal Control Over Financial Reporting. The Company’s management is responsible for establishing and maintaining adequate internal control over financial reporting, as such term is defined in Exchange Act Rules 13a-15(f). Under the supervision and with the participation of the Company’s management, including the Company’s President and Chief Executive Officer and its Chief Financial Officer, the Company conducted an evaluation of the effectiveness of the Company’s internal control over financial reporting based on the framework inInternal Control – Integrated Framework issued by the Committee of Sponsoring Organizations of the Treadway Commission. Based on the Company’s evaluation under the framework inInternal Control – Integrated Framework, the Company’s management concluded that the Company’s internal control over financial reporting was effective as of December 31, 2006. Management’s assessment of the effectiveness of the Company’s internal control over financial reporting as of December 31, 2006 has been audited by KPMG LLP, an independent registered public accounting firm, as stated in their report which is included herein.
Changes in internal controls.There have not been any changes in the Company’s internal controls over financial reporting identified in connection with the Evaluation that occurred during the Company’s quarter ending December 31, 2006 that has materially affected or, to the knowledge of management, is reasonably likely to materially affect the Company’s internal controls.
ITEM 9B. | OTHER INFORMATION |
Not applicable.
PART III
ITEM 10. | DIRECTORS, EXECUTIVE OFFICERS AND CORPORATE GOVERNANCE |
The information contained or to be contained in the Company’s Proxy Statement (the “Proxy Statement”) for the 2007 Annual Meeting of Shareholders under the heading “Corporate Governance – Section 16(a) Beneficial Ownership Reporting Compliance”, “Corporate Governance–Code of Conduct” and “Corporate Governance–Information Regarding the Board of Directors and its Committees” is incorporated herein by reference. Information regarding the Company’s executive officers and directors is contained herein under Item 4A.
ITEM 11. | EXECUTIVE COMPENSATION |
The information contained or to be contained in the Company’s Proxy Statement under the caption “Executive Compensation” is incorporated by reference herein.
ITEM 12. | SECURITY OWNERSHIP OF CERTAIN BENEFICIAL OWNERS AND MANAGEMENT AND RELATED STOCKHOLDER MATTERS |
The information contained or to be contained in the Company’s Proxy Statement under the heading “Security Ownership of Certain Beneficial Owners and Management” is incorporated herein by reference.
Equity Compensation Plan Information
The following table sets forth certain information about the Company’s equity compensation plans as of December 31, 2006.
EQUITY COMPENSATION PLAN INFORMATION
| | | | | | | |
Plan Category | | Number of
securities to be
issued upon exercise
of outstanding
options, warrants
and rights (a) | | Weighted-average
exercise price of
outstanding
options, warrants
and rights (b) | | Number of securities
remaining available
for future issuance
under equity
compensation plans
(excluding securities
reflected in column (a)) (c) |
Equity compensation plans approved by security holders: | | | | | | | |
Stock Option Plans | | 3,990,806 | | $ | 2.97 | | 1,571,100 |
Employee Stock Purchase Plan | | N/A | | | N/A | | 104,633 |
Equity compensation plans not approved by security holders | | — | | | N/A | | — |
Total | | 3,990,806 | | $ | 2.97 | | 1,675,733 |
42
ITEM 13. | CERTAIN RELATIONSHIPS AND RELATED TRANSACTIONS AND DIRECTOR INDEPENDENCE |
The information contained or to be contained in the Company’s Proxy Statement under the headings “Certain Relationships and Related Transactions” and “Corporate Governance–Director Independence” are incorporated herein by reference.
ITEM 14. | PRINCIPAL ACCOUNTING FEES AND SERVICES |
The information contained or to be contained in the Company’s Proxy Statement under the caption “Relationship with Independent Public Accountants” is incorporated herein by reference.
PART IV
ITEM 15. | EXHIBITS, FINANCIAL STATEMENT SCHEDULES |
(a) (1) Financial Statements:
The following financial statements are filed as part of this annual report.
(2) Financial Statement Schedule:
The following financial statement schedule is filed as part of this annual report:
Other schedules are omitted because they are not applicable, not required or because required information is included in the consolidated financial statements or notes thereto.
| | |
(3)(a) | | Exhibits |
| |
3.1 | | Articles of Incorporation of Isolyser Company, Inc. (incorporated by reference to Exhibit 3.1 of the Company’s Annual Report on Form 10-K for the year ended December 31, 2004). |
| |
3.2 | | Amended and Restated Bylaws of Microtek Medical Holdings, Inc. (incorporated by reference to Exhibit 3.1 filed with the Company’s Current Report on Form 8-K dated May 18, 2006). |
| |
4.1 | | Specimen Certificate of Common Stock (incorporated by reference to Exhibit 4.1 filed with the Company’s Quarterly Report for the period ending June 30, 2006). |
43
| | |
| |
4.2 | | First Amended and Restated Shareholder Protection Rights Agreement dated as of December 20, 2006 between Microtek Medical Holdings, Inc. and Computershare Investor Services, LLC (incorporated by reference to Exhibit 4.1 to the Company’s Current Report on Form 8-K dated December 20, 2006). |
| |
4.3 | | Amended and Restated Credit Agreement dated as of May 14, 2001, between the Company and The Chase Manhattan Bank, as Agent (incorporated by reference to Exhibit 4.2 of the Company’s Quarterly Report on Form 10-Q filed August 14, 2001). |
| |
4.4 | | Second Amendment Agreement dated as of September 30, 2002, to the Amended and Restated Credit Agreement, dated as of May 14, 2001 (incorporated by reference to Exhibit 10.1 of the Company’s Quarterly Report on Form 10-Q for the period ending September 30, 2002). |
| |
4.5 | | Fourth Amendment Agreement dated as of March 31, 2003, to the Amended and Restated Credit Agreement, dated as of May 14, 2001 (incorporated by reference to Exhibit 4.2 of the Company’s quarterly report on Form 10-Q for the period ending March 31, 2003). |
| |
4.6 | | Fifth Amendment Agreement dated as of August 7, 2003, to the Amended and Restated Credit Agreement, dated as of May 14, 2001 (incorporated by reference to Exhibit 4.2 of the Company’s quarterly report on Form 10-Q for the period ending June 30, 2003). |
| |
4.7 | | Sixth Amendment and Waiver Agreement dated as of November 21, 2003, to the Amended and Restated Credit Agreement dated as of May 14, 2001 (incorporated by reference to Exhibit 4.8 of the Company’s Annual Report on Form 10-K for the year ended December 31, 2003). |
| |
4.8 | | Seventh Amendment and Waiver Agreement dated as of March 4, 2004, to the Amended and Restated Credit Agreement dated as of May 14, 2001 (incorporated by reference to Exhibit 4.2 of the Company’s Quarterly Report on Form 10-Q for the period ending March 31, 2004). |
| |
4.9 | | Eighth Amendment and Waiver Agreement dated as of May 28, 2004 to the Amended and Restated Credit Agreement dated as of May 14, 2004 (incorporated by reference to Exhibit 4.2 of the Company’s Quarterly Report on Form 10-Q for the period ending June 30, 2004). |
| |
10.1 | | Stock Option Plan and First Amendment to Stock Option Plan (incorporated by reference to Exhibit 4.1 filed with the Company’s Registration Statement on Form S-8, File No. 33-85668). |
| |
10.2 | | Second Amendment to Stock Option Plan (incorporated by reference to Exhibit 4.1 filed with the Company’s Registration Statement on Form S-8, File No. 33-85668). |
| |
10.3 | | Form of Third Amendment to Stock Option Plan (incorporated by reference to Exhibit 10.37 filed with the Company’s Annual Report on Form 10-K for the period ended December 31, 1994). |
| |
10.4 | | Form of Fourth Amendment to the Stock Option Plan (incorporated by reference to Exhibit 10.59 filed with the Company’s Annual Report on Form 10-K for the period ended December 31, 1995). |
| |
10.5 | | Form of Fifth Amendment to Stock Option Plan (incorporated by reference to Exhibit 10.5 filed with the Company’s Annual Report on Form 10-K for the period ended December 31, 1996). |
| |
10.6 | | Form of Incentive Stock Option Agreement pursuant to Stock Option Plan (incorporated by reference to Exhibit 4.2 filed with the Company’s Registration Statement on Form S-8, File No. 33-85668). |
| |
10.7 | | Form of Non-Qualified Stock Option Agreement pursuant to Stock Option Plan (incorporated by reference to Exhibit 4.3, filed with the Company’s Registration Statement on Form S-8, File No. 33-85668). |
| |
10.8 | | Form of Indemnity Agreement entered into between the Company and certain of its officers and directors (incorporated by reference to Exhibit 10.45 filed with the Company’s Registration Statement on Form S-1, File No. 33-83474). |
| |
10.9 | | 1999 Long-Term Incentive Plan (incorporated by reference to Exhibit 10(a) to the Company’s Registration Statement on Form S-8 (File No. 333-117736). |
| |
10.10 | | Form of Employment Agreement with the executive officers of the Company (incorporated by reference to Exhibit 10.2 filed with the Company’s Quarterly Report on Form 10-Q for the period ending September 30, 2002). |
| |
10.11 | | Form of Incentive Stock Option pursuant to 1999 Long-Term Incentive Plan (incorporated by reference to Exhibit 10.1 of the Company’s Quarterly Report on Form 10-Q for the period ending September 30, 2004). |
| |
10.12 | | Form of Nonqualified Stock Option pursuant to 1999 Long-Term Incentive Plan (incorporated by reference to Exhibit 10.2 of the Company’s Quarterly Report on Form 10-Q for the period ending September 30, 2004). |
| |
10.13 | | Form of Nonqualified Stock Option Agreement (For Directors) pursuant to 1999 Long-Term Incentive Plan (incorporated by reference to Exhibit 10.3 of the Company’s Quarterly Report on Form 10-Q for the period ending September 30, 2004) |
| |
10.14 | | Employment Agreement entered into on October 27, 2004 by and between the Company and Barbara J. Osborne (incorporated by reference to Exhibit 10.1 filed with the Company’s Current Report on Form 8-K dated October 27, 2004). |
44
| | |
| |
10.15 | | Summary of base salary adjustments for named executive officers (incorporated by reference to Exhibit 10.15 of the Company’s Annual Report on Form 10-K for the year ended December 31, 2004). |
| |
10.16 | | Summary of compensation arrangements with directors (incorporated by reference to Exhibit 10.16 of the Company’s Annual Report on Form 10-K for the year ended December 31, 2004). |
| |
10.17 | | Separation Agreement and Full Release of All Claims between the Company and Barbara J. Osborne (incorporated by reference to Exhibit 10.1 of the Company’s Quarterly Report on Form 10-Q for the period ended March 31, 2005). |
| |
10.18 | | Annual Executive Performance Bonus Plan (incorporated by reference to Exhibit 10.1 of the Company’s Current Report on Form 8-K filed May 19, 2005). |
| |
10.19 | | Ninth Amendment Agreement dated as of June 30, 2005, to the Amended and Restated Credit Agreement dated as of May 14, 2004 (incorporated by reference to Exhibit 10.1 of the Company’s Current Report on Form 8-K filed on June 30, 2005). |
| |
10.20 | | Employment Agreement effective as of August 1, 2005 between the Company and Mark Alvarez (incorporated by reference to Exhibit 10.1 of the Company’s Current Report on Form 8-K filed on August 4, 2005). |
| |
10.21 | | Long-Term Performance Bonus Plan including the forms of award agreement and restricted stock agreement (incorporated by reference to Exhibit 10.1 of the Company’s Current Report on Form 8-K filed on September 23, 2005). |
| |
10.22 | | Sale of Business Bonus Program including the form of award agreement (incorporated by reference to Exhibit 10.2 of the Company’s Current Report on Form 8-K filed on September 23, 2005). |
| |
10.23 | | Adjustments to Compensation for Named Executive Officers Effective April 1, 2006 (incorporated by reference to Exhibit 10.1 of the Company’s Current Report on Form 8-K filed on March 13, 2006). |
| |
10.24 | | Director Compensation as Adjusted Effective March 8, 2006 (incorporated by reference to Exhibit 10.2 of the Company’s Current Report on Form 8-K filed on March 13, 2006). |
| |
10.25 | | Director Compensation as Adjusted Effective May 18, 2006 (incorporated by reference to Exhibit 10.1 of the Company’s Current Report dated May 18, 2006). |
| |
10.26* | | Amendment to 1992 Stock Option Plan, 1999 Long-Term Incentive Plan and 1999 Employee Stock Purchase Plan. |
| |
21.1* | | Subsidiaries of the Company. |
| |
23.1* | | Consent of KPMG LLP |
| |
31.1* | | Certification of Chief Executive Officer |
| |
31.2* | | Certification of Chief Financial Officer |
| |
32.1* | | Certification pursuant to Section 906 of the Sarbanes-Oxley Act of 2002 |
| |
32.2* | | Certification pursuant to Section 906 of the Sarbanes-Oxley Act of 2002 |
| | |
* | | Filed herewith. |
| |
3(b) | | Executive Compensation Plans and Arrangements. |
| |
1. | | Stock Option Plan and First Amendment to Stock Option Plan (incorporated by reference to Exhibit 4.1 filed with the Company’s Registration Statement on Form S-8, File No. 33-85668). |
| |
2. | | Second Amendment to Stock Option Plan (incorporated by reference to Exhibit 4.1 filed with the Company’s Registration Statement on Form S-8, File No. 33-85668). |
| |
3. | | Form of Third Amendment to Stock Option Plan (incorporated by reference to Exhibit 10.37 filed with the Company’s Annual Report on Form 10-K for the period ended December 31, 1994). |
| |
4. | | Form of Fourth Amendment to the Stock Option Plan (incorporated by reference to Exhibit 10.59 filed with the Company’s Annual Report on Form 10-K for the period ended December 31, 1995). |
| |
5. | | Form of Fifth Amendment to Stock Option Plan (incorporated by reference to Exhibit 10.5 filed with the Company’s Annual Report on Form 10-K for the period ended December 31, 1996). |
45
| | |
| |
6. | | Form of Incentive Stock Option Agreement pursuant to Stock Option Plan (incorporated by reference to Exhibit 4.2 filed with the Company’s Registration Statement on Form S-8, File No. 33-85668). |
| |
7. | | Form of Non-Qualified Stock Option Agreement pursuant to Stock Option Plan (incorporated by reference to Exhibit 4.3, filed with the Company’s Registration Statement on Form S-8, File No. 33-85668). |
| |
8. | | Form of Indemnity Agreement entered into between the Company and certain of its officers and directors (incorporated by reference to Exhibit 10.45 filed with the Company’s Registration Statement on Form S-1, File No. 33-83474). |
| |
9. | | 1999 Long-Term Incentive Plan (incorporated by reference to Exhibit 10(A) to the Company’s Registration Statement on Form S-8, (File No. 333-117736). |
| |
10. | | Form of Employment Agreement with the executive officers of the Company (incorporated by reference to Exhibit 10.2 filed with the Company’s Quarterly Report on Form 10-Q for the period ending September 30, 2002). |
| |
11. | | Form of Incentive Stock Option pursuant to 1999 Long-Term Incentive Plan (incorporated by reference to Exhibit 10.1 of the Company’s Quarterly Report on Form 10-Q for the period ending September 30, 2004). |
| |
12. | | Form of Nonqualified Stock Option pursuant to 1999 Long-Term Incentive Plan (incorporated by reference to Exhibit 10.2 of the Company’s Quarterly Report on Form 10-Q for the period ending September 30, 2004). |
| |
13. | | Form of Nonqualified Stock Option Agreement (For Directors) pursuant to 1999 Long-Term Incentive Plan (incorporated by reference to Exhibit 10.3 of the Company’s Quarterly Report on Form 10-Q for the period ending September 30, 2004) |
| |
14. | | Employment Agreement entered into on October 27, 2004 by and between the Company and Barbara J. Osborne (incorporated by reference to Exhibit 10.1 filed with the Company’s Current Report on Form 8-K dated October 27, 2004). |
| |
15. | | Summary of base salary adjustments for named executive officers (incorporated by reference to Exhibit 10.15 of the Company’s Annual Report on Form 10-K for the year ended December 31, 2004). |
| |
16. | | Summary of compensation arrangements with directors (incorporated by reference to Exhibit 10.16 of the Company’s Annual Report on Form 10-K for the year ended December 31, 2004). |
| |
17. | | Separation Agreement and Full Release of All Claims between the Company and Barbara J. Osborne (incorporated by reference to Exhibit 10.1 of the Company’s Quarterly Report on Form 10-Q for the period ended March 31, 2005). |
| |
18. | | Annual Executive Performance Bonus Plan (incorporated by reference to Exhibit 10.1 of the Company’s Current Report on Form 8-K filed May 19, 2005). |
| |
19. | | Employment Agreement effective as of August 1, 2005 between the Company and Mark Alvarez (incorporated by reference to Exhibit 10.1 of the Company’s Current Report on Form 8-K filed on August 4, 2005). |
| |
20. | | Long-Term Performance Bonus Plan including the forms of award agreement and restricted stock agreement (incorporated by reference to Exhibit 10.1 of the Company’s Current Report on Form 8-K filed on September 23, 2005). |
| |
21. | | Sale of Business Bonus Program including the form of award agreement (incorporated by reference to Exhibit 10.2 of the Company’s Current Report on Form 8-K filed on September 23, 2005). |
46
| | |
| |
22. | | Adjustments to Compensation for Named Executive Officers Effective April 1, 2006 (incorporated by reference to Exhibit 10.1 of the Company’s Current Report on Form 8-K filed on March 13, 2006). |
| |
23. | | Director Compensation as Adjusted Effective March 8, 2006 (incorporated by reference to Exhibit 10.2 of the Company’s Current Report on Form 8-K filed on March 13, 2006). |
| |
24. | | Director Compensation as Adjusted Effective May 18, 2006 (incorporated by reference to Exhibit 10.1 of the Company’s Current Report dated May 18, 2006). |
| |
25. | | Amendment to 1992 Stock Option Plan, 1999 Long-Term Incentive Plan and 1999 Employee Stock Purchase Plan. |
47
SIGNATURES
Pursuant to the requirements of Section 13 or 15(d) of the Securities Exchange Act of 1934, the registrant has duly caused this report to be signed on its behalf by the undersigned, thereunto duly authorized on March 15, 2007.
| | |
MICROTEK MEDICAL HOLDINGS, INC. |
| |
By: | | /s/ Dan R. Lee |
| | Dan R. Lee, Chairman,
President and Chief Executive Officer |
Pursuant to the requirements of the Securities Exchange Act of 1934, this report has been signed by the following persons on behalf of the registrant in the capacities indicated on March 15, 2007.
| | | | |
SIGNATURE | | TITLE | | |
| | |
/s/ Dan R. Lee Dan R. Lee | | Chairman of the Board of Directors, President,
Chief Executive Officer and Director
(principal executive officer) | | |
| | |
/s/ Roger G. Wilson Roger G. Wilson | | Chief Financial Officer and Treasurer
(principal financial and accounting officer) | | |
| | |
/s/ Kenneth F. Davis Kenneth F. Davis | | Director | | |
| | |
/s/ Michael E. Glasscock, III Michael E. Glasscock, III | | Director | | |
| | |
/s/ Rosdon Hendrix Rosdon Hendrix | | Director | | |
| | |
/s/ Gene R. McGrevin Gene R. McGrevin | | Director | | |
| | |
/s/ Marc R. Sarni Marc R. Sarni | | Director | | |
| | |
/s/ Ronald L. Smorada Ronald L. Smorada | | Director | | |
48
REPORT OF INDEPENDENT REGISTERED PUBLIC ACCOUNTING FIRM
The Board of Directors and Shareholders
Microtek Medical Holdings, Inc.:
We have audited the accompanying consolidated balance sheets of Microtek Medical Holdings, Inc. and subsidiaries (the Company) as of December 31, 2006 and 2005, and the related consolidated statements of operations and comprehensive income, changes in shareholders’ equity, and cash flows for each of the years in the three-year period ended December 31, 2006. In connection with our audits of the consolidated financial statements, we also have audited the financial statement schedule listed in the Index at Item 15 on Form 10-K. These consolidated financial statements and financial statement schedule are the responsibility of the Company’s management. Our responsibility is to express an opinion on these consolidated financial statements and financial statement schedule based on our audits.
We conducted our audits in accordance with the standards of the Public Company Accounting Oversight Board (United States). Those standards require that we plan and perform the audit to obtain reasonable assurance about whether the financial statements are free of material misstatement. An audit includes examining, on a test basis, evidence supporting the amounts and disclosures in the financial statements. An audit also includes assessing the accounting principles used and significant estimates made by management, as well as evaluating the overall financial statement presentation. We believe that our audits provide a reasonable basis for our opinion.
In our opinion, the consolidated financial statements referred to above present fairly, in all material respects, the financial position of Microtek Medical Holdings, Inc. and subsidiaries as of December 31, 2006 and 2005, and the results of their operations and their cash flows for each of the years in the three-year period ended December 31, 2006, in conformity with U.S. generally accepted accounting principles. Also in our opinion, the related financial statement schedule, when considered in relation to the basic consolidated financial statements taken as a whole, present fairly, in all material respects, the information set forth therein.
As discussed in Note 1 to the consolidated financial statements, effective January 1, 2006, the Company changed its method of accounting for share based payments in accordance with the provisions of Statement of Financial Accounting Standards (SFAS) No. 123(R), and effective December 31, 2006, changed its method of accounting for defined benefit plans in accordance with SFAS No. 158.
We also have audited, in accordance with the standards of the Public Company Accounting Oversight Board (United States), the effectiveness of the Company’s internal control over financial reporting as of December 31, 2006, based on criteria established in Internal Control—Integrated Framework issued by the Committee of Sponsoring Organizations of the Treadway Commission (COSO), and our report dated March 15, 2007 expressed an unqualified opinion on management’s assessment of, and the effective operation of, internal control over financial reporting.
| | | | |
Jackson, Mississippi | | | | /s/ KPMG LLP |
March 15, 2007 | | | | |
F-1
REPORT OF INDEPENDENT REGISTERED PUBLIC ACCOUNTING FIRM
The Board of Directors and Shareholders
Microtek Medical Holdings, Inc.:
We have audited management’s assessment, included in the accompanying Management’s Report on Internal Control Over Financial Reporting,contained in Item 9A of the Form 10-K, that Microtek Medical Holdings, Inc. and subsidiaries (the Company) maintained effective internal control over financial reporting as of December 31, 2006, based on criteria established in Internal Control—Integrated Framework issued by the Committee of Sponsoring Organizations of the Treadway Commission (COSO). The Company’s management is responsible for maintaining effective internal control over financial reporting and for its assessment of the effectiveness of internal control over financial reporting. Our responsibility is to express an opinion on management’s assessment and an opinion on the effectiveness of the Company’s internal control over financial reporting based on our audit.
We conducted our audit in accordance with the standards of the Public Company Accounting Oversight Board (United States). Those standards require that we plan and perform the audit to obtain reasonable assurance about whether effective internal control over financial reporting was maintained in all material respects. Our audit included obtaining an understanding of internal control over financial reporting, evaluating management’s assessment, testing and evaluating the design and operating effectiveness of internal control, and performing such other procedures as we considered necessary in the circumstances. We believe that our audit provides a reasonable basis for our opinion.
A company’s internal control over financial reporting is a process designed to provide reasonable assurance regarding the reliability of financial reporting and the preparation of financial statements for external purposes in accordance with generally accepted accounting principles. A company’s internal control over financial reporting includes those policies and procedures that (1) pertain to the maintenance of records that, in reasonable detail, accurately and fairly reflect the transactions and dispositions of the assets of the company; (2) provide reasonable assurance that transactions are recorded as necessary to permit preparation of financial statements in accordance with generally accepted accounting principles, and that receipts and expenditures of the company are being made only in accordance with authorizations of management and directors of the company; and (3) provide reasonable assurance regarding prevention or timely detection of unauthorized acquisition, use, or disposition of the company’s assets that could have a material effect on the financial statements.
Because of its inherent limitations, internal control over financial reporting may not prevent or detect misstatements. Also, projections of any evaluation of effectiveness to future periods are subject to the risk that controls may become inadequate because of changes in conditions, or that the degree of compliance with the policies or procedures may deteriorate.
In our opinion, management’s assessment that Microtek Medical Holdings, Inc. and subsidiaries maintained effective internal control over financial reporting as of December 31, 2006, is fairly stated, in all material respects, based on criteria established in Internal Control—Integrated Framework issued by the Committee of Sponsoring Organizations of the Treadway Commission (COSO). Also, in our opinion, Microtek Medical Holdings, Inc. and subsidiaries maintained, in all material respects, effective internal control over financial reporting as of December 31, 2006, based on criteria established in Internal Control—Integrated Framework issued by the Committee of Sponsoring Organizations of the Treadway Commission (COSO).
F-2
We also have audited, in accordance with the standards of the Public Company Accounting Oversight Board (United States), the consolidated balance sheets of Microtek Medical Holdings, Inc. and subsidiaries as of December 31, 2006 and 2005, and the related consolidated statements of operations and comprehensive income, changes in shareholders’ equity, and cash flows for each of the years in the three-year period ended December 31, 2006, and our report dated March 15, 2007 expressed an unqualified opinion on those consolidated financial statements.
| | | | |
Jackson, Mississippi | | | | /s/ KPMG LLP |
March 15, 2007 | | | | |
F-3
MICROTEK MEDICAL HOLDINGS, INC. AND SUBSIDIARIES
CONSOLIDATED BALANCE SHEETS
DECEMBER 31, 2006 AND 2005
In thousands, except share data
| | | | | | | | |
| | | 2006 | | | 2005 | |
ASSETS | | | | | | | | |
CURRENT ASSETS: | | | | | | | | |
Cash and cash equivalents | | $ | 17,059 | | | $ | 14,765 | |
Accounts receivable, net of allowances of $1,626 and $1,635, respectively | | | 18,182 | | | | 19,530 | |
Other receivables | | | 1,540 | | | | 908 | |
Inventories | | | 35,654 | | | | 31,043 | |
Deferred income taxes | | | 3,368 | | | | 3,007 | |
Prepaid expenses and other assets | | | 2,003 | | | | 2,480 | |
| | | | | | | | |
Total current assets | | | 77,806 | | | | 71,733 | |
PROPERTY AND EQUIPMENT: | | | | | | | | |
Land | | | 249 | | | | 245 | |
Building and leasehold improvements | | | 7,268 | | | | 6,680 | |
Equipment | | | 21,226 | | | | 19,292 | |
Furniture and fixtures | | | 3,144 | | | | 2,759 | |
Other | | | 302 | | | | 149 | |
| | | | | | | | |
| | | 32,189 | | | | 29,125 | |
Less accumulated depreciation | | | 24,181 | | | | 22,132 | |
| | | | | | | | |
Property and equipment, net | | | 8,008 | | | | 6,993 | |
INTANGIBLE ASSETS: | | | | | | | | |
Goodwill | | | 34,803 | | | | 30,956 | |
Customer lists | | | 3,514 | | | | 3,120 | |
Covenants not to compete | | | 1,272 | | | | 1,148 | |
Patent and license agreements | | | 11,241 | | | | 5,293 | |
Other | | | 1,927 | | | | 1,043 | |
| | | | | | | | |
| | | 52,757 | | | | 41,560 | |
Less accumulated amortization | | | 5,750 | | | | 4,563 | |
| | | | | | | | |
Intangible assets, net | | | 47,007 | | | | 36,997 | |
Deferred income taxes | | | 16,192 | | | | 19,812 | |
Other assets, net | | | 7,153 | | | | 5,223 | |
| | | | | | | | |
TOTAL ASSETS | | $ | 156,166 | | | $ | 140,758 | |
| | | | | | | | |
| | |
| | | 2006 | | | 2005 | |
LIABILITIES AND SHAREHOLDERS’ EQUITY | | | | | | | | |
CURRENT LIABILITIES: | | | | | | | | |
Accounts payable | | $ | 11,735 | | | $ | 6,903 | |
Accrued compensation | | | 3,794 | | | | 2,261 | |
Income taxes payable | | | 353 | | | | 717 | |
Other accrued liabilities | | | 2,878 | | | | 2,278 | |
Current portion of long-term debt | | | 173 | | | | 420 | |
| | | | | | | | |
Total current liabilities | | | 18,933 | | | | 12,579 | |
LONG-TERM LIABILITIES: | | | | | | | | |
Long-term debt, excluding current portion | | | 721 | | | | 1,249 | |
Deferred income taxes | | | 769 | | | | — | |
Other long-term liabilities | | | 3,507 | | | | 2,864 | |
| | | | | | | | |
Total long-term liabilities | | | 4,997 | | | | 4,113 | |
| | | | | | | | |
TOTAL LIABILITIES | | | 23,930 | | | | 16,692 | |
SHAREHOLDERS’ EQUITY: | | | | | | | | |
Participating preferred stock, no par value; 500,000 shares authorized, none issued | | | — | | | | — | |
Common stock, $.001 par value; 100,000,000 shares authorized; 45,284,519 and 44,987,900 shares issued, respectively | | | 45 | | | | 45 | |
Additional paid-in capital | | | 218,759 | | | | 217,858 | |
Accumulated deficit | | | (81,859 | ) | | | (89,774 | ) |
Unrealized (loss) gain on available for sale securities, net of income taxes of $33 and ($2), respectively | | | (53 | ) | | | 3 | |
Minimum pension liability, net of income taxes of $8 | | | (24 | ) | | | — | |
Cumulative translation adjustment, net of income taxes of ($219) and ($49), respectively | | | 810 | | | | (820 | ) |
| | | | | | | | |
| | | 137,678 | | | | 127,312 | |
Treasury shares, at cost; 2,031,254 and 1,428,513 shares, respectively | | | (5,442 | ) | | | (3,246 | ) |
| | | | | | | | |
Total shareholders’ equity | | | 132,236 | | | | 124,066 | |
| | | | | | | | |
TOTAL LIABILITIES AND SHAREHOLDERS’ EQUITY | | $ | 156,166 | | | $ | 140,758 | |
| | | | | | | | |
See accompanying notes to consolidated financial statements.
F-4
MICROTEK MEDICAL HOLDINGS, INC. AND SUBSIDIARIES
CONSOLIDATED STATEMENTS OF OPERATIONS AND COMPREHENSIVE INCOME
YEARS ENDED DECEMBER 31, 2006, 2005, AND 2004
| | | | | | | | | | | | |
In thousands, except per share data | | 2006 | | | 2005 | | | 2004 | |
NET SALES | | $ | 141,577 | | | $ | 134,458 | | | $ | 126,581 | |
COST OF GOODS SOLD | | | 85,595 | | | | 81,932 | | | | 77,017 | |
| | | | | | | | | | | | |
Gross profit | | | 55,982 | | | | 52,526 | | | | 49,564 | |
OPERATING EXPENSES: | | | | | | | | | | | | |
Selling, general and administrative | | | 42,721 | | | | 40,526 | | | | 39,483 | |
Amortization of intangibles | | | 1,109 | | | | 961 | | | | 809 | |
Research and development | | | 873 | | | | 810 | | | | 1,048 | |
| | | | | | | | | | | | |
Total operating expenses | | | 44,703 | | | | 42,297 | | | | 41,340 | |
| | | | | | | | | | | | |
(Loss) gain on dispositions | | | — | | | | (139 | ) | | | 215 | |
| | | | | | | | | | | | |
INCOME FROM OPERATIONS | | | 11,279 | | | | 10,090 | | | | 8,439 | |
OTHER INCOME (EXPENSE): | | | | | | | | | | | | |
Interest income | | | 435 | | | | 189 | | | | 57 | |
Interest expense | | | (69 | ) | | | (227 | ) | | | (322 | ) |
Foreign currency exchange gain (loss) | | | 236 | | | | (408 | ) | | | 850 | |
Equity in earnings of investee | | | 249 | | | | 202 | | | | 128 | |
Other income, net | | | — | | | | — | | | | 5 | |
| | | | | | | | | | | | |
INCOME BEFORE INCOME TAX PROVISION | | | 12,130 | | | | 9,846 | | | | 9,157 | |
INCOME TAX EXPENSE (BENEFIT) | | | 4,215 | | | | (4,658 | ) | | | (764 | ) |
| | | | | | | | | | | | |
NET INCOME | | $ | 7,915 | | | $ | 14,504 | | | $ | 9,921 | |
| | | | | | | | | | | | |
OTHER COMPREHENSIVE INCOME: | | | | | | | | | | | | |
Unrealized gain (loss) on available for sale securities, net of income taxes of $35, ($7) and ($15), respectively | | | (56 | ) | | | 12 | | | | 25 | |
Minimum pension liability, net of income taxes of $8 | | | (24 | ) | | | — | | | | — | |
Foreign currency translation gain (loss), net of income taxes of ($170), $144 and ($81), respectively | | | 1,630 | | | | (1,536 | ) | | | 497 | |
| | | | | | | | | | | | |
COMPREHENSIVE INCOME | | $ | 9,465 | | | $ | 12,980 | | | $ | 10,443 | |
| | | | | | | | | | | | |
NET INCOME PER COMMON SHARE – Basic | | $ | 0.18 | | | $ | 0.33 | | | $ | 0.23 | |
| | | | | | | | | | | | |
NET INCOME PER COMMON SHARE – Diluted | | $ | 0.18 | | | $ | 0.33 | | | $ | 0.22 | |
| | | | | | | | | | | | |
WEIGHTED AVERAGE NUMBER OF COMMON SHARES OUTSTANDING | | | | | | | | | | | | |
Basic | | | 43,498 | | | | 43,347 | | | | 43,005 | |
| | | | | | | | | | | | |
Diluted | | | 44,506 | | | | 44,050 | | | | 44,500 | |
| | | | | | | | | | | | |
See accompanying notes to consolidated financial statements.
F-5
MICROTEK MEDICAL HOLDINGS, INC. AND SUBSIDIARIES
CONSOLIDATED STATEMENTS OF CHANGES IN SHAREHOLDERS’ EQUITY
| | | | | | | | | | | | | | | | | | | | | | | | | | | | | | | | | | |
| | | Common Stock | | Treasury Stock | | | Additional
Paid-in | | Accumulated | | | Currency
Translation | | | Minimum
Pension | | | Unrealized
Gain
(Loss) on
Available
for Sale | | | Shareholders’ | |
In thousands | | Shares | | Amount | | Shares | | Amount | | | Capital | | Deficit | | | Adjustment | | | Liability | | | Securities | | | Equity | |
BALANCE – December 31, 2003 | | 43,967 | | $ | 44 | | 1,389 | | $ | (3,099 | ) | | $ | 213,613 | | $ | (114,199 | ) | | $ | 219 | | | $ | — | | | $ | (34 | ) | | $ | 96,544 | |
Comprehensive income: | | | | | | | | | | | | | | | | | | | | | | | | | | | | | | | | | | |
Net income | | | | | | | | | | | | | | | | | 9,921 | | | | | | | | | | | | | | | | 9,921 | |
Unrealized gain on available for sale securities, net of income taxes | | | | | | | | | | | | | | | | | | | | | | | | | | | | | 25 | | | | 25 | |
Currency translation gain, net of income taxes | | | | | | | | | | | | | | | | | | | | | 497 | | | | | | | | | | | | 497 | |
| | | | | | | | | | | | | | | | | | | | | | | | | | | | | | | | | | |
Total comprehensive income | | | | | | | | | | | | | | | | | | | | | | | | | | | | | | | | | 10,443 | |
Issuance of 77 shares of common stock pursuant to ESPP | | 77 | | | | | | | | | | | | 184 | | | | | | | | | | | | | | | | | | | 184 | |
Issuance of 117 shares of common stock pursuant to 401(k) plan | | 117 | | | | | | | | | | | | 502 | | | | | | | | | | | | | | | | | | | 502 | |
Exercise of stock options | | 395 | | | 1 | | | | | | | | | 969 | | | | | | | | | | | | | | | | | | | 970 | |
| | | | | | | | | | | | | | | | | | | | | | | | | | | | | | | | | | |
BALANCE – December 31, 2004 | | 44,556 | | | 45 | | 1,389 | | | (3,099 | ) | | | 215,268 | | | (104,278 | ) | | | 716 | | | | — | | | | (9 | ) | | | 108,643 | |
Comprehensive income: | | | | | | | | | | | | | | | | | | | | | | | | | | | | | | | | | | |
Net income | | | | | | | | | | | | | | | | | 14,504 | | | | | | | | | | | | | | | | 14,504 | |
Unrealized gain on available for sale securities, net of income taxes | | | | | | | | | | | | | | | | | | | | | | | | | | | | | 12 | | | | 12 | |
Currency translation loss, net of income taxes | | | | | | | | | | | | | | | | | | | | | (1,536 | ) | | | | | | | | | | | (1,536 | ) |
| | | | | | | | | | | | | | | | | | | | | | | | | | | | | | | | | | |
Total comprehensive income | | | | | | | | | | | | | | | | | | | | | | | | | | | | | | | | | 12,980 | |
Tax benefits related to stock options | | | | | | | | | | | | | | 1,474 | | | | | | | | | | | | | | | | | | | 1,474 | |
Issuance of 51 shares of common stock pursuant to ESPP | | 51 | | | | | | | | | | | | 207 | | | | | | | | | | | | | | | | | | | 207 | |
Issuance of 133 shares of common stock pursuant to 401(k) plan | | 133 | | | | | | | | | | | | 499 | | | | | | | | | | | | | | | | | | | 499 | |
Purchase of 40 shares of treasury stock | | | | | | | 40 | | | (147 | ) | | | | | | | | | | | | | | | | | | | | | | (147 | ) |
Exercise of stock options | | 248 | | | | | | | | | | | | 410 | | | | | | | | | | | | | | | | | | | 410 | |
| | | | | | | | | | | | | | | | | | | | | | | | | | | | | | | | | | |
BALANCE – December 31, 2005 | | 44,988 | | | 45 | | 1,429 | | | (3,246 | ) | | | 217,858 | | | (89,774 | ) | | | (820 | ) | | | — | | | | 3 | | | | 124,066 | |
Comprehensive income: | | | | | | | | | | | | | | | | | | | | | | | | | | | | | | | | | | |
Net income | | | | | | | | | | | | | | | | | 7,915 | | | | | | | | | | | | | | | | 7,915 | |
Unrealized loss on available for sale securities, net of income taxes | | | | | | | | | | | | | | | | | | | | | | | | | | | | | (56 | ) | | | (56 | ) |
Minimum pension liability, net of income taxes | | | | | | | | | | | | | | | | | | | | | | | | | (24 | ) | | | | | | | (24 | ) |
Currency translation gain, net of income taxes | | | | | | | | | | | | | | | | | | | | | 1,630 | | | | | | | | | | | | 1,630 | |
| | | | | | | | | | | | | | | | | | | | | | | | | | | | | | | | | | |
Total comprehensive income | | | | | | | | | | | | | | | | | | | | | | | | | | | | | | | | | 9,465 | |
Stock option compensation expense | | | | | | | | | | | | | | 19 | | | | | | | | | | | | | | | | | | | 19 | |
Issuance of 67 shares of common stock pursuant to ESPP | | 67 | | | | | | | | | | | | 233 | | | | | | | | | | | | | | | | | | | 233 | |
Issuance of 129 shares of common stock pursuant to 401(k) plan | | 129 | | | | | | | | | | | | 459 | | | | | | | | | | | | | | | | | | | 459 | |
Purchase of 603 shares of treasury stock | | | | | | | 603 | | | (2,196 | ) | | | | | | | | | | | | | | | | | | | | | | (2,196 | ) |
Exercise of stock options | | 101 | | | | | | | | | | | | 190 | | | | | | | | | | | | | | | | | | | 190 | |
| | | | | | | | | | | | | | | | | | | | | | | | | | | | | | | | | | |
BALANCE – December 31, 2006 | | 45,285 | | $ | 45 | | 2,032 | | $ | (5,442 | ) | | $ | 218,759 | | $ | (81,859 | ) | | $ | 810 | | | $ | (24 | ) | | $ | (53 | ) | | $ | 132,236 | |
| | | | | | | | | | | | | | | | | | | | | | | | | | | | | | | | | | |
See accompanying notes to consolidated financial statements.
F-6
MICROTEK MEDICAL HOLDINGS, INC. AND SUBSIDIARIES
CONSOLIDATED STATEMENTS OF CASH FLOWS
YEARS ENDED DECEMBER 31, 2006, 2005 AND 2004
| | | | | | | | | | | | |
In thousands | | 2006 | | | 2005 | | | 2004 | |
OPERATING ACTIVITIES: | | | | | | | | | | | | |
Net income | | $ | 7,915 | | | $ | 14,504 | | | $ | 9,921 | |
Adjustments to reconcile net income to net cash provided by operating activities: | | | | | | | | | | | | |
Depreciation | | | 2,061 | | | | 2,182 | | | | 2,206 | |
Amortization of intangibles | | | 1,109 | | | | 961 | | | | 809 | |
Deferred income taxes | | | 3,902 | | | | (5,256 | ) | | | (1,690 | ) |
Provision for doubtful accounts | | | 485 | | | | 893 | | | | 714 | |
Loss (gain) on dispositions | | | — | | | | 139 | | | | (215 | ) |
Equity in earnings of investee | | | (249 | ) | | | (202 | ) | | | (128 | ) |
Other | | | (1 | ) | | | (81 | ) | | | 8 | |
Changes in assets and liabilities, net of effects of acquisitions and disposed businesses: | | | | | | | | | | | | |
Accounts receivable | | | 1,669 | | | | (1,284 | ) | | | (2,985 | ) |
Inventories | | | (2,718 | ) | | | 1,463 | | | | 2,084 | |
Prepaid expenses and other assets | | | (701 | ) | | | (1,797 | ) | | | (783 | ) |
Accounts payable | | | 156 | | | | (1,908 | ) | | | 179 | |
Accrued compensation | | | 886 | | | | (515 | ) | | | 451 | |
Other accrued liabilities | | | (567 | ) | | | (418 | ) | | | 1,624 | |
Other liabilities | | | 571 | | | | 1,021 | | | | (55 | ) |
| | | | | | | | | | | | |
Net cash provided by operating activities | | | 14,518 | | | | 9,702 | | | | 12,140 | |
| | | | | | | | | | | | |
INVESTING ACTIVITIES: | | | | | | | | | | | | |
Purchase of and deposits for property and equipment | | | (2,269 | ) | | | (1,112 | ) | | | (2,068 | ) |
Proceeds from sales of property and equipment | | | 45 | | | | 215 | | | | 600 | |
Acquisition of K.M.M.S Holdings Ltd. | | | (2,310 | ) | | | — | | | | — | |
Acquisition of Ceres Medical | | | (492 | ) | | | — | | | | — | |
Acquisition of Europlak | | | (6,722 | ) | | | — | | | | — | |
Acquisition of International Medical Products, B.V. | | | — | | | | — | | | | (9,628 | ) |
Acquisition of OrthoPlast | | | — | | | | — | | | | (419 | ) |
| | | | | | | | | | | | |
Net cash used in investing activities | | | (11,748 | ) | | | (897 | ) | | | (11,515 | ) |
| | | | | | | | | | | | |
FINANCING ACTIVITIES: | | | | | | | | | | | | |
Borrowings under line of credit agreement | | | 126,484 | | | | 112,042 | | | | 104,551 | |
Repayments under line of credit agreement | | | (127,715 | ) | | | (115,361 | ) | | | (107,182 | ) |
Repayment of notes payable | | | (448 | ) | | | (491 | ) | | | (463 | ) |
Proceeds from issuance of common stock | | | 692 | | | | 706 | | | | 686 | |
Repurchase of treasury stock | | | (2,196 | ) | | | (147 | ) | | | — | |
Proceeds from exercise of stock options | | | 190 | | | | 410 | | | | 970 | |
Bank overdraft | | | 2,173 | | | | 93 | | | | 797 | |
| | | | | | | | | | | | |
Net cash used in financing activities | | | (820 | ) | | | (2,748 | ) | | | (641 | ) |
| | | | | | | | | | | | |
(continued)
F-7
MICROTEK MEDICAL HOLDINGS, INC. AND SUBSIDIARIES
CONSOLIDATED STATEMENTS OF CASH FLOWS
YEARS ENDED DECEMBER 31, 2006, 2005 AND 2004
| | | | | | | | | | | |
In thousands | | 2006 | | 2005 | | | 2004 | |
EFFECT OF EXCHANGE RATE CHANGES ON CASH | | | 344 | | | (256 | ) | | | (482 | ) |
| | | | | | | | | | | |
NET INCREASE (DECREASE) IN CASH AND CASH EQUIVALENTS | | | 2,294 | | | 5,801 | | | | (498 | ) |
CASH AND CASH EQUIVALENTS: | | | | | | | | | | | |
Beginning of year | | | 14,765 | | | 8,964 | | | | 9,462 | |
| | | | | | | | | | | |
End of year | | $ | 17,059 | | $ | 14,765 | | | $ | 8,964 | |
| | | | | | | | | | | |
SUPPLEMENTAL DISCLOSURES OF CASH FLOW INFORMATION: | | | | | | | | | | | |
Cash paid during the year for: | | | | | | | | | | | |
Interest | | $ | 117 | | $ | 257 | | | $ | 315 | |
| | | | | | | | | | | |
Income taxes | | $ | 1,163 | | $ | 543 | | | $ | 482 | |
| | | | | | | | | | | |
SUPPLEMENTAL DISCLOSURES OF NONCASH INVESTING AND FINANCING ACTIVITIES - | | | | | | | | | | | |
Notes payable assumed in acquisitions (Note 2) | | $ | 836 | | $ | — | | | $ | — | |
| | | | | | | | | | | |
Note receivable from sale of inventories (Note 6) | | $ | — | | $ | — | | | $ | 1,051 | |
| | | | | | | | | | | |
Equipment acquired under capital lease | | $ | — | | $ | — | | | $ | 45 | |
| | | | | | | | | | | |
Tax benefits related to stock options (Note 11) | | $ | — | | $ | 1,474 | | | $ | — | |
| | | | | | | | | | | |
(concluded)
See accompanying notes to consolidated financial statements.
F-8
MICROTEK MEDICAL HOLDINGS, INC. AND SUBSIDIARIES
NOTES TO THE CONSOLIDATED FINANCIAL STATEMENTS
AS OF DECEMBER 31, 2006 AND 2005 AND FOR EACH OF THE
THREE YEARS IN THE PERIOD ENDED DECEMBER 31, 2006
1. | NATURE OF BUSINESS AND SIGNIFICANT ACCOUNTING POLICIES |
Nature of Business - Microtek Medical Holdings, Inc. and subsidiaries (the “Company”) manufacture and supply innovative product solutions for patient care, occupational safety and management of infectious and hazardous waste primarily for the healthcare market, which represents one business segment. The Company markets its products to hospitals and other end users through a broad distribution system consisting of multiple channels including distributors, directly through its own sales force, original equipment manufacturers, and private label customers. The Company also markets certain of its products through custom procedure tray companies.
The Company’s revenues are generated through two operating units, Microtek Medical, Inc. (“Microtek”), a subsidiary of the Company, and OREX Technologies International (“OTI”), an operating division. Microtek is the core business of the Company. Since 2002, OTI has focused on commercializing its OREX patented technology in the nuclear industry. As described in Note 4 to these consolidated financial statements, in September 2004, the Company entered into an agreement which grants to Eastern Technologies, Inc. a worldwide exclusive license to manufacture, use and sell the Company’s OREX degradable products and processing technology in the nuclear industry, homeland security industry and for certain other industrial applications. Subject to the terms and conditions of this licensing agreement, OTI no longer sells OREX products to the nuclear power industry. OTI revenues to the nuclear industry amounted to less than one percent of the Company’s consolidated net revenues in 2006 and approximately three percent and six percent of the Company’s consolidated net revenues in 2005 and 2004, respectively.
Principles of Consolidation - The consolidated financial statements include the accounts of the Company and its wholly-owned subsidiaries. All significant intercompany balances and transactions have been eliminated in consolidation.
Revenue Recognition - Revenues from the sale of the Company’s products are recognized at the time of shipment when persuasive evidence of a sale arrangement exists, delivery has occurred, the price is fixed and collectibility of the associated receivable is reasonably assured. Sales taxes collected from customers and remitted to governmental authorities are accounted for on a net basis and therefore are excluded from revenues in the consolidated statements of operations and comprehensive income. The Company does not grant its distributors or other customers price protection rights or rights to return products bought, other than normal and customary rights of return for defects in materials or workmanship. The Company is not obligated to accept product returns for any other reason. Actual returns have not historically been significant.
Cash and Cash Equivalents - Cash equivalents are composed of short-term, highly liquid investments with original maturities of three months or less.
Accounts Receivable –Accounts receivable are stated at the amount the Company expects to collect and are presented net of allowances of $1,626,000 and $1,635,000 at December 31, 2006 and 2005, respectively. Amounts collected on accounts receivable are included in net cash provided by operating activities in the consolidated statements of cash flows. Management’s estimate of allowances is based on a number of factors, including customer credit-worthiness, past transaction history with the customer, current economic industry trends and changes in customer payment terms. If a material deterioration in any of these factors were to occur, the Company’s estimate of its allowances would change.
F-9
Inventories - Inventories are stated at the lower of cost or market. The first-in first-out (“FIFO”) valuation method is used to determine the cost of inventories. Cost includes material, labor and manufacturing overhead for manufactured and assembled goods and materials only for goods purchased for resale. On a periodic basis, management reviews its inventory quantities on hand for obsolescence, physical deterioration, changes in price levels and the existence of quantities on hand which may not reasonably be expected to be used or sold within the normal operating cycles of the Company’s operations. To the extent that any of these conditions are believed to exist or the utility of the inventory quantities in the ordinary course of business is no longer as great as their carrying value, the carrying value of the inventory is adjusted. To the extent that this adjustment is made during an accounting period, an expense is recorded in the Company’s consolidated statement of operations, generally in cost of goods sold. Significant management judgment is required in determining the amount of such an adjustment. In the event that actual results differ from management’s estimates or these estimates and judgments are revised in future periods, the Company may need to record additional adjustments to the carrying value of its inventory which could materially impact the Company’s consolidated financial position and results of operation.
Property and Equipment - Property and equipment are stated at cost. Depreciation on property and equipment is calculated on the straight-line method over the estimated useful lives of the related assets. Property and equipment held under capital leases and leasehold improvements are amortized on a straight-line basis over the shorter of the lease term or estimated useful life of the asset, whichever is shorter. At December 31, 2006, the Company had property and equipment with the following estimated lives:
| | |
Property and Equipment | | Estimated Life |
Building and leasehold improvements | | 3 to 20 years |
Equipment | | 3 to 10 years |
Furniture and fixtures | | 3 to 5 years |
Other | | 3 to 7 years |
Goodwill and Other Intangible Assets - Goodwill represents the excess of costs over fair value of assets of businesses acquired. Goodwill is reviewed for impairment at least annually in accordance with the provisions of Statement of Financial Accounting Standards (“SFAS”) No. 142Goodwill and Other Intangible Assets (“SFAS No. 142”). The Company has chosen December 31st as its annual impairment test date. The Company’s impairment tests performed through December 31, 2006 have indicated that no impairment loss was necessary.
SFAS No. 142 also requires that intangible assets with estimable useful lives be amortized over their respective estimated useful lives to their estimated residual values and be reviewed for impairment in accordance with SFAS No. 144,Accounting for Impairment or Disposal of Long-Lived Assets. The Company’s identifiable intangible assets consist primarily of customer lists and patent and license agreements and are amortized on a straight-line basis over the following estimated useful lives:
| | |
Intangible Assets | | Estimated Useful Life |
Customer lists | | 5 years to 15 years |
Covenants not to compete | | 5 years to 15 years |
Patent and license agreements | | 13 years to 17 years |
Other intangibles | | 4 years to 15 years |
F-10
The Company’s goodwill and intangible assets as of December 31, 2006 and 2005 are summarized as follows (in thousands):
| | | | | | | | | | | | |
| | | December 31, 2006 | | December 31, 2005 |
| | | Gross
Carrying
Amount | | Accumulated
Amortization | | Gross
Carrying
Amount | | Accumulated
Amortization |
Goodwill | | $ | 34,803 | | $ | — | | $ | 30,956 | | $ | — |
Customer lists | | | 3,514 | | | 1,029 | | | 3,120 | | | 719 |
Covenants not to compete | | | 1,272 | | | 913 | | | 1,148 | | | 744 |
Patent and license agreements | | | 11,241 | | | 3,002 | | | 5,293 | | | 2,701 |
Other | | | 1,927 | | | 806 | | | 1,043 | | | 399 |
| | | | | | | | | | | | |
Total | | $ | 52,757 | | $ | 5,750 | | $ | 41,560 | | $ | 4,563 |
| | | | | | | | | | | | |
Amortization expense related to intangible assets was $1,109,000, $961,000 and $809,000 for the years ended December 31, 2006, 2005, and 2004, respectively. Following is the estimated annual amortization expense for each of the five years subsequent to December 31, 2006 (in thousands):
| | | |
| | | Amortization
Expense |
2007 | | $ | 1,697 |
2008 | | | 1,523 |
2009 | | | 1,363 |
2010 | | | 1,107 |
2011 | | | 1,049 |
Impairment of Long-Lived Assets - In accordance with SFAS No. 144, the Company’s long-lived assets, such as property and equipment and purchased intangibles subject to amortization, are reviewed for impairment whenever events or changes in circumstances indicate that the carrying amount of these assets may not be recoverable. Recoverability of long-lived assets to be held and used is measured by a comparison of the carrying amount of the asset to estimated undiscounted future cash flows expected to be generated by the asset. If the carrying amount of the long-lived asset exceeds its estimated future cash flows, an impairment charge is recognized to the extent that the carrying amount of the long-lived asset exceeds its fair value. Fair value is determined through various valuation techniques, including discounted cash flow models, quoted market value and third-party independent appraisals, as considered necessary. Assets held for disposal, if any, are presented separately and are reported at the lower of the carrying amount or fair value, less estimated cost to sell such assets, and are no longer depreciated.
Investment in Available for Sale Securities - The Company holds approximately a 1.5 percent interest in Consolidated Ecoprogress Technology, Inc., a Canadian technology marketing company trading on the Vancouver Securities Exchange. These investments are classified in accordance with SFAS No. 115 as available for sale securities and are stated at market.
Income Taxes - Income taxes are accounted for under the asset and liability method. Deferred tax assets and liabilities are recognized for the future tax consequences attributable to differences between the financial statement carrying amounts of existing assets and liabilities and their respective tax bases and operating loss and tax credit carryforwards. Deferred tax assets and liabilities are measured using enacted tax rates expected to apply to taxable income in the years in which those temporary differences are expected to be recovered or settled. The effect on deferred tax assets and liabilities of a change in tax rates is recognized in income in the period that includes the enactment date. Valuation allowances are established when necessary to reduce deferred tax assets to the amounts expected to be realized (Note 11).
F-11
Pension Plan– The Company has a noncontributory defined benefit pension plan covering certain employees of its Netherlands subsidiaries. The benefits provided under the plan are based on age, years of service and the level of compensation prior to retirement. The Company records annual amounts relating to its pension plan based on calculations that incorporate various actuarial and other assumptions including, discount rates, mortality, assumed rates of return, compensation increases and turnover rates. The Company reviews its assumptions on an annual basis and makes modifications to the assumptions based on current rates and trends when it is appropriate to do so. The effect of modifications to those assumptions is recorded in accumulated other comprehensive income beginning in 2006 and is amortized to net periodic cost over future periods using the corridor method. The Company believes that the assumptions utilized in recording its obligations under its pension plan are reasonable based on its experience and market conditions. Net periodic costs are recognized as employees render services necessary to earn the specified pension benefits.
In September 2006, the Financial Accounting Standards Board (“FASB”) issued SFAS No. 158, Employer’s Accounting for Defined Benefit Pension and Other Postretirement Plans – an amendment of FASB Statements No. 87, 88, 106, and 132(R)(“SFAS No. 158”). SFAS No. 158 requires companies to recognize the funded status of defined benefit pension and other postretirement plans as a net asset or liability in its statement of financial position and to recognize changes in that funded status in the year in which the changes occur through comprehensive income to the extent that those changes are not included in the net periodic cost. The funded status of a defined benefit pension plan is measured as the difference between the fair value of plan assets and the projected benefit obligation under the plan. Additionally, SFAS No. 158 requires companies to measure the funded status of a plan as of the company’s fiscal year-end, with limited exceptions, and expands financial statement disclosures. SFAS No. 158 is effective as of the end of fiscal years ending after December 15, 2006; however, the requirement to measure plan assets and benefit obligations as of the company’s fiscal year-end is effective for fiscal years ending after December 15, 2008.
The Company adopted all requirements of SFAS No. 158 with respect to its international defined benefit pension plan on December 31, 2006, except for the funded status measurement date requirement which will be adopted on December 31, 2008, as allowed under SFAS No. 158. The adoption of SFAS No. 158 did not impact the Company’s compliance with its debt covenants or its cash position. The incremental effect of applying SFAS No. 158 on the Company’s consolidated financial position as of December 31, 2006 was as follows:
| | | | | | | | | | | |
| | | Before
application of
SFAS No. 158 | | Adjustments | | | After
application of
SFAS No. 158 | |
Liability for pension benefits – non-current portion | | $ | 405 | | $ | 32 | | | $ | 437 | |
Deferred income taxes – non-current | | | — | | | (8 | ) | | | (8 | ) |
| | | | | | | | | | | |
Total liabilities | | | 405 | | | 24 | | | | 429 | |
Accumulated other comprehensive income, net of income taxes | | | — | | | (24 | ) | | | (24 | ) |
| | | | | | | | | | | |
Total stockholders’ equity | | $ | — | | $ | (24 | ) | | $ | (24 | ) |
Distribution Expenses- Distribution expenses incurred by the Company include third party freight costs as well as other internal costs such as salaries, depreciation, rent, insurance, utilities, repairs and maintenance, and supplies associated with the Company’s distribution activities. Distribution
F-12
costs of approximately $10,650,000, $10,335,000 and $9,408,000 for the years ended December 31, 2006, 2005 and 2004, respectively, are included in selling, general and administrative expenses in the accompanying consolidated statements of operations.
Research and Development Costs - Research and development costs include product research as well as various product and process development activities and are charged to expense as incurred. Research and development costs in 2006, 2005 and 2004 amounted to $873,000, $810,000 and $1,048,000, respectively.
Preferred Stock - On April 24, 1994, the Company authorized, for future issuance in one or more series or classes, 10 million shares of no par value preferred stock. On December 19, 1996, the Company allocated 500,000 of the authorized shares to a series of stock designated as Participating Preferred Stock.
Earnings Per Share - Earnings per share is calculated in accordance SFAS No. 128,Earnings Per Share, which requires dual presentation of basic and diluted earnings per share on the face of the income statement for all entities with complex capital structures. Basic per share income is computed using the weighted average number of common shares outstanding for the period. Diluted per share income is computed including the dilutive effect of contingently issuable shares. Dilutive potential common shares are calculated in accordance with the treasury stock method, which assumes that proceeds from the exercise of all options are used to repurchase common shares at market value. The number of shares remaining after the exercise proceeds are exhausted represents the potentially dilutive effect of the options. The following table reflects the weighted average number of shares used to calculate basic and diluted earnings per share for the periods presented (in thousands):
| | | | | | |
| | | 2006 | | 2005 | | 2004 |
Basic Shares | | 43,498 | | 43,347 | | 43,005 |
Dilutive Shares (due to stock options) | | 1,008 | | 703 | | 1,495 |
| | | | | | |
Diluted Shares | | 44,506 | | 44,050 | | 44,500 |
| | | | | | |
Options to purchase 1,108,000, 1,154,000 and 796,000 shares were outstanding at December 31, 2006, 2005 and 2004, respectively, but were not included in the computation of diluted net income per share because the exercise price of the options was greater than the average market price of the common shares, and therefore, the effect would be antidilutive.
Stock-Based Compensation - Effective January 1, 2006, the Company adopted the provisions of SFAS No. 123(R),Share-Based Payment,and related interpretations (collectively, “SFAS No. 123(R)”) to account for stock-based compensation using the modified prospective transition method and therefore will not restate its prior period results. SFAS No. 123(R) supersedes Accounting Principles Board (“APB”) Opinion No. 25,Accounting for Stock Issued to Employees, and revises guidance in SFAS No. 123,Accounting for Stock-Based Compensation. SFAS No. 123(R) establishes accounting requirements for share-based compensation to employees and carries forward prior guidance on accounting for awards to non-employees. Specifically, SFAS No. 123(R) requires that compensation expense be recognized in the financial statements for share-based awards based on the grant date fair value of those awards. SFAS No. 123(R) also requires the benefits of tax deductions in excess of recognized compensation expense to be reported as a financing cash flow activity, rather than as an operating cash flow activity as previously required.
F-13
The Company’s initial adoption of SFAS No. 123(R)’s fair value method on January 1, 2006 did not have an impact on the Company’s results of operations or overall financial position. However, the future impact of the adoption of SFAS No. 123(R) on the Company’s results of operations cannot be predicted at this time because it will depend on levels of future grants of share-based payments.
Pursuant to SFAS No. 123(R)’s modified prospective transition method, the Company recognizes stock-based compensation expense based on the grant-date fair value of any new share-based awards granted subsequent to December 31, 2005 that are expected to vest. Compensation expense is recognized on a straight-line basis over the requisite service period, which is generally commensurate with the vesting term. Compensation expense is recognized immediately for share-based awards that are fully vested on the date of the grant. For the year ended December 31, 2006, compensation expense recognized in the Company’s consolidated financial statements related to share-based awards totaled approximately $19,000. For the year ended December 31, 2006, the Company did not record any excess tax benefits generated from stock option exercises because of the Company’s significant net operating loss carryforwards for Federal income tax purposes.
Prior to January 1, 2006, the Company accounted for its share-based payments to employees under the intrinsic value recognition and measurement principles of APB Opinion No. 25 and related interpretations, including FASB Interpretation No. 44,Accounting for Certain Transactions Involving Stock Compensation, an interpretation of APB Opinion No. 25. Accordingly, no stock-based employee compensation cost was reflected in the Company’s consolidated results of operations as all options granted under the Company’s stock options plans had an exercise price equal to the market value of the underlying common stock on the date of the grant. Prior to its adoption of SFAS 123(R), the Company followed the disclosure requirements of SFAS No. 148,Accounting for Stock-Based Compensation – Transition and Disclosure, an amendment of FASB Statement No. 123 and accordingly provided pro forma disclosures of net income and net income per basic and diluted share as if the fair-value-based method had been applied to all outstanding and unvested awards for each period presented.
The following table illustrates the effect on net income and net income per basic and diluted share as if the Company had applied the fair value recognition provisions of SFAS No. 123 to its stock-based employee compensation plans for years ended December 31, 2005 and 2004 (in thousands, except per share data).
| | | | | | | | |
| | | 2005 | | | 2004 | |
Net income, as reported | | $ | 14,504 | | | $ | 9,921 | |
Deduct: Total stock-based employee compensation expense determined under fair value based method for all awards, net of related tax effects | | | (2,061 | ) | | | (1,583 | ) |
| | | | | | | | |
Pro forma net income | | $ | 12,443 | | | $ | 8,338 | |
| | | | | | | | |
Net income per share: | | | | | | | | |
Basic – as reported | | $ | 0.33 | | | $ | 0.23 | |
| | | | | | | | |
Basic – pro forma | | $ | 0.29 | | | $ | 0.19 | |
| | | | | | | | |
Diluted – as reported | | $ | 0.33 | | | $ | 0.22 | |
| | | | | | | | |
Diluted – pro forma | | $ | 0.28 | | | $ | 0.19 | |
| | | | | | | | |
The Company uses the Black-Scholes option pricing model to determine the fair value of the Company’s share-based awards under SFAS No. 123 (R), which is the same valuation technique previously used for pro forma disclosures under SFAS No. 123. The Black-Scholes option valuation model was developed for use in estimating the fair value of traded options which have no
F-14
vesting restrictions and are fully transferable. In addition, option valuation models require the input of highly subjective assumptions including the expected stock price volatility. Because the Company’s employee stock options have characteristics significantly different from those of traded options, and because changes in the subjective input assumptions can materially affect the fair value estimate, in management’s opinion, the existing models do not necessarily provide a reliable single measure of the fair value of its employee stock options.
The following table summarizes the assumptions used to compute the stock-based compensation expense and pro forma information for stock option grants issued during years ended December 31, 2006, 2005 and 2004.
| | | | | | | | | |
| | | 2006 | | | 2005 | | | 2004 | |
Dividend yield | | 0.0 | % | | 0.0 | % | | 0.0 | % |
Forfeiture rate | | 0.0 | % | | 0.0 | % | | 0.0 | % |
Expected volatility | | 40.6 | % | | 42.5 | % | | 25.6 | % |
Risk free interest rate | | 5.0 | % | | 4.1 | % | | 4.0 | % |
Expected term, in years | | 5.0 | | | 9.3 | | | 9.8 | |
Pursuant to the Company’s Credit Agreement (see Note 9), the Company is not permitted to pay any dividends and does not anticipate paying any cash dividends in the foreseeable future. Therefore, an expected dividend yield of zero is assumed for purposes of the Company’s Black Scholes calculations. Pre-vesting forfeiture rates are estimated based on the Company’s historical experience and expectations about future forfeitures. The Company has assumed a pre-vesting forfeiture rate of zero for 2006 because all options issued during the year were to members of the Company’s Board of Directors who have historically exercised their options prior to expiration. Expected price volatility is determined using a weighted average of daily historical volatility of the Company’s stock price over the corresponding expected option life. The average risk-free interest rate is determined using the Federal Reserve nominal rates in effect as of the date of grant for U.S. Treasury zero-coupon bonds with maturities similar to those of the expected term of the share-based award being valued. The expected term of stock options is determined using historical data.
On December 20, 2005, the Company accelerated the vesting of all unvested stock options previously awarded to the Company’s employees. The primary purpose of the accelerated vesting was to eliminate future compensation expense the Company would otherwise recognize in its consolidated statement of operations with respect to these options upon the adoption of SFAS 123(R) on January 1, 2006. As a result of this action, options to purchase approximately 950,000 shares of the Company’s common stock at exercise prices ranging from $1.90 to $4.72 per share and having a weighted average exercise price of $3.96 per share became exercisable immediately. Included in the 2005 pro forma amounts above is stock-based employee compensation of $1,600,000 resulting from this action. The exercise prices and number of shares subject to the accelerated options were unchanged.
Use of Estimates - The preparation of consolidated financial statements in conformity with U.S. generally accepted accounting principles requires management to make estimates and assumptions that affect the amounts reported in the consolidated financial statements and accompanying notes. Significant items subject to such estimates and assumptions include the carrying amount of property and equipment, intangibles and goodwill; valuation allowances for receivables, inventories and deferred income tax assets; valuation of share-based compensation and assets and obligations related to employee benefits. Actual results could differ from those estimates.
F-15
Foreign Currency - The financial position and results of operations of the Company’s foreign subsidiaries in the United Kingdom, the Netherlands, Germany, Malta and France are measured using the foreign subsidiary’s local currency as the functional currency. Revenues and expenses of such subsidiaries have been translated into U.S. dollars at average exchange rates prevailing during the period. Assets and liabilities have been translated at the rates of exchange on the balance sheet date. The resulting translation gain and loss adjustments are recorded directly as a separate component of shareholders’ equity. Foreign currency translation adjustments, net of applicable taxes, resulted in gains of $1,630,000 and $497,000 in 2006 and 2004, respectively, and losses of $1,536,000 in 2005.
Transaction gains and losses that arise from exchange rate fluctuations on transactions denominated in a currency other than the functional currency are included in the results of operations as incurred. Included in operations for the years ended December 31, 2006 and 2004 were foreign currency exchange gains of $236,000 and $850,000, respectively. For the year ended December 31, 2005, foreign currency exchange losses were $408,000. These foreign currency exchange gains and losses resulted from the translation of certain transactions of the Company’s Netherlands subsidiaries which are denominated in a currency other than the functional currency of those subsidiaries.
Derivative Instruments and Hedging Activities -The Company accounts for derivative and hedging activities in accordance with SFAS No. 133,Accounting for Derivative Instruments and Hedging Activities (“SFAS No. 133”). Under SFAS No. 133, derivative instruments are recognized in the balance sheet at fair value and changes in the fair value of such instruments are recognized currently in earnings unless specific hedge accounting criteria are met. At December 31, 2006 and 2005, the Company had no derivative instruments.
Fair Value of Financial Instruments -The carrying amount of the Company’s cash and cash equivalents, accounts receivable, other receivables, prepaid expenses and other assets, accounts payable, and accrued expenses approximate fair value because of the short maturity of these instruments. The carrying value of the Company’s long-term debt also approximates fair value based on interest rates that are believed to be available to the Company for debt with similar prepayment provisions provided for in the existing debt agreements.
Recently Issued Accounting Standards - Accounting for Uncertainty in Income Taxes. In June 2006, the FASB issued Interpretation No. 48,Accounting for Uncertainty in Income Taxes – An interpretation of FASB Statement No. 109, (“FIN No. 48”) which clarifies the accounting and disclosure requirements for uncertainty in tax positions, as defined. The Company is currently evaluating the provisions of FIN No. 48, which is effective for fiscal years beginning after December 15, 2006.
Considering the Effects of Prior Year Financial Statement Misstatements. In September 2006, the Securities and Exchange Commission issued Staff Accounting Bulletin (“SAB”) No. 108,Considering the Effects of Prior Year Misstatements when Quantifying Misstatements in Current Year Financial Statements (“SAB 108”), to address diversity in practice in quantifying financial statement misstatements. SAB 108 requires companies to quantify misstatements based on their impact on each of their financial statements and related disclosures. SAB 108 is effective as of the end of the Company’s 2006 fiscal year, allowing a one-time transitional cumulative effect adjustment to retained earnings as of January 1, 2006 for errors that were not previously deemed material but are material under the guidance in SAB 108. The Company’s adoption of SAB 108 as of December 31, 2006 had no impact on the Company’s consolidated financial statements.
Fair Value Measurement. In September 2006, the FASB issued SFAS No. 157,Fair Value Measurement (“SFAS No. 157”). SFAS No. 157 defines fair value, establishes a framework for the measurement of fair value, and enhances disclosures about fair value measurements but does not require any new fair value measures. SFAS No. 157 is effective for fair value measures already
F-16
required or permitted by other standards for fiscal years beginning after November 15, 2007. The Company is required to adopt SFAS No. 157 on January 1, 2008. SFAS No. 157 is required to be applied prospectively, except for certain financial instruments. Any transition adjustment will be recognized as an adjustment to opening retained earnings in the year of adoption. The Company is currently evaluating the impact of adopting SFAS No. 157 on its consolidated results of operations and financial position.
Each of the following described acquisitions was accounted for as a business combination in accordance with SFAS No. 141,Business Combinations. Accordingly, the results of operations related to the acquired assets have been included in the accompanying consolidated financial statements from their respective acquisition date.
Effective March 1, 2004, Microtek acquired substantially all of the assets of Ortho/Plast, Inc. (“OrthoPlast”), a marketer of a small line of orthopedic products. The purchase price of approximately $419,000 in cash, including certain acquisition costs, was allocated to accounts receivable, inventories, property and equipment and identifiable intangibles (principally customer lists of approximately $200,000 with a useful life of five years) based on those assets’ respective estimated fair values, with the excess allocated to goodwill. The amount allocated to goodwill was not significant. The terms of the related purchase agreement also provide for additional cash consideration up to $600,000 if future revenues from the Company’s orthopedic product line exceed certain targeted levels, as defined in the agreement, through 2009. The additional consideration will be recorded when it is determinable that such target revenues are probable of being met and is expected to result in additional goodwill.
Effective May 28, 2004, Microtek acquired selected fixed assets and inventories related to certain businesses of International Medical Products, B.V. and affiliates (collectively, “IMP”) from Cardinal Health for approximately $9.6 million in cash, including acquisition costs, and an accrued liability for certain employee costs of 400,000 EURO, or approximately $491,000. The purchase price was allocated to the assets acquired and liability assumed, based on their respective estimated fair values, as follows:
| | | | | | |
Purchase price paid as: | | | | | | |
Cash | | | | | $ | 9,628 |
Accrued employee liability | | | | | | 491 |
| | | | | | |
Total purchase consideration | | | | | | 10,119 |
Allocated to: | | | | | | |
Inventories | | $ | 1,816 | | | |
Property and equipment | | | 186 | | | |
Identifiable intangible assets | | | 2,883 | | | |
| | | | | | |
Total allocation | | | | | | 4,885 |
| | | | | | |
Goodwill | | | | | $ | 5,234 |
| | | | | | |
Identifiable intangible assets related to the IMP acquisition included customer lists of approximately $2.3 million (useful life of 15 years), non-compete agreements of approximately $219,000 (useful life of five years) and other intangible assets of approximately $362,000 (useful life of four years).
F-17
Effective March 1, 2006, Microtek acquired KMMS Holdings, Ltd. and its European manufacturing and distribution operations (collectively, “Samco”) for approximately $2.3 million in cash, including acquisition costs. Based on estimated fair values and other information currently available, the preliminary allocation of the total purchase price is summarized as follows (in thousands):
| | | | | | | |
Purchase consideration in cash | | | | | | $ | 2,310 |
Allocated to: | | | | | | | |
Accounts receivable | | $ | 347 | | | | |
Inventories | | | 787 | | | | |
Property and equipment | | | 273 | | | | |
Identifiable intangible assets | | | 166 | | | | |
Accounts payable and other accrued liabilities | | | (625 | ) | | | |
| | | | | | | |
Total allocation | | | | | | | 948 |
| | | | | | | |
Goodwill | | | | | | $ | 1,362 |
| | | | | | | |
Effective July 1, 2006, Microtek acquired substantially all of the assets of Ceres Medical, LLC (Ceres Medical), a marketer of a small line of products sold primarily to cardiology and interventional radiology specialties. The purchase price of approximately $492,000 in cash, including certain acquisition costs, has been preliminarily allocated to the assets and liabilities acquired, primarily accounts receivable of $46,000, inventories of $46,000, property and equipment of $6,000, identifiable intangibles of $176,000 and trade accounts payable of $47,000, based on the respective estimated fair values of those assets and liabilities, with the excess of approximately $265,000 allocated to goodwill. The terms of the related purchase agreement also provide for additional cash consideration up to $550,000 if future contribution margins from the acquired product line exceed certain levels, as defined in the agreement, through 2011. The additional consideration will be recorded when it is determinable that the payment of such amounts is probable and is expected to result in additional goodwill.
Microtek acquired all of the stock of Europlak, a surgeon-owned marketer of minimally invasive surgical products and devices primarily in urology, gastroenterology and related surgical specialties, and all of the stock of Eurobiopsy, a company focused on the design, development, manufacture and commercialization of a line of endoscope biopsy forceps, on October 2, 2006 and December 15, 2006, respectively. Both of these companies are located in France and currently generate substantially all of their revenues from French customers. The combined purchase price of approximately $6.7 million in cash, including certain acquisition costs, is expected to be allocated to the assets and liabilities acquired, primarily accounts receivable, inventories, identifiable intangibles, accounts payable, other accrued liabilities and notes payable, based on the respective estimated fair values of those assets and liabilities, with the excess allocated to goodwill. The terms of the Europlak agreement also provide for additional cash consideration up to approximately $12.4 million through 2021 if certain revenue hurdles, as defined in the agreement, are achieved. The additional consideration will be recorded when it is determinable that the payment of such amounts is probable and is expected to result in additional goodwill.
The Company is currently evaluating the fair value of the assets acquired in the Samco, Ceres Medical, Europlak and Eurobiopsy acquisitions, principally other identifiable intangible assets and goodwill. The preliminary allocations of the total purchase price for each of these acquisitions are subject to revision in 2007 based on the final determination of these fair values.
F-18
The following unaudited pro forma financial information for the years ended December 31, 2006, 2005 and 2004 reflect the Company’s results of operations as if these acquisitions had been completed on January 1, 2004 (in thousands, except per share data):
| | | | | | | | | |
| | | 2006 | | 2005 | | 2004 |
Net revenues | | $ | 147,656 | | $ | 146,396 | | $ | 144,966 |
Net income | | $ | 8,195 | | $ | 15,093 | | $ | 10,778 |
Net income per share – basic | | $ | 0.19 | | $ | 0.35 | | $ | 0.25 |
Net income per share – diluted | | $ | 0.18 | | $ | 0.34 | | $ | 0.24 |
The pro forma financial information above is based on estimates and assumptions which management believes are reasonable. However, the pro forma results are not necessarily indicative of the operating results that would have occurred had these acquisitions been consummated as of the dates indicated, nor are they necessarily indicative of future operating results.
3. | DEFERRED COMPENSATION ARRANGEMENTS |
In conjunction with its acquisition of Deka Medical, Inc. in 2001, Microtek entered into deferred compensation arrangements with certain of Deka’s key employees to gain their assistance with the integration of the Microtek and Deka organizations immediately following the acquisition and their support toward the continued success of the acquired product lines under Microtek’s management. These arrangements provided for lump-sum payments at the end of a four-year employment period and were automatically forfeited if employment was terminated during this period. Pursuant to the terms of the arrangements, in September 2004, Microtek exercised its option to prepay these obligations prior to maturity and accordingly paid a total of $874,000 to these employees in fulfillment of its obligation under these arrangements. Total compensation expense recorded in 2004 with respect to these arrangements was $180,000.
In September 2004, the Company entered into an agreement (the “License Agreement”) which grants to Eastern Technologies, Inc. (“ETI”) a worldwide exclusive license to manufacture, use and sell the Company’s OREX materials and processing technology in the nuclear industry, homeland security industry and certain other industrial applications. Under the terms of the License Agreement, the Company will receive license royalties equal to $75,000 per quarter for the first three years of the agreement. Thereafter and generally until the expiration of the underlying patents related to the product or service generating the subject royalties, the Company will receive license royalties equal to the greater of: (i) generally five percent of net sales, as defined in the agreement, or (ii) $300,000 per year. The royalty rate is subject to downward adjustment in certain events with respect to net sales of certain products. The Company also entered into an exclusive three-year supply agreement (the “Supply Agreement”) under which the Company has agreed to provide certain sourcing and supply chain management services to ETI, and ETI has agreed to purchase a total of approximately $4.8 million of inventory over the term of the Supply Agreement. For these services, the Company will receive management fees totaling $2.7 million, $600,000 of which was received at the signing of the Supply Agreement. The balance of the management fees are payable in quarterly installments of $175,000 beginning December 31, 2004 and at the end of each quarter thereafter until September 30, 2007. The cash payment of $600,000 was recorded as deferred revenue (included in accrued expenses, a current liability) upon receipt. This amount, together with all future management fees collected from ETI, will be recognized into income ratably over the term of the Supply Agreement as nuclear finished goods inventories on hand are sold to ETI. At December 31, 2006 and 2005, amounts recognized into income exceeded cash receipts from ETI by approximately $294,000 and $618,000, which amounts were recorded in the accompanying consolidated balance sheet in prepaid expenses and other current assets.
F-19
Concurrent with the signing of the License Agreement and the Supply Agreement described in Note 4 above, the Company also sold its interest in certain equipment having a net book value of approximately $190,000 to ETI for $400,000. This sale resulted in a gain on disposition of approximately $215,000.
Effective September 26, 2003, Microtek sold substantially all of its assets related to the manufacture and sale of three of its safety products for a total consideration of approximately $1.3 million, consisting of $400,000 in cash and a note receivable for approximately $903,000, bearing interest at seven percent. The note receivable was payable in 36 monthly installments of principal and interest of approximately $9,000 beginning in December 2003, one payment of $103,184 on March 15, 2004 and a final balloon payment representing all remaining principal and accrued interest on December 15, 2006. All remaining amounts outstanding under the note receivable were collected in full in October 2005.
6. | SALE OF INVENTORIES TO A RELATED PARTY |
In September 2004, the Company entered into an agreement with Global Resources, Inc. (“GRI”), a related party as described in Note 7 below, for the sale of certain of its raw material inventories used in the manufacture of finished goods for sale to the nuclear industry. At closing, the Company received cash proceeds of $200,000 and a promissory note in the amount of $1.051 million. The promissory note, including interest at 5%, was repaid ratably as the raw material inventories purchased by GRI in the transaction were consumed by GRI. The final note payment was received in August 2006. The total gain on the sale of these raw material inventories approximated $467,000. Of this total gain, approximately $91,000, an amount commensurate with the Company’s relative ownership interest in GRI, was deferred and recognized into income as the raw material inventories purchased by GRI in the transaction were sold by GRI. Approximately $13,000 and $78,000 of this deferred gain was recognized into income during the years ended December 31, 2006 and 2005, respectively. In August 2006, all of the deferred gain on this transaction was recognized into income.
7. | INVESTMENT IN AFFILIATED COMPANY |
In May 2000, the Company and certain of its affiliates and employees organized GRI. From its manufacturing facilities located in China, GRI provides certain material sourcing and manufacturing of various Microtek’s products where such supply arrangements are advantageous to Microtek based on favorable pricing and other considerations. During 2006, 2005 and 2004, the Company paid a total of $8,483,778, $5,472,080, and $6,643,308, respectively, for products supplied, services rendered and expenses incurred by GRI for the benefit of the Company.
F-20
The Company and a non-executive member of the Company’s management own 19.5 percent and 30 percent, respectively, of GRI. Accordingly, the Company accounts for its investment in GRI under the equity method. The Company’s investment in GRI was approximately $751,000 and $502,000 at December 31, 2006 and 2005, respectively. The Company recorded $249,000, $202,000 and $128,000 of income during the years ended December 31, 2006, 2005 and 2004, respectively, related to this investment. Summary combined unaudited financial information of GRI as of and for the years ended December 31, 2006 and 2005 follows (in thousands):
| | | | | |
| | | 2006 | | 2005 |
Financial Position: | | | | | |
Current assets | | $ | 8,000 | | 6,929 |
Property and equipment, net | | | 4,000 | | 2,495 |
Other assets | | | 170 | | 80 |
| | | | | |
Total assets | | | 12,170 | | 9,504 |
| | | | | |
Current liabilities | | | 7,978 | | 6,101 |
Long-term debt and other liabilities | | | 694 | | 1,173 |
| | | | | |
Total liabilities | | | 8,672 | | 7,274 |
| | | | | |
Stockholders’ equity | | | 3,498 | | 2,230 |
| | | | | |
Results of Operations: | | | | | |
Sales | | | 19,589 | | 17,570 |
| | | | | |
Operating Income | | | 1,976 | | 1,340 |
| | | | | |
Net income | | $ | 1,277 | | 1,035 |
| | | | | |
Inventories are summarized by major classification at December 31, 2006 and 2005 as follows (in thousands):
| | | | | | |
| | | 2006 | | 2005 |
Raw materials | | $ | 13,317 | | $ | 12,381 |
Work-in-progress | | | 1,397 | | | 1,716 |
Finished goods | | | 20,940 | | | 16,946 |
| | | | | | |
Total inventories | | $ | 35,654 | | $ | 31,043 |
| | | | | | |
At December 31, 2006 and 2005, OREX inventories approximated $335,000 and $1.0 million, respectively, and consisted primarily of finished goods.
The Credit Agreement
The Company maintains a credit agreement between the Company and a Bank (the “Credit Agreement”). As amended through December 31, 2006, the Credit Agreement provides for a $23.5 million revolving credit facility, which matures on June 30, 2008. Borrowing availability under the revolving credit facility is based on the lesser of (i) a percentage of eligible accounts receivable and inventories or (ii) $23.5 million, less any outstanding letters of credit issued under the Credit Agreement. Aggregate borrowing availability under the revolving facility at December 31, 2006 was $17.4 million. Revolving credit borrowings bear interest at a floating rate approximating the Bank’s prime rate plus an interest margin (8.5 percent at December 31, 2006). There were no outstanding borrowings under the revolving credit facility as of December 31, 2006. Outstanding borrowings under the revolving credit facility totaled $1.2 million at December 31, 2005. Borrowings under the Credit Agreement are collateralized by the Company’s accounts receivable, inventories, equipment, the Company’s stock of its subsidiaries and certain of the Company’s plants and offices.
F-21
The Credit Agreement contains certain restrictive covenants, including the maintenance of certain financial ratios, earnings before interest, taxes, depreciation and amortization (“EBITDA”) and net worth, and places limitations on acquisitions, dispositions, capital expenditures and additional indebtedness. In addition, the Company is not permitted to pay any dividends. At December 31, 2006 and 2005, the Company was in compliance with all of its financial covenants under the Credit Agreement.
The Credit Agreement provides for the issuance of up to $1.0 million in letters of credit. There were no outstanding letters of credit at December 31, 2006 and 2005. The Credit Agreement also provides for a fee of 0.375 percent per annum on the unused commitment, an annual collateral monitoring fee of $35,000 and an outstanding letter of credit fee of 2.0 percent per annum.
Other Long-Term Debt
The Company is obligated under certain long-term lease arrangements which aggregated $19,000 and $145,000 at December 31, 2006 and 2005, respectively.
In conjunction with the Company’s November 2003 acquisition of Plasco, Inc., the Company signed a Promissory Note in the original principal amount of $1.1 million. This principal amount was reduced in December 2003 to $866,000 as a result of adjustments made to the original purchase price. The note payable, as adjusted, including interest at six percent, was repaid in quarterly installments of principal and interest beginning in March 2004 through October 2006. There was $293,000 outstanding under this note payable at December 31, 2005.
As a result of the Company’s Europlak and Eurobiopsy acquisitions in October and December 2006, respectively, the Company assumed two notes payable to banks with amounts outstanding at December 31, 2006 of approximately $836,000 and $39,000, respectively. The first of these notes payable bears interest at 4.25 percent and is payable in monthly installments of principal and interest through March 2013. The second note payable arrangement bears interest at a floating rate (approximately 5.1 percent at December 31, 2006) and matures in November 2007.
Future minimum lease payments and the aggregate maturities of the Company’s notes payable as of December 31, 2006, are as follows (in thousands):
| | | | | | |
| | | Capital leases | | Notes payable |
2007 | | $ | 15 | | $ | 158 |
2008 | | | 4 | | | 125 |
2009 | | | — | | | 130 |
2010 | | | — | | | 136 |
2011 | | | — | | | 142 |
Thereafter | | | — | | | 184 |
| | | | | | |
Total minimum payments | | $ | 19 | | $ | 875 |
| | | | | | |
Amount representing interest | | | — | | | |
| | | | | | |
Obligations under capital lease | | | 19 | | | |
Obligations due within one year | | | 15 | | | |
| | | | | | |
Long-term obligations under capital lease | | $ | 4 | | | |
| | | | | | |
F-22
The Company leases office, manufacturing and warehouse space and equipment under operating lease agreements expiring through 2016. Rent expense is recognized on a straight-line basis over the term of the respective leases and totaled $3.1 million, $3.0 million and $2.8 million in 2006, 2005 and 2004, respectively. At December 31, 2006, minimum future rental payments under these operating leases are as follows (in thousands):
| | | |
2007 | | $ | 3,062 |
2008 | | | 2,895 |
2009 | | | 2,488 |
2010 | | | 2,334 |
2011 | | | 1,889 |
Thereafter | | | 6,101 |
| | | |
Total minimum payments | | $ | 18,769 |
| | | |
The Company may, at its option, extend certain of its office, manufacturing and warehouse space lease terms through various dates.
The income tax provision is summarized as follows (in thousands):
| | | | | | | | | | | | |
| | | 2006 | | | 2005 | | | 2004 | |
Current: | | | | | | | | | | | | |
Federal | | $ | 211 | | | $ | 105 | | | $ | 166 | |
State | | | 230 | | | | 136 | | | | 218 | |
Foreign | | | (128 | ) | | | 357 | | | | 542 | |
| | | | | | | | | | | | |
| | | 313 | | | | 598 | | | | 926 | |
| | | | | | | | | | | | |
Deferred: | | | | | | | | | | | | |
Federal | | | 3,638 | | | | 2,599 | | | | 5,810 | |
State | | | 30 | | | | 65 | | | | 50 | |
Foreign | | | 234 | | | | 161 | | | | 336 | |
| | | | | | | | | | | | |
| | | 3,902 | | | | 2,825 | | | | 6,196 | |
| | | | | | | | | | | | |
Valuation allowance | | | — | | | | (9,555 | ) | | | (7,886 | ) |
| | | | | | | | | | | | |
Tax benefits resulting from allocating employee stock option tax benefits to additional paid-in-capital | | | — | | | | 1,474 | | | | — | |
| | | | | | | | | | | | |
Total income tax expense (benefit) | | $ | 4,215 | | | $ | (4,658 | ) | | $ | (764 | ) |
| | | | | | | | | | | | |
During 2005, the Company recognized $1,474,000 in income tax benefits associated with the exercise of employee stock options. The benefits recognized related to compensation expense deductions generated from 1997 to 2005 and were recorded in the accompanying consolidated financial statements as additional paid-in-capital.
F-23
The income tax provision allocated to continuing operations using the Federal statutory tax rate differs from the actual income tax benefit as follows ($ amounts in thousands):
| | | | | | | | | | | | | | | | | | | | | |
| | | 2006 | | | 2005 | | | 2004 | |
Federal statutory rate | | $ | 4,124 | | | 34 | % | | $ | 3,348 | | | 34 | % | | $ | 3,113 | | | 34 | % |
State taxes, net of Federal benefit | | | 146 | | | 1 | | | | 154 | | | 2 | | | | 177 | | | 2 | |
Items not deductible for income tax purposes | | | 102 | | | 1 | | | | 112 | | | 1 | | | | 112 | | | 1 | |
Expiration of loss and other credit carryforwards | | | — | | | — | | | | — | | | — | | | | 3,971 | | | 43 | |
Taxes on foreign income which differ from Federal statutory rate | | | (90 | ) | | (1 | ) | | | (37 | ) | | — | | | | (231 | ) | | (2 | ) |
Other, net | | | (67 | ) | | — | | | | (154 | ) | | (2 | ) | | | (20 | ) | | — | |
Valuation allowance | | | — | | | — | | | | (8,081 | ) | | (82 | ) | | | (7,886 | ) | | (86 | ) |
| | | | | | | | | | | | | | | | | | | | | |
Total | | $ | 4,215 | | | 35 | % | | $ | (4,658 | ) | | (47 | )% | | $ | (764 | ) | | (8 | )% |
| | | | | | | | | | | | | | | | | | | | | |
During 2005 and 2004, the Company decreased its valuation allowance by $9.6 million and $7.9 million, respectively, to $4.9 million and $14.4 million, respectively. The Company’s valuation allowance as of December 31, 2006 was relatively unchanged from 2005 and totaled $4.9 million. In assessing the realizability of deferred tax assets, management considers whether it is more likely than not that some portion or all of the deferred tax assets will not be realized. The ultimate realization of deferred tax assets is dependent upon the generation of future taxable income during the periods in which those temporary differences become deductible and the net operating loss carryforwards can be utilized. Management considers the scheduled reversal of deferred tax liabilities, projected future taxable income and tax planning strategies in making this assessment.
Deferred income taxes reflect the net tax effects of temporary differences between the carrying amount of assets and liabilities for financial reporting purposes and the amounts used for income tax purposes. Deferred income taxes as of December 31, 2006 and 2005 are as follows (in thousands):
| | | | | | | | |
| | | 2006 | | | 2005 | |
Deferred income tax assets: | | | | | | | | |
Allowance for doubtful accounts | | $ | 617 | | | $ | 619 | |
Inventories | | | 957 | | | | 804 | |
Accrued expenses | | | 386 | | | | 315 | |
Property and equipment | | | 1,063 | | | | 901 | |
Tax credit carryforwards | | | 968 | | | | 754 | |
Operating loss carryforwards | | | 23,398 | | | | 26,873 | |
Capital loss carryforwards | | | 1,293 | | | | 1,293 | |
Other | | | 495 | | | | 330 | |
| | | | | | | | |
Gross deferred income tax assets | | | 29,177 | | | | 31,889 | |
Less: Valuation allowance | | | (4,872 | ) | | | (4,872 | ) |
| | | | | | | | |
Net deferred income tax assets | | | 24,305 | | | | 27,017 | |
| | | | | | | | |
Deferred income tax liabilities: | | | | | | | | |
Intangible assets | | | 4,615 | | | | 3,596 | |
Cumulative translation adjustment | | | 219 | | | | 49 | |
Other | | | 680 | | | | 553 | |
| | | | | | | | |
Gross deferred income tax liabilities | | | 5,514 | | | | 4,198 | |
| | | | | | | | |
Net deferred income tax assets | | $ | 18,791 | | | $ | 22,819 | |
| | | | | | | | |
Amounts included in: | | | | | | | | |
Deferred income taxes – current asset | | $ | 3,368 | | | $ | 3,007 | |
Deferred income taxes – non-current asset | | | 16,192 | | | | 19,812 | |
Deferred income taxes – non-current liability | | | (769 | ) | | | — | |
| | | | | | | | |
| | $ | 18,791 | | | $ | 22,819 | |
| | | | | | | | |
F-24
A provision has not been made at December 31, 2006 for U.S. or additional foreign withholding taxes on approximately $3.1 million of undistributed earnings of foreign subsidiaries because it is the present intention of management to reinvest the undistributed earnings indefinitely in foreign operations. Generally, such earnings become subject to U.S. tax upon the remittance of dividends and under certain other circumstances. It is not practicable to estimate the amount of deferred tax liability on such undistributed earnings.
At December 31, 2006, the Company had Federal, state and foreign net operating loss carryforwards of $19.9 million, $3.3 million and $161 thousand, respectively. These operating loss carryforwards expire on various dates beginning in 2012 through 2020 for Federal income tax purposes and in 2007 through 2024 for state income tax purposes. The Company’s foreign net operating loss carryforwards may generally be used indefinitely to reduce foreign income taxes otherwise payable.
At December 31, 2006, the Company has capital loss carryforwards of $1.3 million which expire in 2008. The Company also has tax credit carryforwards of $968,000, including Alternative Minimum Tax credit carryforwards for tax purposes of approximately $735,000 which may be used indefinitely to reduce regular Federal income taxes and $233,000 in other tax credit carryforwards which expire on various dates beginning in 2007 through 2018.
12. | STOCK-BASED COMPENSATION PLANS |
Stock Option Plans -At December 31, 2006, the Company has two stock-based employee compensation plans: the 1992 Stock Option Plan (the “1992 Plan”) and the 1999 Stock Option Plan (the “1999 Plan”).
The 1992 Plan was adopted on April 28, 1992 and, as amended, authorized the issuance of up to 4,800,000 shares of common stock to certain employees, consultants and directors of the Company under incentive and/or nonqualified options and/or alternate rights. An alternate right is defined as the right to receive an amount of cash or shares of stock having an aggregate market value equal to the appreciation in the market value of a stated number of shares of the Company’s common stock from the alternate right grant date to the exercise date. Options and/or rights under the 1992 Plan were granted through April 27, 2002 at prices not less than 100 percent of the market value at the date of grant. Options and/or rights become exercisable based upon a vesting schedule determined by the 1992 Plan Committee and become fully exercisable upon a change in control, as defined. Options expire not more than ten years from the date of grant and alternate rights expire at the discretion of the 1992 Plan Committee. At December 31, 2006, currently exercisable options for 814,306 shares were outstanding under the 1992 Plan. There were no alternate rights issued under the 1992 Plan. The expiration of the 1992 Plan on April 27, 2002 does not affect options currently outstanding.
F-25
The 1999 Plan was approved by the shareholders on May 27, 1999, and as amended on May 19, 2004, authorizes the issuance of up to 5,345,000 shares of common stock to certain employees, consultants and directors of the Company under incentive and/or nonqualified options, stock appreciation rights (“SARs”) and other stock awards (collectively, “Stock Awards”). Stock Awards under the 1999 Plan may be granted at prices not less than 100 percent of the market value at the date of grant. Options and/or SARs become exercisable based upon a vesting schedule determined by the 1999 Plan Committee and become fully exercisable upon a change in control, as defined. Options expire not more than ten years from the date of grant and SARs and other stock awards expire at the discretion of the 1999 Plan Committee. The 1999 Plan is unlimited in duration. At December 31, 2006, currently exercisable options for 3,176,500 shares were outstanding under the 1999 Plan.
As discussed in Note 1, on December 20, 2005, the Company accelerated the vesting of all unvested stock options previously awarded to the Company’s employees. The primary purpose of the accelerated vesting was to eliminate future compensation expense of approximately $1.6 million that the Company would have otherwise recognized in its consolidated statement of operations with respect to these options upon the adoption of SFAS 123(R) on January 1, 2006. As a result of this action, options to purchase approximately 950,000 shares of the Company’s common stock at exercise prices ranging from $1.90 to $4.72 per share and having a weighted average exercise price of $3.96 per share became exercisable immediately. The exercise prices and number of shares subject to the accelerated options were unchanged.
A summary of option activity during the three years ended December 31, 2006 is as follows:
| | | | | | |
| | | Shares | | | Weighted
Average Exercise
Price |
Outstanding – December 31, 2003 | | 3,235,128 | | | $ | 2.15 |
Granted | | 1,123,000 | | | | 4.60 |
Exercised | | (395,000 | ) | | | 2.46 |
Canceled | | (65,172 | ) | | | 3.09 |
| | | | | | |
Outstanding – December 31, 2004 | | 3,897,956 | | | | 2.81 |
Granted | | 609,500 | | | | 3.64 |
Exercised | | (247,900 | ) | | | 1.65 |
Canceled | | (115,250 | ) | | | 4.15 |
| | | | | | |
Outstanding – December 31, 2005 | | 4,144,306 | | | | 2.96 |
Granted | | 17,000 | | | | 3.57 |
Exercised | | (100,500 | ) | | | 1.88 |
Canceled | | (70,000 | ) | | | 4.03 |
| | | | | | |
Outstanding – December 31, 2006 | | 3,990,806 | | | $ | 2.97 |
| | | | | | |
At December 31, 2006, 2005 and 2004, exercisable options under the Company’s stock option plans were 3,990,806, 4,144,306 and 2,838,706, respectively, at weighted average exercise prices of $2.97, $2.96 and $2.52, respectively. At December 31, 2006 and 2005, there were 1,571,100 and 1,518,000 shares available for future grants under the Company’s stock option plans.
F-26
The following table summarizes information pertaining to options outstanding and exercisable at December 31, 2006:
| | | | | | | | | | | | |
Range of Exercise Prices | | Number Outstanding | | Average Remaining Contractual Life (Years) | | Weighted Average Exercise Price | | Number Exercisable | | Weighted Average Exercise Price |
| $0.72 - $1.50 | | 470,011 | | 4.3 | | $ | 1.33 | | 470,011 | | $ | 1.33 |
| $1.66 - $2.28 | | 1,272,581 | | 4.6 | | | 1.96 | | 1,272,581 | | | 1.96 |
| $2.35 - $3.59 | | 630,714 | | 4.6 | | | 2.98 | | 630,714 | | | 2.98 |
| $3.60 - $3.99 | | 803,000 | | 7.3 | | | 3.72 | | 803,000 | | | 3.72 |
| $4.00 - $5.02 | | 814,500 | | 6.8 | | | 4.77 | | 814,500 | | | 4.77 |
| | | | | | | | | | | | |
| | 3,990,806 | | 5.6 | | $ | 2.97 | | 3,990,806 | | $ | 2.97 |
| | | | | | | | | | | | |
The aggregate intrinsic value of options outstanding and exercisable was approximately $10.8 million at December 31, 2006. There were 100,500 options exercised during the year ended December 31, 2006. The total intrinsic value of options exercised during the year ended December 31, 2006, determined as of the date of exercise, was $184,000. Cash received from option exercises during the year ended December 31, 2006 totaled $190,000.
The weighted average grant date fair value of options granted in 2006, 2005 and 2004 (determined using the Black Scholes option pricing model with the weighted average assumptions presented in Note 1) was $1.55, $2.09 and $2.04, respectively.
Employee Stock Purchase Plan- In March 1999, the Company adopted an Employee Stock Purchase Plan (the “1999 ESPP”) which authorizes the issuance of up to 700,000 shares of common stock. Under the 1999 ESPP, eligible employees may contribute up to ten percent of their compensation toward the purchase of common stock at each year-end. The employee purchase price is derived from a formula based on fair market value of the Company’s common stock. Rights to purchase shares under the 1999 ESPP were granted in 2006, 2005 and 2004 as follows:
| | | | | | |
| | | 2006 | | 2005 | | 2004 |
Number of shares | | 77,510 | | 66,885 | | 51,005 |
Date Issued | | January 2007 | | January 2006 | | January 2005 |
Pro forma compensation cost associated with the rights granted under the 1999 ESPP is estimated based on fair market value. At December 31, 2006 and 2005, there were 104,633 and 182,143 shares available for future issuance under the 1999 ESPP.
Shareholder Rights Plan- On December 20, 2006, the Company amended its shareholder rights plan under which one common stock purchase right is attached to and trades with each outstanding share of the Company’s common stock. The rights become exercisable and transferable, apart from the common stock, ten days after a person or group, without the Company’s consent, acquires beneficial ownership of, or the right to obtain beneficial ownership of, 15 percent or more of the Company’s common stock or announces or commences a tender or exchange offer that could result in 15 percent ownership. Once exercisable, each right entitles the holder to purchase one one-hundredth of a share of Participating Preferred Stock at a price of $32.00 per one one-hundredth of a Preferred Share, subject to adjustment to prevent dilution. The rights have no voting power and, until exercised, no dilutive effect on net income per common share. The rights expire on December 31, 2016, and are redeemable at the discretion of the Board of Directors at $.001 per right.
If a person acquires 15 percent ownership, other than via an offer approved by the Company under the shareholder rights plan, then each right not owned by the acquirer or related parties will entitle its holder to purchase, at the right’s exercise price, common stock or common stock equivalents
F-27
having a market value immediately prior to the triggering of the right of twice that exercise price. In addition, after an acquirer obtains 15 percent ownership, if the Company is involved in certain mergers, business combinations, or asset sales, each right not owned by the acquirer or related persons will entitle its holder to purchase, at the right’s exercise price, shares of common stock of the other party to the transaction having a market value immediately prior to the triggering of the right of twice that exercise price.
In September 1997, the Company amended its shareholder rights plan to include a provision whereby it may not be amended and rights may not be redeemed by the Board of Directors for a period of one year or longer. The provision only limits the power of a new Board in those situations where a proxy solicitation is used to evade protections afforded by the shareholder rights plan. A replacement Board retains the ability to review and act upon competing acquisition proposals.
13. | STOCK REPURCHASE PROGRAM |
In August 2006, the Board of Directors amended the Company’s existing stock repurchase program to authorize the repurchase of an aggregate of 4.0 million shares over an indefinite period, including approximately 1.7 million shares previously repurchased under the program. As of December 31, 2006, the Company had repurchased approximately 2.0 million shares for an aggregate repurchase price of approximately $5.0 million.
14. | PENSION AND OTHER POSTRETIREMENT PLANS |
The Company has a noncontributory defined benefit pension plan covering certain employees of its Netherlands subsidiaries. The benefits provided under the plan are based on age, years of service and the level of compensation prior to retirement. The Company makes annual contributions to the plan.
As discussed in Note 1, effective December 31, 2006, the Company adopted the recognition and disclosure provisions of SFAS No. 158 which requires companies to recognize the funded status of defined benefit pension and other postretirement plans as a net asset or liability on its balance sheet. Actuarial gains and losses are generally amortized subject to the corridor, over the average remaining service life of the active employees enrolled in the plan.
The following table sets forth the plan’s benefit obligations, fair value of plan assets and funded status at December 31, 2006 and 2005 (in thousands):
| | | | | | | | |
| | | 2006 | | | 2005 | |
Changes in benefit obligation: | | | | | | | | |
Beginning benefit obligation at December 31 | | $ | 2,009 | | | $ | 1,739 | |
Service cost | | | 285 | | | | 280 | |
Interest cost | | | 90 | | | | 76 | |
Curtailments | | | (114 | ) | | | — | |
Benefits paid, actual administrative expenses and insurance premiums | | | (33 | ) | | | (51 | ) |
Actuarial (gain) / loss | | | (329 | ) | | | 226 | |
Impact of exchange rate fluctuations | | | 232 | | | | (261 | ) |
| | | | | | | | |
Ending benefit obligation at December 31 | | | 2,140 | | | $ | 2,009 | |
| | | | | | | | |
Changes in fair value of plan assets: | | | | | | | | |
Beginning fair value of plan assets at December 31 | | | 1,451 | | | | 1,114 | |
Actual return on plan assets | | | (166 | ) | | | 87 | |
Employer contributions | | | 275 | | | | 478 | |
Benefits paid, actual administrative expenses and insurance premiums | | | (33 | ) | | | (51 | ) |
Impact of exchange rate fluctuations | | | 175 | | | | (177 | ) |
| | | | | | | | |
Ending fair value of plan assets at December 31 | | | 1,702 | | �� | | 1,451 | |
| | | | | | | | |
Funded status: | | | | | | | | |
Benefit obligation in excess of fair value of plan assets | | | 437 | | | | 558 | |
Unrecognized net loss | | | 32 | | | | 224 | |
| | | | | | | | |
Net amount recognized | | $ | 405 | | | $ | 334 | |
| | | | | | | | |
F-28
Net periodic pension cost for 2006, 2005 and 2004 included the following components (in thousands):
| | | | | | | | | | | | |
| | | 2006 | | | 2005 | | | 2004 | |
Service cost | | $ | 285 | | | $ | 280 | | | $ | 104 | |
Interest cost | | | 90 | | | | 76 | | | | 40 | |
Expected return on assets | | | (72 | ) | | | (58 | ) | | | (26 | ) |
Amortization of plan net loss | | | 1 | | | | — | | | | — | |
| | | | | | | | | | | | |
Net periodic pension cost | | $ | 304 | | | $ | 298 | | | $ | 118 | |
| | | | | | | | | | | | |
The pre-tax amount recognized in accumulated other comprehensive income is $32,000 and relates to an unrecognized actuarial loss. The pre-tax accrued benefit obligation at December 31, 2006 and 2005 was $437,000 and $334,000, respectively.
Weighted average assumptions used to determine the benefit obligation at December 31, 2006 and 2005 were as follows:
| | | | | | |
| | | 2006 | | | 2005 | |
Discount rate | | 4.75 | % | | 4.25 | % |
Rate of compensation increase | | 3.00 | % | | 3.00 | % |
Weighted average assumptions used to determine net periodic benefit cost for the years ended December 31, 2006, 2005 and 2004 were as follows:
| | | | | | | | | |
| | | 2006 | | | 2005 | | | 2004 | |
Discount rate | | 4.25 | % | | 4.75 | % | | 5.50 | % |
Expected long-term rate of return on plan assets | | 4.25 | % | | 4.75 | % | | 5.50 | % |
Rate of compensation increases | | 3.00 | % | | 3.00 | % | | 3.00 | % |
The accumulated benefit obligation for the plan was $1,799,000 and $1,533,000 at December 31, 2006 and 2005, respectively.
As required by statutory regulations in the Netherlands, the assets of the plan are invested in insurance contracts.
The Company expects to contribute $336,000 to its pension plan in 2007.
Benefits expected to be paid from the pension plan in each year from 2007 to 2011 are $0, $1,000, $1,000, $5,000 and $7,000, respectively. The aggregate benefits expected to be paid in the five years from 2012 to 2016 are $311,000. The expected benefits are based on the same assumptions used to measure the Company’s benefit obligation at December 31, 2006.
F-29
The Company also maintains a 401(k) retirement plan covering employees who meet certain age and length of service requirements, as defined. The Company matches a portion of employee contributions to the 401(k) plan in share of the Company’s common stock. The Company contributed stock with a fair value of $459,000, $499,000 and $502,000 to the 401(k) plan during 2006, 2005 and 2004, respectively.
15. | SIGNIFICANT CUSTOMER AND GEOGRAPHIC CONCENTRATIONS |
As is customary in the healthcare industry, the Company has historically relied to a significant extent on a few large distributors to market and distribute its branded products. Distributor sales to the Company’s largest two diversified distributors accounted for approximately 11.1 percent, 9.9 percent and 10.9 percent of the Company’s consolidated net revenues in 2006, 2005 and 2004, respectively. The Company also sells its products to these two companies on a branded, private label and contract manufacturing basis. In 2006, non-distributor related sales to these two companies amounted 6.7 percent of the Company’s consolidated net revenues as compared to 9.5 percent and 10.1 percent in 2005 and 2004, respectively. The related accounts receivable from these customers were $2.9 million, $3.6 million and $3.3 million at December 31, 2006, 2005 and 2004, respectively.
A significant portion of the Company’s products are manufactured at its facilities in the Dominican Republic, Mexico, the Netherlands, Malta, France or at GRI’s facilities in China. Included in the Company’s consolidated balance sheet at December 31, 2006 and 2005 are the net assets of the Company’s manufacturing and distribution facilities located in the United Kingdom and the Dominican Republic which total $17.5 million and $17.4 million, respectively. Additionally, at December 31, 2006 and 2005, the net assets of the Company’s sales, manufacturing and distribution operations in the Netherlands, Malta, Germany and France totaled $28.4 million and $13.2 million, respectively. The Company’s Dominican Republic and Mexico facilities are engaged in manufacturing operations only and do not sell products to external customers.
Sales from the United Kingdom were $9.0 million, $8.8 million and $6.4 million in 2006, 2005 and 2004, respectively. Sales from the Netherlands, Malta, Germany and France in 2006, 2005 and 2004 were $17.6 million, $14.0 million and $7.9 million, respectively. Total international sales by the Company were $37.7 million, $32.8 million and $23.7 million in 2006, 2005 and 2004, respectively.
The Company’s operations are subject to various political, economic and other risks and uncertainties inherent in the countries in which the Company operates. Among other risks, the Company’s operations are subject to the risks of restrictions on transfer of funds; export duties, quotas, and embargoes; domestic and international customs and tariffs; changing taxation policies; foreign exchange restrictions; and political conditions and governmental regulations.
16. | COMMITMENTS AND CONTINGENCIES |
The Company is involved in routine litigation and proceedings in the ordinary course of business. Management believes that pending litigation matters will not have a material adverse effect on the Company’s consolidated financial position or results of operations.
F-30
17. | UNAUDITED QUARTERLY FINANCIAL INFORMATION |
(in thousands, except per share data)
| | | | | | | | | | | | | |
| | | Quarter |
Year Ended December 31, | | First | | Second | | Third | | | Fourth |
2006 | | | | | | | | | | | | | |
Net sales | | $ | 33,683 | | $ | 36,058 | | $ | 35,108 | | | $ | 36,728 |
Gross profit | | | 13,638 | | | 14,072 | | | 13,740 | | | | 14,532 |
Net income | | | 2,250 | | | 2,155 | | | 1,648 | | | | 1,862 |
Income per common share – | | | | | | | | | | | | | |
Basic | | $ | 0.05 | | $ | 0.05 | | $ | 0.04 | | | $ | 0.04 |
Diluted | | $ | 0.05 | | $ | 0.05 | | $ | 0.04 | | | $ | 0.04 |
2005 | | | | | | | | | | | | | |
Net sales | | $ | 33,743 | | $ | 34,506 | | $ | 33,487 | | | $ | 32,722 |
Gross profit | | | 13,744 | | | 13,474 | | | 11,945 | | | | 13,363 |
Net income | | | 2,101 | | | 2,199 | | | 7,857 | (1) | | | 2,347 |
Income per common share – | | | | | | | | | | | | | |
Basic | | $ | 0.05 | | $ | 0.05 | | $ | 0.18 | (1) | | $ | 0.05 |
Diluted | | $ | 0.05 | | $ | 0.05 | | $ | 0.18 | (1) | | $ | 0.05 |
(1) | Includes the effect of the Company’s net deferred income tax benefit of $6.5 million recorded in the third quarter of 2005. |
F-31
SCHEDULE II – VALUATION AND QUALIFYING ACCOUNTS
| | | | | | | | | | | | | | | | | |
Description | | Balance at
Beginning
of Period | | Charged to
Expense | | Other (1) | | | Deductions (2) | | | Balance at End of Period |
Year Ended December 31, 2004: | | | | | | | | | | | | | | | | | |
Allowances for receivables | | $ | 972 | | $ | 714 | | $ | — | | | $ | (661 | ) | | $ | 1,025 |
Valuation allowance for deferred tax assets | | $ | 22,313 | | $ | — | | $ | (7,886 | ) | | $ | — | | | $ | 14,427 |
Year Ended December 31, 2005: | | | | | | | | | | | | | | | | | |
Allowances for receivables | | $ | 1,025 | | $ | 893 | | $ | — | | | $ | (283 | ) | | $ | 1,635 |
Valuation allowance for deferred tax assets | | $ | 14,427 | | $ | — | | $ | (9,555 | ) | | $ | — | | | $ | 4,872 |
Year Ended December 31, 2006: | | | | | | | | | | | | | | | | | |
Allowances for receivables | | $ | 1,635 | | $ | 485 | | $ | — | | | $ | (494 | ) | | $ | 1,626 |
Valuation allowance for deferred tax assets | | $ | 4,872 | | $ | — | | $ | — | | | $ | — | | | $ | 4,872 |
(1) | Other amounts related to the valuation allowance for deferred tax assets in 2004 and 2005 represent the net change in the valuation allowance during the period. |
(2) | Deductions related to the allowances for receivables represent amounts written off during the period less recoveries of amounts previously written off. |
F-32