UNITED STATES
SECURITIES AND EXCHANGE COMMISSION
Washington, D.C. 20549
FORM 6-K
REPORT OF FOREIGN PRIVATE ISSUER
Pursuant to Rule 13a-16 or 15d-16
under the Securities Exchange Act of 1934
For the month of November, 2014
Commission File Number: 333-13302
ETABLISSEMENTS DELHAIZE FRÈRES
ET CIE “LE LION” (GROUPE DELHAIZE)
(Exact name of registrant as specified in its charter)*
DELHAIZE BROTHERS AND CO.
“THE LION” (DELHAIZE GROUP)
(Translation of registrant’s name into English)*
SQUARE MARIE CURIE 40
1070 BRUSSELS, BELGIUM
(Address of principal executive offices)
* The registrant’s charter (articles of association) specifies the registrant’s name in French, Dutch and English.
Indicate by check mark whether the registrant files or will file annual reports under cover of Form 20-F or Form 40-F.
Form 20-F X Form 40-F
Indicate by check mark if the registrant is submitting the Form 6-K in paper as permitted by Regulation S-T Rule 101(b)(1):
Indicate by check mark if the registrant is submitting the Form 6-K in paper as permitted by Regulation S-T Rule 101(b)(7):
 | Interim Financial Reporting Third Quarter 2014 Regulated Information November 6, 2014 – 7:00 a.m. CET | |
DELHAIZE GROUP THIRD QUARTER 2014 RESULTS
Financial Summary Third Quarter 2014
| » | Revenue growth of 3.3% at identical exchange rates (3.3% organic growth) |
| » | Comparable store sales growth of 5.3% in the U.S. and -5.0% in Belgium |
| » | Group underlying operating profit of€192 million, underlying operating margin of 3.5% (4.2% in the U.S., 1.4% in Belgium) |
| » | Free cash flow generation of€118 million (€426 million for the first nine months of 2014) |
Highlights
| » | Agreement to sell Bottom Dollar Food store locations |
| » | 31 Food Lion stores relaunched under the “Easy, Fresh & Affordable” strategy in August, 45 additional stores will be relaunched next week |
» CEO Comments
Frans Muller, President and Chief Executive Officer of Delhaize Group, commented: “While our overall performance in the third quarter met our expectations, results were decidedly mixed among our key regions. In the U.S., comparable store sales growth was very strong at 5.3%, resulting from both continued good momentum at Food Lion and favourable, albeit temporary, competitive dynamics at Hannaford. These positive volume trends resulted in a 10% increase in our U.S. underlying operating profit. In August, we have launched the first 31 Food Lion stores deploying our new “Easy, Fresh & Affordable” strategy. Although it is too early to draw conclusions, they are experiencing good initial customer response. We will roll out the next 45 stores next week.”
“In Belgium, results were impacted by both weak summer trading and uncertainty caused by the June announcement of the Transformation Plan. While we believe this impact is temporary in nature, disruptions have persisted and conditions have deteriorated in the fourth quarter. We remain determined to make our business more sustainable in the long term and continue to be in a dialogue with our social partners to realize this. In Southeastern Europe, we faced weak economic conditions in our markets and deflation in Serbia, both of which have continued in the fourth quarter. We remain focused on our store expansion plans to increase our strong and growing market positions.”
» Financial Summary
| Q3 2014(1) | YTD 2014(1) | |||||||||||||||||||||||
| Actual Results | At Actual Rates | At Identical Rates | In millions of €, except EPS (in €) | Actual Results | At Actual Rates | At Identical Rates | ||||||||||||||||||
|
|
|
|
| ||||||||||||||||||||
| 5 462 | +3.1% | +3.3% | Revenues | 15 855 | +1.3% | +3.3% | ||||||||||||||||||
| 330 | -1.1% | -0.8% | EBITDA | 959 | -1.6% | +0.5% | ||||||||||||||||||
| 182 | N/A | N/A | Operating profit | 367 | +6.8% | +8.8% | ||||||||||||||||||
| 3.3% | - | - | Operating margin | 2.3% | - | - | ||||||||||||||||||
| 192 | +2.4% | +3.0% | Underlying operating profit | 531 | -8.4% | -6.4% | ||||||||||||||||||
| 3.5% | - | - | Underlying operating margin | 3.4% | - | - | ||||||||||||||||||
| 144 | N/A | N/A | Profit before taxes and discontinued operations | 240 | +17.1% | +19.1% | ||||||||||||||||||
| 109 | N/A | N/A | Net profit from continuing operations | 155 | +9.4% | +10.8% | ||||||||||||||||||
| 109 | N/A | N/A | Group share in net profit | 144 | +91.4% | +94.5% | ||||||||||||||||||
| 1.07 | N/A | N/A | Basic earnings per share - Group share in net profit | 1.42 | +90.6% | +93.7% | ||||||||||||||||||
|
|
|
|
| ||||||||||||||||||||
| (1) | The average exchange rate of the U.S. dollar against the euro weakened by 0.1% in the third quarter of 2014 (€1 = $1.3256) compared to the third quarter of 2013 and weakened by 2.8% in the first nine months of 2014 (€1 = $1.3549) compared to the same period in 2013. |
| Delhaize Group – Earnings Release – Third Quarter 2014 | 1 of 25 | |||||
» Third Quarter 2014 Income Statement
Revenues
In the third quarter of 2014, Delhaize Group’s revenues increased by 3.1% and 3.3% at actual and identical exchange rates, respectively. Organic revenue growth was 3.3%.
In the U.S., revenue growth in local currency was 5.9%. U.S. comparable store sales growth was +5.3%, driven by good volume growth at both Food Lion and Hannaford and favourable, albeit temporary, competitive dynamics at Hannaford. Delhaize America experienced positive retail inflation (+1.8% for the third quarter). Revenues at Delhaize Belgium were down by 4.2% despite modest retail inflation (+0.5% for the third quarter). Comparable store sales declined by 5.0% (-4.9% including a 0.1% positive calendar impact), as a result of a weak summer, particularly impacted by strong deflation in fruit and vegetable, lower advertising activity and uncertainty caused by the Transformation Plan announcement in June. Revenues in Southeastern Europe grew by 4.3% at identical exchange rates. Comparable store sales growth was negative 1.5% (-1.6% including a negative 0.1% calendar effect) despite an increase in retail inflation to 1.9%.
Gross margin
Gross margin was 24.0% of revenues, down 2 basis points at identical exchange rates. A lower gross margin at Delhaize Belgium, mainly driven by deflation affecting fruit and vegetable prices, was offset by a higher gross margin in Southeastern Europe, while Delhaize America’s gross margin remained flat.
Other operating income
Other operating income was€28 million and decreased by€13 million compared to the same period last year as 2013 included the reversal of certain litigation and legal provisions in Serbia.
Selling, general and administrative expenses
Selling, general and administrative expenses (SG&A) were 20.9% of revenues, down 17 basis points compared to the third quarter of last year at identical exchange rates. The improvement mainly results from positive sales leverage in the U.S.
Other operating expenses
Other operating expenses were€14 million. This compared to€200 million in the third quarter last year mainly as a result of impairment charges related to Serbian goodwill and trade names.
Underlying operating profit
Underlying operating profit increased by 2.4% at actual exchange rates and 3.0% at identical exchange rates. Underlying operating margin was 3.5% of revenues, stable compared to last year.
Underlying EBITDA
Underlying EBITDA increased by 2.6% at actual exchange rates and 3.0% at identical exchange rates. EBITDA decreased by 1.1% at actual exchange rates and decreased by 0.8% at identical exchange rates compared to the same period last year.
Operating profit (loss)
Operating profit increased to€182 million from an operating loss of€3 million in the third quarter of last year.
Net financial expenses
Net financial expenses of€40 million are€7 million lower compared to last year as a result of a reduction in outstanding debt and higher foreign currency gains.
Income tax
Tax expense of€35 million was recorded on a pre-tax profit of€144 million resulting in an effective tax rate of 24.4%.
Net profit (loss) from continuing operations
Net profit from continuing operations was€109 million compared to a net loss from continued operations of€64 million in last year´s third quarter. This resulted in a€1.07 basic profit per share compared to a€0.66 basic loss per share in the third quarter of 2013.
Net profit (loss)
Group share in net profit amounted to€109 million. Basic and diluted net profit per share was€1.07 compared to a basic and diluted net loss per share of€0.80 in the third quarter of 2013.
| Delhaize Group – Earnings Release – Third Quarter 2014 | 2 of 25 | |||||
» Year-to-Date 2014 Income Statement
Revenues
In the first nine months of 2014, Delhaize Group’s revenues increased by 1.3% and 3.3% at actual and identical exchange rates, respectively. Organic revenue growth was 3.3%.
In the U.S., revenue growth in local currency was 4.9%. U.S. comparable store sales growth was 4.4%. Revenues at Delhaize Belgium decreased by 1.7% and comparable store sales declined by 2.3% (a 2.4% decline including a negative 0.1% calendar impact). Revenues in Southeastern Europe grew by 4.4% at identical exchange rates.
Gross margin
Gross margin was 24.0% of revenues, decreasing 28 basis points at identical exchange rates as a result of price investments in the U.S. and in Belgium, partly offset by better procurement conditions in Southeastern Europe.
Other operating income
Other operating income was€84 million and decreased by€11 million compared to last year.
Selling, general and administrative expenses
Selling, general and administrative expenses (SG&A) were 21.1% of revenues, a decrease of 6 basis points compared to the first nine months of last year at identical exchange rates.
Other operating expenses
Other operating expenses were€173 million compared to€237 million last year. The decrease compared to last year reflects lower impairments in goodwill and trade names at Delhaize Serbia and the impact of reorganization and store closing expenses recorded in the first nine months of last year in the U.S.
Underlying operating profit
Underlying operating profit was€531 million and decreased by 8.4% at actual exchange rates and 6.4% at identical exchange rates, mainly driven by negative sales leverage in Belgium, partly offset by lower Corporate costs. Underlying operating margin was 3.4% of revenues compared to 3.7% in the first nine months of 2013.
Underlying EBITDA
Underlying EBITDA decreased by 4.3% at actual exchange rates and by 2.3% at identical exchange rates. EBITDA decreased by 1.6% at actual exchange rates but increased by 0.5% at identical exchange rates.
Operating profit
Operating profit increased by 6.8% at actual exchange rates from€344 million to€367 million due to lower goodwill and trade names impairment charges at Delhaize Serbia and lower store closing and reorganization expenses in the U.S., which were partially offset by lower underlying operating profit.
Net financial expenses
Net financial expenses decreased by 7.8% to€130 million compared to€141 million reported last year as a result of lower outstanding debt and higher foreign currency gains.
Income tax
During the first nine months of 2014, the effective tax rate (on continued operations) was 35.7%, an increase compared to last year’s rate of 31.0%. This increase is mainly due to more non-deductible expenses in the current year and a reduction in future U.S. state tax liabilities which occurred last year because of the enactment of reduced state tax rates.
Net profit from continuing operations
Net profit from continuing operations was€155 million in the first nine months of 2014 compared to€142 million in the same period of 2013. This resulted in€1.52 basic earnings per share compared to€1.38 last year.
Result from discontinued operations (net of tax)
The result from discontinued operations net of tax was a loss of€11 million compared to a loss of€64 million in the first nine months of last year. The loss this year is mainly related to the divestitures of Bulgaria and Bosnia & Herzegovina partially offset by a gain on the sale of Sweetbay, Harveys and Reid´s. The loss in 2013 was primarily related to store closing expenses recorded at Sweetbay, impairment losses at Delhaize Montenegro and operating losses in Bulgaria and Bosnia & Herzegovina.
| Delhaize Group – Earnings Release – Third Quarter 2014 | 3 of 25 | |||||
Net profit
Group share in net profit amounted to€144 million in the first nine months of 2014. Basic and diluted net profit per share were€1.42 and€1.41 respectively, compared to€0.74 last year.
» Year-to-Date 2014 Cash Flow Statement and Balance Sheet
Free cash flow
Free cash flow was€426 million in the first nine months of 2014 compared to€463 million in the same period last year. This is mainly explained by higher capital expenditures, higher taxes paid and the payment of higher bonuses in the U.S. in 2014, which are to a large degree offset by the€171 million net proceeds received from the divestment of Sweetbay, Harveys and Reid´s.
Net debt
Compared to year-end 2013, net debt decreased by€178 million to€1.3 billion mainly as a result of the€426 million free cash flow generation, which was partly offset by the payment of the dividend in the second quarter of 2014 and the impact of a stronger U.S. dollar versus the euro.
| Delhaize Group – Earnings Release – Third Quarter 2014 | 4 of 25 | |||||
» Segment Information (at actual exchange rates)
| Q3 2014 | Revenues | Underlying Operating Margin (3) | Underlying Operating Profit/(Loss) (3) | |||||||||||||||
| (in millions) | Q3 2014 | Q3 2013 | 2014 /2013 | Q3 2014 | Q3 2013 | Q3 2014 | Q3 2013 | 2014 /2013 | ||||||||||
United States(1) | $ | 4 655 | 4 396 | +5.9% | 4.2% | 4.1% | 197 | 179 | +10.2% | |||||||||
United States(1) | € | 3 509 | 3 320 | +5.7% | 4.2% | 4.1% | 148 | 135 | +9.7% | |||||||||
Belgium | € | 1 202 | 1 255 | -4.2% | 1.4% | 2.7% | 16 | 35 | -51.3% | |||||||||
Southeastern Europe(2) | € | 751 | 724 | +3.7% | 4.3% | 4.0% | 32 | 28 | +12.2% | |||||||||
Corporate | € | - | - | N/A | N/A | N/A | (4) | (10) | +53.9% | |||||||||
TOTAL | € | 5 462 | 5 299 | +3.1% | 3.5% | 3.5% | 192 | 188 | +2.4% | |||||||||
| YTD 2014 | Revenues | Underlying Operating Margin (3) | Underlying Operating Profit/(Loss) (3) | |||||||||||||||
| (in millions) | YTD 2014 | YTD 2013 | 2014 /2013 | YTD 2014 | YTD 2013 | YTD 2014 | YTD 2013 | 2014 /2013 | ||||||||||
United States(1) | $ | 13 455 | 12 826 | +4.9% | 3.8% | 4.0% | 514 | 510 | +0.8% | |||||||||
United States(1) | € | 9 931 | 9 738 | +2.0% | 3.8% | 4.0% | 379 | 387 | -2.0% | |||||||||
Belgium | € | 3 674 | 3 736 | -1.7% | 2.6% | 3.9% | 94 | 146 | -34.9% | |||||||||
Southeastern Europe(2) | € | 2 250 | 2 176 | +3.4% | 3.4% | 3.5% | 76 | 76 | -0.8% | |||||||||
Corporate | € | - | - | N/A | N/A | N/A | (18) | (29) | +35.6% | |||||||||
TOTAL | € | 15 855 | 15 650 | +1.3% | 3.4% | 3.7% | 531 | 580 | -8.4% | |||||||||
| (1) | The segment “United States” includes the banners Food Lion, Hannaford and Bottom Dollar Food. |
| (2) | The segment “Southeastern Europe” includes our operations in Greece, Serbia and Romania. |
| (3) | For a definition of underlying operating profit, please refer to the “Definitions” page of this document. A reconciliation with reported operating profit is provided on page 21 of this document. |
United States
In the third quarter of 2014, revenues in the U.S. increased by 5.9% to $4.7 billion (€3.5 billion). Comparable store sales growth was 5.3%. Retail inflation at 1.8% moderated compared to the second quarter. We continued to see good momentum and volume growth at both Food Lion and Hannaford. Hannaford also benefited from temporary competitive dynamics which had an impact of approximately 210 basis points on Delhaize America’s comparable store sales. We have launched the “Easy, Fresh & Affordable” strategy in the first 31 Food Lion stores in Wilmington, North Carolina at the end of August. The second group of 45 stores in Greenville, North Carolina will follow next week.
In the third quarter of 2014, underlying operating profit increased by 10.2% to $197 million (€148 million) resulting in an underlying operating margin of 4.2% compared to 4.1% last year. This increase is mainly the result of a flat gross margin, as we are cycling last year’s Food Lion price investments, and lower SG&A expenses as a percentage of revenues as a result of positive sales leverage.
Delhaize Group announced today that it has signed an agreement to sell ALDI Inc. Bottom Dollar Food´s 66 store locations for approximately $15 million and includes the assumption of associated lease liabilities. The transaction is expected to result in an asset impairment and other charges for Delhaize Group of approximately $180 million.
Belgium
Revenues in Belgium were€1.2 billion in the third quarter of 2014, a decrease of 4.2% compared to the same quarter in 2013. Comparable store sales declined by 5.0% (or declined by 4.9% including a positive calendar impact of 0.1%). Our sales were negatively impacted by a weak summer, particularly impacted by strong deflation in fruit and vegetable, lower advertising activity and uncertainty caused by the Transformation Plan announcement in June.
In the third quarter of 2014, underlying operating profit decreased by 51.3% to€16 million as a result of negative sales leverage and strong deflation in fruit and vegetable.
| Delhaize Group – Earnings Release – Third Quarter 2014 | 5 of 25 | |||||
Southeastern Europe
In the third quarter of 2014, revenues in Southeastern Europe increased by 3.7% to€751 million at actual rates (+4.3% at identical exchange rates).
The growth was mainly the result of store expansion at Alfa Beta and Mega Image. Despite weak conditions in our markets and deflation in Serbia, we continued to increase our market share in all three countries.
In the third quarter of 2014, underlying operating profit increased by 12.2% to€32 million, while underlying operating margin increased from 4.0% to 4.3%, resulting from an improved gross margin due to better supplier terms.
» 2014 Outlook
In the U.S., for the fourth quarter we expect Delhaize America to continue to see positive comparable store sales growth. In Belgium, disruptions in our distribution centers and our company-operated stores have taken place during recent weeks. These are likely to have a significant impact on our sales and results in the fourth quarter. There is an agreed meeting schedule in November and December with our social partners where we will further negotiate the proposed Transformation Plan. Although the overall economic climate remains fragile, our Southeastern European segment will continue its network expansion to build on its strong market shares.
In addition, the free cash flow generated in the third quarter makes us confident that we will achieve a healthy free cash flow level for the third consecutive year. We continue to expect Group capital expenditures of approximately€625 million at identical exchange rates excluding leases, and plan to open 180 new stores for the full year 2014.
» Conference Call and Webcast
Delhaize Group’s management will comment on the third quarter 2014 results during a conference call starting November 6, 2014 at 11:00 am CET / 05:00 am ET. The conference call can be attended by calling +44 (0)20 3427 1918 (U.K.), +1 646 254 3361 (U.S.) or +32 2 404 0660 (Belgium), with “Delhaize” as password. The conference call will also be broadcast live over the internet athttp://www.delhaizegroup.com. An on-demand replay of the webcast will be available after the conference call athttp://www.delhaizegroup.com.
» Delhaize Group
Delhaize Group is a Belgian international food retailer present in seven countries on three continents. At the end of the third quarter of 2014, Delhaize Group’s sales network consisted of 3 386 stores. In 2013, Delhaize Group posted€20.9 billion ($27.8 billion) in revenues and€179 million ($237 million) in net profit (Group share). At June 30, 2014, Delhaize Group employed approximately 152 500 people. Delhaize Group’s stock is listed on NYSE Euronext Brussels (DELB) and the New York Stock Exchange (DEG).
This press release is available in English, French and Dutch. You can also find it on the websitehttp://www.delhaizegroup.com. Questions can be sent toinvestor@delhaizegroup.com.
» Financial Calendar
| — Press release – 2014 fourth quarter and full year revenues | January 26, 2015 | |
| — Press release – 2014 fourth quarter and full year results | March 5, 2015 | |
| — Press release – 2015 first quarter results | April 29, 2015 | |
| — Press release – 2015 second quarter results | July 30, 2015 | |
| — Press release – 2015 third quarter results | October 29, 2015 |
» Contacts
Investor Relations: + 32 2 412 2151
Media Relations: + 32 2 412 8669
| Delhaize Group – Earnings Release – Third Quarter 2014 | 6 of 25 | |||||
DELHAIZE GROUP CONDENSED CONSOLIDATED FINANCIAL STATEMENT
» Condensed Consolidated Balance Sheet (Unaudited)
| (in millions of€) | September 30, 2014 | December 31, 2013 | September 30, 2013 | |||
Assets | ||||||
Non-current assets | 8 137 | 7 930 | 7 963 | |||
Goodwill | 3 045 | 2 959 | 3 007 | |||
Intangible assets | 739 | 732 | 741 | |||
Property, plant and equipment | 4 081 | 3 973 | 3 938 | |||
Investment property | 92 | 100 | 102 | |||
Investments accounted for using the equity method | 28 | 24 | 24 | |||
Financial assets | 30 | 29 | 31 | |||
Derivative instruments | 25 | 1 | 3 | |||
Other non-current assets | 97 | 112 | 117 | |||
Current assets | 3 456 | 3 665 | 3 479 | |||
Inventories | 1 377 | 1 353 | 1 357 | |||
Receivables | 556 | 618 | 589 | |||
Financial assets | 163 | 151 | 153 | |||
Derivative instruments | 2 | 40 | 28 | |||
Other current assets | 113 | 104 | 112 | |||
Cash and cash equivalents | 1 239 | 1 149 | 959 | |||
Assets classified as held for sale | 6 | 250 | 281 | |||
Total assets | 11 593 | 11 595 | 11 442 | |||
Liabilities | ||||||
Total equity | 5 392 | 5 074 | 5 037 | |||
Shareholders’ equity | 5 386 | 5 068 | 5 032 | |||
Non-controlling interests | 6 | 6 | 5 | |||
Non-current liabilities | 3 454 | 3 377 | 3 471 | |||
Long-term debt | 2 147 | 2 011 | 2 038 | |||
Obligations under finance lease | 494 | 496 | 509 | |||
Deferred tax liabilities | 384 | 443 | 465 | |||
Derivative instruments | 14 | 8 | 3 | |||
Provisions | 356 | 355 | 391 | |||
Other non-current liabilities | 59 | 64 | 65 | |||
Current liabilities | 2 747 | 3 144 | 2 934 | |||
Long-term debt - current portion | 1 | 228 | 231 | |||
Obligations under finance lease | 65 | 59 | 57 | |||
Bank overdrafts | - | 4 | 9 | |||
Accounts payable | 1 833 | 1 993 | 1 766 | |||
Derivative instruments | - | 3 | 2 | |||
Other current liabilities | 848 | 799 | 797 | |||
Liabilities associated with assets held for sale | - | 58 | 72 | |||
Total liabilities and equity | 11 593 | 11 595 | 11 442 | |||
$ per€ exchange rate | 1.2583 | 1.3791 | 1.3505 |
| Delhaize Group – Earnings Release – Third Quarter 2014 | 7 of 25 | |||||
» Condensed Consolidated Income Statement (Unaudited)
| Q3 2014 | Q3 2013 | (in millions of€) | YTD 2014 | YTD 2013 | ||||
| 5 462 | 5 299 | Revenues | 15 855 | 15 650 | ||||
| (4 151) | (4 026) | Cost of sales | (12 050) | (11 846) | ||||
| 1 311 | 1 273 | Gross profit | 3 805 | 3 804 | ||||
| 24.0% | 24.0% | Gross margin | 24.0% | 24.3% | ||||
| 28 | 41 | Other operating income | 84 | 95 | ||||
| (1 143) | (1 117) | Selling, general and administrative expenses | (3 349) | (3 318) | ||||
| (14) | (200) | Other operating expenses | (173) | (237) | ||||
| 182 | (3) | Operating profit (loss) | 367 | 344 | ||||
| 3.3% | (0.1%) | Operating margin | 2.3% | 2.2% | ||||
| (46) | (49) | Finance costs | (143) | (148) | ||||
| 6 | 2 | Income from investments | 13 | 7 | ||||
| 2 | 1 | Share of results of joint venture equity accounted | 3 | 2 | ||||
| 144 | (49) | Profit (loss) before taxes and discontinued operations | 240 | 205 | ||||
| (35) | (15) | Income tax expense | (85) | (63) | ||||
| 109 | (64) | Net profit (loss) from continuing operations | 155 | 142 | ||||
| - | (14) | Result from discontinued operations, net of tax | (11) | (64) | ||||
| 109 | (78) | Net profit (loss) | 144 | 78 | ||||
| - | 3 | Net profit attributable to non-controlling interests | - | 3 | ||||
| 109 | (81) | Net profit (loss) attributable to equity holders of the Group - Group share in net profit (loss) | 144 | 75 | ||||
(in€, except number of shares) | ||||||||
Group share in net profit (loss) from continuing operations: | ||||||||
| 1.07 | (0.66) | Basic earnings per share | 1.52 | 1.38 | ||||
| 1.07 | (0.66) | Diluted earnings per share | 1.51 | 1.37 | ||||
Group share in net profit (loss): | ||||||||
| 1.07 | (0.80) | Basic earnings per share | 1.42 | 0.74 | ||||
| 1.07 | (0.80) | Diluted earnings per share | 1.41 | 0.74 | ||||
Weighted average number of shares outstanding: | ||||||||
| 101 582 527 | 101 070 323 | Basic | 101 376 763 | 100 961 569 | ||||
| 101 965 813 | 101 704 840 | Diluted | 101 886 443 | 101 554 384 | ||||
| 102 732 803 | 102 449 570 | Shares issued at the end of the period | 102 732 803 | 102 449 570 | ||||
| 101 626 283 | 101 226 721 | Shares outstanding at the end of the period | 101 626 283 | 101 226 721 | ||||
| 1.3256 | 1.3242 | Average $ per€ exchange rate | 1.3549 | 1.3171 |
| Delhaize Group – Earnings Release – Third Quarter 2014 | 8 of 25 | |||||
» Condensed Consolidated Statement of Comprehensive Income (Unaudited)
| Q3 2014 | Q3 2013 | (in millions of€) | YTD 2014 | YTD 2013 | ||||
109 |
(78) |
Net profit (loss) of the period |
144 |
78 | ||||
| 1 | - |
Remeasurements of defined benefit liability (asset) | 1 | - | ||||
| - | - | Tax (expense) benefit | - | - | ||||
| 1 | - | Remeasurements of defined liability (asset), net of tax
| 1 | - | ||||
| 1 | - | Total items that will not be reclassified to profit or loss | 1 | - | ||||
| 1 | (1) |
Unrealized gain (loss) on financial assets available for sale | 1 | (6) | ||||
| - | - | Reclassification adjustment to net profit | - | - | ||||
| - | - | Tax (expense) benefit | - | 1 | ||||
| 1 | (1) | Unrealized gain (loss) on financial assets available for sale, net of tax | 1 | (5) | ||||
| 284 | (120) |
Exchange gain (loss) on translation of foreign operations | 317 | (93) | ||||
| (4) | - | Reclassification adjustment to net profit | (5) | (1) | ||||
| 280 | (120) | Exchange gain (loss) on translation of foreign operations
| 312 | (94) | ||||
| 281 | (121) | Total items that are or may be reclassified subsequently to profit or loss | 313 | (99) | ||||
| 282 | (121) |
Other comprehensive income | 314 | (99) | ||||
| - | - | Attributable to non-controlling interests | - | - | ||||
| 282 | (121) | Attributable to equity holders of the Group | 314 | (99) | ||||
| 391 | (199) |
Total comprehensive income for the period | 458 | (21) | ||||
| - | 3 | Attributable to non-controlling interests | - | 3 | ||||
| 391 | (202) | Attributable to equity holders of the Group | 458 | (24) |
| Delhaize Group – Earnings Release – Third Quarter 2014 | 9 of 25 | |||||
» Condensed Consolidated Statement of Changes in Equity (Unaudited)
| (in millions of€, except number of shares) | Shareholders’ Equity | Non-controlling Interests | Total Equity | |||
Balances at January 1, 2014 | 5 068 | 6 | 5 074 | |||
Other comprehensive income | 314 | - | 314 | |||
Net profit | 144 | - | 144 | |||
Total comprehensive income for the period | 458 | - | 458 | |||
Capital increase | 10 | - | 10 | |||
Dividends declared | (159) | - | (159) | |||
Treasury shares purchased | (2) | - | (2) | |||
Treasury shares sold upon exercise of employee stock options | 4 | - | 4 | |||
Tax payment for restricted stock units vested | (1) | - | (1) | |||
Excess tax benefit on employee stock options and restricted stock units | 1 | - | 1 | |||
Share-based compensation expense | 7 | - | 7 | |||
Balances at September 30, 2014 | 5 386 | 6 | 5 392 | |||
Shares issued | 102 732 803 | |||||
Treasury shares | 1 106 520 | |||||
Shares outstanding | 101 626 283 |
| (in millions of€, except number of shares) | Shareholders’ Equity | Non-controlling Interests | Total Equity | |||
Balances at January 1, 2013 | 5 184 | 2 | 5 186 | |||
Other comprehensive income | (99) | - | (99) | |||
Net profit | 75 | 3 | 78 | |||
Total comprehensive income for the period | (24) | 3 | (21) | |||
Capital increase | 16 | - | 16 | |||
Dividends declared | (142) | - | (142) | |||
Treasury shares purchased | (15) | - | (15) | |||
Treasury shares sold upon exercise of employee stock options | 1 | - | 1 | |||
Tax payment for restricted stock units vested | (4) | - | (4) | |||
Excess tax benefit on employee stock options and restricted stock units | 3 | - | 3 | |||
Share-based compensation expense | 13 | - | 13 | |||
Balances at September 30, 2013 | 5 032 | 5 | 5 037 | |||
Shares issued | 102 449 570 | |||||
Treasury shares | 1 222 849 | |||||
Shares outstanding | 101 226 721 |
| Delhaize Group – Earnings Release – Third Quarter 2014 | 10 of 25 | |||||
» Condensed Consolidated Statement of Cash Flows (Unaudited)
| Q3 2014 | Q3 2013 | (in millions of€) | YTD 2014 | YTD 2013 | ||||
Operating activities | ||||||||
| 109 | (78) | Net profit (loss) | 144 | 78 | ||||
Adjustments for: | ||||||||
| (2) | (1) | Share of results of joint venture equity accounted | (3) | (2) | ||||
| 147 | 146 | Depreciation and amortization | 440 | 454 | ||||
| 1 | 211 | Impairment | 168 | 219 | ||||
| 76 | 68 | Income taxes, finance costs and income from investments | 215 | 195 | ||||
| 4 | (2) | Other non-cash items | 4 | 11 | ||||
| (7) | (23) | Changes in operating assets and liabilities | (132) | (23) | ||||
| (21) | (24) | Interest paid | (113) | (119) | ||||
| 1 | 3 | Interest received | 8 | 10 | ||||
| (25) | (41) | Income taxes paid | (123) | (83) | ||||
| 283 | 259 | Net cash provided by operating activities | 608 | 740 | ||||
Investing activities | ||||||||
| - | 21 | Business acquisitions, net of cash and cash equivalents acquired | (6) | 18 | ||||
| (10) | 3 | Business disposals, net of cash and cash equivalents disposed | 167 | 7 | ||||
| (160) | (147) | Purchase of tangible and intangible assets (capital expenditures) | (389) | (324) | ||||
| 5 | 6 | Sale of tangible and intangible assets | 44 | 22 | ||||
| - | - | Investment in debt securities | (3) | (45) | ||||
| 83 | 11 | Sale and maturity of (investment in) term deposits, net | 6 | (25) | ||||
| - | - | Other investing activities | 2 | - | ||||
| (82) | (106) | Net cash used in investing activities | (179) | (347) | ||||
Financing activities | ||||||||
| 2 | 16 | Proceeds from the exercise of share warrants and stock options | 13 | 13 | ||||
| (2) | (15) | Treasury shares purchased | (2) | (15) | ||||
| - | - | Dividends paid, including dividends paid by subsidiaries to non-controlling interests | (159) | (142) | ||||
| 1 | - | Escrow maturities | 1 | - | ||||
| (14) | (15) | Borrowings under (repayments of) long-term loans, net of direct financing costs | (252) | (200) | ||||
| 1 | - | Settlement of derivative instruments | 7 | (1) | ||||
| (12) | (14) | Net cash used in financing activities | (392) | (345) | ||||
| 49 | (22) | Effect of foreign currency translation | 55 | (16) | ||||
| 238 | 117 | Net increase in cash and cash equivalents | 92 | 32 | ||||
| 1 001 (1) | 836 (4) | Cash and cash equivalents at beginning of period | 1 147 (3) | 921 (1) | ||||
| 1 239 | 953 (2) | Cash and cash equivalents at end of period | 1 239 | 953 (2) |
| (1) | Includes €1 million in assets classified as held for sale |
| (2) | Includes €3 million in assets classified as held for sale, net of €9 million bank overdrafts |
| (3) | Includes €2 million in assets classified as held for sale, net of €4 million bank overdrafts |
| (4) | Includes €2 million in assets classified as held for sale |
| Delhaize Group – Earnings Release – Third Quarter 2014 | 11 of 25 | |||||
» Selected Explanatory Notes
General information
Delhaize Group is a Belgian international food retailer with operations in seven countries on three continents. The Company’s stock is listed on NYSE Euronext Brussels (DELB) and the New York Stock Exchange (DEG).
The condensed interim financial statements of the Group for the nine months ended September 30, 2014 were authorized for issue by the Board of Directors on November 5, 2014.
This interim report only provides an explanation of events and transactions that are significant to an understanding of the changes in financial position and reporting since the last annual reporting period, and should therefore be read in conjunction with the consolidated financial statements for the financial year ended on December 31, 2013.
Basis of presentation and accounting policies
These condensed interim financial statements have been prepared in accordance with International Accounting Standard (IAS) 34Interim Financial Reporting, as issued by the International Accounting Standards Board (IASB), and as adopted by the European Union (EU).
The condensed interim financial statements are presented in millions of euros, the Group’s presentation currency, except where stated otherwise.
The accounting policies applied in this report are consistent with those of the previous financial year except for the impact of new accounting pronouncements adopted in 2014, of which the most important ones for Delhaize Group are listed below:
| — | IFRIC 21Levies; |
| — | Amendments to IAS 32Offsetting Financial Assets and Financial Liabilities; |
| — | Amendments to IAS 39Novation of Derivatives and Continuation of Hedge Accounting; and |
| — | Amendments to IFRS 10, IFRS 12 and IAS 27 regardingInvestment Entities. |
Except for the impact of IFRIC 21, the initial application of these new, amended or revised pronouncements did not have a material impact on the financial position and financial performance of the Group.
IFRIC 21, an interpretation of IAS 37Provisions, Contingent Liabilities and Contingent Assets, requires recognising levies in full when the obligating event that triggers the payment of the levy, as identified by the relevant legislation, occurs. In accordance with the interpretation, several levies (for example property or similar taxes), mainly in the U.S. and Belgium, can no longer be spread over the calendar year, and are recorded in full at the date of the obligating event.
While from a full financial year perspective, the impact of IFRIC 21 is insignificant, the interpretation impacts the Group’s quarterly results, as in some cases the timing of recognition has changed significantly.
In accordance with IAS 8, IFRIC 21 has been implemented with full retrospective effect and comparative periods have therefore been restated as follow:
| — | Operating profit increased by€9 million (mainly selling, general and administrative expenses) and net profit by€6 million in the third quarter of 2013. This resulted in a corresponding increase of both basic and diluted earnings per share in net profit (Group share) by€0.06. |
| — | Operating profit (mainly selling, general and administrative expenses) and net profit decreased by€3 million for the first nine months of 2013. As a consequence, both basic and diluted earnings per share in net profit (Group share) decreased by€0.03. |
On a full year’s basis, shareholders’ equity (retained earnings) decreased by€2 million for December 31, 2013 and 2012, respectively and€3 million for December 31, 2011. A profit and loss timing impact resulted in an increase in both basic and diluted earnings per share (Group share in net profit) of€0.01 for 2012, while 2013 was not influenced.
| Delhaize Group – Earnings Release – Third Quarter 2014 | 12 of 25 | |||||
For additional details on the new accounting pronouncements, see Note 2.5 of the Delhaize Group 2013 consolidated financial statements.
Delhaize Group did not early adopt any new IASB pronouncements that were issued but not yet effective at the balance sheet date.
Segment reporting
Segment information, including a reconciliation from operating profit to underlying operating profit, required by IAS 34, can be found on pages 5 and 6 of this press release and forms an integral part of this report.
Business combinations and acquisition of non-controlling interests
During the first nine months of 2014, Delhaize Group entered into several agreements in Southeastern Europe that have resulted in the acquisition of businesses and were accounted for as business combinations. The total cash consideration transferred for these transactions was€6 million (nothing in the third quarter) and the transactions resulted in an increase of goodwill of€4 million (zero in the third quarter).
In 2013, Delhaize Group launched a tender offer to acquire 16% non-controlling interests in C-Market (Serbian subsidiary), held by the Serbian Privatization Agency, at a price of€300 per share (representing approximately€10 million). The Serbian Privatization Agency suspended twice the privatization procedures of C-Market due to a probe into the entity’s earlier privatization. After expiration of the second suspension period in the second quarter of 2014, Delhaize Group withdrew its offer. A new privatization process has been launched in the third quarter of 2014, but is not yet opened to tendering. Upon opening of such new tendering process Delhaize Group will duly consider its participation in the process.
Divestitures and discontinued operations
Disposal groups and assets held for sale
Disposal of Sweetbay, Harveys and Reid’s
In the second quarter of 2013, Delhaize Group signed an agreement with Bi-Lo Holdings to divest its Sweetbay, Harveys, and Reid´s operations.
The transaction was completed in the second quarter of 2014, for a total final sales price of $234 million (€171 million) in cash. In a first phase, at the end of the first quarter of 2014, Delhaize Group sold 35 operating Sweetbay stores and 2 previously closed stores to Bi-Lo Holdings for an initial net cash consideration of $56 million. During the second quarter of 2014, the remaining 119 operating and 8 previously closed stores were sold for a remaining net cash consideration of $190 million. In the third quarter of 2014, Delhaize America paid $12 million (€9 million) as post-closing adjustments.
The assets and liabilities of Sweetbay, Harveys and Reid’s, part of the “United States” segment, were presented as “held for sale” as of the second quarter of 2013 and the operating results for such banners for all periods presented were classified as “Results from discontinued operations” in the income statement. In 2013, the stores included in the transaction generated revenues of approximately $1.7 billion.
A gain of€8 million realized on the sale was included in “Results from discontinued operations” during the second quarter of 2014.
Disposal of Bulgarian and Bosnian & Herzegovinian operations
In the first part of 2014, Delhaize Group announced the planned sale of its Bulgarian operations to AP Mart and of Delhaize Bosnia & Herzegovina to Tropic Group B.V. Both activities were part of the “Southeastern Europe” segment. These transactions met the requirements of discontinued operations and therefore, the profit or loss after tax relating to our operations in Bulgaria and Bosnia & Herzegovina has been classified as “Result from discontinued operations” and comparative information represented.
Delhaize Group completed the sale of its Bulgarian operations in the second quarter of 2014 and of Delhaize Bosnia & Herzegovina in the third quarter of 2014, both with an immaterial impact on profit or loss, and subject to customary post-closing adjustments. The Bulgarian and Bosnian & Herzegovinian operations were transferred to the buyers, including cash and cash equivalents of€3 million and€1 million, respectively.
| Delhaize Group – Earnings Release – Third Quarter 2014 | 13 of 25 | |||||
Disposal of and classification as held for sale of individual properties
In the second quarter of 2014, Delhaize Group completed the sale of its Sweetbay distribution center in Plant City, Florida, (carrying amount of $23 million) to C&S Wholesale Grocers for an amount of $28 million (€21 million). The distribution center was not part of the Bi-Lo Holdings’ agreement and was used to continue supplying operating Sweetbay stores until the second quarter of 2014.
Delhaize Group holds a number of individual properties, mainly small shops, office buildings, pharmacies or bank branches, which it considers not incremental to its retail operations. The carrying value of individual properties held for sale amounted to€6 million at September 30, 2014, of which€3 million related to properties in the U.S. and€3 million for properties in the “Southeastern Europe” segment.
Discontinued operations
As mentioned above, the Bulgarian operations, Delhaize Bosnia & Herzegovina and the banners Sweetbay, Harveys and Reid’s qualified as discontinued operations.
The overall “Result from discontinued operations” and corresponding net cash flows of the entities classified as discontinued operations are summarized as follows:
(in millions of€, except per share information) | YTD 2014 | YTD 2013 | ||||||||||
Revenues | 476 | 1 158 | ||||||||||
Cost of sales | (363) | (855) | ||||||||||
Other operating income | 6 | 10 | ||||||||||
Selling, general and administrative expenses | (114) | (297) | ||||||||||
Other operating expenses | (2) | (78) | ||||||||||
Net financial costs | 3 | (10) | ||||||||||
|
|
|
| |||||||||
Result before tax | 6 | (72) | ||||||||||
Income taxes | (3) | 19 | ||||||||||
|
|
|
| |||||||||
Result of discontinued operations (net of tax) | 3 | (53) | ||||||||||
Pre-tax loss recognized on re-measurement of assets of disposal groups | (14) | (11) | ||||||||||
Income taxes | - | - | ||||||||||
|
|
|
| |||||||||
Result from discontinued operations (net of tax), fully attributable to equity holders of the Group | (11) | (64) | ||||||||||
Basic earnings (loss) per share from discontinued operations | (0.10) | (0.63) | ||||||||||
Diluted earnings (loss) per share from discontinued operations | (0.10) | (0.63) | ||||||||||
Operating cash flows | (38) | (23) | ||||||||||
Investing cash flows | 15 | (7) | ||||||||||
Financing cash flows | 10 | 18 | ||||||||||
|
|
|
| |||||||||
Total cash flows | (13) | (12) | ||||||||||
In the first nine months of 2014, the Group recognized a total impairment loss of€14 million to write down the carrying value of its Bulgarian operations and Delhaize Bosnia & Herzegovina to their estimated fair value less cost to sell. In 2013, a similar impairment loss of€11 million was recorded related to Delhaize Montenegro.
| Delhaize Group – Earnings Release – Third Quarter 2014 | 14 of 25 | |||||
» Balance Sheet and Cash Flow Statement
Goodwill and intangible assets
In the first half of 2014, the Serbian economy continued to struggle due to the impact of fiscal tightening, lower inflow of investments, and the overall fragile situation in the Serbian and international markets. In the second quarter of 2014, Serbia was hit by devastating flooding, which further negatively impacted the economy. At the same time, competition has further strengthened in the retail market. Based on this, Delhaize Group reconsidered its estimates and forecasts in connection with its Serbian business and concluded that the before said will have a negative short-term impact on the cash flow projects of Delhaize Serbia providing goodwill impairment indicators. Consequently, Delhaize Group updated in the second quarter of 2014 its impairment review of its Serbian trade names and goodwill and recognized impairment charges of a total amount of€150 million, which can be detailed as follows:
(in millions of€) | Impairment | Carrying | ||||||
Goodwill | 140 | 51 | ||||||
Trade names | 10 | 71 | ||||||
|
| |||||||
Total impairment | 150 | 122 |
The Group has identified Serbia as a core market and expects significant growth in the near future. Consistently with previous valuations, the recoverable amount has therefore been based on a Fair Value Less Cost to Sell (FVLCTS) basis, with the following key assumptions:
| Perpetual | Pre-tax | ||||||
Serbia | 3.0% | 15.1% |
Delhaize Group estimated that a decrease in perpetual growth rate by 50 basis points, keeping all other constant, would further decrease the FVLCTS by€9 million. An increase of the discount rate by 100 basis points, keeping all other constant, would decrease the FVLCTS by€38 million. A simultaneous increase in the discount rate and decrease in growth rate by the before mentioned amounts would result in the carrying value of Serbia exceeding the FVLCTS by an additional€46 million. Alternatively, a reduction in the total projected future cash flows by 10%, keeping all other constant, would result in the carrying amount of Serbia exceeding the FVLCTS by an additional€40 million.
The recoverable amount of the trade names has been estimated using the royalty-relief-method. Royalty rates for the various brands range from 0.62% (Tempo) to 1.43% (Maxi), depending on the individual local strength of the different brands and are updated frequently. Revenue growth and discount rates are consistent with the goodwill impairment testing.
Impairment losses are recognized in profit or loss in “Other operating expenses.”
Capital expenditures
During the first nine months of 2014, Delhaize Group incurred capital expenditures of€389 million, consisting of€339 million in property, plant and equipment and€50 million in intangible assets. In the third quarter of 2014, Delhaize Group incurred capital expenditures of€160 million, consisting of€141 million in property, plant and equipment and€19 million in intangible assets.
In addition, the Group added property under finance leases in the first nine months of 2014 for a total amount of€14 million (€5 million in the third quarter of 2014). The carrying amount of tangible and intangible assets that were sold or disposed in 2014 was€30 million (€4 million for the third quarter of 2014) and includes the sale of the Sweetbay distribution center as mentioned above.
| Delhaize Group – Earnings Release – Third Quarter 2014 | 15 of 25 | |||||
Equity
In the first nine months of 2014, Delhaize Group issued 283 233 new shares (all during the second quarter), purchased 32 335 treasury shares (none in the previous quarters of 2014) and used 126 759 treasury shares (48 191 during the third quarter) satisfying mainly the exercise of stock options that were granted as part of the share-based incentive plans. At September 30, 2014, the Group owned 1 106 520 treasury shares.
During the second quarter, the ratio of Delhaize Group American Depositary Shares (“ADS”) to Delhaize Group ordinary shares changed from one ADS for every one ordinary share to four ADSs for every one ordinary share.
Dividends
At Delhaize Group’s shareholders meeting on May 22, 2014, Delhaize Group’s shareholders approved the distribution of a€1.56 gross dividend per share for financial year 2013. After deduction of a 25% withholding tax, this resulted in a net dividend of€1.17 per share. The dividend became payable to owners of Delhaize Group’s ordinary shares on June 2, 2014 and to owners of Delhaize Group ADRs (American Depository Receipts) on June 5, 2014 and was subsequently paid.
Financial instruments
Repayment of long-term debts
In the second quarter of 2014, Delhaize Group repaid the maturing remaining€215 million of the initial€500 million 5.625% senior notes due 2014. In addition, the relating interest rate swaps and cross-currency swaps which Delhaize Group entered into to hedge its exposure to changes in the fair value of the notes and changes in foreign currency exposure, were settled. The redemption did not have a significant impact on the 2014 net income.
Derivative financial instruments and hedging
In 2007, Delhaize Group issued $450 million unsecured bonds at 6.50% due 2017. During 2014, Delhaize Group entered into interest rate swaps to hedge $250 million of its exposure to changes in the fair value of these bonds due to variability in market interest rates (“hedged risk”). The maturity date of these interest rate swap arrangements (“hedging instrument”) match those of the underlying debt (“hedged item”). The Group designated and documented these transactions as fair value hedges.
During the second quarter of 2014, Delhaize Group entered into cross-currency interest rate swaps with various commercial banks to hedge foreign currency risk on intercompany loans (principal and interest) denominated in currencies other than its reporting currency for a notional amount of€220 million.
Financial instruments measured at fair value by fair value hierarchy:
September 30, 2014 | ||||||||||||||||
(in millions of€) | Quoted prices in active markets (Level 1) | Significant other observable inputs (Level 2) | Significant unobservable inputs (Level 3) | Total | ||||||||||||
Financial Assets | ||||||||||||||||
Non-Current | ||||||||||||||||
Financial assets – measured at fair value | 9 | - | - | 9 | ||||||||||||
Derivative instruments | - | 25 | - | 25 | ||||||||||||
Current | ||||||||||||||||
Financial assets – measured at fair value | 141 | - | - | 141 | ||||||||||||
Derivative instruments | - | 2 | - | 2 | ||||||||||||
|
|
|
|
|
|
|
| |||||||||
Total financial assets measured at fair value | 150 | 27 | - | 177 | ||||||||||||
Financial assets measured at amortized cost | 1 838 | |||||||||||||||
|
| |||||||||||||||
Total financial assets | 2 015 | |||||||||||||||
Financial Liabilities | ||||||||||||||||
Non-Current | ||||||||||||||||
Derivative instruments | - | 14 | - | 14 | ||||||||||||
Current | ||||||||||||||||
Derivative instruments | - | - | - | - | ||||||||||||
|
|
|
|
|
|
|
| |||||||||
Total financial liabilities measured at fair value | - | 14 | - | 14 | ||||||||||||
Financial liabilities being part of a fair value hedge relationship | 535 | |||||||||||||||
Financial liabilities measured at amortized cost | 4 005 | |||||||||||||||
|
| |||||||||||||||
Total financial liabilities | 4 554 | |||||||||||||||
| Delhaize Group – Earnings Release – Third Quarter 2014 | 16 of 25 | |||||
During the period there was no transfer between fair value hierarchy levels and there were no changes in the valuation techniques and inputs applied.
Fair value of financial instruments not measured at fair value:
(in millions of€) | Carrying amount | Fair value | ||||||
Financial liabilities being part of a fair value hedge relationship | 535 | 583 | ||||||
Financial liabilities at amortized cost | 1 613 | 2 030 | ||||||
|
|
|
| |||||
Total long-term debt | 2 148 | 2 613 | ||||||
The fair value of the receivables, other financial assets, cash and cash equivalents and accounts payable, all measured at amortized cost, approximate their carrying amounts.
Short term borrowings
In the second quarter of 2014, Delhaize Group and certain of its subsidiaries, including Delhaize America LLC, entered into a new€400 million, five year multi-currency, unsecured revolving credit facility (the “New Facility Agreement”), which is extendable by a maximum of two years if requested by the Group and agreed by each lender for their commitment in the New Facility Agreement. Subsequent to the execution of the New Facility Agreement, Delhaize Group terminated all of its commitments under the€600 million, five-year multi-currency, unsecured revolving credit facility that had been in place since the second quarter of 2011.
Provisions
Since 2009, Delhaize Group’s Romanian operations (Mega Image) have been answering a series of questions sent by the Romanian Competition Authority to various suppliers and retailers operating in Romania in connection with an ongoing antitrust investigation. The questionnaires focused on the contractual and commercial relationships between the retailers and local food suppliers.
During the third quarter of 2014, the Group received the Statement of Objections from the Romanian Competition Authority, which alleges that several retailers (incl. Mega Image) and suppliers were involved in possible competition infringements and recommends to the Competition Plenum to sanction the companies involved. The Romanian legislation provides that antitrust fines, if any, are based on a percentage of the total turnover of the year preceding a decision by the Romanian Competition Plenum. The fine will depend on the gravity and duration of the alleged infringement and mitigating and aggravating circumstances can be applied.
Delhaize Group responded to the Statement of Objections after third quarter end 2014 and hearings in front of the Competition Plenum took place afterwards. After the hearings, the competition Plenum will deliberate and thereafter either close the investigation, impose sanctions or ask the investigation team to continue their investigation in order to better support the conclusions of the Statement of Objections. In case that the Competition Plenum imposes sanctions, it will communicate the amount of the sanctions, and the reasons for conclusion 30 days thereafter. Payment of any fine will have to occur within 30 days after the communication of the decision. The Group has a chance to appeal against the decision of the Competition Authority in front of the court.
The information required by IAS 37 is not disclosed on the grounds that it can be expected to prejudice seriously the outcome of the further process. The Group believes that it has strong arguments that should allow rebutting the alleged infringements – at the latest – in front of court.
| Delhaize Group – Earnings Release – Third Quarter 2014 | 17 of 25 | |||||
Employee Benefits
In 2014, Delhaize Group granted 764 662 performance stock units (of which 74 956 during the third quarter) to senior management of its U.S. operating companies under the “Delhaize Group 2012 Stock Incentive Plan” and 140 981 performance stock units to senior management of its non-U.S. operating companies under the “Delhaize Group 2014 European Performance Stock Unit Plan.” The fair value of the performance stock units was $17.82 (first grant) and $17.01 (second grant) for the U.S. operating companies and€53.45 for the non-U.S. operating companies, based on the share price at grant date. As from 2014, Delhaize Group no longer grants stock options or warrants to its employees.
Performance stock units are restricted stock units, with additional performance conditions. The cliff-vesting of these performance stock units is linked to the achievement of a non-market financial performance condition (Shareholder Value Creation targets over a cumulative 3-year period) which is taken into account when estimating the number of awards that will vest. Shareholders Value Creation has been defined by the Group as six times underlying EBITDA minus the net debt. When the award vest, the associate receives – at no cost to the associate – ADRs or shares equal to the number of restricted stock units that have vested, free of any restrictions.
» Income Statement
Other operating income
| Q3 2014 | Q3 2013 | (in millions of€) | YTD 2014 | YTD 2013 | ||||
| 13 | 12 | Rental income | 39 | 37 | ||||
| 4 | 6 | Income from waste recycling activities | 14 | 15 | ||||
| 1 | 2 | Services rendered to wholesale customers | 4 | 5 | ||||
| 1 | 2 | Gain on sale of property, plant and equipment | 7 | 7 | ||||
| - | 3 | Gain on sale of business | - | 6 | ||||
| 9 | 16 | Other | 20 | 25 | ||||
| 28 | 41 | Total | 84 | 95 |
Other operating expenses
| Q3 2014 | Q3 2013 | (in millions of€) | YTD 2014 | YTD 2013 | ||||
| 2 | (2) | Store closing expenses | 2 | (7) | ||||
| - | - | Reorganization expenses | - | (16) | ||||
| (1) | (195) | Impairment | (154) | (198) | ||||
| (2) | (2) | Loss on sale of property, plant and equipment | (7) | (13) | ||||
| (13) | (1) | Other | (14) | (3) | ||||
| (14) | (200) | Total | (173) | (237) |
In 2014, Delhaize Group recognized impairment charges for€154 million, which primarily relate to the goodwill (€140 million) and trade names (€10 million) in Serbia (both recorded in the second quarter).
Income taxes
During the first nine months of 2014, the effective tax rate (on continued operations) was 35.7%, compared to previous year’s rate of 31.0%. This increase is mainly due to more non-deductible expenses in the current year and a reduction in future U.S. state tax liabilities which occurred last year because of the enactment of reduced state tax rates.
Related party transactions
In the first nine months of 2014, an aggregate number of 176 829 and 52 378 U.S. and European performance stock units, respectively, were granted to members of the Executive Committee, of which 74 956 to a new member of the Delhaize Group Executive Committee in the third quarter of 2014.
In the first quarter of 2014, Nicolas Hollanders, Executive Vice President HR, IT and Sustainability, and the Company entered into a mutual separation agreement. As a result, the Group recognized termination benefits of€1.8 million.
| Delhaize Group – Earnings Release – Third Quarter 2014 | 18 of 25 | |||||
» Contingencies, Commitments and Guarantees
Following the closing of Delhaize Group’s agreed sale of Sweetbay, Harveys and Reid’s, the Group continues to provide guarantees for a number of existing operating or finance lease contracts, which extend through 2036. In the event of a future default of the buyer, Delhaize Group will be obligated to pay rent and otherwise perform the guaranteed leases. The future minimum lease payments over the non-cancellable lease term of the guaranteed leases, excluding other direct costs such as common area maintenance expenses and real estate taxes, amount to $271 million (€215 million) as of September 30, 2014. Currently, the Group does not expect to be required to pay any amounts under these guarantees.
On July 17, 2014, Mega Image entered into an agreement with Angst Retail SRL to acquire 20 stores in the greater Bucharest market. The acquisition is subject to customary conditions and the approval of the Romanian antitrust authorities. It is expected that the transaction will close in the fourth quarter of 2014.
In the second quarter of 2014, Delhaize Group announced its intention to implement significant changes to its Belgium operations (the Transformation Plan). This could impact the jobs of 2 500 Belgian employees in the coming three years, including the termination of company-operated activities in 14 stores in various locations throughout Belgium. The announcement falls under the so-called “Law Renault”, that requires that an employer that intends to implement a collective dismissal must first inform and consult its employees or their representatives before taking any decision on the collective dismissal. The consultation process has started after the announcement and is ongoing. Once the consultation phase is concluded, it will be followed by negotiation and implementation phases. As of September 30, 2014, the negotiation phase had not started and no final agreements with the unions were reached and no decisions taken.
Except for changes mentioned in these interim financial statements, other contingencies are materially unchanged from those described in Note 34 on page 152 of the 2013 Annual Report.
» Subsequent Events
Delhaize Group announced in the fourth quarter that is has signed an agreement to sell ALDI Inc. its 66 Bottom Dollar Food locations for approximately $15 million (approximately€12 million). The Group expects to recognize an impairment loss and other charges related to the sale for a total of approximately $180 million (approximately€140 million) and going forward will classify these operations as assets held for sale and discontinued operations. The transaction is subject to customary closing conditions. The divestment is expected to be completed by the end of the first quarter 2015.
| Delhaize Group – Earnings Release – Third Quarter 2014 | 19 of 25 | |||||
OTHER FINANCIAL AND OPERATING INFORMATION (UNAUDITED)
» Use of non-GAAP (Generally Accepted Accounting Principles) Financial Measures
Delhaize Group uses certain non-GAAP measures in its financial communication. Delhaize Group does not consider these measures as alternative measures to net profit or other financial measures determined in accordance with IFRS. These measures as reported by Delhaize Group may differ from similarly titled measures used by other companies. We believe that these measures are important indicators of our business performance and are widely used by investors, analysts and other interested parties. In the press release, the non-GAAP measures are reconciled to financial measures prepared in accordance with IFRS.
» Number of Stores
| End of 2013 | End of Q2 2014 | Change Q3 2014 | End of Q3 2014 | |||||||||||||
United States(1) | 1 514 | 1 364 | -1 | 1 363 | ||||||||||||
Belgium & Luxembourg | 852 | 860 | +4 | 864 | ||||||||||||
Greece | 281 | 297 | +8 | 305 | ||||||||||||
Romania | 296 | 317 | +33 | 350 | ||||||||||||
Serbia | 381 | 383 | +1 | 384 | ||||||||||||
Bulgaria | 54 | - | - | - | ||||||||||||
Bosnia & Herzegovina | 39 | 38 | -38 | - | ||||||||||||
Indonesia | 117 | 118 | +2 | 120 | ||||||||||||
Total | 3 534 | 3 377 | +9 | 3 386 | ||||||||||||
| (1) | Evolution mainly explained by the 154 Sweetbay, Harveys & Reid’s stores which have been sold to Bi-Lo Holdings in 2014. |
» Organic Revenue Growth Reconciliation
| Q3 2014 | Q3 2013 | % Change | (in millions of€) | YTD 2014 | YTD 2013 | % Change | ||||||
| 5 462 | 5 299 | +3.1% | Revenues | 15 855 | 15 650 | +1.3% | ||||||
| 10 | Effect of exchange rates | 305 | ||||||||||
| 5 472 | 5 299 | +3.3% | Revenues at identical exchange rates | 16 160 | 15 650 | +3.3% | ||||||
| - | - | Effect of acquisitions and divestitures | - | - | ||||||||
| 5 472 | 5 299 | +3.3% | Organic revenue growth | 16 160 | 15 650 | +3.3% |
» Underlying operating profit
Delhaize Group believes “underlying operating profit” is a measure that, for external users of the financial statements, offers a more detailed view than “operating profit” of the operating performance of the period for the Group as it adjusts for a number of elements that management considers as non-representative of underlying operating performance.
| Q3 2014 | ||||||||||||||||||||||||
| (in millions) | United States | United States | Belgium | SEE | Corporate | TOTAL | ||||||||||||||||||
| $ | € | € | € | € | € | |||||||||||||||||||
Operating profit (as reported) | 198 | 149 | 16 | 21 | (4) | 182 | ||||||||||||||||||
Add/(substract): | ||||||||||||||||||||||||
Store closing expenses (reversals) | (3) | (2) | - | - | - | (2) | ||||||||||||||||||
Fixed assets impairment charges (reversals) | 2 | 1 | - | - | - | 1 | ||||||||||||||||||
(Gains)/losses on disposal of fixed assets | 2 | 1 | - | - | - | 1 | ||||||||||||||||||
Other | (2) | (1) | - | 11 | - | 10 | ||||||||||||||||||
Underlying Operating Profit | 197 | 148 | 16 | 32 | (4) | 192 | ||||||||||||||||||
| Delhaize Group – Earnings Release – Third Quarter 2014 | 20 of 25 | |||||
| Q3 2013 | ||||||||||||||||||
| (in millions) | United States | United States | Belgium | SEE | Corporate | TOTAL | ||||||||||||
| $ | € | € | € | € | € | |||||||||||||
Operating profit (loss) (as reported) | 166 | 126 | 37 | (155) | (11) | (3) | ||||||||||||
Add/(substract): | ||||||||||||||||||
Store closing expenses (reversals) | 2 | 2 | - | - | - | 2 | ||||||||||||
Reorganization expenses (reversals) | 1 | 1 | - | - | - | 1 | ||||||||||||
Fixed assets impairment charges (reversals) | 6 | 4 | - | 191 | - | 195 | ||||||||||||
(Gains)/losses on sale of business | - | - | (3) | - | - | (3) | ||||||||||||
Other | 4 | 2 | 1 | (8) | 1 | (4) | ||||||||||||
Underlying Operating Profit | 179 | 135 | 35 | 28 | (10) | 188 | ||||||||||||
The third quarter of 2013 was primarily impacted by€195 million impairment charges (mainly related to goodwill and trade names in Serbia).
| YTD 2014 | ||||||||||||||||||
| (in millions) | United States | United States | Belgium | SEE | Corporate | TOTAL | ||||||||||||
| $ | € | € | € | € | € | |||||||||||||
Operating profit (loss) (as reported) | 511 | 377 | 95 | (85) | (20) | 367 | ||||||||||||
Add/(substract): | ||||||||||||||||||
Store closing expenses (reversals) | (3) | (2) | - | - | - | (2) | ||||||||||||
Fixed assets impairment charges (reversals) | 6 | 4 | - | 150 | - | 154 | ||||||||||||
(Gains)/losses on disposal of fixed assets | 3 | 2 | (2) | - | - | - | ||||||||||||
Other | (3) | (2) | 1 | 11 | 2 | 12 | ||||||||||||
Underlying Operating Profit | 514 | 379 | 94 | 76 | (18) | 531 | ||||||||||||
| YTD 2013 | ||||||||||||||||||
| (in millions) | United States | United States | Belgium | SEE | Corporate | TOTAL | ||||||||||||
| $ | € | € | € | € | € | |||||||||||||
Operating profit (loss) (as reported) | 453 | 344 | 145 | (111) | (34) | 344 | ||||||||||||
Add/(substract): | ||||||||||||||||||
Store closing expenses (reversals) | 9 | 7 | - | - | - | 7 | ||||||||||||
Reorganization expenses (reversals) | 25 | 19 | - | - | - | 19 | ||||||||||||
Fixed assets impairment charges (reversals) | 9 | 7 | - | 191 | - | 198 | ||||||||||||
(Gains)/losses on disposal of fixed assets | - | - | 6 | (1) | 1 | 6 | ||||||||||||
(Gains)/losses on sale of business | - | - | (6) | - | - | (6) | ||||||||||||
Other | 14 | 10 | 1 | (3) | 4 | 12 | ||||||||||||
Underlying Operating Profit | 510 | 387 | 146 | 76 | (29) | 580 | ||||||||||||
The first nine months of 2014 were primarily impacted by€154 million impairment charges, of which€150 million in Serbia.
The first nine months of 2013 were primarily impacted by€198 million impairment charges (mainly for goodwill and trade names in Serbia),€19 million reorganization expenses related to the severance of support services senior management and employees in the U.S. (primarily included in “Other operating expenses”), and€16 million Executive Committee members termination benefits, partially offset by a€5 million net impact related to favorable litigation settlement.
| Delhaize Group – Earnings Release – Third Quarter 2014 | 21 of 25 | |||||
» EBITDA Reconciliation
| Q3 2014 | Q3 2013 | (in millions of€) | YTD 2014 | YTD 2013 | ||||
| 182 | (3) | Operating profit (loss) | 367 | 344 | ||||
| 147 | 143 | Depreciation and amortization | 438 | 433 | ||||
| 1 | 195 | Impairment | 154 | 198 | ||||
| 330 | 335 | EBITDA | 959 | 975 |
| Q3 2014 | Q3 2013 | (in millions of€) | YTD 2014 | YTD 2013 | ||||
| 192 | 188 | Underlying operating profit | 531 | 580 | ||||
| 147 | 143 | Depreciation and amortization | 438 | 433 | ||||
| 339 | 331 | Underlying EBITDA | 969 | 1 013 |
» Free Cash Flow Reconciliation
| Q3 2014 | Q3 2013 | (in millions of€) | YTD 2014 | YTD 2013 | ||||
| 283 | 259 | Net cash provided by operating activities | 608 | 740 | ||||
| (82) | (106) | Net cash used in investing activities | (179) | (347) | ||||
| (83) | (11) | (Sale and maturity of) investment in debt securities and term deposits | (3) | 70 | ||||
| 118 | 142 | Free cash flow | 426 | 463 |
» Net Debt Reconciliation
| (in millions of€, except net debt ratios) | September 30, 2014 | December 31, 2013 | September 30, 2013 | |||
Non-current financial liabilities | 2 641 | 2 507 | 2 547 | |||
Current financial liabilities | 66 | 291 | 297 | |||
Derivative liabilities | 14 | 11 | 5 | |||
Derivative assets | (27) | (41) | (31) | |||
Investment in securities - non-current | (9) | (8) | (11) | |||
Investment in securities - current | (141) | (126) | (129) | |||
Term deposits - current | (10) | (12) | (24) | |||
Cash and cash equivalents | (1 239) | (1 149) | (959) | |||
Net debt | 1 295 | 1 473 | 1 695 | |||
Net debt to equity ratio | 24.0% | 29.0% | 33.7% | |||
EBITDA (rolling 12 months) | 1 282 | 1 297 | 1 341 | |||
Net debt to EBITDA ratio | 101.0% | 113.6% | 126.4% | |||
» Identical Exchange Rates Reconciliation
| (in millions of€, except per share amounts) | Q3 2014 | Q3 2013 | 2014/2013 | |||||||||||||||
| At Actual Rates | Impact of Exchange Rates | At Identical Rates | At Actual Rates | At Actual Rates | At Identical Rates | |||||||||||||
Revenues | 5 462 | 10 | 5 472 | 5 299 | +3.1% | +3.3% | ||||||||||||
Operating profit (loss) | 182 | 2 | 184 | (3) | N/A | N/A | ||||||||||||
Net profit (loss) from continuing operations | 109 | 2 | 111 | (64) | N/A | N/A | ||||||||||||
Basic EPS from continuing operations | 1.07 | 0.02 | 1.09 | (0.66) | N/A | N/A | ||||||||||||
Group share in net profit (loss) | 109 | 1 | 110 | (81) | N/A | N/A | ||||||||||||
Basic EPS from Group share in net profit (loss) | 1.07 | 0.01 | 1.08 | (0.80) | N/A | N/A | ||||||||||||
Free cash flow | 118 | 1 | 119 | 142 | -16.5% | -15.8% | ||||||||||||
| Delhaize Group – Earnings Release – Third Quarter 2014 | 22 of 25 | |||||
| (in millions of€, except per share amounts) | YTD 2014 | YTD 2013 | 2014/2013 | |||||||||||||||
| At Actual Rates | Impact of Exchange Rates | At Identical Rates | At Actual Rates | At Actual Rates | At Identical Rates | |||||||||||||
Revenues | 15 855 | 305 | 16 160 | 15 650 | +1.3% | +3.3% | ||||||||||||
Operating profit | 367 | 7 | 374 | 344 | +6.8% | +8.8% | ||||||||||||
Net profit from continuing operations | 155 | 2 | 157 | 142 | +9.4% | +10.8% | ||||||||||||
Basic EPS from continuing operations | 1.52 | 0.02 | 1.54 | 1.38 | +10.4% | +11.9% | ||||||||||||
Group share in net profit | 144 | 2 | 146 | 75 | +91.4% | +94.5% | ||||||||||||
Basic EPS from Group share in net profit | 1.42 | 0.02 | 1.44 | 0.74 | +90.6% | +93.7% | ||||||||||||
Free cash flow | 426 | 17 | 443 | 463 | -7.8% | -4.3% | ||||||||||||
| (in millions of€) | September 30, 2014 | December 31, 2013 | Change | |||||||||||||||
Net debt | 1 295 | (1) | 1 294 | 1 473 | -12.1% | -12.1% | ||||||||||||
| Delhaize Group – Earnings Release – Third Quarter 2014 | 23 of 25 | |||||
CERTIFICATION OF RESPONSIBLE PERSONS
The undersigned Frans Muller, President and Chief Executive Officer of Delhaize Group, and Pierre Bouchut, Chief Financial Officer of Delhaize Group, confirm that to the best of their knowledge:
a) these interim condensed consolidated financial statements for the nine-month period ending September 30, 2014 are prepared in accordance with IFRS (International Financial Reporting Standards) and give, in all material respects, a true and fair view of the consolidated financial position and consolidated results of Delhaize Group;
b) the interim financial report gives, in all material respects, a true and fair view of all important events and significant transactions with related parties that have occurred in the first nine months of the financial year 2014 and their effects on the summary financial statements, as well as an overview of the most significant risks and uncertainties with which we are confronted.
Brussels, November 5, 2014
| Frans Muller | Pierre Bouchut | |||
| President and CEO | Executive Vice President and CFO |
REPORT OF THE STATUTORY AUDITOR
We have reviewed the consolidated interim financial information of Delhaize Brothers and Co “The Lion” (Delhaize Group) SA (“the company”) and its subsidiaries (jointly “the group”), prepared in accordance with International Financial Reporting Standard IAS 34 – Interim Financial Reporting as adopted by the European Union.
The consolidated condensed statement of financial position shows total assets of€11 593 million and the consolidated condensed income statement shows a consolidated profit (group share) for the period then ended of€144 million.
The board of directors of the company is responsible for the preparation and fair presentation of the consolidated interim financial information in accordance with IAS 34 – Interim Financial Reporting as adopted by the European Union. Our responsibility is to express a conclusion on this consolidated interim financial information based on our review.
Scope of review
We conducted our review of the consolidated interim financial information in accordance with International Standard on Review Engagements (ISRE) 2410 – Review of interim financial information performed by the independent auditor of the entity. A review of interim financial information consists of making inquiries, primarily of persons responsible for financial and accounting matters, and applying analytical and other review procedures. A review is substantially less in scope than an audit performed in accordance with the International Standards on Auditing (ISA) and consequently does not enable us to obtain assurance that we would become aware of all significant matters that might be identified in an audit. Accordingly, we do not express an audit opinion on the consolidated interim financial information.
Conclusion
Based on our review, nothing has come to our attention that causes us to believe that the consolidated interim financial information of Delhaize Brothers and Co “The Lion” (Delhaize Group) SA for the nine-month period ended 30 September 2014 has not been prepared, in all material respects, in accordance with IAS 34 – Interim Financial Reporting as adopted by the European Union.
RISKS
In accordance with the Belgian Royal Decree of November 14, 2007, Delhaize Group states that the other fundamental risks confronting the Company are unchanged from those described on the pages 62 through 67 of the 2013 Annual Report. To the best of our knowledge as of November 5, 2014, there are no other fundamental risks confronting the Company and influencing the remaining months of the financial year 2014. On a regular basis, the Board of Directors and Company management evaluate the business risks that confront Delhaize Group.
| Delhaize Group – Earnings Release – Third Quarter 2014 | 24 of 25 | |||||
DEFINITIONS
| — | American Depositary Share (ADS): An American Depositary Share represents ownership in the common share of a non-U.S. corporation. The underlying common shares are held by a U.S. bank, as depositary agent. The holder of an ADS benefits from dividend and voting rights pertaining to the underlying common share through the bank that issued the ADS. Four Delhaize ADSs represent one share of Delhaize Group common stock and are traded on the New York Stock Exchange |
| — | Basic earnings per share: profit or loss attributable to ordinary equity holders of the parent entity divided by the weighted average number of shares outstanding during the period. Basic earnings per share are calculated on profit (loss) from continuing operations less non-controlling interests attributable to continuing operations, and on the group share in net profit or loss |
| — | Comparable store sales: sales from the same stores, including relocations and expansions, and adjusted for calendar effects |
| — | Diluted earnings per share: is calculated by adjusting the profit or loss attributable to ordinary equity shareholders and the weighted average number of shares outstanding for the effects of all dilutive potential ordinary shares, including those related to convertible instruments, options or warrants or shares issued upon the satisfaction of specified conditions |
| — | EBITDA: operating profit plus depreciation, amortization and impairment |
| — | Free cash flow: cash flow before financing activities, investment in debt securities and term deposits and sale and maturity of debt securities and term deposits |
| — | Net debt: non-current financial liabilities, plus current financial liabilities and derivatives liabilities, minus derivative assets, investments in securities and term deposits, and cash and cash equivalents |
| — | Net financial expenses: finance costs less income from investments |
| — | Organic revenue growth: sales growth, excluding sales from acquisitions and divestitures, at identical currency exchange rates |
| — | Outstanding shares: the number of shares issued by the Company, excluding treasury shares |
| — | Underlying EBITDA: Underlying operating profit plus depreciation and amortization less any depreciation or amortization that has been excluded from underlying operating profit |
| — | Underlying operating profit: operating profit excluding fixed assets impairment charges, reorganization charges, store closing expenses, gains/losses on disposal of fixed assets and businesses and other items that management considers as not being representative of the Group’s operating performance of the period |
| — | Weighted average number of shares: number of shares outstanding at the beginning of the period less treasury shares, adjusted by the number of shares cancelled, repurchased or issued during the period multiplied by a time-weighting factor |
| — | Working capital: inventories plus receivables and other current assets, minus accounts payable and other current liabilities |
CAUTIONARY NOTE REGARDING FORWARD LOOKING STATEMENTS
Statements that are included or incorporated by reference in this press release and other written and oral statements made from time to time by Delhaize Group and its representatives, other than statements of historical fact, which address activities, events and developments that Delhaize Group expects or anticipates will or may occur in the future, including, without limitation, when the sale of Bottom Dollar Food stores to Aldi Supermarkets is expected to be completed; the financial flexibility that will result from the sale; the ultimate value of the transaction to Delhaize Group after working capital adjustments, expected costs savings, the closing, conversion and opening of stores, the expected effect of other portfolio optimization, anticipated revenue and net profit growth, anticipated free cash flow generation, strategic options, future strategies and the anticipated benefits of these strategies and (underlying) operating profit guidance, are “forward-looking statements” within the meaning of the U.S. federal securities laws that are subject to risks and uncertainties. These forward-looking statements generally can be identified as statements that include phrases such as “guidance,” “outlook,” “projected,” “believe,” “target,” “predict,” “estimate,” “forecast,” “strategy,” “may,” “goal,” “expect,” “anticipate,” “intend,” “plan,” “foresee,” “likely,” “will,” “should” or other similar words or phrases. Although such statements are based on current information, actual outcomes and results may differ materially from those projected depending upon a variety of factors, including, but not limited to, conditions to closing the sale of Bottom Dollar Food stores to Aldi, including regulatory approvals; changes in the general economy or the markets of Delhaize Group, in strategy, in consumer spending, in inflation or currency exchange rates or in legislation or regulation; competitive factors; adverse determination with respect to claims; inability to timely develop, remodel, integrate, open, convert or close stores; and supply or quality control problems with vendors. Additional risks and uncertainties that could cause actual results to differ materially from those stated or implied by such forward-looking statements are described in Delhaize Group’s most recent Annual Report on Form 20-F and other filings made by Delhaize Group with the U.S. Securities and Exchange Commission, which risk factors are incorporated herein by reference. Delhaize Group disclaims any obligation to update developments of these risk factors or to announce publicly any revision to any of the forward-looking statements contained in this release, including guidance with respect to underlying operating profit, SG&A, net finance costs, capital expenditures, store openings and free cash flow, or to make corrections to reflect future events or developments.
| Delhaize Group – Earnings Release – Third Quarter 2014 | 25 of 25 | |||||
DELHAIZE GROUP
Q3 2014 results
November 6, 2014
Forward looking statements
This presentation includes forward-looking statements within the meaning of the U.S. federal securities laws that are subject to risks and uncertainties. Forward-looking statements describe further expectations, plans, options, results or strategies. Actual outcomes and results may differ materially from those projected depending upon a variety of factors, including but not limited to changes in the general economy or the markets of Delhaize Group, in consumer spending, in inflation or currency exchange rates or in legislation or regulation; competitive factors; adverse determination with respect to claims; inability to timely develop, remodel, integrate or convert stores; and supply or quality control problems with vendors. Additional risks and uncertainties that could cause actual results to differ materially from those stated or implied by such forward-looking statements are described in our most recent annual report or Form 20-F and other filings with the Securities and Exchange Commission. Delhaize Group disclaims any obligation to update or revise the information contained in this presentation.
DELHAIZE GROUP 2
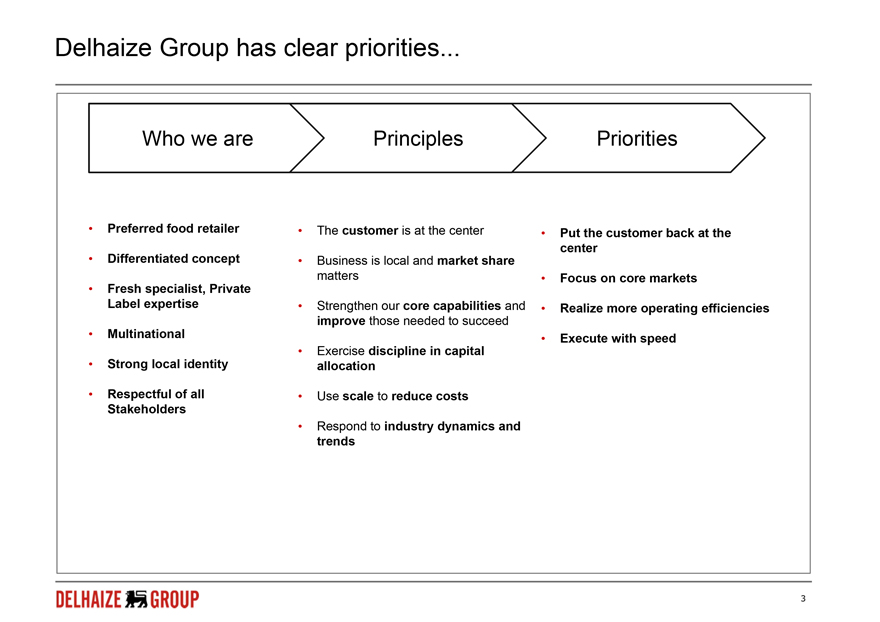
Delhaize Group has clear priorities…
Who we are
Principles
Priorities
Preferred food retailer The customer is at the center Put the customer back at the center
Differentiated concept Business is local and market share matters Focus on core markets
Fresh specialist, Private Label expertise Strengthen our core capabilities and improve those needed to succeed Realize more operating efficiencies
Multinational Execute with speed
Strong local identity Exercise discipline in capital allocation
Respectful of all Stakeholders Use scale to reduce costs Respond to industry dynamics and trends
DELHAIZE GROUP 3
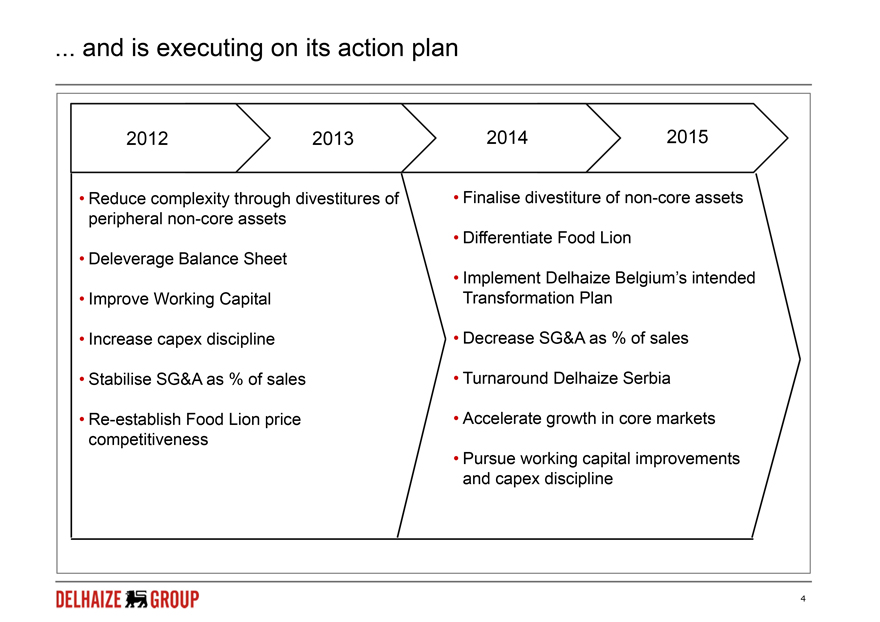
… and is executing on its action plan
2012 2013 2014 2015
Reduce complexity through divestitures of peripheral non-core assets
Finalise divestiture of non-core assets
Differentiate Food Lion
Deleverage Balance Sheet
Implement Delhaize Belgium’s intended Transformation Plan
Improve Working Capital
Increase capex discipline
Decrease SG&A as % of sales
Stabilise SG&A as % of sales
Turnaround Delhaize Serbia
Re-establish Food Lion price competitiveness
Accelerate growth in core markets
Pursue working capital improvements and capex discipline
DELHAIZE GROUP 4
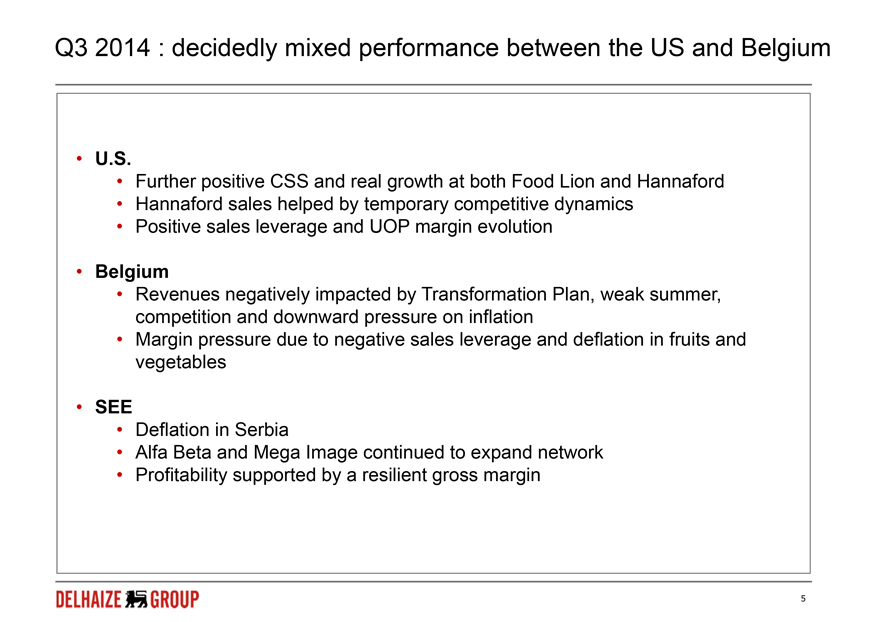
Q3 2014 : decidedly mixed performance between the US and Belgium
U.S.
Further positive CSS and real growth at both Food Lion and Hannaford
Hannaford sales helped by temporary competitive dynamics
Positive sales leverage and UOP margin evolution
Belgium
Revenues negatively impacted by Transformation Plan, weak summer, competition and downward pressure on inflation
Margin pressure due to negative sales leverage and deflation in fruits and vegetables
SEE
Deflation in Serbia
Alfa Beta and Mega Image continued to expand network
Profitability supported by a resilient gross margin
DELHAIZE GROUP 5
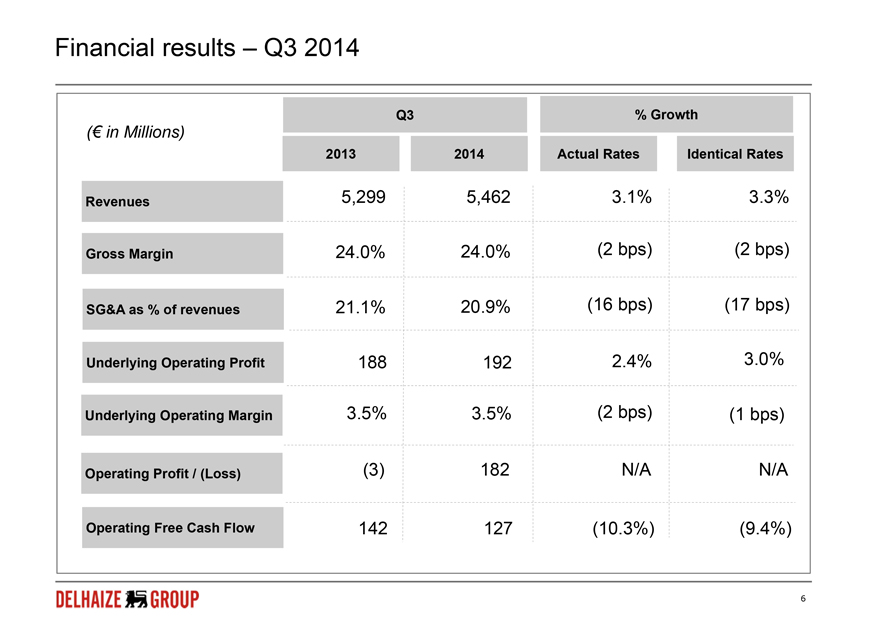
Financial results – Q3 2014
Q3 % Growth
(€ in Millions)
2013 2014 Actual Rates Identical Rates
Revenues 5,299 5,462 3.1% 3.3%
Gross Margin 24.0% 24.0% (2 bps) (2 bps)
SG&A as % of revenues 21.1% 20.9% (16 bps) (17 bps)
Underlying Operating Profit 188 192 2.4% 3.0%
Underlying Operating Margin 3.5% 3.5% (2 bps) (1 bps)
Operating Profit / (Loss) (3) 182 N/A N/A
Operating Free Cash Flow 142 127 (10.3%) (9.4%)
DELHAIZE GROUP 6
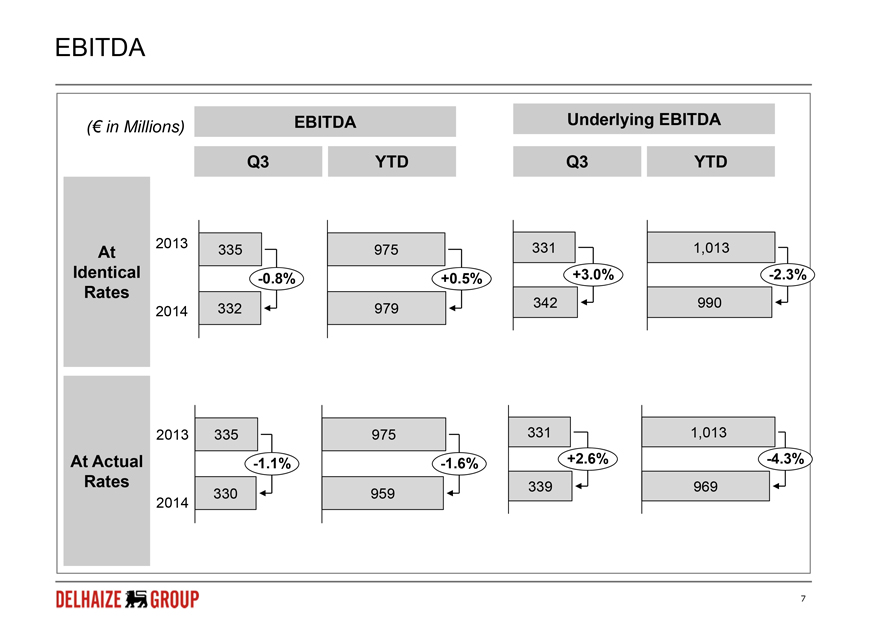
EBITDA
(€ in Millions)
EBITDA
Underlying EBITDA
Q3 YTD
Q3 YTD
At Identical Rates 2013 335 -0.8% 975 +0.5% 331 +3.0% 1,013 -2.3%
2014 332 979 342 990 2013 335 975 331 1,013
At Actual Rates 2014 330 -1.1% 959 -1.6% 339 +2.6% 969 -4.3%
DELHAIZE GROUP 7
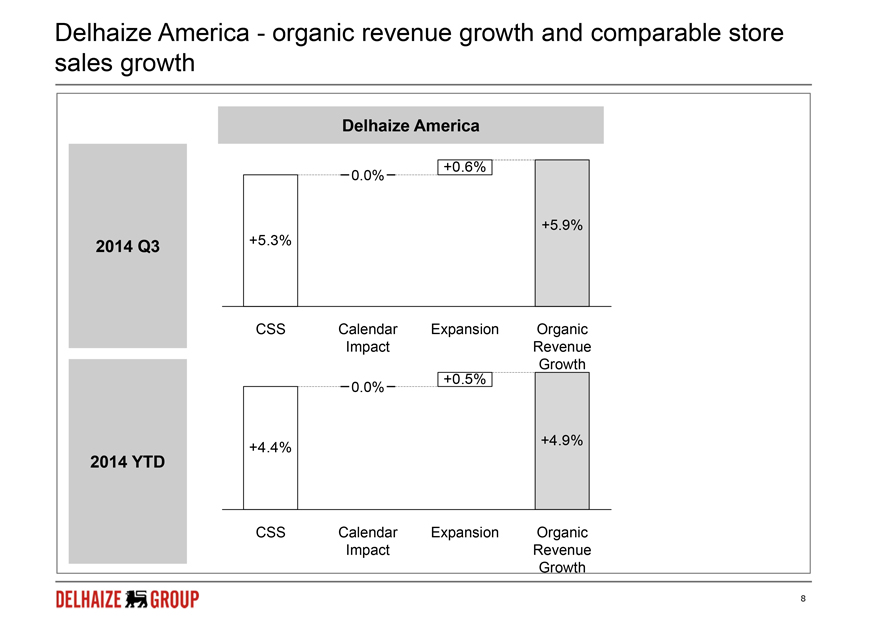
Delhaize America - organic revenue growth and comparable store sales growth
Delhaize America
0.0% +0.6% +5.3% +5.9%
2014 Q3
CSS Calendar Impact Expansion Organic Revenue Growth
0.0% +0.5% +4.4% +4.9%
2014 YTD
CSS Calendar Impact Expansion Organic Revenue Growth
DELHAIZE GROUP 8
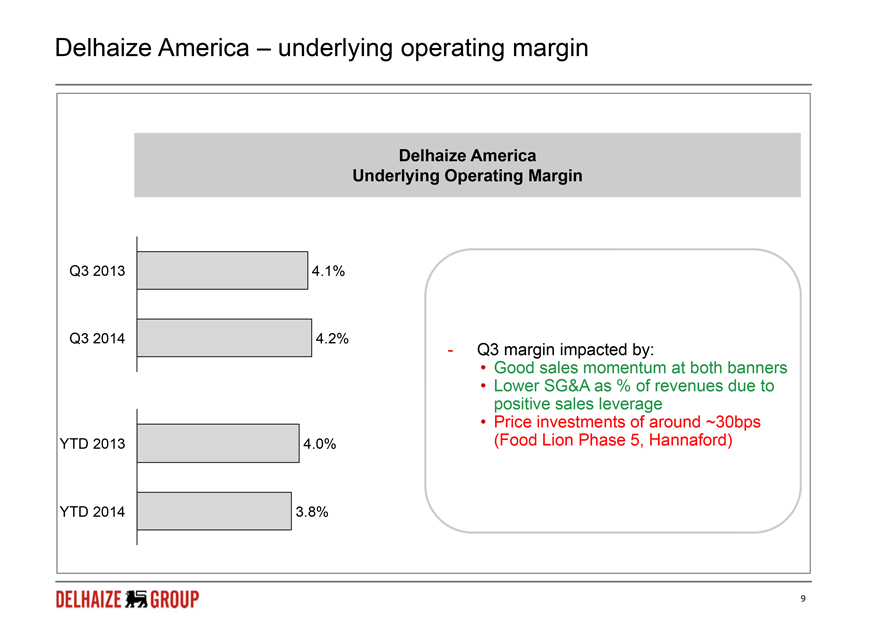
Delhaize America – underlying operating margin
Delhaize America Underlying Operating Margin
Q3 2013 4.1%
Q3 2014 4.2%
YTD 2013 4.0%
YTD 2014 3.8%
Q3 margin impacted by:
Good sales momentum at both banners
Lower SG&A as % of revenues due to positive sales leverage
Price investments of around ~30bps (Food Lion Phase 5, Hannaford)
DELHAIZE GROUP 9
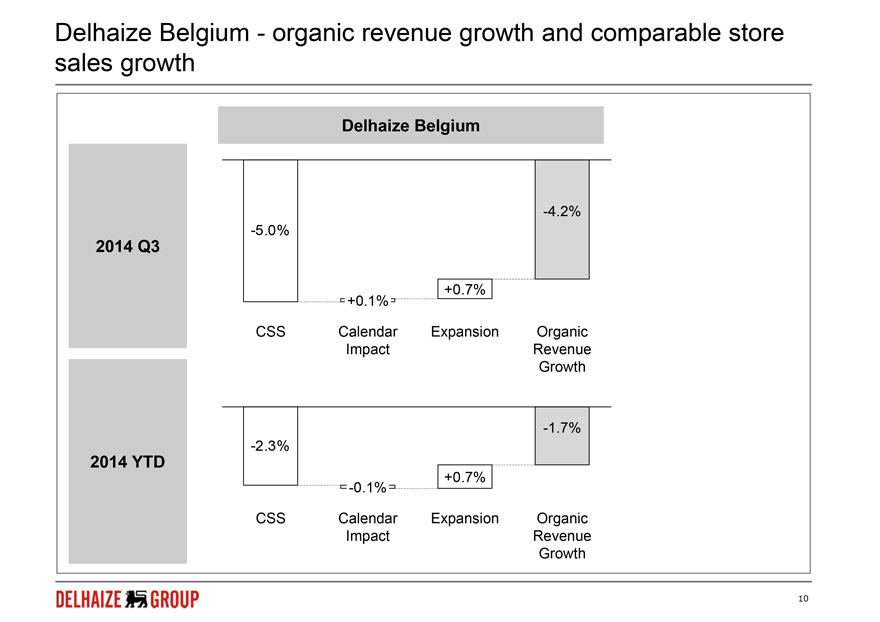
Delhaize Belgium - organic revenue growth and comparable store sales growth
Delhaize Belgium
-4.2%
-5.0%
2014 Q3
+0.7%
+0.1%
CSS
Calendar Impact
Expansion
Organic Revenue Growth
-1.7%
-2.3%
2014 YTD
+0.7%
-0.1%
CSS
Calendar Impact
Expansion
Organic Revenue Growth
DELHAIZE GROUP 10
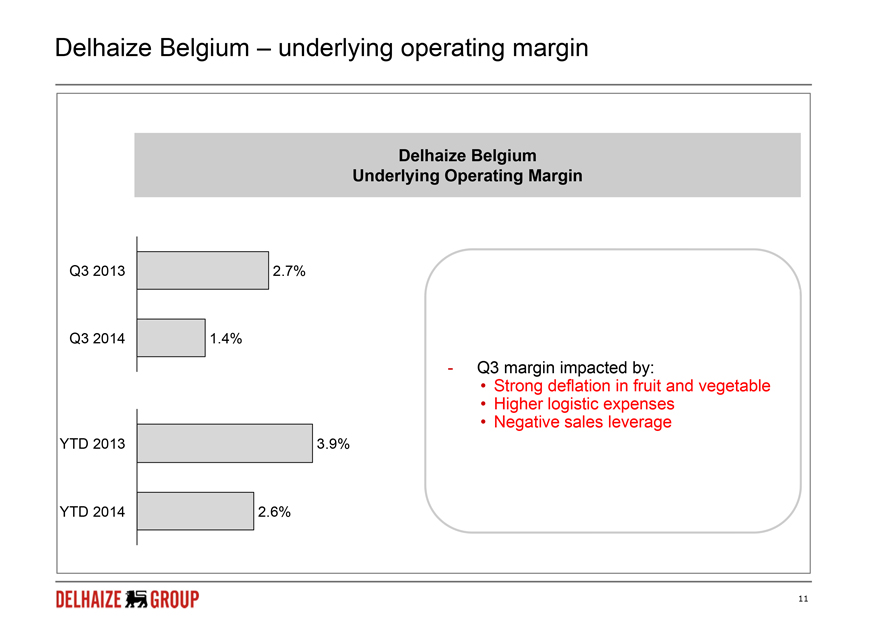
Delhaize Belgium – underlying operating margin
Delhaize Belgium Underlying Operating Margin
Q3 2013 2.7%
Q3 2014 1.4%
YTD 2013 3.9%
YTD 2014 2.6%
Q3 margin impacted by:
Strong deflation in fruit and vegetable
Higher logistic expenses
Negative sales leverage
DELHAIZE GROUP 11

SEE - organic revenue growth and comparable store sales growth
Southeastern Europe
2014 Q3
+5.9% +4.3%
-1.5%
-0.1%
CSS
Calendar Impact
Expansion
Organic Revenue Growth
2014 YTD
+4.4%
+5.2%
-0.6%
-0.2%
CSS
Calendar Impact
Expansion
Organic Revenue Growth
DELHAIZE GROUP 12
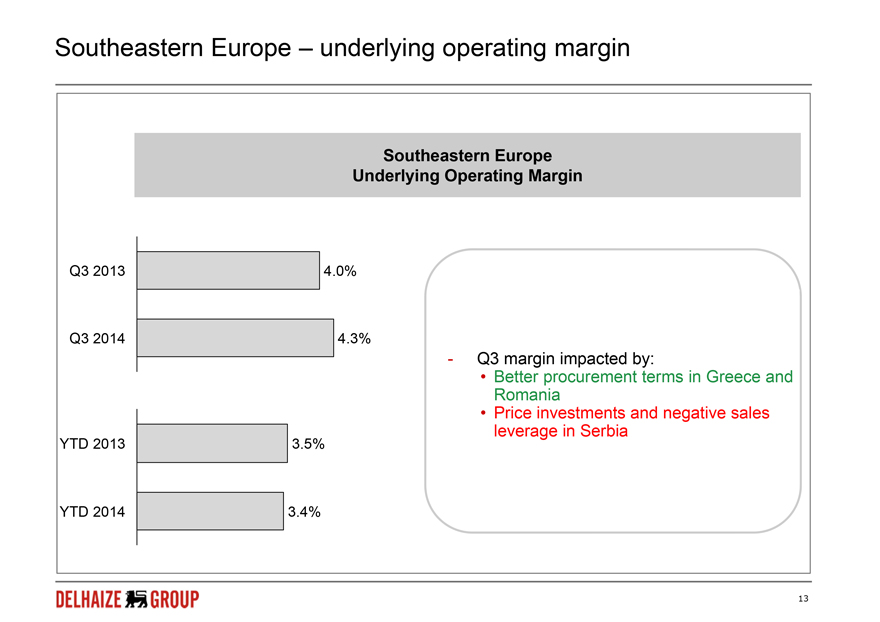
Southeastern Europe – underlying operating margin
Southeastern Europe Underlying Operating Margin
Q3 2013 4.0%
Q3 2014 4.3%
YTD 2013 3.5%
YTD 2014 3.4%
Q3 margin impacted by:
Better procurement terms in Greece and Romania
Price investments and negative sales leverage in Serbia
DELHAIZE GROUP 13
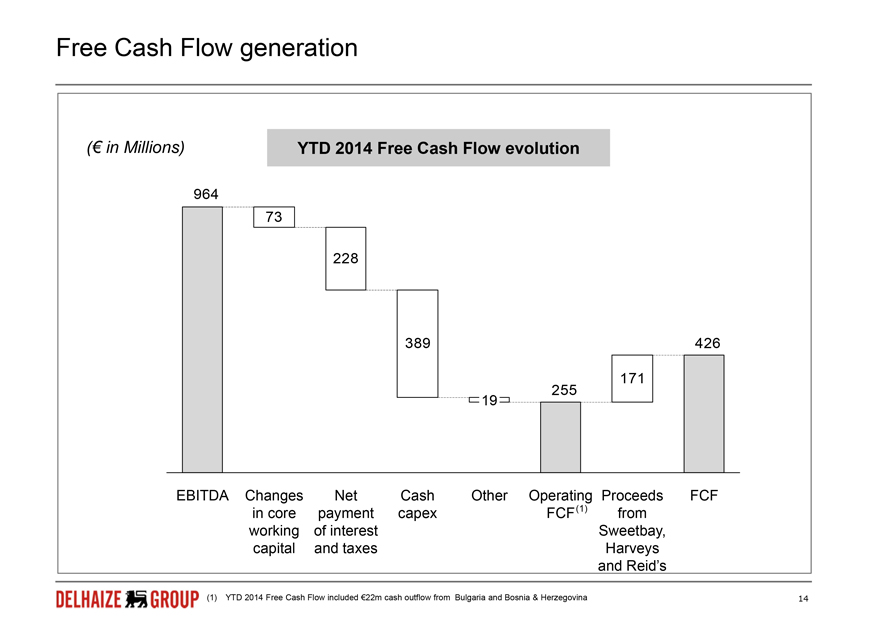
Free Cash Flow generation
(€ in Millions)
YTD 2014 Free Cash Flow evolution
964
73
228
389
426
171
255
19
EBITDA
Changes in core working capital
Net payment of interest and taxes
Cash capex
Other
Operating FCF (1)
Proceeds from Sweetbay, Harveys and Reid’s
FCF
(1) YTD 2014 Free Cash Flow included €22m cash outflow from Bulgaria and Bosnia & Herzegovina
DELHAIZE GROUP 14
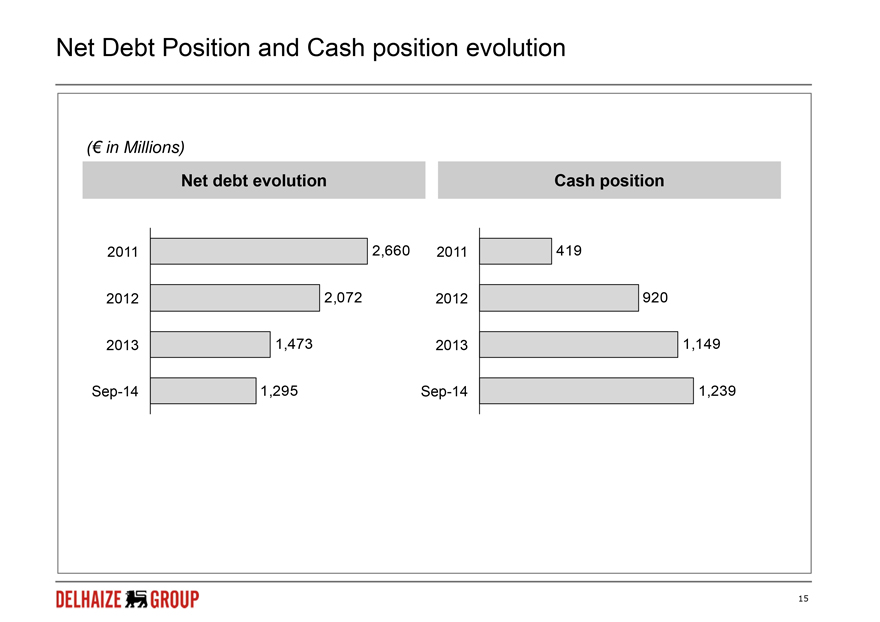
Net Debt Position and Cash position evolution
(€ in Millions)
Net debt evolution
2011 2,660
2012 2,072
2013 1,473
Sep-14 1,295
Cash position
2011 419
2012 920
2013 1,149
Sep-14 1,239
DELHAIZE GROUP 15
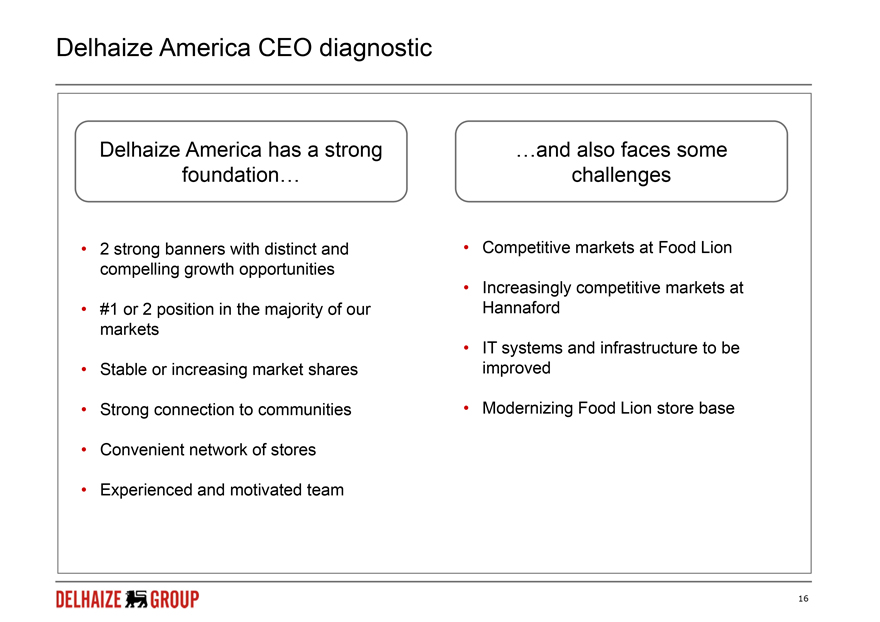
Delhaize America CEO diagnostic
Delhaize America has a strong foundation…
2 strong banners with distinct and compelling growth opportunities
#1 or 2 position in the majority of our markets
Stable or increasing market shares
Strong connection to communities
Convenient network of stores
Experienced and motivated team
…and also faces some challenges
Competitive markets at Food Lion
Increasingly competitive markets at Hannaford
IT systems and infrastructure to be improved
Modernizing Food Lion store base
DELHAIZE GROUP 16
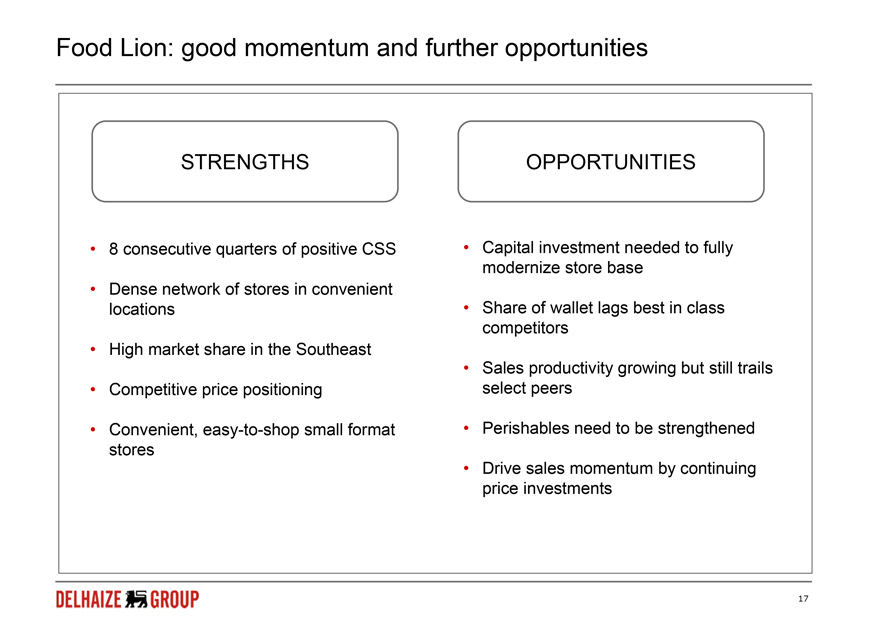
Food Lion: good momentum and further opportunities
STRENGTHS
8 consecutive quarters of positive CSS
• Dense network of stores in convenient locations
High market share in the Southeast
Competitive price positioning
Convenient, easy-to-shop small format stores
OPPORTUNITIES
Capital investment needed to fully modernize store base
Share of wallet lags best in class competitors
Sales productivity growing but still trails select peers
Perishables need to be strengthened
Drive sales momentum by continuing price investments
DELHAIZE GROUP 17

Today there exists a significant opportunity for Food Lion to grow
Average weekly sales
per square foot ($)(1)
Food Lion 2010 7,5
+5.8%
Food Lion 2013 7,9
Average selected peers(2) 10,2
Estimated share of
wallet potential(4)
Food Lion 18% 82%
today
Average of 26% 74%
local peers(3)
Spend at food retailer
Other grocery spend
Therefore we developed our “Easy, Fresh & Affordable” strategy
Leverages strong heritage in convenience and low prices
Addresses key opportunities in fresh experience
EASY fresh & Affordable
You can count on food lion… Every day!
(1) Square footage data notes: peer data from Spectra for 17 states with DA operations, Adjusted by industry average to reflect estimated selling sq ft; Food Lion actual selling sq ft
(2) Walmart supercenter, Walmart Neighborhood Market, Bi-Lo, Harris Teeter, Publix
(3) Local peers include Bi-Lo, Harris Teeter, Publix, Giant Carlisle and Martins
(4) Source: Nielsen Homescan, 52 weeks ending 12/28/13, Cross Outlet Facts, Retail Banner Shopper, Total US
DELHAIZE GROUP 18
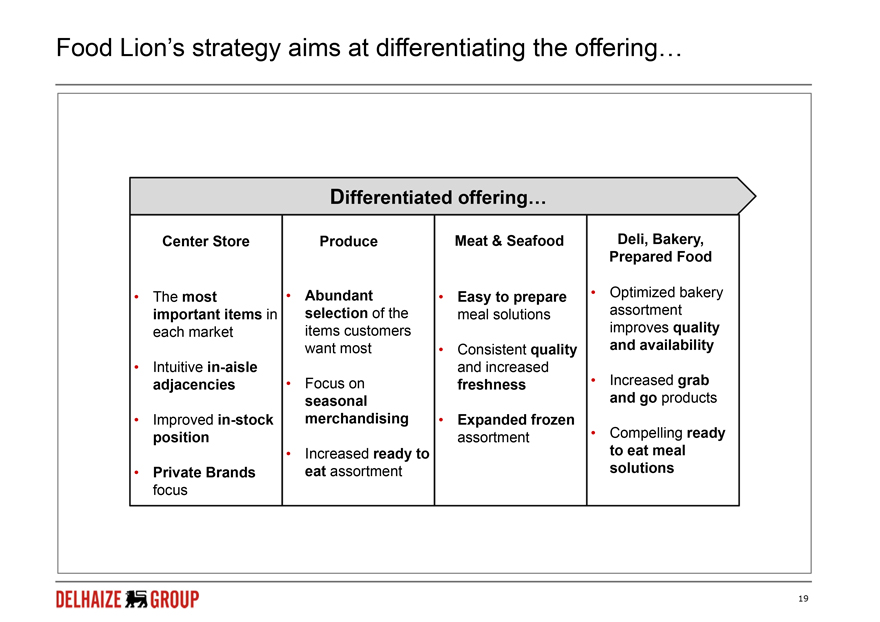
Food Lion’s strategy aims at differentiating the offering…
Differentiated offering
Center Store
The most important items in each market
Intuitive in-aisle adjacencies
Improved in-stock position
Private Brands focus
Produce
Abundant selection of the items customers want most
Focus on seasonal merchandising
Increased ready to eat assortment
Meat & Seafood
Easy to prepare meal solutions
Consistent quality and increased freshness
Expanded frozen assortment
Deli, Bakery, Prepared Food
Optimized bakery assortment improves quality and availability
Increased grab and go products
Compelling ready to eat meal solutions
DELHAIZE GROUP 19
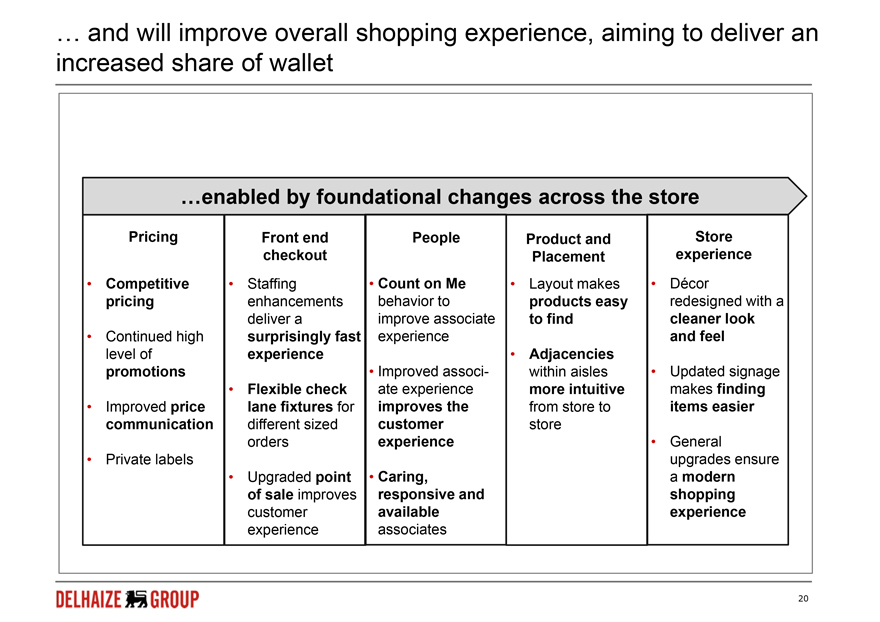
… and will improve overall shopping experience, aiming to deliver an increased share of wallet
…enabled by foundational changes across the store
Pricing
Competitive pricing
Continued high level of promotions
Improved price communication
Private labels
Front end checkout
Staffing enhancements deliver a surprisingly fast experience
Flexible check lane fixtures for different sized orders
Upgraded point of sale improves customer experience
People
Count on Me behavior to improve associate experience
Improved associate experience improves the customer experience
Caring, responsive and available associates
Product and Placement
Layout makes products easy to find
Adjacencies within aisles more intuitive from store to store
Store experience
Décor redesigned with a cleaner look and feel
Updated signage makes finding items easier
General upgrades ensure a modern shopping experience
DELHAIZE GROUP 20
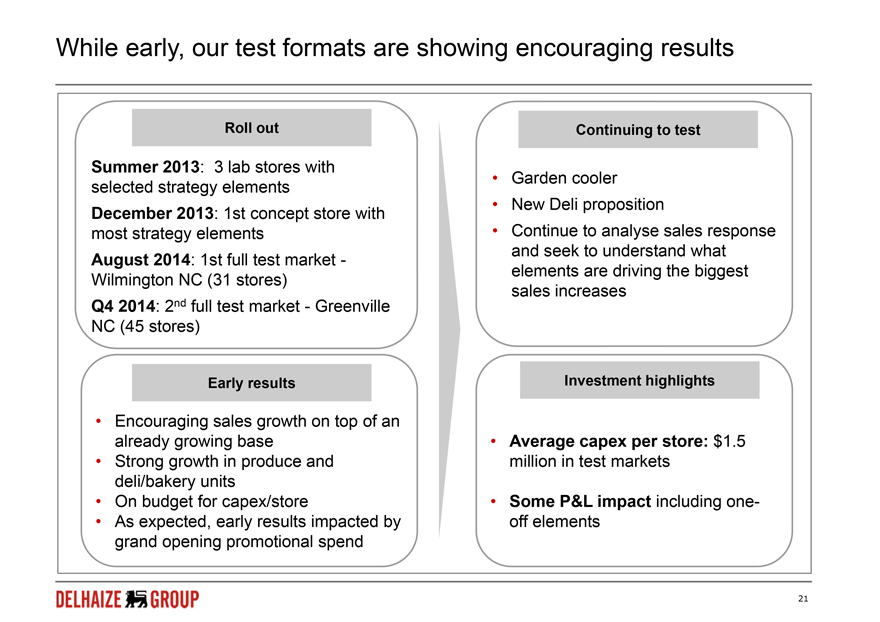
While early, our test formats are showing encouraging results
Roll out
Summer 2013: 3 lab stores with selected strategy elements
December 2013: 1st concept store with most strategy elements
August 2014: 1st full test market - Wilmington NC (31 stores)
Q4 2014: 2nd full test market - Greenville NC (45 stores)
Early results
Encouraging sales growth on top of an already growing base
Strong growth in produce and deli/bakery units
On budget for capex/store
As expected, early results impacted by grand opening promotional spend
Continuing to test
Garden cooler
New Deli proposition
Continue to analyse sales response and seek to understand what elements are driving the biggest sales increases
Investment highlights
Average capex per store: $1.5 million in test markets
Some P&L impact including one-off elements
DELHAIZE GROUP 21
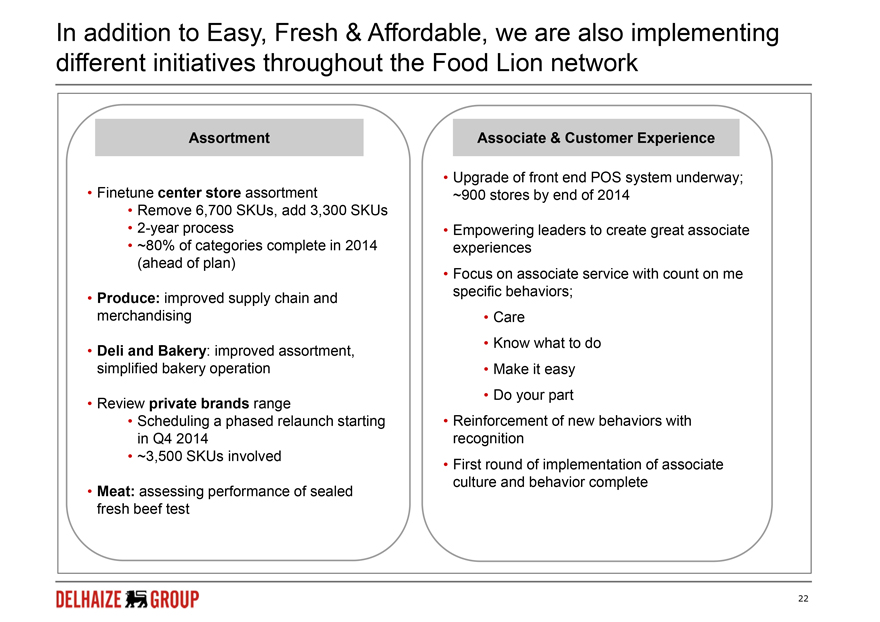
In addition to Easy, Fresh & Affordable, we are also implementing different initiatives throughout the Food Lion network
Assortment
Finetune center store assortment
Remove 6,700 SKUs, add 3,300 SKUs
2-year process
~80% of categories complete in 2014 (ahead of plan)
Produce: improved supply chain and merchandising
Deli and Bakery: improved assortment, simplified bakery operation
Review private brands range
Scheduling a phased relaunch starting in Q4 2014
~3,500 SKUs involved
Meat: assessing performance of sealed fresh beef test
Associate & Customer Experience
Upgrade of front end POS system underway; ~900 stores by end of 2014
Empowering leaders to create great associate experiences
Focus on associate service with count on me specific behaviors;
Care
Know what to do
Make it easy
Do your part
Reinforcement of new behaviors with recognition
First round of implementation of associate culture and behavior complete
DELHAIZE GROUP 22
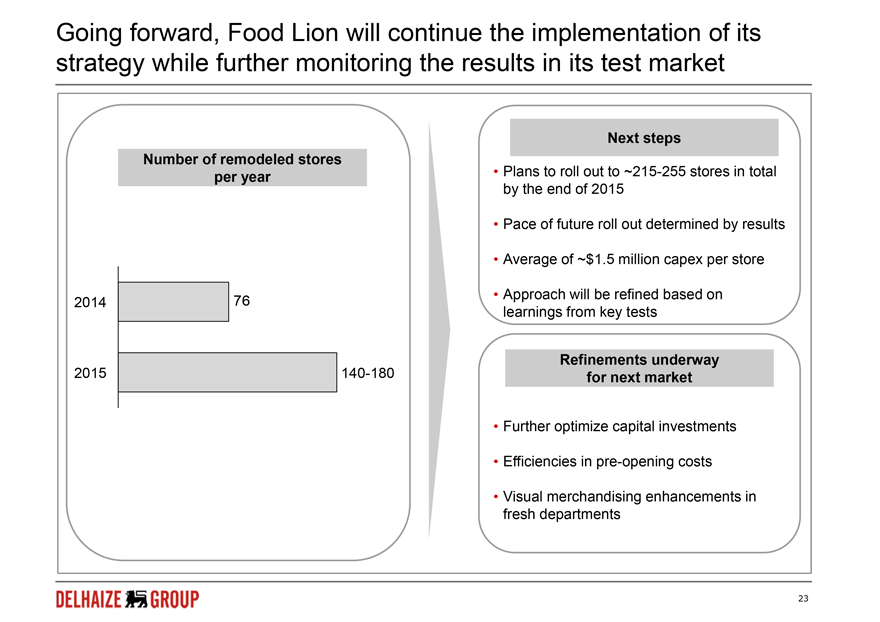
Going forward, Food Lion will continue the implementation of its strategy while further monitoring the results in its test market
Number of remodeled stores per year
2014 76
2015 140-180
Next steps
Plans to roll out to ~215-255 stores in total by the end of 2015
Pace of future roll out determined by results
Average of ~$1.5 million capex per store
Approach will be refined based on learnings from key tests
Refinements underway for next market
Further optimize capital investments
Efficiencies in pre-opening costs
Visual merchandising enhancements in fresh departments
DELHAIZE GROUP 23
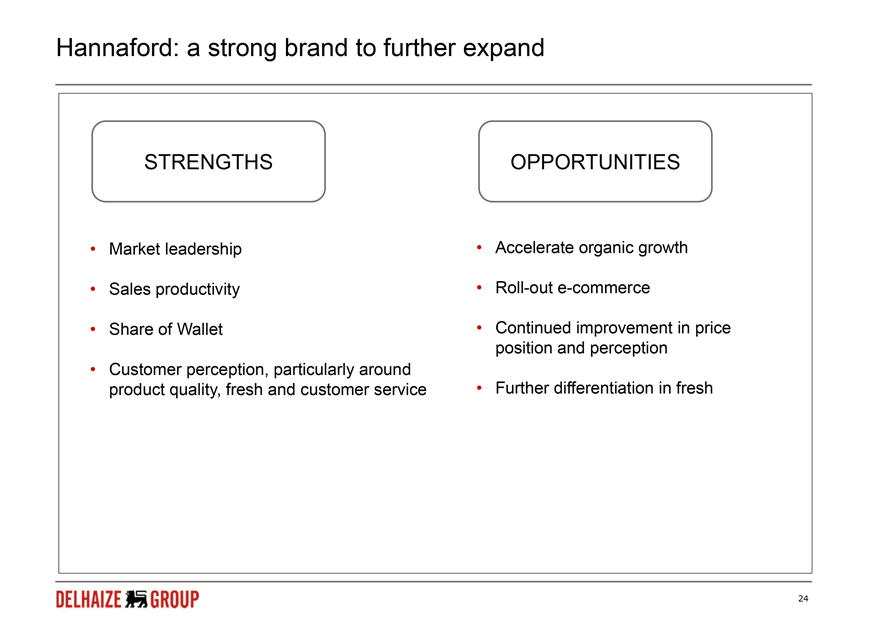
Hannaford: a strong brand to further expand
STRENGTHS
Market leadership
Sales productivity
Share of Wallet
Customer perception, particularly around product quality, fresh and customer service
OPPORTUNITIES
Accelerate organic growth
Roll-out e-commerce
Continued improvement in price position and perception
Further differentiation in fresh
DELHAIZE GROUP
24
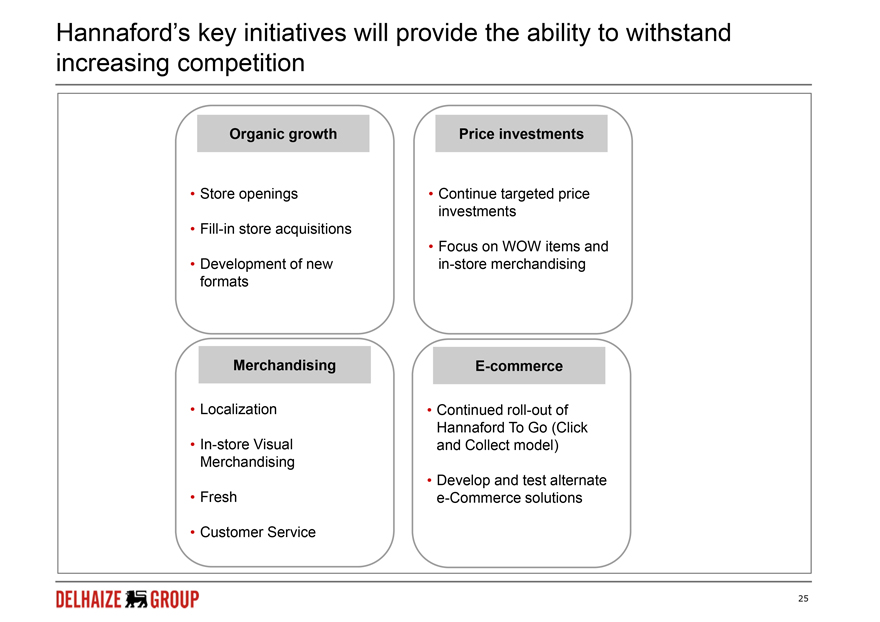
Hannaford’s key initiatives will provide the ability to withstand increasing competition
Organic growth
Store openings
Fill-in store acquisitions
Development of new formats
Merchandising
Localization
In-store Visual Merchandising
Fresh
Customer Service
Price investments
Continue targeted price investments
Focus on WOW items and in-store merchandising
E-commerce
Continued roll-out of Hannaford To Go (Click and Collect model)
Develop and test alternate e-Commerce solutions
DELHAIZE GROUP
25
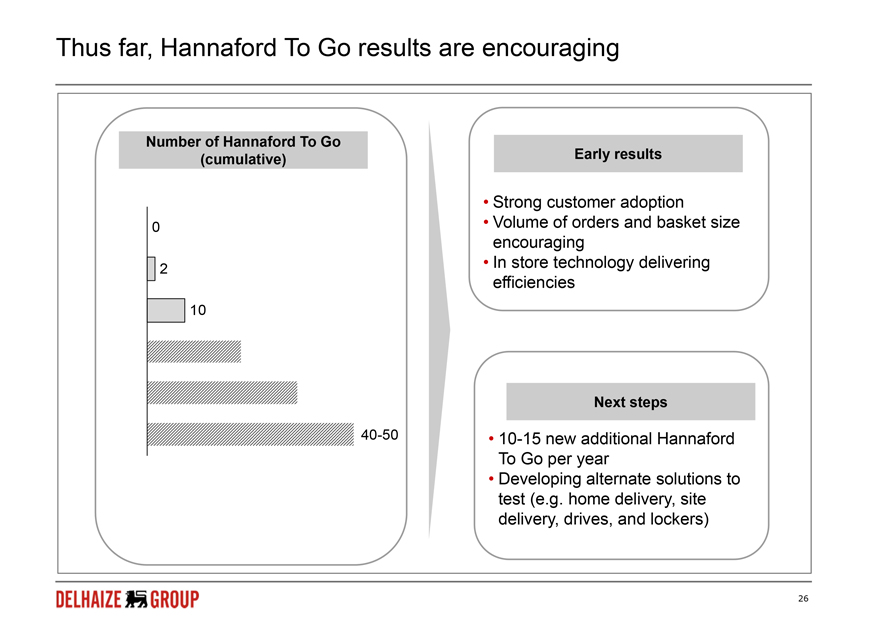
Thus far, Hannaford To Go results are encouraging
Number of Hannaford To Go (cumulative)
0 2 10 40-50
Early results
Strong customer adoption
Volume of orders and basket size encouraging
In store technology delivering efficiencies
Next steps
10-15 new additional Hannaford To Go per year
Developing alternate solutions to test (e.g. home delivery, site delivery, drives, and lockers)
DELHAIZE GROUP
26
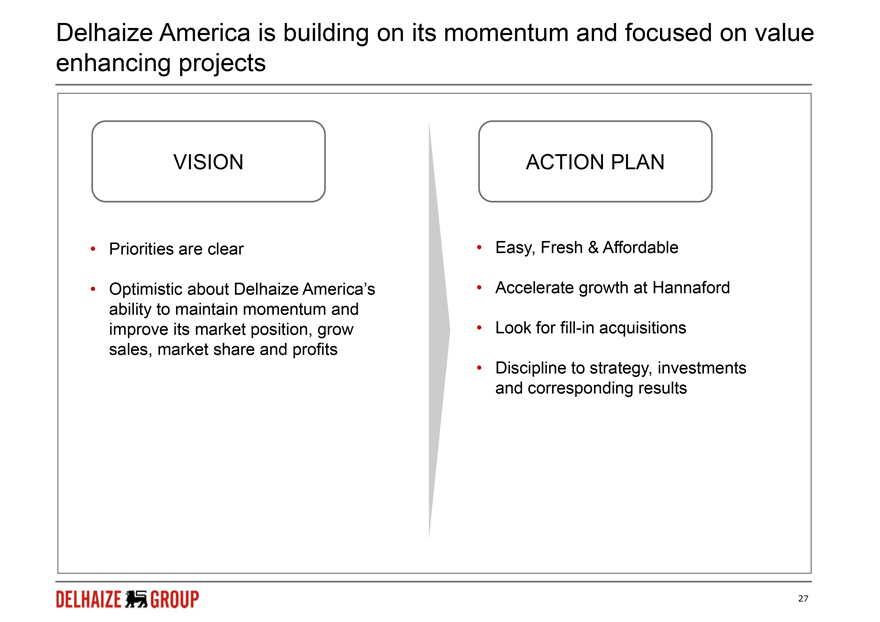
Delhaize America is building on its momentum and focused on value enhancing projects
VISION
Priorities are clear
Optimistic about Delhaize America’s ability to maintain momentum and improve its market position, grow sales, market share and profits
ACTION PLAN
Easy, Fresh & Affordable
Accelerate growth at Hannaford
Look for fill-in acquisitions
Discipline to strategy, investments and corresponding results
DELHAIZE GROUP
27
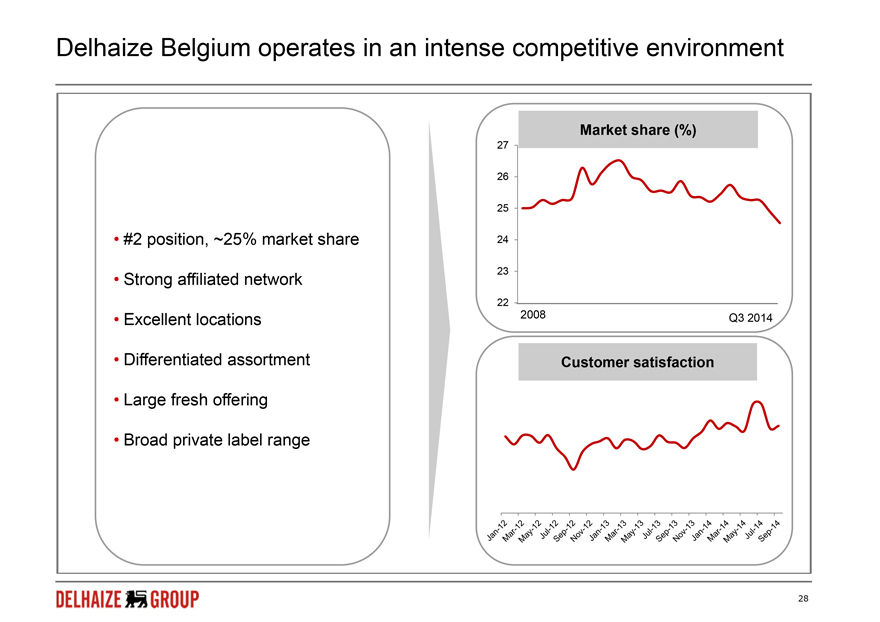
Delhaize Belgium operates in an intense competitive environment
#2 position, ~25% market share
Strong affiliated network
Excellent locations
Differentiated assortment
Large fresh offering
Broad private label range
Market share (%)
27
26
25
24
23
22
2008 Q3 2014
Customer satisfaction
Jan-12 Mar-12 May-12 Jul-12 Sep-12 Nov-12 Jan-13 Mar-13 May-13 Jul-13 Sep-13 Nov-13 Jan-14 Mar-14 May-14 Jul-14 Sep-14
DELHAIZE GROUP
28
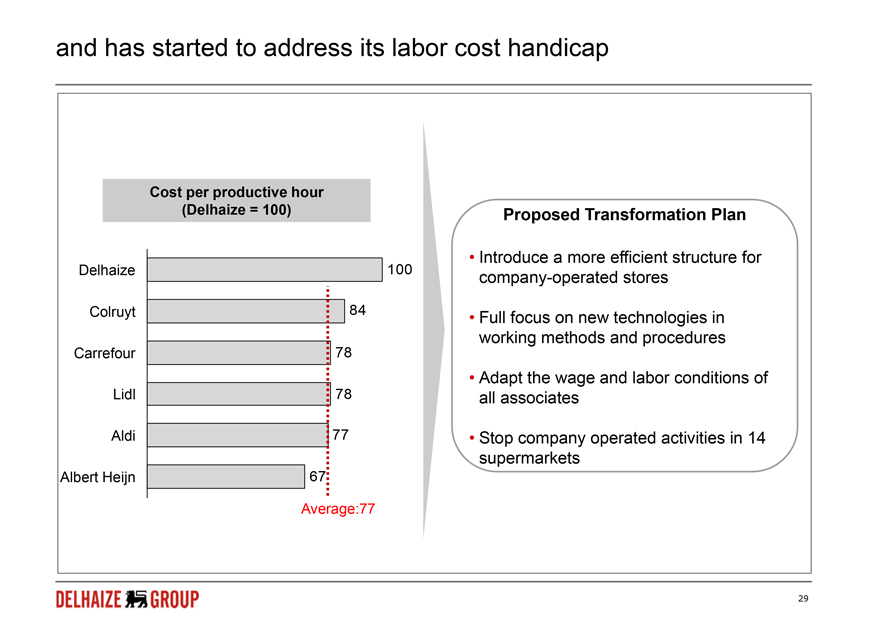
and has started to address its labor cost handicap
Cost per productive hour
(Delhaize = 100)
Delhaize 100
Colruyt 84
Carrefour 78
Lidl 78
Aldi 77
Albert Heijn 67
Average: 77
Proposed Transformation Plan
Introduce a more efficient structure for company-operated stores
Full focus on new technologies in working methods and procedures
Adapt the wage and labor conditions of all associates
Stop company operated activities in 14 supermarkets
DELHAIZE GROUP
29
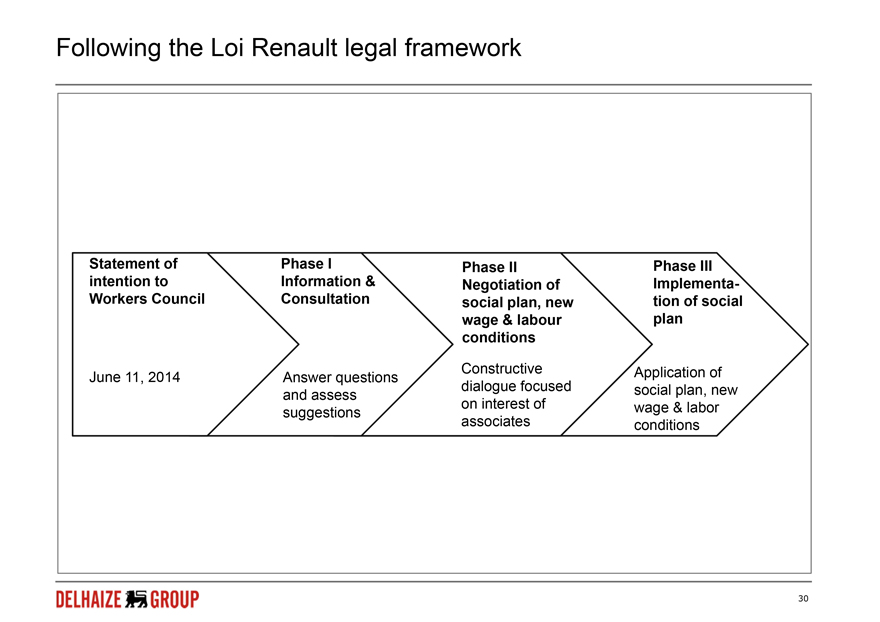
Following the Loi Renault legal framework
Statement of intention to Workers Council
Phase I Information & Consultation
Phase II Negotiation of social plan, new wage & labour conditions
Phase III Implementa- tion of social plan
June 11, 2014 Answer questions Constructive Application of
and assess dialogue focused social plan, new
suggestions on interest of wage & labor
associates conditions
DELHAIZE GROUP
30
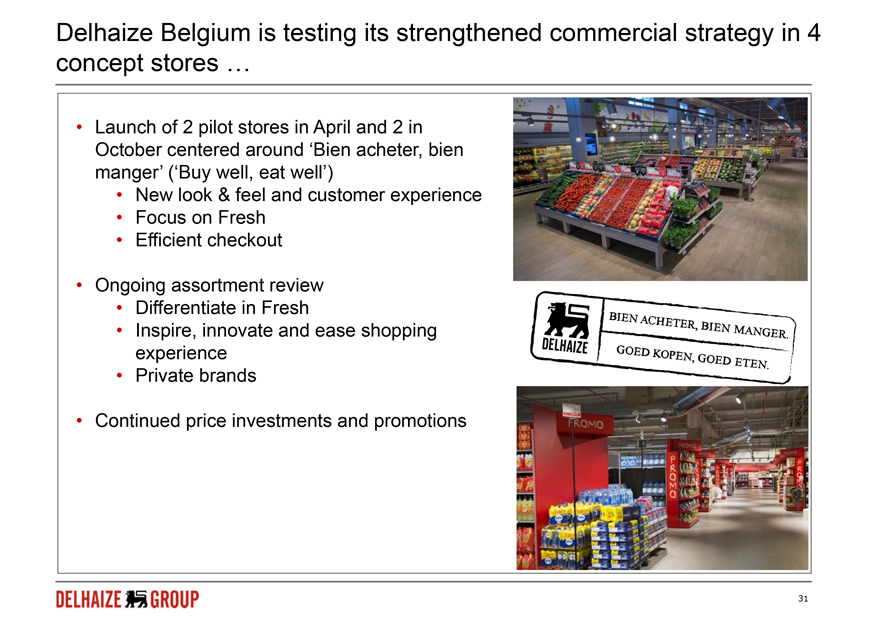
Delhaize Belgium is testing its strengthened commercial strategy in 4 concept stores …
Launch of 2 pilot stores in April and 2 in October centered around ‘Bien acheter, bien manger’ (‘Buy well, eat well’)
New look & feel and customer experience
Focus on Fresh
Efficient checkout
Ongoing assortment review
Differentiate in Fresh
Inspire, innovate and ease shopping experience
Private brands
Continued price investments and promotions
DELHAIZE BIEN ACHETER, BIEN MANGER.
GOED KOPEN, GOED ETEN.
DELHAIZE GROUP 31
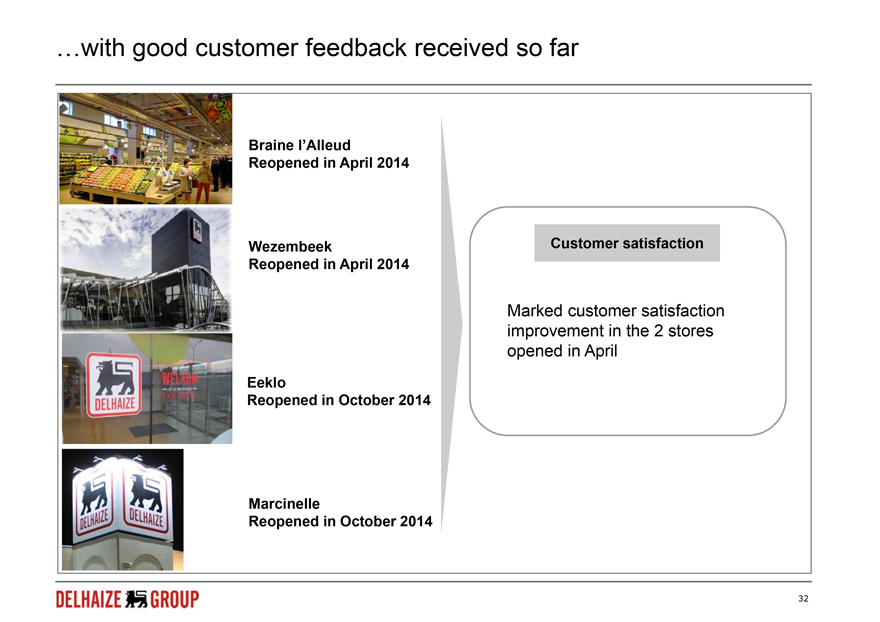
…with good customer feedback received so far
Braine l’Alleud
Reopened in April 2014
Wezembeek
Reopened in April 2014
Eeklo
Reopened in October 2014
DELHAIZE
Marcinelle
Reopened in October 2014
DELHAIZE DELHAIZE
Customer satisfaction
Marked customer satisfaction improvement in the 2 stores opened in April
DELHAIZE GROUP 32
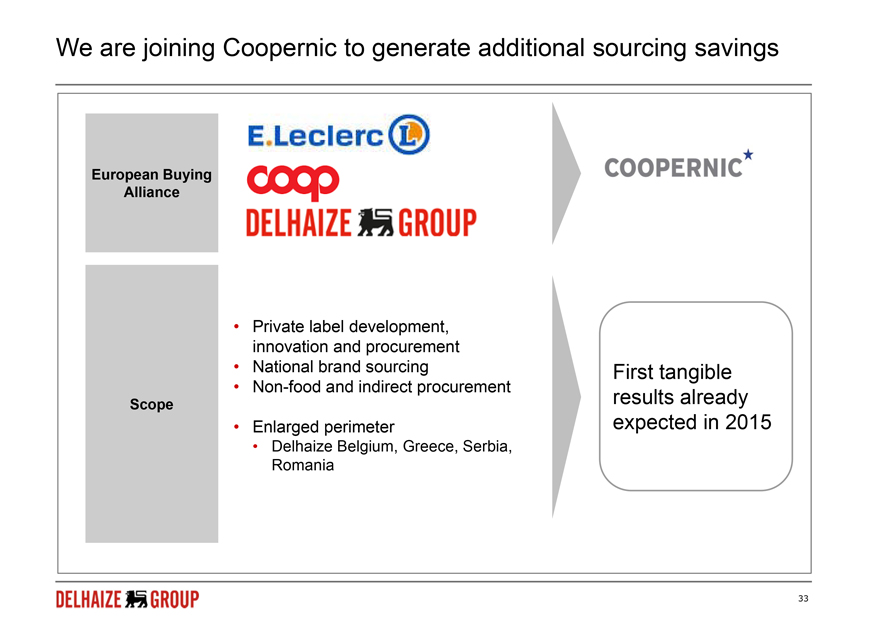
We are joining Coopernic to generate additional sourcing savings
European Buying Alliance
Scope
E.Leclerc L
coop
COOPERNIC
DELHAIZE GROUP
Private label development, innovation and procurement
National brand sourcing
Non-food and indirect procurement
Enlarged perimeter
Delhaize Belgium, Greece, Serbia, Romania
First tangible results already expected in 2015
DELHAIZE GROUP 33
Southeastern Europe continues expansion albeit facing a difficult economic environment
Greece
Pressured market (continued high unemployment, further austerity measures and weak summer) Focused on further store expansion and CSS growth
Serbia
Tough economic conditions (public spending cuts, retail deflation, expected next VAT hike); competition speeding up expansion.
Early success of remodellings
New commercial policy at Tempo recently started
Romania
Competition and Mega Image continue to expand in Bucharest. Food inflation is signficantly lower than expected this year
Earnings growth supported by SG&A control and store expansion
DELHAIZE GROUP 34
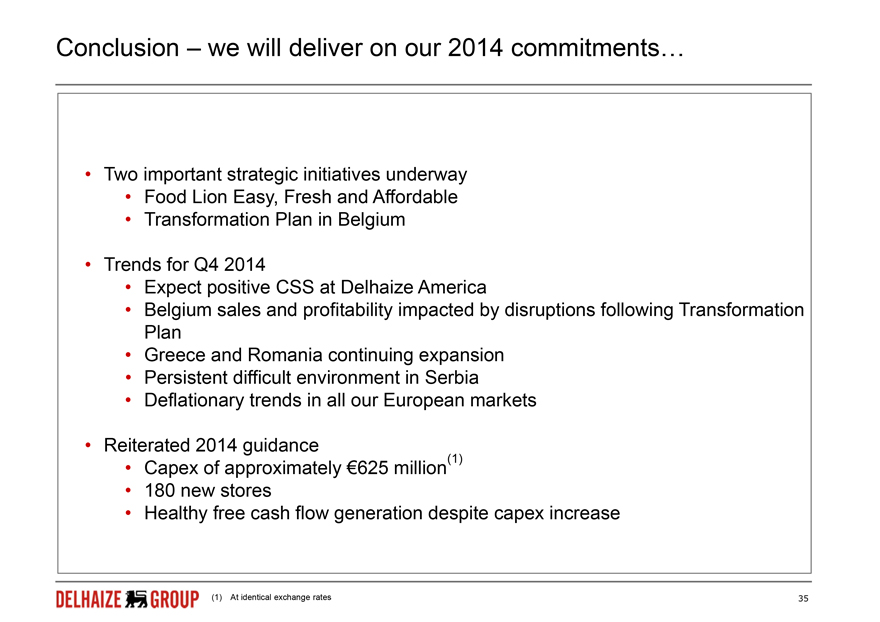
Conclusion — we will deliver on our 2014 commitments…
Two important strategic initiatives underway
Food Lion Easy, Fresh and Affordable
Transformation Plan in Belgium
Trends for Q4 2014
Expect positive CSS at Delhaize America
Belgium sales and profitability impacted by disruptions following Transformation Plan
Greece and Romania continuing expansion
Persistent difficult environment in Serbia
Deflationary trends in all our European markets
Reiterated 2014 guidance
Capex of approximately €625 million (1)
180 new stores
Healthy free cash flow generation despite capex increase
DELHAIZE GROUP
(1) At identical exchange rates
35
…and are preparing for 2015 prospects
Further focus and careful roll-out of Easy, Fresh and Affordable
Accelerate growth at Hannaford
Implement the Transformation Plan in Belgium
Maximise potential benefits of Coopernic
Accelerate organic growth in selected markets
Further financial discipline with respect to capital allocation and free cash flow generation
DELHAIZE GROUP 36
SIGNATURES
Pursuant to the requirements of the Securities Exchange Act of 1934, the registrant has duly caused this report to be signed on its behalf by the undersigned hereunto duly authorized.
ETABLISSEMENTS DELHAIZE FRÈRES ET CIE “LE LION” (GROUPE DELHAIZE) | ||||||||
| Date: November 10, 2014 | By: | /s/ G. Linn Evans | ||||||
| G. Linn Evans | ||||||||
| Senior Vice President | ||||||||