UNITED STATES
SECURITIES AND EXCHANGE COMMISSION
Washington, D.C. 20549
FORMN-CSR
CERTIFIED SHAREHOLDER REPORT
OF REGISTERED MANAGEMENT INVESTMENT COMPANIES
Investment Company Act file number811-09102
iShares, Inc.
(Exact name of registrant as specified in charter)
c/o: State Street Bank and Trust Company
100 Summer Street, 4th Floor, Boston, MA 02110
(Address of principal executive offices) (Zip code)
The Corporation Trust Incorporated
2405 York Road, Suite 201, Lutherville-Timonium, Maryland 21093
(Name and address of agent for service)
Registrant’s telephone number, including area code: (415)670-2000
Date of fiscal year end: October 31, 2019
Date of reporting period: October 31, 2019
Item 1. Reports to Stockholders.
Copies of the annual reports transmitted to shareholders pursuant to Rule30e-1 under the Investment Company Act of 1940 are attached.
 | OCTOBER 31, 2019 |
2019 Annual Report | ||
iShares, Inc.
| · | iShares Emerging Markets High Yield Bond ETF | EMHY | Cboe BZX |
| · | iShares International High Yield Bond ETF | HYXU | Cboe BZX |
| · | iShares J.P. Morgan EM Corporate Bond ETF | CEMB | Cboe BZX |
| · | iShares J.P. Morgan EM Local Currency Bond ETF | LEMB | NYSE Arca |
| · | iShares US & Intl High Yield Corp Bond ETF | GHYG | Cboe BZX |
Beginning on January 1, 2021, as permitted by regulations adopted by the Securities and Exchange Commission, paper copies of each Fund’s shareholder reports will no longer be sent by mail, unless you specifically request paper copies of the reports from your financial intermediary, such as a broker-dealer or bank. Instead, the reports will be made available on a website, and you will be notified by mail each time a report is posted and provided with a website link to access the report.
You may elect to receive all future reports in paper free of charge. If you hold accounts through a financial intermediary, you can follow the instructions included with this disclosure, if applicable, or contact your financial intermediary to request that you continue to receive paper copies of your shareholder reports. Please note that not all financial intermediaries may offer this service. Your election to receive reports in paper will apply to all funds held with your financial intermediary.
If you already elected to receive shareholder reports electronically, you will not be affected by this change and you need not take any action. You may elect to receive electronic delivery of shareholder reports and other communications by contacting your financial intermediary. Please note that not all financial intermediaries may offer this service.
| Page | ||||
| 3 | ||||
| 4 | ||||
| 14 | ||||
| 14 | ||||
| 15 | ||||
Financial Statements | ||||
| 57 | ||||
| 59 | ||||
| 61 | ||||
| 64 | ||||
| 69 | ||||
| 77 | ||||
| 78 | ||||
| 79 | ||||
| 83 | ||||
| 87 | ||||
| 89 | ||||
| 90 | ||||
iShares, Inc.
Global Bond Market Overview
Global investment-grade bonds advanced for the 12 months ended October 31, 2019 (“reporting period”). The Bloomberg Barclays Global Aggregate Index, a broad measure of global bond market performance, returned 9.54% in U.S. dollar terms for the reporting period.
The performance of global bonds was driven primarily by lower interest rates, as concerns about the global economy led central banks around the world to implement a series of interest rate reductions. Following a cycle of higher interest rates in 2018, slowing economic growth and the protracted trade dispute between the U.S. and China prompted central banks to adopt or signal more accommodative monetary policies beginning January 2019. Low inflation and weak economic indicators led investors to anticipate continued stimulative policies from the world’s central banks. Consequently, global bond yields (which are inversely related to prices) declined to their lowest level in 120 years, with more than $17 trillion in bonds worldwide offering a negative yield as of August 2019.
U.S. bond yields declined significantly as the delayed impact of higher interest rates early in the reporting period and the trade dispute between the U.S. and China weighed on economic growth, particularly in the manufacturing and industrial sectors. In response to deteriorating economic conditions, the U.S. Federal Reserve Bank (“Fed”) shifted to a more accommodative monetary policy starting in January 2019. After raising short-term interest rates in December 2018, the Fed reversed course and lowered them three times in 2019. Long-term bond yields declined more than short-term yields, reflecting lower inflation expectations and solid demand for the relative stability of U.S. Treasuries amid economic uncertainty. Consequently, the U.S. Treasury yield curve (a graphical representation of U.S. Treasury yields at different maturities) flattened before briefly inverting in August 2019, as10-year Treasury yields dipped belowtwo-year Treasury yields.
European bonds also posted strong returns in an environment of tepid economic growth and softening exports. The Eurozone’s slowing economy prompted the European Central Bank (“ECB”) to reinstate its monetary stimulus program and lower the interest rate on deposits made by commercial banks. The ECB also signaled its willingness to decrease its headline short-term interest rate in the future, which further helped Eurozone bond yields. Investors generally viewed the nomination of a new president of the ECB late in the reporting period as a positive development, anticipating that she would continue policies that promote low interest rates and monetary stimulus. As yields for many government bonds turned negative, investors seeking higher returns moved toward debt issued by countries that are considered higher risk. Italian bonds in particular benefited from a shift toward higher-yielding debt, despite the fact that the country dipped into recession briefly in 2019 before returning to growth. U.K. bond yields also declined, as uncertainty surrounding Brexit prompted investors to move away from equities, which are generally more exposed to trade risk.
A slowing Chinese economy and the trade dispute between the U.S. and China helped the performance of bonds in the Asia/Pacific region, as concerns about a possible economic downturn prompted investors to move into bonds. Japanese bond prices increased due to strong demand from both domestic and foreign investors, while South Korean bonds benefited from the country’s high credit rating and trade surplus, which investors viewed as signs of stability. Emerging market bonds also posted solid returns, driven by investors’ demand for yield as an increasing number of developed-market bonds offered negative interest rates.
| MARKET OVERVIEW | 3 |
| iShares® Emerging Markets High Yield Bond ETF |
Investment Objective
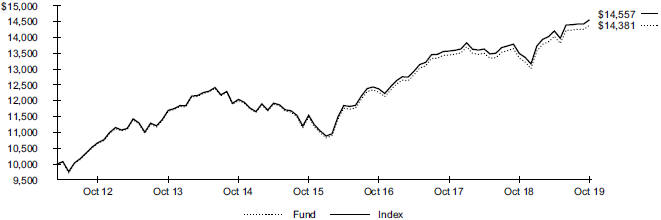
The iShares Emerging Markets High Yield Bond ETF(the “Fund”) seeks to track the investment results of an index composed of U.S. dollar-denominated, emerging market high yield sovereign and corporate bonds, as represented by the Morningstar® Emerging Markets High Yield Bond IndexSM (the “Index”). The Fund invests in a representative sample of securities included in the Index that collectively has an investment profile similar to the Index. Due to the use of representative sampling, the Fund may or may not hold all of the securities that are included in the Index.
Performance
| Average Annual Total Returns | Cumulative Total Returns | |||||||||||||||||||||||||||
| 1 Year | 5 Years | Since Inception | 1 Year | 5 Years | Since Inception | |||||||||||||||||||||||
Fund NAV | 10.51 | % | 4.53 | % | 5.15 | % | 10.51 | % | 24.78 | % | 46.29 | % | ||||||||||||||||
Fund Market | 10.96 | 4.49 | 5.19 | 10.96 | 24.58 | 46.76 | ||||||||||||||||||||||
Index | 10.69 | 4.73 | 5.48 | 10.69 | 26.02 | 49.85 | ||||||||||||||||||||||
GROWTH OF $10,000 INVESTMENT
(SINCE INCEPTION AT NET ASSET VALUE)
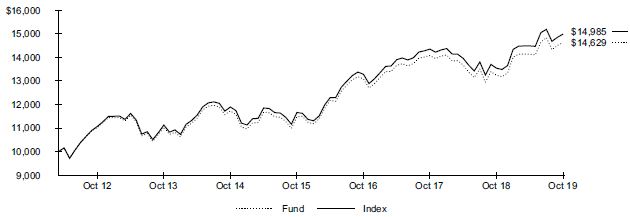
The inception date of the Fund was 4/3/12. The first day of secondary market trading was 4/3/12.
Past performance is no guarantee of future results. Performance results do not reflect the deduction of taxes that a shareholder would pay on fund distributions or on the redemption or sale of fund shares. See “About Fund Performance” on page 14 for more information.
Expense Example
| Actual | Hypothetical 5% Return | |||||||||||||||||||||||||||||
| | Beginning Account Value (05/01/19) | | | Ending Account Value (10/31/19) | | | Expenses Paid During the Period | (a) | | Beginning Account Value (05/01/19) | | | Ending Account Value (10/31/19) | | | Expenses Paid During the Period | (a) | | Annualized Expense Ratio | | ||||||||||
| $ | 1,000.00 | $ 1,035.20 | $ 2.56 | $ 1,000.00 | $ 1,022.70 | $ 2.55 | 0.50 | % | ||||||||||||||||||||||
| (a) | Expenses are calculated using the Fund’s annualized expense ratio (as disclosed in the table), multiplied by the average account value for the period, multiplied by the number of days in the period (184 days) and divided by the number of days in the year (365 days). See “Shareholder Expenses” on page 14 for more information. |
| 4 | 2019ISHARES ANNUAL REPORTTO SHAREHOLDERS |
| Fund Summary as of October 31, 2019 (continued) | iShares® Emerging Markets High Yield Bond ETF |
Portfolio Management Commentary
Emerging market high-yield bonds increased sharply for the reporting period. Demand for emerging market debt strengthened, as low yields in developed countries sent investors in search of higher yields in emerging markets. Similarly, interest rate reductions by the Fed drove capital flows to emerging markets and provided room for emerging market central banks to lower interest rates.
Brazilian bonds contributed the most to the Index’s return, benefiting from declining short-term interest rates as the central bank reduced interest rates multiple times, reaching record lows. While economic growth remained modest, bonds advanced due to low inflation, plans to reform government pensions, and the restructuring and recapitalization of Brazil’sstate-run energy sector.
Turkish bonds also contributed to the Index’s return despite volatility of the Turkish lira in an uncertain political environment. Easing tensions between the U.S. and Turkey led to substantial reductions in interest rates by the Turkish central bank, which drove bond yields sharply lower in the second half of the reporting period.
Similarly, central bank interest rate reductions, declining inflation, and the restructuring of debt and financial commitments from the government in thestate-run energy sector aided Mexican bonds. In China, policy reforms designed to attract more foreign investment in Chinese corporate debt led to substantial foreign inflows. Strong domestic demand in key sectors also benefited Chinese corporate bonds.
On the downside, Argentine bonds detracted significantly from the Index’s return amid concern about the country’s rising debt, including large payments due to the International Monetary Fund in coming years. The weakening of the Argentine peso, which declined substantially against the U.S. dollar amid dramatic political change and uncertainty, also weighed on returns.
Portfolio Information
ALLOCATION BY CREDIT QUALITY
Moody’s Credit Rating* | | Percent of Total Investments | (a) | |
Baa | 13.3 | % | ||
Ba | 34.6 | |||
B | 35.2 | |||
Caa | 7.5 | |||
Ca | 0.1 | |||
C | 0.4 | |||
Not Rated | 8.9 |
TEN LARGEST COUNTRIES
Country | | Percent of Total Investments | (a) | |
Brazil | 19.8 | % | ||
Turkey | 13.0 | |||
China | 8.4 | |||
Mexico | 8.3 | |||
South Africa | 5.0 | |||
Argentina | 4.1 | |||
Ukraine | 3.1 | |||
Egypt | 3.0 | |||
Ecuador | 2.9 | |||
Dominican Republic | 2.7 |
| * | Credit quality ratings shown reflect the ratings assigned by Moody’s Investors Service (“Moody’s”), a widely used independent, nationally recognized statistical rating organization. Moody’s credit ratings are opinions of the credit quality of individual obligations or of an issuer’s general creditworthiness. Investment grade ratings are credit ratings of Baa or higher. Below investment grade ratings are credit ratings of Ba or lower. Unrated investments do not necessarily indicate low credit quality. Credit quality ratings are subject to change. |
| (a) | Excludes money market funds. |
| FUND SUMMARY | 5 |
Fund Summary as of October 31, 2019 | iShares® International High Yield Bond ETF |
Investment Objective
TheiShares International High Yield Bond ETF(the “Fund”) seeks to track the investment results of an index composed of euro, British pound sterling and Canadian dollar-denominated, high yield corporate bonds, as represented by the Markit iBoxx® Global Developed Marketsex-US High Yield Index (the “Index”). The Fund invests in a representative sample of securities included in the Index that collectively has an investment profile similar to the Index. Due to the use of representative sampling, the Fund may or may not hold all of the securities that are included in the Index.
Performance
| Average Annual Total Returns | Cumulative Total Returns | |||||||||||||||||||||||||||
| 1 Year | 5 Years | Since Inception | 1 Year | 5 Years | Since Inception | |||||||||||||||||||||||
Fund NAV | 4.85 | % | 1.39 | % | 3.37 | % | 4.85 | % | 7.14 | % | 28.54 | % | ||||||||||||||||
Fund Market | 4.96 | 1.30 | 3.37 | 4.96 | 6.65 | 28.60 | ||||||||||||||||||||||
Index | 5.18 | 1.68 | 3.54 | 5.18 | 8.67 | 30.11 | ||||||||||||||||||||||
GROWTH OF $10,000 INVESTMENT
(SINCE INCEPTION AT NET ASSET VALUE)
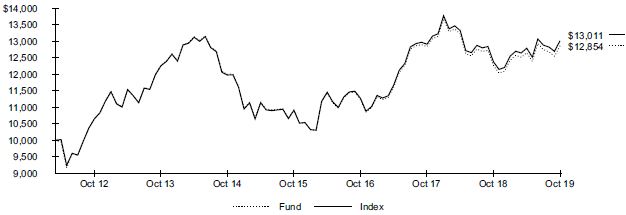
The inception date of the Fund was 4/3/12. The first day of secondary market trading was 4/3/12.
Past performance is no guarantee of future results. Performance results do not reflect the deduction of taxes that a shareholder would pay on fund distributions or on the redemption or sale of fund shares. See “About Fund Performance” on page 14 for more information.
Expense Example
| Actual | Hypothetical 5% Return | |||||||||||||||||||||||||||||
| | Beginning Account Value (05/01/19) | | | Ending Account Value (10/31/19) | | | Expenses Paid During the Period | (a) | | Beginning Account Value (05/01/19) | | | Ending Account Value (10/31/19) |
| | Expenses Paid During the Period | (a) | | Annualized Expense Ratio | | ||||||||||
| $ | 1,000.00 | $ 1,016.30 | $ 2.03 | $ 1,000.00 | $ 1,023.20 | $ 2.04 | 0.40 | % | ||||||||||||||||||||||
| (a) | Expenses are calculated using the Fund’s annualized expense ratio (as disclosed in the table), multiplied by the average account value for the period, multiplied by the number of days in the period (184 days) and divided by the number of days in the year (365 days). See “Shareholder Expenses” on page 14 for more information. |
| 6 | 2019ISHARES ANNUAL REPORTTO SHAREHOLDERS |
| Fund Summary as of October 31, 2019 (continued) | iShares® International High Yield Bond ETF |
Portfolio Management Commentary
International high-yield bonds advanced during the reporting period as investors sought the higher yields available from corporate bonds compared to other segments of the fixed income market. Negative yields in sovereign bonds around the world increased demand for corporate bonds, benefiting the Index’s return.
From a country perspective, Italian euro-denominated high-yield corporate bonds were the leading contributor to the Index’s return. The ECB reduced deposit interest rates and signaled plans for additional stimulus measures, benefiting the European corporate bond market. In Italy, the perception of improving political stability following the formation of a new government increased demand for Italian corporate bonds. Investors seeking European debt especially favored Italian corporate bonds, whose yields exceeded those offered by many other European countries. Investor confidence in Italian companies, many of which are multinational, also aided Italian corporate bonds.
High-yield U.S. corporate bonds also contributed to the Index’s return, benefiting from falling interest rates and investors’ search for yield. The supply of high-yield bonds increased, rising to its highest level in three years during June 2019, as low interest rates and strong investor demand drove significant new issuance. Defaults on high-yield corporate bonds rose near the end of the reporting period, particularly among energy companies. Corporate bonds from Luxembourg and Ireland also contributed modestly to the Index’s returns, benefiting from the ECB’s economic stimulus policies.
From a bond rating perspective, bonds rated Ba, which constituted more than half of the Index on average for the reporting period, contributed the most to the Index’s return. Other rating tiers within the high-yield category also contributed, with higher-rated debt generally contributing more.
Portfolio Information
ALLOCATION BY CREDIT QUALITY
Moody’s Credit Rating* | | Percent of Total Investments | (a) | |
Baa | 1.3 | % | ||
Ba | 55.6 | |||
B | 23.1 | |||
Caa | 6.8 | |||
Not Rated | 13.2 |
TEN LARGEST HOLDINGS
Country | | Percent of Total Investments | (a) | |
United States | 18.9 | % | ||
Italy | 15.9 | |||
France | 12.0 | |||
Germany | 7.9 | |||
United Kingdom | 7.8 | |||
Netherlands | 6.0 | |||
Spain | 5.6 | |||
Ireland | 4.8 | |||
Sweden | 4.1 | |||
Luxembourg | 3.6 |
| * | Credit quality ratings shown reflect the ratings assigned by Moody’s Investors Service (“Moody’s”), a widely used independent, nationally recognized statistical rating organization. Moody’s credit ratings are opinions of the credit quality of individual obligations or of an issuer’s general creditworthiness. Investment grade ratings are credit ratings of Baa or higher. Below investment grade ratings are credit ratings of Ba or lower. Unrated investments do not necessarily indicate low credit quality. Credit quality ratings are subject to change. |
| (a) | Excludes money market funds. |
| FUND SUMMARY | 7 |
Fund Summary as of October 31, 2019 | iShares® J.P. Morgan EM Corporate Bond ETF |
Investment Objective
TheiShares J.P. Morgan EM Corporate Bond ETF(the “Fund”) seeks to track the investment results of an index composed of U.S. dollar-denominated, emerging market corporate bonds, as represented by the J.P. Morgan CEMBI Broad Diversified Core Index (the “Index”). The Fund invests in a representative sample of securities included in the Index that collectively has an investment profile similar to the Index. Due to the use of representative sampling, the Fund may or may not hold all of the securities that are included in the Index.
Performance
| Average Annual Total Returns | Cumulative Total Returns | |||||||||||||||||||||||||||
| 1 Year | 5 Years | Since Inception | 1 Year | 5 Years | Since Inception | |||||||||||||||||||||||
Fund NAV | 12.57 | % | 4.49 | % | 4.58 | % | 12.57 | % | 24.53 | % | 40.19 | % | ||||||||||||||||
Fund Market | 13.14 | 4.69 | 4.64 | 13.14 | 25.78 | 40.79 | ||||||||||||||||||||||
Index | 13.09 | 5.11 | 5.17 | 13.09 | 28.31 | 46.18 | ||||||||||||||||||||||
GROWTH OF $10,000 INVESTMENT
(SINCE INCEPTION AT NET ASSET VALUE)
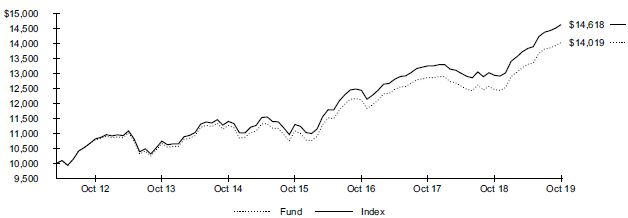
The inception date of the Fund was 4/17/12. The first day of secondary market trading was 4/19/12.
Index Performance through May 31, 2017 reflects the performance of the Morningstar® Emerging Markets Corporate Bond IndexSM. Index performance beginning on June 1, 2017 reflects the performance of the J.P. Morgan CEMBI Broad Diversified Core Index.
Past performance is no guarantee of future results. Performance results do not reflect the deduction of taxes that a shareholder would pay on fund distributions or on the redemption or sale of fund shares. See “About Fund Performance” on page 14 for more information.
Expense Example
| Actual | Hypothetical 5% Return | |||||||||||||||||||||||||||||
| | Beginning Account Value (05/01/19) | | | Ending Account Value (10/31/19) | | | Expenses Paid During the Period | (a) | | Beginning Account Value (05/01/19) | | | Ending Account Value (10/31/19) | | | Expenses Paid During the Period | (a) | | Annualized Expense Ratio | | ||||||||||
| $ | 1,000.00 | $ 1,054.30 | $ 2.59 | $ 1,000.00 | $ 1,022.70 | $ 2.55 | 0.50 | % | ||||||||||||||||||||||
| (a) | Expenses are calculated using the Fund’s annualized expense ratio (as disclosed in the table), multiplied by the average account value for the period, multiplied by the number of days in the period (184 days) and divided by the number of days in the year (365 days). See “Shareholder Expenses” on page 14 for more information. |
| 8 | 2019ISHARES ANNUAL REPORTTO SHAREHOLDERS |
| Fund Summary as of October 31, 2019 (continued) | iShares® J.P. Morgan EM Corporate Bond ETF |
Portfolio Management Commentary
U.S. dollar-denominated emerging market corporate bonds posted a strong positive return for the reporting period. The Index advanced as investors sought the high yields available from corporate bonds compared to other segments of the fixed income market. Negative yields in developed nations’ sovereign and corporate bonds increased demand for emerging market corporate bonds among investors seeking positive yield.
Chinese corporate bonds contributed the most to the Index’s return, as policy reforms designed to attract more foreign investment in Chinese corporate debt led to substantial foreign inflows. In addition, strong domestic demand in key sectors benefited Chinese corporate bonds, which advanced despite U.S.-China trade tensions.
In Brazil, corporate bonds gained, benefiting from declining short-term interest rates as the central bank reduced interest rates multiple times, reaching record lows. While economic growth remained modest, bonds advanced due to low inflation, plans to reform government pensions, and the restructuring and recapitalization of Brazil’sstate-run energy sector.
Mexican corporate bonds contributed to the Index’s return, aided by central bank interest rate reductions and relatively high yields given the country’s degree of economic and political stability. Bond yields in Mexico declined with inflation, which led to solid performance for Mexican bonds despite ongoing credit concerns in the energy sector.
European bonds also contributed to the Index’s performance, particularly in Russia, where revenues from thestate-run energy sector increased cash reserves and drove down bond yields. In Turkey, easing tensions between the U.S. and Turkey led to substantial reductions in interest rates by the Turkish central bank, driving bond yields sharply lower in the second half of the reporting period.
Portfolio Information
ALLOCATION BY CREDIT QUALITY
Moody’s Credit Rating* | | Percent of Total Investments | (a) | |
Aa | 2.8 | % | ||
A | 19.0 | |||
Baa | 32.6 | |||
Ba | 16.0 | |||
B | 10.1 | |||
Caa | 3.0 | |||
Ca | 0.1 | |||
Not Rated | 16.4 |
TEN LARGEST COUNTRIES
Country | | Percent of Total Investments | (a) | |
China | 8.9 | % | ||
Brazil | 6.9 | |||
Mexico | 5.7 | |||
Hong Kong | 5.6 | |||
Russia | 5.4 | |||
United Arab Emirates | 5.2 | |||
India | 5.0 | |||
Colombia | 4.8 | |||
South Korea | 4.7 | |||
Turkey | 4.5 |
| * | Credit quality ratings shown reflect the ratings assigned by Moody’s Investors Service (“Moody’s”), a widely used independent, nationally recognized statistical rating organization. Moody’s credit ratings are opinions of the credit quality of individual obligations or of an issuer’s general creditworthiness. Investment grade ratings are credit ratings of Baa or higher. Below investment grade ratings are credit ratings of Ba or lower. Unrated investments do not necessarily indicate low credit quality. Credit quality ratings are subject to change. |
| (a) | Excludes money market funds. |
| FUND SUMMARY | 9 |
| Fund Summary as of October 31, 2019 | iShares® J.P. Morgan EM Local Currency Bond ETF |
Investment Objective
TheiShares J.P. Morgan EM Local Currency Bond ETF(the “Fund”) seeks to track the investment results of an index composed of local currency denominated, emerging market sovereign bonds, as represented by the J.P. MorganGBI-EM Global Diversified 15% Cap 4.5% Floor Index (the “Index”). The Fund invests in a representative sample of securities included in the Index that collectively has an investment profile similar to the Index. Due to the use of representative sampling, the Fund may or may not hold all of the securities that are included in the Index.
Performance
| Average Annual Total Returns | Cumulative Total Returns | |||||||||||||||||||||||||||
| 1 Year | 5 Years | Since Inception | 1 Year | 5 Years | Since Inception | |||||||||||||||||||||||
Fund NAV | 8.75 | % | (0.46 | )% | 0.59 | % | 8.75 | % | (2.28 | )% | 4.86 | % | ||||||||||||||||
Fund Market | 9.03 | (0.35 | ) | 0.62 | 9.03 | (1.75 | ) | 5.11 | ||||||||||||||||||||
Index | 8.90 | 0.10 | 1.07 | 8.90 | 0.52 | 8.94 | ||||||||||||||||||||||
GROWTH OF $10,000 INVESTMENT
(SINCE INCEPTION AT NET ASSET VALUE)
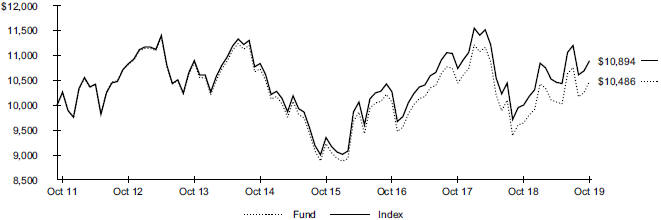
The inception date of the Fund was 10/18/11. The first day of secondary market trading was 10/20/11.
Index performance through May 31, 2017 reflects the performance of the Bloomberg Barclays Emerging Markets Broad Local Currency Bond Index. Index performance beginning on June 1, 2017 reflects the performance of the J.P. MorganGBI-EM Global Diversified 15% Cap 4.5% Floor Index.
Past performance is no guarantee of future results. Performance results do not reflect the deduction of taxes that a shareholder would pay on fund distributions or on the redemption or sale of fund shares. See “About Fund Performance” on page 14 for more information.
Expense Example
| Actual | Hypothetical 5% Return | |||||||||||||||||||||||||||||
| | Beginning Account Value (05/01/19) |
| | Ending Account Value (10/31/19) |
| | Expenses Paid During the Period |
(a) | | Beginning Account Value (05/01/19) |
| | Ending Account Value (10/31/19) |
| | Expenses Paid During the Period |
(a) | | Annualized Expense Ratio |
| ||||||||||
| $ 1,000.00 | $ 1,042.00 | $ 1.54 | $ 1,000.00 | $ 1,023.70 | $ 1.53 | 0.30 | % | |||||||||||||||||||||||
| (a) | Expenses are calculated using the Fund’s annualized expense ratio (as disclosed in the table), multiplied by the average account value for the period, multiplied by the number of days in the period (184 days) and divided by the number of days in the year (365 days). See “Shareholder Expenses” on page 14 for more information. |
| 10 | 2019ISHARES ANNUAL REPORTTO SHAREHOLDERS |
| Fund Summary as of October 31, 2019 (continued) | iShares® J.P. Morgan EM Local Currency Bond ETF |
Portfolio Management Commentary
Emerging market sovereign bonds denominated in local currencies posted a positive return for the reporting period. Central banks around the world reduced interest rates amid trade tensions between the U.S. and China, slowing economic growth, and concerns about Brexit. Demand for emerging market debt strengthened due to relatively low yields in established markets as investors sought higher returns.
Mexican bonds contributed the most to the Index’s return. Bond yields in Mexico declined along with inflation, which led to solid gains for Mexican bonds. The performance of Mexican government bonds was buoyed by investors’ demand for higher-yielding sovereign bonds in emerging markets as yields in developed markets declined, in some cases below zero.
Turkish bonds contributed to the Index’s return despite the volatility of the Turkish lira in an uncertain political environment. Easing tensions between the U.S. and Turkey led to substantial reductions in interest rates by the Turkish central bank, which drove bond yields sharply lower in the second half of the reporting period, particularly benefiting government bonds.
Indonesian bonds also contributed to the Index’s performance. Despite four interest rate decreases by the country’s central bank, yields remained relatively high and attracted foreign investment. The government’s fiscal situation improved as the budget deficit declined, and volatility in the bond market decreased, which also helped attract investors.
On the downside, Argentine bonds detracted significantly from the Index’s return amid concern about the country’s rising debt, including large payments due to the International Monetary Fund in coming years. The weakening of the Argentine peso, which declined substantially against the U.S. dollar amid dramatic political change and uncertainty, also weighed on returns.
Portfolio Information
ALLOCATION BY CREDIT QUALITY
Moody’s Credit Rating* | | Percent of Total Investments | (a) | |
Aa | 4.5 | % | ||
A | 27.6 | |||
Baa | 43.6 | |||
Ba | 17.0 | |||
B | 4.6 | |||
Caa | 2.2 | |||
Not Rated | 0.5 |
TEN LARGEST COUNTRIES
Country | | Percent of Total Investments | (a) | |
Brazil | 12.6 | % | ||
Mexico | 9.2 | |||
Indonesia | 7.8 | |||
Peru | 4.9 | |||
Thailand | 4.7 | |||
South Africa | 4.6 | |||
Philippines | 4.6 | |||
Chile | 4.6 | |||
Hungary | 4.6 | |||
Turkey | 4.5 |
| * | Credit quality ratings shown reflect the ratings assigned by Moody’s Investors Service (“Moody’s”), a widely used independent, nationally recognized statistical rating organization. Moody’s credit ratings are opinions of the credit quality of individual obligations or of an issuer’s general creditworthiness. Investment grade ratings are credit ratings of Baa or higher. Below investment grade ratings are credit ratings of Ba or lower. Unrated investments do not necessarily indicate low credit quality. Credit quality ratings are subject to change. |
| (a) | Excludes money market funds. |
| FUND SUMMARY | 11 |
| Fund Summary as of October 31, 2019 | iShares® US & Intl High Yield Corp Bond ETF |
Investment Objective
TheiShares US & Intl High Yield Corp Bond ETF(the “Fund”) seeks to track the investment results of an index composed of U.S. dollar, euro, British pound sterling and Canadian dollar-denominated, high yield corporate bonds, as represented by the Markit iBoxx® Global Developed Markets High Yield Index (the “Index”). The Fund invests in a representative sample of securities included in the Index that collectively has an investment profile similar to the Index. Due to the use of representative sampling, the Fund may or may not hold all of the securities that are included in the Index.
Performance
| Average Annual Total Returns | Cumulative Total Returns | |||||||||||||||||||||||||||
| 1 Year | 5 Years | Since Inception | 1 Year | 5 Years | Since Inception | |||||||||||||||||||||||
Fund NAV | 7.74 | % | 3.68 | % | 4.91 | % | 7.74 | % | 19.80 | % | 43.81 | % | ||||||||||||||||
Fund Market | 7.57 | 3.68 | 4.90 | 7.57 | 19.82 | 43.74 | ||||||||||||||||||||||
Index | 7.89 | 3.87 | 5.08 | 7.89 | 20.89 | 45.57 | ||||||||||||||||||||||
GROWTH OF $10,000 INVESTMENT
(SINCE INCEPTION AT NET ASSET VALUE)
The inception date of the Fund was 4/3/12. The first day of secondary market trading was 4/5/12.
Past performance is no guarantee of future results. Performance results do not reflect the deduction of taxes that a shareholder would pay on fund distributions or on the redemption or sale of fund shares. See “About Fund Performance” on page 14 for more information.
Expense Example
| Actual | Hypothetical 5% Return | |||||||||||||||||||||||||||||
| | Beginning Account Value (05/01/19) |
| | Ending Account Value (10/31/19) |
| | Expenses Paid During the Period |
(a) | | Beginning Account Value (05/01/19) |
| | Ending Account Value (10/31/19) |
| | Expenses Paid During the Period |
(a) | | Annualized Expense Ratio |
| ||||||||||
| $ 1,000.00 | $ 1,024.60 | $ 2.04 | $ 1,000.00 | $ 1,023.20 | $ 2.04 | 0.40 | % | |||||||||||||||||||||||
| (a) | Expenses are calculated using the Fund’s annualized expense ratio (as disclosed in the table), multiplied by the average account value for the period, multiplied by the number of days in the period (184 days) and divided by the number of days in the year (365 days). See “Shareholder Expenses” on page 14 for more information. |
| 12 | 2019ISHARES ANNUAL REPORTTO SHAREHOLDERS |
| Fund Summary as of October 31, 2019 (continued) | iShares® US & Intl High Yield Corp Bond ETF |
Portfolio Management Commentary
High-yield corporate bonds posted solid gains during the reporting period, benefiting from lower interest rates and investors’ search for yield. Demand for high-yield corporate bonds remained relatively strong, given that they offered more attractive yields than many other segments of the fixed income market.
Corporate bonds issued by companies in the U.S. contributed the most to the Index’s returns. The supply of high-yield bonds increased, rising to its highest level in three years during June 2019, as lower interest rates and strong investor demand drove new issuance.
U.S. high-yield credit spreads, or yield differentials relative to U.S. Treasuries, remained relatively unchanged despite considerable volatility. Credit spreads widened dramatically in late 2018, as riskier asset classes declined sharply. An improving economic outlook narrowed credit spreads in early 2019, but conflicting economic signals and the fast-changing trade conflict between the U.S. and China led to volatility in high-yield spreads thereafter.
Defaults on U.S. high-yield corporate bonds rose during the reporting period, particularly among energy companies. Furthermore, the degree of protection offered to bondholders declined, as corporations issued more lower-rated bonds. The number of investment-grade bonds downgraded to high-yield status remained relatively low.
Italian corporate bonds also contributed to the Index’s returns. The ECB reduced the deposit interest rate and signaled plans for additional stimulus measures, benefiting European bonds. In Italy, the perception of improving political stability following the formation of a new government increased demand for Italian corporate bonds. Investor confidence in Italian companies, many of which are multinational, also benefited Italian corporate bonds. Canadian corporate bonds also contributed modestly to the Index’s return due to strong investor demand and declining yields.
Portfolio Information
ALLOCATION BY CREDIT QUALITY
Moody’s Credit Rating* | | Percent of Total Investments | (a) | |
Baa | 0.8 | % | ||
Ba | 49.4 | |||
B | 34.0 | |||
Caa | 10.5 | |||
Ca | 0.5 | |||
C | 0.2 | |||
Not Rated | 4.6 |
TEN LARGEST COUNTRIES
Country | | Percent of Total Investments | (a) | |
United States | 67.0 | % | ||
Italy | 4.5 | |||
United Kingdom | 4.0 | |||
France | 3.8 | |||
Canada | 3.2 | |||
Luxembourg | 2.9 | |||
Germany | 2.8 | |||
Netherlands | 2.8 | |||
Spain | 1.6 | |||
Ireland | 1.4 |
| * | Credit quality ratings shown reflect the ratings assigned by Moody’s Investors Service (“Moody’s”), a widely used independent, nationally recognized statistical rating organization. Moody’s credit ratings are opinions of the credit quality of individual obligations or of an issuer’s general creditworthiness. Investment grade ratings are credit ratings of Baa or higher. Below investment grade ratings are credit ratings of Ba or lower. Unrated investments do not necessarily indicate low credit quality. Credit quality ratings are subject to change. |
| (a) | Excludes money market funds. |
| FUND SUMMARY | 13 |
| About Fund Performance |
Past performance is no guarantee of future results. Current performance may be lower or higher than the performance data quoted. Performance data current to the most recentmonth-end is available at iShares.com. Performance results assume reinvestment of all dividends and capital gain distributions and do not reflect the deduction of taxes that a shareholder would pay on fund distributions or on the redemption or sale of fund shares. The investment return and principal value of shares will vary with changes in market conditions. Shares may be worth more or less than their original cost when they are redeemed or sold in the market. Performance for certain funds may reflect a waiver of a portion of investment advisory fees. Without such a waiver, performance would have been lower.
Net asset value or “NAV” is the value of one share of a fund as calculated in accordance with the standard formula for valuing mutual fund shares. The price used to calculate market return (“Market Price”) is determined by using the midpoint between the highest bid and the lowest ask on the primary stock exchange on which shares of a fund are listed for trading, as of the time that such fund’s NAV is calculated. Since shares of a fund may not trade in the secondary market until after the fund’s inception, for the period from inception to the first day of secondary market trading in shares of the fund, the NAV of the fund is used as a proxy for the Market Price to calculate market returns. Market and NAV returns assume that dividends and capital gain distributions have been reinvested at Market Price and NAV, respectively.
An index is a statistical composite that tracks a specified financial market or sector. Unlike a fund, an index does not actually hold a portfolio of securities and therefore does not incur the expenses incurred by a fund. These expenses negatively impact fund performance. Also, market returns do not include brokerage commissions that may be payable on secondary market transactions. If brokerage commissions were included, market returns would be lower.
As a shareholder of your Fund, you incur two types of costs: (1) transaction costs, including brokerage commissions on purchases and sales of fund shares and (2) ongoing costs, including management fees and other fund expenses. The expense example, which is based on an investment of $1,000 invested at the beginning of the period (or from the commencement of operations if less than 6 months) and held through the end of the period, is intended to help you understand your ongoing costs (in dollars and cents) of investing in your Fund and to compare these costs with the ongoing costs of investing in other funds.
Actual Expenses— The table provides information about actual account values and actual expenses. Annualized expense ratios reflect contractual and voluntary fee waivers, if any. To estimate the expenses that you paid on your account over the period, simply divide your account value by $1,000 (for example, an $8,600 account value divided by $1,000 = 8.6), then multiply the result by the number under the heading entitled “Expenses Paid During the Period.”
Hypothetical Example for Comparison Purposes— The table also provides information about hypothetical account values and hypothetical expenses based on your Fund’s actual expense ratio and an assumed rate of return of 5% per year before expenses. You may use this information to compare the ongoing costs of investing in your Fund and other funds. To do so, compare this 5% hypothetical example with the 5% hypothetical examples that appear in the shareholder reports of the other funds.
Please note that the expenses shown in the table are meant to highlight your ongoing costs only and do not reflect any transactional costs, such as brokerage commissions paid on purchases and sales of fund shares. Therefore, the hypothetical examples are useful in comparing ongoing costs only and will not help you determine the relative total costs of owning different funds. In addition, if these transactional costs were included, your costs would have been higher.
| 14 | 2019ISHARES ANNUAL REPORTTO SHAREHOLDERS |
October 31, 2019 | iShares® Emerging Markets High Yield Bond ETF (Percentages shown are based on Net Assets) |
| Security | Par (000) | Value | ||||||
Corporate Bonds & Notes | ||||||||
| Argentina — 0.9% | ||||||||
Pampa Energia SA, 7.50%, 01/24/27 | $ | 350 | $ | 279,344 | ||||
YPF SA | 500 | 373,906 | ||||||
7.00%, 12/15/47 (Call 06/15/47)(a) | 400 | 283,875 | ||||||
8.50%, 03/23/21(a) | 500 | 456,250 | ||||||
8.50%, 07/28/25(a) | 800 | 633,600 | ||||||
8.50%, 06/27/29 (Call 03/27/29)(a) | 350 | 265,727 | ||||||
8.75%, 04/04/24(a) | 766 | 635,780 | ||||||
|
| |||||||
| 2,928,482 | ||||||||
| Azerbaijan — 0.3% | ||||||||
Southern Gas Corridor CJSC, 6.88%, 03/24/26(a) | 1,000 | 1,165,000 | ||||||
|
| |||||||
| Bahrain — 0.4% | ||||||||
Oil and Gas Holding Co. BSCC (The) | 600 | 670,313 | ||||||
7.63%, 11/07/24(a) | 400 | 454,125 | ||||||
8.38%, 11/07/28(a) | 200 | 234,750 | ||||||
|
| |||||||
| 1,359,188 | ||||||||
| Brazil — 13.5% | ||||||||
Banco Bradesco SA/Cayman Islands | 600 | 635,438 | ||||||
5.90%, 01/16/21(a) | 800 | 829,120 | ||||||
Banco BTG Pactual SA/Cayman Islands | 200 | 210,688 | ||||||
7.75%, 02/15/29 (Call 02/15/24)(a)(b) | 400 | 422,700 | ||||||
Banco do Brasil SA/Cayman | 900 | 920,025 | ||||||
4.63%, 01/15/25(a) | 600 | 625,658 | ||||||
4.75%, 03/20/24(a) | 200 | 209,938 | ||||||
4.88%, 04/19/23(a) | 400 | 420,625 | ||||||
5.38%, 01/15/21(a) | 300 | 309,469 | ||||||
5.88%, 01/26/22(a) | 900 | 942,390 | ||||||
5.88%, 01/19/23(a) | 600 | 645,187 | ||||||
Braskem Finance Ltd. | 400 | 424,000 | ||||||
5.75%, 04/15/21(a) | 400 | 420,125 | ||||||
6.45%, 02/03/24 | 400 | 445,500 | ||||||
BRF SA, 4.75%, 05/22/24(a) | 400 | 414,095 | ||||||
Cemig Geracao e Transmissao SA, 9.25%, 12/05/24 (Call 12/05/23)(a) | 600 | 699,562 | ||||||
Centrais Eletricas Brasileiras SA, 5.75%, 10/27/21(a) | 1,000 | 1,047,344 | ||||||
CSN Resources SA | 400 | 414,125 | ||||||
7.63%, 04/17/26 (Call 04/17/22)(a) | 400 | 406,000 | ||||||
Embraer Netherlands Finance BV, 5.05%, 06/15/25 | 600 | 658,875 | ||||||
Embraer Overseas Ltd., 5.70%, 09/16/23(a) | 250 | 275,859 | ||||||
Fibria Overseas Finance Ltd., 5.25%, 05/12/24 | 400 | 430,500 | ||||||
Gol Finance Inc., 7.00%, 01/31/25 (Call 01/31/22)(a) | 400 | 409,804 | ||||||
GTL Trade Finance Inc./Gerdau Holdings Inc., 5.89%, 04/29/24 (Call 01/29/24)(a) | 300 | 330,656 | ||||||
Itau Unibanco Holding SA/Cayman Islands | 1,120 | 1,187,235 | ||||||
5.50%, 08/06/22(a) | 760 | 804,080 | ||||||
5.65%, 03/19/22(a) | 800 | 844,869 | ||||||
5.75%, 01/22/21(a) | 300 | 309,750 | ||||||
6.20%, 12/21/21(a) | 800 | 851,000 | ||||||
| Security | Par (000) | Value | ||||||
| Brazil (continued) | ||||||||
JBS Investments II GmbH | $ | 400 | $ | 417,500 | ||||
7.00%, 01/15/26 (Call 01/15/21)(a) | 600 | 651,000 | ||||||
JBS USA LUX SA/JBS USA Finance Inc. | 450 | 468,844 | ||||||
5.88%, 07/15/24 (Call 12/02/19)(a) | 525 | 543,370 | ||||||
6.75%, 02/15/28 (Call 02/15/23)(a) | 400 | 441,250 | ||||||
Klabin Austria GmbH, 5.75%, 04/03/29 | 400 | 424,000 | ||||||
MARB BondCo PLC | 600 | 624,375 | ||||||
7.00%, 03/15/24 (Call 03/15/20)(a) | 400 | 415,750 | ||||||
Minerva Luxembourg SA, 6.50%, 09/20/26 | 700 | 733,250 | ||||||
MV24 Capital BV, 6.75%, 06/01/34(a) | 600 | 627,000 | ||||||
NBM U.S. Holdings Inc. | 200 | 207,550 | ||||||
7.00%, 05/14/26 (Call 05/14/22)(a) | 600 | 636,300 | ||||||
Petrobras Global Finance BV | 956 | 997,825 | ||||||
5.09%, 01/15/30(a) | 2,000 | 2,116,000 | ||||||
5.30%, 01/27/25 | 1,200 | 1,302,600 | ||||||
5.38%, 01/27/21 | 394 | 408,036 | ||||||
5.63%, 05/20/43 | 100 | 105,656 | ||||||
5.75%, 02/01/29 | 992 | 1,101,151 | ||||||
6.00%, 01/27/28 | 1,568 | 1,759,394 | ||||||
6.25%, 03/17/24 | 1,061 | 1,189,016 | ||||||
6.75%, 01/27/41 | 700 | 810,906 | ||||||
6.85%, 06/05/2115 | 1,383 | 1,586,024 | ||||||
6.88%, 01/20/40 | 600 | 700,350 | ||||||
7.25%, 03/17/44 | 786 | 954,990 | ||||||
7.38%, 01/17/27 | 1,301 | 1,575,511 | ||||||
8.75%, 05/23/26 | 1,079 | 1,381,120 | ||||||
Rio Oil Finance Trust, Series2014-1, | 721 | 802,104 | ||||||
Rumo Luxembourg Sarl | 200 | 212,375 | ||||||
7.38%, 02/09/24 (Call 02/09/21)(a) | 400 | 428,520 | ||||||
Ultrapar International SA | 400 | 427,000 | ||||||
5.25%, 06/06/29(a) | 200 | 208,625 | ||||||
Vale Overseas Ltd. | 600 | 624,600 | ||||||
6.25%, 08/10/26 | 900 | 1,049,220 | ||||||
6.88%, 11/21/36 | 900 | 1,137,487 | ||||||
6.88%, 11/10/39 | 800 | 1,022,750 | ||||||
8.25%, 01/17/34 | 300 | 410,063 | ||||||
|
| |||||||
| 45,046,129 | ||||||||
| Chile — 0.5% | ||||||||
AES Gener SA, 7.13%, 03/26/79 | 200 | 207,937 | ||||||
Latam Finance Ltd. | 500 | 528,750 | ||||||
7.00%, 03/01/26 (Call 03/01/23)(a) | 400 | 430,500 | ||||||
VTR Finance BV, 6.88%, 01/15/24 | 600 | 615,000 | ||||||
|
| |||||||
| 1,782,187 | ||||||||
| China — 8.3% | ||||||||
Agile Group Holdings Ltd. | 200 | 206,500 | ||||||
8.50%, 07/18/21 (Call 07/18/20)(a) | 400 | 422,164 | ||||||
CFLD Cayman Investment Ltd. | 600 | 602,772 | ||||||
8.60%, 04/08/24(a) | 400 | 407,500 | ||||||
| SCHEDULES OF INVESTMENTS | 15 |
Schedule of Investments (continued) October 31, 2019 | iShares® Emerging Markets High Yield Bond ETF (Percentages shown are based on Net Assets) |
| Security | Par (000) | Value | ||||||
| China (continued) | ||||||||
9.00%, 07/31/21(a) | $ | 400 | $ | 416,125 | ||||
China Aoyuan Group Ltd. | 300 | 311,625 | ||||||
8.50%, 01/23/22 (Call 01/23/21)(a) | 200 | 210,500 | ||||||
China Evergrande Group | 800 | 749,000 | ||||||
7.50%, 06/28/23 (Call 06/28/20)(a) | 700 | 600,687 | ||||||
8.25%, 03/23/22 (Call 03/23/20)(a) | 1,200 | 1,111,500 | ||||||
8.75%, 06/28/25 (Call 06/28/21)(a) | 2,466 | 2,065,275 | ||||||
9.50%, 04/11/22(a) | 700 | 662,697 | ||||||
9.50%, 03/29/24 (Call 03/29/21)(a) | 700 | 627,594 | ||||||
10.00%, 04/11/23 (Call 04/11/21)(a) | 400 | 372,000 | ||||||
10.50%, 04/11/24 (Call 04/11/22)(a) | 400 | 371,125 | ||||||
China SCE Group Holdings Ltd. | 200 | 197,154 | ||||||
7.25%, 04/19/23 (Call 07/19/21)(a) | 400 | 401,220 | ||||||
7.45%, 04/17/21 (Call 04/17/20)(a) | 400 | 408,216 | ||||||
CIFI Holdings Group Co. Ltd. | 400 | 401,000 | ||||||
6.55%, 03/28/24 (Call 03/28/22)(a) | 400 | 402,972 | ||||||
6.88%, 04/23/21 (Call 04/23/20)(a) | 200 | 205,156 | ||||||
Consolidated Energy Finance SA, | 300 | 292,500 | ||||||
Country Garden Holdings Co. Ltd. | 400 | 402,500 | ||||||
4.75%, 09/28/23 (Call 09/28/20)(a) | 400 | 401,000 | ||||||
7.25%, 04/04/21 (Call 11/29/19)(a) | 400 | 401,500 | ||||||
Easy Tactic Ltd. | 600 | 582,375 | ||||||
5.88%, 02/13/23 (Call 11/17/20)(a) | 400 | 373,504 | ||||||
7.00%, 04/25/21 (Call 04/25/20)(a) | 200 | 200,260 | ||||||
8.13%, 02/27/23 (02/27/21)(a) | 400 | 397,500 | ||||||
Fantasia Holdings Group Co. Ltd. | 200 | 185,308 | ||||||
8.38%, 03/08/21(a) | 400 | 388,500 | ||||||
Fortune Star BVI Ltd. | 1,000 | 996,250 | ||||||
6.75%, 07/02/23 (Call 07/02/22)(a) | 200 | 205,938 | ||||||
Greenland Global Investment Ltd. | 400 | 389,375 | ||||||
6.75%, 06/25/22(a) | 200 | 205,750 | ||||||
Kaisa Group Holdings Ltd. | 600 | 568,687 | ||||||
9.38%, 06/30/24 (Call 06/30/21)(a) | 1,700 | 1,531,062 | ||||||
11.25%, 04/09/22 (Call 04/09/21)(a) | 200 | 202,188 | ||||||
11.50%, 01/30/23 (Call 05/30/21)(a) | 400 | 396,000 | ||||||
KWG Group Holdings Ltd. | 200 | 185,063 | ||||||
6.00%, 09/15/22 (Call 03/15/20)(a) | 400 | 398,250 | ||||||
7.88%, 09/01/23 (Call 09/01/21)(a) | 400 | 410,563 | ||||||
New Metro Global Ltd., 6.50%, 04/23/21 | 200 | 197,076 | ||||||
Ronshine China Holdings Ltd. | 400 | 407,500 | ||||||
10.50%, 03/01/22(a) | 200 | 210,937 | ||||||
Scenery Journey Ltd. | 400 | 402,208 | ||||||
13.75%, 11/06/23 (Call 11/06/21)(a) | 300 | 303,469 | ||||||
Shimao Property Holdings Ltd., | 600 | 615,187 | ||||||
| Security | Par (000) | Value | ||||||
| China (continued) | ||||||||
Sunac China Holdings Ltd. | $ | 200 | $ | 201,750 | ||||
7.35%, 07/19/21 (Call 07/19/20)(a) | 400 | 406,156 | ||||||
7.88%, 02/15/22 (Call 02/15/21)(a) | 400 | 409,115 | ||||||
7.95%, 08/08/22 (Call 08/08/20)(a) | 400 | 408,125 | ||||||
7.95%, 10/11/23 (Call 10/11/21)(a) | 500 | 508,281 | ||||||
8.35%, 04/19/23 (Call 04/19/21)(a) | 200 | 205,750 | ||||||
Tahoe Group Global Co. Ltd., | 200 | 160,000 | ||||||
Times China Holdings Ltd. | 200 | 201,934 | ||||||
6.75%, 07/16/23 (Call 07/16/22)(a) | 200 | 200,938 | ||||||
7.63%, 02/21/22 (Call 02/21/21)(a) | 400 | 413,459 | ||||||
Yankuang Group Cayman Ltd., 6.00%, 01/30/22(a) | 400 | 414,996 | ||||||
Yuzhou Properties Co. Ltd. | 200 | 189,875 | ||||||
7.90%, 05/11/21 (Call 05/11/20)(a) | 400 | 414,192 | ||||||
8.50%, 02/04/23 (Call 02/04/22)(a) | 200 | 208,000 | ||||||
8.50%, 02/26/24 (Call 02/26/22)(a) | 400 | 407,125 | ||||||
8.63%, 01/23/22(a) | 400 | 418,128 | ||||||
|
| |||||||
| 27,571,056 | ||||||||
| Colombia — 1.3% | ||||||||
Banco de Bogota SA | 400 | 426,625 | ||||||
5.38%, 02/19/23(a) | 200 | 213,092 | ||||||
6.25%, 05/12/26(a) | 600 | 679,687 | ||||||
Bancolombia SA | 600 | 618,937 | ||||||
5.13%, 09/11/22 | 400 | 423,421 | ||||||
Colombia Telecomunicaciones SA ESP, 5.38%, 09/27/22 (Call 11/29/19)(a) | 345 | 348,127 | ||||||
Grupo Aval Ltd., 4.75%, 09/26/22(a) | 600 | 626,224 | ||||||
Millicom International Cellular SA | 200 | 206,188 | ||||||
6.00%, 03/15/25 (Call 03/15/20)(a) | 300 | 310,500 | ||||||
6.25%, 03/25/29 (Call 03/25/24)(a) | 400 | 433,617 | ||||||
6.63%, 10/15/26 (Call 10/15/21)(a) | 200 | 217,250 | ||||||
|
| |||||||
| 4,503,668 | ||||||||
| Ghana — 0.1% | ||||||||
Tullow Oil PLC, 7.00%, 03/01/25 | 400 | 411,000 | ||||||
|
| |||||||
| India — 2.2% | ||||||||
ABJA Investment Co. Pte Ltd. | 600 | 583,476 | ||||||
5.95%, 07/31/24(a) | 425 | 445,852 | ||||||
Axis Bank Ltd./Dubai | 200 | 199,938 | ||||||
3.00%, 08/08/22(a) | 400 | 401,500 | ||||||
Bharti Airtel International Netherlands BV | 400 | 415,625 | ||||||
5.35%, 05/20/24(a) | 600 | 631,687 | ||||||
Bharti Airtel Ltd., 4.38%, 06/10/25(a) | 600 | 603,846 | ||||||
Delhi International Airport Ltd., 6.13%, 10/31/26(a) | 200 | 214,222 | ||||||
Greenko Dutch BV, 5.25%, 07/24/24 | 400 | 403,750 | ||||||
ICICI Bank Ltd./Dubai, 3.25%, 09/09/22(a) | 500 | 504,551 | ||||||
JSW Steel Ltd. | 400 | 405,250 | ||||||
5.95%, 04/18/24(a) | 200 | 204,860 | ||||||
Shriram Transport Finance Co. Ltd., 5.95%, 10/24/22(a) | 400 | 403,000 | ||||||
Vedanta Resources Finance II PLC, | 400 | 398,500 | ||||||
| 16 | 2019ISHARES ANNUAL REPORTTO SHAREHOLDERS |
Schedule of Investments (continued) October 31, 2019 | iShares® Emerging Markets High Yield Bond ETF (Percentages shown are based on Net Assets) |
| Security | Par (000) | Value | ||||||
| India (continued) | ||||||||
Vedanta Resources Ltd. | $ | 400 | $ | 367,250 | ||||
6.38%, 07/30/22(a) | 600 | 594,187 | ||||||
7.13%, 05/31/23(a) | 300 | 297,469 | ||||||
8.25%, 06/07/21(a) | 400 | 417,625 | ||||||
|
| |||||||
| 7,492,588 | ||||||||
| Israel — 2.1% | ||||||||
Teva Pharmaceutical Finance Co. BV, 2.95%, 12/18/22 | 350 | 318,500 | ||||||
Teva Pharmaceutical Finance Netherlands III BV | 1,751 | 1,657,775 | ||||||
2.80%, 07/21/23 | 1,575 | 1,366,312 | ||||||
3.15%, 10/01/26 | 2,000 | 1,506,538 | ||||||
4.10%, 10/01/46 | 1,100 | 756,250 | ||||||
6.00%, 04/15/24 (Call 01/15/24) | 800 | 750,000 | ||||||
6.75%, 03/01/28 (Call 12/01/27) | 600 | 541,800 | ||||||
|
| |||||||
| 6,897,175 | ||||||||
| Jamaica — 0.4% | ||||||||
Digicel Group One Ltd., 8.25%, 12/30/22 | 513 | 300,586 | ||||||
Digicel Group Two Ltd., 8.25%, 09/30/22 | 487 | 121,750 | ||||||
Digicel Ltd. | 650 | 484,047 | ||||||
6.75%, 03/01/23 (Call 11/14/19)(a) | 600 | 315,187 | ||||||
|
| |||||||
| 1,221,570 | ||||||||
| Kazakhstan — 1.2% | ||||||||
Development Bank of Kazakhstan JSC, 4.13%, 12/10/22(a) | 750 | 777,375 | ||||||
Halyk Savings Bank of Kazakhstan JSC | 147 | 147,807 | ||||||
7.25%, 01/28/21(a) | 400 | 420,375 | ||||||
Kazakhstan Temir Zholy Finance BV, 6.95%, 07/10/42(a) | 600 | 806,213 | ||||||
KazMunayGas National Co. JSC | 200 | 205,100 | ||||||
4.75%, 04/19/27(a) | 600 | 654,386 | ||||||
5.75%, 04/19/47(a) | 600 | 699,900 | ||||||
Nostrum Oil & Gas Finance BV, 8.00%, 07/25/22 (Call 11/11/19)(a) | 400 | 215,000 | ||||||
|
| |||||||
| 3,926,156 | ||||||||
| Mexico — 8.1% | ||||||||
Banco Nacional de Comercio Exterior SNC, 3.80%, 08/11/26 (Call 08/11/21)(a)(b) | 400 | 406,875 | ||||||
BBVA Bancomer SA/Texas | 600 | 582,330 | ||||||
6.50%, 03/10/21(a) | 600 | 629,438 | ||||||
6.75%, 09/30/22(a) | 800 | 877,340 | ||||||
Cemex Finance LLC, 6.00%, 04/01/24 | 650 | 665,815 | ||||||
Cemex SAB de CV | 500 | 512,938 | ||||||
6.13%, 05/05/25 (Call 05/05/20)(a) | 400 | 414,500 | ||||||
7.75%, 04/16/26 (Call 04/16/21)(a) | 600 | 646,500 | ||||||
Petroleos Mexicanos | 400 | 402,000 | ||||||
4.50%, 01/23/26 | 200 | 197,200 | ||||||
4.63%, 09/21/23 | 810 | 847,260 | ||||||
4.88%, 01/24/22 | 280 | 290,780 | ||||||
5.35%, 02/12/28 | 200 | 197,500 | ||||||
5.38%, 03/13/22 | 600 | 631,500 | ||||||
5.50%, 01/21/21 | 1,600 | 1,652,000 | ||||||
5.63%, 01/23/46 | 600 | 537,810 | ||||||
6.35%, 02/12/48 | 1,900 | 1,818,062 | ||||||
6.38%, 01/23/45 | 2,000 | 1,943,600 | ||||||
| Security | Par (000) | Value | ||||||
| Mexico (continued) | ||||||||
6.49%, 01/23/27 (Call 11/23/26)(c) | $ | 400 | $ | 426,200 | ||||
6.50%, 03/13/27 | 3,500 | 3,711,641 | ||||||
6.50%, 01/23/29 | 1,500 | 1,564,500 | ||||||
6.50%, 06/02/41 | 1,400 | 1,386,000 | ||||||
6.75%, 09/21/47 | 3,800 | 3,782,306 | ||||||
6.84%, 01/23/30 (Call 10/23/29)(c) | 400 | 426,500 | ||||||
6.88%, 08/04/26 | 2,200 | 2,406,800 | ||||||
|
| |||||||
| 26,957,395 | ||||||||
| Netherlands — 0.1% | ||||||||
IHS Netherlands Holdco BV, 8.00%, 09/18/27 | 400 | 418,500 | ||||||
|
| |||||||
| Nigeria — 0.1% | ||||||||
IHS Netherlands Holdco BV, 7.13%, 03/18/25 (09/18/21)(a) | 200 | 206,500 | ||||||
|
| |||||||
| Oman — 0.6% | ||||||||
Bank Muscat SAOG, 3.75%, 05/03/21(a) | 400 | 398,750 | ||||||
Lamar Funding Ltd., 3.96%, 05/07/25(a) | 600 | 560,250 | ||||||
National Bank of Oman SAOG, 5.63%, 09/25/23(a) | 200 | 207,000 | ||||||
Oztel Holdings SPC Ltd. | 400 | 418,250 | ||||||
6.63%, 04/24/28(a) | 500 | 515,937 | ||||||
|
| |||||||
| 2,100,187 | ||||||||
| Panama — 0.3% | ||||||||
C&W Senior Financing DAC | 600 | 630,180 | ||||||
7.50%, 10/15/26 (Call 10/15/21)(a) | 200 | 215,750 | ||||||
|
| |||||||
| 845,930 | ||||||||
| Russia — 2.3% | ||||||||
Alfa Bank AO Via Alfa Bond Issuance PLC, 7.75%, 04/28/21(a) | 600 | 639,187 | ||||||
Credit Bank of Moscow Via CBOM Finance PLC | 400 | 404,875 | ||||||
7.12%, 06/25/24(a) | 400 | 426,125 | ||||||
7.50%, 10/05/27 (Call 10/05/22)(a)(b) | 200 | 187,375 | ||||||
Evraz PLC | 200 | 213,375 | ||||||
5.38%, 03/20/23(a) | 500 | 533,125 | ||||||
6.75%, 01/31/22(a) | 400 | 433,125 | ||||||
8.25%, 01/28/21(a) | 350 | 372,750 | ||||||
GTLK Europe DAC, 5.13%, 05/31/24(a) | 400 | 415,625 | ||||||
Metalloinvest Finance DAC, | 400 | 424,625 | ||||||
Polyus Finance PLC, 5.25%, 02/07/23(a) | 400 | 423,000 | ||||||
Sberbank of Russia Via SB Capital SA, 5.13%, 10/29/22(a) | 1,100 | 1,160,844 | ||||||
VEON Holdings BV | 200 | 202,000 | ||||||
4.95%, 06/16/24 (Call 03/16/24)(a) | 400 | 424,500 | ||||||
5.95%, 02/13/23(a) | 400 | 435,625 | ||||||
VTB Bank OJSC Via VTB Capital SA, 6.95%, 10/17/22(a) | 800 | 863,000 | ||||||
|
| |||||||
| 7,559,156 | ||||||||
| South Africa — 1.6% | ||||||||
AngloGold Ashanti Holdings PLC, 5.13%, 08/01/22 | 445 | 466,073 | ||||||
Eskom Holdings SOC Ltd. | 1,000 | 1,008,125 | ||||||
6.35%, 08/10/28(a) | 500 | 530,156 | ||||||
6.75%, 08/06/23(a) | 617 | 636,281 | ||||||
7.13%, 02/11/25(a) | 660 | 678,975 | ||||||
8.45%, 08/10/28(a) | 200 | 219,000 | ||||||
FirstRand Bank Ltd., 6.25%, 04/23/28 | 200 | 212,563 | ||||||
Gold Fields Orogen Holdings BVI Ltd. 5.13%, 05/15/24 (Call 04/15/24)(a) | 400 | 423,763 | ||||||
| SCHEDULES OF INVESTMENTS | 17 |
Schedule of Investments (continued) October 31, 2019 | iShares® Emerging Markets High Yield Bond ETF (Percentages shown are based on Net Assets) |
| Security | Par (000) | Value | ||||||
| South Africa (continued) | ||||||||
6.13%, 05/15/29 (Call 02/15/29)(a) | $ | 400 | $ | 451,500 | ||||
MTN Mauritius Investment Ltd., 4.76%, 11/11/24(a) | 400 | 408,125 | ||||||
Transnet SOC Ltd., 4.00%, 07/26/22(a) | 471 | 476,299 | ||||||
|
| |||||||
| 5,510,860 | ||||||||
| South Korea — 0.1% | ||||||||
Woori Bank, 5.00%, 06/10/45 | 200 | 202,438 | ||||||
|
| |||||||
| Turkey — 3.9% | ||||||||
Akbank Turk AS | 300 | 297,315 | ||||||
5.13%, 03/31/25(a) | 200 | 190,813 | ||||||
7.20%, 03/16/27 (Call 03/16/22)(a)(b) | 200 | 188,688 | ||||||
KOC Holding AS | 400 | 402,960 | ||||||
6.50%, 03/11/25 (Call 12/11/24)(a) | 400 | 416,750 | ||||||
QNB Finansbank AS | 488 | 487,542 | ||||||
6.88%, 09/07/24(a) | 200 | 210,563 | ||||||
TC Ziraat Bankasi AS | 200 | 198,625 | ||||||
5.13%, 05/03/22(a) | 370 | 360,750 | ||||||
5.13%, 09/29/23(a) | 200 | 190,250 | ||||||
Turk Telekomunikasyon AS | 200 | 196,000 | ||||||
6.88%, 02/28/25(a) | 400 | 424,625 | ||||||
Turkcell Iletisim Hizmetleri AS | 400 | 400,500 | ||||||
5.80%, 04/11/28 (Call 01/11/28)(a) | 200 | 194,625 | ||||||
Turkiye Garanti Bankasi AS | 400 | 401,000 | ||||||
5.88%, 03/16/23(a) | 400 | 405,000 | ||||||
6.13%, 05/24/27 (Call 05/24/22)(a)(b) | 400 | 357,625 | ||||||
6.25%, 04/20/21(a) | 200 | 205,500 | ||||||
Turkiye Halk Bankasi AS | 200 | 186,781 | ||||||
5.00%, 07/13/21(a) | 300 | 277,781 | ||||||
Turkiye Is Bankasi AS | 200 | 198,688 | ||||||
5.38%, 10/06/21(a) | 500 | 500,312 | ||||||
5.50%, 04/21/22(a) | 400 | 398,500 | ||||||
6.00%, 10/24/22(a) | 650 | 627,453 | ||||||
6.13%, 04/25/24(a) | 700 | 681,625 | ||||||
7.00%, 06/29/28 (Call 06/29/23)(a)(b) | 200 | 183,938 | ||||||
Turkiye Sise ve Cam Fabrikalari AS, 6.95%, 03/14/26 (Call 12/14/25)(a) | 400 | 415,750 | ||||||
Turkiye Vakiflar Bankasi TAO | 400 | 395,500 | ||||||
5.63%, 05/30/22(a) | 400 | 392,500 | ||||||
5.75%, 01/30/23(a) | 300 | 290,280 | ||||||
6.00%, 11/01/22(a) | 200 | 193,000 | ||||||
6.88%, 02/03/25 (Call 02/03/20)(a)(b) | 200 | 191,031 | ||||||
8.13%, 03/28/24(a) | 400 | 412,000 | ||||||
Yapi ve Kredi Bankasi AS | 600 | 581,062 | ||||||
5.75%, 02/24/22(a) | 400 | 401,000 | ||||||
5.85%, 06/21/24(a) | 200 | 193,125 | ||||||
6.10%, 03/16/23(a) | 200 | 198,625 | ||||||
8.25%, 10/15/24(a) | 200 | 209,500 | ||||||
8.50%, 03/09/26 (Call 03/09/21)(a)(b) | 400 | 397,250 | ||||||
|
| |||||||
| 12,854,832 | ||||||||
| Security | Par (000) | Value | ||||||
| Ukraine — 0.3% | ||||||||
Metinvest BV | $ | 400 | $ | 417,000 | ||||
8.50%, 04/23/26 (Call 01/23/26)(a) | 400 | 418,000 | ||||||
MHP SE, 7.75%, 05/10/24(a) | 200 | 212,000 | ||||||
|
| |||||||
| 1,047,000 | ||||||||
| United Arab Emirates — 0.3% | ||||||||
DAE Funding LLC | 600 | 611,847 | ||||||
5.00%, 08/01/24 (Call 08/01/20)(a) | 500 | 522,645 | ||||||
|
| |||||||
| 1,134,492 | ||||||||
| United Kingdom — 0.1% | ||||||||
Gtlk Europe Capital DAC, 5.95%, 04/17/25(a) | 400 | 427,250 | ||||||
|
| |||||||
Total Corporate Bonds & Notes — 49.0% |
| 163,568,739 | ||||||
|
| |||||||
Foreign Government Obligations(d) |
| |||||||
| Argentina — 3.1% | ||||||||
Argentine Republic Government International Bond | 900 | 362,813 | ||||||
5.63%, 01/26/22 | 1,628 | 688,339 | ||||||
5.88%, 01/11/28 | 2,350 | 898,875 | ||||||
6.63%, 07/06/28 | 480 | 187,950 | ||||||
6.88%, 04/22/21 | 2,425 | 1,093,523 | ||||||
6.88%, 01/26/27 | 2,224 | 877,785 | ||||||
6.88%, 01/11/48 | 1,650 | 649,687 | ||||||
7.13%, 07/06/36 | 1,120 | 437,850 | ||||||
7.13%, 06/28/2117 | 1,531 | 614,314 | ||||||
7.50%, 04/22/26 | 3,455 | 1,453,259 | ||||||
7.63%, 04/22/46 | 1,581 | 636,353 | ||||||
8.28%, 12/31/33 | 743 | 370,379 | ||||||
Series NY, 3.75%, 12/31/38(e) | 2,750 | 1,105,276 | ||||||
Series NY, 8.28%, 12/31/33 | 2,078 | 1,061,636 | ||||||
|
| |||||||
| 10,438,039 | ||||||||
| Azerbaijan — 0.3% | ||||||||
State Oil Co. of the Azerbaijan Republic | 550 | 572,516 | ||||||
6.95%, 03/18/30(a) | 400 | 479,875 | ||||||
|
| |||||||
| 1,052,391 | ||||||||
| Bahrain — 1.8% | ||||||||
Bahrain Government International Bond | 350 | 360,938 | ||||||
6.00%, 09/19/44(a) | 600 | 604,125 | ||||||
6.13%, 07/05/22(a) | 1,000 | 1,067,812 | ||||||
6.13%, 08/01/23(a) | 800 | 871,250 | ||||||
6.75%, 09/20/29(a) | 600 | 682,500 | ||||||
7.00%, 01/26/26(a) | 600 | 685,875 | ||||||
7.00%, 10/12/28(a) | 800 | 922,500 | ||||||
7.50%, 09/20/47(a) | 600 | 702,750 | ||||||
|
| |||||||
| 5,897,750 | ||||||||
| Brazil — 5.9% | ||||||||
Banco Nacional de Desenvolvimento Economico e Social, | 600 | 662,438 | ||||||
Brazilian Government International Bond | 1,100 | 1,102,750 | ||||||
4.25%, 01/07/25 | 2,348 | 2,486,679 | ||||||
4.50%, 05/30/29 (Call 02/28/29) | 800 | 843,750 | ||||||
4.63%, 01/13/28 (Call 10/13/27) | 1,500 | 1,604,062 | ||||||
| 18 | 2019ISHARES ANNUAL REPORTTO SHAREHOLDERS |
Schedule of Investments (continued) October 31, 2019 | iShares® Emerging Markets High Yield Bond ETF (Percentages shown are based on Net Assets) |
| Security | Par (000) | Value | ||||||
| Brazil (continued) | ||||||||
4.88%, 01/22/21 | $ | 1,511 | $ | 1,561,996 | ||||
5.00%, 01/27/45 | 2,026 | 2,107,673 | ||||||
5.63%, 01/07/41 | 1,367 | 1,534,885 | ||||||
5.63%, 02/21/47 | 1,700 | 1,911,437 | ||||||
6.00%, 04/07/26 | 1,214 | 1,410,137 | ||||||
7.13%, 01/20/37 | 1,060 | 1,363,094 | ||||||
8.25%, 01/20/34 | 750 | 1,038,984 | ||||||
8.75%, 02/04/25 | 400 | 513,750 | ||||||
8.88%, 04/15/24 | 520 | 659,750 | ||||||
10.13%, 05/15/27 | 500 | 713,594 | ||||||
|
| |||||||
| 19,514,979 | ||||||||
| Costa Rica — 0.7% | ||||||||
Costa Rica Government International Bond | 600 | 588,375 | ||||||
4.38%, 04/30/25(a) | 400 | 383,250 | ||||||
5.63%, 04/30/43(a) | 200 | 173,375 | ||||||
7.00%, 04/04/44(a) | 462 | 456,514 | ||||||
7.16%, 03/12/45(a) | 600 | 597,375 | ||||||
|
| |||||||
| 2,198,889 | ||||||||
| Croatia — 0.8% | ||||||||
Croatia Government International Bond | 800 | 884,250 | ||||||
6.00%, 01/26/24(a) | 900 | 1,036,125 | ||||||
6.38%, 03/24/21(a) | 806 | 850,733 | ||||||
|
| |||||||
| 2,771,108 | ||||||||
| Dominican Republic — 2.6% | ||||||||
Dominican Republic International Bond | 800 | 855,750 | ||||||
5.88%, 04/18/24(a) | 640 | 684,800 | ||||||
5.95%, 01/25/27(a) | 1,075 | 1,182,500 | ||||||
6.00%, 07/19/28(a) | 650 | 720,484 | ||||||
6.40%, 06/05/49(a) | 750 | 811,641 | ||||||
6.50%, 02/15/48(a) | 450 | 491,484 | ||||||
6.60%, 01/28/24(a) | 313 | 346,158 | ||||||
6.85%, 01/27/45(a) | 1,190 | 1,343,213 | ||||||
6.88%, 01/29/26(a) | 803 | 916,926 | ||||||
7.45%, 04/30/44(a) | 850 | 1,020,266 | ||||||
7.50%, 05/06/21(a) | 400 | 417,400 | ||||||
|
| |||||||
| 8,790,622 | ||||||||
| Ecuador — 2.8% | ||||||||
Ecuador Government International Bond | 1,900 | 1,707,031 | ||||||
7.95%, 06/20/24(a) | 1,145 | 1,107,430 | ||||||
8.75%, 06/02/23(a) | 500 | 507,969 | ||||||
8.88%, 10/23/27(a) | 1,300 | 1,219,156 | ||||||
9.63%, 06/02/27(a) | 600 | 584,250 | ||||||
9.65%, 12/13/26(a) | 1,044 | 1,028,992 | ||||||
10.75%, 03/28/22(a) | 2,162 | 2,300,503 | ||||||
10.75%, 01/31/29(a) | 1,000 | 1,018,438 | ||||||
|
| |||||||
| 9,473,769 | ||||||||
| Egypt — 2.9% | ||||||||
Egypt Government International Bond | 600 | 617,844 | ||||||
5.88%, 06/11/25(a) | 1,000 | 1,035,625 | ||||||
6.13%, 01/31/22(a) | 1,300 | 1,343,875 | ||||||
6.20%, 03/01/24(a) | 400 | 422,000 | ||||||
6.59%, 02/21/28(a) | 614 | 624,745 | ||||||
6.88%, 04/30/40(a) | 350 | 339,937 | ||||||
7.50%, 01/31/27(a) | 1,200 | 1,300,500 | ||||||
| Security | Par (000) | Value | ||||||
| Egypt (continued) | ||||||||
7.60%, 03/01/29(a) | $ | 1,100 | $ | 1,166,000 | ||||
7.90%, 02/21/48(a) | 800 | 802,000 | ||||||
8.50%, 01/31/47(a) | 1,200 | 1,260,375 | ||||||
8.70%, 03/01/49(a) | 800 | 856,750 | ||||||
|
| |||||||
| 9,769,651 | ||||||||
| El Salvador — 1.1% | ||||||||
El Salvador Government International Bond | 500 | 519,844 | ||||||
6.38%, 01/18/27(a) | 500 | 524,375 | ||||||
7.12%, 01/20/50 (Call 07/20/49)(a) | 600 | 614,250 | ||||||
7.63%, 02/01/41(a) | 350 | 380,187 | ||||||
7.65%, 06/15/35(a) | 500 | 545,469 | ||||||
7.75%, 01/24/23(a) | 400 | 437,750 | ||||||
8.25%, 04/10/32(a) | 200 | 230,750 | ||||||
8.63%, 02/28/29(a) | 400 | 475,250 | ||||||
|
| |||||||
| 3,727,875 | ||||||||
| Ghana — 1.1% | ||||||||
Ghana Government International Bond | 800 | 809,750 | ||||||
7.88%, 08/07/23(a) | 400 | 436,375 | ||||||
8.13%, 01/18/26(a) | 570 | 603,131 | ||||||
8.13%, 03/26/32(a) | 700 | 707,875 | ||||||
8.63%, 06/16/49(a) | 600 | 599,250 | ||||||
8.95%, 03/26/51(a) | 500 | 506,563 | ||||||
|
| |||||||
| 3,662,944 | ||||||||
| Guatemala — 0.6% | ||||||||
Guatemala Government Bond | 200 | 206,687 | ||||||
4.50%, 05/03/26(a) | 400 | 419,250 | ||||||
4.88%, 02/13/28(a) | 400 | 426,625 | ||||||
4.90%, 06/01/30 (Call 03/01/30)(a) | 200 | 212,875 | ||||||
5.75%, 06/06/22(a) | 400 | 428,000 | ||||||
6.13%, 06/01/50 (Call 12/01/49)(a) | 400 | 471,375 | ||||||
|
| |||||||
| 2,164,812 | ||||||||
| Ivory Coast — 0.4% | ||||||||
Ivory Coast Government International Bond | 800 | 785,250 | ||||||
6.38%, 03/03/28(a) | 500 | 516,250 | ||||||
|
| |||||||
| 1,301,500 | ||||||||
| Jamaica — 1.0% | ||||||||
Jamaica Government International Bond | 900 | 1,065,656 | ||||||
7.88%, 07/28/45 | 900 | 1,191,937 | ||||||
8.00%, 03/15/39 | 700 | 931,438 | ||||||
|
| |||||||
| 3,189,031 | ||||||||
| Jordan — 0.5% | ||||||||
Jordan Government International Bond | 400 | 414,250 | ||||||
6.13%, 01/29/26(a) | 600 | 633,375 | ||||||
7.38%, 10/10/47(a) | 600 | 633,187 | ||||||
|
| |||||||
| 1,680,812 | ||||||||
| Lebanon — 1.6% | ||||||||
Lebanon Government International Bond | 700 | 414,750 | ||||||
6.10%, 10/04/22(a) | 800 | 480,000 | ||||||
6.20%, 02/26/25(a) | 350 | 199,500 | ||||||
6.25%, 05/27/22 | 300 | 179,156 | ||||||
6.25%, 11/04/24(a) | 335 | 190,950 | ||||||
| SCHEDULES OF INVESTMENTS | 19 |
Schedule of Investments (continued) October 31, 2019 | iShares® Emerging Markets High Yield Bond ETF (Percentages shown are based on Net Assets) |
| Security | Par (000) | Value | ||||||
| Lebanon (continued) | ||||||||
6.40%, 05/26/23 | $ | 300 | $ | 177,750 | ||||
6.60%, 11/27/26(a) | 750 | 416,250 | ||||||
6.65%, 04/22/24(a) | 420 | 239,400 | ||||||
6.65%, 11/03/28(a) | 500 | 278,750 | ||||||
6.65%, 02/26/30(a) | 790 | 440,425 | ||||||
6.75%, 11/29/27(a) | 600 | 333,000 | ||||||
6.85%, 03/23/27(a) | 700 | 388,500 | ||||||
6.85%, 05/25/29 | 600 | 329,813 | ||||||
7.00%, 03/23/32(a) | 500 | 278,750 | ||||||
7.05%, 11/02/35(a) | 300 | 167,250 | ||||||
7.25%, 03/23/37(a) | 400 | 226,000 | ||||||
8.25%, 04/12/21(a) | 1,056 | 733,920 | ||||||
|
| |||||||
| 5,474,164 | ||||||||
| Morocco — 0.4% | ||||||||
Morocco Government International Bond | 890 | 932,831 | ||||||
5.50%, 12/11/42(a) | 400 | 481,375 | ||||||
|
| |||||||
| 1,414,206 | ||||||||
| Nigeria — 1.9% | ||||||||
Nigeria Government International Bond | 200 | 210,438 | ||||||
6.50%, 11/28/27(a) | 800 | 801,750 | ||||||
6.75%, 01/28/21(a) | 400 | 414,125 | ||||||
7.14%, 02/23/30(a) | 714 | 716,454 | ||||||
7.63%, 11/21/25(a) | 700 | 762,562 | ||||||
7.63%, 11/28/47(a) | 700 | 682,062 | ||||||
7.70%, 02/23/38(a) | 800 | 799,250 | ||||||
7.88%, 02/16/32(a) | 800 | 825,000 | ||||||
8.75%, 01/21/31(a) | 400 | 440,625 | ||||||
9.25%, 01/21/49(a) | 500 | 554,063 | ||||||
|
| |||||||
| 6,206,329 | ||||||||
| Pakistan — 0.5% | ||||||||
Pakistan Government International Bond | 800 | 799,000 | ||||||
8.25%, 04/15/24(a) | 427 | 464,096 | ||||||
8.25%, 09/30/25(a) | 400 | 436,375 | ||||||
|
| |||||||
| 1,699,471 | ||||||||
| Senegal — 0.5% | ||||||||
Senegal Government International Bond | 200 | 218,375 | ||||||
6.25%, 05/23/33(a) | 900 | 919,969 | ||||||
6.75%, 03/13/48(a) | 400 | 392,750 | ||||||
|
| |||||||
| 1,531,094 | ||||||||
| Serbia — 0.3% | ||||||||
Serbia International Bond, 7.25%, 09/28/21(a) | 850 | 926,500 | ||||||
|
| |||||||
| South Africa — 3.3% | ||||||||
Republic of South Africa Government International Bond | 1,000 | 965,250 | ||||||
4.67%, 01/17/24 | 900 | 939,094 | ||||||
4.85%, 09/27/27 | 600 | 609,750 | ||||||
4.85%, 09/30/29 | 1,000 | 987,500 | ||||||
4.88%, 04/14/26 | 700 | 721,437 | ||||||
5.00%, 10/12/46 | 500 | 458,750 | ||||||
5.38%, 07/24/44 | 700 | 671,781 | ||||||
5.65%, 09/27/47 | 800 | 784,750 | ||||||
5.75%, 09/30/49 | 1,700 | 1,641,860 | ||||||
5.88%, 05/30/22 | 450 | 484,594 | ||||||
5.88%, 09/16/25 | 1,086 | 1,183,401 | ||||||
| Security | Par (000) | Value | ||||||
| South Africa (continued) | ||||||||
5.88%, 06/22/30 | $ | 800 | $ | 848,920 | ||||
6.25%, 03/08/41 | 400 | 430,250 | ||||||
6.30%, 06/22/48 | 200 | 212,062 | ||||||
|
| |||||||
| 10,939,399 | ||||||||
| Sri Lanka — 2.3% | ||||||||
Sri Lanka Government International Bond | 200 | 202,250 | ||||||
5.75%, 04/18/23(a) | 700 | 701,969 | ||||||
5.88%, 07/25/22(a) | 562 | 566,918 | ||||||
6.13%, 06/03/25(a) | 300 | 295,875 | ||||||
6.20%, 05/11/27(a) | 800 | 766,750 | ||||||
6.25%, 07/27/21(a) | 578 | 586,851 | ||||||
6.35%, 06/28/24(a) | 200 | 202,500 | ||||||
6.75%, 04/18/28(a) | 600 | 585,750 | ||||||
6.83%, 07/18/26(a) | 400 | 402,125 | ||||||
6.85%, 03/14/24(a) | 700 | 722,610 | ||||||
6.85%, 11/03/25(a) | 1,000 | 1,013,437 | ||||||
7.55%, 03/28/30(a) | 800 | 807,000 | ||||||
7.85%, 03/14/29(a) | 900 | 927,000 | ||||||
|
| |||||||
| 7,781,035 | ||||||||
| Trinidad And Tobago — 0.3% | ||||||||
Trinidad & Tobago Government International Bond | 400 | 418,625 | ||||||
4.50%, 08/04/26(a) | 400 | 415,750 | ||||||
|
| |||||||
| 834,375 | ||||||||
| Turkey — 8.9% | ||||||||
Export Credit Bank of Turkey | 250 | 250,156 | ||||||
5.38%, 02/08/21(a) | 200 | 200,750 | ||||||
5.38%, 10/24/23(a) | 400 | 389,375 | ||||||
Turkey Government International Bond | 700 | 665,000 | ||||||
4.25%, 04/14/26 | 700 | 637,875 | ||||||
4.88%, 10/09/26 | 1,660 | 1,556,769 | ||||||
4.88%, 04/16/43 | 1,729 | 1,377,257 | ||||||
5.13%, 03/25/22 | 549 | 555,005 | ||||||
5.13%, 02/17/28 | 1,200 | 1,119,375 | ||||||
5.63%, 03/30/21 | 1,086 | 1,112,471 | ||||||
5.75%, 03/22/24 | 1,250 | 1,260,156 | ||||||
5.75%, 05/11/47 | 1,976 | 1,697,508 | ||||||
6.00%, 03/25/27 | 1,921 | 1,905,992 | ||||||
6.00%, 01/14/41 | 1,703 | 1,525,782 | ||||||
6.13%, 10/24/28 | 1,000 | 987,188 | ||||||
6.25%, 09/26/22 | 1,383 | 1,431,405 | ||||||
6.35%, 08/10/24 | 1,200 | 1,235,625 | ||||||
6.63%, 02/17/45 | 1,479 | 1,405,512 | ||||||
6.75%, 05/30/40 | 1,075 | 1,044,094 | ||||||
6.88%, 03/17/36 | 1,491 | 1,467,237 | ||||||
7.25%, 12/23/23 | 1,200 | 1,279,875 | ||||||
7.25%, 03/05/38 | 600 | 615,750 | ||||||
7.38%, 02/05/25 | 2,070 | 2,222,662 | ||||||
7.63%, 04/26/29 | 1,500 | 1,610,156 | ||||||
8.00%, 02/14/34 | 813 | 895,062 | ||||||
11.88%, 01/15/30 | 800 | 1,103,750 | ||||||
|
| |||||||
| 29,551,787 | ||||||||
| Ukraine — 2.7% | ||||||||
Ukraine Government International Bond | 1,600 | 1,673,000 | ||||||
7.75%, 09/01/21(a) | 850 | 888,675 | ||||||
| 20 | 2019ISHARES ANNUAL REPORTTO SHAREHOLDERS |
Schedule of Investments (continued) October 31, 2019 | iShares® Emerging Markets High Yield Bond ETF (Percentages shown are based on Net Assets) |
| Security | Par (000) | Value | ||||||
| Ukraine (continued) | ||||||||
7.75%, 09/01/22(a) | $ | 800 | $ | 850,400 | ||||
7.75%, 09/01/23(a) | 775 | 829,250 | ||||||
7.75%, 09/01/24(a) | 718 | 768,978 | ||||||
7.75%, 09/01/25(a) | 736 | 788,992 | ||||||
7.75%, 09/01/26(a) | 800 | 861,200 | ||||||
7.75%, 09/01/27(a) | 748 | 805,222 | ||||||
8.99%, 02/01/24(a) | 500 | 555,750 | ||||||
9.75%, 11/01/28(a) | 700 | 833,219 | ||||||
Ukreximbank Via Biz Finance PLC, 9.75%, 01/22/25(a) | 250 | 265,000 | ||||||
|
| |||||||
| 9,119,686 | ||||||||
| Venezuela — 0.4% | ||||||||
Venezuela Government International Bond | 640 | 60,800 | ||||||
7.00%, 03/31/38(a)(f) | 600 | 57,000 | ||||||
7.65%, 04/21/25(a)(f) | 658 | 62,510 | ||||||
8.25%, 10/13/24(a)(f) | 1,230 | 116,850 | ||||||
9.00%, 05/07/23(a)(f) | 1,037 | 98,515 | ||||||
9.25%, 09/15/27(c)(f) | 1,962 | 186,390 | ||||||
9.25%, 05/07/28(a)(f) | 892 | 84,740 | ||||||
9.38%, 01/13/34(f) | 730 | 69,350 | ||||||
11.75%, 10/21/26(a)(f) | 1,435 | 136,325 | ||||||
11.95%, 08/05/31(a)(f) | 2,030 | 192,850 | ||||||
12.75%, 08/23/22(a)(f) | 1,430 | 135,850 | ||||||
|
| |||||||
| 1,201,180 | ||||||||
| Vietnam — 0.2% | ||||||||
Vietnam Government International Bond, 4.80%, 11/19/24(a) | 600 | 655,557 | ||||||
|
| |||||||
Total Foreign Government Obligations — 48.9% |
| 162,968,955 | ||||||
|
| |||||||
| Security | Shares (000) | Value | ||||||
Short-Term Investments |
| |||||||
| Money Market Funds — 1.2% | ||||||||
BlackRock Cash Funds: Treasury, | 3,849 | $ | 3,849,000 | |||||
|
| |||||||
Total Short-Term Investments — 1.2% |
| 3,849,000 | ||||||
|
| |||||||
Total Investments in Securities — 99.1% |
| 330,386,694 | ||||||
Other Assets, Less Liabilities — 0.9% | 2,991,460 | |||||||
|
| |||||||
Net Assets — 100.0% | $ | 333,378,154 | ||||||
|
| |||||||
| (a) | This security may be resold to qualified foreign investors and foreign institutional buyers under Regulation S of the Securities Act of 1933. |
| (b) | Security is issued at a fixed coupon rate, which converts to a variable rate at a specified date. |
| (c) | Security exempt from registration pursuant to Rule 144A under the Securities Act of 1933, as amended. These securities may be resold in transactions exempt from registration to qualified institutional investors. |
| (d) | U.S. dollar denominated security issued by foreign domiciled entity. |
| (e) | Step coupon security. Coupon rate will either increase(step-up bond) or decrease (step-down bond) at regular intervals until maturity. Interest rate shown reflects the rate currently in effect. |
| (f) | Issuer filed for bankruptcy and/or is in default. |
| (g) | Affiliate of the Fund. |
| (h) | Annualized7-day yield as ofperiod-end. |
Affiliates
Investments in issuers considered to be affiliates of the Fund during the year ended October 31, 2019, for purposes of Section 2(a)(3) of the 1940 Act, were as follows:
| ||||||||||||||||||||||||||||
| Shares Held at 10/31/18 | Net Activity | Shares Held at 10/31/19 | Value at | Net Realized | Change in Unrealized Appreciation | |||||||||||||||||||||||
| Affiliated Issuer | (000) | (000) | (000) | 10/31/19 | Income | Gain (Loss) | (a) | (Depreciation) | ||||||||||||||||||||
| ||||||||||||||||||||||||||||
BlackRock Cash Funds: Treasury, | 3,376 | 473 | 3,849 | $ | 3,849,000 | $ | 46,809 | $ | — | $ | — | |||||||||||||||||
|
|
|
|
|
|
|
| |||||||||||||||||||||
| (a) | Includes realized capital gain distributions from an affiliated fund, if any. |
Fair Value Measurements
Various inputs are used in determining the fair value of financial instruments. For description of the input levels and information about the Fund’s policy regarding valuation of financial instruments, refer to the Notes to Financial Statements.
The following table summarizes the value of the Fund’s investments according to the fair value hierarchy as of October 31, 2019. The breakdown of the Fund’s investments into major categories is disclosed in the Schedule of Investments above.
| ||||||||||||||||
| Level 1 | Level 2 | Level 3 | Total | |||||||||||||
| ||||||||||||||||
Investments | ||||||||||||||||
Assets | ||||||||||||||||
Corporate Bonds & Notes | $ | — | $ | 163,568,739 | $ | — | $ | 163,568,739 | ||||||||
Foreign Government Obligations | — | 162,968,955 | — | 162,968,955 | ||||||||||||
Money Market Funds | 3,849,000 | — | — | 3,849,000 | ||||||||||||
|
|
|
|
|
|
|
| |||||||||
| $ | 3,849,000 | $ | 326,537,694 | $ | — | $ | 330,386,694 | |||||||||
|
|
|
|
|
|
|
| |||||||||
See notes to financial statements.
| SCHEDULES OF INVESTMENTS | 21 |
Schedule of Investments October 31, 2019 | iShares® International High Yield Bond ETF (Percentages shown are based on Net Assets) |
| Security | Par (000) | Value | ||||||||||
Corporate Bonds & Notes |
| |||||||||||
| Belgium — 0.3% | ||||||||||||
Telenet Finance Luxembourg Notes Sarl, 3.50%, 03/01/28 (Call 12/01/22)(a) | EUR | 100 | $ | 121,358 | ||||||||
|
| |||||||||||
| Canada — 2.1% | ||||||||||||
Baytex Energy Corp., 6.63%, 07/19/22 (Call 07/19/20) | CAD | 75 | 56,107 | |||||||||
Bombardier Inc., 6.13%, 05/15/21(a) | EUR | 100 | 115,867 | |||||||||
Brookfield Residential Properties Inc., 6.13%, 05/15/23 (Call 05/15/20)(a) | CAD | 50 | 38,926 | |||||||||
Cott Corp., 5.50%, 07/01/24 (Call 07/01/20)(a) | EUR | 100 | 115,914 | |||||||||
Iron Mountain Canada Operations ULC, 5.38%, 09/15/23 (Call 11/12/19)(a) | CAD | 50 | 39,230 | |||||||||
Mattamy Group Corp., 6.50%, 10/01/25 (Call 10/01/20)(b) | CAD | 25 | 19,874 | |||||||||
Parkland Fuel Corp. | ||||||||||||
5.63%, 05/09/25 (Call 05/09/20) | CAD | 150 | 118,262 | |||||||||
5.75%, 09/16/24 (Call 09/16/20) | CAD | 100 | 78,936 | |||||||||
Quebecor Media Inc., 6.63%, 01/15/23(b) | CAD | 100 | 82,931 | |||||||||
Southern Pacific Resource Corp., 8.75%, 01/25/18(b)(c)(d) | CAD | 50 | 4 | |||||||||
Videotron Ltd. | ||||||||||||
4.50%, 01/15/30 | CAD | 150 | 114,517 | |||||||||
5.63%, 06/15/25 (Call 03/15/25) | CAD | 50 | 41,142 | |||||||||
5.75%, 01/15/26 (Call 09/15/20)(a) | CAD | 50 | 39,860 | |||||||||
|
| |||||||||||
| 861,570 | ||||||||||||
| Denmark — 1.0% | ||||||||||||
DKT Finance ApS, 7.00%, 06/17/23 (Call 06/17/20)(a) | EUR | 100 | 117,903 | |||||||||
TDC AS | ||||||||||||
5.00%, 03/02/22 | EUR | 100 | 122,397 | |||||||||
6.88%, 02/23/23(a) | GBP | 100 | 147,253 | |||||||||
|
| |||||||||||
| 387,553 | ||||||||||||
| Finland — 2.1% | ||||||||||||
Nokia OYJ | ||||||||||||
1.00%, 03/15/21 (Call 02/15/21)(a) | EUR | 100 | 112,506 | |||||||||
2.00%, 03/15/24 (Call 12/15/23)(a) | EUR | 100 | 116,518 | |||||||||
2.00%, 03/11/26 (Call 12/11/25)(a) | EUR | 150 | 172,849 | |||||||||
Teollisuuden Voima OYJ | ||||||||||||
1.13%, 03/09/26 (Call 12/09/25)(a) | EUR | 200 | 220,937 | |||||||||
2.13%, 02/04/25 (Call 11/04/24)(a) | EUR | 100 | 117,931 | |||||||||
2.63%, 01/13/23(a) | EUR | 100 | 118,962 | |||||||||
|
| |||||||||||
| 859,703 | ||||||||||||
| France — 11.9% | ||||||||||||
Altice France SA/France | ||||||||||||
2.50%, 01/15/25 (09/15/21)(a) | EUR | 100 | 111,918 | |||||||||
3.38%, 01/15/28 (Call 09/15/22)(a) | EUR | 200 | 223,338 | |||||||||
5.88%, 02/01/27 (Call 02/01/22)(a) | EUR | 150 | 184,521 | |||||||||
Casino Guichard Perrachon SA | ||||||||||||
1.87%, 06/13/22 (Call 03/13/22)(a) | EUR | 200 | 207,693 | |||||||||
3.58%, 02/07/25 (Call 11/07/24)(a) | EUR | 200 | 178,472 | |||||||||
4.50%, 03/07/24 (Call 12/04/23)(a) | EUR | 100 | 96,439 | |||||||||
4.56%, 01/25/23(a) | EUR | 200 | 207,066 | |||||||||
5.98%, 05/26/21(a) | EUR | 100 | 114,401 | |||||||||
CMA CGM SA | ||||||||||||
5.25%, 01/15/25 (Call 10/15/20)(a) | EUR | 200 | 150,055 | |||||||||
7.75%, 01/15/21 (Call 01/15/20)(a) | EUR | 100 | 92,320 | |||||||||
Elis SA | ||||||||||||
1.00%, 04/03/25 (01/03/25)(a) | EUR | 100 | 110,898 | |||||||||
1.63%, 04/03/28 (Call 01/03/28)(a) | EUR | 100 | 111,077 | |||||||||
1.75%, 04/11/24 (Call 01/11/24)(a) | EUR | 100 | 115,203 | |||||||||
2.88%, 02/15/26 (Call 11/15/25)(a) | EUR | 100 | 122,256 | |||||||||
Europcar Mobility Group, 4.13%, 11/15/24 (Call 11/15/20)(a) | EUR | 200 | 209,987 | |||||||||
| Security | Par (000) | Value | ||||||||||
| France (continued) | ||||||||||||
Faurecia SE | ||||||||||||
2.63%, 06/15/25 (Call 06/15/21)(a) | EUR | 150 | $ | 171,590 | ||||||||
3.13%, 06/15/26 (Call 06/15/22)(a) | EUR | 100 | 116,308 | |||||||||
3.13%, 06/15/26 ( 06/15/22)(a) | EUR | 100 | 116,308 | |||||||||
3.63%, 06/15/23 (Call 06/15/20)(a) | EUR | 100 | 113,458 | |||||||||
La Financiere Atalian SASU, 4.00%, 05/15/24 (Call 05/15/20)(a) | EUR | 100 | 74,523 | |||||||||
Loxam SAS | ||||||||||||
3.25%, 01/14/25 (Call 07/15/21)(a) | EUR | 200 | 222,038 | |||||||||
3.50%, 05/03/23 (Call 11/11/19)(a) | EUR | 100 | 111,848 | |||||||||
5.75%, 07/15/27 (Call 07/15/22)(a) | EUR | 100 | 107,589 | |||||||||
Orano SA | ||||||||||||
3.13%, 03/20/23 (Call 12/20/22)(a) | EUR | 100 | 119,116 | |||||||||
3.38%, 04/23/26 (Call 01/23/26)(a) | EUR | 100 | 119,827 | |||||||||
3.50%, 03/22/21(a) | EUR | 100 | 116,173 | |||||||||
4.88%, 09/23/24 | EUR | 200 | 260,208 | |||||||||
Rexel SA | ||||||||||||
2.13%, 06/15/25 (Call 12/15/20)(a) | EUR | 150 | 169,720 | |||||||||
2.75%, 06/15/26 (Call 06/15/22)(a) | EUR | 100 | 115,609 | |||||||||
SPCM SA, 2.88%, 06/15/23 (Call 06/15/20)(a) | EUR | 100 | 112,192 | |||||||||
SPIE SA | ||||||||||||
2.63%, 06/18/26 (Call 12/18/25)(a) | EUR | 100 | 116,136 | |||||||||
3.13%, 03/22/24 (Call 09/22/23)(a) | EUR | 100 | 119,983 | |||||||||
Synlab Unsecured Bondco PLC, 8.25%, 07/01/23 (Call 07/01/20)(a) | EUR | 150 | 174,181 | |||||||||
Vallourec SA | ||||||||||||
2.25%, 09/30/24(a) | EUR | 100 | 71,619 | |||||||||
6.63%, 10/15/22 (Call 10/15/20)(a) | EUR | 100 | 94,167 | |||||||||
|
| |||||||||||
| 4,858,237 | ||||||||||||
| Germany — 7.9% | ||||||||||||
ADLER Real Estate AG | ||||||||||||
1.50%, 12/06/21 (Call 11/06/21)(a) | EUR | 100 | 112,249 | |||||||||
1.50%, 04/17/22 (Call 03/17/22)(a) | EUR | 100 | 111,512 | |||||||||
3.00%, 04/27/26 (Call 02/27/26)(a) | EUR | 100 | 115,123 | |||||||||
Deutsche Bank AG | ||||||||||||
2.75%, 02/17/25(a) | EUR | 225 | 257,892 | |||||||||
4.50%, 05/19/26(a) | EUR | 100 | 121,526 | |||||||||
Deutsche Lufthansa AG, 5.13%, 08/12/75 (Call 02/12/21)(a)(e) | EUR | 100 | 117,750 | |||||||||
K+S AG | ||||||||||||
2.63%, 04/06/23 (Call 01/06/23)(a) | EUR | 100 | 114,936 | |||||||||
3.25%, 07/18/24 (Call 04/18/24)(a) | EUR | 100 | 116,982 | |||||||||
4.13%, 12/06/21(a) | EUR | 200 | 237,812 | |||||||||
LANXESS AG, 4.50%, 12/06/76 | EUR | 75 | 91,580 | |||||||||
METRO AG | ||||||||||||
1.38%, 10/28/21(a) | EUR | 100 | 114,074 | |||||||||
1.50%, 03/19/25(a) | EUR | 100 | 116,621 | |||||||||
Nidda BondCo GmbH, 5.00%, 09/30/25 (Call 09/30/20)(a) | EUR | 100 | 113,751 | |||||||||
Nidda Healthcare Holding GmbH, 3.50%, 09/30/24 (Call 09/30/20)(a) | EUR | 100 | 115,160 | |||||||||
ProGroup AG, 3.00%, 03/31/26 (Call 03/31/21)(a) | EUR | 100 | 108,747 | |||||||||
RWE AG, 3.50%, 04/21/75 (Call 04/21/25)(a)(e) | EUR | 50 | 61,092 | |||||||||
thyssenkrupp AG | ||||||||||||
1.38%, 03/03/22 (Call 12/03/21)(a) | EUR | 250 | 279,561 | |||||||||
1.75%, 11/25/20 (Call 08/25/20)(a) | EUR | 250 | 281,889 | |||||||||
1.88%, 03/06/23 (Call 02/06/23)(a) | EUR | 150 | 167,019 | |||||||||
2.88%, 02/22/24 (Call 11/22/23)(a) | EUR | 400 | 458,363 | |||||||||
|
| |||||||||||
| 3,213,639 | ||||||||||||
| 22 | 2019ISHARES ANNUAL REPORTTO SHAREHOLDERS |
Schedule of Investments (continued) October 31, 2019 | iShares® International High Yield Bond ETF (Percentages shown are based on Net Assets) |
| Security | �� | Par (000) | Value | |||||||||
| Greece — 1.0% | ||||||||||||
National Bank of Greece SA, 8.25%, 07/18/29 (Call 07/18/24)(a)(e) | EUR | 100 | $ | 122,611 | ||||||||
OTE PLC, 0.88%, 09/24/26(a) | EUR | 150 | 169,430 | |||||||||
Piraeus Group Finance PLC, 9.75%, 06/26/29 (Call 06/26/24)(a)(e) | EUR | 100 | 119,240 | |||||||||
|
| |||||||||||
| 411,281 | ||||||||||||
| Ireland — 4.8% | ||||||||||||
Allied Irish Banks PLC, 4.13%, 11/26/25 (Call 11/26/20)(a)(e) | EUR | 100 | 115,700 | |||||||||
Ardagh Packaging Finance PLC/Ardagh Holdings USA Inc. | ||||||||||||
2.13%, 08/15/26 (Call 08/15/22)(a) | EUR | 100 | 112,686 | |||||||||
2.75%, 03/15/24 (03/15/20)(a) | EUR | 100 | 113,600 | |||||||||
4.13%, 05/15/23 (Call 05/15/20)(a) | EUR | 200 | 227,420 | |||||||||
4.75%, 07/15/27 (Call 07/15/22)(a) | GBP | 100 | 133,326 | |||||||||
Bank of Ireland Group PLC | ||||||||||||
2.38%, 10/14/29 (Call 10/14/24)(a)(e) | EUR | 100 | 113,745 | |||||||||
3.13%, 09/19/27 (Call 09/19/22)(a)(e) | GBP | 100 | 128,965 | |||||||||
eircom Finance DAC | ||||||||||||
1.75%, 11/01/24(a) | EUR | 100 | 110,901 | |||||||||
3.50%, 05/15/26 (Call 05/15/22)(a) | EUR | 100 | 116,779 | |||||||||
James Hardie International Finance DAC, 3.63%, 10/01/26 (Call 10/01/21)(a) | EUR | 100 | 117,715 | |||||||||
Smurfit Kappa Acquisitions ULC | ||||||||||||
2.38%, 02/01/24 (Call 11/01/23)(a) | EUR | 100 | 119,944 | |||||||||
2.88%, 01/15/26 (Call 10/15/25)(a) | EUR | 225 | 273,947 | |||||||||
Smurfit Kappa Treasury ULC, 1.50%, 09/15/27 (Call 06/15/27)(a) | EUR | 125 | 139,114 | |||||||||
Virgin Media Receivables Financing Notes II DAC, 5.75%, 04/15/23 (Call 09/15/20)(a) | GBP | 100 | 132,793 | |||||||||
|
| |||||||||||
| 1,956,635 | ||||||||||||
| Israel — 2.1% | ||||||||||||
Teva Pharmaceutical Finance Netherlands II BV 1.13%, 10/15/24(a) | EUR | 300 | 268,632 | |||||||||
1.25%, 03/31/23 (Call 12/31/22)(a) | EUR | 300 | 293,489 | |||||||||
1.63%, 10/15/28(a) | EUR | 150 | 120,768 | |||||||||
1.88%, 03/31/27 (Call 12/31/26)(a) | EUR | 100 | 84,434 | |||||||||
4.50%, 03/01/25 (Call 12/01/24) | EUR | 100 | 103,139 | |||||||||
|
| |||||||||||
| 870,462 | ||||||||||||
| Italy — 15.8% | ||||||||||||
Banca IFIS SpA, 2.00%, 04/24/23(a) | EUR | 100 | 110,645 | |||||||||
Banca Monte dei Paschi di Siena SpA | ||||||||||||
3.63%, 09/24/24(a) | EUR | 100 | 112,968 | |||||||||
5.38%, 01/18/28 (Call 01/18/23)(a)(e) | EUR | 100 | 86,408 | |||||||||
10.50%, 07/23/29(a) | EUR | 100 | 116,620 | |||||||||
Banca Popolare di Sondrio SCPA, 2.38%, 04/03/24(a) | EUR | 100 | 112,484 | |||||||||
Banco BPM SpA | ||||||||||||
1.75%, 04/24/23(a) | EUR | 100 | 113,338 | |||||||||
2.50%, 06/21/24(a) | EUR | 100 | 115,943 | |||||||||
2.75%, 07/27/20(a) | EUR | 175 | 198,908 | |||||||||
4.25%, 10/01/29(a)(e) | EUR | 100 | 114,888 | |||||||||
4.38%, 09/21/27 (Call 09/21/22)(a)(e) | EUR | 100 | 116,037 | |||||||||
6.00%, 11/05/20(a) | EUR | 100 | 116,912 | |||||||||
6.38%, 05/31/21(a) | EUR | 100 | 120,129 | |||||||||
BPER Banca, 5.13%, 05/31/27 | EUR | 100 | 117,993 | |||||||||
Fiat Chrysler Finance Europe SA, 4.75%, 07/15/22(a) | EUR | 300 | 375,578 | |||||||||
Iccrea Banca SpA, 1.50%, 10/11/22(a) | EUR | 100 | 114,121 | |||||||||
International Game Technology PLC, 3.50%, 06/15/26 (Call 06/15/22)(a) | EUR | 150 | 177,550 | |||||||||
Intesa Sanpaolo SpA 2.86%, 04/23/25(a) | EUR | 100 | 119,177 | |||||||||
| Security | Par (000) | Value | ||||||||||
| Italy (continued) | ||||||||||||
3.93%, 09/15/26(a) | EUR | 175 | $ | 220,138 | ||||||||
6.63%, 09/13/23(a) | EUR | 300 | 402,746 | |||||||||
Leonardo SpA | ||||||||||||
1.50%, 06/07/24 (Call 03/07/24)(a) | EUR | 125 | 143,272 | |||||||||
4.50%, 01/19/21 | EUR | 100 | 117,088 | |||||||||
5.25%, 01/21/22 | EUR | 100 | 123,487 | |||||||||
Mediobanca Banca di Credito Finanziario SpA | ||||||||||||
3.75%, 06/16/26 | EUR | 75 | 90,661 | |||||||||
5.00%, 11/15/20 | EUR | 100 | 116,577 | |||||||||
5.75%, 04/18/23 | EUR | 50 | 63,803 | |||||||||
Rossini Sarl, 6.75%, 10/30/25 (Call 10/30/21)(a) | EUR | 100 | 123,363 | |||||||||
Saipem Finance International BV | ||||||||||||
2.75%, 04/05/22(a) | EUR | 100 | 116,533 | |||||||||
3.00%, 03/08/21(a) | EUR | 100 | 115,218 | |||||||||
3.75%, 09/08/23(a) | EUR | 100 | 122,913 | |||||||||
Salini Impregilo SpA, 1.75%, 10/26/24(a) | EUR | 150 | 151,550 | |||||||||
Telecom Italia SpA/Milano | ||||||||||||
2.38%, 10/12/27 (Call 07/12/27)(a) | EUR | 200 | 229,684 | |||||||||
2.50%, 07/19/23(a) | EUR | 100 | 117,600 | |||||||||
2.88%, 01/28/26 (Call 10/28/25)(a) | EUR | 100 | 118,122 | |||||||||
3.25%, 01/16/23(a) | EUR | 150 | 180,652 | |||||||||
3.63%, 01/19/24(a) | EUR | 100 | 122,489 | |||||||||
3.63%, 05/25/26(a) | EUR | 100 | 123,786 | |||||||||
4.00%, 04/11/24 (Call 01/11/24)(a) | EUR | 125 | 154,237 | |||||||||
5.25%, 02/10/22(a) | EUR | 100 | 124,488 | |||||||||
Unione di Banche Italiane SpA | ||||||||||||
4.25%, 05/05/26 (Call 05/05/21)(a)(e) | EUR | 200 | 231,680 | |||||||||
4.38%, 07/12/29 (07/12/24)(a)(e) | EUR | 150 | 173,628 | |||||||||
5.88%, 03/04/29 (Call 03/04/24)(a)(e) | EUR | 150 | 184,366 | |||||||||
Unipol Gruppo SpA | ||||||||||||
3.00%, 03/18/25(a) | EUR | 175 | 208,882 | |||||||||
3.50%, 11/29/27 (Call 08/29/27)(a) | EUR | 100 | 123,504 | |||||||||
UnipolSai Assicurazioni SpA, 3.88%, 03/01/28(a) | EUR | 100 | 115,805 | |||||||||
|
| |||||||||||
| 6,455,971 | ||||||||||||
| Japan — 2.5% | ||||||||||||
SoftBank Group Corp. | ||||||||||||
3.13%, 09/19/25 (Call 06/21/25)(a) | EUR | 150 | 169,641 | |||||||||
4.00%, 07/30/22 (Call 04/30/22)(a) | EUR | 200 | 237,164 | |||||||||
4.00%, 09/19/29 (06/21/29)(a) | EUR | 100 | 114,075 | |||||||||
4.50%, 04/20/25 (Call 01/20/25)(a) | EUR | 100 | 120,558 | |||||||||
5.00%, 04/15/28 (Call 01/16/28)(a) | EUR | 300 | 367,198 | |||||||||
|
| |||||||||||
| 1,008,636 | ||||||||||||
| Luxembourg — 3.5% | ||||||||||||
Altice Financing SA, 5.25%, 02/15/23 (Call 02/15/20)(a) | EUR | 100 | 114,476 | |||||||||
Altice Finco SA, 4.75%, 01/15/28 | EUR | 100 | 108,330 | |||||||||
Altice Luxembourg SA | ||||||||||||
6.25%, 02/15/25 (Call 02/15/20)(a) | EUR | 200 | 231,800 | |||||||||
8.00%, 05/15/27 (Call 05/15/22)(a) | EUR | 250 | 305,835 | |||||||||
Garfunkelux Holdco 3 SA, 8.50%, 11/01/22 (Call 11/01/19)(a) | GBP | 100 | 122,254 | |||||||||
INEOS Finance PLC, 2.13%, 11/15/25 (Call 11/15/20)(a) | EUR | 100 | 107,997 | |||||||||
INEOS Group Holdings SA, 5.38%, 08/01/24 (Call 08/01/20)(a) | EUR | 100 | 113,971 | |||||||||
Matterhorn Telecom SA | ||||||||||||
2.63%, 09/15/24 (09/15/21)(a) | EUR | 100 | 113,622 | |||||||||
3.13%, 09/15/26 (Call 09/15/22)(a) | EUR | 100 | 111,866 | |||||||||
4.00%, 11/15/27 (Call 11/15/22)(a) | EUR | 100 | 116,355 | |||||||||
|
| |||||||||||
| 1,446,506 | ||||||||||||
| Netherlands — 6.0% | ||||||||||||
Axalta Coating Systems LLC, 4.25%, 08/15/24 (Call 08/15/20)(a) | EUR | 100 | 114,656 | |||||||||
| SCHEDULES OF INVESTMENTS | 23 |
Schedule of Investments (continued) October 31, 2019 | iShares® International High Yield Bond ETF (Percentages shown are based on Net Assets) |
| Security | Par (000) | Value | ||||||||||
| Netherlands (continued) | ||||||||||||
Constellium SE, 4.25%, 02/15/26 (Call 11/15/20)(a) | EUR | 100 | $ | 115,279 | ||||||||
InterXion Holding NV, 4.75%, 06/15/25 (Call 06/15/21)(a) | EUR | 250 | 303,228 | |||||||||
Lincoln Financing SARL, 3.63%, 04/01/24 (Call 10/01/20)(a) | EUR | 100 | 113,577 | |||||||||
OCI NV | ||||||||||||
3.13%, 11/01/24 (Call 11/01/21)(a) | EUR | 100 | 113,846 | |||||||||
5.00%, 04/15/23 (Call 04/15/20)(a) | EUR | 100 | 116,257 | |||||||||
Saipem Finance International BV, 2.63%, 01/07/25(a) | EUR | 100 | 116,779 | |||||||||
Selecta Group BV, 5.88%, 02/01/24 (Call 02/01/20)(a) | EUR | 100 | 112,467 | |||||||||
Sigma Holdco BV, 5.75%, 05/15/26 (Call 05/15/21)(a) | EUR | 100 | 106,041 | |||||||||
SNS Bank NV, 6.25%, 10/26/20(d) | EUR | 50 | 0 | (f) | ||||||||
Starfruit Finco BV/Starfruit U.S. Holdco LLC, 6.50%, 10/01/26 (Call 10/01/21)(a) | EUR | 100 | 112,209 | |||||||||
Trivium Packaging Finance BV, 3.75%, 08/15/26 (Call 08/15/22)(a) | EUR | 100 | 115,766 | |||||||||
United Group BV, 4.88%, 07/01/24 (Call 07/01/20)(a) | EUR | 100 | 115,291 | |||||||||
UPC Holding BV, 3.88%, 06/15/29 (Call 06/15/22)(a) | EUR | 200 | 231,075 | |||||||||
UPCB Finance VII Ltd., 3.63%, 06/15/29 (Call 06/15/22)(a) | EUR | 100 | 117,297 | |||||||||
Ziggo Bond Co. BV, 4.63%, 01/15/25 (Call 01/15/20)(a) | EUR | 150 | 172,143 | |||||||||
Ziggo BV | ||||||||||||
2.88%, 01/15/30 (Call 10/15/24)(a) | EUR | 100 | 113,046 | |||||||||
4.25%, 01/15/27 (Call 01/15/22)(a) | EUR | 200 | 240,065 | |||||||||
|
| |||||||||||
| 2,429,022 | ||||||||||||
| Portugal — 1.5% | ||||||||||||
Banco Comercial Portugues SA, 4.50%, 12/07/27 (Call 12/07/22)(a)(e) | EUR | 100 | 115,800 | |||||||||
Caixa Geral de Depositos SA, 5.75%, 06/28/28 (Call 06/28/23)(a)(e) | EUR | 100 | 125,935 | |||||||||
EDP — Energias de Portugal SA | ||||||||||||
4.50%, 04/30/79 (Call 01/30/24)(a)(e) | EUR | 200 | 247,645 | |||||||||
5.38%, 09/16/75 (Call 03/16/21)(a)(e) | EUR | 100 | 118,596 | |||||||||
|
| |||||||||||
| 607,976 | ||||||||||||
| Spain — 5.6% | ||||||||||||
ABANCA Corp. Bancaria SA, | EUR | 100 | 114,816 | |||||||||
Banco de Sabadell SA | ||||||||||||
1.13%, 03/27/25(a) | EUR | 200 | 222,273 | |||||||||
5.38%, 12/12/28 (Call 12/12/23)(a)(e) | EUR | 100 | 125,418 | |||||||||
5.63%, 05/06/26(a) | EUR | 100 | 132,117 | |||||||||
Bankia SA | ||||||||||||
3.38%, 03/15/27 (Call 03/15/22)(a)(e) | EUR | 100 | 117,687 | |||||||||
3.75%, 02/15/29 (Call 02/15/24)(a)(e) | EUR | 200 | 241,927 | |||||||||
Cellnex Telecom SA | ||||||||||||
2.38%, 01/16/24 (Call 10/16/23)(a) | EUR | 100 | 118,182 | |||||||||
2.88%, 04/18/25 (Call 01/18/25)(a) | EUR | 100 | 121,644 | |||||||||
3.13%, 07/27/22(a) | EUR | 100 | 119,707 | |||||||||
Cirsa Finance International Sarl | ||||||||||||
4.75%, 05/22/25 (Call 05/07/21)(a) | EUR | 100 | 116,027 | |||||||||
6.25%, 12/20/23 (Call 06/20/20)(a) | EUR | 100 | 118,001 | |||||||||
Distribuidora Internacional de Alimentacion SA, 0.88%, 04/06/23 (Call 01/06/23)(a) | EUR | 100 | 48,822 | |||||||||
El Corte Ingles SA, 3.00%, 03/15/24 (Call 10/15/20)(a) | EUR | 100 | 115,963 | |||||||||
Grifols SA, 3.20%, 05/01/25 (Call 05/01/20)(a) | EUR | 200 | 227,644 | |||||||||
Grupo Isolux Corsan SA, Series B, 6.00%, 12/30/21 (Call 12/02/19)(c) | EUR | 141 | 79 | |||||||||
Liberbank SA, 6.88%, 03/14/27 | EUR | 100 | 122,334 | |||||||||
Repsol International Finance BV, 4.50%, 03/25/75 (Call 03/25/25)(a)(e) | EUR | 175 | 224,143 | |||||||||
|
| |||||||||||
| 2,286,784 | ||||||||||||
| Security | Par (000) | Value | ||||||||||
| Sweden — 4.1% | ||||||||||||
Akelius Residential Property AB, 3.88%, 10/05/78 (Call 10/05/23)(a)(e) | EUR | 100 | $ | 119,210 | ||||||||
Fastighets AB Balder, 3.00%, 03/07/78 (Call 03/07/23)(a)(e) | EUR | 100 | 113,706 | |||||||||
Intrum AB | ||||||||||||
2.75%, 07/15/22 (Call 07/15/20)(a) | EUR | 100 | 112,811 | |||||||||
3.00%, 09/15/27 ( 09/15/22)(a) | EUR | 100 | 107,929 | |||||||||
3.13%, 07/15/24 (Call 07/15/20)(a) | EUR | 200 | 226,247 | |||||||||
3.50%, 07/15/26 (Call 07/15/22)(a) | EUR | 175 | 195,937 | |||||||||
Telefonaktiebolaget LM Ericsson | ||||||||||||
0.88%, 03/01/21(a) | EUR | 100 | 112,652 | |||||||||
Series 7Y, 1.88%, 03/01/24(a) | EUR | 100 | 117,792 | |||||||||
Verisure Midholding AB, 5.75%, 12/01/23 (Call 12/01/19)(a) | EUR | 200 | 229,861 | |||||||||
Volvo Car AB | ||||||||||||
2.00%, 01/24/25 (Call 10/24/24)(a) | EUR | 200 | 228,491 | |||||||||
3.25%, 05/18/21(a) | EUR | 100 | 116,424 | |||||||||
|
| |||||||||||
| 1,681,060 | ||||||||||||
| Switzerland — 0.8% | ||||||||||||
Dufry Finance SCA, 4.50%, 08/01/23 (Call 08/01/20)(a) | EUR | 100 | 114,183 | |||||||||
Dufry One BV, 2.50%, 10/15/24 (Call 10/15/20)(a) | EUR | 200 | 228,962 | |||||||||
|
| |||||||||||
| 343,145 | ||||||||||||
| United Kingdom — 7.8% | ||||||||||||
Algeco Global Finance PLC, 6.50%, 02/15/23 (Call 02/15/20)(a) | EUR | 100 | 111,230 | |||||||||
Ardonagh Midco 3 PLC, 8.38%, 07/15/23 (Call 07/15/20)(a) | GBP | 100 | 120,638 | |||||||||
Arqiva Broadcast Finance PLC, 6.75%, 09/30/23 (Call 09/30/20)(a) | GBP | 150 | 207,930 | |||||||||
Cabot Financial Luxembourg SA, 7.50%, 10/01/23 (Call 10/01/20)(a) | GBP | 100 | 133,826 | |||||||||
Centrica PLC, 3.00%, 04/10/76 | EUR | 150 | 170,689 | |||||||||
eG Global Finance PLC | ||||||||||||
4.38%, 02/07/25 (Call 05/15/21)(a) | EUR | 125 | 135,441 | |||||||||
6.25%, 10/30/25 (Call 10/21/25)(a) | EUR | 150 | 172,663 | |||||||||
Fiat Chrysler Automobiles NV, 3.75%, 03/29/24(a) | EUR | 200 | 252,316 | |||||||||
Fiat Chrysler Finance Europe SA, 4.75%, 03/22/21(a) | EUR | 150 | 178,203 | |||||||||
Heathrow Finance PLC, | GBP | 100 | 129,794 | |||||||||
INEOS Finance PLC, 2.88%, 05/01/26 (Call 05/01/22)(a) | EUR | 100 | 110,088 | |||||||||
International Game Technology PLC, 2.38%, 04/15/28 (Call 04/15/23)(a) | EUR | 100 | 110,780 | |||||||||
Jaguar Land Rover Automotive PLC | ||||||||||||
2.20%, 01/15/24(a) | EUR | 100 | 100,870 | |||||||||
2.75%, 01/24/21(a) | GBP | 100 | 128,686 | |||||||||
4.50%, 01/15/26(a) | EUR | 150 | 157,889 | |||||||||
Merlin Entertainments PLC, 2.75%, 03/15/22 (Call 12/15/21)(a) | EUR | 150 | 176,765 | |||||||||
Top Gun Realisations 74 PLC, 6.50%, 07/01/22 (Call 06/24/20)(a)(c) | GBP | 25 | 5,783 | |||||||||
Virgin Media Finance PLC, 4.50%, 01/15/25 (Call 01/15/20)(a) | EUR | 100 | 114,544 | |||||||||
Virgin Media Receivables Financing Notes I DAC, 5.50%, 09/15/24 (Call 11/11/20)(a) | GBP | 100 | 132,580 | |||||||||
Virgin Media Secured Finance PLC | ||||||||||||
4.88%, 01/15/27 (Call 01/15/21)(a) | GBP | 100 | 133,871 | |||||||||
5.25%, 05/15/29 (Call 05/15/24)(a) | GBP | 100 | 138,781 | |||||||||
6.00%, 01/15/25 (Call 01/15/21)(a)(g) | GBP | 100 | 143,000 | |||||||||
6.25%, 03/28/29 (Call 01/15/21)(a) | GBP | 90 | 123,740 | |||||||||
|
| |||||||||||
| 3,190,107 | ||||||||||||
| United States — 18.8% | ||||||||||||
Adient Global Holdings Ltd., 3.50%, 08/15/24 (Call 05/15/24)(a) | EUR | 175 | 164,342 | |||||||||
AMC Entertainment Holdings Inc., 6.38%, 11/15/24 (Call 11/15/19) | GBP | 100 | 123,939 | |||||||||
| 24 | 2019ISHARES ANNUAL REPORTTO SHAREHOLDERS |
Schedule of Investments (continued) October 31, 2019 | iShares® International High Yield Bond ETF (Percentages shown are based on Net Assets) |
| Security | Par (000) | Value | ||||||||||
| United States (continued) | ||||||||||||
Aramark International Finance Sarl, 3.13%, 04/01/25 (Call 04/01/20)(a) | EUR | 100 | $ | 114,537 | ||||||||
Avantor Inc., 4.75%, 10/01/24 (Call 10/01/20)(a) | EUR | 100 | 118,381 | |||||||||
Avis Budget Finance PLC, 4.75%, 01/30/26 (Call 09/30/21)(a) | EUR | 100 | 115,121 | |||||||||
Ball Corp. | ||||||||||||
3.50%, 12/15/20 | EUR | 100 | 115,385 | |||||||||
4.38%, 12/15/23 | EUR | 100 | 129,111 | |||||||||
Bausch Health Companies Inc., 4.50%, 05/15/23 (Call 05/15/20)(a) | EUR | 300 | 337,751 | |||||||||
Belden Inc., 3.88%, 03/15/28 (Call 03/06/23)(a) | EUR | 150 | 174,066 | |||||||||
Chemours Co. (The), 4.00%, 05/15/26 (Call 05/15/21) | EUR | 100 | 100,489 | |||||||||
Coty Inc., 4.75%, 04/15/26 (Call 04/15/21)(a) | EUR | 100 | 113,954 | |||||||||
Crown European Holdings SA | ||||||||||||
0.75%, 02/15/23 (Call 01/15/23)(a) | EUR | 100 | 111,327 | |||||||||
2.25%, 02/01/23 (Call 11/01/22)(a) | EUR | 100 | 116,513 | |||||||||
2.63%, 09/30/24 (Call 03/30/24)(a) | EUR | 125 | 148,628 | |||||||||
2.88%, 02/01/26 (Call 08/01/25)(a) | EUR | 100 | 119,474 | |||||||||
3.38%, 05/15/25 (Call 11/15/24)(a) | EUR | 100 | 122,691 | |||||||||
Darling Global Finance BV, 3.63%, 05/15/26 (Call 05/15/21)(a) | EUR | 100 | 117,499 | |||||||||
Energizer Gamma Acquisition BV, 4.63%, 07/15/26 (Call 07/15/21)(a) | EUR | 100 | 117,410 | |||||||||
Equinix Inc. | ||||||||||||
2.88%, 10/01/25 (Call 10/01/20) | EUR | 150 | 172,870 | |||||||||
2.88%, 02/01/26 (Call 02/01/21) | EUR | 300 | 347,837 | |||||||||
Hanesbrands Finance Luxembourg SCA, 3.50%, 06/15/24 (Call 03/15/24)(a) | EUR | 100 | 123,217 | |||||||||
Hertz Holdings Netherlands BV, 5.50%, 03/30/23 (Call 03/30/20)(a) | EUR | 100 | 114,529 | |||||||||
Infor U.S. Inc., 5.75%, 05/15/22 (Call 05/15/20) | EUR | 100 | 112,904 | |||||||||
International Game Technology PLC | ||||||||||||
3.50%, 07/15/24 (Call 01/15/24)(a) | EUR | 125 | 149,862 | |||||||||
4.75%, 03/05/20(a) | EUR | 100 | 113,181 | |||||||||
IQVIA Inc. | ||||||||||||
2.25%, 01/15/28 (Call 07/15/22)(a) | EUR | 150 | 171,008 | |||||||||
2.88%, 09/15/25 (Call 09/15/20)(a) | EUR | 100 | 114,629 | |||||||||
3.25%, 03/15/25 (Call 03/15/20)(a) | EUR | 250 | 285,085 | |||||||||
3.50%, 10/15/24 (Call 10/15/20)(a) | EUR | 100 | 113,720 | |||||||||
Iron Mountain UK PLC, 3.88%, 11/15/25 (Call 11/15/20)(a) | GBP | 100 | 129,389 | |||||||||
Levi Strauss & Co., 3.38%, 03/15/27 (Call 03/15/22) | EUR | 100 | 119,049 | |||||||||
Liberty Mutual Group Inc., 3.63%, 05/23/59 | ||||||||||||
(Call 05/23/24)(a)(e) | EUR | 100 | 115,852 | |||||||||
LKQ European Holdings BV | ||||||||||||
3.63%, 04/01/26 (Call 04/01/21)(a) | EUR | 100 | 116,060 | |||||||||
4.13%, 04/01/28 (Call 04/01/23)(a) | EUR | 100 | 121,058 | |||||||||
LKQ Italia Bondco SpA, 3.88%, 04/01/24 (Call 01/01/24)(a) | EUR | 100 | 124,709 | |||||||||
Mauser Packaging Solutions Holding Co., | EUR | 100 | 115,019 | |||||||||
MPT Operating Partnership LP/MPT Finance Corp. | ||||||||||||
3.33%, 03/24/25 (Call 12/24/24) | EUR | 100 | 123,738 | |||||||||
4.00%, 08/19/22 (Call 05/19/22) | EUR | 100 | 121,756 | |||||||||
Netflix Inc. | ||||||||||||
3.63%, 05/15/27 | EUR | 250 | 293,265 | |||||||||
3.63%, 06/15/30 (Call 03/15/30)(a) | EUR | 150 | 167,019 | |||||||||
3.88%, 11/15/29(a) | EUR | 200 | 228,324 | |||||||||
4.63%, 05/15/29(a) | EUR | 200 | 243,764 | |||||||||
OI European Group BV 3.13%, 11/15/24 (Call 08/15/24)(a) | EUR | 100 | 115,074 | |||||||||
| Security | Par/ Shares (000) | Value | ||||||||||
| United States (continued) | ||||||||||||
4.88%, 03/31/21(a) | EUR | 100 | $ | 118,151 | ||||||||
Panther BF Aggregator 2 LP/Panther Finance Co. Inc., 4.38%, 05/15/26 (Call 05/15/22)(a) | EUR | 125 | 140,512 | |||||||||
Refinitiv U.S. Holdings Inc., 4.50%, 05/15/26 (Call 11/15/21)(a) | EUR | 250 | 301,865 | |||||||||
Scientific Games International Inc., 5.50%, 02/15/26 (Call 02/15/21)(a) | EUR | 100 | 108,781 | |||||||||
Sealed Air Corp., 4.50%, 09/15/23 (06/15/23)(a) | EUR | 100 | 127,238 | |||||||||
Silgan Holdings Inc., 3.25%, 03/15/25 (Call 03/15/20) | EUR | 100 | 113,996 | |||||||||
Spectrum Brands Inc., 4.00%, 10/01/26 (10/01/21)(a) | EUR | 100 | 117,539 | |||||||||
Tenneco Inc., 5.00%, 07/15/24 (Call 07/15/20)(a) | EUR | 100 | 110,504 | |||||||||
WMG Acquisition Corp., 3.63%, 10/15/26 (Call 10/15/21)(a) | EUR | 100 | 117,624 | |||||||||
|
| |||||||||||
| 7,669,746 | ||||||||||||
|
| |||||||||||
Total Corporate Bonds & Notes — 99.6% |
| 40,659,391 | ||||||||||
|
| |||||||||||
Common Stocks | ||||||||||||
| South Africa — 0.0% | ||||||||||||
Sentry Holdings Ltd.Class A | 0 | (h) | 0 | (f) | ||||||||
|
| |||||||||||
| United Kingdom — 0.0% | ||||||||||||
New Look Retails Holdings Ltd.(d) | 53 | 862 | ||||||||||
|
| |||||||||||
Total Common Stocks — 0.0% |
| 862 | ||||||||||
|
| |||||||||||
Short-Term Investments | ||||||||||||
| Money Market Funds — 0.0% | ||||||||||||
BlackRock Cash Funds: Treasury, | 14 | 14,000 | ||||||||||
|
| |||||||||||
Total Short-Term Investments — 0.0% |
| 14,000 | ||||||||||
|
| |||||||||||
Total Investments in Securities — 99.6% |
| 40,674,253 | ||||||||||
Other Assets, Less Liabilities — 0.4% |
| 164,062 | ||||||||||
|
| |||||||||||
Net Assets — 100.0% |
| $ | 40,838,315 | |||||||||
|
| |||||||||||
| (a) | This security may be resold to qualified foreign investors and foreign institutional buyers under Regulation S of the Securities Act of 1933. |
| (b) | Security exempt from registration pursuant to Rule 144A under the Securities Act of 1933, as amended. These securities may be resold in transactions exempt from registration to qualified institutional investors. |
| (c) | Issuer filed for bankruptcy and/or is in default. |
| (d) | Security is valued using significant unobservable inputs and is classified as Level 3 in the fair value hierarchy. |
| (e) | Security is issued at a fixed coupon rate, which converts to a variable rate at a specified date. |
| (f) | Rounds to less than $1. |
| (g) | Step coupon security. Coupon rate will either increase (step-up bond) or decrease (step-down bond) at regular intervals until maturity. Interest rate shown reflects the rate currently in effect. |
| (h) | Rounds to less than 1,000. |
| (i) | Affiliate of the Fund. |
| (j) | Annualized 7-day yield as of period-end. |
| SCHEDULES OF INVESTMENTS | 25 |
Schedule of Investments (continued) October 31, 2019 | iShares®��International High Yield Bond ETF |
Affiliates
Investments in issuers considered to be affiliates of the Fund during the year ended October 31, 2019, for purposes of Section 2(a)(3) of the 1940 Act, were as follows:
| ||||||||||||||||||||||||||||
Affiliated Issuer | | Shares Held at 10/31/18 (000) | | | Net Activity (000) | | | Shares Held at 10/31/19 (000) | | | Value at 10/31/19 |
| Income | | Net Realized Gain (Loss) | (a) | | Change in Unrealized Appreciation (Depreciation) | | |||||||||
| ||||||||||||||||||||||||||||
BlackRock Cash Funds: Treasury, | 13 | 1 | 14 | $ | 14,000 | $ | 628 | $ | — | $ | — | |||||||||||||||||
|
|
|
|
|
|
|
| |||||||||||||||||||||
| (a) | Includes realized capital gain distributions from an affiliated fund, if any. |
Fair Value Measurements
Various inputs are used in determining the fair value of financial instruments. For description of the input levels and information about the Fund’s policy regarding valuation of financial instruments, refer to the Notes to Financial Statements.
The following table summarizes the value of the Fund’s investments according to the fair value hierarchy as of October 31, 2019. The breakdown of the Fund’s investments into major categories is disclosed in the Schedule of Investments above.
| ||||||||||||||||
| Level 1 | Level 2 | Level 3 | Total | |||||||||||||
| ||||||||||||||||
Investments | ||||||||||||||||
Assets | ||||||||||||||||
Corporate Bonds & Notes | $ | — | $ | 40,659,387 | $ | 4 | $ | 40,659,391 | ||||||||
Common Stocks | — | — | 862 | 862 | ||||||||||||
Money Market Funds | 14,000 | — | — | 14,000 | ||||||||||||
|
|
|
|
|
|
|
| |||||||||
| $ | 14,000 | $ | 40,659,387 | $ | 866 | $ | 40,674,253 | |||||||||
|
|
|
|
|
|
|
| |||||||||
See notes to financial statements.
| 26 | 2019ISHARES ANNUAL REPORTTO SHAREHOLDERS |
Schedule of Investments October 31, 2019 | iShares® J.P. Morgan EM Corporate Bond ETF (Percentages shown are based on Net Assets) |
| Security | Par (000) | Value | ||||||
Corporate Bonds & Notes | ||||||||
| Argentina — 1.7% | ||||||||
Adecoagro SA, 6.00%, 09/21/27 (Call 09/21/22)(a) | $ | 150 | $ | 144,609 | ||||
Agua y Saneamientos Argentinos SA, 6.63%, 02/01/23 (Call 02/01/21)(a) | 150 | 58,875 | ||||||
Arcor SAIC, 6.00%, 07/06/23 (Call 07/06/20)(a) | 225 | 201,305 | ||||||
Genneia SA, 8.75%, 01/20/22 (Call 01/20/20)(a) | 100 | 67,469 | ||||||
Pampa Energia SA, 7.50%, 01/24/27 | 300 | 239,437 | ||||||
Rio Energy SA/UGEN SA/UENSA SA, 6.88%, 02/01/25 (Call 02/01/22)(a) | 150 | 86,156 | ||||||
Stoneway Capital Corp., 10.00%, 03/01/27 (Call 03/01/22)(a) | 266 | 132,505 | ||||||
Tecpetrol SA, 4.88%, 12/12/22 (Call 12/12/20)(a)(b) | 200 | 184,469 | ||||||
Transportadora de Gas del Sur SA, 6.75%, 05/02/25 | 150 | 125,400 | ||||||
YPF SA | ||||||||
6.95%, 07/21/27(a)(b) | 425 | 317,820 | ||||||
7.00%, 12/15/47 (Call 06/15/47)(a)(b) | 350 | 248,391 | ||||||
8.50%, 07/28/25(a) | 600 | 475,200 | ||||||
8.50%, 06/27/29 (Call 03/27/29)(a)(b) | 200 | 151,844 | ||||||
8.75%, 04/04/24(a) | 430 | 356,900 | ||||||
|
| |||||||
| 2,790,380 | ||||||||
| Bahrain — 0.1% | ||||||||
BBK BSC, 5.50%, 07/09/24(a) | 200 | 202,500 | ||||||
|
| |||||||
| Brazil — 6.8% | ||||||||
Banco BTG Pactual SA/Cayman Islands, 5.50%, 01/31/23(a)(b) | 200 | 210,687 | ||||||
Banco do Brasil SA/Cayman | ||||||||
4.63%, 01/15/25(a) | 200 | 208,553 | ||||||
4.75%, 03/20/24(a) | 200 | 209,938 | ||||||
5.88%, 01/19/23(a)(b) | 200 | 215,062 | ||||||
6.25%, (Call 04/15/24)(a)(c)(d) | 200 | 197,960 | ||||||
9.00%, (Call 06/18/24)(a)(c)(d) | 200 | 227,800 | ||||||
9.25%, (Call 04/15/23)(a)(c)(d) | 200 | 226,752 | ||||||
Braskem Netherlands Finance BV | 200 | 202,875 | ||||||
4.50%, 01/10/28(a)(b) | 200 | 200,700 | ||||||
BRF SA, 4.88%, 01/24/30 (Call 10/24/28)(e) | 200 | 198,730 | ||||||
Cemig Geracao e Transmissao SA, 9.25%, 12/05/24 (Call 12/05/23)(a)(b) | 200 | 233,187 | ||||||
CSN Islands XII Corp., 7.00%, (Call 12/23/19)(a)(c) | 100 | 87,868 | ||||||
CSN Resources SA, 7.63%, 02/13/23 | 200 | 207,063 | ||||||
Embraer Netherlands Finance BV | 227 | 249,274 | ||||||
5.40%, 02/01/27 | 50 | 56,531 | ||||||
Fibria Overseas Finance Ltd. | 50 | 53,812 | ||||||
5.50%, 01/17/27(b) | 100 | 109,000 | ||||||
Gerdau Trade Inc., 4.88%, 10/24/27(a) | 200 | 211,769 | ||||||
Gol Finance Inc., 7.00%, 01/31/25 (Call 01/31/22)(a) | 50 | 51,226 | ||||||
GTL Trade Finance Inc./Gerdau Holdings Inc., 5.89%, 04/29/24 (Call 01/29/24)(a) | 150 | 165,328 | ||||||
Itau Unibanco Holding SA/Cayman Islands | 200 | 212,006 | ||||||
5.50%, 08/06/22(a) | 200 | 211,600 | ||||||
5.65%, 03/19/22(a)(b) | 200 | 211,217 | ||||||
6.50%, (Call 03/19/23)(a)(b)(c)(d) | 200 | 207,784 | ||||||
JBS Investments II GmbH | 200 | 208,750 | ||||||
7.00%, 01/15/26 (Call 01/15/22)(a) | 200 | 217,000 | ||||||
| Security | Par (000) | Value | ||||||
| Brazil (continued) | ||||||||
JBS USA LUX SA/JBS USA Finance Inc., 5.88%, 07/15/24 (Call 12/02/19)(a) | $ | 75 | $ | 77,624 | ||||
Klabin Austria GmbH, 5.75%, 04/03/29 (Call 01/03/29)(a) | 200 | 212,000 | ||||||
MARB BondCo PLC, 6.88%, 01/19/25 | 200 | 208,125 | ||||||
Minerva Luxembourg SA, 6.50%, 09/20/26 (Call 09/20/21)(a) | 200 | 209,500 | ||||||
NBM U.S. Holdings Inc., 7.00%, 05/14/26 (Call 05/14/22)(a)(b) | 200 | 212,100 | ||||||
Odebrecht Drilling Norbe VIII/IX Ltd., 7.35%, (7.35% PIK), 12/01/26 (Call 12/01/20)(a)(f) | 50 | 28,710 | ||||||
Odebrecht Offshore Drilling Finance Ltd., 7.72%, (7.72% PIK), 12/01/26 (Call 12/01/21)(a)(b)(f) | 157 | 38,390 | ||||||
Oi SA, 10.00%, (10.00% PIK), 07/27/25(f) | 200 | 181,750 | ||||||
Petrobras Global Finance BV | 150 | 156,563 | ||||||
5.30%, 01/27/25 | 218 | 236,639 | ||||||
5.63%, 05/20/43 | 100 | 105,656 | ||||||
5.75%, 02/01/29 | 200 | 222,006 | ||||||
6.00%, 01/27/28 | 325 | 364,670 | ||||||
6.13%, 01/17/22 | 150 | 160,822 | ||||||
6.25%, 03/17/24(b) | 225 | 252,148 | ||||||
6.75%, 01/27/41 | 100 | 115,844 | ||||||
6.85%, 06/05/2115 | 300 | 344,040 | ||||||
6.88%, 01/20/40 | 148 | 172,753 | ||||||
6.90%, 03/19/49(b) | 200 | 231,772 | ||||||
7.25%, 03/17/44 | 150 | 182,250 | ||||||
7.38%, 01/17/27(b) | 250 | 302,750 | ||||||
8.75%, 05/23/26(b) | 300 | 384,000 | ||||||
Rumo Luxembourg Sarl, 5.88%, 01/18/25 (Call 01/18/22)(a) | 200 | 212,375 | ||||||
St. Marys Cement Inc. Canada, 5.75%, 01/28/27 (Call 10/28/26)(a) | 200 | 225,000 | ||||||
Suzano Austria GmbH | 200 | 206,000 | ||||||
6.00%, 01/15/29 (Call 10/15/28) | 400 | 441,200 | ||||||
Ultrapar International SA, 5.25%, 06/06/29(a) | 200 | 208,625 | ||||||
Vale Overseas Ltd. | 100 | 104,100 | ||||||
6.25%, 08/10/26(b) | 200 | 233,160 | ||||||
6.88%, 11/21/36 | 100 | 126,388 | ||||||
6.88%, 11/10/39 | 200 | 255,687 | ||||||
Vale SA, 5.63%, 09/11/42(b) | 100 | 113,313 | ||||||
|
| |||||||
| 11,318,432 | ||||||||
| Chile — 4.2% | ||||||||
AES Gener SA, 7.13%, 03/26/79 | 200 | 207,938 | ||||||
Banco de Credito e Inversiones SA | 200 | 208,437 | ||||||
4.00%, 02/11/23(a) | 200 | 208,562 | ||||||
Celulosa Arauco y Constitucion SA | 200 | 203,400 | ||||||
4.50%, 08/01/24 (Call 05/01/24) | 200 | 208,312 | ||||||
5.50%, 04/30/49 (Call 10/30/48)(a)(b) | 200 | 211,103 | ||||||
Cencosud SA | 400 | 400,513 | ||||||
4.88%, 01/20/23(a) | 200 | 207,790 | ||||||
5.15%, 02/12/25 (Call 11/12/24)(a) | 200 | 211,000 | ||||||
Colbun SA, 4.50%, 07/10/24 (Call 04/11/24)(a) | 400 | 422,404 | ||||||
Corp. Group Banking SA, 6.75%, 03/15/23 (Call 11/29/19)(a) | 250 | 243,437 | ||||||
Empresa Electrica Guacolda SA, 4.56%, 04/30/25 (Call 01/30/25)(a)(b) | 200 | 173,500 | ||||||
Empresa Nacional de Telecomunicaciones SA | 200 | 208,500 | ||||||
4.88%, 10/30/24(a) | 600 | 626,400 | ||||||
| SCHEDULES OF INVESTMENTS | 27 |
Schedule of Investments (continued) October 31, 2019 | iShares® J.P. Morgan EM Corporate Bond ETF (Percentages shown are based on Net Assets) |
| Security | Par (000) | Value | ||||||
| Chile (continued) | ||||||||
Enel Americas SA, 4.00%, 10/25/26 (Call 07/25/26) | $ | 200 | $ | 206,688 | ||||
Enel Chile SA, 4.88%, 06/12/28 | 300 | 331,875 | ||||||
GNL Quintero SA, 4.63%, 07/31/29(a) | 400 | 422,600 | ||||||
Inversiones CMPC SA, 4.38%, 04/04/27(a) | 200 | 207,394 | ||||||
Inversiones CMPC SA/Cayman Islands Branch, 4.38%, 05/15/23 (Call 02/15/23)(a) | 600 | 621,000 | ||||||
Latam Finance Ltd. | 200 | 211,500 | ||||||
7.00%, 03/01/26 (Call 03/01/23)(a) | 400 | 430,500 | ||||||
SACI Falabella, 3.75%, 04/30/23(a) | 200 | 204,875 | ||||||
Telefonica Chile SA, 3.88%, 10/12/22(a) | 200 | 204,575 | ||||||
VTR Finance BV, 6.88%, 01/15/24 (Call 11/12/19)(a) | 400 | 410,000 | ||||||
|
| |||||||
| 6,992,303 | ||||||||
| China — 8.7% | ||||||||
Agile Group Holdings Ltd., 8.38%, | 200 | 206,000 | ||||||
Alibaba Group Holding Ltd. | 300 | 310,716 | ||||||
3.60%, 11/28/24 (Call 08/28/24) | 200 | 209,232 | ||||||
4.00%, 12/06/37 (Call 06/06/37) | 200 | 214,761 | ||||||
4.20%, 12/06/47 (Call 06/06/47) | 200 | 224,534 | ||||||
Azure Nova International Finance Ltd., 3.50%, 03/21/22(a) | 200 | 202,860 | ||||||
Baidu Inc. | 200 | 205,562 | ||||||
4.13%, 06/30/25 | 200 | 213,000 | ||||||
Bank of China Ltd./Hong Kong | 200 | 200,640 | ||||||
3.88%, 06/30/25(a) | 200 | 213,562 | ||||||
Bank of China Ltd./Macau, 2.88%, 04/20/22(a) | 200 | 202,375 | ||||||
Bank of Communications Co. Ltd./Hong Kong, 2.97%, 05/17/23, (3 mo. LIBOR US + 0.85%)(a)(g) | 200 | 200,150 | ||||||
BOC Aviation Ltd., 3.24%, 09/26/23 (Call 08/26/23), (3 mo. LIBOR US + 1.125%)(a)(b)(g) | 200 | 199,953 | ||||||
China Cinda Finance 2015 I Ltd., 4.25%, 04/23/25(a) | 200 | 211,817 | ||||||
China Cinda Finance 2017 I Ltd. | 200 | 206,596 | ||||||
4.75%, 02/21/29(a) | 200 | 225,312 | ||||||
China Construction Bank Corp. | 200 | 200,750 | ||||||
4.25%, 02/27/29 (Call 02/27/24)(a)(d) | 200 | 209,875 | ||||||
China Evergrande Group | 200 | 185,250 | ||||||
8.75%, 06/28/25 (Call 06/28/21)(a) | 200 | 167,500 | ||||||
10.50%, 04/11/24 (Call 04/11/22)(a) | 200 | 185,563 | ||||||
China Overseas Finance Cayman VI Ltd., 5.95%, 05/08/24(a) | 200 | 226,250 | ||||||
China Overseas Finance Cayman VII Ltd., 4.25%, 04/26/23(a) | 200 | 209,822 | ||||||
China Railway Xunjie Co. Ltd., 2.88%, 07/25/22(a) | 200 | 201,875 | ||||||
CITIC Ltd. | 200 | 201,625 | ||||||
3.88%, 02/28/27(a) | 200 | 209,250 | ||||||
CMHI Finance BVI Co. Ltd., | 200 | 210,869 | ||||||
CNOOC Finance 2012 Ltd., | 200 | 207,187 | ||||||
CNOOC Finance 2015 USA LLC, 4.38%, 05/02/28 | 200 | 222,000 | ||||||
CNOOC Nexen Finance 2014 ULC, 4.25%, 04/30/24 | 200 | 213,687 | ||||||
CNPC General Capital Ltd., 3.40%, 04/16/23(a)(b) | 200 | 205,937 | ||||||
Country Garden Holdings Co. Ltd. | 200 | 201,250 | ||||||
7.25%, 04/08/26 (Call 04/08/23)(a) | 200 | 216,625 | ||||||
CRCC Yuxiang Ltd., 3.50%, 05/16/23(a) | 200 | 205,125 | ||||||
Easy Tactic Ltd., 5.75%, 01/13/22 (Call 01/13/20)(a) | 200 | 194,125 | ||||||
| Security | Par (000) | Value | ||||||
| China (continued) | ||||||||
Fortune Star BVI Ltd., 5.25%, 03/23/22 (Call 03/23/20)(a) | $ | 200 | $ | 199,250 | ||||
Franshion Brilliant Ltd., 4.00%, | 200 | 198,438 | ||||||
Huarong Finance 2017 Co. Ltd. | 400 | 407,875 | ||||||
4.75%, 04/27/27(a) | 200 | 215,812 | ||||||
Huarong Finance 2019 Co. Ltd., 4.50%, 05/29/29(a) | 200 | 211,875 | ||||||
Huarong Finance II Co. Ltd., | 200 | 219,875 | ||||||
ICBCIL Finance Co. Ltd., 3.75%, 03/05/24(a) | 400 | 415,750 | ||||||
Industrial & Commercial Bank of China Ltd./London, | 400 | 401,104 | ||||||
Industrial & Commercial Bank of China Ltd./Singapore | 200 | 200,360 | ||||||
2.89%, 04/24/22, (3 mo. LIBOR US + | 200 | 201,142 | ||||||
JD.com Inc., 3.88%, 04/29/26 | 200 | 207,250 | ||||||
Kaisa Group Holdings Ltd. | 200 | 189,563 | ||||||
9.38%, 06/30/24 (Call 06/30/21)(a) | 200 | 180,125 | ||||||
KWG Group Holdings Ltd., 6.00%, 09/15/22 (Call 03/15/20)(a) | 200 | 199,125 | ||||||
Lenovo Group Ltd., 4.75%, 03/29/23(a) | 200 | 204,063 | ||||||
Nexen Inc. | 200 | 279,812 | ||||||
7.50%, 07/30/39 | 200 | 318,187 | ||||||
Poly Real Estate Finance Ltd., 3.88%, 03/25/24(a) | 200 | 205,687 | ||||||
Proven Honour Capital Ltd., | 400 | 415,250 | ||||||
Shimao Property Holdings Ltd., 4.75%, 07/03/22 (Call 07/03/20)(a) | 200 | 205,062 | ||||||
Sino-Ocean Land Treasure Finance II Ltd., 5.95%, 02/04/27(a) | 200 | 213,105 | ||||||
Sinopec Capital 2013 Ltd., 3.13%, 04/24/23(a) | 200 | 204,313 | ||||||
Sunac China Holdings Ltd., 7.95%, 08/08/22 (Call 08/08/20)(a) | 200 | 204,063 | ||||||
Tencent Holdings Ltd. | 200 | 205,482 | ||||||
3.60%, 01/19/28 (Call 10/19/27)(a) | 300 | 311,653 | ||||||
3.93%, 01/19/38 (Call 07/19/37)(a) | 200 | 212,860 | ||||||
3.98%, 04/11/29 (Call 01/11/29)(a) | 200 | 215,360 | ||||||
Tsinghua Unic Ltd., 5.38%, 01/31/23(a) | 200 | 168,938 | ||||||
Vanke Real Estate Hong Kong Co. Ltd., 4.15%, 04/18/23(a) | 200 | 206,482 | ||||||
Yingde Gases Investment Ltd., 6.25%, 01/19/23 | 200 | 205,063 | ||||||
|
| |||||||
| 14,544,559 | ||||||||
| Colombia — 4.7% | ||||||||
AI Candelaria Spain SLU, 7.50%, 12/15/28 (Call 09/15/28)(a) | 250 | 281,562 | ||||||
Banco Davivienda SA, 5.88%, 07/09/22(a)(b) | 200 | 213,562 | ||||||
Banco de Bogota SA | 200 | 213,313 | ||||||
5.38%, 02/19/23(a)(b) | 200 | 213,092 | ||||||
6.25%, 05/12/26(a) | 400 | 453,125 | ||||||
Bancolombia SA | 400 | 412,625 | ||||||
5.13%, 09/11/22 | 293 | 310,156 | ||||||
Colombia Telecomunicaciones SA ESP | 400 | 403,625 | ||||||
8.50%, (Call 03/30/20)(a)(c)(d) | 100 | 101,778 | ||||||
Ecopetrol SA | 383 | 401,899 | ||||||
5.38%, 06/26/26 (Call 03/26/26) | 735 | 825,497 | ||||||
5.88%, 09/18/23 | 650 | 722,800 | ||||||
5.88%, 05/28/45 | 800 | 922,075 | ||||||
7.38%, 09/18/43 | 250 | 332,344 | ||||||
| 28 | 2019ISHARES ANNUAL REPORTTO SHAREHOLDERS |
Schedule of Investments (continued) October 31, 2019 | iShares® J.P. Morgan EM Corporate Bond ETF (Percentages shown are based on Net Assets) |
| Security | Par (000) | Value | ||||||
| Colombia (continued) | ||||||||
Grupo Aval Ltd., 4.75%, 09/26/22(a) | $ | 400 | $ | 417,483 | ||||
Grupo de Inversiones Suramericana SA, | 200 | 223,687 | ||||||
Millicom International Cellular SA | 400 | 412,375 | ||||||
6.00%, 03/15/25 (Call 03/15/20)(a) | 200 | 207,000 | ||||||
6.25%, 03/25/29 (Call 03/25/24)(a)(b) | 200 | 216,808 | ||||||
6.63%, 10/15/26 (Call 10/15/21)(a) | 200 | 217,250 | ||||||
SURA Asset Management SA, 4.88%, 04/17/24(a) | 100 | 107,938 | ||||||
Transportadora de Gas Internacional SA ESP, | 200 | 231,375 | ||||||
|
| |||||||
| 7,841,369 | ||||||||
| Congo, The Democratic Republic — 0.1% | ||||||||
HTA Group Ltd./Mauritius, 9.13%, 03/08/22 | 200 | 208,230 | ||||||
|
| |||||||
| Ghana — 0.5% | ||||||||
Kosmos Energy Ltd., 7.13%, 04/04/26 | 200 | 208,563 | ||||||
Tullow Oil PLC | 200 | 201,500 | ||||||
7.00%, 03/01/25 (Call 03/01/21)(a) | 400 | 411,000 | ||||||
|
| |||||||
| 821,063 | ||||||||
| Guatemala — 0.4% | ||||||||
Central American Bottling Corp., 5.75%, 01/31/27 | 100 | 105,188 | ||||||
Comunicaciones Celulares SA Via Comcel Trust, | 200 | 205,937 | ||||||
Industrial Senior Trust, 5.50%, 11/01/22(a)(b) | 300 | 312,797 | ||||||
|
| |||||||
| 623,922 | ||||||||
| Hong Kong — 5.5% | ||||||||
AIA Group Ltd. | 200 | 212,400 | ||||||
3.90%, 04/06/28 (Call 01/06/28)(a) | 200 | 216,750 | ||||||
4.50%, 03/16/46 (Call 09/16/45)(a)(b) | 200 | 238,703 | ||||||
Bank of China Hong Kong Ltd., 5.90%, | 600 | 642,000 | ||||||
Bank of East Asia Ltd. (The) | 200 | 202,688 | ||||||
5.50%, (Call 12/02/20)(a)(c)(d) | 150 | 151,219 | ||||||
Celestial Dynasty Ltd., 4.25%, 06/27/29(a) | 200 | 202,625 | ||||||
Celestial Miles Ltd., 5.75%, (Call 01/31/24)(a)(c)(d) | 200 | 210,062 | ||||||
China CITIC Bank International Ltd., 7.10%, | 200 | 216,125 | ||||||
CK Hutchison International 16 Ltd., 2.75%, 10/03/26(a) | 600 | 596,812 | ||||||
CK Hutchison International 19 II Ltd., 3.38%, 09/06/49 | 200 | 199,468 | ||||||
CK Hutchison International 19 Ltd. | 200 | 204,833 | ||||||
3.63%, 04/11/29 (Call 01/11/29)(a) | 200 | 211,922 | ||||||
FWD Group Ltd., 5.75%, 07/09/24(a) | 200 | 206,550 | ||||||
HKT Capital No. 4 Ltd., 3.00%, 07/14/26(a) | 200 | 199,063 | ||||||
HLP Finance Ltd., 4.75%, 06/25/22(a) | 200 | 209,187 | ||||||
Hongkong Electric Finance Ltd., 2.88%, 05/03/26(a) | 200 | 201,063 | ||||||
Hongkong Land Finance Cayman Islands Co. Ltd. (The), 4.50%, 06/01/22(a) | 200 | 210,187 | ||||||
Hutchison Whampoa International 11 Ltd., | 600 | 628,875 | ||||||
Hutchison Whampoa International Ltd., | 100 | 148,046 | ||||||
IFC Development Corporate Treasury Ltd., | 200 | 211,625 | ||||||
Industrial & Commercial Bank of China Asia Ltd., 4.25%, (Call 07/21/21)(a)(c)(d) | 200 | 201,375 | ||||||
| Security | Par (000) | Value | ||||||
| Hong Kong (continued) | ||||||||
Link Finance Cayman 2009 Ltd. (The), | $ | 200 | $ | 208,687 | ||||
Melco Resorts Finance Ltd. | 200 | 207,250 | ||||||
5.63%, 07/17/27 (Call 07/17/22)(a) | 200 | 209,250 | ||||||
Nan Fung Treasury II Ltd., 5.50%, | 200 | 199,750 | ||||||
Nanyang Commercial Bank Ltd., 5.00%, | 200 | 198,563 | ||||||
New World China Land Ltd., 4.75%, 01/23/27(a) | 200 | 210,125 | ||||||
NWD Finance BVI Ltd. | 200 | 201,063 | ||||||
6.25%, (Call 03/07/24)(a)(c) | 200 | 203,400 | ||||||
NWD MTN Ltd., 4.13%, 07/18/29(a) | 200 | 201,063 | ||||||
OVPH Ltd., 5.88%, (Call 03/01/21)(a)(c) | 200 | 204,780 | ||||||
PCPD Capital Ltd., 4.75%, 03/09/22(a) | 200 | 201,750 | ||||||
Radiant Access Ltd., 4.60%, (Call 05/18/20)(a)(c) | 400 | 396,875 | ||||||
Sun Hung Kai Properties Capital Market Ltd. | 200 | 206,250 | ||||||
4.50%, 02/14/22(a) | 200 | 209,062 | ||||||
Swire Pacific MTN Financing Ltd., | 200 | 213,687 | ||||||
Swire Properties MTN Financing Ltd., | 200 | 208,812 | ||||||
|
| |||||||
| 9,201,945 | ||||||||
| India — 4.9% | ||||||||
ABJA Investment Co. Pte Ltd. | 200 | 194,492 | ||||||
5.95%, 07/31/24(a) | 200 | 209,812 | ||||||
Adani Green Energy UP Ltd./Prayatna Developers Pvt Ltd./Parampujya Solar Energy, 6.25%, 12/10/24(a) | 200 | 212,068 | ||||||
Adani Ports & Special Economic Zone Ltd. | 400 | 403,319 | ||||||
4.00%, 07/30/27 (Call 06/30/27)(a) | 200 | 204,063 | ||||||
Axis Bank Ltd./Dubai, 3.00%, 08/08/22(a) | 200 | 200,750 | ||||||
Bharat Petroleum Corp. Ltd., 4.00%, 05/08/25(a) | 200 | 206,562 | ||||||
Bharti Airtel International Netherlands BV, | 200 | 210,562 | ||||||
Bharti Airtel Ltd., 4.38%, 06/10/25(a)(b) | 400 | 402,564 | ||||||
BPRL International Singapore Pte Ltd., | 200 | 212,062 | ||||||
Canara Bank/London, 3.25%, 08/10/22(a) | 200 | 201,712 | ||||||
Delhi International Airport Ltd., 6.13%, 10/31/26(a) | 200 | 214,222 | ||||||
Greenko Dutch BV, 5.25%, 07/24/24 | 200 | 201,875 | ||||||
Greenko Solar Mauritius Ltd., 5.55%, 01/29/25 | 200 | 199,750 | ||||||
ICICI Bank Ltd./Dubai | 200 | 201,820 | ||||||
4.00%, 03/18/26(a) | 250 | 261,641 | ||||||
Indian Oil Corp. Ltd., 4.75%, 01/16/24(a) | 400 | 426,000 | ||||||
JSW Steel Ltd., 5.25%, 04/13/22(a) | 200 | 202,625 | ||||||
NTPC Ltd. | 200 | 212,000 | ||||||
4.38%, 11/26/24(a) | 200 | 212,250 | ||||||
Oil India Ltd., 5.38%, 04/17/24(a) | 200 | 218,875 | ||||||
ONGC Videsh Ltd. | 200 | 205,688 | ||||||
4.63%, 07/15/24(a) | 200 | 213,937 | ||||||
Power Finance Corp. Ltd., 4.50%, 06/18/29(a) | 200 | 209,625 | ||||||
REC Ltd., 5.25%, 11/13/23(a) | 200 | 214,990 | ||||||
Reliance Holdings USA Inc., 5.40%, 02/14/22(a) | 250 | 265,547 | ||||||
Reliance Industries Ltd. | 250 | 261,797 | ||||||
4.13%, 01/28/25(a) | 250 | 266,250 | ||||||
4.88%, 02/10/45(a) | 250 | 299,941 | ||||||
| SCHEDULES OF INVESTMENTS | 29 |
Schedule of Investments (continued) October 31, 2019 | iShares® J.P. Morgan EM Corporate Bond ETF (Percentages shown are based on Net Assets) |
| Security | Par (000) | Value | ||||||
| India (continued) | ||||||||
State Bank of India/London | $ | 200 | $ | 202,188 | ||||
4.38%, 01/24/24(a) | 200 | 211,625 | ||||||
4.88%, 04/17/24(a) | 200 | 216,000 | ||||||
Vedanta Resources Finance II PLC, 9.25%, 04/23/26 | 200 | 199,250 | ||||||
Vedanta Resources Ltd., 7.13%, 05/31/23(a) | 400 | 396,625 | ||||||
|
| |||||||
| 8,172,487 | ||||||||
| Indonesia — 2.4% | ||||||||
Bank Mandiri Persero Tbk PT, 3.75%, 04/11/24(a) | 400 | 413,625 | ||||||
Bank Rakyat Indonesia Persero Tbk PT | 200 | 208,500 | ||||||
4.63%, 07/20/23(a) | 200 | 212,711 | ||||||
Eterna Capital Pte Ltd., Series B, | 209 | 122,965 | ||||||
Indika Energy Capital III Pte Ltd., | 250 | 238,250 | ||||||
Listrindo Capital BV, 4.95%, 09/14/26 | 200 | 203,875 | ||||||
LLPL Capital Pte Ltd., 6.88%, 02/04/39(a) | 395 | 461,509 | ||||||
Medco Oak Tree Pte Ltd., 7.38%, 05/14/26 | 200 | 202,885 | ||||||
Medco Platinum Road Pte Ltd., | 200 | 202,250 | ||||||
Minejesa Capital BV | 400 | 411,500 | ||||||
5.63%, 08/10/37(a) | 400 | 433,625 | ||||||
Perusahaan Gas Negara Tbk PT, 5.13%, 05/16/24(a) | 400 | 433,875 | ||||||
Saka Energi Indonesia PT, 4.45%, 05/05/24(a) | 200 | 202,000 | ||||||
Star Energy Geothermal Wayang Windu Ltd., | 184 | 193,200 | ||||||
|
| |||||||
| 3,940,770 | ||||||||
| Israel — 3.9% | ||||||||
Altice Financing SA | 800 | 821,760 | ||||||
7.50%, 05/15/26 (Call 05/15/21)(a) | 800 | 851,000 | ||||||
Israel Chemicals Ltd., 6.38%, 05/31/38 | 250 | 301,719 | ||||||
Israel Electric Corp. Ltd. | 400 | 434,625 | ||||||
6.88%, 06/21/23(a) | 200 | 227,812 | ||||||
Series 6, 5.00%, 11/12/24(e) | 400 | 441,125 | ||||||
Teva Pharmaceutical Finance Co. BV, | 200 | 182,000 | ||||||
Teva Pharmaceutical Finance Co. LLC, | 200 | 165,500 | ||||||
Teva Pharmaceutical Finance Netherlands III BV | 986 | 855,355 | ||||||
3.15%, 10/01/26 | 1,051 | 791,686 | ||||||
4.10%, 10/01/46 | 740 | 508,750 | ||||||
6.00%, 04/15/24 (Call 01/15/24)(b) | 500 | 468,750 | ||||||
6.75%, 03/01/28 (Call 12/01/27)(b) | 500 | 451,500 | ||||||
|
| |||||||
| 6,501,582 | ||||||||
| Jamaica — 0.5% | ||||||||
Digicel Group One Ltd., 8.25%, 12/30/22 | 625 | 366,211 | ||||||
Digicel Group Two Ltd. | 50 | 12,500 | ||||||
9.13%, (9.13% PIK), 04/01/24 (Call 11/29/19)(a)(f) | 202 | 35,161 | ||||||
Digicel International Finance Ltd./Digicel Holdings Bermuda Ltd., | 200 | 189,250 | ||||||
Digicel Ltd., 6.75%, 03/01/23 (Call 11/14/19)(a) | 400 | 210,125 | ||||||
|
| |||||||
| 813,247 | ||||||||
| Security | Par (000) | Value | ||||||
| Kazakhstan — 0.4% | ||||||||
Halyk Savings Bank of Kazakhstan JSC, | $ | 147 | $ | 147,807 | ||||
Nostrum Oil & Gas Finance BV, | 200 | 107,500 | ||||||
Tengizchevroil Finance Co. International Ltd., | 400 | 419,400 | ||||||
|
| |||||||
| 674,707 | ||||||||
| Kuwait — 1.5% | ||||||||
Al Ahli Bank of Kuwait KSCP, 3.50%, 04/05/22(a) | 200 | 203,250 | ||||||
Burgan Bank SAK, 5.75%, (Call 07/09/24)(a)(c)(d) | 200 | 200,750 | ||||||
Equate Petrochemical BV | 450 | 451,125 | ||||||
4.25%, 11/03/26(a) | 600 | 639,750 | ||||||
Equate Sukuk Spc Ltd., 3.94%, 02/21/24(a) | 200 | 206,812 | ||||||
Kuwait Projects Co. SPC Ltd. | 200 | 203,563 | ||||||
5.00%, 03/15/23(a) | 200 | 210,750 | ||||||
NBK SPC Ltd., 2.75%, 05/30/22(a) | 200 | 201,250 | ||||||
NBK Tier 1 Financing Ltd., 5.75%, (Call 04/09/21)(a)(c)(d) | 200 | 205,937 | ||||||
|
| |||||||
| 2,523,187 | ||||||||
| Macau — 2.4% | ||||||||
Melco Resorts Finance Ltd., 4.88%, 06/06/25 | 404 | 415,236 | ||||||
MGM China Holdings Ltd. | 400 | 419,375 | ||||||
5.88%, 05/15/26 (Call 05/15/22)(a) | 200 | 212,000 | ||||||
Sands China Ltd. | 600 | 634,313 | ||||||
5.13%, 08/08/25 (Call 06/08/25) | 600 | 658,688 | ||||||
5.40%, 08/08/28 (Call 05/08/28) | 800 | 897,429 | ||||||
Studio City Finance Ltd., 7.25%, 02/11/24 | 200 | 211,750 | ||||||
Wynn Macau Ltd. | 200 | 201,000 | ||||||
5.50%, 10/01/27 (Call 10/01/22)(a) | 400 | 410,750 | ||||||
|
| |||||||
| 4,060,541 | ||||||||
| Malaysia — 1.4% | ||||||||
Axiata SPV2 Bhd, 4.36%, 03/24/26(a) | 200 | 214,312 | ||||||
CIMB Bank Bhd, 3.26%, 03/15/22(a) | 200 | 203,313 | ||||||
Gohl Capital Ltd., 4.25%, 01/24/27(a) | 600 | 625,875 | ||||||
IOI Investment L Bhd, 4.38%, 06/27/22(a) | 400 | 413,125 | ||||||
Malayan Banking Bhd, 3.91%, 10/29/26 | 200 | 203,937 | ||||||
TNB Global Ventures Capital Bhd | 400 | 403,500 | ||||||
4.85%, 11/01/28(a) | 200 | 226,598 | ||||||
|
| |||||||
| 2,290,660 | ||||||||
| Mexico — 5.6% | ||||||||
Alfa SAB de CV, 5.25%, 03/25/24 (Call 12/25/23)(a) | 200 | 215,750 | ||||||
America Movil SAB de CV | 200 | 205,500 | ||||||
3.63%, 04/22/29 (Call 01/22/29) | 200 | 212,937 | ||||||
4.38%, 04/22/49 (Call 10/22/48) | 400 | 461,911 | ||||||
6.13%, 03/30/40 | 300 | 406,969 | ||||||
6.38%, 03/01/35 | 200 | 270,062 | ||||||
Banco Inbursa SA Institucion De Banca Multiple Grupo Financiero Inbursa, 4.13%, 06/06/24(a) | 300 | 309,937 | ||||||
Banco Mercantil del Norte SA/Grand Cayman, | 200 | 208,550 | ||||||
| 30 | 2019ISHARES ANNUAL REPORTTO SHAREHOLDERS |
Schedule of Investments (continued) October 31, 2019 | iShares® J.P. Morgan EM Corporate Bond ETF (Percentages shown are based on Net Assets) |
| Security | Par (000) | Value | ||||||
| Mexico (continued) | ||||||||
Banco Santander Mexico SA Institucion de Banca Multiple Grupo Financiero Santand | ||||||||
4.13%, 11/09/22(a)(b) | $ | 150 | $ | 156,141 | ||||
5.95%, 10/01/28 (Call 10/01/23)(a)(d) | 200 | 215,250 | ||||||
BBVA Bancomer SA/Texas | 150 | 159,609 | ||||||
5.13%, 01/18/33 (Call 01/17/28)(a)(d) | 200 | 194,110 | ||||||
6.75%, 09/30/22(a) | 150 | 164,501 | ||||||
Becle SAB de CV, 3.75%, 05/13/25(a)(b) | 150 | 153,469 | ||||||
Cemex Finance LLC, 6.00%, 04/01/24 | 200 | 204,866 | ||||||
Cemex SAB de CV | 200 | 205,175 | ||||||
7.75%, 04/16/26 (Call 04/16/21)(a)(b) | 200 | 215,500 | ||||||
Coca-Cola FEMSA SAB de CV | 150 | 158,766 | ||||||
5.25%, 11/26/43 | 150 | 188,484 | ||||||
Cometa Energia SA de CV, 6.38%, 04/24/35 (Call 01/24/35)(a)(b) | 194 | 208,941 | ||||||
El Puerto de Liverpool SAB de CV, | 200 | 204,813 | ||||||
Fomento Economico Mexicano SAB de CV, 4.38%, 05/10/43 | 150 | 169,969 | ||||||
Fresnillo PLC, 5.50%, 11/13/23(a) | 200 | 218,375 | ||||||
Grupo Bimbo SAB de CV | 200 | 208,938 | ||||||
4.50%, 01/25/22(a) | 100 | 104,125 | ||||||
4.88%, 06/27/44(a) | 200 | 217,960 | ||||||
5.95%, (Call 04/17/23)(a)(c)(d) | 200 | 211,250 | ||||||
Grupo Televisa SAB | 200 | 212,438 | ||||||
6.13%, 01/31/46 (Call 07/31/45)(b) | 200 | 244,000 | ||||||
6.63%, 01/15/40 | 170 | 212,500 | ||||||
Industrias Penoles SAB de CV, 4.15%, 09/12/29 (Call 06/30/29)(e) | 200 | 200,500 | ||||||
Infraestructura Energetica Nova SAB de CV, 4.88%, 01/14/48(a)(b) | 200 | 190,688 | ||||||
Minera Mexico SA de CV, 4.50%, 01/26/50 (Call 07/26/49)(e) | 200 | 195,390 | ||||||
Orbia Advance Corp. SAB de CV | 200 | 210,250 | ||||||
5.50%, 01/15/48 (Call 07/15/47)(a) | 200 | 202,800 | ||||||
PLA Administradora Industrial S de RL de CV, 4.96%, 07/18/29 (Call 04/18/29)(a) | 200 | 208,156 | ||||||
Sigma Alimentos SA de CV, 4.13%, 05/02/26 (Call 02/02/26)(a)(b) | 200 | 208,563 | ||||||
Southern Copper Corp. | 100 | 104,625 | ||||||
5.25%, 11/08/42 | 200 | 224,125 | ||||||
5.88%, 04/23/45(b) | 200 | 241,887 | ||||||
6.75%, 04/16/40 | 100 | 129,656 | ||||||
7.50%, 07/27/35 | 200 | 267,125 | ||||||
Trust F/1401 | 200 | 212,812 | ||||||
6.39%, 01/15/50 (Call 07/15/49)(a) | 200 | 213,272 | ||||||
|
| |||||||
| 9,330,645 | ||||||||
| Morocco — 0.7% | ||||||||
OCP SA | 400 | 422,750 | ||||||
5.63%, 04/25/24(a) | 400 | 438,500 | ||||||
6.88%, 04/25/44(a) | 200 | 249,375 | ||||||
|
| |||||||
| 1,110,625 | ||||||||
| Security | Par (000) | Value | ||||||
| Netherlands — 0.3% | ||||||||
IHS Netherlands Holdco BV, 8.00%, 09/18/27 (Call 09/18/22)(a) | $ | 500 | $ | 523,125 | ||||
|
| |||||||
| Nigeria — 0.1% | ||||||||
United Bank for Africa PLC, 7.75%, 06/08/22(a) | 200 | 211,750 | ||||||
|
| |||||||
| Oman — 0.6% | ||||||||
Bank Muscat SAOG, 4.88%, 03/14/23(a) | 200 | 202,625 | ||||||
National Bank of Oman SAOG, | 200 | 207,000 | ||||||
Oztel Holdings SPC Ltd. | 200 | 209,125 | ||||||
6.63%, 04/24/28(a) | 300 | 309,563 | ||||||
|
| |||||||
| 928,313 | ||||||||
| Panama — 0.6% | ||||||||
Banco General SA, 4.13%, 08/07/27 | 200 | 209,240 | ||||||
Banistmo SA, 3.65%, 09/19/22(a)(b) | 200 | 202,500 | ||||||
C&W Senior Financing DAC | 400 | 420,120 | ||||||
7.50%, 10/15/26 (Call 10/15/21)(a)(b) | 200 | 215,750 | ||||||
|
| |||||||
| 1,047,610 | ||||||||
| Paraguay — 0.1% | ||||||||
Bioceanico Sovereign Certificate Ltd., 0.00%, 06/05/34(a)(b)(h) | 300 | 208,500 | ||||||
|
| |||||||
| Peru — 2.2% | ||||||||
Banco BBVA Peru SA, 5.00%, 08/26/22(a) | 150 | 159,938 | ||||||
Banco de Credito del Peru | 200 | 198,750 | ||||||
4.25%, 04/01/23(a) | 409 | 427,998 | ||||||
Banco de Credito del Peru/Panama, 6.13%, 04/24/27 | 200 | 213,937 | ||||||
Hunt Oil Co. of Peru LLC Sucursal Del Peru, 6.38%, 06/01/28(a)(b) | 200 | 218,687 | ||||||
Inkia Energy Ltd., 5.88%, 11/09/27 (Call 11/09/22)(a) | 200 | 207,625 | ||||||
Kallpa Generacion SA, 4.13%, 08/16/27 | 200 | 204,300 | ||||||
Lima Metro Line 2 Finance Ltd. | 200 | 212,500 | ||||||
5.88%, 07/05/34(a) | 440 | 516,027 | ||||||
Nexa Resources SA, 5.38%, 05/04/27 | 400 | 423,500 | ||||||
Orazul Energy Egenor SCA, 5.63%, 04/28/27 (Call 04/28/22)(a)(b) | 200 | 205,000 | ||||||
Peru LNG Srl, 5.38%, 03/22/30(a) | 400 | 410,038 | ||||||
Transportadora de Gas del Peru SA, | 200 | 213,125 | ||||||
Volcan Cia Minera SAA, 5.38%, 02/02/22(a) | 115 | 119,528 | ||||||
|
| |||||||
| 3,730,953 | ||||||||
| Philippines — 1.2% | ||||||||
Bank of the Philippine Islands, | 200 | 211,625 | ||||||
BDO Unibank Inc., 2.95%, 03/06/23(a) | 400 | 404,000 | ||||||
JGSH Philippines Ltd., 4.38%, 01/23/23(a) | 200 | 207,190 | ||||||
Petron Corp., 4.60%, (Call 07/19/23)(a)(c)(d) | 200 | 197,813 | ||||||
Philippine National Bank, 3.28%, 09/27/24(a) | 400 | 405,287 | ||||||
San Miguel Corp., 4.88%, 04/26/23 (Call 11/15/19)(a) | 200 | 202,184 | ||||||
SMC Global Power Holdings Corp., 6.50%, (Call 04/25/24)(a)(c)(d) | 200 | 206,312 | ||||||
Union Bank of the Philippines, | 200 | 204,150 | ||||||
|
| |||||||
| 2,038,561 | ||||||||
| Poland — 0.2% | ||||||||
Powszechna Kasa Oszczednosci Bank Polski SA Via PKO Finance AB, 4.63%, 09/26/22(a) | 400 | 422,250 | ||||||
|
| |||||||
| SCHEDULES OF INVESTMENTS | 31 |
Schedule of Investments (continued) October 31, 2019 | iShares® J.P. Morgan EM Corporate Bond ETF (Percentages shown are based on Net Assets) |
| Security | Par (000) | Value | ||||||
| Qatar — 2.7% | ||||||||
ABQ Finance Ltd., 3.50%, 02/22/22(a) | $ | 200 | $ | 203,125 | ||||
AKCB Finance Ltd., 4.75%, 10/09/23(a) | 200 | 213,438 | ||||||
Ezdan Sukuk Co. Ltd., 4.88%, 04/05/22(a) | 200 | 175,000 | ||||||
Nakilat Inc., 6.07%, 12/31/33(a) | 350 | 426,016 | ||||||
Ooredoo International Finance Ltd. | 350 | 355,687 | ||||||
3.75%, 06/22/26(a) | 200 | 209,750 | ||||||
3.88%, 01/31/28(a) | 200 | 213,562 | ||||||
4.50%, 01/31/43(a) | 200 | 228,812 | ||||||
5.00%, 10/19/25(a) | 200 | 222,750 | ||||||
QIB Sukuk Ltd. | 200 | 202,125 | ||||||
3.98%, 03/26/24(a) | 200 | 208,813 | ||||||
QIIB Senior Sukuk Ltd., | 200 | 210,375 | ||||||
QNB Finance Ltd., 3.50%, 03/28/24(a) | 400 | 412,400 | ||||||
Ras Laffan Liquefied Natural Gas Co. Ltd. III | 500 | 573,750 | ||||||
6.33%, 09/30/27(a) | 500 | 581,875 | ||||||
|
| |||||||
| 4,437,478 | ||||||||
| Russia — 5.2% | ||||||||
Alfa Bank AO Via Alfa Bond Issuance PLC, 8.00%, (Call 02/03/22)(a)(c)(d) | 200 | 205,063 | ||||||
ALROSA Finance SA, 4.65%, 04/09/24 (Call 01/09/24)(a) | 200 | 209,676 | ||||||
Credit Bank of Moscow Via CBOM Finance PLC | 200 | 213,063 | ||||||
7.50%, 10/05/27 (Call 10/05/22)(a)(d) | 200 | 187,375 | ||||||
Eurochem Finance DAC, 5.50%, 03/13/24(a) | 200 | 214,750 | ||||||
Evraz PLC | 200 | 213,375 | ||||||
5.38%, 03/20/23(a) | 200 | 213,250 | ||||||
Gazprom Neft OAO Via GPN Capital SA | 200 | 207,500 | ||||||
6.00%, 11/27/23(a) | 200 | 222,100 | ||||||
Gazprom OAO Via Gaz Capital SA | 400 | 422,500 | ||||||
4.95%, 02/06/28(a) | 400 | 436,625 | ||||||
6.51%, 03/07/22(a) | 100 | 108,656 | ||||||
7.29%, 08/16/37(a) | 300 | 407,100 | ||||||
8.63%, 04/28/34(a) | 250 | 358,203 | ||||||
Lukoil International Finance BV | 200 | 211,000 | ||||||
4.75%, 11/02/26(a) | 200 | 219,250 | ||||||
6.66%, 06/07/22(a) | 200 | 220,500 | ||||||
Metalloinvest Finance DAC, 4.85%, 05/02/24(a) | 200 | 212,313 | ||||||
MMC Norilsk Nickel OJSC via MMC Finance DAC | 200 | 206,250 | ||||||
6.63%, 10/14/22(a) | 200 | 219,750 | ||||||
Novatek OAO Via Novatek Finance DAC, | 200 | 208,875 | ||||||
Novolipetsk Steel Via Steel Funding DAC | 200 | 210,250 | ||||||
4.70%, 05/30/26(a) | 200 | 213,750 | ||||||
Petropavlovsk 2016 Ltd., 8.13%, 11/14/22 (Call 08/14/22)(a) | 200 | 202,000 | ||||||
Polyus Finance PLC, 5.25%, 02/07/23(a) | 200 | 211,500 | ||||||
Rosneft Oil Co. Via Rosneft International Finance DAC, 4.20%, 03/06/22(a) | 400 | 410,000 | ||||||
Sberbank of Russia Via SB Capital SA 5.13%, 10/29/22(a) | 600 | 633,187 | ||||||
6.13%, 02/07/22(a) | 400 | 429,625 | ||||||
Severstal OAO Via Steel Capital SA, 5.90%, 10/17/22(a) | 200 | 216,010 | ||||||
| Security | Par (000) | Value | ||||||
| Russia (continued) | ||||||||
VEON Holdings BV | $ | 200 | $ | 212,250 | ||||
5.95%, 02/13/23(a) | 200 | 217,812 | ||||||
VTB Bank OJSC Via VTB Capital SA, | 400 | 431,500 | ||||||
VTB Bank PJSC Via VTB Eurasia DAC, 9.50%, | 200 | 221,375 | ||||||
|
| |||||||
| 8,726,433 | ||||||||
| Saudi Arabia — 3.4% | ||||||||
Acwa Power Management And Investments One Ltd., 5.95%, 12/15/39(a) | 400 | 433,125 | ||||||
Almarai Sukuk Ltd., 4.31%, 03/05/24(a) | 200 | 210,437 | ||||||
Dar Al-Arkan Sukuk Co. Ltd. | ||||||||
6.88%, 04/10/22(a) | 200 | 200,688 | ||||||
6.88%, 03/21/23(a) | 200 | 197,500 | ||||||
SABIC Capital II BV | 400 | 420,580 | ||||||
4.50%, 10/10/28(a) | 400 | 443,250 | ||||||
Saudi Electricity Global Sukuk Co., 4.21%, 04/03/22(a) | 200 | 207,938 | ||||||
Saudi Electricity Global Sukuk Co. 2 | 600 | 617,400 | ||||||
5.06%, 04/08/43(a) | 400 | 452,000 | ||||||
Saudi Electricity Global Sukuk Co. 3 | 600 | 630,600 | ||||||
5.50%, 04/08/44 (a) | 400 | 477,600 | ||||||
Saudi Electricity Global Sukuk Co. 4 | 400 | 422,800 | ||||||
4.72%, 09/27/28(a) | 400 | 447,125 | ||||||
Saudi Telecom Co., 3.89%, 05/13/29(a) | 400 | 429,500 | ||||||
|
| |||||||
| 5,590,543 | ||||||||
| Singapore — 2.7% | ||||||||
BOC Aviation Ltd., 3.50%, 10/10/24 | 200 | 205,959 | ||||||
DBS Group Holdings Ltd. | 200 | 200,709 | ||||||
3.60%, (Call 09/07/21)(a)(c)(d) | 200 | 201,250 | ||||||
4.52%, 12/11/28 (Call 12/11/23)(a)(d) | 400 | 425,074 | ||||||
Flex Ltd., 4.75%, 06/15/25 (Call 03/15/25) | 310 | 333,637 | ||||||
GLP Pte Ltd., 3.88%, 06/04/25(a) | 425 | 430,180 | ||||||
Oversea-Chinese Banking Corp. Ltd., | 400 | 426,500 | ||||||
Singapore Telecommunications Ltd., | 200 | 287,875 | ||||||
SingTel Group Treasury Pte Ltd. | 200 | 193,554 | ||||||
3.25%, 06/30/25(a) | 500 | 526,094 | ||||||
3.88%, 08/28/28 (Call 05/28/28)(a) | 200 | 218,799 | ||||||
United Overseas Bank Ltd. | 200 | 200,562 | ||||||
3.50%, 09/16/26 (Call 09/16/21)(a)(d) | 400 | 405,625 | ||||||
3.75%, 04/15/29 (Call 04/15/24)(a)(b)(d) | 200 | 207,397 | ||||||
3.88%, (Call 10/19/23)(a)(c)(d) | 200 | 201,562 | ||||||
|
| |||||||
| 4,464,777 | ||||||||
| South Africa — 2.6% | ||||||||
AngloGold Ashanti Holdings PLC, 5.13%, 08/01/22 | 257 | 270,252 | ||||||
FirstRand Bank Ltd., 6.25%, 04/23/28 | 200 | 212,562 | ||||||
Gold Fields Orogen Holdings BVI Ltd. | 200 | 211,881 | ||||||
6.13%, 05/15/29 (Call 02/15/29)(a) | 200 | 225,750 | ||||||
Liquid Telecommunications Financing PLC, 8.50%, 07/13/22 (Call 07/13/20)(a) | 400 | 398,060 | ||||||
MTN Mauritius Investment Ltd. 4.76%, 11/11/24(a) | 200 | 204,063 | ||||||
| 32 | 2019ISHARES ANNUAL REPORTTO SHAREHOLDERS |
Schedule of Investments (continued) October 31, 2019 | iShares® J.P. Morgan EM Corporate Bond ETF (Percentages shown are based on Net Assets) |
| Security | Par (000) | Value | ||||||
| South Africa (continued) | ||||||||
5.37%, 02/13/22(a) | $ | 200 | $ | 206,750 | ||||
6.50%, 10/13/26(a) | 200 | 220,812 | ||||||
Petra Diamonds U.S. Treasury PLC, 7.25%, 05/01/22 (Call 11/29/19)(a)(b) | 200 | 142,000 | ||||||
Prosus NV | 400 | 440,625 | ||||||
5.50%, 07/21/25 (Call 04/21/25)(a) | 400 | 445,500 | ||||||
Sasol Financing International Ltd., 4.50%, 11/14/22 | 200 | 206,062 | ||||||
SASOL Financing USA LLC 5.88%, 03/27/24 (Call 02/27/24) | 600 | 646,500 | ||||||
6.50%, 09/27/28 (Call 06/27/28) | 400 | 445,188 | ||||||
|
| |||||||
| 4,276,005 | ||||||||
| South Korea — 4.5% | ||||||||
Hanwha Life Insurance Co. Ltd., 4.70%, (Call 04/23/23)(a)(c)(d) | 200 | 202,234 | ||||||
Heungkuk Life Insurance Co. Ltd., 4.48%, (Call 11/09/22)(a)(c)(d) | 200 | 196,625 | ||||||
Hyundai Capital Services Inc. | 400 | 403,528 | ||||||
3.75%, 03/05/23(a) | 200 | 206,371 | ||||||
Kia Motors Corp., 3.00%, 04/25/23(a) | 200 | 202,063 | ||||||
Kookmin Bank | 200 | 203,574 | ||||||
4.35%, (Call 07/02/24)(a)(c)(d) | 200 | 204,250 | ||||||
Korea East-West Power Company Ltd., 2.63%, 06/19/22(a) | 200 | 202,125 | ||||||
Korea Electric Power Corp., 2.50%, 06/24/24(a) | 200 | 202,156 | ||||||
Korea Gas Corp. 3.50%, 07/21/25(a)(b) | 200 | 212,687 | ||||||
3.88%, 02/12/24(a) | 400 | 425,500 | ||||||
6.25%, 01/20/42(a) | 400 | 607,500 | ||||||
Korea Hydro & Nuclear Power Co. Ltd. | 200 | 204,750 | ||||||
3.75%, 07/25/23(a) | 200 | 210,231 | ||||||
Kyobo Life Insurance Co. Ltd., 3.95%, | 200 | 202,000 | ||||||
LG Chem Ltd. | 200 | 206,526 | ||||||
3.63%, 04/15/29(a) | 200 | 207,846 | ||||||
NongHyup Bank, 2.88%, 07/17/22(a) | 200 | 202,688 | ||||||
POSCO, 4.00%, 08/01/23(a) | 200 | 209,783 | ||||||
Shinhan Bank Co. Ltd. | 400 | 406,500 | ||||||
3.88%, 11/05/23(a) | 200 | 211,288 | ||||||
3.88%, 03/24/26(a) | 200 | 209,562 | ||||||
Shinhan Financial Group Co. Ltd. | 200 | 203,500 | ||||||
5.88%, (Call 08/13/23)(a)(c)(d) | 200 | 214,625 | ||||||
SK Innovation Co. Ltd., 4.13%, 07/13/23(a) | 200 | 210,212 | ||||||
SK Telecom Co. Ltd., 3.75%, 04/16/23(a) | 200 | 208,592 | ||||||
Woori Bank | 200 | 202,563 | ||||||
4.75%, 04/30/24(a)(b) | 600 | 642,187 | ||||||
5.25%, (Call 05/16/22)(a)(c)(d) | 200 | 206,188 | ||||||
|
| |||||||
| 7,427,654 | ||||||||
| Taiwan — 0.4% | ||||||||
Competition Team Technologies Ltd., 3.75%, 03/12/24(a) | 400 | 413,625 | ||||||
Formosa Group Cayman Ltd., 3.38%, 04/22/25(a) | 200 | 206,563 | ||||||
|
| |||||||
| 620,188 | ||||||||
| Security | Par (000) | Value | ||||||
| Thailand — 1.8% | ||||||||
Bangkok Bank PCL/Hong Kong | $ | 200 | $ | 201,831 | ||||
4.05%, 03/19/24(a) | 600 | 636,937 | ||||||
4.45%, 09/19/28(a)(b) | 200 | 223,187 | ||||||
5.00%, 10/03/23(a) | 200 | 217,938 | ||||||
Krung Thai Bank PCL/Cayman Islands, 5.20%, 12/26/24 (Call 12/26/19)(a)(d) | 200 | 200,508 | ||||||
PTT Global Chemical PCL, 4.25%, 09/19/22(a) | 200 | 208,301 | ||||||
PTTEP Treasury Center Co. Ltd., 4.60%, (Call 07/17/22)(a)(c)(d) | 200 | 204,250 | ||||||
Siam Commercial Bank PCL/Cayman Islands | 200 | 201,254 | ||||||
3.90%, 02/11/24(a) | 200 | 211,153 | ||||||
4.40%, 02/11/29(a) | 200 | 223,125 | ||||||
Thaioil Treasury Center Co. Ltd., 5.38%, 11/20/48(a) | 400 | 526,316 | ||||||
|
| |||||||
| 3,054,800 | ||||||||
| Togo — 0.1% | ||||||||
Ecobank Transnational Inc., 9.50%, 04/18/24(a) | 200 | 224,000 | ||||||
|
| |||||||
| Turkey — 4.4% | ||||||||
Akbank Turk AS | 200 | 190,813 | ||||||
7.20%, 03/16/27 (Call 03/16/22)(a)(d) | 200 | 188,688 | ||||||
Anadolu Efes Biracilik Ve Malt Sanayii AS, 3.38%, 11/01/22(a) | 200 | 197,937 | ||||||
Arcelik AS, 5.00%, 04/03/23(a) | 200 | 201,725 | ||||||
Coca-Cola Icecek AS, 4.22%, 09/19/24 | 200 | 199,750 | ||||||
KOC Holding AS 5.25%, | 200 | 201,480 | ||||||
6.50%, 03/11/25 (Call 12/11/24)(a) | 200 | 208,375 | ||||||
Petkim Petrokimya Holding AS, 5.88%, 01/26/23 (Call 01/26/21)(a) | 200 | 196,688 | ||||||
QNB Finansbank AS | 200 | 199,812 | ||||||
6.88%, 09/07/24(a) | 200 | 210,562 | ||||||
Tupras Turkiye Petrol Rafinerileri AS, 4.50%, 10/18/24 (Call 07/20/24)(a) | 200 | 190,750 | ||||||
Turk Telekomunikasyon AS | 200 | 196,000 | ||||||
6.88%, 02/28/25(a) | 200 | 212,312 | ||||||
Turkcell Iletisim Hizmetleri AS | 200 | 200,250 | ||||||
5.80%, 04/11/28 (Call 01/11/28)(a) | 200 | 194,625 | ||||||
Turkiye Garanti Bankasi AS | 200 | 200,500 | ||||||
5.88%, 03/16/23(a) | 400 | 405,000 | ||||||
Turkiye Is Bankasi AS | 200 | 199,250 | ||||||
6.00%, 10/24/22(a) | 200 | 193,063 | ||||||
6.13%, 04/25/24(a) | 400 | 389,500 | ||||||
7.00%, 06/29/28 (Call 06/29/23)(a)(d) | 200 | 183,938 | ||||||
Turkiye Sise ve Cam Fabrikalari AS, 6.95%, 03/14/26 (Call 12/14/25)(a) | 200 | 207,875 | ||||||
Turkiye Vakiflar Bankasi TAO | 200 | 196,250 | ||||||
5.75%, 01/30/23(a) | 200 | 193,520 | ||||||
6.00%, 11/01/22(a) | 200 | 193,000 | ||||||
6.88%, 02/03/25 (Call 02/03/20)(a)(d) | 200 | 191,031 | ||||||
8.13%, 03/28/24(a) | 200 | 206,000 | ||||||
Yapi ve Kredi Bankasi AS | 200 | 193,688 | ||||||
| SCHEDULES OF INVESTMENTS | 33 |
Schedule of Investments (continued) October 31, 2019 | iShares® J.P. Morgan EM Corporate Bond ETF (Percentages shown are based on Net Assets) |
| Security |
Par | Value | ||||||
| Turkey (continued) | ||||||||
5.75%, 02/24/22(a) | $ | 200 | $ | 200,500 | ||||
5.85%, 06/21/24(a) | 200 | 193,125 | ||||||
6.10%, 03/16/23(a) | 200 | 198,625 | ||||||
8.25%, 10/15/24(a) | 200 | 209,500 | ||||||
8.50%, 03/09/26 (Call 03/09/21)(a)(d) | 300 | 297,937 | ||||||
13.88%, (Call 01/15/24)(a)(c)(d) | 200 | 215,812 | ||||||
|
| |||||||
| 7,257,881 | ||||||||
| Ukraine — 1.1% | ||||||||
DTEK Finance PLC, 10.75%, (10.75% PIK), 12/31/24 (Call 12/02/19)(f) | 560 | 567,987 | ||||||
Kernel Holding SA, 8.75%, 01/31/22(a) | 200 | 211,937 | ||||||
Metinvest BV | 400 | 417,000 | ||||||
8.50%, 04/23/26 (Call 01/23/26)(a) | 200 | 209,000 | ||||||
MHP Lux SA, 6.95%, 04/03/26(a) | 200 | 206,438 | ||||||
MHP SE, 7.75%, 05/10/24(a) | 200 | 212,000 | ||||||
|
| |||||||
| 1,824,362 | ||||||||
| United Arab Emirates — 5.1% | ||||||||
Abu Dhabi Commercial Bank PJSC, | 200 | 209,000 | ||||||
Abu Dhabi National Energy Co. PJSC 3.63%, 01/12/23(a) | 200 | 205,500 | ||||||
3.88%, 05/06/24(a) | 200 | 208,750 | ||||||
4.38%, 04/23/25(a) | 200 | 214,687 | ||||||
4.38%, 06/22/26(a) | 200 | 216,000 | ||||||
4.88%, 04/23/30(a) | 200 | 226,562 | ||||||
5.88%, 12/13/21(a) | 200 | 214,062 | ||||||
6.50%, 10/27/36(a) | 200 | 269,750 | ||||||
ADCB Finance Cayman Ltd. | 200 | 208,860 | ||||||
4.50%, 03/06/23(a) | 200 | 209,750 | ||||||
ADIB Capital Invest 2 Ltd., 7.13%, | 200 | 218,562 | ||||||
Alpha Star Holding III Ltd., 6.25%, 04/20/22(a) | 200 | 189,880 | ||||||
BOS Funding Ltd., 4.23%, 03/07/22(a) | 200 | 203,250 | ||||||
DIB Sukuk Ltd. | 200 | 204,520 | ||||||
3.66%, 02/14/22(a) | 200 | 204,250 | ||||||
DIB Tier 1 Sukuk 3 Ltd., 6.25%, (Call 01/22/25)(a)(c)(d) | 200 | 213,437 | ||||||
Dolphin Energy Ltd. LLC, 5.50%, 12/15/21(a)(b) | 200 | 212,188 | ||||||
DP World Crescent Ltd. | 200 | 201,850 | ||||||
3.91%, 05/31/23(a) | 200 | 207,200 | ||||||
4.85%, 09/26/28(a) | 400 | 436,125 | ||||||
DP World PLC | 200 | 231,500 | ||||||
6.85%, 07/02/37(a) | 500 | 657,187 | ||||||
Emaar Sukuk Ltd., 3.64%, 09/15/26(a) | 200 | 197,688 | ||||||
EMG SUKUK Ltd., 4.56%, 06/18/24(a) | 200 | 209,125 | ||||||
Emirates NBD PJSC | 200 | 204,000 | ||||||
6.13%, (Call 03/20/25)(a)(c)(d) | 200 | 208,375 | ||||||
Fab Sukuk Co. Ltd. | 200 | 206,469 | ||||||
3.88%, 01/22/24(a) | 200 | 210,438 | ||||||
First Abu Dhabi Bank PJSC, 3.00%, 03/30/22(a) | 200 | 203,000 | ||||||
GEMS MENASA Cayman Ltd./GEMS Education Delaware LLC, 7.13%, 07/31/26 (Call 07/31/22)(a) | 200 | 207,875 | ||||||
MAF Global Securities Ltd., 4.75%, 05/07/24(a) | 200 | 211,125 | ||||||
MAF Sukuk Ltd., 4.64%, 05/14/29(a) | 200 | 212,900 | ||||||
Mashreqbank PSC, 4.25%, 02/26/24(a) | 200 | 209,313 | ||||||
| Security | Par/ Shares (000) | Value | ||||||
| United Arab Emirates (continued) | ||||||||
Rakfunding Cayman Ltd., 4.13%, 04/09/24(a) | $ | 200 | $ | 208,188 | ||||
Ruwais Power Co. PJSC, 6.00%, 08/31/36(a) | 200 | 246,875 | ||||||
Shelf Drilling Holdings Ltd., 8.25%, 02/15/25 (Call 02/15/21)(a) | 200 | 167,994 | ||||||
SIB Sukuk Co. III Ltd., 4.23%, 04/18/23(a) | 200 | 209,313 | ||||||
|
| |||||||
| 8,475,548 | ||||||||
| Vietnam — 0.1% | ||||||||
Mong Duong Finance Holdings BV, 5.13%, 05/07/29 (Call 05/07/23)(a) | 250 | 253,125 | ||||||
|
| |||||||
| Zambia — 1.2% | ||||||||
First Quantum Minerals Ltd. | 400 | 392,000 | ||||||
6.88%, 03/01/26 (Call 03/01/21)(a) | 400 | 392,000 | ||||||
7.25%, 05/15/22 (Call 11/29/19)(a)(b) | 400 | 403,000 | ||||||
7.25%, 04/01/23 (Call 12/02/19)(a) | 400 | 402,136 | ||||||
7.50%, 04/01/25 (Call 04/01/20)(a) | 400 | 400,500 | ||||||
|
| |||||||
| 1,989,636 | ||||||||
|
| |||||||
Total Corporate Bonds & Notes — 97.0% |
| 161,696,646 | ||||||
|
| |||||||
Foreign Government Obligations(i) | ||||||||
| Nigeria — 0.3% | ||||||||
Africa Finance Corp. | 200 | 206,812 | ||||||
4.38%, 04/17/26(a) | 200 | 209,250 | ||||||
|
| |||||||
| 416,062 | ||||||||
| South Korea — 0.1% | ||||||||
Korea Gas Corp., 2.88%, 07/16/29(a)(b) | 200 | 206,915 | ||||||
|
| |||||||
| Supranational — 0.5% | ||||||||
African Export-Import Bank (The) | 400 | 399,000 | ||||||
5.25%, 10/11/23(a) | 400 | 429,000 | ||||||
|
| |||||||
| 828,000 | ||||||||
|
| |||||||
Total Foreign Government Obligations — 0.9% |
| 1,450,977 | ||||||
|
| |||||||
Short-Term Investments |
| |||||||
| Money Market Funds — 11.4% | ||||||||
BlackRock Cash Funds: Institutional, | 17,273 | 17,281,365 | ||||||
BlackRock Cash Funds: Treasury, | 1,688 | 1,688,000 | ||||||
|
| |||||||
| 18,969,365 | ||||||||
|
| |||||||
Total Short-Term Investments — 11.4% |
| 18,969,365 | ||||||
|
| |||||||
Total Investments in Securities — 109.3% |
| 182,116,988 | ||||||
Other Assets, Less Liabilities — (9.3)% |
| (15,432,179 | ) | |||||
|
| |||||||
Net Assets — 100.0% |
| $ | 166,684,809 | |||||
|
| |||||||
| (a) | This security may be resold to qualified foreign investors and foreign institutional buyers under Regulation S of the Securities Act of 1933. |
| (b) | All or a portion of this security is on loan. |
| 34 | 2019ISHARES ANNUAL REPORTTO SHAREHOLDERS |
Schedule of Investments (continued) October 31, 2019 | iShares® J.P. Morgan EM Corporate Bond ETF |
| (c) | Perpetual security with no stated maturity date. |
| (d) | Security is issued at a fixed coupon rate, which converts to a variable rate at a specified date. |
| (e) | Security exempt from registration pursuant to Rule 144A under the Securities Act of 1933, as amended. These securities may be resold in transactions exempt from registration to qualified institutional investors. |
| (f) | Payment-in-kind (“PIK”) bond which gives the issuer an option to make coupon payments in cash or in the form of additional bonds. Stated interest rate represents the cash coupon rate. |
| (g) | Variable or floating rate security. Rate shown is the rate in effect as ofperiod-end. |
| (h) | Zero-coupon bond. |
| (i) | U.S. dollar denominated security issued by foreign domiciled entity. |
| (j) | Affiliate of the Fund. |
| (k) | Annualized7-day yield as ofperiod-end. |
| (l) | All or a portion of this security was purchased with cash collateral received from loaned securities. |
Affiliates
Investments in issuers considered to be affiliates of the Fund during the year ended October 31, 2019, for purposes of Section 2(a)(3) of the 1940 Act, were as follows:
| ||||||||||||||||||||||||||||||
Affiliated Issuer | | Shares Held at 10/31/18 (000) | | | Net Activity (000) | | | Shares Held at 10/31/19 (000) | | | Value at 10/31/19 | | Income |
| | Net Realized Gain (Loss) | (a) | | Change in Unrealized Appreciation (Depreciation) | | ||||||||||
| ||||||||||||||||||||||||||||||
BlackRock Cash Funds: Institutional, | 4,764 | 12,509 | 17,273 | $ | 17,281,365 | $ | 47,017 | (b) | $ | 371 | $ | 2,245 | ||||||||||||||||||
BlackRock Cash Funds: Treasury, | 336 | 1,352 | 1,688 | 1,688,000 | 21,615 | — | — | |||||||||||||||||||||||
|
|
|
|
|
|
|
| |||||||||||||||||||||||
| $ | 18,969,365 | $ | 68,632 | $ | 371 | $ | 2,245 | |||||||||||||||||||||||
|
|
|
|
|
|
|
| |||||||||||||||||||||||
| (a) | Includes realized capital gain distributions from an affiliated fund, if any. |
| (b) | Includes securities lending income earned from the reinvestment of cash collateral from loaned securities (excluding collateral investment fees), net of fees and other payments to and from borrowers of securities, and less fees paid to BTC as securities lending agent. |
Fair Value Measurements
Various inputs are used in determining the fair value of financial instruments. For description of the input levels and information about the Fund’s policy regarding valuation of financial instruments, refer to the Notes to Financial Statements.
The following table summarizes the value of the Fund’s investments according to the fair value hierarchy as of October 31, 2019. The breakdown of the Fund’s investments into major categories is disclosed in the Schedule of Investments above.
| ||||||||||||||||
| Level 1 | Level 2 | Level 3 | Total | |||||||||||||
| ||||||||||||||||
Investments | ||||||||||||||||
Assets | ||||||||||||||||
Corporate Bonds & Notes | $ | — | $ | 161,696,646 | $ | — | $ | 161,696,646 | ||||||||
Foreign Government Obligations | — | 1,450,977 | — | 1,450,977 | ||||||||||||
Money Market Funds | 18,969,365 | — | — | 18,969,365 | ||||||||||||
|
|
|
|
|
|
|
| |||||||||
| $ | 18,969,365 | $ | 163,147,623 | $ | — | $ | 182,116,988 | |||||||||
|
|
|
|
|
|
|
| |||||||||
See notes to financial statements.
| SCHEDULES OF INVESTMENTS | 35 |
Schedule of Investments October 31, 2019 | iShares® J.P. Morgan EM Local Currency Bond ETF (Percentages shown are based on Net Assets) |
| Security | Par (000) | Value | ||||||||||
Foreign Government Obligations |
| |||||||||||
| Argentina — 2.1% | ||||||||||||
Argentine Bonos del Tesoro | ARS | 1,091,824 | $ | 5,061,099 | ||||||||
16.00%, 10/17/23 | ARS | 694,473 | 3,214,556 | |||||||||
18.20%, 10/03/21 | ARS | 695,483 | 2,972,493 | |||||||||
|
| |||||||||||
| 11,248,148 | ||||||||||||
| Brazil — 12.3% | ||||||||||||
Brazil Letras do Tesouro Nacional | BRL | 30,037 | 6,957,850 | |||||||||
0.00%, 01/01/22(a) | BRL | 27,524 | 6,197,896 | |||||||||
0.00%, 07/01/22(a) | BRL | 25,000 | 5,463,924 | |||||||||
0.00%, 07/01/23(a) | BRL | 35,000 | 7,149,808 | |||||||||
Brazil Notas do Tesouro Nacional |
| |||||||||||
Series F, 10.00%, 01/01/21 | BRL | 29,772 | 7,852,704 | |||||||||
Series F, 10.00%, 01/01/23 | BRL | 38,557 | 10,834,672 | |||||||||
Series F, 10.00%, 01/01/25 | BRL | 34,399 | 10,038,201 | |||||||||
Series F, 10.00%, 01/01/27 | BRL | 21,193 | 6,367,594 | |||||||||
Series F, 10.00%, 01/01/29 | BRL | 12,263 | 3,768,229 | |||||||||
Brazilian Government International Bond | BRL | 500 | 134,165 | |||||||||
10.25%, 01/10/28 | BRL | 1,420 | 435,968 | |||||||||
12.50%, 01/05/22 | BRL | 1,633 | 463,608 | |||||||||
|
| |||||||||||
| 65,664,619 | ||||||||||||
| Chile — 4.4% | ||||||||||||
Bonos de la Tesoreria de la Republica en pesos | CLP | 2,020,000 | 2,867,477 | |||||||||
4.50%, 03/01/21 | CLP | 1,555,000 | 2,173,831 | |||||||||
4.50%, 03/01/26 | CLP | 3,100,000 | 4,535,206 | |||||||||
4.70%, 09/01/30(b)(c) | CLP | 2,510,000 | 3,778,674 | |||||||||
5.00%, 03/01/35 | CLP | 3,420,000 | 5,424,005 | |||||||||
6.00%, 01/01/43 | CLP | 2,715,000 | 4,960,297 | |||||||||
|
| |||||||||||
| 23,739,490 | ||||||||||||
| Colombia — 4.3% | ||||||||||||
Colombia Government International Bond | COP | 1,004,000 | 308,580 | |||||||||
9.85%, 06/28/27 | COP | 745,000 | 276,456 | |||||||||
Colombian TES | COP | 12,131,700 | 3,622,288 | |||||||||
6.25%, 11/26/25 | COP | 9,000,300 | 2,765,930 | |||||||||
7.00%, 05/04/22 | COP | 13,663,200 | 4,234,499 | |||||||||
7.00%, 06/30/32 | COP | 7,731,100 | 2,450,898 | |||||||||
7.25%, 10/18/34 | COP | 1,901,700 | 617,700 | |||||||||
7.50%, 08/26/26 | COP | 9,600,600 | 3,138,392 | |||||||||
7.75%, 09/18/30 | COP | 7,263,200 | 2,432,848 | |||||||||
10.00%, 07/24/24 | COP | 8,999,900 | 3,189,186 | |||||||||
|
| |||||||||||
| 23,036,777 | ||||||||||||
| Czech Republic — 4.4% | ||||||||||||
Czech Republic Government Bond | CZK | 50,980 | 2,059,812 | |||||||||
0.45%, 10/25/23(c) | CZK | 24,170 | 1,022,188 | |||||||||
0.95%, 05/15/30(c) | CZK | 60,430 | 2,520,740 | |||||||||
1.00%, 06/26/26(c) | CZK | 51,010 | 2,181,502 | |||||||||
2.40%, 09/17/25(c) | CZK | 66,610 | 3,096,642 | |||||||||
2.50%, 08/25/28(c) | CZK | 51,480 | 2,459,527 | |||||||||
2.75%, 07/23/29 | CZK | 64,520 | 3,171,480 | |||||||||
3.85%, 09/29/21(c) | CZK | 50,260 | 2,301,328 | |||||||||
4.70%, 09/12/22(c) | CZK | 44,150 | 2,118,364 | |||||||||
| Security | Par (000) | Value | ||||||||||
| Czech Republic (continued) | ||||||||||||
5.70%, 05/25/24(c) | CZK | 51,180 | $ | 2,697,564 | ||||||||
|
| |||||||||||
| 23,629,147 | ||||||||||||
| Dominican Republic — 4.3% | ||||||||||||
Dominican Republic International Bond | DOP | 493,650 | 9,410,970 | |||||||||
9.75%, 06/05/26(c) | DOP | 708,500 | 13,592,105 | |||||||||
|
| |||||||||||
| 23,003,075 | ||||||||||||
| Hungary — 4.4% | ||||||||||||
Hungary Government Bond | HUF | 90,030 | 308,101 | |||||||||
1.75%, 10/26/22 | HUF | 703,090 | 2,478,741 | |||||||||
2.50%, 10/27/21 | HUF | 404,000 | 1,440,900 | |||||||||
2.50%, 10/24/24 | HUF | 634,770 | 2,322,631 | |||||||||
2.75%, 12/22/26 | HUF | 614,710 | 2,278,250 | |||||||||
3.00%, 06/26/24 | HUF | 613,570 | 2,288,863 | |||||||||
3.00%, 10/27/27 | HUF | 751,540 | 2,832,704 | |||||||||
5.50%, 06/24/25 | HUF | 706,310 | 2,982,411 | |||||||||
6.00%, 11/24/23 | HUF | 574,020 | 2,367,468 | |||||||||
6.75%, 10/22/28 | HUF | 407,110 | 1,964,584 | |||||||||
7.00%, 06/24/22 | HUF | 613,660 | 2,458,315 | |||||||||
|
| |||||||||||
| 23,722,968 | ||||||||||||
| Indonesia — 7.6% | ||||||||||||
Indonesia Treasury Bond | IDR | 24,670,000 | 1,721,469 | |||||||||
6.13%, 05/15/28 | IDR | 32,071,000 | 2,179,649 | |||||||||
6.63%, 05/15/33 | IDR | 16,885,000 | 1,128,914 | |||||||||
7.00%, 05/15/22 | IDR | 22,073,000 | 1,603,937 | |||||||||
7.00%, 05/15/27 | IDR | 35,328,000 | 2,553,270 | |||||||||
7.00%, 09/15/30 | IDR | 8,634,000 | 608,323 | |||||||||
7.50%, 08/15/32 | IDR | 14,867,000 | 1,069,191 | |||||||||
7.50%, 05/15/38 | IDR | 22,947,000 | 1,625,760 | |||||||||
8.13%, 05/15/24 | IDR | 28,059,000 | 2,131,860 | |||||||||
8.25%, 07/15/21 | IDR | 29,754,000 | 2,193,873 | |||||||||
8.25%, 05/15/29 | IDR | 32,328,000 | 2,503,422 | |||||||||
8.25%, 06/15/32 | IDR | 13,183,000 | 1,001,145 | |||||||||
8.25%, 05/15/36 | IDR | 23,110,000 | 1,748,438 | |||||||||
8.38%, 03/15/24 | IDR | 40,031,000 | 3,060,003 | |||||||||
8.38%, 09/15/26 | IDR | 27,804,000 | 2,162,996 | |||||||||
8.38%, 03/15/34 | IDR | 44,613,000 | 3,438,859 | |||||||||
8.38%, 04/15/39 | IDR | 7,959,000 | 606,975 | |||||||||
8.75%, 05/15/31 | IDR | 17,870,000 | 1,415,647 | |||||||||
9.00%, 03/15/29 | IDR | 28,088,000 | 2,262,128 | |||||||||
9.50%, 07/15/31 | IDR | 11,572,000 | 956,296 | |||||||||
10.50%, 08/15/30 | IDR | 6,985,000 | 617,414 | |||||||||
11.00%, 11/15/20 | IDR | 3,648,000 | 273,529 | |||||||||
11.00%, 09/15/25 | IDR | 10,435,000 | 894,487 | |||||||||
12.80%, 06/15/21 | IDR | 5,677,000 | 446,290 | |||||||||
Perusahaan Penerbit SBSN Indonesia | IDR | 17,485,000 | 1,304,446 | |||||||||
8.88%, 11/15/31 | IDR | 13,500,000 | 1,046,469 | |||||||||
|
| |||||||||||
| 40,554,790 | ||||||||||||
| Malaysia — 4.3% | ||||||||||||
Malaysia Government Bond | MYR | 2,340 | 565,445 | |||||||||
3.73%, 06/15/28 | MYR | 4,708 | 1,146,325 | |||||||||
3.76%, 04/20/23 | MYR | 1,442 | 350,849 | |||||||||
3.80%, 08/17/23 | MYR | 5,637 | 1,373,585 | |||||||||
3.89%, 08/15/29 | MYR | 3,605 | 894,457 | |||||||||
3.90%, 11/30/26 | MYR | 6,640 | 1,630,870 | |||||||||
| 36 | 2019ISHARES ANNUAL REPORTTO SHAREHOLDERS |
Schedule of Investments (continued) October 31, 2019 | iShares® J.P. Morgan EM Local Currency Bond ETF (Percentages shown are based on Net Assets) |
| Security | Par (000) | Value | ||||||||||
| Malaysia (continued) | ||||||||||||
3.90%, 11/16/27 | MYR | 8,397 | $ | 2,067,641 | ||||||||
3.91%, 07/15/26 | MYR | 2,014 | 496,576 | |||||||||
3.96%, 09/15/25 | MYR | 4,449 | 1,095,119 | |||||||||
4.06%, 09/30/24 | MYR | 3,201 | 789,535 | |||||||||
4.16%, 07/15/21 | MYR | 4,008 | 975,767 | |||||||||
4.18%, 07/15/24 | MYR | 6,391 | 1,582,574 | |||||||||
4.76%, 04/07/37 | MYR | 5,364 | 1,435,703 | |||||||||
4.94%, 09/30/43 | MYR | 532 | 145,071 | |||||||||
Malaysia Government Investment Issue | MYR | 9,998 | 2,433,820 | |||||||||
4.09%, 11/30/23 | MYR | 4,191 | 1,032,070 | |||||||||
4.13%, 08/15/25 | MYR | 5,450 | 1,349,169 | |||||||||
4.13%, 07/09/29 | MYR | 3,126 | 786,206 | |||||||||
4.26%, 07/26/27 | MYR | 5,000 | 1,253,760 | |||||||||
4.37%, 10/31/28 | MYR | 7,065 | 1,797,410 | |||||||||
|
| |||||||||||
| 23,201,952 | ||||||||||||
| Mexico — 8.9% | ||||||||||||
Mexican Bonos | MXN | 54,462 | 2,699,538 | |||||||||
6.50%, 06/10/21 | MXN | 69,248 | 3,606,275 | |||||||||
6.50%, 06/09/22 | MXN | 87,423 | 4,554,221 | |||||||||
7.25%, 12/09/21 | MXN | 74,580 | 3,946,423 | |||||||||
7.50%, 06/03/27 | MXN | 88,885 | 4,836,129 | |||||||||
7.75%, 05/29/31 | MXN | 43,707 | 2,433,607 | |||||||||
7.75%, 11/23/34 | MXN | 36,100 | 2,011,819 | |||||||||
7.75%, 11/13/42 | MXN | 61,040 | 3,387,778 | |||||||||
8.00%, 12/07/23 | MXN | 70,615 | 3,867,425 | |||||||||
8.00%, 09/05/24 | MXN | 44,700 | 2,463,295 | |||||||||
8.00%, 11/07/47 | MXN | 38,350 | 2,189,746 | |||||||||
8.50%, 05/31/29 | MXN | 65,700 | 3,830,601 | |||||||||
8.50%, 11/18/38 | MXN | 43,705 | 2,604,503 | |||||||||
10.00%, 12/05/24 | MXN | 70,123 | 4,184,475 | |||||||||
10.00%, 11/20/36 | MXN | 18,623 | 1,253,964 | |||||||||
|
| |||||||||||
| 47,869,799 | ||||||||||||
| Peru — 4.8% | ||||||||||||
Peru Government Bond | PEN | 4,854 | 1,540,040 | |||||||||
5.70%, 08/12/24 | PEN | 8,940 | 2,960,484 | |||||||||
5.94%, 02/12/29(b)(c) | PEN | 9,673 | 3,249,868 | |||||||||
6.15%, 08/12/32(b)(c) | PEN | 9,377 | 3,187,050 | |||||||||
6.35%, 08/12/28 | PEN | 10,693 | 3,687,694 | |||||||||
6.90%, 08/12/37 | PEN | 10,600 | 3,854,236 | |||||||||
6.95%, 08/12/31 | PEN | 10,016 | 3,614,258 | |||||||||
8.20%, 08/12/26 | PEN | 9,384 | 3,527,927 | |||||||||
|
| |||||||||||
| 25,621,557 | ||||||||||||
| Philippines — 4.4% | ||||||||||||
Philippine Government International Bond | PHP | 249,000 | 4,905,808 | |||||||||
4.95%, 01/15/21 | PHP | 405,000 | 8,068,914 | |||||||||
6.25%, 01/14/36 | PHP | 455,000 | 10,786,759 | |||||||||
|
| |||||||||||
| 23,761,481 | ||||||||||||
| Poland — 4.4% | ||||||||||||
Republic of Poland Government Bond | PLN | 6,811 | 1,795,926 | |||||||||
2.00%, 04/25/21 | PLN | 6,468 | 1,711,248 | |||||||||
2.25%, 04/25/22 | PLN | 6,101 | 1,627,344 | |||||||||
2.25%, 10/25/24 | PLN | 1,873 | 503,054 | |||||||||
2.50%, 01/25/23 | PLN | 7,867 | 2,121,327 | |||||||||
2.50%, 04/25/24 | PLN | 7,682 | 2,084,289 | |||||||||
| Security | Par (000) | Value | ||||||||||
| Poland (continued) | ||||||||||||
2.50%, 07/25/26 | PLN | 6,360 | $ | 1,731,970 | ||||||||
2.50%, 07/25/27 | PLN | 8,008 | 2,184,536 | |||||||||
2.75%, 04/25/28 | PLN | 7,508 | 2,088,542 | |||||||||
2.75%, 10/25/29 | PLN | 4,548 | 1,275,276 | |||||||||
3.25%, 07/25/25 | PLN | 7,878 | 2,226,056 | |||||||||
4.00%, 10/25/23 | PLN | 4,711 | 1,345,988 | |||||||||
5.75%, 10/25/21 | PLN | 4,071 | 1,156,036 | |||||||||
5.75%, 09/23/22 | PLN | 5,742 | 1,682,474 | |||||||||
|
| |||||||||||
| 23,534,066 | ||||||||||||
| Romania — 4.4% | ||||||||||||
Romania Government Bond | RON | 9,060 | 2,120,753 | |||||||||
3.25%, 04/29/24 | RON | 9,115 | 2,085,332 | |||||||||
3.40%, 03/08/22 | RON | 10,000 | 2,338,535 | |||||||||
3.50%, 12/19/22 | RON | 9,250 | 2,158,760 | |||||||||
4.00%, 10/27/21 | RON | 9,465 | 2,242,052 | |||||||||
4.25%, 06/28/23 | RON | 6,370 | 1,519,766 | |||||||||
4.75%, 02/24/25 | RON | 10,115 | 2,460,701 | |||||||||
5.00%, 02/12/29 | RON | 8,605 | 2,133,683 | |||||||||
5.80%, 07/26/27 | RON | 10,390 | 2,701,361 | |||||||||
5.85%, 04/26/23 | RON | 9,500 | 2,380,395 | |||||||||
5.95%, 06/11/21 | RON | 6,130 | 1,493,519 | |||||||||
|
| |||||||||||
| 23,634,857 | ||||||||||||
| Russia — 4.3% | ||||||||||||
Russian Federal Bond — OFZ | RUB | 86,135 | 1,365,536 | |||||||||
6.90%, 05/23/29 | RUB | 90,538 | 1,467,133 | |||||||||
7.00%, 12/15/21 | RUB | 90,356 | 1,439,872 | |||||||||
7.00%, 01/25/23 | RUB | 33,312 | 535,129 | |||||||||
7.00%, 08/16/23 | RUB | 62,473 | 1,005,818 | |||||||||
7.05%, 01/19/28 | RUB | 118,567 | 1,937,988 | |||||||||
7.10%, 10/16/24 | RUB | 82,686 | 1,343,483 | |||||||||
7.25%, 05/10/34 | RUB | 54,707 | 906,187 | |||||||||
7.40%, 12/07/22 | RUB | 78,230 | 1,269,580 | |||||||||
7.40%, 07/17/24 | RUB | 50,374 | 827,731 | |||||||||
7.50%, 08/18/21 | RUB | 65,550 | 1,050,447 | |||||||||
7.60%, 04/14/21 | RUB | 46,910 | 749,176 | |||||||||
7.60%, 07/20/22 | RUB | 46,729 | 758,779 | |||||||||
7.70%, 03/23/33 | RUB | 130,885 | 2,248,719 | |||||||||
7.75%, 09/16/26 | RUB | 140,486 | 2,375,059 | |||||||||
7.95%, 10/07/26 | RUB | 29,175 | 498,042 | |||||||||
8.15%, 02/03/27 | RUB | 126,370 | 2,183,809 | |||||||||
8.50%, 09/17/31 | RUB | 71,080 | 1,292,694 | |||||||||
|
| |||||||||||
| 23,255,182 | ||||||||||||
| South Africa — 4.5% | ||||||||||||
Republic of South Africa Government Bond | ZAR | 27,686 | 1,312,987 | |||||||||
6.50%, 02/28/41 | ZAR | 17,629 | 810,707 | |||||||||
6.75%, 03/31/21 | ZAR | 8,279 | 549,295 | |||||||||
7.00%, 02/28/31 | ZAR | 26,800 | 1,483,843 | |||||||||
7.75%, 02/28/23 | ZAR | 27,841 | 1,859,680 | |||||||||
8.00%, 01/31/30 | ZAR | 39,673 | 2,424,445 | |||||||||
8.25%, 03/31/32 | ZAR | 27,921 | 1,680,379 | |||||||||
8.50%, 01/31/37 | ZAR | 32,085 | 1,883,360 | |||||||||
8.75%, 01/31/44 | ZAR | 37,191 | 2,167,308 | |||||||||
8.75%, 02/28/48 | ZAR | 54,853 | 3,187,500 | |||||||||
8.88%, 02/28/35 | ZAR | 21,932 | 1,352,936 | |||||||||
| SCHEDULES OF INVESTMENTS | 37 |
Schedule of Investments (continued) October 31, 2019 | iShares® J.P. Morgan EM Local Currency Bond ETF (Percentages shown are based on Net Assets) |
| Security |
Par (000) | Value | ||||||||||
| South Africa (continued) | ||||||||||||
9.00%, 01/31/40 | ZAR | 21,273 | $ | 1,285,534 | ||||||||
10.50%, 12/21/26 | ZAR | 54,508 | 3,996,736 | |||||||||
|
| |||||||||||
| 23,994,710 | ||||||||||||
| Thailand — 4.5% | ||||||||||||
Thailand Government Bond | THB | 40,106 | 1,337,390 | |||||||||
2.00%, 12/17/22 | THB | 32,254 | 1,081,625 | |||||||||
2.13%, 12/17/26 | THB | 56,370 | 1,934,814 | |||||||||
2.40%, 12/17/23 | THB | 42,075 | 1,440,914 | |||||||||
2.88%, 12/17/28 | THB | 31,094 | 1,140,500 | |||||||||
2.88%, 06/17/46 | THB | 40,854 | 1,657,591 | |||||||||
3.30%, 06/17/38 | THB | 19,496 | 808,035 | |||||||||
3.40%, 06/17/36 | THB | 45,074 | 1,856,420 | |||||||||
3.63%, 06/16/23 | THB | 49,488 | 1,764,578 | |||||||||
3.65%, 12/17/21 | THB | 66,264 | 2,296,144 | |||||||||
3.65%, 06/20/31 | THB | 46,584 | 1,874,042 | |||||||||
3.78%, 06/25/32 | THB | 62,138 | 2,564,365 | |||||||||
3.85%, 12/12/25 | THB | 52,949 | 1,997,813 | |||||||||
4.26%, 12/12/37(c) | THB | 470 | 20,823 | |||||||||
4.88%, 06/22/29 | THB | 57,983 | 2,483,377 | |||||||||
|
| |||||||||||
| 24,258,431 | ||||||||||||
| Turkey — 4.4% | ||||||||||||
Turkey Government Bond | TRY | 11,030 | 1,659,554 | |||||||||
8.00%, 03/12/25 | TRY | 6,445 | 931,914 | |||||||||
8.50%, 09/14/22 | TRY | 8,173 | 1,307,669 | |||||||||
9.00%, 07/24/24 | TRY | 8,098 | 1,243,927 | |||||||||
9.20%, 09/22/21 | TRY | 6,779 | 1,129,131 | |||||||||
9.50%, 01/12/22 | TRY | 7,608 | 1,263,821 | |||||||||
10.40%, 03/20/24 | TRY | 4,792 | 780,135 | |||||||||
10.50%, 08/11/27 | TRY | 12,774 | 2,019,225 | |||||||||
10.60%, 02/11/26 | TRY | 14,603 | 2,347,963 | |||||||||
10.70%, 02/17/21 | TRY | 8,813 | 1,516,517 | |||||||||
10.70%, 08/17/22 | TRY | 10,980 | 1,847,123 | |||||||||
11.00%, 03/02/22 | TRY | 11,626 | 1,980,219 | |||||||||
| Security | Par/ Shares | Value | ||||||||||
| Turkey (continued) | ||||||||||||
11.00%, 02/24/27 | TRY | 11,961 | $ | 1,945,150 | ||||||||
12.20%, 01/18/23 | TRY | 9,328 | 1,629,630 | |||||||||
12.40%, 03/08/28 | TRY | 7,939 | 1,379,324 | |||||||||
16.20%, 06/14/23 | TRY | 3,691 | 712,349 | |||||||||
|
| |||||||||||
| 23,693,651 | ||||||||||||
| Uruguay — 4.4% | ||||||||||||
Uruguay Government International Bond | UYU | 425,652 | 9,650,686 | |||||||||
9.88%, 06/20/22(c) | UYU | 519,927 | 13,604,918 | |||||||||
|
| |||||||||||
| 23,255,604 | ||||||||||||
|
| |||||||||||
Total Foreign Government Obligations — 97.1% |
| 520,680,304 | ||||||||||
|
| |||||||||||
Short-Term Investments |
| |||||||||||
| Money Market Funds — 1.3% | ||||||||||||
BlackRock Cash Funds: Treasury, |
| 6,933 | 6,933,000 | |||||||||
|
| |||||||||||
Total Short-Term Investments — 1.3% |
| 6,933,000 | ||||||||||
|
| |||||||||||
Total Investments in Securities — 98.4% |
| 527,613,304 | ||||||||||
Other Assets, Less Liabilities — 1.6% |
| 8,464,667 | ||||||||||
|
| |||||||||||
Net Assets — 100.0% |
| $ | 536,077,971 | |||||||||
|
| |||||||||||
| (a) | Zero-coupon bond. |
| (b) | Security exempt from registration pursuant to Rule 144A under the Securities Act of 1933, as amended. These securities may be resold in transactions exempt from registration to qualified institutional investors. |
| (c) | This security may be resold to qualified foreign investors and foreign institutional buyers under Regulation S of the Securities Act of 1933. |
| (d) | Affiliate of the Fund. |
| (e) | Annualized7-day yield as ofperiod-end. |
Affiliates
Investments in issuers considered to be affiliates of the Fund during the year ended October 31, 2019, for purposes of Section 2(a)(3) of the 1940 Act, were as follows:
| ||||||||||||||||||||||||||||||||
Affiliated Issuer | | Shares Held at 10/31/18 (000) |
| | Net Activity (000) |
| | Shares Held at 10/31/19 (000) |
| | Value at 10/31/19 | | Income | | Net Realized Gain (Loss) | (a) | | Change in Unrealized Appreciation (Depreciation) | | |||||||||||||
| ||||||||||||||||||||||||||||||||
BlackRock Cash Funds: Treasury, | 35 | 6,898 | 6,933 | $ | 6,933,000 | $ | 65,547 | $ | — | $ | — | |||||||||||||||||||||
|
|
|
|
|
|
|
| |||||||||||||||||||||||||
| (a) | Includes realized capital gain distributions from an affiliated fund, if any. |
Derivative Financial Instruments Categorized by Risk Exposure
For the year ended October 31, 2019, the effect of derivative financial instruments in the Statements of Operations was as follows:
| ||||
Foreign Currency Exchange Contracts | ||||
| ||||
Net Realized Gain (Loss) from: | ||||
Forward foreign currency exchange contracts | $ | 890,901 | ||
|
| |||
| 38 | 2019ISHARES ANNUAL REPORTTO SHAREHOLDERS |
Schedule of Investments (continued) October 31, 2019 | iShares® J.P. Morgan EM Local Currency Bond ETF
|
Average Quarterly Balances of Outstanding Derivative Financial Instruments
Forward foreign currency exchange contracts: | ||||
Average amounts purchased — in USD | $ | 749,111 | ||
Average amounts sold — in USD | $ | 739,435 |
For more information about the Fund’s investment risks regarding derivative financial instruments, refer to the Notes to Financial Statements.
Fair Value Measurements
Various inputs are used in determining the fair value of financial instruments. For description of the input levels and information about the Fund’s policy regarding valuation of financial instruments, refer to the Notes to Financial Statements.
The following table summarizes the value of the Fund’s investments according to the fair value hierarchy as of October 31, 2019. The breakdown of the Fund’s investments into major categories is disclosed in the Schedule of Investments above.
| ||||||||||||||||
| Level 1 | Level 2 | Level 3 | Total | |||||||||||||
| ||||||||||||||||
Investments | ||||||||||||||||
Assets | ||||||||||||||||
Foreign Government Obligations | $ | — | $ | 520,680,304 | $ | — | $ | 520,680,304 | ||||||||
Money Market Funds | 6,933,000 | — | — | 6,933,000 | ||||||||||||
|
|
|
|
|
|
|
| |||||||||
| $ | 6,933,000 | $ | 520,680,304 | $ | — | $ | 527,613,304 | |||||||||
|
|
|
|
|
|
|
| |||||||||
See notes to financial statements.
| SCHEDULES OF INVESTMENTS | 39 |
Schedule of Investments October 31, 2019 | iShares® US & Intl High Yield Corp Bond ETF (Percentages shown are based on Net Assets) |
| Security | Par (000) | Value | ||||||||||
Corporate Bonds & Notes | ||||||||||||
| Australia — 0.2% | ||||||||||||
FMG Resources August 2006 Pty Ltd. | USD | 110 | $ | 108,831 | ||||||||
4.75%, 05/15/22 (Call 02/15/22)(a) | USD | 100 | 103,375 | |||||||||
5.13%, 03/15/23 (Call 12/15/22)(a) | USD | 50 | 52,188 | |||||||||
5.13%, 05/15/24 (Call 02/15/24)(a) | USD | 100 | 105,000 | |||||||||
|
| |||||||||||
| 369,394 | ||||||||||||
| Austria — 0.1% | ||||||||||||
Novomatic AG, 1.63%, 09/20/23 | EUR | 100 | 112,749 | |||||||||
Wienerberger AG, 2.00%, 05/02/24(b) | EUR | 50 | 59,656 | |||||||||
|
| |||||||||||
| 172,405 | ||||||||||||
| Belgium — 0.2% | ||||||||||||
Telenet Finance Luxembourg Notes Sarl | EUR | 100 | 121,358 | |||||||||
5.50%, 03/01/28 (Call 12/01/22)(a) | USD | 200 | 211,350 | |||||||||
|
| |||||||||||
| 332,708 | ||||||||||||
| Brazil — 0.7% | ||||||||||||
JBS Investments II GmbH | USD | 200 | 208,000 | |||||||||
7.00%, 01/15/26 (Call 01/15/22)(a) | USD | 200 | 216,800 | |||||||||
JBS USA LUX SA/JBS USA Finance Inc. | USD | 110 | 113,436 | |||||||||
6.75%, 02/15/28 (Call 02/15/23)(a) | USD | 175 | 193,266 | |||||||||
JBS USA LUX SA/JBS USA Food Co./JBS USA Finance Inc. | USD | 185 | 198,776 | |||||||||
6.50%, 04/15/29 (Call 04/15/24)(a) | USD | 215 | 239,094 | |||||||||
|
| |||||||||||
| 1,169,372 | ||||||||||||
| Canada — 3.1% | ||||||||||||
1011778 BC ULC/New Red Finance Inc. | USD | 70 | 70,459 | |||||||||
4.25%, 05/15/24 (Call 05/15/20)(a) | USD | 300 | 307,875 | |||||||||
5.00%, 10/15/25 (Call 10/15/20)(a) | USD | 400 | 413,000 | |||||||||
Air Canada | ||||||||||||
4.75%, 10/06/23 (Call 12/02/19)(a) | CAD | 25 | 19,673 | |||||||||
7.75%, 04/15/21(a) | USD | 50 | 53,627 | |||||||||
Baytex Energy Corp., 6.63%, 07/19/22 (Call 12/02/19) | CAD | 50 | 37,404 | |||||||||
Bombardier Inc. | USD | 75 | 73,500 | |||||||||
6.00%, 10/15/22 (Call 12/02/19)(a) | USD | 200 | 194,937 | |||||||||
6.13%, 01/15/23(a)(c) | USD | 175 | 171,023 | |||||||||
7.50%, 12/01/24 (Call 12/01/20)(a) | USD | 175 | 169,422 | |||||||||
7.50%, 03/15/25 (Call 03/15/20)(a) | USD | 225 | 215,329 | |||||||||
7.88%, 04/15/27 (Call 04/15/22)(a) | USD | 290 | 273,869 | |||||||||
8.75%, 12/01/21(a) | USD | 175 | 185,603 | |||||||||
Brookfield Residential Properties Inc., 6.13%, 05/15/23 (Call 12/02/19)(a) | CAD | 50 | 38,926 | |||||||||
Brookfield Residential Properties Inc./Brookfield Residential U.S. Corp. | USD | 75 | 76,313 | |||||||||
6.25%, 09/15/27 (Call 09/15/22)(a) | USD | 82 | 83,691 | |||||||||
Cascades Inc., 5.50%, 07/15/21 (Call 12/02/19)(a) | CAD | 25 | 19,259 | |||||||||
CES Energy Solutions Corp., 6.38%, 10/21/24 (Call 10/21/20) | CAD | 50 | 36,235 | |||||||||
Cott Corp., 5.50%, 07/01/24 | EUR | 100 | 115,914 | |||||||||
Crew Energy Inc., 6.50%, 03/14/24 (Call 03/14/20)(a) | CAD | 50 | 31,606 | |||||||||
GFL Environmental Inc. 5.38%, 03/01/23 (Call 11/07/19)(a) | USD | 75 | 77,438 | |||||||||
| Security | Par (000) | Value | ||||||||||
| Canada (continued) | ||||||||||||
7.00%, 06/01/26 (Call 06/01/21)(a) | USD | 50 | $ | 53,224 | ||||||||
8.50%, 05/01/27 (Call 05/01/22)(a) | USD | 75 | 82,313 | |||||||||
Gibson Energy Inc., 5.25%, 07/15/24(b) | CAD | 100 | 80,693 | |||||||||
Iron Mountain Canada Operations ULC, 5.38%, 09/15/23 (Call 11/12/19)(a) | CAD | 25 | 19,615 | |||||||||
MEG Energy Corp. | USD | 100 | 95,209 | |||||||||
6.50%, 01/15/25 (Call 01/15/20)(a) | USD | 100 | 103,885 | |||||||||
7.00%, 03/31/24 (Call 12/02/19)(a)(c) | USD | 150 | 141,103 | |||||||||
NOVA Chemicals Corp. | USD | 140 | 142,546 | |||||||||
5.00%, 05/01/25 (Call 01/31/25)(a) | USD | 75 | 75,767 | |||||||||
5.25%, 08/01/23 (Call 12/02/19)(a) | USD | 75 | 76,011 | |||||||||
5.25%, 06/01/27 (Call 03/03/27)(a) | USD | 175 | 180,436 | |||||||||
NuVista Energy Ltd., 6.50%, 03/02/23 (Call 03/02/20) | CAD | 50 | 36,116 | |||||||||
Open Text Corp. | USD | 125 | 127,656 | |||||||||
5.88%, 06/01/26 (Call 06/01/21)(a)(c) | USD | 100 | 106,816 | |||||||||
Parkland Fuel Corp. | CAD | 100 | 78,841 | |||||||||
5.75%, 09/16/24 (Call 11/29/19)(a) | CAD | 25 | 19,734 | |||||||||
5.75%, 09/16/24 (Call 11/29/19) | CAD | 50 | 39,468 | |||||||||
5.88%, 07/15/27 (Call 07/15/22)(a) | USD | 80 | 84,921 | |||||||||
6.00%, 11/21/22 (Call 12/02/19) | CAD | 50 | 38,736 | |||||||||
Quebecor Media Inc. | USD | 125 | 135,215 | |||||||||
6.63%, 01/15/23(a) | CAD | 75 | 62,198 | |||||||||
Russel Metals Inc., 6.00%, 04/19/22 (Call 11/29/19)(a) | CAD | 25 | 19,240 | |||||||||
Seven Generations Energy Ltd. 5.38%, 09/30/25 (Call 09/30/20)(a) | USD | 150 | 145,383 | |||||||||
6.75%, 05/01/23 (Call 12/02/19)(a) | USD | 50 | 50,777 | |||||||||
6.88%, 06/30/23 (Call 12/02/19)(a) | USD | 50 | 50,894 | |||||||||
Stars Group Holdings BV/Stars Group US Co-Borrower LLC, 7.00%, 07/15/26 (Call 07/15/21)(a) | USD | 175 | 188,615 | |||||||||
Superior Plus LP | CAD | 50 | 38,410 | |||||||||
5.25%, 02/27/24 (Call 02/27/20) | CAD | 50 | 38,767 | |||||||||
Videotron Ltd. | CAD | 150 | 114,517 | |||||||||
5.00%, 07/15/22 | USD | 100 | 105,500 | |||||||||
5.13%, 04/15/27 (Call 04/15/22)(a) | USD | 75 | 78,983 | |||||||||
5.38%, 06/15/24 (Call 03/15/24)(a) | USD | 150 | 162,937 | |||||||||
5.63%, 06/15/25 (Call 03/15/25) | CAD | 50 | 41,142 | |||||||||
5.75%, 01/15/26 (Call 09/15/20)(b) | CAD | 75 | 59,791 | |||||||||
|
| |||||||||||
| 5,540,562 | ||||||||||||
| Denmark — 0.2% | ||||||||||||
DKT Finance ApS, 7.00%, 06/17/23 | EUR | 200 | 235,805 | |||||||||
TDC AS, 6.88%, 02/23/23(b) | GBP | 100 | 147,253 | |||||||||
|
| |||||||||||
| 383,058 | ||||||||||||
| Finland — 0.5% | ||||||||||||
Nokia OYJ | EUR | 100 | 112,506 | |||||||||
2.00%, 03/11/26 (Call 12/11/25)(b) | EUR | 200 | 230,466 | |||||||||
3.38%, 06/12/22 | USD | 100 | 101,125 | |||||||||
4.38%, 06/12/27 | USD | 80 | 81,596 | |||||||||
Teollisuuden Voima OYJ | EUR | 100 | 110,468 | |||||||||
2.00%, 05/08/24 (Call 02/08/24)(b) | EUR | 100 | 117,052 | |||||||||
| 40 | 2019ISHARES ANNUAL REPORTTO SHAREHOLDERS |
Schedule of Investments (continued) October 31, 2019 | iShares® US & Intl High Yield Corp Bond ETF (Percentages shown are based on Net Assets) |
| Security | Par (000) | Value | ||||||||||
| Finland (continued) | ||||||||||||
2.13%, 02/04/25 (Call 11/04/24)(b) | EUR | 100 | $ | 117,931 | ||||||||
|
| |||||||||||
| 871,144 | ||||||||||||
| France — 3.8% | ||||||||||||
Altice France SA/France | EUR | 200 | 223,338 | |||||||||
5.50%, 01/15/28 (Call 09/15/22)(a) | USD | 200 | 203,371 | |||||||||
5.88%, 02/01/27 (Call 02/01/22)(b) | EUR | 200 | 246,028 | |||||||||
7.38%, 05/01/26 (Call 05/01/21)(a) | USD | 800 | 856,676 | |||||||||
8.13%, 02/01/27 (Call 02/01/22)(a) | USD | 200 | 221,719 | |||||||||
Banijay Group SAS, 4.00%, 07/01/22 (Call 12/02/19)(b) | EUR | 100 | 113,709 | |||||||||
Burger King France SAS, 6.00%, 05/01/24 (Call 05/01/20)(b) | EUR | 100 | 117,424 | |||||||||
Casino Guichard Perrachon SA | EUR | 100 | 103,846 | |||||||||
4.05%, 08/05/26 (Call 05/05/26)(b) | EUR | 100 | 88,713 | |||||||||
4.50%, 03/07/24 (Call 12/07/23)(b) | EUR | 200 | 192,878 | |||||||||
4.56%, 01/25/23(b) | EUR | 100 | 103,533 | |||||||||
5.98%, 05/26/21(b) | EUR | 100 | 114,401 | |||||||||
CMA CGM SA | EUR | 100 | 75,027 | |||||||||
6.50%, 07/15/22 (Call 11/11/19)(b) | EUR | 100 | 82,157 | |||||||||
7.75%, 01/15/21 (Call 11/11/19)(b) | EUR | 100 | 92,320 | |||||||||
Elis SA | EUR | 100 | 110,898 | |||||||||
1.63%, 04/03/28 (Call 01/03/28)(b) | EUR | 100 | 111,077 | |||||||||
1.75%, 04/11/24 (Call 01/11/24)(b) | EUR | 100 | 115,203 | |||||||||
1.88%, 02/15/23 (Call 11/15/22)(b) | EUR | 100 | 115,529 | |||||||||
Europcar Mobility Group | EUR | 150 | 154,906 | |||||||||
4.13%, 11/15/24 (Call 11/15/20)(b) | EUR | 100 | 104,993 | |||||||||
Faurecia SE | EUR | 100 | 114,394 | |||||||||
3.13%, 06/15/26 (Call 06/15/22)(b) | EUR | 100 | 116,308 | |||||||||
3.63%, 06/15/23 (Call 11/12/19)(b) | EUR | 100 | 113,458 | |||||||||
Fnac Darty SA, 2.63%, 05/30/26 (Call 05/30/22)(b) | EUR | 100 | 115,509 | |||||||||
Getlink SE, 3.63%, 10/01/23(b) | EUR | 100 | 116,475 | |||||||||
La Financiere Atalian SASU | EUR | 100 | 74,523 | |||||||||
5.13%, 05/15/25 (Call 05/15/21)(b) | EUR | 100 | 74,714 | |||||||||
Loxam SAS | EUR | 125 | 136,656 | |||||||||
3.25%, 01/14/25 (Call 07/15/21)(b) | EUR | 125 | 138,774 | |||||||||
5.75%, 07/15/27 (Call 07/15/22)(b) | EUR | 100 | 107,589 | |||||||||
6.00%, 04/15/25 (Call 04/15/20)(b) | EUR | 100 | 111,751 | |||||||||
Mobilux Finance SAS, 5.50%, 11/15/24 (Call 11/15/19)(b) | EUR | 100 | 114,341 | |||||||||
Nexans SA, 3.25%, 05/26/21 (Call 02/26/21)(b) | EUR | 100 | 115,557 | |||||||||
Orano SA | EUR | 100 | 119,116 | |||||||||
3.38%, 04/23/26 (Call 01/23/26)(b) | EUR | 100 | 119,827 | |||||||||
3.50%, 03/22/21(b) | EUR | 200 | 232,345 | |||||||||
4.88%, 09/23/24 | EUR | 150 | 195,156 | |||||||||
Paprec Holding SA, 4.00%, 03/31/25 (Call 03/31/21)(b) | EUR | 100 | 100,162 | |||||||||
Rexel SA | EUR | 100 | 113,764 | |||||||||
2.75%, 06/15/26 (Call 03/15/22)(b) | EUR | 125 | 144,511 | |||||||||
SPCM SA, 2.88%, 06/15/23 (Call 11/12/19)(b) | EUR | 100 | 112,192 | |||||||||
SPIE SA | EUR | 100 | 116,136 | |||||||||
3.13%, 03/22/24 (Call 09/22/23)(b) | EUR | 100 | 119,983 | |||||||||
| Security | Par (000) | Value | ||||||||||
| France (continued) | ||||||||||||
Tereos Finance Groupe I SA, 4.13%, 06/16/23 (Call 03/16/23)(b) | EUR | 100 | $ | 70,667 | ||||||||
Vallourec SA | EUR | 100 | 71,619 | |||||||||
6.63%, 10/15/22 (Call 10/15/20)(b) | EUR | 100 | 94,167 | |||||||||
|
| |||||||||||
| 6,607,440 | ||||||||||||
| Germany — 2.7% | ||||||||||||
Adler Pelzer Holding GmbH, 4.13%, 04/01/24 | EUR | 100 | 98,090 | |||||||||
ADLER Real Estate AG | EUR | 100 | 112,249 | |||||||||
1.50%, 04/17/22 (Call 03/17/22)(b) | EUR | 100 | 111,512 | |||||||||
3.00%, 04/27/26 (Call 02/27/26)(b) | EUR | 100 | 115,123 | |||||||||
BMBG Bond Finance SCA, 3.00%, 06/15/21 (Call 11/29/19)(b) | EUR | 100 | 111,751 | |||||||||
CBR Fashion Finance BV, 5.13%, 10/01/22 (Call 11/11/19)(b) | EUR | 100 | 111,482 | |||||||||
CeramTec BondCo GmbH, 5.25%, 12/15/25 (Call 12/15/20)(b) | EUR | 100 | 115,312 | |||||||||
DEMIRE Deutsche Mittelstand Real Estate AG, 1.88%, 10/15/24 (Call 07/15/24)(b) | EUR | 100 | 111,445 | |||||||||
Deutsche Bank AG | EUR | 225 | 257,892 | |||||||||
4.30%, 05/24/28 (Call 05/24/23)(d) | USD | 200 | 189,242 | |||||||||
4.50%, 05/19/26(b) | EUR | 100 | 121,526 | |||||||||
Deutsche Bank AG/New York NY, 4.88%, 12/01/32 (Call 12/01/27)(d) | USD | 200 | 183,204 | |||||||||
Deutsche Lufthansa AG, 5.13%, 08/12/75 (Call 02/12/21)(b)(d) | EUR | 100 | 117,750 | |||||||||
Douglas GmbH, 6.25%, 07/15/22 | EUR | 100 | 110,511 | |||||||||
Hapag-Lloyd AG, 5.13%, 07/15/24 (Call 07/15/20)(b) | EUR | 100 | 117,170 | |||||||||
K+S AG | EUR | 100 | 114,936 | |||||||||
3.25%, 07/18/24 (Call 04/18/24)(b) | EUR | 100 | 116,982 | |||||||||
4.13%, 12/06/21(b) | EUR | 100 | 118,906 | |||||||||
KME SE, 6.75%, 02/01/23 (Call 02/01/20)(b) | EUR | 100 | 91,305 | |||||||||
LANXESS AG, 4.50%, 12/06/76 | EUR | 100 | 122,107 | |||||||||
METRO AG, 1.50%, 03/19/25(b) | EUR | 200 | 233,241 | |||||||||
Nidda BondCo GmbH, 5.00%, 09/30/25 (Call 09/30/20)(b) | EUR | 100 | 113,751 | |||||||||
Nidda Healthcare Holding GmbH, 3.50%, 09/30/24 (Call 09/30/20)(b) | EUR | 100 | 115,160 | |||||||||
Platin 1426 GmbH, 5.38%, 06/15/23 (Call 12/15/19)(b) | EUR | 100 | 105,065 | |||||||||
ProGroup AG, 3.00%, 03/31/26 (Call 03/31/21)(b) | EUR | 100 | 108,748 | |||||||||
RWE AG, 3.50%, 04/21/75 (Call 04/21/25)(b)(d) | EUR | 50 | 61,092 | |||||||||
Summit Properties Ltd., 2.00%, 01/31/25 (Call 01/31/21)(b) | EUR | 100 | 106,907 | |||||||||
Techem Verwaltungsgesellschaft 674 mbH, 6.00%, 07/30/26 (Call 07/30/21)(b) | EUR | 100 | 120,907 | |||||||||
Tele Columbus AG, 3.88%, 05/02/25 (Call 05/02/21)(b) | EUR | 100 | 108,571 | |||||||||
thyssenkrupp AG | EUR | 100 | 111,824 | |||||||||
1.75%, 11/25/20 (Call 08/25/20)(b) | EUR | 100 | 112,756 | |||||||||
1.88%, 03/06/23 (Call 02/06/23)(b) | EUR | 175 | 194,856 | |||||||||
2.50%, 02/25/25(b) | EUR | 100 | 114,554 | |||||||||
2.75%, 03/08/21 (Call 12/08/20)(b) | EUR | 75 | 85,622 | |||||||||
2.88%, 02/22/24 (Call 11/22/23)(b) | EUR | 325 | 372,420 | |||||||||
TUI AG, 2.13%, 10/26/21 (Call 07/26/21)(b) | EUR | 100 | 114,100 | |||||||||
| SCHEDULES OF INVESTMENTS | 41 |
Schedule of Investments (continued) October 31, 2019 | iShares® US & Intl High Yield Corp Bond ETF (Percentages shown are based on Net Assets) |
| Security | Par (000) | Value | ||||||||||
| Germany (continued) | ||||||||||||
WEPA Hygieneprodukte GmbH, 3.75%, 05/15/24 (Call 11/11/19)(b) | EUR | 100 | $ | 113,243 | ||||||||
|
| |||||||||||
| 4,841,312 | ||||||||||||
| Greece — 0.3% | ||||||||||||
Intralot Capital Luxembourg SA, 5.25%, 09/15/24 (Call 09/15/20)(b) | EUR | 100 | 60,036 | |||||||||
National Bank of Greece SA, 8.25%, 07/18/29 (Call 07/18/24)(b)(d) | EUR | 100 | 122,611 | |||||||||
OTE PLC, 0.88%, 09/24/26(b) | EUR | 100 | 112,953 | |||||||||
Piraeus Group Finance PLC, 9.75%, 06/26/29 (Call 06/26/24)(b)(d) | EUR | 100 | 119,240 | |||||||||
Titan Global Finance PLC, 2.38%, 11/16/24 (Call 05/16/24)(b) | EUR | 100 | 114,696 | |||||||||
|
| |||||||||||
| 529,536 | ||||||||||||
| Ireland — 1.4% | ||||||||||||
Allied Irish Banks PLC, 4.13%, 11/26/25 (Call 11/26/20)(b)(d) | EUR | 100 | 115,700 | |||||||||
Ardagh Packaging Finance PLC/Ardagh Holdings USA Inc. | EUR | 100 | 112,686 | |||||||||
4.13%, 05/15/23 (Call 11/12/19)(b) | EUR | 100 | 113,710 | |||||||||
4.25%, 09/15/22 (Call 11/11/19)(a) | USD | 200 | 203,000 | |||||||||
4.63%, 05/15/23 (Call 12/02/19)(a) | USD | 200 | 204,644 | |||||||||
4.75%, 07/15/27 (Call 07/15/22)(b) | GBP | 100 | 133,326 | |||||||||
5.25%, 08/15/27 (Call 08/15/22)(a) | USD | 200 | 203,996 | |||||||||
6.00%, 02/15/25 (Call 02/15/20)(a) | USD | 200 | 209,969 | |||||||||
6.75%, 05/15/24 (Call 11/12/19)(b) | EUR | 100 | 117,099 | |||||||||
Bank of Ireland Group PLC, 3.13%, 09/19/27 (Call 09/19/22)(b)(d) | GBP | 100 | 128,965 | |||||||||
eircom Finance DAC | EUR | 100 | 110,901 | |||||||||
3.50%, 05/15/26 (Call 05/15/22)(b) | EUR | 125 | 145,974 | |||||||||
James Hardie International Finance DAC, 3.63%, 10/01/26 (Call 10/01/21)(b) | EUR | 100 | 117,715 | |||||||||
LCPR Senior Secured Financing DAC, 6.75%, 10/15/27 (Call 10/15/22)(a) | USD | 80 | 81,985 | |||||||||
Smurfit Kappa Acquisitions ULC, 2.88%, 01/15/26 (Call 10/15/25)(b) | EUR | 200 | 243,508 | |||||||||
Smurfit Kappa Treasury ULC, 1.50%, 09/15/27 (Call 06/15/27)(b) | EUR | 150 | 166,937 | |||||||||
|
| |||||||||||
| 2,410,115 | ||||||||||||
| Israel — 1.3% | ||||||||||||
Teva Pharmaceutical Finance Netherlands II BV | EUR | 200 | 179,088 | |||||||||
1.25%, 03/31/23 (Call 12/31/22)(b) | EUR | 200 | 195,659 | |||||||||
1.63%, 10/15/28(b) | EUR | 100 | 80,512 | |||||||||
1.88%, 03/31/27 (Call 12/31/26)(b) | EUR | 100 | 84,434 | |||||||||
3.25%, 04/15/22 (Call 01/15/22) | EUR | 100 | 110,173 | |||||||||
4.50%, 03/01/25 (Call 12/01/24) | EUR | 200 | 206,278 | |||||||||
Teva Pharmaceutical Finance Netherlands III BV | USD | 400 | 380,101 | |||||||||
2.80%, 07/21/23 | USD | 400 | 345,500 | |||||||||
3.15%, 10/01/26(c) | USD | 550 | 416,625 | |||||||||
6.00%, 04/15/24 (Call 01/15/24)(c) | USD | 200 | 187,750 | |||||||||
6.75%, 03/01/28 (Call 12/01/27)(c) | USD | 200 | 179,693 | |||||||||
|
| |||||||||||
| 2,365,813 | ||||||||||||
| Italy — 4.4% | ||||||||||||
Banca IFIS SpA, 4.50%, 10/17/27 (Call 10/17/22)(b)(d) | EUR | 100 | 105,868 | |||||||||
| Security | Par (000) | Value | ||||||||||
| Italy (continued) | ||||||||||||
Banca Monte dei Paschi di Siena SpA | EUR | 100 | $ | 112,968 | ||||||||
5.38%, 01/18/28 (Call 01/18/23)(b)(d) | EUR | 100 | 86,409 | |||||||||
10.50%, 07/23/29(b) | EUR | 100 | 116,620 | |||||||||
Banca Popolare di Sondrio SCPA, 2.38%, 04/03/24(b) | EUR | 100 | 112,484 | |||||||||
Banco BPM SpA | EUR | 150 | 170,008 | |||||||||
1.75%, 01/28/25(b) | EUR | 100 | 111,491 | |||||||||
2.00%, 03/08/22(b) | EUR | 100 | 114,176 | |||||||||
2.50%, 06/21/24(b) | EUR | 100 | 115,943 | |||||||||
4.38%, 09/21/27 (Call 09/21/22)(b)(d) | EUR | 100 | 116,037 | |||||||||
6.00%, 11/05/20(b) | EUR | 100 | 116,912 | |||||||||
7.13%, 03/01/21(b) | EUR | 100 | 120,053 | |||||||||
BPER Banca, 5.13%, 05/31/27 (Call 05/31/22)(b)(d) | EUR | 100 | 117,993 | |||||||||
Fiat Chrysler Finance Europe SA, 4.75%, 07/15/22(b) | EUR | 150 | 187,789 | |||||||||
Iccrea Banca SpA, 1.50%, 10/11/22(b) | EUR | 150 | 171,182 | |||||||||
Inter Media and Communication SpA, 4.88%, 12/31/22 (Call 12/31/19)(b) | EUR | 98 | 112,552 | |||||||||
International Game Technology PLC, 3.50%, 06/15/26 (Call 06/15/22)(b) | EUR | 150 | 177,550 | |||||||||
Intesa Sanpaolo SpA | EUR | 100 | 119,177 | |||||||||
3.93%, 09/15/26(b) | EUR | 100 | 125,793 | |||||||||
5.02%, 06/26/24(a) | USD | 200 | 208,640 | |||||||||
6.63%, 09/13/23(b) | EUR | 200 | 268,498 | |||||||||
Leonardo SpA | EUR | 100 | 114,618 | |||||||||
4.50%, 01/19/21 | EUR | 100 | 117,088 | |||||||||
5.25%, 01/21/22 | EUR | 100 | 123,487 | |||||||||
Mediobanca Banca di Credito Finanziario SpA | EUR | 100 | 116,577 | |||||||||
5.75%, 04/18/23 | EUR | 100 | 127,605 | |||||||||
Nexi SpA, 1.75%, 10/31/24(b) | EUR | 150 | 170,308 | |||||||||
Rossini Sarl, 6.75%, 10/30/25 | EUR | 100 | 123,363 | |||||||||
Saipem Finance International BV | EUR | 100 | 116,533 | |||||||||
3.00%, 03/08/21(b) | EUR | 100 | 115,218 | |||||||||
Salini Impregilo SpA | EUR | 100 | 101,033 | |||||||||
3.75%, 06/24/21(b) | EUR | 100 | 113,276 | |||||||||
Sisal Group SpA, 7.00%, 07/31/23 | EUR | 100 | 115,456 | |||||||||
Societa Cattolica di Assicurazioni SC, 4.25%, 12/14/47 (Call 12/14/27)(b)(d) | EUR | 100 | 115,668 | |||||||||
Telecom Italia SpA/Milano | EUR | 100 | 114,842 | |||||||||
2.50%, 07/19/23(b) | EUR | 200 | 235,200 | |||||||||
2.75%, 04/15/25 (Call 01/15/25)(b) | EUR | 150 | 176,286 | |||||||||
2.88%, 01/28/26 (Call 10/28/25)(b) | EUR | 100 | 118,122 | |||||||||
3.00%, 09/30/25(b) | EUR | 200 | 239,461 | |||||||||
3.25%, 01/16/23(b) | EUR | 200 | 240,869 | |||||||||
3.63%, 01/19/24(b) | EUR | 100 | 122,489 | |||||||||
3.63%, 05/25/26(b) | EUR | 200 | 247,571 | |||||||||
4.00%, 04/11/24 (Call 01/11/24)(b) | EUR | 200 | 246,779 | |||||||||
4.50%, 01/25/21(b) | EUR | 100 | 117,535 | |||||||||
5.30%, 05/30/24(a)(c) | USD | 200 | 214,275 | |||||||||
Unione di Banche Italiane SpA | EUR | 250 | 293,441 | |||||||||
4.25%, 05/05/26 (Call 05/05/21)(b)(d) | EUR | 100 | 115,840 | |||||||||
4.45%, 09/15/27 (Call 09/15/22)(b)(d) | EUR | 100 | 119,408 | |||||||||
5.88%, 03/04/29 (Call 03/04/24)(b)(d) | EUR | 150 | 184,366 | |||||||||
| 42 | 2019ISHARES ANNUAL REPORTTO SHAREHOLDERS |
Schedule of Investments (continued) October 31, 2019 | iShares® US & Intl High Yield Corp Bond ETF (Percentages shown are based on Net Assets) |
| Security | Par (000) | Value | ||||||||||
| Italy (continued) | ||||||||||||
Unipol Gruppo SpA | EUR | 100 | $ | 119,361 | ||||||||
3.50%, 11/29/27 (Call 08/29/27)(b) | EUR | 100 | 123,504 | |||||||||
4.38%, 03/05/21(b) | EUR | 100 | 117,740 | |||||||||
UnipolSai Assicurazioni SpA, 3.88%, 03/01/28(b) | EUR | 100 | 115,805 | |||||||||
|
| |||||||||||
| 7,721,267 | ||||||||||||
| Japan — 0.6% | ||||||||||||
SoftBank Group Corp. | EUR | 250 | 282,734 | |||||||||
4.00%, 07/30/22 (Call 04/30/22)(b) | EUR | 100 | 118,582 | |||||||||
4.00%, 04/20/23 (Call 01/20/23)(b) | EUR | 100 | 118,780 | |||||||||
4.00%, 09/19/29 (Call 06/21/29)(b) | EUR | 125 | 142,594 | |||||||||
4.50%, 04/20/25 (Call 01/20/25)(b) | EUR | 100 | 120,558 | |||||||||
4.75%, 07/30/25 (Call 04/30/25)(b) | EUR | 100 | 121,755 | |||||||||
5.00%, 04/15/28 (Call 01/16/28)(b) | EUR | 100 | 122,399 | |||||||||
|
| |||||||||||
| 1,027,402 | ||||||||||||
| Luxembourg — 2.8% | ||||||||||||
Altice Financing SA | EUR | 100 | 114,476 | |||||||||
6.63%, 02/15/23 (Call 12/02/19)(a) | USD | 200 | 205,440 | |||||||||
7.50%, 05/15/26 (Call 05/15/21)(a) | USD | 600 | 638,812 | |||||||||
Altice Finco SA, 4.75%, 01/15/28 (Call 10/15/22)(b) | EUR | 100 | 108,330 | |||||||||
Altice Luxembourg SA | EUR | 100 | 115,900 | |||||||||
7.63%, 02/15/25 (Call 02/15/20)(a) | USD | 200 | 206,500 | |||||||||
8.00%, 05/15/27 (Call 05/15/22)(b) | EUR | 200 | 244,668 | |||||||||
10.50%, 05/15/27 (Call 05/15/22)(a) | USD | 200 | 226,250 | |||||||||
Arena Luxembourg Finance Sarl, 2.88%, 11/01/24 (Call 11/01/20)(b) | EUR | 100 | 115,571 | |||||||||
ContourGlobal Power Holdings SA, 3.38%, 08/01/23 (Call 08/01/20)(b) | EUR | 100 | 114,934 | |||||||||
Crystal Almond SARL, 10.00%, 11/01/21 (Call 11/04/19)(b). | EUR | 79 | 90,397 | |||||||||
Garfunkelux Holdco 3 SA, 8.50%, 11/01/22 (Call 11/12/19)(b) | GBP | 100 | 122,254 | |||||||||
INEOS Finance PLC, 2.13%, 11/15/25 (Call 11/15/20)(b) | EUR | 100 | 107,997 | |||||||||
INEOS Group Holdings SA, 5.38%, 08/01/24 (Call 11/11/19)(b) | EUR | 100 | 113,971 | |||||||||
Intelsat Connect Finance SA, 9.50%, 02/15/23 (Call 08/15/20)(a)(c) | USD | 200 | 187,500 | |||||||||
Intelsat Jackson Holdings SA | USD | 300 | 280,325 | |||||||||
8.00%, 02/15/24 (Call 12/02/19)(a) | USD | 175 | 179,977 | |||||||||
8.50%, 10/15/24 (Call 10/15/20)(a) | USD | 450 | 453,375 | |||||||||
9.50%, 09/30/22(a)(c) | USD | 75 | 86,719 | |||||||||
9.75%, 07/15/25 (Call 07/15/21)(a) | USD | 300 | 310,875 | |||||||||
Intelsat Luxembourg SA, 8.13%, 06/01/23 (Call 12/16/19)(c) | USD | 125 | 106,250 | |||||||||
JBS USA LUX SA/JBS USA Finance Inc., 5.75%, 06/15/25 (Call 06/15/20)(a) | USD | 175 | 181,781 | |||||||||
Matterhorn Telecom SA | EUR | 100 | 111,866 | |||||||||
4.00%, 11/15/27 (Call 11/15/22)(b) | EUR | 100 | 116,355 | |||||||||
Summer BC Holdco A Sarl, 9.25%, 10/31/27 (Call 10/31/22)(b) | EUR | 100 | 110,469 | |||||||||
Summer BC Holdco B SARL, 5.75%, 10/31/26 (Call 10/31/22)(b) | EUR | 100 | 111,705 | |||||||||
Swissport Investments SA, 6.75%, 12/15/21 (Call 11/12/19)(b) | EUR | 100 | 115,084 | |||||||||
| Security | Par (000) | Value | ||||||||||
| Luxembourg (continued) | ||||||||||||
Vivion Investments Sarl, | EUR | 100 | $ | 110,938 | ||||||||
|
| |||||||||||
| 4,988,719 | ||||||||||||
| Netherlands — 2.7% | ||||||||||||
AerCap Holdings NV, 5.88%, 10/10/79 (Call 10/10/24)(d) | USD | 200 | 209,240 | |||||||||
Constellium SE | EUR | 67 | 74,466 | |||||||||
6.63%, 03/01/25 (Call 03/01/20)(a)(c) | USD | 250 | 261,638 | |||||||||
Intertrust Group BV, 3.38%, 11/15/25 (Call 11/15/21)(b) | EUR | 100 | 116,821 | |||||||||
InterXion Holding NV, 4.75%, 06/15/25 (Call 06/15/21)(b) | EUR | 200 | 242,582 | |||||||||
IPD 3 BV, 4.50%, 07/15/22 (Call 11/11/19)(b) | EUR | 100 | 113,720 | |||||||||
Lincoln Financing SARL, 3.63%, 04/01/24 (Call 10/01/20)(b) | EUR | 100 | 113,577 | |||||||||
Maxeda DIY Holding BV, 6.13%, 07/15/22 (Call 11/29/19)(b) | EUR | 100 | 106,335 | |||||||||
Nielsen Co Luxembourg SARL/The, 5.50%, 10/01/21 (Call 12/02/19)(a) | USD | 75 | 75,252 | |||||||||
OCI NV | EUR | 200 | 227,691 | |||||||||
5.25%, 11/01/24 (Call 11/01/21)(a) | USD | 200 | 206,750 | |||||||||
PPF Arena 1 BV, 3.13%, 03/27/26 (Call 12/27/25)(b) | EUR | 100 | 116,313 | |||||||||
Promontoria Holding 264 BV, 6.75%, 08/15/23 (Call 08/15/20)(b) | EUR | 100 | 102,048 | |||||||||
Saipem Finance International BV, 2.63%, 01/07/25(b) | EUR | 100 | 116,779 | |||||||||
Selecta Group BV, 5.88%, 02/01/24 (Call 02/01/20)(b) | EUR | 100 | 112,467 | |||||||||
Sensata Technologies BV | USD | 75 | 79,220 | |||||||||
5.00%, 10/01/25(a) | USD | 150 | 161,655 | |||||||||
5.63%, 11/01/24(a)(c) | USD | 50 | 54,813 | |||||||||
Sigma Holdco BV, 5.75%, 05/15/26 (Call 05/15/21)(b) | EUR | 100 | 106,041 | |||||||||
SRLEV NV, 9.00%, 04/15/41 (Call 04/15/21)(d) | EUR | 100 | 122,527 | |||||||||
Starfruit Finco BV/Starfruit U.S. Holdco LLC, 6.50%, 10/01/26 (Call 10/01/21)(b) | EUR | 100 | 112,209 | |||||||||
Sunshine Mid BV, 6.50%, 05/15/26 (Call 05/15/21)(b) | EUR | 100 | 114,818 | |||||||||
Trivium Packaging Finance BV | EUR | 100 | 115,766 | |||||||||
8.50%, 08/15/27 (Call 08/15/22)(a) | USD | 200 | 213,250 | |||||||||
United Group BV, 4.38%, 07/01/22 (Call 11/11/19)(b) | EUR | 100 | 113,615 | |||||||||
UPC Holding BV, 3.88%, 06/15/29 (Call 06/15/22)(b) | EUR | 100 | 115,538 | |||||||||
UPCB Finance IV Ltd., 5.38%, 01/15/25 (Call 01/15/20)(a) | USD | 200 | 206,250 | |||||||||
UPCB Finance VII Ltd., 3.63%, 06/15/29 (Call 06/15/22)(b) | EUR | 150 | 175,946 | |||||||||
Ziggo Bond Co. BV | EUR | 100 | 114,762 | |||||||||
6.00%, 01/15/27 (Call 01/15/22)(a) | USD | 150 | 157,181 | |||||||||
Ziggo BV | EUR | 100 | 113,046 | |||||||||
4.25%, 01/15/27 (Call 01/15/22)(b) | EUR | 200 | 240,065 | |||||||||
5.50%, 01/15/27 (Call 01/15/22)(a) | USD | 250 | 263,391 | |||||||||
|
| |||||||||||
| 4,775,772 | ||||||||||||
| Norway — 0.1% | ||||||||||||
Aker BP ASA, 4.75%, 06/15/24 | USD | 150 | 156,000 | |||||||||
|
| |||||||||||
| Portugal — 0.4% | ||||||||||||
Banco Comercial Portugues SA, 3.87%, 03/27/30 (Call 03/27/25)(b)(d) | EUR | 100 | 111,251 | |||||||||
Caixa Geral de Depositos SA, 5.75%, 06/28/28 (Call 06/28/23)(b)(d) | EUR | 100 | 125,935 | |||||||||
EDP — Energias de Portugal SA 4.50%, 04/30/79 (Call 01/30/24)(b)(d) | EUR | 200 | 247,645 | |||||||||
5.38%, 09/16/75 (Call 03/16/21)(b)(d) | EUR | 100 | 118,596 | |||||||||
| SCHEDULES OF INVESTMENTS | 43 |
Schedule of Investments (continued) October 31, 2019 | iShares® US & Intl High Yield Corp Bond ETF (Percentages shown are based on Net Assets) |
| Security | Par (000) | Value | ||||||||||
| Portugal (continued) | ||||||||||||
Novo Banco SA, 8.50%, 07/06/28 (Call 07/06/23)(b)(d) | EUR | 100 | $ | 118,710 | ||||||||
|
| |||||||||||
| 722,137 | ||||||||||||
| Singapore — 0.1% | ||||||||||||
Puma International Financing SA, 5.13%, 10/06/24 (Call 10/06/20)(a) | USD | 200 | 196,441 | |||||||||
|
| |||||||||||
| Spain — 1.5% | ||||||||||||
ABANCA Corp. Bancaria SA, 4.63%, 04/07/30(b)(d) | EUR | 100 | 114,816 | |||||||||
Banco de Sabadell SA | EUR | 100 | 111,137 | |||||||||
5.38%, 12/12/28 (Call 12/12/23)(b)(d) | EUR | 100 | 125,418 | |||||||||
5.63%, 05/06/26(b) | EUR | 100 | 132,116 | |||||||||
Bankia SA | EUR | 100 | 112,855 | |||||||||
3.38%, 03/15/27 (Call 03/15/22)(b)(d) | EUR | 100 | 117,687 | |||||||||
3.75%, 02/15/29 (Call 02/15/24)(b)(d) | EUR | 100 | 120,964 | |||||||||
Cellnex Telecom SA | EUR | 100 | 118,182 | |||||||||
2.88%, 04/18/25 (Call 01/18/25)(b) | EUR | 100 | 121,644 | |||||||||
3.13%, 07/27/22(b) | EUR | 100 | 119,707 | |||||||||
Cirsa Finance International Sarl | EUR | 100 | 116,027 | |||||||||
6.25%, 12/20/23 (Call 06/20/20)(b) | EUR | 100 | 118,001 | |||||||||
Codere Finance 2 Luxembourg SA, 6.75%, 11/01/21 (Call 11/29/19)(b) | EUR | 100 | 96,615 | |||||||||
Distribuidora Internacional de Alimentacion SA, 0.88%, 04/06/23 (Call 01/06/23)(b) | EUR | 100 | 48,822 | |||||||||
El Corte Ingles SA, 3.00%, 03/15/24 (Call 10/15/20)(b) | EUR | 100 | 115,963 | |||||||||
Gestamp Funding Luxembourg SA, 3.50%, 05/15/23 (Call 11/11/19)(b) | EUR | 100 | 112,758 | |||||||||
Grifols SA, 3.20%, 05/01/25 (Call 05/01/20)(b) | EUR | 200 | 227,644 | |||||||||
Grupo Isolux Corsan SA | ||||||||||||
Series B, 6.00%, 12/30/21 (Call 12/02/19)(e) | EUR | 28 | 16 | |||||||||
Series C, 0.25%, 12/30/21 (Call 12/02/19)(e) | EUR | 0 | (f) | 0 | (g) | |||||||
Grupo-Antolin Irausa SA, 3.25%, 04/30/24 (Call 04/30/20)(b) | EUR | 100 | 98,138 | |||||||||
NH Hotel Group SA, 3.75%, 10/01/23 (Call 11/11/19)(b) | EUR | 90 | 102,075 | |||||||||
Obrascon Huarte Lain SA, 4.75%, 03/15/22 (Call 12/02/19)(b) | EUR | 100 | 74,410 | |||||||||
Repsol International Finance BV, 4.50%, 03/25/75 (Call 03/25/25)(b)(d) | EUR | 200 | 256,164 | |||||||||
Tasty Bondco 1 SA, 6.25%, 05/15/26 (Call 05/15/22)(b) | EUR | 100 | 115,896 | |||||||||
|
| |||||||||||
| 2,677,055 | ||||||||||||
| Sweden — 0.9% | ||||||||||||
Akelius Residential Property AB, 3.88%, 10/05/78 (Call 07/08/23)(b)(d) | EUR | 100 | 119,210 | |||||||||
Dometic Group AB, 3.00%, 05/08/26 (Call 04/08/26)(b) | EUR | 125 | 142,194 | |||||||||
Fastighets AB Balder, 3.00%, 03/07/78 (Call 03/07/23)(b)(d) | EUR | 100 | 113,706 | |||||||||
Intrum AB | EUR | 50 | 56,406 | |||||||||
3.13%, 07/15/24 (Call 07/15/20)(b) | EUR | 200 | 226,247 | |||||||||
3.50%, 07/15/26 (Call 07/15/22)(b) | EUR | 200 | 223,928 | |||||||||
Telefonaktiebolaget LM Ericsson 4.13%, 05/15/22(c) | USD | 125 | 129,462 | |||||||||
Series 7Y, 1.88%, 03/01/24(b) | EUR | 100 | 117,792 | |||||||||
Verisure Midholding AB, 5.75%, 12/01/23 (Call 12/01/19)(b) | EUR | 200 | 229,861 | |||||||||
| Security | Par (000) | Value | ||||||||||
| Sweden (continued) | ||||||||||||
Volvo Car AB | EUR | 100 | $ | 114,753 | ||||||||
3.25%, 05/18/21(b) | EUR | 100 | 116,424 | |||||||||
|
| |||||||||||
| 1,589,983 | ||||||||||||
| Switzerland — 0.3% | ||||||||||||
Dufry Finance SCA, 4.50%, 08/01/23 (Call 12/02/19)(b) | EUR | 100 | 114,183 | |||||||||
Dufry One BV, 2.50%, 10/15/24 | EUR | 100 | 114,481 | |||||||||
Garrett LX I Sarl/Garrett Borrowing LLC, 5.13%, 10/15/26 (Call 10/15/21)(b) | EUR | 100 | 103,802 | |||||||||
Transocean Inc., 7.50%, 01/15/26 (Call 01/15/21)(a)(c) | USD | 150 | 132,437 | |||||||||
Walnut Bidco PLC, 6.75%, 08/01/24 (Call 08/01/21)(b) | EUR | 100 | 114,488 | |||||||||
|
| |||||||||||
| 579,391 | ||||||||||||
| United Kingdom — 3.9% | ||||||||||||
Algeco Global Finance PLC, 6.50%, 02/15/23 (Call 02/15/20)(b) | EUR | 100 | 111,230 | |||||||||
Ardonagh Midco 3 PLC, 8.38%, 07/15/23 (Call 07/15/20)(b) | GBP | 100 | 120,639 | |||||||||
Arqiva Broadcast Finance PLC, 6.75%, 09/30/23 (Call 09/30/20)(b) | GBP | 100 | 138,620 | |||||||||
Avon International Capital PLC, 6.50%, 08/15/22 (Call 12/02/19)(a) | USD | 50 | 51,875 | |||||||||
Boparan Finance PLC, 4.38%, 07/15/21 (Call 11/12/19)(b) | EUR | 100 | 63,685 | |||||||||
Cabot Financial Luxembourg SA, 7.50%, 10/01/23 (Call 11/11/19)(b) | GBP | 100 | 133,826 | |||||||||
Centrica PLC, 3.00%, 04/10/76 | EUR | 100 | 113,792 | |||||||||
Connect Finco SARL/Connect U.S. Finco LLC, 6.75%, 10/01/26 (Call 10/01/22)(a)(c) | USD | 300 | 310,891 | |||||||||
Co-Operative Group Ltd., 5.13%, 05/17/24 (Call 02/15/24)(b) | GBP | 100 | 136,063 | |||||||||
Drax Finco PLC, 4.25%, 05/01/22 (Call 11/11/19)(b) | GBP | 100 | 131,420 | |||||||||
eG Global Finance PLC | EUR | 100 | 109,234 | |||||||||
4.38%, 02/07/25 (Call 05/15/21)(b) | EUR | 100 | 108,353 | |||||||||
6.25%, 10/30/25 (Call 10/30/21)(b) | EUR | 100 | 115,109 | |||||||||
6.75%, 02/07/25 (Call 05/15/21)(a) | USD | 200 | 200,064 | |||||||||
Fiat Chrysler Automobiles NV | EUR | 200 | 252,316 | |||||||||
5.25%, 04/15/23(c) | USD | 200 | 213,500 | |||||||||
Fiat Chrysler Finance Europe SA, 4.75%, 03/22/21(b) | EUR | 200 | 237,604 | |||||||||
Heathrow Finance PLC, 3.88%, 03/01/27(b) | GBP | 100 | 129,794 | |||||||||
Iceland Bondco PLC, 4.63%, 03/15/25 (Call 09/15/20)(b) | GBP | 100 | 106,039 | |||||||||
IDH Finance PLC, 6.25%, 08/15/22 (Call 12/02/19)(b) | GBP | 100 | 116,783 | |||||||||
INEOS Finance PLC, 2.88%, 05/01/26 (Call 05/01/22)(b) | EUR | 100 | 110,088 | |||||||||
Inmarsat Finance PLC, 4.88%, 05/15/22 (Call 12/02/19)(a) | USD | 200 | 202,534 | |||||||||
International Game Technology PLC | EUR | 100 | 110,780 | |||||||||
6.25%, 01/15/27 (Call 07/15/26)(a) | USD | 200 | 223,747 | |||||||||
International Personal Finance PLC, 5.75%, 04/07/21(b) | EUR | 100 | 104,420 | |||||||||
Jaguar Land Rover Automotive PLC 2.20%, 01/15/24(b) | EUR | 100 | 100,870 | |||||||||
3.88%, 03/01/23(b) | GBP | 100 | 120,665 | |||||||||
4.50%, 01/15/26(b) | EUR | 100 | 105,259 | |||||||||
5.63%, 02/01/23 (Call 12/02/19)(a) | USD | 150 | 149,433 | |||||||||
Jerrold Finco PLC, 6.25%, 09/15/21 (Call 09/15/20)(b) | GBP | 100 | 131,485 | |||||||||
KCA Deutag UK Finance PLC, 9.88%, 04/01/22 (Call 04/01/20)(a)(c) | USD | 200 | 126,463 | |||||||||
Mclaren Finance PLC, 5.00%, 08/01/22 (Call 11/11/19)(b) | GBP | 100 | 123,312 | |||||||||
Merlin Entertainments PLC, 2.75%, 03/15/22 (Call 12/15/21)(b) | EUR | 100 | 117,844 | |||||||||
| 44 | 2019ISHARES ANNUAL REPORTTO SHAREHOLDERS |
Schedule of Investments (continued) October 31, 2019 | iShares® US & Intl High Yield Corp Bond ETF (Percentages shown are based on Net Assets) |
| Security | Par (000) | Value | ||||||||||
| United Kingdom (continued) | ||||||||||||
Nomad Foods Bondco PLC, 3.25%, 05/15/24 (Call 05/15/20)(b) | EUR | 100 | $ | 114,458 | ||||||||
Pinewood Finance Co. Ltd., 3.25%, 09/30/25 (Call 09/30/21)(b) | GBP | 100 | 132,060 | |||||||||
Pinnacle Bidco PLC, 6.38%, 02/15/25 (Call 02/15/21)(b) | GBP | 100 | 137,631 | |||||||||
Pizzaexpress Financing 2 PLC, 6.63%, 08/01/21 (Call 11/11/19)(b) | GBP | 100 | 111,719 | |||||||||
Playtech PLC, 4.25%, 03/07/26 | EUR | 100 | 118,880 | |||||||||
Shop Direct Funding PLC, 7.75%, 11/15/22 (Call 11/29/19)(b) | GBP | 100 | 109,466 | |||||||||
Stonegate Pub Co. Financing PLC, 4.88%, 03/15/22 (Call 11/11/19)(b) | GBP | 100 | 132,058 | |||||||||
Top Gun Realisations 74 PLC, 6.50%, 07/01/22 (Call 11/11/19)(b)(e) | GBP | 25 | 5,783 | |||||||||
Virgin Media Finance PLC, 4.50%, 01/15/25 (Call 01/15/20)(b) | EUR | 100 | 114,544 | |||||||||
Virgin Media Receivables Financing Notes I DAC, 5.50%, 09/15/24 (Call 11/11/19)(b) | GBP | 100 | 132,580 | |||||||||
Virgin Media Secured Finance PLC | GBP | 150 | 195,113 | |||||||||
4.88%, 01/15/27 (Call 01/15/21)(b) | GBP | 100 | 133,871 | |||||||||
5.00%, 04/15/27 (Call 04/15/22)(b) | GBP | 100 | 136,235 | |||||||||
5.25%, 05/15/29 (Call 05/15/24)(b) | GBP | 100 | 138,781 | |||||||||
5.50%, 08/15/26 (Call 08/15/21)(a) | USD | 200 | 211,000 | |||||||||
5.50%, 05/15/29 (Call 05/15/24)(a) | USD | 200 | 212,000 | |||||||||
6.00%, 01/15/25 (Call 01/15/21)(b)(h) | GBP | 100 | 143,000 | |||||||||
|
| |||||||||||
| 6,906,916 | ||||||||||||
| United States — 65.5% | ||||||||||||
Acadia Healthcare Co. Inc., 5.63%, 02/15/23 (Call 12/02/19) | USD | 100 | 101,750 | |||||||||
Acrisure LLC/Acrisure Finance Inc. | USD | 150 | 137,551 | |||||||||
8.13%, 02/15/24 (Call 02/15/21)(a) | USD | 120 | 127,314 | |||||||||
10.13%, 08/01/26 (Call 08/01/22)(a) | USD | 55 | 56,925 | |||||||||
Adient Global Holdings Ltd., 3.50%, 08/15/24 (Call 05/15/24)(b) | EUR | 100 | 93,910 | |||||||||
Adient U.S. LLC, 7.00%, 05/15/26 (Call 05/15/22)(a) | USD | 310 | 325,555 | |||||||||
ADT Security Corp. (The) | USD | 125 | 125,524 | |||||||||
4.13%, 06/15/23(c) | USD | 100 | 101,792 | |||||||||
6.25%, 10/15/21 | USD | 125 | 133,750 | |||||||||
AECOM | USD | 150 | 158,580 | |||||||||
5.88%, 10/15/24 (Call 07/15/24) | USD | 125 | 134,912 | |||||||||
AES Corp./VA | USD | 50 | 50,870 | |||||||||
4.50%, 03/15/23 (Call 03/15/20) | USD | 100 | 102,603 | |||||||||
4.88%, 05/15/23 (Call 12/02/19)(c) | USD | 86 | 87,484 | |||||||||
5.13%, 09/01/27 (Call 09/01/22)(c) | USD | 70 | 75,062 | |||||||||
5.50%, 04/15/25 (Call 04/15/20)(c) | USD | 125 | 130,013 | |||||||||
6.00%, 05/15/26 (Call 05/15/21) | USD | 75 | 80,274 | |||||||||
AK Steel Corp., 7.63%, 10/01/21 (Call 12/02/19) | USD | 75 | 73,562 | |||||||||
Albertsons Companies Inc./Safeway Inc./New | ||||||||||||
Albertsons LP/Albertsons LLC | USD | 150 | 155,580 | |||||||||
5.88%, 02/15/28 (Call 08/15/22)(a) | USD | 125 | 133,832 | |||||||||
6.63%, 06/15/24 (Call 12/02/19) | USD | 200 | 209,750 | |||||||||
7.50%, 03/15/26 (Call 03/15/22)(a) | USD | 105 | 117,203 | |||||||||
| Security | Par (000) | Value | ||||||||||
| United States (continued) | ||||||||||||
Alcoa Nederland Holding BV | USD | 200 | $ | 210,800 | ||||||||
7.00%, 09/30/26 (Call 09/30/21)(a)(c) | USD | 200 | 217,533 | |||||||||
Allegheny Technologies Inc. | USD | 50 | 51,424 | |||||||||
7.88%, 08/15/23 (Call 05/15/23) | USD | 75 | 81,866 | |||||||||
Allied Universal Holdco LLC/Allied Universal Finance Corp. | USD | 140 | 149,021 | |||||||||
9.75%, 07/15/27 (Call 07/15/22)(a) | USD | 165 | 173,886 | |||||||||
Allison Transmission Inc. | USD | 50 | 51,181 | |||||||||
5.00%, 10/01/24 (Call 11/12/19)(a) | USD | 225 | 230,501 | |||||||||
5.88%, 06/01/29 (Call 06/01/24)(a) | USD | 70 | 75,403 | |||||||||
Ally Financial Inc. | USD | 150 | 165,112 | |||||||||
5.75%, 11/20/25 (Call 10/21/25) | USD | 150 | 167,250 | |||||||||
AMC Entertainment Holdings Inc. | USD | 75 | 71,337 | |||||||||
5.88%, 11/15/26 (Call 11/15/21) | USD | 75 | 68,344 | |||||||||
6.13%, 05/15/27 (Call 05/15/22)(c) | USD | 75 | 67,828 | |||||||||
6.38%, 11/15/24 (Call 11/29/19) | GBP | 100 | 123,939 | |||||||||
AMC Networks Inc. | USD | 125 | 126,108 | |||||||||
4.75%, 08/01/25 (Call 08/01/21)(c) | USD | 100 | 101,000 | |||||||||
5.00%, 04/01/24 (Call 04/01/20) | USD | 125 | 127,108 | |||||||||
American Airlines Group Inc., 5.00%, 06/01/22(a) | USD | 45 | 46,976 | |||||||||
American Axle & Manufacturing Inc. | USD | 110 | 106,287 | |||||||||
6.25%, 03/15/26 (Call 03/15/21) | USD | 70 | 66,593 | |||||||||
6.50%, 04/01/27 (Call 04/01/22) | USD | 75 | 71,156 | |||||||||
6.63%, 10/15/22 (Call 12/02/19) | USD | 50 | 50,409 | |||||||||
American Builders & Contractors Supply Co. Inc., 4.00%, 01/15/28 (Call 01/15/23)(a) | USD | 170 | 169,787 | |||||||||
AmeriGas Partners LP/AmeriGas Finance Corp. | USD | 125 | 134,387 | |||||||||
5.63%, 05/20/24 (Call 03/20/24) | USD | 100 | 108,198 | |||||||||
5.75%, 05/20/27 (Call 02/20/27) | USD | 75 | 82,263 | |||||||||
5.88%, 08/20/26 (Call 05/20/26) | USD | 75 | 83,306 | |||||||||
Anixter Inc., 5.13%, 10/01/21 | USD | 75 | 77,483 | |||||||||
Antero Midstream Partners LP/Antero Midstream Finance Corp. | ||||||||||||
5.38%, 09/15/24 (Call 11/15/19) | USD | 125 | 101,927 | |||||||||
5.75%, 03/01/27 (Call 03/01/22)(a)(c) | USD | 110 | 82,225 | |||||||||
5.75%, 01/15/28 (Call 01/15/23)(a) | USD | 100 | 73,500 | |||||||||
Antero Resources Corp. | USD | 75 | 49,688 | |||||||||
5.13%, 12/01/22 (Call 12/02/19) | USD | 150 | 112,687 | |||||||||
5.38%, 11/01/21 (Call 12/02/19) | USD | 125 | 111,562 | |||||||||
5.63%, 06/01/23 (Call 12/02/19)(c) | USD | 125 | 88,648 | |||||||||
APX Group Inc. | USD | 50 | 44,016 | |||||||||
7.88%, 12/01/22 (Call 12/02/19) | USD | 125 | 124,844 | |||||||||
8.75%, 12/01/20 (Call 12/02/19) | USD | 67 | 66,006 | |||||||||
Aramark International Finance Sarl, 3.13%, 04/01/25 (Call 04/01/20)(b) | EUR | 100 | 114,537 | |||||||||
Aramark Services Inc. | USD | 50 | 51,396 | |||||||||
5.00%, 04/01/25 (Call 04/01/20)(a) | USD | 75 | 78,094 | |||||||||
5.00%, 02/01/28 (Call 02/01/23)(a) | USD | 200 | 209,000 | |||||||||
| SCHEDULES OF INVESTMENTS | 45 |
Schedule of Investments (continued) October 31, 2019 | iShares® US & Intl High Yield Corp Bond ETF (Percentages shown are based on Net Assets) |
| Security | Par (000) | Value | ||||||||||
| United States (continued) | ||||||||||||
5.13%, 01/15/24 (Call 12/02/19) | USD | 125 | $ | 128,876 | ||||||||
Arconic Inc. | USD | 150 | 160,875 | |||||||||
5.40%, 04/15/21 (Call 01/15/21) | USD | 175 | 180,290 | |||||||||
5.87%, 02/23/22 | USD | 100 | 106,660 | |||||||||
Ascent Resources Utica Holdings LLC/ARU Finance Corp. | USD | 100 | 75,500 | |||||||||
10.00%, 04/01/22 (Call 04/01/20)(a) | USD | 150 | 141,750 | |||||||||
Ashland LLC, 4.75%, 08/15/22 (Call 05/15/22) | USD | 125 | 130,937 | |||||||||
Avantor Inc. | EUR | 100 | 118,381 | |||||||||
6.00%, 10/01/24 (Call 10/01/20)(a) | USD | 250 | 267,220 | |||||||||
9.00%, 10/01/25 (Call 10/01/20)(a) | USD | 275 | 307,557 | |||||||||
Avis Budget Car Rental LLC/Avis Budget Finance Inc., 5.75%, 07/15/27 | USD | 55 | 56,469 | |||||||||
Avis Budget Finance PLC, 4.75%, 01/30/26 | EUR | 100 | 115,121 | |||||||||
Avon International Operations Inc., 7.88%, 08/15/22 (Call 12/02/19)(a) | USD | 100 | 104,174 | |||||||||
Avon Products Inc., 7.00%, 03/15/23 | USD | 50 | 52,625 | |||||||||
Axalta Coating Systems Dutch Holding B BV, 3.75%, 01/15/25 (Call 01/15/20)(b) | EUR | 125 | 143,139 | |||||||||
B&G Foods Inc. | USD | 125 | 127,424 | |||||||||
5.25%, 09/15/27 (Call 03/01/22) | USD | 90 | 89,775 | |||||||||
Ball Corp. | EUR | 100 | 115,385 | |||||||||
4.00%, 11/15/23 | USD | 125 | 130,898 | |||||||||
4.38%, 12/15/20 | USD | 125 | 127,422 | |||||||||
4.38%, 12/15/23 | EUR | 100 | 129,111 | |||||||||
4.88%, 03/15/26 (Call 12/15/25)(c) | USD | 150 | 162,937 | |||||||||
5.00%, 03/15/22 | USD | 100 | 105,750 | |||||||||
5.25%, 07/01/25 | USD | 175 | 194,687 | |||||||||
Banff Merger Sub Inc., 9.75%, 09/01/26 (Call 09/01/21)(a) | USD | 200 | 187,250 | |||||||||
Bausch Health Americas Inc. | USD | 290 | 326,387 | |||||||||
9.25%, 04/01/26 (Call 04/01/22)(a) | USD | 200 | 227,168 | |||||||||
Bausch Health Companies Inc. | EUR | 225 | 253,313 | |||||||||
5.50%, 03/01/23 (Call 12/02/19)(a) | USD | 52 | 52,534 | |||||||||
5.50%, 11/01/25 (Call 11/01/20)(a) | USD | 225 | 235,091 | |||||||||
5.75%, 08/15/27 (Call 08/15/22)(a) | USD | 65 | 70,708 | |||||||||
5.88%, 05/15/23 (Call 12/02/19)(a) | USD | 234 | 237,510 | |||||||||
6.13%, 04/15/25 (Call 04/15/20)(a) | USD | 500 | 520,625 | |||||||||
6.50%, 03/15/22 (Call 12/02/19)(a) | USD | 150 | 154,125 | |||||||||
7.00%, 03/15/24 (Call 03/15/20)(a) | USD | 350 | 366,599 | |||||||||
7.00%, 01/15/28 (Call 01/15/23)(a)(c) | USD | 110 | 118,911 | |||||||||
7.25%, 05/30/29 (Call 05/30/24)(a)(c) | USD | 95 | 104,791 | |||||||||
9.00%, 12/15/25 (Call 12/15/21)(a) | USD | 300 | 337,560 | |||||||||
BBA U.S. Holdings Inc., 4.00%, 03/01/28 (Call 03/01/23)(a) | USD | 65 | 64,513 | |||||||||
Beacon Roofing Supply Inc., 4.88%, 11/01/25 (Call 11/01/20)(a)(c) | USD | 175 | 172,594 | |||||||||
Belden Inc., 3.88%, 03/15/28 (Call 03/15/23)(b) | EUR | 150 | 174,066 | |||||||||
Berry Global Inc. | USD | 65 | 65,203 | |||||||||
4.88%, 07/15/26 (Call 07/15/22)(a) | USD | 210 | 220,834 | |||||||||
5.13%, 07/15/23 (Call 12/02/19) | USD | 100 | 102,500 | |||||||||
5.50%, 05/15/22 (Call 12/02/19) | USD | 50 | 50,804 | |||||||||
5.63%, 07/15/27 (Call 07/15/22)(a) | USD | 65 | 68,849 | |||||||||
| Security | Par (000) | Value | ||||||||||
| United States (continued) | ||||||||||||
6.00%, 10/15/22 (Call 12/02/19) | USD | 65 | $ | 66,171 | ||||||||
Blue Cube Spinco LLC | USD | 100 | 109,314 | |||||||||
10.00%, 10/15/25 (Call 10/15/20) | USD | 100 | 111,875 | |||||||||
Blue Racer Midstream LLC/Blue Racer Finance Corp., 6.13%, 11/15/22 (Call 12/02/19)(a) | USD | 125 | 122,875 | |||||||||
Boyd Gaming Corp. | USD | 100 | 106,192 | |||||||||
6.38%, 04/01/26 (Call 04/01/21) | USD | 100 | 106,368 | |||||||||
6.88%, 05/15/23 (Call 11/15/19) | USD | 100 | 103,625 | |||||||||
Brand Industrial Services Inc., 8.50%, 07/15/25 | USD | 150 | 145,687 | |||||||||
Brookfield Property REIT Inc./BPR Cumulus LLC/BPR Nimbus LLC/GGSI Sellco LL, 5.75%, 05/15/26 (Call 05/15/22)(a) | USD | 170 | 177,650 | |||||||||
Buckeye Partners LP, 6.38%, 01/22/78 (Call 01/22/23)(d) | USD | 50 | 36,448 | |||||||||
Builders FirstSource Inc., 6.75%, 06/01/27 (Call 06/01/22)(a) | USD | 100 | 108,762 | |||||||||
Cablevision Systems Corp., 5.88%, 09/15/22 | USD | 100 | 107,841 | |||||||||
Caesars Resort Collection LLC/CRC Finco Inc., 5.25%, 10/15/25 (Call 10/15/20)(a)(c) | USD | 225 | 230,625 | |||||||||
California Resources Corp., 8.00%, 12/15/22 (Call 12/02/19)(a)(c) | USD | 325 | 98,312 | |||||||||
Callon Petroleum Co. | USD | 75 | 71,259 | |||||||||
6.38%, 07/01/26 (Call 07/01/21)(c) | USD | 50 | 46,125 | |||||||||
Calpine Corp. | USD | 200 | 207,484 | |||||||||
5.38%, 01/15/23 (Call 12/02/19) | USD | 200 | 202,698 | |||||||||
5.50%, 02/01/24 (Call 12/02/19)(c) | USD | 100 | 101,187 | |||||||||
5.75%, 01/15/25 (Call 12/02/19) | USD | 225 | 231,187 | |||||||||
5.88%, 01/15/24 (Call 12/02/19)(a) | USD | 75 | 76,571 | |||||||||
6.00%, 01/15/22 (Call 12/02/19)(a) | USD | 100 | 100,190 | |||||||||
Calumet Specialty Products Partners LP/Calumet Finance Corp., 11.00%, 04/15/25 | USD | 70 | 69,825 | |||||||||
Catalent Pharma Solutions Inc., 4.75%, 12/15/24 (Call 12/15/19)(b) | EUR | 100 | 114,584 | |||||||||
CBL & Associates LP | USD | 75 | 52,515 | |||||||||
5.95%, 12/15/26 (Call 09/15/26)(c) | USD | 100 | 66,785 | |||||||||
CCO Holdings LLC/CCO Holdings Capital Corp. | USD | 100 | 101,750 | |||||||||
4.75%, 03/01/30 (Call 09/01/24)(a) | USD | 100 | 101,886 | |||||||||
5.00%, 02/01/28 (Call 08/01/22)(a) | USD | 375 | 392,166 | |||||||||
5.13%, 02/15/23 (Call 12/02/19) | USD | 200 | 203,536 | |||||||||
5.13%, 05/01/23 (Call 12/02/19)(a) | USD | 150 | 153,544 | |||||||||
5.13%, 05/01/27 (Call 05/01/22)(a) | USD | 525 | 553,219 | |||||||||
5.25%, 09/30/22 (Call 12/02/19) | USD | 150 | 151,875 | |||||||||
5.38%, 05/01/25 (Call 05/01/20)(a) | USD | 150 | 155,692 | |||||||||
5.38%, 06/01/29 (Call 06/01/24)(a) | USD | 225 | 239,906 | |||||||||
5.50%, 05/01/26 (Call 05/01/21)(a) | USD | 250 | 263,750 | |||||||||
5.75%, 09/01/23 (Call 12/02/19) | USD | 75 | 76,557 | |||||||||
5.75%, 02/15/26 (Call 02/15/21)(a) | USD | 375 | 396,620 | |||||||||
5.88%, 04/01/24 (Call 12/02/19)(a) | USD | 275 | 286,687 | |||||||||
5.88%, 05/01/27 (Call 05/01/21)(a) | USD | 100 | 106,107 | |||||||||
CDK Global Inc. | USD | 75 | 78,789 | |||||||||
5.00%, 10/15/24 (Call 07/15/24) | USD | 75 | 81,113 | |||||||||
5.25%, 05/15/29 (Call 05/15/24)(a) | USD | 50 | 53,063 | |||||||||
5.88%, 06/15/26 (Call 06/15/21) | USD | 100 | 107,036 | |||||||||
| 46 | 2019ISHARES ANNUAL REPORTTO SHAREHOLDERS |
Schedule of Investments (continued) October 31, 2019 | iShares® US & Intl High Yield Corp Bond ETF (Percentages shown are based on Net Assets) |
| Security | Par (000) | Value | ||||||||||
| United States (continued) | ||||||||||||
CDW LLC/CDW Finance Corp. | USD | 70 | $ | 72,534 | ||||||||
5.00%, 09/01/25 (Call 03/01/20)(c) | USD | 75 | 78,370 | |||||||||
5.50%, 12/01/24 (Call 06/01/24) | USD | 100 | 111,299 | |||||||||
Cedar Fair LP, 5.25%, 07/15/29 | USD | 70 | 74,927 | |||||||||
Centene Corp. | USD | 125 | 127,909 | |||||||||
4.75%, 01/15/25 (Call 01/15/20)(c) | USD | 250 | 258,668 | |||||||||
5.38%, 06/01/26 (Call 06/01/21)(a) | USD | 275 | 290,692 | |||||||||
6.13%, 02/15/24 (Call 12/02/19) | USD | 150 | 156,234 | |||||||||
CenturyLink Inc. | USD | 75 | 79,150 | |||||||||
Series S, 6.45%, 06/15/21 | USD | 200 | 210,500 | |||||||||
Series T, 5.80%, 03/15/22 | USD | 175 | 184,848 | |||||||||
Series W, 6.75%, 12/01/23 | USD | 100 | 111,385 | |||||||||
Series Y, 7.50%, 04/01/24 (Call 01/01/24) | USD | 150 | 170,250 | |||||||||
CF Industries Inc., 3.45%, 06/01/23 | USD | 150 | 153,109 | |||||||||
Change Healthcare Holdings LLC/Change Healthcare Finance Inc., 5.75%, 03/01/25 (Call 03/01/20)(a) | USD | 190 | 194,408 | |||||||||
Charles River Laboratories International Inc., 4.25%, 05/01/28 (Call 05/01/23)(a) | USD | 80 | 81,500 | |||||||||
Chemours Co. (The) | EUR | 100 | 100,489 | |||||||||
5.38%, 05/15/27 (Call 02/15/27) | USD | 75 | 66,477 | |||||||||
6.63%, 05/15/23 (Call 12/02/19) | USD | 125 | 124,415 | |||||||||
7.00%, 05/15/25 (Call 05/15/20)(c) | USD | 125 | 120,208 | |||||||||
Cheniere Corpus Christi Holdings LLC, 5.13%, 06/30/27 (Call 01/01/27) | USD | 100 | 107,842 | |||||||||
Cheniere Energy Partners LP | USD | 170 | 172,938 | |||||||||
5.25%, 10/01/25 (Call 10/01/20) | USD | 261 | 270,706 | |||||||||
5.63%, 10/01/26 (Call 10/01/21) | USD | 155 | 163,719 | |||||||||
Chesapeake Energy Corp. | USD | 135 | 91,062 | |||||||||
7.50%, 10/01/26 (Call 10/01/21) | USD | 50 | 30,961 | |||||||||
8.00%, 03/15/26 (Call 03/15/22)(a) | USD | 156 | 97,792 | |||||||||
CHS/Community Health Systems Inc. | USD | 125 | 124,687 | |||||||||
6.25%, 03/31/23 (Call 03/31/20) | USD | 475 | 463,549 | |||||||||
6.88%, 02/01/22 (Call 12/02/19) | USD | 375 | 286,676 | |||||||||
8.00%, 03/15/26 (Call 03/15/22)(a) | USD | 275 | 268,469 | |||||||||
8.13%, 06/30/24 (Call 06/30/21)(a)(c) | USD | 225 | 172,103 | |||||||||
8.63%, 01/15/24 (Call 01/15/21)(a)(c) | USD | 150 | 152,873 | |||||||||
9.88%, 06/30/23 (Call 06/30/20)(a)(h) | USD | 250 | 208,687 | |||||||||
Churchill Downs Inc. | USD | 50 | 51,688 | |||||||||
5.50%, 04/01/27 (Call 04/01/22)(a) | USD | 100 | 106,125 | |||||||||
Cincinnati Bell Inc., 7.00%, 07/15/24 | USD | 100 | 90,177 | |||||||||
Cinemark USA Inc. | USD | 125 | 126,875 | |||||||||
5.13%, 12/15/22 (Call 12/02/19) | USD | 50 | 50,661 | |||||||||
CIT Bank N.A., 2.97%, 09/27/25 | USD | 50 | 50,444 | |||||||||
CIT Group Inc. | USD | 75 | 76,688 | |||||||||
4.75%, 02/16/24 (Call 11/16/23) | USD | 100 | 106,807 | |||||||||
5.00%, 08/15/22 | USD | 150 | 159,592 | |||||||||
5.00%, 08/01/23 | USD | 100 | 107,866 | |||||||||
5.25%, 03/07/25 (Call 12/07/24) | USD | 75 | 82,540 | |||||||||
6.13%, 03/09/28 | USD | 50 | 59,000 | |||||||||
Citgo Holding Inc., 9.25%, 08/01/24 | USD | 190 | 198,402 | |||||||||
| Security | Par (000) | Value | ||||||||||
| United States (continued) | ||||||||||||
Clear Channel Worldwide Holdings Inc. | USD | 200 | $ | 208,436 | ||||||||
9.25%, 02/15/24 (Call 02/15/21)(a)(c) | USD | 294 | 323,334 | |||||||||
Clearway Energy Operating LLC | USD | 75 | 76,219 | |||||||||
5.75%, 10/15/25 (Call 10/15/21) | USD | 110 | 112,469 | |||||||||
Cleveland-Cliffs Inc. | USD | 50 | 51,612 | |||||||||
5.75%, 03/01/25 (Call 03/01/20)(c) | USD | 126 | 124,795 | |||||||||
5.88%, 06/01/27 (Call 06/01/22)(a) | USD | 125 | 119,109 | |||||||||
CNX Resources Corp. | USD | 115 | 112,739 | |||||||||
7.25%, 03/14/27 (Call 03/14/22)(a) | USD | 75 | 60,375 | |||||||||
Colfax Corp. | EUR | 100 | 114,153 | |||||||||
6.00%, 02/15/24 (Call 02/15/21)(a) | USD | 80 | 85,111 | |||||||||
6.38%, 02/15/26 (Call 02/15/22)(a) | USD | 65 | 70,363 | |||||||||
CommScope Inc. | USD | 160 | 162,560 | |||||||||
5.50%, 06/15/24 (Call 11/12/19)(a)(c) | USD | 85 | 80,431 | |||||||||
6.00%, 03/01/26 (Call 03/01/22)(a) | USD | 255 | 261,778 | |||||||||
8.25%, 03/01/27 (Call 03/01/22)(a)(c) | USD | 155 | 145,963 | |||||||||
CommScope Technologies LLC | USD | 100 | 81,531 | |||||||||
6.00%, 06/15/25 (Call 06/15/20)(a) | USD | 250 | 221,798 | |||||||||
Coty Inc., 4.75%, 04/15/26 (Call 04/15/21)(b) | EUR | 100 | 113,954 | |||||||||
Covanta Holding Corp. | USD | 50 | 51,500 | |||||||||
5.88%, 07/01/25 (Call 07/01/20) | USD | 50 | 52,159 | |||||||||
6.00%, 01/01/27 (Call 01/01/22) | USD | 50 | 52,563 | |||||||||
Crestwood Midstream Partners LP/Crestwood Midstream Finance Corp. | ||||||||||||
5.63%, 05/01/27 (Call 05/01/22)(a) | USD | 110 | 110,977 | |||||||||
5.75%, 04/01/25 (Call 04/01/20) | USD | 75 | 77,625 | |||||||||
6.25%, 04/01/23 (Call 11/15/19) | USD | 100 | 101,970 | |||||||||
Crown Americas LLC/Crown Americas Capital Corp. IV, 4.50%, 01/15/23 | USD | 175 | 183,201 | |||||||||
Crown Americas LLC/Crown Americas Capital Corp. V, 4.25%, 09/30/26 (Call 03/31/26) | USD | 50 | 52,150 | |||||||||
Crown Americas LLC/Crown Americas Capital Corp. VI, 4.75%, 02/01/26 (Call 02/01/21) | USD | 100 | 104,867 | |||||||||
Crown European Holdings SA | EUR | 100 | 111,327 | |||||||||
2.25%, 02/01/23 (Call 11/01/22)(b) | EUR | 100 | 116,513 | |||||||||
2.88%, 02/01/26 (Call 08/01/25)(b) | EUR | 100 | 119,474 | |||||||||
3.38%, 05/15/25 (Call 11/15/24)(b) | EUR | 100 | 122,691 | |||||||||
4.00%, 07/15/22 (Call 04/15/22)(b) | EUR | 100 | 121,051 | |||||||||
CrownRock LP/CrownRock Finance Inc., 5.63%, 10/15/25 (Call 10/15/20)(a) | USD | 150 | 145,906 | |||||||||
CSC Holdings LLC | USD | 125 | 134,835 | |||||||||
5.38%, 07/15/23 (Call 11/12/19)(a) | USD | 200 | 205,246 | |||||||||
5.38%, 02/01/28 (Call 02/01/23)(a) | USD | 200 | 211,564 | |||||||||
5.50%, 05/15/26 (Call 05/15/21)(a) | USD | 200 | 211,244 | |||||||||
5.50%, 04/15/27 (Call 04/15/22)(a) | USD | 200 | 212,596 | |||||||||
5.75%, 01/15/30 (Call 01/15/25)(a) | USD | 400 | 420,512 | |||||||||
6.50%, 02/01/29 (Call 02/01/24)(a) | USD | 200 | 223,875 | |||||||||
6.63%, 10/15/25 (Call 10/15/20)(a) | USD | 200 | 213,000 | |||||||||
6.75%, 11/15/21(a) | USD | 150 | 161,625 | |||||||||
7.50%, 04/01/28 (Call 04/01/23)(a) | USD | 200 | 225,750 | |||||||||
| SCHEDULES OF INVESTMENTS | 47 |
Schedule of Investments (continued) October 31, 2019 | iShares® US & Intl High Yield Corp Bond ETF (Percentages shown are based on Net Assets) |
| Security | Par (000) | Value | ||||||||||
| United States (continued) | ||||||||||||
10.88%, 10/15/25 (Call 10/15/20)(a) | USD | 225 | $ | 253,903 | ||||||||
Dana Financing Luxembourg Sarl, | USD | 75 | 77,424 | |||||||||
Dana Inc., 5.50%, 12/15/24 (Call 12/15/19)(c) | USD | 75 | 77,180 | |||||||||
Darling Global Finance BV, | EUR | 100 | 117,499 | |||||||||
DaVita Inc. | ||||||||||||
5.00%, 05/01/25 (Call 05/01/20)(c) | USD | 200 | 202,540 | |||||||||
5.13%, 07/15/24 (Call 11/15/19) | USD | 275 | 281,122 | |||||||||
DCP Midstream Operating LP | ||||||||||||
3.88%, 03/15/23 (Call 12/15/22) | USD | 75 | 75,879 | |||||||||
4.75%, 09/30/21 (Call 06/30/21)(a) | USD | 75 | 76,690 | |||||||||
5.13%, 05/15/29 (Call 02/15/29) | USD | 110 | 111,600 | |||||||||
5.38%, 07/15/25 (Call 04/15/25) | USD | 150 | 157,519 | |||||||||
5.85%, 05/21/43 (Call 05/21/23)(a)(d) | USD | 75 | 67,696 | |||||||||
Dell Inc., 4.63%, 04/01/21 | USD | 50 | 51,400 | |||||||||
Dell International LLC/EMC Corp. | USD | 132 | 134,179 | |||||||||
5.88%, 06/15/21 (Call 11/15/19)(a) | ||||||||||||
7.13%, 06/15/24 (Call 11/15/19)(a) | USD | 225 | 238,055 | |||||||||
Denbury Resources Inc. | ||||||||||||
7.75%, 02/15/24 (Call 08/15/20)(a) | USD | 50 | 36,750 | |||||||||
9.00%, 05/15/21 (Call 12/02/19)(a) | USD | 75 | 64,453 | |||||||||
9.25%, 03/31/22 (Call 12/02/19)(a) | USD | 75 | 61,500 | |||||||||
Diamond Offshore Drilling Inc., 7.88%, 08/15/25 (Call 05/15/25) | USD | 75 | 59,953 | |||||||||
Diamond Resorts International Inc. | ||||||||||||
7.75%, 09/01/23 (Call 12/02/19)(a)(c) | USD | 75 | 77,609 | |||||||||
10.75%, 09/01/24 (Call 12/02/19)(a) | USD | 100 | 103,594 | |||||||||
Diamond Sports Group LLC/Diamond Sports Finance Co. | ||||||||||||
5.38%, 08/15/26 (Call 08/15/22)(a) | USD | 455 | 475,475 | |||||||||
6.63%, 08/15/27 (Call 08/15/22)(a)(c) | USD | 265 | 273,281 | |||||||||
Diamondback Energy Inc. | ||||||||||||
4.75%, 11/01/24 (Call 12/02/19)(c) | USD | 100 | 103,375 | |||||||||
5.38%, 05/31/25 (Call 05/31/20) | USD | 160 | 167,200 | |||||||||
DISH DBS Corp. | ||||||||||||
5.00%, 03/15/23 | USD | 250 | 250,469 | |||||||||
5.88%, 07/15/22(c) | USD | 325 | 339,685 | |||||||||
5.88%, 11/15/24 | USD | 300 | 300,288 | |||||||||
6.75%, 06/01/21 | USD | 250 | 262,812 | |||||||||
7.75%, 07/01/26 | USD | 300 | 303,405 | |||||||||
Dun & Bradstreet Corp./The | ||||||||||||
6.88%, 08/15/26 (Call 02/15/22)(a) | USD | 100 | 109,405 | |||||||||
10.25%, 02/15/27 (Call 02/15/22)(a) | USD | 105 | 115,131 | |||||||||
Edgewell Personal Care Co. | ||||||||||||
4.70%, 05/19/21 | USD | 75 | 76,977 | |||||||||
4.70%, 05/24/22(c) | USD | 75 | 77,625 | |||||||||
Elanco Animal Health Inc. | ||||||||||||
3.91%, 08/27/21 | USD | 50 | 51,310 | |||||||||
4.27%, 08/28/23 (Call 07/28/23) | USD | 100 | 104,687 | |||||||||
4.90%, 08/28/28 (Call 05/28/28) | USD | 100 | 108,685 | |||||||||
Eldorado Resorts Inc. | ||||||||||||
6.00%, 04/01/25 (Call 04/01/20) | USD | 100 | 105,375 | |||||||||
6.00%, 09/15/26 (Call 09/15/21) | USD | 90 | 98,744 | |||||||||
EMC Corp., 3.38%, 06/01/23 (Call 03/01/23) | USD | 175 | 176,524 | |||||||||
Encompass Health Corp. | ||||||||||||
4.50%, 02/01/28 (Call 02/01/23) | USD | 80 | 81,764 | |||||||||
4.75%, 02/01/30 (Call 02/01/25) | USD | 75 | 77,163 | |||||||||
5.75%, 11/01/24 (Call 12/02/19) | USD | 137 | 138,709 | |||||||||
| Security | Par (000) | Value | ||||||||||
| United States (continued) | ||||||||||||
Endeavor Energy Resources LP/EER Finance Inc. 5.50%, 01/30/26 (Call 01/30/21)(a) | USD | 50 | $ | 51,617 | ||||||||
5.75%, 01/30/28 (Call 01/30/23)(a) | USD | 75 | 79,223 | |||||||||
Endo Dac/Endo Finance LLC/Endo Finco Inc. | ||||||||||||
6.00%, 07/15/23 (Call 12/02/19)(a)(c) | USD | 200 | 132,000 | |||||||||
6.00%, 02/01/25 (Call 02/01/20)(a)(c) | USD | 200 | 124,125 | |||||||||
Energizer Gamma Acquisition BV, 4.63%, 07/15/26 (Call 07/15/21)(b) | EUR | 100 | 117,410 | |||||||||
Energizer Holdings Inc. | ||||||||||||
5.50%, 06/15/25 (Call 06/15/20)(a) | USD | 75 | 77,813 | |||||||||
6.38%, 07/15/26 (Call 07/15/21)(a)(c) | USD | 115 | 122,512 | |||||||||
7.75%, 01/15/27 (Call 01/15/22)(a)(c) | USD | 65 | 71,917 | |||||||||
EnLink Midstream Partners LP | ||||||||||||
4.15%, 06/01/25 (Call 03/01/25)(c) | USD | 100 | 90,612 | |||||||||
4.40%, 04/01/24 (Call 01/01/24) | USD | 75 | 70,515 | |||||||||
4.85%, 07/15/26 (Call 04/15/26) | USD | 100 | 91,426 | |||||||||
Envision Healthcare Corp., | USD | 175 | 100,625 | |||||||||
Equinix Inc. | ||||||||||||
2.88%, 03/15/24 (Call 09/15/20) | EUR | 100 | 115,362 | |||||||||
2.88%, 10/01/25 (Call 10/01/20) | EUR | 150 | 172,870 | |||||||||
2.88%, 02/01/26 (Call 02/01/21) | EUR | 200 | 231,891 | |||||||||
ESH Hospitality Inc. | ||||||||||||
4.63%, 10/01/27 (Call 10/01/22)(a) | USD | 125 | 125,680 | |||||||||
5.25%, 05/01/25 (Call 05/01/20)(a) | USD | 175 | 180,730 | |||||||||
Exela Intermediate LLC/Exela Finance Inc., | USD | 150 | 71,156 | |||||||||
Extraction Oil & Gas Inc. | ||||||||||||
5.63%, 02/01/26 (Call 02/01/21)(a) | USD | 100 | 42,500 | |||||||||
7.38%, 05/15/24 (Call 05/15/20)(a) | USD | 100 | 42,248 | |||||||||
Ferrellgas LP/Ferrellgas Finance Corp. | ||||||||||||
6.50%, 05/01/21 (Call 12/02/19)(c) | USD | 75 | 63,449 | |||||||||
6.75%, 01/15/22 (Call 12/02/19)(c) | USD | 100 | 84,344 | |||||||||
6.75%, 06/15/23 (Call 11/15/19)(c) | USD | 75 | 63,375 | |||||||||
Fifth Third Bancorp., | USD | 75 | 76,159 | |||||||||
Flex Acquisition Co. Inc. | ||||||||||||
6.88%, 01/15/25 (Call 01/15/20)(a)(c) | USD | 75 | 70,866 | |||||||||
7.88%, 07/15/26 (Call 07/15/21)(a)(c) | USD | 75 | 70,906 | |||||||||
Fortress Transportation & Infrastructure Investors LLC | ||||||||||||
6.50%, 10/01/25 (Call 10/01/21)(a) | USD | 100 | 101,750 | |||||||||
6.75%, 03/15/22 (Call 03/15/20)(a) | USD | 100 | 104,125 | |||||||||
Foxtrot Escrow Issuer LLC/Foxtrot Escrow Corp., | ||||||||||||
12.25%, 11/15/26 (Call 11/15/22)(a) | USD | 65 | 65,332 | |||||||||
Freedom Mortgage Corp. | ||||||||||||
8.13%, 11/15/24 (Call 11/15/20)(a) | USD | 75 | 70,613 | |||||||||
8.25%, 04/15/25 (Call 04/15/21)(a) | USD | 100 | 94,250 | |||||||||
Freeport-McMoRan Inc. | ||||||||||||
3.55%, 03/01/22 (Call 12/01/21) | USD | 248 | 249,525 | |||||||||
3.88%, 03/15/23 (Call 12/15/22) | USD | 350 | 355,931 | |||||||||
4.55%, 11/14/24 (Call 08/14/24)(c) | USD | 125 | 129,687 | |||||||||
5.00%, 09/01/27 (Call 09/01/22) | USD | 105 | 107,001 | |||||||||
5.25%, 09/01/29 (Call 09/01/24) | USD | 85 | 86,407 | |||||||||
Frontier Communications Corp. | ||||||||||||
6.88%, 01/15/25 (Call 10/15/24) | USD | 100 | 44,760 | |||||||||
7.13%, 01/15/23 | USD | 125 | 56,469 | |||||||||
7.63%, 04/15/24(c) | USD | 100 | 45,490 | |||||||||
8.00%, 04/01/27 (Call 04/01/22)(a) | USD | 285 | 299,250 | |||||||||
8.50%, 04/01/26 (Call 04/01/21)(a) | USD | 275 | 276,031 | |||||||||
8.75%, 04/15/22 | USD | 75 | 35,016 | |||||||||
10.50%, 09/15/22 (Call 06/15/22) | USD | 350 | 165,566 | |||||||||
| 48 | 2019ISHARES ANNUAL REPORTTO SHAREHOLDERS |
Schedule of Investments (continued) October 31, 2019 | iShares® US��& Intl High Yield Corp Bond ETF (Percentages shown are based on Net Assets) |
| Security | Par (000) | Value | ||||||||||
| United States (continued) | ||||||||||||
11.00%, 09/15/25 (Call 06/15/25) | USD | 525 | $ | 245,723 | ||||||||
Genesis Energy LP/Genesis Energy Finance Corp. | ||||||||||||
6.00%, 05/15/23 (Call 12/02/19) | USD | 50 | 48,768 | |||||||||
6.25%, 05/15/26 (Call 02/15/21) | USD | 50 | 46,250 | |||||||||
6.50%, 10/01/25 (Call 10/01/20) | USD | 100 | 95,000 | |||||||||
6.75%, 08/01/22 (Call 12/02/19) | USD | 150 | 151,297 | |||||||||
Genworth Holdings Inc., 7.63%, 09/24/21 | USD | 100 | 103,521 | |||||||||
Global Partners LP/GLP Finance Corp., 7.00%, 08/01/27 (Call 08/01/22)(a) | USD | 50 | 52,240 | |||||||||
Golden Nugget Inc. | ||||||||||||
6.75%, 10/15/24 (Call 12/02/19)(a) | USD | 175 | 180,705 | |||||||||
8.75%, 10/01/25 (Call 10/01/20)(a) | USD | 125 | 131,719 | |||||||||
Goodyear Tire & Rubber Co. (The) | ||||||||||||
4.88%, 03/15/27 (Call 12/15/26)(c) | USD | 100 | 100,577 | |||||||||
5.00%, 05/31/26 (Call 05/31/21)(c) | USD | 125 | 129,375 | |||||||||
5.13%, 11/15/23 (Call 12/02/19)(c) | USD | 125 | 126,702 | |||||||||
Gray Television Inc. | ||||||||||||
5.13%, 10/15/24 (Call 11/12/19)(a)(c) | USD | 75 | 77,710 | |||||||||
5.88%, 07/15/26 (Call 07/15/21)(a)(c) | USD | 150 | 157,690 | |||||||||
7.00%, 05/15/27 (Call 05/15/22)(a)(c) | USD | 100 | 109,250 | |||||||||
Griffon Corp., 5.25%, 03/01/22 (Call 12/02/19) | USD | 125 | 125,840 | |||||||||
Gulfport Energy Corp. | ||||||||||||
6.00%, 10/15/24 (Call 12/02/19) | USD | 125 | 79,635 | |||||||||
6.38%, 05/15/25 (Call 05/15/20) | USD | 75 | 45,563 | |||||||||
6.38%, 01/15/26 (Call 01/15/21) | USD | 75 | 45,000 | |||||||||
Hanesbrands Finance Luxembourg SCA, 3.50%, 06/15/24 (Call 03/15/24)(b) | EUR | 100 | 123,217 | |||||||||
Hanesbrands Inc. | ||||||||||||
4.63%, 05/15/24 (Call 02/15/24)(a) | USD | 175 | 183,747 | |||||||||
4.88%, 05/15/26 (Call 02/15/26)(a)(c) | USD | 125 | 132,227 | |||||||||
Harland Clarke Holdings Corp. | ||||||||||||
8.38%, 08/15/22 (Call 12/02/19)(a) | USD | 125 | 99,279 | |||||||||
9.25%, 03/01/21 (Call 12/02/19)(a)(c) | USD | 125 | 115,339 | |||||||||
HCA Healthcare Inc., 6.25%, 02/15/21 | USD | 125 | 131,256 | |||||||||
HCA Inc. | USD | 425 | 466,969 | |||||||||
5.38%, 09/01/26 (Call 03/01/26) | USD | 170 | 185,725 | |||||||||
5.63%, 09/01/28 (Call 03/01/28)(c) | USD | 225 | 252,844 | |||||||||
5.88%, 05/01/23 | USD | 200 | 219,985 | |||||||||
5.88%, 02/15/26 (Call 08/15/25) | USD | 200 | 224,803 | |||||||||
5.88%, 02/01/29 (Call 08/01/28)(c) | USD | 120 | 135,900 | |||||||||
7.50%, 02/15/22 | USD | 350 | 387,805 | |||||||||
Herc Holdings Inc., | USD | 190 | 198,003 | |||||||||
Hertz Corp. (The) | USD | 125 | 124,017 | |||||||||
6.25%, 10/15/22 (Call 12/02/19) | USD | 75 | 75,677 | |||||||||
7.13%, 08/01/26 (Call 08/01/22)(a) | USD | 85 | 87,653 | |||||||||
7.63%, 06/01/22 (Call 12/02/19)(a) | USD | 250 | 260,151 | |||||||||
Hertz Holdings Netherlands BV, | EUR | 100 | 114,529 | |||||||||
Hilcorp Energy I LP/Hilcorp Finance Co. | ||||||||||||
5.00%, 12/01/24 (Call 12/02/19)(a) | USD | 75 | 66,773 | |||||||||
5.75%, 10/01/25 (Call 04/01/20)(a) | USD | 75 | 66,063 | |||||||||
6.25%, 11/01/28 (Call 11/01/23)(a) | USD | 75 | 66,563 | |||||||||
Hilton Domestic Operating Co. Inc. | ||||||||||||
4.25%, 09/01/24 (Call 11/25/19) | USD | 175 | 178,248 | |||||||||
4.88%, 01/15/30 (Call 01/15/25)(a) | USD | 130 | 137,949 | |||||||||
5.13%, 05/01/26 (Call 05/01/21) | USD | 250 | 263,026 | |||||||||
| Security | Par (000) | Value | ||||||||||
| United States (continued) | ||||||||||||
Hilton Worldwide Finance LLC/Hilton Worldwide | ||||||||||||
Finance Corp. | USD | 100 | $ | 102,994 | ||||||||
4.88%, 04/01/27 (Call 04/01/22)(c) | USD | 100 | 105,748 | |||||||||
Hologic Inc. 4.38%, 10/15/25 (Call 10/15/20)(a) | USD | 100 | 102,580 | |||||||||
4.63%, 02/01/28 (Call 02/01/23)(a) | USD | 125 | 131,164 | |||||||||
Howard Hughes Corp. (The), 5.38%, 03/15/25 (Call 03/15/20)(a) | USD | 225 | 233,466 | |||||||||
HUB International Ltd., 7.00%, 05/01/26 (Call 05/01/21)(a) | USD | 175 | 180,620 | |||||||||
Hughes Satellite Systems Corp. | USD | 150 | 160,687 | |||||||||
6.63%, 08/01/26(c) | USD | 100 | 108,532 | |||||||||
7.63%, 06/15/21 | USD | 100 | 107,750 | |||||||||
Icahn Enterprises LP/Icahn Enterprises Finance Corp. | USD | 175 | 177,312 | |||||||||
5.88%, 02/01/22 (Call 12/02/19) | USD | 200 | 201,884 | |||||||||
6.25%, 02/01/22 (Call 12/02/19) | USD | 250 | 256,284 | |||||||||
6.25%, 05/15/26 (Call 05/15/22) | USD | 140 | 148,503 | |||||||||
6.38%, 12/15/25 (Call 12/15/20) | USD | 150 | 158,037 | |||||||||
6.75%, 02/01/24 (Call 02/01/20) | USD | 75 | 78,134 | |||||||||
iHeartCommunications Inc. | USD | 120 | 123,879 | |||||||||
6.38%, 05/01/26 (Call 05/01/22) | USD | 125 | 134,273 | |||||||||
8.38%, 05/01/27 (Call 05/01/22)(c) | USD | 200 | 214,325 | |||||||||
Infor U.S. Inc. | EUR | 100 | 112,904 | |||||||||
6.50%, 05/15/22 (Call 11/15/19) | USD | 225 | 228,487 | |||||||||
International Game Technology PLC | EUR | 100 | 119,890 | |||||||||
6.50%, 02/15/25 (Call 08/15/24)(a) | USD | 200 | 222,750 | |||||||||
IQVIA Inc. | ||||||||||||
2.25%, 01/15/28 (Call 07/15/22)(b) | EUR | 100 | 114,005 | |||||||||
2.88%, 09/15/25 (Call 09/15/20)(b) | EUR | 100 | 114,629 | |||||||||
3.25%, 03/15/25 (Call 03/15/20)(b) | EUR | 300 | 342,102 | |||||||||
5.00%, 10/15/26 (Call 10/15/21)(a) | USD | 200 | 211,162 | |||||||||
5.00%, 05/15/27 (Call 05/15/22)(a) | USD | 200 | 211,750 | |||||||||
Iron Mountain Inc. | ||||||||||||
4.88%, 09/15/27 (Call 09/15/22)(a) | USD | 225 | 232,205 | |||||||||
4.88%, 09/15/29 (Call 09/15/24)(a) | USD | 120 | 122,597 | |||||||||
5.25%, 03/15/28 (Call 12/27/22)(a) | USD | 150 | 157,594 | |||||||||
5.75%, 08/15/24 (Call 11/12/19)(c) | USD | 175 | 176,750 | |||||||||
6.00%, 08/15/23 (Call 11/12/19)(c) | USD | 75 | 76,736 | |||||||||
Iron Mountain UK PLC, | GBP | 100 | 129,389 | |||||||||
iStar Inc. | ||||||||||||
4.75%, 10/01/24 (Call 07/01/24) | USD | 50 | 51,500 | |||||||||
5.25%, 09/15/22 (Call 12/02/19) | USD | 50 | 51,194 | |||||||||
Jack Ohio Finance LLC/Jack Ohio Finance 1 Corp., 6.75%, 11/15/21 (Call 12/02/19)(a) | USD | 125 | 127,841 | |||||||||
Jaguar Holding Co. II/Pharmaceutical Product Development LLC, 6.38%, 08/01/23 (Call 12/02/19)(a) | USD | 250 | 258,750 | |||||||||
JC Penney Corp. Inc. | ||||||||||||
5.88%, 07/01/23 (Call 12/02/19)(a) | USD | 75 | 66,047 | |||||||||
8.63%, 03/15/25 (Call 03/15/21)(a) | USD | 75 | 48,070 | |||||||||
K Hovnanian Enterprises Inc. | ||||||||||||
10.00%, 07/15/22 (Call 12/02/19)(a) | USD | 50 | 43,042 | |||||||||
10.50%, 07/15/24 (Call 07/15/20)(a) | USD | 75 | 59,232 | |||||||||
KB Home, 7.00%, 12/15/21 (Call 09/15/21) | USD | 75 | 80,888 | |||||||||
Kennedy-Wilson Inc., 5.88%, 04/01/24 (Call 12/02/19) | USD | 150 | 155,250 | |||||||||
| SCHEDULES OF INVESTMENTS | 49 |
Schedule of Investments (continued) October 31, 2019 | iShares® US & Intl High Yield Corp Bond ETF (Percentages shown are based on Net Assets) |
| Security | Par (000) | Value | ||||||||||
| United States (continued) | ||||||||||||
KFC Holding Co./Pizza Hut Holdings LLC/Taco Bell of America LLC | ||||||||||||
4.75%, 06/01/27 (Call 06/01/22)(a)(c) | USD | 100 | $ | 104,568 | ||||||||
5.00%, 06/01/24 (Call 12/02/19)(a) | USD | 150 | 155,812 | |||||||||
5.25%, 06/01/26 (Call 06/01/21)(a) | USD | 175 | 185,040 | |||||||||
L Brands Inc. | USD | 75 | 69,914 | |||||||||
5.63%, 02/15/22 | USD | 125 | 132,002 | |||||||||
5.63%, 10/15/23(c) | USD | 75 | 79,568 | |||||||||
6.63%, 04/01/21 | USD | 50 | 52,667 | |||||||||
7.50%, 06/15/29 (Call 06/15/24)(c) | USD | 75 | 74,615 | |||||||||
LABL Escrow Issuer LLC | USD | 100 | 104,007 | |||||||||
10.50%, 07/15/27 (Call 07/15/22)(a) | USD | 105 | 105,727 | |||||||||
Ladder Capital Finance Holdings LLLP/Ladder Capital Finance Corp. | ||||||||||||
5.25%, 03/15/22 (Call 09/15/21)(a) | USD | 50 | 51,813 | |||||||||
5.25%, 10/01/25 (Call 10/01/20)(a) | USD | 60 | 61,158 | |||||||||
Lamar Media Corp. | USD | 50 | 50,943 | |||||||||
5.38%, 01/15/24 (Call 12/02/19) | USD | 75 | 76,922 | |||||||||
5.75%, 02/01/26 (Call 02/01/21) | USD | 70 | 74,014 | |||||||||
Lamb Weston Holdings Inc. | USD | 100 | 105,342 | |||||||||
4.88%, 11/01/26 (Call 11/01/21)(a) | USD | 125 | 131,822 | |||||||||
Lennar Corp. | USD | 75 | 77,063 | |||||||||
4.50%, 04/30/24 (Call 01/31/24) | USD | 100 | 105,903 | |||||||||
4.75%, 04/01/21 (Call 02/01/21) | USD | 75 | 76,973 | |||||||||
4.75%, 11/15/22 (Call 08/15/22) | USD | 75 | 78,979 | |||||||||
4.75%, 05/30/25 (Call 02/28/25) | USD | 100 | 107,443 | |||||||||
4.75%, 11/29/27 (Call 05/29/27) | USD | 125 | 135,135 | |||||||||
4.88%, 12/15/23 (Call 09/15/23) | USD | 55 | 58,868 | |||||||||
5.88%, 11/15/24 (Call 05/15/24) | USD | 50 | 55,875 | |||||||||
Level 3 Financing Inc. | USD | 145 | 147,537 | |||||||||
5.13%, 05/01/23 (Call 12/02/19) | USD | 175 | 177,187 | |||||||||
5.25%, 03/15/26 (Call 03/15/21) | USD | 100 | 104,346 | |||||||||
5.38%, 08/15/22 (Call 12/02/19) | USD | 189 | 189,662 | |||||||||
5.38%, 01/15/24 (Call 12/02/19) | USD | 125 | 127,371 | |||||||||
5.38%, 05/01/25 (Call 05/01/20) | USD | 125 | 129,474 | |||||||||
5.63%, 02/01/23 (Call 12/02/19) | USD | 75 | 75,661 | |||||||||
Levi Strauss & Co., | EUR | 100 | 119,050 | |||||||||
Liberty Mutual Group Inc., 3.63%, 05/23/59 (Call 05/23/24)(b)(d) | EUR | 100 | 115,852 | |||||||||
Lions Gate Capital Holdings LLC | USD | 100 | 94,250 | |||||||||
6.38%, 02/01/24 (Call 02/01/21)(a) | USD | 40 | 38,525 | |||||||||
Live Nation Entertainment Inc., | USD | 100 | 104,260 | |||||||||
LKQ European Holdings BV, 4.13%, 04/01/28 (Call 04/01/23)(b) | EUR | 100 | 121,059 | |||||||||
LKQ Italia Bondco SpA, 3.88%, 04/01/24 (Call 01/01/24)(b) | EUR | 100 | 124,709 | |||||||||
Mallinckrodt International Finance SA, 4.75%, 04/15/23(c) | USD | 100 | 31,043 | |||||||||
Mallinckrodt International Finance SA/Mallinckrodt CB LLC | ||||||||||||
5.50%, 04/15/25 (Call 04/15/20)(a)(c) | USD | 100 | 32,813 | |||||||||
5.63%, 10/15/23 (Call 12/02/19)(a)(c) | USD | 100 | 34,500 | |||||||||
5.75%, 08/01/22 (Call 12/02/19)(a) | USD | 100 | 39,525 | |||||||||
| Security | Par (000) | Value | ||||||||||
| United States (continued) | ||||||||||||
Marriott Ownership Resorts Inc./ILG LLC, 6.50%, 09/15/26 (Call 09/15/21) | USD | 100 | $ | 107,873 | ||||||||
Matador Resources Co., | USD | 175 | 168,000 | |||||||||
Match Group Inc., | USD | 75 | 78,223 | |||||||||
Mattel Inc., | USD | 250 | 261,934 | |||||||||
Mauser Packaging Solutions Holding Co. | EUR | 100 | 115,019 | |||||||||
5.50%, 04/15/24 (Call 04/15/20)(a) | USD | 200 | 205,763 | |||||||||
7.25%, 04/15/25 (Call 04/15/20)(a)(c) | USD | 225 | 215,156 | |||||||||
MEDNAX Inc. | USD | 100 | 101,490 | |||||||||
6.25%, 01/15/27 (Call 01/15/22)(a) | USD | 165 | 163,350 | |||||||||
Meredith Corp., 6.88%, 02/01/26 (Call 02/01/21) | USD | 200 | 206,892 | |||||||||
Meritage Homes Corp., 6.00%, 06/01/25 (Call 03/01/25) | USD | 50 | 56,303 | |||||||||
MGM Growth Properties Operating Partnership LP/MGP FinanceCo-Issuer Inc. | ||||||||||||
4.50%, 09/01/26 (Call 06/01/26) | USD | 75 | 79,813 | |||||||||
5.63%, 05/01/24 (Call 02/01/24)(c) | USD | 150 | 165,588 | |||||||||
5.75%, 02/01/27 (Call 11/01/26)(a) | USD | 130 | 147,029 | |||||||||
MGM Resorts International | USD | 50 | 52,485 | |||||||||
5.50%, 04/15/27 (Call 01/15/27)(c) | USD | 170 | 187,035 | |||||||||
5.75%, 06/15/25 (Call 03/15/25)(c) | USD | 125 | 138,750 | |||||||||
6.00%, 03/15/23 | USD | 200 | 220,910 | |||||||||
6.63%, 12/15/21 | USD | 175 | 189,875 | |||||||||
7.75%, 03/15/22 | USD | 150 | 167,988 | |||||||||
Molina Healthcare Inc., 5.38%, 11/15/22 (Call 08/15/22) | USD | 150 | 158,906 | |||||||||
Moss Creek Resources Holdings Inc. 7.50%, 01/15/26 (Call 01/15/21)(a) | USD | 100 | 68,350 | |||||||||
10.50%, 05/15/27 (Call 05/15/22)(a) | USD | 75 | 57,672 | |||||||||
MPH Acquisition Holdings LLC, | USD | 200 | 186,016 | |||||||||
MPT Operating Partnership LP/MPT Finance Corp. | EUR | 100 | 123,738 | |||||||||
4.00%, 08/19/22 (Call 05/19/22) | EUR | 100 | 121,756 | |||||||||
4.63%, 08/01/29 (Call 08/01/24) | USD | 140 | 145,573 | |||||||||
5.00%, 10/15/27 (Call 10/15/22) | USD | 275 | 290,577 | |||||||||
5.25%, 08/01/26 (Call 08/01/21) | USD | 75 | 78,907 | |||||||||
6.38%, 03/01/24 (Call 12/02/19) | USD | 75 | 78,566 | |||||||||
MSCI Inc. | USD | 100 | 105,064 | |||||||||
5.25%, 11/15/24 (Call 12/02/19)(a) | USD | 150 | 154,357 | |||||||||
5.38%, 05/15/27 (Call 05/15/22)(a) | USD | 75 | 80,474 | |||||||||
5.75%, 08/15/25 (Call 08/15/20)(a) | USD | 100 | 105,125 | |||||||||
Murphy Oil Corp. | USD | 75 | 75,771 | |||||||||
4.20%, 12/01/22 (Call 09/01/22) | USD | 100 | 102,021 | |||||||||
5.75%, 08/15/25 (Call 08/15/20) | USD | 75 | 76,386 | |||||||||
6.88%, 08/15/24 (Call 12/02/19) | USD | 50 | 52,902 | |||||||||
Nabors Industries Inc. | USD | 125 | 115,292 | |||||||||
5.50%, 01/15/23 (Call 11/15/22)(c) | USD | 75 | 62,728 | |||||||||
5.75%, 02/01/25 (Call 11/01/24) | USD | 150 | 111,478 | |||||||||
Nationstar Mortgage Holdings Inc. 8.13%, 07/15/23 (Call 07/15/20)(a) | USD | 125 | 132,435 | |||||||||
9.13%, 07/15/26 (Call 07/15/21)(a) | USD | 150 | 163,500 | |||||||||
Nationstar Mortgage LLC/Nationstar Capital Corp., | USD | 83 | 83,311 | |||||||||
Navient Corp. | USD | 175 | 182,219 | |||||||||
| 50 | 2019ISHARES ANNUAL REPORTTO SHAREHOLDERS |
Schedule of Investments (continued) October 31, 2019 | iShares® US & Intl High Yield Corp Bond ETF (Percentages shown are based on Net Assets) |
| Security | Par (000) | Value | ||||||||||
| United States (continued) | ||||||||||||
5.88%, 03/25/21 | USD | 100 | $ | 103,688 | ||||||||
5.88%, 10/25/24 | USD | 75 | 77,272 | |||||||||
6.13%, 03/25/24 | USD | 150 | 157,843 | |||||||||
6.50%, 06/15/22 | USD | 125 | 134,337 | |||||||||
6.63%, 07/26/21 | USD | 100 | 105,833 | |||||||||
6.75%, 06/25/25(c) | USD | 75 | 79,290 | |||||||||
6.75%, 06/15/26(c) | USD | 75 | 78,375 | |||||||||
7.25%, 01/25/22 | USD | 75 | 81,353 | |||||||||
7.25%, 09/25/23 | USD | 75 | 82,124 | |||||||||
Navios Maritime Holdings Inc./Navios Maritime Finance II U.S. Inc., 7.38%, 01/15/22 (Call 12/02/19)(a) | USD | 75 | 44,016 | |||||||||
Navistar International Corp., | USD | 150 | 152,719 | |||||||||
NCR Corp. | USD | 100 | 101,000 | |||||||||
5.75%, 09/01/27 (Call 09/01/22)(a) | USD | 75 | 76,634 | |||||||||
5.88%, 12/15/21 (Call 12/02/19) | USD | 50 | 50,201 | |||||||||
6.13%, 09/01/29 (Call 09/01/24)(a) | USD | 85 | 88,898 | |||||||||
6.38%, 12/15/23 (Call 12/02/19) | USD | 100 | 102,538 | |||||||||
Neiman Marcus Group Ltd. LLC/Neiman Marcus Group LLC/Mariposa Borrower/NMG, 8.00%, 10/25/24 (Call 12/02/19)(a) | USD | 83 | 22,410 | |||||||||
Netflix Inc. | EUR | 200 | 234,612 | |||||||||
3.63%, 06/15/30 (Call 03/15/30)(b) | EUR | 200 | 222,692 | |||||||||
3.88%, 11/15/29(b) | EUR | 100 | 114,162 | |||||||||
4.38%, 11/15/26(c) | USD | 175 | 178,249 | |||||||||
4.63%, 05/15/29(b) | EUR | 200 | 243,764 | |||||||||
4.88%, 04/15/28 | USD | 225 | 232,490 | |||||||||
4.88%, 06/15/30 (Call 03/15/30)(a) | USD | 165 | 166,923 | |||||||||
5.38%, 02/01/21 | USD | 75 | 77,469 | |||||||||
5.38%, 11/15/29(a)(c) | USD | 110 | 115,925 | |||||||||
5.50%, 02/15/22 | USD | 75 | 79,498 | |||||||||
5.75%, 03/01/24(c) | USD | 50 | 55,071 | |||||||||
5.88%, 02/15/25 | USD | 100 | 110,328 | |||||||||
5.88%, 11/15/28 | USD | 300 | 330,037 | |||||||||
6.38%, 05/15/29(a) | USD | 150 | 168,298 | |||||||||
Nexstar Broadcasting Inc. | USD | 125 | 130,469 | |||||||||
5.63%, 07/15/27 (Call 07/15/22)(a)(c) | USD | 175 | 185,010 | |||||||||
5.88%, 11/15/22 (Call 11/12/19) | USD | 50 | 50,982 | |||||||||
NextEra Energy Operating Partners LP | USD | 75 | 74,813 | |||||||||
4.25%, 07/15/24 (Call 04/15/24)(a) | USD | 95 | 98,082 | |||||||||
4.25%, 09/15/24 (Call 07/15/24)(a) | USD | 75 | 77,125 | |||||||||
4.50%, 09/15/27 (Call 06/15/27)(a) | USD | 75 | 76,778 | |||||||||
NGL Energy Partners LP/NGL Energy Finance Corp. | ||||||||||||
7.50%, 11/01/23 (Call 12/02/19) | USD | 100 | 99,377 | |||||||||
7.50%, 04/15/26 (Call 04/15/22)(a) | USD | 70 | 66,712 | |||||||||
Nielsen Co Luxembourg SARL/The, 5.00%, 02/01/25 (Call 02/01/20)(a)(c) | USD | 75 | 74,813 | |||||||||
Nielsen Finance LLC/Nielsen Finance Co., 5.00%, 04/15/22 (Call 12/02/19)(a) | USD | 325 | 327,437 | |||||||||
Noble Holding International Ltd. | USD | 110 | 72,958 | |||||||||
7.95%, 04/01/25 (Call 01/01/25)(c) | USD | 50 | 28,267 | |||||||||
Novelis Corp. | USD | 250 | 263,150 | |||||||||
6.25%, 08/15/24 (Call 12/02/19)(a) | USD | 150 | 157,484 | |||||||||
| Security | Par (000) | Value | ||||||||||
| United States (continued) | ||||||||||||
NRG Energy Inc. | USD | 90 | $ | 97,031 | ||||||||
5.75%, 01/15/28 (Call 01/15/23) | USD | 150 | 163,002 | |||||||||
6.63%, 01/15/27 (Call 07/15/21)(c) | USD | 250 | 271,712 | |||||||||
7.25%, 05/15/26 (Call 05/15/21) | USD | 125 | 137,221 | |||||||||
NuStar Logistics LP | USD | 75 | 77,938 | |||||||||
6.00%, 06/01/26 (Call 03/01/26) | USD | 75 | 80,408 | |||||||||
Oasis Petroleum Inc. | USD | 50 | 33,875 | |||||||||
6.88%, 03/15/22 (Call 12/02/19) | USD | 125 | 109,687 | |||||||||
OI European Group BV, 3.13%, 11/15/24 (Call 08/15/24)(b) | EUR | 100 | 115,074 | |||||||||
Olin Corp. | USD | 75 | 74,006 | |||||||||
5.13%, 09/15/27 (Call 03/15/22)(c) | USD | 100 | 103,250 | |||||||||
5.63%, 08/01/29 (Call 08/01/24) | USD | 95 | 99,216 | |||||||||
Ortho-Clinical Diagnostics Inc./Ortho-Clinical Diagnostics SA, 6.63%, 05/15/22 (Call 12/02/19)(a)(c) | USD | 200 | 193,250 | |||||||||
Outfront Media Capital LLC/Outfront Media Capital Corp. | USD | 85 | 88,975 | |||||||||
5.63%, 02/15/24 (Call 12/02/19) | USD | 50 | 51,401 | |||||||||
5.88%, 03/15/25 (Call 12/02/19) | USD | 75 | 77,438 | |||||||||
Owens-Brockway Glass Container Inc. | USD | 150 | 154,875 | |||||||||
5.88%, 08/15/23(a) | USD | 100 | 105,625 | |||||||||
Pacific Drilling SA, 8.38%, 10/01/23 (Call 10/01/20)(a) | USD | 100 | 79,938 | |||||||||
Panther BF Aggregator 2 LP/Panther Finance Co. Inc. | EUR | 100 | 112,410 | |||||||||
6.25%, 05/15/26 (Call 05/15/22)(a)(c) | USD | 165 | 175,019 | |||||||||
8.50%, 05/15/27 (Call 05/15/22)(a) | USD | 300 | 302,250 | |||||||||
Par Pharmaceutical Inc., 7.50%, 04/01/27 (Call 04/01/22)(a) | USD | 255 | 243,118 | |||||||||
Parsley Energy LLC/Parsley Finance Corp. | USD | 50 | 51,020 | |||||||||
5.38%, 01/15/25 (Call 01/15/20)(a) | USD | 85 | 87,106 | |||||||||
5.63%, 10/15/27 (Call 10/15/22)(a) | USD | 100 | 103,351 | |||||||||
6.25%, 06/01/24 (Call 12/02/19)(a) | USD | 50 | 52,063 | |||||||||
PBF Holding Co. LLC/PBF Finance Corp. | USD | 75 | 77,625 | |||||||||
7.25%, 06/15/25 (Call 06/15/20) | USD | 100 | 104,862 | |||||||||
PDC Energy Inc. | USD | 75 | 69,179 | |||||||||
6.13%, 09/15/24 (Call 12/02/19) | USD | 50 | 48,531 | |||||||||
Peabody Energy Corp. | USD | 75 | 69,375 | |||||||||
6.38%, 03/31/25 (Call 03/31/20)(a) | USD | 75 | 61,667 | |||||||||
Penske Automotive Group Inc. | USD | 60 | 62,978 | |||||||||
5.75%, 10/01/22 (Call 12/02/19) | USD | 75 | 75,881 | |||||||||
Performance Food Group Inc., 5.50%, 10/15/27 | USD | 105 | 111,320 | |||||||||
PetSmart Inc. | USD | 167 | 164,621 | |||||||||
7.13%, 03/15/23 (Call 12/02/19)(a) | USD | 300 | 277,500 | |||||||||
8.88%, 06/01/25 (Call 06/01/20)(a) | USD | 100 | 93,042 | |||||||||
Pilgrim’s Pride Corp. | USD | 150 | 155,437 | |||||||||
5.88%, 09/30/27 (Call 09/30/22)(a) | USD | 100 | 107,075 | |||||||||
| SCHEDULES OF INVESTMENTS | 51 |
Schedule of Investments (continued) October 31, 2019 | iShares® US & Intl High Yield Corp Bond ETF (Percentages shown are based on Net Assets) |
| Security | Par (000) | Value | ||||||||||
| United States (continued) | ||||||||||||
Pitney Bowes Inc. | USD | 75 | $ | 75,540 | ||||||||
4.38%, 05/15/22 (Call 04/15/22) | USD | 75 | 75,009 | |||||||||
4.63%, 03/15/24 (Call 12/15/23) | USD | 75 | 70,680 | |||||||||
5.20%, 04/01/23 (Call 03/01/23) | USD | 50 | 49,344 | |||||||||
Post Holdings Inc. | USD | 250 | 260,650 | |||||||||
5.50%, 03/01/25 (Call 03/01/20)(a) | USD | 125 | 131,059 | |||||||||
5.50%, 12/15/29 (Call 12/15/24)(a) | USD | 120 | 126,651 | |||||||||
5.63%, 01/15/28 (Call 12/01/22)(a)(c) | USD | 125 | 133,468 | |||||||||
5.75%, 03/01/27 (Call 03/01/22)(a)(c) | USD | 225 | 239,542 | |||||||||
Prestige Brands Inc., 6.38%, 03/01/24 (Call 12/02/19)(a)(c) | USD | 100 | 104,375 | |||||||||
Prime Security Services Borrower LLC/Prime Finance Inc. | USD | 140 | 143,252 | |||||||||
5.75%, 04/15/26(a) | USD | 205 | 210,063 | |||||||||
9.25%, 05/15/23 (Call 12/02/19)(a) | USD | 228 | 239,856 | |||||||||
PulteGroup Inc. | USD | 50 | 51,094 | |||||||||
5.00%, 01/15/27 (Call 10/15/26) | USD | 75 | 81,956 | |||||||||
5.50%, 03/01/26 (Call 12/01/25) | USD | 105 | 117,684 | |||||||||
QEP Resources Inc. | USD | 75 | 71,187 | |||||||||
5.38%, 10/01/22 (Call 07/01/22) | USD | 75 | 72,722 | |||||||||
5.63%, 03/01/26 (Call 12/01/25) | USD | 75 | 67,500 | |||||||||
Qorvo Inc., 5.50%, 07/15/26 (Call 07/15/21)(c) | USD | 150 | 160,309 | |||||||||
Quicken Loans Inc. | USD | 175 | 179,999 | |||||||||
5.75%, 05/01/25 (Call 05/01/20)(a) | USD | 175 | 180,596 | |||||||||
QVC Inc. | USD | 125 | 130,005 | |||||||||
4.45%, 02/15/25 (Call 11/15/24) | USD | 75 | 78,650 | |||||||||
4.85%, 04/01/24 | USD | 75 | 79,843 | |||||||||
5.13%, 07/02/22 | USD | 75 | 79,091 | |||||||||
Qwest Corp., 6.75%, 12/01/21(c) | USD | 125 | 134,551 | |||||||||
Rackspace Hosting Inc., 8.63%, 11/15/24 (Call 12/02/19)(a)(c) | USD | 175 | 159,687 | |||||||||
Range Resources Corp. | USD | 100 | 80,375 | |||||||||
5.00%, 08/15/22 (Call 05/15/22)(c) | USD | 125 | 115,859 | |||||||||
5.00%, 03/15/23 (Call 12/15/22)(c) | USD | 100 | 86,185 | |||||||||
5.75%, 06/01/21 (Call 03/01/21) | USD | 100 | 99,104 | |||||||||
Realogy Group LLC/RealogyCo-Issuer Corp. | USD | 75 | 73,133 | |||||||||
5.25%, 12/01/21 (Call 12/02/19)(a) | USD | 75 | 75,427 | |||||||||
9.38%, 04/01/27 (Call 04/01/22)(a)(c) | USD | 100 | 98,250 | |||||||||
Refinitiv U.S. Holdings Inc. | EUR | 100 | 120,746 | |||||||||
6.25%, 05/15/26 (Call 11/15/21)(a) | USD | 175 | 189,875 | |||||||||
6.88%, 11/15/26 (Call 11/15/21)(b) | EUR | 100 | 126,087 | |||||||||
8.25%, 11/15/26 (Call 11/15/21)(a) | USD | 250 | 280,937 | |||||||||
RegionalCare Hospital Partners Holdings Inc., 8.25%, 05/01/23 (Call 12/02/19)(a) | USD | 125 | 133,402 | |||||||||
RegionalCare Hospital Partners Holdings Inc./LifePoint Health Inc., 9.75%, 12/01/26 (Call 12/01/21)(a) | USD | 225 | 246,356 | |||||||||
Reynolds Group Issuer Inc./Reynolds Group Issuer LLC/Reynolds Group Issuer Lu | ||||||||||||
5.13%, 07/15/23 (Call 12/02/19)(a) | USD | 225 | 230,837 | |||||||||
7.00%, 07/15/24 (Call 12/02/19)(a) | USD | 100 | 103,544 | |||||||||
Rite Aid Corp., 6.13%, 04/01/23 (Call 12/02/19)(a) | USD | 250 | 212,428 | |||||||||
Rowan Companies Inc., 4.88%, 06/01/22 (Call 03/01/22) | USD | 75 | 50,250 | |||||||||
| Security | Par (000) | Value | ||||||||||
| United States (continued) | ||||||||||||
Ryman Hospitality Properties Inc., 4.75%, 10/15/27 (Call 10/15/22)(a) | USD | 115 | $ | 118,893 | ||||||||
Sabre GLBL Inc., 5.25%, 11/15/23 (Call 12/02/19)(a) | USD | 125 | 128,125 | |||||||||
Samsonite Finco Sarl, 3.50%, 05/15/26 (Call 05/15/21)(b) | EUR | 100 | 113,335 | |||||||||
SBA Communications Corp. | USD | 150 | 153,022 | |||||||||
4.88%, 07/15/22 (Call 12/02/19) | USD | 100 | 101,375 | |||||||||
4.88%, 09/01/24 (Call 12/02/19) | USD | 150 | 155,812 | |||||||||
Scientific Games International Inc. | EUR | 100 | 112,915 | |||||||||
5.00%, 10/15/25 (Call 10/15/20)(a) | USD | 175 | 180,031 | |||||||||
8.25%, 03/15/26 (Call 03/15/22)(a) | USD | 200 | 212,000 | |||||||||
10.00%, 12/01/22 (Call 12/02/19) | USD | 136 | 140,080 | |||||||||
Sealed Air Corp. | EUR | 100 | 127,238 | |||||||||
4.88%, 12/01/22 (Call 09/01/22)(a) | USD | 75 | 79,125 | |||||||||
5.13%, 12/01/24 (Call 09/01/24)(a) | USD | 75 | 80,693 | |||||||||
5.25%, 04/01/23 (Call 01/01/23)(a) | USD | 50 | 53,508 | |||||||||
5.50%, 09/15/25 (Call 06/15/25)(a) | USD | 75 | 81,623 | |||||||||
6.50%, 12/01/20 (Call 09/01/20)(a) | USD | 75 | 77,515 | |||||||||
SemGroup Corp./Rose Rock Finance Corp., 5.63%, 07/15/22 (Call 11/15/19) | USD | 50 | 50,665 | |||||||||
Senior Housing Properties Trust, 4.75%, 02/15/28 (Call 08/15/27)(c) | USD | 75 | 77,056 | |||||||||
Sensata Technologies Inc., 4.38%, 02/15/30(a) | USD | 45 | 45,436 | |||||||||
Service Corp. International/U.S. | USD | 75 | 78,273 | |||||||||
5.13%, 06/01/29 (Call 06/01/24) | USD | 100 | 107,125 | |||||||||
5.38%, 05/15/24 (Call 12/02/19) | USD | 125 | 128,775 | |||||||||
ServiceMaster Co. LLC (The), 5.13%, 11/15/24 (Call 11/15/19)(a) | USD | 150 | 155,510 | |||||||||
SESI LLC | USD | 100 | 76,125 | |||||||||
7.75%, 09/15/24 (Call 09/15/20) | USD | 75 | 41,703 | |||||||||
Silgan Holdings Inc., 3.25%, 03/15/25 (Call 03/15/20) | EUR | 100 | 113,996 | |||||||||
Sinclair Television Group Inc. | USD | 50 | 50,625 | |||||||||
5.63%, 08/01/24 (Call 11/15/19)(a) | USD | 125 | 128,738 | |||||||||
6.13%, 10/01/22 (Call 11/15/19)(c) | USD | 75 | 75,980 | |||||||||
Sirius XM Radio Inc. | USD | 225 | 229,594 | |||||||||
4.63%, 05/15/23 (Call 12/02/19)(a) | USD | 100 | 101,633 | |||||||||
4.63%, 07/15/24 (Call 07/15/21)(a) | USD | 225 | 235,474 | |||||||||
5.00%, 08/01/27 (Call 08/01/22)(a) | USD | 200 | 210,565 | |||||||||
5.38%, 04/15/25 (Call 04/15/20)(a) | USD | 175 | 181,878 | |||||||||
5.38%, 07/15/26 (Call 07/15/21)(a)(c) | USD | 125 | 132,187 | |||||||||
5.50%, 07/01/29 (Call 07/01/24)(a) | USD | 190 | 205,737 | |||||||||
Six Flags Entertainment Corp. | USD | 125 | 129,062 | |||||||||
5.50%, 04/15/27 (Call 04/15/22)(a) | USD | 65 | 68,088 | |||||||||
SM Energy Co. | USD | 75 | 65,320 | |||||||||
5.63%, 06/01/25 (Call 06/01/20) | USD | 75 | 63,752 | |||||||||
6.13%, 11/15/22 (Call 12/02/19) | USD | 75 | 71,438 | |||||||||
6.63%, 01/15/27 (Call 01/15/22)(c) | USD | 75 | 63,125 | |||||||||
6.75%, 09/15/26 (Call 09/15/21) | USD | 75 | 63,738 | |||||||||
Solera LLC/Solera Finance Inc., 10.50%, 03/01/24 (Call 12/02/19)(a)(c) | USD | 275 | 287,176 | |||||||||
Southwestern Energy Co. | USD | 125 | 108,700 | |||||||||
| 52 | 2019ISHARES ANNUAL REPORTTO SHAREHOLDERS |
Schedule of Investments (continued) October 31, 2019 | iShares® US & Intl High Yield Corp Bond ETF (Percentages shown are based on Net Assets) |
| Security | Par (000) | Value | ||||||||||
| United States (continued) | ||||||||||||
7.50%, 04/01/26 (Call 04/01/21) | USD | 125 | $ | 108,132 | ||||||||
7.75%, 10/01/27 (Call 10/01/22)(c) | USD | 75 | 64,500 | |||||||||
Spectrum Brands Inc., 5.75%, 07/15/25 (Call 07/15/20) | USD | 150 | 156,623 | |||||||||
Springleaf Finance Corp. | USD | 100 | 107,750 | |||||||||
6.13%, 05/15/22 | USD | 150 | 161,437 | |||||||||
6.13%, 03/15/24 (Call 09/15/23) | USD | 215 | 234,568 | |||||||||
6.63%, 01/15/28 (Call 07/15/27) | USD | 135 | 149,512 | |||||||||
6.88%, 03/15/25 | USD | 200 | 226,750 | |||||||||
7.13%, 03/15/26 | USD | 250 | 285,151 | |||||||||
7.75%, 10/01/21 | USD | 100 | 109,002 | |||||||||
8.25%, 12/15/20 | USD | 125 | 132,894 | |||||||||
Sprint Communications Inc. | USD | 325 | 344,094 | |||||||||
11.50%, 11/15/21 | USD | 125 | 144,314 | |||||||||
Sprint Corp. | USD | 350 | 380,187 | |||||||||
7.25%, 09/15/21 | USD | 400 | 426,824 | |||||||||
7.63%, 02/15/25 (Call 11/15/24) | USD | 250 | 275,337 | |||||||||
7.63%, 03/01/26 (Call 11/01/25) | USD | 225 | 249,213 | |||||||||
7.88%, 09/15/23 | USD | 650 | 717,795 | |||||||||
SS&C Technologies Inc., 5.50%, 09/30/27 (Call 03/30/22)(a) | USD | 275 | 293,451 | |||||||||
Standard Industries Inc./NJ | USD | 125 | 129,587 | |||||||||
5.00%, 02/15/27 (Call 02/15/22)(a) | USD | 75 | 78,484 | |||||||||
5.38%, 11/15/24 (Call 12/02/19)(a) | USD | 250 | 257,200 | |||||||||
5.50%, 02/15/23 (Call 12/02/19)(a) | USD | 100 | 101,875 | |||||||||
6.00%, 10/15/25 (Call 10/15/20)(a) | USD | 125 | 131,621 | |||||||||
Staples Inc. | USD | 300 | 312,732 | |||||||||
10.75%, 04/15/27 (Call 04/15/22)(a) | USD | 160 | 166,400 | |||||||||
Starwood Property Trust Inc. | USD | 75 | 75,516 | |||||||||
4.75%, 03/15/25 (Call 09/15/24) | USD | 75 | 77,883 | |||||||||
5.00%, 12/15/21 (Call 09/15/21) | USD | 150 | 156,000 | |||||||||
Suburban Propane Partners LP/Suburban Energy Finance Corp., 5.50%, 06/01/24 (Call 12/02/19) | USD | 75 | 76,853 | |||||||||
Summit Materials LLC/Summit Materials Finance Corp., 6.13%, 07/15/23 (Call 11/15/19) | USD | 100 | 101,747 | |||||||||
Sunoco LP/Sunoco Finance Corp. | USD | 175 | 179,594 | |||||||||
5.50%, 02/15/26 (Call 02/15/21) | USD | 100 | 103,826 | |||||||||
5.88%, 03/15/28 (Call 03/15/23) | USD | 60 | 63,298 | |||||||||
6.00%, 04/15/27 (Call 04/15/22) | USD | 80 | 84,799 | |||||||||
Symantec Corp. | USD | 75 | 77,040 | |||||||||
5.00%, 04/15/25 (Call 04/15/20)(a) | USD | 150 | 153,404 | |||||||||
Talen Energy Supply LLC | USD | 100 | 75,227 | |||||||||
6.63%, 01/15/28 (Call 01/15/23)(a) | USD | 70 | 67,395 | |||||||||
7.25%, 05/15/27 (Call 05/15/22)(a) | USD | 115 | 114,712 | |||||||||
10.50%, 01/15/26 (Call 01/15/22)(a) | USD | 75 | 63,844 | |||||||||
Tallgrass Energy Partners LP/Tallgrass Energy Finance Corp. | ||||||||||||
4.75%, 10/01/23 (Call 10/01/20)(a)(c) | USD | 75 | 73,486 | |||||||||
5.50%, 09/15/24 (Call 12/02/19)(a) | USD | 100 | 97,625 | |||||||||
5.50%, 01/15/28 (Call 01/15/23)(a) | USD | 150 | 141,000 | |||||||||
| Security | Par (000) | Value | ||||||||||
| United States (continued) | ||||||||||||
Targa Resources Partners LP/Targa Resources Partners Finance Corp. | ||||||||||||
4.25%, 11/15/23 (Call 12/02/19)(c) | USD | 100 | $ | 100,798 | ||||||||
5.00%, 01/15/28 (Call 01/15/23) | USD | 100 | 99,042 | |||||||||
5.13%, 02/01/25 (Call 02/01/20) | USD | 50 | 51,399 | |||||||||
5.25%, 05/01/23 (Call 12/02/19) | USD | 75 | 75,603 | |||||||||
5.38%, 02/01/27 (Call 02/01/22)(c) | USD | 100 | 102,923 | |||||||||
5.88%, 04/15/26 (Call 04/15/21) | USD | 200 | 209,555 | |||||||||
6.50%, 07/15/27 (Call 07/15/22)(a) | USD | 125 | 134,177 | |||||||||
6.75%, 03/15/24 (Call 12/02/19) | USD | 75 | 77,878 | |||||||||
6.88%, 01/15/29 (Call 01/15/24)(a) | USD | 100 | 107,853 | |||||||||
Taylor Morrison Communities Inc. | USD | 65 | 72,046 | |||||||||
5.88%, 06/15/27 (Call 03/15/27)(a) | USD | 75 | 83,813 | |||||||||
TEGNA Inc. | USD | 145 | 147,023 | |||||||||
6.38%, 10/15/23 (Call 12/02/19) | USD | 100 | 103,097 | |||||||||
Teleflex Inc. | USD | 100 | 105,112 | |||||||||
4.88%, 06/01/26 (Call 06/01/21)(c) | USD | 50 | 52,422 | |||||||||
Tempur Sealy International Inc. | USD | 75 | 78,339 | |||||||||
5.63%, 10/15/23 (Call 12/02/19) | USD | 75 | 77,227 | |||||||||
Tenet Healthcare Corp. | USD | 300 | 308,953 | |||||||||
4.63%, 09/01/24 (Call 09/01/21)(a) | USD | 135 | 138,993 | |||||||||
4.88%, 01/01/26 (Call 03/01/22)(a) | USD | 310 | 320,850 | |||||||||
5.13%, 05/01/25 (Call 05/01/20) | USD | 200 | 204,750 | |||||||||
5.13%, 11/01/27 (Call 11/01/22)(a) | USD | 240 | 250,220 | |||||||||
6.25%, 02/01/27 (Call 02/01/22)(a) | USD | 210 | 222,012 | |||||||||
6.75%, 06/15/23 | USD | 350 | 370,960 | |||||||||
7.00%, 08/01/25 (Call 08/01/20)(c) | USD | 75 | 77,531 | |||||||||
8.13%, 04/01/22 | USD | 350 | 378,525 | |||||||||
Tenneco Inc., 4.88%, 04/15/22 (Call 11/29/19)(b) | EUR | 175 | 193,435 | |||||||||
TerraForm Power Operating LLC | USD | 100 | 103,102 | |||||||||
4.75%, 01/15/30 (Call 01/15/25)(a) | USD | 125 | 129,219 | |||||||||
5.00%, 01/31/28 (Call 07/31/27)(a) | USD | 75 | 79,290 | |||||||||
Tesla Inc., 5.30%, 08/15/25 | USD | 275 | 259,462 | |||||||||
T-Mobile USA Inc. | USD | 75 | 77,308 | |||||||||
4.50%, 02/01/26 (Call 02/01/21) | USD | 125 | 128,906 | |||||||||
4.75%, 02/01/28 (Call 02/01/23) | USD | 250 | 263,125 | |||||||||
5.13%, 04/15/25 (Call 04/15/20) | USD | 75 | 77,848 | |||||||||
5.38%, 04/15/27 (Call 04/15/22) | USD | 75 | 80,746 | |||||||||
6.00%, 03/01/23 (Call 11/12/19) | USD | 175 | 178,294 | |||||||||
6.00%, 04/15/24 (Call 11/12/19) | USD | 225 | 233,719 | |||||||||
6.38%, 03/01/25 (Call 11/12/19) | USD | 325 | 337,400 | |||||||||
6.50%, 01/15/26 (Call 01/15/21) | USD | 325 | 348,595 | |||||||||
Toll Brothers Finance Corp. | USD | 50 | 49,134 | |||||||||
4.35%, 02/15/28 (Call 11/15/27) | USD | 50 | 51,984 | |||||||||
4.38%, 04/15/23 (Call 01/15/23) | USD | 50 | 52,459 | |||||||||
4.88%, 03/15/27 (Call 12/15/26) | USD | 60 | 65,253 | |||||||||
5.88%, 02/15/22 (Call 11/15/21) | USD | 50 | 53,188 | |||||||||
TransDigm Inc. | USD | 370 | 368,775 | |||||||||
6.00%, 07/15/22 (Call 12/02/19) | USD | 150 | 152,550 | |||||||||
6.25%, 03/15/26 (Call 03/15/22)(a) | USD | 625 | 669,141 | |||||||||
6.38%, 06/15/26 (Call 06/15/21) | USD | 200 | 208,500 | |||||||||
| SCHEDULES OF INVESTMENTS | 53 |
Schedule of Investments (continued) October 31, 2019 | iShares® US & Intl High Yield Corp Bond ETF (Percentages shown are based on Net Assets) |
| Security | Par (000) | Value | ||||||||||
| United States (continued) | ||||||||||||
6.50%, 07/15/24 (Call 12/02/19) | USD | 200 | $ | 206,175 | ||||||||
6.50%, 05/15/25 (Call 05/15/20) | USD | 150 | 155,392 | |||||||||
7.50%, 03/15/27 (Call 03/15/22) | USD | 75 | 80,720 | |||||||||
Transocean Guardian Ltd., 5.88%, 01/15/24 (Call 07/15/21)(a) | USD | 67 | 66,917 | |||||||||
Transocean Inc. | USD | 100 | 88,250 | |||||||||
9.00%, 07/15/23 (Call 07/15/20)(a) | USD | 200 | 201,875 | |||||||||
Transocean Phoenix 2 Ltd., 7.75%, 10/15/24 (Call 10/15/20)(a) | USD | 35 | 36,138 | |||||||||
Transocean Pontus Ltd., 6.13%, 08/01/25 (Call 08/01/21)(a) | USD | 67 | 66,354 | |||||||||
Transocean Poseidon Ltd., 6.88%, 02/01/27 (Call 02/01/22)(a) | USD | 80 | 80,862 | |||||||||
Transocean Proteus Ltd., 6.25%, 12/01/24 (Call 12/01/20)(a) | USD | 93 | 94,191 | |||||||||
Transocean Sentry Ltd., 5.38%, 05/15/23 (Call 05/16/21)(a) | USD | 25 | 24,773 | |||||||||
TRI Pointe Group Inc./TRI Pointe Homes Inc., 5.88%, 06/15/24 | USD | 50 | 53,878 | |||||||||
Triumph Group Inc. | USD | 50 | 52,513 | |||||||||
7.75%, 08/15/25 (Call 08/15/20)(c) | USD | 67 | 67,105 | |||||||||
Tronox Finance PLC, 5.75%, 10/01/25 (Call 10/01/20)(a)(c) | USD | 75 | 70,470 | |||||||||
Tronox Inc., 6.50%, 04/15/26 (Call 04/15/21)(a)(c) | USD | 125 | 120,692 | |||||||||
U.S. Steel Corp. | USD | 100 | 84,041 | |||||||||
6.88%, 08/15/25 (Call 08/15/20)(c) | USD | 100 | 90,377 | |||||||||
Uber Technologies Inc. | USD | 75 | 76,519 | |||||||||
7.50%, 09/15/27 (Call 09/15/22)(a) | USD | 190 | 188,100 | |||||||||
8.00%, 11/01/26 (Call 11/01/21)(a) | USD | 200 | 200,500 | |||||||||
United Airlines Holdings Inc., 4.25%, 10/01/22 | USD | 50 | 51,593 | |||||||||
United Rentals North America Inc. | USD | 30 | 30,308 | |||||||||
4.63%, 07/15/23 (Call 11/20/19) | USD | 175 | 178,981 | |||||||||
4.63%, 10/15/25 (Call 10/15/20) | USD | 130 | 132,796 | |||||||||
4.88%, 01/15/28 (Call 01/15/23) | USD | 275 | 283,937 | |||||||||
5.25%, 01/15/30 (Call 01/15/25) | USD | 75 | 78,938 | |||||||||
5.50%, 07/15/25 (Call 07/15/20) | USD | 100 | 104,120 | |||||||||
5.50%, 05/15/27 (Call 05/15/22) | USD | 125 | 132,031 | |||||||||
5.88%, 09/15/26 (Call 09/15/21) | USD | 125 | 132,649 | |||||||||
6.50%, 12/15/26 (Call 12/15/21) | USD | 200 | 216,489 | |||||||||
Uniti Group LP/Uniti Fiber Holdings Inc./CSL Capital LLC, 7.13%, 12/15/24 | USD | 75 | 62,438 | |||||||||
Uniti Group LP/Uniti Group Finance Inc./CSL Capital LLC | USD | 100 | 95,292 | |||||||||
8.25%, 10/15/23 (Call 12/02/19) | USD | 175 | 150,062 | |||||||||
Univision Communications Inc. | USD | 200 | 200,459 | |||||||||
5.13%, 02/15/25 (Call 02/15/20)(a)(c) | USD | 200 | 195,462 | |||||||||
USA Compression Partners LP/USA Compression Finance Corp. | ||||||||||||
6.88%, 04/01/26 (Call 04/01/21) | USD | 100 | 100,246 | |||||||||
6.88%, 09/01/27 (Call 09/01/22)(a) | USD | 105 | 105,656 | |||||||||
Valaris PLC, 7.75%, 02/01/26 (Call 11/01/25)(c) | USD | 150 | 78,750 | |||||||||
Vector Group Ltd., 6.13%, 02/01/25 (Call 02/01/20)(a) | USD | 125 | 120,013 | |||||||||
VeriSign Inc. | USD | 100 | 101,805 | |||||||||
4.75%, 07/15/27 (Call 07/15/22) | USD | 125 | 132,187 | |||||||||
| Security | Par (000) | Value | ||||||||||
| United States (continued) | ||||||||||||
5.25%, 04/01/25 (Call 01/01/25) | USD | 75 | $ | 82,299 | ||||||||
Veritas U.S. Inc./Veritas Bermuda Ltd., 10.50%, 02/01/24 (Call 11/12/19)(a)(c) | USD | 200 | 189,000 | |||||||||
Verscend Escrow Corp., 9.75%, 08/15/26 (Call 08/15/21)(a) | USD | 250 | 266,836 | |||||||||
Vertiv Group Corp., 9.25%, 10/15/24 (Call 12/02/19)(a) | USD | 125 | 117,812 | |||||||||
Viacom Inc. | USD | 100 | 104,073 | |||||||||
6.25%, 02/28/57 (Call 02/28/27)(c)(d) | USD | 100 | 109,050 | |||||||||
ViaSat Inc. | USD | 100 | 101,745 | |||||||||
5.63%, 04/15/27 (Call 04/15/22)(a) | USD | 105 | 110,787 | |||||||||
Viking Cruises Ltd., 5.88%, 09/15/27 (Call 09/15/22)(a) | USD | 125 | 132,844 | |||||||||
Vistra Energy Corp., 5.88%, 06/01/23 (Call 12/02/19) | USD | 75 | 76,651 | |||||||||
Vistra Operations Co. LLC | USD | 155 | 160,619 | |||||||||
5.50%, 09/01/26 (Call 09/01/21)(a)(c) | USD | 175 | 184,707 | |||||||||
5.63%, 02/15/27 (Call 02/15/22)(a) | USD | 200 | 212,552 | |||||||||
VOC Escrow Ltd., 5.00%, 02/15/28 (Call 02/15/23)(a) | USD | 100 | 104,187 | |||||||||
Washington Prime Group LP, 6.45%, 08/15/24 (Call 06/15/24)(c) | USD | 100 | 96,000 | |||||||||
WellCare Health Plans Inc. | USD | 150 | 157,172 | |||||||||
5.38%, 08/15/26 (Call 08/15/21)(a) | USD | 110 | 117,370 | |||||||||
West Corp., 8.50%, 10/15/25 (Call 10/15/20)(a)(c) | USD | 175 | 132,473 | |||||||||
Western Digital Corp., 4.75%, 02/15/26 (Call 11/15/25)(c) | USD | 350 | 357,426 | |||||||||
Whiting Petroleum Corp. | USD | 125 | 117,500 | |||||||||
6.25%, 04/01/23 (Call 01/01/23) | USD | 50 | 36,250 | |||||||||
6.63%, 01/15/26 (Call 10/15/25)(c) | USD | 175 | 108,496 | |||||||||
William Lyon Homes Inc., 5.88%, 01/31/25 (Call 01/31/20) | USD | 100 | 102,014 | |||||||||
WMG Acquisition Corp., 4.13%, 11/01/24 (Call 11/12/19)(b) | EUR | 90 | 103,501 | |||||||||
WPX Energy Inc. | USD | 75 | 75,750 | |||||||||
5.25%, 10/15/27 (Call 10/15/22) | USD | 90 | 87,525 | |||||||||
5.75%, 06/01/26 (Call 06/01/21) | USD | 75 | 75,716 | |||||||||
8.25%, 08/01/23 (Call 06/01/23) | USD | 43 | 47,945 | |||||||||
WR Grace & Co.-Conn, 5.13%, 10/01/21(a) | USD | 100 | 103,775 | |||||||||
Wyndham Destinations Inc. | USD | 38 | 38,421 | |||||||||
4.25%, 03/01/22 (Call 12/01/21) | USD | 106 | 108,385 | |||||||||
5.75%, 04/01/27 (Call 01/01/27) | USD | 50 | 54,755 | |||||||||
Wynn Las Vegas LLC/Wynn Las Vegas Capital Corp. | USD | 75 | 77,674 | |||||||||
5.25%, 05/15/27 (Call 02/15/27)(a)(c) | USD | 125 | 130,376 | |||||||||
5.50%, 03/01/25 (Call 12/01/24)(a) | USD | 275 | 291,920 | |||||||||
Xerox Corp. | USD | 150 | 153,393 | |||||||||
4.50%, 05/15/21 | USD | 150 | 153,844 | |||||||||
XPO Logistics Inc. | USD | 125 | 129,053 | |||||||||
6.50%, 06/15/22 (Call 12/02/19)(a) | USD | 175 | 178,542 | |||||||||
6.75%, 08/15/24 (Call 08/15/21)(a) | USD | 125 | 135,742 | |||||||||
Yum! Brands Inc., 4.75%, 01/15/30 (Call 10/15/29)(a) | USD | 95 | 99,493 | |||||||||
Zayo Group LLC/Zayo Capital Inc. | USD | 300 | 305,475 | |||||||||
6.00%, 04/01/23 (Call 12/02/19)(c) | USD | 200 | 205,702 | |||||||||
| 54 | 2019ISHARES ANNUAL REPORTTO SHAREHOLDERS |
Schedule of Investments (continued) October 31, 2019 | iShares® US & Intl High Yield Corp Bond ETF (Percentages shown are based on Net Assets) |
| Security | Par/ Shares | Value | ||||||||||
| United States (continued) | ||||||||||||
6.38%, 05/15/25 (Call 05/15/20)(c) | USD | 125 | $ | 128,466 | ||||||||
|
| |||||||||||
| 115,417,393 | ||||||||||||
|
| |||||||||||
Total Corporate Bonds & Notes — 97.7% |
| 172,351,335 | ||||||||||
|
| |||||||||||
Common Stocks |
| |||||||||||
| United Kingdom — 0.0% | ||||||||||||
New Look Retails Holdings Ltd.(j) | 53 | 862 | ||||||||||
|
| |||||||||||
Total Common Stocks — 0.0% |
| 862 | ||||||||||
|
| |||||||||||
Preferred Stocks |
| |||||||||||
| United States — 0.0% | ||||||||||||
MYT Holding Co.10.00%, 06/07/29(a) | 17 | 14,204 | ||||||||||
|
| |||||||||||
Total Preferred Stocks — 0.0% | 14,204 | |||||||||||
|
| |||||||||||
Short-Term Investments |
| |||||||||||
| Money Market Funds — 13.5% | ||||||||||||
BlackRock Cash Funds: Institutional, | 20,898 | 20,908,212 | ||||||||||
BlackRock Cash Funds: Treasury, | 2,846 | 2,846,000 | ||||||||||
|
| |||||||||||
| 23,754,212 | ||||||||||||
|
| |||||||||||
Total Short-Term Investments — 13.5% |
| 23,754,212 | ||||||||||
|
| |||||||||||
Total Investments in Securities — 111.2% |
| 196,120,613 | ||||||||||
Other Assets, Less Liabilities — (11.2)% |
| (19,820,312 | ) | |||||||||
|
| |||||||||||
Net Assets — 100.0% |
| $ | 176,300,301 | |||||||||
|
| |||||||||||
| (a) | Security exempt from registration pursuant to Rule 144A under the Securities Act of 1933, as amended. These securities may be resold in transactions exempt from registration to qualified institutional investors. |
| (b) | This security may be resold to qualified foreign investors and foreign institutional buyers under Regulation S of the Securities Act of 1933. |
| (c) | All or a portion of this security is on loan. |
| (d) | Security is issued at a fixed coupon rate, which converts to a variable rate at a specified date. |
| (e) | Issuer filed for bankruptcy and/or is in default. |
| (f) | Rounds to less than 1,000. |
| (g) | Rounds to less than $1. |
| (h) | Step coupon security. Coupon rate will either increase(step-up bond) or decrease (step-down bond) at regular intervals until maturity. Interest rate shown reflects the rate currently in effect. |
| (i) | Perpetual security with no stated maturity date. |
| (j) | Security is valued using significant unobservable inputs and is classified as Level 3 in the fair value hierarchy. |
| (k) | Affiliate of the Fund. |
| (l) | Annualized7-day yield as ofperiod-end. |
| (m) | All or a portion of this security was purchased with cash collateral received from loaned securities. |
Affiliates
Investments in issuers considered to be affiliates of the Fund during the year ended October 31, 2019, for purposes of Section 2(a)(3) of the 1940 Act, were as follows:
| ||||||||||||||||||||||||||||
| Shares Held at 10/31/18 | Net Activity | Shares Held at 10/31/19 | Value at | Net Realized | Change in Unrealized Appreciation | |||||||||||||||||||||||
| Affiliated Issuer | (000) | (000) | (000) | 10/31/19 | Income | Gain (Loss) | (a) | (Depreciation) | ||||||||||||||||||||
| ||||||||||||||||||||||||||||
BlackRock Cash Funds: Institutional, | 38,617 | (17,719 | ) | 20,898 | $ | 20,908,212 | $ | 141,367 | (b) | $ | 1,733 | $ | 4,787 | |||||||||||||||
BlackRock Cash Funds: Treasury, | 2,804 | 42 | 2,846 | 2,846,000 | 30,711 | — | — | |||||||||||||||||||||
|
|
|
|
|
|
|
| |||||||||||||||||||||
| $ | 23,754,212 | $ | 172,078 | $ | 1,733 | $ | 4,787 | |||||||||||||||||||||
|
|
|
|
|
|
|
| |||||||||||||||||||||
| (a) | Includes realized capital gain distributions from an affiliated fund, if any. |
| (b) | Includes securities lending income earned from the reinvestment of cash collateral from loaned securities (excluding collateral investment fees), net of fees and other payments to and from borrowers of securities, and less fees paid to BTC as securities lending agent. |
Fair Value Measurements
Various inputs are used in determining the fair value of financial instruments. For description of the input levels and information about the Fund’s policy regarding valuation of financial instruments, refer to the Notes to Financial Statements.
| SCHEDULES OF INVESTMENTS | 55 |
Schedule of Investments (continued) October 31, 2019 | iShares® US & Intl High Yield Corp Bond ETF |
Fair Value Measurements (continued)
The following table summarizes the value of the Fund’s investments according to the fair value hierarchy as of October 31, 2019. The breakdown of the Fund’s investments into major categories is disclosed in the Schedule of Investments above.
| ||||||||||||||||
| Level 1 | Level 2 | Level 3 | Total | |||||||||||||
| ||||||||||||||||
Investments | ||||||||||||||||
Assets | ||||||||||||||||
Corporate Bonds & Notes | $ | — | $ | 172,351,335 | $ | — | $ | 172,351,335 | ||||||||
Common Stocks | — | — | 862 | 862 | ||||||||||||
Preferred Stocks | 14,204 | — | — | 14,204 | ||||||||||||
Money Market Funds | 23,754,212 | — | — | 23,754,212 | ||||||||||||
|
|
|
|
|
|
|
| |||||||||
| $ | 23,768,416 | $ | 172,351,335 | $ | 862 | $ | 196,120,613 | |||||||||
|
|
|
|
|
|
|
| |||||||||
See notes to financial statements.
| 56 | 2019ISHARES ANNUAL REPORTTO SHAREHOLDERS |
Statements of Assets and Liabilities
October 31, 2019
| iShares Emerging Markets High Yield Bond ETF | iShares International High Yield Bond ETF | iShares J.P. Morgan EM Corporate | iShares J.P. Morgan Bond ETF | |||||||||||||
| ||||||||||||||||
ASSETS | ||||||||||||||||
Investments in securities, at value (including securities on loan)(a): | ||||||||||||||||
Unaffiliated(b) | $ | 326,537,694 | $ | 40,660,253 | $ | 163,147,623 | $ | 520,680,304 | ||||||||
Affiliated(c) | 3,849,000 | 14,000 | 18,969,365 | 6,933,000 | ||||||||||||
Cash | 925 | 661 | 472 | 756 | ||||||||||||
Foreign currency, at value(d) | — | 724,082 | — | 3,611,650 | ||||||||||||
Receivables: | ||||||||||||||||
Investments sold | 5,672,114 | 845,570 | 2,096,454 | 11,988,854 | ||||||||||||
Securities lending income — Affiliated | — | — | 6,229 | — | ||||||||||||
Capital shares sold | — | — | 3,000,748 | 7,991,931 | ||||||||||||
Dividends | 5,056 | 20 | 3,050 | 10,194 | ||||||||||||
Interest | 4,801,985 | 544,839 | 1,815,125 | 9,462,872 | ||||||||||||
|
|
|
|
|
|
|
| |||||||||
Total assets | 340,866,774 | 42,789,425 | 189,039,066 | 560,679,561 | ||||||||||||
|
|
|
|
|
|
|
| |||||||||
LIABILITIES | ||||||||||||||||
Collateral on securities loaned, at value | — | — | 17,277,732 | — | ||||||||||||
Deferred foreign capital gain tax | — | — | — | 407,277 | ||||||||||||
Payables: | ||||||||||||||||
Investments purchased | 7,347,631 | 1,937,397 | 5,009,384 | 7,996,059 | ||||||||||||
Capital shares redeemed | — | — | — | 16,054,210 | ||||||||||||
Investment advisory fees | 140,989 | 13,713 | 67,141 | 144,044 | ||||||||||||
|
|
|
|
|
|
|
| |||||||||
Total liabilities | 7,488,620 | 1,951,110 | 22,354,257 | 24,601,590 | ||||||||||||
|
|
|
|
|
|
|
| |||||||||
NET ASSETS | $ | 333,378,154 | $ | 40,838,315 | $ | 166,684,809 | $ | 536,077,971 | ||||||||
|
|
|
|
|
|
|
| |||||||||
NET ASSETS CONSIST OF: | ||||||||||||||||
Paid-in capital | $ | 377,215,324 | $ | 47,086,679 | $ | 163,300,867 | $ | 574,401,731 | ||||||||
Accumulated earnings (loss) | (43,837,170 | ) | (6,248,364 | ) | 3,383,942 | (38,323,760 | ) | |||||||||
|
|
|
|
|
|
|
| |||||||||
NET ASSETS | $ | 333,378,154 | $ | 40,838,315 | $ | 166,684,809 | $ | 536,077,971 | ||||||||
|
|
|
|
|
|
|
| |||||||||
Shares outstanding | 7,150,000 | 800,000 | 3,250,000 | 11,800,000 | ||||||||||||
|
|
|
|
|
|
|
| |||||||||
Net asset value | $ | 46.63 | $ | 51.05 | $ | 51.29 | $ | 45.43 | ||||||||
|
|
|
|
|
|
|
| |||||||||
Shares authorized | 500 million | 500 million | 500 million | 500 million | ||||||||||||
|
|
|
|
|
|
|
| |||||||||
Par value | $ | 0.001 | $ | 0.001 | $ | 0.001 | $ | 0.001 | ||||||||
|
|
|
|
|
|
|
| |||||||||
(a) Securities loaned, at value | $ | — | $ | — | $ | 15,800,812 | $ | — | ||||||||
(b) Investments, at cost — Unaffiliated | $ | 342,395,574 | $ | 43,026,261 | $ | 159,745,387 | $ | 547,320,941 | ||||||||
(c) Investments, at cost — Affiliated | $ | 3,849,000 | $ | 14,000 | $ | 18,966,605 | $ | 6,933,000 | ||||||||
(d) Foreign currency, at cost | $ | — | $ | 712,423 | $ | — | $ | 3,589,579 | ||||||||
See notes to financial statements.
| FINANCIAL STATEMENTS | 57 |
Statements of Assets and Liabilities (continued)
October 31, 2019
iShares US & Intl High Yield Corp Bond ETF | ||||
| ||||
ASSETS | ||||
Investments in securities, at value (including securities on loan)(a): | ||||
Unaffiliated(b) | $ | 172,366,401 | ||
Affiliated(c) | 23,754,212 | |||
Foreign currency, at value(d) | 463,785 | |||
Receivables: | ||||
Investments sold | 3,276,691 | |||
Securities lending income — Affiliated | 10,029 | |||
Dividends | 3,277 | |||
Interest | 2,553,671 | |||
|
| |||
Total assets | 202,428,066 | |||
|
| |||
LIABILITIES | ||||
Bank overdraft | 56 | |||
Collateral on securities loaned, at value | 20,897,912 | |||
Payables: | ||||
Investments purchased | 5,170,179 | |||
Investment advisory fees | 59,618 | |||
|
| |||
Total liabilities | 26,127,765 | |||
|
| |||
NET ASSETS | $ | 176,300,301 | ||
|
| |||
NET ASSETS CONSIST OF: | ||||
Paid-in capital | $ | 182,217,754 | ||
Accumulated loss | (5,917,453 | ) | ||
|
| |||
NET ASSETS | $ | 176,300,301 | ||
|
| |||
Shares outstanding | 3,600,000 | |||
|
| |||
Net asset value | $ | 48.97 | ||
|
| |||
Shares authorized | 500 million | |||
|
| |||
Par value | $ | 0.001 | ||
|
| |||
(a) Securities loaned, at value | $ | 20,049,243 | ||
(b) Investments, at cost — Unaffiliated | $ | 173,888,723 | ||
(c) Investments, at cost — Affiliated | $ | 23,744,336 | ||
(d) Foreign currency, at cost | $ | 454,207 | ||
See notes to financial statements.
| 58 | 2019ISHARES ANNUAL REPORTTO SHAREHOLDERS |
Year Ended October 31, 2019
iShares Emerging Markets High Yield Bond ETF | iShares International High Yield Bond ETF | iShares J.P. Morgan Corporate | iShares J.P. Morgan Bond ETF | |||||||||||||
| ||||||||||||||||
INVESTMENT INCOME | ||||||||||||||||
Dividends — Affiliated | $ | 46,809 | $ | 628 | $ | 21,615 | $ | 65,547 | ||||||||
Interest — Unaffiliated | 20,214,217 | 1,642,112 | 5,275,826 | 38,803,716 | ||||||||||||
Securities lending income — Affiliated — net | — | — | 47,017 | — | ||||||||||||
Other income — Unaffiliated | 39,635 | 1,199 | 3,750 | — | ||||||||||||
Foreign taxes withheld | — | — | — | (309,384 | ) | |||||||||||
Other foreign taxes | — | — | — | (645 | ) | |||||||||||
|
|
|
|
|
|
|
| |||||||||
Total investment income | 20,300,661 | 1,643,939 | 5,348,208 | 38,559,234 | ||||||||||||
|
|
|
|
|
|
|
| |||||||||
EXPENSES | ||||||||||||||||
Investment advisory fees | 1,623,871 | 191,658 | 533,235 | 1,594,693 | ||||||||||||
|
|
|
|
|
|
|
| |||||||||
Total expenses | 1,623,871 | 191,658 | 533,235 | 1,594,693 | ||||||||||||
|
|
|
|
|
|
|
| |||||||||
Net investment income | 18,676,790 | 1,452,281 | 4,814,973 | 36,964,541 | ||||||||||||
|
|
|
|
|
|
|
| |||||||||
REALIZED AND UNREALIZED GAIN (LOSS) | ||||||||||||||||
Net realized gain (loss) from: | ||||||||||||||||
Investments — Unaffiliated(a) | (2,772,461 | ) | (1,584,613 | ) | (178,856 | ) | (23,255,278 | ) | ||||||||
Investments — Affiliated | — | — | 371 | — | ||||||||||||
In-kind redemptions — Unaffiliated | (13,276,521 | ) | (1,738,978 | ) | 85,215 | (153,263 | ) | |||||||||
Forward foreign currency exchange contracts | — | — | — | 890,901 | ||||||||||||
Foreign currency transactions | — | (92,065 | ) | — | (1,845,939 | ) | ||||||||||
|
|
|
|
|
|
|
| |||||||||
Net realized loss | (16,048,982 | ) | (3,415,656 | ) | (93,270 | ) | (24,363,579 | ) | ||||||||
|
|
|
|
|
|
|
| |||||||||
Net change in unrealized appreciation (depreciation) on: | ||||||||||||||||
Investments — Unaffiliated(b) | 26,046,919 | 3,580,454 | 7,347,333 | 19,528,241 | ||||||||||||
Investments — Affiliated | — | — | 2,245 | — | ||||||||||||
Foreign currency translations | — | 66,938 | — | 94,326 | ||||||||||||
|
|
|
|
|
|
|
| |||||||||
Net change in unrealized appreciation (depreciation) | 26,046,919 | 3,647,392 | 7,349,578 | 19,622,567 | ||||||||||||
|
|
|
|
|
|
|
| |||||||||
Net realized and unrealized gain (loss) | 9,997,937 | 231,736 | 7,256,308 | (4,741,012 | ) | |||||||||||
|
|
|
|
|
|
|
| |||||||||
NET INCREASE IN NET ASSETS RESULTING FROM OPERATIONS | $ | 28,674,727 | $ | 1,684,017 | $ | 12,071,281 | $ | 32,223,529 | ||||||||
|
|
|
|
|
|
|
| |||||||||
(a) Net of foreign capital gain tax of | $ | — | $ | — | $ | — | $ | 88,337 | ||||||||
(b) Net of deferred foreign capital gain tax of | $ | — | $ | — | $ | — | $ | 404,612 | ||||||||
See notes to financial statements.
| FINANCIAL STATEMENTS | 59 |
Statements of Operations (continued)
Year Ended October 31, 2019
iShares US & Intl High Yield Corp Bond ETF | ||||
| ||||
INVESTMENT INCOME | ||||
Dividends — Affiliated | $ | 30,711 | ||
Interest — Unaffiliated | 9,237,202 | |||
Securities lending income — Affiliated — net | 141,367 | |||
Other income — Unaffiliated | 4,809 | |||
|
| |||
Total investment income | 9,414,089 | |||
|
| |||
EXPENSES | ||||
Investment advisory fees | 694,909 | |||
|
| |||
Total expenses | 694,909 | |||
|
| |||
Net investment income | 8,719,180 | |||
|
| |||
REALIZED AND UNREALIZED GAIN (LOSS) | ||||
Net realized gain (loss) from: | ||||
Investments — Unaffiliated | (1,877,898 | ) | ||
Investments — Affiliated | 1,733 | |||
In-kind redemptions — Unaffiliated | (3,298,460 | ) | ||
Foreign currency transactions | (71,670 | ) | ||
|
| |||
Net realized loss | (5,246,295 | ) | ||
|
| |||
Net change in unrealized appreciation (depreciation) on: | ||||
Investments — Unaffiliated | 7,411,886 | |||
Investments — Affiliated | 4,787 | |||
Foreign currency translations | 50,262 | |||
|
| |||
Net change in unrealized appreciation (depreciation) | 7,466,935 | |||
|
| |||
Net realized and unrealized gain | 2,220,640 | |||
|
| |||
NET INCREASE IN NET ASSETS RESULTING FROM OPERATIONS | $ | 10,939,820 | ||
|
| |||
See notes to financial statements.
| 60 | 2019ISHARES ANNUAL REPORTTO SHAREHOLDERS |
Statements of Changes in Net Assets
| iShares Emerging Markets High Yield Bond ETF | iShares International High Yield Bond ETF | |||||||||||||||||||||||||||||||
| Year Ended 10/31/19 | Year Ended 10/31/18 | Year Ended 10/31/19 | Year Ended 10/31/18 | |||||||||||||||||||||||||||||
| ||||||||||||||||||||||||||||||||
INCREASE (DECREASE) IN NET ASSETS | ||||||||||||||||||||||||||||||||
OPERATIONS | ||||||||||||||||||||||||||||||||
Net investment income | $ | 18,676,790 | $ | 28,721,946 | $ | 1,452,281 | $ | 2,770,717 | ||||||||||||||||||||||||
Net realized loss | (16,048,982 | ) | (15,349,658 | ) | (3,415,656 | ) | (1,464,166 | ) | ||||||||||||||||||||||||
Net change in unrealized appreciation (depreciation) | 26,046,919 | (47,772,345 | ) | 3,647,392 | (6,024,377 | ) | ||||||||||||||||||||||||||
|
|
|
|
|
|
|
| |||||||||||||||||||||||||
Net increase (decrease) in net assets resulting from operations | 28,674,727 | (34,400,057 | ) | 1,684,017 | (4,717,826 | ) | ||||||||||||||||||||||||||
|
|
|
|
|
|
|
| |||||||||||||||||||||||||
DISTRIBUTIONS TO SHAREHOLDERS(a) | ||||||||||||||||||||||||||||||||
Decrease in net assets resulting from distributions to shareholders | (22,615,509 | ) | (27,754,319 | ) | (1,938,517 | ) | — | |||||||||||||||||||||||||
|
|
|
|
|
|
|
| |||||||||||||||||||||||||
CAPITAL SHARE TRANSACTIONS | ||||||||||||||||||||||||||||||||
Net decrease in net assets derived from capital share transactions | (71,222,529 | ) | (164,171,431 | ) | (24,764,950 | ) | (19,584,391 | ) | ||||||||||||||||||||||||
|
|
|
|
|
|
|
| |||||||||||||||||||||||||
NET ASSETS | ||||||||||||||||||||||||||||||||
Total decrease in net assets | (65,163,311 | ) | (226,325,807 | ) | (25,019,450 | ) | (24,302,217 | ) | ||||||||||||||||||||||||
Beginning of year | 398,541,465 | 624,867,272 | 65,857,765 | 90,159,982 | ||||||||||||||||||||||||||||
|
|
|
|
|
|
|
| |||||||||||||||||||||||||
End of year | $ | 333,378,154 | $ | 398,541,465 | $ | 40,838,315 | $ | 65,857,765 | ||||||||||||||||||||||||
|
|
|
|
|
|
|
| |||||||||||||||||||||||||
| (a) | Distributions for annual periods determined in accordance with U.S. federal income tax regulations. |
See notes to financial statements.
| FINANCIAL STATEMENTS | 61 |
Statements of Changes in Net Assets (continued)
| iShares J.P. Morgan EM Corporate Bond ETF | iShares J.P. Morgan EM Local Currency Bond ETF | |||||||||||||||||||||||||||||||
| Year Ended 10/31/19 | Year Ended 10/31/18 | Year Ended 10/31/19 | Year Ended 10/31/18 | |||||||||||||||||||||||||||||
| ||||||||||||||||||||||||||||||||
INCREASE (DECREASE) IN NET ASSETS | ||||||||||||||||||||||||||||||||
OPERATIONS | ||||||||||||||||||||||||||||||||
Net investment income | $ | 4,814,973 | $ | 3,660,887 | $ | 36,964,541 | $ | 23,465,098 | ||||||||||||||||||||||||
Net realized loss | (93,270 | ) | (1,093,675 | ) | (24,363,579 | ) | (22,455,298 | ) | ||||||||||||||||||||||||
Net change in unrealized appreciation (depreciation) | 7,349,578 | (5,355,536 | ) | 19,622,567 | (39,280,027 | ) | ||||||||||||||||||||||||||
|
|
|
|
|
|
|
| |||||||||||||||||||||||||
Net increase (decrease) in net assets resulting from operations | 12,071,281 | (2,788,324 | ) | 32,223,529 | (38,270,227 | ) | ||||||||||||||||||||||||||
|
|
|
|
|
|
|
| |||||||||||||||||||||||||
DISTRIBUTIONS TO SHAREHOLDERS(a) | ||||||||||||||||||||||||||||||||
Decrease in net assets resulting from distributions to shareholders | (4,625,003 | ) | (3,577,391 | ) | (14,295,840 | ) | — | |||||||||||||||||||||||||
|
|
|
|
|
|
|
| |||||||||||||||||||||||||
CAPITAL SHARE TRANSACTIONS | ||||||||||||||||||||||||||||||||
Net increase (decrease) in net assets derived from capital share transactions | 87,723,168 | (9,387,512 | ) | 94,418,220 | 152,785,390 | |||||||||||||||||||||||||||
|
|
|
|
|
|
|
| |||||||||||||||||||||||||
NET ASSETS | ||||||||||||||||||||||||||||||||
Total increase (decrease) in net assets | 95,169,446 | (15,753,227 | ) | 112,345,909 | 114,515,163 | |||||||||||||||||||||||||||
Beginning of year | 71,515,363 | 87,268,590 | 423,732,062 | 309,216,899 | ||||||||||||||||||||||||||||
|
|
|
|
|
|
|
| |||||||||||||||||||||||||
End of year | $ | 166,684,809 | $ | 71,515,363 | $ | 536,077,971 | $ | 423,732,062 | ||||||||||||||||||||||||
|
|
|
|
|
|
|
| |||||||||||||||||||||||||
| (a) | Distributions for annual periods determined in accordance with U.S. federal income tax regulations. |
See notes to financial statements.
| 62 | 2019ISHARES ANNUAL REPORTTO SHAREHOLDERS |
Statements of Changes in Net Assets (continued)
| iShares US & Intl High Yield Corp Bond ETF | ||||||||||||
| Year Ended 10/31/19 | Year Ended 10/31/18 | |||||||||||
| ||||||||||||
INCREASE (DECREASE) IN NET ASSETS | ||||||||||||
OPERATIONS | ||||||||||||
Net investment income | $ | 8,719,180 | $ | 10,899,570 | ||||||||
Net realized gain (loss) | (5,246,295 | ) | 1,032,242 | |||||||||
Net change in unrealized appreciation (depreciation) | 7,466,935 | (13,646,920 | ) | |||||||||
|
|
|
| |||||||||
Net increase (decrease) in net assets resulting from operations | 10,939,820 | (1,715,108 | ) | |||||||||
|
|
|
| |||||||||
DISTRIBUTIONS TO SHAREHOLDERS(a) | ||||||||||||
Decrease in net assets resulting from distributions to shareholders | (9,914,724 | ) | (11,429,826 | ) | ||||||||
|
|
|
| |||||||||
CAPITAL SHARE TRANSACTIONS | ||||||||||||
Net increase (decrease) in net assets derived from capital share transactions | (36,077,886 | ) | 10,395,402 | |||||||||
|
|
|
| |||||||||
NET ASSETS | ||||||||||||
Total decrease in net assets | (35,052,790 | ) | (2,749,532 | ) | ||||||||
Beginning of year | 211,353,091 | 214,102,623 | ||||||||||
|
|
|
| |||||||||
End of year | $ | 176,300,301 | $ | 211,353,091 | ||||||||
|
|
|
| |||||||||
| (a) | Distributions for annual periods determined in accordance with U.S. federal income tax regulations. |
See notes to financial statements.
| FINANCIAL STATEMENTS | 63 |
(For a share outstanding throughout each period)
iShares Emerging Markets High Yield Bond ETF | ||||||||||||||||||||||||||||||||
| Year Ended 10/31/19 | Year Ended 10/31/18 | Year Ended 10/31/17 | Year Ended 10/31/16 | Year Ended 10/31/15 | ||||||||||||||||||||||||||||
| ||||||||||||||||||||||||||||||||
Net asset value, beginning of year | $ | 45.29 | $ | 50.60 | $ | 49.97 | $ | 46.82 | $ | 51.03 | ||||||||||||||||||||||
|
|
|
|
|
|
|
|
|
| |||||||||||||||||||||||
Net investment income(a) | 2.66 | 2.44 | 2.87 | 3.03 | 2.99 | |||||||||||||||||||||||||||
Net realized and unrealized gain (loss)(b) | 1.93 | (5.40 | ) | 0.77 | 3.25 | (4.11 | ) | |||||||||||||||||||||||||
|
|
|
|
|
|
|
|
|
| |||||||||||||||||||||||
Net increase (decrease) from investment operations | 4.59 | (2.96 | ) | 3.64 | 6.28 | (1.12 | ) | |||||||||||||||||||||||||
|
|
|
|
|
|
|
|
|
| |||||||||||||||||||||||
Distributions(c) | ||||||||||||||||||||||||||||||||
From net investment income | (3.25 | ) | (2.35 | ) | (3.01 | ) | (3.13 | ) | (3.09 | ) | ||||||||||||||||||||||
|
|
|
|
|
|
|
|
|
| |||||||||||||||||||||||
Total distributions | (3.25 | ) | (2.35 | ) | (3.01 | ) | (3.13 | ) | (3.09 | ) | ||||||||||||||||||||||
|
|
|
|
|
|
|
|
|
| |||||||||||||||||||||||
Net asset value, end of year | $ | 46.63 | $ | 45.29 | $ | 50.60 | $ | 49.97 | $ | 46.82 | ||||||||||||||||||||||
|
|
|
|
|
|
|
|
|
| |||||||||||||||||||||||
Total Return | ||||||||||||||||||||||||||||||||
Based on net asset value | 10.51 | % | (5.96 | )%(d) | 7.60 | % | 14.02 | % | (2.13 | )% | ||||||||||||||||||||||
|
|
|
|
|
|
|
|
|
| |||||||||||||||||||||||
Ratios to Average Net Assets | ||||||||||||||||||||||||||||||||
Total expenses | 0.50 | % | 0.50 | % | 0.50 | % | 0.50 | % | 0.55 | % | ||||||||||||||||||||||
|
|
|
|
|
|
|
|
|
| |||||||||||||||||||||||
Net investment income | 5.75 | % | 5.11 | % | 5.73 | % | 6.35 | % | 6.29 | % | ||||||||||||||||||||||
|
|
|
|
|
|
|
|
|
| |||||||||||||||||||||||
Supplemental Data | ||||||||||||||||||||||||||||||||
Net assets, end of year (000) | $ | 333,378 | $ | 398,541 | $ | 624,867 | $ | 107,431 | $ | 159,199 | ||||||||||||||||||||||
|
|
|
|
|
|
|
|
|
| |||||||||||||||||||||||
Portfolio turnover rate(e) | 32 | % | 19 | % | 25 | % | 29 | % | 39 | % | ||||||||||||||||||||||
|
|
|
|
|
|
|
|
|
| |||||||||||||||||||||||
| (a) | Based on average shares outstanding. |
| (b) | The amounts reported for a share outstanding may not accord with the change in aggregate gains and losses in securities for the fiscal period due to the timing of capital share transactions in relation to the fluctuating market values of the Fund’s underlying securities. |
| (c) | Distributions for annual periods determined in accordance with U.S. federal income tax regulations. |
| (d) | Includes payment received from an affiliate, which had no impact on the Fund’s total return. |
| (e) | Portfolio turnover rate excludesin-kind transactions. |
See notes to financial statements.
| 64 | 2019ISHARES ANNUAL REPORTTO SHAREHOLDERS |
Financial Highlights (continued)
(For a share outstanding throughout each period)
| iShares International High Yield Bond ETF | ||||||||||||||||||||||||||||||||
|
|
|
| |||||||||||||||||||||||||||||
| Year Ended 10/31/19 | Year Ended 10/31/18 | Year Ended 10/31/17 | Year Ended 10/31/16 | Year Ended 10/31/15 | ||||||||||||||||||||||||||||
| ||||||||||||||||||||||||||||||||
Net asset value, beginning of year | $ | 50.66 | $ | 53.04 | $ | 46.91 | $ | 46.44 | $ | 52.90 | ||||||||||||||||||||||
|
|
|
|
|
|
|
|
|
|
| ||||||||||||||||||||||
Net investment income(a) | 1.51 | 1.54 | 1.77 | 1.82 | 1.84 | |||||||||||||||||||||||||||
Net realized and unrealized gain (loss)(b) | 0.82 | (3.92 | ) | 4.85 | (0.47 | ) | (6.57 | ) | ||||||||||||||||||||||||
|
|
|
|
|
|
|
|
|
|
| ||||||||||||||||||||||
Net increase (decrease) from investment operations | 2.33 | (2.38 | ) | 6.62 | 1.35 | (4.73 | ) | |||||||||||||||||||||||||
|
|
|
|
|
|
|
|
|
|
| ||||||||||||||||||||||
Distributions(c) | ||||||||||||||||||||||||||||||||
From net investment income | (1.94 | ) | — | (0.40 | ) | (0.26 | ) | (0.05 | ) | |||||||||||||||||||||||
From net realized gain | — | — | — | — | (0.02 | ) | ||||||||||||||||||||||||||
Return of capital | — | — | (0.09 | ) | (0.62 | ) | (1.66 | ) | ||||||||||||||||||||||||
|
|
|
|
|
|
|
|
|
|
| ||||||||||||||||||||||
Total distributions | (1.94 | ) | — | (0.49 | ) | (0.88 | ) | (1.73 | ) | |||||||||||||||||||||||
|
|
|
|
|
|
|
|
|
|
| ||||||||||||||||||||||
Net asset value, end of year | $ | 51.05 | $ | 50.66 | $ | 53.04 | $ | 46.91 | $ | 46.44 | ||||||||||||||||||||||
|
|
|
|
|
|
|
|
|
|
| ||||||||||||||||||||||
Total Return | ||||||||||||||||||||||||||||||||
Based on net asset value | 4.85 | % | (4.49 | )% | 14.21 | % | 2.95 | % | (9.02 | )% | ||||||||||||||||||||||
|
|
|
|
|
|
|
|
|
|
| ||||||||||||||||||||||
Ratios to Average Net Assets | ||||||||||||||||||||||||||||||||
Total expenses | 0.40 | % | 0.40 | % | 0.40 | % | 0.51 | % | 0.55 | % | ||||||||||||||||||||||
|
|
|
|
|
|
|
|
|
|
| ||||||||||||||||||||||
Total expenses after fees waived | 0.40 | % | 0.40 | % | 0.40 | % | 0.40 | % | 0.40 | % | ||||||||||||||||||||||
|
|
|
|
|
|
|
|
|
|
| ||||||||||||||||||||||
Net investment income | 3.03 | % | 2.87 | % | 3.62 | % | 3.93 | % | 3.85 | % | ||||||||||||||||||||||
|
|
|
|
|
|
|
|
|
|
| ||||||||||||||||||||||
Supplemental Data | ||||||||||||||||||||||||||||||||
Net assets, end of year (000) | $ | 40,838 | $ | 65,858 | $ | 90,160 | $ | 154,796 | $ | 185,756 | ||||||||||||||||||||||
|
|
|
|
|
|
|
|
|
|
| ||||||||||||||||||||||
Portfolio turnover rate(d) | 34 | % | 31 | % | 49 | % | 24 | % | 28 | % | ||||||||||||||||||||||
|
|
|
|
|
|
|
|
|
|
| ||||||||||||||||||||||
| (a) | Based on average shares outstanding. |
| (b) | The amounts reported for a share outstanding may not accord with the change in aggregate gains and losses in securities for the fiscal period due to the timing of capital share transactions in relation to the fluctuating market values of the Fund’s underlying securities. |
| (c) | Distributions for annual periods determined in accordance with U.S. federal income tax regulations. |
| (d) | Portfolio turnover rate excludesin-kind transactions. |
See notes to financial statements.
| FINANCIAL HIGHLIGHTS | 65 |
Financial Highlights (continued)
(For a share outstanding throughout each period)
iShares J.P. Morgan EM Corporate Bond ETF | ||||||||||||||||||||||||||||||||
| Year Ended 10/31/19 | Year Ended 10/31/18 | Year Ended 10/31/17 | Year Ended 10/31/16 | Year Ended 10/31/15 | ||||||||||||||||||||||||||||
| ||||||||||||||||||||||||||||||||
Net asset value, beginning of year | $ | 47.68 | $ | 51.33 | $ | 50.40 | $ | 48.21 | $ | 51.18 | ||||||||||||||||||||||
|
|
|
|
|
|
|
|
|
| |||||||||||||||||||||||
Net investment income(a) | 2.25 | 2.16 | 2.10 | 2.19 | 2.19 | |||||||||||||||||||||||||||
Net realized and unrealized gain (loss)(b) | 3.61 | (3.70 | ) | 0.90 | 2.18 | (3.02 | ) | |||||||||||||||||||||||||
|
|
|
|
|
|
|
|
|
| |||||||||||||||||||||||
Net increase (decrease) from investment operations | 5.86 | (1.54 | ) | 3.00 | 4.37 | (0.83 | ) | |||||||||||||||||||||||||
|
|
|
|
|
|
|
|
|
| |||||||||||||||||||||||
Distributions(c) | ||||||||||||||||||||||||||||||||
From net investment income | (2.25 | ) | (2.11 | ) | (2.07 | ) | (2.18 | ) | (2.14 | ) | ||||||||||||||||||||||
|
|
|
|
|
|
|
|
|
| |||||||||||||||||||||||
Total distributions | (2.25 | ) | (2.11 | ) | (2.07 | ) | (2.18 | ) | (2.14 | ) | ||||||||||||||||||||||
|
|
|
|
|
|
|
|
|
| |||||||||||||||||||||||
Net asset value, end of year | $ | 51.29 | $ | 47.68 | $ | 51.33 | $ | 50.40 | $ | 48.21 | ||||||||||||||||||||||
|
|
|
|
|
|
|
|
|
| |||||||||||||||||||||||
Total Return | ||||||||||||||||||||||||||||||||
Based on net asset value | 12.57 | % | (3.09 | )% | 6.14 | % | 9.33 | % | (1.62 | )% | ||||||||||||||||||||||
|
|
|
|
|
|
|
|
|
| |||||||||||||||||||||||
Ratios to Average Net Assets | ||||||||||||||||||||||||||||||||
Total expenses | 0.50 | % | 0.50 | % | 0.50 | % | 0.50 | % | 0.53 | % | ||||||||||||||||||||||
|
|
|
|
|
|
|
|
|
| |||||||||||||||||||||||
Net investment income | 4.51 | % | 4.37 | % | 4.16 | % | 4.51 | % | 4.47 | % | ||||||||||||||||||||||
|
|
|
|
|
|
|
|
|
| |||||||||||||||||||||||
Supplemental Data | ||||||||||||||||||||||||||||||||
Net assets, end of year (000) | $ | 166,685 | $ | 71,515 | $ | 87,269 | $ | 32,758 | $ | 28,929 | ||||||||||||||||||||||
|
|
|
|
|
|
|
|
|
| |||||||||||||||||||||||
Portfolio turnover rate(d) | 21 | % | 16 | % | 62 | % | 22 | % | 11 | % | ||||||||||||||||||||||
|
|
|
|
|
|
|
|
|
| |||||||||||||||||||||||
| (a) | Based on average shares outstanding. |
| (b) | The amounts reported for a share outstanding may not accord with the change in aggregate gains and losses in securities for the fiscal period due to the timing of capital share transactions in relation to the fluctuating market values of the Fund’s underlying securities. |
| (c) | Distributions for annual periods determined in accordance with U.S. federal income tax regulations. |
| (d) | Portfolio turnover rate excludesin-kind transactions. |
See notes to financial statements.
| 66 | 2019ISHARES ANNUAL REPORTTO SHAREHOLDERS |
Financial Highlights (continued)
(For a share outstanding throughout each period)
| iShares J.P. Morgan EM Local Currency Bond ETF | ||||||||||||||||||||||||||||||||||||||||
|
|
|
| |||||||||||||||||||||||||||||||||||||
| Year Ended 10/31/19 | Year Ended 10/31/18 | Year Ended 10/31/17 | Year Ended 10/31/16 | Year Ended 10/31/15 | ||||||||||||||||||||||||||||||||||||
| ||||||||||||||||||||||||||||||||||||||||
Net asset value, beginning of year | $ | 43.24 | $ | 46.85 | $ | 45.14 | $ | 41.31 | $ | 48.74 | ||||||||||||||||||||||||||||||
|
|
|
|
|
|
|
|
|
| |||||||||||||||||||||||||||||||
Net investment income(a) | 3.09 | 2.87 | 2.29 | 1.94 | 2.03 | |||||||||||||||||||||||||||||||||||
Net realized and unrealized gain (loss)(b) | 0.59 | (6.48 | ) | (0.58 | ) | 1.89 | (8.87 | ) | ||||||||||||||||||||||||||||||||
|
|
|
|
|
|
|
|
|
| |||||||||||||||||||||||||||||||
Net increase (decrease) from investment operations | 3.68 | (3.61 | ) | 1.71 | 3.83 | (6.84 | ) | |||||||||||||||||||||||||||||||||
|
|
|
|
|
|
|
|
|
| |||||||||||||||||||||||||||||||
Distributions(c) | ||||||||||||||||||||||||||||||||||||||||
From net investment income | (1.49 | ) | — | — | — | — | ||||||||||||||||||||||||||||||||||
Return of capital | — | — | — | — | (0.59 | ) | ||||||||||||||||||||||||||||||||||
|
|
|
|
|
|
|
|
|
| |||||||||||||||||||||||||||||||
Total distributions | (1.49 | ) | — | — | — | (0.59 | ) | |||||||||||||||||||||||||||||||||
|
|
|
|
|
|
|
|
|
| |||||||||||||||||||||||||||||||
Net asset value, end of year | $ | 45.43 | $ | 43.24 | $ | 46.85 | $ | 45.14 | $ | 41.31 | ||||||||||||||||||||||||||||||
|
|
|
|
|
|
|
|
|
| |||||||||||||||||||||||||||||||
Total Return | ||||||||||||||||||||||||||||||||||||||||
Based on net asset value | 8.75 | % | (7.71 | )% | 3.79 | % | 9.06 | %(d) | (13.99 | )%(d) | ||||||||||||||||||||||||||||||
|
|
|
|
|
|
|
|
|
| |||||||||||||||||||||||||||||||
Ratios to Average Net Assets | ||||||||||||||||||||||||||||||||||||||||
Total expenses | 0.30 | % | 0.42 | % | 0.50 | % | 0.50 | % | 0.53 | % | ||||||||||||||||||||||||||||||
|
|
|
|
|
|
|
|
|
| |||||||||||||||||||||||||||||||
Total expenses after fees waived | 0.30 | % | 0.41 | % | 0.50 | % | 0.50 | % | 0.50 | % | ||||||||||||||||||||||||||||||
|
|
|
|
|
|
|
|
|
| |||||||||||||||||||||||||||||||
Net investment income | 6.95 | % | 6.19 | % | 5.04 | % | 4.56 | % | 4.63 | % | ||||||||||||||||||||||||||||||
|
|
|
|
|
|
|
|
|
| |||||||||||||||||||||||||||||||
Supplemental Data | ||||||||||||||||||||||||||||||||||||||||
Net assets, end of year (000) | $ | 536,078 | $ | 423,732 | $ | 309,217 | $ | 451,410 | $ | 520,532 | ||||||||||||||||||||||||||||||
|
|
|
|
|
|
|
|
|
| |||||||||||||||||||||||||||||||
Portfolio turnover rate(e) | 44 | % | 51 | % | 97 | % | 59 | % | 46 | % | ||||||||||||||||||||||||||||||
|
|
|
|
|
|
|
|
|
| |||||||||||||||||||||||||||||||
| (a) | Based on average shares outstanding. |
| (b) | The amounts reported for a share outstanding may not accord with the change in aggregate gains and losses in securities for the fiscal period due to the timing of capital share transactions in relation to the fluctuating market values of the Fund’s underlying securities. |
| (c) | Distributions for annual periods determined in accordance with U.S. federal income tax regulations. |
| (d) | The total return disclosed is based on the net asset value (“NAV”) calculated daily for the creation and redemption of shares in the Fund, which may differ from the NAV calculated for financial reporting purposes. Based on the NAV calculated for financial reporting purposes, the total return for the years ended October 31, 2016 and October 31, 2015 were 9.27% and (14.16)%, respectively. |
| (e) | Portfolio turnover rate excludesin-kind transactions. |
See notes to financial statements.
| FINANCIAL HIGHLIGHTS | 67 |
Financial Highlights (continued)
(For a share outstanding throughout each period)
iShares US & Intl High Yield Corp Bond ETF | ||||||||||||||||||||||||||||||||
| Year Ended 10/31/19 | Year Ended 10/31/18 | Year Ended 10/31/17 | Year Ended 10/31/16 | Year Ended 10/31/15 | ||||||||||||||||||||||||||||
| ||||||||||||||||||||||||||||||||
Net asset value, beginning of year | $ | 48.03 | $ | 50.98 | $ | 48.77 | $ | 47.57 | $ | 52.00 | ||||||||||||||||||||||
|
|
|
|
|
|
|
|
|
| |||||||||||||||||||||||
Net investment income(a) | 2.42 | 2.46 | 2.45 | 2.55 | 2.56 | |||||||||||||||||||||||||||
Net realized and unrealized gain (loss)(b) | 1.17 | (2.80 | ) | 2.08 | 0.57 | (4.76 | ) | |||||||||||||||||||||||||
|
|
|
|
|
|
|
|
|
| |||||||||||||||||||||||
Net increase (decrease) from investment operations | 3.59 | (0.34 | ) | 4.53 | 3.12 | (2.20 | ) | |||||||||||||||||||||||||
|
|
|
|
|
|
|
|
|
| |||||||||||||||||||||||
Distributions(c) | ||||||||||||||||||||||||||||||||
From net investment income | (2.65 | ) | (2.61 | ) | (2.32 | ) | (1.92 | ) | (2.23 | ) | ||||||||||||||||||||||
|
|
|
|
|
|
|
|
|
| |||||||||||||||||||||||
Total distributions | (2.65 | ) | (2.61 | ) | (2.32 | ) | (1.92 | ) | (2.23 | ) | ||||||||||||||||||||||
|
|
|
|
|
|
|
|
|
| |||||||||||||||||||||||
Net asset value, end of year | $ | 48.97 | $ | 48.03 | $ | 50.98 | $ | 48.77 | $ | 47.57 | ||||||||||||||||||||||
|
|
|
|
|
|
|
|
|
| |||||||||||||||||||||||
Total Return | ||||||||||||||||||||||||||||||||
Based on net asset value | 7.74 | % | (0.71 | )% | 9.58 | % | 6.82 | % | (4.32 | )% | ||||||||||||||||||||||
|
|
|
|
|
|
|
|
|
| |||||||||||||||||||||||
Ratios to Average Net Assets | ||||||||||||||||||||||||||||||||
Total expenses | 0.40 | % | 0.40 | % | 0.40 | % | 0.51 | % | 0.55 | % | ||||||||||||||||||||||
|
|
|
|
|
|
|
|
|
| |||||||||||||||||||||||
Total expenses after fees waived | 0.40 | % | 0.40 | % | 0.40 | % | 0.40 | % | 0.40 | % | ||||||||||||||||||||||
|
|
|
|
|
|
|
|
|
| |||||||||||||||||||||||
Net investment income | 5.02 | % | 4.95 | % | 4.93 | % | 5.44 | % | 5.18 | % | ||||||||||||||||||||||
|
|
|
|
|
|
|
|
|
| |||||||||||||||||||||||
Supplemental Data | ||||||||||||||||||||||||||||||||
Net assets, end of year (000) | $ | 176,300 | $ | 211,353 | $ | 214,103 | $ | 97,547 | $ | 118,931 | ||||||||||||||||||||||
|
|
|
|
|
|
|
|
|
| |||||||||||||||||||||||
Portfolio turnover rate(d) | 24 | % | 20 | % | 22 | % | 24 | % | 21 | % | ||||||||||||||||||||||
|
|
|
|
|
|
|
|
|
| |||||||||||||||||||||||
| (a) | Based on average shares outstanding. |
| (b) | The amounts reported for a share outstanding may not accord with the change in aggregate gains and losses in securities for the fiscal period due to the timing of capital share transactions in relation to the fluctuating market values of the Fund’s underlying securities. |
| (c) | Distributions for annual periods determined in accordance with U.S. federal income tax regulations. |
| (d) | Portfolio turnover rate excludesin-kind transactions. |
See notes to financial statements.
| 68 | 2019ISHARES ANNUAL REPORTTO SHAREHOLDERS |
| 1. | ORGANIZATION |
iShares, Inc. (the “Company”) is registered under the Investment Company Act of 1940, as amended (the “1940 Act”), as anopen-end management investment company. The Company is organized as a Maryland corporation and is authorized to have multiple series or portfolios.
These financial statements relate only to the following funds (each, a “Fund,” and collectively, the “Funds”):
| iShares ETF | Diversification Classification | |
Emerging Markets High Yield Bond | Non-diversified | |
International High Yield Bond | Diversified | |
J.P. Morgan EM Corporate Bond | Diversified | |
J.P. Morgan EM Local Currency Bond | Non-diversified | |
US & Intl High Yield Corp Bond | Diversified |
| 2. | SIGNIFICANT ACCOUNTING POLICIES |
The following significant accounting policies are consistently followed by each Fund in the preparation of its financial statements in conformity with accounting principles generally accepted in the United States of America (“U.S. GAAP”). The preparation of financial statements in conformity with U.S. GAAP requires management to make certain estimates and assumptions that affect the reported amounts of assets and liabilities and disclosures of contingent assets and liabilities at the date of the financial statements and the reported amounts of increases and decreases in net assets from operations during the reporting period. Actual results could differ from those estimates. Each Fund is considered an investment company under U.S. GAAP and follows the accounting and reporting guidance applicable to investment companies.
Investment Transactions and Income Recognition:Investment transactions are accounted for on trade date. Realized gains and losses on investment transactions are determined using the specific identification method. Dividend income and capital gain distributions, if any, are recognized on theex-dividend date, net of any foreign taxes withheld at source. Any taxes withheld that are reclaimable from foreign tax authorities are reflected in tax reclaims receivable. Distributions received by the Funds may include a return of capital that is estimated by management. Such amounts are recorded as a reduction of the cost of investments or reclassified to capital gains. Upon notification from issuers, some of the dividend income received from a real estate investment trust may bere-designated as a return of capital or capital gain.Non-cash dividends, if any, are recognized on theex-dividend date and recorded asnon-cash dividend income at fair value. Interest income, including amortization and accretion of premiums and discounts on debt securities, andpayment-in-kind interest income, if any, are recognized daily on the accrual basis.
Foreign Currency Translation:The accounting records of the Funds are maintained in U.S. dollars. Foreign currencies, as well as investment securities and other assets and liabilities denominated innon-U.S. currencies are translated to U.S. dollars using prevailing market rates as quoted by one or more data service providers. Purchases and sales of investments, income receipts and expense payments are translated into U.S. dollars on the respective dates of such transactions.
Each Fund does not isolate the effect of fluctuations in foreign exchange rates from the effect of fluctuations in the market prices of investments. Such fluctuations are reflected by the Funds as a component of net realized and unrealized gain (loss) from investments for financial reporting purposes. Each Fund reports realized currency gain (loss) on foreign currency related transactions as components of net realized gain (loss) for financial reporting purposes, whereas such components are generally treated as ordinary income for U.S. federal income tax purposes.
Foreign Taxes:The Funds may be subject to foreign taxes (a portion of which may be reclaimable) on income, stock dividends, capital gains on investments, or certain foreign currency transactions. All foreign taxes are recorded in accordance with the applicable foreign tax regulations and rates that exist in the foreign jurisdictions in which each Fund invests. These foreign taxes, if any, are paid by each Fund and are reflected in its statement of operations as follows: foreign taxes withheld at source are presented as a reduction of income, foreign taxes on securities lending income are presented as a reduction of securities lending income, foreign taxes on stock dividends are presented as “other foreign taxes”, and foreign taxes on capital gains from sales of investments and foreign taxes on foreign currency transactions are included in their respective net realized gain (loss) categories. Foreign taxes payable or deferred as of October 31, 2019, if any, are disclosed in the statement of assets and liabilities.
In-kind Redemptions:For financial reporting purposes,in-kind redemptions are treated as sales of securities resulting in realized capital gains or losses to the Funds. Because such gains or losses are not taxable to the Funds and are not distributed to existing Fund shareholders, the gains or losses are reclassified from accumulated net realized gain (loss) topaid-in capital at the end of the Funds’ tax year. These reclassifications have no effect on net assets or net asset value per share.
Distributions:Dividends and distributions paid by each Fund are recorded on theex-dividend dates. Distributions are determined on a tax basis and may differ from net investment income and net realized capital gains for financial reporting purposes. Dividends and distributions are paid in U.S. dollars and cannot be automatically reinvested in additional shares of the Funds.
Recent Accounting Standards:In March 2017, the Financial Accounting Standards Board issued Accounting Standards Update “Premium Amortization on Purchase Callable Debt Securities” which amends the amortization period for certain purchased callable debt securities. Under the new guidance, premium amortization of purchased callable debt securities that have explicit,non-contingent call features and are callable at fixed prices will be amortized to the earliest call date. The guidance will be applied on a modified retrospective basis and is effective for fiscal years, and their interim periods, beginning after December 15, 2018. Management continues to evaluate the impact of this guidance to the Funds.
| NOTESTO FINANCIAL STATEMENTS | 69 |
Notes to Financial Statements (continued)
Indemnifications:In the normal course of business, each Fund enters into contracts that contain a variety of representations that provide general indemnification. The Funds’ maximum exposure under these arrangements is unknown because it involves future potential claims against the Funds, which cannot be predicted with any certainty.
| 3. | INVESTMENT VALUATION AND FAIR VALUE MEASUREMENTS |
Investment Valuation Policies:Each Fund’s investments are valued at fair value (also referred to as “market value” within the financial statements) each day that the Fund’s listing exchange is open and, for financial reporting purposes, as of the report date should the reporting period end on a day that the Fund’s listing exchange is not open. U.S. GAAP defines fair value as the price a fund would receive to sell an asset or pay to transfer a liability in an orderly transaction between market participants at the measurement date. A fund determines the fair value of its financial instruments using various independent dealers or pricing services under policies approved by the Board of Directors of the Company (the “Board”). The BlackRock Global Valuation Methodologies Committee (the “Global Valuation Committee”) is the committee formed by management to develop global pricing policies and procedures and to oversee the pricing function for all financial instruments.
Fair Value Inputs and Methodologies:The following methods and inputs are used to establish the fair value of each Fund’s assets and liabilities:
| • | Equity investments traded on a recognized securities exchange are valued at that day’s last traded price or official closing price, as applicable, on the exchange where the stock is primarily traded. Equity investments traded on a recognized exchange for which there were no sales on that day are valued at the last traded price. |
| • | Fixed-income investments are valued using the last available bid price or current market quotations provided by independent dealers or prices (including evaluated prices) supplied by approved independent third-party pricing services. Pricing services generally value fixed income securities assuming orderly transactions of an institutional round lot size, but a fund may hold or transact in such securities in smaller, odd lot sizes. Odd lots may trade at lower prices than institutional round lots. The pricing services may use matrix pricing or valuation models that utilize certain inputs and assumptions to derive values, including transaction data, credit quality information, perceived market movements, news, and other relevant information and by other methods, which may include consideration of: yields or prices of securities of comparable quality, coupon, maturity and type; indications as to values from dealers; general market conditions; and/or other factors and assumptions. |
| • | Investments inopen-end U.S. mutual funds (including money market funds) are valued at that day’s published net asset value (“NAV”). |
| • | Forward foreign currency exchange contracts are valued based on that day’s prevailing forward exchange rate for the underlying currencies. Interpolated values are derived when the settlement date of the contract is an interim date for which quotations are not available. |
If events (e.g., a company announcement, market volatility or a natural disaster) occur that are expected to materially affect the value of an investment, or in the event that application of these methods of valuation results in a price for an investment that is deemed not to be representative of the market value of such investment, or if a price is not available, the investment will be valued by the Global Valuation Committee, in accordance with policies approved by the Board as reflecting fair value (“Fair Valued Investments”). The fair valuation approaches that may be used by the Global Valuation Committee include market approach, income approach and the cost approach. Valuation techniques used under these approaches take into consideration inputs that include but are not limited to (i) attributes specific to the investment; (ii) the principal market for the investment; (iii) the customary participants in the principal market for the investment; (iv) data assumptions by market participants for the investment, if reasonably available; (v) quoted prices for similar investments in active markets; and (vi) other inputs, such as future cash flows, interest rates, yield curves, volatilities, prepayment speeds, loss severities, credit risks and/or default rates.
Fair value pricing could result in a difference between the prices used to calculate a fund’s NAV and the prices used by the fund’s underlying index, which in turn could result in a difference between the fund’s performance and the performance of the fund’s underlying index.
Fair Value Hierarchy:Various inputs are used in determining the fair value of financial instruments. These inputs to valuation techniques are categorized into a fair value hierarchy consisting of three broad levels for financial reporting purposes as follows:
| • | Level 1 — Unadjusted price quotations in active markets for identical assets or liabilities; |
| • | Level 2 — Inputs other than quoted prices included within Level 1 that are observable for the asset or liability either directly or indirectly, including, but not limited to, quoted prices for similar assets or liabilities in markets that are active, quoted prices for identical or similar assets or liabilities in markets that are not considered to be active, inputs other than quoted prices that are observable for the asset or liability (such as interest rates, yield curves, volatilities, prepayment speeds, loss severities, credit risks and default rates) or other market-corroborated inputs; and |
| • | Level 3 — Unobservable inputs based on the best information available in the circumstances, to the extent observable inputs are not available, (including the Global Valuation Committee’s assumptions used in determining the fair value of financial instruments). |
The hierarchy gives the highest priority to unadjusted quoted prices in active markets for identical assets or liabilities (Level 1 measurements) and the lowest priority to unobservable inputs (Level 3 measurements). Accordingly, the degree of judgement exercised in determining fair value is greatest for instruments categorized in Level 3. The inputs used to measure fair value may fall into different levels of the fair value hierarchy. In such cases, for disclosure purposes, the fair value hierarchy classification is determined based on the lowest level input that is significant to the fair value measurement in its entirety. The fair value hierarchy for each Fund’s investments is included in its schedule of investments. The categorization of a value determined for financial instruments is based on the pricing transparency of the financial instruments and is not necessarily an indication of the risks associated with investing in those securities.
| 4. | SECURITIES AND OTHER INVESTMENTS |
Securities Lending:Each Fund may lend its securities to approved borrowers, such as brokers, dealers and other financial institutions. The borrower pledges and maintains with the Fund collateral consisting of cash, an irrevocable letter of credit issued by an approved bank, or securities issued or guaranteed by the U.S. government. The initial collateral received by each Fund is required to have a value of at least 102% of the current market value of the loaned securities for securities traded on U.S. exchanges and a value of at least 105% for all other securities. The collateral is maintained thereafter at a value equal to at least 100% of the current value of the securities
| 70 | 2019ISHARES ANNUAL REPORTTO SHAREHOLDERS |
Notes to Financial Statements (continued)
on loan. The market value of the loaned securities is determined at the close of each business day of the Fund and any additional required collateral is delivered to the Fund or excess collateral is returned by the Fund, on the next business day. During the term of the loan, each Fund is entitled to all distributions made on or in respect of the loaned securities but does not receive interest income on securities received as collateral. Loans of securities are terminable at any time and the borrower, after notice, is required to return borrowed securities within the standard time period for settlement of securities transactions.
As of October 31, 2019, any securities on loan were collateralized by cash and/or U.S. government obligations. Cash collateral received was invested in money market funds managed by BlackRock Fund Advisors (“BFA”), the Funds’ investment adviser, or its affiliates and is disclosed in the schedules of investments. Anynon-cash collateral received cannot be sold,re-invested or pledged by the Fund, except in the event of borrower default. The securities on loan for each Fund, if any, are also disclosed in its schedule of investments. The market value of any securities on loan as of October 31, 2019 and the value of the related cash collateral are disclosed in the statements of assets and liabilities.
Securities lending transactions are entered into by a fund under Master Securities Lending Agreements (each, an “MSLA”) which provide the right, in the event of default (including bankruptcy or insolvency) for thenon-defaulting party to liquidate the collateral and calculate a net exposure to the defaulting party or request additional collateral. In the event that a borrower defaults, the fund, as lender, would offset the market value of the collateral received against the market value of the securities loaned. The value of the collateral is typically greater than the market value of the securities loaned, leaving the lender with a net amount payable to the defaulting party. However, bankruptcy or insolvency laws of a particular jurisdiction may impose restrictions on or prohibitions against such a right of offset in the event of an MSLA counterparty’s bankruptcy or insolvency. Under the MSLA, absent an event of default, the borrower can resell orre-pledge the loaned securities, and the fund can reinvest cash collateral received in connection with loaned securities.
The following table is a summary of the securities lending agreements by counterparty which are subject to offset under an MSLA as of October 31, 2019:
| ||||||||||||||||
iShares ETF and Counterparty | | Market Value of Securities on Loan |
| | Cash Collateral Received | (a) | | Non-Cash Collateral Received |
| Net Amount | ||||||
| ||||||||||||||||
J.P. Morgan EM Corporate Bond | ||||||||||||||||
Barclays Bank PLC | $ | 1,882,759 | $ | 1,882,759 | $ | — | $ | — | ||||||||
Barclays Capital Inc. | 847,959 | 847,959 | — | — | ||||||||||||
BofA Securities, Inc. | 2,015,535 | 2,015,535 | — | — | ||||||||||||
Citigroup Global Markets Inc. | 312,484 | 312,484 | — | — | ||||||||||||
Credit Suisse Securities (USA) LLC | 212,100 | 212,100 | — | — | ||||||||||||
HSBC Securities (USA) Inc. | 519,534 | 519,534 | — | — | ||||||||||||
Jefferies LLC | 2,611,235 | 2,611,235 | — | — | ||||||||||||
JPMorgan Securities LLC | 2,106,679 | 2,106,679 | — | — | ||||||||||||
Morgan Stanley & Co. LLC | 958,236 | 958,236 | — | — | ||||||||||||
Nomura Securities International Inc. | 1,674,810 | 1,674,810 | — | — | ||||||||||||
UBS AG | 50,214 | 50,214 | — | — | ||||||||||||
Wells Fargo Securities LLC | 2,609,267 | 2,609,267 | — | — | ||||||||||||
|
|
|
|
|
|
|
| |||||||||
| $ | 15,800,812 | $ | 15,800,812 | $ | — | $ | — | |||||||||
|
|
|
|
|
|
|
| |||||||||
US & Intl High Yield Corp Bond | ||||||||||||||||
Barclays Bank PLC | $ | 462,401 | $ | 462,401 | $ | — | $ | — | ||||||||
Barclays Capital Inc. | 1,826,480 | 1,826,480 | — | — | ||||||||||||
BMO Capital Markets | 95,700 | 95,700 | — | — | ||||||||||||
BNP Paribas Prime Brokerage International Ltd. | 1,648,453 | 1,648,453 | — | — | ||||||||||||
BofA Securities, Inc. | 1,550,283 | 1,550,283 | — | — | ||||||||||||
Citadel Clearing LLC | 2,005,942 | 2,005,942 | — | — | ||||||||||||
Citigroup Global Markets Inc. | 257,295 | 257,295 | — | — | ||||||||||||
Credit Suisse Securities (USA) LLC | 935,551 | 935,551 | — | — | ||||||||||||
Deutsche Bank Securities Inc. | 593,050 | 593,050 | — | — | ||||||||||||
Goldman Sachs & Co. | 5,407,944 | 5,407,944 | — | — | ||||||||||||
Jefferies LLC | 211,728 | 211,728 | — | — | ||||||||||||
JPMorgan Securities LLC | 3,422,097 | 3,422,097 | — | — | ||||||||||||
Morgan Stanley & Co. LLC | 547,815 | 547,815 | — | — | ||||||||||||
State Street Bank & Trust Company | 138,440 | 138,440 | — | — | ||||||||||||
UBS AG | 751,364 | 751,364 | — | — | ||||||||||||
UBS Securities LLC | 7,200 | 7,200 | — | — | ||||||||||||
Wells Fargo Bank, National Association | 187,500 | 187,500 | — | — | ||||||||||||
|
|
|
|
|
|
|
| |||||||||
| $ | 20,049,243 | $ | 20,049,243 | $ | — | $ | — | |||||||||
|
|
|
|
|
|
|
| |||||||||
| (a) | Collateral received in excess of the market value of securities on loan is not presented in this table. The total cash collateral received by each Fund is disclosed in the Fund’s statement of assets and liabilities. |
The risks of securities lending include the risk that the borrower may not provide additional collateral when required or may not return the securities when due. To mitigate these risks, each Fund benefits from a borrower default indemnity provided by BlackRock, Inc. (“BlackRock”). BlackRock’s indemnity allows for full replacement of the securities loaned to the extent the collateral received does not cover the value of the securities loaned in the event of borrower default. Each Fund could incur a loss if the value of an investment purchased with cash collateral falls below the market value of the loaned securities or if the value of an investment purchased with cash collateral falls below the value of the original cash collateral received. Such losses are borne entirely by each Fund.
| NOTESTO FINANCIAL STATEMENTS | 71 |
Notes to Financial Statements (continued)
| 5. | DERIVATIVE FINANCIAL INSTRUMENTS |
Forward Foreign Currency Exchange Contracts:The iShares J.P. Morgan EM Local Currency Bond ETF uses forward foreign currency exchange contracts to offset the Fund’s exposure to the component currencies of thenon-U.S. dollar-denominated securities held in its portfolio. A forward foreign currency exchange contract is an agreement between two parties to buy and sell a currency against another currency at an agreed upon price and quantity. The contracts are tradedover-the-counter (“OTC”) and not on an organized exchange.
The contract ismarked-to-market daily and the change in market value is recorded as unrealized appreciation or depreciation in the statement of assets and liabilities. When the contract is closed, a realized gain or loss is recorded in the statement of operations equal to the difference between the value at the time it was opened and the value at the time it was closed.Non-deliverable forward foreign currency exchange contracts (“NDFs”) are settled with the counterparty in cash without the delivery of foreign currency. The use of forward foreign currency exchange contracts involves the risk that the value of a contract changes unfavorably due to movements in the value of the referenced foreign currencies. A fund’s risk of loss from counterparty credit risk on OTC derivatives is generally limited to the aggregate unrealized gain netted against any collateral held by the fund.
| 6. | INVESTMENT ADVISORY AGREEMENT AND OTHER TRANSACTIONS WITH AFFILIATES |
Investment Advisory Fees:Pursuant to an Investment Advisory Agreement with the Company, BFA manages the investment of each Fund’s assets. BFA is a California corporation indirectly owned by BlackRock. Under the Investment Advisory Agreement, BFA is responsible for substantially all expenses of the Funds, except (i) interest and taxes; (ii) brokerage commissions and other expenses connected with the execution of portfolio transactions; (iii) distribution fees; (iv) the advisory fee payable to BFA; and (v) litigation expenses and any extraordinary expenses (in each case as determined by a majority of the independent directors).
For its investment advisory services to each Fund, BFA is entitled to an annual investment advisory fee, accrued daily and paid monthly by the Funds, based on the average daily net assets of each Fund as follows:
| ||||
| iShares ETF | Investment Advisory Fee | |||
| ||||
Emerging Markets High Yield Bond | 0.50% | |||
International High Yield Bond | 0.40 | |||
J.P. Morgan EM Corporate Bond | 0.50 | |||
J.P. Morgan EM Local Currency Bond | 0.30 | |||
US & Intl High Yield Corp Bond | 0.40 | |||
| ||||
Sub-Adviser:BFA has entered into asub-advisory agreement with BlackRock International Limited (the“Sub-Adviser”), an affiliate of BFA, under which BFA pays theSub-Adviser for services it provides to the iShares International High Yield Bond ETF, iShares J.P. Morgan EM Local Currency Bond ETF and iShares US & Intl High Yield Corp Bond ETF.
Distributor:BlackRock Investments, LLC, an affiliate of BFA, is the distributor for each Fund. Pursuant to the distribution agreement, BFA is responsible for any fees or expenses for distribution services provided to the Funds.
Securities Lending:The U.S. Securities and Exchange Commission (the “SEC”) has issued an exemptive order which permits BlackRock Institutional Trust Company, N.A. (“BTC”), an affiliate of BFA, to serve as securities lending agent for the Funds, subject to applicable conditions. As securities lending agent, BTC bears all operational costs directly related to securities lending. Each Fund is responsible for fees in connection with the investment of cash collateral received for securities on loan in a money market fund managed by BFA, or its affiliates, however, BTC has agreed to reduce the amount of securities lending income it receives in order to effectively limit the collateral investment fees each Fund bears to an annual rate of 0.04% (the “collateral investment fees”). Securities lending income is equal to the total of income earned from the reinvestment of cash collateral (excluding collateral investment fees), net of fees and other payments to and from borrowers of securities. Each Fund retains a portion of securities lending income and remits the remaining portion to BTC as compensation for its services as securities lending agent.
Pursuant to the current securities lending agreement, each Fund retains 82% of securities lending income (which excludes collateral investment fees), and the amount retained can never be less than 70% of the total of securities lending income plus the collateral investment fees.
In addition, commencing the business day following the date that the aggregate securities lending income plus the collateral investment fees generated across all 1940 Act iShares exchange-traded funds (the “iShares ETF Complex”) in that calendar year exceeds a specified threshold, each Fund, pursuant to the securities lending agreement, will retain for the remainder of that calendar year 85% of securities lending income (which excludes collateral investment fees) and the amount retained can never be less than 70% of the total of securities lending income plus the collateral investment fees.
Prior to January 1, 2019, each Fund retained 80% of securities lending income (which excludes collateral investment fees) and the amount retained was not less than 70% of the total of securities lending income plus the collateral investment fees. In addition, commencing the business day following the date that the aggregate securities lending income plus the collateral investment fees generated across the iShares ETF Complex in a calendar year exceeded a specified threshold, each Fund, pursuant to the securities lending agreement, retained for the remainder of that calendar year 85% of securities lending income (which excludes collateral investment fees), and the amount retained could never be less than 70% of the total of securities lending income plus the collateral investment fees.
| 72 | 2019ISHARES ANNUAL REPORTTO SHAREHOLDERS |
Notes to Financial Statements (continued)
The share of securities lending income earned by each Fund is shown as securities lending income — affiliated — net in its statement of operations. For the year ended October 31, 2019, the Funds paid BTC the following amounts for securities lending agent services:
| iShares ETF | Fees Paid to BTC | |||
J.P. Morgan EM Corporate Bond | $ | 13,647 | ||
US & Intl High Yield Corp Bond | 39,947 | |||
Officers and Directors:Certain officers and/or directors of the Company are officers and/or directors of BlackRock or its affiliates.
Other Transactions:Cross trading is the buying or selling of portfolio securities between funds to which BFA (or an affiliate) serves as investment adviser. At its regularly scheduled quarterly meetings, the Board reviews such transactions as of the most recent calendar quarter for compliance with the requirements and restrictions set forth by Rule17a-7.
For the year ended October 31, 2019, transactions executed by the Funds pursuant to Rule17a-7 under the 1940 Act were as follows:
| iShares ETF | Purchases | Sales | Net Realized Gain (Loss) | |||||||||
Emerging Markets High Yield Bond | $ | 2,663,202 | $ | 2,279,026 | $ | (132,721 | ) | |||||
International High Yield Bond | 115,820 | 506,951 | (11,347 | ) | ||||||||
J.P. Morgan EM Corporate Bond | 495,999 | 683,092 | 26,757 | |||||||||
J.P. Morgan EM Local Currency Bond | — | 2,479,009 | (290,563 | ) | ||||||||
US & Intl High Yield Corp Bond | 115,820 | 1,208,577 | 40,122 | |||||||||
Each Fund may invest its positive cash balances in certain money market funds managed by BFA or an affiliate. The income earned on these temporary cash investments is shown as dividends — affiliated in the statement of operations.
A fund, in order to improve its portfolio liquidity and its ability to track its underlying index, may invest in shares of other iShares funds that invest in securities in the fund’s underlying index.
| 7. | PURCHASES AND SALES |
For the year ended October 31, 2019, purchases and sales of investments, including TBA rolls and excludingin-kind transactions and short-term investments, were as follows:
| iShares ETF | Purchases | Sales | ||||||
Emerging Markets High Yield Bond | $ | 102,783,256 | $ | 106,265,764 | ||||
International High Yield Bond | 16,580,385 | 16,357,445 | ||||||
J.P. Morgan EM Corporate Bond | 48,997,201 | 21,783,819 | ||||||
J.P. Morgan EM Local Currency Bond | 389,688,400 | 225,308,856 | ||||||
US & Intl High Yield Corp Bond | 41,699,800 | 41,522,743 | ||||||
For the year ended October 31, 2019,in-kind transactions were as follows:
| iShares ETF | In-kind Purchases | In-kind Sales | ||||||
Emerging Markets High Yield Bond | $ | 80,972,370 | $ | 150,655,940 | ||||
International High Yield Bond | — | 23,861,566 | ||||||
J.P. Morgan EM Corporate Bond | 60,305,580 | 2,176,632 | ||||||
J.P. Morgan EM Local Currency Bond | 76,755,241 | 136,180,626 | ||||||
US & Intl High Yield Corp Bond | 26,830,339 | 62,252,518 | ||||||
| 8. | INCOME TAX INFORMATION |
Each Fund is treated as an entity separate from the Company’s other funds for federal income tax purposes. It is the policy of each Fund to qualify as a regulated investment company by complying with the provisions applicable to regulated investment companies, as defined under Subchapter M of the Internal Revenue Code of 1986, as amended, and to annually distribute substantially all of its ordinary income and any net capital gains (taking into account any capital loss carryforwards) sufficient to relieve it from all, or substantially all, federal income and excise taxes. Accordingly, no provision for federal income taxes is required.
Management has analyzed tax laws and regulations and their application to the Funds as of October 31, 2019, inclusive of the open tax return years, and does not believe that there are any uncertain tax positions that require recognition of a tax liability in the Funds’ financial statements.
| NOTESTO FINANCIAL STATEMENTS | 73 |
Notes to Financial Statements (continued)
U.S. GAAP requires that certain components of net assets be adjusted to reflect permanent differences between financial and tax reporting. These reclassifications have no effect on net assets or NAV per share. As of October 31, 2019, the following permanent differences attributable to realized gains (losses) fromin-kind redemptions, were reclassified to the following accounts:
| ||||||||
| iShares ETF | Paid-in Capital | Accumulated Earnings (Loss) | ||||||
| ||||||||
Emerging Markets High Yield Bond | $ | (14,754,409 | ) | $ | 14,754,409 | |||
International High Yield Bond | (1,741,439 | ) | 1,741,439 | |||||
J.P. Morgan EM Corporate Bond | 80,251 | (80,251) | ||||||
J.P. Morgan EM Local Currency Bond | (2,478,297 | ) | 2,478,297 | |||||
US & Intl High Yield Corp Bond | (3,323,683 | ) | 3,323,683 | |||||
| ||||||||
The tax character of distributions paid was as follows:
| ||||||||
| iShares ETF | Year Ended 10/31/19 | Year Ended 10/31/18 | ||||||
| ||||||||
Emerging Markets High Yield Bond | $ | 22,615,509 | $ | 27,754,319 | ||||
|
|
|
| |||||
International High Yield Bond | $ | 1,938,517 | $ | — | ||||
|
|
|
| |||||
J.P. Morgan EM Corporate Bond | $ | 4,625,003 | $ | 3,577,391 | ||||
|
|
|
| |||||
J.P. Morgan EM Local Currency Bond | $ | 14,295,840 | $ | — | ||||
|
|
|
| |||||
US & Intl High Yield Corp Bond | $ | 9,914,724 | $ | 11,429,826 | ||||
|
|
|
| |||||
As of October 31, 2019, the tax components of accumulated net earnings (losses) were as follows:
| ||||||||||||||||
| iShares ETF | | Undistributed Ordinary Income |
| | Non-expiring Capital Loss Carryforwards |
(a) | | Net Unrealized Gains (Losses) | (b) | Total | ||||||
| ||||||||||||||||
Emerging Markets High Yield Bond | $ | 2,343,351 | $ | (27,756,911 | ) | $ | (18,423,610 | ) | $ | (43,837,170) | ||||||
International High Yield Bond | 297,041 | (4,190,278 | ) | (2,355,127 | ) | (6,248,364) | ||||||||||
J.P. Morgan EM Corporate Bond | 533,655 | (469,018 | ) | 3,319,305 | 3,383,942 | |||||||||||
J.P. Morgan EM Local Currency Bond | 19,160,897 | (9,018,049 | ) | (48,466,608 | ) | (38,323,760) | ||||||||||
US & Intl High Yield Corp Bond | 337,871 | (4,742,455 | ) | (1,512,869 | ) | (5,917,453) | ||||||||||
| ||||||||||||||||
| (a) | Amounts available to offset future realized capital gains. |
| (b) | The difference between book-basis andtax-basis unrealized gains (losses) was attributable primarily to the tax deferral of losses on wash sales and the accrual of income on securities in default. |
For the year ended October 31, 2019, the iShares J.P. Morgan EM Local Currency Bond ETF utilized $2,260,339 of its capital loss carryforwards.
As of October 31, 2019, gross unrealized appreciation and depreciation based on cost of investments (including short positions and derivatives, if any) for U.S. federal income tax purposes were as follows:
| ||||||||||||||||
| iShares ETF | Tax Cost | Gross Unrealized Appreciation | Gross Unrealized Depreciation | Net Unrealized Appreciation (Depreciation) | ||||||||||||
| ||||||||||||||||
Emerging Markets High Yield Bond | $ | 348,810,304 | $ | 12,071,352 | $ | (30,494,962 | ) | $ | (18,423,610) | |||||||
International High Yield Bond | 43,042,660 | 472,217 | (2,840,624 | ) | (2,368,407) | |||||||||||
J.P. Morgan EM Corporate Bond | 178,797,683 | 5,248,604 | (1,929,299 | ) | 3,319,305 | |||||||||||
J.P. Morgan EM Local Currency Bond | 575,641,852 | 19,129,708 | (67,158,256 | ) | (48,028,548) | |||||||||||
US & Intl High Yield Corp Bond | 197,645,545 | 4,432,808 | (5,957,740 | ) | (1,524,932) | |||||||||||
| ||||||||||||||||
| 9. | PRINCIPAL RISKS |
In the normal course of business, each Fund invests in securities or other instruments and may enter into certain transactions, and such activities subject the Fund to various risks, including, among others, fluctuations in the market (market risk) or failure of an issuer to meet all of its obligations. The value of securities or other instruments may also be affected by various factors, including, without limitation: (i) the general economy; (ii) the overall market as well as local, regional or global political and/or social instability; (iii) regulation, taxation or international tax treaties between various countries; or (iv) currency, interest rate or price fluctuations. Each Fund’s prospectus provides details of the risks to which the Fund is subject.
| 74 | 2019ISHARES ANNUAL REPORTTO SHAREHOLDERS |
Notes to Financial Statements (continued)
BFA uses a “passive” or index approach to try to achieve each Fund’s investment objective following the securities included in its underlying index during upturns as well as downturns. BFA does not take steps to reduce market exposure or to lessen the effects of a declining market. Divergence from the underlying index and the composition of the portfolio is monitored by BFA.
Market Risk:Market risk arises mainly from uncertainty about future values of financial instruments influenced by price, currency and interest rate movements. It represents the potential loss a fund may suffer through holding market positions in the face of market movements. A fund is exposed to market risk by its investment in equity, fixed income and/or financial derivative instruments or by its investment in underlying funds. The fair value of securities held by a fund may decline due to general market conditions, economic trends or events that are not specifically related to the issuers of the securities including local, regional or global political, social or economic instability or to factors that affect a particular industry or group of industries. The extent of a fund’s exposure to market risk is the market value of the investments held as shown in the fund’s schedule of investments.
Investing in the securities ofnon-U.S. issuers involves certain considerations and risks not typically associated with securities of U.S. issuers. Such risks include, but are not limited to: differences in accounting, auditing and financial reporting standards; more substantial governmental involvement in the economy; higher inflation rates, greater social, economic and political uncertainties; possible nationalization or expropriation of assets; less availability of public information about issuers; imposition of withholding or other taxes; higher transaction and custody costs and delays in settlement procedures; and lower level of regulation of the securities markets and issuers.Non-U.S. securities may be less liquid, more difficult to value, and have greater price volatility due to exchange rate fluctuations. These and other risks are heightened for investments in issuers from countries with less developed capital markets.
Changes in market interest rates or economic conditions may affect the value and/or liquidity of fixed income investments. Interest rate risk is the risk that prices of bonds and other fixed-income securities will decrease as interest rates rise and increase as interest rates fall. Securities with longer durations tend to be more sensitive to interest rate changes, usually making their prices more volatile than those of securities with shorter durations. Given the environment of historically low interest rates, a fund may be subject to a greater risk of price losses if interest rates rise.
Credit Risk:Credit risk is the risk that an issuer or guarantor of debt instruments or the counterparty to a financial transaction, including derivatives contracts, repurchase agreements or loans of portfolio securities, is unable or unwilling to make timely interest and/or principal payments or to otherwise honor its obligations. BFA and its affiliates manage counterparty credit risk by entering into transactions only with counterparties that they believe have the financial resources to honor their obligations and by monitoring the financial stability of those counterparties. Financial assets, which potentially expose a fund to issuer and counterparty credit risks, consist principally of financial instruments and receivables due from counterparties. The extent of a fund’s exposure to credit and counterparty risks with respect to those financial assets is approximated by their value recorded in its statement of assets and liabilities.
High yield securities that are rated below investment-grade (commonly referred to as “junk bonds”) or are unrated may be deemed speculative, involve greater levels of risk than higher-rated securities of similar maturity and are more likely to default. High yield securities may be issued by less creditworthy issuers, and issuers of high yield securities may be unable to meet their interest or principal payment obligations. High yield securities are subject to extreme price fluctuations, may be less liquid than higher rated fixed-income securities, even under normal economic conditions, and frequently have redemption features.
Concentration Risk:A diversified portfolio, where this is appropriate and consistent with a fund’s objectives, minimizes the risk that a price change of a particular investment will have a material impact on the NAV of a fund. The investment concentrations within each Fund’s portfolio are disclosed in its schedule of investments.
| 10. | CAPITAL SHARE TRANSACTIONS |
Capital shares are issued and redeemed by each Fund only in aggregations of a specified number of shares or multiples thereof (“Creation Units”) at NAV. Except when aggregated in Creation Units, shares of each Fund are not redeemable.
Transactions in capital shares were as follows:
| ||||||||||||||||
| Year Ended 10/31/19 | Year Ended 10/31/18 | |||||||||||||||
| iShares ETF | Shares | Amount | Shares | Amount | ||||||||||||
| ||||||||||||||||
Emerging Markets High Yield Bond | ||||||||||||||||
Shares sold | 1,800,000 | $ | 83,994,813 | 2,900,000 | $ | 140,178,128 | ||||||||||
Shares redeemed | (3,450,000 | ) | (155,217,342 | ) | (6,450,000 | ) | (304,349,559 | ) | ||||||||
|
|
|
|
|
|
|
| |||||||||
Net decrease | (1,650,000 | ) | $ | (71,222,529 | ) | (3,550,000 | ) | $ | (164,171,431 | ) | ||||||
|
|
|
|
|
|
|
| |||||||||
International High Yield Bond | ||||||||||||||||
Shares sold | — | $ | — | 300,000 | $ | 16,483,746 | ||||||||||
Shares redeemed | (500,000 | ) | (24,764,950 | ) | (700,000 | ) | (36,068,137 | ) | ||||||||
|
|
|
|
|
|
|
| |||||||||
Net decrease | (500,000 | ) | $ | (24,764,950 | ) | (400,000 | ) | $ | (19,584,391 | ) | ||||||
|
|
|
|
|
|
|
| |||||||||
| NOTESTO FINANCIAL STATEMENTS | 75 |
Notes to Financial Statements (continued)
| ||||||||||||||||
| Year Ended 10/31/19 | Year Ended 10/31/18 | |||||||||||||||
| iShares ETF | Shares | Amount | Shares | Amount | ||||||||||||
| ||||||||||||||||
J.P. Morgan EM Corporate Bond | ||||||||||||||||
Shares sold | 1,800,000 | $ | 90,269,497 | 100,000 | $ | 5,051,273 | ||||||||||
Shares redeemed | (50,000 | ) | (2,546,329 | ) | (300,000 | ) | (14,438,785 | ) | ||||||||
|
|
|
|
|
|
|
| |||||||||
Net increase (decrease) | 1,750,000 | $ | 87,723,168 | (200,000 | ) | $ | (9,387,512 | ) | ||||||||
|
|
|
|
|
|
|
| |||||||||
J.P. Morgan EM Local Currency Bond | ||||||||||||||||
Shares sold | 8,400,000 | $ | 376,361,928 | 4,400,000 | $ | 206,994,308 | ||||||||||
Shares redeemed | (6,400,000 | ) | (281,943,708 | ) | (1,200,000 | ) | (54,208,918 | ) | ||||||||
|
|
|
|
|
|
|
| |||||||||
Net increase | 2,000,000 | $ | 94,418,220 | 3,200,000 | $ | 152,785,390 | ||||||||||
|
|
|
|
|
|
|
| |||||||||
US & Intl High Yield Corp Bond | ||||||||||||||||
Shares sold | 600,000 | $ | 29,090,655 | 800,000 | $ | 40,180,000 | ||||||||||
Shares redeemed | (1,400,000 | ) | (65,168,541 | ) | (600,000 | ) | (29,784,598 | ) | ||||||||
|
|
|
|
|
|
|
| |||||||||
Net increase (decrease) | (800,000 | ) | $ | (36,077,886 | ) | 200,000 | $ | 10,395,402 | ||||||||
|
|
|
|
|
|
|
| |||||||||
The consideration for the purchase of Creation Units of a fund in the Company generally consists of thein-kind deposit of a designated portfolio of securities and a specified amount of cash. Certain funds in the Company may be offered in Creation Units solely or partially for cash in U.S. dollars. Investors purchasing and redeeming Creation Units may pay a purchase transaction fee and a redemption transaction fee directly to State Street Bank and Trust Company, the Company’s administrator, to offset transfer and other transaction costs associated with the issuance and redemption of Creation Units, including Creation Units for cash. Investors transacting in Creation Units for cash may also pay an additional variable charge to compensate the relevant fund for certain transaction costs (i.e., stamp taxes, taxes on currency or other financial transactions, and brokerage costs) and market impact expenses relating to investing in portfolio securities. Such variable charges, if any, are included in shares sold in the table above.
From time to time, settlement of securities related toin-kind contributions orin-kind redemptions may be delayed. In such cases, securities related toin-kind transactions are reflected as a receivable or a payable in the statement of assets and liabilities.
| 11. | LEGAL PROCEEDINGS |
On June 16, 2016, investors in certain iShares funds (iShares Core S&PSmall-Cap ETF, iShares Russell 1000 Growth ETF, iShares Core S&P 500 ETF, iShares RussellMid-Cap Growth ETF, iShares RussellMid-Cap ETF, iShares RussellMid-Cap Value ETF, iShares Select Dividend ETF, iShares MorningstarMid-Cap ETF, iShares MorningstarLarge-Cap ETF, iShares U.S. Aerospace & Defense ETF and iShares Preferred and Income Securities ETF) filed a class action lawsuit against iShares Trust, BlackRock, Inc. and certain of its advisory affiliates, and certain directors/trustees and officers of the Funds (collectively, “Defendants”) in California State Court. The lawsuit alleges the Defendants violated federal securities laws by failing to adequately disclose in the prospectuses issued by the funds noted above the risks of using stop-loss orders in the event of a ‘flash crash’, such as the one that occurred on May 6, 2010. On September 18, 2017, the court issued a Statement of Decision holding that the Plaintiffs lack standing to assert their claims. On October 11, 2017, the court entered final judgment dismissing all of the Plaintiffs’ claims with prejudice. Plaintiffs have appealed the court’s decision. The appeal was fully briefed on January 18, 2019, and a hearing on Plaintiffs’ appeal took place on November 19, 2019.
| 12. | SUBSEQUENT EVENTS |
Management has evaluated the impact of all subsequent events on the Funds through the date the financial statements were available to be issued and has determined that there were no subsequent events requiring adjustment or additional disclosure in the financial statements.
| 76 | 2019ISHARES ANNUAL REPORTTO SHAREHOLDERS |
Report of Independent Registered Public Accounting Firm
To the Board of Directors of iShares, Inc. and
Shareholders of iShares Emerging Markets High Yield Bond ETF,
iShares International High Yield Bond ETF, iShares J.P. Morgan EM Corporate Bond ETF,
iShares J.P. Morgan EM Local Currency Bond ETF and iShares US & Intl High Yield Corp Bond ETF
Opinions on the Financial Statements
We have audited the accompanying statements of assets and liabilities, including the schedules of investments, of iShares Emerging Markets High Yield Bond ETF, iShares International High Yield Bond ETF, iShares J.P. Morgan EM Corporate Bond ETF, iShares J.P. Morgan EM Local Currency Bond ETF and iShares US & Intl High Yield Corp Bond ETF (five of the funds constituting iShares, Inc., hereafter collectively referred to as the “Funds”) as of October 31, 2019, the related statements of operations for the year ended October 31, 2019, the statements of changes in net assets for each of the two years in the period ended October 31, 2019, including the related notes, and the financial highlights for each of the five years in the period ended October 31, 2019 (collectively referred to as the “financial statements”). In our opinion, the financial statements present fairly, in all material respects, the financial position of each of the Funds as of October 31, 2019, the results of each of their operations for the year then ended, the changes in each of their net assets for each of the two years in the period ended October 31, 2019 and each of the financial highlights for each of the five years in the period ended October 31, 2019 in conformity with accounting principles generally accepted in the United States of America.
Basis for Opinions
These financial statements are the responsibility of the Funds’ management. Our responsibility is to express an opinion on the Funds’ financial statements based on our audits. We are a public accounting firm registered with the Public Company Accounting Oversight Board (United States) (PCAOB) and are required to be independent with respect to the Funds in accordance with the U.S. federal securities laws and the applicable rules and regulations of the Securities and Exchange Commission and the PCAOB.
We conducted our audits of these financial statements in accordance with the standards of the PCAOB. Those standards require that we plan and perform the audit to obtain reasonable assurance about whether the financial statements are free of material misstatement, whether due to error or fraud.
Our audits included performing procedures to assess the risks of material misstatement of the financial statements, whether due to error or fraud, and performing procedures that respond to those risks. Such procedures included examining, on a test basis, evidence regarding the amounts and disclosures in the financial statements. Our audits also included evaluating the accounting principles used and significant estimates made by management, as well as evaluating the overall presentation of the financial statements. Our procedures included confirmation of securities owned as of October 31, 2019 by correspondence with the custodian, transfer agent and brokers; when replies were not received from brokers, we performed other auditing procedures. We believe that our audits provide a reasonable basis for our opinions.
/s/PricewaterhouseCoopers LLP
Philadelphia, Pennsylvania
December 19, 2019
We have served as the auditor of one or more BlackRock investment companies since 2000.
| REPORTOF INDEPENDENT REGISTERED PUBLIC ACCOUNTING FIRM | 77 |
| Important Tax Information (unaudited) |
For the fiscal year ended October 31, 2019, the Funds earned foreign source income and paid foreign taxes which they intend to pass through to their shareholders:
| iShares ETF | Foreign Source Income Earned | Foreign Taxes Paid | ||||||
Emerging Markets High Yield Bond | $ | 20,047,738 | $ | — | ||||
International High Yield Bond | 1,419,207 | — | ||||||
J.P. Morgan EM Corporate Bond | 5,148,181 | — | ||||||
J.P. Morgan EM Local Currency Bond | 39,112,793 | 275,741 | ||||||
For the fiscal year ended October 31, 2019, the Funds hereby designate the following maximum amounts allowable as interest-related dividends eligible for exemption from U.S. withholding tax for nonresident aliens and foreign corporations:
| iShares ETF | Interest-Related Dividends | |||
J.P. Morgan EM Local Currency Bond | $ | 60,463 | ||
US & Intl High Yield Corp Bond | 4,789,831 | |||
The Funds hereby designate the following amounts of distributions from direct federal obligation interest for the fiscal year ended October 31, 2019:
| iShares ETF | Federal Obligation Interest | |||
Emerging Markets High Yield Bond | $ | 22,611 | ||
International High Yield Bond | 284 | |||
J.P. Morgan EM Corporate Bond | 9,934 | |||
J.P. Morgan EM Local Currency Bond | 64,537 | |||
US & Intl High Yield Corp Bond | 14,712 | |||
The law varies in each state as to whether and what percent of ordinary income dividends attribute to federal obligations is exempt from state income tax. Shareholders are advised to check with their tax advisers to determine if any portion of the dividends received is exempt from state income tax.
| 78 | 2019ISHARES ANNUAL REPORTTO SHAREHOLDERS |
Board Review and Approval of Investment Advisory Contract
I. iShares Emerging Markets High Yield Bond ETF and iShares J.P. Morgan EM Corporate Bond ETF (the “Funds”)
Under Section 15(c) of the Investment Company Act of 1940 (the “1940 Act”), the Company’s Board of Directors (the “Board”), including a majority of Directors who are not “interested persons” of the Company (as that term is defined in the 1940 Act) (the “Independent Directors”), is required annually to consider and approve the Investment Advisory Contract between the Company and BFA (the “Advisory Contract”) on behalf of the Funds. The Board’s consideration entails a year-long process whereby the Board and its committees (composed solely of Independent Directors) assess BlackRock’s services to the Funds, including investment management; fund accounting; administrative and shareholder services; oversight of the Funds’ service providers; risk management and oversight; legal and compliance services; and ability to meet applicable legal and regulatory requirements. The Independent Directors requested, and BFA provided, such information as the Independent Directors, with advice from independent counsel, deemed reasonably necessary to evaluate the Advisory Contract. At meetings on May 6, 2019 and May 17, 2019, a committee composed of all of the Independent Directors (the “15(c) Committee”), with independent counsel, met with management and reviewed and discussed information provided in response to initial requests of the 15(c) Committee and/or their independent counsel, and requested certain additional information, which management agreed to provide. At a meeting held on June17-19, 2019, the Board, including the Independent Directors, reviewed the additional information provided by management in response to these requests.
After extensive discussions and deliberations, the Board, including all of the Independent Directors, approved the continuance of the Advisory Contract for the Funds, based on a review of qualitative and quantitative information provided by BFA and their cumulative experience as Directors. The Board noted its satisfaction with the extent and quality of information provided and its frequent interactions with management, as well as the detailed responses and other information provided by BFA. The Independent Directors were advised by their independent counsel throughout the process, including about the legal standards applicable to their review. In approving the Advisory Contract for the Funds, the Board, including the Independent Directors, considered various factors, including: (i) the expenses and performance of each Fund; (ii) the nature, extent and quality of the services provided by BFA; (iii) the costs of services provided to each Fund and profits realized by BFA and its affiliates; (iv) economies of scale; (v) the fees and services provided for other comparable funds/accounts managed by BFA and its affiliates; and (vi) other benefits to BFA and/or its affiliates. The material factors, no one of which was controlling, and conclusions that formed the basis for the Board, including the Independent Directors, to approve the Advisory Contract are discussed below.
Expenses and Performance of the Funds:The Board reviewed statistical information prepared by Broadridge Financial Solutions Inc. (“Broadridge”), an independent provider of investment company data, regarding the expense ratio components, including gross and net total expenses, fees and expenses of another fund in which each Fund invests (if applicable), and waivers/reimbursements (if applicable) of each Fund in comparison with the same information for other ETFs (including, where applicable, funds sponsored by an “at cost” service provider), objectively selected by Broadridge as comprising each Fund’s applicable peer group pursuant to Broadridge’s proprietary ETF methodology (the “Peer Group”). The Board was provided with a detailed description of the proprietary ETF methodology used by Broadridge to determine the applicable Peer Groups. The Board further noted that due to the limitations in providing comparable funds in the various Peer Groups, the statistical information provided in Broadridge’s report may or may not provide meaningful direct comparisons to the Funds in all instances.
The Board also noted that the investment advisory fee rates and overall expenses (net of any waivers and reimbursements) for the Funds were higher than the median of the investment advisory fee rates and overall expenses (net of any waivers and reimbursements) of the funds in their respective Peer Group, excluding iShares funds. In addition, to the extent that any of the comparison funds included in the Peer Group, excluding iShares funds, track the same index as any particular Fund, Broadridge also provided, and the Board reviewed, a comparison of such Fund’s performance for theone-, three-, five-,ten-year, and since inception periods, as applicable, and for the quarter ended December 31, 2018, to that of relevant comparison fund(s) for the same periods. The Board noted that each Fund seeks to track its specified underlying index and that, during the year, the Board received periodic reports on each Fund’s short- and longer-term performance in comparison with its underlying index. Such periodic comparative performance information, including additional detailed information as requested by the Board, was also considered. The Board noted that each Fund generally performed in line with its respective underlying index over the relevant periods.
Based on this review, the other factors considered at the meeting, and their general knowledge of ETF pricing, the Board concluded that the investment advisory fee rate and expense level and the historical performance of each Fund supported the Board’s approval of the continuance of the Advisory Contract for the coming year.
Nature, Extent and Quality of Services Provided by BFA:Based on management’s representations, including information about recent and proposed enhancements to the iShares business, including with respect to capital markets support and analysis, technology, portfolio management, product design and quality, compliance and risk management, global public policy and other services, the Board expected that there would be no diminution in the scope of services required of or provided by BFA under the Advisory Contract for the coming year as compared to the scope of services provided by BFA during prior years. In reviewing the scope of these services, the Board considered BFA’s investment philosophy and experience, noting that BFA and its affiliates have committed significant resources over time, including during the past year, to support the iShares funds and their shareholders and have made significant investments into the iShares business. The Board also considered BFA’s compliance program and its compliance record with respect to the Funds. In that regard, the Board noted that BFA reports to the Board about portfolio management and compliance matters on a periodic basis in connection with regularly scheduled meetings of the Board, and on other occasions as necessary and appropriate, and has provided information and made relevant officers and other employees of BFA (and its affiliates) available as needed to provide further assistance with these matters. The Board also reviewed the background and experience of the persons responsible for theday-to-day management of the Funds, as well as the resources available to them in managing the Funds. In addition to the above considerations, the Board reviewed and considered detailed presentations regarding BFA’s investment performance, investment and risk management processes and strategies provided at the June17-19, 2019 meeting and throughout the year.
Based on review of this information, and the performance information discussed above, the Board concluded that the nature, extent and quality of services provided to the Funds under the Advisory Contract supported the Board’s approval of the continuance of the Advisory Contract for the coming year.
Costs of Services Provided to the Funds and Profits Realized by BFA and its Affiliates:The Board reviewed information about the estimated profitability to BlackRock in managing the Funds, based on the fees payable to BFA and its affiliates (including fees under the Advisory Contract), and other sources of revenue and expense to BFA and its affiliates from the Funds’ operations for the last calendar year. The Board reviewed BlackRock’s methodology for calculating estimated profitability of the iShares
| BOARD REVIEWAND APPROVALOF INVESTMENT ADVISORY CONTRACT | 79 |
Board Review and Approval of Investment Advisory Contract (continued)
funds, noting that the 15(c) Committee and the Board had focused on the methodology and profitability presentation during their meetings. The Board recognized that profitability may be affected by numerous factors including, among other things, fee waivers by the Adviser, the types of funds managed, expense allocations and business mix. The Board thus recognized that calculating and comparing profitability at individual fund levels is challenging. The Board discussed the sources of direct and ancillary revenue with management, including the revenues to BTC, a BlackRock affiliate, from securities lending by the Funds. The Board also discussed BFA’s estimated profit margin as reflected in the Funds’ profitability analysis and reviewed information regarding potential economies of scale (as discussed below).
Based on this review, the Board concluded that the profits realized by BFA and its affiliates under the Advisory Contract and from other relationships between the Funds and BFA and/or its affiliates, if any, were within a reasonable range in light of the factors and other information considered.
Economies of Scale:The Board reviewed information and considered the extent to which economies of scale might be realized as the assets of the Funds increase, noting that the issue of potential economies of scale had been focused on by the 15(c) Committee and the Board during their meetings and addressed by management. The 15(c) Committee and the Board received information regarding BlackRock’s historical estimated profitability, including BFA’s and its affiliates’ estimated costs in providing services, noting that such costs have increased over the past year. The estimated cost information distinguished, among other things, between fixed and variable costs, and showed how the level and nature of fixed and variable costs may impact the existence or size of scale benefits, with the Board recognizing that potential economies of scale are difficult to measure. The 15(c) Committee and the Board reviewed information provided by BFA regarding the sharing of scale benefits with the iShares funds through various means, including, as applicable, through relatively low fee rates established at inception, breakpoints, waivers, or other fee reductions, as well as through additional investment in the iShares business and the provision of improved or additional infrastructure and services to the iShares funds and their shareholders. The Board noted that the Advisory Contract for the Funds did not provide for breakpoints in the Funds’ investment advisory fee rate as the assets of the Funds increase. However, the Board would continue to assess the appropriateness of adding breakpoints in the future.
The Board concluded that this review of potential economies of scale and the sharing of related benefits, as well as the other factors considered at the meeting, supported the Board’s approval of the continuance of the Advisory Contract for the coming year.
Fees and Services Provided for Other Comparable Funds/Accounts Managed by BFA and its Affiliates:The Board considered information regarding the investment advisory/management fee rates for other funds/accounts in the U.S. for which BFA (or its affiliates) provides investment advisory/management services, includingopen-end funds registered under the 1940 Act (includingsub-advised funds), collective trust funds, and institutional separate accounts (collectively, the “Other Accounts”). The Board acknowledged BFA’s representation that the iShares funds are fundamentally different investment vehicles from the Other Accounts. The Board noted that BFA and its affiliates do not manage Other Accounts with substantially the same investment objectives and strategies as the Funds and that track the same indexes. The Board further noted that BFA provided the Board with detailed information regarding how the Other Accounts generally differ from the Funds, including in terms of the types of services and generally more extensive services provided to the Funds, as well as other significant differences. In that regard, the Board considered that the pricing of services to institutional clients is typically based on a number of factors beyond the nature and extent of the specific services to be provided and often depends on the overall relationship between the client and its affiliates and the adviser and its affiliates. In addition, the Board considered the relative complexity and inherent risks and challenges of managing and providing other services to the Funds, as a publicly traded ETFs, as compared to the Other Accounts, particularly those that are institutional clients, in light of differing regulatory requirements and client-imposed mandates. The Board also acknowledged management’s assertion that, for certain iShares funds, and for client segmentation purposes, BlackRock has launched an iShares fund that may provide a similar investment exposure at a lower investment advisory fee rate. The Board also considered the“all-inclusive” nature of the Funds’ advisory fee structure, and the Funds’ expenses borne by BFA under this arrangement. The Board noted that the investment advisory fee rates under the Advisory Contract for the Funds was generally higher than the investment advisory/management fee rates for certain of the Other Accounts (particularly institutional clients) and concluded that the differences appeared to be consistent with the factors discussed.
Other Benefits to BFA and/or its Affiliates:The Board reviewed other benefits or ancillary revenue received by BFA and/or its affiliates in connection with the services provided to the Funds by BFA, both direct and indirect, such as payment of revenue to BTC, the Funds’ securities lending agent, for loaning portfolio securities (which was included in the profit margins reviewed by the Board pursuant to BFA’s estimated profitability methodology), payment of advisory fees or other fees to BFA (or its affiliates) in connection with any investments by the Funds in other funds for which BFA (or its affiliates) provides investment advisory services or other services and BlackRock’s increased profile in the investment community. The Board also noted the revenue received by BFA and/or its affiliates pursuant to an agreement that permits a service provider to use certain portions of BlackRock’s technology platform to service accounts managed by BFA and/or its affiliates, including the iShares funds. The Board noted that BFA generally does not use soft dollars or consider the value of research or other services that may be provided to BFA (including its affiliates) in selecting brokers for portfolio transactions for the Funds. The Board further noted that any portfolio transactions on behalf of the Funds placed through a BFA affiliate or purchased from an underwriting syndicate in which a BFA affiliate participates (including associated commissions) are reported to the Board pursuant to Rule17e-1 or Rule10f-3, as applicable, under the 1940 Act. The Board concluded that any such ancillary benefits would not be disadvantageous to the Funds and thus would not alter the Board’s conclusion with respect to the appropriateness of approving the continuance of the Advisory Contract for the coming year.
Conclusion:Based on a review of the factors described above, as well as such other factors as deemed appropriate by the Board, the Board, including all of the Independent Directors, determined that the Funds’ investment advisory fee rates under the Advisory Contract do not constitute fees that are so disproportionately large as to bear no reasonable relationship to the services rendered and that could not have been the product ofarm’s-length bargaining, and concluded to approve the continuance of the Advisory Contract for the coming year.
II. iShares International High Yield Bond ETF, iShares J.P. Morgan EM Local Currency Bond ETF, iShares US & Intl High Yield Corp Bond ETF (the “Funds”)
Under Section 15(c) of the Investment Company Act of 1940 (the “1940 Act”), the Company’s Board of Directors (the “Board”), including a majority of Directors who are not “interested persons” of the Company (as that term is defined in the 1940 Act) (the “Independent Directors”), is required annually to consider and approve the Investment Advisory Contract between the Company and BFA (the “Advisory Contract”), and theSub-Advisory Agreement between BFA and BlackRock International Limited (“BIL”) (the“Sub-Advisory Agreement”), on behalf of the Funds. The Advisory Contract and theSub-Advisory Agreement are referred to hereafter as the “Advisory Agreements”.
| 80 | 2019ISHARES ANNUAL REPORTTO SHAREHOLDERS |
Board Review and Approval of Investment Advisory Contract (continued)
The Board’s consideration entails a year-long process whereby the Board and its committees (composed solely of Independent Directors) assess BlackRock’s services to the Funds, including investment management; fund accounting; administrative and shareholder services; oversight of the Funds’ service providers; risk management and oversight; legal and compliance services; and ability to meet applicable legal and regulatory requirements. The Independent Directors requested, and BFA provided, such information as the Independent Directors, with advice from independent counsel, deemed reasonably necessary to evaluate the Advisory Contract. At meetings on May 6, 2019 and May 17, 2019, a committee composed of all of the Independent Directors (the “15(c) Committee”), with independent counsel, met with management and reviewed and discussed information provided in response to initial requests of the 15(c) Committee and/or their independent counsel, and requested certain additional information, which management agreed to provide. At a meeting held on June17-19, 2019, the Board, including the Independent Directors, reviewed the additional information provided by management in response to these requests.
After extensive discussions and deliberations, the Board, including all of the Independent Directors, approved the continuance of the Advisory Contract for the Funds, based on a review of qualitative and quantitative information provided by BFA and their cumulative experience as Directors. The Board noted its satisfaction with the extent and quality of information provided and its frequent interactions with management, as well as the detailed responses and other information provided by BFA. The Independent Directors were advised by their independent counsel throughout the process, including about the legal standards applicable to their review. In approving the Advisory Contract for the Funds, the Board, including the Independent Directors, considered various factors, including: (i) the expenses and performance of each Fund; (ii) the nature, extent and quality of the services provided by BFA; (iii) the costs of services provided to each Fund and profits realized by BFA and its affiliates; (iv) economies of scale; (v) the fees and services provided for other comparable funds/accounts managed by BFA and its affiliates; and (vi) other benefits to BFA and/or its affiliates. The material factors, no one of which was controlling, and conclusions that formed the basis for the Board, including the Independent Directors, to approve the Advisory Contract are discussed below.
Expenses and Performance of the Funds:The Board reviewed statistical information prepared by Broadridge Financial Solutions Inc. (“Broadridge”), an independent provider of investment company data, regarding the expense ratio components, including gross and net total expenses, fees and expenses of another fund in which each Fund invests (if applicable), and waivers/reimbursements (if applicable) of each Fund in comparison with the same information for other ETFs (including, where applicable, funds sponsored by an “at cost” service provider), objectively selected by Broadridge as comprising each Fund’s applicable peer group pursuant to Broadridge’s proprietary ETF methodology (the “Peer Group”). The Board was provided with a detailed description of the proprietary ETF methodology used by Broadridge to determine the applicable Peer Groups. The Board further noted that due to the limitations in providing comparable funds in the various Peer Groups, the statistical information provided in Broadridge’s report may or may not provide meaningful direct comparisons to the Funds in all instances.
The Board also noted that the investment advisory fee rates and overall expenses (net of any waivers and reimbursements) for the Funds were lower than the median of the investment advisory fee rates and overall expenses (net of any waivers and reimbursements) of the funds in their respective Peer Group, excluding iShares funds. The Board also noted that BFA pays BIL for itssub-advisory services, and that there are no additional fees imposed on the Fund in respect of the services provided under theSub-Advisory Agreement.
In addition, to the extent that any of the comparison funds included in the Peer Group, excluding iShares funds, track the same index as any particular Fund, Broadridge also provided, and the Board reviewed, a comparison of such Fund’s performance for theone-, three-, five-,ten-year, and since inception periods, as applicable, and for the quarter ended December 31, 2018, to that of relevant comparison fund(s) for the same periods. The Board noted that each Fund seeks to track its specified underlying index and that, during the year, the Board received periodic reports on each Fund’s short- and longer-term performance in comparison with its underlying index. Such periodic comparative performance information, including additional detailed information as requested by the Board, was also considered. The Board noted that each Fund generally performed in line with its respective underlying index over the relevant periods.
Based on this review, the other factors considered at the meeting, and their general knowledge of ETF pricing, the Board concluded that the investment advisory fee rate and expense level and the historical performance of each Fund supported the Board’s approval of the continuance of the Advisory Contract for the coming year.
Nature, Extent and Quality of Services Provided by BFA:Based on management’s representations, including information about recent and proposed enhancements to the iShares business, including with respect to capital markets support and analysis, technology, portfolio management, product design and quality, compliance and risk management, global public policy and other services, the Board expected that there would be no diminution in the scope of services required of or provided by BFA under the Advisory Contract for the coming year as compared to the scope of services provided by BFA during prior years. In reviewing the scope of these services, the Board considered BFA’s investment philosophy and experience, noting that BFA and its affiliates have committed significant resources over time, including during the past year, to support the iShares funds and their shareholders and have made significant investments into the iShares business. The Board also considered BFA’s compliance program and its compliance record with respect to the Funds. In that regard, the Board noted that BFA reports to the Board about portfolio management and compliance matters on a periodic basis in connection with regularly scheduled meetings of the Board, and on other occasions as necessary and appropriate, and has provided information and made relevant officers and other employees of BFA (and its affiliates) available as needed to provide further assistance with these matters. The Board also reviewed the background and experience of the persons responsible for theday-to-day management of the Funds, as well as the resources available to them in managing the Funds. In addition to the above considerations, the Board reviewed and considered detailed presentations regarding BFA’s investment performance, investment and risk management processes and strategies provided at the June17-19, 2019 meeting and throughout the year.
Based on review of this information, and the performance information discussed above, the Board concluded that the nature, extent and quality of services provided to the Funds under the Advisory Contract supported the Board’s approval of the continuance of the Advisory Contract for the coming year.
Costs of Services Provided to the Funds and Profits Realized by BFA and its Affiliates:The Board reviewed information about the estimated profitability to BlackRock in managing the Funds, based on the fees payable to BFA and its affiliates (including fees under the Advisory Contract), and other sources of revenue and expense to BFA and its affiliates from the Funds’ operations for the last calendar year. The Board reviewed BlackRock’s methodology for calculating estimated profitability of the iShares funds, noting that the 15(c) Committee and the Board had focused on the methodology and profitability presentation during their meetings. The Board recognized that
| BOARD REVIEWAND APPROVALOF INVESTMENT ADVISORY CONTRACT | 81 |
Board Review and Approval of Investment Advisory Contract (continued)
profitability may be affected by numerous factors including, among other things, fee waivers by the Adviser, the types of funds managed, expense allocations and business mix. The Board thus recognized that calculating and comparing profitability at individual fund levels is challenging. The Board discussed the sources of direct and ancillary revenue with management, including the revenues to BTC, a BlackRock affiliate, from securities lending by the Funds. The Board also discussed BFA’s estimated profit margin as reflected in the Funds’ profitability analysis and reviewed information regarding potential economies of scale (as discussed below).
Based on this review, the Board concluded that the profits realized by BFA and its affiliates under the Advisory Contract and from other relationships between the Funds and BFA and/or its affiliates, if any, were within a reasonable range in light of the factors and other information considered.
Economies of Scale:The Board reviewed information and considered the extent to which economies of scale might be realized as the assets of the Funds increase, noting that the issue of potential economies of scale had been focused on by the 15(c) Committee and the Board during their meetings and addressed by management. The 15(c) Committee and the Board received information regarding BlackRock’s historical estimated profitability, including BFA’s and its affiliates’ estimated costs in providing services, noting that such costs have increased over the past year. The estimated cost information distinguished, among other things, between fixed and variable costs, and showed how the level and nature of fixed and variable costs may impact the existence or size of scale benefits, with the Board recognizing that potential economies of scale are difficult to measure. The 15(c) Committee and the Board reviewed information provided by BFA regarding the sharing of scale benefits with the iShares funds through various means, including, as applicable, through relatively low fee rates established at inception, breakpoints, waivers, or other fee reductions, as well as through additional investment in the iShares business and the provision of improved or additional infrastructure and services to the iShares funds and their shareholders. The Board noted that the Advisory Contract for the Funds did not provide for breakpoints in the Funds’ investment advisory fee rate as the assets of the Funds increase. However, the Board noted that it would continue to assess the appropriateness of adding breakpoints in the future.
The Board concluded that this review of potential economies of scale and the sharing of related benefits, as well as the other factors considered at the meeting, supported the Board’s approval of the continuance of the Advisory Contract for the coming year.
Fees and Services Provided for Other Comparable Funds/Accounts Managed by BFA and its Affiliates:The Board considered information regarding the investment advisory/management fee rates for other funds/accounts in the U.S. for which BFA (or its affiliates) provides investment advisory/management services, includingopen-end funds registered under the 1940 Act (includingsub-advised funds), collective trust funds, and institutional separate accounts (collectively, the “Other Accounts”). The Board acknowledged BFA’s representation that the iShares funds are fundamentally different investment vehicles from the Other Accounts. The Board noted that BFA and its affiliates do not manage Other Accounts with substantially the same investment objective and strategy as the Funds and that track the same index. The Board further noted that BFA provided the Board with detailed information regarding how the Other Accounts generally differ from the Funds, including in terms of the types of services and generally more extensive services provided to the Funds, as well as other significant differences. In that regard, the Board considered that the pricing of services to institutional clients is typically based on a number of factors beyond the nature and extent of the specific services to be provided and often depends on the overall relationship between the client and its affiliates and the adviser and its affiliates. In addition, the Board considered the relative complexity and inherent risks and challenges of managing and providing other services to the Funds, as a publicly traded ETFs, as compared to the Other Accounts, particularly those that are institutional clients, in light of differing regulatory requirements and client-imposed mandates. The Board also acknowledged management’s assertion that, for certain iShares funds, and for client segmentation purposes, BlackRock has launched an iShares fund that may provide a similar investment exposure at a lower investment advisory fee rate. The Board also considered the“all-inclusive” nature of the Funds’ advisory fee structure, and the Funds’ expenses borne by BFA under this arrangement. The Board noted that the investment advisory fee rates under the Advisory Contract for the Funds was generally higher than the investment advisory/management fee rates for certain of the Other Accounts (particularly institutional clients) and concluded that the differences appeared to be consistent with the factors discussed.
Other Benefits to BFA and/or its Affiliates:The Board reviewed other benefits or ancillary revenue received by BFA and/or its affiliates in connection with the services provided to the Funds by BFA, both direct and indirect, such as payment of revenue to BTC, the Funds’ securities lending agent, for loaning portfolio securities (which was included in the profit margins reviewed by the Board pursuant to BFA’s estimated profitability methodology), payment of advisory fees or other fees to BFA (or its affiliates) in connection with any investments by the Funds in other funds for which BFA (or its affiliates) provides investment advisory services or other services and BlackRock’s increased profile in the investment community. The Board also noted the revenue received by BFA and/or its affiliates pursuant to an agreement that permits a service provider to use certain portions of BlackRock’s technology platform to service accounts managed by BFA and/or its affiliates, including the iShares funds. The Board noted that BFA generally does not use soft dollars or consider the value of research or other services that may be provided to BFA (including its affiliates) in selecting brokers for portfolio transactions for the Funds. The Board further noted that any portfolio transactions on behalf of the Funds placed through a BFA affiliate or purchased from an underwriting syndicate in which a BFA affiliate participates (including associated commissions) are reported to the Board pursuant to Rule17e-1 or Rule10f-3, as applicable, under the 1940 Act. The Board concluded that any such ancillary benefits would not be disadvantageous to the Funds and thus would not alter the Board’s conclusion with respect to the appropriateness of approving the continuance of the Advisory Contract for the coming year.
Conclusion:Based on a review of the factors described above, as well as such other factors as deemed appropriate by the Board, the Board, including all of the Independent Directors, determined that the Funds’ investment advisory fee rates under the Advisory Contract do not constitute fees that are so disproportionately large as to bear no reasonable relationship to the services rendered and that could not have been the product ofarm’s-length bargaining, and concluded to approve the
| 82 | 2019ISHARES ANNUAL REPORTTO SHAREHOLDERS |
| Supplemental Information (unaudited) |
Section 19(a) Notices
The amounts and sources of distributions reported are estimates and are being provided pursuant to regulatory requirements and are not being provided for tax reporting purposes. The actual amounts and sources for tax reporting purposes will depend upon each fund’s investment experience during the year and may be subject to changes based on tax regulations. Shareholders will receive a Form1099-DIV each calendar year that will inform them how to report these distributions for federal income tax purposes.
| Total Cumulative Distributions for the Fiscal Year | % Breakdown of the Total Cumulative Distributions for the Fiscal Year | |||||||||||||||||||||||||||||||||||
| iShares ETF | Net Investment Income | Net Realized Capital Gains | Return of Capital | Total Per Share | Net Investment Income | Net Realized Capital Gains | Return of Capital | Total Per Share | ||||||||||||||||||||||||||||
Emerging Markets High Yield Bond(a) | $ | 3.177781 | $ | — | $ | 0.069254 | $ | 3.247035 | 98 | % | — | % | 2 | % | 100 | % | ||||||||||||||||||||
J.P. Morgan EM Corporate | 2.225796 | — | 0.020438 | 2.246234 | 99 | — | 1 | 100 | ||||||||||||||||||||||||||||
US & Intl High Yield Corp Bond(a) | 2.569951 | — | 0.083403 | 2.653354 | 97 | — | 3 | 100 | ||||||||||||||||||||||||||||
| (a) | The Fund estimates that it has distributed more than its net investment income and net realized capital gains; therefore, a portion of the distribution may be a return of capital. A return of capital may occur, for example, when some or all of the shareholder’s investment in the Fund is returned to the shareholder. A return of capital does not necessarily reflect the Fund’s investment performance and should not be confused with “yield” or “income”. When distributions exceed total return performance, the difference will incrementally reduce the Fund’s net asset value per share. |
Premium/Discount Information
The Premium/Discount Information section is intended to present information about the differences between the daily market price on secondary markets for shares of a fund and that fund’s NAV. NAV is the price at which a fund issues and redeems shares. It is calculated in accordance with the standard formula for valuing mutual fund shares. The “Market Price” of a fund generally is determined using the midpoint between the highest bid and the lowest ask on the primary securities exchange on which shares of such fund are listed for trading, as of the time that the fund’s NAV is calculated. A fund’s Market Price may be at, above or below its NAV. The NAV of a fund will fluctuate with changes in the value of its portfolio holdings. The Market Price of a fund will fluctuate in accordance with changes in its NAV, as well as market supply and demand.
Premiums or discounts are the differences (expressed as a percentage) between the NAV and Market Price of a fund on a given day, generally at the time the NAV is calculated. A premium is the amount that a fund is trading above the reported NAV, expressed as a percentage of the NAV. A discount is the amount that a fund is trading below the reported NAV, expressed as a percentage of the NAV.
Premium/discount information for the Funds covering the most recently completed calendar year and the most recently completed calendar quarters since that year (or since the Fund began trading, if shorter) is publicly accessible, free of charge, at iShares.com.
The following information shows the frequency of distributions of premiums and discounts for the Funds for the immediately preceding five calendar years (or from the date a Fund began trading on the secondary market, if less than five years) through the date of the most recent calendarquarter-end. Each line in each table shows the number of trading days in which the Fund traded within the premium/discount range indicated. Premium/discount ranges with no trading days are omitted. The number of trading days in each premium/discount range is also shown as a percentage of the total number of trading days in the period covered by each table. All data presented here represents past performance, which cannot be used to predict future results.
iShares Emerging Markets High Yield Bond ETF
Period Covered: January 01, 2014 through September 30, 2019
| Premium/Discount Range | Number of Days | Percentage of Total Days | ||||||||||||||
Greater than 1.0% and Less than 1.5% | 1 | 0.07 | % | |||||||||||||
Greater than 0.5% and Less than 1.0% | 215 | 14.87 | ||||||||||||||
Greater than 0.0% and Less than 0.5% | 1,042 | 72.05 | ||||||||||||||
At NAV | 15 | 1.04 | ||||||||||||||
Less than 0.0% and Greater than –0.5% | 160 | 11.07 | ||||||||||||||
Less than –0.5% and Greater than –1.0% | 11 | 0.76 | ||||||||||||||
Less than –1.0% and Greater than –1.5% | 2 | 0.14 | ||||||||||||||
|
|
|
| |||||||||||||
| 1,446 | 100.00 | % | ||||||||||||||
|
|
|
| |||||||||||||
| SUPPLEMENTAL INFORMATION | 83 |
| Supplemental Information (unaudited) (continued) |
iShares International High Yield Bond ETF
Period Covered: January 01, 2014 through September 30, 2019
| Premium/Discount Range | Number of Days | Percentage of Total Days | ||||||||||||||
Greater than 2.5% and Less than 3.0% | 1 | 0.07 | % | |||||||||||||
Greater than 2.0% and Less than 2.5% | 1 | 0.07 | ||||||||||||||
Greater than 1.5% and Less than 2.0% | 5 | 0.35 | ||||||||||||||
Greater than 1.0% and Less than 1.5% | 34 | 2.35 | ||||||||||||||
Greater than 0.5% and Less than 1.0% | 359 | 24.83 | ||||||||||||||
Greater than 0.0% and Less than 0.5% | 874 | 60.44 | ||||||||||||||
At NAV | 13 | 0.90 | ||||||||||||||
Less than 0.0% and Greater than –0.5% | 140 | 9.68 | ||||||||||||||
Less than –0.5% and Greater than –1.0% | 18 | 1.24 | ||||||||||||||
Less than –1.0% and Greater than –1.5% | 1 | 0.07 | ||||||||||||||
|
|
|
| |||||||||||||
| 1,446 | 100.00 | % | ||||||||||||||
|
|
|
| |||||||||||||
iShares J.P. Morgan EM Corporate Bond ETF
Period Covered: January 01, 2014 through September 30, 2019
| Premium/Discount Range | Number of Days | Percentage of Total Days | ||||||||||||||
Greater than 6.0% | 3 | 0.21 | % | |||||||||||||
Greater than 4.5% and Less than 5.0% | 1 | 0.07 | ||||||||||||||
Greater than 4.0% and Less than 4.5% | 4 | 0.28 | ||||||||||||||
Greater than 3.5% and Less than 4.0% | 19 | 1.31 | ||||||||||||||
Greater than 3.0% and Less than 3.5% | 10 | 0.69 | ||||||||||||||
Greater than 2.5% and Less than 3.0% | 5 | 0.35 | ||||||||||||||
Greater than 2.0% and Less than 2.5% | 10 | 0.69 | ||||||||||||||
Greater than 1.5% and Less than 2.0% | 17 | 1.18 | ||||||||||||||
Greater than 1.0% and Less than 1.5% | 53 | 3.67 | ||||||||||||||
Greater than 0.5% and Less than 1.0% | 228 | 15.77 | ||||||||||||||
Greater than 0.0% and Less than 0.5% | 715 | 49.44 | ||||||||||||||
At NAV | 14 | 0.97 | ||||||||||||||
Less than 0.0% and Greater than –0.5% | 239 | 16.52 | ||||||||||||||
Less than –0.5% and Greater than –1.0% | 70 | 4.84 | ||||||||||||||
Less than –1.0% and Greater than –1.5% | 51 | 3.53 | ||||||||||||||
Less than –1.5% and Greater than –2.0% | 7 | 0.48 | ||||||||||||||
|
|
|
| |||||||||||||
| 1,446 | 100.00 | % | ||||||||||||||
|
|
|
| |||||||||||||
iShares J.P. Morgan EM Local Currency Bond ETF
Period Covered: January 01, 2014 through September 30, 2019
| Premium/Discount Range | Number of Days | Percentage of Total Days | ||||||||||||||
Greater than 2.0% and Less than 2.5% | 1 | 0.07 | % | |||||||||||||
Greater than 1.5% and Less than 2.0% | 1 | 0.07 | ||||||||||||||
Greater than 1.0% and Less than 1.5% | 16 | 1.11 | ||||||||||||||
Greater than 0.5% and Less than 1.0% | 156 | 10.79 | ||||||||||||||
Greater than 0.0% and Less than 0.5% | 820 | 56.70 | ||||||||||||||
At NAV | 15 | 1.04 | ||||||||||||||
Less than 0.0% and Greater than –0.5% | 388 | 26.83 | ||||||||||||||
Less than –0.5% and Greater than –1.0% | 41 | 2.84 | ||||||||||||||
Less than –1.0% and Greater than –1.5% | 7 | 0.48 | ||||||||||||||
Less than –3.0% and Greater than –3.5% | 1 | 0.07 | ||||||||||||||
|
|
|
| |||||||||||||
| 1,446 | 100.00 | % | ||||||||||||||
|
|
|
| |||||||||||||
| 84 | 2019ISHARES ANNUAL REPORTTO SHAREHOLDERS |
| Supplemental Information (unaudited) (continued) |
iShares US & Intl High Yield Corp Bond ETF
Period Covered: January 01, 2014 through September 30, 2019
| Premium/Discount Range | Number of Days | Percentage of Total Days | ||||||||||||||
Greater than 2.0% and Less than 2.5% | 1 | 0.07 | % | |||||||||||||
Greater than 1.5% and Less than 2.0% | 4 | 0.28 | ||||||||||||||
Greater than 1.0% and Less than 1.5% | 63 | 4.36 | ||||||||||||||
Greater than 0.5% and Less than 1.0% | 283 | 19.57 | ||||||||||||||
Greater than 0.0% and Less than 0.5% | 885 | 61.19 | ||||||||||||||
At NAV | 8 | 0.55 | ||||||||||||||
Less than 0.0% and Greater than –0.5% | 134 | 9.27 | ||||||||||||||
Less than –0.5% and Greater than –1.0% | 53 | 3.67 | ||||||||||||||
Less than –1.0% and Greater than –1.5% | 14 | 0.97 | ||||||||||||||
Less than –1.5% and Greater than –2.0% | 1 | 0.07 | ||||||||||||||
|
|
|
| |||||||||||||
| 1,446 | 100.00 | % | ||||||||||||||
|
|
|
| |||||||||||||
Regulation under the Alternative Investment Fund Managers Directive
The Alternative Investment Fund Managers Directive (the “Directive”) imposes detailed and prescriptive obligations on fund managers established in the European Union (the “EU”). These do not currently apply to managers established outside of the EU, such as BFA (the “Company”). Rather,non-EU managers are only required to comply with certain disclosure, reporting and transparency obligations of the Directive if such managers market a fund to EU investors.
The Company has registered the iShares Emerging Markets High Yield Bond ETF (the “Fund”) to be marketed to EU investors in the United Kingdom, the Netherlands, Finland, Sweden, and Luxembourg.
Report on Remuneration
The Company is required under the Directive to make quantitative disclosures of remuneration. These disclosures are made in line with BlackRock’s interpretation of currently available regulatory guidance on quantitative remuneration disclosures. As market or regulatory practice develops BlackRock may consider it appropriate to make changes to the way in which quantitative remuneration disclosures are calculated. Where such changes are made, this may result in disclosures in relation to a fund not being comparable to the disclosures made in the prior year, or in relation to other BlackRock fund disclosures in that same year.
Disclosures are provided in relation to (a) the staff of the Company; (b) staff who are senior management; and (c) staff who have the ability to materially affect the risk profile of the Fund.
All individuals included in the aggregated figures disclosed are rewarded in line with BlackRock’s remuneration policy for their responsibilities across the relevant BlackRock business area. As all individuals have a number of areas of responsibilities, only the portion of remuneration for those individuals’ services attributable to the Fund is included in the aggregate figures disclosed.
BlackRock has a clear and well definedpay-for-performance philosophy, and compensation programmes which support that philosophy.
BlackRock operates a total compensation model for remuneration which includes a base salary, which is contractual, and a discretionary bonus scheme. Although all employees are eligible to receive a discretionary bonus, there is no contractual obligation to make a discretionary bonus award to any employees. For senior management, a significant percentage of variable remuneration is deferred over time. All employees are subject to a claw-back policy.
Remuneration decisions for employees are made once annually in January following the end of the performance year, based on BlackRock’s full-year financial results and othernon-financial goals and objectives. Alongside financial performance, individual total compensation is also based on strategic and operating results and other considerations such as management and leadership capabilities. No set formulas are established and no fixed benchmarks are used in determining annual incentive awards.
Annual incentive awards are paid from a bonus pool which is reviewed throughout the year by BlackRock’s independent compensation committee, taking into account both actual and projected financial information together with information provided by the Enterprise Risk and Regulatory Compliance departments in relation to any activities, incidents or events that warrant consideration in making compensation decisions. Individuals are not involved in setting their own remuneration.
Each of the control functions (Enterprise Risk, Legal & Compliance, and Internal Audit) each have their own organisational structures which are independent of the business units. Functional bonus pools for those control functions are determined with reference to the performance of each individual function and the remuneration of the senior members of control functions is directly overseen by BlackRock’s independent remuneration committee.
Members of staff and senior management of the Company typically provide both AIFMD andnon-AIFMD related services in respect of multiple funds, clients and functions of the Company and across the broader BlackRock group. Therefore, the figures disclosed are a sum of each individual’s portion of remuneration attributable to the Fund according to an objective apportionment methodology which acknowledges the multiple-service nature of the Company. Accordingly the figures are not representative of any individual’s actual remuneration or their remuneration structure.
| SUPPLEMENTAL INFORMATION | 85 |
Supplemental Information (unaudited) (continued)
The amount of the total remuneration awarded by the Company to its staff which has been attributed to the iShares Emerging Markets High Yield Bond ETF in respect of the Company’s financial year ending December 31, 2018 was USD 26.96 thousand. This figure is comprised of fixed remuneration of USD 11.65 thousand and variable remuneration of USD 15.31 thousand. There were a total of 469 beneficiaries of the remuneration described above.
The amount of the aggregate remuneration awarded by the Company, which has been attributed to the iShares Emerging Markets High Yield Bond ETF in respect of the Company’s financial year ending December 31, 2018, to its senior management was USD 3.74 thousand, and to members of its staff whose actions have a material impact on the risk profile of the Fund was USD 0.49 thousand.
| 86 | 2019ISHARES ANNUAL REPORTTO SHAREHOLDERS |
| Director and Officer Information |
The Board of Directors has responsibility for the overall management and operations of the Funds, including general supervision of the duties performed by BFA and other service providers. Each Director serves until he or she resigns, is removed, dies, retires or becomes incapacitated. Each officer shall hold office until his or her successor is elected and qualifies or until his or her death, resignation or removal. Directors who are not “interested persons” (as defined in the 1940 Act) of the Company are referred to as independent directors (“Independent Directors”).
The registered investment companies advised by BFA or its affiliates (the “BlackRock-advised Funds”) are organized into one complex ofopen-end equity, multi-asset, index and money market funds (the “BlackRock Multi-Asset Complex”), one complex ofclosed-end funds andopen-endnon-index fixed-income funds (the “BlackRock Fixed-Income Complex”) and one complex of ETFs (“Exchange-Traded Fund Complex”) (each, a “BlackRock Fund Complex”). Each Fund is included in the BlackRock Fund Complex referred to as the Exchange-Traded Fund Complex. Each Director also serves as a Trustee of iShares Trust and a Trustee of iShares U.S. ETF Trust and, as a result, oversees all of the funds within the Exchange-Traded Fund Complex, which consists of 352 funds as of October 31, 2019. With the exception of Robert S. Kapito, Salim Ramji, Charles Park and Neal J. Andrews, the address of each Director and officer is c/o BlackRock, Inc., 400 Howard Street, San Francisco, CA 94105. The address of Mr. Kapito, Mr. Ramji, Mr. Park and Mr. Andrews is c/o BlackRock, Inc., Park Avenue Plaza, 55 East 52nd Street, New York, NY 10055. The Board has designated Cecilia H. Herbert as its Independent Board Chair. Additional information about the Funds’ Directors and officers may be found in the Funds’ combined Statement of Additional Information, which is available without charge, upon request, by calling toll-free1-800-iShares(1-800-474-2737).
| Interested Directors | ||||||
| Name (Age) | Position(s) | Principal Occupation(s) During the Past 5 Years | Other Directorships Held by Director | |||
Robert S. Kapito(a) (62) | Director (since 2009). | President, BlackRock, Inc. (since 2006); Vice Chairman of BlackRock, Inc. and Head of BlackRock’s Portfolio Management Group (since its formation in 1998) and BlackRock, Inc.’s predecessor entities (since 1988); Trustee, University of Pennsylvania (since 2009); President of Board of Directors, Hope & Heroes Children’s Cancer Fund (since 2002). | Director of BlackRock, Inc. (since 2006); Trustee of iShares Trust (since 2009); Trustee of iShares U.S. ETF Trust (since 2011). | |||
Salim Ramji(b) (49) | Director (since 2019). | Senior Managing Director, BlackRock, Inc. (since 2014); Global Head of BlackRock’s ETF and Index Investments Business (since 2019); Head of BlackRock’s U.S. Wealth Advisory Business (2015-2019); Global Head of Corporate Strategy, BlackRock, Inc. (2014-2015); Senior Partner, McKinsey & Company (2010-2014). | Trustee of iShares Trust (since 2019); Trustee of iShares U.S. ETF Trust (since 2019). | |||
(a) Robert S. Kapito is deemed to be an “interested person” (as defined in the 1940 Act) of the Company due to his affiliations with BlackRock, Inc. and its affiliates. | ||||||
(b) Salim Ramji is deemed to be an “interested person” (as defined in the 1940 Act) of the Company due to his affiliations with BlackRock, Inc. and its affiliates. | ||||||
| Independent Directors | ||||||
| Name (Age) | Position(s) | Principal Occupation(s) During the Past 5 Years | Other Directorships Held by Director | |||
Cecilia H. Herbert (70) | Director (since 2005); Independent Board Chair (since 2016). | Chair of the Finance Committee (since 2019) and Trustee and Member of the Finance, Technology and Quality Committees of Stanford Health Care (since 2016); Member of the Audit Committee (since 2018) and Trustee and Member of the Investment Committee, WNET, a New York public media company (since 2011); Chair (1994-2005) and Member (since 1992) of the Investment Committee, Archdiocese of San Francisco; Trustee of Forward Funds (14 portfolios) (2009-2018); Trustee of Salient MF Trust (4 portfolios) (2015-2018); Director (1998-2013) and President (2007-2011) of the Board of Directors, Catholic Charities CYO; Trustee (2002-2011) and Chair of the Finance and Investment Committee (2006-2010) of the Thacher School. | Trustee of iShares Trust (since 2005); Trustee of iShares U.S. ETF Trust (since 2011); Independent Board Chair of iShares Trust and iShares U.S. ETF Trust (since 2016); Trustee of Thrivent Church Loan and Income Fund (since 2019). | |||
Jane D. Carlin (63) | Director (since 2015); Risk Committee Chair (since 2016). | Consultant (since 2012); Member of the Audit Committee (2012-2018), Chair of the Nominating and Governance Committee (2017-2018) and Director of PHH Corporation (mortgage solutions) (2012-2018); Managing Director and Global Head of Financial Holding Company Governance & Assurance and the Global Head of Operational Risk Management of Morgan Stanley (2006-2012). | Trustee of iShares Trust (since 2015); Trustee of iShares U.S. ETF Trust (since 2015); Member of the Audit Committee (since 2016) and Director of The Hanover Insurance Group, Inc. (since 2016). | |||
Richard L. Fagnani (64) | Director (since 2017); Audit Committee Chair (since 2019). | Partner, KPMG LLP (2002-2016). | Trustee of iShares Trust (since 2017); Trustee of iShares U.S. ETF Trust (since 2017). | |||
| DIRECTORAND OFFICER INFORMATION | 87 |
| Director and Officer Information (continued) |
| Independent Directors (continued) | ||||||
| Name (Age) | Position(s) | Principal Occupation(s) During the Past 5 Years | Other Directorships Held by Director | |||
John E. Kerrigan (64) | Director (since 2005); Nominating and Governance and Equity Plus Committee Chairs (since 2019). | Chief Investment Officer, Santa Clara University (since 2002). | Trustee of iShares Trust (since 2005); Trustee of iShares U.S. ETF Trust (since 2011). | |||
Drew E. Lawton (60) | Director (since 2017); 15(c) Committee Chair (since 2017). | Senior Managing Director of New York Life Insurance Company (2010-2015). | Trustee of iShares Trust (since 2017); Trustee of iShares U.S. ETF Trust (since 2017). | |||
John E. Martinez (58) | Director (since 2003); Securities Lending Committee Chair (since 2019). | Director of Real Estate Equity Exchange, Inc. (since 2005). | Trustee of iShares Trust (since 2003); Trustee of iShares U.S. ETF Trust (since 2011); Director of Cloudera Foundation (since 2017); and Director of Reading Partners (2012-2016). | |||
Madhav V. Rajan (55) | Director (since 2011); Fixed Income Plus Committee Chair (since 2019). | Dean, and George Pratt Shultz Professor of Accounting, University of Chicago Booth School of Business (since 2017); Robert K. Jaedicke Professor of Accounting, Stanford University Graduate School of Business (2001-2017); Professor of Law (by courtesy), Stanford Law School (2005-2017); Senior Associate Dean for Academic Affairs and Head of MBA Program, Stanford University Graduate School of Business (2010-2016). | Trustee of iShares Trust (since 2011); Trustee of iShares U.S. ETF Trust (since 2011). | |||
| Officers | ||||||
| Name (Age) | Position(s) | Principal Occupation(s) During the Past 5 Years | ||||
Armando Senra (48) | President (since 2019). | Managing Director, BlackRock, Inc. (since 2007); Head of U.S., Canada and Latam iShares, BlackRock, Inc. (since 2019); Head of Latin America Region, BlackRock, Inc. (2006-2019); Managing Director, Bank of America Merrill Lynch (1994-2006). | ||||
Neal J. Andrews (53) | Treasurer and Chief Financial Officer (since 2019). | Managing Director, BlackRock, Inc. (since 2006); Chief Financial Officer of the BlackRock-advised Funds in the BlackRock Multi-Asset Complex and the BlackRock Fixed-Income Complex (since 2007). | ||||
Charles Park (52) | Chief Compliance Officer (since 2006). | Chief Compliance Officer of BlackRock Advisors, LLC and the BlackRock-advised Funds in the BlackRock Multi-Asset Complex and the BlackRock Fixed-Income Complex (since 2014); Chief Compliance Officer of BFA (since 2006). | ||||
Deepa Damre (44) | Secretary (since 2019). | Managing Director, BlackRock, Inc. (since 2014); Director, BlackRock, Inc. (2009-2013). | ||||
Scott Radell (50) | Executive Vice President (since 2012). | Managing Director, BlackRock, Inc. (since 2009); Head of Portfolio Solutions, BlackRock, Inc. (since 2009). | ||||
Alan Mason (58) | Executive Vice President (since 2016). | Managing Director, BlackRock, Inc. (since 2009). | ||||
Marybeth Leithead (56) | Executive Vice President (since 2019). | Managing Director, BlackRock, Inc. (since 2017); Chief Operating Officer of Americas iShares (since 2017); Portfolio Manager, Municipal Institutional & Wealth Management (2009-2016). | ||||
| 88 | 2019ISHARES ANNUAL REPORTTO SHAREHOLDERS |
Electronic Delivery
Shareholders can sign up for email notifications announcing that the shareholder report or prospectus has been posted on the iShares website at iShares.com. Once you have enrolled, you will no longer receive prospectuses and shareholder reports in the mail.
To enroll in electronic delivery:
| • | Go to icsdelivery.com. |
| • | If your brokerage firm is not listed, electronic delivery may not be available. Please contact your broker-dealer or financial advisor. |
Householding
Householding is an option available to certain fund investors. Householding is a method of delivery, based on the preference of the individual investor, in which a single copy of certain shareholder documents can be delivered to investors who share the same address, even if their accounts are registered under different names. Please contact your broker-dealer if you are interested in enrolling in householding and receiving a single copy of prospectuses and other shareholder documents, or if you are currently enrolled in householding and wish to change your householding status.
Availability of Quarterly Schedule of Investments
The iShares Funds file their complete schedule of portfolio holdings with the SEC for the first and third quarters of each fiscal year as an exhibit to its reports on FormN-PORT, and for reporting periods ended prior to March 31, 2019, filed such information on FormN-Q. The iShares Funds’ FormsN-Q are available on the SEC’s website at sec.gov. The iShares Funds also disclose their complete schedule of portfolio holdings on a daily basis on the iShares website at iShares.com.
Availability of Proxy Voting Policies and Proxy Voting Records
A description of the policies and procedures that the iShares Funds use to determine how to vote proxies relating to portfolio securities and information about how the iShares Funds voted proxies relating to portfolio securities during the most recent twelve-month period ending June 30 is available without charge, upon request (1) by calling toll-free1-800-474-2737; (2) on the iShares website at iShares.com; and (3) on the SEC website at sec.gov.
| GENERAL INFORMATION | 89 |
Glossary of Terms Used in this Report
| Portfolio Abbreviations — Fixed Income | ||
| LIBOR | London Interbank Offered Rate | |
| PIK | Payment-in-kind | |
| Currency Abbreviations | ||
| ARS | Argentine Peso | |
| BRL | Brazilian Real | |
| CAD | Canadian Dollar | |
| CLP | Chilean Peso | |
| COP | Colombian Peso | |
| CZK | Czech Koruna | |
| DOP | Dominican Peso | |
| EUR | Euro | |
| GBP | British Pound | |
| HUF | Hungarian Forint | |
| IDR | Indonesian Rupiah | |
| MXN | Mexican Peso | |
| MYR | Malaysian Ringgit | |
| PEN | Peru Nuevo Sol | |
| PHP | Philippine Peso | |
| PLN | Polish Zloty | |
| RON | Romanian Leu | |
| RUB | New Russian Ruble | |
| THB | Thai Baht | |
| TRY | Turkish Lira | |
| UYU | Uruguayan Peso | |
| ZAR | South African Rand | |
| 90 | 2019ISHARES ANNUAL REPORTTO SHAREHOLDERS |
Want to know more?
iShares.com | 1-800-474-2737
This report is intended for the Funds’ shareholders. It may not be distributed to prospective investors unless it is preceded or accompanied by the current prospectus.
Investing involves risk, including possible loss of principal.
The iShares Funds are distributed by BlackRock Investments, LLC (together with its affiliates, “BlackRock”).
The iShares Funds are not sponsored, endorsed, issued, sold or promoted by JPMorgan Chase & Co., Markit Indices Limited or Morningstar, Inc., nor do these companies make any representation regarding the advisability of investing in the iShares Funds. BlackRock is not affiliated with the companies listed above.
©2019 BlackRock, Inc. All rights reserved.iSHARES andBLACKROCK are registered trademarks of BlackRock, Inc. or its subsidiaries. All other marks are the property of their respective owners.
iS-AR-1002-1019
|  |
Item 2. Code of Ethics.
The registrant has adopted a code of ethics, as of the end of the period covered by this report, applicable to the registrant’s principal executive officer, principal financial officer, principal accounting officer or controller, or persons performing similar functions. During the period covered by this report, the code of ethics was amended to clarify an inconsistency in to whom persons covered by the code should report suspected violations of the code. The amendment clarifies that such reporting should be made to BlackRock’s General Counsel, and retains the alternative option of anonymous reporting following “whistleblower” policies. Othernon-material changes were also made in connection with this amendment. During the period covered by this report, there have been no waivers granted under the code of ethics. The registrant undertakes to provide a copy of the code of ethics to any person upon request, without charge, by calling1-800-474-2737.
Item 3. Audit Committee Financial Expert.
The registrant’s Board of Directors has determined that the registrant has more than one audit committee financial expert, as that term is defined under Item 3(b) and 3(c), serving on its audit committee. The audit committee financial experts serving on the registrant’s audit committee are Richard L. Fagnani, John E. Kerrigan, and Madhav V. Rajan, all of whom are independent, as that term is defined under Item 3(a)(2).
Item 4. Principal Accountant Fees and Services.
The principal accountant fees disclosed in items 4(a), 4(b), 4(c), 4(d) and 4(g) are for the five series of the registrant for which the fiscalyear-end is October 31, 2019 (the “Funds”), and whose annual financial statements are reported in Item 1.
| (a) | Audit Fees – The aggregate fees billed for each of the last two fiscal years for professional services rendered by the principal accountant for the audit of the Funds’ annual financial statements or services that are normally provided by the accountant in connection with statutory and regulatory filings or engagements for those fiscal years were $78,000 for the fiscal year ended October 31, 2018 and $78,000 for the fiscal year ended October 31, 2019. |
| (b) | Audit-Related Fees – There were no fees billed for the fiscal years ended October 31, 2018 and October 31, 2019 for assurance and related services by the principal accountant that were reasonably related to the performance of the audit of the Fund’s financial statements and are not reported under (a) of this Item. |
| (c) | Tax Fees – The aggregate fees billed in each of the last two fiscal years for professional services rendered by the principal accountant for tax compliance, tax advice and tax planning for the Funds were $18,905 for the fiscal year ended October 31, 2018 and $18,905 for the fiscal year ended October 31, 2019. These services related to the review of the Funds’ tax returns and excise tax calculations. |
| (d) | All Other Fees – There were no other fees billed in each of the fiscal years ended October 31, 2018 and October 31, 2019 for products and services provided by the principal accountant, other than the services reported in (a) through (c) of this Item. |
| (e) | (1) The registrant’s audit committee charter, as amended, provides that the audit committee is responsible for the approval, prior to appointment, of the engagement of the principal accountant to annually audit and provide their opinion on the registrant’s financial statements. The audit committee must also approve, prior to appointment, the engagement of the principal accountant to provide non-audit services to the registrant or to any entity controlling, controlled by or under common control with the registrant’s investment adviser (“Adviser Affiliate”) that provides ongoing services to the registrant, if the engagement relates directly to the operations and financial reporting of the registrant. |
(2) There were no services described in (b) through (d) above that were approved by the audit committee pursuant to paragraph (c)(7)(i)(C) of Rule2-01 of RegulationS-X.
| (f) | None of the hours expended on the principal accountant’s engagement to audit the Funds’ financial statements for the fiscal year ended October 31, 2019 were attributable to work performed by persons other than the principal accountant’s full-time, permanent employees. |
| (g) | The aggregatenon-audit fees billed by the registrant’s principal accountant for services rendered to the Funds, and rendered to the registrant’s investment adviser, and any Adviser Affiliate that provides ongoing services to the registrant for the last two fiscal years were $18,905 for the fiscal year ended October 31, 2018 and $18,905 for the fiscal year ended October 31, 2019. |
| (h) | The registrant’s audit committee has considered whether the provision ofnon-audit services rendered to the registrant’s investment adviser and any Adviser Affiliate that provides ongoing services to the registrant that were notpre-approved pursuant to paragraph (c)(7)(ii) of Rule2-01 of RegulationS-X, if any, is compatible with maintaining the principal accountant’s independence, and has determined that the provision of these services, if any, does not compromise the principal accountant’s independence. |
Item 5. Audit Committee of Listed Registrants
(a) The registrant is a listed issuer as defined in Rule10A-3 under the Exchange Act of 1934 and has a separately-designated standing audit committee established in accordance with Section 3(a)(58)(A) of the Exchange Act of 1934. The registrant’s audit committee members are Richard L. Fagnani, John E. Kerrigan, and Madhav V. Rajan.
(b) Not applicable.
Item 6. Investments.
| (a) | Schedules of investments are included as part of the reports to shareholders filed under Item 1 of this Form. |
| (b) | Not applicable. |
Item 7. Disclosure of Proxy Voting Policies and Procedures forClosed-End Management Investment Companies.
Not applicable to the registrant.
Item 8. Portfolio Managers ofClosed-End Management Investment Companies.
Not applicable to the registrant.
Item 9. Purchases of Equity Securities byClosed-End Management Investment Company and Affiliated Purchasers.
Not applicable to the registrant.
Item 10. Submission of Matters to a Vote of Security Holders.
There were no material changes to the procedures by which shareholders may recommend nominees to the registrant’s Board of Directors.
Item 11. Controls and Procedures.
(a) The President (the registrant’s Principal Executive Officer) and Treasurer and Chief Financial Officer (the registrant’s Principal Financial Officer) have concluded that the registrant’s disclosure controls and procedures (as defined in Rule30a-3(c) under the Investment Company Act of 1940) are effective as of a date within 90 days of the filing date of this report, based on their evaluation of these controls and procedures required by Rule30a-3(b) under the Investment Company Act of 1940 and Rules13a-15(b) or15d-15(b) under the Exchange Act of 1934.
(b) There were no changes in the registrant’s internal control over financial reporting (as defined in Rule30a-3(d) under the Investment Company Act of 1940) that occurred during the period covered by this report that have materially affected, or are reasonably likely to materially affect, the registrant’s internal control over financial reporting.
Item 12. Disclosure of Securities Lending Activities forClosed-End Management Investment Companies.
Not applicable to the registrant.
Item 13. Exhibits.
(a) (1) Code of Ethics is not filed as an exhibit; please refer to Item 2.
(a) (2) Section 302 Certifications are attached.
(a) (3) Not applicable.
(a) (4) Not applicable.
(b) Section 906 Certifications are attached.
SIGNATURES
Pursuant to the requirements of the Securities Exchange Act of 1934 and the Investment Company Act of 1940, the registrant has duly caused this report to be signed on its behalf by the undersigned, thereunto duly authorized.
iShares, Inc. | ||
| By: /s/ Armando Senra | ||
Armando Senra, President (Principal Executive Officer) | ||
Date: December 31, 2019 | ||
Pursuant to the requirements of the Securities Exchange Act of 1934 and the Investment Company Act of 1940, this report has been signed below by the following persons on behalf of the registrant and in the capacities and on the dates indicated.
| By: /s/ Armando Senra | ||
Armando Senra, President (Principal Executive Officer) | ||
Date: December 31, 2019 | ||
| By: /s/ Neal Andrews | ||
Neal Andrews, Treasurer and Chief Financial Officer (Principal Financial Officer) | ||
Date: December 31, 2019 | ||