| | |
| UNITED STATES |
| SECURITIES AND EXCHANGE COMMISSION |
| Washington, D.C. 20549 |
| |
| FORM N-CSR |
| |
| CERTIFIED SHAREHOLDER REPORT OF REGISTERED |
| MANAGEMENT INVESTMENT COMPANIES |
| |
| Investment Company Act file number: (811- 07237) |
| |
| Exact name of registrant as specified in charter: Putnam Investment Funds |
| |
| Address of principal executive offices: One Post Office Square, Boston, Massachusetts 02109 |
| |
| Name and address of agent for service: | Beth S. Mazor, Vice President |
| | One Post Office Square |
| | Boston, Massachusetts 02109 |
| |
| Copy to: | John W. Gerstmayr, Esq. |
| | Ropes & Gray LLP |
| | One International Place |
| | Boston, Massachusetts 02110 |
| |
| Registrant’s telephone number, including area code: | (617) 292-1000 |
Date of fiscal year end: February 29, 2008
Date of reporting period: March 1, 2007 — August 31, 2007
Item 1. Report to Stockholders:
The following is a copy of the report transmitted to stockholders pursuant to Rule 30e-1 under the Investment Company Act of 1940:
What makes Putnam different?

In 1830, Massachusetts Supreme Judicial Court Justice Samuel Putnam established The Prudent Man Rule, a legal foundation for responsible money management.
THE PRUDENT MAN RULE
All that can be required of a trustee to invest is that he shall conduct himself faithfully and exercise a sound discretion. He is to observe how men of prudence, discretion, and intelligence manage their own affairs, not in regard to speculation, but in regard to the permanent disposition of their funds, considering the probable income, as well as the probable safety of the capital to be invested.

A time-honored tradition in money management
Since 1937, our values have been rooted in a profound sense of responsibility for the money entrusted to us.
A prudent approach to investing
We use a research-driven team approach to seek consistent, dependable, superior investment results over time, although there is no guarantee a fund will meet its objectives.
Funds for every investment goal
We offer a broad range of mutual funds and other financial products so investors and their financial representatives can build diversified portfolios.
A commitment to doing what’s right for investors
With a focus on investment performance, below-average expenses, and in-depth information about our funds, we put the interests of investors first and seek to set the standard for integrity and service.
Industry-leading service
We help investors, along with their financial representatives, make informed investment decisions with confidence.
Putnam
Small Cap
Value Fund
8| 31| 07
Semiannual Report
| |
| Message from the Trustees | 2 |
| About the fund | 4 |
| Performance snapshot | 6 |
| Report from the fund managers | 7 |
| Performance in depth | 13 |
| Expenses | 16 |
| Portfolio turnover | 18 |
| Risk | 19 |
| Your fund’s management | 20 |
| Terms and definitions | 22 |
| Trustee approval of management contract | 24 |
| Other information for shareholders | 29 |
| Financial statements | 30 |
| Shareholder meeting results | 52 |
| Brokerage commissions | 53 |
Cover photograph: © White-Packert Photography
Message from the Trustees
Dear Fellow Shareholder
We are pleased to announce that Marsh & McLennan Companies, Inc. recently completed the sale of its ownership interest in Putnam Investments Trust, the parent company of Putnam Management and its affiliates, to Great-West Lifeco Inc. Great-West Lifeco is a financial services holding company with operations in Canada, the United States, and Europe and is a member of the Power Financial Corporation group of companies. With this sale, Putnam becomes part of a successful organization with a long-standing commitment to high-quality investment management and financial services. Please know that the change in ownership is not expected to affect the Putnam funds, the way Putnam manages money, or the funds’ management teams. Putnam will continue to operate as a separate company headquartered in Boston, and there will be no change in the funds’ fees or in the services the funds provide.
We would also like to take this opportunity to announce that Putnam President and Chief Executive Officer Ed Haldeman, one of your fund’s Trustees since 2004, was recently named President of the Funds, assuming this role from George Putnam, III. This change, together with the completion of the transaction with Great-West Lifeco, has enabled George Putnam to become an independent Trustee of the funds. Both George and Ed will continue serving on the Board of Trustees in our collective role of overseeing the Putnam funds on your behalf.
Lastly, we are pleased to inform you that a new independent Trustee, Robert J. Darretta, has joined your fund’s Board of Trustees. Mr. Darretta brings extensive leadership experience in corporate finance and accounting. He is a former Vice Chairman of the Board of
2
Directors of Johnson & Johnson, one of the leading U.S. health-care and consumer products companies, where he also served as Chief Financial Officer, Executive Vice President, and Treasurer.
In the following pages, members of your fund’s management team discuss the fund’s performance and strategies for the fiscal year ended August 31, 2007, and provide their outlook for the months ahead. As always, we thank you for your support of the Putnam funds.

Putnam Small Cap Value Fund: seeking to uncover
opportunities that others may have overlooked
Small-cap investing can often be as much an art as a science. Because the small-cap universe is so large — comprising 2,000 companies or more — and changes so quickly, many promising and profitable smaller companies fail to capture Wall Street’s attention. And because so many small-cap stocks represent relatively new businesses, investing in them can be both volatile and rewarding. Finding those companies that offer the best prospects for success takes a trained eye and a disciplined approach.
Because of their size, smaller companies are usually more agile than larger companies and are able to respond more quickly to market changes or demand for new products and services. Many small-cap companies are in the early stages of their corporate lives, having recently made the transition to being publicly traded. They also react differently to economic conditions than do larger companies. On one hand, an uptick in the economy can make it easier for small companies and start-ups to obtain financing; on the other hand, smaller companies with less robust balance sheets often have greater difficulty weathering a market downturn.
Putnam Small Cap Value Fund’s management team looks for stocks that are not only undervalued but that appear to have a catalyst that could unlock the value in the stock. Events such as a change in management, restructuring, or a new product that fills a need often have this effect. In addition, the management team considers stocks that have recently fallen out of favor with investors. The stocks of smaller companies are historically much more volatile than blue chips; relatively minor earnings disappointments or increased competition in the market can trigger a disproportionate drop in share prices. In targeting stocks that management believes have been oversold, the fund seeks exposure to stocks that have favorable risk/reward profiles.
The fund invests some or all of its assets in small and/or midsize companies. Such investments increase the risk of greater price fluctuations. Value investing seeks underpriced stocks, but there is no guarantee that a stock’s price will rise.

In-depth analysis is key to
successful stock selection.
Drawing on the expertise of a dedicated team of stock analysts, the fund’s management team seeks attractive value stocks. Once a stock is selected for the portfolio, it is regularly assessed by members of the team to ensure that it continues to meet their criteria, including:
Valuation They carefully consider how each stock is valued, seeking stocks whose valuations are attractive relative to the company’s profitability potential.
Change They focus on company fundamentals against the broader context of industry trends to identify whether individual companies possess a catalyst for positive change.
Quality They look for high-quality companies, seeking characteristics such as sound balance sheets, profitable business models, and competent management.
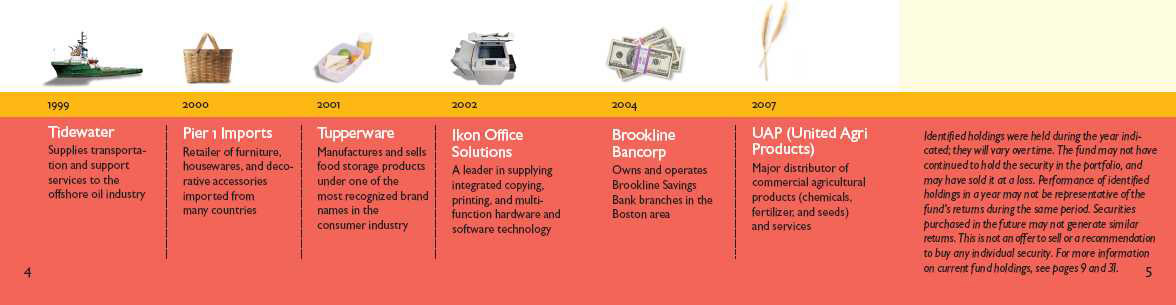
Putnam Small Cap Value Fund holdings have
spanned sectors and industries over time.
Performance snapshot
Putnam Small Cap
Value Fund
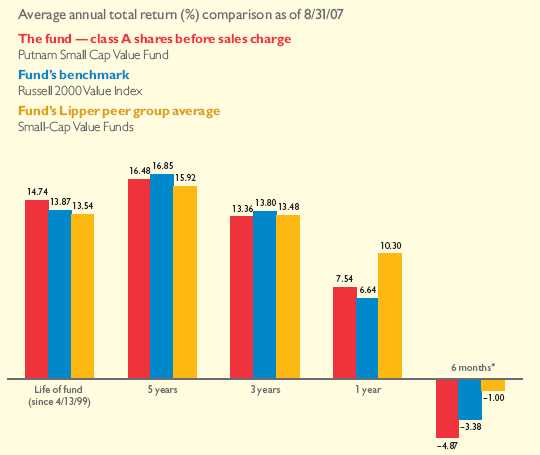
Current performance may be lower or higher than the quoted past performance, which cannot guarantee future results. Share price, principal value, and return will fluctuate, and you may have a gain or a loss when you sell your shares. Performance of class A shares assumes reinvestment of distributions and does not account for taxes. Fund returns in the bar chart do not reflect a sales charge. See pages 13–15 for additional performance information. For a portion of the periods, this fund may have limited expenses, without which returns would have been lower. A 1% short-term trading fee may apply. To obtain the most recent month-end performance, visit www.putnam.com.
* Returns for the six-month period are not annualized, but cumulative.
6
Report from the fund managers
The period in review
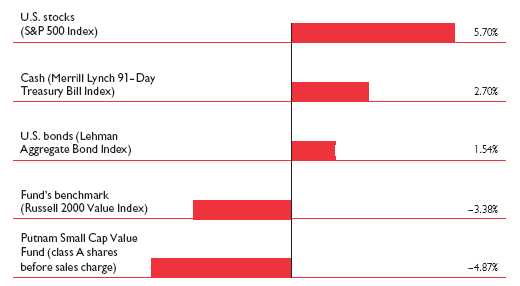
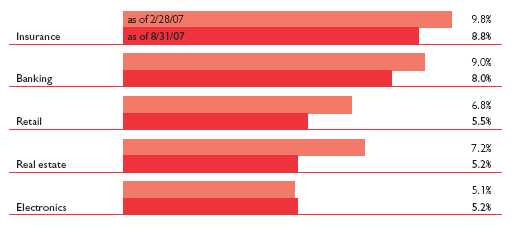
The semiannual period ended August 31, 2007, was a challenging one for equities — and especially for small-cap value stocks. From July through August, markets were roiled by rapid changes in investor sentiment, prompted by concerns that problems in the subprime mortgage arena would spread into other sectors. Financial stocks were the hardest hit, which had an impact on your fund’s benchmark, the Russell 2000 Value Index, one-third of whose component stocks are in that sector. While your fund had less of an exposure to financials, weak performance by several stocks in that and other sectors hindered returns and caused it to lag its benchmark. The fund also lagged the average for its Lipper peer group, Small-Cap Value Funds. We believe this reflects larger sector bets by other funds in the peer group. Your fund’s investment process, by contrast, is founded on careful, bottom-up evaluation of individual stocks, an approach we cons ider more prudent and better suited to a longer-term investment horizon. While fund holdings in the energy and manufacturing sectors contributed positively to performance, their strength was offset by weaker positions in insurance, banking, and telecommunications.
Market overview
U.S. stocks advanced modestly in the first half of your fund’s fiscal year, but their path was anything but smooth. Recovering from a sluggish winter, equity markets delivered strong gains from mid-March through May. In fact, by early June, the Dow Jones Industrial Average and the S&P 500 Index had reached record highs. Investor enthusiasm was short-lived, however, as rumblings about problems in the subprime mortgage market amplified to a roar.
By July, the market reflected growing concerns about potential inflation and a continued slowdown in the housing market. Subprime worries spread to the entire financial sector, sparking a mid-July selloff and prompting the Federal Reserve (the Fed) to lower the discount rate, a move that encouraged U.S. banks
7
to borrow directly from the Fed as needed to support home mortgage lending. Investor fears peaked again in mid-August, driving the S&P 500 Index down to within a few points of its low for the year. By the close of the fund’s fiscal year on August 31, markets had begun to make something of a recovery from their swoon, while analysts and investors began looking to the Fed for additional supportive measures.
The events of the past few months brought about a change in the market, as investors became more risk-averse. The resulting flight to quality favored large-cap growth stocks over smaller-cap stocks for the first time in several years.
Strategy overview
We seek out high-quality, undervalued stocks with what we consider to be improving fundamentals. Small-cap stocks are often under-researched, overlooked, and inefficiently priced. We look for companies that we believe have sustainable revenues, healthy balance sheets, and strong cash flow. We also look for any positive catalyst that we believe may improve a company’s prospects and stimulate capital appreciation. As value investors, we know we must be patient, because it can take many months for the market to recognize a stock’s true worth. Often, we may hold a stock for 12 to 18 months before it approaches what we consider its fair price. We believe our intermediate- to long-term outlook differentiates this
Market sector and fund performance
This comparison shows your fund’s performance in the context of different market sectors for the six months ended 8/31/07. See page 6 and pages 13–15 for additional fund performance information. Index descriptions can be found on page 23.
8
fund from other funds that may focus on achieving results over shorter periods.
We use bottom-up analysis to identify stocks we believe are inexpensive and have a catalyst for positive change. The fund also seeks broad diversification across industries and market sectors. Because the small-cap value universe is so vast and the market typically operates with a number of inefficiencies, we have a large number of stocks to evaluate and select for the portfolio. This focus on diversification helps us pursue one of our key performance objectives: to avoid large positions in any stocks that might severely underperform.
Your fund’s holdings
As noted earlier, subprime woes escalated over the period and spread to affect companies throughout the financial sector. Although it deals with higher-quality prime mortgages, shares of Triad Guaranty, a provider of private mortgage insurance, declined. We have not eliminated it, however, because we believe that the company will eventually recover. PFF Bancorp has a series of banks located in inland California, north of Los Angeles. This area, nicknamed the “inland empire,” has experienced explosive expansion in jobs and strong housing growth. While this was a difficult period for the company, we believe the slowdown is temporary; the area’s demographics indicate an active housing future when the current crunch
Comparison of top industry weightings
This chart shows how the fund’s top weightings have changed over the last six months. Weightings are shown as a percentage of net assets. Holdings will vary over time.
9
subsides. We have taken advantage of lower prices to increase the fund’s position in this stock.
Detractors from performance were not confined to the financial sector. InPhonic, which distributes cell phones and activates service, restated its 2006 financials and subsequently reported weak second quarter results, which was followed by the resignation of the company’s CFO. These events caused us to question the company’s business model and financial stability. Given these concerns, we significantly trimmed the fund’s position and eliminated the stock from the portfolio as the period ended.
Despite these disappointments, the fund’s portfolio included several stocks that gained value during the period. Real estate may have peaked, but buildings still require basic services. Tennant, a manufacturer of commercial floor cleaning equipment, was particularly strong. The company’s products are used in office buildings, airports, and warehouses throughout the United States and overseas. The company has expanded its product line and increased its plants’ output. In addition, Tennant has wisely developed a strong international presence, which, given the growth of the global economy, appears likely to prove increasingly beneficial. As the stock has appreciated, it has come closer to what we consider its fair value. We have sold part of the
Top holdings
This table shows the fund’s top holdings, and the percentage of the fund’s net assets that each represented, as of 8/31/07. The fund’s holdings will change over time.
| |
| Holding (percent of fund’s net assets) | Industry |
|
| GulfMark Offshore, Inc. (0.9%) | Energy |
|
| Ruddick Corp. (0.9%) | Food |
|
| Advanta Corp. Class B (0.9%) | Financial |
|
| Tidewater, Inc. (0.9%) | Energy |
|
| Ultra Clean Holdings (0.8%) | Semiconductor |
|
| SkyWest, Inc. (0.8%) | Airlines |
|
| Goodman Global, Inc. (0.8%) | Building materials |
|
| AMETEK, Inc. (0.8%) | Conglomerates |
|
| Benchmark Electronics, Inc. (0.8%) | Electronics |
|
| Sciele Pharma, Inc. (0.8%) | Pharmaceuticals |
|
10
fund’s holdings to lock in profits but still maintain a sizeable position.
A consumer-driven change has aided the performance of mattress manufacturer Tempur-Pedic. As market demand has shifted from traditional innerspring to foam, this company has developed a well-recognized consumer brand. The company’s growth has been well orchestrated, including a new and more efficient factory as well as new products that we think can help it remain a market leader. Tempur-Pedic initiated its first dividend in March, along with a large share buyback. Its attractive fundamentals and solid management have led us to retain the fund’s significant position in the stock.
Another company that benefited from changing market demand was Tidewater, which owns a fleet of vessels serving the global offshore energy industry. As drilling moves from land-based to ocean-based, there has been increasing demand for Tidewater’s services, including towing drilling rigs and equipment, and transporting supplies and personnel. This stock has been held in the fund for some time. We have seen it grow into the upper capitalization levels of our value universe, but believe it has the potential to appreciate further.
Please note that the holdings discussed in this report may not have been held by the fund for the entire period. Portfolio composition is subject to review in accordance with the fund’s investment strategy and may vary in the future.
11
The outlook for your fund
The following commentary reflects anticipated developments that could affect your fund over the next six months, as well as your management team’s plans for responding to them.
While our management approach is tied to individual stock analysis and selection rather than macroeconomic forecasts, the current market environment has a significant impact on our strategy as we look ahead. The economy is slowing, and gun-shy investors are seeking to reduce their risk exposure. Simultaneously, small-cap value stocks have produced several years of strong returns and, while we continue to find opportunities in this asset class, we believe that the recent shift in favor of larger-cap stocks may be maintained, unless the economy experiences a dramatic shift.
Given this environment, we agree with our asset allocation specialists’ emphasis on safety. Thus, as the crisis of confidence increases, we have shifted our focus to higher-quality stocks within the small-cap universe. During the semiannual period we began to cycle out of weaker names and to seek companies that we believe are more likely to be able to withstand an economic slowdown. This does not, however, indicate a shift to a sector-focused strategy. We continue to rely on our bottom-up analysis and disciplined investment process to identify such companies and we feel confident that we can uncover opportunities throughout the small-cap value market.
The views expressed in this report are exclusively those of Putnam Management. They are not meant as investment advice.
The fund invests some or all of its assets in small and/or midsize companies. Such investments increase the risk of greater price fluctuations. Value investing seeks underpriced stocks, but there is no guarantee that a stock's price will rise.
12
Your fund’s performance
This section shows your fund’s performance for periods ended August 31, 2007, the end of the first half of its current fiscal year. In accordance with regulatory requirements for mutual funds, we also include performance as of the most recent calendar quarter-end and expense information taken from the fund’s current prospectus. Performance should always be considered in light of a fund’s investment strategy. Data represents past performance. Past performance does not guarantee future results. More recent returns may be less or more than those shown. Investment return and principal value will fluctuate, and you may have a gain or a loss when you sell your shares. For the most recent month-end performance, please visit www.putnam.com or call Putnam at 1-800-225-1581. Class Y shares are generally only available to corporate and institutional clients and clients in other approved programs. See the Terms and Definitions section in this report for definitions of the share classes offered by your fund.
Fund performance
Total return for periods ended 8/31/07
| | | | | | | | | | |
| | Class A | | Class B | | Class C | | Class M | | Class R | Class Y |
| (inception dates) | (4/13/99) | | (5/3/99) | | (7/26/99) | | (3/29/00) | | (3/30/07) | (1/3/01) |
|
| | NAV | POP | NAV | CDSC | NAV | CDSC | NAV | POP | NAV | NAV |
|
| Life of fund | 216.77% | 200.17% | 197.95% | 197.95% | 197.79% | 197.79% | 204.21% | 194.21% | 210.42% | 222.30% |
| Annual average | 14.74 | 14.01 | 13.91 | 13.91 | 13.90 | 13.90 | 14.19 | 13.74 | 14.47 | 14.98 |
|
| 5 years | 114.38 | 103.06 | 106.45 | 104.45 | 106.66 | 106.66 | 109.20 | 102.32 | 111.84 | 117.24 |
| Annual average | 16.48 | 15.22 | 15.60 | 15.38 | 15.62 | 15.62 | 15.91 | 15.14 | 16.20 | 16.79 |
|
| 3 years | 45.66 | 37.98 | 42.36 | 39.81 | 42.46 | 42.46 | 43.57 | 38.90 | 44.66 | 46.80 |
| Annual average | 13.36 | 11.33 | 12.49 | 11.82 | 12.52 | 12.52 | 12.81 | 11.58 | 13.10 | 13.65 |
|
| 1 year | 7.54 | 1.91 | 6.73 | 2.35 | 6.79 | 5.91 | 7.04 | 3.57 | 7.29 | 7.86 |
|
| 6 months | –4.87 | –9.86 | –5.25 | –9.99 | –5.24 | –6.18 | –5.05 | –8.13 | –4.94 | –4.71 |
|
Current performance may be lower or higher than the quoted past performance, which cannot guarantee future results. After sales charge returns (public offering price, or POP) for class A and M shares reflect a maximum 5.25% and 3.25% load, respectively. Class B share returns reflect the applicable contingent deferred sales charge (CDSC), which is 5% in the first year, declining to 1% in the sixth year, and is eliminated thereafter. Class C shares reflect a 1% CDSC for the first year and is eliminated thereafter. Class R and Y shares have no initial sales charge or CDSC. Performance for class B, C, M, R, and Y shares before their inception is derived from the historical performance of class A shares, adjusted for the applicable sales charge (or CDSC) and, except for class Y shares, the higher operating expenses for such shares.
For a portion of the periods, this fund may have limited expenses, without which returns would have been lower.
A 1% short-term trading fee may be applied to shares exchanged or sold within 90 days of purchase.
13
Comparative index returns
For periods ended 8/31/07
| | |
| | | Lipper Small-Cap |
| | Russell 2000 | Value Funds |
| | Value Index | category average* |
|
| Life of fund | 197.07% | 193.45% |
| Annual average | 13.87 | 13.54 |
|
| 5 years | 117.81 | 110.72 |
| Annual average | 16.85 | 15.92 |
|
| 3 years | 47.38 | 46.54 |
| Annual average | 13.80 | 13.48 |
|
| 1 year | 6.64 | 10.30 |
|
| 6 months | –3.38 | –1.00 |
|
Index and Lipper results should be compared to fund performance at net asset value.
* Over the 6-month, 1-year, 3-year, 5-year, and life-of-fund periods ended 8/31/07, there were 292, 275, 219, 169, and 112 funds, respectively, in this Lipper category.
Fund price and distribution* information
For the six-month period ended 8/31/07
| | | | | | | | |
| | | | | | | |
| Distributions | Class A | Class B | Class C | Class M | Class R | Class Y |
|
| Share value: | NAV | POP | NAV | NAV | NAV | POP | NAV | NAV |
|
| 2/28/07 | $16.62 | $17.54 | $15.24 | $15.28 | $15.83 | $16.36 | — | $16.97 |
|
| 3/30/07† | — | — | — | — | — | — | $16.83 | — |
|
| 8/31/07 | 15.81 | 16.69 | 14.44 | 14.48 | 15.03 | 15.53 | 15.80 | 16.17 |
|
* The fund made no distributions during the period.
† Inception date of class R shares.
14
Fund performance as of most recent calendar quarter
Total return for periods ended 9/30/07
| | | | | | | | | | |
| | Class A | | Class B | | Class C | | Class M | | Class R | Class Y |
| (inception dates) | (4/13/99) | | (5/3/99) | | (7/26/99) | | (3/29/00) | | (3/30/07) | (1/3/01) |
|
| | NAV | POP | NAV | CDSC | NAV | CDSC | NAV | POP | NAV | NAV |
|
| Life of fund | 215.97% | 199.41% | 196.92% | 196.92% | 196.76% | 196.76% | 203.19% | 193.23% | 209.44% | 221.50% |
| Annual average | 14.56 | 13.83 | 13.72 | 13.72 | 13.71 | 13.71 | 14.00 | 13.55 | 14.28 | 14.79 |
|
| 5 years | 132.09 | 119.96 | 123.37 | 121.37 | 123.58 | 123.58 | 126.33 | 119.04 | 129.27 | 135.13 |
| Annual average | 18.34 | 17.08 | 17.44 | 17.23 | 17.46 | 17.46 | 17.75 | 16.98 | 18.05 | 18.65 |
|
| 3 years | 37.78 | 30.54 | 34.72 | 32.30 | 34.74 | 34.74 | 35.77 | 31.36 | 36.76 | 38.94 |
| Annual average | 11.27 | 9.29 | 10.44 | 9.78 | 10.45 | 10.45 | 10.73 | 9.52 | 11.00 | 11.59 |
|
| 1 year | 5.14 | -0.37 | 4.34 | 0.06 | 4.40 | 3.55 | 4.65 | 1.27 | 4.89 | 5.43 |
|
| 6 months | -6.41 | -11.31 | -6.74 | -11.40 | -6.72 | -7.66 | -6.61 | -9.65 | -6.53 | -6.28 |
|
Fund’s annual operating expenses
For the fiscal year ended 2/28/07
| | | | | | |
| | Class A | Class B | Class C | Class M | Class R | Class Y |
|
| Total annual fund | | | | | | |
| operating expenses | 1.31% | 2.06% | 2.06% | 1.81% | 1.56% | 1.06% |
|
Expense information in this table is taken from the most recent prospectus, is subject to change, and may differ from that shown in the next section and in the financial highlights of this report. Expenses are shown as a percentage of average net assets.
15
Your fund’s expenses
As a mutual fund investor, you pay ongoing expenses, such as management fees, distribution fees (12b-1 fees), and other expenses. In the most recent six-month period, your fund limited these expenses; had it not done so, expenses would have been higher. Using the information below, you can estimate how these expenses affect your investment and compare them with the expenses of other funds. You may also pay one-time transaction expenses, including sales charges (loads) and redemption fees, which are not shown in this section and would have resulted in higher total expenses. For more information, see your fund’s prospectus or talk to your financial representative.
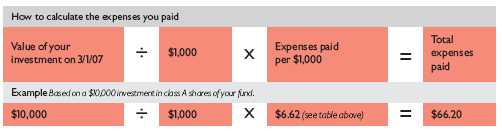
Review your fund’s expenses
The table below shows the expenses you would have paid on a $1,000 investment in Putnam Small Cap Value Fund from March 1, 2007, to August 31, 2007. It also shows how much a $1,000 investment would be worth at the close of the period, assuming actual returns and expenses.
| | | | | | |
| | Class A | Class B | Class C | Class M | Class R | Class Y |
|
| Expenses paid per $1,000* | $ 6.62 | $ 10.28 | $ 10.28 | $ 9.07 | $ 6.61 | $ 5.40 |
|
| Ending value (after expenses) | $951.30 | $947.50 | $947.60 | $949.50 | $950.60 | $952.90 |
|
* Expenses for each share class are calculated using the fund’s annualized expense ratio for each class, which represents the ongoing expenses as a percentage of average net assets for the six months ended 8/31/07 (for the period from 3/30/07 to 8/31/07 for class R shares). The expense ratio may differ for each share class (see the last table in this section). Expenses are calculated by multiplying the expense ratio by the average account value for the period; then multiplying the result by the number of days in the period; and then dividing that result by the number of days in the year.
Estimate the expenses you paid
To estimate the ongoing expenses you paid for the six months ended August 31, 2007, use the calculation method below. To find the value of your investment on March 1, 2007, call Putnam at 1-800-225-1581.
16
Compare expenses using the SEC’s method
The Securities and Exchange Commission (SEC) has established guidelines to help investors assess fund expenses. Per these guidelines, the table below shows your fund’s expenses based on a $1,000 investment, assuming a hypothetical 5% annualized return. You can use this information to compare the ongoing expenses (but not transaction expenses or total costs) of investing in the fund with those of other funds. All mutual fund shareholder reports will provide this information to help you make this comparison. Please note that you cannot use this information to estimate your actual ending account balance and expenses paid during the period.
| | | | | | | |
| | Class A | Class B | Class C | Class M | Class R | Class Y |
|
| Expenses paid per $1,000* | $ 6.85 | $ 10.63 | $ 10.63 | $ 9.37 | $ 6.82 | $ 5.58 |
|
| Ending value (after expenses) | $1,018.35 | $1,014.58 | $1,014.58 | $1,015.84 | $1,014.40 | $1,019.61 |
|
* Expenses for each share class are calculated using the fund’s annualized expense ratio for each class, which represents the ongoing expenses as a percentage of average net assets for the six months ended 8/31/07 (for the period from 3/30/07 to 8/31/07 for class R shares). The expense ratio may differ for each share class (see the last table in this section). Expenses are calculated by multiplying the expense ratio by the average account value for the period; then multiplying the result by the number of days in the period; and then dividing that result by the number of days in the year.
Compare expenses using industry averages
You can also compare your fund’s expenses with the average of its peer group, as defined by Lipper, an independent fund-rating agency that ranks funds relative to others that Lipper considers to have similar investment styles or objectives. The expense ratio for each share class shown below indicates how much of your fund’s average net assets have been used to pay ongoing expenses during the period.
| | | | | | | |
| | Class A | Class B | Class C | Class M | Class R | Class Y |
|
| Your fund’s annualized | | | | | | |
| expense ratio | 1.35% | 2.10% | 2.10% | 1.85% | 1.60% | 1.10% |
|
| Average annualized expense | | | | | | |
| ratio for Lipper peer group* | 1.50% | 2.25% | 2.25% | 2.00% | 1.75% | 1.25% |
|
* Putnam is committed to keeping fund expenses below the Lipper peer group average expense ratio and will limit fund expenses if they exceed the Lipper average. The Lipper average is a simple average of front-end load funds in the peer group that excludes 12b-1 fees as well as any expense offset and brokerage service arrangements that may reduce fund expenses. To facilitate the comparison in this presentation, Putnam has adjusted the Lipper average to reflect the 12b-1 fees carried by each class of shares other than class Y shares, which do not incur 12b-1 fees. Investors should note that the other funds in the peer group may be significantly smaller or larger than the fund, and that an asset-weighted average would likely be lower than the simple average. Also, the fund and Lipper report expense data at different times and for different periods. The fund� 6;s expense ratio shown here is annualized data for the most recent six-month period, while the quarterly updated Lipper average is based on the most recent fiscal year-end data available for the peer group funds as of 6/30/07.
17
Your fund’s
portfolio turnover
Putnam funds are actively managed by teams of experts who buy and sell securities based on intensive analysis of companies, industries, economies, and markets. Portfolio turnover is a measure of how often a fund’s managers buy and sell securities for your fund. A portfolio turnover of 100%, for example, means that the managers sold and replaced securities valued at 100% of a fund’s assets within a one-year period. Funds with high turnover may be more likely to generate capital gains and dividends that must be distributed to shareholders as taxable income. High turnover may also cause a fund to pay more brokerage commissions and other transaction costs, which may detract from performance.
Turnover comparisons
Percentage of holdings that change every year
| | | | | | |
| | 2007 | 2006 | 2005 | 2004 | 2003 |
|
| Putnam Small Cap Value Fund | 47% | 29% | 24% | 24% | 36% |
|
| Lipper Small-Cap Value Funds | | | | | |
| category average | 69% | 73% | 67% | 66% | 76% |
|
Turnover data for the fund is calculated based on the fund’s fiscal-year period, which ends on February 28. Turnover data for the fund’s Lipper category is calculated based on the average of the turnover of each fund in the category for its fiscal year ended during the indicated year. Fiscal years vary across funds in the Lipper category, which may limit the comparability of the fund’s portfolio turnover rate to the Lipper average. Comparative data for 2007 is based on information available as of 8/31/07.
18
Your fund’s risk
This risk comparison is designed to help you understand how your fund compares with other funds. The comparison utilizes a risk measure developed by Morningstar, an independent fund-rating agency. This risk measure is referred to as the fund’s Morningstar Risk.
Your fund’s Morningstar® Risk
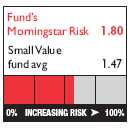
Your fund’s Morningstar Risk is shown alongside that of the average fund in its Morningstar category. The risk bar broadens the comparison by translating the fund’s Morningstar Risk into a percentile, which is based on the fund’s ranking among all funds rated by Morningstar as of September 30, 2007. A higher Morningstar Risk generally indicates that a fund’s monthly returns have varied more widely.
Morningstar determines a fund’s Morningstar Risk by assessing variations in the fund’s monthly returns — with an emphasis on downside variations — over a 3-year period, if available. Those measures are weighted and averaged to produce the fund’s Morningstar Risk. The information shown is provided for the fund’s class A shares only; information for other classes may vary. Morningstar Risk is based on historical data and does not indicate future results. Morningstar does not purport to measure the risk associated with a current investment in a fund, either on an absolute basis or on a relative basis. Low Morningstar Risk does not mean that you cannot lose money on an investment in a fund. Copyright 2007 Morningstar, Inc. All Rights Reserved. The information contained herein (1) is proprietary to Morningstar and/or its content providers; (2) may not be copied or distributed; and (3) is not warranted to be accurate, complete, or timely. Neither Morningstar nor its content providers are responsible for any damages or losses arising from any use of this information.
19
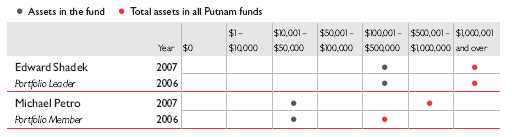
Your fund’s management
Your fund is managed by the members of the Putnam Small- and Mid-Cap Value Team. Edward Shadek is the Portfolio Leader and Michael Petro is a Portfolio Member of the fund. The Portfolio Leader and Portfolio Member coordinate the team’s management of the fund.
For a complete listing of the members of the Putnam Small- and Mid-Cap Value Team, including those who are not Portfolio Leaders or Portfolio Members of your fund, visit Putnam’s Individual Investor Web site at www.putnam.com.
Investment team fund ownership
The table below shows how much the fund’s current Portfolio Leader and Portfolio Member have invested in the fund and in all Putnam mutual funds (in dollar ranges). Information shown is as of August 31, 2007, and August 31, 2006.
Trustee and Putnam employee fund ownership
As of August 31, 2007, all of the Trustees of the Putnam funds owned fund shares. The table below shows the approximate value of investments in the fund and all Putnam funds as of that date by the Trustees and Putnam employees. These amounts include investments by the Trustees’ and employees’ immediate family members and investments through retirement and deferred compensation plans.
| | |
| | | Total assets in |
| | Assets in the fund | all Putnam funds |
|
| Trustees | $ 616,000 | $ 92,000,000 |
|
| Putnam employees | $14,301,000 | $751,000,000 |
|
20
Other Putnam funds managed by the Portfolio Leader
and Portfolio Member
Edward Shadek is also a Portfolio Leader of Putnam Mid Cap Value Fund.
Edward Shadek and Michael Petro may also manage other accounts and variable trust funds advised by Putnam Management or an affiliate.
Changes in your fund’s Portfolio Leader and Portfolio Member
Your fund’s Portfolio Leader and Portfolio Member did not change during the year ended August 31, 2007.
21
Terms and definitions
Important terms
Total return shows how the value of the fund’s shares changed over time, assuming you held the shares through the entire period and reinvested all distributions in the fund.
Net asset value (NAV) is the price, or value, of one share of a mutual fund, without a sales charge. NAVs fluctuate with market conditions. NAV is calculated by dividing the net assets of each class of shares by the number of outstanding shares in the class.
Public offering price (POP) is the price of a mutual fund share plus the maximum sales charge levied at the time of purchase. POP performance figures shown here assume the 5.25% maximum sales charge for class A shares and 3.25% for class M shares.
Contingent deferred sales charge (CDSC) is generally a charge applied at the time of the redemption of class B or C shares and assumes redemption at the end of the period. Your fund’s class B CDSC declines from a 5% maximum during the first year to 1% during the sixth year. After the sixth year, the CDSC no longer applies. The CDSC for class C shares is 1% for one year after purchase.
Share classes
Class A shares are generally subject to an initial sales charge and no CDSC (except on certain redemptions of shares bought without an initial sales charge).
Class B shares are not subject to an initial sales charge. They may be subject to a CDSC.
Class C shares are not subject to an initial sales charge and are subject to a CDSC only if the shares are redeemed during the first year.
Class M shares have a lower initial sales charge and a higher 12b-1 fee than class A shares and no CDSC (except on certain redemptions of shares bought without an initial sales charge).
Class R shares are not subject to an initial sales charge or CDSC and are available only to certain defined contribution plans.
Class Y shares are not subject to an initial sales charge or CDSC, and carry no 12b-1 fee. They are only available to eligible purchasers, including eligible defined contribution plans or corporate IRAs.
22
Comparative indexes
Lehman Aggregate Bond Index is an unmanaged index of U.S. investment-grade fixed-income securities.
Merrill Lynch 91-Day Treasury Bill Index is an unmanaged index that seeks to measure the performance of U.S. Treasury bills available in the marketplace.
Russell 2000 Value Index is an unmanaged index of those companies in the small-cap Russell 2000 Index chosen for their value orientation.
S&P 500 Index is an unmanaged index of common stock performance.
Indexes assume reinvestment of all distributions and do not account for fees. Securities and performance of a fund and an index will differ. You cannot invest directly in an index.
Lipper is a third-party industry-ranking entity that ranks mutual funds. Its rankings do not reflect sales charges. Lipper rankings are based on total return at net asset value relative to other funds that have similar current investment styles or objectives as determined by Lipper. Lipper may change a fund’s category assignment at its discretion. Lipper category averages reflect performance trends for funds within a category.
23
Trustee approval of
management contract
General conclusions
The Board of Trustees of the Putnam funds oversees the management of each fund and, as required by law, determines annually whether to approve the continuance of your fund’s management contract with Putnam Investment Management (“Putnam Management”). In this regard, the Board of Trustees, with the assistance of its Contract Committee consisting solely of Trustees who are not “interested persons” (as such term is defined in the Investment Company Act of 1940, as amended) of the Putnam funds (the “Independent Trustees”), requests and evaluates all information it deems reasonably necessary under the circumstances. Over the course of several months ending in June 2007, the Contract Committee met several times to consider the information provided by Putnam Management and other information developed with the assistance of the Board’s independent counsel and independent staff. The Contract Committee revie wed and discussed key aspects of this information with all of the Independent Trustees. The Contract Committee recommended, and the Independent Trustees approved, the continuance of your fund’s management contract, effective July 1, 2007.
In addition, in anticipation of the sale of Putnam Investments to Great-West Lifeco, at a series of meetings ending in March 2007, the Trustees reviewed and approved new management and distribution arrangements to take effect upon the change of control. Shareholders of all funds approved the management contracts in May 2007, and the change of control transaction was completed on August 3, 2007. Upon the change of control, the management contracts that were approved by the Trustees in June 2007 automatically terminated and were replaced by new contracts that had been approved by shareholders. In connection with their review for the June 2007 continuance of the Putnam funds’ management contracts, the Trustees did not identify any facts or circumstances that would alter the substance of the conclusions and recommendations they made in their review of the contracts to take effect upon the change of control.
The Independent Trustees’ approval was based on the following conclusions:
• That the fee schedule in effect for your fund represented reasonable compensation in light of the nature and quality of the services being provided to the fund, the fees paid by competitive funds and the costs incurred by Putnam Management in providing such services, and
• That this fee schedule represented an appropriate sharing between fund shareholders and Putnam Management of such economies of scale as may exist in the management of the fund at current asset levels.
These conclusions were based on a comprehensive consideration of all information provided to the Trustees and were not the result of any single factor. Some of the factors that figured particularly in the Trustees’ deliberations and how the Trustees considered these factors are described below, although individual Trustees may have evaluated the information presented differently, giving different weights to various factors. It is also important to recognize that the fee arrangements for your fund and the other Putnam funds are the result of many years of review and discussion between the Independent Trustees and Putnam Management, that
24
certain aspects of such arrangements may receive greater scrutiny in some years than others, and that the Trustees’ conclusions may be based, in part, on their consideration of these same arrangements in prior years.
Management fee schedules and categories; total expenses
The Trustees reviewed the management fee schedules in effect for all Putnam funds, including fee levels and breakpoints, and the assignment of funds to particular fee categories. In reviewing fees and expenses, the Trustees generally focused their attention on material changes in circumstances — for example, changes in a fund’s size or investment style, changes in Putnam Management’s operating costs or responsibilities, or changes in competitive practices in the mutual fund industry — that suggest that consideration of fee changes might be warranted. The Trustees concluded that the circumstances did not warrant changes to the management fee structure of your fund, which had been carefully developed over the years, re-examined on many occasions and adjusted where appropriate. The Trustees focused on two areas of particular interest, as discussed further below:
• Competitiveness. The Trustees reviewed comparative fee and expense information for competitive funds, which indicated that, in a custom peer group of competitive funds selected by Lipper Inc., your fund ranked in the 31st percentile in management fees and in the 10th percentile in total expenses (less any applicable 12b-1 fees) as of December 31, 2006 (the first percentile being the least expensive funds and the 100th percentile being the most expensive funds). (Because the fund’s custom peer group is smaller than the fund’s broad Lipper Inc. peer group, this expense information may differ from the Lipper peer expense information found elsewhere in this report.) The Trustees noted that expense ratios for a number of Putnam funds, which show the percentage of fund assets used to pay for managem ent and administrative services, distribution (12b-1) fees and other expenses, had been increasing recently as a result of declining net assets and the natural operation of fee breakpoints.
The Trustees noted that the expense ratio increases described above were currently being controlled by expense limitations implemented in January 2004 and which Putnam Management had committed to maintain at least through 2007. In anticipation of the change of control of Putnam Investments, the Trustees requested, and received a commitment from Putnam Management and Great-West Lifeco, to extend this program through at least June 30, 2009. These expense limitations give effect to a commitment by Putnam Management that the expense ratio of each open-end fund would be no higher than the average expense ratio of the competitive funds included in the fund’s relevant Lipper universe (exclusive of any applicable 12b-1 charges in each case). The Trustees observed that this commitment to limit fund expenses has served shareholders well since its inception.
In order to ensure that the expenses of the Putnam funds continue to meet evolving competitive standards, the Trustees requested, and Putnam Management agreed, to extend for the twelve months beginning July 1, 2007, an additional expense limitation for certain funds at an amount equal to the average expense ratio (exclusive of 12b-1 charges) of a custom peer
25
group of competitive funds selected by Lipper to correspond to the size of the fund. This additional expense limitation will be applied to those open-end funds that had above-average expense ratios (exclusive of 12b-1 charges) based on the custom peer group data for the period ended December 31, 2006. This additional expense limitation will not be applied to your fund because it had a below-average expense ratio relative to its custom peer group.
• Economies of scale. Your fund currently has the benefit of breakpoints in its management fee that provide shareholders with significant economies of scale, which means that the effective management fee rate of a fund (as a percentage of fund assets) declines as a fund grows in size and crosses specified asset thresholds. Conversely, as a fund shrinks in size — as has been the case for many Putnam funds in recent years — these breakpoints result in increasing fee levels. In recent years, the Trustees have examined the operation of the existing breakpoint structure during periods of both growth and decline in asset levels. The Trustees concluded that the fee schedules in effect for the funds represented an appropriate sharing of economies of scale at current asset levels. In reaching this conclu sion, the Trustees considered the Contract Committee’s stated intent to continue to work with Putnam Management to plan for an eventual resumption in the growth of assets, and to consider the potential economies that might be produced under various growth assumptions.
In connection with their review of the management fees and total expenses of the Putnam funds, the Trustees also reviewed the costs of the services to be provided and profits to be realized by Putnam Management and its affiliates from the relationship with the funds. This information included trends in revenues, expenses and profitability of Putnam Management and its affiliates relating to the investment management and distribution services provided to the funds. In this regard, the Trustees also reviewed an analysis of Putnam Management’s revenues, expenses and profitability with respect to the funds’ management contracts, allocated on a fund-by-fund basis.
Investment performance
The quality of the investment process provided by Putnam Management represented a major factor in the Trustees’ evaluation of the quality of services provided by Putnam Management under your fund’s management contract. The Trustees were assisted in their review of the Putnam funds’ investment process and performance by the work of the Investment Process Committee of the Trustees and the Investment Oversight Committees of the Trustees, which had met on a regular monthly basis with the funds’ portfolio teams throughout the year. The Trustees concluded that Putnam Management generally provides a high-quality investment process — as measured by the experience and skills of the individuals assigned to the management of fund portfolios, the resources made available to such personnel, and in general the ability of Putnam Management to attract and retain high-quality personnel — but also recognized that this does no t guarantee favorable investment results for every fund in every time period. The Trustees considered the investment performance of each fund over multiple time periods
26
and considered information comparing each fund’s performance with various benchmarks and with the performance of competitive funds.
The Trustees noted the satisfactory investment performance of many Putnam funds. They also noted the disappointing investment performance of certain funds in recent years and discussed with senior management of Putnam Management the factors contributing to such underperformance and actions being taken to improve performance. The Trustees recognized that, in recent years, Putnam Management has made significant changes in its investment personnel and processes and in the fund product line to address areas of underperformance. In particular, they noted the important contributions of Putnam Management’s leadership in attracting, retaining and supporting high-quality investment professionals and in systematically implementing an investment process that seeks to merge the best features of fundamental and quantitative analysis. The Trustees indicated their intention to continue to monitor performance trends to assess the effectiveness of t hese changes and to evaluate whether additional changes to address areas of underperformance are warranted.
In the case of your fund, the Trustees considered that your fund’s class A share cumulative total return performance at net asset value was in the following percentiles of its Lipper Inc. peer group (Lipper Small-Cap Value Funds) for the one-, three- and five-year periods ended March 31, 2007 (the first percentile being the best-performing funds and the 100th percentile being the worst-performing funds):
| | |
| One-year period | Three-year period | Five-year period |
|
| 51st | 29th | 39th |
(Because of the passage of time, these performance results may differ from the performance results for more recent periods shown elsewhere in this report. Over the one-, three- and five-year periods ended March 31, 2007, there were 267, 216, and 164 funds, respectively, in your fund’s Lipper peer group.* Past performance is no guarantee of future returns.)
As a general matter, the Trustees concluded that cooperative efforts between the Trustees and Putnam Management represent the most effective way to address investment performance problems. The Trustees noted that investors in the Putnam funds have, in effect, placed their trust in the Putnam organization, under the oversight of the funds’ Trustees, to make appropriate decisions regarding the management of the funds. Based on the responsiveness of Putnam Management in the recent past to Trustee concerns about investment performance, the Trustees concluded that it is preferable to seek change within Putnam Management to address performance shortcomings. In the Trustees’ view, the alternative of terminating a
* The percentile rankings for your fund’s class A share annualized total return performance in the Lipper Small-Cap Value Funds category for the one-, five- and life-of-fund periods ended September 30, 2007 were 78%, 36%, and 39%, respectively. Over the one-, five- and life-of-fund periods ended September 30, 2007, the fund ranked 222nd out of 284, 62nd out of 172, and 45th out of 115 funds, respectively. Note that this more recent information was not available when the Trustees approved the continuance of your fund’s management contract.
27
management contract and engaging a new investment adviser for an underperforming fund would entail significant disruptions and would not provide any greater assurance of improved investment performance.
Brokerage and soft-dollar allocations; other benefits
The Trustees considered various potential benefits that Putnam Management may receive in connection with the services it provides under the management contract with your fund. These include benefits related to brokerage and soft-dollar allocations, whereby a portion of the commissions paid by a fund for brokerage may be used to acquire research services that may be useful to Putnam Management in managing the assets of the fund and of other clients. The Trustees indicated their continued intent to monitor the potential benefits associated with the allocation of fund brokerage to ensure that the principle of seeking “best price and execution” remains paramount in the portfolio trading process.
The Trustees’ annual review of your fund’s management contract also included the review of its distributor’s contract and distribution plan with Putnam Retail Management Limited Partnership and the custodian agreement and investor servicing agreement with Putnam Fiduciary Trust Company (“PFTC”), each of which provides benefits to affiliates of Putnam Management. In the case of the custodian agreement, the Trustees considered that, effective January 1, 2007, the Putnam funds had engaged State Street Bank and Trust Company as custodian and began to transition the responsibility for providing custody services away from PFTC.
Comparison of retail and institutional fee schedules
The information examined by the Trustees as part of their annual contract review has included for many years information regarding fees charged by Putnam Management and its affiliates to institutional clients such as defined benefit pension plans, college endowments, etc. This information included comparison of such fees with fees charged to the funds, as well as a detailed assessment of the differences in the services provided to these two types of clients. The Trustees observed, in this regard, that the differences in fee rates between institutional clients and the funds are by no means uniform when examined by individual asset sectors, suggesting that differences in the pricing of investment management services to these types of clients reflect to a substantial degree historical competitive forces operating in separate market places. The Trustees considered the fact that fee rates across all asset sectors are higher on average for fun ds than for institutional clients, as well as the differences between the services that Putnam Management provides to the Putnam funds and those that it provides to institutional clients of the firm, but did not rely on such comparisons to any significant extent in concluding that the management fees paid by your fund are reasonable.
28
Other information
for shareholders
Important notice regarding delivery of shareholder documents
In accordance with SEC regulations, Putnam sends a single copy of annual and semiannual shareholder reports, prospectuses, and proxy statements to Putnam shareholders who share the same address, unless a shareholder requests otherwise. If you prefer to receive your own copy of these documents, please call Putnam at 1-800-225-1581, and Putnam will begin sending individual copies within 30 days.
Proxy voting
Putnam is committed to managing our mutual funds in the best interests of our shareholders. The Putnam funds’ proxy voting guidelines and procedures, as well as information regarding how your fund voted proxies relating to portfolio securities during the 12-month period ended June 30, 2007, are available on the Putnam Individual Investor Web site, www.putnam.com/individual, and on the SEC’s Web site, www.sec.gov. If you have questions about finding forms on the SEC’s Web site, you may call the SEC at 1-800-SEC-0330. You may also obtain the Putnam funds’ proxy voting guidelines and procedures at no charge by calling Putnam’s Shareholder Services at 1-800-225-1581.
Fund portfolio holdings
The fund will file a complete schedule of its portfolio holdings with the SEC for the first and third quarters of each fiscal year on Form N-Q. Shareholders may obtain the fund’s Forms N-Q on the SEC’s Web site at www.sec.gov. In addition, the fund’s Forms N-Q may be reviewed and copied at the SEC’s Public Reference Room in Washington, D.C. You may call the SEC at 1-800-SEC-0330 for information about the SEC’s Web site or the operation of the Public Reference Room.
29
Financial statements
A guide to financial statements
These sections of the report, as well as the accompanying Notes, constitute the fund’s financial statements.
The fund’s portfolio lists all the fund’s investments and their values as of the last day of the reporting period. Holdings are organized by asset type and industry sector, country, or state to show areas of concentration and diversification.
Statement of assets and liabilities shows how the fund’s net assets and share price are determined. All investment and noninvestment assets are added together. Any unpaid expenses and other liabilities are subtracted from this total. The result is divided by the number of shares to determine the net asset value per share, which is calculated separately for each class of shares. (For funds with preferred shares, the amount subtracted from total assets includes the liquidation preference of preferred shares.)
Statement of operations shows the fund’s net investment gain or loss. This is done by first adding up all the fund’s earnings — from dividends and interest income — and subtracting its operating expenses to determine net investment income (or loss). Then, any net gain or loss the fund realized on the sales of its holdings — as well as any unrealized gains or losses over the period — is added to or subtracted from the net investment result to determine the fund’s net gain or loss for the fiscal period.
Statement of changes in net assets shows how the fund’s net assets were affected by the fund’s net investment gain or loss, by distributions to shareholders, and by changes in the number of the fund’s shares. It lists distributions and their sources (net investment income or realized capital gains) over the current reporting period and the most recent fiscal year-end. The distributions listed here may not match the sources listed in the Statement of operations because the distributions are determined on a tax basis and may be paid in a different period from the one in which they were earned. Dividend sources are estimated at the time of declaration. Actual results may vary. Any non-taxable return of capital cannot be determined until final tax calculations are completed after the end of the fund’s fiscal year.
Financial highlights provide an overview of the fund’s investment results, per-share distributions, expense ratios, net investment income ratios, and portfolio turnover in one summary table, reflecting the five most recent reporting periods. In a semiannual report, the highlight table also includes the current reporting period.
30
The fund’s portfolio 8/31/07 (Unaudited)
| | | |
| COMMON STOCKS (100.2%)* | | | |
|
| | Shares | | Value |
|
| Advertising and Marketing Services (0.6%) | | | |
| Nu Skin Enterprises, Inc. Class A | 247,775 | $ | 3,855,379 |
|
| |
| Aerospace and Defense (1.3%) | | | |
| Innovative Solutions & Support, Inc. † (S) | 215,450 | | 3,891,027 |
| Teledyne Technologies, Inc. † | 82,100 | | 4,097,611 |
| | | | 7,988,638 |
|
| |
| Airlines (0.8%) | | | |
| SkyWest, Inc. (S) | 199,800 | | 5,020,974 |
|
| |
| Automotive (1.7%) | | | |
| American Axle & Manufacturing Holdings, Inc. (S) | 148,600 | | 3,465,352 |
| ArvinMeritor, Inc. (S) | 236,300 | | 4,123,435 |
| Midas, Inc. † | 172,600 | | 3,500,328 |
| | | | 11,089,115 |
|
| |
| Banking (8.0%) | | | |
| BancTec, Inc. 144A (F) † | 482,500 | | 3,860,000 |
| BankUnited Financial Corp. Class A | 212,400 | | 3,632,040 |
| Citizens Republic Bancorp, Inc. | 257,739 | | 4,543,939 |
| City Holding Co. | 94,900 | | 3,509,402 |
| Colonial Bancgroup, Inc. | 185,900 | | 3,944,798 |
| Columbia Banking Systems, Inc. | 114,700 | | 3,499,497 |
| East West Bancorp, Inc. | 101,100 | | 3,619,380 |
| FirstFed Financial Corp. † (S) | 63,300 | | 3,180,825 |
| Flagstar Bancorp, Inc. | 264,800 | | 3,257,040 |
| Hanmi Financial Corp. | 221,500 | | 3,428,820 |
| PFF Bancorp, Inc. | 217,700 | | 3,814,104 |
| Provident Bankshares Corp. | 116,740 | | 3,607,266 |
| Sterling Bancshares, Inc. | 314,800 | | 3,598,164 |
| Webster Financial Corp. | 89,400 | | 3,795,924 |
| | | | 51,291,199 |
|
| |
| Basic Materials (0.7%) | | | |
| Ameron International Corp. | 46,800 | | 4,469,400 |
|
| |
| Building Materials (2.9%) | | | |
| Comfort Systems USA, Inc. | 295,200 | | 4,295,160 |
| Goodman Global, Inc. † | 212,870 | | 4,979,029 |
| Interface, Inc. Class A (S) | 236,400 | | 4,264,656 |
| Lennox International, Inc. | 133,373 | | 4,797,427 |
| | | | 18,336,272 |
|
| |
| Chemicals (4.3%) | | | |
| A. Schulman, Inc. | 148,100 | | 3,190,074 |
| Airgas, Inc. | 84,500 | | 3,905,590 |
| Olin Corp. | 203,500 | | 4,363,040 |
31
| | | |
| COMMON STOCKS (100.2%)* continued | | | |
|
| | Shares | | Value |
|
| Chemicals continued | | | |
| Omnova Solutions, Inc. † | 624,613 | $ | 3,691,463 |
| RPM, Inc. | 193,000 | | 4,369,520 |
| Spartech Corp. | 164,200 | | 3,556,572 |
| UAP Holding Corp. | 143,220 | | 4,283,710 |
| | | | 27,359,969 |
|
| |
| Commercial and Consumer Services (2.3%) | | | |
| Aaron Rents, Inc. (S) | 128,972 | | 3,300,393 |
| Advance America Cash Advance Centers, Inc. | 266,600 | | 3,345,830 |
| Maximus, Inc. | 84,200 | | 3,602,076 |
| URS Corp. † | 85,500 | | 4,569,120 |
| | | | 14,817,419 |
|
| |
| Communications Equipment (1.2%) | | | |
| Belden CDT, Inc. | 79,900 | | 3,883,939 |
| Gilat Satellite Networks, Ltd. (Israel) † | 389,800 | | 3,664,120 |
| | | | 7,548,059 |
|
| |
| Computers (3.1%) | | | |
| Agilysys, Inc. | 216,111 | | 3,686,854 |
| Emulex Corp. † | 220,500 | | 4,308,570 |
| Monotype Imaging Holdings, Inc. † | 298,730 | | 3,647,493 |
| Smart Modular Technologies WWH, Inc. † | 380,200 | | 4,163,190 |
| Xyratex, Ltd. (Bermuda) † | 188,200 | | 3,918,324 |
| | | | 19,724,431 |
|
| |
| Conglomerates (1.5%) | | | |
| AMETEK, Inc. | 123,800 | | 4,950,762 |
| Crane Co. | 98,370 | | 4,405,992 |
| | | | 9,356,754 |
|
| |
| Construction (0.6%) | | | |
| Drew Industries, Inc. † | 94,800 | | 3,722,796 |
|
| |
| Consumer Finance (0.6%) | | | |
| Capital Trust, Inc. Class A (R) | 119,075 | | 4,127,140 |
|
| |
| Consumer Goods (0.4%) | | | |
| Prestige Brands Holdings, Inc. † | 231,700 | | 2,541,749 |
|
| |
| Consumer Services (0.4%) | | | |
| Stamps.com, Inc. † | 217,700 | | 2,642,878 |
|
| |
| Distribution (1.0%) | | | |
| Spartan Stores, Inc. | 124,200 | | 3,159,648 |
| Watsco, Inc. | 73,100 | | 3,517,572 |
| | | | 6,677,220 |
|
| |
| Electric Utilities (1.3%) | | | |
| Black Hills Corp. | 102,246 | | 4,211,513 |
| Westar Energy, Inc. (S) | 177,400 | | 4,309,046 |
| | | | 8,520,559 |
32
| | | |
| COMMON STOCKS (100.2%)* continued | | | |
|
| | Shares | | Value |
|
| Electrical Equipment (0.6%) | | | |
| WESCO International, Inc. † | 78,700 | $ | 3,745,333 |
|
| |
| Electronics (5.2%) | | | |
| Avnet, Inc. † | 76,538 | | 3,008,709 |
| Benchmark Electronics, Inc. † (S) | 196,849 | | 4,936,973 |
| Directed Electronics, Inc. † (S) | 506,960 | | 2,727,445 |
| General Cable Corp. † (S) | 54,467 | | 3,168,890 |
| Microsemi Corp. † (S) | 170,000 | | 4,311,200 |
| MoSys, Inc. † (S) | 428,583 | | 2,807,219 |
| Park Electrochemical Corp. | 134,600 | | 3,978,776 |
| TTM Technologies, Inc. † | 382,500 | | 4,467,600 |
| X-Rite, Inc. | 258,100 | | 3,690,830 |
| | | | 33,097,642 |
|
| |
| Energy (2.4%) | | | |
| Exterran Holdings, Inc. † | 43,900 | | 3,402,250 |
| GulfMark Offshore, Inc. † | 130,600 | | 5,988,010 |
| Tidewater, Inc. (S) | 87,100 | | 5,700,695 |
| | | | 15,090,955 |
|
| |
| Entertainment (0.4%) | | | |
| Carmike Cinemas, Inc. (S) | 159,800 | | 2,563,192 |
|
| |
| Financial (1.5%) | | | |
| Advanta Corp. Class B | 222,500 | | 5,825,050 |
| Financial Federal Corp. | 124,200 | | 3,789,342 |
| | | | 9,614,392 |
|
| |
| Food (0.9%) | | | |
| Ruddick Corp. (S) | 183,100 | | 5,965,398 |
|
| |
| Forest Products and Packaging (1.0%) | | | |
| Silgan Holdings, Inc. | 50,100 | | 2,559,609 |
| Universal Forest Products, Inc. | 95,479 | | 3,560,412 |
| | | | 6,120,021 |
|
| |
| Health Care Services (2.7%) | | | |
| AMERIGROUP Corp. † | 120,045 | | 3,801,825 |
| AMN Healthcare Services, Inc. † (S) | 168,036 | | 2,996,082 |
| Healthspring, Inc. † (S) | 241,580 | | 4,515,130 |
| Hooper Holmes, Inc. † | 1,222,600 | | 2,726,398 |
| Pediatrix Medical Group, Inc. † | 59,500 | | 3,549,175 |
| | | | 17,588,610 |
|
| |
| Household Furniture and Appliances (0.7%) | | | |
| Tempur-Pedic International, Inc. (S) | 154,911 | | 4,476,928 |
|
| |
| Insurance (8.8%) | | | |
| American Equity Investment Life Holding Co. | 464,800 | | 4,745,608 |
| Commerce Group, Inc. (S) | 135,100 | | 4,306,988 |
33
| | | |
| COMMON STOCKS (100.2%)* continued | | | |
|
| | Shares | | Value |
|
| Insurance continued | | | |
| FBL Financial Group, Inc. Class A | 105,097 | $ | 4,112,446 |
| Fremont General Corp. | 224,800 | | 1,011,600 |
| Infinity Property & Casualty Corp. | 81,600 | | 3,383,136 |
| Landamerica Financial Group, Inc. | 54,600 | | 3,024,294 |
| Navigators Group, Inc. † | 88,141 | | 4,777,242 |
| Philadelphia Consolidated Holding Corp. † | 111,500 | | 4,462,230 |
| Phoenix Companies, Inc. (The) | 48,200 | | 667,570 |
| Presidential Life Corp. | 261,200 | | 4,518,760 |
| Safety Insurance Group, Inc. | 111,200 | | 3,796,368 |
| Selective Insurance Group | 207,998 | | 4,388,758 |
| State Auto Financial Corp. | 124,700 | | 3,731,024 |
| Stewart Information Services | 87,000 | | 3,224,220 |
| Triad Guaranty, Inc. † | 88,800 | | 1,485,624 |
| Zenith National Insurance Corp. | 102,200 | | 4,405,842 |
| | | | 56,041,710 |
|
| |
| Investment Banking/Brokerage (1.7%) | | | |
| MCG Capital Corp. | 276,500 | | 4,014,780 |
| SWS Group, Inc. | 170,800 | | 3,029,992 |
| TradeStation Group, Inc. † | 357,100 | | 3,953,097 |
| | | | 10,997,869 |
|
| |
| Leisure (1.0%) | | | |
| Arctic Cat, Inc. | 177,188 | | 2,996,249 |
| Monaco Coach Corp. | 269,745 | | 3,611,886 |
| | | | 6,608,135 |
|
| |
| Machinery (2.5%) | | | |
| Applied Industrial Technologies, Inc. | 135,200 | | 4,323,696 |
| Gardner Denver, Inc. † | 100,811 | | 4,023,367 |
| Imation Corp. (S) | 118,400 | | 3,444,256 |
| Tennant Co. | 92,070 | | 3,868,781 |
| | | | 15,660,100 |
|
| |
| Manufacturing (1.7%) | | | |
| EnPro Industries, Inc. † | 77,400 | | 3,234,546 |
| Gehl, Co. † | 134,600 | | 3,200,788 |
| Smith (A.O.) Corp. | 88,300 | | 4,256,060 |
| | | | 10,691,394 |
|
| |
| Media (0.5%) | | | |
| Journal Communications, Inc. Class A | 289,700 | | 3,004,189 |
|
| |
| Medical Technology (2.1%) | | | |
| Datascope Corp. | 99,900 | | 3,332,664 |
| Hanger Orthopedic Group, Inc. † | 247,860 | | 2,609,966 |
| PSS World Medical, Inc. † (S) | 209,400 | | 3,995,352 |
| Vital Signs, Inc. | 72,128 | | 3,616,498 |
| | | | 13,554,480 |
34
| | | |
| COMMON STOCKS (100.2%)* continued | | | |
|
| | Shares | | Value |
|
| Metal Fabricators (1.4%) | | | |
| Mueller Industries, Inc. | 132,300 | $ | 4,582,872 |
| USEC, Inc. † (S) | 302,800 | | 4,054,492 |
| | | | 8,637,364 |
|
| |
| Metals (1.4%) | | | |
| Quanex Corp. (S) | 107,125 | | 4,639,584 |
| Steel Dynamics, Inc. | 97,200 | | 4,216,536 |
| | | | 8,856,120 |
|
| |
| Natural Gas Utilities (1.1%) | | | |
| Energen Corp. | 89,400 | | 4,800,780 |
| Laclede Group, Inc. (The) | 62,200 | | 2,030,208 |
| | | | 6,830,988 |
|
| |
| Office Equipment & Supplies (0.5%) | | | |
| Ennis Inc. | 132,200 | | 2,875,350 |
|
| |
| Oil & Gas (3.5%) | | | |
| Cabot Oil & Gas Corp. Class A | 133,200 | | 4,440,888 |
| Energy Partners, Ltd. † | 248,100 | | 3,391,527 |
| Petroleum Development Corp. † | 55,700 | | 2,229,671 |
| Pioneer Drilling Co. † | 298,700 | | 3,632,192 |
| St. Mary Land & Exploration Co. (S) | 137,100 | | 4,572,285 |
| Swift Energy Co. † | 111,300 | | 4,142,586 |
| | | | 22,409,149 |
|
| |
| Pharmaceuticals (1.7%) | | | |
| Alpharma, Inc. Class A † (S) | 134,220 | | 3,073,638 |
| Owens & Minor, Inc. | 71,000 | | 2,832,900 |
| Sciele Pharma, Inc. † (S) | 213,610 | | 4,930,119 |
| | | | 10,836,657 |
|
| |
| Photography/Imaging (0.7%) | | | |
| Ikon Office Solutions, Inc. | 307,332 | | 4,314,941 |
|
| |
| Publishing (0.5%) | | | |
| GateHouse Media, Inc. (S) | 224,690 | | 2,925,464 |
|
| |
| Real Estate (5.2%) | | | |
| Arbor Realty Trust, Inc (R) | 200,400 | | 4,012,008 |
| Deerfield Triarc Capital Corp. (R) | 366,000 | | 3,202,500 |
| DiamondRock Hospitality Co. (R) | 189,810 | | 3,407,090 |
| Entertainment Properties Trust (R) | 72,072 | | 3,447,924 |
| Getty Realty Corp. (R) | 168,000 | | 4,581,360 |
| Grubb & Ellis Co. † | 81,616 | | 739,441 |
| Hersha Hospitality Trust (R) | 304,500 | | 3,328,185 |
| JER Investors Trust, Inc. (R) | 92,300 | | 1,147,289 |
| M/I Schottenstein Homes, Inc. | 96,800 | | 1,764,664 |
| National Health Investors, Inc. (R) | 99,000 | | 2,993,760 |
35
| | | |
| COMMON STOCKS (100.2%)* continued | | | |
|
| | Shares | | Value |
|
| Real Estate continued | | | |
| NorthStar Realty Finance Corp. (R) | 322,775 | $ | 3,424,643 |
| RAIT Investment Trust (R) | 165,200 | | 1,462,020 |
| | | | 33,510,884 |
|
| |
| Restaurants (0.6%) | | | |
| Landry’s Restaurants, Inc. (S) | 129,100 | | 3,701,297 |
|
| |
| Retail (5.5%) | | | |
| Cache, Inc. † (S) | 203,690 | | 3,417,918 |
| CSK Auto Corp. † | 336,000 | | 4,441,920 |
| Haverty Furniture Cos., Inc. | 244,600 | | 2,622,112 |
| Jos. A. Bank Clothiers, Inc. † (S) | 126,200 | | 3,804,930 |
| Nash Finch Co. (S) | 73,700 | | 2,764,487 |
| Nautilus, Inc. (S) | 334,420 | | 3,183,678 |
| Sonic Automotive, Inc. | 134,500 | | 3,577,700 |
| Stage Stores, Inc. | 206,100 | | 3,571,713 |
| Toro Co. (The) | 64,100 | | 3,791,515 |
| Wolverine World Wide, Inc. (S) | 146,900 | | 3,862,001 |
| | | | 35,037,974 |
|
| |
| Semiconductor (3.0%) | | | |
| Brooks Automation, Inc. † | 269,584 | | 3,814,614 |
| Cohu, Inc. | 155,364 | | 3,074,654 |
| GSI Group, Inc. (Canada) † | 199,132 | | 1,941,537 |
| Standard Microsystems Corp. † | 131,322 | | 4,724,966 |
| Ultra Clean Holdings † | 350,910 | | 5,242,595 |
| | | | 18,798,366 |
|
| |
| Shipping (0.7%) | | | |
| Arkansas Best Corp. (S) | 121,700 | | 4,369,030 |
|
| |
| Software (1.0%) | | | |
| Chordiant Software, Inc. † | 175,600 | | 2,623,464 |
| Parametric Technology Corp. † | 230,200 | | 4,053,822 |
| | | | 6,677,286 |
|
| |
| Staffing (1.6%) | | | |
| Gevity HR, Inc. | 163,500 | | 1,883,520 |
| Kforce, Inc. † | 270,180 | | 4,112,140 |
| MPS Group, Inc. † | 316,100 | | 4,349,536 |
| | | | 10,345,196 |
|
| |
| Technology (0.6%) | | | |
| CACI International, Inc. Class A † | 80,900 | | 4,127,518 |
|
| |
| Technology Services (0.7%) | | | |
| United Online, Inc. (S) | 326,700 | | 4,694,679 |
36
| | | | |
| COMMON STOCKS (100.2%)* continued | | | | |
|
| | | Shares | | Value |
|
| Telecommunications (2.4%) | | | | |
| Brightpoint, Inc. † (S) | | 349,230�� | $ | 4,068,530 |
| Centennial Communications Corp. † | | 346,700 | | 3,258,980 |
| Consolidated Communications Holdings, Inc. | | 226,500 | | 4,208,370 |
| Earthlink, Inc. † | | 492,354 | | 3,751,737 |
| | | | | 15,287,617 |
|
| |
| Textiles (1.1%) | | | | |
| Phillips-Van Heusen Corp. | | 71,600 | | 4,169,268 |
| Unifirst Corp. | | 62,930 | | 2,604,043 |
| | | | | 6,773,311 |
|
| |
| Transportation Services (0.6%) | | | | |
| Landstar Systems, Inc. | | 84,200 | | 3,621,439 |
|
| Total common stocks (cost $511,799,634) | | | $ | 638,540,929 |
|
| |
| SHORT-TERM INVESTMENTS (15.6%)* (cost $99,189,018) | | | | |
|
| | | Principal amount | | Value |
|
| Short-term investments held as collateral for loaned | | | | |
| securities with yields ranging from 4.00% to 5.88% | | | | |
| and due dates ranging from September 4, 2007 | | | | |
| to October 16, 2007 (d) | $ | 99,419,069 | $ | 99,189,018 |
|
| |
| |
| TOTAL INVESTMENTS | | | | |
|
| Total investments (cost $610,988,652) | | | $ | 737,729,947 |
* Percentages indicated are based on net assets of $637,228,061.
† Non-income-producing security.
(d) See Note 1 to the financial statements.
(F) Security is valued at fair value following procedures approved by the Trustees.
(R) Real Estate Investment Trust.
(S) Securities on loan, in part or in entirety, at August 31, 2007.
144A after the name of an issuer represents securities exempt from registration under Rule 144A under the Securities Act of 1933, as amended. These securities may be resold in transactions exempt from registration, normally to qualified institutional buyers.
The accompanying notes are an integral part of these financial statements.
37
Statement of assets and liabilities 8/31/07 (Unaudited)
| |
| ASSETS | |
|
| Investment in securities, at value, including $95,704,787 of securities on loan (Note 1): | |
| Unaffiliated issuers (identified cost $610,988,652) | $737,729,947 |
|
| Dividends, interest and other receivables | 820,474 |
|
| Receivable for shares of the fund sold | 3,887,133 |
|
| Receivable for securities sold | 1,133,573 |
|
| Total assets | 743,571,127 |
|
| |
| LIABILITIES | |
|
| Payable to custodian (Note 2) | 353,758 |
|
| Payable for securities purchased | 2,379,248 |
|
| Payable for shares of the fund repurchased | 2,337,945 |
|
| Payable for compensation of Manager (Notes 2 and 5) | 1,362,990 |
|
| Payable for investor servicing (Note 2) | 163,106 |
|
| Payable for custodian fees (Note 2) | 15,429 |
|
| Payable for Trustee compensation and expenses (Note 2) | 99,028 |
|
| Payable for administrative services (Note 2) | 4,485 |
|
| Payable for distribution fees (Note 2) | 301,792 |
|
| Collateral on securities loaned, at value (Note 1) | 99,189,018 |
|
| Other accrued expenses | 136,267 |
|
| Total liabilities | 106,343,066 |
|
| Net assets | $637,228,061 |
|
| |
| REPRESENTED BY | |
|
| Paid-in capital (Unlimited shares authorized) (Notes 1 and 4) | $406,142,473 |
|
| Undistributed net investment income (Note 1) | 2,381,696 |
|
| Accumulated net realized gain on investments (Note 1) | 101,962,597 |
|
| Net unrealized appreciation of investments | 126,741,295 |
|
| Total — Representing net assets applicable to capital shares outstanding | $637,228,061 |
(Continued on next page)
38
Statement of assets and liabilities (Continued)
| |
| COMPUTATION OF NET ASSET VALUE AND OFFERING PRICE | |
|
| Net asset value and redemption price per class A share | |
| ($497,471,662 divided by 31,469,103 shares) | $15.81 |
|
| Offering price per class A share | |
| (100/94.75 of $15.81)* | $16.69 |
|
| Net asset value and offering price per class B share | |
| ($56,709,138 divided by 3,927,491 shares)** | $14.44 |
|
| Net asset value and offering price per class C share | |
| ($33,763,702 divided by 2,332,307 shares)** | $14.48 |
|
| Net asset value and redemption price per class M share | |
| ($6,185,563 divided by 411,664 shares) | $15.03 |
|
| Offering price per class M share | |
| (100/96.75 of $15.03)* | $15.53 |
|
| Net asset value, offering price and redemption price per class R share | |
| ($2,463 divided by 156 shares) | $15.80 |
|
| Net asset value, offering price and redemption price per class Y share | |
| ($43,095,533 divided by 2,665,771 shares) | $16.17 |
* On single retail sales of less than $50,000. On sales of $50,000 or more the offering price is reduced.
** Redemption price per share is equal to net asset value less any applicable contingent deferred sales charge.
The accompanying notes are an integral part of these financial statements.
39
Statement of operations Six months ended 8/31/07 (Unaudited)
| |
| INVESTMENT INCOME | |
|
| Dividends | $ 6,819,082 |
|
| Interest (including interest income of $23,007 | |
| from investments in affiliated issuers) (Note 5) | 24,163 |
|
| Securities lending | 525,270 |
|
| Total investment income | 7,368,515 |
|
| |
| EXPENSES | |
|
| Compensation of Manager (Note 2) | 2,841,098 |
|
| Investor servicing fees (Note 2) | 1,008,160 |
|
| Custodian fees (Note 2) | 32,629 |
|
| Trustee compensation and expenses (Note 2) | 31,045 |
|
| Administrative services (Note 2) | 11,438 |
|
| Distribution fees — Class A (Note 2) | 694,885 |
|
| Distribution fees — Class B (Note 2) | 465,549 |
|
| Distribution fees — Class C (Note 2) | 189,887 |
|
| Distribution fees — Class M (Note 2) | 27,149 |
|
| Distribution fees — Class R (Note 2) | 3 |
|
| Other | 158,757 |
|
| Non-recurring costs (Notes 2 and 6) | 457 |
|
| Costs assumed by Manager (Notes 2 and 6) | (457) |
|
| Fees waived by Manager (Note 5) | (170) |
|
| Total expenses | 5,460,430 |
|
| Expense reduction (Note 2) | (83,722) |
|
| Net expenses | 5,376,708 |
|
| Net investment income | 1,991,807 |
|
| Net realized gain on investments (Notes 1 and 3) | 60,472,389 |
|
| Net unrealized depreciation of investments during the period | (92,711,357) |
|
| Net loss on investments | (32,238,968) |
|
| Net decrease in net assets resulting from operations | $(30,247,161) |
The accompanying notes are an integral part of these financial statements.
40
Statement of changes in net assets
| | |
| DECREASE IN NET ASSETS | | |
|
| Six months ended | Year ended |
| | 8/31/07* | 2/28/07 |
|
| Operations: | | |
| Net investment income | $ 1,991,807 | $ 1,882,992 |
|
| Net realized gain on investments | 60,472,389 | 125,200,537 |
|
| Net unrealized depreciation of investments | (92,711,357) | (55,138,117) |
|
| Net increase (decrease) in net assets resulting from operations | (30,247,161) | 71,945,412 |
|
| Distributions to shareholders (Note 1): | | |
|
| From ordinary income | | |
|
| Net investment income | | |
|
| Class A | — | (1,638,067) |
|
| Class B | — | — |
|
| Class C | — | — |
|
| Class M | — | — |
|
| Class R | — | — |
|
| Class Y | — | (263,291) |
|
| Net realized short-term gain on investments | | |
|
| Class A | — | (4,676,415) |
|
| Class B | — | (1,664,140) |
|
| Class C | — | (395,144) |
|
| Class M | — | (69,083) |
|
| Class R | — | — |
|
| Class Y | — | (435,539) |
|
| From net realized long-term gain on investments | | |
|
| Class A | — | (82,960,150) |
|
| Class B | — | (29,522,037) |
|
| Class C | — | (7,009,898) |
|
| Class M | — | (1,225,549) |
|
| Class R | — | — |
|
| Class Y | — | (7,726,506) |
|
| Redemption fees (Note 1) | 12,598 | 5,628 |
|
| Increase (decrease) from capital share transactions (Note 4) | (95,680,697) | 9,527,508 |
|
| Total decrease in net assets | (125,915,260) | (56,107,271) |
|
| |
| NET ASSETS | | |
|
| Beginning of period | 763,143,321 | 819,250,592 |
|
| End of period (including undistributed net investment | | |
| income of $2,381,696 and $389,889, respectively) | $637,228,061 | $763,143,321 |
* Unaudited
The accompanying notes are an integral part of these financial statements.
41
Financial highlights (For a common share outstanding throughout the period)
| | | | | | | | | | | | | | | |
| INVESTMENT OPERATIONS: | | | | LESS DISTRIBUTIONS: | | | | | | RATIOS AND SUPPLEMENTAL DATA: | |
|
| | | | Net | | | | | | | | Total | | | Ratio of net | |
| | Net asset | | realized and | Total | From | From | | | | Net asset | return | Net | Ratio of | investment | |
| | value, | Net | unrealized | from | net | net realized | From | | | value, | at net | assets, | expenses to | income (loss) | Portfolio |
| | beginning | investment | gain (loss) on | investment | investment | gain on | return of | Total | Redemption | end | asset | end of period | average net | to average | turnover |
| Period ended | of period | income (loss)(a) | investments | operations | income | investments | capital | distributions | fees | of period | value (%)(b) | (in thousands) | assets (%)(c) | net assets (%) | (%) |
|
| CLASS A | | | | | | | | | | | | | | | |
| August 31, 2007** | $16.62 | .06(d) | (.87) | (.81) | — | — | — | — | —(f) | $15.81 | (4.87)* | $497,472 | .68(d)* | .34(d)* | 23.35* |
| February 28, 2007 | 18.17 | .08(d,e) | 1.75 | 1.83 | (.06) | (3.32) | — | (3.38) | —(f) | 16.62 | 10.32(e) | 522,839 | 1.27(d,e) | .46(d,e) | 47.18 |
| February 28, 2006 | 19.11 | .05(d,g) | 2.80 | 2.85 | — | (3.79) | — | (3.79) | —(f) | 18.17 | 16.24 | 476,251 | 1.25(d) | .28(d,g) | 28.65 |
| February 28, 2005 | 18.01 | —(d,f) | 3.00 | 3.00 | — | (1.90) | — | (1.90) | —(f) | 19.11 | 16.83 | 496,588 | 1.38(d) | (.03)(d) | 24.00 |
| February 29, 2004 | 10.51 | .04 | 7.46 | 7.50 | — | — | — | — | — | 18.01 | 71.36 | 482,998 | 1.34 | .29 | 24.40 |
| February 28, 2003 | 13.83 | .02 | (3.13) | (3.11) | — | (.21) | —(f) | (.21) | — | 10.51 | (22.56) | 346,527 | 1.27 | .19 | 36.46 |
|
| |
| CLASS B | | | | | | | | | | | | | | | |
| August 31, 2007** | $15.24 | (.02)(d) | (.78) | (.80) | — | — | — | — | —(f) | $14.44 | (5.25)* | $56,709 | 1.06(d)* | (.09)(d)* | 23.35* |
| February 28, 2007 | 16.98 | (.05)(d,e) | 1.63 | 1.58 | — | (3.32) | — | (3.32) | —(f) | 15.24 | 9.52(e) | 147,307 | 2.02(d,e) | (.29)(d,e) | 47.18 |
| February 28, 2006 | 18.22 | (.08)(d,g) | 2.63 | 2.55 | — | (3.79) | — | (3.79) | —(f) | 16.98 | 15.35 | 242,985 | 2.00(d) | (.47)(d,g) | 28.65 |
| February 28, 2005 | 17.37 | (.14)(d) | 2.89 | 2.75 | — | (1.90) | — | (1.90) | —(f) | 18.22 | 15.99 | 281,226 | 2.13(d) | (.78)(d) | 24.00 |
| February 29, 2004 | 10.21 | (.06) | 7.22 | 7.16 | — | — | — | — | — | 17.37 | 70.13 | 320,905 | 2.09 | (.46) | 24.40 |
| February 28, 2003 | 13.55 | (.07) | (3.06) | (3.13) | — | (.21) | —(f) | (.21) | — | 10.21 | (23.17) | 267,374 | 2.02 | (.57) | 36.46 |
|
| |
| CLASS C | | | | | | | | | | | | | | | |
| August 31, 2007** | $15.28 | (.01)(d) | (.79) | (.80) | — | — | — | — | —(f) | $14.48 | (5.24)* | $33,764 | 1.06(d)* | (.04)(d)* | 23.35* |
| February 28, 2007 | 17.02 | (.05)(d,e) | 1.63 | 1.58 | — | (3.32) | — | (3.32) | —(f) | 15.28 | 9.51(e) | 38,799 | 2.02(d,e) | (.29)(d,e) | 47.18 |
| February 28, 2006 | 18.25 | (.08)(d,g) | 2.64 | 2.56 | — | (3.79) | — | (3.79) | —(f) | 17.02 | 15.39 | 43,993 | 2.00(d) | (.47)(d,g) | 28.65 |
| February 28, 2005 | 17.40 | (.14)(d) | 2.89 | 2.75 | — | (1.90) | — | (1.90) | —(f) | 18.25 | 15.96 | 46,641 | 2.13(d) | (.78)(d) | 24.00 |
| February 29, 2004 | 10.23 | (.06) | 7.23 | 7.17 | — | — | — | — | — | 17.40 | 70.09 | 49,511 | 2.09 | (.46) | 24.40 |
| February 28, 2003 | 13.57 | (.07) | (3.06) | (3.13) | — | (.21) | —(f) | (.21) | — | 10.23 | (23.14) | 42,732 | 2.02 | (.56) | 36.46 |
|
| |
| CLASS M | | | | | | | | | | | | | | | |
| August 31, 2007** | $15.83 | .01(d) | (.81) | (.80) | — | — | — | — | —(f) | $15.03 | (5.05)* | $6,186 | .93(d)* | .08(d)* | 23.35* |
| February 28, 2007 | 17.49 | (.01)(d,e) | 1.67 | 1.66 | — | (3.32) | — | (3.32) | —(f) | 15.83 | 9.71(e) | 7,322 | 1.77(d,e) | (.04)(d,e) | 47.18 |
| February 28, 2006 | 18.61 | (.04)(d,g) | 2.71 | 2.67 | — | (3.79) | — | (3.79) | —(f) | 17.49 | 15.70 | 7,799 | 1.75(d) | (.22)(d,g) | 28.65 |
| February 28, 2005 | 17.67 | (.09)(d) | 2.93 | 2.84 | — | (1.90) | — | (1.90) | —(f) | 18.61 | 16.24 | 10,561 | 1.88(d) | (.53)(d) | 24.00 |
| February 29, 2004 | 10.36 | (.03) | 7.34 | 7.31 | — | — | — | — | — | 17.67 | 70.56 | 11,935 | 1.84 | (.21) | 24.40 |
| February 28, 2003 | 13.70 | (.04) | (3.09) | (3.13) | — | (.21) | —(f) | (.21) | — | 10.36 | (22.92) | 10,027 | 1.77 | (.34) | 36.46 |
|
| |
| CLASS R | | | | | | | | | | | | | | | |
| August 31, 2007†** | $16.83 | .03(d) | (1.06) | (1.03) | — | — | — | — | —(f) | $15.80 | (6.12)* | $2 | .68(d)* | .17(d)* | 23.35* |
|
| |
| CLASS Y | | | | | | | | | | | | | | | |
| August 31, 2007** | $16.97 | .08(d) | (.88) | (.80) | — | — | — | — | —(f) | $16.17 | (4.71)* | $43,096 | .56(d)* | .46(d)* | 23.35* |
| February 28, 2007 | 18.49 | .13(d,e) | 1.78 | 1.91 | (.11) | (3.32) | — | (3.43) | —(f) | 16.97 | 10.56(e) | 46,876 | 1.02(d,e) | .71(d,e) | 47.18 |
| February 28, 2006 | 19.34 | .11(d,g) | 2.83 | 2.94 | — | (3.79) | — | (3.79) | —(f) | 18.49 | 16.53 | 48,223 | 1.00(d) | .55(d,g) | 28.65 |
| February 28, 2005 | 18.16 | .03(d) | 3.05 | 3.08 | — | (1.90) | — | (1.90) | —(f) | 19.34 | 17.14 | 85,561 | 1.13(d) | .25(d) | 24.00 |
| February 29, 2004 | 10.57 | .08 | 7.51 | 7.59 | — | — | — | — | — | 18.16 | 71.81 | 103,874 | 1.09 | .52 | 24.40 |
| February 28, 2003 | 13.87 | .06 | (3.15) | (3.09) | — | (.21) | —(f) | (.21) | — | 10.57 | (22.35) | 36,979 | 1.02 | .48 | 36.46 |
|
See notes to financial highlights at the end of this section.
The accompanying notes are an integral part of these financial statements.
Financial highlights (Continued)
* Not annualized.
** Unaudited.
† For the period March 30, 2007 (commencement of operations) to August 31, 2007.
(a) Per share net investment income (loss) has been determined on the basis of the weighted average number of shares outstanding during the period.
(b) Total return assumes dividend reinvestment and does not reflect the effect of sales charges.
(c) Includes amounts paid through expense offset and brokerage service arrangements (Note 2).
(d) Reflects waivers of certain fund expenses in connection with investments in Putnam Prime Money Market Fund in effect during the period. As a result of such waivers, the expenses of each class reflect a reduction of the following amounts (Note 5):
| |
| | Percentage |
| | of average |
| | net assets |
|
| August 31, 2007 | <0.01% |
|
| February 28, 2007 | <0.01 |
|
| February 28, 2006 | <0.01 |
|
| February 28, 2005 | <0.01 |
|
(e) Reflects a non-recurring reimbursement from Putnam Investments relating to the calculation of certain amounts paid by the fund to Putnam in previous years for transfer agent services, which amounted to $0.01 per share and 0.04% of average net assets for the period ended February 28, 2007.
(f) Amount represents less than $0.01 per share.
(g) Reflects a non-recurring accrual related to Putnam Management’s settlement with the SEC regarding brokerage allocation practices, which amounted to the following amounts:
| | | |
| | | | Percentage |
| | | | of average |
| | Per share | | net assets |
|
| Class A | <$0.01 | | 0.02% |
|
| Class B | <0.01 | | 0.02 |
|
| Class C | <0.01 | | 0.02 |
|
| Class M | <0.01 | | 0.02 |
|
| Class Y | <0.01 | | 0.02 |
|
The accompanying notes are an integral part of these financial statements.
44
Notes to financial statements 8/31/07 (Unaudited)
Note 1: Significant accounting policies
Putnam Small Cap Value Fund (the “fund”) is one of a series of Putnam Investment Funds (the “trust”), a Massachusetts business trust, which is registered under the Investment Company Act of 1940, as amended, as a diversified, open-end management investment company. The fund seeks capital appreciation by investing primarily in common stocks of small U.S. companies which Putnam Investment Management, LLC (“Putnam Management”), the fund’s manager, a wholly-owned subsidiary of Putnam, LLC, believes are currently undervalued by the market.
The fund offers class A, class B, class C, class M, class R and class Y shares. The fund began offering class R shares on March 30, 2007. Class A and class M shares are sold with a maximum front-end sales charge of 5.25% and 3.25%, respectively, and generally do not pay a contingent deferred sales charge. Class B shares, which convert to class A shares after approximately six years, do not pay a front-end sales charge and are subject to a contingent deferred sales charge, if those shares are redeemed within six years of purchase. Class C shares have a one-year 1.00% contingent deferred sales charge and do not convert to class A shares. Class R shares, which are offered to qualified employee-benefit plans, are sold without a front-end sales charge or a contingent deferred sales charge. The expenses for class A, class B, class C, class M and class R shares may differ based on the distribution fee of each class, which is identified in Note 2. Class Y shares, which are sold at net asset value, are generally subject to the same expenses as class A, class B, class C, class M and class R shares, but do not bear a distribution fee. Class Y shares are generally only available to corporate and institutional clients and clients in other approved programs.
Effective October 2, 2006, a 1.00% redemption fee may apply on any shares purchased on or after such date that are redeemed (either by selling or exchanging into another fund) within 90 days of purchase. The redemption fee is accounted for as an addition to paid-in-capital. Prior to October 2, 2006, a 2.00% redemption fee applied to any shares that were redeemed (either by selling or exchanging into another fund) within 5 days of purchase.
Investment income, realized gains and losses and expenses of the fund are borne pro-rata based on the relative net assets of each class to the total net assets of the fund, except that each class bears expenses unique to that class (including the distribution fees applicable to such classes). Each class votes as a class only with respect to its own distribution plan or other matters on which a class vote is required by law or determined by the Trustees. Shares of each class would receive their pro-rata share of the net assets of the fund, if the fund were liquidated. In addition, the Trustees declare separate dividends on each class of shares.
In the normal course of business, the fund enters into contracts that may include agreements to indemnify another party under given circumstances. The fund’s maximum exposure under these arrangements is unknown as this would involve future claims that may be, but have not yet been, made against the fund. However, the fund expects the risk of material loss to be remote.
The following is a summary of significant accounting policies consistently followed by the fund in the preparation of its financial statements. The preparation of financial statements is in conformity with accounting principles generally accepted in the United States of America and requires management to make estimates and assumptions that affect the reported amounts of assets and liabilities in the financial statements and the reported amounts of increases and decreases in net assets from operations during the reporting period. Actual results could differ from those estimates.
A) Security valuation Investments for which market quotations are readily available are valued at the last reported sales price on their principal exchange, or official closing price for certain markets. If no sales are reported — as in the case of some securities traded over-the-counter — a
45
security is valued at its last reported bid price. Many securities markets and exchanges outside the U.S. close prior to the close of the New York Stock Exchange and therefore the closing prices for securities in such markets or on such exchanges may not fully reflect events that occur after such close but before the close of the New York Stock Exchange. Accordingly, on certain days, the fund will fair value foreign equity securities taking into account multiple factors, including movements in the U.S. securities markets. The number of days on which fair value prices will be used will depend on market activity and it is possible that fair value prices will be used by the fund to a significant extent. Securities quoted in foreign currencies, if any, are translated into U.S. dollars at the current exchange rate. Certain investments, including certain restricted securities, are also valued at fair value following procedures approved by the Trustees. Such valuations and procedures are reviewed periodically by the Trustees. The fair value of securities is generally determined as the amount that the fund could reasonably expect to realize from an orderly disposition of such securities over a reasonable period of time. By its nature, a fair value price is a good faith estimate of the value of a security at a given point in time and does not reflect an actual market price, which may be different by a material amount.
B) Joint trading account Pursuant to an exemptive order from the Securities and Exchange Commission (the “SEC”), the fund may transfer uninvested cash balances, including cash collateral received under security lending arrangements, into a joint trading account along with the cash of other registered investment companies and certain other accounts managed by Putnam Management. These balances may be invested in issues of high-grade short-term investments having maturities of up to 397 days for collateral received under security lending arrangements and up to 90 days for other cash investments.
C) Repurchase agreements The fund, or any joint trading account, through its custodian, receives delivery of the underlying securities, the market value of which at the time of purchase is required to be in an amount at least equal to the resale price, including accrued interest. Collateral for certain tri-party repurchase agreements is held at the counterparty’s custodian in a segregated account for the benefit of the fund and the counterparty. Putnam Management is responsible for determining that the value of these underlying securities is at all times at least equal to the resale price, including accrued interest.
D) Security transactions and related investment income Security transactions are recorded on the trade date (the date the order to buy or sell is executed). Gains or losses on securities sold are determined on the identified cost basis.
Interest income is recorded on the accrual basis. Dividend income, net of applicable withholding taxes, is recognized on the ex-dividend date except that certain dividends from foreign securities, if any, are recognized as soon as the fund is informed of the ex-dividend date. Non-cash dividends, if any, are recorded at the fair market value of the securities received. Dividends representing a return of capital or capital gains, if any, are reflected as a reduction of cost and/or as a realized gain.
E) Security lending The fund may lend securities, through its agents, to qualified borrowers in order to earn additional income. The loans are collateralized by cash and/or securities in an amount at least equal to the market value of the securities loaned. The market value of securities loaned is determined daily and any additional required collateral is allocated to the fund on the next business day. The risk of borrower default will be borne by the fund’s agents; the fund will bear the risk of loss with respect to the investment of the cash collateral. Income from securities lending is included in investment income on the Statement of operations. At August 31, 2007, the value of securities loaned amounted to $95,722,782. Certain of these securities were sold prior to period end and are included in the Receivable for securities sold on the Statement of assets and lia bilities. The fund
46
received cash collateral of $99,189,018 which is pooled with collateral of other Putnam funds into 42 issues of short-term investments.
F) Federal taxes It is the policy of the fund to distribute all of its taxable income within the prescribed time and otherwise comply with the provisions of the Internal Revenue Code of 1986 (the “Code”) applicable to regulated investment companies. It is also the intention of the fund to distribute an amount sufficient to avoid imposition of any excise tax under Section 4982 of the Code, as amended. Therefore, no provision has been made for federal taxes on income, capital gains or unrealized appreciation on securities held nor for excise tax on income and capital gains.
The aggregate identified cost on a tax basis is $611,533,199, resulting in gross unrealized appreciation and depreciation of $173,950,438 and $47,753,690, respectively, or net unrealized appreciation of $126,196,748.
G) Distributions to shareholders Distributions to shareholders from net investment income are recorded by the fund on the ex-dividend date. Distributions from capital gains, if any, are recorded on the ex-dividend date and paid at least annually. The amount and character of income and gains to be distributed are determined in accordance with income tax regulations, which may differ from generally accepted accounting principles. Dividend sources are estimated at the time of declaration. Actual results may vary. Any non-taxable return of capital cannot be determined until final tax calculations are completed after the end of the fund’s fiscal year. Reclassifications are made to the fund’s capital accounts to reflect income and gains available for distribution (or available capital loss carryovers) under income tax regulations.
H) Expenses of the trust Expenses directly charged or attributable to any fund will be paid from the assets of that fund. Generally, expenses of the trust will be allocated among and charged to the assets of each fund on a basis that the Trustees deem fair and equitable, which may be based on the relative assets of each fund or the nature of the services performed and relative applicability to each fund.
Note 2: Management fee, administrative
services and other transactions
Putnam Management is paid for management and investment advisory services quarterly based on the average net assets of the fund. Such fee is based on the following annual rates: 0.80% of the first $500 million of average net assets, 0.70% of the next $500 million, 0.65% of the next $500 million, 0.60% of the next $5 billion, 0.575% of the next $5 billion, 0.555% of the next $5 billion, 0.54% of the next $5 billion and 0.53% thereafter.
Putnam Management has agreed to waive fees and reimburse expenses of the fund through June 30, 2009 to the extent necessary to ensure that the fund’s expenses do not exceed the simple average of the expenses of all front-end load funds viewed by Lipper Inc. as having the same investment classification or objective as the fund. The expense reimbursement is based on a comparison of the fund’s expenses with the average annualized operating expenses of the funds in its Lipper peer group for each calendar quarter during the fund’s last fiscal year, excluding 12b-1 fees and without giving effect to any expense offset and brokerage service arrangements that may reduce fund expenses. For the period ended August 31, 2007, Putnam Management did not waive any of its management fee from the fund.
Effective August 3, 2007, Marsh & McLennan Companies, Inc. sold its ownership interest in Putnam Management, its parent companies and affiliates to a wholly-owned subsidiary of Great-West Lifeco, Inc. The fund’s shareholders have approved a new management contract for the fund that became effective upon the sale.
For the period ended August 31, 2007, Putnam Management has assumed $457 of legal, shareholder servicing and communication, audit
47
and Trustee fees incurred by the fund in connection with certain legal and regulatory matters (including those described in Note 6).
The fund reimburses Putnam Management an allocated amount for the compensation and related expenses of certain officers of the fund and their staff who provide administrative services to the fund. The aggregate amount of all such reimbursements is determined annually by the Trustees.
Custodial functions for the fund’s assets were provided by Putnam Fiduciary Trust Company (“PFTC”), an affiliate of Putnam Management, and by State Street Bank and Trust Company. Custody fees are based on the fund’s asset level, the number of its security holdings and transaction volumes. Putnam Investor Services, a division of PFTC, provided investor servicing agent functions to the fund. Putnam Investor Services received fees for investor servicing, subject to certain limitations, based on the number of shareholder accounts in the fund and the level of defined contribution plan assets in the fund. During the period ended August 31, 2007, the fund incurred $1,014,938 for custody and investor servicing agent functions provided by PFTC.
Under the custodian contract between the fund and State Street Bank and Trust Company, the custodian bank has a lien on the securities of the fund to the extent permitted by the fund’s investment restrictions to cover any advances made by the custodian bank for the settlement of securities purchased by the fund. At August 31, 2007, the payable to the custodian bank represents the amount due for cash advanced for the settlement of securities purchased.
The fund has entered into arrangements with PFTC and State Street Bank and Trust Company whereby PFTC’s and State Street Bank and Trust Company’s fees are reduced by credits allowed on cash balances. The fund also reduced expenses through brokerage service arrangements. For the six months ended August 31, 2007, the fund’s expenses were reduced by $83,722 under these arrangements.
Each independent Trustee of the fund receives an annual Trustee fee, of which $394, as a quarterly retainer, has been allocated to the fund, and an additional fee for each Trustees meeting attended. Trustees receive additional fees for attendance at certain committee meetings and industry seminars and for certain compliance-related matters. Trustees also are reimbursed for expenses they incur relating to their services as Trustees.
The fund has adopted a Trustee Fee Deferral Plan (the “Deferral Plan”) which allows the Trustees to defer the receipt of all or a portion of Trustees fees payable on or after July 1, 1995. The deferred fees remain invested in certain Putnam funds until distribution in accordance with the Deferral Plan.
The fund has adopted an unfunded noncontributory defined benefit pension plan (the “Pension Plan”) covering all Trustees of the fund who have served as a Trustee for at least five years and were first elected prior to 2004. Benefits under the Pension Plan are equal to 50% of the Trustee’s average annual attendance and retainer fees for the three years ended December 31, 2005. The retirement benefit is payable during a Trustee’s lifetime, beginning the year following retirement, for the number of years of service through December 31, 2006. Pension expense for the fund is included in Trustee compensation and expenses in the Statement of operations. Accrued pension liability is included in Payable for Trustee compensation and expenses in the Statement of assets and liabilities. The Trustees have terminated the Pension Plan with respect to any Trustee first elected after 2003.
The fund has adopted distribution plans (the “Plans”) with respect to its class A, class B, class C, class M and class R shares pursuant to Rule 12b-1 under the Investment Company Act of 1940. The purpose of the Plans is to compensate Putnam Retail Management, a wholly-owned subsidiary of Putnam, LLC and Putnam Retail Management GP, Inc., for services provided and expenses incurred in distributing shares of the fund. The Plans provide for payments by the fund to Putnam
48
Retail Management at an annual rate of up to 0.35%, 1.00%, 1.00%, 1.00% and 1.00% of the average net assets attributable to class A, class B, class C, class M and class R shares, respectively. The Trustees have approved payment by the fund at an annual rate of 0.25%, 1.00%, 1.00%, 0.75% and 0.50% of the average net assets attributable to class A, class B, class C, class M and class R shares, respectively.
For the six months ended August 31, 2007, Putnam Retail Management, acting as underwriter, received net commissions of $13,952 and $133 from the sale of class A and class M shares, respectively, and received $36,050 and $82 in contingent deferred sales charges from redemptions of class B and class C shares, respectively. A deferred sales charge of up to 1.00% and 0.65% is assessed on certain redemptions of class A and class M shares, respectively. For the six months ended August 31, 2007, Putnam Retail Management, acting as underwriter, received $148 and no monies on class A and class M redemptions, respectively.
Note 3: Purchases and sales of securities
During the six months ended August 31, 2007, cost of purchases and proceeds from sales of investment securities other than short-term investments aggregated $170,253,390 and $263,426,595, respectively. There were no purchases or sales of U.S. government securities.
Note 4: Capital shares
At August 31, 2007, there was an unlimited number of shares of beneficial interest authorized. Transactions in capital shares were as follows:
| | | |
| CLASS A | Shares | | Amount |
|
| Six months ended 8/31/07: | | |
| | | | |
| Shares sold | 7,213,677 | $ | 124,647,971 |
|
| Shares issued | | | |
| in connection | | | |
| with reinvestment | | | |
| of distributions | — | | — |
|
| | 7,213,677 | | 124,647,971 |
|
| Shares | | | |
| repurchased | (7,207,015) | (123,403,365) |
|
| Net increase | 6,662 | $ | 1,244,606 |
| |
| Year ended 2/28/07: | | | |
| | | | |
| Shares sold | 9,147,477 | $ | 163,667,395 |
|
| Shares issued | | | |
| in connection | | | |
| with reinvestment | | | |
| of distributions | 4,854,842 | | 79,619,407 |
|
| | 14,002,319 | | 243,286,802 |
|
| Shares | | | |
| repurchased | (8,744,848) | (155,916,886) |
|
| Net increase | 5,257,471 | $ | 87,369,916 |
|
| |
| CLASS B | Shares | | Amount |
|
| Six months ended 8/31/07: | | |
| | | | |
| Shares sold | 255,864 | $ | 3,998,907 |
|
| Shares issued | | | |
| in connection | | | |
| with reinvestment | | | |
| of distributions | — | | — |
|
| | 255,864 | | 3,998,907 |
|
| Shares | | | |
| repurchased | (5,996,575) | | (95,590,149) |
|
| Net decrease | (5,740,711) | $ | (91,591,242) |
| |
| Year ended 2/28/07: | | | |
| | | | |
| Shares sold | 487,424 | $ | 7,864,900 |
|
| Shares issued | | | |
| in connection | | | |
| with reinvestment | | | |
| of distributions | 1,882,079 | | 28,344,104 |
|
| | 2,369,503 | | 36,209,004 |
|
| Shares | | | |
| repurchased | (7,007,437) | (115,206,257) |
|
| Net decrease | (4,637,934) | $ | (78,997,253) |
49
| | | |
| CLASS C | Shares | | Amount |
|
| Six months ended 8/31/07: | | |
| | | | |
| Shares sold | 177,290 | $ | 2,772,994 |
|
| Shares issued | | | |
| in connection | | | |
| with reinvestment | | | |
| of distributions | — | | — |
|
| | 177,290 | | 2,772,994 |
|
| Shares | | | |
| repurchased | (384,973) | (5,835,025) |
|
| Net decrease | (207,683) | $ | (3,062,031) |
| |
| Year ended 2/28/07: | | | |
| | | | |
| Shares sold | 146,129 | $ | 2,332,593 |
|
| Shares issued | | | |
| in connection | | | |
| with reinvestment | | | |
| of distributions | 420,971 | | 6,352,459 |
|
| | 567,100 | | 8,685,052 |
|
| Shares | | | |
| repurchased | (612,101) | (10,040,828) |
|
| Net decrease | (45,001) | $ | (1,355,776) |
|
| |
| CLASS M | Shares | | Amount |
|
| Six months ended 8/31/07: | | |
| | | | |
| Shares sold | 25,902 | $ | 420,380 |
|
| Shares issued | | | |
| in connection | | | |
| with reinvestment | | | |
| of distributions | — | | — |
|
| | 25,902 | | 420,380 |
|
| Shares | | | |
| repurchased | (76,668) | (1,251,322) |
|
| Net decrease | (50,766) | $ | (830,942) |
| |
| Year ended 2/28/07: | | | |
| | | | |
| Shares sold | 24,767 | $ | 415,085 |
|
| Shares issued | | | |
| in connection | | | |
| with reinvestment | | | |
| of distributions | 80,233 | | 1,254,852 |
|
| | 105,000 | | 1,669,937 |
|
| Shares | | | |
| repurchased | (88,505) | (1,518,958) |
|
| Net increase | 16,495 | $ | 150,979 |
| | | |
| | |
| CLASS R | Shares | Amount |
|
| For the period 3/30/07 (commencement of operations) |
| to 8/31/07: | | |
| | | | |
| Shares sold | 156 | $ | 2,552 |
|
| Shares issued | | |
| in connection | | |
| with reinvestment | | |
| of distributions | — | — |
|
| | 156 | 2,552 |
|
| Shares | | |
| repurchased | — | — |
|
| Net increase | 156 | $ | 2,552 |
|
| |
| CLASS Y | Shares | Amount |
|
| Six months ended 8/31/07: | |
| | | | |
| Shares sold | 449,267 | $ | 7,960,382 |
|
| Shares issued | | |
| in connection | | |
| with reinvestment | | |
| of distributions | — | — |
|
| | 449,267 | 7,960,382 |
|
| Shares | | |
| repurchased | (545,441) | (9,404,022) |
|
| Net decrease | (96,174) | $ | (1,443,640) |
| |
| Year ended 2/28/07: | | |
| | | | |
| Shares sold | 786,248 | $ | 13,763,970 |
|
| Shares issued | | |
| in connection | | |
| with reinvestment | | |
| of distributions | 503,603 | 8,425,336 |
|
| | 1,289,851 | 22,189,306 |
|
| Shares | | |
| repurchased | (1,136,040) | (19,829,664) |
|
| Net increase | 153,811 | $ | 2,359,642 |
At August 31, 2007, Putnam, LLC owned 59 class R shares of the fund (38% of class R shares outstanding), valued at $932.
Note 5: Investment in Putnam Prime
Money Market Fund
The fund invests in Putnam Prime Money Market Fund, an open-end management investment company managed by Putnam Management.
50
Investments in Putnam Prime Money Market Fund are valued at its closing net asset value each business day. Management fees paid by the fund are reduced by an amount equal to the management and administrative services fees paid by Putnam Prime Money Market Fund with respect to assets invested by the fund in Putnam Prime Money Market Fund. For the period ended August 31, 2007, management fees paid were reduced by $170 relating to the fund’s investment in Putnam Prime Money Market Fund. Income distributions earned by the fund are recorded as income in the Statement of operations and totaled $23,007 for the period ended August 31, 2007. During the period ended August 31, 2007, cost of purchases and proceeds of sales of investments in Putnam Prime Money Market Fund aggregated $20,546,191 and $20,546,191, respectively.
Note 6: Regulatory matters and litigation
In late 2003 and 2004, Putnam Management settled charges brought by the SEC and the Massachusetts Securities Division in connection with excessive short-term trading in Putnam funds. Payments from Putnam Management will be distributed to certain open-end Putnam funds and their shareholders. These allegations and related matters have served as the general basis for certain lawsuits, including purported class action lawsuits against Putnam Management and, in a limited number of cases, some Putnam funds. Putnam Management believes that these lawsuits will have no material adverse effect on the funds or on Putnam Management’s ability to provide investment management services. In addition, Putnam Management has agreed to bear any costs incurred by the Putnam funds as a result of these matters.
Putnam Management and Putnam Retail Management are named as defendants in a civil suit in which the plaintiffs allege that the management and distribution fees paid by certain Putnam funds were excessive and seek recovery under the Investment Company Act of 1940. Putnam Management and Putnam Retail Management have contested the plaintiffs’ claims and the matter is currently pending in the U.S. District Court for the District of Massachusetts. Based on currently available information, Putnam Management believes that this action is without merit and that it is unlikely to have a material effect on Putnam Management’s and Putnam Retail Management’s ability to provide services to their clients, including the fund.
Note 7: New accounting pronouncements
In June 2006, the Financial Accounting Standards Board (“FASB”) issued Interpretation No. 48, Accounting for Uncertainty in Income Taxes (the “Interpretation”). The Interpretation prescribes a minimum threshold for financial statement recognition of the benefit of a tax position taken or expected to be taken by a filer in the filer’s tax return. Upon adoption, the Interpretation did not have a material effect on the fund’s financial statements. However, the conclusions regarding the Interpretation may be subject to review and adjustment at a later date based on factors including, but not limited to, further implementation guidance expected from the FASB, and on-going analysis of tax laws, regulations and interpretations thereof.
In September 2006, the FASB issued Statement of Financial Accounting Standards No. 157, Fair Value Measurements (the “Standard”). The Standard defines fair value, sets out a framework for measuring fair value and requires additional disclosures about fair value measurements. The Standard applies to fair value measurements already required or permitted by existing standards. The Standard is effective for financial statements issued for fiscal years beginning after November 15, 2007 and interim periods within those fiscal years. Putnam Management is currently evaluating what impact the adoption of the Standard will have on the fund’s financial statements.
51
Shareholder meeting
results (unaudited)
May 15, 2007 meeting
A proposal to approve a new management contract between the fund and Putnam Investment Management, LLC was approved as follows:
| | |
| Votes for | Votes against | Abstentions |
|
| 25,824,442 | 1,133,136 | 956,228 |
|
All tabulations are rounded to the nearest whole number.
52
Brokerage commissions
(unaudited)
Brokerage commissions are paid to firms that execute trades on behalf of your fund. When choosing these firms, Putnam is required by law to seek the best execution of the trades, taking all relevant factors into consideration, including expected quality of execution and commission rate. Listed below are the largest relationships based upon brokerage commissions for your fund and the other funds in Putnam’s U.S. Small- and Mid-Cap group for the year ended August 31, 2007. The other Putnam mutual funds in this group are Putnam Capital Opportunities Fund, Putnam Discovery Growth Fund, Putnam Mid Cap Value Fund, Putnam New Opportunities Fund, Putnam OTC & Emerging Growth Fund, Putnam Small Cap Growth Fund, Putnam Vista Fund, Putnam VT Capital Opportunities Fund, Putnam VT Discovery Growth Fund, Putnam VT Mid Cap Value Fund, Putnam VT New Opportunities Fund, Putnam VT OTC & Emerging Growth Fund, Putnam VT Small Cap Value Fund, and Putnam VT Vista Fund.
The top five firms that received brokerage commissions for trades executed for the U.S. Small-and Mid-Cap group are (in descending order) Citigroup Global Markets, Merrill Lynch, Credit Suisse First Boston, Morgan Stanley Dean Witter, and RBC Capital Markets. Commissions paid to these firms together represented approximately 37% of the total brokerage commissions paid for the year ended August 31, 2007.
Commissions paid to the next 10 firms together represented approximately 40% of the total brokerage commissions paid during the period. These firms are (in alphabetical order) Bear Stearns & Company, CIBC World Markets, Deutsche Bank Securities, Goldman Sachs, JPMorgan Clearing, Lehman Brothers, SG Cowen, UBS Warburg, Wachovia Securities, and Weeden & Company.
Additional information about brokerage commissions is available on the Securities and Exchange Commission (SEC) Web site at www.sec.gov. Putnam funds disclose commissions by firm to the SEC in semiannual filings on Form N-SAR.
53
The Putnam
family of funds
The following is a list of Putnam’s open-end mutual funds offered to the public. Investors should carefully consider the investment objective, risks, charges, and expenses of a fund before investing. For a prospectus containing this and other information for any Putnam fund or product, call your financial advisor at 1-800-225-1581 and ask for a prospectus. Please read the prospectus carefully before investing.
| |
| Growth funds | Value funds |
| Discovery Growth Fund | Classic Equity Fund |
| Growth Opportunities Fund | Convertible Income-Growth Trust |
| Health Sciences Trust | Equity Income Fund |
| International New Opportunities Fund* | The George Putnam Fund of Boston |
| New Opportunities Fund | The Putnam Fund for Growth |
| OTC & Emerging Growth Fund | and Income |
| Small Cap Growth Fund* | International Growth and Income Fund* |
| Vista Fund | Mid Cap Value Fund |
| Voyager Fund | New Value Fund |
| | Small Cap Value Fund* |
| |
| Blend funds | Income funds |
| Capital Appreciation Fund | American Government Income Fund |
| Capital Opportunities Fund* | Diversified Income Trust |
| Europe Equity Fund* | Floating Rate Income Fund |
| Global Equity Fund* | Global Income Trust* |
| Global Natural Resources Fund* | High Yield Advantage Fund* |
| International Capital | High Yield Trust* |
| Opportunities Fund* | Income Fund |
| International Equity Fund* | Limited Duration Government |
| Investors Fund | Income Fund |
| Research Fund | Money Market Fund† |
| Tax Smart Equity Fund® | U.S. Government Income Trust |
| Utilities Growth and Income Fund | |
* A 1% redemption fee on total assets redeemed or exchanged within 90 days of purchase may be imposed for all share classes of these funds.
† An investment in a money market fund is not insured or guaranteed by the Federal Deposit Insurance Corporation or any other government agency. Although the fund seeks to preserve your investment at $1.00 per share, it is possible to lose money by investing in the fund.
54
| |
| Tax-free income funds | Putnam RetirementReady® Funds |
| AMT-Free Insured Municipal Fund | Putnam RetirementReady Funds — ten |
| Tax Exempt Income Fund | investment portfolios that offer diversifica- |
| Tax Exempt Money Market Fund§ | tion among stocks, bonds, and money |
| Tax-Free High Yield Fund | market instruments and adjust to become |
| | more conservative over time based on a |
| State tax-free income funds: | target date for withdrawing assets. |
| Arizona, California, Massachusetts, Michigan, | |
| Minnesota, New Jersey, New York, Ohio, | The ten funds: |
| and Pennsylvania | Putnam RetirementReady 2050 Fund |
| | Putnam RetirementReady 2045 Fund |
| Asset allocation funds | Putnam RetirementReady 2040 Fund |
| Income Strategies Fund | Putnam RetirementReady 2035 Fund |
| | Putnam RetirementReady 2030 Fund |
| Putnam Asset Allocation Funds — three | Putnam RetirementReady 2025 Fund |
| investment portfolios that spread your | Putnam RetirementReady 2020 Fund |
| money across a variety of stocks, bonds, | Putnam RetirementReady 2015 Fund |
| and money market investments. | Putnam RetirementReady 2010 Fund |
| | Putnam RetirementReady Maturity Fund |
| The three portfolios: | |
| Asset Allocation: Balanced Portfolio | |
| Asset Allocation: Conservative Portfolio | |
| Asset Allocation: Growth Portfolio | |
With the exception of money market funds, a 1% redemption fee may be applied to shares exchanged or sold within 7 days of purchase (90 days, for certain funds).
Check your account balances and the most recent month-end performance at www.putnam.com.
55
Putnam puts your
interests first
In January 2004, Putnam began introducing a number of voluntary initiatives designed to reduce fund expenses, provide investors with more useful information, and help safeguard the interests of all Putnam investors. Visit www.putnam.com for details.
Cost-cutting initiatives
Reduced sales charges The maximum sales charge for class A shares has been reduced to 5.25% for equity funds (formerly 5.75%) and 3.75% for most income funds (formerly 4.50%) . The maximum sales charge for class M shares has been reduced to 3.25% for equity funds (formerly 3.50%) .*
Lower class B purchase limit To help ensure that investors are in the most cost-effective share class, the maximum amount that can be invested in class B shares has been reduced to $100,000. (Larger trades or accumulated amounts will be refused.)
Ongoing expenses will be limited Through calendar 2007, total ongoing expenses, including management fees for all funds, will be maintained at or below the average of each fund’s industry peers in its Lipper load-fund universe. For more information, please see the Statement of Additional information.
Improved disclosure
Putnam fund prospectuses and shareholder reports have been revised to disclose additional information that will help shareholders compare funds and weigh their costs and risks along with their potential benefits. Shareholders will find easy-to-understand information about fund expense ratios, portfolio manager compensation, risk comparisons, turnover comparisons, brokerage commissions, and employee and trustee ownership of Putnam funds. Disclosure of breakpoint discounts has also been enhanced to alert investors to potential cost savings.
Protecting investors’ interests
Short-term trading fee introduced To discourage short-term trading, which can interfere with a fund’s long-term strategy, a 1% short-term trading fee may be imposed on any Putnam fund shares (other than money market funds) redeemed or exchanged within seven calendar days of purchase (for certain funds, this fee applies for 90 days).
* The maximum sales charge for class A shares of Putnam Limited Duration Government Income Fund and Putnam Floating Rate Income Fund remains 3.25% .
56
Fund information
Founded nearly 70 years ago, Putnam Investments was built around the concept that a balance between risk and reward is the hallmark of a well-rounded financial program. We manage over 100 mutual funds in growth, value, blend, fixed income, and international.
| | |
| Investment Manager | Officers | Francis J. McNamara, III |
| Putnam Investment | Charles E. Haldeman, Jr. | Vice President and |
| Management, LLC | President | Chief Legal Officer |
| One Post Office Square | | |
| Boston, MA 02109 | Charles E. Porter | Robert R. Leveille |
| Executive Vice President, | Vice President and |
| Marketing Services | Principal Executive Officer, | Chief Compliance Officer |
| Putnam Retail Management | Associate Treasurer and | |
| One Post Office Square | Compliance Liaison | Mark C. Trenchard |
| Boston, MA 02109 | | Vice President and |
| Jonathan S. Horwitz | BSA Compliance Officer |
| Custodian | Senior Vice President | |
| State Street Bank and | and Treasurer | Judith Cohen |
| Trust Company | | Vice President, Clerk and |
| Steven D. Krichmar | Assistant Treasurer |
| Legal Counsel | Vice President and | |
| Ropes & Gray LLP | Principal Financial Officer | Wanda M. McManus |
| | Vice President, Senior Associate |
| Trustees | Janet C. Smith | Treasurer and Assistant Clerk |
| John A. Hill, Chairman | Vice President, Principal | |
| Jameson Adkins Baxter, | Accounting Officer and | Nancy E. Florek |
| Vice Chairman | Assistant Treasurer | Vice President, Assistant Clerk, |
| Charles B. Curtis | | Assistant Treasurer |
| Robert J. Darretta | Susan G. Malloy | and Proxy Manager |
| Myra R. Drucker | Vice President and | |
| Charles E. Haldeman, Jr. | Assistant Treasurer | |
| Paul L. Joskow | | |
| Elizabeth T. Kennan | Beth S. Mazor | |
| Kenneth R. Leibler | Vice President | |
| Robert E. Patterson | | |
| George Putnam, III | James P. Pappas | |
| W. Thomas Stephens | Vice President | |
| Richard B. Worley | | |
| Richard S. Robie, III | |
| Vice President | |
| | |
This report is for the information of shareholders of Putnam Small Cap Value Fund. It may also be used as sales literature when preceded or accompanied by the current prospectus, the most recent copy of Putnam’s Quarterly Performance Summary, and Putnam’s Quarterly Ranking Summary. For more recent performance, please visit www.putnam.com. Investors should carefully consider the investment objective, risks, charges, and expenses of a fund, which are described in its prospectus. For this and other information or to request a prospectus, call 1-800-225-1581 toll free. Please read the prospectus carefully before investing. The fund’s Statement of Additional Information contains additional information about the fund’s Trustees and is available without charge upon request by calling 1-800-225-1581.

Item 2. Code of Ethics:
Not applicable
Item 3. Audit Committee Financial Expert:
Not applicable
Item 4. Principal Accountant Fees and Services:
Not applicable
Item 5. Audit Committee of Listed Registrants
Not applicable
Item 6. Schedule of Investments:
The registrant’s schedule of investments in unaffiliated issuers is included in the report to
shareholders in Item 1 above.
Item 7. Disclosure of Proxy Voting Policies and Procedures For Closed-End Management
Investment Companies:
Not applicable
Item 8. Portfolio Managers of Closed-End Investment Companies
Not Applicable
Item 9. Purchases of Equity Securities by Closed-End Management Investment Companies and
Affiliated Purchasers:
Not applicable
Item 10. Submission of Matters to a Vote of Security Holders:
Not applicable
Item 11. Controls and Procedures:
(a) The registrant's principal executive officer and principal financial officer have concluded, based on their evaluation of the effectiveness of the design and operation of the registrant's disclosure controls and procedures as of a date within 90 days of the filing date of this report, that the design and operation of such procedures are generally effective to provide reasonable assurance that information required to be disclosed by the registrant in this report is recorded, processed, summarized and reported within the time periods specified in the Commission's rules and forms.
(b) Changes in internal control over financial reporting: During the period, Putnam Fiduciary Trust Company, the fund's transfer agent, began utilizing shareholder systems and systems support provided by DST Systems, Inc. and certain of its affiliates.
Item 12. Exhibits:
(a)(1) Not applicable
(a)(2) Separate certifications for the principal executive officer and principal financial officer of the registrant as required by Rule 30a-2(a) under the Investment Company Act of 1940, as amended, are filed herewith.
(b) The certifications required by Rule 30a-2(b) under the Investment Company Act of 1940, as amended, are filed herewith.
SIGNATURES
Pursuant to the requirements of the Securities Exchange Act of 1934 and the Investment Company Act of 1940, the registrant has duly caused this report to be signed on its behalf by the undersigned, thereunto duly authorized.
Putnam Investment Funds
By (Signature and Title):
/s/Janet C. Smith
Janet C. Smith
Principal Accounting Officer
Date: October 30, 2007
Pursuant to the requirements of the Securities Exchange Act of 1934 and the Investment Company Act of 1940, this report has been signed below by the following persons on behalf of the registrant and in the capacities and on the dates indicated.
By (Signature and Title):
/s/Charles E. Porter
Charles E. Porter
Principal Executive Officer
Date: October 30, 2007
By (Signature and Title):
/s/Steven D. Krichmar
Steven D. Krichmar
Principal Financial Officer
Date: October 30, 2007