UNITED STATES
SECURITIES AND EXCHANGE COMMISSION
Washington, D.C. 20549
FORM N-CSR
CERTIFIED SHAREHOLDER REPORT OF REGISTERED
MANAGEMENT INVESTMENT COMPANIES
Investment Company Act file number: (811- 07237)
Exact name of registrant as specified in charter: Putnam Investment Funds
Address of principal executive offices: One Post Office Square, Boston, Massachusetts 02109
| |
| Name and address of agent for service: | Beth S. Mazor, Vice President |
| | One Post Office Square |
| | Boston, Massachusetts 02109 |
| |
| Copy to: | John W. Gerstmayr, Esq. |
| | Ropes & Gray LLP |
| | One International Place |
| | Boston, Massachusetts 02110 |
Registrant’s telephone number, including area code: (617) 292-1000
Date of fiscal year end: April 30, 2008
Date of reporting period: May 1, 2007 — October 31, 2007
Item 1. Report to Stockholders:
The following is a copy of the report transmitted to stockholders pursuant to Rule 30e-1 under the Investment Company Act of 1940:
What makes Putnam different?

In 1830, Massachusetts Supreme Judicial Court Justice Samuel Putnam established The Prudent Man Rule, a legal foundation for responsible money management.
THE PRUDENT MAN RULE
All that can be required of a trustee to invest is that he shall conduct himself faithfully and exercise a sound discretion. He is to observe how men of prudence, discretion, and intelligence manage their own affairs, not in regard to speculation, but in regard to the permanent disposition of their funds, considering the probable income, as well as the probable safety of the capital to be invested.

A time-honored tradition in money management
Since 1937, our values have been rooted in a profound sense of responsibility for the money entrusted to us.
A prudent approach to investing
We use a research-driven team approach to seek consistent, dependable, superior investment results over time, although there is no guarantee a fund will meet its objectives.
Funds for every investment goal
We offer a broad range of mutual funds and other financial products so investors and their financial representatives can build diversified portfolios.
A commitment to doing what’s right for investors
With a focus on investment performance, below-average expenses, and in-depth information about our funds, we put the interests of investors first and seek to set the standard for integrity and service.
Industry-leading service
We help investors, along with their financial representatives, make informed investment decisions with confidence.
Putnam Capital
Opportunities
Fund
10| 31| 07
Semiannual Report
| |
| Message from the Trustees | 2 |
| About the fund | 4 |
| Performance snapshot | 6 |
| Report from the fund managers | 7 |
| Performance in depth | 12 |
| Expenses | 15 |
| Portfolio turnover | 17 |
| Risk | 18 |
| Your fund’s management | 19 |
| Terms and definitions | 21 |
| Trustee approval of management contract | 23 |
| Other information for shareholders | 28 |
| Financial statements | 29 |
| Shareholder meeting results | 59 |
| Brokerage commissions | 60 |
Cover photograph: © Marco Cristofori
Message from the Trustees
Dear Fellow Shareholder
In November, Putnam Investments celebrated its 70th anniversary. From modest beginnings in Boston, Massachusetts, Putnam has grown into a global asset manager that serves millions of investors worldwide. Coincident with this anniversary, we are pleased to announce that Great-West Lifeco Inc. recently completed its purchase of Putnam Investments from Marsh & McLennan Companies, Inc. Great-West Lifeco is a financial services holding company with operations in Canada, the United States, and Europe, and is a member of the Power Financial Corporation group of companies. With this change, Putnam becomes part of a successful organization with a long-standing commitment to high-quality investment management and financial services. The change in ownership is not expected to affect the Putnam funds, the way Putnam manages money, or the funds’ management teams.
We would also like to take this opportunity to announce that Putnam President and Chief Executive Officer Ed Haldeman, one of your fund’s Trustees since 2004, was named President of the Funds, assuming this role from George Putnam, III. This change, together with the completion of the transaction with Great-West Lifeco, has enabled George Putnam to become an independent Trustee of the funds. Both George and Ed will continue serving on the Board of Trustees in our collective role of overseeing the Putnam funds on your behalf.
Lastly, we are pleased to announce that a new independent Trustee, Robert J. Darretta, has joined your fund’s Board of Trustees. Mr. Darretta brings extensive leadership experience in corporate finance and accounting. He is a former Vice Chairman of the Board of Directors of Johnson & Johnson, one of the leading U.S. health-care and consumer products companies, where he also served as Chief Financial Officer, Executive Vice President, and Treasurer.
2
Although the mutual fund industry has undergone many changes since George Putnam introduced his innovative balanced fund in 1937, Putnam’s guiding principles have not. As we celebrate Putnam’s 70-year milestone, we look forward to Putnam continuing its long tradition of prudent money management and to the new chapter opened by its recent change in ownership. As always, we thank you for your support of the Putnam funds.

Putnam Capital Opportunities Fund: seeking
overlooked, underpriced small and midsize companies

Every company, whatever its industry, growth rate, or size, has an underlying value. This value can be based on the firm’s physical assets (factories, inventory, staff) or on less easily quantifiable measures (long-term competitive advantage, management team expertise, or research and development efforts). A stock’s price, however, may or may not accurately reflect the company’s underlying value.
A stock may be mispriced for many reasons, such as when the company has problems that concern its management, industry, or product line. Temporary factors, such as a cyclical industry downturn or a one-time inventory issue, may also cause a stock to be undervalued.
In addition, unlike the widely followed large, blue-chip companies, smaller companies are less likely to be covered by industry researchers. This lack of coverage can lead to the undervaluation of these stocks. It is up to the fund’s management team to uncover the reasons behind a stock’s valuation and to determine whether the market’s generally held assumptions are on target.
To uncover undervalued stocks with the long-term potential for growth, the members of Putnam Capital Opportunities Fund’s management team draw on their experience as well as on the expertise of Putnam’s equity analysts. Because the fund is managed in Putnam’s blend style, the team is not focused solely on either growth- or value-style stocks and can choose from thousands of U.S. small and midsize companies. This flexibility means the fund’s portfolio is broadly diversified, which can help reduce the risk of investing in these companies.
The fund invests some or all of its assets in small and/or midsize companies. Such investments increase the risk of greater price fluctuations.
Investor overreaction
can mean investment
opportunities
An important factor in the analysis performed by the management team of Putnam Capital Opportunities Fund is “behavioral insight.” When an event that negatively affects a company occurs, such as a temporary inventory shortage or a change in management, investors may overreact, either by selling off the stock or buying it in large quantities. This overreaction can skew a stock’s price out of proportion, resulting in a buying or a selling opportunity for astute investment managers.
The portfolio managers and analysts of Putnam Capital Opportunities Fund determine behavioral rankings as part of their detailed stock-by-stock valuation process. Their process integrates sophisticated quantitative models, behavioral insights, and an in-depth analysis of each company’s fundamental worth.
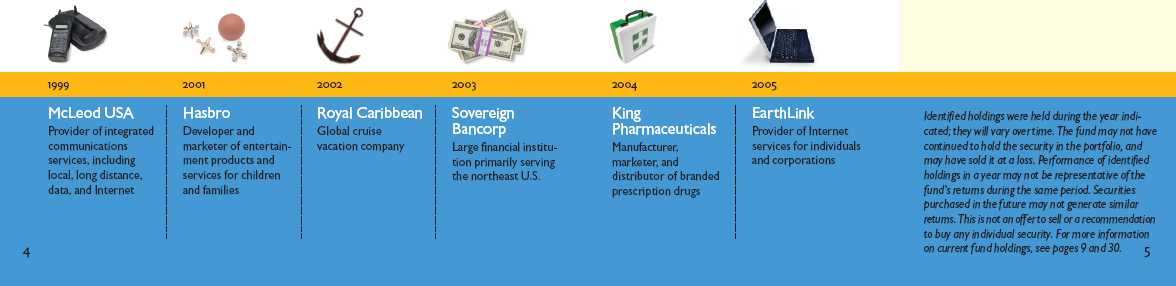
Putnam Capital Opportunities Fund holdings have spanned sectors and industries over time.
Performance snapshot
Putnam Capital
Opportunities Fund
Average annual total return (%) comparison as of 10/31/07
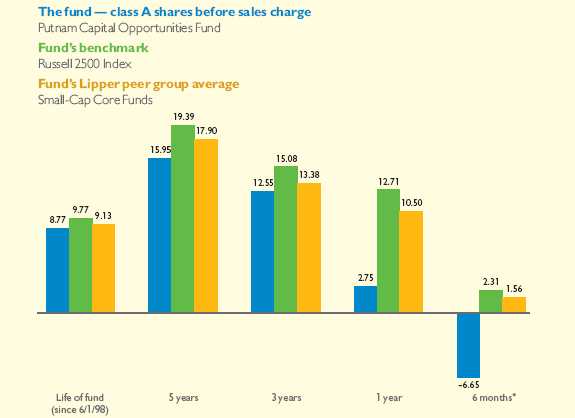
Current performance may be lower or higher than the quoted past performance, which cannot guarantee future results. Share price, principal value, and return will fluctuate, and you may have a gain or a loss when you sell your shares. Performance of class A shares assumes reinvestment of distributions and does not account for taxes. Fund returns in the bar chart do not reflect a sales charge. See pages 12–14 for additional performance information. For a portion of the periods, this fund may have limited expenses, without which returns would have been lower. A 1% short-term trading fee may apply. To obtain the most recent month-end performance, visit www.putnam.com.
* Returns for the six-month period are not annualized, but cumulative.
6
Report from the fund managers
The period in review
In a challenging period for the U.S. stock market, your fund did not keep pace with its benchmark, the Russell 2500 Index, or the average return for funds in its Lipper peer group, Small-Cap Core Funds. During the first half of the fund’s fiscal year, the types of stocks we regularly target for the portfolio did not perform well. Throughout the period, we continued to employ our disciplined investment strategy, using a series of valuation factors to identify stocks that we believe are trading below their intrinsic value. Our goal is to find those that will appreciate over time as the market recognizes their value. Over the six months ended October 31, 2007, this stock selection discipline went unrewarded, as the market generally favored stocks we considered to be too expensive. Within the fund’s portfolio, stocks in the financial sector were among the top detractors, while holdings in steel-related industries contributed positively to returns. Despite the difficult ma rket environment, dominated by negative investor sentiment related to the housing market downturn, we continued to focus on our valuation discipline and took advantage of the fund’s flexibility to invest in both growth- and value-style stocks.
Market overview
Although the broad stock market delivered gains for the six months ended October 31, 2007, it was a turbulent time for investors. The dominant theme was a wave of anxiety in response to a rising number of mortgage foreclosures, particularly among subprime mortgages, which are loans made to borrowers who, according to the lender, represent a higher risk. Stocks in the financial sector were hit particularly hard, and market volatility increased as investors grew more concerned about weakness spreading to other sectors and the overall economy. In response, the Federal Reserve (the Fed) took steps to restore calm by lowering key interest rates, a move that encouraged U.S. banks to borrow directly from the Fed as needed to support home-mortgage lending.
7
Issues related to the mortgage defaults caused mounting losses to several hedge funds and global financial institutions. At the same time, many blue-chip stocks dropped sharply as financial institutions, struggling to maintain liquidity, were in many cases compelled to sell high-quality stocks when they could not find buyers for low-quality bonds. After a swift and sharp decline in August, stocks recovered, but the market remained quite volatile throughout the final two months of the period.
Strategy overview
We continue to adhere to our disciplined strategy of targeting companies that we believe have sound business models and steadily growing cash flows. In selecting stocks for the portfolio, we carefully assess the underlying value of each company’s business. While a company’s stock price may fluctuate, this underlying value is crucial in determining its long-term growth potential. We target small and midsize U.S. companies across a wide range of industries, and we have the flexibility to invest in both growth- and value-style stocks. In seeking stocks whose current prices do not reflect the company’s fundamental, long-term value, we analyze factors such as future earnings-growth potential and the ability to generate cash over the long term. We look for situations where short-term factors cause a stock to become undervalued or overvalued, and strive
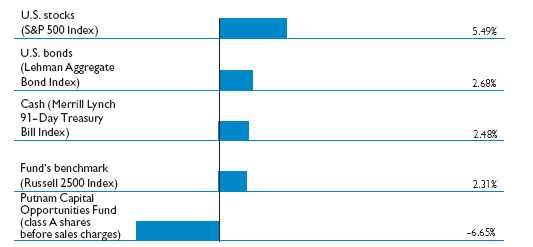
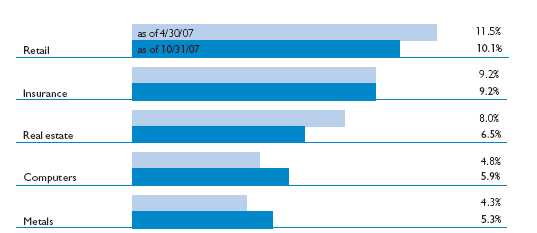
Market sector and fund performance
This comparison shows your fund’s performance in the context of different market sectors for the six months ended 10/31/07. See page 6 and pages 12–14 for additional fund performance information. Index descriptions can be found on page 22.
8
to take advantage of them. We also evaluate the attractiveness of a company compared with other firms in its industry. When our analysis indicates that a stock is being fairly priced by the market, we reduce or eliminate the fund’s position in that stock and reinvest the proceeds in securities that may have greater potential for long-term appreciation.
Your fund’s holdings
The rise in mortgage foreclosures took its biggest toll on stocks in the financial sector, particularly mortgage-related companies. Within the fund’s portfolio, the stocks of mortgage insurers Radian Group and Triad Guaranty were among the top detractors from returns. These companies provide insurance to cover residential first mortgage loans and expand home ownership opportunities by enabling people to purchase homes with down payments of less than 20%. By the close of the period, we had sold Triad from the portfolio. Another detractor for the period was FirstFed Financial, a Southern California bank that struggled with an increase in non-performing loans, which are loans that are close to being in default.
The slumping housing market also affected home builders such as fund holding NVR. As demand for homes has dropped, this Virginia-based company struggled with declining prices and a downturn in home sales.
Comparison of top industry weightings
This chart shows how the fund’s top weightings have changed over the last six months.
Weightings are shown as a percentage of net assets. Holdings will vary over time.
9
In the pharmaceuticals sector, drug company King Pharmaceuticals lost patent protection for its largest drug, Altace. The company’s stock declined as investors realized this successful hypertension drug could face generic competition sooner than expected. In the retail sector, slowing sales hurt the stock of Rent-A-Center, while the stock of Select Comfort declined as demand slowed for its “sleep number” beds. By the close of the period, we had sold Rent-A-Center from the portfolio.
Contributing positively to performance for the period were stocks in steel-related industries. U.S. steel producer Steel Dynamics was a highlight, as the company’s scrap steel division benefited from rising steel prices, which have been almost twice as high as historical averages for the past two years. Valuations of steel companies have also increased with industry consolidation. Cleveland-Cliffs, which mines and supplies iron ore, saw strong demand from steel manufacturers and also benefited from price increases.
Also helping fund returns was United Online, a provider of Internet and media services. The growing popularity of social networking Web sites, such as this company’s classmates.com site, boosted the stock for the period. The stock of The Manitowoc Company, an industrial manufacturer, also experienced gains as demand increased for its cranes in the energy and construction markets. Real-estate investment trust
Top holdings
This table shows the fund’s top holdings, and the percentage of the fund’s net assets that each represented, as of 10/31/07. The fund’s holdings will change over time.
| | |
| Holding (Percent of fund’s net assets) | Industry |
|
| Watson Pharmaceuticals, Inc. (1.9%) | Pharmaceuticals |
|
| Steel Dynamics, Inc. (1.9%) | Metals |
|
| Brocade Communications Systems, Inc. (1.8%) | Computers |
|
| MicroStrategy, Inc. (1.8%) | Software |
|
| Hasbro, Inc. (1.8%) | Toys |
|
| Emulex Corp. (1.7%) | Computers |
|
| Cleveland-Cliffs, Inc. (1.7%) | Metals |
|
| Autoliv, Inc. (Sweden) (1.7%) | Trucks and parts |
|
| Overseas Shipholding Group (1.7%) | Shipping |
|
| Dollar Tree Stores, Inc. (1.6%) | Retail |
|
10
Equity Inns also delivered gains after it was acquired by a private equity group led by Goldman Sachs.
Please note that the holdings discussed in this report may not have been held by the fund for the entire period. Portfolio composition is subject to review in accordance with the fund’s investment strategy and may vary in the future.
The outlook for your fund
The following commentary reflects anticipated developments that could affect your fund over the next six months, as well as your management team’s plans for responding to them.
Despite a turbulent market environment, dominated by the continued slump in the housing market and a wave of fear triggered by rising foreclosures, investors have also had positive news to consider. Economic expansion was sustained by solid growth in consumer spending and booming exports during the period, and although unemployment rose slightly during the year, it remained below 5%, and the economy continued to add jobs. The inflation story was also positive. Despite a falling dollar, the core inflation rate — consumer prices excluding food and energy — has generally drifted down. While corporate profits soared in the first half of 2007, they hit a road bump as many financial firms were forced to recognize the consequences of high-risk mortgage loans made in 2005 and 2006. At the close of the period, the short-term economic outlook remained uncertain as negative investor sentiment continued to weigh on the markets.
As always, we are more concerned with the long-term potential of individual companies than with short-term developments in the economy or the markets. While the market as a whole is affected by world events and economic cycles, we believe investors’ long-term goals are best served by our bottom-up approach to stock selection, which relies heavily on research and analysis. Regardless of the direction the market takes in the months ahead, our strategy and focus remain the same. We will continue to conduct intensive research to identify a wide array of companies with the potential to reward investors over time.
The views expressed in this report are exclusively those of Putnam Management. They are not meant as investment advice.
The fund invests some or all of its assets in small and/or midsize companies. Such investments increase the risk of fluctuations in the value of your investment.
11
Your fund’s performance
This section shows your fund’s performance for periods ended October 31, 2007, the end of the first half of its current fiscal year. In accordance with regulatory requirements for mutual funds, we also include performance as of the most recent calendar quarter-end and expense information taken from the fund’s current prospectus. Performance should always be considered in light of a fund’s investment strategy. Data represents past performance. Past performance does not guarantee future results. More recent returns may be less or more than those shown. Investment return and principal value will fluctuate, and you may have a gain or a loss when you sell your shares. For the most recent month-end performance, please visit www.putnam.com or call Putnam at 1-800-225-1581. Class Y shares are generally only available to corporate and institutional clients and clients in other approved programs. See the Terms and definitions section in this report for definiti ons of the share classes offered by your fund.
Fund performance
Total return for periods ended 10/31/07
| | | | | | | | | | |
| | Class A | | Class B | | Class C | | Class M | | Class R | Class Y |
| (inception dates) | (6/1/98) | | (6/29/98) | | (7/26/99) | | (6/29/98) | | (1/21/03) | (10/2/00) |
| | NAV | POP | NAV | CDSC | NAV | CDSC | NAV | POP | NAV | NAV |
|
| Life of fund | 120.71% | 109.15% | 105.96% | 105.96% | 105.92% | 105.92% | 110.44% | 103.49% | 115.60% | 124.95% |
| Annual average | 8.77 | 8.15 | 7.97 | 7.97 | 7.97 | 7.97 | 8.22 | 7.83 | 8.50 | 8.99 |
|
| 5 years | 109.60 | 98.49 | 101.82 | 99.82 | 101.65 | 101.65 | 104.33 | 97.59 | 106.88 | 112.22 |
| Annual average | 15.95 | 14.70 | 15.08 | 14.85 | 15.06 | 15.06 | 15.36 | 14.59 | 15.65 | 16.24 |
|
| 3 years | 42.59 | 35.10 | 39.39 | 36.39 | 39.36 | 39.36 | 40.33 | 35.80 | 41.41 | 43.63 |
| Annual average | 12.55 | 10.55 | 11.71 | 10.90 | 11.70 | 11.70 | 11.96 | 10.74 | 12.24 | 12.83 |
|
| 1 year | 2.75 | -2.66 | 1.93 | -2.56 | 1.90 | 1.00 | 2.15 | -1.17 | 2.42 | 2.95 |
|
| 6 months | -6.65 | -11.53 | -7.02 | -11.67 | -7.03 | -7.96 | -6.93 | -9.97 | -6.81 | -6.60 |
|
Current performance may be lower or higher than the quoted past performance, which cannot guarantee future results. After sales charge returns (public offering price, or POP) for class A and M shares reflect a maximum 5.25% and 3.25% load, respectively. Class B share returns reflect the applicable contingent deferred sales charge (CDSC), which is 5% in the first year, declining to 1% in the sixth year, and is eliminated thereafter. Class C shares reflect a 1% CDSC for the first year and is eliminated thereafter. Class R and Y shares have no initial sales charge or CDSC. Performance for class B, C, M, R, and Y shares before their inception is derived from the historical performance of class A shares, adjusted for the applicable sales charge (or CDSC) and, except for class Y shares, the higher operating expenses for such shares.
For a portion of the periods, this fund may have limited expenses, without which returns would have been lower.
A 1% short-term trading fee may be applied to shares exchanged or sold within 90 days of purchase.
12
Comparative index returns
For periods ended 10/31/07
| | |
| | | Lipper Small-Cap |
| | | Core Funds |
| | Russell 2500 Index | category average* |
|
| Life of fund | 140.67% | 136.43% |
| Annual average | 9.77 | 9.13 |
|
| 5 years | 142.59 | 130.01 |
| Annual average | 19.39 | 17.90 |
|
| 3 years | 52.41 | 46.19 |
| Annual average | 15.08 | 13.38 |
|
| 1 year | 12.71 | 10.50 |
|
| 6 months | 2.31 | 1.56 |
|
Index and Lipper results should be compared to fund performance at net asset value.
* Over the 6-month, 1-year, 3-year, 5-year, and life-of-fund periods ended 10/31/07, there were 806, 757, 580, 458, and 191 funds, respectively, in this Lipper category.
Fund price and distribution* information
For the six-month period ended 10/31/07
| | | | | | | | |
| | Class A | | Class B | Class C | Class M | | Class R | Class Y |
| Share value: | NAV | POP | NAV | NAV | NAV | POP | NAV | NAV |
|
| 4/30/07 | $12.49 | $13.18 | $11.54 | $11.66 | $11.84 | $12.24 | $12.34 | $12.72 |
|
| 10/31/07 | 11.66 | 12.31 | 10.73 | 10.84 | 11.02 | 11.39 | 11.50 | 11.88 |
|
* The fund made no distributions during the period.
13
Fund performance as of most recent calendar quarter
Total return for periods ended 9/30/07
| | | | | | | | | | |
| | Class A | | Class B | | Class C | | Class M | | Class R | Class Y |
| (inception dates) | (6/1/98) | | (6/29/98) | | (7/26/99) | | (6/29/98) | | (1/21/03) | (10/2/00) |
| | NAV | POP | NAV | CDSC | NAV | CDSC | NAV | POP | NAV | NAV |
|
| Life of fund | 119.58% | 108.07% | 105.00% | 105.00% | 105.16% | 105.16% | 109.48% | 102.57% | 114.67% | 123.82% |
| Annual average | 8.79 | 8.16 | 7.99 | 7.99 | 8.00 | 8.00 | 8.24 | 7.85 | 8.53 | 9.01 |
|
| 5 years | 116.61 | 105.24 | 108.64 | 106.64 | 108.89 | 108.89 | 111.49 | 104.52 | 113.96 | 119.58 |
| Annual average | 16.72 | 15.47 | 15.85 | 15.62 | 15.87 | 15.87 | 16.16 | 15.38 | 16.43 | 17.04 |
|
| 3 years | 45.07 | 37.41 | 41.77 | 38.77 | 41.85 | 41.85 | 42.84 | 38.25 | 44.01 | 46.11 |
| Annual average | 13.20 | 11.17 | 12.34 | 11.54 | 12.36 | 12.36 | 12.62 | 11.40 | 12.93 | 13.47 |
|
| 1 year | 7.25 | 1.58 | 6.43 | 1.75 | 6.46 | 5.52 | 6.66 | 3.20 | 7.04 | 7.56 |
|
| 6 months | -4.29 | -9.30 | -4.73 | -9.49 | -4.68 | -5.63 | -4.61 | -7.74 | -4.43 | -4.21 |
|
Fund’s annual operating expenses
For the fiscal year ended 4/30/07
| | | | | | |
| | Class A | Class B | Class C | Class M | Class R | Class Y |
|
| Total annual fund | | | | | | |
| operating expenses | 1.23% | 1.98% | 1.98% | 1.73% | 1.48% | 0.98% |
|
Expense information in this table is taken from the most recent prospectus, is subject to change, and may differ from that shown in the next section and in the financial highlights of this report. Expenses are shown as a percentage of average net assets.
14
Your fund’s expenses
As a mutual fund investor, you pay ongoing expenses, such as management fees, distribution fees (12b-1 fees), and other expenses. In the most recent six-month period, your fund limited these expenses; had it not done so, expenses would have been higher. Using the information below, you can estimate how these expenses affect your investment and compare them with the expenses of other funds. You may also pay one-time transaction expenses, including sales charges (loads) and redemption fees, which are not shown in this section and would have resulted in higher total expenses. For more information, see your fund’s prospectus or talk to your financial representative.
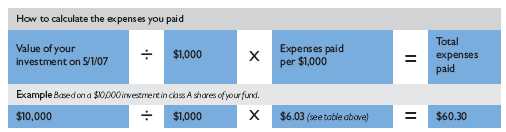
Review your fund’s expenses
The table below shows the expenses you would have paid on a $1,000 investment in Putnam Capital Opportunities Fund from May 1, 2007, to October 31, 2007. It also shows how much a $1,000 investment would be worth at the close of the period, assuming actual returns and expenses.
| | | | | | |
| | Class A | Class B | Class C | Class M | Class R | Class Y |
|
| Expenses paid per $1,000* | $ 6.03 | $ 9.65 | $ 9.65 | $ 8.44 | $ 7.24 | $ 4.81 |
|
| Ending value (after expenses) | $933.50 | $929.80 | $929.70 | $930.70 | $931.90 | $934.00 |
|
* Expenses for each share class are calculated using the fund’s annualized expense ratio for each class, which represents the ongoing expenses as a percentage of average net assets for the six months ended 10/31/07. The expense ratio may differ for each share class (see the last table in this section). Expenses are calculated by multiplying the expense ratio by the average account value for the period; then multiplying the result by the number of days in the period; and then dividing that result by the number of days in the year.
Estimate the expenses you paid
To estimate the ongoing expenses you paid for the six months ended October 31, 2007, use the calculation method below. To find the value of your investment on May 1, 2007, call Putnam at 1-800-225-1581.
15
Compare expenses using the SEC’s method
The Securities and Exchange Commission (SEC) has established guidelines to help investors assess fund expenses. Per these guidelines, the table below shows your fund’s expenses based on a $1,000 investment, assuming a hypothetical 5% annualized return. You can use this information to compare the ongoing expenses (but not transaction expenses or total costs) of investing in the fund with those of other funds. All mutual fund shareholder reports will provide this information to help you make this comparison. Please note that you cannot use this information to estimate your actual ending account balance and expenses paid during the period.
| | | | | | |
| | Class A | Class B | Class C | Class M | Class R | Class Y |
|
| Expenses paid per $1,000* | $ 6.29 | $ 10.08 | $ 10.08 | $ 8.82 | $ 7.56 | $ 5.03 |
|
| Ending value (after expenses) | $1,018.90 | $1,015.13 | $1,015.13 | $1,016.39 | $1,017.65 | $1,020.16 |
|
* Expenses for each share class are calculated using the fund’s annualized expense ratio for each class, which represents the ongoing expenses as a percentage of average net assets for the six months ended 10/31/07. The expense ratio may differ for each share class (see the last table in this section). Expenses are calculated by multiplying the expense ratio by the average account value for the period; then multiplying the result by the number of days in the period; and then dividing that result by the number of days in the year.
Compare expenses using industry averages
You can also compare your fund’s expenses with the average of its peer group, as defined by Lipper, an independent fund-rating agency that ranks funds relative to others that Lipper considers to have similar investment styles or objectives. The expense ratio for each share class shown below indicates how much of your fund’s average net assets have been used to pay ongoing expenses during the period.
| | | | | | |
| | Class A | Class B | Class C | Class M | Class R | Class Y |
|
| Your fund’s annualized | | | | | | |
| expense ratio | 1.24% | 1.99% | 1.99% | 1.74% | 1.49% | 0.99% |
|
| Average annualized expense | | | | | | |
| ratio for Lipper peer group* | 1.49% | 2.24% | 2.24% | 1.99% | 1.74% | 1.24% |
|
* Putnam is committed to keeping fund expenses below the Lipper peer group average expense ratio and will limit fund expenses if they exceed the Lipper average. The Lipper average is a simple average of front-end load funds in the peer group that excludes 12b-1 fees as well as any expense offset and brokerage service arrangements that may reduce fund expenses. To facilitate the comparison in this presentation, Putnam has adjusted the Lipper average to reflect the 12b-1 fees carried by each class of shares other than class Y shares, which do not incur 12b-1 fees. Investors should note that the other funds in the peer group may be significantly smaller or larger than the fund, and that an asset-weighted average would likely be lower than the simple average. Also, the fund and Lipper report expense data at different times and for different periods. The fund’s expense ratio shown here is annualized data for the most rec ent six-month period, while the quarterly updated Lipper average is based on the most recent fiscal year-end data available for the peer group funds as of 9/30/07.
16
Your fund’s
portfolio turnover
Putnam funds are actively managed by teams of experts who buy and sell securities based on intensive analysis of companies, industries, economies, and markets. Portfolio turnover is a measure of how often a fund’s managers buy and sell securities for your fund. A portfolio turnover of 100%, for example, means that the managers sold and replaced securities valued at 100% of a fund’s average portfolio value within a given period. Funds with high turnover may be more likely to generate capital gains that must be distributed to shareholders as taxable income. High turnover may also cause a fund to pay more brokerage commissions and other transaction costs, which may detract from performance.
Turnover comparisons
Percentage of holdings that change every year
| | | | | |
| | 2007 | 2006 | 2005 | 2004 | 2003 |
|
| Putnam Capital | | | | | |
| Opportunities Fund | 59% | 60% | 71% | 135% | 91% |
|
| Lipper Small-Cap Core Funds | | | | | |
| category average | 82% | 83% | 86% | 86% | 88% |
|
Turnover data for the fund is calculated based on the fund’s fiscal-year period, which ends on April 30. Turnover data for the fund’s Lipper category is calculated based on the average of the turnover of each fund in the category for its fiscal year ended during the indicated year. Fiscal years vary across funds in the Lipper category, which may limit the comparability of the fund’s portfolio turnover rate to the Lipper average. Comparative data for 2007 is based on information available as of 10/31/07.
17
Your fund’s risk
This risk comparison is designed to help you understand how your fund compares with other funds. The comparison utilizes a risk measure developed by Morningstar, an independent fund-rating agency. This risk measure is referred to as the fund’s Morningstar Risk.
Your fund’s Morningstar® Risk
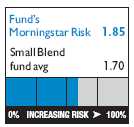
Your fund’s Morningstar Risk is shown alongside that of the average fund in its Morningstar category. The risk bar broadens the comparison by translating the fund’s Morningstar Risk into a percentile, which is based on the fund’s ranking among all funds rated by Morningstar as of September 30, 2007. A higher Morningstar Risk generally indicates that a fund’s monthly returns have varied more widely.
Morningstar determines a fund’s Morningstar Risk by assessing variations in the fund’s monthly returns — with an emphasis on downside variations — over a 3-year period, if available. Those measures are weighted and averaged to produce the fund’s Morningstar Risk. The information shown is provided for the fund’s class A shares only; information for other classes may vary. Morningstar Risk is based on historical data and does not indicate future results. Morningstar does not purport to measure the risk associated with a current investment in a fund, either on an absolute basis or on a relative basis. Low Morningstar Risk does not mean that you cannot lose money on an investment in a fund. Copyright 2007 Morningstar, Inc. All Rights Reserved. The information contained herein (1) is proprietary to Morningstar and/or its content providers; (2) may not be copied or distributed; and (3) is not warranted to be accurate, complete, or timely. Neither Morningstar nor its content providers are responsible for any damages or losses arising from any use of this information.
18
Your fund’s management
Your fund is managed by the members of the Putnam U.S. Small- and Mid-Cap Core Team. Joseph Joseph is the Portfolio Leader of the fund. Randy Farina, John Ferry, Gerald Moore, and Franz Valencia are Portfolio Members. The Portfolio Leader and Portfolio Members coordinate the team’s management of the fund.
For a complete listing of the members of the Putnam U.S. Small- and Mid-Cap Core Team, including those who are not Portfolio Leaders or Portfolio Members of your fund, visit Putnam’s Individual Investor Web site at www.putnam.com.
Investment team fund ownership
The table below shows how much the fund’s current Portfolio Leader and Portfolio Members have invested in the fund and in all Putnam mutual funds (in dollar ranges). Information shown is as of October 31, 2007, and October 31, 2006.
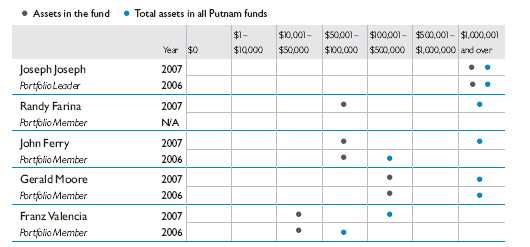
N/A indicates the individual was not a Portfolio Leader or Portfolio Member as of 10/31/06.
Trustee and Putnam employee fund ownership
As of October 31, 2007, all of the Trustees of the Putnam funds owned fund shares. The table below shows the approximate value of investments in the fund and all Putnam funds as of that date by the Trustees and Putnam employees. These amounts include investments by the Trustees’ and employees’ immediate family members and investments through retirement and deferred compensation plans.
| | |
| | | Total assets in |
| | Assets in the fund | all Putnam funds |
|
| Trustees | $ 326,000 | $ 92,000,000 |
|
| Putnam employees | $7,306,000 | $777,000,000 |
|
19
Other Putnam funds managed by the Portfolio Leader and Portfolio Members
Joseph Joseph is also a Portfolio Leader of Putnam International Capital Opportunities Fund and a Portfolio Member of Putnam Capital Appreciation Fund.
Randy Farina is also a Portfolio Member of Putnam International Capital Opportunities Fund.
John Ferry is also a Portfolio Member of Putnam International Capital Opportunities Fund.
Franz Valencia is also a Portfolio Member of Putnam International Capital Opportunities Fund.
Joseph Joseph, Randy Farina, John Ferry, Gerald Moore, and Franz Valencia may also manage other accounts and variable trust funds advised by Putnam Management or an affiliate.
Changes in your fund’s Portfolio Leader and Portfolio Members
During the year ended October 31, 2007, Portfolio Member Randy Farina joined your fund’s management team.
20
Terms and definitions
Important terms
Total return shows how the value of the fund’s shares changed over time, assuming you held the shares through the entire period and reinvested all distributions in the fund.
Net asset value (NAV) is the price, or value, of one share of a mutual fund, without a sales charge. NAVs fluctuate with market conditions. NAV is calculated by dividing the net assets of each class of shares by the number of outstanding shares in the class.
Public offering price (POP) is the price of a mutual fund share plus the maximum sales charge levied at the time of purchase. POP performance figures shown here assume the 5.25% maximum sales charge for class A shares and 3.25% for class M shares.
Contingent deferred sales charge (CDSC) is generally a charge applied at the time of the redemption of class B or C shares and assumes redemption at the end of the period. Your fund’s class B CDSC declines from a 5% maximum during the first year to 1% during the sixth year. After the sixth year, the CDSC no longer applies. The CDSC for class C shares is 1% for one year after purchase.
Share classes
Class A shares are generally subject to an initial sales charge and no CDSC (except on certain redemptions of shares bought without an initial sales charge).
Class B shares are not subject to an initial sales charge. They may be subject to a CDSC.
Class C shares are not subject to an initial sales charge and are subject to a CDSC only if the shares are redeemed during the first year.
Class M shares have a lower initial sales charge and a higher 12b-1 fee than class A shares and no CDSC (except on certain redemptions of shares bought without an initial sales charge).
Class R shares are not subject to an initial sales charge or CDSC and are available only to certain defined contribution plans.
Class Y shares are not subject to an initial sales charge or CDSC, and carry no 12b-1 fee. They are generally only available to corporate and institutional clients and clients in other approved programs.
21
Comparative indexes
Lehman Aggregate Bond Index is an unmanaged index of U.S. investment-grade fixed-income securities.
Merrill Lynch 91-Day Treasury Bill Index is an unmanaged index that seeks to measure the performance of U.S. Treasury bills available in the marketplace.
Russell 2500 Index is an unmanaged index of the 2,500 small and midsize companies in the Russell 3000 Index.
S&P 500 Index is an unmanaged index of common stock performance.
Indexes assume reinvestment of all distributions and do not account for fees. Securities and performance of a fund and an index will differ. You cannot invest directly in an index.
Lipper is a third-party industry-ranking entity that ranks mutual funds. Its rankings do not reflect sales charges. Lipper rankings are based on total return at net asset value relative to other funds that have similar current investment styles or objectives as determined by Lipper. Lipper may change a fund’s category assignment at its discretion. Lipper category averages reflect performance trends for funds within a category.
22
Trustee approval of management contract
General conclusions
The Board of Trustees of the Putnam funds oversees the management of each fund and, as required by law, determines annually whether to approve the continuance of your fund’s management contract with Putnam Investment Management (“Putnam Management”). In this regard, the Board of Trustees, with the assistance of its Contract Committee consisting solely of Trustees who are not “interested persons” (as such term is defined in the Investment Company Act of 1940, as amended) of the Putnam funds (the “Independent Trustees”), requests and evaluates all information it deems reasonably necessary under the circumstances. Over the course of several months ending in June 2007, the Contract Committee met several times to consider the information provided by Putnam Management and other information developed with the assistance of the Board’s independent counsel and independent staff. The Contract Committee reviewed and discussed key aspects of this information with all of the Independent Trustees. The Contract Committee recommended, and the Independent Trustees approved, the continuance of your fund’s management contract, effective July 1, 2007.
In addition, in anticipation of the sale of Putnam Investments to Great-West Lifeco, at a series of meetings ending in March 2007, the Trustees reviewed and approved new management and distribution arrangements to take effect upon the change of control. Shareholders of all funds approved the management contracts in May 2007, and the change of control transaction was completed on August 3, 2007. Upon the change of control, the management contracts that were approved by the Trustees in June 2007 automatically terminated and were replaced by new contracts that had been approved by shareholders. In connection with their review for the June 2007 continuance of the Putnam funds’ management contracts, the Trustees did not identify any facts or circumstances that would alter the substance of the conclusions and recommendations they made in their review of the contracts to take effect upon the change of control.
The Independent Trustees’ approval was based on the following conclusions:
• That the fee schedule in effect for your fund represented reasonable compensation in light of the nature and quality of the services being provided to the fund, the fees paid by competitive funds and the costs incurred by Putnam Management in providing such services, and
• That this fee schedule represented an appropriate sharing between fund shareholders and Putnam Management of such economies of scale as may exist in the management of the fund at current asset levels.
These conclusions were based on a comprehensive consideration of all information provided to the Trustees and were not the result of any single factor. Some of the factors that figured particularly in the Trustees’ deliberations and how the Trustees considered these factors are described below, although individual Trustees may have evaluated the information presented differently, giving different weights to various factors. It is also important to recognize that the fee arrangements for your fund and the other Putnam funds are the result of many years of review and discussion between the Independent Trustees and Putnam Management, that
23
certain aspects of such arrangements may receive greater scrutiny in some years than others, and that the Trustees’ conclusions may be based, in part, on their consideration of these same arrangements in prior years.
Management fee schedules and categories; total expenses
The Trustees reviewed the management fee schedules in effect for all Putnam funds, including fee levels and breakpoints, and the assignment of funds to particular fee categories. In reviewing fees and expenses, the Trustees generally focused their attention on material changes in circumstances — for example, changes in a fund’s size or investment style, changes in Putnam Management’s operating costs or responsibilities, or changes in competitive practices in the mutual fund industry — that suggest that consideration of fee changes might be warranted. The Trustees concluded that the circumstances did not warrant changes to the management fee structure of your fund, which had been carefully developed over the years, re-examined on many occasions and adjusted where appropriate. The Trustees focused on two areas of particular interest, as discussed further below:
• Competitiveness. The Trustees reviewed comparative fee and expense information for competitive funds, which indicated that, in a custom peer group of competitive funds selected by Lipper Inc., your fund ranked in the 1st percentile in management fees and in the 17th percentile in total expenses (less any applicable 12b-1 fees) as of December 31, 2006 (the first percentile being the least expensive funds and the 100th percentile being the most expensive funds). (Because the fund’s custom peer group is smaller than the fund’s broad Lipper Inc. peer group, this expense information may differ from the Lipper peer expense information found elsewhere in this report.) The Trustees noted that expense ratios for a number of Putnam funds, which show the percentage of fund assets used to pay for management and administrative services, distribution (12b-1) fees and other expenses, ha d been increasing recently as a result of declining net assets and the natural operation of fee breakpoints.
The Trustees noted that the expense ratio increases described above were currently being controlled by expense limitations implemented in January 2004 and which Putnam Management had committed to maintain at least through 2007. In anticipation of the change of control of Putnam Investments, the Trustees requested, and received a commitment from Putnam Management and Great-West Lifeco, to extend this program through at least June 30, 2009. These expense limitations give effect to a commitment by Putnam Management that the expense ratio of each open-end fund would be no higher than the average expense ratio of the competitive funds included in the fund’s relevant Lipper universe (exclusive of any applicable 12b-1 charges in each case). The Trustees observed that this commitment to limit fund expenses has served shareholders well since its inception.
In order to ensure that the expenses of the Putnam funds continue to meet evolving competitive standards, the Trustees requested, and Putnam Management agreed, to extend for the twelve months beginning July 1, 2007, an additional expense limitation for certain funds at an
24
amount equal to the average expense ratio (exclusive of 12b-1 charges) of a custom peer group of competitive funds selected by Lipper to correspond to the size of the fund. This additional expense limitation will be applied to those open-end funds that had above-average expense ratios (exclusive of 12b-1 charges) based on the custom peer group data for the period ended December 31, 2006. This additional expense limitation will not be applied to your fund because it had a below-average expense ratio relative to its custom peer group.
• Economies of scale. Your fund currently has the benefit of breakpoints in its management fee that provide shareholders with significant economies of scale, which means that the effective management fee rate of a fund (as a percentage of fund assets) declines as a fund grows in size and crosses specified asset thresholds. Conversely, as a fund shrinks in size — as has been the case for many Putnam funds in recent years — these breakpoints result in increasing fee levels. In recent years, the Trustees have examined the operation of the existing breakpoint structure during periods of both growth and decline in asset levels. The Trustees concluded that the fee schedules in effect for the funds represented an appropriate sharing of economies of scale at current asset levels. In reaching this conclusion, the Trustees considered the Contract Committee’s stated intent to con tinue to work with Putnam Management to plan for an eventual resumption in the growth of assets, and to consider the potential economies that might be produced under various growth assumptions.
In connection with their review of the management fees and total expenses of the Putnam funds, the Trustees also reviewed the costs of the services to be provided and profits to be realized by Putnam Management and its affiliates from the relationship with the funds. This information included trends in revenues, expenses and profitability of Putnam Management and its affiliates relating to the investment management and distribution services provided to the funds. In this regard, the Trustees also reviewed an analysis of Putnam Management’s revenues, expenses and profitability with respect to the funds’ management contracts, allocated on a fund-by-fund basis.
Investment performance
The quality of the investment process provided by Putnam Management represented a major factor in the Trustees’ evaluation of the quality of services provided by Putnam Management under your fund’s management contract. The Trustees were assisted in their review of the Putnam funds’ investment process and performance by the work of the Investment Process Committee of the Trustees and the Investment Oversight Committees of the Trustees, which had met on a regular monthly basis with the funds’ portfolio teams throughout the year. The Trustees concluded that Putnam Management generally provides a high-quality investment process — as measured by the experience and skills of the individuals assigned to the management of fund portfolios, the resources made available to such personnel, and in general the ability of Putnam Management to attract and retain high-quality personnel — but also recognized that this does not guarantee favorable investm ent results for every fund in every time period. The Trustees considered the investment performance of each fund over multiple time periods
25
and considered information comparing each fund’s performance with various benchmarks and with the performance of competitive funds.
The Trustees noted the satisfactory investment performance of many Putnam funds. They also noted the disappointing investment performance of certain funds in recent years and discussed with senior management of Putnam Management the factors contributing to such underperformance and actions being taken to improve performance. The Trustees recognized that, in recent years, Putnam Management has made significant changes in its investment personnel and processes and in the fund product line to address areas of underperformance. In particular, they noted the important contributions of Putnam Management’s leadership in attracting, retaining and supporting high-quality investment professionals and in systematically implementing an investment process that seeks to merge the best features of fundamental and quantitative analysis. The Trustees indicated their intention to continue to monitor performance trends to assess the effectiveness of these changes and to evaluate whether additional changes to address areas of underperformance are warranted.
In the case of your fund, the Trustees considered that your fund’s class A share cumulative total return performance at net asset value was in the following percentiles of its Lipper Inc. peer group (Lipper Small-Cap Core Funds) for the one-, three- and five-year periods ended March 31, 2007 (the first percentile being the best-performing funds and the 100th percentile being the worst-performing funds):
| | |
| One-year period | Three-year period | Five-year period |
|
| 20th | 14th | 87th |
(Because of the passage of time, these performance results may differ from the performance results for more recent periods shown elsewhere in this report. Over the one-, three- and five-year periods ended March 31, 2007, there were 711, 546, and 435 funds, respectively, in your fund’s Lipper peer group.* Past performance is no guarantee of future returns.)
The Trustees noted the disappointing performance for your fund for the five-year period ended March 31, 2007. In this regard, the Trustees considered that Putnam Management had implemented management team changes that it believed would clarify and strengthen the fund’s investment philosophy and process by focusing on a blend of quantitative techniques and fundamental analysis.
As a general matter, the Trustees concluded that cooperative efforts between the Trustees and Putnam Management represent the most effective way to address investment performance problems. The Trustees noted that investors in the Putnam funds have, in effect, placed their trust in the Putnam organization, under the oversight of the funds’ Trustees, to make appropriate decisions regarding the management of the funds. Based on the responsiveness of Putnam
* The percentile rankings for your fund’s class A share annualized total return performance in the Lipper Small-Cap Core Funds category for the one- and five-year periods ended September 30, 2007 were 86% and 74%, respectively. Over the one- and five-year periods ended September 30, 2007, the fund ranked 640th out of 744 and 331st out of 451 funds, respectively. Note that this more recent information was not available when the Trustees approved the continuance of your fund’s management contract.
26
Management in the recent past to Trustee concerns about investment performance, the Trustees concluded that it is preferable to seek change within Putnam Management to address performance shortcomings. In the Trustees’ view, the alternative of terminating a management contract and engaging a new investment adviser for an underperforming fund would entail significant disruptions and would not provide any greater assurance of improved investment performance.
Brokerage and soft-dollar allocations; other benefits
The Trustees considered various potential benefits that Putnam Management may receive in connection with the services it provides under the management contract with your fund. These include benefits related to brokerage and soft-dollar allocations, whereby a portion of the commissions paid by a fund for brokerage may be used to acquire research services that may be useful to Putnam Management in managing the assets of the fund and of other clients. The Trustees indicated their continued intent to monitor the potential benefits associated with the allocation of fund brokerage to ensure that the principle of seeking “best price and execution” remains paramount in the portfolio trading process.
The Trustees’ annual review of your fund’s management contract also included the review of its distributor’s contract and distribution plan with Putnam Retail Management Limited Partnership and the custodian agreement and investor servicing agreement with Putnam Fiduciary Trust Company (“PFTC”), each of which provides benefits to affiliates of Putnam Management. In the case of the custodian agreement, the Trustees considered that, effective January 1, 2007, the Putnam funds had engaged State Street Bank and Trust Company as custodian and began to transition the responsibility for providing custody services away from PFTC.
Comparison of retail and institutional fee schedules
The information examined by the Trustees as part of their annual contract review has included for many years information regarding fees charged by Putnam Management and its affiliates to institutional clients such as defined benefit pension plans, college endowments, etc. This information included comparison of such fees with fees charged to the funds, as well as a detailed assessment of the differences in the services provided to these two types of clients. The Trustees observed, in this regard, that the differences in fee rates between institutional clients and the funds are by no means uniform when examined by individual asset sectors, suggesting that differences in the pricing of investment management services to these types of clients reflect to a substantial degree historical competitive forces operating in separate market places. The Trustees considered the fact that fee rates across all asset sectors are higher on average for funds than for institutional cli ents, as well as the differences between the services that Putnam Management provides to the Putnam funds and those that it provides to institutional clients of the firm, but did not rely on such comparisons to any significant extent in concluding that the management fees paid by your fund are reasonable.
27
Other information for shareholders
Important notice regarding delivery of shareholder documents
In accordance with SEC regulations, Putnam sends a single copy of annual and semiannual shareholder reports, prospectuses, and proxy statements to Putnam shareholders who share the same address, unless a shareholder requests otherwise. If you prefer to receive your own copy of these documents, please call Putnam at 1-800-225-1581, and Putnam will begin sending individual copies within 30 days.
Proxy voting
Putnam is committed to managing our mutual funds in the best interests of our shareholders. The Putnam funds’ proxy voting guidelines and procedures, as well as information regarding how your fund voted proxies relating to portfolio securities during the 12-month period ended June 30, 2007, are available on the Putnam Individual Investor Web site, www.putnam.com/individual, and on the SEC’s Web site, www.sec.gov. If you have questions about finding forms on the SEC’s Web site, you may call the SEC at 1-800-SEC-0330. You may also obtain the Putnam funds’ proxy voting guidelines and procedures at no charge by calling Putnam’s Shareholder Services at 1-800-225-1581.
Fund portfolio holdings
The fund will file a complete schedule of its portfolio holdings with the SEC for the first and third quarters of each fiscal year on Form N-Q. Shareholders may obtain the fund’s Forms N-Q on the SEC’s Web site at www.sec.gov. In addition, the fund’s Forms N-Q may be reviewed and copied at the SEC’s Public Reference Room in Washington, D.C. You may call the SEC at 1-800-SEC-0330 for information about the SEC’s Web site or the operation of the Public Reference Room.
28
Financial statements
A guide to financial statements
These sections of the report, as well as the accompanying Notes, constitute the fund’s financial statements.
The fund’s portfolio lists all the fund’s investments and their values as of the last day of the reporting period. Holdings are organized by asset type and industry sector, country, or state to show areas of concentration and diversification.
Statement of assets and liabilities shows how the fund’s net assets and share price are determined. All investment and noninvestment assets are added together. Any unpaid expenses and other liabilities are subtracted from this total. The result is divided by the number of shares to determine the net asset value per share, which is calculated separately for each class of shares. (For funds with preferred shares, the amount subtracted from total assets includes the liquidation preference of preferred shares.)
Statement of operations shows the fund’s net investment gain or loss. This is done by first adding up all the fund’s earnings — from dividends and interest income — and subtracting its operating expenses to determine net investment income (or loss). Then, any net gain or loss the fund realized on the sales of its holdings — as well as any unrealized gains or losses over the period — is added to or subtracted from the net investment result to determine the fund’s net gain or loss for the fiscal period.
Statement of changes in net assets shows how the fund’s net assets were affected by the fund’s net investment gain or loss, by distributions to shareholders, and by changes in the number of the fund’s shares. It lists distributions and their sources (net investment income or realized capital gains) over the current reporting period and the most recent fiscal year-end. The distributions listed here may not match the sources listed in the Statement of operations because the distributions are determined on a tax basis and may be paid in a different period from the one in which they were earned. Dividend sources are estimated at the time of declaration. Actual results may vary. Any non-taxable return of capital cannot be determined until final tax calculations are completed after the end of the fund’s fiscal year.
Financial highlights provide an overview of the fund’s investment results, per-share distributions, expense ratios, net investment income ratios, and portfolio turnover in one summary table, reflecting the five most recent reporting periods. In a semiannual report, the highlight table also includes the current reporting period.
29
The fund’s portfolio 10/31/07 (Unaudited)
| | | |
| COMMON STOCKS (93.6%)* | | | |
|
| | Shares | | Value |
| |
| Advertising and Marketing Services (0.1%) | | | |
| Greenfield Online, Inc. † | 53,400 | $ | 814,884 |
| Nu Skin Enterprises, Inc. Class A | 15,047 | | 259,862 |
| ValueClick, Inc. † | 8,600 | | 233,834 |
| | | | 1,308,580 |
|
| |
| Aerospace and Defense (0.6%) | | | |
| Alliant Techsystems, Inc. † | 3,900 | | 430,521 |
| Teledyne Technologies, Inc. † | 5,300 | | 277,243 |
| United Industrial Corp. | 67,086 | | 5,421,891 |
| | | | 6,129,655 |
|
| |
| Airlines (0.8%) | | | |
| Continental Airlines, Inc. Class B † (S) | 89,831 | | 3,085,695 |
| ExpressJet Holdings, Inc. † (S) | 934,471 | | 3,102,444 |
| Midwest Express Holdings, Inc. † | 148,900 | | 2,415,158 |
| | | | 8,603,297 |
|
| |
| Automotive (0.7%) | | | |
| Group 1 Automotive, Inc. | 9,200 | | 285,660 |
| Lear Corp. † | 2,606 | | 92,591 |
| Tenneco Automotive, Inc. † (S) | 207,395 | | 6,348,361 |
| | | | 6,726,612 |
|
| |
| Banking (1.9%) | | | |
| Bank of Hawaii Corp. | 2,751 | | 146,243 |
| BankUnited Financial Corp. Class A | 39,900 | | 344,337 |
| Center Financial Corp. | 10,450 | | 133,656 |
| City Bank | 35,387 | | 847,519 |
| City Holding Co. | 26,003 | | 983,173 |
| Community Bancorp † | 16,400 | | 332,428 |
| Corus Bankshares, Inc. # | 431,400 | | 4,754,028 |
| Cullen/Frost Bankers, Inc. | 4,166 | | 221,548 |
| First Citizens BancShares, Inc. Class A | 925 | | 150,618 |
| First Regional Bancorp † | 4,980 | | 117,030 |
| FirstFed Financial Corp. † | 230,999 | | 9,882,137 |
| Frontier Financial Corp. | 2,179 | | 48,352 |
| Great Southern Bancorp, Inc. | 4,472 | | 104,645 |
| Imperial Capital Bancorp, Inc. | 1,590 | | 34,328 |
| International Bancshares Corp. | 10,827 | | 236,678 |
| Lakeland Financial Corp. | 4,200 | | 87,822 |
| PFF Bancorp, Inc. | 1,361 | | 14,495 |
| Republic Bancorp, Inc. Class A | 9,350 | | 144,458 |
| Southwest Bancorp, Inc. | 18,096 | | 342,557 |
| SVB Financial Group † | 6,861 | | 355,331 |
| Wilmington Trust Corp. | 9,024 | | 328,203 |
| | | | 19,609,586 |
30
| | | |
| COMMON STOCKS (93.6%)* continued | | | |
|
| | Shares | | Value |
| |
| Basic Materials (0.1%) | | | |
| Ameron International Corp. | 2,000 | $ | 215,740 |
| Foamex International, Inc. † | 55,548 | | 455,494 |
| | | | 671,234 |
|
| |
| Biotechnology (2.2%) | | | |
| Albany Molecular Research, Inc. † | 126,141 | | 2,281,891 |
| Applera Corp. — Applied Biosystems Group | 89,762 | | 3,333,761 |
| Immunomedics, Inc. † (S) | 206,300 | | 474,490 |
| Invitrogen Corp. † | 114,500 | | 10,404,615 |
| Quidel Corp. † | 181,810 | | 3,754,377 |
| Savient Pharmaceuticals, Inc. † | 145,057 | | 2,042,403 |
| | | | 22,291,537 |
|
| |
| Broadcasting (0.2%) | | | |
| Sinclair Broadcast Group, Inc. Class A | 151,700 | | 1,826,468 |
|
| |
| Building Materials (—%) | | | |
| Genlyte Group, Inc. (The) † | 1,470 | | 95,697 |
| Lennox International, Inc. | 7,300 | | 260,610 |
| | | | 356,307 |
|
| |
| Chemicals (1.7%) | | | |
| Arch Chemicals, Inc. | 17,651 | | 805,239 |
| Cambrex Corp. | 115,648 | | 1,317,231 |
| Celanese Corp. (Ser. A) | 7,900 | | 331,484 |
| FMC Corp. | 102,186 | | 5,875,695 |
| Georgia Gulf Corp. (S) | 29,689 | | 359,237 |
| Hercules, Inc. | 13,380 | | 251,678 |
| Huntsman Corp. | 7,480 | | 197,098 |
| Innospec, Inc. (United Kingdom) | 7,546 | | 160,654 |
| Lubrizol Corp. (The) | 5,400 | | 366,552 |
| NewMarket Corp. | 75,839 | | 4,077,105 |
| Olin Corp. | 14,603 | | 332,656 |
| OM Group, Inc. † | 48,800 | | 2,585,424 |
| PolyOne Corp. † | 66,900 | | 534,531 |
| Spartech Corp. | 10,260 | | 157,696 |
| Valspar Corp. | 10,840 | | 271,325 |
| Westlake Chemical Corp. | 7,280 | | 178,651 |
| | | | 17,802,256 |
|
| |
| Coal (—%) | | | |
| Foundation Coal Holdings, Inc. | 5,200 | | 222,144 |
|
| |
| Commercial and Consumer Services (2.5%) | | | |
| ABM Industries, Inc. | 6,800 | | 159,936 |
| Bowne & Co., Inc. | 100,562 | | 1,747,768 |
| Brink’s Co. (The) | 1,968 | | 123,295 |
| Chemed Corp. | 110,327 | | 6,323,944 |
| CPI Corp. | 47,318 | | 1,571,431 |
| ICT Group, Inc. † | 29,800 | | 325,416 |
31
| | | |
| COMMON STOCKS (93.6%)* continued | | | |
|
| | Shares | | Value |
| |
| Commercial and Consumer Services continued | | | |
| Jackson Hewitt Tax Service, Inc. | 155,812 | $ | 4,869,125 |
| Landauer, Inc. | 21,200 | | 1,044,524 |
| MoneyGram International, Inc. | 13,464 | | 214,751 |
| Spherion Corp. † | 131,143 | | 1,143,567 |
| Tech Data Corp. † | 201,500 | | 7,924,995 |
| URS Corp. † | 8,440 | | 521,676 |
| Viad Corp. | 5,080 | | 180,035 |
| | | | 26,150,463 |
|
| |
| Communications Equipment (—%) | | | |
| F5 Networks, Inc. † | 5,828 | | 209,983 |
| Foundry Networks, Inc. † | 9,400 | | 198,716 |
| | | | 408,699 |
|
| |
| Computers (5.9%) | | | |
| Actuate Corp. † | 256,000 | | 2,250,240 |
| ANSYS, Inc. † (S) | 166,795 | | 6,473,314 |
| Blackbaud, Inc. | 14,337 | | 386,382 |
| Brocade Communications Systems, Inc. † | 1,960,128 | | 18,640,817 |
| Catapult Communications Corp. † | 33,710 | | 250,465 |
| Checkpoint Systems, Inc. † | 13,700 | | 414,425 |
| Cognos, Inc. (Canada) † | 39,800 | | 2,003,134 |
| Emulex Corp. † | 831,898 | | 18,018,911 |
| Logitech International SA (Switzerland) † | 6,218 | | 216,517 |
| Magma Design Automation, Inc. † | 167,557 | | 2,494,924 |
| Micros Systems, Inc. † | 82,391 | | 5,917,322 |
| MTS Systems Corp. | 6,400 | | 284,736 |
| Polycom, Inc. † | 6,925 | | 193,762 |
| Red Hat, Inc. † | 8,927 | | 192,734 |
| SPSS, Inc. † (S) | 46,844 | | 1,780,072 |
| Trident Microsystems, Inc. † | 178,610 | | 1,344,933 |
| | | | 60,862,688 |
|
| |
| Conglomerates (0.1%) | | | |
| AMETEK, Inc. | 11,820 | | 555,540 |
| SPX Corp. | 1,330 | | 134,729 |
| | | | 690,269 |
|
| |
| Construction (0.6%) | | | |
| Builders FirstSource, Inc. † (S) | 18,462 | | 133,850 |
| Chicago Bridge & Iron Co., NV (Netherlands) | 110,468 | | 5,523,400 |
| Eagle Materials, Inc. | 3,820 | | 150,928 |
| | | | 5,808,178 |
|
| |
| Consumer (0.8%) | | | |
| CSS Industries, Inc. | 58,458 | | 2,314,937 |
| Helen of Troy, Ltd. (Bermuda) † | 156,200 | | 2,811,600 |
| Hooker Furniture Corp. (S) | 138,844 | | 2,990,700 |
| Tupperware Brands Corp. | 5,140 | | 185,554 |
| | | | 8,302,791 |
32
| | | |
| COMMON STOCKS (93.6%)* continued | | | |
|
| | Shares | | Value |
| |
| Consumer Finance (0.5%) | | | |
| AmeriCredit Corp. † | 79,300 | $ | 1,118,923 |
| Asta Funding, Inc. | 53,995 | | 1,918,982 |
| Encore Capital Group, Inc. † | 4,500 | | 51,345 |
| World Acceptance Corp. † | 57,289 | | 1,848,143 |
| | | | 4,937,393 |
|
| |
| Consumer Goods (1.7%) | | | |
| American Greetings Corp. Class A | 6,530 | | 172,000 |
| Blyth Industries, Inc. | 186,587 | | 3,561,946 |
| Chattem, Inc. † (S) | 183,700 | | 13,648,910 |
| Jarden Corp. † | 1,308 | | 46,460 |
| Scotts Miracle-Gro Co. (The) Class A | 4,600 | | 211,094 |
| | | | 17,640,410 |
|
| |
| Consumer Services (1.0%) | | | |
| Labor Ready, Inc. † | 557,778 | | 9,805,737 |
| Visual Sciences, Inc. † | 17,400 | | 316,680 |
| | | | 10,122,417 |
|
| |
| Distribution (—%) | | | |
| Huttig Building Products, Inc. † | 6,308 | | 26,178 |
|
| |
| Electric Utilities (0.7%) | | | |
| Alliant Energy Corp. | 2,967 | | 118,680 |
| Black Hills Corp. | 12,680 | | 563,246 |
| CenterPoint Energy, Inc. | 3,110 | | 52,124 |
| OGE Energy Corp. | 6,720 | | 257,376 |
| Puget Energy, Inc. | 12,000 | | 339,000 |
| UniSource Energy Corp. (S) | 181,796 | | 5,766,569 |
| Westar Energy, Inc. | 23,390 | | 622,642 |
| | | | 7,719,637 |
|
| |
| Electrical Equipment (0.3%) | | | |
| GrafTech International, Ltd. † | 42,925 | | 811,283 |
| Insteel Industries, Inc. | 37,348 | | 433,237 |
| LoJack Corp. † | 86,400 | | 1,518,048 |
| Rofin-Sinar Technologies, Inc. † | 4,660 | | 366,369 |
| | | | 3,128,937 |
|
| |
| Electronics (2.2%) | | | |
| Ansoft Corp. † | 56,098 | | 1,687,428 |
| ASE Test, Ltd. (Taiwan) † | 205,700 | | 2,982,650 |
| DSP Group, Inc. † | 6,570 | | 103,740 |
| General Cable Corp. † (S) | 12,504 | | 900,163 |
| Greatbatch, Inc. † | 41,000 | | 1,019,260 |
| LSI Logic Corp. † | 133,000 | | 877,800 |
| Methode Electronics, Inc. Class A | 107,269 | | 1,345,153 |
| Nam Tai Electronics, Inc. (Hong Kong) | 144,900 | | 1,746,045 |
| QLogic Corp. † | 16,569 | | 257,317 |
| Stoneridge, Inc. † | 51,403 | | 528,937 |
33
| | | |
| COMMON STOCKS (93.6%)* continued | | | |
|
| | Shares | | Value |
| |
| Electronics continued | | | |
| Synopsys, Inc. † | 190,263 | $ | 5,376,832 |
| TriQuint Semiconductor, Inc. † | 325,487 | | 2,040,803 |
| TTM Technologies, Inc. † (S) | 99,727 | | 1,279,497 |
| Varian, Inc. † | 5,310 | | 392,356 |
| Zoran Corp. † | 91,800 | | 2,340,900 |
| | | | 22,878,881 |
|
| |
| Energy (2.9%) | | | |
| Cal Dive International, Inc. † (S) | 15,900 | | 210,357 |
| Grey Wolf, Inc. † | 742,200 | | 4,178,586 |
| Hercules Offshore, Inc. † (S) | 8,656 | | 234,058 |
| Markwest Hydrocarbon, Inc. | 5,600 | | 338,688 |
| NATCO Group, Inc. † | 46,143 | | 2,459,883 |
| Parker Drilling Co. † (S) | 1,026,805 | | 8,666,234 |
| Tidewater, Inc. (S) | 120,316 | | 6,577,676 |
| Trico Marine Services, Inc. † (S) | 207,100 | | 6,720,395 |
| | | | 29,385,877 |
|
| |
| Energy (Other) (—%) | | | |
| Verenium Corp. † (S) | 39,797 | | 211,720 |
|
| |
| Entertainment (—%) | | | |
| Audiovox Corp. Class A † | 300 | | 3,600 |
|
| |
| Financial (0.3%) | | | |
| Advanta Corp. Class B | 14,355 | | 226,809 |
| Asset Acceptance Capital Corp. | 36,962 | | 397,711 |
| PMI Group, Inc. (The) | 3,600 | | 57,708 |
| Radian Group, Inc. | 190,768 | | 2,401,769 |
| | | | 3,083,997 |
|
| |
| Food (—%) | | | |
| Arden Group, Inc. | 553 | | 78,758 |
| Overhill Farms, Inc. † | 23,200 | | 80,272 |
| Village Super Market, Inc. Class A | 3,196 | | 174,470 |
| | | | 333,500 |
|
| |
| Forest Products and Packaging (0.2%) | | | |
| Buckeye Technologies, Inc. † | 72,107 | | 1,292,157 |
| Neenah Paper, Inc. | 9,400 | | 319,600 |
| Packaging Corp. of America | 5,250 | | 167,160 |
| Sonoco Products Co. | 4,380 | | 135,430 |
| | | | 1,914,347 |
|
| |
| Gaming & Lottery (—%) | | | |
| Dover Downs Gaming & Entertainment, Inc. | 2,047 | | 22,374 |
34
| | | |
| COMMON STOCKS (93.6%)* continued | | | |
|
| | Shares | | Value |
| |
| Health Care Services (1.5%) | | | |
| AMN Healthcare Services, Inc. † | 6,455 | $ | 122,710 |
| Healthspring, Inc. † | 89,800 | | 1,885,800 |
| Lincare Holdings, Inc. † (S) | 311,710 | | 10,838,157 |
| Medcath Corp. † | 60,100 | | 1,666,573 |
| Molina Healthcare, Inc. † | 1,960 | | 74,696 |
| Odyssey Healthcare, Inc. † | 59,398 | | 608,830 |
| Pediatrix Medical Group, Inc. † | 6,290 | | 411,995 |
| | | | 15,608,761 |
|
| |
| Homebuilding (0.8%) | | | |
| NVR, Inc. † (S) | 16,387 | | 7,796,115 |
| Winnebago Industries, Inc. | 4,100 | | 105,698 |
| | | | 7,901,813 |
|
| |
| Household Furniture and Appliances (0.9%) | | | |
| American Woodmark Corp. (S) | 89,300 | | 2,264,648 |
| Conn’s, Inc. † (S) | 4,985 | | 127,466 |
| Select Comfort Corp. † (S) | 528,928 | | 6,045,647 |
| Tempur-Pedic International, Inc. (S) | 12,942 | | 465,912 |
| | | | 8,903,673 |
|
| |
| Insurance (9.2%) | | | |
| American Financial Group, Inc. | 36,625 | | 1,095,088 |
| American Physicians Capital, Inc. | 76,919 | | 3,350,592 |
| Amerisafe, Inc. † | 166,167 | | 2,686,920 |
| Aspen Insurance Holdings, Ltd. (Bermuda) | 157,505 | | 4,309,337 |
| CNA Surety Corp. † | 116,517 | | 2,305,871 |
| Commerce Group, Inc. (S) | 135,650 | | 4,949,869 |
| Delphi Financial Group Class A | 93,550 | | 3,625,063 |
| EMC Insurance Group, Inc. | 33,799 | | 889,928 |
| Employers Holdings, Inc. | 1,180 | | 22,609 |
| Endurance Specialty Holdings, Ltd. (Bermuda) | 57,369 | | 2,249,438 |
| FBL Financial Group, Inc. Class A | 5,400 | | 218,592 |
| First Mercury Financial Corp. † | 28,775 | | 637,366 |
| FPIC Insurance Group, Inc. † | 25,800 | | 1,077,924 |
| Hanover Insurance Group, Inc. (The) | 29,295 | | 1,349,621 |
| Harleysville Group, Inc. | 63,622 | | 1,983,098 |
| HCC Insurance Holdings, Inc. | 549,626 | | 16,428,321 |
| Hilb, Rogal & Hamilton Co. | 7,899 | | 348,109 |
| Horace Mann Educators Corp. | 25,109 | | 519,505 |
| IPC Holdings, Ltd. (Bermuda) | 58,950 | | 1,763,195 |
| Mercury General Corp. | 897 | | 46,025 |
| Midland Co. (The) | 15,843 | | 1,007,932 |
| National Interstate Corp. | 24,239 | | 775,648 |
| Odyssey Re Holdings Corp. | 45,400 | | 1,687,972 |
| Phoenix Companies, Inc. (The) | 17,400 | | 239,772 |
| Platinum Underwriters Holdings, Ltd. (Bermuda) | 1,440 | | 51,840 |
| RenaissanceRe Holdings, Ltd. (Bermuda) | 103,586 | | 6,043,207 |
| Safety Insurance Group, Inc. | 85,744 | | 3,083,354 |
35
| | | |
| COMMON STOCKS (93.6%)* continued | | | |
|
| | Shares | | Value |
| |
| Insurance continued | | | |
| SeaBright Insurance Holdings, Inc. † | 84,000 | $ | 1,401,120 |
| Selective Insurance Group | 153,872 | | 3,740,628 |
| Stancorp Financial Group | 85,174 | | 4,695,643 |
| State Auto Financial Corp. | 2,625 | | 72,240 |
| W.R. Berkley Corp. | 504,174 | | 15,170,596 |
| Zenith National Insurance Corp. | 167,052 | | 6,712,149 |
| | | | 94,538,572 |
|
| |
| Investment Banking/Brokerage (0.5%) | | | |
| Affiliated Managers Group † | 25,335 | | 3,332,819 |
| Eaton Vance Corp. | 4,162 | | 208,225 |
| FBR Capital Markets Corp. † | 12,940 | | 165,632 |
| Federated Investors, Inc. | 11,429 | | 491,447 |
| Investment Technology Group, Inc. † | 9,067 | | 379,907 |
| Jefferies Group, Inc. | 14,410 | | 385,179 |
| Pzena Investment Management, Inc. Class A † | 480 | | 9,302 |
| Raymond James Financial, Inc. | 8,300 | | 309,175 |
| Waddell & Reed Financial, Inc. Class A | 5,539 | | 184,006 |
| | | | 5,465,692 |
|
| |
| Leisure (0.1%) | | | |
| Polaris Industries, Inc. | 633 | | 31,131 |
| Steinway Musical Instruments, Inc. | 9,144 | | 273,863 |
| Thor Industries, Inc. | 5,500 | | 264,000 |
| | | | 568,994 |
|
| |
| Machinery (2.5%) | | | |
| Applied Industrial Technologies, Inc. | 65,943 | | 2,337,679 |
| Cascade Corp. | 92,064 | | 5,798,191 |
| Gardner Denver, Inc. † | 76,700 | | 2,771,171 |
| Manitowoc Co., Inc. (The) | 215,300 | | 10,605,678 |
| NACCO Industries, Inc. Class A | 11,300 | | 1,170,567 |
| Regal-Beloit Corp. | 38,400 | | 1,883,136 |
| Terex Corp. † | 3,026 | | 224,590 |
| Wabtec Corp. | 39,900 | | 1,497,447 |
| | | | 26,288,459 |
|
| |
| Manufacturing (1.0%) | | | |
| Acuity Brands, Inc. | 6,200 | | 296,360 |
| Knoll, Inc. | 7,200 | | 136,728 |
| Teleflex, Inc. | 125,610 | | 9,195,908 |
| Thomas & Betts Corp. † | 8,140 | | 455,921 |
| | | | 10,084,917 |
|
| |
| Medical Technology (2.3%) | | | |
| Edwards Lifesciences Corp. † (S) | 76,644 | | 3,849,062 |
| Immucor, Inc. † (S) | 263,851 | | 8,509,195 |
| LCA-Vision, Inc. (S) | 10,270 | | 175,309 |
| Mentor Corp. | 258,732 | | 11,014,221 |
36
| | | |
| COMMON STOCKS (93.6%)* continued | | | |
|
| | Shares | | Value |
| |
| Medical Technology continued | | | |
| PerkinElmer, Inc. | 3,860 | $ | 106,227 |
| Steris Corp. | 1,424 | | 41,353 |
| | | | 23,695,367 |
|
| |
| Metal Fabricators (0.1%) | | | |
| USEC, Inc. † (S) | 82,689 | | 727,663 |
|
| |
| Metals (5.3%) | | | |
| AK Steel Holding Corp. † | 55,674 | | 2,790,938 |
| Cleveland-Cliffs, Inc. (S) | 186,358 | | 17,825,143 |
| North American Galvanizing & Coatings, Inc. † (S) | 462,191 | | 4,011,818 |
| Quanex Corp. (S) | 254,188 | | 10,470,004 |
| Shiloh Industries, Inc. | 6,400 | | 67,264 |
| Steel Dynamics, Inc. | 367,627 | | 19,565,109 |
| | | | 54,730,276 |
|
| |
| Natural Gas Utilities (0.1%) | | | |
| Atmos Energy Corp. | 19,877 | | 557,550 |
| Energen Corp. | 6,416 | | 410,624 |
| MDU Resources Group, Inc. | 6,807 | | 191,685 |
| | | | 1,159,859 |
|
| |
| Office Equipment & Supplies (0.6%) | | | |
| Ennis Inc. | 175,000 | | 3,577,000 |
| Herman Miller, Inc. | 5,930 | | 161,415 |
| Steelcase, Inc. (S) | 140,757 | | 2,515,328 |
| | | | 6,253,743 |
|
| |
| Oil & Gas (0.8%) | | | |
| Alon USA Energy, Inc. | 7,680 | | 282,394 |
| Calumet Specialty Products Partners, LP | 20,900 | | 971,850 |
| Cimarex Energy Co. (S) | 6,420 | | 260,074 |
| Comstock Resources, Inc. † | 7,335 | | 268,094 |
| Encore Acquisition Co. † | 5,000 | | 183,500 |
| Headwaters, Inc. † (S) | 8,330 | | 119,536 |
| Meridian Resource Corp. † | 100,220 | | 253,557 |
| Plains Exploration & Production Co. † | 6,386 | | 325,367 |
| St. Mary Land & Exploration Co. | 6,700 | | 283,812 |
| Swift Energy Co. † | 4,655 | | 220,787 |
| Tesoro Corp. (S) | 72,526 | | 4,389,999 |
| Unit Corp. † | 6,084 | | 290,633 |
| | | | 7,849,603 |
|
| |
| Pharmaceuticals (4.8%) | | | |
| Alpharma, Inc. Class A † (S) | 362,405 | | 7,472,791 |
| Biovail Corp. (Canada) | 152,158 | | 3,044,682 |
| Bradley Pharmaceuticals, Inc. † (S) | 209,860 | | 4,127,946 |
| Endo Pharmaceuticals Holdings, Inc. † | 91,736 | | 2,687,865 |
| King Pharmaceuticals, Inc. † | 812,366 | | 8,611,080 |
| Mylan Laboratories, Inc. | 12,191 | | 183,353 |
37
| | | |
| COMMON STOCKS (93.6%)* continued | | | |
|
| | Shares | | Value |
| |
| Pharmaceuticals continued | | | |
| Sciele Pharma, Inc. † (S) | 149,840 | $ | 3,811,930 |
| Watson Pharmaceuticals, Inc. † (S) | 645,820 | | 19,736,259 |
| | | | 49,675,906 |
|
| |
| Publishing (—%) | | | |
| Lee Enterprises, Inc. | 12,100 | | 194,205 |
|
| |
| Railroads (0.1%) | | | |
| GATX Corp. | 16,575 | | 679,078 |
|
| |
| Real Estate (6.5%) | | | |
| Annaly Mortgage Management, Inc. (R) | 2,800 | | 47,852 |
| Anthracite Capital, Inc. (R) | 428,265 | | 3,563,165 |
| Apartment Investment & Management Co. Class A (R) | 1,600 | | 74,768 |
| Ashford Hospitality Trust, Inc. (R) | 284,300 | | 2,797,512 |
| CB Richard Ellis Group, Inc. Class A † | 8,321 | | 202,866 |
| CBL & Associates Properties (R) | 261,296 | | 8,651,511 |
| Colonial Properties Trust (R) | 4,885 | | 153,047 |
| DiamondRock Hospitality Co. (R) | 248,987 | | 4,770,591 |
| Douglas Emmett, Inc. (R) | 3,632 | | 95,558 |
| Entertainment Properties Trust (R) | 17,829 | | 978,277 |
| Essex Property Trust, Inc. (R) | 1,010 | | 124,664 |
| FelCor Lodging Trust, Inc. (R) | 94,987 | | 1,989,028 |
| First Industrial Realty Trust (R) | 21,816 | | 889,002 |
| Gramercy Capital Corp. (R) | 153,446 | | 4,046,371 |
| Hospitality Properties Trust (R) | 263,441 | | 10,432,264 |
| Jones Lang LaSalle, Inc. | 3,140 | | 299,336 |
| Kite Realty Group Trust (R) | 15,705 | | 284,575 |
| LaSalle Hotel Properties (R) | 9,857 | | 407,291 |
| Lexington Corporate Properties Trust (R) | 16,197 | | 320,539 |
| LTC Properties, Inc. (R) | 97,336 | | 2,466,494 |
| Macerich Co. (The) (R) | 545 | | 46,712 |
| Medical Properties Trust, Inc. (R) | 56,550 | | 742,502 |
| Mid-America Apartment Communities, Inc. (R) | 4,380 | | 227,760 |
| National Health Investors, Inc. (R) | 151,280 | | 4,430,991 |
| National Retail Properties, Inc. (R) | 242,244 | | 6,140,885 |
| Nationwide Health Properties, Inc. (R) | 91,502 | | 2,856,692 |
| NorthStar Realty Finance Corp. (R) | 352,220 | | 3,293,257 |
| Omega Healthcare Investors, Inc. (R) | 272,995 | | 4,567,206 |
| RAIT Investment Trust (R) | 25,100 | | 228,410 |
| Resource Capital Corp. (R) | 410 | | 4,231 |
| Saul Centers, Inc. (R) | 7,968 | | 436,806 |
| SL Green Realty Corp. (R) | 2,482 | | 299,478 |
| Tanger Factory Outlet Centers (R) | 8,703 | | 366,570 |
| Taubman Centers, Inc. (R) | 5,157 | | 303,593 |
| Ventas, Inc. (R) | 5,879 | | 252,150 |
| | | | 66,791,954 |
38
| | | |
| COMMON STOCKS (93.6%)* continued | | | |
|
| | Shares | | Value |
| |
| Regional Bells (0.1%) | | | |
| Cincinnati Bell, Inc. † | 204,500 | $ | 1,108,390 |
|
| |
| Restaurants (0.4%) | | | |
| Brinker International, Inc. | 7,700 | | 195,503 |
| Denny’s Corp. † | 111,042 | | 535,222 |
| Domino’s Pizza, Inc. | 206,688 | | 3,191,263 |
| | | | 3,921,988 |
|
| |
| Retail (10.1%) | | | |
| Aeropostale, Inc. † | 629,334 | | 14,411,749 |
| American Eagle Outfitters, Inc. | 11,309 | | 268,928 |
| AnnTaylor Stores Corp. † | 392,500 | | 12,163,575 |
| Big 5 Sporting Goods Corp. | 12,000 | | 214,200 |
| Books-A-Million, Inc. | 193,300 | | 2,588,287 |
| Brown Shoe Co., Inc. | 82,692 | | 1,686,917 |
| Buckle, Inc. (The) (S) | 64,958 | | 2,799,690 |
| Cash America International, Inc. | 19,062 | | 743,418 |
| Cato Corp. (The) Class A | 330,401 | | 6,634,452 |
| CSK Auto Corp. † | 145,736 | | 1,661,390 |
| Dollar Tree Stores, Inc. † | 431,487 | | 16,525,952 |
| EZCORP, Inc. Class A † | 209,886 | | 2,762,100 |
| Ingles Markets, Inc. Class A | 20,023 | | 555,638 |
| Jos. A. Bank Clothiers, Inc. † (S) | 56,000 | | 1,635,760 |
| Nash Finch Co. (S) | 50,420 | | 1,888,229 |
| NBTY, Inc. † | 10,866 | | 386,830 |
| PC Mall, Inc. † | 93,600 | | 1,638,000 |
| Perry Ellis International, Inc. † | 45,373 | | 1,052,654 |
| Systemax, Inc. (S) | 184,526 | | 4,317,908 |
| Toro Co. (The) (S) | 194,112 | | 10,804,274 |
| USANA Health Sciences, Inc. † (S) | 133,474 | | 5,447,074 |
| Wilsons The Leather Experts, Inc. † | 13,525 | | 19,206 |
| Wolverine World Wide, Inc. (S) | 524,779 | | 13,455,334 |
| | | | 103,661,565 |
|
| |
| Schools (1.6%) | | | |
| Career Education Corp. † | 451,000 | | 16,118,740 |
| ITT Educational Services, Inc. † | 1,030 | | 131,006 |
| | | | 16,249,746 |
|
| |
| Semiconductor (0.2%) | | | |
| Advanced Energy Industries, Inc. † | 79,975 | | 1,279,600 |
| Brooks Automation, Inc. † | 11,400 | | 147,972 |
| ChipMOS TECHNOLOGIES (Bermuda), Ltd. (Bermuda) † (S) | 18,829 | | 105,819 |
| Credence Systems Corp. † | 52,848 | | 161,186 |
| Micrel, Inc. | 9,350 | | 84,618 |
| Novellus Systems, Inc. † | 6,442 | | 183,017 |
| Photronics, Inc. † | 36,100 | | 394,934 |
| | | | 2,357,146 |
39
| | | |
| COMMON STOCKS (93.6%)* continued | | | |
|
| | Shares | | Value |
| |
| Shipping (2.3%) | | | |
| Accuride Corp. † | 324,747 | $ | 3,312,419 |
| Arkansas Best Corp. (S) | 68,570 | | 1,882,247 |
| Con-way, Inc. | 5,020 | | 213,902 |
| General Maritime Corp. (S) | 5,280 | | 148,790 |
| Overseas Shipholding Group | 237,660 | | 17,681,904 |
| Wabash National Corp. | 6,523 | | 66,208 |
| | | | 23,305,470 |
|
| |
| Software (2.7%) | | | |
| Citrix Systems, Inc. † | 7,357 | | 316,277 |
| Epicor Software Corp. † (S) | 365,240 | | 4,266,003 |
| McAfee, Inc. † | 2,300 | | 95,105 |
| MicroStrategy, Inc. † (S) | 188,867 | | 18,571,279 |
| TIBCO Software, Inc. † | 22,000 | | 201,960 |
| Websense, Inc. † (S) | 213,002 | | 3,919,237 |
| | | | 27,369,861 |
|
| |
| Staffing (0.2%) | | | |
| Heidrick & Struggles International, Inc. | 54,474 | | 2,354,366 |
|
| |
| Technology (0.2%) | | | |
| Amkor Technologies, Inc. † | 191,300 | | 2,167,429 |
| CACI International, Inc. Class A † | 3,540 | | 190,629 |
| | | | 2,358,058 |
|
| |
| Technology Services (2.7%) | | | |
| Acxiom Corp. | 313,100 | | 4,114,134 |
| Asiainfo Holdings, Inc. (China) † | 171,993 | | 2,103,474 |
| COMSYS IT Partners, Inc. † | 168,389 | | 2,993,956 |
| CSG Systems International, Inc. † (S) | 70,900 | | 1,455,577 |
| Factset Research Systems, Inc. | 6,345 | | 447,449 |
| Fair Isaac Corp. | 6,079 | | 230,516 |
| Global Payments, Inc. | 8,869 | | 421,810 |
| Harris Interactive, Inc. † | 137,476 | | 633,764 |
| Pegasystems, Inc. | 19,200 | | 224,832 |
| SonicWall, Inc. † | 161,406 | | 1,668,938 |
| United Online, Inc. (S) | 782,182 | | 13,766,403 |
| | | | 28,060,853 |
|
| |
| Telecommunications (3.3%) | | | |
| ADTRAN, Inc. | 141,310 | | 3,401,332 |
| CenturyTel, Inc. | 352,100 | | 15,510,005 |
| Citizens Communications Co. | 1,069 | | 14,068 |
| j2 Global Communications, Inc. † (S) | 288,181 | | 9,708,818 |
| NeuStar, Inc. Class A † | 6,880 | | 235,296 |
| Premiere Global Services, Inc. † | 26,009 | | 428,628 |
| Syniverse Holdings, Inc. † | 12,611 | | 210,478 |
| USA Mobility, Inc. † | 176,700 | | 2,763,588 |
| UTStarcom, Inc. † (S) | 501,764 | | 1,605,645 |
| | | | 33,877,858 |
40
| | | |
| COMMON STOCKS (93.6%)* continued | | | |
|
| | Shares | | Value |
| |
| Textiles (0.5%) | | | |
| Jones Apparel Group, Inc. | 42,175 | $ | 883,145 |
| Kellwood Co. | 151,125 | | 2,504,141 |
| Maidenform Brands, Inc. † | 107,200 | | 1,591,920 |
| | | | 4,979,206 |
|
| |
| Tobacco (0.3%) | | | |
| Alliance One International, Inc. † | 199,010 | | 1,299,535 |
| Universal Corp. | 42,433 | | 2,068,184 |
| | | | 3,367,719 |
|
| |
| Toys (1.9%) | | | |
| Hasbro, Inc. | 605,882 | | 18,085,578 |
| Jakks Pacific, Inc. † | 34,436 | | 912,554 |
| RC2 Corp. † | 3,100 | | 92,442 |
| | | | 19,090,574 |
|
| |
| Transportation (—%) | | | |
| Hornbeck Offshore Services, Inc. † | 10,000 | | 391,000 |
|
| |
| Transportation Services (0.2%) | | | |
| HUB Group, Inc. Class A † (S) | 84,454 | | 2,142,598 |
| Pacer International, Inc. | 16,898 | | 249,077 |
| | | | 2,391,675 |
|
| |
| Trucks & Parts (1.8%) | | | |
| Autoliv, Inc. (Sweden) | 281,295 | | 17,772,218 |
| Noble International, Ltd. | 41,195 | | 769,111 |
| Standard Motor Products, Inc. | 60,938 | | 509,442 |
| | | | 19,050,771 |
|
| |
| Total common stocks (cost $849,479,062) | | $ | 964,194,813 |
|
| |
| |
| SHORT-TERM INVESTMENTS (21.5%)* | | | |
|
| | Principal amount/shares | | Value |
| |
| Short-term investments held as collateral for loaned | | | |
| securities with yields ranging from 4.50% to 5.69% | | | |
| and due dates ranging from November 1, 2007 | | | |
| to November 28, 2007 (d) | $ 162,141,754 | $ | 161,878,950 |
| Interest in $630,000,000 joint tri-party repurchase | | | |
| agreement dated October 31, 2007 with Deutsche Bank | | | |
| Securities, Inc. due November 1, 2007 with respect | | | |
| to various U.S. Government obligations — maturity | | | |
| value of $24,171,323 for an effective yield of 4.95% | | | |
| (collateralized by Fannie Mae, Federal Home Loan | | | |
| Banks, Freddie Mac and Ginnie Mae securities with | | | |
| coupon rates ranging from zero % to 12.50% and due | | | |
| dates ranging from November 1, 2007 to | | | |
| December 15, 2046 valued at $642,600,168) | 24,168,000 | | 24,168,000 |
41
| | | |
| SHORT-TERM INVESTMENTS (21.5%)* continued | | | |
|
| | Principal amount/shares | | Value |
| |
| Interest in $550,000,000 joint tri-party repurchase | | | |
| agreement dated October 31, 2007 with Bank | | | |
| of America Securities, LLC, due November 1, 2007 | | | |
| with respect to various U.S. Government obligations | | | |
| — maturity value of $24,995,423 for an effective | | | |
| yield of 4.93% (collateralized by Fannie Mae and | | | |
| Freddie Mac securities with coupon rates ranging | | | |
| from 5.00% to 6.00% and due dates ranging from | | | |
| July 1, 2034 to September 1, 2037 valued | | | |
| at $561,000,000) | $ 24,992,000 | $ | 24,992,000 |
| Putnam Prime Money Market Fund (e) | 10,537,971 | | 10,537,971 |
|
| |
| Total short-term investments (cost $221,576,921) | | $ | 221,576,921 |
|
| |
| |
| TOTAL INVESTMENTS | | | |
|
| Total investments (cost $1,071,055,983) | | $ | 1,185,771,734 |
* Percentages indicated are based on net assets of $1,029,862,937.
† Non-income-producing security.
# A portion of this security was pledged and segregated with the custodian to cover margin requirements for futures contracts at October 31, 2007.
(d) See Note 1 to the financial statements.
(e) See Note 5 to the financial statements regarding investments in Putnam Prime Money Market Fund.
(R) Real Estate Investment Trust.
(S) Securities on loan, in part or in entirety, at October 31, 2007.
At October 31, 2007, liquid assets totaling $517,237 have been designated as collateral for open futures contracts.
| | | | | |
| FUTURES CONTRACTS OUTSTANDING at 10/31/07 (Unaudited) | | | |
|
| | Number of | | | Expiration | Unrealized |
| | contracts | Value | | date | appreciation |
|
| Russell 2000 Index Mini (Long) | 391 | $32,542,930 | | Dec-07 | $274,584 |
| S&P Mid Cap 400 Index E-Mini (Long) | 227 | 20,704,670 | | Dec-07 | 214,836 |
| S&P 500 Index (Long) | 14 | 5,442,150 | | Dec-07 | 27,817 |
|
| Total | | | | | $517,237 |
The accompanying notes are an integral part of these financial statements.
42
Statement of assets and liabilities 10/31/07 (Unaudited)
| |
| ASSETS | |
|
| Investment in securities, at value, including $156,000,029 of securities on loan (Note 1): | |
| Unaffiliated issuers (identified cost $1,060,518,012) | $1,175,233,763 |
| Affiliated issuers (identified cost $10,537,971) (Note 5) | 10,537,971 |
|
| Cash | 529,926 |
|
| Dividends, interest and other receivables | 1,244,291 |
|
| Receivable for shares of the fund sold | 849,124 |
|
| Receivable for securities sold | 7,596,166 |
|
| Receivable for variation margin (Note 1) | 1,032,202 |
|
| Total assets | 1,197,023,443 |
|
| |
| LIABILITIES | |
|
| Payable for shares of the fund repurchased | 2,566,006 |
|
| Payable for compensation of Manager (Notes 2 and 5) | 1,532,865 |
|
| Payable for investor servicing (Note 2) | 665,129 |
|
| Payable for custodian fee (Note 2) | 1,425 |
|
| Payable for Trustee compensation and expenses (Note 2) | 117,764 |
|
| Payable for administrative services (Note 2) | 1,812 |
|
| Payable for distribution fees (Note 2) | 243,914 |
|
| Collateral on securities loaned, at value (Note 1) | 161,878,950 |
|
| Other accrued expenses | 152,641 |
|
| Total liabilities | 167,160,506 |
|
| Net assets | $1,029,862,937 |
|
| |
| REPRESENTED BY | |
|
| Paid-in capital (Unlimited shares authorized) (Notes 1 and 4) | $ 835,512,540 |
|
| Undistributed net investment income (Note 1) | 4,762,074 |
|
| Accumulated net realized gain on investments (Note 1) | 74,355,335 |
|
| Net unrealized appreciation of investments | 115,232,988 |
|
| Total — Representing net assets applicable to capital shares outstanding | $1,029,862,937 |
(Continued on next page)
43
Statement of assets and liabilities (Continued)
| |
| COMPUTATION OF NET ASSET VALUE AND OFFERING PRICE | |
|
| Net asset value and redemption price per class A share | |
| ($462,028,220 divided by 39,633,848 shares) | $11.66 |
|
| Offering price per class A share | |
| (100/94.75 of $11.66)* | $12.31 |
|
| Net asset value and offering price per class B share | |
| ($128,524,928 divided by 11,979,250 shares)** | $10.73 |
|
| Net asset value and offering price per class C share | |
| ($28,631,105 divided by 2,640,517 shares)** | $10.84 |
|
| Net asset value and redemption price per class M share | |
| ($12,369,717 divided by 1,122,002 shares) | $11.02 |
|
| Offering price per class M share | |
| (100/96.75 of $11.02)* | $11.39 |
|
| Net asset value, offering price and redemption price per class R share | |
| ($2,688,771 divided by 233,765 shares) | $11.50 |
|
| Net asset value, offering price and redemption price per class Y share | |
| ($395,620,196 divided by 33,295,452 shares) | $11.88 |
* On single retail sales of less than $50,000. On sales of $50,000 or more the offering price is reduced.
** Redemption price per share is equal to net asset value less any applicable contingent deferred sales charge.
The accompanying notes are an integral part of these financial statements.
44
Statement of operations Six months ended 10/31/07 (Unaudited)
| |
| INVESTMENT INCOME | |
|
| Dividends (net of foreign tax of $19,216) | $ 9,623,005 |
|
| Interest (including interest income of $437,087 from investments in affiliated issuers) (Note 5) | 491,012 |
|
| Securities lending | 1,298,407 |
|
| Total investment income | 11,412,424 |
|
| |
| EXPENSES | |
|
| Compensation of Manager (Note 2) | 3,271,047 |
|
| Investor servicing fees (Note 2) | 1,966,717 |
|
| Custodian fees (Note 2) | 1,685 |
|
| Trustee compensation and expenses (Note 2) | 39,915 |
|
| Administrative services (Note 2) | 12,364 |
|
| Distribution fees — Class A (Note 2) | 612,173 |
|
| Distribution fees — Class B (Note 2) | 753,268 |
|
| Distribution fees — Class C (Note 2) | 164,038 |
|
| Distribution fees — Class M (Note 2) | 53,870 |
|
| Distribution fees — Class R (Note 2) | 6,797 |
|
| Other | 182,028 |
|
| Non-recurring costs (Notes 2 and 6) | 681 |
|
| Costs assumed by Manager (Notes 2 and 6) | (681) |
|
| Fees waived and reimbursed by Manager (Note 5) | (6,278) |
|
| Total expenses | 7,057,624 |
|
| Expense reduction (Note 2) | (29,223) |
|
| Net expenses | 7,028,401 |
|
| Net investment income | 4,384,023 |
|
| Net realized loss on investments (Notes 1 and 3) | (5,850,679) |
|
| Net realized gain on futures contracts (Note 1) | 129,759 |
|
| Net unrealized depreciation of investments and futures contracts during the period | (74,372,457) |
|
| Net loss on investments | (80,093,377) |
|
| Net decrease in net assets resulting from operations | $(75,709,354) |
The accompanying notes are an integral part of these financial statements.
45
Statement of changes in net assets
| | | | |
| INCREASE (DECREASE) IN NET ASSETS | | | | |
|
| | Six months ended | | Year ended |
| | | 10/31/07* | | 4/30/07 |
|
| Operations: | | | | |
| Net investment income | $ | 4,384,023 | $ | 1,792,463 |
|
| Net realized gain (loss) on investments | | (5,720,920) | | 145,999,971 |
|
| Net unrealized depreciation of investments | | (74,372,457) | | (22,651,574) |
|
| Net increase (decrease) in net assets resulting from operations | | (75,709,354) | | 125,140,860 |
|
| Distributions to shareholders (Note 1): | | | | |
|
| From ordinary income | | | | |
|
| Net investment income | | | | |
|
| Class A | | — | | (37,308) |
|
| Class Y | | — | | (962,566) |
|
| Net realized short-term gain on investments | | | | |
|
| Class A | | — | | (11,154,909) |
|
| Class B | | — | | (4,576,972) |
|
| Class C | | — | | (803,789) |
|
| Class M | | — | | (377,781) |
|
| Class R | | — | | (41,557) |
|
| Class Y | | — | | (9,284,105) |
|
| From net realized long-term gain on investments | | | | |
|
| Class A | | — | | (44,731,557) |
|
| Class B | | — | | (18,353,809) |
|
| Class C | | — | | (3,223,220) |
|
| Class M | | — | | (1,514,917) |
|
| Class R | | — | | (166,647) |
|
| Class Y | | — | | (37,229,571) |
|
| Redemption fees (Note 1) | | 14,694 | | 16,754 |
|
| Increase (decrease) from capital share transactions (Note 4) | | (56,390,529) | | 20,948,092 |
|
| Total increase (decrease) in net assets | | (132,085,189) | | 13,646,998 |
|
| |
| NET ASSETS | | | | |
|
| Beginning of period | 1,161,948,126 | 1,148,301,128 |
|
| End of period (including undistributed net investment | | | | |
| income of $4,762,074 and $378,051, respectively) | $1,029,862,937 | $1,161,948,126 |
* Unaudited
The accompanying notes are an integral part of these financial statements.
46
This page left blank intentionally.
47
| | | | | | | | | | | | | | | | |
| Financial highlights | (For a common share outstanding throughout the period) | | | | | | | | | |
|
| |
| INVESTMENT OPERATIONS: | | | | | LESS DISTRIBUTIONS: | | | | | | RATIOS AND SUPPLEMENTAL DATA: | |
|
| | | | | Net | | | | | | | | Total | | | Ratio of net | |
| | Net asset | | | realized and | Total | From | From | | | | Net asset | return | Net | Ratio of | investment | |
| | value, | Net | | unrealized | from | net | net realized | From | | | value, | at net | assets, | expenses to | income (loss) | Portfolio |
| | beginning | investment | gain (loss) on | investment | investment | gain on | return of | Total | Redemption | end | asset | end of period | average net | to average | turnover |
| Period ended | of period | income (loss)(a) | investments | operations | income | investments | capital | distributions | fees | of period | value (%)(b) | (in thousands) | assets (%)(c) | net assets (%) | (%) |
|
| CLASS A | | | | | | | | | | | | | | | | |
| October 31, 2007** | $12.49 | .05(d) | (.88) | (.83) | — | — | — | — | —(e) | $11.66 | (6.65)* | $462,028 | .62*(d) | .42*(d) | 11.34* |
| April 30, 2007 | 12.60 | .03(d) | 1.36 | 1.39 | —(e) | (1.50) | — | (1.50) | —(e) | 12.49 | 11.72 | 508,647 | 1.23(d) | .23(d) | 58.83 |
| April 30, 2006 | 10.97 | .02(d,g) | 3.60 | 3.62 | (.07) | (1.92) | — | (1.99) | —(e) | 12.60 | 34.85 | 476,325 | 1.20(d,g) | .13(d,g) | 60.27 |
| April 30, 2005 | 10.16 | .06(d,f) | .75 | .81 | — | — | — | — | —(e) | 10.97 | 7.97 | 378,942 | 1.23(d) | .51(d,f) | 70.94 |
| April 30, 2004 | 7.74 | .01 | | 2.41 | 2.42 | — | — | — | — | — | 10.16 | 31.27 | 397,300 | 1.19 | .10 | 134.62 |
| April 30, 2003 | 10.67 | —(e) | (2.78) | (2.78) | — | (.15) | —(e) | (.15) | — | 7.74 | (26.09) | 378,331 | 1.17 | (.01) | 90.52 |
|
| |
| CLASS B | | | | | | | | | | | | | | | | |
| October 31, 2007** | $11.54 | —(d,e) | (.81) | (.81) | — | — | — | — | —(e) | $10.73 | (7.02)* | $128,525 | 1.00*(d) | .04*(d) | 11.34* |
| April 30, 2007 | 11.83 | (.06)(d) | 1.27 | 1.21 | — | (1.50) | — | (1.50) | —(e) | 11.54 | 10.92 | 167,550 | 1.98(d) | (.53)(d) | 58.83 |
| April 30, 2006 | 10.42 | (.07)(d,g) | 3.40 | 3.33 | — | (1.92) | — | (1.92) | —(e) | 11.83 | 33.73 | 228,590 | 1.95(d,g) | (.61)(d,g) | 60.27 |
| April 30, 2005 | 9.71 | (.02)(d,f) | .73 | .71 | — | — | — | — | —(e) | 10.42 | 7.31 | 218,327 | 1.98(d) | (.23)(d,f ) | 70.94 |
| April 30, 2004 | 7.46 | (.06) | | 2.31 | 2.25 | — | — | — | — | — | 9.71 | 30.16 | 271,803 | 1.94 | (.64) | 134.62 |
| April 30, 2003 | 10.37 | (.06) | | (2.70) | (2.76) | — | (.15) | —(e) | (.15) | — | 7.46 | (26.65) | 272,147 | 1.92 | (.79) | 90.52 |
|
| |
| CLASS C | | | | | | | | | | | | | | | | |
| October 31, 2007** | $11.66 | —(d,e) | (.82) | (.82) | — | — | — | — | —(e) | $10.84 | (7.03)* | $28,631 | 1.00*(d) | .04*(d) | 11.34* |
| April 30, 2007 | 11.94 | (.06)(d) | 1.28 | 1.22 | — | (1.50) | — | (1.50) | —(e) | 11.66 | 10.89 | 34,473 | 1.98(d) | (.52)(d) | 58.83 |
| April 30, 2006 | 10.50 | (.07)(d,g) | 3.43 | 3.36 | — | (1.92) | — | (1.92) | —(e) | 11.94 | 33.76 | 34,354 | 1.95(d,g) | (.62)(d,g) | 60.27 |
| April 30, 2005 | 9.79 | (.02)(d,f) | .73 | .71 | — | — | — | — | —(e) | 10.50 | 7.25 | 29,854 | 1.98(d) | (.23)(d,f ) | 70.94 |
| April 30, 2004 | 7.52 | (.06) | | 2.33 | 2.27 | — | — | — | — | — | 9.79 | 30.19 | 35,584 | 1.94 | (.65) | 134.62 |
| April 30, 2003 | 10.45 | (.06) | | (2.72) | (2.78) | — | (.15) | —(e) | (.15) | — | 7.52 | (26.64) | 34,709 | 1.92 | (.76) | 90.52 |
|
| |
| CLASS M | | | | | | | | | | | | | | | | |
| October 31, 2007** | $11.84 | .02(d) | (.84) | (.82) | — | — | — | — | —(e) | $11.02 | (6.93)* | $12,370 | .87*(d) | .17*(d) | 11.34* |
| April 30, 2007 | 12.07 | (.03)(d) | 1.30 | 1.27 | — | (1.50) | — | (1.50) | —(e) | 11.84 | 11.20 | 15,921 | 1.73(d) | (.27)(d) | 58.83 |
| April 30, 2006 | 10.59 | (.04)(d,g) | 3.46 | 3.42 | (.02) | (1.92) | — | (1.94) | —(e) | 12.07 | 34.05 | 17,785 | 1.70(d,g) | (.36)(d,g) | 60.27 |
| April 30, 2005 | 9.85 | —(d,e,f) | .74 | .74 | — | — | — | — | —(e) | 10.59 | 7.51 | 15,802 | 1.73(d) | .02(d,f) | 70.94 |
| April 30, 2004 | 7.55 | (.04) | | 2.34 | 2.30 | — | — | — | — | — | 9.85 | 30.46 | 18,501 | 1.69 | (.40) | 134.62 |
| April 30, 2003 | 10.46 | (.06) | | (2.70) | (2.76) | — | (.15) | —(e) | (.15) | — | 7.55 | (26.42) | 15,789 | 1.67 | (.54) | 90.52 |
|
| |
| CLASS R | | | | | | | | | | | | | | | | |
| October 31, 2007** | $12.34 | .03(d) | (.87) | (.84) | — | — | — | — | —(e) | $11.50 | (6.81)* | $2,689 | .75*(d) | .29*(d) | 11.34* |
| April 30, 2007 | 12.49 | —(d,e) | 1.35 | 1.35 | — | (1.50) | — | (1.50) | —(e) | 12.34 | 11.48 | 2,610 | 1.48(d) | (.02)(d) | 58.83 |
| April 30, 2006 | 10.92 | (.03)(d,g) | 3.59 | 3.56 | (.07) | (1.92) | — | (1.99) | —(e) | 12.49 | 34.37 | 1,390 | 1.45(d,g) | (.21)(d,g) | 60.27 |
| April 30, 2005 | 10.13 | .02(d,f) | .77 | .79 | — | — | — | — | —(e) | 10.92 | 7.80 | 457 | 1.48(d) | .16(d,f) | 70.94 |
| April 30, 2004 | 7.74 | (.02) | | 2.41 | 2.39 | — | — | — | — | — | 10.13 | 30.88 | 51 | 1.44 | (.18) | 134.62 |
| April 30, 2003† | 7.67 | (.01) | | .08 | .07 | — | — | — | — | — | 7.74 | .91* | 1 | .39* | (.07)* | 90.52 |
|
| |
| CLASS Y | | | | | | | | | | | | | | | | |
| October 31, 2007** | $12.72 | .07(d) | (.91) | (.84) | — | — | — | — | —(e) | $11.88 | (6.60)* | $395,620 | .50*(d) | .54*(d) | 11.34* |
| April 30, 2007 | 12.79 | .06(d) | 1.40 | 1.46 | (.03) | (1.50) | — | (1.53) | —(e) | 12.72 | 12.12 | 432,748 | .98(d) | .48(d) | 58.83 |
| April 30, 2006 | 11.12 | .05(d,g) | 3.65 | 3.70 | (.11) | (1.92) | — | (2.03) | —(e) | 12.79 | 35.06 | 389,857 | .95(d,g) | .38(d,g) | 60.27 |
| April 30, 2005 | 10.26 | .08(d,f) | .78 | .86 | — | — | — | — | —(e) | 11.12 | 8.38 | 322,592 | .98(d) | .76(d,f) | 70.94 |
| April 30, 2004 | 7.81 | .03 | | 2.42 | 2.45 | — | — | — | — | — | 10.26 | 31.37 | 324,942 | .94 | .31 | 134.62 |
| April 30, 2003 | 10.73 | .02 | | (2.79) | (2.77) | — | (.15) | —(e) | (.15) | — | 7.81 | (25.85) | 233,163 | .92 | .24 | 90.52 |
|
See notes to financial highlights at the end of this section.
The accompanying notes are an integral part of these financial statements.
Financial highlights (Continued)
* Not annualized.
** Unaudited.
† For the period January 21, 2003 (commencement of operations) to April 30, 2003.
(a) Per share net investment income (loss) has been determined on the basis of the weighted average number of shares outstanding during the period.
(b) Total return assumes dividend reinvestment and does not reflect the effect of sales charges.
(c) Includes amounts paid through expense offset and brokerage service arrangements (Note 2).
(d) Reflects waivers of certain fund expenses in connection with investments in Putnam Prime Market Fund in effect during the period. As a result of such waivers, the expenses of each class reflect a reduction of the following amounts (Note 5):
| |
| | Percentage |
| | of average |
| | net assets |
|
| October 31, 2007 | <0.01% |
|
| April 30, 2007 | <0.01 |
|
| April 30, 2006 | <0.01 |
|
| April 30, 2005 | <0.01 |
|
(e) Amount represents less than $0.01 per share.
(f) Reflects a non-recurring accrual related to Putnam Management’s settlement with the SEC regarding brokerage allocation practices, which amounted to the following amounts:
| | |
| | | Percentage |
| | | of average |
| | Per share | net assets |
|
| Class A | <$0.01 | 0.03% |
|
| Class B | <0.01 | 0.03 |
|
| Class C | <0.01 | 0.03 |
|
| Class M | <0.01 | 0.03 |
|
| Class R | 0.01 | 0.09 |
|
| Class Y | <0.01 | 0.03 |
|
(g) Reflects a non-recurring reimbursement from Putnam Investments relating to the calculation of certain amounts paid by the fund to Putnam in previous years for transfer agent services, which amounted to less than $0.01 per share and 0.03% of average net assets for the period ended April 30, 2006.
The accompanying notes are an integral part of these financial statements.
50
Notes to financial statements 10/31/07 (Unaudited)
Note 1: Significant accounting policies
Putnam Capital Opportunities Fund (the “fund”) is a series of Putnam Investment Funds (the “trust”), a Massachusetts business trust, which is registered under the Investment Company Act of 1940, as amended, as a diversified, open-end management investment company. The fund invests primarily in common stocks of U.S. companies that Putnam Investment Management, LLC (“Putnam Management”), the fund’s manager, an indirect wholly-owned subsidiary of Putnam, LLC, believes have favorable investment potential, such as stocks of companies with stock prices that reflect a value lower than that which Putnam Management places on the company. Putnam Management may also consider other factors it believes will cause the stock price to rise.
The fund offers class A, class B, class C, class M, class R and class Y shares. Class A and class M shares are sold with a maximum front-end sales charge of 5.25% and 3.25%, respectively, and generally do not pay a contingent deferred sales charge. Effective January 2, 2008, the class A and class M maximum front-end sales charge will change to 5.75% and 3.50%, respectively. Class B shares, which convert to class A shares after approximately eight years, do not pay a front-end sales charge and are subject to a contingent deferred sales charge, if those shares are redeemed within six years of purchase. Class C shares have a one-year 1.00% contingent deferred sales charge and do not convert to class A shares. Class R shares, which are offered to qualified employee-benefit plans, are sold without a front-end sales charge or a contingent deferred sales charge. The expenses for class A, class B, class C, class M and class R shares may differ based on the distribution fee of each class, which is identified in Note 2. Class Y shares, which are sold at net asset value, are generally subject to the same expenses as class A, class B, class C, class M and class R shares, but do not bear a distribution fee. Class Y shares are generally only available to corporate and institutional clients and clients in other approved programs.
A 1.00% redemption fee may apply on any shares that are redeemed (either by selling or exchanging into another fund) within 90 days of purchase. The redemption fee is accounted for as an addition to paid-in-capital.
Investment income, realized and unrealized gains and losses and expenses of the fund are borne pro-rata based on the relative net assets of each class to the total net assets of the fund, except that each class bears expenses unique to that class (including the distribution fees applicable to such classes). Each class votes as a class only with respect to its own distribution plan or other matters on which a class vote is required by law or determined by the Trustees. If the fund were liquidated, shares of each class would receive their pro-rata share of the net assets of the fund. In addition, the Trustees declare separate dividends on each class of shares.
In the normal course of business, the fund enters into contracts that may include agreements to indemnify another party under given circumstances. The fund’s maximum exposure under these arrangements is unknown as this would involve future claims that may be, but have not yet been, made against the fund. However, the fund expects the risk of material loss to be remote.
The following is a summary of significant accounting policies consistently followed by the fund in the preparation of its financial statements. The preparation of financial statements is in conformity with accounting principles generally accepted in the United States of America and requires management to make estimates and assumptions that affect the reported amounts of assets and liabilities in the financial statements and the reported amounts of increases and decreases in net assets from operations during the reporting period. Actual results could differ from those estimates.
A) Security valuation Investments for which market quotations are readily available are valued at the last reported sales price on their principal exchange, or official closing price for certain markets. If no sales are reported — as in the case of
51
some securities traded over-the-counter — a security is valued at its last reported bid price. Many securities markets and exchanges outside the U.S. close prior to the close of the New York Stock Exchange and therefore the closing prices for securities in such markets or on such exchanges may not fully reflect events that occur after such close but before the close of the New York Stock Exchange. Accordingly, on certain days, the fund will fair value foreign equity securities taking into account multiple factors, including movements in the U.S. securities markets. The number of days on which fair value prices will be used will depend on market activity and it is possible that fair value prices will be used by the fund to a significant extent. At October 31, 2007, fair value pricing was used for certain foreign securities in the portfolio. Securities quoted in foreign currencies, if any, are translated into U.S. dollars at the current exchange rate. Certain inv estments, including certain restricted securities and derivatives, are also valued at fair value following procedures approved by the Trustees. Such valuations and procedures are reviewed periodically by the Trustees. The fair value of securities is generally determined as the amount that the fund could reasonably expect to realize from an orderly disposition of such securities over a reasonable period of time. By its nature, a fair value price is a good faith estimate of the value of a security at a given point in time and does not reflect an actual market price, which may be different by a material amount.
B) Joint trading account Pursuant to an exemptive order from the Securities and Exchange Commission (the “SEC”), the fund may transfer uninvested cash balances, including cash collateral received under security lending arrangements, into a joint trading account along with the cash of other registered investment companies and certain other accounts managed by Putnam Management. These balances may be invested in issues of high-grade short-term investments having maturities of up to 397 days for collateral received under security lending arrangements and up to 90 days for other cash investments.
C) Repurchase agreements The fund, or any joint trading account, through its custodian, receives delivery of the underlying securities, the market value of which at the time of purchase is required to be in an amount at least equal to the resale price, including accrued interest. Collateral for certain tri-party repurchase agreements is held at the counterparty’s custodian in a segregated account for the benefit of the fund and the counterparty. Putnam Management is responsible for determining that the value of these underlying securities is at all times at least equal to the resale price, including accrued interest.
D) Security transactions and related investment income Security transactions are recorded on the trade date (the date the order to buy or sell is executed). Gains or losses on securities sold are determined on the identified cost basis.
Interest income is recorded on the accrual basis. Dividend income, net of applicable withholding taxes, is recognized on the ex-dividend date except that certain dividends from foreign securities, if any, are recognized as soon as the fund is informed of the ex-dividend date. Non-cash dividends, if any, are recorded at the fair market value of the securities received. Dividends representing a return of capital or capital gains, if any, are reflected as a reduction of cost and/or as a realized gain.
E) Futures and options contracts The fund may use futures and options contracts to hedge against changes in the values of securities the fund owns or expects to purchase, or for other investment purposes. The fund may also write options on swaps or securities it owns or in which it may invest to increase its current returns.
The potential risk to the fund is that the change in value of futures and options contracts may not correspond to the change in value of the hedged instruments. In addition, losses may arise from changes in the value of the underlying instruments, if there is an illiquid secondary market for the contracts, or if the counterparty to the contract is unable to perform. Risks may exceed amounts recognized on the Statement of assets and liabilities.
52
When the contract is closed, the fund records a realized gain or loss equal to the difference between the value of the contract at the time it was opened and the value at the time it was closed. Realized gains and losses on purchased options are included in realized gains and losses on investment securities. If a written call option is exercised, the premium originally received is recorded as an addition to sales proceeds. If a written put option is exercised, the premium originally received is recorded as a reduction to the cost of investments.
Futures contracts are valued at the quoted daily settlement prices established by the exchange on which they trade. The fund and the broker agree to exchange an amount of cash equal to the daily fluctuation in the value of the futures contract. Such receipts or payments are known as “variation margin.” Exchange traded options are valued at the last sale price or, if no sales are reported, the last bid price for purchased options and the last ask price for written options. Options traded over-the-counter are valued using prices supplied by dealers. Futures and written option contracts outstanding at period end, if any, are listed after the fund’s portfolio.
F) Security lending The fund may lend securities, through its agents, to qualified borrowers in order to earn additional income. The loans are collateralized by cash and/or securities in an amount at least equal to the market value of the securities loaned. The market value of securities loaned is determined daily and any additional required collateral is allocated to the fund on the next business day. The risk of borrower default will be borne by the fund’s agents; the fund will bear the risk of loss with respect to the investment of the cash collateral. Income from securities lending is included in investment income on the Statement of operations. At October 31, 2007, the value of securities loaned amounted to $156,000,029. The fund received cash collateral of $161,878,950 which is pooled with collateral of other Putnam funds into 54 issues of short-term investments.
G) Federal taxes It is the policy of the fund to distribute all of its taxable income within the prescribed time and otherwise comply with the provisions of the Internal Revenue Code of 1986, as amended, (the “Code”) applicable to regulated investment companies. It is also the intention of the fund to distribute an amount sufficient to avoid imposition of any excise tax under Section 4982 of the Code, as amended. Therefore, no provision has been made for federal taxes on income, capital gains or unrealized appreciation on securities held nor for excise tax on income and capital gains.
The aggregate identified cost on a tax basis is $1,071,585,898, resulting in gross unrealized appreciation and depreciation of $194,474,768 and $80,288,932, respectively, or net unrealized appreciation of $114,185,836.
H) Distributions to shareholders Distributions to shareholders from net investment income are recorded by the fund on the ex-dividend date. Distributions from capital gains, if any, are recorded on the ex-dividend date and paid at least annually. The amount and character of income and gains to be distributed are determined in accordance with income tax regulations, which may differ from generally accepted accounting principles. Dividend sources are estimated at the time of declaration. Actual results may vary. Any non-taxable return of capital cannot be determined until final tax calculations are completed after the end of the fund’s fiscal year. Reclassifications are made to the fund’s capital accounts to reflect income and gains available for distribution (or available capital loss carryovers) under income tax regulations.
I) Expenses of the trust Expenses directly charged or attributable to any fund will be paid from the assets of that fund. Generally, expenses of the trust will be allocated among and charged to the assets of each fund on a basis that the Trustees deem fair and equitable, which may be based on the relative assets of each fund or the nature of the services performed and relative applicability to each fund.
53
Note 2: Management fee, administrative services and other transactions
Putnam Management is paid for management and investment advisory services quarterly based on the average net assets of the fund. Such fee is based on the following annual rates: 0.65% of the first $500 million of average net assets, 0.55% of the next $500 million, 0.50% of the next $500 million, 0.45% of the next $5 billion, 0.425% of the next $5 billion, 0.405% of the next $5 billion, 0.39% of the next $5 billion and 0.38% thereafter.
Putnam Management has agreed to waive fees and reimburse expenses of the fund through June 30, 2009 to the extent necessary to ensure that the fund’s expenses do not exceed the simple average of the expenses of all front-end load funds viewed by Lipper, Inc. as having the same investment classification or objective as the fund. The expense reimbursement is based on a comparison of the fund’s expenses with the average annualized operating expenses of the funds in its Lipper peer group for each calendar quarter during the fund’s last fiscal year, excluding 12b-1 fees and without giving effect to any expense offset and brokerage service arrangements that may reduce fund expenses. For the period ended October 31, 2007, Putnam Management did not waive any of its management fee from the fund.
Effective August 3, 2007, Marsh & McLennan Companies, Inc. sold its ownership interest in Putnam Management, its parent companies and affiliates to a wholly-owned subsidiary of Great-West Lifeco, Inc. The fund’s shareholders have approved a new management contract for the fund that became effective upon the sale.
For the period ended October 31, 2007, Putnam Management has assumed $681 of legal, shareholder servicing and communication, audit and Trustee fees incurred by the fund in connection with certain legal and regulatory matters (including those described in Note 6).
The fund reimburses Putnam Management an allocated amount for the compensation and related expenses of certain officers of the fund and their staff who provide administrative services to the fund. The aggregate amount of all such reimbursements is determined annually by the Trustees.
Custodial services for the fund’s assets were provided by Putnam Fiduciary Trust Company (“PFTC”), an affiliate of Putnam Management, and by State Street Bank and Trust Company (“State Street”). Custody fees are based on the fund’s asset level, the number of its security holdings, transaction volumes and with respect to PFTC, certain fees related to the transition of assets to State Street. Putnam Investor Services, a division of PFTC, provided investor servicing agent functions to the fund. Putnam Investor Services received fees for investor servicing, subject to certain limitations, based on the number of shareholder accounts in the fund and the level of defined contribution plan assets in the fund. During the period ended October 31, 2007, the fund incurred $1,968,402 for custody and investor servicing agent functions provided by PFTC.
The fund has entered into arrangements with PFTC and State Street whereby PFTC’s and State Street’s fees are reduced by credits allowed on cash balances. The fund also reduced expenses through brokerage service arrangements. For the six months ended October 31, 2007, the fund’s expenses were reduced by $29,223 under these arrangements.
Each independent Trustee of the fund receives an annual Trustee fee, of which $466, as a quarterly retainer, has been allocated to the fund, and an additional fee for each Trustees meeting attended. Trustees receive additional fees for attendance at certain committee meetings and industry seminars and for certain compliance-related matters. Trustees also are reimbursed for expenses they incur relating to their services as Trustees.
The fund has adopted a Trustee Fee Deferral Plan (the “Deferral Plan”) which allows the Trustees to defer the receipt of all or a portion of Trustees fees payable on or after July 1, 1995. The deferred fees remain invested in certain Putnam funds until distribution in accordance with the Deferral Plan.
54
The fund has adopted an unfunded noncontribu-tory defined benefit pension plan (the “Pension Plan”) covering all Trustees of the fund who have served as a Trustee for at least five years and were first elected prior to 2004. Benefits under the Pension Plan are equal to 50% of the Trustee’s average annual attendance and retainer fees for the three years ended December 31, 2005. The retirement benefit is payable during a Trustee’s lifetime, beginning the year following retirement, for the number of years of service through December 31, 2006. Pension expense for the fund is included in Trustee compensation and expenses in the Statement of operations. Accrued pension liability is included in Payable for Trustee compensation and expenses in the Statement of assets and liabilities. The Trustees have terminated the Pension Plan with respect to any Trustee first elected after 2003.
The fund has adopted distribution plans (the “Plans”) with respect to its class A, class B, class C, class M and class R shares pursuant to Rule 12b-1 under the Investment Company Act of 1940. The purpose of the Plans is to compensate Putnam Retail Management, a wholly-owned subsidiary of Putnam, LLC and Putnam Retail Management GP, Inc., for services provided and expenses incurred in distributing shares of the fund. The Plans provide for payments by the fund to Putnam Retail Management at an annual rate of up to 0.35%, 1.00%, 1.00%, 1.00% and 1.00% of the average net assets attributable to class A, class B, class C, class M and class R shares, respectively. The Trustees have approved payment by the fund at an annual rate of 0.25%, 1.00%, 1.00%, 0.75% and 0.50% of the average net assets attributable to class A, class B, class C, class M and class R shares, respectively.
For the six months ended October 31, 2007, Putnam Retail Management, acting as underwriter, received net commissions of $14,929 and $260 from the sale of class A and class M shares, respectively, and received $50,706 and $1,623 in contingent deferred sales charges from redemptions of class B and class C shares, respectively. A deferred sales charge of up to 1.00% and 0.65% is assessed on certain redemptions of class A and class M shares, respectively. For the six months ended October 31, 2007, Putnam Retail Management, acting as underwriter, received $1,211 and no monies on class A and class M redemptions, respectively.
Note 3: Purchases and sales of securities
During the six months ended October 31, 2007, cost of purchases and proceeds from sales of investment securities other than short-term investments aggregated $122,223,538 and $217,642,009, respectively. There were no purchases or sales of U.S. government securities.
Note 4: Capital shares
At October 31, 2007, there was an unlimited number of shares of beneficial interest authorized. Transactions in capital shares were as follows:
| | |
| CLASS A | Shares | Amount |
|
| Six months ended 10/31/07: | |
| Shares sold | 5,756,564 | $ 69,766,123 |
|
| Shares issued | | |
| in connection | | |
| with reinvestment | | |
| of distributions | — | — |
|
| | 5,756,564 | 69,766,123 |
|
| Shares | | |
| repurchased | (6,837,079) | (82,448,867) |
|
| Net decrease | (1,080,515) | $ (12,682,744) |
| |
| Year ended 4/30/07: | | |
| Shares sold | 9,808,941 | $ 118,438,959 |
|
| Shares issued | | |
| in connection | | |
| with reinvestment | | |
| of distributions | 4,582,695 | 54,075,773 |
|
| | 14,391,636 | 172,514,732 |
|
| Shares | | |
| repurchased | (11,490,063) | (138,374,308) |
|
| Net increase | 2,901,573 | $ 34,140,424 |
55
| | |
| CLASS B | Shares | Amount |
|
| Six months ended 10/31/07: | |
| Shares sold | 354,711 | $ 3,994,269 |
|
| Shares issued | | |
| in connection | | |
| with reinvestment | | |
| of distributions | — | — |
|
| | 354,711 | 3,994,269 |
|
| Shares | | |
| repurchased | (2,892,031) | (32,389,028) |
|
| Net decrease | (2,537,320) | $(28,394,759) |
| |
| Year ended 4/30/07: | | |
| Shares sold | 1,251,892 | $ 14,107,708 |
|
| Shares issued | | |
| in connection | | |
| with reinvestment | | |
| of distributions | 1,991,563 | 21,767,811 |
|
| | 3,243,455 | 35,875,519 |
|
| Shares | | |
| repurchased | (8,051,716) | (90,392,060) |
|
| Net decrease | (4,808,261) | $(54,516,541) |
|
| |
| CLASS C | Shares | Amount |
|
| Six months ended 10/31/07: | |
| Shares sold | 173,275 | $ 1,979,711 |
|
| Shares issued | | |
| in connection | | |
| with reinvestment | | |
| of distributions | — | — |
|
| | 173,275 | 1,979,711 |
|
| Shares | | |
| repurchased | (488,184) | (5,393,655) |
|
| Net decrease | (314,909) | $(3,413,944) |
| |
| Year ended 4/30/07: | | |
| Shares sold | 363,421 | $ 4,117,564 |
|
| Shares issued | | |
| in connection | | |
| with reinvestment | | |
| of distributions | 318,046 | 3,514,415 |
|
| | 681,467 | 7,631,979 |
|
| Shares | | |
| repurchased | (603,086) | (6,836,810) |
|
| Net increase | 78,381 | $ 795,169 |
| | |
| CLASS M | Shares | Amount |
|
| Six months ended 10/31/07: | |
| Shares sold | 80,341 | $ 951,169 |
|
| Shares issued | | |
| in connection | | |
| with reinvestment | | |
| of distributions | — | — |
|
| | 80,341 | 951,169 |
|
| Shares | | |
| repurchased | (302,467) | (3,483,958) |
|
| Net decrease | (222,126) | $(2,532,789) |
| |
| Year ended 4/30/07: | | |
| Shares sold | 170,482 | $ 1,970,798 |
|
| Shares issued | | |
| in connection | | |
| with reinvestment | | |
| of distributions | 166,975 | 1,871,793 |
|
| | 337,457 | 3,842,591 |
|
| Shares | | |
| repurchased | (466,560) | (5,369,933) |
|
| Net decrease | (129,103) | $(1,527,342) |
|
| |
| CLASS R | Shares | Amount |
|
| Six months ended 10/31/07: | |
| Shares sold | 62,649 | $ 740,562 |
|
| Shares issued | | |
| in connection | | |
| with reinvestment | | |
| of distributions | — | — |
|
| | 62,649 | 740,562 |
|
| Shares | | |
| repurchased | (40,358) | (475,367) |
|
| Net increase | 22,291 | $ 265,195 |
| |
| Year ended 4/30/07: | | |
| Shares sold | 108,028 | $1,289,813 |
|
| Shares issued | | |
| in connection | | |
| with reinvestment | | |
| of distributions | 17,840 | 208,204 |
|
| | 125,868 | 1,498,017 |
|
| Shares | | |
| repurchased | (25,689) | (309,715) |
|
| Net increase | 100,179 | $1,188,302 |
56
| | |
| CLASS Y | Shares | Amount |
|
| Six months ended 10/31/07: | |
| Shares sold | 5,661,011 | $ 69,584,690 |
|
| Shares issued | | |
| in connection | | |
| with reinvestment | | |
| of distributions | — | — |
|
| | 5,661,011 | 69,584,690 |
|
| Shares | | |
| repurchased | (6,392,142) | (79,216,178) |
|
| Net decrease | (731,131) | $(9,631,488) |
| |
| Year ended 4/30/07: | | |
| Shares sold | 10,341,302 | $ 126,094,342 |
|
| Shares issued | | |
| in connection | | |
| with reinvestment | | |
| of distributions | 3,956,354 | 47,476,242 |
|
| | 14,297,656 | 173,570,584 |
|
| Shares | | |
| repurchased | (10,740,907) | (132,702,504) |
|
| Net increase | 3,556,749 | $ 40,868,080 |
Note 5: Investment in Putnam Prime Money Market Fund
The fund invests in Putnam Prime Money Market Fund, an open-end management investment company managed by Putnam Management. Investments in Putnam Prime Money Market Fund are valued at its closing net asset value each business day. Management fees paid by the fund are reduced by an amount equal to the management fees paid by Putnam Prime Money Market Fund with respect to assets invested by the fund in Putnam Prime Money Market Fund. For the period ended October 31, 2007, management fees paid were reduced by $6,278 relating to the fund’s investment in Putnam Prime Money Market Fund. Income distributions earned by the fund are recorded as income in the Statement of operations and totaled $437,087 for the period ended October 31, 2007. During the period ended October 31, 2007, cost of purchases and proceeds of sales of investments in Putnam Prime Money Market Fund aggregated $79,618,702 and $86,243,286, respectively.
Note 6: Regulatory matters and litigation
In late 2003 and 2004, Putnam Management settled charges brought by the Securities and Exchange Commission (the “SEC”) and the Massachusetts Securities Division in connection with excessive short-term trading in Putnam funds. Payments from Putnam Management will be distributed to certain open-end Putnam funds and their shareholders. These allegations and related matters have served as the general basis for certain lawsuits, including purported class action lawsuits against Putnam Management and, in a limited number of cases, some Putnam funds. Putnam Management believes that these lawsuits will have no material adverse effect on the funds or on Putnam Management’s ability to provide investment management services. In addition, Putnam Management has agreed to bear any costs incurred by the Putnam funds as a result of these matters.
Putnam Management and Putnam Retail Management are named as defendants in a civil suit in which the plaintiffs allege that the management and distribution fees paid by certain Putnam funds were excessive and seek recovery under the Investment Company Act of 1940. Putnam Management and Putnam Retail Management have contested the plaintiffs’ claims and the matter is currently pending in the U.S. District Court for the District of Massachusetts. Based on currently available information, Putnam Management believes that this action is without merit and that it is unlikely to have a material effect on Putnam Management’s and Putnam Retail Management’s ability to provide services to their clients, including the fund.
57
Note 7: New accounting pronouncements
In June 2006, the Financial Accounting Standards Board (“FASB”) issued Interpretation No. 48, Accounting for Uncertainty in Income Taxes (the “Interpretation”). The Interpretation prescribes a minimum threshold for financial statement recognition of the benefit of a tax position taken or expected to be taken by a filer in the filer’s tax return. Upon adoption, the Interpretation did not have a material effect on the fund’s financial statements. However, the conclusions regarding the Interpretation may be subject to review and adjustment at a later date based on factors including, but not limited to, further implementation guidance expected from the FASB, and on-going analysis of tax laws, regulations and interpretations thereof.
In September 2006, the FASB issued Statement of Financial Accounting Standards No. 157, Fair Value Measurements (the “Standard”). The Standard defines fair value, sets out a framework for measuring fair value and requires additional disclosures about fair value measurements. The Standard applies to fair value measurements already required or permitted by existing standards. The Standard is effective for financial statements issued for fiscal years beginning after November 15, 2007 and interim periods within those fiscal years. Putnam Management is currently evaluating what impact the adoption of the Standard will have on the fund’s financial statements.
58
Shareholder meeting results (unaudited)
May 15, 2007 meeting
A proposal to approve a new management contract between the fund and Putnam Investment Management, LLC was approved as follows:
| | |
| Votes for | Votes against | Abstentions |
|
| 66,693,788 | 1,166,533 | 1,244,612 |
|
All tabulations are rounded to the nearest whole number.
59
Brokerage commissions (unaudited)
Brokerage commissions are paid to firms that execute trades on behalf of your fund. When choosing these firms, Putnam is required by law to seek the best execution of the trades, taking all relevant factors into consideration, including expected quality of execution and commission rate. Listed below are the largest relationships based upon brokerage commissions for your fund and the other funds in Putnam’s U.S. Small- and Mid-Cap group for the year ended October 31, 2007. The other Putnam mutual funds in this group are Putnam Discovery Growth Fund, Putnam Mid Cap Value Fund, Putnam New Opportunities Fund, Putnam OTC & Emerging Growth Fund, Putnam Small Cap Growth Fund, Putnam Small Cap Value Fund, Putnam Vista Fund, Putnam VT Capital Opportunities Fund, Putnam VT Discovery Growth Fund, Putnam VT Mid Cap Value Fund, Putnam VT New Opportunities Fund, Putnam VT OTC & Emerging Growth Fund, Putnam VT Small Cap Value Fund, and Putnam VT Vista Fund.
The top five firms that received brokerage commissions for trades executed for the U.S. Small-and Mid-Cap group are (in descending order) Citigroup Global Markets, Merrill Lynch, Credit Suisse First Boston, Morgan Stanley Dean Witter, and UBS Warburg. Commissions paid to these firms together represented approximately 39% of the total brokerage commissions paid for the year ended October 31, 2007.
Commissions paid to the next 10 firms together represented approximately 39% of the total brokerage commissions paid during the period. These firms are (in alphabetical order) Bear Stearns & Company, CIBC World Markets, Deutsche Bank Securities, Goldman Sachs, JPMorgan Clearing, Lehman Brothers, RBC Capital Markets, SG Cowen, Thomas Weisel Partners, and Wachovia Securities.
Additional information about brokerage commissions is available on the Securities and Exchange Commission (SEC) Web site at www.sec.gov. Putnam funds disclose commissions by firm to the SEC in semiannual filings on Form N-SAR.
60
Fund information
Founded 70 years ago, Putnam Investments was built around the concept that a balance between risk and reward is the hallmark of a well-rounded financial program. We manage over 100 mutual funds in growth, value, blend, fixed income, and international.
| | |
| Investment Manager | Officers | Francis J. McNamara, III |
| Putnam Investment | Charles E. Haldeman, Jr. | Vice President and Chief |
| Management, LLC | President | Legal Officer |
| One Post Office Square | | |
| Boston, MA 02109 | Charles E. Porter | Robert R. Leveille |
| | Executive Vice President, | Vice President and Chief |
| Marketing Services | Principal Executive Officer, | Compliance Officer |
| Putnam Retail Management | Associate Treasurer and | |
| One Post Office Square | Compliance Liaison | Mark C. Trenchard |
| Boston, MA 02109 | | Vice President and BSA |
| | Jonathan S. Horwitz | Compliance Officer |
| Custodian | Senior Vice President | |
| State Street Bank and | and Treasurer | Judith Cohen |
| Trust Company | | Vice President, Clerk and |
| | Steven D. Krichmar | Assistant Treasurer |
| Legal Counsel | Vice President and Principal | |
| Ropes & Gray LLP | Financial Officer | Wanda M. McManus |
| | | Vice President, Senior Associate |
| Trustees | Janet C. Smith | Treasurer and Assistant Clerk |
| John A. Hill, Chairman | Vice President, Principal | |
| Jameson Adkins Baxter, | Accounting Officer and | Nancy E. Florek |
| Vice Chairman | Assistant Treasurer | Vice President, Assistant Clerk, |
| Charles B. Curtis | | Assistant Treasurer and |
| Robert J. Darretta | Susan G. Malloy | Proxy Manager |
| Myra R. Drucker | Vice President and | |
| Charles E. Haldeman, Jr. | Assistant Treasurer | |
| Paul L. Joskow | | |
| Elizabeth T. Kennan | Beth S. Mazor | |
| Kenneth R. Leibler | Vice President | |
| Robert E. Patterson | | |
| George Putnam, III | James P. Pappas | |
| W. Thomas Stephens | Vice President | |
| Richard B. Worley | | |
| Richard S. Robie, III | |
| Vice President | |
This report is for the information of shareholders of Putnam Capital Opportunities Fund. It may also be used as sales literature when preceded or accompanied by the current prospectus, the most recent copy of Putnam’s Quarterly Performance Summary, and Putnam’s Quarterly Ranking Summary. For more recent performance, please visit www.putnam.com. Investors should carefully consider the investment objective, risks, charges, and expenses of a fund, which are described in its prospectus. For this and other information or to request a prospectus, call 1-800-225-1581 toll free. Please read the prospectus carefully before investing. The fund’s Statement of Additional Information contains additional information about the fund’s Trustees and is available without charge upon request by calling 1-800-225-1581.

Item 2. Code of Ethics:
Not applicable
Item 3. Audit Committee Financial Expert:
Not applicable
Item 4. Principal Accountant Fees and Services:
Not applicable
Item 5. Audit Committee of Listed Registrants
Not applicable
Item 6. Schedule of Investments:
The registrant’s schedule of investments in unaffiliated issuers is included in the report to shareholders in Item 1 above.
Item 7. Disclosure of Proxy Voting Policies and Procedures For Closed-End Management Investment Companies:
Not applicable
Item 8. Portfolio Managers of Closed-End Investment Companies
Not Applicable
Item 9. Purchases of Equity Securities by Closed-End Management Investment Companies and Affiliated Purchasers:
Not applicable
Item 10. Submission of Matters to a Vote of Security Holders:
Not applicable
Item 11. Controls and Procedures:
(a) The registrant's principal executive officer and principal financial officer have concluded, based on their evaluation of the effectiveness of the design and operation of the registrant's disclosure controls and procedures as of a date within 90 days of the filing date of this report, that the design and operation of such procedures are generally effective to provide reasonable assurance that information required to be disclosed by the registrant in this report is recorded, processed, summarized and reported within the time periods specified in the Commission's rules and forms.
(b) Changes in internal control over financial reporting: During the period, Putnam Fiduciary Trust Company, the fund's transfer agent, began utilizing shareholder systems and systems support provided by DST Systems, Inc. and certain of its affiliates.
Item 12. Exhibits:
(a)(1) Not applicable
(a)(2) Separate certifications for the principal executive officer and principal financial officer of the registrant as required by Rule 30a-2(a) under the Investment Company Act of 1940, as amended, are filed herewith.
(b) The certifications required by Rule 30a-2(b) under the Investment Company Act of 1940, as amended, are filed herewith.
SIGNATURES
Pursuant to the requirements of the Securities Exchange Act of 1934 and the Investment Company Act of 1940, the registrant has duly caused this report to be signed on its behalf by the undersigned, thereunto duly authorized.
Putnam Investment Funds
By (Signature and Title):
/s/Janet C. Smith
Janet C. Smith
Principal Accounting Officer
Date: December 28, 2007
Pursuant to the requirements of the Securities Exchange Act of 1934 and the Investment Company Act of 1940, this report has been signed below by the following persons on behalf of the registrant and in the capacities and on the dates indicated.
By (Signature and Title):
/s/Charles E. Porter
Charles E. Porter
Principal Executive Officer
Date: December 28, 2007
By (Signature and Title):
/s/Steven D. Krichmar
Steven D. Krichmar
Principal Financial Officer
Date: December 28, 2007
UNITED STATES
SECURITIES AND EXCHANGE COMMISSION
Washington, D.C. 20549
FORM N-CSR
CERTIFIED SHAREHOLDER REPORT OF REGISTERED
MANAGEMENT INVESTMENT COMPANIES
Investment Company Act file number: (811- 07237)
Exact name of registrant as specified in charter: Putnam Investment Funds
Address of principal executive offices: One Post Office Square, Boston, Massachusetts 02109
| |
| Name and address of agent for service: | Beth S. Mazor, Vice President |
| | One Post Office Square |
| | Boston, Massachusetts 02109 |
| |
| Copy to: | John W. Gerstmayr, Esq. |
| | Ropes & Gray LLP |
| | One International Place |
| | Boston, Massachusetts 02110 |
Registrant’s telephone number, including area code: (617) 292-1000
Date of fiscal year end: April 30, 2008
Date of reporting period: May 1, 2007 — October 31, 2007
Item 1. Report to Stockholders:
The following is a copy of the report transmitted to stockholders pursuant to Rule 30e-1 under the Investment Company Act of 1940:

What makes Putnam different?

In 1830, Massachusetts Supreme Judicial Court Justice Samuel Putnam established The Prudent Man Rule, a legal foundation for responsible money management.
THE PRUDENT MAN RULE
All that can be required of a trustee to invest is that he shall conduct himself faithfully and exercise a sound discretion. He is to observe how men of prudence, discretion, and intelligence manage their own affairs, not in regard to speculation, but in regard to the permanent disposition of their funds, considering the probable income, as well as the probable safety of the capital to be invested.

A time-honored tradition in money management
Since 1937, our values have been rooted in a profound sense of responsibility for the money entrusted to us.
A prudent approach to investing
We use a research-driven team approach to seek consistent, dependable, superior investment results over time, although there is no guarantee a fund will meet its objectives.
Funds for every investment goal
We offer a broad range of mutual funds and other financial products so investors and their financial representatives can build diversified portfolios.
A commitment to doing what’s right for investors
With a focus on investment performance, below-average expenses, and in-depth information about our funds, we put the interests of investors first and seek to set the standard for integrity and service.
Industry-leading service
We help investors, along with their financial representatives, make informed investment decisions with confidence.
Putnam
Mid Cap
Value Fund
10| 31| 07
Semiannual Report
| |
| Message from the Trustees | 2 |
| About the fund | 4 |
| Performance snapshot | 6 |
| Report from the fund managers | 7 |
| Performance in depth | 12 |
| Expenses | 15 |
| Portfolio turnover | 17 |
| Risk | 18 |
| Your fund’s management | 19 |
| Terms and definitions | 21 |
| Trustee approval of management contract | 23 |
| Other information for shareholders | 28 |
| Financial statements | 29 |
| Shareholder meeting results | 51 |
| Brokerage commissions | 52 |
Cover photograph: © White-Packert Photography
Message from the Trustees
Dear Fellow Shareholder
In November, Putnam Investments celebrated its 70th anniversary. From modest beginnings in Boston, Massachusetts, Putnam has grown into a global asset manager that serves millions of investors worldwide. Coincident with this anniversary, we are pleased to announce that Great-West Lifeco Inc. recently completed its purchase of Putnam Investments from Marsh & McLennan Companies, Inc. Great-West Lifeco is a financial services holding company with operations in Canada, the United States, and Europe, and is a member of the Power Financial Corporation group of companies. With this change, Putnam becomes part of a successful organization with a long-standing commitment to high-quality investment management and financial services. The change in ownership is not expected to affect the Putnam funds, the way Putnam manages money, or the funds’ management teams.
We would also like to take this opportunity to announce that Putnam President and Chief Executive Officer Ed Haldeman, one of your fund’s Trustees since 2004, was named President of the Funds, assuming this role from George Putnam, III. This change, together with the completion of the transaction with Great-West Lifeco, has enabled George Putnam to become an independent Trustee of the funds. Both George and Ed will continue serving on the Board of Trustees in our collective role of overseeing the Putnam funds on your behalf.
Lastly, we are pleased to announce that a new independent Trustee, Robert J. Darretta, has joined your fund’s Board of Trustees. Mr. Darretta brings extensive leadership experience in corporate finance and accounting. He is a former Vice Chairman of the Board of Directors of Johnson & Johnson, one of the leading U.S. health-care and consumer products companies, where he also served as Chief Financial Officer, Executive Vice President, and Treasurer.
2
Although the mutual fund industry has undergone many changes since George Putnam introduced his innovative balanced fund in 1937, Putnam’s guiding principles have not. As we celebrate Putnam’s 70-year milestone, we look forward to Putnam continuing its long tradition of prudent money management and to the new chapter opened by its recent change in ownership. As always, we thank you for your support of the Putnam funds.

Putnam Mid Cap Value Fund: seeking undervalued
companies before their potential is recognized

Hidden opportunities —and a measure of patience — are key ingredients in the investment strategy of Putnam Mid Cap Value Fund. The fund invests in stocks of midsize companies, which tend to be followed by fewer Wall Street analysts than stocks of larger companies. For firms with strong research capabilities, such as Putnam, these stocks can represent attractive opportunities. With support from a team of dedicated stock analysts, the fund’s management team seeks to identify promising midsize companies before the market recognizes their potential.
Another advantage of midsize companies is that they tend to be more agile than large companies, while offering a greater degree of stability than smaller, less mature companies. Most midsize companies have developed a solid infrastructure, including professional management and a comprehensive business plan. Most have also weathered a full economic cycle.
Because Putnam Mid Cap Value Fund is managed in the value style, its managers also take another important factor into consideration: The stocks they purchase must be attractively priced in relation to the company’s earnings and growth potential. A value stock’s price may be low because the company’s potential is being underestimated or because the company is in an industry that is currently out of favor with investors. Often, companies in the portfolio are undergoing positive changes that may improve their earnings and growth potential. Catalysts for change can include restructuring, introduction of new products, new management, acquisitions, or streamlining of operations to cut costs.
Of course, such changes can take time. As noted in the fund’s first annual report to shareholders in April 2000, “Once a stock is in the portfolio, patience is called for while waiting for the positive change that can lift the stock’s share price. Accordingly, investors should understand that this fund is most appropriate for those with long-term investment horizons.”
The fund invests some or all of its assets in small and/or midsize companies. Such investments increase the risk of greater fluctuations in the value of your investment. Value investing seeks under-priced stocks, but there is no guarantee that a stock’s price will rise.
In-depth analysis is key to successful stock selection.
Drawing on the expertise of a dedicated team of stock analysts, the fund’s management team seeks attractive value stocks. Once a stock is selected for the portfolio, it is regularly assessed by members of the team to ensure that it continues to meet their criteria, including:
Valuation They carefully consider how each stock is valued, seeking stocks whose valuations are attractive relative to the company’s profitability potential.
Change They focus on company fundamentals against the broader context of industry trends to identify whether individual companies possess a catalyst for positive change.
Quality They look for high-quality companies, seeking characteristics such as sound balance sheets, profitable business models, and competent management.
Putnam Mid Cap Value Fund holdings
have spanned industries over time.
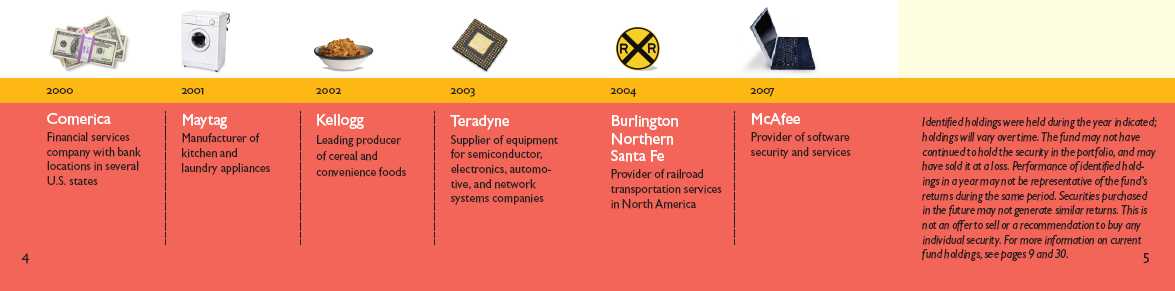
Performance snapshot
Putnam Mid Cap
Value Fund
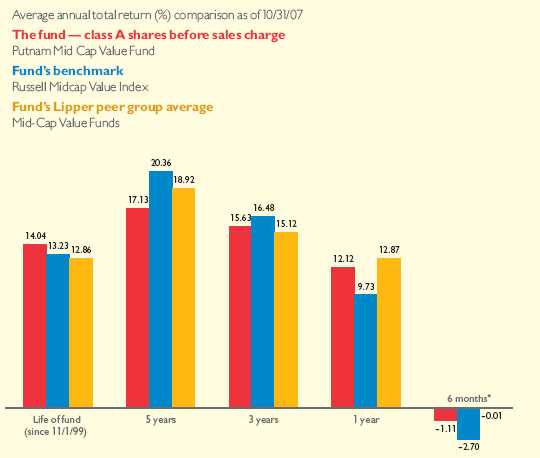
Current performance may be lower or higher than the quoted past performance, which cannot guarantee future results. Share price, principal value, and return will fluctuate, and you may have a gain or a loss when you sell your shares. Performance of class A shares assumes reinvestment of distributions and does not account for taxes. Fund returns in the bar chart do not reflect a sales charge. See pages 12–14 for additional performance information. For a portion of the periods, this fund may have limited expenses, without which returns would have been lower. A 1% short-term trading fee may apply. To obtain the most recent month-end performance, visit www.putnam.com.
* Returns for the six-month period are not annualized, but cumulative.
6
Report from the fund managers
The period in review
The first six months of your fund’s 2008 fiscal year proved to be a difficult period for mid-cap value stocks. However, we are pleased to report that our diversified portfolio of stocks outperformed the fund’s benchmark index, the Russell Midcap Value Index, for the six months ended October 31, 2007. The benchmark carried a significant weighting in the financials industry, which was hit hard by the contagion unleashed by the subprime mortgage crisis. Our approach of underweighting financials relative to the benchmark thus proved beneficial, as was our successful stock selection within that sector. Strong security selection and a larger-than-benchmark position in the energy and information technology sectors also helped the fund’s performance relative to its benchmark, as these sectors delivered solid performance for the period. On the down side, a slight emphasis on and less successful stock selection in the lagging consumer cy clicals area hurt relative performance, as did the poor performance of an investment in the transportation industry. Although the fund outperformed its benchmark during the semiannual period, it did trail the average of its Lipper group — Mid-Cap Value Funds — largely, we believe, because the fund’s peers had underweighted financials even more than we did.
Market overview
The capital markets endured a volatile period, particularly within the mid-cap value area. Problems in the subprime mortgage market hurt financials —especially bank stocks — in the summer, as investors were unclear about how much exposure institutions might have to the subprime area. There also were concerns that a continuing slowdown in the housing market could further dampen consumer spending. Crude oil prices marched steadily higher, helping energy stocks but further exacerbating worries of a consumer slowdown. Even though the Federal Reserve (the Fed) lowered short-term interest rates in
7
September and October — helping to sustain strong overall economic growth in the third quarter — uncertainty remained about the health and direction of the economy. At the same time, overseas economies posted strong growth, helping the performance of capital goods, materials, and industrials stocks. Investors rotated away from the value-priced stocks that had led the market for some time, instead looking for higher-quality companies offering steadier or more compelling earnings growth. Overall, there was a sharp division between which stocks fared well and which declined, with only a narrow swath of shares posting the best gains.
Strategy overview
In the face of a challenging investment environment, we did not change our basic approach. We pursued a bottom-up process, selecting stocks one at a time, believing that successful stock selection should be the driver of long-term outperformance of the benchmark. Our parallel goal was to maintain diversification. We invested across all industry sectors within the mid-cap value universe, and occasionally selected stocks that were outside the fund’s benchmark.
Early in the period, we recognized that stocks in the financials sector were going to face problems as the economic boom of the past several years looked to be unraveling. In response, we started to trim our positions in finance stocks, underweighting that area even more than we had previously.
Market sector and fund performance
This comparison shows your fund’s performance in the context of different market sectors for the six months ended 10/31/07. See page 6 and pages 12—14 for additional fund performance information. Index descriptions can be found on page 22.
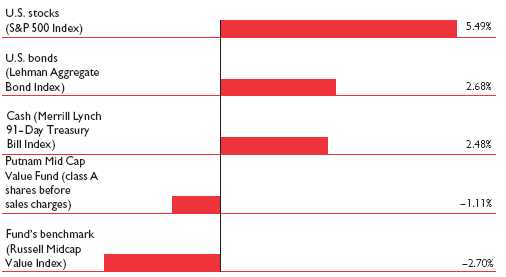
8
We also worked to cull some of the lower-quality investments in the portfolio, particularly among financials. We felt that while these holdings may offer significant upside potential, they could put a significant drag on performance as the market continued to move toward what it perceived to be higher-quality securities.
Overall, we invested in stocks from across the value continuum, including contrarian investments — those that were out of favor but offered compelling turnaround stories — as well as stocks of companies with improving business prospects and earnings-growth potential that were not reflected in valuations, and reasonably priced shares of firms with strong business fundamentals. Further, we favored higher-quality companies offering more reliable earnings growth, as we perceived the market was starting to favor these companies.
Your fund’s holdings
The energy sector continued to be a fertile area for the fund during the semi-annual period, as companies in the sector benefited from the steady, upward march in petroleum prices. We maintained and even increased our emphasis on energy, which helped support the fund’s outperformance of its benchmark. Energy services company National-Oilwell Varco was among the top-performing stocks for your fund. The stock rose as investors looked to profit from investing in companies that could benefit directly from rising oil prices.
Comparison of top industry weightings
This chart shows how the fund’s top weightings have changed over the past six months. Weightings are shown as a percentage of net assets. Holdings will vary over time.
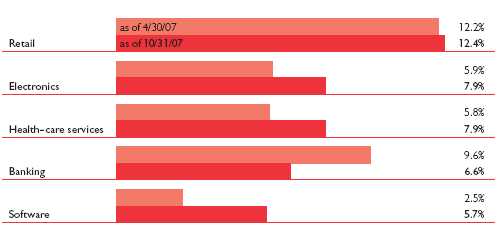
9
Additionally, the company was able to continue to exceed earnings estimates due to increased drilling activity as well as new-rig construction. Energy exploration and production company Newfield Exploration also rose on the strength of increased drilling activity.
Investments outside the energy sector that buoyed performance included an out-of-benchmark position in online educational services provider Apollo Group. The stock of this company had struggled previously as the firm’s costs to acquire new students had been going up at the same time that investors were concerned about admissions trends. However, for two quarters in a row the company successfully cut costs and posted growth in earnings from tuition. Security software and services provider McAfee posted advances as the company moved on from accounting issues that had held back t he stock previously. The company’s new CEO helped the company take advantage of solid business trends in both the consumer and business enterprise areas. Lastly, General Cable, not part of the benchmark, made a significant acquisition during the period that investors felt would solidify the company’s competitive position.
As would be expected during a period of negative returns, there were a number of fund holdings that declined. The top four detractors from performance relative to the benchmark during this six-month time frame were benchmark components as well as consumer-related stocks that were hurt by the market’s concerns about the health of the U.S. economy.
Top holdings
This table shows the fund’s top holdings, and the percentage of the fund’s net assets that each represented, as of 10/31/07. The fund’s holdings will change over time.
| |
| Holding (percent of fund’s net assets) | Industry |
|
| McAfee, Inc. (3.4%) | Software |
|
| BJ's Wholesale Club, Inc. (3.1%) | Retail |
|
| General Cable Corp. (2.7%) | Electronics |
|
| WESCO International, Inc. (2.6%) | Electrical equipment |
|
| OfficeMax, Inc. (2.4%) | Retail |
|
| Parametric Technology Corp. (2.3%) | Software |
|
| United States Steel Corp. (2.3%) | Metals |
|
| Jones Apparel Group, Inc. (2.2%) | Textiles |
|
| Atmel Corp. (2.1%) | Electronics |
|
| Interpublic Group of Companies, Inc. (The) (2.0%) | Media |
|
10
We purchased additional Office Max shares because its share price was attractive relative to its main competitors, Staples and Office Depot, and because the company’s profit margins looked to be improving. However, the firm missed its second-quarter earnings targets and was dragged down further by Office Depot’s poor third quarter. Drugstore retailer Rite Aid, a previous turnaround story, declined, as the company, in its purchase of Eckerd’s, added more debt to its already debt-laden balance sheet. Its comparable store sales were below expectations, and industry competitor Walgreen’s endured a poor quarter. Worries about the housing sector dragged down appliance manufacturer Whirlpool. Finally, Jones Apparel Group benefited from the sale of its Barney’s retail franchise. Unfortunately, its main business — wholesaling to department stores — remained under pressure. All four of these stocks remained in the fund at period-end, due to our sustained confidence in their long-term prospects.
Please note that the holdings discussed in this report may not have been held by the fund for the entire period. Portfolio composition is subject to review in accordance with the fund’s investment strategy and may vary in the future.
The outlook for your fund
The following commentary reflects anticipated developments that could affect your fund over the next six months, as well as your management team’s plans for responding to them.
As we close out calendar 2007 and head into 2008, many mid-cap value stocks have had difficulties in the aftermath of the last few quarters. While some valuations may be compelling, we plan to avoid stocks that don’t appear to harbor a catalyst for change, or that don’t project an attractive long-term story. If the market continues to gravitate away from value toward growth stocks, we intend to look for stocks of companies offering attractive valuations combined with good growth prospects. We will be looking for companies with solid franchises and clearly positive business fundamentals.
On the positive side, the Fed historically has shown its willingness to cut short-term interest rates to help provide stimulus in election years. Any such moves could open up significant new opportunities during the next several quarters. For now, though, amid significant uncertainty about the economy, we have become more interested in higher-quality companies offering earnings growth. We feel this is the most prudent approach in an environment where we perceive only a narrow selection of stocks could post gains while the rest of the market could decline or tread water.
The views expressed in this report are exclusively those of Putnam Management. They are not meant as investment advice.
The fund invests some or all of its assets in small and/or midsize companies. Such investments increase the risk of fluctuations in the value of your investment. Value investing seeks underpriced stocks, but there is no guarantee that a stock’s price will rise.
11
Your fund’s performance
This section shows your fund’s performance for periods ended October 31, 2007, the end of the first half of its current fiscal year. In accordance with regulatory requirements for mutual funds, we also include performance as of the most recent calendar quarter-end and expense information taken from the fund’s current prospectus. Performance should always be considered in light of a fund’s investment strategy. Data represents past performance. Past performance does not guarantee future results. More recent returns may be less or more than those shown. Investment return and principal value will fluctuate, and you may have a gain or a loss when you sell your shares. For the most recent month-end performance, please visit www.putnam.com or call Putnam at 1-800-225-1581. Class Y shares are generally only available to corporate and institutional clients and clients in other approved programs. See the Terms and Definitions sectio n in this report for definitions of the share classes offered by your fund.
Fund performance
Total return for periods ended 10/31/07
| | | | | | | | | | |
| | Class A | | Class B | | Class C | | Class M | | Class R | Class Y |
| (inception dates) | (11/1/99) | | (1/16/01) | | (1/16/01) | | (1/16/01) | | (4/1/03) | (4/2/02) |
|
| | NAV | POP | NAV | CDSC | NAV | CDSC | NAV | POP | NAV | NAV |
|
| Life of fund | 186.24% | 171.23% | 169.61% | 169.61% | 169.64% | 169.64% | 175.23% | 166.21% | 180.84% | 190.40% |
| Annual average | 14.04 | 13.27 | 13.19 | 13.19 | 13.19 | 13.19 | 13.48 | 13.01 | 13.77 | 14.24 |
|
| 5 years | 120.51 | 109.00 | 112.39 | 110.39 | 112.49 | 112.49 | 115.18 | 108.11 | 117.92 | 123.45 |
| Annual average | 17.13 | 15.89 | 16.26 | 16.04 | 16.27 | 16.27 | 16.56 | 15.79 | 16.86 | 17.45 |
|
| 3 years | 54.60 | 46.52 | 51.15 | 48.15 | 51.22 | 51.22 | 52.39 | 47.44 | 53.51 | 55.89 |
| Annual average | 15.63 | 13.58 | 14.76 | 14.00 | 14.78 | 14.78 | 15.08 | 13.82 | 15.36 | 15.95 |
|
| 1 year | 12.12 | 6.25 | 11.27 | 6.28 | 11.32 | 10.32 | 11.61 | 7.98 | 11.90 | 12.49 |
|
| 6 months | –1.11 | –6.29 | –1.46 | –6.39 | –1.46 | –2.45 | –1.32 | –4.55 | –1.24 | –0.92 |
|
Current performance may be lower or higher than the quoted past performance, which cannot guarantee future results. After sales charge returns (public offering price, or POP) for class A and M shares reflect a maximum 5.25% and 3.25% load, respectively. Class B share returns reflect the applicable contingent deferred sales charge (CDSC), which is 5% in the first year, declining to 1% in the sixth year, and is eliminated thereafter. Class C shares reflect a 1% CDSC for the first year and is eliminated thereafter. Class R and Y shares have no initial sales charge or CDSC. Performance for class B, C, M, R, and Y shares before their inception is derived from the historical performance of class A shares, adjusted for the applicable sales charge (or CDSC) and, except for class Y shares, the higher operating expenses for such shares. For a portion of the periods, this fund may have limited expenses, without which returns would have been l ower.
A 1% short-term trading fee may be applied to shares exchanged or sold within 7 days of purchase.
12
Comparative index returns
For periods ended 10/31/07
| | |
| | | Lipper Mid-Cap |
| | Russell Midcap | Value Funds |
| | Value Index | category average* |
|
| Life of fund | 170.31% | 167.05% |
| Annual average | 13.23 | 12.86 |
|
| 5 years | 152.56 | 141.01 |
| Annual average | 20.36 | 18.92 |
|
| 3 years | 58.02 | 52.98 |
| Annual average | 16.48 | 15.12 |
|
| 1 year | 9.73 | 12.87 |
|
| 6 months | –2.70 | –0.01 |
|
Index and Lipper results should be compared to fund performance at net asset value.
* Over the 6-month, 1-year, 3-year, 5-year, and life-of-fund periods ended 10/31/07, there were 323, 307, 239, 188, and 83 funds, respectively, in this Lipper category.
Fund price and distribution* information
For the six-month period ended 10/31/07
| | | | | | | | |
| | | | | | |
| | Class A | Class B | Class C | Class M | Class R | Class Y |
|
| Share value: | NAV | POP | NAV | NAV | NAV | POP | NAV | NAV |
| 4/30/07 | $16.26 | $17.16 | $15.76 | $15.74 | $15.93 | $16.47 | $16.08 | $16.30 |
|
| 10/31/07 | 16.08 | 16.97 | 15.53 | 15.51 | 15.72 | 16.25 | 15.88 | 16.15 |
|
* The fund did not make any distributions during the period.
13
Fund performance as of most recent calendar quarter
Total return for periods ended 9/30/07
| | | | | | | | | | |
| | Class A | | Class B | | Class C | | Class M | | Class R | Class Y |
| (inception dates) | (11/1/99) | | (1/16/01) | | (1/16/01) | | (1/16/01) | | (4/1/03) | (4/2/02) |
| | NAV | POP | NAV | CDSC | NAV | CDSC | NAV | POP | NAV | NAV |
|
| Life of fund | 180.01% | 165.33% | 164.06% | 164.06% | 163.90% | 163.90% | 169.28% | 160.45% | 174.83% | 183.92% |
| Annual average | 13.88 | 13.11 | 13.04 | 13.04 | 13.04 | 13.04 | 13.32 | 12.85 | 13.62 | 14.08 |
|
| 5 years | 127.01 | 115.03 | 118.71 | 116.71 | 118.66 | 118.66 | 121.58 | 114.40 | 124.42 | 129.92 |
| Annual average | 17.82 | 16.55 | 16.94 | 16.73 | 16.94 | 16.94 | 17.25 | 16.48 | 17.55 | 18.12 |
|
| 3 years | 53.91 | 45.83 | 50.58 | 47.58 | 50.43 | 50.43 | 51.64 | 46.74 | 52.77 | 55.10 |
| Annual average | 15.46 | 13.40 | 14.62 | 13.85 | 14.58 | 14.58 | 14.89 | 13.64 | 15.17 | 15.75 |
|
| 1 year | 15.72 | 9.68 | 14.87 | 9.87 | 14.85 | 13.85 | 15.11 | 11.39 | 15.45 | 16.02 |
|
| 6 months | 0.51 | –4.78 | 0.13 | –4.87 | 0.07 | –0.93 | 0.26 | –3.03 | 0.39 | 0.64 |
|
Fund’s annual operating expenses
For the fiscal year ended 4/30/07
| | | | | | |
| | Class A | Class B | Class C | Class M | Class R | Class Y |
|
| Total annual fund | | | | | | |
| operating expenses | 1.23% | 1.98% | 1.98% | 1.73% | 1.48% | 0.98% |
|
Expense information in this table is taken from the most recent prospectus, is subject to change, and may differ from that shown in the next section and in the financial highlights of this report. Expenses are shown as a percentage of average net assets.
14
Your fund’s expenses
As a mutual fund investor, you pay ongoing expenses, such as management fees, distribution fees (12b-1 fees), and other expenses. In the most recent six-month period, your fund limited these expenses; had it not done so, expenses would have been higher. Using the information below, you can estimate how these expenses affect your investment and compare them with the expenses of other funds. You may also pay one-time transaction expenses, including sales charges (loads) and redemption fees, which are not shown in this section and would have resulted in higher total expenses. For more information, see your fund’s prospectus or talk to your financial representative.
Review your fund’s expenses
The table below shows the expenses you would have paid on a $1,000 investment in Putnam Mid Cap Value Fund from May 1, 2007, to October 31, 2007. It also shows how much a $1,000 investment would be worth at the close of the period, assuming actual returns and expenses.
| | | | | | |
| | Class A | Class B | Class C | Class M | Class R | Class Y |
|
| Expenses paid per $1,000* | $ 6.20 | $ 9.93 | $ 9.93 | $ 8.69 | $ 7.44 | $ 4.95 |
|
| Ending value (after expenses) | $988.90 | $985.40 | $985.40 | $986.80 | $987.60 | $990.80 |
|
* Expenses for each share class are calculated using the fund’s annualized expense ratio for each class, which represents the ongoing expenses as a percentage of average net assets for the six months ended 10/31/07. The expense ratio may differ for each share class (see the last table in this section). Expenses are calculated by multiplying the expense ratio by the average account value for the period; then multiplying the result by the number of days in the period; and then dividing that result by the number of days in the year.
Estimate the expenses you paid
To estimate the ongoing expenses you paid for the six months ended October 31, 2007, use the calculation method below. To find the value of your investment on May 1, 2007, call Putnam at 1-800-225-1581.
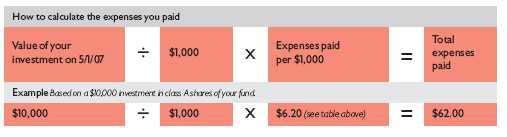
15
Compare expenses using the SEC’s method
The Securities and Exchange Commission (SEC) has established guidelines to help investors assess fund expenses. Per these guidelines, the table below shows your fund’s expenses based on a $1,000 investment, assuming a hypothetical 5% annualized return. You can use this information to compare the ongoing expenses (but not transaction expenses or total costs) of investing in the fund with those of other funds. All mutual fund shareholder reports will provide this information to help you make this comparison. Please note that you cannot use this information to estimate your actual ending account balance and expenses paid during the period.
| | | | | | |
| | Class A | Class B | Class C | Class M | Class R | Class Y |
|
| Expenses paid per $1,000* | $ 6.29 | $ 10.08 | $ 10.08 | $ 8.82 | $ 7.56 | $ 5.03 |
|
| Ending value (after expenses) | $1,018.90 | $1,015.13 | $1,015.13 | $1,016.39 | $1,017.65 | $1,020.16 |
|
* Expenses for each share class are calculated using the fund’s annualized expense ratio for each class, which represents the ongoing expenses as a percentage of average net assets for the six months ended 10/31/07. The expense ratio may differ for each share class (see the last table in this section). Expenses are calculated by multiplying the expense ratio by the average account value for the period; then multiplying the result by the number of days in the period; and then dividing that result by the number of days in the year.
Compare expenses using industry averages
You can also compare your fund’s expenses with the average of its peer group, as defined by Lipper, an independent fund-rating agency that ranks funds relative to others that Lipper considers to have similar investment styles or objectives. The expense ratio for each share class shown below indicates how much of your fund’s average net assets have been used to pay ongoing expenses during the period.
| | | | | | |
| | Class A | Class B | Class C | Class M | Class R | Class Y |
| Your fund's annualized | | | | | | |
| expense ratio | 1.24% | 1.99% | 1.99% | 1.74% | 1.49% | 0.99% |
|
| Average annualized expense | | | | | | |
| ratio for Lipper peer group* | 1.34% | 2.09% | 2.09% | 1.84% | 1.59% | 1.09% |
|
* Putnam is committed to keeping fund expenses below the Lipper peer group average expense ratio and will limit fund expenses if they exceed the Lipper average. The Lipper average is a simple average of front-end load funds in the peer group that excludes 12b-1 fees as well as any expense offset and brokerage service arrangements that may reduce fund expenses. To facilitate the comparison in this presentation, Putnam has adjusted the Lipper average to reflect the 12b-1 fees carried by each class of shares other than class Y shares, which do not incur 12b-1 fees. Investors should note that the other funds in the peer group may be significantly smaller or larger than the fund, and that an asset-weighted average would likely be lower than the simple average. Also, the fund and Lipper report expense data at different times and for different periods. The fund� 6;s expense ratio shown here is annualized data for the most recent six-month period, while the quarterly updated Lipper average is based on the most recent fiscal year-end data available for the peer group funds as of 9/30/07.
16
Your fund’s portfolio turnover
Putnam funds are actively managed by teams of experts who buy and sell securities based on intensive analysis of companies, industries, economies, and markets. Portfolio turnover is a measure of how often a fund’s managers buy and sell securities for your fund. A portfolio turnover of 100%, for example, means that the managers sold and replaced securities valued at 100% of a fund’s average portfolio value within a given period. Funds with high turnover may be more likely to generate capital gains that must be distributed to shareholders as taxable income. High turnover may also cause a fund to pay more brokerage commissions and other transaction costs, which may detract from performance.
Turnover comparisons
Percentage of holdings that change every year
| | | | | |
| | 2007 | 2006 | 2005 | 2004 | 2003 |
| Putnam Mid Cap Value Fund | 63% | 64% | 89% | 84% | 45% |
|
| Lipper Mid-Cap Value Funds | | | | | |
| category average | 83% | 82% | 90% | 74% | 82% |
|
Turnover data for the fund is calculated based on the fund’s fiscal-year period, which ends on April 30. Turnover data for the fund’s Lipper category is calculated based on the average of the turnover of each fund in the category for its fiscal year ended during the indicated year. Fiscal years vary across funds in the Lipper category, which may limit the comparability of the fund’s portfolio turnover rate to the Lipper average. Comparative data for 2007 is based on information available as of 10/31/07.
17
Your fund’s risk
This risk comparison is designed to help you understand how your fund compares with other funds. The comparison utilizes a risk measure developed by Morningstar, an independent fund-rating agency. This risk measure is referred to as the fund’s Morningstar Risk.
Your fund’s Morningstar® Risk

Your fund’s Morningstar Risk is shown alongside that of the average fund in its Morningstar category. The risk bar broadens the comparison by translating the fund’s Morningstar Risk into a percentile, which is based on the fund’s ranking among all funds rated by Morningstar as of September 30, 2007. A higher Morningstar Risk generally indicates that a fund’s monthly returns have varied more widely.
Morningstar determines a fund’s Morningstar Risk by assessing variations in the fund’s monthly returns — with an emphasis on downside variations — over a 3-year period, if available. Those measures are weighted and averaged to produce the fund’s Morningstar Risk. The information shown is provided for the fund’s class A shares only; information for other classes may vary. Morningstar Risk is based on historical data and does not indicate future results. Morningstar does not purport to measure the risk associated with a current investment in a fund, either on an absolute basis or on a relative basis. Low Morningstar Risk does not mean that you cannot lose money on an investment in a fund. Copyright 2007 Morningstar, Inc. All Rights Reserved. The information contained herein (1) is proprietary to Morningstar and/or its content providers; (2) may not be copied or distributed; and (3) is not warranted to be accurate, complete, or timely. Neither Morningstar nor its content providers are responsible for any damages or losses arising from any use of this information.
18
Your fund’s management
Your fund is managed by the members of the Putnam Small- and Mid-Cap Value Team. James Polk and Edward Shadek are Portfolio Leaders of the fund. The Portfolio Leaders coordinate the team’s management of the fund.
For a complete listing of the members of the Putnam Small- and Mid-Cap Value Team, including those who are not Portfolio Leaders or Portfolio Members of your fund, visit Putnam’s Individual Investor Web site at www.putnam.com.
Investment team fund ownership
The table below shows how much the fund’s current Portfolio Leaders have invested in the fund and in all Putnam mutual funds (in dollar ranges). Information shown is as of October 31, 2007, and October 31, 2006.
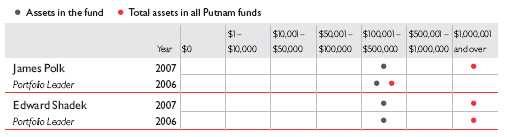
Trustee and Putnam employee fund ownership
As of October 31, 2007, all of the Trustees of the Putnam funds owned fund shares. The table below shows the approximate value of investments in the fund and all Putnam funds as of that date by the Trustees and Putnam employees. These amounts include investments by the Trustees’ and employees’ immediate family members and investments through retirement and deferred compensation plans.
| | |
| | | Total assets in |
| | Assets in the fund | all Putnam funds |
|
| Trustees | $ 165,000 | $ 92,000,000 |
|
| Putnam employees | $7,183,000 | $777,000,000 |
|
19
Other Putnam funds managed by the Portfolio Leaders
Edward Shadek is also a Portfolio Leader of Putnam Small Cap Value Fund.
James Polk and Edward Shadek may also manage other accounts and variable trust funds advised by Putnam Management or an affiliate.
Changes in your fund’s Portfolio Leaders
Your fund’s Portfolio Leaders did not change during the year ended October 31, 2007.
20
Terms and definitions
Important terms
Total return shows how the value of the fund’s shares changed over time, assuming you held the shares through the entire period and reinvested all distributions in the fund.
Net asset value (NAV) is the price, or value, of one share of a mutual fund, without a sales charge. NAVs fluctuate with market conditions. NAV is calculated by dividing the net assets of each class of shares by the number of outstanding shares in the class.
Public offering price (POP) is the price of a mutual fund share plus the maximum sales charge levied at the time of purchase. POP performance figures shown here assume the 5.25% maximum sales charge for class A shares and 3.25% for class M shares.
Contingent deferred sales charge (CDSC) is generally a charge applied at the time of the redemption of class B or C shares and assumes redemption at the end of the period. Your fund’s class B CDSC declines from a 5% maximum during the first year to 1% during the sixth year. After the sixth year, the CDSC no longer applies. The CDSC for class C shares is 1% for one year after purchase.
Share classes
Class A shares are generally subject to an initial sales charge and no CDSC (except on certain redemptions of shares bought without an initial sales charge).
Class B shares are not subject to an initial sales charge. They may be subject to a CDSC.
Class C shares are not subject to an initial sales charge and are subject to a CDSC only if the shares are redeemed during the first year.
Class M shares have a lower initial sales charge and a higher 12b-1 fee than class A shares and no CDSC (except on certain redemptions of shares bought without an initial sales charge).
Class R shares are not subject to an initial sales charge or CDSC and are available only to certain defined contribution plans.
Class Y shares are not subject to an initial sales charge or CDSC, and carry no 12b-1 fee. They are generally only available to corporate and institutional clients and clients in other approved programs.
21
Comparative indexes
Lehman Aggregate Bond Index is an unmanaged index of U.S. investment-grade fixed-income securities.
Merrill Lynch 91-Day Treasury Bill Index is an unmanaged index that seeks to measure the performance of U.S. Treasury bills available in the marketplace.
Russell Midcap Value Index is an unmanaged index of those companies in the Russell Midcap Index chosen for their value orientation.
S&P 500 Index is an unmanaged index of common stock performance.
Indexes assume reinvestment of all distributions and do not account for fees. Securities and performance of a fund and an index will differ. You cannot invest directly in an index.
Lipper is a third-party industry-ranking entity that ranks mutual funds. Its rankings do not reflect sales charges. Lipper rankings are based on total return at net asset value relative to other funds that have similar current investment styles or objectives as determined by Lipper. Lipper may change a fund’s category assignment at its discretion. Lipper category averages reflect performance trends for funds within a category.
22
Trustee approval of
management contract
General conclusions
The Board of Trustees of the Putnam funds oversees the management of each fund and, as required by law, determines annually whether to approve the continuance of your fund’s management contract with Putnam Investment Management (“Putnam Management”). In this regard, the Board of Trustees, with the assistance of its Contract Committee consisting solely of Trustees who are not “interested persons” (as such term is defined in the Investment Company Act of 1940, as amended) of the Putnam funds (the “Independent Trustees”), requests and evaluates all information it deems reasonably necessary under the circumstances. Over the course of several months ending in June 2007, the Contract Committee met several times to consider the information provided by Putnam Management and other information developed with the assistance of the Board’s independent counsel and independent staff. The Contract Committee revie wed and discussed key aspects of this information with all of the Independent Trustees. The Contract Committee recommended, and the Independent Trustees approved, the continuance of your fund’s management contract, effective July 1, 2007.
In addition, in anticipation of the sale of Putnam Investments to Great-West Lifeco, at a series of meetings ending in March 2007, the Trustees reviewed and approved new management and distribution arrangements to take effect upon the change of control. Shareholders of all funds approved the management contracts in May 2007, and the change of control transaction was completed on August 3, 2007. Upon the change of control, the management contracts that were approved by the Trustees in June 2007 automatically terminated and were replaced by new contracts that had been approved by shareholders. In connection with their review for the June 2007 continuance of the Putnam funds’ management contracts, the Trustees did not identify any facts or circumstances that would alter the substance of the conclusions and recommendations they made in their review of the contracts to take effect upon the change of control.
The Independent Trustees’ approval was based on the following conclusions:
• That the fee schedule in effect for your fund represented reasonable compensation in light of the nature and quality of the services being provided to the fund, the fees paid by competitive funds and the costs incurred by Putnam Management in providing such services, and
• That this fee schedule represented an appropriate sharing between fund shareholders and Putnam Management of such economies of scale as may exist in the management of the fund at current asset levels.
These conclusions were based on a comprehensive consideration of all information provided to the Trustees and were not the result of any single factor. Some of the factors that figured particularly in the Trustees’ deliberations and how the Trustees considered these factors are described below, although individual Trustees may have evaluated the information presented differently, giving different weights to various factors. It is also important to recognize that the fee arrangements for your fund and the other Putnam funds are the result of many years of review and discussion between the Independent Trustees and Putnam Management, that
23
certain aspects of such arrangements may receive greater scrutiny in some years than others, and that the Trustees’ conclusions may be based, in part, on their consideration of these same arrangements in prior years.
Management fee schedules and categories; total expenses
The Trustees reviewed the management fee schedules in effect for all Putnam funds, including fee levels and breakpoints, and the assignment of funds to particular fee categories. In reviewing fees and expenses, the Trustees generally focused their attention on material changes in circumstances — for example, changes in a fund’s size or investment style, changes in Putnam Management’s operating costs or responsibilities, or changes in competitive practices in the mutual fund industry — that suggest that consideration of fee changes might be warranted. The Trustees concluded that the circumstances did not warrant changes to the management fee structure of your fund, which had been carefully developed over the years, reexamined on many occasions and adjusted where appropriate. The Trustees focused on two areas of particular interest, as discussed further below:
• Competitiveness. The Trustees reviewed comparative fee and expense information for competitive funds, which indicated that, in a custom peer group of competitive funds selected by Lipper Inc., your fund ranked in the 24th percentile in management fees and in the 28th percentile in total expenses (less any applicable 12b-1 fees) as of December 31, 2006 (the first percentile being the least expensive funds and the 100th percentile being the most expensive funds). (Because the fund’s custom peer group is smaller than the fund’s broad Lipper Inc. peer group, this expense information may differ from the Lipper peer expense information found elsewhere in this report.) The Trustees noted that expense ratios for a number of Putnam funds, which show the percentage of fund assets used to pay for management and administrative services, distribution (12b-1) fees and other expenses, had been increasing recently as a result of declining net assets and the natural operation of fee breakpoints.
The Trustees noted that the expense ratio increases described above were currently being controlled by expense limitations implemented in January 2004 and which Putnam Management had committed to maintain at least through 2007. In anticipation of the change of control of Putnam Investments, the Trustees requested, and received a commitment from Putnam Management and Great-West Lifeco, to extend this program through at least June 30, 2009. These expense limitations give effect to a commitment by Putnam Management that the expense ratio of each open-end fund would be no higher than the average expense ratio of the competitive funds included in the fund’s relevant Lipper universe (exclusive of any applicable 12b-1 charges in each case). The Trustees observed that this commitment to limit fund expenses has served shareholders well since its inception.
In order to ensure that the expenses of the Putnam funds continue to meet evolving competitive standards, the Trustees requested, and Putnam Management agreed, to extend for the twelve months beginning July 1, 2007, an additional expense limitation for certain funds at an
24
amount equal to the average expense ratio (exclusive of 12b-1 charges) of a custom peer group of competitive funds selected by Lipper to correspond to the size of the fund. This additional expense limitation will be applied to those open-end funds that had above-average expense ratios (exclusive of 12b-1 charges) based on the custom peer group data for the period ended December 31, 2006. This additional expense limitation will not be applied to your fund because it had a below-average expense ratio relative to its custom peer group.
• Economies of scale. Your fund currently has the benefit of breakpoints in its management fee that provide shareholders with significant economies of scale, which means that the effective management fee rate of a fund (as a percentage of fund assets) declines as a fund grows in size and crosses specified asset thresholds. Conversely, as a fund shrinks in size — as has been the case for many Putnam funds in recent years — these breakpoints result in increasing fee levels. In recent years, the Trustees have examined the operation of the existing breakpoint structure during periods of both growth and decline in asset levels. The Trustees concluded that the fee schedules in effect for the funds represented an appropriate sharin g of economies of scale at current asset levels. In reaching this conclusion, the Trustees considered the Contract Committee’s stated intent to continue to work with Putnam Management to plan for an eventual resumption in the growth of assets, and to consider the potential economies that might be produced under various growth assumptions.
In connection with their review of the management fees and total expenses of the Putnam funds, the Trustees also reviewed the costs of the services to be provided and profits to be realized by Putnam Management and its affiliates from the relationship with the funds. This information included trends in revenues, expenses and profitability of Putnam Management and its affiliates relating to the investment management and distribution services provided to the funds. In this regard, the Trustees also reviewed an analysis of Putnam Management’s revenues, expenses and profitability with respect to the funds’ management contracts, allocated on a fund-by-fund basis.
Investment performance
The quality of the investment process provided by Putnam Management represented a major factor in the Trustees’ evaluation of the quality of services provided by Putnam Management under your fund’s management contract. The Trustees were assisted in their review of the Putnam funds’ investment process and performance by the work of the Investment Process Committee of the Trustees and the Investment Oversight Committees of the Trustees, which had met on a regular monthly basis with the funds’ portfolio teams throughout the year. The Trustees concluded that Putnam Management generally provides a high-quality investment process — as measured by the experience and skills of the individuals assigned to the management of fund portfolios, the resources made available to such personnel, and in general the ability of Putnam Management to attract and retain high-quality personnel — but also recognized that this does no t guarantee favorable investment results for every fund in every
25
time period. The Trustees considered the investment performance of each fund over multiple time periods and considered information comparing each fund’s performance with various benchmarks and with the performance of competitive funds.
The Trustees noted the satisfactory investment performance of many Putnam funds. They also noted the disappointing investment performance of certain funds in recent years and discussed with senior management of Putnam Management the factors contributing to such under-performance and actions being taken to improve performance. The Trustees recognized that, in recent years, Putnam Management has made significant changes in its investment personnel and processes and in the fund product line to address areas of underperformance. In particular, they noted the important contributions of Putnam Management’s leadership in attracting, retaining and supporting high-quality investment professionals and in systematically implementing an investment process that seeks to merge the best features of fundamental and quantitative analysis.
The Trustees indicated their intention to continue to monitor performance trends to assess the effectiveness of these changes and to evaluate whether additional changes to address areas of underperformance are warranted.
In the case of your fund, the Trustees considered that your fund’s class A share cumulative total return performance at net asset value was in the following percentiles of its Lipper Inc. peer group (Lipper Mid-Cap Value Funds) for the one-, three- and five-year periods ended March 31, 2007 (the first percentile being the best-performing funds and the 100th percentile being the worst-performing funds):
| | |
| One-year period | Three-year period | Five-year period |
|
| 58th | 36th | 72nd |
(Because of the passage of time, these performance results may differ from the performance results for more recent periods shown elsewhere in this report. Over the one-, three- and five-year periods ended March 31, 2007, there were 299, 230 and 176 funds, respectively, in your fund’s Lipper peer group.* Past performance is no guarantee of future returns.)
As a general matter, the Trustees concluded that cooperative efforts between the Trustees and Putnam Management represent the most effective way to address investment performance problems. The Trustees noted that investors in the Putnam funds have, in effect, placed their trust in the Putnam organization, under the oversight of the funds’ Trustees, to make appropriate decisions regarding the management of the funds. Based on the responsiveness of Putnam Management in the recent past to Trustee concerns about investment performance, the Trustees concluded that it is preferable to seek change within Putnam Management to address performance shortcomings. In the Trustees’ view, the alternative of terminating a
* The percentile rankings for your fund’s class A share annualized total return performance in the Lipper Mid-Cap Value Funds category for the one- and five-year periods ended September 30, 2007 were 46% and 61%, respectively. Over the one- and five-year periods ended September 30, 2007, the fund ranked 140th out of 308 and 111th out of 183, respectively. Note that this more recent information was not available when the Trustees approved the continuance of your fund’s management contract.
26
management contract and engaging a new investment adviser for an underperforming fund would entail significant disruptions and would not provide any greater assurance of improved investment performance.
Brokerage and soft-dollar allocations; other benefits
The Trustees considered various potential benefits that Putnam Management may receive in connection with the services it provides under the management contract with your fund. These include benefits related to brokerage and soft-dollar allocations, whereby a portion of the commissions paid by a fund for brokerage may be used to acquire research services that may be useful to Putnam Management in managing the assets of the fund and of other clients. The Trustees indicated their continued intent to monitor the potential benefits associated with the allocation of fund brokerage to ensure that the principle of seeking “best price and execution” remains paramount in the portfolio trading process.
The Trustees’ annual review of your fund’s management contract also included the review of its distributor’s contract and distribution plan with Putnam Retail Management Limited Partnership and the custodian agreement and investor servicing agreement with Putnam Fiduciary Trust Company (“PFTC”), each of which provides benefits to affiliates of Putnam Management. In the case of the custodian agreement, the Trustees considered that, effective January 1, 2007, the Putnam funds had engaged State Street Bank and Trust Company as custodian and began to transition the responsibility for providing custody services away from PFTC.
Comparison of retail and institutional fee schedules
The information examined by the Trustees as part of their annual contract review has included for many years information regarding fees charged by Putnam Management and its affiliates to institutional clients such as defined benefit pension plans, college endowments, etc. This information included comparison of such fees with fees charged to the funds, as well as a detailed assessment of the differences in the services provided to these two types of clients. The Trustees observed, in this regard, that the differences in fee rates between institutional clients and the funds are by no means uniform when examined by individual asset sectors, suggesting that differences in the pricing of investment management services to these types of clients reflect to a substantial degree historical competitive forces operating in separate market places. The Trustees considered the fact that fee rates across all asset sectors are higher on average for funds than for institutional clients, as well as the differences between the services that Putnam Management provides to the Putnam funds and those that it provides to institutional clients of the firm, but did not rely on such comparisons to any significant extent in concluding that the management fees paid by your fund are reasonable.
27
Other information
for shareholders
Important notice regarding delivery of shareholder documents
In accordance with SEC regulations, Putnam sends a single copy of annual and semiannual shareholder reports, prospectuses, and proxy statements to Putnam shareholders who share the same address, unless a shareholder requests otherwise. If you prefer to receive your own copy of these documents, please call Putnam at 1-800-225-1581, and Putnam will begin sending individual copies within 30 days.
Proxy voting
Putnam is committed to managing our mutual funds in the best interests of our shareholders. The Putnam funds’ proxy voting guidelines and procedures, as well as information regarding how your fund voted proxies relating to portfolio securities during the 12-month period ended June 30, 2007, are available on the Putnam Individual Investor Web site, www.putnam.com/individual, and on the SEC’s Web site, www.sec.gov. If you have questions about finding forms on the SEC’s Web site, you may call the SEC at 1-800-SEC-0330. You may also obtain the Putnam funds’ proxy voting guidelines and procedures at no charge by calling Putnam’s Shareholder Services at 1-800-225-1581.
Fund portfolio holdings
The fund will file a complete schedule of its portfolio holdings with the SEC for the first and third quarters of each fiscal year on Form N-Q. Shareholders may obtain the fund’s Forms N-Q on the SEC’s Web site at www.sec.gov. In addition, the fund’s Forms N-Q may be reviewed and copied at the SEC’s Public Reference Room in Washington, D.C. You may call the SEC at 1-800-SEC-0330 for information about the SEC’s Web site or the operation of the Public Reference Room.
28
Financial statements
A guide to financial statements
These sections of the report, as well as the accompanying Notes, constitute the fund’s financial statements.
The fund’s portfolio lists all the fund’s investments and their values as of the last day of the reporting period. Holdings are organized by asset type and industry sector, country, or state to show areas of concentration and diversification.
Statement of assets and liabilities shows how the fund’s net assets and share price are determined. All investment and noninvestment assets are added together. Any unpaid expenses and other liabilities are subtracted from this total. The result is divided by the number of shares to determine the net asset value per share, which is calculated separately for each class of shares. (For funds with preferred shares, the amount subtracted from total assets includes the liquidation preference of preferred shares.)
Statement of operations shows the fund’s net investment gain or loss. This is done by first adding up all the fund’s earnings — from dividends and interest income — and subtracting its operating expenses to determine net investment income (or loss). Then, any net gain or loss the fund realized on the sales of its holdings — as well as any unrealized gains or losses over the period — is added to or subtracted from the net investment result to determine the fund’s net gain or loss for the fiscal period.
Statement of changes in net assets shows how the fund’s net assets were affected by the fund’s net investment gain or loss, by distributions to shareholders, and by changes in the number of the fund’s shares. It lists distributions and their sources (net investment income or realized capital gains) over the current reporting period and the most recent fiscal year-end. The distributions listed here may not match the sources listed in the Statement of operations because the distributions are determined on a tax basis and may be paid in a different period from the one in which they were earned. Dividend sources are estimated at the time of declaration. Actual results may vary. Any non-taxable return of capital cannot be determined until final tax calculations are completed after the end of the fund’s fiscal year.
Financial highlights provide an overview of the fund’s investment results, per-share distributions, expense ratios, net investment income ratios, and portfolio turnover in one summary table, reflecting the five most recent reporting periods. In a semiannual report, the highlight table also includes the current reporting period.
29
The fund’s portfolio 10/31/07 (Unaudited)
| | | |
| COMMON STOCKS (96.0%)* | | | |
|
| | Shares | | Value |
|
| Aerospace and Defense (1.6%) | | | |
| L-3 Communications Holdings, Inc. | 141,600 | $ | 15,525,024 |
|
| |
| Banking (6.6%) | | | |
| Capitol Federal Financial | 272,600 | | 9,003,978 |
| City National Corp. | 87,100 | | 5,887,960 |
| Colonial Bancgroup, Inc. | 184,100 | | 3,531,038 |
| Comerica, Inc. | 81,000 | | 3,781,080 |
| Cullen/Frost Bankers, Inc. | 82,500 | | 4,387,350 |
| First Citizens BancShares, Inc. Class A | 66,500 | | 10,828,195 |
| New York Community Bancorp, Inc. | 440,900 | | 8,205,149 |
| TCF Financial Corp. | 469,800 | | 10,697,346 |
| Webster Financial Corp. | 233,100 | | 8,447,544 |
| | | | 64,769,640 |
|
| |
| Building Materials (1.0%) | | | |
| Stanley Works (The) | 173,300 | | 9,973,415 |
|
| |
| Chemicals (0.8%) | | | |
| Cytec Industries, Inc. | 114,200 | | 7,618,282 |
|
| |
| Commercial and Consumer Services (1.5%) | | | |
| URS Corp. † | 243,400 | | 15,044,554 |
|
| |
| Construction (0.2%) | | | |
| USG Corp. † (S) | 53,300 | | 2,118,675 |
|
| |
| Consumer Goods (3.9%) | | | |
| Alberto-Culver Co. | 439,895 | | 11,432,871 |
| Clorox Co. | 158,600 | | 9,923,602 |
| Newell Rubbermaid, Inc. | 575,400 | | 16,778,664 |
| | | | 38,135,137 |
|
| |
| Electric Utilities (3.0%) | | | |
| Ameren Corp. | 37,600 | | 2,032,656 |
| Edison International | 192,500 | | 11,193,875 |
| PG&E Corp. | 113,700 | | 5,563,341 |
| Progress Energy, Inc. | 77,780 | | 3,733,440 |
| Wisconsin Energy Corp. | 134,000 | | 6,415,920 |
| | | | 28,939,232 |
|
| |
| Electrical Equipment (2.6%) | | | |
| WESCO International, Inc. † (S) | 546,000 | | 25,470,900 |
|
| |
| Electronics (7.9%) | | | |
| Amphenol Corp. Class A | 316,000 | | 13,989,320 |
| Atmel Corp. † (S) | 4,245,800 | | 20,761,962 |
| Avnet, Inc. † | 210,800 | | 8,794,576 |
30
| | | |
| COMMON STOCKS (96.0%)* continued | | | |
|
| | Shares | | Value |
|
| Electronics continued | | | |
| General Cable Corp. † (S) | 365,900 | $ | 26,341,141 |
| Jabil Circuit, Inc. | 332,400 | | 7,223,052 |
| | | | 77,110,051 |
|
| |
| Energy (2.9%) | | | |
| Cameron International Corp. † | 55,900 | | 5,442,424 |
| Grant Prideco, Inc. † (S) | 200,100 | | 9,836,916 |
| National-Oilwell Varco, Inc. † | 183,500 | | 13,439,540 |
| | | | 28,718,880 |
|
| |
| Financial (1.4%) | | | |
| Assurant, Inc. | 239,300 | | 13,984,692 |
|
| |
| Food (0.8%) | | | |
| McCormick & Co., Inc. | 233,000 | | 8,161,990 |
|
| |
| Health Care Services (7.9%) | | | |
| AmerisourceBergen Corp. | 240,000 | | 11,306,400 |
| Coventry Health Care, Inc. † | 164,900 | | 9,945,119 |
| DaVita, Inc. † | 134,500 | | 8,768,055 |
| Lincare Holdings, Inc. † (S) | 502,900 | | 17,485,833 |
| Omnicare, Inc. (S) | 352,530 | | 10,399,635 |
| Pediatrix Medical Group, Inc. † | 288,500 | | 18,896,750 |
| | | | 76,801,792 |
|
| |
| Household Furniture and Appliances (1.7%) | | | |
| Whirlpool Corp. (S) | 211,300 | | 16,730,734 |
|
| |
| Insurance (4.3%) | | | |
| Everest Re Group, Ltd. (Barbados) | 92,000 | | 9,801,680 |
| Fidelity National Title Group, Inc. Class A | 526,400 | | 8,101,296 |
| Phoenix Companies, Inc. (The) | 791,800 | | 10,911,004 |
| W.R. Berkley Corp. | 456,000 | | 13,721,040 |
| | | | 42,535,020 |
|
| |
| Investment Banking/Brokerage (1.2%) | | | |
| Ameriprise Financial, Inc. | 81,600 | | 5,139,168 |
| Waddell & Reed Financial, Inc. Class A | 195,700 | | 6,501,154 |
| | | | 11,640,322 |
|
| |
| Machinery (3.4%) | | | |
| Joy Global, Inc. | 191,500 | | 11,118,490 |
| Kennametal, Inc. (S) | 153,000 | | 13,955,130 |
| Terex Corp. † | 112,800 | | 8,372,016 |
| | | | 33,445,636 |
|
| |
| Media (2.0%) | | | |
| Interpublic Group of Companies, Inc. (The) † (S) | 1,892,600 | | 19,588,410 |
31
| | | |
| COMMON STOCKS (96.0%)* continued | | | |
|
| | Shares | | Value |
|
| Metals (3.9%) | | | |
| Steel Dynamics, Inc. (S) | 292,900 | $ | 15,588,138 |
| United States Steel Corp. | 205,400 | | 22,162,660 |
| | | | 37,750,798 |
|
| |
| Natural Gas Utilities (0.8%) | | | |
| National Fuel Gas Co. (S) | 160,500 | | 7,782,645 |
|
| |
| Oil & Gas (5.4%) | | | |
| EOG Resources, Inc. | 112,400 | | 9,958,640 |
| Hess Corp. | 227,800 | | 16,312,758 |
| Newfield Exploration Co. † | 256,200 | | 13,793,808 |
| Questar Corp. | 227,100 | | 12,962,868 |
| | | | 53,028,074 |
|
| |
| Pharmaceuticals (0.8%) | | | |
| Sepracor, Inc. † | 270,400 | | 7,446,816 |
|
| |
| Power Producers (1.3%) | | | |
| AES Corp. (The) † | 584,800 | | 12,520,568 |
|
| |
| Real Estate (5.3%) | | | |
| Annaly Mortgage Management, Inc. (R) | 858,490 | | 14,671,594 |
| Colonial Properties Trust (R) | 135,900 | | 4,257,747 |
| DiamondRock Hospitality Co. (R) | 549,200 | | 10,522,672 |
| General Growth Properties, Inc. (R) | 178,500 | | 9,703,260 |
| HCP, Inc. (R) | 145,600 | | 4,956,224 |
| Host Marriott Corp. (R) | 338,900 | | 7,510,024 |
| | | | 51,621,521 |
|
| |
| Retail (12.4%) | | | |
| BJ’s Wholesale Club, Inc. † (S) # | 836,200 | | 30,002,856 |
| OfficeMax, Inc. (S) | 728,300 | | 23,050,695 |
| Rite Aid Corp. † (S) | 3,041,400 | | 11,891,874 |
| Ross Stores, Inc. | 326,600 | | 8,824,732 |
| Sally Beauty Holdings, Inc. † (S) | 1,514,195 | | 14,006,304 |
| Supervalu, Inc. | 381,200 | | 14,771,500 |
| Timberland Co. (The) Class A † | 935,200 | | 18,245,752 |
| | | | 120,793,713 |
|
| |
| Schools (0.9%) | | | |
| Apollo Group, Inc. Class A † | 113,200 | | 8,972,232 |
|
| |
| Shipping (1.3%) | | | |
| Con-way, Inc. | 289,280 | | 12,326,221 |
|
| |
| Software (5.7%) | | | |
| McAfee, Inc. † | 799,920 | | 33,076,692 |
| Parametric Technology Corp. † | 1,188,600 | | 22,702,260 |
| | | | 55,778,952 |
32
| | | |
| COMMON STOCKS (96.0%)* continued | | | |
|
| | Shares | | Value |
|
| Technology Services (1.3%) | | | |
| Computer Sciences Corp. † | 210,900 | $ | 12,314,451 |
|
| |
| Textiles (2.2%) | | | |
| Jones Apparel Group, Inc. | 1,033,600 | | 21,643,584 |
|
| |
| Total common stocks (cost $820,279,023) | | $ | 938,291,961 |
|
| |
| SHORT-TERM INVESTMENTS (19.6%)* | | | |
|
| | Principal amount/shares | | Value |
|
| Short-term investments held as collateral for loaned | | | |
| securities with yields ranging from 4.50% to 5.69% | | | |
| and due dates ranging from November 1, 2007 | | | |
| to November 28, 2007 (d) | $ 148,279,227 | $ | 148,038,892 |
| Interest in $630,000,000 joint tri-party repurchase agreement | | | |
| dated October 31, 2007 with Deutsche Bank Securities, Inc. | | | |
| due November 1, 2007 with respect to various U.S. | | | |
| Government obligations — maturity value | | | |
| of $17,593,419 for an effective yield of 4.95% | | | |
| (collateralized by Fannie Mae, Federal Home Loan | | | |
| Banks, Freddie Mac and Ginnie Mae securities | | | |
| with yields of zero % to 12.5% and due dates | | | |
| of November 1, 2007 to December 15, 2046, | | | |
| valued at $642,600,168) | 17,591,000 | | 17,591,000 |
| Putnam Prime Money Market Fund (e) | 26,105,605 | | 26,105,605 |
|
| |
| Total short-term investments (cost $191,735,497) | | $ | 191,735,497 |
|
| |
| TOTAL INVESTMENTS | | | |
| Total investments (cost $1,012,014,520) | | $ | 1,130,027,458 |
* Percentages indicated are based on net assets of $977,623,795.
† Non-income-producing security.
# A portion of this security was pledged and segregated with the custodian to cover margin requirements for futures contracts at October 31, 2007.
(d) See Note 1 to the financial statements.
(e) See Note 5 to the financial statements regarding investments in Putnam Prime Money Market Fund.
(R) Real Estate Investment Trust.
(S) Securities on loan, in part or in entirety, at October 31, 2007.
At October 31, 2007, liquid assets totaling $283,855 have been designated as collateral for open futures contracts.
| | | | | |
| FUTURES CONTRACTS OUTSTANDING at 10/31/07 (Unaudited) | | | |
|
| | Number of | | | Expiration | Unrealized |
| | contracts | Value | | date | appreciation |
|
| S&P 500 Index (Long) | 12 | $4,664,700 | | Dec-07 | $134,655 |
| S&P Mid Cap 400 Index E-Mini (Long) | 60 | 5,472,600 | | Dec-07 | 146,900 |
|
| Total | | | | | $281,555 |
The accompanying notes are an integral part of these financial statements.
33
Statement of assets and liabilities 10/31/07 (Unaudited)
| |
| ASSETS | |
|
| Investment in securities, at value, including $141,107,840 | |
| of securities on loan (Note 1): | |
| Unaffiliated issuers (identified cost $985,908,915) | $1,103,921,853 |
| Affiliated issuers (identified cost $26,105,605) (Note 5) | 26,105,605 |
|
| Cash | 170,784 |
|
| Dividends, interest and other receivables | 631,514 |
|
| Receivable for shares of the fund sold | 756,318 |
|
| Receivable for securities sold | 6,234,203 |
|
| Receivable for variation margin (Note 1) | 173,779 |
|
| Total assets | 1,137,994,056 |
|
| |
| LIABILITIES | |
|
| Payable for securities purchased | 7,459,795 |
|
| Payable for shares of the fund repurchased | 2,261,153 |
|
| Payable for compensation of Manager (Notes 2 and 5) | 1,561,639 |
|
| Payable for investor servicing (Note 2) | 490,283 |
|
| Payable for custodian fees (Note 2) | 11,153 |
|
| Payable for Trustee compensation and expenses (Note 2) | 88,002 |
|
| Payable for administrative services (Note 2) | 1,756 |
|
| Payable for distribution fees (Note 2) | 308,775 |
|
| Collateral on securities loaned, at value (Note 1) | 148,038,892 |
|
| Other accrued expenses | 148,813 |
|
| Total liabilities | 160,370,261 |
|
| Net assets | $ 977,623,795 |
|
| |
| REPRESENTED BY | |
|
| Paid-in capital (Unlimited shares authorized) (Notes 1 and 4) | $ 713,578,830 |
|
| Undistributed net investment income (Note 1) | 3,181,854 |
|
| Accumulated net realized gain on investments (Note 1) | 142,568,618 |
|
| Net unrealized appreciation of investments | 118,294,493 |
|
| Total — Representing net assets applicable to capital shares outstanding | $ 977,623,795 |
(Continued on next page)
34
Statement of assets and liabilities (Continued)
| |
| COMPUTATION OF NET ASSET VALUE AND OFFERING PRICE | |
|
| Net asset value and redemption price per class A share | |
| ($717,654,573 divided by 44,629,041 shares) | $16.08 |
|
| Offering price per class A share | |
| (100/94.75 of $16.08)* | $16.97 |
|
| Net asset value and offering price per class B share | |
| ($125,400,493 divided by 8,072,894 shares)** | $15.53 |
|
| Net asset value and offering price per class C share | |
| ($43,267,867 divided by 2,789,530 shares)** | $15.51 |
|
| Net asset value and redemption price per class M share | |
| ($13,139,986 divided by 836,029 shares) | $15.72 |
|
| Offering price per class M share | |
| (100/96.75 of $15.72)* | $16.25 |
|
| Net asset value, offering price and redemption price per class R share | |
| ($7,108,908 divided by 447,627 shares) | $15.88 |
|
| Net asset value, offering price and redemption price per class Y share | |
| ($71,051,968 divided by 4,400,599 shares) | $16.15 |
* On single retail sales of less than $50,000. On sales of $50,000 or more the offering price is reduced.
** Redemption price per share is equal to net asset value less any applicable contingent deferred sales charge.
The accompanying notes are an integral part of these financial statements.
35
Statement of operations Six months ended 10/31/07 (Unaudited)
| |
| INVESTMENT INCOME | |
|
| Dividends | $ 8,746,317 |
|
| Interest (including interest income of $751,387 from | |
| investments in affiliated issuers) (Note 5) | 816,599 |
|
| Securities lending | 216,400 |
|
| Total investment income | 9,779,316 |
|
| |
| EXPENSES | |
|
| Compensation of Manager (Note 2) | 3,268,819 |
|
| Investor servicing fees (Note 2) | 1,520,627 |
|
| Custodian fees (Note 2) | 12,437 |
|
| Trustee compensation and expenses (Note 2) | 36,445 |
|
| Administrative services (Note 2) | 11,850 |
|
| Distribution fees — Class A (Note 2) | 895,531 |
|
| Distribution fees — Class B (Note 2) | 856,966 |
|
| Distribution fees — Class C (Note 2) | 222,984 |
|
| Distribution fees — Class M (Note 2) | 52,325 |
|
| Distribution fees — Class R (Note 2) | 16,158 |
|
| Other | 164,151 |
|
| Non-recurring costs (Notes 2 and 6) | 603 |
|
| Costs assumed by Manager (Notes 2 and 6) | (603) |
|
| Fees waived and reimbursed by Manager (Note 5) | (10,177) |
|
| Total expenses | 7,048,116 |
|
| Expense reduction (Note 2) | (45,929) |
|
| Net expenses | 7,002,187 |
|
| Net investment income | 2,777,129 |
|
| Net realized gain on investments (Notes 1 and 3) | 75,993,637 |
|
| Net realized gain on futures contracts (Note 1) | 506,011 |
|
| Net unrealized depreciation of investments | |
| and futures contracts during the period | (92,790,251) |
|
| Net loss on investments | (16,290,603) |
|
| Net decrease in net assets resulting from operations | $(13,513,474) |
The accompanying notes are an integral part of these financial statements.
36
Statement of changes in net assets
| | |
| INCREASE (DECREASE) IN NET ASSETS | | |
|
| Six months ended | Year ended |
| | 10/31/07* | 4/30/07 |
|
| Operations: | | |
| Net investment income | $ 2,777,129 | $ 12,755,369 |
|
| Net realized gain on investments | 76,499,648 | 121,390,714 |
|
| Net unrealized depreciation of investments | (92,790,251) | (1,633,980) |
|
| Net increase (decrease) in net assets resulting from operations | (13,513,474) | 132,512,103 |
|
| Distributions to shareholders (Note 1): | | |
|
| From ordinary income | | |
|
| Net investment income | | |
|
| Class A | — | (9,194,467) |
|
| Class B | — | (1,602,571) |
|
| Class C | — | (349,906) |
|
| Class M | — | (141,220) |
|
| Class R | — | (55,482) |
|
| Class Y | — | (785,150) |
|
| Net realized short-term gain on investments | | |
|
| Class A | — | (15,017,629) |
|
| Class B | — | (5,871,099) |
|
| Class C | — | (1,031,302) |
|
| Class M | — | (339,621) |
|
| Class R | — | (98,859) |
|
| Class Y | — | (1,107,118) |
|
| From net realized long-term gain on investments | | |
|
| Class A | — | (46,087,266) |
|
| Class B | — | (18,017,683) |
|
| Class C | — | (3,164,939) |
|
| Class M | — | (1,042,257) |
|
| Class R | — | (303,385) |
|
| Class Y | — | (3,397,610) |
|
| Redemption fees (Note 1) | 392 | 2,579 |
|
| Increase (decrease) from capital share transactions (Note 4) | (66,372,556) | 38,387,864 |
|
| Total increase (decrease) in net assets | $(79,885,638) | $ 63,294,982 |
(Continued on next page)
37
Statement of changes in net assets (Continued)
| | |
| NET ASSETS | | |
|
| | Six months ended | Year ended |
| | 10/31/07* | 4/30/07 |
|
| Beginning of period | $1,057,509,433 | $ 994,214,451 |
|
| End of period (including undistributed net investment | | |
| income of $3,181,854 and $404,725, respectively) | $ 977,623,795 | $1,057,509,433 |
* Unaudited
The accompanying notes are an integral part of these financial statements.
38
This page left blank intentionally.
39
Financial highlights (For a common share outstanding throughout the period)
| | | | | | | | | | | | | | |
| INVESTMENT OPERATIONS: | | | | LESS DISTRIBUTIONS: | | | | | RATIOS AND SUPPLEMENTAL DATA: | |
| | | | Net | | | | | | | Total | | | Ratio of net | |
| | Net asset | | realized and | Total | From | From | | | Net asset | return | Net | Ratio of | investment | |
| | value, | Net | unrealized | from | net | net realized | | | value, | at net | assets, | expenses to | income (loss) | Portfolio |
| | beginning | investment | gain (loss) on | investment | investment | gain on | Total | Redemption | end | asset | end of period | average net | to average | turnover |
| Period ended | of period | income (loss)(a) | investments | operations | income | investments | distributions | fees | of period | value (%)(b) | (in thousands) | assets (%)(c) | net assets (%) | (%) |
|
| CLASS A | | | | | | | | | | | | | | |
| October 31, 2007** | $16.26 | .05(d) | (.23) | (.18) | — | — | — | —(h) | $16.08 | (1.11)* | $717,655 | .63(d)* | .34(d)* | 42.05* |
| April 30, 2007 | 15.91 | .24(d,e) | 1.95 | 2.19 | (.24) | (1.60) | (1.84) | —(h) | 16.26 | 14.66 | 707,081 | 1.23(d) | 1.53(d,e) | 63.15 |
| April 30, 2006 | 13.88 | .04(d,f) | 3.70 | 3.74 | (.01) | (1.70) | (1.71) | —(h) | 15.91 | 28.18 | 614,761 | 1.22(d,f) | .28(d,f) | 63.63 |
| April 30, 2005 | 12.53 | .03(d,g) | 1.51 | 1.54 | —(h) | (.19) | (.19) | —(h) | 13.88 | 12.31 | 455,115 | 1.30(d) | .21(d,g) | 88.96 |
| April 30, 2004 | 9.67 | .05 | 2.82 | 2.87 | (.01) | — | (.01) | — | 12.53 | 29.72 | 378,117 | 1.28 | .46 | 83.90 |
| April 30, 2003 | 12.00 | .05 | (2.17) | (2.12) | (.06) | (.15) | (.21) | — | 9.67 | (17.67) | 293,124 | 1.28 | .54 | 44.93 |
|
| |
| CLASS B | | | | | | | | | | | | | | |
| October 31, 2007** | $15.76 | .01(d) | (.24) | (.23) | — | — | — | —(h) | $15.53 | (1.46)* | $125,400 | 1.00(d)* | .05(d)* | 42.05* |
| April 30, 2007 | 15.46 | .12(d,e) | 1.89 | 2.01 | (.11) | (1.60) | (1.71) | —(h) | 15.76 | 13.79 | 228,560 | 1.98(d) | .78(d,e) | 63.15 |
| April 30, 2006 | 13.62 | (.07)(d,f) | 3.61 | 3.54 | — | (1.70) | (1.70) | —(h) | 15.46 | 27.18 | 276,306 | 1.97(d,f) | (.46)(d,f) | 63.63 |
| April 30, 2005 | 12.39 | (.07)(d,g) | 1.49 | 1.42 | — | (.19) | (.19) | —(h) | 13.62 | 11.47 | 259,429 | 2.05(d) | (.52)(d,g) | 88.96 |
| April 30, 2004 | 9.62 | (.03) | 2.80 | 2.77 | — | — | — | — | 12.39 | 28.79 | 271,485 | 2.03 | (.28) | 83.90 |
| April 30, 2003 | 11.96 | (.02) | (2.17) | (2.19) | —(h) | (.15) | (.15) | — | 9.62 | (18.28) | 228,248 | 2.03 | (.22) | 44.93 |
|
| |
| CLASS C | | | | | | | | | | | | | | |
| October 31, 2007** | $15.74 | —(d) | (.23) | (.23) | — | — | — | —(h) | $15.51 | (1.46)* | $43,268 | 1.00(d)* | (.02)(d)* | 42.05* |
| April 30, 2007 | 15.47 | .12(d,e) | 1.88 | 2.00 | (.13) | (1.60) | (1.73) | —(h) | 15.74 | 13.77 | 45,357 | 1.98(d) | .80(d,e) | 63.15 |
| April 30, 2006 | 13.62 | (.07)(d,f) | 3.62 | 3.55 | — | (1.70) | (1.70) | —(h) | 15.47 | 27.26 | 39,800 | 1.97(d,f) | (.47)(d,f) | 63.63 |
| April 30, 2005 | 12.39 | (.07)(d,g) | 1.49 | 1.42 | — | (.19) | (.19) | —(h) | 13.62 | 11.47 | 30,903 | 2.05(d) | (.52)(d,g) | 88.96 |
| April 30, 2004 | 9.62 | (.03) | 2.80 | 2.77 | — | — | — | — | 12.39 | 28.79 | 30,149 | 2.03 | (.29) | 83.90 |
| April 30, 2003 | 11.96 | (.02) | (2.17) | (2.19) | —(h) | (.15) | (.15) | — | 9.62 | (18.29) | 25,611 | 2.03 | (.22) | 44.93 |
|
| |
| CLASS M | | | | | | | | | | | | | | |
| October 31, 2007** | $15.93 | .02(d) | (.23) | (.21) | — | — | — | —(h) | $15.72 | (1.32)* | $13,140 | .88(d)* | .11(d)* | 42.05* |
| April 30, 2007 | 15.63 | .16(d,e) | 1.90 | 2.06 | (.16) | (1.60) | (1.76) | —(h) | 15.93 | 14.04 | 15,160 | 1.73(d) | 1.03(d,e) | 63.15 |
| April 30, 2006 | 13.71 | (.03)(d,f) | 3.65 | 3.62 | — | (1.70) | (1.70) | —(h) | 15.63 | 27.61 | 14,075 | 1.72(d,f) | (.21)(d,f) | 63.63 |
| April 30, 2005 | 12.44 | (.04)(d,g) | 1.50 | 1.46 | — | (.19) | (.19) | —(h) | 13.71 | 11.74 | 13,306 | 1.80(d) | (.28)(d,g) | 88.96 |
| April 30, 2004 | 9.64 | —(h) | 2.80 | 2.80 | — | — | — | — | 12.44 | 29.05 | 12,513 | 1.78 | (.03) | 83.90 |
| April 30, 2003 | 11.97 | —(h) | (2.16) | (2.16) | (.02) | (.15) | (.17) | — | 9.64 | (18.04) | 10,478 | 1.78 | .03 | 44.93 |
|
| |
| CLASS R | | | | | | | | | | | | | | |
| October 31, 2007** | $16.08 | .03(d) | (.23) | (.20) | — | — | — | —(h) | $15.88 | (1.24)* | $7,109 | .75(d)* | .21(d)* | 42.05* |
| April 30, 2007 | 15.77 | .18(d,e) | 1.95 | 2.13 | (.22) | (1.60) | (1.82) | —(h) | 16.08 | 14.39 | 6,110 | 1.48(d) | 1.21(d,e) | 63.15 |
| April 30, 2006 | 13.81 | (.01)(d,f) | 3.69 | 3.68 | (.02) | (1.70) | (1.72) | —(h) | 15.77 | 27.86 | 2,959 | 1.47(d,f) | (.03)(d,f) | 63.63 |
| April 30, 2005 | 12.50 | (.03)(d,g) | 1.54 | 1.51 | (.01) | (.19) | (.20) | —(h) | 13.81 | 12.06 | 345 | 1.55(d) | (.18)(d,g) | 88.96 |
| April 30, 2004 | 9.67 | .03 | 2.82 | 2.85 | (.02) | — | (.02) | — | 12.50 | 29.43 | 15 | 1.53 | .21 | 83.90 |
| April 30, 2003† | 9.00 | —(h) | .67 | .67 | — | — | — | — | 9.67 | 7.44* | 1 | .13* | .02* | 44.93 |
|
| |
| CLASS Y | | | | | | | | | | | | | | |
| October 31, 2007** | $16.30 | .07(d) | (.22) | (.15) | — | — | — | —(h) | $16.15 | (.92)* | $71,052 | .50(d)* | .46(d)* | 42.05* |
| April 30, 2007 | 15.94 | .27(d,e) | 1.97 | 2.24 | (.28) | (1.60) | (1.88) | —(h) | 16.30 | 14.96 | 55,241 | .98(d) | 1.76(d,e) | 63.15 |
| April 30, 2006 | 13.90 | .08(d,f) | 3.71 | 3.79 | (.05) | (1.70) | (1.75) | —(h) | 15.94 | 28.50 | 46,314 | .97(d,f) | .52(d,f) | 63.63 |
| April 30, 2005 | 12.55 | .06(d,g) | 1.51 | 1.57 | (.03) | (.19) | (.22) | —(h) | 13.90 | 12.53 | 36,322 | 1.05(d) | .45(d,g) | 88.96 |
| April 30, 2004 | 9.68 | .08 | 2.83 | 2.91 | (.04) | — | (.04) | — | 12.55 | 30.06 | 24,872 | 1.03 | .71 | 83.90 |
| April 30, 2003 | 12.00 | .08 | (2.17) | (2.09) | (.08) | (.15) | (.23) | — | 9.68 | (17.44) | 15,852 | 1.03 | .79 | 44.93 |
|
See notes to financial highlights at the end of this section.
The accompanying notes are an integral part of these financial statements.
Financial highlights (Continued)
* Not annualized.
** Unaudited.
† For the period April 1, 2003 (commencement of operations) to April 30, 2003.
(a) Per share net investment income (loss) has been determined on the basis of the weighted average number of shares outstanding during the period.
(b) Total return assumes dividend reinvestment and does not reflect the effect of sales charges.
(c) Includes amounts paid through expense offset and brokerage service arrangements (Note 2).
(d) Reflects waivers of certain fund expenses in connection with investments in Putnam Prime Money Market Fund in effect during the period. As a result of such waivers, the expenses of each class reflect a reduction of the following amounts (Note 5):
| |
| | Percentage |
| | of average |
| | net assets |
|
| October 31, 2007 | <0.01% |
|
| April 30, 2007 | <0.01 |
|
| April 30, 2006 | <0.01 |
|
| April 30, 2005 | <0.01 |
|
(e) Reflects a special dividend received by the fund which amounted to the following amounts:
| | |
| | | Percentage |
| | | of average |
| | Per share | net assets |
|
| Class A | $0.17 | 1.10% |
|
| Class B | 0.16 | 1.10 |
|
| Class C | 0.17 | 1.13 |
|
| Class M | 0.17 | 1.10 |
|
| Class R | 0.16 | 1.06 |
|
| Class Y | 0.17 | 1.09 |
|
(f) Reflects a non-recurring accrual related to a reimbursement to the fund from Putnam Investments relating to the calculation of certain amounts paid by the fund to Putnam in previous years for transfer agent services, which amounted to less than $0.01 per share and 0.01% of average net assets for the period ended April 30, 2006.
(g) Reflects a non-recurring accrual related to Putnam Management’s settlement with the SEC regarding brokerage allocation practices. As a result, the expenses of each class reflect a reduction of the following amounts:
| | |
| | | Percentage |
| | | of average |
| | Per share | net assets |
|
| Class A | <$0.01 | 0.01% |
|
| Class B | <0.01 | 0.01 |
|
| Class C | <0.01 | 0.01 |
|
| Class M | <0.01 | 0.01 |
|
| Class R | <0.01 | 0.01 |
|
| Class Y | <0.01 | 0.01 |
|
(h) Amount represents less than $0.01 per share.
The accompanying notes are an integral part of these financial statements.
42
Notes to financial statements 10/31/07 (Unaudited)
Note 1: Significant accounting policies
Putnam Mid Cap Value Fund (the “fund”) is a series of Putnam Investment Funds (the “trust”), a Massachusetts business trust, which is registered under the Investment Company Act of 1940, as amended, as a diversified, open-end management investment company. The fund seeks capital appreciation by investing primarily in common stocks of midsize companies which Putnam Investment Management, LLC (“Putnam Management”), the fund’s manager, a wholly-owned subsidiary of Putnam, LLC, believes are currently undervalued. The fund seeks current income as a secondary objective.
The fund offers class A, class B, class C, class M, class R and class Y shares. Class A and class M shares are sold with a maximum front-end sales charge of 5.25% and 3.25%, respectively, and generally do not pay a contingent deferred sales charge. Class B shares, which convert to class A shares after approximately six and a half years, do not pay a front-end sales charge and are subject to a contingent deferred sales charge, if those shares are redeemed within six years of purchase. Effective January 2, 2008, the class A and class M maximum front-end sales charge will change to 5.75% and 3.50%, respectively. Class C shares have a one-year 1.00% contingent deferred sales charge and do not convert to class A shares. Class R shares, which are offered to qualified employee-benefit plans, are sold without a front-end sales charge or a contingent deferred sales charge. The expenses for class A, class B, class C, class M and class R shares may differ based on the distribution fee of each class, which is identified in Note 2. Class Y shares, which are sold at net asset value, are generally subject to the same expenses as class A, class B, class C, class M and class R shares, but do not bear a distribution fee. Class Y shares are generally only available to corporate and institutional clients and clients in other approved programs.
A 1.00% redemption fee may apply on any shares that are redeemed (either by selling or exchanging into another fund) within 7 days of purchase. The redemption fee is accounted for as an addition to paid-in-capital.
Investment income, realized and unrealized gains and losses and expenses of the fund are borne pro-rata based on the relative net assets of each class to the total net assets of the fund, except that each class bears expenses unique to that class (including the distribution fees applicable to such classes). Each class votes as a class only with respect to its own distribution plan or other matters on which a class vote is required by law or determined by the Trustees. If the fund were liquidated, shares of each class would receive their pro-rata share of the net assets of the fund. In addition, the Trustees declare separate dividends on each class of shares.
In the normal course of business, the fund enters into contracts that may include agreements to indemnify another party under given circumstances. The fund’s maximum exposure under these arrangements is unknown as this would involve future claims that may be, but have not yet been, made against the fund. However, the fund expects the risk of material loss to be remote.
The following is a summary of significant accounting policies consistently followed by the fund in the preparation of its financial statements. The preparation of financial statements is in conformity with accounting principles generally accepted in the United States of America and requires management to make estimates and assumptions that affect the reported amounts of assets and liabilities in the financial statements and the reported amounts of increases and decreases in net assets from operations during the reporting period. Actual results could differ from those estimates.
A) Security valuation Investments for which market quotations are readily available are valued at the last reported sales price on their principal exchange, or official closing price for certain markets. If no sales are reported — as in the case of some securities traded over-the-counter — a security is valued at its last reported bid price. Many securities markets and exchanges outside
43
the U.S. close prior to the close of the New York Stock Exchange and therefore the closing prices for securities in such markets or on such exchanges may not fully reflect events that occur after such close but before the close of the New York Stock Exchange. Accordingly, on certain days, the fund will fair value foreign equity securities taking into account multiple factors, including movements in the U.S. securities markets. The number of days on which fair value prices will be used will depend on market activity and it is possible that fair value prices will be used by the fund to a significant extent. Securities quoted in foreign currencies, if any, are translated into U.S. dollars at the current exchange rate. Certain investments, including certain restricted securities and derivatives, are also valued at fair value following procedures approved by the Trustees. Such valuations and procedures are reviewed periodically by the Trustee s. The fair value of securities is generally determined as the amount that the fund could reasonably expect to realize from an orderly disposition of such securities over a reasonable period of time. By its nature, a fair value price is a good faith estimate of the value of a security at a given point in time and does not reflect an actual market price, which may be different by a material amount.
B) Joint trading account Pursuant to an exemptive order from the Securities and Exchange Commission (the “SEC”), the fund may transfer uninvested cash balances, including cash collateral received under security lending arrangements, into a joint trading account along with the cash of other registered investment companies and certain other accounts managed by Putnam Management. These balances may be invested in issues of high-grade short-term investments having maturities of up to 397 days for collateral received under security lending arrangements and up to 90 days for other cash investments.
C) Repurchase agreements The fund, or any joint trading account, through its custodian, receives delivery of the underlying securities, the market value of which at the time of purchase is required to be in an amount at least equal to the resale price, including accrued interest. Collateral for certain tri-party repurchase agreements is held at the counterparty’s custodian in a segregated account for the benefit of the fund and the counterparty. Putnam Management is responsible for determining that the value of these underlying securities is at all times at least equal to the resale price, including accrued interest.
D) Security transactions and related investment income Security transactions are recorded on the trade date (the date the order to buy or sell is executed). Gains or losses on securities sold are determined on the identified cost basis. Interest income is recorded on the accrual basis. Dividend income, net of applicable withholding taxes, is recognized on the ex-dividend date except that certain dividends from foreign securities, if any, are recognized as soon as the fund is informed of the ex-dividend date. Non-cash dividends, if any, are recorded at the fair market value of the securities received. Dividends representing a return of capital or capital gains, if any, are reflected as a reduction of cost and/or as a realized gain.
E) Futures and options contracts The fund may use futures and options contracts to hedge against changes in the values of securities the fund owns or expects to purchase, or for other investment purposes. The fund may also write options on swaps or securities it owns or in which it may invest to increase its current returns.
The potential risk to the fund is that the change in value of futures and options contracts may not correspond to the change in value of the hedged instruments. In addition, losses may arise from changes in the value of the underlying instruments, if there is an illiquid secondary market for the contracts, or if the counterparty to the contract is unable to perform. Risks may exceed amounts recognized on the Statement of assets and liabilities. When the contract is closed, the fund records a realized gain or loss equal to the difference between the value of the contract at the time it was opened and the value at the time it
44
was closed. Realized gains and losses on purchased options are included in realized gains and losses on investment securities. If a written call option is exercised, the premium originally received is recorded as an addition to sales proceeds. If a written put option is exercised, the premium originally received is recorded as a reduction to the cost of investments.
Futures contracts are valued at the quoted daily settlement prices established by the exchange on which they trade. The fund and the broker agree to exchange an amount of cash equal to the daily fluctuation in the value of the futures contract. Such receipts or payments are known as “variation margin.” Exchange traded options are valued at the last sale price or, if no sales are reported, the last bid price for purchased options and the last ask price for written options. Options traded over-the-counter are valued using prices supplied by dealers. Futures and written option contracts outstanding at period end, if any, are listed after the fund’s portfolio.
F) Securities lending The fund may lend securities, through its agents, to qualified borrowers in order to earn additional income. The loans are collateralized by cash and/or securities in an amount at least equal to the market value of the securities loaned. The market value of securities loaned is determined daily and any additional required collateral is allocated to the fund on the next business day. The risk of borrower default will be borne by the fund’s agents; the fund will bear the risk of loss with respect to the investment of the cash collateral. Income from securities lending is included in investment income on the Statement of operations. At October 31, 2007, the value of securities loaned amounted to $141,107,840. The fund received cash collateral of $148,038,892 which is pooled with collateral of other Putnam funds into 54 issues of short-term inv estments.
G) Federal taxes It is the policy of the fund to distribute all of its taxable income within the prescribed time and otherwise comply with the provisions of the Internal Revenue Code of 1986, as amended, (the “Code”) applicable to regulated investment companies. It is also the intention of the fund to distribute an amount sufficient to avoid imposition of any excise tax under Section 4982 of the Code, as amended. Therefore, no provision has been made for federal taxes on income, capital gains or unrealized appreciation on securities held nor for excise tax on income and capital gains.
The aggregate identified cost on a tax basis is $1,012,399,233, resulting in gross unrealized appreciation and depreciation of $170,876,847 and $53,248,622, respectively, or net unrealized appreciation of $117,628,225.
H) Distributions to shareholders Distributions to shareholders from net investment income are recorded by the fund on the ex-dividend date. Distributions from capital gains, if any, are recorded on the ex-dividend date and paid at least annually. The amount and character of income and gains to be distributed are determined in accordance with income tax regulations, which may differ from generally accepted accounting principles. Dividend sources are estimated at the time of declaration. Actual results may vary. Any non-taxable return of capital cannot be determined until final tax calculations are completed after the end of the fund’s fiscal year. Reclassifications are made to the fund’s capital accounts to reflect income and gains available for distribution (or available capital loss carryovers) under income tax regulations.
I) Expenses of the trust Expenses directly charged or attributable to any fund will be paid from the assets of that fund. Generally, expenses of the trust will be allocated among and charged to the assets of each fund on a basis that the Trustees deem fair and equitable, which may be based on the relative assets of each fund or the nature of the services performed and relative applicability to each fund.
Note 2: Management fee, administrative services and other transactions
Putnam Management is paid for management and investment advisory services quarterly based on
45
the average net assets of the fund. Such fee is based on the following annual rates: 0.70% of the first $500 million of average net assets, 0.60% of the next $500 million, 0.55% of the next $500 million, 0.50% of the next $5 billion, 0.475% of the next $5 billion, 0.455% of the next $5 billion, 0.44% of the next $5 billion and 0.43% thereafter.
Putnam Management has agreed to waive fees and reimburse expenses of the fund through June 30, 2009 to the extent necessary to ensure that the fund’s expenses do not exceed the simple average of the expenses of all front-end load funds viewed by Lipper Inc. as having the same investment classification or objective as the fund. The expense reimbursement is based on a comparison of the fund’s expenses with the average annualized operating expenses of the funds in its Lipper peer group for each calendar quarter during the fund’s last fiscal year, excluding 12b-1 fees and without giving effect to any expense offset and brokerage service arrangements that may reduce fund expenses.
For the period ended October 31, 2007, Putnam Management did not waive any of its management fee from the fund.
Effective August 3, 2007, Marsh & McLennan Companies, Inc. sold its ownership interest in Putnam Management, its parent companies and affiliates to a wholly-owned subsidiary of Great-West Lifeco, Inc. The fund’s shareholders have approved a new management contract for the fund that became effective upon the sale.
For the period ended October 31, 2007, Putnam Management has assumed $603 of legal, shareholder servicing and communication, audit and Trustee fees incurred by the fund in connection with certain legal and regulatory matters (including those described in Note 6).
The fund reimburses Putnam Management an allocated amount for the compensation and related expenses of certain officers of the fund and their staff who provide administrative services to the fund. The aggregate amount of all such reimbursements is determined annually by the Trustees.
Custodial services for the fund’s assets were provided by Putnam Fiduciary Trust Company (“PFTC”), an affiliate of Putnam Management, and by State Street Bank and Trust Company (“State Street”). Custody fees are based on the fund’s asset level, the number of its security holdings, transaction volumes and with respect to PFTC, certain fees related to the transition of assets to State Street. Putnam Investor Services, a division of PFTC, provided investor servicing agent functions to the fund. Putnam Investor Services received fees for investor servicing, subject to certain limitations, based on the number of shareholder accounts in the fund and the level of defined contribution plan assets in the fund. During the period ended October 31, 2007, the fund incurred $1,524,525 for custody and investor servicing agent functions provided by PFTC.
The fund has entered into arrangements with PFTC and State Street whereby PFTC’s and State Street’s fees are reduced by credits allowed on cash balances. The fund also reduced expenses through brokerage service arrangements. For the six months ended October 31, 2007, the fund’s expenses were reduced by $45,929 under these arrangements.
Each independent Trustee of the fund receives an annual Trustee fee, of which $448, as a quarterly retainer, has been allocated to the fund, and an additional fee for each Trustees meeting attended. Trustees receive additional fees for attendance at certain committee meetings and industry seminars and for certain compliance-related matters. Trustees also are reimbursed for expenses they incur relating to their services as Trustees.
The fund has adopted a Trustee Fee Deferral Plan (the “Deferral Plan”) which allows the Trustees to defer the receipt of all or a portion of Trustees fees payable on or after July 1, 1995. The deferred fees remain invested in certain Putnam funds until distribution in accordance with the Deferral Plan.
The fund has adopted an unfunded noncontributory defined benefit pension plan (the “Pension Plan”) covering all Trustees of the fund who have served as a Trustee for at least five years and were
46
first elected prior to 2004. Benefits under the Pension Plan are equal to 50% of the Trustee’s average annual attendance and retainer fees for the three years ended December 31, 2005. The retirement benefit is payable during a Trustee’s lifetime, beginning the year following retirement, for the number of years of service through December 31, 2006. Pension expense for the fund is included in Trustee compensation and expenses in the Statement of operations. Accrued pension liability is included in Payable for Trustee compensation and expenses in the Statement of assets and liabilities. The Trustees have terminated the Pension Plan with respect to any Trustee first elected after 2003.
The fund has adopted distribution plans (the “Plans”) with respect to its class A, class B, class C, class M and class R shares pursuant to Rule 12b-1 under the Investment Company Act of 1940. The purpose of the Plans is to compensate Putnam Retail Management, a wholly-owned subsidiary of Putnam, LLC and Putnam Retail Management GP, Inc., for services provided and expenses incurred in distributing shares of the fund. The Plans provide for payments by the fund to Putnam Retail Management at an annual rate of up to 0.35%, 1.00%, 1.00%, 1.00% and 1.00% of the average net assets attributable to class A, class B, class C, class M and class R shares, respectively. The Trustees have approved payment by the fund at an annual rate of 0.25%, 1.00%, 1.00%, 0.75% and 0.50% of the average net assets attributable to class A, class B, class C, class M and class R shares, respectively.
For the six months ended October 31, 2007, Putnam Retail Management, acting as underwriter, received net commissions of $30,931 and $430 from the sale of class A and class M shares, respectively, and received $77,723 and $1,169 in contingent deferred sales charges from redemptions of class B and class C shares, respectively.
A deferred sales charge of up to 1.00% and 0.65% is assessed on certain redemptions of class A and class M shares, respectively. For the six month period ended October 31, 2007, Putnam Retail Management, acting as underwriter, received $125 and no monies on class A and class M redemptions, respectively.
Note 3: Purchases and sales of securities
During the six months ended October 31, 2007, cost of purchases and proceeds from sales of investment securities other than short-term investments aggregated $407,808,332 and $477,514,334, respectively. There were no purchases or sales of U.S. government securities.
Note 4: Capital shares
At October 31, 2007, there was an unlimited number of shares of beneficial interest authorized. Transactions in capital shares were as follows:
| | |
| CLASS A | Shares | Amount |
|
| Six months ended 10/31/07: | |
| Shares sold | 8,059,611 | $ 132,554,875 |
|
| Shares issued | | |
| in connection | | |
| with reinvestment | | |
| of distributions | — | — |
|
| | 8,059,611 | 132,554,875 |
|
| Shares | | |
| repurchased | (6,918,400) | (110,366,192) |
|
| Net increase | 1,141,211 | $ 22,188,683 |
| |
| Year ended 4/30/07: | | |
| Shares sold | 11,065,524 | $ 171,087,729 |
|
| Shares issued | | |
| in connection | | |
| with reinvestment | | |
| of distributions | 4,401,770 | 66,246,570 |
|
| | 15,467,294 | 237,334,299 |
|
| Shares | | |
| repurchased | (10,619,341) | (163,746,656) |
|
| Net increase | 4,847,953 | $ 73,587,643 |
47
| | |
| CLASS B | Shares | Amount |
|
| Six months ended 10/31/07: | |
| Shares sold | 397,502 | $ 6,188,640 |
|
| Shares issued | | |
| in connection | | |
| with reinvestment | | |
| of distributions | — | — |
|
| | 397,502 | 6,188,640 |
|
| Shares | | |
| repurchased | (6,824,039) | (109,121,274) |
|
| Net decrease | (6,426,537) | $(102,932,634) |
| |
| Year ended 4/30/07: | | |
| Shares sold | 1,741,453 | $ 26,080,981 |
|
| Shares issued | | |
| in connection | | |
| with reinvestment | | |
| of distributions | 1,612,227 | 23,603,039 |
|
| | 3,353,680 | 49,684,020 |
|
| Shares | | |
| repurchased | (6,723,039) | (100,622,152) |
|
| Net decrease | (3,369,359) | $ (50,938,132) |
|
| |
| CLASS C | Shares | Amount |
|
| Six months ended 10/31/07: | |
| Shares sold | 243,356 | $ 3,778,490 |
|
| Shares issued | | |
| in connection | | |
| with reinvestment | | |
| of distributions | — | — |
|
| | 243,356 | 3,778,490 |
|
| Shares | | |
| repurchased | (335,173) | (5,163,633) |
|
| Net decrease | (91,817) | $(1,385,143) |
| |
| Year ended 4/30/07: | | |
| Shares sold | 590,164 | $ 8,887,360 |
|
| Shares issued | | |
| in connection | | |
| with reinvestment | | |
| of distributions | 267,479 | 3,910,542 |
|
| | 857,643 | 12,797,902 |
|
| Shares | | |
| repurchased | (549,119) | (8,191,995) |
|
| Net increase | 308,524 | $ 4,605,907 |
| | |
| CLASS M | Shares | Amount |
|
| Six months ended 10/31/07: | |
| Shares sold | 36,086 | $ 573,189 |
|
| Shares issued | | |
| in connection | | |
| with reinvestment | | |
| of distributions | — | — |
|
| | 36,086 | 573,189 |
|
| Shares | | |
| repurchased | (151,705) | (2,400,079) |
|
| Net decrease | (115,619) | $(1,826,890) |
| |
| Year ended 4/30/07: | | |
| Shares sold | 145,190 | $ 2,194,014 |
|
| Shares issued | | |
| in connection | | |
| with reinvestment | | |
| of distributions | 100,308 | 1,482,555 |
|
| | 245,498 | 3,676,569 |
|
| Shares | | |
| repurchased | (194,624) | (2,955,810) |
|
| Net increase | 50,874 | $ 720,759 |
|
| |
| CLASS R | Shares | Amount |
|
| Six months ended 10/31/07: | |
| Shares sold | 145,153 | $ 2,274,007 |
|
| Shares issued | | |
| in connection | | |
| with reinvestment | | |
| of distributions | — | — |
|
| | 145,153 | 2,274,007 |
|
| Shares | | |
| repurchased | (77,611) | (1,225,317) |
|
| Net increase | 67,542 | $ 1,048,690 |
| |
| Year ended 4/30/07: | | |
| Shares sold | 267,511 | $ 4,067,285 |
|
| Shares issued | | |
| in connection | | |
| with reinvestment | | |
| of distributions | 30,369 | 452,494 |
|
| | 297,880 | 4,519,779 |
|
| Shares | | |
| repurchased | (105,485) | (1,587,287) |
|
| Net increase | 192,395 | $ 2,932,492 |
48
| | |
| CLASS Y | Shares | Amount |
|
| Six months ended 10/31/07: | |
| Shares sold | 1,495,359 | $ 24,224,823 |
|
| Shares issued | | |
| in connection | | |
| with reinvestment | | |
| of distributions | — | — |
|
| | 1,495,359 | 24,224,823 |
|
| Shares | | |
| repurchased | (482,979) | (7,690,085) |
|
| Net increase | 1,012,380 | $ 16,534,738 |
| |
| Year ended 4/30/07: | | |
| Shares sold | 976,196 | $ 15,203,911 |
|
| Shares issued | | |
| in connection | | |
| with reinvestment | | |
| of distributions | 350,784 | 5,289,878 |
|
| | 1,326,980 | 20,493,789 |
|
| Shares | | |
| repurchased | (843,474) | (13,014,594) |
|
| Net increase | 483,506 | $ 7,479,195 |
Note 5: Investment in Putnam Prime Money Market Fund
The fund invests in Putnam Prime Money Market Fund, an open-end management investment company managed by Putnam Management. Investments in Putnam Prime Money Market Fund are valued at its closing net asset value each business day. Management fees paid by the fund are reduced by an amount equal to the management fees paid by Putnam Prime Money Market Fund with respect to assets invested by the fund in Putnam Prime Money Market Fund. For the period ended October 31, 2007, management fees paid were reduced by $10,177 relating to the fund’s investment in Putnam Prime Money Market Fund. Income distributions earned by the fund are recorded as income in the Statement of operations and totaled $751,387 for the period ended October 31, 2007. During the period ended October 31, 2007, cost of purchases and proceeds of sales of investments in Putnam Prime Money Market Fund aggregated $204,917,596 and $220,682,431, respectively.
Note 6: Regulatory matters and litigation
In late 2003 and 2004, Putnam Management settled charges brought by the SEC and the Massachusetts Securities Division in connection with excessive short-term trading in Putnam funds. Payments from Putnam Management will be distributed to certain open-end Putnam funds and their shareholders. These allegations and related matters have served as the general basis for certain lawsuits, including purported class action lawsuits against Putnam Management and, in a limited number of cases, some Putnam funds. Putnam Management believes that these lawsuits will have no material adverse effect on the funds or on Putnam Management’s ability to provide investment management services. In addition, Putnam Management has agreed to bear any costs incurred by the Putnam funds as a result of these matters.
Putnam Management and Putnam Retail Management are named as defendants in a civil suit in which the plaintiffs allege that the management and distribution fees paid by certain Putnam funds were excessive and seek recovery under the Investment Company Act of 1940. Putnam Management and Putnam Retail Management have contested the plaintiffs’ claims and the matter is currently pending in the U.S. District Court for the District of Massachusetts. Based on currently available information, Putnam Management believes that this action is without merit and that it is unlikely to have a material effect on Putnam Management’s and Putnam Retail Management’s ability to provide services to their clients, including the fund.
Note 7: New accounting pronouncements
In June 2006, the Financial Accounting Standards Board (“FASB”) issued Interpretation No. 48, Accounting for Uncertainty in Income Taxes (the “Interpretation”). The Interpretation prescribes a minimum threshold for financial statement recognition of the benefit of a tax position taken or expected to be taken by a filer in the filer’s tax return. Upon adoption, the Interpretation did not
49
have a material effect on the fund’s financial statements. However, the conclusions regarding the Interpretation may be subject to review and adjustment at a later date based on factors including, but not limited to, further implementation guidance expected from the FASB, and on-going analysis of tax laws, regulations and interpretations thereof.
In September 2006, the FASB issued Statement of Financial Accounting Standards No. 157, Fair Value Measurements (the “Standard”). The Standard defines fair value, sets out a framework for measuring fair value and requires additional disclosures about fair value measurements. The Standard applies to fair value measurements already required or permitted by existing standards. The Standard is effective for financial statements issued for fiscal years beginning after November 15, 2007 and interim periods within those fiscal years. Putnam Management is currently evaluating what impact the adoption of the Standard will have on the fund’s financial statements.
50
Shareholder meeting
results (unaudited)
May 15, 2007 meeting
A proposal to approve a new management contract between the fund and Putnam Investment Management, LLC was approved as follows:
| | |
| Votes for | Votes against | Abstentions |
|
| 37,792,211 | 1,488,626 | 1,471,855 |
|
All tabulations are rounded to the nearest whole number.
51
Brokerage commissions
(unaudited)
Brokerage commissions are paid to firms that execute trades on behalf of your fund. When choosing these firms, Putnam is required by law to seek the best execution of the trades, taking all relevant factors into consideration, including expected quality of execution and commission rate. Listed below are the largest relationships based upon brokerage commissions for your fund and the other funds in Putnam’s U.S. Small- and Mid-Cap group for the year ended October 31, 2007. The other Putnam mutual funds in this group are Putnam Capital Opportunities Fund, Putnam Discovery Growth Fund, Putnam New Opportunities Fund, Putnam OTC & Emerging Growth Fund, Putnam Small Cap Growth Fund, Putnam Small Cap Value Fund, Putnam Vista Fund, Putnam VT Capital Opportunities Fund, Putnam VT Discovery Growth Fund, Putnam VT Mid Cap Value Fund, Putnam VT New Opportunities Fund, Putnam VT OTC & Emerging Growth Fund, Putnam VT Small Cap Value Fu nd, and Putnam VT Vista Fund.
The top five firms that received brokerage commissions for trades executed for the U.S. Small-and Mid-Cap group are (in descending order) Citigroup Global Markets, Merrill Lynch, Credit Suisse First Boston, Morgan Stanley Dean Witter, and UBS Warburg. Commissions paid to these firms together represented approximately 39% of the total brokerage commissions paid for the year ended October 31, 2007.
Commissions paid to the next 10 firms together represented approximately 39% of the total brokerage commissions paid during the period. These firms are (in alphabetical order) Bear Stearns & Company, CIBC World Markets, Deutsche Bank Securities, Goldman Sachs, JPMorgan Clearing, Lehman Brothers, RBC Capital Markets, SG Cowen, Thomas Weisel Partners, and Wachovia Securities.
Additional information about brokerage commissions is available on the Securities and Exchange Commission (SEC) Web site at www.sec.gov. Putnam funds disclose commissions by firm to the SEC in semiannual filings on Form N-SAR.
52
Fund information
Founded 70 years ago, Putnam Investments was built around the concept that a balance between risk and reward is the hallmark of a well-rounded financial program. We manage over 100 mutual funds in growth, value, blend, fixed income, and international.
| | |
| Investment Manager | Officers | Francis J. McNamara, III |
| Putnam Investment | Charles E. Haldeman, Jr. | Vice President and |
| Management, LLC | President | Chief Legal Officer |
| One Post Office Square | | |
| Boston, MA 02109 | Charles E. Porter | Robert R. Leveille |
| Executive Vice President, | Vice President and |
| Marketing Services | Principal Executive Officer, | Chief Compliance Officer |
| Putnam Retail Management | Associate Treasurer and | |
| One Post Office Square | Compliance Liaison | Mark C. Trenchard |
| Boston, MA 02109 | | Vice President and |
| Jonathan S. Horwitz | BSA Compliance Officer |
| Custodian | Senior Vice President | |
| State Street Bank and | and Treasurer | Judith Cohen |
| Trust Company | | Vice President, Clerk and |
| Steven D. Krichmar | Assistant Treasurer |
| Legal Counsel | Vice President and | |
| Ropes & Gray LLP | Principal Financial Officer | Wanda M. McManus |
| | Vice President, Senior Associate |
| Trustees | Janet C. Smith | Treasurer and Assistant Clerk |
| John A. Hill, Chairman | Vice President, Principal | |
| Jameson Adkins Baxter, | Accounting Officer and | Nancy E. Florek |
| Vice Chairman | Assistant Treasurer | Vice President, Assistant Clerk, |
| Charles B. Curtis | | Assistant Treasurer and |
| Robert J. Darretta | Susan G. Malloy | Proxy Manager |
| Myra R. Drucker | Vice President and | |
| Charles E. Haldeman, Jr. | Assistant Treasurer | |
| Paul L. Joskow | | |
| Elizabeth T. Kennan | Beth S. Mazor | |
| Kenneth R. Leibler | Vice President | |
| Robert E. Patterson | | |
| George Putnam, III | James P. Pappas | |
| W. Thomas Stephens | Vice President | |
| Richard B. Worley | | |
| Richard S. Robie, III | |
| Vice President | |
This report is for the information of shareholders of Putnam Mid Cap Value Fund. It may also be used as sales literature when preceded or accompanied by the current prospectus, the most recent copy of Putnam’s Quarterly Performance Summary, and Putnam’s Quarterly Ranking Summary. For more recent performance, please visit www.putnam.com. Investors should carefully consider the investment objective, risks, charges, and expenses of a fund, which are described in its prospectus. For this and other information or to request a prospectus, call 1-800-225-1581 toll free. Please read the prospectus carefully before investing. The fund’s Statement of Additional Information contains additional information about the fund’s Trustees and is available without charge upon request by calling 1-800-225-1581.

Item 2. Code of Ethics:
Not applicable
Item 3. Audit Committee Financial Expert:
Not applicable
Item 4. Principal Accountant Fees and Services:
Not applicable
Item 5. Audit Committee of Listed Registrants
Not applicable
Item 6. Schedule of Investments:
The registrant’s schedule of investments in unaffiliated issuers is included in the report to shareholders in Item 1 above.
Item 7. Disclosure of Proxy Voting Policies and Procedures For Closed-End Management Investment Companies:
Not applicable
Item 8. Portfolio Managers of Closed-End Investment Companies
Not Applicable
Item 9. Purchases of Equity Securities by Closed-End Management Investment Companies and Affiliated Purchasers:
Not applicable
Item 10. Submission of Matters to a Vote of Security Holders:
Not applicable
Item 11. Controls and Procedures:
(a) The registrant's principal executive officer and principal financial officer have concluded, based on their evaluation of the effectiveness of the design and operation of the registrant's disclosure controls and procedures as of a date within 90 days of the filing date of this report, that the design and operation of such procedures are generally effective to provide reasonable assurance that information required to be disclosed by the registrant in this report is recorded, processed, summarized and reported within the time periods specified in the Commission's rules and forms.
(b) Changes in internal control over financial reporting: During the period, Putnam Fiduciary Trust Company, the fund's transfer agent, began utilizing shareholder systems and systems support provided by DST Systems, Inc. and certain of its affiliates.
Item 12. Exhibits:
(a)(1) Not applicable
(a)(2) Separate certifications for the principal executive officer and principal financial officer of the registrant as required by Rule 30a-2(a) under the Investment Company Act of 1940, as amended, are filed herewith.
(b) The certifications required by Rule 30a-2(b) under the Investment Company Act of 1940, as amended, are filed herewith.
SIGNATURES
Pursuant to the requirements of the Securities Exchange Act of 1934 and the Investment Company Act of 1940, the registrant has duly caused this report to be signed on its behalf by the undersigned, thereunto duly authorized.
Putnam Investment Funds
By (Signature and Title):
/s/Janet C. Smith
Janet C. Smith
Principal Accounting Officer
Date: December 28, 2007
Pursuant to the requirements of the Securities Exchange Act of 1934 and the Investment Company Act of 1940, this report has been signed below by the following persons on behalf of the registrant and in the capacities and on the dates indicated.
By (Signature and Title):
/s/Charles E. Porter
Charles E. Porter
Principal Executive Officer
Date: December 28, 2007
By (Signature and Title):
/s/Steven D. Krichmar
Steven D. Krichmar
Principal Financial Officer
Date: December 28, 2007