| | |
| UNITED STATES |
| SECURITIES AND EXCHANGE COMMISSION |
| Washington, D.C. 20549 |
| |
| FORM N-CSR |
| |
| CERTIFIED SHAREHOLDER REPORT OF REGISTERED |
| MANAGEMENT INVESTMENT COMPANIES |
| |
| Investment Company Act file number: (811- 07237) | |
| |
| Exact name of registrant as specified in charter: Putnam Investment Funds |
| |
| Address of principal executive offices: One Post Office Square, Boston, Massachusetts 02109 |
| |
| Name and address of agent for service: | Beth S. Mazor, Vice President |
| | One Post Office Square |
| | Boston, Massachusetts 02109 |
| |
| Copy to: | John W. Gerstmayr, Esq. |
| | Ropes & Gray LLP |
| | One International Place |
| | Boston, Massachusetts 02110 |
| |
| Registrant’s telephone number, including area code: | (617) 292-1000 |
Date of fiscal year end: September 30, 2008
Date of reporting period: October 1, 2007 — March 31, 2008
Item 1. Report to Stockholders:
The following is a copy of the report transmitted to stockholders pursuant to Rule 30e-1 under the Investment Company Act of 1940:

What makes Putnam different?

In 1830, Massachusetts Supreme Judicial Court Justice Samuel Putnam established The Prudent Man Rule, a legal foundation for responsible money management.
THE PRUDENT MAN RULE
All that can be required of a trustee to invest is that he shall conduct himself faithfully and exercise a sound discretion. He is to observe how men of prudence, discretion, and intelligence manage their own affairs, not in regard to speculation, but in regard to the permanent disposition of their funds, considering the probable income, as well as the probable safety of the capital to be invested.

A time-honored tradition in money management
Since 1937, our values have been rooted in a profound sense of responsibility for the money entrusted to us.
A prudent approach to investing
We use a research-driven team approach to seek consistent, dependable, superior investment results over time, although there is no guarantee a fund will meet its objectives.
Funds for every investment goal
We offer a broad range of mutual funds and other financial products so investors and their financial representatives can build diversified portfolios.
A commitment to doing what’s right for investors
With a focus on investment performance, below-average expenses, and in-depth information about our funds, we put the interests of investors first and seek to set the standard for integrity and service.
Industry-leading service
We help investors, along with their financial representatives, make informed investment decisions with confidence.
Putnam
International New
Opportunities Fund
3 | 31 | 08
Semiannual Report
| |
| Message from the Trustees | 2 |
| About the fund | 4 |
| Performance snapshot | 6 |
| Interview with your fund’s Portfolio Leader | 7 |
| Performance in depth | 12 |
| Expenses | 15 |
| Portfolio turnover | 17 |
| Risk | 18 |
| Your fund’s management | 19 |
| Terms and definitions | 20 |
| Trustee approval of management contract | 22 |
| Other information for shareholders | 27 |
| Financial statements | 28 |
| Brokerage commissions | 51 |
Cover photograph: Vineyard, Napa County, California © Charles O’Rear
Message from the Trustees
Dear Fellow Shareholder:
Challenges continued to mount for investors in the first quarter of 2008. The markets struggled as economic news — from falling housing prices to rising inflation — painted a gloomy backdrop to an already-difficult situation. Many economists now believe that the United States is in or near recession. Fortunately, the Federal Reserve Board (the Fed) and federal lawmakers have reacted quickly, employing creative and, in some instances, unprecedented moves to ameliorate the situation. As of this writing, the Fed has cut rates a total of 3.25 percentage points since last September and added nearly $400 billion in liquidity to the credit markets. In a historic move, the Fed also provided financing to facilitate JPMorgan Chase’s buyout of investment bank Bear Stearns, which was on the brink of failure. In February, lawmakers, working with the president, approved an economic stimulus package that will put $168 billion into the hands of millions of U.S. taxpayers startin g this month.
As investors it is important to keep a long-term perspective and remember the counsel of your financial representative during times like these. Markets can recover quickly, and investors who sit on the sidelines run the risk of missing the rebound. The normal condition of the economy and corporate earnings is one of growth, albeit with occasional interruptions. What’s more, recessions in the United States are usually short-lived compared with economic expansions. Since 1960, the economy has experienced 7 recessions lasting an average of 11 months, versus 64 months for the average expansion. Perhaps most important is the value that a properly diversified portfolio can offer by balancing areas of weakness with areas of strength.
2
Starting this month, we have changed the portfolio manager’s commentary in this report to a question-and-answer format. We feel this new approach makes the information more readable and accessible, and we hope you think so as well.
Lastly, we would like to take this opportunity to welcome new shareholders to the fund and to thank all of our investors for your continued confidence in Putnam Investments.

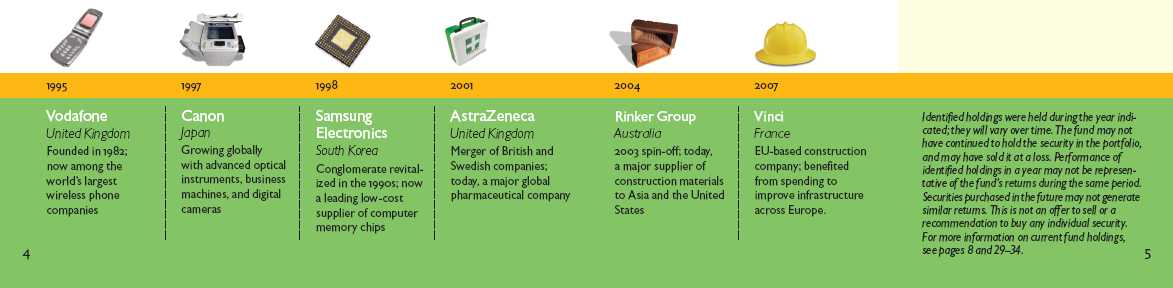
Putnam International New Opportunities Fund:
Seeking to benefit from growing companies abroad

If you have ever worn an Adidas sports shoe, used a Nokia wireless phone, or taken digital pictures with a Canon camera, you probably understand part of the philosophy behind Putnam International New Opportunities Fund: Successful companies outside the United States, with products and services in strong demand, can be a great investment.
Of course, there is more to a growth company than great products, and that’s why the fund’s management team relies on a disciplined strategy and research by Putnam’s in-house analysts to select portfolio holdings from the thousands of companies operating abroad. The team searches for companies that are well managed, with sound business models and solid balance sheets.
The fund also invests in companies of various sizes to benefit from different types of growth potential: large companies that dominate their industries, as well as midsize and small companies in an expansionary-growth phase. It is important to note that investments in small or midsize companies increase the risk of greater price fluctuations.
The fund currently invests primarily in developed markets such as Japan, Canada, and the European Union, but it can also invest in emerging markets, which may offer faster rates of economic growth but subject the fund to greater risk of volatility and illiquid securities. For enhanced access to information about international companies, Putnam has analysts in London and Tokyo, as well as in Boston.
While investing in companies that operate under different economic and political systems involves risk, it may give your investment a chance to grow, even during a downturn in the U.S. economy. International economies may be expanding at times when the U.S. economy is sluggish. Also, investing in securities denominated in foreign currencies provides another type of diversification. While the euro, the yen, the pound, and other currencies can fluctuate in value, your investment can benefit when these currencies strengthen against the U.S. dollar.
In making investment decisions, the fund’s management team is guided by Putnam’s risk controls, which call for regular review of fund holdings and the discipline to sell stocks when they involve more risk than reward. For more than 13 years, the fund has helped investors benefit from investing in rapidly growing international companies.
In-depth analysis is key to successful stock selection.
Drawing on the expertise of a dedicated team of stock analysts, the fund’s management team seeks attractive growth stocks. Once a stock is selected for the portfolio, it is regularly assessed by members of the team to ensure that it continues to meet their criteria, including:
Growth They examine each company’s financials, including its sales and earnings, and target those companies believed to offer growth potential.
Quality They look for high-quality companies, seeking characteristics such as solid management teams, sound business models, a record of strong performance, and high levels of free-cash flow.
Valuation They carefully consider how each stock is valued, seeking stocks whose valuations are attractive relative to the company’s growth potential.
Putnam International New Opportunities Fund’s holdings
have spanned many sectors and international markets.
Performance snapshot
Putnam International New
Opportunities Fund
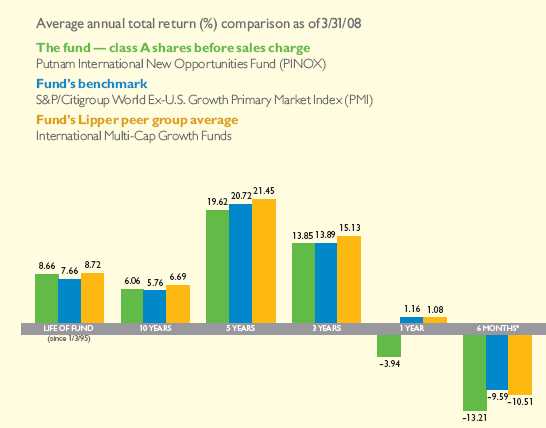
Current performance may be lower or higher than the quoted past performance, which cannot guarantee future results. Share price, principal value, and return will fluctuate, and you may have a gain or a loss when you sell your shares. Performance of class A shares assumes reinvestment of distributions and does not account for taxes. Fund returns in the bar chart do not reflect a sales charge of 5.75%; had they, returns would have been lower. See pages 7 and 12–14 for additional performance information. For a portion of the periods, this fund may have limited expenses, without which returns would have been lower. A 1% short-term trading fee may apply. To obtain the most recent month-end performance, visit www.putnam.com.
* Returns for the six-month period are not annualized, but cumulative.
6

The period in review
Steve, thanks for spending time today to discuss International New Opportunities Fund. Let’s start with an update on fund performance during the period.
Conditions were challenging as international markets experienced substantial declines during the review period. The main problem was the ongoing revelation of losses related to U.S. mortgage-backed securities and the impact of the U.S. economic slowdown, which reduced forecasts for growth in international markets. The fund posted a decline of 13.21% for the six months ended March 31, 2008, and lagged behind the average of its Lipper peer group and its benchmark index. The primary cause of the under-performance was stock selection, while sector and market allocations had a neutral impact. Foreign currency exposure, although helpful on an absolute basis as the U.S. dollar weakened, did not help us keep pace with the benchmark, because of the fund’s exposure to the Japanese yen and the Australian dollar,
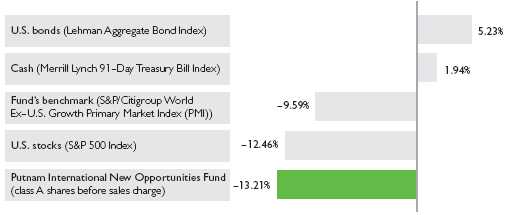
Broad market index and fund performance
This comparison shows your fund’s performance in the context of broad market indexes for the six months ended 3/31/08. See page 6 and pages 12–14 for additional fund performance information. Index descriptions can be found on page 21.
7
which were not among the strongest foreign currencies during the period.
Why did international markets retreat, given that international economies have generally been stronger than the U.S. economy in recent years?
The world’s financial systems are highly interconnected, so sometimes an economic or market issue in one country can take on widespread significance. The U.S. subprime crisis is an example, because it spread to broader credit markets, then to stock markets, and spilled over to Europe and Asia. Also, the U.S. economy is large enough that problems here can have global consequences. Currently, international economies are generally stronger than the U.S. economy, but the outlook for growth has deteriorated somewhat because of U.S. weakness, and stock prices have been affected as a result.
How did the fund’s positioning influence performance?
As I mentioned, the fund’s underperformance was mainly caused by security selection. Our research led us to anticipate a slowdown in consumer spending, particularly in Europe, and so we trimmed positions in the consumer cyclicals sector, which we believed most likely to be affected by weaker spending. We also added to positions in consumer staples stocks, which we believed most likely to weather the slowdown. These decisions helped results, but we acted somewhat late, when some of the cyclical
Top 10 holdings
This table shows the fund’s top 10 holdings and the percentage of the fund’s net assets that each represented as of 3/31/08. Holdings will vary over time.
| | |
| HOLDING (percentage of fund’s net assets) | COUNTRY | SECTOR/INDUSTRY |
|
| Total SA (3.8%) | France | Energy/Oil and gas |
|
| Nestle SA (3.0%) | Switzerland | Consumer staples/Food |
|
| Reckitt Benckiser PLC (2.7%) | United Kingdom | Consumer staples/Consumer goods |
|
| Nokia OYJ (2.3%) | Finland | Technology/ |
| | | Communications equipment |
|
| Novartis AG (2.0%) | Switzerland | Health care/Pharmaceuticals |
|
| Banco Santander Central Hispano SA (2.0%) | Spain | Financials/Banking |
|
| Alstom (1.8%) | France | Capital goods/Machinery |
|
| RWE AG (1.7%) | Germany | Utilities and power/Electric utilities |
|
| Samsung Electronics Co., Ltd. (1.7%) | South Korea | Technology/Electronics |
|
| Zurich Financial Services AG (1.7%) | Switzerland | Financials/Insurance |
|
8
stocks were already declining. Another decision we made was to keep an underweight position in financial stocks, such as banks and brokerage companies. This was the correct action, as many were hurt by mortgage investments. Two sector weightings — an underweight to basic materials stocks and an overweight to technology — were disappointing, but our stock selection fared well enough in both sectors to more than overcome the sector positioning.
What were some individual holdings that performed well?
Consumer staples did well relative to the benchmark’s decline because these companies sell the type of products people need whether the economy is accelerating or decelerating. In the United Kingdom, Reckitt Benckiser which makes and distributes branded products like Woolite® fabric detergent, Airwick® air fresheners, and French’s® mustard, outperformed the benchmark. In Portugal, grocery-market operator Jerónimo Martins contributed to performance. We sold the stock during the period when it reached a valuation that reflected its full potential, in our view. And in Switzerland, Nestlé, the global packaged foods distributor, also had positive relative results.
There was strength in the basic materials sector because demand for construction and building resources is still strong in emerging markets such as China, India, and Brazil. The fund held an overweight position in the Anglo-Australian firm Rio
Comparison of top country weightings
This chart shows how the fund’s top weightings have changed over the past six months. Weightings are shown as a percentage of net assets. Holdings will vary over time.

9
Tinto, which mines a wide variety of minerals, including aluminum, copper, and iron, as well as gold and diamonds. Also in this sector, K+S, a German fertilizer company, performed very well. As you may know from your grocery bills, food prices are rising, a trend that is stimulating the agricultural sector and creating demand for fertilizers that can increase crop yields.
What were some examples of underperformers?
Although the energy sector did better than most others, the fund was hurt by two holdings in this sector. Renewable Energy of Norway is a small-cap solar-energy company that we have followed since its initial public offering in May 2006. Like many solar-energy stocks, its price rose quickly in 2006 and 2007, but then the industry was battered when the market turned risk averse. We decided to sell it because we believed it was vulnerable should energy prices fall from record-high levels. Saipem of Italy, an oilfield services company, also suffered when the market punished stocks with high price multiples. We sold this stock, believing that it had little chance of recovery in the near term.
Other underperformers were in the consumer cyclicals sector. Although we emphasized companies that we believed would continue to deliver solid earnings in a downturn, anxious investors divested of both strong and weak stocks. Alibaba of China and Piaggio of Italy were two disappointments in this sector. Alibaba is an online auction service similar to eBay, though it serves the business-to-business market more than eBay does. We sold the stock because its risk profile had increased. We also parted with Piaggio. Although this stock had performed well for the fund in previous periods, and we had been optimistic regarding its outlook at the beginning of the period, we became convinced that it too would eventually succumb to weaker European consumer spending, and so we sold the position.
What steps are you taking to cope with the adverse economic conditions?
We believe the big question mark is still the financials sector. Fortunately, we have maintained an underweight in this sector and the fund’s holdings have performed reasonably well. Now we are taking a proactive stance. There are some growth-oriented financial companies that, in our view, do not have major problems with subprime lending or downgraded securities, yet their stocks have also fallen during the turmoil. An example of such a stock, which we began purchasing for the fund after the end of the fiscal period, is UniCredit, an Italian financial services conglomerate. We are also maintaining above-normal cash positions, looking for opportunities to establish positions in other high-quality financial companies with strong growth prospects.
Does that mean you have a constructive outlook for the markets?
10
We are reasonably optimistic. We believe that the markets appear to be near a low point for this economic cycle. That said, in our opinion volatility is likely to persist in the coming quarters, particularly in international markets. The United States led this downturn, and U.S. stocks were among the first to be downgraded. Other regions, particularly Europe, are still coming to grips with diminished earnings expectations. For this reason, U.S. stocks might perform competitively as international markets adjust to lower expectations. Over the long term, however, we believe international stocks are more attractive investments because of superior growth conditions in other regions. As the markets are likely to be on the road to recovery, we think investors are likely to favor growth-style stocks because of their earnings prospects, and we are favoring stocks in which we have the most confidence.
Steve, thanks for sharing your thoughts today.
I N T H E N E W S
In an April report tracking the global economy, the International Monetary Fund (IMF) downgraded its 2008 growth forecast to 3.7%. That rate nearly matches the average of 3.9% growth that the IMF has recorded over the previous 10 years, but is 0.5% below its prior projection issued in January. The report attributes the reduced outlook to the credit crisis affecting key parts of the world’s financial system in the wake of the U.S. housing market’s downturn. The IMF, which was founded after World War II and now includes 185 member countries, seeks to promote international monetary cooperation.
The views expressed in this report are exclusively those of Putnam Management. They are not meant as investment advice.
International investing involves certain risks, such as currency fluctuations, economic instability, and political developments. Additional risks may be associated with emerging-market securities, including illiquidity and volatility. The fund invests some or all of its assets in small and/or midsize companies. Such investments increase the risk of fluctua-tions in the value of your investment. Stocks with above-average earnings may be more volatile, especially if earnings do not continue to grow.
Please note that the holdings discussed in this report may not have been held by the fund for the entire period. Portfolio composition is subject to review in accordance with the fund’s investment strategy and may vary in the future.
11
Your fund’s performance
This section shows your fund’s performance, price, and distribution information for periods ended March 31, 2008, the end of the first half of its current fiscal year. In accordance with regulatory requirements for mutual funds, we also include expense information taken from the fund’s current prospectus. Performance should always be considered in light of a fund’s investment strategy. Data represents past performance. Past performance does not guarantee future results. More recent returns may be less or more than those shown. Investment return and principal value will fluctuate, and you may have a gain or a loss when you sell your shares. Performance information does not reflect any deduction for taxes a shareholder may owe on fund distributions or on the redemption of fund shares. For the most recent month-end performance, please visit the Individual Investors section of www.putnam.com or call Putnam at 1-800-225-1581. Class Y shares are generally o nly available to corporate and institutional clients and clients in other approved programs. See the Terms and Definitions section in this report for definitions of the share classes offered by your fund.
Fund performance
Total return for periods ended 3/31/08
| | | | | | | | | | |
| | Class A | | Class B | | Class C | | Class M | | Class R | Class Y |
| (inception dates) | (1/3/95) | | (7/21/95) | | (2/1/99) | | (7/21/95) | | (12/1/03) | (10/4/05) |
| | NAV | POP | NAV | CDSC | NAV | CDSC | NAV | POP | NAV | NAV |
|
| Annual average | | | | | | | | | | |
| (life of fund) | 8.66% | 8.17% | 7.86% | 7.86% | 7.86% | 7.86% | 8.13% | 7.84% | 8.40% | 8.71% |
|
| 10 years | 80.15 | 69.80 | 67.26 | 67.26 | 67.41 | 67.41 | 71.37 | 65.37 | 76.02 | 81.33 |
| Annual average | 6.06 | 5.44 | 5.28 | 5.28 | 5.29 | 5.29 | 5.53 | 5.16 | 5.82 | 6.13 |
|
| 5 years | 144.87 | 130.91 | 135.79 | 133.79 | 136.00 | 136.00 | 138.70 | 130.46 | 142.38 | 146.47 |
| Annual average | 19.62 | 18.22 | 18.71 | 18.51 | 18.74 | 18.74 | 19.01 | 18.17 | 19.37 | 19.77 |
|
| 3 years | 47.57 | 39.08 | 44.24 | 41.24 | 44.32 | 44.32 | 45.36 | 40.22 | 46.48 | 48.54 |
| Annual average | 13.85 | 11.62 | 12.99 | 12.20 | 13.01 | 13.01 | 13.28 | 11.93 | 13.57 | 14.10 |
|
| 1 year | –3.94 | –9.48 | –4.63 | –9.37 | –4.64 | –5.59 | –4.39 | –7.72 | –4.14 | –3.64 |
|
| 6 months | –13.21 | –18.18 | –13.56 | –17.86 | –13.52 | –14.38 | –13.45 | –16.49 | –13.31 | –13.10 |
|
Current performance may be lower or higher than the quoted past performance, which cannot guarantee future results. After sales charge returns (public offering price, or POP) for class A and M shares reflect a maximum 5.75% and 3.50% load, respectively, as of 1/2/08. Class B share returns reflect the applicable contingent deferred sales charge (CDSC), which is 5% in the first year, declining to 1% in the sixth year, and is eliminated thereafter. Class C shares reflect a 1% CDSC for the first year that is eliminated thereafter. Class R and Y shares have no initial sales charge or CDSC. Performance for class B, C, M, R, and Y shares before their inception is derived from the historical performance of class A shares, adjusted for the applicable sales charge (or CDSC) and, except for class Y shares, the higher operating expenses for such shares.
For a portion of the periods, this fund may have limited expenses, without which returns would have been lower.
A 1% short-term trading fee may be applied to shares exchanged or sold within 90 days of purchase.
12
| | | |
| Comparative index returns | | | |
| For periods ended 3/31/08 | | | |
|
| |
| | S&P/Citigroup World | | Lipper International |
| | Ex-U.S. Growth Primary | | Multi-Cap Growth |
| | Market Index (PMI) | | Funds category average* |
|
| Annual average | | | |
| (life of fund) | 7.66% | | 8.72% |
|
| 10 years | 75.01 | | 98.68 |
| Annual average | 5.76 | | 6.69 |
|
| 5 years | 156.44 | | 166.13 |
| Annual average | 20.72 | | 21.45 |
|
| 3 years | 47.73 | | 53.14 |
| Annual average | 13.89 | | 15.13 |
|
| 1 year | 1.16 | | 1.08 |
|
| 6 months | –9.59 | | –10.51 |
|
Index and Lipper results should be compared to fund performance at net asset value.
* Over the 6-month, 1-year, 3-year, 5-year, 10-year, and life-of-fund periods ended 3/31/08, there were 237, 232, 164, 136, 57, and 22 funds, respectively, in this Lipper category.
Fund price and distribution information
For the six-month period ended 3/31/08
| | | | | | | | |
| | | | | | |
| Distributions | Class A | Class B | Class C | Class M | Class R | Class Y |
|
| Number | 1 | 1 | 1 | 1 | 1 | 1 |
|
| Income | $0.250 | $0.093 | $0.131 | $0.156 | $0.270 | $0.298 |
|
| Capital gains | — | — | — | — | — | — |
|
| Total | $0.250 | $0.093 | $0.131 | $0.156 | $0.270 | $0.298 |
|
| Share value: | NAV | POP | NAV | NAV | NAV | POP | NAV | NAV |
|
| 9/30/07 | $19.90 | $21.11* | $18.47 | $19.00 | $19.00 | $19.69* | $19.76 | $19.95 |
|
| 3/31/08 | 17.04 | 18.08 | 15.88 | 16.31 | 16.30 | 16.89 | 16.88 | 17.06 |
|
The classification of distributions, if any, is an estimate. Final distribution information will appear on your year-end tax forms.
* Reflects an increase in sales charges that took effect on 1/2/08.
13
| | | | | | |
| Fund’s annual operating expenses | | | | |
| For the fiscal year ended 9/30/07 | | | | | |
|
| |
| | Class A | Class B | Class C | Class M | Class R | Class Y |
|
| Net expenses* | 1.55% | 2.30% | 2.30% | 2.05% | 1.80% | 1.30% |
|
| Total annual fund | | | | | | |
| operating expenses | 1.66 | 2.41 | 2.41 | 2.16 | 1.91 | 1.41 |
|
* Reflects Putnam Management's decision to contractually limit expenses through 9/30/08.
Expense information in this table is taken from the most recent prospectus, is subject to change, and may differ from that shown in the next section and in the financial highlights of this report. Expenses are shown as a percentage of average net assets.
14
Your fund’s expenses
As a mutual fund investor, you pay ongoing expenses, such as management fees, distribution fees (12b-1 fees), and other expenses. In the most recent six-month period, your fund’s management team limited these expenses; had it not done so, expenses would have been higher. Using the information below, you can estimate how these expenses affect your investment and compare them with the expenses of other funds. You may also pay one-time transaction expenses, including sales charges (loads) and redemption fees, which are not shown in this section and would have resulted in higher total expenses. For more information, see your fund’s prospectus or talk to your financial representative.
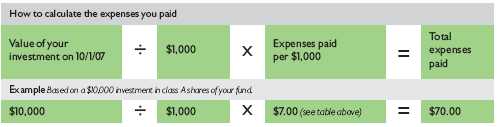
Review your fund’s expenses
The table below shows the expenses you would have paid on a $1,000 investment in Putnam International New Opportunities Fund from October 1, 2007 to March 31, 2008. It also shows how much a $1,000 investment would be worth at the close of the period, assuming actual returns and expenses.
| | | | | | |
| | Class A | Class B | Class C | Class M | Class R | Class Y |
|
| Expenses paid per $1,000* | $ 7.00 | $ 10.49 | $ 10.49 | $ 9.33 | $ 8.17 | $ 5.84 |
|
| Ending value (after expenses) | $867.90 | $864.40 | $864.80 | $865.50 | $866.90 | $869.00 |
|
* Expenses for each share class are calculated using the fund’s annualized expense ratio for each class, which represents the ongoing expenses as a percentage of average net assets for the six months ended 3/31/08. The expense ratio may differ for each share class (see the last table in this section). Expenses are calculated by multiplying the expense ratio by the average account value for the period; then multiplying the result by the number of days in the period; and then dividing that result by the number of days in the year.
Estimate the expenses you paid
To estimate the ongoing expenses you paid for the six months ended March 31, 2008, use the calculation method below. To find the value of your investment on October 1, 2007, call Putnam at 1-800-225-1581.
15
Compare expenses using the SEC’s method
The Securities and Exchange Commission (SEC) has established guidelines to help investors assess fund expenses. Per these guidelines, the table below shows your fund’s expenses based on a $1,000 investment, assuming a hypothetical 5% annualized return. You can use this information to compare the ongoing expenses (but not transaction expenses or total costs) of investing in the fund with those of other funds. All mutual fund shareholder reports will provide this information to help you make this comparison. Please note that you cannot use this information to estimate your actual ending account balance and expenses paid during the period.
| | | | | | |
| | Class A | Class B | Class C | Class M | Class R | Class Y |
|
| Expenses paid per $1,000* | $ 7.57 | $ 11.33 | $ 11.33 | $ 10.08 | $ 8.82 | $ 6.31 |
|
| Ending value (after expenses) | $1,017.50 | $1,013.75 | $1,013.75 | $1,015.00 | $1,016.25 | $1,018.75 |
|
* Expenses for each share class are calculated using the fund’s annualized expense ratio for each class, which represents the ongoing expenses as a percentage of average net assets for the six months ended 3/31/08. The expense ratio may differ for each share class (see the last table in this section). Expenses are calculated by multiplying the expense ratio by the average account value for the period; then multiplying the result by the number of days in the period; and then dividing that result by the number of days in the year.
Compare expenses using industry averages
You can also compare your fund’s expenses with the average of its peer group, as defined by Lipper, an independent fund-rating agency that ranks funds relative to others that Lipper considers to have similar investment styles or objectives. The expense ratio for each share class shown below indicates how much of your fund’s average net assets have been used to pay ongoing expenses during the period.
| | | | | | |
| | Class A | Class B | Class C | Class M | Class R | Class Y |
|
| Your fund’s annualized | | | | | | |
| expense ratio | 1.50% | 2.25% | 2.25% | 2.00% | 1.75% | 1.25% |
|
| Average annualized expense | | | | | | |
| ratio for Lipper peer group* | 1.52% | 2.27% | 2.27% | 2.02% | 1.77% | 1.27% |
|
* Putnam is committed to keeping fund expenses below the Lipper peer group average expense ratio and will limit fund expenses if they exceed the Lipper average. The Lipper average is a simple average of front-end load funds in the peer group that excludes 12b-1 fees as well as any expense offset and brokerage service arrangements that may reduce fund expenses. To facilitate the comparison in this presentation, Putnam has adjusted the Lipper average to reflect the 12b-1 fees carried by each class of shares other than class Y shares, which do not incur 12b-1 fees. Investors should note that the other funds in the peer group may be significantly smaller or larger than the fund, and that an asset-weighted average would likely be lower than the simple average. Also, the fund and Lipper report expense data at different times and for different periods. The fund’s expense ratio shown here is annualized data for the most rec ent six-month period, while the quarterly updated Lipper average is based on the most recent fiscal year-end data available for the peer group funds as of 3/31/08.
16
Your fund’s
portfolio turnover
Putnam funds are actively managed by teams of experts who buy and sell securities based on intensive analysis of companies, industries, economies, and markets. Portfolio turnover is a measure of how often a fund’s managers buy and sell securities for the fund. A portfolio turnover of 100%, for example, means that the managers sold and replaced securities valued at 100% of a fund’s assets within a one-year period. Funds with high turnover may be more likely to generate capital gains that must be distributed to shareholders as taxable income. High turnover may also cause a fund to pay more brokerage commissions and other transaction costs, which may detract from performance.
Funds that invest in bonds or other fixed-income instruments may have higher turnover than funds that invest only in stocks. Short-term bond funds tend to have higher turnover than longer-term bond funds, because shorter-term bonds will mature or be sold more frequently than longer-term bonds. You can use the table below to compare your fund’s turnover with the average turnover for funds in its Lipper category.
Turnover comparisons
Percentage of holdings that change every year
| | | | | | |
| | | 2007 | 2006 | 2005 | 2004 | 2003 |
|
| Putnam International New | | | | | | |
| Opportunities Fund | | 120% | 79% | 92% | 120% | 144% |
|
| Lipper International Multi-Cap | | | | | | |
| Growth Funds category average | | 75% | 85% | 87% | 103% | 125% |
|
Turnover data for the fund is calculated based on the fund's fiscal-year period, which ends on September 30. Turnover data for the fund's Lipper category is calculated based on the average of the turnover of each fund in the category for its fiscal year ended during the indicated year. Fiscal years vary across funds in the Lipper category, which may limit the comparability of the fund's portfolio turnover rate to the Lipper average. Comparative data for 2007 is based on information available as of 12/31/07.
17
Your fund’s risk
This risk comparison is designed to help you understand how your fund compares with other funds. The comparison utilizes a risk measure developed by Morningstar, an independent fund-rating agency. This risk measure is referred to as the fund’s Morningstar Risk.
Your fund’s Morningstar ® Risk
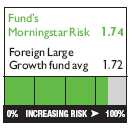
Your fund’s Morningstar Risk is shown alongside that of the average fund in its Morningstar category. The risk bar broadens the comparison by translating the fund’s Morningstar Risk into a percentile, which is based on the fund’s ranking among all funds rated by Morningstar as of March 31, 2008. A higher Morningstar Risk generally indicates that a fund’s monthly returns have varied more widely.
Morningstar determines a fund’s Morningstar Risk by assessing variations in the fund’s monthly returns — with an emphasis on downside variations — over a 3-year period, if available. Those measures are weighted and averaged to produce the fund’s Morningstar Risk. The information shown is provided for the fund’s class A shares only; information for other classes may vary. Morningstar Risk is based on historical data and does not indicate future results. Morningstar does not purport to measure the risk associated with a current investment in a fund, either on an absolute basis or on a relative basis. Low Morningstar Risk does not mean that you cannot lose money on an investment in a fund. Copyright 2008 Morningstar, Inc. All Rights Reserved. The information contained herein (1) is proprietary to Morningstar and/or its content providers; (2) may not be copied or distributed; and (3) is not warranted to be accurate, complete, or timely. Neither Morningstar nor its content providers are responsible for any damages or losses arising from any use of this information.
18
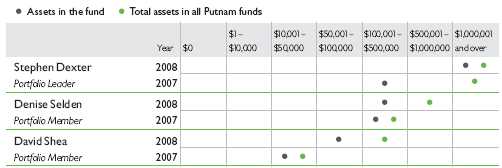
Your fund’s management
Your fund is managed by the members of the Putnam International Growth Team. Stephen Dexter is the Portfolio Leader and Denise Selden and David Shea are Portfolio Members of the fund. The Portfolio Leader and Portfolio Members coordinate the team’s management of the fund.
For a complete listing of the members of the Putnam International Growth Team, including those who are not Portfolio Leaders or Portfolio Members of your fund, please visit the Individual Investors section of www.putnam.com.
Investment team fund ownership
The table below shows how much the fund’s current Portfolio Leader and Portfolio Members have invested in the fund and in all Putnam mutual funds (in dollar ranges). Information shown is as of March 31, 2008, and March 31, 2007.
Trustee and Putnam employee fund ownership
As of March 31, 2008, all of the Trustees of the Putnam funds owned fund shares. The table below shows the approximate value of investments in the fund and all Putnam funds as of that date by the Trustees and Putnam employees. These amounts include investments by the Trustees’ and employees’ immediate family members and investments through retirement and deferred compensation plans.
| | |
| | | Total assets in |
| | Assets in the fund | all Putnam funds |
|
| Trustees | $ 406,000 | $ 88,000,000 |
|
| Putnam employees | $15,778,000 | $630,000,000 |
|
Other Putnam funds managed by the Portfolio Leader and Portfolio Members
Stephen Dexter, Denise Selden, and David Shea are not Portfolio Leaders or Portfolio Members of any other Putnam mutual fund. They may, however, also manage other accounts and variable trust funds advised by Putnam Management or an affiliate.
19
Terms and definitions
Important terms
Total return shows how the value of the fund’s shares changed over time, assuming you held the shares through the entire period and reinvested all distributions in the fund.
Net asset value (NAV) is the price, or value, of one share of a mutual fund, without a sales charge. NAVs fluctuate with market conditions. NAV is calculated by dividing the net assets of each class of shares by the number of outstanding shares in the class.
Public offering price (POP) is the price of a mutual fund share plus the maximum sales charge levied at the time of purchase. POP performance figures shown here assume the 5.75% maximum sales charge for class A shares and 3.50% for class M shares.
Contingent deferred sales charge (CDSC) is generally a charge applied at the time of the redemption of class B or C shares and assumes redemption at the end of the period. Your fund’s class B CDSC declines from a 5% maximum during the first year to 1% during the sixth year. After the sixth year, the CDSC no longer applies. The CDSC for class C shares is 1% for one year after purchase.
Share classes
Class A shares are generally subject to an initial sales charge and no CDSC (except on certain redemptions of shares bought without an initial sales charge).
Class B shares are not subject to an initial sales charge. They may be subject to a CDSC.
Class C shares are not subject to an initial sales charge and are subject to a CDSC only if the shares are redeemed during the first year.
Class M shares have a lower initial sales charge and a higher 12b-1 fee than class A shares and no CDSC (except on certain redemptions of shares bought without an initial sales charge).
Class R shares are not subject to an initial sales charge or CDSC and are available only to certain defined contribution plans.
Class Y shares are not subject to an initial sales charge or CDSC, and carry no 12b-1 fee. They are generally only available to corporate and institutional clients and clients in other approved programs.
20
Comparative indexes
Lehman Aggregate Bond Index is an unmanaged index of U.S. investment-grade fixed-income securities.
Merrill Lynch 91-Day Treasury Bill Index is an unmanaged index that seeks to measure the performance of U.S. Treasury bills available in the marketplace.
S&P 500 Index is an unmanaged index of common stock performance.
S&P/Citigroup World Ex-U.S. Growth Primary Market Index (PMI) is an unmanaged index of mostly large- and some small-cap stocks from developed countries, excluding the United States, chosen for their growth orientation.
Indexes assume reinvestment of all distributions and do not account for fees. Securities and performance of a fund and an index will differ. You cannot invest directly in an index.
Lipper is a third-party industry-ranking entity that ranks mutual funds. Its rankings do not reflect sales charges. Lipper rankings are based on total return at net asset value relative to other funds that have similar current investment styles or objectives as determined by Lipper. Lipper may change a fund’s category assignment at its discretion. Lipper category averages reflect performance trends for funds within a category.
21
Trustee approval of
management contract
General conclusions
The Board of Trustees of the Putnam funds oversees the management of each fund and, as required by law, determines annually whether to approve the continuance of your fund’s management contract with Putnam Investment Management (“Putnam Management”) and the sub-management contract between Putnam Management’s affiliate, Putnam Investments Limited (“PIL”), and Putnam Management. In this regard, the Board of Trustees, with the assistance of its Contract Committee consisting solely of Trustees who are not“interested persons” (as such term is defined in the Investment Company Act of 1940, as amended) of the Putnam funds (the “Independent Trustees”), requests and evaluates all information it deems reasonably necessary under the circumstances. Over the course of several months ending in June 2007, the Contract Committee met several times to consider the information provided by Putnam Management and other information develop ed with the assistance of the Board’s independent counsel and independent staff. The Contract Committee reviewed and discussed key aspects of this information with all of the Independent Trustees. The Contract Committee recommended, and the Independent Trustees approved, the continuance of your fund’s management contract and sub-management contract, effective July 1, 2007. (Because PIL is an affiliate of Putnam Management and Putnam Management remains fully responsible for all services provided by PIL, the Trustees have not evaluated PIL as a separate entity, and all subsequent references to Putnam Management below should be deemed to include reference to PIL as necessary or appropriate in the context.)
In addition, in anticipation of the sale of Putnam Investments to Great-West Lifeco, at a series of meetings ending in March 2007, the Trustees reviewed and approved new management and distribution arrangements to take effect upon the change of control. Shareholders of all funds approved the management contracts in May 2007, and the change of control transaction was completed on August 3, 2007. Upon the change of control, the management contracts that were approved by the Trustees in June 2007 automatically terminated and were replaced by new contracts that had been approved by shareholders. In connection with their review for the June 2007 continuance of the Putnam funds’ management contracts, the Trustees did not identify any facts or circumstances that would alter the substance of the conclusions and recommendations they made in their review of the contracts to take effect upon the change of control.
The Independent Trustees’ approval was based on the following conclusions:
• That the fee schedule in effect for your fund represented reasonable compensation in light of the nature and quality of the services being provided to the fund, the fees paid by competitive funds and the costs incurred by Putnam Management in providing such services, and
• That this fee schedule represented an appropriate sharing between fund shareholders and Putnam Management of such economies of scale as may exist in the management of the fund at current asset levels.
These conclusions were based on a comprehensive consideration of all information provided to the Trustees and were not the result of any single factor. Some of the factors that figured
22
particularly in the Trustees’ deliberations and how the Trustees considered these factors are described below, although individual Trustees may have evaluated the information presented differently, giving different weights to various factors. It is also important to recognize that the fee arrangements for your fund and the other Putnam funds are the result of many years of review and discussion between the Independent Trustees and Putnam Management, that certain aspects of such arrangements may receive greater scrutiny in some years than others, and that the Trustees’ conclusions may be based, in part, on their consideration of these same arrangements in prior years.
Management fee schedules and categories; total expenses
The Trustees reviewed the management fee schedules in effect for all Putnam funds, including fee levels and breakpoints, and the assignment of funds to particular fee categories. In reviewing fees and expenses, the Trustees generally focused their attention on material changes in circumstances —for example, changes in a fund’s size or investment style, changes in Putnam Management’s operating costs or responsibilities, or changes in competitive practices in the mutual fund industry — that suggest that consideration of fee changes might be warranted. The Trustees concluded that the circumstances did not warrant changes to the management fee structure of your fund, which had been carefully developed over the years, re-examined on many occasions and adjusted where appropriate. The Trustees focused on two areas of particular interest, as discussed further below:
• Competitiveness. The Trustees reviewed comparative fee and expense information for competitive funds, which indicated that, in a custom peer group of competitive funds selected by Lipper Inc., your fund ranked in the 41st percentile in management fees and in the 59th percentile in total expenses (less any applicable 12b-1 fees) as of December 31, 2006 (the first percentile being the least expensive funds and the 100th percentile being the most expensive funds). (Because the fund’s custom peer group is smaller than the fund’s broad Lipper Inc. peer group, this expense information may differ from the Lipper peer expense information found elsewhere in this report.) The Trustees noted that expense ratios for a number of Putnam funds, which show the percentage of fund assets used to pay for management and administrative services, distribution (12b-1) fees and other expe nses, had been increasing recently as a result of declining net assets and the natural operation of fee breakpoints.
The Trustees noted that the expense ratio increases described above were currently being controlled by expense limitations implemented in January 2004 and which Putnam Management had committed to maintain at least through 2007. In anticipation of the change of control of Putnam Investments, the Trustees requested, and received a commitment from Putnam Management and Great-West Lifeco, to extend this program through at least June 30, 2009. These expense limitations give effect to a commitment by Putnam Management that the expense ratio of each open-end fund would be no higher than the average expense ratio of the competitive funds included in the fund’s relevant Lipper universe (exclusive of any applicable 12b-1 charges in each case). The Trustees observed that this commitment to limit fund expenses has served shareholders well since its inception.
23
In order to ensure that the expenses of the Putnam funds continue to meet evolving competitive standards, the Trustees requested, and Putnam Management agreed, to extend for the twelve months beginning July 1, 2007, an additional expense limitation for certain funds at an amount equal to the average expense ratio (exclusive of 12b-1 charges) of a custom peer group of competitive funds selected by Lipper to correspond to the size of the fund. This additional expense limitation will be applied to those open-end funds that had above-average expense ratios (exclusive of 12b-1 charges) based on the custom peer group data for the period ended December 31, 2006. This additional expense limitation will be applied to your fund.
• Economies of scale. Your fund currently has the benefit of breakpoints in its management fee that provide shareholders with significant economies of scale, which means that the effective management fee rate of a fund (as a percentage of fund assets) declines as a fund grows in size and crosses specified asset thresholds. Conversely, as a fund shrinks in size — as has been the case for many Putnam funds in recent years — these breakpoints result in increasing fee levels. In recent years, the Trustees have examined the operation of the existing breakpoint structure during periods of both growth and decline in asset levels. The Trustees concluded that the fee schedules in effect for the funds represented an appropriate sharing of economies of scale at current asset levels. In reaching this conclusion, the Trustees considered the Contract Committee’s stated intent to continue to work with Putnam Management to plan for an eventual resumption in the growth of assets, and to consider the potential economies that might be produced under various growth assumptions.
In connection with their review of the management fees and total expenses of the Putnam funds, the Trustees also reviewed the costs of the services to be provided and profits to be realized by Putnam Management and its affiliates from the relationship with the funds. This information included trends in revenues, expenses and profitability of Putnam Management and its affiliates relating to the investment management and distribution services provided to the funds. In this regard, the Trustees also reviewed an analysis of Putnam Management’s revenues, expenses and profitability with respect to the funds’ management contracts, allocated on a fund-by-fund basis.
Investment performance during the review period
The quality of the investment process provided by Putnam Management represented a major factor in the Trustees’ evaluation of the quality of services provided by Putnam Management under your fund’s management contract. The Trustees were assisted in their review of the Putnam funds’ investment process and performance by the work of the Investment Process Committee of the Trustees and the Investment Oversight Committees of the Trustees, which had met on a regular monthly basis with the funds’ portfolio teams throughout the year. The Trustees concluded that Putnam Management generally provides a high-quality investment process — as measured by the experience and skills of the individuals assigned to the management of fund portfolios, the resources made available to such personnel, and in general the ability of Putnam Management to
24
attract and retain high-quality personnel — but also recognized that this does not guarantee favorable investment results for every fund in every time period. The Trustees considered the investment performance of each fund over multiple time periods and considered information comparing each fund’s performance with various benchmarks and with the performance of competitive funds.
The Trustees noted the satisfactory investment performance of many Putnam funds. They also noted the disappointing investment performance of certain funds in recent years and discussed with senior management of Putnam Management the factors contributing to such underperfor-mance and actions being taken to improve performance. The Trustees recognized that, in recent years, Putnam Management has made significant changes in its investment personnel and processes and in the fund product line to address areas of underperformance. In particular, they noted the important contributions of Putnam Management’s leadership in attracting, retaining and supporting high-quality investment professionals and in systematically implementing an investment process that seeks to merge the best features of fundamental and quantitative analysis. The Trustees indicated their intention to continue to monitor performance trends to assess the effectiveness of these changes and to evaluate whether additional changes to address areas of underperformance are warranted.
In the case of your fund, the Trustees considered that your fund’s class A share cumulative total return performance at net asset value was in the following percentiles of its Lipper Inc. peer group (Lipper International Multi-Cap Growth Funds) for the one-, three- and five-year periods ended March 31, 2007 (the first percentile being the best-performing funds and the 100th percentile being the worst-performing funds):
| | |
| One-year period | Three-year period | Five-year period |
|
| 16th | 24th | 33rd |
(Because of the passage of time, these performance results may differ from the performance results for more recent periods shown elsewhere in this report. Over the one-, three- and five-year periods ended March 31, 2007, there were 192, 143, and 121 funds, respectively, in your fund’s Lipper peer group.* Past performance is no guarantee of future returns.)
As a general matter, the Trustees concluded that cooperative efforts between the Trustees and Putnam Management represent the most effective way to address investment performance problems. The Trustees noted that investors in the Putnam funds have, in effect, placed their trust in the Putnam organization, under the oversight of the funds’ Trustees, to make appropriate decisions regarding the management of the funds. Based on the responsiveness of Putnam Management in
* The percentile rankings for your fund’s class A share annualized total return performance in the Lipper International Multi-Cap Growth Funds category for the one-, five-, and ten-year periods ended March 31, 2008, were 85%, 74%, and 61%, respectively.
Over the one-, five-, and ten-year periods ended March 31, 2008, the fund ranked 196th out of 232, 101st out of 136, and 35th out of 57, respectively. Note that this more recent information was not available when the Trustees approved the continuance of your fund’s management contract.
25
the recent past to Trustee concerns about investment performance, the Trustees concluded that it is preferable to seek change within Putnam Management to address performance shortcomings. In the Trustees’ view, the alternative of terminating a management contract and engaging a new investment adviser for an underperforming fund would entail significant disruptions and would not provide any greater assurance of improved investment performance.
Brokerage and soft-dollar allocations; other benefits
The Trustees considered various potential benefits that Putnam Management may receive in connection with the services it provides under the management contract with your fund. These include benefits related to brokerage and soft-dollar allocations, whereby a portion of the commissions paid by a fund for brokerage may be used to acquire research services that may be useful to Putnam Management in managing the assets of the fund and of other clients. The Trustees indicated their continued intent to monitor the potential benefits associated with the allocation of fund brokerage to ensure that the principle of seeking“best price and execution” remains paramount in the portfolio trading process.
The Trustees’ annual review of your fund’s management contract also included the review of its distributor’s contract and distribution plan with Putnam Retail Management Limited Partnership and the custodian agreement and investor servicing agreement with Putnam Fiduciary Trust Company (“PFTC”), each of which provides benefits to affiliates of Putnam Management. In the case of the custodian agreement, the Trustees considered that, effective January 1, 2007, the Putnam funds had engaged State Street Bank and Trust Company as custodian and began to transition the responsibility for providing custody services away from PFTC.
Comparison of retail and institutional fee schedules
The information examined by the Trustees as part of their annual contract review has included for many years information regarding fees charged by Putnam Management and its affiliates to institutional clients such as defined benefit pension plans, college endowments, etc. This information included comparison of such fees with fees charged to the funds, as well as a detailed assessment of the differences in the services provided to these two types of clients. The Trustees observed, in this regard, that the differences in fee rates between institutional clients and the funds are by no means uniform when examined by individual asset sectors, suggesting that differences in the pricing of investment management services to these types of clients reflect to a substantial degree historical competitive forces operating in separate market places. The Trustees considered the fact that fee rates across all asset sectors are higher on average for funds than for institutional cli ents, as well as the differences between the services that Putnam Management provides to the Putnam funds and those that it provides to institutional clients of the firm, but did not rely on such comparisons to any significant extent in concluding that the management fees paid by your fund are reasonable.
26
Other information
for shareholders
Important notice regarding delivery of shareholder documents
In accordance with SEC regulations, Putnam sends a single copy of annual and semiannual shareholder reports, prospectuses, and proxy statements to Putnam shareholders who share the same address, unless a shareholder requests otherwise. If you prefer to receive your own copy of these documents, please call Putnam at 1-800-225-1581, and Putnam will begin sending individual copies within 30 days.
Proxy voting
Putnam is committed to managing our mutual funds in the best interests of our shareholders. The Putnam funds’ proxy voting guidelines and procedures, as well as information regarding how your fund voted proxies relating to portfolio securities during the 12-month period ended June 30, 2007, are available in the Individual Investors section of www.putnam.com, and on the SEC’s Web site, www.sec.gov. If you have questions about finding forms on the SEC’s Web site, you may call the SEC at 1-800-SEC-0330. You may also obtain the Putnam funds’ proxy voting guidelines and procedures at no charge by calling Putnam’s Shareholder Services at 1-800-225-1581.
Fund portfolio holdings
The fund will file a complete schedule of its portfolio holdings with the SEC for the first and third quarters of each fiscal year on Form N-Q. Shareholders may obtain the fund’s Forms N-Q on the SEC’s Web site at www.sec.gov. In addition, the fund’s Forms N-Q may be reviewed and copied at the SEC’s Public Reference Room in Washington, D.C. You may call the SEC at 1-800-SEC-0330 for information about the SEC’s Web site or the operation of the Public Reference Room.
27
Financial statements
A guide to financial statements
These sections of the report, as well as the accompanying Notes, constitute the fund’s financial statements.
The fund’s portfolio lists all the fund’s investments and their values as of the last day of the reporting period. Holdings are organized by asset type and industry sector, country, or state to show areas of concentration and diversification.
Statement of assets and liabilities shows how the fund’s net assets and share price are determined. All investment and noninvestment assets are added together. Any unpaid expenses and other liabilities are subtracted from this total. The result is divided by the number of shares to determine the net asset value per share, which is calculated separately for each class of shares. (For funds with preferred shares, the amount subtracted from total assets includes the liquidation preference of preferred shares.)
Statement of operations shows the fund’s net investment gain or loss. This is done by first adding up all the fund’s earnings — from dividends and interest income — and subtracting its operating expenses to determine net investment income (or loss). Then, any net gain or loss the fund realized on the sales of its holdings — as well as any unrealized gains or losses over the period — is added to or subtracted from the net investment result to determine the fund’s net gain or loss for the fiscal period.
Statement of changes in net assets shows how the fund’s net assets were affected by the fund’s net investment gain or loss, by distributions to shareholders, and by changes in the number of the fund’s shares. It lists distributions and their sources (net investment income or realized capital gains) over the current reporting period and the most recent fiscal year-end. The distributions listed here may not match the sources listed in the Statement of operations because the distributions are determined on a tax basis and may be paid in a different period from the one in which they were earned. Dividend sources are estimated at the time of declaration. Actual results may vary. Any non-taxable return of capital cannot be determined until final tax calculations are completed after the end of the fund’s fiscal year.
Financial highlights provide an overview of the fund’s investment results, per-share distributions, expense ratios, net investment income ratios, and portfolio turnover in one summary table, reflecting the five most recent reporting periods. In a semiannual report, the highlight table also includes the current reporting period.
28
| | | |
| The fund’s portfolio 3/31/08 (Unaudited) | | | |
|
| |
| |
| |
| COMMON STOCKS (94.4%)* | | | |
|
| | Shares | | Value |
|
| Advertising and Marketing Services (0.7%) | | | |
| Focus Media Holding, Ltd. ADR (China) † (S) | 59,560 | $ | 2,093,534 |
| JC Decaux SA (France) | 104,264 | | 3,063,911 |
| | | | 5,157,445 |
|
| |
| Aerospace and Defense (1.8%) | | | |
| BAE Systems PLC (United Kingdom) | 1,010,191 | | 9,719,100 |
| Safran SA (France) | 180,965 | | 3,704,219 |
| | | | 13,423,319 |
|
| |
| Airlines (0.6%) | | | |
| Air Arabia (United Arab Emirates) † | 9,512,322 | | 4,818,202 |
|
| |
| Automotive (1.5%) | | | |
| Porsche AG (Preference) (Germany) | 22,990 | | 4,200,825 |
| Suzuki Motor Corp. (Japan) | 298,300 | | 7,523,310 |
| | | | 11,724,135 |
|
| |
| Banking (5.7%) | | | |
| Banco Santander Central Hispano SA (Spain) | 744,785 | | 14,833,796 |
| National Bank of Greece SA (Greece) | 126,560 | | 6,675,210 |
| Raiffeisen International Bank Holding AG (Austria) | 31,378 | | 4,276,118 |
| Societe Generale (France) | 32,921 | | 3,222,306 |
| Societe Generale NV New (France) † | 8,230 | | 791,654 |
| Standard Chartered PLC (United Kingdom) | 284,087 | | 9,699,325 |
| Toronto-Dominion Bank (Canada) | 59,600 | | 3,658,551 |
| | | | 43,156,960 |
|
| |
| Basic Materials (0.5%) | | | |
| Anglo American PLC (United Kingdom) | 64,356 | | 3,863,687 |
|
| |
| Beverage (2.3%) | | | |
| Coca-Cola Hellenic Bottling Co., SA (Greece) | 151,880 | | 7,071,062 |
| InBev NV (Belgium) | 115,839 | | 10,190,226 |
| | | | 17,261,288 |
|
| |
| Broadcasting (0.8%) | | | |
| Seven Network, Ltd. (Australia) | 702,810 | | 6,098,493 |
|
| |
| Cable Television (0.9%) | | | |
| Rogers Communications Class B (Canada) | 201,000 | | 7,218,092 |
|
| |
| Chemicals (1.5%) | | | |
| BASF AG (Germany) | 59,422 | | 8,000,355 |
| K&S AG (Germany) | 11,554 | | 3,780,199 |
| | | | 11,780,554 |
29
| | | |
| COMMON STOCKS (94.4%)* continued | | | |
|
| | Shares | | Value |
|
| Commercial and Consumer Services (1.1%) | | | |
| De La Rue PLC (United Kingdom) | 277,525 | $ | 4,877,956 |
| Melco International Development, Ltd. (Hong Kong) | 2,735,000 | | 3,802,614 |
| | | | 8,680,570 |
|
| |
| Communications Equipment (3.0%) | | | |
| Nokia OYJ (Finland) | 552,190 | | 17,464,184 |
| Research in Motion, Ltd. (Canada) † | 49,738 | | 5,587,240 |
| | | | 23,051,424 |
|
| |
| Computers (0.5%) | | | |
| Sharp Corp. (Japan) | 209,000 | | 3,550,401 |
|
| |
| Conglomerates (0.7%) | | | |
| Vivendi SA (France) | 137,043 | | 5,352,961 |
|
| |
| Construction (0.5%) | | | |
| Holcim, Ltd. (Switzerland) | 39,945 | | 4,194,788 |
|
| |
| Consumer Goods (3.9%) | | | |
| Beiersdorf AG (Germany) | 112,719 | | 9,479,925 |
| Reckitt Benckiser PLC (United Kingdom) | 367,042 | | 20,311,061 |
| | | | 29,790,986 |
|
| |
| Distribution (0.4%) | | | |
| Medion AG (Germany) † | 117,661 | | 2,972,938 |
|
| |
| Electric Utilities (5.3%) | | | |
| Enel SpA (Italy) | 729,319 | | 7,734,796 |
| Fortum OYJ (Finland) | 92,800 | | 3,780,054 |
| RWE AG (Germany) | 106,200 | | 13,049,713 |
| Scottish and Southern Energy PLC (United Kingdom) | 265,057 | | 7,378,420 |
| Suez SA (France) | 125,764 | | 8,250,845 |
| | | | 40,193,828 |
|
| |
| Electrical Equipment (1.3%) | | | |
| Tognum AG (Germany) † | 143,476 | | 3,145,166 |
| Vestas Wind Systems A/S (Denmark) † | 29,250 | | 3,194,962 |
| Zumtobel AG (Austria) | 123,735 | | 3,284,586 |
| | | | 9,624,714 |
|
| |
| Electronics (3.1%) | | | |
| LG Electronics, Inc. (South Korea) | 49,990 | | 6,412,211 |
| Samsung Electronics Co., Ltd. (South Korea) | 20,672 | | 13,007,430 |
| Shinko Electric Industries (Japan) | 396,200 | | 4,469,765 |
| | | | 23,889,406 |
|
| |
| Energy (0.8%) | | | |
| Petroleum Geo-Services ASA (Norway) | 230,750 | | 5,709,390 |
30
| | | |
| COMMON STOCKS (94.4%)* continued | | | |
|
| | Shares | | Value |
|
| Financial (4.6%) | | | |
| Deutsche Boerse AG (Germany) | 34,896 | $ | 5,619,085 |
| Hellenic Exchanges SA (Greece) | 265,780 | | 6,308,588 |
| IG Group Holdings PLC (United Kingdom) | 1,112,728 | | 7,219,809 |
| Man Group PLC (United Kingdom) | 710,842 | | 7,815,048 |
| Sony Financial Holdings, Inc. (Japan) | 1,344 | | 5,431,528 |
| Sony Financial Holdings, Inc. 144A (Japan) | 589 | | 2,380,335 |
| | | | 34,774,393 |
|
| |
| Food (4.1%) | | | |
| Barry Callebaut AG (Switzerland) † | 5,809 | | 5,029,944 |
| Carrefour Supermarche SA (France) | 44,146 | | 3,404,832 |
| Nestle SA (Switzerland) | 44,974 | | 22,471,151 |
| | | | 30,905,927 |
|
| |
| Health Care Services (1.4%) | | | |
| Suzuken Co., Ltd. (Japan) | 157,000 | | 6,455,074 |
| Toho Pharmaceutical Co., Ltd. (Japan) | 178,500 | | 4,555,581 |
| | | | 11,010,655 |
|
| |
| Insurance (5.3%) | | | |
| ING Groep NV (Netherlands) | 246,417 | | 9,224,597 |
| Prudential PLC (United Kingdom) | 743,821 | | 9,814,620 |
| Topdanmark A/S (Denmark) † (S) | 50,900 | | 8,565,940 |
| Zurich Financial Services AG (Switzerland) | 40,058 | | 12,613,914 |
| | | | 40,219,071 |
|
| |
| Investment Banking/Brokerage (0.7%) | | | |
| Babcock & Brown, Ltd. (Australia) (S) | 372,627 | | 5,010,062 |
|
| |
| Machinery (3.0%) | | | |
| Alstom (France) | 62,066 | | 13,450,846 |
| Fanuc, Ltd. (Japan) | 64,400 | | 6,122,262 |
| Komatsu, Ltd. (Japan) | 112,400 | | 3,116,586 |
| | | | 22,689,694 |
|
| |
| Manufacturing (1.9%) | | | |
| Charter PLC (United Kingdom) † | 264,154 | | 4,451,774 |
| Glory, Ltd. (Japan) | 312,800 | | 6,649,980 |
| NSK, Ltd. (Japan) | 410,000 | | 3,104,192 |
| | | | 14,205,946 |
|
| |
| Media (0.4%) | | | |
| Astral Media, Inc. (Canada) | 83,000 | | 3,147,719 |
|
| |
| Medical Technology (1.6%) | | | |
| Terumo Corp. (Japan) | 228,600 | | 11,920,578 |
|
| |
| Metals (4.9%) | | | |
| Barrick Gold Corp. (Canada) | 178,589 | | 7,796,007 |
| BHP Billiton, Ltd. (Australia) | 111,193 | | 3,636,996 |
31
| | | |
| COMMON STOCKS (94.4%)* continued | | | |
|
| | Shares | | Value |
|
| Metals continued | | | |
| Franco-Nevada Corp. (Canada) † | 209,000 | $ | 4,116,574 |
| Rio Tinto PLC (United Kingdom) | 69,751 | | 7,236,993 |
| Rio Tinto, Ltd. (Australia) | 65,311 | | 7,307,746 |
| Xstrata PLC (London Exchange) (Switzerland) | 52,594 | | 3,677,889 |
| Yamana Gold, Inc. (Canada) | 230,805 | | 3,380,919 |
| | | | 37,153,124 |
|
| |
| Office Equipment & Supplies (0.8%) | | | |
| Canon, Inc. (Japan) | 126,800 | | 5,836,462 |
|
| |
| Oil & Gas (12.2%) | | | |
| BG Group PLC (United Kingdom) | 338,937 | | 7,842,361 |
| BP PLC (United Kingdom) | 741,517 | | 7,527,453 |
| Fred Olsen Energy ASA (Norway) | 110,500 | | 6,271,012 |
| Imperial Oil, Ltd. (Toronto Exchange) (Canada) | 179,700 | | 9,403,618 |
| Inpex Holdings, Inc. (Japan) | 452 | | 5,031,288 |
| Lukoil (Russia) | 108,100 | | 9,242,550 |
| Seadrill, Ltd. (Bermuda) | 152,599 | | 4,090,363 |
| Statoil ASA (Norway) | 149,150 | | 4,469,462 |
| Suncor Energy, Inc. (Canada) | 104,600 | | 10,093,732 |
| Total SA (France) | 389,568 | | 28,920,955 |
| | | | 92,892,794 |
|
| |
| Pharmaceuticals (7.3%) | | | |
| Astellas Pharma, Inc. (Japan) | 291,100 | | 11,268,010 |
| AstraZeneca PLC (London Exchange) (United Kingdom) | 94,484 | | 3,529,362 |
| Hisamitsu Pharmaceutical Co., Inc. (Japan) | 136,600 | | 4,972,503 |
| Novartis AG (Switzerland) | 296,017 | | 15,170,424 |
| Novo Nordisk A/S Class B (Denmark) | 91,850 | | 6,280,176 |
| Roche Holding AG (Switzerland) | 34,210 | | 6,437,625 |
| Teva Pharmaceutical Industries, Ltd. ADR (Israel) (S) | 94,100 | | 4,346,479 |
| UCB SA (Belgium) | 110,387 | | 3,833,552 |
| | | | 55,838,131 |
|
| |
| Railroads (0.4%) | | | |
| East Japan Railway Co. (Japan) | 330 | | 2,743,381 |
|
| |
| Real Estate (0.5%) | | | |
| Wing Tai Holdings, Ltd. (Singapore) | 2,320,000 | | 3,686,013 |
|
| |
| Retail (1.6%) | | | |
| Esprit Holdings, Ltd. (Hong Kong) | 992,500 | | 11,911,734 |
|
| |
| Technology Services (0.8%) | | | |
| United Internet AG (Germany) | 281,655 | | 6,058,643 |
|
| |
| Telecommunications (3.6%) | | | |
| France Telecom SA (France) | 110,789 | | 3,724,245 |
| Koninklijke (Royal) KPN NV (Netherlands) | 289,492 | | 4,888,576 |
| StarHub, Ltd. (Singapore) | 2,242,000 | | 4,944,631 |
32
| | | | |
| COMMON STOCKS (94.4%)* continued | | | | |
|
| | | Shares | | Value |
|
| Telecommunications continued | | | | |
| Telefonica SA (Spain) | | 391,837 | $ | 11,254,828 |
| Telekom Austria AG (Austria) | | 130,405 | | 2,693,990 |
| | | | | 27,506,270 |
|
| Tobacco (2.0%) | | | | |
| BAT Industries PLC (United Kingdom) | | 234,190 | | 8,780,452 |
| Japan Tobacco, Inc. (Japan) | | 1,218 | | 6,094,886 |
| | | | | 14,875,338 |
|
| Transportation (0.4%) | | | | |
| DP World, Ltd. (United Arab Emirates) † | | 1,068,283 | | 1,014,869 |
| DP World, Ltd. 144A (United Arab Emirates) † | | 2,253,850 | | 2,141,156 |
| | | | | 3,156,025 |
|
| Total common stocks (cost $691,042,897) | | | $ | 717,055,541 |
|
| |
| SHORT-TERM INVESTMENTS (6.6%)* | | | | |
|
| | Principal amount/shares | | Value |
|
| Short-term investments held as collateral for loaned | | | | |
| securities with yields ranging from 1.35% to 3.25% | | | | |
| and due dates ranging from April 1, 2008 to May 9, 2008 (d) | $ | 18,731,884 | $ | 18,723,830 |
| Putnam Prime Money Market Fund (e) | | 31,158,689 | | 31,158,689 |
|
| Total short-term investments (cost $49,882,519) | | | $ | 49,882,519 |
|
| |
| TOTAL INVESTMENTS | | | | |
|
| Total investments (cost $740,925,416) | | | $ | 766,938,060 |
* Percentages indicated are based on net assets of $759,934,293.
† Non-income-producing security.
(d) See Note 1 to the financial statements.
(e) See Note 5 to the financial statements regarding investments in Putnam Prime Money Market Fund.
(S) Securities on loan, in part or in entirety, at March 31, 2008.
At March 31, 2008, liquid assets totaling $1,028,068 have been designated as collateral for open forward contracts.
144A after the name of an issuer represents securities exempt from registration under Rule 144A under the Securities Act of 1933, as amended. These securities may be resold in transactions exempt from registration, normally to qualified institutional buyers.
ADR after the name of a foreign holding stands for American Depository Receipts representing ownership of foreign securities on deposit with a custodian bank.
33
DIVERSIFICATION BY COUNTRY
Distribution of investments by country of issue at March 31, 2008 (as a percentage of Portfolio Value):
| | | | |
| United Kingdom | 16.0% | | Norway | 2.2% |
| Japan | 13.5 | | Hong Kong | 2.1 |
| France | 9.9 | | Belgium | 1.9 |
| Switzerland | 9.3 | | Netherlands | 1.9 |
| Germany | 7.5 | | Austria | 1.4 |
| Canada | 7.3 | | Russia | 1.2 |
| United States | 4.2 | | Singapore | 1.2 |
| Spain | 3.5 | | United Arab Emirates | 1.1 |
| Australia | 2.9 | | Italy | 1.0 |
| Finland | 2.8 | | Israel | 0.6 |
| Greece | 2.7 | | Bermuda | 0.5 |
| South Korea | 2.6 | | China | 0.3 |
| |
|
| Denmark | 2.4 | | Total | 100.0% |
FORWARD CURRENCY CONTRACTS TO BUY at 3/31/08 (aggregate face value $209,090,156) (Unaudited)
| | | | | |
| | | | | | Unrealized |
| | | Aggregate | | Delivery | appreciation/ |
| | Value | face value | | date | (depreciation) |
|
| Australian Dollar | $54,487,369 | $52,805,647 | | 4/16/08 | $1,681,722 |
| British Pound | 51,489,322 | 51,589,055 | | 6/18/08 | (99,733) |
| Canadian Dollar | 9,584,673 | 9,788,037 | | 4/16/08 | (203,364) |
| Euro | 7,233,595 | 7,152,578 | | 6/18/08 | 81,017 |
| Japanese Yen | 55,394,114 | 52,350,094 | | 5/21/08 | 3,044,020 |
| Norwegian Krone | 19,131,113 | 18,896,154 | | 6/18/08 | 234,959 |
| Swedish Krona | 9,521,848 | 9,212,694 | | 6/18/08 | 309,154 |
| Swiss Franc | 7,355,384 | 7,295,897 | | 6/18/08 | 59,487 |
|
| Total | | | | | $5,107,262 |
FORWARD CURRENCY CONTRACTS TO SELL at 3/31/08 (aggregate face value $152,610,125) (Unaudited)
| | | | | |
| | | | | | Unrealized |
| | | Aggregate | | Delivery | appreciation/ |
| | Value | face value | | date | (depreciation) |
|
| Australian Dollar | $ 7,513,308 | $ 7,229,735 | | 4/16/08 | $ (283,573) |
| British Pound | 6,202,759 | 6,259,690 | | 6/18/08 | 56,931 |
| Canadian Dollar | 17,930,202 | 18,479,996 | | 4/16/08 | 549,794 |
| Euro | 67,567,544 | 65,419,854 | | 6/18/08 | (2,147,690) |
| Japanese Yen | 15,577,455 | 14,779,532 | | 5/21/08 | (797,923) |
| Norwegian Krone | 2,007,362 | 2,011,509 | | 6/18/08 | 4,147 |
| Swedish Krona | 10,102,230 | 9,791,381 | | 6/18/08 | (310,849) |
| Swiss Franc | 29,788,451 | 28,638,428 | | 6/18/08 | (1,150,023) |
|
| Total | | | | | $(4,079,186) |
The accompanying notes are an integral part of these financial statements.
34
| | |
| Statement of assets and liabilities 3/31/08 (Unaudited) | | |
| |
| |
| ASSETS |
|
| Investment in securities, at value, including $17,987,491 of securities on loan (Note 1): | | |
| Unaffiliated issuers (identified cost $709,766,727) | $ | 735,779,371 |
| Affiliated issuers (identified cost $31,158,689) (Note 5) | | 31,158,689 |
|
| Cash | | 4,542,829 |
|
| Foreign currency (cost $231,504) (Note 1) | | 228,768 |
|
| Dividends, interest and other receivables | | 2,456,304 |
|
| Receivable for shares of the fund sold | | 2,066,080 |
|
| Receivable for securities sold | | 4,164,903 |
|
| Receivable for open forward currency contracts (Note 1) | | 6,162,333 |
|
| Receivable for closed forward currency contracts (Note 1) | | 1,865,133 |
|
| Foreign tax reclaim | | 299,718 |
|
| Total assets | | 788,724,128 |
| |
| |
| LIABILITIES | | |
|
| Payable for shares of the fund repurchased | | 1,199,636 |
|
| Payable for compensation of Manager (Notes 2 and 5) | | 1,508,245 |
|
| Payable for investor servicing fees (Note 2) | | 207,051 |
|
| Payable for custodian fees (Note 2) | | 48,016 |
|
| Payable for Trustee compensation and expenses (Note 2) | | 209,039 |
|
| Payable for administrative services (Note 2) | | 1,968 |
|
| Payable for distribution fees (Note 2) | | 465,305 |
|
| Payable for open forward currency contracts (Note 1) | | 5,134,257 |
|
| Payable for closed forward currency contracts (Note 1) | | 1,119,934 |
|
| Collateral on securities loaned, at value (Note 1) | | 18,723,830 |
|
| Other accrued expenses | | 172,554 |
|
| Total liabilities | | 28,789,835 |
|
| Net assets | $ | 759,934,293 |
| |
| |
| REPRESENTED BY | | |
|
| Paid-in capital (Unlimited shares authorized) (Notes 1 and 4) | $ | 1,172,753,373 |
|
| Distributions in excess of net investment income (Note 1) | | (3,071,843) |
|
| Accumulated net realized loss on investments | | |
| and foreign currency transactions (Note 1) | | (436,781,436) |
|
| Net unrealized appreciation of investments | | |
| and assets and liabilities in foreign currencies | | 27,034,199 |
|
| Total — Representing net assets applicable to capital shares outstanding | $ | 759,934,293 |
| (Continued on next page) | | |
35
| |
| Statement of assets and liabilities (Continued) | |
| |
| |
| COMPUTATION OF NET ASSET VALUE AND OFFERING PRICE | |
|
| Net asset value and redemption price per class A share | |
| ($587,727,746 divided by 34,485,165 shares) | $17.04 |
|
| Offering price per class A share | |
| (100/94.25 of $17.04)* | $18.08 |
|
| Net asset value and offering price per class B share | |
| ($75,066,921 divided by 4,726,661 shares)** | $15.88 |
|
| Net asset value and offering price per class C share | |
| ($17,020,990 divided by 1,043,635 shares)** | $16.31 |
|
| Net asset value and redemption price per class M share | |
| ($16,258,481 divided by 997,230 shares) | $16.30 |
|
| Offering price per class M share | |
| (100/96.50 of $16.30)* | $16.89 |
|
| Net asset value, offering price and redemption price per class R share | |
| ($2,222,813 divided by 131,690 shares) | $16.88 |
|
| Net asset value, offering price and redemption price per class Y share | |
| ($61,637,342 divided by 3,613,565 shares) | $17.06 |
* On single retail sales of less than $50,000. On sales of $50,000 or more the offering price is reduced.
** Redemption price per share is equal to net asset value less any applicable contingent deferred sales charge.
The accompanying notes are an integral part of these financial statements.
36
| |
| Statement of operations Six months ended 3/31/08 (Unaudited) | |
|
| |
| INVESTMENT INCOME | |
|
| Dividends (net of foreign tax of $582,584) | $ 6,756,972 |
|
| Interest (including interest income of $247,192 | |
| from investments in affiliated issuers) (Note 5) | 255,289 |
|
| Securities lending | 59,013 |
|
| Total investment income | 7,071,274 |
|
| |
| EXPENSES | |
|
| Compensation of Manager (Note 2) | 4,041,394 |
|
| Investor servicing fees (Note 2) | 1,420,194 |
|
| Custodian fees (Note 2) | 68,396 |
|
| Trustee compensation and expenses (Note 2) | 16,673 |
|
| Administrative services (Note 2) | 18,118 |
|
| Distribution fees — Class A (Note 2) | 807,108 |
|
| Distribution fees — Class B (Note 2) | 488,327 |
|
| Distribution fees — Class C (Note 2) | 100,612 |
|
| Distribution fees — Class M (Note 2) | 69,752 |
|
| Distribution fees — Class R (Note 2) | 5,292 |
|
| Other | 217,303 |
|
| Non-recurring costs (Notes 2 and 6) | 1,481 |
|
| Costs assumed by Manager (Notes 2 and 6) | (1,481) |
|
| Fees waived and reimbursed by Manager (Notes 2 and 5) | (527,575) |
|
| Total expenses | 6,725,594 |
|
| Expense reduction (Note 2) | (115,779) |
|
| Net expenses | 6,609,815 |
|
| Net investment income | 461,459 |
|
| Net realized gain on investments (Notes 1 and 3) | 14,381,507 |
|
| Net realized loss on foreign currency transactions (Note 1) | (5,828,521) |
|
| Net unrealized depreciation of assets and liabilities | |
| in foreign currencies during the period | (1,916,945) |
|
| Net unrealized depreciation of investments during the period | (128,560,098) |
|
| Net loss on investments | (121,924,057) |
|
| Net decrease in net assets resulting from operations | $(121,462,598) |
The accompanying notes are an integral part of these financial statements.
37
| | | | |
| Statement of changes in net assets | | | | |
|
| |
| INCREASE (DECREASE) IN NET ASSETS | | | | |
|
| Six months ended | | Year ended |
| | | 3/31/08* | | 9/30/07 |
|
| Operations: | | | | |
| Net investment income | $ | 461,459 | $ | 2,914,261 |
|
| Net realized gain on investments | | | | |
| and foreign currency transactions | | 8,552,986 | | 167,682,595 |
|
| Net unrealized appreciation (depreciation) of investments | | | | |
| and assets and liabilities in foreign currencies | (130,477,043) | | 36,916,039 |
|
| Net increase (decrease) in net assets resulting from operations | (121,462,598) | | 207,512,895 |
|
| Distributions to shareholders (Note 1): | | | | |
|
| From ordinary income | | | | |
|
| Net investment income | | | | |
|
| Class A | | (8,707,157) | | (2,778,960) |
|
| Class B | | (540,969) | | — |
|
| Class C | | (151,824) | | — |
|
| Class M | | (166,283) | | — |
|
| Class R | | (39,925) | | (1,746) |
|
| Class Y | | (934,024) | | (118,436) |
|
| Redemption fees (Note 1) | | 14,117 | | 23,181 |
|
| Increase (decrease) from capital share transactions (Note 4) | | 14,185,885 | | (87,331,331) |
|
| Total increase (decrease) in net assets | (117,802,778) | | 117,305,603 |
|
| |
| NET ASSETS | | | | |
|
| Beginning of period | | 877,737,071 | | 760,431,468 |
|
| End of period (including distributions in excess of net | | | | |
| investment income of $3,071,843 and undistributed net | | | | |
| investment income of $7,006,880, respectively) | $ | 759,934,293 | $ | 877,737,071 |
| * Unaudited | | | | |
The accompanying notes are an integral part of these financial statements.
38
This page left blank intentionally.
39
| | | | | | | | | | | | | |
| Financial highlights (For a common share outstanding throughout the period) | | | | | | | |
|
| |
| INVESTMENT OPERATIONS: | | | | LESS DISTRIBUTIONS: | | | | RATIOS AND SUPPLEMENTAL DATA: | |
|
| | | | Net | | | | | | Total | | | Ratio of net | |
| | Net asset | | realized and | Total | From | | | Net asset | return | Net | Ratio of | investment | |
| | value, | Net | unrealized | from | net | | | value, | at net | assets, | expenses to | income (loss) | Portfolio |
| | beginning | investment | gain (loss) on | investment | investment | Total | Redemption | end | asset | end of period | average net | to average | turnover |
| Period ended | of period | income (loss) (a) | investments | operations | income | distributions | fees | of period | value (%)(b) | (in thousands) | assets (%)(c) | net assets (%) | (%) |
|
| CLASS A | | | | | | | | | | | | | |
| March 31, 2008** | $19.90 | .02 (d) | (2.63) | (2.61) | (.25) | (.25) | — (e) | $17.04 | (13.21) * | $587,728 | .75 *(d) | .10 *(d) | 68.10 |
| September 30, 2007 | 15.50 | .09 (d) | 4.39 | 4.48 | (.08) | (.08) | — (e) | 19.90 | 28.96 | 697,001 | 1.55 (d) | .49 (d) | 120.15 |
| September 30, 2006 | 13.51 | .07 (d,f) | 2.14 | 2.21 | (.22) | (.22) | — (e) | 15.50 | 16.63 | 586,766 | 1.60 (d,f) | .48 (d,f) | 78.99 |
| September 30, 2005 | 10.34 | .11 (d,g) | 3.08 | 3.19 | (.02) | (.02) | — (e) | 13.51 | 30.93 (g) | 558,101 | 1.70 (d) | .92 (d,g) | 92.11 |
| September 30, 2004 | 9.01 | .05 (d) | 1.37 | 1.42 | (.09) | (.09) | — (e) | 10.34 | 15.77 | 442,192 | 1.68 (d) | .47 (d) | 120.02 |
| September 30, 2003 | 7.37 | .04 | 1.60 | 1.64 | — | — | — | 9.01 | 22.25 | 481,845 | 1.71 | .54 | 143.91 |
|
| |
| CLASS B | | | | | | | | | | | | | |
| March 31, 2008** | $18.47 | (.05) (d) | (2.45) | (2.50) | (.09) | (.09) | — (e) | $15.88 | (13.56) * | $75,067 | 1.12 *(d) | (.29) *(d) | 68.10 |
| September 30, 2007 | 14.43 | (.05) (d) | 4.09 | 4.04 | — | — | — (e) | 18.47 | 28.00 | 115,758 | 2.30 (d) | (.28) (d) | 120.15 |
| September 30, 2006 | 12.57 | (.04) (d,f) | 2.00 | 1.96 | (.10) | (.10) | — (e) | 14.43 | 15.74 | 122,375 | 2.35 (d,f) | (.31) (d,f) | 78.99 |
| September 30, 2005 | 9.67 | .01 (d,g) | 2.89 | 2.90 | — | — | — (e) | 12.57 | 29.99 (g) | 149,742 | 2.45 (d) | .07 (d,g) | 92.11 |
| September 30, 2004 | 8.43 | (.03) (d) | 1.29 | 1.26 | (.02) | (.02) | — (e) | 9.67 | 14.93 | 224,449 | 2.43 (d) | (.31) (d) | 120.02 |
| September 30, 2003 | 6.95 | (.01) | 1.49 | 1.48 | — | — | — | 8.43 | 21.30 | 355,278 | 2.46 | (.21) | 143.91 |
|
| |
| CLASS C | | | | | | | | | | | | | |
| March 31, 2008** | $19.00 | (.05) (d) | (2.51) | (2.56) | (.13) | (.13) | — (e) | $16.31 | (13.52) * | $17,021 | 1.12 *(d) | (.27) *(d) | 68.10 |
| September 30, 2007 | 14.85 | (.05) (d) | 4.20 | 4.15 | — | — | — (e) | 19.00 | 27.95 | 21,466 | 2.30 (d) | (.26) (d) | 120.15 |
| September 30, 2006 | 12.96 | (.04) (d,f) | 2.06 | 2.02 | (.13) | (.13) | — (e) | 14.85 | 15.74 | 16,183 | 2.35 (d,f) | (.27) (d,f) | 78.99 |
| September 30, 2005 | 9.97 | .02 (d,g) | 2.97 | 2.99 | — | — | — (e) | 12.96 | 29.99 (g) | 15,098 | 2.45 (d) | .15 (d,g) | 92.11 |
| September 30, 2004 | 8.69 | (.03) (d) | 1.32 | 1.29 | (.01) | (.01) | — (e) | 9.97 | 14.85 | 14,058 | 2.43 (d) | (.30) (d) | 120.02 |
| September 30, 2003 | 7.16 | (.02) | 1.55 | 1.53 | — | — | — | 8.69 | 21.37 | 19,034 | 2.46 | (.21) | 143.91 |
|
| |
| CLASS M | | | | | | | | | | | | | |
| March 31, 2008** | $19.00 | (.03) (d) | (2.51) | (2.54) | (.16) | (.16) | — (e) | $16.30 | (13.45) * | $16,258 | 1.00 *(d) | (.15) *(d) | 68.10 |
| September 30, 2007 | 14.81 | — (d,e) | 4.19 | 4.19 | — | — | — (e) | 19.00 | 28.29 | 20,759 | 2.05 (d) | (.02) (d) | 120.15 |
| September 30, 2006 | 12.92 | (.01) (d,f) | 2.06 | 2.05 | (.16) | (.16) | — (e) | 14.81 | 16.02 | 18,470 | 2.10 (d,f) | (.04) (d,f) | 78.99 |
| September 30, 2005 | 9.92 | .04 (d,g) | 2.96 | 3.00 | — | — | — (e) | 12.92 | 30.24 (g) | 18,907 | 2.20 (d) | .38 (d,g) | 92.11 |
| September 30, 2004 | 8.64 | (.01) (d) | 1.33 | 1.32 | (.04) | (.04) | — (e) | 9.92 | 15.26 | 18,730 | 2.18 (d) | (.06) (d) | 120.02 |
| September 30, 2003 | 7.10 | — (e) | 1.54 | 1.54 | — | — | — | 8.64 | 21.69 | 27,403 | 2.21 | .02 | 143.91 |
|
| |
| CLASS R | | | | | | | | | | | | | |
| March 31, 2008** | $19.76 | — (d) | (2.61) | (2.61) | (.27) | (.27) | — (e) | $16.88 | (13.31) * | $2,223 | .87 *(d) | .03 *(d) | 68.10 |
| September 30, 2007 | 15.42 | .05 (d) | 4.36 | 4.41 | (.07) | (.07) | — (e) | 19.76 | 28.70 | 986 | 1.80 (d) | .26 (d) | 120.15 |
| September 30, 2006 | 13.47 | .03 (d,f) | 2.13 | 2.16 | (.21) | (.21) | — (e) | 15.42 | 16.28 | 307 | 1.85 (d,f) | .23 (d,f) | 78.99 |
| September 30, 2005 | 10.34 | .13 (d,g) | 3.03 | 3.16 | (.03) | (.03) | — (e) | 13.47 | 30.59 (g) | 67 | 1.95 (d) | 1.07 (d,g) | 92.11 |
| September 30, 2004† | 9.77 | .01 (d) | .65 | .66 | (.09) | (.09) | — | 10.34 | 6.75 * | 10 | 1.61 *(d) | .18 *(d) | 120.02 |
|
| |
| CLASS Y | | | | | | | | | | | | | |
| March 31, 2008** | $19.95 | .05 (d) | (2.64) | (2.59) | (.30) | (.30) | — (e) | $17.06 | (13.10) * | $61,637 | .62 *(d) | .25 *(d) | 68.10 |
| September 30, 2007 | 15.53 | .14 (d) | 4.39 | 4.53 | (.11) | (.11) | — (e) | 19.95 | 29.33 | 21,767 | 1.30 (d) | .76 (d) | 120.15 |
| September 30, 2006†† | 13.49 | .11 (d,f) | 2.16 | 2.27 | (.23) | (.23) | — (e) | 15.53 | 17.09 * | 16,331 | 1.34 *(d,f) | .75 *(d,f) | 78.99 |
|
See notes to financial highlights at the end of this section.
The accompanying notes are an integral part of these financial statements.
Financial highlights (Continued)
* Not annualized
** Unaudited.
† For the period December 1, 2003 (commencement of operations) to September 30, 2004.
†† For the period October 4, 2005 (commencement of operations) to September 30, 2006.
(a) Per share net investment income (loss) has been determined on the basis of the weighted average number of shares outstanding during the period.
(b) Total return assumes dividend reinvestment and does not reflect the effect of sales charges.
(c) Includes amounts paid through expense offset and brokerage service arrangements (Note 2).
(d) Reflects an involuntary contractual expense limitation and/or waivers of certain fund expenses in connection with investments in Putnam Prime Money Market Fund in effect during the period. As a result of such limitation and/or waivers, the expenses of each class reflect a reduction of the following amounts (Notes 2 and 5):
| |
| | Percentage |
| | of average |
| | net assets |
|
| March 31, 2008 | 0.06% |
|
| September 30, 2007 | 0.11 |
|
| September 30, 2006 | 0.09 |
|
| September 30, 2005 | 0.05 |
|
| September 30, 2004 | 0.08 |
|
(e) Amount represents less than $0.01 per share.
(f) Reflects a non-recurring reimbursement from Putnam Investments relating to the calculation of certain amounts paid by the fund to Putnam in previous years for transfer agent services, which amounted to less than $0.01 per share and 0.03% of average net assets for the period ended September 30, 2006.
(g) Reflects a non-recurring accrual related to Putnam Management’s settlement with the SEC regarding brokerage allocation practices, which amounted to the following amounts:
| | |
| | | Percentage |
| | | of average |
| | Per share | net assets |
|
| Class A | $0.01 | 0.09% |
|
| Class B | 0.01 | 0.09 |
|
| Class C | 0.01 | 0.09 |
|
| Class M | 0.01 | 0.09 |
|
| Class R | 0.02 | 0.13 |
|
The accompanying notes are an integral part of these financial statements.
42
Notes to financial statements 3/31/08 (Unaudited)
Note 1: Significant accounting policies
Putnam International New Opportunities Fund (the“Fund”) is a series of Putnam Investment Funds (the“Trust”), a Massachusetts business trust, which is registered under the Investment Company Act of 1940, as amended, as a diversified, open-end management investment company. The objective of the fund is to seek long-term capital appreciation by investing primarily in common stocks of companies outside the United States.
The fund offers class A, class B, class C, class M, class R and class Y shares. Class A and class M shares are sold with a maximum front-end sales charge of 5.75% and 3.50%, respectively, and generally do not pay a contingent deferred sales charge. Class B shares, which convert to class A shares after approximately eight years, do not pay a front-end sales charge and are subject to a contingent deferred sales charge, if those shares are redeemed within six years of purchase. Class C shares have a one-year 1.00% contingent deferred sales charge and do not convert to class A shares. Class R shares, which are offered to qualified employee-benefit plans, are sold at net asset value. The expenses for class A, class B, class C, class M and class R shares may differ based on the distribution fee of each class, which is identified in Note 2. Class Y shares, which are sold at net asset value, are generally subject to the same expenses as class A, class B, class C, class M an d class R shares, but do not bear a distribution fee. Class Y shares are generally only available to corporate and institutional clients and clients in other approved programs.
A 1.00% redemption fee may apply on any shares that are redeemed (either by selling or exchanging into another fund) within 90 days of purchase. The redemption fee is accounted for as an addition to paid-in-capital.
Investment income, realized and unrealized gains and losses and expenses of the fund are borne pro-rata based on the relative net assets of each class to the total net assets of the fund, except that each class bears expenses unique to that class (including the distribution fees applicable to such classes). Each class votes as a class only with respect to its own distribution plan or other matters on which a class vote is required by law or determined by the Trustees. If the fund were liquidated, shares of each class would receive their pro-rata share of the net assets of the fund. In addition, the Trustees declare separate dividends on each class of shares.
In the normal course of business, the fund enters into contracts that may include agreements to indemnify another party under given circumstances.The fund’s maximum exposure under these arrangements is unknown, as this would involve future claims that may be, but have not yet been, made against the fund. However, the fund’s management team expects the risk of material loss to be remote.
The following is a summary of significant accounting policies consistently followed by the fund in the preparation of its financial statements. The preparation of financial statements is in conformity with accounting principles generally accepted in the United States of America and requires management to make estimates and assumptions that affect the reported amounts of assets and liabilities in the financial statements and the reported amounts of increases and decreases in net assets from operations during the reporting period. Actual results could differ from those estimates.
A) Security valuation Investments for which market quotations are readily available are valued at the last reported sales price on their principal exchange, or official closing price for certain markets. If no sales are reported — as in the case of some securities traded over-the-counter — a security is valued at its last reported bid price. Many securities markets and exchanges outside the U.S. close prior to the close of the New York Stock Exchange and therefore the closing prices for securities in such markets or on such exchanges may not fully reflect events that occur after such close but before the close of the New York Stock Exchange. Accordingly, on certain days, the fund will fair value foreign equity securities taking into account multiple factors, including
43
movements in the U.S. securities markets. The number of days on which fair value prices will be used will depend on market activity and it is possible that fair value prices will be used by the fund to a significant extent. Securities quoted in foreign currencies, if any, are translated into U.S. dollars at the current exchange rate. Certain investments, including certain restricted securities and derivatives, are also valued at fair value following procedures approved by the Trustees. Such valuations and procedures are reviewed periodically by the Trustees. The fair value of securities is generally determined as the amount that the fund could reasonably expect to realize from an orderly disposition of such securities over a reasonable period of time. By its nature, a fair value price is a good faith estimate of the value of a security at a given point in time and does not reflect an actual market price, which may be different by a material amount.
B) Joint trading account Pursuant to an exemptive order from the Securities and Exchange Commission (the“SEC”), the fund may transfer uninvested cash balances, including cash collateral received under security lending arrangements, into a joint trading account along with the cash of other registered investment companies and certain other accounts managed by Putnam Investment Management, LLC (“Putnam Management”), the fund’s manager, a wholly-owned subsidiary of Putnam, LLC. These balances may be invested in issues of short-term investments having maturities of up to 397 days for collateral received under security lending arrangements and up to 90 days for other cash investments.
C) Repurchase agreements The fund, or any joint trading account, through its custodian, receives delivery of the underlying securities, the market value of which at the time of purchase is required to be in an amount at least equal to the resale price, including accrued interest. Collateral for certain tri-party repurchase agreements is held at the counterparty’s custodian in a segregated account for the benefit of the fund and the counterparty. Putnam Management is responsible for determining that the value of these underlying securities is at all times at least equal to the resale price, including accrued interest.
D) Security transactions and related investment income Security transactions are recorded on the trade date (date the order to buy or sell is executed). Gains or losses on securities sold are determined on the identified cost basis.
Interest income is recorded on the accrual basis. Dividend income, net of applicable withholding taxes, is recognized on the ex-dividend date, except that certain dividends from foreign securities are recognized as soon as the fund is informed of the ex-dividend date. Non-cash dividends, if any, are recorded at the fair market value of the securities received. Dividends representing a return of capital or capital gains, if any, are reflected as a reduction of cost and/or as a realized gain.
E) Foreign currency translation The accounting records of the fund are maintained in U.S. dollars. The market value of foreign securities, currency holdings, and other assets and liabilities is recorded in the books and records of the fund after translation to U.S. dollars based on the exchange rates on that day. The cost of each security is determined using historical exchange rates. Income and withholding taxes are translated at prevailing exchange rates when earned or incurred. The fund does not isolate that portion of realized or unrealized gains or losses resulting from changes in the foreign exchange rate on investments from fluctuations arising from changes in the market prices of the securities. Such gains and losses are included with the net realized and unrealized gain or loss on investments. Net realized gains and losses on foreign currency transactions represent net realized exchange gains or losses on closed fo rward currency contracts, disposition of foreign currencies, currency gains and losses realized between the trade and settlement dates on securities transactions and the difference between the amount of investment income and foreign withholding taxes recorded on the fund’s books and the U.S. dollar
44
equivalent amounts actually received or paid. Net unrealized appreciation and depreciation of assets and liabilities in foreign currencies arise from changes in the value of open forward currency contracts and assets and liabilities other than investments at the period end, resulting from changes in the exchange rate. Investments in foreign securities involve certain risks, including those related to economic instability, unfavorable political developments, and currency fluctuations, not present with domestic investments.
F) Forward currency contracts The fund may buy and sell forward currency contracts, which are agreements between two parties to buy and sell currencies at a set price on a future date. These contracts are used to protect against a decline in value relative to the U.S. dollar of the currencies in which its portfolio securities are denominated or quoted (or an increase in the value of a currency in which securities a fund intends to buy are denominated, when a fund holds cash reserves and short term investments), or for other investment purposes. The U.S. dollar value of forward currency contracts is determined using current forward currency exchange rates supplied by a quotation service. The market value of the contract will fluctuate with changes in currency exchange rates. The contract is marked to market daily and the change in market value is recorded as an unrealized gain or loss. When the contract is closed, the fund r ecords a realized gain or loss equal to the difference between the value of the contract at the time it was opened and the value at the time it was closed. The fund could be exposed to risk if the value of the currency changes unfavorably, if the counterparties to the contracts are unable to meet the terms of their contracts or if the fund is unable to enter into a closing position. Risks may exceed amounts recognized on the Statement of assets and liabilities. Forward currency contracts outstanding at period end, if any, are listed after the fund’s portfolio.
G) Security lending The fund may lend securities, through its agents, to qualified borrowers in order to earn additional income. The loans are collateralized by cash and/or securities in an amount at least equal to the market value of the securities loaned. The market value of securities loaned is determined daily and any additional required collateral is allocated to the fund on the next business day. The risk of borrower default will be borne by the fund’s agents; the fund will bear the risk of loss with respect to the investment of the cash collateral. Income from securities lending is included in investment income on the Statement of operations. At March 31, 2008, the value of securities loaned amounted to $17,987,491. The fund received cash collateral of $18,723,830 which is pooled with collateral of other Putnam funds into 57 issues of short-term investments.
H) Federal taxes It is the policy of the fund to distribute all of its taxable income within the prescribed time and otherwise comply with the provisions of the Internal Revenue Code of 1986 (the “Code”) applicable to regulated investment companies. It is also the intention of the fund to distribute an amount sufficient to avoid imposition of any excise tax under Section 4982 of the Code, as amended. Therefore, no provision has been made for federal taxes on income, capital gains or unrealized appreciation on securities held nor for excise tax on income and capital gains.
At September 30, 2007, the fund had a capital loss carryover of $444,902,408 available to the extent allowed by the Code to offset future net capital gain, if any. The amount of the carryover and the expiration dates are:
| | | |
| Loss Carryover | Expiration | | |
| | |
| $271,599,219 | September 30, 2010 | | |
| | |
| 173,303,189 | September 30, 2011 | | |
| | |
The aggregate identified cost on a tax basis is $741,357,431, resulting in gross unrealized appreciation and depreciation of $69,248,925 and $43,668,296, respectively, or net unrealized appreciation of $25,580,629.
I) Distributions to shareholders Distributions to shareholders from net investment income are
45
recorded by the fund on the ex-dividend date. Distributions from capital gains, if any, are recorded on the ex-dividend date and paid at least annually. The amount and character of income and gains to be distributed are determined in accordance with income tax regulations, which may differ from generally accepted accounting principles. Dividend sources are estimated at the time of declaration. Actual results may vary. Any non-taxable return of capital cannot be determined until final tax calculations are completed after the end of the fund’s fiscal year. Reclassifications are made to the fund’s capital accounts to reflect income and gains available for distribution (or available capital loss carryovers) under income tax regulations.
J) Expenses of the trust Expenses directly charged or attributable to any fund will be paid from the assets of that fund. Generally, expenses of the trust will be allocated among and charged to the assets of each fund on a basis that the Trustees deem fair and equitable, which may be based on the relative assets of each fund or the nature of the services performed and relative applicability to each fund.
Note 2: Management fee, administrative services and other transactions
Putnam Management is paid for management and investment advisory services quarterly based on the average net assets of the fund. Such fee is based on the following annual rates: 1.00% of the first $500 million of average net assets, 0.90% of the next $500 million, 0.85% of the next $500 million, 0.80% of the next $5 billion, 0.775% of the next $5 billion, 0.755% of the next $5 billion, 0.74% of the next $5 billion and 0.73% thereafter.
Putnam Management has agreed to waive fees and reimburse expenses of the fund through June 30, 2009 to the extent necessary to ensure that the fund’s expenses do not exceed the simple average of the expenses of all front-end load funds viewed by Lipper Inc. as having the same investment classification or objective as the fund. The expense reimbursement is based on a comparison of the fund’s expenses with the average annualized operating expenses of the funds in its Lipper peer group for each calendar quarter during the fund’s last fiscal year, excluding 12b-1 fees and without giving effect to any expense offset and brokerage service arrangements that may reduce fund expenses.
Putnam Management has further agreed to waive fees and reimburse expenses of the fund for the period from July 1, 2007 to June 30, 2008 to the extent necessary to ensure that the fund’s expenses do not exceed the simple average of the expenses of a custom group of competitive funds selected by Lipper Inc. based on the size of the fund. The expense reimbursement is based on a comparison of the fund’s total expenses with the average operating expenses of the funds in this Lipper custom peer group for their respective 2006 fiscal years, excluding 12b-1 fees and after adjustment for certain expense offset and brokerage service arrangements that reduced expenses of the fund.
For the period ended March 31, 2008, the fund’s expenses were limited to the lower of the limits specified above and accordingly, Putnam Management waived $522,739 of its management fee from the fund.
Putnam Investments Limited (“PIL”), an affiliate of Putnam Management, is authorized by the Trustees to manage a separate portion of the assets of the fund as determined by Putnam Management from time to time. Putnam Management pays a quarterly sub-management fee to PIL for its services at an annual rate of 0.35% of the average net assets of the portion of the fund managed by PIL.
For the period ended March 31, 2008, Putnam Management has assumed $1,481 of legal, shareholder servicing and communication, audit and Trustee fees incurred by the fund in connection with certain legal and regulatory matters (including those described in Note 6).
The fund reimburses Putnam Management an allocated amount for the compensation and related expenses of certain officers of the fund and their
46
staff who provide administrative services to the fund. The aggregate amount of all such reimbursements is determined annually by the Trustees.
Custodial services for the fund’s assets were provided by Putnam Fiduciary Trust Company (“PFTC”), an affiliate of Putnam Management, and by State Street Bank and Trust Company (“State Street”). Custody fees are based on the fund’s asset level, the number of its security holdings, transaction volumes and with respect to PFTC, certain fees related to the transition of assets to State Street. Putnam Investor Services, a division of PFTC, provided investor servicing agent functions to the fund. Putnam Investor Services received fees for investor servicing, subject to certain limitations, based on the number of shareholder accounts in the fund and the level of defined contribution plan assets in the fund. During the period ended March 31, 2008, the fund incurred $1,431,249 for custody and investor servicing agent functions provided by PFTC.
The fund has entered into expense offset arrangements with PFTC and State Street whereby PFTC’s and State Street’s fees are reduced by credits allowed on cash balances. The fund also reduced expenses through brokerage/service arrangements. For the six months ended March 31, 2008, the fund’s expenses were reduced by $51,146 under the expense offset arrangements and by $64,633 under the brokerage/service arrangements.
Each independent Trustee of the fund receives an annual Trustee fee, of which $439, as a quarterly retainer, has been allocated to the fund, and an additional fee for each Trustees meeting attended. Trustees receive additional fees for attendance at certain committee meetings and industry seminars and for certain compliance-related matters. Trustees also are reimbursed for expenses they incur relating to their services as Trustees.
The fund has adopted a Trustee Fee Deferral Plan (the “Deferral Plan”) which allows the Trustees to defer the receipt of all or a portion of Trustees fees payable on or after July 1, 1995. The deferred fees remain invested in certain Putnam funds until distribution in accordance with the Deferral Plan.
The fund has adopted an unfunded noncontributory defined benefit pension plan (the“Pension Plan”) covering all Trustees of the fund who have served as a Trustee for at least five years and were first elected prior to 2004. Benefits under the Pension Plan are equal to 50% of the Trustee’s average annual attendance and retainer fees for the three years ended December 31, 2005. The retirement benefit is payable during a Trustee’s lifetime, beginning the year following retirement, for the number of years of service through December 31, 2006. Pension expense for the fund is included in Trustee compensation and expenses in the Statement of operations. Accrued pension liability is included in Payable for Trustee compensation and expenses in the Statement of assets and liabilities. The Trustees have terminated the Pension Plan with respect to any Trustee first elected after 2003.
The fund has adopted distribution plans (the “Plans”) with respect to its class A, class B, class C, class M and class R shares pursuant to Rule 12b-1 under the Investment Company Act of 1940. The purpose of the Plans is to compensate Putnam Retail Management Limited Partnership, a wholly-owned subsidiary of Putnam, LLC and Putnam Retail Management GP, Inc., for services provided and expenses incurred in distributing shares of the fund. The Plans provide for payments by the fund to Putnam Retail Management Limited Partnership at an annual rate of up to 0.35%, 1.00%, 1.00%, 1.00% and 1.00% of the average net assets attributable to class A, class B, class C, class M and class R shares, respectively. The Trustees have approved payment by the fund at an annual rate of 0.25%, 1.00%, 1.00%, 0.75% and 0.50% of the average net assets attributable to class A, class B, class C, class M and class R shares, respectively.
For the six months ended March 31, 2008, Putnam Retail Management Limited Partnership, acting as underwriter, received net commissions of $28,078 and $529 from the sale of class A and class M shares, respectively, and received $25,379 and $291 in contingent deferred sales charges from redemptions of class B and class C shares, respectively.
47
A deferred sales charge of up to 1.00% and 0.65% is assessed on certain redemptions of class A and class M shares, respectively. For the six months ended March 31, 2008, Putnam Retail Management Limited Partnership, acting as underwriter, received $649 and no monies on class A and class M redemptions, respectively.
Note 3: Purchases and sales of securities
During the six months ended March 31, 2008, cost of purchases and proceeds from sales of investment securities other than short-term investments aggregated $569,634,136 and $602,218,406, respectively. There were no purchases or sales of U.S. government securities.
Note 4: Capital shares
At March 31, 2008, there was an unlimited number of shares of beneficial interest authorized. Transactions in capital shares were as follows:
| | | | |
| CLASS A | Shares | | Amount | |
| |
| Six months ended 3/31/08: | | | |
| | | | |
| Shares sold | 2,845,608 | $ | 52,393,577 | |
| |
| Shares issued | | | | |
| in connection | | | | |
| with reinvestment | | | | |
| of distributions | 438,951 | | 8,085,470 | |
| |
| | 3,284,559 | | 60,479,047 | |
| |
| Shares | | | | |
| repurchased | (3,817,667) | | (69,068,897) | |
| |
| Net decrease | (533,108) | $ | (8,589,850) | |
| | |
| Year ended 9/30/07: | | | | |
| | | | | |
| Shares sold | 4,643,062 | $ | 83,246,390 | |
| |
| Shares issued | | | | |
| in connection | | | | |
| with reinvestment | | | | |
| of distributions | 152,964 | | 2,585,087 | |
| |
| | 4,796,026 | | 85,831,477 | |
| |
| Shares repurchased | (7,633,964) | | (135,705,562) | |
| |
| Net decrease | (2,837,938) | $ | (49,874,085) | |
| | | | |
| CLASS B | Shares | | Amount | |
| |
| Six months ended 3/31/08: | | | |
| | | | |
| Shares sold | 308,089 | $ | 5,422,939 | |
| |
| Shares issued | | | | |
| in connection | | | | |
| with reinvestment | | | | |
| of distributions | 28,755 | | 497,042 | |
| |
| | 336,844 | | 5,919,981 | |
| |
| Shares | | | | |
| repurchased | (1,878,511) | | (31,815,067) | |
| |
| Net decrease | (1,541,667) | $ | (25,895,086) | |
| | |
| Year ended 9/30/07: | | | | |
| | | | | |
| Shares sold | 624,112 | $ | 10,308,466 | |
| |
| Shares issued | | | | |
| in connection | | | | |
| with reinvestment | | | | |
| of distributions | — | | — | |
| |
| | 624,112 | | 10,308,466 | |
| |
| Shares | | | | |
| repurchased | (2,838,789) | | (47,206,998) | |
| |
| Net decrease | (2,214,677) | $ | (36,898,532) | |
| |
| | |
| CLASS C | Shares | | Amount | |
| |
| Six months ended 3/31/08: | | | |
| | | | |
| Shares sold | 139,733 | $ | 2,497,484 | |
| |
| Shares issued | | | | |
| in connection | | | | |
| with reinvestment | | | | |
| of distributions | 7,430 | | 131,288 | |
| |
| | 147,163 | | 2,628,772 | |
| |
| Shares | | | | |
| repurchased | (233,094) | | (3,916,010) | |
| |
| Net decrease | (85,931) | $ | (1,287,238) | |
| | |
| Year ended 9/30/07: | | | | |
| | | | | |
| Shares sold | 279,828 | $ | 4,914,289 | |
| |
| Shares issued | | | | |
| in connection | | | | |
| with reinvestment | | | | |
| of distributions | — | | — | |
| |
| | 279,828 | | 4,914,289 | |
| |
| Shares | | | | |
| repurchased | (240,352) | | (4,138,521) | |
| |
| Net increase | 39,476 | $ | 775,768 | |
48
| | | | |
| CLASS M | Shares | | Amount | |
| |
| Six months ended 3/31/08: | | | |
| | | | |
| Shares sold | 34,910 | $ | 614,858 | |
| |
| Shares issued | | | | |
| in connection | | | | |
| with reinvestment | | | | |
| of distributions | 8,683 | | 153,256 | |
| |
| | 43,593 | | 768,114 | |
| |
| Shares | | | | |
| repurchased | (138,966) | | (2,429,309) | |
| |
| Net decrease | (95,373) | $ | (1,661,195) | |
| | |
| Year ended 9/30/07: | | | | |
| | | | | |
| Shares sold | 60,332 | $ | 1,032,635 | |
| |
| Shares issued | | | | |
| in connection | | | | |
| with reinvestment | | | | |
| of distributions | — | | — | |
| |
| | 60,332 | | 1,032,635 | |
| |
| Shares | | | | |
| repurchased | (215,256) | | (3,639,386) | |
| |
| Net decrease | (154,924) | $ | (2,606,751) | |
| |
| | |
| CLASS R | Shares | | Amount | |
| |
| Six months ended 3/31/08: | | | |
| | | | |
| Shares sold | 117,439 | $ | 2,244,383 | |
| |
| Shares issued | | | | |
| in connection | | | | |
| with reinvestment | | | | |
| of distributions | 2,165 | | 39,593 | |
| |
| | 119,604 | | 2,283,976 | |
| |
| Shares | | | | |
| repurchased | (37,809) | | (650,042) | |
| |
| Net increase | 81,795 | $ | 1,633,934 | |
| | |
| Year ended 9/30/07: | | | | |
| | | | | |
| Shares sold | 35,506 | $ | 641,758 | |
| |
| Shares issued | | | | |
| in connection | | | | |
| with reinvestment | | | | |
| of distributions | 100 | | 1,682 | |
| |
| | 35,606 | | 643,440 | |
| |
| Shares | | | | |
| repurchased | (5,625) | | (97,529) | |
| |
| Net increase | 29,981 | $ | 545,911 | |
| | | | |
| CLASS Y | Shares | | Amount | |
| |
| Six months ended 3/31/08: | | | |
| | | | |
| Shares sold | 3,706,632 | $ | 71,737,867 | |
| |
| Shares issued | | | | |
| in connection | | | | |
| with reinvestment | | | | |
| of distributions | 50,707 | | 934,024 | |
| |
| | 3,757,339 | | 72,671,891 | |
| |
| Shares | | | | |
| repurchased | (1,234,978) | | (22,686,571) | |
| |
| Net increase | 2,522,361 | $ | 49,985,320 | |
| | |
| Year ended 9/30/07: | | | | |
| | | | | |
| Shares sold | 277,093 | $ | 4,946,632 | |
| |
| Shares issued | | | | |
| in connection | | | | |
| with reinvestment | | | | |
| of distributions | 7,008 | | 118,436 | |
| |
| | 284,101 | | 5,065,068 | |
| |
| Shares | | | | |
| repurchased | (244,341) | | (4,338,710) | |
| |
| Net increase | 39,760 | $ | 726,358 | |
Note 5: Investment in Putnam Prime Money Market Fund
The fund invests in Putnam Prime Money Market Fund, an open-end management investment company managed by Putnam Management. Investments in Putnam Prime Money Market Fund are valued at its closing net asset value each business day. Management fees paid by the fund are reduced by an amount equal to the management fees paid by Putnam Prime Money Market Fund with respect to assets invested by the fund in Putnam Prime Money Market Fund. For the period ended March 31, 2008, management fees paid were reduced by $4,836 relating to the fund’s investment in Putnam Prime Money Market Fund. Income distributions earned by the fund are recorded as income in the Statement of operations and totaled $247,192 for the period ended March 31, 2008. During the period ended March 31, 2008, cost of purchases and proceeds of sales of investments in Putnam Prime Money Market Fund aggregated $163,360,414 and $149,968,901, respectively.
49
Note 6: Regulatory matters and litigation
In late 2003 and 2004, Putnam Management settled charges brought by the SEC and the Massachusetts Securities Division in connection with excessive short-term trading in Putnam funds. Payments from Putnam Management will be distributed to certain open-end Putnam funds and their shareholders. These allegations and related matters have served as the general basis for certain lawsuits, including purported class action lawsuits against Putnam Management and, in a limited number of cases, some Putnam funds. Putnam Management believes that these lawsuits will have no material adverse effect on the funds or on Putnam Management’s ability to provide investment management services. In addition, Putnam Management has agreed to bear any costs incurred by the Putnam funds as a result of these matters.
Note 7: New accounting pronouncements
In June 2006, the Financial Accounting Standards Board (“FASB”) issued Interpretation No. 48, Accounting for Uncertainty in Income Taxes (the “Interpretation”). The Interpretation prescribes a minimum threshold for financial statement recognition of the benefit of a tax position taken or expected to be taken by a filer in the filer’s tax return. Upon adoption, the Interpretation did not have a material effect on the fund’s financial statements. However, the conclusions regarding the Interpretation may be subject to review and adjustment at a later date based on factors including, but not limited to, further implementation guidance expected from the FASB, and on-going analysis of tax laws, regulations and interpretations thereof.
In September 2006, the FASB issued Statement of Financial Accounting Standards No. 157, Fair Value Measurements (the “Standard”). The Standard defines fair value, sets out a framework for measuring fair value and expands disclosures about fair value measurements. The Standard applies to fair value measurements already required or permitted by existing standards. The Standard is effective for fiscal years beginning after November 15, 2007 and interim periods within those fiscal years. Putnam Management does not believe the adoption of the Standard will impact the amounts reported in the financial statements; however, additional disclosures will be required about the inputs used to develop the measurements of fair value.
In March 2008, FASB issued Statement of Financial Accounting Standards No. 161 (“FAS 161”), Disclosures about Derivative Instruments and Hedging Activities —an amendment of FASB Statement No. 133 (“FAS 133”), which expands the disclosure requirements in FAS 133 about an entity’s derivative instruments and hedging activities. FAS 161 is effective for fiscal years and interim periods beginning after November 15, 2008. Putnam Management is currently evaluating the impact the adoption of these accounting pronouncements will have on the Fund’s financial statements and related disclosures.
50
Brokerage commissions
(unaudited)
Brokerage commissions are paid to firms that execute trades on behalf of your fund. When choosing these firms, Putnam is required by law to seek the best execution of the trades, taking all relevant factors into consideration, including expected quality of execution and commission rate. Listed below are the largest relationships based upon brokerage commissions for your fund and the other funds in Putnam’s International group for the year ended March 31, 2008. The other Putnam mutual funds in this group are Putnam Europe Equity Fund, Putnam Global Equity Fund, Putnam International Capital Opportunities Fund, Putnam International Equity Fund, Putnam International Growth and Income Fund, Putnam VT Global Equity Fund, Putnam VT International Equity Fund, Putnam VT International Growth and Income Fund, and Putnam VT International New Opportunities Fund.
The top five firms that received brokerage commissions for trades executed for the International group are (in descending order) Credit Suisse First Boston, Goldman Sachs, Merrill Lynch, Deutsche Bank Securities, and UBS Warburg. Commissions paid to these firms together represented approximately 53% of the total brokerage commissions paid for the year ended March 31, 2008.
Commissions paid to the next 10 firms together represented approximately 32% of the total brokerage commissions paid during the period. These firms are (in alphabetical order) ABN AMRO U.S., Citigroup Global Markets, Daiwa Securities Co., Dresdner Kleinwort Wasserstein, JPMorgan Clearing, Lehman Brothers, Macquarie, Morgan Stanley and Company, Nomura Securities, and Sanford Bernstein & Co.
Commission amounts do not include “mark-ups” paid on bond or derivative trades made directly with a dealer. Additional information about brokerage commissions is available on the Securities and Exchange Commission (SEC) Web site at www.sec.gov. Putnam funds disclose commissions by firm to the SEC in semiannual filings on Form N-SAR.
51
Putnam puts your
interests first
Putnam has introduced a number of voluntary initiatives designed to reduce fund expenses, provide investors with more useful information, and help safeguard the interests of all Putnam investors. Visit the Individual Investors section at www.putnam.com for details.
Cost-cutting initiatives
Ongoing expenses will be limited Through calendar 2008, total ongoing expenses, including management fees for all funds, will be maintained at or below the average of each fund’s industry peers in its Lipper load-fund universe. For more information, please see the Statement of Additional information.
Lower class B purchase limit To help ensure that investors are in the most cost-effective share class, the maximum amount that can be invested in class B shares has been reduced to $100,000. (Larger trades or accumulated amounts will be refused.)
Improved disclosure
Putnam fund prospectuses and shareholder reports have been revised to disclose additional information that will help shareholders compare funds and weigh their costs and risks along with their potential benefits. Shareholders will find easy-to-understand information about fund expense ratios, portfolio manager compensation, risk comparisons, turnover comparisons, brokerage commissions, and employee and trustee ownership of Putnam funds. Disclosure of breakpoint discounts has also been enhanced to alert investors to potential cost savings.
Protecting investors’ interests
Short-term trading fee introduced To discourage short-term trading, which can interfere with a fund’s long-term strategy, a 1% short-term trading fee may be imposed on any Putnam fund shares (other than money market funds) redeemed or exchanged within seven calendar days of purchase (for certain funds, this fee applies for 90 days).
52
Fund information
Founded over 70 years ago, Putnam Investments was built around the concept that a balance between risk and reward is the hallmark of a well-rounded financial program. We manage over 100 mutual funds in growth, value, blend, fixed income, and international.
| | |
| Investment Manager | Officers | Francis J. McNamara, III |
| Putnam Investment | Charles E. Haldeman, Jr. | Vice President and |
| Management, LLC | President | Chief Legal Officer |
| One Post Office Square | | |
| Boston, MA 02109 | Charles E. Porter | Robert R. Leveille |
| | Executive Vice President, | Vice President and |
| Marketing Services | Principal Executive Officer, | Chief Compliance Officer |
| Putnam Retail Management | Associate Treasurer and | |
| One Post Office Square | Compliance Liaison | Mark C. Trenchard |
| Boston, MA 02109 | | Vice President and |
| | Jonathan S. Horwitz | BSA Compliance Officer |
| Custodian | Senior Vice President | |
| State Street Bank and | and Treasurer | Judith Cohen |
| Trust Company | | Vice President, Clerk and |
| | Steven D. Krichmar | Assistant Treasurer |
| Legal Counsel | Vice President and | |
| Ropes & Gray LLP | Principal Financial Officer | Wanda M. McManus |
| | | Vice President, Senior Associate |
| Trustees | Janet C. Smith | Treasurer and Assistant Clerk |
| John A. Hill, Chairman | Vice President, Principal | |
| Jameson Adkins Baxter, | Accounting Officer and | Nancy E. Florek |
| Vice Chairman | Assistant Treasurer | Vice President, Assistant Clerk, |
| Charles B. Curtis | | Assistant Treasurer and |
| Robert J. Darretta | Susan G. Malloy | Proxy Manager |
| Myra R. Drucker | Vice President and | |
| Charles E. Haldeman, Jr. | Assistant Treasurer | |
| Paul L. Joskow | | |
| Elizabeth T. Kennan | Beth S. Mazor | |
| Kenneth R. Leibler | Vice President | |
| Robert E. Patterson | | |
| George Putnam, III | James P. Pappas | |
| | Vice President | |
| | | |
| | | |
This report is for the information of shareholders of Putnam International New Opportunities Fund. It may also be used as sales literature when preceded or accompanied by the current prospectus, the most recent copy of Putnam’s Quarterly Performance Summary, and Putnam’s Quarterly Ranking Summary. For more recent performance, please visit www.putnam.com. Investors should carefully consider the investment objective, risks, charges, and expenses of a fund, which are described in its prospectus. For this and other information or to request a prospectus, call 1-800-225-1581 toll free. Please read the prospectus carefully before investing. The fund’s Statement of Additional Information contains additional information about the fund’s Trustees and is available without charge upon request by calling 1-800-225-1581.

Item 2. Code of Ethics:
Not applicable
Item 3. Audit Committee Financial Expert:
Not applicable
Item 4. Principal Accountant Fees and Services:
Not applicable
Item 5. Audit Committee of Listed Registrants
Not applicable
Item 6. Schedule of Investments:
The registrant’s schedule of investments in unaffiliated issuers is included in the report to shareholders in Item 1 above.
Item 7. Disclosure of Proxy Voting Policies and Procedures For Closed - End Management Investment Companies:
Not applicable
Item 8. Portfolio Managers of Closed - End Investment Companies
Not Applicable
Item 9. Purchases of Equity Securities by Closed - End Management Investment Companies and Affiliated Purchasers:
Not applicable
Item 10. Submission of Matters to a Vote of Security Holders:
Not applicable
Item 11. Controls and Procedures:
(a) The registrant's principal executive officer and principal financial officer have concluded, based on their evaluation of the effectiveness of the design and operation of the registrant's disclosure controls and procedures as of a date within 90 days of the filing date of this report, that the design and operation of such procedures are generally effective to provide reasonable assurance that information required to be disclosed by the registrant in this report is recorded, processed, summarized and reported within the time periods specified in the Commission's rules and forms.
(b) Changes in internal control over financial reporting: Not applicable
Item 12. Exhibits:
(a)(1) Not applicable
(a)(2) Separate certifications for the principal executive officer and principal financial officer of the registrant as required by Rule 30a-2(a) under the Investment Company Act of 1940, as amended, are filed herewith.
(b) The certifications required by Rule 30a-2(b) under the Investment Company Act of 1940, as amended, are filed herewith.
SIGNATURES
Pursuant to the requirements of the Securities Exchange Act of 1934 and the Investment Company Act of 1940, the registrant has duly caused this report to be signed on its behalf by the undersigned, thereunto duly authorized.
Putnam Investment Funds
By (Signature and Title):
/s/Janet C. Smith
Janet C. Smith
Principal Accounting Officer
Date: May 30, 2008
Pursuant to the requirements of the Securities Exchange Act of 1934 and the Investment Company Act of 1940, this report has been signed below by the following persons on behalf of the registrant and in the capacities and on the dates indicated.
By (Signature and Title):
/s/Charles E. Porter
Charles E. Porter
Principal Executive Officer
Date: May 30, 2008
By (Signature and Title):
/s/Steven D. Krichmar
Steven D. Krichmar
Principal Financial Officer
Date: May 30, 2008