| | |
| UNITED STATES |
| SECURITIES AND EXCHANGE COMMISSION |
| Washington, D.C. 20549 |
| |
| FORM N-CSR |
| |
| CERTIFIED SHAREHOLDER REPORT OF REGISTERED |
| MANAGEMENT INVESTMENT COMPANIES |
| |
| Investment Company Act file number: (811- 07237) | |
| | |
| Exact name of registrant as specified in charter: | Putnam Investment Funds |
| | |
| Address of principal executive offices: One Post Office Square, Boston, Massachusetts 02109 |
| |
| Name and address of agent for service: | Beth S. Mazor, Vice President |
| | One Post Office Square |
| | Boston, Massachusetts 02109 |
| | |
| Copy to: | John W. Gerstmayr, Esq. |
| | Ropes & Gray LLP |
| | One International Place |
| | Boston, Massachusetts 02110 |
| | |
| Registrant’s telephone number, including area code: | (617) 292-1000 |
| | |
| Date of fiscal year end: April 30, 2009 | | |
| | | |
| Date of reporting period: May 1, 2008 — October 31, 2008 |
Item 1. Report to Stockholders:
The following is a copy of the report transmitted to stockholders pursuant to Rule 30e-1 under the Investment Company Act of 1940:
What makes Putnam different?

In 1830, Massachusetts Supreme Judicial Court Justice Samuel Putnam established The Prudent Man Rule, a legal foundation for responsible money management.
THE PRUDENT MAN RULE
All that can be required of a trustee to invest is that he shall conduct himself faithfully and exercise a sound discretion. He is to observe how men of prudence, discretion, and intelligence manage their own affairs, not in regard to speculation, but in regard to the permanent disposition of their funds, considering the probable income, as well as the probable safety of the capital to be invested.

A time-honored tradition in money management
Since 1937, our values have been rooted in a profound sense of responsibility for the money entrusted to us.
A prudent approach to investing
We use a research-driven approach to seek superior investment results over time.
Funds for every investment goal
We offer a broad range of mutual funds and other financial products so investors and their financial representatives can build diversified portfolios.
A commitment to doing what’s right for investors
With a focus on investment performance, below-average expenses, and in-depth information about our funds, we put the interests of investors first and seek to set the standard for integrity and service.
Industry-leading service
We help investors, along with their financial representatives, make informed investment decisions with confidence.
Putnam Capital
Opportunities
Fund
10 | 31 | 08
Semiannual Report
| |
| Message from the Trustees | 2 |
| About the fund | 4 |
| Performance snapshot | 6 |
| Interview with your fund’s Portfolio Manager | 7 |
| Performance in depth. | 11 |
| Expenses | 13 |
| Portfolio turnover | 15 |
| Risk | 16 |
| Your fund’s management. | 16 |
| Terms and definitions | 18 |
| Trustee approval of management contract | 19 |
| Other shareholder information | 24 |
| Financial statements | 25 |
| Brokerage commissions | 49 |
Cover photograph: © Marco Cristofori
Message from the Trustees
Dear Fellow Shareholder:
For several months now, financial markets have been experiencing significant upheaval. Coordinated responses by economic and financial authorities in the United States and overseas should restore stability in due course, but investors should not expect a reduction in volatility in the near term.
Putnam, meanwhile, is making several important changes to its equity fund lineup and portfolio teams under the leadership of its newly appointed President and Chief Executive Officer, Robert L. Reynolds. Putnam is removing product redundancies, seeking the best investment talent, bolstering equity research, fostering individual portfolio manager’s authority and accountability, and realigning compensation for managers so that only those who achieve top-quartile returns for shareholders are eligible for full bonuses.
In addition, Putnam is defining fundamental research as the cornerstone of its equity management approach, with quantitative analysts providing input to — but not driving — investment decisions. Putnam is also streamlining its range of equity funds by merging six equity funds into larger funds with similar investment objectives. In addition to removing product redundancies, these mergers are generally expected to result in lower expense ratios for shareholders.
Mr. Reynolds, who joined Putnam in July, has substantial industry experience and an outstanding record of success, including serving as Vice Chairman and Chief Operating Officer at Fidelity Investments from 2000
2
to 2007. Charles E. Haldeman, Jr., former President and CEO, has taken on the role of Chairman of Putnam Investment Management, LLC, the firm’s fund management company. Mr. Haldeman continues to serve as President of the Funds and as a Trustee. Mr. Reynolds also serves as a Trustee.
We would like to take this opportunity to welcome new shareholders to the fund and to thank all of our investors for your continued confidence in Putnam during these challenging times.

About the fund
Seeking overlooked, underpriced small and midsize companies
Every company, whatever its industry, growth rate, or size, has an underlying value. This value can be based on the firm’s physical assets (factories, inventory, or staff) or on less easily quantifiable measures (long-term competitive advantage, management expertise, or research and development efforts). A stock’s price, however, may or may not accurately reflect the company’s underlying value.
A stock may be mispriced for many reasons, such as when the company has problems that concern its management, industry, or product line. Temporary factors, such as a cyclical industry downturn or a one-time inventory issue, may also cause a stock to be undervalued.
In addition, unlike the widely followed large, blue-chip companies, smaller companies are less likely to be covered by industry researchers. This lack of coverage can lead to the undervaluation of these stocks. It is up to the fund’s manager to uncover the reasons behind a stock’s valuation and to determine whether the market’s generally held assumptions are on target.
To uncover undervalued stocks with the long-term potential for growth, the manager draws on his experience as well as on the expertise of Putnam’s equity analysts. Because the fund is managed in Putnam’s “blend” style, the manager is not focused solely on either growth- or value-style stocks and can choose from thousands of small and midsize U.S. companies. This flexibility means the fund’s portfolio is broadly diversified, which can help reduce the risk of investing in these companies.
The fund invests some or all of its assets in small and/or midsize investments greater price fluctuations.

Investor overreaction
can mean investment
opportunities
An important factor in the analysis for Putnam Capital Opportunities Fund is “behavioral insight.” When an event that negatively affects a company occurs, such as a temporary inventory shortage or a change in management, investors may overreact, either by selling off the stock or buying it in large quantities. This overreaction can skew a stock’s price out of proportion to the real impact of the event. The result can develop into a buying or a selling opportunity for astute investment managers.
The portfolio manager and equity analysts for Putnam Capital Opportunities Fund determine behavioral rankings as part of their detailed stock-by-stock valuation process. Their process integrates sophisticated quantitative models, behavioral insights, and an in-depth analysis of each company’s fundamental worth.
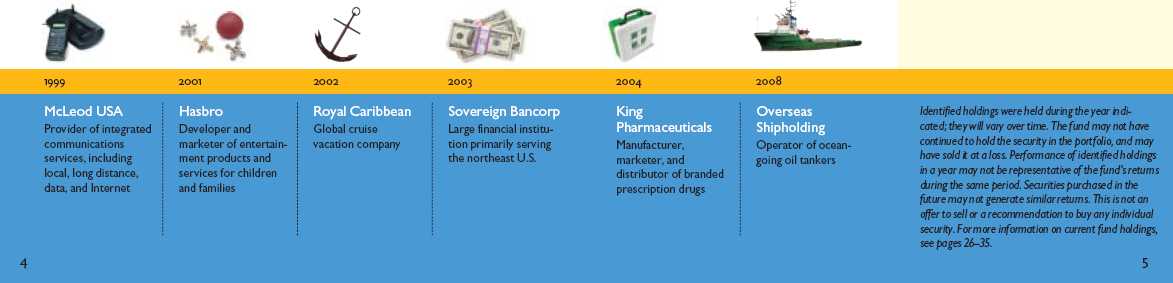
Putnam Capital Opportunities Fund holdings have
spanned sectors and industries over time.
Performance snapshot
Average annual total return (%) comparison as of 10/31/08
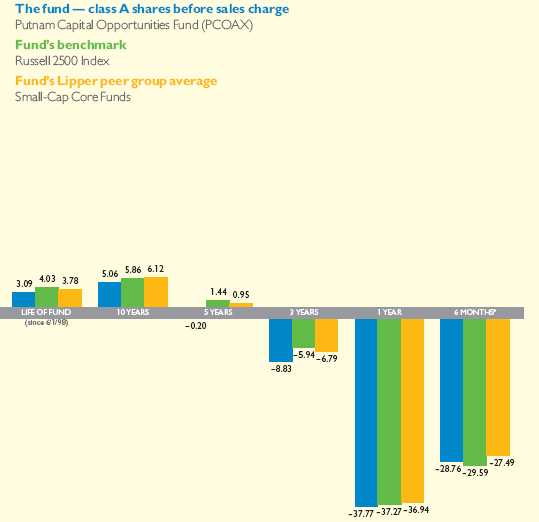
Current performance may be lower or higher than the quoted past performance, which cannot guarantee future results. Share price, principal value, and return will fluctuate, and you may have a gain or a loss when you sell your shares. Performance of class A shares assumes reinvestment of distributions and does not account for taxes. Fund returns in the bar chart do not reflect a sales charge of 5.75%; had they, returns would have been lower. See pages 7 and 11–13 for additional performance information. For a portion of the periods, this fund may have limited expenses, without which returns would have been lower. A 1% short-term trading fee may apply. To obtain the most recent month-end performance, visit www.putnam.com.
* Returns for the six-month period are not annualized, but cumulative.
6
Interview with your
fund’s Portfolio Manager
Joseph Joseph
Joe, investors were faced with unprecedented volatility during the reporting period. How did the fund perform?
With the historic market sell-off in September and October coming on the heels of an already-depressed market, the reporting period proved disappointing, with the fund delivering a loss of 28.76% for the six months ended October 31, 2008. While good stock selection in the consumer and health-care sectors helped the fund hold up better than the –29.59% return of its benchmark, the Russell 2500 Index, it lagged the average return for its Lipper peer group, which returned –27.49%.
What contributed to the sharp decline in the financial markets, particularly in the final months of the fiscal year?
The faltering housing market and subprime mortgage meltdown are at the heart of the financial crisis. However, as the housing market struggled during the fiscal year, losses spread to the traditional mortgage market. Small and large investors alike experienced great losses on securities backed by subprime mortgages and mortgage-backed securities. Ultimately, the decline in the value of these securities contributed to the demise of several financial institutions and a severe credit crunch.
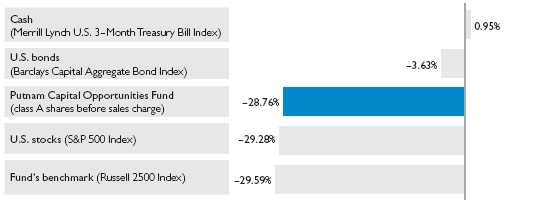
Broad market index and fund performance
This comparison shows your fund’s performance in the context of broad market indexes for the six months ended 10/31/08. See page 6 and pages 11–13 for additional fund performance information. Index descriptions can be found on page 18.
7
In addition, the strength of the nation’s banking system came into question as several lenders failed as a result of their exposure to subprime debt and the lack of liquidity in the financial markets. As of this interview, several major financial institutions were in the process of being acquired, including Washington Mutual Inc., Merrill Lynch & Co., and Wachovia Corp. The loss of investor confidence is affecting relatively healthy financial institutions like Goldman Sachs, which reported profits despite the market’s decline.
Could you discuss some of the fund’s holdings that struggled in this environment?
Three holdings come to mind. Autoliv Inc., which makes safety systems for automobiles, suffered when car sales slowed faster than expected in response to the credit crisis and the deteriorating outlook for auto suppliers. The global economic slowdown is also dampening prospects for Manitowoc Co., which builds cranes for use in infrastructure construction and energy projects worldwide. The market appears to be anticipating a slowdown in this business as well as continued weak demand for Manitowoc’s food service appliances. Finally, Trico Marine Services, Inc., which provides marine support services to the oil and gas industry, underperformed due to anticipated spending cutbacks by oil and gas exploration and production companies. By the end of the period, the holding had been sold.
Top 10 holdings
This table shows the fund’s top 10 holdings and the percentage of the fund’s net assets that each represented as of 10/31/08. Also shown is each holding’s market sector and the specific industry within that sector. Holdings will vary over time.
| | |
| HOLDING (percentage of fund’s net assets) | SECTOR | INDUSTRY |
|
| Wolverine World Wide, Inc. (1.4%) | Consumer cyclicals | Retail |
| Dollar Tree, Inc. (1.4%) | Consumer cyclicals | Retail |
| Watson Pharmaceuticals, Inc. (1.4%) | Health care | Pharmaceuticals |
| Aeropostale, Inc. (1.3%) | Consumer cyclicals | Retail |
| Hasbro, Inc. (1.3%) | Consumer cyclicals | Toys |
| Invitrogen Corp. (1.2%) | Health care | Biotechnology |
| Lincare Holdings, Inc. (1.2%) | Health care | Health-care services |
| Career Education Corp. (1.1%) | Consumer staples | Schools |
| King Pharmaceuticals, Inc. (1.1%) | Health care | Pharmaceuticals |
| Toro Co. (The) (1.0%) | Consumer cyclicals | Retail |
8
Which stocks helped performance?
The fund’s best-performing stock was Dollar Tree, Inc. At the start of the fiscal year, the company’s stock was relatively undervalued. As fears of recession turned into reality, Dollar Tree’s competitively priced products appealed to consumers on tight budgets, and company fundamentals improved. Lincare Holdings outperformed when Medicare’s changes to reimbursement for the company’s services proved to be less negative than expected. Longs Drug Stores Corp. also contributed positively to results when Walgreens and CVS Caremark made offers to buy the company.
What is your outlook as the fund enters the second half of its fiscal year?
Deepening fears about the lack of liquidity in the credit markets and a U.S. recession have widened into broader concerns about the global economy and the fate of financial institutions abroad. We are seeing a concerted effort by central banks, the U.S. Treasury, and their global counterparts to lower short-term interest rates in hopes of reassuring markets, encouraging lending, and stabilizing economies.
However, not even coordinated policy action can reverse the economic damage caused by the absence of credit and the loss of confidence across various market participants. Deleveraging, or the selling of excess debt, is under way
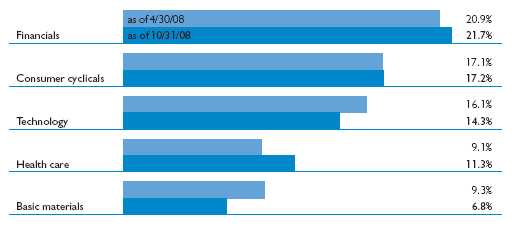
Comparison of top sector weightings
This chart shows how the fund’s top weightings have changed over the past six months. Weightings are shown as a percentage of net assets. Holdings will vary over time.
9
and, we believe, must continue in order to restore more solid underpinnings to the financials sector. Consequently, we expect further volatility in the months ahead.
Not surprisingly, the prolonged instability is creating tremendous buying opportunities. We’ll continue to employ our disciplined investment strategy, using a series of valuation factors to identify stocks that we believe are trading below their intrinsic value. Our goal is to find those that will appreciate over time as the market recognizes their value.
Joe, thank you for your time and insights today.
The views expressed in this report are exclusively those of Putnam Management. They are not meant as investment advice.
Please note that the holdings discussed in this report may not have been held by the fund for the entire period. Portfolio composition is subject to review in accordance with the fund’s investment strategy and may vary in the future.
I N T H E N E W S
In November, the Federal Reserve Bank (the Fed) and the U.S. Treasury announced $800 billion in new lending programs to help the consumer lending and home mortgage markets. The Treasury and the Fed said they would create a $200 billion program to support the issuance of securities that are backed by car loans, student loans, credit card debt, and small-business loans. In a separate action, the Fed said it would lower mortgage rates and increase the availability of credit for the housing market by buying up to $600 billion in debt tied to home loans backed by Fannie Mae, Freddie Mac, and other government-controlled financing agencies.
10
Your fund’s performance
This section shows your fund’s performance, price, and distribution information for periods ended October 31, 2008, the end of the first half of its current fiscal year. In accordance with regulatory requirements for mutual funds, we also include performance as of the most recent calendar quarter-end and expense information taken from the fund’s current prospectus. Performance should always be considered in light of a fund’s investment strategy. Data represents past performance. Past performance does not guarantee future results. More recent returns may be less or more than those shown. Investment return and principal value will fluctuate, and you may have a gain or a loss when you sell your shares. Performance information does not reflect any deduction for taxes a shareholder may owe on fund distributions or on the redemption of fund shares. For the most recent month-end performance, please visit the Individual Investors section of www.putnam.com or call Putnam at 1-800-225-1581. Class Y shares are generally only available to corporate and institutional clients and clients in other approved programs. See the Terms and Definitions section in this report for definitions of the share classes offered by your fund.
Fund performance Total return for periods ended 10/31/08
| | | | | | | | | | |
| | Class A | Class B | Class C | Class M | Class R | Class Y |
| (inception dates) | (6/1/98) | (6/29/98) | (7/26/99) | (6/29/98) | (1/21/03) | (10/2/00) |
|
| | NAV | POP | NAV | CDSC | NAV | CDSC | NAV | POP | NAV | NAV |
|
| Annual average | | | | | | | | | | |
| (life of fund) | 3.09% | 2.51% | 2.34% | 2.34% | 2.34% | 2.34% | 2.58% | 2.23% | 2.84% | 3.30% |
|
| 10 years | 63.75 | 54.44 | 52.10 | 52.10 | 52.08 | 52.08 | 55.69 | 50.20 | 59.67 | 67.25 |
| Annual average | 5.06 | 4.44 | 4.28 | 4.28 | 4.28 | 4.28 | 4.53 | 4.15 | 4.79 | 5.28 |
|
| 5 years | –1.02 | –6.69 | –4.65 | –5.94 | –4.73 | –4.73 | –3.44 | –6.80 | –2.30 | 0.18 |
| Annual average | –0.20 | –1.38 | –0.95 | –1.22 | –0.96 | –0.96 | –0.70 | –1.40 | –0.46 | 0.04 |
|
| 3 years | –24.22 | –28.56 | –25.90 | –27.40 | –25.94 | –25.94 | –25.30 | –27.91 | –24.81 | –23.73 |
| Annual average | –8.83 | –10.60 | –9.51 | –10.12 | –9.53 | –9.53 | –9.27 | –10.33 | –9.07 | –8.63 |
|
| 1 year | –37.77 | –41.34 | –38.23 | –41.02 | –38.21 | –38.77 | –38.03 | –40.20 | –37.90 | –37.64 |
|
| 6 months | –28.76 | –32.82 | –28.99 | –32.54 | –29.01 | –29.72 | –28.98 | –31.49 | –28.84 | –28.74 |
|
Current performance may be lower or higher than the quoted past performance, which cannot guarantee future results. After sales charge returns (public offering price, or POP) for class A and M shares reflect a maximum 5.75% and 3.50% load. Class B share returns reflect the applicable contingent deferred sales charge (CDSC), which is 5% in the first year, declining to 1% in the sixth year, and is eliminated thereafter. Class C shares reflect a 1% CDSC for the first year that is eliminated thereafter. Class R and Y shares have no initial sales charge or CDSC. Performance for class B, C, M, R, and Y shares before their inception is derived from the historical performance of class A shares, adjusted for the applicable sales charge (or CDSC) and, except for class Y shares, the higher operating expenses for such shares.
For a portion of the periods, this fund may have limited expenses, without which returns would have been lower.
A 1% short-term trading fee may be applied to shares exchanged or sold within 90 days of purchase.
11
Comparative index returns For periods ended 10/31/08
| | |
| | | Lipper Small-Cap |
| | Russell 2500 | Core Funds |
| | Index | category average* |
|
| Annual average (life of fund) | 4.03% | 3.78% |
|
| 10 years | 76.68 | 88.99 |
| Annual average | 5.86 | 6.12 |
|
| 5 years | 7.41 | 5.76 |
| Annual average | 1.44 | 0.95 |
|
| 3 years | –16.79 | –18.66 |
| Annual average | –5.94 | –6.79 |
|
| 1 year | –37.27 | –36.94 |
|
| 6 months | –29.59 | –27.49 |
|
Index and Lipper results should be compared to fund performance at net asset value.
* Over the 6-month, 1-year, 3-year, 5-year, 10-year, and life-of-fund periods ended 10/31/08 , there were 814, 777, 625, 485, 204, and 184 funds, respectively, in this Lipper category.
Fund price and distribution information For the six-month period ended 10/31/08
| | | | | | | | |
| Distributions | Class A | Class B | Class C | Class M | Class R | Class Y |
|
| Share value | NAV | POP | NAV | NAV | NAV | POP | NAV | NAV |
|
| 4/30/08 | $9.25 | $9.81 | $8.45 | $8.55 | $8.73 | $9.05 | $9.12 | $9.43 |
|
| 10/31/08 | 6.59 | 6.99 | 6.00 | 6.07 | 6.20 | 6.42 | 6.49 | 6.72 |
|
The classification of distributions, if any, is an estimate. Final distribution information will appear on your year-end tax forms.
The fund made no distributions during the period.
Fund performance as of most recent calendar quarter
Total return for periods ended 9/30/08
| | | | | | | | | | |
| | Class A | Class B | Class C | Class M | Class R | Class Y |
| (inception dates) | (6/1/98) | (6/29/98) | (7/26/99) | (6/29/98) | (1/21/03) | (10/2/00) |
|
| | NAV | POP | NAV | CDSC | NAV | CDSC | NAV | POP | NAV | NAV |
|
| Annual average | | | | | | | | | | |
| (life of fund) | 5.47% | 4.87% | 4.70% | 4.70% | 4.70% | 4.70% | 4.95% | 4.58% | 5.22% | 5.69% |
|
| 10 years | 109.97 | 97.86 | 94.89 | 94.89 | 95.16 | 95.16 | 99.70 | 92.83 | 104.86 | 114.61 |
| Annual average | 7.70 | 7.06 | 6.90 | 6.90 | 6.92 | 6.92 | 7.16 | 6.79 | 7.43 | 7.94 |
|
| 5 years | 33.94 | 26.27 | 29.05 | 27.31 | 29.05 | 29.05 | 30.68 | 26.09 | 32.32 | 35.72 |
| Annual average | 6.02 | 4.78 | 5.23 | 4.95 | 5.23 | 5.23 | 5.50 | 4.75 | 5.76 | 6.30 |
|
| 3 years | –5.96 | –11.39 | –8.00 | –9.87 | –8.02 | –8.02 | –7.34 | –10.58 | –6.55 | –5.19 |
| Annual average | –2.03 | –3.95 | –2.74 | –3.40 | –2.75 | –2.75 | –2.51 | –3.66 | –2.23 | –1.76 |
|
| 1 year | –21.02 | –25.58 | –21.60 | –25.15 | –21.64 | –22.35 | –21.38 | –24.14 | –21.19 | –20.81 |
|
| 6 months | –6.52 | –11.87 | –6.77 | –11.43 | –6.80 | –7.74 | –6.67 | –9.90 | –6.50 | –6.39 |
|
12
Fund’s annual operating expenses For the fiscal year ended 4/30/08
| | | | | | | |
| | | Class A | Class B | Class C | Class M | Class R | Class Y |
|
| Total annual fund operating expenses | | 1.23% | 1.98% | 1.98% | 1.73% | 1.48% | 0.98% |
|
Expense information in this table is taken from the most recent prospectus, is subject to change, and may differ from that shown in the next section and in the financial highlights of this report. Expenses are shown as a percentage of average net assets.
Your fund’s expenses
As a mutual fund investor, you pay ongoing expenses, such as management fees, distribution fees (12b-1 fees), and other expenses. In the most recent six-month period, your fund limited these expenses; had it not done so, expenses would have been higher. Using the following information, you can estimate how these expenses affect your investment and compare them with the expenses of other funds. You may also pay one-time transaction expenses, including sales charges (loads) and redemption fees, which are not shown in this section and would have resulted in higher total expenses. For more information, see your fund’s prospectus or talk to your financial representative.
Review your fund’s expenses
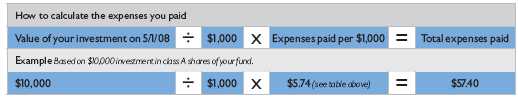
The following table shows the expenses you would have paid on a $1,000 investment in Putnam Capital Opportunities Fund from May 1, 2008, to October 31, 2008. It also shows how much a $1,000 investment would be worth at the close of the period, assuming actual returns and expenses.
| | | | | | | |
| | | Class A | Class B | Class C | Class M | Class R | Class Y |
|
| Expenses paid per $1,000* | | $5.74 | $8.97 | $8.96 | $7.89 | $6.82 | $4.66 |
|
| Ending value (after expenses) | | $712.40 | $710.10 | $709.90 | $710.20 | $711.60 | $712.60 |
|
* Expenses for each share class are calculated using the fund’s annualized expense ratio for each class, which represents the ongoing expenses as a percentage of average net assets for the six months ended 10/31/08. The expense ratio may differ for each share class (see the last table in this section). Expenses are calculated by multiplying the expense ratio by the average account value for the period; then multiplying the result by the number of days in the period; and then dividing that result by the number of days in the year.
Estimate the expenses you paid
To estimate the ongoing expenses you paid for the six months ended October 31, 2008, use the following calculation method. To find the value of your investment on May 1, 2008, call Putnam at 1-800-225-1581.
13
Compare expenses using the SEC’s method
The Securities and Exchange Commission (SEC) has established guidelines to help investors assess fund expenses. Per these guidelines, the following table shows your fund’s expenses based on a $1,000 investment, assuming a hypothetical 5% annualized return. You can use this information to compare the ongoing expenses (but not transaction expenses or total costs) of investing in the fund with those of other funds. All mutual fund shareholder reports will provide this information to help you make this comparison. Please note that you cannot use this information to estimate your actual ending account balance and expenses paid during the period.
| | | | | | | |
| | | Class A | Class B | Class C | Class M | Class R | Class Y |
|
| Expenses paid per $1,000* | | $6.77 | $10.56 | $10.56 | $9.30 | $8.03 | $5.50 |
|
| Ending value (after expenses) | | $1,018.50 | $1,014.72 | $1,014.72 | $1,015.98 | $1,017.24 | $1,019.76 |
|
* Expenses for each share class are calculated using the fund’s annualized expense ratio for each class, which represents the ongoing expenses as a percentage of average net assets for the six months ended 10/31/08. The expense ratio may differ for each share class (see the last table in this section). Expenses are calculated by multiplying the expense ratio by the average account value for the period; then multiplying the result by the number of days in the period; and then dividing that result by the number of days in the year.
Compare expenses using industry averages
You can also compare your fund’s expenses with the average of its peer group, as defined by Lipper, an independent fund-rating agency that ranks funds relative to others that Lipper considers to have similar investment styles or objectives. The expense ratio for each share class shown indicates how much of your fund’s average net assets have been used to pay ongoing expenses during the period.
| | | | | | | |
| | | Class A | Class B | Class C | Class M | Class R | Class Y |
|
| Your fund’s annualized | | | | | | | |
| expense ratio | | 1.33% | 2.08% | 2.08% | 1.83% | 1.58% | 1.08% |
|
| Average annualized expense | | | | | | | |
| ratio for Lipper peer group* | | 1.47% | 2.22% | 2.22% | 1.97% | 1.72% | 1.22% |
|
* Putnam keeps fund expenses below the Lipper peer group average expense ratio by limiting our fund expenses if they exceed the Lipper average. The Lipper average is a simple average of front-end load funds in the peer group that excludes 12b-1 fees as well as any expense offset and brokerage/service arrangements that may reduce fund expenses. To facilitate the comparison in this presentation, Putnam has adjusted the Lipper average to reflect 12b-1 fees. Investors should note that the other funds in the peer group may be significantly smaller or larger than the fund, and that an asset-weighted average would likely be lower than the simple average. Also, the fund and Lipper report expense data at different times; the fund’s expense ratio shown here is annualized data for the most recent six-month period, while the quarterly updated Lipper average is based on the most recent fiscal year-end data available for the peer group funds as of 9/30/08.
14
Your fund’s portfolio turnover
Putnam funds are actively managed by teams of experts who buy and sell securities based on intensive analysis of companies, industries, economies, and markets. Portfolio turnover is a measure of how often a fund’s managers buy and sell securities for your fund. A portfolio turnover of 100%, for example, means that the managers sold and replaced securities valued at 100% of a fund’s average portfolio value within a given period. Funds with high turnover may be more likely to generate capital gains that must be distributed to shareholders as taxable income. High turnover may also cause a fund to pay more brokerage commissions and other transaction costs, which may detract from performance.
You can use the following table to compare your fund’s turnover with the average turnover for funds in its Lipper category.
Turnover comparisons Percentage of holdings that change every year
| | | | | | |
| | | 2008 | 2007 | 2006 | 2005 | 2004 |
|
| Putnam Capital Opportunities Fund | | 37% | 59% | 60% | 71% | 135% |
|
| Lipper Small-Cap Core Funds | | | | | | |
| category average | | 91% | 82% | 83% | 86% | 86% |
|
Turnover data for the fund is calculated based on the fund’s fiscal-year period, which ends on April 30. Turnover data for the fund’s Lipper category is calculated based on the average of the turnover of each fund in the category for its fiscal year ended during the indicated year. Fiscal years vary across funds in the Lipper category, which may limit the comparability of the fund’s portfolio turnover rate to the Lipper average. Comparative data for 2008 is based on information available as of 10/31/08.
15
Your fund’s risk
This risk comparison is designed to help you understand how your fund compares with other funds. The comparison utilizes a risk measure developed by Morningstar, an independent fund-rating agency. This risk measure is referred to as the fund’s Morningstar Risk.
Your fund’s Morningstar® Risk
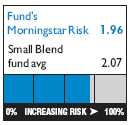
Your fund’s Morningstar Risk is shown alongside that of the average fund in its Morningstar category. The risk bar broadens the comparison by translating the fund’s Morningstar Risk into a percentile, which is based on the fund’s ranking among all funds rated by Morningstar as of September 30, 2008. A higher Morningstar Risk generally indicates that a fund’s monthly returns have varied more widely.
Morningstar determines a fund’s Morningstar Risk by assessing variations in the fund’s monthly returns — with an emphasis on downside variations — over a 3-year period, if available.Those measures are weighted and averaged to produce the fund’s Morningstar Risk.The information shown is provided for the fund’s class A shares only; information for other classes may vary. Morningstar Risk is based on historical data and does not indicate future results. Morningstar does not purport to measure the risk associated with a current investment in a fund, either on an absolute basis or on a relative basis. Low Morningstar Risk does not mean that you cannot lose money on an investment in a fund. Copyright 2008 Morningstar, Inc. All Rights Reserved.The information contained herein (1) is proprietary to Morningstar and/or its content providers; (2) may not be copied or distributed; and (3) is not warranted to be accurate, complete, or timely. Neithe r Morningstar nor its content providers are responsible for any damages or losses arising from any use of this information.
Your fund’s management
Your fund’s Portfolio Manager is Joseph Joseph.
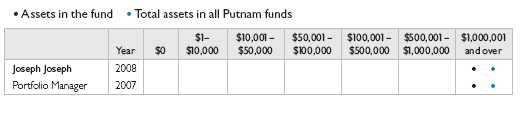
Portfolio management fund ownership
The following table shows how much the fund’s current Portfolio Manager has invested in the fund and in all Putnam mutual funds (in dollar ranges). Information shown is as of October 31, 2008, and October 31, 2007.
16
Trustee and Putnam employee fund ownership
As of October 31, 2008, 12 of the 13 Trustees of the Putnam funds owned fund shares. The table below shows the approximate value of investments in the fund and all Putnam funds as of that date by the Trustees and Putnam employees. These amounts include investments by the Trustees’ and employees’ immediate family members and investments through retirement and deferred compensation plans.
| | |
| | Assets in the fund | Total assets in all Putnam funds |
|
| Trustees | $202,000 | $33,000,000 |
|
| Putnam employees | $5,726,000 | $396,000,000 |
|
Other Putnam funds managed by the Portfolio Manager
Joseph Joseph is also a Portfolio Manager of Putnam International Capital Opportunities Fund.
Joseph Joseph may also manage other accounts and variable trust funds advised by Putnam Management or an affiliate.
Changes in your fund’s investment team
During the reporting period ended October 31, 2008, Randy Farina, John Ferry, and Franz Valencia left your fund’s management team.
17
Terms and definitions
Important terms
Total return shows how the value of the fund’s shares changed over time, assuming you held the shares through the entire period and reinvested all distributions in the fund.
Net asset value (NAV) is the price, or value, of one share of a mutual fund, without a sales charge. NAVs fluctuate with market conditions. NAV is calculated by dividing the net assets of each class of shares by the number of outstanding shares in the class.
Public offering price (POP) is the price of a mutual fund share plus the maximum sales charge levied at the time of purchase. POP performance figures shown here assume the 5.75% maximum sales charge for class A shares and 3.50% for class M shares.
Contingent deferred sales charge (CDSC) is generally a charge applied at the time of the redemption of class B or C shares and assumes redemption at the end of the period. Your fund’s class B CDSC declines from a 5% maximum during the first year to 1% during the sixth year. After the sixth year, the CDSC no longer applies. The CDSC for class C shares is 1% for one year after purchase.
Share classes
Class A shares are generally subject to an initial sales charge and no CDSC (except on certain redemptions of shares bought without an initial sales charge).
Class B shares are not subject to an initial sales charge. They may be subject to a CDSC.
Class C shares are not subject to an initial sales charge and are subject to a CDSC only if the shares are redeemed during the first year.
Class M shares have a lower initial sales charge and a higher 12b-1 fee than class A shares and no CDSC (except on certain redemptions of shares bought without an initial sales charge).
Class R shares are not subject to an initial sales charge or CDSC and are available only to certain defined contribution plans.
Class Y shares are not subject to an initial sales charge or CDSC, and carry no 12b-1 fee. They are generally only available to corporate and institutional clients and clients in other approved programs.
Comparative indexes
Barclays Capital Aggregate Bond Index is an unmanaged index of U.S. investment-grade fixed-income securities.
Merrill Lynch U.S. 3-Month Treasury Bill Index is an unmanaged index that seeks to measure the performance of U.S. Treasury bills available in the marketplace.
Russell 2500 Index is an unmanaged index of the 2,500 small and midsize companies in the Russell 3000 Index.
S&P 500 Index is an unmanaged index of common stock performance.
Indexes assume reinvestment of all distributions and do not account for fees. Securities and performance of a fund and an index will differ. You cannot invest directly in an index.
Lipper is a third-party industry-ranking entity that ranks mutual funds. Its rankings do not reflect sales charges. Lipper rankings are based on total return at net asset value relative to other funds that have similar current investment styles or objectives as determined by Lipper. Lipper may change a fund’s category assignment at its discretion. Lipper category averages reflect performance trends for funds within a category.
18
Trustee approval of management contract
General conclusions
The Board of Trustees of the Putnam funds oversees the management of each fund and, as required by law, determines annually whether to approve the continuance of your fund’s management contract with Putnam Investment Management (“Putnam Management”). In this regard, the Board of Trustees, with the assistance of its Contract Committee consisting solely of Trustees who are not “interested persons” (as such term is defined in the Investment Company Act of 1940, as amended) of the Putnam funds (the “Independent Trustees”), requests and evaluates all information it deems reasonably necessary under the circumstances. Over the course of several months ending in June 2008, the Contract Committee met several times to consider the information provided by Putnam Management and other information developed with the assistance of the Board’s independent counsel and independent staff. The Contract Committee reviewed and discussed key aspects of t his information with all of the Independent Trustees. The Contract Committee recommended, and the Independent Trustees approved, the continuance of your fund’s management contract, effective July 1, 2008.
The Independent Trustees’ approval was based on the following conclusions:
•That the fee schedule in effect for your fund represented reasonable compensation in light of the nature and quality of the services being provided to the fund, the fees paid by competitive funds and the costs incurred by Putnam Management in providing such services, and
•That this fee schedule represented an appropriate sharing between fund shareholders and Putnam Management of such economies of scale as may exist in the management of the fund at current asset levels.
These conclusions were based on a comprehensive consideration of all information provided to the Trustees, were subject to the continued application of certain expense reductions and waivers and other considerations noted below, and were not the result of any single factor. Some of the factors that figured particularly in the Trustees’ deliberations and how the Trustees considered these factors are described below, although individual Trustees may have evaluated the information presented differently, giving different weights to various factors. It is also important to recognize that the fee arrangements for your fund and the other Putnam funds are the result of many years of review and discussion between the Independent Trustees and Putnam Management, that certain aspects of such arrangements may receive greater scrutiny in some years than others, and that the Trustees’ conclusions may be based, in part, on their consideration of these same arrangements in prio r years.
Management fee schedules and categories; total expenses
The Trustees reviewed the management fee schedules in effect for all Putnam funds, including fee levels and breakpoints, and the assignment of funds to particular fee categories. In reviewing fees and expenses, the Trustees generally focused their attention on material changes in circumstances — for example, changes in a fund’s size or investment style, changes in Putnam Management’s operating costs or responsibilities, or changes in competitive practices in the mutual fund industry — that suggest that consideration of fee changes might be warranted. The Trustees concluded that the circumstances did not warrant changes to the management fee structure of your fund, which had
19
been carefully developed over the years, re-examined on many occasions and adjusted where appropriate. In this regard, the Trustees also noted that shareholders of your fund voted in 2007 to approve new management contracts containing an identical fee structure. The Trustees focused on two areas of particular interest, as discussed further below:
•Competitiveness. The Trustees reviewed comparative fee and expense information for competitive funds, which indicated that, in a custom peer group of competitive funds selected by Lipper Inc., your fund ranked in the 1st percentile in management fees and in the 14th percentile in total expenses (less any applicable 12b-1 fees) as of December 31, 2007 (the first percentile being the least expensive funds and the 100th percentile being the most expensive funds). (Because the fund’s custom peer group is smaller than the fund’s broad Lipper Inc. peer group, this expense information may differ from the Lipper peer expense information found elsewhere in this report.) The Trustees noted that expense ratios for a number of Putnam funds, which show the percentage of fund assets used to pay for management and administrative services, distribution (12b-1) fees and other expenses, had been increasin g recently as a result of declining net assets and the natural operation of fee breakpoints.
The Trustees noted that the expense ratio increases described above were currently being controlled by expense limitations initially implemented in January 2004. The Trustees have received a commitment from Putnam Management and its parent company to continue this program through at least June 30, 2009. These expense limitations give effect to a commitment by Putnam Management that the expense ratio of each open-end fund would be no higher than the average expense ratio of the competitive funds included in the fund’s relevant Lipper universe (exclusive of any applicable 12b-1 charges in each case). The Trustees observed that this commitment to limit fund expenses has served shareholders well since its inception.
In order to ensure that the expenses of the Putnam funds continue to meet evolving competitive standards, the Trustees requested, and Putnam Management agreed, to extend for the twelve months beginning July 1, 2008, an additional expense limitation for certain funds at an amount equal to the average expense ratio (exclusive of 12b-1 charges) of a custom peer group of competitive funds selected by Lipper to correspond to the size of the fund. This additional expense limitation will be applied to those open-end funds that had above-average expense ratios (exclusive of 12b-1 charges) based on the custom peer group data for the period ended December 31, 2007. This additional expense limitation will not be applied to your fund because it had a below-average expense ratio relative to its custom peer group.
In addition, the Trustees devoted particular attention to analyzing the Putnam funds’ fees and expenses relative to those of competitors in fund complexes of comparable size and with a comparable mix of asset categories. The Trustees concluded that this analysis did not reveal any matters requiring further attention at the current time.
•Economies of scale. Your fund currently has the benefit of breakpoints in its management fee that provide shareholders with significant economies of scale, which means that the effective management fee rate of the fund (as a percentage of fund assets) declines as the fund grows in size and crosses specified asset thresholds. Conversely, if the fund shrinks in size — as has been the case for many Putnam funds in recent years — these breakpoints result in increasing fee levels. In recent years, the Trustees have examined the operation of the existing breakpoint structure during periods of both growth and decline in asset
20
levels. The Trustees concluded that the fee schedule in effect for your fund represented an appropriate sharing of economies of scale at current asset levels.
In connection with their review of the management fees and total expenses of the Putnam funds, the Trustees also reviewed the costs of the services to be provided and profits to be realized by Putnam Management and its affiliates from the relationship with the funds. This information included trends in revenues, expenses and profitability of Putnam Management and its affiliates relating to the investment management and distribution services provided to the funds. In this regard, the Trustees also reviewed an analysis of Putnam Management’s revenues, expenses and profitability with respect to the funds’ management contracts, allocated on a fund-by-fund basis.
Investment performance
The quality of the investment process provided by Putnam Management represented a major factor in the Trustees’ evaluation of the quality of services provided by Putnam Management under your fund’s management contract. The Trustees were assisted in their review of the Putnam funds’ investment process and performance by the work of the Investment Oversight Coordinating Committee of the Trustees and the Investment Oversight Committees of the Trustees, which had met on a regular monthly basis with the funds’ portfolio teams throughout the year. The Trustees concluded that Putnam Management generally provides a high-quality investment process — as measured by the experience and skills of the individuals assigned to the management of fund portfolios, the resources made available to such personnel, and in general the ability of Putnam Management to attract and retain high-quality personnel — but also recognized that this does not guarantee favorab le investment results for every fund in every time period. The Trustees considered the investment performance of each fund over multiple time periods and considered information comparing each fund’s performance with various benchmarks and with the performance of competitive funds.
While the Trustees noted the satisfactory investment performance of certain Putnam funds, they considered the disappointing investment performance of many funds in recent periods, particularly over periods in 2007 and 2008. They discussed with senior management of Putnam Management the factors contributing to such underperformance and actions being taken to improve performance. The Trustees recognized that, in recent years, Putnam Management has taken steps to strengthen its investment personnel and processes to address areas of underperformance, including recent efforts to further centralize Putnam Management’s equity research function. In this regard, the Trustees took into consideration efforts by Putnam Management to improve its ability to assess and mitigate investment risk in individual funds, across asset classes, and across the complex as a whole. The Trustees indicated their intention to continue to monitor performance trends to assess the effectiveness of these efforts and to evaluate whether additional changes to address areas of underperformance are warranted.
In the case of your fund, the Trustees considered that your fund’s class A share cumulative total return performance at net asset value was in the following percentiles of its Lipper Inc. peer group (Lipper Small-Cap Core Funds) for the one-year, three-year and five-year periods ended December 31, 2007 (the first percentile being the best-performing funds and the 100th percentile being the worst-performing funds):
21
| |
| One-year period | 90th |
|
| Three-year period | 65th |
|
| Five-year period | 84th |
|
(Because of the passage of time, these performance results may differ from the performance results for more recent periods shown elsewhere in this report.) Over the one-year, three-year, and five-year periods ended December 31, 2007, there were 775, 611, and 478 funds, respectively, in your fund’s Lipper peer group.* Past performance is no guarantee of future returns.
The Trustees noted the disappointing performance for your fund for the one-year and five-year periods ended December 31, 2007. In this regard, the Trustees considered Putnam Management’s belief that the research centralization efforts underway in the equity space at Putnam Management will strengthen the fund’s investment process and enhance its performance potential.
As a general matter, the Trustees believe that cooperative efforts between the Trustees and Putnam Management represent the most effective way to address investment performance problems. The Trustees noted that investors in the Putnam funds have, in effect, placed their trust in the Putnam organization, under the oversight of the funds’ Trustees, to make appropriate decisions regarding the management of the funds. Based on the responsiveness of Putnam Management in the recent past to Trustee concerns about investment performance, the Trustees concluded that it is preferable to seek change within Putnam Management to address performance shortcomings. In the Trustees’ view, the alternative of engaging a new investment adviser for an underperforming fund would entail significant disruptions and would not provide any greater assurance of improved investment performance.
Brokerage and soft-dollar allocations; other benefits
The Trustees considered various potential benefits that Putnam Management may receive in connection with the services it provides under the management contract with your fund. These include benefits related to brokerage and soft-dollar allocations, whereby a portion of the commissions paid by a fund for brokerage may be used to acquire research services that may be useful to Putnam Management in managing the assets of the fund and of other clients. The Trustees considered changes made in 2008, at Putnam Management’s request, to the Putnam funds’ brokerage allocation policy, which expanded the permitted categories of brokerage and research services payable with soft dollars and increased the permitted soft dollar allocation to third-party services over what had been authorized in previous years. The Trustees indicated their continued intent to monitor the potential benefits associated with the allocation of fund brokerage and trends in industry practice to ensur e that the principle of seeking “best price and execution” remains paramount in the portfolio trading process.
The Trustees’ annual review of your fund’s management contract arrangements also included the review of its distributor’s contract and distribution plan with Putnam Retail Management Limited Partnership and the investor servicing agreement with Putnam Fiduciary Trust Company (“PFTC”), each of
* The percentile rankings for your fund’s class A share annualized total return performance in the Lipper Small-Cap Core Funds category for the one-year, five-year, and ten-year periods ended September 30, 2008 were 71%, 74%, and 72%, respectively. Over the one-year, five-year, and ten-year periods ended September 30, 2008, your fund ranked 560th out of 796, 362nd out of 493, and 146th out of 204 funds, respectively. Note that this more recent information was not available when theTrustees approved the continuance of your fund’s management contract.
22
which provides benefits to affiliates of Putnam Management. In the case of the investor servicing agreement, the Trustees considered that certain shareholder servicing functions were shifted to a third-party service provider by PFTC in 2007.
Comparison of retail and institutional fee schedules
The information examined by the Trustees as part of their annual contract review has included for many years information regarding fees charged by Putnam Management and its affiliates to institutional clients such as defined benefit pension plans, college endowments, etc. This information included comparisons of such fees with fees charged to the funds, as well as a detailed assessment of the differences in the services provided to these two types of clients. The Trustees observed, in this regard, that the differences in fee rates between institutional clients and mutual funds are by no means uniform when examined by individual asset sectors, suggesting that differences in the pricing of investment management services to these types of clients reflect to a substantial degree historical competitive forces operating in separate market places. The Trustees considered the fact that fee rates across different asset classes are typically higher on average for mutual funds than for institutional clients, as well as the differences between the services that Putnam Management provides to the Putnam funds and those that it provides to institutional clients of the firm, but did not rely on such comparisons to any significant extent in concluding that the management fees paid by your fund are reasonable.
23
Other information for shareholders
Important notice regarding delivery of shareholder documents
In accordance with SEC regulations, Putnam sends a single copy of annual and semiannual shareholder reports, prospectuses, and proxy statements to Putnam shareholders who share the same address, unless a shareholder requests otherwise. If you prefer to receive your own copy of these documents, please call Putnam at 1-800-225-1581, and Putnam will begin sending individual copies within 30 days.
Proxy voting
Putnam is committed to managing our mutual funds in the best interests of our shareholders. The Putnam funds’ proxy voting guidelines and procedures, as well as information regarding how your fund voted proxies relating to portfolio securities during the 12-month period ended June 30, 2008, are available in the Individual Investors section of www.putnam.com, and on the SEC’s Web site, www.sec.gov. If you have questions about finding forms on the SEC’s Web site, you may call the SEC at 1-800-SEC-0330. You may also obtain the Putnam funds’ proxy voting guidelines and procedures at no charge by calling Putnam’s Shareholder Services at 1-800-225-1581.
Fund portfolio holdings
The fund will file a complete schedule of its portfolio holdings with the SEC for the first and third quarters of each fiscal year on Form N-Q. Shareholders may obtain the fund’s Forms N-Q on the SEC’s Web site at www.sec.gov. In addition, the fund’s Forms N-Q may be reviewed and copied at the SEC’s Public Reference Room in Washington, D.C. You may call the SEC at 1-800-SEC-0330 for information about the SEC’s Web site or the operation of the Public Reference Room.
24
Financial statements
A guide to financial statements
These sections of the report, as well as the accompanying Notes, constitute the fund’s financial statements.
The fund’s portfolio lists all the fund’s investments and their values as of the last day of the reporting period. Holdings are organized by asset type and industry sector, country, or state to show areas of concentration and diversification.
Statement of assets and liabilities shows how the fund’s net assets and share price are determined. All investment and noninvestment assets are added together. Any unpaid expenses and other liabilities are subtracted from this total. The result is divided by the number of shares to determine the net asset value per share, which is calculated separately for each class of shares. (For funds with preferred shares, the amount subtracted from total assets includes the liquidation preference of preferred shares.)
Statement of operations shows the fund’s net investment gain or loss. This is done by first adding up all the fund’s earnings —from dividends and interest income — and subtracting its operating expenses to determine net investment income (or loss). Then, any net gain or loss the fund realized on the sales of its holdings — as well as any unrealized gains or losses over the period — is added to or subtracted from the net investment result to determine the fund’s net gain or loss for the fiscal period.
Statement of changes in net assets shows how the fund’s net assets were affected by the fund’s net investment gain or loss, by distributions to shareholders, and by changes in the number of the fund’s shares. It lists distributions and their sources (net investment income or realized capital gains) over the current reporting period and the most recent fiscal year-end. The distributions listed here may not match the sources listed in the Statement of operations because the distributions are determined on a tax basis and may be paid in a different period from the one in which they were earned. Dividend sources are estimated at the time of declaration. Actual results may vary. Any non-taxable return of capital cannot be determined until final tax calculations are completed after the end of the fund’s fiscal year.
Financial highlights provide an overview of the fund’s investment results, per-share distributions, expense ratios, net investment income ratios, and portfolio turnover in one summary table, reflecting the five most recent reporting periods. In a semiannual report, the highlight table also includes the current reporting period.
25
The fund’s portfolio 10/31/08 (Unaudited)
| | |
| COMMON STOCKS (96.0%)* | Shares | Value |
|
| Advertising and marketing services (0.2%) | | |
| ValueClick, Inc. † | 142,931 | $1,057,689 |
|
| Valuevision Media, Inc. Class A † | 21,700 | 14,973 |
|
| | | 1,072,662 |
| Aerospace and defense (0.9%) | | |
| Alliant Techsystems, Inc. † S | 18,700 | 1,543,498 |
|
| Cubic Corp. | 44,700 | 994,575 |
|
| Orbital Sciences Corp. † | 27,900 | 571,671 |
|
| Teledyne Technologies, Inc. † | 30,412 | 1,385,875 |
|
| | | 4,495,619 |
| Automotive (0.3%) | | |
| BorgWarner, Inc. | 54,700 | 1,229,109 |
|
| Lear Corp. † | 98,605 | 198,196 |
|
| | | 1,427,305 |
| Banking (6.5%) | | |
| BancFirst Corp. | 4,400 | 221,760 |
|
| Bank of Hawaii Corp. | 5,251 | 266,278 |
|
| Cardinal Financial Corp. | 7,000 | 43,680 |
|
| City Bank | 46,000 | 473,800 |
|
| City Holding Co. | 27,303 | 1,142,358 |
|
| City National Corp. | 50,300 | 2,692,559 |
|
| Colonial Bancgroup, Inc. | 430,800 | 1,749,048 |
|
| Commerce Bancshares, Inc. | 20,400 | 964,512 |
|
| Cullen/Frost Bankers, Inc. | 23,666 | 1,324,586 |
|
| First Citizens BancShares, Inc. Class A | 4,225 | 646,087 |
|
| Frontier Financial Corp. | 4,079 | 27,166 |
|
| Imperial Capital Bancorp, Inc. | 2,990 | 15,428 |
|
| Independent Bank Corp. | 29,800 | 857,346 |
|
| International Bancshares Corp. | 62,427 | 1,621,229 |
|
| National City Corp. | 391,100 | 1,055,970 |
|
| PacWest Bancorp | 80,250 | 2,005,448 |
|
| Seacoast Banking Corp. of Florida S | 91,100 | 808,968 |
|
| Smithtown Bancorp, Inc. S | 38,700 | 761,229 |
|
| SVB Financial Group † | 89,248 | 4,591,810 |
|
| Tompkins Financial Corp. | 2,600 | 127,400 |
|
| UCBH Holdings, Inc. | 115,300 | 608,784 |
|
| Webster Financial Corp. | 100,100 | 1,855,854 |
|
| Whitney Holding Corp. | 159,800 | 3,036,200 |
|
| Wilmington Trust Corp. | 169,124 | 4,880,919 |
|
| | | 31,778,419 |
| Beverage (—%) | | |
| Coca-Cola Bottling Company Consolidated | 5,446 | 240,604 |
|
| | | 240,604 |
| Biotechnology (2.3%) | | |
| Applied Biosystems, Inc. | 43,400 | 1,338,022 |
|
| Cubist Pharmaceuticals, Inc. † S | 74,200 | 1,883,938 |
|
| eResearch Technology, Inc. † | 113,338 | 732,163 |
|
| Invitrogen Corp. † | 212,100 | 6,106,359 |
|
| Quidel Corp. † S | 90,000 | 1,422,900 |
|
| | | 11,483,382 |
26
| | |
| COMMON STOCKS (96.0%)* cont. | Shares | Value |
|
| Broadcasting (0.1%) | | |
| Sinclair Broadcast Group, Inc. Class A | 106,974 | $345,526 |
|
| | | 345,526 |
| Building materials (0.9%) | | |
| AAON, Inc. | 20,500 | 338,045 |
|
| Apogee Enterprises, Inc. | 77,000 | 759,220 |
|
| Lennox International, Inc. | 116,500 | 3,474,030 |
|
| | | 4,571,295 |
| Chemicals (4.1%) | | |
| Ashland, Inc. | 43,800 | 989,442 |
|
| Balchem Corp. | 30,400 | 777,024 |
|
| CF Industries Holdings, Inc. | 22,400 | 1,437,856 |
|
| Compass Minerals International, Inc. | 26,800 | 1,472,124 |
|
| Cytec Industries, Inc. | 37,400 | 1,059,168 |
|
| Eastman Chemical Co. | 39,900 | 1,611,561 |
|
| FMC Corp. | 64,437 | 2,805,587 |
|
| International Flavors & Fragrances, Inc. | 70,300 | 2,241,164 |
|
| Lubrizol Corp. (The) S | 56,200 | 2,111,996 |
|
| Olin Corp. | 111,532 | 2,025,421 |
|
| OM Group, Inc. † S | 46,200 | 985,908 |
|
| Spartech Corp. | 77,320 | 491,755 |
|
| Valspar Corp. | 106,840 | 2,184,878 |
|
| | | 20,193,884 |
| Coal (0.3%) | | |
| Foundation Coal Holdings, Inc. | 81,400 | 1,689,864 |
|
| | | 1,689,864 |
| Commercial and consumer services (3.1%) | | |
| Alliance Data Systems Corp. † | 49,493 | 2,482,569 |
|
| Bowne & Co., Inc. | 76,600 | 596,714 |
|
| Brink’s Co. (The) | 46,700 | 2,264,483 |
|
| Chemed Corp. | 45,107 | 1,975,236 |
|
| CPI Corp. | 17,334 | 126,538 |
|
| Deluxe Corp. | 68,400 | 831,744 |
|
| Dun & Bradstreet Corp. (The) | 24,600 | 1,812,774 |
|
| DynCorp International, Inc. Class A † | 38,656 | 511,032 |
|
| EZCORP, Inc. Class A † | 220,286 | 3,489,330 |
|
| Global Cash Access, Inc. † | 242,600 | 684,132 |
|
| Pre-Paid Legal Services, Inc. † S | 6,825 | 269,451 |
|
| | | 15,044,003 |
| Communications equipment (1.2%) | | |
| F5 Networks, Inc. † | 136,128 | 3,378,697 |
|
| Foundry Networks, Inc. † | 167,900 | 2,493,315 |
|
| | | 5,872,012 |
| Computers (4.8%) | | |
| ANSYS, Inc. † | 98,433 | 2,818,137 |
|
| Blackbaud, Inc. S | 155,437 | 2,362,642 |
|
| Brocade Communications Systems, Inc. † | 790,392 | 2,979,778 |
|
| Cogent, Inc. † | 81,600 | 745,824 |
|
| Emulex Corp. † | 263,017 | 2,498,662 |
|
| Jack Henry & Associates, Inc. | 131,000 | 2,490,310 |
|
| Logitech International SA (Switzerland) † | 99,900 | 1,477,521 |
|
| Logitech International SA (Switzerland) † | 18,814 | 284,235 |
|
27
| | |
| COMMON STOCKS (96.0%)* cont. | Shares | Value |
|
| Computers cont. | | |
| Micros Systems, Inc. † | 96,837 | $1,649,134 |
|
| MTS Systems Corp. | 47,100 | 1,529,808 |
|
| Polycom, Inc. † | 128,325 | 2,696,108 |
|
| Progress Software Corp. † | 53,557 | 1,228,598 |
|
| SPSS, Inc. † | 28,444 | 664,452 |
|
| | | 23,425,209 |
| Conglomerates (0.6%) | | |
| AMETEK, Inc. | 84,600 | 2,812,950 |
|
| | | 2,812,950 |
| Construction (0.9%) | | |
| Chicago Bridge & Iron Co., NV (Netherlands) | 110,718 | 1,371,796 |
|
| Drew Industries, Inc. † S | 10,700 | 129,470 |
|
| Perini Corp. † S | 144,400 | 2,746,488 |
|
| | | 4,247,754 |
| Consumer (1.4%) | | |
| CSS Industries, Inc. | 44,318 | 983,860 |
|
| Helen of Troy, Ltd. (Bermuda) † | 139,000 | 2,500,610 |
|
| Hooker Furniture Corp. | 37,900 | 345,269 |
|
| Scotts Miracle-Gro Co. (The) Class A | 111,275 | 2,906,503 |
|
| | | 6,736,242 |
| Consumer finance (0.2%) | | |
| Portfolio Recovery Associates, Inc. † | 10,599 | 380,292 |
|
| World Acceptance Corp. † | 30,089 | 556,045 |
|
| | | 936,337 |
| Consumer goods (0.8%) | | |
| Blyth Industries, Inc. | 82,800 | 712,080 |
|
| Church & Dwight Co., Inc. | 57,300 | 3,385,857 |
|
| | | 4,097,937 |
| Consumer services (0.9%) | | |
| TrueBlue, Inc. † S | 548,620 | 4,570,005 |
|
| | | 4,570,005 |
| Electric utilities (1.4%) | | |
| Alliant Energy Corp. | 48,500 | 1,424,930 |
|
| Avista Corp. | 86,100 | 1,709,946 |
|
| Northwestern Corp. | 73,900 | 1,444,006 |
|
| UniSource Energy Corp. | 92,200 | 2,542,876 |
|
| | | 7,121,758 |
| Electrical equipment (0.5%) | | |
| Hubbell, Inc. Class B | 75,000 | 2,690,250 |
|
| | | 2,690,250 |
| Electronics (1.7%) | | |
| Intersil Corp. Class A | 151,700 | 2,076,773 |
|
| QLogic Corp. † | 194,369 | 2,336,315 |
|
| Semtech Corp. † | 137,300 | 1,664,076 |
|
| Synopsys, Inc. † | 113,163 | 2,068,620 |
|
| | | 8,145,784 |
| Energy (oil field) (1.3%) | | |
| Basic Energy Services, Inc. † S | 103,700 | 1,418,616 |
|
| Core Laboratories NV (Netherlands) | 14,780 | 1,089,286 |
|
| Dresser-Rand Group, Inc. † | 88,200 | 1,975,680 |
|
| ION Geophysical Corp. † | 143,900 | 943,984 |
|
| Key Energy Services, Inc. † | 174,600 | 1,082,520 |
|
| | | 6,510,086 |
28
| | |
| COMMON STOCKS (96.0%)* cont. | Shares | Value |
|
| Financial (0.2%) | | |
| Advanta Corp. Class B | 13,932 | $62,973 |
|
| Financial Federal Corp. | 14,100 | 326,415 |
|
| MGIC Investment Corp. | 133,200 | 516,816 |
|
| | | 906,204 |
| Forest products and packaging (1.0%) | | |
| Packaging Corp. of America | 63,350 | 1,066,181 |
|
| Sealed Air Corp. | 125,851 | 2,129,399 |
|
| Sonoco Products Co. | 67,680 | 1,704,182 |
|
| | | 4,899,762 |
| Health-care services (3.3%) | | |
| AMERIGROUP Corp. † | 115,100 | 2,877,500 |
|
| IMS Health, Inc. | 85,300 | 1,223,202 |
|
| Lincare Holdings, Inc. † S | 223,000 | 5,876,050 |
|
| Medcath Corp. † | 47,612 | 734,177 |
|
| Molina Healthcare, Inc. † S | 85,300 | 1,899,631 |
|
| RehabCare Group, Inc. † | 4,043 | 69,257 |
|
| Warner Chilcott, Ltd. Class A (Bermuda) † | 261,900 | 3,632,553 |
|
| | | 16,312,370 |
| Homebuilding (0.5%) | | |
| NVR, Inc. † S | 5,300 | 2,598,113 |
|
| | | 2,598,113 |
| Household furniture and appliances (0.1%) | | |
| American Woodmark Corp. S | 28,100 | 520,974 |
|
| Select Comfort Corp. † | 395,400 | 189,792 |
|
| | | 710,766 |
| Insurance (7.3%) | | |
| American Financial Group, Inc. | 70,910 | 1,611,784 |
|
| American Physicians Capital, Inc. | 21,400 | 875,474 |
|
| Amerisafe, Inc. † | 40,300 | 694,772 |
|
| Aspen Insurance Holdings, Ltd. (Bermuda) | 52,405 | 1,203,219 |
|
| CNA Surety Corp. † | 83,017 | 1,149,785 |
|
| Delphi Financial Group Class A | 85,850 | 1,352,138 |
|
| Employers Holdings, Inc. | 2,232 | 28,480 |
|
| Endurance Specialty Holdings, Ltd. (Bermuda) | 67,869 | 2,052,359 |
|
| Fidelity National Title Group, Inc. Class A | 19,700 | 177,497 |
|
| First Mercury Financial Corp. † | 14,875 | 160,501 |
|
| Hanover Insurance Group, Inc. (The) | 52,010 | 2,041,393 |
|
| Harleysville Group, Inc. | 20,022 | 632,295 |
|
| HCC Insurance Holdings, Inc. | 102,726 | 2,266,136 |
|
| IPC Holdings, Ltd. (Bermuda) | 55,950 | 1,544,780 |
|
| Mercury General Corp. | 1,697 | 87,175 |
|
| National Interstate Corp. | 18,239 | 319,183 |
|
| Odyssey Re Holdings Corp. | 25,400 | 1,001,776 |
|
| Phoenix Companies, Inc. (The) | 32,900 | 212,863 |
|
| Platinum Underwriters Holdings, Ltd. (Bermuda) | 2,740 | 86,968 |
|
| RenaissanceRe Holdings, Ltd. (Bermuda) | 65,786 | 3,019,577 |
|
| Safety Insurance Group, Inc. | 71,144 | 2,702,761 |
|
| SeaBright Insurance Holdings, Inc. † | 84,000 | 878,640 |
|
| Selective Insurance Group | 138,072 | 3,279,210 |
|
29
| | |
| COMMON STOCKS (96.0%)* cont. | Shares | Value |
|
| Insurance cont. | | |
| Stancorp Financial Group | 61,574 | $2,098,442 |
|
| State Auto Financial Corp. | 4,925 | 129,725 |
|
| W.R. Berkley Corp. | 151,674 | 3,984,476 |
|
| Willis Group Holdings, Ltd. (United Kingdom) | 1,925 | 50,512 |
|
| Zenith National Insurance Corp. | 64,303 | 2,112,997 |
|
| | | 35,754,918 |
| Investment banking/Brokerage (2.2%) | | |
| Affiliated Managers Group † | 29,420 | 1,364,500 |
|
| Eaton Vance Corp. | 188,446 | 4,145,812 |
|
| FBR Capital Markets Corp. † | 95,793 | 527,819 |
|
| Federated Investors, Inc. Class B | 68,063 | 1,647,125 |
|
| Interactive Brokers Group, Inc. Class A † | 20,700 | 442,359 |
|
| Investment Technology Group, Inc. † | 6,033 | 123,134 |
|
| Janus Capital Group, Inc. | 6,800 | 79,832 |
|
| Jefferies Group, Inc. | 64,610 | 1,022,776 |
|
| Raymond James Financial, Inc. | 3,673 | 85,544 |
|
| Waddell & Reed Financial, Inc. Class A | 87,723 | 1,273,738 |
|
| | | 10,712,639 |
| Machinery (1.7%) | | |
| AGCO Corp. † S | 37,300 | 1,175,696 |
|
| Applied Industrial Technologies, Inc. S | 146,643 | 2,960,722 |
|
| Gardner Denver, Inc. † | 36,600 | 937,692 |
|
| Manitowoc Co., Inc. (The) S | 225,900 | 2,222,856 |
|
| Regal-Beloit Corp. | 40,300 | 1,312,168 |
|
| | | 8,609,134 |
| Manufacturing (0.8%) | | |
| EnPro Industries, Inc. † S | 71,200 | 1,581,352 |
|
| Robbins & Myers, Inc. | 32,513 | 663,265 |
|
| Roper Industries, Inc. | 32,000 | 1,451,200 |
|
| | | 3,695,817 |
| Media (0.1%) | | |
| R. H. Donnelley Corp. † S | 622,500 | 529,125 |
|
| | | 529,125 |
| Medical technology (1.2%) | | |
| Conmed Corp. † | 40,700 | 1,066,340 |
|
| Edwards Lifesciences Corp. † | 41,494 | 2,192,543 |
|
| Invacare Corp. | 54,000 | 982,260 |
|
| Mentor Corp. S | 90,939 | 1,536,869 |
|
| | | 5,778,012 |
| Metals (0.9%) | | |
| Carpenter Technology Corp. | 53,900 | 975,590 |
|
| Century Aluminum Co. † | 81,700 | 1,026,969 |
|
| North American Galvanizing & Coatings, Inc. † | 180,391 | 662,035 |
|
| Reliance Steel & Aluminum Co. | 62,150 | 1,556,236 |
|
| | | 4,220,830 |
| Natural gas utilities (2.7%) | | |
| AGL Resources, Inc. | 51,000 | 1,550,400 |
|
| Atmos Energy Corp. | 71,000 | 1,723,170 |
|
| Energen Corp. | 46,800 | 1,571,076 |
|
| National Fuel Gas Co. | 41,500 | 1,501,885 |
|
| Southwest Gas Corp. | 62,500 | 1,632,500 |
|
30
| | |
| COMMON STOCKS (96.0%)* cont. | Shares | Value |
|
| Natural gas utilities cont. | | |
| UGI Corp. | 71,200 | $1,699,544 |
|
| WGL Holdings, Inc. | 118,300 | 3,808,077 |
|
| | | 13,486,652 |
| Office equipment and supplies (0.4%) | | |
| Ennis Inc. | 64,700 | 761,519 |
|
| Steelcase, Inc. | 121,857 | 1,133,270 |
|
| | | 1,894,789 |
| Oil and gas (4.7%) | | |
| Berry Petroleum Co. Class A | 74,552 | 1,737,062 |
|
| Cabot Oil & Gas Corp. Class A | 80,200 | 2,251,214 |
|
| Comstock Resources, Inc. † | 59,687 | 2,949,732 |
|
| Encore Acquisition Co. † | 66,700 | 2,077,705 |
|
| Endeavour International Corp. † | 167,948 | 125,961 |
|
| Forest Oil Corp. † | 61,900 | 1,808,099 |
|
| Frontier Oil Corp. | 75,700 | 999,997 |
|
| Helmerich & Payne, Inc. | 61,100 | 2,096,341 |
|
| Petroleum Development Corp. † | 47,740 | 988,695 |
|
| Swift Energy Co. † | 60,700 | 1,947,256 |
|
| Tesoro Corp. | 103,426 | 1,000,129 |
|
| Unit Corp. † | 63,784 | 2,394,451 |
|
| Vaalco Energy, Inc. † | 86,800 | 460,040 |
|
| Whiting Petroleum Corp. † | 47,405 | 2,464,586 |
|
| | | 23,301,268 |
| Pharmaceuticals (4.5%) | | |
| Biovail Corp. (Canada) | 271,200 | 2,332,320 |
|
| Cephalon, Inc. † | 29,800 | 2,137,256 |
|
| Emergent Biosolutions, Inc. † | 60,275 | 1,085,553 |
|
| Endo Pharmaceuticals Holdings, Inc. † | 93,100 | 1,722,350 |
|
| King Pharmaceuticals, Inc. † | 590,846 | 5,193,536 |
|
| Medicis Pharmaceutical Corp. Class A | 167,500 | 2,390,225 |
|
| Nektar Therapeutics † | 48,704 | 269,333 |
|
| Par Pharmaceutical Cos., Inc. † | 23,400 | 234,000 |
|
| PharmaNet Development Group, Inc. † | 8,600 | 13,760 |
|
| Watson Pharmaceuticals, Inc. † | 254,222 | 6,652,990 |
|
| | | 22,031,323 |
| Publishing (0.1%) | | |
| Lee Enterprises, Inc. S | 268,900 | 672,250 |
|
| | | 672,250 |
| Railroads (0.6%) | | |
| GATX Corp. | 104,995 | 2,997,607 |
|
| | | 2,997,607 |
| Real estate (5.5%) | | |
| Alexandria Real Estate Equities, Inc. R | 1,000 | 69,520 |
|
| Annaly Capital Management, Inc. R | 5,000 | 69,500 |
|
| Anworth Mortgage Asset Corp. R | 11,900 | 69,734 |
|
| Ashford Hospitality Trust, Inc. R | 284,300 | 460,566 |
|
| CB Richard Ellis Group, Inc. Class A † | 15,421 | 108,101 |
|
| CBL & Associates Properties R | 9,030 | 83,347 |
|
| Colonial Properties Trust R | 8,785 | 92,594 |
|
| DiamondRock Hospitality Co. R | 299,222 | 1,549,970 |
|
| Douglas Emmett, Inc. R | 6,532 | 98,633 |
|
31
| | |
| COMMON STOCKS (96.0%)* cont. | Shares | Value |
|
| Real estate cont. | | |
| Entertainment Properties Trust R | 18,729 | $701,401 |
|
| Essex Property Trust, Inc. R | 1,810 | 176,113 |
|
| FelCor Lodging Trust, Inc. R | 94,987 | 285,911 |
|
| First Industrial Realty Trust R | 4,490 | 46,427 |
|
| Hospitality Properties Trust R | 176,241 | 1,788,846 |
|
| Inland Real Estate Corp. R | 14,950 | 171,327 |
|
| Jones Lang LaSalle, Inc. | 5,940 | 195,545 |
|
| Kimco Realty Corp. R | 72,700 | 1,641,566 |
|
| Kite Realty Group Trust R | 30,855 | 187,598 |
|
| LaSalle Hotel Properties R | 62,707 | 882,915 |
|
| Lexington Corporate Properties Trust R | 29,097 | 233,649 |
|
| LTC Properties, Inc. R | 68,848 | 1,664,056 |
|
| Macerich Co. (The) R | 20,345 | 598,550 |
|
| Mack-Cali Realty Corp. R | 2,000 | 45,440 |
|
| MFA Mortgage Investments, Inc. R | 70,500 | 387,750 |
|
| Mid-America Apartment Communities, Inc. R | 7,880 | 277,691 |
|
| National Health Investors, Inc. R | 142,680 | 4,271,839 |
|
| National Retail Properties, Inc. R | 200,344 | 3,572,134 |
|
| Nationwide Health Properties, Inc. R | 80,702 | 2,408,148 |
|
| Omega Healthcare Investors, Inc. R | 171,687 | 2,587,323 |
|
| Pennsylvania Real Estate Investment Trust R | 11,705 | 148,068 |
|
| Ramco-Gershenson Properties R | 6,258 | 82,480 |
|
| Saul Centers, Inc. R | 1,383 | 50,604 |
|
| SL Green Realty Corp. R | 4,482 | 188,423 |
|
| Tanger Factory Outlet Centers R | 11,833 | 428,000 |
|
| Taubman Centers, Inc. R | 29,529 | 980,953 |
|
| Ventas, Inc. R | 10,579 | 381,479 |
|
| | | 26,986,201 |
| Retail (9.2%) | | |
| Abercrombie & Fitch Co. Class A | 64,100 | 1,856,336 |
|
| Aeropostale, Inc. † # S | 269,000 | 6,512,490 |
|
| AnnTaylor Stores Corp. † | 322,800 | 4,057,596 |
|
| Books-A-Million, Inc. | 186,186 | 586,486 |
|
| Brown Shoe Co., Inc. S | 66,566 | 701,606 |
|
| Buckle, Inc. (The) | 39,600 | 1,043,064 |
|
| Cash America International, Inc. | 19,962 | 706,056 |
|
| Cato Corp. (The) Class A | 33,061 | 513,107 |
|
| Dollar Tree, Inc. † | 175,577 | 6,675,433 |
|
| Jos. A. Bank Clothiers, Inc. † S | 25,100 | 639,297 |
|
| Nash Finch Co. | 44,240 | 1,744,383 |
|
| NBTY, Inc. † | 147,000 | 3,435,390 |
|
| Perry Ellis International, Inc. † | 45,373 | 444,202 |
|
| Systemax, Inc. S | 163,026 | 2,308,448 |
|
| Timberland Co. (The) Class A † | 128,800 | 1,558,480 |
|
| Toro Co. (The) S | 152,862 | 5,142,278 |
|
| Weyco Group, Inc. | 3,999 | 111,172 |
|
| Wolverine World Wide, Inc. | 299,600 | 7,040,600 |
|
| | | 45,076,424 |
32
| | |
| COMMON STOCKS (96.0%)* cont. | Shares | Value |
|
| Schools (1.1%) | | |
| Career Education Corp. † | 341,993 | $5,406,909 |
|
| | | 5,406,909 |
| Semiconductor (0.5%) | | |
| Hittite Microwave Corp. † | 37,800 | 1,238,706 |
|
| Novellus Systems, Inc. † | 90,042 | 1,422,664 |
|
| | | 2,661,370 |
| Shipping (0.7%) | | |
| Accuride Corp. † | 94,587 | 30,268 |
|
| Arkansas Best Corp. | 58,028 | 1,693,837 |
|
| General Maritime Corp. | 62,980 | 954,147 |
|
| Overseas Shipholding Group | 23,860 | 896,659 |
|
| | | 3,574,911 |
| Software (3.1%) | | |
| Akamai Technologies, Inc. † S | 177,241 | 2,548,726 |
|
| Citrix Systems, Inc. † | 95,857 | 2,470,235 |
|
| McAfee, Inc. † | 83,246 | 2,709,657 |
|
| MicroStrategy, Inc. † | 34,667 | 1,364,840 |
|
| Red Hat, Inc. † S | 163,027 | 2,169,889 |
|
| TIBCO Software, Inc. † | 366,800 | 1,889,020 |
|
| Websense, Inc. † | 107,214 | 2,092,817 |
|
| | | 15,245,184 |
| Staffing (0.2%) | | |
| Administaff, Inc. | 41,100 | 821,589 |
|
| CDI Corp. | 8,336 | 108,368 |
|
| Korn/Ferry International † | 19,820 | 275,300 |
|
| | | 1,205,257 |
| Technology (0.4%) | | |
| CACI International, Inc. Class A † | 43,940 | 1,809,449 |
|
| | | 1,809,449 |
| Technology services (2.7%) | | |
| Acxiom Corp. | 119,600 | 940,056 |
|
| COMSYS IT Partners, Inc. † | 127,818 | 777,133 |
|
| CSG Systems International, Inc. † | 47,900 | 796,577 |
|
| Factset Research Systems, Inc. S | 72,245 | 2,802,384 |
|
| Fair Isaac Corp. | 69,779 | 1,087,855 |
|
| Global Payments, Inc. | 83,869 | 3,397,533 |
|
| Global Sources, Ltd. (Bermuda) † | 21,910 | 173,089 |
|
| IHS, Inc. Class A † | 47,600 | 1,684,564 |
|
| LoopNet, Inc. † | 92,400 | 699,468 |
|
| NIC, Inc. | 146,000 | 784,020 |
|
| | | 13,142,679 |
| Telecommunications (2.4%) | | |
| ADTRAN, Inc. | 104,010 | 1,580,952 |
|
| CenturyTel, Inc. | 196,200 | 4,926,582 |
|
| NeuStar, Inc. Class A † | 130,780 | 2,576,366 |
|
| Syniverse Holdings, Inc. † | 152,011 | 2,857,807 |
|
| | | 11,941,707 |
| Textiles (0.2%) | | |
| Maidenform Brands, Inc. † | 69,500 | 763,110 |
|
| | | 763,110 |
| Tobacco (0.3%) | | |
| Universal Corp. S | 34,953 | 1,383,789 |
|
| | | 1,383,789 |
33
| | |
| COMMON STOCKS (96.0%)* cont. | Shares | Value |
|
| Toys (1.4%) | | |
| Hasbro, Inc. | 216,100 | $6,282,027 |
|
| Jakks Pacific, Inc. † | 36,136 | 808,362 |
|
| | | 7,090,389 |
| Transportation services (0.5%) | | |
| HUB Group, Inc. Class A † | 39,034 | 1,227,619 |
|
| Pacer International, Inc. | 94,420 | 1,066,002 |
|
| | | 2,293,621 |
| Trucks and parts (1.1%) | | |
| ATC Technology Corp. † | 10,700 | 234,651 |
|
| Autoliv, Inc. (Sweden) | 228,754 | 4,886,185 |
|
| Superior Industries International, Inc. | 36,942 | 528,271 |
|
| | | 5,649,107 |
| Waste Management (—%) | | |
| Rentech, Inc. † S | 43,506 | 32,194 |
|
| | | 32,194 |
| | | |
| Total common stocks (cost $609,445,584) | | $472,882,767 |
| |
| |
| SHORT-TERM INVESTMENTS (15.7%)* | Principal amount/shares | Value |
|
| U.S. Treasury Bills for an effective yield of 0.61%, | | |
| December 4, 2008 # | $1,807,000 | $1,806,530 |
|
| Short-term investments held as collateral for loaned | | |
| securities with yields ranging from 0.13% to 2.68% | | |
| and due dates ranging from November 3, 2008 | | |
| to November 10, 2008 d | 32,296,386 | 32,288,833 |
|
| Federated Prime Obligations Fund | 43,126,321 | 43,126,321 |
|
| Total short-term investments (cost $77,221,684) | | $77,221,684 |
| |
| |
| TOTAL INVESTMENTS | | |
|
| Total investments (cost $686,667,268) | | $550,104,451 |
* Percentages indicated are based on net assets of $492,597,623.
† Non-income-producing security.
# A portion of these securities were pledged and segregated with the custodian to cover margin requirements for futures contracts at October 31, 2008.
d See Note 1 to the financial statements.
R Real Estate Investment Trust.
S Securities on loan, in part or in entirety, at October 31, 2008.
At October 31, 2008, liquid assets totaling $11,229,310 have been designated as collateral for open futures contracts.
In September 2006, the FASB issued Statement of Financial Accounting Standards No. 157, Fair Value Measurements (SFAS 157). SFAS 157 is effective for financial statements issued for fiscal years beginning after November 15, 2007 and interim periods within those fiscal years. While the adoption of SFAS 157 does not have a material effect on the fund’s net asset value, it does require additional disclosures about fair value measurements. The Standard establishes a three-level hierarchy for disclosure of fair value measurements. The valuation hierarchy is based upon the transparency of inputs to the valuation of the fund’s investments. The three levels are defined as follows:
Level 1 — Valuations based on quoted prices for identical securities in active markets.
Level 2 — Valuations based on quoted prices in markets that are not active or for which all significant inputs are observable, either directly or indirectly.
Level 3 — Valuations based on inputs that are unobservable and significant to the fair value measurement.
34
The following is a summary of the inputs used to value the fund’s net assets as of October 31, 2008:
| | |
| Valuation inputs | Investments in securities | Other financial instruments |
|
| Level 1 | $515,724,853 | $1,325,950 |
|
| Level 2 | 34,379,598 | — |
|
| Level 3 | — | — |
|
| Total | $550,104,451 | $1,325,950 |
Other financial instruments include futures, written options, TBA sale commitments, swaps and forward contracts which are valued at the unrealized appreciation/(depreciation) on the instrument.
| | | | | |
| FUTURES CONTRACTS OUTSTANDING at 10/31/08 (Unaudited) | | | |
| |
| Number of | | | Expiration | Unrealized |
| | contracts | Value | | date | appreciation |
|
| Russell 2000 Index Mini (Long) | 106 | $5,686,900 | | Dec-08 | $683,742 |
|
| S&P 500 Index (Long) | 2 | 483,650 | | Dec-08 | 44,393 |
|
| S&P Mid Cap 400 Index E-Mini (Long) | 89 | 5,058,760 | | Dec-08 | 597,815 |
|
| Total | | | | | $1,325,950 |
The accompanying notes are an integral part of these financial statements.
35
Statement of assets and liabilities 10/31/08 (Unaudited)
| |
| ASSETS | |
|
| Investment in securities, at value, including $30,895,887 of securities on loan (Note 1): | |
| Unaffiliated issuers (identified cost $686,667,268) | $550,104,451 |
|
| Dividends, interest and other receivables | 957,225 |
|
| Receivable for shares of the fund sold | 2,564,950 |
|
| Receivable for securities sold | 12,989,604 |
|
| Receivable for variation margin (Note 1) | 2,256,031 |
|
| Total assets | 568,872,261 |
| |
| |
| LIABILITIES | |
|
| Payable to custodian (Note 2) | 1,964,590 |
|
| Payable for securities purchased | 35,619,886 |
|
| Payable for shares of the fund repurchased | 4,828,234 |
|
| Payable for compensation of Manager (Notes 2 and 5) | 1,003,544 |
|
| Payable for investor servicing fees (Note 2) | 226,712 |
|
| Payable for custodian fees (Note 2) | 11,828 |
|
| Payable for Trustee compensation and expenses (Note 2) | 103,333 |
|
| Payable for administrative services (Note 2) | 3,848 |
|
| Payable for distribution fees (Note 2) | 97,526 |
|
| Collateral on securities loaned, at value (Note 1) | 32,288,833 |
|
| Other accrued expenses | 126,304 |
|
| Total liabilities | 76,274,638 |
| |
| Net assets | $492,597,623 |
|
| |
| REPRESENTED BY | |
|
| Paid-in capital (Unlimited shares authorized) (Notes 1 and 4) | $720,153,583 |
|
| Undistributed net investment income (Note 1) | 4,571,239 |
|
| Accumulated net realized loss on investments (Note 1) | (96,890,332) |
|
| Net unrealized depreciation of investments | (135,236,867) |
|
| Total — Representing net assets applicable to capital shares outstanding | $492,597,623 |
|
| |
| COMPUTATION OF NET ASSET VALUE AND OFFERING PRICE | |
|
| Net asset value and redemption price per class A share ($206,432,204 divided by 31,346,058 shares) | $6.59 |
|
| Offering price per class A share (100/94.25 of $6.59)* | $6.99 |
|
| Net asset value and offering price per class B share ($45,587,712 divided by 7,602,480 shares)** | $6.00 |
|
| Net asset value and offering price per class C share ($11,037,265 divided by 1,819,331 shares)** | $6.07 |
|
| Net asset value and redemption price per class M share ($4,547,646 divided by 734,003 shares) | $6.20 |
|
| Offering price per class M share (100/96.50 of $6.20)* | $6.42 |
|
| Net asset value, offering price and redemption price per class R share | |
| ($1,832,550 divided by 282,582 shares) | $6.49 |
|
| Net asset value, offering price and redemption price per class Y share | |
| ($223,160,246 divided by 33,203,004 shares) | $6.72 |
|
* On single retail sales of less than $50,000. On sales of $50,000 or more the offering price is reduced.
** Redemption price per share is equal to net asset value less any applicable contingent deferred sales charge.
The accompanying notes are an integral part of these financial statements.
36
Statement of operations Six months ended 10/31/08 (Unaudited)
| |
| INVESTMENT INCOME | |
|
| Dividends (net of foreign tax of $16,508) | $6,556,545 |
|
| Interest (including interest income of $143,862 from investments in affiliated issuers) (Note 5) | 207,311 |
|
| Securities lending | 628,947 |
|
| Total investment income | 7,392,803 |
| |
| |
| EXPENSES | |
|
| Compensation of Manager (Note 2) | 2,192,759 |
|
| Investor servicing fees (Note 2) | 1,469,713 |
|
| Custodian fees (Note 2) | 9,943 |
|
| Trustee compensation and expenses (Note 2) | 22,222 |
|
| Administrative services (Note 2) | 11,901 |
|
| Distribution fees — Class A (Note 2) | 375,793 |
|
| Distribution fees — Class B (Note 2) | 344,688 |
|
| Distribution fees — Class C (Note 2) | 80,044 |
|
| Distribution fees — Class M (Note 2) | 25,565 |
|
| Distribution fees — Class R (Note 2) | 6,021 |
|
| Other | 115,508 |
|
| Fees waived and reimbursed by Manager (Note 5) | (5,272) |
|
| Total expenses | 4,648,885 |
| | |
| Expense reduction (Note 2) | (52,387) |
|
| Net expenses | 4,596,498 |
| |
| Net investment income | 2,796,305 |
|
| |
| Net realized loss on investments (Notes 1 and 3) | (89,817,728) |
|
| Net realized loss on futures contracts (Note 1) | (4,913,887) |
|
| Net unrealized depreciation of investments and futures contracts during the period | (114,686,704) |
|
| Net loss on investments | (209,418,319) |
| |
| Net decrease in net assets resulting from operations | $(206,622,014) |
|
The accompanying notes are an integral part of these financial statements.
37
Statement of changes in net assets
| | |
| DECREASE IN NET ASSETS | Six months ended 10/31/08* | Year ended 4/30/08 |
|
| Operations: | | |
| Net investment income | $2,796,305 | $6,770,097 |
|
| Net realized loss on investments | (94,731,615) | (1,212,784) |
|
| Net unrealized depreciation of investments | (114,686,704) | (210,155,608) |
|
| Net decrease in net assets resulting from operations | (206,622,014) | (204,598,295) |
|
| Distributions to shareholders (Note 1): | | |
| From ordinary income | | |
| Net investment income | | |
|
| Class A | — | (1,966,613) |
|
| Class R | — | (7,314) |
|
| Class Y | — | (2,741,840) |
|
| Net realized short-term gain on investments | | |
|
| Class A | — | (6,362,572) |
|
| Class B | — | (1,886,606) |
|
| Class C | — | (411,146) |
|
| Class M | — | (172,248) |
|
| Class R | — | (38,929) |
|
| Class Y | — | (5,450,645) |
|
| From net realized long-term gain on investments | | |
| Class A | — | (29,923,370) |
|
| Class B | — | (8,872,768) |
|
| Class C | — | (1,933,631) |
|
| Class M | — | (810,087) |
|
| Class R | — | (183,084) |
|
| Class Y | — | (25,634,549) |
|
| Redemption fees (Note 1) | 19,664 | 25,001 |
|
| Decrease from capital share transactions (Note 4) | (91,345,289) | (80,434,168) |
|
| Total decrease in net assets | (297,947,639) | (371,402,864) |
|
| |
| NET ASSETS | | |
|
| Beginning of period | 790,545,262 | 1,161,948,126 |
|
| End of period (including undistributed net investment | | |
| income of $4,571,239 and $1,774,934, respectively) | $492,597,623 | $790,545,262 |
|
* Unaudited
The accompanying notes are an integral part of these financial statements.
38
|
| This page left blank intentionally. |
39
Financial highlights (For a common share outstanding throughout the period)
| | | | | | | | | | | | | | | | | | | | | | | | | | | | |
| INVESTMENT OPERATIONS: | | | | | | | | LESS DISTRIBUTIONS: | | | | | | | | | | RATIOS AND SUPPLEMENTAL DATA: | | |
|
| | | | | | | | | | | | | | | | | | | | | | | | | | | Ratio of net | | |
| | | | | | | Net realized | | | | | | | | | | | | | | | | | | Ratio | | investment | | |
| | | Net asset value, | | | | and unrealized | | Total from | | From net | | From net | | | | | | | | Total return | | Net assets, | | of expenses | | income (loss) | | |
| | | beginning | | Net investment | | gain (loss) on | | investment | | investment | | realized gain on | | Total | | Redemption | | Net asset value, | | at net asset | | end of period | | to average | | to average | | Portfolio |
| Period ended | | of period | | income (loss) a | | investments | | operations | | income | | investments | | distributions | | fees | | end of period | | value (%) b | | (in thousands) | | net assets (%) c | | net assets (%) | | turnover (%) |
|
| Class A | | | | | | | | | | | | | | | | | | | | | | | | | | | | |
| October 31, 2008 ** | | $9.25 | | .03 d | | (2.69) | | (2.66) | | — | | — | | — | | — e | | $6.59 | | (28.76) * | | $206,432 | | .67 *d | | .39 *d | | 35.72 * |
| April 30, 2008 | | 12.49 | | .08 d | | (2.33) | | (2.25) | | (.05) | | (.94) | | (.99) | | — e | | 9.25 | | (18.45) | | 341,118 | | 1.23 d | | .71 d | | 37.06 |
| April 30, 2007 | | 12.60 | | .03 d | | 1.36 | | 1.39 | | — e | | (1.50) | | (1.50) | | — e | | 12.49 | | 11.72 | | 508,647 | | 1.23 d | | .23 d | | 58.83 |
| April 30, 2006 | | 10.97 | | .02 d,g | | 3.60 | | 3.62 | | (.07) | | (1.92) | | (1.99) | | — e | | 12.60 | | 34.85 | | 476,325 | | 1.20 d,g | | .13 d,g | | 60.27 |
| April 30, 2005 | | 10.16 | | .06 d,f | | .75 | | .81 | | — | | — | | — | | — e | | 10.97 | | 7.97 | | 378,942 | | 1.23 d | | .51 d,f | | 70.94 |
| April 30, 2004 | | 7.74 | | .01 | | 2.41 | | 2.42 | | — | | — | | — | | — | | 10.16 | | 31.27 | | 397,300 | | 1.19 | | .10 | | 134.62 |
|
| Class B | | | | | | | | | | | | | | | | | | | | | | | | | | | | |
| October 31, 2008 ** | | $8.45 | | — d,e | | (2.45) | | (2.45) | | — | | — | | — | | — e | | $6.00 | | (28.99) * | | $45,588 | | 1.05 *d | | .01 *d | | 35.72 * |
| April 30, 2008 | | 11.54 | | — d,e | | (2.15) | | (2.15) | | — | | (.94) | | (.94) | | — e | | 8.45 | | (19.11) | | 81,892 | | 1.98 d | | (.04) d | | 37.06 |
| April 30, 2007 | | 11.83 | | (.06) d | | 1.27 | | 1.21 | | — | | (1.50) | | (1.50) | | — e | | 11.54 | | 10.92 | | 167,550 | | 1.98 d | | (.53) d | | 58.83 |
| April 30, 2006 | | 10.42 | | (.07) d,g | | 3.40 | | 3.33 | | — | | (1.92) | | (1.92) | | — e | | 11.83 | | 33.73 | | 228,590 | | 1.95 d,g | | (.61) d,g | | 60.27 |
| April 30, 2005 | | 9.71 | | (.02) d,f | | .73 | | .71 | | — | | — | | — | | — e | | 10.42 | | 7.31 | | 218,327 | | 1.98 d | | (.23) d,f | | 70.94 |
| April 30, 2004 | | 7.46 | | (.06) | | 2.31 | | 2.25 | | — | | — | | — | | — | | 9.71 | | 30.16 | | 271,803 | | 1.94 | | (.64) | | 134.62 |
|
| Class C | | | | | | | | | | | | | | | | | | | | | | | | | | | | |
| October 31, 2008 ** | | $8.55 | | — d,e | | (2.48) | | (2.48) | | — | | — | | — | | — e | | $6.07 | | (29.01) * | | $11,037 | | 1.05 *d | | .01 *d | | 35.72 * |
| April 30, 2008 | | 11.66 | | — d,e | | (2.17) | | (2.17) | | — | | (.94) | | (.94) | | — e | | 8.55 | | (19.09) | | 18,438 | | 1.98 d | | (.04) d | | 37.06 |
| April 30, 2007 | | 11.94 | | (.06) d | | 1.28 | | 1.22 | | — | | (1.50) | | (1.50) | | — e | | 11.66 | | 10.89 | | 34,473 | | 1.98 d | | (.52) d | | 58.83 |
| April 30, 2006 | | 10.50 | | (.07) d,g | | 3.43 | | 3.36 | | — | | (1.92) | | (1.92) | | — e | | 11.94 | | 33.76 | | 34,354 | | 1.95 d,g | | (.62) d,g | | 60.27 |
| April 30, 2005 | | 9.79 | | (.02) d,f | | .73 | | .71 | | — | | — | | — | | — e | | 10.50 | | 7.25 | | 29,854 | | 1.98 d | | (.23) d,f | | 70.94 |
| April 30, 2004 | | 7.52 | | (.06) | | 2.33 | | 2.27 | | — | | — | | — | | — | | 9.79 | | 30.19 | | 35,584 | | 1.94 | | (.65) | | 134.62 |
|
| Class M | | | | | | | | | | | | | | | | | | | | | | | | | | | | |
| October 31, 2008 ** | | $8.73 | | .01 d | | (2.54) | | (2.53) | | — | | — | | — | | — e | | $6.20 | | (28.98) * | | $4,548 | | .92 *d | | .14 *d | | 35.72 * |
| April 30, 2008 | | 11.84 | | .02 d | | (2.19) | | (2.17) | | — | | (.94) | | (.94) | | — e | | 8.73 | | (18.78) | | 7,995 | | 1.73 d | | .21 d | | 37.06 |
| April 30, 2007 | | 12.07 | | (.03) d | | 1.30 | | 1.27 | | — | | (1.50) | | (1.50) | | — e | | 11.84 | | 11.20 | | 15,921 | | 1.73 d | | (.27) d | | 58.83 |
| April 30, 2006 | | 10.59 | | (.04) d,g | | 3.46 | | 3.42 | | (.02) | | (1.92) | | (1.94) | | — e | | 12.07 | | 34.05 | | 17,785 | | 1.70 d,g | | (.36) d,g | | 60.27 |
| April 30, 2005 | | 9.85 | | — d,e,f | | .74 | | .74 | | — | | — | | — | | — e�� | | 10.59 | | 7.51 | | 15,802 | | 1.73 d | | .02 d,f | | 70.94 |
| April 30, 2004 | | 7.55 | | (.04) | | 2.34 | | 2.30 | | — | | — | | — | | — | | 9.85 | | 30.46 | | 18,501 | | 1.69 | | (.40) | | 134.62 |
|
| Class R | | | | | | | | | | | | | | | | | | | | | | | | | | | | |
| October 31, 2008 ** | | $9.12 | | .02 d | | (2.65) | | (2.63) | | — | | — | | — | | — e | | $6.49 | | (28.84) * | | $1,833 | | .80 *d | | .27 *d | | 35.72 * |
| April 30, 2008 | | 12.34 | | .05 d | | (2.30) | | (2.25) | | (.03) | | (.94) | | (.97) | | — e | | 9.12 | | (18.67) | | 2,577 | | 1.48 d | | .47 d | | 37.06 |
| April 30, 2007 | | 12.49 | | — d,e | | 1.35 | | 1.35 | | — | | (1.50) | | (1.50) | | — e | | 12.34 | | 11.48 | | 2,610 | | 1.48 d | | (.02) d | | 58.83 |
| April 30, 2006 | | 10.92 | | (.03) d,g | | 3.59 | | 3.56 | | (.07) | | (1.92) | | (1.99) | | — e | | 12.49 | | 34.37 | | 1,390 | | 1.45 d,g | | (.21) d,g | | 60.27 |
| April 30, 2005 | | 10.13 | | .02 d,f | | .77 | | .79 | | — | | — | | — | | — e | | 10.92 | | 7.80 | | 457 | | 1.48 d | | .16 d,f | | 70.94 |
| April 30, 2004 | | 7.74 | | (.02) | | 2.41 | | 2.39 | | — | | — | | — | | — | | 10.13 | | 30.88 | | 51 | | 1.44 | | (.18) | | 134.62 |
|
| Class Y | | | | | | | | | | | | | | | | | | | | | | | | | | | | |
| October 31, 2008 ** | | $9.43 | | .05 d | | (2.76) | | (2.71) | | — | | — | | — | | — e | | $6.72 | | (28.74) * | | $223,160 | | .55 *d | | .52 *d | | 35.72 * |
| April 30, 2008 | | 12.72 | | .11 d | | (2.38) | | (2.27) | | (.08) | | (.94) | | (1.02) | | — e | | 9.43 | | (18.27) | | 338,526 | | .98 d | | .97 d | | 37.06 |
| April 30, 2007 | | 12.79 | | .06 d | | 1.40 | | 1.46 | | (.03) | | (1.50) | | (1.53) | | — e | | 12.72 | | 12.12 | | 432,748 | | .98 d | | .48 d | | 58.83 |
| April 30, 2006 | | 11.12 | | .05 d,g | | 3.65 | | 3.70 | | (.11) | | (1.92) | | (2.03) | | — e | | 12.79 | | 35.06 | | 389,857 | | .95 d,g | | .38 d,g | | 60.27 |
| April 30, 2005 | | 10.26 | | .08 d,f | | .78 | | .86 | | — | | — | | — | | — e | | 11.12 | | 8.38 | | 322,592 | | .98 d | | .76 d,f | | 70.94 |
| April 30, 2004 | | 7.81 | | .03 | | 2.42 | | 2.45 | | — | | — | | — | | — | | 10.26 | | 31.37 | | 324,942 | | .94 | | .31 | | 134.62 |
|
See notes to financial highlights at the end of this section.
The accompanying notes are an integral part of these financial statements.
Financial highlights (Continued)
* Not annualized.
**Unaudited.
a Per share net investment income (loss) has been determined on the basis of the weighted average number of shares outstanding during the period.
b Total return assumes dividend reinvestment and does not reflect the effect of sales charges.
c Includes amounts paid through expense offset and brokerage/service arrangements (Note 2).
d Reflects an involuntary contractual expense limitation and/or waivers of certain fund expenses in connection with investments in Putnam Prime Money Market Fund in effect during the period. As a result of such limitation and/or waivers, the expenses of each class reflect a reduction of the following amounts (Notes 2 and 5):
| |
| | Percentage of |
| | average net assets |
|
| October 31, 2008 | <0.01% |
|
| April 30, 2008 | <0.01 |
|
| April 30, 2007 | <0.01 |
|
| April 30, 2006 | <0.01 |
|
| April 30, 2005 | <0.01 |
|
e Amount represents less than $0.01 per share.
f Reflects a non-recurring accrual related to Putnam Management’s settlement with the SEC regarding brokerage allocation practices, which amounted to the following amounts:
| | |
| | | Percentage of |
| | Per share | average net assets |
|
| Class A | <$0.01 | 0.03% |
|
| Class B | <0.01 | 0.03 |
|
| Class C | <0.01 | 0.03 |
|
| Class M | <0.01 | 0.03 |
|
| Class R | 0.01 | 0.09 |
|
| Class Y | <0.01 | 0.03 |
|
g Reflects a non-recurring reimbursement from Putnam Investments relating to the calculation of certain amounts paid by the fund to Putnam in previous years for transfer agent services, which amounted to less than $0.01 per share and 0.03% of average net assets for the period ended April 30, 2006.
The accompanying notes are an integral part of these financial statements.
42
Notes to financial statements 10/31/08 (Unaudited)
Note 1: Significant accounting policies
Putnam Capital Opportunities Fund (the “fund”) is a series of Putnam Investment Funds (the “trust”), a Massachusetts business trust, which is registered under the Investment Company Act of 1940, as amended, as a diversified, open-end management investment company. The fund invests primarily in common stocks of U.S. companies that Putnam Investment Management, LLC (“Putnam Management”), the fund’s manager, an indirect wholly-owned subsidiary of Putnam, LLC, believes have favorable investment potential, such as stocks of companies with stock prices that reflect a value lower than that which Putnam Management places on the company. Putnam Management may also consider other factors it believes will cause the stock price to rise.
The fund offers class A, class B, class C, class M, class R and class Y shares. Class A and class M shares are sold with a maximum front-end sales charge of 5.75% and 3.50%, respectively, and generally do not pay a contingent deferred sales charge.Class B shares, which convert to class A shares after approximately eight years, do not pay a front-end sales charge and are subject to a contingent deferred sales charge, if those shares are redeemed within six years of purchase. Class C shares have a one-year 1.00% contingent deferred sales charge and do not convert to class A shares. Class R shares, which are offered to qualified employee-benefit plans, are sold at net asset value. The expenses for class A, class B, class C, class M and class R shares may differ based on the distribution fee of each class, which is identified in Note 2. Class Y shares, which are sold at net asset value, are generally subject to the same expenses as class A, class B, class C, class M and class R shares, but do not bear a distribution fee. Class Y shares are generally only available to corporate and institutional clients and clients in other approved programs.
A 1.00% redemption fee may apply on any shares that are redeemed (either by selling or exchanging into another fund) within 90 days of purchase. The redemption fee is accounted for as an addition to paid-in-capital.
Investment income, realized and unrealized gains and losses and expenses of the fund are borne pro-rata based on the relative net assets of each class to the total net assets of the fund, except that each class bears expenses unique to that class (including the distribution fees applicable to such classes). Each class votes as a class only with respect to its own distribution plan or other matters on which a class vote is required by law or determined by the Trustees. If the fund were liquidated, shares of each class would receive their pro-rata share of the net assets of the fund. In addition, the Trustees declare separate dividends on each class of shares.
In the normal course of business, the fund enters into contracts that may include agreements to indemnify another party under given circumstances. The fund’s maximum exposure under these arrangements is unknown as this would involve future claims that may be, but have not yet been, made against the fund. However, the fund’s management team expects the risk of material loss to be remote.
The following is a summary of significant accounting policies consistently followed by the fund in the preparation of its financial statements. The preparation of financial statements is in conformity with accounting principles generally accepted in the United States of America and requires management to make estimates and assumptions that affect the reported amounts of assets and liabilities in the financial statements and the reported amounts of increases and decreases in net assets from operations during the reporting period. Actual results could differ from those estimates.
A) Security valuation Investments for which market quotations are readily available are valued at the last reported sales price on their principal exchange, or official closing price for certain markets. If no sales are reported — as in the case of some securities traded over-the-counter — a security is valued at its last reported bid price. Many securities markets and exchanges outside the U.S. close prior to the close of the New York Stock Exchange and therefore the closing prices for securities in such markets or on such exchanges may not fully reflect events that occur after such close but before the close of the New York Stock Exchange. Accordingly, on certain days, the fund will fair value foreign equity securities taking into account multiple factors, including movements in the U.S. securities markets. The number of days on which fair value prices will be used will depend on market activity and it is possib le that fair value prices will be used by the fund to a significant extent. Securities quoted in foreign currencies, if any, are translated into U.S. dollars at the current exchange rate. Certain investments, including certain restricted securities and derivatives, are also valued at fair value following procedures approved by the Trustees. Such valuations and procedures are reviewed periodically by the Trustees. The fair value of
43
securities is generally determined as the amount that the fund could reasonably expect to realize from an orderly disposition of such securities over a reasonable period of time. By its nature, a fair value price is a good faith estimate of the value of a security at a given point in time and does not reflect an actual market price, which may be different by a material amount.
B) Joint trading account Pursuant to an exemptive order from the Securities and Exchange Commission (the “SEC”), the fund may transfer uninvested cash balances, including cash collateral received under security lending arrangements, into a joint trading account along with the cash of other registered investment companies and certain other accounts managed by Putnam Management. These balances may be invested in issues of short-term investments having maturities of up to 397 days for collateral received under security lending arrangements and up to 90 days for other cash investments.
C) Repurchase agreements The fund, or any joint trading account, through its custodian, receives delivery of the underlying securities, the market value of which at the time of purchase is required to be in an amount at least equal to the resale price, including accrued interest. Collateral for certain tri-party repurchase agreements is held at the counterparty’s custodian in a segregated account for the benefit of the fund and the counterparty. Putnam Management is responsible for determining that the value of these underlying securities is at all times at least equal to the resale price, including accrued interest.
D) Security transactions and related investment income Security transactions are recorded on the trade date (the date the order to buy or sell is executed). Gains or losses on securities sold are determined on the identified cost basis.
Interest income is recorded on the accrual basis. Dividend income, net of applicable withholding taxes, is recognized on the ex-dividend date except that certain dividends from foreign securities, if any, are recognized as soon as the fund is informed of the ex-dividend date. Non-cash dividends, if any, are recorded at the fair market value of the securities received. Dividends representing a return of capital or capital gains, if any, are reflected as a reduction of cost and/or as a realized gain.
E) Futures and options contracts The fund may use futures and options contracts to hedge against changes in the values of securities the fund owns, owned or expects to purchase, or for other investment purposes. The fund may also write options on swaps or securities it owns or in which it may invest to increase its current returns.
The potential risk to the fund is that the change in value of futures and options contracts may not correspond to the change in value of the hedged instruments. In addition, losses may arise from changes in the value of the underlying instruments, if there is an illiquid secondary market for the contracts, or if the counterparty to the contract is unable to perform. Risks may exceed amounts recognized on the Statement of assets and liabilities. When the contract is closed, the fund records a realized gain or loss equal to the difference between the value of the contract at the time it was opened and the value at the time it was closed. Realized gains and losses on purchased options are included in realized gains and losses on investment securities. If a written call option is exercised, the premium originally received is recorded as an addition to sales proceeds. If a written put option is exercised, the premium originally received is recorded as a reduction to the cost of investments.
Futures contracts are valued at the quoted daily settlement prices established by the exchange on which they trade. The fund and the broker agree to exchange an amount of cash equal to the daily fluctuation in the value of the futures contract. Such receipts or payments are known as “variation margin.” Exchange traded options are valued at the last sale price or, if no sales are reported, the last bid price for purchased options and the last ask price for written options. Options traded over-the-counter are valued using prices supplied by dealers. Futures and written option contracts outstanding at period end, if any, are listed after the fund’s portfolio.
F) Securities lending The fund may lend securities, through its agents, to qualified borrowers in order to earn additional income. The loans are collateralized by cash and/or securities in an amount at least equal to the market value of the securities loaned. The market value of securities loaned is determined daily and any additional required collateral is allocated to the fund on the next business day. The risk of borrower default will be borne by the fund’s agents; the fund will bear the risk of loss with respect to the investment of the cash collateral. Income from securities lending is included in investment income on the Statement of operations. At October 31, 2008, the value of securities loaned amounted to $31,123,532. Certain of these securities were sold prior to period end and are included in the Receivable for securities sold on the Statement of assets and liabilities. The fund received cash collateral of $ 32,288,833, which is pooled with collateral of other Putnam funds into 15 issues of short-term investments.
44
G) Federal taxes It is the policy of the fund to distribute all of its taxable income within the prescribed time and otherwise comply with the provisions of the Internal Revenue Code of 1986, as amended (the “Code”), applicable to regulated investment companies. It is also the intention of the fund to distribute an amount sufficient to avoid imposition of any excise tax under Section 4982 of the Code. The fund is subject to the provisions of FASB Interpretation No. 48, Accounting for Uncertainties in Income Taxes (FIN 48). FIN 48 sets forth a minimum threshold for financial statement recognition of the benefit of a tax position taken or expected to be taken in a tax return. The fund did not have any unrecognized tax benefits in the accompanying financial statements. Therefore, no provision has been made for federal taxes on income, capital gains or unrealized appreciation on securities held nor for excise tax on i ncome and capital gains. Each of the fund’s federal tax returns for the prior three fiscal years remains subject to examination by the Internal Revenue Service.
At April 30, 2008, the fund had a capital loss carryover of $1,419,369 available to the extent allowed by the Code to offset future net capital gain, if any. This capital loss carryover will expire on April 30, 2016.
The aggregate identified cost on a tax basis is $687,229,764, resulting in gross unrealized appreciation and depreciation of $26,106,368 and $163,231,681, respectively, or net unrealized depreciation of $137,125,313.
H) Distributions to shareholders Distributions to shareholders from net investment income are recorded by the fund on the ex-dividend date. Distributions from capital gains, if any, are recorded on the ex-dividend date and paid at least annually. The amount and character of income and gains to be distributed are determined in accordance with income tax regulations, which may differ from generally accepted accounting principles. Dividend sources are estimated at the time of declaration. Actual results may vary. Any non-taxable return of capital cannot be determined until final tax calculations are completed after the end of the fund’s fiscal year. Reclassifications are made to the fund’s capital accounts to reflect income and gains available for distribution (or available capital loss carryovers) under income tax regulations.
I) Expenses of the trust Expenses directly charged or attributable to any fund will be paid from the assets of that fund. Generally, expenses of the trust will be allocated among and charged to the assets of each fund on a basis that the Trustees deem fair and equitable, which may be based on the relative assets of each fund or the nature of the services performed and relative applicability to each fund.
Note 2: Management fee, administrative
services and other transactions
The fund pays Putnam Management for management and investment advisory services quarterly based on the average net assets of the fund. Such fee is based on the following annual rates: 0.65% of the first $500 million of average net assets, 0.55% of the next $500 million, 0.50% of the next $500 million, 0.45% of the next $5 billion, 0.425% of the next $5 billion, 0.405% of the next $5 billion, 0.39% of the next $5 billion and 0.38% thereafter.
Putnam Management has agreed to waive fees and reimburse expenses of the fund through June 30, 2009 to the extent necessary to ensure that the fund’s expenses do not exceed the simple average of the expenses of all front-end load funds viewed by Lipper, Inc. as having the same investment classification or objective as the fund. The expense reimbursement is based on a comparison of the fund’s expenses with the average annualized operating expenses of the funds in its Lipper peer group for each calendar quarter during the fund’s last fiscal year, excluding 12b-1 fees and without giving effect to any expense offset and brokerage/service arrangements that may reduce fund expenses. For the period ended October 31, 2008, Putnam Management did not waive any of its management fee from the fund.
The fund reimburses Putnam Management an allocated amount for the compensation and related expenses of certain officers of the fund and their staff who provide administrative services to the fund. The aggregate amount of all such reimbursements is determined annually by theTrustees.
Custodial functions for the fund’s assets were provided by State Street Bank andTrust Company (“State Street”). Custody fees are based on the fund’s asset level, the number of its security holdings and transaction volumes.
Putnam Investor Services, a division of Putnam Fiduciary Trust Company (“PFTC”), which is an affiliate of Putnam Management, provided investor servicing agent functions to the fund. Putnam Investor Services received fees for investor servicing, subject to certain limitations, based on the number of shareholder accounts in the fund and the level of defined contribution plan assets in the fund. During the period ended October 31, 2008, the fund incurred $1,469,713 for investor servicing agent functions provided by PFTC.
45
Under the custodian contract between the fund and State Street, the custodian bank has a lien on the securities of the fund to the extent permitted by the fund’s investment restrictions to cover any advances made by the custodian bank for the settlement of securities purchased by the fund. At October 31, 2008, the payable to the custodian bank represents the amount due for cash advanced for the settlement of securities purchased.
The fund has entered into expense offset arrangements with PFTC and State Street whereby PFTC’s and State Street’s fees are reduced by credits allowed on cash balances. The fund also reduced expenses through brokerage/service arrangements. For the six months ended October 31, 2008, the fund’s expenses were reduced by $9,334 under the expense offset arrangements and by $43,053 under the brokerage/ service arrangements.
Each independent Trustee of the fund receives an annual Trustee fee, of which $478, as a quarterly retainer, has been allocated to the fund, and an additional fee for each Trustees meeting attended. Trustees receive additional fees for attendance at certain committee meetings and industry seminars and for certain compliance-related matters. Trustees also are reimbursed for expenses they incur relating to their services as Trustees.
The fund has adopted a Trustee Fee Deferral Plan (the “Deferral Plan”) which allows the Trustees to defer the receipt of all or a portion of Trustees fees payable on or after July 1, 1995. The deferred fees remain invested in certain Putnam funds until distribution in accordance with the Deferral Plan.
The fund has adopted an unfunded noncontributory defined benefit pension plan (the “Pension Plan”) covering all Trustees of the fund who have served as a Trustee for at least five years and were first elected prior to 2004. Benefits under the Pension Plan are equal to 50% of the Trustee’s average annual attendance and retainer fees for the three years ended December 31, 2005. The retirement benefit is payable during a Trustee’s lifetime, beginning the year following retirement, for the number of years of service through December 31, 2006. Pension expense for the fund is included in Trustee compensation and expenses in the Statement of operations. Accrued pension liability is included in Payable for Trustee compensation and expenses in the Statement of assets and liabilities. The Trustees have terminated the Pension Plan with respect to any Trustee first elected after 2003.
The fund has adopted distribution plans (the “Plans”) with respect to its class A, class B, class C, class M and class R shares pursuant to Rule 12b-1 under the Investment Company Act of 1940. The purpose of the Plans is to compensate Putnam Retail Management Limited Partnership, a wholly-owned subsidiary of Putnam, LLC and Putnam Retail Management GP, Inc., for services provided and expenses incurred in distributing shares of the fund. The Plans provide for payments by the fund to Putnam Retail Management Limited Partnership at an annual rate of up to 0.35%, 1.00%, 1.00%, 1.00% and 1.00% of the average net assets attributable to class A, class B, class C, class M and class R shares, respectively. The Trustees have approved payment by the fund at an annual rate of 0.25%, 1.00%, 1.00%, 0.75% and 0.50% of the average net assets attributable to class A, class B, class C, class M and class R shares, respectively.
For the six months ended October 31, 2008, Putnam Retail Management Limited Partnership, acting as underwriter, received net commissions of $13,452 and $262 from the sale of class A and class M shares, respectively, and received $31,909 and $510 in contingent deferred sales charges from redemptions of class B and class C shares, respectively. A deferred sales charge of up to 1.00% and 0.65% is assessed on certain redemptions of class A and class M shares, respectively. For the six months ended October 31, 2008, Putnam Retail Management Limited Partnership, acting as underwriter, received $209 and no monies on class A and class M redemptions, respectively.
Note 3: Purchases and sales of securities
During the six months ended October 31, 2008, cost of purchases and proceeds from sales of investment securities other than short-term investments aggregated $244,924,112 and $342,976,043, respectively. There were no purchases or sales of U.S. government securities.
Note 4: Capital shares
At October 31, 2008, there was an unlimited number of shares of beneficial interest authorized. Transactions in capital shares were as follows:
46
| | | | |
| | Six months ended 10/31/08 | Year ended 4/30/08 |
|
| Class A | Shares | Amount | Shares | Amount |
|
| Shares sold | 2,423,524 | $20,433,962 | 9,186,586 | $102,071,632 |
|
| Shares issued in connection with | — | — | 3,611,873 | 35,432,467 |
| reinvestment of distributions | | | | |
|
| | 2,423,524 | 20,433,962 | 12,798,459 | 137,504,099 |
|
| Shares repurchased | (7,948,264) | (68,436,409) | (16,642,024) | (174,351,792) |
|
| Net decrease | (5,524,740) | $(48,002,447) | (3,843,565) | $(36,847,693) |
| |
| |
| | Six months ended 10/31/08 | Year ended 4/30/08 |
|
| Class B | Shares | Amount | Shares | Amount |
|
| Shares sold | 172,369 | $1,314,971 | 572,414 | $5,885,137 |
|
| Shares issued in connection with | — | — | 1,129,811 | 10,157,002 |
| reinvestment of distributions | | | | |
|
| | 172,369 | 1,314,971 | 1,702,225 | 16,042,139 |
|
| Shares repurchased | (2,255,765) | (17,749,328) | (6,532,919) | (63,700,443) |
|
| Net decrease | (2,083,396) | $(16,434,357) | (4,830,694) | $(47,658,304) |
| |
| |
| | Six months ended 10/31/08 | Year ended 4/30/08 |
|
| Class C | Shares | Amount | Shares | Amount |
|
| Shares sold | 81,627 | $610,672 | 261,761 | $2,757,544 |
|
| Shares issued in connection with | — | — | 232,696 | 2,117,530 |
| reinvestment of distributions | | | | |
|
| | 81,627 | 610,672 | 494,457 | 4,875,074 |
|
| Shares repurchased | (417,633) | (3,308,946) | (1,294,546) | (12,456,530) |
|
| Net decrease | (336,006) | $(2,698,274) | (800,089) | $(7,581,456) |
| |
| |
| | Six months ended 10/31/08 | Year ended 4/30/08 |
|
| Class M | Shares | Amount | Shares | Amount |
|
| Shares sold | 33,998 | $265,709 | 106,329 | $1,180,400 |
|
| Shares issued in connection with | — | — | 103,254 | 957,165 |
| reinvestment of distributions | | | | |
|
| | 33,998 | 265,709 | 209,583 | 2,137,565 |
|
| Shares repurchased | (216,239) | (1,769,288) | (637,467) | (6,481,935) |
|
| Net decrease | (182,241) | $(1,503,579) | (427,884) | $(4,344,370) |
| |
| |
| | Six months ended 10/31/08 | Year ended 4/30/08 |
|
| Class R | Shares | Amount | Shares | Amount |
|
| Shares sold | 60,974 | $473,174 | 130,113 | $1,362,436 |
|
| Shares issued in connection with | — | — | 23,661 | 229,032 |
| reinvestment of distributions | | | | |
|
| | 60,974 | 473,174 | 153,774 | 1,591,468 |
|
| Shares repurchased | (60,919) | (506,319) | (82,721) | (857,834) |
|
| Net increase/(decrease) | 55 | $(33,145) | 71,053 | $733,634 |
|
47
| | | | |
| | Six months ended 10/31/08 | Year ended 4/30/08 |
|
| Class Y | Shares | Amount | Shares | Amount |
|
| Shares sold | 3,591,478 | $31,782,355 | 13,760,126 | $145,613,015 |
|
| Shares issued in connection with | — | — | 3,386,069 | 33,826,825 |
| reinvestment of distributions | | | | |
|
| | 3,591,478 | 31,782,355 | 17,146,195 | 179,439,840 |
|
| Shares repurchased | (6,287,361) | (54,455,842) | (15,273,891) | (164,175,819) |
|
| Net increase/(decrease) | (2,695,883) | $(22,673,487) | 1,872,304 | $15,264,021 |
|
Note 5: Investment in Putnam Prime Money Market Fund
The fund invested in Putnam Prime Money Market Fund, an open-end management investment company managed by Putnam Management. Investments in Putnam Prime Money Market Fund were valued at its closing net asset value each business day. Management fees paid by the fund were reduced by an amount equal to the management fees paid by Putnam Prime Money Market Fund with respect to assets invested by the fund in Putnam Prime Money Market Fund. For the period ended October 31, 2008, management fees paid were reduced by $5,272 relating to the fund’s investment in Putnam Prime Money Market Fund. Income distributions earned by the fund were recorded as interest income in the Statement of operations and totaled $143,862 for the period ended October 31, 2008. During the period ended October 31, 2008, cost of purchases and proceeds of sales of investments in Putnam Prime Money Market Fund aggregated $83,546,080 and $101,412,413, respectively.
On September 17, 2008, the Trustees of the Putnam Prime Money Market Fund voted to close that fund effective September 17, 2008. On September 24, 2008 the fund received shares of Federated Prime Obligations Fund, an unaffiliated management investment company registered under the Investment Company Act of 1940, in liquidation of its shares of Putnam Prime Money Market Fund.
Note 6: Regulatory matters and litigation
In late 2003 and 2004, Putnam Management settled charges brought by the SEC and the Massachusetts Securities Division in connection with excessive short-term trading in Putnam funds. Distribution of payments from Putnam Management to certain open-end Putnam funds and their shareholders is expected to be completed in the next several months. These allegations and related matters have served as the general basis for certain lawsuits, including purported class action lawsuits against Putnam Management and, in a limited number of cases, some Putnam funds. Putnam Management believes that these lawsuits will have no material adverse effect on the funds or on Putnam Management’s ability to provide investment management services. In addition, Putnam Management has agreed to bear any costs incurred by the Putnam funds as a result of these matters.
Note 7: New accounting pronouncements
In March 2008, Statement of Financial Accounting Standards No. 161, Disclosures about Derivative Instruments and Hedging Activities (“SFAS 161”) — an amendment of FASB Statement No. 133, was issued and is effective for fiscal years beginning after November 15, 2008. SFAS 161 requires enhanced disclosures about how and why an entity uses derivative instruments and how derivative instruments affect an entity’s financial position. Putnam Management is currently evaluating the impact the adoption of SFAS 161 will have on the fund’s financial statement disclosures.
In September 2008, FASB Staff Position FAS 133-1 and FIN 45-4, “Disclosures about Credit Derivatives and Certain Guarantees: An Amendment of FASB Statement No. 133 and FASB Interpretation No. 45; and Clarification of the Effective Date of FASB Statement No. 161” (the “Amendment”) was issued and is effective for annual and interim reporting periods ending after November 15, 2008. The Amendment requires enhanced disclosures regarding a fund’s credit derivatives holdings and hybrid financial instruments containing embedded credit derivatives. Putnam Management is currently evaluating the impact the adoption of the Amendment will have on the fund’s financial statement disclosures.
Note 8: Market conditions
Recent events in the financial sector have resulted in an unusually high degree of volatility in the financial markets. The fund’s investments in the financial sector, as reflected in the fund’s schedule of investments, exposes investors to the negative (or positive) performance resulting from these events.
48
Brokerage commissions (unaudited)
Brokerage commissions are paid to firms that execute trades on behalf of your fund. When choosing these firms, Putnam is required by law to seek the best execution of the trades, taking all relevant factors into consideration, including expected quality of execution and commission rate. Listed below are the largest relationships based upon brokerage commissions for your fund and the other funds in Putnam’s U.S. Small- and Mid-Cap group for the year ended October 31, 2008. The Putnam mutual funds in this group are Putnam Capital Opportunities Fund, Putnam Discovery Growth Fund, Putnam Mid Cap Value Fund, Putnam New Opportunities Fund, Putnam OTC & Emerging Growth Fund, Putnam Small Cap Growth Fund, Putnam Small Cap Value Fund, Putnam Vista Fund, Putnam VT Capital Opportunities Fund, Putnam VT Discovery Growth Fund, Putnam VT Mid Cap Value Fund, Putnam VT New Opportunities Fund, Putnam VT OTC & Emerging Growth Fund, Putnam VT Small Cap Value Fund, and Putnam VT Vista Fund.
The top five firms that received brokerage commissions for trades executed for the U.S. Small- and Mid-Cap group are (in descending order) Morgan Stanley & Co., UBS Securities, Credit Suisse First Boston, Citigroup Global Markets, and RBC Capital Markets. Commissions paid to these firms together represented approximately 43% of the total brokerage commissions paid for the year ended October 31, 2008.
Commissions paid to the next 10 firms together represented approximately 34% of the total brokerage commissions paid during the period. These firms are Bear Stearns & Co., CIBC World Markets Corp., Cowen & Co., Goldman, Sachs & Co., Investment Technology Group, Lehman Brothers, Merrill Lynch, Pierce, Fenner and Smith, J.P.Morgan Securities, Wachovia Securities, and Weeden & Co.
Commission amounts do not include “mark-ups” paid on bond or derivative trades made directly with a dealer. Additional information about brokerage commissions is available on the Securities and Exchange Commission (SEC) Web site at www.sec.gov. Putnam funds disclose commissions by firm to the SEC in semiannual filings on Form N-SAR.
49
Putnam puts your interests first
Putnam has introduced a number of voluntary initiatives designed to reduce fund expenses, provide investors with more useful information, and help safeguard the interests of all Putnam investors. Visit the Individual Investors section at www.putnam.com for details.
Cost-cutting initiatives
Ongoing expenses will be limited Through calendar 2008, total ongoing expenses, including management fees for all funds, will be maintained at or below the average of each fund’s industry peers in its Lipper load-fund universe. For more information, please see the Statement of Additional information.
Lower class B purchase limit To help ensure that investors are in the most cost-effective share class, the maximum amount that can be invested in class B shares has been reduced to $100,000. (Larger trades or accumulated amounts will be refused.)
Improved disclosure
Putnam fund prospectuses and shareholder reports have been revised to disclose additional information that will help shareholders compare funds and weigh their costs and risks along with their potential benefits. Shareholders will find easy-to-understand information about fund expense ratios, portfolio manager compensation, risk comparisons, turnover comparisons, brokerage commissions, and employee and trustee ownership of Putnam funds. Disclosure of breakpoint discounts has also been enhanced to alert investors to potential cost savings.
Protecting investors’ interests
Short-term trading fee introduced To discourage short-term trading, which can interfere with a fund’s long-term strategy, a 1% short-term trading fee may be imposed on any Putnam fund shares (other than money market funds) redeemed or exchanged within 7 calendar days of purchase (for certain funds, this fee applies for 90 days).
50
The Putnam family of funds
The following is a list of Putnam’s open-end mutual funds offered to the public. Investors should carefully consider the investment objective, risks, charges, and expenses of a fund before investing. For a prospectus containing this and other information for any Putnam fund or product, call your financial advisor at 1-800-225-1581 and ask for a prospectus. Please read the prospectus carefully before investing.
| |
| Growth funds | Value funds |
| Discovery Growth Fund | Classic Equity Fund |
| Growth Opportunities Fund | Convertible Income-Growth Trust |
| Health Sciences Trust | Equity Income Fund |
| International New Opportunities Fund* | The George Putnam Fund of Boston |
| New Opportunities Fund | The Putnam Fund for Growth and Income |
| OTC & Emerging Growth Fund | International Growth and Income Fund* |
| Small Cap Growth Fund* | Mid Cap Value Fund |
| Vista Fund | New Value Fund |
| Voyager Fund | Small Cap Value Fund* |
| | |
| Blend funds | Income funds |
| Capital Appreciation Fund | American Government Income Fund |
| Capital Opportunities Fund* | Diversified Income Trust |
| Europe Equity Fund* | Floating Rate Income Fund |
| Global Equity Fund* | Global Income Trust* |
| Global Natural Resources Fund* | High Yield Advantage Fund* |
| International Capital Opportunities Fund* | High Yield Trust* |
| International Equity Fund* | Income Fund |
| Investors Fund�� | Money Market Fund† |
| Research Fund | U.S. Government Income Trust |
| Tax Smart Equity Fund® | |
| Utilities Growth and Income Fund | |
* A 1% redemption fee on total assets redeemed or exchanged within 90 days of purchase may be imposed for all share classes of these funds.
† An investment in a money market fund is not insured or guaranteed by the Federal Deposit Insurance Corporation or any other government agency. Although the fund seeks to preserve the value of your investment at $1.00 per share, it is possible to lose money by investing in the fund.
51
| |
| Tax-free income funds | Putnam RetirementReady® Funds |
| AMT-Free Insured Municipal Fund | Putnam RetirementReady Funds — 10 investment |
| Tax Exempt Income Fund | portfolios that offer diversification among stocks, |
| Tax Exempt Money Market Fund† | bonds, and money market instruments and adjust |
| Tax-Free High Yield Fund | to become more conservative over time based |
| on a target date for withdrawing assets. |
| State tax-free income funds: | |
| Arizona, California, Massachusetts, Michigan, | The 10 funds: |
| Minnesota, New Jersey, New York, Ohio, | Putnam RetirementReady 2050 Fund |
| and Pennsylvania | Putnam RetirementReady 2045 Fund |
| | Putnam RetirementReady 2040 Fund |
| Asset allocation funds | Putnam RetirementReady 2035 Fund |
| Income Strategies Fund | Putnam RetirementReady 2030 Fund |
| Putnam Asset Allocation Funds — three investment | Putnam RetirementReady 2025 Fund |
| portfolios that spread your money across a variety | Putnam RetirementReady 2020 Fund |
| of stocks, bonds, and money market investments. | Putnam RetirementReady 2015 Fund |
| | Putnam RetirementReady 2010 Fund |
| The three portfolios: | Putnam RetirementReady Maturity Fund |
| Asset Allocation: Balanced Portfolio | |
| Asset Allocation: Conservative Portfolio | |
| Asset Allocation: Growth Portfolio | |
With the exception of money market funds, a 1% redemption fee may be applied to shares exchanged or sold within 7 days of purchase (90 days, for certain funds).
Check your account balances and the most recent month-end performance in the Individual Investors section at www.putnam.com.
52
Fund information
Founded over 70 years ago, Putnam Investments was built around the concept that a balance between risk and reward is the hallmark of a well-rounded financial program. We manage nearly 100 mutual funds in growth, value, blend, fixed income, and international.
| | |
| Investment Manager | Officers | Francis J. McNamara, III |
| Putnam Investment | Charles E. Haldeman, Jr. | Vice President and |
| Management, LLC | President | Chief Legal Officer |
| One Post Office Square | | |
| Boston, MA 02109 | Charles E. Porter | Robert R. Leveille |
| Executive Vice President, | Vice President and Chief |
| Marketing Services | Principal Executive Officer, | Compliance Officer |
| Putnam Retail Management | Associate Treasurer and | |
| One Post Office Square | Compliance Liaison | Mark C. Trenchard |
| Boston, MA 02109 | | Vice President and BSA |
| Jonathan S. Horwitz | Compliance Officer |
| Custodian | Senior Vice President | |
| State Street Bank and | and Treasurer | Judith Cohen |
| Trust Company | | Vice President, Clerk and |
| Steven D. Krichmar | Assistant Treasurer |
| Legal Counsel | Vice President and Principal | |
| Ropes & Gray LLP | Financial Officer | Wanda M. McManus |
| | | Vice President, Senior Associate |
| Trustees | Janet C. Smith | Treasurer and Assistant Clerk |
| John A. Hill, Chairman | Vice President, Principal | |
| Jameson A. Baxter, | Accounting Officer and | Nancy E. Florek |
| Vice Chairman | Assistant Treasurer | Vice President, Assistant |
| Charles B. Curtis | | Clerk, Assistant Treasurer |
| Robert J. Darretta | Susan G. Malloy | and Proxy Manager |
| Myra R. Drucker | Vice President and | |
| Charles E. Haldeman, Jr. | Assistant Treasurer | |
| Paul L. Joskow | | |
| Elizabeth T. Kennan | Beth S. Mazor | |
| Kenneth R. Leibler | Vice President | |
| Robert E. Patterson | | |
| George Putnam, III | James P. Pappas | |
| Robert L. Reynolds | Vice President | |
| Richard B. Worley | | |
| | |
This report is for the information of shareholders of Putnam Capital Opportunities Fund. It may also be used as sales literature when preceded or accompanied by the current prospectus, the most recent copy of Putnam’s Quarterly Performance Summary, and Putnam’s Quarterly Ranking Summary. For more recent performance, please visit www.putnam.com. Investors should carefully consider the investment objective, risks, charges, and expenses of a fund, which are described in its prospectus. For this and other information or to request a prospectus, call 1-800-225-1581 toll free. Please read the prospectus carefully before investing. The fund’s Statement of Additional Information contains additional information about the fund’s Trustees and is available without charge upon request by calling 1-800-225-1581.

Item 2. Code of Ethics:
Not applicable
Item 3. Audit Committee Financial Expert:
Not applicable
Item 4. Principal Accountant Fees and Services:
Not applicable
Item 5. Audit Committee of Listed Registrants
Not applicable
Item 6. Schedule of Investments:
The registrant’s schedule of investments in unaffiliated issuers is included in the report to shareholders in Item 1 above.
Item 7. Disclosure of Proxy Voting Policies and Procedures For Closed-End Management Investment Companies:
Not applicable
Item 8. Portfolio Managers of Closed-End Investment Companies
Not Applicable
Item 9. Purchases of Equity Securities by Closed-End Management Investment Companies and Affiliated Purchasers:
Not applicable
Item 10. Submission of Matters to a Vote of Security Holders:
Not applicable
Item 11. Controls and Procedures:
(a) The registrant's principal executive officer and principal financial officer have concluded, based on their evaluation of the effectiveness of the design and operation of the registrant's disclosure controls and procedures as of a date within 90 days of the filing date of this report, that the design and operation of such procedures are generally effective to provide reasonable assurance that information required to be disclosed by the registrant in this report is recorded, processed, summarized and reported within the time periods specified in the Commission's rules and forms.
(b) Changes in internal control over financial reporting: Not applicable
Item 12. Exhibits:
(a)(1) Not applicable
(a)(2) Separate certifications for the principal executive officer and principal financial officer of the registrant as required by Rule 30a-2(a) under the Investment Company Act of 1940, as amended, are filed herewith.
(b) The certifications required by Rule 30a-2(b) under the Investment Company Act of 1940, as amended, are filed herewith.
SIGNATURES
Pursuant to the requirements of the Securities Exchange Act of 1934 and the Investment Company Act of 1940, the registrant has duly caused this report to be signed on its behalf by the undersigned, thereunto duly authorized.
Putnam Investment Funds
By (Signature and Title):
/s/Janet C. Smith
Janet C. Smith
Principal Accounting Officer
Date: December 29, 2008
Pursuant to the requirements of the Securities Exchange Act of 1934 and the Investment Company Act of 1940, this report has been signed below by the following persons on behalf of the registrant and in the capacities and on the dates indicated.
By (Signature and Title):
/s/Charles E. Porter
Charles E. Porter
Principal Executive Officer
Date: December 29, 2008
By (Signature and Title):
/s/Steven D. Krichmar
Steven D. Krichmar
Principal Financial Officer
Date: December 29, 2008
| | |
| UNITED STATES |
| SECURITIES AND EXCHANGE COMMISSION |
| Washington, D.C. 20549 |
| |
| FORM N-CSR |
| |
| CERTIFIED SHAREHOLDER REPORT OF REGISTERED |
| MANAGEMENT INVESTMENT COMPANIES |
| |
| Investment Company Act file number: (811- 07237) | |
| | |
| Exact name of registrant as specified in charter: | Putnam Investment Funds |
| | |
| Address of principal executive offices: One Post Office Square, Boston, Massachusetts 02109 |
| |
| Name and address of agent for service: | Beth S. Mazor, Vice President |
| | One Post Office Square |
| | Boston, Massachusetts 02109 |
| | |
| Copy to: | John W. Gerstmayr, Esq. |
| | Ropes & Gray LLP |
| | One International Place |
| | Boston, Massachusetts 02110 |
| | |
| Registrant’s telephone number, including area code: | (617) 292-1000 |
| | |
| Date of fiscal year end: April 30, 2009 | | |
| | | |
| Date of reporting period: May 1, 2008 — October 31, 2008 |
Item 1. Report to Stockholders:
The following is a copy of the report transmitted to stockholders pursuant to Rule 30e-1 under the Investment Company Act of 1940:

What makes Putnam different?

In 1830, Massachusetts Supreme Judicial Court Justice Samuel Putnam established The Prudent Man Rule, a legal foundation for responsible money management.
THE PRUDENT MAN RULE
All that can be required of a trustee to invest is that he shall conduct himself faithfully and exercise a sound discretion. He is to observe how men of prudence, discretion, and intelligence manage their own affairs, not in regard to speculation, but in regard to the permanent disposition of their funds, considering the probable income, as well as the probable safety of the capital to be invested.

A time-honored tradition in money management
Since 1937, our values have been rooted in a profound sense of responsibility for the money entrusted to us.
A prudent approach to investing
We use a research-driven approach to seek superior investment results over time.
Funds for every investment goal
We offer a broad range of mutual funds and other financial products so investors and their financial representatives can build diversified portfolios.
A commitment to doing what’s right for investors
With a focus on investment performance, below-average expenses, and in-depth information about our funds, we put the interests of investors first and seek to set the standard for integrity and service.
Industry-leading service
We help investors, along with their financial representatives, make informed investment decisions with confidence.
Putnam
Mid Cap
Value Fund
10|31|08
Semiannual Report
| | |
| Message from the Trustees | 2 | |
| About the fund | 4 | |
| Performance snapshot | 6 | |
| Interview with your fund’s Portfolio Manager | 7 | |
| Performance in depth. | 12 | |
| Expenses | 14 | |
| Portfolio turnover | 16 | |
| Risk | 17 | |
| Your fund’s management. | 18 | |
| Terms and definitions | 19 | |
| Trustee approval of management contract | 20 | |
| Other information for shareholders. | 25 | |
| Financial statements | 26 | |
| Brokerage commissions | 43 | |
Cover photograph: © White-Packert Photography
Message from the Trustees
Dear Fellow Shareholder:
For several months now, financial markets have been experiencing significant upheaval. Coordinated responses by economic and financial authorities in the United States and overseas should restore stability in due course, but investors should not expect a reduction in volatility in the near term.
Putnam, meanwhile, is making several important changes to its equity fund lineup and portfolio teams under the leadership of its newly appointed President and Chief Executive Officer, Robert L. Reynolds. Putnam is removing product redundancies, seeking the best investment talent, bolstering equity research, fostering individual portfolio manager’s authority and accountability, and realigning compensation for managers so that only those who achieve top-quartile returns for shareholders are eligible for full bonuses.
In addition, Putnam is defining fundamental research as the cornerstone of its equity management approach, with quantitative analysts providing input to — but not driving — investment decisions. Putnam is also streamlining its range of equity funds by merging six equity funds into larger funds with similar investment objectives. In addition to removing product redundancies, these mergers are generally expected to result in lower expense ratios for shareholders.
Mr. Reynolds, who joined Putnam in July, has substantial industry experience and an outstanding record of success, including serving as Vice Chairman and Chief Operating Officer at Fidelity Investments from 2000
2
to 2007. Charles E. Haldeman, Jr., former President and CEO, has taken on the role of Chairman of Putnam Investment Management, LLC, the firm’s fund management company. Mr. Haldeman continues to serve as President of the Funds and as a Trustee. Mr. Reynolds also serves as a Trustee.
We would like to take this opportunity to welcome new shareholders to the fund and to thank all of our investors for your continued confidence in Putnam during these challenging times.

About the fund
Seeking undervalued companies before their potential is recognized
Hidden opportunities — and a measure of patience — are key ingredients in the investment strategy of Putnam Mid Cap Value Fund. The fund invests in stocks of midsize companies, which tend to be followed by fewer Wall Street analysts than stocks of larger companies. For firms with strong research capabilities, such as Putnam, these stocks can represent attractive opportunities. With support from a team of dedicated stock analysts, the fund’s portfolio manager seeks to identify promising midsize companies before the market recognizes their potential.
Another advantage of midsize companies is that they tend to be more agile than large companies, while offering a greater degree of stability than smaller, less mature companies. Most midsize companies have developed a solid infrastructure, including professional management and a comprehensive business plan. Most have also weathered a full economic cycle.
Because Putnam Mid Cap Value Fund is managed in the value style, the portfolio manager also takes another important factor into consideration: The stocks purchased must be attractively priced in relation to the company’s earnings and growth potential. A value stock’s price may be low because the company’s potential is being underestimated or because the company is in an industry that is currently out of favor with investors. Often, companies in the portfolio are undergoing positive changes that may improve their earnings and growth potential. Catalysts for change can include restructuring, introduction of new products, new management, acquisitions, or streamlining of operations to cut costs.
Of course, such changes can take time. As noted in the fund’s first annual report to shareholders in April 2000, “Once a stock is in the portfolio, patience is called for while waiting for the positive change that can lift the stock’s share price. Accordingly, investors should understand that this fund is most appropriate for those with long-term investment horizons.”
The fund invests some or all of its assets in small and/or midsize companies. Such investments increase the risk of greater fluctuations in the value of your investment. Value investing seeks underpriced stocks, but there is no guarantee that a stock’s price will rise.

In-depth analysis is key to
successful stock selection
Drawing on the expertise of a dedicated team of stock analysts, the fund’s portfolio manager seeks attractive value stocks. Once a stock is selected for the portfolio, it is regularly assessed to ensure that it continues to meet certain criteria, including:
Valuation Carefully consider how each stock is valued, seeking stocks whose valuations are attractive relative to the company’s profitability potential.
Change Focus on company fundamentals against the broader context of industry trends to identify whether individual companies possess a catalyst for positive change.
Quality Look for high-quality companies, seeking characteristics such as sound balance sheets, profitable business models, and competent management.
Putnam Mid Cap Value Fund holdings
have spanned industries over time.
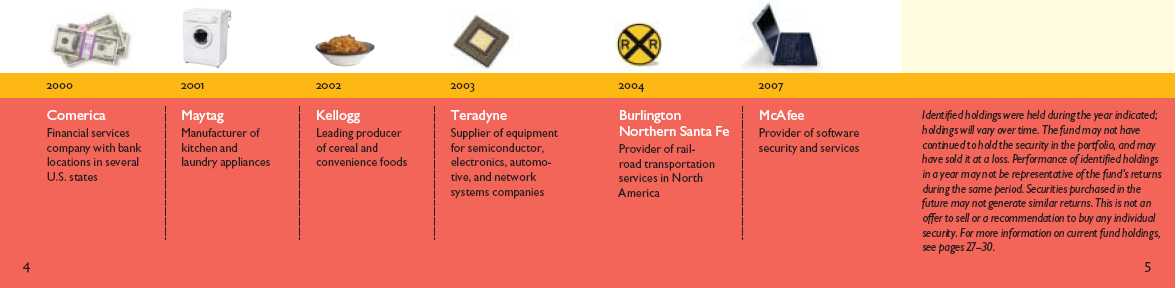
Performance snapshot
Average annual total return (%) comparison as of 10/31/08
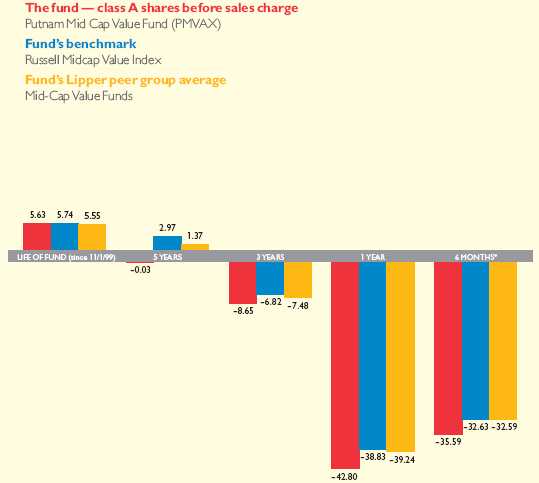
Current performance may be lower or higher than the quoted past performance, which cannot guarantee future results. Share price, principal value, and return will fluctuate, and you may have a gain or a loss when you sell your shares. Performance of class A shares assumes reinvestment of distributions and does not account for taxes. Fund returns in the bar chart do not reflect a sales charge of 5.75%; had they, returns would have been lower. See pages 7 and 12–14 for additional performance information. For a portion of the periods, this fund may have limited expenses, without which returns would have been lower. A 1% short-term trading fee may apply. To obtain the most recent month-end performance, visit www.putnam.com.
* Returns for the six-month period are not annualized, but cumulative.
6
Interview with your
fund’s Portfolio Manager
James Polk
Jim, thanks for talking with us today. How did Putnam Mid Cap Value Fund perform during the first six months of its fiscal year?
The fund struggled with the rest of the market during a difficult period. For the six months ending October 31, 2008, the fund declined 35.59%, underperforming the –32.63% return of the Russell Midcap Value Index and the –32.59% return of its Lipper peer group, Mid-Cap Value Funds.
Why did the market decline so significantly?
Most of the sharp drop occurred late in the period. Earlier on, concerns that the U.S. economy was slowing were offset by confidence that growth would be sustained overseas. However, the capital markets experienced a steep decline in the second half of the period, with September proving particularly difficult. The U.S. government stepped in to buoy several financial institutions, but the failure of investment bank Lehman Brothers caused the credit markets to seize up. Unemployment spiked sharply amid signs of a broad economic slowdown. Investors, fearing prospects in the United States were so bad that they would pull down the rest of the world markets, quickly sold off stocks. In a major reversal
Broad market index and fund performance
This comparison shows your fund’s performance in the context of broad market indexes for the six months ended 10/31/08. See page 6 and pages 12–14 for additional fund performance information. Index descriptions can be found on page 19.
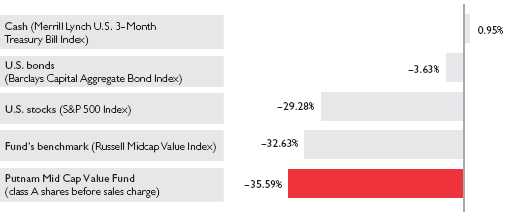
7
of what had occurred earlier in the year, basic materials and energy stocks were crushed, partly because of a massive sell-off by hedge funds.
What changes did you make to the portfolio?
Earlier in the period — in the face of slowing U.S. economic growth — we had moved to position the fund more conservatively. We did so by reducing our holdings in the basic materials and energy sectors, for example, but maintained some positions there because of what appeared to be continued positive growth prospects in China and elsewhere abroad. However, we didn’t anticipate the magnitude of the downdraft. The market pitched to the negative so quickly that the fund was left with some exposure to the hardest-hit parts of the market. We reinstituted some of these energy and basic materials shares in September and October, feeling that they were already oversold and that their valuations adequately reflected business fundamentals. Yet, they declined even further. Elsewhere, we increased the fund’s stake in financials, a move that helped performance, because this area was one of the top performers late in the period. We be lieved that many financial stocks were selling at attractive valuations.
Which of the fund’s holdings detracted from its performance relative to the benchmark index?
At the sector level, fund performance was held back by unfavorable stock selection in basic materials (although
Top 10 holdings
This table shows the fund’s top 10 holdings and the percentage of the fund’s net assets that each represented as of 10/31/08. Also shown is each holding’s market sector and the specific industry within that sector. Holdings will vary over time.
| | |
| HOLDING (percentage of fund’s net assets) | SECTOR | INDUSTRY |
|
| Omnicare, Inc. (4.1%) | Health care | Health-care services |
| W.R. Berkley Corp. (3.4%) | Financials | Insurance |
| Atmel Corp. (3.0%) | Technology | Semiconductor |
| Con-way, Inc. (2.8%) | Transportation | Shipping |
| Nasdaq OMX Group, Inc. (The) (2.6%) | Financials | Financial |
| OfficeMax, Inc. (2.5%) | Consumer cyclicals | Retail |
| Pediatrix Medical Group, Inc. (2.5%) | Health care | Health-care services |
| Abercrombie & Fitch Co. Class A (2.4%) | Consumer cyclicals | Retail |
| BJ's Wholesale Club, Inc. (2.3%) | Consumer staples | Retail |
| Maxim Integrated Products, Inc. (2.2%) | Technology | Semiconductor |
8
this was offset by carrying an underweight there), poor security selection, an overweight in energy, and an overweight in transportation.
Individual holdings that dampened returns included two steel companies, United States Steel and Steel Dynamics. Both firms were hurt by concerns about the possibility of slowing economic growth in China. In a similar vein, DryShips, a company that ships iron ore to China, declined drastically, beyond what would reasonably be expected given the firm’s rational business model. We feel that these stocks encountered unique downward selling pressures as hedge funds fled them. We also suffered the misfortune of holding banking firm Washington Mutual, which declared bankruptcy during the period, and we eliminated our position in this holding by the end of the period. Last ly, General Growth Properties, a real estate investment trust [REIT] that specializes in malls, was hurt by concerns about slowing retail sales, a management reshuffling, and the company’s debt load in the aftermath of its acquisition of real estate management and development company Rouse. This holding was also sold by the end of the period.
Which holdings contributed to performance?
Within such a negative market environment, contributions generally came from areas or holdings that fell less than the benchmark. At the sector level, the fund’s relative performance was helped by good stock selection and an overweight in health care (a relatively
Comparison of top sector weightings
This chart shows how the fund’s top weightings have changed over the past six months.
Weightings are shown as a percentage of net assets. Holdings will vary over time.
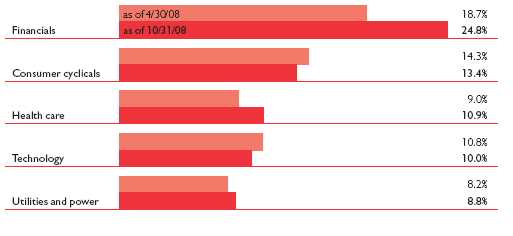
9
defensive group that attracted investors within a difficult environment), favorable security selection in technology, and a modest cash position, which offset some losses we incurred in a declining market.
Among the stocks that helped performance was Omnicare, which provides pharmacy services to hospitals and nursing homes. This stock outperformed the benchmark as the company’s management team made some strides with its restructuring program. Semiconductor manufacturer Atmel benefited from a positive management shift, cost reductions, and a bid from Microchip to acquire the company. NASDAQ OMX Group, which operates the Nasdaq stock exchange, was helped by the combination of fertile acquisitions and stable costs. North Carolina-based regional bank First Citizens BancShares attracted interest because of its solid market share. Finally, property and casualty insurer W.R. Berkley rebounded due to anticipated increases in market share and pricing.
I N T H E N E W S
In November, the Federal Reserve Bank (the Fed) and the U.S. Treasury announced $800 billion in new lending programs to help the consumer lending and home mortgage markets. The Treasury and the Fed said they would create a $200 billion program to support the issuance of securities that are backed by car loans, student loans, credit card debt, and small-business loans. In a separate action, the Fed said it would lower mortgage rates and increase the availability of credit for the housing market by buying up to $600 billion in debt tied to home loans backed by Fannie Mae, Freddie Mac, and other government-controlled financing agencies.
Jim, what’s your outlook for the months ahead?
The backdrop remains extremely uncertain. The fourth quarter likely will be difficult, as corporate business fundamentals remain weak and investors wrestle with the magnitude of the breakdown in the financial markets. The Federal Reserve [the Fed] — in concert with other central banks overseas — has injected significant stimulus into the economy, but it will be some time before these moves bear fruit. Typically, it takes 18 to 24 months for the Fed’s rate cuts to influence the economy. It’s possible the United States could recover before other markets, because it started to stumble earlier and therefore could benefit from government stimulus moves first. But questions remain, particularly: When will we reach the bottom that is fully reflected in stock valuations? Many companies have chosen not to give
10
guidance on their anticipated earnings because they don’t know what the future holds. As a result, there are significant disconnects between companies’ intrinsic values and what the market is willing to pay for them.
For our part, we will look to invest in attractively valued stocks that should benefit early in any recovery. We’ll try to use market volatility to our advantage, investing in beaten-down stocks and, in some cases, trading in and out of stocks a bit more actively than we have in the past. Meeting with companies, prospecting for new ideas, continuing to evaluate opportunities to see if we can unearth better ideas, paying attention to the size of our positions — these are all methods we intend to employ to help your fund weather this ongoing financial turmoil.
Thank you, Jim, for your time and insights today.
The views expressed in this report are exclusively those of Putnam Management. They are not meant as investment advice.
Please note that the holdings discussed in this report may not have been held by the fund for the entire period. Portfolio composition is subject to review in accordance with the fund’s investment strategy and may vary in the future.
11
Your fund’s performance
This section shows your fund’s performance, price, and distribution information for periods ended October 31, 2008, the end of the first half of its current fiscal year. In accordance with regulatory requirements for mutual funds, we also include performance as of the most recent calendar quarter-end and expense information taken from the fund’s current prospectus. Performance should always be considered in light of a fund’s investment strategy. Data represents past performance. Past performance does not guarantee future results. More recent returns may be less or more than those shown. Investment return and principal value will fluctuate, and you may have a gain or a loss when you sell your shares. Performance information does not reflect any deduction for taxes a shareholder may owe on fund distributions or on the redemption of fund shares. For the most recent month-end performance, please visit the Individual Investors section of www.putnam.com or call Putnam at 1-800-225-1581. Class Y shares are generally only available to corporate and institutional clients and clients in other approved programs. See the Terms and Definitions section in this report for definitions of the share classes offered by your fund.
| | | | | | | | | | |
| Fund performance Total return for periods ended 10/31/08 | | | | |
| |
| | Class A | Class B | Class C | Class M | Class R | Class Y |
| (inception dates) | (11/1/99) | (1/16/01) | (1/16/01) | (1/16/01) | (4/1/03) | (4/2/02) |
|
| | NAV | POP | NAV | CDSC | NAV | CDSC | NAV | POP | NAV | NAV |
|
| Life of fund | 63.72% | 54.28% | 53.15% | 53.15% | 52.98% | 52.98% | 56.59% | 51.12% | 60.26% | 66.39% |
| Annual average | 5.63 | 4.93 | 4.85 | 4.85 | 4.83 | 4.83 | 5.11 | 4.69 | 5.38 | 5.82 |
|
| 5 years | –0.16 | –5.93 | –3.81 | –5.08 | –3.88 | –3.88 | –2.59 | –5.98 | –1.37 | 1.12 |
| Annual average | –0.03 | –1.22 | –0.77 | –1.04 | –0.79 | –0.79 | –0.52 | –1.23 | –0.28 | 0.22 |
|
| 3 years | –23.78 | –28.15 | –25.45 | –26.95 | –25.51 | –25.51 | –24.92 | –27.54 | –24.32 | –23.21 |
| Annual average | –8.65 | –10.43 | –9.33 | –9.94 | –9.35 | –9.35 | –9.11 | –10.18 | –8.87 | –8.43 |
|
| 1 year | –42.80 | –46.09 | –43.20 | –45.57 | –43.26 | –43.74 | –43.11 | –45.10 | –42.94 | –42.70 |
|
| 6 months | –35.59 | –39.29 | –35.83 | –39.04 | –35.83 | –36.47 | –35.73 | –37.97 | –35.68 | –35.55 |
|
Current performance may be lower or higher than the quoted past performance, which cannot guarantee future results. After sales charge returns (public offering price, or POP) for class A and M shares reflect a maximum 5.75% and 3.50% load. Class B share returns reflect the applicable contingent deferred sales charge (CDSC), which is 5% in the first year, declining to 1% in the sixth year, and is eliminated thereafter. Class C shares reflect a 1% CDSC for the first year that is eliminated thereafter. Class R and Y shares have no initial sales charge or CDSC. Performance for class B, C, M, R, and Y shares before their inception is derived from the historical performance of class A shares, adjusted for the applicable sales charge (or CDSC) and, except for class Y shares, the higher operating expenses for such shares.
For a portion of the periods, this fund may have limited expenses, without which returns would have been lower.
A 1% short-term trading fee may be applied to shares exchanged or sold within 7 days of purchase.
12
Comparative index returns For periods ended 10/31/08
| | |
| | | Lipper Mid-Cap |
| | Russell Midcap | Value Funds |
| | Value Index | category average* |
|
| Life of fund | 65.36% | 66.18% |
| Annual average | 5.74 | 5.55 |
|
| 5 years | 15.75 | 7.49 |
| Annual average | 2.97 | 1.37 |
|
| 3 years | –19.11 | –20.61 |
| Annual average | –6.82 | –7.48 |
|
| 1 year | –38.83 | –39.24 |
|
| 6 months | –32.63 | –32.59 |
|
Index and Lipper results should be compared to fund performance at net asset value.
* Over the 6-month, 1-year, 3-year, 5-year, and life-of-fund periods ended 10/31/08 , there were 366, 354, 271, 206, and 80 funds, respectively, in this Lipper category.
Fund price and distribution information For the six-month period ended 10/31/08
| | | | | | | | |
| | Class A | Class B | Class C | Class M | Class R | Class Y |
|
| Share value | NAV | POP | NAV | NAV | NAV | POP | NAV | NAV |
|
| 4/30/08 | $11.97 | $12.70 | $11.50 | $11.47 | $11.67 | $12.09 | $11.80 | $12.01 |
|
| 10/31/08 | 7.71 | 8.18 | 7.38 | 7.36 | 7.50 | 7.77 | 7.59 | 7.74 |
|
The classification of distributions, if any, is an estimate. Final distribution information will appear on your year-end tax forms.
The fund made no distributions during the period.
Fund performance as of most recent calendar quarter
Total return for periods ended 9/30/08
| | | | | | | | | | |
| | Class A | Class B | Class C | Class M | Class R | Class Y |
| (inception dates) | (11/1/99) | (1/16/01) | (1/16/01) | (1/16/01) | (4/1/03) | (4/2/02) |
|
| | NAV | POP | NAV | CDSC | NAV | CDSC | NAV | POP | NAV | NAV |
|
| Life of fund | 108.10% | 96.10% | 94.65% | 94.65% | 94.55% | 94.55% | 98.98% | 92.02% | 103.76% | 111.54% |
| Annual average | 8.56 | 7.84 | 7.75 | 7.75 | 7.75 | 7.75 | 8.02 | 7.59 | 8.31 | 8.76 |
|
| 5 years | 35.33 | 27.56 | 30.33 | 28.61 | 30.31 | 30.31 | 31.92 | 27.27 | 33.73 | 37.07 |
| Annual average | 6.24 | 4.99 | 5.44 | 5.16 | 5.44 | 5.44 | 5.70 | 4.94 | 5.99 | 6.51 |
|
| 3 years | –6.70 | –12.07 | –8.76 | –10.59 | –8.84 | –8.84 | –8.17 | –11.37 | –7.35 | –5.97 |
| Annual average | –2.29 | –4.20 | –3.01 | –3.66 | –3.04 | –3.04 | –2.80 | –3.94 | –2.51 | –2.03 |
|
| 1 year | –25.68 | –29.95 | –26.29 | –29.37 | –26.28 | –26.89 | –26.11 | –28.70 | –25.86 | –25.49 |
|
| 6 months | –14.19 | –19.14 | –14.57 | –18.84 | –14.60 | –15.45 | –14.53 | –17.49 | –14.30 | –14.14 |
|
13
Fund’s annual operating expenses For the fiscal year ended 4/30/08
| | | | | | |
| | Class A | Class B | Class C | Class M | Class R | Class Y |
|
| Net expenses* | 1.27% | 2.02% | 2.02% | 1.77% | 1.52% | 1.02% |
|
| Total annual fund operating expenses | 1.28 | 2.03 | 2.03 | 1.78 | 1.53 | 1.03 |
|
* Reflects Putnam Management’s decision to contractually limit expenses through 4/30/09.
Expense information in this table is taken from the most recent prospectus, is subject to change, and may differ from that shown in the next section and in the financial highlights of this report. Expenses are shown as a percentage of average net assets.
Your fund’s expenses
As a mutual fund investor, you pay ongoing expenses, such as management fees, distribution fees (12b-1 fees), and other expenses. In the most recent six-month period, your fund limited these expenses; had it not done so, expenses would have been higher. Using the following information, you can estimate how these expenses affect your investment and compare them with the expenses of other funds. You may also pay one-time transaction expenses, including sales charges (loads) and redemption fees, which are not shown in this section and would have resulted in higher total expenses. For more information, see your fund’s prospectus or talk to your financial representative.
Review your fund’s expenses
The following table shows the expenses you would have paid on a $1,000 investment in Putnam Mid Cap Value Fund from May 1, 2008, to October 31, 2008. It also shows how much a $1,000 investment would be worth at the close of the period, assuming actual returns and expenses.
| | | | | | |
| | Class A | Class B | Class C | Class M | Class R | Class Y |
|
| Expenses paid per $1,000* | $5.39 | $8.48 | $8.48 | $7.45 | $6.42 | $4.35 |
|
| Ending value (after expenses) | $644.10 | $641.70 | $641.70 | $642.70 | $643.20 | $644.50 |
|
* Expenses for each share class are calculated using the fund’s annualized expense ratio for each class, which represents the ongoing expenses as a percentage of average net assets for the six months ended 10/31/08. The expense ratio may differ for each share class (see the last table in this section). Expenses are calculated by multiplying the expense ratio by the average account value for the period; then multiplying the result by the number of days in the period; and then dividing that result by the number of days in the year.
Estimate the expenses you paid
To estimate the ongoing expenses you paid for the six months ended October 31, 2008, use the following calculation method. To find the value of your investment on May 1, 2008, call Putnam at 1-800-225-1581.
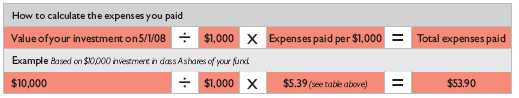
14
Compare expenses using the SEC’s method
The Securities and Exchange Commission (SEC) has established guidelines to help investors assess fund expenses. Per these guidelines, the following table shows your fund’s expenses based on a $1,000 investment, assuming a hypothetical 5% annualized return. You can use this information to compare the ongoing expenses (but not transaction expenses or total costs) of investing in the fund with those of other funds. All mutual fund shareholder reports will provide this information to help you make this comparison. Please note that you cannot use this information to estimate your actual ending account balance and expenses paid during the period.
| | | | | | |
| | Class A | Class B | Class C | Class M | Class R | Class Y |
|
| Expenses paid per $1,000* | $6.61 | $10.41 | $10.41 | $9.15 | $7.88 | $5.35 |
|
| Ending value (after expenses) | $1,018.65 | $1,014.87 | $1,014.87 | $1,016.13 | $1,017.39 | $1,019.91 |
|
* Expenses for each share class are calculated using the fund’s annualized expense ratio for each class, which represents the ongoing expenses as a percentage of average net assets for the six months ended 10/31/08. The expense ratio may differ for each share class (see the last table in this section). Expenses are calculated by multiplying the expense ratio by the average account value for the period; then multiplying the result by the number of days in the period; and then dividing that result by the number of days in the year.
Compare expenses using industry averages
You can also compare your fund’s expenses with the average of its peer group, as defined by Lipper, an independent fund-rating agency that ranks funds relative to others that Lipper considers to have similar investment styles or objectives. The expense ratio for each share class shown indicates how much of your fund’s average net assets have been used to pay ongoing expenses during the period.
| | | | | | |
| | Class A | Class B | Class C | Class M | Class R | Class Y |
|
| Your fund’s annualized | | | | | | |
| expense ratio | 1.30% | 2.05% | 2.05% | 1.80% | 1.55% | 1.05% |
|
| Average annualized expense | | | | | | |
| ratio for Lipper peer group* | 1.33% | 2.08% | 2.08% | 1.83% | 1.58% | 1.08% |
|
* Putnam keeps fund expenses below the Lipper peer group average expense ratio by limiting our fund expenses if they exceed the Lipper average. The Lipper average is a simple average of front-end load funds in the peer group that excludes 12b-1 fees as well as any expense offset and brokerage/service arrangements that may reduce fund expenses. To facilitate the comparison in this presentation, Putnam has adjusted the Lipper average to reflect 12b-1 fees. Investors should note that the other funds in the peer group may be significantly smaller or larger than the fund, and that an asset-weighted average would likely be lower than the simple average. Also, the fund and Lipper report expense data at different times; the fund’s expense ratio shown here is annualized data for the most recent six-month period, while the quarterly updated Lipper average is based on the most recent fiscal year-end data available for the peer group funds as of 9/30/08.
15
Your fund’s portfolio turnover
Putnam funds are actively managed by teams of experts who buy and sell securities based on intensive analysis of companies, industries, economies, and markets. Portfolio turnover is a measure of how often a fund’s managers buy and sell securities for your fund. A portfolio turnover of 100%, for example, means that the managers sold and replaced securities valued at 100% of a fund’s average portfolio value within a given period. Funds with high turnover may be more likely to generate capital gains that must be distributed to shareholders as taxable income. High turnover may also cause a fund to pay more brokerage commissions and other transaction costs, which may detract from performance.
You can use the following table to compare your fund’s turnover with the average turnover for funds in its Lipper category.
| | | | | |
| Turnover comparisons Percentage of holdings that change every year | | |
| |
| | 2008 | 2007 | 2006 | 2005 | 2004 |
|
| Putnam Mid Cap Value Fund | 71% | 63% | 64% | 89% | 84% |
|
| Lipper Mid-Cap Value Funds | | | | | |
| category average | 80% | 79% | 82% | 90% | 74% |
|
Turnover data for the fund is calculated based on the fund’s fiscal-year period, which ends on April 30. Turnover data for the fund’s Lipper category is calculated based on the average of the turnover of each fund in the category for its fiscal year ended during the indicated year. Fiscal years vary across funds in the Lipper category, which may limit the comparability of the fund’s portfolio turnover rate to the Lipper average. Comparative data for 2008 is based on information available as of 10/31/08.
16
Your fund’s risk
This risk comparison is designed to help you understand how your fund compares with other funds. The comparison utilizes a risk measure developed by Morningstar, an independent fund-rating agency. This risk measure is referred to as the fund’s Morningstar Risk.
Your fund’s Morningstar® Risk
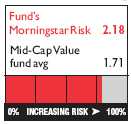
Your fund’s Morningstar Risk is shown alongside that of the average fund in its Morningstar category. The risk bar broadens the comparison by translating the fund’s Morningstar Risk into a percentile, which is based on the fund’s ranking among all funds rated by Morningstar as of September 30, 2008. A higher Morningstar Risk generally indicates that a fund’s monthly returns have varied more widely.
Morningstar determines a fund’s Morningstar Risk by assessing variations in the fund’s monthly returns — with an emphasis on downside variations — over a 3-year period, if available.Those measures are weighted and averaged to produce the fund’s Morningstar Risk.The information shown is provided for the fund’s class A shares only; information for other classes may vary. Morningstar Risk is based on historical data and does not indicate future results. Morningstar does not purport to measure the risk associated with a current investment in a fund, either on an absolute basis or on a relative basis. Low Morningstar Risk does not mean that you cannot lose money on an investment in a fund. Copyright 2008 Morningstar, Inc. All Rights Reserved.The information contained herein (1) is proprietary to Morningstar and/or its content providers; (2) may not be copied or distributed; and (3) is not warranted to be accurate, complete, or timely. Neither Morningstar nor its content providers are responsible for any damages or losses arising from any use of this information.
17
Your fund’s management
Your fund’s Portfolio Manager is James Polk.
Portfolio management fund ownership
The following table shows how much the fund’s current Portfolio Manager has invested in the fund and in all Putnam mutual funds (in dollar ranges). Information shown is as of October 31, 2008, and October 31, 2007.
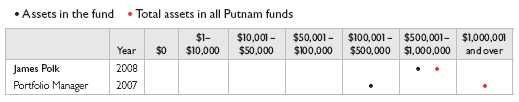
Trustee and Putnam employee fund ownership
As of October 31, 2008, 12 of the 13 Trustees of the Putnam funds owned fund shares. The table below shows the approximate value of investments in the fund and all Putnam funds as of that date by the Trustees and Putnam employees. These amounts include investments by the Trustees’ and employees’ immediate family members and investments through retirement and deferred compensation plans.
| | |
| | Assets in the fund | Total assets in all Putnam funds |
|
| Trustees | $93,000 | $33,000,000 |
|
| Putnam employees | $4,303,000 | $396,000,000 |
|
Other Putnam funds managed by the Portfolio Manager
James Polk may also manage other accounts and variable trust funds advised by Putnam Management or an affiliate.
Changes in your fund’s portfolio management
During the reporting period ended October 31, 2008, Edward Shadek left your fund’s management team.
18
Terms and definitions
Important terms
Total return shows how the value of the fund’s shares changed over time, assuming you held the shares through the entire period and reinvested all distributions in the fund.
Net asset value (NAV) is the price, or value, of one share of a mutual fund, without a sales charge. NAVs fluctuate with market conditions. NAV is calculated by dividing the net assets of each class of shares by the number of outstanding shares in the class.
Public offering price (POP) is the price of a mutual fund share plus the maximum sales charge levied at the time of purchase. POP performance figures shown here assume the 5.75% maximum sales charge for class A shares and 3.50% for class M shares.
Contingent deferred sales charge (CDSC) is generally a charge applied at the time of the redemption of class B or C shares and assumes redemption at the end of the period. Your fund’s class B CDSC declines from a 5% maximum during the first year to 1% during the sixth year. After the sixth year, the CDSC no longer applies. The CDSC for class C shares is 1% for one year after purchase.
Share classes
Class A shares are generally subject to an initial sales charge and no CDSC (except on certain redemptions of shares bought without an initial sales charge).
Class B shares are not subject to an initial sales charge. They may be subject to a CDSC.
Class C shares are not subject to an initial sales charge and are subject to a CDSC only if the shares are redeemed during the first year.
Class M shares have a lower initial sales charge and a higher 12b-1 fee than class A shares and no CDSC (except on certain redemptions of shares bought without an initial sales charge).
Class R shares are not subject to an initial sales charge or CDSC and are available only to certain defined contribution plans.
Class Y shares are not subject to an initial sales charge or CDSC, and carry no 12b-1 fee. They are generally only available to corporate and institutional clients and clients in other approved programs.
Comparative indexes
Barclays Capital Aggregate Bond Index is an unmanaged index of U.S. investment-grade fixed-income securities.
Merrill Lynch U.S. 3-Month Treasury Bill Index is an unmanaged index that seeks to measure the performance of U.S. Treasury bills available in the marketplace.
Russell Midcap Value Index is an unmanaged index of those companies in the Russell Midcap Index chosen for their value orientation.
S&P 500 Index is an unmanaged index of common stock performance.
Indexes assume reinvestment of all distributions and do not account for fees. Securities and performance of a fund and an index will differ. You cannot invest directly in an index.
Lipper is a third-party industry-ranking entity that ranks mutual funds. Its rankings do not reflect sales charges. Lipper rankings are based on total return at net asset value relative to other funds that have similar current investment styles or objectives as determined by Lipper. Lipper may change a fund’s category assignment at its discretion. Lipper category averages reflect performance trends for funds within a category.
19
Trustee approval of management contract
General conclusions
The Board of Trustees of the Putnam funds oversees the management of each fund and, as required by law, determines annually whether to approve the continuance of your fund’s management contract with Putnam Investment Management (“Putnam Management”). In this regard, the Board of Trustees, with the assistance of its Contract Committee consisting solely of Trustees who are not “interested persons” (as such term is defined in the Investment Company Act of 1940, as amended) of the Putnam funds (the “Independent Trustees”), requests and evaluates all information it deems reasonably necessary under the circumstances. Over the course of several months ending in June 2008, the Contract Committee met several times to consider the information provided by Putnam Management and other information developed with the assistance of the Board’s independent counsel and independent staff. The Contract Committee reviewed and discussed key aspects of t his information with all of the Independent Trustees. The Contract Committee recommended, and the Independent Trustees approved, the continuance of your fund’s management contract, effective July 1, 2008.
The Independent Trustees’ approval was based on the following conclusions:
• That the fee schedule in effect for your fund represented reasonable compensation in light of the nature and quality of the services being provided to the fund, the fees paid by competitive funds and the costs incurred by Putnam Management in providing such services, and
• That this fee schedule represented an appropriate sharing between fund shareholders and Putnam Management of such economies of scale as may exist in the management of the fund at current asset levels.
These conclusions were based on a comprehensive consideration of all information provided to the Trustees, were subject to the continued application of certain expense reductions and waivers and other considerations noted below, and were not the result of any single factor. Some of the factors that figured particularly in the Trustees’ deliberations and how the Trustees considered these factors are described below, although individual Trustees may have evaluated the information presented differently, giving different weights to various factors. It is also important to recognize that the fee arrangements for your fund and the other Putnam funds are the result of many years of review and discussion between the Independent Trustees and Putnam Management, that certain aspects of such arrangements may receive greater scrutiny in some years than others, and that the Trustees’ conclusions may be based, in part, on their consideration of these same arrangements in prio r years.
Management fee schedules and
categories; total expenses
The Trustees reviewed the management fee schedules in effect for all Putnam funds, including fee levels and breakpoints, and the assignment of funds to particular fee categories. In reviewing fees and expenses, the Trustees generally focused their attention on material changes in circumstances — for example, changes in a fund’s size or investment style, changes in Putnam Management’s operating costs or responsibilities, or changes in competitive practices in the mutual fund industry — that suggest that consideration of fee changes might be warranted. The
20
Trustees concluded that the circumstances did not warrant changes to the management fee structure of your fund, which had been carefully developed over the years, re-examined on many occasions and adjusted where appropriate. In this regard, the Trustees also noted that shareholders of your fund voted in 2007 to approve new management contracts containing an identical fee structure. The Trustees focused on two areas of particular interest, as discussed further below:
• Competitiveness. The Trustees reviewed comparative fee and expense information for competitive funds, which indicated that, in a custom peer group of competitive funds selected by Lipper Inc., your fund ranked in the 14th percentile in management fees and in the 24th percentile in total expenses (less any applicable 12b-1 fees) as of December 31, 2007 (the first percentile being the least expensive funds and the 100th percentile being the most expensive funds). (Because the fund’s custom peer group is smaller than the fund’s broad Lipper Inc. peer group, this expense information may differ from the Lipper peer expense information found elsewhere in this report.) The Trustees noted that expense ratios for a number of Putnam funds, which show the percentage of fund assets used to pay for management and administrative services, distribution (12b-1) fees and other expenses, had been increas ing recently as a result of declining net assets and the natural operation of fee breakpoints.
The Trustees noted that the expense ratio increases described above were currently being controlled by expense limitations initially implemented in January 2004. The Trustees have received a commitment from Putnam Management and its parent company to continue this program through at least June 30, 2009. These expense limitations give effect to a commitment by Putnam Management that the expense ratio of each open-end fund would be no higher than the average expense ratio of the competitive funds included in the fund’s relevant Lipper universe (exclusive of any applicable 12b-1 charges in each case). The Trustees observed that this commitment to limit fund expenses has served shareholders well since its inception.
In order to ensure that the expenses of the Putnam funds continue to meet evolving competitive standards, the Trustees requested, and Putnam Management agreed, to extend for the twelve months beginning July 1, 2008, an additional expense limitation for certain funds at an amount equal to the average expense ratio (exclusive of 12b-1 charges) of a custom peer group of competitive funds selected by Lipper to correspond to the size of the fund. This additional expense limitation will be applied to those open-end funds that had above-average expense ratios (exclusive of 12b-1 charges) based on the custom peer group data for the period ended December 31, 2007. This additional expense limitation will not be applied to your fund because it had a below-average expense ratio relative to its custom peer group.
In addition, the Trustees devoted particular attention to analyzing the Putnam funds’ fees and expenses relative to those of competitors in fund complexes of comparable size and with a comparable mix of asset categories. The Trustees concluded that this analysis did not reveal any matters requiring further attention at the current time.
• Economies of scale. Your fund currently has the benefit of breakpoints in its management fee that provide shareholders with significant economies of scale, which means that the effective management fee rate of the fund (as a percentage of fund assets) declines as the fund grows in size and crosses specified asset thresholds. Conversely, if the fund shrinks in size — as has been the case for many Putnam funds in recent years — these breakpoints result in increasing fee levels. In recent years,
21
the Trustees have examined the operation of the existing breakpoint structure during periods of both growth and decline in asset levels. The Trustees concluded that the fee schedule in effect for your fund represented an appropriate sharing of economies of scale at current asset levels.
In connection with their review of the management fees and total expenses of the Putnam funds, the Trustees also reviewed the costs of the services to be provided and profits to be realized by Putnam Management and its affiliates from the relationship with the funds. This information included trends in revenues, expenses and profitability of Putnam Management and its affiliates relating to the investment management and distribution services provided to the funds. In this regard, the Trustees also reviewed an analysis of Putnam Management’s revenues, expenses and profitability with respect to the funds’ management contracts, allocated on a fund-by-fund basis.
Investment performance
The quality of the investment process provided by Putnam Management represented a major factor in the Trustees’ evaluation of the quality of services provided by Putnam Management under your fund’s management contract. The Trustees were assisted in their review of the Putnam funds’ investment process and performance by the work of the Investment Oversight Coordinating Committee of the Trustees and the Investment Oversight Committees of the Trustees, which had met on a regular monthly basis with the funds’ portfolio teams throughout the year. The Trustees concluded that Putnam Management generally provides a high-quality investment process — as measured by the experience and skills of the individuals assigned to the management of fund portfolios, the resources made available to such personnel, and in general the ability of Putnam Management to attract and retain high-quality personnel — but also recognized that this does not guarantee favorable investment results for every fund in every time period. The Trustees considered the investment performance of each fund over multiple time periods and considered information comparing each fund’s performance with various benchmarks and with the performance of competitive funds.
While the Trustees noted the satisfactory investment performance of certain Putnam funds, they considered the disappointing investment performance of many funds in recent periods, particularly over periods in 2007 and 2008. They discussed with senior management of Putnam Management the factors contributing to such underperformance and actions being taken to improve performance. The Trustees recognized that, in recent years, Putnam Management has taken steps to strengthen its investment personnel and processes to address areas of underperformance, including recent efforts to further centralize Putnam Management’s equity research function. In this regard, the Trustees took into consideration efforts by Putnam Management to improve its ability to assess and mitigate investment risk in individual funds, across asset classes, and across the complex as a whole. The Trustees indicated their intention to continue to monitor performance trends to assess the effectiveness of these efforts and to evaluate whether additional changes to address areas of underperformance are warranted.
In the case of your fund, the Trustees considered that your fund’s class A share cumulative total return performance at net asset value was in the following percentiles of its Lipper Inc. peer group (Lipper Mid-Cap Value Funds) for the one-year, three-year and five-year periods ended December 31, 2007 (the first percentile
22
being the best-performing funds and the 100th percentile being the worst-performing funds):
| | |
| One-year period | 49th | |
| |
| Three-year period | 39th | |
| |
| Five-year period | 61st | |
| |
(Because of the passage of time, these performance results may differ from the performance results for more recent periods shown elsewhere in this report.) Over the one-year, three-year and five-year periods ended December 31, 2007, there were 313, 242, and 194 funds, respectively, in your fund’s Lipper peer group.* Past performance is no guarantee of future returns.
As a general matter, the Trustees believe that cooperative efforts between the Trustees and Putnam Management represent the most effective way to address investment performance problems. The Trustees noted that investors in the Putnam funds have, in effect, placed their trust in the Putnam organization, under the oversight of the funds’ Trustees, to make appropriate decisions regarding the management of the funds. Based on the responsiveness of Putnam Management in the recent past to Trustee concerns about investment performance, the Trustees concluded that it is preferable to seek change within Putnam Management to address performance shortcomings. In the Trustees’ view, the alternative of engaging a new investment adviser for an underperforming fund would entail significant disruptions and would not provide any greater assurance of improved investment performance.
Brokerage and soft-dollar allocations;
other benefits
The Trustees considered various potential benefits that Putnam Management may receive in connection with the services it provides under the management contract with your fund. These include benefits related to brokerage and soft-dollar allocations, whereby a portion of the commissions paid by a fund for brokerage may be used to acquire research services that may be useful to Putnam Management in managing the assets of the fund and of other clients. The Trustees considered changes made in 2008, at Putnam Management’s request, to the Putnam funds’ brokerage allocation policy, which expanded the permitted categories of brokerage and research services payable with soft dollars and increased the permitted soft dollar allocation to third-party services over what had been authorized in previous years. The Trustees indicated their continued intent to monitor the potential benefits associated with the allocation of fund brokerage and trends in industry practice to ensur e that the principle of seeking “best price and execution” remains paramount in the portfolio trading process.
The Trustees’ annual review of your fund’s management contract arrangements also included the review of its distributor’s contract and distribution plan with Putnam Retail Management Limited Partnership and the investor servicing agreement with Putnam Fiduciary Trust Company (“PFTC”), each of which provides benefits to affiliates of Putnam Management. In the case of the investor servicing agreement, the Trustees considered
* The percentile rankings for your fund’s class A share annualized total return performance in the Lipper Mid-Cap Value Funds category for the one-year and five-year periods ended September 30, 2008 were 80% and 71%, respectively. Over the one-year and five-year periods ended September 30, 2008, your fund ranked 287th out of 359 and 149th out of 209 funds, respectively. Note that this more recent information was not available when theTrustees approved the continuance of your fund’s management contract.
23
that certain shareholder servicing functions were shifted to a third-party service provider by PFTC in 2007.
Comparison of retail and institutional
fee schedules
The information examined by the Trustees as part of their annual contract review has included for many years information regarding fees charged by Putnam Management and its affiliates to institutional clients such as defined benefit pension plans, college endowments, etc. This information included comparisons of such fees with fees charged to the funds, as well as a detailed assessment of the differences in the services provided to these two types of clients. The Trustees observed, in this regard, that the differences in fee rates between institutional clients and mutual funds are by no means uniform when examined by individual asset sectors, suggesting that differences in the pricing of investment management services to these types of clients reflect to a substantial degree historical competitive forces operating in separate market places. The Trustees considered the fact that fee rates across different asset classes are typically higher o n average for mutual funds than for institutional clients, as well as the differences between the services that Putnam Management provides to the Putnam funds and those that it provides to institutional clients of the firm, but did not rely on such comparisons to any significant extent in concluding that the management fees paid by your fund are reasonable.
24
Other information for shareholders
Important notice regarding delivery
of shareholder documents
In accordance with SEC regulations, Putnam sends a single copy of annual and semiannual shareholder reports, prospectuses, and proxy statements to Putnam shareholders who share the same address, unless a shareholder requests otherwise. If you prefer to receive your own copy of these documents, please call Putnam at 1-800-225-1581, and Putnam will begin sending individual copies within 30 days.
Proxy voting
Putnam is committed to managing our mutual funds in the best interests of our shareholders. The Putnam funds’ proxy voting guidelines and procedures, as well as information regarding how your fund voted proxies relating to portfolio securities during the 12-month period ended June 30, 2008, are available in the Individual Investors section of www. putnam.com, and on the SEC’s Web site, www. sec.gov. If you have questions about finding forms on the SEC’s Web site, you may call the SEC at 1-800-SEC-0330. You may also obtain the Putnam funds’ proxy voting guidelines and procedures at no charge by calling Putnam’s Shareholder Services at 1-800-225-1581.
Fund portfolio holdings
The fund will file a complete schedule of its portfolio holdings with the SEC for the first and third quarters of each fiscal year on Form N-Q. Shareholders may obtain the fund’s Forms N-Q on the SEC’s Web site at www.sec.gov. In addition, the fund’s Forms N-Q may be reviewed and copied at the SEC’s Public Reference Room in Washington, D.C. You may call the SEC at 1-800-SEC-0330 for information about the SEC’s Web site or the operation of the Public Reference Room.
25
Financial statements
A guide to financial statements
These sections of the report, as well as the accompanying Notes, constitute the fund’s financial statements.
The fund’s portfolio lists all the fund’s investments and their values as of the last day of the reporting period. Holdings are organized by asset type and industry sector, country, or state to show areas of concentration and diversification.
Statement of assets and liabilities shows how the fund’s net assets and share price are determined. All investment and noninvestment assets are added together. Any unpaid expenses and other liabilities are subtracted from this total. The result is divided by the number of shares to determine the net asset value per share, which is calculated separately for each class of shares. (For funds with preferred shares, the amount subtracted from total assets includes the liquidation preference of preferred shares.)
Statement of operations shows the fund’s net investment gain or loss. This is done by first adding up all the fund’s earnings —from dividends and interest income — and subtracting its operating expenses to determine net investment income (or loss). Then, any net gain or loss the fund realized on the sales of its holdings — as well as any unrealized gains or losses over the period — is added to or subtracted from the net investment result to determine the fund’s net gain or loss for the fiscal period.
Statement of changes in net assets shows how the fund’s net assets were affected by the fund’s net investment gain or loss, by distributions to shareholders, and by changes in the number of the fund’s shares. It lists distributions and their sources (net investment income or realized capital gains) over the current reporting period and the most recent fiscal year-end. The distributions listed here may not match the sources listed in the Statement of operations because the distributions are determined on a tax basis and may be paid in a different period from the one in which they were earned. Dividend sources are estimated at the time of declaration. Actual results may vary. Any non-taxable return of capital cannot be determined until final tax calculations are completed after the end of the fund’s fiscal year.
Financial highlights provide an overview of the fund’s investment results, per-share distributions, expense ratios, net investment income ratios, and portfolio turnover in one summary table, reflecting the five most recent reporting periods. In a semiannual report, the highlight table also includes the current reporting period.
26
| | |
| The fund’s portfolio 10/31/08 (Unaudited) | | |
|
| |
| COMMON STOCKS (97.7%)* | Shares | Value |
|
| Aerospace and defense (1.5%) | | |
| L-3 Communications Holdings, Inc. | 100,900 | $8,190,053 |
|
| | | 8,190,053 |
| Airlines (1.5%) | | |
| UAL Corp. S | 553,400 | 8,057,504 |
|
| | | 8,057,504 |
| Banking (7.1%) | | |
| City National Corp. | 78,100 | 4,180,693 |
|
| Cullen/Frost Bankers, Inc. | 86,400 | 4,835,808 |
|
| Fifth Third Bancorp | 623,300 | 6,762,805 |
|
| First Citizens BancShares, Inc. Class A | 69,070 | 10,562,184 |
|
| TCF Financial Corp. | 457,200 | 8,110,728 |
|
| UMB Financial Corp. | 92,700 | 4,202,091 |
|
| | | 38,654,309 |
| Building materials (1.6%) | | |
| Stanley Works (The) | 265,200 | 8,682,648 |
|
| | | 8,682,648 |
| Chemicals (1.9%) | | |
| Celanese Corp. Ser. A | 400,000 | 5,544,000 |
|
| PPG Industries, Inc. | 95,800 | 4,749,764 |
|
| | | 10,293,764 |
| Coal (0.8%) | | |
| Massey Energy Co. | 198,400 | 4,581,056 |
|
| | | 4,581,056 |
| Commercial and consumer services (0.9%) | | |
| URS Corp. † | 174,700 | 5,134,433 |
|
| | | 5,134,433 |
| Construction (0.5%) | | |
| USG Corp. † | 193,700 | 2,870,634 |
|
| | | 2,870,634 |
| Consumer (0.8%) | | |
| Harman International Industries, Inc. | 247,500 | 4,546,575 |
|
| | | 4,546,575 |
| Consumer goods (4.3%) | | |
| Clorox Co. | 156,800 | 9,535,008 |
|
| Newell Rubbermaid, Inc. | 526,800 | 7,243,500 |
|
| Weight Watchers International, Inc. | 216,000 | 6,756,480 |
|
| | | 23,534,988 |
| Containers (0.4%) | | |
| Owens-Illinois, Inc. † | 93,901 | 2,148,455 |
|
| | | 2,148,455 |
| Electric utilities (4.9%) | | |
| Edison International | 258,700 | 9,207,133 |
|
| PG&E Corp. | 152,700 | 5,599,509 |
|
| Progress Energy, Inc. | 104,380 | 4,109,441 |
|
| Wisconsin Energy Corp. | 180,000 | 7,830,000 |
|
| | | 26,746,083 |
| Electrical equipment (1.6%) | | |
| WESCO International, Inc. † | 424,600 | 8,441,048 |
|
| | | 8,441,048 |
| Electronics (1.8%) | | |
| Avnet, Inc. † | 243,200 | 4,071,168 |
|
| General Cable Corp. † S | 337,900 | 5,771,332 |
|
| | | 9,842,500 |
27
| | |
| COMMON STOCKS (97.7%)* cont. | Shares | Value |
|
| Energy (oil field) (1.8%) | | |
| National-Oilwell Varco, Inc. † | 191,233 | $5,715,954 |
|
| Oceaneering International, Inc. † | 137,800 | 3,881,826 |
|
| | | 9,597,780 |
| Financial (3.7%) | | |
| CIT Group, Inc. | 1,329,400 | 5,503,716 |
|
| Nasdaq OMX Group, Inc. (The) † | 442,200 | 14,353,812 |
|
| | | 19,857,528 |
| Gaming and lottery (1.0%) | | |
| Scientific Games Corp. Class A † S | 287,300 | 5,171,400 |
|
| | | 5,171,400 |
| Health-care services (9.1%) | | |
| AmerisourceBergen Corp. | 290,500 | 9,083,935 |
|
| Coventry Health Care, Inc. † S | 349,827 | 4,614,218 |
|
| Omnicare, Inc. S | 813,230 | 22,420,751 |
|
| Pediatrix Medical Group, Inc. † | 344,400 | 13,311,060 |
|
| | | 49,429,964 |
| Insurance (11.0%) | | |
| Fidelity National Title Group, Inc. Class A | 874,900 | 7,882,849 |
|
| Marsh & McLennan Cos., Inc. | 351,600 | 10,308,912 |
|
| PartnerRe, Ltd. (Bermuda) | 57,900 | 3,919,251 |
|
| Progressive Corp. (The) | 641,700 | 9,157,059 |
|
| Reinsurance Group of America, Inc. Class A ## | 46,950 | 1,753,113 |
|
| W.R. Berkley Corp. | 704,200 | 18,499,334 |
|
| Willis Group Holdings, Ltd. (United Kingdom) | 187,400 | 4,917,376 |
|
| XL Capital, Ltd. Class A (Bermuda) | 347,000 | 3,365,900 |
|
| | | 59,803,794 |
| Investment banking/Brokerage (1.7%) | | |
| Ameriprise Financial, Inc. | 238,262 | 5,146,459 |
|
| Eaton Vance Corp. | 175,500 | 3,861,000 |
|
| | | 9,007,459 |
| Machinery (1.4%) | | |
| Kennametal, Inc. | 361,000 | 7,660,420 |
|
| | | 7,660,420 |
| Media (1.7%) | | |
| Interpublic Group of Companies, Inc. (The) † S | 1,770,600 | 9,189,414 |
|
| | | 9,189,414 |
| Metals (1.9%) | | |
| Steel Dynamics, Inc. | 398,300 | 4,747,736 |
|
| United States Steel Corp. | 145,100 | 5,351,288 |
|
| | | 10,099,024 |
| Natural gas utilities (3.4%) | | |
| National Fuel Gas Co. | 215,600 | 7,802,564 |
|
| Questar Corp. | 305,100 | 10,513,746 |
|
| | | 18,316,310 |
| Oil and gas (3.9%) | | |
| Cabot Oil & Gas Corp. Class A S | 185,200 | 5,198,564 |
|
| Frontier Oil Corp. | 337,000 | 4,451,770 |
|
| Newfield Exploration Co. † | 306,700 | 7,047,966 |
|
| Pioneer Natural Resources Co. | 151,200 | 4,207,896 |
|
| | | 20,906,196 |
| Pharmaceuticals (1.8%) | | |
| Sepracor, Inc. † | 751,100 | 10,004,652 |
|
| | | 10,004,652 |
28
| | |
| COMMON STOCKS (97.7%)* cont. | Shares | Value |
|
| Power producers (0.5%) | | |
| Reliant Resources, Inc. † | 487,400 | $2,558,850 |
|
| | | 2,558,850 |
| Real estate (1.4%) | | |
| Annaly Capital Management, Inc. R | 407,790 | 5,668,281 |
|
| Colonial Properties Trust R | 182,500 | 1,923,550 |
|
| | | 7,591,831 |
| Retail (11.5%) | | |
| Abercrombie & Fitch Co. Class A | 447,200 | 12,950,912 |
|
| BJ’s Wholesale Club, Inc. † S | 352,111 | 12,394,307 |
|
| OfficeMax, Inc. S | 1,654,800 | 13,321,140 |
|
| Ross Stores, Inc. | 192,400 | 6,289,556 |
|
| Sally Beauty Holdings, Inc. † S | 2,014,195 | 10,232,111 |
|
| Timberland Co. (The) Class A † S | 597,539 | 7,230,222 |
|
| | | 62,418,248 |
| Semiconductor (5.2%) | | |
| Atmel Corp. † | 3,940,000 | 16,351,000 |
|
| Maxim Integrated Products, Inc. | 866,100 | 11,778,960 |
|
| | | 28,129,960 |
| Shipping (4.1%) | | |
| Con-way, Inc. | 439,680 | 14,966,707 |
|
| DryShips, Inc. (Greece) S | 383,100 | 7,374,675 |
|
| | | 22,341,382 |
| Software (3.0%) | | |
| McAfee, Inc. † | 314,620 | 10,240,881 |
|
| Parametric Technology Corp. † | 481,100 | 6,249,489 |
|
| | | 16,490,370 |
| Total common stocks (cost $738,813,888) | | $530,298,632 |
|
| | |
| SHORT-TERM INVESTMENTS (13. 5%)* | Principal amount/shares | Value |
|
| Federated Prime Obligations Fund | 16,776,702 | $16,776,702 |
|
| Short-term investments held as collateral for loaned | | |
| securities with yields ranging from 0.13% to 2.68% | | |
| and due dates ranging from November 3, 2008 | | |
| to November 10, 2008 d | $56,663,985 | 56,650,734 |
|
| Total short-term investments (cost $73,427,436) | | $73,427,436 |
|
| |
| TOTAL INVESTMENTS | | |
|
| Total investments (cost $812,241,324) | | $603,726,068 |
* Percentages indicated are based on net assets of $542,982,633.
† Non-income-producing security.
## Forward commitments, in part or in entirety (Note 1).
d See Note 1 to the financial statements.
R Real Estate Investment Trust.
S Securities on loan, in part or in entirety, at October 31, 2008.
At October 31, 2008, liquid assets totaling $1,591,136 have been designated as collateral for open forward commitments.
In September 2006, the FASB issued Statement of Financial Accounting Standards No. 157, Fair Value Measurements (SFAS 157). SFAS 157 is effective for financial statements issued for fiscal years beginning after November 15, 2007 and interim periods within those fiscal years. While the adoption of SFAS 157 does not have a material effect on the fund’s net asset value, it does require additional disclosures about fair value measurements. The Standard establishes a three-level hierarchy for disclosure of fair value measurements. The valuation hierarchy is based upon the transparency of inputs to the valuation of the fund’s investments. The three levels are defined as follows:
Level 1 — Valuations based on quoted prices for identical securities in active markets.
Level 2 — Valuations based on quoted prices in markets that are not active or for which all significant inputs are observable, either directly or indirectly.
Level 3 — Valuations based on inputs that are unobservable and significant to the fair value measurement.
The following is a summary of the inputs used to value the fund’s net assets as of October 31, 2008:
| | |
| Valuation inputs | Investments in securities | Other financial instruments |
|
| Level 1 | $547,075,334 | $— |
| |
| Level 2 | 56,650,734 | — |
| |
| Level 3 | — | — |
|
| Total | $603,726,068 | $— |
Other financial instruments include futures, written options, TBA sale commitments, swaps and forward contracts which are valued at the unrealized appreciation/(depreciation) on the instrument.
The accompanying notes are an integral part of these financial statements.
30
| |
| Statement of assets and liabilities 10/31/08 (Unaudited) | |
|
| |
| ASSETS | |
|
| Investment in securities, at value, including $53,214,260 of securities on loan (Note 1): | |
| Unaffiliated issuers (identified cost $812,241,324) | $603,726,068 |
|
| Cash | 155,524 |
|
| Dividends, interest and other receivables | 487,685 |
|
| Receivable for shares of the fund sold | 1,408,051 |
|
| Receivable for securities sold | 13,148,766 |
|
| Total assets | 618,926,094 |
|
| |
| LIABILITIES | |
|
| Payable for securities purchased | 14,415,030 |
|
| Payable for purchases of delayed delivery securities (Note 1) | 1,591,136 |
|
| Payable for shares of the fund repurchased | 1,557,610 |
|
| Payable for compensation of Manager (Notes 2 and 5) | 1,143,777 |
|
| Payable for investor servicing fees (Note 2) | 232,295 |
|
| Payable for custodian fees (Note 2) | 7,273 |
|
| Payable for Trustee compensation and expenses (Note 2) | 79,067 |
|
| Payable for administrative services (Note 2) | 4,135 |
|
| Payable for distribution fees (Note 2) | 146,069 |
|
| Collateral on securities loaned, at value (Note 1) | 56,650,734 |
|
| Other accrued expenses | 116,335 |
|
| Total liabilities | 75,943,461 |
| |
| Net assets | $542,982,633 |
|
| |
| REPRESENTED BY | |
|
| Paid-in capital (Unlimited shares authorized) (Notes 1 and 4) | $861,638,238 |
|
| Undistributed net investment income (Note 1) | 1,445,379 |
|
| Accumulated net realized loss on investments (Note 1) | (111,585,728) |
|
| Net unrealized depreciation of investments | (208,515,256) |
|
| Total — Representing net assets applicable to capital shares outstanding | $542,982,633 |
|
| |
| COMPUTATION OF NET ASSET VALUE AND OFFERING PRICE | |
|
| Net asset value and redemption price per class A share ($444,322,562 divided by 57,642,079 shares) | $7.71 |
|
| Offering price per class A share (100/94.25 of $7.71)* | $8.18 |
|
| Net asset value and offering price per class B share ($35,079,412 divided by 4,755,599 shares)** | $7.38 |
|
| Net asset value and offering price per class C share ($16,624,998 divided by 2,257,948 shares)** | $7.36 |
|
| Net asset value and redemption price per class M share ($3,973,928 divided by 529,932 shares) | $7.50 |
|
| Offering price per class M share (100/96.50 of $7.50)* | $7.77 |
|
| Net asset value, offering price and redemption price per class R share | |
| ($5,106,282 divided by 672,894 shares) | $7.59 |
|
| Net asset value, offering price and redemption price per class Y share | |
| ($37,875,451 divided by 4,891,126 shares) | $7.74 |
|
* On single retail sales of less than $50,000. On sales of $50,000 or more the offering price is reduced.
** Redemption price per share is equal to net asset value less any applicable contingent deferred sales charge.
The accompanying notes are an integral part of these financial statements.
31
| |
| Statement of operations Six months ended 10/31/08 (Unaudited) | |
|
| |
| INVESTMENT INCOME | |
|
| Dividends | $5,996,084 |
|
| Interest (including interest income of $359,640 from investments in affiliated issuers) (Note 5) | 439,544 |
|
| Securities lending | 405,057 |
|
| Total investment income | 6,840,685 |
|
| |
| EXPENSES | |
|
| Compensation of Manager (Note 2) | 2,662,002 |
|
| Investor servicing fees (Note 2) | 1,483,385 |
|
| Custodian fees (Note 2) | 9,029 |
|
| Trustee compensation and expenses (Note 2) | 23,150 |
|
| Administrative services (Note 2) | 12,847 |
|
| Distribution fees — Class A (Note 2) | 803,605 |
|
| Distribution fees — Class B (Note 2) | 325,151 |
|
| Distribution fees — Class C (Note 2) | 131,170 |
|
| Distribution fees — Class M (Note 2) | 25,178 |
|
| Distribution fees — Class R (Note 2) | 17,400 |
|
| Other | 121,382 |
|
| Fees waived and reimbursed by Manager (Notes 2 and 5) | (93,350) |
|
| Total expenses | 5,520,949 |
| Expense reduction (Note 2) | (40,122) |
|
| Net expenses | 5,480,827 |
| |
| Net investment income | 1,359,858 |
|
| |
| Net realized loss on investments (Notes 1 and 3) | (91,006,505) |
|
| Net realized loss on futures contracts (Note 1) | (15,706) |
|
| Net unrealized depreciation of investments and future contracts during the period | (235,660,261) |
|
| Net loss on investments | (326,682,472) |
| |
| Net decrease in net assets resulting from operations | $(325,322,614) |
|
The accompanying notes are an integral part of these financial statements.
32
| | | |
| | |
| Statement of changes in net assets | | |
|
| |
| DECREASE IN NET ASSETS | Six months ended 10/31/08* | Year ended 4/30/08 |
|
| Operations: | | |
| Net investment income | $1,359,858 | $1,076,672 |
|
| Net realized gain (loss) on investments | (91,022,211) | 59,310,028 |
|
| Net unrealized depreciation of investments | (235,660,261) | (183,939,739) |
|
| Net decrease in net assets resulting from operations | (325,322,614) | (123,553,039) |
|
| Distributions to shareholders (Note 1): | | |
| From ordinary income | | |
| Net investment income | | |
|
| Class A | — | (2,669,498) |
|
| Class B | — | — |
|
| Class C | — | — |
|
| Class M | — | — |
|
| Class R | — | (20,840) |
|
| Class Y | — | (431,757) |
|
| Net realized short-term gain on investments | | |
|
| Class A | — | (29,392,166) |
|
| Class B | — | (5,177,970) |
|
| Class C | — | (1,830,878) |
|
| Class M | — | (532,138) |
|
| Class R | — | (341,395) |
|
| Class Y | — | (2,871,111) |
|
| From return of capital | | |
| Class A | — | (230,896) |
|
| Class B | — | (40,676) |
|
| Class C | — | (14,383) |
|
| Class M | — | (4,180) |
|
| Class R | — | (2,682) |
|
| Class Y | — | (22,554) |
|
| From net realized long-term gain on investments | | |
| Class A | — | (76,194,080) |
|
| Class B | — | (13,422,986) |
|
| Class C | — | (4,746,234) |
|
| Class M | — | (1,379,475) |
|
| Class R | — | (885,007) |
|
| Class Y | — | (7,442,856) |
|
| Redemption fees (Note 1) | 3,276 | 1,385 |
|
| Increase (decrease) from capital share transactions (Note 4) | 155,865,493 | (73,867,539) |
|
| Total decrease in net assets | (169,453,845) | (345,072,955) |
| |
| NET ASSETS | | |
|
| Beginning of period | 712,436,478 | 1,057,509,433 |
|
| End of period (including undistributed net investment | | |
| income of $1,445,379 and $85,521, respectively) | $542,982,633 | $712,436,478 |
|
* Unaudited
The accompanying notes are an integral part of these financial statements.
33
| | | | | | | | | | | | | | | |
| Financial highlights (For a common share outstanding throughout the period) | |
|
| |
| INVESTMENT OPERATIONS: | | | | LESS DISTRIBUTIONS: | | | | | | RATIOS AND SUPPLEMENTAL DATA: | |
|
| | | | Net | | | | | | | | | | | Ratio of net | |
| | Net asset | | realized and | | | From net | | | | | | | Ratio | investment | |
| | value, | Net | unrealized | Total from | From net | realized | | | | | Total return | Net assets, | of expenses | income (loss) | |
| | beginning | investment | gain (loss) on | investment | investment | gain on | From return | Total | Redemption | Net asset value, | at net asset | end of period | to average | to average | Portfolio |
| Period ended | of period | income (loss)a | investments | operations | income | investments | of capital | distributions | fees | end of period | value (%)b | (in thousands) | net assets (%)c | net assets (%) | turnover (%) |
|
| Class A | | | | | | | | | | | | | | | |
| October 31, 2008 ** | $11.97 | .02 d | (4.28) | (4.26) | — | — | — | — | — e | $7.71 | (35.59) * | $444,323 | .66 *d | .21 *d | 54.28 * |
| April 30, 2008 | 16.26 | .04 d | (1.85) | (1.81) | (.06) | (2.41) | (.01) | (2.48) | — e | 11.97 | (12.18) | 527,392 | 1.27 d | .25 d | 70.64 |
| April 30, 2007 | 15.91 | .24 d,f | 1.95 | 2.19 | (.24) | (1.60) | — | (1.84) | — e | 16.26 | 14.66 | 707,081 | 1.23 d | 1.53 d,f | 63.15 |
| April 30, 2006 | 13.88 | .04 d,g | 3.70 | 3.74 | (.01) | (1.70) | — | (1.71) | — e | 15.91 | 28.18 | 614,761 | 1.22 d,g | .28 d,g | 63.63 |
| April 30, 2005 | 12.53 | .03 d,h | 1.51 | 1.54 | — e | (.19) | — | (.19) | — e | 13.88 | 12.31 | 455,115 | 1.30 d | .21 d,h | 88.96 |
| April 30, 2004 | 9.67 | .05 | 2.82 | 2.87 | (.01) | — | — | (.01) | — | 12.53 | 29.72 | 378,117 | 1.28 | .46 | 83.90 |
|
| Class B | | | | | | | | | | | | | | | |
| October 31, 2008 ** | $11.50 | (.02) d | (4.10) | (4.12) | — | — | — | — | — e | $7.38 | (35.83) * | $35,079 | 1.03 *d | (.17) *d | 54.28 * |
| April 30, 2008 | 15.76 | (.07) d | (1.77) | (1.84) | — | (2.41) | (.01) | (2.42) | — e | 11.50 | (12.78) | 81,207 | 2.02 d | (.49) d | 70.64 |
| April 30, 2007 | 15.46 | .12 d,f | 1.89 | 2.01 | (.11) | (1.60) | — | (1.71) | — e | 15.76 | 13.79 | 228,560 | 1.98 d | .78 d,f | 63.15 |
| April 30, 2006 | 13.62 | (.07) d,g | 3.61 | 3.54 | — | (1.70) | — | (1.70) | — e | 15.46 | 27.18 | 276,306 | 1.97 d,g | (.46) d,g | 63.63 |
| April 30, 2005 | 12.39 | (.07) d,h | 1.49 | 1.42 | — | (.19) | — | (.19) | — e | 13.62 | 11.47 | 259,429 | 2.05 d | (.52) d,h | 88.96 |
| April 30, 2004 | 9.62 | (.03) | 2.80 | 2.77 | — | — | — | — | — | 12.39 | 28.79 | 271,485 | 2.03 | (.28) | 83.90 |
|
| Class C | | | | | | | | | | | | | | | |
| October 31, 2008 ** | $11.47 | (.02) d | (4.09) | (4.11) | — | — | — | — | — e | $7.36 | (35.83) * | $16,625 | 1.03 *d | (.17) *d | 54.28 * |
| April 30, 2008 | 15.74 | (.07) d | (1.78) | (1.85) | — | (2.41) | (.01) | (2.42) | — e | 11.47 | (12.87) | 30,367 | 2.02 d | (.50) d | 70.64 |
| April 30, 2007 | 15.47 | .12 d,f | 1.88 | 2.00 | (.13) | (1.60) | — | (1.73) | — e | 15.74 | 13.77 | 45,357 | 1.98 d | .80 d,f | 63.15 |
| April 30, 2006 | 13.62 | (.07) d,g | 3.62 | 3.55 | — | (1.70) | — | (1.70) | — e | 15.47 | 27.26 | 39,800 | 1.97 d,g | (.47) d,g | 63.63 |
| April 30, 2005 | 12.39 | (.07) d,h | 1.49 | 1.42 | — | (.19) | — | (.19) | — e | 13.62 | 11.47 | 30,903 | 2.05 d | (.52) d,h | 88.96 |
| April 30, 2004 | 9.62 | (.03) | 2.80 | 2.77 | — | — | — | — | — | 12.39 | 28.79 | 30,149 | 2.03 | (.29) | 83.90 |
|
| Class M | | | | | | | | | | | | | | | |
| October 31, 2008 ** | $11.67 | (.01) d | (4.16) | (4.17) | — | — | — | — | — e | $7.50 | (35.73) * | $3,974 | .91 *d | (.05) *d | 54.28 * |
| April 30, 2008 | 15.93 | (.03) d | (1.81) | (1.84) | — | (2.41) | (.01) | (2.42) | — e | 11.67 | (12.64) | 8,204 | 1.77 d | (.24) d | 70.64 |
| April 30, 2007 | 15.63 | .16 d,f | 1.90 | 2.06 | (.16) | (1.60) | — | (1.76) | — e | 15.93 | 14.04 | 15,160 | 1.73 d | 1.03 d,f | 63.15 |
| April 30, 2006 | 13.71 | (.03) d,g | 3.65 | 3.62 | — | (1.70) | — | (1.70) | — e | 15.63 | 27.61 | 14,075 | 1.72 d,g | (.21) d,g | 63.63 |
| April 30, 2005 | 12.44 | (.04) d,h | 1.50 | 1.46 | — | (.19) | — | (.19) | — e | 13.71 | 11.74 | 13,306 | 1.80 d | (.28) d,h | 88.96 |
| April 30, 2004 | 9.64 | — e | 2.80 | 2.80 | — | — | — | — | — | 12.44 | 29.05 | 12,513 | 1.78 | (.03) | 83.90 |
|
| Class R | | | | | | | | | | | | | | | |
| October 31, 2008 ** | $11.80 | .01 d | (4.22) | (4.21) | — | — | — | — | — e | $7.59 | (35.68) * | $5,106 | .78 *d | .08 *d | 54.28 * |
| April 30, 2008 | 16.08 | — d,e | (1.82) | (1.82) | (.04) | (2.41) | (.01) | (2.46) | — e | 11.80 | (12.39) | 7,143 | 1.52 d | .01 d | 70.64 |
| April 30, 2007 | 15.77 | .18 d,f | 1.95 | 2.13 | (.22) | (1.60) | — | (1.82) | — e | 16.08 | 14.39 | 6,110 | 1.48 d | 1.21 d,f | 63.15 |
| April 30, 2006 | 13.81 | (.01) d,g | 3.69 | 3.68 | (.02) | (1.70) | — | (1.72) | — e | 15.77 | 27.86 | 2,959 | 1.47 d,g | (.03) d,g | 63.63 |
| April 30, 2005 | 12.50 | (.03) d,h | 1.54 | 1.51 | (.01) | (.19) | — | (.20) | — e | 13.81 | 12.06 | 345 | 1.55 d | (.18) d,h | 88.96 |
| April 30, 2004 | 9.67 | .03 | 2.82 | 2.85 | (.02) | — | — | (.02) | — | 12.50 | 29.43 | 15 | 1.53 | .21 | 83.90 |
|
| Class Y | | | | | | | | | | | | | | | |
| October 31, 2008 ** | $12.01 | .04 d | (4.31) | (4.27) | — | — | — | — | — e | $7.74 | (35.55) * | $37,875 | .53 *d | .33 *d | 54.28 * |
| April 30, 2008 | 16.30 | .07 d | (1.84) | (1.77) | (.10) | (2.41) | (.01) | (2.52) | — e | 12.01 | (11.91) | 58,124 | 1.02 d | .51 d | 70.64 |
| April 30, 2007 | 15.94 | .27 d,f | 1.97 | 2.24 | (.28) | (1.60) | — | (1.88) | — e | 16.30 | 14.96 | 55,241 | .98 d | 1.76 d,f | 63.15 |
| April 30, 2006 | 13.90 | .08 d,g | 3.71 | 3.79 | (.05) | (1.70) | — | (1.75) | — e | 15.94 | 28.50 | 46,314 | .97 d,g | .52 d,g | 63.63 |
| April 30, 2005 | 12.55 | .06 d,h | 1.51 | 1.57 | (.03) | (.19) | — | (.22) | — e | 13.90 | 12.53 | 36,322 | 1.05 d | .45 d,h | 88.96 |
| April 30, 2004 | 9.68 | .08 | 2.83 | 2.91 | (.04) | — | — | (.04) | — | 12.55 | 30.06 | 24,872 | 1.03 | .71 | 83.90 |
|
See notes to financial highlights at the end of this section.
The accompanying notes are an integral part of these financial statements.
Financial highlights (Continued)
* Not annualized.
** Unaudited.
a Per share net investment income (loss) has been determined on the basis of the weighted average number of shares outstanding during the period.
b Total return assumes dividend reinvestment and does not reflect the effect of sales charges.
c Includes amounts paid through expense offset and brokerage/service arrangements (Note 2).
d Reflects an involuntary contractual expense limitation and/or waivers of certain fund expenses in connection with investments in Putnam Prime Money Market Fund in effect during the period. As a result of such limitation and/or waivers, the expenses of each class reflect a reduction of the following amounts (Notes 2 and 5):
| |
| | Percentage of |
| | average net assets |
|
| October 31, 2008 | 0.01% |
|
| April 30, 2008 | 0.01 |
|
| April 30, 2007 | <0.01 |
|
| April 30, 2006 | <0.01 |
|
| April 30, 2005 | <0.01 |
|
e Amount represents less than $0.01 per share.
f Reflects a special dividend received by the fund which amounted to the following amounts:
| | |
| | | Percentage of |
| | Per share | average net assets |
|
| Class A | $0.17 | 1.10% |
|
| Class B | 0.16 | 1.10 |
|
| Class C | 0.17 | 1.13 |
|
| Class M | 0.17 | 1.10 |
|
| Class R | 0.16 | 1.06 |
|
| Class Y | 0.17 | 1.09 |
|
g Reflects a non-recurring accrual related to a reimbursement to the fund from Putnam Investments relating to the calculation of certain amounts paid by the fund to Putnam in previous years for transfer agent services, which amounted to less than $0.01 per share and 0.01% of average net assets for the period ended April 30, 2006.
h Reflects a non-recurring accrual related to Putnam Management’s settlement with the SEC regarding brokerage allocation practices. As a result, the expenses of each class reflect a reduction of the following amounts:
| | |
| | | Percentage of |
| | Per share | average net assets |
|
| Class A | <$0.01 | 0.01% |
|
| Class B | <0.01 | 0.01 |
|
| Class C | <0.01 | 0.01 |
|
| Class M | <0.01 | 0.01 |
|
| Class R | <0.01 | 0.01 |
|
| Class Y | <0.01 | 0.01 |
|
The accompanying notes are an integral part of these financial statements.
36
Notes to financial statements 10/31/08 (Unaudited)
Note 1: Significant accounting policies
Putnam Mid Cap Value Fund (the “fund”) is a series of Putnam Investment Funds (the “Trust”), a Massachusetts business trust, which is registered under the Investment Company Act of 1940, as amended, as a diversified, open-end management investment company. The fund seeks capital appreciation by investing primarily in common stocks of midsize companies which Putnam Investment Management, LLC (“Putnam Management”), the fund’s manager, a wholly-owned subsidiary of Putnam, LLC, believes are currently undervalued. The fund seeks current income as a secondary objective.
The fund offers class A, class B, class C, class M, class R and class Y shares. Class A and class M shares are sold with a maximum front-end sales charge of 5.75% and 3.50%, respectively, and generally do not pay a contingent deferred sales charge. Class B shares, which convert to class A shares after approximately six and a half years, do not pay a front-end sales charge and are subject to a contingent deferred sales charge, if those shares are redeemed within six years of purchase. Class C shares have a one-year 1.00% contingent deferred sales charge and do not convert to class A shares. Class R shares, which are offered to qualified employee-benefit plans, are sold at net asset value.The expenses for class A, class B, class C, class M and class R shares may differ based on the distribution fee of each class, which is identified in Note 2. Class Y shares, which are sold at net asset value, are generally subject to the same expenses as class A, class B, class C, cl ass M and class R shares, but do not bear a distribution fee. Class Y shares are generally only available to corporate and institutional clients and clients in other approved programs.
A 1.00% redemption fee may apply on any shares that are redeemed (either by selling or exchanging into another fund) within 7 days of purchase. The redemption fee is accounted for as an addition to paid-in-capital.
Investment income, realized and unrealized gains and losses and expenses of the fund are borne pro-rata based on the relative net assets of each class to the total net assets of the fund, except that each class bears expenses unique to that class (including the distribution fees applicable to such classes). Each class votes as a class only with respect to its own distribution plan or other matters on which a class vote is required by law or determined by the Trustees. If the fund were liquidated, shares of each class would receive their pro-rata share of the net assets of the fund. In addition, the Trustees declare separate dividends on each class of shares.
In the normal course of business, the fund enters into contracts that may include agreements to indemnify another party under given circumstances. The fund’s maximum exposure under these arrangements is unknown as this would involve future claims that may be, but have not yet been, made against the fund. However, the fund’s management team expects the risk of material loss to be remote.
The following is a summary of significant accounting policies consistently followed by the fund in the preparation of its financial statements. The preparation of financial statements is in conformity with accounting principles generally accepted in the United States of America and requires management to make estimates and assumptions that affect the reported amounts of assets and liabilities in the financial statements and the reported amounts of increases and decreases in net assets from operations during the reporting period. Actual results could differ from those estimates.
A) Security valuation Investments for which market quotations are readily available are valued at the last reported sales price on their principal exchange, or official closing price for certain markets. If no sales are reported — as in the case of some securities traded over-the-counter — a security is valued at its last reported bid price. Many securities markets and exchanges outside the U.S. close prior to the close of the New York Stock Exchange and therefore the closing prices for securities in such markets or on such exchanges may not fully reflect events that occur after such close but before the close of the New York Stock Exchange. Accordingly, on certain days, the fund will fair value foreign equity securities taking into account multiple factors, including movements in the U.S. securities markets. The number of days on which fair value prices will be used will depend on market activity and it is possib le that fair value prices will be used by the fund to a significant extent. Securities quoted in foreign currencies, if any, are translated into U.S. dollars at the current exchange rate. Certain investments, including certain restricted securities and derivatives, are also valued at fair value following procedures approved by the Trustees. Such valuations and procedures are reviewed periodically by the Trustees. The fair value of securities is generally determined as the amount that the fund could reasonably expect to realize from an orderly disposition of such securities over a reasonable
37
period of time. By its nature, a fair value price is a good faith estimate of the value of a security at a given point in time and does not reflect an actual market price, which may be different by a material amount.
B) Joint trading account Pursuant to an exemptive order from the Securities and Exchange Commission (the “SEC”), the fund may transfer uninvested cash balances, including cash collateral received under security lending arrangements, into a joint trading account along with the cash of other registered investment companies and certain other accounts managed by Putnam Management. These balances may be invested in issues of short-term investments having maturities of up to 397 days for collateral received under security lending arrangements and up to 90 days for other cash investments.
C) Repurchase agreements The fund, or any joint trading account, through its custodian, receives delivery of the underlying securities, the market value of which at the time of purchase is required to be in an amount at least equal to the resale price, including accrued interest. Collateral for certain tri-party repurchase agreements is held at the counterparty’s custodian in a segregated account for the benefit of the fund and the counterparty. Putnam Management is responsible for determining that the value of these underlying securities is at all times at least equal to the resale price, including accrued interest.
D) Security transactions and related investment income Security transactions are recorded on the trade date (the date the order to buy or sell is executed). Gains or losses on securities sold are determined on the identified cost basis.
Interest income is recorded on the accrual basis. Dividend income, net of applicable withholding taxes, is recognized on the ex-dividend date except that certain dividends from foreign securities, if any, are recognized as soon as the fund is informed of the ex-dividend date. Non-cash dividends, if any, are recorded at the fair market value of the securities received. Dividends representing a return of capital or capital gains, if any, are reflected as a reduction of cost and/or as a realized gain.
All premiums/discounts are amortized/accreted on a yield-to-maturity basis.
Securities purchased or sold on a forward commitment basis may be settled a month or more after the trade date; interest income is accrued based on the terms of the securities. Losses may arise due to changes in the market value of the underlying securities or if the counterparty does not perform under the contract.
E) Futures and options contracts The fund may use futures and options contracts to hedge against changes in the values of securities the fund owns, owned or expects to purchase, or for other investment purposes. The fund may also write options on swaps or securities it owns or in which it may invest to increase its current returns.
The potential risk to the fund is that the change in value of futures and options contracts may not correspond to the change in value of the hedged instruments. In addition, losses may arise from changes in the value of the underlying instruments, if there is an illiquid secondary market for the contracts, or if the counterparty to the contract is unable to perform. Risks may exceed amounts recognized on the Statement of assets and liabilities.When the contract is closed, the fund records a realized gain or loss equal to the difference between the value of the contract at the time it was opened and the value at the time it was closed. Realized gains and losses on purchased options are included in realized gains and losses on investment securities. If a written call option is exercised, the premium originally received is recorded as an addition to sales proceeds. If a written put option is exercised, the premium originally received is recorded as a reduction to the c ost of investments.
Futures contracts are valued at the quoted daily settlement prices established by the exchange on which they trade. The fund and the broker agree to exchange an amount of cash equal to the daily fluctuation in the value of the futures contract. Such receipts or payments are known as “variation margin.” Exchange traded options are valued at the last sale price or, if no sales are reported, the last bid price for purchased options and the last ask price for written options. Options traded over-the-counter are valued using prices supplied by dealers. Futures and written option contracts outstanding at period end, if any, are listed after the fund’s portfolio.
F) Securities lending The fund may lend securities, through its agents, to qualified borrowers in order to earn additional income. The loans are collateralized by cash and/or securities in an amount at least equal to the market value of the securities loaned. The market value of securities loaned is determined daily and any additional required collateral is allocated to the fund on the next business day. The risk of borrower default will be borne by the fund’s agents; the fund will bear the risk of loss with respect to the investment of the cash collateral. Income from securities lending is included in investment income on the Statement of operations. At October 31, 2008, the value of securities loaned amounted to
38
$53,214,260. The fund received cash collateral of $56,650,734 which is pooled with collateral of other Putnam funds into 15 issues of short-term investments.
G) Federal taxes It is the policy of the fund to distribute all of its taxable income within the prescribed time and otherwise comply with the provisions of the Internal Revenue Code of 1986, as amended (the “Code”), applicable to regulated investment companies. It is also the intention of the fund to distribute an amount sufficient to avoid imposition of any excise tax under Section 4982 of the Code. The fund is subject to the provisions of FASB Interpretation No. 48, Accounting for Uncertainties in Income Taxes (FIN 48). FIN 48 sets forth a minimum threshold for financial statement recognition of the benefit of a tax position taken or expected to be taken in a tax return. The fund did not have any unrecognized tax benefits in the accompanying financial statements. Therefore, no provision has been made for federal taxes on income, capital gains or unrealized appreciation on securities held nor for excise tax on i ncome and capital gains. Each of the fund’s federal tax returns for the prior three fiscal years remains subject to examination by the Internal Revenue Service.
Pursuant to federal income tax regulations applicable to regulated investment companies, the fund has elected to defer to its fiscal year ending April 30, 2009 $17,652,910 of losses recognized during the period November 1, 2007 to April 30, 2008.
The aggregate identified cost on a tax basis is $815,067,529, resulting in gross unrealized appreciation and depreciation of $27,334,251 and $238,675,712, respectively, or net unrealized depreciation of $211,341,461.
H) Distributions to shareholders Distributions to shareholders from net investment income are recorded by the fund on the ex-dividend date. Distributions from capital gains, if any, are recorded on the ex-dividend date and paid at least annually. The amount and character of income and gains to be distributed are determined in accordance with income tax regulations, which may differ from generally accepted accounting principles. Dividend sources are estimated at the time of declaration. Actual results may vary. Any non-taxable return of capital cannot be determined until final tax calculations are completed after the end of the fund’s fiscal year. Reclassifications are made to the fund’s capital accounts to reflect income and gains available for distribution (or available capital loss carryovers) under income tax regulations.
I) Expenses of the trust Expenses directly charged or attributable to any fund will be paid from the assets of that fund. Generally, expenses of the trust will be allocated among and charged to the assets of each fund on a basis that the Trustees deem fair and equitable, which may be based on the relative assets of each fund or the nature of the services performed and relative applicability to each fund.
Note 2: Management fee, administrative
services and other transactions
The fund pays Putnam Management for management and investment advisory services quarterly based on the average net assets of the fund. Such fee is based on the following annual rates: 0.70% of the first $500 million of average net assets, 0.60% of the next $500 million, 0.55% of the next $500 million, 0.50% of the next $5 billion, 0.475% of the next $5 billion, 0.455% of the next $5 billion, 0.44% of the next $5 billion and 0.43% thereafter.
Putnam Management has agreed to waive fees and reimburse expenses of the fund through June 30, 2009 to the extent necessary to ensure that the fund’s expenses do not exceed the simple average of the expenses of all front-end load funds viewed by Lipper Inc. as having the same investment classification or objective as the fund. The expense reimbursement is based on a comparison of the fund’s expenses with the average annualized operating expenses of the funds in its Lipper peer group for each calendar quarter during the fund’s last fiscal year, excluding 12b-1 fees and without giving effect to any expense offset and brokerage/service arrangements that may reduce fund expenses. For the period ended October 31, 2008, Putnam Management waived $80,154 of its management fee from the fund.
The fund reimburses Putnam Management an allocated amount for the compensation and related expenses of certain officers of the fund and their staff who provide administrative services to the fund. The aggregate amount of all such reimbursements is determined annually by theTrustees.
Custodial functions for the fund’s assets were provided by State Street Bank andTrust Company (“State Street”). Custody fees are based on the fund’s asset level, the number of its security holdings and transaction volumes.
Putnam Investor Services, a division of Putnam Fiduciary Trust Company (“PFTC”), which is an affiliate of Putnam Management, provided investor servicing agent functions to the fund. Putnam Investor Services received fees for investor servicing, subject to certain limitations, based on the number of shareholder accounts in the fund and the level of defined contribution plan assets
39
in the fund. During the period ended October 31, 2008, the fund incurred $1,483,385 for investor servicing agent functions provided by PFTC.
The fund has entered into expense offset arrangements with PFTC and State Street whereby PFTC’s and State Street’s fees are reduced by credits allowed on cash balances. The fund also reduced expenses through brokerage/service arrangements. For the six months ended October 31, 2008, the fund’s expenses were reduced by $19,387 under the expense offset arrangements and by $20,735 under the brokerage/ service arrangements.
Each independent Trustee of the fund receives an annual Trustee fee, of which $501, as a quarterly retainer, has been allocated to the fund, and an additional fee for each Trustees meeting attended. Trustees receive additional fees for attendance at certain committee meetings and industry seminars and for certain compliance-related matters. Trustees also are reimbursed for expenses they incur relating to their services as Trustees.
The fund has adopted a Trustee Fee Deferral Plan (the “Deferral Plan”) which allows the Trustees to defer the receipt of all or a portion of Trustees fees payable on or after July 1, 1995. The deferred fees remain invested in certain Putnam funds until distribution in accordance with the Deferral Plan.
The fund has adopted an unfunded noncontribu-tory defined benefit pension plan (the “Pension Plan”) covering all Trustees of the fund who have served as a Trustee for at least five years and were first elected prior to 2004. Benefits under the Pension Plan are equal to 50% of the Trustee’s average annual attendance and retainer fees for the three years ended December 31, 2005. The retirement benefit is payable during a Trustee’s lifetime, beginning the year following retirement, for the number of years of service through December 31, 2006. Pension expense for the fund is included in Trustee compensation and expenses in the Statement of operations. Accrued pension liability is included in Payable for Trustee compensation and expenses in the Statement of assets and liabilities. The Trustees have terminated the Pension Plan with respect to any Trustee first elected after 2003.
The fund has adopted distribution plans (the “Plans”) with respect to its class A, class B, class C, class M and class R shares pursuant to Rule 12b-1 under the Investment Company Act of 1940. The purpose of the Plans is to compensate Putnam Retail Management Limited Partnership, a wholly-owned subsidiary of Putnam, LLC and Putnam Retail Management GP, Inc., for services provided and expenses incurred in distributing shares of the fund. The Plans provide for payments by the fund to Putnam Retail Management Limited Partnership at an annual rate of up to 0.35%, 1.00%, 1.00%, 1.00% and 1.00% of the average net assets attributable to class A, class B, class C, class M and class R shares, respectively. The Trustees have approved payment by the fund at an annual rate of 0.25%, 1.00%, 1.00%, 0.75% and 0.50% of the average net assets attributable to class A, class B, class C, class M and class R shares, respectively.
For the six months ended October 31, 2008, Putnam Retail Management Limited Partnership, acting as underwriter, received net commissions of $21,526 and $175 from the sale of class A and class M shares, respectively, and received $45,708 and $1,156 in contingent deferred sales charges from redemptions of class B and class C shares, respectively.
A deferred sales charge of up to 1.00% and 0.65% is assessed on certain redemptions of class A and class M shares, respectively. For the six months ended October 31, 2008, Putnam Retail Management Limited Partnership, acting as underwriter, received $388 and no monies on class A and class M redemptions, respectively.
Note 3: Purchases and sales of securities
During the six months ended October 31, 2008, cost of purchases and proceeds from sales of investment securities other than short-term investments aggregated $577,493,169 and $412,003,837, respectively. There were no purchases or sales of U.S. government securities.
Note 4: Capital shares
At October 31, 2008, there was an unlimited number of shares of beneficial interest authorized. Transactions in capital shares were as follows:
40
| | | | |
| | Six months ended 10/31/08 | Year ended 4/30/08 |
|
| Class A | Shares | Amount | Shares | Amount |
|
| Shares sold | 25,812,096 | $ 312,541,351 | 11,359,043 | $173,993,786 |
|
| Shares issued in connection with | — | — | 7,957,847 | 102,258,356 |
| reinvestment of distributions | | | | |
|
| | 25,812,096 | 312,541,351 | 19,316,890 | 276,252,142 |
|
| Shares repurchased | (12,232,122) | (129,554,380) | (18,742,615) | (255,052,696) |
|
| Net increase | 13,579,974 | $182,986,971 | 574,275 | $21,199,446 |
| |
| |
| | Six months ended 10/31/08 | Year ended 4/30/08 |
|
| Class B | Shares | Amount | Shares | Amount |
|
| Shares sold | 206,411 | $2,127,507 | 700,594 | $9,831,363 |
|
| Shares issued in connection with | — | — | 1,393,404 | 17,250,338 |
| reinvestment of distributions | | | | |
|
| | 206,411 | 2,127,507 | 2,093,998 | 27,081,701 |
|
| Shares repurchased | (2,514,286) | (25,256,753) | (9,529,955) | (141,473,310) |
|
| Net decrease | (2,307,875) | $(23,129,246) | (7,435,957) | $(114,391,609) |
| |
| |
| | Six months ended 10/31/08 | Year ended 4/30/08 |
|
| Class C | Shares | Amount | Shares | Amount |
|
| Shares sold | 88,331 | $860,791 | 401,851 | $5,709,070 |
|
| Shares issued in connection with | — | — | 454,007 | 5,611,525 |
| reinvestment of distributions | | | | |
|
| | 88,331 | 860,791 | 855,858 | 11,320,595 |
|
| Shares repurchased | (476,936) | (4,795,495) | (1,090,652) | (14,059,135) |
|
| Net decrease | (388,605) | $(3,934,704) | (234,794) | $(2,738,540) |
| |
| |
| | Six months ended 10/31/08 | Year ended 4/30/08 |
|
| Class M | Shares | Amount | Shares | Amount |
|
| Shares sold | 10,933 | $109,124 | 53,263 | $784,040 |
|
| Shares issued in connection with | — | — | 149,337 | 1,875,677 |
| reinvestment of distributions | | | | |
|
| | 10,933 | 109,124 | 202,600 | 2,659,717 |
|
| Shares repurchased | (183,761) | (1,918,673) | (451,488) | (5,979,073) |
|
| Net decrease | (172,828) | $(1,809,549) | (248,888) | $(3,319,356) |
| |
| |
| | Six months ended 10/31/08 | Year ended 4/30/08 |
|
| Class R | Shares | Amount | Shares | Amount |
|
| Shares sold | 167,293 | $1,762,772 | 373,124 | $5,200,248 |
|
| Shares issued in connection with | — | — | 97,239 | 1,232,990 |
| reinvestment of distributions | | | | |
|
| | 167,293 | 1,762,772 | 470,363 | 6,433,238 |
|
| Shares repurchased | (99,873) | (1,014,734) | (244,974) | (3,223,304) |
|
| Net increase | 67,420 | $748,038 | 225,389 | $3,209,934 |
|
41
| | | | |
| | Six months ended 10/31/08 | Year ended 4/30/08 |
|
| Class Y | Shares | Amount | Shares | Amount |
|
| Shares sold | 934,917 | $10,206,483 | 2,307,397 | $34,323,413 |
|
| Shares issued in connection with | — | — | 836,047 | 10,768,278 |
| reinvestment of distributions | | | | |
|
| | 934,917 | 10,206,483 | 3,143,444 | 45,091,691 |
|
| Shares repurchased | (884,303) | (9,202,500) | (1,691,151) | (22,919,105) |
|
| Net increase | 50,614 | $1,003,983 | 1,452,293 | $22,172,586 |
|
Note 5: Investment in Putnam Prime Money
Market Fund
The fund invested in Putnam Prime Money Market Fund, an open-end management investment company managed by Putnam Management. Investments in Putnam Prime Money Market Fund were valued at its closing net asset value each business day. Management fees paid by the fund were reduced by an amount equal to the management fees paid by Putnam Prime Money Market Fund with respect to assets invested by the fund in Putnam Prime Money Market Fund. For the period ended October 31, 2008, management fees paid were reduced by $13,196 relating to the fund’s investment in Putnam Prime Money Market Fund. Income distributions earned by the fund were recorded as interest income in the Statement of operations and totaled $359,640 for the period ended October 31, 2008. During the period ended October 31, 2008, cost of purchases and proceeds of sales of investments in Putnam Prime Money Market Fund aggregated $210,342,624 and $234,730,329, respectively.
On September 17, 2008, the Trustees of the Putnam Prime Money Market Fund voted to close that fund effective September 17, 2008. On September 24, 2008 the fund received shares of Federated Prime Obligations Fund, an unaffiliated management investment company registered under the Investment Company Act of 1940, in liquidation of its shares of Putnam Prime Money Market Fund.
Note 6: Regulatory matters and litigation
In late 2003 and 2004, Putnam Management settled charges brought by the SEC and the Massachusetts Securities Division in connection with excessive short-term trading in Putnam funds. Distribution of payments from Putnam Management to certain open-end Putnam funds and their shareholders is expected to be completed in the next several months. These allegations and related matters have served as the general basis for certain lawsuits, including purported class action lawsuits against Putnam Management and, in a limited number of cases, some Putnam funds. Putnam Management believes that these lawsuits will have no material adverse effect on the funds or on Putnam Management’s ability to provide investment management services. In addition, Putnam Management has agreed to bear any costs incurred by the Putnam funds as a result of these matters.
Note 7: New accounting pronouncements
In March 2008, Statement of Financial Accounting Standards No. 161, Disclosures about Derivative Instruments and Hedging Activities (“SFAS 161”) - an amendment of FASB Statement No. 133, was issued and is effective for fiscal years beginning after November 15, 2008. SFAS 161 requires enhanced disclosures about how and why an entity uses derivative instruments and how derivative instruments affect an entity’s financial position. Putnam Management is currently evaluating the impact the adoption of SFAS 161 will have on the fund’s financial statement disclosures.
In September 2008, FASB Staff Position FAS 133-1 and FIN 45-4, “Disclosures about Credit Derivatives and Certain Guarantees: An Amendment of FASB Statement No. 133 and FASB Interpretation No. 45; and Clarification of the Effective Date of FASB Statement No. 161” (the “Amendment”) was issued and is effective for annual and interim reporting periods ending after November 15, 2008. The Amendment requires enhanced disclosures regarding a fund’s credit derivatives holdings and hybrid financial instruments containing embedded credit derivatives. Putnam Management is currently evaluating the impact the adoption of the Amendment will have on the fund’s financial statement disclosures.
Note 8: Market conditions
Recent events in the financial sector have resulted in an unusually high degree of volatility in the financial markets. The fund’s investments in the financial sector, as reflected in the fund’s schedule of investments, exposes investors to the negative (or positive) performance resulting from these events.
42
Brokerage commissions (unaudited)
Brokerage commissions are paid to firms that execute trades on behalf of your fund. When choosing these firms, Putnam is required by law to seek the best execution of the trades, taking all relevant factors into consideration, including expected quality of execution and commission rate. Listed below are the largest relationships based upon brokerage commissions for your fund and the other funds in Putnam’s U.S. Small- and Mid-Cap group for the year ended October 31, 2008. The Putnam mutual funds in this group are Putnam Capital Opportunities Fund, Putnam Discovery Growth Fund, Putnam Mid Cap Value Fund, Putnam New Opportunities Fund, Putnam OTC & Emerging Growth Fund, Putnam Small Cap Growth Fund, Putnam Small Cap Value Fund, Putnam Vista Fund, Putnam VT Capital Opportunities Fund, Putnam VT Discovery Growth Fund, Putnam VT Mid Cap Value Fund, Putnam VT New Opportunities Fund, Putnam VT OTC & Emerging Growth Fund, Putnam VT Small Cap Value Fund, and Putnam VT Vista Fund.
The top five firms that received brokerage commissions for trades executed for the U.S. Small- and Mid-Cap group are (in descending order) Morgan Stanley & Co., UBS Securities, Credit Suisse First Boston, Citigroup Global Markets, and RBC Capital Markets. Commissions paid to these firms together represented approximately 43% of the total brokerage commissions paid for the year ended October 31, 2008.
Commissions paid to the next 10 firms together represented approximately 34% of the total brokerage commissions paid during the period. These firms are Bear Stearns & Co., CIBC World Markets, SG Cowen Securities, Goldman, Sachs & Co., Investment Technology, Lehman Brothers, Merrill Lynch, Pierce, Fenner and Smith, J.P. Morgan Securities, Wachovia Securities, and Weeden & Co.
Commission amounts do not include “mark-ups” paid on bond or derivative trades made directly with a dealer. Additional information about brokerage commissions is available on the Securities and Exchange Commission (SEC) Web site at www.sec.gov. Putnam funds disclose commissions by firm to the SEC in semiannual filings on Form N-SAR.
43
Putnam puts your interests first
Putnam has introduced a number of voluntary initiatives designed to reduce fund expenses, provide investors with more useful information, and help safeguard the interests of all Putnam investors. Visit the Individual Investors section at www.putnam.com for details.
Cost-cutting initiatives
Ongoing expenses will be limited Through calendar 2008, total ongoing expenses, including management fees for all funds, will be maintained at or below the average of each fund’s industry peers in its Lipper load-fund universe. For more information, please see the Statement of Additional information.
Lower class B purchase limit To help ensure that investors are in the most cost-effective share class, the maximum amount that can be invested in class B shares has been reduced to $100,000. (Larger trades or accumulated amounts will be refused.)
Improved disclosure
Putnam fund prospectuses and shareholder reports have been revised to disclose additional information that will help shareholders compare funds and weigh their costs and risks along with their potential benefits. Shareholders will find easy-to-understand information about fund expense ratios, portfolio manager compensation, risk comparisons, turnover comparisons, brokerage commissions, and employee and trustee ownership of Putnam funds. Disclosure of breakpoint discounts has also been enhanced to alert investors to potential cost savings.
Protecting investors’ interests
Short-term trading fee introduced To discourage short-term trading, which can interfere with a fund’s long-term strategy, a 1% short-term trading fee may be imposed on any Putnam fund shares (other than money market funds) redeemed or exchanged within 7 calendar days of purchase (for certain funds, this fee applies for 90 days).
44
Fund information
Founded over 70 years ago, Putnam Investments was built around the concept that a balance between risk and reward is the hallmark of a well-rounded financial program. We manage nearly 100 mutual funds in growth, value, blend, fixed income, and international.
| | |
| Investment Manager | Officers | Francis J. McNamara, III |
| Putnam Investment | Charles E. Haldeman, Jr. | Vice President and |
| Management, LLC | President | Chief Legal Officer |
| One Post Office Square | | |
| Boston, MA 02109 | Charles E. Porter | Robert R. Leveille |
| Executive Vice President, | Vice President and Chief |
| Marketing Services | Principal Executive Officer, | Compliance Officer |
| Putnam Retail Management | Associate Treasurer and | |
| One Post Office Square | Compliance Liaison | Mark C. Trenchard |
| Boston, MA 02109 | | Vice President and BSA |
| | Jonathan S. Horwitz | Compliance Officer |
| Custodian | Senior Vice President | |
| State Street Bank and Trust | and Treasurer | Judith Cohen |
| Company | | Vice President, Clerk and |
| Steven D. Krichmar | Assistant Treasurer |
| Legal Counsel | Vice President and Principal | |
| Ropes & Gray LLP | Financial Officer | Wanda M. McManus |
| | | Vice President, Senior Associate |
| Trustees | Janet C. Smith | Treasurer and Assistant Clerk |
| John A. Hill, Chairman | Vice President, Principal | |
| Jameson A. Baxter, | Accounting Officer and | Nancy E. Florek |
| Vice Chairman | Assistant Treasurer | Vice President, Assistant |
| Charles B. Curtis | | Clerk, Assistant Treasurer |
| Robert J. Darretta | Susan G. Malloy | and Proxy Manager |
| Myra R. Drucker | Vice President and | |
| Charles E. Haldeman, Jr. | Assistant Treasurer | |
| Paul L. Joskow | | |
| Elizabeth T. Kennan | Beth S. Mazor | |
| Kenneth R. Leibler | Vice President | |
| Robert E. Patterson | | |
| George Putnam, III | James P. Pappas | |
| Robert L. Reynolds | Vice President | |
| Richard B. Worley | | |
| | | |
|
|
|
|
|
|
|
|
|
|
|
|
|
This report is for the information of shareholders of Putnam Mid Cap Value Fund. It may also be used as sales literature when preceded or accompanied by the current prospectus, the most recent copy of Putnam’s Quarterly Performance Summary, and Putnam’s Quarterly Ranking Summary. For more recent performance, please visit www.putnam.com. Investors should carefully consider the investment objective, risks, charges, and expenses of a fund, which are described in its prospectus. For this and other information or to request a prospectus, call 1-800-225-1581 toll free. Please read the prospectus carefully before investing. The fund’s Statement of Additional Information contains additional information about the fund’s Trustees and is available without charge upon request by calling 1-800-225-1581.

Item 2. Code of Ethics:
Not applicable
Item 3. Audit Committee Financial Expert:
Not applicable
Item 4. Principal Accountant Fees and Services:
Not applicable
Item 5. Audit Committee of Listed Registrants
Not applicable
Item 6. Schedule of Investments:
The registrant’s schedule of investments in unaffiliated issuers is included in the report to shareholders in Item 1 above.
Item 7. Disclosure of Proxy Voting Policies and Procedures For Closed-End Management Investment Companies:
Not applicable
Item 8. Portfolio Managers of Closed-End Investment Companies
Not Applicable
Item 9. Purchases of Equity Securities by Closed-End Management Investment Companies and Affiliated Purchasers:
Not applicable
Item 10. Submission of Matters to a Vote of Security Holders:
Not applicable
Item 11. Controls and Procedures:
(a) The registrant's principal executive officer and principal financial officer have concluded, based on their evaluation of the effectiveness of the design and operation of the registrant's disclosure controls and procedures as of a date within 90 days of the filing date of this report, that the design and operation of such procedures are generally effective to provide reasonable assurance that information required to be disclosed by the registrant in this report is recorded, processed, summarized and reported within the time periods specified in the Commission's rules and forms.
(b) Changes in internal control over financial reporting: Not applicable
Item 12. Exhibits:
(a)(1) Not applicable
(a)(2) Separate certifications for the principal executive officer and principal financial officer of the registrant as required by Rule 30a-2(a) under the Investment Company Act of 1940, as amended, are filed herewith.
(b) The certifications required by Rule 30a-2(b) under the Investment Company Act of 1940, as amended, are filed herewith.
SIGNATURES
Pursuant to the requirements of the Securities Exchange Act of 1934 and the Investment Company Act of 1940, the registrant has duly caused this report to be signed on its behalf by the undersigned, thereunto duly authorized.
Putnam Investment Funds
By (Signature and Title):
/s/Janet C. Smith
Janet C. Smith
Principal Accounting Officer
Date: December 29, 2008
Pursuant to the requirements of the Securities Exchange Act of 1934 and the Investment Company Act of 1940, this report has been signed below by the following persons on behalf of the registrant and in the capacities and on the dates indicated.
By (Signature and Title):
/s/Charles E. Porter
Charles E. Porter
Principal Executive Officer
Date: December 29, 2008
By (Signature and Title):
/s/Steven D. Krichmar
Steven D. Krichmar
Principal Financial Officer
Date: December 29, 2008