| | | |
| | |
| UNITED STATES |
| SECURITIES AND EXCHANGE COMMISSION |
| Washington, D.C. 20549 |
| |
| FORM N-CSR |
| |
| CERTIFIED SHAREHOLDER REPORT OF REGISTERED |
| MANAGEMENT INVESTMENT COMPANIES |
| | |
| Investment Company Act file number: (811- 07237) | |
| | |
| Exact name of registrant as specified in charter: | Putnam Investment Funds |
| |
| Address of principal executive offices: One Post Office Square, Boston, Massachusetts 02109 |
| | | |
| Name and address of agent for service: | | Beth S. Mazor, Vice President |
| | One Post Office Square |
| | Boston, Massachusetts 02109 |
| | | |
| Copy to: | | John W. Gerstmayr, Esq. |
| | Ropes & Gray LLP |
| | One International Place |
| | Boston, Massachusetts 02110 |
| | |
| Registrant’s telephone number, including area code: | (617) 292-1000 |
| | | |
| Date of fiscal year end: September 30, 2009 | | |
| |
| Date of reporting period: October 1, 2008 — March 31, 2009 |
Item 1. Report to Stockholders:
The following is a copy of the report transmitted to stockholders pursuant to Rule 30e-1 under the Investment Company Act of 1940:

Since 1937, when George Putnam created a prudent mix of stocks and bonds in a single, professionally managed portfolio, we have championed the wisdom of the balanced approach. Today, we offer a world of equity, fixed-income, multi-asset, and absolute-return portfolios so investors can pursue a range of financial goals. Our seasoned portfolio managers seek superior results over time, backed by original, fundamental research on a global scale. We believe in service excellence, in the value of experienced financial advice, and in putting clients first in everything we do.
In 1830, Massachusetts Supreme Judicial Court Justice Samuel Putnam established The Prudent Man Rule, a legal foundation for responsible money management.

THE PRUDENT MAN RULE
All that can be required of a trustee to invest is that he shall conduct himself faithfully and exercise a sound discretion. He is to observe how men of prudence, discretion, and intelligence manage their own affairs, not in regard to speculation, but in regard to the permanent disposition of their funds, considering the probable income, as well as the probable safety of the capital to be invested.

Putnam
International New
Opportunities Fund
3|31|09
Semiannual Report
| | |
| Message from the Trustees | 2 | |
| About the fund | 4 | |
| Performance snapshot | 6 | |
| Interview with your fund’s Portfolio Manager | 7 | |
| Performance in depth | 12 | |
| Expenses | 14 | |
| Portfolio turnover | 15 | |
| Your fund’s management | 16 | |
| Terms and definitions | 17 | |
| Trustee approval of management contract | 18 | |
| Other information for shareholders | 23 | |
| Financial statements | 24 | |
Message from the Trustees
Dear Fellow Shareholder:
After 18 months of deep and painful losses, the stock market showed a glimmer of promise late in the first quarter. For the first 10 weeks of 2009, the S&P 500 Index fell by approximately 25%, before abruptly reversing course with just three weeks left in the quarter. Recent technical and valuation improvements also may augur well for the fixed-income market.
While the bottom of a bear market can only be identified in retrospect, we are encouraged by the upswing because it corresponds closely to historic turning points in the stock market. Notably, the upswing followed more aggressive government stimulus efforts and Federal Reserve action, as well as the kind of widespread sell-offs by investors that are often associated with market bottoms.
Under President and CEO Robert L. Reynolds, Putnam Investments has instituted several changes in order to position Putnam mutual funds for a market recovery. In April, Walter C. Donovan, a 25-year investment-industry veteran, joined Putnam as Chief Investment Officer. Mr. Donovan will lead a reinvigorated investment organization strengthened by the arrival during the past few months of several well-regarded senior portfolio managers, research analysts, and equity traders.
We also are pleased to announce that Ravi Akhoury has been elected to the Board of Trustees of the Putnam Funds. From 1992 to 2007, Mr. Akhoury was Chairman and CEO of MacKay Shields, a
2
multi-product investment management firm with over $40 billion in assets under management. He serves as advisor to New York Life Insurance Company, and previously was a member of its Executive Management Committee.
We would like to take this opportunity to welcome new shareholders to the fund and to thank all of our investors for your continued confidence in Putnam.
Respectfully yours,

About the fund
Seeking to benefit from growing companies abroad

If you have ever worn an Adidas sports shoe, used a Nokia wireless phone, or taken digital pictures with a Canon camera, you probably understand part of the philosophy behind Putnam International New Opportunities Fund: Successful international companies, with products and services in strong demand, can be a great investment.
Of course, there is more to a growth company than great products, and that’s why the fund’s portfolio manager relies on a disciplined strategy and research by Putnam’s in-house analysts to select portfolio holdings from the thousands of companies operating abroad. The manager and analysts search for companies that are well managed, with sound business models and solid balance sheets.
The fund also invests in companies of various sizes to benefit from different types of growth potential: large companies that dominate their industries, as well as midsize and small companies in an expansionary-growth phase.
The fund currently invests primarily in developed markets such as Japan, Canada, and the European Union, but it can also invest in emerging markets, which may offer faster rates of economic growth but subject the fund to greater risk of volatility and illiquid securities. For enhanced access to information about international companies, Putnam has analysts in London and Singapore, as well as in Boston.
While investing in companies that operate under different economic and political systems involves risk, it may give your investment a chance to grow, even during a downturn in the U.S. economy. International economies may be expanding at times when the U.S. economy is sluggish. Also, investing in securities denominated in foreign currencies provides another type of diversification. While the euro, the yen, the pound, and other currencies can fluctuate in value, your investment can benefit when these currencies strengthen against the U.S. dollar.
In making investment decisions, the fund’s manager is guided by Putnam’s risk controls, which call for regular review of fund holdings and the discipline to sell stocks when they involve more risk than reward. Since 1995, the fund has helped investors benefit from investing in rapidly growing international companies.
International investing involves certain risks, such as currency fluctuations, economic instability, and political developments. Additional risks may be associated with emerging-market securities, including illiquidity and volatility. The fund invests some or all of its assets in small and/or midsize companies. Such investments increase the risk of fluctuations in the value of your investment. Stocks with above-average earnings may be more volatile, especially if earnings do not continue to grow.
In-depth analysis is key to
successful stock selection.
Drawing on the expertise of a dedicated team of stock analysts, the fund’s manager seeks attractive growth stocks. Once a stock is selected for the portfolio, it is regularly assessed to ensure that it continues to meet certain criteria, including:
Growth Examining each company’s financials, including its sales and earnings, and targeting those companies believed to offer growth potential.
Quality Looking for characteristics such as solid management teams, sound business models, a record of strong performance, and high levels of free-cash flow.
Valuation Carefully considering how each stock is valued, seeking stocks whose valuations are attractive relative to the company’s growth potential.
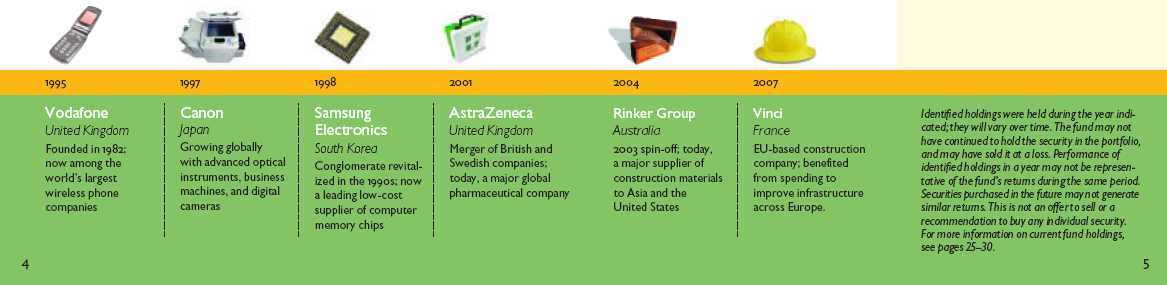
Putnam International New Opportunities Fund’s holdings
have spanned many sectors and international markets.
Performance snapshot
Average annual total return (%) comparison as of 3/31/09
The fund — class A shares before sales charge
Putnam International New Opportunities Fund (PINOX)
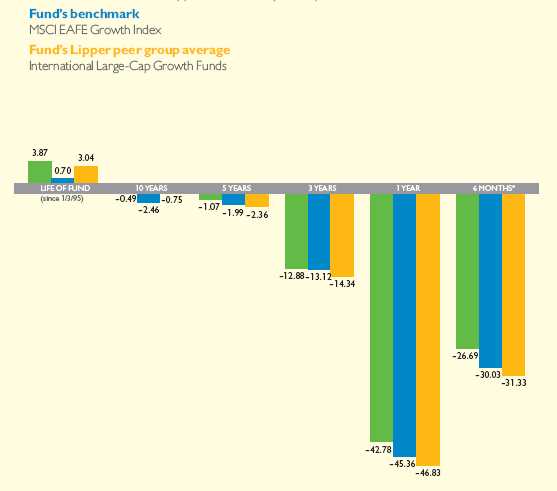
Current performance may be lower or higher than the quoted past performance, which cannot guarantee future results. Share price, principal value, and return will fluctuate, and you may have a gain or a loss when you sell your shares. Performance of class A shares assumes reinvestment of distributions and does not account for taxes. Fund returns in the bar chart do not reflect a sales charge of 5.75%; had they, returns would have been lower. See pages 7 and 12–13 for additional performance information. For a portion of the periods, this fund may have limited expenses, without which returns would have been lower. Due to market volatility, current performance may be higher or lower than performance shown. A 1% short-term trading fee may apply. To obtain the most recent month-end performance, visit putnam.com.
* Returns for the six-month period are not annualized, but cumulative.
6
Interview with your
fund’s Portfolio Manager
Jeff Sacknowitz
Jeff, the six-month period ended March 31, 2009, was marked by unprecedented stock market volatility and declines. The average international large-cap growth fund, as measured by Lipper, declined by more than 31%. How did Putnam International New Opportunities Fund perform?
It is obviously very disappointing to report a sharp decline in absolute performance due to weakness in global stock markets. However, the fund was able to perform better than its benchmark and its Lipper peer group average. The period brought almost unprecedented volatility in global financial markets. In the span of just six months, we experienced two significant market declines followed by meaningful recoveries, including a particularly sharp recovery in the final weeks of the period. While this has been a difficult environment for investors, the fund was able to navigate it with relative success due to our rigorous process for identifying attractive stocks.
Which regions or sectors were hardest hit by declines, and which showed strength?
In terms of regions, stocks in Europe and Japan were particularly poor performers. Stocks in certain
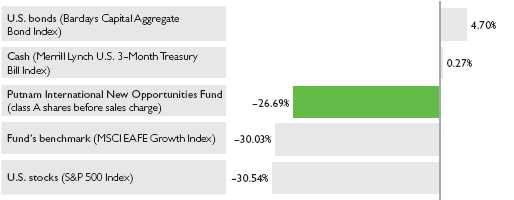
Broad market index and fund performance
This comparison shows your fund’s performance in the context of broad market indexes for the six months ended 3/31/09. See page 6 and pages 12–13 for additional fund performance information. Index descriptions can be found on page 17.
7
high-growth emerging-market economies — China in particular — fared better. The fund’s exposure to Europe was a detractor, although it helped that the fund had a smaller position in Europe than the benchmark. The decision to have minimal exposure to Japanese industrial stocks was also beneficial, as stocks in that sector declined significantly more than the overall market. On a sector basis, the weakest performers were stocks in economically sensitive industries such as industrials, financials, and information technology. Fortunately, the fund’s sector positioning worked well. The portfolio was positioned defensively early in the period, emphasizing areas such as health care and consumer staples, while maintaining underweight positions in economically sensitive sectors, which suffered the greatest declines. However, the decision to increase exposure to these sectors later in the period helped performance.
Can you discuss some of the stocks that detracted from fund performance?
One of the top detractors for the period was the National Bank of Greece, which was expected to be a relatively defensive holding within the volatile financials sector. This stock was one of the weaker performers in the sector as investors grew more concerned about the stability of Greece’s banking system. By the close of the period, this stock had been sold from the fund’s portfolio. Another disappointment for the period was ArcelorMittal of Luxembourg, one
Top 10 holdings
This table shows the fund’s top 10 holdings and the percentage of the fund’s net assets that each represented as of 3/31/09. Holdings will vary over time.
| | |
| HOLDING (percentage of fund’s net assets) | COUNTRY | SECTOR/INDUSTRY |
|
| Nestle SA (4.8%) | Switzerland | Consumer staples/Food |
| Roche Holding AG (4.0%) | Switzerland | Health care/Pharmaceuticals |
| Novartis AG (3.4%) | Switzerland | Health care/Pharmaceuticals |
| BHP Billiton, Ltd. (3.0%) | Australia | Basic materials/Metals |
| Nintendo Co., Ltd. (2.7%) | Japan | Consumer cyclicals/Toys |
| Total SA (2.6%) | France | Energy/Oil and gas |
| BG Group PLC (2.3%) | United Kingdom | Energy/Oil and gas |
| BHP Billiton PLC (2.0%) | United Kingdom | Basic materials/Metals |
| BP PLC (1.9%) | United Kingdom | Energy/Oil and gas |
| British American Tobacco (BAT) PLC (1.8%) | United Kingdom | Consumer staples/Tobacco |
8
of the world’s leading steel companies. The analysts and I correctly anticipated weakness in materials, and limited holdings in this sector, but the decision to own ArcelorMittal was a negative factor as steel companies, especially those based in Europe, performed poorly. Vallourec, a French company that produces steel products for oil exploration, was also among the top detractors. The sharp decline in oil prices has resulted in a significant slowdown in new oil-drilling contracts — a factor we believed had already been discounted into this stock. However, the negative impact on demand for Vallourec’s products was greater than anticipated. This stock remained in the portfolio at the close of the period, as it still appeared to offer attractive growth potential over the long term.
Which stocks contributed positively to performance?
A top-performing fund holding for the period was Zhaojin Mining Industry Company Limited, a China-based gold exploration and mining company. This stock was added to the portfolio due to concerns about competitive currency devaluations as the global economic slowdown intensified. That strategy proved advantageous as gold prices increased significantly and the stock’s price doubled. By the close of the period, we had trimmed more than half of the fund’s position in this stock, reflecting our rigorous sell discipline.
Another of the portfolio’s strongest performers was Anheuser-Busch InBev, a Belgium-based beer company with operations in over 30 countries.
Comparison of top country weightings
This chart shows how the fund’s top weightings have changed over the past six months. Weightings are shown as a percentage of net assets. Holdings will vary over time.
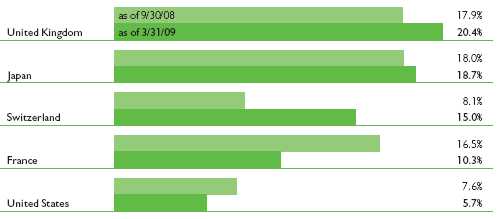
9
It was formed in 2008 when InBev —already a global company with strong beverage businesses in Brazil and Western Europe — acquired Anheuser-Busch, the largest beer company in the United States. The company has a strong management team, and its stock performed well as investors anticipated that the acquisition will enable it to cut costs and improve margins by running the business more efficiently. First Solar, a designer and manufacturer of solar modules, was also a highlight for the period. The solar energy industry is interesting to our team of analysts because of its strong growth prospects. Prices of stocks in this sector, which had become quite expensive, have declined sharply along with energy prices. As a result of the downturn, many smaller solar businesses with weak balance sheets may be unable to maintain their competitive positions. We believe First Solar’s scale, low-cost manu facturing, and energy-efficient products will help it thrive during this challenging time and improve its competitive positioning ahead of the sector’s recovery. Another holding worth noting is BHP Billiton PLC, a U.K.-based producer of iron ore and other materials. As we entered into the weak economic period, and all stocks in this sector sold off, we built a position in this company, which we view as one of the better-managed companies in the sector, with a very strong balance sheet. This decision worked well, as it was one of the period’s top performers.
IN THE NEWS
At the G-20 summit in London in early April 2009, world economic leaders pledged $1.1 trillion to fund a global stimulus package designed to provide emergency loans to dozens of countries and to rekindle trade activity. About $500 billion from the Group of 20 nations will be used to increase capital available to the International Monetary Fund, an organization of 185 countries that encourages financial, employment, trade, anti-poverty, and economic efforts worldwide. In its April World Economic Outlook (WEO), the IMF predicts that world output will decline by 1.3% in 2009, with a slow recovery expected in 2010.
You recently became the fund’s manager. Can you tell us a little about your investment approach?
I worked closely with the fund’s previous managers for many years as an analyst, and my overall management philosophy and approach is similar. A key component of this approach is bottom-up stock selection, which means focusing more on the long-term potential of individual companies than on short-term developments in the markets or economy. We are fortunate
10
to have a strong team of international analysts who are experts in their fields. Our process directly and efficiently links their recommendations to our portfolio decision making. I think the fund benefits significantly by empowering the analysts in this way. We have also implemented a more rigorous process for screening global markets for companies that exhibit robust growth characteristics while offering relatively attractive valuations and sound balance sheets. This helps us identify companies whose growth is likely to endure, and helps ensure that we are not overpaying for that growth. A number of the top contributors for the period were stocks that we initially uncovered with this screening process.
Tell us about your outlook in this difficult environment.
There is still cause for concern about global economic conditions, and we are likely to see continued turbulence in the months ahead. In fact, we do not expect to see a sustained recovery until 2010. While the stock market has delivered unprecedented volatility, it is important to remain patient and to maintain a long-term perspective. We will continue to focus on disciplined, rigorous research and bottom-up stock analysis, regardless of short-term fluctuations in the markets.
Jeff, thanks for sharing your thoughts today.
The views expressed in this report are exclusively those of Putnam Management. They are not meant as investment advice.
Please note that the holdings discussed in this report may not have been held by the fund for the entire period. Portfolio composition is subject to review in accordance with the fund’s investment strategy and may vary in the future. Current and future portfolio holdings are subject to risk.
11
Your fund’s performance
This section shows your fund’s performance, price, and distribution information for periods ended March 31, 2009, the end of the first half of its current fiscal year. In accordance with regulatory requirements for mutual funds, we also include expense information taken from the fund’s current prospectus. Performance should always be considered in light of a fund’s investment strategy. Data represents past performance. Past performance does not guarantee future results. More recent returns may be less or more than those shown. Investment return and principal value will fluctuate, and you may have a gain or a loss when you sell your shares. Performance information does not reflect any deduction for taxes a shareholder may owe on fund distributions or on the redemption of fund shares. For the most recent month-end performance, please visit the Individual Investors section of putnam.com or call Putnam at 1-800-225-1581. Class Y shares are generally only avail able to corporate and institutional clients and clients in other approved programs. See the Terms and Definitions section in this report for definitions of the share classes offered by your fund.
Fund performance Total return for periods ended 3/31/09
| | | | | | | | | | |
| | Class A | Class B | Class C | Class M | Class R | Class Y |
| (inception dates) | (1/3/95) | (7/21/95) | (2/1/99) | (7/21/95) | (12/1/03) | (10/4/05) |
| | NAV | POP | NAV | CDSC | NAV | CDSC | NAV | POP | NAV | NAV |
|
| Annual average | | | | | | | | | | |
| (life of fund) | 3.87% | 3.44% | 3.10% | 3.10% | 3.10% | 3.10% | 3.37% | 3.11% | 3.62% | 3.94% |
|
| 10 years | –4.81 | –10.25 | –11.70 | –11.70 | –11.62 | –11.62 | –9.44 | –12.63 | –7.00 | –4.00 |
| Annual average | –0.49 | –1.08 | –1.24 | –1.24 | –1.23 | –1.23 | –0.99 | –1.34 | –0.72 | –0.41 |
|
| 5 years | –5.24 | –10.68 | –8.76 | –10.56 | –8.69 | –8.69 | –7.55 | –10.77 | –6.34 | –4.43 |
| Annual average | –1.07 | –2.23 | –1.82 | –2.21 | –1.80 | –1.80 | –1.56 | –2.25 | –1.30 | –0.90 |
|
| 3 years | –33.87 | –37.69 | –35.43 | –37.36 | –35.35 | –35.35 | –34.90 | –37.17 | –34.40 | –33.43 |
| Annual average | –12.88 | –14.59 | –13.57 | –14.44 | –13.53 | –13.53 | –13.33 | –14.35 | –13.11 | –12.68 |
|
| 1 year | –42.78 | –46.07 | –43.26 | –46.10 | –43.23 | –43.79 | –43.07 | –45.06 | –42.95 | –42.67 |
|
| 6 months | –26.69 | –30.90 | –26.99 | –30.64 | –26.97 | –27.70 | –26.87 | –29.43 | –26.77 | –26.63 |
|
Current performance may be lower or higher than the quoted past performance, which cannot guarantee future results. After-sales-charge returns (public offering price, or POP) for class A and M shares reflect a maximum 5.75% and 3.50% load, respectively. Class B share returns reflect the applicable contingent deferred sales charge (CDSC), which is 5% in the first year, declining to 1% in the sixth year, and is eliminated thereafter. Class C shares reflect a 1% CDSC for the first year that is eliminated thereafter. Class R and Y shares have no initial sales charge or CDSC. Performance for class B, C, M, R, and Y shares before their inception is derived from the historical performance of class A shares, adjusted for the applicable sales charge (or CDSC) and, except for class Y shares, the higher operating expenses for such shares.
For a portion of the periods, this fund may have limited expenses, without which returns would have been lower.
Due to market volatility, current performance may be higher or lower than performance shown. A 1% short-term trading fee may be applied to shares exchanged or sold within 90 days of purchase.
12
Comparative index returns For periods ended 3/31/09
| | |
| | MSCI EAFE | Lipper International Large-Cap |
| | Growth Index | Growth Funds category average* |
|
| Annual average (life of fund) | 0.70% | 3.04% |
|
| 10 years | –22.07 | –4.76 |
| Annual average | –2.46 | –0.75 |
|
| 5 years | –9.55 | –11.01 |
| Annual average | –1.99 | –2.36 |
|
| 3 years | –34.42 | –37.04 |
| Annual average | –13.12 | –14.34 |
|
| 1 year | –45.36 | –46.83 |
|
| 6 months | –30.03 | –31.33 |
|
Index and Lipper results should be compared to fund performance at net asset value.
* Over the 6-month, 1-year, 3-year, 5-year, 10-year, and life-of-fund periods ended 3/31/09, there were 113, 107, 89, 73, 45, and 13 funds, respectively, in this Lipper category.
Fund price and distribution information For the six-month period ended 3/31/09
| | | | | | | | |
| | Class A | Class B | Class C | Class M | Class R | Class Y |
|
| Share value | NAV | POP | NAV | NAV | NAV | POP | NAV | NAV |
|
| 9/30/08 | $13.30 | $14.11 | $12.34 | $12.68 | $12.69 | $13.15 | $13.15 | $13.33 |
|
| 3/31/09 | 9.75 | 10.34 | 9.01 | 9.26 | 9.28 | 9.62 | 9.63 | 9.78 |
|
The classification of distributions, if any, is an estimate. Final distribution information will appear on your year-end tax forms.
The fund made no distributions during the period.
Fund’s annual operating expenses For the fiscal year ended 9/30/08
| | | | | | |
| | Class A | Class B | Class C | Class M | Class R | Class Y |
|
| Net expenses* | 1.52% | 2.27% | 2.27% | 2.02% | 1.77% | 1.27% |
|
| Total annual fund operating expenses | 1.65 | 2.40 | 2.40 | 2.15 | 1.90 | 1.40 |
|
Expense information in this table is taken from the most recent prospectus, is subject to change, and may differ from that shown in the next section and in the financial highlights of this report. Expenses are shown as a percentage of average net assets.
* Reflects Putnam Management’s decision to contractually limit expenses through 9/30/09.
Your fund’s expenses
As a mutual fund investor, you pay ongoing expenses, such as management fees, distribution fees (12b-1 fees), and other expenses. In the most recent six-month period, your fund limited these expenses; had it not done so, expenses would have been higher. Using the following information, you can estimate how these expenses affect your investment and compare them with the expenses of other funds. You may also pay one-time transaction expenses, including sales charges (loads) and redemption fees, which are not shown in this section and would have resulted in higher total expenses. For more information, see your fund’s prospectus or talk to your financial representative.
Review your fund’s expenses
The following table shows the expenses you would have paid on a $1,000 investment in Putnam International New Opportunities Fund from October 1, 2008, to March 31, 2009. It also shows how much a $1,000 investment would be worth at the close of the period, assuming actual returns and expenses.
| | | | | | |
| | Class A | Class B | Class C | Class M | Class R | Class Y |
|
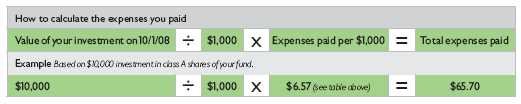
| Expenses paid per $1,000* | $6.57 | $9.79 | $9.79 | $8.72 | $7.64 | $5.49 |
|
| Ending value (after expenses) | $733.10 | $730.10 | $730.30 | $731.30 | $732.30 | $733.70 |
|
* Expenses for each share class are calculated using the fund’s annualized expense ratio for each class, which represents the ongoing expenses as a percentage of average net assets for the six months ended 3/31/09. The expense ratio may differ for each share class (see the last table in this section). Expenses are calculated by multiplying the expense ratio by the average account value for the period; then multiplying the result by the number of days in the period; and then dividing that result by the number of days in the year.
Estimate the expenses you paid
To estimate the ongoing expenses you paid for the six months ended March 31, 2009, use the following calculation method. To find the value of your investment on October 1, 2008, call Putnam at 1-800-225-1581.
Compare expenses using industry averages
The Securities and Exchange Commission (SEC) has established guidelines to help investors assess fund expenses. Per these guidelines, the following table shows your fund’s expenses based on a $1,000 investment, assuming a hypothetical 5% annualized return. You can use this information to compare the ongoing expenses (but not transaction expenses or total costs) of investing in the fund with those of other funds. All mutual fund shareholder reports will provide this information to help you make this comparison. Please note that you cannot use this information to estimate your actual ending account balance and expenses paid during the period.
14
| | | | | | |
| | Class A | Class B | Class C | Class M | Class R | Class Y |
|
| Expenses paid per $1,000* | $7.64 | $11.40 | $11.40 | $10.15 | $8.90 | $6.39 |
|
| Ending value (after expenses) | $1,017.35 | $1,013.61 | $1,013.61 | $1,014.86 | $1,016.11 | $1,018.60 |
|
* Expenses for each share class are calculated using the fund’s annualized expense ratio for each class, which represents the ongoing expenses as a percentage of average net assets for the six months ended 3/31/09. The expense ratio may differ for each share class (see the last table in this section). Expenses are calculated by multiplying the expense ratio by the average account value for the period; then multiplying the result by the number of days in the period; and then dividing that result by the number of days in the year.
Compare expenses using industry averages
You can also compare your fund’s expenses with the average of its peer group, as defined by Lipper, an independent fund-rating agency that ranks funds relative to others that Lipper considers to have similar investment styles or objectives. The expense ratio for each share class shown indicates how much of your fund’s average net assets have been used to pay ongoing expenses during the period.
| | | | | | |
| | Class A | Class B | Class C | Class M | Class R | Class Y |
|
| Your fund’s annualized | | | | | | |
| expense ratio | 1.52% | 2.27% | 2.27% | 2.02% | 1.77% | 1.27% |
|
| Average annualized expense | | | | | | |
| ratio for Lipper peer group* | 1.52% | 2.27% | 2.27% | 2.02% | 1.77% | 1.27% |
|
* Putnam keeps fund expenses below the Lipper peer group average expense ratio by limiting our fund expenses if they exceed the Lipper average. The Lipper average is a simple average of front-end load funds in the peer group that excludes 12b-1 fees as well as any expense offset and brokerage/service arrangements that may reduce fund expenses. To facilitate the comparison in this presentation, Putnam has adjusted the Lipper average to reflect 12b-1 fees. Investors should note that the other funds in the peer group may be significantly smaller or larger than the fund, and that an asset-weighted average would likely be lower than the simple average. Also, the fund and Lipper report expense data at different times; the fund’s expense ratio shown here is annualized data for the most recent six-month period, while the quarterly updated Lipper average is based on the most recent fiscal year-end data available for the peer group funds as of 3/31/09.
Your fund’s portfolio turnover
Putnam funds are actively managed by experts who buy and sell securities based on intensive analysis of companies, industries, economies, and markets. Portfolio turnover is a measure of how often a fund’s managers buy and sell securities for your fund. A portfolio turnover of 100%, for example, means that the managers sold and replaced securities valued at 100% of a fund’s assets within a one-year period. Funds with high turnover may be more likely to generate capital gains that must be distributed to shareholders as taxable income. High turnover may also cause a fund to pay more brokerage commissions and other transaction costs, which may detract from performance.
You can use the following table to compare your fund’s turnover with the average turnover for funds in its Lipper category.
15
Turnover comparisons Percentage of holdings that change every year
| | | | | |
| | 2008 | 2007 | 2006 | 2005 | 2004 |
|
| Putnam International | | | | | |
| New Opportunities Fund | 122% | 120% | 79% | 92% | 120% |
|
| |
| Lipper International Large-Cap | | | | | |
| Growth Funds category average | 74% | 73% | 73% | 92% | 84% |
|
Turnover data for the fund is calculated based on the fund’s fiscal-year period, which ends on September 30. Turnover data for the fund’s Lipper category is calculated based on the average of the turnover of each fund in the category for its fiscal year ended during the indicated year. Fiscal years vary across funds in the Lipper category, which may limit the comparability of the fund’s portfolio turnover rate to the Lipper average. Comparative data for 2008 is based on information available as of 12/31/08.
Your fund’s management
Your fund’s Portfolio Manager is Jeff Sacknowitz.
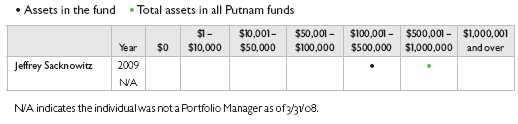
Portfolio management fund ownership
The following table shows how much the fund’s current Portfolio Manager has invested in the fund and in all Putnam mutual funds (in dollar ranges). Information shown is as of March 31, 2009, and March 31, 2008.
Trustee and Putnam employee fund ownership
As of March 31, 2009, all of the Trustees of the Putnam funds owned fund shares. The following table shows the approximate value of investments in the fund and all Putnam funds as of that date by the Trustees and Putnam employees. These amounts include investments by the Trustees’ and employees’ immediate family members and investments through retirement and deferred compensation plans.
| | |
| | Assets in the fund | Total assets in all Putnam funds |
| Trustees | $228,000 | $30,000,000 |
|
| Putnam employees | $5,592,000 | $319,000,000 |
|
Other Putnam funds managed by the Portfolio Manager
Jeff Sacknowitz is not a Portfolio Manager of any other Putnam mutual fund. He may, however, also manage other accounts and variable trust funds advised by Putnam Management or an affiliate.
16
Terms and definitions
Important terms
Total return shows how the value of the fund’s shares changed over time, assuming you held the shares through the entire period and reinvested all distributions in the fund.
Net asset value (NAV) is the price, or value, of one share of a mutual fund, without a sales charge. NAVs fluctuate with market conditions. NAV is calculated by dividing the net assets of each class of shares by the number of outstanding shares in the class.
Public offering price (POP) is the price of a mutual fund share plus the maximum sales charge levied at the time of purchase. POP performance figures shown here assume the 5.75% maximum sales charge for class A shares and 3.50% for class M shares.
Contingent deferred sales charge (CDSC) is generally a charge applied at the time of the redemption of class B or C shares and assumes redemption at the end of the period. Your fund’s class B CDSC declines from a 5% maximum during the first year to 1% during the sixth year. After the sixth year, the CDSC no longer applies. The CDSC for class C shares is 1% for one year after purchase.
Share classes
Class A shares are generally subject to an initial sales charge and no CDSC (except on certain redemptions of shares bought without an initial sales charge).
Class B shares are not subject to an initial sales charge. They may be subject to a CDSC.
Class C shares are not subject to an initial sales charge and are subject to a CDSC only if the shares are redeemed during the first year.
Class M shares have a lower initial sales charge and a higher 12b-1 fee than class A shares and no CDSC (except on certain redemptions of shares bought without an initial sales charge).
Class R shares are not subject to an initial sales charge or CDSC and are available only to certain defined contribution plans.
Class Y shares are not subject to an initial sales charge or CDSC, and carry no 12b-1 fee. They are generally only available to corporate and institutional clients and clients in other approved programs.
Comparative indexes
Barclays Capital Aggregate Bond Index is an unmanaged index of U.S. investment-grade fixed-income securities.
Merrill Lynch U.S. 3-Month Treasury Bill Index is an unmanaged index that seeks to measure the performance of U.S. Treasury bills available in the marketplace.
S&P 500 Index is an unmanaged index of common stock performance.
Morgan Stanley Capital International (MSCI) EAFE Growth Index is an unmanaged index of equity securities from developed countries in Western Europe, the Far East, and Australasia.
Indexes assume reinvestment of all distributions and do not account for fees. Securities and performance of a fund and an index will differ. You cannot invest directly in an index.
Lipper is a third-party industry-ranking entity that ranks mutual funds. Its rankings do not reflect sales charges. Lipper rankings are based on total return at net asset value relative to other funds that have similar current investment styles or objectives as determined by Lipper. Lipper may change a fund’s category assignment at its discretion. Lipper category averages reflect performance trends for funds within a category.
17
Trustee approval of management contract
General conclusions
The Board of Trustees of the Putnam funds oversees the management of each fund and, as required by law, determines annually whether to approve the continuance of your fund’s management contract with Putnam Investment Management (“Putnam Management”) and the sub-management contract, in respect of your fund, between Putnam Management’s affiliate, Putnam Investments Limited (“PIL”), and Putnam Management. In May 2008, the Board of Trustees also approved a new sub-advisory contract among Putnam Management, PIL and another affiliate, The Putnam Advisory Company (“PAC”), in respect of your fund. In this regard, the Board of Trustees, with the assistance of its Contract Committee consisting solely of Trustees who are not “interested persons” (as such term is defined in the Investment Company Act of 1940, as amended) of the Putnam funds (the “Independent Trustees”), requests and evaluates all information it deems reason ably necessary under the circumstances. Over the course of several months ending in June 2008, the Contract Committee met several times to consider the information provided by Putnam Management and other information developed with the assistance of the Board’s independent counsel and independent staff. The Contract Committee reviewed and discussed key aspects of this information with all of the Independent Trustees. The Contract Committee recommended, and the Independent Trustees approved, the continuance of your fund’s management, sub-management and sub-advisory contracts, effective July 1, 2008. (Because PIL and PAC are affiliates of Putnam Management and Putnam Management remains fully responsible for all services provided by PIL and PAC, the Trustees have not evaluated PIL and PAC as separate entities, except as otherwise indicated below, and all subsequent references to Putnam Management below should be deemed to include reference to PIL and PAC as necessary or a ppropriate in the context.)
The Independent Trustees’ approval was based on the following conclusions:
• That the fee schedule in effect for your fund represented reasonable compensation in light of the nature and quality of the services being provided to the fund, the fees paid by competitive funds and the costs incurred by Putnam Management in providing such services, and
• That this fee schedule represented an appropriate sharing between fund shareholders and Putnam Management of such economies of scale as may exist in the management of the fund at current asset levels.
These conclusions were based on a comprehensive consideration of all information provided to the Trustees, were subject to the continued application of certain expense reductions and waivers and other considerations noted below, and were not the result of any single factor. Some of the factors that figured particularly in the Trustees’ deliberations and how the Trustees considered these factors are described below, although individual Trustees may have evaluated the information presented differently, giving different weights to various factors. It is also important to recognize that the fee arrangements for your fund and the other Putnam funds are the result of many years of review and discussion between the Independent Trustees and Putnam Management, that certain aspects of such arrangements may receive greater scrutiny in some years than others, and that the Trustees’ conclusions may be based, in part, on their consideration of these same arrangements in prio r years.
18
Management fee schedules and
categories; total expenses
The Trustees reviewed the management fee schedules in effect for all Putnam funds, including fee levels and breakpoints, and the assignment of funds to particular fee categories. In reviewing fees and expenses, the Trustees generally focused their attention on material changes in circumstances — for example, changes in a fund’s size or investment style, changes in Putnam Management’s operating costs or responsibilities, or changes in competitive practices in the mutual fund industry — that suggest that consideration of fee changes might be warranted. The Trustees concluded that the circumstances did not warrant changes to the management fee structure of your fund, which had been carefully developed over the years, re-examined on many occasions and adjusted where appropriate. In this regard, the Trustees also noted that shareholders of your fund voted in 2007 to approve new management contracts containing an identical fee structure. The Trustees focuse d on two areas of particular interest, as discussed further below:
• Competitiveness. The Trustees reviewed comparative fee and expense information for competitive funds, which indicated that, in a custom peer group of competitive funds selected by Lipper Inc., your fund ranked in the 31st percentile in management fees and in the 55th percentile in total expenses (less any applicable 12b-1 fees) as of December 31, 2007 (the first percentile being the least expensive funds and the 100th percentile being the most expensive funds). (Because the fund’s custom peer group is smaller than the fund’s broad Lipper Inc. peer group, this expense information may differ from the Lipper peer expense information found elsewhere in this report.) The Trustees noted that expense ratios for a number of Putnam funds, which show the percentage of fund assets used to pay for management and administrative services, distribution (12b-1) fees and o ther expenses, had been increasing recently as a result of declining net assets and the natural operation of fee breakpoints.
The Trustees noted that the expense ratio increases described above were currently being controlled by expense limitations initially implemented in January 2004. The Trustees have received a commitment from Putnam Management and its parent company to continue this program through at least June 30, 2009. These expense limitations give effect to a commitment by Putnam Management that the expense ratio of each open-end fund would be no higher than the average expense ratio of the competitive funds included in the fund’s relevant Lipper universe (exclusive of any applicable 12b-1 charges in each case). The Trustees observed that this commitment to limit fund expenses has served shareholders well since its inception.
In order to ensure that the expenses of the Putnam funds continue to meet evolving competitive standards, the Trustees requested, and Putnam Management agreed, to extend for the twelve months beginning July 1, 2008, an additional expense limitation for certain funds at an amount equal to the average expense ratio (exclusive of 12b-1 charges) of a custom peer group of competitive funds selected by Lipper to correspond to the size of the fund. This additional expense limitation will be applied to those open-end funds that had above-average expense ratios (exclusive of 12b-1 charges) based on the custom peer group data for the period ended December 31, 2007. This additional expense limitation will not be applied to your fund because it had a below-average expense ratio relative to its custom peer group.
In addition, the Trustees devoted particular attention to analyzing the Putnam funds’ fees and expenses relative to those of competitors
19
in fund complexes of comparable size and with a comparable mix of asset categories. The Trustees concluded that this analysis did not reveal any matters requiring further attention at the current time.
• Economies of scale. Your fund currently has the benefit of breakpoints in its management fee that provide shareholders with significant economies of scale, which means that the effective management fee rate of the fund (as a percentage of fund assets) declines as the fund grows in size and crosses specified asset thresholds. Conversely, if the fund shrinks in size — as has been the case for many Putnam funds in recent years — these breakpoints result in increasing fee levels. In recent years, the Trustees have examined the operation of the existing breakpoint structure during periods of both growth and decline in asset levels. The Trustees concluded that the fee schedule in effect for your fund represented an appropriate sharing of economies of scale at current asset levels.
In connection with their review of the management fees and total expenses of the Putnam funds, the Trustees also reviewed the costs of the services to be provided and profits to be realized by Putnam Management and its affiliates from the relationship with the funds. This information included trends in revenues, expenses and profitability of Putnam Management and its affiliates relating to the investment management and distribution services provided to the funds. In this regard, the Trustees also reviewed an analysis of Putnam Management’s revenues, expenses and profitability with respect to the funds’ management contracts, allocated on a fund-by-fund basis.
Investment performance
The quality of the investment process provided by Putnam Management represented a major factor in the Trustees’ evaluation of the quality of services provided by Putnam Management under your fund’s management contract. The Trustees were assisted in their review of the Putnam funds’ investment process and performance by the work of the Investment Oversight Coordinating Committee of the Trustees and the Investment Oversight Committees of the Trustees, which had met on a regular monthly basis with the funds’ portfolio teams throughout the year. The Trustees concluded that Putnam Management generally provides a high-quality investment process — as measured by the experience and skills of the individuals assigned to the management of fund portfolios, the resources made available to such personnel, and in general the ability of Putnam Management to attract and retain high-quality personnel — but also recognized that this does not guarantee favorable investment results for every fund in every time period. The Trustees considered the investment performance of each fund over multiple time periods and considered information comparing each fund’s performance with various benchmarks and with the performance of competitive funds.
While the Trustees noted the satisfactory investment performance of certain Putnam funds, they considered the disappointing investment performance of many funds in recent periods, particularly over periods in 2007 and 2008. They discussed with senior management of Putnam Management the factors contributing to such underperformance and actions being taken to improve performance. The Trustees recognized that, in recent years, Putnam Management has taken steps to strengthen its investment personnel and processes to address areas of underperformance, including recent efforts to further centralize Putnam Management’s equity research function. In this regard, the Trustees took into consideration efforts by Putnam Management to improve its ability to assess and mitigate investment risk in individual funds, across asset classes, and
20
across the complex as a whole. The Trustees indicated their intention to continue to monitor performance trends to assess the effectiveness of these efforts and to evaluate whether additional changes to address areas of underperformance are warranted.
In the case of your fund, the Trustees considered that your fund’s class A share cumulative total return performance at net asset value was in the following percentiles of its Lipper Inc. peer group (Lipper International Multi-Cap Growth Funds) for the one-year, three-year and five-year periods ended December 31, 2007 (the first percentile being the best-performing funds and the 100th percentile being the worst-performing funds):
| | |
| One-year period | 70th | |
| |
| Three-year period | 47th | |
| |
| Five-year period | 74th | |
| |
(Because of the passage of time, and because Lipper changed the peer group for your fund after December 31, 2007, these performance results may differ from the performance results for more recent periods shown elsewhere in this report.) Over the one-year, three-year and five-year periods ended December 31, 2007, there were 220, 150, and 136 funds, respectively, in your fund’s Lipper peer group.* Past performance is no guarantee of future returns.
As a general matter, the Trustees believe that cooperative efforts between the Trustees and Putnam Management represent the most effective way to address investment performance problems. The Trustees noted that investors in the Putnam funds have, in effect, placed their trust in the Putnam organization, under the oversight of the funds’ Trustees, to make appropriate decisions regarding the management of the funds. Based on the responsiveness of Putnam Management in the recent past to Trustee concerns about investment performance, the Trustees concluded that it is preferable to seek change within Putnam Management to address performance shortcomings. In the Trustees’ view, the alternative of engaging a new investment adviser for an underperforming fund would entail significant disruptions and would not provide any greater assurance of improved investment performance.
Brokerage and soft-dollar allocations;
other benefits
The Trustees considered various potential benefits that Putnam Management may receive in connection with the services it provides under the management contract with your fund. These include benefits related to brokerage and soft-dollar allocations, whereby a portion of the commissions paid by a fund for brokerage may be used to acquire research services that may be useful to Putnam Management in managing the assets of the fund and of other clients. The Trustees considered changes made in 2008, at Putnam Management’s request, to the Putnam funds’ brokerage allocation policy, which expanded the permitted categories of brokerage and research services payable with soft dollars and increased the permitted soft dollar allocation to third-party services over what had been authorized in previous years. The Trustees indicated their continued intent to monitor
* Subsequent to theTrustees’ review of your fund’s management contract, Lipper changed the peer group of this fund to Lipper International Large-Cap Growth Funds. The percentile rankings for your fund’s class A share annualized total return performance in the Lipper International Large-Cap Growth Funds category for the one-year, five-year, and ten-year periods ended March 31, 2009, were 21%, 22%, and 49%, respectively. Over the one-year, five-year, and ten-year periods ended March 31, 2009, your fund ranked 21st out of 103, 15th out of 69, and 21st out of 42 funds, respectively. Note that this more recent information was not available when theTrustees approved the continuance of your fund’s management contract.
21
the potential benefits associated with the allocation of fund brokerage and trends in industry practice to ensure that the principle of seeking “best price and execution” remains paramount in the portfolio trading process.
The Trustees’ annual review of your fund’s management contract arrangements also included the review of its distributor’s contract and distribution plan with Putnam Retail Management Limited Partnership and the investor servicing agreement with Putnam Fiduciary Trust Company (“PFTC”), each of which provides benefits to affiliates of Putnam Management. In the case of the investor servicing agreement, the Trustees considered that certain shareholder servicing functions were shifted to a third-party service provider by PFTC in 2007.
Comparison of retail and institutional
fee schedules
The information examined by the Trustees as part of their annual contract review has included for many years information regarding fees charged by Putnam Management and its affiliates to institutional clients such as defined benefit pension plans, college endowments, etc. This information included comparisons of such fees with fees charged to the funds, as well as a detailed assessment of the differences in the services provided to these two types of clients. The Trustees observed, in this regard, that the differences in fee rates between institutional clients and mutual funds are by no means uniform when examined by individual asset sectors, suggesting that differences in the pricing of investment management services to these types of clients reflect to a substantial degree historical competitive forces operating in separate market places. The Trustees considered the fact that fee rates across different asset classes are typically higher on average for mutual funds than for institutional clients, as well as the differences between the services that Putnam Management provides to the Putnam funds and those that it provides to institutional clients of the firm, but did not rely on such comparisons to any significant extent in concluding that the management fees paid by your fund are reasonable.
Approval of the Sub-Advisory
Contract among Putnam
Management, Putnam
Investments Limited and
The Putnam Advisory Company
In May 2008, the Trustees approved a new sub-advisory contract among Putnam Management, PIL and PAC in respect of your fund, under which PAC’s Singapore branch would begin providing discretionary investment management services for your fund. The Contract Committee reviewed information provided by Putnam Management and PAC and, upon completion of this review, recommended, and the Independent Trustees and the full Board of Trustees approved, the sub-advisory contract in respect of your fund, effective January 30, 2009.
The Trustees considered numerous factors they believed relevant in approving your fund’s sub-advisory contract, including Putnam Management’s belief that the interest of shareholders would be best served by utilizing investment professionals in PAC’s Singapore office to manage a portion of your fund’s assets and PAC’s expertise in managing assets invested in Asian markets. The Trustees also considered that applicable securities laws require a sub-advisory relationship among Putnam Management, PIL and PAC in order for Putnam’s investment professionals in Singapore to be involved in the management of your fund. The Trustees noted that Putnam Management and/or PIL, but not your fund, would pay the sub-advisory fee to PAC for its services and that the sub-advisory relationship with PAC will not reduce the nature, quality or overall level of service provided to your fund.
22
Other information for shareholders
Important notice regarding delivery
of shareholder documents
In accordance with SEC regulations, Putnam sends a single copy of annual and semiannual shareholder reports, prospectuses, and proxy statements to Putnam shareholders who share the same address, unless a shareholder requests otherwise. If you prefer to receive your own copy of these documents, please call Putnam at 1-800-225-1581, and Putnam will begin sending individual copies within 30 days.
Proxy voting
Putnam is committed to managing our mutual funds in the best interests of our shareholders. The Putnam funds’ proxy voting guidelines and procedures, as well as information regarding how your fund voted proxies relating to portfolio securities during the 12-month period ended June 30, 2008, are available in the Individual Investors section of putnam.com, and on the SEC’s Web site, www.sec.gov. If you have questions about finding forms on the SEC’s Web site, you may call the SEC at 1-800-SEC-0330. You may also obtain the Putnam funds’ proxy voting guidelines and procedures at no charge by calling Putnam’s Shareholder Services at 1-800-225-1581.
Fund portfolio holdings
The fund will file a complete schedule of its portfolio holdings with the SEC for the first and third quarters of each fiscal year on Form N-Q. Shareholders may obtain the fund’s Forms N-Q on the SEC’s Web site at www.sec.gov. In addition, the fund’s Forms N-Q may be reviewed and copied at the SEC’s Public Reference Room in Washington, D.C. You may call the SEC at 1-800-SEC-0330 for information about the SEC’s Web site or the operation of the Public Reference Room.
23
Financial statements
A guide to financial statements
These sections of the report, as well as the accompanying Notes, constitute the fund’s financial statements.
The fund’s portfolio lists all the fund’s investments and their values as of the last day of the reporting period. Holdings are organized by asset type and industry sector, country, or state to show areas of concentration and diversification.
Statement of assets and liabilities shows how the fund’s net assets and share price are determined. All investment and noninvestment assets are added together. Any unpaid expenses and other liabilities are subtracted from this total. The result is divided by the number of shares to determine the net asset value per share, which is calculated separately for each class of shares. (For funds with preferred shares, the amount subtracted from total assets includes the liquidation preference of preferred shares.)
Statement of operations shows the fund’s net investment gain or loss. This is done by first adding up all the fund’s earnings —from dividends and interest income — and subtracting its operating expenses to determine net investment income (or loss). Then, any net gain or loss the fund realized on the sales of its holdings — as well as any unrealized gains or losses over the period — is added to or subtracted from the net investment result to determine the fund’s net gain or loss for the fiscal period.
Statement of changes in net assets shows how the fund’s net assets were affected by the fund’s net investment gain or loss, by distributions to shareholders, and by changes in the number of the fund’s shares. It lists distributions and their sources (net investment income or realized capital gains) over the current reporting period and the most recent fiscal year-end. The distributions listed here may not match the sources listed in the Statement of operations because the distributions are determined on a tax basis and may be paid in a different period from the one in which they were earned. Dividend sources are estimated at the time of declaration. Actual results may vary. Any non-taxable return of capital cannot be determined until final tax calculations are completed after the end of the fund’s fiscal year.
Financial highlights provide an overview of the fund’s investment results, per-share distributions, expense ratios, net investment income ratios, and portfolio turnover in one summary table, reflecting the five most recent reporting periods. In a semiannual report, the highlight table also includes the current reporting period.
24
The fund’s portfolio 3/31/09 (Unaudited)
| | |
| COMMON STOCKS (96.7%)* | Shares | Value |
|
| Aerospace and defense (3.3%) | | |
| Cobham PLC (United Kingdom) | 1,361,574 | $3,354,430 |
|
| Finmeccanica SpA (Italy) | 401,577 | 4,994,405 |
|
| MTU Aero Engines Holding AG (Germany) | 90,995 | 2,133,166 |
|
| | | 10,482,001 |
| Airlines (0.7%) | | |
| easyJet PLC (United Kingdom) † | 571,300 | 2,292,293 |
|
| | | 2,292,293 |
| Automotive (1.2%) | | |
| Honda Motor Co., Ltd. (Japan) | 118,700 | 2,837,370 |
|
| Volkswagen AG (Germany) | 3,594 | 1,106,107 |
|
| | | 3,943,477 |
| Banking (4.1%) | | |
| HSBC Holdings PLC (London Exchange) (United Kingdom) | 358,809 | 2,030,584 |
|
| HSBC Holdings PLC (Rights) (United Kingdom) † | 112,131 | 226,785 |
|
| Industrial & Commercial Bank of China (China) | 8,408,000 | 4,373,857 |
|
| Itau Unibanco Banco Multiplo SA ADR (Brazil) | 253,418 | 2,757,192 |
|
| Mitsubishi UFJ Financial Group, Inc. (Japan) | 354,900 | 1,741,833 |
|
| Mitsubishi UFJ Financial Group, Inc. 144A (Japan) † | 206,466 | 1,013,326 |
|
| Standard Chartered PLC (United Kingdom) | 83,182 | 1,031,506 |
|
| | | 13,175,083 |
| Beverage (1.3%) | | |
| Britvic PLC (United Kingdom) | 908,999 | 2,948,136 |
|
| Anheuser-Busch InBev NV 144A (Belgium) † | 39,684 | 1,095,397 |
|
| | | 4,043,533 |
| Chemicals (2.4%) | | |
| Israel Chemicals, Ltd. (Israel) | 96,397 | 792,883 |
|
| Linde AG (Germany) | 30,487 | 2,070,864 |
|
| Syngenta AG (Switzerland) | 23,736 | 4,768,455 |
|
| | | 7,632,202 |
| Commercial and consumer services (1.1%) | | |
| Nissha Printing Co., Ltd. (Japan) | 47,800 | 1,530,481 |
|
| SECOM Co., Ltd. (Japan) | 55,200 | 2,041,378 |
|
| | | 3,571,859 |
| Communications equipment (1.1%) | | |
| Nokia OYJ (Finland) | 294,053 | 3,441,250 |
|
| | | 3,441,250 |
| Computers (2.9%) | | |
| Apple, Inc. † | 26,375 | 2,772,540 |
|
| Elpida Memory, Inc. (Japan) † | 324,900 | 2,273,914 |
|
| Ju Teng International Holdings, Ltd. (Hong Kong) † | 8,216,000 | 2,497,091 |
|
| Otsuka Corp. (Japan) | 48,300 | 1,790,828 |
|
| | | 9,334,373 |
| Conglomerates (1.0%) | | |
| Vivendi SA (France) | 119,637 | 3,159,936 |
|
| | | 3,159,936 |
| Consumer (1.0%) | | |
| LVMH Moet Hennessy Louis Vuitton SA (France) | 51,771 | 3,244,193 |
|
| | | 3,244,193 |
| Consumer goods (1.7%) | | |
| Reckitt Benckiser PLC (United Kingdom) | 149,123 | 5,610,486 |
|
| | | 5,610,486 |
25
| | |
| COMMON STOCKS (96.7%)* cont. | Shares | Value |
|
| Distribution (0.5%) | | |
| Olam International, Ltd. (Singapore) | 1,700,000 | $1,634,854 |
|
| | | 1,634,854 |
| Electric utilities (1.7%) | | |
| E.On AG (Germany) | 86,808 | 2,415,418 |
|
| Public Power Corp. SA (Greece) | 169,780 | 3,084,981 |
|
| | | 5,500,399 |
| Electrical equipment (2.3%) | | |
| Funai Electric Co., Ltd. (Japan) | 49,200 | 1,450,987 |
|
| Prysmian SpA (Italy) | 284,357 | 2,830,305 |
|
| Siemens AG (Germany) | 54,035 | 3,093,259 |
|
| | | 7,374,551 |
| Electronics (0.9%) | | |
| High Tech Computer Corp. (Taiwan) | 88,000 | 1,089,662 |
|
| Micron Technology, Inc. † | 477,142 | 1,937,197 |
|
| | | 3,026,859 |
| Energy (other) (0.8%) | | |
| First Solar, Inc. † | 18,963 | 2,516,390 |
|
| | | 2,516,390 |
| Engineering and construction (0.8%) | | |
| Vinci SA (France) | 68,863 | 2,549,681 |
|
| | | 2,549,681 |
| Environmental (0.9%) | | |
| Kurita Water Industries, Ltd. (Japan) | 143,300 | 2,754,482 |
|
| | | 2,754,482 |
| Food (7.7%) | | |
| China Green Holdings, Ltd. (China) | 2,301,000 | 1,356,559 |
|
| Nestle SA (Switzerland) | 456,353 | 15,436,466 |
|
| Toyo Suisan Kaisha, Ltd. (Japan) | 184,000 | 3,763,865 |
|
| WM Morrison Supermarkets PLC (United Kingdom) | 1,101,741 | 4,031,883 |
|
| | | 24,588,773 |
| Health-care services (0.9%) | | |
| Suzuken Co., Ltd. (Japan) | 116,100 | 3,025,762 |
|
| | | 3,025,762 |
| Insurance (5.9%) | | |
| Allianz SE (Germany) | 29,312 | 2,468,408 |
|
| ING Canada, Inc. (Canada) | 52,600 | 1,502,738 |
|
| ING Canada, Inc. 144A (Canada) | 3,670 | 104,849 |
|
| Insurance Australia Group, Ltd. (Australia) | 560,505 | 1,365,457 |
|
| Muenchener Rueckversicherungs-Gesellschaft AG (Germany) | 21,586 | 2,635,572 |
|
| Ping An Insurance (Group) Co., of China, Ltd. (China) | 379,500 | 2,265,827 |
|
| Prudential PLC (United Kingdom) | 506,707 | 2,440,876 |
|
| Tokio Marine Holdings, Inc. (Japan) | 181,300 | 4,471,794 |
|
| Zurich Financial Services AG (Switzerland) | 10,137 | 1,598,566 |
|
| | | 18,854,087 |
| Leisure (0.3%) | | |
| Fields Corp. (Japan) | 715 | 1,014,625 |
|
| | | 1,014,625 |
| Machinery (1.9%) | | |
| Alstom SA (France) | 69,019 | 3,571,872 |
|
| Fuji Machine Manufacturing Co., Ltd. (Japan) | 314,800 | 2,552,513 |
|
| | | 6,124,385 |
26
| | |
| COMMON STOCKS (96.7%)* cont. | Shares | Value |
|
| Medical technology (1.3%) | | |
| Terumo Corp. (Japan) | 112,200 | $4,165,774 |
|
| | | 4,165,774 |
| Metals (7.2%) | | |
| ArcelorMittal (Luxembourg) | 39,700 | 803,196 |
|
| BHP Billiton PLC (United Kingdom) | 320,542 | 6,344,448 |
|
| BHP Billiton, Ltd. (Australia) | 425,860 | 9,491,226 |
|
| Vallourec SA (France) | 29,045 | 2,691,632 |
|
| Xstrata PLC (United Kingdom) | 313,568 | 2,091,514 |
|
| Zhaojin Mining Industry Co., Ltd. (Hong Kong) | 1,192,500 | 1,689,946 |
|
| | | 23,111,962 |
| Natural gas utilities (3.6%) | | |
| Centrica PLC (United Kingdom) | 1,278,659 | 4,179,868 |
|
| Gaz de France SA (France) | 109,302 | 3,756,632 |
|
| Tokyo Gas Co., Ltd. (Japan) | 1,060,000 | 3,698,486 |
|
| | | 11,634,986 |
| Oil and gas (9.4%) | | |
| BG Group PLC (United Kingdom) | 488,643 | 7,404,134 |
|
| BP PLC (United Kingdom) | 915,390 | 6,124,316 |
|
| China Petroleum & Chemical Corp. (China) | 4,734,000 | 3,037,174 |
|
| Nexen, Inc. (Canada) | 90,800 | 1,540,595 |
|
| Petroleo Brasileiro SA ADR (Preference) (Brazil) | 141,825 | 3,474,713 |
|
| Total SA (France) | 169,156 | 8,386,281 |
|
| | | 29,967,213 |
| Pharmaceuticals (10.9%) | | |
| Astellas Pharma, Inc. (Japan) | 101,100 | 3,110,738 |
|
| AstraZeneca PLC (United Kingdom) | 94,484 | 3,350,365 |
|
| Novartis AG (Switzerland) | 290,983 | 10,975,092 |
|
| Roche Holding AG (Switzerland) | 92,991 | 12,758,185 |
|
| Teva Pharmaceutical Industries, Ltd. ADR (Israel) | 38,200 | 1,720,910 |
|
| UCB SA (Belgium) | 99,354 | 2,929,389 |
|
| | | 34,844,679 |
| Publishing (1.2%) | | |
| Reed Elsevier PLC (United Kingdom) | 524,531 | 3,762,720 |
|
| | | 3,762,720 |
| Real estate (1.4%) | | |
| Link REIT (The) (Hong Kong) R | 1,427,500 | 2,819,072 |
|
| Unibail-Rodamco (France) R | 12,060 | 1,715,274 |
|
| | | 4,534,346 |
| Retail (2.8%) | | |
| Koninklijke Ahold NV (Netherlands) | 253,094 | 2,769,809 |
|
| Lawson, Inc. (Japan) | 43,000 | 1,771,599 |
|
| Point, Inc. (Japan) | 96,400 | 4,343,116 |
|
| | | 8,884,524 |
| Shipping (0.6%) | | |
| D/S Norden (Denmark) | 64,407 | 1,802,863 |
|
| | | 1,802,863 |
| Software (2.2%) | | |
| UBISOFT Entertainment (France) † | 169,152 | 3,093,488 |
|
| VMware, Inc. Class A † | 172,204 | 4,067,458 |
|
| | | 7,160,946 |
27
| | | | |
| COMMON STOCKS (96.7%)* cont. | | | Shares | Value |
|
| Telecommunications (3.8%) | | | | |
| America Movil SAB de CV ADR Ser. L (Mexico) | | | 78,170 | $2,116,844 |
|
| China Unicom Hong Kong, Ltd. (China) | | | 1,702,000 | 1,783,459 |
|
| France Telecom SA (France) | | | 35,129 | 798,567 |
|
| Koninklijke (Royal) KPN NV (Netherlands) | | | 393,958 | 5,266,534 |
|
| Vodafone Group PLC (United Kingdom) | | | 1,186,038 | 2,071,362 |
|
| | | | | 12,036,766 |
| Telephone (0.8%) | | | | |
| Swisscom AG (Switzerland) | | | 9,394 | 2,633,780 |
|
| | | | | 2,633,780 |
| Tobacco (2.4%) | | | | |
| British American Tobacco (BAT) PLC (United Kingdom) | | 252,628 | 5,847,792 |
|
| Japan Tobacco, Inc. (Japan) | | | 643 | 1,715,566 |
|
| | | | | 7,563,358 |
| Toys (2.7%) | | | | |
| Nintendo Co., Ltd. (Japan) | | | 29,500 | 8,645,088 |
|
| | | | | 8,645,088 |
| Total common stocks (cost $370,268,670) | | | | $309,644,539 |
| |
| |
| WARRANTS (1.2%)* † | Expiration | Strike | | |
| | date | price | Warrants | Value |
|
| Baoshan Iron & Steel Co. 144A (China) | 12/23/09 | $0.00 | 4,390,200 | $3,687,768 |
|
| Total warrants (cost $3,223,699) | | | | $3,687,768 |
| |
| |
| SHORT-TERM INVESTMENTS (2.1%)* | | | Shares | Value |
|
| Federated Prime Obligations Fund | | | 6,804,001 | $6,804,001 |
|
| Total short-term investments (cost $6,804,001) | | | | $6,804,001 |
| |
| |
| TOTAL INVESTMENTS | | | | |
|
| Total investments (cost $380,296,370) | | | | $320,136,308 |
* Percentages indicated are based on net assets of $320,087,483.
† Non-income-producing security.
R Real Estate Investment Trust.
At March 31, 2009, liquid assets totaling $1,893,640 have been designated as collateral for open forward contracts.
144A after the name of an issuer represents securities exempt from registration under Rule 144A under the Securities Act of 1933, as amended. These securities may be resold in transactions exempt from registration, normally to qualified institutional buyers.
ADR after the name of a foreign holding stands for American Depository Receipts representing ownership of foreign securities on deposit with a custodian bank.
28
DIVERSIFICATION BY COUNTRY
Distribution of investments by country of risk at March 31, 2009 (as a percentage of Portfolio Value):
| | | | |
| United Kingdom | 20.3% | | Brazil | 1.9% |
| |
|
| Japan | 18.7 | | Belgium | 1.3 |
| |
|
| Switzerland | 15.0 | | Finland | 1.1 |
| |
|
| France | 10.3 | | Canada | 1.0 |
| |
|
| United States | 5.7 | | Greece | 1.0 |
| |
|
| China | 5.2 | | Israel | 0.8 |
| |
|
| Germany | 5.0 | | Mexico | 0.7 |
| |
|
| Australia | 3.4 | | Denmark | 0.6 |
| |
|
| Netherlands | 2.5 | | Singapore | 0.5 |
| |
|
| Italy | 2.4 | | Other | 0.4 |
| |
|
| Hong Kong | 2.2 | | Total | 100.0% |
| | |
FORWARD CURRENCY CONTRACTS TO BUY at 3/31/09 (aggregate face value $135,391,870) (Unaudited)
| | | | | |
| | | | | | Unrealized |
| | | Aggregate | | Delivery | appreciation/ |
| | Value | face value | | date | (depreciation) |
|
| Australian Dollar | $19,515,748 | $18,034,535 | | 4/15/09 | $1,481,213 |
|
| British Pound | 11,350,971 | 11,161,067 | | 4/15/09 | 189,904 |
|
| Canadian Dollar | 14,798,087 | 14,460,843 | | 4/15/09 | 337,244 |
|
| Danish Krone | 2,247,430 | 2,137,987 | | 4/15/09 | 109,443 |
|
| Euro | 53,791,886 | 51,097,046 | | 4/15/09 | 2,694,840 |
|
| Japanese Yen | 16,150,022 | 16,267,612 | | 4/15/09 | (117,590) |
|
| Norwegian Krone | 4,287,777 | 4,052,776 | | 4/15/09 | 235,001 |
|
| Singapore Dollar | 1,970,793 | 1,942,510 | | 4/15/09 | 28,283 |
|
| Swedish Krona | 9,237,029 | 8,189,440 | | 4/15/09 | 1,047,589 |
|
| Swiss Franc | 8,301,013 | 8,048,054 | | 4/15/09 | 252,959 |
|
| Total | | | | | $6,258,886 |
FORWARD CURRENCY CONTRACTS TO SELL at 3/31/09 (aggregate face value $100,177,994) (Unaudited)
| | | | | |
| | | | | | Unrealized |
| | | Aggregate | | Delivery | appreciation/ |
| | Value | face value | | date | (depreciation) |
|
| Australian Dollar | $7,255,587 | $6,679,277 | | 4/15/09 | $(576,310) |
|
| British Pound | 1,600,112 | 1,573,112 | | 4/15/09 | (27,000) |
|
| Canadian Dollar | 17,510,365 | 17,105,595 | | 4/15/09 | (404,770) |
|
| Euro | 44,214,603 | 41,985,961 | | 4/15/09 | (2,228,642) |
|
| Hong Kong Dollar | 12,676,699 | 12,666,156 | | 4/15/09 | (10,543) |
|
| Japanese Yen | 689,326 | 692,652 | | 4/15/09 | 3,326 |
|
| Norwegian Krone | 3,159,982 | 2,986,817 | | 4/15/09 | (173,165) |
|
| Swedish Krona | 4,909,087 | 4,352,403 | | 4/15/09 | (556,684) |
|
| Swiss Franc | 12,527,479 | 12,136,021 | | 4/15/09 | (391,458) |
|
| Total | | | | | $(4,365,246) |
29
In September 2006, the FASB issued Statement of Financial Accounting Standards No. 157, Fair Value Measurements (SFAS 157). SFAS 157 is effective for financial statements issued for fiscal years beginning after November 15, 2007 and interim periods within those fiscal years. While the adoption of SFAS 157 does not have a material effect on the fund’s net asset value, it does require additional disclosures about fair value measurements. The Standard establishes a three-level hierarchy for disclosure of fair value measurements. The valuation hierarchy is based upon the transparency of inputs to the valuation of the fund’s investments. The three levels are defined as follows:
Level 1 — Valuations based on quoted prices for identical securities in active markets.
Level 2 — Valuations based on quoted prices in markets that are not active or for which all significant inputs are observable, either directly or indirectly.
Level 3 — Valuations based on inputs that are unobservable and significant to the fair value measurement.
The following is a summary of the inputs used to value the fund’s net assets as of March 31, 2009:
| | |
| Valuation inputs | Investments in securities | Other financial instruments |
|
| Level 1 | $32,330,052 | $— |
|
| Level 2 | 287,806,256 | 1,893,640 |
|
| Level 3 | — | — |
|
| Total | $320,136,308 | $1,893,640 |
Other financial instruments include futures, written options, TBA sale commitments, swaps and forward contracts which are valued at the unrealized appreciation/(depreciation) on the instrument.
The accompanying notes are an integral part of these financial statements.
30
Statement of assets and liabilities 3/31/09 (Unaudited)
| | |
| ASSETS | | |
|
| Investment in securities, at value (Note 1): | | |
| Unaffiliated issuers (identified cost $380,296,370) | | $320,136,308 |
|
| Cash | | 502,476 |
|
| Foreign currency (cost $19,150) (Note 1) | | 19,198 |
|
| Dividends, interest and other receivables | | 1,167,889 |
|
| Foreign tax reclaim | | 778,203 |
|
| Receivable for shares of the fund sold | | 379,093 |
|
| Receivable for investments sold | | 3,731,340 |
|
| Unrealized appreciation on forward currency contracts (Note 1) | | 6,379,802 |
|
| Total assets | | 333,094,309 |
|
| |
| LIABILITIES | | |
|
| Payable for investments purchased | | 6,776,884 |
|
| Payable for shares of the fund repurchased | | 407,669 |
|
| Payable for compensation of Manager (Note 2) | | 527,173 |
|
| Payable for investor servicing fees (Note 2) | | 81,448 |
|
| Payable for custodian fees (Note 2) | | 37,975 |
|
| Payable for Trustee compensation and expenses (Note 2) | | 168,114 |
|
| Payable for administrative services (Note 2) | | 2,100 |
|
| Payable for distribution fees (Note 2) | | 196,729 |
|
| Unrealized depreciation on forward currency contracts (Note 1) | | 4,486,162 |
|
| Payable for receivable purchase agreement (Note 2) | | 172,521 |
|
| Other accrued expenses | | 150,051 |
|
| Total liabilities | | 13,006,826 |
| |
| Net assets | | $320,087,483 |
|
| |
| REPRESENTED BY | | |
|
| Paid-in capital (Unlimited shares authorized) (Notes 1 and 4) | $1,025,981,984 |
|
| Distributions in excess of net investment income (Note 1) | | (1,495,682) |
|
| Accumulated net realized loss on investments and foreign currency transactions (Note 1) | | (646,306,533) |
|
| Net unrealized depreciation of investments and assets and liabilities in foreign currencies | | (58,092,286) |
|
| Total — Representing net assets applicable to capital shares outstanding | | $320,087,483 |
|
| |
| COMPUTATION OF NET ASSET VALUE AND OFFERING PRICE | | |
|
| Net asset value and redemption price per class A share ($264,550,531 divided by 27,141,873 shares) | $9.75 |
|
| Offering price per class A share (100/94.25 of $9.75)* | | $10.34 |
|
| Net asset value and offering price per class B share ($20,781,371 divided by 2,305,280 shares)** | | $9.01 |
|
| Net asset value and offering price per class C share ($7,096,069 divided by 766,496 shares)** | | $9.26 |
|
| Net asset value and redemption price per class M share ($6,713,151 divided by 723,553 shares) | | $9.28 |
|
| Offering price per class M share (100/96.50 of $9.28)* | | $9.62 |
|
| Net asset value, offering price and redemption price per class R share | | |
| ($1,106,968 divided by 114,950 shares) | | $9.63 |
|
| Net asset value, offering price and redemption price per class Y share | | |
| ($19,839,393 divided by 2,028,414 shares) | | $9.78 |
|
* On single retail sales of less than $50,000. On sales of $50,000 or more the offering price is reduced.
** Redemption price per share is equal to net asset value less any applicable contingent deferred sales charge. The accompanying notes are an integral part of these financial statements.
31
Statement of operations Six months ended 3/31/09 (Unaudited)
| |
| INVESTMENT INCOME | |
|
| Dividends (net of foreign tax of $385,745) | $5,825,836 |
|
| Interest | 115,857 |
|
| Securities lending | 45,788 |
|
| Total investment income | 5,987,481 |
|
| |
| EXPENSES | |
|
| Compensation of Manager (Note 2) | 1,853,567 |
|
| Investor servicing fees (Note 2) | 771,082 |
|
| Custodian fees (Note 2) | 41,378 |
|
| Trustee compensation and expenses (Note 2) | 20,627 |
|
| Administrative services (Note 2) | 14,503 |
|
| Distribution fees — Class A (Note 2) | 370,725 |
|
| Distribution fees — Class B (Note 2) | 128,375 |
|
| Distribution fees — Class C (Note 2) | 40,752 |
|
| Distribution fees — Class M (Note 2) | 28,600 |
|
| Distribution fees — Class R (Note 2) | 3,143 |
|
| Other | 158,253 |
|
| Fees reimbursed by Manager (Note 2) | (498,401) |
|
| Total expenses | 2,932,604 |
| | |
| Expense reduction (Note 2) | (70,777) |
|
| Net expenses | 2,861,827 |
| |
| Net investment income | 3,125,654 |
|
| |
| Net realized loss on investments (Notes 1 and 3) | (163,891,834) |
|
| Net realized loss on futures contracts (Note 1) | (183,813) |
|
| Net realized loss on foreign currency transactions (Note 1) | (6,741,545) |
|
| Net unrealized appreciation of assets and liabilities in | |
| foreign currencies during the period | 4,325,910 |
|
| Net unrealized appreciation of investments during the period | 24,409,970 |
|
| Net loss on investments | (142,081,312) |
| |
| Net decrease in net assets resulting from operations | $(138,955,658) |
|
The accompanying notes are an integral part of these financial statements.
32
Statement of changes in net assets
| | |
| DECREASE IN NET ASSETS | Six months ended 3/31/09* | Year ended 9/30/08 |
|
| Operations: | | |
| Net investment income | $3,125,654 | $9,525,810 |
|
| Net realized loss on investments and foreign currency | | |
| transactions | (170,817,192) | (40,768,509) |
|
| Net unrealized appreciation (depreciation) of investments | | |
| and assets and liabilities in foreign currencies | 28,735,880 | (244,339,408) |
|
| Net decrease in net assets resulting from operations | (138,955,658) | (275,582,107) |
|
| Distributions to shareholders: (Note 1) | | |
| From ordinary income | | |
| Net investment income | | |
|
| Class A | — | (8,707,411) |
|
| Class B | — | (540,969) |
|
| Class C | — | (151,824) |
|
| Class M | — | (166,283) |
|
| Class R | — | (39,925) |
|
| Class Y | — | (934,024) |
|
| Redemption fees (Note 1) | 5,969 | 62,181 |
|
| Decrease from capital share transactions (Note 4) | (74,992,919) | (57,646,618) |
|
| Total decrease in net assets | (213,942,608) | (343,706,980) |
|
| |
| NET ASSETS | | |
|
| Beginning of period | 534,030,091 | 877,737,071 |
|
| End of period (including distributions in excess of net investment income | |
| of $1,495,682 and $4,621,336, respectively) | $320,087,483 | $534,030,091 |
|
| |
| * Unaudited | | |
The accompanying notes are an integral part of these financial statements.
33
Financial highlights (For a common share outstanding throughout the period)
| | | | | | | | | | | | | |
| INVESTMENT OPERATIONS: | LESS DISTRIBUTIONS: | RATIOS AND SUPPLEMENTAL DATA: | |
|
| | | | | | | | | | | | Ratio | Ratio of net | |
| | | | Net realized | | | | | | | | of expenses | investment | |
| | Net asset value, | | and unrealized | Total from | From net | | | Net asset | Total return | Net assets, | to average | income (loss) | |
| | beginning | Net investment | gain (loss) on | investment | investment | Total | Redemption | value, end of | at net asset | end of period | net assets | to average | Portfolio |
| Period ended | of period | income (loss) a,b | investments | operations | income | distributions | fees c | period | value (%) d | (in thousands) | (%) b,e | net assets (%) b | turnover (%) |
|
| Class A | | | | | | | | | | | | | |
| March 31, 2009 ** | $13.30 | .09 | (3.64) | (3.55) | — | — | — | $9.75 | (26.69) * | $264,551 | .76 * | .88 * | 90.25 * |
| September 30, 2008 | 19.90 | .23 | (6.58) | (6.35) | (.25) | (.25) | — | 13.30 | (32.26) | 420,839 | 1.51 | 1.33 | 121.56 |
| September 30, 2007 | 15.50 | .09 | 4.39 | 4.48 | (.08) | (.08) | — | 19.90 | 28.96 | 697,001 | 1.55 | .49 | 120.15 |
| September 30, 2006 | 13.51 | .07 f | 2.14 | 2.21 | (.22) | (.22) | — | 15.50 | 16.63 | 586,766 | 1.60 f | .48 f | 78.99 |
| September 30, 2005 | 10.34 | .11 g | 3.08 | 3.19 | (.02) | (.02) | — | 13.51 | 30.93 g | 558,101 | 1.70 | .92 g | 92.11 |
| September 30, 2004 | 9.01 | .05 | 1.37 | 1.42 | (.09) | (.09) | — | 10.34 | 15.77 | 442,192 | 1.68 | .47 | 120.02 |
|
| Class B | | | | | | | | | | | | | |
| March 31, 2009 ** | $12.34 | .05 | (3.38) | (3.33) | — | — | — | $9.01 | (26.99) * | $20,781 | 1.13 * | .48 * | 90.25 * |
| September 30, 2008 | 18.47 | .06 | (6.10) | (6.04) | (.09) | (.09) | — | 12.34 | (32.83) | 39,186 | 2.26 | .38 | 121.56 |
| September 30, 2007 | 14.43 | (.05) | 4.09 | 4.04 | — | — | — | 18.47 | 28.00 | 115,758 | 2.30 | (.28) | 120.15 |
| September 30, 2006 | 12.57 | (.04) f | 2.00 | 1.96 | (.10) | (.10) | — | 14.43 | 15.74 | 122,375 | 2.35 f | (.31) f | 78.99 |
| September 30, 2005 | 9.67 | .01 g | 2.89 | 2.90 | — | — | — | 12.57 | 29.99 g | 149,742 | 2.45 | .07 g | 92.11 |
| September 30, 2004 | 8.43 | (.03) | 1.29 | 1.26 | (.02) | (.02) | — | 9.67 | 14.93 | 224,449 | 2.43 | (.31) | 120.02 |
|
| Class C | | | | | | | | | | | | | |
| March 31, 2009 ** | $12.68 | .05 | (3.47) | (3.42) | — | — | — | $9.26 | (26.97) * | $7,096 | 1.13 * | .50 * | 90.25 * |
| September 30, 2008 | 19.00 | .09 | (6.28) | (6.19) | (.13) | (.13) | — | 12.68 | (32.77) | 11,973 | 2.26 | .54 | 121.56 |
| September 30, 2007 | 14.85 | (.05) | 4.20 | 4.15 | — | — | — | 19.00 | 27.95 | 21,466 | 2.30 | (.26) | 120.15 |
| September 30, 2006 | 12.96 | (.04) f | 2.06 | 2.02 | (.13) | (.13) | — | 14.85 | 15.74 | 16,183 | 2.35 f | (.27) f | 78.99 |
| September 30, 2005 | 9.97 | .02 g | 2.97 | 2.99 | — | — | — | 12.96 | 29.99 g | 15,098 | 2.45 | .15 g | 92.11 |
| September 30, 2004 | 8.69 | (.03) | 1.32 | 1.29 | (.01) | (.01) | — | 9.97 | 14.85 | 14,058 | 2.43 | (.30) | 120.02 |
|
| Class M | | | | | | | | | | | | | |
| March 31, 2009 ** | $12.69 | .06 | (3.47) | (3.41) | — | — | — | $9.28 | (26.87) * | $6,713 | 1.01 * | .63 * | 90.25 * |
| September 30, 2008 | 19.00 | .13 | (6.28) | (6.15) | (.16) | (.16) | — | 12.69 | (32.62) | 10,800 | 2.01 | .79 | 121.56 |
| September 30, 2007 | 14.81 | — c | 4.19 | 4.19 | — | — | — | 19.00 | 28.29 | 20,759 | 2.05 | (.02) | 120.15 |
| September 30, 2006 | 12.92 | (.01) f | 2.06 | 2.05 | (.16) | (.16) | — | 14.81 | 16.02 | 18,470 | 2.10 f | (.04) f | 78.99 |
| September 30, 2005 | 9.92 | .04 g | 2.96 | 3.00 | — | — | — | 12.92 | 30.24 g | 18,907 | 2.20 | .38 g | 92.11 |
| September 30, 2004 | 8.64 | (.01) | 1.33 | 1.32 | (.04) | (.04) | — | 9.92 | 15.26 | 18,730 | 2.18 | (.06) | 120.02 |
|
| Class R | | | | | | | | | | | | | |
| March 31, 2009 ** | $13.15 | .08 | (3.60) | (3.52) | — | — | — | $9.63 | (26.77) * | $1,107 | .88 * | .76 * | 90.25 * |
| September 30, 2008 | 19.76 | .22 | (6.56) | (6.34) | (.27) | (.27) | — | 13.15 | (32.47) | 1,718 | 1.76 | 1.28 | 121.56 |
| September 30, 2007 | 15.42 | .05 | 4.36 | 4.41 | (.07) | (.07) | — | 19.76 | 28.70 | 986 | 1.80 | .26 | 120.15 |
| September 30, 2006 | 13.47 | .03 f | 2.13 | 2.16 | (.21) | (.21) | — | 15.42 | 16.28 | 307 | 1.85 f | .23 f | 78.99 |
| September 30, 2005 | 10.34 | .13 g | 3.03 | 3.16 | (.03) | (.03) | — | 13.47 | 30.59 g | 67 | 1.95 | 1.07 g | 92.11 |
| September 30, 2004† | 9.77 | .01 | .65 | .66 | (.09) | (.09) | — | 10.34 | 6.75 * | 10 | 1.61 * | .18 * | 120.02 |
|
| Class Y | | | | | | | | | | | | | |
| March 31, 2009 ** | $13.33 | .09 | (3.64) | (3.55) | — | — | — | $9.78 | (26.63) * | $19,839 | .63 * | .92 * | 90.25 * |
| September 30, 2008 | 19.95 | .29 | (6.61) | (6.32) | (.30) | (.30) | — | 13.33 | (32.10) | 49,515 | 1.26 | 1.70 | 121.56 |
| September 30, 2007 | 15.53 | .14 | 4.39 | 4.53 | (.11) | (.11) | — | 19.95 | 29.33 | 21,767 | 1.30 | .76 | 120.15 |
| September 30, 2006†† | 13.49 | .11 f | 2.16 | 2.27 | (.23) | (.23) | — | 15.53 | 17.09 * | 16,331 | 1.34 *f | .75 *f | 78.99 |
|
See notes to financial highlights at the end of this section.
The accompanying notes are an integral part of these financial statements.
Financial highlights (Continued)
* Not annualized.
** Unaudited.
† For the period December 1, 2003 (commencement of operations) to September 30, 2004.
†† For the period October 4, 2005 (commencement of operations) to September 30, 2006.
a Per share net investment income (loss) has been determined on the basis of the weighted average number of shares outstanding during the period.
b Reflects an involuntary contractual expense limitation in effect during the period. For periods prior to March 31, 2009, certain fund expenses were waived in connection with the fund’s investment in Putnam Prime Money Market Fund. As a result of such limitation and/or waivers, the expenses of each class reflect a reduction of the following amounts (Note 2):
| |
| | Percentage of |
| | average net assets |
|
| March 31, 2009 | 0.13% |
|
| September 30, 2008 | 0.14 |
|
| September 30, 2007 | 0.11 |
|
| September 30, 2006 | 0.09 |
|
| September 30, 2005 | 0.05 |
|
| September 30, 2004 | 0.08 |
|
c Amount represents less than $0.01 per share.
d Total return assumes dividend reinvestment and does not reflect the effect of sales charges.
e Includes amounts paid through expense offset and brokerage/service arrangements (Note 2).
f Reflects a non-recurring reimbursement from Putnam Investments relating to the calculation of certain amounts paid by the fund to Putnam in previous years for transfer agent services, which amounted to less than $0.01 per share and 0.03% of average net assets for the period ended September 30, 2006.
g Reflects a non-recurring accrual related to Putnam Management’s settlement with the SEC regarding brokerage allocation practices, which amounted to the following amounts:
| | |
| | | Percentage of |
| | Per share | average net assets |
|
| Class A | $0.01 | 0.09% |
|
| Class B | 0.01 | 0.09 |
|
| Class C | 0.01 | 0.09 |
|
| Class M | 0.01 | 0.09 |
|
| Class R | 0.02 | 0.13 |
|
The accompanying notes are an integral part of these financial statements.
36
Notes to financial statements 3/31/09 (Unaudited)
Note 1: Significant accounting policies
Putnam International New Opportunities Fund (the “Fund”) is a diversified series of Putnam Investment Funds (the “Trust”), a Massachusetts business trust, which is registered under the Investment Company Act of 1940, as amended, as an open-end management investment company. The objective of the fund is to seek long-term capital appreciation by investing primarily in common stocks of companies outside the United States.
The fund offers class A, class B, class C, class M, class R and class Y shares. Class A and class M shares are sold with a maximum front-end sales charge of 5.75% and 3.50%, respectively, and generally do not pay a contingent deferred sales charge. Class B shares, which convert to class A shares after approximately eight years, do not pay a front-end sales charge and are subject to a contingent deferred sales charge, if those shares are redeemed within six years of purchase. Class C shares have a one-year 1.00% contingent deferred sales charge and do not convert to class A shares. Class R shares, which are offered to qualified employee-benefit plans, are sold at net asset value. The expenses for class A, class B, class C, class M and class R shares may differ based on the distribution fee of each class, which is identified in Note 2. Class Y shares, which are sold at net asset value, are generally subject to the same expenses as class A, class B, class C, class M an d class R shares, but do not bear a distribution fee. Class Y shares are generally only available to corporate and institutional clients and clients in other approved programs.
A 1.00% redemption fee may apply on any shares that are redeemed (either by selling or exchanging into another fund) within 90 days of purchase. The redemption fee is accounted for as an addition to paid-in-capital.
Investment income, realized and unrealized gains and losses and expenses of the fund are borne pro-rata based on the relative net assets of each class to the total net assets of the fund, except that each class bears expenses unique to that class (including the distribution fees applicable to such classes). Each class votes as a class only with respect to its own distribution plan or other matters on which a class vote is required by law or determined by the Trustees. If the fund were liquidated, shares of each class would receive their pro-rata share of the net assets of the fund. In addition, the Trustees declare separate dividends on each class of shares.
In the normal course of business, the fund enters into contracts that may include agreements to indemnify another party under given circumstances. The fund’s maximum exposure under these arrangements is unknown as this would involve future claims that may be, but have not yet been, made against the fund. However, the fund’s management team expects the risk of material loss to be remote.
The following is a summary of significant accounting policies consistently followed by the fund in the preparation of its financial statements. The preparation of financial statements is in conformity with accounting principles generally accepted in the United States of America and requires management to make estimates and assumptions that affect the reported amounts of assets and liabilities in the financial statements and the reported amounts of increases and decreases in net assets from operations during the reporting period. Actual results could differ from those estimates.
A) Security valuation Investments for which market quotations are readily available are valued at the last reported sales price on their principal exchange, or official closing price for certain markets. If no sales are reported — as in the case of some securities traded over-the-counter — a security is valued at its last reported bid price. Many securities markets and exchanges outside the U.S. close prior to the close of the New York Stock Exchange and therefore the closing prices for securities in such markets or on such exchanges may not fully reflect events that occur after such close but before the close of the New York Stock Exchange. Accordingly, on certain days, the fund will fair value foreign equity securities taking into account multiple factors, including movements in the U.S. securities markets. The number of days on which fair value prices will be used will depend on market activity and it is possib le that fair value prices will be used by the fund to a significant extent. At March 31, 2009, fair value pricing was used for certain foreign securities in the portfolio. Securities quoted in foreign currencies, if any, are translated into U.S. dollars at the current exchange rate. To the extent a pricing service or dealer is unable to value a security or provides a valuation which Putnam Investment Management, LLC (“Putnam Management”), the fund’s manager, a wholly-owned subsidiary of Putnam Investments, LLC,
37
does not believe accurately reflects the security’s fair value, the security will be valued at fair value by Putnam Management. Certain investments, including certain restricted and illiquid securities and derivatives, are also valued at fair value following procedures approved by the Trustees. Such valuations and procedures are reviewed periodically by the Trustees. The fair value of securities is generally determined as the amount that the fund could reasonably expect to realize from an orderly disposition of such securities over a reasonable period of time. By its nature, a fair value price is a good faith estimate of the value of a security at a given point in time and does not reflect an actual market price, which may be different by a material amount.
B) Joint trading account Pursuant to an exemptive order from the Securities and Exchange Commission (the “SEC”), the fund may transfer uninvested cash balances, including cash collateral received under security lending arrangements, into a joint trading account along with the cash of other registered investment companies and certain other accounts managed by Putnam Management. These balances may be invested in issues of short-term investments having maturities of up to 397 days for collateral received under security lending arrangements and up to 90 days for other cash investments.
C) Security transactions and related investment income Security transactions are recorded on the trade date (date the order to buy or sell is executed). Gains or losses on securities sold are determined on the identified cost basis.
Interest income is recorded on the accrual basis. Dividend income, net of applicable withholding taxes, is recognized on the ex-dividend date, except that certain dividends from foreign securities are recognized as soon as the fund is informed of the ex-dividend date. Non-cash dividends, if any, are recorded at the fair market value of the securities received. Dividends representing a return of capital or capital gains, if any, are reflected as a reduction of cost and/or as a realized gain.
D) Foreign currency translation The accounting records of the fund are maintained in U.S. dollars. The market value of foreign securities, currency holdings, and other assets and liabilities is recorded in the books and records of the fund after translation to U.S. dollars based on the exchange rates on that day. The cost of each security is determined using historical exchange rates. Income and withholding taxes are translated at prevailing exchange rates when earned or incurred. The fund does not isolate that portion of realized or unrealized gains or losses resulting from changes in the foreign exchange rate on investments from fluctuations arising from changes in the market prices of the securities. Such gains and losses are included with the net realized and unrealized gain or loss on investments. Net realized gains and losses on foreign currency transactions represent net realized e xchange gains or losses on closed forward currency contracts, disposition of foreign currencies, currency gains and losses realized between the trade and settlement dates on securities transactions and the difference between the amount of investment income and foreign withholding taxes recorded on the fund’s books and the U.S. dollar equivalent amounts actually received or paid. Net unrealized appreciation and depreciation of assets and liabilities in foreign currencies arise from changes in the value of open forward currency contracts and assets and liabilities other than investments at the period end, resulting from changes in the exchange rate. Investments in foreign securities involve certain risks, including those related to economic instability, unfavorable political developments, and currency fluctuations, not present with domestic investments.
E) Forward currency contracts The fund may buy and sell forward currency contracts, which are agreements between two parties to buy and sell currencies at a set price on a future date. These contracts are used to protect against a decline in value relative to the U.S. dollar of the currencies in which its portfolio securities are denominated or quoted (or an increase in the value of a currency in which securities a fund intends to buy are denominated, when a fund holds cash reserves and short term investments), or for other investment purposes. The U.S. dollar value of forward currency contracts is determined using current forward currency exchange rates supplied by a quotation service. The market value of the contract will fluctuate with changes in currency exchange rates. The contract is marked to market daily and the change in market value is recorded as an unrealized gain or loss. When the contract is closed, the fund r ecords a realized gain or loss equal to the difference between the value of the contract at the time it was opened and the value at the time it was closed. The fund could be exposed to risk if the value of the currency changes unfavorably, if the counterparties to the contracts are unable to meet the terms of their contracts or if the fund is unable to enter into a closing position. Risks may exceed amounts recognized on the Statement of assets and liabilities. Forward currency contracts outstanding at period end, if any, are listed after the fund’s portfolio
F) Master agreements The fund is a party to ISDA (International Swap and Derivatives Association, Inc.)
38
Master Agreements (“Master Agreements”) with certain counterparties that govern over the counter derivative and foreign exchange contracts entered into from time to time. The Master Agreements may contain provisions regarding, among other things, the parties’ general obligations, representations, agreements, collateral requirements, events of default and early termination. With respect to certain counterparties, in accordance with the terms of the Master Agreements, collateral posted to the fund is held in a segregated account by the fund’s custodian; collateral pledged by the fund is segregated by the fund’s custodian and identified in The fund’s portfolio. Collateral can be in the form of cash or debt securities issued by the U.S. Government or related agencies or other securities as agreed to by the fund and the applicable counterparty. Termination events applicable to the fund may occur upon a decline in the fund’s net assets b elow a specified threshold over a certain period of time. Termination events applicable to counterparties may occur upon a decline in the counterparty’s long-term and short-term credit ratings below a specified level. In each case, upon occurrence, the other party may elect to terminate early and cause settlement of all derivative and foreign exchange contracts outstanding, including the payment of any losses and costs resulting from such early termination, as reasonably determined by the terminating party. Any decision by one or more of the fund’s counterparties to elect early termination could impact the fund’s future derivative activity.
As of March 31, 2009, due to a decrease in the fund’s net asset value during the year, such counterparties were entitled to elect, but had not yet elected, to terminate early, and cause settlement of all outstanding derivative and foreign exchange contracts outstanding under the applicable Master Agreements, including the payment by the fund of any losses and costs resulting from such early termination, as reasonably determined by such counterparty. At March 31, 2009, the fund had net unrealized gains of $4,061,349 and net unrealized losses of $2,167,709 on derivative contracts subject to the Master Agreements. The fund intends to seek a waiver of or other relief from this provision, from the counterparties.
G) Securities lending The fund may lend securities, through its agents, to qualified borrowers in order to earn additional income. The loans are collateralized by cash and/or securities in an amount at least equal to the market value of the securities loaned. The market value of securities loaned is determined daily and any additional required collateral is allocated to the fund on the next business day. The risk of borrower default will be borne by the fund’s agents; the fund will bear the risk of loss with respect to the investment of the cash collateral. Income from securities lending is included in investment income on the Statement of operations. At March 31, 2009, the fund had no securities out on loan.
H) Federal taxes It is the policy of the fund to distribute all of its taxable income within the prescribed time and otherwise comply with the provisions of the Internal Revenue Code of 1986, as amended (the “Code”), applicable to regulated investment companies. It is also the intention of the fund to distribute an amount sufficient to avoid imposition of any excise tax under Section 4982 of the Code. The fund is subject to the provisions of FASB Interpretation No. 48, Accounting for Uncertainties in Income Taxes (“FIN 48”). FIN 48 sets forth a minimum threshold for financial statement recognition of the benefit of a tax position taken or expected to be taken in a tax return. The fund did not have any unrecognized tax benefits in the accompanying financial statements. No provision has been made for federal taxes on income, capital gains or unrealized appreciation on securities held nor for excise tax on income and capital gains. Each of the fund’s federal tax returns for the prior three fiscal years remains subject to examination by the Internal Revenue Service and state departments of revenue.
At September 30, 2008, the fund had a capital loss carryover of $429,850,774 available to the extent allowed by the Code to offset future net capital gain, if any. The amount of the carryover and the expiration dates are:
| | |
| Loss Carryover | Expiration | |
| |
| $256,547,585 | September 30, 2010 | |
| |
| 173,303,189 | September 30, 2011 | |
| |
Pursuant to federal income tax regulations applicable to regulated investment companies, the fund has elected to defer to its fiscal year ending September 30, 2009 $44,744,260 of losses recognized during the period November 1, 2007 to September 30, 2008.
The aggregate identified cost on a tax basis is $381,190,678, resulting in gross unrealized appreciation and depreciation of $13,584,921 and $74,639,291, respectively, or net unrealized depreciation of $61,054,370.
I) Distributions to shareholders Distributions to shareholders from net investment income are recorded by the fund on the ex-dividend date. Distributions from capital gains, if any, are recorded on the ex-dividend date and paid at least annually.The amount
39
and character of income and gains to be distributed are determined in accordance with income tax regulations, which may differ from generally accepted accounting principles. Dividend sources are estimated at the time of declaration. Actual results may vary. Any non-taxable return of capital cannot be determined until final tax calculations are completed after the end of the fund’s fiscal year. Reclassifications are made to the fund’s capital accounts to reflect income and gains available for distribution (or available capital loss carryovers) under income tax regulations.
J) Expenses of the trust Expenses directly charged or attributable to any fund will be paid from the assets of that fund. Generally, expenses of the trust will be allocated among and charged to the assets of each fund on a basis that the Trustees deem fair and equitable, which may be based on the relative assets of each fund or the nature of the services performed and relative applicability to each fund.
Note 2: Management fee, administrative
services and other transactions
The fund pays Putnam Management for management and investment advisory services quarterly based on the average net assets of the fund. Such fee is based on the following annual rates: 1.00% of the first $500 million of average net assets, 0.90% of the next $500 million, 0.85% of the next $500 million, 0.80% of the next $5 billion, 0.775% of the next $5 billion, 0.755% of the next $5 billion, 0.74% of the next $5 billion and 0.73% thereafter.
Putnam Management has agreed to waive fees and reimburse expenses of the fund through September 30, 2009 to the extent necessary to ensure that the fund’s expenses do not exceed the simple average of the expenses of all front-end load funds viewed by Lipper Inc. as having the same investment classification or objective as the fund. The expense reimbursement is based on a comparison of the fund’s expenses with the average annualized operating expenses of the funds in its Lipper peer group for each calendar quarter during the fund’s last fiscal year, excluding 12b-1 fees and without giving effect to any expense offset and brokerage/service arrangements that may reduce fund expenses. For the period ended March 31, 2009, Putnam Management waived $498,401 of its management fee from the fund.
Putnam Investments Limited (“PIL”), an affiliate of Putnam Management, is authorized by the Trustees to manage a separate portion of the assets of the fund as determined by Putnam Management from time to time. Putnam Management pays a quarterly sub-management fee to PIL for its services at an annual rate of 0.35% of the average net assets of the portion of the fund managed by PIL.
Effective January 31, 2009, The Putnam Advisory Company, LLC (“PAC”), an affiliate of Putnam Management, is authorized by the Trustees to manage a separate portion of the assets of the fund, as designated from time to time by Putnam Management or PIL. Putnam Management or PIL, as applicable, pays a quarterly sub-advisory fee to PAC for its services at the annual rate of 0.35% of the average net assets of the portion of the fund’s assets for which PAC is engaged as sub-adviser.
On September 26, 2008, the fund entered into an Agreement with another registered investment company (the “Seller”) managed by Putnam Management. Under the Agreement, the Seller sold to the fund the right to receive, in the aggregate, $669,427 in net payments from Lehman Brothers Special Financing, Inc. in connection with certain terminated derivatives transactions (the“Receivable”), in exchange for an initial payment plus (or minus) additional amounts based on the fund’s ultimate realized gain (or loss) with respect to the Receivable. The Receivable will be offset against the fund’s net payable to Lehman Brothers Special Financing, Inc. and is included in the Statement of assets and liabilities within Payable for investments purchased. Future payments under the Agreement are valued at fair value following procedures approved by the Trustees and are included in the Statement of assets and liabilities. All remaining payments under the Ag reement will be recorded as realized gain or loss.
The fund reimburses Putnam Management an allocated amount for the compensation and related expenses of certain officers of the fund and their staff who provide administrative services to the fund. The aggregate amount of all such reimbursements is determined annually by the Trustees.
Custodial functions for the fund’s assets were provided by State Street Bank and Trust Company (“State Street”). Custody fees are based on the fund’s asset level, the number of its security holdings and transaction volumes.
Putnam Investor Services, Inc., an affiliate of Putnam Management, provided investor servicing agent functions to the fund. Prior to December 31, 2008, these
40
services were provided by Putnam Investor Services, a division of Putnam Fiduciary Trust Company (“PFTC”), which is an affiliate of Putnam Management. Putnam Investor Services, Inc. and Putnam Investor Services received fees for investor servicing, subject to certain limitations, based on the number of shareholder accounts in the fund and the level of defined contribution plan assets in the fund. The amounts incurred for investor servicing agent functions provided by affiliates of Putnam Management during the six months ended March 31, 2009 are included in Investor servicing fees in the Statement of operations.
The fund has entered into expense offset arrangements with PFTC and State Street whereby PFTC’s and State Street’s fees are reduced by credits allowed on cash balances. The fund also reduced expenses through brokerage/service arrangements. For the six months ended March 31, 2009, the fund’s expenses were reduced by $1,383 under the expense offset arrangements and by $69,394 under the brokerage/ service arrangements.
Each independent Trustee of the fund receives an annual Trustee fee, of which $437, as a quarterly retainer, has been allocated to the fund, and an additional fee for each Trustees meeting attended. Trustees receive additional fees for attendance at certain committee meetings and industry seminars and for certain compliance-related matters. Trustees also are reimbursed for expenses they incur relating to their services as Trustees.
The fund has adopted a Trustee Fee Deferral Plan (the “Deferral Plan”) which allows the Trustees to defer the receipt of all or a portion of Trustees fees payable on or after July 1, 1995. The deferred fees remain invested in certain Putnam funds until distribution in accordance with the Deferral Plan.
The fund has adopted an unfunded noncontributory defined benefit pension plan (the “Pension Plan”) covering all Trustees of the fund who have served as a Trustee for at least five years and were first elected prior to 2004. Benefits under the Pension Plan are equal to 50% of the Trustee’s average annual attendance and retainer fees for the three years ended December 31, 2005. The retirement benefit is payable during a Trustee’s lifetime, beginning the year following retirement, for the number of years of service through December 31, 2006. Pension expense for the fund is included in Trustee compensation and expenses in the Statement of operations. Accrued pension liability is included in Payable for Trustee compensation and expenses in the Statement of assets and liabilities. The Trustees have terminated the Pension Plan with respect to any Trustee first elected after 2003.
The fund has adopted distribution plans (the “Plans”) with respect to its class A, class B, class C, class M and class R shares pursuant to Rule 12b-1 under the Investment Company Act of 1940. The purpose of the Plans is to compensate Putnam Retail Management Limited Partnership, a wholly-owned subsidiary of Putnam Investments, LLC and Putnam Retail Management GP, Inc., for services provided and expenses incurred in distributing shares of the fund. The Plans provide for payments by the fund to Putnam Retail Management Limited Partnership at an annual rate of up to 0.35%, 1.00%, 1.00%, 1.00% and 1.00% of the average net assets attributable to class A, class B, class C, class M and class R shares, respectively. The Trustees have approved payment by the fund at an annual rate of 0.25%, 1.00%, 1.00%, 0.75% and 0.50% of the average net assets attributable to class A, class B, class C, class M and class R shares, respectively.
For the six months ended March 31, 2009, Putnam Retail Management Limited Partnership, acting as underwriter, received net commissions of $10,627 and $267 from the sale of class A and class M shares, respectively, and received $18,347 and $1,060 in contingent deferred sales charges from redemptions of class B and class C shares, respectively.
A deferred sales charge of up to 1.00% and 0.65% is assessed on certain redemptions of class A and class M shares, respectively. For the six months ended March 31, 2009, Putnam Retail Management Limited Partnership, acting as underwriter, received $6,515 and no monies on class A and class M redemptions, respectively.
Note 3: Purchases and sales of securities
During the six months ended March 31, 2009, cost of purchases and proceeds from sales of investment securities other than short-term investments aggregated $336,454,226 and $377,874,510, respectively. There were no purchases or sales of U.S. government securities.
Note 4: Capital shares
At March 31, 2009, there was an unlimited number of shares of beneficial interest authorized. Transactions in capital shares were as follows:
41
| | | | |
| | Six months ended 3/31/09 | Year ended 9/30/08 |
| Class A | Shares | Amount | Shares | Amount |
|
| Shares sold | 1,098,825 | $11,276,441 | 4,572,439 | $81,492,721 |
|
| Shares issued in connection with | — | — | 438,951 | 8,085,470 |
| reinvestment of distributions | | | | |
|
| | 1,098,825 | 11,276,441 | 5,011,390 | 89,578,191 |
|
| Shares repurchased | (5,604,997) | (57,781,129) | (8,381,618) | (143,521,349) |
|
| Net decrease | (4,506,172) | $(46,504,688) | (3,370,228) | $(53,943,158) |
|
| |
| | Six months ended 3/31/09 | Year ended 9/30/08 |
| Class B | Shares | Amount | Shares | Amount |
|
| Shares sold | 98,270 | $937,354 | 401,331 | $6,884,103 |
|
| Shares issued in connection with | — | — | 28,755 | 494,589 |
| reinvestment of distributions | | | | |
|
| | 98,270 | 937,354 | 430,086 | 7,378,692 |
|
| Shares repurchased | (967,261) | (9,145,034) | (3,524,143) | (57,485,523) |
|
| Net decrease | (868,991) | $(8,207,680) | (3,094,057) | $(50,106,831) |
|
| |
| | Six months ended 3/31/09 | Year ended 9/30/08 |
| Class C | Shares | Amount | Shares | Amount |
|
| Shares sold | 49,167 | $485,098 | 185,438 | $3,242,591 |
|
| Shares issued in connection with | — | — | 7,430 | 131,288 |
| reinvestment of distributions | | | | |
|
| | 49,167 | 485,098 | 192,868 | 3,373,879 |
|
| Shares repurchased | (227,022) | (2,229,710) | (378,083) | (6,188,260) |
|
| Net decrease | (177,855) | $(1,744,612) | (185,215) | $(2,814,381) |
|
| |
| | Six months ended 3/31/09 | Year ended 9/30/08 |
| Class M | Shares | Amount | Shares | Amount |
|
| Shares sold | 20,613 | $206,570 | 47,039 | $810,741 |
|
| Shares issued in connection with | — | — | 8,683 | 153,256 |
| reinvestment of distributions | | | | |
|
| | 20,613 | 206,570 | 55,722 | 963,997 |
|
| Shares repurchased | (148,253) | (1,460,151) | (297,132) | (4,875,660) |
|
| Net decrease | (127,640) | $(1,253,581) | (241,410) | $(3,911,663) |
|
| |
| | Six months ended 3/31/09 | Year ended 9/30/08 |
| Class R | Shares | Amount | Shares | Amount |
|
| Shares sold | 23,247 | $235,887 | 164,158 | $3,043,909 |
|
| Shares issued in connection with | — | — | 2,168 | 39,593 |
| reinvestment of distributions | | | | |
|
| | 23,247 | 235,887 | 166,326 | 3,083,502 |
|
| Shares repurchased | (38,929) | (385,519) | (85,589) | (1,402,655) |
|
| Net increase (decrease) | (15,682) | $(149,632) | 80,737 | $1,680,847 |
|
42
| | | | |
| | Six months ended 3/31/09 | Year ended 9/30/08 |
| Class Y | Shares | Amount | Shares | Amount |
|
| Shares sold | 918,753 | $9,811,979 | 4,316,229 | $81,573,645 |
|
| Shares issued in connection with | — | — | 50,707 | 934,024 |
| reinvestment of distributions | | | | |
|
| | 918,753 | 9,811,979 | 4,366,936 | 82,507,669 |
|
| Shares repurchased | (2,605,894) | (26,944,705) | (1,742,585) | (31,059,101) |
|
| Net increase (decrease) | (1,687,141) | $(17,132,726) | 2,624,351 | $51,448,568 |
|
Note 5: Regulatory matters and litigation
In late 2003 and 2004, Putnam Management settled charges brought by the Securities and Exchange Commission (the “SEC”) and the Massachusetts Securities Division in connection with excessive short-term trading in Putnam funds. Distribution of payments from Putnam Management to certain open-end Putnam funds and their shareholders is expected to be completed in the next several months. These allegations and related matters have served as the general basis for certain lawsuits, including purported class action lawsuits against Putnam Management and, in a limited number of cases, some Putnam funds. Putnam Management believes that these lawsuits will have no material adverse effect on the funds or on Putnam Management’s ability to provide investment management services. In addition, Putnam Management has agreed to bear any costs incurred by the Putnam funds as a result of these matters.
Note 6: New accounting pronouncements
In March 2008, Statement of Financial Accounting Standards No. 161, Disclosures about Derivative Instruments and Hedging Activities (“SFAS 161”) — an amendment of FASB Statement No. 133, was issued and is effective for fiscal years and interim periods beginning after November 15, 2008. SFAS 161 requires enhanced disclosures about how and why an entity uses derivative instruments and how derivative instruments affect an entity’s financial position. Putnam Management is currently evaluating the impact the adoption of SFAS 161 will have on the fund’s financial statement disclosures.
In April 2009, FASB issued a new FASB Staff Position FSP FAS 157-4 which amends FASB Statement No. 157, Fair Value Measurements, and is effective for interim and annual periods ending after June 15, 2009. FSP FAS 157-4 provides additional guidance when the volume and level of activity for the asset or liability measured at fair value has significantly decreased. Additionally, FSP FAS 157-4 expands disclosure by reporting entities with respect to categories of assets and liabilities carried at fair value. Putnam Management believes applying the provisions of FSP FAS 157-4 will not have a material impact on the fund’s financial statements.
Note 7: Market and credit risk
In the normal course of business, the fund trades financial instruments and enters into financial transactions where risk of potential loss exists due to changes in the market (market risk) or failure of the contracting party to the transaction to perform (credit risk). The fund may be exposed to additional credit risk that an institution or other entity with which the funds have unsettled or open transactions will default.
43
Services for shareholders
Investor services
Systematic investment plan Tell us how much you wish to invest regularly — weekly, semimonthly, or monthly — and the amount you choose will be transferred automatically from your checking or savings account. There’s no additional fee for this service, and you can suspend it at any time. This plan may be a great way to save for college expenses or to plan for your retirement.
Please note that regular investing does not guarantee a profit or protect against loss in a declining market. Before arranging a systematic investment plan, consider your financial ability to continue making purchases in periods when prices are low.
Systematic exchange You can make regular transfers from one Putnam fund to another Putnam fund. There are no additional fees for this service, and you can cancel or change your options at any time.
Dividends PLUS You can choose to have the dividend distributions from one of your Putnam funds automatically reinvested in another Putnam fund at no additional charge.
Free exchange privilege You can exchange money between Putnam funds free of charge, as long as they are the same class of shares. A signature guarantee is required if you are exchanging more than $500,000.
Reinstatement privilege If you’ve sold Putnam shares or received a check for a dividend or capital gain, you may reinvest the proceeds with Putnam within 90 days of the transaction and they will be reinvested at the fund’s current net asset value — with no sales charge. However, reinstatement of class B shares may have special tax consequences. Ask your financial or tax representative for details.
Check-writing service You have ready access to many Putnam accounts. It’s as simple as writing a check, and there are no special fees or service charges. For more information about the check-writing service, call Putnam or visit our Web site.
Dollar cost averaging When you’re investing for long-term goals, it’s time, not timing, that counts. Investing on a systematic basis is a better strategy than trying to figure out when the markets will go up or down. This means investing the same amount of money regularly over a long period. This method of investing is called dollar cost averaging. When a fund’s share price declines, your investment dollars buy more shares at lower prices. When it increases, they buy fewer shares. Over time, you will pay a lower average price per share.
For more information
Visit the Individual Investors section at putnam.com A secure section of our Web site contains complete information on your account, including balances and transactions, updated daily. You may also conduct transactions, such as exchanges, additional investments, and address changes. Log on today to get your password.
Call us toll free at 1-800-225-1581 Ask a helpful Putnam representative or your financial advisor for details about any of these or other services, or see your prospectus.
44
Fund information
Founded over 70 years ago, Putnam Investments was built around the concept that a balance between risk and reward is the hallmark of a well-rounded financial program. We manage 100 mutual funds across income, value, blend, growth, asset allocation, absolute return, and global sector categories.
| | |
| Investment Manager | Ravi Akhoury | Susan G. Malloy |
| Putnam Investment | Charles B. Curtis | Vice President and |
| Management, LLC | Robert J. Darretta | Assistant Treasurer |
| One Post Office Square | Myra R. Drucker | |
| Boston, MA 02109 | Charles E. Haldeman, Jr. | Beth S. Mazor |
| Paul L. Joskow | Vice President |
| Investment Sub-Manager | Elizabeth T. Kennan | |
| Putnam Investment Limited | Kenneth R. Leibler | James P. Pappas |
| 57–59 St James’s Street | Robert E. Patterson | Vice President |
| London, England SW1A 1LD | George Putnam, III | |
| Robert L. Reynolds | Francis J. McNamara, III |
| Investment Sub-Advisor | Richard B. Worley | Vice President and |
| The Putnam Advisory | | Chief Legal Officer |
| Company, LLC | Officers | |
| One Post Office Square | Charles E. Haldeman, Jr. | Robert R. Leveille |
| Boston, MA 02109 | President | Vice President and |
| | | Chief Compliance Officer |
| Marketing Services | Charles E. Porter | |
| Putnam Retail Management | Executive Vice President, | Mark C. Trenchard |
| One Post Office Square | Principal Executive Officer, | Vice President and |
| Boston, MA 02109 | Associate Treasurer and | BSA Compliance Officer |
| Compliance Liaison | |
| Custodian | | Judith Cohen |
| State Street Bank and | Jonathan S. Horwitz | Vice President, Clerk and |
| Trust Company | Senior Vice President | Assistant Treasurer |
| Legal Counsel | and Treasurer | |
| Ropes & Gray LLP | | Wanda M. McManus |
| Steven D. Krichmar | Vice President, Senior Associate |
| Trustees | Vice President and | Treasurer and Assistant Clerk |
| John A. Hill, Chairman | Principal Financial Officer | |
| Jameson A. Baxter, | | Nancy E. Florek |
| Vice Chairman | Janet C. Smith | Vice President, Assistant Clerk, |
| Vice President, Principal | Assistant Treasurer and |
| Accounting Officer and | Proxy Manager |
| Assistant Treasurer | |
| | | |
|
|
|
|
|
|
|
|
|
|
|
|
This report is for the information of shareholders of Putnam International New Opportunities Fund. It may also be used as sales literature when preceded or accompanied by the current prospectus, the most recent copy of Putnam’s Quarterly Performance Summary, and Putnam’s Quarterly Ranking Summary. For more recent performance, please visit putnam.com. Investors should carefully consider the investment objective, risks, charges, and expenses of a fund, which are described in its prospectus. For this and other information or to request a prospectus, call 1-800-225-1581 toll free. Please read the prospectus carefully before investing. The fund’s Statement of Additional Information contains additional information about the fund’s Trustees and is available without charge upon request by calling 1-800-225-1581.

One Post Office Square
Boston, MA 02109
putnam.com
1-800-225-1581
Forwarding service requested
SA010 256151 5/09
PRSRT STD
U.S. POSTAGE PAID
PUTNAM
INVESTMENTS
Item 2. Code of Ethics:
Not applicable
Item 3. Audit Committee Financial Expert:
Not applicable
Item 4. Principal Accountant Fees and Services:
Not applicable
Item 5. Audit Committee of Listed Registrants
Not applicable
Item 6. Schedule of Investments:
The registrant’s schedule of investments in unaffiliated issuers is included in the report to shareholders in Item 1 above.
Item 7. Disclosure of Proxy Voting Policies and Procedures For Closed-End Management Investment Companies:
Not applicable
Item 8. Portfolio Managers of Closed-End Investment Companies
Not Applicable
Item 9. Purchases of Equity Securities by Closed-End Management Investment Companies and Affiliated Purchasers:
Not applicable
Item 10. Submission of Matters to a Vote of Security Holders:
Not applicable
Item 11. Controls and Procedures:
(a) The registrant's principal executive officer and principal financial officer have concluded, based on their evaluation of the effectiveness of the design and operation of the registrant's disclosure controls and procedures as of a date within 90 days of the filing date of this report, that the design and operation of such procedures are generally effective to provide reasonable assurance that information required to be disclosed by the registrant in this report is recorded, processed, summarized and reported within the time periods specified in the Commission's rules and forms.
(b) Changes in internal control over financial reporting: Not applicable
Item 12. Exhibits:
(a)(1) Not applicable
(a)(2) Separate certifications for the principal executive officer and principal financial officer of the registrant as required by Rule 30a-2(a) under the Investment Company Act of 1940, as amended, are filed herewith.
(b) The certifications required by Rule 30a-2(b) under the Investment Company Act of 1940, as amended, are filed herewith.
SIGNATURES
Pursuant to the requirements of the Securities Exchange Act of 1934 and the Investment Company Act of 1940, the registrant has duly caused this report to be signed on its behalf by the undersigned, thereunto duly authorized.
Putnam Investment Funds
By (Signature and Title):
/s/Janet C. Smith
Janet C. Smith
Principal Accounting Officer
Date: May 29, 2009
Pursuant to the requirements of the Securities Exchange Act of 1934 and the Investment Company Act of 1940, this report has been signed below by the following persons on behalf of the registrant and in the capacities and on the dates indicated.
By (Signature and Title):
/s/Charles E. Porter
Charles E. Porter
Principal Executive Officer
Date: May 29, 2009
By (Signature and Title):
/s/Steven D. Krichmar
Steven D. Krichmar
Principal Financial Officer
Date: May 29, 2009