| | |
| |
| UNITED STATES |
| SECURITIES AND EXCHANGE COMMISSION |
| Washington, D.C. 20549 |
| |
| FORM N-CSR |
| |
| CERTIFIED SHAREHOLDER REPORT OF REGISTERED |
| MANAGEMENT INVESTMENT COMPANIES |
| |
| Investment Company Act file number: (811-07237) | |
| | |
| Exact name of registrant as specified in charter: Putnam Investment Funds |
| | |
| Address of principal executive offices: One Post Office Square, Boston, Massachusetts 02109 |
| |
| Name and address of agent for service: | Beth S. Mazor, Vice President |
| | One Post Office Square |
| | Boston, Massachusetts 02109 |
| | |
| Copy to: | John W. Gerstmayr, Esq. |
| | Ropes & Gray LLP |
| | One International Place |
| | Boston, Massachusetts 02110 |
| | |
| Registrant’s telephone number, including area code: | (617) 292-1000 | |
| | |
| Date of fiscal year end: April 30, 2010 | |
| | |
| Date of reporting period: May 1, 2009 — October 31, 2009 |
Item 1. Report to Stockholders:
The following is a copy of the report transmitted to stockholders pursuant to Rule 30e-1 under the Investment Company Act of 1940:

A BALANCED APPROACH
Since 1937, when George Putnam created a diverse mix of stocks and bonds in a single, professionally managed portfolio, Putnam has championed the balanced approach.
A WORLD OF INVESTING
Today, we offer investors a world of equity, fixed-income, multi-asset, and absolute-return portfolios to suit a range of financial goals.
A COMMITMENT TO EXCELLENCE
Our portfolio managers seek superior results over time, backed by original, fundamental research on a global scale. We believe in the value of experienced financial advice, in providing exemplary service, and in putting clients first in all we do.

Putnam Capital
Opportunities Fund
Semiannual report
10 | 31 | 09
| |
| Message from the Trustees | 2 |
|
| About the fund | 4 |
|
| Performance snapshot | 6 |
|
| Interview with your fund’s portfolio manager | 7 |
|
| Performance in depth | 11 |
|
| Expenses | 13 |
|
| Terms and definitions | 15 |
|
| Trustee approval of management contract | 16 |
|
| Other information for shareholders | 26 |
|
| Financial statements | 27 |
|
Message from the Trustees
Dear Fellow Shareholder:
The stock market’s performance since March has helped restore investor confidence and rebuild portfolios. While this upward trend is welcome, investors should not be surprised if this rate of appreciation levels off in coming months. Time-tested investment principles, such as diversification, asset allocation, and a long-term perspective, apply now more than ever.
In this improved climate, we are pleased to report that many Putnam mutual funds have delivered strong and competitive results over the past year. This performance reflects the intense efforts of an investment team infused with a determination to excel and strengthened by the arrival of several senior portfolio managers, research analysts, and traders.
In another development, Charles E. “Ed” Haldeman, Jr. has stepped down as President of the Putnam Funds and as a member of the Board of Trustees of the Funds to become Chief Executive Officer of the Federal Home Loan Mortgage Corporation (FHLMC), also known as Freddie Mac. Effective July 2009, Robert L. Reynolds, President and Chief Executive Officer of Putnam Investments and a Trustee of the Putnam Funds, replaced Mr. Haldeman as President of the Putnam Funds.
2
We would like to thank all shareholders who took the time to vote by proxy on a number of issues, including shareholder-friendly fee changes, at this fall’s Putnam Funds’ shareholder meeting. We also would like to take this opportunity to welcome new shareholders to the fund and to thank all our investors for your continued confidence in Putnam.
Respectfully yours,

About the fund
Seeking overlooked, underpriced small and midsize companies
Every company, whatever its industry, growth rate, or size, has an underlying value. This value is based in part on the cash flows the company generates. The price of the company’s stock, however, may not accurately reflect this underlying value. A stock may be mispriced for different reasons, and it is often the result of behavioral bias, or investor overreaction to short-term factors. Mispriced stocks can provide attractive opportunities for investors with the expertise and insight to identify them.
With the support of a team of dedicated stock analysts, the manager of Putnam Capital Opportunities Fund uses a series of valuation factors to identify stocks that are trading below their intrinsic value. His goal is to find those that will appreciate over time as the market recognizes their value. It is up to him to uncover the reasons behind a stock’s valuation and to determine whether the market’s generally held assumptions are on target.
Another advantage the fund offers is its focus on stocks of small and midsize companies. Unlike widely followed large blue-chip companies, smaller companies are typically covered by fewer stock analysts. This lack of coverage can lead to the undervaluation of these stocks —and the opportunity to target investments that others may haveoverlooked.
To uncover undervalued stocks with the long-term potential for growth, the manager draws on his experience as well as on the proprietary research and extensive capabilities of analysts in Putnam’s Global Equity Research group. Because the fund is managed in Putnam’s blend style, the manager is not focused solely on either growth- or value-style stocks and can choose from thousands of small and midsize U.S. companies. This flexibility means the fund’s portfolio is broadly diversified, which can help reduce the risk of investing in a narrow range of sectors or stocks.
In all his decisions, the portfolio manager is guided by Putnam’s risk controls, which call for regular review of fund holdings and the discipline to sell stocks when they reach what is considered their true worth.
Consider these risks before investing:
The fund invests some or all of its assets in small and/or midsize companies. Such investments increase the risk of greater price fluctuations.
Investor overreaction can mean investment opportunities
An important factor in the analysis for Putnam Capital Opportunities Fund is “behavioral insight.” Investors frequently focus on short-term financial performance while ignoring the potential for a stock to outperform over the long term. For example, they may overreact to a specific event, such as a management change, and either sell off the stock or buy it in large quantities. This overreaction can skew a stock’s price out of proportion to the real impact of the event. The result can develop into a buying or a selling opportunity for astute investmentmanagers.
The portfolio manager and equity analysts for Putnam Capital Opportunities Fund determine behavioral rankings as part of their detailed stock-by-stock valuation process. Their process integrates sophisticated quantitative models, behavioral insights, and an in-depth analysis of each company’s fundamental worth.
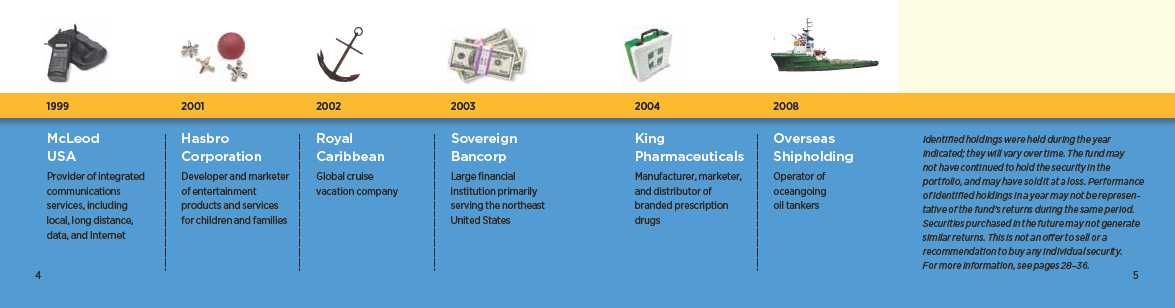
Putnam Capital Opportunities Fund holdings have
spanned sectors and industries over time.
Performance snapshot
Average annual total return (%) comparison as of 10/31/09
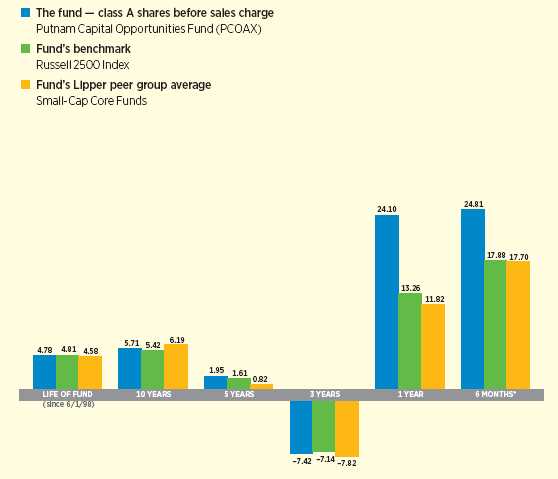
Current performance may be lower or higher than the quoted past performance, which cannot guarantee future results. Share price, principal value, and return will fluctuate, and you may have a gain or a loss when you sell your shares. Performance of class A shares assumes reinvestment of distributions and does not account for taxes. Fund returns in the bar chart do not reflect a sales charge of 5.75%; had they, returns would have been lower. See pages 7 and 11–12 for additional performance information. For a portion of the periods, this fund may have limited expenses, without which returns would have been lower. Due to market volatility, current performance may be higher or lower than performance shown. A 1% short-term trading fee may apply. To obtain the most recent month-end performance, visit putnam.com.
* Returns for the six-month period are not annualized, but cumulative.
6
Interview with your
fund’s portfolio manager
Joseph (Joe) Joseph
Joe, how did Putnam Capital Opportunities Fund perform for the period?
We’re pleased to report that Putnam Capital Opportunities Fund performed well, both on an absolute and on a relative basis. For the six months ended October 31, 2009, the fund rose 24.81% — outperforming the average 17.70% return for its Lipper peer group, Small-Cap Core Funds, and its benchmark, the Russell 2500 Index, which returned 17.88%.
What contributed to these favorable results, both for the fund and the stock market?
The reporting period captured a six-month snapshot of an equity market that proved to be one of the most rewarding on record. Of course, this performance comes on the heels of one of the most historic declines in stock prices that had occurred during the previous six months. At the heart of this cathartic recovery was improving investor sentiment. By mid March, leading economic indicators were stabilizing as the government-stimulus measures around the globe started to take effect. Then, in an extraordinary change of heart, investors — concluding that the worst-case scenarios were unlikely to materialize — regained their appetite for risk.
With many corporations posting better-than-expected earnings, in large part due to aggressive cost cutting, equities made considerable gains, including small and midsize company stocks held by Putnam Capital Opportunities Fund.
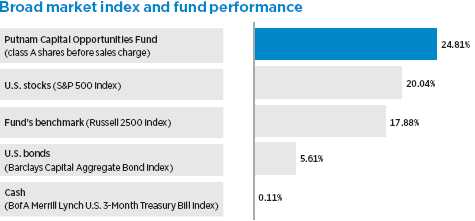
This comparison shows your fund’s performance in the context of broad market indexes for the six months ended 10/31/09. See page 6 and pages 11–12 for additional fund performance information. Index descriptions can be found on page 15.
7
How did you adjust the portfolio in light of these changing market conditions?
Our fundamental philosophy and investment approach have not changed. But we did take steps in the months leading up to the period to lay the groundwork for such a recovery — which, in hindsight, proved very rewarding. In October 2008, with a downturn in corporate business fundamentals and a contraction in the credit markets leading to sharply deteriorating economic prospects, the prices of securities with any perceived risk fell precipitously, regardless of their underlying fundamentals. Many well-managed companies that we had been following for some time became quite inexpensive amid the wholesale loss of confidence. Consequently, we added several of these stocks to the portfolio, increasing exposure to industries with economic sensitivity and moving out of step with most investors at the time.
Using a series of valuation factors to identify stocks that were trading well below their intrinsic value, we increased the fund’s exposure to technology, consumer discretionary, and basic materials stocks. We added to these areas after selling holdings in more defensive sectors, such as consumer staples, utilities, and health care. This groundwork fueled much of the fund’s strong outperformance relative to its benchmark and peers for the reporting period, because the portfolio was positioned for the return of confidence and improving economic fundamentals that eventually materialized.
Toward the end of the period, we trimmed the fund’s overweight positions in economically sensitive industries, including technology, basic materials, energy, and consumer discretionary, to lock in gains. Even with these sales, many of these sectors still represent some of the fund’s largest industry allocations. We reallocated the sale proceeds to more defensive industries, which had trailed in the rally and thus, we thought, offered better risk/return potential than those sectors that had led the
| | |
| Top 10 holdings | | |
|
| HOLDING (percentage of fund’s net assets) | SECTOR | INDUSTRY |
|
| Actuant Corp. (1.6%) | Capital goods | Manufacturing |
| Lincare Holdings, Inc. (1.4%) | Health care | Health-care services |
| King Pharmaceuticals, Inc. (1.2%) | Health care | Pharmaceuticals |
| Toro Co. (The) (1.1%) | Consumer cyclicals | Retail |
| TrueBlue, Inc. (1.0%) | Consumer staples | Consumer services |
| Watson Pharmaceuticals, Inc. (1.0%) | Health care | Pharmaceuticals |
| TradeStation Group, Inc. (0.9%) | Financials | Investment banking/Brokerage |
| Oshkosh Corp. (0.9%) | Consumer cyclicals | Automotive |
| Autoliv, Inc. (Sweden) (0.9%) | Capital goods | Trucks and parts |
| WABCO Holdings, Inc. (0.9%) | Capital goods | Trucks and parts |
This table shows the fund’s top 10 holdings and the percentage of the fund’s net assets that each represented as of 10/31/09. Short-term holdings are excluded. Holdings will vary over time.
8
“The reporting period captured a six-
month snapshot of an equity market
that proved to be one of the most
rewarding on record.”
Joseph Joseph
rally and had become overvalued. At the close of the reporting period, the fund held greater-than-benchmark positions in information technology, energy, and financials.
Which stocks contributed to performance during the period?
Oshkosh Corp., which manufactures heavy duty military, fire and emergency, and refuse-hauling trucks, was the top-performing stock for the six months. Despite some investor concerns about its debt levels, the company continues to generate a solid cash flow in a slow economy, especially given its large contracts with the U.S. Defense Department.
Amid healthier capital markets and improved liquidity, financial stocks performed well, including the fund’s investments in SVB Financial Group. Generally speaking, the portfolio is underweight banks because we are concerned about balance sheet issues and growing problems in the commercial real estate market, which could be problematic for financial institutions that lend in that area. However, the fund is overweight asset managers that I believe are well positioned to benefit from economic growth and improving capital markets.
In the health-care sector, Lincare Holdings, which provides oxygen and other respiratory services to in-home patients, performed well. Technology stocks also contributed favorably. Shares of Brocade Communications Systems, a data center networking solutions and services firm that helps businesses manage vital information assets, recovered nicely after selling off sharply in the correction. F5 Networks is a
Comparison of top sector weightings
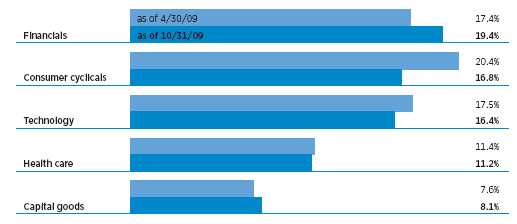
This chart shows how the fund’s top weightings have changed over the past six months. Weightings are shown as a percentage of net assets. Holdings will vary over time.
9
networking appliances company that ensures the secure, reliable, and fast delivery of applications. The company continued to increase market share during the economic downturn, which speaks to the competitiveness of its products.
IN THE NEWS
It took over a year for the Dow Jones Industrial Average to return to the 10000-point level. In October 2009, the index reclaimed the threshold, capping off a seven-month rally during which the Dow bounced back more than 53%. Round numbers like 10000 have historically served as key psychological milestones. In 1966, the Dow first hit 1000, but spent the next 16 years trading mostly below that number. In 1999, when the Dow crossed 10000 for the first time, it just kept rising. While it is impossible to predict where the Dow will go from here, the 10000 mark, combined with persistently low interest rates on many traditional savings vehicles, might motivate some investors sitting in cash to jump back into the market, pushing stocks higher.
What were some stocks that detracted from performance?
The fund’s investments in Amerigroup Corporation detracted from performance because of uncertainty surrounding the final shape of a national health-care bill. The online broker-dealer TradeStation Group was hurt by the decline in short-term interest rates.
How do you see the balance of the fiscal year playing out?
Although the markets have not fully recovered from where they stood on the eve of the Lehman Brothers collapse in September 2008, they have made considerable progress since bottoming in early March. As investors contemplate this rally, they should not lose sight of the problems still facing the U.S. economy and the financial markets. The economy may be emerging from recession, but growth is likely to be anemic for some time.
Regardless of the direction that the stock market takes in the months ahead, our investment approach remains rooted in a disciplined investment strategy that uses a series of valuation factors to identify stocks that we believe are trading below their intrinsic value. Our goal is to find stocks that will appreciate over time before investors recognize their value.
Thank you, Joe, for your time and insights today.
The views expressed in this report are exclusively those of Putnam Management. They are not meant as investment advice.
Please note that the holdings discussed in this report may not have been held by the fund for the entire period. Portfolio composition is subject to review in accordance with the fund’s investment strategy and may vary in the future. Current and future portfolio holdings are subject to risk.

Portfolio Manager Joseph Joseph has an M.B.A. from the Stern School of Business at New York University and a B.A. from Loyola College. A Certified Public Accountant, he joined Putnam in 1994 and has been in the investment industry since 1987.
10
Your fund’s performance
This section shows your fund’s performance, price, and distribution information for periods ended October 31, 2009, the end of the first half of its current fiscal year. In accordance with regulatory requirements for mutual funds, we also include performance as of the most recent calendar quarter-end and expense information taken from the fund’s current prospectus. Performance should always be considered in light of a fund’s investment strategy. Data represents past performance. Past performance does not guarantee future results. More recent returns may be less or more than those shown. Investment return and principal value will fluctuate, and you may have a gain or a loss when you sell your shares. Performance information does not reflect any deduction for taxes a shareholder may owe on fund distributions or on the redemption of fund shares. For the most recent month-end performance, please visit the Individual Investors section at putn am.com or call Putnam at 1-800-225-1581. Class Y shares are generally only available to corporate and institutional clients and clients in other approved programs. See the Terms and Definitions section in this report for definitions of the share classes offered by your fund.
Fund performance Total return for periods ended 10/31/09
| | | | | | | | | | |
| | Class A | Class B | Class C | Class M | Class R | Class Y |
| (inception dates) | (6/1/98) | (6/29/98) | (7/26/99) | (6/29/98) | (1/21/03) | (10/2/00) |
|
| | NAV | POP | NAV | CDSC | NAV | CDSC | NAV | POP | NAV | NAV |
|
| Annual average | | | | | | | | | | |
| (life of fund) | 4.78% | 4.24% | 4.01% | 4.01% | 4.00% | 4.00% | 4.26% | 3.93% | 4.53% | 5.00% |
|
| 10 years | 74.18 | 64.08 | 61.80 | 61.80 | 61.70 | 61.70 | 65.78 | 59.96 | 69.97 | 78.45 |
| Annual average | 5.71 | 5.08 | 4.93 | 4.93 | 4.92 | 4.92 | 5.18 | 4.81 | 5.45 | 5.96 |
|
| 5 years | 10.12 | 3.79 | 6.05 | 4.62 | 5.96 | 5.96 | 7.39 | 3.63 | 8.75 | 11.50 |
| Annual average | 1.95 | 0.75 | 1.18 | 0.91 | 1.16 | 1.16 | 1.44 | 0.72 | 1.69 | 2.20 |
|
| 3 years | –20.65 | –25.21 | –22.45 | –24.31 | –22.52 | –22.52 | –21.84 | –24.55 | –21.24 | –20.08 |
| Annual average | –7.42 | –9.23 | –8.13 | –8.87 | –8.15 | –8.15 | –7.89 | –8.96 | –7.65 | –7.20 |
|
| 1 year | 24.10 | 17.00 | 23.17 | 18.17 | 23.07 | 22.06 | 23.48 | 19.25 | 23.83 | 24.49 |
|
| 6 months | 24.81 | 17.56 | 24.41 | 19.41 | 24.09 | 23.09 | 24.39 | 20.09 | 24.49 | 24.81 |
|
Current performance may be lower or higher than the quoted past performance, which cannot guarantee future results. After-sales-charge returns (public offering price, or POP) for class A and M shares reflect a maximum 5.75% and 3.50% load, respectively. Class B share returns reflect the applicable contingent deferred sales charge (CDSC), which is 5% in the first year, declining to 1% in the sixth year, and is eliminated thereafter. Class C shares reflect a 1% CDSC for the first year that is eliminated thereafter. Class R and Y shares have no initial sales charge or CDSC. Performance for class B, C, M, R, and Y shares before their inception is derived from the historical performance of class A shares, adjusted for the applicable sales charge (or CDSC) and, except for class Y shares, the higher operating expenses for such shares.
For a portion of the periods, this fund may have limited expenses, without which returns would have been lower.
Due to market volatility, current performance may be higher or lower than performance shown. A 1% short-term trading fee may be applied to shares exchanged or sold within 90 days of purchase.
11
| | |
| Comparative index returns For periods ended 10/31/09 | |
| |
| | | Lipper Small-Cap Core Funds |
| | Russell 2500 Index | category average* |
|
| Annual average (life of fund) | 4.81% | 4.58% |
|
| 10 years | 69.58 | 90.79 |
| Annual average | 5.42 | 6.19 |
|
| 5 years | 8.29 | 5.20 |
| Annual average | 1.61 | 0.82 |
|
| 3 years | –19.92 | –21.18 |
| Annual average | –7.14 | –7.82 |
|
| 1 year | 13.26 | 11.82 |
|
| 6 months | 17.88 | 17.70 |
|
Index and Lipper results should be compared to fund performance at net asset value.
* Over the 6-month, 1-year, 3-year, 5-year, 10-year, and life-of-fund periods ended 10/31/09, there were 769, 754, 629, 511, 264, and 190 funds, respectively, in this Lipper category.
Fund price and distribution information For the six-month period ended 10/31/09
| | | | | | | | |
| | Class A | Class B | Class C | Class M | Class R | Class Y |
|
| Share value | NAV | POP | NAV | NAV | NAV | POP | NAV | NAV |
|
| 4/30/09 | $6.49 | $6.89 | $5.94 | $6.02 | $6.15 | $6.37 | $6.41 | $6.61 |
|
| 10/31/09 | 8.10 | 8.59 | 7.39 | 7.47 | 7.65 | 7.93 | 7.98 | 8.25 |
|
The classification of distributions, if any, is an estimate. Final distribution information will appear on your year-end tax forms.
The fund made no distributions during the period.
Fund performance as of most recent calendar quarter
Total return for periods ended 9/30/09
| | | | | | | | | | |
| | Class A | Class B | Class C | Class M | Class R | Class Y |
| (inception dates) | (6/1/98) | (6/29/98) | (7/26/99) | (6/29/98) | (1/21/03) | (10/2/00) |
|
| | NAV | POP | NAV | CDSC | NAV | CDSC | NAV | POP | NAV | NAV |
|
| Annual average | | | | | | | | | | |
| (life of fund) | 5.21% | 4.66% | 4.43% | 4.43% | 4.43% | 4.43% | 4.68% | 4.35% | 4.95% | 5.43% |
|
| 10 years | 90.92 | 79.97 | 76.99 | 76.99 | 77.20 | 77.20 | 81.29 | 74.84 | 86.11 | 95.45 |
| Annual average | 6.68 | 6.05 | 5.88 | 5.88 | 5.89 | 5.89 | 6.13 | 5.75 | 6.41 | 6.93 |
|
| 5 years | 17.49 | 10.69 | 13.05 | 11.53 | 13.04 | 13.04 | 14.54 | 10.54 | 15.97 | 18.84 |
| Annual average | 3.28 | 2.05 | 2.48 | 2.21 | 2.48 | 2.48 | 2.75 | 2.02 | 3.01 | 3.51 |
|
| 3 years | –13.14 | –18.11 | –15.12 | –17.15 | –15.16 | –15.16 | –14.48 | –17.45 | –13.80 | –12.52 |
| Annual average | –4.59 | –6.44 | –5.32 | –6.08 | –5.33 | –5.33 | –5.08 | –6.19 | –4.83 | –4.36 |
|
| 1 year | 2.54 | –3.38 | 1.72 | –3.28 | 1.70 | 0.70 | 1.99 | –1.53 | 2.19 | 2.71 |
|
| 6 months | 53.92 | 45.19 | 53.28 | 48.28 | 53.24 | 52.24 | 53.46 | 48.05 | 53.51 | 53.85 |
|
12
Your fund’s expenses
As a mutual fund investor, you pay ongoing expenses, such as management fees, distribution fees (12b-1 fees), and other expenses. In the most recent six-month period, your fund limited these expenses; had it not done so, expenses would have been higher. Using the following information, you can estimate how these expenses affect your investment and compare them with the expenses of other funds. You may also pay one-time transaction expenses, including sales charges (loads) and redemption fees, which are not shown in this section and would have resulted in higher total expenses. For more information, see your fund’s prospectus or talk to your financial representative.
Expense ratios
| | | | | | |
| | Class A | Class B | Class C | Class M | Class R | Class Y |
|
| Total annual operating expenses for the fiscal year | | | | | | |
| ended 4/30/09 | 1.41% | 2.16% | 2.16% | 1.91% | 1.66% | 1.16% |
|
| Annualized expense ratio for the six-month period | | | | | | |
| ended 10/31/09 | 1.43% | 2.18% | 2.18% | 1.93% | 1.68% | 1.18% |
|
Fiscal-year expense information in this table is taken from the most recent prospectus, is subject to change, and may differ from that shown for the annualized expense ratio and in the financial highlights of this report. Expenses are shown as a percentage of average net assets.
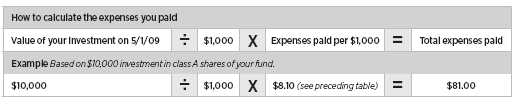
Expenses per $1,000
The following table shows the expenses you would have paid on a $1,000 investment in Putnam Capital Opportunities Fund from May 1, 2009, to October 31, 2009. It also shows how much a $1,000 investment would be worth at the close of the period, assuming actual returns and expenses.
| | | | | | |
| | Class A | Class B | Class C | Class M | Class R | Class Y |
|
| Expenses paid per $1,000*† | $8.10 | $12.33 | $12.31 | $10.92 | $9.51 | $6.69 |
|
| Ending value (after expenses) | $1,248.10 | $1,244.10 | $1,240.90 | $1,243.90 | $1,244.90 | $1,248.10 |
|
* Expenses for each share class are calculated using the fund’s annualized expense ratio for each class, which represents the ongoing expenses as a percentage of average net assets for the six months ended 10/31/09. The expense ratio may differ for each share class.
† Expenses are calculated by multiplying the expense ratio by the average account value for the period; then multiplying the result by the number of days in the period; and then dividing that result by the number of days in the year.
Estimate the expenses you paid
To estimate the ongoing expenses you paid for the six months ended October 31, 2009, use the following calculation method. To find the value of your investment on May 1, 2009, call Putnam at 1-800-225-1581.
13
Compare expenses using the SEC’s method
The Securities and Exchange Commission (SEC) has established guidelines to help investors assess fund expenses. Per these guidelines, the following table shows your fund’s expenses based on a $1,000 investment, assuming a hypothetical 5% annualized return. You can use this information to compare the ongoing expenses (but not transaction expenses or total costs) of investing in the fund with those of other funds. All mutual fund shareholder reports will provide this information to help you make this comparison. Please note that you cannot use this information to estimate your actual ending account balance and expenses paid during the period.
| | | | | | |
| | Class A | Class B | Class C | Class M | Class R | Class Y |
|
| Expenses paid per $1,000*† | $7.27 | $11.07 | $11.07 | $9.80 | $8.54 | $6.01 |
|
| Ending value (after expenses) | $1,018.00 | $1,014.22 | $1,014.22 | $1,015.48 | $1,016.74 | $1,019.26 |
|
* Expenses for each share class are calculated using the fund’s annualized expense ratio for each class, which represents the ongoing expenses as a percentage of average net assets for the six months ended 10/31/09. The expense ratio may differ for each share class.
† Expenses are calculated by multiplying the expense ratio by the average account value for the period; then multiplying the result by the number of days in the period; and then dividing that result by the number of days in the year.
14
Terms and definitions
Important terms
Total return shows how the value of the fund’s shares changed over time, assuming you held the shares through the entire period and reinvested all distributions in the fund.
Net asset value (NAV) is the price, or value, of one share of a mutual fund, without a sales charge. NAVs fluctuate with market conditions. NAV is calculated by dividing the net assets of each class of shares by the number of outstanding shares in the class.
Public offering price (POP) is the price of a mutual fund share plus the maximum sales charge levied at the time of purchase. POP performance figures shown here assume the 5.75% maximum sales charge for class A shares and 3.50% for class M shares.
Contingent deferred sales charge (CDSC) is generally a charge applied at the time of the redemption of class B or C shares and assumes redemption at the end of the period. Your fund’s class B CDSC declines from a 5% maximum during the first year to 1% during the sixth year. After the sixth year, the CDSC no longer applies. The CDSC for class C shares is 1% for one year after purchase.
Share classes
Class A shares are generally subject to an initial sales charge and no CDSC (except on certain redemptions of shares bought without an initial sales charge).
Class B shares are not subject to an initial sales charge. They may be subject to a CDSC.
Class C shares are not subject to an initial sales charge and are subject to a CDSC only if the shares are redeemed during the first year.
Class M shares have a lower initial sales charge and a higher 12b-1 fee than class A shares and no CDSC (except on certain redemptions of shares bought without an initial sales charge).
Class R shares are not subject to an initial sales charge or CDSC and are available only to certain defined contribution plans.
Class Y shares are not subject to an initial sales charge or CDSC, and carry no 12b-1 fee. They are generally only available to corporate and institutional clients and clients in other approved programs.
Comparative indexes
Barclays Capital Aggregate Bond Index is an unmanaged index of U.S. investment-grade fixed-income securities.
BofA Merrill Lynch U.S. 3-Month Treasury Bill Index is an unmanaged index that seeks to measure the performance of U.S. Treasury bills available in the marketplace.
Russell 2500 Index is an unmanaged index of the 2,500 small and midsize companies in the Russell 3000 Index.
S&P 500 Index is an unmanaged index of common stock performance.
Indexes assume reinvestment of all distributions and do not account for fees. Securities and performance of a fund and an index will differ. You cannot invest directly in an index.
Lipper is a third-party industry-ranking entity that ranks mutual funds. Its rankings do not reflect sales charges. Lipper rankings are based on total return at net asset value relative to other funds that have similar current investment styles or objectives as determined by Lipper. Lipper may change a fund’s category assignment at its discretion. Lipper category averages reflect performance trends for funds within a category.
15
Trustee approval of management contract
General conclusions
The Board of Trustees of the Putnam funds oversees the management of each fund and, as required by law, determines annually whether to approve the continuance of your fund’s management contract with Putnam Investment Management (“Putnam Management”).
In this regard, the Board of Trustees, with the assistance of its Contract Committee consisting solely of Trustees who are not “interested persons” (as such term is defined in the Investment Company Act of 1940, as amended) of the Putnam funds (the “Independent Trustees”), requests and evaluates all information it deems reasonably necessary under the circumstances. Over the course of several months ending in June 2009, the Contract Committee met several times to consider the information provided by Putnam Management and other information developed with the assistance of the Board’s independent counsel and independent staff. The Contract Committee reviewed and discussed key aspects of this information with all of the Independent Trustees. At the Trustees’ June 12, 2009 meeting, the Contract Committee recommended, and the Independent Trustees approved, the continuance of your fund’s management contract, effective July 1 , 2009. In addition, at the Trustees’ September 11, 2009 meeting, the Contract Committee recommended, and the Independent Trustees approved, a sub-management contract with respect to your fund between Putnam Management and its affiliate, Putnam Investments Limited (“PIL”), to be effective August 30, 2010. (Because PIL is an affiliate of Putnam Management and Putnam Management remains fully responsible for all services provided by PIL, the Trustees have not evaluated PIL as a separate entity, and all subsequent references to Putnam Management below should be deemed to include reference to PIL as necessary or appropriate in the context.)
The Independent Trustees’ approval was based on the following conclusions:
• That the fee schedule in effect for your fund represented reasonable compensation in light of the nature and quality of the services being provided to the fund, the fees paid by competitive funds and the costs incurred by Putnam Management in providing such services, and
• That such fee schedule represented an appropriate sharing between fund shareholders and Putnam Management of such economies of scale as may exist in the management of the fund at current asset levels.
These conclusions were based on a comprehensive consideration of all information provided to the Trustees, were subject to the continued application of certain expense reductions and waivers pending other considerations noted below, and were not the result of any single factor. Some of the factors that figured particularly in the Trustees’ deliberations and how the Trustees considered these factors are described below, although individual Trustees may have evaluated the information presented differently, giving different weights to various factors. It is also important to recognize that the fee arrangements for your fund and the other Putnam funds are the result of many years of review and discussion between the Independent Trustees and Putnam Management, that certain aspects of the arrangements may receive greater scrutiny in some years than others, and that the Trustees’ conclusions may be based, in part, on their consideration of these sam e arrangements in prior years.
Consideration of strategic
pricing proposal
The Trustees considered that the Contract Committee had been engaged in a detailed review of Putnam Management’s strategic pricing proposal that was first presented
16
to the Committee at its May 2009 meeting. The proposal included proposed changes to the basic structure of the management fees in place for all open-end funds (except the Putnam RetirementReady® Funds and Putnam Money Market Liquidity Fund), including implementation of a breakpoint structure based on the aggregate net assets of all such funds in lieu of the individual breakpoint structures in place for each fund, as well as implementation of performance fees for certain funds. In addition, the proposal recommended substituting separate expense limitations on investor servicing fees and on other expenses as a group in lieu of the total expense limitations in place for many funds.
While the Contract Committee noted the likelihood that the Trustees and Putnam Management would reach agreement on the strategic pricing matters in later months, the terms of the management contracts required that the Trustees approve the continuance of the contracts in order to prevent their expiration at June 30, 2009. The Contract Committee’s recommendations in June reflect its conclusion that the terms of the contractual arrangements for your fund continued to be appropriate for the upcoming term, absent any possible agreement with respect to the matters addressed in Putnam Management’s proposal.
The Trustees were mindful of the significant changes that had occurred at Putnam Management in the past two years, including a change of ownership, the installation of a new senior management team at Putnam Management, the substantial decline in assets under management resulting from extraordinary market forces as well as continued net redemptions in many funds, the introduction of new fund products representing novel investment strategies and the introduction of performance fees for certain new funds. The Trustees were also mindful that many other leading firms in the industry had also been experiencing significant challenges due to the changing financial and competitive environment. For these reasons, even though the Trustees believed that the current contractual arrangements in place between the funds and Putnam Management and its affiliates have served shareholders well and continued to be appropriate for the nea r term, the Trustees believed that it was an appropriate time to reconsider the current structure of the funds’ contractual arrangements with Putnam Management with a view to possible changes that might better serve the interests of shareholders in this new environment. The Trustees concluded their review of Putnam Management’s strategic pricing proposal in July 2009, and their considerations regarding the proposal are discussed below under the heading “Subsequent approval of strategic pricing proposal.” With the exception of the discussion under this heading, the following discussion generally addresses only the Trustees’ reasons for recommending the continuance of the current contractual arrangements (and the new sub-management contract between Putnam Management and PIL, which the Trustees evaluated in large part based on their review of contractual arrangements in June 2009) as, at the time the Trustees determined to make this recommendation, the Trustees had not yet reached any c onclusions with respect to the strategic pricing proposal.
Management fee schedules and
categories; total expenses
The Trustees reviewed the management fee schedules in effect for all Putnam funds, including fee levels and breakpoints, and the assignment of funds to particular fee categories. The general fee structure has been carefully developed over the years and re-examined on many occasions and adjusted where appropriate. In this regard, the Trustees noted that shareholders of all funds voted by overwhelming majorities in 2007 to approve new management contracts containing identical fee schedules.
17
In reviewing fees and expenses, the Trustees generally focused their attention on material changes in circumstances — for example, changes in a fund’s size or investment style, changes in Putnam Management’s operating costs, or changes in competitive practices in the mutual fund industry — that suggest that consideration of fee changes might be warranted. The Trustees concluded that the circumstances did not warrant changes to the management fee structure of your fund at that time but, as indicated above, based on their detailed review of the current fee structure, were prepared to consider possible changes to this arrangement that might better serve the interests of shareholders in the future. The Trustees focused on two areas of particular interest, as discussed further below:
• Competitiveness. The Trustees reviewed comparative fee and expense information for competitive funds, which indicated that, in a custom peer group of competitive funds selected by Lipper Inc., your fund ranked in the 7th percentile in management fees and in the 24th percentile in total expenses (less any applicable 12b-1 fees) as of December 31, 2008 (the first percentile being the least expensive funds and the 100th percentile being the most expensive funds).
The Trustees noted that expense ratios for a number of Putnam funds, which show the percentage of fund assets used to pay for management and administrative services, distribution (12b-1) fees (as applicable) and other expenses, had been increasing recently as a result of declining net assets and the natural operation of fee breakpoints. The Trustees expressed their intention to monitor the funds’ percentile rankings in management fees and in total expenses to ensure that fees and expenses of the funds continue to meet evolving competitive standards.
The Trustees noted that the expense ratio increases described above were being controlled by expense limitations initially implemented in January 2004. These expense limitations give effect to a commitment by Putnam Management that the expense ratio of each open-end fund would be no higher than the average expense ratio of the competitive funds included in the fund’s relevant Lipper universe (exclusive of any applicable 12b-1 charges in each case). The Trustees observed that this commitment to limit fund expenses has served shareholders well since its inception and, while the Contract Committee was reviewing proposed alternative expense limitation arrangements as noted above, the Trustees received a commitment from Putnam Management and its parent company to continue this program through at least June 30, 2010, or such earlier time as the Trustees and Putnam Management reach agreement on alternative arrangements .
In order to ensure that the expenses of the Putnam funds continue to meet evolving competitive standards, the Trustees requested, and Putnam Management agreed, to extend for the twelve months beginning July 1, 2009, or until such earlier time as the Trustees and Putnam Management reach agreement on alternative expense limitation arrangements, an additional expense limitation for certain funds at an amount equal to the average expense ratio (exclusive of 12b-1 charges) of a custom peer group of competitive funds selected by Lipper to correspond to the size of the fund. This additional expense limitation is applicable to those open-end funds that had above-average expense ratios (exclusive of 12b-1 charges) based on the custom peer group data for the period ended December 31, 2007. This additional expense limitation was not applied to your fund because it had a below-average expense ratio relative to its custom peer group.
• Economies of scale. Your fund currently has the benefit of breakpoints in its management fee that provide shareholders with significant
18
economies of scale, which means that the effective management fee rate of the fund (as a percentage of fund assets) declines as the fund grows in size and crosses specified asset thresholds. Conversely, as the fund shrinks in size — as has been the case for many Putnam funds in recent years — these breakpoints result in increasing fee levels. In recent years, the Trustees have examined the operation of the existing breakpoint structure during periods of both growth and decline in asset levels. The Trustees concluded that the fee schedule in effect for your fund represented an appropriate sharing of economies of scale at that time but, as noted above, were in the process of reviewing a proposal to eliminate individual fund breakpoints for all of the open-end funds (except for the Putnam RetirementReady® Funds and Putnam Money Market Liquidity Fund) in favor of a breakpoint structure based on the aggregate net assets of all such funds.
In connection with their review of the management fees and total expenses of the Putnam funds, the Trustees also reviewed the costs of the services provided and profits realized by Putnam Management and its affiliates from their contractual relationships with the funds. This information included trends in revenues, expenses and profitability of Putnam Management and its affiliates relating to the investment management and distribution services provided to the funds. In this regard, the Trustees also reviewed an analysis of Putnam Management’s revenues, expenses and profitability with respect to the funds’ management contracts, allocated on a fund-by-fund basis.
Investment performance
The quality of the investment process provided by Putnam Management represented a major factor in the Trustees’ evaluation of the quality of services provided by Putnam Management under your fund’s management contract. The Trustees were assisted in their review of the Putnam funds’ investment process and performance by the work of the Investment Oversight Coordinating Committee of the Trustees and the Investment Oversight Committees of the Trustees, which had met on a regular monthly basis with the funds’ portfolio teams throughout the year. The Trustees concluded that Putnam Management generally provides a high-quality investment process — as measured by the experience and skills of the individuals assigned to the management of fund portfolios, the resources made available to such personnel, and in general the ability of Putnam Management to attract and retain high-quality personnel — b ut also recognized that this does not guarantee favorable investment results for every fund in every time period. The Trustees considered the investment performance of each fund over multiple time periods and considered information comparing each fund’s performance with various benchmarks and with the performance of competitive funds.
The Trustees noted the disappointing investment performance of many of the funds for periods ended March 31, 2009. They discussed with senior management of Putnam Management the factors contributing to such underperformance and the actions being taken to improve performance. The Trustees recognized that, in recent years, Putnam Management has taken steps to strengthen its investment personnel and processes to address areas of underperformance, including Putnam Management’s continuing efforts to strengthen the equity research function, recent changes in portfolio managers including increased accountability of individual managers rather than teams, recent changes in Putnam Management’s approach to incentive compensation, including emphasis on top quartile performance over a rolling three-year period, and the recent arrival of a new chief investment officer. The Trustees also recognized the substantial improvement in performance of many funds si nce the implementation of those changes. The
19
Trustees indicated their intention to continue to monitor performance trends to assess the effectiveness of these efforts and to evaluate whether additional changes to address areas of underperformance are warranted.
In the case of your fund, the Trustees considered that your fund’s class A share cumulative total return performance at net asset value was in the following percentiles of its Lipper Inc. peer group (Lipper Small-Cap Core Funds) for the one-year, three-year and five-year periods ended March 31, 2009 (the first percentile being the best-performing funds and the 100th percentile being the worst-performing funds):
| | | |
| One-year period | 38th | | |
| | |
| Three-year period | 62nd | | |
| | |
| Five-year period | 47th | | |
| | |
Over the one-year, three-year and five-year periods ended March 31, 2009, there were 760, 608 and 484 funds, respectively, in your fund’s Lipper peer group. Past performance is no guarantee of future results.
As a general matter, the Trustees believe that cooperative efforts between the Trustees and Putnam Management represent the most effective way to address investment performance problems. The Trustees noted that investors in the Putnam funds have, in effect, placed their trust in the Putnam organization, under the oversight of the funds’ Trustees, to make appropriate decisions regarding the management of the funds. Based on the responsiveness of Putnam Management in the recent past to Trustee concerns about investment performance, the Trustees concluded that it is preferable to seek change within Putnam Management to address performance shortcomings. In the Trustees’ view, the alternative of engaging a new investment adviser for an underperforming fund would entail significant disruptions and would not provide any greater assurance of improved investment performance.
Brokerage and soft-dollar allocations;
other benefits
The Trustees considered various potential benefits that Putnam Management may receive in connection with the services it provides under the management contract with your fund. These include benefits related to brokerage and soft-dollar allocations, whereby a portion of the commissions paid by a fund for brokerage may be used to acquire research services that may be useful to Putnam Management in managing the assets of the fund and of other clients. The Trustees considered a change made, at Putnam Management’s request, to the Putnam funds’ brokerage allocation policy commencing in 2009, which increased the permitted soft dollar allocation to third-party services over what had been authorized in previous years. The Trustees noted that a portion of available soft dollars continue to be allocated to the payment of fund expenses, although the amount allocated for this purpose has declined in recent years. The Trustees indicated their continued int ent to monitor regulatory developments in this area with the assistance of their Brokerage Committee and also indicated their continued intent to monitor the potential benefits associated with the allocation of fund brokerage and trends in industry practice to ensure that the principle of seeking best price and execution remains paramount in the portfolio trading process.
The Trustees’ annual review of your fund’s management contract also included the review of the investor servicing agreement with Putnam Investor Services, Inc. (“PSERV”), which agreement provides benefits to an affiliate of Putnam Management. The Trustees considered that effective January 1, 2009, the Trustees, PSERV and Putnam Fiduciary Trust Company entered into a new fee schedule that includes for the open-end funds (other than funds of Putnam Variable Trust and Putnam Money Market Liquidity Fund) an expense limitation
20
but, as noted above, also considered that this expense limitation is subject to review as part of the Trustees’ pending review of Putnam’s strategic pricing proposal.
In the case of your fund, the Trustees’ annual review of the fund’s management contract also included the review of the fund’s distributor’s contract and distribution plans with Putnam Retail Management Limited Partnership, which contract and plans also provide benefits to an affiliate of Putnam Management.
Comparison of retail and institutional
fee schedules
The information examined by the Trustees as part of their annual contract review has included for many years information regarding fees charged by Putnam Management and its affiliates to institutional clients such as defined benefit pension plans, college endowments, etc. This information included comparisons of such fees with fees charged to the funds, as well as a detailed assessment of the differences in the services provided to these two types of clients. The Trustees observed, in this regard, that the differences in fee rates between institutional clients and mutual funds are by no means uniform when examined by individual asset sectors, suggesting that differences in the pricing of investment management services to these types of clients reflect to a substantial degree historical competitive forces operating in separate market places. The Trustees considered the fact that fee rates across different asset classes are typically higher on average fo r mutual funds than for institutional clients, as well as the differences between the services that Putnam Management provides to the Putnam funds and those that it provides to institutional clients of the firm, but did not rely on such comparisons to any significant extent in concluding that the management fees paid by your fund are reasonable.
Subsequent approval of strategic
pricing proposal
As mentioned above, at a series of meetings beginning in May 2009 and ending on July 10, 2009, the Contract Committee and the Trustees engaged in a detailed review of Putnam Management’s strategic pricing proposal. Following this review, the Trustees of each fund, including all of the Independent Trustees, voted unanimously on July 10, 2009 to approve proposed management contracts reflecting the proposal, as modified based on discussions between the Independent Trustees and Putnam Management, for each fund. In considering the proposed contracts, the Independent Trustees focused largely on the specific proposed changes described below relating to management fees. They also took into account the factors that they considered in connection with their most recent annual approval on June 12, 2009 of the continuance of the funds’ current management contracts and the extensive materials that they had reviewed in connection with that approval process, as described above.
At a meeting held on November 19, 2009, shareholders approved the proposed management contract for your fund. Subject to shareholder approval of similar management contracts for substantially all of the other Putnam funds, the new management contract is expected to be implemented on January 1, 2010 (but no later than February 1, 2010).
• Considerations relating to Fund Family fee rate calculations. The Independent Trustees considered that the proposed management contracts would change the manner in which fund shareholders share in potential economies of scale associated with the management of the funds. Under the current management contracts, shareholders of a fund (other than Putnam Money Market Liquidity Fund and the Putnam RetirementReady® Funds) benefit from increased fund size through reductions in the effective manage-
21
ment fee paid to Putnam Management once the fund’s net assets exceed the first breakpoint in the fund’s fee schedule ($500 million for most funds). Conversely, in the case of funds with net assets above the level of the first breakpoint, the effective management fee increases as the fund’s average net assets decline below a breakpoint. These breakpoints are measured solely by the net assets of each individual fund and are not affected by possible growth (or decline) of net assets of other funds in the Fund Family. (“Fund Family” for purposes of this discussion refers to all open-end mutual funds sponsored by Putnam Management, except for the Putnam RetirementReady® Funds and Putnam Money Market Liquidity Fund.) Under the proposed management contracts, potential economies of scale would be shared ratably among shareholders of all funds, regardless of their size. The management fees paid by a fund (and indirectly by shareholders) would no longer be affected by the growth (or decline) of assets of the particular fund, but rather would be affected solely by the growth (or decline) of the aggregate net assets of all funds in the Fund Family, regardless of whether the net assets of the particular fund are growing or declining.
The table below shows the proposed effective management fee rate for your fund, based on June 30, 2009 net assets of the Fund Family ($52.3 billion). This table also shows the effective management fee rate payable by your fund under its current management contract, based on the net assets of the fund as of June 30, 2009. Finally, this table shows the difference in the effective management fees, based on net assets as of June 30, 2009, between the proposed management contract and the current contract.
| | | |
| | Proposed Effective | Current Effective | |
| Name of Fund | Contractual Rate | Contractual Rate | Difference |
|
| Putnam Capital | | | |
| Opportunities Fund | 0.642% | 0.650% | (0.008)% |
As shown in the foregoing table, based on June 30, 2009 net asset levels, the proposed management contract would provide for payment of a management fee rate that is lower for your fund than the management fee rate payable under the current management contract. For a small number of funds (although not your fund), the management fee rate would be slightly higher under the proposed contract at these asset levels, but by only immaterial amounts. In the aggregate, the financial impact on Putnam Management of implementing this proposed change for all funds at June 30, 2009 net asset levels is a reduction in annual management fee revenue of approximately $24.0 million. (Putnam Management has already incurred a significant portion of this revenue reduction through the waiver of a portion of its current management fees for certain funds pending shareholder consideration of the proposed management contracts. Putnam is not ob liged to continue such waivers beyond July 31, 2010 in the event that the proposed contracts are not approved by shareholders.) The Independent Trustees carefully considered the implications of this proposed change under a variety of economic circumstances. They considered the fact that at current asset levels the management fees paid by the funds under the proposed contract would be lower for almost all funds, and would not be materially higher for any fund. They considered the possibility that under some circumstances, the current management contract could result in a lower fee for a particular fund than the proposed management contract. Such circumstances might occur, for example, if the aggregate net assets of the Fund Family remain largely unchanged and the net assets of an individual fund grew substantially, or if the net assets of an individual fund remain largely
22
unchanged and the aggregate net assets of the Fund Family declined substantially.
The Independent Trustees noted that future changes in the net assets of individual funds are inherently unpredictable and that experience has shown that funds often grow in size and decline in size over time depending on market conditions and the changing popularity of particular investment styles and asset classes. They noted that, while the aggregate net assets of the Fund Family have changed substantially over time, basing a management fee on the aggregate level of assets of the Fund Family would likely reduce fluctuations in costs paid by individual funds and lead to greater stability and predictability of fund operating costs over time.
The Independent Trustees considered that the proposed management contract would likely be advantageous for newly organized funds that have yet to attract significant assets and for funds in specialty asset classes that are unlikely to grow to a significant size. In each case, such funds would participate in the benefits of scale made possible by the aggregate size of the Fund Family to an extent that would not be possible based solely on their individual size.
The Independent Trustees also considered that for funds that have achieved or are likely to achieve considerable scale on their own, the proposed management contract could result in sharing of economies which might lead to slightly higher costs under some circumstances, but they noted that any such increases are immaterial at current asset levels and that over time such funds are likely to realize offsetting benefits from their opportunity to participate, both through the exchange privilege and through the Fund Family breakpoint fee structure, in the improved growth prospects of a diversified Fund Family able to offer competitively priced products.
The Independent Trustees noted that the implementation of the proposed management contracts would result in a reduction in aggregate fee revenues for Putnam Management at current asset levels. They also noted that applying various projections of growth equally to the aggregate net assets of the Fund Family and to the net assets of individual funds also showed revenue reductions for Putnam Management. They recognized, however, the possibility that under some scenarios Putnam Management might realize greater future revenues, with respect to certain funds, under the proposed contracts than under the current contracts, but considered such circumstances to be both less likely and inherently unpredictable.
The Independent Trustees considered the extent to which Putnam Management may realize economies of scale in connection with the management of the funds. In this regard, they considered the possibility that such economies of scale as may exist in the management of mutual funds may be associated more closely with the size of the aggregate assets of the mutual fund complex than with the size of any individual fund. In this regard the Independent Trustees considered the financial information provided to them by Putnam Management over a period of many years regarding the allocation of costs involved in calculating the profitability of its mutual fund business as a whole and the profitability of individual funds. The Independent Trustees noted that the methodologies for such cost allocations had been reviewed on a number of occasions in the past by independent financial consultants engaged by the Independent Trustees. The Independent Trustees noted that thes e methodologies support Putnam Management’s assertion that many of its operating costs and any associated economies of scale are related more to the aggregate net assets under management in various sectors of its business than to the size of individual funds. They noted that on a number of occasions in the past the Independent Trustees had separately considered the possibility of calculating management fees in whole or in part based on aggregate net assets of the Putnam funds.
23
The Independent Trustees considered the fact that the proposed contracts would result in a sharing among the affected funds of economies of scale that for the most part are now enjoyed by the larger funds, without materially increasing the current costs of any of the larger funds. They concluded that this sharing of economies among funds was appropriate in light of the diverse investment opportunities available to shareholders of all funds through the existence of the exchange privilege. They also considered that the proposed change in management fee structure would allow Putnam Management to introduce new investment products at more attractive pricing levels than may be currently be the case.
After considering all of the foregoing, the Independent Trustees concluded that the proposed calculation of management fees based on the aggregate net assets of the Fund Family represented a fair and reasonable means of sharing possible economies of scale among the shareholders of all funds.
• Considerations relating to addition of fee rate adjustments based on investment performance for certain funds. The Independent Trustees considered that Putnam’s proposal to add fee rate adjustments based on investment performance to the management contracts of certain funds reflected a desire by Putnam Management to align its fee revenues more closely with investment performance in the case of certain funds. They noted that Putnam Management already has a significant financial interest in achieving good performance results for the funds it manages. Putnam Management’s fees are based on the assets under its management (whether calculated on an individual fund or complex-wide basis). Good performance results in higher asset levels and therefore higher revenues to Putnam Management. Moreover, good performance also tend s to attract additional investors to particular funds or the complex generally, also resulting in higher revenues. Nevertheless, the Independent Trustees concluded that adjusting management fees based on performance for certain selected funds could provide additional benefits to shareholders.
The Independent Trustees noted that Putnam Management proposed the addition of performance adjustments only for certain of the funds (performance adjustments were not proposed for your fund) and considered whether similar adjustments might be appropriate for other funds. In this regard, they considered Putnam Management’s belief that the addition of performance adjustments would be most appropriate for shareholders of U.S. growth funds, international equity funds and Putnam Global Equity Fund. They also considered Putnam Management’s view that it would continue to monitor whether performance fees would be appropriate for other funds. Accordingly, the Independent Trustees concluded that it would be desirable to gain further experience with the operation of performance adjustments for certain funds and the market’s receptivity to such fee structures before giving further consideration to whether similar performance adjustments would be app ropriate for other funds as well.
• Considerations relating to standardization of payment terms. The proposed management contracts for all funds provide that management fees will be computed and paid monthly within 15 days after the end of each month. The current contracts of the funds contain quarterly computation and payment terms in some cases. These differences largely reflect practices in place at earlier times when many of the funds were first organized. Under the proposed contract, certain funds would make payments to Putnam Management earlier than they do under their current contract. This would reduce a fund’s opportunity to earn income on accrued but unpaid management fees by a small amount, but would not have a material effect on a fund’s operating costs.
24
The Independent Trustees considered the fact that standardizing the payment terms for all funds would involve an acceleration in the timing of payments to Putnam Management for some funds and a corresponding loss of a potential opportunity for such funds to earn income on accrued but unpaid management fees. The Independent Trustees did not view this change as having a material impact on shareholders of any fund. In this regard, the Independent Trustees noted that the proposed contracts conform to the payment terms included in management contracts for all Putnam funds organized in recent years and that standardizing payment terms across all funds would reduce administrative burdens for both the funds and Putnam Management.
• Considerations relating to comparisons with management fees and total expenses of competitive funds. As part of their evaluation of the proposed management contracts, the Independent Trustees also reviewed the general approach taken by Putnam Management and the Independent Trustees in recent years in imposing appropriate limits on total fund expenses. As part of the annual contract review process in recent years, Putnam Management agreed to waive fees as needed to limit total fund expenses to a maximum level equal to the average total expenses of comparable competitive funds in the mutual fund industry. In connection with its proposal to implement new management contracts, Putnam Management also proposed, and the Independent Trustees approved, certain changes in this approach that shift the focus from controlling total expenses to imposing separate limits on certain c ategories of expenses, as required. As a general matter, Putnam Management and the Independent Trustees concluded that management fees for the Putnam funds are competitive with the fees charged by comparable funds in the industry. Nevertheless, the Independent Trustees considered specific management fee waivers proposed to be implemented as of August 1, 2009 by Putnam Management with respect to the current management fees of certain funds, as well as projected reductions in management fees for almost all funds that would result under the proposed contracts. Putnam Management and the Independent Trustees also agreed to impose separate expense limitations of 37.5 basis points on the general category of shareholder servicing expenses and 20 basis points on the general category of other ordinary operating expenses. These new expense limitations, as well as the fee waivers, were implemented for all funds effective as of August 1, 2009, replac ing the expense limitation referred to above.
These changes resulted in lower total expenses for many funds, but in the case of some funds total expenses increased after application of the new waivers and expense limitations (as compared with the results obtained using the expense limitation method previously in place). In this regard, the Independent Trustees considered the likelihood that total expenses for most of these funds would have increased in any event in the normal course under the previous expense limitation arrangement, as the reported total expense levels of many competitive funds increased in response to the major decline in asset values that began in September 2008. These new waivers and expense limitations will continue in effect until at least July 31, 2010 and will be re-evaluated by the Independent Trustees as part of the annual contract review process prior to their scheduled expiration. However, the management fee waivers referred to above would largely become permanent reduc tions in fees as a result of the implementation of the proposed management contracts.
Under these new expense limitation arrangements effective August 1, 2009, your fund is subject to expense limitations of 37.5 basis points on the category of shareholder servicing fees and 20 basis points on the general category of other ordinary operating expenses.
25
Other information for shareholders
Important notice regarding delivery of shareholder documents
In accordance with SEC regulations, Putnam sends a single copy of annual and semiannual shareholder reports, prospectuses, and proxy statements to Putnam shareholders who share the same address, unless a shareholder requests otherwise. If you prefer to receive your own copy of these documents, please call Putnam at 1-800-225-1581, and Putnam will begin sending individual copies within30days.
Proxy voting
Putnam is committed to managing our mutual funds in the best interests of our shareholders. The Putnam funds’ proxy voting guidelines and procedures, as well as information regarding how your fund voted proxies relating to portfolio securities during the 12-month period ended June 30, 2009, are available in the Individual Investors section of putnam.com, and on the SEC’s Web site, www.sec.gov. If you have questions about finding forms on the SEC’s Web site, you may call the SEC at 1-800-SEC-0330. You may also obtain the Putnam funds’ proxy voting guidelines and procedures at no charge by calling Putnam’s Shareholder Services at 1-800-225-1581.
Fund portfolio holdings
The fund will file a complete schedule of its portfolio holdings with the SEC for the first and third quarters of each fiscal year on Form N-Q. Shareholders may obtain the fund’s Forms N-Q on the SEC’s Web site at www.sec.gov. In addition, the fund’s Forms N-Q may be reviewed and copied at the SEC’s Public Reference Room in Washington, D.C. You may call the SEC at 1-800-SEC-0330 for information about the SEC’s Web site or the operation of the Public Reference Room.
Trustee and employee fund ownership
Putnam employees and members of the Board of Trustees place their faith, confidence, and, most importantly, investment dollars in Putnam mutual funds. As of October 31, 2009, Putnam employees had approximately $303,000,000 and the Trustees had approximately $40,000,000 invested in Putnam mutual funds. These amounts include investments by the Trustees’ and employees’ immediate family members as well as investments through retirement and deferred compensation plans.
26
Financial statements
A guide to financial statements
These sections of the report, as well as the accompanying Notes, constitute the fund’s financial statements.
The fund’s portfolio lists all the fund’s investments and their values as of the last day of the reporting period. Holdings are organized by asset type and industry sector, country, or state to show areas of concentration and diversification.
Statement of assets and liabilities shows how the fund’s net assets and share price are determined. All investment and noninvestment assets are added together. Any unpaid expenses and other liabilities are subtracted from this total. The result is divided by the number of shares to determine the net asset value per share, which is calculated separately for each class of shares. (For funds with preferred shares, the amount subtracted from total assets includes the liquidation preference of preferred shares.)
Statement of operations shows the fund’s net investment gain or loss. This is done by first adding up all the fund’s earnings — from dividends and interest income — and subtracting its operating expenses to determine net investment income (or loss). Then, any net gain or loss the fund realized on the sales of its holdings — as well as any unrealized gains or losses over the period — is added to or subtracted from the net investment result to determine the fund’s net gain or loss for the fiscal period.
Statement of changes in net assets shows how the fund’s net assets were affected by the fund’s net investment gain or loss, by distributions to shareholders, and by changes in the number of the fund’s shares. It lists distributions and their sources (net investment income or realized capital gains) over the current reporting period and the most recent fiscal year-end. The distributions listed here may not match the sources listed in the Statement of operations because the distributions are determined on a tax basis and may be paid in a different period from the one in which they were earned. Dividend sources are estimated at the time of declaration. Actual results may vary. Any non-taxable return of capital cannot be determined until final tax calculations are completed after the end of the fund’s fiscal year.
Financial highlights provide an overview of the fund’s investment results, per-share distributions, expense ratios, net investment income ratios, and portfolio turnover in one summary table, reflecting the five most recent reporting periods. In a semiannual report, the highlight table also includes the currentreportingperiod.
27
| | |
| The fund’s portfolio 10/31/09 (Unaudited) | | |
| |
| COMMON STOCKS (98.5%)* | Shares | Value |
|
| Advertising and marketing services (0.6%) | | |
| Clear Channel Outdoor Holdings, Inc. Class A † | 42,500 | $289,850 |
|
| inVentiv Health, Inc. † | 41,100 | 697,878 |
|
| ValueClick, Inc. † | 62,237 | 612,412 |
|
| | | 1,600,140 |
| Aerospace and defense (0.7%) | | |
| Alliant Techsystems, Inc. † | 9,744 | 757,888 |
|
| Teledyne Technologies, Inc. † | 30,051 | 1,026,542 |
|
| | | 1,784,430 |
| Automotive (1.9%) | | |
| BorgWarner, Inc. | 22,763 | 690,174 |
|
| Harley-Davidson, Inc. | 72,200 | 1,799,224 |
|
| Oshkosh Corp. | 74,400 | 2,325,744 |
|
| | | 4,815,142 |
| Banking (3.6%) | | |
| City Holding Co. | 8,999 | 275,099 |
|
| City National Corp. S | 23,918 | 900,991 |
|
| Commerce Bancshares, Inc. | 6,627 | 254,212 |
|
| Cullen/Frost Bankers, Inc. | 7,774 | 363,745 |
|
| First Citizens BancShares, Inc. Class A | 4,835 | 720,415 |
|
| International Bancshares Corp. S | 22,312 | 331,333 |
|
| NBH Holdings Corp. 144A | 66,250 | 1,325,000 |
|
| PacWest Bancorp S | 26,449 | 449,104 |
|
| Provident New York Bancorp | 14,900 | 127,097 |
|
| Seacoast Banking Corp. of Florida | 191,859 | 285,870 |
|
| Smithtown Bancorp, Inc. | 19,888 | 205,841 |
|
| SVB Financial Group † S | 50,577 | 2,086,301 |
|
| Union Bankshares Corp. | 21,845 | 269,130 |
|
| Webster Financial Corp. | 52,090 | 589,138 |
|
| Whitney Holding Corp. | 68,013 | 546,144 |
|
| Wilmington Trust Corp. | 46,768 | 563,554 |
|
| | | 9,292,974 |
| Biotechnology (0.3%) | | |
| Cubist Pharmaceuticals, Inc. † S | 38,361 | 649,835 |
|
| | | 649,835 |
| Building materials (0.4%) | | |
| AAON, Inc. | 24,264 | 436,995 |
|
| Apogee Enterprises, Inc. | 39,899 | 528,263 |
|
| | | 965,258 |
| Chemicals (4.1%) | | |
| Ashland, Inc. | 18,519 | 639,646 |
|
| CF Industries Holdings, Inc. | 3,005 | 250,166 |
|
| Compass Minerals International, Inc. | 12,351 | 769,714 |
|
| Cytec Industries, Inc. | 19,988 | 663,002 |
|
| Eastman Chemical Co. | 17,719 | 930,425 |
|
| FMC Corp. | 18,003 | 919,953 |
|
| Innophos Holdings, Inc. | 36,000 | 696,600 |
|
| International Flavors & Fragrances, Inc. | 24,262 | 924,140 |
|
28
| | |
| COMMON STOCKS (98.5%)* cont. | Shares | Value |
|
| Chemicals cont. | | |
| Lubrizol Corp. (The) | 17,502 | $1,164,933 |
|
| Methanex Corp. (Canada) | 45,200 | 775,180 |
|
| Olin Corp. | 48,302 | 737,572 |
|
| OM Group, Inc. † | 19,979 | 539,833 |
|
| Spartech Corp. | 32,621 | 312,183 |
|
| Valspar Corp. | 46,754 | 1,186,149 |
|
| | | 10,509,496 |
| Commercial and consumer services (2.2%) | | |
| Alliance Data Systems Corp. † S | 20,159 | 1,108,342 |
|
| Bowne & Co., Inc. | 113,581 | 741,684 |
|
| Brink’s Home Security Holdings, Inc. † | 24,226 | 750,521 |
|
| Chemed Corp. | 23,523 | 1,066,062 |
|
| Deluxe Corp. | 35,346 | 502,974 |
|
| Dun & Bradstreet Corp. (The) | 12,728 | 974,456 |
|
| Global Cash Access, Inc. † | 31,128 | 197,040 |
|
| Pre-Paid Legal Services, Inc. † | 3,824 | 151,201 |
|
| Sotheby’s Holdings, Inc. Class A S | 16,900 | 268,034 |
|
| | | 5,760,314 |
| Communications equipment (1.5%) | | |
| F5 Networks, Inc. † | 46,928 | 2,106,598 |
|
| Netgear, Inc. † | 42,900 | 782,067 |
|
| Syniverse Holdings, Inc. † | 56,425 | 966,560 |
|
| | | 3,855,225 |
| Computers (4.4%) | | |
| ANSYS, Inc. † S | 44,235 | 1,795,056 |
|
| Blackbaud, Inc. | 50,693 | 1,124,878 |
|
| Brocade Communications Systems, Inc. † | 165,908 | 1,423,491 |
|
| Cogent, Inc. † | 22,884 | 220,831 |
|
| Emulex Corp. † | 207,960 | 2,100,396 |
|
| Jack Henry & Associates, Inc. | 34,478 | 795,407 |
|
| Logitech International SA (Switzerland) † | 88,351 | 1,501,967 |
|
| Logitech International SA (Switzerland) † S | 12,152 | 207,818 |
|
| Polycom, Inc. † | 29,527 | 633,945 |
|
| Quest Software, Inc. † | 47,900 | 803,283 |
|
| Silicon Graphics International Corp. † | 88,500 | 527,460 |
|
| | | 11,134,532 |
| Conglomerates (1.0%) | | |
| AMETEK, Inc. | 43,660 | 1,523,297 |
|
| Harsco Corp. | 29,000 | 913,210 |
|
| | | 2,436,507 |
| Construction (0.9%) | | |
| Chicago Bridge & Iron Co., NV (Netherlands) | 57,339 | 1,078,547 |
|
| Tutor Perini Corp. † | 74,754 | 1,319,408 |
|
| | | 2,397,955 |
| Consumer (0.9%) | | |
| CSS Industries, Inc. | 22,977 | 466,433 |
|
| Helen of Troy, Ltd. (Bermuda) † | 72,016 | 1,644,845 |
|
| Hooker Furniture Corp. | 20,634 | 264,322 |
|
| | | 2,375,600 |
29
| | |
| COMMON STOCKS (98.5%)* cont. | Shares | Value |
|
| Consumer goods (1.0%) | | |
| Bare Escentuals, Inc. † S | 94,600 | $1,194,798 |
|
| Blyth, Inc. | 10,728 | 380,093 |
|
| Church & Dwight Co., Inc. | 19,063 | 1,084,303 |
|
| | | 2,659,194 |
| Consumer services (1.2%) | | |
| Brink’s Co. (The) | 24,226 | 574,883 |
|
| TrueBlue, Inc. † | 206,254 | 2,495,673 |
|
| | | 3,070,556 |
| Electric utilities (2.8%) | | |
| Alliant Energy Corp. | 25,072 | 665,912 |
|
| Black Hills Corp. | 32,700 | 796,899 |
|
| El Paso Electric Co. † | 58,100 | 1,089,375 |
|
| Integrys Energy Group, Inc. | 15,100 | 522,460 |
|
| NSTAR | 25,800 | 798,510 |
|
| Pepco Holdings, Inc. | 54,500 | 813,685 |
|
| Pinnacle West Capital Corp. | 28,700 | 898,884 |
|
| PNM Resources, Inc. | 66,100 | 708,592 |
|
| Westar Energy, Inc. | 47,900 | 917,285 |
|
| | | 7,211,602 |
| Electrical equipment (0.6%) | | |
| Hubbell, Inc. Class B | 38,815 | 1,650,802 |
|
| | | 1,650,802 |
| Electronics (2.5%) | | |
| International Rectifier Corp. † | 61,400 | 1,122,392 |
|
| Intersil Corp. Class A | 80,707 | 1,012,873 |
|
| Omnivision Technologies, Inc. † | 57,900 | 709,854 |
|
| QLogic Corp. † | 76,442 | 1,340,793 |
|
| Semtech Corp. † | 56,339 | 871,564 |
|
| Synopsys, Inc. † | 45,031 | 990,682 |
|
| Zoran Corp. † | 50,000 | 443,500 |
|
| | | 6,491,658 |
| Energy (oil field) (2.2%) | | |
| Basic Energy Services, Inc. † | 57,681 | 403,767 |
|
| Cal Dive International, Inc. † | 41,700 | 320,256 |
|
| CARBO Ceramics, Inc. | 14,500 | 846,655 |
|
| Complete Production Services, Inc. † | 71,100 | 677,583 |
|
| Core Laboratories NV (Netherlands) | 6,631 | 691,613 |
|
| Hercules Offshore, Inc. † | 133,000 | 682,290 |
|
| ION Geophysical Corp. † | 62,607 | 239,785 |
|
| Key Energy Services, Inc. † | 127,558 | 932,449 |
|
| Rowan Cos., Inc. | 15,000 | 348,750 |
|
| Superior Energy Services † | 25,200 | 544,572 |
|
| | | 5,687,720 |
| Energy (other) (0.3%) | | |
| Headwaters, Inc. † S | 201,064 | 828,384 |
|
| | | 828,384 |
| Financial (0.4%) | | |
| Broadridge Financial Solutions, Inc. | 32,900 | 684,649 |
|
| MGIC Investment Corp. † S | 73,101 | 315,065 |
|
| | | 999,714 |
30
| | |
| COMMON STOCKS (98.5%)* cont. | Shares | Value |
|
| Forest products and packaging (1.0%) | | |
| Packaging Corp. of America | 33,551 | $613,312 |
|
| Sealed Air Corp. | 54,514 | 1,048,304 |
|
| Sonoco Products Co. | 28,948 | 774,359 |
|
| | | 2,435,975 |
| Health-care services (4.9%) | | |
| Amedisys, Inc. † S | 16,300 | 648,577 |
|
| AMERIGROUP Corp. † S | 59,472 | 1,311,358 |
|
| Centene Corp. † | 29,700 | 529,551 |
|
| Cross Country Healthcare, Inc. † | 56,000 | 462,560 |
|
| Gentiva Health Services, Inc. † S | 41,900 | 1,005,600 |
|
| IMS Health, Inc. | 67,345 | 1,103,785 |
|
| LifePoint Hospitals, Inc. † | 25,800 | 730,914 |
|
| Lincare Holdings, Inc. † | 115,460 | 3,626,599 |
|
| Medcath Corp. † | 44,157 | 362,529 |
|
| Molina Healthcare, Inc. † | 44,045 | 824,522 |
|
| Omnicare, Inc. S | 37,000 | 801,790 |
|
| RehabCare Group, Inc. † | 26,500 | 496,875 |
|
| Res-Care, Inc. † | 59,200 | 712,176 |
|
| | | 12,616,836 |
| Homebuilding (0.4%) | | |
| NVR, Inc. † | 1,369 | 906,648 |
|
| | | 906,648 |
| Household furniture and appliances (0.9%) | | |
| American Woodmark Corp. | 14,451 | 284,251 |
|
| Whirlpool Corp. S | 27,000 | 1,932,930 |
|
| | | 2,217,181 |
| Insurance (5.2%) | | |
| American Financial Group, Inc. | 26,783 | 658,862 |
|
| American Physicians Capital, Inc. | 8,750 | 247,450 |
|
| Amerisafe, Inc. † S | 15,596 | 289,150 |
|
| Aspen Insurance Holdings, Ltd. (Bermuda) | 24,575 | 634,035 |
|
| CNA Surety Corp. † | 42,964 | 621,259 |
|
| Delphi Financial Group Class A | 38,225 | 829,483 |
|
| Endurance Specialty Holdings, Ltd. (Bermuda) | 27,079 | 974,573 |
|
| Fidelity National Financial, Inc. Class A | 9,621 | 130,557 |
|
| Hanover Insurance Group, Inc. (The) | 22,601 | 950,824 |
|
| Harleysville Group, Inc. | 11,035 | 345,727 |
|
| HCC Insurance Holdings, Inc. | 31,807 | 839,387 |
|
| RenaissanceRe Holdings, Ltd. | 15,037 | 789,443 |
|
| Safety Insurance Group, Inc. | 29,545 | 988,871 |
|
| SeaBright Insurance Holdings, Inc. † | 41,245 | 461,119 |
|
| Selective Insurance Group | 65,873 | 1,009,174 |
|
| Stancorp Financial Group | 30,322 | 1,113,121 |
|
| Validus Holdings, Ltd. (Bermuda) | 24,151 | 611,020 |
|
| W.R. Berkley Corp. | 34,989 | 864,928 |
|
| Zenith National Insurance Corp. | 28,110 | 801,978 |
|
| | | 13,160,961 |
31
| | |
| COMMON STOCKS (98.5%)* cont. | Shares | Value |
|
| Investment banking/Brokerage (5.0%) | | |
| Affiliated Managers Group † | 11,349 | $720,548 |
|
| Eaton Vance Corp. S | 42,242 | 1,199,250 |
|
| FBR Capital Markets Corp. † | 49,657 | 302,908 |
|
| Federated Investors, Inc. S | 82,413 | 2,163,341 |
|
| Jefferies Group, Inc. † | 31,206 | 814,477 |
|
| Legg Mason, Inc. S | 27,900 | 812,169 |
|
| optionsXpress Holdings, Inc. | 75,100 | 1,173,813 |
|
| SEI Investments Co. | 90,800 | 1,586,276 |
|
| TradeStation Group, Inc. † S | 304,400 | 2,349,968 |
|
| Waddell & Reed Financial, Inc. Class A S | 59,922 | 1,681,411 |
|
| | | 12,804,161 |
| Leisure (0.4%) | | |
| Polaris Industries, Inc. S | 23,300 | 980,231 |
|
| | | 980,231 |
| Machinery (2.2%) | | |
| AGCO Corp. † S | 19,419 | 545,868 |
|
| Applied Industrial Technologies, Inc. | 76,006 | 1,537,601 |
|
| Gardner Denver, Inc. † | 19,034 | 683,511 |
|
| Kennametal, Inc. | 49,800 | 1,173,288 |
|
| Manitowoc Co., Inc. (The) S | 151,168 | 1,381,676 |
|
| Regal-Beloit Corp. | 6,996 | 327,972 |
|
| | | 5,649,916 |
| Manufacturing (2.2%) | | |
| Actuant Corp. Class A | 256,500 | 4,003,965 |
|
| EnPro Industries, Inc. † | 36,785 | 830,605 |
|
| Roper Industries, Inc. S | 16,450 | 831,548 |
|
| | | 5,666,118 |
| Medical technology (1.6%) | | |
| Conmed Corp. † | 59,672 | 1,264,450 |
|
| Hill-Rom Holdings, Inc. | 50,400 | 987,336 |
|
| Invacare Corp. S | 27,879 | 625,326 |
|
| Kinetic Concepts, Inc. † S | 14,400 | 477,936 |
|
| SurModics, Inc. † S | 24,700 | 632,567 |
|
| | | 3,987,615 |
| Metals (1.5%) | | |
| Carpenter Technology Corp. | 18,210 | 382,956 |
|
| Century Aluminum Co. † S | 112,702 | 977,126 |
|
| Cliffs Natural Resources, Inc. | 13,000 | 462,410 |
|
| Reliance Steel & Aluminum Co. | 27,820 | 1,014,874 |
|
| Schnitzer Steel Industries, Inc. Class A | 12,000 | 518,880 |
|
| United States Steel Corp. S | 17,200 | 593,228 |
|
| | | 3,949,474 |
| Natural gas utilities (0.6%) | | |
| NiSource, Inc. | 58,600 | 757,112 |
|
| Southwest Gas Corp. | 32,462 | 811,225 |
|
| | | 1,568,337 |
| Office equipment and supplies (0.3%) | | |
| Ennis Inc. | 33,585 | 508,813 |
|
| Steelcase, Inc. | 63,049 | 363,793 |
|
| | | 872,606 |
32
| | |
| COMMON STOCKS (98.5%)* cont. | Shares | Value |
|
| Oil and gas (4.4%) | | |
| Berry Petroleum Co. Class A S | 26,105 | $662,023 |
|
| Cabot Oil & Gas Corp. Class A | 32,314 | 1,243,120 |
|
| Clayton Williams Energy, Inc. † | 15,300 | 400,860 |
|
| Comstock Resources, Inc. † | 22,715 | 933,359 |
|
| Encore Acquisition Co. † | 29,670 | 1,099,867 |
|
| Oil States International, Inc. † S | 20,900 | 719,796 |
|
| Patterson-UTI Energy, Inc. S | 50,300 | 783,674 |
|
| Penn Virginia Corp. | 31,000 | 627,750 |
|
| Petroleum Development Corp. † | 32,545 | 543,502 |
|
| St. Mary Land & Exploration Co. | 16,000 | 545,600 |
|
| Swift Energy Co. † S | 35,616 | 754,347 |
|
| Unit Corp. † S | 23,451 | 916,465 |
|
| Vaalco Energy, Inc. † | 44,100 | 187,866 |
|
| W&T Offshore, Inc. | 51,600 | 601,140 |
|
| Whiting Petroleum Corp. † | 19,214 | 1,083,670 |
|
| | | 11,103,039 |
| Pharmaceuticals (4.5%) | | |
| Biovail Corp. (Canada) S | 140,324 | 1,888,761 |
|
| Endo Pharmaceuticals Holdings, Inc. † | 48,144 | 1,078,426 |
|
| King Pharmaceuticals, Inc. † S | 305,783 | 3,097,582 |
|
| Medicis Pharmaceutical Corp. Class A S | 86,743 | 1,836,349 |
|
| Par Pharmaceutical Cos., Inc. † | 47,400 | 993,978 |
|
| Watson Pharmaceuticals, Inc. † | 71,872 | 2,473,834 |
|
| | | 11,368,930 |
| Power producers (0.3%) | | |
| Mirant Corp. † S | 49,800 | 696,204 |
|
| | | 696,204 |
| Publishing (0.3%) | | |
| Gannett Co., Inc. | 72,000 | 707,040 |
|
| | | 707,040 |
| Real estate (5.2%) | | |
| DiamondRock Hospitality Co. † R | 99,122 | 754,318 |
|
| Entertainment Properties Trust R | 9,864 | 335,573 |
|
| Hospitality Properties Trust R | 91,194 | 1,760,956 |
|
| Kimco Realty Corp. R | 33,622 | 424,982 |
|
| LaSalle Hotel Properties R | 74,794 | 1,283,465 |
|
| LTC Properties, Inc. R | 35,657 | 846,854 |
|
| Macerich Co. (The) R | 19,304 | 575,259 |
|
| National Health Investors, Inc. R | 66,762 | 2,002,860 |
|
| National Retail Properties, Inc. R S | 103,678 | 2,009,280 |
|
| Nationwide Health Properties, Inc. R | 24,962 | 805,025 |
|
| Omega Healthcare Investors, Inc. R S | 76,342 | 1,157,345 |
|
| Taubman Centers, Inc. R S | 43,439 | 1,325,324 |
|
| | | 13,281,241 |
| Restaurants (0.5%) | | |
| Red Robin Gourmet Burgers, Inc. † | 55,800 | 932,418 |
|
| Sonic Corp. † | 45,800 | 428,230 |
|
| | | 1,360,648 |
33
| | |
| COMMON STOCKS (98.5%)* cont. | Shares | Value |
|
| Retail (7.6%) | | |
| Abercrombie & Fitch Co. Class A | 37,170 | $1,219,919 |
|
| Aeropostale, Inc. † S | 27,502 | 1,032,150 |
|
| AnnTaylor Stores Corp. † | 149,142 | 1,934,372 |
|
| Books-A-Million, Inc. | 94,778 | 820,777 |
|
| Brown Shoe Co., Inc. | 34,477 | 357,526 |
|
| Buckle, Inc. (The) S | 20,511 | 615,535 |
|
| Cabela’s, Inc. † S | 97,400 | 1,224,318 |
|
| Cato Corp. (The) Class A | 17,085 | 336,745 |
|
| Dollar Tree, Inc. † | 22,534 | 1,016,959 |
|
| Jos. A. Bank Clothiers, Inc. † | 14,558 | 596,587 |
|
| Kenneth Cole Productions, Inc. Class A † | 50,360 | 478,924 |
|
| Nash Finch Co. S | 36,323 | 1,052,641 |
|
| NBTY, Inc. † | 23,753 | 864,847 |
|
| Regis Corp. | 16,900 | 274,456 |
|
| Saks, Inc. † S | 258,667 | 1,451,122 |
|
| Systemax, Inc. † S | 84,346 | 1,136,984 |
|
| Timberland Co. (The) Class A † | 100,755 | 1,630,216 |
|
| Toro Co. (The) S | 72,411 | 2,680,655 |
|
| Wolverine World Wide, Inc. | 22,283 | 569,999 |
|
| | | 19,294,732 |
| Schools (0.5%) | | |
| Career Education Corp. † | 64,127 | 1,336,407 |
|
| | | 1,336,407 |
| Semiconductor (1.6%) | | |
| Hittite Microwave Corp. † | 13,865 | 510,232 |
|
| KLA-Tencor Corp. | 21,926 | 712,814 |
|
| Lam Research Corp. † | 20,472 | 690,316 |
|
| MKS Instruments, Inc. † | 42,100 | 658,444 |
|
| Novellus Systems, Inc. † | 35,027 | 720,856 |
|
| Verigy, Ltd. (Singapore) † | 71,000 | 698,640 |
|
| | | 3,991,302 |
| Shipping (0.9%) | | |
| Arkansas Best Corp. | 48,267 | 1,246,254 |
|
| Overseas Shipholding Group | 10,116 | 397,053 |
|
| Ship Finance International, Ltd. (Bermuda) S | 54,817 | 623,269 |
|
| | | 2,266,576 |
| Software (3.6%) | | |
| Akamai Technologies, Inc. † S | 78,386 | 1,724,492 |
|
| Autodesk, Inc. † | 44,500 | 1,109,385 |
|
| Citrix Systems, Inc. † S | 35,652 | 1,310,568 |
|
| MicroStrategy, Inc. † | 14,397 | 1,256,426 |
|
| Omnicell, Inc. † | 34,000 | 334,560 |
|
| Red Hat, Inc. † S | 33,347 | 860,686 |
|
| Shanda Interactive Entertainment, Ltd. ADR | | |
| (China) † S | 11,200 | 489,216 |
|
| THQ, Inc. † S | 42,400 | 221,752 |
|
| TIBCO Software, Inc. † S | 102,298 | 895,108 |
|
| Websense, Inc. † | 54,614 | 877,101 |
|
| | | 9,079,294 |
34
| | |
| COMMON STOCKS (98.5%)* cont. | Shares | Value |
|
| Staffing (0.6%) | | |
| Administaff, Inc. | 21,349 | $529,882 |
|
| CDI Corp. | 4,770 | 58,099 |
|
| Heidrick & Struggles International, Inc. | 38,900 | 1,064,304 |
|
| | | 1,652,285 |
| Technology services (2.9%) | | |
| Acxiom Corp. † | 59,187 | 679,467 |
|
| FactSet Research Systems, Inc. S | 21,008 | 1,345,562 |
|
| Fair Isaac Corp. S | 42,401 | 862,012 |
|
| Global Payments, Inc. S | 25,654 | 1,262,946 |
|
| IHS, Inc. Class A † | 21,149 | 1,094,672 |
|
| Perfect World Co., Ltd. ADR (China) † | 29,100 | 1,280,691 |
|
| Sohu.com, Inc. (China) † S | 14,100 | 783,960 |
|
| | | 7,309,310 |
| Telecommunications (1.1%) | | |
| ADTRAN, Inc. | 33,196 | 764,836 |
|
| CenturyTel, Inc. | 11,911 | 386,631 |
|
| NeuStar, Inc. Class A † | 69,526 | 1,606,051 |
|
| | | 2,757,518 |
| Textiles (0.8%) | | |
| Maidenform Brands, Inc. † | 35,908 | 504,148 |
|
| Mohawk Industries, Inc. † | 24,900 | 1,066,467 |
|
| Perry Ellis International, Inc. † | 25,107 | 343,213 |
|
| | | 1,913,828 |
| Tobacco (0.3%) | | |
| Universal Corp. S | 17,994 | 748,370 |
|
| | | 748,370 |
| Toys (0.9%) | | |
| Hasbro, Inc. | 75,784 | 2,066,630 |
|
| Jakks Pacific, Inc. † | 18,913 | 269,132 |
|
| | | 2,335,762 |
| Transportation (0.5%) | | |
| GATX Corp. | 43,478 | 1,181,732 |
|
| | | 1,181,732 |
| Transportation services (0.3%) | | |
| HUB Group, Inc. Class A † | 20,119 | 500,158 |
|
| Pacer International, Inc. | 49,488 | 141,536 |
|
| | | 641,694 |
| Trucks and parts (2.0%) | | |
| Autoliv, Inc. (Sweden) S | 67,843 | 2,278,168 |
|
| Superior Industries International, Inc. S | 42,883 | 569,486 |
|
| WABCO Holdings, Inc. | 95,500 | 2,265,261 |
|
| | | 5,112,915 |
| Total common stocks (cost $244,276,510) | | $251,131,924 |
|
| |
| SHORT-TERM INVESTMENTS (21.9%)* | Principal amount/shares | Value |
| Putnam Money Market Liquidity Fund e | 4,519,598 | $4,519,598 |
|
| Short-term investments held as collateral for loaned | | |
| securities with a yield of 0.35% a due date | | |
| of November 2, 2009 d | $51,177,513 | 51,176,518 |
|
| U.S. Treasury Cash Management Bills, for an | | |
| effective yield of 0.34%, June 10, 2010 | 215,000 | 214,496 |
|
| Total short-term investments (cost $55,910,666) | | $55,910,612 |
35
| |
| TOTAL INVESTMENTS | |
|
| Total investments (cost $300,187,176) | $307,042,536 |
Key to holding’s abbreviations
ADR American Depository Receipts
* Percentages indicated are based on net assets of $254,907,675.
† Non-income-producing security.
d See Note 1 to the financial statements.
e See Note 6 to the financial statements regarding investments in Putnam Money Market Liquidity Fund.
R Real Estate Investment Trust.
S Securities on loan, in part or in entirety, at October 31, 2009.
144A after the name of an issuer represents securities exempt from registration under Rule 144A under the Securities Act of 1933, as amended. These securities may be resold in transactions exempt from registration, normally to qualified institutional buyers.
ADR after the name of a foreign holding represents ownership of foreign securities on deposit with a custodian bank.
In September 2006, Accounting Standards Codification ASC 820 Fair Value Measurements and Disclosures (“ASC 820”) was issued. ASC 820 is effective for financial statements issued for fiscal years beginning after November 15, 2007 and interim periods within those fiscal years. While the adoption of ASC 820 does not have a material effect on the fund’s net asset value, it does require additional disclosures about fair value measurements. ASC 820 establishes a three-level hierarchy for disclosure of fair value measurements. The valuation hierarchy is based upon the transparency of inputs to the valuation of the fund’s investments. The three levels are defined as follows:
Level 1 — Valuations based on quoted prices for identical securities in active markets.
Level 2 — Valuations based on quoted prices in markets that are not active or for which all significant inputs are observable, either directly or indirectly.
Level 3 — Valuations based on inputs that are unobservable and significant to the fair value measurement.
The following is a summary of the inputs used to value the fund’s net assets as of October 31, 2009:
| | | |
| | | Valuation inputs | |
|
| Investments in securities: | Level 1 | Level 2 | Level 3 |
|
| Common stocks: | | | |
|
| Basic materials | $19,292,900 | $— | $— |
|
| Capital goods | 20,736,787 | — | — |
|
| Communication services | 2,757,518 | — | — |
|
| Conglomerates | 2,436,507 | — | — |
|
| Consumer cyclicals | 42,819,235 | — | — |
|
| Consumer staples | 11,880,101 | — | — |
|
| Energy | 17,619,143 | — | — |
|
| Financial | 48,214,051 | 1,325,000 | — |
|
| Health care | 28,623,216 | — | — |
|
| Technology | 41,653,503 | 207,818 | — |
|
| Transportation | 4,090,002 | — | — |
|
| Utilities and power | 9,476,143 | — | — |
|
| Total common stocks | 249,599,106 | 1,532,818 | — |
|
| Short-term investments | 4,519,598 | 51,391,014 | — |
|
| Totals by level | $254,118,704 | $52,923,832 | $— |
The accompanying notes are an integral part of these financial statements.
36
| |
| Statement of assets and liabilities 10/31/09 (Unaudited) | |
| |
| ASSETS | |
|
| Investment in securities, at value, including $47,503,846 of securities on loan (Note 1): | |
| Unaffiliated issuers (identified cost $295,667,578) | $302,522,938 |
| Affiliated issuers (identified cost $4,519,598) (Note 6) | 4,519,598 |
|
| Dividends, interest and other receivables receivables | 300,934 |
|
| Receivable for shares of the fund sold | 210,555 |
|
| Receivable for investments sold | 274,218 |
|
| Total assets | 307,828,243 |
| |
| |
| LIABILITIES | |
|
| Payable for investments purchased | 225,141 |
|
| Payable for shares of the fund repurchased | 660,231 |
|
| Payable for compensation of Manager (Note 2) | 433,355 |
|
| Payable for investor servicing fees (Note 2) | 72,252 |
|
| Payable for custodian fees (Note 2) | 7,639 |
|
| Payable for Trustee compensation and expenses (Note 2) | 107,791 |
|
| Payable for administrative services (Note 2) | 1,718 |
|
| Payable for distribution fees (Note 2) | 87,323 |
|
| Collateral on securities loaned, at value (Note 1) | 51,176,518 |
|
| Other accrued expenses | 148,600 |
|
| Total liabilities | 52,920,568 |
| |
| Net assets | $254,907,675 |
|
| |
| REPRESENTED BY | |
|
| Paid-in capital (Unlimited shares authorized) (Notes 1 and 4) | $395,070,885 |
|
| Undistributed net investment income (Note 1) | 628,638 |
|
| Accumulated net realized loss on investments (Note 1) | (147,647,208) |
|
| Net unrealized appreciation of investments | 6,855,360 |
|
| Total — Representing net assets applicable to capital shares outstanding | $254,907,675 |
| |
| |
| COMPUTATION OF NET ASSET VALUE AND OFFERING PRICE | |
|
| Net asset value and redemption price per class A share | |
| ($185,787,995 divided by 22,943,188 shares) | $8.10 |
|
| Offering price per class A share (100/94.25 of $8.10)* | $8.59 |
|
| Net asset value and offering price per class B share ($34,988,561 divided by 4,736,976 shares)** | $7.39 |
|
| Net asset value and offering price per class C share ($10,781,874 divided by 1,442,594 shares)** | $7.47 |
|
| Net asset value and redemption price per class M share ($4,691,565 divided by 613,659 shares) | $7.65 |
|
| Offering price per class M share (100/96.50 of $7.65)* | $7.93 |
|
| Net asset value, offering price and redemption price per class R share | |
| ($2,279,363 divided by 285,775 shares) | $7.98 |
|
| Net asset value, offering price and redemption price per class Y share | |
| ($16,378,317 divided by 1,985,122 shares) | $8.25 |
|
* On single retail sales of less than $50,000. On sales of $50,000 or more the offering price is reduced.
** Redemption price per share is equal to net asset value less any applicable contingent deferred sales charge.
The accompanying notes are an integral part of these financial statements.
37
| |
| Statement of operations Six months ended 10/31/09 (Unaudited) | |
| |
| INVESTMENT INCOME | |
|
| Dividends (net of foreign tax of $6,991) | $1,729,307 |
|
| Interest (including interest income of $2,636 from investments in affiliated issuers) (Note 6) | 2,758 |
|
| Securities lending | 98,306 |
|
| Total investment income | 1,830,371 |
|
| |
| EXPENSES | |
|
| Compensation of Manager (Note 2) | 816,346 |
|
| Investor servicing fees (Note 2) | 503,902 |
|
| Custodian fees (Note 2) | 9,356 |
|
| Trustee compensation and expenses (Note 2) | 12,819 |
|
| Administrative services (Note 2) | 6,476 |
|
| Distribution fees — Class A (Note 2) | 227,866 |
|
| Distribution fees — Class B (Note 2) | 181,173 |
|
| Distribution fees — Class C (Note 2) | 51,341 |
|
| Distribution fees — Class M (Note 2) | 17,151 |
|
| Distribution fees — Class R (Note 2) | 5,358 |
|
| Other | 139,143 |
|
| Total expenses | 1,970,931 |
| | |
| Expense reduction (Note 2) | (20,818) |
|
| Net expenses | 1,950,113 |
| |
| Net investment loss | (119,742) |
|
| Net realized gain on investments (Notes 1 and 3) | 13,023,969 |
|
| Net realized loss on futures contracts (Note 1) | (60,436) |
|
| Net unrealized appreciation of investments during the period | 40,846,286 |
|
| Net gain on investments | 53,809,819 |
| |
| Net increase in net assets resulting from operations | $53,690,077 |
|
The accompanying notes are an integral part of these financial statements.
38
| | |
| Statement of changes in net assets | | |
| |
| INCREASE (DECREASE) IN NET ASSETS | Six months ended 10/31/09* | Year ended 4/30/09 |
|
| Operations: | | |
| Net investment income (loss) | $(119,742) | $3,502,564 |
|
| Net realized gain (loss) on investments | 12,963,533 | (229,365,533) |
|
| Net unrealized appreciation (depreciation) of investments | 40,846,286 | (13,440,763) |
|
| Net increase (decrease) in net assets resulting from operations | 53,690,077 | (239,303,732) |
|
| Distributions to shareholders (Note 1): | | |
| From ordinary income | | |
| Net investment income | | |
|
| Class A | — | (1,681,141) |
|
| Class M | — | (2,862) |
|
| Class R | — | (11,556) |
|
| Class Y | — | (2,681,993) |
|
| Redemption fees (Note 1) | 3,924 | 21,083 |
|
| Decrease from capital share transactions (Note 4) | (24,288,866) | (321,382,521) |
|
| Total increase (decrease) in net assets | 29,405,135 | (565,042,722) |
| |
| |
| NET ASSETS | | |
|
| Beginning of period | 225,502,540 | 790,545,262 |
|
| End of period (including undistributed net investment | | |
| income of $628,638 and $748,380, respectively) | $254,907,675 | $225,502,540 |
| |
| * Unaudited | | |
The accompanying notes are an integral part of these financial statements.
39
Financial highlights (For a common share outstanding throughout the period) | | | | | | | | | | | | | | |
| INVESTMENT OPERATIONS: | LESS DISTRIBUTIONS: | RATIOS AND SUPPLEMENTAL DATA: | |
|
| | | | | | | | | | | | | Ratio | Ratio ofnet | |
| | | | Net realized | | | From net | | | | | | of expenses | investment | |
| | Net asset value, | | and unrealized | Total from | From net | realized | | | Net asset | Total return | Net assets, | toaverage | income (loss) | |
| | beginning | Net investment | gain (loss) on | investment | investment | gain on | Total | Redemption | value, end | at net asset | end of period | net assets | to average | Portfolio |
| Period ended | ofperiod | income (loss) a | investments | operations | income | investments | distributions | fees c | of period | value (%) d | (in thousands) | (%) e | net assets (%) | turnover (%) |
|
| Class A | | | | | | | | | | | | | | |
| October 31, 2009 ** | $6.49 | — c | 1.61 | 1.61 | — | — | — | — | $8.10 | 24.81* | $185,788 | .72* | .02* | 19 .80* |
| April 30, 2009 | 9.25 | .05 | (2.75) | (2.70) | (.06) | — | (.06) | — | 6.49 | (29.16) | 163,115 | 1.35 b | .71 b | 58.18 |
| April 30, 2008 | 12.49 | .08 | (2.33) | (2.25) | (.05) | (.9 4) | (.99) | — | 9.25 | (18.45) | 341,118 | 1.23 b | .71 b | 37.06 |
| April 30, 2007 | 12.60 | .03 | 1.36 | 1.39 | — c | (1.50) | (1.50) | — | 12.49 | 11.72 | 508,647 | 1.23 b | .23 b | 58.83 |
| April 30, 2006 | 10.97 | .02 f | 3.60 | 3.62 | (.07) | (1.9 2) | (1.99) | — | 12.60 | 34.85 | 476,325 | 1.20 b,f | .13 b,f | 60.27 |
| April 30, 2005 | 10.16 | .06 g | .75 | .81 | — | — | — | — | 10.97 | 7.97 | 378,942 | 1.23 b | .51 b,g | 70.9 4 |
|
| Class B | | | | | | | | | | | | | | |
| October 31, 2009 ** | $5.94 | (.02) | 1.47 | 1.45 | — | — | — | — | $7.39 | 24.41* | $34,989 | 1.10* | (.36)* | 19 .80* |
| April 30, 2009 | 8.45 | — c | (2.51) | (2.51) | — | — | — | — | 5.94 | (29.70) | 34,319 | 2.10 b | (.05) b | 58.18 |
| April 30, 2008 | 11.54 | — c | (2.15) | (2.15) | — | (.9 4) | (.94) | — | 8.45 | (19.11) | 81,892 | 1.9 8 b | (.04) b | 37.06 |
| April 30, 2007 | 11.83 | (.06) | 1.27 | 1.21 | — | (1.50) | (1.50) | — | 11.54 | 10.92 | 167,550 | 1.9 8 b | (.53) b | 58.83 |
| April 30, 2006 | 10.42 | (.07) f | 3.40 | 3.33 | — | (1.9 2) | (1.92) | — | 11.83 | 33.73 | 228,590 | 1.9 5 b,f | (.61) b,f | 60.27 |
| April 30, 2005 | 9.71 | (.02) g | .73 | .71 | — | — | — | — | 10.42 | 7.31 | 218,327 | 1.9 8 b | (.23) b,g | 70.9 4 |
|
| Class C | | | | | | | | | | | | | | |
| October 31, 2009 ** | $6.02 | (.03) | 1.48 | 1.45 | — | — | — | — | $7.47 | 24.09* | $10,782 | 1.10* | (.36)* | 19 .80* |
| April 30, 2009 | 8.55 | — c | (2.53) | (2.53) | — | — | — | — | 6.02 | (29.59) | 8,907 | 2.10 b | (.04) b | 58.18 |
| April 30, 2008 | 11.66 | — c | (2.17) | (2.17) | — | (.9 4) | (.94) | — | 8.55 | (19.09) | 18,438 | 1.9 8 b | (.04) b | 37.06 |
| April 30, 2007 | 11.94 | (.06) | 1.28 | 1.22 | — | (1.50) | (1.50) | — | 11.66 | 10.89 | 34,473 | 1.9 8 b | (.52) b | 58.83 |
| April 30, 2006 | 10.50 | (.07) f | 3.43 | 3.36 | — | (1.9 2) | (1.92) | — | 11.94 | 33.76 | 34,354 | 1.9 5 b,f | (.62) b,f | 60.27 |
| April 30, 2005 | 9.79 | (.02) g | .73 | .71 | — | — | — | — | 10.50 | 7.25 | 29,854 | 1.9 8 b | (.23) b,g | 70.9 4 |
|
| Class M | | | | | | | | | | | | | | |
| October 31, 2009 ** | $6.15 | (.02) | 1.52 | 1.50 | — | — | — | — | $7.65 | 24.39* | $4,692 | .9 8* | (.23)* | 19 .80* |
| April 30, 2009 | 8.73 | .01 | (2.59 ) | (2.58) | — c | — | — | — | 6.15 | (29.50) | 4,034 | 1.85 b | .20 b | 58.18 |
| April 30, 2008 | 11.84 | .02 | (2.19 ) | (2.17) | — | (.9 4) | (.94) | — | 8.73 | (18.78) | 7,995 | 1.73 b | .21 b | 37.06 |
| April 30, 2007 | 12.07 | (.03) | 1.30 | 1.27 | — | (1.50) | (1.50) | — | 11.84 | 11.20 | 15,921 | 1.73 b | (.27) b | 58.83 |
| April 30, 2006 | 10.59 | (.04) f | 3.46 | 3.42 | (.02) | (1.9 2) | (1.94) | — | 12.07 | 34.05 | 17,785 | 1.70 b,f | (.36) b,f | 60.27 |
| April 30, 2005 | 9.85 | — c,g | .74 | .74 | — | — | — | — | 10.59 | 7.51 | 15,802 | 1.73 b | .02 b,g | 70.9 4 |
|
| Class R | | | | | | | | | | | | | | |
| October 31, 2009 ** | $6.41 | (.01) | 1.58 | 1.57 | — | — | — | — | $7.98 | 24.49* | $2,279 | .85* | (.11)* | 19 .80* |
| April 30, 2009 | 9.12 | .03 | (2.70) | (2.67) | (.04) | — | (.04) | — | 6.41 | (29.22) | 1,845 | 1.60 b | .46 b | 58.18 |
| April 30, 2008 | 12.34 | .05 | (2.30) | (2.25) | (.03) | (.9 4) | (.97) | — | 9.12 | (18.67) | 2,577 | 1.48 b | .47 b | 37.06 |
| April 30, 2007 | 12.49 | — c | 1.35 | 1.35 | — | (1.50) | (1.50) | — | 12.34 | 11.48 | 2,610 | 1.48 b | (.02) b | 58.83 |
| April 30, 2006 | 10.92�� | (.03) f | 3.59 | 3.56 | (.07) | (1.9 2) | (1.99) | — | 12.49 | 34.37 | 1,390 | 1.45 b,f | (.21) b,f | 60.27 |
| April 30, 2005 | 10.13 | .02 g | .77 | .79 | — | — | — | — | 10.92 | 7.80 | 457 | 1.48 b | .16 b,g | 70.9 4 |
|
| Class Y | | | | | | | | | | | | | | |
| October 31, 2009 ** | $6.61 | .01 | 1.63 | 1.64 | — | — | — | — | $8.25 | 24.81* | $16,378 | .60* | .14* | 19 .80* |
| April 30, 2009 | 9.43 | .08 | (2.82) | (2.74) | (.08) | — | (.08) | — | 6.61 | (28.92) | 13,283 | 1.10 b | 1.00 b | 58.18 |
| April 30, 2008 | 12.72 | .11 | (2.38) | (2.27) | (.08) | (.9 4) | (1.02) | — | 9.43 | (18.27) | 338,526 | .9 8 b | .9 7 b | 37.06 |
| April 30, 2007 | 12.79 | .06 | 1.40 | 1.46 | (.03) | (1.50) | (1.53) | — | 12.72 | 12.12 | 432,748 | .9 8 b | .48 b | 58.83 |
| April 30, 2006 | 11.12 | .05 f | 3.65 | 3.70 | (.11) | (1.9 2) | (2.03) | — | 12.79 | 35.06 | 389,857 | .9 5 b,f | .38 b,f | 60.27 |
| April 30, 2005 | 10.26 | .08 g | .78 | .86 | — | — | — | — | 11.12 | 8.38 | 322,592 | .9 8 b | .76 b,g | 70.9 4 |
|
See notes to financial highlights at the end of this section.
The accompanying notes are an integral part of these financial statements.
Financial highlights (Continued)
* Not annualized.
** Unaudited.
a Per share net investment income (loss) has been determined on the basis of the weighted average number of shares outstanding during the period.
b Reflects an involuntary contractual expense limitation and/or waivers of certain fund expenses in connection with investments in Putnam Prime Money Market Fund in effect during the period. As a result of such limitation and/or waivers, the expenses of each class reflect a reduction of the following amounts (Notes 2):
| |
| | Percentage of |
| | average net assets |
|
| April 30, 2009 | 0.01% |
|
| April 30, 2008 | <0.01 |
|
| April 30, 2007 | <0.01 |
|
| April 30, 2006 | <0.01 |
|
| April 30, 2005 | <0.01 |
|
c Amount represents less than $0.01 per share.
d Total return assumes dividend reinvestment and does not reflect the effect of sales charges.
e Includes amounts paid through expense offset and brokerage/service arrangements (Note 2).
f Reflects a non-recurring reimbursement from Putnam Investments relating to the calculation of certain amounts paid by the fund to Putnam in previous years for transfer agent services, which amounted to less than $0.01 per share and 0.03% of average net assets for the period ended April 30, 2006.
g Reflects a non-recurring accrual related to Putnam Management’s settlement with the SEC regarding brokerage allocation practices, which amounted to the following amounts:
| | |
| | | Percentage of |
| | Per share | average net assets |
|
| Class A | <$0.01 | 0.03% |
|
| Class B | <0.01 | 0.03 |
|
| Class C | <0.01 | 0.03 |
|
| Class M | <0.01 | 0.03 |
|
| Class R | 0.01 | 0.09 |
|
| Class Y | <0.01 | 0.03 |
|
The accompanying notes are an integral part of these financial statements.
42
Notes to financial statements 10/31/09 (Unaudited)
Note 1: Significant accounting policies
Putnam Capital Opportunities Fund (the “fund”) is a diversified series of Putnam Investment Funds (the “trust”), a Massachusetts business trust registered under the Investment Company Act of 1940, as amended, as an open-end management investment company. The fund invests primarily in common stocks of U.S. companies that Putnam Investment Management, LLC (“Putnam Management”), the fund’s manager, an indirect wholly-owned subsidiary of Putnam, LLC, believes have favorable investment potential, such as stocks of companies with stock prices that reflect a value lower than that which Putnam Management places on the company. Putnam Management may also consider other factors it believes will cause the stock price to rise.
The fund offers class A, class B, class C, class M, class R and class Y shares. Class A and class M shares are sold with a maximum front-end sales charge of 5.75% and 3.50%, respectively, and generally do not pay a contingent deferred sales charge. Class B shares, which convert to class A shares after approximately eight years, do not pay a front-end sales charge and are subject to a contingent deferred sales charge, if those shares are redeemed within six years of purchase. Class C shares have a one-year 1.00% contingent deferred sales charge and do not convert to class A shares. Class R shares, which are offered to qualified employee-benefit plans, are sold at net asset value. The expenses for class A, class B, class C, class M and class R shares may differ based on the distribution fee of each class, which is identified in Note 2. Class Y shares, which are sold at net asset value, are generally subject to the same expenses as class A, class B, class C, class M and class R shares, but do not bear a distribution fee. Class Y shares are generally only available to corporate and institutional clients and clients in other approved programs.
A 1.00% redemption fee may apply on any shares that are redeemed (either by selling or exchanging into another fund) within 90 days of purchase. The redemption fee is accounted for as an addition to paid-in-capital.
Investment income, realized and unrealized gains and losses and expenses of the fund are borne pro-rata based on the relative net assets of each class to the total net assets of the fund, except that each class bears expenses unique to that class (including the distribution fees applicable to such classes). Each class votes as a class only with respect to its own distribution plan or other matters on which a class vote is required by law or determined by the Trustees. If the fund were liquidated, shares of each class would receive their pro-rata share of the net assets of the fund. In addition, the Trustees declare separate dividends on each class of shares.
In the normal course of business, the fund enters into contracts that may include agreements to indemnify another party under given circumstances. The fund’s maximum exposure under these arrangements is unknown as this would involve future claims that may be, but have not yet been, made against the fund. However, the fund’s management team expects the risk of material loss to be remote.
The following is a summary of significant accounting policies consistently followed by the fund in the preparation of its financial statements. The preparation of financial statements is in conformity with accounting principles generally accepted in the United States of America and requires management to make estimates and assumptions that affect the reported amounts of assets and liabilities in the financial statements and the reported amounts of increases and decreases in net assets from operations during the reporting period. Actual results could differ from those estimates. Subsequent events after the Statement of assets and liabilities date through the date that the financial statements were issued, December 7, 2009, have been evaluated in the preparation of the financial statements.
A) Security valuation Investments for which market quotations are readily available are valued at the last reported sales price on their principal exchange, or official closing price for certain markets. If no sales are reported — as in the case of some securities traded over-the-counter — a security is valued at its last reported bid price. Many securities markets and exchanges outside the U.S. close prior to the close of the New York Stock Exchange and therefore the closing prices for securities in such markets or on such exchanges may not fully reflect events that occur after such close but before the close of the New York Stock Exchange. Accordingly, on certain days, the fund will fair value foreign equity securities taking into account multiple factors, including movements in the U.S. securities markets. The number of days on which fair value prices will be used will depend on market activity an d it is possible that fair value prices will be used by the fund to a significant extent. At October 31, 2009, fair value pricing was used for certain foreign securities in the portfolio. Securities quoted in foreign currencies, if any, are translated into U.S. dollars at the current exchange rate. To the extent a pricing service or dealer is unable to value a security or provides a valuation that Putnam Management does not believe accurately reflects the security’s fair value, the security will be valued at fair value by Putnam Management. Certain
43
investments, including certain restricted and illiquid securities and derivatives, are also valued at fair value following procedures approved by the Trustees. Such valuations and procedures are reviewed periodically by the Trustees. The fair value of securities is generally determined as the amount that the fund could reasonably expect to realize from an orderly disposition of such securities over a reasonable period of time. By its nature, a fair value price is a good faith estimate of the value of a security in a current sale and does not reflect an actual market price, which may be different by a material amount.
B) Joint trading account Pursuant to an exemptive order from the Securities and Exchange Commission (the “SEC”), the fund may transfer uninvested cash balances, including cash collateral received under security lending arrangements, into a joint trading account along with the cash of other registered investment companies and certain other accounts managed by Putnam Management. These balances may be invested in issues of short-term investments having maturities of up to 397 days for collateral received under security lending arrangements and up to 90 days for other cash investments.
C) Security transactions and related investment income Security transactions are recorded on the trade date (the date the order to buy or sell is executed). Gains or losses on securities sold are determined on the identified cost basis.
Interest income is recorded on the accrual basis. Dividend income, net of applicable withholding taxes, is recognized on the ex-dividend date except that certain dividends from foreign securities, if any, are recognized as soon as the fund is informed of the ex-dividend date. Non-cash dividends, if any, are recorded at the fair market value of the securities received. Dividends representing a return of capital or capital gains, if any, are reflected as a reduction of cost and/or as a realized gain.
D) Futures and options contracts The fund may use futures and options contracts to hedge against changes in the values of securities the fund owns, owned or expects to purchase, or for other investment purposes. The fund may also write options on swaps or securities it owns or in which it may invest to increase its current returns.
The potential risk to the fund is that the change in value of futures and options contracts may not correspond to the change in value of the hedged instruments. In addition, losses may arise from changes in the value of the underlying instruments, if there is an illiquid secondary market for the contracts, if interest or exchange rates move unexpectedly or if the counterparty to the contract is unable to perform. With futures, there is minimal counterparty credit risk to the fund since futures are exchange traded and the exchange’s clearinghouse, as counterparty to all exchange traded futures, guarantees the futures against default. Risks may exceed amounts recognized on the Statement of assets and liabilities. When the contract is closed, the fund records a realized gain or loss equal to the difference between the value of the contract at the time it was opened and the value at the time it was closed. Realized gains and losses on purchased options are included in realized gains and losses on investment securities. If a written call option is exercised, the premium originally received is recorded as an addition to sales proceeds. If a written put option is exercised, the premium originally received is recorded as a reduction to the cost of investments.
Futures contracts are valued at the quoted daily settlement prices established by the exchange on which they trade. The fund and the broker agree to exchange an amount of cash equal to the daily fluctuation in the value of the futures contract. Such receipts or payments are known as “variation margin.” Exchange traded options are valued at the last sale price or, if no sales are reported, the last bid price for purchased options and the last ask price for written options. Options traded over-the-counter are valued using prices supplied by dealers. Futures and written option contracts outstanding at period end, if any, are listed after the fund’s portfolio. For the six months ended October 31, 2009 the transaction volume of futures contracts was minimal and the fund did not have any activity on written or purchased options contracts.
E) Securities lending The fund may lend securities, through its agents, to qualified borrowers in order to earn additional income. The loans are collateralized by cash and/or securities in an amount at least equal to the market value of the securities loaned. The market value of securities loaned is determined daily and any additional required collateral is allocated to the fund on the next business day. The risk of borrower default will be borne by the fund’s agents; the fund will bear the risk of loss with respect to the investment of the cash collateral. Income from securities lending is included in investment income on the Statement of operations. At October 31, 2009, the value of securities loaned amounted to $47,503,846. The fund received cash collateral of $51,176,518 which is pooled with collateral of other Putnam funds into a single broker cash account covered under the FDIC Temporary Liquidity G uarantee Program.
F) Federal taxes It is the policy of the fund to distribute all of its taxable income within the prescribed time and otherwise comply with the provisions of the Internal Revenue Code of 1986, as amended (the “Code”), applicable to regulated investment companies. It is also the intention of the fund to distribute an amount sufficient to avoid imposition of any excise tax under
44
Section 4982 of the Code. The fund is subject to the provisions of ASC 740 Income Taxes (“ASC 740”). ASC 740 sets forth a minimum threshold for financial statement recognition of the benefit of a tax position taken or expected to be taken in a tax return. The fund did not have any unrecognized tax benefits in the accompanying financial statements. No provision has been made for federal taxes on income, capital gains or unrealized appreciation on securities held nor for excise tax on income and capital gains. Each of the fund’s federal tax returns for the prior three fiscal years remains subject to examination by the Internal Revenue Service and state departments of revenue.
At April 30, 2009, the fund had a capital loss carryover of $92,045,382 available to the extent allowed by the Code to offset future net capital gain, if any. The amounts of the carryovers and the expiration dates are:
| | | |
| Loss Carryover | Expiration | | |
| | |
| $ 1,397,639 | April 30, 2016 | | |
| | |
| 90,647,743 | April 30, 2017 | | |
| | |
Pursuant to federal income tax regulations applicable to regulated investment companies, the fund has elected to defer to its fiscal year ending April 30, 2010, $63,602,468 of losses recognized during the period November 1, 2008 to April 30, 2009.
The aggregate identified cost on a tax basis is $305,150,068, resulting in gross unrealized appreciation and depreciation of $37,184,837 and $35,292,369, respectively, or net unrealized appreciation of $1,892,468.
G) Distributions to shareholders Distributions to shareholders from net investment income are recorded by the fund on the ex-dividend date. Distributions from capital gains, if any, are recorded on the ex-dividend date and paid at least annually. The amount and character of income and gains to be distributed are determined in accordance with income tax regulations, which may differ from generally accepted accounting principles. Dividend sources are estimated at the time of declaration. Actual results may vary. Any non-taxable return of capital cannot be determined until final tax calculations are completed after the end of the fund’s fiscal year. Reclassifications are made to the fund’s capital accounts to reflect income and gains available for distribution (or available capital loss carryovers) under income tax regulations.
H) Expenses of the trust Expenses directly charged or attributable to any fund will be paid from the assets of that fund. Generally, expenses of the trust will be allocated among and charged to the assets of each fund on a basis that the Trustees deem fair and equitable, which may be based on the relative assets of each fund or the nature of the services performed and relative applicability to each fund.
Note 2: Management fee, administrative
services and other transactions
The fund pays Putnam Management for management and investment advisory services quarterly based on the average net assets of the fund. Such fee is based on the following annual rates: 0.65% of the first $500 million of average net assets, 0.55% of the next $500 million, 0.50% of the next $500 million, 0.45% of the next $5 billion, 0.425% of the next $5 billion, 0.405% of the next $5 billion, 0.39% of the next $5 billion and 0.38% thereafter.
Putnam Management had agreed to waive fees and reimburse expenses of the fund through July 31, 2009 to the extent necessary to ensure that the fund’s expenses do not exceed the simple average of the expenses of all front-end load funds viewed by Lipper Inc. as having the same investment classification or objective as the fund. The expense reimbursement is based on a comparison of the fund’s expenses with the average annualized operating expenses of the funds in its Lipper peer group for each calendar quarter during the fund’s last fiscal year, excluding 12b-1 fees and without giving effect to any expense offset and brokerage/service arrangements that may reduce fund expenses. During the period ended October 31, 2009, the fund’s expenses were not reduced as a result of this limit.
Effective August 1, 2009 through July 31, 2010, Putnam Management has also contractually agreed to reimburse the fund’s expenses to the extent necessary to limit the cumulative expenses of the fund, exclusive of brokerage, interest, taxes, investment-related expenses, extraordinary expenses and payments under the fund’s investor servicing contract, investment management contract and distribution plans, on a fiscal year-to-date basis (or from August 1, 2009 through the fund’s next fiscal year end, as applicable), to an annual rate of 0.20% of the fund’s average net assets over such fiscal year-to-date period (or since August 1, 2009, as applicable). During the period ended October 31, 2009, the fund’s expenses were not reduced as a result of this limit.
The fund reimburses Putnam Management an allocated amount for the compensation and related expenses of certain officers of the fund and their staff who provide administrative services to the fund. The aggregate amount of all such reimbursements is determined annually by the Trustees.
Custodial functions for the fund’s assets are provided by State Street Bank and Trust Company (“State Street”). Custody fees are based on the fund’s asset level, the number of its security holdings and transaction volumes.
45
Putnam Investor Services, Inc., an affiliate of Putnam Management, provided investor servicing agent functions to the fund. Putnam Investor Services, Inc. received fees for investor servicing, subject to certain limitations, based on the number of shareholder accounts in the fund and the level of defined contribution plan assets in the fund. The amounts incurred for investor servicing agent functions provided by affiliates of Putnam Management during the six months ended October 31, 2009 are included in Investor servicing fees in the Statement of operations.
The fund has entered into expense offset arrangements with Putnam Fiduciary Trust Company (“PFTC”), which is an affiliate of Putnam Management and State Street whereby PFTC’s and State Street’s fees are reduced by credits allowed on cash balances. The fund also reduced expenses through brokerage/service arrangements. For the six months ended October 31, 2009, the fund’s expenses were reduced by $287 under the expense offset arrangements and by $20,531 under the brokerage/service arrangements.
Each independent Trustee of the fund receives an annual Trustee fee, of which $199, as a quarterly retainer, has been allocated to the fund, and an additional fee for each Trustees meeting attended. Trustees receive additional fees for attendance at certain committee meetings and industry seminars and for certain compliance-related matters. Trustees also are reimbursed for expenses they incur relating to their services as Trustees.
The fund has adopted a Trustee Fee Deferral Plan (the “Deferral Plan”) which allows the Trustees to defer the receipt of all or a portion of Trustees fees payable on or after July 1, 1995. The deferred fees remain invested in certain Putnam funds until distribution in accordance with the Deferral Plan.
The fund has adopted an unfunded noncontributory defined benefit pension plan (the “Pension Plan”) covering all Trustees of the fund who have served as a Trustee for at least five years and were first elected prior to 2004. Benefits under the Pension Plan are equal to 50% of the Trustee’s average annual attendance and retainer fees for the three years ended December 31, 2005. The retirement benefit is payable during a Trustee’s lifetime, beginning the year following retirement, for the number of years of service through December 31, 2006. Pension expense for the fund is included in Trustee compensation and expenses in the Statement of operations. Accrued pension liability is included in Payable for Trustee compensation and expenses in the Statement of assets and liabilities. The Trustees have terminated the Pension Plan with respect to any Trustee first elected after 2003.
The fund has adopted distribution plans (the “Plans”) with respect to its class A, class B, class C, class M and class R shares pursuant to Rule 12b-1 under the Investment Company Act of 1940. The purpose of the Plans is to compensate Putnam Retail Management Limited Partnership, a wholly-owned subsidiary of Putnam Investments, LLC and Putnam Retail Management GP, Inc., for services provided and expenses incurred in distributing shares of the fund. The Plans provide for payments by the fund to Putnam Retail Management Limited Partnership at an annual rate of up to 0.35%, 1.00%, 1.00%, 1.00% and 1.00% of the average net assets attributable to class A, class B, class C, class M and class R shares, respectively. The Trustees have approved payment by the fund at an annual rate of 0.25%, 1.00%, 1.00%, 0.75% and 0.50% of the average net assets attributable to class A, class B, class C, class M and class R shares, respectively.
For the six months ended October 31, 2009, Putnam Retail Management Limited Partnership, acting as underwriter, received net commissions of $9,546 and $135 from the sale of class A and class M shares, respectively, and received $9,751 and $181 in contingent deferred sales charges from redemptions of class B and class C shares, respectively.
A deferred sales charge of up to 1.00% and 0.65% is assessed on certain redemptions of class A and class M shares, respectively. For the six months ended October 31, 2009, Putnam Retail Management Limited Partnership, acting as underwriter, received $2 and no monies on class A and class M redemptions, respectively.
Note 3: Purchases and sales of securities
During the six months ended October 31, 2009, cost of purchases and proceeds from sales of investment securities other than short-term investments aggregated $48,488,784 and $75,935,376, respectively. There were no purchases or sales of U.S. government securities.
Note 4: Capital shares
At October 31, 2009 there was an unlimited number of shares of beneficial interest authorized. In certain circumstances shares may be purchased or redeemed through the delivery to the fund or receipt by the shareholders, respectively, of securities, the fair value of which is used to determine the number of shares issued or redeemed. Transactions in capital shares were as follows:
46
| | | | |
| | Six months ended 10/31/09 | Year ended 4/30/09 |
|
| Class A | Shares | Amount | Shares | Amount |
|
| Shares sold | 1,824,322 | $13,925,479 | 4,918,441 | $34,837,736 |
|
| Shares issued in connection with | | | | |
| reinvestment of distributions | — | — | 269,345 | 1,532,574 |
|
| | 1,824,322 | 13,925,479 | 5,187,786 | 36,370,310 |
|
| Shares repurchased | (4,004,533) | (30,136,115) | (16,935,185) | (119,807,943) |
|
| Net decrease | (2,180,211) | $(16,210,636) | (11,747,399) | $(83,437,633) |
|
| |
| | Six months ended 10/31/09 | Year ended 4/30/09 |
|
| Class B | Shares | Amount | Shares | Amount |
|
| Shares sold | 117,247 | $808,054 | 372,848 | $2,348,902 |
|
| Shares issued in connection with | | | | |
| reinvestment of distributions | — | — | — | — |
|
| | 117,247 | 808,054 | 372,848 | 2,348,902 |
|
| Shares repurchased | (1,153,766) | (7,966,520) | (4,285,229) | (28,385,196) |
|
| Net decrease | (1,036,519) | $(7,158,466) | (3,912,381) | $(26,036,294) |
|
| |
| | Six months ended 10/31/09 | Year ended 4/30/09 |
|
| Class C | Shares | Amount | Shares | Amount |
|
| Shares sold | 87,824 | $616,740 | 136,489 | $901,556 |
|
| Shares issued in connection with | | | | |
| reinvestment of distributions | — | — | — | — |
|
| | 87,824 | 616,740 | 136,489 | 901,556 |
|
| Shares repurchased | (125,990) | (885,484) | (811,066) | (5,355,288) |
|
| Net decrease | (38,166) | $(268,744) | (674,577) | $(4,453,732) |
|
| |
| | Six months ended 10/31/09 | Year ended 4/30/09 |
|
| Class M | Shares | Amount | Shares | Amount |
|
| Shares sold | 30,601 | $215,200 | 62,742 | $417,824 |
|
| Shares issued in connection with | | | | |
| reinvestment of distributions | — | — | 526 | 2,838 |
|
| | 30,601 | 215,200 | 63,268 | 420,662 |
|
| Shares repurchased | (73,382) | (522,311) | (323,072) | (2,350,090) |
|
| Net decrease | (42,781) | $(307,111) | (259,804) | $(1,929,428) |
|
| |
| | Six months ended 10/31/09 | Year ended 4/30/09 |
|
| Class R | Shares | Amount | Shares | Amount |
|
| Shares sold | 68,916 | $513,408 | 122,366 | $816,604 |
|
| Shares issued in connection with | | | | |
| reinvestment of distributions | — | — | 1,943 | 10,921 |
|
| | 68,916 | 513,408 | 124,309 | 827,525 |
|
| Shares repurchased | (71,007) | (530,187) | (118,970) | (831,391) |
|
| Net increase (decrease) | (2,091) | $(16,779) | 5,339 | $(3,866) |
|
47
| | | | |
| | Six months ended 10/31/09 | Year ended 4/30/09 |
|
| Class Y | Shares | Amount | Shares | Amount |
|
| Shares sold | 300,107 | $2,199,869 | 6,763,412 | $51,128,347 |
|
| Shares issued in connection with | | | | |
| reinvestment of distributions | — | — | 463,203 | 2,681,946 |
|
| | 300,107 | 2,199,869 | 7,226,615 | 53,810,293 |
|
| Shares repurchased | (325,635) | (2,526,999) | (19,586,634) | (133,391,785) |
|
| Redemptions in kind | | | (21,528,218) | (125,940,076) |
|
| Net decrease | (25,528) | $(327,130) | (33,888,237) | $(205,521,568) |
|
Note 5: Summary of derivative activity
As of October 31, 2009, the fund did not hold any derivative instruments.
The following is a summary of realized losses of derivative instruments on the Statement of operations for the six months ended October 31, 2009 (see Note 1):
| | | | |
| Derivatives not accounted | | | | |
| for as hedging instruments | | | | |
| under ASC 815 | Futures | Total | | |
| | |
| Equity contracts | $(60,436) | $(60,436) | | |
| | |
| Total | $(60,436) | $(60,436) | | |
| | |
As of October 31, 2009, the fund did not have any change in unrealized related to derivative instruments.
Note 6: Investment in Putnam Money Market
Liquidity Fund
The fund invested in Putnam Money Market Liquidity Fund, an open-end management investment company managed by Putnam Management. Investments in Putnam Money Market Liquidity Fund are valued at its closing net asset value each business day. Income distributions earned by the fund are recorded as interest income in the Statement of operations and totaled $2,636 for the period ended October 31, 2009. During the period ended October 31, 2009, cost of purchases and proceeds of sales of investments in Putnam Money Market Liquidity Fund aggregated $26,920,259 and $24,075,335, respectively. Management fees charged to Putnam Money Market Liquidity Fund have been waived by Putnam Management.
Note 7: Regulatory matters and litigation
In late 2003 and 2004, Putnam Management settled charges brought by the SEC and the Massachusetts Securities Division in connection with excessive short-term trading in Putnam funds. Distribution of payments from Putnam Management to certain open-end Putnam funds and their shareholders is expected to be completed in the next several months. These allegations and related matters have served as the general basis for certain lawsuits, including purported class action lawsuits against Putnam Management and, in a limited number of cases, some Putnam funds. Putnam Management believes that these lawsuits will have no material adverse effect on the funds or on Putnam Management’s ability to provide investment management services. In addition, Putnam Management has agreed to bear any costs incurred by the Putnam funds as a result of these matters.
Note 8: Other
At a meeting held on November 19, 2009, shareholders approved a new management contract for your fund. Subject to shareholder approval of similar management contracts for substantially all of the other Putnam funds, the new management contract is expected to be implemented on January 1, 2010 (but no later than February 1, 2010). Under the new management contract, management fee breakpoints would be determined by reference to the assets of all of the open-end Putnam funds, rather than only the assets of the fund.
Note 9: Market and credit risk
In the normal course of business, the fund trades financial instruments and enters into financial transactions where risk of potential loss exists due to changes in the market (market risk) or failure of the contracting party to the transaction to perform (credit risk). The fund may be exposed to additional credit risk that an institution or other entity with which the fund has unsettled or open transactions will default.
48
Fund information
Founded over 70 years ago, Putnam Investments was built around the concept that a balance between risk and reward is the hallmark of a well-rounded financial program. We manage over 100 funds across income, value, blend, growth, asset allocation, absolute return, and global sector categories.
| | |
| Investment Manager | Officers | Robert R. Leveille |
| Putnam Investment | Robert L. Reynolds | Vice President and |
| Management, LLC | President | Chief Compliance Officer |
| One Post Office Square | | |
| Boston, MA 02109 | Charles E. Porter | Mark C. Trenchard |
| | Executive Vice President, | Vice President and |
| Marketing Services | Principal Executive Officer, | BSA Compliance Officer |
| Putnam Retail Management | Associate Treasurer and | |
| One Post Office Square | Compliance Liaison | Judith Cohen |
| Boston, MA 02109 | | Vice President, Clerk and |
| | Assistant Treasurer |
| | Jonathan S. Horwitz | |
| Custodian | Senior Vice President | Wanda M. McManus |
| State Street Bank | and Treasurer | Vice President, Senior Associate |
| and Trust Company | | Treasurer and Assistant Clerk |
| | Steven D. Krichmar | |
| Legal Counsel | Vice President and | Nancy E. Florek |
| Ropes & Gray LLP | Principal Financial Officer | Vice President, Assistant Clerk, |
| | | Assistant Treasurer and |
| Trustees | Janet C. Smith | Proxy Manager |
| John A. Hill, Chairman | Vice President, Principal | |
| Jameson A. Baxter, | Accounting Officer and | |
| Vice Chairman | Assistant Treasurer | |
| Ravi Akhoury | | |
| Charles B. Curtis | Susan G. Malloy | |
| Robert J. Darretta | Vice President and | |
| Myra R. Drucker | Assistant Treasurer | |
| Paul L. Joskow | | |
| Elizabeth T. Kennan | Beth S. Mazor | |
| Kenneth R. Leibler | Vice President | |
| Robert E. Patterson | | |
| George Putnam, III | James P. Pappas | |
| Robert L. Reynolds | Vice President | |
| W. Thomas Stephens | | |
| Richard B. Worley | Francis J. McNamara, III | |
| Vice President and | |
| | Chief Legal Officer | |
This report is for the information of shareholders of Putnam Capital Opportunities Fund. It may also be used as sales literature when preceded or accompanied by the current prospectus, the most recent copy of Putnam’s Quarterly Performance Summary, and Putnam’s Quarterly Ranking Summary. For more recent performance, please visit putnam.com. Investors should carefully consider the investment objective, risks, charges, and expenses of a fund, which are described in its prospectus. For this and other information or to request a prospectus, call 1-800-225-1581 toll free. Please read the prospectus carefully before investing. The fund’s Statement of Additional Information contains additional information about the fund’s Trustees and is available without charge upon request by calling 1-800-225-1581.

Item 2. Code of Ethics:
Not applicable
Item 3. Audit Committee Financial Expert:
Not applicable
Item 4. Principal Accountant Fees and Services:
Not applicable
Item 5. Audit Committee of Listed Registrants
Not applicable
Item 6. Schedule of Investments:
The registrant’s schedule of investments in unaffiliated issuers is included in the report to shareholders in Item 1 above.
Item 7. Disclosure of Proxy Voting Policies and Procedures For Closed-End Management Investment Companies:
Not applicable
Item 8. Portfolio Managers of Closed-End Investment Companies
Not Applicable
Item 9. Purchases of Equity Securities by Closed-End Management Investment Companies and Affiliated Purchasers:
Not applicable
Item 10. Submission of Matters to a Vote of Security Holders:
Not applicable
Item 11. Controls and Procedures:
(a) The registrant's principal executive officer and principal financial officer have concluded, based on their evaluation of the effectiveness of the design and operation of the registrant's disclosure controls and procedures as of a date within 90 days of the filing date of this report, that the design and operation of such procedures are generally effective to provide reasonable assurance that information required to be disclosed by the registrant in this report is recorded, processed, summarized and reported within the time periods specified in the Commission's rules and forms.
(b) Changes in internal control over financial reporting: Not applicable
Item 12. Exhibits:
(a)(1) Not applicable
(a)(2) Separate certifications for the principal executive officer and principal financial officer of the registrant as required by Rule 30a-2(a) under the Investment Company Act of 1940, as amended, are filed herewith.
(b) The certifications required by Rule 30a-2(b) under the Investment Company Act of 1940, as amended, are filed herewith.
SIGNATURES
Pursuant to the requirements of the Securities Exchange Act of 1934 and the Investment Company Act of 1940, the registrant has duly caused this report to be signed on its behalf by the undersigned, thereunto duly authorized.
Putnam Investment Funds
By (Signature and Title):
/s/Janet C. Smith
Janet C. Smith
Principal Accounting Officer
Date: December 30, 2009
Pursuant to the requirements of the Securities Exchange Act of 1934 and the Investment Company Act of 1940, this report has been signed below by the following persons on behalf of the registrant and in the capacities and on the dates indicated.
By (Signature and Title):
/s/Charles E. Porter
Charles E. Porter
Principal Executive Officer
Date: December 30, 2009
By (Signature and Title):
/s/Steven D. Krichmar
Steven D. Krichmar
Principal Financial Officer
Date: December 30, 2009
| |
| UNITED STATES |
| SECURITIES AND EXCHANGE COMMISSION |
| Washington, D.C. 20549 |
|
| FORM N-CSR |
|
| CERTIFIED SHAREHOLDER REPORT OF REGISTERED |
| MANAGEMENT INVESTMENT COMPANIES |
|
| Investment Company Act file number: (811-07237) |
| | |
| Exact name of registrant as specified in charter: | Putnam Investment Funds |
| |
| Address of principal executive offices: One Post Office Square, Boston, Massachusetts 02109 |
| | |
| Name and address of agent for service: | Beth S. Mazor, Vice President |
| | One Post Office Square |
| | Boston, Massachusetts 02109 |
| |
| Copy to: | John W. Gerstmayr, Esq. |
| | Ropes & Gray LLP |
| | One International Place |
| | Boston, Massachusetts 02110 |
| |
| Registrant’s telephone number, including area code: | (617) 292-1000 |
| | |
| Date of fiscal year end: April 30, 2010 | |
| |
| Date of reporting period: May 1, 2009 — October 31, 2009 |
Item 1. Report to Stockholders:
The following is a copy of the report transmitted to stockholders pursuant to Rule 30e-1 under the Investment Company Act of 1940:

A BALANCED APPROACH
Since 1937, when George Putnam created a diverse mix of stocks and bonds in a single, professionally managed portfolio, Putnam has championed the balanced approach.
A WORLD OF INVESTING
Today, we offer investors a world of equity, fixed-income, multi-asset, and absolute-return portfolios to suit a range of financial goals.
A COMMITMENT TO EXCELLENCE
Our portfolio managers seek superior results over time, backed by original, fundamental research on a global scale. We believe in the value of experienced financial advice, in providing exemplary service, and in putting clients first in all we do.

Putnam
Mid Cap
Value Fund
Semiannual report
10 | 31 | 09
| |
| Message from the Trustees | 2 |
|
| About the fund | 4 |
|
| Performance snapshot | 6 |
|
| Interview with your fund’s portfolio manager | 7 |
|
| Performance in depth | 11 |
|
| Expenses | 13 |
|
| Terms and definitions | 15 |
|
| Trustee approval of management contract | 16 |
|
| Other information for shareholders | 27 |
|
| Financial statements | 28 |
|
Message from the Trustees
Dear Fellow Shareholder:
The stock market’s performance since March has helped restore investor confidence and rebuild portfolios. While this upward trend is welcome, investors should not be surprised if this rate of appreciation levels off in coming months. Time-tested investment principles, such as diversification, asset allocation, and a long-term perspective, apply now more than ever.
In this improved climate, we are pleased to report that many Putnam mutual funds have delivered strong and competitive results over the past year. This performance reflects the intense efforts of an investment team infused with a determination to excel and strengthened by the arrival of several senior portfolio managers, research analysts, and traders.
In another development, Charles E. “Ed” Haldeman, Jr. has stepped down as President of the Putnam Funds and as a member of the Board of Trustees of the Funds to become Chief Executive Officer of the Federal Home Loan Mortgage Corporation (FHLMC), also known as Freddie Mac. Effective July 2009, Robert L. Reynolds, President and Chief Executive Officer of Putnam Investments and a Trustee of the Putnam Funds, replaced Mr. Haldeman as President of the Putnam Funds.
2
We would like to thank all shareholders who took the time to vote by proxy on a number of issues, including shareholder-friendly fee changes, at this fall’s Putnam Funds’ shareholder meetings. We also would like to take this opportunity to welcome new shareholders to the fund and to thank all our investors for your continued confidence in Putnam.

About the fund
Seeking undervalued companies before their potential is recognized
Hidden opportunities — and a measure of patience — are key ingredients in the strategy of Putnam Mid Cap Value Fund. The fund invests in stocks of midsize companies, seeking to take advantage of potential rewards as they mature through their business life cycles.
One advantage of investing in midsize companies is that Wall Street analysts generally prefer to monitor the stocks of large companies, and consequently they pay less attention to the mid-cap universe. This contributes to market inefficiencies that can lead to mispriced stocks, enhancing the possibility of finding bargains. For firms with strong research capabilities, these stocks can represent attractive opportunities. With support from a team of dedicated stock analysts, the fund’s portfolio manager seeks to identify promising midsize companies before the market recognizes their potential.
Another advantage of midsize companies is that they tend to offer a greater degree of stability than smaller, less mature companies. Most midsize companies have developed a solid infrastructure, including professional management and a comprehensive business plan. At the same time, mid-cap companies are generally more agile than larger companies, which means they can offer stronger growth potential.
Because the fund is managed in the value style, the manager seeks stocks that are attractively priced in relation to the company’s earnings and growth potential. A stock price may be low because the company is being underestimated or because its industry is currently out of favor with investors. Often, companies in the portfolio are undergoing changes that may lift their stock prices, such as restructuring, introduction of new products, or streamlining of operations to cut costs.
Of course, such changes can take time. As noted in the fund’s first report to shareholders, “Once a stock is in the portfolio, patience is called for while waiting for the positive change … this fund is most appropriate for those with long-term investment horizons.”
Consider these risks before investing:
The fund invests some or all of its assets in small and/or midsize companies. Such investments increase the risk of greater fluctuations in the value of your investment. Value investing seeks underpriced stocks, but there is no guarantee that a stock’s price will rise.
In-depth analysis is key to successful stock selection
Drawing on the expertise of a dedicated team of stock analysts, the fund’s portfolio manager seeks attractive value stocks. Once a stock is selected for the portfolio, it is regularly assessed to ensure that it continues to meet certain criteria, including:
Valuation The manager carefully considers how each stock is valued, seeking stocks whose valuations are attractive relative to the company’s profitability potential.
Change The manager focuses on company fundamentals against the broader context of industry trends to identify whether individual companies possess a catalyst for positive change.
Quality The manager looks for high-quality companies, seeking characteristics such as sound balance sheets, profitable business models, and competent management.
Putnam Mid Cap Value Fund holdings have spanned industries over time.
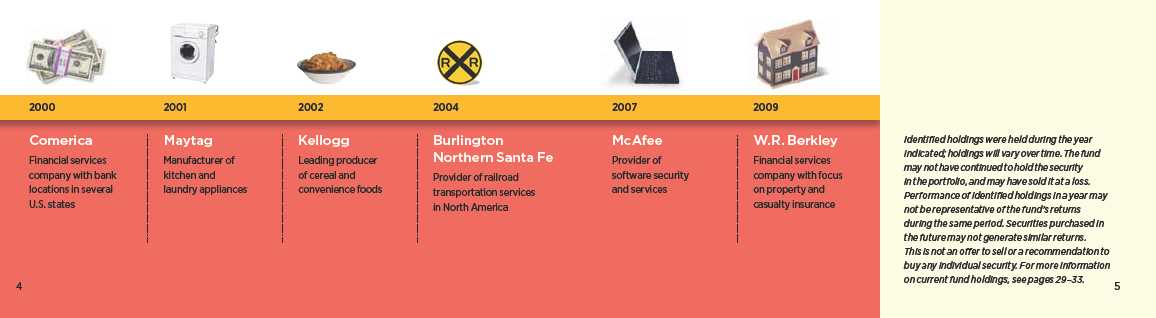
Performance
snapshot
Average annual total return (%) comparison as of 10/31/09
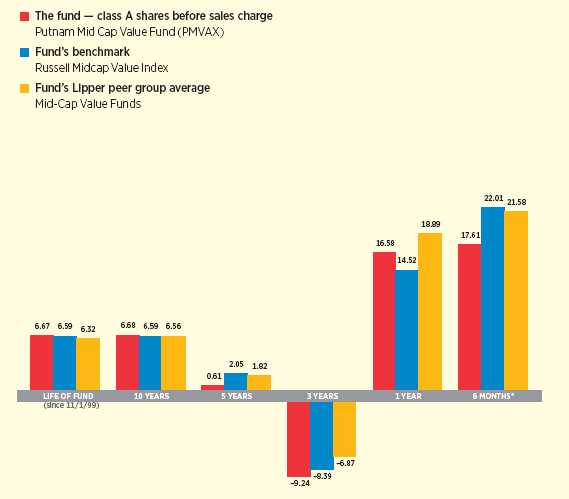
Current performance may be lower or higher than the quoted past performance, which cannot guarantee future results. Share price, principal value, and return will fluctuate, and you may have a gain or a loss when you sell your shares. Performance of class A shares assumes reinvestment of distributions and does not account for taxes. Fund returns in the bar chart do not reflect a sales charge of 5.75%; had they, returns would have been lower. See pages 7 and 11–12 for additional performance information. For a portion of the periods, this fund may have limited expenses, without which returns would have been lower. Due to market volatility, current performance may be higher or lower than performance shown. A 1% short-term trading fee may apply. To obtain the most recent month-end performance, visit putnam.com.
* Returns for the six-month period are not annualized, butcumulative.
6
Interview with your
fund’s portfolio manager
James Polk
Jim, how did Putnam Mid Cap Value Fund perform during the first six months of its fiscal year?
During a strong market rally, the fund offered a solid return of 17.61%. Unfortunately, during the period captured by this report the fund underperformed both its benchmark, the Russell Midcap Value Index, and its Lipper peer group, Mid-Cap Value Funds, which returned 22.01% and 21.58%, respectively. This was largely due to our underweight of financial stocks, which enjoyed sizable gains during the period. Year-to-date through October 31, 2009, however, the fund outperformed, returning 24.65% while its benchmark returned 21.49%.
Describe the market backdrop during the period.
It’s been all over the place — up significantly in some months, flat or down in others. During the rising months, typically more speculative issues have outperformed, whether they are smaller-capitalization stocks, lower-quality companies, or firms in economically sensitive industries. August was an exception. The market rose strongly, led by stocks in more conservative or defensive sectors considered less cyclical in nature.
How have you positioned the fund?
I positioned the fund to benefit from an improving worldwide economy bolstered by the significant fiscal stimulus provided by national governments and central banks.
Broad market index and fund performance

This comparison shows your fund’s performance in the context of broad market indexes for the six months ended 10/31/09. See page 6 and pages 11–12 for additional fund performance information. Index descriptions can be found on page 15.
7
That has translated into fund investments among more speculative names, which have tended to outperform during the market’s good months.
I underweighted financials, which make up a significant portion of the benchmark, because I wanted to take advantage of attractive opportunities elsewhere. This hurt performance during the period, as financial stocks rose significantly. We decreased energy holdings, because many stocks in this industry by period-end reflected higher oil and natural gas prices. We continued to overweight information technology, where we found a number of very cheap stocks of companies with significant cash reserves. Health care also remained a favored sector, as reform proposals in Washington emerged in a less onerous form than many anticipated. We looked to invest in health-care companies that would be unaffected by possible reform, or those whose stock prices had been particularly beaten up. We continued to underweight utilities and telecommunication services.
The market’s rising tide lifted most boats during the period. With valuations starting at low levels, we found a number of opportunities, and increased the number of stocks in the fund above our average target levels. By period-end, though, it had become more of a stock-picker’s market, so we started to sift through holdings to determine which companies were best positioned to gain market share or benefit from their positive business models. By doing so, we looked to reduce the number of holdings in the fund and increase the size of our largest positions.
Which holdings detracted from performance?
At the sector level, the fund’s returns were held back by unfavorable security selection in the financials, consumer discretionary, industrials, and telecommunications services groups. The fund’s holding in
| | |
| Top 10 holdings | | |
| |
| HOLDING (percentage of fund’s net assets) | SECTOR | INDUSTRY |
|
| Atmel Corp. (2.4%) | Technology | Semiconductor |
| Lincare Holdings, Inc. (2.4%) | Health care | Health-care services |
| Mednax, Inc. (2.1%) | Health care | Health-care services |
| Brocade Communications Systems, Inc. (2.0%) | Technology | Computers |
| Cymer, Inc. (2.0%) | Technology | Semiconductor |
| Alberto-Culver Co. (1.9%) | Consumer staples | Consumer goods |
| OfficeMax, Inc. (1.7%) | Consumer cyclicals | Retail |
| XL Capital, Ltd. (1.7%) | Financials | Insurance |
| Owens-Illinois, Inc. (1.7%) | Capital goods | Containers |
| Micron Technology, Inc. (1.6%) | Technology | Electronics |
This table shows the fund’s top 10 holdings and the percentage of the fund’s net assets that each represented as of 10/31/09. Short-term holdings are excluded. Holdings will vary over time.
8
“The overall market’s rising tide lifted
most boats during the period.”
James Polk
Omnicare, which supplies pharmaceuticals to nursing homes, underperformed, in part due to poor execution by management. Fund performance also was curtailed by the fund’s ownership of financial services company CIT Group. This small-business lender relied on the asset-backed security market — which was at the heart of the credit crisis — for funding. When that market contracted violently, CIT’s funding source disappeared, leading to the firm’s bankruptcy. We were fortunate to have sold out of the stock in advance of the company’s default, minimizing losses in the fund. Title insurance company Fidelity National Financial suffered from a decline in mortgage-financing activity. Atmel, which manufactures semiconductors for touch screens, lagged after it became apparent that the company was not going to be acquired, the expectation of which had previously driven the stock upward. Finally, Domino’s Pizza, an out-of-benchmark holding, declined despite positive business fundamentals, because investors shied away from its high debt profile.
Which holdings contributed?
We benefited the most from positive stock selection in the utilities and energy areas, as well as from underweighting utilities and consumer discretionary stocks.
Looking at stocks, the share price of coal company Massey Energy rose because of sustained strong demand from China for the coal byproduct it uses to convert iron ore to steel. Insurance company XL Capital rebounded as investors realized the company’s credit losses did not destroy its franchise value. Data storage and networking specialist Brocade Communications Systems rose on the strength of the company’s attractiveness as an acquisition target. Con-way, a trucking

This chart shows how the fund’s top weightings have changed over the past six months. Weightings are shown as a percentage of net assets. Holdings will vary over time.
9
company, appreciated from a very cheap level because of the combination of improved business volumes and cost-cutting measures. Lastly, retailer OfficeMax continued its turnaround by cutting costs and benefiting from an improving economy.
IN THE NEWS
It took over a year for the Dow Jones Industrial Average to return to the 10000-point level. In October 2009, the index reclaimed the threshold, capping off a seven-month rally during which the Dow bounced back more than 53%. Round numbers like 10000 have historically served as key psychological milestones. In 1966, the Dow first hit 1000, but spent the next 16 years trading mostly below that number. In 1999, when the Dow crossed 10000 for the first time, it just kept rising. While it is impossible to predict where the Dow will go from here, the 10000 mark, combined with persistently low interest rates on many traditional savings vehicles, might motivate some investors sitting in cash to jump back into the market, pushing stocks higher.
What’s your outlook?
Governmental stimulus programs have infused a significant amount of liquidity into the financial system. Ordinarily, this would lead to fears that building inflationary pressures could encourage central banks to raise short-term interest rates. However, I believe the low-rate environment will continue for a while. Poor economic data, particularly rising unemployment, have caused investors to remain skeptical about the economy and the market. A great deal of cash remains on the sidelines. Therefore, I believe going forward we’ll see more of a stock-picker’s market. To that end, we will continue to look for well-positioned companies that have the opportunity to gain market share or improve their profit margins. Given the underlying volatility that remains, I intend to continue paring the number of names in the fund as I look for the better-quality companies within each indu stry.
Thanks for talking with us today, Jim.
The views expressed in this report are exclusively those of Putnam Management. They are not meant as investment advice.
Please note that the holdings discussed in this report may not have been held by the fund for the entire period. Portfolio composition is subject to review in accordance with the fund’s investment strategy and may vary in the future. Current and future portfolio holdings are subject to risk.

Portfolio Manager James Polk has an M.B.A. from Babson College and a B.A. from Colby College. A CFA charterholder, he joined Putnam in 1998 and has been in the investment industry since 1994.
10
Your fund’s performance
This section shows your fund’s performance, price, and distribution information for periods ended October 31, 2009, the end of the first half of its current fiscal year. In accordance with regulatory requirements for mutual funds, we also include performance as of the most recent calendar quarter-end and expense information taken from the fund’s current prospectus. Performance should always be considered in light of a fund’s investment strategy. Data represents past performance. Past performance does not guarantee future results. More recent returns may be less or more than those shown. Investment return and principal value will fluctuate, and you may have a gain or a loss when you sell your shares. Performance information does not reflect any deduction for taxes a shareholder may owe on fund distributions or on the redemption of fund shares. For the most recent month-end performance, please visit the Individual Investors section at putn am.com or call Putnam at 1-800-225-1581. Class Y shares are generally only available to corporate and institutional clients and clients in other approved programs. See the Terms and Definitions section in this report for definitions of the share classes offered by your fund.
Fund performance Total return for periods ended 10/31/09
| | | | | | | | | | |
| | Class A | Class B | Class C | Class M | Class R | Class Y |
| (inception dates) | (11/1/99) | (1/16/01) | (1/16/01) | (1/16/01) | (4/1/03) | (4/2/02) |
|
| | NAV | POP | NAV | CDSC | NAV | CDSC | NAV | POP | NAV | NAV |
|
| Annual average | | | | | | | | | | |
| (life of fund) | 6.67% | 6.04% | 5.89% | 5.89% | 5.89% | 5.89% | 6.15% | 5.77% | 6.42% | 6.89% |
|
| 10 years | 90.87 | 79.87 | 77.22 | 77.22 | 77.30 | 77.30 | 81.65 | 75.30 | 86.38 | 94.81 |
| Annual average | 6.68 | 6.05 | 5.89 | 5.89 | 5.89 | 5.89 | 6.15 | 5.77 | 6.42 | 6.90 |
|
| 5 years | 3.09 | –2.86 | –0.65 | –1.96 | –0.56 | –0.56 | 0.57 | –2.98 | 1.87 | 4.58 |
| Annual average | 0.61 | –0.58 | –0.13 | –0.40 | –0.11 | –0.11 | 0.11 | –0.60 | 0.37 | 0.90 |
|
| 3 years | –25.23 | –29.53 | –26.86 | –28.51 | –26.80 | –26.80 | –26.34 | –28.91 | –25.74 | –24.54 |
| Annual average | –9.24 | –11.01 | –9.90 | –10.58 | –9.88 | –9.88 | –9.69 | –10.75 | –9.44 | –8.96 |
|
| 1 year | 16.58 | 9.89 | 15.72 | 10.72 | 15.90 | 14.90 | 16.00 | 11.97 | 16.30 | 17.08 |
|
| 6 months | 17.61 | 10.91 | 17.31 | 12.31 | 17.33 | 16.33 | 17.41 | 13.28 | 17.44 | 17.83 |
|
Current performance may be lower or higher than the quoted past performance, which cannot guarantee future results. After-sales-charge returns (public offering price, or POP) for class A and M shares reflect a maximum 5.75% and 3.50% load, respectively. Class B share returns reflect the applicable contingent deferred sales charge (CDSC), which is 5% in the first year, declining to 1% in the sixth year, and is eliminated thereafter. Class C shares reflect a 1% CDSC for the first year that is eliminated thereafter. Class R and Y shares have no initial sales charge or CDSC. Performance for class B, C, M, R, and Y shares before their inception is derived from the historical performance of class A shares, adjusted for the applicable sales charge (or CDSC) and, except for class Y shares, the higher operating expenses for such shares.
For a portion of the periods, this fund may have limited expenses, without which returns would have been lower.
Due to market volatility, current performance may be higher or lower than performance shown. A 1% short-term trading fee may be applied to shares exchanged or sold within 7 days of purchase.
11
| | |
| Comparative index returns For periods ended 10/31/09 | |
|
| | | Lipper Mid-Cap Value Funds |
| | Russell Midcap Value Index | category average* |
|
| Annual average | | |
| (life of fund) | 6.59% | 6.32% |
|
| 10 years | 89.37 | 92.45 |
| Annual average | 6.59 | 6.56 |
|
| 5 years | 10.71 | 9.86 |
| Annual average | 2.05 | 1.82 |
|
| 3 years | –23.13 | –19.03 |
| Annual average | –8.39 | –6.87 |
|
| 1 year | 14.52 | 18.89 |
|
| 6 months | 22.01 | 21.58 |
|
Index and Lipper results should be compared to fund performance at net asset value.
* Over the 6-month, 1-year, 3-year, 5-year, 10-year, and life-of-fund periods ended 10/31/09, there were 254, 249, 205, 161, 58, and 60 funds, respectively, in this Lipper category.
Fund price and distribution information For the six-month period ended 10/31/09
| | | | | | | | |
| | Class A | Class B | Class C | Class M | Class R | Class Y |
|
| Share value | NAV | POP | NAV | NAV | NAV | POP | NAV | NAV |
|
| 4/30/09 | $7.61 | $8.07 | $7.28 | $7.27 | $7.41 | $7.68 | $7.51 | $7.63 |
|
| 10/31/09 | 8.95 | 9.50 | 8.54 | 8.53 | 8.70 | 9.02 | 8.82 | 8.99 |
|
The classification of distributions, if any, is an estimate. Final distribution information will appear on your year-end tax forms.
The fund made no distributions during the period.
Fund performance as of most recent calendar quarter
Total return for periods ended 9/30/09
| | | | | | | | | | |
| | Class A | Class B | Class C | Class M | Class R | Class Y |
| (inception dates) | (11/1/99) | (1/16/01) | (1/16/01) | (1/16/01) | (4/1/03) | (4/2/02) |
|
| | NAV | POP | NAV | CDSC | NAV | CDSC | NAV | POP | NAV | NAV |
|
| Life of fund | 106.44% | 94.54% | 91.75% | 91.75% | 91.85% | 91.85% | 96.68% | 89.80% | 101.80% | 110.63% |
| Annual average | 7.58 | 6.94 | 6.78 | 6.78 | 6.79 | 6.79 | 7.06 | 6.67 | 7.33 | 7.80 |
|
| 5 years | 13.48 | 6.97 | 9.34 | 7.90 | 9.36 | 9.36 | 10.76 | 6.86 | 12.18 | 15.06 |
| Annual average | 2.56 | 1.36 | 1.80 | 1.53 | 1.81 | 1.81 | 2.06 | 1.34 | 2.33 | 2.85 |
|
| 3 years | –14.68 | –19.58 | –16.59 | –18.46 | –16.51 | –16.51 | –15.92 | –18.85 | –15.23 | –13.93 |
| Annual average | –5.15 | –7.01 | –5.87 | –6.58 | –5.84 | –5.84 | –5.62 | –6.73 | –5.36 | –4.88 |
|
| 1 year | –0.80 | –6.52 | –1.49 | –6.42 | –1.39 | –2.38 | –1.15 | –4.66 | –0.96 | –0.43 |
|
| 6 months | 51.49 | 42.77 | 50.98 | 45.98 | 51.06 | 50.06 | 51.20 | 45.82 | 51.35 | 51.88 |
|
12
Your fund’s expenses
As a mutual fund investor, you pay ongoing expenses, such as management fees, distribution fees (12b-1 fees), and other expenses. In the most recent six-month period, your fund limited these expenses; had it not done so, expenses would have been higher. Using the following information, you can estimate how these expenses affect your investment and compare them with the expenses of other funds. You may also pay one-time transaction expenses, including sales charges (loads) and redemption fees, which are not shown in this section and would have resulted in higher total expenses. For more information, see your fund’s prospectus or talk to your financial representative.
| | | | | | |
| Expense ratios | | | | | | |
|
| | Class A | Class B | Class C | Class M | Class R | Class Y |
|
| Total annual operating expenses for the fiscal year | | | | | | |
| ended 4/30/09 | 1.39% | 2.14% | 2.14% | 1.89% | 1.64% | 1.14% |
|
| Annualized expense ratio for the six-month period | | | | | | |
| ended 10/31/09 | 1.34% | 2.09% | 2.09% | 1.84% | 1.59% | 1.09% |
|
Fiscal-year expense information in this table is taken from the most recent prospectus, is subject to change, and may differ from that shown for the annualized expense ratio and in the financial highlights of this report. Expenses are shown as a percentage of average net assets.
Expenses per $1,000
The following table shows the expenses you would have paid on a $1,000 investment in Putnam Mid Cap Value Fund from May 1, 2009, to October 31, 2009. It also shows how much a $1,000 investment would be worth at the close of the period, assuming actual returns and expenses.
| | | | | | |
| | Class A | Class B | Class C | Class M | Class R | Class Y |
|
| Expenses paid per $1,000*† | $7.35 | $11.45 | $11.45 | $10.08 | $8.71 | $5.98 |
|
| Ending value (after expenses) | $1,176.10 | $1,173.10 | $1,173.30 | $1,174.10 | $1,174.40 | $1,178.30 |
|
* Expenses for each share class are calculated using the fund’s annualized expense ratio for each class, which represents the ongoing expenses as a percentage of average net assets for the six months ended 10/31/09. The expense ratio may differ for each share class.
† Expenses are calculated by multiplying the expense ratio by the average account value for the period; then multiplying the result by the number of days in the period; and then dividing that result by the number of days in the year.
Estimate the expenses you paid
To estimate the ongoing expenses you paid for the six months ended October 31, 2009, use the following calculation method. To find the value of your investment on May 1, 2009, call Putnam at 1-800-225-1581.

13
Compare expenses using the SEC’s method
The Securities and Exchange Commission (SEC) has established guidelines to help investors assess fund expenses. Per these guidelines, the following table shows your fund’s expenses based on a $1,000 investment, assuming a hypothetical 5% annualized return. You can use this information to compare the ongoing expenses (but not transaction expenses or total costs) of investing in the fund with those of other funds. All mutual fund shareholder reports will provide this information to help you make this comparison. Please note that you cannot use this information to estimate your actual ending account balance and expenses paid during the period.
| | | | | | |
| | Class A | Class B | Class C | Class M | Class R | Class Y |
|
| Expenses paid per $1,000*† | $6.82 | $10.61 | $10.61 | $9.35 | $8.08 | $5.55 |
|
| Ending value (after expenses) | $1,018.45 | $1,014.67 | $1,014.67 | $1,015.93 | $1,017.19 | $1,019.71 |
|
* Expenses for each share class are calculated using the fund’s annualized expense ratio for each class, which represents the ongoing expenses as a percentage of average net assets for the six months ended 10/31/09. The expense ratio may differ for each share class.
† Expenses are calculated by multiplying the expense ratio by the average account value for the period; then multiplying the result by the number of days in the period; and then dividing that result by the number of days in the year.
14
Terms and definitions
Important terms
Total return shows how the value of the fund’s shares changed over time, assuming you held the shares through the entire period and reinvested all distributions in the fund.
Net asset value (NAV) is the price, or value, of one share of a mutual fund, without a sales charge. NAVs fluctuate with market conditions. NAV is calculated by dividing the net assets of each class of shares by the number of outstanding shares in the class.
Public offering price (POP) is the price of a mutual fund share plus the maximum sales charge levied at the time of purchase. POP performance figures shown here assume the 5.75% maximum sales charge for class A shares and 3.50% for class M shares.
Contingent deferred sales charge (CDSC) is generally a charge applied at the time of the redemption of class B or C shares and assumes redemption at the end of the period. Your fund’s class B CDSC declines from a 5% maximum during the first year to 1% during the sixth year. After the sixth year, the CDSC no longer applies. The CDSC for class C shares is 1% for one year after purchase.
Share classes
Class A shares are generally subject to an initial sales charge and no CDSC (except on certain redemptions of shares bought without an initial sales charge).
Class B shares are not subject to an initial sales charge. They may be subject to a CDSC.
Class C shares are not subject to an initial sales charge and are subject to a CDSC only if the shares are redeemed during the first year.
Class M shares have a lower initial sales charge and a higher 12b-1 fee than class A shares and no CDSC (except on certain redemptions of shares bought without an initial sales charge).
Class R shares are not subject to an initial sales charge or CDSC and are available only to certain defined contribution plans.
Class Y shares are not subject to an initial sales charge or CDSC, and carry no 12b-1 fee. They are generally only available to corporate and institutional clients and clients in other approved programs.
Comparative indexes
Barclays Capital Aggregate Bond Index is an unmanaged index of U.S. investment-grade fixed-income securities.
BofA Merrill Lynch U.S. 3-Month Treasury Bill Index is an unmanaged index that seeks to measure the performance of U.S. Treasury bills available in the marketplace.
Russell Midcap Value Index is an unmanaged index of those companies in the Russell Midcap Index chosen for their value orientation.
S&P 500 Index is an unmanaged index of common stock performance.
Indexes assume reinvestment of all distributions and do not account for fees. Securities and performance of a fund and an index will differ. You cannot invest directly in an index.
Lipper is a third-party industry-ranking entity that ranks mutual funds. Its rankings do not reflect sales charges. Lipper rankings are based on total return at net asset value relative to other funds that have similar current investment styles or objectives as determined by Lipper. Lipper may change a fund’s category assignment at its discretion. Lipper category averages reflect performance trends for funds within a category.
15
Trustee approval of management contract
General conclusions
The Board of Trustees of the Putnam funds oversees the management of each fund and, as required by law, determines annually whether to approve the continuance of your fund’s management contract with Putnam Investment Management (“Putnam Management”).
In this regard, the Board of Trustees, with the assistance of its Contract Committee consisting solely of Trustees who are not “interested persons” (as such term is defined in the Investment Company Act of 1940, as amended) of the Putnam funds (the “Independent Trustees”), requests and evaluates all information it deems reasonably necessary under the circumstances. Over the course of several months ending in June 2009, the Contract Committee met several times to consider the information provided by Putnam Management and other information developed with the assistance of the Board’s independent counsel and independent staff. The Contract Committee reviewed and discussed key aspects of this information with all of the Independent Trustees. At the Trustees’ June 12, 2009 meeting, the Contract Committee recommended, and the Independent Trustees approved, the continuance of your fund’s management contract, effective July 1 , 2009. In addition, at the Trustees’ September 11, 2009 meeting, the Contract Committee recommended, and the Independent Trustees approved, a sub-management contract with respect to your fund between Putnam Management and its affiliate, Putnam Investments Limited (“PIL”), to be effective August 30, 2010. (Because PIL is an affiliate of Putnam Management and Putnam Management remains fully responsible for all services provided by PIL, the Trustees have not evaluated PIL as a separate entity, and all subsequent references to Putnam Management below should be deemed to include reference to PIL as necessary or appropriate in the context.)
The Independent Trustees’ approval was based on the following conclusions:
• That the fee schedule in effect for your fund represented reasonable compensation in light of the nature and quality of the services being provided to the fund, the fees paid by competitive funds and the costs incurred by Putnam Management in providing such services, and
• That such fee schedule represented an appropriate sharing between fund shareholders and Putnam Management of such economies of scale as may exist in the management of the fund at current asset levels.
These conclusions were based on a comprehensive consideration of all information provided to the Trustees, were subject to the continued application of certain expense reductions and waivers pending other considerations noted below, and were not the result of any single factor. Some of the factors that figured particularly in the Trustees’ deliberations and how the Trustees considered these factors are described below, although individual Trustees may have evaluated the information presented differently, giving different weights to various factors. It is also important to recognize that the fee arrangements for your fund and the other Putnam funds are the result of many years of review and discussion between the Independent Trustees and Putnam Management, that certain aspects of the arrangements may receive greater scrutiny in some years than others, and that the Trustees’ conclusions may be based, in part, on their consideration of these sam e arrangements in prior years.
Consideration of strategic
pricing proposal
The Trustees considered that the Contract Committee had been engaged in a detailed review of Putnam Management’s strategic pricing proposal that was first presented to
16
the Committee at its May 2009 meeting. The proposal included proposed changes to the basic structure of the management fees in place for all open-end funds (except the Putnam RetirementReady® Funds and Putnam Money Market Liquidity Fund), including implementation of a breakpoint structure based on the aggregate net assets of all such funds in lieu of the individual breakpoint structures in place for each fund, as well as implementation of performance fees for certain funds. In addition, the proposal recommended substituting separate expense limitations on investor servicing fees and on other expenses as a group in lieu of the total expense limitations in place for many funds.
While the Contract Committee noted the likelihood that the Trustees and Putnam Management would reach agreement on the strategic pricing matters in later months, the terms of the management contracts required that the Trustees approve the continuance of the contracts in order to prevent their expiration at June 30, 2009. The Contract Committee’s recommendations in June reflect its conclusion that the terms of the contractual arrangements for your fund continued to be appropriate for the upcoming term, absent any possible agreement with respect to the matters addressed in Putnam Management’s proposal.
The Trustees were mindful of the significant changes that had occurred at Putnam Management in the past two years, including a change of ownership, the installation of a new senior management team at Putnam Management, the substantial decline in assets under management resulting from extraordinary market forces as well as continued net redemptions in many funds, the introduction of new fund products representing novel investment strategies and the introduction of performance fees for certain new funds. The Trustees were also mindful that many other leading firms in the industry had also been experiencing significant challenges due to the changing financial and competitive environment. For these reasons, even though the Trustees believed that the current contractual arrangements in place between the funds and Putnam Management and its affiliates have served shareholders well and continued to be appropriate for the nea r term, the Trustees believed that it was an appropriate time to reconsider the current structure of the funds’ contractual arrangements with Putnam Management with a view to possible changes that might better serve the interests of shareholders in this new environment. The Trustees concluded their review of Putnam Management’s strategic pricing proposal in July 2009, and their considerations regarding the proposal are discussed below under the heading “Subsequent approval of strategic pricing proposal.” With the exception of the discussion under this heading, the following discussion generally addresses only the Trustees’ reasons for recommending the continuance of the current contractual arrangements (and the new sub-management contract between Putnam Management and PIL, which the Trustees evaluated in large part based on their review of contractual arrangements in June 2009) as, at the time the Trustees determined to make this recommendation, the Trustees had not yet reached any c onclusions with respect to the strategic pricing proposal.
Management fee schedules and
categories; total expenses
The Trustees reviewed the management fee schedules in effect for all Putnam funds, including fee levels and breakpoints, and the assignment of funds to particular fee categories. The general fee structure has been carefully developed over the years and re-examined on many occasions and adjusted where appropriate. In this regard, the Trustees noted that shareholders of all funds voted by overwhelming majorities in 2007 to approve new management contracts containing identical fee schedules.
17
In reviewing fees and expenses, the Trustees generally focused their attention on material changes in circumstances — for example, changes in a fund’s size or investment style, changes in Putnam Management’s operating costs, or changes in competitive practices in the mutual fund industry — that suggest that consideration of fee changes might be warranted. The Trustees concluded that the circumstances did not warrant changes to the management fee structure of your fund at that time but, as indicated above, based on their detailed review of the current fee structure, were prepared to consider possible changes to this arrangement that might better serve the interests of shareholders in the future. The Trustees focused on two areas of particular interest, as discussed further below:
• Competitiveness. The Trustees reviewed comparative fee and expense information for competitive funds, which indicated that, in a custom peer group of competitive funds selected by Lipper Inc., your fund ranked in the 21st percentile in management fees and in the 45th percentile in total expenses (less any applicable 12b-1 fees) as of December 31, 2008 (the first percentile being the least expensive funds and the 100th percentile being the most expensive funds).
The Trustees noted that expense ratios for a number of Putnam funds, which show the percentage of fund assets used to pay for management and administrative services, distribution (12b-1) fees (as applicable) and other expenses, had been increasing recently as a result of declining net assets and the natural operation of fee breakpoints. The Trustees expressed their intention to monitor the funds’ percentile rankings in management fees and in total expenses to ensure that fees and expenses of the funds continue to meet evolving competitive standards.
The Trustees noted that the expense ratio increases described above were being controlled by expense limitations initially implemented in January 2004. These expense limitations give effect to a commitment by Putnam Management that the expense ratio of each open-end fund would be no higher than the average expense ratio of the competitive funds included in the fund’s relevant Lipper universe (exclusive of any applicable 12b-1 charges in each case). The Trustees observed that this commitment to limit fund expenses has served shareholders well since its inception and, while the Contract Committee was reviewing proposed alternative expense limitation arrangements as noted above, the Trustees received a commitment from Putnam Management and its parent company to continue this program through at least June 30, 2010, or such earlier time as the Trustees and Putnam Management reach agreement on alternative arrangements .
In order to ensure that the expenses of the Putnam funds continue to meet evolving competitive standards, the Trustees requested, and Putnam Management agreed, to extend for the twelve months beginning July 1, 2009, or until such earlier time as the Trustees and Putnam Management reach agreement on alternative expense limitation arrangements, an additional expense limitation for certain funds at an amount equal to the average expense ratio (exclusive of 12b-1 charges) of a custom peer group of competitive funds selected by Lipper to correspond to the size of the fund. This additional expense limitation is applicable to those open-end funds that had above-average expense ratios (exclusive of 12b-1 charges) based on the custom peer group data for the period ended December 31, 2007. This additional expense limitation was not applied to your fund because it had a below-average expense ratio relative to its custom peer group.
• Economies of scale. Your fund currently has the benefit of breakpoints in its management fee that provide shareholders with significant
18
economies of scale, which means that the effective management fee rate of the fund (as a percentage of fund assets) declines as the fund grows in size and crosses specified asset thresholds. Conversely, as the fund shrinks in size — as has been the case for many Putnam funds in recent years — these breakpoints result in increasing fee levels. In recent years, the Trustees have examined the operation of the existing breakpoint structure during periods of both growth and decline in asset levels. The Trustees concluded that the fee schedule in effect for your fund represented an appropriate sharing of economies of scale at that time but, as noted above, were in the process of reviewing a proposal to eliminate individual fund breakpoints for all of the open-end funds (except for the Putnam RetirementReady® Funds and Putnam Money Market Liquidity Fund) in favor of a breakpoint structure based on the aggregate net assets of all such funds.
In connection with their review of the management fees and total expenses of the Putnam funds, the Trustees also reviewed the costs of the services provided and profits realized by Putnam Management and its affiliates from their contractual relationships with the funds. This information included trends in revenues, expenses and profitability of Putnam Management and its affiliates relating to the investment management and distribution services provided to the funds. In this regard, the Trustees also reviewed an analysis of Putnam Management’s revenues, expenses and profitability with respect to the funds’ management contracts, allocated on a fund-by-fund basis.
Investment performance
The quality of the investment process provided by Putnam Management represented a major factor in the Trustees’ evaluation of the quality of services provided by Putnam Management under your fund’s management contract. The Trustees were assisted in their review of the Putnam funds’ investment process and performance by the work of the Investment Oversight Coordinating Committee of the Trustees and the Investment Oversight Committees of the Trustees, which had met on a regular monthly basis with the funds’ portfolio teams throughout the year. The Trustees concluded that Putnam Management generally provides a high-quality investment process — as measured by the experience and skills of the individuals assigned to the management of fund portfolios, the resources made available to such personnel, and in general the ability of Putnam Management to attract and retain high-quality personnel — b ut also recognized that this does not guarantee favorable investment results for every fund in every time period. The Trustees considered the investment performance of each fund over multiple time periods and considered information comparing each fund’s performance with various benchmarks and with the performance of competitive funds.
The Trustees noted the disappointing investment performance of many of the funds for periods ended March 31, 2009. They discussed with senior management of Putnam Management the factors contributing to such underperformance and the actions being taken to improve performance. The Trustees recognized that, in recent years, Putnam Management has taken steps to strengthen its investment personnel and processes to address areas of underperformance, including Putnam Management’s continuing efforts to strengthen the equity research function, recent changes in portfolio managers including increased accountability of individual managers rather than teams, recent changes in Putnam Management’s approach to incentive compensation, including emphasis on top quartile performance over a rolling three-year period, and the recent arrival of a new chief investment officer. The Trustees also recognized the substantial improvement in performance of many funds si nce the implementation of those changes. The
19
Trustees indicated their intention to continue to monitor performance trends to assess the effectiveness of these efforts and to evaluate whether additional changes to address areas of underperformance are warranted.
In the case of your fund, the Trustees considered that your fund’s class A share cumulative total return performance at net asset value was in the following percentiles of its Lipper Inc. peer group (Lipper Mid-Cap Value Funds) for the one-year, three-year and five-year periods ended March 31, 2009 (the first percentile being the best-performing funds and the 100th percentile being the worst-performing funds):
| | | |
| One-year period | 81st | | |
| | |
| Three-year period | 83rd | | |
| | |
| Five-year period | 74th | | |
| | |
Over the one-year, three-year and five-year periods ended March 31, 2009, there were 360, 292 and 218 funds, respectively, in your fund’s Lipper peer group. Past performance is no guarantee of future results.
The Trustees noted the disappointing performance for certain funds, as well as certain circumstances that may have contributed to that performance and the actions taken by Putnam Management to address these funds’ performance. The Trustees also considered the four broad initiatives that Putnam Management has implemented to improve its investment approach, to reduce the likelihood of fourth quartile results, and to deliver on its long-term investment goals. Specifically, Putnam Management has:
1. Increased accountability and reduced complexity in the portfolio management process for the Putnam equity funds by replacing a team management structure with a decision-making process that vests full authority and responsibility with individual portfolio managers;
2. Clarified Putnam Management’s investment process by affirming a fundamental-driven approach to investing, with quantitative analysis providing additional input for investment decisions;
3. Strengthened Putnam Management’s large-cap equity research capability by adding multiple new investment personnel to the team and by bringing U.S. and international research under common leadership; and
4. Realigned compensation structure for portfolio managers and research analysts so that only those who achieve top-quartile returns over a rolling three-year basis are eligible for full bonuses.
The Trustees noted the disappointing performance for your fund for the one-year and three-year periods ended March 31, 2009. In this regard, in addition to initiatives 1, 2 and 4 described above, the Trustees considered that in November 2008, an existing portfolio manager took over sole responsibility for managing the fund’s investments.
As a general matter, the Trustees believe that cooperative efforts between the Trustees and Putnam Management represent the most effective way to address investment performance problems. The Trustees noted that investors in the Putnam funds have, in effect, placed their trust in the Putnam organization, under the oversight of the funds’ Trustees, to make appropriate decisions regarding the management of the funds. Based on the responsiveness of Putnam Management in the recent past to Trustee concerns about investment performance, the Trustees concluded that it is preferable to seek change within Putnam Management to address performance shortcomings. In the Trustees’ view, the alternative of engaging a new investment adviser for an underperforming fund would entail significant disruptions and would not provide any greater assurance of improved investment performance.
20
Brokerage and soft-dollar allocations;
other benefits
The Trustees considered various potential benefits that Putnam Management may receive in connection with the services it provides under the management contract with your fund. These include benefits related to brokerage and soft-dollar allocations, whereby a portion of the commissions paid by a fund for brokerage may be used to acquire research services that may be useful to Putnam Management in managing the assets of the fund and of other clients. The Trustees considered a change made, at Putnam Management’s request, to the Putnam funds’ brokerage allocation policy commencing in 2009, which increased the permitted soft dollar allocation to third-party services over what had been authorized in previous years. The Trustees noted that a portion of available soft dollars continue to be allocated to the payment of fund expenses, although the amount allocated for this purpose has declined in recent years. The Trustees indicated their continued int ent to monitor regulatory developments in this area with the assistance of their Brokerage Committee and also indicated their continued intent to monitor the potential benefits associated with the allocation of fund brokerage and trends in industry practice to ensure that the principle of seeking best price and execution remains paramount in the portfolio trading process.
The Trustees’ annual review of your fund’s management contract also included the review of the investor servicing agreement with Putnam Investor Services, Inc. (“PSERV”), which agreement provides benefits to an affiliate of Putnam Management. The Trustees considered that effective January 1, 2009, the Trustees, PSERV and Putnam Fiduciary Trust Company entered into a new fee schedule that includes for the open-end funds (other than funds of Putnam Variable Trust and Putnam Money Market Liquidity Fund) an expense limitation but, as noted above, also considered that this expense limitation is subject to review as part of the Trustees’ pending review of Putnam’s strategic pricing proposal.
In the case of your fund, the Trustees’ annual review of the fund’s management contract also included the review of the fund’s distributor’s contract and distribution plans with Putnam Retail Management Limited Partnership, which contract and plans also provide benefits to an affiliate of Putnam Management.
Comparison of retail and institutional
fee schedules
The information examined by the Trustees as part of their annual contract review has included for many years information regarding fees charged by Putnam Management and its affiliates to institutional clients such as defined benefit pension plans, college endowments, etc. This information included comparisons of such fees with fees charged to the funds, as well as a detailed assessment of the differences in the services provided to these two types of clients. The Trustees observed, in this regard, that the differences in fee rates between institutional clients and mutual funds are by no means uniform when examined by individual asset sectors, suggesting that differences in the pricing of investment management services to these types of clients reflect to a substantial degree historical competitive forces operating in separate market places. The Trustees considered the fact that fee rates across different asset classes are typically higher on average fo r mutual funds than for institutional clients, as well as the differences between the services that Putnam Management provides to the Putnam funds and those that it provides to institutional clients of the firm, but did not rely on such comparisons to any significant extent in concluding that the management fees paid by your fund are reasonable.
21
Subsequent approval of strategic
pricing proposal
As mentioned above, at a series of meetings beginning in May 2009 and ending on July 10, 2009, the Contract Committee and the Trustees engaged in a detailed review of Putnam Management’s strategic pricing proposal. Following this review, the Trustees of each fund, including all of the Independent Trustees, voted unanimously on July 10, 2009 to approve proposed management contracts reflecting the proposal, as modified based on discussions between the Independent Trustees and Putnam Management, for each fund. In considering the proposed contracts, the Independent Trustees focused largely on the specific proposed changes described below relating to management fees. They also took into account the factors that they considered in connection with their most recent annual approval on June 12, 2009 of the continuance of the funds’ current management contracts and the extensive materials that they had reviewed in connection with that approval process, as described above.
At a meeting held on November 19, 2009, shareholders approved the proposed management contract for your fund. Subject to shareholder approval of similar management contracts for substantially all of the other Putnam funds, the new management contract is expected to be implemented on January 1, 2010 (but no later than February 1, 2010).
• Considerations relating to Fund Family fee rate calculations. The Independent Trustees considered that the proposed management contracts would change the manner in which fund shareholders share in potential economies of scale associated with the management of the funds. Under the current management contracts, shareholders of a fund (other than Putnam Money Market Liquidity Fund and the Putnam RetirementReady® Funds) benefit from increased fund size through reductions in the effective management fee paid to Putnam Management once the fund’s net assets exceed the first breakpoint in the fund’s fee schedule ($500 million for most funds). Conversely, in the case of funds with net assets above the level of the first breakpoint, the effective management fee increases as the fund� 46;s average net assets decline below a breakpoint. These breakpoints are measured solely by the net assets of each individual fund and are not affected by possible growth (or decline) of net assets of other funds in the Fund Family. (“Fund Family” for purposes of this discussion refers to all open-end mutual funds sponsored by Putnam Management, except for the Putnam RetirementReady® Funds and Putnam Money Market Liquidity Fund.) Under the proposed management contracts, potential economies of scale would be shared ratably among shareholders of all funds, regardless of their size. The management fees paid by a fund (and indirectly by shareholders) would no longer be affected by the growth (or decline) of assets of the particular fund, but rather would be affected solely by the growth (or decline) of the aggregate net assets of all funds in the Fund Family, regardless of whether the net assets of the particular fund are growing or declining.
The table below shows the proposed effective management fee rate for your fund, based on June 30, 2009 net assets of the Fund Family ($52.3 billion). This table also shows the effective management fee rate payable by your fund under its current management contract, based on the net assets of the fund as of June 30, 2009. Finally, this table shows the difference in the effective management fees, based on net assets as of June 30, 2009, between the proposed management contract and the current contract.
| | | |
| | Proposed Effective | Current Effective | |
| Name of Fund | Contractual Rate | Contractual Rate | Difference |
|
| Putnam Mid Cap | | | |
| Value Fund | 0.602% | 0.700% | (0.098)% |
22
As shown in the foregoing table, based on June 30, 2009 net asset levels, the proposed management contract would provide for payment of a management fee rate that is lower for your fund than the management fee rate payable under the current management contract. For a small number of funds (although not your fund), the management fee rate would be slightly higher under the proposed contract at these asset levels, but by only immaterial amounts. In the aggregate, the financial impact on Putnam Management of implementing this proposed change for all funds at June 30, 2009 net asset levels is a reduction in annual management fee revenue of approximately $24.0million. (Putnam Management has already incurred a significant portion of this revenue reduction through the waiver of a portion of its current management fees for certain funds pending shareholder consideration of the proposed management contracts. Putnam is not obliged to continue such waivers beyond July 31, 2010 in the event that the proposed contracts are not approved by shareholders.) The Independent Trustees carefully considered the implications of this proposed change under a variety of economic circumstances. They considered the fact that at current asset levels the management fees paid by the funds under the proposed contract would be lower for almost all funds, and would not be materially higher for any fund. They considered the possibility that under some circumstances, the current management contract could result in a lower fee for a particular fund than the proposed management contract. Such circumstances might occur, for example, if the aggregate net assets of the Fund Family remain largely unchanged and the net assets of an individual fund grew substantially, or if the net assets of an individual fund remain largely unchanged and the aggregate net assets of the Fund Family declined substantially.
The Independent Trustees noted that future changes in the net assets of individual funds are inherently unpredictable and that experience has shown that funds often grow in size and decline in size over time depending on market conditions and the changing popularity of particular investment styles and asset classes. They noted that, while the aggregate net assets of the Fund Family have changed substantially over time, basing a management fee on the aggregate level of assets of the Fund Family would likely reduce fluctuations in costs paid by individual funds and lead to greater stability and predictability of fund operating costs over time.
The Independent Trustees considered that the proposed management contract would likely be advantageous for newly organized funds that have yet to attract significant assets and for funds in specialty asset classes that are unlikely to grow to a significant size. In each case, such funds would participate in the benefits of scale made possible by the aggregate size of the Fund Family to an extent that would not be possible based solely on their individual size.
The Independent Trustees also considered that for funds that have achieved or are likely to achieve considerable scale on their own, the proposed management contract could result in sharing of economies which might lead to slightly higher costs under some circumstances, but they noted that any such increases are immaterial at current asset levels and that over time such funds are likely to realize offsetting benefits from their opportunity to participate, both through the exchange privilege and through the Fund Family breakpoint fee structure, in the improved growth prospects of a diversified Fund Family able to offer competitively priced products.
The Independent Trustees noted that the implementation of the proposed management contracts would result in a reduction in aggregate fee revenues for Putnam Management at current asset levels. They also noted that applying various projections of growth equally to
23
the aggregate net assets of the Fund Family and to the net assets of individual funds also showed revenue reductions for Putnam Management. They recognized, however, the possibility that under some scenarios Putnam Management might realize greater future revenues, with respect to certain funds, under the proposed contracts than under the current contracts, but considered such circumstances to be both less likely and inherently unpredictable.
The Independent Trustees considered the extent to which Putnam Management may realize economies of scale in connection with the management of the funds. In this regard, they considered the possibility that such economies of scale as may exist in the management of mutual funds may be associated more closely with the size of the aggregate assets of the mutual fund complex than with the size of any individual fund. In this regard the Independent Trustees considered the financial information provided to them by Putnam Management over a period of many years regarding the allocation of costs involved in calculating the profitability of its mutual fund business as a whole and the profitability of individual funds. The Independent Trustees noted that the methodologies for such cost allocations had been reviewed on a number of occasions in the past by independent financial consultants engaged by the Independent Trustees. The Independent Trustees noted that thes e methodologies support Putnam Management’s assertion that many of its operating costs and any associated economies of scale are related more to the aggregate net assets under management in various sectors of its business than to the size of individual funds. They noted that on a number of occasions in the past the Independent Trustees had separately considered the possibility of calculating management fees in whole or in part based on aggregate net assets of the Putnam funds. The Independent Trustees considered the fact that the proposed contracts would result in a sharing among the affected funds of economies of scale that for the most part are now enjoyed by the larger funds, without materially increasing the current costs of any of the larger funds. They concluded that this sharing of economies among funds was appropriate in light of the diverse investment opportunities available to shareholders of all funds through the existence of the exchange privilege. They al so considered that the proposed change in management fee structure would allow Putnam Management to introduce new investment products at more attractive pricing levels than may be currently be the case.
After considering all of the foregoing, the Independent Trustees concluded that the proposed calculation of management fees based on the aggregate net assets of the Fund Family represented a fair and reasonable means of sharing possible economies of scale among the shareholders of all funds.
• Considerations relating to addition of fee rate adjustments based on investment performance for certain funds. The Independent Trustees considered that Putnam’s proposal to add fee rate adjustments based on investment performance to the management contracts of certain funds reflected a desire by Putnam Management to align its fee revenues more closely with investment performance in the case of certain funds. They noted that Putnam Management already has a significant financial interest in achieving good performance results for the funds it manages. Putnam Management’s fees are based on the assets under its management (whether calculated on an individual fund or complex-wide basis). Good performance results in higher asset levels and therefore higher revenues to Putnam Management. Moreover, good performance also tends to attract additional investors to partic ular funds or the complex generally, also resulting
24
in higher revenues. Nevertheless, the Independent Trustees concluded that adjusting management fees based on performance for certain selected funds could provide additional benefits to shareholders.
The Independent Trustees noted that Putnam Management proposed the addition of performance adjustments only for certain of the funds (performance adjustments were not proposed for your fund) and considered whether similar adjustments might be appropriate for other funds. In this regard, they considered Putnam Management’s belief that the addition of performance adjustments would be most appropriate for shareholders of U.S. growth funds, international equity funds and Putnam Global Equity Fund. They also considered Putnam Management’s view that it would continue to monitor whether performance fees would be appropriate for other funds. Accordingly, the Independent Trustees concluded that it would be desirable to gain further experience with the operation of performance adjustments for certain funds and the market’s receptivity to such fee structures before giving further consideration to whether similar performance adjustments would be app ropriate for other funds as well.
• Considerations relating to standardization of payment terms. The proposed management contracts for all funds provide that management fees will be computed and paid monthly within 15 days after the end of each month. The current contracts of the funds contain quarterly computation and payment terms in some cases. These differences largely reflect practices in place at earlier times when many of the funds were first organized. Under the proposed contract, certain funds would make payments to Putnam Management earlier than they do under their current contract. This would reduce a fund’s opportunity to earn income on accrued but unpaid management fees by a small amount, but would not have a material effect on a fund’s operating costs.
The Independent Trustees considered the fact that standardizing the payment terms for all funds would involve an acceleration in the timing of payments to Putnam Management for some funds and a corresponding loss of a potential opportunity for such funds to earn income on accrued but unpaid management fees. The Independent Trustees did not view this change as having a material impact on shareholders of any fund. In this regard, the Independent Trustees noted that the proposed contracts conform to the payment terms included in management contracts for all Putnam funds organized in recent years and that standardizing payment terms across all funds would reduce administrative burdens for both the funds and Putnam Management.
• Considerations relating to comparisons with management fees and total expenses of competitive funds. As part of their evaluation of the proposed management contracts, the Independent Trustees also reviewed the general approach taken by Putnam Management and the Independent Trustees in recent years in imposing appropriate limits on total fund expenses. As part of the annual contract review process in recent years, Putnam Management agreed to waive fees as needed to limit total fund expenses to a maximum level equal to the average total expenses of comparable competitive funds in the mutual fund industry. In connection with its proposal to implement new management contracts, Putnam Management also proposed, and the Independent Trustees approved, certain changes in this approach that shift the focus from controlling total expenses to imposing separate limits on certain c ategories of expenses, as required. As a general matter, Putnam Management and the Independent Trustees concluded that management fees for the Putnam funds are competitive with the fees charged by comparable funds in the industry.
25
Nevertheless, the Independent Trustees considered specific management fee waivers proposed to be implemented as of August 1, 2009 by Putnam Management with respect to the current management fees of certain funds, as well as projected reductions in management fees for almost all funds that would result under the proposed contracts. Putnam Management and the Independent Trustees also agreed to impose separate expense limitations of 37.5 basis points on the general category of shareholder servicing expenses and 20 basis points on the general category of other ordinary operating expenses. These new expense limitations, as well as the fee waivers, were implemented for all funds effective as of August 1, 2009, replacing the expense limitation referred to above.
These changes resulted in lower total expenses for many funds, but in the case of some funds total expenses increased after application of the new waivers and expense limitations (as compared with the results obtained using the expense limitation method previously in place). In this regard, the Independent Trustees considered the likelihood that total expenses for most of these funds would have increased in any event in the normal course under the previous expense limitation arrangement, as the reported total expense levels of many competitive funds increased in response to the major decline in asset values that began in September 2008. These new waivers and expense limitations will continue in effect until at least July 31, 2010 and will be re-evaluated by the Independent Trustees as part of the annual contract review process prior to their scheduled expiration. However, the management fee waivers referred to above would largely become permanent reductions in fees as a result of the implementation of the proposed management contracts.
Under these new expense limitation arrangements effective August 1, 2009, your fund is subject to expense limitations of 37.5 basis points on the category of shareholder servicing fees and 20 basis points on the general category of other ordinary operating expenses.
26
Other information for shareholders
Important notice regarding delivery
of shareholder documents
In accordance with SEC regulations, Putnam sends a single copy of annual and semiannual shareholder reports, prospectuses, and proxy statements to Putnam shareholders who share the same address, unless a shareholder requests otherwise. If you prefer to receive your own copy of these documents, please call Putnam at 1-800-225-1581, and Putnam will begin sending individual copies within30days.
Proxy voting
Putnam is committed to managing our mutual funds in the best interests of our shareholders. The Putnam funds’ proxy voting guidelines and procedures, as well as information regarding how your fund voted proxies relating to portfolio securities during the 12-month period ended June 30, 2009, are available in the Individual Investors section of putnam.com, and on the SEC’s Web site, www.sec.gov. If you have questions about finding forms on the SEC’s Web site, you may call the SEC at 1-800-SEC-0330. You may also obtain the Putnam funds’ proxy voting guidelines and procedures at no charge by calling Putnam’s Shareholder Services at 1-800-225-1581.
Fund portfolio holdings
The fund will file a complete schedule of its portfolio holdings with the SEC for the first and third quarters of each fiscal year on Form N-Q. Shareholders may obtain the fund’s Forms N-Q on the SEC’s Web site at www.sec.gov. In addition, the fund’s Forms N-Q may be reviewed and copied at the SEC’s Public Reference Room in Washington, D.C. You may call the SEC at 1-800-SEC-0330 for information about the SEC’s Web site or the operation of the Public Reference Room.
Trustee and employee fund ownership
Putnam employees and members of the Board of Trustees place their faith, confidence, and, most importantly, investment dollars in Putnam mutual funds. As of October 31, 2009, Putnam employees had approximately $303,000,000 and the Trustees had approximately $40,000,000 invested in Putnam mutual funds. These amounts include investments by the Trustees’ and employees’ immediate family members as well as investments through retirement and deferred compensation plans.
27
Financial statements
A guide to financial statements
These sections of the report, as well as the accompanying Notes, constitute the fund’s financial statements.
The fund’s portfolio lists all the fund’s investments and their values as of the last day of the reporting period. Holdings are organized by asset type and industry sector, country, or state to show areas of concentration and diversification.
Statement of assets and liabilities shows how the fund’s net assets and share price are determined. All investment and noninvestment assets are added together. Any unpaid expenses and other liabilities are subtracted from this total. The result is divided by the number of shares to determine the net asset value per share, which is calculated separately for each class of shares. (For funds with preferred shares, the amount subtracted from total assets includes the liquidation preference of preferred shares.)
Statement of operations shows the fund’s net investment gain or loss. This is done by first adding up all the fund’s earnings — from dividends and interest income — and subtracting its operating expenses to determine net investment income (or loss). Then, any net gain or loss the fund realized on the sales of its holdings — as well as any unrealized gains or losses over the period — is added to or subtracted from the net investment result to determine the fund’s net gain or loss for the fiscal period.
Statement of changes in net assets shows how the fund’s net assets were affected by the fund’s net investment gain or loss, by distributions to shareholders, and by changes in the number of the fund’s shares. It lists distributions and their sources (net investment income or realized capital gains) over the current reporting period and the most recent fiscal year-end. The distributions listed here may not match the sources listed in the Statement of operations because the distributions are determined on a tax basis and may be paid in a different period from the one in which they were earned. Dividend sources are estimated at the time of declaration. Actual results may vary. Any non-taxable return of capital cannot be determined until final tax calculations are completed after the end of the fund’s fiscal year.
Financial highlights provide an overview of the fund’s investment results, per-share distributions, expense ratios, net investment income ratios, and portfolio turnover in one summary table, reflecting the five most recent reporting periods. In a semiannual report, the highlight table also includes the currentreportingperiod.
28
| | |
| The fund’s portfolio 10/31/09 (Unaudited) | | |
| |
| COMMON STOCKS (98.0%)* | Shares | Value |
|
| Aerospace and defense (0.7%) | | |
| BE Aerospace, Inc. † | 206,300 | $3,657,699 |
|
| | | 3,657,699 |
| Banking (4.2%) | | |
| Comerica, Inc. | 163,100 | 4,526,025 |
|
| First Horizon National Corp. | 333,700 | 3,947,671 |
|
| People’s United Financial, Inc. | 219,200 | 3,513,776 |
|
| State Street Corp. | 109,846 | 4,611,335 |
|
| SunTrust Banks, Inc. | 259,200 | 4,953,312 |
|
| | | 21,552,119 |
| Beverage (0.8%)�� | | |
| Molson Coors Brewing Co. Class B | 85,600 | 4,191,832 |
|
| | | 4,191,832 |
| Biotechnology (0.9%) | | |
| Viropharma, Inc. † | 627,400 | 4,730,596 |
|
| | | 4,730,596 |
| Building materials (3.4%) | | |
| Masco Corp. | 434,300 | 5,103,025 |
|
| Owens Corning, Inc. † S | 340,700 | 7,532,877 |
|
| Stanley Works (The) | 106,600 | 4,821,518 |
|
| | | 17,457,420 |
| Chemicals (1.8%) | | |
| Terra Industries, Inc. | 158,300 | 5,029,191 |
|
| Valspar Corp. | 165,100 | 4,188,587 |
|
| | | 9,217,778 |
| Coal (2.1%) | | |
| Massey Energy Co. S | 183,000 | 5,323,470 |
|
| Walter Industries, Inc. S | 94,700 | 5,539,950 |
|
| | | 10,863,420 |
| Combined utilities (0.5%) | | |
| El Paso Corp. | 273,100 | 2,679,111 |
|
| | | 2,679,111 |
| Commercial and consumer services (2.1%) | | |
| Alliance Data Systems Corp. † S | 122,700 | 6,746,046 |
|
| Hillenbrand, Inc. | 203,300 | 4,061,934 |
|
| | | 10,807,980 |
| Communications equipment (1.1%) | | |
| Tellabs, Inc. † S | 974,000 | 5,863,480 |
|
| | | 5,863,480 |
| Computers (2.0%) | | |
| Brocade Communications Systems, Inc. † | 1,213,995 | 10,416,077 |
|
| | | 10,416,077 |
| Construction (1.4%) | | |
| USG Corp. † S | 549,500 | 7,220,430 |
|
| | | 7,220,430 |
| Consumer goods (6.1%) | | |
| Alberto-Culver Co. | 366,000 | 9,816,120 |
|
| Church & Dwight Co., Inc. | 96,800 | 5,505,984 |
|
| Clorox Co. S | 78,500 | 4,649,555 |
|
| Energizer Holdings, Inc. † | 89,200 | 5,429,604 |
|
| Newell Rubbermaid, Inc. S | 409,544 | 5,942,483 |
|
| | | 31,343,746 |
29
| | |
| COMMON STOCKS (98.0%)* cont. | Shares | Value |
|
| Consumer services (1.0%) | | |
| Avis Budget Group, Inc. † | 602,200 | $5,058,480 |
|
| | | 5,058,480 |
| Containers (2.9%) | | |
| Owens-Illinois, Inc. † | 274,300 | 8,744,684 |
|
| Silgan Holdings, Inc. | 113,300 | 6,089,875 |
|
| | | 14,834,559 |
| Electric utilities (0.6%) | | |
| Progress Energy, Inc. | 77,580 | 2,911,577 |
|
| | | 2,911,577 |
| Electronics (1.6%) | | |
| Micron Technology, Inc. † S | 1,187,537 | 8,063,376 |
|
| | | 8,063,376 |
| Energy (oil field) (2.6%) | | |
| Oceaneering International, Inc. † | 66,100 | 3,377,710 |
|
| Superior Well Services, Inc. † S Δ | 484,211 | 5,137,479 |
|
| Weatherford International, Ltd. (Switzerland) † | 259,100 | 4,542,023 |
|
| | | 13,057,212 |
| Engineering and construction (1.1%) | | |
| Fluor Corp. | 122,600 | 5,445,892 |
|
| | | 5,445,892 |
| Financial (1.1%) | | |
| Discover Financial Services | 382,400 | 5,407,136 |
|
| | | 5,407,136 |
| Health-care services (7.2%) | | |
| AmerisourceBergen Corp. | 288,000 | 6,379,200 |
|
| Coventry Health Care, Inc. † | 182,300 | 3,615,009 |
|
| Lincare Holdings, Inc. † S | 389,600 | 12,237,336 |
|
| Mednax, Inc. † | 206,500 | 10,721,480 |
|
| Omnicare, Inc. S | 165,930 | 3,595,703 |
|
| | | 36,548,728 |
| Homebuilding (0.9%) | | |
| M.D.C. Holdings, Inc. | 133,100 | 4,341,722 |
|
| | | 4,341,722 |
| Insurance (7.7%) | | |
| Fidelity National Financial, Inc. Class A | 410,800 | 5,574,556 |
|
| Hartford Financial Services Group, Inc. (The) S | 188,234 | 4,615,498 |
|
| HCC Insurance Holdings, Inc. | 165,500 | 4,367,545 |
|
| Marsh & McLennan Cos., Inc. S | 251,100 | 5,890,806 |
|
| Validus Holdings, Ltd. (Bermuda) | 198,500 | 5,022,050 |
|
| W.R. Berkley Corp. | 205,900 | 5,089,848 |
|
| XL Capital, Ltd. Class A | 536,800 | 8,808,888 |
|
| | | 39,369,191 |
| Investment banking/Brokerage (2.6%) | | |
| Ameriprise Financial, Inc. | 195,662 | 6,783,602 |
|
| Invesco, Ltd. | 219,868 | 4,650,208 |
|
| Investment Technology Group, Inc. † | 74,073 | 1,597,755 |
|
| | | 13,031,565 |
| Manufacturing (1.1%) | | |
| General Cable Corp. † S | 185,200 | 5,767,128 |
|
| | | 5,767,128 |
| Media (0.9%) | | |
| Interpublic Group of Companies, Inc. (The) † S | 727,263 | 4,378,123 |
|
| | | 4,378,123 |
30
| | |
| COMMON STOCKS (98.0%)* cont. | Shares | Value |
|
| Medical technology (1.3%) | | |
| Cooper Companies, Inc. (The) S | 144,800 | $4,055,848 |
|
| Kinetic Concepts, Inc. † S | 76,100 | 2,525,759 |
|
| | | 6,581,607 |
| Metals (2.1%) | | |
| Nucor Corp. | 48,400 | 1,928,740 |
|
| Steel Dynamics, Inc. | 319,000 | 4,271,410 |
|
| United States Steel Corp. S | 134,800 | 4,649,252 |
|
| | | 10,849,402 |
| Natural gas utilities (2.4%) | | |
| National Fuel Gas Co. | 100,000 | 4,534,000 |
|
| Questar Corp. | 198,400 | 7,904,256 |
|
| | | 12,438,256 |
| Oil and gas (5.4%) | | |
| Cabot Oil & Gas Corp. Class A S | 160,700 | 6,182,129 |
|
| Carrizo Oil & Gas, Inc. † S | 226,700 | 5,254,906 |
|
| Newfield Exploration Co. † | 143,063 | 5,868,444 |
|
| PetroHawk Energy Corp. † | 167,700 | 3,944,304 |
|
| Pioneer Natural Resources Co. | 154,000 | 6,330,940 |
|
| | | 27,580,723 |
| Power producers (1.5%) | | |
| AES Corp. (The) † | 602,400 | 7,873,368 |
|
| | | 7,873,368 |
| Real estate (3.1%) | | |
| Boston Properties, Inc. R S | 33,800 | 2,054,026 |
|
| Chimera Investment Corp. R S | 1,386,037 | 4,837,269 |
|
| Glimcher Realty Trust R | 1,205,500 | 3,254,850 |
|
| Host Marriott Corp. R | 356,800 | 3,607,248 |
|
| ProLogis Trust R | 170,100 | 1,927,233 |
|
| | | 15,680,626 |
| Restaurants (1.3%) | | |
| Domino’s Pizza, Inc. † | 886,500 | 6,506,910 |
|
| | | 6,506,910 |
| Retail (10.2%) | | |
| Big Lots, Inc. † | 166,400 | 4,168,320 |
|
| BJ’s Wholesale Club, Inc. † S | 137,811 | 4,827,519 |
|
| Gap, Inc. (The) | 259,300 | 5,533,462 |
|
| Macy’s, Inc. S | 361,500 | 6,351,555 |
|
| Mead Johnson Nutrition Co. Class A S | 144,800 | 6,087,392 |
|
| NBTY, Inc. † | 73,400 | 2,672,494 |
|
| OfficeMax, Inc. † | 778,300 | 8,895,969 |
|
| Pier 1 Imports, Inc. † | 1,282,600 | 4,514,752 |
|
| Ross Stores, Inc. S | 99,800 | 4,392,198 |
|
| Sally Beauty Holdings, Inc. † | 699,255 | 4,719,971 |
|
| | | 52,163,632 |
| Schools (0.5%) | | |
| Apollo Group, Inc. Class A † | 44,100 | 2,518,110 |
|
| | | 2,518,110 |
| Semiconductor (4.4%) | | |
| Atmel Corp. † | 3,347,200 | 12,451,584 |
|
| Cymer, Inc. † S | 294,228 | 10,074,367 |
|
| | | 22,525,951 |
31
| | |
| COMMON STOCKS (98.0%)* cont. | Shares | Value |
|
| Shipping (3.3%) | | |
| Con-way, Inc. | 192,480 | $6,349,915 |
|
| Genco Shipping & Trading, Ltd. S | 369,300 | 7,345,377 |
|
| Ryder System, Inc. S | 71,800 | 2,911,490 |
|
| | | 16,606,782 |
| Software (1.3%) | | |
| Amdocs, Ltd. (Guernsey) † | 255,200 | 6,431,040 |
|
| | | 6,431,040 |
| Technology services (1.1%) | | |
| United Online, Inc. | 698,424 | 5,587,392 |
|
| | | 5,587,392 |
| Telephone (0.6%) | | |
| Leap Wireless International, Inc. † S | 245,800 | 3,249,476 |
|
| | | 3,249,476 |
| Toys (1.1%) | | |
| Mattel, Inc. | 291,300 | 5,514,310 |
|
| | | 5,514,310 |
| Total common stocks (cost $430,060,280) | | $500,323,962 |
| |
| |
| SHORT-TERM INVESTMENTS (23.5%)* | Principal amount/shares | Value |
|
| Short-term investments held as collateral for loaned | | |
| securities with a yield of 0.35% and a due date | | |
| of November 2, 2009 d | $104,378,755 | $104,376,725 |
|
| Putnam Money Market Liquidity Fund e | 15,418,619 | 15,418,619 |
|
| Total short-term investments (cost $119,795,344) | | $119,795,344 |
|
| |
| TOTAL INVESTMENTS | | |
|
| Total investments (cost $549,855,624) | | $620,119,306 |
* Percentages indicated are based on net assets of $510,736,409.
† Non-income-producing security.
Δ Forward commitments, in part or in entirety (Note 1).
d See Note 1 to the financial statements.
e See Note 6 to the financial statements regarding investments in Putnam Money Market Liquidity Fund.
R Real Estate Investment Trust.
S Securities on loan, in part or in entirety, at October 31, 2009.
At October 31, 2009, liquid assets totaling $616,938 have been designated as collateral for open forward commitments.
In September 2006, Accounting Standards Codification ASC 820 Fair Value Measurements and Disclosures (“ASC 820”) was issues. ASC 820 is effective for financial statements issued for fiscal years beginning after November 15, 2007 and interim periods within those fiscal years. While the adoption of ASC 820 does not have a material effect on the fund’s net asset value, it does require additional disclosures about fair value measurements. ASC 820 establishes a three-level hierarchy for disclosure of fair value measurements. The valuation hierarchy is based upon the transparency of inputs to the valuation of the fund’s investments. The three levels are defined as follows:
Level 1 — Valuations based on quoted prices for identical securities in active markets.
Level 2 — Valuations based on quoted prices in markets that are not active or for which all significant inputs are observable, either directly or indirectly.
Level 3 — Valuations based on inputs that are unobservable and significant to the fair value measurement.
32
The following is a summary of the inputs used to value the fund’s net assets as of October 31, 2009:
| | | |
| | Valuation inputs | |
| Investments in securities: | Level 1 | Level 2 | Level 3 |
| Common stocks: | | | |
| Basic materials | $27,287,610 | $— | $— |
| Capital goods | 29,705,278 | — | — |
| Communication services | 3,249,476 | — | — |
| Consumer cyclicals | 79,028,305 | — | — |
| Consumer staples | 65,253,960 | — | — |
|
| Energy | 51,501,355 | — | — |
|
| Financial | 95,040,637 | — | — |
|
| Health care | 47,860,931 | — | — |
|
| Technology | 58,887,316 | — | — |
|
| Transportation | 16,606,782 | — | — |
|
| Utilities and power | 25,902,312 | — | — |
|
| Total common stocks | 500,323,962 | — | — |
|
| Short-term investments | 15,418,619 | 104,376,725 | — |
|
| Totals by level | $515,742,581 | $104,376,725 | $— |
The accompanying notes are an integral part of these financial statements.
33
| |
| Statement of assets and liabilities 10/31/09 (Unaudited) | |
| |
| ASSETS | |
|
| Investment in securities, at value, including $97,098,556 of securities on loan (Note 1): | |
| Unaffiliated issuers (identified cost $534,437,005) | $604,700,687 |
| Affiliated issuers (identified cost $15,418,619) (Note 6) | 15,418,619 |
|
| Cash | 192,425 |
|
| Dividends, interest and other receivables | 399,225 |
|
| Receivable for shares of the fund sold | 838,247 |
|
| Receivable for investments sold | 8,524,264 |
|
| Total assets | 630,073,467 |
|
| |
| LIABILITIES | |
|
| Payable for investments purchased | 8,449,212 |
|
| Payable for purchase of delayed delivery securities (Note 1) | 616,938 |
|
| Payable for shares of the fund repurchased | 4,349,916 |
|
| Payable for compensation of Manager (Note 2) | 975,719 |
|
| Payable for investor servicing fees (Note 2) | 148,801 |
|
| Payable for custodian fees (Note 2) | 5,058 |
|
| Payable for Trustee compensation and expenses (Note 2) | 85,028 |
|
| Payable for administrative services (Note 2) | 3,645 |
|
| Payable for distribution fees (Note 2) | 139,060 |
|
| Collateral on securities loaned, at value (Note 1) | 104,376,725 |
|
| Other accrued expenses | 186,956 |
|
| Total liabilities | 119,337,058 |
| |
| Net assets | $510,736,409 |
|
| |
| REPRESENTED BY | |
|
| Paid-in capital (Unlimited shares authorized) (Notes 1 and 4) | $751,066,130 |
|
| Undistributed net investment income (Note 1) | 128,929 |
|
| Accumulated net realized loss on investments (Note 1) | (310,722,332) |
|
| Net unrealized appreciation of investments | 70,263,682 |
|
| Total — Representing net assets applicable to capital shares outstanding | $510,736,409 |
|
| |
| COMPUTATION OF NET ASSET VALUE AND OFFERING PRICE | |
|
| Net asset value and redemption price per class A share | |
| ($426,252,152 divided by 47,604,627 shares) | $8.95 |
|
| Offering price per class A share (100/94.25 of $8.95)* | $9.50 |
|
| Net asset value and offering price per class B share ($22,665,947 divided by 2,654,569 shares)** | $8.54 |
|
| Net asset value and offering price per class C share ($13,417,291 divided by 1,573,872 shares)** | $8.53 |
|
| Net asset value and redemption price per class M share ($4,413,599 divided by 507,175 shares) | $8.70 |
|
| Offering price per class M share (100/96.50 of $8.70)* | $9.02 |
|
| Net asset value, offering price and redemption price per class R share | |
| ($6,872,675 divided by 778,861 shares) | $8.82 |
|
| Net asset value, offering price and redemption price per class Y share | |
| ($37,114,745 divided by 4,129,984 shares) | $8.99 |
|
* On single retail sales of less than $50,000. On sales of $50,000 or more the offering price is reduced.
** Redemption price per share is equal to net asset value less any applicable contingent deferred sales charge.
The accompanying notes are an integral part of these financial statements.
34
| |
| Statement of operations Six months ended 10/31/09 (Unaudited) | |
|
| |
| INVESTMENT INCOME | |
|
| Dividends | $2,907,457 |
|
| Interest (including interest income of $25,352 from investments in affiliated issuers) (Note 6) | 25,352 |
|
| Securities lending | 156,437 |
|
| Total investment income | 3,089,246 |
|
| |
| EXPENSES | |
|
| Compensation of Manager (Note 2) | 1,864,976 |
|
| Investor servicing fees (Note 2) | 925,498 |
|
| Custodian fees (Note 2) | 7,940 |
|
| Trustee compensation and expenses (Note 2) | 21,906 |
|
| Administrative services (Note 2) | 11,395 |
|
| Distribution fees — Class A (Note 2) | 563,171 |
|
| Distribution fees — Class B (Note 2) | 127,479 |
|
| Distribution fees — Class C (Note 2) | 70,337 |
|
| Distribution fees — Class M (Note 2) | 16,678 |
|
| Distribution fees — Class R (Note 2) | 17,218 |
|
| Other | 188,868 |
|
| Fees waived by Manager (Note 2) | (89,890) |
|
| Total expenses | 3,725,576 |
| | |
| Expense reduction (Note 2) | (9,507) |
|
| Net expenses | 3,716,069 |
| |
| Net investment loss | (626,823) |
|
| Net realized gain on investments (Notes 1 and 3) | 42,458,263 |
|
| Net realized loss on written options (Notes 1 and 3) | (1,091,124) |
|
| Net unrealized appreciation of investments and written options during the period | 45,483,391 |
|
| Net gain on investments | 86,850,530 |
| |
| Net increase in net assets resulting from operations | $86,223,707 |
|
The accompanying notes are an integral part of these financial statements.
35
| | |
| Statement of changes in net assets | | |
| |
| |
| INCREASE (DECREASE) IN NET ASSETS | Six months ended 10/31/09* | Year ended 4/30/09 |
|
| Operations: | | |
| Net investment income (loss) | $(626,823) | $2,985,545 |
|
| Net realized gain (loss) on investments | 41,367,139 | (332,221,545) |
|
| Net unrealized appreciation (depreciation) of investments | 45,483,391 | (2,364,714) |
|
| Net increase (decrease) in net assets resulting from operations | 86,223,707 | (331,600,714) |
|
| Distributions to shareholders (Note 1): | | |
| From ordinary income | | |
| Net investment income | | |
|
| Class A | — | (1,751,492) |
|
| Class B | — | — |
|
| Class C | — | — |
|
| Class M | — | — |
|
| Class R | — | (3,614) |
|
| Class Y | — | (253,749) |
|
| Redemption fees (Note 1) | 1,252 | 3,618 |
|
| Increase (decrease) from capital share transactions (Note 4) | (65,804,522) | 111,485,445 |
|
| Total increase (decrease) in net assets | 20,420,437 | (222,120,506) |
|
| |
| NET ASSETS | | |
|
| Beginning of period | 490,315,972 | 712,436,478 |
|
| End of period (including undistributed net investment | | |
| income of $128,929 and $755,752, respectively) | $510,736,409 | $490,315,972 |
|
| * Unaudited | | |
The accompanying notes are an integral part of these financial statements.
36
|
| This page left blank intentionally. |
37
Financial highlights (For a common share outstanding throughout the period)
| | | | | | | | | | | | | | | |
| INVESTMENT OPERATIONS: | LESS DISTRIBUTIONS: | | RATIOS AND SUPPLEMENTAL DATA: | |
|
| | | | Net realized | | | | | | | | | | Ratio | Ratio ofnet | |
| | Net asset | Net | and | | | From net | | | | | | | of expenses | investment | |
| | value, | investment | unrealized | Total from | From net | realized | | | | Net asset | Total return | Net assets, | to average | income (loss) | |
| | beginning | income | gain (loss) on | investment | investment | gain on | From return | Total | Redemption | value, end of | at net asset | end of period | net assets | to average | Portfolio |
| Period ended | ofperiod | (loss) a | investments | operations | income | investments | of capital | distributions | fees b | period | value (%) c | (in thousands) | (%) d,e | net assets (%) d | turnover (%) |
|
| Class A | | | | | | | | | | | | | | | |
| October 31, 2009 ** | $7.61 | (.01) | 1.35 | 1.34 | — | — | — | — | — | $8.95 | 17.61* | $426,252 | .68 * | (.09 )* | 58 .72* |
| April 30, 2009 | 11.97 | .05 | (4.38 ) | (4.33) | (.03) | — | — | (.03) | — | 7.61 | (36.15) | 412,152 | 1.30 | .54 | 130.22 |
| April 30, 2008 | 16.26 | .04 | (1.8 5) | (1.81) | (.06) | (2.41) | (.01) | (2.48) | — | 11.97 | (12.18) | 527,392 | 1.27 | .25 | 70.64 |
| April 30, 2007 | 15.91 | .24 f | 1.9 5 | 2.19 | (.24) | (1.60) | — | (1.84) | — | 16.26 | 14.66 | 707,081 | 1.23 | 1.53 f | 63.15 |
| April 30, 2006 | 13.88 | .04 g | 3.70 | 3.74 | (.01) | (1.70) | — | (1.71) | — | 15.91 | 28.18 | 614,761 | 1.22 g | .28 g | 63.63 |
| April 30, 2005 | 12.53 | .03 h | 1.51 | 1.54 | — c | (.19 ) | — | (.19) | — | 13.88 | 12.31 | 455,115 | 1.30 | .21 h | 8 8 .9 6 |
|
| Class B | | | | | | | | | | | | | | | |
| October 31, 2009 ** | $7.28 | (.04) | 1.30 | 1.26 | — | — | — | — | — | $8.54 | 17.31* | $22,666 | 1.05* | (.47)* | 58 .72* |
| April 30, 2009 | 11.50 | (.02) | (4.20) | (4.22) | — | — | — | — | — | 7.28 | (36.70) | 24,934 | 2.05 | (.24) | 130.22 |
| April 30, 2008 | 15.76 | (.07) | (1.77) | (1.84) | — | (2.41) | (.01) | (2.42) | — | 11.50 | (12.78) | 81,207 | 2.02 | (.49 ) | 70.64 |
| April 30, 2007 | 15.46 | .12 f | 1.8 9 | 2.01 | (.11) | (1.60) | — | (1.71) | — | 15.76 | 13.79 | 228,560 | 1.9 8 | .78 f | 63.15 |
| April 30, 2006 | 13.62 | (.07) g | 3.61 | 3.54 | — | (1.70) | — | (1.70) | — | 15.46 | 27.18 | 276,306 | 1.9 7 g | (.46) g | 63.63 |
| April 30, 2005 | 12.39 | (.07) h | 1.49 | 1.42 | — | (.19 ) | — | (.19) | — | 13.62 | 11.47 | 259,429 | 2.05 | (.52) h | 8 8 .9 6 |
|
| Class C | | | | | | | | | | | | | | | |
| October 31, 2009 ** | $7.27 | (.04) | 1.30 | 1.26 | — | — | — | — | — | $8.53 | 17.33* | $13,417 | 1.05* | (.47)* | 58 .72* |
| April 30, 2009 | 11.47 | (.02) | (4.18 ) | (4.20) | — | — | — | — | — | 7.27 | (36.62) | 12,816 | 2.05 | (.23) | 130.22 |
| April 30, 2008 | 15.74 | (.07) | (1.78 ) | (1.85) | — | (2.41) | (.01) | (2.42) | — | 11.47 | (12.87) | 30,367 | 2.02 | (.50) | 70.64 |
| April 30, 2007 | 15.47 | .12 f | 1.8 8 | 2.00 | (.13) | (1.60) | — | (1.73) | — | 15.74 | 13.77 | 45,357 | 1.9 8 | .8 0 f | 63.15 |
| April 30, 2006 | 13.62 | (.07) g | 3.62 | 3.55 | — | (1.70) | — | (1.70) | — | 15.47 | 27.26 | 39,800 | 1.9 7 g | (.47) g | 63.63 |
| April 30, 2005 | 12.39 | (.07) h | 1.49 | 1.42 | — | (.19 ) | — | (.19) | — | 13.62 | 11.47 | 30,903 | 2.05 | (.52) h | 8 8 .9 6 |
|
| Class M | | | | | | | | | | | | | | | |
| October 31, 2009 ** | $7.41 | (.03) | 1.32 | 1.29 | — | — | — | — | — | $8.70 | 17.41* | $4,414 | .9 3* | (.35)* | 58 .72* |
| April 30, 2009 | 11.67 | — b | (4.26) | (4.26) | — | — | — | — | — | 7.41 | (36.50) | 3,886 | 1.8 0 | .02 | 130.22 |
| April 30, 2008 | 15.93 | (.03) | (1.8 1) | (1.84) | — | (2.41) | (.01) | (2.42) | — | 11.67 | (12.64) | 8,204 | 1.77 | (.24) | 70.64 |
| April 30, 2007 | 15.63 | .16 f | 1.9 0 | 2.06 | (.16) | (1.60) | — | (1.76) | — | 15.93 | 14.04 | 15,160 | 1.73 | 1.03 f | 63.15 |
| April 30, 2006 | 13.71 | (.03) g | 3.65 | 3.62 | — | (1.70) | — | (1.70) | — | 15.63 | 27.61 | 14,075 | 1.72 g | (.21) g | 63.63 |
| April 30, 2005 | 12.44 | (.04) h | 1.50 | 1.46 | — | (.19 ) | — | (.19) | — | 13.71 | 11.74 | 13,306 | 1.8 0 | (.28 ) h | 8 8 .9 6 |
|
| Class R | | | | | | | | | | | | | | | |
| October 31, 2009 ** | $7.51 | (.02) | 1.33 | 1.31 | — | — | — | — | — | $8.82 | 17.44* | $6,873 | .8 0* | (.22)* | 58 .72* |
| April 30, 2009 | 11.80 | .02 | (4.30) | (4.28) | (.01) | — | — | (.01) | — | 7.51 | (36.31) | 5,935 | 1.55 | .28 | 130.22 |
| April 30, 2008 | 16.08 | — b | (1.8 2) | (1.82) | (.04) | (2.41) | (.01) | (2.46) | — | 11.80 | (12.39) | 7,143 | 1.52 | .01 | 70.64 |
| April 30, 2007 | 15.77 | .18 f | 1.9 5 | 2.13 | (.22) | (1.60) | — | (1.82) | — | 16.08 | 14.39 | 6,110 | 1.48 | 1.21 f | 63.15 |
| April 30, 2006 | 13.81 | (.01) g | 3.69 | 3.68 | (.02) | (1.70) | — | (1.72) | — | 15.77 | 27.86 | 2,959 | 1.47 g | (.03) g | 63.63 |
| April 30, 2005 | 12.50 | (.03) h | 1.54 | 1.51 | (.01) | (.19 ) | — | (.20) | — | 13.81 | 12.06 | 345 | 1.55 | (.18 ) h | 8 8 .9 6 |
|
| Class Y | | | | | | | | | | | | | | | |
| October 31, 2009 ** | $7.63 | — b | 1.36 | 1.36 | — | — | — | — | — | $8.99 | 17.83* | $37,115 | .55* | .03* | 58 .72* |
| April 30, 2009 | 12.01 | .07 | (4.40) | (4.33) | (.05) | — | — | (.05) | — | 7.63 | (35.96) | 30,592 | 1.05 | .78 | 130.22 |
| April 30, 2008 | 16.30 | .07 | (1.8 4) | (1.77) | (.10) | (2.41) | (.01) | (2.52) | — | 12.01 | (11.91) | 58,124 | 1.02 | .51 | 70.64 |
| April 30, 2007 | 15.94 | .27 f | 1.9 7 | 2.24 | (.28 ) | (1.60) | — | (1.88) | — | 16.30 | 14.96 | 55,241 | .9 8 | 1.76 f | 63.15 |
| April 30, 2006 | 13.90 | .08 g | 3.71 | 3.79 | (.05) | (1.70) | — | (1.75) | — | 15.94 | 28.50 | 46,314 | .9 7 g | .52 g | 63.63 |
| April 30, 2005 | 12.55 | .06 h | 1.51 | 1.57 | (.03) | (.19 ) | — | (.22) | — | 13.90 | 12.53 | 36,322 | 1.05 | .45 h | 8 8 .9 6 |
|
See notes to financial highlights at the end of this section.
The accompanying notes are an integral part of these financial statements.
Financial highlights (Continued)
* Not annualized.
** Unaudited.
a Per share net investment income (loss) has been determined on the basis of the weighted average number of shares outstanding during the period.
b Amount represents less than $0.01 per share.
c Total return assumes dividend reinvestment and does not reflect the effect of sales charges.
d Reflects an involuntary contractual expense limitation in effect during the period. For periods prior to October31, 2009, certain fund expenses were waived in connection with the fund’s investment in Putnam Prime Money Market Fund. As a result of such limitation and/or waivers, the expenses of each class reflect a reduction of the following amounts (Note 2):
| |
| | Percentage of |
| | average net assets |
|
| October 31, 2009 | 0.02% |
|
| April 30, 2009 | 0.05 |
|
| April 30, 2008 | 0.01 |
|
| April 30, 2007 | <0.01 |
|
| April 30, 2006 | <0.01 |
|
| April 30, 2005 | <0.01 |
|
e Includes amounts paid through expense offset and brokerage/service arrangements (Note 2).
f Reflects a special dividend received by the fund which amounted to the following amounts:
| | |
| | | Percentage of |
| | Per share | average net assets |
|
| Class A | $0.17 | 1.10% |
|
| Class B | 0.16 | 1.10 |
|
| Class C | 0.17 | 1.13 |
|
| Class M | 0.17 | 1.10 |
|
| Class R | 0.16 | 1.06 |
|
| Class Y | 0.17 | 1.09 |
|
g Reflects a non-recurring accrual related to a reimbursement to the fund from Putnam Investments relating to the calculation of certain amounts paid by the fund to Putnam in previous years for transfer agent services, which amounted to less than $0.01 per share and 0.01% of average net assets for the period ended April 30, 2006.
h Reflects a non-recurring accrual related to Putnam Management’s settlement with the SEC regarding brokerage allocation practices. As a result, the expenses of each class reflect a reduction of the following amounts:
| | |
| | | Percentage of |
| | Per share | average net assets |
|
| Class A | <$0.01 | 0.01% |
|
| Class B | <0.01 | 0.01 |
|
| Class C | <0.01 | 0.01 |
|
| Class M | <0.01 | 0.01 |
|
| Class R | <0.01 | 0.01 |
|
| Class Y | <0.01 | 0.01 |
|
| |
| |
| The accompanying notes are an integral part of these financial statements. | | |
40
Notes to financial statements 10/31/09 (Unaudited)
Note 1: Significant accounting policies
Putnam Mid Cap Value Fund (the “fund”) is a diversified series of Putnam Investment Funds (the “Trust”), a Massachusetts business trust, which is registered under the Investment Company Act of 1940, as amended, as an open-end management investment company. The fund seeks capital appreciation by investing primarily in common stocks of midsize companies which Putnam Investment Management, LLC (“Putnam Management”), the fund’s manager, an indirect wholly-owned subsidiary of Putnam Investments, LLC, believes are currently undervalued. The fund seeks current income as a secondary objective.
The fund offers class A, class B, class C, class M, class R and class Y shares. Class A and class M shares are sold with a maximum front-end sales charge of 5.75% and 3.50%, respectively, and generally do not pay a contingent deferred sales charge. Class B shares, which convert to class A shares after approximately six and a half years, do not pay a front-end sales charge and are subject to a contingent deferred sales charge, if those shares are redeemed within six years of purchase. Effective December 2009, class B shares will convert to class A shares after approximately five and a half years. ClassC shares have a one-year 1.00% contingent deferred sales charge and do not convert to class A shares. Class R shares, which are offered to qualified employee-benefit plans, are sold at net asset value. The expenses for class A, classB, class C, classM and class R shares may differ based on the distribution fee of each class, which is identified in Note 2. Class Y shares, which are sold at net asset value, are generally subject to the same expenses as class A, class B, class C, class M and class R shares, but do not bear a distribution fee. Class Y shares are generally only available to corporate and institutional clients and clients in other approved programs.
A 1.00% redemption fee may apply on any shares that are redeemed (either by selling or exchanging into another fund) within 7 days of purchase. The redemption fee is accounted for as an addition to paid-in-capital.
Investment income, realized and unrealized gains and losses and expenses of the fund are borne pro-rata based on the relative net assets of each class to the total net assets of the fund, except that each class bears expenses unique to that class (including the distribution fees applicable to such classes). Each class votes as a class only with respect to its own distribution plan or other matters on which a class vote is required by law or determined by the Trustees. If the fund were liquidated, shares of each class would receive their pro-rata share of the net assets of the fund. In addition, the Trustees declare separate dividends on each class of shares.
In the normal course of business, the fund enters into contracts that may include agreements to indemnify another party under given circumstances. The fund’s maximum exposure under these arrangements is unknown as this would involve future claims that may be, but have not yet been, made against the fund. However, the fund’s management team expects the risk of material loss to be remote.
The following is a summary of significant accounting policies consistently followed by the fund in the preparation of its financial statements. The preparation of financial statements is in conformity with accounting principles generally accepted in the United States of America and requires management to make estimates and assumptions that affect the reported amounts of assets and liabilities in the financial statements and the reported amounts of increases and decreases in net assets from operations during the reporting period. Actual results could differ from those estimates. Subsequent events after the Statement of assets and liabilities date through the date that the financial statements were issued, December 8, 2009, have been evaluated in the preparation of the financial statements.
A) Security valuation Investments for which market quotations are readily available are valued at the last reported sales price on their principal exchange, or official closing price for certain markets. If no sales are reported — as in the case of some securities traded over-the-counter — a security is valued at its last reported bid price. Many securities markets and exchanges outside the U.S. close prior to the close of the New York Stock Exchange and therefore the closing prices for securities in such markets or on such exchanges may not fully reflect events that occur after such close but before the close of the New York Stock Exchange. Accordingly, on certain days, the fund will fair value foreign equity securities taking into account multiple factors, including movements in the U.S. securities markets. The number of days on which fair value prices will be used will depend on market activity an d it is possible that fair value prices will be used by the fund to a significant extent. Securities quoted in foreign currencies, if any, are translated into U.S. dollars at the current exchange rate. To the extent a pricing service or dealer is unable to value a security or provides a valuation that Putnam Management does not believe accurately reflects the security’s fair value, the security will be valued at fair value by Putnam Management. Certain
41
investments, including certain restricted and illiquid securities and derivatives, are also valued at fair value following procedures approved by the Trustees. Such valuations and procedures are reviewed periodically by the Trustees. The fair value of securities is generally determined as the amount that the fund could reasonably expect to realize from an orderly disposition of such securities over a reasonable period of time. By its nature, a fair value price is a good faith estimate of the value of a security in a current sale and does not reflect an actual market price, which may be different by a material amount.
B) Joint trading account Pursuant to an exemptive order from the Securities and Exchange Commission (the “SEC”), the fund may transfer uninvested cash balances, including cash collateral received under security lending arrangements, into a joint trading account along with the cash of other registered investment companies and certain other accounts managed by Putnam Management. These balances may be invested in issues of short-term investments having maturities of up to 397 days for collateral received under security lending arrangements and up to 90 days for other cash investments.
C) Security transactions and related investment income Security transactions are recorded on the trade date (the date the order to buy or sell is executed). Gains or losses on securities sold are determined on the identified cost basis.
Interest income is recorded on the accrual basis. Dividend income, net of applicable withholding taxes, is recognized on the ex-dividend date except that certain dividends from foreign securities, if any, are recognized as soon as the fund is informed of the ex-dividend date. Non-cash dividends, if any, are recorded at the fair market value of the securities received. Dividends representing a return of capital or capital gains, if any, are reflected as a reduction of cost and/or as a realized gain.
Securities purchased or sold on a forward commitment basis may be settled a month or more after the trade date; interest income is accrued based on the terms of the securities. Losses may arise due to changes in the market value of the underlying securities or if the counterparty does not perform under the contract.
D) Futures and options contracts The fund may use futures and options contracts to hedge against changes in the values of securities the fund owns, owned or expects to purchase, or for other investment purposes. The fund may also write options on swaps or securities it owns or in which it may invest to increase its current returns.
The potential risk to the fund is that the change in value of futures and options contracts may not correspond to the change in value of the hedged instruments. In addition, losses may arise from changes in the value of the underlying instruments, if there is an illiquid secondary market for the contracts, if interest or exchange rates move unexpectedly or if the counter-party to the contract is unable to perform. With futures, there is minimal counterparty credit risk to the fund since futures are exchange traded and the exchange’s clearinghouse, as counterparty to all exchange traded futures, guarantees the futures against default. Risks may exceed amounts recognized on the Statement of assets and liabilities. When the contract is closed, the fund records a realized gain or loss equal to the difference between the value of the contract at the time it was opened and the value at the time it was closed. Realized gains and losses on purchased options are included in realized gains and losses on investment securities. If a written call option is exercised, the premium originally received is recorded as an addition to sales proceeds. If a written put option is exercised, the premium originally received is recorded as a reduction to the cost of investments.
Futures contracts are valued at the quoted daily settlement prices established by the exchange on which they trade. The fund and the broker agree to exchange an amount of cash equal to the daily fluctuation in the value of the futures contract. Such receipts or payments are known as “variation margin.” Exchange traded options are valued at the last sale price or, if no sales are reported, the last bid price for purchased options and the last ask price for written options. Options traded over-the-counter are valued using prices supplied by dealers. Futures and written option contracts outstanding at period end, if any, are listed after the fund’s portfolio. The fund had an average contract amount of approximately $1,400,000 on Purchased options contracts for the six months ended October31, 2009. See Note 3 for the volume of Written options contracts activity for the six months ended October 31, 2009. For the six months ended October 31, 2 009 the fund did not have any activity on Futures contracts.
E) Master agreements The fund is a party to ISDA (International Swap and Derivatives Association, Inc.) Master Agreements (“Master Agreements”) with certain counterparties that govern over the counter derivative and foreign exchange contracts entered into from time to time. The Master Agreements may contain provisions regarding, among other things, the parties’ general obligations, representations, agreements, collateral requirements, events of default and early termination. With respect to certain counterparties, in accordance with the terms of the Master Agreements, collateral posted to the fund is held in a segregated account by the fund’s custodian and with respect to those amounts which can be sold or repledged, are presented in the fund’s portfolio. Collateral pledged
42
by the fund is segregated by the fund’s custodian and identified in the fund’s portfolio. Collateral can be in the form of cash or debt securities issued by the U.S. Government or related agencies or other securities as agreed to by the fund and the applicable counterparty. Collateral requirements are determined based on the fund’s net position with each counterparty. Termination events applicable to the fund may occur upon a decline in the fund’s net assets below a specified threshold over a certain period of time. Termination events applicable to counterparties may occur upon a decline in the counterparty’s long-term and short-term credit ratings below a specified level. In each case, upon occurrence, the other party may elect to terminate early and cause settlement of all derivative and foreign exchange contracts outstanding, including the payment of any losses and costs resulting from such early termination, as reasonably d etermined by the terminating party. Any decision by one or more of the fund’s counterpar-ties to elect early termination could impact the fund’s future derivative activity.
F) Securities lending The fund may lend securities, through its agents, to qualified borrowers in order to earn additional income. The loans are collateralized by cash and/or securities in an amount at least equal to the market value of the securities loaned. The market value of securities loaned is determined daily and any additional required collateral is allocated to the fund on the next business day. The risk of borrower default will be borne by the fund’s agents; the fund will bear the risk of loss with respect to the investment of the cash collateral. Income from securities lending is included in investment income on the Statement of operations. At October31, 2009, the value of securities loaned amounted to $97,098,556. The fund received cash collateral of $104,376,725 which is pooled with collateral of other Putnam funds into a single broker cash account covered under the FDIC Temporary Liquidity G uarantee Program.
G) Federal taxes It is the policy of the fund to distribute all of its taxable income within the prescribed time and otherwise comply with the provisions of the Internal Revenue Code of 1986, as amended (the “Code”), applicable to regulated investment companies. It is also the intention of the fund to distribute an amount sufficient to avoid imposition of any excise tax under Section 4982 of the Code. The fund is subject to the provisions of ASC 740 Income Taxes (“ASC 740”). ASC 740 sets forth a minimum threshold for financial statement recognition of the benefit of a tax position taken or expected to be taken in a tax return. The fund did not have any unrecognized tax benefits in the accompanying financial statements. No provision has been made for federal taxes on income, capital gains or unrealized appreciatio n on securities held nor for excise tax on income and capital gains. Each of the fund’s federal tax returns for the prior three fiscal years remains subject to examination by the Internal Revenue Service and state departments of revenue.
At April 30, 2009, the fund had a capital loss carryover of $92,313,532 available to the extent allowed by the Code to offset future net capital gain, if any. This capital loss carryover will expire on April 30, 2017.
Pursuant to federal income tax regulations applicable to regulated investment companies, the fund has elected to defer to its fiscal year ending April 30, 2010 $225,980,838 of losses recognized during the period November 1, 2008 to April 30, 2009.
The aggregate identified cost on a tax basis is $583,650,726, resulting in gross unrealized appreciation and depreciation of $61,628,092 and $25,159,512, respectively, or net unrealized appreciation of $36,468,580.
H) Distributions to shareholders Distributions to shareholders from net investment income are recorded by the fund on the ex-dividend date. Distributions from capital gains, if any, are recorded on the ex-dividend date and paid at least annually. The amount and character of income and gains to be distributed are determined in accordance with income tax regulations, which may differ from generally accepted accounting principles. Dividend sources are estimated at the time of declaration. Actual results may vary. Any non-taxable return of capital cannot be determined until final tax calculations are completed after the end of the fund’s fiscal year. Reclassifications are made to the fund’s capital accounts to reflect income and gains available for distribution (or available capital loss carryovers) under income tax regulations.
I) Expenses of the trust Expenses directly charged or attributable to any fund will be paid from the assets of that fund. Generally, expenses of the trust will be allocated among and charged to the assets of each fund on a basis that the Trustees deem fair and equitable, which may be based on the relative assets of each fund or the nature of the services performed and relative applicability to each fund.
Note 2: Management fee, administrative services and other transactions
The fund pays Putnam Management for management and investment advisory services quarterly based on the average net assets of the fund. Such fee is based on the following annual rates: 0.70% of the first $500million of average net assets, 0.60% of the next $500 million, 0.55% of the next $500 million, 0.50% of the next $5 billion, 0.475% of the next $5 billion, 0.455%
43
of the next $5 billion, 0.44% of the next $5 billion and 0.43% thereafter.
Putnam Management had agreed to waive fees and reimburse expenses of the fund through July 31, 2009 to the extent necessary to ensure that the fund’s expenses do not exceed the simple average of the expenses of all front-end load funds viewed by Lipper Inc. as having the same investment classification or objective as the fund. The expense reimbursement is based on a comparison of the fund’s expenses with the average annualized operating expenses of the funds in its Lipper peer group for each calendar quarter during the fund’s last fiscal year, excluding 12b-1 fees and without giving effect to any expense offset and brokerage/service arrangements that may reduce fund expenses. During the six months ended October 31, 2009, the fund’s expenses were reduced by $89,890 as a result of this limit.
Effective August 1, 2009 through July 31, 2010, Putnam Management has also contractually agreed to reimburse the fund’s expenses to the extent necessary to limit the cumulative expenses of the fund, exclusive of brokerage, interest, taxes, investment-related expenses, extraordinary expenses and payments under the fund’s investor servicing contract, investment management contract and distribution plans, on a fiscal year-to-date basis (or from August 1, 2009 through the fund’s next fiscal year end, as applicable), to an annual rate of 0.20% of the fund’s average net assets over such fiscal year-to-date period (or since August 1, 2009, as applicable). During the six months ended October 31, 2009, the fund’s expenses were not reduced as a result of this limit.
The fund reimburses Putnam Management an allocated amount for the compensation and related expenses of certain officers of the fund and their staff who provide administrative services to the fund. The aggregate amount of all such reimbursements is determined annually by the Trustees.
Custodial functions for the fund’s assets are provided by State Street Bank and Trust Company (“State Street”). Custody fees are based on the fund’s asset level, the number of its security holdings and transaction volumes.
Putnam Investor Services, Inc., an affiliate of Putnam Management, provided investor servicing agent functions to the fund. Putnam Investor Services, Inc. received fees for investor servicing, subject to certain limitations, based on the number of shareholder accounts in the fund and the level of defined contribution plan assets in the fund. The amounts incurred for investor servicing agent functions provided by affiliates of Putnam Management during the six months ended October 31, 2009, are included in Investor servicing fees in the Statement of operations.
The fund has entered into expense offset arrangements with PFTC and State Street whereby PFTC’s and State Street’s fees are reduced by credits allowed on cash balances. The fund also reduced expenses through brokerage/service arrangements. For the six months ended October 31, 2009, the fund’s expenses were reduced by $785 under the expense offset arrangements and by $8,722 under the brokerage/ service arrangements.
Each independent Trustee of the fund receives an annual Trustee fee, of which $423, as a quarterly retainer, has been allocated to the fund, and an additional fee for each Trustees meeting attended. Trustees receive additional fees for attendance at certain committee meetings and industry seminars and for certain compliance-related matters. Trustees also are reimbursed for expenses they incur relating to their services as Trustees.
The fund has adopted a Trustee Fee Deferral Plan (the “Deferral Plan”) which allows the Trustees to defer the receipt of all or a portion of Trustees fees payable on or after July 1, 1995. The deferred fees remain invested in certain Putnam funds until distribution in accordance with the Deferral Plan.
The fund has adopted an unfunded noncontributory defined benefit pension plan (the “Pension Plan”) covering all Trustees of the fund who have served as a Trustee for at least five years and were first elected prior to 2004. Benefits under the Pension Plan are equal to 50% of the Trustee’s average annual attendance and retainer fees for the three years ended December 31, 2005. The retirement benefit is payable during a Trustee’s lifetime, beginning the year following retirement, for the number of years of service through December 31, 2006. Pension expense for the fund is included in Trustee compensation and expenses in the Statement of operations. Accrued pension liability is included in Payable for Trustee compensation and expenses in the Statement of assets and liabilities. The Trustees have terminated the Pension Plan with respect to any Trustee first elected after 2003.
The fund has adopted distribution plans (the “Plans”) with respect to its class A, class B, class C, class M and class R shares pursuant to Rule 12b-1 under the Investment Company Act of 1940. The purpose of the Plans is to compensate Putnam Retail Management Limited Partnership, a wholly-owned subsidiary of Putnam Investments, LLC and Putnam Retail Management GP, Inc., for services provided and expenses incurred in distributing shares of the fund. The Plans provide for payments by the fund to Putnam Retail Management Limited Partnership at an annual rate of up to 0.35%, 1.00%, 1.00%, 1.00% and 1.00% of the average net assets attributable to class A, class B, class C, class M and class R shares, respectively. The Trustees have approved payment by the fund at an annual rate of 0.25%, 1.00%, 1.00%, 0.75% and 0.50%
44
of the average net assets attributable to class A, class B, class C, class M and class R shares, respectively.
For the six months ended October 31, 2009, Putnam Retail Management Limited Partnership, acting as underwriter, received net commissions of $13,287 and $145 from the sale of class A and class M shares, respectively, and received $19,678 and $169 in contingent deferred sales charges from redemptions of class B and class C shares, respectively.
A deferred sales charge of up to 1.00% and 0.65% is assessed on certain redemptions of class A and classM shares, respectively. For the six months ended October 31, 2009, Putnam Retail Management Limited Partnership, acting as underwriter, received no monies on class A and class M redemptions, respectively.
Note 3: Purchases and sales of securities
During the six months ended October 31, 2009, cost of purchases and proceeds from sales of investment securities other than short-term investments aggregated $298,074,577 and $358,098,920, respectively. There were no purchases or sales of U.S. government securities.
Written option transactions during the six months ended October 31, 2009 are summarized as follows:
| | |
| | Contract | Premiums |
| | Amounts | Received |
|
| Written options | | |
| outstanding at | | |
| beginning of period | $1,411,545 | $1,552,700 |
|
| Options opened | — | — |
|
| Options exercised | — | — |
|
| Options expired | — | — |
|
| Options closed | (1,411,545) | (1,552,700) |
|
| Written options | | |
| outstanding at | | |
| end of period | $— | $— |
|
Note 4: Capital shares
At October 31, 2009, there was an unlimited number of shares of beneficial interest authorized. Transactions in capital shares were as follows:
| | | | |
| | Six months ended 10/31/09 | Year ended 4/30/09 |
|
| Class A | Shares | Amount | Shares | Amount |
|
| Shares sold | 6,050,473 | $52,487,000 | 38,923,674 | $393,128,137 |
|
| Shares issued in connection with | | | | |
| reinvestment of distributions | — | — | 259,917 | 1,686,863 |
|
| | 6,050,473 | 52,487,000 | 39,183,591 | 394,815,000 |
|
| Shares repurchased | (12,613,713) | (110,996,506) | (29,077,829) | (239,454,121) |
|
| Net increase (decrease) | (6,563,240) | $(58,509,506) | 10,105,762 | $155,360,879 |
| |
| |
| | Six months ended 10/31/09 | Year ended 4/30/09 |
|
| Class B | Shares | Amount | Shares | Amount |
|
| Shares sold | 131,933 | $1,107,797 | 427,708 | $3,538,642 |
|
| Shares issued in connection with | | | | |
| reinvestment of distributions | — | — | — | — |
|
| | 131,933 | 1,107,797 | 427,708 | 3,538,642 |
|
| Shares repurchased | (900,757) | (7,586,456) | (4,067,789) | (35,231,755) |
|
| Net decrease | (768,824) | $(6,478,659) | (3,640,081) | $(31,693,113) |
|
| |
| | Six months ended 10/31/09 | Year ended 4/30/09 |
|
| Class C | Shares | Amount | Shares | Amount |
|
| Shares sold | 53,945 | $443,657 | 194,964 | $1,549,164 |
|
| Shares issued in connection with | | | | |
| reinvestment of distributions | — | — | — | — |
|
| | 53,945 | 443,657 | 194,964 | 1,549,164 |
|
| Shares repurchased | (242,562) | (2,025,873) | (1,079,028) | (8,592,643) |
|
| Net decrease | (188,617) | $(1,582,216) | (884,064) | $(7,043,479) |
|
45
| | | | |
| | Six months ended 10/31/09 | Year ended 4/30/09 |
|
| Class M | Shares | Amount | Shares | Amount |
|
| Shares sold | 26,877 | $225,574 | 125,498 | $851,553 |
|
| Shares issued in connection with | | | | |
| reinvestment of distributions | — | — | — | — |
|
| | 26,877 | 225,574 | 125,498 | 851,553 |
|
| Shares repurchased | (43,911) | (374,309) | (304,049) | (2,699,555) |
|
| Net decrease | (17,034) | $(148,735) | (178,551) | $(1,848,002) |
|
| |
| | Six months ended 10/31/09 | Year ended 4/30/09 |
|
| Class R | Shares | Amount | Shares | Amount |
|
| Shares sold | 143,050 | $1,243,689 | 445,813 | $3,591,828 |
|
| Shares issued in connection with | | | | |
| reinvestment of distributions | — | — | 553 | 3,543 |
|
| | 143,050 | 1,243,689 | 446,366 | 3,595,371 |
|
| Shares repurchased | (154,568) | (1,363,325) | (261,461) | (2,105,863) |
|
| Net increase (decrease) | (11,518) | $(119,636) | 184,905 | $1,489,508 |
|
| |
| | Six months ended 10/31/09 | Year ended 4/30/09 |
|
| Class Y | Shares | Amount | Shares | Amount |
|
| Shares sold | 520,703 | $4,531,776 | 1,941,009 | $16,906,406 |
|
| Shares issued in connection with | | | | |
| reinvestment of distributions | — | — | 39,032 | 253,705 |
|
| | 520,703 | 4,531,776 | 1,980,041 | 17,160,111 |
|
| Shares repurchased | (401,715) | (3,497,546) | (2,809,557) | (21,940,459) |
|
| Net increase (decrease) | 118,988 | $1,034,230 | (829,516) | $(4,780,348) |
|
At October 31, 2009, a shareholder of record owned 5.3% of the outstanding shares of the fund.
Note 5: Summary of derivative activity
As of October 31, 2009, the fund did not hold any derivative instruments.
The following is a summary of realized and unrealized gains or losses of derivative instruments on the Statement of operations for the six months ended October 31, 2009 (see Note 1):
Amount of Realized Gain or (Loss) on Derivatives Recognized in Income
| | |
| Derivatives not accounted | | |
| for as hedging instruments | | |
| under ASC 815 | Options | Total |
|
| Equity contracts | $(1,902,831) | $(1,902,831) |
|
| Total | $(1,902,831) | $(1,902,831) |
|
Change in Unrealized Appreciation or (Depreciation) on Derivatives Recognized in Income
| | |
| Derivatives not accounted | | |
| for as hedging instruments | | |
| under ASC 815 | Options | Total |
|
| Equity contracts | $(130,145) | $(130,145) |
|
| Total | $(130,145) | $(130,145) |
|
Note 6: Investment in Putnam Money Market
Liquidity Fund
The fund invested in Putnam Money Market Liquidity Fund, an open-end management investment company managed by Putnam Management. Investments in Putnam Money Market Liquidity Fund are valued at its closing net asset value each business day. Income distributions earned by the fund are recorded as interest income in the Statement of operations and totaled $25,352 for the six months ended October 31, 2009. During the six months ended October 31, 2009, cost of purchases and proceeds of sales of investments in Putnam Money
46
Market Liquidity Fund aggregated $166,444,270 and $175,578,256, respectively. Management fees charged to Putnam Money Market Liquidity Fund have been waived by Putnam Management.
Note 7: Regulatory matters and litigation
In late 2003 and 2004, Putnam Management settled charges brought by the SEC and the Massachusetts Securities Division in connection with excessive short-term trading in Putnam funds. Distribution of payments from Putnam Management to certain open-end Putnam funds and their shareholders is expected to be completed in the next several months. These allegations and related matters have served as the general basis for certain lawsuits, including purported class action lawsuits against Putnam Management and, in a limited number of cases, some Putnam funds. Putnam Management believes that these lawsuits will have no material adverse effect on the funds or on Putnam Management’s ability to provide investment management services. In addition, Putnam Management has agreed to bear any costs incurred by the Putnam funds as a result of these matters.
Note 8: Other
At a meeting held on November 19, 2009, shareholders approved a new management contract for your fund. Subject to shareholder approval of similar management contracts for substantially all of the other Putnam funds, the new management contract is expected to be implemented on January 1, 2010 (but no later than February 1, 2010). Under the new management contract, management fee breakpoints would be determined by reference to the assets of all of the open-end Putnam funds, rather than only the assets of the fund.
Note 9: Market and credit risk
In the normal course of business, the fund trades finan-cial instruments and enters into financial transactions where risk of potential loss exists due to changes in the market (market risk) or failure of the contracting party to the transaction to perform (credit risk). The fund may be exposed to additional credit risk that an institution or other entity with which the fund has unsettled or open transactions will default.
47
Services for shareholders
Investor services
Systematic investment plan Tell us how much you wish to invest regularly — weekly, semimonthly, or monthly — and the amount you choose will be transferred automatically from your checking or savings account. There’s no additional fee for this service, and you can suspend it at any time. This plan may be a great way to save for college expenses or to plan for your retirement.
Please note that regular investing does not guarantee a profit or protect against loss in a declining market. Before arranging a systematic investment plan, consider your financial ability to continue making purchases in periods when prices are low.
Systematic exchange You can make regular transfers from one Putnam fund to another Putnam fund. There are no additional fees for this service, and you can cancel or change your options at any time.
Dividends PLUS You can choose to have the dividend distributions from one of your Putnam funds automatically reinvested in another Putnam fund at no additional charge.
Free exchange privilege You can exchange money between Putnam funds free of charge, as long as they are the same class of shares. A signature guarantee is required if you are exchanging more than $500,000.
Reinstatement privilege If you’ve sold Putnam shares or received a check for a dividend or capital gain, you may reinvest the proceeds with Putnam within 90 days of the transaction and they will be reinvested at the fund’s current net asset value — with no sales charge. However, reinstatement of class B shares may have special tax consequences. Ask your financial or tax representative for details.
Check-writing service You have ready access to many Putnam accounts. It’s as simple as writing a check, and there are no special fees or service charges. For more information about the check-writing service, call Putnam or visit our Web site.
Dollar cost averaging When you’re investing for long-term goals, it’s time, not timing, that counts. Investing on a systematic basis is a better strategy than trying to figure out when the markets will go up or down. This means investing the same amount of money regularly over a long period. This method of investing is called dollar cost averaging. When a fund’s share price declines, your investment dollars buy more shares at lower prices. When it increases, they buy fewer shares. Over time, you will pay a lower average price per share.
For more information
Visit the Individual Investors section at putnam.com A secure section of our Web site contains complete information on your account, including balances and transactions, updated daily. You may also conduct transactions, such as exchanges, additional investments, and address changes. Log on today to get your password.
Call us toll free at 1-800-225-1581 Ask a helpful Putnam representative or your financial advisor for details about any of these or other services, or see your prospectus.
48
Fund information
Founded over 70 years ago, Putnam Investments was built around the concept that a balance between risk and reward is the hallmark of a well-rounded financial program. We manage over 100 funds across income, value, blend, growth, asset allocation, absolute return, and global sectorcategories.
| | |
| Investment Manager | Officers | Robert R. Leveille |
| Putnam Investment | Robert L. Reynolds | Vice President and |
| Management, LLC | President | Chief Compliance Officer |
| One Post Office Square | | |
| Boston, MA 02109 | Charles E. Porter | Mark C. Trenchard |
| | Executive Vice President, | Vice President and |
| Marketing Services | Principal Executive Officer, | BSA Compliance Officer |
| Putnam Retail Management | Associate Treasurer and | |
| One Post Office Square | Compliance Liaison | Judith Cohen |
| Boston, MA 02109 | | Vice President, Clerk and |
| | Jonathan S. Horwitz | Assistant Treasurer |
| Custodian | Senior Vice President | |
| State Street Bank | and Treasurer | Wanda M. McManus |
| and Trust Company | | Vice President, Senior Associate |
| | Steven D. Krichmar | Treasurer and Assistant Clerk |
| Legal Counsel | Vice President and | |
| Ropes & Gray LLP | Principal Financial Officer | Nancy E. Florek |
| | | Vice President, Assistant Clerk, |
| Trustees | Janet C. Smith | Assistant Treasurer and |
| John A. Hill, Chairman | Vice President, Principal | Proxy Manager |
| Jameson A. Baxter, | Accounting Officer and | |
| Vice Chairman | Assistant Treasurer | |
| Ravi Akhoury | | |
| Charles B. Curtis | Susan G. Malloy | |
| Robert J. Darretta | Vice President and | |
| Myra R. Drucker | Assistant Treasurer | |
| Paul L. Joskow | | |
| Elizabeth T. Kennan | Beth S. Mazor | |
| Kenneth R. Leibler | Vice President | |
| Robert E. Patterson | | |
| George Putnam, III | James P. Pappas | |
| Robert L. Reynolds | Vice President | |
| W. Thomas Stephens | | |
| Richard B. Worley | Francis J. McNamara, III | |
| Vice President and | |
| | Chief Legal Officer | |
This report is for the information of shareholders of Putnam Mid Cap Value Fund. It may also be used as sales literature when preceded or accompanied by the current prospectus, the most recent copy of Putnam’s Quarterly Performance Summary, and Putnam’s Quarterly Ranking Summary. For more recent performance, please visit putnam.com. Investors should carefully consider the investment objective, risks, charges, and expenses of a fund, which are described in its prospectus. For this and other information or to request a prospectus, call 1-800-225-1581 toll free. Please read the prospectus carefully before investing. The fund’s Statement of Additional Information contains additional information about the fund’s Trustees and is available without charge upon request by calling 1-800-225-1581.

Item 2. Code of Ethics:
Not applicable
Item 3. Audit Committee Financial Expert:
Not applicable
Item 4. Principal Accountant Fees and Services:
Not applicable
Item 5. Audit Committee of Listed Registrants
Not applicable
Item 6. Schedule of Investments:
The registrant’s schedule of investments in unaffiliated issuers is included in the report to shareholders in Item 1 above.
Item 7. Disclosure of Proxy Voting Policies and Procedures For Closed-End Management Investment Companies:
Not applicable
Item 8. Portfolio Managers of Closed-End Investment Companies
Not Applicable
Item 9. Purchases of Equity Securities by Closed-End Management Investment Companies and Affiliated Purchasers:
Not applicable
Item 10. Submission of Matters to a Vote of Security Holders:
Not applicable
Item 11. Controls and Procedures:
(a) The registrant's principal executive officer and principal financial officer have concluded, based on their evaluation of the effectiveness of the design and operation of the registrant's disclosure controls and procedures as of a date within 90 days of the filing date of this report, that the design and operation of such procedures are generally effective to provide reasonable assurance that information required to be disclosed by the registrant in this report is recorded, processed, summarized and reported within the time periods specified in the Commission's rules and forms.
(b) Changes in internal control over financial reporting: Not applicable
Item 12. Exhibits:
(a)(1) Not applicable
(a)(2) Separate certifications for the principal executive officer and principal financial officer of the registrant as required by Rule 30a-2(a) under the Investment Company Act of 1940, as amended, are filed herewith.
(b) The certifications required by Rule 30a-2(b) under the Investment Company Act of 1940, as amended, are filed herewith.
SIGNATURES
Pursuant to the requirements of the Securities Exchange Act of 1934 and the Investment Company Act of 1940, the registrant has duly caused this report to be signed on its behalf by the undersigned, thereunto duly authorized.
Putnam Investment Funds
By (Signature and Title):
/s/Janet C. Smith
Janet C. Smith
Principal Accounting Officer
Date: December 30, 2009
Pursuant to the requirements of the Securities Exchange Act of 1934 and the Investment Company Act of 1940, this report has been signed below by the following persons on behalf of the registrant and in the capacities and on the dates indicated.
By (Signature and Title):
/s/Charles E. Porter
Charles E. Porter
Principal Executive Officer
Date: December 30, 2009
By (Signature and Title):
/s/Steven D. Krichmar
Steven D. Krichmar
Principal Financial Officer
Date: December 30, 2009