| | | |
| |
| UNITED STATES |
| SECURITIES AND EXCHANGE COMMISSION |
| Washington, D.C. 20549 |
| |
| FORM N-CSR |
| |
| CERTIFIED SHAREHOLDER REPORT OF REGISTERED |
| MANAGEMENT INVESTMENT COMPANIES |
| |
| Investment Company Act file number: (811- 07237 ) |
| | |
| Exact name of registrant as specified in charter: | Putnam Investment Funds |
| |
| Address of principal executive offices: One Post Office Square, Boston, Massachusetts 02109 |
| | |
| Name and address of agent for service: | Beth S. Mazor, Vice President |
| | One Post Office Square |
| | Boston, Massachusetts 02109 |
| | |
| Copy to: | John W. Gerstmayr, Esq. |
| | Ropes & Gray LLP |
| | One International Place |
| | Boston, Massachusetts 02110 |
| | |
| Registrant’s telephone number, including area code: | (617) 292-1000 | | |
| | |
| Date of fiscal year end: July 31, 2010 | |
| |
| Date of reporting period: August 1, 2009 — January 31, 2010 |
Item 1. Report to Stockholders:
The following is a copy of the report transmitted to stockholders pursuant to Rule 30e-1 under the Investment Company Act of 1940:

A BALANCED APPROACH
Since 1937, when George Putnam created a diverse mix of stocks and bonds in a single, professionally managed portfolio, Putnam has championed the balanced approach.
A WORLD OF INVESTING
Today, we offer investors a world of equity, fixed-income, multi-asset, and absolute-return portfolios to suit a range of financial goals.
A COMMITMENT TO EXCELLENCE
Our portfolio managers seek superior results over time, backed by original, fundamental research on a global scale. We believe in the value of experienced financial advice, in providing exemplary service, and in putting clients first in all we do.

Putnam
Growth Opportunities
Fund
Semiannual report
1 | 31 | 10
| |
| Message from the Trustees | 2 |
|
| About the fund | 4 |
|
| Performance snapshot | 6 |
|
| Interview with your fund’s portfolio manager | 7 |
|
| Your fund’s performance | 11 |
|
| Your fund’s expenses | 13 |
|
| Terms and definitions | 15 |
|
| Trustee approval of management contract | 16 |
|
| Other information for shareholders | 26 |
|
| Financial statements | 27 |
|
| Shareholder meeting results | 50 |
|
Message from the Trustees
Dear Fellow Shareholder:
Last year’s rally in both stocks and bonds helped investors recoup some of the losses in their portfolios, and Putnam’s shareholders were particularly well served. After such strong growth, we are not surprised that the markets paused at the start of 2010.
While no one believes that 2010 will be a repeat performance of 2009, we do feel that — based on an optimistic earnings outlook and growing evidence of a global economic recovery — today’s markets offer ample opportunities for active money management, which is something that Putnam does exceedingly well.
If there is any lesson to be learned from the extraordinary volatility of the past year, it is the importance of positioning one’s portfolio to limit downside risk. It is our belief that the best way to achieve this is by diversifying across all asset classes and investment strategies, and by adhering to your plan in every kind of market environment.
Lastly, we would like to thank all shareholders who took the time to vote by proxy on a number of issues, including shareholder-friendly management fee changes, presented at the Putnam Funds’ shareholder meetings. We would also like to
2
welcome new shareholders to the fund and thank all of our investors for your continued confidence in Putnam.
About the fund
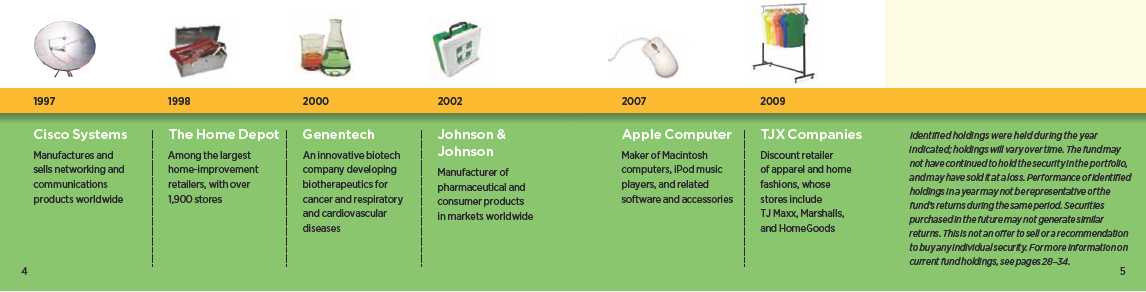
Seeking overlooked, underpriced small and midsize companies
When Putnam Growth Opportunities Fund opened to the investing public in August 1997, its managers were committed to seeking growth potential in the types of U.S. companies that dominated the markets — large yet flexible, coupling the benefits of size and scale with the ability to respond to changing tastes and new technologies.
More than a decade later, the fund continues to target the stocks of these types of companies, using rigorous research techniques to identify those believed to have both a competitive edge and the potential to produce strong profits. Of course, as with any fund that invests in stocks, there are risks involved. The fund’s focus on large U.S. companies can affect its performance, particularly during times when large-cap stocks are out of favor. The fund’s manager seeks to mitigate this risk by investing with a long-term perspective, looking for companies he believes have the fundamental strength to deliver results over time, despite market setbacks. While the fund’s management strategy favors growth stocks, the manager also seeks to cushion the impact of market volatility at times when growth-style investing is out of favor.
In the fund’s first report to shareholders, then-Chairman of the Trustees George Putnam wrote of the management team: “Besides taking advantage of today’s opportunities, they have sought companies that have proved themselves in fair weather and foul, mindful that exuberant markets such as today’s do not last forever.”
While not all large-cap companies in which the fund has invested have been able to weather the tough times, many that were in the fund’s portfolio in the mid-1990s have continued to grow and prosper. In fact, several have since been added to the select group of companies that make up the Dow Jones Industrial Average.
Regardless of how market conditions change in the years ahead, the fund will continue to seek leading companies with dominant products, services, and barriers to entry against potential competitors. These companies, when the market underestimates the sustainability of their growth and returns, can be attractive investments.
Consider these risks before investing:
Stocks with above-average earnings may be more volatile, especially if earnings do not continue to grow.

In-depth analysis is key to
successful stock selection
Drawing on the expertise of a dedicated team of stock analysts, the fund’s portfolio manager seeks attractive growth stocks. Once a stock is selected for the portfolio, it is regularly assessed to ensure that it continues to meet certain criteria, including:
Growth The fund’s manager examines each company’s financials, including its sales and earnings, and targets those believed to offer growth potential.
Quality The manager looks for high-quality companies, seeking characteristics such as solid management teams, sound business models, a record of strong performance, and high levels of free-cash flow.
Valuation Carefully considering how each stock is valued, the manager seeks stocks whose valuations are attractive relative to the company’s growth potential.
Putnam Growth Opportunities Fund seeks to invest in
leading large companies with the potential to grow rapidly.
Performance
snapshot
Average annual total return (%) comparison as of 1/31/10
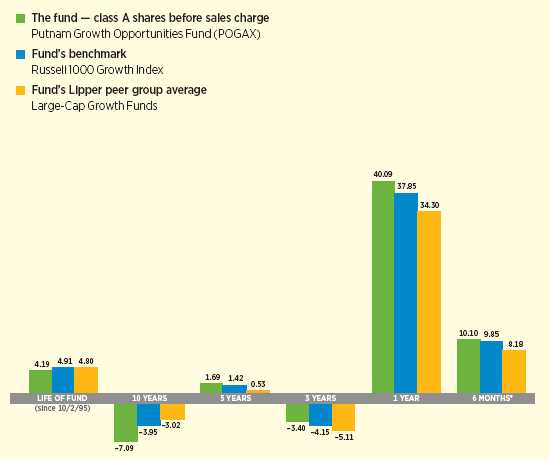
Current performance may be lower or higher than the quoted past performance, which cannot guarantee future results. Share price, principal value, and return will fluctuate, and you may have a gain or a loss when you sell your shares. Performance of class A shares assumes reinvestment of distributions and does not account for taxes. Fund returns in the bar chart do not reflect a sales charge of 5.75%; had they, returns would have been lower. See pages 7 and 11–12 for additional performance information. For a portion of the periods, this fund may have limited expenses, without which returns would have been lower. A 1% short-term trading fee may apply. To obtain the most recent month-end performance, visit putnam.com.
* Returns for the six-month period are not annualized, but cumulative.
6
Interview with your
fund’s portfolio manager
Robert Brookby
Rob, how did Putnam Growth Opportunities Fund perform for the six months ended January 31, 2010?
I am pleased to report that the fund delivered a solid return for the period, gaining 10.10% as the stock market recovered from one of its most difficult downturns in decades. The fund also outperformed its benchmark, the Russell 1000 Growth Index, which returned 9.85%, and the average return of its peer group, Lipper Large-Cap Growth Funds, which was 8.18%.
How did market conditions change during the period?
Early on, we saw a worst-case-averted situation in the markets and the economy. This included significant monetary and fiscal stimulus, and a change of mindset, where it became acceptable again for investors to take on some risk. At the same time, we saw broad participation from companies across the economy in cutting costs and right-sizing their businesses for the new reality.
As for the performance of stocks, it’s important to note that companies typically are able to make progress faster than investors expect. In fact, as early as the second quarter of last year, we started to see company earnings exceeding the expectations of Wall Street analysts and investors. This trend continued through the close of the period, making it a constructive time for equities.
Broad market index and fund performance
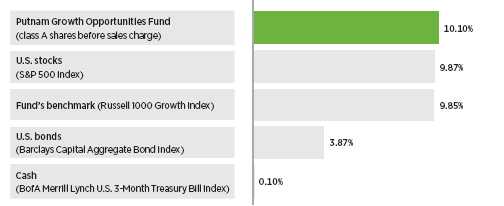
This comparison shows your fund’s performance in the context of broad market indexes for the six months ended 1/31/10. See pages 6 and 11–12 for additional fund performance information. Index descriptions can be found on page 15.
7
What helped the fund outperform its benchmark and peers?
In terms of sectors, the top performers for the fund were basic materials and energy, which reflects not only our successful stock selection but also what was going on from a macroeconomic perspective. During the period, demand for commodities was resurrected after their dramatic decline in the darkest days of the recession. Most notably, global demand was boosted by China’s economic stimulus programs, which quickly led to new infrastructure and building projects and the need for steel, coal, copper, and ultimately, crude oil for shipping. In the fund’s portfolio, three of the top five contributors to performance were in energy or basic materials.
Can you tell us about some of those?
One top contributor was Anadarko Petroleum Corporation, an oil and gas company that we believe offers strong growth prospects, and has benefited from some attractive recent oil discoveries, particularly in West Africa. Teck Resources was another strong performer. The company produces copper and metallurgical, or “met,” coal used to fire steel plants. Earlier in the calendar year, I opportunistically bought the stock after the industry sold off , and shares have continued to deliver gains. Another portfolio highlight was Halliburton, a Houston-based oil and gas company.
What detracted from returns during the period?
The fund struggled most in the consumer staples area, and primarily because of two stocks, CVS Caremark and Apollo Group. CVS was a considerable negative surprise, as the company typically has proven to be a relatively dependable performer in a generally stable industry — retail pharmaceuticals. However, struggles in the company’s Caremark division led to declines in the stock. Caremark is a pharmacy benefit manager, or PBM. PBMs administer drug benefit programs for employers and health insurance carriers. While Caremark has a history as a strong
| | |
| Top 10 holdings |
| |
| HOLDING (percentage of fund’s net assets) | SECTOR | INDUSTRY |
|
| Apple, Inc. (3.6%) | Technology | Computers |
| Google, Inc. Class A (3.5%) | Technology | Technology services |
| Microsoft Corp. (3.2%) | Technology | Software |
| Cisco Systems, Inc. (2.6%) | Technology | Communications equipment |
| Qualcomm, Inc. (2.4%) | Technology | Communications equipment |
| IBM Corp. (2.3%) | Technology | Computers |
| United Technologies Corp. (2.2%) | Capital goods | Aerospace and defense |
| CVS Caremark Corp. (1.9%) | Consumer staples | Retail |
| Hewlett-Packard Co. (1.8%) | Technology | Computers |
| Aflac, Inc. (1.8%) | Financials | Insurance |
This table shows the fund’s top 10 holdings and the percentage of the fund’s net assets that each represented as of 1/31/10. Short-term holdings are excluded. Holdings will vary over time.
8
“We saw broad participation from
companies across the economy in
cutting costs and right-sizing their
businesses for the new reality.”
Robert Brookby
performer, it has made some missteps in its relationships with clients since merging with CVS in 2007, which resulted in a number of key clients switching to other PBMs. Despite its recent declines, I continued to hold this stock in the portfolio at the close of the period. The company has already taken steps to resolve certain issues, including replacing the president of the division and investing in programs to improve processes and productivity.
Apollo Group is a provider of online and on-campus educational programs and services through subsidiaries such as University of Phoenix, the largest online university. The company has experienced strong growth, and actually had a considerable increase in enrollment as unemployment rose and adults looked to improve their skills and job prospects. However, a few issues have cast a negative cloud over Apollo and the for-profit education industry as a whole. The most significant issue is related to government concerns about Title IV government-sponsored student aid, which accounts for the bulk of these schools’ revenue. The government is evaluating how for-profit recruiters are compensated, and may consider changes in policy around Title IV funds. I still held this stock at the close of the period, as I believed it represented a good value. However, I will be watching developments carefully, since they could alter A pollo’s fundamental business model.
What is your outlook?
I look at the markets and economy in three phases. Phase one, which is well under way, is the implementation of government programs to resuscitate the economy. Unprecedented levels of government stimulus have been pumped into the system, the stock market
Comparison of top sector weightings

This chart shows how the fund’s top weightings have changed over the past six months. Weightings are shown as a percentage of net assets. Holdings will vary over time.
9
has rallied, and investors have concluded that things may not be as bad as they feared. Phases two and three of my outlook, however, relate to the challenges that remain for our economy. We must consider the still-high unemployment rate, the possibility of much slower growth when government stimulus programs phase out, the potential for higher taxes and massive deficits, and — over the longer-term — the aging baby boomers, the first wave of whom are retiring now.
I consider all these short- and long-term factors when positioning the fund’s portfolio. I want the fund’s investors to be able to capitalize on improving conditions, but I don’t want to expose them to too much risk. Therefore, I am striving for a careful balance of stocks with high growth potential and those with more defensive characteristics.
Thanks for your time and insights, Rob.
The views expressed in this report are exclusively those of Putnam Management. They are not meant as investment advice.
Please note that the holdings discussed in this report may not have been held by the fund for the entire period. Portfolio composition is subject to review in accordance with the fund’s investment strategy and may vary in the future. Current and future portfolio holdings are subject to risk.
IN THE NEWS
After two straight years of stagnation, the global economy is recovering faster than previously thought. In its World Economic Outlook released in late January, the International Monetary Fund (IMF) upgraded its view on global growth — predicting that world economies will expand 3.9% in 2010, up from –0.8% last year. The recovery, according to the IMF, will not be consistent across the board, with emerging markets leading more advanced economies, which remain dependent on government stimulus. Asia, in particular, will lead the pack, with strong growth coming from China and India. Meanwhile, the United States is already showing signs of growth, with gross domestic product (GDP) increasing by 5.9% in the fourth quarter of 2009, up from 2.2% in the third quarter.
Of special interest
We are pleased to report that the fund benefited during the period as a result of a second court-ordered settlement distribution made to eligible holders of Enron Corporation common stock. Enron’s stock became worthless in 2001 when it was determined that the company had defrauded shareholders by conspiring to conceal losses and inflate profits. The company declared bankruptcy in December 2001, and its assets were later sold off to recoup creditors. Shareholders who purchased Enron stock between September 9, 1997, and December 2, 2001, were eligible to participate in the settlement. The fund had received $12,097,538 in the prior fiscal year, and a second settlement of $ 2,326,616 on December 28, 2009.

Portfolio Manager Robert Brookby has an M.B.A. from Harvard Business School and a B.A. from Northwestern University. Rob joined Putnam in 2008 and has been in the investment industry since 1999.
10
Your fund’s performance
This section shows your fund’s performance, price, and distribution information for periods ended January 31, 2010, the end of the first half of its current fiscal year. In accordance with regulatory requirements for mutual funds, we also include performance as of the most recent calendar quarter-end and expense information taken from the fund’s current prospectus. Performance should always be considered in light of a fund’s investment strategy. Data represents past performance. Past performance does not guarantee future results. More recent returns may be less or more than those shown. Investment return and principal value will fluctuate, and you may have a gain or a loss when you sell your shares. Performance information does not reflect any deduction for taxes a shareholder may owe on fund distributions or on the redemption of fund shares. For the most recent month-end performance, please visit the Individual Investors section at putn am.com or call Putnam at 1-800-225-1581. Class Y shares are generally only available to corporate and institutional clients and clients in other approved programs. See the Terms and Definitions section in this report for definitions of the share classes offered by your fund.
Fund performance Total return for periods ended 1/31/10
| | | | | | | | | | |
| | Class A | Class B | Class C | Class M | Class R | Class Y |
| (inception dates) | (10/2/95) | (8/1/97) | (2/1/99) | (8/1/97) | (1/21/03) | (7/1/99) |
|
| | NAV | POP | NAV | CDSC | NAV | CDSC | NAV | POP | NAV | NAV |
|
| Annual average | | | | | | | | | | |
| (life of fund) | 4.19% | 3.76% | 3.38% | 3.38% | 3.43% | 3.43% | 3.63% | 3.38% | 3.93% | 4.40% |
|
| 10 years | –52.09 | –54.84 | –55.59 | –55.59 | –55.54 | –55.54 | –54.47 | –56.07 | –53.25 | –50.87 |
| Annual average | –7.09 | –7.64 | –7.80 | –7.80 | –7.79 | –7.79 | –7.57 | –7.90 | –7.32 | –6.86 |
|
| 5 years | 8.75 | 2.52 | 4.62 | 2.62 | 4.74 | 4.74 | 5.99 | 2.25 | 7.33 | 10.08 |
| Annual average | 1.69 | 0.50 | 0.91 | 0.52 | 0.93 | 0.93 | 1.17 | 0.45 | 1.42 | 1.94 |
|
| 3 years | –9.86 | –15.03 | –11.90 | –14.54 | –11.81 | –11.81 | –11.17 | –14.28 | –10.50 | –9.16 |
| Annual average | –3.40 | –5.28 | –4.14 | –5.10 | –4.10 | –4.10 | –3.87 | –5.01 | –3.63 | –3.15 |
|
| 1 year | 40.09 | 31.99 | 38.99 | 33.99 | 39.03 | 38.02 | 39.33 | 34.47 | 39.72 | 40.32 |
|
| 6 months | 10.10 | 3.75 | 9.66 | 4.66 | 9.71 | 8.71 | 9.85 | 6.01 | 9.92 | 10.24 |
|
Current performance may be lower or higher than the quoted past performance, which cannot guarantee future results. After-sales-charge returns (public offering price, or POP) for class A and M shares reflect a maximum 5.75% and 3.50% load, respectively. Class B share returns reflect the applicable contingent deferred sales charge (CDSC), which is 5% in the first year, declining to 1% in the sixth year, and is eliminated thereafter. Class C shares reflect a 1% CDSC for the first year that is eliminated thereafter. Class R and Y shares have no initial sales charge or CDSC. Performance for class B, C, M, R, and Y shares before their inception is derived from the historical performance of class A shares, adjusted for the applicable sales charge (or CDSC) and, except for class Y shares, the higher operating expenses for such shares.
Recent and prior performance benefited from the receipt of multiple Enron Corporation class action settlements pertaining to investments made prior to 2002.
For a portion of the periods, this fund may have limited expenses, without which returns would have been lower.
A 1% short-term trading fee may be applied to shares exchanged or sold within 7 days of purchase.
11
Comparative index returns For periods ended 1/31/10
| | |
| | | Lipper Large-Cap Growth Funds |
| | Russell 1000 Growth Index | category average* |
|
| Annual average (life of fund) | 4.91% | 4.80% |
|
| 10 years | –33.19 | –23.66 |
| Annual average | –3.95 | –3.02 |
|
| 5 years | 7.29 | 3.03 |
| Annual average | 1.42 | 0.53 |
|
| 3 years | –11.94 | –14.39 |
| Annual average | –4.15 | –5.11 |
|
| 1 year | 37.85 | 34.30 |
|
| 6 months | 9.85 | 8.18 |
|
Index and Lipper results should be compared to fund performance at net asset value.
* Over the 6-month, 1-year, 3-year, 5-year, 10-year, and life-of-fund periods ended 1/31/10, there were 857, 822, 714, 592, 314, and 131 funds, respectively, in this Lipper category.
Fund price and distribution information For the six-month period ended 1/31/10
| | | | | | | | |
| Distributions | Class A | Class B | Class C | Class M | Class R | Class Y |
|
| Number | 1 | — | — | 1 | 1 | 1 |
|
| Income | $0.057 | — | — | $0.001 | $0.036 | $0.086 |
|
| Capital gains | — | — | — | — | — | — |
|
| Total | $0.057 | — | — | $0.001 | $0.036 | $0.086 |
|
| Share value | NAV | POP | NAV | NAV | NAV | POP | NAV | NAV |
|
| 7/31/09 | $12.24 | $12.99 | $11.28 | $11.43 | $11.58 | $12.00 | $12.05 | $12.55 |
|
| 1/31/10 | 13.42 | 14.24 | 12.37 | 12.54 | 12.72 | 13.18 | 13.21 | 13.75 |
|
The classification of distributions, if any, is an estimate. Final distribution information will appear on your year-end tax forms.
Fund performance as of most recent calendar quarter
Total return for periods ended 12/31/09
| | | | | | | | | | |
| | Class A | Class B | Class C | Class M | Class R | Class Y |
| (inception dates) | (10/2/95) | (8/1/97) | (2/1/99) | (8/1/97) | (1/21/03) | (7/1/99) |
|
| | NAV | POP | NAV | CDSC | NAV | CDSC | NAV | POP | NAV | NAV |
|
| Annual average | | | | | | | | | | |
| (life of fund) | 4.54% | 4.10% | 3.72% | 3.72% | 3.76% | 3.76% | 3.97% | 3.71% | 4.28% | 4.75% |
|
| 10 years | –52.43 | –55.16 | –55.91 | –55.91 | –55.88 | –55.88 | –54.82 | –56.40 | –53.56 | –51.21 |
| Annual average | –7.16 | –7.71 | –7.86 | –7.86 | –7.86 | –7.86 | –7.64 | –7.97 | –7.38 | –6.92 |
|
| 5 years | 9.16 | 2.91 | 5.09 | 3.09 | 5.12 | 5.12 | 6.41 | 2.72 | 7.87 | 10.61 |
| Annual average | 1.77 | 0.58 | 1.00 | 0.61 | 1.00 | 1.00 | 1.25 | 0.54 | 1.53 | 2.04 |
|
| 3 years | –3.70 | –9.23 | –5.90 | –8.72 | –5.82 | –5.82 | –5.13 | –8.46 | –4.37 | –2.89 |
| Annual average | –1.25 | –3.18 | –2.01 | –3.00 | –1.98 | –1.98 | –1.74 | –2.90 | –1.48 | –0.97 |
|
| 1 year | 41.22 | 33.07 | 40.09 | 35.09 | 40.11 | 39.11 | 40.50 | 35.62 | 40.87 | 41.62 |
|
| 6 months | 23.94 | 16.84 | 23.50 | 18.50 | 23.47 | 22.47 | 23.64 | 19.31 | 23.86 | 24.22 |
|
12
Your fund’s expenses
As a mutual fund investor, you pay ongoing expenses, such as management fees, distribution fees (12b-1 fees), and other expenses. In the most recent six-month period, your fund limited these expenses; had it not done so, expenses would have been higher. Using the following information, you can estimate how these expenses affect your investment and compare them with the expenses of other funds. You may also pay one-time transaction expenses, including sales charges (loads) and redemption fees, which are not shown in this section and would have resulted in higher total expenses. For more information, see your fund’s prospectus or talk to your financial representative.
Expense ratios
| | | | | | |
| | Class A | Class B | Class C | Class M | Class R | Class Y |
|
| |
| Net expenses for the fiscal year ended 7/31/09*† | 1.33% | 2.08% | 2.08% | 1.83% | 1.58% | 1.08% |
|
| Total annual operating expenses for the fiscal year | | | | | |
| ended 7/31/09† | 1.46% | 2.21% | 2.21% | 1.96% | 1.71% | 1.21% |
|
| Annualized expense ratio for the six-month period | | | | | |
| ended 1/31/10 | 1.32% | 2.07% | 2.07% | 1.82% | 1.57% | 1.07% |
|
Fiscal-year expense information in this table is taken from the most recent prospectus, is subject to change, and may differ from that shown for the annualized expense ratio and in the financial highlights of this report. Expenses are shown as a percentage of average net assets.
* Reflects Putnam Management’s decision to contractually limit expenses through 7/31/10.
† Reflects projected expenses based on a new expense arrangement and the fund’s recent (8/31/09) asset level.
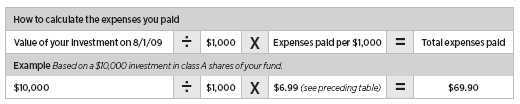
Expenses per $1,000
The following table shows the expenses you would have paid on a $1,000 investment in Putnam Growth Opportunities Fund from August 1, 2009, to January 31, 2010. It also shows how much a $1,000 investment would be worth at the close of the period, assuming actual returns and expenses.
| | | | | | |
| | Class A | Class B | Class C | Class M | Class R | Class Y |
|
| Expenses paid per $1,000 *† | $6.99 | $10.94 | $10.94 | $9.63 | $8.31 | $5.67 |
|
| Ending value (after expenses) | $1,101.00 | $1,096.60 | $1,097.10 | $1,098.50 | $1,099.20 | $1,102.40 |
|
* Expenses for each share class are calculated using the fund’s annualized expense ratio for each class, which represents the ongoing expenses as a percentage of average net assets for the six months ended 1/31/10. The expense ratio may differ for each share class.
† Expenses are calculated by multiplying the expense ratio by the average account value for the period; then multiplying the result by the number of days in the period; and then dividing that result by the number of days in the year.
13
Estimate the expenses you paid
To estimate the ongoing expenses you paid for the six months ended January 31, 2010, use the following calculation method. To find the value of your investment on August 1, 2009, call Putnam at 1-800-225-1581.
Compare expenses using the SEC’s method
The Securities and Exchange Commission (SEC) has established guidelines to help investors assess fund expenses. Per these guidelines, the following table shows your fund’s expenses based on a $1,000 investment, assuming a hypothetical 5% annualized return. You can use this information to compare the ongoing expenses (but not transaction expenses or total costs) of investing in the fund with those of other funds. All mutual fund shareholder reports will provide this information to help you make this comparison. Please note that you cannot use this information to estimate your actual ending account balance and expenses paid during the period.
| | | | | | |
| | Class A | Class B | Class C | Class M | Class R | Class Y |
|
| Expenses paid per $1,000 *† | $6.72 | $10.51 | $10.51 | $9.25 | $7.98 | $5.45 |
|
| Ending value (after expenses) | $1,018.55 | $1,014.77 | $1,014.77 | $1,016.03 | $1,017.29 | $1,019.81 |
|
* Expenses for each share class are calculated using the fund’s annualized expense ratio for each class, which represents the ongoing expenses as a percentage of average net assets for the six months ended 1/31/10. The expense ratio may differ for each share class.
† Expenses are calculated by multiplying the expense ratio by the average account value for the period; then multiplying the result by the number of days in the period; and then dividing that result by the number of days in the year.
14
Terms and definitions
Important terms
Total return shows how the value of the fund’s shares changed over time, assuming you held the shares through the entire period and reinvested all distributions in the fund.
Net asset value (NAV) is the price, or value, of one share of a mutual fund, without a sales charge. NAVs fluctuate with market conditions. NAV is calculated by dividing the net assets of each class of shares by the number of outstanding shares in the class.
Public offering price (POP) is the price of a mutual fund share plus the maximum sales charge levied at the time of purchase. POP performance figures shown here assume the 5.75% maximum sales charge for class A shares and 3.50% for class M shares.
Contingent deferred sales charge (CDSC) is generally a charge applied at the time of the redemption of class B or C shares and assumes redemption at the end of the period. Your fund’s class B CDSC declines from a 5% maximum during the first year to 1% during the sixth year. After the sixth year, the CDSC no longer applies. The CDSC for class C shares is 1% for one year after purchase.
Share classes
Class A shares are generally subject to an initial sales charge and no CDSC (except on certain redemptions of shares bought without an initial sales charge).
Class B shares are not subject to an initial sales charge. They may be subject to a CDSC.
Class C shares are not subject to an initial sales charge and are subject to a CDSC only if the shares are redeemed during the first year.
Class M shares have a lower initial sales charge and a higher 12b-1 fee than class A shares and no CDSC (except on certain redemptions of shares bought without an initial sales charge).
Class R shares are not subject to an initial sales charge or CDSC and are available only to certain defined contribution plans.
Class Y shares are not subject to an initial sales charge or CDSC, and carry no 12b-1 fee. They are generally only available to corporate and institutional clients and clients in other approvedprograms.
Comparative indexes
Barclays Capital Aggregate Bond Index is an unmanaged index of U.S. investment-grade fixed-income securities.
BofA Merrill Lynch U.S. 3-month Treasury Bill Index is an unmanaged index that seeks to measure the performance of U.S. Treasury bills available in the marketplace.
Russell 1000 Growth Index is an unmanaged index of those companies in the large-cap Russell 1000 Index chosen for their growth orientation.
S&P 500 Index is an unmanaged index of common stock performance.
Indexes assume reinvestment of all distributions and do not account for fees. Securities and performance of a fund and an index will differ. You cannot invest directly in an index.
Lipper is a third-party industry-ranking entity that ranks mutual funds. Its rankings do not reflect sales charges. Lipper rankings are based on total return at net asset value relative to other funds that have similar current investment styles or objectives as determined by Lipper. Lipper may change a fund’s category assignment at its discretion. Lipper category averages reflect performance trends for funds within a category.
15
Trustee approval of management contract
General conclusions
The Board of Trustees of the Putnam funds oversees the management of each fund and, as required by law, determines annually whether to approve the continuance of your fund’s management contract with Putnam Investment Management (“Putnam Management”).
In this regard, the Board of Trustees, with the assistance of its Contract Committee consisting solely of Trustees who are not “interested persons” (as such term is defined in the Investment Company Act of 1940, as amended) of the Putnam funds (the “Independent Trustees”), requests and evaluates all information it deems reasonably necessary under the circumstances. Over the course of several months ending in June 2009, the Contract Committee met several times to consider the information provided by Putnam Management and other information developed with the assistance of the Board’s independent counsel and independent staff. The Contract Committee reviewed and discussed key aspects of this information with all of the Independent Trustees. At the Trustees’ June 12, 2009 meeting, the Contract Committee recommended, and the Independent Trustees approved, the continuance of your fund’s management contract, effective July 1 , 2009. In addition, at the Trustees’ September 11, 2009 meeting, the Contract Committee recommended, and the Independent Trustees approved, a sub-management contract with respect to your fund between Putnam Management and its affiliate, Putnam Investments Limited (“PIL”), effective November 30, 2009. (Because PIL is an affiliate of Putnam Management and Putnam Management remains fully responsible for all services provided by PIL, the Trustees have not evaluated PIL as a separate entity, and all subsequent references to Putnam Management below should be deemed to include reference to PIL as necessary or appropriate in the context.)
The Independent Trustees’ approval was based on the following conclusions:
• That the fee schedule in effect for your fund represented reasonable compensation in light of the nature and quality of the services being provided to the fund, the fees paid by competitive funds and the costs incurred by Putnam Management in providing such services, and
• That such fee schedule represented an appropriate sharing between fund shareholders and Putnam Management of such economies of scale as may exist in the management of the fund at current asset levels.
These conclusions were based on a comprehensive consideration of all information provided to the Trustees, were subject to the continued application of certain expense reductions and waivers pending other considerations noted below, and were not the result of any single factor. Some of the factors that figured particularly in the Trustees’ deliberations and how the Trustees considered these factors are described below, although individual Trustees may have evaluated the information presented differently, giving different weights to various factors. It is also important to recognize that the fee arrangements for your fund and the other Putnam funds are the result of many years of review and discussion between the Independent Trustees and Putnam Management, that certain aspects of the arrangements may receive greater scrutiny in some years than others, and that the Trustees’ conclusions may be based, in part, on their consideration of these sam e arrangements in prior years.
16
Consideration of strategic
pricing proposal
The Trustees considered that the Contract Committee had been engaged in a detailed review of Putnam Management’s strategic pricing proposal that was first presented to the Committee at its May 2009 meeting. The proposal included proposed changes to the basic structure of the management fees in place for all open-end funds (except the Putnam RetirementReady® Funds and Putnam Money Market Liquidity Fund), including implementation of a breakpoint structure based on the aggregate net assets of all such funds in lieu of the individual breakpoint structures in place for each fund, as well as implementation of performance fees for certain funds. In addition, the proposal recommended substituting separate expense limitations on investor servicing fees and on other expenses as a group in lieu of the total expense limitations in place for many funds.
While the Contract Committee noted the likelihood that the Trustees and Putnam Management would reach agreement on the strategic pricing matters in later months, the terms of the management contracts required that the Trustees approve the continuance of the contracts in order to prevent their expiration at June 30, 2009. The Contract Committee’s recommendations in June reflect its conclusion that the terms of the contractual arrangements for your fund continued to be appropriate for the upcoming term, absent any possible agreement with respect to the matters addressed in Putnam Management’s proposal.
The Trustees were mindful of the significant changes that had occurred at Putnam Management in the past two years, including a change of ownership, the installation of a new senior management team at Putnam Management, the substantial decline in assets under management resulting from extraordinary market forces as well as continued net redemptions in many funds, the introduction of new fund products representing novel investment strategies and the introduction of performance fees for certain new funds. The Trustees were also mindful that many other leading firms in the industry had also been experiencing significant challenges due to the changing financial and competitive environment. For these reasons, even though the Trustees believed that the current contractual arrangements in place between the funds and Putnam Management and its affiliates have served shareholders well and continued to be appropriate for the nea r term, the Trustees believed that it was an appropriate time to reconsider the current structure of the funds’ contractual arrangements with Putnam Management with a view to possible changes that might better serve the interests of shareholders in this new environment. The Trustees concluded their review of Putnam Management’s strategic pricing proposal in July 2009, and their considerations regarding the proposal are discussed below under the heading “Subsequent approval of strategic pricing proposal.” With the exception of the discussion under this heading, the following discussion generally addresses only the Trustees’ reasons for recommending the continuance of the current contractual arrangements (and the new sub-management contract between Putnam Management and PIL, which the Trustees evaluated in large part based on their review of contractual arrangements in June 2009) as, at the time the Trustees determined to make this recommendation, the Trustees had not yet reached any c onclusions with respect to the strategic pricing proposal.
Management fee schedules and
categories; total expenses
The Trustees reviewed the management fee schedules in effect for all Putnam funds, including fee levels and breakpoints, and the assignment of funds to particular fee
17
categories. The general fee structure has been carefully developed over the years and re-examined on many occasions and adjusted where appropriate. In this regard, the Trustees noted that shareholders of all funds voted by overwhelming majorities in 2007 to approve new management contracts containing identical fee schedules.
In reviewing fees and expenses, the Trustees generally focused their attention on material changes in circumstances — for example, changes in a fund’s size or investment style, changes in Putnam Management’s operating costs, or changes in competitive practices in the mutual fund industry — that suggest that consideration of fee changes might be warranted. The Trustees concluded that the circumstances did not warrant changes to the management fee structure of your fund at that time but, as indicated above, based on their detailed review of the current fee structure, were prepared to consider possible changes to this arrangement that might better serve the interests of shareholders in the future. The Trustees focused on two areas of particular interest, as discussed further below:
• Competitiveness. The Trustees reviewed comparative fee and expense information for competitive funds, which indicated that, in a custom peer group of competitive funds selected by Lipper Inc., your fund ranked in the 10th percentile in management fees and in the 52nd percentile in total expenses (less any applicable 12b-1 fees) as of December 31, 2008 (the first percentile being the least expensive funds and the 100th percentile being the most expensive funds).
The Trustees noted that expense ratios for a number of Putnam funds, which show the percentage of fund assets used to pay for management and administrative services, distribution (12b-1) fees (as applicable) and other expenses, had been increasing recently as a result of declining net assets and the natural operation of fee breakpoints. The Trustees expressed their intention to monitor the funds’ percentile rankings in management fees and in total expenses to ensure that fees and expenses of the funds continue to meet evolving competitive standards.
The Trustees noted that the expense ratio increases described above were being controlled by expense limitations initially implemented in January 2004. These expense limitations give effect to a commitment by Putnam Management that the expense ratio of each open-end fund would be no higher than the average expense ratio of the competitive funds included in the fund’s relevant Lipper universe (exclusive of any applicable 12b-1 charges in each case). The Trustees observed that this commitment to limit fund expenses has served shareholders well since its inception and, while the Contract Committee was reviewing proposed alternative expense limitation arrangements as noted above, the Trustees received a commitment from Putnam Management and its parent company to continue this program through at least June 30, 2010, or such earlier time as the Trustees and Putnam Management reach agreement on alternative arrangements.
In order to ensure that the expenses of the Putnam funds continue to meet evolving competitive standards, the Trustees requested, and Putnam Management agreed, to extend for the twelve months beginning July 1, 2009, or until such earlier time as the Trustees and Putnam Management reach agreement on alternative expense limitation arrangements, an additional expense limitation for certain funds at an amount equal to the average expense ratio (exclusive of 12b-1 charges) of a custom peer group of competitive funds selected by Lipper to correspond to the size of the fund. This additional expense limitation is applicable to those open-end funds that had above-average expense ratios (exclusive of
18
12b-1 charges) based on the custom peer group data for the period ended December 31, 2007. This additional expense limitation was not applied to your fund because it had a below-average expense ratio relative to its custom peer group.
• Economies of scale. Your fund currently has the benefit of breakpoints in its management fee that provide shareholders with significant economies of scale, which means that the effective management fee rate of the fund (as a percentage of fund assets) declines as the fund grows in size and crosses specified asset thresholds. Conversely, as the fund shrinks in size - as has been the case for many Putnam funds in recent years - these breakpoints result in increasing fee levels. In recent years, the Trustees have examined the operation of the existing breakpoint structure during periods of both growth and decline in asset levels. The Trustees concluded that the fee schedule in effect for your fund represented an appropriate sharing of economies of scale at that time but, as noted above, were in the process of reviewing a proposal to el iminate individual fund breakpoints for all of the open-end funds (except for the Putnam RetirementReady® Funds and Putnam Money Market Liquidity Fund) in favor of a breakpoint structure based on the aggregate net assets of all such funds.
In connection with their review of the management fees and total expenses of the Putnam funds, the Trustees also reviewed the costs of the services provided and profits realized by Putnam Management and its affiliates from their contractual relationships with the funds. This information included trends in revenues, expenses and profitability of Putnam Management and its affiliates relating to the investment management and distribution services provided to the funds. In this regard, the Trustees also reviewed an analysis of Putnam Management’s revenues, expenses and profitability with respect to the funds’ management contracts, allocated on a fund-by-fund basis.
Investment performance
The quality of the investment process provided by Putnam Management represented a major factor in the Trustees’ evaluation of the quality of services provided by Putnam Management under your fund’s management contract. The Trustees were assisted in their review of the Putnam funds’ investment process and performance by the work of the Investment Oversight Coordinating Committee of the Trustees and the Investment Oversight Committees of the Trustees, which had met on a regular monthly basis with the funds’ portfolio teams throughout the year. The Trustees concluded that Putnam Management generally provides a high-quality investment process — as measured by the experience and skills of the individuals assigned to the management of fund portfolios, the resources made available to such personnel, and in general the ability of Putnam Management to attract and retain high-quality personnel — but also recognized that this does no t guarantee favorable investment results for every fund in every time period. The Trustees considered the investment performance of each fund over multiple time periods and considered information comparing each fund’s performance with various benchmarks and with the performance of competitive funds.
The Trustees noted the disappointing investment performance of many of the funds for periods ended March 31, 2009. They discussed with senior management of Putnam Management the factors contributing to such underperformance and the actions being taken to improve performance. The Trustees recognized that, in recent years, Putnam Management has taken steps to strengthen its investment personnel and processes to address areas of underperformance, including Putnam Management’s continuing efforts
19
to strengthen the equity research function, recent changes in portfolio managers including increased accountability of individual managers rather than teams, recent changes in Putnam Management’s approach to incentive compensation, including emphasis on top quartile performance over a rolling three-year period, and the recent arrival of a new chief investment officer. The Trustees also recognized the substantial improvement in performance of many funds since the implementation of those changes. The Trustees indicated their intention to continue to monitor performance trends to assess the effectiveness of these efforts and to evaluate whether additional changes to address areas of underperformance are warranted.
In the case of your fund, the Trustees considered that your fund’s class A share cumulative total return performance at net asset value was in the following percentiles of its Lipper Inc. peer group (Lipper Large-Cap Growth Funds) for the one-year, three-year and five-year periods ended March 31, 2009 (the first percentile being the best-performing funds and the 100th percentile being the worst-performing funds):
| | | |
| One-year period | 6th | | |
| | |
| Three-year period | 32nd | | |
| | |
| Five-year period | 57th | | |
| | |
Over the one-year, three-year and five-year periods ended March 31, 2009, there were 798, 684 and 573 funds, respectively, in your fund’s Lipper peer group. Past performance is no guarantee of future results.
As a general matter, the Trustees believe that cooperative efforts between the Trustees and Putnam Management represent the most effective way to address investment performance problems. The Trustees noted that investors in the Putnam funds have, in effect, placed their trust in the Putnam organization, under the oversight of the funds’ Trustees, to make appropriate decisions regarding the management of the funds. Based on the responsiveness of Putnam Management in the recent past to Trustee concerns about investment performance, the Trustees concluded that it is preferable to seek change within Putnam Management to address performance shortcomings. In the Trustees’ view, the alternative of engaging a new investment adviser for an underperforming fund would entail significant disruptions and would not provide any greater assurance of improved investment performance.
Brokerage and soft-dollar allocations;
other benefits
The Trustees considered various potential benefits that Putnam Management may receive in connection with the services it provides under the management contract with your fund. These include benefits related to brokerage and soft-dollar allocations, whereby a portion of the commissions paid by a fund for brokerage may be used to acquire research services that may be useful to Putnam Management in managing the assets of the fund and of other clients. The Trustees considered a change made, at Putnam Management’s request, to the Putnam funds’ brokerage allocation policy commencing in 2009, which increased the permitted soft dollar allocation to third-party services over what had been authorized in previous years. The Trustees noted that a portion of available soft dollars continue to be allocated to the payment of fund expenses, although the amount allocated for this purpose has declined in recent years. The Trustees indicated their continued int ent to monitor regulatory developments in this area with the assistance of their Brokerage Committee and also indicated their continued intent to monitor the potential benefits associated with the allocation of fund brokerage and trends in industry practice to ensure that the principle of seeking best price and execution remains paramount in the portfolio trading process.
20
The Trustees’ annual review of your fund’s management contract also included the review of the investor servicing agreement with Putnam Investor Services, Inc. (“PSERV”), which agreement provides benefits to an affiliate of Putnam Management. The Trustees considered that effective January 1, 2009, the Trustees, PSERV and Putnam Management entered into a new fee schedule that includes for the open-end funds (other than funds of Putnam Variable Trust and Putnam Money Market Liquidity Fund) an expense limitation but, as noted above, also considered that this expense limitation is subject to review as part of the Trustees’ pending review of Putnam’s strategic pricing proposal.
In the case of your fund, the Trustees’ annual review of the fund’s management contract also included the review of the fund’s distributor’s contract and distribution plans with Putnam Retail Management Limited Partnership, which contract and plans also provide benefits to an affiliate of Putnam Management.
Comparison of retail and institutional
fee schedules
The information examined by the Trustees as part of their annual contract review has included for many years information regarding fees charged by Putnam Management and its affiliates to institutional clients such as defined benefit pension plans, college endowments, etc. This information included comparisons of such fees with fees charged to the funds, as well as a detailed assessment of the differences in the services provided to these two types of clients. The Trustees observed, in this regard, that the differences in fee rates between institutional clients and mutual funds are by no means uniform when examined by individual asset sectors, suggesting that differences in the pricing of investment management services to these types of clients reflect to a substantial degree historical competitive forces operating in separate market places. The Trustees considered the fact that fee rates across different asset classe s are typically higher on average for mutual funds than for institutional clients, as well as the differences between the services that Putnam Management provides to the Putnam funds and those that it provides to institutional clients of the firm, but did not rely on such comparisons to any significant extent in concluding that the management fees paid by your fund are reasonable.
Subsequent approval of strategic
pricing proposal
As mentioned above, at a series of meetings beginning in May 2009 and ending on July 10, 2009, the Contract Committee and the Trustees engaged in a detailed review of Putnam Management’s strategic pricing proposal. Following this review, the Trustees of each fund, including all of the Independent Trustees, voted unanimously on July 10, 2009 to approve proposed management contracts reflecting the proposal, as modified based on discussions between the Independent Trustees and Putnam Management, for each fund. In considering the proposed contracts, the Independent Trustees focused largely on the specific proposed changes described below relating to management fees. They also took into account the factors that they considered in connection with their most recent annual approval on June 12, 2009 of the continuance of the funds’ current management contracts and the extensive materials that they had reviewed in connection with that approval process, as described above.
On December 18, 2009, shareholders approved the proposed management contract for your fund. The new management contract was implemented on January 1, 2010.
• Considerations relating to Fund Family fee rate calculations. The Independent Trustees considered that the proposed management contracts would change the manner in which
21
fund shareholders share in potential economies of scale associated with the management of the funds. Under the current management contracts, shareholders of a fund (other than Putnam Money Market Liquidity Fund and the Putnam RetirementReady® Funds, which do not pay management fees to Putnam Management) benefit from increased fund size through reductions in the effective management fee paid to Putnam Management once the fund’s net assets exceed the first breakpoint in the fund’s fee schedule ($500 million for most funds). Conversely, in the case of funds with net assets above the level of the first breakpoint, the effective management fee increases as the fund’s average net assets decline below a breakpoint. These breakpoints are measured solely by the net assets of each individual fund and are not affected by possible growth (or decline) of net assets of other funds in the Fund Family. (“Fund Family” for purposes of this discussion refers to all open-end mutual funds sponsored by Putnam Management, except for the Putnam RetirementReady® Funds and Putnam Money Market Liquidity Fund.) Under the proposed management contracts, potential economies of scale would be shared ratably among shareholders of all funds, regardless of their size. The management fees paid by a fund (and indirectly by shareholders) would no longer be affected by the growth (or decline) of assets of the particular fund, but rather would be affected solely by the growth (or decline) of the aggregate net assets of all funds in the Fund Family, regardless of whether the net assets of the particular fund are growing or declining.
The table below shows the proposed effective management fee rate for your fund, based on June 30, 2009 net assets of the Fund Family ($52.3 billion). This table also shows the effective management fee rate payable by your fund under its current management contract, based on the net assets of the fund as of June 30, 2009. Finally, this table shows the difference in the effective management fees, based on net assets as of June 30, 2009, between the proposed management contract and the current contract.
| | | |
| | Proposed Effective | Current Effective | |
| Name of Fund | Contractual Rate | Contractual Rate | Difference |
|
| Putnam Growth Opportunities Fund | 0.572% | 0.700% | (0.128)% |
As shown in the foregoing table, based on June 30, 2009 net asset levels, the proposed management contract would provide for payment of a management fee rate that is lower for your fund than the management fee rate payable under the current management contract. For a small number of funds (although not your fund), the management fee rate would be slightly higher under the proposed contract at these asset levels, but by only immaterial amounts. In the aggregate, the financial impact on Putnam Management of implementing this proposed change for all funds at June 30, 2009 net asset levels is a reduction in annual management fee revenue of approximately $24.0 million. (Putnam Management has already incurred a significant portion of this revenue reduction through the waiver of a portion of its current management fees for certain funds pending shareholder consideration of the proposed management contracts. Putnam is n ot obliged to continue such waivers beyond July 31, 2010 in the event that the proposed contracts are not approved by shareholders.) The Independent Trustees carefully considered the implications of this proposed change under a variety of economic circumstances. They considered the fact that at current asset levels the management fees paid by the funds under the proposed contract would be lower for almost all funds, and would not be materially higher for any fund. They considered the possibility that under some circumstances, the current management contract could result in a lower fee for a particular fund than
22
the proposed management contract. Such circumstances might occur, for example, if the aggregate net assets of the Fund Family remain largely unchanged and the net assets of an individual fund grew substantially, or if the net assets of an individual fund remain largely unchanged and the aggregate net assets of the Fund Family declined substantially.
The Independent Trustees noted that future changes in the net assets of individual funds are inherently unpredictable and that experience has shown that funds often grow in size and decline in size over time depending on market conditions and the changing popularity of particular investment styles and asset classes. They noted that, while the aggregate net assets of the Fund Family have changed substantially over time, basing a management fee on the aggregate level of assets of the Fund Family would likely reduce fluctuations in costs paid by individual funds and lead to greater stability and predictability of fund operating costs over time.
The Independent Trustees considered that the proposed management contract would likely be advantageous for newly organized funds that have yet to attract significant assets and for funds in specialty asset classes that are unlikely to grow to a significant size. In each case, such funds would participate in the benefits of scale made possible by the aggregate size of the Fund Family to an extent that would not be possible based solely on their individual size.
The Independent Trustees also considered that for funds that have achieved or are likely to achieve considerable scale on their own, the proposed management contract could result in sharing of economies which might lead to slightly higher costs under some circumstances, but they noted that any such increases are immaterial at current asset levels and that over time such funds are likely to realize offsetting benefits from their opportunity to participate, both through the exchange privilege and through the Fund Family breakpoint fee structure, in the improved growth prospects of a diversified Fund Family able to offer competitively priced products.
The Independent Trustees noted that the implementation of the proposed management contracts would result in a reduction in aggregate fee revenues for Putnam Management at current asset levels. They also noted that applying various projections of growth equally to the aggregate net assets of the Fund Family and to the net assets of individual funds also showed revenue reductions for Putnam Management. They recognized, however, the possibility that under some scenarios Putnam Management might realize greater future revenues, with respect to certain funds, under the proposed contracts than under the current contracts, but considered such circumstances to be both less likely and inherently unpredictable.
The Independent Trustees considered the extent to which Putnam Management may realize economies of scale in connection with the management of the funds. In this regard, they considered the possibility that such economies of scale as may exist in the management of mutual funds may be associated more closely with the size of the aggregate assets of the mutual fund complex than with the size of any individual fund. In this regard the Independent Trustees considered the financial information provided to them by Putnam Management over a period of many years regarding the allocation of costs involved in calculating the profitability of its mutual fund business as a whole and the profitability of individual funds. The Independent Trustees noted that the methodologies for such cost allocations had been reviewed on a number of occasions in the past by independent financial consultants engaged by the Independent Trustees. The Independent Trustees noted
23
that these methodologies support Putnam Management’s assertion that many of its operating costs and any associated economies of scale are related more to the aggregate net assets under management in various sectors of its business than to the size of individual funds. They noted that on a number of occasions in the past the Independent Trustees had separately considered the possibility of calculating management fees in whole or in part based on aggregate net assets of the Putnam funds.
The Independent Trustees considered the fact that the proposed contracts would result in a sharing among the affected funds of economies of scale that for the most part are now enjoyed by the larger funds, without materially increasing the current costs of any of the larger funds. They concluded that this sharing of economies among funds was appropriate in light of the diverse investment opportunities available to shareholders of all funds through the existence of the exchange privilege. They also considered that the proposed change in management fee structure would allow Putnam Management to introduce new investment products at more attractive pricing levels than may be currently be the case.
After considering all of the foregoing, the Independent Trustees concluded that the proposed calculation of management fees based on the aggregate net assets of the Fund Family represented a fair and reasonable means of sharing possible economies of scale among the shareholders of all funds.
• Considerations relating to addition of fee rate adjustments based on investment performance for certain funds. The Independent Trustees considered that Putnam’s proposal to add fee rate adjustments based on investment performance to the management contracts of certain funds reflected a desire by Putnam Management to align its fee revenues more closely with investment performance in the case of certain funds. They noted that Putnam Management already has a significant financial interest in achieving good performance results for the funds it manages. Putnam Management’s fees are based on the assets under its management (whether calculated on an individual fund or complex-wide basis). Good performance results in higher asset levels and therefore higher revenues to Putnam Management. Moreover, good performance also tends to at tract additional investors to particular funds or the complex generally, also resulting in higher revenues. Nevertheless, the Independent Trustees concluded that adjusting management fees based on performance for certain selected funds could provide additional benefits to shareholders.
The Independent Trustees noted that Putnam Management proposed the addition of performance adjustments only for certain of the funds and considered whether similar adjustments might be appropriate for other funds. In this regard, they considered Putnam Management’s belief that the addition of performance adjustments would be most appropriate for shareholders of U.S. growth funds, including your fund, international equity funds and Putnam Global Equity Fund. They also considered Putnam Management’s view that it would continue to monitor whether performance fees would be appropriate for other funds. Accordingly, the Independent Trustees concluded that it would be desirable to gain further experience with the operation of performance adjustments for certain funds and the market’s receptivity to such fee structures before giving further consideration to whether similar performance adjustments would be appropriate for other funds as well.
• Considerations relating to standardization of payment terms. The proposed management contracts for all funds provide that management fees will be computed and paid monthly within 15 days after the end of each month. The current contracts of the funds contain
24
quarterly computation and payment terms in some cases. These differences largely reflect practices in place at earlier times when many of the funds were first organized. Under the proposed contract, certain funds would make payments to Putnam Management earlier than they do under their current contract. This would reduce a fund’s opportunity to earn income on accrued but unpaid management fees by a small amount, but would not have a material effect on a fund’s operating costs.
The Independent Trustees considered the fact that standardizing the payment terms for all funds would involve an acceleration in the timing of payments to Putnam Management for some funds and a corresponding loss of a potential opportunity for such funds to earn income on accrued but unpaid management fees. The Independent Trustees did not view this change as having a material impact on shareholders of any fund. In this regard, the Independent Trustees noted that the proposed contracts conform to the payment terms included in management contracts for all Putnam funds organized in recent years and that standardizing payment terms across all funds would reduce administrative burdens for both the funds and Putnam Management.
• Considerations relating to comparisons with management fees and total expenses of competitive funds. As part of their evaluation of the proposed management contracts, the Independent Trustees also reviewed the general approach taken by Putnam Management and the Independent Trustees in recent years in imposing appropriate limits on total fund expenses. As part of the annual contract review process in recent years, Putnam Management agreed to waive fees as needed to limit total fund expenses to a maximum level equal to the average total expenses of comparable competitive funds in the mutual fund industry. In connection with its proposal to implement new management contracts, Putnam Management also proposed, and the Independent Trustees approved, certain changes in this approach that shift the focus from controlling total expenses to i mposing separate limits on certain categories of expenses, as required. As a general matter, Putnam Management and the Independent Trustees concluded that management fees for the Putnam funds are competitive with the fees charged by comparable funds in the industry. Nevertheless, the Independent Trustees considered specific management fee waivers proposed to be implemented as of August 1, 2009 by Putnam Management with respect to the current management fees of certain funds, as well as projected reductions in management fees for almost all funds that would result under the proposed contracts. Putnam Management and the Independent Trustees also agreed to impose separate expense limitations of 37.5 basis points on the general category of shareholder servicing expenses and 20 basis points on the general category of other ordinary operating expenses. These new expense limitations, as well as the fee waivers, were implemented for all funds effective as of August 1, 2009, replacing the expense limitation referred to above.
These changes resulted in lower total expenses for many funds, but in the case of some funds total expenses increased after application of the new waivers and expense limitations (as compared with the results obtained using the expense limitation method previously in place). In this regard, the Independent Trustees considered the likelihood that total expenses for most of these funds would have increased in any event in the normal course under the previous expense limitation arrangement, as the reported total expense levels of many competitive funds increased in response to the major decline in asset values that began in September 2008. These new waivers and expense limitations will continue in effect until at least July 31, 2010 and will be re-evaluated by
25
the Independent Trustees as part of the annual contract review process prior to their scheduled expiration. However, the management fee waivers referred to above would largely become permanent reductions in fees as a result of the implementation of the proposed management contracts.
Under these new expense limitation arrangements effective August 1, 2009, your fund was subject to a management fee waiver that reduced the fund’s management fee pending implementation of the proposed management contract, and in any event, through July 31, 2010. In addition, your fund is subject to expense limitations of 37.5 basis points on the category of shareholder servicing fees and 20 basis points on the general category of other ordinary operating expenses.
Other information for shareholders
Important notice regarding delivery
of shareholder documents
In accordance with SEC regulations, Putnam sends a single copy of annual and semiannual shareholder reports, prospectuses, and proxy statements to Putnam shareholders who share the same address, unless a shareholder requests otherwise. If you prefer to receive your own copy of these documents, please call Putnam at 1-800-225-1581, and Putnam will begin sending individual copies within 30 days.
Proxy voting
Putnam is committed to managing our mutual funds in the best interests of our shareholders. The Putnam funds’ proxy voting guidelines and procedures, as well as information regarding how your fund voted proxies relating to portfolio securities during the 12-month period ended June 30, 2009, are available in the Individual Investors section of putnam.com, and on the SEC’s Web site, www.sec.gov. If you have questions about finding forms on the SEC’s Web site, you may call the SEC at 1-800-SEC-0330. You may also obtain the Putnam funds’ proxy voting guidelines and procedures at no charge by calling Putnam’s Shareholder Services at 1-800-225-1581.
Fund portfolio holdings
The fund will file a complete schedule of its portfolio holdings with the SEC for the first and third quarters of each fiscal year on Form N-Q. Shareholders may obtain the fund’s Forms N-Q on the SEC’s Web site at www.sec.gov. In addition, the fund’s Forms N-Q may be reviewed and copied at the SEC’s Public Reference Room in Washington, D.C. You may call the SEC at 1-800-SEC-0330 for information about the SEC’s Web site or the operation of the Public Reference Room.
Trustee and employee
fund ownership
Putnam employees and members of the Board of Trustees place their faith, confidence, and, most importantly, investment dollars in Putnam mutual funds. As of January 31, 2010, Putnam employees had approximately $294,000,000 and the Trustees had approximately $45,000,000 invested in Putnam mutual funds. These amounts include investments by the Trustees’ and employees’ immediate family members as well as investments through retirement and deferred compensation plans.
26
Financial statements
A guide to financial statements
These sections of the report, as well as the accompanying Notes, constitute the fund’s financial statements.
The fund’s portfolio lists all the fund’s investments and their values as of the last day of the reporting period. Holdings are organized by asset type and industry sector, country, or state to show areas of concentration and diversification.
Statement of assets and liabilities shows how the fund’s net assets and share price are determined. All investment and noninvestment assets are added together. Any unpaid expenses and other liabilities are subtracted from this total. The result is divided by the number of shares to determine the net asset value per share, which is calculated separately for each class of shares. (For funds with preferred shares, the amount subtracted from total assets includes the liquidation preference of preferred shares.)
Statement of operations shows the fund’s net investment gain or loss. This is done by first adding up all the fund’s earnings — from dividends and interest income — and subtracting its operating expenses to determine net investment income (or loss). Then, any net gain or loss the fund realized on the sales of its holdings — as well as any unrealized gains or losses over the period — is added to or subtracted from the net investment result to determine the fund’s net gain or loss for the fiscal period.
Statement of changes in net assets shows how the fund’s net assets were affected by the fund’s net investment gain or loss, by distributions to shareholders, and by changes in the number of the fund’s shares. It lists distributions and their sources (net investment income or realized capital gains) over the current reporting period and the most recent fiscal year-end. The distributions listed here may not match the sources listed in the Statement of operations because the distributions are determined on a tax basis and may be paid in a different period from the one in which they were earned. Dividend sources are estimated at the time of declaration. Actual results may vary. Any non-taxable return of capital cannot be determined until final tax calculations are completed after the end of the fund’s fiscal year.
Financial highlights provide an overview of the fund’s investment results, per-share distributions, expense ratios, net investment income ratios, and portfolio turnover in one summary table, reflecting the five most recent reporting periods. In a semiannual report, the highlights table also includes the current reporting period.
27
The fund’s portfolio 1/31/10 (Unaudited)
| | |
| COMMON STOCKS (97.7%)* | Shares | Value |
|
| Aerospace and defense (4.0%) | | |
| Goodrich Corp. | 41,900 | $2,594,029 |
|
| Raytheon Co. S | 63,900 | 3,350,277 |
|
| United Technologies Corp. | 103,600 | 6,990,928 |
|
| | | 12,935,234 |
| Automotive (0.8%) | | |
| Hertz Global Holdings, Inc. † S | 92,200 | 955,192 |
|
| Lear Corp. † | 23,300 | 1,603,040 |
|
| | | 2,558,232 |
| Banking (2.7%) | | |
| Banco Santander Brasil SA ADS (Brazil) † | 136,303 | 1,641,088 |
|
| JPMorgan Chase & Co. | 81,100 | 3,158,034 |
|
| State Street Corp. | 39,400 | 1,689,472 |
|
| Wells Fargo & Co. | 74,500 | 2,118,035 |
|
| | | 8,606,629 |
| Beverage (1.2%) | | |
| Coca-Cola Enterprises, Inc. | 96,700 | 1,952,373 |
|
| Molson Coors Brewing Co. Class B | 42,500 | 1,785,000 |
|
| | | 3,737,373 |
| Biotechnology (2.7%) | | |
| Amgen, Inc. † | 35,800 | 2,093,584 |
|
| Dendreon Corp. † | 50,900 | 1,409,930 |
|
| Facet Biotech Corp. † | 50,200 | 790,650 |
|
| Genzyme Corp. † | 49,200 | 2,669,592 |
|
| Gilead Sciences, Inc. † | 39,600 | 1,911,492 |
|
| | | 8,875,248 |
| Cable television (1.0%) | | |
| DIRECTV Class A † S | 107,000 | 3,247,450 |
|
| | | 3,247,450 |
| Chemicals (2.3%) | | |
| Agrium, Inc. (Canada) S | 31,700 | 1,786,295 |
|
| Albemarle Corp. | 85,400 | 3,050,488 |
|
| Monsanto Co. | 32,600 | 2,473,688 |
|
| | | 7,310,471 |
| Combined utilities (0.7%) | | |
| El Paso Corp. | 234,400 | 2,379,160 |
|
| | | 2,379,160 |
| Communications equipment (6.6%) | | |
| Cisco Systems, Inc. † | 379,912 | 8,536,623 |
|
| CommScope, Inc. † | 81,670 | 2,222,241 |
|
| F5 Networks, Inc. † | 16,799 | 830,375 |
|
| Harris Corp. | 46,500 | 1,995,780 |
|
| Qualcomm, Inc. | 202,600 | 7,939,894 |
|
| | | 21,524,913 |
| Computers (9.4%) | | |
| Apple, Inc. † | 61,132 | 11,744,685 |
|
| EMC Corp. † | 273,700 | 4,562,579 |
|
| Hewlett-Packard Co. | 126,600 | 5,959,062 |
|
| IBM Corp. | 60,000 | 7,343,400 |
|
| Polycom, Inc. † | 40,000 | 897,200 |
|
| | | 30,506,926 |
28
| | |
| COMMON STOCKS (97.7%)* cont. | Shares | Value |
|
| Conglomerates (1.3%) | | |
| 3M Co. | 53,900 | $4,338,411 |
|
| | | 4,338,411 |
| Consumer (0.9%) | | |
| Jarden Corp. | 96,068 | 2,928,153 |
|
| | | 2,928,153 |
| Consumer finance (1.9%) | | |
| Cia Brasileira de Meios de Pagamento (Brazil) | 81,800 | 647,733 |
|
| Mastercard, Inc. Class A | 21,900 | 5,472,810 |
|
| | | 6,120,543 |
| Consumer goods (1.2%) | | |
| Colgate-Palmolive Co. | 14,600 | 1,168,438 |
|
| Procter & Gamble Co. (The) | 44,900 | 2,763,595 |
|
| | | 3,932,033 |
| Containers (0.5%) | | |
| Owens-Illinois, Inc. † | 49,200 | 1,339,224 |
|
| | | 1,339,224 |
| Electric utilities (0.9%) | | |
| CenterPoint Energy, Inc. | 213,164 | 2,973,638 |
|
| | | 2,973,638 |
| Electronics (2.7%) | | |
| Integrated Device Technology, Inc. † | 250,657 | 1,421,225 |
|
| Marvell Technology Group, Ltd. † | 52,200 | 909,846 |
|
| Texas Instruments, Inc. | 176,300 | 3,966,750 |
|
| Tyco Electronics, Ltd. (Switzerland) | 101,200 | 2,517,856 |
|
| | | 8,815,677 |
| Energy (oil field) (2.5%) | | |
| Halliburton Co. | 160,400 | 4,685,284 |
|
| Schlumberger, Ltd. | 48,000 | 3,046,080 |
|
| Smith International, Inc. | 10,800 | 327,456 |
|
| | | 8,058,820 |
| Energy (other) (0.5%) | | |
| First Solar, Inc. † S | 15,500 | 1,756,150 |
|
| | | 1,756,150 |
| Engineering and construction (0.4%) | | |
| Shaw Group, Inc. † | 35,700 | 1,152,753 |
|
| | | 1,152,753 |
| Food (2.7%) | | |
| Campbell Soup Co. | 83,900 | 2,777,929 |
|
| General Mills, Inc. | 36,400 | 2,595,684 |
|
| Kraft Foods, Inc. Class A | 125,000 | 3,457,500 |
|
| | | 8,831,113 |
| Forest products and packaging (0.5%) | | |
| Packaging Corp. of America | 69,200 | 1,525,168 |
|
| | | 1,525,168 |
| Health-care services (3.8%) | | |
| Aetna, Inc. | 77,300 | 2,316,681 |
|
| AmerisourceBergen Corp. | 101,600 | 2,769,616 |
|
| Express Scripts, Inc. † | 23,000 | 1,928,780 |
|
| Omnicare, Inc. S | 116,590 | 2,914,750 |
|
| Warner Chilcott PLC Class A (Ireland) † | 83,301 | 2,276,616 |
|
| | | 12,206,443 |
29
| | |
| COMMON STOCKS (97.7%)* cont. | Shares | Value |
|
| Insurance (2.4%) | | |
| Aflac, Inc. | 117,698 | $5,700,114 |
|
| Assured Guaranty, Ltd. (Bermuda) | 91,500 | 2,073,390 |
|
| | | 7,773,504 |
| Investment banking/Brokerage (1.7%) | | |
| BlackRock, Inc. | 3,700 | 791,134 |
|
| Bond Street Holdings, LLC Class A F † | 56,513 | 1,130,260 |
|
| Goldman Sachs Group, Inc. (The) | 23,900 | 3,554,408 |
|
| | | 5,475,802 |
| Machinery (0.4%) | | |
| Baldor Electric Co. | 46,700 | 1,152,556 |
|
| | | 1,152,556 |
| Manufacturing (0.7%) | | |
| Eaton Corp. | 38,200 | 2,339,368 |
|
| | | 2,339,368 |
| Media (0.7%) | | |
| Time Warner, Inc. | 80,700 | 2,215,215 |
|
| | | 2,215,215 |
| Medical technology (6.4%) | | |
| Baxter International, Inc. | 51,500 | 2,965,885 |
|
| Covidien PLC (Ireland) | 108,900 | 5,505,984 |
|
| Hospira, Inc. † | 42,300 | 2,142,072 |
|
| Life Technologies Corp. † | 27,900 | 1,386,909 |
|
| Pall Corp. | 52,000 | 1,792,440 |
|
| PSS World Medical, Inc. † | 83,000 | 1,703,160 |
|
| St. Jude Medical, Inc. † S | 110,400 | 4,165,392 |
|
| Stryker Corp. S | 21,800 | 1,131,856 |
|
| | | 20,793,698 |
| Metals (1.1%) | | |
| Steel Dynamics, Inc. | 164,100 | 2,491,038 |
|
| Teck Resources, Ltd. Class B (Canada) † | 31,963 | 1,049,026 |
|
| | | 3,540,064 |
| Oil and gas (2.9%) | | |
| Anadarko Petroleum Corp. | 74,700 | 4,764,366 |
|
| PetroHawk Energy Corp. † | 66,028 | 1,474,405 |
|
| Suncor Energy, Inc. (Canada) | 78,500 | 2,484,525 |
|
| Warren Resources, Inc. † | 291,760 | 673,966 |
|
| | | 9,397,262 |
| Pharmaceuticals (2.4%) | | |
| Abbott Laboratories | 87,300 | 4,621,662 |
|
| Teva Pharmaceutical Industries, Ltd. ADR (Israel) | 58,000 | 3,289,760 |
|
| | | 7,911,422 |
| Railroads (0.5%) | | |
| CSX Corp. | 38,700 | 1,658,682 |
|
| | | 1,658,682 |
| Retail (9.7%) | | |
| Amazon.com, Inc. † | 26,300 | 3,298,283 |
|
| Big Lots, Inc. † S | 119,000 | 3,380,790 |
|
| Costco Wholesale Corp. | 49,300 | 2,831,299 |
|
| CVS Caremark Corp. | 186,500 | 6,037,005 |
|
| Lowe’s Cos., Inc. | 154,200 | 3,338,430 |
|
30
| | |
| COMMON STOCKS (97.7%)* cont. | Shares | Value |
|
| Retail cont. | | |
| Macy’s, Inc. | 89,600 | $1,427,328 |
|
| Staples, Inc. S | 69,300 | 1,625,778 |
|
| Target Corp. | 101,700 | 5,214,159 |
|
| Wal-Mart Stores, Inc. S | 81,500 | 4,354,545 |
|
| | | 31,507,617 |
| Schools (1.3%) | | |
| Apollo Group, Inc. Class A † | 71,740 | 4,346,727 |
|
| | | 4,346,727 |
| Semiconductor (1.8%) | | |
| Atmel Corp. † | 549,300 | 2,548,752 |
|
| Cypress Semiconductor Corp. † | 47,000 | 472,350 |
|
| Formfactor, Inc. † | 86,473 | 1,337,737 |
|
| Novellus Systems, Inc. † | 76,500 | 1,598,850 |
|
| | | 5,957,689 |
| Software (5.2%) | | |
| Longtop Financial Technologies Ltd. ADR (China) † | 18,200 | 630,812 |
|
| Microsoft Corp. | 363,600 | 10,246,248 |
|
| Oracle Corp. | 189,800 | 4,376,788 |
|
| Sybase, Inc. † | 42,700 | 1,736,609 |
|
| | | 16,990,457 |
| Technology (0.5%) | | |
| Tech Data Corp. † | 39,700 | 1,617,775 |
|
| | | 1,617,775 |
| Technology services (4.3%) | | |
| Baidu, Inc. ADR (China) † | 2,759 | 1,135,908 |
|
| eBay, Inc. † | 70,500 | 1,622,910 |
|
| Google, Inc. Class A † | 21,335 | 11,295,176 |
|
| | | 14,053,994 |
| Telecommunications (1.9%) | | |
| American Tower Corp. Class A † | 93,700 | 3,977,565 |
|
| Iridium Communications, Inc. † S | 162,287 | 1,087,323 |
|
| NII Holdings, Inc. † | 35,742 | 1,170,193 |
|
| | | 6,235,081 |
| Textiles (0.5%) | | |
| VF Corp. | 20,700 | 1,491,021 |
|
| | | 1,491,021 |
| Tobacco (1.1%) | | |
| Philip Morris International, Inc. | 79,400 | 3,613,494 |
|
| | | 3,613,494 |
| Toys (0.5%) | | |
| Mattel, Inc. | 25,700 | 506,804 |
|
| Nintendo Co., Ltd. ADR (Japan) | 33,300 | 1,162,170 |
|
| | | 1,668,974 |
| Transportation services (0.5%) | | |
| FedEx Corp. | 18,500 | 1,449,475 |
|
| | | 1,449,475 |
| | | |
| Total common stocks (cost $294,532,981) | | $316,849,639 |
| |
| CONVERTIBLE PREFERRED STOCKS (1.1%)* | Shares | Value |
|
| Bank of America Corp. 10.00% cv. pfd.† | 228,232 | $3,446,303 |
|
| Total convertible preferred stocks (cost $3,524,313) | | $3,446,303 |
31
| | | | |
| WARRANTS (0.9%)* † | Expiration | Strike | | |
| | date | price | Warrants | Value |
|
| JPMorgan Chase & Co. | 10/28/18 | $42.42 | 212,468 | $2,762,084 |
|
| Total warrants (cost $2,284,031) | | | | $2,762,084 |
| | | |
| | |
| U.S. TREASURY OBLIGATIONS (—%)* | | |
| | Principal amount | Value |
|
| U.S. Treasury Inflation Protected Securities 0.875%, | | |
| April 15, 2010 i | $119,890 | $120,087 |
|
| Total U.S. treasury obligations (cost $120,087) | | $120,087 |
| | | |
| PURCHASED OPTIONS | Expiration date/ | Contract | |
| OUTSTANDING (—%)* | strike price | amount | Value |
|
| Costco Wholesale Corp. (Call) | Apr-10/$60.00 | 19,393 | $21,584 |
|
| Lorillard, Inc. (Call) | Jan-11/$95.00 | 18,124 | 15,859 |
|
| TiVo, Inc. (Call) | Feb-10/$12.50 | 191,636 | 43,118 |
|
| Total purchased options outstanding (cost $230,430) | | | $80,561 |
| |
| |
| SHORT-TERM INVESTMENTS (5.9%)* | Principal amount/shares | Value |
|
| Putnam Money Market Liquidity Fund e | | 1,495,597 | $1,495,597 |
|
| Short-term investments held as collateral for loaned securities with | | |
| yields ranging from 0.09% to 0.27% and due dates ranging from | | |
| February 1, 2010 to March 23, 2010 d | | $17,296,009 | 17,294,380 |
|
| U.S. Treasury Bills with an effective yield of 0.31%, April 1, 2010 | 6,000 | 5,995 |
|
| U.S. Treasury Bills with an effective yield of 0.22%, August 26, 2010 | 85,000 | 84,905 |
|
| U.S. Treasury Bills with effective yields ranging from 0.26% to 0.35%, | | |
| November 18, 2010 | | 181,000 | 180,421 |
|
| Total short-term investments (cost $19,061,415) | | | $19,061,298 |
| |
| |
| TOTAL INVESTMENTS | | | |
|
| Total investments (cost $319,753,257) | | | $342,319,972 |
Key to holding’s abbreviations
| |
| ADR | American Depository Receipts |
| ADS | American Depository Shares |
* Percentages indicated are based on net assets of $324,350,255.
† Non-income-producing security.
d See Note 1 to the financial statements regarding securities lending.
e See Note 6 to the financial statements regarding investments in Putnam Money Market Liquidity Fund.
F Is valued at fair value following procedures approved by the Trustees. Securities may be classified as Level 2 or Level 3 for Accounting Standards Codification ASC 820 Fair Value Measurements and Disclosures (“ASC 820”) based on the securities valuation inputs.
i Security purchased with cash or securities received, that was pledged to the fund for collateral on certain derivative contracts (Note 1).
S Securities on loan, in part or in entirety, at January 31, 2010.
At January 31, 2010, liquid assets totaling $11,452,277 have been segregated to cover certain derivatives contracts.
ADR and ADS after the name of a foreign holding represents ownership of foreign securities on deposit with a custodian bank.
The dates shown on debt obligations are the original maturity dates.
32
WRITTEN OPTIONS OUTSTANDING at 1/31/10 (premiums received $173,480) (Unaudited)
| | | |
| | Contract | Expiration date/ | |
| | amount | strike price | Value |
|
| Costco Wholesale Corp. (Call) | 19,393 | Apr-10/$65.00 | $3,581 |
|
| Costco Wholesale Corp. (Put) | 19,393 | Apr-10/$52.50 | 15,955 |
|
| Steel Dynamics, Inc. (Call) | 59,897 | Feb-10/$17.00 | 11,054 |
|
| TiVo, Inc. (Call) | 191,636 | Feb-10/$15.00 | 14,374 |
|
| Total | | | $44,964 |
ASC 820 establishes a three-level hierarchy for disclosure of fair value measurements. The valuation hierarchy is based upon the transparency of inputs to the valuation of the fund’s investments. The three levels are defined as follows:
Level 1 — Valuations based on quoted prices for identical securities in active markets.
Level 2 — Valuations based on quoted prices in markets that are not active or for which all significant inputs are observable, either directly or indirectly.
Level 3 — Valuations based on inputs that are unobservable and significant to the fair value measurement.
The following is a summary of the inputs used to value the fund’s net assets as of January 31, 2010:
| | | |
| | Valuation inputs | |
|
| Investments in securities: | Level 1 | Level 2 | Level 3 |
|
| Common stocks: | | | |
|
| Basic materials | $12,375,703 | $— | $— |
|
| Capital goods | 18,919,135 | — | — |
|
| Communication services | 9,482,531 | — | — |
|
| Conglomerates | 4,338,411 | — | — |
|
| Consumer cyclicals | 33,500,908 | — | — |
|
| Consumer staples | 33,329,044 | — | — |
|
| Energy | 19,212,232 | — | — |
|
| Financials | 26,846,218 | — | 1,130,260 |
|
| Health care | 49,786,811 | — | — |
|
| Technology | 99,467,431 | — | — |
|
| Transportation | 3,108,157 | — | — |
|
| Utilities and power | 5,352,798 | — | — |
|
| Total common stocks | 315,719,379 | — | 1,130,260 |
| Convertible preferred stocks | 3,446,303 | — | — |
|
| Purchased options outstanding | — | 80,561 | — |
|
| U.S. treasury obligations | — | 120,087 | — |
|
| Warrants | 2,762,084 | — | — |
|
| Short-term investments | 1,495,597 | 17,565,701 | — |
|
| Totals by level | $323,423,363 | $17,766,349 | $1,130,260 |
| | Level 1 | Level 2 | Level 3 |
|
| Other financial instruments: | $— | $(44,964) | $— |
|
| Other financial instruments include written options. | | | |
33
The following is a reconciliation of Level 3 assets as of January 31, 2010:
| | | | | | | |
| | | | | | | Net | |
| | | | | Change in net | | transfers | |
| | Balance as | Accrued | Realized | unrealized | Net | in and/ | Balance as of |
| Investments | of July 31, | discounts/ | gain/ | appreciation/ | purchases/ | or out of | January 31, |
| in securities: | 2009 | premiums | (loss) | (depreciation) | sales | Level 3 | 2010 |
|
| Common | | | | | | | |
| stocks: | | | | | | | |
|
| Financials | $— | $— | $— | $— | $1,130,260 | $— | $1,130,260 |
|
| Total common | | | | | | | |
| stocks | $— | — | — | — | 1,130,260 | — | $1,130,260 |
|
| Totals: | $— | $— | $— | $— | $1,130,260 | $— | $1,130,260 |
|
The accompanying notes are an integral part of these financial statements.
34
Statement of assets and liabilities 1/31/10 (Unaudited)
| |
| ASSETS | |
|
| Investment in securities, at value, including $16,628,431 of securities on loan (Note 1): | |
| Unaffiliated issuers (identified cost $318,257,660) | $340,824,375 |
| Affiliated issuers (identified cost $1,495,597) (Note 6) | 1,495,597 |
|
| Dividends, interest and other receivables | 295,680 |
|
| Receivable for shares of the fund sold | 101,080 |
|
| Receivable for investments sold | 2,201,554 |
|
| Total assets | 344,918,286 |
| |
| LIABILITIES | |
|
| Payable for compensation of Manager (Note 2) | 164,467 |
|
| Payable for investments purchased | 2,001,236 |
|
| Payable for shares of the fund repurchased | 295,342 |
|
| Payable for investor servicing fees (Note 2) | 104,430 |
|
| Payable for custodian fees (Note 2) | 5,310 |
|
| Payable for Trustee compensation and expenses (Note 2) | 183,410 |
|
| Payable for administrative services (Note 2) | 1,051 |
|
| Payable for distribution fees (Note 2) | 105,423 |
|
| Written options outstanding, at value (premiums received $173,480) (Notes 1 and 3) | 44,964 |
|
| Collateral on securities loaned, at value (Note 1) | 17,294,380 |
|
| Collateral on certain derivative contracts, at value (Note 1) | 120,087 |
|
| Other accrued expenses | 247,931 |
|
| Total liabilities | 20,568,031 |
| |
| Net assets | $324,350,255 |
|
| |
| REPRESENTED BY | |
|
| Paid-in capital (Unlimited shares authorized) (Notes 1 and 4) | $3,107,939,816 |
|
| Distributions in excess of net investment income (Note 1) | (623,648) |
|
| Accumulated net realized loss on investments and foreign currency transactions (Note 1) | (2,805,661,144) |
|
| Net unrealized appreciation of investments | 22,695,231 |
|
| Total — Representing net assets applicable to capital shares outstanding | $324,350,255 |
| |
| |
| COMPUTATION OF NET ASSET VALUE AND OFFERING PRICE | |
|
| Net asset value and redemption price per class A share ($266,926,947 divided by 19,890,563 shares) | $13.42 |
|
| Offering price per class A share (100/94.25 of $13.42)* | $14.24 |
|
| Net asset value and offering price per class B share ($34,088,675 divided by 2,755,508 shares)** | $12.37 |
|
| Net asset value and offering price per class C share ($12,534,305 divided by 999,931 shares)** | $12.54 |
|
| Net asset value and redemption price per class M share ($4,628,352 divided by 363,869 shares) | $12.72 |
|
| Offering price per class M share (100/96.50 of $12.72)* | $13.18 |
|
| Net asset value, offering price and redemption price per class R share | |
| ($225,699 divided by 17,079 shares) | $13.21 |
|
| Net asset value, offering price and redemption price per class Y share | |
| ($5,946,277 divided by 432,342 shares) | $13.75 |
|
* On single retail sales of less than $50,000. On sales of $50,000 or more the offering price is reduced.
** Redemption price per share is equal to net asset value less any applicable contingent deferred sales charge.
The accompanying notes are an integral part of these financial statements.
35
Statement of operations Six months ended 1/31/10 (Unaudited)
| |
| INVESTMENT INCOME | |
|
| Dividends (net of foreign tax of $6,628) | $1,846,143 |
|
| Interest (net of foreign tax of $134) (including interest income of | |
| $3,591 from investments in affiliated issuers) (Note 6) | 4,391 |
|
| Securities lending | 51,227 |
|
| Total investment income | 1,901,761 |
| |
| |
| EXPENSES | |
|
| Compensation of Manager (Note 2) | 1,134,498 |
|
| Investor servicing fees (Note 2) | 625,351 |
|
| Custodian fees (Note 2) | 10,174 |
|
| Trustee compensation and expenses (Note 2) | 11,749 |
|
| Administrative services (Note 2) | 5,758 |
|
| Distribution fees — Class A (Note 2) | 342,158 |
|
| Distribution fees — Class B (Note 2) | 187,443 |
|
| Distribution fees — Class C (Note 2) | 64,701 |
|
| Distribution fees — Class M (Note 2) | 17,909 |
|
| Distribution fees — Class R (Note 2) | 544 |
|
| Other | 186,764 |
|
| Fees waived and reimbursed by Manager (Note 2) | (177,377) |
|
| Total expenses | 2,409,672 |
| | |
| Expense reduction (Note 2) | (4,041) |
|
| Net expenses | 2,405,631 |
| |
| Net investment loss | (503,870) |
|
| |
| Net realized gain on investments (Notes 1 and 3) | 33,513,599 |
|
| Net realized loss on futures contracts (Note 1) | (41,185) |
|
| Net realized loss on foreign currency transactions (Note 1) | (6,243) |
|
| Net realized gain on written options (Notes 1 and 3) | 289,840 |
|
| Net unrealized depreciation of investments, futures contracts | |
| and written options during the period | (1,744,277) |
|
| Net gain on investments | 32,011,734 |
| |
| Net increase in net assets resulting from operations | $31,507,864 |
|
The accompanying notes are an integral part of these financial statements.
36
Statement of changes in net assets
| | |
| INCREASE (DECREASE) IN NET ASSETS | Six months ended 1/31/10* | Year ended 7/31/09 |
|
| Operations: | | |
| Net investment income (loss) | $(503,870) | $1,042,454 |
|
| Net realized gain (loss) on investments | | |
| and foreign currency transactions | 33,756,011 | (86,831,023) |
|
| Net unrealized appreciation (depreciation) of investments | (1,744,277) | 39,609,863 |
|
| Net increase (decrease) in net assets resulting from operations | 31,507,864 | (46,178,706) |
|
| Distributions to shareholders (Note 1): | | |
| From ordinary income | | |
| Net investment income | | |
|
| Class A | (1,146,925) | — |
|
| Class M | (368) | — |
|
| Class R | (597) | — |
|
| Class Y | (39,549) | — |
|
| Increase in capital from settlement payments | — | 122,732 |
|
| Redemption fees (Note 1) | 291 | 1,123 |
|
| Decrease from capital share transactions (Note 4) | (20,383,178) | (46,972,335) |
|
| Total increase (decrease) in net assets | 9,937,538 | (93,027,186) |
| |
| NET ASSETS: | | |
|
| Beginning of period | 314,412,717 | 407,439,903 |
|
| End of period including distributions in excess of net investment | | |
| income of $623,648 and undistributed net investment | | |
| income of $1,067,661, respectively) | $324,350,255 | $314,412,717 |
|
| * Unaudited | | |
The accompanying notes are an integral part of these financial statements.
37
Financial highlights (For a common share outstanding throughout the period)
| | | | | | | | | | | | | | |
| INVESTMENT OPERATIONS: | LESS DISTRIBUTIONS: | RATIOS AND SUPPLEMENTAL DATA: | |
|
| | | | | | | | | | | | | Ratio | Ratio ofnet | |
| | | | Net realized | | | | | | | | | ofexpenses | investment | |
| | Net asset value, | | and unrealized | Total from | From net | | | Non-recurring | Net asset | Total return | Net assets, | toaverage | income (loss) | |
| | beginning | Net investment | gain (loss) on | investment | investment | Total | Redemption | reimburse- | value, | endof atnet asset | endof period | netassets | toaverage | Portfolio |
| Period ended | ofperiod | income (loss) a | investments | operations | income | distributions | fees b | ments | period | value (%) c | (inthousands) | (%) d,e | netassets (%) d | turnover (% ) |
|
| Class A | | | | | | | | | | | | | | |
| January 31, 2010 ** | $12.24 | (.01) | 1.25 f | 1.24 | (.06) | (.06) | — | — | $13.42 | 10.10 *f | $266,927 | .67 * | (.09) * | 48.98 * |
| July 31, 2009 | 13.54 | .05 | (1.35) g | (1.30) | — | — | — | — b,h | 12.24 | (9.60) g | 254,606 | 1.27 | .49 | 160.17 |
| July 31, 2008 | 14.84 | (.01) | (1.29) | (1.30) | — | — | — | — | 13.54 | (8.76) | 305,508 | 1.29 | (.04) | 69.13 |
| July 31, 2007 | 12.99 | (.04) | 1.89 | 1.85 | — | — | — | — | 14.84 | 14.24 | 361,708 | 1.32 | (.30) | 64.83 |
| July 31, 2006 | 13.20 | — b,i | (.09) | (.09) | (.12) | (.12) | — | — | 12.99 | (.74) i | 353,600 | 1.26 i | (.03) i | 88.39 |
| July 31, 2005 | 11.94 | .07 j,k | 1.19 | 1.26 | — | — | — | — | 13.20 | 10.55 k | 451,245 | 1.37 | .60 j, k | 114.18 |
|
| Class B | | | | | | | | | | | | | | |
| January 31, 2010 ** | $11.28 | (.06) | 1.15 f | 1.09 | — | — | — | — | $12.37 | 9.66 *f | $34,089 | 1.04 * | (.47) * | 48.98 * |
| July 31, 2009 | 12.57 | (.02) | (1.27) g | (1.29) | — | — | — | — b,h | 11.28 | (10.26) g | 37,357 | 2.02 | (.20) | 160.17 |
| July 31, 2008 | 13.89 | (.11) | (1.21) | (1.32) | — | — | — | — | 12.57 | (9.50) | 73,688 | 2.04 | (.81) | 69.13 |
| July 31, 2007 | 12.24 | (.14) | 1.79 | 1.65 | — | — | — | — | 13.89 | 13.48 | 167,563 | 2.07 | (1.03) | 64.83 |
| July 31, 2006 | 12.44 | (.10) i | (.09) | (.19) | (.01) | (.01) | — | — | 12.24 | (1.55) i | 267,264 | 2.01 i | (.77 ) i | 88.39 |
| July 31, 2005 | 11.34 | (.02) j,k | 1.12 | 1.10 | — | — | — | — | 12.44 | 9.70 k | 425,258 | 2.12 | (.17) j, k | 114.18 |
|
| Class C | | | | | | | | | | | | | | |
| January 31, 2010 ** | $11.43 | (.06) | 1.17 f | 1.11 | — | — | — | — | $12.54 | 9.71 *f | $12,534 | 1.04 * | (.47) * | 48.98 * |
| July 31, 2009 | 12.74 | (.02) | (1.29) g | (1.31) | — | — | — | — b,h | 11.43 | (10.28) g | 12,159 | 2.02 | (.25) | 160.17 |
| July 31, 2008 | 14.07 | (.11) | (1.22) | (1.33) | — | — | — | — | 12.74 | (9.45) | 16,311 | 2.04 | (.79) | 69.13 |
| July 31, 2007 | 12.40 | (.14) | 1.81 | 1.67 | — | — | — | — | 14.07 | 13.47 | 22,364 | 2.07 | (1.04) | 64.83 |
| July 31, 2006 | 12.60 | (.10) i | (.09) | (.19) | (.01) | (.01) | — | — | 12.40 | (1.53) i | 26,724 | 2.01 i | (.77 ) i | 88.39 |
| July 31, 2005 | 11.48 | (.02) j,k | 1.14 | 1.12 | — | — | — | — | 12.60 | 9.76 k | 36,807 | 2.12 | (.15) j, k | 114.18 |
|
| Class M | | | | | | | | | | | | | | |
| January 31, 2010 ** | $11.58 | (.04) | 1.18 f | 1.14 | — b | — b | — | — | $12.72 | 9.85 *f | $4,628 | .92 * | (.35) * | 48.98 * |
| July 31, 2009 | 12.88 | — b | (1.30) g | (1.30) | — | — | — | — b,h | 11.58 | (10.09) g | 4,470 | 1.77 | — l | 160.17 |
| July 31, 2008 | 14.19 | (.08) | (1.23) | (1.31) | — | — | — | — | 12.88 | (9.23) | 5,675 | 1.79 | (.54) | 69.13 |
| July 31, 2007 | 12.48 | (.11) | 1.82 | 1.71 | — | — | — | — | 14.19 | 13.70 | 8,011 | 1.82 | (.79) | 64.83 |
| July 31, 2006 | 12.68 | (.07) i | (.09) | (.16) | (.04) | (.04) | — | — | 12.48 | (1.27) i | 9,472 | 1.76 i | (.52) i | 88.39 |
| July 31, 2005 | 11.52 | .02 j,k | 1.14 | 1.16 | — | — | — | — | 12.68 | 10.07 k | 13,271 | 1.87 | .13 j, k | 114.18 |
|
| Class R | | | | | | | | | | | | | | |
| January 31, 2010 ** | $12.05 | (.03) | 1.23 f | 1.20 | (.04) | (.04) | — | — | $13.21 | 9.92 *f | $226 | .79 * | (.23) * | 48.98 * |
| July 31, 2009 | 13.36 | .02 | (1.33) g | (1.31) | — | — | — | — b,h | 12.05 | (9.81) g | 183 | 1.52 | .22 | 160.17 |
| July 31, 2008 | 14.68 | (.04) | (1.28) | (1.32) | — | — | — | — | 13.36 | (8.99) | 172 | 1.54 | (.30) | 69.13 |
| July 31, 2007 | 12.88 | (.08) | 1.88 | 1.80 | — | — | — | — | 14.68 | 13.98 | 134 | 1.57 | (.57) | 64.83 |
| July 31, 2006 | 13.12 | (.04) i | (.08) | (.12) | (.12) | (.12) | — | — | 12.88 | (.96) i | 65 | 1.51 i | (.29) i | 88.39 |
| July 31, 2005 | 11.90 | (.01) j,k | 1.23 | 1.22 | — | — | — | — | 13.12 | 10.25 k | 55 | 1.62 | (.11) j, k | 114.18 |
|
| Class Y | | | | | | | | | | | | | | |
| January 31, 2010 ** | $12.55 | — b | 1.29 f | 1.29 | (.09) | (.09) | — | — | $13.75 | 10.24 *f | $5,946 | .54 * | .03 * | 48.98 * |
| July 31, 2009 | 13.85 | .08 | (1.38) g | (1.30) | — | — | — | — b,h | 12.55 | (9.39) g | 5,638 | 1.02 | .73 | 160.17 |
| July 31, 2008 | 15.14 | .03 | (1.32) | (1.29) | — | — | — | — | 13.85 | (8.52) | 6,084 | 1.04 | .21 | 69.13 |
| July 31, 2007 | 13.22 | (.01) | 1.93 | 1.92 | — | — | — | — | 15.14 | 14.52 | 7,746 | 1.07 | (.05) | 64.83 |
| July 31, 2006 | 13.44 | .03 i | (.09) | (.06) | (.16) | (.16) | — | — | 13.22 | (.53) i | 7,397 | 1.01 i | .23 i | 88.39 |
| July 31, 2005 | 12.12 | .10 j,k | 1.22 | 1.32 | — | — | — | — | 13.44 | 10.89 k | 9,062 | 1.12 | .77 j, k | 114.18 |
|
See notes to financial highlights at the end of this section.
The accompanying notes are an integral part of these financial statements.
Financial highlights (Continued)
* Not annualized.
** Unaudited.
a Per share net investment income (loss) has been determined on the basis of the weighted average number of shares outstanding during the period.
b Amount represents less than $0.01 per share.
c Total return assumes dividend reinvestment and does not reflect the effect of sales charges.
d Reflects an involuntary contractual expense limitation in effect during the period. For periods prior to January 31, 2010, certain fund expenses were waived in connection with the fund’s investment in Putnam Prime Money Market Fund. As a result of such limitation and/or waivers, the expenses of each class reflect a reduction of the following amounts (Note 2):
| |
| | Percentage of |
| | average net assets |
|
| January 31, 2010 | 0.05% |
|
| July 31, 2009 | 0.25 |
|
| July 31, 2008 | 0.16 |
|
| July 31, 2007 | 0.21 |
|
| July 31, 2006 | 0.30 |
|
| July 31, 2005 | 0.08 |
|
e Includes amounts paid through expense offset and brokerage/service arrangements (Note 2).
f Reflects a non-recurring litigation payment received by the fund from Enron Corporation which amounted to the following amounts per share outstanding on December 28, 2009:
| |
| | Per share |
|
| Class A | $0.09 |
|
| Class B | 0.09 |
|
| Class C | 0.09 |
|
| Class M | 0.09 |
|
| Class R | 0.09 |
|
| Class Y | 0.10 |
|
This payment resulted in an increase to total returns of 0.73% for the period ended January 31, 2010.
g Reflects a non-recurring litigation payment received by the fund from Enron Corporation which amounted to the following amounts per share outstanding on December 29, 2008:
| |
| | Per share |
|
| Class A | $0.44 |
|
| Class B | 0.41 |
|
| Class C | 0.41 |
|
| Class M | 0.42 |
|
| Class R | 0.43 |
|
| Class Y | 0.45 |
|
This payment resulted in an increase to total returns of 3.25% for the period ended July 31, 2009.
The accompanying notes are an integral part of these financial statements.
40
Financial highlights (Continued)
h Reflects a non-recurring reimbursement pursuant to a settlement between the Securities and Exchange Commission (the “SEC”) and Millennium Partners, L.P., Millennium Management, L.L.C., and Millennium International Management, L.L.C., which amounted to less than $0.01 per share as of June 23, 2009.
i Reflects a non-recurring reimbursement from Putnam Investments relating to the calculation of certain amounts paid by the fund to Putnam in previous years for transfer agent services, which amounted to $0.01 per share and 0.08% of average net assets for the period ended July 31, 2006.
j Reflects a dividend received by the fund from a single issuer which amounted to the following amounts:
| | |
| | | Percentage of |
| | Per share | average net assets |
|
| Class A | $0.09 | 0.70% |
|
| Class B | 0.08 | 0.69 |
|
| Class C | 0.08 | 0.70 |
|
| Class M | 0.09 | 0.74 |
|
| Class R | 0.04 | 0.32 |
|
| Class Y | 0.08 | 0.60 |
|
k Reflects a non-recurring accrual related to Putnam Management’s settlement with the SEC regarding brokerage allocation practices, which amounted to the following amounts:
| | |
| | | Percentage of |
| | Per share | average net assets |
|
| Class A | $0.01 | 0.07% |
|
| Class B | 0.01 | 0.08 |
|
| Class C | 0.01 | 0.07 |
|
| Class M | 0.01 | 0.07 |
|
| Class R | 0.01 | 0.11 |
|
| Class Y | 0.01 | 0.05 |
|
l Amount represents less than 0.01% of average net assets.
The accompanying notes are an integral part of these financial statements.
41
Notes to financial statements 1/31/10 (Unaudited)
Note 1: Significant accounting policies
Putnam Growth Opportunities Fund (the “fund”) is a diversified series of Putnam Investment Funds (the “Trust”), a Massachusetts business trust registered under the Investment Company Act of 1940, as amended, as an open-end management investment company. The investment objective of the fund is to seek capital appreciation by investing in a portfolio primarily consisting of common stocks of large U.S. companies that Putnam Investment Management, LLC (“Putnam Management”), the fund’s manager, an indirect wholly-owned subsidiary of Putnam Investments, LLC, believes are fast-growing and whose earnings are likely to increase over time.
The fund offers class A, class B, class C, class M, class R and class Y shares. Class A and class M shares are sold with a maximum front-end sales charge of 5.75% and 3.50%, respectively, and generally do not pay a contingent deferred sales charge. Class B shares, which convert to class A shares after approximately eight years, do not pay a front-end sales charge and are subject to a contingent deferred sales charge, if those shares are redeemed within six years of purchase. Class C shares have a one-year 1.00% contingent deferred sales charge and do not convert to class A shares. Class R shares, which are offered to qualified employee-benefit plans, are sold at net asset value. The expenses for class A, class B, class C, class M and class R shares may differ based on the distribution fee of each class, which is identified in Note 2. Class Y shares, which are sold at net asset value, are generally subject to the same expenses as class A, class B, class C, class M and class R shares, but do not bear a distribution fee. Class Y shares are generally only available to corporate and institutional clients and clients in other approved programs.
A 1.00% redemption fee may apply on any shares that are redeemed (either by selling or exchanging into another fund) within 7 days of purchase. The redemption fee is accounted for as an addition to paid-in-capital.
Investment income, realized and unrealized gains and losses and expenses of the fund are borne pro-rata based on the relative net assets of each class to the total net assets of the fund, except that each class bears expenses unique to that class (including the distribution fees applicable to such classes). Each class votes as a class only with respect to its own distribution plan or other matters on which a class vote is required by law or determined by the Trustees. If the fund were liquidated, shares of each class would receive their pro-rata share of the net assets of the fund. In addition, the Trustees declare separate dividends on each class of shares.
In the normal course of business, the fund enters into contracts that may include agreements to indemnify another party under given circumstances. The fund’s maximum exposure under these arrangements is unknown as this would involve future claims that may be, but have not yet been, made against the fund. However, the fund’s management team expects the risk of material loss to be remote.
The following is a summary of significant accounting policies consistently followed by the fund in the preparation of its financial statements. The preparation of financial statements is in conformity with accounting principles generally accepted in the United States of America and requires management to make estimates and assumptions that affect the reported amounts of assets and liabilities in the financial statements and the reported amounts of increases and decreases in net assets from operations during the reporting period. Actual results could differ from those estimates. Subsequent events after the Statement of assets and liabilities date through the date that the financial statements were issued, March 11, 2010, have been evaluated in the preparation of the financial statements.
A) Security valuation Investments for which market quotations are readily available are valued at the last reported sales price on their principal exchange, or official closing price for certain markets. If no sales are reported — as in the case of some securities traded over-the-counter — a security is valued at its last reported bid price. Market quotations are not considered to be readily available for certain debt obligations; such investments are valued on the basis of valuations furnished by an independent pricing service approved by the Trustees or dealers selected by Putnam Management. Such services or dealers determine valuations for normal institutional-size trading units of such securities using methods based on market transactions for comparable securities and various relationships, generally recognized by institutional traders, between securities (which considers such factors as security prices, yields, maturities and ratings). Many securities markets and exchanges outside the U.S. close prior to the close of the New York Stock Exchange and therefore the closing prices for securities in such markets or on such exchanges may not fully reflect events that occur after such close but before the close of the New York Stock Exchange. Accordingly, on certain days, the fund will fair value foreign equity securities taking into account multiple factors, including movements in the U.S. securities markets. The number of days on which
42
fair value prices will be used will depend on market activity and it is possible that fair value prices will be used by the fund to a significant extent. Securities quoted in foreign currencies, if any, are translated into U.S. dollars at the current exchange rate. To the extent a pricing service or dealer is unable to value a security or provides a valuation that Putnam Management does not believe accurately reflects the security’s fair value, the security will be valued at fair value by Putnam Management. Certain investments, including certain restricted and illiquid securities and derivatives, are also valued at fair value following procedures approved by the Trustees. Such valuations and procedures are reviewed periodically by the Trustees. The fair value of securities is generally determined as the amount that the fund could reasonably expect to realize from an orderly disposition of such securities over a reasonable period of time. By its na ture, a fair value price is a good faith estimate of the value of a security in a current sale and does not reflect an actual market price, which may be different by a material amount.
B) Joint trading account Pursuant to an exemptive order from the Securities and Exchange Commission (the “SEC”), the fund may transfer uninvested cash balances, including cash collateral received under security lending arrangements, into a joint trading account along with the cash of other registered investment companies and certain other accounts managed by Putnam Management. These balances may be invested in issues of short-term investments having maturities of up to 397 days for collateral received under security lending arrangements and up to 90 days for other cash investments.
C) Security transactions and related investment income Security transactions are recorded on the trade date (the date the order to buy or sell is executed). Gains or losses on securities sold are determined on the identified cost basis.
Interest income is recorded on the accrual basis. Dividend income, net of applicable withholding taxes, is recognized on the ex-dividend date except that certain dividends from foreign securities, if any, are recognized as soon as the fund is informed of the ex-dividend date. Non-cash dividends, if any, are recorded at the fair market value of the securities received. Dividends representing a return of capital or capital gains, if any, are reflected as a reduction of cost and/or as a realized gain.
All premiums/discounts are amortized/accreted on a yield-to-maturity basis.
D) Foreign currency translation The accounting records of the fund are maintained in U.S. dollars. The market value of foreign securities, currency holdings, and other assets and liabilities is recorded in the books and records of the fund after translation to U.S. dollars based on the exchange rates on that day. The cost of each security is determined using historical exchange rates. Income and withholding taxes are translated at prevailing exchange rates when earned or incurred. The fund does not isolate that portion of realized or unrealized gains or losses resulting from changes in the foreign exchange rate on investments from fluctuations arising from changes in the market prices of the securities. Such gains and losses are included with the net realized and unrealized gain or loss on investments. Net realized gains and losses on foreign currency transactions represent net realized exchange gains or losses on closed forward currency contracts, disposition of foreign currencies, currency gains and losses realized between the trade and settlement dates on securities transactions and the difference between the amount of investment income and foreign withholding taxes recorded on the fund’s books and the U.S. dollar equivalent amounts actually received or paid. Net unrealized appreciation and depreciation of assets and liabilities in foreign currencies arise from changes in the value of open forward currency contracts and assets and liabilities other than investments at the period end, resulting from changes in the exchange rate. Investments in foreign securities involve certain risks, including those related to economic instability, unfavorable political developments, and currency fluctuations, not present with domestic investments.
E) Futures and options contracts The fund may use futures and options contracts to hedge against changes in the values of securities the fund owns, owned or expects to purchase, or for other investment purposes. The fund may also write options on swaps or securities it owns or in which it may invest to increase its current returns.
The potential risk to the fund is that the change in value of futures and options contracts may not correspond to the change in value of the hedged instruments. In addition, losses may arise from changes in the value of the underlying instruments, if there is an illiquid secondary market for the contracts, if interest or exchange rates move unexpectedly or if the counterparty to the contract is unable to perform. With futures, there is minimal counterparty credit risk to the fund since futures are exchange traded and the exchange’s clearinghouse, as counterparty to all exchange traded futures, guarantees the futures against default. Risks may exceed amounts recognized on the Statement of assets and liabilities. When the contract is closed, the fund records a realized gain or loss equal to the difference between the value of the contract at the time it was opened and the value at the time it was closed. Realized gains and losses on purchased option s are included in realized gains and losses on investment
43
securities. If a written call option is exercised, the premium originally received is recorded as an addition to sales proceeds. If a written put option is exercised, the premium originally received is recorded as a reduction to the cost of investments.
Futures contracts are valued at the quoted daily settlement prices established by the exchange on which they trade. The fund and the broker agree to exchange an amount of cash equal to the daily fluctuation in the value of the futures contract. Such receipts or payments are known as “variation margin.” Exchange traded options are valued at the last sale price or, if no sales are reported, the last bid price for purchased options and the last ask price for written options. Options traded over-the-counter are valued using prices supplied by dealers. Futures and written option contracts outstanding at period end, if any, are listed after the fund’s portfolio. See Note 3 for the volume of Written options contracts activity for the six months ended January 31, 2010. The fund had an average contract amount of approximately 100,000 on Purchased options contracts for the six months ended January 31, 2010. For the six months ended January31, 2010 , the transaction volume of Futures contracts was minimal.
F) Master agreements The fund is a party to ISDA (International Swap and Derivatives Association, Inc.) Master Agreements (“Master Agreements”) with certain counterparties that govern over the counter derivative and foreign exchange contracts entered into from time to time. The Master Agreements may contain provisions regarding, among other things, the parties’ general obligations, representations, agreements, collateral requirements, events of default and early termination. With respect to certain counterparties, in accordance with the terms of the Master Agreements, collateral posted to the fund is held in a segregated account by the fund’s custodian and with respect to those amounts which can be sold or repledged, are presented in the fund’s portfolio. Collateral pledged by the fund is segregated by the fund’s custodian and identified in the fund’s portfolio. Collateral ca n be in the form of cash or debt securities issued by the U.S. Government or related agencies or other securities as agreed to by the fund and the applicable counterparty. Collateral requirements are determined based on the fund’s net position with each counterparty. Termination events applicable to the fund may occur upon a decline in the fund’s net assets below a specified threshold over a certain period of time. Termination events applicable to counterparties may occur upon a decline in the counterparty’s long-term and short-term credit ratings below a specified level. In each case, upon occurrence, the other party may elect to terminate early and cause settlement of all derivative and foreign exchange contracts outstanding, including the payment of any losses and costs resulting from such early termination, as reasonably determined by the terminating party. Any decision by one or more of the fund’s counterparties to elect early termination could imp act the fund’s future derivative activity.
At January 31, 2010, the fund had a net liability position of $9,006 on derivative contracts subject to the Master Agreements.
G) Securities lending The fund may lend securities, through its agents, to qualified borrowers in order to earn additional income. The loans are collateralized by cash and/or securities in an amount at least equal to the market value of the securities loaned. The market value of securities loaned is determined daily and any additional required collateral is allocated to the fund on the next business day. The risk of borrower default will be borne by the fund’s agents; the fund will bear the risk of loss with respect to the investment of the cash collateral. Income from securities lending is included in investment income on the Statement of operations. At January 31, 2010, the value of securities loaned amounted to $16,628,431. The fund received cash collateral of $17,294,380 which is pooled with collateral of other Putnam funds into 37 issues of short-term investments.
H) Federal taxes It is the policy of the fund to distribute all of its taxable income within the prescribed time and otherwise comply with the provisions of the Internal Revenue Code of 1986, as amended (the “Code”), applicable to regulated investment companies. It is also the intention of the fund to distribute an amount sufficient to avoid imposition of any excise tax under Section 4982 of the Code. The fund is subject to the provisions of Accounting Standards Codification ASC740 Income Taxes (“ASC 740”). ASC 740 sets forth a minimum threshold for financial statement recognition of the benefit of a tax position taken or expected to be taken in a tax return. The fund did not have any unrecognized tax benefits in the accompanying financial statements. No provision has been made for federal taxes on income, capita l gains or unrealized appreciation on securities held nor for excise tax on income and capital gains. Each of the fund’s federal tax returns for the prior three fiscal years remains subject to examination by the Internal Revenue Service and state departments of revenue.
At July 31, 2009, the fund had a capital loss carryover of $2,775,646,305 available to the extent allowed by
44
the Code to offset future net capital gain, if any. The amounts of the carryovers and the expiration dates are:
| | | |
| Loss Carryover | Expiration | | |
| | |
| $1,972,175,445 | July 31, 2010 | | |
| | |
| 773,706,178 | July 31, 2011 | | |
| | |
| 29,764,682 | July 31, 2017 | | |
| | |
Pursuant to federal income tax regulations applicable to regulated investment companies, the fund has elected to defer to its fiscal year ending July 31, 2010 $63,331,569 of losses recognized during the period November 1, 2008 to July 31, 2009.
The aggregate identified cost on a tax basis is $320,193,431, resulting in gross unrealized appreciation and depreciation of $35,718,463 and $13,591,922, respectively, or net unrealized appreciation of $22,126,541.
I) Distributions to shareholders Distributions to shareholders from net investment income are recorded by the fund on the ex-dividend date. Distributions from capital gains, if any, are recorded on the ex-dividend date and paid at least annually. The amount and character of income and gains to be distributed are determined in accordance with income tax regulations, which may differ from generally accepted accounting principles. Dividend sources are estimated at the time of declaration. Actual results may vary. Any non-taxable return of capital cannot be determined until final tax calculations are completed after the end of the fund’s fiscal year. Reclassifications are made to the fund’s capital accounts to reflect income and gains available for distribution (or available capital loss carryovers) under income tax regulations.
J) Expenses of the Trust Expenses directly charged or attributable to any fund will be paid from the assets of that fund. Generally, expenses of the Trust will be allocated among and charged to the assets of each fund on a basis that the Trustees deem fair and equitable, which may be based on the relative assets of each fund or the nature of the services performed and relative applicability to each fund.
Note 2: Management fee, administrative
services and other transactions
Prior to January 1, 2010, the fund paid Putnam Management for management and investment advisory services quarterly based on the average net assets of the fund. Such fee was based on the following annual rates: 0.70% of the first $500 million of average net assets, 0.60% of the next $500 million, 0.55% of the next $500 million, 0.50% of the next $5 billion, 0.475% of the next $5 billion, 0.455% of the next $5 billion, 0.44% of the next $5 billion and 0.43% thereafter.
Effective January 1, 2010, the fund pays Putnam Management a management fee (“base fee”) (based on the fund’s average net assets and computed and paid monthly) at annual rates that may vary based on the average of the aggregate net assets of most open-end funds, as defined in the fund’s management contract, sponsored by Putnam Management. Such annual rates may vary as follows: 0.710% of the first $5 billion of average net assets, 0.660% of the next $5 billion, 0.610% of the next $10 billion, 0.560% of the next $10 billion, 0.510% of the next $50 billion, 0.490% of the next $50 billion, 0.480% of the next $100 billion and 0.475% thereafter.
In addition, beginning with the fund’s thirteenth complete calendar month of operation under the new management contract, the monthly management fee will consist of the monthly base fee plus or minus a performance adjustment for the month. The performance adjustment will be determined based on performance over the thirty-six month period then ended or, if the new management contract has not yet been effective for thirty-six complete calendar months, the period from the date the new management contract became effective to the end of the month for which the fee adjustment is being computed. Each month, the performance adjustment will be calculated by multiplying the performance adjustment rate and the fund’s average net assets over the performance period and the result will be divided by twelve. The resulting dollar amount will be added to, or subtracted from, the base fee for that month. The performance adjustment rate is equal to 0.03 multipl ied by the difference between the fund’s annualized performance (measured by the fund’s class A shares) and the annualized performance of the Russell 1000 Growth Index, each measured over the performance period. The maximum annualized performance adjustment rates are +/– 0.12%. The monthly base fee is determined based on the fund’s average net assets for the month, while the performance adjustment will be determined based on the fund’s average net assets over the performance period of up to thirty-six months. This means it is possible that, if the fund underperforms significantly over the performance period, and the fund’s assets have declined significantly over that period, the negative performance adjustment may exceed the base fee. In this event, Putnam Management would make a payment to the fund.
Effective August 1, 2009 through July 31, 2010, Putnam Management has contractually agreed to reimburse the fund’s expenses to the extent necessary to limit the cumulative expenses of the fund, exclusive of brokerage, interest, taxes, investment-related expenses, extraordinary expenses and payments under the fund’s investor servicing contract, investment
45
management contract and distribution plans, on a fiscal year-to-date basis (or from August 1, 2009 through the fund’s next fiscal year end, as applicable), to an annual rate of 0.20% of the fund’s average net assets over such fiscal year-to-date period (or since August 1, 2009, as applicable). During the period ended January 31, 2010, the fund’s expenses were not reduced as a result of this limit.
Putnam Management has also contractually agreed, from August 1, 2009 through July 31, 2010, to limit the management fee for the fund to an annual rate of 0.572% of the fund’s average net assets. During the period ended January 31, 2010, the fund’s expenses were reduced by $177,377 as a result of this limit.
Effective November 30, 2009, Putnam Investments Limited (“PIL”), an affiliate of Putnam Management, is authorized by the Trustees to manage a separate portion of the assets of the fund as determined by Putnam Management from time to time. Putnam Management pays a quarterly sub-management fee to PIL for its services at an annual rate of 0.35% of the average net assets of the portion of the fund managed by PIL.
The fund reimburses Putnam Management an allocated amount for the compensation and related expenses of certain officers of the fund and their staff who provide administrative services to the fund. The aggregate amount of all such reimbursements is determined annually by the Trustees.
Custodial functions for the fund’s assets are provided by State Street Bank and Trust Company (“State Street”). Custody fees are based on the fund’s asset level, the number of its security holdings and transaction volumes.
Putnam Investor Services, Inc., an affiliate of Putnam Management, provided investor servicing agent functions to the fund. Putnam Investor Services, Inc. received fees for investor servicing, subject to certain limitations, based on the fund’s retail asset level, the number of shareholder accounts in the fund and the level of defined contribution plan assets in the fund. The amounts incurred for investor servicing agent functions during the six months ended January 31, 2010 are included in Investor servicing fees in the Statement of operations.
The fund has entered into expense offset arrangements with Putnam Investor Services, Inc. and State Street whereby Putnam Investor Services, Inc.’s and State Street’s fees are reduced by credits allowed on cash balances. The fund also reduced expenses through brokerage/service arrangements. For the six months ended January 31, 2010, the fund’s expenses were reduced by $283 under the expense offset arrangements and by $3,758 under the brokerage/service arrangements.
Each independent Trustee of the fund receives an annual Trustee fee, of which $249, as a quarterly retainer, has been allocated to the fund, and an additional fee for each Trustees meeting attended. Trustees receive additional fees for attendance at certain committee meetings and industry seminars and for certain compliance-related matters. Trustees also are reimbursed for expenses they incur relating to their services as Trustees.
The fund has adopted a Trustee Fee Deferral Plan (the “Deferral Plan”) which allows the Trustees to defer the receipt of all or a portion of Trustees fees payable on or after July 1, 1995. The deferred fees remain invested in certain Putnam funds until distribution in accordance with the Deferral Plan.
The fund has adopted an unfunded noncontributory defined benefit pension plan (the “Pension Plan”) covering all Trustees of the fund who have served as a Trustee for at least five years and were first elected prior to 2004. Benefits under the Pension Plan are equal to 50% of the Trustee’s average annual attendance and retainer fees for the three years ended December 31, 2005. The retirement benefit is payable during a Trustee’s lifetime, beginning the year following retirement, for the number of years of service through December 31, 2006. Pension expense for the fund is included in Trustee compensation and expenses in the Statement of operations. Accrued pension liability is included in Payable for Trustee compensation and expenses in the Statement of assets and liabilities. The Trustees have terminated the Pension Plan with respect to any Trustee first elected after 2003.
The fund has adopted distribution plans (the “Plans”) with respect to its class A, class B, class C, class M and class R shares pursuant to Rule 12b-1 under the Investment Company Act of 1940. The purpose of the Plans is to compensate Putnam Retail Management Limited Partnership, a wholly-owned subsidiary of Putnam Investments, LLC and Putnam Retail Management GP, Inc., for services provided and expenses incurred in distributing shares of the fund. The Plans provide for payments by the fund to Putnam Retail Management Limited Partnership at an annual rate of up to 0.35%, 1.00%, 1.00%, 1.00% and 1.00% of the average net assets attributable to class A, class B, class C, class M and class R shares, respectively. The Trustees have approved payment by the fund at an annual rate of 0.25%, 1.00%, 1.00%, 0.75% and 0.50% of the average net assets attributable to class A, class B, class C, class M and class R shares, respectively.
For the six months ended January 31, 2010, Putnam Retail Management Limited Partnership, acting as
46
underwriter, received net commissions of $18,551 and $275 from the sale of class A and class M shares, respectively, and received $17,360 and $162 in contingent deferred sales charges from redemptions of class B and class C shares, respectively.
A deferred sales charge of up to 1.00% and 0.65% is assessed on certain redemptions of class A and class M shares, respectively. For the six months ended January 31, 2010, Putnam Retail Management Limited Partnership, acting as underwriter, received $1 and no monies on class A and class M redemptions,respectively.
Note 3: Purchases and sales of securities
During the six months ended January 31, 2010, cost of purchases and proceeds from sales of investment securities other than short-term investments aggregated $158,029,111 and $171,640,506, respectively. There were no purchases or sales of U.S. government securities.
Written option transactions during the period ended January 31, 2010 are summarized as follows:
| | |
| | Contract | Premiums |
| | Amounts | Received |
|
| Written options | | |
| outstanding at | | |
| beginning of period | — | $— |
|
| Options opened | 855,333 | 1,001,602 |
| Options exercised | (171,197) | (532,805) |
| Options expired | (328,387) | (210,750) |
| Options closed | (65,430) | (84,567) |
|
| Written options | | |
| outstanding at | | |
| end of period | 290,319 | $173,480 |
|
Note 4: Capital shares
At January 31, 2010, there was an unlimited number of shares of beneficial interest authorized. Transactions in capital shares were as follows:
| | | | |
| | Six months ended 1/31/10 | Year ended 7/31/09 |
|
| Class A | Shares | Amount | Shares | Amount |
|
| Shares sold | 895,565 | $11,940,832 | 3,212,259 | $34,113,537 |
|
| Shares issued in connection with | | | | |
| reinvestment of distributions | 81,172 | 1,096,643 | — | — |
|
| | 976,737 | 13,037,475 | 3,212,259 | 34,113,537 |
|
| Shares repurchased | (1,889,141) | (25,202,166) | (4,974,052) | (53,205,456) |
|
| Net decrease | (912,404) | $(12,164,691) | (1,761,793) | $(19,091,919) |
|
| |
| | Six months ended 1/31/10 | Year ended 7/31/09 |
|
| Class B | Shares | Amount | Shares | Amount |
|
| Shares sold | 102,584 | $1,257,034 | 330,976 | $3,173,384 |
|
| Shares issued in connection with | | | | |
| reinvestment of distributions | — | — | — | — |
|
| | 102,584 | 1,257,034 | 330,976 | 3,173,384 |
|
| Shares repurchased | (659,542) | (8,156,011) | (2,879,223) | (28,400,108) |
|
| Net decrease | (556,958) | $(6,898,977) | (2,548,247) | $(25,226,724) |
|
| |
| | Six months ended 1/31/10 | Year ended 7/31/09 |
|
| Class C | Shares | Amount | Shares | Amount |
|
| Shares sold | 37,799 | $470,258 | 84,612 | $793,194 |
|
| Shares issued in connection with | | | | |
| reinvestment of distributions | — | — | — | — |
|
| | 37,799 | 470,258 | 84,612 | 793,194 |
|
| Shares repurchased | (101,894) | (1,272,172) | (301,252) | (2,949,238) |
|
| Net decrease | (64,095) | $(801,914) | (216,640) | $(2,156,044) |
|
47
| | | | |
| | Six months ended 1/31/10 | Year ended 7/31/09 |
|
| Class M | Shares | Amount | Shares | Amount |
|
| Shares sold | 11,573 | $149,840 | 28,769 | $283,556 |
|
| Shares issued in connection with | | | | |
| reinvestment of distributions | 28 | 363 | — | — |
|
| | 11,601 | 150,203 | 28,769 | 283,556 |
|
| Shares repurchased | (33,660) | (429,258) | (83,597) | (831,932) |
|
| Net decrease | (22,059) | $(279,055) | (54,828) | $(548,376) |
|
| |
| | Six months ended 1/31/10 | Year ended 7/31/09 |
|
| Class R | Shares | Amount | Shares | Amount |
|
| Shares sold | 3,332 | $43,334 | 5,872 | $62,109 |
|
| Shares issued in connection with | | | | |
| reinvestment of distributions | 45 | 597 | — | — |
|
| | 3,377 | 43,931 | 5,872 | 62,109 |
|
| Shares repurchased | (1,457) | (19,198) | (3,602) | (37,855) |
|
| Net increase | 1,920 | $24,733 | 2,270 | $24,254 |
|
| |
| | Six months ended 1/31/10 | Year ended 7/31/09 |
|
| Class Y | Shares | Amount | Shares | Amount |
|
| Shares sold | 44,450 | $603,790 | 141,794 | $1,468,853 |
|
| Shares issued in connection with | | | | |
| reinvestment of distributions | 2,657 | 36,798 | — | — |
|
| | 47,107 | 640,588 | 141,794 | 1,468,853 |
|
| Shares repurchased | (63,905) | (903,862) | (131,956) | (1,442,379) |
|
| Net increase (decrease) | (16,798) | $(263,274) | 9,838 | $26,474 |
|
Note 5: Summary of derivative activity
The following is a summary of the market values of derivative instruments as of January 31, 2010:
Market value of derivative instruments as of January 31, 2010
| | | | |
| | Asset derivatives | Liability derivatives |
|
| Derivatives not | | | | |
| accounted for as | Statement of | | Statement of | |
| hedging instruments | assets and | | assets and | |
| under ASC 815 | liabilities location | Market value | liabilities location | Market value |
|
| |
| Equity contracts | Investments | $80,561 | Payables | $44,964 |
|
| Total | | $80,561 | | $44,964 |
|
48
The following is a summary of realized and unrealized gains or losses of derivative instruments on the Statement of operations for the six months ended January 31, 2010 (see Note 1):
Amount of Realized Gain or (Loss) on
Derivatives Recognized in Income
| | | |
| Derivatives not | | | |
| accounted for as | | | |
| hedging instru- | | | |
| ments under | | | |
| ASC 815 | Options | Futures | Total |
|
| Equity contracts | $257,709 | $(41,185) | $216,524 |
|
| Total | $257,709 | $(41,185) | $216,524 |
|
Change in Unrealized Appreciation or
(Depreciation) on Derivatives Recognized
in Income
| | | |
| Derivatives not | | | |
| accounted for as | | | |
| hedging instru- | | | |
| ments under | | | |
| ASC 815 | Options | Futures | Total |
|
| Equity contracts | $(23,163) | $893 | $(22,270) |
|
| Total | $(23,163) | $893 | $(22,270) |
|
Note 6: Investment in Putnam Money Market
Liquidity Fund
The fund invested in Putnam Money Market Liquidity Fund, an open-end management investment company managed by Putnam Management. Investments in Putnam Money Market Liquidity Fund are valued at its closing net asset value each business day. Income distributions earned by the fund are recorded as interest income in the Statement of operations and totaled $3,591 for the period ended January 31, 2010. During the period ended January 31, 2010, cost of purchases and proceeds of sales of investments in Putnam Money Market Liquidity Fund aggregated $46,307,673 and $56,048,640, respectively. Management fees charged to Putnam Money Market Liquidity Fund have been waived by Putnam Management.
Note 7: Regulatory matters and litigation
In late 2003 and 2004, Putnam Management settled charges brought by the SEC and the Massachusetts Securities Division in connection with excessive short-term trading in Putnam funds. Distribution of payments from Putnam Management to certain open-end Putnam funds and their shareholders is expected to be completed in the next several months. These allegations and related matters have served as the general basis for certain lawsuits, including purported class action lawsuits against Putnam Management and, in a limited number of cases, some Putnam funds. Putnam Management believes that these lawsuits will have no material adverse effect on the funds or on Putnam Management’s ability to provide investment management services. In addition, Putnam Management has agreed to bear any costs incurred by the Putnam funds as a result of these matters.
Note 8: Market and credit risk
In the normal course of business, the fund trades financial instruments and enters into financial transactions where risk of potential loss exists due to changes in the market (market risk) or failure of the contracting party to the transaction to perform (credit risk). The fund may be exposed to additional credit risk that an institution or other entity with which the fund has unsettled or open transactions will default.
49
Shareholder meeting results (Unaudited)
December 18, 2009 meeting
At the meeting, each of the nominees for Trustees was elected, with all the funds of the Trust voting together as a single class, as follows:
| | |
| | Votes for | Votes withheld |
|
| Ravi Akhoury | 144,159,880 | 5,756,274 |
|
| Jameson A. Baxter | 144,089,420 | 5,826,734 |
|
| Charles B. Curtis | 144,163,005 | 5,753,149 |
|
| Robert J. Darretta | 144,131,113 | 5,785,041 |
|
| Myra R. Drucker | 144,185,199 | 5,730,955 |
|
| John A. Hill | 144,123,942 | 5,792,212 |
|
| Paul L. Joskow | 144,226,682 | 5,689,472 |
|
| Elizabeth T. Kennan | 143,986,867 | 5,929,287 |
|
| Kenneth R. Leibler | 144,161,109 | 5,755,045 |
|
| Robert E. Patterson | 144,163,377 | 5,752,777 |
|
| George Putnam, III | 144,132,419 | 5,783,735 |
|
| Robert L. Reynolds | 144,288,500 | 5,627,654 |
|
| W. Thomas Stephens | 144,223,485 | 5,692,669 |
|
| Richard B. Worley | 144,224,274 | 5,691,880 |
|
A proposal to approve a new management contract between the fund and Putnam Management with both Fund Family breakpoints and performance fees was approved as follows:
| | | |
| Votes | Votes | | Broker |
| for | against | Abstentions | non-votes |
|
| 12,145,623 | 634,844 | 430,946 | 3,982,845 |
|
A proposal to approve a new management contract between the fund and Putnam Management with Fund Family breakpoints only was approved as follows:
| | | |
| Votes | Votes | | Broker |
| for | against | Abstentions | non-votes |
|
| 12,110,190 | 637,398 | 463,826 | 3,982,844 |
|
A proposal to approve a new management contract between the fund and Putnam Management with performance fees only was approved as follows:
| | | |
| Votes | Votes | | Broker |
| for | against | Abstentions | non-votes |
|
| 12,115,139 | 633,401 | 462,873 | 3,982,845 |
|
A proposal to amend the fundamental investment restrictions with respect to diversification of investments was approved as follows:
| | | |
| Votes | Votes | | Broker |
| for | against | Abstentions | non-votes |
|
| 12,317,266 | 498,499 | 395,648 | 3,982,845 |
|
50
Shareholder meeting results (Unaudited) (Continued)
A proposal to amend the fundamental investment restrictions with respect to borrowing was approved as follows:
| | | |
| Votes | Votes | | Broker |
| for | against | Abstentions | non-votes |
|
| 12,058,451 | 756,931 | 396,032 | 3,982,844 |
|
A proposal to amend the fundamental investment restrictions with respect to making loans was approved as follows:
| | | |
| Votes | Votes | | Broker |
| for | against | Abstentions | non-votes |
|
| 12,063,340 | 719,495 | 428,578 | 3,982,845 |
|
All tabulations are rounded to the nearest whole number.
51
Services for shareholders
Investor services
Systematic investment plan Tell us how much you wish to invest regularly — weekly, semimonthly, or monthly — and the amount you choose will be transferred automatically from your checking or savings account. There’s no additional fee for this service, and you can suspend it at any time. This plan may be a great way to save for college expenses or to plan for your retirement.
Please note that regular investing does not guarantee a profit or protect against loss in a declining market. Before arranging a systematic investment plan, consider your financial ability to continue making purchases in periods when prices are low.
Systematic exchange You can make regular transfers from one Putnam fund to another Putnam fund. There are no additional fees for this service, and you can cancel or change your options at any time.
Dividends PLUS You can choose to have the dividend distributions from one of your Putnam funds automatically reinvested in another Putnam fund at no additional charge.
Free exchange privilege You can exchange money between Putnam funds free of charge, as long as they are the same class of shares. A signature guarantee is required if you are exchanging more than $500,000.
Reinstatement privilege If you’ve sold Putnam shares or received a check for a dividend or capital gain, you may reinvest the proceeds with Putnam within 90 days of the transaction and they will be reinvested at the fund’s current net asset value — with no sales charge. However, reinstatement of class B shares may have special tax consequences. Ask your financial or tax representative for details.
Check-writing service You have ready access to many Putnam accounts. It’s as simple as writing a check, and there are no special fees or service charges. For more information about the check-writing service, call Putnam or visit our Web site.
Dollar cost averaging When you’re investing for long-term goals, it’s time, not timing, that counts. Investing on a systematic basis is a better strategy than trying to figure out when the markets will go up or down. This means investing the same amount of money regularly over a long period. This method of investing is called dollar cost averaging. When a fund’s share price declines, your investment dollars buy more shares at lower prices. When it increases, they buy fewer shares. Over time, you will pay a lower average price per share.
For more information
Visit the Individual Investors section at putnam.com A secure section of our Web site contains complete information on your account, including balances and transactions, updated daily. You may also conduct transactions, such as exchanges, additional investments, and address changes. Log on today to get your password.
Call us toll free at 1-800-225-1581 Ask a helpful Putnam representative or your financial advisor for details about any of these or other services, or see your prospectus.
52
Fund information
Founded over 70 years ago, Putnam Investments was built around the concept that a balance between risk and reward is the hallmark of a well-rounded financial program. We manage over 100 funds across income, value, blend, growth, asset allocation, absolute return, and global sector categories.
| | |
| Investment Manager | Robert L. Reynolds | Francis J. McNamara, III |
| Putnam Investment | W. Thomas Stephens | Vice President and |
| Management, LLC | Richard B. Worley | Chief Legal Officer |
| One Post Office Square | | |
| Boston, MA 02109 | Officers | Robert R. Leveille |
| | Robert L. Reynolds | Vice President and Chief |
| Investment Sub-Manager | President | Compliance Officer |
| Putnam Investments Limited | | |
| 57–59 St James’s Street | Jonathan S. Horwitz | Mark C. Trenchard |
| London, England SW1A 1LD | Executive Vice President, | Vice President and BSA |
| | Principal Executive | Compliance Officer |
| Marketing Services | Officer, Treasurer and | |
| Putnam Retail Management | Compliance Liaison | Judith Cohen |
| One Post Office Square | | Vice President, Clerk and |
| Boston, MA 02109 | Charles E. Porter | Assistant Treasurer |
| Senior Advisor to the Trustees | |
| Custodian | | Wanda M. McManus |
| State Street Bank and | Steven D. Krichmar | Vice President, Senior Associate |
| Trust Company | Vice President and Principal | Treasurer and Assistant Clerk |
| | Financial Officer | |
| Legal Counsel | | Nancy E. Florek |
| Ropes & Gray LLP | Janet C. Smith | Vice President, Assistant Clerk, |
| | Vice President, Principal | Assistant Treasurer and Proxy |
| Trustees | Accounting Officer and | Manager |
| John A. Hill, Chairman | Assistant Treasurer | |
| Jameson A. Baxter, | | |
| Vice Chairman | Susan G. Malloy | |
| Ravi Akhoury | Vice President and | |
| Charles B. Curtis | Assistant Treasurer | |
| Robert J. Darretta | | |
| Myra R. Drucker | Beth S. Mazor | |
| Paul L. Joskow | Vice President | |
| Elizabeth T. Kennan | | |
| Kenneth R. Leibler | James P. Pappas | |
| Robert E. Patterson | Vice President | |
| George Putnam, III | | |
This report is for the information of shareholders of Putnam Growth Opportunities Fund. It may also be used as sales literature when preceded or accompanied by the current prospectus, the most recent copy of Putnam’s Quarterly Performance Summary, and Putnam’s Quarterly Ranking Summary. For more recent performance, please visit putnam.com. Investors should carefully consider the investment objective, risks, charges, and expenses of a fund, which are described in its prospectus. For this and other information or to request a prospectus, or a summary prospectus if available, call 1-800-225-1581 toll free. Please read the prospectus carefully before investing. The fund’s Statement of Additional Information contains additional information about the fund’s Trustees and is available without charge upon request by calling 1-800-225-1581.

Item 2. Code of Ethics:
Not applicable
Item 3. Audit Committee Financial Expert:
Not applicable
Item 4. Principal Accountant Fees and Services:
Not applicable
Item 5. Audit Committee of Listed Registrants
Not applicable
Item 6. Schedule of Investments:
The registrant’s schedule of investments in unaffiliated issuers is included in the report to shareholders in Item 1 above.
Item 7. Disclosure of Proxy Voting Policies and Procedures For Closed-End Management Investment Companies:
Not applicable
Item 8. Portfolio Managers of Closed-End Investment Companies
Not Applicable
Item 9. Purchases of Equity Securities by Closed-End Management Investment Companies and Affiliated Purchasers:
Not applicable
Item 10. Submission of Matters to a Vote of Security Holders:
Not applicable
Item 11. Controls and Procedures:
(a) The registrant's principal executive officer and principal financial officer have concluded, based on their evaluation of the effectiveness of the design and operation of the registrant's disclosure controls and procedures as of a date within 90 days of the filing date of this report, that the design and operation of such procedures are generally effective to provide reasonable assurance that information required to be disclosed by the registrant in this report is recorded, processed, summarized and reported within the time periods specified in the Commission's rules and forms.
(b) Changes in internal control over financial reporting: Not applicable
Item 12. Exhibits:
(a)(1) Not applicable
(a)(2) Separate certifications for the principal executive officer and principal financial officer of the registrant as required by Rule 30a-2(a) under the Investment Company Act of 1940, as amended, are filed herewith.
(b) The certifications required by Rule 30a-2(b) under the Investment Company Act of 1940, as amended, are filed herewith.
Putnam Investment Funds
By (Signature and Title):
/s/Janet C. Smith
Janet C. Smith
Principal Accounting Officer
Date: March 31, 2010
Pursuant to the requirements of the Securities Exchange Act of 1934 and the Investment Company Act of 1940, this report has been signed below by the following persons on behalf of the registrant and in the capacities and on the dates indicated.
By (Signature and Title):
/s/Jonathan S. Horwitz
Jonathan S. Horwitz
Principal Executive Officer
Date: March 31, 2010
By (Signature and Title):
/s/Steven D. Krichmar
Steven D. Krichmar
Principal Financial Officer
Date: March 31, 2010
| | | |
| | |
| UNITED STATES |
| SECURITIES AND EXCHANGE COMMISSION |
| Washington, D.C. 20549 |
| |
| FORM N-CSR |
| |
| CERTIFIED SHAREHOLDER REPORT OF REGISTERED |
| MANAGEMENT INVESTMENT COMPANIES |
| | |
| Investment Company Act file number: (811-07237) | |
| | |
| Exact name of registrant as specified in charter: | Putnam Investment Funds |
| |
| Address of principal executive offices: One Post Office Square, Boston, Massachusetts 02109 |
| | |
| Name and address of agent for service: | | Beth S. Mazor, Vice President |
| | One Post Office Square |
| | Boston, Massachusetts 02109 |
| | |
| Copy to: | | John W. Gerstmayr, Esq. |
| | Ropes & Gray LLP |
| | One International Place |
| | Boston, Massachusetts 02110 |
| | |
| Registrant’s telephone number, including area code: | (617) 292-1000 |
| | | |
| Date of fiscal year end: July 31, 2010 | | |
| |
| Date of reporting period: August 1, 2009 — January 31, 2010 |
Item 1. Report to Stockholders:
The following is a copy of the report transmitted to stockholders pursuant to Rule 30e-1 under the Investment Company Act of 1940:

A BALANCED APPROACH
Since 1937, when George Putnam created a diverse mix of stocks and bonds in a single, professionally managed portfolio, Putnam has championed the balanced approach.
A WORLD OF INVESTING
Today, we offer investors a world of equity, fixed-income, multi-asset, and absolute-return portfolios to suit a range of financial goals.
A COMMITMENT TO EXCELLENCE
Our portfolio managers seek superior results over time, backed by original, fundamental research on a global scale. We believe in the value of experienced financial advice, in providing exemplary service, and in putting clients first in all we do.

Putnam
Research
Fund
Semiannual report
1 | 31 | 10
| |
| Message from the Trustees | 2 |
|
| About the fund | 4 |
|
| Performance snapshot | 6 |
|
| Interview with your fund’s portfolio manager | 7 |
|
| Your fund’s performance | 11 |
|
| Your fund’s expenses | 13 |
|
| Terms and definitions | 15 |
|
| Trustee approval of management contract | 16 |
|
| Other information for shareholders | 27 |
|
| Financial statements | 28 |
|
| Shareholder meeting results | 54 |
|
Message from the Trustees
Dear Fellow Shareholder:
Last year’s rally in both stocks and bonds helped investors recoup some of the losses in their portfolios, and Putnam’s shareholders were particularly well served. After such strong growth, we are not surprised that the markets paused at the start of 2010.
While no one believes that 2010 will be a repeat performance of 2009, we do feel that today’s markets — based on an optimistic earnings outlook and growing evidence of a global economic recovery — offer ample opportunities for active money management, which is something that Putnam does well.
If there is any lesson to be learned from the extraordinary volatility of the past year, it is the importance of positioning one’s portfolio to limit downside risk. It is our belief that the best way to achieve this is by diversifying across all asset classes and investment strategies, and by adhering to your plan in every type of market environment.
Lastly, we would like to thank all shareholders who took the time to vote by proxy on a number of issues, including shareholder-friendly management fee changes, presented at the Putnam Funds’ shareholder meetings. We would also like to
2
welcome new shareholders to the fund and thank all of our investors for your continued confidence in Putnam.
About the fund
Building a portfolio of best ideas
Research is at the heart of investing. Whether it is undertaken by Wall Street firms or by Putnam’s in-house analysts, research is used by investment managers to assess whether a company’s stock is undervalued, overvalued, or on target at its current price.
One approach to determining a company’s worth is to measure its tangible assets, such as physical plants or inventory. Other measures of worth are less quantifiable and may involve the evaluation of the company’s long-term competitive advantage, the expertise of its management team, or the success of its research and development efforts.
Analysts consider these factors along with financial yardsticks such as the price-to-earnings ratio and earnings growth. By digging deep into the information available, analysts work to develop a set of expectations about the financial and competitive health of a specific company versus other firms in the industry — both in the United States and within the broader global marketplace. Of course, there is no foolproof way to uncover all information about a company, and surprises can always occur.
Putnam’s Global Equity Research team gathers information from on-site interviews with company management and through meetings with sources who are able to provide additional information about the company’s true worth and likely future direction.
By including Putnam Research Fund as part of a diversified portfolio, you are investing in what we like to call a “best ideas” fund: It represents the select stock picks of Putnam’s large-cap equity research analysts, incorporated into a single portfolio, regardless of investment style (growth or value). We believe that each stock pick represents a specialized and comprehensive view of a company, compiled by a focused, dedicated analyst.
Consider these risks before investing:
This fund may invest a portion of its assets in small and/or midsize companies. Such investments increase the risk of greater price fluctuations.

Putnam’s research
analysts specialize in
sectors and industries
Consumer staples Broadcasting, lodging/tourism, department stores, retail, electronics, food, household goods, homebuilding, restaurants
Energy Integrated oil and gas, drilling, exploration, equipment, services
Financials Banking, brokerage, consumer finance, insurance, real estate investment trusts, mortgage finance
Health care Biotechnology, equipment, pharmaceuticals, services
Industrials Aerospace and defense, construction and farm machinery, electrical components, office services
Technology Computer hardware/software, semiconductors, services
Materials Gold, metals, paper products/packaging, specialty chemicals, steel
Telecommunications Alternative carriers, wireless services
Utilities Electric utilities, gas utilities, independent power producers
Putnam Research Fund holdings have spanned sectors and
industries over time.
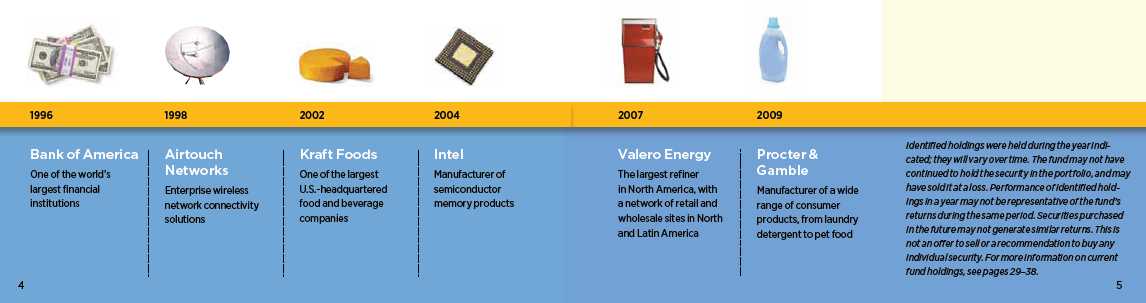
Performance
snapshot
Average annual total return (%) comparison as of 1/31/10
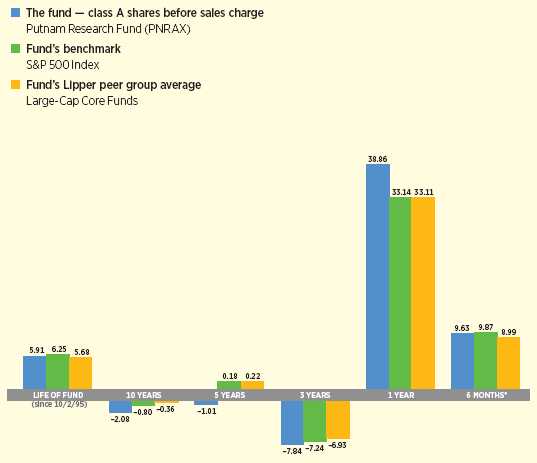
Current performance may be lower or higher than the quoted past performance, which cannot guarantee future results. Share price, principal value, and return will fluctuate, and you may have a gain or a loss when you sell your shares. Performance of class A shares assumes reinvestment of distributions and does not account for taxes. Fund returns in the bar chart do not reflect a sales charge of 5.75%; had they, returns would have been lower. See pages 7 and 11–12 for additional performance information. For a portion of the periods, this fund may have limited expenses, without which returns would have been lower. A 1% short-term trading fee may apply. To obtain the most recent month-end performance, visit putnam.com.
* Returns for the six-month period are not annualized, but cumulative.
6
Interview with your
fund’s portfolio manager
Andrew Matteis
The stock market continued its rally through the end of 2009 before giving back some gains in January. How did the fund perform during the semiannual period, Andy?
For the six months ended January 31, 2010, Putnam Research Fund returned 9.63%, slightly lagging the 9.87% return of its benchmark, the S&P 500 Index, but edging out the 8.99% average return of its peer group, the Lipper Large-Cap Core Funds category.
It was a somewhat challenging period on the whole. During the summer months, lower-quality securities led the market as investors continued to snatch up stocks that essentially had been priced for bankruptcy as recently as March. That trend began to change in the final months of 2009, as investors turned their sights toward companies that would not just survive, but thrive as the economy gained traction heading into 2010. Despite the changes in the market during the period, the fund posted competitive results. This performance was largely driven by solid individual security selection, which is the way we manage the portfolio.
Tell us more about how the portfolio is assembled and which sectors had a notable impact on performance.
Putnam Research Fund is designed to be a true stock-picking portfolio. Our sector analysts, rather than simply recommending stocks, determine the relative weights of the companies they cover. As portfolio manager, I combine their decisions while helping to
Broad market index and fund performance
This comparison shows your fund’s performance in the context of broad market indexes for the six months ended 1/31/10. See pages 6 and 11–12 for additional fund performance information. Index descriptions can be found on page 15.
7
ensure the fund doesn’t take significant overweight or underweight positions in any one sector.
The sectors that worked well for the fund over the period included communications, consumer cyclicals, and financials. Of the three, consumer cyclicals and financials generally were driven by the flood of money reentering the market in the spring and summer of 2009, as investors came to believe the worst of the recession was behind us. The communications sector, on the other hand, showed strength later in the period as investors bought some of the more stable names that had been overlooked in the stock market rally.
Detractors from fund performance included technology, consumer staples, and capital goods. The fund posted positive absolute returns in all three sectors, but our holdings lagged those of the benchmark.
Let’s talk about specific holdings. Which stocks contributed to the fund’s performance?
One of the biggest contributors to performance was Wyndham, the hotel chain. Travelers responded to the discounted rates many hotels were offering during the period, and occupancy rates have been steadily improving. Business at Wyndham was particularly strong and, as a result, management tripled the dividend and resumed its share-repurchase program.
Another strong performer was UAL, the holding company for United Airlines. Between March and October 2009, the stocks that led the market were usually those of highly leveraged, economically sensitive companies, a category that certainly included the airline industry. United Airlines, in particular, benefited from having slashed costs and improving earnings. Stable fuel
Top 10 holdings
| | |
| HOLDING (percentage of fund’s net assets) | SECTOR | INDUSTRY |
|
| Microsoft Corp. (2.6%) | Technology | Software |
| Exxon Mobil Corp. (2.4%) | Energy | Oil and gas |
| Pfizer, Inc. (2.4%) | Health care | Pharmaceuticals |
| Chevron Corp. (2.1%) | Energy | Oil and gas |
| Apple, Inc. (2.0%) | Technology | Computers |
| Raytheon Co. (1.9%) | Capital goods | Aerospace and defense |
| Bank of America Corp. (1.8%) | Financials | Banking |
| Wells Fargo & Co. (1.8%) | Financials | Banking |
| Philip Morris International, Inc. (1.6%) | Consumer staples | Tobacco |
| IBM Corp. (1.3%) | Technology | Computers |
This table shows the fund’s top 10 holdings and the percentage of the fund’s net assets that each represented as of 1/31/10. Short-term holdings are excluded. Holdings will vary over time.
8
prices were also a help — oil traded in a fairly narrow range during the period, and that may have helped attract investors concerned about fluctuating expenses for the airline.
Two energy holdings are worth noting — Anadarko Petroleum and Newfield Exploration. Anadarko has what we believe to be one of the best exploration portfolios in the industry. During the period, the company announced a number of successful oil wells, and the stock benefited. Newfield Exploration, a U.S.-based exploration and production company, demonstrated above-average volume growth during the period, while improving its returns relative to its peers. The valuation of the stock was very compelling going into the period, and the stock appreciated as the company refocused its efforts on the best prospects within its portfolio.
“The fund is a true stock-picking
portfolio… which I believe will be
even more important to performance
in 2010 than it was in 2009.”
Andrew Matteis
Which holdings produced disappointing returns?
Our exposure to biotech firm Amgen detracted from relative returns. Amgen faced two main headwinds during the period: Clinical trials raised safety concerns about Aranesp, a treatment for chronic kidney disease, and the FDA delayed the approval of Denosumab, a treatment for osteoporosis, until sometime in 2010.
Also, our decision not to own benchmark component Boeing detracted from performance. Our analysts have a positive outlook on the aerospace industry, but favored companies that offered what we thought
Comparison of top sector weightings
This chart shows how the fund’s top sector weightings have changed over the past six months. Weightings are shown as a percentage of net assets. Holdings will vary over time.
9
were better risk/reward profiles — that is, the level of risk the fund assumes in seeking out returns. Specifically, we favored companies with revenue streams not as dependent on securing contracts, and we continue to find other, more compelling opportunities heading into 2010.
IN THE NEWS
After two straight years of stagnation, the global economy is recovering faster than previously thought. In its World Economic Outlook released in late January, the International Monetary Fund (IMF) upgraded its view on global growth — predicting that world economies will expand 3.9% in 2010, up from –0.8% last year. The recovery, according to the IMF, will not be consistent across the board, with emerging markets leading more advanced economies, which remain dependent on government stimulus. Asia, in particular, will lead the pack, with strong growth from China and India. Meanwhile, the United States is already showing signs of growth, with gross domestic product (GDP) increasing by 5.9% in the fourth quarter of 2009, up from 2.2% in the third quarter.
What’s your outlook for the stock market and the fund for the remainder of 2010?
Many firms aggressively managed costs during the recession and are now reaping the benefits in the recovery. As January’s correction demonstrated, it’s unlikely the markets will continue to rebound at last year’s pace, but I believe there is still plenty of room for equities to run. Consumer spending and employment figures should continue to improve, and I expect a number of companies we track may post robust earnings in the coming quarters.
There are some looming issues that represent some concern, however. I believe interest rates are bound to rise as policy stimulus is withdrawn this year, and what effect this has on the larger economic picture remains to be seen. With a good deal of uncertainty in the market and fewer compelling valuation opportunities, I believe stock selection will be even more important to performance in 2010 than it was in 2009. In such an environment, I believe the Putnam Research Fund’s intensive focus on fundamental research and bottom-up stock selection should serve investors well.
Thank you, Andy, for your time and insights today.
The views expressed in this report are exclusively those of Putnam Management. They are not meant as investment advice.
Please note that the holdings discussed in this report may not have been held by the fund for the entire period. Portfolio composition is subject to review in accordance with the fund’s investment strategy and may vary in the future. Current and future portfolio holdings are subject to risk.

Portfolio Manager Andrew Matteis is Head of Large Cap Equity Research at Putnam. He holds an M.P.A. and an M.B.A. from New York University and a B.A. from Lehman College. Andy joined Putnam in 1993 and has been in the investment industry since 1985.
10
Your fund’s performance
This section shows your fund’s performance, price, and distribution information for periods ended January 31, 2010, the end of the first half of its current fiscal year. In accordance with regulatory requirements for mutual funds, we also include performance as of the most recent calendar quarter-end and expense information taken from the fund’s current prospectus. Performance should always be considered in light of a fund’s investment strategy. Data represents past performance. Past performance does not guarantee future results. More recent returns may be less or more than those shown. Investment return and principal value will fluctuate, and you may have a gain or a loss when you sell your shares. Performance information does not reflect any deduction for taxes a shareholder may owe on fund distributions or on the redemption of fund shares. For the most recent month-end performance, please visit the Individual Investors section at putn am.com or call Putnam at 1-800-225-1581. Class Y shares are generally only available to corporate and institutional clients and clients in other approved programs. See the Terms and Definitions section in this report for definitions of the share classes offered by your fund.
Fund performance Total return for periods ended 1/31/10
| | | | | | | | | | |
| | Class A | Class B | Class C | Class M | Class R | Class Y |
| (inception dates) | (10/2/95) | (6/15/98) | (2/1/99) | (6/15/98) | (1/21/03) | (4/4/00) |
|
| | NAV | POP | NAV | CDSC | NAV | CDSC | NAV | POP | NAV | NAV |
|
| Annual average | | | | | | | | | | |
| (life of fund) | 5.91% | 5.48% | 5.08% | 5.08% | 5.12% | 5.12% | 5.38% | 5.12% | 5.66% | 6.10% |
|
| 10 years | –18.98 | –23.65 | –24.84 | –24.84 | –24.94 | –24.94 | –22.91 | –25.61 | –20.92 | –16.93 |
| Annual average | –2.08 | –2.66 | –2.82 | –2.82 | –2.83 | –2.83 | –2.57 | –2.92 | –2.32 | –1.84 |
|
| 5 years | –4.96 | –10.42 | –8.46 | –10.29 | –8.51 | –8.51 | –7.26 | –10.51 | –6.09 | –3.74 |
| Annual average | –1.01 | –2.18 | –1.75 | –2.15 | –1.76 | –1.76 | –1.50 | –2.20 | –1.25 | –0.76 |
|
| 3 years | –21.72 | –26.20 | –23.49 | –25.78 | –23.51 | –23.51 | –22.85 | –25.57 | –22.31 | –21.12 |
| Annual average | –7.84 | –9.63 | –8.54 | –9.46 | –8.55 | –8.55 | –8.28 | –9.37 | –8.07 | –7.60 |
|
| 1 year | 38.86 | 30.85 | 37.84 | 32.84 | 37.81 | 36.81 | 38.26 | 33.43 | 38.59 | 39.17 |
|
| 6 months | 9.63 | 3.30 | 9.31 | 4.31 | 9.22 | 8.22 | 9.42 | 5.54 | 9.55 | 9.80 |
|
Current performance may be lower or higher than the quoted past performance, which cannot guarantee future results. After-sales-charge returns (public offering price, or POP) for class A and M shares reflect a maximum 5.75% and 3.50% load, respectively. Class B share returns reflect the applicable contingent deferred sales charge (CDSC), which is 5% in the first year, declining to 1% in the sixth year, and is eliminated thereafter. Class C shares reflect a 1% CDSC for the first year that is eliminated thereafter. Class R and Y shares have no initial sales charge or CDSC. Performance for class B, C, M, R, and Y shares before their inception is derived from the historical performance of class A shares, adjusted for the applicable sales charge (or CDSC) and, except for class Y shares, the higher operating expenses for such shares.
For a portion of the periods, this fund may have limited expenses, without which returns would have been lower.
A 1% short-term trading fee may be applied to shares exchanged or sold within 7 days of purchase.
Performance benefited from receipt of a Tyco International Ltd. class action settlement pertaining to investments made prior to 2003.
11
Comparative index returns For periods ended 1/31/10
| | |
| | | Lipper Large-Cap Core Funds |
| | S&P 500 Index | category average* |
|
| Annual average (life of fund) | 6.25% | 5.68% |
|
| 10 years | –7.73 | –0.47 |
| Annual average | –0.80 | –0.36 |
|
| 5 years | 0.90 | 1.46 |
| Annual average | 0.18 | 0.22 |
|
| 3 years | –20.18 | –19.19 |
| Annual average | –7.24 | –6.93 |
|
| 1 year | 33.14 | 33.11 |
|
| 6 months | 9.87 | 8.99 |
|
Index and Lipper results should be compared to fund performance at net asset value.
* Over the 6-month, 1-year, 3-year, 5-year, 10-year, and life-of-fund periods ended 1/31/10, there were 947, 910, 786, 655, 372, and 172 funds, respectively, in this Lipper category.
Fund price and distribution information For the six-month period ended 1/31/10
| | | | | | | | |
| Distributions | Class A | Class B | Class C | Class M | Class R | Class Y |
|
| Number | 1 | 1 | 1 | 1 | 1 | 1 |
|
| Income | $0.108 | $0.002 | $0.029 | $0.053 | $0.085 | $0.136 |
|
| Capital gains | — | — | — | — | — | — |
|
| Total | $0.108 | $0.002 | $0.029 | $0.053 | $0.085 | $0.136 |
|
| Share value | NAV | POP | NAV | NAV | NAV | POP | NAV | NAV |
|
| 7/31/09 | $11.59 | $12.30 | $10.87 | $10.94 | $11.17 | $11.58 | $11.55 | $11.66 |
|
| 1/31/10 | 12.60 | 13.37 | 11.88 | 11.92 | 12.17 | 12.61 | 12.57 | 12.67 |
|
The classification of distributions, if any, is an estimate. Final distribution information will appear on your year-end tax forms.
Fund performance as of most recent calendar quarter
Total return for periods ended 12/31/09
| | | | | | | | | | |
| | Class A | Class B | Class C | Class M | Class R | Class Y |
| (inception dates) | (10/2/95) | (6/15/98) | (2/1/99) | (6/15/98) | (1/21/03) | (4/4/00) |
|
| | NAV | POP | NAV | CDSC | NAV | CDSC | NAV | POP | NAV | NAV |
|
| Annual average | | | | | | | | | | |
| (life of fund) | 6.23% | 5.79% | 5.40% | 5.40% | 5.44% | 5.44% | 5.70% | 5.44% | 5.97% | 6.42% |
|
| 10 years | –19.25 | –23.88 | –25.08 | –25.08 | –25.11 | –25.11 | –23.14 | –25.85 | –21.18 | –17.21 |
| Annual average | –2.12 | –2.69 | –2.85 | –2.85 | –2.85 | –2.85 | –2.60 | –2.95 | –2.35 | –1.87 |
|
| 5 years | –2.91 | –8.46 | –6.50 | –8.37 | –6.47 | –6.47 | –5.25 | –8.58 | –4.06 | –1.67 |
| Annual average | –0.59 | –1.75 | –1.34 | –1.73 | –1.33 | –1.33 | –1.07 | –1.78 | –0.83 | –0.34 |
|
| 3 years | –16.91 | –21.68 | –18.79 | –21.23 | –18.76 | –18.76 | –18.11 | –20.95 | –17.52 | –16.25 |
| Annual average | –5.99 | –7.82 | –6.70 | –7.65 | –6.69 | –6.69 | –6.44 | –7.54 | –6.22 | –5.74 |
|
| 1 year | 34.28 | 26.56 | 33.25 | 28.25 | 33.22 | 32.22 | 33.58 | 28.97 | 33.87 | 34.60 |
|
| 6 months | 22.33 | 15.28 | 21.94 | 16.93 | 21.86 | 20.86 | 22.04 | 17.74 | 22.18 | 22.45 |
|
12
Your fund’s expenses
As a mutual fund investor, you pay ongoing expenses, such as management fees, distribution fees (12b-1 fees), and other expenses. In the most recent six-month period, your fund limited these expenses; had it not done so, expenses would have been higher. Using the following information, you can estimate how these expenses affect your investment and compare them with the expenses of other funds. You may also pay one-time transaction expenses, including sales charges (loads) and redemption fees, which are not shown in this section and would have resulted in higher total expenses. For more information, see your fund’s prospectus or talk to your financial representative.
Expense ratios
| | | | | | |
| | Class A | Class B | Class C | Class M | Class R | Class Y |
|
| Net expenses for the fiscal year ended 7/31/09*† | 1.31% | 2.06% | 2.06% | 1.81% | 1.56% | 1.06% |
|
| Total annual operating expenses for the fiscal year | | | | | | |
| ended 7/31/09† | 1.39% | 2.14% | 2.14% | 1.89% | 1.64% | 1.14% |
|
| Annualized expense ratio for the six-month period | | | | | | |
| ended 1/31/10 | 1.21% | 1.96% | 1.96% | 1.71% | 1.46% | 0.96% |
|
Fiscal-year expense information in this table is taken from the most recent prospectus, is subject to change, and may differ from that shown for the annualized expense ratio and in the financial highlights of this report. Expenses are shown as a percentage of average net assets.
* Reflects Putnam Management’s decision to contractually limit expenses through 7/31/10.
† Reflects projected expenses based on a new expense arrangement and the fund’s recent (8/31/09) asset level.
Expenses per $1,000
The following table shows the expenses you would have paid on a $1,000 investment in Putnam Research Fund from August 1, 2009, to January 31, 2010. It also shows how much a $1,000 investment would be worth at the close of the period, assuming actual returns and expenses.
| | | | | | |
| | Class A | Class B | Class C | Class M | Class R | Class Y |
|
| Expenses paid per $1,000 *† | $6.39 | $10.34 | $10.34 | $9.03 | $7.71 | $5.08 |
|
| Ending value (after expenses) | $1,096.30 | $1,093.10 | $1,092.20 | $1,094.20 | $1,095.50 | $1,098.00 |
|
* Expenses for each share class are calculated using the fund’s annualized expense ratio for each class, which represents the ongoing expenses as a percentage of average net assets for the six months ended 1/31/10. The expense ratio may differ for each share class.
† Expenses are calculated by multiplying the expense ratio by the average account value for the period; then multiplying the result by the number of days in the period; and then dividing that result by the number of days in the year.
13
Estimate the expenses you paid
To estimate the ongoing expenses you paid for the six months ended January 31, 2010, use the following calculation method. To find the value of your investment on August 1, 2009, call Putnam at 1-800-225-1581.

Compare expenses using the SEC’s method
The Securities and Exchange Commission (SEC) has established guidelines to help investors assess fund expenses. Per these guidelines, the following table shows your fund’s expenses based on a $1,000 investment, assuming a hypothetical 5% annualized return. You can use this information to compare the ongoing expenses (but not transaction expenses or total costs) of investing in the fund with those of other funds. All mutual fund shareholder reports will provide this information to help you make this comparison. Please note that you cannot use this information to estimate your actual ending account balance and expenses paid during the period.
| | | | | | |
| | Class A | Class B | Class C | Class M | Class R | Class Y |
|
| Expenses paid per $1,000 *† | $6.16 | $9.96 | $9.96 | $8.69 | $7.43 | $4.89 |
|
| Ending value (after expenses) | $1,019.11 | $1,015.32 | $1,015.32 | $1,016.59 | $1,017.85 | $1,020.37 |
|
* Expenses for each share class are calculated using the fund’s annualized expense ratio for each class, which represents the ongoing expenses as a percentage of average net assets for the six months ended 1/31/10. The expense ratio may differ for each share class.
† Expenses are calculated by multiplying the expense ratio by the average account value for the period; then multiplying the result by the number of days in the period; and then dividing that result by the number of days in the year.
14
Terms and definitions
Important terms
Total return shows how the value of the fund’s shares changed over time, assuming you held the shares through the entire period and reinvested all distributions in the fund.
Net asset value (NAV) is the price, or value, of one share of a mutual fund, without a sales charge. NAVs fluctuate with market conditions. NAV is calculated by dividing the net assets of each class of shares by the number of outstanding shares in the class.
Public offering price (POP) is the price of a mutual fund share plus the maximum sales charge levied at the time of purchase. POP performance figures shown here assume the 5.75% maximum sales charge for class A shares and 3.50% for class M shares.
Contingent deferred sales charge (CDSC) is generally a charge applied at the time of the redemption of class B or C shares and assumes redemption at the end of the period. Your fund’s class B CDSC declines from a 5% maximum during the first year to 1% during the sixth year. After the sixth year, the CDSC no longer applies. The CDSC for class C shares is 1% for one year after purchase.
Share classes
Class A shares are generally subject to an initial sales charge and no CDSC (except on certain redemptions of shares bought without an initial sales charge).
Class B shares are not subject to an initial sales charge. They may be subject to a CDSC.
Class C shares are not subject to an initial sales charge and are subject to a CDSC only if the shares are redeemed during the first year.
Class M shares have a lower initial sales charge and a higher 12b-1 fee than class A shares and no CDSC (except on certain redemptions of shares bought without an initial sales charge).
Class R shares are not subject to an initial sales charge or CDSC and are available only to certain defined contribution plans.
Class Y shares are not subject to an initial sales charge or CDSC, and carry no 12b-1 fee. They are generally only available to corporate and institutional clients and clients in other approved programs.
Comparative indexes
Barclays Capital Aggregate Bond Index is an unmanaged index of U.S. investment-grade fixed-income securities.
BofA Merrill Lynch U.S. 3-month Treasury Bill Index is an unmanaged index that seeks to measure the performance of U.S. Treasury bills available in the marketplace.
S&P 500 Index is an unmanaged index of common stock performance.
Indexes assume reinvestment of all distributions and do not account for fees. Securities and performance of a fund and an index will differ. You cannot invest directly in an index.
Lipper is a third-party industry-ranking entity that ranks mutual funds. Its rankings do not reflect sales charges. Lipper rankings are based on total return at net asset value relative to other funds that have similar current investment styles or objectives as determined by Lipper. Lipper may change a fund’s category assignment at its discretion. Lipper category averages reflect performance trends for funds within a category.
15
Trustee approval of management contract
General conclusions
The Board of Trustees of the Putnam funds oversees the management of each fund and, as required by law, determines annually whether to approve the continuance of your fund’s management contract with Putnam Investment Management (“Putnam Management”) and the sub-management contract, with respect to your fund, between Putnam Management and its affiliate, Putnam Investments Limited (“PIL”), and the sub-advisory contract among Putnam Management, PIL and another affiliate, Putnam Advisory Company (“PAC”).
In this regard, the Board of Trustees, with the assistance of its Contract Committee consisting solely of Trustees who are not “interested persons” (as such term is defined in the Investment Company Act of 1940, as amended) of the Putnam funds (the “Independent Trustees”), requests and evaluates all information it deems reasonably necessary under the circumstances. Over the course of several months ending in June 2009, the Contract Committee met several times to consider the information provided by Putnam Management and other information developed with the assistance of the Board’s independent counsel and independent staff. The Contract Committee reviewed and discussed key aspects of this information with all of the Independent Trustees. At the Trustees’ June 12, 2009 meeting, the Contract Committee recommended, and the Independent Trustees approved, the continuance of your fund’s management, sub-management and sub-ad visory contracts, effective July 1, 2009. (Because PIL and PAC are affiliates of Putnam Management and Putnam Management remains fully responsible for all services provided by PIL and PAC, the Trustees have not evaluated PIL and PAC as separate entities, except as otherwise indicated below, and all subsequent references to Putnam Management below should be deemed to include reference to PIL and PAC as necessary or appropriate in the context.)
The Independent Trustees’ approval was based on the following conclusions:
• That the fee schedule in effect for your fund represented reasonable compensation in light of the nature and quality of the services being provided to the fund, the fees paid by competitive funds and the costs incurred by Putnam Management in providing such services, and
• That such fee schedule represented an appropriate sharing between fund shareholders and Putnam Management of such economies of scale as may exist in the management of the fund at current asset levels.
These conclusions were based on a comprehensive consideration of all information provided to the Trustees, were subject to the continued application of certain expense reductions and waivers pending other considerations noted below, and were not the result of any single factor. Some of the factors that figured particularly in the Trustees’ deliberations and how the Trustees considered these factors are described below, although individual Trustees may have evaluated the information presented differently, giving different weights to various factors. It is also important to recognize that the fee arrangements for your fund and the other Putnam funds are the result of many years of review and discussion between the Independent Trustees and Putnam Management, that certain aspects of the arrangements may receive greater scrutiny in some years than others, and that the Trustees’ conclusions may be based, in part, on their consideration of these sam e arrangements in prior years.
Consideration of strategic
pricing proposal
The Trustees considered that the Contract Committee had been engaged in a detailed
16
review of Putnam Management’s strategic pricing proposal that was first presented to the Committee at its May 2009 meeting. The proposal included proposed changes to the basic structure of the management fees in place for all open-end funds (except the Putnam RetirementReady® Funds and Putnam Money Market Liquidity Fund), including implementation of a breakpoint structure based on the aggregate net assets of all such funds in lieu of the individual breakpoint structures in place for each fund, as well as implementation of performance fees for certain funds. In addition, the proposal recommended substituting separate expense limitations on investor servicing fees and on other expenses as a group in lieu of the total expense limitations in place for many funds.
While the Contract Committee noted the likelihood that the Trustees and Putnam Management would reach agreement on the strategic pricing matters in later months, the terms of the management contracts required that the Trustees approve the continuance of the contracts in order to prevent their expiration at June 30, 2009. The Contract Committee’s recommendations in June reflect its conclusion that the terms of the contractual arrangements for your fund continued to be appropriate for the upcoming term, absent any possible agreement with respect to the matters addressed in Putnam Management’s proposal.
The Trustees were mindful of the significant changes that had occurred at Putnam Management in the past two years, including a change of ownership, the installation of a new senior management team at Putnam Management, the substantial decline in assets under management resulting from extraordinary market forces as well as continued net redemptions in many funds, the introduction of new fund products representing novel investment strategies and the introduction of performance fees for certain new funds. The Trustees were also mindful that many other leading firms in the industry had also been experiencing significant challenges due to the changing financial and competitive environment. For these reasons, even though the Trustees believed that the current contractual arrangements in place between the funds and Putnam Management and its affiliates have served shareholders well and continued to be appropriate for the nea r term, the Trustees believed that it was an appropriate time to reconsider the current structure of the funds’ contractual arrangements with Putnam Management with a view to possible changes that might better serve the interests of shareholders in this new environment. The Trustees concluded their review of Putnam Management’s strategic pricing proposal in July 2009, and their considerations regarding the proposal are discussed below under the heading “Subsequent approval of strategic pricing proposal.” With the exception of the discussion under this heading, the following discussion generally addresses only the Trustees’ reasons for recommending the continuance of the current contractual arrangements as, at the time the Trustees determined to make this recommendation, the Trustees had not yet reached any conclusions with respect to the strategic pricing proposal.
Management fee schedules and
categories; total expenses
The Trustees reviewed the management fee schedules in effect for all Putnam funds, including fee levels and breakpoints, and the assignment of funds to particular fee categories. The general fee structure has been carefully developed over the years and re-examined on many occasions and adjusted where appropriate. In this regard, the Trustees noted that shareholders of all funds voted by overwhelming majorities in 2007 to approve new management contracts containing identical fee schedules.
In reviewing fees and expenses, the Trustees generally focused their attention on
17
material changes in circumstances — for example, changes in a fund’s size or investment style, changes in Putnam Management’s operating costs, or changes in competitive practices in the mutual fund industry — that suggest that consideration of fee changes might be warranted. The Trustees concluded that the circumstances did not warrant changes to the management fee structure of your fund at that time but, as indicated above, based on their detailed review of the current fee structure, were prepared to consider possible changes to this arrangement that might better serve the interests of shareholders in the future. The Trustees focused on two areas of particular interest, as discussed further below:
• Competitiveness. The Trustees reviewed comparative fee and expense information for competitive funds, which indicated that, in a custom peer group of competitive funds selected by Lipper Inc., your fund ranked in the 24th percentile in management fees and in the 62nd percentile in total expenses (less any applicable 12b-1 fees) as of December 31, 2008 (the first percentile being the least expensive funds and the 100th percentile being the most expensive funds).
The Trustees noted that expense ratios for a number of Putnam funds, which show the percentage of fund assets used to pay for management and administrative services, distribution (12b-1) fees and other expenses, had been increasing recently as a result of declining net assets and the natural operation of fee breakpoints. The Trustees expressed their intention to monitor the funds’ percentile rankings in management fees and in total expenses to ensure that fees and expenses of the funds continue to meet evolving competitive standards.
The Trustees noted that the expense ratio increases described above were being controlled by expense limitations initially implemented in January 2004. These expense limitations give effect to a commitment by Putnam Management that the expense ratio of each open-end fund would be no higher than the average expense ratio of the competitive funds included in the fund’s relevant Lipper universe (exclusive of any applicable 12b-1 charges in each case). The Trustees observed that this commitment to limit fund expenses has served shareholders well since its inception and, while the Contract Committee was reviewing proposed alternative expense limitation arrangements as noted above, the Trustees received a commitment from Putnam Management and its parent company to continue this program through at least June 30, 2010, or such earlier time as the Trustees and Putnam Management reach agreement on alternative arrang ements.
In order to ensure that the expenses of the Putnam funds continue to meet evolving competitive standards, the Trustees requested, and Putnam Management agreed, to extend for the twelve months beginning July 1, 2009, or until such earlier time as the Trustees and Putnam Management reach agreement on alternative expense limitation arrangements, an additional expense limitation for certain funds at an amount equal to the average expense ratio (exclusive of 12b-1 charges) of a custom peer group of competitive funds selected by Lipper to correspond to the size of the fund. This additional expense limitation will be applied to those open-end funds that had above-average expense ratios (exclusive of 12b-1 charges) based on the custom peer group data for the period ended December 31, 2007. This additional expense limitation was applied to your fund.
• Economies of scale. Your fund currently has the benefit of breakpoints in its management fee that provide shareholders with significant economies of scale, which means that the effective management fee rate of the fund (as a percentage of fund assets) declines as the fund grows in size and crosses specified asset thresholds. Conversely, as the fund shrinks in
18
size — as has been the case for many Putnam funds in recent years — these breakpoints result in increasing fee levels. In recent years, the Trustees have examined the operation of the existing breakpoint structure during periods of both growth and decline in asset levels. The Trustees concluded that the fee schedule in effect for your fund represented an appropriate sharing of economies of scale at that time but, as noted above, were in the process of reviewing a proposal to eliminate individual fund breakpoints for all of the open-end funds (except for the Putnam RetirementReady® Funds and Putnam Money Market Liquidity Fund) in favor of a breakpoint structure based on the aggregate net assets of all such funds.
In connection with their review of the management fees and total expenses of the Putnam funds, the Trustees also reviewed the costs of the services provided and profits realized by Putnam Management and its affiliates from their contractual relationships with the funds. This information included trends in revenues, expenses and profitability of Putnam Management and its affiliates relating to the investment management and distribution services provided to the funds. In this regard, the Trustees also reviewed an analysis of Putnam Management’s revenues, expenses and profitability with respect to the funds’ management contracts, allocated on a fund-by-fund basis.
Investment performance
The quality of the investment process provided by Putnam Management represented a major factor in the Trustees’ evaluation of the quality of services provided by Putnam Management under your fund’s management contract. The Trustees were assisted in their review of the Putnam funds’ investment process and performance by the work of the Investment Oversight Coordinating Committee of the Trustees and the Investment Oversight Committees of the Trustees, which had met on a regular monthly basis with the funds’ portfolio teams throughout the year. The Trustees concluded that Putnam Management generally provides a high-quality investment process — as measured by the experience and skills of the individuals assigned to the management of fund portfolios, the resources made available to such personnel, and in general the ability of Putnam Management to attract and retain high-quality personnel — b ut also recognized that this does not guarantee favorable investment results for every fund in every time period. The Trustees considered the investment performance of each fund over multiple time periods and considered information comparing each fund’s performance with various benchmarks and with the performance of competitive funds.
The Trustees noted the disappointing investment performance of many of the funds for periods ended March 31, 2009. They discussed with senior management of Putnam Management the factors contributing to such underperformance and the actions being taken to improve performance. The Trustees recognized that, in recent years, Putnam Management has taken steps to strengthen its investment personnel and processes to address areas of underperformance, including Putnam Management’s continuing efforts to strengthen the equity research function, recent changes in portfolio managers including increased accountability of individual managers rather than teams, recent changes in Putnam Management’s approach to incentive compensation, including emphasis on top quartile performance over a rolling three-year period, and the recent arrival of a new chief investment officer. The Trustees also recognized the substantial improvement in performance of many funds si nce the implementation of those changes. The Trustees indicated their intention to continue to monitor performance trends to assess the effectiveness of these efforts and to evaluate whether additional changes to address areas of underperformance are warranted.
19
In the case of your fund, the Trustees considered that your fund’s class A share cumulative total return performance at net asset value was in the following percentiles of its Lipper Inc. peer group (Lipper Large-Cap Core Funds) for the one-year, three-year and five-year periods ended March 31, 2009 (the first percentile being the best-performing funds and the 100th percentile being the worst-performing funds):
| | | |
| One-year period | 20th | | |
| | |
| Three-year period | 78th | | |
| | |
| Five-year period | 83rd | | |
| | |
Over the one-year, three-year and five-year periods ended March 31, 2009, there were 885, 763 and 638 funds, respectively, in your fund’s Lipper peer group. Past performance is no guarantee of future results.
The Trustees noted the disappointing performance for certain funds, as well as certain circumstances that may have contributed to that performance and the actions taken by Putnam Management to address these funds’ performance, as detailed below. The Trustees also considered the four broad initiatives that Putnam Management has implemented to improve its investment approach, to reduce the likelihood of fourth quartile results, and to deliver on its long-term investment goals. Specifically, Putnam Management has:
1. Increased accountability and reduced complexity in the portfolio management process for the Putnam equity funds by replacing a team management structure with a decision-making process that vests full authority and responsibility with individual portfolio managers;
2. Clarified Putnam Management’s investment process by affirming a fundamental-driven approach to investing, with quantitative analysis providing additional input for investment decisions;
3.Strengthened Putnam Management’s large-cap equity research capability by adding multiple new investment personnel to the team and by bringing U.S. and international research under common leadership; and
4. Realigned compensation structure for portfolio managers and research analysts so that only those who achieve top-quartile returns over a rolling three-year basis are eligible for full bonuses.
The Trustees noted the disappointing performance for your fund for the three-year and five-year periods ended March 31, 2009. In this regard, in addition to initiatives 1 through 4 described above, the Trustees considered various changes made to the fund’s portfolio team since April 2008, resulting in the fund being managed by a sole portfolio manager as of February 2009. The Trustees also noted the fund’s improved performance over the one-year period ended March 31, 2009.
As a general matter, the Trustees believe that cooperative efforts between the Trustees and Putnam Management represent the most effective way to address investment performance problems. The Trustees noted that investors in the Putnam funds have, in effect, placed their trust in the Putnam organization, under the oversight of the funds’ Trustees, to make appropriate decisions regarding the management of the funds. Based on the responsiveness of Putnam Management in the recent past to Trustee concerns about investment performance, the Trustees concluded that it is preferable to seek change within Putnam Management to address performance shortcomings. In the Trustees’ view, the alternative of engaging a new investment adviser for an underperforming fund would entail significant disruptions and would not provide any greater assurance of improved investment performance.
Brokerage and soft-dollar allocations;
other benefits
The Trustees considered various potential benefits that Putnam Management may receive
20
in connection with the services it provides under the management contract with your fund. These include benefits related to brokerage and soft-dollar allocations, whereby a portion of the commissions paid by a fund for brokerage may be used to acquire research services that may be useful to Putnam Management in managing the assets of the fund and of other clients. The Trustees considered a change made, at Putnam Management’s request, to the Putnam funds’ brokerage allocation policy commencing in 2009, which increased the permitted soft dollar allocation to third-party services over what had been authorized in previous years. The Trustees noted that a portion of available soft dollars continue to be allocated to the payment of fund expenses, although the amount allocated for this purpose has declined in recent years. The Trustees indicated their continued intent to monitor regulatory developments in this area with the assistance of their Broke rage Committee and also indicated their continued intent to monitor the potential benefits associated with the allocation of fund brokerage and trends in industry practice to ensure that the principle of seeking best price and execution remains paramount in the portfolio trading process.
The Trustees’ annual review of your fund’s management contract also included the review of the investor servicing agreement with Putnam Investor Services, Inc. (“PSERV”), which agreement provides benefits to an affiliate of Putnam Management. The Trustees considered that effective January 1, 2009, the Trustees, PSERV and Putnam Management entered into a new fee schedule that includes for the open-end funds (other than funds of Putnam Variable Trust and Putnam Money Market Liquidity Fund) an expense limitation but, as noted above, also considered that this expense limitation is subject to review as part of the Trustees’ pending review of Putnam’s strategic pricing proposal.
In the case of your fund, the Trustees’ annual review of the fund’s management contract also included the review of the fund’s distributor’s contract and distribution plans with Putnam Retail Management Limited Partnership, which contract and plans also provide benefits to an affiliate of Putnam Management.
Comparison of retail and institutional
fee schedules
The information examined by the Trustees as part of their annual contract review has included for many years information regarding fees charged by Putnam Management and its affiliates to institutional clients such as defined benefit pension plans, college endowments, etc. This information included comparisons of such fees with fees charged to the funds, as well as a detailed assessment of the differences in the services provided to these two types of clients. The Trustees observed, in this regard, that the differences in fee rates between institutional clients and mutual funds are by no means uniform when examined by individual asset sectors, suggesting that differences in the pricing of investment management services to these types of clients reflect to a substantial degree historical competitive forces operating in separate market places. The Trustees considered the fact that fee rates across different asset classes are typically higher on average fo r mutual funds than for institutional clients, as well as the differences between the services that Putnam Management provides to the Putnam funds and those that it provides to institutional clients of the firm, but did not rely on such comparisons to any significant extent in concluding that the management fees paid by your fund are reasonable.
Subsequent approval of strategic
pricing proposal
As mentioned above, at a series of meetings beginning in May 2009 and ending on July 10, 2009, the Contract Committee and the Trustees engaged in a detailed review
21
of Putnam Management’s strategic pricing proposal. Following this review, the Trustees of each fund, including all of the Independent Trustees, voted unanimously on July 10, 2009 to approve proposed management contracts reflecting the proposal, as modified based on discussions between the Independent Trustees and Putnam Management, for each fund. In considering the proposed contracts, the Independent Trustees focused largely on the specific proposed changes described below relating to management fees. They also took into account the factors that they considered in connection with their most recent annual approval on June 12, 2009 of the continuance of the funds’ current management contracts and the extensive materials that they had reviewed in connection with that approval process, as described above.
On December 18, 2009, shareholders approved the proposed management contract for your fund. The new management contract was implemented on January 1, 2010.
• Considerations relating to Fund Family fee rate calculations. The Independent Trustees considered that the proposed management contracts would change the manner in which fund shareholders share in potential economies of scale associated with the management of the funds. Under the current management contracts, shareholders of a fund (other than Putnam Money Market Liquidity Fund and the Putnam RetirementReady® Funds, which do not pay management fees to Putnam Management) benefit from increased fund size through reductions in the effective management fee paid to Putnam Management once the fund’s net assets exceed the first breakpoint in the fund’s fee schedule ($500 million for most funds). Conversely, in the case of funds with net assets above the level of the first breakpoint, the effective management fee increases as the fund’s average net assets decline below a breakpoint. These breakpoints are measured solely by the net assets of each individual fund and are not affected by possible growth (or decline) of net assets of other funds in the Fund Family. (“Fund Family” for purposes of this discussion refers to all open-end mutual funds sponsored by Putnam Management, except for the Putnam RetirementReady® Funds and Putnam Money Market Liquidity Fund.) Under the proposed management contracts, potential economies of scale would be shared ratably among shareholders of all funds, regardless of their size. The management fees paid by a fund (and indirectly by shareholders) would no longer be affected by the growth (or decline) of assets of the particular fund, but rather would be affected solely by the growth (or decline) of the aggregate net assets of all funds in the Fund Family, regardless of whether the net assets of the particular fund are growing or declining.
The table below shows the proposed effective management fee rate for your fund, based on June 30, 2009 net assets of the Fund Family ($52.3 billion). This table also shows the effective management fee rate payable by your fund under its current management contract, based on the net assets of the fund as of June 30, 2009. Finally, this table shows the difference in the effective management fees, based on net assets as of June 30, 2009, between the proposed management contract and the current contract.
| | | |
| | Proposed Effective | Current Effective | |
| Name of Fund | Contractual Rate | Contractual Rate | Difference |
|
| Putnam Research Fund | 0.572% | 0.650% | (0.078%) |
22
As shown in the foregoing table, based on June 30, 2009 net asset levels, the proposed management contract would provide for payment of a management fee rate that is lower for your fund than the management fee rate payable under the current management contract. For a small number of funds (although not your fund), the management fee rate would be slightly higher under the proposed contract at these asset levels, but by only immaterial amounts. In the aggregate, the financial impact on Putnam Management of implementing this proposed change for all funds at June 30, 2009 net asset levels is a reduction in annual management fee revenue of approximately $24.0 million. (Putnam Management has already incurred a significant portion of this revenue reduction through the waiver of a portion of its current management fees for certain funds pending shareholder consideration of the proposed management contracts. Putnam is not obliged to continue such waivers beyon d July 31, 2010 in the event that the proposed contracts are not approved by shareholders.) The Independent Trustees carefully considered the implications of this proposed change under a variety of economic circumstances. They considered the fact that at current asset levels the management fees paid by the funds under the proposed contract would be lower for almost all funds, and would not be materially higher for any fund. They considered the possibility that under some circumstances, the current management contract could result in a lower fee for a particular fund than the proposed management contract. Such circumstances might occur, for example, if the aggregate net assets of the Fund Family remain largely unchanged and the net assets of an individual fund grew substantially, or if the net assets of an individual fund remain largely unchanged and the aggregate net assets of the Fund Family declined substantially.
The Independent Trustees noted that future changes in the net assets of individual funds are inherently unpredictable and that experience has shown that funds often grow in size and decline in size over time depending on market conditions and the changing popularity of particular investment styles and asset classes. They noted that, while the aggregate net assets of the Fund Family have changed substantially over time, basing a management fee on the aggregate level of assets of the Fund Family would likely reduce fluctuations in costs paid by individual funds and lead to greater stability and predictability of fund operating costs over time.
The Independent Trustees considered that the proposed management contract would likely be advantageous for newly organized funds that have yet to attract significant assets and for funds in specialty asset classes that are unlikely to grow to a significant size. In each case, such funds would participate in the benefits of scale made possible by the aggregate size of the Fund Family to an extent that would not be possible based solely on their individual size.
The Independent Trustees also considered that for funds that have achieved or are likely to achieve considerable scale on their own, the proposed management contract could result in sharing of economies which might lead to slightly higher costs under some circumstances, but they noted that any such increases are immaterial at current asset levels and that over time such funds are likely to realize offsetting benefits from their opportunity to participate, both through the exchange privilege and through the Fund Family breakpoint fee structure, in the improved growth prospects of a diversified Fund Family able to offer competitively priced products.
The Independent Trustees noted that the implementation of the proposed management contracts would result in a reduction in aggregate fee revenues for Putnam Management at current asset levels. They also noted that applying various projections of growth equally to the aggregate net assets of the Fund
23
Family and to the net assets of individual funds also showed revenue reductions for Putnam Management. They recognized, however, the possibility that under some scenarios Putnam Management might realize greater future revenues, with respect to certain funds, under the proposed contracts than under the current contracts, but considered such circumstances to be both less likely and inherently unpredictable.
The Independent Trustees considered the extent to which Putnam Management may realize economies of scale in connection with the management of the funds. In this regard, they considered the possibility that such economies of scale as may exist in the management of mutual funds may be associated more closely with the size of the aggregate assets of the mutual fund complex than with the size of any individual fund. In this regard the Independent Trustees considered the financial information provided to them by Putnam Management over a period of many years regarding the allocation of costs involved in calculating the profitability of its mutual fund business as a whole and the profitability of individual funds. The Independent Trustees noted that the methodologies for such cost allocations had been reviewed on a number of occasions in the past by independent financial consultants engaged by the Independent Trustees. The Independent Trustees noted that thes e methodologies support Putnam Management’s assertion that many of its operating costs and any associated economies of scale are related more to the aggregate net assets under management in various sectors of its business than to the size of individual funds. They noted that on a number of occasions in the past the Independent Trustees had separately considered the possibility of calculating management fees in whole or in part based on aggregate net assets of the Putnam funds.
The Independent Trustees considered the fact that the proposed contracts would result in a sharing among the affected funds of economies of scale that for the most part are now enjoyed by the larger funds, without materially increasing the current costs of any of the larger funds. They concluded that this sharing of economies among funds was appropriate in light of the diverse investment opportunities available to shareholders of all funds through the existence of the exchange privilege. They also considered that the proposed change in management fee structure would allow Putnam Management to introduce new investment products at more attractive pricing levels than may be currently be the case.
After considering all of the foregoing, the Independent Trustees concluded that the proposed calculation of management fees based on the aggregate net assets of the Fund Family represented a fair and reasonable means of sharing possible economies of scale among the shareholders of all funds.
• Considerations relating to addition of fee rate adjustments based on investment performance for certain funds. The Independent Trustees considered that Putnam’s proposal to add fee rate adjustments based on investment performance to the management contracts of certain funds reflected a desire by Putnam Management to align its fee revenues more closely with investment performance in the case of certain funds. They noted that Putnam Management already has a significant financial interest in achieving good performance results for the funds it manages. Putnam Management’s fees are based on the assets under its management (whether calculated on an individual fund or complex-wide basis). Good performance results in higher asset levels and therefore higher revenues to Putnam Management. Moreover, good performance also tends to at tract additional investors to particular funds or the complex generally, also resulting in higher revenues. Nevertheless, the Independent Trustees concluded that adjusting management fees based on performance for
24
certain selected funds could provide additional benefits to shareholders.
The Independent Trustees noted that Putnam Management proposed the addition of performance adjustments only for certain of the funds and considered whether similar adjustments might be appropriate for other funds. In this regard, they considered Putnam Management’s belief that the addition of performance adjustments would be most appropriate for shareholders of U.S. growth funds, international equity funds and Putnam Global Equity Fund. They also considered Putnam Management’s view that it would continue to monitor whether performance fees would be appropriate for other funds. Accordingly, the Independent Trustees concluded that it would be desirable to gain further experience with the operation of performance adjustments for certain funds and the market’s receptivity to such fee structures before giving further consideration to whether similar performance adjustments would be appropriate for other funds as well.
• Considerations relating to standardization of payment terms. The proposed management contracts for all funds provide that management fees will be computed and paid monthly within 15 days after the end of each month. The current contracts of the funds contain quarterly computation and payment terms in some cases. These differences largely reflect practices in place at earlier times when many of the funds were first organized. Under the proposed contract, certain funds would make payments to Putnam Management earlier than they do under their current contract. This would reduce a fund’s opportunity to earn income on accrued but unpaid management fees by a small amount, but would not have a material effect on a fund’s operating costs.
The Independent Trustees considered the fact that standardizing the payment terms for all funds would involve an acceleration in the timing of payments to Putnam Management for some funds and a corresponding loss of a potential opportunity for such funds to earn income on accrued but unpaid management fees. The Independent Trustees did not view this change as having a material impact on shareholders of any fund. In this regard, the Independent Trustees noted that the proposed contracts conform to the payment terms included in management contracts for all Putnam funds organized in recent years and that standardizing payment terms across all funds would reduce administrative burdens for both the funds and Putnam Management.
• Considerations relating to comparisons with management fees and total expenses of competitive funds. As part of their evaluation of the proposed management contracts, the Independent Trustees also reviewed the general approach taken by Putnam Management and the Independent Trustees in recent years in imposing appropriate limits on total fund expenses. As part of the annual contract review process in recent years, Putnam Management agreed to waive fees as needed to limit total fund expenses to a maximum level equal to the average total expenses of comparable competitive funds in the mutual fund industry. In connection with its proposal to implement new management contracts, Putnam Management also proposed, and the Independent Trustees approved, certain changes in this approach that shift the focus from controlling total expenses to imposing separate limits on certain c ategories of expenses, as required. As a general matter, Putnam Management and the Independent Trustees concluded that management fees for the Putnam funds are competitive with the fees charged by comparable funds in the industry. Nevertheless, the Independent Trustees considered specific management fee waivers proposed to be implemented as of August 1, 2009 by Putnam Management with respect to the current management fees of certain funds, as well as projected reductions in management
25
fees for almost all funds that would result under the proposed contracts. Putnam Management and the Independent Trustees also agreed to impose separate expense limitations of 37.5 basis points on the general category of shareholder servicing expenses and 20 basis points on the general category of other ordinary operating expenses. These new expense limitations, as well as the fee waivers, were implemented for all funds effective as of August 1, 2009, replacing the expense limitation referred to above.
These changes resulted in lower total expenses for many funds, but in the case of some funds total expenses increased after application of the new waivers and expense limitations (as compared with the results obtained using the expense limitation method previously in place). In this regard, the Independent Trustees considered the likelihood that total expenses for most of these funds would have increased in any event in the normal course under the previous expense limitation arrangement, as the reported total expense levels of many competitive funds increased in response to the major decline in asset values that began in September 2008. These new waivers and expense limitations will continue in effect until at least July 31, 2010 and will be re-evaluated by the Independent Trustees as part of the annual contract review process prior to their scheduled expiration. However, the management fee waivers referred to above would largely become permanent reductions in fees as a result of the implementation of the proposed management contracts.
Under these new expense limitation arrangements effective August 1, 2009, your fund was subject to a management fee waiver that reduced the fund’s management fee pending implementation of the proposed management contract, and in any event, through July 31, 2010. In addition, your fund is subject to expense limitations of 37.5 basis points on the category of shareholder servicing fees and 20 basis points on the general category of other ordinary operating expenses.
26
Other information for shareholders
Important notice regarding delivery
of shareholder documents
In accordance with SEC regulations, Putnam sends a single copy of annual and semiannual shareholder reports, prospectuses, and proxy statements to Putnam shareholders who share the same address, unless a shareholder requests otherwise. If you prefer to receive your own copy of these documents, please call Putnam at 1-800-225-1581, and Putnam will begin sending individual copies within 30 days.
Proxy voting
Putnam is committed to managing our mutual funds in the best interests of our shareholders. The Putnam funds’ proxy voting guidelines and procedures, as well as information regarding how your fund voted proxies relating to portfolio securities during the 12-month period ended June 30, 2009, are available in the Individual Investors section of putnam.com, and on the SEC’s Web site, www.sec.gov. If you have questions about finding forms on the SEC’s Web site, you may call the SEC at 1-800-SEC-0330. You may also obtain the Putnam funds’ proxy voting guidelines and procedures at no charge by calling Putnam’s Shareholder Services at 1-800-225-1581.
Fund portfolio holdings
The fund will file a complete schedule of its portfolio holdings with the SEC for the first and third quarters of each fiscal year on Form N-Q. Shareholders may obtain the fund’s Forms N-Q on the SEC’s Web site at www.sec.gov. In addition, the fund’s Forms N-Q may be reviewed and copied at the SEC’s Public Reference Room in Washington, D.C. You may call the SEC at 1-800-SEC-0330 for information about the SEC’s Web site or the operation of the Public Reference Room.
Trustee and employee
fund ownership
Putnam employees and members of the Board of Trustees place their faith, confidence, and, most importantly, investment dollars in Putnam mutual funds. As of January 31, 2010, Putnam employees had approximately $294,000,000 and the Trustees had approximately $45,000,000 invested in Putnam mutual funds. These amounts include investments by the Trustees’ and employees’ immediate family members as well as investments through retirement and deferred compensation plans.
27
Financial statements
A guide to financial statements
These sections of the report, as well as the accompanying Notes, constitute the fund’s financial statements.
The fund’s portfolio lists all the fund’s investments and their values as of the last day of the reporting period. Holdings are organized by asset type and industry sector, country, or state to show areas of concentration and diversification.
Statement of assets and liabilities shows how the fund’s net assets and share price are determined. All investment and noninvestment assets are added together. Any unpaid expenses and other liabilities are subtracted from this total. The result is divided by the number of shares to determine the net asset value per share, which is calculated separately for each class of shares. (For funds with preferred shares, the amount subtracted from total assets includes the liquidation preference of preferred shares.)
Statement of operations shows the fund’s net investment gain or loss. This is done by first adding up all the fund’s earnings — from dividends and interest income — and subtracting its operating expenses to determine net investment income (or loss). Then, any net gain or loss the fund realized on the sales of its holdings — as well as any unrealized gains or losses over the period — is added to or subtracted from the net investment result to determine the fund’s net gain or loss for the fiscal period.
Statement of changes in net assets shows how the fund’s net assets were affected by the fund’s net investment gain or loss, by distributions to shareholders, and by changes in the number of the fund’s shares. It lists distributions and their sources (net investment income or realized capital gains) over the current reporting period and the most recent fiscal year-end. The distributions listed here may not match the sources listed in the Statement of operations because the distributions are determined on a tax basis and may be paid in a different period from the one in which they were earned. Dividend sources are estimated at the time of declaration. Actual results may vary. Any non-taxable return of capital cannot be determined until final tax calculations are completed after the end of the fund’s fiscal year.
Financial highlights provide an overview of the fund’s investment results, per-share distributions, expense ratios, net investment income ratios, and portfolio turnover in one summary table, reflecting the five most recent reporting periods. In a semiannual report, the highlights table also includes the current reporting period.
28
The fund’s portfolio 1/31/10 (Unaudited)
| | |
| COMMON STOCKS (94.4%)* | Shares | Value |
|
| Advertising and marketing services (0.2%) | | |
| Omnicom Group, Inc. | 12,442 | $439,203 |
|
| | | 439,203 |
| Aerospace and defense (5.7%) | | |
| BAE Systems PLC (United Kingdom) | 250 | 1,408 |
|
| Goodrich Corp. | 43,500 | 2,693,085 |
|
| L-3 Communications Holdings, Inc. | 19,100 | 1,591,794 |
|
| Northrop Grumman Corp. | 10,700 | 605,620 |
|
| Precision Castparts Corp. | 9,000 | 947,250 |
|
| Raytheon Co. | 84,100 | 4,409,363 |
|
| United Technologies Corp. | 41,100 | 2,773,428 |
|
| | | 13,021,948 |
| Agriculture (0.2%) | | |
| Archer Daniels Midland Co. | 15,375 | 460,789 |
|
| | | 460,789 |
| Airlines (0.3%) | | |
| JetBlue Airways Corp. † | 10,400 | 51,376 |
|
| UAL Corp. † | 33,300 | 407,259 |
|
| US Airways Group, Inc. † | 59,000 | 313,290 |
|
| | | 771,925 |
| Automotive (0.3%) | | |
| Ford Motor Co. † | 55,200 | 598,368 |
|
| | | 598,368 |
| Banking (4.2%) | | |
| Bank of New York Mellon Corp. (The) | 42,000 | 1,221,780 |
|
| JPMorgan Chase & Co. | 38,630 | 1,504,252 |
|
| PNC Financial Services Group, Inc. | 15,600 | 864,708 |
|
| State Street Corp. | 28,000 | 1,200,640 |
|
| SunTrust Banks, Inc. | 29,030 | 706,300 |
|
| Wells Fargo & Co. | 143,162 | 4,070,096 |
|
| | | 9,567,776 |
| Beverage (1.7%) | | |
| Coca-Cola Enterprises, Inc. | 58,700 | 1,185,153 |
|
| Molson Coors Brewing Co. Class B | 28,200 | 1,184,400 |
|
| PepsiCo, Inc. | 24,400 | 1,454,728 |
|
| | | 3,824,281 |
| Biotechnology (2.2%) | | |
| Amgen, Inc. † | 32,292 | 1,888,436 |
|
| Dendreon Corp. † | 26,650 | 738,205 |
|
| Facet Biotech Corp. † | 34,500 | 543,375 |
|
| Genzyme Corp. † | 36,490 | 1,979,947 |
|
| | | 5,149,963 |
| Broadcasting (0.2%) | | |
| CBS Corp. Class B | 16,366 | 211,612 |
|
| Liberty Media Corp. - Entertainment † | 4,211 | 197,496 |
|
| | | 409,108 |
| Building materials (0.1%) | | |
| Owens Corning, Inc. † | 13,111 | 337,346 |
|
| | | 337,346 |
29
| | |
| COMMON STOCKS (94.4%)* cont. | Shares | Value |
|
| Cable television (1.6%) | | |
| Comcast Corp. Class A | 105,497 | $1,670,018 |
|
| DIRECTV Class A † S | 48,053 | 1,458,409 |
|
| Time Warner Cable, Inc. S | 12,432 | 541,911 |
|
| | | 3,670,338 |
| Chemicals (1.7%) | | |
| Air Products & Chemicals, Inc. | 8,700 | 660,852 |
|
| Airgas, Inc. | 5,800 | 245,108 |
|
| Celanese Corp. Ser. A | 11,200 | 325,920 |
|
| Dow Chemical Co. (The) | 37,564 | 1,017,609 |
|
| E.I. du Pont de Nemours & Co. | 18,287 | 596,339 |
|
| FMC Corp. | 40 | 2,038 |
|
| Monsanto Co. | 13,000 | 986,440 |
|
| | | 3,834,306 |
| Coal (0.2%) | | |
| CONSOL Energy, Inc. | 10,442 | 486,702 |
|
| | | 486,702 |
| Combined utilities (0.6%) | | |
| El Paso Corp. | 141,800 | 1,439,270 |
|
| | | 1,439,270 |
| Commercial and consumer services (0.9%) | | |
| Alliance Data Systems Corp. † S | 3,100 | 184,326 |
|
| Automatic Data Processing, Inc. | 10,171 | 414,875 |
|
| Expedia, Inc. † | 26,129 | 559,422 |
|
| Monster Worldwide, Inc. † | 1,200 | 18,708 |
|
| Paychex, Inc. | 6,423 | 186,203 |
|
| Visa, Inc. Class A S | 9,414 | 772,230 |
|
| | | 2,135,764 |
| Communications equipment (3.7%) | | |
| Cisco Systems, Inc. † | 129,353 | 2,906,562 |
|
| Corning, Inc. | 30,325 | 548,276 |
|
| Harris Corp. | 44,300 | 1,901,356 |
|
| Motorola, Inc. † | 77,231 | 474,971 |
|
| Qualcomm, Inc. | 64,422 | 2,524,698 |
|
| Tellabs, Inc. † | 33,444 | 215,045 |
|
| | | 8,570,908 |
| Computers (5.1%) | | |
| Apple, Inc. † | 23,900 | 4,591,668 |
|
| EMC Corp. † | 85,900 | 1,431,953 |
|
| Hewlett-Packard Co. | 46,700 | 2,198,169 |
|
| IBM Corp. | 24,600 | 3,010,794 |
|
| Juniper Networks, Inc. † | 18,700 | 464,321 |
|
| | | 11,696,905 |
| Conglomerates (0.7%) | | |
| General Electric Co. | 41,900 | 673,752 |
|
| SPX Corp. | 800 | 43,552 |
|
| Tyco International, Ltd. | 22,200 | 786,546 |
|
| | | 1,503,850 |
| Consumer (—%) | | |
| Harman International Industries, Inc. | 1,800 | 63,990 |
|
| | | 63,990 |
30
| | |
| COMMON STOCKS (94.4%)* cont. | Shares | Value |
|
| Consumer finance (0.9%) | | |
| American Express Co. | 28,700 | $1,080,842 |
|
| Capital One Financial Corp. | 11,800 | 434,948 |
|
| Mastercard, Inc. Class A S | 2,286 | 571,271 |
|
| SLM Corp. † | 4,600 | 48,438 |
|
| | | 2,135,499 |
| Consumer goods (1.7%) | | |
| Estee Lauder Cos., Inc. (The) Class A | 4,300 | 225,836 |
|
| Newell Rubbermaid, Inc. | 50,627 | 687,008 |
|
| Procter & Gamble Co. (The) | 47,200 | 2,905,160 |
|
| | | 3,818,004 |
| Containers (0.2%) | | |
| Crown Holdings, Inc. † | 2,547 | 60,644 |
|
| Owens-Illinois, Inc. † | 11,083 | 301,679 |
|
| Pactiv Corp. † | 3,102 | 69,950 |
|
| | | 432,273 |
| Distribution (0.1%) | | |
| Fastenal Co. S | 4,000 | 165,920 |
|
| W.W. Grainger, Inc. | 1,600 | 158,848 |
|
| | | 324,768 |
| Electric utilities (3.5%) | | |
| Alliant Energy Corp. | 26,200 | 817,440 |
|
| Ameren Corp. | 40,100 | 1,024,555 |
|
| American Electric Power Co., Inc. | 36,675 | 1,270,789 |
|
| CMS Energy Corp. S | 32,700 | 496,059 |
|
| Edison International | 35,300 | 1,176,196 |
|
| Entergy Corp. | 12,800 | 976,768 |
|
| Great Plains Energy, Inc. | 21,345 | 381,222 |
|
| NV Energy, Inc. | 66,700 | 768,384 |
|
| PG&E Corp. | 28,900 | 1,220,736 |
|
| | | 8,132,149 |
| Electronics (1.4%) | | |
| Broadcom Corp. Class A † | 10,800 | 288,576 |
|
| Integrated Device Technology, Inc. † | 145,200 | 823,284 |
|
| Micron Technology, Inc. † S | 21,500 | 187,480 |
|
| Texas Instruments, Inc. | 58,500 | 1,316,250 |
|
| Thermo Fisher Scientific, Inc. † | 14,900 | 687,635 |
|
| | | 3,303,225 |
| Energy (oil field) (2.0%) | | |
| Halliburton Co. | 55,500 | 1,621,155 |
|
| Schlumberger, Ltd. | 35,200 | 2,233,792 |
|
| Smith International, Inc. S | 21,500 | 651,880 |
|
| | | 4,506,827 |
| Energy (other) (0.4%) | | |
| First Solar, Inc. † S | 7,100 | 804,430 |
|
| | | 804,430 |
| Engineering and construction (0.2%) | | |
| Fluor Corp. | 8,700 | 394,458 |
|
| Shaw Group, Inc. † | 3,300 | 106,557 |
|
| | | 501,015 |
| Environmental (0.1%) | | |
| Foster Wheeler AG † | 10,200 | 285,396 |
|
| | | 285,396 |
31
| | |
| COMMON STOCKS (94.4%)* cont. | Shares | Value |
|
| Financial (0.5%) | | |
| CME Group, Inc. | 2,376 | $681,484 |
|
| Discover Financial Services | 18,900 | 258,552 |
|
| Intercontinental Exchange, Inc. † | 2,318 | 221,323 |
|
| Moody’s Corp. | 2,800 | 77,252 |
|
| | | 1,238,611 |
| Food (2.6%) | | |
| Campbell Soup Co. | 27,400 | 907,214 |
|
| Dean Foods Co. † | 47,500 | 837,425 |
|
| General Mills, Inc. | 15,200 | 1,083,912 |
|
| Kellogg Co. | 22,400 | 1,219,008 |
|
| Kraft Foods, Inc. Class A S | 61,700 | 1,706,622 |
|
| Mead Johnson Nutrition Co. Class A | 4,800 | 217,104 |
|
| | | 5,971,285 |
| Forest products and packaging (0.2%) | | |
| International Paper Co. | 11,690 | 267,818 |
|
| MeadWestvaco Corp. | 6,269 | 150,895 |
|
| | | 418,713 |
| Health-care services (2.0%) | | |
| Aetna, Inc. | 16,700 | 500,499 |
|
| AmerisourceBergen Corp. | 15,300 | 417,078 |
|
| Express Scripts, Inc. † | 6,400 | 536,704 |
|
| McKesson Corp. | 12,400 | 729,368 |
|
| Omnicare, Inc. | 12,615 | 315,375 |
|
| Universal Health Services, Inc. Class B | 6,600 | 192,456 |
|
| WellPoint, Inc. † | 28,100 | 1,790,532 |
|
| | | 4,482,012 |
| Homebuilding (0.1%) | | |
| D.R. Horton, Inc. | 11,995 | 141,421 |
|
| Toll Brothers, Inc. † | 6,044 | 111,633 |
|
| | | 253,054 |
| Insurance (2.5%) | | |
| Aflac, Inc. | 22,100 | 1,070,303 |
|
| Assured Guaranty, Ltd. (Bermuda) | 15,400 | 348,964 |
|
| Hartford Financial Services Group, Inc. (The) | 22,400 | 537,376 |
|
| Marsh & McLennan Cos., Inc. | 24,860 | 535,982 |
|
| MetLife, Inc. | 22,800 | 805,296 |
|
| Prudential Financial, Inc. | 16,900 | 844,831 |
|
| RenaissanceRe Holdings, Ltd. | 3,397 | 184,049 |
|
| Travelers Cos., Inc. (The) | 21,800 | 1,104,606 |
|
| XL Capital, Ltd. Class A | 25,600 | 429,312 |
|
| | | 5,860,719 |
| Investment banking/Brokerage (2.2%) | | |
| Ameriprise Financial, Inc. | 3,100 | 118,544 |
|
| BlackRock, Inc. S | 538 | 115,035 |
|
| Bond Street Holdings, LLC Class A F † | 57,779 | 1,155,580 |
|
| Charles Schwab Corp. (The) | 12,400 | 226,796 |
|
| Franklin Resources, Inc. | 4,700 | 465,441 |
|
| Goldman Sachs Group, Inc. (The) | 14,282 | 2,124,019 |
|
32
| | |
| COMMON STOCKS (94.4%)* cont. | Shares | Value |
|
| Investment banking/Brokerage cont. | | |
| Invesco, Ltd. | 18,200 | $351,260 |
|
| Janus Capital Group, Inc. | 3,600 | 43,956 |
|
| T. Rowe Price Group, Inc. | 7,400 | 367,188 |
|
| TD Ameritrade Holding Corp. † | 8,400 | 149,184 |
|
| | | 5,117,003 |
| Lodging/Tourism (0.7%) | | |
| Marriott International, Inc. Class A S | 19,016 | 498,790 |
|
| Wyndham Worldwide Corp. S | 50,676 | 1,063,689 |
|
| | | 1,562,479 |
| Machinery (0.6%) | | |
| Baldor Electric Co. | 3,400 | 83,912 |
|
| Cummins, Inc. | 5,400 | 243,864 |
|
| Deere (John) & Co. | 8,200 | 409,590 |
|
| Parker-Hannifin Corp. | 9,700 | 542,327 |
|
| Terex Corp. † | 2,000 | 39,100 |
|
| | | 1,318,793 |
| Manufacturing (0.2%) | | |
| Cooper Industries PLC Class A | 11,700 | 501,930 |
|
| | | 501,930 |
| Media (1.7%) | | |
| Interpublic Group of Companies, Inc. (The) † | 63,419 | 409,687 |
|
| News Corp., Ltd. (The) Class A | 66,564 | 839,372 |
|
| Time Warner, Inc. | 42,938 | 1,178,648 |
|
| Viacom, Inc. Class B † | 18,854 | 549,406 |
|
| Walt Disney Co. (The) | 30,650 | 905,708 |
|
| | | 3,882,821 |
| Medical technology (2.6%) | | |
| Baxter International, Inc. | 21,400 | 1,232,426 |
|
| Becton, Dickinson and Co. | 2,300 | 173,351 |
|
| Boston Scientific Corp. † | 69,300 | 598,059 |
|
| Covidien PLC (Ireland) | 10,665 | 539,222 |
|
| Hospira, Inc. † | 11,600 | 587,424 |
|
| Life Technologies Corp. † | 10,400 | 516,984 |
|
| Medtronic, Inc. | 36,800 | 1,578,352 |
|
| St. Jude Medical, Inc. † | 21,700 | 818,741 |
|
| | | 6,044,559 |
| Metals (0.8%) | | |
| Alcoa, Inc. | 4,800 | 61,104 |
|
| Freeport-McMoRan Copper & Gold, Inc. Class B † S | 11,164 | 744,527 |
|
| Newmont Mining Corp. | 9,321 | 399,498 |
|
| Nucor Corp. | 6,761 | 275,849 |
|
| Steel Dynamics, Inc. | 7,270 | 110,359 |
|
| United States Steel Corp. S | 6,411 | 284,841 |
|
| | | 1,876,178 |
| Office equipment and supplies (0.2%) | | |
| Avery Dennison Corp. | 15,600 | 507,156 |
|
| | | 507,156 |
| Oil and gas (8.4%) | | |
| Anadarko Petroleum Corp. | 32,600 | 2,079,228 |
|
| Chevron Corp. | 67,100 | 4,839,252 |
|
| EOG Resources, Inc. | 12,500 | 1,130,250 |
|
33
| | |
| COMMON STOCKS (94.4%)* cont. | Shares | Value |
|
| Oil and gas cont. | | |
| Exxon Mobil Corp. S | 87,400 | $5,631,182 |
|
| Newfield Exploration Co. † | 24,300 | 1,189,242 |
|
| Occidental Petroleum Corp. | 35,200 | 2,757,568 |
|
| PetroHawk Energy Corp. † | 48,200 | 1,076,306 |
|
| XTO Energy, Inc. | 15,700 | 699,749 |
|
| | | 19,402,777 |
| Pharmaceuticals (5.8%) | | |
| Abbott Laboratories | 49,700 | 2,631,118 |
|
| Cephalon, Inc. † | 12,900 | 823,536 |
|
| Johnson & Johnson | 33,198 | 2,086,826 |
|
| Merck & Co., Inc. | 58,957 | 2,250,978 |
|
| Pfizer, Inc. | 293,812 | 5,482,532 |
|
| | | 13,274,990 |
| Publishing (0.1%) | | |
| Gannett Co., Inc. | 7,944 | 128,296 |
|
| R. R. Donnelley & Sons Co. | 4,945 | 98,010 |
|
| | | 226,306 |
| Railroads (0.3%) | | |
| Canadian National Railway Co. (Canada) | 15,200 | 758,936 |
|
| | | 758,936 |
| Real estate (1.1%) | | |
| Digital Realty Trust, Inc. R S | 17,200 | 825,600 |
|
| HCP, Inc. R S | 27,600 | 782,460 |
|
| Simon Property Group, Inc. R | 12,363 | 890,136 |
|
| | | 2,498,196 |
| Regional Bells (1.5%) | | |
| AT&T, Inc. | 98,116 | 2,488,222 |
|
| Verizon Communications, Inc. | 32,130 | 945,265 |
|
| | | 3,433,487 |
| Restaurants (0.7%) | | |
| McDonald’s Corp. | 27,152 | 1,695,099 |
|
| | | 1,695,099 |
| Retail (6.3%) | | |
| Advance Auto Parts, Inc. | 2,674 | 105,489 |
|
| Amazon.com, Inc. † | 8,709 | 1,092,196 |
|
| Best Buy Co., Inc. | 3,851 | 141,139 |
|
| Big Lots, Inc. † | 9,763 | 277,367 |
|
| Coach, Inc. | 15,486 | 540,152 |
|
| Costco Wholesale Corp. | 14,372 | 825,384 |
|
| CVS Caremark Corp. | 46,600 | 1,508,442 |
|
| Dick’s Sporting Goods, Inc. † | 14,015 | 313,516 |
|
| Dollar General Corp. † | 7,594 | 178,383 |
|
| GameStop Corp. Class A † | 3,423 | 67,673 |
|
| Home Depot, Inc. (The) | 45,097 | 1,263,167 |
|
| Lowe’s Cos., Inc. | 62,857 | 1,360,854 |
|
| Macy’s, Inc. | 42,538 | 677,630 |
|
| O’Reilly Automotive, Inc. † | 6,835 | 258,363 |
|
| OfficeMax, Inc. † | 5,300 | 68,741 |
|
| RadioShack Corp. | 3,249 | 63,420 |
|
| Staples, Inc. | 22,108 | 518,654 |
|
| Target Corp. | 27,587 | 1,414,385 |
|
34
| | |
| COMMON STOCKS (94.4%)* cont. | Shares | Value |
|
| Retail cont. | | |
| Urban Outfitters, Inc. † | 11,467 | $362,013 |
|
| Wal-Mart Stores, Inc. | 54,884 | 2,932,452 |
|
| Walgreen Co. | 12,400 | 447,020 |
|
| | | 14,416,440 |
| Schools (0.7%) | | |
| Apollo Group, Inc. Class A † | 19,248 | 1,166,236 |
|
| Career Education Corp. † | 20,922 | 455,054 |
|
| | | 1,621,290 |
| Semiconductor (1.5%) | | |
| Atmel Corp. † | 371,900 | 1,725,616 |
|
| Formfactor, Inc. † | 78,059 | 1,207,573 |
|
| KLA-Tencor Corp. | 14,700 | 414,540 |
|
| | | 3,347,729 |
| Shipping (—%) | | |
| YRC Worldwide, Inc. † | 100 | 93 |
|
| | | 93 |
| Software (5.0%) | | |
| Autonomy Corp. PLC (United Kingdom) † | 10,529 | 261,849 |
|
| CA, Inc. | 34,300 | 755,972 |
|
| Electronic Arts, Inc. † | 45,200 | 735,856 |
|
| Microsoft Corp. | 210,100 | 5,920,618 |
|
| Oracle Corp. | 125,600 | 2,896,336 |
|
| Parametric Technology Corp. † | 21,200 | 351,072 |
|
| Sybase, Inc. † | 12,200 | 496,174 |
|
| UBISOFT Entertainment (France) † | 5,818 | 79,710 |
|
| | | 11,497,587 |
| Staffing (—%) | | |
| Robert Half International, Inc. | 3,526 | 94,920 |
|
| | | 94,920 |
| Technology services (1.8%) | | |
| Baidu, Inc. ADR (China) † | 705 | 290,256 |
|
| Fidelity National Information Services, Inc. | 7,122 | 167,794 |
|
| Global Payments, Inc. | 900 | 40,050 |
|
| Google, Inc. Class A † | 5,182 | 2,743,454 |
|
| Western Union Co. (The) | 13,782 | 255,518 |
|
| Yahoo!, Inc. † | 46,584 | 699,226 |
|
| | | 4,196,298 |
| Telecommunications (0.2%) | | |
| American Tower Corp. Class A † | 10,241 | 434,730 |
|
| | | 434,730 |
| Telephone (0.1%) | | |
| Qwest Communications International, Inc. | 33,228 | 139,890 |
|
| | | 139,890 |
| Textiles (0.2%) | | |
| Hanesbrands, Inc. † | 15,357 | 352,750 |
|
| | | 352,750 |
| Tobacco (2.6%) | | |
| Altria Group, Inc. | 49,200 | 977,112 |
|
| Lorillard, Inc. | 17,600 | 1,332,320 |
|
| Philip Morris International, Inc. | 80,650 | 3,670,378 |
|
| | | 5,979,810 |
35
| | | | |
| COMMON STOCKS (94.4%)* cont. | | | Shares | Value |
|
| Toys (0.2%) | | | | |
| Hasbro, Inc. | | | 15,064 | $460,205 |
|
| | | | | 460,205 |
| Transportation services (0.8%) | | | | |
| FedEx Corp. | | | 12,000 | 940,200 |
|
| United Parcel Service, Inc. Class B | | | 17,200 | 993,644 |
|
| | | | | 1,933,844 |
| Waste Management (0.1%) | | | | |
| Waste Management, Inc. | | | 3,600 | 115,380 |
|
| | | | | 115,380 |
| Total common stocks (cost $213,205,758) | | | | $217,142,396 |
| |
| |
| CONVERTIBLE PREFERRED STOCKS (1.8%)* | | | Shares | Value |
|
| Bank of America Corp. 10.00% cv. pfd. † | | | 281,021 | $4,243,417 |
|
| Total convertible preferred stocks (cost $4,478,133) | | | | $4,243,417 |
| |
| |
| WARRANTS (0.9%)* † | Expiration | Strike | | |
| | date | Price | Warrants | Value |
|
| JPMorgan Chase & Co. | 10/28/18 | $42.42 | 166,180 | $2,160,340 |
|
| Total warrants (cost $1,786,435) | | | | $2,160,340 |
| |
| |
| SHORT-TERM INVESTMENTS (9.2%)* | | Principal amount/shares | Value |
|
| U.S. Treasury Bills for an effective yield of 0.38%, | | | | |
| February 11, 2010 | | | $150,000 | $149,984 |
|
| U.S. Treasury Bills for an effective yield of 0.30%, | | | | |
| April 1, 2010 | | | 890,000 | 889,316 |
|
| U.S. Treasury Bills for an effective yield of 0.26%, | | | | |
| November 18, 2010 # | | | 350,000 | 348,881 |
|
| U.S. Treasury Bills for an effective yield of 0.20%, | | | | |
| August 26, 2010 | | | 34,000 | 33,962 |
|
| Short-term investments held as collateral for loaned | | | | |
| securities with yields ranging from 0.09% to 0.27% | | | | |
| and due dates ranging from February 1, 2010 | | | | |
| to March 23, 2010 d | | | 13,984,775 | 13,983,458 |
|
| Putnam Money Market Liquidity Fund e | | | 5,639,920 | 5,639,920 |
|
| Total short-term investments (cost $21,046,162) | | | | $21,045,521 |
| |
| |
| TOTAL INVESTMENTS | | | | |
|
| Total investments (cost $240,516,488) | | | | $244,591,674 |
Key to holding’s abbreviations
| |
| ADR | American Depository Receipts |
* Percentages indicated are based on net assets of $229,977,901.
† Non-income-producing security.
# This security, in part or in entirety, was pledged and segregated with the broker to cover margin requirements for futures contracts at January 31, 2010.
d See Note 1 to the financial statements regarding securities lending.
e See Note 6 to the financial statements regarding investments in Putnam Money Market Liquidity Fund.
36
F Is valued at fair value following procedures approved by the Trustees. Securities may be classified as Level 2 or Level 3 for Accounting Standards Codification ASC 820 Fair Value Measurements and Disclosures (“ASC 820”) based on the securities valuation inputs. On January 31, 2010, fair value pricing was also used for certain foreign securities in the portfolio (Note 1).
R Real Estate Investment Trust.
S Securities on loan, in part or in entirety, at January 31, 2010.
At January 31, 2010, liquid assets totaling $194,258 have been segregated to cover certain derivatives contracts.
ADR after the name of a foreign holding represents ownership of foreign securities on deposit with a custodian bank.
FUTURES CONTRACTS OUTSTANDING at 1/31/10 (Unaudited)
| | | | | |
| | Number of | | | Expiration | Unrealized |
| | contracts | Value | | date | depreciation |
|
| S&P 500 Index (Long) | 10 | $2,676,000 | | Mar-10 | $(154,787) |
|
| Total | | | | | $(154,787) |
ASC 820 establishes a three-level hierarchy for disclosure of fair value measurements. The valuation hierarchy is based upon the transparency of inputs to the valuation of the fund’s investments. The three levels are defined as follows:
Level 1 — Valuations based on quoted prices for identical securities in active markets.
Level 2 — Valuations based on quoted prices in markets that are not active or for which all significant inputs are observable, either directly or indirectly.
Level 3 — Valuations based on inputs that are unobservable and significant to the fair value measurement.
The following is a summary of the inputs used to value the fund’s net assets as of January 31, 2010:
| | | | | |
| | | |
| | | | Valuation inputs | |
|
| Investments in securities: | Level 1 | Level 2 | Level 3 |
|
| Common stocks: | | | |
|
| Basic materials | $6,589,986 | $— | $— |
|
| Capital goods | 16,682,483 | 1,408 | — |
|
| Communication services | 7,678,445 | — | — |
|
| Conglomerates | 1,503,850 | — | — |
|
| Consumer cyclicals | 22,356,988 | — | — |
|
| Consumer staples | 26,110,303 | — | — |
|
| Energy | 25,200,736 | — | — |
|
| Financials | 25,262,224 | — | 1,155,580 |
|
| Health care | 28,951,524 | — | — |
|
| Technology | 42,271,093 | 341,559 | — |
|
| Transportation | 3,464,798 | — | — |
|
| Utilities and power | 9,571,419 | — | — |
|
| Total common stocks | 215,643,849 | 342,967 | 1,155,580 |
| | | | |
| Convertible preferred stocks | 4,243,417 | — | — |
|
| Warrants | 2,160,340 | — | — |
|
| Short-term investments | 5,639,920 | 15,405,601 | — |
|
| Totals by level | $227,687,526 | $15,748,568 | $1,155,580 |
| | | | |
| | Level 1 | Level 2 | Level 3 |
|
| Other financial instruments: | $(154,787) | $— | $(37,949) |
|
Other financial instruments include futures and receivable purchase agreement.
37
The following is a reconciliation of Level 3 assets as of January 31, 2010:
| | | | | | | |
| | | | | Change in net | | | |
| | Balance as | Accrued | Realized | unrealized | Net | Net transfers | Balance as of |
| Investments | of July 31, | discounts/ | gain/ | appreciation/ | purchases/ | in and/or out | January 31, |
| in securities: | 2009 | premiums | (loss) | (depreciation) | sales | of Level 3 | 2010 |
|
| Common stocks: | | | | | | | |
|
| Financials | $— | $— | $— | $— | $1,155,580 | $— | $1,155,580 |
|
| Total common | | | | | | | |
| | $— | $— | $— | $— | $1,155,580 | $— | $1,155,580 |
| stocks | | | | | | | |
|
| | | | | Change in net | | | |
| | Balance as | Accrued | Realized | unrealized | Net | Net transfers | Balance as of |
| | of July 31, | discounts/ | gain/ | appreciation/ | purchases/ | in and/or out | January 31, |
| | 2009†† | premiums | (loss) | (depreciation)† | sales | of Level 3 | 2010†† |
|
| Other financial | | | | | | | |
| instruments: | $(40,283) | $— | $— | $2,334 | $— | $— | $(37,949) |
|
† Includes $2,334 related to Level 3 securities still held at period end. Total change in unrealized appreciation/ (depreciation) for securities (including Level 1 and Level 2) can be found in the Statement of operations.
†† Includes amount payable under receivable purchase agreement.
The accompanying notes are an integral part of these financial statements.
38
Statement of assets and liabilities 1/31/10 (Unaudited)
| |
| ASSETS | |
|
| Investment in securities, at value, including $13,427,025 of securities on loan (Note 1): | |
| Unaffiliated issuers (identified cost $234,876,568) | $238,951,754 |
| Affiliated issuers (identified cost $5,639,920) (Note 6) | 5,639,920 |
|
| Dividends, interest and other receivables | 201,207 |
|
| Receivable for shares of the fund sold | 49,366 |
|
| Receivable for investments sold | 1,887,552 |
|
| Total assets | 246,729,799 |
|
| |
| LIABILITIES | |
|
| Payable for compensation of Manager (Note 2) | 116,212 |
|
| Payable for variation margin (Note 1) | 22,000 |
|
| Payable for investments purchased | 1,862,304 |
|
| Payable for shares of the fund repurchased | 311,112 |
|
| Payable for investor servicing fees (Note 2) | 73,110 |
|
| Payable for custodian fees (Note 2) | 5,459 |
|
| Payable for Trustee compensation and expenses (Note 2) | 117,227 |
|
| Payable for administrative services (Note 2) | 743 |
|
| Payable for distribution fees (Note 2) | 76,043 |
|
| Payable for receivable purchase agreement (Note 2) | 37,949 |
|
| Collateral on securities loaned, at value (Note 1) | 13,983,458 |
|
| Other accrued expenses | 146,281 |
|
| Total liabilities | 16,751,898 |
| |
| Net assets | $229,977,901 |
|
| |
| REPRESENTED BY | |
|
| Paid-in capital (Unlimited shares authorized) (Notes 1 and 4) | $776,983,428 |
|
| Distributions in excess of net investment income (Note 1) | (631,651) |
|
| Accumulated net realized loss on investments and foreign currency transactions (Note 1) | (550,340,863) |
|
| Net unrealized appreciation of investments | 3,966,987 |
|
| Total — Representing net assets applicable to capital shares outstanding | $229,977,901 |
|
| |
| COMPUTATION OF NET ASSET VALUE AND OFFERING PRICE | |
|
| Net asset value and redemption price per class A share ($187,530,524 divided by 14,881,895 shares) | $12.60 |
|
| Offering price per class A share (100/94.25 of $12.60)* | $13.37 |
|
| Net asset value and offering price per class B share ($23,447,737 divided by 1,974,333 shares)** | $11.88 |
|
| Net asset value and offering price per class C share ($10,963,232 divided by 919,394 shares)** | $11.92 |
|
| Net asset value and redemption price per class M share ($4,381,466 divided by 360,165 shares) | $12.17 |
|
| Offering price per class M share (100/96.50 of $12.17)* | $12.61 |
|
| Net asset value, offering price and redemption price per class R share | |
| ($89,883 divided by 7,152 shares) | $12.57 |
|
| Net asset value, offering price and redemption price per class Y share | |
| ($3,565,059 divided by 281,408 shares) | $12.67 |
|
* On single retail sales of less than $50,000. On sales of $50,000 or more the offering price is reduced.
** Redemption price per share is equal to net asset value less any applicable contingent deferred sales charge.
The accompanying notes are an integral part of these financial statements.
39
Statement of operations Six months ended 1/31/10 (Unaudited)
| |
| INVESTMENT INCOME | |
|
| Dividends (net of foreign tax of $1,123) | $2,121,529 |
|
| Interest (including interest income of $11,572 from investments in affiliated issuers) (Note 6) | 13,723 |
|
| Securities lending | 34,363 |
|
| Total investment income | 2,169,615 |
|
| |
| EXPENSES | |
|
| Compensation of Manager (Note 2) | 762,916 |
|
| Investor servicing fees (Note 2) | 445,439 |
|
| Custodian fees (Note 2) | 10,387 |
|
| Trustee compensation and expenses (Note 2) | 7,456 |
|
| Administrative services (Note 2) | 3,808 |
|
| Distribution fees — Class A (Note 2) | 241,549 |
|
| Distribution fees — Class B (Note 2) | 133,384 |
|
| Distribution fees — Class C (Note 2) | 58,031 |
|
| Distribution fees — Class M (Note 2) | 17,056 |
|
| Distribution fees — Class R (Note 2) | 275 |
|
| Other | 3,555 |
|
| Fees waived and reimbursed by Manager (Note 2) | (77,604) |
|
| Total expenses | 1,606,252 |
| | |
| Expense reduction (Note 2) | (16,738) |
|
| Net expenses | 1,589,514 |
| |
| Net investment income | 580,101 |
|
| |
| Net realized gain on investments (Notes 1 and 3) | 8,200,542 |
|
| Net realized gain on futures contracts (Note 1) | 1,410,552 |
|
| Net realized loss on foreign currency transactions (Note 1) | (203) |
|
| Net unrealized appreciation of investments and futures contracts during the period | 11,529,118 |
|
| Net gain on investments | 21,140,009 |
| |
| Net increase in net assets resulting from operations | $21,720,110 |
|
The accompanying notes are an integral part of these financial statements.
40
Statement of changes in net assets
| | |
| INCREASE (DECREASE) IN NET ASSETS | Six months ended 1/31/10* | Year ended 7/31/09 |
|
| Operations: | | |
| Net investment income | $580,101 | $2,110,522 |
|
| Net realized gain (loss) on investments and foreign | | |
| currency transactions | 9,610,891 | (99,740,624) |
|
| Net unrealized appreciation of investments and assets | | |
| and liabilities in foreign currencies | 11,529,118 | 30,464,931 |
|
| Net increase (decrease) in net assets resulting | | |
| from operations | 21,720,110 | (67,165,171) |
|
| Distributions to shareholders (Note 1): | | |
| From ordinary income | | |
| Net investment income | | |
|
| Class A | (1,614,711) | (1,778,919) |
|
| Class B | (4,294) | — |
|
| Class C | (27,823) | — |
|
| Class M | (19,333) | (9,930) |
|
| Class R | (756) | (432) |
|
| Class Y | (41,982) | (53,046) |
|
| Redemption fees (Note 1) | 48 | 747 |
|
| Decrease from capital share transactions (Note 4) | (16,687,642) | (70,310,310) |
|
| Total increase (decrease) in net assets | 3,323,617 | (139,317,061) |
|
| |
| NET ASSETS | | |
|
| Beginning of period | 226,654,284 | 365,971,345 |
|
| End of period (including distributions in excess of net investment | |
| income of $631,651 and undistributed net investment income | | |
| of $497,147, respectively) | $229,977,901 | $226,654,284 |
|
* Unaudited
The accompanying notes are an integral part of these financial statements.
41
Financial highlights (For a common share outstanding throughout the period)
| | | | | | | | | | | | | |
| INVESTMENT OPERATIONS: | | | LESS DISTRIBUTIONS: | | | RATIOS AND SUPPLEMENTAL DATA: | |
|
| | | | | | | | | | | | Ratio | Ratio of net | |
| | | | Net realized | | | | | | | | of expenses | investment | |
| | Net asset value, | | and unrealized | Total from | From net | | | Net asset | Total return | Net assets, | to average | income (loss) | |
| | beginning | Net investment | gain (loss) on | investment | investment | Total | Redemption | value, end of | at net asset | end of period | net assets | to average | Portfolio |
| Period ended | of period | income (loss) a | investments | operations | income | distributions | fees e | period | value (%) b | (in thousands) | (%) c,d | net assets (%) d | turnover (%) |
|
| Class A | | | | | | | | | | | | | |
| January 31, 2010 ** | $11.59 | .04 | 1.08 | 1.12 | (.11) | (.11) | — | $12.60 | 9.63 * | $187,531 | .61 * | .31 * | 46.94 * |
| July 31, 2009 | 13.99 | .11 | (2.41) j | (2.30) | (.10) | (.10) | — | 11.59 | (16.26) j | 179,816 | 1.18 | 1.04 | 129.81 |
| July 31, 2008 | 16.74 | .08 | (2.78) | (2.70) | (.05) | (.05) | — | 13.99 | (16.16) | 271,560 | 1.24 | .51 | 118.70 |
| July 31, 2007 | 14.50 | .06 | 2.20 | 2.26 | (.02) | (.02) | — | 16.74 | 15.58 | 455,608 | 1.25 | .40 | 78.84 |
| July 31, 2006 | 14.49 | .06 i | (.01) | .05 | (.04) | (.04) | — | 14.50 | .35 i | 486,691 | 1.10 h,i | .44 i | 85.13 |
| July 31, 2005 | 12.48 | .11 f,g | 1.97 | 2.08 | (.07) | (.07) | — | 14.49 | 16.67 g | 660,027 | 1.19 h | .83 f,g | 113.03 |
|
| Class B | | | | | | | | | | | | | |
| January 31, 2010 ** | $10.87 | (.01) | 1.02 | 1.01 | — e | — e | — | $11.88 | 9.31 * | $23,448 | .99 * | (.06) * | 46.94 * |
| July 31, 2009 | 13.09 | .03 | (2.25) j | (2.22) | — | — | — | 10.87 | (16.96) j | 27,769 | 1.93 | .31 | 129.81 |
| July 31, 2008 | 15.73 | (.04) | (2.60) | (2.64) | — | — | — | 13.09 | (16.78) | 65,767 | 1.99 | (.24) | 118.70 |
| July 31, 2007 | 13.72 | (.05) | 2.06 | 2.01 | — | — | — | 15.73 | 14.65 | 146,984 | 2.00 | (.35) | 78.84 |
| July 31, 2006 | 13.77 | (.04) i | (.01) | (.05) | — | — | — | 13.72 | (.36) i | 234,490 | 1.85 h,i | (.31) i | 85.13 |
| July 31, 2005 | 11.90 | .01 f,g | 1.86 | 1.87 | — | — | — | 13.77 | 15.72 g | 336,983 | 1.94 h | .08 f,g | 113.03 |
|
| Class C | | | | | | | | | | | | | |
| January 31, 2010 ** | $10.94 | (.01) | 1.02 | 1.01 | (.03) | (.03) | — | $11.92 | 9.22 * | $10,963 | .99 * | (.07) * | 46.94 * |
| July 31, 2009 | 13.17 | .03 | (2.26) j | (2.23) | — | — | — | 10.94 | (16.93) j | 10,874 | 1.93 | .29 | 129.81 |
| July 31, 2008 | 15.83 | (.04) | (2.62) | (2.66) | — | — | — | 13.17 | (16.80) | 16,486 | 1.99 | (.24) | 118.70 |
| July 31, 2007 | 13.80 | (.05) | 2.08 | 2.03 | — | — | — | 15.83 | 14.71 | 26,731 | 2.00 | (.35) | 78.84 |
| July 31, 2006 | 13.85 | (.04) i | (.01) | (.05) | — | — | — | 13.80 | (.36) i | 30,016 | 1.85 h,i | (.31) i | 85.13 |
| July 31, 2005 | 11.97 | .01 f,g | 1.87 | 1.88 | — | — | — | 13.85 | 15.71 g | 40,237 | 1.94 h | .08 f,g | 113.03 |
|
| Class M | | | | | | | | | | | | | |
| January 31, 2010 ** | $11.17 | .01 | 1.04 | 1.05 | (.05) | (.05) | — | $12.17 | 9.42 * | $4,381 | .86 * | .05 * | 46.94 * |
| July 31, 2009 | 13.44 | .05 | (2.30) j | (2.25) | (.02) | (.02) | — | 11.17 | (16.69) j | 4,254 | 1.68 | .54 | 129.81 |
| July 31, 2008 | 16.11 | — e | (2.67) | (2.67) | — | — | — | 13.44 | (16.57) | 7,030 | 1.74 | .01 | 118.70 |
| July 31, 2007 | 14.01 | (.02) | 2.12 | 2.10 | — | — | — | 16.11 | 14.99 | 11,300 | 1.75 | (.10) | 78.84 |
| July 31, 2006 | 14.03 | (.01) i | (.01) | (.02) | — | — | — | 14.01 | (.14) i | 12,956 | 1.60 h,i | (.06) i | 85.13 |
| July 31, 2005 | 12.09 | .04 f,g | 1.90 | 1.94 | — | — | — | 14.03 | 16.05 g | 17,603 | 1.69 h | .33 f,g | 113.03 |
|
| Class R | | | | | | | | | | | | | |
| January 31, 2010 ** | $11.55 | .02 | 1.09 | 1.11 | (.09) | (.09) | — | $12.57 | 9.55 * | $90 | .74 * | .19 * | 46.94 * |
| July 31, 2009 | 13.92 | .09 | (2.40) j | (2.31) | (.06) | (.06) | — | 11.55 | (16.51) j | 103 | 1.43 | .77 | 129.81 |
| July 31, 2008 | 16.65 | .04 | (2.76) | (2.72) | (.01) | (.01) | — | 13.92 | (16.34) | 101 | 1.49 | .27 | 118.70 |
| July 31, 2007 | 14.44 | .02 | 2.19 | 2.21 | — | — | — | 16.65 | 15.31 | 286 | 1.50 | .12 | 78.84 |
| July 31, 2006 | 14.44 | .02 i | (.01) | .01 | (.01) | (.01) | — | 14.44 | .09 i | 272 | 1.35 h,i | .17 i | 85.13 |
| July 31, 2005 | 12.44 | .08 f,g | 1.95 | 2.03 | (.03) | (.03) | — | 14.44 | 16.33 g | 252 | 1.44 h | .63 f,g | 113.03 |
|
| Class Y | | | | | | | | | | | | | |
| January 31, 2010 ** | $11.66 | .06 | 1.09 | 1.15 | (.14) | (.14) | — | $12.67 | 9.80 * | $3,565 | .49 * | .44 * | 46.94 * |
| July 31, 2009 | 14.10 | .14 | (2.43) j | (2.29) | (.15) | (.15) | — | 11.66 | (16.04) j | 3,838 | .93 | 1.30 | 129.81 |
| July 31, 2008 | 16.88 | .12 | (2.80) | (2.68) | (.10) | (.10) | — | 14.10 | (15.96) | 5,026 | .99 | .76 | 118.70 |
| July 31, 2007 | 14.62 | .11 | 2.21 | 2.32 | (.06) | (.06) | — | 16.88 | 15.88 | 71,184 | 1.00 | .64 | 78.84 |
| July 31, 2006 | 14.62 | .10 i | (.02) | .08 | (.08) | (.08) | — | 14.62 | .55 i | 80,374 | .85 h,i | .68 i | 85.13 |
| July 31, 2005 | 12.60 | .14 f,g | 1.98 | 2.12 | (.10) | (.10) | — | 14.62 | 16.91 g | 97,893 | .94 h | 1.02 f,g | 113.03 |
|
See notes to financial highlights at the end of this section.
The accompanying notes are an integral part of these financial statements.
Financial highlights (Continued)
* Not annualized.
** Unaudited.
a Per share net investment income (loss) has been determined on the basis of the weighted average number of shares outstanding during the period.
b Total return assumes dividend reinvestment and does not reflect the effect of sales charges.
c Includes amounts paid through expense offset and brokerage/service arrangements (Note 2).
d Reflects an involuntary contractual expense limitation in effect during the period. For periods prior to January 31, 2010 certain fund expenses were waived in connection with the fund’s investment in Putnam Prime Money Market Fund. As a result of such limitation and/or waivers, the expenses of each class reflect a reduction of the following amounts (Note 2):
| |
| | Percentage of |
| | average net assets |
|
| January 31, 2010 | 0.03% |
|
| July 31, 2009 | 0.27 |
|
| July 31, 2008 | 0.03 |
|
| July 31, 2007 | <0.01 |
|
| July 31, 2006 | <0.01 |
|
| July 31, 2005 | 0.01 |
|
e Amount represents less than $0.01 per share.
f Reflects a special dividend received by the fund which amounted to the following:
| | |
| | | Percentage of |
| | Per share | average net assets |
|
| Class A | $0.05 | 0.38% |
|
| Class B | 0.05 | 0.38 |
|
| Class C | 0.05 | 0.38 |
|
| Class M | 0.05 | 0.38 |
|
| Class R | 0.06 | 0.42 |
|
| Class Y | 0.05 | 0.34 |
|
The accompanying notes are an integral part of these financial statements.
44
Financial highlights (Continued)
g Reflects a non-recurring accrual related to Putnam Management’s settlement with the Securities and Exchange Commission (the “SEC”) regarding brokerage allocation practices, which amounted to the following:
| | |
| | | Percentage of |
| | Per share | average net assets |
|
| Class A | $0.01 | 0.10% |
|
| Class B | 0.01 | 0.10 |
|
| Class C | 0.01 | 0.10 |
|
| Class M | 0.01 | 0.10 |
|
| Class R | 0.01 | 0.08 |
|
| Class Y | 0.01 | 0.10 |
|
h Does not reflect reimbursements from Putnam Management related to changes in the calculation of fees pursuant to the fund’s management contract in connection with a settlement with the SEC, which amounted to 0.01% and 0.13% of average net assets for the periods ended July 31, 2006 and July 31, 2005, respectively.
i Reflects a non-recurring reimbursement from Putnam Investments relating to the calculation of certain amounts paid by the fund to Putnam in previous years for transfer agent services, which amounted to $0.01 per share and 0.07% of average net assets for the period ended July 31, 2006.
j Reflects a non-recurring litigation payment received by the fund from Tyco International, Ltd. which amounted to the following amounts per share outstanding on March 13, 2009:
| |
| | Per share |
|
| Class A | $0.15 |
|
| Class B | $0.14 |
|
| Class C | $0.14 |
|
| Class M | $0.14 |
|
| Class R | $0.15 |
|
| Class Y | $0.15 |
|
This payment resulted in an increase to total returns of 1.08% for the year ended July 31, 2009.
The accompanying notes are an integral part of these financial statements.
45
Notes to financial statements 1/31/10 (Unaudited)
Note 1: Significant accounting policies
Putnam Research Fund (the “fund”) is a series of Putnam Investment Funds (the “trust”), a Massachusetts business trust, which is registered under the Investment Company Act of 1940, as amended, as an open-end management investment company. The objective of the fund is to seek capital appreciation by investing primarily in common stocks.
The fund offers class A, class B, class C, class M, class R and class Y shares. Class A and class M shares are sold with a maximum front-end sales charge of 5.75% and 3.50%, respectively, and generally do not pay a contingent deferred sales charge. Class B shares, which convert to class A shares after approximately eight years, do not pay a front-end sales charge and are subject to a contingent deferred sales charge, if those shares are redeemed within six years of purchase. Class C shares have a one-year 1.00% contingent deferred sales charge and do not convert to class A shares. Class R shares, which are offered to qualified employee-benefit plans, are sold at net asset value. The expenses for class A, class B, class C, class M and class R shares may differ based on the distribution fee of each class, which is identified in Note 2. Class Y shares, which are sold at net asset value, are generally subject to the same expenses as class A, class B, class C, class M and class R shares, but do not bear a distribution fee. Class Y shares are generally only available to corporate and institutional clients and clients in other approved programs.
A 1.00% redemption fee may apply on any shares that are redeemed (either by selling or exchanging into another fund) within 7 days of purchase. The redemption fee is accounted for as an addition to paid-in-capital.
Investment income, realized and unrealized gains and losses and expenses of the fund are borne pro-rata based on the relative net assets of each class to the total net assets of the fund, except that each class bears expenses unique to that class (including the distribution fees applicable to such classes). Each class votes as a class only with respect to its own distribution plan or other matters on which a class vote is required by law or determined by the Trustees. If the fund were liquidated, shares of each class would receive their pro-rata share of the net assets of the fund. In addition, the Trustees declare separate dividends on each class of shares.
In the normal course of business, the fund enters into contracts that may include agreements to indemnify another party under given circumstances. The fund’s maximum exposure under these arrangements is unknown as this would involve future claims that may be, but have not yet been, made against the fund. However, the fund’s management team expects the risk of material loss to be remote.
The following is a summary of significant accounting policies consistently followed by the fund in the preparation of its financial statements. The preparation of financial statements is in conformity with accounting principles generally accepted in the United States of America and requires management to make estimates and assumptions that affect the reported amounts of assets and liabilities in the financial statements and the reported amounts of increases and decreases in net assets from operations during the reporting period. Actual results could differ from those estimates. Subsequent events after the Statement of assets and liabilities date through the date that the financial statements were issued, March 15, 2010, have been evaluated in the preparation of the financial statements.
A) Security valuation Investments for which market quotations are readily available are valued at the last reported sales price on their principal exchange, or official closing price for certain markets. If no sales are reported — as in the case of some securities traded over-the-counter — a security is valued at its last reported bid price. Many securities markets and exchanges outside the U.S. close prior to the close of the New York Stock Exchange and therefore the closing prices for securities in such markets or on such exchanges may not fully reflect events that occur after such close but before the close of the New York Stock Exchange. Accordingly, on certain days, the fund will fair value foreign equity securities taking into account multiple factors, including movements in the U.S. securities markets. The number of days on which fair value prices will be used will depend on market activity an d it is possible that fair value prices will be used by the fund to a significant extent. At January 31, 2010, fair value pricing was used for certain foreign securities in the portfolio. Securities quoted in foreign currencies, if any, are translated into U.S. dollars at the current exchange rate. To the extent a pricing service or dealer is unable to value a security or provides a valuation that Putnam Investment Management, LLC (“Putnam Management”), the fund’s manager, an indirect wholly-owned subsidiary of Putnam Investments, LLC, does not believe accurately reflects the security’s fair value, the security will be valued at fair value by Putnam Management. Certain investments, including certain restricted and illiquid securities and derivatives, are also valued at fair value following procedures approved by the Trustees. Such valuations and procedures are reviewed periodically by the Trustees. The fair value of securities is generally determined as the amount that
46
the fund could reasonably expect to realize from an orderly disposition of such securities over a reasonable period of time. By its nature, a fair value price is a good faith estimate of the value of a security in a current sale and does not reflect an actual market price, which may be different by a material amount.
B) Joint trading account Pursuant to an exemptive order from the Securities and Exchange Commission (the “SEC”), the fund may transfer uninvested cash balances, including cash collateral received under security lending arrangements, into a joint trading account along with the cash of other registered investment companies and certain other accounts managed by Putnam Management. These balances may be invested in issues of short-term investments having maturities of up to 397 days for collateral received under security lending arrangements and up to 90 days for other cash investments.
C) Security transactions and related investment income Security transactions are recorded on the trade date (the date the order to buy or sell is executed). Gains or losses on securities sold are determined on the identified cost basis.
Interest income is recorded on the accrual basis. Dividend income, net of applicable withholding taxes, is recognized on the ex-dividend date except that certain dividends from foreign securities, if any, are recognized as soon as the fund is informed of the ex-dividend date. Non-cash dividends, if any, are recorded at the fair market value of the securities received. Dividends representing a return of capital or capital gains, if any, are reflected as a reduction of cost and/or as a realized gain. All premiums/discounts are amortized/accreted on a yield-to-maturity basis.
D) Foreign currency translation The accounting records of the fund are maintained in U.S. dollars. The market value of foreign securities, currency holdings, and other assets and liabilities is recorded in the books and records of the fund after translation to U.S. dollars based on the exchange rates on that day. The cost of each security is determined using historical exchange rates. Income and withholding taxes are translated at prevailing exchange rates when earned or incurred. The fund does not isolate that portion of realized or unrealized gains or losses resulting from changes in the foreign exchange rate on investments from fluctuations arising from changes in the market prices of the securities. Such gains and losses are included with the net realized and unrealized gain or loss on investments. Net realized gains and losses on foreign currency transactions represent net realized exchange gains or losse s on closed forward currency contracts, disposition of foreign currencies, currency gains and losses realized between the trade and settlement dates on securities transactions and the difference between the amount of investment income and foreign withholding taxes recorded on the fund’s books and the U.S. dollar equivalent amounts actually received or paid. Net unrealized appreciation and depreciation of assets and liabilities in foreign currencies arise from changes in the value of open forward currency contracts and assets and liabilities other than investments at the period end, resulting from changes in the exchange rate. Investments in foreign securities involve certain risks, including those related to economic instability, unfavorable political developments, and currency fluctuations, not present with domestic investments.
E) Futures and options contracts The fund may use futures and options contracts to hedge against changes in the values of securities the fund owns, owned or expects to purchase, or for other investment purposes. The fund may also write options on swaps or securities it owns or in which it may invest to increase its current returns.
The potential risk to the fund is that the change in value of futures and options contracts may not correspond to the change in value of the hedged instruments. In addition, losses may arise from changes in the value of the underlying instruments, if there is an illiquid secondary market for the contracts, if interest or exchange rates move unexpectedly or if the counterparty to the contract is unable to perform. With futures, there is minimal counterparty credit risk to the fund since futures are exchange traded and the exchange’s clearinghouse, as counterparty to all exchange traded futures, guarantees the futures against default. Risks may exceed amounts recognized on the Statement of assets and liabilities. When the contract is closed, the fund records a realized gain or loss equal to the difference between the value of the contract at the time it was opened and the value at the time it was closed. Realized gains and losses on purchased option s are included in realized gains and losses on investment securities. If a written call option is exercised, the premium originally received is recorded as an addition to sales proceeds. If a written put option is exercised, the premium originally received is recorded as a reduction to the cost of investments.
Futures contracts are valued at the quoted daily settlement prices established by the exchange on which they trade. The fund and the broker agree to exchange an amount of cash equal to the daily fluctuation in the value of the futures contract. Such receipts or payments are known as “variation margin.” Exchange traded options are valued at the last sale price or, if no sales are reported, the last bid price for purchased options and the last ask price for written options. Options traded over-the-counter are valued using prices supplied by dealers. Futures and written option contracts outstanding at period end, if any, are listed after the
47
fund’s portfolio. The fund had an average contract amount of approximately 24 on futures contracts for the six months ended January 31, 2010. The fund had an average contract amount of approximately 2,345 on purchased options contracts for the six months ended January 31, 2010. For the six months ended January 31, 2010 the fund did not have any activity on written options contracts.
F) Master agreements The fund is a party to ISDA (International Swap and Derivatives Association, Inc.) Master Agreements (“Master Agreements”) with certain counterparties that govern over the counter derivative and foreign exchange contracts entered into from time to time. The Master Agreements may contain provisions regarding, among other things, the parties’ general obligations, representations, agreements, collateral requirements, events of default and early termination. With respect to certain counterparties, in accordance with the terms of the Master Agreements, collateral posted to the fund is held in a segregated account by the fund’s custodian and with respect to those amounts which can be sold or repledged, are presented in the fund’s portfolio. Collateral pledged by the fund is segregated by the fund’s custodian and identified in the fund’s portfolio. Collateral ca n be in the form of cash or debt securities issued by the U.S. Government or related agencies or other securities as agreed to by the fund and the applicable counterparty. Collateral requirements are determined based on the fund’s net position with each counterparty. Termination events applicable to the fund may occur upon a decline in the fund’s net assets below a specified threshold over a certain period of time. Termination events applicable to counterparties may occur upon a decline in the counterparty’s long-term and short-term credit ratings below a specified level. In each case, upon occurrence, the other party may elect to terminate early and cause settlement of all derivative and foreign exchange contracts outstanding, including the payment of any losses and costs resulting from such early termination, as reasonably determined by the terminating party. Any decision by one or more of the fund’s counterparties to elect early termination could impact the fund’s future derivativ e activity. At January 31, 2010, the fund did not have a net liability position on derivative contracts subject to the Master Agreements.
G) Securities lending The fund may lend securities, through its agents, to qualified borrowers in order to earn additional income. The loans are collateralized by cash and/or securities in an amount at least equal to the market value of the securities loaned. The market value of securities loaned is determined daily and any additional required collateral is allocated to the fund on the next business day. The risk of borrower default will be borne by the fund’s agents; the fund will bear the risk of loss with respect to the investment of the cash collateral. Income from securities lending is included in investment income on the Statement of operations. At January 31, 2010, the value of securities loaned amounted to $13,427,025. The fund received cash collateral of $13,983,458 which is pooled with collateral of other Putnam funds into 37 issues of short-term investments.
H) Federal taxes It is the policy of the fund to distribute all of its taxable income within the prescribed time and otherwise comply with the provisions of the Internal Revenue Code of 1986, as amended (the “Code”), applicable to regulated investment companies. It is also the intention of the fund to distribute an amount sufficient to avoid imposition of any excise tax under Section 4982 of the Code. The fund is subject to the provisions of Accounting Standards Codification ASC 740 Income Taxes (“ASC 740”). ASC 740 sets forth a minimum threshold for financial statement recognition of the benefit of a tax position taken or expected to be taken in a tax return. The fund did not have any unrecognized tax benefits in the accompanying financial statements. No provision has been made for federal taxes on income, capit al gains or unrealized appreciation on securities held nor for excise tax on income and capital gains. Each of the fund’s federal tax returns for the prior three fiscal years remains subject to examination by the Internal Revenue Service and state departments of revenue.
At July 31, 2009, the fund had a capital loss carryover of $481,665,465 available to the extent allowed by the Code to offset future net capital gain, if any. The amounts of the carryovers and the expiration dates are:
| | | | |
| Loss Carryover | Expiration | | | |
| | | |
| $110,556,619 | July 31, 2010 | | | |
| | | |
| 289,150,448 | July 31, 2011 | | | |
| | | |
| 81,958,398 | July 31, 2017 | | | |
| | | |
Pursuant to federal income tax regulations applicable to regulated investment companies, the fund has elected to defer to its fiscal year ending July 31, 2010 $77,783,198 of losses recognized during the period November 1, 2008 to July 31, 2009.
The aggregate identified cost on a tax basis is $240,826,304, resulting in gross unrealized appreciation and depreciation of $20,342,073 and $16,576,703, respectively, or net unrealized appreciation of $3,765,370.
I) Distributions to shareholders Distributions to shareholders from net investment income are recorded by the fund on the ex-dividend date. Distributions from capital gains, if any, are recorded on the ex-dividend date and paid at least annually. The amount and character of income and gains to be distributed are
48
determined in accordance with income tax regulations, which may differ from generally accepted accounting principles. Dividend sources are estimated at the time of declaration. Actual results may vary. Any non-taxable return of capital cannot be determined until final tax calculations are completed after the end of the fund’s fiscal year. Reclassifications are made to the fund’s capital accounts to reflect income and gains available for distribution (or available capital loss carryovers) under income tax regulations.
J) Expenses of the trust Expenses directly charged or attributable to any fund will be paid from the assets of that fund. Generally, expenses of the trust will be allocated among and charged to the assets of each fund on a basis that the Trustees deem fair and equitable, which may be based on the relative assets of each fund or the nature of the services performed and relative applicability to each fund.
Note 2: Management fee, administrative
services and other transactions
Effective January 1, 2010 , the fund pays Putnam Management a management fee (based on the fund’s average net assets and computed and paid monthly) at annual rates that may vary based on the average of the aggregate net assets of most open-end funds, as defined in the fund’s management contract, sponsored by Putnam Management. Such annual rates may vary as follows: 0.71% of the first $5 billion of average net assets, 0.66% of the next $5 billion, 0.61% of the next $10 billion, 0.56% of the next $10 billion, 0.51% of the next $50 billion, 0.49% of the next $50 billion, 0.48% of the next $100 billion, and 0.475% thereafter.
Prior to January 1, 2010, the fund paid Putnam Management for management and investment advisory services quarterly based on the average net assets of the fund. Such fee was based on the following annual rates: 0.65% of the first $500 million of average net assets, 0.55% of the next $500 million, 0.50% of the next $500 million, 0.45% of the next $5 billion, 0.425% of the next $5 billion, 0.405% of the next $5 billion, 0.39% of the next $5 billion and 0.38% thereafter.
Effective August 1, 2009 through July 31, 2010, Putnam Management has contractually agreed to reimburse the fund’s expenses to the extent necessary to limit the cumulative expenses of the fund, exclusive of brokerage, interest, taxes, investment-related expenses, extraordinary expenses and payments under the fund’s investor servicing contract, investment management contract and distribution plans, on a fiscal year-to-date basis (or from August 1, 2009 through the fund’s next fiscal year end, as applicable), to an annual rate of 0.20% of the fund’s average net assets over such fiscal year-to-date period (or since August 1, 2009, as applicable). During the period ended January 31, 2010, the fund’s expenses were not reduced as a result of this limit.
Putnam Management has contractually agreed, from August 1, 2009 through July 31, 2010, to limit the management fee for the fund to an annual rate of 0.572% of the fund’s average net assets. During the period ended January 31, 2010, the fund’s expenses were reduced by $77,604 as a result of this limit.
Putnam Investments Limited (“PIL”), an affiliate of Putnam Management, is authorized by the Trustees to manage a separate portion of the assets of the fund as determined by Putnam Management from time to time. Putnam Management pays a quarterly sub-management fee to PIL for its services at an annual rate of 0.35% of the average net assets of the portion of the fund managed by PIL.
The Putnam Advisory Company, LLC (“PAC”), an affiliate of Putnam Management, is authorized by the Trustees to manage a separate portion of the assets of the fund, as designated from time to time by Putnam Management or PIL. Putnam Management or PIL, as applicable, pays a quarterly sub-advisory fee to PAC for its services at the annual rate of 0.35% of the average net assets of the portion of the fund’s assets for which PAC is engaged as sub-adviser.
On September 15, 2008, the fund terminated its outstanding derivatives contracts with Lehman Brothers Special Financing, Inc. (“LBSF”) in connection with the bankruptcy filing of LBSF’s parent company, Lehman Brothers Holdings, Inc. On September 26, 2008, the fund entered into a receivable purchase agreement (“Agreement”) with another registered investment company (the “Seller”) managed by Putnam Management. Under the Agreement, the Seller sold to the fund the right to receive, in the aggregate, $156,309 in net payments from LBSF in connection with certain terminated derivatives transactions (the “Receivable”), in exchange for an initial payment plus (or minus) additional amounts based on the fund’s ultimate realized gain (or loss) with respect to the Receivable. The Receivable will be offset against the fund’s net payable to LBSF and is included in the Statement of assets and liabilities in Payabl e for investments purchased. Future payments under the Agreement are valued at fair value following procedures approved by the Trustees and are included in the Statement of assets and liabilities. All remaining payments under the Agreement will be recorded as realized gain or loss. The fund’s net payable to LBSF was calculated in accordance with the fund’s master contract with LBSF. Putnam Management currently is in discussions with LBSF regarding resolution of amounts payable to LBSF. Amounts recorded are estimates and
49
final payments may differ from these estimates by a material amount.
The fund reimburses Putnam Management an allocated amount for the compensation and related expenses of certain officers of the fund and their staff who provide administrative services to the fund. The aggregate amount of all such reimbursements is determined annually by the Trustees.
Custodial functions for the fund’s assets are provided by State Street Bank and Trust Company (“State Street”). Custody fees are based on the fund’s asset level, the number of its security holdings and transaction volumes.
Putnam Investor Services, Inc., an affiliate of Putnam Management, provided investor servicing agent functions to the fund. Putnam Investor Services, Inc. received fees for investor servicing, subject to certain limitations, based on the fund’s retail asset level, the number of shareholder accounts in the fund and the level of defined contribution plan assets in the fund. The amounts incurred for investor servicing agent functions during the six months ended January 31, 2010 are included in Investor servicing fees in the Statement of operations.
The fund has entered into expense offset arrangements with Putnam Investor Services, Inc. and State Street whereby Putnam Investor Services, Inc.’s and State Street’s fees are reduced by credits allowed on cash balances. The fund also reduced expenses through brokerage/service arrangements. For the six months ended January 31, 2010, the fund’s expenses were reduced by $176 under the expense offset arrangements and by $16,562 under the brokerage/service arrangements.
Each independent Trustee of the fund receives an annual Trustee fee, of which $176, as a quarterly retainer, has been allocated to the fund, and an additional fee for each Trustees meeting attended. Trustees receive additional fees for attendance at certain committee meetings and industry seminars and for certain compliance-related matters. Trustees also are reimbursed for expenses they incur relating to their services as Trustees.
The fund has adopted a Trustee Fee Deferral Plan (the “Deferral Plan”) which allows the Trustees to defer the receipt of all or a portion of Trustees fees payable on or after July 1, 1995. The deferred fees remain invested in certain Putnam funds until distribution in accordance with the Deferral Plan.
The fund has adopted an unfunded noncontributory defined benefit pension plan (the “Pension Plan”) covering all Trustees of the fund who have served as a Trustee for at least five years and were first elected prior to 2004. Benefits under the Pension Plan are equal to 50% of the Trustee’s average annual attendance and retainer fees for the three years ended December 31, 2005. The retirement benefit is payable during a Trustee’s lifetime, beginning the year following retirement, for the number of years of service through December 31, 2006. Pension expense for the fund is included in Trustee compensation and expenses in the Statement of operations. Accrued pension liability is included in Payable for Trustee compensation and expenses in the Statement of assets and liabilities. The Trustees have terminated the Pension Plan with respect to any Trustee first elected after 2003.
The fund has adopted distribution plans (the “Plans”) with respect to its class A, class B, class C, class M and class R shares pursuant to Rule 12b-1 under the Investment Company Act of 1940. The purpose of the Plans is to compensate Putnam Retail Management Limited Partnership, a wholly-owned subsidiary of Putnam Investments, LLC and Putnam Retail Management GP, Inc., for services provided and expenses incurred in distributing shares of the fund. The Plans provide for payments by the fund to Putnam Retail Management Limited Partnership at an annual rate of up to 0.35%, 1.00%, 1.00%, 1.00% and 1.00% of the average net assets attributable to class A, class B, class C, class M and class R shares, respectively. The Trustees have approved payment by the fund at an annual rate of 0.25%, 1.00%, 1.00%, 0.75% and 0.50% of the average net assets attributable to class A, class B, class C, class M and class R shares, respectively.
For the six months ended January 31, 2010, Putnam Retail Management Limited Partnership, acting as underwriter, received net commissions of $7,310 and $201 from the sale of class A and class M shares, respectively, and received $8,617 and $40 in contingent deferred sales charges from redemptions of class B and class C shares, respectively.
A deferred sales charge of up to 1.00% and 0.65% is assessed on certain redemptions of class A and class M shares, respectively. For the period ended January 31, 2010, Putnam Retail Management Limited Partnership, acting as underwriter, received no monies on class A and class M redemptions.
Note 3: Purchases and sales of securities
During the six months ended January 31, 2010, cost of purchases and proceeds from sales of investment securities other than short-term investments aggregated $105,041,194 and $109,657,615, respectively. There were no purchases or sales of U.S. government securities.
50
Note 4: Capital shares
At January 31, 2010, there was an unlimited number of shares of beneficial interest authorized. Transactions in capital shares were as follows:
| | | | |
| | Six months ended 1/31/10 | Year ended 7/31/09 |
|
| Class A | Shares | Amount | Shares | Amount |
|
| Shares sold | 691,144 | $8,760,889 | 2,266,839 | $23,710,888 |
|
| Shares issued in connection with | | | | |
| reinvestment of distributions | 120,632 | 1,552,543 | 181,221 | 1,710,731 |
|
| | 811,776 | 10,313,432 | 2,448,060 | 25,421,619 |
|
| Shares repurchased�� | (1,449,001) | (18,301,020) | (6,344,099) | (66,878,869) |
|
| Net decrease | (637,225) | $(7,987,588) | (3,896,039) | $(41,457,250) |
|
| |
| | Six months ended 1/31/10 | Year ended 7/31/09 |
|
| Class B | Shares | Amount | Shares | Amount |
|
| Shares sold | 64,070 | $755,835 | 166,904 | $1,616,731 |
|
| Shares issued in connection with | | | | |
| reinvestment of distributions | 341 | 4,147 | — | — |
|
| | 64,411 | 759,982 | 166,904 | 1,616,731 |
|
| Shares repurchased | (644,380) | (7,658,488) | (2,637,378) | (26,133,207) |
|
| Net decrease | (579,969) | $(6,898,506) | (2,470,474) | $(24,516,476) |
|
| |
| | Six months ended 1/31/10 | Year ended 7/31/09 |
|
| Class C | Shares | Amount | Shares | Amount |
|
| Shares sold | 11,530 | $138,026 | 46,003 | $459,098 |
|
| Shares issued in connection with | | | | |
| reinvestment of distributions | 2,105 | 25,677 | — | — |
|
| | 13,635 | 163,703 | 46,003 | 459,098 |
|
| Shares repurchased | (88,170) | (1,072,991) | (304,129) | (3,065,543) |
|
| Net decrease | (74,535) | $(909,288) | (258,126) | $(2,606,445) |
|
| |
| | Six months ended 1/31/10 | Year ended 7/31/09 |
|
| Class M | Shares | Amount | Shares | Amount |
|
| Shares sold | 3,994 | $48,447 | 18,505 | $182,803 |
|
| Shares issued in connection with | | | | |
| reinvestment of distributions | 1,504 | 18,704 | 1,045 | 9,545 |
|
| | 5,498 | 67,151 | 19,550 | 192,348 |
|
| Shares repurchased | (26,216) | (318,655) | (161,723) | (1,636,522) |
|
| Net decrease | (20,718) | $(251,504) | (142,173) | $(1,444,174) |
|
| |
| | Six months ended 1/31/10 | Year ended 7/31/09 |
|
| Class R | Shares | Amount | Shares | Amount |
|
| Shares sold | 971 | $12,208 | 2,485 | $25,551 |
|
| Shares issued in connection with | | | | |
| reinvestment of distributions | 59 | 756 | 46 | 432 |
|
| | 1,030 | 12,964 | 2,531 | 25,983 |
|
| Shares repurchased | (2,781) | (36,467) | (887) | (10,411) |
|
| Net increase (decrease) | (1,751) | $(23,503) | 1,644 | $15,572 |
|
51
| | | | |
| | Six months ended 1/31/10 | Year ended 7/31/09 |
|
| Class Y | Shares | Amount | Shares | Amount |
|
| Shares sold | 14,316 | $182,808 | 54,230 | $546,044 |
|
| Shares issued in connection with | | | | |
| reinvestment of distributions | 3,184 | 41,199 | 5,596 | 53,046 |
|
| | 17,500 | 224,007 | 59,826 | 599,090 |
|
| Shares repurchased | (65,322) | (841,260) | (87,105) | (900,627) |
|
| Net decrease | (47,822) | $(617,253) | (27,279) | $(301,537) |
|
Note 5: Summary of derivative activity
The following is a summary of the market values of derivative instruments as of January 31, 2010:
| | | |
| | Asset derivatives | Liability derivatives |
|
| Derivatives not | | | |
| accounted for as | Statement of | Statement of | |
| hedging instruments | assets and | assets and | |
| under ASC 815 | liabilities location Market value | liabilities location | Market value |
|
| | | Payables, | |
| | | Net assets — Unrealized | |
| Equity contracts | $— | appreciation/(depreciation) | $154,787* |
|
| Total | $— | | $154,787 |
|
* Includes cumulative appreciation/depreciation of futures contracts as reported in The fund’s portfolio. Only current day’s variation margin is reported within the Statement of assets and liabilities.
The following is a summary of realized and unrealized gains or losses of derivative instruments on the Statement of operations for the six months ended January 31, 2010 (see Note 1):
Amount of Realized Gain or (Loss) on Derivatives Recognized in Income
| | | |
| Derivatives not accounted for as hedging | | | |
| instruments under ASC 815 | Options | Futures | Total |
|
| Equity contracts | $(16,329) | $1,410,552 | $1,394,223 |
|
| Total | $(16,329) | $1,410,552 | $1,394,223 |
|
Change in Unrealized Appreciation or (Depreciation) on Derivatives Recognized in Income
| | | |
| Derivatives not accounted for as hedging | | | |
| instruments under ASC 815 | Options | Futures | Total |
|
| Equity contracts | $(1,157) | $(348,062) | $(349,219) |
|
| Total | $(1,157) | $(348,062) | $(349,219) |
|
Note 6: Investment in Putnam Money Market
Liquidity Fund
The fund invested in Putnam Money Market Liquidity Fund, an open-end management investment company managed by Putnam Management. Investments in Putnam Money Market Liquidity Fund are valued at its closing net asset value each business day. Income distributions earned by the fund are recorded as interest income in the Statement of operations and totaled $11,572 for the period ended January 31, 2010. During the period ended January 31, 2010, cost of purchases and proceeds of sales of investments in Putnam Money Market Liquidity Fund aggregated $28,233,692 and $37,066,307, respectively. Management fees charged to Putnam Money Market Liquidity Fund have been waived by Putnam Management.
Note 7: Regulatory matters and litigation
In late 2003 and 2004, Putnam Management settled charges brought by the SEC and the Massachusetts Securities Division in connection with excessive short-term trading in Putnam funds. Distribution of payments from Putnam Management to certain open-end Putnam funds and their shareholders is expected to be completed in the next several months. These allegations and related matters have served as the general basis for certain lawsuits, including purported class action lawsuits against Putnam Management and, in a
52
limited number of cases, some Putnam funds. Putnam Management believes that these lawsuits will have no material adverse effect on the funds or on Putnam Management’s ability to provide investment management services. In addition, Putnam Management has agreed to bear any costs incurred by the Putnam funds as a result of these matters.
Note 8: Market and credit risk
In the normal course of business, the fund trades financial instruments and enters into financial transactions where risk of potential loss exists due to changes in the market (market risk) or failure of the contracting party to the transaction to perform (credit risk). The fund may be exposed to additional credit risk that an institution or other entity with which the fund has unsettled or open transactions will default.
53
Shareholder meeting results (Unaudited)
December 18, 2009 meeting
At the meeting, each of the nominees for Trustees was elected, with all funds of the Trust voting together as a single class, as follows:
| | |
| | Votes for | Votes withheld |
|
| Ravi Akhoury | 144,159,880 | 5,756,274 |
|
| Jameson A. Baxter | 144,089,420 | 5,826,734 |
|
| Charles B. Curtis | 144,163,005 | 5,753,149 |
|
| Robert J. Darretta | 144,131,113 | 5,785,041 |
|
| Myra R. Drucker | 144,185,199 | 5,730,955 |
|
| John A. Hill | 144,123,942 | 5,792,212 |
|
| Paul L. Joskow | 144,226,682 | 5,689,472 |
|
| Elizabeth T. Kennan | 143,986,867 | 5,929,287 |
|
| Kenneth R. Leibler | 144,161,109 | 5,755,045 |
|
| Robert E. Patterson | 144,163,377 | 5,752,777 |
|
| George Putnam, III | 144,132,419 | 5,783,735 |
|
| Robert L. Reynolds | 144,288,500 | 5,627,654 |
|
| W. Thomas Stephens | 144,223,485 | 5,692,669 |
|
| Richard B. Worley | 144,224,274 | 5,691,880 |
|
A proposal to approve a new management contract between the fund and Putnam Management was approved as follows:
| | | |
| Votes | Votes | | Broker |
| for | against | Abstentions | non-votes |
|
| 9,979,027 | 287,996 | 1,080,842 | 3,916,044 |
|
All tabulations are rounded to the nearest whole number.
54
The Putnam family of funds
The following is a list of Putnam’s open-end mutual funds offered to the public. Investors should carefully consider the investment objective, risks, charges, and expenses of a fund before investing. For a prospectus, or a summary prospectus if available, containing this and other information for any Putnam fund or product, call your financial advisor at 1-800-225-1581 and ask for a prospectus. Please read the prospectus carefully before investing.
Growth
Growth Opportunities Fund
International Growth Fund* **
New Opportunities Fund
Small Cap Growth Fund*
Vista Fund
Voyager Fund
Blend
Asia Pacific Equity Fund*
Capital Opportunities Fund*
Capital Spectrum Fund‡
Emerging Markets Equity Fund*
Equity Spectrum Fund‡
Europe Equity Fund*
Global Equity Fund*
Global Natural Resources Fund*
International Capital Opportunities Fund*
International Equity Fund*
Investors Fund
Research Fund
Value
Convertible Income-Growth Trust
Equity Income Fund
The George Putnam Fund of Boston
The Putnam Fund for Growth and Income
International Value Fund*
Mid Cap Value Fund
Small Cap Value Fund*
Income
American Government Income Fund
Diversified Income Trust
Floating Rate Income Fund
Global Income Trust*
High Yield Advantage Fund*
High Yield Trust*
Income Fund
Money Market Fund†
U.S. Government Income Trust
* A 1% redemption fee on total assets redeemed or exchanged within 90 days of purchase may be imposed for all share classes of these funds.
† An investment in a money market fund is not insured or guaranteed by the Federal Deposit Insurance Corporation or any other government agency. Although the fund seeks to preserve the value of your investment at $1.00 per share, it is possible to lose money by investing in the fund.
** Prior to January 1, 2010, the fund was known as Putnam International New Opportunities Fund.
†† Prior to January 1, 2010, the fund was known as Putnam International Growth and Income Fund.
55
Tax-free income
AMT-Free Municipal Fund
Tax Exempt Income Fund
Tax Exempt Money Market Fund†
Tax-Free High Yield Fund
State tax-free income funds:
Arizona, California, Massachusetts, Michigan, Minnesota, New Jersey, New York, Ohio, and Pennsylvania
Absolute Return
Absolute Return 100 Fund
Absolute Return 300 Fund
Absolute Return 500 Fund
Absolute Return 700 Fund
Global Sector*
Global Consumer Fund
Global Energy Fund
Global Financials Fund
Global Health Care Fund
Global Industrials Fund
Global Natural Resources Fund
Global Technology Fund
Global Telecommunications Fund
Global Utilities Fund
Asset allocation
Income Strategies Fund
Putnam Asset Allocation Funds — three investment portfolios that spread your money across a variety of stocks, bonds, and money market investments.
The three portfolios:
Asset Allocation: Balanced Portfolio
Asset Allocation: Conservative Portfolio
Asset Allocation: Growth Portfolio
Putnam RetirementReady®
Putnam RetirementReady Funds — 10 investment portfolios that offer diversification among stocks, bonds, and money market instruments and adjust to become more conservative over time based on a target date for withdrawing assets.
The 10 funds:
Putnam RetirementReady 2050 Fund
Putnam RetirementReady 2045 Fund
Putnam RetirementReady 2040 Fund
Putnam RetirementReady 2035 Fund
Putnam RetirementReady 2030 Fund
Putnam RetirementReady 2025 Fund
Putnam RetirementReady 2020 Fund
Putnam RetirementReady 2015 Fund
Putnam RetirementReady 2010 Fund
Putnam RetirementReady Maturity Fund
‡ A 1% redemption fee on total assets redeemed or exchanged within 30 days of purchase may be imposed for all share classes of these funds.
With the exception of money market funds, a 1% redemption fee may be applied to shares exchanged or sold within 7 days of purchase (90 days, for certain funds).
Check your account balances and the most recent month-end performance in the Individual Investors section at putnam.com.
56
Services for shareholders
Investor services
Systematic investment plan Tell us how much you wish to invest regularly — weekly, semimonthly, or monthly — and the amount you choose will be transferred automatically from your checking or savings account. There’s no additional fee for this service, and you can suspend it at any time. This plan may be a great way to save for college expenses or to plan for your retirement.
Please note that regular investing does not guarantee a profit or protect against loss in a declining market. Before arranging a systematic investment plan, consider your financial ability to continue making purchases in periods when prices are low.
Systematic exchange You can make regular transfers from one Putnam fund to another Putnam fund. There are no additional fees for this service, and you can cancel or change your options at any time.
Dividends PLUS You can choose to have the dividend distributions from one of your Putnam funds automatically reinvested in another Putnam fund at no additional charge.
Free exchange privilege You can exchange money between Putnam funds free of charge, as long as they are the same class of shares. A signature guarantee is required if you are exchanging more than $500,000.
Reinstatement privilege If you’ve sold Putnam shares or received a check for a dividend or capital gain, you may reinvest the proceeds with Putnam within 90 days of the transaction and they will be reinvested at the fund’s current net asset value — with no sales charge. However, reinstatement of class B shares may have special tax consequences. Ask your financial or tax representative for details.
Check-writing service You have ready access to many Putnam accounts. It’s as simple as writing a check, and there are no special fees or service charges. For more information about the check-writing service, call Putnam or visit our Web site.
Dollar cost averaging When you’re investing for long-term goals, it’s time, not timing, that counts. Investing on a systematic basis is a better strategy than trying to figure out when the markets will go up or down. This means investing the same amount of money regularly over a long period. This method of investing is called dollar cost averaging. When a fund’s share price declines, your investment dollars buy more shares at lower prices. When it increases, they buy fewer shares. Over time, you will pay a lower average price per share.
For more information
Visit the Individual Investors section at putnam.com A secure section of our Web site contains complete information on your account, including balances and transactions, updated daily. You may also conduct transactions, such as exchanges, additional investments, and address changes. Log on today to get your password.
Call us toll free at 1-800-225-1581 Ask a helpful Putnam representative or your financial advisor for details about any of these or other services, or see your prospectus.
57
Putnam’s commitment
to confidentiality
In order to conduct business with our shareholders, we must obtain certain personal information such as account holders’ names, addresses, Social Security numbers, and dates of birth. Using this information, we are able to maintain accurate records of accounts and transactions.
It is our policy to protect the confidentiality of our shareholder information, whether or not a shareholder currently owns shares of our funds. In particular, it is our policy not to sell information about you or your accounts to outside marketing firms. We have safeguards in place designed to prevent unauthorized access to our computer systems and procedures to protect personal information from unauthorized use.
Within the Putnam organization, your information is shared with those who need it to service your account or provide you with information about other Putnam products or services. Under certain circumstances, we must also share account information with outside vendors who provide services to us, such as mailings and proxy solicitations. In these cases, the service providers enter into confidentiality agreements with us, and we provide only the information necessary to process transactions and perform other services related to your account. It is also our policy to share account information with your financial advisor, if you've provided us with information about your advisor and that person is listed on your Putnam account.
If you would like clarification about our confidentiality policies or have any questions or concerns, please don't hesitate to contact us at 1-800-225-1581, Monday through Friday, 8:00 a.m. to 8:00 p.m. Eastern Time.
58
Fund information
Founded over 70 years ago, Putnam Investments was built around the concept that a balance between risk and reward is the hallmark of a well-rounded financial program. We manage over 100 funds across income, value, blend, growth, asset allocation, absolute return, and global sector categories.
| | |
| Investment Manager | Robert J. Darretta | Susan G. Malloy |
| Putnam Investment | Myra R. Drucker | Vice President and |
| Management, LLC | Paul L. Joskow | Assistant Treasurer |
| One Post Office Square | Elizabeth T. Kennan | |
| Boston, MA 02109 | Kenneth R. Leibler | Beth S. Mazor |
| | Robert E. Patterson | Vice President |
| Investment Sub-Manager | George Putnam, III | |
| Putnam Investments Limited | Robert L. Reynolds | James P. Pappas |
| 57–59 St James’s Street | W. Thomas Stephens | Vice President |
| London, England SW1A 1LD | Richard B. Worley | |
| | | Francis J. McNamara, III |
| Investment Sub-Advisor | Officers | Vice President and |
| The Putnam Advisory | Robert L. Reynolds | Chief Legal Officer |
| Company, LLC | President | |
| One Post Office Square | | Robert R. Leveille |
| Boston, MA 02109 | Jonathan S. Horwitz | Vice President and |
| Executive Vice President, | Chief Compliance Officer |
| Marketing Services | Principal Executive | |
| Putnam Retail Management | Officer, Treasurer and | Mark C. Trenchard |
| One Post Office Square | Compliance Liaison | Vice President and |
| Boston, MA 02109 | | BSA Compliance Officer |
| Charles E. Porter | |
| Custodian | Senior Advisor to the Trustees | Judith Cohen |
| State Street Bank and | | Vice President, Clerk and |
| Trust Company | Steven D. Krichmar | Assistant Treasurer |
| Vice President and | |
| Legal Counsel | Principal Financial Officer | Wanda M. McManus |
| Ropes & Gray LLP | | Vice President, Senior Associate |
| Janet C. Smith | Treasurer and Assistant Clerk |
| Trustees | Vice President, Principal | |
| John A. Hill, Chairman | Accounting Officer and | Nancy E. Florek |
| Jameson A. Baxter, | Assistant Treasurer | Vice President, Assistant Clerk, |
| Vice Chairman | | Assistant Treasurer and |
| Ravi Akhoury | | Proxy Manager |
| Charles B. Curtis | | |
This report is for the information of shareholders of Putnam Research Fund. It may also be used as sales literature when preceded or accompanied by the current prospectus, the most recent copy of Putnam’s Quarterly Performance Summary, and Putnam’s Quarterly Ranking Summary. For more recent performance, please visit putnam.com. Investors should carefully consider the investment objective, risks, charges, and expenses of a fund, which are described in its prospectus. For this and other information or to request a prospectus, or a summary prospectus if available, call 1-800-225-1581 toll free. Please read the prospectus carefully before investing. The fund’s Statement of Additional Information contains additional information about the fund’s Trustees and is available without charge upon request by calling 1-800-225-1581.
60

Item 2. Code of Ethics:
Not applicable
Item 3. Audit Committee Financial Expert:
Not applicable
Item 4. Principal Accountant Fees and Services:
Not applicable
Item 5. Audit Committee of Listed Registrants
Not applicable
Item 6. Schedule of Investments:
The registrant’s schedule of investments in unaffiliated issuers is included in the report to shareholders in Item 1 above.
Item 7. Disclosure of Proxy Voting Policies and Procedures For Closed-End Management
Investment Companies:
Not applicable
Item 8. Portfolio Managers of Closed-End Investment Companies
Not Applicable
Item 9. Purchases of Equity Securities by Closed-End Management Investment Companies and
Affiliated Purchasers:
Not applicable
Item 10. Submission of Matters to a Vote of Security Holders:
Not applicable
Item 11. Controls and Procedures:
(a) The registrant's principal executive officer and principal financial officer have concluded, based on their evaluation of the effectiveness of the design and operation of the registrant's disclosure controls and procedures as of a date within 90 days of the filing date of this report, that the design and operation of such procedures are generally effective to provide reasonable assurance that information required to be disclosed by the registrant in this report is recorded, processed, summarized and reported within the time periods specified in the Commission's rules and forms.
(b) Changes in internal control over financial reporting: Not applicable
Item 12. Exhibits:
(a)(1) Not applicable
(a)(2) Separate certifications for the principal executive officer and principal financial officer of the registrant as required by Rule 30a-2(a) under the Investment Company Act of 1940, as amended, are filed herewith.
(b) The certifications required by Rule 30a-2(b) under the Investment Company Act of 1940, as amended, are filed herewith.
Putnam Investment Funds
By (Signature and Title):
/s/Janet C. Smith
Janet C. Smith
Principal Accounting Officer
Date: March 31, 2010
Pursuant to the requirements of the Securities Exchange Act of 1934 and the Investment Company Act of 1940, this report has been signed below by the following persons on behalf of the registrant and in the capacities and on the dates indicated.
By (Signature and Title):
/s/Jonathan S. Horwitz
Jonathan S. Horwitz
Principal Executive Officer
Date: March 31, 2010
By (Signature and Title):
/s/Steven D. Krichmar
Steven D. Krichmar
Principal Financial Officer
Date: March 31, 2010