| | | |
| | |
| UNITED STATES |
| SECURITIES AND EXCHANGE COMMISSION |
| Washington, D.C. 20549 |
| |
| FORM N-CSR |
| |
| CERTIFIED SHAREHOLDER REPORT OF REGISTERED |
| MANAGEMENT INVESTMENT COMPANIES |
| | |
| Investment Company Act file number: (811-07237) | |
| | |
| Exact name of registrant as specified in charter: | Putnam Investment Funds |
| |
| Address of principal executive offices: One Post Office Square, Boston, Massachusetts 02109 |
| | |
| Name and address of agent for service: | | Beth S. Mazor, Vice President |
| | One Post Office Square |
| | Boston, Massachusetts 02109 |
| | |
| Copy to: | | John W. Gerstmayr, Esq. |
| | Ropes & Gray LLP |
| | One International Place |
| | Boston, Massachusetts 02110 |
| | |
| Registrant’s telephone number, including area code: | (617) 292-1000 |
| | | |
| Date of fiscal year end: August 31, 2010 | | |
| |
| Date of reporting period: September 1, 2009 — February 28, 2010 |
Item 1. Report to Stockholders:
The following is a copy of the report transmitted to stockholders pursuant to Rule 30e-1 under the Investment Company Act of 1940:

A BALANCED APPROACH
Since 1937, when George Putnam created a diverse mix of stocks and bonds in a single, professionally managed portfolio, Putnam has championed the balanced approach.
A WORLD OF INVESTING
Today, we offer investors a world of equity, fixed-income, multi-asset, and absolute-return portfolios to suit a range of financial goals.
A COMMITMENT TO EXCELLENCE
Our portfolio managers seek superior results over time, backed by original, fundamental research on a global scale. We believe in the value of experienced financial advice, in providing exemplary service, and in putting clients first in all we do.

Putnam
International Capital
Opportunities Fund
Semiannual report
2 | 28 | 10
| |
| Message from the Trustees | 2 |
|
| About the fund | 4 |
|
| Performance snapshot | 6 |
|
| Interview with your fund’s portfolio managers | 7 |
|
| Your fund’s performance | 12 |
|
| Your fund’s expenses | 14 |
|
| Terms and definitions | 16 |
|
| Trustee approval of management contract | 17 |
|
| Other information for shareholders | 28 |
|
| Financial statements | 29 |
|
| Shareholder meeting results | 57 |
|
Message from the Trustees
Dear Fellow Shareholder:
What a difference a year makes. The rebound that followed the market lows in early March 2009 turned out to be one of the strongest in generations. After a slow start, the markets have continued to rise during the first few months of 2010.
It is unlikely that this year will be a repeat performance of 2009. Still, based on an encouraging earnings outlook and evidence of an improving but fragile global economic recovery, today’s markets offer opportunities for active money management, which is Putnam’s core strength.
If there is any lesson to be learned from the extraordinary volatility of the past two years, it is the importance of positioning one’s portfolio to limit downside risk.It is our belief that the best way to achieve this is by diversifying across all asset classes and investment strategies, and by adhering to your plan in every type of market environment.
Diversification and downside protection are worthwhile endeavors — and not just from a psychological standpoint. A portfolio diversified across all asset classes has been shown in the past to conserve wealth better during downturns and to benefit in a rising market environment.
2
Lastly, we would like to thank all shareholders who took the time to vote by proxy on a number of issues, including shareholder-friendly management fee changes, which went into effect earlier this year. We would also like to welcome new shareholders to the fund and thank all of our investors for your continued confidence in Putnam.
About the fund
Targeting smaller international companies
In international economies, as in the United States, small and midsize companies can offer attractive long-term investment potential. Such companies can seize new opportunities quickly or occupy profitable business niches. International markets may be particularly fertile ground compared with the United States, because relatively fewer research analysts cover smaller companies overseas.
Putnam International Capital Opportunities Fund has invested in stocks of small and midsize international companies since late 1995. While investing in companies located in other countries involves risk, including the possibility of currency fluctuations, economic instability, and political developments, it may also give your money a chance to grow, even during a downturn in the U.S. economy. That’s because international economies generally follow a different business cycle than that of the United States. In foreign markets, interest rates are managed by institutions such as the European
Central Bank or the Bank of Japan. Also, while foreign currencies such as the euro, the yen, and the pound fluctuate in value, your investment may benefit if these currencies strengthen against the U.S. dollar.
With thousands of smaller-company securities around the world to choose from, the fund’s managers rely on the proprietary research and extensive capabilities of analysts in Putnam’s Global Equity Research group.
Reflecting Putnam’s blend strategy, the portfolio can hold both value and growth stocks without a bias toward either style. This flexibility may help keep the fund diversified given the risks of changing market conditions. In addition to developed markets, including Europe, Japan, Australia, and Canada, the fund can invest in emerging markets, which may offer faster rates of economic growth despite greater risk of volatility and illiquid securities. In all their decisions, the portfolio managers are guided by Putnam’s risk controls, which call for regular review of fund holdings and the discipline to sell stocks when they reach what the managers consider their true worth.
Consider these risks before investing: Interna tional investing involves certain risks, such as currency fluctuations, economic instability, and political developments. Additional risks may be associated with emerging-market securities, including illiquidity and volatility. The fund invests some or all of its assets in small and/or midsize companies. Such investments increase the risk of greater price fluctuations. The use of derivatives involves special risks and may result in losses. Growth stocks may be more susceptible to earnings disappointments, and value stocks may fail to rebound.

In-depth analysis is key to
successful stock selection.
Drawing on the expertise of a dedicated group of stock analysts, the fund’s portfolio managers seek stocks that are believed to be mispriced by the market. Once a stock is selected for the portfolio, it is regularly assessed by the managers to ensure that it continues to meet their criteria, including:
Quality The managers look for high-quality companies, seeking characteristics such as solid management teams, sound business models , and strong balance sheets.
Valuation The managers carefully consider how each stock is valued, seeking stocks whose valuations are attractive relative to the company’s growth potential.
Cash flow The managers examine each company’s financials, particularly the amount of cash a company generates relative to the earnings that it reports, and target those believed to offer attractive and sustainable cash flow.
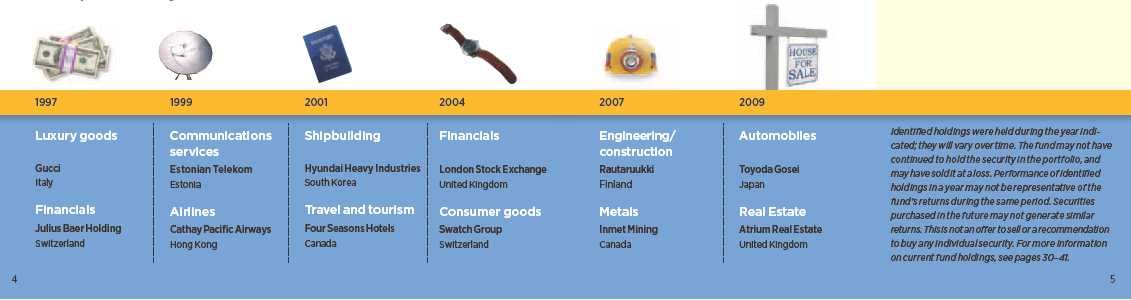
Putnam International Capital Opportunities Fund’s holdings
have spanned many sectors and international markets.
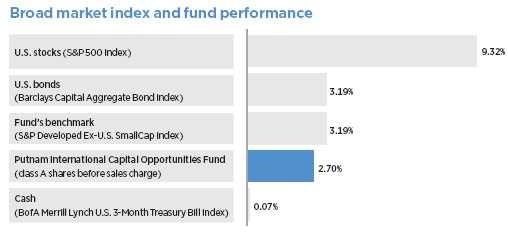
Performance
snapshot
Annualized total return (%) comparison as of 2/28/10
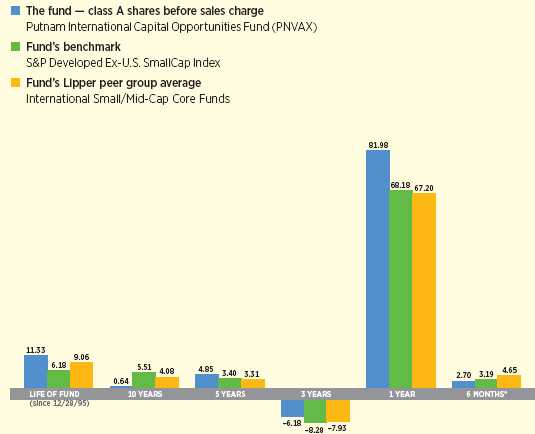
Current performance may be lower or higher than the quoted past performance, which cannot guarantee future results. Share price, principal value, and return will fluctuate, and you may have a gain or a loss when you sell your shares. Performance of class A shares assumes reinvestment of distributions and does not account for taxes. Fund returns in the bar chart do not reflect a sales charge of 5.75%; had they, returns would have been lower. See pages 7 and 12–13 for additional performance information. For a portion of the periods, this fund may have limited expenses, without which returns would have been lower. A 1% short-term trading fee may apply. To obtain the most recent month-end performance, visit putnam.com.
* Returns for the six-month period are not annualized, but cumulative.
6
Interview with your
fund’s portfolio managers
Joe Joseph and Randy Farina
There were signs of recovery in the global economy during the period. How did Putnam International Capital Opportunities Fund perform?
Joe: Early in the six-month period markets were generally positive, but they retraced some gains in November and December, followed by a bit more turbulence in February. Over the full six months, the fund’s class A shares rose 2.70%. The fund’s Lipper peer group of International Small/ Mid-Cap Core Funds on average posted a better result of 4.65%. The fund’s benchmark index, the S&P Developed Ex-U.S. SmallCap Index, also performed better than the fund, advancing3.19%. International markets lagged U.S. stocks. Several currencies weakened versus the dollar, including the euro and the British pound, which had a negative effect on the fund’s performance.
Worries about the sovereign debt levels of Greece, Spain, and other countries caused turmoil in European financial markets. Did this have an impact on the fund?
Joe: The fund does not own banks in the European markets most directly influenced by the debt crisis, such as Greece, Spain, and Ireland, and so the turmoil did not have a direct impact on the portfolio. The fund also has an underweight position in the banking industry relative to the benchmark index. The
This comparison shows your fund’s performance in the context of broad market indexes for the sixmonths ended 2/28/10. See pages 6 and 12–13 for additional fund performance information. Index descriptions can be found on page 16.
7
banks we hold in the portfolio are generally well capitalized and have strong balance sheets. As a result, although the financials sector underperformed during this period, the financial holdings in the fund were actually a source of relative strength.
What stocks contributed positively to the fund’s performance during the period?
Randy: Among the top contributors was Shire, a pharmaceuticals company headquartered in Ireland, and whose stock trades in the United Kingdom. We believe that it performed better than the benchmark index because the market recognized that it was undervalued — there was no significant change in its earnings. We believe Shire is still undervalued, and we continue to hold it.
Wotif.com Holdings of Australia is an Internet travel company that has benefited from rising travel bookings. Among developed markets, Australia has one of the strongest rates of economic growth and solid consumer demand. This demonstrates one of the benefits of owning a fund that can invest in international markets.
Two other contributors were Norwegian companies TGS Nopec and Petroleum Geo-Services, which specialize in seismic exploration for energy resources. As small companies in a specialized niche, their stock prices tend to be more volatile than prices of large, diversified oil companies. The stocks sank to attractive levels during the recession, but have performed well in the recovery.
What stocks lagged and accounted for the fund’s relative underperformance?
Randy: Several Japanese REITs [real estate investment trusts] underperformed the index, in part because Japan was one of the weakest markets in the world. REITs are stocks of trusts or corporations that invest in properties or mortgages. Examples included
Top 10 holdings
| | |
| HOLDING (percentage of fund’s net assets) | COUNTRY | SECTOR/INDUSTRY |
|
| Banque Cantonale Vaudoise (BCV) (0.9%) | Switzerland | Financials/Banking |
| Shire PLC (0.9%) | Ireland | Health care/Pharmaceuticals |
| Partners Group Holding AG (0.8%) | Switzerland | Financials/Investment banking/ |
| | | Brokerage |
| Wotif.com Holdings, Ltd. (0.8%) | Australia | Consumer staples/Consumer services |
| Next PLC (0.8%) | United Kingdom | Consumer cyclicals/Retail |
| Publicis Group SA (0.8%) | France | Consumer cyclicals/Advertising |
| | | and marketing services |
| Dassault Systemes SA (0.7%) | France | Technology/Software |
| Andritz AG (0.7%) | Austria | Capital goods/Machinery |
| Recordati SpA (0.7%) | Italy | Health care/Pharmaceuticals |
| Methanex Corp. (0.6%) | Canada | Basic materials/Chemicals |
This table shows the fund’s top 10 holdings and the percentage of the fund’s net assets that each represented as of 2/28/10. Short-term holdings are excluded. Holdings will vary over time.
8
“Our comparative equity research indi-
cates that the stocks of international
small companies offer attractive valu-
ations, particularly when compared
with U.S.largecaps.”
Joe Joseph
Leopalace21 and Tokyu Land Corporation, which lease and manage commercial and residential properties. As in most countries, this industry is depressed in Japan. We continue to hold the stocks because they are attractively valued.
In Mexico, the fund owned Cemex, a major cement and basic materials company. While emerging markets in general have begun to rebound, there is concern that construction of new infrastructure projects in Mexico might not be as robust as in other markets. We continue to own Cemex because we believe it has potential to perform well if these doubts are erased.
What changes did you make to the portfolio during the period?
Joe: We reduced positions in consumer staples stocks, which increased the portfolio’s underweight relative to the benchmark index. In our view, stocks in this sector have generally become more expensive. To offset this change, we increased positions in financial stocks, particularly in REITs, because we found that many of them were very attractively valued, following steep declines during the real estate crisis. This helped to bring the financials sector in the portfolio to a neutral weighting relative to the benchmark. Earlier, we had built an overweight in the asset management and capital market industries. Stocks in these industries fell to attractive valuations and stand to benefit from an improvement in the financial markets, but in
Comparison of top country weightings
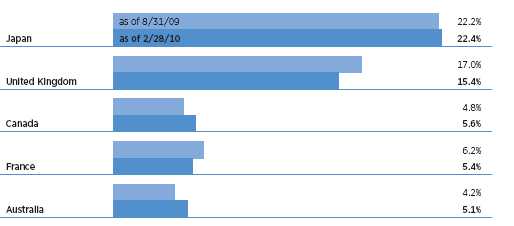
This chart shows how the fund’s top weightings have changed over the past six months. Weightings are shown as a percentage of net assets. Holdings will vary over time.
9
our view they do not have the same negative credit risks that banks have.
IN THE NEWS
After two straight years of stagnation, the global economy is recovering faster than previously thought. In its World Economic Outlook, the International Monetary Fund (IMF) upgraded its view on global growth —predicting that world economies will expand 3.9% in 2010, up from –0.8% last year. The recovery, according to the IMF, will not be consistent across the board, with emerging markets leading more advanced economies, which continue to remain dependent on government stimulus for growth. Asia, in particular, is expected to lead the pack, with strong growth coming from China and India. Meanwhile, the United States is already showing signs of growth, with gross domestic product (GDP) increasing by 5.6% in the fourth quarter of 2009, up from 2.2% in the third quarter.
Would you say that the fund now favors stocks that can benefit from a recoveringeconomy?
Randy: The fund now has more exposure to sectors that can benefit from an economic upturn because this is where we find attractive valuations. It is important to note that our investment strategy is not based on economic forecasts, and we did not make these adjustments because of strong confidence that the economy will improve. Instead, cyclical stocks are relatively cheap, we believe, perhaps because many investors are still reluctant to believe the recovery is solid. We think that some of our competitors are more defensively positioned, which might be why the fund has lagged the peer group a bit lately.
We have an overweight to advertisers, auto components companies, and homebuilders. We believe these industries are improving, and they have substantial potential for growth. One of the portfolio’s biggest overweights continues to be in information technology. Our research indicates many of these companies have three attractive features in this environment: less debt on their balance sheets relative to other sectors; strong free cash flow; and relatively low valuations, which we believe give them greater performance potential. The fund is neutral to the benchmark in defensive sectors such as health care and consumer staples. We have increased the underweight in utilities.
What is your outlook for the coming sixmonths?
Joe: We do not invest the fund based on market forecasts, just as we do not invest based on economic forecasts. What we can say is that our comparative equity research indicates that the stocks of international small companies offer attractive valuations, particularly when compared with U.S. large caps. We also believe they are very attractive compared with emerging-market stocks. Within our investment universe, we have favored companies we consider undervalued relative to their ability to generate cash flow. This is the source of long-term investment performance, in our view.
Joe and Randy, thanks for discussing the fund today.
10
The views expressed in this report are exclusively those of Putnam Management. They are not meant as investment advice.
Please note that the holdings discussed in this report may not have been held by the fund for the entire period. Portfolio composition is subject to review in accordance with the fund’s investment strategy and may vary in the future. Current and future portfolio holdings are subject to risk.

Portfolio Manager Joseph Joseph has an M.B.A. from the Stern School of Business at New York University and a B.A. from Loyola College. A Certified Public Accountant, he joined Putnam in 1994 and has been in the investment industry since1987.

Portfolio Manager Randy Farina has an M.S. in Finance from Boston College and a B.S. from the University of Massachusetts Lowell. A CFA charterholder, he joined Putnam in 1997 and has been in the investment industry since 1995.
11
Your fund’s performance
This section shows your fund’s performance, price, and distribution information for periods ended February 28, 2010, the end of the first half of its current fiscal year. In accordance with regulatory requirements for mutual funds, we also include performance as of the most recent calendar quarter-end and expense information taken from the fund’s current prospectus. Performance should always be considered in light of a fund’s investment strategy. Data represents past performance. Past performance does not guarantee future results. More recent returns may be less or more than those shown. Investment return and principal value will fluctuate, and you may have a gain or a loss when you sell your shares. Performance information does not reflect any deduction for taxes a shareholder may owe on fund distributions or on the redemption of fund shares. For the most recent month-end performance, please visit the Individual Investors section at put nam.com or call Putnam at 1-800-225-1581. Class Y shares are generally only available to corporate and institutional clients and clients in other approved programs. See the Terms and Definitions section in this report for definitions of the share classes offered by your fund.
Fund performance Total return for periods ended 2/28/10
| | | | | | | | | | |
| | Class A | Class B | Class C | Class M | Class R | Class Y |
| (inception dates) | (12/28/95) | (10/30/96) | (7/26/99) | (10/30/96) | (1/21/03) | (2/1/00) |
|
| | NAV | POP | NAV | CDSC | NAV | CDSC | NAV | POP | NAV | NAV |
|
| Annual average | | | | | | | | | | |
| (life of fund) | 11.33% | 10.86% | 10.49% | 10.49% | 10.50% | 10.50% | 10.77% | 10.49% | 11.07% | 11.52% |
|
| 10 years | 6.59 | 0.45 | –1.20 | –1.20 | –1.13 | –1.13 | 1.40 | –2.15 | 4.23 | 9.25 |
| Annual average | 0.64 | 0.04 | –0.12 | –0.12 | –0.11 | –0.11 | 0.14 | –0.22 | 0.42 | 0.89 |
|
| 5 years | 26.72 | 19.43 | 22.00 | 20.00 | 22.08 | 22.08 | 23.60 | 19.26 | 25.20 | 28.33 |
| Annual average | 4.85 | 3.62 | 4.06 | 3.71 | 4.07 | 4.07 | 4.33 | 3.59 | 4.60 | 5.12 |
|
| 3 years | –17.42 | –22.16 | –19.27 | –21.60 | –19.22 | –19.22 | –18.65 | –21.50 | –18.02 | –16.80 |
| Annual average | –6.18 | –8.01 | –6.89 | –7.79 | –6.87 | –6.87 | –6.65 | –7.75 | –6.41 | –5.95 |
|
| 1 year | 81.98 | 71.50 | 80.62 | 75.62 | 80.72 | 79.72 | 81.14 | 74.85 | 81.50 | 82.49 |
|
| 6 months | 2.70 | –3.21 | 2.32 | –2.68 | 2.35 | 1.35 | 2.46 | –1.12 | 2.59 | 2.84 |
|
Current performance may be lower or higher than the quoted past performance, which cannot guarantee future results. After-sales-charge returns (public offering price, or POP) for class A and M shares reflect a maximum 5.75% and 3.50% load, respectively. Class B share returns reflect the applicable contingent deferred sales charge (CDSC), which is 5% in the first year, declining to 1% in the sixth year, and is eliminated thereafter. Class C shares reflect a 1% CDSC for the first year that is eliminated thereafter. Class R and Y shares have no initial sales charge or CDSC. Performance for classB, C, M, R, and Y shares before their inception is derived from the historical performance of classA shares, adjusted for the applicable sales charge (or CDSC) and, except for class Y shares, the higher operating expenses for such shares.
For a portion of the periods, this fund may have limited expenses, without which returns would have been lower.
A 1% short-term trading fee may be applied to shares exchanged or sold within 90 days of purchase.
12
Comparative index returns For periods ended 2/28/10
| | |
| | S&P Developed Ex-U.S. | Lipper International Small/Mid-Cap |
| | SmallCap Index | Core Funds category average* |
|
| Annual average (life of fund) | 6.18% | 9.06% |
|
| 10 years | 70.95 | 56.65 |
| Annual average | 5.51 | 4.08 |
|
| 5 years | 18.18 | 17.79 |
| Annual average | 3.40 | 3.31 |
|
| 3 years | –22.83 | –21.84 |
| Annual average | –8.28 | –7.93 |
|
| 1 year | 68.18 | 67.20 |
|
| 6 months | 3.19 | 4.65 |
|
Index and Lipper results should be compared to fund performance at net asset value.
* Over the 6-month, 1-year, 3-year, 5-year, 10-year, and life-of-fund periods ended 2/28/10, there were 43, 43, 26, 20, 13, and 3 funds, respectively, in this Lipper category.
Fund price and distribution information For the six-month period ended 2/28/10
| | | | | | | | |
| Distributions | Class A | Class B | Class C | Class M | Class R | Class Y |
|
| Number | 1 | — | — | — | 1 | 1 |
|
| Income | $0.115 | — | — | — | $0.094 | $0.178 |
|
| Capital gains | — | — | — | — | — | — |
|
| Total | $0.115 | — | — | — | $0.094 | $0.178 |
|
| Share value | NAV | POP | NAV | NAV | NAV | POP | NAV | NAV |
|
| 8/31/09 | $28.69 | $30.44 | $28.42 | $28.48 | $28.50 | $29.53 | $28.29 | $28.73 |
|
| 2/28/10 | 29.35 | 31.14 | 29.08 | 29.15 | 29.20 | 30.26 | 28.93 | 29.37 |
|
The classification of distributions, if any, is an estimate. Final distribution information will appear on your year-end tax forms.
Fund performance as of most recent calendar quarter
Total return for periods ended 3/31/10
| | | | | | | | | | |
| | Class A | Class B | Class C | Class M | Class R | Class Y |
| (inception dates) | (12/28/95) | (10/30/96) | (7/26/99) | (10/30/96) | (1/21/03) | (2/1/00) |
|
| | NAV | POP | NAV | CDSC | NAV | CDSC | NAV | POP | NAV | NAV |
|
| Annual average | | | | | | | | | | |
| (life of fund) | 11.89% | 11.42% | 11.05% | 11.05% | 11.06% | 11.06% | 11.33% | 11.05% | 11.63% | 12.09% |
|
| 10 years | 23.18 | 16.10 | 14.20 | 14.20 | 14.24 | 14.24 | 17.14 | 13.04 | 20.51 | 26.26 |
| Annual average | 2.11 | 1.50 | 1.34 | 1.34 | 1.34 | 1.34 | 1.59 | 1.23 | 1.88 | 2.36 |
|
| 5 years | 41.52 | 33.40 | 36.27 | 34.27 | 36.33 | 36.33 | 38.00 | 33.18 | 39.87 | 43.30 |
| Annual average | 7.19 | 5.93 | 6.38 | 6.07 | 6.39 | 6.39 | 6.65 | 5.90 | 6.94 | 7.46 |
|
| 3 years | –12.93 | –17.94 | –14.88 | –17.33 | –14.86 | –14.86 | –14.23 | –17.22 | –13.52 | –12.27 |
| Annual average | –4.51 | –6.38 | –5.23 | –6.15 | –5.22 | –5.22 | –4.99 | –6.11 | –4.73 | –4.27 |
|
| 1 year | 80.07 | 69.75 | 78.74 | 73.74 | 78.73 | 77.73 | 79.17 | 72.91 | 79.74 | 80.52 |
|
| 6 months | 5.73 | –0.33 | 5.35 | 0.35 | 5.33 | 4.33 | 5.46 | 1.77 | 5.64 | 5.88 |
|
13
Your fund’s expenses
As a mutual fund investor, you pay ongoing expenses, such as management fees, distribution fees (12b-1 fees), and other expenses. Using the following information, you can estimate how these expenses affect your investment and compare them with the expenses of other funds. You may also pay one-time transaction expenses, including sales charges (loads) and redemption fees, which are not shown in this section and would have resulted in higher total expenses. For more information, see your fund’s prospectus or talk to your financial representative.
Expense ratios
| | | | | | |
| | Class A | Class B | Class C | Class M | Class R | Class Y |
|
| Total fund annual operating expenses for the fiscal | | | | | | |
| year ended 8/31/09* | 1.67% | 2.42% | 2.42% | 2.17% | 1.92% | 1.42% |
|
| Annualized expense ratio for the six-month period | | | | | | |
| ended 2/28/10 | 1.67% | 2.42% | 2.42% | 2.17% | 1.92% | 1.42% |
|
Fiscal-year expense information in this table is taken from the most recent prospectus, is subject to change, and may differ from that shown for the annualized expense ratio and in the financial highlights of this report. Expenses are shown as a percentage of average net assets.
* Reflects projected expenses based on a new expense arrangement.
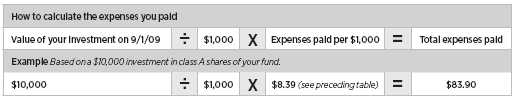
Expenses per $1,000
The following table shows the expenses you would have paid on a $1,000 investment in Putnam International Capital Opportunities Fund from September 1, 2009, to February 28, 2010. It also shows how much a $1,000 investment would be worth at the close of the period, assuming actual returns and expenses.
| | | | | | |
| | Class A | Class B | Class C | Class M | Class R | Class Y |
|
| Expenses paid per $1,000*† | $8.39 | $12.14 | $12.14 | $10.89 | $9.64 | $7.14 |
|
| Ending value (after expenses) | $1,027.00 | $1,023.20 | $1,023.50 | $1,024.60 | $1,025.90 | $1,028.40 |
|
* Expenses for each share class are calculated using the fund’s annualized expense ratio for each class, which represents the ongoing expenses as a percentage of average net assets for the six months ended 2/28/10. The expense ratio may differ for each share class.
† Expenses are calculated by multiplying the expense ratio by the average account value for the period; then multiplying the result by the number of days in the period; and then dividing that result by the number of days in theyear.
14
Estimate the expenses you paid
To estimate the ongoing expenses you paid for the six months ended February 28, 2010, use the following calculation method. To find the value of your investment on September 1, 2009, call Putnam at 1-800-225-1581.
Compare expenses using the SEC’s method
The Securities and Exchange Commission (SEC) has established guidelines to help investors assess fund expenses. Per these guidelines, the following table shows your fund’s expenses based on a $1,000 investment, assuming a hypothetical 5% annualized return. You can use this information to compare the ongoing expenses (but not transaction expenses or total costs) of investing in the fund with those of other funds. All mutual fund shareholder reports will provide this information to help you make this comparison. Please note that you cannot use this information to estimate your actual ending account balance and expenses paid during the period.
| | | | | | |
| | Class A | Class B | Class C | Class M | Class R | Class Y |
|
| Expenses paid per $1,000*† | $8.35 | $12.08 | $12.08 | $10.84 | $9.59 | $7.10 |
|
| Ending value (after expenses) | $1,016.51 | $1,012.79 | $1,012.79 | $1,014.03 | $1,015.27 | $1,017.75 |
|
* Expenses for each share class are calculated using the fund’s annualized expense ratio for each class, which represents the ongoing expenses as a percentage of average net assets for the six months ended 2/28/10. The expense ratio may differ for each share class.
† Expenses are calculated by multiplying the expense ratio by the average account value for the period; then multiplying the result by the number of days in the period; and then dividing that result by the number of days in theyear.
15
Terms and definitions
Important terms
Total return shows how the value of the fund’s shares changed over time, assuming you held the shares through the entire period and reinvested all distributions in the fund.
Net asset value (NAV) is the price, or value, of one share of a mutual fund, without a sales charge. NAVs fluctuate with market conditions. NAV is calculated by dividing the net assets of each class of shares by the number of outstanding shares in the class.
Public offering price (POP) is the price of a mutual fund share plus the maximum sales charge levied at the time of purchase. POP performance figures shown here assume the 5.75% maximum sales charge for class A shares and 3.50% for class M shares.
Contingent deferred sales charge (CDSC) is generally a charge applied at the time of the redemption of class B or C shares and assumes redemption at the end of the period. Your fund’s class B CDSC declines from a 5% maximum during the first year to 1% during the sixth year. After the sixth year, the CDSC no longer applies. The CDSC for class C shares is 1% for one year after purchase.
Share classes
Class A shares are generally subject to an initial sales charge and no CDSC (except on certain redemptions of shares bought without an initial sales charge).
Class B shares are not subject to an initial sales charge. They may be subject to a CDSC.
Class C shares are not subject to an initial sales charge and are subject to a CDSC only if the shares are redeemed during the first year.
Class M shares have a lower initial sales charge and a higher 12b-1 fee than class A shares and no CDSC (except on certain redemptions of shares bought without an initial sales charge).
Class R shares are not subject to an initial sales charge or CDSC and are available only to certain defined contribution plans.
Class Y shares are not subject to an initial sales charge or CDSC, and carry no 12b-1 fee. They are generally only available to corporate and institutional clients and clients in other approvedprograms.
Comparative indexes
Barclays Capital Aggregate Bond Index is an unmanaged index of U.S. investment-grade fixed-income securities.
BofA (Bank of America) Merrill Lynch U.S.
3-Month Treasury Bill Index is an unmanaged index that seeks to measure the performance of U.S. Treasury bills available in the marketplace.
S&P 500 Index is an unmanaged index of common stock performance.
S&P Developed Ex-U.S. SmallCap Index is an unmanaged index of small-cap stocks from developed countries, excluding the UnitedStates.
Indexes assume reinvestment of all distributions and do not account for fees. Securities and performance of a fund and an index will differ. You cannot invest directly in an index.
Lipper is a third-party industry-ranking entity that ranks mutual funds. Its rankings do not reflect sales charges. Lipper rankings are based on total return at net asset value relative to other funds that have similar current investment styles or objectives as determined by Lipper. Lipper may change a fund’s category assignment at its discretion. Lipper category averages reflect performance trends for funds within a category.
16
Trustee approval of management contract
General conclusions
The Board of Trustees of the Putnam funds oversees the management of each fund and, as required by law, determines annually whether to approve the continuance of your fund’s management contract with Putnam Investment Management (“Putnam Management”) and the sub-management contract, with respect to your fund, between Putnam Management and its affiliate, Putnam Investments Limited (“PIL”).
In this regard, the Board of Trustees, with the assistance of its Contract Committee consisting solely of Trustees who are not “interested persons” (as such term is defined in the Investment Company Act of 1940, as amended) of the Putnam funds (the “Independent Trustees”), requests and evaluates all information it deems reasonably necessary under the circumstances. Over the course of several months ending in June 2009, the Contract Committee met several times to consider the information provided by Putnam Management and other information developed with the assistance of the Board’s independent counsel and independent staff. The Contract Committee reviewed and discussed key aspects of this information with all of the Independent Trustees. At the Trustees’ June12, 2009 meeting, the Contract Committee recommended, and the Independent Trustees approved, the continuance of your fund’s management and sub-management contract s, effective July 1, 2009. (Because PIL is an affiliate of Putnam Management and Putnam Management remains fully responsible for all services provided by PIL, the Trustees have not evaluated PIL as a separate entity, and all subsequent references to Putnam Management below should be deemed to include reference to PIL as necessary or appropriate in the context.)
The Independent Trustees’ approval was based on the following conclusions:
• That the fee schedule in effect for your fund represented reasonable compensation in light of the nature and quality of the services being provided to the fund, the fees paid by competitive funds and the costs incurred by Putnam Management in providing such services, and
• That such fee schedule represented an appropriate sharing between fund shareholders and Putnam Management of such economies of scale as may exist in the management of the fund at current asset levels.
These conclusions were based on a comprehensive consideration of all information provided to the Trustees, were subject to the continued application of certain expense reductions and waivers pending other considerations noted below, and were not the result of any single factor. Some of the factors that figured particularly in the Trustees’ deliberations and how the Trustees considered these factors are described below, although individual Trustees may have evaluated the information presented differently, giving different weights to various factors. It is also important to recognize that the fee arrangements for your fund and the other Putnam funds are the result of many years of review and discussion between the Independent Trustees and Putnam Management, that certain aspects of the arrangements may receive greater scrutiny in some years than others, and that the Trustees’ conclusions may be based, in part, on their consideration of these sam e arrangements in prior years.
Consideration of strategic
pricing proposal
The Trustees considered that the Contract Committee had been engaged in a detailed review of Putnam Management’s strategic pricing proposal that was first presented
17
to the Committee at its May 2009 meeting. The proposal included proposed changes to the basic structure of the management fees in place for all open-end funds (except the Putnam RetirementReady® Funds and Putnam Money Market Liquidity Fund), including implementation of a breakpoint structure based on the aggregate net assets of all such funds in lieu of the individual breakpoint structures in place for each fund, as well as implementation of performance fees for certain funds. In addition, the proposal recommended substituting separate expense limitations on investor servicing fees and on other expenses as a group in lieu of the total expense limitations in place for many funds.
While the Contract Committee noted the likelihood that the Trustees and Putnam Management would reach agreement on the strategic pricing matters in later months, the terms of the management contracts required that the Trustees approve the continuance of the contracts in order to prevent their expiration at June 30, 2009. The Contract Committee’s recommendations in June reflect its conclusion that the terms of the contractual arrangements for your fund continued to be appropriate for the upcoming term, absent any possible agreement with respect to the matters addressed in Putnam Management’s proposal.
The Trustees were mindful of the significant changes that had occurred at Putnam Management in the past two years, including a change of ownership, the installation of a new senior management team at Putnam Management, the substantial decline in assets under management resulting from extraordinary market forces as well as continued net redemptions in many funds, the introduction of new fund products representing novel investment strategies and the introduction of performance fees for certain new funds. The Trustees were also mindful that many other leading firms in the industry had also been experiencing significant challenges due to the changing financial and competitive environment. For these reasons, even though the Trustees believed that the current contractual arrangements in place between the funds and Putnam Management and its affiliates have served shareholders well and continued to be appropriate for the nea r term, the Trustees believed that it was an appropriate time to reconsider the current structure of the funds’ contractual arrangements with Putnam Management with a view to possible changes that might better serve the interests of shareholders in this new environment. The Trustees concluded their review of Putnam Management’s strategic pricing proposal in July 2009, and their considerations regarding the proposal are discussed below under the heading “Subsequent approval of strategic pricing proposal.” With the exception of the discussion under this heading, the following discussion generally addresses only the Trustees’ reasons for recommending the continuance of the current contractual arrangements as, at the time the Trustees determined to make this recommendation, the Trustees had not yet reached any conclusions with respect to the strategic pricing proposal.
Management fee schedules and
categories; total expenses
The Trustees reviewed the management fee schedules in effect for all Putnam funds, including fee levels and breakpoints, and the assignment of funds to particular fee categories. The general fee structure has been carefully developed over the years and re-examined on many occasions and adjusted where appropriate. In this regard, the Trustees noted that shareholders of all funds voted by overwhelming majorities in 2007 to approve new management contracts containing identical fee schedules.
In reviewing fees and expenses, the Trustees generally focused their attention on material changes in circumstances — for example,
18
changes in a fund’s size or investment style, changes in Putnam Management’s operating costs, or changes in competitive practices in the mutual fund industry — that suggest that consideration of fee changes might be warranted. The Trustees concluded that the circumstances did not warrant changes to the management fee structure of your fund at that time but, as indicated above, based on their detailed review of the current fee structure, were prepared to consider possible changes to this arrangement that might better serve the interests of shareholders in the future. The Trustees focused on two areas of particular interest, as discussed further below:
• Competitiveness. The Trustees reviewed comparative fee and expense information for competitive funds, which indicated that, in a custom peer group of competitive funds selected by Lipper Inc., your fund ranked in the 34th percentile in management fees and in the 21st percentile in total expenses (less any applicable 12b-1 fees) as of December 31, 2008 (the first percentile being the least expensive funds and the 100th percentile being the most expensive funds).
The Trustees noted that expense ratios for a number of Putnam funds, which show the percentage of fund assets used to pay for management and administrative services, distribution (12b-1) fees (as applicable) and other expenses, had been increasing recently as a result of declining net assets and the natural operation of fee breakpoints. The Trustees expressed their intention to monitor the funds’ percentile rankings in management fees and in total expenses to ensure that fees and expenses of the funds continue to meet evolving competitive standards.
The Trustees noted that the expense ratio increases described above were being controlled by expense limitations initially implemented in January 2004. These expense limitations give effect to a commitment by Putnam Management that the expense ratio of each open-end fund would be no higher than the average expense ratio of the competitive funds included in the fund’s relevant Lipper universe (exclusive of any applicable 12b-1 charges in each case). The Trustees observed that this commitment to limit fund expenses has served shareholders well since its inception and, while the Contract Committee was reviewing proposed alternative expense limitation arrangements as noted above, the Trustees received a commitment from Putnam Management and its parent company to continue this program through at least June30, 2010, or such earlier time as the Trustees and Putnam Management reach agreement on alternative arrangements.
In order to ensure that the expenses of the Putnam funds continue to meet evolving competitive standards, the Trustees requested, and Putnam Management agreed, to extend for the twelve months beginning July 1, 2009, or until such earlier time as the Trustees and Putnam Management reach agreement on alternative expense limitation arrangements, an additional expense limitation for certain funds at an amount equal to the average expense ratio (exclusive of 12b-1 charges) of a custom peer group of competitive funds selected by Lipper to correspond to the size of the fund. This additional expense limitation is applicable to those open-end funds that had above-average expense ratios (exclusive of 12b-1 charges) based on the custom peer group data for the period ended December 31, 2007. This additional expense limitation was not applied to your fund because it had a below-average expense ratio relative to its custom peergroup.
• Economies of scale. Your fund currently has the benefit of breakpoints in its management fee that provide shareholders with significant economies of scale, which means that the effective management fee rate of the fund (as
19
a percentage of fund assets) declines as the fund grows in size and crosses specified asset thresholds. Conversely, as the fund shrinks in size — as has been the case for many Putnam funds in recent years — these breakpoints result in increasing fee levels. In recent years, the Trustees have examined the operation of the existing breakpoint structure during periods of both growth and decline in asset levels. The Trustees concluded that the fee schedule in effect for your fund represented an appropriate sharing of economies of scale at that time but, as noted above, were in the process of reviewing a proposal to eliminate individual fund breakpoints for all of the open-end funds (except for the Putnam RetirementReady® Funds and Putnam Money Market Liquidity Fund) in favor of a breakpoint structure based on the aggregate net assets of all such funds.
In connection with their review of the management fees and total expenses of the Putnam funds, the Trustees also reviewed the costs of the services provided and profits realized by Putnam Management and its affiliates from their contractual relationships with the funds. This information included trends in revenues, expenses and profitability of Putnam Management and its affiliates relating to the investment management and distribution services provided to the funds. In this regard, the Trustees also reviewed an analysis of Putnam Management’s revenues, expenses and profitability with respect to the funds’ management contracts, allocated on a fund-by-fund basis.
Investment performance
The quality of the investment process provided by Putnam Management represented a major factor in the Trustees’ evaluation of the quality of services provided by Putnam Management under your fund’s management contract. The Trustees were assisted in their review of the Putnam funds’ investment process and performance by the work of the Investment Oversight Coordinating Committee of the Trustees and the Investment Oversight Committees of the Trustees, which had met on a regular monthly basis with the funds’ portfolio teams throughout the year. The Trustees concluded that Putnam Management generally provides a high-quality investment process— as measured by the experience and skills of the individuals assigned to the management of fund portfolios, the resources made available to such personnel, and in general the ability of Putnam Management to attract and retain high-quality personnel — bu t also recognized that this does not guarantee favorable investment results for every fund in every time period. The Trustees considered the investment performance of each fund over multiple time periods and considered information comparing each fund’s performance with various benchmarks and with the performance of competitive funds.
The Trustees noted the disappointing investment performance of many of the funds for periods ended March 31, 2009. They discussed with senior management of Putnam Management the factors contributing to such underperformance and the actions being taken to improve performance. The Trustees recognized that, in recent years, Putnam Management has taken steps to strengthen its investment personnel and processes to address areas of underperformance, including Putnam Management’s continuing efforts to strengthen the equity research function, recent changes in portfolio managers including increased accountability of individual managers rather than teams, recent changes in Putnam Management’s approach to incentive compensation, including emphasis on top quartile performance over a rolling three-year period, and the recent arrival of a new chief investment officer. The Trustees also recognized the substantial improvement in performance of many funds si nce the implementation of those changes. The Trustees indicated their intention to continue
20
to monitor performance trends to assess the effectiveness of these efforts and to evaluate whether additional changes to address areas of underperformance are warranted.
In the case of your fund, the Trustees considered that your fund’s class A share cumulative total return performance at net asset value was in the following percentiles of its Lipper Inc. peer group (Lipper International Small/ Mid-Cap Core Funds) for the one-year, three-year and five-year periods ended March 31, 2009 (the first percentile being the best-performing funds and the 100th percentile being the worst-performing funds):
| | | |
| One-year period | 55th | | |
| | |
| Three-year period | 34th | | |
| | |
| Five-year period | 30th | | |
| | |
Over the one-year, three-year and five-year periods ended March 31, 2009, there were 67, 41 and 39 funds, respectively, in your fund’s Lipper peer group. Past performance is no guarantee of future results.
As a general matter, the Trustees believe that cooperative efforts between the Trustees and Putnam Management represent the most effective way to address investment performance problems. The Trustees noted that investors in the Putnam funds have, in effect, placed their trust in the Putnam organization, under the oversight of the funds’ Trustees, to make appropriate decisions regarding the management of the funds. Based on the responsiveness of Putnam Management in the recent past to Trustee concerns about investment performance, the Trustees concluded that it is preferable to seek change within Putnam Management to address performance shortcomings. In the Trustees’ view, the alternative of engaging a new investment adviser for an underperforming fund would entail significant disruptions and would not provide any greater assurance of improved investment performance.
Brokerage and soft-dollar allocations;
other benefits
The Trustees considered various potential benefits that Putnam Management may receive in connection with the services it provides under the management contract with your fund. These include benefits related to brokerage and soft-dollar allocations, whereby a portion of the commissions paid by a fund for brokerage may be used to acquire research services that may be useful to Putnam Management in managing the assets of the fund and of other clients. The Trustees considered a change made, at Putnam Management’s request, to the Putnam funds’ brokerage allocation policy commencing in 2009, which increased the permitted soft dollar allocation to third-party services over what had been authorized in previous years. The Trustees noted that a portion of available soft dollars continue to be allocated to the payment of fund expenses, although the amount allocated for this purpose has declined in recent years. The Trustees indicated their continued int ent to monitor regulatory developments in this area with the assistance of their Brokerage Committee and also indicated their continued intent to monitor the potential benefits associated with the allocation of fund brokerage and trends in industry practice to ensure that the principle of seeking best price and execution remains paramount in the portfolio trading process.
The Trustees’ annual review of your fund’s management contract also included the review of the investor servicing agreement with Putnam Investor Services, Inc. (“PSERV”), which agreement provides benefits to an affiliate of Putnam Management. The Trustees considered that effective January 1, 2009, the Trustees, PSERV and Putnam Management entered into a new fee schedule that includes for the open-end funds (other than funds of Putnam Variable Trust and Putnam Money Market Liquidity Fund) an expense limitation
21
but, as noted above, also considered that this expense limitation is subject to review as part of the Trustees’ pending review of Putnam’s strategic pricing proposal.
In the case of your fund, the Trustees’ annual review of the fund’s management contract also included the review of the fund’s distributor’s contract and distribution plans with Putnam Retail Management Limited Partnership, which contract and plans also provide benefits to an affiliate of Putnam Management.
Comparison of retail and institutional
fee schedules
The information examined by the Trustees as part of their annual contract review has included for many years information regarding fees charged by Putnam Management and its affiliates to institutional clients such as defined benefit pension plans, college endowments, etc. This information included comparisons of such fees with fees charged to the funds, as well as a detailed assessment of the differences in the services provided to these two types of clients. The Trustees observed, in this regard, that the differences in fee rates between institutional clients and mutual funds are by no means uniform when examined by individual asset sectors, suggesting that differences in the pricing of investment management services to these types of clients reflect to a substantial degree historical competitive forces operating in separate market places. The Trustees considered the fact that fee rates across different asset classes are typically higher on average fo r mutual funds than for institutional clients, as well as the differences between the services that Putnam Management provides to the Putnam funds and those that it provides to institutional clients of the firm, but did not rely on such comparisons to any significant extent in concluding that the management fees paid by your fund are reasonable.
Subsequent approval of strategic
pricing proposal
As mentioned above, at a series of meetings beginning in May 2009 and ending on July 10, 2009, the Contract Committee and the Trustees engaged in a detailed review of Putnam Management’s strategic pricing proposal. Following this review, the Trustees of each fund, including all of the Independent Trustees, voted unanimously on July 10, 2009 to approve proposed management contracts reflecting the proposal, as modified based on discussions between the Independent Trustees and Putnam Management, for each fund. In considering the proposed contracts, the Independent Trustees focused largely on the specific proposed changes described below relating to management fees. They also took into account the factors that they considered in connection with their most recent annual approval on June 12, 2009 of the continuance of the funds’ current management contracts and the extensive materials that they had reviewed in connection with that approval process, as described above.
On December 18, 2009, shareholders approved the proposed management contract for your fund. The new management contract was implemented on January 1, 2010.
• Considerations relating to Fund Family fee rate calculations. The Independent Trustees considered that the proposed management contracts would change the manner in which fund shareholders share in potential economies of scale associated with the management of the funds. Under the current management contracts, shareholders of a fund (other than Putnam Money Market Liquidity Fund and the Putnam RetirementReady® Funds, which do not pay management fees to Putnam Management) benefit from increased fund size through reductions in the effective management fee paid to Putnam Management once the fund’s net assets exceed the first breakpoint in
22
the fund’s fee schedule ($500 million for most funds). Conversely, in the case of funds with net assets above the level of the first breakpoint, the effective management fee increases as the fund’s average net assets decline below a breakpoint. These breakpoints are measured solely by the net assets of each individual fund and are not affected by possible growth (or decline) of net assets of other funds in the Fund Family. (“Fund Family” for purposes of this discussion refers to all open-end mutual funds sponsored by Putnam Management, except for the Putnam RetirementReady® Funds and Putnam Money Market Liquidity Fund.) Under the proposed management contracts, potential economies of scale would be shared ratably among shareholders of all funds, regardless of their size. The management fees paid by a fund (and indirectly by shareholders) would no longer be affected by the growth (or decline) o f assets of the particular fund, but rather would be affected solely by the growth (or decline) of the aggregate net assets of all funds in the Fund Family, regardless of whether the net assets of the particular fund are growing or declining.
The table below shows the proposed effective management fee rate for your fund, based on June 30, 2009 net assets of the Fund Family ($52.3 billion). This table also shows the effective management fee rate payable by your fund under its current management contract, based on the net assets of the fund as of June30, 2009. Finally, this table shows the difference in the effective management fees, based on net assets as of June 30, 2009, between the proposed management contract and the current contract.
| | | |
| | Proposed Effective | Current Effective | |
| Name of Fund | Contractual Rate | Contractual Rate | Difference |
|
| Putnam International Capital Opportunities Fund | 0.942% | 0.948% | (0.006)% |
As shown in the foregoing table, based on June 30, 2009 net asset levels, the proposed management contract would provide for payment of a management fee rate that is lower for your fund than the management fee rate payable under the current management contract. For a small number of funds (although not your fund), the management fee rate would be slightly higher under the proposed contract at these asset levels, but by only immaterial amounts. In the aggregate, the financial impact on Putnam Management of implementing this proposed change for all funds at June 30, 2009 net asset levels is a reduction in annual management fee revenue of approximately $24.0 million. (Putnam Management has already incurred a significant portion of this revenue reduction through the waiver of a portion of its current management fees for certain funds pending shareholder consideration of the proposed management contracts. Putnam is not ob liged to continue such waivers beyond July 31, 2010 in the event that the proposed contracts are not approved by shareholders.) The Independent Trustees carefully considered the implications of this proposed change under a variety of economic circumstances. They considered the fact that at current asset levels the management fees paid by the funds under the proposed contract would be lower for almost all funds, and would not be materially higher for any fund. They considered the possibility that under some circumstances, the current management contract could result in a lower fee for a particular fund than the proposed management contract. Such circumstances might occur, for example, if the aggregate net assets of the Fund Family remain largely unchanged and the net assets of an individual fund grew substantially, or if the net assets of an individual fund remain largely unchanged and
23
the aggregate net assets of the Fund Family declined substantially.
The Independent Trustees noted that future changes in the net assets of individual funds are inherently unpredictable and that experience has shown that funds often grow in size and decline in size over time depending on market conditions and the changing popularity of particular investment styles and asset classes. They noted that, while the aggregate net assets of the Fund Family have changed substantially over time, basing a management fee on the aggregate level of assets of the Fund Family would likely reduce fluctuations in costs paid by individual funds and lead to greater stability and predictability of fund operating costs over time.
The Independent Trustees considered that the proposed management contract would likely be advantageous for newly organized funds that have yet to attract significant assets and for funds in specialty asset classes that are unlikely to grow to a significant size. In each case, such funds would participate in the benefits of scale made possible by the aggregate size of the Fund Family to an extent that would not be possible based solely on their individual size.
The Independent Trustees also considered that for funds that have achieved or are likely to achieve considerable scale on their own, the proposed management contract could result in sharing of economies which might lead to slightly higher costs under some circumstances, but they noted that any such increases are immaterial at current asset levels and that over time such funds are likely to realize offsetting benefits from their opportunity to participate, both through the exchange privilege and through the Fund Family breakpoint fee structure, in the improved growth prospects of a diversified Fund Family able to offer competitively priced products.
The Independent Trustees noted that the implementation of the proposed management contracts would result in a reduction in aggregate fee revenues for Putnam Management at current asset levels. They also noted that applying various projections of growth equally to the aggregate net assets of the Fund Family and to the net assets of individual funds also showed revenue reductions for Putnam Management. They recognized, however, the possibility that under some scenarios Putnam Management might realize greater future revenues, with respect to certain funds, under the proposed contracts than under the current contracts, but considered such circumstances to be both less likely and inherently unpredictable.
The Independent Trustees considered the extent to which Putnam Management may realize economies of scale in connection with the management of the funds. In this regard, they considered the possibility that such economies of scale as may exist in the management of mutual funds may be associated more closely with the size of the aggregate assets of the mutual fund complex than with the size of any individual fund. In this regard the Independent Trustees considered the financial information provided to them by Putnam Management over a period of many years regarding the allocation of costs involved in calculating the profitability of its mutual fund business as a whole and the profitability of individual funds. The Independent Trustees noted that the methodologies for such cost allocations had been reviewed on a number of occasions in the past by independent financial consultants engaged by the Independent Trustees. The Independent Trustees noted that thes e methodologies support Putnam Management’s assertion that many of its operating costs and any associated economies of scale are related more to the aggregate net assets under management in various sectors of its business than to the size of individual funds. They noted that on a number of occasions in the past the Independent Trustees had separately considered the possibility of
24
calculating management fees in whole or in part based on aggregate net assets of the Putnam funds.
The Independent Trustees considered the fact that the proposed contracts would result in a sharing among the affected funds of economies of scale that for the most part are now enjoyed by the larger funds, without materially increasing the current costs of any of the larger funds. They concluded that this sharing of economies among funds was appropriate in light of the diverse investment opportunities available to shareholders of all funds through the existence of the exchange privilege. They also considered that the proposed change in management fee structure would allow Putnam Management to introduce new investment products at more attractive pricing levels than may currently be the case.
After considering all of the foregoing, the Independent Trustees concluded that the proposed calculation of management fees based on the aggregate net assets of the Fund Family represented a fair and reasonable means of sharing possible economies of scale among the shareholders of all funds.
• Considerations relating to addition of fee rate adjustments based on investment performance for certain funds. The Independent Trustees considered that Putnam’s proposal to add fee rate adjustments based on investment performance to the management contracts of certain funds reflected a desire by Putnam Management to align its fee revenues more closely with investment performance in the case of certain funds. They noted that Putnam Management already has a significant financial interest in achieving good performance results for the funds it manages. Putnam Management’s fees are based on the assets under its management (whether calculated on an individual fund or complex-wide basis). Good performance results in higher asset levels and therefore higher revenues to Putnam Management. Moreove r, good performance also tends to attract additional investors to particular funds or the complex generally, also resulting in higher revenues. Nevertheless, the Independent Trustees concluded that adjusting management fees based on performance for certain selected funds could provide additional benefits to shareholders.
The Independent Trustees noted that Putnam Management proposed the addition of performance adjustments only for certain of the funds and considered whether similar adjustments might be appropriate for other funds. In this regard, they considered Putnam Management’s belief that the addition of performance adjustments would be most appropriate for shareholders of U.S. growth funds, international equity funds, including your fund, and Putnam Global Equity Fund. They also considered Putnam Management’s view that it would continue to monitor whether performance fees would be appropriate for other funds. Accordingly, the Independent Trustees concluded that it would be desirable to gain further experience with the operation of performance adjustments for certain funds and the market’s receptivity to such fee structures before giving further consideration to whether similar performance adjustments would be appropriate for other funds as well.
• Considerations relating to standardization of payment terms. The proposed management contracts for all funds provide thatmanagement fees will be computed and paid monthly within 15 days after the end of each month. The current contracts of the funds contain quarterly computation and payment terms in some cases. These differences largely reflect practices in place at earlier times when many of the funds were first organized. Under the proposed contract, certain funds would make payments to Putnam Management earlier than they do under their current contract. This would reduce a fund’s opportunity to earn income on accrued but
25
unpaid management fees by a small amount, but would not have a material effect on a fund’s operating costs.
The Independent Trustees considered the fact that standardizing the payment terms for all funds would involve an acceleration in the timing of payments to Putnam Management for some funds and a corresponding loss of a potential opportunity for such funds to earn income on accrued but unpaid management fees. The Independent Trustees did not view this change as having a material impact on shareholders of any fund. In this regard, the Independent Trustees noted that the proposed contracts conform to the payment terms included in management contracts for all Putnam funds organized in recent years and that standardizing payment terms across all funds would reduce administrative burdens for both the funds and Putnam Management.
• Considerations relating to comparisons with management fees and total expenses of competitive funds. As part of their evaluation of the proposed management contracts, the Independent Trustees also reviewed the general approach taken by Putnam Management and the Independent Trustees in recent years in imposing appropriate limits on total fund expenses. As part of the annual contract review process in recent years, Putnam Management agreed to waive fees as needed to limit total fund expenses to a maximum level equal to the average total expenses of comparable competitive funds in the mutual fund industry. In connection with its proposal to implement new management contracts, Putnam Management also proposed, and the Independent Trustees approved, certain changes in this approach that shift the focus from controlling total expenses to imposing separate limits on certain c ategories of expenses, as required. As a general matter, Putnam Management and the Independent Trustees concluded that management fees for the Putnam funds are competitive with the fees charged by comparable funds in the industry. Nevertheless, the Independent Trustees considered specific management fee waivers proposed to be implemented as of August 1, 2009 by Putnam Management with respect to the current management fees of certain funds, as well as projected reductions in management fees for almost all funds that would result under the proposed contracts. Putnam Management and the Independent Trustees also agreed to impose separate expense limitations of 37.5 basis points on the general category of shareholder servicing expenses and 20 basis points on the general category of other ordinary operating expenses. These new expense limitations, as well as the fee waivers, were implemented for all funds effective as of August 1, 2009, replacing the expense limitation referred to above.
These changes resulted in lower total expenses for many funds, but in the case of some funds total expenses increased after application of the new waivers and expense limitations (as compared with the results obtained using the expense limitation method previously in place). In this regard, the Independent Trustees considered the likelihood that total expenses for most of these funds would have increased in any event in the normal course under the previous expense limitation arrangement, as the reported total expense levels of many competitive funds increased in response to the major decline in asset values that began in September 2008. These new waivers and expense limitations will continue in effect until at least July 31, 2010 and will be re-evaluated by the Independent Trustees as part of the annual contract review process prior to their scheduled expiration. However, the management fee waivers referred to above would largely become permanent reduc tions in fees as a result of the implementation of the proposed management contracts.
26
Under these new expense limitation arrangements effective August 1, 2009, your fund is subject to expense limitations of 37.5 basis points on the category of shareholder servicing fees and 20 basis points on the general category of other ordinary operating expenses.
27
Other information for shareholders
Important notice regarding delivery
of shareholder documents
In accordance with SEC regulations, Putnam sends a single copy of annual and semiannual shareholder reports, prospectuses, and proxy statements to Putnam shareholders who share the same address, unless a shareholder requests otherwise. If you prefer to receive your own copy of these documents, please call Putnam at 1-800-225-1581, and Putnam will begin sending individual copies within 30 days.
Proxy voting
Putnam is committed to managing our mutual funds in the best interests of our shareholders. The Putnam funds’ proxy voting guidelines and procedures, as well as information regarding how your fund voted proxies relating to portfolio securities during the 12-month period ended June 30, 2009, are available in the Individual Investors section of putnam.com, and on the SEC’s Web site, www.sec.gov. If you have questions about finding forms on the SEC’s Web site, you may call the SEC at 1-800-SEC-0330. You may also obtain the Putnam funds’ proxy voting guidelines and procedures at no charge by calling Putnam’s Shareholder Services at 1-800-225-1581.
Fund portfolio holdings
The fund will file a complete schedule of its portfolio holdings with the SEC for the first and third quarters of each fiscal year on Form N-Q. Shareholders may obtain the fund’s Forms N-Q on the SEC’s Web site at www.sec.gov. In addition, the fund’s Forms N-Q may be reviewed and copied at the SEC’s Public Reference Room in Washington, D.C. You may call the SEC at 1-800-SEC-0330 for information about the SEC’s Web site or the operation of the Public Reference Room.
Trustee and employee
fund ownership
Putnam employees and members of the Board of Trustees place their faith, confidence, and, most importantly, investment dollars in Putnam mutual funds. As of February 28, 2010, Putnam employees had approximately $323,000,000 and the Trustees had approximately $46,000,000 invested in Putnam mutual funds. These amounts include investments by the Trustees’ and employees’ immediate family members as well as investments through retirement and deferred compensation plans.
28
Financial statements
A guide to financial statements
These sections of the report, as well as the accompanying Notes, constitute the fund’s financial statements.
The fund’s portfolio lists all the fund’s investments and their values as of the last day of the reporting period. Holdings are organized by asset type and industry sector, country, or state to show areas of concentration and diversification.
Statement of assets and liabilities shows how the fund’s net assets and share price are determined. All investment and noninvestment assets are added together. Any unpaid expenses and other liabilities are subtracted from this total. The result is divided by the number of shares to determine the net asset value per share, which is calculated separately for each class of shares. (For funds with preferred shares, the amount subtracted from total assets includes the liquidation preference of preferred shares.)
Statement of operations shows the fund’s net investment gain or loss. This is done by first adding up all the fund’s earnings — from dividends and interest income — and subtracting its operating expenses to determine net investment income (or loss). Then, any net gain or loss the fund realized on the sales of its holdings — as well as any unrealized gains or losses over the period — is added to or subtracted from the net investment result to determine the fund’s net gain or loss for the fiscal period.
Statement of changes in net assets shows how the fund’s net assets were affected by the fund’s net investment gain or loss, by distributions to shareholders, and by changes in the number of the fund’s shares. It lists distributions and their sources (net investment income or realized capital gains) over the current reporting period and the most recent fiscal year-end. The distributions listed here may not match the sources listed in the Statement of operations because the distributions are determined on a tax basis and may be paid in a different period from the one in which they were earned. Dividend sources are estimated at the time of declaration. Actual results may vary. Any non-taxable return of capital cannot be determined until final tax calculations are completed after the end of the fund’s fiscal year.
Financial highlights provide an overview of the fund’s investment results, per-share distributions, expense ratios, net investment income ratios, and portfolio turnover in one summary table, reflecting the five most recent reporting periods. In a semiannual report, the highlights table also includes the current reporting period.
29
The fund’s portfolio 2/28/10 (Unaudited)
| | |
| COMMON STOCKS (99.3%)* | Shares | Value |
|
| Australia (5.1%) | | |
| Abacus Property Group R | 9,468,822 | $3,566,091 |
|
| Alesco Corp., Ltd. | 632,868 | 2,479,943 |
|
| Beach Petroleum, Ltd. | 3,007,404 | 1,793,332 |
|
| BlueScope Steel, Ltd. | 1,844,235 | 4,002,016 |
|
| Corporate Express Australia, Ltd. | 689,262 | 2,645,302 |
|
| Crane Group, Ltd. S | 256,608 | 1,932,843 |
|
| Flight Centre, Ltd. S | 305,618 | 5,171,279 |
|
| Iluka Resources, Ltd. † | 1,033,034 | 3,316,231 |
|
| Incitec Pivot, Ltd. | 1,771,200 | 5,145,882 |
|
| ING Industrial Fund † | 6,817,552 | 2,598,152 |
|
| Kagara Zinc, Ltd. † | 3,457,985 | 2,573,643 |
|
| Macquarie Office Trust | 12,908,400 | 3,240,989 |
|
| Pacific Brands, Ltd. † | 5,203,903 | 5,319,627 |
|
| Sigma Pharmaceuticals, Ltd. | 3,028,332 | 2,443,955 |
|
| Sims Group, Ltd. | 216,116 | 3,765,363 |
|
| Valad Property Group † R | 31,562,741 | 2,971,743 |
|
| Wotif.com Holdings, Ltd. | 1,462,007 | 9,622,606 |
|
| | | 62,588,997 |
| Austria (1.0%) | | |
| Andritz AG | 141,449 | 8,033,063 |
|
| Bank Austria Creditanstalt AG † F | 471 | — |
|
| CA Immobilien Anlagen AG † | 198,642 | 1,964,052 |
|
| EVN AG | 146,458 | 2,561,081 |
|
| | | 12,558,196 |
| Belgium (1.0%) | | |
| Euronav NV S | 167,367 | 3,398,542 |
|
| Gimv NV | 13,677 | 682,669 |
|
| Omega Pharma SA | 81,458 | 4,011,505 |
|
| UCB SA | 100,765 | 4,460,035 |
|
| | | 12,552,751 |
| Bermuda (1.2%) | | |
| Aspen Insurance Holdings, Ltd. | 216,714 | 6,124,338 |
|
| Hiscox, Ltd. | 856,535 | 4,643,685 |
|
| Ship Finance International, Ltd. | 253,071 | 4,023,829 |
|
| | | 14,791,852 |
| Canada (5.6%) | | |
| Atco, Ltd. Class I | 40,300 | 1,843,315 |
|
| Biovail Corp. | 328,600 | 4,865,255 |
|
| Canaccord Capital, Inc. | 976,143 | 7,862,240 |
|
| Dorel Industries, Inc. Class B | 92,400 | 2,663,222 |
|
| Ensign Energy Services, Inc. | 321,224 | 4,600,260 |
|
| Forzani Group, Ltd. (The) | 309,940 | 4,250,033 |
|
| Industrial Alliance Insurance and Financial Services, Inc. | 90,000 | 2,838,817 |
|
| Inmet Mining Corp. | 107,793 | 5,879,618 |
|
| InnVest Real Estate Investment Trust R | 904,500 | 4,851,065 |
|
| Lundin Mining Corp. † | 1,312,500 | 5,554,037 |
|
| Methanex Corp. | 332,491 | 7,875,952 |
|
30
| | |
| COMMON STOCKS (99.3%)* cont. | Shares | Value |
|
| Canada cont. | | |
| Pason Systems, Inc. | 380,100 | $4,662,695 |
|
| Precision Drilling Trust (Units) † | 585,000 | 4,511,554 |
|
| Sherritt International Corp. | 829,000 | 5,857,237 |
|
| | | 68,115,300 |
| Cayman Islands (0.2%) | | |
| Herbalife, Ltd. | 51,400 | 2,058,570 |
|
| | | 2,058,570 |
| China (2.5%) | | |
| Hebei CoalChem Holdings, Ltd. (Rights) † F | 39,441 | 5 |
|
| Hopson Development Holdings 144A | 1,246,000 | 1,743,331 |
|
| Hopson Development Holdings, Ltd. | 3,910,000 | 5,470,645 |
|
| Kingboard Chemical Holdings, Ltd. | 670,500 | 3,006,145 |
|
| Perfect World Co., Ltd. ADR † | 104,600 | 4,137,976 |
|
| Shanda Interactive Entertainment, Ltd. ADR † S | 51,300 | 2,323,890 |
|
| Sinofert Holdings, Ltd. | 5,402,000 | 3,027,442 |
|
| Sohu.com, Inc. † | 50,800 | 2,601,468 |
|
| SRE Group, Ltd. † | 38,402,000 | 3,661,150 |
|
| TPV Technology, Ltd. | 7,534,000 | 5,047,321 |
|
| | | 31,019,373 |
| Denmark (1.7%) | | |
| Dampskibsselskabet Torm A/S | 257,150 | 2,753,766 |
|
| East Asiatic Co., Ltd. A/S S | 141,681 | 4,045,954 |
|
| GN Store Nord † | 707,200 | 3,831,940 |
|
| H. Lundbeck A/S | 191,312 | 3,379,514 |
|
| Sydbank A/S † | 258,180 | 6,356,669 |
|
| | | 20,367,843 |
| Finland (1.1%) | | |
| Cramo OYJ | 239,014 | 4,023,343 |
|
| Jaakko Poyry Group OYJ | 198,777 | 2,574,494 |
|
| Rautaruukki OYJ | 123,798 | 2,335,117 |
|
| Tieto OYJ | 174,900 | 3,927,857 |
|
| | | 12,860,811 |
| France (5.4%) | | |
| Air France-KLM † | 141,616 | 1,891,445 |
|
| Beneteau SA | 298,318 | 4,918,011 |
|
| CNP Assurances | 19,932 | 1,787,795 |
|
| Dassault Systemes SA | 139,764 | 8,051,576 |
|
| Havas Advertising SA | 1,306,935 | 5,350,424 |
|
| IMS-International Metal Service † | 111,322 | 1,649,511 |
|
| Ingenico | 155,809 | 3,713,435 |
|
| M6-Metropole Television | 217,895 | 5,391,969 |
|
| Nexans SA | 27,285 | 1,926,717 |
|
| Nexity | 131,725 | 4,837,421 |
|
| Publicis Group SA | 241,178 | 9,515,495 |
|
| Rexel SA † | 349,337 | 4,519,740 |
|
| SEB SA | 76,198 | 4,901,249 |
|
| Teleperformance | 226,068 | 7,207,518 |
|
| | | 65,662,306 |
31
| | |
| COMMON STOCKS (99.3%)* cont. | Shares | Value |
|
| Germany (5.1%) | | |
| Carl Zeiss Meditec AG S | 139,172 | $2,242,239 |
|
| Celesio AG | 166,831 | 4,861,097 |
|
| Deutsche Lufthansa AG | 224,021 | 3,343,832 |
|
| Draegerwerk AG & Co., KGaA (Preference) | 31,072 | 1,988,897 |
|
| ElringKlinger AG | 106,186 | 2,470,019 |
|
| Gildemeister AG | 558,205 | 7,206,880 |
|
| HeidelbergCement AG | 125,326 | 6,387,754 |
|
| HeidelbergCement AG 144A | 23,135 | 1,179,170 |
|
| Heidelberger Druckmaschinen AG † S | 432,135 | 3,002,653 |
|
| Krones AG | 62,800 | 3,301,782 |
|
| MTU Aero Engines Holding AG | 75,919 | 3,849,362 |
|
| Norddeutsche Affinerie AG † S | 159,751 | 7,380,889 |
|
| Puma AG Rudolf Dassier Sport | 15,561 | 4,399,568 |
|
| Rheinmetall AG | 59,056 | 3,698,901 |
|
| Stada Arzneimittel | 83,539 | 2,902,318 |
|
| Wincor Nixdorf AG | 53,308 | 3,614,399 |
|
| | | 61,829,760 |
| Greece (0.8%) | | |
| Mytilineos Holdings SA | 543,040 | 2,995,243 |
|
| Public Power Corp. SA † | 146,194 | 2,200,073 |
|
| Titan Cement Co. SA | 170,867 | 4,188,668 |
|
| | | 9,383,984 |
| Hong Kong (1.1%) | | |
| Dah Sing Financial Group † | 833,600 | 4,231,418 |
|
| Industrial & Commercial Bank of China | 703,000 | 1,512,529 |
|
| Sino-Forest Corp. † | 38,935 | 757,892 |
|
| VTech Holdings, Ltd. | 321,000 | 3,234,028 |
|
| Wing Hang Bank, Ltd. | 483,000 | 4,047,868 |
|
| | | 13,783,735 |
| India (1.0%) | | |
| Hindalco Industries, Ltd. | 907,930 | 3,204,053 |
|
| Satyam Computer Services., Ltd. † | 1,649,153 | 3,417,099 |
|
| Tata Iron & Steel Co., Ltd. | 451,107 | 5,621,465 |
|
| | | 12,242,617 |
| Indonesia (0.3%) | | |
| Medco Energi Internasional Tbk PT | 11,608,000 | 3,080,944 |
|
| | | 3,080,944 |
| Ireland (2.2%) | | |
| Kingspan Group PLC † | 1,046,694 | 7,127,463 |
|
| Paddy Power PLC | 226,264 | 7,164,463 |
|
| Shire PLC | 506,826 | 10,871,986 |
|
| United Drug PLC | 722,702 | 2,234,243 |
|
| | | 27,398,155 |
| Italy (3.7%) | | |
| A2A SpA | 1,950,100 | 3,370,262 |
|
| Arnoldo Mondadori Editore SpA † | 937,075 | 3,535,081 |
|
| Buzzi Unicem SpA | 212,627 | 2,643,835 |
|
| Danieli & Co. SpA | 277,111 | 6,359,147 |
|
32
| | |
| COMMON STOCKS (99.3%)* cont. | Shares | Value |
|
| Italy cont. | | |
| Fondiaria SAI SpA | 156,741 | $2,279,812 |
|
| Gemina SpA † S | 3,816,000 | 3,297,503 |
|
| Hera SpA | 1,624,677 | 3,679,633 |
|
| Iride SpA S | 1,879,597 | 3,317,531 |
|
| Merloni Electtrodomestici SpA † S | 278,683 | 3,279,212 |
|
| Milano Assicurazioni SpA | 1,313,610 | 3,497,506 |
|
| Recordati SpA | 1,070,466 | 8,032,851 |
|
| Saras SpA S | 1,035,054 | 2,376,653 |
|
| | | 45,669,026 |
| Japan (22.4%) | | |
| ADEKA Corp. | 504,100 | 4,691,545 |
|
| Aeon Delight Co., Ltd. | 181,700 | 2,486,464 |
|
| Aica Kogyo Co., Ltd. | 208,100 | 2,199,031 |
|
| Amano Corp. | 285,000 | 2,501,688 |
|
| ASKUL Corp. | 139,100 | 2,542,183 |
|
| Axell Corp. | 33,600 | 1,213,774 |
|
| Brother Industries, Ltd. | 273,300 | 3,112,532 |
|
| Canon Electronics, Inc. | 91,600 | 1,931,785 |
|
| Canon Sales Co., Inc. | 256,100 | 3,397,951 |
|
| Capcom Co., Ltd. | 264,000 | 4,501,013 |
|
| Central Glass Co., Ltd. | 816,000 | 3,746,658 |
|
| Chiyoda Integre Co., Ltd. | 281,600 | 3,571,497 |
|
| Circle K Sunkus Co., Ltd. | 181,700 | 2,279,940 |
|
| Daifuku Co., Ltd. | 963,500 | 7,134,628 |
|
| Daimei Telecom Engineering Corp. | 289,000 | 2,068,467 |
|
| Disco Corp. S | 50,900 | 2,801,047 |
|
| FCC Co., Ltd. | 279,600 | 5,585,078 |
|
| Hirose Electric Co., Ltd. | 31,700 | 3,371,202 |
|
| Hitachi Chemical Co., Ltd. | 297,600 | 6,095,341 |
|
| Ibiden Co., Ltd. | 138,800 | 4,675,089 |
|
| ITO EN, Ltd. | 178,700 | 2,741,032 |
|
| Itochu Techno-Solutions Corp. | 42,700 | 1,359,903 |
|
| Japan Aviation Electronics Industry, Ltd. | 737,000 | 5,192,010 |
|
| Japan Real Estate Investment Corp. R | 481 | 4,151,778 |
|
| JSR Corp. | 258,800 | 5,067,657 |
|
| JTEKT Corp. | 115,200 | 1,210,858 |
|
| Kaneka Corp. | 429,000 | 2,558,744 |
|
| Kansai Paint Co., Ltd. | 556,000 | 4,505,064 |
|
| Kansai Urban Banking Corp. S | 1,715,000 | 2,856,403 |
|
| Keihin Corp. | 213,400 | 3,729,577 |
|
| Kenedix, Inc. † S | 9,658 | 2,783,495 |
|
| Kobayashi Pharmaceutical Co., Ltd. | 108,100 | 4,409,886 |
|
| Komori Corp. | 442,400 | 4,948,746 |
|
| Kose Corp. | 171,600 | 3,727,076 |
|
| Kuroda Electric Co., Ltd. | 244,700 | 3,409,167 |
|
33
| | |
| COMMON STOCKS (99.3%)* cont. | Shares | Value |
|
| Japan cont. | | |
| Leopalace21 Corp. † | 575,800 | $2,773,378 |
|
| Makino Milling Machine Co., Ltd. † | 383,000 | 1,969,739 |
|
| Mandom Corp. | 114,400 | 3,205,672 |
|
| Maruichi Steel Tube, Ltd. S | 150,400 | 2,980,581 |
|
| Meitec Corp. | 166,400 | 3,044,862 |
|
| Musashino Bank, Ltd. (The) | 85,900 | 2,426,390 |
|
| Nifco, Inc. | 296,400 | 6,684,510 |
|
| Nihon Kohden Corp. | 224,000 | 3,877,020 |
|
| Nihon Parkerizing Co., Ltd. | 354,000 | 4,517,623 |
|
| Nippon Electric Glass Co., Ltd. | 374,000 | 4,857,034 |
|
| Nippon Konpo Unyu Soko Co. | 257,000 | 2,892,190 |
|
| Nippon Residential Investment Corp. R F | 1,353 | 3,145,733 |
|
| Nippon Thompson Co., Ltd. | 610,000 | 3,912,897 |
|
| Nishimatsuya Chain Co., Ltd. | 353,800 | 3,324,589 |
|
| Nissin Kogyo Co., Ltd. | 226,300 | 3,399,848 |
|
| Nitto Denko Corp. | 191,700 | 7,065,243 |
|
| NOK Corp. | 394,800 | 5,504,808 |
|
| NTT Urban Development Corp. | 3,093 | 2,464,375 |
|
| Okinawa Cellular Telephone Co. | 248 | 459,104 |
|
| Okinawa Electric Power Co., Inc. (The) | 66,900 | 3,696,590 |
|
| Onward Kashiyama Co., Ltd. S | 365,000 | 2,485,089 |
|
| Sankyo Co., Ltd. | 97,300 | 4,697,468 |
|
| Sanwa Holdings Corp. | 814,000 | 2,390,885 |
|
| Seikagaku Corp. | 189,300 | 2,034,453 |
|
| Shin-Etsu Polymer Co., Ltd. | 679,100 | 4,715,335 |
|
| Shinko Electric Industries | 138,900 | 2,013,315 |
|
| Sohgo Security Services Co., Ltd. | 322,700 | 3,675,134 |
|
| Stanley Eelctric Co., Ltd. | 198,600 | 3,647,481 |
|
| Sundrug Co., Ltd. S | 114,400 | 2,773,099 |
|
| Suruga Bank, Ltd. (The) | 440,000 | 4,035,562 |
|
| Taikisha, Ltd. | 220,000 | 3,708,755 |
|
| Tamron Co., Ltd. | 348,100 | 5,053,444 |
|
| Tanabe Seiyaku Co., Ltd. | 351,000 | 5,178,494 |
|
| Tokai Rika Co., Ltd. | 77,300 | 1,390,982 |
|
| Tokai Tokyo Securities Co., Ltd. | 661,000 | 2,544,024 |
|
| Tokyu Land Corp. | 1,069,000 | 3,861,681 |
|
| Toppan Forms Co., Ltd. | 239,800 | 2,596,079 |
|
| Toshiba Machine Co., Ltd. | 304,000 | 1,224,758 |
|
| Toyoda Gosei Co., Ltd. | 184,000 | 4,770,831 |
|
| Toyota Boshoku Corp. | 262,700 | 4,535,019 |
|
| Tsuruha Holdings, Inc. | 14,700 | 569,075 |
|
| Yamaha Corp. | 217,400 | 2,573,765 |
|
| Yamaha Motor Co., Ltd. | 200,000 | 2,658,114 |
|
| Yamato Kogyo Co., Ltd. | 172,900 | 5,461,741 |
|
| | | 273,355,078 |
34
| | |
| COMMON STOCKS (99.3%)* cont. | Shares | Value |
|
| Mexico (0.8%) | | |
| Cemex SAB de CV (Units) † | 3,884,296 | $3,725,790 |
|
| Grupo Financiero Banorte SA de CV | 1,701,600 | 6,366,368 |
|
| | | 10,092,158 |
| Netherlands (2.9%) | | |
| Aalberts Industries NV | 286,993 | 3,990,637 |
|
| Arcadis NV | 346,745 | 7,673,770 |
|
| Hunter Douglas NV | 163,266 | 7,396,538 |
|
| Koninklijke Boskalis Westminster NV | 161,349 | 5,193,583 |
|
| Mediq NV | 200,806 | 3,433,512 |
|
| Ordina NV † | 474,260 | 2,998,243 |
|
| SNS Reaal † | 371,660 | 1,892,040 |
|
| Vastned Offices (Industrial) NV R | 143,870 | 2,475,658 |
|
| | | 35,053,981 |
| New Zealand (0.2%) | | |
| Vector, Ltd. | 1,818,532 | 2,467,802 |
|
| | | 2,467,802 |
| Norway (2.7%) | | |
| DNO International ASA † S | 6,817,000 | 7,495,010 |
|
| Petroleum Geo-Services ASA † | 403,600 | 5,109,855 |
|
| Schibsted ASA † | 129,200 | 3,190,663 |
|
| Sparebank 1 SR Bank | 710,158 | 6,486,558 |
|
| TGS Nopec Geophysical Co. ASA † | 396,100 | 7,577,623 |
|
| Veidekke ASA | 372,200 | 2,952,669 |
|
| | | 32,812,378 |
| Poland (0.1%) | | |
| Grupa Lotos SA † | 93,048 | 877,842 |
|
| | | 877,842 |
| Portugal (0.2%) | | |
| Banco BPI SA | 1,119,799 | 2,955,555 |
|
| | | 2,955,555 |
| Russia (0.5%) | | |
| Oriflame Cosmetics SA SDR | 101,848 | 5,952,593 |
|
| | | 5,952,593 |
| Singapore (0.7%) | | |
| Great Eastern Holdings, Ltd. | 219,000 | 2,194,208 |
|
| Neptune Orient Lines, Ltd. S | 2,598,000 | 3,290,714 |
|
| Raffles Education Corp., Ltd. | 13,377,000 | 3,664,801 |
|
| | | 9,149,723 |
| South Africa (0.9%) | | |
| Aquarius Platinum, Ltd. † | 629,535 | 3,528,150 |
|
| Massmart Holdings, Ltd. | 368,111 | 4,381,500 |
|
| Telkom SA, Ltd. | 776,690 | 3,381,953 |
|
| | | 11,291,603 |
| South Korea (2.6%) | | |
| Busan Bank | 304,050 | 3,055,186 |
|
| Cheil Communications, Inc. | 15,152 | 3,959,855 |
|
| Daegu Bank | 433,710 | 5,536,405 |
|
| Halla Climate Control | 413,750 | 4,639,253 |
|
| LG Fashion Corp. | 252,420 | 6,291,994 |
|
| LG Home Shopping, Inc. | 47,556 | 2,998,399 |
|
| NHN Corp. † | 34,659 | 5,410,798 |
|
| | | 31,891,890 |
35
| | |
| COMMON STOCKS (99.3%)* cont. | Shares | Value |
|
| Spain (0.8%) | | |
| Fomento de Construcciones y Contratas SA S | 79,041 | $2,652,396 |
|
| Gestevision Telecinco SA S | 494,467 | 6,539,529 |
|
| | | 9,191,925 |
| Sweden (2.2%) | | |
| AF AB Class B | 84,060 | 2,314,759 |
|
| Cardo AB | 94,300 | 2,967,700 |
|
| Eniro AB † S | 1,497,600 | 5,197,005 |
|
| Meda AB Class A | 426,800 | 4,782,064 |
|
| Modern Times Group AB Class B | 87,794 | 4,828,997 |
|
| PA Resources AB † | 923,213 | 2,918,400 |
|
| Trelleborg AB Class B † | 612,000 | 3,955,210 |
|
| | | 26,964,135 |
| Switzerland (4.9%) | | |
| Adecco SA | 140,968 | 7,010,329 |
|
| Baloise Holding AG Class R | 55,778 | 4,799,671 |
|
| Banque Cantonale Vaudoise (BCV) | 25,004 | 11,142,125 |
|
| Bucher Industries AG | 50,146 | 5,930,846 |
|
| Forbo Holding AG † | 8,215 | 2,805,784 |
|
| George Fischer AG † | 24,088 | 7,290,557 |
|
| Helvetia Patria Holding | 6,884 | 2,186,109 |
|
| Logitech International SA † | 356,903 | 5,497,463 |
|
| Partners Group Holding AG | 77,482 | 9,798,897 |
|
| Sika AG | 2,102 | 2,944,131 |
|
| | | 59,405,912 |
| Taiwan (2.3%) | | |
| Coretronic Corporation | 2,732,000 | 3,735,755 |
|
| Greatek Electronics, Inc. | 3,313,389 | 3,187,541 |
|
| Kinsus Interconnect Technology Corp. | 1,585,000 | 3,632,827 |
|
| Lite-On Technology Corp. | 3,748,055 | 4,827,076 |
|
| Novatek Microelectronics Corp., Ltd. | 1,684,780 | 4,744,157 |
|
| Radiant Opto-Electronics Corp. | 3,275,890 | 4,009,564 |
|
| Vanguard International Semiconductor Corp. | 9,151,000 | 3,952,269 |
|
| | | 28,089,189 |
| United Arab Emirates (0.5%) | | |
| Dragon Oil PLC † | 809,114 | 5,588,096 |
|
| | | 5,588,096 |
| United Kingdom (15.4%) | | |
| Aegis Group PLC | 3,155,502 | 5,604,673 |
|
| Amdocs, Ltd. † S | 201,175 | 5,850,169 |
|
| Amlin PLC | 690,863 | 4,158,388 |
|
| Arriva PLC | 525,898 | 4,105,135 |
|
| Ashmore Group PLC | 1,560,887 | 5,592,362 |
|
| Ashtead Group PLC | 3,428,336 | 4,434,975 |
|
| Aveva Group PLC | 371,819 | 5,838,815 |
|
| Barratt Developments PLC † | 2,642,380 | 4,584,516 |
|
| Bellway PLC | 245,078 | 2,484,745 |
|
36
| | |
| COMMON STOCKS (99.3%)* cont. | Shares | Value |
|
| United Kingdom cont. | | |
| BlueBay Asset Management | 750,100 | $4,245,052 |
|
| Brit Insurance Holdings PLC | 117,959 | 1,384,770 |
|
| Close Brothers Group PLC | 324,213 | 3,334,021 |
|
| Dana Petroleum PLC † | 367,969 | 6,148,621 |
|
| Davis Service Group PLC | 937,346 | 5,802,056 |
|
| Debenhams PLC † | 709,557 | 678,823 |
|
| Greggs PLC | 250,790 | 1,588,300 |
|
| Halfords Group PLC | 877,769 | 6,076,978 |
|
| Hargreaves Lansdown, PLC | 1,150,533 | 5,639,440 |
|
| Hays PLC | 2,141,482 | 3,405,294 |
|
| Holidaybreak PLC | 499,327 | 1,918,410 |
|
| IMI PLC | 476,887 | 4,107,900 |
|
| Informa PLC | 502,560 | 2,570,611 |
|
| Interserve PLC | 841,641 | 2,567,615 |
|
| JKX Oil & Gas PLC | 1,427,568 | 5,469,470 |
|
| Kazakhmys PLC † | 290,663 | 5,942,572 |
|
| Keller Group PLC | 259,074 | 2,614,796 |
|
| Kier Group PLC | 154,621 | 2,362,066 |
|
| Lonmin PLC † | 111,073 | 3,060,008 |
|
| Man Group PLC | 507,844 | 1,739,760 |
|
| Meggitt Holdings PLC | 980,810 | 4,148,081 |
|
| Michael Page International PLC | 784,236 | 4,437,043 |
|
| Morgan Sindall PLC | 257,716 | 2,180,672 |
|
| Next PLC | 333,415 | 9,531,085 |
|
| Persimmon PLC † | 427,929 | 2,545,093 |
|
| Rathbone Brothers | 324,166 | 4,042,748 |
|
| Redrow PLC † | 1,936,696 | 3,956,600 |
|
| Savills PLC | 1,206,961 | 5,733,854 |
|
| Schroders PLC | 353,177 | 6,439,906 |
|
| Segro PLC R | 429,708 | 2,087,908 |
|
| SIG PLC † | 1,286,806 | 2,248,297 |
|
| Spectris PLC | 256,323 | 3,079,426 |
|
| Speedy Hire PLC | 5,693,221 | 2,321,869 |
|
| Taylor Wimpey PLC † | 6,398,238 | 3,472,692 |
|
| Tomkins PLC | 2,090,675 | 6,139,015 |
|
| Travis Perkins PLC † | 288,340 | 2,940,945 |
|
| United Business Media PLC | 493,117 | 3,287,648 |
|
| Vedanta Resources PLC | 149,672 | 5,814,279 |
|
| | | 187,717,502 |
| United States (0.2%) | | |
| Axis Capital Holdings, Ltd. | 62,562 | 1,967,575 |
|
| | | 1,967,575 |
| Total common stocks (cost $1,058,467,047) | | $1,210,789,157 |
37
| | |
| U.S. TREASURY OBLIGATIONS (—%)* i | Principal amount | Value |
|
| U.S. Treasury Inflation Protected Securities 1 3/4s, | | |
| January 15, 2028 | $72,179 | $68,536 |
|
| Total U.S. treasury obligations (cost $68,536) | | $68,536 |
| | | |
| | | | | |
| WARRANTS (—%)* † | | Expiration | Strike | | |
| | | date | price | Warrants | Value |
|
| Buru Energy, Ltd. | AUD | 10/13/10 | 0.94 | 100,901 | $814 |
|
| Total warrants (cost $—) | | | | | $814 |
|
| | |
| SHORT-TERM INVESTMENTS (5.3%)* | Principal amount/shares | Value |
|
| Putnam Money Market Liquidity Fund e | 9,042,831 | $9,042,831 |
|
| Short-term investments held as collateral for loaned securities | | |
| with yields ranging from 0.03% to 0.25% and due dates ranging from | | |
| March 1, 2010 to April 26, 2010 d | $51,937,096 | 51,936,291 |
|
| U.S. Treasury Bills, for effective yields ranging from 0.23% to 0.36%, | | |
| November 18, 2010 ## | 1,944,000 | 1,938,384 |
|
| U.S. Treasury Bills, for effective yields ranging from 0.18% to 0.22%, | | |
| August 26, 2010 ## | 449,000 | 448,566 |
|
| U.S. Treasury Bills, for effective yields ranging from 0.29% to 0.43%, | | |
| April 1, 2010 ## | 135,000 | 134,958 |
|
| U.S. Treasury Cash Management Bills, for effective yields ranging from | | |
| 0.38% to 0.40%, June 10, 2010 ## | 880,000 | 879,057 |
|
| Total short-term investments (cost $64,381,782) | | $64,380,087 |
|
| |
| TOTAL INVESTMENTS | | |
| Total investments (cost $1,122,917,365) | | $1,275,238,594 |
Key to holding’s currency abbreviations
AUD Australian Dollar
USD/$ United States Dollar
Key to holding’s abbreviations
ADR American Depository Receipts
SDR Swedish Depository Receipts
* Percentages indicated are based on net assets of $1,218,726,381.
† Non-income-producing security.
## These securities, in part or in entirety, were pledged and segregated with the custodian for collateral on certain derivative contracts at February 28, 2010.
d See Note 1 to the financial statements regarding securities lending.
e See Note 6 to the financial statements regarding investments in Putnam Money Market Liquidity Fund.
F Is valued at fair value following procedures approved by the Trustees. Securities may be classified as Level 2 or Level 3 for Accounting Standards Codification ASC 820 Fair Value Measurements and Disclosures (“ASC 820”) based on the securities valuation inputs.
i Securities purchased with cash or securities received, that were pledged to the fund for collateral on certain derivative contracts (Note 1).
R Real Estate Investment Trust.
S Securities on loan, in part or in entirety, at February 28, 2010.
At February 28, 2010, liquid assets totaling $6,239,436 have been segregated to cover certain derivativescontracts.
Debt obligations are considered secured unless otherwise indicated.
38
144A after the name of an issuer represents securities exempt from registration under Rule 144A under the Securities Act of 1933, as amended. These securities may be resold in transactions exempt from registration, normally to qualified institutional buyers.
ADR and SDR after the name of a foreign holding represents ownership of foreign securities on deposit with a custodian bank.
FORWARD CURRENCY CONTRACTS TO BUY at 2/28/10 (aggregate face value $273,422,514) (Unaudited)
| | | | | |
| | | | | | Unrealized |
| | | Aggregate | | Delivery | appreciation/ |
| | Value | face value | | date | (depreciation) |
|
| Australian Dollar | $23,511,293 | $23,319,015 | | 3/17/10 | $192,278 |
|
| British Pound | 38,423,821 | 40,214,369 | | 3/17/10 | (1,790,548) |
|
| Canadian Dollar | 46,916,475 | 46,662,640 | | 3/17/10 | 253,835 |
|
| Euro | 104,709,466 | 106,997,030 | | 3/17/10 | (2,287,564) |
|
| Norwegian Krone | 19,313,131 | 19,500,749 | | 3/17/10 | (187,618) |
|
| Singapore Dollar | 5,989,818 | 5,935,652 | | 3/17/10 | 54,166 |
|
| Swedish Krona | 12,203,087 | 12,016,012 | | 3/17/10 | 187,075 |
|
| Swiss Franc | 18,447,773 | 18,777,047 | | 3/17/10 | (329,274) |
|
| Total | | | | | $(3,907,650) |
| | | |
FORWARD CURRENCY CONTRACTS TO SELL at 2/28/10 (aggregate face value $214,808,843) (Unaudited)
| | | | | |
| | | | | | Unrealized |
| | | Aggregate | | Delivery | appreciation/ |
| | Value | face value | | date | (depreciation) |
|
| Australian Dollar | $14,410,528 | $14,282,247 | | 3/17/10 | $(128,281) |
|
| British Pound | 23,314,936 | 24,391,273 | | 3/17/10 | 1,076,337 |
|
| Danish Krone | 12,865,085 | 12,987,603 | | 3/17/10 | 122,518 |
|
| Euro | 64,556,113 | 65,958,935 | | 3/17/10 | 1,402,822 |
|
| Hong Kong Dollar | 3,438,156 | 3,434,969 | | 3/17/10 | (3,187) |
|
| Japanese Yen | 35,565,163 | 34,971,253 | | 3/17/10 | (593,910) |
|
| Norwegian Krone | 39,126,372 | 39,495,564 | | 3/17/10 | 369,192 |
|
| Swedish Krona | 19,588,859 | 19,286,999 | | 3/17/10 | (301,860) |
|
| Total | | | | | $1,943,631 |
39
ASC 820 establishes a three-level hierarchy for disclosure of fair value measurements. The valuation hierarchy is based upon the transparency of inputs to the valuation of the fund’s investments. The three levels are defined asfollows:
Level 1 — Valuations based on quoted prices for identical securities in active markets.
Level 2 — Valuations based on quoted prices in markets that are not active or for which all significant inputs are observable, either directly or indirectly.
Level 3 — Valuations based on inputs that are unobservable and significant to the fair value measurement.
The following is a summary of the inputs used to value the fund’s net assets as of February 28, 2010:
| | | |
| | | Valuation inputs | |
|
| Investments in securities: | Level 1 | Level 2 | Level 3 |
|
| Common stocks: | | | |
|
| Australia | $62,588,997 | $— | $— |
|
| Austria | 12,558,196 | — | — |
|
| Belgium | 12,552,751 | — | — |
|
| Bermuda | 14,791,852 | — | — |
|
| Canada | 68,115,300 | — | — |
|
| Cayman Islands | 2,058,570 | — | — |
|
| China | 31,019,368 | — | 5 |
|
| Denmark | 20,367,843 | — | — |
|
| Finland | 12,860,811 | — | — |
|
| France | 65,662,306 | — | — |
|
| Germany | 61,829,760 | — | — |
|
| Greece | 9,383,984 | — | — |
|
| Hong Kong | 13,783,735 | — | — |
|
| India | 12,242,617 | — | — |
|
| Indonesia | 3,080,944 | — | — |
|
| Ireland | 27,398,155 | — | — |
|
| Italy | 45,669,026 | — | — |
|
| Japan | 270,209,345 | — | 3,145,733 |
|
| Mexico | 10,092,158 | — | — |
|
| Netherlands | 35,053,981 | — | — |
|
| New Zealand | 2,467,802 | — | — |
|
| Norway | 32,812,378 | — | — |
|
| Poland | 877,842 | — | — |
|
| Portugal | 2,955,555 | — | — |
|
| Russia | 5,952,593 | — | — |
|
| Singapore | 9,149,723 | — | — |
|
| South Africa | 11,291,603 | — | — |
|
| South Korea | 31,891,890 | — | — |
|
| Spain | 9,191,925 | — | — |
|
| Sweden | 26,964,135 | — | — |
|
| Switzerland | 59,405,912 | — | — |
|
| Taiwan | 28,089,189 | — | — |
|
| United Arab Emirates | 5,588,096 | — | — |
|
| United Kingdom | 187,717,502 | — | — |
|
| United States | 1,967,575 | — | — |
|
| Total common stocks | 1,207,643,419 | — | 3,145,738 |
40
| | | |
| | | Valuation inputs | |
|
| Investments in securities: | Level 1 | Level 2 | Level 3 |
|
| Warrants | 814 | — | — |
|
| U.S. Treasury Obligations | — | 68,536 | — |
|
| Short-term investments | 9,042,831 | 55,337,256 | — |
|
| Totals by level | $1,216,687,064 | $55,405,792 | $3,145,738 |
| | Level 1 | Level 2 | Level 3 |
|
| Other financial instruments: | $— | $(1,964,019) | $(576,867) |
|
Other financial instruments include forward currency contracts and receivable purchase agreements.
The following is a reconciliation of Level 3 assets as of February 28, 2010:
| | | | | | | |
| | | | | Change in net | | Net trans- | |
| | Balance as | Accrued | Realized | unrealized | Net | fers in and/ | Balance as of |
| Investments | of Aug. 31, | discounts/ | gain/ | appreciation/ | purchases/ | or out | Feb. 28, |
| in securities: | 2009 | premiums | (loss) | (depreciation)† | sales | of Level 3 | 2010 |
|
| Common | | | | | | | |
| stocks: | | | | | | | |
| China | $— | $— | $— | $5 | $— | $— | $5 |
|
| Japan | — | — | — | (703,447) | 3,849,180 | — | 3,145,733 |
|
| Total | | | | | | | |
| common | | | | | | | |
| stocks | — | — | — | (703,442) | 3,849,180 | — | 3,145,738 |
|
| Totals: | $— | $— | $— | $(703,442) | $3,849,180 | $— | $3,145,738 |
|
† Includes $(703,442) related to Level 3 securities still held at period end. Total change in unrealized appreciation/ (depreciation) for securities (including Level 1 and Level 2) can be found in the Statement of operations.
| | | | | | | |
| | | | | Change in net | | Net transfers | |
| | Balance as | Accrued | Realized | unrealized | Net | in and/or | Balance as of |
| | of Aug. 31, | discounts/ | gain/ | appreciation/ | purchases/ | out | Feb. 28, |
| | 2009†† | premiums | (loss) | (depreciation)† | sales | of Level 3 | 2010†† |
|
| Other | | | | | | | |
| financial | | | | | | | |
| instruments | $(593,544) | $— | $— | $16,677 | $— | $— | $(576,867) |
|
† Includes $16,677 related to Level 3 securities still held at period end. Total change in unrealized appreciation/ (depreciation) for securities (including Level 1 and Level 2) can be found in the Statement of operations.
†† Includes amount payable under receivable purchase agreement.
The accompanying notes are an integral part of these financial statements.
41
Statement of assets and liabilities 2/28/10 (Unaudited)
| |
| ASSETS | |
|
| Investment in securities, at value, including $48,001,039 of securities on loan (Note 1): | |
| Unaffiliated issuers (identified cost $1,113,874,534) | $1,266,195,763 |
| Affiliated issuers (identified cost $9,042,831) (Note 6) | 9,042,831 |
|
| Cash | 8,076 |
|
| Foreign currency (cost $132,435) (Note 1) | 132,148 |
|
| Dividends, interest and other receivables receivables | 1,267,398 |
|
| Foreign Tax reclaim | 763,166 |
|
| Receivable for shares of the fund sold | 2,335,548 |
|
| Receivable for investments sold | 9,296,402 |
|
| Unrealized appreciation on forward currency contracts (Note 1) | 3,680,644 |
|
| Total assets | 1,292,721,976 |
|
| |
| LIABILITIES | |
|
| Payable for investments purchased | 9,577,446 |
|
| Payable for shares of the fund repurchased | 2,598,259 |
|
| Payable for compensation of Manager (Note 2) | 875,142 |
|
| Payable for investor servicing fees (Note 2) | 754,118 |
|
| Payable for custodian fees (Note 2) | 36,011 |
|
| Payable for Trustee compensation and expenses (Note 2) | 145,789 |
|
| Payable for administrative services (Note 2) | 18,448 |
|
| Payable for distribution fees (Note 2) | 535,957 |
|
| Unrealized depreciation on forward currency contracts (Note 1) | 5,644,663 |
|
| Payable for receivable purchase agreement (Note 2) | 576,867 |
|
| Interest payable (Note 2) | 19,586 |
|
| Collateral on securities loaned, at value (Note 1) | 51,936,291 |
|
| Collateral on certain derivative contracts, at value (Note 1) | 68,536 |
|
| Foreign tax payable (Note 1) | 810,269 |
|
| Other accrued expenses | 398,213 |
|
| Total liabilities | 73,995,595 |
| |
| Net assets | $1,218,726,381 |
|
| |
| REPRESENTED BY | |
|
| Paid-in capital (Unlimited shares authorized) (Notes 1 and 4) | $1,433,381,840 |
|
| Distributions in excess of net investment income (Note 1) | (3,759,387) |
|
| Accumulated net realized loss on investments and foreign currency transactions (Note 1) | (361,165,033) |
|
| Net unrealized appreciation of investments and assets and liabilities in foreign currencies | 150,268,961 |
|
| Total — Representing net assets applicable to capital shares outstanding | $1,218,726,381 |
| |
| (Continued on next page) | |
42
Statement of assets and liabilities (Continued)
| |
| COMPUTATION OF NET ASSET VALUE AND OFFERING PRICE | |
|
| Net asset value and redemption price per class A share | |
| ($883,348,757 divided by 30,095,185 shares) | $29.35 |
|
| Offering price per class A share (100/94.25 of $29.35)* | $31.14 |
|
| Net asset value and offering price per class B share ($60,716,776 divided by 2,087,950 shares)** | $29.08 |
|
| Net asset value and offering price per class C share ($62,922,927 divided by 2,158,697 shares)** | $29.15 |
|
| Net asset value and redemption price per class M share ($10,837,393 divided by 371,181 shares) | $29.20 |
|
| Offering price per class M share (100/96.50 of $29.20)*` | $30.26 |
|
| Net asset value, offering price and redemption price per class R share | |
| ($79,167,862 divided by 2,736,360 shares) | $28.93 |
|
| Net asset value, offering price and redemption price per class Y share | |
| ($121,732,666 divided by 4,144,186 shares) | $29.37 |
|
* On single retail sales of less than $50,000. On sales of $50,000 or more the offering price is reduced.
** Redemption price per share is equal to net asset value less any applicable contingent deferred sales charge.
The accompanying notes are an integral part of these financial statements.
43
Statement of operations Six months ended 2/28/10 (Unaudited)
| |
| INVESTMENT INCOME | |
|
| Dividends (net of foreign tax of $538,413) | $7,578,453 |
|
| Interest (including interest income of $15,947 from investments in affiliated issuers) (Note 6) | 20,553 |
|
| Securities lending | 331,664 |
|
| Total investment income | 7,930,670 |
|
| |
| EXPENSES | |
|
| Compensation of Manager (Note 2) | 5,796,907 |
|
| Investor servicing fees (Note 2) | 2,311,073 |
|
| Custodian fees (Note 2) | 113,346 |
|
| Trustee compensation and expenses (Note 2) | 41,383 |
|
| Administrative services (Note 2) | 33,824 |
|
| Distribution fees — Class A (Note 2) | 1,140,294 |
|
| Distribution fees — Class B (Note 2) | 342,489 |
|
| Distribution fees — Class C (Note 2) | 325,016 |
|
| Distribution fees — Class M (Note 2) | 42,623 |
|
| Distribution fees — Class R (Note 2) | 181,948 |
|
| Interest expense (Note 2) | 12,431 |
|
| Other | 517,232 |
|
| Total expenses | 10,858,566 |
| | |
| Expense reduction (Note 2) | (54,664) |
|
| Net expenses | 10,803,902 |
| |
| Net investment loss | (2,873,232) |
|
| |
| Net realized gain on investments (net of foreign tax of $17,992) (Notes 1 and 3) | 38,818,956 |
|
| Net realized gain on futures contracts (Note 1) | 1,328,192 |
|
| Net realized loss on foreign currency transactions (Note 1) | (924,790) |
|
| Net unrealized depreciation of assets and liabilities in foreign currencies during the period | (1,000,570) |
|
| Net unrealized depreciation of investments, futures and receivable purchase agreements | |
| (net of foreign tax of $810,269) during the period | (3,702,411) |
|
| Net gain on investments | 34,519,377 |
| |
| Net increase in net assets resulting from operations | $31,646,145 |
|
The accompanying notes are an integral part of these financial statements.
44
Statement of changes in net assets
| | | |
| INCREASE (DECREASE) IN NET ASSETS | Six months ended 2/28/10* | Year ended 8/31/09 |
|
| Operations: | | | |
| Net investment income (loss) | | $(2,873,232) | $16,431,077 |
|
| Net realized gain (loss) on investments | | | |
| and foreign currency transactions | | 39,222,358 | (415,162,760) |
|
| Net unrealized appreciation (depreciation) of investments | | | |
| and assets and liabilities in foreign currencies | | (4,702,981) | 145,500,544 |
|
| Net increase (decrease) in net assets resulting from operations | 31,646,145 | (253,231,139) |
|
| Distributions to shareholders (Note 1): | | | |
| From ordinary income | | | |
| Net investment income | | | |
|
| Class A | | (3,488,863) | (16,139,372) |
|
| Class B | | — | (125,275) |
|
| Class C | | — | (470,606) |
|
| Class M | | — | (108,371) |
|
| Class R | | (237,266) | (426,304) |
|
| Class Y | | (671,445) | (1,887,481) |
|
| Increase in capital from settlement payments | | — | 1,094,795 |
|
| Redemption fees (Note 1) | | 42,785 | 82,106 |
|
| Increase (decrease) from capital share transactions (Note 4) | 6,191,544 | (227,588,635) |
|
| Total increase (decrease) in net assets | | 33,482,900 | (498,800,282) |
|
| |
| NET ASSETS | | | |
|
| Beginning of period | | 1,185,243,481 | 1,684,043,763 |
|
| End of period (including distributions in excess of net investment | | |
| income of $3,759,387 and undistributed net investment | | | |
| income of $3,511,419, respectively) | | $1,218,726,381 | $1,185,243,481 |
|
| * Unaudited | | | |
The accompanying notes are an integral part of these financial statements.
45
Financial highlights (For a common share outstanding throughout the period)
| | | | | | | | | | | | | | | |
| INVESTMENT OPERATIONS: | LESS DISTRIBUTIONS: | RATIOS AND SUPPLEMENTAL DATA: | |
|
| | | | Net realized | | | | | | | | | | | Ratio ofnet | |
| | Net asset | Net | and | | | From net | | | | | | | Ratio | investment | |
| | value, | investment | unrealized | Total from | From net | realized | | | | Net asset | Total return | Net assets, | of expenses | income (loss) | |
| | beginning | income | gain (loss) on | investment | investment | gain on | Total | Redemption | Non-recurring | value, end | at net asset | end of period | to average net | to average | Portfolio |
| Period ended | of period | (loss) a | investments | operations | income | investments | distributions | fees b | reimbursements | of period | value (%) c | (in thousands) | assets (%) e | net assets (%) | turnover (%) |
|
| Class A | | | | | | | | | | | | | | | |
| February 28, 2010 ** | $28.69 | (.06) | .84 | .78 | (.12) | — | (.12) | — | — | $29.35 | 2.70 * | $883,349 | .83 *j | (.19) * | 15.42 * |
| August 31, 2009 | 32.09 | .39 | (3.35) | (2.96) | (.47) | — | (.47) | — | .03 f,g | 28.69 | (8.33) | 874,265 | 1.64 d,j | 1.78 d | 84.28 |
| August 31, 2008 | 41.54 | .63 | (8.27) | (7.64) | (1.50) | (.31) | (1.81) | — | — | 32.09 | (19.01) | 1,259,641 | 1.47 d | 1.68 d | 40.76 |
| August 31, 2007 | 33.00 | .45 | 8.83 | 9.28 | (.74) | — | (.74) | — | — | 41.54 | 28.43 | 1,432,999 | 1.49 d | 1.15 d | 37.17 |
| August 31, 2006 | 26.80 | .27 h | 6.33 | 6.60 | (.40) | — | (.40) | — | — | 33.00 | 24.88 h | 943,421 | 1.54 d,h | .89 d,h | 44.79 |
| August 31, 2005 | 20.47 | .18 i | 6.49 | 6.67 | (.34) | — | (.34) | — | — | 26.80 | 32.83 i | 744,751 | 1.60 d | .77 d,i | 63.85 |
|
| Class B | | | | | | | | | | | | | | | |
| February 28, 2010 ** | $28.42 | (.17) | .83 | .66 | — | — | — | — | — | $29.08 | 2.32 * | $60,717 | 1.20 *j | (.56) * | 15.42 * |
| August 31, 2009 | 31.30 | .22 | (3.10) | (2.88) | (.03) | — | (.03) | — | .03 f,g | 28.42 | (9.04) | 72,873 | 2.39 d,j | 1.04 d | 84.28 |
| August 31, 2008 | 40.45 | .27 | (7.99) | (7.72) | (1.12) | (.31) | (1.43) | — | — | 31.30 | (19.61) | 166,262 | 2.22 d | .74 d | 40.76 |
| August 31, 2007 | 32.15 | .13 | 8.64 | 8.77 | (.47) | — | (.47) | — | — | 40.45 | 27.45 | 416,584 | 2.24 d | .36 d | 37.17 |
| August 31, 2006 | 26.11 | .04 h | 6.19 | 6.23 | (.19) | — | (.19) | — | — | 32.15 | 23.98 h | 425,910 | 2.29 d,h | .13 d,h | 44.79 |
| August 31, 2005 | 19.96 | — b,i | 6.33 | 6.33 | (.18) | — | (.18) | — | — | 26.11 | 31.82 i | 432,291 | 2.35 d | .01 d,i | 63.85 |
|
| Class C | | | | | | | | | | | | | | | |
| February 28, 2010 ** | $28.48 | (.17) | .84 | .67 | — | — | — | — | — | $29.15 | 2.35 * | $62,923 | 1.20 *j | (.56) * | 15.42 * |
| August 31, 2009 | 31.61 | .22 | (3.20) | (2.98) | (.18) | — | (.18) | — | .03 f,g | 28.48 | (9.02) | 62,683 | 2.39 d,j | 1.02 d | 84.28 |
| August 31, 2008 | 40.96 | .33 | (8.14) | (7.81) | (1.23) | (.31) | (1.54) | — | — | 31.61 | (19.63) | 99,261 | 2.22 d | .89 d | 40.76 |
| August 31, 2007 | 32.57 | .15 | 8.74 | 8.89 | (.50) | — | (.50) | — | — | 40.96 | 27.48 | 128,552 | 2.24 d | .39 d | 37.17 |
| August 31, 2006 | 26.46 | .04 h | 6.27 | 6.31 | (.20) | — | (.20) | — | — | 32.57 | 23.95 h | 79,202 | 2.29 d,h | .13 d,h | 44.79 |
| August 31, 2005 | 20.22 | — b,i | 6.41 | 6.41 | (.17) | — | (.17) | — | — | 26.46 | 31.80 i | 71,006 | 2.35 d | .01 d,i | 63.85 |
|
| Class M | | | | | | | | | | | | | | | |
| February 28, 2010 ** | $28.50 | (.13) | .83 | .70 | — | — | — | — | — | $29.20 | 2.46 * | $10,837 | 1.08 *j | (.44) * | 15.42 * |
| August 31, 2009 | 31.66 | .28 | (3.23) | (2.95) | (.24) | — | (.24) | — | .03 f,g | 28.50 | (8.79) | 10,957 | 2.14 d,j | 1.28 d | 84.28 |
| August 31, 2008 | 40.97 | .40 | (8.12) | (7.72) | (1.28) | (.31) | (1.59) | — | — | 31.66 | (19.40) | 17,334 | 1.97 d | 1.08 d | 40.76 |
| August 31, 2007 | 32.57 | .24 | 8.73 | 8.97 | (.57) | — | (.57) | — | — | 40.97 | 27.77 | 28,812 | 1.99 d | .63 d | 37.17 |
| August 31, 2006 | 26.47 | .11 h | 6.27 | 6.38 | (.28) | — | (.28) | — | — | 32.57 | 24.26 h | 23,720 | 2.04 d,h | .38 d,h | 44.79 |
| August 31, 2005 | 20.23 | .06 i | 6.41 | 6.47 | (.23) | — | (.23) | — | — | 26.47 | 32.12 i | 20,121 | 2.10 d | .27 d,i | 63.85 |
|
| Class R | | | | | | | | | | | | | | | |
| February 28, 2010 ** | $28.29 | (.10) | .83 | .73 | (.09) | — | (.09) | — | — | $28.93 | 2.59 * | $79,168 | .95 *j | (.32) * | 15.42 * |
| August 31, 2009 | 31.72 | .31 | (3.31) | (3.00) | (.46) | — | (.46) | — | .03 f,g | 28.29 | (8.55) | 58,878 | 1.89 d,j | 1.42 d | 84.28 |
| August 31, 2008 | 41.17 | .58 | (8.23) | (7.65) | (1.49) | (.31) | (1.80) | — | — | 31.72 | (19.21) | 23,843 | 1.72 d | 1.59 d | 40.76 |
| August 31, 2007 | 32.78 | .42 | 8.70 | 9.12 | (.73) | — | (.73) | — | — | 41.17 | 28.10 | 8,008 | 1.74 d | 1.03 d | 37.17 |
| August 31, 2006 | 26.68 | .18 h | 6.32 | 6.50 | (.40) | — | (.40) | — | — | 32.78 | 24.61 h | 1,216 | 1.79 d,h | .59 d,h | 44.79 |
| August 31, 2005 | 20.45 | .13 i | 6.47 | 6.60 | (.37) | — | (.37) | — | — | 26.68 | 32.53 i | 304 | 1.85 d | .52 d,i | 63.85 |
|
| Class Y | | | | | | | | | | | | | | | |
| February 28, 2010 ** | $28.73 | (.02) | .84 | .82 | (.18) | — | (.18) | — | — | $29.37 | 2.84 * | $121,733 | .70 *j | (.07) * | 15.42 * |
| August 31, 2009 | 32.21 | .43 | (3.38) | (2.95) | (.56) | — | (.56) | — | .03 f,g | 28.73 | (8.11) | 105,588 | 1.39 d,j | 2.00 d | 84.28 |
| August 31, 2008 | 41.69 | .72 | (8.30) | (7.58) | (1.59) | (.31) | (1.90) | — | — | 32.21 | (18.82) | 117,703 | 1.22 d | 1.93 d | 40.76 |
| August 31, 2007 | 33.10 | .53 | 8.88 | 9.41 | (.82) | — | (.82) | — | — | 41.69 | 28.76 | 99,570 | 1.24 d | 1.36 d | 37.17 |
| August 31, 2006 | 26.88 | .35 h | 6.34 | 6.69 | (.47) | — | (.47) | — | — | 33.10 | 25.17 h | 78,458 | 1.29 d,h | 1.14 d,h | 44.79 |
| August 31, 2005 | 20.53 | .24 i | 6.51 | 6.75 | (.40) | — | (.40) | — | — | 26.88 | 33.13 i | 57,334 | 1.35 d | 1.01 d,i | 63.85 |
|
See notes to financial highlights at the end of this section.
The accompanying notes are an integral part of these financial statements.
Financial highlights (Continued)
*Not annualized.
**Unaudited.
a Per share net investment income (loss) has been determined on the basis of the weighted average number of shares outstanding during the period.
b Amount represents less than $0.01 per share.
c Total return assumes dividend reinvestment and does not reflect the effect of sales charges.
d Reflects an involuntary contractual expense limitation in effect during the period. Prior to February 28, 2010 certain fund expenses were waived in connection with investments in Putnam Prime Money Market Fund. As a result of such limitation and/or waivers, the expenses of each class reflect a reduction of the following amounts:
| |
| | Percentage of |
| | average net assets |
|
| August 31, 2009 | 0.07% |
|
| August 31, 2008 | <0.01 |
|
| August 31, 2007 | <0.01 |
|
| August 31, 2006 | <0.01 |
|
| August 31, 2005 | 0.01 |
|
e Includes amounts paid through expense offset and brokerage/service arrangements (Note 2).
f Reflects a non-recurring reimbursement pursuant to a settlement between the Securities and Exchange Commission (the “SEC”) and Bear, Stearns & Co., Inc. and Bear, Stearns Securities Corp., which amounted to $0.02 per share outstanding as of May 21, 2009.
g Reflects a non-recurring reimbursement pursuant to a settlement between the SEC and Millennium Partners, L.P., Millennium Management, L.L.C., and Millennium International Management, L.L.C., which amounted to $0.01 per share outstanding as of June 23, 2009.
h Reflects a non-recurring reimbursement from Putnam Investments relating to the calculation of certain amounts paid by the fund to Putnam in previous years for transfer agent services, which amounted to $0.01 per share and 0.02% of average net assets for the period ended August 31, 2006.
i Reflects a non-recurring accrual related to Putnam Management’s settlement with the SEC regarding brokerage allocation practices, which amounted to the following amounts:
| | |
| | | Percentage of |
| | Per share | average net assets |
|
| Class A | $0.01 | 0.02% |
|
| Class B | 0.01 | 0.02 |
|
| Class C | 0.01 | 0.02 |
|
| Class M | 0.01 | 0.02 |
|
| Class R | 0.01 | 0.03 |
|
| Class Y | 0.01 | 0.02 |
|
j Includes interest accrued in connection with certain terminated derivatives contracts, which amounted to less than 0.01% of average net assets as of February 28, 2010 and August 31, 2009 (Note 2).
The accompanying notes are an integral part of these financial statements.
48
Notes to financial statements 2/28/10 (Unaudited)
Note 1: Significant accounting policies
Putnam International Capital Opportunities Fund (the “fund”) is a diversified series of Putnam Investment Funds (the “trust”), which is a Massachusetts business trust registered under the Investment Company Act of 1940, as amended, as an open-end management investment company. The investment objective of the fund is to seek long-term capital appreciation by investing primarily in equity securities of small-and mid-capitalization companies whose principal place of business is located outside of the United States or whose securities are principally traded on foreign markets that Putnam Investment Management, LLC (“Putnam Management”), the fund’s manager, an indirect wholly-owned subsidiary of Putnam Investments, LLC, believes have favorable investment potential.
The fund offers class A, class B, class C, class M, class R and class Y shares. Class A and class M shares are sold with a maximum front-end sales charge of 5.75% and 3.50%, respectively, and generally do not pay a contingent deferred sales charge. Class B shares, which convert to class A shares after approximately eight years, do not pay a front-end sales charge and are subject to a contingent deferred sales charge if those shares are redeemed within six years of purchase. Class C shares have a one-year 1.00% contingent deferred sales charge and do not convert to class A shares. Class R shares, which are offered to qualified employee-benefit plans, are sold at net asset value. The expenses for class A, class B, class C, class M and class R shares may differ based on the distribution fee of each class, which is identified in Note 2. ClassY shares, which are sold at net asset value, are generally subject to the same expenses as class A, class B, class C , class M and class R shares, but do not bear a distribution fee. Class Y shares are generally only available to corporate and institutional clients and clients in other approved programs.
A 1.00% redemption fee may apply on any shares that are redeemed (either by selling or exchanging into another fund) within 90 days of purchase. The redemption fee is accounted for as an addition to paid-in-capital.
Investment income, realized and unrealized gains and losses and expenses of the fund are borne pro-rata based on the relative net assets of each class to the total net assets of the fund, except that each class bears expenses unique to that class (including the distribution fees applicable to such classes). Each class votes as a class only with respect to its own distribution plan or other matters on which a class vote is required by law or determined by the Trustees. If the fund were liquidated, shares of each class would receive their pro-rata share of the net assets of the fund. In addition, the Trustees declare separate dividends on each class of shares.
In the normal course of business, the fund enters into contracts that may include agreements to indemnify another party under given circumstances. The fund’s maximum exposure under these arrangements is unknown as this would involve future claims that may be, but have not yet been, made against the fund. However, the fund’s management team expects the risk of material loss to be remote.
The following is a summary of significant accounting policies consistently followed by the fund in the preparation of its financial statements. The preparation of financial statements is in conformity with accounting principles generally accepted in the United States of America and requires management to make estimates and assumptions that affect the reported amounts of assets and liabilities in the financial statements and the reported amounts of increases and decreases in net assets from operations during the reporting period. Actual results could differ from those estimates. Subsequent events after the Statement of assets and liabilities date through the date that the financial statements were issued, April 14, 2010, have been evaluated in the preparation of the financial statements.
A) Security valuation Investments for which market quotations are readily available are valued at the last reported sales price on their principal exchange, or official closing price for certain markets. If no sales are reported — as in the case of some securities traded over-the-counter — a security is valued at its last reported bid price. Many securities markets and exchanges outside the U.S. close prior to the close of the New York Stock Exchange and therefore the closing prices for securities in such markets or on such exchanges may not fully reflect events that occur after such close but before the close of the New York Stock Exchange. Accordingly, on certain days, the fund will fair value foreign equity securities taking into account multiple factors, including movements in the U.S. securities markets. The number of days on which fair value prices will be used will depend on market activity an d it is possible that fair value prices will be used by the fund to a significant extent. Securities quoted in foreign currencies, if any, are translated into U.S. dollars at the current exchange rate. To the extent a pricing service or dealer is unable to value a security or provides a valuation that Putnam Management does not believe accurately reflects the security’s fair value, the security will be valued at fair value by Putnam Management. Certain
49
investments, including certain restricted and illiquid securities and derivatives, are also valued at fair value following procedures approved by the Trustees. Such valuations and procedures are reviewed periodically by the Trustees. The fair value of securities is generally determined as the amount that the fund could reasonably expect to realize from an orderly disposition of such securities over a reasonable period of time. By its nature, a fair value price is a good faith estimate of the value of a security in a current sale and does not reflect an actual market price, which may be different by a material amount.
B) Joint trading account Pursuant to an exemptive order from the Securities and Exchange Commission (the “SEC”), the fund may transfer uninvested cash balances, including cash collateral received under security lending arrangements, into a joint trading account along with the cash of other registered investment companies and certain other accounts managed by Putnam Management. These balances may be invested in issues of short-term investments having maturities of up to 397 days for collateral received under security lending arrangements and up to 90 days for other cash investments.
C) Security transactions and related investment income Security transactions are recorded on the trade date (the date the order to buy or sell is executed). Gains or losses on securities sold are determined on the identified cost basis. Interest income is recorded on the accrual basis. Dividend income, net of applicable withholding taxes, is recognized on the ex-dividend date except that certain dividends from foreign securities, if any, are recognized as soon as the fund is informed of the ex-dividend date. Non-cash dividends, if any, are recorded at the fair market value of the securities received. Dividends representing a return of capital or capital gains, if any, are reflected as a reduction of cost and/or as a realized gain.
D) Foreign currency translation The accounting records of the fund are maintained in U.S. dollars. The market value of foreign securities, currency holdings, and other assets and liabilities is recorded in the books and records of the fund after translation to U.S. dollars based on the exchange rates on that day. The cost of each security is determined using historical exchange rates. Income and withholding taxes are translated at prevailing exchange rates when earned or incurred. The fund does not isolate that portion of realized or unrealized gains or losses resulting from changes in the foreign exchange rate on investments from fluctuations arising from changes in the market prices of the securities. Such gains and losses are included with the net realized and unrealized gain or loss on investments. Net realized gains and losses on foreign currency transactions represent net realized exchange gains or losses on closed forward currency contracts, disposition of foreign currencies, currency gains and losses realized between the trade and settlement dates on securities transactions and the difference between the amount of investment income and foreign withholding taxes recorded on the fund’s books and the U.S. dollar equivalent amounts actually received or paid. Net unrealized appreciation and depreciation of assets and liabilities in foreign currencies arise from changes in the value of open forward currency contracts and assets and liabilities other than investments at the period end, resulting from changes in the exchange rate. Investments in foreign securities involve certain risks, including those related to economic instability, unfavorable political developments, and currency fluctuations, not present with domestic investments.
The fund may be subject to taxes imposed by governments of countries in which it invests. Such taxes are generally based on either income or gains earned or repatriated. The fund accrues and applies such taxes to net investment income, net realized gains and net unrealized gains as income and/or capital gains are earned.
E) Futures and options contracts The fund may use futures and options contracts to hedge against changes in the values of securities the fund owns, owned or expects to purchase, or for other investment purposes. The fund may also write options on swaps or securities it owns or in which it may invest to increase its current returns.
The potential risk to the fund is that the change in value of futures and options contracts may not correspond to the change in value of the hedged instruments. In addition, losses may arise from changes in the value of the underlying instruments, if there is an illiquid secondary market for the contracts, if interest or exchange rates move unexpectedly or if the counterparty to the contract is unable to perform. With futures, there is minimal counterparty credit risk to the fund since futures are exchange traded and the exchange’s clearinghouse, as counterparty to all exchange traded futures, guarantees the futures against default. Risks may exceed amounts recognized on the Statement of assets and liabilities. When the contract is closed, the fund records a realized gain or loss equal to the difference between the value of the contract at the time it was opened and the value at the time it was closed. Realized gains and losses on purchased option s are included in realized gains and losses on investment securities. If a written call option is exercised, the premium originally received is recorded as an addition to sales proceeds. If a written put option is exercised, the premium originally received is recorded as a reduction to the cost of investments.
50
Futures contracts are valued at the quoted daily settlement prices established by the exchange on which they trade. The fund and the broker agree to exchange an amount of cash equal to the daily fluctuation in the value of the futures contract. Such receipts or payments are known as “variation margin.” Exchange traded options are valued at the last sale price or, if no sales are reported, the last bid price for purchased options and the last ask price for written options. Options traded over-the-counter are valued using prices supplied by dealers. Futures and written option contracts outstanding at period end, if any, are listed after the fund’s portfolio. For the six months ended February 28, 2009 the transaction volume of futures contracts was minimal, the fund did not have any activity on purchased or written options contracts.
F) Forward currency contracts The fund may buy and sell forward currency contracts, which are agreements between two parties to buy and sell currencies at a set price on a future date. These contracts are used to protect against a decline in value relative to the U.S. dollar of the currencies in which its portfolio securities are denominated or quoted (or an increase in the value of a currency in which securities a fund intends to buy are denominated, when a fund holds cash reserves and short term investments), or for other investment purposes. The U.S. dollar value of forward currency contracts is determined using current forward currency exchange rates supplied by a quotation service. The market value of the contract will fluctuate with changes in currency exchange rates. The contract is marked to market daily and the change in market value is recorded as an unrealized gain or loss. When the contract is clos ed, the fund records a realized gain or loss equal to the difference between the value of the contract at the time it was opened and the value at the time it was closed. The fund could be exposed to risk if the value of the currency changes unfavorably, if the counterparties to the contracts are unable to meet the terms of their contracts or if the fund is unable to enter into a closing position. Risks may exceed amounts recognized on the Statement of assets and liabilities. Forward currency contracts outstanding at period end, if any, are listed after the fund’s portfolio. Outstanding contracts at period end are indicative of the volume of activity during the period.
G) Master agreements The fund is a party to ISDA (International Swap and Derivatives Association, Inc.) Master Agreements (“Master Agreements”) with certain counterparties that govern over-the-counter derivative and foreign exchange contracts entered into from time to time. The Master Agreements may contain provisions regarding, among other things, the parties’ general obligations, representations, agreements, collateral requirements, events of default and early termination. With respect to certain counterparties, in accordance with the terms of the Master Agreements, collateral posted to the fund is held in a segregated account by the fund’s custodian and with respect to those amounts which can be sold or repledged, are presented in the fund’s portfolio. Collateral posted to the fund which can not be sold or repledged totaled $785,058 at February 28 , 2010. Collateral pledged by the fund is segregated by the fund’s custodian and identified in the fund’s portfolio. Collateral can be in the form of cash or debt securities issued by the U.S. Government or related agencies or other securities as agreed to by the fund and the applicable counterparty. Collateral requirements are determined based on the fund’s net position with each counterparty. Termination events applicable to the fund may occur upon a decline in the fund’s net assets below a specified threshold over a certain period of time. Termination events applicable to counterparties may occur upon a decline in the counterparty’s long-term and short-term credit ratings below a specified level. In each case, upon occurrence, the other party may elect to terminate early and cause settlement of all derivative and foreign exchange contracts outstanding, including the payment of any losses and costs resulting from such early termination, as reasonably determined by the terminating p arty. Any decision by one or more of the fund’s counterparties to elect early termination could impact the fund’s future derivative activity.
At February 28, 2010, the fund had a net liability position of $2,934,779 on derivative contracts subject to the Master Agreements. Collateral posted by the fund totaled $2,737,984.
H) Securities lending The fund may lend securities, through its agents, to qualified borrowers in order to earn additional income. The loans are collateralized by cash and/or securities in an amount at least equal to the market value of the securities loaned. The market value of securities loaned is determined daily and any additional required collateral is allocated to the fund on the next business day. The risk of borrower default will be borne by the fund’s agents; the fund will bear the risk of loss with respect to the investment of the cash collateral. Income from securities lending is included in investment income on the Statement of operations. At February 28, 2010, the value of securities loaned amounted to $48,637,702 which includes an amount for a security that is deemed worthless at period end. The fund received cash collateral of $51,936,291 which is pooled with collateral of other Putnam fund s into 45issues of short-term investments.
I) Federal taxes It is the policy of the fund to distribute all of its taxable income within the prescribed time and otherwise comply with the provisions of the Internal Revenue Code of 1986, as amended (the “Code”),
51
applicable to regulated investment companies. It is also the intention of the fund to distribute an amount sufficient to avoid imposition of any excise tax under Section 4982 of the Code. The fund is subject to the provisions of Accounting Standards Codification ASC740 Income Taxes (“ASC 740”). ASC 740 sets forth a minimum threshold for financial statement recognition of the benefit of a tax position taken or expected to be taken in a tax return. The fund did not have any unrecognized tax benefits in the accompanying finan-cial statements. No provision has been made for federal taxes on income, capital gains or unrealized appreciation on securities held nor for excise tax on income and capital gains. Each of the fund’s federal tax returns for the prior three fiscal years remains subject to examination by the Internal Revenue Service and state departments of re venue.
At August 31, 2009, the fund had a capital loss carryover of $237,568,171 available to the extent allowed by the Code to offset future net capital gain, if any. The amounts of the carryovers and the expiration dates are:
| | | |
| Loss Carryover | Expiration | | |
| | |
| $10,367,419 | August 31, 2016 | | |
| | |
| 227,200,752 | August 31, 2017 | | |
| | |
Pursuant to federal income tax regulations applicable to regulated investment companies, the fund has elected to defer to its fiscal year ending August 31, 2010 $150,068,141 of losses recognized during the period November 1, 2008 to August 31, 2009.
The aggregate identified cost on a tax basis is $1,135,379,757, resulting in gross unrealized appreciation and depreciation of $251,558,041 and $111,699,204, respectively, or net unrealized appreciation of $139,858,837.
J) Distributions to shareholders Distributions to shareholders from net investment income are recorded by the fund on the ex-dividend date. Distributions from capital gains, if any, are recorded on the ex-dividend date and paid at least annually. The amount and character of income and gains to be distributed are determined in accordance with income tax regulations, which may differ from generally accepted accounting principles. Dividend sources are estimated at the time of declaration. Actual results may vary. Any non-taxable return of capital cannot be determined until final tax calculations are completed after the end of the fund’s fiscal year. Reclassifications are made to the fund’s capital accounts to reflect income and gains available for distribution (or available capital loss carryovers) under income tax regulations.
K) Expenses of the trust Expenses directly charged or attributable to any fund will be paid from the assets of that fund. Generally, expenses of the trust will be allocated among and charged to the assets of each fund on a basis that the Trustees deem fair and equitable, which may be based on the relative assets of each fund or the nature of the services performed and relative applicability to each fund.
Note 2: Management fee, administrative
services and other transactions
Effective January 1, 2010, the fund pays Putnam Management a management fee (“base fee”) (based on the fund’s average net assets and computed and paid monthly) at annual rates that may vary based on the average of the aggregate net assets of most open-end funds, as defined in the fund’s management contract, sponsored by Putnam Management. Such annual rates may vary as follows: 1.08% of the first $5 billion of average net assets, 1.03% of the next $5 billion, 0.98% of the next $10 billion, 0.93% of the next $10 billion, 0.88% of the next $50 billion, 0.86% of the next $50 billion, 0.85% of the next $100 billion, and 0.845% thereafter.
In addition, beginning with the fund’s thirteenth complete calendar month of operation under the new management contract, the monthly management fee will consist of the monthly base fee plus or minus a performance adjustment for the month. The performance adjustment will be determined based on performance over the thirty-six month period then ended or, if the new management contract has not yet been effective for thirty-six complete calendar months, the period from the date the new management contract became effective to the end of the month for which the fee adjustment is being computed. Each month, the performance adjustment will be calculated by multiplying the performance adjustment rate and the fund’s average net assets over the performance period and the result will be divided by twelve. The resulting dollar amount will be added to, or subtracted from, the base fee for that month. The performance adjustment rate is equal to 0.03 multipl ied by the difference between the fund’s annualized performance (measured by the fund’s class A shares) and the annualized performance of the S&P Developed Ex-U.S. SmallCap Index, each measured over the performance period. The maximum annualized performance adjustment rates are +/–0.21%. The monthly base fee is determined based on the fund’s average net assets for the month, while the performance adjustment will be determined based on the fund’s average net assets over the performance period of up to thirty-six months. This means it is
52
possible that, if the fund underperforms significantly over the performance period, and the fund’s assets have declined significantly over that period, the negative performance adjustment may exceed the base fee. In this event, Putnam Management would make a payment to the fund.
Prior to January 1, 2010, the fund paid Putnam Management for management and investment advisory services quarterly based on the average net assets of the fund. Such fee was based on the following annual rates: 1.00% of the first $500 million of average net assets, 0.90% of the next $500 million, 0.85% of the next $500 million, 0.80% of the next $5 billion, 0.775% of the next $5 billion, 0.755% of the next $5 billion, 0.74% of the next $5 billion and 0.73% thereafter.
Effective August 1, 2009 through July 31, 2010, Putnam Management has contractually agreed to reimburse the fund’s expenses to the extent necessary to limit the cumulative expenses of the fund, exclusive of brokerage, interest, taxes, investment-related expenses, extraordinary expenses and payments under the fund’s investor servicing contract, investment management contract and distribution plans, on a fiscal year-to-date basis (or from August 1, 2009 through the fund’s next fiscal year end, as applicable), to an annual rate of 0.20% of the fund’s average net assets over such fiscal year-to-date period (or since August 1, 2009, as applicable). During the period ended February 28, 2010, the fund’s expenses were not reduced as a result of this limit.
Putnam Investments Limited (“PIL”), an affiliate of Putnam Management, is authorized by the Trustees to manage a separate portion of the assets of the fund as determined by Putnam Management from time to time. Putnam Management pays a quarterly sub-management fee to PIL for its services at an annual rate of 0.35% of the average net assets of the portion of the fund managed by PIL.
On September 15, 2008, the fund terminated its outstanding derivatives contracts with Lehman Brothers Special Financing, Inc. (“LBSF”) in connection with the bankruptcy filing of LBSF’s parent company, Lehman Brothers Holdings, Inc. On September 26, 2008, the fund entered into a receivable purchase agreement (“Agreement”) with another registered investment company (the “Seller”) managed by Putnam Management. Under the Agreement, the Seller sold to the fund the right to receive, in the aggregate, $2,376,079 in net payments from LBSF in connection with certain terminated derivatives transactions (the “Receivable”), in exchange for an initial payment plus (or minus) additional amounts based on the fund’s ultimate realized gain (or loss) with respect to the Receivable. The Receivable will be offset against the fund’s net payable to LBSF and is included in the Stateme nt of assets and liabilities in Payable for investments purchased. Future payments under the Agreement are valued at fair value following procedures approved by the Trustees and are included in the Statement of assets and liabilities. All remaining payments under the Agreement will be recorded as realized gain or loss. The fund’s net payable to LBSF was calculated in accordance with the fund’s master contract with LBSF. The fund has accrued interest on the net payable, which is included in the Statement of operations in Interest expense. Putnam Management currently is in discussions with LBSF regarding resolution of amounts payable to LBSF. Amounts recorded are estimates and final payments may differ from these estimates by a material amount.
The fund reimburses Putnam Management an allocated amount for the compensation and related expenses of certain officers of the fund and their staff who provide administrative services to the fund. The aggregate amount of all such reimbursements is determined annually by the Trustees.
Custodial functions for the fund’s assets are provided by State Street Bank and Trust Company (“State Street”). Custody fees are based on the fund’s asset level, the number of its security holdings and transaction volumes.
Putnam Investor Services, Inc., an affiliate of Putnam Management, provided investor servicing agent functions to the fund. Putnam Investor Services, Inc. received fees for investor servicing, subject to certain limitations, based on the fund’s retail asset level, the number of shareholder accounts in the fund and the level of defined contribution plan assets in the fund. The amounts incurred for investor servicing agent functions during the six months ended February 28, 2010 are included in Investor servicing fees in the Statement of operations.
The fund has entered into expense offset arrangements with Putnam Investor Services, Inc. and State Street whereby Putnam Investor Services, Inc.’s and State Street’s fees are reduced by credits allowed on cash balances. The fund also reduced expenses through brokerage/service arrangements. For the six months ended February 28, 2010, the fund’s expenses were reduced by $851 under the expense offset arrangements and by $53,813 under the brokerage/service arrangements.
53
Each independent Trustee of the fund receives an annual Trustee fee, of which $911, as a quarterly retainer, has been allocated to the fund, and an additional fee for each Trustees meeting attended. Trustees receive additional fees for attendance at certain committee meetings and industry seminars and for certain compliance-related matters. Trustees also are reimbursed for expenses they incur relating to their services asTrustees.
The fund has adopted a Trustee Fee Deferral Plan (the “Deferral Plan”) which allows the Trustees to defer the receipt of all or a portion of Trustees fees payable on or after July 1, 1995. The deferred fees remain invested in certain Putnam funds until distribution in accordance with the Deferral Plan.
The fund has adopted an unfunded noncontributory defined benefit pension plan (the “Pension Plan”) covering all Trustees of the fund who have served as a Trustee for at least five years and were first elected prior to 2004. Benefits under the Pension Plan are equal to 50% of the Trustee’s average annual attendance and retainer fees for the three years ended December 31, 2005. The retirement benefit is payable during a Trustee’s lifetime, beginning the year following retirement, for the number of years of service through December 31, 2006. Pension expense for the fund is included in Trustee compensation and expenses in the Statement of operations. Accrued pension liability is included in Payable for Trustee compensation and expenses in the Statement of assets and liabilities. The Trustees have terminated the Pension Plan with respect to any Trustee first elected after 2003.
The fund has adopted distribution plans (the “Plans”) with respect to its class A, class B, class C, class M and class R shares pursuant to Rule 12b-1 under the Investment Company Act of 1940. The purpose of the Plans is to compensate Putnam Retail Management Limited Partnership, a wholly-owned subsidiary of Putnam Investments, LLC and Putnam Retail Management GP, Inc., for services provided and expenses incurred in distributing shares of the fund. The Plans provide for payments by the fund to Putnam Retail Management Limited Partnership at an annual rate of up to 0.35%, 1.00%, 1.00%, 1.00% and 1.00% of the average net assets attributable to class A, class B, class C, class M and class R shares, respectively. The Trustees have approved payment by the fund at an annual rate of 0.25%, 1.00%, 1.00%, 0.75% and 0.50% of the average net assets attributable to class A, class B, class C, class M and class R shares, respectively.
For the six months ended February 28, 2010, Putnam Retail Management Limited Partnership, acting as underwriter, received net commissions of $44,066 and $1,411 from the sale of class A and class M shares, respectively, and received $23,806 and $2,016 in contingent deferred sales charges from redemptions of class B and class C shares, respectively.
A deferred sales charge of up to 1.00% and 0.65% is assessed on certain redemptions of class A and classM shares, respectively. For the six months ended February 28, 2010, Putnam Retail Management Limited Partnership, acting as underwriter, received $10 and no monies on class A and class M redemptions,respectively.
Note 3: Purchases and sales of securities
During the six months ended February 28, 2010, cost of purchases and proceeds from sales of investment securities other than short-term investments aggregated $200,198,522 and $187,141,773, respectively. There were no purchases or sales of U.S. government securities.
Note 4: Capital shares
At February 28, 2009, there was an unlimited number of shares of beneficial interest authorized. Transactions in capital shares were as follows:
| | | | |
| | Six months ended 2/28/10 | Year ended 8/31/09 |
|
| Class A | Shares | Amount | Shares | Amount |
|
| Shares sold | 3,100,712 | $93,615,213 | 6,950,193 | $149,032,571 |
|
| Shares issued in connection with | | | | |
| reinvestment of distributions | 108,654 | 3,236,698 | 799,709 | 14,722,639 |
|
| | 3,209,366 | 96,851,911 | 7,749,902 | 163,755,210 |
|
| Shares repurchased | (3,591,986) | (108,498,441) | (16,523,435) | (343,979,419) |
|
| Net decrease | (382,620) | $(11,646,530) | (8,773,533) | $(180,224,209) |
|
54
| | | | |
| | Six months ended 2/28/10 | Year ended 8/31/09 |
|
| Class B | Shares | Amount | Shares | Amount |
|
| Shares sold | 86,876 | $2,621,061 | 269,839 | $5,969,911 |
|
| Shares issued in connection with | | | | |
| reinvestment of distributions | — | — | 6,298 | 115,446 |
|
| | 86,876 | 2,621,061 | 276,137 | 6,085,357 |
|
| Shares repurchased | (563,380) | (16,926,955) | (3,024,237) | (63,252,598) |
|
| Net decrease | (476,504) | $(14,305,894) | (2,748,100) | $(57,167,241) |
|
| |
| | Six months ended 2/28/10 | Year ended 8/31/09 |
|
| Class C | Shares | Amount | Shares | Amount |
|
| Shares sold | 188,241 | $5,682,465 | 210,128 | $4,806,262 |
|
| Shares issued in connection with | | | | |
| reinvestment of distributions | — | — | 20,666 | 379,640 |
|
| | 188,241 | 5,682,465 | 230,794 | 5,185,902 |
|
| Shares repurchased | (230,258) | (6,888,738) | (1,170,045) | (24,064,164) |
|
| Net decrease | (42,017) | $(1,206,273) | (939,251) | $(18,878,262) |
|
| |
| | Six months ended 2/28/10 | Year ended 8/31/09 |
|
| Class M | Shares | Amount | Shares | Amount |
|
| Shares sold | 23,737 | $710,196 | 40,140 | $832,739 |
|
| Shares issued in connection with | | | | |
| reinvestment of distributions | — | — | 5,593 | 102,633 |
|
| | 23,737 | 710,196 | 45,733 | 935,372 |
|
| Shares repurchased | (37,062) | (1,114,310) | (208,772) | (4,348,218) |
|
| Net decrease | (13,325) | $(404,114) | (163,039) | $(3,412,846) |
|
| |
| | Six months ended 2/28/10 | Year ended 8/31/09 |
|
| Class R | Shares | Amount | Shares | Amount |
|
| Shares sold | 1,564,566 | $46,856,525 | 2,171,277 | $49,049,161 |
|
| Shares issued in connection with | | | | |
| reinvestment of distributions | 7,724 | 226,935 | 21,506 | 391,187 |
|
| | 1,572,290 | 47,083,460 | 2,192,783 | 49,440,348 |
|
| Shares repurchased | (916,930) | (27,341,829) | (863,362) | (18,857,770) |
|
| Net increase | 655,360 | $19,741,631 | 1,329,421 | $30,582,578 |
|
| |
| | Six months ended 2/28/10 | Year ended 8/31/09 |
|
| Class Y | Shares | Amount | Shares | Amount |
|
| Shares sold | 1,195,226 | $36,396,938 | 1,977,382 | $42,166,171 |
|
| Shares issued in connection with | | | | |
| reinvestment of distributions | 17,496 | 521,192 | 97,860 | 1,801,594 |
|
| | 1,212,722 | 36,918,130 | 2,075,242 | 43,967,765 |
|
| Shares repurchased | (743,735) | (22,905,406) | (2,054,165) | (42,456,420) |
|
| Net increase | 468,987 | $14,012,724 | 21,077 | $1,511,345 |
|
55
Note 5: Summary of derivative activity
The following is a summary of the market values of derivative instruments as of February 28, 2010:
Market values of derivative instruments as of February 28, 2010
| | | | |
| | Asset derivatives | Liability derivatives |
|
| Derivatives not | | | | |
| accounted for as | Statement of | | Statement of | |
| hedging instruments | assets and | | assets and | |
| under ASC 815 | liabilities location | Market value | liabilities location | Market value |
|
| Foreign exchange | | | | |
| contracts | Receivables | $3,680,644 | Payables | $5,644,663 |
|
| Total | | $3,680,644 | | $5,644,663 |
|
The following is a summary of realized and unrealized gains or losses of derivative instruments on the Statement of operations for the six months ended February 28, 2010 (see Note 1):
Amount of realized gain or (loss) on derivatives recognized in net gain (loss) on investments
| | | |
| Derivatives not accounted for as hedging | | Forward currency | |
| instruments under ASC 815 | Futures | contracts | Total |
|
| Foreign exchange contracts | $— | $(986,883) | $(986,883) |
|
| Equity contracts | 1,328,192 | — | 1,328,192 |
|
| Total | $1,328,192 | $(986,883) | $341,309 |
|
Change in unrealized appreciation or (depreciation) on derivatives recognized in net gain (loss) on investments
| | | |
| Derivatives not accounted for as hedging | | Forward currency | |
| instruments under ASC 815 | Futures | contracts | Total |
|
| Foreign exchange contracts | $— | $(975,038) | $(975,038) |
|
| Equity contracts | (964,156) | — | (964,156) |
|
| Total | $(964,156) | $(975,038) | $(1,939,194) |
|
Note 6: Investment in Putnam Money Market
Liquidity Fund
The fund invested in Putnam Money Market Liquidity Fund, an open-end management investment company managed by Putnam Management. Investments in Putnam Money Market Liquidity Fund are valued at its closing net asset value each business day. Income distributions earned by the fund are recorded as interest income in the Statement of operations and totaled $15,947 for the period ended February 28, 2010. During the period ended February 28, 2010, cost of purchases and proceeds of sales of investments in Putnam Money Market Liquidity Fund aggregated $77,868,501 and $98,770,791, respectively. Management fees charged to Putnam Money Market Liquidity Fund have been waived by Putnam Management.
Note 7: Regulatory matters and litigation
In late 2003 and 2004, Putnam Management settled charges brought by the SEC and the Massachusetts Securities Division in connection with excessive short-term trading in Putnam funds. Distribution of payments from Putnam Management to certain open-end Putnam funds and their shareholders is expected to be completed in the next several months. These allegations and related matters have served as the general basis for certain lawsuits, including purported class action lawsuits against Putnam Management and, in a limited number of cases, some Putnam funds. Putnam Management believes that these lawsuits will have no material adverse effect on the funds or on Putnam Management’s ability to provide investment management services. In addition, Putnam Management has agreed to bear any costs incurred by the Putnam funds as a result of these matters.
Note 8: Market and credit risk
In the normal course of business, the fund trades financial instruments and enters into financial transactions where risk of potential loss exists due to changes in the market (market risk) or failure of the contracting party to the transaction to perform (credit risk). The fund may be exposed to additional credit risk that an institution or other entity with which the fund has unsettled or open transactions will default.
56
Shareholder meeting results (Unaudited)
December 18, 2009 meeting
At the meeting, each of the nominees for Trustee was elected, with all funds of the Trust voting together as single class, as follows:
| | |
| | Votes for | Votes withheld |
|
| Ravi Akhoury | 144,159,880 | 5,756,274 |
|
| Jameson A. Baxter | 144,089,420 | 5,826,734 |
|
| Charles B. Curtis | 144,163,005 | 5,753,149 |
|
| Robert J. Darretta | 144,131,113 | 5,785,041 |
|
| Myra R. Drucker | 144,185,199 | 5,730,955 |
|
| John A. Hill | 144,123,942 | 5,792,212 |
|
| Paul L. Joskow | 144,226,682 | 5,689,472 |
|
| Elizabeth T. Kennan | 143,986,867 | 5,929,287 |
|
| Kenneth R. Leibler | 144,161,109 | 5,755,045 |
|
| Robert E. Patterson | 144,163,377 | 5,752,777 |
|
| George Putnam, III | 144,132,419 | 5,783,735 |
|
| Robert L. Reynolds | 144,288,500 | 5,627,654 |
|
| W. Thomas Stephens | 144,223,485 | 5,692,669 |
|
| Richard B. Worley | 144,224,274 | 5,691,880 |
|
A proposal to approve a new management contract between the fund and Putnam Management with both Fund Family breakpoints and performance fees was approved as follows:
| | | |
| Votes | Votes | | Broker |
| for | against | Abstentions | non-votes |
|
| 16,949,671 | 1,094,657 | 763,507 | 5,999,694 |
|
A proposal to approve a new management contract between the fund and Putnam Management with Fund Family breakpoints only was approved as follows:
| | | |
| Votes | Votes | | Broker |
| for | against | Abstentions | non-votes |
|
| 17,008,549 | 989,910 | 809,375 | 5,999,694 |
|
A proposal to approve a new management contract between the fund and Putnam Management with performance fees only was approved as follows:
| | | |
| Votes | Votes | | Broker |
| for | against | Abstentions | non-votes |
|
| 17,028,251 | 1,003,802 | 775,780 | 5,999,695 |
|
A proposal to amend the fundamental investment restrictions with respect to diversification of investments was approved as follows:
57
Shareholder meeting results (Unaudited) (Continued)
A proposal to amend the fundamental investment restrictions with respect to borrowing was approved as follows:
| | | |
| Votes | Votes | | Broker |
| for | against | Abstentions | non-votes |
|
| 16,845,314 | 1,169,199 | 793,320 | 5,999,695 |
|
A proposal to amend the fundamental investment restrictions with respect to making loans was approved asfollows:
| | | |
| Votes | Votes | | Broker |
| for | against | Abstentions | non-votes |
|
| 16,849,515 | 1,154,227 | 804,092 | 5,999,694 |
|
All tabulations are rounded to the nearest whole number.
58
The Putnam family of funds
The following is a list of Putnam’s open-end mutual funds offered to the public. Investors should carefully consider the investment objective, risks, charges, and expenses of a fund before investing. For a prospectus , or a summary prospectus if available, containing this and other information for any Putnam fund or product, call your financial advisor at 1-800-225-1581 and ask for a prospectus. Please read the prospectus carefully before investing.
Growth
Growth Opportunities Fund
International Growth Fund* **
New Opportunities Fund
Small Cap Growth Fund*
Vista Fund
Voyager Fund
Blend
Asia Pacific Equity Fund*
Capital Opportunities Fund*
Capital Spectrum Fund‡
Emerging Markets Equity Fund*
Equity Spectrum Fund‡
Europe Equity Fund*
Global Equity Fund*
Global Natural Resources Fund*
International Capital Opportunities Fund*
International Equity Fund*
Investors Fund
Research Fund
Value
Convertible Income-Growth Trust
Equity Income Fund
The George Putnam Fund of Boston
The Putnam Fund for Growth and Income
International Value Fund*
Mid Cap Value Fund
Small Cap Value Fund*
Income
American Government Income Fund
Diversified Income Trust
Floating Rate Income Fund
Global Income Trust*
High Yield Advantage Fund*
High Yield Trust*
Income Fund
Money Market Fund†
U.S. Government Income Trust
* A 1% redemption fee on total assets redeemed or exchanged within 90 days of purchase may be imposed for all share classes of these funds.
† An investment in a money market fund is not insured or guaranteed by the Federal Deposit Insurance Corporation or any other government agency. Although the fund seeks to preserve the value of your investment at $1.00 per share, it is possible to lose money by investing in the fund.
** Prior to January 1, 2010, the fund was known as Putnam International New Opportunities Fund.
†† Prior to January 1, 2010, the fund was known as Putnam International Growth and Income Fund.
59
Tax-free income
AMT-Free Municipal Fund
Tax Exempt Income Fund
Tax Exempt Money Market Fund†
Tax-Free High Yield Fund
State tax-free income funds:
Arizona, California, Massachusetts, Michigan, Minnesota, New Jersey, New York, Ohio, and Pennsylvania
Absolute Return
Absolute Return 100 Fund
Absolute Return 300 Fund
Absolute Return 500 Fund
Absolute Return 700 Fund
Global Sector*
Global Consumer Fund
Global Energy Fund
Global Financials Fund
Global Health Care Fund
Global Industrials Fund
Global Natural Resources Fund
Global Technology Fund
Global Telecommunications Fund
Global Utilities Fund
Asset allocation
Income Strategies Fund
Putnam Asset Allocation Funds — three investment portfolios that spread your money across a variety of stocks, bonds, and money market investments.
The three portfolios:
Asset Allocation: Balanced Portfolio
Asset Allocation: Conservative Portfolio
Asset Allocation: Growth Portfolio
Putnam RetirementReady®
Putnam RetirementReady Funds — 10 investment portfolios that offer diversification among stocks, bonds, and money market instruments and adjust to become more conservative over time based on a target date for withdrawing assets.
The 10 funds:
Putnam RetirementReady 2050 Fund
Putnam RetirementReady 2045 Fund
Putnam RetirementReady 2040 Fund
Putnam RetirementReady 2035 Fund
Putnam RetirementReady 2030 Fund
Putnam RetirementReady 2025 Fund
Putnam RetirementReady 2020 Fund
Putnam RetirementReady 2015 Fund
Putnam RetirementReady 2010 Fund
Putnam RetirementReady Maturity Fund
‡ A 1% redemption fee on total assets redeemed or exchanged within 30 days of purchase may be imposed for all share classes of these funds.
With the exception of money market funds, a 1% redemption fee may be applied to shares exchanged or sold within 7 days of purchase (90 days, for certain funds).
Check your account balances and the most recent month-end performance in the Individual Investors section at putnam.com.
60
Fund information
Founded over 70 years ago, Putnam Investments was built around the concept that a balance between risk and reward is the hallmark of a well-rounded financial program. We manage over 100 funds across income, value, blend, growth, asset allocation, absolute return, and global sector categories.
| | |
| Investment Manager | Robert E. Patterson | James P. Pappas |
| Putnam Investment | George Putnam, III | Vice President |
| Management, LLC | Robert L. Reynolds | |
| One Post Office Square | W. Thomas Stephens | Francis J. McNamara, III |
| Boston, MA 02109 | Richard B. Worley | Vice President and |
| | | Chief Legal Officer |
| Investment Sub-Manager | Officers | |
| Putnam Investments Limited | Robert L. Reynolds | Robert R. Leveille |
| 57-59 St James’s Street | President | Vice President and |
| London, England SW1A 1LD | | Chief Compliance Officer |
| | Jonathan S. Horwitz | |
| Marketing Services | Executive Vice President, | Mark C. Trenchard |
| Putnam Retail Management | Principal Executive | Vice President and |
| One Post Office Square | Officer, Treasurer and | BSA Compliance Officer |
| Boston, MA 02109 | Compliance Liaison | |
| | Judith Cohen |
| Custodian | Charles E. Porter | Vice President, Clerk |
| State Street Bank | Senior Advisor to the Trustees | and Assistant Treasurer |
| and Trust Company | | |
| | Steven D. Krichmar | Wanda M. McManus |
| Legal Counsel | Vice President and Principal | Vice President, Senior Associate |
| Ropes & Gray LLP | Financial Officer | Treasurer and Assistant Clerk |
| |
| Trustees | Janet C. Smith | Nancy E. Florek |
| John A. Hill, Chairman | Vice President, Principal | Vice President, Assistant Clerk, |
| Jameson A. Baxter, | Accounting Officer and | Assistant Treasurer and |
| Vice Chairman | Assistant Treasurer | Proxy Manager |
| Ravi Akhoury | | |
| Charles B. Curtis | Susan G. Malloy | |
| Robert J. Darretta | Vice President and | |
| Myra R. Drucker | Assistant Treasurer | |
| Paul L. Joskow | | |
| Elizabeth T. Kennan | Beth S. Mazor | |
| Kenneth R. Leibler | Vice President | |
| | |
This report is for the information of shareholders of Putnam International Capital Opportunities Fund. It may also be used as sales literature when preceded or accompanied by the current prospectus, the most recent copy of Putnam’s Quarterly Performance Summary, and Putnam’s Quarterly Ranking Summary. For more recent performance, please visit putnam.com. Investors should carefully consider the investment objective, risks, charges, and expenses of a fund, which are described in its prospectus. For this and other information or to request a prospectus, or a summary prospectus, call 1-800-225-1581 toll free. Please read the prospectus carefully before investing. The fund’s Statement of Additional Information contains additional information about the fund’s Trustees and is available without charge upon request by calling 1-800-225-1581.

Item 2. Code of Ethics:
Not applicable
Item 3. Audit Committee Financial Expert:
Not applicable
Item 4. Principal Accountant Fees and Services:
Not applicable
Item 5. Audit Committee of Listed Registrants
Not applicable
Item 6. Schedule of Investments:
The registrant’s schedule of investments in unaffiliated issuers is included in the report to shareholders in Item 1 above.
Item 7. Disclosure of Proxy Voting Policies and Procedures For Closed- End Management Investment Companies:
Not applicable
Item 8. Portfolio Managers of Closed- End Investment Companies
Not Applicable
Item 9. Purchases of Equity Securities by Closed-End Management Investment Companies and Affiliated Purchasers:
Not applicable
Item 10. Submission of Matters to a Vote of Security Holders:
Not applicable
Item 11. Controls and Procedures:
(a) The registrant's principal executive officer and principal financial officer have concluded, based on their evaluation of the effectiveness of the design and operation of the registrant's disclosure controls and procedures as of a date within 90 days of the filing date of this report, that the design and operation of such procedures are generally effective to provide reasonable assurance that information required to be disclosed by the registrant in this report is recorded, processed, summarized and reported within the time periods specified in the Commission's rules and forms.
(b) Changes in internal control over financial reporting: Not applicable
Item 12. Exhibits:
(a)(1) Not applicable
(a)(2) Separate certifications for the principal executive officer and principal financial officer of the registrant as required by Rule 30a-2(a) under the Investment Company Act of 1940, as amended, are filed herewith.
(b) The certifications required by Rule 30a-2(b) under the Investment Company Act of 1940, as amended, are filed herewith.
Putnam Investment Funds
By (Signature and Title):
/s/Janet C. Smith
Janet C. Smith
Principal Accounting Officer
Date: April 28, 2010
Pursuant to the requirements of the Securities Exchange Act of 1934 and the Investment Company Act of 1940, this report has been signed below by the following persons on behalf of the registrant and in the capacities and on the dates indicated.
By (Signature and Title):
/s/Jonathan S. Horwitz
Jonathan S. Horwitz
Principal Executive Officer
Date: April 28, 2010
By (Signature and Title):
/s/Steven D. Krichmar
Steven D. Krichmar
Principal Financial Officer
Date: April 28, 2010