| | | |
| UNITED STATES |
| SECURITIES AND EXCHANGE COMMISSION |
| Washington, D.C. 20549 |
|
| FORM N-CSR |
|
| CERTIFIED SHAREHOLDER REPORT OF REGISTERED |
| MANAGEMENT INVESTMENT COMPANIES |
| |
| Investment Company Act file number: (811-07237) | |
| |
| Exact name of registrant as specified in charter: | Putnam Investment Funds |
|
| Address of principal executive offices: One Post Office Square, Boston, Massachusetts 02109 |
| |
| Name and address of agent for service: | | Beth S. Mazor, Vice President |
| | One Post Office Square |
| | Boston, Massachusetts 02109 |
| |
| Copy to: | | John W. Gerstmayr, Esq. |
| | Ropes & Gray LLP |
| | 800 Boylston Street |
| | Boston, Massachusetts 02199-3600 |
| |
| Registrant’s telephone number, including area code: | (617) 292-1000 |
| | |
| Date of fiscal year end: February 28, 2011 | | |
|
| Date of reporting period: March 1, 2010 — August 31, 2010 |
Item 1. Report to Stockholders:
The following is a copy of the report transmitted to stockholders pursuant to Rule 30e-1 under the Investment Company Act of 1940:

Putnam
Small Cap Value
Fund
Semiannual report
8 | 31 | 10
| | | |
| Message from the Trustees | 1 | | |
| | |
| About the fund | 2 | | |
| | |
| Performance snapshot | 4 | | |
| | |
| Interview with your fund’s portfolio manager | 5 | | |
| | |
| Your fund’s performance | 10 | | |
| | |
| Your fund’s expenses | 12 | | |
| | |
| Terms and definitions | 14 | | |
| | |
| Trustee approval of management contract | 15 | | |
| | |
| Other information for shareholders | 20 | | |
| | |
| Financial statements | 21 | | |
| | |
Message from the Trustees
Dear Fellow Shareholder:
More than two years have passed since the global financial crisis reached its peak in September 2008. Although conditions have improved since then, investors find themselves in uncertain territory again today. And while the economic recovery has been painfully slow, corporate America is showing signs of health. Companies have posted impressive earnings results this year and have taken advantage of low interest rates to gain more financial flexibility going forward.
We believe Putnam’s risk-focused, active-management approach is well-suited for pursuing opportunities for shareholders in today’s volatile investment environment. Compared with 2009’s bull market, times like these require a greater degree of investment analysis and security-selection skill.
In developments affecting oversight of your fund, Barbara M. Baumann has been elected to the Board of Trustees of the Putnam Funds, effective July 1, 2010. Ms. Baumann is president and owner of Cross Creek Energy Corporation of Denver, Colorado, a strategic consultant to domestic energy firms and direct investor in energy assets. We also want to thank Elizabeth T. Kennan, who has retired from the Board of Trustees, for her many years of dedicated and thoughtful leadership.
Lastly, we would like to take this opportunity to welcome new shareholders to the fund and to thank all of our investors for your continued confidence in Putnam.

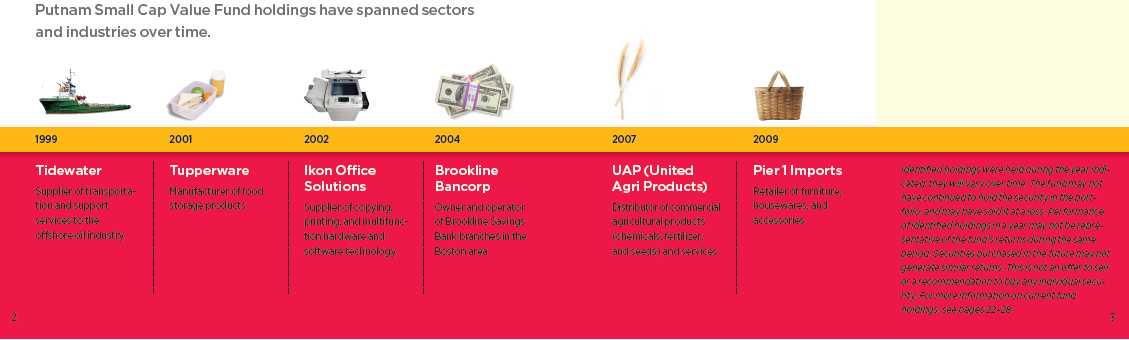
About the fund
Seeking to uncover opportunities that others may have overlooked
Small-cap investing can often be as much an art as a science. Because the small-cap universe is large and can change quickly, many promising and profitable smaller companies fail to capture Wall Street’s attention. And because so many small-cap stocks represent relatively new businesses, investing in them can be both volatile and rewarding. Finding companies that offer the best prospects for success takes a trained eye and a disciplined approach.
Because of their size, smaller companies are usually more agile than larger ones and are able to respond more quickly to market changes or demand for new products and services. Many small-cap companies are in the early stages of their corporate lives, having recently made the transition to being publicly traded. They also react differently to economic conditions than larger companies.
On one hand, an uptick in the economy can make it easier for small companies and startups to obtain financing; conversely, smaller companies with less robust balance sheets often have greater difficulty weathering a market downturn.
Putnam Small Cap Value Fund’s portfolio manager looks for stocks that are not only undervalued but that appear to have a catalyst that could unlock the value in the stock. Events such as a change in management, restructuring, or a new product often have this effect. In addition, the manager considers stocks that have recently fallen out of favor with investors. Because stocks of smaller companies are historically much more volatile than those of blue-chip companies, the manager also carefully considers each stock’s risk/reward profile.
Consider these risks before investing: The fund invests some or all of its assets in small and/or midsize companies. Such investments increase the risk of greater price fluctuations. Value stocks may fail to rebound, and the market may not favor value-style investing.

In-depth analysis is key to successful stock selection
Drawing on the expertise of a dedicated team of stock analysts, the fund’s portfolio manager seeks attractive value stocks. Once a stock is selected for the portfolio, it is regularly assessed by the portfolio manager to ensure that it continues to meet his criteria, including:
Valuation The manager carefully considers how each stock is valued, seeking stocks whose valuations are attractive relative to the company’s profitability potential.
Change The manager focuses on company fundamentals against the broader context of industry trends to identify whether individual companies possess a catalyst for positive change.
Quality The manager looks for high-quality companies, seeking characteristics such as sound balance sheets, profitable business models, and competent management.

Current performance may be lower or higher than the quoted past performance, which cannot guarantee future results. Share price, principal value, and return will fluctuate, and you may have a gain or a loss when you sell your shares. Performance of class A shares assumes reinvestment of distributions and does not account for taxes. Fund returns in the bar chart do not reflect a sales charge of 5.75%; had they, returns would have been lower. See pages 5 and 10–11 for additional performance information. For a portion of the periods, the fund had expense limitations, without which returns would have been lower. A short-term trading fee of 1% may apply to redemptions or exchanges from certain funds within the time period specified in the fund’s prospectus. To obtain the most recent month-end performance, visit putnam.com.
* Returns for the six-month period are not annualized, but cumulative.
4
Interview with your fund’s portfolio manager
Eric Harthun
After a vigorous year-long rally, stocks reversed course in the spring of 2010. How did Putnam Small Cap Value Fund perform for the reporting period?
For the six months ended August 31, 2010, the fund��s class A shares returned –3.95%, slightly ahead of its benchmark, the Russell 2000 Value Index, which had a return of –4.05%. The average return for its Lipper peer group, Small-Cap Value Funds, was –4.01% for the same period.
What contributed to the market’s reversal?
Since the spring of 2009, financial markets had been moving higher in anticipation of stronger economic growth. Accommodative monetary and fiscal policies that kept interest rates low and fostered growth set the stage for the rally. With investors demonstrating a willingness to take on more risk, cyclical and economically sensitive investments climbed dramatically, and lower-quality stocks that had lagged in the prior market correction outperformed higher-quality stocks. In this environment, our focus on undervalued stocks helped it post strong returns into the early months of the current reporting period.
By the spring of 2010, and throughout the balance of the reporting period, stocks declined in response to concerns surrounding the sovereign debt crisis in several European countries. Fearing that the crisis might spread beyond the European Union, stifle the fledgling recovery, and push the world economy into a double-dip recession, investors sold equities in favor of safe-harbor investments. The second quarter of 2010 became the worst for stocks since the final three months of 2008, when the global financial crisis destabilized world markets. Consequently, small-cap value stocks, such as those that the fund holds, along with other equities perceived as risky, lost ground to more defensive investments.
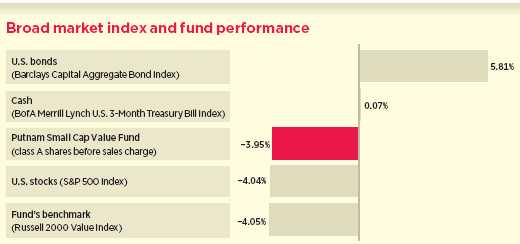
This comparison shows your fund’s performance in the context of broad market indexes for the six months ended 8/31/10. See pages 4 and 10–11 for additional fund performance information. Index descriptions can be found on page 14.
5
Which sectors or industries notably influenced fund performance during the reporting period?
Given the unevenness of the recovery, it’s not surprising that the various sectors that compose the Russell 2000 Value Index produced mixed results. However, the overall performance of the fund versus the benchmark was driven by stock selection, with an overall positive contribution coming from a majority of the sectors. Investments in the information technology and energy sectors were beneficial for the fund.
The health-care sector proved to be the most disappointing. Our decision to overweight investments in the sector further detracted from results, including the fund’s overweight position in Amedisys, which was the fund’s biggest detractor for the six-month period. Utilities and consumer staples were slightly negative contributors to performance as well.
Could you elaborate on Amedisys and the other holdings that detracted from results?
A leading provider of home health care and hospice services, Amedisys faced regulatory questions from the government about its Medicare reimbursement practices. The ongoing investigation negatively affected the company’s business fundamentals, and its stock price suffered. We exited the position during the period.
The regulatory environment also negatively affected the fund’s investments in the online education industry. The Obama administration’s probe into the business practices of for-profit providers of career-oriented post-secondary education, including the fund’s positions in Lincoln Educational Services, Career Education Corporation, and Grand Canyon Education, depressed their stock prices. However, unlike Amedisys and its more mature business model, we think these three holdings have better business prospects
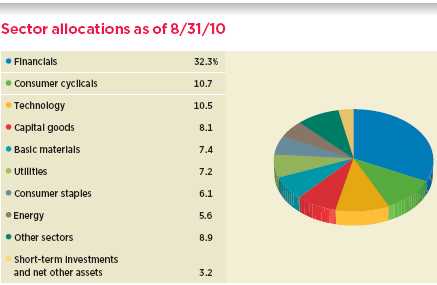
Allocations are represented as a percentage of the fund’s net assets. Holdings and allocations may vary over time.
Summary information may differ from the portfolio schedule included in the financial statements due to the inclusion of derivative securities and the exclusion of as of trades, if any, and the use of different classifications of securities for presentation purposes.
6
and the potential to grow their businesses in the current economic environment. Finally, the stock of Quantum, which provides data storage for computers, sold off amid the rush for safety in April. The company’s second-quarter earnings were profitable but came in less than expected, eroding confidence in the company. We believe investors have oversold the stock and think Quantum’s new data duplication products could provide meaningful growth potential for the company going forward.

As the markets became more concerned about a double-dip recession and the potential for falling advertising revenues, newspaper companies suffered. Investments in McClatchy, the third-largest newspaper company in the United States and online publishing operation, lost ground after recovering from March 2009 lows. However, we continue to own this stock, which we view as undervalued, because we think the company’s prospects are better than what investors believe despite an economy that may not be accelerating as fast as first thought.
Which holdings contributed positively to performance during the period?
Investments in the information technology and energy sectors ranked as some of the strongest contributors to performance. Cirrus Logic, the fund’s top performer, is a leading supplier of signal processing components for audio and energy applications. Approximately one third of the company’s revenue is attributable to one of its customers, Apple, which has translated into strong growth for Cirrus Logic. This holding was sold prior to the end of the period to lock in gains. Kraton Performance Polymers, which produces polymers that improve the performance of a wide range of
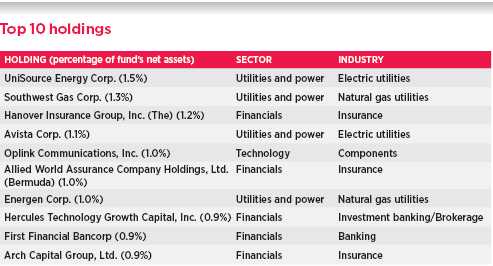
This table shows the fund’s top 10 holdings and the percentage of the fund’s net assets that each represented as of 8/31/10. Short-term holdings are excluded. Holdings will vary over time.
7
products, including adhesive coatings and consumer and personal care products, benefited from the strong demand of its industrial customer base.
MIPS Technologies is an intellectual property company with products used in communications applications. This company is a good example of our research and stock-picking approach, which strives to find small, overlooked businesses. We bought the stock when it was misunderstood by most investors and have since seen its price climb significantly from the level at which it was purchased.
In the energy sector, SM Energy is an asset-rich exploration company with a North American focus. We are confident in the company’s prospects to harvest new sources of oil. Superior Well Services, which is involved in the technology of pressure pumping of natural gas, rallied on news that the company was being acquired. As its stock price approached the acquisition price, we sold a significant portion of the position to lock in gains and tendered the balance of the position as dictated by the terms of the deal in early September.
While many companies in the health-care sector lagged, the fund held several rewarding investments in that sector. One such investment was in Questcor Pharmaceuticals, which provides drugs for the treatment of rare central nervous system and inflammatory disorders, and holds the rights to Acthar, which has proven effective for treating infantile spasms. More recently, this drug has been found to be effective as a back-up drug for treating multiple sclerosis.
Do you expect markets to remain volatile for the balance of the fiscal year?
Yes. The U.S. recovery continues to be threatened by persistent high unemployment, the negative effects of a stronger dollar on exports, and broader concerns about global economic growth. While a deceleration in the pace of U.S. recovery at this stage could be considered normal, we do not see hard evidence that economic growth is reversing
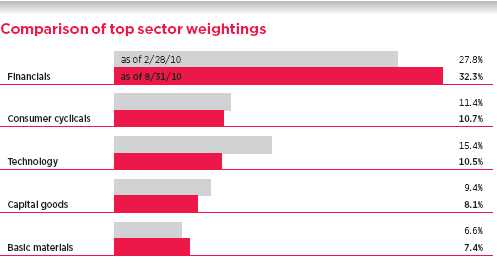
This chart shows how the fund’s top weightings have changed over the past six months. Weightings are shown as a percentage of net assets. Holdings will vary over time.
All data reflect new calculation methodology in effect within the past six months.
Summary information may differ from the portfolio schedule included in the financial statements due to the inclusion of derivative securities and the exclusion of as of trades, if any, and the use of different classifications of securities for presentation purposes.
8
or that profits are shrinking. But market inflection points have been triggered by subtle changes in psychology rather than facts, and it has caused a disproportionate amount of skepticism that, in our opinion, has become self-reinforcing in the near term.
To be sure, some of the forces that have driven the economic recovery are waning. The fiscal stimulus that was concentrated in the first half of the year is dwindling. Inventory replenishment also seems to have run its course. Thus the role of psychology may take on special prominence in the months ahead. Should market volatility seriously dampen consumers’ spirits, their caution may turn economic expansion into contraction. We are particularly concerned about sectors leveraged to housing, where the expiration of homebuyer tax credits exacerbates inherent weakness.
At its August meeting, the Federal Open Market Committee acknowledged that the pace of recovery had slowed in recent months and voted to maintain its accommodative monetary policy. Federal Reserve Chairman Ben Bernanke announced that the central bank “will do all that it can” to ensure the economic recovery continues.
In this climate, we believe strategies that reduce volatility and downside risk remain as important as finding undervalued small-cap companies before their intrinsic value is recognized by the markets.
Thank you, Eric, for your time and insights today.
The views expressed in this report are exclusively those of Putnam Management. They are not meant as investment advice.
Please note that the holdings discussed in this report may not have been held by the fund for the entire period. Portfolio composition is subject to review in accordance with the fund’s investment strategy and may vary in the future. Current and future portfolio holdings are subject to risk.

Portfolio Manager Eric Harthun has an M.B.A. from The University of Chicago Booth School of Business and a B.S. from San Diego State University. A CFA charterholder, Eric joined Putnam in 2000 and has been in the investment industry since 1994.
IN THE NEWS
Despite an increase in market volatility and a decelerating economic recovery, cash on U.S. corporate balance sheets is at a record high. The Federal Reserve estimates that non-financial companies hold nearly $2 trillion in cash and other liquid assets. Many firms implemented cost-cutting measures and other efficiencies in 2009. Concerned about the strength of the economic recovery and the debt crisis in Europe, companies have been reluctant to spend in recent months. Ultimately, that cash may be deployed on hiring, dividends, mergers, stock repurchases, and other shareholder-friendly activities.
9
Your fund’s performance
This section shows your fund’s performance, price, and distribution information for periods ended August 31, 2010, the end of the first half of its current fiscal year. In accordance with regulatory requirements for mutual funds, we also include performance as of the most recent calendar quarter-end and expense information taken from the fund’s current prospectus. Performance should always be considered in light of a fund’s investment strategy. Data represents past performance. Past performance does not guarantee future results. More recent returns may be less or more than those shown. Investment return and principal value will fluctuate, and you may have a gain or a loss when you sell your shares. Performance information does not reflect any deduction for taxes a shareholder may owe on fund distributions or on the redemption of fund shares. For the most recent month-end performance, please visit the Individual Investors section at putna m.com or call Putnam at 1-800-225-1581. Class Y shares are generally only available to corporate and institutional clients and clients in other approved programs. See the Terms and Definitions section in this report for definitions of the share classes offered by your fund.
Fund performance Total return for periods ended 8/31/10
| | | | | | | | | | |
| | Class A | Class B | Class C | Class M | Class R | Class Y |
| (inception dates) | (4/13/99) | (5/3/99) | (7/26/99) | (3/29/00) | (3/30/07) | (1/3/01) |
|
| | NAV | POP | NAV | CDSC | NAV | CDSC | NAV | POP | NAV | NAV |
|
| Annual average | | | | | | | | | | |
| (life of fund) | 6.99% | 6.43% | 6.21% | 6.21% | 6.19% | 6.19% | 6.46% | 6.13% | 6.73% | 7.23% |
|
| 10 years | 66.08 | 56.55 | 54.27 | 54.27 | 54.01 | 54.01 | 57.92 | 52.38 | 62.07 | 70.31 |
| Annual average | 5.20 | 4.58 | 4.43 | 4.43 | 4.41 | 4.41 | 4.68 | 4.30 | 4.95 | 5.47 |
|
| 5 years | –22.16 | –26.62 | –24.95 | –25.65 | –25.03 | –25.03 | –24.07 | –26.73 | –23.10 | –21.10 |
| Annual average | –4.89 | –6.00 | –5.58 | –5.76 | –5.60 | –5.60 | –5.36 | –6.03 | –5.12 | –4.63 |
|
| 3 years | –31.88 | –35.78 | –33.34 | –34.75 | –33.45 | –33.45 | –32.93 | –35.30 | –32.38 | –31.35 |
| Annual average | –12.01 | –13.72 | –12.64 | –13.27 | –12.69 | –12.69 | –12.47 | –13.51 | –12.23 | –11.78 |
|
| 1 year | 7.27 | 1.11 | 6.55 | 1.55 | 6.47 | 5.47 | 6.63 | 2.89 | 7.10 | 7.56 |
|
| 6 months | –3.95 | –9.43 | –4.22 | –9.01 | –4.35 | –5.30 | –4.24 | –7.55 | –4.11 | –3.83 |
|
Current performance may be lower or higher than the quoted past performance, which cannot guarantee future results. After-sales-charge returns (public offering price, or POP) for class A and M shares reflect a maximum 5.75% and 3.50% load, respectively. Class B share returns reflect the applicable contingent deferred sales charge (CDSC), which is 5% in the first year, declining to 1% in the sixth year, and is eliminated thereafter. Class C shares reflect a 1% CDSC for the first year that is eliminated thereafter. Class R and Y shares have no initial sales charge or CDSC. Performance for class B, C, M, R, and Y shares before their inception is derived from the historical performance of class A shares, adjusted for the applicable sales charge (or CDSC) and the higher operating expenses for such shares, except for class Y shares, for which 12b-1 fees are not applicable.
For a portion of the periods, the fund had expense limitations, without which returns would have been lower.
Class B share performance does not assume conversion to class A shares.
A short-term trading fee of 1% may apply to redemptions or exchanges from certain funds within the time period specified in the fund’s prospectus.
10
Comparative index returns For periods ended 8/31/10
| | |
| | | Lipper Small-Cap Value Funds |
| | Russell 2000 Value Index | category average* |
|
| Annual average (life of fund) | 7.64% | 8.16% |
|
| 10 years | 88.82 | 95.47 |
| Annual average | 6.56 | 6.70 |
|
| 5 years | –6.49 | –3.03 |
| Annual average | –1.33 | –0.73 |
|
| 3 years | –22.20 | –19.43 |
| Annual average | –8.03 | –7.06 |
|
| 1 year | 6.06 | 7.59 |
|
| 6 months | –4.05 | –4.01 |
|
Index and Lipper results should be compared to fund performance at net asset value.
* Over the 6-month, 1-year, 3-year, 5-year, 10-year, and life-of-fund periods ended 8/31/10, there were 265, 253, 223, 177, 84, and 72 funds, respectively, in this Lipper category.
Fund price and distribution information For the six-month period ended 8/31/10
| | | | | | | | |
| | Class A | Class B | Class C | Class M | Class R | Class Y |
|
| Share value | NAV | POP | NAV | NAV | NAV | POP | NAV | NAV |
|
| 2/28/10 | $8.10 | $8.59 | $7.11 | $7.13 | $7.55 | $7.82 | $8.04 | $8.36 |
|
| 8/31/10 | 7.78 | 8.25 | 6.81 | 6.82 | 7.23 | 7.49 | 7.71 | 8.04 |
|
The classification of distributions, if any, is an estimate. Final distribution information will appear on your year-end tax forms.
The fund made no distributions during the period.
Fund performance as of most recent calendar quarter
Total return for periods ended 9/30/10
| | | | | | | | | | |
| | Class A | Class B | Class C | Class M | Class R | Class Y |
| (inception dates) | (4/13/99) | (5/3/99) | (7/26/99) | (3/29/00) | (3/30/07) | (1/3/01) |
|
| | NAV | POP | NAV | CDSC | NAV | CDSC | NAV | POP | NAV | NAV |
|
| Annual average | | | | | | | | | | |
| (life of fund) | 7.96% | 7.41% | 7.18% | 7.18% | 7.17% | 7.17% | 7.44% | 7.11% | 7.70% | 8.20% |
|
| 10 years | 83.46 | 72.88 | 70.37 | 70.37 | 70.29 | 70.29 | 74.68 | 68.60 | 79.03 | 88.12 |
| Annual average | 6.26 | 5.63 | 5.47 | 5.47 | 5.47 | 5.47 | 5.74 | 5.36 | 6.00 | 6.52 |
|
| 5 years | –13.16 | –18.13 | –16.31 | –17.09 | –16.31 | –16.31 | –15.21 | –18.18 | –14.18 | –12.02 |
| Annual average | –2.78 | –3.92 | –3.50 | –3.68 | –3.50 | –3.50 | –3.25 | –3.93 | –3.01 | –2.53 |
|
| 3 years | –23.81 | –28.18 | –25.45 | –27.03 | –25.49 | –25.49 | –24.89 | –27.50 | –24.33 | –23.22 |
| Annual average | –8.67 | –10.45 | –9.33 | –9.97 | –9.34 | –9.34 | –9.10 | –10.16 | –8.87 | –8.43 |
|
| 1 year | 11.66 | 5.27 | 10.71 | 5.71 | 10.78 | 9.78 | 11.10 | 7.18 | 11.39 | 11.92 |
|
| 6 months | –0.91 | –6.57 | –1.30 | –6.23 | –1.30 | –2.28 | –1.10 | –4.61 | –1.04 | –0.78 |
|
11
Your fund’s expenses
As a mutual fund investor, you pay ongoing expenses, such as management fees, distribution fees (12b-1 fees), and other expenses. Using the following information, you can estimate how these expenses affect your investment and compare them with the expenses of other funds. You may also pay one-time transaction expenses, including sales charges (loads) and redemption fees, which are not shown in this section and would have resulted in higher total expenses. For more information, see your fund’s prospectus or talk to your financial representative.
Expense ratios
| | | | | | |
| | Class A | Class B | Class C | Class M | Class R | Class Y |
|
| Total annual operating expenses for the fiscal year | | | | | | |
| ended 2/28/10* | 1.42% | 2.17% | 2.17% | 1.92% | 1.67% | 1.17% |
|
| Annualized expense ratio for the six-month period | | | | | | |
| ended 8/31/10 | 1.31% | 2.06% | 2.06% | 1.81% | 1.56% | 1.06% |
|
Fiscal-year expense information in this table is taken from the most recent prospectus, is subject to change, and may differ from that shown for the annualized expense ratio and in the financial highlights of this report. Expenses are shown as a percentage of average net assets.
* Reflects projected expenses under a new management contract effective 1/1/10, changes to the fund’s investor servicing contract, and a new expense arrangement, which gives effect to changes in the allocations of certain expenses among Putnam funds.
Expenses per $1,000
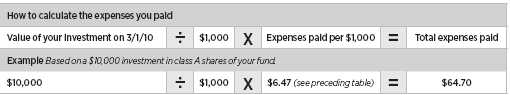
The following table shows the expenses you would have paid on a $1,000 investment in Putnam Small Cap Value Fund from March 1, 2010, to August 31, 2010. It also shows how much a $1,000 investment would be worth at the close of the period, assuming actual returns and expenses.
| | | | | | |
| | Class A | Class B | Class C | Class M | Class R | Class Y |
|
| Expenses paid per $1,000*† | $6.47 | $10.17 | $10.16 | $8.93 | $7.70 | $5.24 |
|
| Ending value (after expenses) | $960.50 | $957.80 | $956.50 | $957.60 | $958.90 | $961.70 |
|
* Expenses for each share class are calculated using the fund’s annualized expense ratio for each class, which represents the ongoing expenses as a percentage of average net assets for the six months ended 8/31/10. The expense ratio may differ for each share class.
† Expenses are calculated by multiplying the expense ratio by the average account value for the period; then multiplying the result by the number of days in the period; and then dividing that result by the number of days in the year.
12
Estimate the expenses you paid
To estimate the ongoing expenses you paid for the six months ended August 31, 2010, use the following calculation method. To find the value of your investment on March 1, 2010, call Putnam at 1-800-225-1581.
Compare expenses using the SEC’s method
The Securities and Exchange Commission (SEC) has established guidelines to help investors assess fund expenses. Per these guidelines, the following table shows your fund’s expenses based on a $1,000 investment, assuming a hypothetical 5% annualized return. You can use this information to compare the ongoing expenses (but not transaction expenses or total costs) of investing in the fund with those of other funds. All mutual fund shareholder reports will provide this information to help you make this comparison. Please note that you cannot use this information to estimate your actual ending account balance and expenses paid during the period.
| | | | | | |
| | Class A | Class B | Class C | Class M | Class R | Class Y |
|
| Expenses paid per $1,000*† | $6.67 | $10.46 | $10.46 | $9.20 | $7.93 | $5.40 |
|
| Ending value (after expenses) | $1,018.60 | $1,014.82 | $1,014.82 | $1,016.08 | $1,017.34 | $1,019.86 |
|
* Expenses for each share class are calculated using the fund’s annualized expense ratio for each class, which represents the ongoing expenses as a percentage of average net assets for the six months ended 8/31/10. The expense ratio may differ for each share class.
† Expenses are calculated by multiplying the expense ratio by the average account value for the period; then multiplying the result by the number of days in the period; and then dividing that result by the number of days in the year.
13
Terms and definitions
Important terms
Total return shows how the value of the fund’s shares changed over time, assuming you held the shares through the entire period and reinvested all distributions in the fund.
Net asset value (NAV) is the price, or value, of one share of a mutual fund, without a sales charge. NAVs fluctuate with market conditions. NAV is calculated by dividing the net assets of each class of shares by the number of outstanding shares in the class.
Public offering price (POP) is the price of a mutual fund share plus the maximum sales charge levied at the time of purchase. POP performance figures shown here assume the 5.75% maximum sales charge for class A shares and 3.50% for class M shares.
Contingent deferred sales charge (CDSC) is generally a charge applied at the time of the redemption of class B or C shares and assumes redemption at the end of the period. Your fund’s class B CDSC declines from a 5% maximum during the first year to 1% during the sixth year. After the sixth year, the CDSC no longer applies. The CDSC for class C shares is 1% for one year after purchase.
Share classes
Class A shares are generally subject to an initial sales charge and no CDSC (except on certain redemptions of shares bought without an initial sales charge).
Class B shares are not subject to an initial sales charge. They may be subject to a CDSC.
Class C shares are not subject to an initial sales charge and are subject to a CDSC only if the shares are redeemed during the first year.
Class M shares have a lower initial sales charge and a higher 12b-1 fee than class A shares and no CDSC (except on certain redemptions of shares bought without an initial sales charge).
Class R shares are not subject to an initial sales charge or CDSC and are available only to certain defined contribution plans.
Class Y shares are not subject to an initial sales charge or CDSC, and carry no 12b-1 fee. They are generally only available to corporate and institutional clients and clients in other approved programs.
Comparative indexes
Barclays Capital Aggregate Bond Index is an unmanaged index of U.S. investment-grade fixed-income securities.
BofA (Bank of America) Merrill Lynch U.S. 3-Month Treasury Bill Index is an unmanaged index that seeks to measure the performance of U.S. Treasury bills available in the marketplace.
Russell 2000 Value Index is an unmanaged index of those companies in the small-cap Russell 2000 Index chosen for their value orientation.
S&P 500 Index is an unmanaged index of common stock performance.
Indexes assume reinvestment of all distributions and do not account for fees. Securities and performance of a fund and an index will differ. You cannot invest directly in an index.
Lipper is a third-party industry-ranking entity that ranks mutual funds. Its rankings do not reflect sales charges. Lipper rankings are based on total return at net asset value relative to other funds that have similar current investment styles or objectives as determined by Lipper. Lipper may change a fund’s category assignment at its discretion. Lipper category averages reflect performance trends for funds within a category.
14
Trustee approval of management contract
General conclusions
The Board of Trustees of the Putnam funds oversees the management of each fund and, as required by law, determines annually whether to approve the continuance of your fund’s management contract with Putnam Investment Management (“Putnam Management”) and the sub-management contract with respect to your fund between Putnam Management and its affiliate, Putnam Investments Limited (“PIL”).
In this regard, the Board of Trustees, with the assistance of its Contract Committee consisting solely of Trustees who are not “interested persons” (as this term is defined in the Investment Company Act of 1940, as amended) of the Putnam funds (the “Independent Trustees”), requests and evaluates all information it deems reasonably necessary under the circumstances. Over the course of several months ending in June 2010, the Contract Committee met several times with representatives of Putnam Management and in executive session to consider the information provided by Putnam Management and other information developed with the assistance of the Board’s independent counsel and independent staff. The Contract Committee reviewed and discussed key aspects of this information with all of the Independent Trustees. At the Trustees’ June 11, 2010 meeting, the Contract Committee recommended, and the Independent Trustees approved, the continuance of your fund� 6;s management and sub-management contracts, effective July 1, 2010. (Because PIL is an affiliate of Putnam Management and Putnam Management remains fully responsible for all services provided by PIL, the Trustees have not evaluated PIL as a separate entity, and all subsequent references to Putnam Management below should be deemed to include reference to PIL as necessary or appropriate in the context.)
The Independent Trustees’ approval was based on the following conclusions:
• That the fee schedule in effect for your fund represented reasonable compensation in light of the nature and quality of the services being provided to the fund, the fees paid by competitive funds, and the costs incurred by Putnam Management in providing such services, and
• That the fee schedule represented an appropriate sharing between fund shareholders and Putnam Management of such economies of scale as may exist in the management of the fund at current asset levels.
These conclusions were based on a comprehensive consideration of all information provided to the Trustees and were not the result of any single factor. Some of the factors that figured particularly in the Trustees’ deliberations and how the Trustees considered these factors are described below, although individual Trustees may have evaluated the information presented differently, giving different weights to various factors. It is also important to recognize that the fee arrangements for your fund and the other Putnam funds are the result of many years of review and discussion between the Independent Trustees and Putnam Management, that certain aspects of the arrangements may receive greater scrutiny in some years than others, and that the Trustees’ conclusions may be based, in part, on their consideration of fee arrangements in prior years.
Consideration of implementation of strategic pricing initiative
The Trustees were mindful that new management contracts had been implemented for all but a few funds at the beginning of 2010 as part of Putnam Management’s strategic pricing initiative. These new management contracts reflected the implementation of more competitive fee levels for many funds,
15
complex-wide breakpoints for the open-end funds and performance fees for certain funds. The Trustees had approved these new management contracts on July 10, 2009 and submitted them to shareholder meetings of the affected funds in late 2009, where the contracts were in all cases approved by overwhelming majorities of the shares voted.
Because the management contracts had been implemented only recently, the Contract Committee had limited practical experience with the operation of the new fee structures. The financial data available to the Committee reflected actual operations under the prior contracts; information was also available on a pro forma basis, adjusted to reflect the fees payable under the new management contracts. In light of the limited information available regarding operations under the new management contracts, in recommending the continuation of the new management contracts in June 2010, the Contract Committee relied to a considerable extent on its review of the financial information and analysis that formed the basis of the Board’s approval of the new management contracts on July 10, 2009.
Management fee schedules and categories; total expenses
The Trustees reviewed the management fee schedules in effect for all Putnam funds, including fee levels and breakpoints. In reviewing management fees, the Trustees generally focus their attention on material changes in circumstances — for example, changes in assets under management or investment style, changes in Putnam Management’s operating costs, or changes in competitive practices in the mutual fund industry — that suggest that consideration of fee changes might be warranted. The Trustees concluded that the circumstances did not warrant changes to the management fee structure of your fund.
As in the past, the Trustees continued to focus on the competitiveness of the total expense ratio of each fund. In order to ensure that expenses of the Putnam funds continue to meet evolving competitive standards, the Trustees and Putnam Management agreed in 2009 to implement: (i) a contractual expense limitation applicable to all retail open-end funds of 37.5 basis points on investor servicing fees and expenses and (ii) a contractual expense limitation applicable to all open-end funds of 20 basis points on so-called “other expenses” (i.e., all expenses exclusive of management fees, investor servicing fees, distribution fees, taxes, brokerage commissions and extraordinary expenses). These expense limitations serve in particular to maintain competitive expense levels for funds with large numbers of small shareholder accounts and funds with relatively small net assets.
The Trustees reviewed comparative fee and expense information for competitive funds, which indicated that, in a custom peer group of competitive funds selected by Lipper Inc., your fund ranked in the 34th percentile in effective management fees (determined for your fund and the other funds in the custom peer group based on fund asset size and the applicable contractual management fee schedule) and in the 59th percentile in total expenses (less any applicable 12b-1 fees) as of December 31, 2009 (the first percentile representing the least expensive funds and the 100th percentile the most expensive funds). The Trustees also considered that your fund ranked in the 1st percentile in effective management fees, on a pro forma basis adjusted to reflect the impact of the strategic pricing initiative discussed above, as of December 31, 2009.
Your fund currently has the benefit of breakpoints in its management fee that provide shareholders with significant economies of scale in the form of reduced fee levels as assets under management in the Putnam family
16
of funds increase. The Contract Committee observed that the complex-wide breakpoints of the open-end funds have only been in place for a short while, and the Trustees will examine the operation of this new breakpoint structure in future years in light of actual experience.
In connection with their review of the management fees and total expenses of the Putnam funds, the Trustees also reviewed the costs of the services provided and profits realized by Putnam Management and its affiliates from their contractual relationships with the funds. This information included trends in revenues, expenses and profitability of Putnam Management and its affiliates relating to the investment management, investor servicing and distribution services provided to the funds. In this regard, the Trustees also reviewed an analysis of Putnam Management’s revenues, expenses and profitability, allocated on a fund-by-fund basis, with respect to the funds’ management, distribution, and investor servicing contracts. For each fund, the analysis presented information about revenues, expenses and profitability for each of the agreements separately and for the agreements taken together on a combined basis. The Trustees concluded that, at curre nt asset levels, the fee schedules currently in place represented an appropriate sharing of economies of scale at that time.
The information examined by the Trustees as part of their annual contract review for the Putnam funds has included for many years information regarding fees charged by Putnam Management and its affiliates to institutional clients such as defined benefit pension plans, college endowments, and the like. This information included comparisons of such fees with fees charged to the funds, as well as a detailed assessment of the differences in the services provided to these two types of clients. The Trustees observed, in this regard, that the differences in fee rates between institutional clients and mutual funds are by no means uniform when examined by individual asset sectors, suggesting that differences in the pricing of investment management services to these types of clients may reflect historical competitive forces operating in separate market places. The Trustees considered the fact that fee rates across different as set classes are typically higher on average for mutual funds than for institutional clients, as well as the differences between the services that Putnam Management provides to the Putnam funds and those that it provides to institutional clients of the firm, and did not rely on these comparisons to any significant extent in concluding that the management fees paid by your fund are reasonable.
Investment performance
The quality of the investment process provided by Putnam Management represented a major factor in the Trustees’ evaluation of the quality of services provided by Putnam Management under your fund’s management contract. The Trustees were assisted in their review of the Putnam funds’ investment process and performance by the work of the Investment Oversight Coordinating Committee of the Trustees and the Investment Oversight Committees of the Trustees, which met on a regular monthly basis with the funds’ portfolio teams throughout the year. The Trustees concluded that Putnam Management generally provides a high-quality investment process — as measured by the experience and skills of the individuals assigned to the management of fund portfolios, the resources made available to such personnel, and in general the ability of Putnam Management to attract and retain high-quality personnel — but also recognized that this does not gu arantee favorable investment results for every fund in every time period. The Trustees considered the investment performance of each fund over multiple time periods and considered information comparing each fund’s
17
performance with various benchmarks and with the performance of competitive funds.
The Committee noted the substantial improvement in the performance of most Putnam funds during 2009. The Committee also noted the disappointing investment performance of a number of the funds for periods ended December 31, 2009 and considered information provided by Putnam Management regarding the factors contributing to the underperformance and actions being taken to improve performance. The Trustees recognized that, in recent years, Putnam Management has taken steps to strengthen its investment personnel and processes to address areas of underperformance, including Putnam Management’s continuing efforts to strengthen the equity research function, recent changes in portfolio managers, increased accountability of individual managers rather than teams, recent changes in Putnam Management’s approach to incentive compensation, including emphasis on top quartile performance over a rolling three-year period, and the recent arrival of a new chief i nvestment officer. The Trustees indicated their intention to continue to monitor performance trends to assess the effectiveness of these efforts and to evaluate whether additional changes to address areas of underperformance are warranted.
In the case of your fund, the Trustees considered that your fund’s class A share cumulative total return performance at net asset value was in the following percentiles of its Lipper Inc. peer group (Lipper Small-Cap Value Funds) for the one-year, three-year and five-year periods ended December 31, 2009 (the first percentile representing the best-performing funds and the 100th percentile the worst-performing funds):
| | | |
| One-year period | 51st | | |
| | |
| Three-year period | 97th | | |
| | |
| Five-year period | 94th | | |
| | |
Over the one-year, three-year and five-year periods ended December 31, 2009, there were 310, 266 and 209 funds, respectively, in your fund’s Lipper peer group. (When considering performance information, shareholders should be mindful that past performance is not a guarantee of future results.)
The Trustees took note of your fund’s 4th quartile performance for each of the three-year and five-year periods ended December 31, 2009 and considered the circumstances that may have contributed to the disappointing performance as well as any actions taken by Putnam Management intended to improve performance, including that in November 2009, an existing portfolio manager took over sole responsibility for managing the fund’s investments. The Trustees also considered that Putnam Management has taken the following actions:
• Increased accountability and reduced complexity in the portfolio management process for the Putnam equity funds by replacing a team management structure with a decision-making process that vests full authority and responsibility with individual portfolio managers. Putnam Management has also taken other steps, such as eliminating sleeves in certain Putnam equity funds, to reduce process complexity in the portfolio management of these funds;
• Clarified its investment process by affirming a fundamental-driven approach to investing, with quantitative analysis providing additional input for investment decisions;
• Strengthened its large-cap equity research capability by adding multiple new investment personnel to the team and by bringing U.S. and international research under common leadership; and
• Realigned the compensation structure for portfolio managers and research analysts so that only those who achieve top-quartile returns
18
over a rolling three-year basis are eligible for full bonuses.
As a general matter, the Trustees believe that cooperative efforts between the Trustees and Putnam Management represent the most effective way to address investment performance problems. The Trustees noted that investors in the Putnam funds have, in effect, placed their trust in the Putnam organization, under the oversight of the funds’ Trustees, to make appropriate decisions regarding the management of the funds. Based on the responsiveness of Putnam Management in the recent past to Trustee concerns about investment performance, the Trustees concluded that it is preferable to seek change within Putnam Management to address performance shortcomings. In the Trustees’ view, the alternative of engaging a new investment adviser for an underperforming fund would entail significant disruptions and would not provide any greater assurance of improved investment performance.
Brokerage and soft-dollar allocations; investor servicing; distribution
The Trustees considered various potential benefits that Putnam Management may receive in connection with the services it provides under the management contract with your fund. These include benefits related to brokerage and soft-dollar allocations, whereby a portion of the commissions paid by a fund for brokerage may be used to acquire research services that are expected to be useful to Putnam Management in managing the assets of the fund and of other clients. The Trustees considered a change made, at Putnam Management’s request, to the Putnam funds’ brokerage allocation policies commencing in 2010, which increased the permitted soft dollar allocation to third-party services over what had been authorized in previous years. The Trustees noted that a portion of available soft dollars continues to be allocated to the payment of fund expenses. The Trustees indicated their continued intent to monitor regulatory developments in this area with the assistance of their Brokerage Committee and also indicated their continued intent to monitor the potential benefits associated with fund brokerage and soft-dollar allocations and trends in industry practices to ensure that the principle of seeking best price and execution remains paramount in the portfolio trading process.
Putnam Management may also receive bene-fits from payments that the funds make to Putnam Management’s affiliates for investor or distribution services. In conjunction with the annual review of your fund’s management contract, the Trustees reviewed your fund’s investor servicing agreement with Putnam Investor Services, Inc. (“PSERV”) and its distributor’s contracts and distribution plans with Putnam Retail Management Limited Partnership (“PRM”), both of which are affiliates of Putnam Management. The Trustees concluded that the fees payable by the funds to PSERV and PRM, as applicable, for such services are reasonable in relation to the nature and quality of such services.
19
Other information for shareholders
Important notice regarding delivery of shareholder documents
In accordance with SEC regulations, Putnam sends a single copy of annual and semiannual shareholder reports, prospectuses, and proxy statements to Putnam shareholders who share the same address, unless a shareholder requests otherwise. If you prefer to receive your own copy of these documents, please call Putnam at 1-800-225-1581, and Putnam will begin sending individual copies within 30 days.
Proxy voting
Putnam is committed to managing our mutual funds in the best interests of our shareholders. The Putnam funds’ proxy voting guidelines and procedures, as well as information regarding how your fund voted proxies relating to portfolio securities during the 12-month period ended June 30, 2010, are available in the Individual Investors section of putnam.com, and on the SEC’s Web site, www.sec.gov. If you have questions about finding forms on the SEC’s Web site, you may call the SEC at 1-800-SEC-0330. You may also obtain the Putnam funds’ proxy voting guidelines and procedures at no charge by calling Putnam’s Shareholder Services at 1-800-225-1581.
Fund portfolio holdings
The fund will file a complete schedule of its portfolio holdings with the SEC for the first and third quarters of each fiscal year on Form N-Q. Shareholders may obtain the fund’s Forms N-Q on the SEC’s Web site at www.sec.gov. In addition, the fund’s Forms N-Q may be reviewed and copied at the SEC’s Public Reference Room in Washington, D.C. You may call the SEC at 1-800-SEC-0330 for information about the SEC’s Web site or the operation of the Public Reference Room.
Trustee and employee fund ownership
Putnam employees and members of the Board of Trustees place their faith, confidence, and, most importantly, investment dollars in Putnam mutual funds. As of August 31, 2010, Putnam employees had approximately $298,000,000 and the Trustees had approximately $57,000,000 invested in Putnam mutual funds. These amounts include investments by the Trustees’ and employees’ immediate family members as well as investments through retirement and deferred compensation plans.
20
Financial statements
A guide to financial statements
These sections of the report, as well as the accompanying Notes, constitute the fund’s financial statements.
The fund’s portfolio lists all the fund’s investments and their values as of the last day of the reporting period. Holdings are organized by asset type and industry sector, country, or state to show areas of concentration and diversification.
Statement of assets and liabilities shows how the fund’s net assets and share price are determined. All investment and non-investment assets are added together. Any unpaid expenses and other liabilities are subtracted from this total. The result is divided by the number of shares to determine the net asset value per share, which is calculated separately for each class of shares. (For funds with preferred shares, the amount subtracted from total assets includes the liquidation preference of preferred shares.)
Statement of operations shows the fund’s net investment gain or loss. This is done by first adding up all the fund’s earnings — from dividends and interest income — and subtracting its operating expenses to determine net investment income (or loss). Then, any net gain or loss the fund realized on the sales of its holdings — as well as any unrealized gains or losses over the period — is added to or subtracted from the net investment result to determine the fund’s net gain or loss for the fiscal period.
Statement of changes in net assets shows how the fund’s net assets were affected by the fund’s net investment gain or loss, by distributions to shareholders, and by changes in the number of the fund’s shares. It lists distributions and their sources (net investment income or realized capital gains) over the current reporting period and the most recent fiscal year-end. The distributions listed here may not match the sources listed in the Statement of operations because the distributions are determined on a tax basis and may be paid in a different period from the one in which they were earned. Dividend sources are estimated at the time of declaration. Actual results may vary. Any non-taxable return of capital cannot be determined until final tax calculations are completed after the end of the fund’s fiscal year.
Financial highlights provide an overview of the fund’s investment results, per-share distributions, expense ratios, net investment income ratios, and portfolio turnover in one summary table, reflecting the five most recent reporting periods. In a semiannual report, the highlights table also includes the current reporting period.
21
The fund’s portfolio 8/31/10 (Unaudited)
| | |
| COMMON STOCKS (96.5%)* | Shares | Value |
|
| Aerospace and defense (0.7%) | | |
| GenCorp, Inc. † | 14,763 | $64,662 |
|
| Innovative Solutions & Support, Inc. † | 104,405 | 548,126 |
|
| Teledyne Technologies, Inc. † | 11,500 | 416,070 |
|
| | | 1,028,858 |
| Airlines (1.0%) | | |
| Hawaiian Holdings, Inc. † | 94,572 | 463,403 |
|
| SkyWest, Inc. | 85,900 | 1,094,366 |
|
| | | 1,557,769 |
| Banking (12.5%) | | |
| Bancorp, Inc. † | 178,400 | 1,145,328 |
|
| Bond Street Holdings, LLC 144A Class A F † | 22,389 | 458,975 |
|
| Brookline Bancorp, Inc. | 98,600 | 922,896 |
|
| Columbia Banking Systems, Inc. | 47,796 | 851,247 |
|
| Danvers Bancorp, Inc. | 40,334 | 607,833 |
|
| ESSA Bancorp, Inc. | 76,587 | 856,243 |
|
| First Citizens BancShares, Inc. Class A | 6,300 | 1,058,211 |
|
| First Community Bancshares Inc. | 62,000 | 800,420 |
|
| First Financial Bancorp | 88,300 | 1,408,385 |
|
| First Horizon National Corp. | 70,670 | 712,354 |
|
| First Midwest Bancorp, Inc. | 39,668 | 435,555 |
|
| First of Long Island Corp. (The) | 34,677 | 853,054 |
|
| Hudson Valley Holding Corp. | 16,985 | 276,176 |
|
| Metro Bancorp, Inc. † | 75,149 | 695,128 |
|
| Oritani Financial Corp. | 123,394 | 1,161,138 |
|
| PacWest Bancorp | 38,723 | 660,614 |
|
| Popular, Inc. (Puerto Rico) † | 245,500 | 628,480 |
|
| Provident New York Bancorp | 96,300 | 777,141 |
|
| Seacoast Banking Corp. of Florida † | 312,223 | 377,790 |
|
| Susquehanna Bancshares, Inc. | 108,600 | 859,026 |
|
| SVB Financial Group † | 27,100 | 1,007,307 |
|
| Trustmark Corp. | 26,933 | 513,612 |
|
| UMB Financial Corp. | 22,000 | 701,360 |
|
| United Financial Bancorp, Inc. | 60,400 | 812,984 |
|
| Washington Federal, Inc. | 31,423 | 448,406 |
|
| Whitney Holding Corp. | 54,520 | 405,084 |
|
| | | 19,434,747 |
| Biotechnology (0.7%) | | |
| Viropharma, Inc. † | 89,700 | 1,124,838 |
|
| | | 1,124,838 |
| Chemicals (4.7%) | | |
| A. Schulman, Inc. | 44,399 | 806,730 |
|
| Innophos Holdings, Inc. | 33,400 | 974,278 |
|
| Koppers Holdings, Inc. | 34,900 | 698,000 |
|
| Kraton Performance Polymers, Inc. † | 35,992 | 972,504 |
|
| OM Group, Inc. † | 41,600 | 1,064,960 |
|
| Omnova Solutions, Inc. † | 95,900 | 584,990 |
|
22
| | |
| COMMON STOCKS (96.5%)* cont. | Shares | Value |
|
| Chemicals cont. | | |
| PolyOne Corp. † | 103,000 | $1,004,250 |
|
| RPM International, Inc. | 67,000 | 1,132,300 |
|
| | | 7,238,012 |
| Coal (0.5%) | | |
| James River Coal Co. † | 48,700 | 770,434 |
|
| | | 770,434 |
| Commercial and consumer services (2.7%) | | |
| Aaron, Inc. S | 65,150 | 1,061,294 |
|
| Alliance Data Systems Corp. † S | 14,500 | 814,755 |
|
| Deluxe Corp. | 62,700 | 1,048,971 |
|
| Ennis Inc. | 26,600 | 409,374 |
|
| Schawk, Inc. | 55,380 | 841,776 |
|
| | | 4,176,170 |
| Communications equipment (1.6%) | | |
| ARRIS Group, Inc. † | 85,051 | 694,867 |
|
| Ceragon Networks, Ltd. (Israel) † | 122,138 | 1,033,287 |
|
| Netgear, Inc. † | 38,200 | 806,784 |
|
| | | 2,534,938 |
| Components (1.0%) | | |
| Oplink Communications, Inc. † | 99,195 | 1,559,345 |
|
| | | 1,559,345 |
| Computers (1.8%) | | |
| Quantum Corp. † | 446,000 | 642,240 |
|
| SMART Modular Technologies WWH, Inc. † | 157,054 | 736,583 |
|
| Smith Micro Software, Inc. † | 108,200 | 827,730 |
|
| TeleCommunication Systems, Inc. Class A † | 201,600 | 620,928 |
|
| | | 2,827,481 |
| Consumer goods (1.0%) | | |
| American Greetings Corp. Class A | 50,456 | 973,801 |
|
| Newell Rubbermaid, Inc. | 40,600 | 609,812 |
|
| | | 1,583,613 |
| Consumer services (1.1%) | | |
| Geo Group, Inc. (The) † | 38,800 | 857,480 |
|
| Stamps.com, Inc. † | 69,200 | 791,648 |
|
| | | 1,649,128 |
| Distribution (0.6%) | | |
| Spartan Stores, Inc. | 69,400 | 907,058 |
|
| | | 907,058 |
| Electric utilities (4.9%) | | |
| Avista Corp. | 83,100 | 1,734,297 |
|
| CMS Energy Corp. | 75,600 | 1,323,000 |
|
| Great Plains Energy, Inc. | 64,700 | 1,196,303 |
|
| UIL Holdings Corp. | 37,400 | 990,726 |
|
| UniSource Energy Corp. | 72,400 | 2,355,172 |
|
| | | 7,599,498 |
| Electronics (1.7%) | | |
| EnerSys † | 48,050 | 1,060,464 |
|
| MIPS Technologies, Inc. † | 133,000 | 876,470 |
|
| TTM Technologies, Inc. † | 82,722 | 683,284 |
|
| | | 2,620,218 |
23
| | |
| COMMON STOCKS (96.5%)* cont. | Shares | Value |
|
| Energy (oil field) (1.4%) | | |
| Helix Energy Solutions Group, Inc. † | 63,600 | $578,760 |
|
| Superior Well Services, Inc. † S | 27,958 | 618,711 |
|
| Tidewater, Inc. | 22,800 | 913,824 |
|
| | | 2,111,295 |
| Engineering and construction (0.6%) | | |
| EMCOR Group, Inc. † | 40,500 | 920,970 |
|
| | | 920,970 |
| Financial (0.7%) | | |
| NewStar Financial, Inc. † | 152,800 | 1,025,288 |
|
| | | 1,025,288 |
| Food (1.2%) | | |
| Ruddick Corp. | 23,400 | 757,458 |
|
| Weiss Markets, Inc. | 29,300 | 1,030,188 |
|
| | | 1,787,646 |
| Forest products and packaging (2.2%) | | |
| Buckeye Technologies, Inc. † | 111,400 | 1,323,432 |
|
| Louisiana-Pacific Corp. † | 81,877 | 545,301 |
|
| Rock-Tenn Co. Class A | 17,900 | 862,422 |
|
| Universal Forest Products, Inc. | 27,642 | 716,204 |
|
| | | 3,447,359 |
| Health-care services (2.3%) | | |
| Addus HomeCare Corp. † | 63,465 | 331,922 |
|
| AmSurg Corp. † | 39,400 | 656,798 |
|
| Health Management Associates, Inc. Class A † | 144,448 | 902,800 |
|
| Providence Service Corp. (The) † | 65,400 | 884,208 |
|
| Triple-S Management Corp. Class B (Puerto Rico) † | 52,400 | 834,208 |
|
| | | 3,609,936 |
| Homebuilding (0.3%) | | |
| M/I Homes, Inc. † | 56,428 | 532,116 |
|
| | | 532,116 |
| Insurance (7.2%) | | |
| Allied World Assurance Company Holdings, Ltd. (Bermuda) | 30,300 | 1,526,211 |
|
| American Equity Investment Life Holding Co. | 91,867 | 871,818 |
|
| Arch Capital Group, Ltd. † S | 17,500 | 1,396,500 |
|
| Assured Guaranty, Ltd. (Bermuda) | 43,400 | 670,530 |
|
| Employers Holdings, Inc. | 62,928 | 922,524 |
|
| Hanover Insurance Group, Inc. (The) | 42,300 | 1,834,974 |
|
| HCC Insurance Holdings, Inc. | 45,900 | 1,158,057 |
|
| Horace Mann Educators Corp. | 35,008 | 574,131 |
|
| Infinity Property & Casualty Corp. | 28,800 | 1,334,880 |
|
| Reinsurance Group of America, Inc. Class A | 19,800 | 866,052 |
|
| | | 11,155,677 |
| Investment banking/Brokerage (2.5%) | | |
| Cowen Group, Inc. † | 143,054 | 490,675 |
|
| E*Trade Financial Corp. † | 52,080 | 646,313 |
|
| Investment Technology Group, Inc. † | 48,300 | 641,907 |
|
| SWS Group, Inc. | 50,039 | 360,781 |
|
| TradeStation Group, Inc. † | 207,691 | 1,219,146 |
|
| Waddell & Reed Financial, Inc. Class A | 24,800 | 570,648 |
|
| | | 3,929,470 |
24
| | |
| COMMON STOCKS (96.5%)* cont. | Shares | Value |
|
| Machinery (2.3%) | | |
| Applied Industrial Technologies, Inc. | 34,200 | $916,560 |
|
| Cascade Corp. | 27,423 | 856,146 |
|
| DXP Enterprises, Inc. † | 56,900 | 1,032,735 |
|
| H&E Equipment Services, Inc. † | 117,600 | 800,856 |
|
| | | 3,606,297 |
| Manufacturing (1.8%) | | |
| EnPro Industries, Inc. † | 25,100 | 685,481 |
|
| Exide Technologies † | 171,300 | 717,747 |
|
| General Cable Corp. † | 37,000 | 823,250 |
|
| Titan International, Inc. S | 51,046 | 517,606 |
|
| | | 2,744,084 |
| Medical technology (1.3%) | | |
| Cutera, Inc. † | 95,305 | 670,947 |
|
| Palomar Medical Technologies, Inc. † | 81,317 | 718,842 |
|
| Vital Images, Inc. † | 54,300 | 685,266 |
|
| | | 2,075,055 |
| Metals (0.6%) | | |
| Gibraltar Industries, Inc. † | 27,862 | 211,751 |
|
| Horsehead Holding Corp. † | 82,328 | 652,038 |
|
| | | 863,789 |
| Natural gas utilities (2.3%) | | |
| Energen Corp. | 35,600 | 1,519,408 |
|
| Southwest Gas Corp. | 64,500 | 2,028,525 |
|
| | | 3,547,933 |
| Oil and gas (4.2%) | | |
| Approach Resources, Inc. † | 72,967 | 634,813 |
|
| Cabot Oil & Gas Corp. Class A | 27,400 | 762,816 |
|
| Penn Virginia Corp. | 24,900 | 347,106 |
|
| Petroquest Energy, Inc. † | 60,355 | 360,923 |
|
| Pioneer Drilling Co. † | 140,225 | 762,824 |
|
| Rex Energy Corp. † | 86,700 | 980,577 |
|
| Rosetta Resources, Inc. † | 63,000 | 1,241,100 |
|
| SM Energy Co. | 36,600 | 1,390,434 |
|
| | | 6,480,593 |
| Pharmaceuticals (0.7%) | | |
| Questcor Pharmaceuticals, Inc. † | 119,800 | 1,160,862 |
|
| | | 1,160,862 |
| Publishing (0.3%) | | |
| McClatchy Co. (The) Class A † S | 167,600 | 449,168 |
|
| | | 449,168 |
| Railroads (0.3%) | | |
| RailAmerica, Inc. † | 40,800 | 407,184 |
|
| | | 407,184 |
| Real estate (8.5%) | | |
| Apartment Investment & Management Co. Class A R | 38,100 | 778,764 |
|
| Chimera Investment Corp. R | 338,200 | 1,329,126 |
|
| Colony Financial, Inc. R | 46,108 | 817,034 |
|
| DCT Industrial Trust, Inc. R | 147,300 | 681,999 |
|
| Entertainment Properties Trust R | 20,900 | 900,581 |
|
| Essex Property Trust, Inc. R S | 5,100 | 539,427 |
|
| Glimcher Realty Trust R | 46,200 | 274,428 |
|
| Government Properties Income Trust R | 38,100 | 978,027 |
|
25
| | |
| COMMON STOCKS (96.5%)* cont. | Shares | Value |
|
| Real estate cont. | | |
| Hudson Pacific Properties, Inc. † R | 20,833 | $343,745 |
|
| LaSalle Hotel Properties R | 28,200 | 594,174 |
|
| MFA Financial, Inc. R | 85,960 | 633,525 |
|
| National Health Investors, Inc. R | 24,600 | 1,031,232 |
|
| National Retail Properties, Inc. R | 15,200 | 370,272 |
|
| One Liberty Properties, Inc. R | 37,098 | 531,985 |
|
| PS Business Parks, Inc. R | 14,800 | 832,796 |
|
| Retail Opportunity Investments Corp. | 89,200 | 842,940 |
|
| Tanger Factory Outlet Centers, Inc. R | 10,100 | 466,822 |
|
| Taubman Centers, Inc. R | 16,200 | 672,138 |
|
| Winthrop Realty Trust R | 35,837 | 490,967 |
|
| | | 13,109,982 |
| Restaurants (1.3%) | | |
| DineEquity, Inc. † | 21,500 | 686,280 |
|
| Domino’s Pizza, Inc. † | 99,329 | 1,273,398 |
|
| | | 1,959,678 |
| Retail (6.3%) | | |
| Charming Shoppes, Inc. † | 197,900 | 666,923 |
|
| Dress Barn, Inc. † | 36,200 | 754,770 |
|
| Express, Inc. † S | 46,988 | 639,507 |
|
| Gordmans Stores, Inc. † | 64,000 | 684,160 |
|
| Haverty Furniture Cos., Inc. | 21,200 | 203,732 |
|
| Iconix Brand Group, Inc. † | 70,200 | 1,069,497 |
|
| Jos. A. Bank Clothiers, Inc. † S | 21,900 | 800,007 |
|
| Kenneth Cole Productions, Inc. Class A † | 62,731 | 757,790 |
|
| Lithia Motors, Inc. Class A | 79,900 | 610,436 |
|
| OfficeMax, Inc. † | 55,100 | 536,674 |
|
| Pier 1 Imports, Inc. † | 75,554 | 460,879 |
|
| Stage Stores, Inc. | 70,200 | 783,432 |
|
| Steven Madden, Ltd. † | 21,894 | 753,810 |
|
| Talbots, Inc. (The) † | 96,482 | 962,890 |
|
| | | 9,684,507 |
| Schools (1.1%) | | |
| Career Education Corp. † | 38,500 | 674,905 |
|
| Grand Canyon Education, Inc. † | 29,795 | 509,197 |
|
| Lincoln Educational Services Corp. † | 42,500 | 464,100 |
|
| | | 1,648,202 |
| Semiconductor (2.0%) | | |
| Atmel Corp. † | 188,200 | 1,091,560 |
|
| Cymer, Inc. † | 27,699 | 815,182 |
|
| Ultra Clean Holdings, Inc. † | 134,937 | 1,142,916 |
|
| | | 3,049,658 |
| Shipping (0.5%) | | |
| Scorpio Tankers, Inc. (Monaco) † | 68,500 | 741,170 |
|
| | | 741,170 |
| Technology (0.5%) | | |
| Electro Scientific Industries, Inc. † | 73,918 | 802,010 |
|
| | | 802,010 |
26
| | |
| COMMON STOCKS (96.5%)* cont. | Shares | Value |
|
| | | |
| Technology services (1.8%) | | |
| BancTec, Inc. 144A F † | 160,833 | $884,582 |
|
| CSG Systems International, Inc. † | 57,800 | 1,057,740 |
|
| United Online, Inc. | 13,508 | 66,594 |
|
| Web.com Group, Inc. † | 190,487 | 832,428 |
|
| | | 2,841,344 |
| Telecommunications (2.1%) | | |
| Cogent Communications Group, Inc. † | 104,500 | 911,240 |
|
| Earthlink, Inc. | 90,705 | 776,435 |
|
| NTELOS Holdings Corp. | 62,700 | 1,014,486 |
|
| TeleNav, Inc. † | 97,435 | 545,636 |
|
| | | 3,247,797 |
| Textiles (0.6%) | | |
| Phillips-Van Heusen Corp. | 22,064 | 1,007,884 |
|
| | | 1,007,884 |
| Toys (0.4%) | | |
| RC2 Corp. † | 37,905 | 697,831 |
|
| | | 697,831 |
| Trucks and parts (2.7%) | | |
| American Axle & Manufacturing Holdings, Inc. † | 81,300 | 680,481 |
|
| ArvinMeritor, Inc. † | 81,800 | 1,069,126 |
|
| Douglas Dynamics, Inc. † | 37,185 | 422,422 |
|
| Modine Manufacturing Co. † | 111,000 | 1,103,340 |
|
| Tenneco Automotive, Inc. † | 40,300 | 996,215 |
|
| | | 4,271,584 |
| | | |
| Total common stocks (cost $145,472,554) | | $149,528,476 |
| |
| |
| INVESTMENT COMPANIES (0.9%)* | Shares | Value |
|
| Hercules Technology Growth Capital, Inc. | 154,917 | $1,418,265 |
|
| Total investment companies (cost $1,553,237) | | $1,418,265 |
| |
| |
| SHORT-TERM INVESTMENTS (6.5%)* | Shares | Value |
|
| Putnam Cash Collateral Pool, LLC 0.19% d | 5,994,500 | $5,994,500 |
|
| Putnam Money Market Liquidity Fund 0.15% e | 4,132,901 | 4,132,901 |
|
| Total short-term investments (cost $10,127,401) | | $10,127,401 |
| |
| |
| TOTAL INVESTMENTS | | |
|
| Total investments (cost $157,153,192) | | $161,074,142 |
Notes to the fund’s portfolio
Unless noted otherwise, the notes to the fund’s portfolio are for the close of the fund’s reporting period, which ran from March 1, 2010 through August 31, 2010 (the reporting period).
* Percentages indicated are based on net assets of $154,938,190.
† Non-income-producing security.
d See Note 1 to the financial statements regarding securities lending. The rate quoted in the security description is the annualized 7-day yield of the fund at the close of the reporting period.
e See Note 5 to the financial statements regarding investments in Putnam Money Market Liquidity Fund. The rate quoted in the security description is the annualized 7-day yield of the fund at the close of the reporting period.
27
F Is valued at fair value following procedures approved by the Trustees. Securities may be classified as Level 2 or Level 3 for Accounting Standards Codification ASC 820 based on the securities valuation inputs.
R Real Estate Investment Trust.
S Securities on loan, in part or in entirety, at the close of the reporting period.
144A after the name of an issuer represents securities exempt from registration under Rule 144A under the Securities Act of 1933, as amended. These securities may be resold in transactions exempt from registration, normally to qualified institutional buyers.
ASC 820 establishes a three-level hierarchy for disclosure of fair value measurements. The valuation hierarchy is based upon the transparency of inputs to the valuation of the fund’s investments. The three levels are defined as follows:
Level 1 — Valuations based on quoted prices for identical securities in active markets.
Level 2 — Valuations based on quoted prices in markets that are not active or for which all significant inputs are observable, either directly or indirectly.
Level 3 — Valuations based on inputs that are unobservable and significant to the fair value measurement.
The following is a summary of the inputs used to value the fund’s net assets as of the close of the reporting period:
| | | | |
| | | Valuation inputs | |
|
| Investments in securities: | Level 1 | Level 2 | Level 3 |
|
| Common stocks: | | | |
|
| Basic materials | $11,549,160 | $— | $— |
|
| Capital goods | 12,571,793 | — | — |
|
| Communication services | 3,247,797 | — | — |
|
| Consumer cyclicals | 16,547,676 | — | — |
|
| Consumer staples | 9,535,325 | — | — |
|
| Energy | 9,362,322 | — | — |
|
| Financials | 48,196,189 | — | 458,975 |
|
| Health care | 7,970,691 | — | — |
|
| Technology | 15,350,412 | — | 884,582 |
|
| Transportation | 2,706,123 | — | — |
|
| Utilities and power | 11,147,431 | — | — |
|
| Total common stocks | 148,184,919 | — | 1,343,557 |
| | | | |
| Investment companies | 1,418,265 | — | — |
|
| Short-term investments | 4,132,901 | 5,994,500 | — |
|
| Totals by level | $153,736,085 | $5,994,500 | $1,343,557 |
At the start and/or close of the reporting period, Level 3 investments in securities were not considered a significant portion of the fund’s portfolio.
The accompanying notes are an integral part of these financial statements.
28
Statement of assets and liabilities 8/31/10 (Unaudited)
| | |
| ASSETS | | |
|
| Investment in securities, at value, including $5,790,477 of securities on loan (Note 1): | | |
| Unaffiliated issuers (identified cost $147,025,791) | $150,946,741 |
| Affiliated issuers (identified cost $10,127,401) (Notes 1 and 5) | | 10,127,401 |
|
| Dividends, interest and other receivables | | 201,732 |
|
| Receivable for shares of the fund sold | | 32,824 |
|
| Receivable for investments sold | | 2,663,914 |
|
| Total assets | 163,972,612 |
| |
| LIABILITIES | | |
|
| Payable for investments purchased | | 2,440,176 |
|
| Payable for shares of the fund repurchased | | 224,699 |
|
| Payable for compensation of Manager (Note 2) | | 87,515 |
|
| Payable for investor servicing fees (Note 2) | | 43,081 |
|
| Payable for custodian fees (Note 2) | | 8,328 |
|
| Payable for Trustee compensation and expenses (Note 2) | | 90,167 |
|
| Payable for administrative services (Note 2) | | 1,705 |
|
| Payable for distribution fees (Note 2) | | 70,689 |
|
| Collateral on securities loaned, at value (Note 1) | | 5,994,500 |
|
| Other accrued expenses | | 73,562 |
|
| Total liabilities | | 9,034,422 |
| |
| Net assets | $154,938,190 |
|
| |
| REPRESENTED BY | | |
|
| Paid-in capital (Unlimited shares authorized) (Notes 1 and 4) | $234,088,776 |
|
| Undistributed net investment income (Note 1) | | 115,810 |
|
| Accumulated net realized loss on investments | (83,187,346) |
|
| Net unrealized appreciation of investments | | 3,920,950 |
|
| Total — Representing net assets applicable to capital shares outstanding | $154,938,190 |
| |
| COMPUTATION OF NET ASSET VALUE AND OFFERING PRICE | | |
|
| Net asset value and redemption price per class A share ($127,593,726 divided by 16,401,434 shares) | $7.78 |
|
| Offering price per class A share (100/94.25 of $7.78)* | | $8.25 |
|
| Net asset value and offering price per class B share ($4,739,645 divided by 696,281 shares)** | | $6.81 |
|
| Net asset value and offering price per class C share ($8,835,416 divided by 1,294,930 shares)** | | $6.82 |
|
| Net asset value and redemption price per class M share ($1,241,586 divided by 171,641 shares) | | $7.23 |
|
| Offering price per class M share (100/96.50 of $7.23)* | | $7.49 |
|
| Net asset value, offering price and redemption price per class R share | | |
| ($226,097 divided by 29,328 shares) | | $7.71 |
|
| Net asset value, offering price and redemption price per class Y share | | |
| ($12,301,720 divided by 1,530,212 shares) | | $8.04 |
|
* On single retail sales of less than $50,000. On sales of $50,000 or more the offering price is reduced.
** Redemption price per share is equal to net asset value less any applicable contingent deferred sales charge.
The accompanying notes are an integral part of these financial statements.
29
Statement of operations Six months ended 8/31/10 (Unaudited)
| |
| INVESTMENT INCOME | |
|
| Dividends | $1,215,066 |
|
| Interest (including interest income of $2,764 from investments in affiliated issuers) (Note 5) | 2,764 |
|
| Securities lending | 88,071 |
|
| Total investment income | 1,305,901 |
| |
| EXPENSES | |
|
| Compensation of Manager (Note 2) | 570,220 |
|
| Investor servicing fees (Note 2) | 327,030 |
|
| Custodian fees (Note 2) | 10,222 |
|
| Trustee compensation and expenses (Note 2) | 6,813 |
|
| Administrative services (Note 2) | 4,389 |
|
| Distribution fees — Class A (Note 2) | 185,754 |
|
| Distribution fees — Class B (Note 2) | 27,107 |
|
| Distribution fees — Class C (Note 2) | 50,785 |
|
| Distribution fees — Class M (Note 2) | 5,368 |
|
| Distribution fees — Class R (Note 2) | 595 |
|
| Other | 38,974 |
|
| Total expenses | 1,227,257 |
| | |
| Expense reduction (Note 2) | (16,673) |
|
| Net expenses | 1,210,584 |
| |
| Net investment income | 95,317 |
|
| |
| Net realized gain on investments (Notes 1 and 3) | 12,986,178 |
|
| Net unrealized depreciation of investments during the period | (18,856,915) |
|
| Net loss on investments | (5,870,737) |
| |
| Net decrease in net assets resulting from operations | $(5,775,420) |
|
The accompanying notes are an integral part of these financial statements.
30
Statement of changes in net assets
| | |
| INCREASE (DECREASE) IN NET ASSETS | Six months ended 8/31/10* | Year ended 2/28/10 |
|
| Operations: | | |
| Net investment income | $95,317 | $186,768 |
|
| Net realized gain (loss) on investments | 12,986,178 | (22,904,451) |
|
| Net unrealized appreciation (depreciation) of investments | (18,856,915) | 115,971,245 |
|
| Net increase (decrease) in net assets resulting from operations | (5,775,420) | 93,253,562 |
|
| Distributions to shareholders (Note 1): | | |
| From ordinary income | | |
| Net investment income | | |
|
| Class A | — | (2,599,210) |
|
| Class B | — | (71,216) |
|
| Class C | — | (126,867) |
|
| Class M | — | (20,821) |
|
| Class R | — | (3,019) |
|
| Class Y | — | (240,724) |
|
| Redemption fees (Note 1) | 12,928 | 11,341 |
|
| Decrease from capital share transactions (Note 4) | (14,290,700) | (52,466,410) |
|
| Total increase (decrease) in net assets | (20,053,192) | 37,736,636 |
| |
| NET ASSETS | | |
|
| Beginning of period | 174,991,382 | 137,254,746 |
|
| End of period (including undistributed net investment income | | |
| of $115,810 and $20,493, respectively) | $154,938,190 | $174,991,382 |
|
* Unaudited
The accompanying notes are an integral part of these financial statements.
31
Financial highlights (For a common share outstanding throughout the period)
| | | | | | | | | | | | | | |
| INVESTMENT OPERATIONS: | LESS DISTRIBUTIONS: | RATIOS AND SUPPLEMENTAL DATA: |
|
| | | | | | | | | | | | | Ratio | Ratio | |
| | | | Net realized | | | From | | | | | | of expenses | of net investment | |
| | Net asset value, | | and unrealized | Total from | From | net realized | | | | Total return | Net assets, | to average | income (loss) | Portfolio |
| | beginning | Net investment | gain (loss) | investment | net investment | gain on | Total | Redemption | Net asset value, | at net asset | end of period | net assets | to average | turnover |
| Period ended | of period | income (loss) a | on investments | operations | income | investments | distributions | fees b`` | end of period | value (%) c | (in thousands) | (%) d | net assets (%) | (%) |
|
| Class A | | | | | | | | | | | | | | |
| August 31, 2010** | $8.10 | .01 | (.33) | (.32) | — | — | — | — | $7.78 | (3.95)* | $127,594 | .66* | .08* | 30.78* |
| February 28, 2010 | 4.69 | .01 | 3.54 | 3.55 | (.14) | — | (.14) | — | 8.10 | 75.74 | 144,577 | 1.46 e | .15 e | 79.12 |
| February 28, 2009 | 10.21 | .09 | (5.16) | (5.07) | — | (.45) | (.45) | — | 4.69 | (50.44) | 111,011 | 1.47 e | 1.07 e | 52.60 |
| February 29, 2008 | 16.62 | .10 | (3.57) | (3.47) | (.09) | (2.85) | (2.94) | — | 10.21 | (22.54) | 342,770 | 1.37 e | .66 e | 49.22 |
| February 28, 2007 | 18.17 | .08 f | 1.75 | 1.83 | (.06) | (3.32) | (3.38) | — | 16.62 | 10.32 f | 522,839 | 1.27 e,f | .46 e,f | 47.18 |
| February 28, 2006 | 19.11 | .05 g | 2.80 | 2.85 | — | (3.79) | (3.79) | — | 18.17 | 16.24 | 476,251 | 1.25 e | .28 e,g | 28.65 |
|
| Class B | | | | | | | | | | | | | | |
| August 31, 2010** | $7.11 | (.02) | (.28) | (.30) | — | — | — | — | $6.81 | (4.22)* | $4,740 | 1.04* | (.30)* | 30.78* |
| February 28, 2010 | 4.13 | (.04) | 3.10 | 3.06 | (.08) | — | (.08) | — | 7.11 | 74.28 | 5,494 | 2.21 e | (.59) e | 79.12 |
| February 28, 2009 | 9.15 | .02 | (4.59) | (4.57) | — | (.45) | (.45) | — | 4.13 | (50.82) | 4,973 | 2.22 e | .31 e | 52.60 |
| February 29, 2008 | 15.24 | (.04) | (3.20) | (3.24) | — | (2.85) | (2.85) | — | 9.15 | (23.06) | 19,600 | 2.12 e | (.16) e | 49.22 |
| February 28, 2007 | 16.98 | (.05) f | 1.63 | 1.58 | — | (3.32) | (3.32) | — | 15.24 | 9.52 f | 147,307 | 2.02 e,f | (.29) e,f | 47.18 |
| February 28, 2006 | 18.22 | (.08) g | 2.63 | 2.55 | — | (3.79) | (3.79) | — | 16.98 | 15.35 | 242,985 | 2.00 e | (.47) e,g | 28.65 |
|
| Class C | | | | | | | | | | | | | | |
| August 31, 2010** | $7.13 | (.02) | (.29) | (.31) | — | — | — | — | $6.82 | (4.35)* | $8,835 | 1.04* | (.30)* | 30.78* |
| February 28, 2010 | 4.14 | (.04) | 3.12 | 3.08 | (.09) | — | (.09) | — | 7.13 | 74.49 | 9,778 | 2.21 e | (.60) e | 79.12 |
| February 28, 2009 | 9.18 | .02 | (4.61) | (4.59) | — | (.45) | (.45) | — | 4.14 | (50.88) | 7,166 | 2.22 e | .32 e | 52.60 |
| February 29, 2008 | 15.28 | (.01) | (3.24) | (3.25) | — | (2.85) | (2.85) | — | 9.18 | (23.08) | 19,800 | 2.12 e | (.10) e | 49.22 |
| February 28, 2007 | 17.02 | (.05) f | 1.63 | 1.58 | — | (3.32) | (3.32) | — | 15.28 | 9.51 f | 38,799 | 2.02 e,f | (.29) e,f | 47.18 |
| February 28, 2006 | 18.25 | (.08) g | 2.64 | 2.56 | — | (3.79) | (3.79) | — | 17.02 | 15.39 | 43,993 | 2.00 e | (.47) e,g | 28.65 |
|
| Class M | | | | | | | | | | | | | | |
| August 31, 2010** | $7.55 | (.01) | (.31) | (.32) | — | — | — | — | $7.23 | (4.24)* | $1,242 | .91* | (.17)* | 30.78* |
| February 28, 2010 | 4.38 | (.02) | 3.30 | 3.28 | (.11) | — | (.11) | — | 7.55 | 74.90 | 1,375 | 1.96 e | (.35) e | 79.12 |
| February 28, 2009 | 9.64 | .05 | (4.86) | (4.81) | — | (.45) | (.45) | — | 4.38 | (50.73) | 954 | 1.97 e | .55 e | 52.60 |
| February 29, 2008 | 15.83 | .02 | (3.36) | (3.34) | — | (2.85) | (2.85) | — | 9.64 | (22.83) | 3,493 | 1.87 e | .16 e | 49.22 |
| February 28, 2007 | 17.49 | (.01) f | 1.67 | 1.66 | — | (3.32) | (3.32) | — | 15.83 | 9.71 f | 7,322 | 1.77 e,f | (.04) e,f | 47.18 |
| February 28, 2006 | 18.61 | (.04) g | 2.71 | 2.67 | — | (3.79) | (3.79) | — | 17.49 | 15.70 | 7,799 | 1.75 e | (.22) e,g | 28.65 |
|
| Class R | | | | | | | | | | | | | | |
| August 31, 2010** | $8.04 | — b | (.33) | (.33) | — | — | — | — | $7.71 | (4.11)* | $226 | .79* | (.05)* | 30.78* |
| February 28, 2010 | 4.66 | (.01) | 3.52 | 3.51 | (.13) | — | (.13) | — | 8.04 | 75.43 | 213 | 1.71 e | (.12) e | 79.12 |
| February 28, 2009 | 10.18 | .06 | (5.13) | (5.07) | — | (.45) | (.45) | — | 4.66 | (50.59) | 76 | 1.72 e | .75 e | 52.60 |
| February 29, 2008† | 16.83 | .05 | (3.74) | (3.69) | (.11) | (2.85) | (2.96) | — | 10.18 | (23.62)* | 29 | 1.49* e | .39* e | 49.22 |
|
| Class Y | | | | | | | | | | | | | | |
| August 31, 2010** | $8.36 | .02 | (.34) | (.32) | — | — | — | — | $8.04 | (3.83)* | $12,302 | .54* | .20* | 30.78* |
| February 28, 2010 | 4.84 | .03 | 3.65 | 3.68 | (.16) | — | (.16) | — | 8.36 | 76.08 | 13,554 | 1.21 e | .42 e | 79.12 |
| February 28, 2009 | 10.48 | .12 | (5.31) | (5.19) | — | (.45) | (.45) | — | 4.84 | (50.28) | 13,074 | 1.22 e | 1.32 e | 52.60 |
| February 29, 2008 | 16.97 | .14 | (3.64) | (3.50) | (.14) | (2.85) | (2.99) | — | 10.48 | (22.30) | 30,898 | 1.12 e | .91 e | 49.22 |
| February 28, 2007 | 18.49 | .13 f | 1.78 | 1.91 | (.11) | (3.32) | (3.43) | — | 16.97 | 10.56 f | 46,876 | 1.02 e,f | .71 e,f | 47.18 |
| February 28, 2006 | 19.34 | .11 g | 2.83 | 2.94 | — | (3.79) | (3.79) | — | 18.49 | 16.53 | 48,223 | 1.00 e | .55 e,g | 28.65 |
|
See notes to financial highlights at the end of this section.
The accompanying notes are an integral part of these financial statements.
Financial highlights (Continued)
* Not annualized.
** Unaudited.
† For the period March 30, 2007 (commencement of operations) to February 29, 2008.
a Per share net investment income (loss) has been determined on the basis of the weighted average number of shares outstanding during the period.
b Amount represents less than $0.01 per share.
c Total return assumes dividend reinvestment and does not reflect the effect of sales charges.
d Includes amounts paid through expense offset and brokerage/service arrangements (Note 2).
e Reflects an involuntary contractual expense limitation in effect during the period. For periods prior to February 28, 2010, certain fund expenses were waived in connection with the fund’s investment in Putnam Prime Money Market Fund. As a result of such limitation and/or waivers, the expenses of each class reflect a reduction of the following amounts:
| |
| | Percentage of |
| | average net assets |
|
| February 28, 2010 | 0.13% |
|
| February 28. 2009 | 0.05 |
|
| February 29, 2008 | <0.01 |
|
| February 28, 2007 | <0.01 |
|
| February 28, 2006 | <0.01 |
|
f Reflects a non-recurring reimbursement from Putnam Investments relating to the calculation of certain amounts paid by the fund to Putnam in previous years for transfer agent services, which amounted to $0.01 per share and 0.04% of average net assets for the period ended February 28, 2007.
g Reflects a non-recurring accrual related to Putnam Management’s settlement with the Securities and Exchange Commission (the SEC) regarding brokerage allocation practices, which amounted to the following amounts:
| | |
| | | Percentage of |
| | Per share | average net assets |
|
| Class A | <$0.01 | 0.02% |
|
| Class B | <0.01 | 0.02 |
|
| Class C | <0.01 | 0.02 |
|
| Class M | <0.01 | 0.02 |
|
| Class Y | <0.01 | 0.02 |
|
The accompanying notes are an integral part of these financial statements.
34
Notes to financial statements 8/31/10 (Unaudited)
Note 1: Significant accounting policies
Putnam Small Cap Value Fund (the fund) is a series of Putnam Investment Funds (the Trust), a diversified Massachusetts business trust registered under the Investment Company Act of 1940, as amended, as an open-end management investment company. The fund seeks capital appreciation by investing primarily in common stocks of small U.S. companies which Putnam Investment Management, LLC (Putnam Management), the fund’s manager, an indirect wholly-owned subsidiary of Putnam Investments, LLC, believes are currently undervalued by the market.
The fund offers class A, class B, class C, class M, class R and class Y shares. Class A and class M shares are sold with a maximum front-end sales charge of 5.75% and 3.50%, respectively, and generally do not pay a contingent deferred sales charge. Class B shares, which convert to class A shares after approximately six years, do not pay a front-end sales charge and are subject to a contingent deferred sales charge, if those shares are redeemed within six years of purchase. Class C shares have a one-year 1.00% contingent deferred sales charge and do not convert to class A shares. Class R shares, which are offered to qualified employee-benefit plans, are sold at net asset value. The expenses for class A, class B, class C, class M and class R shares may differ based on the distribution fee of each class, which is identified in Note 2. Class Y shares, which are sold at net asset value, are generally subject to the same expenses as class A, class B, class C , class M and class R shares, but do not bear a distribution fee. Class Y shares are generally only available to corporate and institutional clients and clients in other approved programs.
A 1.00% redemption fee applied on certain shares that were redeemed (either by selling or exchanging into another fund) within 90 days of purchase. The redemption fee is accounted for as an addition to paid-in-capital. Effective August 2, 2010, the redemption fee may apply on any shares that are redeemed (either by selling or exchanging into another fund) within 60 days of purchase.
Investment income, realized and unrealized gains and losses and expenses of the fund are borne pro-rata based on the relative net assets of each class to the total net assets of the fund, except that each class bears expenses unique to that class (including the distribution fees applicable to such classes). Each class votes as a class only with respect to its own distribution plan or other matters on which a class vote is required by law or determined by the Trustees. If the fund were liquidated, shares of each class would receive their pro-rata share of the net assets of the fund. In addition, the Trustees declare separate dividends on each class of shares.
In the normal course of business, the fund enters into contracts that may include agreements to indemnify another party under given circumstances. The fund’s maximum exposure under these arrangements is unknown as this would involve future claims that may be, but have not yet been, made against the fund. However, the fund’s management team expects the risk of material loss to be remote.
The following is a summary of significant accounting policies consistently followed by the fund in the preparation of its financial statements. The preparation of financial statements is in conformity with accounting principles generally accepted in the United States of America and requires management to make estimates and assumptions that affect the reported amounts of assets and liabilities in the financial statements and the reported amounts of increases and decreases in net assets from operations. Actual results could differ from those estimates. Subsequent events after the Statement of assets and liabilities date through the date that the financial statements were issued have been evaluated in the preparation of the financial statements. Unless otherwise noted, the “reporting period” represents the period from March 1, 2010 through August 31, 2010.
A) Security valuation Investments for which market quotations are readily available are valued at the last reported sales price on their principal exchange, or official closing price for certain markets and are classified as Level 1 securities. If no sales are reported — as in the case of some securities traded over-the-counter — a security is valued at its last reported bid price and is generally categorized as a Level 2 security.
Many securities markets and exchanges outside the U.S. close prior to the close of the New York Stock Exchange and therefore the closing prices for securities in such markets or on such exchanges may not fully reflect events that occur after such close but before the close of the New York Stock Exchange. Accordingly, on certain days, the fund will fair value foreign equity securities taking into account multiple factors including movements in the U.S. securities markets, currency valuations and comparisons to the valuation of American Depository Receipts, exchange-traded funds and futures contracts. These securities, which will generally represent a transfer from a Level 1 to a Level 2 security, will be classified as Level 2. The number of days on which fair value prices will be used will depend on market activity and it is possible that fair value prices will be used by the fund to a significant extent. Securities quoted in foreign currencies, if any, are translated into U.S. dollars at the current exchange rate.
35
To the extent a pricing service or dealer is unable to value a security or provides a valuation that Putnam Management does not believe accurately reflects the security’s fair value, the security will be valued at fair value by Putnam Management. Certain investments, including certain restricted and illiquid securities and derivatives, are also valued at fair value following procedures approved by the Trustees. These valuations consider such factors as significant market or specific security events such as interest rate or credit quality changes, various relationships with other securities, discount rates, U.S. Treasury, U.S. swap and credit yields, index levels, convexity exposures and recovery rates. These securities are classified as Level 2 or as Level 3 depending on the priority of the significant inputs.
Such valuations and procedures are reviewed periodically by the Trustees. The fair value of securities is generally determined as the amount that the fund could reasonably expect to realize from an orderly disposition of such securities over a reasonable period of time. By its nature, a fair value price is a good faith estimate of the value of a security in a current sale and does not reflect an actual market price, which may be different by a material amount.
B) Joint trading account Pursuant to an exemptive order from the Securities and Exchange Commission (the SEC), the fund may transfer uninvested cash balances, including cash collateral received under security lending arrangements, into a joint trading account along with the cash of other registered investment companies and certain other accounts managed by Putnam Management. These balances may be invested in issues of short-term investments having maturities of up to 397 days for collateral received under security lending arrangements and up to 90 days for other cash investments.
C) Security transactions and related investment income Security transactions are recorded on the trade date (the date the order to buy or sell is executed). Gains or losses on securities sold are determined on the identified cost basis.
Interest income is recorded on the accrual basis. Dividend income, net of applicable withholding taxes, is recognized on the ex-dividend date except that certain dividends from foreign securities, if any, are recognized as soon as the fund is informed of the ex-dividend date. Non-cash dividends, if any, are recorded at the fair market value of the securities received. Dividends representing a return of capital or capital gains, if any, are reflected as a reduction of cost and/or as a realized gain.
D) Securities lending The fund may lend securities, through its agent, to qualified borrowers in order to earn additional income. The loans are collateralized by cash in an amount at least equal to the market value of the securities loaned. The market value of securities loaned is determined daily and any additional required collateral is allocated to the fund on the next business day. The risk of borrower default will be borne by the fund’s agent; the fund will bear the risk of loss with respect to the investment of the cash collateral. Income from securities lending is included in investment income on the Statement of operations. Effective August 2010, cash collateral is invested in Putnam Cash Collateral Pool, LLC, a limited liability company managed by an affiliate of Putnam Management and is valued at its closing net asset value each business day. There are no management fees charged by Putnam Cash Collateral Pool, LLC. At the close of the reporting period, the value of securities loaned amounted to $5,790,477 and the fund received cash collateral of $5,994,500.
E) Interfund lending Effective July 2010, the fund, along with other Putnam funds, may participate in an interfund lending program pursuant to an exemptive order issued by the SEC. This program allows the fund to borrow from or lend to other Putnam funds that permit such transactions. Interfund lending transactions are subject to each fund’s investment policies and borrowing and lending limits. Interest earned or paid on the interfund lending transaction will be based on the average of certain current market rates. During the reporting period, the fund did not utilize the program.
F) Line of credit Effective July 2010, the fund participates, along with other Putnam funds, in a $285 million unsecured committed line of credit and a $165 million unsecured uncommitted line of credit, both provided by State Street Bank and Trust Company (State Street). Borrowings may be made for temporary or emergency purposes, including the funding of shareholder redemption requests and trade settlements. Interest is charged to the fund based on the fund’s borrowing at a rate equal to the Federal Funds rate plus 1.25% for the committed line of credit and the Federal Funds rate plus 1.30% for the uncommitted line of credit. A closing fee equal to 0.03% of the committed line of credit and $100,000 for the uncommitted line of credit has been paid by the participating funds. In addition, a commitment fee of 0.15% per annum on any unutilized portion of the committed line of credit is allocated to the participating fund s based on their relative net assets and paid quarterly. During the reporting period, the fund had no borrowings against these arrangements.
36
G) Federal taxes It is the policy of the fund to distribute all of its taxable income within the prescribed time period and otherwise comply with the provisions of the Internal Revenue Code of 1986, as amended (the Code), applicable to regulated investment companies. It is also the intention of the fund to distribute an amount sufficient to avoid imposition of any excise tax under Section 4982 of the Code. The fund is subject to the provisions of Accounting Standards Codification ASC 740 Income Taxes (ASC 740). ASC 740 sets forth a minimum threshold for financial statement recognition of the benefit of a tax position taken or expected to be taken in a tax return. The fund did not have a liability to record for any unrecognized tax benefits in the accompanying financial statements. No provision has been made for federal taxes on inco me, capital gains or unrealized appreciation on securities held nor for excise tax on income and capital gains. Each of the fund’s federal tax returns for the prior three fiscal years remains subject to examination by the Internal Revenue Service.
At February 28, 2010, the fund had a capital loss carryover of $92,806,050 available to the extent allowed by the Code to offset future net capital gain, if any. The amounts of the carryovers and the expiration dates are:
| | |
| Loss carryover | Expiration |
|
| $4,439,974 | | February 28, 2017 |
|
| 88,366,076 | | February 28, 2018 |
|
The aggregate identified cost on a tax basis is $160,520,663, resulting in gross unrealized appreciation and depreciation of $19,796,527 and $19,243,048, respectively, or net unrealized appreciation of $553,479.
H) Distributions to shareholders Distributions to shareholders from net investment income are recorded by the fund on the ex-dividend date. Distributions from capital gains, if any, are recorded on the ex-dividend date and paid at least annually. The amount and character of income and gains to be distributed are determined in accordance with income tax regulations, which may differ from generally accepted accounting principles. Dividend sources are estimated at the time of declaration. Actual results may vary. Any non-taxable return of capital cannot be determined until final tax calculations are completed after the end of the fund’s fiscal year. Reclassifications are made to the fund’s capital accounts to reflect income and gains available for distribution (or available capital loss carryovers) under income tax regulations.
I) Expenses of the Trust Expenses directly charged or attributable to any fund will be paid from the assets of that fund. Generally, expenses of the Trust will be allocated among and charged to the assets of each fund on a basis that the Trustees deem fair and equitable, which may be based on the relative assets of each fund or the nature of the services performed and relative applicability to each fund.
Note 2: Management fee, administrative services and other transactions
The fund pays Putnam Management a management fee (based on the fund’s average net assets and computed and paid monthly) at annual rates that may vary based on the average of the aggregate net assets of most open-end funds, as defined in the fund’s management contract, sponsored by Putnam Management. Such annual rates may vary as follows: 0.78% of the first $5 billion, 0.73% of the next $5 billion, 0.68% of the next $10 billion, 0.63% of the next $10 billion, 0.58% of the next $50 billion, 0.56% of the next $50 billion, 0.55% of the next $100 billion and 0.545% of any excess thereafter.
Putnam Management has contractually agreed, through June 30, 2011, to waive fees or reimburse the fund’s expenses to the extent necessary to limit the cumulative expenses of the fund, exclusive of brokerage, interest, taxes, investment-related expenses, extraordinary expenses and payments under the fund’s investor servicing contract, investment management contract and distribution plans, on a fiscal year-to-date basis to an annual rate of 0.20% of the fund’s average net assets over such fiscal year-to-date period. During the reporting period, the fund’s expenses were not reduced as a result of this limit.
Putnam Management has also contractually agreed, through July 31, 2010, to limit the management fee for the fund to an annual rate of 0.642% of the fund’s average net assets. During the reporting period, the fund’s expenses were not reduced as a result of this limit.
Effective June 30, 2010, Putnam Investments Limited (PIL), an affiliate of Putnam Management, is authorized by the Trustees to manage a separate portion of the assets of the fund as determined by Putnam Management from time to time. Putnam Management pays a quarterly sub-management fee to PIL for its services at an annual rate of 0.35% of the average net assets of the portion of the fund managed by PIL.
37
The fund reimburses Putnam Management an allocated amount for the compensation and related expenses of certain officers of the fund and their staff who provide administrative services to the fund. The aggregate amount of all such reimbursements is determined annually by the Trustees.
Custodial functions for the fund’s assets are provided by State Street. Custody fees are based on the fund’s asset level, the number of its security holdings and transaction volumes.
Putnam Investor Services, Inc., an affiliate of Putnam Management, provides investor servicing agent functions to the fund. Putnam Investor Services, Inc. received fees for investor servicing, subject to certain limitations, based on the fund’s retail asset level, the number of shareholder accounts in the fund and the level of defined contribution plan assets in the fund. The amounts incurred for investor servicing agent functions during the reporting period are included in Investor servicing fees in the Statement of operations.
The fund has entered into expense offset arrangements with Putnam Investor Services, Inc. and State Street whereby Putnam Investor Services, Inc.’s and State Street’s fees are reduced by credits allowed on cash balances. The fund also reduced expenses through brokerage/service arrangements. For the reporting period, the fund’s expenses were reduced by $82 under the expense offset arrangements and by $16,591 under the brokerage/service arrangements.
Each independent Trustee of the fund receives an annual Trustee fee, of which $122, as a quarterly retainer, has been allocated to the fund, and an additional fee for each Trustees meeting attended. Trustees also are reimbursed for expenses they incur relating to their services as Trustees.
The fund has adopted a Trustee Fee Deferral Plan (the Deferral Plan) which allows the Trustees to defer the receipt of all or a portion of Trustees fees payable on or after July 1, 1995. The deferred fees remain invested in certain Putnam funds until distribution in accordance with the Deferral Plan.
The fund has adopted an unfunded noncontributory defined benefit pension plan (the Pension Plan) covering all Trustees of the fund who have served as a Trustee for at least five years and were first elected prior to 2004. Benefits under the Pension Plan are equal to 50% of the Trustee’s average annual attendance and retainer fees for the three years ended December 31, 2005. The retirement benefit is payable during a Trustee’s lifetime, beginning the year following retirement, for the number of years of service through December 31, 2006. Pension expense for the fund is included in Trustee compensation and expenses in the Statement of operations. Accrued pension liability is included in Payable for Trustee compensation and expenses in the Statement of assets and liabilities. The Trustees have terminated the Pension Plan with respect to any Trustee first elected after 2003.
The fund has adopted distribution plans (the Plans) with respect to its class A, class B, class C, class M and class R shares pursuant to Rule 12b-1 under the Investment Company Act of 1940. The purpose of the Plans is to compensate Putnam Retail Management Limited Partnership, a wholly-owned subsidiary of Putnam Investments, LLC and Putnam Retail Management GP, Inc., for services provided and expenses incurred in distributing shares of the fund. The Plans provide for payments by the fund to Putnam Retail Management Limited Partnership at an annual rate of up 0.35%, 1.00%, 1.00%, 1.00% and 1.00% of the average net assets attributable to class A, class B, class C, class M and class R shares, respectively. The Trustees have approved payment by the fund at an annual rate of 0.25%, 1.00%, 1.00%, 0.75% and 0.50% of the average net assets attributable to class A, class B, class C, class M and class R shares, respectively.
For the reporting period, Putnam Retail Management Limited Partnership, acting as underwriter, received net commissions of $7,250 and $80 from the sale of class A and class M shares, respectively, and received $3,308 and $458 in contingent deferred sales charges from redemptions of class B and class C shares, respectively.
A deferred sales charge of up to 1.00% and 0.65% is assessed on certain redemptions of class A and class M shares, respectively. For the reporting period, Putnam Retail Management Limited Partnership, acting as underwriter, received no monies on class A and class M redemptions.
Note 3: Purchases and sales of securities
During the reporting period, cost of purchases and proceeds from sales of investment securities other than short-term investments aggregated $53,003,393 and $69,286,143, respectively. There were no purchases or proceeds from sales of long-term U.S. government securities.
38
Note 4: Capital shares
At the close of the reporting period, there was an unlimited number of shares of beneficial interest authorized. Transactions in capital shares were as follows:
| | | | |
| | Six months ended 8/31/10 | Year ended 2/28/10 |
|
| Class A | Shares | Amount | Shares | Amount |
|
| Shares sold | 735,984 | $6,395,247 | 2,398,929 | $16,074,200 |
|
| Shares issued in connection with | | | | |
| reinvestment of distributions | — | — | 319,982 | 2,479,857 |
|
| | 735,984 | 6,395,247 | 2,718,911 | 18,554,057 |
|
| Shares repurchased | (2,186,743) | (18,693,122) | (8,532,799) | (58,160,807) |
|
| Net decrease | (1,450,759) | $(12,297,875) | (5,813,888) | $(39,606,750) |
|
| |
| | Six months ended 8/31/10 | Year ended 2/28/10 |
|
| Class B | Shares | Amount | Shares | Amount |
|
| Shares sold | 93,769 | $706,314 | 219,258 | $1,309,205 |
|
| Shares issued in connection with | | | | |
| reinvestment of distributions | — | — | 10,100 | 68,880 |
|
| | 93,769 | 706,314 | 229,358 | 1,378,085 |
|
| Shares repurchased | (169,912) | (1,287,632) | (661,214) | (3,965,126) |
|
| Net decrease | (76,143) | $(581,318) | (431,856) | $(2,587,041) |
|
| |
| | Six months ended 8/31/10 | Year ended 2/28/10 |
|
| Class C | Shares | Amount | Shares | Amount |
|
| Shares sold | 65,849 | $510,474 | 117,691 | $695,560 |
|
| Shares issued in connection with | | | | |
| reinvestment of distributions | — | — | 16,197 | 110,785 |
|
| | 65,849 | 510,474 | 133,888 | 806,345 |
|
| Shares repurchased | (142,300) | (1,073,002) | (492,265) | (2,923,564) |
|
| Net decrease | (76,451) | $(562,528) | (358,377) | $(2,117,219) |
|
| |
| | Six months ended 8/31/10 | Year ended 2/28/10 |
|
| Class M | Shares | Amount | Shares | Amount |
|
| Shares sold | 8,761 | $73,522 | 27,353 | $162,428 |
|
| Shares issued in connection with | | | | |
| reinvestment of distributions | — | — | 2,693 | 19,470 |
|
| | 8,761 | 73,522 | 30,046 | 181,898 |
|
| Shares repurchased | (19,303) | (156,594) | (65,670) | (405,361) |
|
| Net decrease | (10,542) | $(83,072) | (35,624) | $(223,463) |
|
| |
| | Six months ended 8/31/10 | Year ended 2/28/10 |
|
| Class R | Shares | Amount | Shares | Amount |
|
| Shares sold | 5,542 | $47,225 | 20,897 | $136,359 |
|
| Shares issued in connection with | | | | |
| reinvestment of distributions | — | — | 393 | 3,019 |
|
| | 5,542 | 47,225 | 21,290 | 139,378 |
|
| Shares repurchased | (2,661) | (22,523) | (11,253) | (69,796) |
|
| Net increase | 2,881 | $24,702 | 10,037 | $69,582 |
|
39
| | | | |
| | Six months ended 8/31/10 | Year ended 2/28/10 |
|
| Class Y | Shares | Amount | Shares | Amount |
|
| Shares sold | 245,926 | $2,200,748 | 569,760 | $3,881,720 |
|
| Shares issued in connection with | | | | |
| reinvestment of distributions | — | — | 28,635 | 228,796 |
|
| | 245,926 | 2,200,748 | 598,395 | 4,110,516 |
|
| Shares repurchased | (337,330) | (2,991,357) | (1,679,904) | (12,112,035) |
|
| Net decrease | (91,404) | $(790,609) | (1,081,509) | $(8,001,519) |
|
Note 5: Investment in Putnam Money Market Liquidity Fund
The fund invested in Putnam Money Market Liquidity Fund, an open-end management investment company managed by Putnam Management. Investments in Putnam Money Market Liquidity Fund are valued at its closing net asset value each business day. Income distributions earned by the fund are recorded as interest income in the Statement of operations and totaled $2,764 for the reporting period. During the reporting period, cost of purchases and proceeds of sales of investments in Putnam Money Market Liquidity Fund aggregated $26,324,963 and $25,575,193, respectively. Management fees charged to Putnam Money Market Liquidity Fund have been waived by Putnam Management.
Note 6: Regulatory matters and litigation
In late 2003 and 2004, Putnam Management settled charges brought by the SEC and the Massachusetts Securities Division in connection with excessive short-term trading in Putnam funds. Distribution of payments from Putnam Management to certain open-end Putnam funds and their shareholders is expected to be completed in the next several months. These allegations and related matters have served as the general basis for certain lawsuits, including purported class action lawsuits against Putnam Management and, in a limited number of cases, some Putnam funds. Putnam Management believes that these lawsuits will have no material adverse effect on the funds or on Putnam Management’s ability to provide investment management services. In addition, Putnam Management has agreed to bear any costs incurred by the Putnam funds as a result of these matters.
Note 7: Market and credit risk
In the normal course of business, the fund trades financial instruments and enters into financial transactions where risk of potential loss exists due to changes in the market (market risk) or failure of the contracting party to the transaction to perform (credit risk). The fund may be exposed to additional credit risk that an institution or other entity with which the fund has unsettled or open transactions will default.
40
Services for shareholders
Investor services
Systematic investment plan Tell us how much you wish to invest regularly — weekly, semimonthly, or monthly — and the amount you choose will be transferred automatically from your checking or savings account. There’s no additional fee for this service, and you can suspend it at any time. This plan may be a great way to save for college expenses or to plan for your retirement.
Please note that regular investing does not guarantee a profit or protect against loss in a declining market. Before arranging a systematic investment plan, consider your financial ability to continue making purchases in periods when prices are low.
Systematic exchange You can make regular transfers from one Putnam fund to another Putnam fund. There are no additional fees for this service, and you can cancel or change your options at any time.
Dividends PLUS You can choose to have the dividend distributions from one of your Putnam funds automatically reinvested in another Putnam fund at no additional charge.
Free exchange privilege You can exchange money between Putnam funds free of charge, as long as they are the same class of shares. A signature guarantee is required if you are exchanging more than $500,000. The fund reserves the right to revise or terminate the exchange privilege.
Reinstatement privilege If you’ve sold Putnam shares or received a check for a dividend or capital gain, you may reinvest the proceeds with Putnam within 90 days of the transaction and they will be reinvested at the fund’s current net asset value — with no sales charge. However, reinstatement of class B shares may have special tax consequences. Ask your financial or tax representative for details.
Check-writing service You have ready access to many Putnam accounts. It’s as simple as writing a check, and there are no special fees or service charges. For more information about the check-writing service, call Putnam or visit our Web site.
Dollar cost averaging When you’re investing for long-term goals, it’s time, not timing, that counts. Investing on a systematic basis is a better strategy than trying to figure out when the markets will go up or down. This means investing the same amount of money regularly over a long period. This method of investing is called dollar cost averaging. When a fund’s share price declines, your investment dollars buy more shares at lower prices. When it increases, they buy fewer shares. Over time, you will pay a lower average price per share.
For more information
Visit the Individual Investors section at putnam.com A secure section of our Web site contains complete information on your account, including balances and transactions, updated daily. You may also conduct transactions, such as exchanges, additional investments, and address changes. Log on today to get your password.
Call us toll free at 1-800-225-1581 Ask a helpful Putnam representative or your financial advisor for details about any of these or other services, or see your prospectus.
41
The Putnam family of funds
The following is a list of Putnam’s open-end mutual funds offered to the public. Investors should carefully consider the investment objective, risks, charges, and expenses of a fund before investing. For a prospectus, or a summary prospectus if available, containing this and other information for any Putnam fund or product, call your financial advisor at 1-800-225-1581 and ask for a prospectus. Please read the prospectus carefully before investing.
| |
| Growth | Value |
| Growth Opportunities Fund | Convertible Securities Fund |
| International Growth Fund | Prior to September 30, 2010, the fund was known as |
| Prior to January 1, 2010, the fund was known as | Putnam Convertible Income-Growth Trust |
| Putnam International New Opportunities Fund | Equity Income Fund |
| Multi-Cap Growth Fund | George Putnam Balanced Fund |
| Prior to September 1, 2010, the fund was known as | Prior to September 30, 2010, the fund was known as |
| Putnam New Opportunities Fund | The George Putnam Fund of Boston |
| Small Cap Growth Fund | The Putnam Fund for Growth and Income |
| Voyager Fund | International Value Fund |
| | Prior to January 1, 2010, the fund was known as |
| Blend | Putnam International Growth and Income Fund |
| Asia Pacific Equity Fund | Multi-Cap Value Fund |
| Capital Opportunities Fund | Prior to September 1, 2010, the fund was known as |
| Capital Spectrum Fund | Putnam Mid Cap Value Fund |
| Emerging Markets Equity Fund | Small Cap Value Fund |
| Equity Spectrum Fund | |
| Europe Equity Fund | Income |
| Global Equity Fund | American Government Income Fund |
| International Capital Opportunities Fund | Diversified Income Trust |
| International Equity Fund | Floating Rate Income Fund |
| Investors Fund | Global Income Trust |
| Multi-Cap Core Fund | High Yield Advantage Fund |
| Research Fund | High Yield Trust |
| Income Fund |
| | Money Market Fund* |
| | U.S. Government Income Trust |
* An investment in a money market fund is not insured or guaranteed by the Federal Deposit Insurance Corporation or any other government agency. Although the fund seeks to preserve the value of your investment at $1.00 per share, it is possible to lose money by investing in the fund.
42
| |
| Tax-free income | Asset allocation |
| AMT-Free Municipal Fund | Income Strategies Fund |
| Tax Exempt Income Fund | Putnam Asset Allocation Funds — three |
| Tax Exempt Money Market Fund* | investment portfolios that spread your |
| Tax-Free High Yield Fund | money across a variety of stocks, bonds, |
| and money market investments. |
| State tax-free income funds: | |
| Arizona, California, Massachusetts, Michigan, | The three portfolios: |
| Minnesota, New Jersey, New York, Ohio, | Asset Allocation: Balanced Portfolio |
| and Pennsylvania | Asset Allocation: Conservative Portfolio |
| Asset Allocation: Growth Portfolio |
| Absolute Return | |
| Absolute Return 100 Fund | Putnam RetirementReady® |
| Absolute Return 300 Fund | Putnam RetirementReady Funds — 10 |
| Absolute Return 500 Fund | investment portfolios that offer diversifi- |
| Absolute Return 700 Fund | cation among stocks, bonds, and money |
| market instruments and adjust to become |
| Global Sector | more conservative over time based on a |
| Global Consumer Fund | target date for withdrawing assets. |
| Global Energy Fund | |
| Global Financials Fund | The 10 funds: |
| Global Health Care Fund | Putnam RetirementReady 2050 Fund |
| Global Industrials Fund | Putnam RetirementReady 2045 Fund |
| Global Natural Resources Fund | Putnam RetirementReady 2040 Fund |
| Global Sector Fund | Putnam RetirementReady 2035 Fund |
| Global Technology Fund | Putnam RetirementReady 2030 Fund |
| Global Telecommunications Fund | Putnam RetirementReady 2025 Fund |
| Global Utilities Fund | Putnam RetirementReady 2020 Fund |
| Putnam RetirementReady 2015 Fund |
| Putnam RetirementReady 2010 Fund |
| Putnam RetirementReady Maturity Fund |
| | |
| | |
| | |
A short-term trading fee of 1% may apply to redemptions or exchanges from certain funds within the time period specified in the fund's prospectus.
Check your account balances and the most recent month-end performance in the Individual Investors section at putnam.com.
43
Fund information
Founded over 70 years ago, Putnam Investments was built around the concept that a balance between risk and reward is the hallmark of a well-rounded financial program. We manage over 100 funds across income, value, blend, growth, asset allocation, absolute return, and global sector categories.
| | |
| Investment Manager | Robert E. Patterson | Francis J. McNamara, III |
| Putnam Investment | George Putnam, III | Vice President and |
| Management, LLC | Robert L. Reynolds | Chief Legal Officer |
| One Post Office Square | W. Thomas Stephens | |
| Boston, MA 02109 | Richard B. Worley | Robert R. Leveille |
| | | Vice President and |
| Investment Sub-Manager | Officers | Chief Compliance Officer |
| Putnam Investments Limited | Robert L. Reynolds | |
| 57–59 St James’s Street | President | Mark C. Trenchard |
| London, England SW1A 1LD | | Vice President and |
| | Jonathan S. Horwitz | BSA Compliance Officer |
| Marketing Services | Executive Vice President, | |
| Putnam Retail Management | Principal Executive | Judith Cohen |
| One Post Office Square | Officer, Treasurer and | Vice President, Clerk and |
| Boston, MA 02109 | Compliance Liaison | Assistant Treasurer |
| |
| Custodian | Steven D. Krichmar | Michael Higgins |
| State Street Bank | Vice President and | Vice President, Senior Associate |
| and Trust Company | Principal Financial Officer | Treasurer, Assistant Clerk |
| |
| Legal Counsel | Janet C. Smith | Nancy E. Florek |
| Ropes & Gray LLP | Vice President, Principal | Vice President, Assistant Clerk, |
| Accounting Officer and | Assistant Treasurer and |
| Trustees | Assistant Treasurer | Proxy Manager |
| John A. Hill, Chairman | | |
| Jameson A. Baxter, | Susan G. Malloy | |
| Vice Chairman | Vice President and | |
| Ravi Akhoury | Assistant Treasurer | |
| Barbara M. Baumann | | |
| Charles B. Curtis | Beth S. Mazor | |
| Robert J. Darretta | Vice President | |
| Myra R. Drucker | | |
| Paul L. Joskow | James P. Pappas | |
| Kenneth R. Leibler | Vice President | |
This report is for the information of shareholders of Putnam Small Cap Value Fund. It may also be used as sales literature when preceded or accompanied by the current prospectus, the most recent copy of Putnam’s Quarterly Performance Summary, and Putnam’s Quarterly Ranking Summary. For more recent performance, please visit putnam.com. Investors should carefully consider the investment objective, risks, charges, and expenses of a fund, which are described in its prospectus. For this and other information or to request a prospectus, or a summary prospectus if available, call 1-800-225-1581 toll free. Please read the prospectus carefully before investing. The fund’s Statement of Additional Information contains additional information about the fund’s Trustees and is available without charge upon request by calling 1-800-225-1581.
44
Item 2. Code of Ethics:
Not applicable
Item 3. Audit Committee Financial Expert:
Not applicable
Item 4. Principal Accountant Fees and Services:
Not applicable
Item 5. Audit Committee of Listed Registrants
Not applicable
Item 6. Schedule of Investments:
The registrant’s schedule of investments in unaffiliated issuers is included in the report to shareholders in Item 1 above.
Item 7. Disclosure of Proxy Voting Policies and Procedures For Closed-End Management Investment Companies:
Not applicable
Item 8. Portfolio Managers of Closed-End Investment Companies
Not Applicable
Item 9. Purchases of Equity Securities by Closed-End Management Investment Companies and Affiliated Purchasers:
Not applicable
Item 10. Submission of Matters to a Vote of Security Holders:
Not applicable
Item 11. Controls and Procedures:
(a) The registrant's principal executive officer and principal financial officer have concluded, based on their evaluation of the effectiveness of the design and operation of the registrant's disclosure controls and procedures as of a date within 90 days of the filing date of this report, that the design and operation of such procedures are generally effective to provide reasonable assurance that information required to be disclosed by the registrant in this report is recorded, processed, summarized and reported within the time periods specified in the Commission's rules and forms.
(b) Changes in internal control over financial reporting: Not applicable
Item 12. Exhibits:
(a)(1) Not applicable
(a)(2) Separate certifications for the principal executive officer and principal financial officer of the registrant as required by Rule 30a-2(a) under the Investment Company Act of 1940, as amended, are filed herewith.
(b) The certifications required by Rule 30a-2(b) under the Investment Company Act of 1940, as amended, are filed herewith.
Putnam Investment Funds
By (Signature and Title):
/s/Janet C. Smith
Janet C. Smith
Principal Accounting Officer
Date: October 29, 2010
Pursuant to the requirements of the Securities Exchange Act of 1934 and the Investment Company Act of 1940, this report has been signed below by the following persons on behalf of the registrant and in the capacities and on the dates indicated.
By (Signature and Title):
/s/Jonathan S. Horwitz
Jonathan S. Horwitz
Principal Executive Officer
Date: October 29, 2010
By (Signature and Title):
/s/Steven D. Krichmar
Steven D. Krichmar
Principal Financial Officer
Date: October 29, 2010