| | | |
| UNITED STATES |
| SECURITIES AND EXCHANGE COMMISSION |
| Washington, D.C. 20549 |
| |
| FORM N-CSR |
| |
| CERTIFIED SHAREHOLDER REPORT OF REGISTERED |
| MANAGEMENT INVESTMENT COMPANIES |
| | |
| Investment Company Act file number: (811-07237) | |
| | |
| Exact name of registrant as specified in charter: | Putnam Investment Funds |
| |
| Address of principal executive offices: One Post Office Square, Boston, Massachusetts 02109 |
| | |
| Name and address of agent for service: | | Beth S. Mazor, Vice President |
| | One Post Office Square |
| | Boston, Massachusetts 02109 |
| | |
| Copy to: | | John W. Gerstmayr, Esq. |
| | Ropes & Gray LLP |
| | 800 Boylston Street |
| | Boston, Massachusetts 02199-3600 |
| | |
| Registrant’s telephone number, including area code: | (617) 292-1000 |
| | | |
| Date of fiscal year end: April 30, 2011 | | |
| |
| Date of reporting period: May 1, 2010 — October 31, 2010 |
Item 1. Report to Stockholders:
The following is a copy of the report transmitted to stockholders pursuant to Rule 30e-1 under the Investment Company Act of 1940:
Putnam Capital
Opportunities
Fund
Semiannual report
10 | 31 | 10
| | |
| Message from the Trustees | 1 | |
| |
| About the fund | 2 | |
| |
| Performance snapshot | 4 | |
| |
| Interview with your fund’s portfolio manager | 5 | |
| |
| Your fund’s performance | 10 | |
| |
| Your fund’s expenses | 12 | |
| |
| Terms and definitions | 14 | |
| |
| Trustee approval of management contract | 15 | |
| |
| Other information for shareholders | 19 | |
| |
| Financial statements | 20 | |
| |
Message from the Trustees
Dear Fellow Shareholder:
Stock markets around the world rallied strongly over the past few months, riding a rising tide of strengthening investor confidence and slowly improving economic and corporate data. Indeed, U.S stocks delivered their best September in 71 years, and continued to add to those gains in October. Bond markets also have generated positive results for much of 2010 and continue to be a source of refuge for risk-averse investors.
It is important to recognize, however, that we may see periods of heightened market volatility as markets and economies seek more solid ground. The slow pace of the U.S. economic recovery and ongoing European sovereign debt concerns have made markets more susceptible to disappointing news. We believe, however, that Putnam’s research-intensive, actively managed investment approach is well suited for this environment.
In developments affecting oversight of your fund, Barbara M. Baumann has been elected to the Board of Trustees of the Putnam Funds, effective July 1, 2010. Ms. Baumann is president and owner of Cross Creek Energy Corporation of Denver, Colorado, a strategic consultant to domestic energy firms and direct investor in energy assets. We also want to thank Elizabeth T. Kennan, who has retired from the Board of Trustees, for her many years of dedicated and thoughtful leadership.
Lastly, we would like to take this opportunity to welcome new shareholders to the fund and to thank all of our investors for your continued confidence in Putnam.

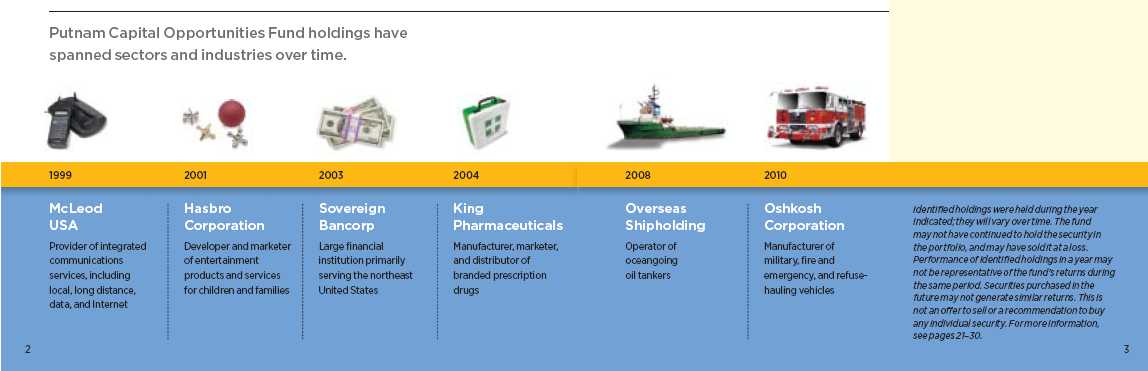
About the fund
Seeking overlooked, underpriced small and midsize companies
Every company, whatever its industry, growth rate, or size, has an underlying value. This value is based in part on the cash flows the company generates. The price of a company’s stock, however, may not accurately reflect this underlying value. A stock may be mispriced for different reasons, and is often the res ult of behavioral bias — when investors overreact to short-term factors.
Mispriced stocks can provide attractive opportunities for investors who have the expertise and insight to identify them. The managers of Putnam Capital Opportunities Fund look for stocks they believe are trading below their intrinsic value and can appreciate over time. It is up to the managers to uncover the reasons behind a stock’s valuation and to determine whether the market’s generally held assumptions are on target.
The fund focuses on stocks of small and midsize companies, which are typically covered by fewer analysts than large companies. With fewer analysts following these stocks, there may be more overlooked investment opportunities to pursue.
In seeking stocks with long-term growth potential, the managers draw on their own experience as well as that of the analysts in Putnam’s Global Equity Research organization. Because the fund is managed in the blend style, the managers are no t focused solely on either growth-or value-style stocks and can choose from thousands of small and midsize U.S. companies. This flexibility means the fund’s portfolio is broadly diversified, which can help reduce the risk of investing in a narrow range of sectors or stocks.
In all their decisions, the managers are guided by Putnam’s risk controls, which call for regular review of fund holdings and the discipline to sell stocks when they reach what is considered their true worth.
Consider these risks before investing: The fund invests some or all of its assets in small and/or midsize companies. Such investments increase the risk of greater price fluctuations.
Growth stocks may be more susceptible to earnings disappointments, and value stocks may fail to rebound. The market may not favor growth-or value-style investing.

Investor overreaction can mean investment opportunities
An important factor in the analysis for Putnam Capital Opportunities Fund is “behavioral insight. ” Investors frequently focus on short-term financial performance while ignoring the potential for a stock to outperform over the long term . For example, investors may overreact to a specific event, such as a management change, and either sell off the stock or buy it in large quantities. This overreaction can skew a stock’s price out of proportion to the real impact of the event. The result can develop into a buying or a selling opportunity for astute investment managers.
The portfolio managers for Putnam Capital Opportunities Fund determine behavioral rankings as part of their detailed stock-by-stock valuation process. Their process integrates behavioral insights and an in-depth analysis of each company’s fundamental worth.
Performance snapshot
Annualized total return (%) comparison as of 10/31/10
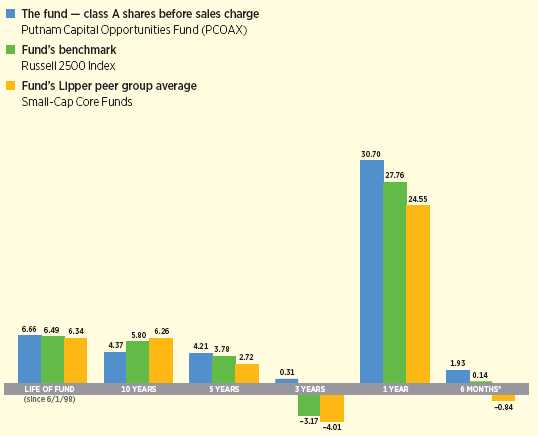
Current performance may be lower or higher than the quoted past performance, which cannot guarantee future results. Share price, principal value, and return will fluctuate, and you may have a gain or a loss when you sell your shares. Performance of class A shares assumes reinvestment of distributions and does not account for taxes. Fund returns in the bar chart do not reflect a sales charge of 5.75%; had they, returns would have been lower. See pages 5 and 10–11 for additional performance information. For a portion of the periods, the fund may have had expense limitations, without which returns would have been lower. A short-term trading fee of 1% may apply to redemptions or exchanges from certain funds within the time period specified in the fund’s prospectus. To obtain the most recent month-end performance, visit putnam.com.
* Returns for the six-month period are not annualized, but cumulative.
4
Interview with your fund’s portfolio manager
Joseph Joseph
Joe, for the period we’re discussing, overall returns for stocks were flat. How did Putnam Capital Opportunities Fund perform?
Despite the fact that stock returns were flat, it was a fairly volatile six-month period for the markets overall.
I’m pleased to report that the fund was able to deliver a positive return and outperform its benchmark and Lipper peer group. Class A shares of the fund gained 1.93% at net asset value, while its benchmark, the Russell 2500 Index, returned 0.14%. The average return for the fund’s peer group, Lipper Small-Cap Core Funds, was –0.84%.
Tell us more about market conditions over the six-month period.
Just as the period began in May, a prolonged, historically strong rally in the stock market came to an abrupt end, and volatility returned to the market in full force.
A major cause of concern for investors was a sovereign debt crisis in Greece that brought out broader worries about debt issues in other European Union countries. This resulted in anxiety across global markets and a market correction, with stocks declining sharply through June as investors also became discouraged about the slow pace of the U.S. economic recovery. Stocks staged a strong rebound in July, declined again in August, and then went on to rally considerably through September.
What strategies helped the fund outperform its benchmark and peers?
Our stock selection was beneficial during the period, particularly in the health-care, industrial, and consumer discretionary sectors. Also helping performance was our decision to maintain an overweight position in technology relative to the benchmark, as well as an underweight position in financials.
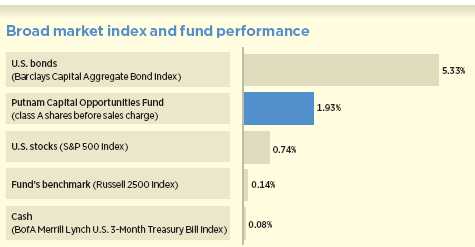
This comparison shows your fund’s performance in the context of broad market indexes for the six months ended 10/31/10. See pages 4 and 10–11 for additional fund performance information. Index descriptions can be found on page 14.
5
Which investments did well for the fund?
One of the biggest contributors to performance was the stock of Valeant Pharmaceuticals International, a specialty drug company headquartered in Canada. Valeant is now one of Canada’s largest publicly traded drug manufacturers, after completing its merger with Biovail Corporation in September.
The stock was a top performer as investors reacted favorably to news of the merger. In addition, we believe this stock remains attractive as the merger has resulted in an enhanced product line, financial strength, and cost-cutting initiatives that should enable Valeant to pursue more growth opportunities.
Another top-performing stock in the fund’s portfolio was that of WABCO Holdings, a provider of electronic and mechanical products for truck, bus, and car manufacturers. The company benefited from improved demand for trucks, particularly in Europe and emerging markets. Also during the period, investors reacted positively to the resolution of a lawsuit against the company.
Republic Airways Holdings was another portfolio highlight. The company includes several wholly owned airline subsidiaries, including recently acquired Frontier and Midwest, that offer service in the United States, Canada, Mexico, and Costa Rica. The company has reported improved profitability, due in part to significant traffic growth and improved industry pricing.
Another fund holding worth noting is F5 Networks, a networking appliances company that ensures the secure, reliable, and fast delivery of applications.
This stock was one of the top performers for the fund’s previous fiscal year, and it continued to make a positive contribution. The company was able to increase its market share during the severe economic downturn, which speaks to the competitiveness of its products. We sold F5 Networks from the portfolio when it exceeded our valuation target.
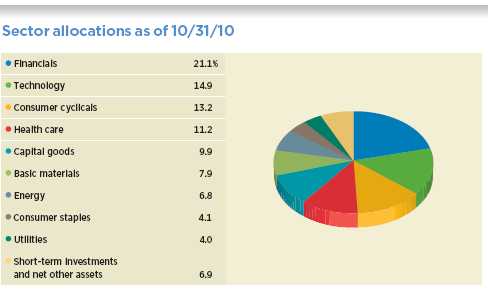
Allocations are represented as a percentage of the fund’s net assets. Summary information may differ from the portfolio schedule included in the financial statements due to the inclusion of derivative securities and the exclusion of as-of trades, if any, and the use of different classifications of securities for presentation purposes. Holdings and allocations may vary over time.
6

What are some stocks that had a negative impact on performance?
TradeStation Group was a detractor during the period. The stock of this company, which offers technology for traders of financial securities, underperformed as trading volumes were below expectations. In addition, investors were anticipating a long period of low interest rates. Because the company tends to benefit from rising rates, this market sentiment weighed on the stock price.
The stock of Career Education Corporation also dampened fund performance for the period. This company has schools on approximately 90 campuses in the United States and Europe.
The stock came under pressure as the government increased its scrutiny of business practices in the for-profit education industry. Investigations and inquiries have cast a negative cloud over Career Education and the industry as a whole.
The performance of Headwaters, a provider of building products and construction materials, was also a disappointment during the period. The stock was hurt by a weakening outlook for non-residential construction.
Can you tell us about your investment process?
We have a disciplined investment strategy that uses a series of valuation factors to identify stocks that we believe are trading below their intrinsic value. We look for stocks we believe will appreciate over time, and we seek to buy them for the portfolio before most investors recognize their value.
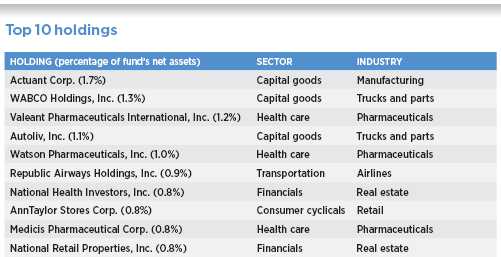
This table shows the fund’s top 10 holdings and the percentage of the fund’s net assets that each represented as of 10/31/10. Short-term holdings are excluded. Holdings will vary over time.
7
Typically, we try to avoid companies with excessive leverage. We try to own companies with high returns on capital or those whose returns on capital we expect to improve over time. We also seek companies that generate significant free cash flow and where management has a history of deploying that cash in a shareholder-friendly manner.
Your analysis includes “behavioral insight” — finding buying or selling opportunities based on investor sentiment. Can you cite a recent example?
Recently, investors have become enthusiastic —and, in our opinion, over-exuberant — about the investment opportunities around “cloud” computing. This refers to the storing and management of data over the Internet rather than on an individual computer.
Investor sentiment drove up the valuations of companies in this field and, in many cases, these valuations exceeded our estimates of the companies’ fair value. As a result, we sold the fund’s positions in several of these stocks shortly after the close of the period.
What is your outlook for the markets, and are there particular sectors on which you are focusing?
Our investment process is grounded in fundamental, bottom-up research, meaning we focus on individual stock selection rather than trying to predict the direction of the economy or the broader market. That said, we are starting to see some signs of a gradual improvement in the economy.
As of the close of the period, we were finding the most attractive opportunities in the information technology, industrial, and health-care sectors, while consumer staples, utilities, and telecommunications stocks appeared to be closer to fair value.
Thank you for this update, Joe.
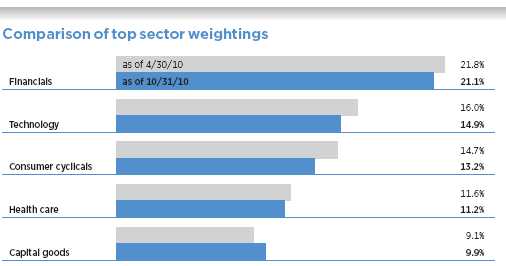
This chart shows how the fund’s top weightings have changed over the past six months. Weightings are shown as a percentage of net assets. Summary information may differ from the portfolio schedule included in the financial statements due to the inclusion of derivative securities and the exclusion of as-of trades, if any, and the use of different classifications of securities for presentation purposes. Holdings will vary over time.
Data in the chart reflect a new calculation methodology placed in effect within the past six months.
8
The views expressed in this report are exclusively those of Putnam Management. They are not meant as investment advice.
Please note that the holdings discussed in this report may not have been held by the fund for the entire period. Portfolio composition is subject to review in accordance with the fund’s investment strategy and may vary in the future. Current and future portfolio holdings are subject to risk.

Portfolio Manager Joseph Joseph has an M.B.A. from the Stern School of Business at New York University and a B.A. from Loyola College. A Certified Public Accountant, he joined Putnam in 1994 and has been in the investment industry since 1987.
In addition to Joe, your fund’s portfolio managers are Randy Farina and John McLanahan.
IN THE NEWS
U.S. corporate profits soared in the first 10 months of 2010, despite the slow economic recovery. Earnings rose 10.5% in the first quarter and 3.0% in the second quarter, and are on track for a positive third quarter. The profit picture is remarkable because it occurred during a period of decelerating growth, with the nation’s gross domestic product slowing to 1.7% in the second quarter. There are several factors behind the rosy profit picture. The recession forced many companies to cut costs, and this year’s slow growth environment has helped further reduce wage pressure. Corporate borrowing rates are also low. Although sluggish economic growth remains a threat to profits, the consensus estimate for S&P 500 companies is for near-record earnings in 2011.
9
Your fund’s performance
This section shows your fund’s performance, price, and distribution information for periods ended October 31, 2010, the end of the first half of its current fiscal year. In accordance with regulatory requirements for mutual funds, we also include performance as of the most recent calendar quarter-end and expense information taken from the fund’s current prospectus. Performance should always be considered in light of a fund’s investment strategy. Data represents past performance. Past performance does not guarantee future results. More recent returns may be less or more than those shown. Investment return and principal value will fluctuate, and you may have a gain or a loss when you sell your shares. Performance information does not reflect any deduction for taxes a shareholder may owe on fund distributions or on the redemption of fund shares. For the most recent month-end performance, please visit the Individual Investors section at putn am.com or call Putnam at 1-800-225-1581. Class Y shares are generally only available to corporate and institutional clients and clients in other approved programs. See the Terms and Definitions section in this report for definitions of the share classes offered by your fund.
Fund performance Total return for periods ended 10/31/10
| | | | | | | | | | |
| | Class A | Class B | Class C | Class M | Class R | Class Y |
| (inception dates) | (6/1/98) | (6/29/98) | (7/26/99) | (6/29/98) | (1/21/03) | (10/2/00) |
|
| | NAV | POP | NAV | CDSC | NAV | CDSC | NAV | POP | NAV | NAV |
|
| Annual average | | | | | | | | | | |
| (life of fund) | 6.66% | 6.15% | 5.88% | 5.88% | 5.88% | 5.88% | 6.13% | 5.83% | 6.40% | 6.90% |
|
| 10 years | 53.31 | 44.51 | 42.29 | 42.29 | 42.22 | 42.22 | 45.75 | 40.68 | 49.52 | 57.48 |
| Annual average | 4.37 | 3.75 | 3.59 | 3.59 | 3.58 | 3.58 | 3.84 | 3.47 | 4.10 | 4.65 |
|
| 5 years | 22.92 | 15.88 | 18.44 | 16.84 | 18.35 | 18.35 | 19.97 | 15.79 | 21.35 | 24.52 |
| Annual average | 4.21 | 2.99 | 3.44 | 3.16 | 3.43 | 3.43 | 3.71 | 2.98 | 3.95 | 4.48 |
|
| 3 years | 0.94 | –4.85 | –1.27 | –3.95 | –1.26 | –1.26 | –0.47 | –3.96 | 0.22 | 1.82 |
| Annual average | 0.31 | –1.64 | –0.43 | –1.33 | –0.42 | –0.42 | –0.16 | –1.34 | 0.07 | 0.60 |
|
| 1 year | 30.70 | 23.25 | 29.77 | 24.77 | 29.85 | 28.85 | 30.07 | 25.47 | 30.32 | 31.16 |
|
| 6 months | 1.93 | –3.92 | 1.70 | –3.30 | 1.57 | 0.57 | 1.74 | –1.78 | 1.86 | 2.18 |
|
Current performance may be lower or higher than the quoted past performance, which cannot guarantee future results. After-sales-charge returns (public offering price, or POP) for class A and M shares reflect a maximum 5.75% and 3.50% load, respectively. Class B share returns reflect the applicable contingent deferred sales charge (CDSC), which is 5% in the first year, declining to 1% in the sixth year, and is eliminated thereafter. Class C shares reflect a 1% CDSC for the first year that is eliminated thereafter. Class R and Y shares have no initial sales charge or CDSC. Performance for class B, C, M, R, and Y shares before their inception is derived from the historical performance of class A shares, adjusted for the applicable sales charge (or CDSC) and the higher operating expenses for such shares, except for class Y shares, for which 12b-1 fees are not applicable.
For a portion of the periods, the fund may have had expense limitations, without which returns would have been lower.
Class B share performance does not reflect conversion to class A shares.
A short-term trading fee of 1% may apply to redemptions or exchanges from certain funds within the time period specified in the fund’s prospectus.
10
| | |
| Comparative index returns For periods ended 10/31/10 | |
| |
| | | Lipper Small-Cap Core Funds |
| | Russell 2500 Index | category average* |
|
| Annual average (life of fund) | 6.49% | 6.34% |
|
| 10 years | 75.76 | 90.42 |
| Annual average | 5.80 | 6.26 |
|
| 5 years | 20.41 | 15.27 |
| Annual average | 3.78 | 2.72 |
|
| 3 years | –9.22 | –11.20 |
| Annual average | –3.17 | –4.01 |
|
| 1 year | 27.76 | 24.55 |
|
| 6 months | 0.14 | –0.84 |
|
Index and Lipper results should be compared to fund performance at net asset value.
* Over the 6-month, 1-year, 3-year, 5-year, 10-year, and life-of-fund periods ended 10/31/10, there were 827, 814, 710, 578, 308, and 203 funds, respectively, in this Lipper category.
Fund price and distribution information For the six-month period ended 10/31/10
| | | | | | | | |
| | Class A | Class B | Class C | Class M | Class R | Class Y |
|
| Share value | NAV | POP | NAV | NAV | NAV | POP | NAV | NAV |
|
| 4/30/10 | $10.35 | $10.98 | $9.43 | $9.55 | $9.78 | $10.13 | $10.19 | $10.53 |
|
| 10/31/10 | 10.55 | 11.19 | 9.59 | 9.70 | 9.95 | 10.31 | 10.38 | 10.76 |
|
The classification of distributions, if any, is an estimate. Final distribution information will appear on your year-end tax forms.
The fund made no distributions during the period.
Fund performance as of most recent calendar quarter
Total return for periods ended 9/30/10
| | | | | | | | | | |
| | Class A | Class B | Class C | Class M | Class R | Class Y |
| (inception dates) | (6/1/98) | (6/29/98) | (7/26/99) | (6/29/98) | (1/21/03) | (10/2/00) |
|
| | NAV | POP | NAV | CDSC | NAV | CDSC | NAV | POP | NAV | NAV |
|
| Annual average | | | | | | | | | | |
| (life of fund) | 6.32% | 5.81% | 5.53% | 5.53% | 5.53% | 5.53% | 5.78% | 5.47% | 6.05% | 6.55% |
|
| 10 years | 45.18 | 36.81 | 34.68 | 34.68 | 34.70 | 34.70 | 38.03 | 33.15 | 41.64 | 49.10 |
| Annual average | 3.80 | 3.18 | 3.02 | 3.02 | 3.02 | 3.02 | 3.28 | 2.90 | 3.54 | 4.08 |
|
| 5 years | 15.44 | 8.77 | 11.18 | 9.67 | 11.17 | 11.17 | 12.51 | 8.57 | 14.07 | 16.94 |
| Annual average | 2.91 | 1.70 | 2.14 | 1.86 | 2.14 | 2.14 | 2.39 | 1.66 | 2.67 | 3.18 |
|
| 3 years | –3.06 | –8.65 | –5.25 | –7.83 | –5.29 | –5.29 | –4.54 | –7.90 | –3.80 | –2.32 |
| Annual average | –1.03 | –2.97 | –1.78 | –2.68 | –1.80 | –1.80 | –1.54 | –2.71 | –1.28 | –0.78 |
|
| 1 year | 19.71 | 12.77 | 18.81 | 13.81 | 18.85 | 17.85 | 19.05 | 14.87 | 19.46 | 20.09 |
|
| 6 months | 1.82 | –4.00 | 1.44 | –3.56 | 1.42 | 0.42 | 1.50 | –2.06 | 1.64 | 1.99 |
|
11
Your fund’s expenses
As a mutual fund investor, you pay ongoing expenses, such as management fees, distribution fees (12b-1 fees), and other expenses. Using the following information, you can estimate how these expenses affect your investment and compare them with the expenses of other funds. You may also pay one-time transaction expenses, including sales charges (loads) and redemption fees, which are not shown in this section and would have resulted in higher total expenses. For more information, see your fund’s prospectus or talk to your financial representative.
Expense ratios
| | | | | | |
| | Class A | Class B | Class C | Class M | Class R | Class Y |
|
| Total annual operating expenses for the fiscal year | | | | | | |
| ended 4/30/10* | 1.34% | 2.09% | 2.09% | 1.84% | 1.59% | 1.09% |
|
| Annualized expense ratio for the six-month period | | | | | | |
| ended 10/31/10 | 1.31% | 2.06% | 2.06% | 1.81% | 1.56% | 1.06% |
|
Fiscal-year expense information in this table is taken from the most recent prospectus, is subject to change, and may differ from that shown for the annualized expense ratio and in the financial highlights of this report. Expenses are shown as a percentage of average net assets.
* Restated to reflect projected expenses under a new management contract effective 1/1/10 and a new expense arrangement.
Expenses per $1,000
The following table shows the expenses you would have paid on a $1,000 investment in Putnam Capital Opportunities Fund from May 1, 2010, to October 31, 2010. It also shows how much a $1,000 investment would be worth at the close of the period, assuming actual returns and expenses.
| | | | | | |
| | Class A | Class B | Class C | Class M | Class R | Class Y |
|
| Expenses paid per $1,000*† | $6.67 | $10.47 | $10.47 | $9.20 | $7.94 | $5.40 |
|
| Ending value (after expenses) | $1,019.30 | $1,017.00 | $1,015.70 | $1,017.40 | $1,018.60 | $1,021.80 |
|
* Expenses for each share class are calculated using the fund’s annualized expense ratio for each class, which represents the ongoing expenses as a percentage of average net assets for the six months ended 10/31/10. The expense ratio may differ for each share class.
† Expenses are calculated by multiplying the expense ratio by the average account value for the period; then multiplying the result by the number of days in the period; and then dividing that result by the number of days in the year.
12
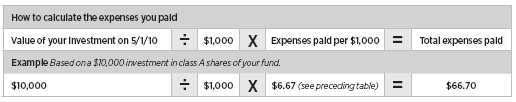
Estimate the expenses you paid
To estimate the ongoing expenses you paid for the six months ended October 31, 2010, use the following calculation method. To find the value of your investment on May 1, 2010, call Putnam at 1-800-225-1581.
Compare expenses using the SEC’s method
The Securities and Exchange Commission (SEC) has established guidelines to help investors assess fund expenses. Per these guidelines, the following table shows your fund’s expenses based on a $1,000 investment, assuming a hypothetical 5% annualized return. You can use this information to compare the ongoing expenses (but not transaction expenses or total costs) of investing in the fund with those of other funds. All mutual fund shareholder reports will provide this information to help you make this comparison. Please note that you cannot use this information to estimate your actual ending account balance and expenses paid during the period.
| | | | | | |
| | Class A | Class B | Class C | Class M | Class R | Class Y |
|
| Expenses paid per $1,000*† | $6.67 | $10.46 | $10.46 | $9.20 | $7.93 | $5.40 |
|
| Ending value (after expenses) | $1,018.60 | $1,014.82 | $1,014.82 | $1,016.08 | $1,017.34 | $1,019.86 |
|
* Expenses for each share class are calculated using the fund’s annualized expense ratio for each class, which represents the ongoing expenses as a percentage of average net assets for the six months ended 10/31/10. The expense ratio may differ for each share class.
† Expenses are calculated by multiplying the expense ratio by the average account value for the period; then multiplying the result by the number of days in the period; and then dividing that result by the number of days in the year.
13
Terms and definitions
Important terms
Total return shows how the value of the fund’s shares changed over time, assuming you held the shares through the entire period and reinvested all distributions in the fund.
Net asset value (NAV) is the price, or value, of one share of a mutual fund, without a sales charge. NAVs fluctuate with market conditions. NAV is calculated by dividing the net assets of each class of shares by the number of outstanding shares in the class.
Public offering price (POP) is the price of a mutual fund share plus the maximum sales charge levied at the time of purchase. POP performance figures shown here assume the 5.75% maximum sales charge for class A shares and 3.50% for class M shares.
Contingent deferred sales charge (CDSC) is generally a charge applied at the time of the redemption of class B or C shares and assumes redemption at the end of the period. Your fund’s class B CDSC declines from a 5% maximum during the first year to 1% during the sixth year. After the sixth year, the CDSC no longer applies. The CDSC for class C shares is 1% for one year after purchase.
Share classes
Class A shares are generally subject to an initial sales charge and no CDSC (except on certain redemptions of shares bought without an initial sales charge).
Class B shares are not subject to an initial sales charge. They may be subject to a CDSC.
Class C shares are not subject to an initial sales charge and are subject to a CDSC only if the shares are redeemed during the first year.
Class M shares have a lower initial sales charge and a higher 12b-1 fee than class A shares and no CDSC (except on certain redemptions of shares bought without an initial sales charge).
Class R shares are not subject to an initial sales charge or CDSC and are available only to certain defined contribution plans.
Class Y shares are not subject to an initial sales charge or CDSC, and carry no 12b-1 fee. They are generally only available to corporate and institutional clients and clients in other approved programs.
Comparative indexes
Barclays Capital Aggregate Bond Index is an unmanaged index of U.S. investment-grade fixed-income securities.
BofA (Bank of America) Merrill Lynch U.S. 3-Month Treasury Bill Index is an unmanaged index that seeks to measure the performance of U.S. Treasury bills available in the marketplace.
Russell 2500 Index is an unmanaged index of the 2,500 small and midsize companies in the Russell 3000 Index.
S&P 500 Index is an unmanaged index of common stock performance.
Indexes assume reinvestment of all distributions and do not account for fees. Securities and performance of a fund and an index will differ. You cannot invest directly in an index.
Lipper is a third-party industry-ranking entity that ranks mutual funds. Its rankings do not reflect sales charges. Lipper rankings are based on total return at net asset value relative to other funds that have similar current investment styles or objectives as determined by Lipper. Lipper may change a fund’s category assignment at its discretion. Lipper category averages reflect performance trends for funds within a category.
14
Trustee approval of management contract
General conclusions
The Board of Trustees of the Putnam funds oversees the management of each fund and, as required by law, determines annually whether to approve the continuance of your fund’s management contract with Putnam Investment Management (“Putnam Management”) and the sub-management contract with respect to your fund, between Putnam Management and its affiliate, Putnam Investments Limited (“PIL”).
In this regard, the Board of Trustees, with the assistance of its Contract Committee consisting solely of Trustees who are not “interested persons” (as this term is defined in the Investment Company Act of 1940, as amended) of the Putnam funds (the “Independent Trustees”), requests and evaluates all information it deems reasonably necessary under the circumstances. Over the course of several months ending in June 2010, the Contract Committee met on a number of occasions with representatives of Putnam Management and in executive session to consider the information provided by Putnam Management and other information developed with the assistance of the Board’s independent counsel and independent staff. The Contract Committee reviewed and discussed key aspects of this information with all of the Independent Trustees. At the Trustees’ June 11, 2010 meeting, the Contract Committee recommended, and the Independent Trustees appro ved, the continuance of your fund’s management contract, and sub-management contracts, effective July 1, 2010. (Because PIL is an affiliate of Putnam Management and Putnam Management remains fully responsible for all services provided by PIL, the Trustees have not evaluated PIL as a separate entity, and all subsequent references to Putnam Management below should be deemed to include reference to PIL as necessary or appropriate in the context.)
The Independent Trustees’ approval was based on the following conclusions:
• That the fee schedule in effect for your fund represented reasonable compensation in light of the nature and quality of the services being provided to the fund, the fees paid by competitive funds, and the costs incurred by Putnam Management in providing such services, and
• That the fee schedule represented an appropriate sharing between fund shareholders and Putnam Management of such economies of scale as may exist in the management of the fund at current asset levels.
These conclusions were based on a comprehensive consideration of all information provided to the Trustees and were not the result of any single factor. Some of the factors that figured particularly in the Trustees’ deliberations and how the Trustees considered these factors are described below, although individual Trustees may have evaluated the information presented differently, giving different weights to various factors. It is also important to recognize that the fee arrangements for your fund and the other Putnam funds are the result of many years of review and discussion between the Independent Trustees and Putnam Management, that certain aspects of the arrangements may receive greater scrutiny in some years than others, and that the Trustees’ conclusions may be based, in part, on their consideration of fee arrangements in prior years.
Consideration of implementation of strategic pricing initiative
The Trustees were mindful that new management contracts had been implemented for all but a few funds at the beginning of 2010 as part of Putnam Management’s strategic pricing initiative. These new management contracts reflected the implementation of more competitive fee levels for many funds, complex-wide breakpoints for the open-end funds and performance fees for some funds.
15
The Trustees had approved these new management contracts on July 10, 2009 and submitted them to shareholder meetings of the affected funds in late 2009, where the contracts were in all cases approved by overwhelming majorities of the shares voted.
Because the management contracts had been implemented only recently, the Contract Committee had limited practical experience with the operation of the new fee structures. The financial data available to the Committee reflected actual operations under the prior contracts; information was also available on a pro forma basis, adjusted to reflect the fees payable under the new management contracts. In light of the limited information available regarding operations under the new management contracts, in recommending the continuation of the new management contracts in June 2010, the Contract Committee relied to a considerable extent on its review of the financial information and analysis that formed the basis of the Board’s approval of the new management contracts on July 10, 2009.
Management fee schedules and categories; total expenses
The Trustees reviewed the management fee schedules in effect for all Putnam funds, including fee levels and breakpoints. In reviewing management fees, the Trustees generally focus their attention on material changes in circumstances — for example, changes in assets under management or investment style, changes in Putnam Management’s operating costs, or changes in competitive practices in the mutual fund industry — that suggest that consideration of fee changes might be warranted. The Trustees concluded that the circumstances did not warrant changes to the management fee structure of your fund.
As in the past, the Trustees continued to focus on the competitiveness of the total expense ratio of each fund. In order to ensure that expenses of the Putnam funds continue to meet evolving competitive standards, the Trustees and Putnam Management agreed in 2009 to implement certain expense limitations. Most funds had sufficiently low expenses that these expense limitations did not apply. However, in the case of your fund, the first of the expense limitations applied. The expense limitations were (i) a contractual expense limitation applicable to all retail open-end funds of 37.5 basis points on investor servicing fees and expenses and (ii) a contractual expense limitation applicable to all open-end funds of 20 basis points on so-called “other expenses” (i.e., all expenses exclusive of management fees, investor servicing fees, distribution fees, taxes, brokerage commissions and extraordinary expenses) . These expense limitations serve in particular to maintain competitive expense levels for funds with large numbers of small shareholder accounts and funds with relatively small net assets.
The Trustees reviewed comparative fee and expense information for a custom group of competitive funds selected by Lipper Inc. This comparative information included your fund’s percentile ranking for effective management fees and total expenses (excluding any applicable 12b-1 fee), which provides a general indication of your fund’s relative standing. In the custom peer group, your fund ranked in the 1st quintile in effective management fees (determined for your fund and the other funds in the custom peer group based on fund asset size and the applicable contractual management fee schedule) and in the 2nd quintile in total expenses (excluding any applicable 12b-1 fees) as of December 31, 2009 (the first quintile representing the least expensive funds and the fifth quintile the most expensive funds). The Trustees also considered that your fund ranked in the 1st quintile in effective management fees, on a pro forma basis adjusted to reflect the impact of the strategic pricing initiative discussed above, as of December 31, 2009.
Your fund currently has the benefit of breakpoints in its management fee that provide shareholders with significant economies of scale in the form of reduced fee levels as assets under management in the Putnam family of funds increase. The Contract Committee
16
observed that the complex-wide breakpoints of the open-end funds have only been in place for a short while, and the Trustees will examine the operation of this new breakpoint structure in future years in light of actual experience.
In connection with their review of the management fees and total expenses of the Putnam funds, the Trustees also reviewed the costs of the services provided and the profits realized by Putnam Management and its affiliates from their contractual relationships with the funds. This information included trends in revenues, expenses and profitability of Putnam Management and its affiliates relating to the investment management, investor servicing and distribution services provided to the funds. In this regard, the Trustees also reviewed an analysis of Putnam Management’s revenues, expenses and profitability, allocated on a fund-by-fund basis, with respect to the funds’ management, distribution, and investor servicing contracts. For each fund, the analysis presented information about revenues, expenses and profitability for each of the agreements separately and for the agreements taken together on a combined basis. The Trustees concluded that, at c urrent asset levels, the fee schedules currently in place represented an appropriate sharing of economies of scale at that time.
The information examined by the Trustees as part of their annual contract review for the Putnam funds has included for many years information regarding fees charged by Putnam Management and its affiliates to institutional clients such as defined benefit pension plans, college endowments, and the like. This information included comparisons of such fees with fees charged to the funds, as well as an assessment of the differences in the services provided to these two types of clients. The Trustees observed, in this regard, that the differences in fee rates between institutional clients and mutual funds are by no means uniform when examined by individual asset sectors, suggesting that differences in the pricing of investment management services to these types of clients may reflect historical competitive forces operating in separate market places. The Trustees considered the fact that fee rates across different asset clas ses are typically higher on average for mutual funds than for institutional clients, as well as the differences between the services that Putnam Management provides to the Putnam funds and those that it provides to its institutional clients, and did not rely on these comparisons to any significant extent in concluding that the management fees paid by your fund are reasonable.
Investment performance
The quality of the investment process provided by Putnam Management represented a major factor in the Trustees’ evaluation of the quality of services provided by Putnam Management under your fund’s management contract. The Trustees were assisted in their review of the Putnam funds’ investment process and performance by the work of the Investment Oversight Coordinating Committee of the Trustees and the Investment Oversight Committees of the Trustees, which met on a regular basis with the funds’ portfolio teams throughout the year. The Trustees concluded that Putnam Management generally provides a high-quality investment process — based on the experience and skills of the individuals assigned to the management of fund portfolios, the resources made available to them, and in general Putnam Management’s ability to attract and retain high-quality personnel — but also recognized that this does not guarantee favorable invest ment results for every fund in every time period. The Trustees considered the investment performance of each fund over multiple time periods and considered information comparing each fund’s performance with various benchmarks and with the performance of competitive funds.
The Committee noted the substantial improvement in the performance of most Putnam funds during 2009. The Committee also noted the disappointing investment performance of a number of the funds for periods ended December 31, 2009 and considered information provided by Putnam Management regarding the factors contributing to the
17
underperformance and actions being taken to improve performance. The Trustees indicated their intention to continue to monitor performance trends to assess the effectiveness of these efforts and to evaluate whether additional changes to address areas of underperformance are warranted.
In the case of your fund, the Trustees considered that your fund’s class A share cumulative total return performance at net asset value was in the following quartiles of its Lipper Inc. peer group (Lipper Small-Cap Core Funds) for the one-year, three-year and five-year periods ended December 31, 2009 (the first quartile representing the best-performing funds and the fourth quartile the worst-performing funds):
| | | |
| One-year period | 1st | | |
| | |
| Three-year period | 2nd | | |
| | |
| Five-year period | 2nd | | |
| | |
Over the one-year, three-year and five-year periods ended December 31, 2009, there were 756, 631 and 522 funds, respectively, in your fund’s Lipper peer group. (When considering performance information, shareholders should be mindful that past performance is not a guarantee of future results.)
Brokerage and soft-dollar allocations; investor servicing
The Trustees considered various potential benefits that Putnam Management may receive in connection with the services it provides under the management contract with your fund. These include benefits related to brokerage and soft-dollar allocations, whereby a portion of the commissions paid by a fund for brokerage may be used to acquire research services that are expected to be useful to Putnam Management in managing the assets of the fund and of other clients. The Trustees considered a change made, at Putnam Management’s request, to the Putnam funds’ brokerage allocation policies commencing in 2010, which increased the permitted soft dollar allocation to third-party services over what had been authorized in previous years. The Trustees noted that a portion of available soft dollars continues to be allocated to the payment of fund expenses. The Trustees indicated their continued intent to monitor regulatory developments in this area with the assistance of their Brokerage Committee and also indicated their continued intent to monitor the potential benefits associated with fund brokerage and soft-dollar allocations and trends in industry practices to ensure that the principle of seeking best price and execution remains paramount in the portfolio trading process.
Putnam Management may also receive benefits from payments that the funds make to Putnam Management’s affiliates for investor or distribution services. In conjunction with the annual review of your fund’s management contract, the Trustees reviewed your fund’s investor servicing agreement with Putnam Investor Services, Inc. (“PSERV”) and its distributor’s contracts and distribution plans with Putnam Retail Management Limited Partnership (“PRM”), both of which are affiliates of Putnam Management. The Trustees concluded that the fees payable by the funds to PSERV and PRM, as applicable, for such services are reasonable in relation to the nature and quality of such services.
18
Other information for shareholders
Important notice regarding delivery of shareholder documents
In accordance with SEC regulations, Putnam sends a single copy of annual and semiannual shareholder reports, prospectuses, and proxy statements to Putnam shareholders who share the same address, unless a shareholder requests otherwise. If you prefer to receive your own copy of these documents, please call Putnam at 1-800-225-1581, and Putnam will begin sending individual copies within 30 days.
Proxy voting
Putnam is committed to managing our mutual funds in the best interests of our shareholders. The Putnam funds’ proxy voting guidelines and procedures, as well as information regarding how your fund voted proxies relating to portfolio securities during the 12-month period ended June 30, 2010, are available in the Individual Investors section of putnam.com, and on the SEC’s Web site, www.sec.gov. If you have questions about finding forms on the SEC’s Web site, you may call the SEC at 1-800-SEC-0330. You may also obtain the Putnam funds’ proxy voting guidelines and procedures at no charge by calling Putnam’s Shareholder Services at 1-800-225-1581.
Fund portfolio holdings
The fund will file a complete schedule of its portfolio holdings with the SEC for the first and third quarters of each fiscal year on Form N-Q. Shareholders may obtain the fund’s Forms N-Q on the SEC’s Web site at www.sec.gov. In addition, the fund’s Forms N-Q may be reviewed and copied at the SEC’s Public Reference Room in Washington, D.C. You may call the SEC at 1-800-SEC-0330 for information about the SEC’s Web site or the operation of the Public Reference Room.
Trustee and employee fund ownership
Putnam employees and members of the Board of Trustees place their faith, confidence, and, most importantly, investment dollars in Putnam mutual funds. As of October 31, 2010, Putnam employees had approximately $324,000,000 and the Trustees had approximately $68,000,000 invested in Putnam mutual funds. These amounts include investments by the Trustees’ and employees’ immediate family members as well as investments through retirement and deferred compensation plans.
19
Financial statements
A guide to financial statements
These sections of the report, as well as the accompanying Notes, constitute the fund’s financial statements.
The fund’s portfolio lists all the fund’s investments and their values as of the last day of the reporting period. Holdings are organized by asset type and industry sector, country, or state to show areas of concentration and diversification.
Statement of assets and liabilities shows how the fund’s net assets and share price are determined. All investment and non-investment assets are added together. Any unpaid expenses and other liabilities are subtracted from this total. The result is divided by the number of shares to determine the net asset value per share, which is calculated separately for each class of shares. (For funds with preferred shares, the amount subtracted from total assets includes the liquidation preference of preferred shares.)
Statement of operations shows the fund’s net investment gain or loss. This is done by first adding up all the fund’s earnings — from dividends and interest income — and subtracting its operating expenses to determine net investment income (or loss). Then, any net gain or loss the fund realized on the sales of its holdings — as well as any unrealized gains or losses over the period — is added to or subtracted from the net investment result to determine the fund’s net gain or loss for the fiscal period.
Statement of changes in net assets shows how the fund’s net assets were affected by the fund’s net investment gain or loss, by distributions to shareholders, and by changes in the number of the fund’s shares. It lists distributions and their sources (net investment income or realized capital gains) over the current reporting period and the most recent fiscal year-end. The distributions listed here may not match the sources listed in the Statement of operations because the distributions are determined on a tax basis and may be paid in a different period from the one in which they were earned. Dividend sources are estimated at the time of declaration. Actual results may vary. Any non-taxable return of capital cannot be determined until final tax calculations are completed after the end of the fund’s fiscal year.
Financial highlights provide an overview of the fund’s investment results, per-share distributions, expense ratios, net investment income ratios, and portfolio turnover in one summary table, reflecting the five most recent reporting periods. In a semiannual report, the highlights table also includes the current reporting period.
20
| | |
| The fund’s portfolio 10/31/10 (Unaudited) | | |
| |
| COMMON STOCKS (97.7%)* | Shares | Value |
|
| Advertising and marketing services (0.3%) | | |
| ValueClick, Inc. † | 58,937 | $810,973 |
|
| | | 810,973 |
| Aerospace and defense (0.6%) | | |
| Alliant Techsystems, Inc. † | 9,144 | 697,139 |
|
| Teledyne Technologies, Inc. † | 26,951 | 1,120,353 |
|
| | | 1,817,492 |
| Airlines (0.9%) | | |
| Republic Airways Holdings, Inc. † S | 299,700 | 2,784,213 |
|
| | | 2,784,213 |
| Automotive (0.4%) | | |
| BorgWarner, Inc. † | 21,563 | 1,209,900 |
|
| | | 1,209,900 |
| Banking (6.5%) | | |
| Bancorp, Inc. † | 239,200 | 1,791,608 |
|
| Bond Street Holdings, LLC 144A Class A † F | 38,819 | 795,790 |
|
| Brookline Bancorp, Inc. | 23,630 | 230,156 |
|
| City Holding Co. S | 8,399 | 266,248 |
|
| City National Corp. | 22,718 | 1,171,567 |
|
| Commerce Bancshares, Inc. | 6,458 | 237,913 |
|
| Cullen/Frost Bankers, Inc. | 7,174 | 376,205 |
|
| Danvers Bancorp, Inc. | 123,641 | 1,858,324 |
|
| East West Bancorp, Inc. | 109,627 | 1,932,724 |
|
| First Citizens BancShares, Inc. Class A | 5,335 | 996,471 |
|
| IBERIABANK Corp. | 14,400 | 749,520 |
|
| International Bancshares Corp. | 21,112 | 361,649 |
|
| NBH Holdings Corp. 144A Class A † | 66,250 | 1,291,875 |
|
| OmniAmerican Bancorp, Inc. † | 46,500 | 544,515 |
|
| PacWest Bancorp S | 24,849 | 433,118 |
|
| Popular, Inc. (Puerto Rico) † | 166,900 | 455,637 |
|
| Provident New York Bancorp | 197,498 | 1,751,807 |
|
| Seacoast Banking Corp. of Florida † S | 181,559 | 226,949 |
|
| SVB Financial Group † | 41,277 | 1,788,945 |
|
| Union First Market Bankshares Corp. | 20,645 | 265,495 |
|
| Webster Financial Corp. | 49,290 | 843,845 |
|
| Whitney Holding Corp. | 64,213 | 531,684 |
|
| Wilmington Trust Corp. | 44,268 | 314,745 |
|
| | | 19,216,790 |
| Biotechnology (0.3%) | | |
| Cubist Pharmaceuticals, Inc. † | 36,161 | 841,828 |
|
| | | 841,828 |
| Broadcasting (0.2%) | | |
| Clear Channel Outdoor Holdings, Inc. Class A † | 42,500 | 504,900 |
|
| | | 504,900 |
| Building materials (0.9%) | | |
| AAON, Inc. S | 23,064 | 566,221 |
|
| Apogee Enterprises, Inc. | 37,699 | 395,463 |
|
| Mohawk Industries, Inc. † | 31,600 | 1,811,944 |
|
| | | 2,773,628 |
| Cable television (0.3%) | | |
| IAC/InterActiveCorp. † | 34,700 | 968,130 |
|
| | | 968,130 |
21
| | |
| COMMON STOCKS (97.7%)* cont. | Shares | Value |
|
| Chemicals (4.2%) | | |
| American Vanguard Corp. | 16,600 | $122,342 |
|
| Ashland, Inc. | 17,519 | 904,506 |
|
| CF Industries Holdings, Inc. | 3,005 | 368,203 |
|
| Compass Minerals International, Inc. | 11,751 | 926,801 |
|
| Cytec Industries, Inc. | 18,988 | 940,286 |
|
| Eastman Chemical Co. | 12,319 | 967,904 |
|
| FMC Corp. | 10,303 | 753,149 |
|
| Georgia Gulf Corp. † | 30,800 | 623,084 |
|
| Innophos Holdings, Inc. | 28,700 | 1,053,864 |
|
| International Flavors & Fragrances, Inc. | 16,762 | 840,782 |
|
| Lubrizol Corp. (The) | 8,902 | 912,366 |
|
| Methanex Corp. (Canada) | 42,900 | 1,191,333 |
|
| Olin Corp. | 38,202 | 763,658 |
|
| OM Group, Inc. † | 18,979 | 631,431 |
|
| Valspar Corp. | 44,254 | 1,420,553 |
|
| | | 12,420,262 |
| Coal (0.6%) | | |
| James River Coal Co. † S | 16,000 | 276,960 |
|
| Massey Energy Co. | 23,600 | 992,852 |
|
| Penn Virginia Corp. | 29,400 | 435,708 |
|
| | | 1,705,520 |
| Commercial and consumer services (1.5%) | | |
| Alliance Data Systems Corp. † S | 19,159 | 1,163,334 |
|
| Deluxe Corp. | 33,446 | 683,636 |
|
| Dun & Bradstreet Corp. (The) | 12,128 | 902,444 |
|
| Ennis Inc. | 41,522 | 749,057 |
|
| Global Cash Access, Inc. † | 97,328 | 354,274 |
|
| Sotheby’s Holdings, Inc. Class A | 15,900 | 697,056 |
|
| | | 4,549,801 |
| Communications equipment (0.4%) | | |
| Netgear, Inc. † | 40,700 | 1,253,967 |
|
| | | 1,253,967 |
| Computers (4.0%) | | |
| ANSYS, Inc. † | 31,035 | 1,404,334 |
|
| Blackbaud, Inc. | 47,893 | 1,216,003 |
|
| Brocade Communications Systems, Inc. † | 194,008 | 1,226,131 |
|
| Emulex Corp. † | 175,160 | 1,996,824 |
|
| Lexmark International, Inc. Class A † | 24,600 | 935,538 |
|
| Logitech International SA (NASDAQ) (Switzerland) † | 80,651 | 1,515,432 |
|
| Logitech International SA (Virt-X Exchange) (Switzerland) † S | 11,617 | 219,974 |
|
| Polycom, Inc. † S | 27,927 | 943,374 |
|
| Progress Software Corp. † | 14,500 | 541,865 |
|
| Quest Software, Inc. † | 45,200 | 1,182,884 |
|
| Satyam Computer Services., Ltd. ADR (India) † | 190,000 | 665,000 |
|
| | | 11,847,359 |
| Conglomerates (0.9%) | | |
| AMETEK, Inc. | 38,760 | 2,094,978 |
|
| Harsco Corp. | 27,400 | 635,132 |
|
| | | 2,730,110 |
22
| | |
| COMMON STOCKS (97.7%)* cont. | Shares | Value |
|
| Construction (1.0%) | | |
| Chicago Bridge & Iron Co., NV (Netherlands) † | 54,139 | $1,364,844 |
|
| Tutor Perini Corp. † | 67,854 | 1,574,891 |
|
| | | 2,939,735 |
| Consumer (0.7%) | | |
| CSS Industries, Inc. | 21,777 | 364,329 |
|
| Helen of Troy, Ltd. (Bermuda) † | 63,916 | 1,639,445 |
|
| Hooker Furniture Corp. | 19,534 | 206,474 |
|
| | | 2,210,248 |
| Consumer goods (1.1%) | | |
| Blyth, Inc. | 10,128 | 406,335 |
|
| Church & Dwight Co., Inc. | 15,863 | 1,044,579 |
|
| Weight Watchers International, Inc. S | 58,500 | 1,959,165 |
|
| | | 3,410,079 |
| Consumer services (0.9%) | | |
| Brink’s Co. (The) | 23,026 | 543,414 |
|
| TrueBlue, Inc. † | 159,854 | 2,245,949 |
|
| | | 2,789,363 |
| Electric utilities (3.3%) | | |
| Allegheny Energy, Inc. | 38,100 | 883,920 |
|
| Alliant Energy Corp. | 23,872 | 872,044 |
|
| Black Hills Corp. | 31,100 | 990,224 |
|
| El Paso Electric Co. † | 54,900 | 1,350,540 |
|
| Integrys Energy Group, Inc. | 14,400 | 765,936 |
|
| NSTAR | 24,300 | 1,013,553 |
|
| Pepco Holdings, Inc. | 51,700 | 995,742 |
|
| Pinnacle West Capital Corp. | 27,100 | 1,115,436 |
|
| PNM Resources, Inc. | 62,600 | 738,054 |
|
| Westar Energy, Inc. | 45,200 | 1,143,560 |
|
| | | 9,869,009 |
| Electrical equipment (0.6%) | | |
| Hubbell, Inc. Class B | 34,315 | 1,853,696 |
|
| | | 1,853,696 |
| Electronics (3.1%) | | |
| Diodes, Inc. † | 24,100 | 529,718 |
|
| Fairchild Semiconductor Intl., Inc. † | 47,400 | 534,198 |
|
| International Rectifier Corp. † | 55,700 | 1,293,911 |
|
| Intersil Corp. Class A | 76,307 | 998,859 |
|
| Multi-Fineline Electronix, Inc. † | 18,600 | 455,328 |
|
| Omnivision Technologies, Inc. † | 40,100 | 1,087,913 |
|
| QLogic Corp. † | 69,642 | 1,223,610 |
|
| Silicon Laboratories, Inc. † S | 28,500 | 1,137,150 |
|
| Synopsys, Inc. † | 53,831 | 1,376,997 |
|
| Zoran Corp. † | 90,000 | 637,200 |
|
| | | 9,274,884 |
| Energy (oil field) (2.1%) | | |
| Basic Energy Services, Inc. † | 54,481 | 602,560 |
|
| Cal Dive International, Inc. † | 39,500 | 199,870 |
|
| Complete Production Services, Inc. † | 28,100 | 658,383 |
|
| Global Industries, Ltd. † | 67,900 | 393,141 |
|
| Helix Energy Solutions Group, Inc. † | 58,400 | 741,096 |
|
23
| | |
| COMMON STOCKS (97.7%)* cont. | Shares | Value |
|
| Energy (oil field) cont. | | |
| Hercules Offshore, Inc. † | 157,200 | $370,992 |
|
| ION Geophysical Corp. † | 59,307 | 290,011 |
|
| Key Energy Services, Inc. † | 81,958 | 807,286 |
|
| Rowan Cos., Inc. † | 14,400 | 473,760 |
|
| Superior Energy Services † | 23,900 | 660,118 |
|
| TETRA Technologies, Inc. † | 42,800 | 417,728 |
|
| Tidewater, Inc. S | 11,300 | 521,269 |
|
| | | 6,136,214 |
| Energy (other) (0.2%) | | |
| Headwaters, Inc. † | 190,264 | 646,898 |
|
| | | 646,898 |
| Financial (0.9%) | | |
| Broadridge Financial Solutions, Inc. | 31,300 | 688,600 |
|
| GATX Corp. | 41,278 | 1,306,861 |
|
| MGIC Investment Corp. † S | 69,301 | 611,235 |
|
| | | 2,606,696 |
| Forest products and packaging (0.9%) | | |
| Packaging Corp. of America | 25,851 | 631,540 |
|
| Sealed Air Corp. | 51,714 | 1,197,179 |
|
| Sonoco Products Co. | 22,948 | 768,758 |
|
| | | 2,597,477 |
| Health-care services (4.8%) | | |
| Amedisys, Inc. † S | 15,300 | 389,538 |
|
| AMERIGROUP Corp. † | 52,572 | 2,193,830 |
|
| AMN Healthcare Services, Inc. † | 99,400 | 526,820 |
|
| Centene Corp. † | 28,100 | 627,192 |
|
| Coventry Health Care, Inc. † | 44,800 | 1,049,216 |
|
| Cross Country Healthcare, Inc. † | 53,100 | 387,630 |
|
| Gentiva Health Services, Inc. † | 39,700 | 924,216 |
|
| Health Net, Inc. † | 41,900 | 1,126,691 |
|
| Healthways, Inc. † | 64,200 | 672,816 |
|
| Kindred Healthcare, Inc. † | 45,700 | 627,004 |
|
| LifePoint Hospitals, Inc. † | 24,300 | 824,256 |
|
| Medcath Corp. † | 41,957 | 415,794 |
|
| Molina Healthcare, Inc. † | 41,845 | 1,084,622 |
|
| Omnicare, Inc. | 34,800 | 839,376 |
|
| Parexel International Corp. † | 60,500 | 1,300,750 |
|
| Res-Care, Inc. † | 88,200 | 1,166,886 |
|
| | | 14,156,637 |
| Homebuilding (0.3%) | | |
| NVR, Inc. † | 1,369 | 858,924 |
|
| | | 858,924 |
| Household furniture and appliances (0.7%) | | |
| American Woodmark Corp. | 13,851 | 245,163 |
|
| Whirlpool Corp. | 24,000 | 1,819,920 |
|
| | | 2,065,083 |
| Insurance (4.8%) | | |
| American Financial Group, Inc. | 25,183 | 770,096 |
|
| Amerisafe, Inc. † | 14,696 | 280,547 |
|
| Aspen Insurance Holdings, Ltd. | 23,375 | 663,149 |
|
24
| | |
| COMMON STOCKS (97.7%)* cont. | Shares | Value |
|
| Insurance cont. | | |
| CNA Surety Corp. † | 40,764 | $784,707 |
|
| Delphi Financial Group Class A | 36,025 | 975,197 |
|
| Endurance Specialty Holdings, Ltd. (Bermuda) | 25,479 | 1,054,831 |
|
| Hanover Insurance Group, Inc. (The) | 21,401 | 968,395 |
|
| Harleysville Group, Inc. | 10,435 | 358,234 |
|
| HCC Insurance Holdings, Inc. | 30,207 | 799,881 |
|
| RenaissanceRe Holdings, Ltd. | 14,437 | 869,974 |
|
| Safety Insurance Group, Inc. | 27,945 | 1,298,325 |
|
| SeaBright Insurance Holdings, Inc. | 39,045 | 326,807 |
|
| Selective Insurance Group | 62,373 | 1,055,351 |
|
| Stancorp Financial Group | 28,722 | 1,232,174 |
|
| Universal American Financial Corp. | 75,300 | 1,210,824 |
|
| Validus Holdings, Ltd. | 23,151 | 656,562 |
|
| W.R. Berkley Corp. | 33,189 | 913,361 |
|
| | | 14,218,415 |
| Investment banking/Brokerage (3.8%) | | |
| Calamos Asset Management, Inc. Class A | 21,600 | 258,984 |
|
| Eaton Vance Corp. | 21,142 | 608,255 |
|
| Federated Investors, Inc. S | 73,713 | 1,836,191 |
|
| Jefferies Group, Inc. S | 29,606 | 708,472 |
|
| Legg Mason, Inc. | 26,300 | 816,089 |
|
| optionsXpress Holdings, Inc. † | 71,100 | 1,135,467 |
|
| SEI Investments Co. | 97,400 | 2,157,410 |
|
| TradeStation Group, Inc. † | 386,000 | 2,119,140 |
|
| Waddell & Reed Financial, Inc. Class A | 54,922 | 1,596,583 |
|
| | | 11,236,591 |
| Leisure (0.5%) | | |
| Polaris Industries, Inc. | 22,100 | 1,571,089 |
|
| | | 1,571,089 |
| Machinery (2.7%) | | |
| AGCO Corp. † | 18,419 | 782,255 |
|
| Applied Industrial Technologies, Inc. | 67,606 | 2,055,898 |
|
| Gardner Denver, Inc. | 18,034 | 1,042,726 |
|
| Kennametal, Inc. | 42,300 | 1,444,122 |
|
| Manitowoc Co., Inc. (The) | 137,768 | 1,534,736 |
|
| Regal-Beloit Corp. | 6,496 | 374,884 |
|
| Terex Corp. † | 37,200 | 835,140 |
|
| | | 8,069,761 |
| Manufacturing (3.2%) | | |
| Actuant Corp. Class A | 231,900 | 5,210,793 |
|
| EnPro Industries, Inc. † | 34,585 | 1,215,317 |
|
| LSB Industries, Inc. † | 29,100 | 650,385 |
|
| Oshkosh Corp. † | 43,900 | 1,295,489 |
|
| Roper Industries, Inc. | 15,450 | 1,072,694 |
|
| | | 9,444,678 |
| Medical technology (1.8%) | | |
| Conmed Corp. † | 54,072 | 1,190,125 |
|
| Hill-Rom Holdings, Inc. | 47,600 | 1,844,500 |
|
| Hologic, Inc. † | 57,700 | 924,354 |
|
25
| | |
| COMMON STOCKS (97.7%)* cont. | Shares | Value |
|
| Medical technology cont. | | |
| Invacare Corp. S | 26,279 | $709,533 |
|
| Kinetic Concepts, Inc. † | 13,800 | 524,814 |
|
| SurModics, Inc. † S | 23,500 | 281,060 |
|
| | | 5,474,386 |
| Metals (1.9%) | | |
| Century Aluminum Co. † | 51,202 | 692,251 |
|
| Cliffs Natural Resources, Inc. S | 2,800 | 182,560 |
|
| Coeur d’Alene Mines Corp. † S | 44,200 | 910,962 |
|
| Commercial Metals Co. | 47,600 | 660,688 |
|
| Contango Ore, Inc. F | 1,330 | 599 |
|
| Reliance Steel & Aluminum Co. | 26,220 | 1,097,307 |
|
| Schnitzer Steel Industries, Inc. Class A | 8,400 | 434,196 |
|
| Steel Dynamics, Inc. | 62,600 | 908,952 |
|
| U.S. Steel Corp. S | 14,400 | 616,176 |
|
| | | 5,503,691 |
| Natural gas utilities (0.7%) | | |
| NiSource, Inc. S | 55,400 | 958,974 |
|
| Southwest Gas Corp. | 30,862 | 1,072,763 |
|
| | | 2,031,737 |
| Office equipment and supplies (0.2%) | | |
| Steelcase, Inc. | 59,649 | 501,648 |
|
| | | 501,648 |
| Oil and gas (3.9%) | | |
| Atwood Oceanics, Inc. † | 26,600 | 864,766 |
|
| Berry Petroleum Co. Class A | 24,605 | 841,737 |
|
| Cabot Oil & Gas Corp. Class A | 16,814 | 487,270 |
|
| Clayton Williams Energy, Inc. † | 14,600 | 871,912 |
|
| Contango Oil & Gas Co. † | 13,300 | 699,447 |
|
| Oil States International, Inc. † | 19,800 | 1,012,176 |
|
| Patterson-UTI Energy, Inc. S | 47,500 | 921,975 |
|
| Petroleum Development Corp. † | 30,945 | 965,793 |
|
| SM Energy Co. | 15,000 | 625,200 |
|
| Stone Energy Corp. † S | 32,800 | 512,664 |
|
| Swift Energy Co. † | 29,516 | 940,085 |
|
| Unit Corp. † | 22,251 | 872,907 |
|
| Vaalco Energy, Inc. † | 41,900 | 246,372 |
|
| W&T Offshore, Inc. S | 62,600 | 681,088 |
|
| Whiting Petroleum Corp. † | 11,014 | 1,106,246 |
|
| | | 11,649,638 |
| Pharmaceuticals (4.4%) | | |
| Cephalon, Inc. † | 13,800 | 916,872 |
|
| Endo Pharmaceuticals Holdings, Inc. † | 45,444 | 1,669,613 |
|
| Medicis Pharmaceutical Corp. Class A | 77,843 | 2,315,829 |
|
| Par Pharmaceutical Cos., Inc. † | 44,700 | 1,453,197 |
|
| Valeant Pharmaceuticals International, Inc. (Canada) S | 129,024 | 3,562,353 |
|
| Watson Pharmaceuticals, Inc. † | 64,972 | 3,030,944 |
|
| | | 12,948,808 |
| Publishing (0.6%) | | |
| Gannett Co., Inc. | 149,000 | 1,765,650 |
|
| | | 1,765,650 |
26
| | |
| COMMON STOCKS (97.7%)* cont. | Shares | Value |
|
| Real estate (5.5%) | | |
| DiamondRock Hospitality Co. R | 96,611 | $1,022,144 |
|
| Entertainment Properties Trust R | 9,264 | 428,275 |
|
| Hospitality Properties Trust R | 81,394 | 1,856,597 |
|
| Kimco Realty Corp. R | 32,022 | 551,739 |
|
| LaSalle Hotel Properties R S | 68,394 | 1,620,254 |
|
| LTC Properties, Inc. R | 33,757 | 940,132 |
|
| Macerich Co. (The) R | 18,913 | 843,709 |
|
| National Health Investors, Inc. R | 52,562 | 2,433,621 |
|
| National Retail Properties, Inc. R S | 84,178 | 2,281,224 |
|
| Nationwide Health Properties, Inc. R | 23,762 | 970,202 |
|
| Omega Healthcare Investors, Inc. R | 69,642 | 1,601,766 |
|
| Taubman Centers, Inc. R | 38,439 | 1,784,338 |
|
| | | 16,334,001 |
| Restaurants (0.5%) | | |
| Red Robin Gourmet Burgers, Inc. † | 52,900 | 1,073,870 |
|
| Sonic Corp. † | 43,500 | 386,280 |
|
| | | 1,460,150 |
| Retail (5.8%) | | |
| Abercrombie & Fitch Co. Class A | 34,970 | 1,498,814 |
|
| Aeropostale, Inc. † | 39,003 | 950,893 |
|
| AnnTaylor Stores Corp. † | 100,942 | 2,351,949 |
|
| Books-A-Million, Inc. | 89,778 | 570,090 |
|
| Brown Shoe Co., Inc. | 32,777 | 385,130 |
|
| Buckle, Inc. (The) S | 19,411 | 564,666 |
|
| Cabela’s, Inc. † S | 88,500 | 1,640,790 |
|
| Cato Corp. (The) Class A | 16,085 | 425,448 |
|
| Dollar Tree, Inc. † | 31,101 | 1,595,792 |
|
| Jos. A. Bank Clothiers, Inc. † | 20,937 | 912,853 |
|
| Kenneth Cole Productions, Inc. Class A † | 47,560 | 639,682 |
|
| Nash Finch Co. | 28,523 | 1,195,114 |
|
| Saks, Inc. † S | 94,767 | 1,055,704 |
|
| Systemax, Inc. | 60,046 | 777,596 |
|
| Timberland Co. (The) Class A † | 89,555 | 1,878,864 |
|
| Toro Co. (The) | 5,411 | 307,128 |
|
| Wolverine World Wide, Inc. | 21,083 | 613,937 |
|
| | | 17,364,450 |
| Schools (0.3%) | | |
| Career Education Corp. † | 51,427 | 902,030 |
|
| | | 902,030 |
| Semiconductor (2.1%) | | |
| Hittite Microwave Corp. † | 7,365 | 380,550 |
|
| KLA-Tencor Corp. | 20,726 | 740,333 |
|
| Lam Research Corp. † | 19,372 | 887,044 |
|
| MKS Instruments, Inc. † | 39,900 | 823,935 |
|
| Novellus Systems, Inc. † | 33,227 | 970,561 |
|
| Teradyne, Inc. † | 51,400 | 577,736 |
|
| Tessera Technologies, Inc. † | 58,400 | 1,152,232 |
|
| Verigy, Ltd. (Singapore) † | 93,400 | 855,544 |
|
| | | 6,387,935 |
27
| | |
| COMMON STOCKS (97.7%)* cont. | Shares | Value |
|
| Shipping (0.9%) | | |
| Arkansas Best Corp. | 43,867 | $1,111,151 |
|
| Con-way, Inc. | 12,000 | 396,120 |
|
| Overseas Shipholding Group S | 9,516 | 318,120 |
|
| Ship Finance International, Ltd. (Norway) S | 46,917 | 943,501 |
|
| | | 2,768,892 |
| Software (1.8%) | | |
| AsiaInfo-Linkage, Inc. (China) † S | 36,500 | 811,030 |
|
| Autodesk, Inc. † | 22,100 | 799,578 |
|
| MicroStrategy, Inc. † | 16,297 | 1,476,997 |
|
| Shanda Interactive Entertainment, Ltd. ADR (China) † S | 10,600 | 428,346 |
|
| TIBCO Software, Inc. † | 41,198 | 791,826 |
|
| Websense, Inc. † | 58,414 | 1,175,290 |
|
| | | 5,483,067 |
| Staffing (0.6%) | | |
| Administaff, Inc. | 20,149 | 528,105 |
|
| CDI Corp. | 24,070 | 344,923 |
|
| Heidrick & Struggles International, Inc. | 36,700 | 788,316 |
|
| | | 1,661,344 |
| Technology (0.5%) | | |
| Amkor Technologies, Inc. † S | 63,100 | 454,951 |
|
| ON Semiconductor Corp. † | 146,100 | 1,120,587 |
|
| | | 1,575,538 |
| Technology services (2.9%) | | |
| Acxiom Corp. † | 55,987 | 982,572 |
|
| CSG Systems International, Inc. † | 48,700 | 946,728 |
|
| DST Systems, Inc. | 22,900 | 990,883 |
|
| FactSet Research Systems, Inc. | 8,708 | 764,388 |
|
| Fair Isaac Corp. S | 40,201 | 966,432 |
|
| Global Payments, Inc. | 22,654 | 882,600 |
|
| IHS, Inc. Class A † | 19,949 | 1,441,116 |
|
| Perfect World Co., Ltd. ADR (China) † S | 38,400 | 1,244,160 |
|
| Unisys Corp. † | 21,400 | 493,270 |
|
| | | 8,712,149 |
| Telecommunications (0.9%) | | |
| ADTRAN, Inc. | 27,396 | 884,069 |
|
| NeuStar, Inc. Class A † | 74,326 | 1,918,354 |
|
| | | 2,802,423 |
| Textiles (0.7%) | | |
| Jones Group, Inc. (The) | 53,700 | 776,502 |
|
| Maidenform Brands, Inc. † | 33,808 | 904,702 |
|
| Perry Ellis International, Inc. † | 23,807 | 535,181 |
|
| | | 2,216,385 |
| Tobacco (0.2%) | | |
| Universal Corp. | 16,994 | 704,231 |
|
| | | 704,231 |
| Toys (0.9%) | | |
| Hasbro, Inc. | 48,584 | 2,247,010 |
|
| Jakks Pacific, Inc. † | 17,913 | 337,660 |
|
| | | 2,584,670 |
| Transportation services (0.3%) | | |
| HUB Group, Inc. Class A † | 19,119 | 620,794 |
|
| Pacer International, Inc. † | 46,825 | 260,815 |
|
| | | 881,609 |
28
| | |
| COMMON STOCKS (97.7%)* cont. | Shares | Value |
|
| Trucks and parts (2.7%) | | |
| Autoliv, Inc. (Sweden) S | 45,343 | $3,232,956 |
|
| Superior Industries International, Inc. | 40,683 | 730,260 |
|
| WABCO Holdings, Inc. † | 85,700 | 3,978,191 |
|
| | | 7,941,407 |
| | | |
| Total common stocks (cost $237,281,595) | | $291,046,189 |
| |
| |
| SHORT-TERM INVESTMENTS (11.6%)* | Principal amount/shares | Value |
|
| Putnam Cash Collateral Pool, LLC 0.21% d | 29,288,328 | $29,288,328 |
|
| Putnam Money Market Liquidity Fund 0.16% e | 4,718,704 | 4,718,704 |
|
| U.S. Treasury Bills, for an effective yield of 0.27%, | | |
| June 2, 2011 # | $279,000 | 278,555 |
|
| U.S. Treasury Bills, for effective yields ranging from | | |
| 0.19% to 0.23%, March 10, 2011 # | 211,000 | 210,892 |
|
| Total short-term investments (cost $34,496,442) | | $34,496,479 |
|
| |
| TOTAL INVESTMENTS | | |
|
| Total investments (cost $271,778,037) | | $325,542,668 |
Key to holding’s abbreviations
ADR American Depository Receipts
Unless noted otherwise, the notes to the fund’s portfolio are for the close of the fund’s reporting period, which ran from May 1, 2010 through October 31, 2010 (the reporting period).
* Percentages indicated are based on net assets of $297,945,004.
† Non-income-producing security.
# These securities, in part or in entirety, were pledged and segregated with the broker to cover margin requirements for futures contracts at the close of the reporting period.
d See Note 1 to the financial statements regarding securities lending. The rate quoted in the security description is the annualized 7-day yield of the fund at the close of the reporting period.
e See Note 6 to the financial statements regarding investments in Putnam Money Market Liquidity Fund. The rate quoted in the security description is the annualized 7-day yield of the fund at the close of the reporting period.
F Is valued at fair value following procedures approved by the Trustees. Securities may be classified as Level 2 or Level 3 for Accounting Standards Codification ASC 820 Fair Value Measurements and Disclosures (ASC 820) based on the securities’ valuation inputs.
R Real Estate Investment Trust.
S Securities on loan, in part or in entirety, at the close of the reporting period.
144A after the name of an issuer represents securities exempt from registration under Rule 144A under the Securities Act of 1933, as amended. These securities may be resold in transactions exempt from registration, normally to qualified institutional buyers.
ADR after the name of a foreign holding represents ownership of foreign securities on deposit with a custodian bank.
29
| | | | | |
| FUTURES CONTRACTS OUTSTANDING at 10/31/10 (Unaudited) | | | |
| |
| | | | | | Unrealized |
| Number of | | | Expiration | appreciation/ |
| | contracts | Value | | date | (depreciation) |
|
| Russell 2000 Index Mini (Long) | 28 | $1,966,160 | | Dec-10 | $(3,116) |
|
| S&P 500 Index (Long) | 1 | 294,925 | | Dec-10 | (579) |
|
| S&P Mid Cap 400 Index E-Mini (Long) | 22 | 1,820,500 | | Dec-10 | 1,571 |
|
| Total | | | | | $(2,124) |
ASC 820 establishes a three-level hierarchy for disclosure of fair value measurements. The valuation hierarchy is based upon the transparency of inputs to the valuation of the fund’s investments. The three levels are defined as follows:
Level 1 — Valuations based on quoted prices for identical securities in active markets.
Level 2 — Valuations based on quoted prices in markets that are not active or for which all significant inputs are observable, either directly or indirectly.
Level 3 — Valuations based on inputs that are unobservable and significant to the fair value measurement.
The following is a summary of the inputs used to value the fund’s net assets as of the close of the reporting period:
| | | |
| | | Valuation inputs | |
|
| Investments in securities: | Level 1 | Level 2 | Level 3 |
|
| Common stocks: | | | |
|
| Basic materials | $23,460,566 | $— | $599 |
|
| Capital goods | 29,628,682 | — | — |
|
| Communication services | 3,770,553 | — | — |
|
| Conglomerates | 2,730,110 | — | — |
|
| Consumer cyclicals | 39,290,587 | — | — |
|
| Consumer staples | 12,122,311 | — | — |
|
| Energy | 20,138,270 | — | — |
|
| Financial | 61,524,828 | 1,291,875 | 795,790 |
|
| Health care | 33,421,659 | — | — |
|
| Technology | 44,534,899 | — | — |
|
| Transportation | 6,434,714 | — | — |
|
| Utilities and power | 11,900,746 | — | — |
|
| Total common stocks | 288,957,925 | 1,291,875 | 796,389 |
| Short-term investments | 4,718,704 | 29,777,775 | — |
|
| Totals by level | $293,676,629 | $31,069,650 | $796,389 |
| | | | |
| | | Valuation inputs | |
|
| Other financial instruments: | Level 1 | Level 2 | Level 3 |
|
| Futures contracts | $(2,124) | $— | $— |
|
| Totals by level | $(2,124) | $— | $— |
At the start and/or close of the reporting period, Level 3 investments in securities were not considered a significant portion of the fund’s portfolio.
The accompanying notes are an integral part of these financial statements.
30
| |
| Statement of assets and liabilities 10/31/10 (Unaudited) | |
| |
| ASSETS | |
|
| Investment in securities, at value, including $28,702,830 of securities on loan (Note 1): | |
| Unaffiliated issuers (identified cost $237,771,005) | $291,535,636 |
| Affiliated issuers (identified cost $34,007,032) (Notes 1 and 6) | 34,007,032 |
|
| Dividends, interest and other receivables | 316,500 |
|
| Receivable for shares of the fund sold | 473,241 |
|
| Receivable for investments sold | 3,310,844 |
|
| Receivable for variation margin (Note 1) | 21,560 |
|
| Total assets | 329,664,813 |
| |
| LIABILITIES | |
|
| Payable to custodian | 308,670 |
|
| Payable for investments purchased | 784,091 |
|
| Payable for shares of the fund repurchased | 821,521 |
|
| Payable for compensation of Manager (Note 2) | 158,113 |
|
| Payable for investor servicing fees (Note 2) | 75,923 |
|
| Payable for custodian fees (Note 2) | 15,755 |
|
| Payable for Trustee compensation and expenses (Note 2) | 107,794 |
|
| Payable for administrative services (Note 2) | 1,040 |
|
| Payable for distribution fees (Note 2) | 84,900 |
|
| Collateral on securities loaned, at value (Note 1) | 29,288,328 |
|
| Other accrued expenses | 73,674 |
|
| Total liabilities | 31,719,809 |
| |
| Net assets | $297,945,004 |
|
| |
| REPRESENTED BY | |
|
| Paid-in capital (Unlimited shares authorized) (Notes 1 and 4) | $365,181,883 |
|
| Accumulated net investment loss (Note 1) | (91,920) |
|
| Accumulated net realized loss on investments and foreign currency transactions (Note 1) | (120,907,466) |
|
| Net unrealized appreciation of investments | 53,762,507 |
|
| Total — Representing net assets applicable to capital shares outstanding | $297,945,004 |
| |
| COMPUTATION OF NET ASSET VALUE AND OFFERING PRICE | |
|
| Net asset value and redemption price per class A share | |
| ($224,497,591 divided by 21,274,323 shares) | $10.55 |
|
| Offering price per class A share (100/94.25 of $10.55)* | $11.19 |
|
| Net asset value and offering price per class B share ($24,503,680 divided by 2,555,753 shares)** | $9.59 |
|
| Net asset value and offering price per class C share ($13,431,294 divided by 1,384,651 shares)** | $9.70 |
|
| Net asset value and redemption price per class M share ($5,275,040 divided by 530,312 shares) | $9.95 |
|
| Offering price per class M share (100/96.50 of $9.95)* | $10.31 |
|
| Net asset value, offering price and redemption price per class R share | |
| ($5,262,089 divided by 506,770 shares) | $10.38 |
|
| Net asset value, offering price and redemption price per class Y share | |
| ($24,975,310 divided by 2,321,909 shares) | $10.76 |
|
* On single retail sales of less than $50,000. On sales of $50,000 or more the offering price is reduced.
** Redemption price per share is equal to net asset value less any applicable contingent deferred sales charge.
The accompanying notes are an integral part of these financial statements.
31
| |
| Statement of operations Six months ended 10/31/10 (Unaudited) | |
| |
| INVESTMENT INCOME | |
|
| Dividends (net of foreign tax of $5,767) | $1,829,613 |
|
| Interest (including interest income of $886 from investments in affiliated issuers) (Note 6) | 1,307 |
|
| Securities lending (including interest income of $24,442 from | |
| investments in affiliated issuers) (Note 1) | 64,586 |
|
| Total investment income | 1,895,506 |
| |
|
| EXPENSES | |
|
| Compensation of Manager (Note 2) | 900,698 |
|
| Investor servicing fees (Note 2) | 498,971 |
|
| Custodian fees (Note 2) | 13,748 |
|
| Trustee compensation and expenses (Note 2) | 9,525 |
|
| Administrative services (Note 2) | 5,193 |
|
| Distribution fees — Class A (Note 2) | 268,141 |
|
| Distribution fees — Class B (Note 2) | 132,678 |
|
| Distribution fees — Class C (Note 2) | 62,369 |
|
| Distribution fees — Class M (Note 2) | 19,535 |
|
| Distribution fees — Class R (Note 2) | 9,625 |
|
| Other | 74,342 |
|
| Total expenses | 1,994,825 |
| | |
| Expense reduction (Note 2) | (7,399) |
|
| Net expenses | 1,987,426 |
| |
| Net investment loss | (91,920) |
|
| |
| Net realized gain on investments (Notes 1 and 3) | 17,300,156 |
|
| Net realized loss on futures contracts (Note 1) | (88,401) |
|
| Net realized loss on foreign currency transactions (Note 1) | (8) |
|
| Net unrealized depreciation of investments and futures contracts during the period | (13,794,576) |
|
| Net gain on investments | 3,417,171 |
| |
| Net increase in net assets resulting from operations | $3,325,251 |
|
The accompanying notes are an integral part of these financial statements.
32
| | |
| Statement of changes in net assets | | |
| |
| INCREASE (DECREASE) IN NET ASSETS | Six months ended 10/31/10* | Year ended 4/30/10 |
|
| Operations: | | |
| Net investment loss | $(91,920) | $(100,092) |
|
| Net realized gain on investments | | |
| and foreign currency transactions | 17,211,747 | 22,334,573 |
|
| Net unrealized appreciation (depreciation) of investments | (13,794,576) | 101,548,009 |
|
| Net increase in net assets resulting from operations | 3,325,251 | 123,782,490 |
|
| Distributions to shareholders (Note 1): | | |
| From ordinary income | | |
| Net investment income | | |
|
| Class A | — | (649,822) |
|
| Class R | — | (4,462) |
|
| Class Y | — | (94,096) |
|
| From return of capital | | |
| Class A | — | (32,515) |
|
| Class R | — | (223) |
|
| Class Y | — | (4,708) |
|
| Redemption fees (Note 1) | 32,077 | 10,018 |
|
| Decrease from capital share transactions (Note 4) | (19,324,560) | (34,596,986) |
|
| Total increase (decrease) in net assets | (15,967,232) | 88,409,696 |
|
| |
| NET ASSETS | | |
|
| Beginning of period | 313,912,236 | 225,502,540 |
|
| End of period (including accumulated net investment losses | | |
| of $91,920 and $—, respectively) | $297,945,004 | $313,912,236 |
|
| * Unaudited | | |
The accompanying notes are an integral part of these financial statements.
33
Financial highlights (For a common share outstanding throughout the period)
| | | | | | | | | | | | | | | |
| INVESTMENT OPERATIONS: | LESS DISTRIBUTIONS: | RATIOS AND SUPPLEMENTAL DATA: | |
|
| | | | | | | | | | | | | | | Ratio | |
| | Net asset | | Net realized | | | | | | | | | | Ratio | of net investment | |
| | value, | | and unrealized | Total from | From | From | | | | | Total return | Net assets, | of expenses | income (loss) | |
| | beginning | Net investment | gain (loss) | investment | net investment | net realized gain | From | Total | Redemption | Net asset value, | at net asset | end of period | to average | to average | Portfolio |
| Period ended | of period | income (loss) a | on investments | operations | income | on investments | return of capital | distributions | fees b | end of period | value (%) c | (in thousands) | net assets (%) d | net assets (%) | turnover (%) |
|
| Class A | | | | | | | | | | | | | | | |
| October 31, 2010** | $10.35 | — b | .20 | .20 | — | — | — | — | — | $10.55 | 1.93* | $224,498 | .66* | .02* | 9.32* |
| April 30, 2010 | 6.49 | .01 | 3.88 | 3.89 | (.03) | — | — b | (.03) | — | 10.35 | 60.03 | 234,809 | 1.39 | .09 | 29.92 |
| April 30, 2009 | 9.25 | .05 | (2.75) | (2.70) | (.06) | — | — | (.06) | — | 6.49 | (29.16) | 163,115 | 1.35 e | .71 e | 58.18 |
| April 30, 2008 | 12.49 | .08 | (2.33) | (2.25) | (.05) | (.94) | — | (.99) | — | 9.25 | (18.45) | 341,118 | 1.23 e | .71 e | 37.06 |
| April 30, 2007 | 12.60 | .03 | 1.36 | 1.39 | — b | (1.50) | — | (1.50) | — | 12.49 | 11.72 | 508,647 | 1.23 e | .23 e | 58.83 |
| April 30, 2006 | 10.97 | .02 f | 3.60 | 3.62 | (.07) | (1.92) | — | (1.99) | — | 12.60 | 34.85 | 476,325 | 1.20 e,f | .13 e,f | 60.27 |
|
| Class B | | | | | | | | | | | | | | | |
| October 31, 2010** | $9.43 | (.03) | .19 | .16 | — | — | — | — | — | $9.59 | 1.70* | $24,504 | 1.04* | (.36)* | 9.32* |
| April 30, 2010 | 5.94 | (.05) | 3.54 | 3.49 | — | — | — | — | — | 9.43 | 58.75 | 34,146 | 2.14 | (.65) | 29.92 |
| April 30, 2009 | 8.45 | — b | (2.51) | (2.51) | — | — | — | — | — | 5.94 | (29.70) | 34,319 | 2.10 e | (.05) e | 58.18 |
| April 30, 2008 | 11.54 | — b | (2.15) | (2.15) | — | (.94) | — | (.94) | — | 8.45 | (19.11) | 81,892 | 1.98 e | (.04) e | 37.06 |
| April 30, 2007 | 11.83 | (.06) | 1.27 | 1.21 | — | (1.50) | — | (1.50) | — | 11.54 | 10.92 | 167,550 | 1.98 e | (.53) e | 58.83 |
| April 30, 2006 | 10.42 | (.07) f | 3.40 | 3.33 | — | (1.92) | — | (1.92) | — | 11.83 | 33.73 | 228,590 | 1.95 e,f | (.61) e,f | 60.27 |
|
| Class C | | | | | | | | | | | | | | | |
| October 31, 2010** | $9.55 | (.03) | .18 | .15 | — | — | — | — | — | $9.70 | 1.57* | $13,431 | 1.04* | (.36)* | 9.32* |
| April 30, 2010 | 6.02 | (.05) | 3.58 | 3.53 | — | — | — | — | — | 9.55 | 58.64 | 13,492 | 2.14 | (.66) | 29.92 |
| April 30, 2009 | 8.55 | — b | (2.53) | (2.53) | — | — | — | — | — | 6.02 | (29.59) | 8,907 | 2.10 e | (.04) e | 58.18 |
| April 30, 2008 | 11.66 | — b | (2.17) | (2.17) | — | (.94) | — | (.94) | — | 8.55 | (19.09) | 18,438 | 1.98 e | (.04) e | 37.06 |
| April 30, 2007 | 11.94 | (.06) | 1.28 | 1.22 | — | (1.50) | — | (1.50) | — | 11.66 | 10.89 | 34,473 | 1.98 e | (.52) e | 58.83 |
| April 30, 2006 | 10.50 | (.07) f | 3.43 | 3.36 | — | (1.92) | — | (1.92) | — | 11.94 | 33.76 | 34,354 | 1.95 e,f | (.62) e,f | 60.27 |
|
| Class M | | | | | | | | | | | | | | | |
| October 31, 2010** | $9.78 | (.02) | .19 | .17 | — | — | — | — | — | $9.95 | 1.74* | $5,275 | .91* | (.23)* | 9.32* |
| April 30, 2010 | 6.15 | (.03) | 3.66 | 3.63 | — | — | — | — | — | 9.78 | 59.03 | 5,700 | 1.89 | (.41) | 29.92 |
| April 30, 2009 | 8.73 | .01 | (2.59) | (2.58) | — b | — | — | — | — | 6.15 | (29.50) | 4,034 | 1.85 e | .20 e | 58.18 |
| April 30, 2008 | 11.84 | .02 | (2.19) | (2.17) | — | (.94) | — | (.94) | — | 8.73 | (18.78) | 7,995 | 1.73 e | .21 e | 37.06 |
| April 30, 2007 | 12.07 | (.03) | 1.30 | 1.27 | — | (1.50) | — | (1.50) | — | 11.84 | 11.20 | 15,921 | 1.73 e | (.27) e | 58.83 |
| April 30, 2006 | 10.59 | (.04) f | 3.46 | 3.42 | (.02) | (1.92) | — | (1.94) | — | 12.07 | 34.05 | 17,785 | 1.70 e,f | (.36) e,f | 60.27 |
|
| Class R | | | | | | | | | | | | | | | |
| October 31, 2010** | $10.19 | (.01) | .20 | .19 | — | — | — | — | — | $10.38 | 1.86* | $5,262 | .79* | (.11)* | 9.32* |
| April 30, 2010 | 6.41 | (.01) | 3.81 | 3.80 | (.02) | — | — b | (.02) | — | 10.19 | 59.27 | 3,337 | 1.64 | (.17) | 29.92 |
| April 30, 2009 | 9.12 | .03 | (2.70) | (2.67) | (.04) | — | — | (.04) | — | 6.41 | (29.22) | 1,845 | 1.60 e | .46 e | 58.18 |
| April 30, 2008 | 12.34 | .05 | (2.30) | (2.25) | (.03) | (.94) | — | (.97) | — | 9.12 | (18.67) | 2,577 | 1.48 e | .47 e | 37.06 |
| April 30, 2007 | 12.49 | — b | 1.35 | 1.35 | — | (1.50) | — | (1.50) | — | 12.34 | 11.48 | 2,610 | 1.48 e | (.02) e | 58.83 |
| April 30, 2006 | 10.92 | (.03) f | 3.59 | 3.56 | (.07) | (1.92) | — | (1.99) | — | 12.49 | 34.37 | 1,390 | 1.45 e,f | (.21) e,f | 60.27 |
|
| Class Y | | | | | | | | | | | | | | | |
| October 31, 2010** | $10.53 | .01 | .22 | .23 | — | — | — | — | — | $10.76 | 2.18* | $24,975 | .53* | .14* | 9.32* |
| April 30, 2010 | 6.61 | .03 | 3.94 | 3.97 | (.05) | — | — b | (.05) | — | 10.53 | 60.20 | 22,430 | 1.14 | .33 | 29.92 |
| April 30, 2009 | 9.43 | .08 | (2.82) | (2.74) | (.08) | — | — | (.08) | — | 6.61 | (28.92) | 13,283 | 1.10 e | 1.00 e | 58.18 |
| April 30, 2008 | 12.72 | .11 | (2.38) | (2.27) | (.08) | (.94) | — | (1.02) | — | 9.43 | (18.27) | 338,526 | .98 e | .97 e | 37.06 |
| April 30, 2007 | 12.79 | .06 | 1.40 | 1.46 | (.03) | (1.50) | — | (1.53) | — | 12.72 | 12.12 | 432,748 | .98 e | .48 e | 58.83 |
| April 30, 2006 | 11.12 | .05 f | 3.65 | 3.70 | (.11) | (1.92) | — | (2.03) | — | 12.79 | 35.06 | 389,857 | .95 e,f | .38 e,f | 60.27 |
|
See notes to financial highlights at the end of this section.
The accompanying notes are an integral part of these financial statements.
Financial highlights (Continued)
* Not annualized.
** Unaudited.
a Per share net investment income (loss) has been determined on the basis of the weighted average number of shares outstanding during the period.
b Amount represents less than $0.01 per share.
c Total return assumes dividend reinvestment and does not reflect the effect of sales charges.
d Includes amounts paid through expense offset and brokerage/service arrangements (Note 2).
e Reflects an involuntary contractual expense limitation and/or waivers of certain fund expenses in connection with investments in Putnam Prime Money Market Fund in effect during the period. As a result of such limitation and/or waivers, the expenses of each class reflect a reduction of the following amounts (Note 2):
| |
| | Percentage of |
| | average net assets |
|
| April 30, 2009 | 0.01% |
|
| April 30, 2008 | <0.01 |
|
| April 30, 2007 | <0.01 |
|
| April 30, 2006 | <0.01 |
|
f Reflects a non-recurring reimbursement from Putnam Investments relating to the calculation of certain amounts paid by the fund to Putnam in previous years for transfer agent services, which amounted to less than $0.01 per share and 0.03% of average net assets for the period ended April 30, 2006.
The accompanying notes are an integral part of these financial statements.
36
Notes to financial statements 10/31/10 (Unaudited)
Note 1: Significant accounting policies
Putnam Capital Opportunities Fund (the fund) is a diversified series of Putnam Investment Funds (the trust), a Massachusetts business trust registered under the Investment Company Act of 1940, as amended, as an open-end management investment company. The fund invests primarily in common stocks of U.S. companies that Putnam Investment Management, LLC (Putnam Management), the fund’s manager, an indirect wholly-owned subsidiary of Putnam, LLC, believes have favorable investment potential, such as stocks of companies with stock prices that reflect a value lower than that which Putnam Management places on the company. Putnam Management may also consider other factors it believes will cause the stock price to rise.
The fund offers class A, class B, class C, class M, class R and class Y shares. Class A and class M shares are sold with a maximum front-end sales charge of 5.75% and 3.50%, respectively, and generally do not pay a contingent deferred sales charge. Class B shares, which convert to class A shares after approximately eight years, do not pay a front-end sales charge and are subject to a contingent deferred sales charge if those shares are redeemed within six years of purchase. Class C shares have a one-year 1.00% contingent deferred sales charge and do not convert to class A shares. Class R shares, which are offered to qualified employee-benefit plans, are sold at net asset value. The expenses for class A, class B, class C, class M and class R shares may differ based on the distribution fee of each class, which is identified in Note 2. Class Y shares, which are sold at net asset value, are generally subject to the same expenses as class A, class B, class C, class M and class R shares, but do not bear a distribution fee. Class Y shares are generally only available to corporate and institutional clients and clients in other approved programs.
Prior to August 2, 2010, a 1.00% redemption fee applied on any shares that were redeemed (either by selling or exchanging into another fund) within 90 days of purchase. Effective August 2, 2010, this redemption fee may apply on any shares that are redeemed (either by selling or exchanging into another fund) within 60 days of purchase. The redemption fee is accounted for as an addition to paid-in-capital.
Investment income, realized and unrealized gains and losses and expenses of the fund are borne pro-rata based on the relative net assets of each class to the total net assets of the fund, except that each class bears expenses unique to that class (including the distribution fees applicable to such classes). Each class votes as a class only with respect to its own distribution plan or other matters on which a class vote is required by law or determined by the Trustees. If the fund were liquidated, shares of each class would receive their pro-rata share of the net assets of the fund. In addition, the Trustees declare separate dividends on each class of shares.
In the normal course of business, the fund enters into contracts that may include agreements to indemnify another party under given circumstances. The fund’s maximum exposure under these arrangements is unknown as this would involve future claims that may be, but have not yet been, made against the fund. However, the fund’s management team expects the risk of material loss to be remote.
The following is a summary of significant accounting policies consistently followed by the fund in the preparation of its financial statements. The preparation of financial statements is in conformity with accounting principles generally accepted in the United States of America and requires management to make estimates and assumptions that affect the reported amounts of assets and liabilities in the financial statements and the reported amounts of increases and decreases in net assets from operations. Actual results could differ from those estimates. Subsequent events after the Statement of assets and liabilities date through the date that the financial statements were issued have been evaluated in the preparation of the financial statements. Unless otherwise noted, the “reporting period” represents the period from May 1, 2010 through October 31, 2010.
A) Security valuation Investments for which market quotations are readily available are valued at the last reported sales price on their principal exchange, or official closing price for certain markets and are classified as Level 1 securities. If no sales are reported — as in the case of some securities traded over-the-counter — a security is valued at its last reported bid price and is generally categorized as a Level 2 security.
Many securities markets and exchanges outside the U.S. close prior to the close of the New York Stock Exchange and therefore the closing prices for securities in such markets or on such exchanges may not fully reflect events that occur after such close but before the close of the New York Stock Exchange. Accordingly, on certain days, the fund will fair value foreign equity securities taking into account multiple factors including movements in the U.S. securities markets, currency valuations and comparisons to the valuation of American Depository Receipts, exchange-traded funds and futures contracts. These securities, which will generally represent a transfer from a Level 1 to a Level 2 security, will be classified as Level 2. The number of days on which fair value prices will be used
37
will depend on market activity and it is possible that fair value prices will be used by the fund to a significant extent. Securities quoted in foreign currencies, if any, are translated into U.S. dollars at the current exchange rate.
To the extent a pricing service or dealer is unable to value a security or provides a valuation that Putnam Management does not believe accurately reflects the security’s fair value, the security will be valued at fair value by Putnam Management. Certain investments, including certain restricted and illiquid securities and derivatives, are also valued at fair value following procedures approved by the Trustees. These valuations consider such factors as significant market or specific security events such as interest rate or credit quality changes, various relationships with other securities, discount rates, U.S. Treasury, U.S. swap and credit yields, index levels, convexity exposures and recovery rates. These securities are classified as Level 2 or as Level 3 depending on the priority of the significant inputs.
Such valuations and procedures are reviewed periodically by the Trustees. The fair value of securities is generally determined as the amount that the fund could reasonably expect to realize from an orderly disposition of such securities over a reasonable period of time. By its nature, a fair value price is a good faith estimate of the value of a security in a current sale and does not reflect an actual market price, which may be different by a material amount.
B) Joint trading account Pursuant to an exemptive order from the Securities and Exchange Commission (the SEC), the fund may transfer uninvested cash balances, including cash collateral received under security lending arrangements, into a joint trading account along with the cash of other registered investment companies and certain other accounts managed by Putnam Management. These balances may be invested in issues of short-term investments having maturities of up to 397 days for collateral received under security lending arrangements and up to 90 days for other cash investments.
C) Security transactions and related investment income Security transactions are recorded on the trade date (the date the order to buy or sell is executed). Gains or losses on securities sold are determined on the identified cost basis.
Interest income is recorded on the accrual basis. Dividend income, net of applicable withholding taxes, is recognized on the ex-dividend date except that certain dividends from foreign securities, if any, are recognized as soon as the fund is informed of the ex-dividend date. Non-cash dividends, if any, are recorded at the fair market value of the securities received. Dividends representing a return of capital or capital gains, if any, are reflected as a reduction of cost and/or as a realized gain.
D) Foreign currency translation The accounting records of the fund are maintained in U.S. dollars. The market value of foreign securities, currency holdings, and other assets and liabilities is recorded in the books and records of the fund after translation to U.S. dollars based on the exchange rates on that day. The cost of each security is determined using historical exchange rates. Income and withholding taxes are translated at prevailing exchange rates when earned or incurred. The fund does not isolate that portion of realized or unrealized gains or losses resulting from changes in the foreign exchange rate on investments from fluctuations arising from changes in the market prices of the securities. Such gains and losses are included with the net realized and unrealized gain or loss on investments. Net realized gains and losses on foreign currency transactions represent net realized exchange gains or losse s on closed forward currency contracts, disposition of foreign currencies, currency gains and losses realized between the trade and settlement dates on securities transactions and the difference between the amount of investment income and foreign withholding taxes recorded on the fund’s books and the U.S. dollar equivalent amounts actually received or paid. Net unrealized appreciation and depreciation of assets and liabilities in foreign currencies arise from changes in the value of open forward currency contracts and assets and liabilities other than investments at the period end, resulting from changes in the exchange rate. Investments in foreign securities involve certain risks, including those related to economic instability, unfavorable political developments, and currency fluctuations, not present with domestic investments.
E) Futures contracts The fund uses futures contracts to equitize cash. The potential risk to the fund is that the change in value of futures contracts may not correspond to the change in value of the hedged instruments. In addition, losses may arise from changes in the value of the underlying instruments if there is an illiquid secondary market for the contracts, if interest or exchange rates move unexpectedly or if the counterparty to the contract is unable to perform. With futures, there is minimal counterparty credit risk to the fund since futures are exchange traded and the exchange’s clearinghouse, as counterparty to all exchange traded futures, guarantees the futures against default. Risks may exceed amounts recognized on the Statement of assets and liabilities. When the contract is closed, the fund records a realized gain or loss equal to the difference between the value of the contract at the time it was opened and the value at the time it was closed.
38
Futures contracts are valued at the quoted daily settlement prices established by the exchange on which they trade. The fund and the broker agree to exchange an amount of cash equal to the daily fluctuation in the value of the futures contract. Such receipts or payments are known as “variation margin.” Futures contracts outstanding at period end, if any, are listed after the fund’s portfolio. Outstanding contracts on futures contracts at the close of the reporting period are indicative of the volume of activity during the period.
F) Securities lending The fund may lend securities, through its agent, to qualified borrowers in order to earn additional income. The loans are collateralized by cash in an amount at least equal to the market value of the securities loaned. The market value of securities loaned is determined daily and any additional required collateral is allocated to the fund on the next business day. The risk of borrower default will be borne by the fund’s agent; the fund will bear the risk of loss with respect to the investment of the cash collateral. Income from securities lending is included in investment income on the Statement of operations. Effective August 2010, cash collateral is invested in Putnam Cash Collateral Pool, LLC, a limited liability company managed by an affiliate of Putnam Management and is valued at its closing net asset value each business day. There are no management fees charged by Putnam Cash C ollateral Pool, LLC. At the close of the reporting period, the value of securities loaned amounted to $28,702,830 and the fund received cash collateral of $29,288,328.
G) Interfund lending Effective July 2010, the fund, along with other Putnam funds, may participate in an interfund lending program pursuant to an exemptive order issued by the SEC. This program allows the fund to borrow from or lend to other Putnam funds that permit such transactions. Interfund lending transactions are subject to each fund’s investment policies and borrowing and lending limits. Interest earned or paid on the interfund lending transaction will be based on the average of certain current market rates. During the reporting period, the fund did not utilize the program.
H) Line of credit Effective July 2010, the fund participates, along with other Putnam funds, in a $285 million unsecured committed line of credit and a $165 million unsecured uncommitted line of credit, both provided by State Street Bank and Trust Company (State Street). Borrowings may be made for temporary or emergency purposes, including the funding of shareholder redemption requests and trade settlements. Interest is charged to the fund based on the fund’s borrowing at a rate equal to the Federal Funds rate plus 1.25% for the committed line of credit and the Federal Funds rate plus 1.30% for the uncommitted line of credit. A closing fee equal to 0.03% of the committed line of credit and $100,000 for the uncommitted line of credit has been paid by the participating funds. In addition, a commitment fee of 0.15% per annum on any unutilized portion of the committed line of credit is allocated to the partic ipating funds based on their relative net assets and paid quarterly. During the reporting period, the fund had no borrowings against these arrangements.
I) Federal taxes It is the policy of the fund to distribute all of its taxable income within the prescribed time period and otherwise comply with the provisions of the Internal Revenue Code of 1986, as amended (the Code), applicable to regulated investment companies. It is also the intention of the fund to distribute an amount sufficient to avoid imposition of any excise tax under Section 4982 of the Code. The fund is subject to the provisions of Accounting Standards Codification ASC 740 Income Taxes (ASC 740). ASC 740 sets forth a minimum threshold for financial statement recognition of the benefit of a tax position taken or expected to be taken in a tax return. The fund did not have a liability to record for any unrecognized tax benefits in the accompanying financial statements. No provision has been made for federal taxes on inco me, capital gains or unrealized appreciation on securities held nor for excise tax on income and capital gains. Each of the fund’s federal tax returns for the prior three fiscal years remains subject to examination by the Internal Revenue Service.
At April 30, 2010, the fund had a capital loss carryover of $134,096,438 available to the extent allowed by the Code to offset future net capital gain, if any. The amounts of the carryovers and the expiration dates are:
| |
| Loss carryover | Expiration |
|
| $1,397,639 | April 30, 2016 |
|
| 90,647,744 | April 30, 2017 |
|
| 42,051,055 | April 30, 2018 |
|
The aggregate identified cost on a tax basis is $275,800,812, resulting in gross unrealized appreciation and depreciation of $71,464,676 and $21,722,820, respectively, or net unrealized appreciation of $49,741,856.
J) Distributions to shareholders Distributions to shareholders from net investment income are recorded by the fund on the ex-dividend date. Distributions from capital gains, if any, are recorded on the ex-dividend date and paid at
39
least annually. The amount and character of income and gains to be distributed are determined in accordance with income tax regulations, which may differ from generally accepted accounting principles. Dividend sources are estimated at the time of declaration. Actual results may vary. Any non-taxable return of capital cannot be determined until final tax calculations are completed after the end of the fund’s fiscal year. Reclassifications are made to the fund’s capital accounts to reflect income and gains available for distribution (or available capital loss carryovers) under income tax regulations.
K) Expenses of the Trust Expenses directly charged or attributable to any fund will be paid from the assets of that fund. Generally, expenses of the Trust will be allocated among and charged to the assets of each fund on a basis that the Trustees deem fair and equitable, which may be based on the relative assets of each fund or the nature of the services performed and relative applicability to each fund.
Note 2: Management fee, administrative services and other transactions
The fund pays Putnam Management a management fee (based on the fund’s average net assets and computed and paid monthly) at annual rates that may vary based on the average of the aggregate net assets of most open-end funds, as defined in the fund’s management contract, sponsored by Putnam Management. Such annual rates may vary as follows: 0.780% of the first $5 billion, 0.730% of the next $5 billion, 0.680% of the next $10 billion, 0.630% of the next $10 billion, 0.580% of the next $50 billion, 0.560% of the next $50 billion, 0.550% of the next $100 billion and 0.545% of any excess thereafter.
Putnam Management has contractually agreed, through June 30, 2011, to waive fees or reimburse the fund’s expenses to the extent necessary to limit the cumulative expenses of the fund, exclusive of brokerage, interest, taxes, investment-related expenses, extraordinary expenses and payments under the fund’s investor servicing contract, investment management contract and distribution plans, on a fiscal year-to-date basis to an annual rate of 0.20% of the fund’s average net assets over such fiscal year-to-date period. During the reporting period, the fund’s expenses were not reduced as a result of this limit.
Effective August 30, 2010, Putnam Investments Limited (PIL), an affiliate of Putnam Management, is authorized by the Trustees to manage a separate portion of the assets of the fund as determined by Putnam Management from time to time. Putnam Management pays a quarterly sub-management fee to PIL for its services at an annual rate of 0.35% of the average net assets of the portion of the fund managed by PIL.
The fund reimburses Putnam Management an allocated amount for the compensation and related expenses of certain officers of the fund and their staff who provide administrative services to the fund. The aggregate amount of all such reimbursements is determined annually by the Trustees.
Custodial functions for the fund’s assets are provided by State Street. Custody fees are based on the fund’s asset level, the number of its security holdings and transaction volumes.
Putnam Investor Services, Inc., an affiliate of Putnam Management, provides investor servicing agent functions to the fund. Putnam Investor Services, Inc. received fees for investor servicing based on the fund’s retail asset level, the number of shareholder accounts in the fund and the level of defined contribution plan assets in the fund. Investor servicing fees will not exceed an annual rate of 0.375% of the fund’s average net assets. The amounts incurred for investor servicing agent functions during the reporting period are included in Investor servicing fees in the Statement of operations.
The fund has entered into expense offset arrangements with Putnam Investor Services, Inc. and State Street whereby Putnam Investor Services, Inc.’s and State Street’s fees are reduced by credits allowed on cash balances. The fund also reduced expenses through brokerage/service arrangements. For the reporting period, the fund’s expenses were reduced by $211 under the expense offset arrangements and by $7,188 under the brokerage/service arrangements.
Each independent Trustee of the fund receives an annual Trustee fee, of which $199, as a quarterly retainer, has been allocated to the fund, and an additional fee for each Trustees meeting attended. Trustees also are reimbursed for expenses they incur relating to their services as Trustees.
The fund has adopted a Trustee Fee Deferral Plan (the Deferral Plan) which allows the Trustees to defer the receipt of all or a portion of Trustees fees payable on or after July 1, 1995. The deferred fees remain invested in certain Putnam funds until distribution in accordance with the Deferral Plan.
The fund has adopted an unfunded noncontributory defined benefit pension plan (the Pension Plan) covering all Trustees of the fund who have served as a Trustee for at least five years and were first elected prior to 2004. Benefits under the Pension Plan are equal to 50% of the Trustee’s average annual attendance and retainer fees for
40
the three years ended December 31, 2005. The retirement benefit is payable during a Trustee’s lifetime, beginning the year following retirement, for the number of years of service through December 31, 2006. Pension expense for the fund is included in Trustee compensation and expenses in the Statement of operations. Accrued pension liability is included in Payable for Trustee compensation and expenses in the Statement of assets and liabilities. The Trustees have terminated the Pension Plan with respect to any Trustee first elected after 2003.
The fund has adopted distribution plans (the Plans) with respect to its class A, class B, class C, class M and class R shares pursuant to Rule 12b-1 under the Investment Company Act of 1940. The purpose of the Plans is to compensate Putnam Retail Management Limited Partnership, a wholly-owned subsidiary of Putnam Investments, LLC and Putnam Retail Management GP, Inc., for services provided and expenses incurred in distributing shares of the fund. The Plans provide for payments by the fund to Putnam Retail Management Limited Partnership at an annual rate of up to 0.35%, 1.00%, 1.00%, 1.00% and 1.00% of the average net assets attributable to class A, class B, class C, class M and class R shares, respectively. The Trustees have approved payment by the fund at an annual rate of 0.25%, 1.00%, 1.00%, 0.75% and 0.50% of the average net assets attributable to class A, class B, class C, class M and class R shares, respectively.
For the reporting period, Putnam Retail Management Limited Partnership, acting as underwriter, received net commissions of $12,631 and $108 from the sale of class A and class M shares, respectively, and received $9,596 and $340 in contingent deferred sales charges from redemptions of class B and class C shares, respectively.
A deferred sales charge of up to 1.00% and 0.65% is assessed on certain redemptions of class A and class M shares, respectively. For the reporting period, Putnam Retail Management Limited Partnership, acting as underwriter, received no monies on class A and class M redemptions.
Note 3: Purchases and sales of securities
During the reporting period, cost of purchases and proceeds from sales of investment securities other than short-term investments aggregated $26,213,079 and $49,863,708, respectively. There were no purchases or proceeds from sales of long-term U.S. government securities.
Note 4: Capital shares
At the close of the reporting period, there was an unlimited number of shares of beneficial interest authorized. Transactions in capital shares were as follows:
| | | | |
| | Six months ended 10/31/10 | Year ended 4/30/10 |
|
| Class A | Shares | Amount | Shares | Amount |
|
| Shares sold | 2,143,012 | $20,765,097 | 4,262,762 | $36,865,570 |
|
| Shares issued in connection with | | | | |
| reinvestment of distributions | — | — | 76,747 | 660,788 |
|
| | 2,143,012 | 20,765,097 | 4,339,509 | 37,526,358 |
|
| Shares repurchased | (3,564,708) | (33,794,328) | (6,766,889) | (55,684,758) |
|
| Net decrease | (1,421,696) | $(13,029,231) | (2,427,380) | $(18,158,400) |
|
| |
| | Six months ended 10/31/10 | Year ended 4/30/10 |
|
| Class B | Shares | Amount | Shares | Amount |
|
| Shares sold | 97,282 | $862,023 | 259,732 | $2,028,646 |
|
| Shares issued in connection with | | | | |
| reinvestment of distributions | — | — | — | — |
|
| | 97,282 | 862,023 | 259,732 | 2,028,646 |
|
| Shares repurchased | (1,160,771) | (10,144,877) | (2,413,985) | (18,794,134) |
|
| Net decrease | (1,063,489) | $(9,282,854) | (2,154,253) | $(16,765,488) |
|
41
| | | | |
| | Six months ended 10/31/10 | Year ended 4/30/10 |
|
| Class C | Shares | Amount | Shares | Amount |
|
| Shares sold | 127,011 | $1,131,521 | 222,194 | $1,772,443 |
|
| Shares issued in connection with | | | | |
| reinvestment of distributions | — | — | — | — |
|
| | 127,011 | 1,131,521 | 222,194 | 1,772,443 |
|
| Shares repurchased | (155,604) | (1,374,642) | (289,710) | (2,294,432) |
|
| Net decrease | (28,593) | $(243,121) | (67,516) | $(521,989) |
|
| |
| | Six months ended 10/31/10 | Year ended 4/30/10 |
|
| Class M | Shares | Amount | Shares | Amount |
|
| Shares sold | 15,687 | $142,523 | 74,419 | $600,855 |
|
| Shares issued in connection with | | | | |
| reinvestment of distributions | — | — | — | — |
|
| | 15,687 | 142,523 | 74,419 | 600,855 |
|
| Shares repurchased | (68,344) | (632,006) | (147,890) | (1,171,708) |
|
| Net decrease | (52,657) | $(489,483) | (73,471) | $(570,853) |
|
| |
| | Six months ended 10/31/10 | Year ended 4/30/10 |
|
| Class R | Shares | Amount | Shares | Amount |
|
| Shares sold | 241,071 | $2,285,685 | 155,900 | $1,331,839 |
|
| Shares issued in connection with | | | | |
| reinvestment of distributions | — | — | 513 | 4,355 |
|
| | 241,071 | 2,285,685 | 156,413 | 1,336,194 |
|
| Shares repurchased | (61,584) | (580,332) | (116,996) | (954,667) |
|
| Net increase | 179,487 | $1,705,353 | 39,417 | $381,527 |
|
| |
| | Six months ended 10/31/10 | Year ended 4/30/10 |
|
| Class Y | Shares | Amount | Shares | Amount |
|
| Shares sold | 497,409 | $5,018,230 | 630,608 | $5,358,395 |
|
| Shares issued in connection with | | | | |
| reinvestment of distributions | — | — | 10,695 | 93,578 |
|
| | 497,409 | 5,018,230 | 641,303 | 5,451,973 |
|
| Shares repurchased | (305,105) | (3,003,454) | (522,348) | (4,413,756) |
|
| Net increase | 192,304 | $2,014,776 | 118,955 | $1,038,217 |
|
Note 5: Summary of derivative activity
The following is a summary of the market values of derivative instruments as of the close of the reporting period:
Market values of derivative instruments as of the close of the reporting period
| | | | |
| | Asset derivatives | Liability derivatives |
|
| Derivatives not | | | | |
| accounted for as | Statement of | | Statement of | |
| hedging instruments | assets and | Market | assets and | Market |
| under ASC 815 | liabilities location | value | liabilities location | value |
|
| | Receivables, Net assets — | | Payables, Net assets — | |
| | Unrealized appreciation/ | | Unrealized appreciation/ | |
| Equity contracts | (depreciation) | $1,571* | (depreciation) | $3,695* |
|
| Total | | $1,571 | | $3,695 |
|
* Includes cumulative appreciation/depreciation of futures contracts as reported in the fund’s portfolio. Only current day’s variation margin is reported within the Statement of assets and liabilities.
42
The following is a summary of realized and unrealized gains or losses of derivative instruments on the Statement of operations for the reporting period (see Note 1):
Amount of realized gain or (loss) on derivatives recognized in net gain or (loss) on investments
| | |
| Derivatives not accounted for as hedging | | |
| instruments under ASC 815 | Futures | Total |
|
| Equity contracts | $(88,401) | $(88,401) |
|
| Total | $(88,401) | $(88,401) |
|
Change in unrealized appreciation or (depreciation) on derivatives recognized in net gain or (loss) on investments
| | |
| Derivatives not accounted for as hedging | | |
| instruments under ASC 815 | Futures | Total |
|
| Equity contracts | $(2,124) | $(2,124) |
|
| Total | $(2,124) | $(2,124) |
|
Note 6: Investment in Putnam Money Market Liquidity Fund
The fund invested in Putnam Money Market Liquidity Fund, an open-end management investment company managed by Putnam Management. Investments in Putnam Money Market Liquidity Fund are valued at its closing net asset value each business day. Income distributions earned by the fund are recorded as interest income in the Statement of operations and totaled $886 for the reporting period. During the reporting period, cost of purchases and proceeds of sales of investments in Putnam Money Market Liquidity Fund aggregated $21,853,165 and $19,615,128, respectively. Management fees charged to Putnam Money Market Liquidity Fund have been waived by Putnam Management.
Note 7: Regulatory matters and litigation
In late 2003 and 2004, Putnam Management settled charges brought by the SEC and the Massachusetts Securities Division in connection with excessive short-term trading in Putnam funds. Distribution of payments from Putnam Management to certain open-end Putnam funds and their shareholders is expected to be completed in the next several months. These allegations and related matters have served as the general basis for certain lawsuits, including purported class action lawsuits against Putnam Management and, in a limited number of cases, some Putnam funds. Putnam Management believes that these lawsuits will have no material adverse effect on the funds or on Putnam Management’s ability to provide investment management services. In addition, Putnam Management has agreed to bear any costs incurred by the Putnam funds as a result of these matters.
Note 8: Market and credit risk
In the normal course of business, the fund trades financial instruments and enters into financial transactions where risk of potential loss exists due to changes in the market (market risk) or failure of the contracting party to the transaction to perform (credit risk). The fund may be exposed to additional credit risk that an institution or other entity with which the fund has unsettled or open transactions will default.
43
Services for shareholders
Investor services
Systematic investment plan Tell us how much you wish to invest regularly — weekly, semimonthly, or monthly — and the amount you choose will be transferred automatically from your checking or savings account. There’s no additional fee for this service, and you can suspend it at any time. This plan may be a great way to save for college expenses or to plan for your retirement.
Please note that regular investing does not guarantee a profit or protect against loss in a declining market. Before arranging a systematic investment plan, consider your financial ability to continue making purchases in periods when prices are low.
Systematic exchange You can make regular transfers from one Putnam fund to another Putnam fund. There are no additional fees for this service, and you can cancel or change your options at any time.
Dividends PLUS You can choose to have the dividend distributions from one of your Putnam funds automatically reinvested in another Putnam fund at no additional charge.
Free exchange privilege You can exchange money between Putnam funds free of charge, as long as they are the same class of shares. A signature guarantee is required if you are exchanging more than $500,000. The fund reserves the right to revise or terminate the exchange privilege.
Reinstatement privilege If you’ve sold Putnam shares or received a check for a dividend or capital gain, you may reinvest the proceeds with Putnam within 90 days of the transaction and they will be reinvested at the fund’s current net asset value — with no sales charge. However, reinstatement of class B shares may have special tax consequences. Ask your financial or tax representative for details.
Check-writing service You have ready access to many Putnam accounts. It’s as simple as writing a check, and there are no special fees or service charges. For more information about the check-writing service, call Putnam or visit our Web site.
Dollar cost averaging When you’re investing for long-term goals, it’s time, not timing, that counts. Investing on a systematic basis is a better strategy than trying to figure out when the markets will go up or down. This means investing the same amount of money regularly over a long period. This method of investing is called dollar cost averaging. When a fund’s share price declines, your investment dollars buy more shares at lower prices. When it increases, they buy fewer shares. Over time, you will pay a lower average price per share.
For more information
Visit the Individual Investors section at putnam.com A secure section of our Web site contains complete information on your account, including balances and transactions, updated daily. You may also conduct transactions, such as exchanges, additional investments, and address changes. Log on today to get your password.
Call us toll free at 1-800-225-1581 Ask a helpful Putnam representative or your financial advisor for details about any of these or other services, or see your prospectus.
44
Fund information
Founded over 70 years ago, Putnam Investments was built around the concept that a balance between risk and reward is the hallmark of a well-rounded financial program. We manage over 100 funds across income, value, blend, growth, asset allocation, absolute return, and global sector categories.
| | |
| Investment Manager | Myra R. Drucker | Robert R. Leveille |
| Putnam Investment | Paul L. Joskow | Vice President and |
| Management, LLC | Kenneth R. Leibler | Chief Compliance Officer |
| One Post Office Square | Robert E. Patterson | |
| Boston, MA 02109 | George Putnam, III | Mark C. Trenchard |
| | Robert L. Reynolds | Vice President and |
| Investment Sub-Manager | W. Thomas Stephens | BSA Compliance Officer |
| Putnam Investments Limited | Richard B. Worley | |
| 57–59 St James’s Street | | Francis J. McNamara, III |
| London, England SW1A 1LD | Officers | Vice President and |
| | Robert L. Reynolds | Chief Legal Officer |
| Marketing Services | President | |
| Putnam Retail Management | | James P. Pappas |
| One Post Office Square | Jonathan S. Horwitz | Vice President |
| Boston, MA 02109 | Executive Vice President, | |
| Principal Executive Officer, | Judith Cohen |
| Custodian | Treasurer and | Vice President, Clerk and |
| State Street Bank | Compliance Liaison | Assistant Treasurer |
| and Trust Company | | |
| Steven D. Krichmar | Michael Higgins |
| Legal Counsel | Vice President and | Vice President, Senior Associate |
| Ropes & Gray LLP | Principal Financial Officer | Treasurer and Assistant Clerk |
| | | |
| Trustees | Janet C. Smith | Nancy E. Florek |
| John A. Hill, Chairman | Vice President, Assistant | Vice President, Assistant Clerk, |
| Jameson A. Baxter, | Treasurer and Principal | Assistant Treasurer and |
| Vice Chairman | Accounting Officer | Proxy Manager |
| Ravi Akhoury | | |
| Barbara M. Baumann | Beth S. Mazor | Susan G. Malloy |
| Charles B. Curtis | Vice President | Vice President and |
| Robert J. Darretta | | Assistant Treasurer |
| | |
This report is for the information of shareholders of Putnam Capital Opportunities Fund. It may also be used as sales literature when preceded or accompanied by the current prospectus, the most recent copy of Putnam’s Quarterly Performance Summary, and Putnam’s Quarterly Ranking Summary. For more recent performance, please visit putnam.com. Investors should carefully consider the investment objective, risks, charges, and expenses of a fund, which are described in its prospectus. For this and other information or to request a prospectus, or a summary prospectus if available, call 1-800-225-1581 toll free. Please read the prospectus carefully before investing. The fund’s Statement of Additional Information contains additional information about the fund’s Trustees and is available without charge upon request by calling 1-800-225-1581.
Item 2. Code of Ethics:
Not applicable
Item 3. Audit Committee Financial Expert:
Not applicable
Item 4. Principal Accountant Fees and Services:
Not applicable
Item 5. Audit Committee of Listed Registrants
Not applicable
Item 6. Schedule of Investments:
The registrant’s schedule of investments in unaffiliated issuers is included in the report to shareholders in Item 1 above.
Item 7. Disclosure of Proxy Voting Policies and Procedures For Closed-End Management Investment Companies:
Not applicable
Item 8. Portfolio Managers of Closed-End Investment Companies
Not Applicable
Item 9. Purchases of Equity Securities by Closed-End Management Investment Companies and Affiliated Purchasers:
Not applicable
Item 10. Submission of Matters to a Vote of Security Holders:
Not applicable
Item 11. Controls and Procedures:
(a) The registrant's principal executive officer and principal financial officer have concluded, based on their evaluation of the effectiveness of the design and operation of the registrant's disclosure controls and procedures as of a date within 90 days of the filing date of this report, that the design and operation of such procedures are generally effective to provide reasonable assurance that information required to be disclosed by the registrant in this report is recorded, processed, summarized and reported within the time periods specified in the Commission's rules and forms.
(b) Changes in internal control over financial reporting: Not applicable
Item 12. Exhibits:
(a)(1) Not applicable
(a)(2) Separate certifications for the principal executive officer and principal financial officer of the registrant as required by Rule 30a-2(a) under the Investment Company Act of 1940, as amended, are filed herewith.
(b) The certifications required by Rule 30a-2(b) under the Investment Company Act of 1940, as amended, are filed herewith.
Putnam Investment Funds
By (Signature and Title):
/s/Janet C. Smith
Janet C. Smith
Principal Accounting Officer
Date: December 29, 2010
Pursuant to the requirements of the Securities Exchange Act of 1934 and the Investment Company Act of 1940, this report has been signed below by the following persons on behalf of the registrant and in the capacities and on the dates indicated.
By (Signature and Title):
/s/Jonathan S. Horwitz
Jonathan S. Horwitz
Principal Executive Officer
Date: December 29, 2010
By (Signature and Title):
/s/Steven D. Krichmar
Steven D. Krichmar
Principal Financial Officer
Date: December 29, 2010
| | | |
| | |
| UNITED STATES |
| SECURITIES AND EXCHANGE COMMISSION |
| Washington, D.C. 20549 |
| |
| FORM N-CSR |
| |
| CERTIFIED SHAREHOLDER REPORT OF REGISTERED |
| MANAGEMENT INVESTMENT COMPANIES |
| | |
| Investment Company Act file number: (811-07237) | |
| | |
| Exact name of registrant as specified in charter: | Putnam Investment Funds |
| |
| Address of principal executive offices: One Post Office Square, Boston, Massachusetts 02109 |
| | |
| Name and address of agent for service: | Beth S. Mazor, Vice President |
| | One Post Office Square |
| | Boston, Massachusetts 02109 |
| | |
| Copy to: | | John W. Gerstmayr, Esq. |
| | Ropes & Gray LLP |
| | 800 Boylston Street |
| | Boston, Massachusetts 02199-3600 |
| | |
| Registrant’s telephone number, including area code: | (617) 292-1000 |
| | | |
| Date of fiscal year end: April 30, 2011 | | |
| |
| Date of reporting period: May 1, 2010 — October 31, 2010 |
Item 1. Report to Stockholders:
The following is a copy of the report transmitted to stockholders pursuant to Rule 30e-1 under the Investment Company Act of 1940:
Putnam
Multi-Cap
Value Fund
Semiannual report
10 | 31 | 10
| | | |
| Message from the Trustees | 1 | | |
| | |
| About the fund | 2 | | |
| | |
| Performance snapshot | 4 | | |
| | |
| Interview with your fund’s portfolio manager | 5 | | |
| | |
| Your fund’s performance | 10 | | |
| | |
| Your fund’s expenses | 12 | | |
| | |
| Terms and definitions | 14 | | |
| | |
| Trustee approval of management contract | 15 | | |
| | |
| Other information for shareholders | 19 | | |
| | |
| Financial statements | 20 | | |
| | |
Message from the Trustees
Dear Fellow Shareholder:
Stock markets around the world rallied strongly over the past few months, riding a rising tide of strengthening investor confidence and slowly improving economic and corporate data. Indeed, U.S stocks delivered their best September in 71 years, and continued to add to those gains in October. Bond markets also have generated positive results for much of 2010 and continue to be a source of refuge for risk-averse investors.
It is important to recognize, however, that we may see periods of heightened market volatility as markets and economies seek more solid ground. The slow pace of the U.S. economic recovery and ongoing European sovereign debt concerns have made markets more susceptible to disappointing news. We believe, however, that Putnam’s research-intensive, actively managed investment approach is well suited for this environment.
In developments affecting oversight of your fund, Barbara M. Baumann has been elected to the Board of Trustees of the Putnam Funds, effective July 1, 2010. Ms. Baumann is president and owner of Cross Creek Energy Corporation of Denver, Colorado, a strategic consultant to domestic energy firms and direct investor in energy assets. We also want to thank Elizabeth T. Kennan, who has retired from the Board of Trustees, for her many years of dedicated and thoughtful leadership.
Lastly, we would like to take this opportunity to welcome new shareholders to the fund and to thank all of our investors for your continued confidence in Putnam.

About the fund
Seeking undervalued companies before their potential is recognized
Hidden opportunities and flexibility are key ingredients in the strategy of Putnam Multi-Cap Value Fund. The fund’s manager looks for investment potential in stocks that are currently out of favor with investors. Introduced in 1999 as Putnam Mid Cap Value Fund, the fund now ha s the flexibility to invest in a wider range of companies.
The fund can invest in small companies that are in their emerging or expansionary phases, and these companies can remain in the fund’s portfolio even as they grow larger. Historically, investing in stocks of smaller companies comes with the risk of greater price fluctuations. Combining small-cap and mid-cap stocks with those of larger, more establ ished companies provides a more diversified approach to help manage those risks.
The fund is managed in the value style, which means the manager seeks stocks that are attractively priced in relation to the company’s earnings and growth potential. A stock price may be low because the company is being underestimated or because its industry is in the midst of a downturn. Often, companies in the portfolio are undergoing changes that may lift their stock prices, such as restructuring, introduction of new products, or streamlining of operations to cut costs.
Supported by a strong research team, the fund’s portfolio manager uses his stock-picking expertise and multiple resources to identify opportunities. Putnam’s stock analysts strive to out-analyze the competition by generating independent research. They visit regularly with company managements, talk to private companies and consultants, and attend trade shows, seeking information that hasn’t already factored into stock prices. As opportunities emerge across companies of all sizes, Putnam Multi-Cap Value Fund will continue to seek hidden opportunities for investors.
Consider these risks before investing:
The fund invests some or all of its assets in small and/or midsize companies. Such investments increase the risk of greater price fluctuations. Value stocks may fail to rebound, and the market may not favor value-style investing.
Multi-cap investing at Putnam
Putnam’s suite of multi-cap equity funds is designed to provide a streamlined approach to investing across the broad universe of U.S. stocks. Each fund invests with a specific style and has the flexibility to invest in companies of all sizes.
The fund managers can select stocks from across their style universe, regardless of company size. The managers can own stocks throughout a company’s entire growth cycle, without capitalization restraints that might force them to sell holdings that get too large, or that would prevent them from taking advantage of certain attractively priced stocks.
Supported by a strong research team, the managers use their stock-picking expertise to identify opportunities and manage risk.
Putnam Multi-Cap Growth Fund targets stocks of companies that are believed to offer above-average growth potential.
Putnam Multi-Cap Value Fund targets companies whose stocks are priced below their long-term potential, and where there may be a catalyst for positive change.
Putnam Multi-Cap Core Fund uses a blend strategy, investing in both growth stocks and value stocks, seeking capital appreciation for investors.
Identified holdings were held during the year indicated; holdings will vary over time. The fund may not have continued to hold the security in the portfolio, and may have sold it at a loss. Performance of identified holdings in a year may not be representative of the fund’s returns during the same period. Securities purchased in the future may not generate similar returns. This is not an offer to sell or a recommendation to buy any individual security. For more information on current fund holdings, see pages 21–26.
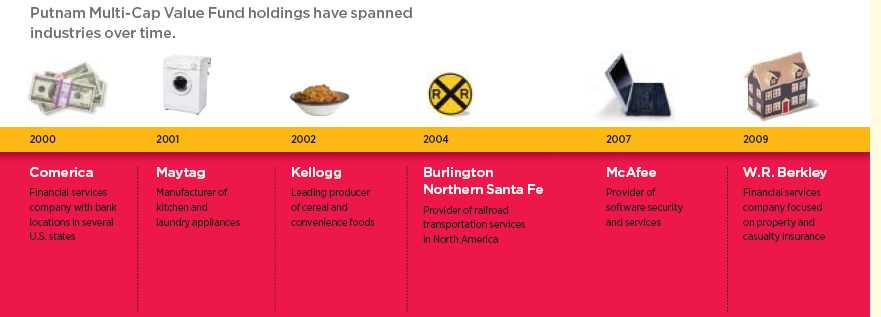

Current performance may be lower or higher than the quoted past performance, which cannot guarantee future results. Share price, principal value, and return will fluctuate, and you may have a gain or a loss when you sell your shares. Performance of class A shares assumes reinvestment of distributions and does not account for taxes. Fund returns in the bar chart do not reflect a sales charge of 5.75%; had they, returns would have been lower. See pages 5 and 10–11 for additional performance information. For a portion of the periods, the fund may have had expense limitations, without which returns would have been lower. To obtain the most recent month-end performance, visit putnam.com.
* Returns for the six-month period are not annualized, but cumulative.
4
Interview with your fund’s portfolio manager
James Polk
Jim, for the six-month period ended October 31, 2010, overall returns for stocks were flat. How did Putnam Multi-Cap Value Fund perform?
While returns for broad stock market indexes were flat, it was a volatile six-month period for the financial markets. Value stocks struggled more than growth stocks, and the fund’s performance lagged that of our benchmark and our Lipper peer group. For the period, class A shares of the fund returned –3.52% at net asset value, while our benchmark, the Russell 3000 Value Index, returned –2.01%. The average return for our peer group, Lipper Multi-Cap Value Funds, was –1.16%.
The fund’s underperformance relative to the benchmark was due in part to our bias toward cyclical stocks — those that are more sensitive to economic conditions. These stocks, particularly in areas such as consumer discretionary and industrials, suffered sharp declines for the first four months of the period.
Tell us more about market conditions over the six-month period.
Just as the period began in May, a prolonged, historically strong rally in the stock market came to an abrupt end, and volatility returned to the market in full force. A major cause of concern for investors was a debt crisis in Greece that brought out broader worries about debt issues in other European Union countries. This led to global market jitters and a market correction, and U.S. stock indexes declined sharply through June. Stocks then staged a strong recovery in July but declined again in August, as investors continued to see data that didn’t support a real improvement in the economy. Finally, stocks seemed to find an equilibrium and came roaring back in September and October.
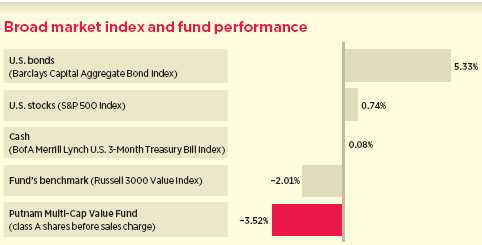
This comparison shows your fund’s performance in the context of broad market indexes for the six months ended 10/31/10. See pages 4 and 10–11 for additional fund performance information. Index descriptions can be found on page 14.
5
How was the fund positioned in this environment?
For the period overall, stocks in defensive sectors such as telecommunications, utilities, and staples were the strongest performers. Although our stock selection was generally solid in these areas, we maintained underweight positions, and this hindered returns relative to the benchmark. Fund performance was also dampened by our stock selection in the weaker-performing consumer discretionary and industrial sectors.
We also implemented strategies with options to hedge against losses on stocks in the portfolio, and in some cases in an attempt to enhance returns.
Can you tell us about specific stocks that detracted from performance?
Overall, I believe the portfolio was structured well for the market environment. However, a few stocks had a significant negative impact on performance for this volatile six-month period.
One was Avis Budget Group, which provides car and truck rental services to consumers and businesses. I believe the fundamentals of the car rental industry continue to improve. There are fewer players competing for business, more rational pricing, and improving volumes as business and travel trends recover.
Despite these fundamental strengths, the stock of Avis struggled as the company got into a bidding war with Hertz to acquire Dollar Thrifty Automotive Group. While the uncertainty surrounding the situation took its toll on the stock during the period, its performance has improved more recently as the bidding war was resolved in Avis’s favor. I think this stock represents the importance of patience in investing, particularly for value stocks, which often take longer than six months to reward investors.
Another detractor for the period was Talbots, a classic turnaround story, and a stock that happened to be one of the fund’s top performers for the previous fiscal year.
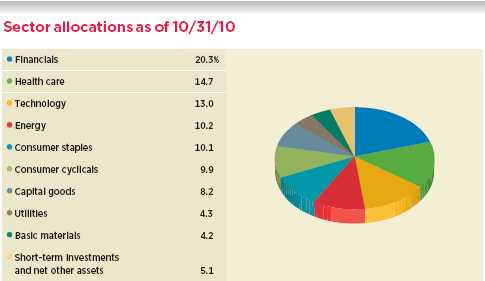
Allocations are represented as a percentage of the fund’s net assets. Summary information may differ from the portfolio schedule included in the financial statements due to the inclusion of derivative securities and the exclusion of as-of trades, if any, and the use of different classifications of securities for presentation purposes. Holdings and allocations may vary over time.
6
Talbots, a retailer of women’s clothing, had lost its market share and relevance among younger consumers in recent years. Under the direction of its CEO, the company has worked aggressively to bring the brand back to life while also cutting costs and improving its balance sheet. I believe all the metrics are positive, and the company has started to attract younger customers, who are making purchases. However, volumes in the stores still need to improve, and this caused concern for investors during the past six months. I still believe Talbots represents an attractive investment opportunity, and it remained in the portfolio at the close of the period.

Fund performance was also affected by weakness in construction-related companies, specifically USG Corporation, a manufacturer and distributor of building materials; Louisiana-Pacific Corporation, which produces strand boards, wood products, and structural panels; and Masco Corporation, which manufactures, distributes, and installs home improvement and building products. These stocks were hit hard through most of the period as investors grew skeptical about a rebound in the economy and consumer spending.
Which investments did well for the fund?
NBTY, a manufacturer of nutritional supplements, was one of the top contributors to performance for the period. This was due to the fact that the company was acquired by The Carlyle Group, a private investment firm, for $4 billion. An acquisition also benefited the stock of Alberto-Culver, a manufacturer of beauty care, food, and household products. The company was acquired by Unilever, a global consumer goods company. By the close of the period, we had sold the fund’s positions in NBTY and Alberto-Culver.
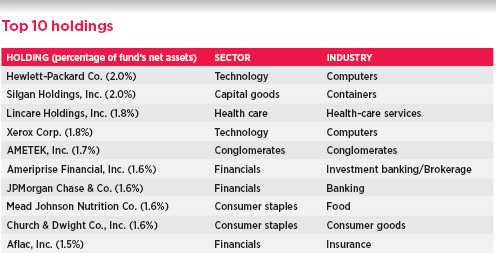
This table shows the fund’s top 10 holdings and the percentage of the fund’s net assets that each represented as of 10/31/10. Short-term holdings are excluded. Holdings will vary over time.
7
Also boosting performance was our investment in Atmel, a semiconductor company, and another example of the importance of a long-term perspective when investing in value stocks. We owned this stock in the portfolio for several years, and the company has been working to cut costs, streamline its product line, and strip out slow-growth areas of its businesses. The company’s focus on microcontrollers has been critical. A microcontroller is an entire computer on a single chip, and is used in devices such as smart phones and tablet computers, for which demand has been surging. During the period, investors finally recognized the improvements and growth potential in Atmel, and its stock rallied considerably.
On September 1, the fund’s name and investment strategy changed. Can you tell us more about this?
Since it was introduced in 1999, the fund has invested primarily in stocks of midsize companies. With this change, we are now able to invest in companies of all sizes. This is a great enhancement, as it expands our investment universe considerably. In addition to providing us with a much wider range of opportunities, we now have the flexibility to hold companies in the portfolio for their entire growth cycle. For example, if a company is growing, we no longer have the capitalization restraints that would force us to sell that stock simply because the company got too large.
We also have great resources for covering this larger universe of stocks. In addition to Putnam’s newly expanded team of large-cap analysts, we have several analysts dedicated to researching small- and mid-cap stocks. These teams are conducting fundamental analysis on companies every day. This attention to bottom-up research makes a tremendous difference. Rather than rely on macroeconomic views of the market, we roll up our sleeves and research, company-by-company, to find the best opportunities for our investors.
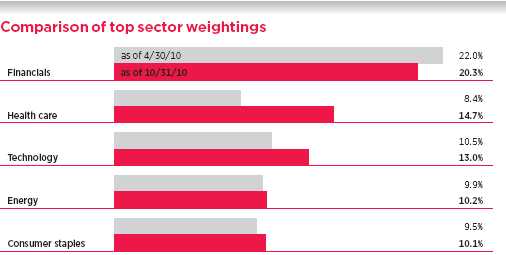
This chart shows how the fund’s top weightings have changed over the past six months. Weightings are shown as a percentage of net assets. Summary information may differ from the portfolio schedule included in the financial statements due to the inclusion of derivative securities and the exclusion of as-of trades, if any, and the use of different classifications of securities for presentation purposes. Holdings will vary over time.
Data in the chart reflect a new calculation methodology placed in effect within the past six months.
8
What is your outlook for the markets and the fund in the months ahead?
I believe we are likely to see continued uncertainty and volatility in the markets for a while. Economic data continue to be mixed and unemployment is still very high, but we have a Federal Reserve that is determined to get our economy growing again, and this should provide a tail wind for investors.
In terms of my management style in this environment, I am remaining nimble and paying closer attention to price targets, valuations, and buying points. Our broad strategy remains unchanged. Regardless of what happens in the markets, we continue to conduct rigorous research to identify companies whose stocks might be mispriced or those that we believe will be significantly better positioned 12 to 18 months down the road.
Thank you, Jim, for your time and insights today.
The views expressed in this report are exclusively those of Putnam Management. They are not meant as investment advice.
Please note that the holdings discussed in this report may not have been held by the fund for the entire period. Portfolio composition is subject to review in accordance with the fund’s investment strategy and may vary in the future. Current and future portfolio holdings are subject to risk.

Portfolio Manager James Polk has an M.B.A. from Babson College and a B.A. from Colby College. A CFA charterholder, he joined Putnam in 1998 and has been in the investment industry since 1994.
IN THE NEWS
U.S. corporate profits soared in the first 10 months of 2010, despite the slow economic recovery. Earnings rose 10.5% in the first quarter and 3.0% in the second quarter, and are on track for a positive third quarter. The profit picture is remarkable because it occurred during a period of decelerating growth, with the nation’s gross domestic product slowing to 1.7% in the second quarter. There are several factors behind the rosy profit picture. The recession forced many companies to cut costs, and this year’s slow growth environment has helped further reduce wage pressure. Corporate borrowing rates are also low. Although sluggish economic growth remains a threat to profits, the consensus estimate for S&P 500 companies is for near-record earnings in 2011.
9
Your fund’s performance
This section shows your fund’s performance, price, and distribution information for periods ended October 31, 2010, the end of the first half of its current fiscal year. In accordance with regulatory requirements for mutual funds, we also include performance as of the most recent calendar quarter-end and expense information taken from the fund’s current prospectus. Performance should always be considered in light of a fund’s investment strategy. Data represents past performance. Past performance does not guarantee future results. More recent returns may be less or more than those shown. Investment return and principal value will fluctuate, and you may have a gain or a loss when you sell your shares. Performance information does not reflect any deduction for taxes a shareholder may owe on fund distributions or on the redemption of fund shares. For the most recent month-end performance, please visit the Individual Investors section at putn am.com or call Putnam at 1-800-225-1581. Class Y shares are generally only available to corporate and institutional clients and clients in other approved programs. See the Terms and Definitions section in this report for definitions of the share classes offered by your fund.
Fund performance Total return for periods ended 10/31/10
| | | | | | | | | | |
| | Class A | Class B | Class C | Class M | Class R | Class Y |
| (inception dates) | (11/1/99) | (1/16/01) | (1/16/01) | (1/16/01) | (4/1/03) | (4/2/02) |
|
| | NAV | POP | NAV | CDSC | NAV | CDSC | NAV | POP | NAV | NAV |
|
| Annual average | | | | | | | | | | |
| (life of fund) | 8.29% | 7.71% | 7.48% | 7.48% | 7.48% | 7.48% | 7.75% | 7.40% | 8.03% | 8.51% |
|
| 10 years | 93.78 | 82.57 | 79.75 | 79.75 | 79.71 | 79.71 | 84.29 | 77.81 | 89.14 | 98.05 |
| Annual average | 6.84 | 6.20 | 6.04 | 6.04 | 6.04 | 6.04 | 6.30 | 5.92 | 6.58 | 7.07 |
|
| 5 years | 11.86 | 5.45 | 7.68 | 6.24 | 7.69 | 7.69 | 9.02 | 5.21 | 10.46 | 13.33 |
| Annual average | 2.27 | 1.07 | 1.49 | 1.22 | 1.49 | 1.49 | 1.74 | 1.02 | 2.01 | 2.53 |
|
| 3 years | –16.06 | –20.88 | –17.95 | –20.01 | –17.98 | –17.98 | –17.39 | –20.28 | –16.71 | –15.44 |
| Annual average | –5.67 | –7.51 | –6.38 | –7.17 | –6.39 | –6.39 | –6.17 | –7.28 | –5.91 | –5.44 |
|
| 1 year | 25.88 | 18.59 | 24.82 | 19.82 | 24.74 | 23.74 | 25.17 | 20.73 | 25.51 | 26.06 |
|
| 6 months | –3.52 | –9.05 | –3.88 | –8.68 | –3.89 | –4.85 | –3.80 | –7.16 | –3.66 | –3.42 |
|
Current performance may be lower or higher than the quoted past performance, which cannot guarantee future results. After-sales-charge returns (public offering price, or POP) for class A and M shares reflect a maximum 5.75% and 3.50% load, respectively. Class B share returns reflect the applicable contingent deferred sales charge (CDSC), which is 5% in the first year, declining to 1% in the sixth year, and is eliminated thereafter. Class C shares reflect a 1% CDSC for the first year that is eliminated thereafter. Class R and Y shares have no initial sales charge or CDSC. Performance for class B, C, M, R, and Y shares before their inception is derived from the historical performance of class A shares, adjusted for the applicable sales charge (or CDSC) and the higher operating expenses for such shares, except for class Y shares, for which 12b-1 fees are not applicable.
For a portion of the periods, the fund may have had expense limitations, without which returns would have been lower.
Class B share performance does not reflect conversion to class A shares.
10
Comparative index returns For periods ended 10/31/10
| | | |
| | Russell 3000 | Russell Midcap | Lipper Multi-Cap Value |
| | Value Index | Value Index† | Funds category average* |
|
| Annual average (life of fund) | 3.33% | 8.34% | 4.13% |
|
| 10 years | 34.86 | 115.86 | 46.07 |
| Annual average | 3.04 | 8.00 | 3.49 |
|
| 5 years | 3.70 | 18.11 | 5.10 |
| Annual average | 0.73 | 3.38 | 0.90 |
|
| 3 years | –22.50 | –10.69 | –19.34 |
| Annual average | –8.14 | –3.70 | –7.03 |
|
| 1 year | 16.40 | 27.49 | 16.46 |
|
| 6 months | –2.01 | 0.75 | –1.16 |
|
Index and Lipper results should be compared to fund performance at net asset value.
* Over the 6-month, 1-year, 3-year, 5-year, 10-year, and life-of-fund periods ended 10/31/10, there were 353, 337, 287, 238, 94, and 80 funds, respectively, in this Lipper category.
† Effective September 1, 2010, the Russell 3000 Value Index replaced the Russell Midcap Value Index as the fund’s primary benchmark. In Punam Management’s opinion, the securities tracked by this index more accurately reflect the types of securities that will generally be held by the fund.
Fund price and distribution information For the six-month period ended 10/31/10
| | | | | | | | |
| | Class A | Class B | Class C | Class M | Class R | Class Y |
|
| Share value | NAV | POP | NAV | NAV | NAV | POP | NAV | NAV |
|
| 4/30/10 | $11.66 | $12.37 | $11.09 | $11.07 | $11.32 | $11.73 | $11.49 | $11.69 |
|
| 10/31/10 | 11.25 | 11.94 | 10.66 | 10.64 | 10.89 | 11.28 | 11.07 | 11.29 |
|
The classification of distributions, if any, is an estimate. Final distribution information will appear on your year-end tax forms.
The fund made no distributions during the period.
Fund performance as of most recent calendar quarter
Total return for periods ended 9/30/10
| | | | | | | | | | |
| | Class A | Class B | Class C | Class M | Class R | Class Y |
| (inception dates) | (11/1/99) | (1/16/01) | (1/16/01) | (1/16/01) | (4/1/03) | (4/2/02) |
|
| | NAV | POP | NAV | CDSC | NAV | CDSC | NAV | POP | NAV | NAV |
|
| Annual average | | | | | | | | | | |
| (life of fund) | 8.13% | 7.54% | 7.32% | 7.32% | 7.32% | 7.32% | 7.59% | 7.24% | 7.87% | 8.34% |
|
| 10 years | 97.85 | 86.44 | 83.62 | 83.62 | 83.75 | 83.75 | 88.36 | 81.80 | 93.16 | 102.23 |
| Annual average | 7.06 | 6.43 | 6.27 | 6.27 | 6.27 | 6.27 | 6.54 | 6.16 | 6.81 | 7.30 |
|
| 5 years | 5.24 | –0.82 | 1.35 | 0.00 | 1.39 | 1.39 | 2.62 | –0.95 | 3.96 | 6.65 |
| Annual average | 1.03 | –0.16 | 0.27 | 0.00 | 0.28 | 0.28 | 0.52 | –0.19 | 0.78 | 1.30 |
|
| 3 years | –16.17 | –21.00 | –18.11 | –20.17 | –18.01 | –18.01 | –17.42 | –20.32 | –16.81 | –15.50 |
| Annual average | –5.71 | –7.56 | –6.44 | –7.23 | –6.40 | –6.40 | –6.18 | –7.29 | –5.95 | –5.46 |
|
| 1 year | 13.70 | 7.17 | 12.77 | 7.77 | 12.78 | 11.78 | 13.06 | 9.12 | 13.30 | 13.91 |
|
| 6 months | –0.54 | –6.23 | –0.95 | –5.90 | –0.86 | –1.85 | –0.75 | –4.23 | –0.64 | –0.45 |
|
11
Your fund’s expenses
As a mutual fund investor, you pay ongoing expenses, such as management fees, distribution fees (12b-1 fees), and other expenses. In the most recent six-month period, your fund’s expenses were limited; had expenses not been limited, they would have been higher. Using the following information, you can estimate how these expenses affect your investment and compare them with the expenses of other funds. You may also pay one-time transaction expenses, including sales charges (loads) and redemption fees, which are not shown in this section and would have resulted in higher total expenses. For more information, see your fund’s prospectus or talk to your financial representative.
Expense ratios
| | | | | | |
| | Class A | Class B | Class C | Class M | Class R | Class Y |
|
| Total annual operating expenses for the fiscal year | | | | | | |
| ended 4/30/10* | 1.20% | 1.95% | 1.95% | 1.70% | 1.45% | 0.95% |
|
| Annualized expense ratio for the six-month period | | | | | | |
| ended 10/31/10 | 1.22% | 1.97% | 1.97% | 1.72% | 1.47% | 0.97% |
|
Fiscal-year expense information in this table is taken from the most recent prospectus, is subject to change, and may differ from that shown for the annualized expense ratio and in the financial highlights of this report. Expenses are shown as a percentage of average net assets.
* Restated to reflect projected expenses under a new management contract effective 9/1/10.
Expenses per $1,000
The following table shows the expenses you would have paid on a $1,000 investment in Putnam Multi-Cap Value Fund from May 1, 2010, to October 31, 2010. It also shows how much a $1,000 investment would be worth at the close of the period, assuming actual returns and expenses.
| | | | | | |
| | Class A | Class B | Class C | Class M | Class R | Class Y |
|
| Expenses paid per $1,000*† | $6.04 | $9.74 | $9.74 | $8.51 | $7.27 | $4.81 |
|
| Ending value (after expenses) | $964.80 | $961.20 | $961.10 | $962.00 | $963.40 | $965.80 |
|
* Expenses for each share class are calculated using the fund’s annualized expense ratio for each class, which represents the ongoing expenses as a percentage of average net assets for the six months ended 10/31/10. The expense ratio may differ for each share class.
† Expenses are calculated by multiplying the expense ratio by the average account value for the period; then multiplying the result by the number of days in the period; and then dividing that result by the number of days in the year.
12
Estimate the expenses you paid
To estimate the ongoing expenses you paid for the six months ended October 31, 2010, use the following calculation method. To find the value of your investment on May 1, 2010, call Putnam at 1-800-225-1581.
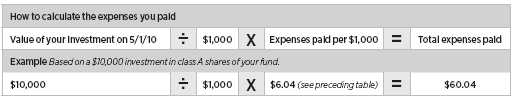
Compare expenses using the SEC’s method
The Securities and Exchange Commission (SEC) has established guidelines to help investors assess fund expenses. Per these guidelines, the following table shows your fund’s expenses based on a $1,000 investment, assuming a hypothetical 5% annualized return. You can use this information to compare the ongoing expenses (but not transaction expenses or total costs) of investing in the fund with those of other funds. All mutual fund shareholder reports will provide this information to help you make this comparison. Please note that you cannot use this information to estimate your actual ending account balance and expenses paid during the period.
| | | | | | |
| | Class A | Class B | Class C | Class M | Class R | Class Y |
|
| Expenses paid per $1,000*† | $6.21 | $10.01 | $10.01 | $8.74 | $7.48 | $4.94 |
|
| Ending value (after expenses) | $1,019.06 | $1,015.27 | $1,015.27 | $1,016.53 | $1,017.80 | $1,020.32 |
|
* Expenses for each share class are calculated using the fund’s annualized expense ratio for each class, which represents the ongoing expenses as a percentage of average net assets for the six months ended 10/31/10. The expense ratio may differ for each share class.
† Expenses are calculated by multiplying the expense ratio by the average account value for the period; then multiplying the result by the number of days in the period; and then dividing that result by the number of days in the year.
13
Terms and definitions
Important terms
Total return shows how the value of the fund’s shares changed over time, assuming you held the shares through the entire period and reinvested all distributions in the fund.
Net asset value (NAV) is the price, or value, of one share of a mutual fund, without a sales charge. NAVs fluctuate with market conditions. NAV is calculated by dividing the net assets of each class of shares by the number of outstanding shares in the class.
Public offering price (POP) is the price of a mutual fund share plus the maximum sales charge levied at the time of purchase. POP performance figures shown here assume the 5.75% maximum sales charge for class A shares and 3.50% for class M shares.
Contingent deferred sales charge (CDSC) is generally a charge applied at the time of the redemption of class B or C shares and assumes redemption at the end of the period. Your fund’s class B CDSC declines from a 5% maximum during the first year to 1% during the sixth year. After the sixth year, the CDSC no longer applies. The CDSC for class C shares is 1% for one year after purchase.
Share classes
Class A shares are generally subject to an initial sales charge and no CDSC (except on certain redemptions of shares bought without an initial sales charge).
Class B shares are not subject to an initial sales charge. They may be subject to a CDSC.
Class C shares are not subject to an initial sales charge and are subject to a CDSC only if the shares are redeemed during the first year.
Class M shares have a lower initial sales charge and a higher 12b-1 fee than class A shares and no CDSC (except on certain redemptions of shares bought without an initial sales charge).
Class R shares are not subject to an initial sales charge or CDSC and are available only to certain defined contribution plans.
Class Y shares are not subject to an initial sales charge or CDSC, and carry no 12b-1 fee. They are generally only available to corporate and institutional clients and clients in other approved programs.
Comparative indexes
Barclays Capital Aggregate Bond Index is an unmanaged index of U.S. investment-grade fixed-income securities.
BofA (Bank of America) Merrill Lynch U.S. 3-Month Treasury Bill Index is an unmanaged index that seeks to measure the performance of U.S. Treasury bills available in the marketplace.
Russell 3000 Value Index is an unmanaged index of those companies in the Russell 3000 Index chosen for their value orientation.
Russell Midcap Value Index is an unmanaged index of those companies in the Russell Midcap Index chosen for their value orientation.
S&P 500 Index is an unmanaged index of common stock performance.
Indexes assume reinvestment of all distributions and do not account for fees. Securities and performance of a fund and an index will differ. You cannot invest directly in an index.
Lipper is a third-party industry-ranking entity that ranks mutual funds. Its rankings do not reflect sales charges. Lipper rankings are based on total return at net asset value relative to other funds that have similar current investment styles or objectives as determined by Lipper. Lipper may change a fund’s category assignment at its discretion. Lipper category averages reflect performance trends for funds within a category.
14
Trustee approval of management contract
General conclusions
The Board of Trustees of the Putnam funds oversees the management of each fund and, as required by law, determines annually whether to approve the continuance of your fund’s management contract with Putnam Investment Management (“Putnam Management”) and the sub-management contract with respect to your fund between Putnam Management and its affiliate, Putnam Investments Limited (“PIL”).
In this regard, the Board of Trustees, with the assistance of its Contract Committee consisting solely of Trustees who are not “interested persons” (as this term is defined in the Investment Company Act of 1940, as amended) of the Putnam funds (the “Independent Trustees”), requests and evaluates all information it deems reasonably necessary under the circumstances. Over the course of several months ending in June 2010, the Contract Committee met on a number of occasions with representatives of Putnam Management and in executive session to consider the information provided by Putnam Management and other information developed with the assistance of the Board’s independent counsel and independent staff. The Contract Committee reviewed and discussed key aspects of this information with all of the Independent Trustees. At the Trustees’ June 11, 2010 meeting, the Contract Committee recommended, and the Independent Trustees appro ved, the continuance of your fund’s management contract, and sub-management contracts, effective July 1, 2010. (Because PIL is an affiliate of Putnam Management and Putnam Management remains fully responsible for all services provided by PIL, the Trustees have not evaluated PIL as a separate entity, and all subsequent references to Putnam Management below should be deemed to include reference to PIL as necessary or appropriate in the context.)
The Independent Trustees’ approval was based on the following conclusions:
• That the fee schedule in effect for your fund represented reasonable compensation in light of the nature and quality of the services being provided to the fund, the fees paid by competitive funds, and the costs incurred by Putnam Management in providing such services, and
• That the fee schedule represented an appropriate sharing between fund shareholders and Putnam Management of such economies of scale as may exist in the management of the fund at current asset levels.
These conclusions were based on a comprehensive consideration of all information provided to the Trustees and were not the result of any single factor. Some of the factors that figured particularly in the Trustees’ deliberations and how the Trustees considered these factors are described below, although individual Trustees may have evaluated the information presented differently, giving different weights to various factors. It is also important to recognize that the fee arrangements for your fund and the other Putnam funds are the result of many years of review and discussion between the Independent Trustees and Putnam Management, that certain aspects of the arrangements may receive greater scrutiny in some years than others, and that the Trustees’ conclusions may be based, in part, on their consideration of fee arrangements in prior years.
Consideration of implementation of strategic pricing initiative
The Trustees were mindful that new management contracts had been implemented for all but a few funds at the beginning of 2010 as part of Putnam Management’s strategic pricing initiative. These new management contracts reflected the implementation of more competitive fee levels for many funds, complex-wide breakpoints
15
for the open-end funds and performance fees for some funds. The Trustees had approved these new management contracts on July 10, 2009 and submitted them to shareholder meetings of the affected funds in late 2009, where the contracts were in all cases approved by overwhelming majorities of the shares voted.
Because the management contracts had been implemented only recently, the Contract Committee had limited practical experience with the operation of the new fee structures. The financial data available to the Committee reflected actual operations under the prior contracts; information was also available on a pro forma basis, adjusted to reflect the fees payable under the new management contracts. In light of the limited information available regarding operations under the new management contracts, in recommending the continuation of the new management contracts in June 2010, the Contract Committee relied to a considerable extent on its review of the financial information and analysis that formed the basis of the Board’s approval of the new management contracts on July 10, 2009.
Management fee schedules and categories; total expenses
The Trustees reviewed the management fee schedules in effect for all Putnam funds, including fee levels and breakpoints. In reviewing management fees, the Trustees generally focus their attention on material changes in circumstances — for example, changes in assets under management or investment style, changes in Putnam Management’s operating costs, or changes in competitive practices in the mutual fund industry — that suggest that consideration of fee changes might be warranted. The Trustees concluded that the circumstances did not warrant changes to the management fee structure of your fund.
As in the past, the Trustees continued to focus on the competitiveness of the total expense ratio of each fund. In order to ensure that expenses of the Putnam funds continue to meet evolving competitive standards, the Trustees and Putnam Management agreed in 2009 to implement certain expense limitations. Most funds, including your fund, had sufficiently low expenses that these expense limitations did not apply. The expense limitations were: (i) a contractual expense limitation applicable to all retail open-end funds of 37.5 basis points on investor servicing fees and expenses and (ii) a contractual expense limitation applicable to all open-end funds of 20 basis points on so-called “other expenses” (i.e., all expenses exclusive of management fees, investor servicing fees, distribution fees, taxes, brokerage commissions and extraordinary expenses). These expense limitations serve in particular to maintai n competitive expense levels for funds with large numbers of small shareholder accounts and funds with relatively small net assets.
The Trustees reviewed comparative fee and expense information for a custom group of competitive funds selected by Lipper Inc. This comparative information included your fund’s percentile ranking for effective management fees and total expenses (excluding any applicable 12b-1 fee), which provides a general indication of your fund’s relative standing. In the custom peer group, your fund ranked in the 2nd quintile in effective management fees (determined for your fund and the other funds in the custom peer group based on fund asset size and the applicable contractual management fee schedule) and in the 2nd quintile in total expenses (excluding any applicable 12b-1 fees) as of December 31, 2009 (the first quintile representing the least expensive funds and the fifth quintile the most expensive funds). The Trustees also considered that your fund ranked in the 1st quintile in effective management fees, on a pro forma basis adjusted to reflect the i mpact of the strategic pricing initiative discussed above, as of December 31, 2009.
16
Your fund currently has the benefit of breakpoints in its management fee that provide shareholders with significant economies of scale in the form of reduced fee levels as assets under management in the Putnam family of funds increase. The Contract Committee observed that the complex-wide breakpoints of the open-end funds have only been in place for a short while, and the Trustees will examine the operation of this new breakpoint structure in future years in light of actual experience.
In connection with their review of the management fees and total expenses of the Putnam funds, the Trustees also reviewed the costs of the services provided and the profits realized by Putnam Management and its affiliates from their contractual relationships with the funds. This information included trends in revenues, expenses and profitability of Putnam Management and its affiliates relating to the investment management, investor servicing and distribution services provided to the funds. In this regard, the Trustees also reviewed an analysis of Putnam Management’s revenues, expenses and profitability, allocated on a fund-by-fund basis, with respect to the funds’ management, distribution, and investor servicing contracts. For each fund, the analysis presented information about revenues, expenses and profitability for each of the agreements separately and for the agreements taken together on a combined basis. The Trustees concluded that, at c urrent asset levels, the fee schedules currently in place represented an appropriate sharing of economies of scale at that time.
The information examined by the Trustees as part of their annual contract review for the Putnam funds has included for many years information regarding fees charged by Putnam Management and its affiliates to institutional clients such as defined benefit pension plans, college endowments, and the like. This information included comparisons of such fees with fees charged to the funds, as well as an assessment of the differences in the services provided to these two types of clients. The Trustees observed, in this regard, that the differences in fee rates between institutional clients and mutual funds are by no means uniform when examined by individual asset sectors, suggesting that differences in the pricing of investment management services to these types of clients may reflect historical competitive forces operating in separate market places. The Trustees considered the fact that fee rates across different asset clas ses are typically higher on average for mutual funds than for institutional clients, as well as the differences between the services that Putnam Management provides to the Putnam funds and those that it provides to its institutional clients, and did not rely on these comparisons to any significant extent in concluding that the management fees paid by your fund are reasonable.
Investment performance
The quality of the investment process provided by Putnam Management represented a major factor in the Trustees’ evaluation of the quality of services provided by Putnam Management under your fund’s management contract. The Trustees were assisted in their review of the Putnam funds’ investment process and performance by the work of the Investment Oversight Coordinating Committee of the Trustees and the Investment Oversight Committees of the Trustees, which met on a regular basis with the funds’ portfolio teams throughout the year. The Trustees concluded that Putnam Management generally provides a high-quality investment process — based on the experience and skills of the individuals assigned to the management of fund portfolios, the resources made available to them, and in general Putnam Management’s ability to attract and retain high-quality personnel — but also recognized that this does not guarantee favorable invest ment results for every fund in every time period. The Trustees considered the investment performance of each fund over multiple time periods and considered information comparing each fund’s
17
performance with various benchmarks and with the performance of competitive funds.
The Committee noted the substantial improvement in the performance of most Putnam funds during 2009. The Committee also noted the disappointing investment performance of a number of the funds for periods ended December 31, 2009 and considered information provided by Putnam Management regarding the factors contributing to the underperformance and actions being taken to improve performance. The Trustees indicated their intention to continue to monitor performance trends to assess the effectiveness of these efforts and to evaluate whether additional changes to address areas of underperformance are warranted.
In the case of your fund, the Trustees considered that your fund’s class A share cumulative total return performance at net asset value was in the following quartiles of its Lipper Inc. peer group (Lipper Mid-Cap Value Funds) for the one-year, three-year and five-year periods ended December 31, 2009 (the first quartile representing the best-performing funds and the fourth quartile the worst-performing funds):
| | | |
| One-year period | 2nd | | |
| | |
| Three-year period | 3rd | | |
| | |
| Five-year period | 3rd | | |
| | |
Over the one-year, three-year and five-year periods ended December 31, 2009, there were 251, 210 and 161 funds, respectively, in your fund’s Lipper peer group. (When considering performance information, shareholders should be mindful that past performance is not a guarantee of future results.)
Brokerage and soft-dollar allocations; investor servicing
The Trustees considered various potential benefits that Putnam Management may receive in connection with the services it provides under the management contract with your fund. These include benefits related to brokerage and soft-dollar allocations, whereby a portion of the commissions paid by a fund for brokerage may be used to acquire research services that are expected to be useful to Putnam Management in managing the assets of the fund and of other clients. The Trustees considered a change made, at Putnam Management’s request, to the Putnam funds’ brokerage allocation policies commencing in 2010, which increased the permitted soft dollar allocation to third-party services over what had been authorized in previous years. The Trustees noted that a portion of available soft dollars continues to be allocated to the payment of fund expenses. The Trustees indicated their continued intent to monitor regulatory developments in this area with the assistance of their Brokerage Committee and also indicated their continued intent to monitor the potential benefits associated with fund brokerage and soft-dollar allocations and trends in industry practices to ensure that the principle of seeking best price and execution remains paramount in the portfolio trading process.
Putnam Management may also receive benefits from payments that the funds make to Putnam Management’s affiliates for investor or distribution services. In conjunction with the annual review of your fund’s management contract, the Trustees reviewed your fund’s investor servicing agreement with Putnam Investor Services, Inc. (“PSERV”) and its distributor’s contracts and distribution plans with Putnam Retail Management Limited Partnership (“PRM”), both of which are affiliates of Putnam Management. The Trustees concluded that the fees payable by the funds to PSERV and PRM, as applicable, for such services are reasonable in relation to the nature and quality of such services.
18
Other information for shareholders
Important notice regarding delivery of shareholder documents
In accordance with SEC regulations, Putnam sends a single copy of annual and semiannual shareholder reports, prospectuses, and proxy statements to Putnam shareholders who share the same address, unless a shareholder requests otherwise. If you prefer to receive your own copy of these documents, please call Putnam at 1-800-225-1581, and Putnam will begin sending individual copies within 30 days.
Proxy voting
Putnam is committed to managing our mutual funds in the best interests of our shareholders. The Putnam funds’ proxy voting guidelines and procedures, as well as information regarding how your fund voted proxies relating to portfolio securities during the 12-month period ended June 30, 2010, are available in the Individual Investors section of putnam.com, and on the SEC’s Web site, www.sec.gov. If you have questions about finding forms on the SEC’s Web site, you may call the SEC at 1-800-SEC-0330. You may also obtain the Putnam funds’ proxy voting guidelines and procedures at no charge by calling Putnam’s Shareholder Services at 1-800-225-1581.
Fund portfolio holdings
The fund will file a complete schedule of its portfolio holdings with the SEC for the first and third quarters of each fiscal year on Form N-Q. Shareholders may obtain the fund’s Forms N-Q on the SEC’s Web site at www.sec.gov. In addition, the fund’s Forms N-Q may be reviewed and copied at the SEC’s Public Reference Room in Washington, D.C. You may call the SEC at 1-800-SEC-0330 for information about the SEC’s Web site or the operation of the Public Reference Room.
Trustee and employee fund ownership
Putnam employees and members of the Board of Trustees place their faith, confidence, and, most importantly, investment dollars in Putnam mutual funds. As of October 31, 2010, Putnam employees had approximately $324,000,000 and the Trustees had approximately $68,000,000 invested in Putnam mutual funds. These amounts include investments by the Trustees’ and employees’ immediate family members as well as investments through retirement and deferred compensation plans.
19
Financial statements
A guide to financial statements
These sections of the report, as well as the accompanying Notes, constitute the fund’s financial statements.
The fund’s portfolio lists all the fund’s investments and their values as of the last day of the reporting period. Holdings are organized by asset type and industry sector, country, or state to show areas of concentration and diversification.
Statement of assets and liabilities shows how the fund’s net assets and share price are determined. All investment and non-investment assets are added together. Any unpaid expenses and other liabilities are subtracted from this total. The result is divided by the number of shares to determine the net asset value per share, which is calculated separately for each class of shares. (For funds with preferred shares, the amount subtracted from total assets includes the liquidation preference of preferred shares.)
Statement of operations shows the fund’s net investment gain or loss. This is done by first adding up all the fund’s earnings — from dividends and interest income — and subtracting its operating expenses to determine net investment income (or loss). Then, any net gain or loss the fund realized on the sales of its holdings — as well as any unrealized gains or losses over the period — is added to or subtracted from the net investment result to determine the fund’s net gain or loss for the fiscal period.
Statement of changes in net assets shows how the fund’s net assets were affected by the fund’s net investment gain or loss, by distributions to shareholders, and by changes in the number of the fund’s shares. It lists distributions and their sources (net investment income or realized capital gains) over the current reporting period and the most recent fiscal year-end. The distributions listed here may not match the sources listed in the Statement of operations because the distributions are determined on a tax basis and may be paid in a different period from the one in which they were earned. Dividend sources are estimated at the time of declaration. Actual results may vary. Any non-taxable return of capital cannot be determined until final tax calculations are completed after the end of the fund’s fiscal year.
Financial highlights provide an overview of the fund’s investment results, per-share distributions, expense ratios, net investment income ratios, and portfolio turnover in one summary table, reflecting the five most recent reporting periods. In a semiannual report, the highlights table also includes the current reporting period.
20
The fund’s portfolio 10/31/10 (Unaudited)
| | |
| COMMON STOCKS (97.8%)* | Shares | Value |
|
| Aerospace and defense (2.5%) | | |
| BE Aerospace, Inc. † | 135,000 | $4,962,600 |
|
| Empresa Brasileira de Aeronautica SA (Embraer) ADR (Brazil) | 95,800 | 2,763,830 |
|
| Northrop Grumman Corp. | 88,000 | 5,562,480 |
|
| | | 13,288,910 |
| Banking (5.9%) | | |
| Bond Street Holdings, LLC 144A Class A † F | 77,846 | 1,595,843 |
|
| Comerica, Inc. | 68,700 | 2,458,086 |
|
| Huntington Bancshares, Inc. S | 760,050 | 4,309,484 |
|
| JPMorgan Chase & Co. | 231,700 | 8,718,871 |
|
| People’s United Financial, Inc. | 216,800 | 2,668,808 |
|
| SunTrust Banks, Inc. | 263,600 | 6,595,272 |
|
| SVB Financial Group † | 125,300 | 5,430,502 |
|
| | | 31,776,866 |
| Beverage (0.6%) | | |
| PepsiCo, Inc. | 48,000 | 3,134,400 |
|
| | | 3,134,400 |
| Biotechnology (1.0%) | | |
| Viropharma, Inc. † | 344,502 | 5,636,053 |
|
| | | 5,636,053 |
| Building materials (0.8%) | | |
| Masco Corp. | 395,100 | 4,211,766 |
|
| | | 4,211,766 |
| Chemicals (1.3%) | | |
| Huntsman Corp. | 510,900 | 7,075,965 |
|
| | | 7,075,965 |
| Coal (1.5%) | | |
| James River Coal Co. † S | 311,900 | 5,398,989 |
|
| Walter Energy, Inc. | 30,100 | 2,647,596 |
|
| | | 8,046,585 |
| Commercial and consumer services (0.8%) | | |
| Healthcare Services Group, Inc. | 171,600 | 4,123,548 |
|
| | | 4,123,548 |
| Communications equipment (1.2%) | | |
| ARRIS Group, Inc. † S | 362,900 | 3,378,599 |
|
| Tellabs, Inc. S | 454,800 | 3,101,736 |
|
| | | 6,480,335 |
| Computers (6.0%) | | |
| Brocade Communications Systems, Inc. † | 952,342 | 6,018,801 |
|
| Hewlett-Packard Co. | 256,200 | 10,775,772 |
|
| Polycom, Inc. † | 138,600 | 4,681,908 |
|
| Silicon Graphics International Corp. † | 213,998 | 1,619,965 |
|
| Xerox Corp. | 814,300 | 9,527,310 |
|
| | | 32,623,756 |
| Conglomerates (1.7%) | | |
| AMETEK, Inc. | 166,200 | 8,983,110 |
|
| | | 8,983,110 |
| Construction (0.5%) | | |
| USG Corp. † S | 225,900 | 2,864,412 |
|
| | | 2,864,412 |
| Consumer finance (0.5%) | | |
| Discover Financial Services | 160,400 | 2,831,060 |
|
| | | 2,831,060 |
21
| | |
| COMMON STOCKS (97.8%)* cont. | Shares | Value |
|
| Consumer goods (3.1%) | | |
| Church & Dwight Co., Inc. | 128,000 | $8,428,800 |
|
| Newell Rubbermaid, Inc. | 471,344 | 8,319,222 |
|
| | | 16,748,022 |
| Consumer services (1.8%) | | |
| Avis Budget Group, Inc. † | 611,900 | 7,104,159 |
|
| Hertz Global Holdings, Inc. † S | 232,700 | 2,634,164 |
|
| | | 9,738,323 |
| Containers (2.0%) | | |
| Silgan Holdings, Inc. S | 314,400 | 10,611,000 |
|
| | | 10,611,000 |
| Electric utilities (3.5%) | | |
| Ameren Corp. | 191,500 | 5,549,670 |
|
| DTE Energy Co. | 117,500 | 5,494,300 |
|
| Great Plains Energy, Inc. | 245,800 | 4,677,574 |
|
| Progress Energy, Inc. | 76,780 | 3,455,100 |
|
| | | 19,176,644 |
| Electronics (0.8%) | | |
| Cognex Corp. | 114,400 | 3,054,480 |
|
| Jabil Circuit, Inc. | 95,100 | 1,458,834 |
|
| | | 4,513,314 |
| Energy (oil field) (2.2%) | | |
| Helix Energy Solutions Group, Inc. † | 517,800 | 6,570,882 |
|
| National Oilwell Varco, Inc. | 104,100 | 5,596,416 |
|
| | | 12,167,298 |
| Financial (0.4%) | | |
| MGIC Investment Corp. † S | 268,977 | 2,372,377 |
|
| | | 2,372,377 |
| Food (1.6%) | | |
| Mead Johnson Nutrition Co. Class A | 146,900 | 8,640,658 |
|
| | | 8,640,658 |
| Forest products and packaging (0.6%) | | |
| Louisiana-Pacific Corp. † | 423,900 | 3,280,986 |
|
| | | 3,280,986 |
| Health-care services (5.9%) | | |
| Aetna, Inc. | 190,800 | 5,697,288 |
|
| AmerisourceBergen Corp. | 141,000 | 4,627,620 |
|
| Coventry Health Care, Inc. † | 123,100 | 2,883,002 |
|
| Humana, Inc. † | 70,500 | 4,109,445 |
|
| Lincare Holdings, Inc. | 376,550 | 9,873,141 |
|
| Mednax, Inc. † | 79,300 | 4,695,353 |
|
| | | 31,885,849 |
| Insurance (8.7%) | | |
| Aflac, Inc. | 149,900 | 8,377,911 |
|
| Assured Guaranty, Ltd. (Bermuda) | 234,200 | 4,461,510 |
|
| Employers Holdings, Inc. | 108,735 | 1,760,420 |
|
| Hanover Insurance Group, Inc. (The) | 168,100 | 7,606,525 |
|
| Hartford Financial Services Group, Inc. (The) | 273,534 | 6,559,345 |
|
| HCC Insurance Holdings, Inc. | 199,100 | 5,272,168 |
|
| Marsh & McLennan Cos., Inc. | 214,300 | 5,353,214 |
|
| XL Group PLC | 364,600 | 7,711,290 |
|
| | | 47,102,383 |
22
| | |
| COMMON STOCKS (97.8%)* cont. | Shares | Value |
|
| Investment banking/Brokerage (2.8%) | | |
| Ameriprise Financial, Inc. | 171,762 | $8,878,378 |
|
| E*Trade Financial Corp. † | 313,990 | 4,490,057 |
|
| Invesco, Ltd. | 69,568 | 1,600,064 |
|
| | | 14,968,499 |
| Machinery (0.8%) | | |
| Gardner Denver, Inc. | 72,200 | 4,174,604 |
|
| | | 4,174,604 |
| Manufacturing (1.4%) | | |
| Ingersoll-Rand PLC | 191,800 | 7,539,658 |
|
| | | 7,539,658 |
| Medical technology (5.0%) | | |
| Boston Scientific Corp. † | 971,900 | 6,200,722 |
|
| Cooper Cos., Inc. (The) | 102,900 | 5,077,086 |
|
| Covidien PLC (Ireland) | 179,742 | 7,166,314 |
|
| Medtronic, Inc. | 152,200 | 5,358,962 |
|
| Merit Medical Systems, Inc. † | 201,644 | 3,187,992 |
|
| | | 26,991,076 |
| Metals (1.7%) | | |
| Freeport-McMoRan Copper & Gold, Inc. Class B | 51,500 | 4,876,020 |
|
| U.S. Steel Corp. S | 106,600 | 4,561,414 |
|
| | | 9,437,434 |
| Natural gas utilities (0.7%) | | |
| National Fuel Gas Co. | 70,700 | 3,901,226 |
|
| | | 3,901,226 |
| Office equipment and supplies (0.3%) | | |
| ACCO Brands Corp. † | 284,800 | 1,774,304 |
|
| | | 1,774,304 |
| Oil and gas (6.5%) | | |
| Apache Corp. | 55,500 | 5,606,610 |
|
| Cabot Oil & Gas Corp. Class A | 117,700 | 3,410,946 |
|
| Petrohawk Energy Corp. † | 420,200 | 7,147,602 |
|
| Pioneer Natural Resources Co. | 85,655 | 5,978,719 |
|
| QEP Resources, Inc. | 162,500 | 5,367,375 |
|
| Southwestern Energy Co. † S | 112,500 | 3,808,125 |
|
| Swift Energy Co. † | 123,200 | 3,923,920 |
|
| | | 35,243,297 |
| Pharmaceuticals (2.8%) | | |
| Akorn, Inc. † S | 669,700 | 2,993,559 |
|
| Jazz Pharmaceuticals, Inc. † S | 393,700 | 4,185,031 |
|
| Pfizer, Inc. | 464,900 | 8,089,260 |
|
| | | 15,267,850 |
| Real estate (2.0%) | | |
| CB Richard Ellis Group, Inc. Class A † | 71,200 | 1,306,520 |
|
| Chimera Investment Corp. R | 1,379,237 | 5,654,872 |
|
| Host Marriott Corp. R S | 240,142 | 3,815,856 |
|
| | | 10,777,248 |
| Restaurants (1.4%) | | |
| Domino’s Pizza, Inc. † | 515,500 | 7,650,020 |
|
| | | 7,650,020 |
| Retail (6.9%) | | |
| Jo-Ann Stores, Inc. † | 98,800 | 4,273,100 |
|
| K-Swiss, Inc. Class A † S | 37,806 | 459,721 |
|
| OfficeMax, Inc. † | 407,100 | 7,205,670 |
|
23
| | |
| COMMON STOCKS (97.8%)* cont. | Shares | Value |
|
| Retail cont. | | |
| RadioShack Corp. | 151,300 | $3,045,669 |
|
| Ross Stores, Inc. | 51,900 | 3,061,581 |
|
| Staples, Inc. | 196,600 | 4,024,402 |
|
| SUPERVALU, Inc. | 225,600 | 2,434,224 |
|
| Talbots, Inc. (The) † S | 691,280 | 6,760,718 |
|
| Urban Outfitters, Inc. † S | 189,200 | 5,821,684 |
|
| | | 37,086,769 |
| Schools (1.1%) | | |
| Apollo Group, Inc. Class A † | 90,200 | 3,380,696 |
|
| Career Education Corp. † S | 156,552 | 2,745,922 |
|
| | | 6,126,618 |
| Semiconductor (2.0%) | | |
| Atmel Corp. † | 664,029 | 5,883,297 |
|
| Cymer, Inc. † S | 129,019 | 4,767,252 |
|
| | | 10,650,549 |
| Shipping (1.7%) | | |
| Genco Shipping & Trading, Ltd. † S | 323,200 | 5,348,960 |
|
| Nordic American Tanker Shipping (Bermuda) S | 144,100 | 3,750,923 |
|
| | | 9,099,883 |
| Software (0.8%) | | |
| CA, Inc. | 188,500 | 4,375,085 |
|
| | | 4,375,085 |
| Technology services (1.8%) | | |
| Unisys Corp. † | 240,600 | 5,545,830 |
|
| Yahoo!, Inc. † | 258,400 | 4,266,184 |
|
| | | 9,812,014 |
| Textiles (1.5%) | | |
| Hanesbrands, Inc. † | 325,100 | 8,062,480 |
|
| | | 8,062,480 |
| Toys (0.4%) | | |
| Mattel, Inc. | 103,800 | 2,421,654 |
|
| | | 2,421,654 |
| Trucks and parts (1.3%) | | |
| Autoliv, Inc. (Sweden) S | 98,500 | 7,023,049 |
|
| | | 7,023,049 |
| Total common stocks (cost $456,215,381) | | $529,696,937 |
| | | |
| | | |
| PURCHASED OPTIONS | Expiration date/ | Contract | |
| OUTSTANDING (0.6%)* | strike price | amount | Value |
|
| Avis Budget Group, Inc. (Call) | Dec-10/$12.50 | 704,568 | $397,799 |
|
| Avis Budget Group, Inc. (Call) | Nov-10/12.50 | 395,250 | 100,694 |
|
| Domino’s Pizza, Inc. (Call) | Dec-10/12.50 | 580,167 | 1,436,900 |
|
| Genco Shipping & Trading, Ltd. (Call) | Dec-10/18.00 | 489,459 | 189,470 |
|
| iShares Russell 2000 Index Fund (Put) | Dec-10/64.00 | 199,087 | 266,521 |
|
| iShares Russell 2000 Index Fund (Put) | Nov-10/65.00 | 297,700 | 140,824 |
|
| iShares Russell 2000 Index Fund (Put) | Dec-10/65.00 | 65,121 | 101,679 |
|
| iShares Russell 2000 Index Fund (Put) | Nov-10/66.00 | 108,287 | 66,867 |
|
| Talbots, Inc. (Call) | Jan-11/10.00 | 264,239 | 253,582 |
|
| Talbots, Inc. (Call) | Dec-10/12.00 | 637,050 | 115,357 |
|
| Talbots, Inc. (Call) | Jan-11/14.00 | 799,800 | 96,112 |
|
| Total purchased options outstanding (cost $5,653,902) | | $3,165,805 |
24
| | |
| U.S. TREASURY OBLIGATIONS (0.1%)* i | Principal amount | Value |
|
| U.S. Treasury Notes 2 3/4s, February 15, 2019 | $60,000 | $62,497 |
|
| U.S. Treasury Notes 1 3/8s, September 15, 2012 | 40,000 | 40,847 |
|
| U.S. Treasury Notes 4 3/4s, May 31, 2012 | 80,000 | 87,233 |
|
| U.S. Treasury Notes 3 7/8s, May 15, 2018 | 335,000 | 383,625 |
|
| U.S. Treasury Notes 2 5/8s, February 29, 2016 | 187,000 | 200,516 |
|
| Total U.S. treasury obligations (cost $774,718) | | $774,718 |
|
| |
| MORTGAGE-BACKED SECURITIES (0.0%)* i | Principal amount | Value |
|
| Fannie Mae Ser. 2010-99, Class JU, 3s, 2040 | $52,542 | $54,955 |
|
| Total mortgage-backed securities (cost $54,955) | | $54,955 |
|
| |
| SHORT-TERM INVESTMENTS (14.4%)* | Principal amount/shares | Value |
|
| Putnam Cash Collateral Pool, LLC 0.21% d | 67,193,991 | $67,193,991 |
|
| Putnam Money Market Liquidity Fund 0.16% e | 7,395,425 | 7,395,425 |
|
| U.S. Treasury Bills with effective yields ranging from | | |
| 0.26% to 0.27%, December 16, 2010 | $2,703,000 | 2,702,130 |
|
| U.S. Treasury Bills, zero %, September 22, 2011 i | 210,000 | 209,601 |
|
| U.S. Treasury Bills, zero %, March 31, 2011 i | 272,000 | 271,810 |
|
| U.S. Treasury Bills, zero %, December 2, 2010 i | 150,000 | 149,985 |
|
| Total short-term investments (cost $77,922,942) | | $77,922,942 |
|
| |
| TOTAL INVESTMENTS | | |
|
| Total investments (cost $540,621,898) | | $611,615,357 |
Key to holding’s abbreviations
| | | |
| ADR | American Depositary Receipts | | |
Notes to the fund’s portfolio
Unless noted otherwise, the notes to the fund’s portfolio are for the close of the fund’s reporting period, which ran from May 1, 2010 through October 31, 2010 (the reporting period).
* Percentages indicated are based on net assets of $541,353,318.
† Non-income-producing security.
d See Note 1 to the financial statements regarding securities lending. The rate quoted in the security description is the annualized 7-day yield of the fund at the close of the reporting period.
e See Note 6 to the financial statements regarding investments in Putnam Money Market Liquidity Fund. The rate quoted in the security description is the annualized 7-day yield of the fund at the close of the reporting period.
F Is valued at fair value following procedures approved by the Trustees. Securities may be classified as Level 2 or Level 3 for Accounting Standards Codification ASC 820 Fair Value Measurements and Disclosures (ASC 820) based on the securities’ valuation inputs.
i Securities purchased with cash or securities received, that were pledged to the fund for collateral on certain derivatives contracts (Note 1).
R Real Estate Investment Trust.
S Securities on loan, in part or in entirety, at the close of the reporting period.
At the close of the reporting period, the fund maintained liquid assets totaling $28,826,775 to cover certain derivatives contracts.
Debt obligations are considered secured unless otherwise indicated.
25
144A after the name of an issuer represents securities exempt from registration under Rule 144A under the Securities Act of 1933, as amended. These securities may be resold in transactions exempt from registration, normally to qualified institutional buyers.
ADR after the name of a foreign holding represents ownership of foreign securities on deposit with a custodian bank.
The dates shown on debt obligations are the original maturity dates.
| | | | | |
| WRITTEN OPTIONS OUTSTANDING at 10/31/10 (premiums received $797,127) (Unaudited) | | |
|
| | Contract | | Expiration date/ | | |
| | amount | | strike price | | Value |
|
| Avis Budget Group, Inc. (Call) | 704,568 | | Dec-10/$15.00 | | $71,239 |
|
| Domino’s Pizza, Inc. (Call) | 580,167 | | Dec-10/15.00 | | 392,228 |
|
| Talbots, Inc. (Call) | 637,050 | | Dec-10/15.00 | | 12,741 |
|
| Total | | | | | $476,208 |
ASC 820 establishes a three-level hierarchy for disclosure of fair value measurements. The valuation hierarchy is based upon the transparency of inputs to the valuation of the fund’s investments. The three levels are defined as follows:
Level 1 — Valuations based on quoted prices for identical securities in active markets.
Level 2 — Valuations based on quoted prices in markets that are not active or for which all significant inputs are observable, either directly or indirectly.
Level 3 — Valuations based on inputs that are unobservable and significant to the fair value measurement.
The following is a summary of the inputs used to value the fund’s net assets as of the close of the reporting period:
| | | | |
| | | Valuation inputs | |
|
| Investments in securities: | Level 1 | Level 2 | Level 3 |
|
| Common stocks: | | | |
|
| Basic materials | $22,658,797 | $— | $— |
|
| Capital goods | 44,411,525 | — | — |
|
| Conglomerates | 8,983,110 | — | — |
|
| Consumer cyclicals | 53,471,993 | — | — |
|
| Consumer staples | 54,472,265 | — | — |
|
| Energy | 55,457,180 | — | — |
|
| Financial | 108,232,590 | — | 1,595,843 |
|
| Health care | 79,780,828 | — | — |
|
| Technology | 68,455,053 | — | — |
|
| Transportation | 9,099,883 | — | — |
|
| Utilities and power | 23,077,870 | — | — |
|
| Total common stocks | 528,101,094 | — | 1,595,843 |
| | | | |
| Purchased options outstanding | — | 3,165,805 | — |
|
| U.S. Treasury obligations | — | 774,718 | — |
|
| Mortgage-backed securities | — | 54,955 | — |
|
| Short-term investments | 7,395,425 | 70,527,517 | — |
|
| Totals by level | $535,496,519 | $74,522,995 | $1,595,843 |
| | | | |
| | | Valuation inputs | |
|
| Other financial instruments: | Level 1 | Level 2 | Level 3 |
|
| Written options | $— | $(476,208) | $— |
|
| Totals by level | $— | $(476,208) | $— |
At the start and/or close of the reporting period, Level 3 investments in securities and other financial instruments were not considered a significant portion of the fund’s portfolio.
The accompanying notes are an integral part of these financial statements.
26
Statement of assets and liabilities 10/31/10 (Unaudited)
| |
| ASSETS | |
|
| Investment in securities, at value, including $65,569,706 of securities on loan (Note 1): | |
| Unaffiliated issuers (identified cost $466,032,482) | $537,025,941 |
| Affiliated issuers (identified cost $74,589,416) (Notes 1 and 6) | 74,589,416 |
|
| Dividends, interest and other receivables | 690,793 |
|
| Receivable for shares of the fund sold | 877,024 |
|
| Receivable for investments sold | 3,014,018 |
|
| Total assets | 616,197,192 |
|
| |
| LIABILITIES | |
|
| Payable to custodian (Note 2) | 248,263 |
|
| Payable for investments purchased | 3,401,952 |
|
| Payable for shares of the fund repurchased | 1,379,897 |
|
| Payable for compensation of Manager (Note 2) | 259,076 |
|
| Payable for investor servicing fees (Note 2) | 94,561 |
|
| Payable for custodian fees (Note 2) | 10,955 |
|
| Payable for Trustee compensation and expenses (Note 2) | 88,689 |
|
| Payable for administrative services (Note 2) | 1,941 |
|
| Payable for distribution fees (Note 2) | 128,569 |
|
| Written options outstanding, at value (premiums received $797,127) (Notes 1 and 3) | 476,208 |
|
| Collateral on securities loaned, at value (Note 1) | 67,193,991 |
|
| Collateral on certain derivative contracts, at value (Note 1) | 1,461,069 |
|
| Other accrued expenses | 98,703 |
|
| Total liabilities | 74,843,874 |
| |
| Net assets | $541,353,318 |
|
| |
| REPRESENTED BY | |
|
| Paid-in capital (Unlimited shares authorized) (Notes 1 and 4) | $656,904,934 |
|
| Undistributed net investment income (Note 1) | 400,780 |
|
| Accumulated net realized loss on investments (Note 1) | (187,266,774) |
|
| Net unrealized appreciation of investments | 71,314,378 |
|
| Total — Representing net assets applicable to capital shares outstanding | $541,353,318 |
(Continued on next page)
27
Statement of assets and liabilities (Continued)
| |
| COMPUTATION OF NET ASSET VALUE AND OFFERING PRICE | |
|
| Net asset value and redemption price per class A share | |
| ($448,663,821 divided by 39,893,857 shares) | $11.25 |
|
| Offering price per class A share (100/94.25 of $11.25)* | $11.94 |
|
| Net asset value and offering price per class B share ($14,993,851 divided by 1,406,693 shares)** | $10.66 |
|
| Net asset value and offering price per class C share ($16,296,308 divided by 1,531,172 shares)** | $10.64 |
|
| Net asset value and redemption price per class M share ($3,716,347 divided by 341,216 shares) | $10.89 |
|
| Offering price per class M share (100/96.50 of $10.89)* | $11.28 |
|
| Net asset value, offering price and redemption price per class R share | |
| ($9,080,361 divided by 820,157 shares) | $11.07 |
|
| Net asset value, offering price and redemption price per class Y share | |
| ($48,602,630 divided by 4,304,983 shares) | $11.29 |
|
* On single retail sales of less than $50,000. On sales of $50,000 or more the offering price is reduced.
** Redemption price per share is equal to net asset value less any applicable contingent deferred sales charge.
The accompanying notes are an integral part of these financial statements.
28
Statement of operations Six months ended 10/31/10 (Unaudited)
| |
| INVESTMENT INCOME | |
|
| Dividends (net of foreign tax of $4,361) | $3,358,641 |
|
| Interest (including interest income of $9,138 from investments in affiliated issuers) (Note 6) | 12,518 |
|
| Securities lending (including interest income of $10,186 from | |
| investments in affiliated issuers) (Note 1) | 50,254 |
|
| Total investment income | 3,421,413 |
|
| |
| EXPENSES | |
|
| Compensation of Manager (Note 2) | 1,550,026 |
|
| Investor servicing fees (Note 2) | 833,519 |
|
| Custodian fees (Note 2) | 9,969 |
|
| Trustee compensation and expenses (Note 2) | 17,539 |
|
| Administrative services (Note 2) | 9,648 |
|
| Distribution fees — Class A (Note 2) | 550,898 |
|
| Distribution fees — Class B (Note 2) | 77,798 |
|
| Distribution fees — Class C (Note 2) | 77,147 |
|
| Distribution fees — Class M (Note 2) | 13,970 |
|
| Distribution fees — Class R (Note 2) | 21,307 |
|
| Other | 143,126 |
|
| Total expenses | 3,304,947 |
| | |
| Expense reduction (Note 2) | (103,079) |
|
| Net expenses | 3,201,868 |
| |
| Net investment income | 219,545 |
|
| |
| Net realized gain on investments (Notes 1 and 3) | 57,838,092 |
|
| Net realized gain on written options (Notes 1 and 3) | 2,784,502 |
|
| Net unrealized depreciation of investments and written options during the period | (83,893,545) |
|
| Net loss on investments | (23,270,951) |
| |
| Net decrease in net assets resulting from operations | $(23,051,406) |
|
The accompanying notes are an integral part of these financial statements.
29
Statement of changes in net assets
| | |
| INCREASE (DECREASE) IN NET ASSETS | Six months ended 10/31/10* | Year ended 4/30/10 |
|
| Operations: | | |
| Net investment income | $219,545 | $258,215 |
|
| Net realized gain on investments | 60,622,594 | 104,181,046 |
|
| Net unrealized appreciation (depreciation) of investments | (83,893,545) | 130,427,632 |
|
| Net increase (decrease) in net assets resulting | | |
| from operations | (23,051,406) | 234,866,893 |
|
| Distributions to shareholders (Note 1): | | |
| From ordinary income | | |
| Net investment income | | |
|
| Class A | — | (667,894) |
|
| Class Y | — | (149,970) |
|
| Increase in capital from settlement payments | — | 4,189 |
|
| Redemption fees (Note 1) | 640 | 1,563 |
|
| Decrease from capital share transactions (Note 4) | (30,537,445) | (129,429,224) |
|
| Total increase (decrease) in net assets | (53,588,211) | 104,625,557 |
|
| |
| NET ASSETS | | |
|
| Beginning of period | 594,941,529 | 490,315,972 |
|
| End of period (including undistributed net investment | | |
| income of $400,780 and $181,235, respectively) | $541,353,318 | $594,941,529 |
|
* Unaudited
The accompanying notes are an integral part of these financial statements.
30
|
| This page left blank intentionally. |
31
Financial highlights (For a common share outstanding throughout the period)
| | | | | | | | | | | | | | | | |
| INVESTMENT OPERATIONS: | | LESS DISTRIBUTIONS: | | RATIOS AND SUPPLEMENTAL DATA: |
|
| | | | | | | | | | | | | | | | Ratio | |
| | Net asset | Net | Net realized | | From | From | | | | | | | | Ratio | of net investment | |
| | value, | investment | and unrealized | Total from | net | net realized | From | | | | | | Net assets, | of expenses | income (loss) | |
| | beginning | income | gain (loss) | investment | investment | gain | return | Total | Redemption | Non-recurring | Net asset value, | Total return at net | end of period | to average | to average | Portfolio |
| Period ended | of period | (loss) a | on investments | operations | income | on investments | of capital | distributions | fees b | reimbursements | end of period | asset value (%) c | (in thousands) | net assets (%) d | net assets (%) | turnover (%) |
|
| Class A | | | | | | | | | | | | | | | | |
| October 31, 2010 ** | $11.66 | .01 | (.42) | (.41) | — | — | — | — | — | — | $11.25 | (3.52) * | $448,664 | .61* | .06* | 53.25* |
| April 30, 2010 | 7.61 | .01 | 4.05 | 4.06 | (.01) | — | — | (.01) | — | — b,f | 11.66 | 53.44 | 494,841 | 1.30 e | .09 e | 98.42 |
| April 30, 2009 | 11.97 | .05 | (4.38) | (4.33) | (.03) | — | — | (.03) | — | — | 7.61 | (36.15) | 412,152 | 1.30 e | .54 e | 130.22 |
| April 30, 2008 | 16.26 | .04 | (1.85) | (1.81) | (.06) | (2.41) | (.01) | (2.48) | — | — | 11.97 | (12.18) | 527,392 | 1.27 e | .25 e | 70.64 |
| April 30, 2007 | 15.91 | .24 g | 1.95 | 2.19 | (.24) | (1.60) | — | (1.84) | — | — | 16.26 | 14.66 | 707,081 | 1.23 e | 1.53 e,g | 63.15 |
| April 30, 2006 | 13.88 | .04 h | 3.70 | 3.74 | (.01) | (1.70) | — | (1.71) | — | — | 15.91 | 28.18 | 614,761 | 1.22 e,h | .28 e,h | 63.63 |
|
| Class B | | | | | | | | | | | | | | | | |
| October 31, 2010 ** | $11.09 | (.03) | (.40) | (.43) | — | — | — | — | — | — | $10.66 | (3.88) * | $14,994 | .99* | (.32)* | 53.25* |
| April 30, 2010 | 7.28 | (.06) | 3.87 | 3.81 | — | — | — | — | — | — b,f | 11.09 | 52.34 | 18,509 | 2.05 e | (.67) e | 98.42 |
| April 30, 2009 | 11.50 | (.02) | (4.20) | (4.22) | — | — | — | — | — | — | 7.28 | (36.70) | 24,934 | 2.05 e | (.24) e | 130.22 |
| April 30, 2008 | 15.76 | (.07) | (1.77) | (1.84) | — | (2.41) | (.01) | (2.42) | — | — | 11.50 | (12.78) | 81,207 | 2.02 e | (.49) e | 70.64 |
| April 30, 2007 | 15.46 | .12 g | 1.89 | 2.01 | (.11) | (1.60) | — | (1.71) | — | — | 15.76 | 13.79 | 228,560 | 1.98 e | .78 e,g | 63.15 |
| April 30, 2006 | 13.62 | (.07) h | 3.61 | 3.54 | — | (1.70) | — | (1.70) | — | — | 15.46 | 27.18 | 276,306 | 1.97 e,h | (.46) e,h | 63.63 |
|
| Class C | | | | | | | | | | | | | | | | |
| October 31, 2010 ** | $11.07 | (.03) | (.40) | (.43) | — | — | — | — | — | — | $10.64 | (3.89) * | $16,296 | .99* | (.32)* | 53.25* |
| April 30, 2010 | 7.27 | (.06) | 3.86 | 3.80 | — | — | — | — | — | — b,f | 11.07 | 52.27 | 16,894 | 2.05 e | (.67) e | 98.42 |
| April 30, 2009 | 11.47 | (.02) | (4.18) | (4.20) | — | — | — | — | — | — | 7.27 | (36.62) | 12,816 | 2.05 e | (.23) e | 130.22 |
| April 30, 2008 | 15.74 | (.07) | (1.78) | (1.85) | — | (2.41) | (.01) | (2.42) | — | — | 11.47 | (12.87) | 30,367 | 2.02 e | (.50) e | 70.64 |
| April 30, 2007 | 15.47 | .12 g | 1.88 | 2.00 | (.13) | (1.60) | — | (1.73) | — | — | 15.74 | 13.77 | 45,357 | 1.98 e | .80 e,g | 63.15 |
| April 30, 2006 | 13.62 | (.07) h | 3.62 | 3.55 | — | (1.70) | — | (1.70) | — | — | 15.47 | 27.26 | 39,800 | 1.97 e,h | (.47) e,h | 63.63 |
|
| Class M | | | | | | | | | | | | | | | | |
| October 31, 2010 ** | $11.32 | (.02) | (.41) | (.43) | — | — | — | — | — | — | $10.89 | (3.80) * | $3,716 | .87* | (.20)* | 53.25* |
| April 30, 2010 | 7.41 | (.04) | 3.95 | 3.91 | — | — | — | — | — | — b,f | 11.32 | 52.77 | 4,299 | 1.80 e | (.43) e | 98.42 |
| April 30, 2009 | 11.67 | — b | (4.26) | (4.26) | — | — | — | — | — | — | 7.41 | (36.50) | 3,886 | 1.80 e | .02 e | 130.22 |
| April 30, 2008 | 15.93 | (.03) | (1.81) | (1.84) | — | (2.41) | (.01) | (2.42) | — | — | 11.67 | (12.64) | 8,204 | 1.77 e | (.24) e | 70.64 |
| April 30, 2007 | 15.63 | .16 g | 1.90 | 2.06 | (.16) | (1.60) | — | (1.76) | — | — | 15.93 | 14.04 | 15,160 | 1.73 e | 1.03 e,g | 63.15 |
| April 30, 2006 | 13.71 | (.03) h | 3.65 | 3.62 | — | (1.70) | — | (1.70) | — | — | 15.63 | 27.61 | 14,075 | 1.72 e,h | (.21) e,h | 63.63 |
|
| Class R | | | | | | | | | | | | | | | | |
| October 31, 2010 ** | $11.49 | (.01) | (.41) | (.42) | — | — | — | — | — | — | $11.07 | (3.66) * | $9,080 | .74* | (.07)* | 53.25* |
| April 30, 2010 | 7.51 | (.02) | 4.00 | 3.98 | — | — | — | — | — | — b,f | 11.49 | 53.00 | 9,265 | 1.55 e | (.17) e | 98.42 |
| April 30, 2009 | 11.80 | .02 | (4.30) | (4.28) | (.01) | — | — | (.01) | — | — | 7.51 | (36.31) | 5,935 | 1.55 e | .28 e | 130.22 |
| April 30, 2008 | 16.08 | — b | (1.82) | (1.82) | (.04) | (2.41) | (.01) | (2.46) | — | — | 11.80 | (12.39) | 7,143 | 1.52 e | .01 e | 70.64 |
| April 30, 2007 | 15.77 | .18 g | 1.95 | 2.13 | (.22) | (1.60) | — | (1.82) | — | — | 16.08 | 14.39 | 6,110 | 1.48 e | 1.21 e,g | 63.15 |
| April 30, 2006 | 13.81 | (.01) h | 3.69 | 3.68 | (.02) | (1.70) | — | (1.72) | — | — | 15.77 | 27.86 | 2,959 | 1.47 e,h | (.03) e,h | 63.63 |
|
| Class Y | | | | | | | | | | | | | | | | |
| October 31, 2010 ** | $11.69 | .02 | (.42) | (.40) | — | — | — | — | — | — | $11.29 | (3.42) * | $48,603 | .49* | .18* | 53.25* |
| April 30, 2010 | 7.63 | .03 | 4.07 | 4.10 | (.04) | — | — | (.04) | — | — b,f | 11.69 | 53.79 | 51,132 | 1.05 e | .33 e | 98.42 |
| April 30, 2009 | 12.01 | .07 | (4.40) | (4.33) | (.05) | — | — | (.05) | — | — | 7.63 | (35.96) | 30,592 | 1.05 e | .78 e | 130.22 |
| April 30, 2008 | 16.30 | .07 | (1.84) | (1.77) | (.10) | (2.41) | (.01) | (2.52) | — | — | 12.01 | (11.91) | 58,124 | 1.02 e | .51 e | 70.64 |
| April 30, 2007 | 15.94 | .27 g | 1.97 | 2.24 | (.28) | (1.60) | — | (1.88) | — | — | 16.30 | 14.96 | 55,241 | .98 e | 1.76 e,g | 63.15 |
| April 30, 2006 | 13.90 | .08 h | 3.71 | 3.79 | (.05) | (1.70) | — | (1.75) | — | — | 15.94 | 28.50 | 46,314 | .97 e,h | .52 e,h | 63.63 |
|
See notes to financial highlights at the end of this section.
The accompanying notes are an integral part of these financial statements.
Financial highlights (Continued)
* Not annualized.
** Unaudited.
a Per share net investment income (loss) has been determined on the basis of the weighted average number of shares outstanding during the period.
b Amount represents less than $0.01 per share.
c Total return assumes dividend reinvestment and does not reflect the effect of sales charges.
d Includes amounts paid through expense offset and brokerage/service arrangements (Note 2).
e Reflects an involuntary contractual expense limitation in effect during the period. For periods prior to April 30, 2010, certain fund expenses were waived in connection with the fund’s investment in Putnam Prime Money Market Fund.
As a result of such limitation and/or waivers, the expenses of each class reflect a reduction of the following amounts:
| |
| | Percentage of |
| | average net assets |
|
| April 30, 2010 | 0.02% |
|
| April 30, 2009 | 0.05 |
|
| April 30, 2008 | 0.01 |
|
| April 30, 2007 | <0.01 |
|
| April 30, 2006 | <0.01 |
|
f Reflects a non-recurring reimbursement pursuant to a settlement between the Securities and Exchange Commission (the “SEC”) and Prudential Securities, Inc., which amounted to less than $0.01 per share outstanding as of March 30, 2010.
g Reflects a special dividend received by the fund which amounted to the following amounts:
| | |
| | | Percentage of |
| | Per share | average net assets |
|
| Class A | $0.17 | 1.10% |
|
| Class B | 0.16 | 1.10 |
|
| Class C | 0.17 | 1.13 |
|
| Class M | 0.17 | 1.10 |
|
| Class R | 0.16 | 1.06 |
|
| Class Y | 0.17 | 1.09 |
|
h Reflects a non-recurring accrual related to a reimbursement to the fund from Putnam Investments relating to the calculation of certain amounts paid by the fund to Putnam in previous years for transfer agent services, which amounted to less than $0.01 per share and 0.01% of average net assets for the period ended April 30, 2006.
The accompanying notes are an integral part of these financial statements.
34
Notes to financial statements 10/31/10 (Unaudited)
Note 1: Significant accounting policies
Putnam Multi-Cap Value Fund (the fund) formerly Putnam Mid Cap Value Fund, is a diversified series of Putnam Investment Funds (the Trust), a Massachusetts business trust registered under the Investment Company Act of 1940, as amended, as an open-end management investment company. The fund seeks capital appreciation by investing primarily in common stocks of any size that Putnam Investment Management, LLC (Putnam Management), the fund’s manager, an indirect wholly-owned subsidiary of Putnam Investments, LLC, believes are currently undervalued. The fund seeks current income as a secondary objective.
The fund offers class A, class B, class C, class M, class R and class Y shares. Class A and class M shares are sold with a maximum front-end sales charge of 5.75% and 3.50%, respectively, and generally do not pay a contingent deferred sales charge. Class B shares, which convert to class A shares after approximately five and a half years, do not pay a front-end sales charge and are subject to a contingent deferred sales charge if those shares are redeemed within six years of purchase. Class C shares have a one-year 1.00% contingent deferred sales charge and do not convert to class A shares. Class R shares, which are offered to qualified employee-benefit plans, are sold at net asset value. The expenses for class A, class B, class C, class M and class R shares may differ based on the distribution fee of each class, which is identified in Note 2. Class Y shares, which are sold at net asset value, are generally subject to the same expenses as class A, class B, class C, class M and class R shares, but do not bear a distribution fee. Class Y shares are generally only available to corporate and institutional clients and clients in other approved programs.
Prior to August 2, 2010, a 1.00% redemption fee applied to certain shares that were redeemed (either by selling or exchanging into another fund) within 7 days of purchase. The redemption fee was accounted for as an addition to paid-in-capital. Effective August 2, 2010, this redemption fee no longer applies to shares redeemed.
Investment income, realized and unrealized gains and losses and expenses of the fund are borne pro-rata based on the relative net assets of each class to the total net assets of the fund, except that each class bears expenses unique to that class (including the distribution fees applicable to such classes). Each class votes as a class only with respect to its own distribution plan or other matters on which a class vote is required by law or determined by the Trustees. If the fund were liquidated, shares of each class would receive their pro-rata share of the net assets of the fund. In addition, the Trustees declare separate dividends on each class of shares.
In the normal course of business, the fund enters into contracts that may include agreements to indemnify another party under given circumstances. The fund’s maximum exposure under these arrangements is unknown as this would involve future claims that may be, but have not yet been, made against the fund. However, the fund’s management team expects the risk of material loss to be remote.
The following is a summary of significant accounting policies consistently followed by the fund in the preparation of its financial statements. The preparation of financial statements is in conformity with accounting principles generally accepted in the United States of America and requires management to make estimates and assumptions that affect the reported amounts of assets and liabilities in the financial statements and the reported amounts of increases and decreases in net assets from operations. Actual results could differ from those estimates. Subsequent events after the Statement of assets and liabilities date through the date that the financial statements were issued have been evaluated in the preparation of the financial statements. Unless otherwise noted, the “reporting period” represents the period from May 1, 2010 through October 31, 2010.
A) Security valuation Investments for which market quotations are readily available are valued at the last reported sales price on their principal exchange, or official closing price for certain markets and are classified as Level 1 securities. If no sales are reported — as in the case of some securities traded over-the-counter — a security is valued at its last reported bid price and is generally categorized as a Level 2 security.
Market quotations are not considered to be readily available for certain debt obligations; such investments are valued on the basis of valuations furnished by an independent pricing service approved by the Trustees or dealers selected by Putnam Management. Such services or dealers determine valuations for normal institutional-size trading units of such securities using methods based on market transactions for comparable securities and various relationships, generally recognized by institutional traders, between securities (which considers such factors as security prices, yields, maturities and ratings). These securities will generally be categorized as Level 2.
Many securities markets and exchanges outside the U.S. close prior to the close of the New York Stock Exchange and therefore the closing prices for securities in such markets or on such exchanges may not fully reflect events
35
that occur after such close but before the close of the New York Stock Exchange. Accordingly, on certain days, the fund will fair value foreign equity securities taking into account multiple factors including movements in the U.S. securities markets, currency valuations and comparisons to the valuation of American Depository Receipts, exchange-traded funds and futures contracts. These securities, which will generally represent a transfer from a Level 1 to a Level 2 security, will be classified as Level 2. The number of days on which fair value prices will be used will depend on market activity and it is possible that fair value prices will be used by the fund to a significant extent. Securities quoted in foreign currencies, if any, are translated into U.S. dollars at the current exchange rate.
To the extent a pricing service or dealer is unable to value a security or provides a valuation that Putnam Management does not believe accurately reflects the security’s fair value, the security will be valued at fair value by Putnam Management. Certain investments, including certain restricted and illiquid securities and derivatives, are also valued at fair value following procedures approved by the Trustees. These valuations consider such factors as significant market or specific security events such as interest rate or credit quality changes, various relationships with other securities, discount rates, U.S. Treasury, U.S. swap and credit yields, index levels, convexity exposures and recovery rates. These securities are classified as Level 2 or as Level 3 depending on the priority of the significant inputs.
Such valuations and procedures are reviewed periodically by the Trustees. The fair value of securities is generally determined as the amount that the fund could reasonably expect to realize from an orderly disposition of such securities over a reasonable period of time. By its nature, a fair value price is a good faith estimate of the value of a security in a current sale and does not reflect an actual market price, which may be different by a material amount.
B) Joint trading account Pursuant to an exemptive order from the Securities and Exchange Commission (the SEC), the fund may transfer uninvested cash balances, including cash collateral received under security lending arrangements, into a joint trading account along with the cash of other registered investment companies and certain other accounts managed by Putnam Management. These balances may be invested in issues of short-term investments having maturities of up to 397 days for collateral received under security lending arrangements and up to 90 days for other cash investments.
C) Security transactions and related investment income Security transactions are recorded on the trade date (the date the order to buy or sell is executed). Gains or losses on securities sold are determined on the identified cost basis. Interest income is recorded on the accrual basis. Dividend income, net of applicable withholding taxes, is recognized on the ex-dividend date except that certain dividends from foreign securities, if any, are recognized as soon as the fund is informed of the ex-dividend date. Non-cash dividends, if any, are recorded at the fair market value of the securities received. Dividends representing a return of capital or capital gains, if any, are reflected as a reduction of cost and/or as a realized gain. All premiums/discounts are amortized/accreted on a yield-to-maturity basis.
D) Options contracts The fund uses options contracts to hedge against changes in values of securities it owns, owned or expects to own and to enhance returns on securities owned. The potential risk to the fund is that the change in value of options contracts may not correspond to the change in value of the hedged instruments. In addition, losses may arise from changes in the value of the underlying instruments if there is an illiquid secondary market for the contracts, if interest or exchange rates move unexpectedly or if the counterparty to the contract is unable to perform. Realized gains and losses on purchased options are included in realized gains and losses on investment securities. If a written call option is exercised, the premium originally received is recorded as an addition to sales proceeds. If a written put option is exercised, the premium originally received is recorded as a reduction to the cost of investments.
Exchange traded options are valued at the last sale price or, if no sales are reported, the last bid price for purchased options and the last ask price for written options. Options traded over-the-counter are valued using prices supplied by dealers. Written option contracts outstanding at period end, if any, are listed after the fund’s portfolio. The fund had an average contract amount of approximately 5,700,000 on purchased options contracts for the reporting period. See Note 3 for the volume of written options contracts activity for the reporting period.
E) Master agreements The fund is a party to ISDA (International Swap and Derivatives Association, Inc.) Master Agreements (Master Agreements) with certain counterparties that govern over-the-counter derivative and foreign exchange contracts entered into from time to time. The Master Agreements may contain provisions regarding, among other things, the parties’ general obligations, representations, agreements, collateral requirements, events of default and early termination. With respect to certain counterparties, in accordance with the terms of the Master Agreements, collateral posted to the fund is held in a segregated account by the fund’s custodian and with respect
36
to those amounts which can be sold or repledged, are presented in the fund’s portfolio. Collateral posted to the fund which cannot be sold or repledged totaled $1,237,597 at the close of the reporting period. Collateral pledged by the fund is segregated by the fund’s custodian and identified in the fund’s portfolio. Collateral can be in the form of cash or debt securities issued by the U.S. Government or related agencies or other securities as agreed to by the fund and the applicable counterparty. Collateral requirements are determined based on the fund’s net position with each counterparty. Termination events applicable to the fund may occur upon a decline in the fund’s net assets below a specified threshold over a certain period of time. Termination events applicable to counterparties may occur upon a decline in the counterparty’s long-term and short-term credit ratings below a specified level. In each case, upon occurre nce, the other party may elect to terminate early and cause settlement of all derivative and foreign exchange contracts outstanding, including the payment of any losses and costs resulting from such early termination, as reasonably determined by the terminating party. Any decision by one or more of the fund’s counterparties to elect early termination could impact the fund’s future derivative activity.
At the close of the reporting period, the fund did not have a net liability position on derivative contracts subject to the Master Agreements. There was no collateral posted by the fund.
F) Securities lending The fund may lend securities, through its agent, to qualified borrowers in order to earn additional income. The loans are collateralized by cash in an amount at least equal to the market value of the securities loaned. The market value of securities loaned is determined daily and any additional required collateral is allocated to the fund on the next business day. The risk of borrower default will be borne by the fund’s agent; the fund will bear the risk of loss with respect to the investment of the cash collateral. Income from securities lending is included in investment income on the Statement of operations. Effective August 2010, cash collateral is invested in Putnam Cash Collateral Pool, LLC, a limited liability company managed by an affiliate of Putnam Management and is valued at its closing net asset value each business day. There are no management fees charged by Putnam Cash C ollateral Pool, LLC. At the close of the reporting period, the value of securities loaned amounted to $65,569,706 and the fund received cash collateral of $67,193,991.
G) Interfund lending Effective July 2010, the fund, along with other Putnam funds, may participate in an interfund lending program pursuant to an exemptive order issued by the SEC. This program allows the fund to borrow from other Putnam funds that permit such transactions. Interfund lending transactions are subject to each fund’s investment policies and borrowing and lending limits. Interest earned or paid on the interfund lending transaction will be based on the average of certain current market rates. During the reporting period, the fund did not utilize the program.
H) Line of credit Effective July 2010, the fund participates, along with other Putnam funds, in a $285 million unsecured committed line of credit and a $165 million unsecured uncommitted line of credit, both provided by State Street Bank and Trust Company (State Street). Borrowings may be made for temporary or emergency purposes, including the funding of shareholder redemption requests and trade settlements. Interest is charged to the fund based on the fund’s borrowing at a rate equal to the Federal Funds rate plus 1.25% for the committed line of credit and the Federal Funds rate plus 1.30% for the uncommitted line of credit. A closing fee equal to 0.03% of the committed line of credit and $100,000 for the uncommitted line of credit has been paid by the participating funds. In addition, a commitment fee of 0.15% per annum on any unutilized portion of the committed line of credit is allocated to the partic ipating funds based on their relative net assets and paid quarterly. During the reporting period, the fund had no borrowings against these arrangements.
I) Federal taxes It is the policy of the fund to distribute all of its taxable income within the prescribed time period and otherwise comply with the provisions of the Internal Revenue Code of 1986, as amended (the Code), applicable to regulated investment companies. It is also the intention of the fund to distribute an amount sufficient to avoid imposition of any excise tax under Section 4982 of the Code. The fund is subject to the provisions of Accounting Standards Codification ASC 740 Income Taxes (ASC 740). ASC 740 sets forth a minimum threshold for financial statement recognition of the benefit of a tax position taken or expected to be taken in a tax return. The fund did not have a liability to record for any unrecognized tax benefits in the accompanying financial statements. No provision has been made for federal taxes on inco me, capital gains or unrealized appreciation on securities held nor for excise tax on income and capital gains. Each of the fund’s federal tax returns for the prior three fiscal years remains subject to examination by the Internal Revenue Service.
37
At April 30, 2010, the fund had a capital loss carryover of $230,458,526 available to the extent allowed by the Code to offset future net capital gain, if any. The amounts of the carryovers and the expiration dates are:
| | |
| Loss carryover | | Expiration |
|
| $92,313,532 | | April 30, 2017 |
|
| 138,144,994 | | April 30, 2018 |
|
The aggregate identified cost on a tax basis is $557,435,670, resulting in gross unrealized appreciation and depreciation of $74,454,119 and $20,274,432, respectively, or net unrealized appreciation of $54,179,687.
J) Distributions to shareholders Distributions to shareholders from net investment income are recorded by the fund on the ex-dividend date. Distributions from capital gains, if any, are recorded on the ex-dividend date and paid at least annually. The amount and character of income and gains to be distributed are determined in accordance with income tax regulations, which may differ from generally accepted accounting principles. Dividend sources are estimated at the time of declaration. Actual results may vary. Any non-taxable return of capital cannot be determined until final tax calculations are completed after the end of the fund’s fiscal year. Reclassifications are made to the fund’s capital accounts to reflect income and gains available for distribution (or available capital loss carryovers) under income tax regulations.
K) Expenses of the Trust Expenses directly charged or attributable to any fund will be paid from the assets of that fund. Generally, expenses of the Trust will be allocated among and charged to the assets of each fund on a basis that the Trustees deem fair and equitable, which may be based on the relative assets of each fund or the nature of the services performed and relative applicability to each fund.
Note 2: Management fee, administrative services and other transactions
Effective September 1, 2010, the fund pays Putnam Management a management fee (based on the fund’s average net assets and computed and paid monthly) at annual rates that may vary based on the average of the aggregate net assets of most open-end funds, as defined in the fund’s management contract, sponsored by Putnam Management. Such annual rates may vary as follows: 0.710% of the first $5 billion, 0.660% of the next $5 billion, 0.610% of the next $10 billion, 0.560% of the next $10 billion, 0.510% of the next $50 billion, 0.490% of the next $50 billion, 0.480% of the next $100 billion, and 0.475% thereafter.
Prior to September 1, 2010, the fund paid Putnam Management for a management fee (based on the fund’s average net assets and computed and paid monthly) at annual rates that may vary based on the average of the aggregate net assets of most open-end funds, as defined in the fund’s management contract, sponsored by Putnam Management. Such annual rates varied as follows: 0.740% of the first $5 billion, 0.690% of the next $5 billion, 0.640% of the next $10 billion, 0.590% of the next $10 billion, 0.540% of the next $50 billion, 0.520% of the next $50 billion, 0.510% of the next $100 billion, and 0.505% thereafter.
Putnam Management has contractually agreed, through June 30, 2011, to waive fees or reimburse the fund’s expenses to the extent necessary to limit the cumulative expenses of the fund, exclusive of brokerage, interest, taxes, investment-related expenses, extraordinary expenses and payments under the fund’s investor servicing contract, investment management contract and distribution plans, on a fiscal year-to-date basis to an annual rate of 0.20% of the fund’s average net assets over such fiscal year-to-date period. During the reporting period, the fund’s expenses were not reduced as a result of this limit.
Effective August 30, 2010, Putnam Investments Limited (PIL), an affiliate of Putnam Management, is authorized by the Trustees to manage a separate portion of the assets of the fund as determined by Putnam Management from time to time. Putnam Management pays a quarterly sub-management fee to PIL for its services at an annual rate of 0.35% of the average net assets of the portion of the fund managed by PIL.
The fund reimburses Putnam Management an allocated amount for the compensation and related expenses of certain officers of the fund and their staff who provide administrative services to the fund. The aggregate amount of all such reimbursements is determined annually by the Trustees.
Custodial functions for the fund’s assets are provided by State Street. Custody fees are based on the fund’s asset level, the number of its security holdings and transaction volumes.
Putnam Investor Services, Inc., an affiliate of Putnam Management, provides investor servicing agent functions to the fund. Putnam Investor Services, Inc. received fees for investor servicing based on the fund’s retail asset level, the number of shareholder accounts in the fund and the level of defined contribution plan assets in the fund.
38
Investor servicing fees will not exceed an annual rate of 0.375% of the fund’s average net assets. The amounts incurred for investor servicing agent functions during the reporting period are included in Investor servicing fees in the Statement of operations.
The fund has entered into expense offset arrangements with Putnam Investor Services, Inc. and State Street whereby Putnam Investor Services, Inc.’s and State Street’s fees are reduced by credits allowed on cash balances. The fund also reduced expenses through brokerage/service arrangements. For the reporting period, the fund’s expenses were reduced by $331 under the expense offset arrangements and by $102,748 under the brokerage/service arrangements.
Each independent Trustee of the fund receives an annual Trustee fee, of which $372, as a quarterly retainer, has been allocated to the fund, and an additional fee for each Trustees meeting attended. Trustees also are reimbursed for expenses they incur relating to their services as Trustees.
The fund has adopted a Trustee Fee Deferral Plan (the Deferral Plan) which allows the Trustees to defer the receipt of all or a portion of Trustees fees payable on or after July 1, 1995. The deferred fees remain invested in certain Putnam funds until distribution in accordance with the Deferral Plan.
The fund has adopted an unfunded noncontributory defined benefit pension plan (the Pension Plan) covering all Trustees of the fund who have served as a Trustee for at least five years and were first elected prior to 2004. Benefits under the Pension Plan are equal to 50% of the Trustee’s average annual attendance and retainer fees for the three years ended December 31, 2005. The retirement benefit is payable during a Trustee’s lifetime, beginning the year following retirement, for the number of years of service through December 31, 2006. Pension expense for the fund is included in Trustee compensation and expenses in the Statement of operations. Accrued pension liability is included in Payable for Trustee compensation and expenses in the Statement of assets and liabilities. The Trustees have terminated the Pension Plan with respect to any Trustee first elected after 2003.
The fund has adopted distribution plans (the Plans) with respect to its class A, class B, class C, class M and class R shares pursuant to Rule 12b-1 under the Investment Company Act of 1940. The purpose of the Plans is to compensate Putnam Retail Management Limited Partnership, a wholly-owned subsidiary of Putnam Investments, LLC and Putnam Retail Management GP, Inc., for services provided and expenses incurred in distributing shares of the fund. The Plans provide for payments by the fund to Putnam Retail Management Limited Partnership at an annual rate of up to 0.35%, 1.00%, 1.00%, 1.00% and 1.00% of the average net assets attributable to class A, class B, class C, class M and class R shares, respectively. The Trustees have approved payment by the fund at an annual rate of 0.25%, 1.00%, 1.00%, 0.75% and 0.50% of the average net assets attributable to class A, class B, class C, class M and class R shares, respectively.
For the reporting period, Putnam Retail Management Limited Partnership, acting as underwriter, received net commissions of $14,394 and $69 from the sale of class A and class M shares, respectively, and received $8,797 and $66 in contingent deferred sales charges from redemptions of class B and class C shares, respectively.
A deferred sales charge of up to 1.00% and 0.65% is assessed on certain redemptions of class A and class M shares, respectively. For the reporting period, Putnam Retail Management Limited Partnership, acting as underwriter, received no monies on class A and class M redemptions.
Note 3: Purchases and sales of securities
During the reporting period, cost of purchases and proceeds from sales of investment securities other than short-term investments aggregated $274,143,797 and $305,928,255, respectively. There were no purchases or proceeds from sales of long-term U.S. government securities.
Written option transactions during the reporting period are summarized as follows:
| | |
| | Written equity option | Written equity option |
| | contract amounts | premiums received |
|
| Written options outstanding | | |
| at beginning of period | 5,956,617 | $1,933,900 |
|
| Options opened | 5,673,974 | 2,487,660 |
| Options exercised | (981,362) | (513,605) |
| Options expired | (6,431,341) | (2,039,783) |
| Options closed | (2,296,103) | (1,071,045) |
|
| Written options outstanding | | |
| at end of period | 1,921,785 | $797,127 |
|
39
Note 4: Capital shares
At the close of the reporting period, there was an unlimited number of shares of beneficial interest authorized.
Transactions in capital shares were as follows:
| | | | |
| | Six months ended 10/31/10 | Year ended 4/30/10 |
|
| Class A | Shares | Amount | Shares | Amount |
|
| Shares sold | 4,369,721 | $46,076,676 | 14,410,859 | $136,866,480 |
|
| Shares issued in connection with | | | | |
| reinvestment of distributions | — | — | 67,760 | 647,791 |
|
| | 4,369,721 | 46,076,676 | 14,478,619 | 137,514,271 |
|
| Shares repurchased | (6,928,324) | (73,152,712) | (26,194,026) | (251,951,429) |
|
| Net decrease | (2,558,603) | $(27,076,036) | (11,715,407) | $(114,437,158) |
|
| |
| | Six months ended 10/31/10 | Year ended 4/30/10 |
|
| Class B | Shares | Amount | Shares | Amount |
|
| Shares sold | 136,404 | $1,371,819 | 299,746 | $2,793,967 |
|
| Shares issued in connection with | | | | |
| reinvestment of distributions | — | — | — | — |
|
| | 136,404 | 1,371,819 | 299,746 | 2,793,967 |
|
| Shares repurchased | (398,760) | (4,017,540) | (2,054,090) | (18,385,400) |
|
| Net decrease | (262,356) | $(2,645,721) | (1,754,344) | $(15,591,433) |
|
| |
| | Six months ended 10/31/10 | Year ended 4/30/10 |
|
| Class C | Shares | Amount | Shares | Amount |
|
| Shares sold | 148,107 | $1,474,877 | 156,195 | $1,502,351 |
|
| Shares issued in connection with | | | | |
| reinvestment of distributions | — | — | — | — |
|
| | 148,107 | 1,474,877 | 156,195 | 1,502,351 |
|
| Shares repurchased | (142,648) | (1,419,854) | (392,971) | (3,487,764) |
|
| Net increase (decrease) | 5,459 | $55,023 | (236,776) | $(1,985,413) |
|
| |
| | Six months ended 10/31/10 | Year ended 4/30/10 |
|
| Class M | Shares | Amount | Shares | Amount |
|
| Shares sold | 5,899 | $60,495 | 56,381 | $523,637 |
|
| Shares issued in connection with | | | | |
| reinvestment of distributions | — | — | — | — |
|
| | 5,899 | 60,495 | 56,381 | 523,637 |
|
| Shares repurchased | (44,583) | (457,838) | (200,690) | (1,862,118) |
|
| Net decrease | (38,684) | $(397,343) | (144,309) | $(1,338,481) |
|
| |
| | Six months ended 10/31/10 | Year ended 4/30/10 |
|
| Class R | Shares | Amount | Shares | Amount |
|
| Shares sold | 126,122 | $1,316,767 | 307,134 | $2,945,416 |
|
| Shares issued in connection with | | | | |
| reinvestment of distributions | — | — | — | — |
|
| | 126,122 | 1,316,767 | 307,134 | 2,945,416 |
|
| Shares repurchased | (112,378) | (1,165,635) | (291,100) | (2,766,949) |
|
| Net increase | 13,744 | $151,132 | 16,034 | $178,467 |
|
40
| | | | |
| | Six months ended 10/31/10 | Year ended 4/30/10 |
|
| Class Y | Shares | Amount | Shares | Amount |
|
| Shares sold | 491,175 | $5,285,771 | 1,222,198 | $11,975,412 |
|
| Shares issued in connection with | | | | |
| reinvestment of distributions | — | — | 15,539 | 148,710 |
|
| | 491,175 | 5,285,771 | 1,237,737 | 12,124,122 |
|
| Shares repurchased | (561,271) | (5,910,271) | (873,654) | (8,379,328) |
|
| Net increase (decrease) | (70,096) | $(624,500) | 364,083 | $3,744,794 |
|
At the close of the reporting period, three shareholders of record owned 6.0%, 6.5% and 10.1%, respectively, of the outstanding shares of the fund.
Note 5: Summary of derivative activity
The following is a summary of the market values of derivative instruments as of the close of the reporting period:
Market values of derivative instruments as of the close of the reporting period
| | | | |
| | Asset derivatives | Liability derivatives |
|
| Derivatives not | | | | |
| accounted for as | Statement of | | Statement of | |
| hedging instruments | assets and | | assets and | |
| under ASC 815 | liabilities location | Market value | liabilities location | Market value |
|
| |
| Equity contracts | Investments | $3,165,805 | Payables | $476,208 |
|
| Total | | $3,165,805 | | $476,208 |
|
The following is a summary of realized and change in unrealized gains or losses of derivative instruments on the Statement of operations for the reporting period (see Note 1):
Amount of realized gain or (loss) on derivatives recognized in net gain or (loss) on investments
| | |
| Derivatives not accounted for as hedging | | |
| instruments under ASC 815 | Options | Total |
|
| Equity contracts | $(492,444) | $(492,444) |
|
| Total | $(492,444) | $(492,444) |
|
Change in unrealized appreciation or (depreciation) on derivatives recognized in net gain or (loss) on investments
| | |
| Derivatives not accounted for as hedging | | |
| instruments under ASC 815 | Options | Total |
|
| Equity contracts | $(911,575) | $(911,575) |
|
| Total | $(911,575) | $(911,575) |
|
Note 6: Investment in Putnam Money Market Liquidity Fund
The fund invested in Putnam Money Market Liquidity Fund, an open-end management investment company managed by Putnam Management. Investments in Putnam Money Market Liquidity Fund are valued at its closing net asset value each business day. Income distributions earned by the fund are recorded as interest income in the Statement of operations and totaled $9,138 for the reporting period. During the reporting period, cost of purchases and proceeds of sales of investments in Putnam Money Market Liquidity Fund aggregated $156,532,070 and $161,612,670, respectively. Management fees charged to Putnam Money Market Liquidity Fund have been waived by Putnam Management.
41
Note 7: Regulatory matters and litigation
In late 2003 and 2004, Putnam Management settled charges brought by the Securities and Exchange Commission (the SEC) and the Massachusetts Securities Division in connection with excessive short-term trading in Putnam funds. Distribution of payments from Putnam Management to certain open-end Putnam funds and their shareholders is expected to be completed in the next several months. These allegations and related matters have served as the general basis for certain lawsuits, including purported class action lawsuits against Putnam Management and, in a limited number of cases, some Putnam funds. Putnam Management believes that these lawsuits will have no material adverse effect on the funds or on Putnam Management’s ability to provide investment management services. In addition, Putnam Management has agreed to bear any costs incurred by the Putnam funds as a result of these matters.
Note 8: Market and credit risk
In the normal course of business, the fund trades financial instruments and enters into financial transactions where risk of potential loss exists due to changes in the market (market risk) or failure of the contracting party to the transaction to perform (credit risk). The fund may be exposed to additional credit risk that an institution or other entity with which the fund has unsettled or open transactions will default.
42
The Putnam family of funds
The following is a list of Putnam’s open-end mutual funds offered to the public. Investors should carefully consider the investment objective, risks, charges, and expenses of a fund before investing. For a prospectus, or a summary prospectus if available, containing this and other information for any Putnam fund or product, call your financial advisor at 1-800-225-1581 and ask for a prospectus. Please read the prospectus carefully before investing.
| |
| Growth | Value |
| Growth Opportunities Fund | Convertible Securities Fund |
| International Growth Fund | Prior to September 30, 2010, the fund was known as |
| Prior to January 1, 2010, the fund was known as | Putnam Convertible Income-Growth Trust |
| Putnam International New Opportunities Fund | Equity Income Fund |
| Multi-Cap Growth Fund | George Putnam Balanced Fund |
| Prior to September 1, 2010, the fund was known as | Prior to September 30, 2010, the fund was known as |
| Putnam New Opportunities Fund | The George Putnam Fund of Boston |
| Small Cap Growth Fund | The Putnam Fund for Growth and Income |
| Voyager Fund | International Value Fund |
| | Prior to January 1, 2010, the fund was known as |
| Blend | Putnam International Growth and Income Fund |
| Asia Pacific Equity Fund | Multi-Cap Value Fund |
| Capital Opportunities Fund | Prior to September 1, 2010, the fund was known as |
| Capital Spectrum Fund | Putnam Mid Cap Value Fund |
| Emerging Markets Equity Fund | Small Cap Value Fund |
| Equity Spectrum Fund | |
| Europe Equity Fund | Income |
| Global Equity Fund | American Government Income Fund |
| International Capital Opportunities Fund | Diversified Income Trust |
| International Equity Fund | Floating Rate Income Fund |
| Investors Fund | Global Income Trust |
| Multi-Cap Core Fund | High Yield Advantage Fund |
| Research Fund | High Yield Trust |
| Income Fund |
| | Money Market Fund* |
| | U.S. Government Income Trust |
* An investment in a money market fund is not insured or guaranteed by the Federal Deposit Insurance Corporation or any other government agency. Although the fund seeks to preserve the value of your investment at $1.00 per share, it is possible to lose money by investing in the fund.
43
| |
| Tax-free income | Asset allocation |
| AMT-Free Municipal Fund | Income Strategies Fund |
| Tax Exempt Income Fund | Putnam Asset Allocation Funds — three |
| Tax Exempt Money Market Fund* | investment portfolios that spread your |
| Tax-Free High Yield Fund | money across a variety of stocks, bonds, |
| State tax-free income funds: | and money market investments. |
| Arizona, California, Massachusetts, Michigan, | |
| Minnesota, New Jersey, New York, Ohio, | The three portfolios: |
| and Pennsylvania | Asset Allocation: Balanced Portfolio |
| | Asset Allocation: Conservative Portfolio |
| Absolute Return | Asset Allocation: Growth Portfolio |
| Absolute Return 100 Fund | |
| Absolute Return 300 Fund | Putnam RetirementReady® |
| Absolute Return 500 Fund | Putnam RetirementReady Funds — 10 |
| Absolute Return 700 Fund | investment portfolios that offer diversifi- |
| | cation among stocks, bonds, and money |
| Global Sector | market instruments and adjust to become |
| Global Consumer Fund | more conservative over time based on a |
| Global Energy Fund | target date for withdrawing assets. |
| Global Financials Fund | |
| Global Health Care Fund | The 10 funds: |
| Global Industrials Fund | Putnam RetirementReady 2055 Fund |
| Global Natural Resources Fund | Putnam RetirementReady 2050 Fund |
| Global Sector Fund | Putnam RetirementReady 2045 Fund |
| Global Technology Fund | Putnam RetirementReady 2040 Fund |
| Global Telecommunications Fund | Putnam RetirementReady 2035 Fund |
| Global Utilities Fund | Putnam RetirementReady 2030 Fund |
| Putnam RetirementReady 2025 Fund |
| | Putnam RetirementReady 2020 Fund |
| | Putnam RetirementReady 2015 Fund |
| | Putnam RetirementReady Maturity Fund |
A short-term trading fee of 1% may apply to redemptions or exchanges from certain funds within the time period specified in the fund's prospectus.
Check your account balances and the most recent month-end performance in the Individual Investors section at putnam.com.
44
Fund information
Founded over 70 years ago, Putnam Investments was built around the concept that a balance between risk and reward is the hallmark of a well-rounded financial program. We manage over 100 funds across income, value, blend, growth, asset allocation, absolute return, and global sector categories.
| | |
| Investment Manager | Kenneth R. Leibler | Mark C. Trenchard |
| Putnam Investment | Robert E. Patterson | Vice President and |
| Management, LLC | George Putnam, III | BSA Compliance Officer |
| One Post Office Square | Robert L. Reynolds | |
| Boston, MA 02109 | W. Thomas Stephens | Francis J. McNamara, III |
| | Richard B. Worley | Vice President and |
| Investment Sub-Manager | | Chief Legal Officer |
| Putnam Investments Limited | Officers | |
| 57–59 St James’s Street | Robert L. Reynolds | James P. Pappas |
| London, England SW1A 1LD | President | Vice President |
| | | |
| Marketing Services | Jonathan S. Horwitz | Judith Cohen |
| Putnam Retail Management | Executive Vice President, | Vice President, Clerk and |
| One Post Office Square | Principal Executive | Assistant Treasurer |
| Boston, MA 02109 | Officer, Treasurer and | |
| | Compliance Liaison | Michael Higgins |
| Custodian | | Vice President, Senior Associate |
| State Street Bank | Steven D. Krichmar | Treasurer and Assistant Clerk |
| and Trust Company | Vice President and | |
| | Principal Financial Officer | Nancy E. Florek |
| Legal Counsel | | Vice President, Assistant Clerk, |
| Ropes & Gray LLP | Janet C. Smith | Assistant Treasurer and |
| | Vice President, Assistant | Proxy Manager |
| Trustees | Treasurer and Principal | |
| John A. Hill, Chairman | Accounting Officer | Susan G. Malloy |
| Jameson A. Baxter, | | Vice President and |
| Vice Chairman | Beth S. Mazor | Assistant Treasurer |
| Ravi Akhoury | Vice President | |
| Barbara M. Baumann | | |
| Charles B. Curtis | Robert R. Leveille | |
| Robert J. Darretta | Vice President and | |
| Myra R. Drucker | Chief Compliance Officer | |
| Paul L. Joskow | | |
This report is for the information of shareholders of Putnam Multi-Cap Value Fund. It may also be used as sales literature when preceded or accompanied by the current prospectus, the most recent copy of Putnam’s Quarterly Performance Summary, and Putnam’s Quarterly Ranking Summary. For more recent performance, please visit putnam.com. Investors should carefully consider the investment objective, risks, charges, and expenses of a fund, which are described in its prospectus. For this and other information or to request a prospectus, or a summary prospectus if available, call 1-800-225-1581 toll free. Please read the prospectus carefully before investing. The fund’s Statement of Additional Information contains additional information about the fund’s Trustees and is available without charge upon request by calling 1-800-225-1581.

Item 2. Code of Ethics:
Not applicable
Item 3. Audit Committee Financial Expert:
Not applicable
Item 4. Principal Accountant Fees and Services:
Not applicable
Item 5. Audit Committee of Listed Registrants
Not applicable
Item 6. Schedule of Investments:
The registrant’s schedule of investments in unaffiliated issuers is included in the report to shareholders in Item 1 above.
Item 7. Disclosure of Proxy Voting Policies and Procedures For Closed-End Management Investment Companies:
Not applicable
Item 8. Portfolio Managers of Closed-End Investment Companies
Not Applicable
Item 9. Purchases of Equity Securities by Closed-End Management Investment Companies and Affiliated Purchasers:
Not applicable
Item 10. Submission of Matters to a Vote of Security Holders:
Not applicable
Item 11. Controls and Procedures:
(a) The registrant's principal executive officer and principal financial officer have concluded, based on their evaluation of the effectiveness of the design and operation of the registrant's disclosure controls and procedures as of a date within 90 days of the filing date of this report, that the design and operation of such procedures are generally effective to provide reasonable assurance that information required to be disclosed by the registrant in this report is recorded, processed, summarized and reported within the time periods specified in the Commission's rules and forms.
(b) Changes in internal control over financial reporting: Not applicable
Item 12. Exhibits:
(a)(1) Not applicable
(a)(2) Separate certifications for the principal executive officer and principal financial officer of the registrant as required by Rule 30a-2(a) under the Investment Company Act of 1940, as amended, are filed herewith.
(b) The certifications required by Rule 30a-2(b) under the Investment Company Act of 1940, as amended, are filed herewith.
Putnam Investment Funds
By (Signature and Title):
/s/Janet C. Smith
Janet C. Smith
Principal Accounting Officer
Date: December 29, 2010
Pursuant to the requirements of the Securities Exchange Act of 1934 and the Investment Company Act of 1940, this report has been signed below by the following persons on behalf of the registrant and in the capacities and on the dates indicated.
By (Signature and Title):
/s/Jonathan S. Horwitz
Jonathan S. Horwitz
Principal Executive Officer
Date: December 29, 2010
By (Signature and Title):
/s/Steven D. Krichmar
Steven D. Krichmar
Principal Financial Officer
Date: December 29, 2010