| | | |
| | |
| UNITED STATES |
| SECURITIES AND EXCHANGE COMMISSION |
| Washington, D.C. 20549 |
| |
| FORM N-CSR |
| |
| CERTIFIED SHAREHOLDER REPORT OF REGISTERED |
| MANAGEMENT INVESTMENT COMPANIES |
| | |
| Investment Company Act file number: (811-07237) | |
| | |
| Exact name of registrant as specified in charter: | Putnam Investment Funds |
| |
| Address of principal executive offices: One Post Office Square, Boston, Massachusetts 02109 |
| | |
| Name and address of agent for service: | Beth S. Mazor, Vice President |
| | One Post Office Square |
| | Boston, Massachusetts 02109 |
| | |
| Copy to: | | John W. Gerstmayr, Esq. |
| | Ropes & Gray LLP |
| | 800 Boylston Street |
| | Boston, Massachusetts 02199-3600 |
| | |
| Registrant’s telephone number, including area code: | (617) 292-1000 |
| | | |
| Date of fiscal year end: July 31, 2011 | | |
| |
| Date of reporting period: August 1, 2010 — January 31, 2011 |
Item 1. Report to Stockholders:
The following is a copy of the report transmitted to stockholders pursuant to Rule 30e-1 under the Investment Company Act of 1940:

Putnam
Growth Opportunities
Fund
Semiannual report
1 | 31 | 11
| | |
| Message from the Trustees | 1 | |
| |
| About the fund | 2 | |
| |
| Performance snapshot | 4 | |
| |
| Interview with your fund’s portfolio manager | 5 | |
| |
| Your fund’s performance | 10 | |
| |
| Your fund’s expenses | 12 | |
| |
| Terms and definitions | 14 | |
| |
| Other information for shareholders | 15 | |
| |
| Financial statements | 16 | |
| |
Message from the Trustees
Dear Fellow Shareholder:
The U.S. economy and most economies around the world have continued to strengthen in early 2011, building on last year’s solid growth. The U.S. stock market added gains, delivering one of the best January returns in several years. Investors are encouraged by positive economic data, healthy corporate earnings, extended tax cuts, and historically low interest rates. Bond markets remain mixed, however, as U.S. Treasury yields have risen from their historic lows and investors have sought returns in riskier asset classes.
Putnam’s investment team maintains a positive outlook for U.S. equities in 2011, encouraged by steadily improving conditions in both the economy and in corporate America. The global outlook is less certain, with ongoing European debt issues, signs of inflation in emerging markets, and recent political uprisings in Egypt and other countries. While these global developments may well lead to future market volatility, we also believe that an active, research-focused manager like Putnam can uncover opportunities for shareholders in this environment.
In developments affecting oversight of your fund, we wish to thank Richard B. Worley and Myra R. Drucker, who have retired from the Board of Trustees, for their many years of dedicated and thoughtful leadership.
Lastly, we would like to take this opportunity to welcome new shareholders to the fund and to thank all of our investors for your continued confidence in Putnam.

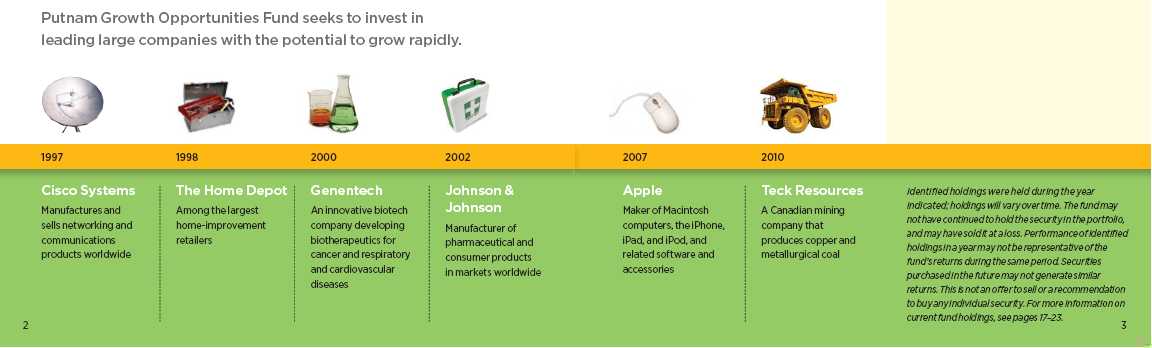
About the fund
Seeking to harness the growth potential of large companies
When Putnam Growth Opportunities Fund opened to the investing public in August 1997, its managers were committed to seeking growth potential in the types of U.S. companies that dominated the markets — large yet flexible, coupling the benefits of size and scale with the ability to respond to changing tastes and new technologies.
More than a decade later, the fund continues to target the stocks of these types of companies, using rigorous research techniques to identify those believed to have both a competitive edge and the potential to produce strong profits. Of course, as with any fund that invests in stocks, there are risks involved. The fund’s focus on large U.S. companies can affect its performance, particularly during times when large-cap stocks are out of favor. The fund’s manager seeks to mitigate this risk by investing with a long-term perspective, looking for companies he believes have the fundamental strength to deliver results over time, despite market setbacks. While the fund’s strategy favors growth stocks, the manager also seeks to cushion the impact of market volatility at times when growth-style investing is out of favor.
In the fund’s first report to shareholders, then-Chairman of the Trustees George Putnam wrote of the management team: “Besides taking advantage of today’s opportunities, they have sought companies that have proved themselves in fair weather and foul, mindful that exuberant markets such as today’s do not last forever.”
While not all large-cap companies have been able to weather the tough times, many that were in the fund’s portfolio in the mid-1990s have continued to grow and prosper. In fact, several have since been added to the select group of companies that make up the Dow Jones Industrial Average.
Regardless of how market conditions change in the years ahead, the fund will continue to seek leading companies with dominant products, services, and barriers to entry against potential competitors. These companies can be attractive investments, especially when the market underestimates the sustainability of their growth.
Consider these risks before investing: Stocks with above-average earnings may be more volatile, especially if earnings do not continue to grow.
In-depth analysis is key to successful stock selection
Drawing on the expertise of a dedicated team of stock analysts, the fund’s portfolio manager seeks attractive growth stocks. Once a stock is selected for the portfolio, it is regularly assessed to ensure that it continues to be attractive. Areas of focus include:
Growth The manager examines each company’s financials, including its sales and earnings, and targets those companies believed to offer growth potential.
Quality The manager looks for high-quality companies, seeking characteristics such as solid management teams, sound business models, a record of strong performance, and high levels of free-cash flow.
Valuation The manager carefully considers how each stock is valued, seeking stocks whose valuations are attractive relative to the company’s growth potential.
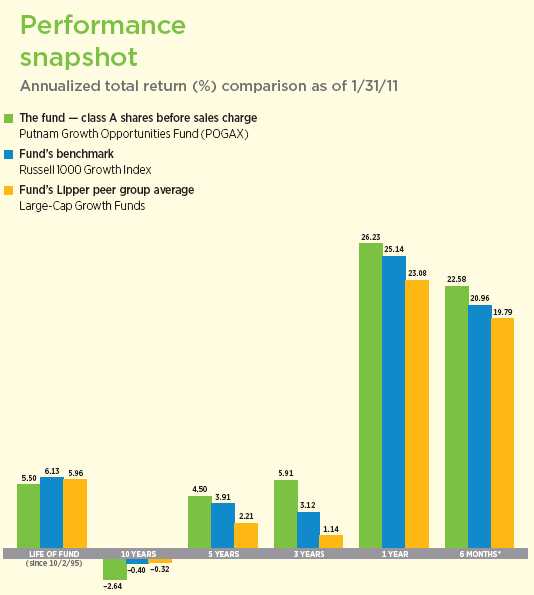
Current performance may be lower or higher than the quoted past performance, which cannot guarantee future results. Share price, principal value, and return will fluctuate, and you may have a gain or a loss when you sell your shares. Performance of class A shares assumes reinvestment of distributions and does not account for taxes. Fund returns in the bar chart do not reflect a sales charge of 5.75%; had they, returns would have been lower. See pages 5 and 10–11 for additional performance information. For a portion of the periods, the fund had expense limitations, without which returns would have been lower. A short-term trading fee of 1% may apply to redemptions or exchanges from certain funds within the time period specified in the fund’s prospectus. To obtain the most recent month-end performance, visit putnam.com.
* Returns for the six-month period are not annualized, but cumulative.
4
Interview with your fund’s portfolio manager
Robert Brookby
Rob, how did Putnam Growth Opportunities Fund perform during the six months ended January 31, 2011?
I am pleased to report that the fund’s class A shares delivered a solid return of 22.58% at net asset value, outperforming the fund’s benchmark, the Russell 1000 Growth Index, which advanced 20.96%. The fund’s performance also topped the average 19.79% return for funds in its Lipper peer group, Large-Cap Growth Funds.
Stocks generally performed well during the semiannual period. What can you tell us about market conditions during this time?
For the 2010 calendar year, stocks had healthy returns, but the second half of the year was much stronger than the volatile first half. A few factors contributed to the market’s strength in the latter half of 2010. First, the Federal Reserve announced that it would implement another round of quantitative easing, known as “QE2” — a plan to buy $600 billion in Treasury bonds to help stimulate the economy. This boosted investor confidence as well as stock prices.
Improving corporate earnings have been another positive influence on stock market performance. Earnings have been consistently better than investors expected, and U.S. businesses are close to exceeding the levels of profitability last seen in 2006 and 2007. In addition to generating strong profits, businesses have also dramatically improved their balance sheets. Corporations across the economy have cut costs and right-sized their businesses, and many are now flush with cash. As a result, we have seen increasing dividends and sizable stock buybacks, indicating that CEOs have more confidence in the recovery. Many elements of the recovery
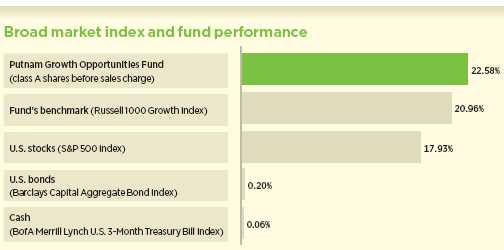
This comparison shows your fund’s performance in the context of broad market indexes for the six months ended 1/31/11. See pages 4 and 10–11 for additional fund performance information. Index descriptions can be found on page 14.
5
fell into place during this period, helping the stock market’s advance.
Could you highlight some stock holdings or strategies that helped performance for the period?
A top performer for the fund was National Oilwell Varco, a manufacturer of equipment and components used in oil and gas drilling. Despite the oil spill in the Gulf of Mexico in April 2010, which halted offshore drilling activity, investment in drilling equipment has remained strong. With oil prices in the $80 to $90 per barrel range, companies want to continue to invest in drilling, and many are looking to upgrade their rigs. All of this helped National Oilwell, whose equipment and components are used on most major oil rigs.
Another key contributor to performance was the stock of Teck Resources, a Canadian mining company that produces copper and metallurgical coal that is used in the production of steel. This company benefited from two key trends: demand from China and commodity inflation. China has been a remarkable growth story, with an enormous amount of infrastructure and building projects that are generating robust demand for commodities such as copper and metallurgical coal. Teck Resources also benefited from rising commodity prices because investors were drawn to hard assets as inflationary concerns grew.
The stock of Priceline.com, an online travel booking company, also helped fund performance. Hotels and airlines make their services accessible through the Priceline.com Web site, providing a convenient way for travelers to make plans via the Internet. The company has benefited particularly from its business with European hotels, which tend to have fragmented booking systems. The Priceline.com site serves as a convenient and efficient distribution model for these hotels, especially the smaller ones. In addition, European hotel bookings have been on the rise as global economies recover, boosting Priceline.com’s profitability.
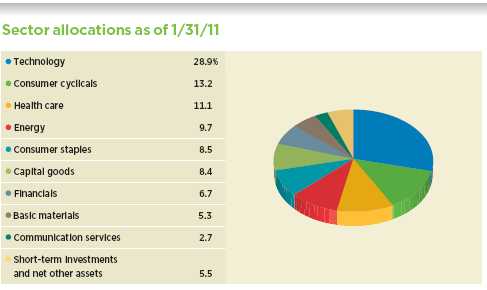
Allocations are represented as a percentage of the fund’s net assets. Summary information may differ from the portfolio schedule included in the financial statements due to the inclusion of derivative securities and the exclusion of as-of trades, if any, and the use of different classifications of securities for presentation purposes. Holdings and allocations may vary over time.
6

Which holdings or strategies detracted from the fund’s returns during the period?
Our decision to hold a relatively small position in Freeport-McMoRan Copper & Gold detracted from returns. Mining companies fared very well in the period, but within this sector, we decided to allocate more of the fund’s assets to Teck Resources, which we believed was more attractively priced and offered more upside potential. Our strategy was effective, as Teck was a top performer for the fund. However, our decision to hold a smaller position in Freeport-McMoRan held back returns relative to the benchmark.
Similarly, our decision to avoid the stock of Exxon Mobil hurt performance for this period. Despite being very well managed, I believe Exxon Mobil does not offer adequate organic growth potential. In fact, the company recently acquired XTO Energy to improve its reserve replacement ratio. I believe this industry giant will struggle to consistently replace the oil it is producing through exploration, and therefore I have focused on other well-managed oil companies that we believe offer considerably stronger organic growth potential.
Another recent detractor that we continue to hold is PNC Financial Services Group, a Pennsylvania-based bank. We believe this is a well-managed bank that remains an attractive long-term growth opportunity. For the period, however, its stock price was essentially flat while other financial services stocks performed considerably better.
Health-care stocks have had a difficult run.
What is your view on this sector?
Health care was one of the worst-performing sectors in 2010, as it struggled with the double whammy of health-care reform and the economic downturn. It is difficult at this
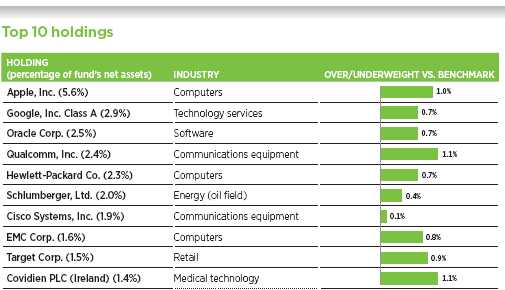
This table shows the fund’s top 10 holdings and the percentage of the fund’s net assets that each represented as of 1/31/11. Short-term holdings are excluded. Holdings will vary over time.
7
point to determine the effect of reform on business models, and this has caused investors to shy away from health-care stocks. At the same time, as a result of the downturn, many people stopped using health-care services. This was to be expected for those who had lost their jobs, but we were surprised to see this trend even among those who remained employed and had health insurance coverage. I believe we will begin to see improvement in the health-care sector as the recovery continues and employment picks up and, longer term, when reform takes effect and millions more people have access to health insurance.
Where are you seeing opportunities for the coming months?
We are about 19 months past the ultimate trough in recessionary activity, and we try to look at opportunities in three phases of the recovery: early-, mid-, and late-cycle. As the economy emerged from recession, we sought to take advantage of early-cycle opportunities — stocks that tend to rebound the fastest — in areas such as retail. Indeed, despite the still-bleak unemployment situation, consumer spending has been surprisingly strong, and retail stocks have performed well.
We also started considering opportunities that will emerge later in the recovery cycle, when consumers start looking at bigger purchases, such as new cars and homes. Achieving this mid- to late-cycle recovery, however, will require the lending market to open up and the employment situation to improve. Once the jobs situation improves and people gain confidence that the recovery will truly take hold, we should start to see some growth in later-cycle sectors. In terms of the fund’s portfolio, we have started to shift out of some early-cycle consumer stocks in favor of those later-cycle opportunities in housing and auto-related industries.
The return of loan growth is an important aspect of our outlook. Most people borrow
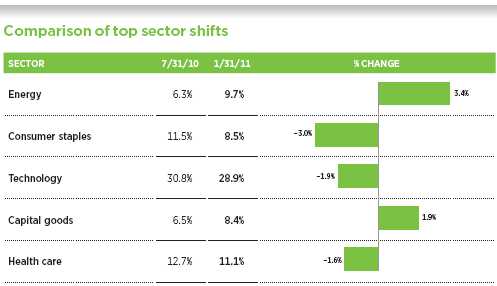
This chart shows the fund’s largest allocation shifts, by percentage, over the past six months. Weightings are shown as a percentage of net assets. Summary information may differ from the portfolio schedule included in the financial statements due to the inclusion of derivative securities and the exclusion of as-of trades, if any, and the use of different classifications of securities for presentation purposes. Holdings will vary over time.
8
money to purchase big-ticket items such as houses and cars, and corporations must take loans to expand. For quite some time in the financials sector, investors have been analyzing the situation in terms of when things will get “less worse,” assessing factors such as credit card delinquencies and mortgage foreclosures. It appears that we are entering a better environment, and a return to loan growth could be a significant positive driver in the year ahead, particularly for financial stocks.
When positioning the portfolio, I want the fund’s investors to be able to capitalize on improving conditions, but I don’t want to expose them to too much risk. I strive for a careful balance of stocks with high growth potential and those with more defensive characteristics.
Thank you, Rob, for your time and insights today.
The views expressed in this report are exclusively those of Putnam Management. They are not meant as investment advice.
Please note that the holdings discussed in this report may not have been held by the fund for the entire period. Portfolio composition is subject to review in accordance with the fund’s investment strategy and may vary in the future. Current and future portfolio holdings are subject to risk.
Of special interest
We are pleased to report that the fund benefited during the period as a result of a third court-ordered settlement distribution made to eligible holders of Enron Corporation common stock. Enron’s stock became worthless in 2001 when it was determined that the company had defrauded shareholders by conspiring to conceal losses and inflate profits. The company declared bankruptcy in December 2001, and its assets were later sold off to recoup creditors. Shareholders who purchased Enron stock between September 9, 1997, and December 2, 2001, were eligible to participate in the settlement. The fund received $12,097,538 on December 29, 2008, a second settlement of $2,326,616 on December 28, 2009, and a third settlement of $3,189,551 on January 19, 2011.

Portfolio Manager Robert Brookby has an M.B.A. from Harvard Business School and a B.A. from Northwestern University. Rob joined Putnam in 2008 and has been in the investment industry since 1999.
IN THE NEWS
The U.S. economic recovery is progressing, although the unemployment rate remains persistently high. Increases in exports, consumer spending, and existing home sales drove the fourth-quarter GDP growth of 2.8%, the Commerce Department reported. At its December meeting, the Federal Open Market Committee noted that the recent economic growth has been “insufficient to bring about a significant improvement in labor market conditions.” In January, the U.S. unemployment rate did inch down to 9.0% from 9.4%. Consumer spending remains constrained by high unemployment, while businesses may be investing more in equipment and less on new hires.
9
Your fund’s performance
This section shows your fund’s performance, price, and distribution information for periods ended January 31, 2011, the end of the first half of its current fiscal year. In accordance with regulatory requirements for mutual funds, we also include performance as of the most recent calendar quarter-end and expense information taken from the fund’s current prospectus. Performance should always be considered in light of a fund’s investment strategy. Data represent past performance. Past performance does not guarantee future results. More recent returns may be less or more than those shown. Investment return and principal value will fluctuate, and you may have a gain or a loss when you sell your shares. Performance information does not reflect any deduction for taxes a shareholder may owe on fund distributions or on the redemption of fund shares. For the most recent month-end performance, please visit the Individual Investors section at putnam.com or call Putnam at 1-800-225-1581. Class R and class Y shares are not available to all investors. See the Terms and Definitions section in this report for definitions of the share classes offered by your fund.
Fund performance Total return for periods ended 1/31/11
| | | | | | | | | | |
| | Class A | Class B | Class C | Class M | Class R | Class Y |
| (inception dates) | (10/2/95) | (8/1/97) | (2/1/99) | (8/1/97) | (1/21/03) | (7/1/99) |
|
| | NAV | POP | NAV | CDSC | NAV | CDSC | NAV | POP | NAV | NAV |
|
| Annual average | | | | | | | | | | |
| (life of fund) | 5.50% | 5.10% | 4.68% | 4.68% | 4.72% | 4.72% | 4.94% | 4.69% | 5.24% | 5.72% |
|
| 10 years | –23.47 | –27.87 | –29.02 | –29.02 | –29.01 | –29.01 | –27.31 | –29.85 | –25.29 | –21.55 |
| Annual average | –2.64 | –3.21 | –3.37 | –3.37 | –3.37 | –3.37 | –3.14 | –3.48 | –2.87 | –2.40 |
|
| 5 years | 24.63 | 17.48 | 19.97 | 17.97 | 20.03 | 20.03 | 21.55 | 17.26 | 23.14 | 26.23 |
| Annual average | 4.50 | 3.27 | 3.71 | 3.36 | 3.72 | 3.72 | 3.98 | 3.24 | 4.25 | 4.77 |
|
| 3 years | 18.80 | 11.99 | 16.10 | 13.10 | 16.12 | 16.12 | 17.01 | 12.87 | 18.00 | 19.67 |
| Annual average | 5.91 | 3.85 | 5.10 | 4.19 | 5.11 | 5.11 | 5.38 | 4.12 | 5.67 | 6.17 |
|
| 1 year | 26.23 | 18.96 | 25.30 | 20.30 | 25.20 | 24.20 | 25.55 | 21.17 | 25.97 | 26.55 |
|
| 6 months | 22.58 | 15.55 | 22.14 | 17.14 | 22.08 | 21.08 | 22.19 | 17.95 | 22.44 | 22.71 |
|
Current performance may be lower or higher than the quoted past performance, which cannot guarantee future results. After-sales-charge returns (public offering price, or POP) for class A and M shares reflect a maximum 5.75% and 3.50% load, respectively. Class B share returns reflect the applicable contingent deferred sales charge (CDSC), which is 5% in the first year, declining over time to 1% in the sixth year, and is eliminated thereafter. Class C shares reflect a 1% CDSC for the first year that is eliminated thereafter. Class R and Y shares have no initial sales charge or CDSC. Performance for class B, C, M, R, and Y shares before their inception is derived from the historical performance of class A shares, adjusted for the applicable sales charge (or CDSC) and the higher operating expenses for such shares, except for class Y shares, for which 12b-1 fees are not applicable.
Recent and prior performance benefited from the receipt of multiple Enron Corporation class action settlements pertaining to investments made prior to 2002.
For a portion of the periods, the fund had expense limitations, without which returns would have been lower.
Class B share performance does not reflect conversion to class A shares.
A short-term trading fee of 1% may apply to redemptions or exchanges from certain funds within the time period specified in the fund’s prospectus.
10
Comparative index returns For periods ended 1/31/11
| | |
| | | Lipper Large-Cap Growth Funds |
| | Russell 1000 Growth Index | category average* |
|
| Annual average (life of fund) | 6.13% | 5.96% |
|
| 10 years | –3.92 | –0.99 |
| Annual average | –0.40 | –0.32 |
|
| 5 years | 21.17 | 11.96 |
| Annual average | 3.91 | 2.21 |
|
| 3 years | 9.64 | 3.77 |
| Annual average | 3.12 | 1.14 |
|
| 1 year | 25.14 | 23.08 |
|
| 6 months | 20.96 | 19.79 |
|
Index and Lipper results should be compared to fund performance at net asset value.
* Over the 6-month, 1-year, 3-year, 5-year, 10-year, and life-of-fund periods ended 1/31/11, there were 906, 865, 764, 643, 394, and 134 funds, respectively, in this Lipper category.
Fund price and distribution information For the six-month period ended 1/31/11
| | | | | | | | |
| | Class A | Class B | Class C | Class M | Class R | Class Y |
|
| Share value | NAV | POP | NAV | NAV | NAV | POP | NAV | NAV |
|
| 7/31/10 | $13.82 | $14.66 | $12.69 | $12.86 | $13.07 | $13.54 | $13.59 | $14.18 |
|
| 1/31/11 | 16.94 | 17.97 | 15.50 | 15.70 | 15.97 | 16.55 | 16.64 | 17.40 |
|
The classification of distributions, if any, is an estimate. Final distribution information will appear on your year-end tax forms.
The fund made no distributions during the period.
Fund performance as of most recent calendar quarter
Total return for periods ended 12/31/10
| | | | | | | | | | |
| | Class A | Class B | Class C | Class M | Class R | Class Y |
| (inception dates) | (10/2/95) | (8/1/97) | (2/1/99) | (8/1/97) | (1/21/03) | (7/1/99) |
|
| | NAV | POP | NAV | CDSC | NAV | CDSC | NAV | POP | NAV | NAV |
|
| Annual average | | | | | | | | | | |
| (life of fund) | 5.32% | 4.91% | 4.50% | 4.50% | 4.55% | 4.55% | 4.76% | 4.52% | 5.06% | 5.54% |
|
| 10 years | –24.04 | –28.42 | –29.58 | –29.58 | –29.56 | –29.56 | –27.84 | –30.36 | –25.86 | –22.10 |
| Annual average | –2.71 | –3.29 | –3.45 | –3.45 | –3.44 | –3.44 | –3.21 | –3.55 | –2.95 | –2.47 |
|
| 5 years | 23.31 | 16.19 | 18.70 | 16.70 | 18.78 | 18.78 | 20.26 | 16.03 | 21.87 | 24.89 |
| Annual average | 4.28 | 3.05 | 3.49 | 3.14 | 3.50 | 3.50 | 3.76 | 3.02 | 4.03 | 4.55 |
|
| 3 years | 6.86 | 0.73 | 4.45 | 1.45 | 4.53 | 4.53 | 5.31 | 1.65 | 6.12 | 7.70 |
| Annual average | 2.24 | 0.24 | 1.46 | 0.48 | 1.49 | 1.49 | 1.74 | 0.55 | 2.00 | 2.50 |
|
| 1 year | 17.19 | 10.42 | 16.32 | 11.32 | 16.34 | 15.34 | 16.63 | 12.56 | 16.87 | 17.47 |
|
| 6 months | 27.36 | 20.02 | 26.92 | 21.92 | 26.89 | 25.89 | 27.05 | 22.63 | 27.19 | 27.59 |
|
11
Your fund’s expenses
As a mutual fund investor, you pay ongoing expenses, such as management fees, distribution fees (12b-1 fees), and other expenses. Using the following information, you can estimate how these expenses affect your investment and compare them with the expenses of other funds. You may also pay one-time transaction expenses, including sales charges (loads) and redemption fees, which are not shown in this section and would have resulted in higher total expenses. For more information, see your fund’s prospectus or talk to your financial representative.
Expense ratios
| | | | | | |
| | Class A | Class B | Class C | Class M | Class R | Class Y |
|
| Total annual operating expenses for the fiscal year | | | | | | |
| ended 7/31/10* | 1.25% | 2.00% | 2.00% | 1.75% | 1.50% | 1.00% |
|
| Annualized expense ratio for the six-month period | | | | | | |
| ended 1/31/11† | 1.23% | 1.98% | 1.98% | 1.73% | 1.48% | 0.98% |
|
Fiscal-year expense information in this table is taken from the most recent prospectus, is subject to change, and may differ from that shown for the annualized expense ratio and in the financial highlights of this report. Expenses are shown as a percentage of average net assets.
* Restated to reflect projected expenses under a new management contract effective 1/1/10.
† Includes 0.01% of annualized performance fees for the six months ended 1/31/11.
Expenses per $1,000
The following table shows the expenses you would have paid on a $1,000 investment in the fund from August 1, 2010, to January 31, 2011. It also shows how much a $1,000 investment would be worth at the close of the period, assuming actual returns and expenses.
| | | | | | |
| | Class A | Class B | Class C | Class M | Class R | Class Y |
|
| Expenses paid per $1,000*† | $6.90 | $11.09 | $11.08 | $9.69 | $8.30 | $5.50 |
|
| Ending value (after expenses) | $1,225.80 | $1,221.40 | $1,220.80 | $1,221.90 | $1,224.40 | $1,227.10 |
|
* Expenses for each share class are calculated using the fund’s annualized expense ratio for each class, which represents the ongoing expenses as a percentage of average net assets for the six months ended 1/31/11. The expense ratio may differ for each share class.
† Expenses are calculated by multiplying the expense ratio by the average account value for the period; then multiplying the result by the number of days in the period; and then dividing that result by the number of days in the year.
12
Estimate the expenses you paid
To estimate the ongoing expenses you paid for the six months ended January 31, 2011, use the following calculation method. To find the value of your investment on August 1, 2010, call Putnam at 1-800-225-1581.

Compare expenses using the SEC’s method
The Securities and Exchange Commission (SEC) has established guidelines to help investors assess fund expenses. Per these guidelines, the following table shows your fund’s expenses based on a $1,000 investment, assuming a hypothetical 5% annualized return. You can use this information to compare the ongoing expenses (but not transaction expenses or total costs) of investing in the fund with those of other funds. All mutual fund shareholder reports will provide this information to help you make this comparison. Please note that you cannot use this information to estimate your actual ending account balance and expenses paid during the period.
| | | | | | |
| | Class A | Class B | Class C | Class M | Class R | Class Y |
|
| Expenses paid per $1,000*† | $6.26 | $10.06 | $10.06 | $8.79 | $7.53 | $4.99 |
|
| Ending value (after expenses) | $1,019.00 | $1,015.22 | $1,015.22 | $1,016.48 | $1,017.74 | $1,020.27 |
|
* Expenses for each share class are calculated using the fund’s annualized expense ratio for each class, which represents the ongoing expenses as a percentage of average net assets for the six months ended 1/31/11. The expense ratio may differ for each share class.
† Expenses are calculated by multiplying the expense ratio by the average account value for the period; then multiplying the result by the number of days in the period; and then dividing that result by the number of days in the year.
13
Terms and definitions
Important terms
Total return shows how the value of the fund’s shares changed over time, assuming you held the shares through the entire period and reinvested all distributions in the fund.
Net asset value (NAV) is the price, or value, of one share of a mutual fund, without a sales charge. NAVs fluctuate with market conditions. NAV is calculated by dividing the net assets of each class of shares by the number of outstanding shares in the class.
Public offering price (POP) is the price of a mutual fund share plus the maximum sales charge levied at the time of purchase. POP performance figures shown here assume the 5.75% maximum sales charge for class A shares and 3.50% for class M shares.
Contingent deferred sales charge (CDSC) is generally a charge applied at the time of the redemption of class B or C shares and assumes redemption at the end of the period. Your fund’s class B CDSC declines over time from a 5% maximum during the first year to 1% during the sixth year. After the sixth year, the CDSC no longer applies. The CDSC for class C shares is 1% for one year after purchase.
Share classes
Class A shares are generally subject to an initial sales charge and no CDSC (except on certain redemptions of shares bought without an initial sales charge).
Class B shares are not subject to an initial sales charge. They may be subject to a CDSC.
Class C shares are not subject to an initial sales charge and are subject to a CDSC only if the shares are redeemed during the first year.
Class M shares have a lower initial sales charge and a higher 12b-1 fee than class A shares and no CDSC (except on certain redemptions of shares bought without an initial sales charge).
Class R shares are not subject to an initial sales charge or CDSC and are available only to certain defined contribution plans.
Class Y shares are not subject to an initial sales charge or CDSC, and carry no 12b-1 fee. They are generally only available to corporate and institutional clients and clients in other approved programs.
Comparative indexes
Barclays Capital Aggregate Bond Index is an unmanaged index of U.S. investment-grade fixed-income securities.
BofA (Bank of America) Merrill Lynch U.S. 3-Month Treasury Bill Index is an unmanaged index that seeks to measure the performance of U.S. Treasury bills available in the marketplace.
Russell 1000 Growth Index is an unmanaged index of those companies in the large-cap Russell 1000 Index chosen for their growth orientation.
S&P 500 Index is an unmanaged index of common stock performance.
Indexes assume reinvestment of all distributions and do not account for fees. Securities and performance of a fund and an index will differ. You cannot invest directly in an index.
Lipper is a third-party industry-ranking entity that ranks mutual funds. Its rankings do not reflect sales charges. Lipper rankings are based on total return at net asset value relative to other funds that have similar current investment styles or objectives as determined by Lipper. Lipper may change a fund’s category assignment at its discretion. Lipper category averages reflect performance trends for funds within a category.
14
Other information for shareholders
Important notice regarding delivery of shareholder documents
In accordance with SEC regulations, Putnam sends a single copy of annual and semiannual shareholder reports, prospectuses, and proxy statements to Putnam shareholders who share the same address, unless a shareholder requests otherwise. If you prefer to receive your own copy of these documents, please call Putnam at 1-800-225-1581, and Putnam will begin sending individual copies within 30 days.
Proxy voting
Putnam is committed to managing our mutual funds in the best interests of our shareholders. The Putnam funds’ proxy voting guidelines and procedures, as well as information regarding how your fund voted proxies relating to portfolio securities during the 12-month period ended June 30, 2010, are available in the Individual Investors section of putnam.com, and on the SEC’s Web site, www.sec.gov. If you have questions about finding forms on the SEC’s Web site, you may call the SEC at 1-800-SEC-0330. You may also obtain the Putnam funds’ proxy voting guidelines and procedures at no charge by calling Putnam’s Shareholder Services at 1-800-225-1581.
Fund portfolio holdings
The fund will file a complete schedule of its portfolio holdings with the SEC for the first and third quarters of each fiscal year on Form N-Q. Shareholders may obtain the fund’s Forms N-Q on the SEC’s Web site at www.sec.gov. In addition, the fund’s Forms N-Q may be reviewed and copied at the SEC’s Public Reference Room in Washington, D.C. You may call the SEC at 1-800-SEC-0330 for information about the SEC’s Web site or the operation of the Public Reference Room.
Trustee and employee fund ownership
Putnam employees and members of the Board of Trustees place their faith, confidence, and, most importantly, investment dollars in Putnam mutual funds. As of January 31, 2011, Putnam employees had approximately $352,000,000 and the Trustees had approximately $68,000,000 invested in Putnam mutual funds. These amounts include investments by the Trustees’ and employees’ immediate family members as well as investments through retirement and deferred compensation plans.
15
Financial statements
A guide to financial statements
These sections of the report, as well as the accompanying Notes, constitute the fund’s financial statements.
The fund’s portfolio lists all the fund’s investments and their values as of the last day of the reporting period. Holdings are organized by asset type and industry sector, country, or state to show areas of concentration and diversification.
Statement of assets and liabilities shows how the fund’s net assets and share price are determined. All investment and non-investment assets are added together. Any unpaid expenses and other liabilities are subtracted from this total. The result is divided by the number of shares to determine the net asset value per share, which is calculated separately for each class of shares. (For funds with preferred shares, the amount subtracted from total assets includes the liquidation preference of preferred shares.)
Statement of operations shows the fund’s net investment gain or loss. This is done by first adding up all the fund’s earnings — from dividends and interest income — and subtracting its operating expenses to determine net investment income (or loss). Then, any net gain or loss the fund realized on the sales of its holdings — as well as any unrealized gains or losses over the period — is added to or subtracted from the net investment result to determine the fund’s net gain or loss for the fiscal period.
Statement of changes in net assets shows how the fund’s net assets were affected by the fund’s net investment gain or loss, by distributions to shareholders, and by changes in the number of the fund’s shares. It lists distributions and their sources (net investment income or realized capital gains) over the current reporting period and the most recent fiscal year-end. The distributions listed here may not match the sources listed in the Statement of operations because the distributions are determined on a tax basis and may be paid in a different period from the one in which they were earned. Dividend sources are estimated at the time of declaration. Actual results may vary. Any non-taxable return of capital cannot be determined until final tax calculations are completed after the end of the fund’s fiscal year.
Financial highlights provide an overview of the fund’s investment results, per-share distributions, expense ratios, net investment income ratios, and portfolio turnover in one summary table, reflecting the five most recent reporting periods. In a semiannual report, the highlights table also includes the current reporting period.
16
The fund’s portfolio 1/31/11 (Unaudited)
| | |
| COMMON STOCKS (97.8%)* | Shares | Value |
|
| Aerospace and defense (3.7%) | | |
| General Dynamics Corp. | 9,400 | $708,760 |
|
| Goodrich Corp. | 31,300 | 2,836,406 |
|
| MTU Aero Engines Holding AG (Germany) | 13,180 | 928,689 |
|
| Northrop Grumman Corp. | 15,800 | 1,094,940 |
|
| Precision Castparts Corp. S | 29,437 | 4,209,197 |
|
| United Technologies Corp. | 45,300 | 3,682,890 |
|
| | | 13,460,882 |
| Automotive (1.2%) | | |
| Ford Motor Co. † | 176,100 | 2,808,795 |
|
| Lear Corp. † | 14,700 | 1,552,761 |
|
| | | 4,361,556 |
| Banking (1.9%) | | |
| Bond Street Holdings, LLC 144A Class A † F | 50,163 | 1,025,833 |
|
| JPMorgan Chase & Co. | 50,200 | 2,255,988 |
|
| PNC Financial Services Group, Inc. | 29,400 | 1,764,000 |
|
| State Street Corp. | 41,700 | 1,948,224 |
|
| | | 6,994,045 |
| Beverage (2.0%) | | |
| Coca-Cola Co. (The) | 42,700 | 2,683,695 |
|
| Coca-Cola Enterprises, Inc. | 92,600 | 2,329,816 |
|
| PepsiCo, Inc. | 32,700 | 2,102,937 |
|
| | | 7,116,448 |
| Biotechnology (1.8%) | | |
| Celgene Corp. † | 51,800 | 2,669,254 |
|
| Dendreon Corp. † | 31,276 | 1,095,911 |
|
| Genzyme Corp. † | 19,000 | 1,393,650 |
|
| Human Genome Sciences, Inc. † | 61,100 | 1,482,286 |
|
| | | 6,641,101 |
| Building materials (0.2%) | | |
| Owens Corning, Inc. † | 19,600 | 656,012 |
|
| | | 656,012 |
| Cable television (0.7%) | | |
| DIRECTV Class A † | 61,100 | 2,590,029 |
|
| | | 2,590,029 |
| Chemicals (3.9%) | | |
| Agrium, Inc. (Canada) | 17,500 | 1,546,825 |
|
| Air Products & Chemicals, Inc. | 9,900 | 863,775 |
|
| Albemarle Corp. | 58,900 | 3,307,824 |
|
| Celanese Corp. Ser. A | 65,600 | 2,721,744 |
|
| Huabao International Holdings, Ltd. (China) | 368,000 | 544,473 |
|
| Huntsman Corp. | 124,200 | 2,162,322 |
|
| LyondellBasell Industries NV Class A (Netherlands) † | 83,200 | 2,990,208 |
|
| | | 14,137,171 |
| Coal (0.3%) | | |
| Alpha Natural Resources, Inc. † | 20,000 | 1,074,600 |
|
| | | 1,074,600 |
| Commercial and consumer services (2.0%) | | |
| Mastercard, Inc. Class A | 15,100 | 3,571,301 |
|
| Priceline.com, Inc. † S | 8,750 | 3,749,550 |
|
| | | 7,320,851 |
17
| | |
| COMMON STOCKS (97.8%)* cont. | Shares | Value |
|
| Communications equipment (4.3%) | | |
| Cisco Systems, Inc. † | 331,412 | $7,009,364 |
|
| Qualcomm, Inc. | 160,900 | 8,709,517 |
|
| | | 15,718,881 |
| Computers (11.1%) | | |
| Apple, Inc. † | 60,232 | 20,437,922 |
|
| EMC Corp. † S | 235,400 | 5,859,106 |
|
| Hewlett-Packard Co. | 180,400 | 8,242,476 |
|
| IBM Corp. | 12,600 | 2,041,200 |
|
| Polycom, Inc. † | 52,600 | 2,306,510 |
|
| Seagate Technology † | 60,100 | 841,400 |
|
| Synchronoss Technologies, Inc. † S | 21,400 | 609,044 |
|
| | | 40,337,658 |
| Conglomerates (2.0%) | | |
| 3M Co. | 24,400 | 2,145,248 |
|
| Honeywell International, Inc. | 39,600 | 2,217,996 |
|
| Tyco International, Ltd. | 67,700 | 3,034,991 |
|
| | | 7,398,235 |
| Consumer goods (2.3%) | | |
| Colgate-Palmolive Co. | 38,900 | 2,986,353 |
|
| Estee Lauder Cos., Inc. (The) Class A S | 18,700 | 1,505,350 |
|
| Newell Rubbermaid, Inc. | 61,771 | 1,189,092 |
|
| Procter & Gamble Co. (The) | 44,600 | 2,815,598 |
|
| | | 8,496,393 |
| Consumer services (0.6%) | | |
| Hertz Global Holdings, Inc. † | 155,100 | 2,281,521 |
|
| | | 2,281,521 |
| Electric utilities (0.6%) | | |
| AES Corp. (The) † | 188,000 | 2,331,200 |
|
| | | 2,331,200 |
| Electrical equipment (0.7%) | | |
| Emerson Electric Co. S | 22,000 | 1,295,360 |
|
| GrafTech International, Ltd. † | 44,600 | 936,600 |
|
| WESCO International, Inc. † S | 7,100 | 397,955 |
|
| | | 2,629,915 |
| Electronics (4.3%) | | |
| Agilent Technologies, Inc. † | 37,600 | 1,572,808 |
|
| Elster Group SE ADR (Germany) † | 42,418 | 674,870 |
|
| Hollysys Automation Technologies, Ltd. (China) † S | 42,300 | 678,915 |
|
| Intel Corp. | 67,300 | 1,444,258 |
|
| Marvell Technology Group, Ltd. † | 97,300 | 1,849,673 |
|
| SanDisk Corp. † | 54,052 | 2,452,339 |
|
| Sensata Technologies Holding NV (Netherlands) † | 41,249 | 1,299,756 |
|
| Texas Instruments, Inc. | 80,400 | 2,726,364 |
|
| Tyco Electronics, Ltd. (Switzerland) | 76,700 | 2,778,841 |
|
| | | 15,477,824 |
| Energy (oil field) (4.1%) | | |
| Global Geophysical Services, Inc. † | 93,934 | 1,042,667 |
|
| National Oilwell Varco, Inc. | 58,800 | 4,345,320 |
|
| Schlumberger, Ltd. | 82,700 | 7,359,473 |
|
| Weatherford International, Ltd. (Switzerland) † | 85,700 | 2,032,804 |
|
| | | 14,780,264 |
18
| | |
| COMMON STOCKS (97.8%)* cont. | Shares | Value |
|
| Energy (other) (0.4%) | | |
| First Solar, Inc. † S | 9,372 | $1,448,724 |
|
| | | 1,448,724 |
| Engineering and construction (0.4%) | | |
| Shaw Group, Inc. † S | 35,000 | 1,321,950 |
|
| | | 1,321,950 |
| Financial (1.0%) | | |
| CME Group, Inc. | 9,850 | 3,039,316 |
|
| LPL Investment Holdings, Inc. † | 21,273 | 728,813 |
|
| | | 3,768,129 |
| Health-care services (3.4%) | | |
| Aetna, Inc. | 111,200 | 3,662,928 |
|
| Express Scripts, Inc. † S | 58,900 | 3,317,837 |
|
| HealthSouth Corp. † S | 80,500 | 1,820,910 |
|
| McKesson Corp. | 18,500 | 1,390,645 |
|
| Quest Diagnostics, Inc. | 37,974 | 2,162,619 |
|
| | | 12,354,939 |
| Insurance (2.2%) | | |
| Aflac, Inc. S | 75,098 | 4,324,143 |
|
| Assured Guaranty, Ltd. (Bermuda) | 23,700 | 342,702 |
|
| Hartford Financial Services Group, Inc. (The) | 119,300 | 3,314,154 |
|
| | | 7,980,999 |
| Investment banking/Brokerage (0.4%) | | |
| Invesco, Ltd. S | 54,700 | 1,353,278 |
|
| | | 1,353,278 |
| Lodging/Tourism (0.3%) | | |
| Carnival Corp. | 27,700 | 1,238,467 |
|
| | | 1,238,467 |
| Machinery (1.2%) | | |
| Parker Hannifin Corp. S | 49,500 | 4,425,795 |
|
| | | 4,425,795 |
| Manufacturing (2.4%) | | |
| Eaton Corp. S | 30,700 | 3,314,372 |
|
| Illinois Tool Works, Inc. | 55,100 | 2,947,299 |
|
| Ingersoll-Rand PLC | 53,000 | 2,501,600 |
|
| | | 8,763,271 |
| Media (2.1%) | | |
| Interpublic Group of Companies, Inc. (The) † | 203,600 | 2,176,484 |
|
| Time Warner, Inc. | 91,000 | 2,861,950 |
|
| Walt Disney Co. (The) | 66,200 | 2,573,194 |
|
| | | 7,611,628 |
| Medical technology (5.0%) | | |
| Baxter International, Inc. | 86,700 | 4,204,083 |
|
| Covidien PLC (Ireland) | 108,100 | 5,131,507 |
|
| Hospira, Inc. † | 26,400 | 1,458,072 |
|
| Medtronic, Inc. | 41,298 | 1,582,539 |
|
| Pall Corp. S | 29,700 | 1,645,677 |
|
| Thermo Fisher Scientific, Inc. † | 73,300 | 4,197,891 |
|
| | | 18,219,769 |
| Metals (1.4%) | | |
| Freeport-McMoRan Copper & Gold, Inc. Class B | 15,000 | 1,631,250 |
|
| Teck Resources Limited Class B (Canada) | 58,663 | 3,554,978 |
|
| | | 5,186,228 |
19
| | |
| COMMON STOCKS (97.8%)* cont. | Shares | Value |
|
| Oil and gas (5.0%) | | |
| Anadarko Petroleum Corp. | 18,400 | $1,418,272 |
|
| Hess Corp. | 28,600 | 2,405,832 |
|
| Linn Energy, LLC (Units) | 67,600 | 2,676,284 |
|
| Nexen, Inc. (Canada) | 46,400 | 1,165,561 |
|
| Occidental Petroleum Corp. | 38,000 | 3,673,840 |
|
| Oil States International, Inc. † S | 32,100 | 2,175,096 |
|
| Petrohawk Energy Corp. † | 46,528 | 932,886 |
|
| Petroleo Brasileiro SA ADR (Brazil) S | 58,900 | 2,163,397 |
|
| Warren Resources, Inc. † | 261,460 | 1,458,947 |
|
| | | 18,070,115 |
| Pharmaceuticals (0.7%) | | |
| Teva Pharmaceutical Industries, Ltd. ADR (Israel) | 47,900 | 2,617,735 |
|
| | | 2,617,735 |
| Railroads (0.3%) | | |
| Kansas City Southern † S | 24,980 | 1,248,500 |
|
| | | 1,248,500 |
| Real estate (0.6%) | | |
| CB Richard Ellis Group, Inc. Class A † | 96,400 | 2,139,116 |
|
| | | 2,139,116 |
| Restaurants (1.2%) | | |
| McDonald’s Corp. | 27,900 | 2,055,393 |
|
| Starbucks Corp. | 76,000 | 2,396,280 |
|
| | | 4,451,673 |
| Retail (7.4%) | | |
| Amazon.com, Inc. † | 22,800 | 3,867,792 |
|
| Amer Sports OYJ Class A (Finland) | 50,150 | 702,878 |
|
| American Eagle Outfitters, Inc. | 80,700 | 1,166,922 |
|
| Bed Bath & Beyond, Inc. † S | 49,600 | 2,380,800 |
|
| Costco Wholesale Corp. | 32,800 | 2,356,352 |
|
| CVS Caremark Corp. | 51,400 | 1,757,880 |
|
| Iconix Brand Group, Inc. † S | 62,500 | 1,240,625 |
|
| Kohl’s Corp. † | 62,600 | 3,178,828 |
|
| Lowe’s Cos., Inc. | 107,700 | 2,670,960 |
|
| Office Depot, Inc. † S | 61,700 | 323,925 |
|
| Target Corp. | 100,800 | 5,526,864 |
|
| Urban Outfitters, Inc. † | 49,400 | 1,670,708 |
|
| | | 26,844,534 |
| Semiconductor (0.9%) | | |
| KLA-Tencor Corp. S | 24,000 | 1,057,920 |
|
| Novellus Systems, Inc. † | 60,600 | 2,185,842 |
|
| | | 3,243,762 |
| Shipping (1.3%) | | |
| Swift Transportation Co. † S | 121,597 | 1,737,621 |
|
| United Parcel Service, Inc. Class B S | 40,100 | 2,871,962 |
|
| | | 4,609,583 |
| Software (4.5%) | | |
| BMC Software, Inc. † | 67,700 | 3,229,290 |
|
| Microsoft Corp. | 146,867 | 4,071,888 |
|
| Oracle Corp. | 279,600 | 8,955,588 |
|
| | | 16,256,766 |
20
| | |
| COMMON STOCKS (97.8%)* cont. | Shares | Value |
|
| Technology (0.6%) | | |
| Tech Data Corp. † | 42,100 | $1,974,911 |
|
| | | 1,974,911 |
| Technology services (3.2%) | | |
| Google, Inc. Class A † | 17,378 | 10,433,056 |
|
| Western Union Co. (The) S | 61,700 | 1,251,276 |
|
| | | 11,684,332 |
| Telecommunications (2.0%) | | |
| ADTRAN, Inc. S | 36,400 | 1,497,132 |
|
| American Tower Corp. Class A † S | 63,000 | 3,204,180 |
|
| Iridium Communications, Inc. † S | 135,087 | 1,037,468 |
|
| NII Holdings, Inc. † | 38,942 | 1,634,785 |
|
| | | 7,373,565 |
| Textiles (0.8%) | | |
| Hanesbrands, Inc. † S | 79,200 | 1,823,184 |
|
| VF Corp. | 14,400 | 1,191,168 |
|
| | | 3,014,352 |
| Tobacco (1.2%) | | |
| Philip Morris International, Inc. | 77,500 | 4,436,100 |
|
| | | 4,436,100 |
| Toys (0.2%) | | |
| Hasbro, Inc. | 15,100 | 665,759 |
|
| | | 665,759 |
| | | |
| Total common stocks (cost $294,979,494) | | $356,108,566 |
| | | |
| | | | |
| WARRANTS (0.5%)* † | Expiration | Strike | | |
| | date | price | Warrants | Value |
|
| Citigroup, Inc. | 1/4/19 | $10.61 | 163,930 | $162,291 |
|
| JPMorgan Chase & Co. W | 10/28/18 | 42.42 | 111,068 | 1,621,593 |
|
| Total warrants (cost $1,359,550) | | | | $1,783,884 |
| | | |
| | | | |
| PURCHASED OPTIONS | Expiration date/ | | Contract | |
| OUTSTANDING (0.1%)* | strike price | | amount | Value |
|
| JPMorgan Chase & Co. (Call) | Jan-12/$45.00 | | 52,400 | $240,894 |
|
| Total purchased options outstanding (cost $148,292) | | | | $240,894 |
|
| |
| SHORT-TERM INVESTMENTS (13.6%)* | Principal amount/shares | Value |
|
| Putnam Cash Collateral Pool, LLC 0.20% d | | | 41,213,788 | $41,213,788 |
|
| Putnam Money Market Liquidity Fund 0.17% e | | | 7,962,965 | 7,962,965 |
|
| U.S. Treasury Bills with an effective yield of 0.24%, | | | | |
| October 20, 2011 | | | $24,000 | 23,965 |
|
| U.S. Treasury Bills with an effective yield of 0.20%, | | | | |
| August 25, 2011 | | | 189,000 | 188,738 |
|
| Total short-term investments (cost $49,389,498) | | | | $49,389,456 |
|
| |
| TOTAL INVESTMENTS | | | | |
|
| Total investments (cost $345,876,834) | | | | $407,522,800 |
21
Key to holding’s abbreviations
ADR American Depository Receipts
Notes to the fund’s portfolio
Unless noted otherwise, the notes to the fund’s portfolio are for the close of the fund’s reporting period, which ran from August 1, 2010 through January 31, 2011 (the reporting period).
* Percentages indicated are based on net assets of $364,169,175.
† Non-income-producing security.
d See Note 1 to the financial statements regarding securities lending. The rate quoted in the security description is the annualized 7-day yield of the fund at the close of the reporting period.
e See Note 6 to the financial statements regarding investments in Putnam Money Market Liquidity Fund. The rate quoted in the security description is the annualized 7-day yield of the fund at the close of the reporting period.
F Is valued at fair value following procedures approved by the Trustees. Securities may be classified as Level 2 or Level 3 for Accounting Standards Codification ASC 820 Fair Value Measurements and Disclosures (ASC 820) based on the securities’ valuation inputs. At the close of the reporting period, fair value pricing was also used for certain foreign securities in the portfolio (Note 1).
S Securities on loan, in part or in entirety, at the close of the reporting period.
W Warrants issued to the U.S. Treasury under the Troubled Asset Relief Program (TARP).
At the close of the reporting period, the fund maintained liquid assets totaling $71,597 to cover certain derivatives contracts.
144A after the name of an issuer represents securities exempt from registration under Rule 144A under the Securities Act of 1933, as amended. These securities may be resold in transactions exempt from registration, normally to qualified institutional buyers.
ADR after the name of a foreign holding represents ownership of foreign securities on deposit with a custodian bank.
FORWARD CURRENCY CONTRACTS at 1/31/11 (aggregate face value $1,504,979) (Unaudited)
| | | | | | |
| | | Contract | Delivery | | Aggregate | Unrealized |
| Counterparty | Currency | type | date | Value | face value | depreciation |
|
| UBS AG | | | | | | |
|
| | Euro | Sell | 2/16/11 | $1,539,532 | $1,504,979 | $(34,553) |
|
| Total | | | | | | $(34,553) |
| | | | | | |
| TOTAL RETURN SWAP CONTRACTS OUTSTANDING at 1/31/11 (Unaudited) | | |
| |
| | | | | Fixed payments | Total return | Unrealized |
| Swap counterparty / | Termination | | received (paid) by | received by | appreciation/ |
| Notional amount | date | | fund per annum | or paid by fund | (depreciation) |
|
| Goldman Sachs International | | | | | |
| baskets | 8,486 | 9/14/11 | | (1 month | A basket | $16,834 |
| | | | | USD-LIBOR-BBA | (GSGLPMIN) | |
| | | | | plus 60 bp) | of common stocks | |
|
| baskets | 13,817 | 9/26/11 | | (1 month | A basket | (51,097) |
| | | | | USD-LIBOR-BBA | (GSCBPBNK) | |
| | | | | plus 35 bps) | of common stocks | |
|
| Total | | | | | | $(34,263) |
22
ASC 820 establishes a three-level hierarchy for disclosure of fair value measurements. The valuation hierarchy is based upon the transparency of inputs to the valuation of the fund’s investments. The three levels are defined as follows:
Level 1 — Valuations based on quoted prices for identical securities in active markets.
Level 2 — Valuations based on quoted prices in markets that are not active or for which all significant inputs are observable, either directly or indirectly.
Level 3 — Valuations based on inputs that are unobservable and significant to the fair value measurement.
The following is a summary of the inputs used to value the fund’s net assets as of the close of the reporting period:
| | | |
| | | Valuation inputs | |
|
| Investments in securities: | Level 1 | Level 2 | Level 3 |
|
| Common stocks: | | | |
|
| Basic materials | $18,778,926 | $544,473 | $— |
|
| Capital goods | 29,673,124 | 928,689 | — |
|
| Communication services | 9,963,594 | — | — |
|
| Conglomerates | 7,398,235 | — | — |
|
| Consumer cyclicals | 46,896,049 | 702,878 | — |
|
| Consumer staples | 30,896,367 | — | — |
|
| Energy | 35,373,703 | — | — |
|
| Financials | 21,209,734 | — | 1,025,833 |
|
| Health care | 39,833,544 | — | — |
|
| Technology | 104,694,134 | — | — |
|
| Transportation | 5,858,083 | — | — |
|
| Utilities and power | 2,331,200 | — | — |
|
| Total common stocks | 352,906,693 | 2,176,040 | 1,025,833 |
| | | | |
| Purchased options outstanding | — | 240,894 | — |
|
| Warrants | 1,783,884 | — | — |
|
| Short-term investments | 7,962,965 | 41,426,491 | — |
|
| Totals by level | $362,653,542 | $43,843,425 | $1,025,833 |
| | | | |
| | | Valuation inputs | |
|
| Other financial instruments: | Level 1 | Level 2 | Level 3 |
|
| Forward currency contracts | $— | $(34,553) | $— |
|
| Total return swap contracts | — | (34,263) | — |
|
| Totals by level | $— | $(68,816) | $— |
At the start and/or close of the reporting period, Level 3 investments in securities were not considered a significant portion of the fund’s portfolio.
The accompanying notes are an integral part of these financial statements.
23
Statement of assets and liabilities 1/31/11 (Unaudited)
| | |
| ASSETS | | |
|
| Investment in securities, at value, including $40,962,740 of securities on loan (Note 1): | | |
| Unaffiliated issuers (identified cost $296,700,081) | | $358,346,047 |
| Affiliated issuers (identified cost $49,176,753) (Notes 1 and 6) | | 49,176,753 |
|
| Dividends, interest and other receivables | | 247,590 |
|
| Receivable for shares of the fund sold | | 222,081 |
|
| Receivable for investments sold | | 8,818,899 |
|
| Unrealized appreciation on swap contracts (Note 1) | | 16,834 |
|
| Total assets | | 416,828,204 |
|
| |
| LIABILITIES | | |
|
| Payable for investments purchased | | 10,077,168 |
|
| Payable for shares of the fund repurchased | | 581,932 |
|
| Payable for compensation of Manager (Note 2) | | 182,719 |
|
| Payable for investor servicing fees (Note 2) | | 94,696 |
|
| Payable for custodian fees (Note 2) | | 7,798 |
|
| Payable for Trustee compensation and expenses (Note 2) | | 191,920 |
|
| Payable for administrative services (Note 2) | | 662 |
|
| Payable for distribution fees (Note 2) | | 105,359 |
|
| Unrealized depreciation on forward currency contracts (Note 1) | | 34,553 |
|
| Unrealized depreciation on swap contracts (Note 1) | | 51,097 |
|
| Collateral on securities loaned, at value (Note 1) | | 41,213,788 |
|
| Other accrued expenses | | 117,337 |
|
| Total liabilities | | 52,659,029 |
| |
| Net assets | | $364,169,175 |
|
| |
| REPRESENTED BY | | |
|
| Paid-in capital (Unlimited shares authorized) (Notes 1 and 4) | $1,096,661,556 |
|
| Accumulated net investment loss (Note 1) | | (505,751) |
|
| Accumulated net realized loss on investments and foreign currency transactions (Note 1) | | (793,564,324) |
|
| Net unrealized appreciation of investments and assets and liabilities in foreign currencies | | 61,577,694 |
|
| Total — Representing net assets applicable to capital shares outstanding | | $364,169,175 |
|
| |
| COMPUTATION OF NET ASSET VALUE AND OFFERING PRICE | | |
|
| Net asset value and redemption price per class A share ($304,151,797 divided by 17,957,960 shares) | $16.94 |
|
| Offering price per class A share (100/94.25 of $16.94)* | | $17.97 |
|
| Net asset value and offering price per class B share ($29,518,422 divided by 1,905,002 shares)** | $15.50 |
|
| Net asset value and offering price per class C share ($14,149,387 divided by 901,096 shares)** | $15.70 |
|
| Net asset value and redemption price per class M share ($5,160,406 divided by 323,077 shares) | $15.97 |
|
| Offering price per class M share (100/96.50 of $15.97)* | | $16.55 |
|
| Net asset value, offering price and redemption price per class R share | | |
| ($358,741 divided by 21,564 shares) | | $16.64 |
|
| Net asset value, offering price and redemption price per class Y share | | |
| ($10,830,422 divided by 622,329 shares) | | $17.40 |
|
* On single retail sales of less than $50,000. On sales of $50,000 or more the offering price is reduced.
** Redemption price per share is equal to net asset value less any applicable contingent deferred sales charge.
The accompanying notes are an integral part of these financial statements.
24
Statement of operations Six months ended 1/31/11 (Unaudited)
| |
| INVESTMENT INCOME | |
|
| Dividends (net of foreign tax of $10,038) | $1,909,639 |
|
| Interest (including interest income of $5,039 from investments in affiliated issuers) (Note 6) | 5,324 |
|
| Securities lending (Note 1) | 15,658 |
|
| Total investment income | 1,930,621 |
|
| |
| EXPENSES | |
|
| Compensation of Manager (Note 2) | 962,049 |
|
| Investor servicing fees (Note 2) | 577,797 |
|
| Custodian fees (Note 2) | 9,624 |
|
| Trustee compensation and expenses (Note 2) | 16,859 |
|
| Administrative services (Note 2) | 4,752 |
|
| Distribution fees — Class A (Note 2) | 354,887 |
|
| Distribution fees — Class B (Note 2) | 145,662 |
|
| Distribution fees — Class C (Note 2) | 66,479 |
|
| Distribution fees — Class M (Note 2) | 18,074 |
|
| Distribution fees — Class R (Note 2) | 796 |
|
| Other | 92,510 |
|
| Total expenses | 2,249,489 |
| | |
| Expense reduction (Note 2) | (16,553) |
|
| Net expenses | 2,232,936 |
| |
| Net investment loss | (302,315) |
|
| |
| Net realized gain on investments (Notes 1 and 3) | 20,212,423 |
|
| Net realized gain on swap contracts (Note 1) | 741,285 |
|
| Net realized loss on futures contracts (Note 1) | (7,615) |
|
| Net realized loss on foreign currency transactions (Note 1) | (74,710) |
|
| Net realized gain on written options (Notes 1 and 3) | 117,312 |
|
| Net unrealized depreciation of assets and liabilities in foreign currencies during the period | (17,033) |
|
| Net unrealized appreciation of investments and swap contracts during the period | 47,732,577 |
|
| Net gain on investments | 68,704,239 |
| |
| Net increase in net assets resulting from operations | $68,401,924 |
|
The accompanying notes are an integral part of these financial statements.
25
Statement of changes in net assets
| | |
| INCREASE (DECREASE) IN NET ASSETS | Six months ended 1/31/11* | Year ended 7/31/10 |
|
| Operations: | | |
| Net investment loss | $(302,315) | $(932,589) |
|
| Net realized gain on investments | | |
| and foreign currency transactions | 20,988,695 | 52,859,755 |
|
| Net unrealized appreciation (depreciation) of investments | | |
| and assets and liabilities in foreign currencies | 47,715,544 | (10,577,358) |
|
| Net increase in net assets resulting from operations | 68,401,924 | 41,349,808 |
|
| Distributions to shareholders (Note 1): | | |
| From ordinary income | | |
| Net investment income | | |
|
| Class A | — | (1,122,145) |
|
| Class M | — | (360) |
|
| Class R | — | (584) |
|
| Class Y | — | (38,695) |
|
| From return of capital | | |
| Class A | — | (24,780) |
|
| Class M | — | (8) |
|
| Class R | — | (13) |
|
| Class Y | — | (854) |
|
| Redemption fees (Note 1) | 864 | 1,044 |
|
| Decrease from capital share transactions (Note 4) | (17,604,004) | (41,205,739) |
|
| Total increase (decrease) in net assets | 50,798,784 | (1,042,326) |
| |
| NET ASSETS | | |
|
| Beginning of period | 313,370,391 | 314,412,717 |
|
| End of period (including accumulated net investment | | |
| loss of $505,751 and distributions in excess of net investment | | |
| income of $203,436, respectively) | $364,169,175 | $313,370,391 |
|
* Unaudited
The accompanying notes are an integral part of these financial statements.
26
|
| This page left blank intentionally. |
27
Financial highlights (For a common share outstanding throughout the period)
| | | | | | | | | | | | | | | |
| INVESTMENT OPERATIONS: | LESS DISTRIBUTIONS: | | RATIOS AND SUPPLEMENTAL DATA: | |
|
| | | | | | | | | | | | | | | Ratio | |
| | Net asset | | Net realized | | | | | | | | | | Ratio | of net investment | |
| | value, | | and unrealized | Total from | From | | | | | | Total return | Net assets, | of expenses | income (loss) | |
| | beginning | Net investment | gain (loss) | investment | net investment | From | Total | Redemption | Non-recurring | Net asset value, | at net asset | end of period | to average | to average | Portfolio |
| Period ended | of period | income (loss) a | on investments | operations | income | return of capital | distributions | fees b | reimbursments | end of period | value (%) c | (in thousands) | net assets (%) d | net assets (%) | turnover (%) |
|
| Class A | | | | | | | | | | | | | | | |
| January 31, 2011** | $13.82 | (.01) | 3.13 e | 3.12 | — | — | — | — | — | $16.94 | 22.58 *e | $304,152 | .62* | (.04)* | 43.46* |
| July 31, 2010 | 12.24 | (.02) | 1.66 f | 1.64 | (.06) | — b | (.06) | — | — | 13.82 | 13.39 f | 261,202 | 1.32 g | (.17) g | 96.14 |
| July 31, 2009 | 13.54 | .05 | (1.35) h | (1.30) | — | — | — | — | — b,i | 12.24 | (9.60) h | 254,606 | 1.27 g | .49 g | 160.17 |
| July 31, 2008 | 14.84 | (.01) | (1.29) | (1.30) | — | — | — | — | — | 13.54 | (8.76) | 305,508 | 1.29 g | (.04) g | 69.13 |
| July 31, 2007 | 12.99 | (.04) | 1.89 | 1.85 | — | — | — | — | — | 14.84 | 14.24 | 361,708 | 1.32 g | (.30) g | 64.83 |
| July 31, 2006 | 13.20 | — b,j | (.09) | (.09) | (.12) | — | (.12) | — | — | 12.99 | (.74) j | 353,600 | 1.26 g,j | (.03) g,j | 88.39 |
|
| Class B | | | | | | | | | | | | | | | |
| January 31, 2011** | $12.69 | (.06) | 2.87 e | 2.81 | — | — | — | — | — | $15.50 | 22.14 *e | $29,518 | 1.00* | (.42)* | 43.46* |
| July 31, 2010 | 11.28 | (.11) | 1.52 f | 1.41 | — | — | — | — | — | 12.69 | 12.50 f | 28,983 | 2.07 g | (.91) g | 96.14 |
| July 31, 2009 | 12.57 | (.02) | (1.27) h | (1.29) | — | — | — | — | — b,i | 11.28 | (10.26) h | 37,357 | 2.02 g | (.20) g | 160.17 |
| July 31, 2008 | 13.89 | (.11) | (1.21) | (1.32) | — | — | — | — | — | 12.57 | (9.50) | 73,688 | 2.04 g | (.81) g | 69.13 |
| July 31, 2007 | 12.24 | (.14) | 1.79 | 1.65 | — | — | — | — | — | 13.89 | 13.48 | 167,563 | 2.07 g | (1.03) g | 64.83 |
| July 31, 2006 | 12.44 | (.10) j | (.09) | (.19) | (.01) | — | (.01) | — | — | 12.24 | (1.55) j | 267,264 | 2.01 g,j | (.77) g,j | 88.39 |
|
| Class C | | | | | | | | | | | | | | | |
| January 31, 2011** | $12.86 | (.06) | 2.90 e | 2.84 | — | — | — | — | — | $15.70 | 22.08 *e | $14,149 | 1.00* | (.42)* | 43.46* |
| July 31, 2010 | 11.43 | (.12) | 1.55 f | 1.43 | — | — | — | — | — | 12.86 | 12.51 f | 12,321 | 2.07 g | (.92) g | 96.14 |
| July 31, 2009 | 12.74 | (.02) | (1.29) h | (1.31) | — | — | — | — | — b,i | 11.43 | (10.28) h | 12,159 | 2.02 g | (.25) g | 160.17 |
| July 31, 2008 | 14.07 | (.11) | (1.22) | (1.33) | — | — | — | — | — | 12.74 | (9.45) | 16,311 | 2.04 g | (.79) g | 69.13 |
| July 31, 2007 | 12.40 | (.14) | 1.81 | 1.67 | — | — | — | — | — | 14.07 | 13.47 | 22,364 | 2.07 g | (1.04) g | 64.83 |
| July 31, 2006 | 12.60 | (.10) j | (.09) | (.19) | (.01) | — | (.01) | — | — | 12.40 | (1.53) j | 26,724 | 2.01 g,j | (.77) g,j | 88.39 |
|
| Class M | | | | | | | | | | | | | | | |
| January 31, 2011** | $13.07 | (.04) | 2.94 e | 2.90 | — | — | — | — | — | $15.97 | 22.19 *e | $5,160 | .87* | (.29)* | 43.46* |
| July 31, 2010 | 11.58 | (.09) | 1.58 f | 1.49 | — b | — b | — b | — | — | 13.07 | 12.88 f | 4,460 | 1.82 g | (.67) g | 96.14 |
| July 31, 2009 | 12.88 | — b | (1.30) h | (1.30) | — | — | — | — | — b,i | 11.58 | (10.09) h | 4,470 | 1.77 g | — g,k | 160.17 |
| July 31, 2008 | 14.19 | (.08) | (1.23) | (1.31) | — | — | — | — | — | 12.88 | (9.23) | 5,675 | 1.79 g | (.54) g | 69.13 |
| July 31, 2007 | 12.48 | (.11) | 1.82 | 1.71 | — | — | — | — | — | 14.19 | 13.70 | 8,011 | 1.82 g | (.79) g | 64.83 |
| July 31, 2006 | 12.68 | (.07) j | (.09) | (.16) | (.04) | — | (.04) | — | — | 12.48 | (1.27) j | 9,472 | 1.76 g,j | (.52) g,j | 88.39 |
|
| Class R | | | | | | | | | | | | | | | |
| January 31, 2011** | $13.59 | (.03) | 3.08 e | 3.05 | — | — | — | — | — | $16.64 | 22.44 *e | $359 | .75* | (.17)* | 43.46* |
| July 31, 2010 | 12.05 | (.06) | 1.64 f | 1.58 | (.04) | — b | (.04) | — | — | 13.59 | 13.08 f | 241 | 1.57 g | (.43) g | 96.14 |
| July 31, 2009 | 13.36 | .02 | (1.33) h | (1.31) | — | — | — | — | — b,i | 12.05 | (9.81) h | 183 | 1.52 g | .22 g | 160.17 |
| July 31, 2008 | 14.68 | (.04) | (1.28) | (1.32) | — | — | — | — | — | 13.36 | (8.99) | 172 | 1.54 g | (.30) g | 69.13 |
| July 31, 2007 | 12.88 | (.08) | 1.88 | 1.80 | — | — | — | — | — | 14.68 | 13.98 | 134 | 1.57 g | (.57) g | 64.83 |
| July 31, 2006 | 13.12 | (.04) j | (.08) | (.12) | (.12) | — | (.12) | — | — | 12.88 | (.96) j | 65 | 1.51 g,j | (.29) g,j | 88.39 |
|
| Class Y | | | | | | | | | | | | | | | |
| January 31, 2011** | $14.18 | .01 | 3.21 e | 3.22 | — | — | — | — | — | $17.40 | 22.71 *e | $10,830 | .50* | .08* | 43.46* |
| July 31, 2010 | 12.55 | .01 | 1.71 f | 1.72 | (.09) | — b | (.09) | — | — | 14.18 | 13.69 f | 6,163 | 1.07 g | .08 g | 96.14 |
| July 31, 2009 | 13.85 | .08 | (1.38) h | (1.30) | — | — | — | — | — b,i | 12.55 | (9.39) h | 5,638 | 1.02 g | .73 g | 160.17 |
| July 31, 2008 | 15.14 | .03 | (1.32) | (1.29) | — | — | — | — | — | 13.85 | (8.52) | 6,084 | 1.04 g | .21 g | 69.13 |
| July 31, 2007 | 13.22 | (.01) | 1.93 | 1.92 | — | — | — | — | — | 15.14 | 14.52 | 7,746 | 1.07 g | (.05) g | 64.83 |
| July 31, 2006 | 13.44 | .03 j | (.09) | (.06) | (.16) | — | (.16) | — | — | 13.22 | (.53) j | 7,397 | 1.01 g,j | .23 g,j | 88.39 |
|
See notes to financial highlights at the end of this section.
The accompanying notes are an integral part of these financial statements.
Financial highlights (Continued)
* Not annualized.
** Unaudited.
a Per share net investment income (loss) has been determined on the basis of the weighted average number of shares outstanding during the period.
b Amount represents less than $0.01 per share.
c Total return assumes dividend reinvestment and does not reflect the effect of sales charges.
d Includes amounts paid through expense offset and brokerage/service arrangements (Note 2).
e Reflects a non-recurring litigation payment received by the fund from Enron Corporation which amounted to the following amounts per share outstanding on January 19, 2011:
| |
| | Per share |
|
| Class A | $0.15 |
|
| Class B | 0.14 |
|
| Class C | 0.14 |
|
| Class M | 0.14 |
|
| Class R | 0.15 |
|
| Class Y | 0.15 |
|
This payment resulted in an increase to total returns of 1.09% for the six-months ended January 31, 2011.
f Reflects a non-recurring litigation payment received by the fund from Enron Corporation which amounted to the following amounts per share outstanding on December 28, 2009:
| |
| | Per share |
|
| Class A | $0.09 |
|
| Class B | 0.09 |
|
| Class C | 0.09 |
|
| Class M | 0.09 |
|
| Class R | 0.09 |
|
| Class Y | 0.10 |
|
This payment resulted in an increase to total returns of 0.74% for the year ended July 31, 2010.
g Reflects an involuntary contractual expense limitation in effect during the period. For periods prior to July 31, 2010, certain fund expenses were waived in connection with the fund’s investment in Putnam Prime Money Market Fund. As a result of such limitation and/or waivers, the expenses of each class reflect a reduction of the following amounts:
| |
| | Percentage of |
| | average net assets |
|
| July 31, 2010 | 0.05% |
|
| July 31, 2009 | 0.25 |
|
| July 31, 2008 | 0.16 |
|
| July 31, 2007 | 0.21 |
|
| July 31, 2006 | 0.30 |
|
The accompanying notes are an integral part of these financial statements.
30
Financial highlights (Continued)
h Reflects a non-recurring litigation payment received by the fund from Enron Corporation which amounted to the following amounts per share outstanding on December 29, 2008:
| |
| | Per share |
|
| Class A | $0.44 |
|
| Class B | 0.41 |
|
| Class C | 0.41 |
|
| Class M | 0.42 |
|
| Class R | 0.43 |
|
| Class Y | 0.45 |
|
This payment resulted in an increase to total returns of 3.25% for the year ended July 31, 2009.
i Reflects a non-recurring reimbursement pursuant to a settlement between the Securities and Exchange Commission (the SEC) and Millennium Partners, L.P., Millennium Management, L.L.C., and Millennium International Management, L.L.C., which amounted to less than $0.01 per share outstanding on June 23, 2009.
j Reflects a non-recurring reimbursement from Putnam Investments relating to the calculation of certain amounts paid by the fund to Putnam in previous years for transfer agent services, which amounted to $0.01 per share and 0.08% of average net assets for the period ended July 31, 2006.
k Amount represents less than 0.01% of average net assets.
The accompanying notes are an integral part of these financial statements.
31
Notes to financial statements 1/31/11 (Unaudited)
Note 1: Significant accounting policies
Putnam Growth Opportunities Fund (the fund), is a diversified series of Putnam Investment Funds (the Trust), a Massachusetts business trust registered under the Investment Company Act of 1940, as amended, as an open-end management investment company. The investment objective of the fund is to seek capital appreciation by investing in a portfolio primarily consisting of common stocks of large U.S. companies that Putnam Investment Management, LLC (Putnam Management), the fund’s manager, an indirect wholly-owned subsidiary of Putnam Investments, LLC, believes are fast-growing and whose earnings are likely to increase over time.
The fund offers class A, class B, class C, class M, class R and class Y shares. Class A and class M shares are sold with a maximum front-end sales charge of 5.75% and 3.50%, respectively, and generally do not pay a contingent deferred sales charge. Class B shares, which convert to class A shares after approximately eight years, do not pay a front-end sales charge and are subject to a contingent deferred sales charge if those shares are redeemed within six years of purchase. Class C shares have a one-year 1.00% contingent deferred sales charge and do not convert to class A shares. Class R shares, which are not available to all investors, are sold at net asset value. The expenses for class A, class B, class C, class M and class R shares may differ based on the distribution fee of each class, which is identified in Note 2. Class Y shares, which are sold at net asset value, are generally subject to the same expenses as class A, class B, class C, class M and class R shares, but do not bear a distribution fee. Class Y shares are not available to all investors.
A 1.00% redemption fee may apply on any shares that are redeemed (either by selling or exchanging into another fund) within 7 days of purchase. The redemption fee is accounted for as an addition to paid-in-capital.
Investment income, realized and unrealized gains and losses and expenses of the fund are borne pro-rata based on the relative net assets of each class to the total net assets of the fund, except that each class bears expenses unique to that class (including the distribution fees applicable to such classes). Each class votes as a class only with respect to its own distribution plan or other matters on which a class vote is required by law or determined by the Trustees. If the fund were liquidated, shares of each class would receive their pro-rata share of the net assets of the fund. In addition, the Trustees declare separate dividends on each class of shares.
In the normal course of business, the fund enters into contracts that may include agreements to indemnify another party under given circumstances. The fund’s maximum exposure under these arrangements is unknown as this would involve future claims that may be, but have not yet been, made against the fund. However, the fund’s management team expects the risk of material loss to be remote.
The following is a summary of significant accounting policies consistently followed by the fund in the preparation of its financial statements. The preparation of financial statements is in conformity with accounting principles generally accepted in the United States of America and requires management to make estimates and assumptions that affect the reported amounts of assets and liabilities in the financial statements and the reported amounts of increases and decreases in net assets from operations. Actual results could differ from those estimates. Subsequent events after the Statement of assets and liabilities date through the date that the financial statements were issued have been evaluated in the preparation of the financial statements. Unless otherwise noted, the “reporting period” represents the period from August 1, 2010 through January 31, 2011.
A) Security valuation Investments for which market quotations are readily available are valued at the last reported sales price on their principal exchange, or official closing price for certain markets, and are classified as Level 1 securities. If no sales are reported — as in the case of some securities traded over-the-counter — a security is valued at its last reported bid price and is generally categorized as a Level 2 security.
Market quotations are not considered to be readily available for certain debt obligations; such investments are valued on the basis of valuations furnished by an independent pricing service approved by the Trustees or dealers selected by Putnam Management. Such services or dealers determine valuations for normal institutional-size trading units of such securities using methods based on market transactions for comparable securities and various relationships, generally recognized by institutional traders, between securities (which considers such factors as security prices, yields, maturities and ratings). These securities will generally be categorized as Level 2.
Many securities markets and exchanges outside the U.S. close prior to the close of the New York Stock Exchange and therefore the closing prices for securities in such markets or on such exchanges may not fully reflect events
32
that occur after such close but before the close of the New York Stock Exchange. Accordingly, on certain days, the fund will fair value foreign equity securities taking into account multiple factors including movements in the U.S. securities markets, currency valuations and comparisons to the valuation of American Depository Receipts, exchange-traded funds and futures contracts. These securities, which will generally represent a transfer from a Level 1 to a Level 2 security, will be classified as Level 2. The number of days on which fair value prices will be used will depend on market activity and it is possible that fair value prices will be used by the fund to a significant extent. At the close of the reporting period, fair value pricing was used for certain foreign securities in the portfolio. Securities quoted in foreign currencies, if any, are translated into U.S. dollars at the current exchange rate.
To the extent a pricing service or dealer is unable to value a security or provides a valuation that Putnam Management does not believe accurately reflects the security’s fair value, the security will be valued at fair value by Putnam Management. Certain investments, including certain restricted and illiquid securities and derivatives, are also valued at fair value following procedures approved by the Trustees. These valuations consider such factors as significant market or specific security events such as interest rate or credit quality changes, various relationships with other securities, discount rates, U.S. Treasury, U.S. swap and credit yields, index levels, convexity exposures and recovery rates. These securities are classified as Level 2 or as Level 3 depending on the priority of the significant inputs.
Such valuations and procedures are reviewed periodically by the Trustees. The fair value of securities is generally determined as the amount that the fund could reasonably expect to realize from an orderly disposition of such securities over a reasonable period of time. By its nature, a fair value price is a good faith estimate of the value of a security in a current sale and does not reflect an actual market price, which may be different by a material amount.
B) Security transactions and related investment income Security transactions are recorded on the trade date (the date the order to buy or sell is executed). Gains or losses on securities sold are determined on the identified cost basis.
Interest income is recorded on the accrual basis. Dividend income, net of applicable withholding taxes, is recognized on the ex-dividend date except that certain dividends from foreign securities, if any, are recognized as soon as the fund is informed of the ex-dividend date. Non-cash dividends, if any, are recorded at the fair market value of the securities received. Dividends representing a return of capital or capital gains, if any, are reflected as a reduction of cost and/or as a realized gain.
All premiums/discounts are amortized/accreted on a yield-to-maturity basis.
C) Foreign currency translation The accounting records of the fund are maintained in U.S. dollars. The market value of foreign securities, currency holdings, and other assets and liabilities is recorded in the books and records of the fund after translation to U.S. dollars based on the exchange rates on that day. The cost of each security is determined using historical exchange rates. Income and withholding taxes are translated at prevailing exchange rates when earned or incurred. The fund does not isolate that portion of realized or unrealized gains or losses resulting from changes in the foreign exchange rate on investments from fluctuations arising from changes in the market prices of the securities. Such gains and losses are included with the net realized and unrealized gain or loss on investments. Net realized gains and losses on foreign currency transactions represent net realized exchange gains or losses on closed forward currency contracts, disposition of foreign currencies, currency gains and losses realized between the trade and settlement dates on securities transactions and the difference between the amount of investment income and foreign withholding taxes recorded on the fund’s books and the U.S. dollar equivalent amounts actually received or paid. Net unrealized appreciation and depreciation of assets and liabilities in foreign currencies arise from changes in the value of open forward currency contracts and assets and liabilities other than investments at the period end, resulting from changes in the exchange rate. Investments in foreign securities involve certain risks, including those related to economic instability, unfavorable political developments, and currency fluctuations, not present with domestic investments.
D) Futures contracts The fund uses futures contracts to equitize cash. The potential risk to the fund is that the change in value of futures contracts may not correspond to the change in value of the hedged instruments. In addition, losses may arise from changes in the value of the underlying instruments if there is an illiquid secondary market for the contracts, if interest or exchange rates move unexpectedly or if the counterparty to the contract is unable to perform. With futures, there is minimal counterparty credit risk to the fund since futures are exchange traded and the exchange’s clearinghouse, as counterparty to all exchange traded futures, guarantees the futures against default. Risks may exceed amounts recognized on the Statement of assets and liabilities. When the contract
33
is closed, the fund records a realized gain or loss equal to the difference between the value of the contract at the time it was opened and the value at the time it was closed.
Futures contracts are valued at the quoted daily settlement prices established by the exchange on which they trade. The fund and the broker agree to exchange an amount of cash equal to the daily fluctuation in the value of the futures contract. Such receipts or payments are known as “variation margin.” Futures contracts outstanding at period end, if any, are listed after the fund’s portfolio. For the reporting period, the transaction volume of futures contracts was minimal.
E) Options contracts The fund uses options contracts to enhance a return on a security owned. The potential risk to the fund is that the change in value of options contracts may not correspond to the change in value of the hedged instruments. In addition, losses may arise from changes in the value of the underlying instruments if there is an illiquid secondary market for the contracts, if interest or exchange rates move unexpectedly or if the counterparty to the contract is unable to perform. Realized gains and losses on purchased options are included in realized gains and losses on investment securities. If a written call option is exercised, the premium originally received is recorded as an addition to sales proceeds. If a written put option is exercised, the premium originally received is recorded as a reduction to the cost of investments.
Exchange traded options are valued at the last sale price or, if no sales are reported, the last bid price for purchased options and the last ask price for written options. Options traded over-the-counter are valued using prices supplied by dealers. Written option contracts outstanding at period end, if any, are listed after the fund’s portfolio. The fund had an average contract amount of approximately 40,700 on purchased options contracts for the reporting period. See Note 3 for the volume of written options contracts activity for the reporting period.
F) Forward currency contracts The fund buys and sells forward currency contracts, which are agreements between two parties to buy and sell currencies at a set price on a future date. These contracts are used to hedge foreign exchange risk. The U.S. dollar value of forward currency contracts is determined using current forward currency exchange rates supplied by a quotation service. The market value of the contract will fluctuate with changes in currency exchange rates. The contract is marked to market daily and the change in market value is recorded as an unrealized gain or loss. When the contract is closed, the fund records a realized gain or loss equal to the difference between the value of the contract at the time it was opened and the value at the time it was closed. The fund could be exposed to risk if the value of the currency changes unfavorably, if the counterparties to the contracts are unable to meet the terms of their contracts or if the fund is unable to enter into a closing position. Risks may exceed amounts recognized on the Statement of assets and liabilities. Forward currency contracts outstanding at period end, if any, are listed after the fund’s portfolio. The fund had an average contract amount of approximately $1,036,000 on forward currency contracts for the reporting period.
G) Total return swap contracts The fund enters into total return swap contracts, which are arrangements to exchange a market linked return for a periodic payment, both based on a notional principal amount to gain exposure to specific sectors/industries. To the extent that the total return of the security, index or other financial measure underlying the transaction exceeds or falls short of the offsetting interest rate obligation, the fund will receive a payment from or make a payment to the counterparty. Total return swap contracts are marked to market daily based upon quotations from market makers and the change, if any, is recorded as an unrealized gain or loss. Payments received or made are recorded as realized gains or losses. Certain total return swap contracts may include extended effective dates. Payments related to these swap contracts are accrued based on the terms of the contract. The fund could be exposed to credit or market risk due to unfavorable changes in the fluctuation of interest rates or in the price of the underlying security or index, the possibility that there is no liquid market for these agreements or that the counterparty may default on its obligation to perform. The fund’s maximum risk of loss from counterparty risk is the fair value of the contract. This risk may be mitigated by having a master netting arrangement between the fund and the counterparty. Risk of loss may exceed amounts recognized on the Statement of assets and liabilities. Total return swap contracts outstanding at period end, if any, are listed after the fund’s portfolio. Outstanding notional on total return swap contracts at the close of the reporting period are indicative of the volume of activity during the period.
H) Master agreements The fund is a party to ISDA (International Swap and Derivatives Association, Inc.) Master Agreements (Master Agreements) with certain counterparties that govern over-the-counter derivative and foreign exchange contracts entered into from time to time. The Master Agreements may contain provisions regarding, among other things, the parties’ general obligations, representations, agreements, collateral requirements, events
34
of default and early termination. With respect to certain counterparties, in accordance with the terms of the Master Agreements, collateral posted to the fund is held in a segregated account by the fund’s custodian and with respect to those amounts which can be sold or repledged, are presented in the fund’s portfolio. Collateral posted to the fund which cannot be sold or repledged totaled $269,906 at the close of the reporting period. Collateral pledged by the fund is segregated by the fund’s custodian and identified in the fund’s portfolio. Collateral can be in the form of cash or debt securities issued by the U.S. Government or related agencies or other securities as agreed to by the fund and the applicable counterparty. Collateral requirements are determined based on the fund’s net position with each counterparty. Termination events applicable to the fund may occur upon a decline in the fund’s net assets below a specified threshold over a certain period of time. Termination events applicable to counterparties may occur upon a decline in the counterparty’s long-term and short-term credit ratings below a specified level. In each case, upon occurrence, the other party may elect to terminate early and cause settlement of all derivative and foreign exchange contracts outstanding, including the payment of any losses and costs resulting from such early termination, as reasonably determined by the terminating party. Any decision by one or more of the fund’s counterparties to elect early termination could impact the fund’s future derivative activity.
At the close of the reporting period, the fund had a net liability position of $68,816 on derivative contracts subject to the Master Agreements. There was no collateral posted by the fund.
I) Securities lending The fund may lend securities, through its agent, to qualified borrowers in order to earn additional income. The loans are collateralized by cash in an amount at least equal to the market value of the securities loaned. The market value of securities loaned is determined daily and any additional required collateral is allocated to the fund on the next business day. The risk of borrower default will be borne by the fund’s agent; the fund will bear the risk of loss with respect to the investment of the cash collateral. Income from securities lending is included in investment income on the Statement of operations. Effective August 2010, cash collateral is invested in Putnam Cash Collateral Pool, LLC, a limited liability company managed by an affiliate of Putnam Management. Investments in Putnam Cash Collateral Pool, LLC are valued at its closing net asset value each business day. There are no management fees charged by Putnam Cash Collateral Pool, LLC. At the close of the reporting period, the value of securities loaned amounted to $40,962,740 and the fund received cash collateral of $41,213,788.
J) Interfund lending Effective July 2010, the fund, along with other Putnam funds, may participate in an inter-fund lending program pursuant to an exemptive order issued by the Securities and Exchange Commission (the SEC). This program allows the fund to borrow from or lend to other Putnam funds that permit such transactions. Interfund lending transactions are subject to each fund’s investment policies and borrowing and lending limits. Interest earned or paid on the interfund lending transaction will be based on the average of certain current market rates. During the reporting period, the fund did not utilize the program.
K) Line of credit Effective July 2010, the fund participates, along with other Putnam funds, in a $285 million unsecured committed line of credit and a $165 million unsecured uncommitted line of credit, both provided by State Street Bank and Trust Company (State Street). Borrowings may be made for temporary or emergency purposes, including the funding of shareholder redemption requests and trade settlements. Interest is charged to the fund based on the fund’s borrowing at a rate equal to the Federal Funds rate plus 1.25% for the committed line of credit and the Federal Funds rate plus 1.30% for the uncommitted line of credit. A closing fee equal to 0.03% of the committed line of credit and $100,000 for the uncommitted line of credit has been paid by the participating funds. In addition, a commitment fee of 0.15% per annum on any unutilized portion of the committed line of credit is allocated to the participating funds based on their relative net assets and paid quarterly. During the reporting period, the fund had no borrowings against these arrangements.
L) Federal taxes It is the policy of the fund to distribute all of its taxable income within the prescribed time period and otherwise comply with the provisions of the Internal Revenue Code of 1986, as amended (the Code), applicable to regulated investment companies. It is also the intention of the fund to distribute an amount sufficient to avoid imposition of any excise tax under Section 4982 of the Code. The fund is subject to the provisions of Accounting Standards Codification ASC 740 Income Taxes (ASC 740). ASC 740 sets forth a minimum threshold for financial statement recognition of the benefit of a tax position taken or expected to be taken in a tax return. The fund did not have a liability to record for any unrecognized tax benefits in the accompanying financial statements. No provision has been made for federal taxes on income, capital gains or unrealized appreciation on securities held nor for excise tax on income and capital gains. Each of the fund’s federal tax returns for the prior three fiscal years remains subject to examination by the Internal Revenue Service.
35
At July 31, 2010, the fund had a capital loss carryover of $814,062,755 available to the extent allowed by the Code to offset future net capital gain, if any. The amounts of the carryovers and the expiration dates are:
| | |
| Loss carryover | | Expiration |
|
| $773,706,178 | | July 31, 2011 |
|
| 29,764,682 | | July 31, 2017 |
|
| 10,591,895 | | July 31, 2018 |
|
The aggregate identified cost on a tax basis is $346,240,230, resulting in gross unrealized appreciation and depreciation of $68,890,283 and $7,607,713, respectively, or net unrealized appreciation of $61,282,570.
M) Distributions to shareholders Distributions to shareholders from net investment income are recorded by the fund on the ex-dividend date. Distributions from capital gains, if any, are recorded on the ex-dividend date and paid at least annually. The amount and character of income and gains to be distributed are determined in accordance with income tax regulations, which may differ from generally accepted accounting principles. Dividend sources are estimated at the time of declaration. Actual results may vary. Any non-taxable return of capital cannot be determined until final tax calculations are completed after the end of the fund’s fiscal year. Reclassifications are made to the fund’s capital accounts to reflect income and gains available for distribution (or available capital loss carryovers) under income tax regulations.
N) Expenses of the Trust Expenses directly charged or attributable to any fund will be paid from the assets of that fund. Generally, expenses of the Trust will be allocated among and charged to the assets of each fund on a basis that the Trustees deem fair and equitable, which may be based on the relative assets of each fund or the nature of the services performed and relative applicability to each fund.
Note 2: Management fee, administrative services and other transactions
The fund pays Putnam Management a management fee (base fee) (based on the fund’s average net assets and computed and paid monthly) at annual rates that may vary based on the average of the aggregate net assets of most open-end funds, as defined in the fund’s management contract, sponsored by Putnam Management. Such annual rates may vary as follows: 0.710% of the first $5 billion, 0.660% of the next $5 billion, 0.610% of the next $10 billion, 0.560% of the next $10 billion, 0.510% of the next $50 billion, 0.490% of the next $50 billion, 0.480% of the next $100 billion and 0.475% of any excess thereafter.
In addition, beginning with the fund’s thirteenth complete calendar month of operation under the management contract (January 2011), the monthly management fee consists of the monthly base fee plus or minus a performance adjustment for the month. The performance adjustment is determined based on performance over the thirty-six month period then ended or, if the management contract has not yet been effective for thirty-six complete calendar months, the period from the date the management contract became effective to the end of the month for which the fee adjustment is being computed. Each month, the performance adjustment is calculated by multiplying the performance adjustment rate and the fund’s average net assets over the performance period and the result is divided by twelve. The resulting dollar amount is added to, or subtracted from, the base fee for that month. The performance adjustment rate is equal to 0.03 multiplied by the difference between the fund’s annualized performance (measured by the fund’s class A shares) and the annualized performance of the Russell 1000 Growth Index, each measured over the performance period. The maximum annualized performance adjustment rates are +/– 0.12%. The monthly base fee is determined based on the fund’s average net assets for the month, while the performance adjustment will be determined based on the fund’s average net assets over the performance period of up to thirty-six months. This means it is possible that, if the fund underperforms significantly over the performance period, and the fund’s assets have declined significantly over that period, the negative performance adjustment may exceed the base fee. In this event, Putnam Management would make a payment to the fund.
For the reporting period ended, the base fee represented an effective rate of 0.28% of the fund’s average net assets before an increase of $9,618 (less than 0.01% of the fund’s average net assets) based on performance.
Putnam Management has contractually agreed, through June 30, 2011, to waive fees or reimburse the fund’s expenses to the extent necessary to limit the cumulative expenses of the fund, exclusive of brokerage, interest, taxes, investment-related expenses, extraordinary expenses and payments under the fund’s investor servicing contract, investment management contract and distribution plans, on a fiscal year-to-date basis to an annual rate
36
of 0.20% of the fund’s average net assets over such fiscal year-to-date period. During the reporting period, the fund’s expenses were not reduced as a result of this limit.
Putnam Investments Limited (PIL), an affiliate of Putnam Management, is authorized by the Trustees to manage a separate portion of the assets of the fund as determined by Putnam Management from time to time. Putnam Management pays a quarterly sub-management fee to PIL for its services at an annual rate of 0.35% of the average net assets of the portion of the fund managed by PIL.
The fund reimburses Putnam Management an allocated amount for the compensation and related expenses of certain officers of the fund and their staff who provide administrative services to the fund. The aggregate amount of all such reimbursements is determined annually by the Trustees.
Custodial functions for the fund’s assets are provided by State Street. Custody fees are based on the fund’s asset level, the number of its security holdings and transaction volumes.
Putnam Investor Services, Inc., an affiliate of Putnam Management, provides investor servicing agent functions to the fund. Putnam Investor Services, Inc. received fees for investor servicing based on the fund’s retail asset level, the number of shareholder accounts in the fund and the level of defined contribution plan assets in the fund. Investor servicing fees will not exceed an annual rate of 0.375% of the fund’s average net assets. The amounts incurred for investor servicing agent functions during the reporting period are included in Investor servicing fees in the Statement of operations.
The fund has entered into expense offset arrangements with Putnam Investor Services, Inc. and State Street whereby Putnam Investor Services, Inc.’s and State Street’s fees are reduced by credits allowed on cash balances. The fund also reduced expenses through brokerage/service arrangements. For the reporting period, the fund’s expenses were reduced by $916 under the expense offset arrangements and by $15,637 under the brokerage/service arrangements.
Each independent Trustee of the fund receives an annual Trustee fee, of which $226, as a quarterly retainer, has been allocated to the fund, and an additional fee for each Trustees meeting attended. Trustees also are reimbursed for expenses they incur relating to their services as Trustees.
The fund has adopted a Trustee Fee Deferral Plan (the Deferral Plan) which allows the Trustees to defer the receipt of all or a portion of Trustees fees payable on or after July 1, 1995. The deferred fees remain invested in certain Putnam funds until distribution in accordance with the Deferral Plan.
The fund has adopted an unfunded noncontributory defined benefit pension plan (the Pension Plan) covering all Trustees of the fund who have served as a Trustee for at least five years and were first elected prior to 2004. Benefits under the Pension Plan are equal to 50% of the Trustee’s average annual attendance and retainer fees for the three years ended December 31, 2005. The retirement benefit is payable during a Trustee’s lifetime, beginning the year following retirement, for the number of years of service through December 31, 2006. Pension expense for the fund is included in Trustee compensation and expenses in the Statement of operations. Accrued pension liability is included in Payable for Trustee compensation and expenses in the Statement of assets and liabilities. The Trustees have terminated the Pension Plan with respect to any Trustee first elected after 2003.
The fund has adopted distribution plans (the Plans) with respect to its class A, class B, class C, class M and class R shares pursuant to Rule 12b-1 under the Investment Company Act of 1940. The purpose of the Plans is to compensate Putnam Retail Management Limited Partnership, a wholly-owned subsidiary of Putnam Investments, LLC and Putnam Retail Management GP, Inc., for services provided and expenses incurred in distributing shares of the fund. The Plans provide for payments by the fund to Putnam Retail Management Limited Partnership at an annual rate of up to 0.35%, 1.00%, 1.00%, 1.00% and 1.00% of the average net assets attributable to class A, class B, class C, class M and class R shares, respectively. The Trustees have approved payment by the fund at an annual rate of 0.25%, 1.00%, 1.00%, 0.75% and 0.50% of the average net assets attributable to class A, class B, class C, class M and class R shares, respectively.
For the reporting period, Putnam Retail Management Limited Partnership, acting as underwriter, received net commissions of $17,252 and $225 from the sale of class A and class M shares, respectively, and received $16,789 and $127 in contingent deferred sales charges from redemptions of class B and class C shares, respectively.
A deferred sales charge of up to 1.00% and 0.65% is assessed on certain redemptions of class A and class M shares, respectively. For the reporting period, Putnam Retail Management Limited Partnership, acting as underwriter, received $21 and no monies on class A and class M redemptions, respectively.
37
Note 3: Purchases and sales of securities
During the reporting period, cost of purchases and proceeds from sales of investment securities other than short-term investments aggregated $141,941,173 and $156,043,311, respectively. There were no purchases or proceeds from sales of long-term U.S. government securities.
Written option transactions during the reporting period are summarized as follows:
| | |
| | Contract amounts | Premiums received |
|
| Written options outstanding | | |
| at beginning of the reporting period | — | $— |
|
| Options opened | 58,656 | 117,312 |
| Options exercised | — | — |
| Options expired | (58,656) | (117,312) |
| Options closed | — | — |
|
| Written options outstanding | | |
| at end of the reporting period | — | $— |
|
Note 4: Capital shares
At the close of the reporting period, there was an unlimited number of shares of beneficial interest authorized.
Transactions in capital shares were as follows:
| | | | |
| | Six months ended 1/31/11 | Year ended 7/31/10 |
|
| Class A | Shares | Amount | Shares | Amount |
|
| Shares sold | 870,105 | $13,090,099 | 1,680,141 | $23,075,904 |
|
| Shares issued in connection with | | | | |
| reinvestment of distributions | — | — | 81,173 | 1,096,643 |
|
| | 870,105 | 13,090,099 | 1,761,314 | 24,172,547 |
|
| Shares repurchased | (1,812,943) | (27,551,776) | (3,663,483) | (50,183,806) |
|
| Net decrease | (942,838) | $(14,461,677) | (1,902,169) | $(26,011,259) |
|
| |
| | Six months ended 1/31/11 | Year ended 7/31/10 |
|
| Class B | Shares | Amount | Shares | Amount |
|
| Shares sold | 60,826 | $848,076 | 210,585 | $2,674,530 |
|
| Shares issued in connection with | | | | |
| reinvestment of distributions | — | — | — | — |
|
| | 60,826 | 848,076 | 210,585 | 2,674,530 |
|
| Shares repurchased | (439,434) | (6,116,201) | (1,239,441) | (15,727,420) |
|
| Net decrease | (378,608) | $(5,268,125) | (1,028,856) | $(13,052,890) |
|
| |
| | Six months ended 1/31/11 | Year ended 7/31/10 |
|
| Class C | Shares | Amount | Shares | Amount |
|
| Shares sold | 25,586 | $366,701 | 66,119 | $846,853 |
|
| Shares issued in connection with | | | | |
| reinvestment of distributions | — | — | — | — |
|
| | 25,586 | 366,701 | 66,119 | 846,853 |
|
| Shares repurchased | (82,484) | (1,180,035) | (172,151) | (2,201,988) |
|
| Net decrease | (56,898) | $(813,334) | (106,032) | $(1,355,135) |
|
38
| | | | |
| | Six months ended 1/31/11 | Year ended 7/31/10 |
|
| Class M | Shares | Amount | Shares | Amount |
|
| Shares sold | 5,316 | $77,607 | 16,372 | $214,790 |
|
| Shares issued in connection with | | | | |
| reinvestment of distributions | — | — | 28 | 362 |
|
| | 5,316 | 77,607 | 16,400 | 215,152 |
|
| Shares repurchased | (23,597) | (340,806) | (60,970) | (796,202) |
|
| Net decrease | (18,281) | $(263,199) | (44,570) | $(581,050) |
|
| |
| | Six months ended 1/31/11 | Year ended 7/31/10 |
|
| Class R | Shares | Amount | Shares | Amount |
|
| Shares sold | 7,728 | $115,695 | 6,107 | $81,723 |
|
| Shares issued in connection with | | | | |
| reinvestment of distributions | — | — | 45 | 597 |
|
| | 7,728 | 115,695 | 6,152 | 82,320 |
|
| Shares repurchased | (3,904) | (62,663) | (3,571) | (48,234) |
|
| Net increase | 3,824 | $53,032 | 2,581 | $34,086 |
|
| |
| | Six months ended 1/31/11 | Year ended 7/31/10 |
|
| Class Y | Shares | Amount | Shares | Amount |
|
| Shares sold | 226,955 | $3,770,909 | 85,523 | $1,187,350 |
|
| Shares issued in connection with | | | | |
| reinvestment of distributions | — | — | 2,657 | 36,798 |
|
| | 226,955 | 3,770,909 | 88,180 | 1,224,148 |
|
| Shares repurchased | (39,251) | (621,610) | (102,695) | (1,463,639) |
|
| Net increase (decrease) | 187,704 | $3,149,299 | (14,515) | $(239,491) |
|
Note 5: Summary of derivative activity
The following is a summary of the market values of derivative instruments as of the close of the reporting period:
Market values of derivative instruments as of the close of the reporting period
| | | | |
| | Asset derivatives | Liability derivatives |
|
| Derivatives not | | | | |
| accounted for as | Statement of | | Statement of | |
| hedging instruments | assets and | | assets and | |
| under ASC 815 | liabilities location | Market value | liabilities location | Market value |
|
| Foreign exchange | | | | |
| contracts | Receivables | $— | Payables | $34,553 |
|
| | Investments, | | | |
| Equity contracts | Receivables | 2,041,612 | Payables | 51,097 |
|
| Total | | $2,041,612 | | $85,650 |
|
39
The following is a summary of realized and change in unrealized gains or losses of derivative instruments on the Statement of operations for the reporting period (see Note 1):
Amount of realized gain or (loss) on derivatives recognized in net gain or (loss) on investments
| | | | | | |
| Derivatives not | | | | | | |
| accounted for as | | | | Forward | | |
| hedging instruments | | | | currency | | |
| under ASC 815 | Options | Warrants | Futures | contracts | Swaps | Total |
|
| Foreign exchange | | | | | | |
| contracts | $— | $— | $— | $(72,494) | $— | $(72,494) |
|
| Equity contracts | (67,806) | 44,059 | (7,615) | — | 741,285 | $709,923 |
|
| Total | $(67,806) | $44,059 | $(7,615) | $(72,494) | $741,285 | $637,429 |
|
Change in unrealized appreciation or (depreciation) on derivatives recognized in net gain or (loss) on investments
| | | | | |
| Derivatives not | | | | | |
| accounted for as | | | Forward | | |
| hedging instruments | | | currency | | |
| under ASC 815 | Options | Warrants | contracts | Swaps | Total |
|
| Foreign exchange | | | | | |
| contracts | $— | $— | $(17,044) | $— | $(17,044) |
|
| Equity contracts | 92,602 | (615) | — | (255,209) | $(163,222) |
|
| Total | $92,602 | $(615) | $(17,044) | $(255,209) | $(180,266) |
|
Note 6: Investment in Putnam Money Market Liquidity Fund
The fund invested in Putnam Money Market Liquidity Fund, an open-end management investment company managed by Putnam Management. Investments in Putnam Money Market Liquidity Fund are valued at its closing net asset value each business day. Income distributions earned by the fund are recorded as interest income in the Statement of operations and totaled $5,039 for the reporting period. During the reporting period, cost of purchases and proceeds of sales of investments in Putnam Money Market Liquidity Fund aggregated $49,886,990 and $44,606,889, respectively. Management fees charged to Putnam Money Market Liquidity Fund have been waived by Putnam Management.
Note 7: Regulatory matters and litigation
In late 2003 and 2004, Putnam Management settled charges brought by the SEC and the Massachusetts Securities Division in connection with excessive short-term trading in Putnam funds. Distribution of payments from Putnam Management to certain open-end Putnam funds and their shareholders is expected to be completed in the next several months. These allegations and related matters have served as the general basis for certain lawsuits, including purported class action lawsuits against Putnam Management and, in a limited number of cases, some Putnam funds. Putnam Management believes that these lawsuits will have no material adverse effect on the funds or on Putnam Management’s ability to provide investment management services. In addition, Putnam Management has agreed to bear any costs incurred by the Putnam funds as a result of these matters.
Note 8: Market and credit risk
In the normal course of business, the fund trades financial instruments and enters into financial transactions where risk of potential loss exists due to changes in the market (market risk) or failure of the contracting party to the transaction to perform (credit risk). The fund may be exposed to additional credit risk that an institution or other entity with which the fund has unsettled or open transactions will default.
40
Services for shareholders
Investor services
Systematic investment plan Tell us how much you wish to invest regularly — weekly, semimonthly, or monthly — and the amount you choose will be transferred automatically from your checking or savings account. There’s no additional fee for this service, and you can suspend it at any time. This plan may be a great way to save for college expenses or to plan for your retirement.
Please note that regular investing does not guarantee a profit or protect against loss in a declining market. Before arranging a systematic investment plan, consider your financial ability to continue making purchases in periods when prices are low.
Systematic exchange You can make regular transfers from one Putnam fund to another Putnam fund. There are no additional fees for this service, and you can cancel or change your options at any time.
Dividends PLUS You can choose to have the dividend distributions from one of your Putnam funds automatically reinvested in another Putnam fund at no additional charge.
Free exchange privilege You can exchange money between Putnam funds free of charge, as long as they are the same class of shares. A signature guarantee is required if you are exchanging more than $500,000. The fund reserves the right to revise or terminate the exchange privilege.
Reinstatement privilege If you’ve sold Putnam shares or received a check for a dividend or capital gain, you may reinvest the proceeds with Putnam within 90 days of the transaction and they will be reinvested at the fund’s current net asset value — with no sales charge. However, reinstatement of class B shares may have special tax consequences. Ask your financial or tax representative for details.
Check-writing service You have ready access to many Putnam accounts. It’s as simple as writing a check, and there are no special fees or service charges. For more information about the check-writing service, call Putnam or visit our Web site.
Dollar cost averaging When you’re investing for long-term goals, it’s time, not timing, that counts. Investing on a systematic basis is a better strategy than trying to figure out when the markets will go up or down. This means investing the same amount of money regularly over a long period. This method of investing is called dollar cost averaging. When a fund’s share price declines, your investment dollars buy more shares at lower prices. When it increases, they buy fewer shares. Over time, you will pay a lower average price per share.
For more information
Visit the Individual Investors section at putnam.com A secure section of our Web site contains complete information on your account, including balances and transactions, updated daily. You may also conduct transactions, such as exchanges, additional investments, and address changes. Log on today to get your password.
Call us toll free at 1-800-225-1581 Ask a helpful Putnam representative or your financial advisor for details about any of these or other services, or see your prospectus.
41
The Putnam family of funds
The following is a list of Putnam’s open-end mutual funds offered to the public. Investors should carefully consider the investment objective, risks, charges, and expenses of a fund before investing. For a prospectus, or a summary prospectus if available, containing this and other information for any Putnam fund or product, call your financial advisor at 1-800-225-1581 and ask for a prospectus. Please read the prospectus carefully before investing.
| |
| Growth | Value |
| Growth Opportunities Fund | Convertible Securities Fund |
| International Growth Fund | Prior to September 30, 2010, the fund was known as |
| Prior to January 1, 2010, the fund was known as | Putnam Convertible Income-Growth Trust |
| Putnam International New Opportunities Fund | Equity Income Fund |
| Multi-Cap Growth Fund | George Putnam Balanced Fund |
| Prior to September 1, 2010, the fund was known as | Prior to September 30, 2010, the fund was known as |
| Putnam New Opportunities Fund | The George Putnam Fund of Boston |
| Small Cap Growth Fund | The Putnam Fund for Growth and Income |
| Voyager Fund | International Value Fund |
| | Prior to January 1, 2010, the fund was known as |
| Blend | Putnam International Growth and Income Fund |
| Asia Pacific Equity Fund | Multi-Cap Value Fund |
| Capital Opportunities Fund | Prior to September 1, 2010, the fund was known as |
| Capital Spectrum Fund | Putnam Mid Cap Value Fund |
| Emerging Markets Equity Fund | Small Cap Value Fund |
| Equity Spectrum Fund | |
| Europe Equity Fund | Income |
| Global Equity Fund | American Government Income Fund |
| International Capital Opportunities Fund | Diversified Income Trust |
| International Equity Fund | Floating Rate Income Fund |
| Investors Fund | Global Income Trust |
| Multi-Cap Core Fund | High Yield Advantage Fund |
| Research Fund | High Yield Trust |
| Income Fund |
| | Money Market Fund* |
| | U.S. Government Income Trust |
* An investment in a money market fund is not insured or guaranteed by the Federal Deposit Insurance Corporation or any other government agency. Although the fund seeks to preserve the value of your investment at $1.00 per share, it is possible to lose money by investing in the fund.
42
| |
| Tax-free income | Asset allocation |
| AMT-Free Municipal Fund | Income Strategies Fund |
| Tax Exempt Income Fund | Putnam Asset Allocation Funds — three |
| Tax Exempt Money Market Fund* | investment portfolios that spread your |
| Tax-Free High Yield Fund | money across a variety of stocks, bonds, |
| | and money market investments. |
| State tax-free income funds: | |
| Arizona, California, Massachusetts, Michigan, | The three portfolios: |
| Minnesota, New Jersey, New York, Ohio, | Asset Allocation: Balanced Portfolio |
| and Pennsylvania | Asset Allocation: Conservative Portfolio |
| | Asset Allocation: Growth Portfolio |
| Absolute Return | |
| Absolute Return 100 Fund | Putnam RetirementReady® |
| Absolute Return 300 Fund | Putnam RetirementReady Funds — 10 |
| Absolute Return 500 Fund | investment portfolios that offer diversifi- |
| Absolute Return 700 Fund | cation among stocks, bonds, and money |
| | market instruments and adjust to become |
| Global Sector | more conservative over time based on a |
| Global Consumer Fund | target date for withdrawing assets. |
| Global Energy Fund | |
| Global Financials Fund | The 10 funds: |
| Global Health Care Fund | Putnam RetirementReady 2055 Fund |
| Global Industrials Fund | Putnam RetirementReady 2050 Fund |
| Global Natural Resources Fund | Putnam RetirementReady 2045 Fund |
| Global Sector Fund | Putnam RetirementReady 2040 Fund |
| Global Technology Fund | Putnam RetirementReady 2035 Fund |
| Global Telecommunications Fund | Putnam RetirementReady 2030 Fund |
| Global Utilities Fund | Putnam RetirementReady 2025 Fund |
| | Putnam RetirementReady 2020 Fund |
| | Putnam RetirementReady 2015 Fund |
| | Putnam RetirementReady Maturity Fund |
A short-term trading fee of 1% may apply to redemptions or exchanges from certain funds within the time period specified in the fund's prospectus.
Check your account balances and the most recent month-end performance in the Individual Investors section at putnam.com.
43
Putnam’s commitment to confidentiality
In order to conduct business with our shareholders, we must obtain certain personal information such as account holders’ names, addresses, Social Security numbers, and dates of birth. Using this information, we are able to maintain accurate records of accounts and transactions.
It is our policy to protect the confidentiality of our shareholder information, whether or not a shareholder currently owns shares of our funds. In particular, it is our policy not to sell information about you or your accounts to outside marketing firms. We have safeguards in place designed to prevent unauthorized access to our computer systems and procedures to protect personal information from unauthorized use.
Within the Putnam organization, your information is shared with those who need it to service your account or provide you with information about other Putnam products or services. Under certain circumstances, we must also share account information with outside vendors who provide services to us, such as mailings and proxy solicitations. In these cases, the service providers enter into confidentiality agreements with us, and we provide only the information necessary to process transactions and perform other services related to your account. It is also our policy to share account information with your financial advisor, if you've provided us with information about your advisor and that person is listed on your Putnam account.
If you would like clarification about our confidentiality policies or have any questions or concerns, please don't hesitate to contact us at 1-800-225-1581, Monday through Friday, 8:00 a.m. to 8:00 p.m. Eastern Time.
44
Fund information
Founded over 70 years ago, Putnam Investments was built around the concept that a balance between risk and reward is the hallmark of a well-rounded financial program. We manage over 100 funds across income, value, blend, growth, asset allocation, absolute return, and global sector categories.
| | |
| Investment Manager | Kenneth R. Leibler | Mark C. Trenchard |
| Putnam Investment | Robert E. Patterson | Vice President and |
| Management, LLC | George Putnam, III | BSA Compliance Officer |
| One Post Office Square | Robert L. Reynolds | |
| Boston, MA 02109 | W. Thomas Stephens | Francis J. McNamara, III |
| | | Vice President and |
| Investment Sub-Manager | Officers | Chief Legal Officer |
| Putnam Investments Limited | Robert L. Reynolds | |
| 57–59 St James’s Street | President | James P. Pappas |
| London, England SW1A 1LD | | Vice President |
| | Jonathan S. Horwitz | |
| Marketing Services | Executive Vice President, | Judith Cohen |
| Putnam Retail Management | Principal Executive | Vice President, Clerk and |
| One Post Office Square | Officer, Treasurer and | Assistant Treasurer |
| Boston, MA 02109 | Compliance Liaison | |
| | | Michael Higgins |
| Custodian | Steven D. Krichmar | Vice President, Senior Associate |
| State Street Bank | Vice President and | Treasurer and Assistant Clerk |
| and Trust Company | Principal Financial Officer | |
| | | Nancy E. Florek |
| Legal Counsel | Janet C. Smith | Vice President, Assistant Clerk, |
| Ropes & Gray LLP | Vice President, Assistant | Assistant Treasurer and |
| | Treasurer and Principal | Proxy Manager |
| Trustees | Accounting Officer | |
| John A. Hill, Chairman | | Susan G. Malloy |
| Jameson A. Baxter, | Beth S. Mazor | Vice President and |
| Vice Chairman | Vice President | Assistant Treasurer |
| Ravi Akhoury | | |
| Barbara M. Baumann | Robert R. Leveille | |
| Charles B. Curtis | Vice President and | |
| Robert J. Darretta | Chief Compliance Officer | |
| Paul L. Joskow | | |
| | |
This report is for the information of shareholders of Putnam Growth Opportunities Fund. It may also be used as sales literature when preceded or accompanied by the current prospectus, the most recent copy of Putnam’s Quarterly Performance Summary, and Putnam’s Quarterly Ranking Summary. For more recent performance, please visit putnam.com. Investors should carefully consider the investment objective, risks, charges, and expenses of a fund, which are described in its prospectus. For this and other information or to request a prospectus, or a summary prospectus if available, call 1-800-225-1581 toll free. Please read the prospectus carefully before investing. The fund’s Statement of Additional Information contains additional information about the fund’s Trustees and is available without charge upon request by calling 1-800-225-1581.

Item 2. Code of Ethics:
Not applicable
Item 3. Audit Committee Financial Expert:
Not applicable
Item 4. Principal Accountant Fees and Services:
Not applicable
Item 5. Audit Committee of Listed Registrants
Not applicable
Item 6. Schedule of Investments:
The registrant’s schedule of investments in unaffiliated issuers is included in the report to shareholders in Item 1 above.
Item 7. Disclosure of Proxy Voting Policies and Procedures For Closed-End Management Investment Companies:
Not applicable
Item 8. Portfolio Managers of Closed-End Investment Companies
Not Applicable
Item 9. Purchases of Equity Securities by Closed-End Management Investment Companies and Affiliated Purchasers:
Not applicable
Item 10. Submission of Matters to a Vote of Security Holders:
Not applicable
Item 11. Controls and Procedures:
(a) The registrant's principal executive officer and principal financial officer have concluded, based on their evaluation of the effectiveness of the design and operation of the registrant's disclosure controls and procedures as of a date within 90 days of the filing date of this report, that the design and operation of such procedures are generally effective to provide reasonable assurance that information required to be disclosed by the registrant in this report is recorded, processed, summarized and reported within the time periods specified in the Commission's rules and forms.
(b) Changes in internal control over financial reporting: Not applicable
Item 12. Exhibits:
(a)(1) Not applicable
(a)(2) Separate certifications for the principal executive officer and principal financial officer of the registrant as required by Rule 30a-2(a) under the Investment Company Act of 1940, as amended, are filed herewith.
(b) The certifications required by Rule 30a-2(b) under the Investment Company Act of 1940, as amended, are filed herewith.
Putnam Investment Funds
By (Signature and Title):
/s/Janet C. Smith
Janet C. Smith
Principal Accounting Officer
Date: March 31, 2011
Pursuant to the requirements of the Securities Exchange Act of 1934 and the Investment Company Act of 1940, this report has been signed below by the following persons on behalf of the registrant and in the capacities and on the dates indicated.
By (Signature and Title):
/s/Jonathan S. Horwitz
Jonathan S. Horwitz
Principal Executive Officer
Date: March 31, 2011
By (Signature and Title):
/s/Steven D. Krichmar
Steven D. Krichmar
Principal Financial Officer
Date: March 31, 2011
| | | |
| UNITED STATES |
| SECURITIES AND EXCHANGE COMMISSION |
| Washington, D.C. 20549 |
| |
| FORM N-CSR |
| |
| CERTIFIED SHAREHOLDER REPORT OF REGISTERED |
| MANAGEMENT INVESTMENT COMPANIES |
| | |
| Investment Company Act file number: (811-07237) | |
| | |
| Exact name of registrant as specified in charter: | Putnam Investment Funds |
| |
| Address of principal executive offices: One Post Office Square, Boston, Massachusetts 02109 |
| | |
| Name and address of agent for service: | Beth S. Mazor, Vice President |
| | One Post Office Square |
| | Boston, Massachusetts 02109 |
| | |
| Copy to: | | John W. Gerstmayr, Esq. |
| | Ropes & Gray LLP |
| | 800 Boylston Street |
| | Boston, Massachusetts 02199-3600 |
| | |
| Registrant’s telephone number, including area code: | (617) 292-1000 |
| | | |
| Date of fiscal year end: July 31, 2011 | | |
| |
| Date of reporting period: August 1, 2010 — January 31, 2011 |
Item 1. Report to Stockholders:
The following is a copy of the report transmitted to stockholders pursuant to Rule 30e-1 under the Investment Company Act of 1940:
Putnam
Research
Fund
Semiannual report
1 | 31 | 11
| | | |
| Message from the Trustees | 1 | | |
| | |
| About the fund | 2 | | |
| | |
| Performance snapshot | 4 | | |
| | |
| Interview with your fund’s portfolio managers | 5 | | |
| | |
| Your fund’s performance | 10 | | |
| | |
| Your fund’s expenses | 12 | | |
| | |
| Terms and definitions | 14 | | |
| | |
| Other information for shareholders | 15 | | |
| | |
| Financial statements | 16 | | |
| | |
Message from the Trustees
Dear Fellow Shareholder:
The U.S. economy and most economies around the world have continued to strengthen in early 2011, building on last year’s solid growth. The U.S. stock market added gains, delivering one of the best January returns in several years. Investors are encouraged by positive economic data, healthy corporate earnings, extended tax cuts, and historically low interest rates. Bond markets remain mixed, however, as U.S. Treasury yields have risen from their historic lows and investors have sought returns in riskier asset classes.
Putnam’s investment team maintains a positive outlook for U.S. equities in 2011, encouraged by steadily improving conditions in both the economy and in corporate America. The global outlook is less certain, with ongoing European debt issues, signs of inflation in emerging markets, and recent political uprisings in Egypt and other countries. While these global developments may well lead to future market volatility, we also believe that an active, research-focused manager like Putnam can uncover opportunities for shareholders in this environment.
In developments affecting oversight of your fund, we wish to thank Richard B. Worley and Myra R. Drucker, who have retired from the Board of Trustees, for their many years of dedicated and thoughtful leadership.
Lastly, we would like to take this opportunity to welcome new shareholders to the fund and to thank all of our investors for your continued confidence in Putnam.

About the fund
Building a portfolio of best ideas
Research is at the heart of investing. Whether it is undertaken by Wall Street firms or by Putnam’s in-house analysts, research is used by investment managers to assess whether a company’s stock is undervalued, overvalued, or on target at its current price.
One approach to determining a company’s worth is to measure its tangible assets, such as physical plants or inventory. Other measures of worth are less quantifiable and may involve the evaluation of the company’s long-term competitive advantage, the expertise of its management team, or the success of its research and development efforts.
Analysts consider these factors along with financial yardsticks such as the price-to-earnings ratio and earnings growth. By digging deep into the information available, analysts work to develop a set of expectations about the financial and competitive health of a specific company versus other firms in the industry — both in the United States and within the broader global marketplace. Of course, there is no foolproof way to uncover all information about a company, and surprises can always occur.
Putnam’s Global Equity Research team gathers information from on-site interviews with company management and through meetings with sources who are able to provide additional information about the company’s true worth and likely future direction.
By including Putnam Research Fund as part of a diversified portfolio, you are investing in what we like to call a “best ideas” fund: It represents the select stock picks of Putnam’s large-cap equity research analysts, incorporated into a single portfolio, regardless of investment style (growth or value). We believe that each stock pick represents a specialized and comprehensive view of a company, compiled by a focused, dedicated analyst.
Consider these risks before investing: Growth stocks may be more susceptible to earnings disappointments, and value stocks may fail to rebound. The market may not favor growth- or value-style investing.
Putnam’s research analysts specialize in sectors and industries
Consumer staples Broadcasting, lodging/tourism, department stores, retail, electronics, food, household goods, homebuilding, restaurants
Energy Integrated oil and gas, drilling, exploration, equipment, services
Financials Banking, brokerage, consumer finance, insurance, real estate investment trusts, mortgage finance
Health care Biotechnology, equipment, pharmaceuticals, services
Industrials Aerospace and defense, construction and farm machinery, electrical components, office services
Technology Computer hardware/software, semiconductors, services
Materials Gold, metals, paper products/packaging, specialty chemicals, steel
Telecommunications Alternative carriers, wireless services
Utilities Electric utilities, gas utilities, independent power producers
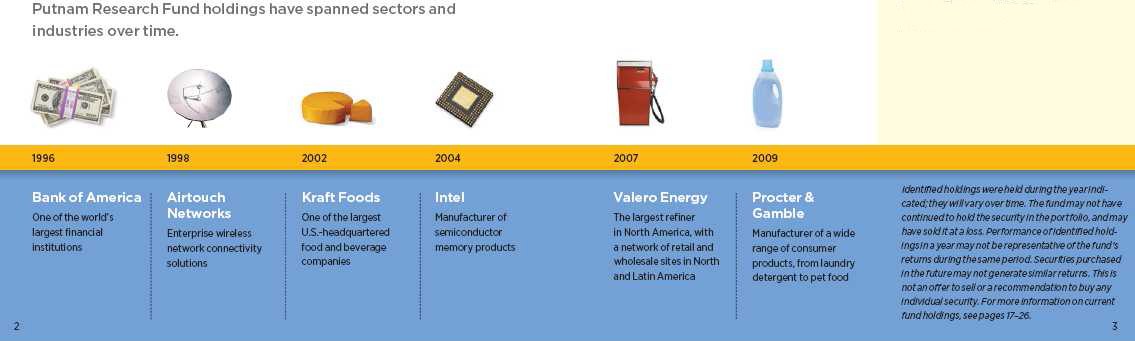
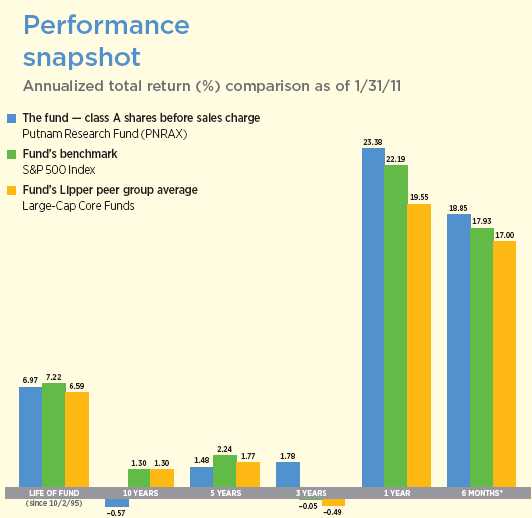
Current performance may be lower or higher than the quoted past performance, which cannot guarantee future results. Share price, principal value, and return will fluctuate, and you may have a gain or a loss when you sell your shares. Performance of class A shares assumes reinvestment of distributions and does not account for taxes. Fund returns in the bar chart do not reflect a sales charge of 5.75%; had they, returns would have been lower. See pages 5 and 10–11 for additional performance information. For a portion of the periods, the fund had expense limitations, without which returns would have been lower. A short-term trading fee of 1% may apply to redemptions or exchanges from certain funds within the time period specified in the fund’s prospectus. To obtain the most recent month-end performance, visit putnam.com.
* Returns for the six-month period are not annualized, but cumulative.
4
Interview with your fund’s portfolio managers
How did Putnam Research Fund perform in the fiscal year’s first half, which ended on January 31, 2011?
The fund’s class A shares finished the period with an 18.85% gain, above the 17.93% result of the benchmark S&P 500 Index. The fund also performed better than the average of its Lipper peer group, Large-Cap Core Funds, which was 17.00%. We achieved these results through our fundamental research process to identify attractive stocks in all sectors of the market.
Stocks advanced solidly again this period. What explains the market’s results?
Investors generally became more confident about the economic recovery, and stock prices rose in anticipation that growth would continue to support robust corporate earnings. At the beginning of the period, there was still considerable skepticism about the economy and fear of a double-dip recession. However, since September, data have shown the recovery to be on track. GDP grew at an annualized rate of 2.8% in the fourth quarter, up from 2.6% in the third quarter. In addition, the Fed’s decision to maintain low interest rates and inject more liquidity into financial markets through a renewed Treasury purchase program bolstered confidence. Near the end of the period, the federal government also took action to prevent taxes from rising, giving investors another reason to be optimistic. On a fundamental level, corporate profits remained impressive throughout the entire period.
Why did the fund perform better than the broader market?
Putnam Research Fund’s strategy focuses on stock selection, to showcase Putnam’s commitment to active investment management and fundamental research. The
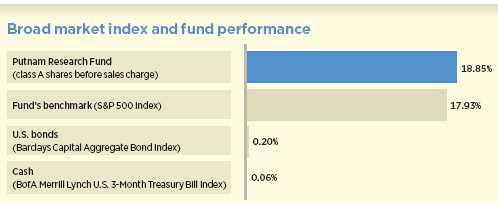
This comparison shows your fund’s performance in the context of broad market indexes for the six months ended 1/31/11. See pages 4 and 10–11 for additional fund performance information. Index descriptions can be found on page 14.
5
fund’s sector weightings are kept quite close to those of the benchmark so that the results, whether better or worse than the index, depend on our ability to identify stocks that can perform better than the market. We want to demonstrate our philosophy that talented, skilled, and experienced investors can assemble a better portfolio than the market in general. In this period, we are pleased to report that our stock selection across nearly all sectors contributed positively to the fund’s performance. In only one sector, financials, did results not keep pace with the benchmark.
What stocks contributed strong results on an individual basis?
A couple of the top contributors were energy stocks. This sector benefited from growing demand driven by the recovery in the U.S. and global economies, which led to higher prices for oil. One of the fund’s top performers was Hess, which we held as an overweight position relative to the benchmark. The company successfully increased its production at the Bakken field in North Dakota, and it is poised to undertake an aggressive exploration campaign that can add to its reserves. As a relatively large oil company it benefited disproportionately from rising oil prices. The fund also had an overweight position in National Oilwell Varco, which has benefited from the industry’s new emphasis on buying the newest and safest offshore rig equipment. Varco is the leading manufacturer of the key drilling and safety equipment for these rigs, and a large number of new offshore projects were announced last year.
In the technology sector, the fund held an overweight position in Atmel, a developer of semiconductor integrated circuits. This company, under new management, sold off underperforming divisions and reinvested the proceeds to become the market-share leader in touch-screen microchip technology. We sold this holding at a profit before the end of the fiscal period, when it reached what we considered fair value.
In the consumer cyclicals sector, the fund saw great results from an overweight position
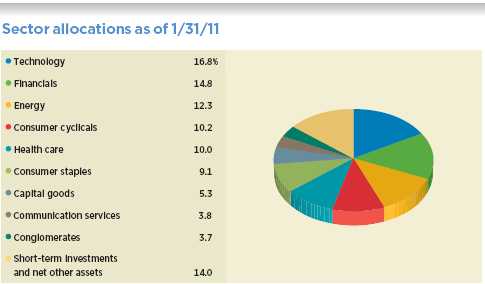
Allocations are represented as a percentage of the fund’s net assets. Summary information may differ from the portfolio schedule included in the financial statements due to the inclusion of derivative securities and the exclusion of as-of trades, if any, and the use of different classifications of securities for presentation purposes. Holdings and allocations may vary over time.
6
in Priceline.com. This company is a leading provider of online travel services in the United States and abroad. We added this to the portfolio before the beginning of the period, at a time when the stock had fallen in price because the Iceland volcano had shut down air travel across the North Atlantic, and consumer spending in general appeared in jeopardy. However, when the company reported earnings early in the period, the stock jumped higher, and it has continued to appreciate. We still believe the market has not yet fully recognized the stock’s potential, especially because 75% of its profits come from overseas, where growth is faster and the upside is greater than in the United States.

Where did you see disappointing performance?
Two of the fund’s for-profit college stocks underperformed the index, and for largely the same reasons. Career Education, which is an out-of-benchmark position, and Apollo Group, an overweight position versus the benchmark, have been penalized by the market because of concerns about new government regulations. The final rules to be issued soon by the U.S. Department of Education are likely to be quite burdensome, but in our view the market has overreacted in assigning low valuations to these stocks. We believe the companies are flexible enough to adjust to the regulations in ways that can enhance their long-term profitability.
For example, after receiving criticism for the number of students who did not complete their programs, yet took on debt, the companies now make greater efforts to attract students more likely to finish their degrees. This benefits the students and also helps the companies, because students who complete
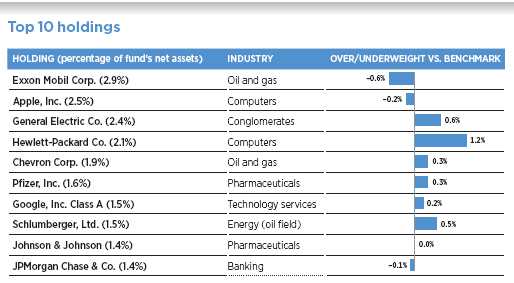
This table shows the fund’s top 10 holdings and the percentage of the fund’s net assets that each represented as of 1/31/11. Short-term holdings are excluded. Holdings will vary over time.
7
their programs pay more in tuition, without significant additional costs to the companies. We think the demand for education will remain high, and we believe these companies can find ways to grow profits even under new regulations. For these reasons, we continue to own both stocks.
Holdings in the financials sector also underperformed the index. An example is Assured Guaranty, which is based in Bermuda and specializes in credit protection products for public finance, infrastructure, and structured finance markets. The stock fell after Standard & Poor’s announced new ratings criteria for insurance companies, which suggested that Assured Guaranty needed to raise capital or face a downgrade. However, the announcement left the timing of the capital requirements uncertain.
Also, since the announcement, S&P continues to take feedback regarding its rating methods and may adjust them. In short, there is a cloud of uncertainty over the stock, but our fundamental research indicates the company can continue to grow its earnings. We believe that the uncertainty will be dispelled in coming months, giving the stock potential to appreciate.
What is your outlook for the stock market and for the fund?
We believe the market rally that began last September has some staying power. Corporate profits remain near some of the best levels in history, the economy appears to be gaining momentum, and there has even been some progress on reducing unemployment, which would help to support consumer spending.
At the same time, we are cognizant of the fact that new jobs are not yet being created at the same pace that is typical of past recoveries, and the housing market remains weak. Fortunately, companies have done well in generating earnings despite these weaknesses. We also expect to see greater
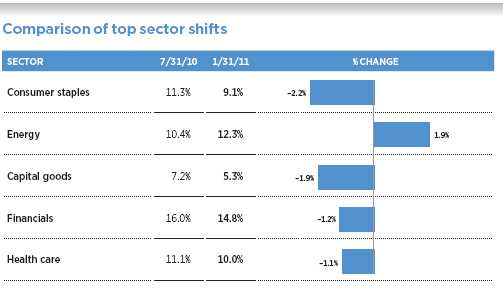
This chart shows the fund’s largest allocation shifts, by percentage, over the past six months. Weightings are shown as a percentage of net assets. Summary information may differ from the portfolio schedule included in the financial statements due to the inclusion of derivative securities and the exclusion of as-of trades, if any, and the use of different classifications of securities for presentation purposes. Holdings will vary over time.
8
disparities in stock performance during the coming period. During 2010 many stocks rose and fell in unison, reacting more to macroeconomic issues than to the fundamental characteristics of each individual company. We believe that it has led to some mispricings — some stocks are overvalued and a number are undervalued. In 2011, macro issues may begin to take a back seat, and company-level issues should become more important. We regard such an environment to be more fertile for the fundamental research and active stock selection that we employ with this fund.
Thank you for your time and insights.
The views expressed in this report are exclusively those of Putnam Management. They are not meant as investment advice.
Please note that the holdings discussed in this report may not have been held by the fund for the entire period. Portfolio composition is subject to review in accordance with the fund’s investment strategy and may vary in the future. Current and future portfolio holdings are subject to risk.
Your fund’s management team
Putnam Research Fund is managed by a team of senior equity analysts at Putnam: Kelsey Chen, Steven Curbow, George Gianarikas, Ferat Ongoren, Walter Scully, and Michael Yogg. They are overseen by Putnam’s Chief Investment Officer Walter Donovan, who has been in the investment industry since 1985.
IN THE NEWS
The U.S. economic recovery is progressing, although the unemployment rate remains persistently high. Increases in exports, consumer spending, and existing home sales drove the fourth-quarter GDP growth of 2.8%, the Commerce Department reported. At its December meeting, the Federal Open Market Committee noted that the recent economic growth has been “insufficient to bring about a significant improvement in labor market conditions.” In January, the U.S. unemployment rate did inch down to 9.0% from 9.4%. Consumer spending remains constrained by high unemployment, while businesses may be investing more in equipment and less on new hires.
9
Your fund’s performance
This section shows your fund’s performance, price, and distribution information for periods ended January 31, 2011, the end of the first half of its current fiscal year. In accordance with regulatory requirements for mutual funds, we also include performance as of the most recent calendar quarter-end and expense information taken from the fund’s current prospectus. Performance should always be considered in light of a fund’s investment strategy. Data represent past performance. Past performance does not guarantee future results. More recent returns may be less or more than those shown. Investment return and principal value will fluctuate, and you may have a gain or a loss when you sell your shares. Performance information does not reflect any deduction for taxes a shareholder may owe on fund distributions or on the redemption of fund shares. For the most recent month-end performance, please visit the Individual Investors section at putnam.com or call Putnam at 1-800-225-1581. Class R and class Y shares are not available to all investors. See the Terms and Definitions section in this report for definitions of the share classes offered by your fund.
Fund performance Total return for periods ended 1/31/11
| | | | | | | | | | |
| | Class A | Class B | Class C | Class M | Class R | Class Y |
| (inception dates) | (10/2/95) | (6/15/98) | (2/1/99) | (6/15/98) | (1/21/03) | (4/4/00) |
|
| | NAV | POP | NAV | CDSC | NAV | CDSC | NAV | POP | NAV | NAV |
|
| Annual average | | | | | | | | | | |
| (life of fund) | 6.97% | 6.56% | 6.13% | 6.13% | 6.17% | 6.17% | 6.44% | 6.19% | 6.71% | 7.16% |
|
| 10 years | –5.59 | –11.03 | –12.50 | –12.50 | –12.47 | –12.47 | –10.20 | –13.35 | –7.89 | –3.19 |
| Annual average | –0.57 | –1.16 | –1.33 | –1.33 | –1.32 | –1.32 | –1.07 | –1.42 | –0.82 | –0.32 |
|
| 5 years | 7.61 | 1.43 | 3.58 | 1.58 | 3.57 | 3.57 | 4.91 | 1.24 | 6.25 | 8.92 |
| Annual average | 1.48 | 0.28 | 0.71 | 0.31 | 0.70 | 0.70 | 0.96 | 0.25 | 1.22 | 1.72 |
|
| 3 years | 5.43 | –0.65 | 2.99 | –0.01 | 3.06 | 3.06 | 3.82 | 0.16 | 4.61 | 6.16 |
| Annual average | 1.78 | –0.22 | 0.99 | 0.00 | 1.01 | 1.01 | 1.26 | 0.05 | 1.51 | 2.01 |
|
| 1 year | 23.38 | 16.28 | 22.39 | 17.39 | 22.48 | 21.48 | 22.71 | 18.43 | 23.00 | 23.65 |
|
| 6 months | 18.85 | 12.00 | 18.40 | 13.40 | 18.41 | 17.41 | 18.62 | 14.43 | 18.75 | 19.04 |
|
Current performance may be lower or higher than the quoted past performance, which cannot guarantee future results. After-sales-charge returns (public offering price, or POP) for class A and M shares reflect a maximum 5.75% and 3.50% load, respectively. Class B share returns reflect the applicable contingent deferred sales charge (CDSC), which is 5% in the first year, declining over time to 1% in the sixth year, and is eliminated thereafter. Class C shares reflect a 1% CDSC for the first year that is eliminated thereafter. Class R and Y shares have no initial sales charge or CDSC. Performance for class B, C, M, R, and Y shares before their inception is derived from the historical performance of class A shares, adjusted for the applicable sales charge (or CDSC) and the higher operating expenses for such shares, except for class Y shares, for which 12b-1 fees are not applicable.
Prior performance benefited from the receipt of a Tyco International, Ltd. class action settlement pertaining to investments made prior to 2003.
For a portion of the periods, the fund had expense limitations, without which returns would have been lower.
Class B share performance does not reflect conversion to class A shares.
A short-term trading fee of 1% may apply to redemptions or exchanges from certain funds within the time period specified in the fund’s prospectus.
10
Comparative index returns For periods ended 1/31/11
| | |
| | | Lipper Large-Cap Core Funds |
| | S&P 500 Index | category average* |
|
| Annual average (life of fund) | 7.22% | 6.59% |
|
| 10 years | 13.76 | 16.34 |
| Annual average | 1.30 | 1.30 |
|
| 5 years | 11.69 | 9.58 |
| Annual average | 2.24 | 1.77 |
|
| 3 years | –0.16 | –1.29 |
| Annual average | –0.05 | –0.49 |
|
| 1 year | 22.19 | 19.55 |
|
| 6 months | 17.93 | 17.00 |
|
Index and Lipper results should be compared to fund performance at net asset value.
* Over the 6-month, 1-year, 3-year, 5-year, 10-year, and life-of-fund periods ended 1/31/11, there were 1,081, 1,063, 914, 769, 462, and 182 funds, respectively, in this Lipper category.
Fund price and distribution information For the six-month period ended 1/31/11
| | | | | | | | |
| Distributions | Class A | Class B | Class C | Class M | Class R | Class Y |
|
| Number | 1 | — | — | 1 | 1 | 1 |
|
| Income | $0.082 | — | — | $0.013 | $0.058 | $0.120 |
|
| Capital gains | — | — | — | — | — | — |
|
| Total | $0.082 | — | — | $0.013 | $0.058 | $0.120 |
|
| Share value | NAV | POP | NAV | NAV | NAV | POP | NAV | NAV |
|
| 7/31/10 | $13.08 | $13.88 | $12.28 | $12.33 | $12.59 | $13.05 | $13.02 | $13.16 |
|
| 1/31/11 | 15.46 | 16.40 | 14.54 | 14.60 | 14.92 | 15.46 | 15.40 | 15.54 |
|
The classification of distributions, if any, is an estimate. Final distribution information will appear on your year-end tax forms.
Fund performance as of most recent calendar quarter
Total return for periods ended 12/31/10
| | | | | | | | | | |
| | Class A | Class B | Class C | Class M | Class R | Class Y |
| (inception dates) | (10/2/95) | (6/15/98) | (2/1/99) | (6/15/98) | (1/21/03) | (4/4/00) |
|
| | NAV | POP | NAV | CDSC | NAV | CDSC | NAV | POP | NAV | NAV |
|
| Annual average | | | | | | | | | | |
| (life of fund) | 6.87% | 6.45% | 6.02% | 6.02% | 6.06% | 6.06% | 6.33% | 6.08% | 6.60% | 7.06% |
|
| 10 years | –4.04 | –9.56 | –11.03 | –11.03 | –11.02 | –11.02 | –8.73 | –11.95 | –6.34 | –1.60 |
| Annual average | –0.41 | –1.00 | –1.16 | –1.16 | –1.16 | –1.16 | –0.91 | –1.26 | –0.65 | –0.16 |
|
| 5 years | 7.63 | 1.47 | 3.58 | 1.58 | 3.64 | 3.64 | 5.00 | 1.32 | 6.27 | 9.02 |
| Annual average | 1.48 | 0.29 | 0.71 | 0.31 | 0.72 | 0.72 | 0.98 | 0.26 | 1.22 | 1.74 |
|
| 3 years | –3.74 | –9.25 | –5.92 | –8.75 | –5.88 | –5.88 | –5.14 | –8.45 | –4.45 | –3.01 |
| Annual average | –1.26 | –3.18 | –2.01 | –3.01 | –2.00 | –2.00 | –1.74 | –2.90 | –1.51 | –1.01 |
|
| 1 year | 16.31 | 9.61 | 15.39 | 10.38 | 15.40 | 14.40 | 15.68 | 11.62 | 16.00 | 16.59 |
|
| 6 months | 25.30 | 18.11 | 24.89 | 19.89 | 24.87 | 23.87 | 25.07 | 20.74 | 25.21 | 25.46 |
|
11
Your fund’s expenses
As a mutual fund investor, you pay ongoing expenses, such as management fees, distribution fees (12b-1 fees), and other expenses. Using the following information, you can estimate how these expenses affect your investment and compare them with the expenses of other funds. You may also pay one-time transaction expenses, including sales charges (loads) and redemption fees, which are not shown in this section and would have resulted in higher total expenses. For more information, see your fund’s prospectus or talk to your financial representative.
Expense ratios
| | | | | | |
| | Class A | Class B | Class C | Class M | Class R | Class Y |
|
| Total annual operating expenses for the fiscal year | | | | | | |
| ended 7/31/10* | 1.22% | 1.97% | 1.97% | 1.72% | 1.47% | 0.97% |
|
| Annualized expense ratio for the six-month period | | | | | | |
| ended 1/31/11 | 1.24% | 1.99% | 1.99% | 1.74% | 1.49% | 0.99% |
|
Fiscal-year expense information in this table is taken from the most recent prospectus, is subject to change, and may differ from that shown for the annualized expense ratio and in the financial highlights of this report. Expenses are shown as a percentage of average net assets.
* Restated to reflect projected expenses under a new management contract effective 1/1/10.
Expenses per $1,000
The following table shows the expenses you would have paid on a $1,000 investment in the fund from August 1, 2010, to January 31, 2011. It also shows how much a $1,000 investment would be worth at the close of the period, assuming actual returns and expenses.
| | | | | | |
| | Class A | Class B | Class C | Class M | Class R | Class Y |
|
| Expenses paid per $1,000*† | $6.84 | $10.95 | $10.96 | $9.59 | $8.22 | $5.47 |
|
| Ending value (after expenses) | $1,188.50 | $1,184.00 | $1,184.10 | $1,186.20 | $1,187.50 | $1,190.40 |
|
* Expenses for each share class are calculated using the fund’s annualized expense ratio for each class, which represents the ongoing expenses as a percentage of average net assets for the six months ended 1/31/11. The expense ratio may differ for each share class.
† Expenses are calculated by multiplying the expense ratio by the average account value for the period; then multiplying the result by the number of days in the period; and then dividing that result by the number of days in the year.
12
Estimate the expenses you paid
To estimate the ongoing expenses you paid for the six months ended January 31, 2011, use the following calculation method. To find the value of your investment on August 1, 2010, call Putnam at 1-800-225-1581.
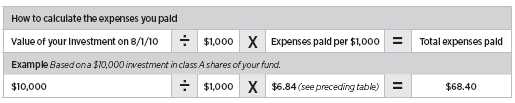
Compare expenses using the SEC’s method
The Securities and Exchange Commission (SEC) has established guidelines to help investors assess fund expenses. Per these guidelines, the following table shows your fund’s expenses based on a $1,000 investment, assuming a hypothetical 5% annualized return. You can use this information to compare the ongoing expenses (but not transaction expenses or total costs) of investing in the fund with those of other funds. All mutual fund shareholder reports will provide this information to help you make this comparison. Please note that you cannot use this information to estimate your actual ending account balance and expenses paid during the period.
| | | | | | |
| | Class A | Class B | Class C | Class M | Class R | Class Y |
|
| Expenses paid per $1,000*† | $6.31 | $10.11 | $10.11 | $8.84 | $7.58 | $5.04 |
|
| Ending value (after expenses) | $1,018.95 | $1,015.17 | $1,015.17 | $1,016.43 | $1,017.69 | $1,020.21 |
|
* Expenses for each share class are calculated using the fund’s annualized expense ratio for each class, which represents the ongoing expenses as a percentage of average net assets for the six months ended 1/31/11. The expense ratio may differ for each share class.
† Expenses are calculated by multiplying the expense ratio by the average account value for the period; then multiplying the result by the number of days in the period; and then dividing that result by the number of days in the year.
13
Terms and definitions
Important terms
Total return shows how the value of the fund’s shares changed over time, assuming you held the shares through the entire period and reinvested all distributions in the fund.
Net asset value (NAV) is the price, or value, of one share of a mutual fund, without a sales charge. NAVs fluctuate with market conditions. NAV is calculated by dividing the net assets of each class of shares by the number of outstanding shares in the class.
Public offering price (POP) is the price of a mutual fund share plus the maximum sales charge levied at the time of purchase. POP performance figures shown here assume the 5.75% maximum sales charge for class A shares and 3.50% for class M shares.
Contingent deferred sales charge (CDSC) is generally a charge applied at the time of the redemption of class B or C shares and assumes redemption at the end of the period. Your fund’s class B CDSC declines over time from a 5% maximum during the first year to 1% during the sixth year. After the sixth year, the CDSC no longer applies. The CDSC for class C shares is 1% for one year after purchase.
Share classes
Class A shares are generally subject to an initial sales charge and no CDSC (except on certain redemptions of shares bought without an initial sales charge).
Class B shares are not subject to an initial sales charge. They may be subject to a CDSC.
Class C shares are not subject to an initial sales charge and are subject to a CDSC only if the shares are redeemed during the first year.
Class M shares have a lower initial sales charge and a higher 12b-1 fee than class A shares and no CDSC (except on certain redemptions of shares bought without an initial sales charge).
Class R shares are not subject to an initial sales charge or CDSC and are available only to certain defined contribution plans.
Class Y shares are not subject to an initial sales charge or CDSC, and carry no 12b-1 fee. They are generally only available to corporate and institutional clients and clients in other approved programs.
Comparative indexes
Barclays Capital Aggregate Bond Index is an unmanaged index of U.S. investment-grade fixed-income securities.
BofA (Bank of America) Merrill Lynch U.S. 3-Month Treasury Bill Index is an unmanaged index that seeks to measure the performance of U.S. Treasury bills available in the marketplace.
S&P 500 Index is an unmanaged index of common stock performance.
Indexes assume reinvestment of all distributions and do not account for fees. Securities and performance of a fund and an index will differ. You cannot invest directly in an index.
Lipper is a third-party industry-ranking entity that ranks mutual funds. Its rankings do not reflect sales charges. Lipper rankings are based on total return at net asset value relative to other funds that have similar current investment styles or objectives as determined by Lipper. Lipper may change a fund’s category assignment at its discretion. Lipper category averages reflect performance trends for funds within a category.
14
Other information for shareholders
Important notice regarding delivery of shareholder documents
In accordance with SEC regulations, Putnam sends a single copy of annual and semiannual shareholder reports, prospectuses, and proxy statements to Putnam shareholders who share the same address, unless a shareholder requests otherwise. If you prefer to receive your own copy of these documents, please call Putnam at 1-800-225-1581, and Putnam will begin sending individual copies within 30 days.
Proxy voting
Putnam is committed to managing our mutual funds in the best interests of our shareholders. The Putnam funds’ proxy voting guidelines and procedures, as well as information regarding how your fund voted proxies relating to portfolio securities during the 12-month period ended June 30, 2010, are available in the Individual Investors section of putnam.com, and on the SEC’s Web site, www.sec.gov. If you have questions about finding forms on the SEC’s Web site, you may call the SEC at 1-800-SEC-0330. You may also obtain the Putnam funds’ proxy voting guidelines and procedures at no charge by calling Putnam’s Shareholder Services at 1-800-225-1581.
Fund portfolio holdings
The fund will file a complete schedule of its portfolio holdings with the SEC for the first and third quarters of each fiscal year on Form N-Q. Shareholders may obtain the fund’s Forms N-Q on the SEC’s Web site at www.sec.gov. In addition, the fund’s Forms N-Q may be reviewed and copied at the SEC’s Public Reference Room in Washington, D.C. You may call the SEC at 1-800-SEC-0330 for information about the SEC’s Web site or the operation of the Public Reference Room.
Trustee and employee fund ownership
Putnam employees and members of the Board of Trustees place their faith, confidence, and, most importantly, investment dollars in Putnam mutual funds. As of January 31, 2011, Putnam employees had approximately $352,000,000 and the Trustees had approximately $68,000,000 invested in Putnam mutual funds. These amounts include investments by the Trustees’ and employees’ immediate family members as well as investments through retirement and deferred compensation plans.
15
Financial statements
A guide to financial statements
These sections of the report, as well as the accompanying Notes, constitute the fund’s financial statements.
The fund’s portfolio lists all the fund’s investments and their values as of the last day of the reporting period. Holdings are organized by asset type and industry sector, country, or state to show areas of concentration and diversification.
Statement of assets and liabilities shows how the fund’s net assets and share price are determined. All investment and non-investment assets are added together. Any unpaid expenses and other liabilities are subtracted from this total. The result is divided by the number of shares to determine the net asset value per share, which is calculated separately for each class of shares. (For funds with preferred shares, the amount subtracted from total assets includes the liquidation preference of preferred shares.)
Statement of operations shows the fund’s net investment gain or loss. This is done by first adding up all the fund’s earnings — from dividends and interest income — and subtracting its operating expenses to determine net investment income (or loss). Then, any net gain or loss the fund realized on the sales of its holdings — as well as any unrealized gains or losses over the period — is added to or subtracted from the net investment result to determine the fund’s net gain or loss for the fiscal period.
Statement of changes in net assets shows how the fund’s net assets were affected by the fund’s net investment gain or loss, by distributions to shareholders, and by changes in the number of the fund’s shares. It lists distributions and their sources (net investment income or realized capital gains) over the current reporting period and the most recent fiscal year-end. The distributions listed here may not match the sources listed in the Statement of operations because the distributions are determined on a tax basis and may be paid in a different period from the one in which they were earned. Dividend sources are estimated at the time of declaration. Actual results may vary. Any non-taxable return of capital cannot be determined until final tax calculations are completed after the end of the fund’s fiscal year.
Financial highlights provide an overview of the fund’s investment results, per-share distributions, expense ratios, net investment income ratios, and portfolio turnover in one summary table, reflecting the five most recent reporting periods. In a semiannual report, the highlights table also includes the current reporting period.
16
The fund’s portfolio 1/31/11 (Unaudited)
| | |
| COMMON STOCKS (93.6%)* | Shares | Value |
|
| Aerospace and defense (2.3%) | | |
| General Dynamics Corp. | 9,588 | $722,935 |
|
| L-3 Communications Holdings, Inc. | 10,384 | 812,548 |
|
| Northrop Grumman Corp. | 7,207 | 499,445 |
|
| Precision Castparts Corp. | 9,695 | 1,386,288 |
|
| Raytheon Co. | 4,114 | 205,659 |
|
| Safran SA (France) | 27,075 | 978,446 |
|
| United Technologies Corp. | 8,047 | 654,221 |
|
| | | 5,259,542 |
| Agriculture (0.1%) | | |
| Archer Daniels Midland Co. | 8,808 | 287,757 |
|
| | | 287,757 |
| Airlines (0.2%) | | |
| Delta Air Lines, Inc. † | 26,544 | 309,768 |
|
| United Continental Holdings, Inc. † | 10,772 | 273,609 |
|
| | | 583,377 |
| Automotive (0.7%) | | |
| Ford Motor Co. † | 85,009 | 1,355,894 |
|
| General Motors Co. † | 6,815 | 248,679 |
|
| RSC Holdings, Inc. † | 8,002 | 95,704 |
|
| | | 1,700,277 |
| Banking (7.0%) | | |
| Bank of America Corp. | 180,669 | 2,480,585 |
|
| Bank of New York Mellon Corp. (The) | 22,208 | 693,556 |
|
| BB&T Corp. | 13,049 | 360,674 |
|
| Bond Street Holdings, LLC 144A Class A † F | 14,838 | 303,437 |
|
| Citigroup, Inc. † | 520,669 | 2,509,625 |
|
| Comerica, Inc. | 3,320 | 126,824 |
|
| Fifth Third Bancorp | 19,076 | 283,660 |
|
| First Horizon National Corp. | 4,907 | 55,596 |
|
| Hudson City Bancorp, Inc. | 9,905 | 108,757 |
|
| Huntington Bancshares, Inc. | 16,235 | 117,541 |
|
| JPMorgan Chase & Co. | 70,062 | 3,148,586 |
|
| KeyCorp | 16,561 | 147,393 |
|
| M&T Bank Corp. | 2,246 | 194,212 |
|
| Marshall & Ilsley Corp. | 10 | 70 |
|
| Northern Trust Corp. | 4,344 | 225,801 |
|
| People’s United Financial, Inc. | 6,940 | 89,595 |
|
| PNC Financial Services Group, Inc. | 9,890 | 593,400 |
|
| Regions Financial Corp. | 23,626 | 167,745 |
|
| State Street Corp. | 8,999 | 420,433 |
|
| SunTrust Banks, Inc. | 9,404 | 286,164 |
|
| U.S. Bancorp | 34,363 | 927,801 |
|
| Wells Fargo & Co. | 94,064 | 3,049,555 |
|
| Zions Bancorp. | 3,348 | 78,946 |
|
| | | 16,369,956 |
| Beverage (2.1%) | | |
| Coca-Cola Co. (The) | 43,454 | 2,731,084 |
|
| Coca-Cola Enterprises, Inc. | 35,336 | 889,054 |
|
17
| | |
| COMMON STOCKS (93.6%)* cont. | Shares | Value |
|
| Beverage cont. | | |
| Hansen Natural Corp. † | 2,619 | $148,340 |
|
| PepsiCo, Inc. | 16,471 | 1,059,250 |
|
| | | 4,827,728 |
| Biotechnology (1.6%) | | |
| Amgen, Inc. † | 4,631 | 255,075 |
|
| Auxilium Pharmaceuticals, Inc. † | 27,184 | 616,805 |
|
| Celgene Corp. † | 23,506 | 1,211,264 |
|
| Complete Genomics, Inc. † | 1,990 | 15,084 |
|
| Dendreon Corp. † | 17,921 | 627,952 |
|
| Genzyme Corp. † | 12,321 | 903,745 |
|
| | | 3,629,925 |
| Broadcasting (0.2%) | | |
| CBS Corp. Class B | 22,910 | 454,305 |
|
| | | 454,305 |
| Building materials (0.3%) | | |
| Owens Corning, Inc. † | 19,536 | 653,870 |
|
| | | 653,870 |
| Cable television (1.5%) | | |
| Comcast Corp. Class A | 85,450 | 1,943,988 |
|
| DIRECTV Class A † | 24,143 | 1,023,422 |
|
| Time Warner Cable, Inc. | 8,509 | 577,165 |
|
| | | 3,544,575 |
| Chemicals (2.2%) | | |
| Air Products & Chemicals, Inc. | 5,501 | 479,962 |
|
| Albemarle Corp. | 4,073 | 228,740 |
|
| Celanese Corp. Ser. A | 4,037 | 167,495 |
|
| CF Industries Holdings, Inc. | 2,820 | 380,813 |
|
| Dow Chemical Co. (The) | 28,986 | 1,028,423 |
|
| E.I. du Pont de Nemours & Co. | 17,395 | 881,579 |
|
| FMC Corp. | 40 | 3,042 |
|
| Huntsman Corp. | 24,323 | 423,463 |
|
| LyondellBasell Industries NV Class A (Netherlands) † | 10,133 | 364,180 |
|
| Monsanto Co. | 9,214 | 676,123 |
|
| PPG Industries, Inc. | 5,192 | 437,582 |
|
| | | 5,071,402 |
| Coal (0.3%) | | |
| CONSOL Energy, Inc. | 12,268 | 609,720 |
|
| Patriot Coal Corp. † | 5,463 | 142,967 |
|
| | | 752,687 |
| Commercial and consumer services (1.3%) | | |
| Alliance Data Systems Corp. † | 8,075 | 571,226 |
|
| Automatic Data Processing, Inc. | 4,220 | 202,138 |
|
| Dun & Bradstreet Corp. (The) | 1,215 | 103,214 |
|
| Mastercard, Inc. Class A | 1,747 | 413,183 |
|
| Monster Worldwide, Inc. † | 1,388 | 23,110 |
|
| Moody’s Corp. | 3,958 | 116,246 |
|
| Paychex, Inc. | 1,871 | 59,872 |
|
| Priceline.com, Inc. † | 2,199 | 942,315 |
|
| Visa, Inc. Class A | 9,039 | 631,374 |
|
| | | 3,062,678 |
18
| | |
| COMMON STOCKS (93.6%)* cont. | Shares | Value |
|
| Communications equipment (2.8%) | | |
| Cisco Systems, Inc. † | 142,869 | $3,021,679 |
|
| Corning, Inc. | 13,314 | 295,704 |
|
| Harris Corp. | 14,016 | 652,305 |
|
| Qualcomm, Inc. | 47,621 | 2,577,725 |
|
| | | 6,547,413 |
| Computers (6.1%) | | |
| Apple, Inc. † | 17,246 | 5,851,913 |
|
| EMC Corp. † | 44,171 | 1,099,416 |
|
| Hewlett-Packard Co. | 107,309 | 4,902,948 |
|
| IBM Corp. | 9,531 | 1,544,022 |
|
| Seagate Technology † | 14,246 | 199,444 |
|
| Teradata Corp. † | 3,172 | 136,364 |
|
| Xerox Corp. | 33,023 | 350,704 |
|
| | | 14,084,811 |
| Conglomerates (3.7%) | | |
| General Electric Co. | 280,923 | 5,657,789 |
|
| Honeywell International, Inc. | 19,372 | 1,085,026 |
|
| Tyco International, Ltd. | 40,070 | 1,796,338 |
|
| | | 8,539,153 |
| Consumer finance (0.7%) | | |
| American Express Co. | 18,173 | 788,345 |
|
| Capital One Financial Corp. | 6,572 | 316,508 |
|
| Discover Financial Services | 19,820 | 408,094 |
|
| SLM Corp. † | 3,643 | 52,496 |
|
| | | 1,565,443 |
| Consumer goods (2.4%) | | |
| Colgate-Palmolive Co. | 24,696 | 1,895,912 |
|
| Energizer Holdings, Inc. † | 3,600 | 261,864 |
|
| Estee Lauder Cos., Inc. (The) Class A | 1,634 | 131,537 |
|
| hhgregg, Inc. † | 3,063 | 56,145 |
|
| Newell Rubbermaid, Inc. | 14,855 | 285,959 |
|
| Procter & Gamble Co. (The) | 45,942 | 2,900,318 |
|
| | | 5,531,735 |
| Consumer services (0.2%) | | |
| Avis Budget Group, Inc. † | 4,635 | 64,148 |
|
| Hertz Global Holdings, Inc. † | 19,523 | 287,183 |
|
| Netflix, Inc. † | 665 | 142,363 |
|
| | | 493,694 |
| Containers (0.1%) | | |
| Crown Holdings, Inc. † | 8,679 | 289,531 |
|
| | | 289,531 |
| Distribution (—%) | | |
| Genuine Parts Co. | 1,383 | 71,570 |
|
| | | 71,570 |
| Electric utilities (3.1%) | | |
| AES Corp. (The) † | 74,910 | 928,884 |
|
| Ameren Corp. | 36,242 | 1,028,186 |
|
| American Electric Power Co., Inc. | 26,261 | 936,992 |
|
| Edison International | 21,428 | 777,408 |
|
| Entergy Corp. | 9,794 | 706,833 |
|
| Great Plains Energy, Inc. | 17,866 | 351,603 |
|
19
| | |
| COMMON STOCKS (93.6%)* cont. | Shares | Value |
|
| Electric utilities cont. | | |
| NV Energy, Inc. | 62,484 | $897,895 |
|
| PG&E Corp. | 20,823 | 963,688 |
|
| PPL Corp. | 22,682 | 584,969 |
|
| | | 7,176,458 |
| Electrical equipment (0.4%) | | |
| Emerson Electric Co. | 14,543 | 856,292 |
|
| | | 856,292 |
| Electronics (1.8%) | | |
| Agilent Technologies, Inc. † | 8,404 | 351,539 |
|
| Intel Corp. | 18,494 | 396,881 |
|
| SanDisk Corp. † | 52,239 | 2,370,083 |
|
| Texas Instruments, Inc. | 30,063 | 1,019,436 |
|
| | | 4,137,939 |
| Energy (oil field) (2.9%) | | |
| National Oilwell Varco, Inc. | 34,927 | 2,581,105 |
|
| Schlumberger, Ltd. | 38,081 | 3,388,828 |
|
| Weatherford International, Ltd. (Switzerland) † | 34,336 | 814,450 |
|
| | | 6,784,383 |
| Energy (other) (0.8%) | | |
| First Solar, Inc. † | 12,490 | 1,930,704 |
|
| | | 1,930,704 |
| Engineering and construction (0.2%) | | |
| Fluor Corp. | 4,979 | 344,497 |
|
| Shaw Group, Inc. † | 1,875 | 70,819 |
|
| | | 415,316 |
| Financial (0.4%) | | |
| Assurant, Inc. | 3,200 | 125,536 |
|
| CME Group, Inc. | 1,992 | 614,652 |
|
| IntercontinentalExchange, Inc. † | 1,564 | 188,446 |
|
| Nasdaq OMX Group, Inc. (The) † | 1,042 | 25,508 |
|
| NYSE Euronext | 2,082 | 66,228 |
|
| | | 1,020,370 |
| Food (0.9%) | | |
| Hershey Co. (The) | 27,908 | 1,303,025 |
|
| Kraft Foods, Inc. Class A | 15,091 | 461,332 |
|
| Mead Johnson Nutrition Co. Class A | 4,121 | 238,894 |
|
| | | 2,003,251 |
| Forest products and packaging (0.2%) | | |
| International Paper Co. | 16,192 | 467,625 |
|
| | | 467,625 |
| Health-care services (1.9%) | | |
| Aetna, Inc. | 28,431 | 936,517 |
|
| AmerisourceBergen Corp. | 10,278 | 368,569 |
|
| Cardinal Health, Inc. | 4,804 | 199,414 |
|
| CIGNA Corp. | 14,039 | 589,919 |
|
| Express Scripts, Inc. † | 9,756 | 549,555 |
|
| Fresenius Medical Care AG & Co., KGaA ADR (Germany) | 1,284 | 75,191 |
|
| McKesson Corp. | 4,499 | 338,190 |
|
| Omnicare, Inc. | 2,765 | 71,669 |
|
| Quest Diagnostics, Inc. | 6,245 | 355,653 |
|
| WellPoint, Inc. † | 16,246 | 1,009,202 |
|
| | | 4,493,879 |
20
| | |
| COMMON STOCKS (93.6%)* cont. | Shares | Value |
|
| Industrial (0.1%) | | |
| China Ming Yang Wind Power Group, Ltd. ADS (China) † | 17,107 | $157,898 |
|
| | | 157,898 |
| Insurance (3.5%) | | |
| ACE, Ltd. | 6,400 | 394,176 |
|
| Aflac, Inc. | 20,400 | 1,174,632 |
|
| Allstate Corp. (The) | 12,700 | 395,478 |
|
| Assured Guaranty, Ltd. (Bermuda) | 51,900 | 750,474 |
|
| Berkshire Hathaway, Inc. Class B † | 14,975 | 1,224,206 |
|
| Chubb Corp. (The) | 3,500 | 202,755 |
|
| Hartford Financial Services Group, Inc. (The) | 29,400 | 816,732 |
|
| Marsh & McLennan Cos., Inc. | 10,000 | 278,800 |
|
| MBIA, Inc. † | 27,900 | 298,530 |
|
| MetLife, Inc. | 19,300 | 883,361 |
|
| Progressive Corp. (The) | 18,800 | 372,428 |
|
| Prudential Financial, Inc. | 12,800 | 787,328 |
|
| XL Group PLC | 26,500 | 607,380 |
|
| | | 8,186,280 |
| Investment banking/Brokerage (1.8%) | | |
| Ameriprise Financial, Inc. | 4,719 | 290,926 |
|
| BlackRock, Inc. | 367 | 72,673 |
|
| Charles Schwab Corp. (The) | 18,886 | 340,892 |
|
| Franklin Resources, Inc. | 3,496 | 421,792 |
|
| Goldman Sachs Group, Inc. (The) | 9,164 | 1,499,414 |
|
| Invesco, Ltd. | 12,618 | 312,169 |
|
| Morgan Stanley | 27,112 | 797,093 |
|
| T. Rowe Price Group, Inc. | 5,252 | 346,212 |
|
| | | 4,081,171 |
| Lodging/Tourism (0.4%) | | |
| Wyndham Worldwide Corp. | 33,065 | 930,118 |
|
| | | 930,118 |
| Machinery (1.2%) | | |
| Cummins, Inc. | 1,613 | 170,784 |
|
| Deere & Co. | 7,535 | 684,932 |
|
| Parker Hannifin Corp. | 20,824 | 1,861,874 |
|
| | | 2,717,590 |
| Manufacturing (1.1%) | | |
| Eaton Corp. | 3,904 | 421,476 |
|
| Illinois Tool Works, Inc. | 21,313 | 1,140,032 |
|
| Ingersoll-Rand PLC | 23,091 | 1,089,895 |
|
| | | 2,651,403 |
| Media (1.8%) | | |
| Interpublic Group of Companies, Inc. (The) † | 47,756 | 510,512 |
|
| Time Warner, Inc. | 35,496 | 1,116,349 |
|
| Viacom, Inc. Class B | 19,093 | 793,314 |
|
| Walt Disney Co. (The) | 47,870 | 1,860,707 |
|
| | | 4,280,882 |
| Medical technology (2.0%) | | |
| Baxter International, Inc. | 17,389 | 843,193 |
|
| Becton, Dickinson and Co. | 1,730 | 143,504 |
|
| Boston Scientific Corp. † | 47,686 | 332,848 |
|
21
| | |
| COMMON STOCKS (93.6%)* cont. | Shares | Value |
|
| Medical technology cont. | | |
| Covidien PLC (Ireland) | 7,620 | $361,721 |
|
| Hospira, Inc. † | 4,713 | 260,299 |
|
| Intuitive Surgical, Inc. † | 477 | 154,028 |
|
| Life Technologies Corp. † | 5,550 | 301,310 |
|
| Medtronic, Inc. | 25,043 | 959,648 |
|
| St. Jude Medical, Inc. † | 7,905 | 320,153 |
|
| Stryker Corp. | 5,394 | 310,479 |
|
| Thermo Fisher Scientific, Inc. † | 13,372 | 765,814 |
|
| | | 4,752,997 |
| Metals (0.8%) | | |
| Cliffs Natural Resources, Inc. | 3,005 | 256,807 |
|
| Freeport-McMoRan Copper & Gold, Inc. Class B | 9,588 | 1,042,695 |
|
| Newmont Mining Corp. | 2,163 | 119,116 |
|
| Nucor Corp. | 8,488 | 389,684 |
|
| | | 1,808,302 |
| Oil and gas (8.3%) | | |
| Chevron Corp. | 46,183 | 4,384,152 |
|
| Devon Energy Corp. | 13,943 | 1,236,605 |
|
| Exxon Mobil Corp. | 82,624 | 6,666,104 |
|
| Hess Corp. | 20,396 | 1,715,712 |
|
| Occidental Petroleum Corp. | 30,397 | 2,938,782 |
|
| Petrohawk Energy Corp. † | 51,079 | 1,024,134 |
|
| Southwestern Energy Co. † | 31,637 | 1,249,662 |
|
| | | 19,215,151 |
| Pharmaceuticals (4.5%) | | |
| Abbott Laboratories | 27,691 | 1,250,526 |
|
| Johnson & Johnson | 55,334 | 3,307,313 |
|
| Merck & Co., Inc. | 64,378 | 2,135,418 |
|
| Pfizer, Inc. | 208,562 | 3,800,000 |
|
| Somaxon Pharmaceuticals, Inc. † | 23,139 | 69,880 |
|
| | | 10,563,137 |
| Publishing (—%) | | |
| Gannett Co., Inc. | 4,417 | 65,107 |
|
| | | 65,107 |
| Real estate (1.4%) | | |
| American Capital Agency Corp. R | 2,330 | 66,848 |
|
| Digital Realty Trust, Inc. R | 18,929 | 1,029,738 |
|
| Equity Residential Trust R | 9,802 | 531,170 |
|
| HCP, Inc. R | 14,892 | 552,344 |
|
| ProLogis R | 37,041 | 552,652 |
|
| Simon Property Group, Inc. R | 4,908 | 497,917 |
|
| | | 3,230,669 |
| Regional Bells (2.2%) | | |
| AT&T, Inc. | 85,950 | 2,365,344 |
|
| Verizon Communications, Inc. | 77,307 | 2,753,675 |
|
| | | 5,119,019 |
| Restaurants (0.6%) | | |
| McDonald’s Corp. | 17,983 | 1,324,808 |
|
| | | 1,324,808 |
22
| | |
| COMMON STOCKS (93.6%)* cont. | Shares | Value |
|
| Retail (5.3%) | | |
| Amazon.com, Inc. † | 6,714 | $1,138,963 |
|
| Bed Bath & Beyond, Inc. † | 22,633 | 1,086,384 |
|
| Best Buy Co., Inc. | 10,510 | 357,340 |
|
| Coach, Inc. | 11,082 | 599,425 |
|
| Costco Wholesale Corp. | 3,608 | 259,199 |
|
| CVS Caremark Corp. | 28,355 | 969,741 |
|
| Dollar General Corp. † | 8,898 | 247,453 |
|
| GameStop Corp. Class A † | 1,757 | 37,020 |
|
| Home Depot, Inc. (The) | 2,742 | 100,823 |
|
| Kohl’s Corp. † | 12,924 | 656,281 |
|
| Limited Brands, Inc. | 3,151 | 92,135 |
|
| Lowe’s Cos., Inc. | 58,725 | 1,456,380 |
|
| Macy’s, Inc. | 6,798 | 157,374 |
|
| O’Reilly Automotive, Inc. † | 1,328 | 75,470 |
|
| Office Depot, Inc. † | 36,664 | 192,486 |
|
| OfficeMax, Inc. † | 14,151 | 227,407 |
|
| Staples, Inc. | 23,059 | 514,446 |
|
| Target Corp. | 19,535 | 1,071,104 |
|
| TJX Cos., Inc. (The) | 13,136 | 622,515 |
|
| Urban Outfitters, Inc. † | 13,213 | 446,864 |
|
| Wal-Mart Stores, Inc. | 29,892 | 1,676,044 |
|
| Walgreen Co. | 9,308 | 376,416 |
|
| | | 12,361,270 |
| Schools (0.6%) | | |
| Apollo Group, Inc. Class A † | 21,220 | 875,749 |
|
| Career Education Corp. † | 20,876 | 468,457 |
|
| | | 1,344,206 |
| Semiconductor (0.3%) | | |
| Novellus Systems, Inc. † | 19,473 | 702,391 |
|
| | | 702,391 |
| Shipping (1.0%) | | |
| FedEx Corp. | 6,020 | 543,726 |
|
| Swift Transporation Co. † | 24,870 | 355,392 |
|
| United Parcel Service, Inc. Class B | 18,753 | 1,343,090 |
|
| | | 2,242,208 |
| Software (3.6%) | | |
| Adobe Systems, Inc. † | 26,644 | 880,584 |
|
| Akamai Technologies, Inc. † | 3,438 | 166,124 |
|
| BMC Software, Inc. † | 16,623 | 792,917 |
|
| CA, Inc. | 47,767 | 1,136,855 |
|
| Citrix Systems, Inc. † | 3,497 | 220,940 |
|
| Electronic Arts, Inc. † | 6,175 | 96,268 |
|
| Microsoft Corp. | 69,402 | 1,924,170 |
|
| Oracle Corp. | 96,490 | 3,090,575 |
|
| Red Hat, Inc. † | 3,506 | 144,868 |
|
| | | 8,453,301 |
23
| | |
| COMMON STOCKS (93.6%)* cont. | Shares | Value |
|
| Staffing (—%) | | |
| Robert Half International, Inc. | 2,113 | $66,264 |
|
| | | 66,264 |
| Technology services (2.2%) | | |
| Cognizant Technology Solutions Corp. † | 6,222 | 453,895 |
|
| Fidelity National Information Services, Inc. | 4,875 | 148,346 |
|
| Fiserv, Inc. † | 2,865 | 176,971 |
|
| Google, Inc. Class A † | 5,783 | 3,471,882 |
|
| VeriSign, Inc. | 3,263 | 109,800 |
|
| Western Union Co. (The) | 14,732 | 298,765 |
|
| Yahoo!, Inc. † | 25,506 | 411,157 |
|
| | | 5,070,816 |
| Telecommunications (0.1%) | | |
| Sycamore Networks, Inc. | 5,846 | 121,948 |
|
| | | 121,948 |
| Textiles (0.3%) | | |
| Hanesbrands, Inc. † | 17,964 | 413,531 |
|
| NIKE, Inc. Class B | 4,179 | 344,684 |
|
| | | 758,215 |
| Tobacco (1.7%) | | |
| Altria Group, Inc. | 39,312 | 924,225 |
|
| Lorillard, Inc. | 2,533 | 190,583 |
|
| Philip Morris International, Inc. | 50,106 | 2,868,073 |
|
| | | 3,982,881 |
| Toys (0.4%) | | |
| Hasbro, Inc. | 19,812 | 873,511 |
|
| | | 873,511 |
| | | |
| Total common stocks (cost $200,363,505) | | $217,669,189 |
|
| |
| SHORT-TERM INVESTMENTS (6.4%)* | Principal amount/shares | Value |
|
| U.S. Treasury Bills for an effective yield of 0.24%, | | |
| October 20, 2011 # | $625,000 | $624,089 |
|
| U.S. Treasury Bills for an effective yield of 0.21%, | | |
| March 10, 2011 # | 425,000 | 424,906 |
|
| Putnam Money Market Liquidity Fund 0.17% e | 13,767,329 | 13,767,329 |
|
| Total short-term investments (cost $14,816,127) | | $14,816,324 |
|
| |
| TOTAL INVESTMENTS | | |
|
| Total investments (cost $215,179,632) | | $232,485,513 |
| |
| Key to holding’s abbreviations |
| ADR | American Depository Receipts |
| ADS | American Depository Shares |
Notes to the fund’s portfolio
Unless noted otherwise, the notes to the fund’s portfolio are for the close of the fund’s reporting period, which ran from August 1, 2010 through January 31, 2011 (the reporting period).
* Percentages indicated are based on net assets of $232,604,332.
† Non-income-producing security.
# These securities, in part or in entirety, were pledged and segregated with the broker to cover margin requirements for futures contracts at the close of the reporting period.
24
e See Note 6 to the financial statements regarding investments in Putnam Money Market Liquidity Fund. The rate quoted in the security description is the annualized 7-day yield of the fund at the close of the reporting period.
F Is valued at fair value following procedures approved by the Trustees. Securities may be classified as Level 2 or Level 3 for Accounting Standards Codification ASC 820 Fair Value Measurements and Disclosures (ASC 820) based on the securities’ valuation inputs. At the close of the reporting period, fair value pricing was also used for certain foreign securities in the portfolio (Note 1).
R Real Estate Investment Trust.
144A after the name of an issuer represents securities exempt from registration under Rule 144A under the Securities Act of 1933, as amended. These securities may be resold in transactions exempt from registration, normally to qualified institutional buyers.
ADR and ADS, after the name of a foreign holding represents ownership of foreign securities on deposit with a custodian bank.
| | | | | |
| FUTURES CONTRACTS OUTSTANDING at 1/31/11 (Unaudited) | | | |
|
| | Number of | | | Expiration | Unrealized |
| | contracts | Value | | date | appreciation |
|
| S&P 500 Index (Long) | 31 | $9,938,600 | | Mar-11 | $200,983 |
|
| Total | | | | | $200,983 |
| | | |
TOTAL RETURN SWAP CONTRACTS OUTSTANDING at 1/31/11 (Unaudited)
| | | | | | | |
| | Upfront | | | Fixed payments | Total return | |
| Swap counterparty / | premium | Termination | | received (paid) by | received by | Unrealized |
| Notional amount | received (paid) | date | | fund per annum | or paid by fund | appreciation |
|
| Goldman Sachs International | | | | | |
| baskets | 1,996 | $— | 9/14/11 | | (1 month USD- | A basket | $3,960 |
| | | | | LIBOR-BBA plus | (GSGLPMIN) | |
| | | | | 60 bp) | of common stocks | |
|
| Total | | | | | | $3,960 |
25
ASC 820 establishes a three-level hierarchy for disclosure of fair value measurements. The valuation hierarchy is based upon the transparency of inputs to the valuation of the fund’s investments. The three levels are defined as follows:
Level 1 — Valuations based on quoted prices for identical securities in active markets.
Level 2 — Valuations based on quoted prices in markets that are not active or for which all significant inputs are observable, either directly or indirectly.
Level 3 — Valuations based on inputs that are unobservable and significant to the fair value measurement.
The following is a summary of the inputs used to value the fund’s net assets as of the close of the reporting period:
| | | | |
| | | |
| | | Valuation inputs | |
|
| Investments in securities: | Level 1 | Level 2 | Level 3 |
|
| Common stocks: | | | |
|
| Basic materials | $7,635,086 | $— | $— |
|
| Capital goods | 11,369,126 | 978,446 | — |
|
| Communication services | 8,785,542 | — | — |
|
| Conglomerates | 8,539,153 | — | — |
|
| Consumer cyclicals | 23,534,877 | — | — |
|
| Consumer staples | 21,251,493 | — | — |
|
| Energy | 28,682,925 | — | — |
|
| Financials | 34,150,452 | — | 303,437 |
|
| Health care | 23,439,938 | — | — |
|
| Technology | 38,996,671 | — | — |
|
| Transportation | 2,825,585 | — | — |
|
| Utilities and power | 7,176,458 | — | — |
|
| Total common stocks | 216,387,306 | 978,446 | 303,437 |
| | | | |
| Short-term investments | 13,767,329 | 1,048,995 | — |
|
| Totals by level | $230,154,635 | $2,027,441 | $303,437 |
| | | |
| | | Valuation inputs | |
|
| Other financial instruments: | Level 1 | Level 2 | Level 3 |
|
| Futures contracts | $200,983 | $— | $— |
|
| Total return swap contracts | — | 3,960 | — |
|
| Totals by level | $200,983 | $3,960 | $— |
At the start and close of the reporting period, Level 3 investments in securities and other financial instruments were not considered a significant portion of the fund’s portfolio.
The accompanying notes are an integral part of these financial statements.
26
Statement of assets and liabilities 1/31/11 (Unaudited)
| |
| ASSETS | |
|
| Investment in securities, at value (Note 1): | |
| Unaffiliated issuers (identified cost $201,412,303) | $218,718,184 |
| Affiliated issuers (identified cost $13,767,329) (Note 6) | 13,767,329 |
|
| Dividends, interest and other receivables | 234,853 |
|
| Receivable for shares of the fund sold | 90,242 |
|
| Receivable for investments sold | 6,710,099 |
|
| Unrealized appreciation on swap contracts (Note 1) | 3,960 |
|
| Receivable for variation margin (Note 1) | 84,475 |
|
| Total assets | 239,609,142 |
|
| |
| LIABILITIES | |
|
| Payable for investments purchased | 6,296,458 |
|
| Payable for shares of the fund repurchased | 261,436 |
|
| Payable for compensation of Manager (Note 2) | 111,260 |
|
| Payable for investor servicing fees (Note 2) | 56,833 |
|
| Payable for custodian fees (Note 2) | 11,690 |
|
| Payable for Trustee compensation and expenses (Note 2) | 121,240 |
|
| Payable for administrative services (Note 2) | 427 |
|
| Payable for distribution fees (Note 2) | 69,978 |
|
| Other accrued expenses | 75,488 |
|
| Total liabilities | 7,004,810 |
| |
| Net assets | $232,604,332 |
|
| |
| REPRESENTED BY | |
|
| Paid-in capital (Unlimited shares authorized) (Notes 1 and 4) | $622,503,885 |
|
| Distributions in excess of net investment income (Note 1) | (593,514) |
|
| Accumulated net realized loss on investments and foreign currency transactions (Note 1) | (406,816,863) |
|
| Net unrealized appreciation of investments | 17,510,824 |
|
| Total — Representing net assets applicable to capital shares outstanding | $232,604,332 |
|
| |
| COMPUTATION OF NET ASSET VALUE AND OFFERING PRICE | |
|
| Net asset value and redemption price per class A share ($193,640,314 divided by 12,523,793 shares) | $15.46 |
|
| Offering price per class A share (100/94.25 of $15.46)* | $16.40 |
|
| Net asset value and offering price per class B share ($17,920,100 divided by 1,232,189 shares)** | $14.54 |
|
| Net asset value and offering price per class C share ($12,203,099 divided by 835,703 shares)** | $14.60 |
|
| Net asset value and redemption price per class M share ($4,368,948 divided by 292,791 shares) | $14.92 |
|
| Offering price per class M share (100/96.50 of $14.92)* | $15.46 |
|
| Net asset value, offering price and redemption price per class R share | |
| ($132,576 divided by 8,607 shares) | $15.40 |
|
| Net asset value, offering price and redemption price per class Y share | |
| ($4,339,295 divided by 279,166 shares) | $15.54 |
|
* On single retail sales of less than $50,000. On sales of $50,000 or more the offering price is reduced.
** Redemption price per share is equal to net asset value less any applicable contingent deferred sales charge.
The accompanying notes are an integral part of these financial statements.
27
Statement of operations Six months ended 1/31/11 (Unaudited)
| |
| INVESTMENT INCOME | |
|
| Dividends (net of foreign tax of $3,342) | $2,010,666 |
|
| Interest (including interest income of $6,824 from investments in affiliated issuers) (Note 6) | 8,000 |
|
| Securities lending (Note 1) | 918 |
|
| Total investment income | 2,019,584 |
|
| |
| EXPENSES | |
|
| Compensation of Manager (Note 2) | 635,843 |
|
| Investor servicing fees (Note 2) | 381,546 |
|
| Custodian fees (Note 2) | 12,617 |
|
| Trustee compensation and expenses (Note 2) | 11,926 |
|
| Administrative services (Note 2) | 3,187 |
|
| Distribution fees — Class A (Note 2) | 235,543 |
|
| Distribution fees — Class B (Note 2) | 90,413 |
|
| Distribution fees — Class C (Note 2) | 57,286 |
|
| Distribution fees — Class M (Note 2) | 15,682 |
|
| Distribution fees — Class R (Note 2) | 281 |
|
| Other | 69,598 |
|
| Total expenses | 1,513,922 |
| | |
| Expense reduction (Note 2) | (9,784) |
|
| Net expenses | 1,504,138 |
| |
| Net investment income | 515,446 |
|
| |
| Net realized gain on investments (Notes 1 and 3) | 16,873,207 |
|
| Net realized gain on swap contracts (Note 1) | 122,426 |
|
| Net realized gain on futures contracts (Note 1) | 658,175 |
|
| Net realized loss on foreign currency transactions (Note 1) | (121) |
|
| Net realized gain on written options (Notes 1 and 3) | 7,500 |
|
| Net unrealized appreciation of investments, futures contracts, | |
| written options and swap contracts during the period | 20,532,015 |
|
| Net gain on investments | 38,193,202 |
| |
| Net increase in net assets resulting from operations | $38,708,648 |
|
The accompanying notes are an integral part of these financial statements.
28
Statement of changes in net assets
| | |
| INCREASE (DECREASE) IN NET ASSETS | Six months ended 1/31/11* | Year ended 7/31/10 |
|
| Operations: | | |
| Net investment income | $515,446 | $970,441 |
|
| Net realized gain on investments | | |
| and foreign currency transactions | 17,661,187 | 24,998,174 |
|
| Net unrealized appreciation of investments | 20,532,015 | 4,540,940 |
|
| Net increase in net assets resulting from operations | 38,708,648 | 30,509,555 |
|
| Distributions to shareholders (Note 1): | | |
| From ordinary income | | |
| Net investment income | | |
|
| Class A | (1,039,218) | (1,493,699) |
|
| Class B | — | (3,972) |
|
| Class C | — | (25,738) |
|
| Class M | (3,872) | (17,884) |
|
| Class R | (480) | (699) |
|
| Class Y | (33,260) | (38,836) |
|
| From return of capital | | |
| Class A | — | (121,001) |
|
| Class B | — | (322) |
|
| Class C | — | (2,085) |
|
| Class M | — | (1,449) |
|
| Class R | — | (57) |
|
| Class Y | — | (3,146) |
|
| Redemption fees (Note 1) | 81 | 110 |
|
| Decrease from capital share transactions (Note 4) | (26,286,403) | (34,196,225) |
|
| Total increase (decrease) in net assets | 11,345,496 | (5,395,448) |
|
| |
| NET ASSETS | | |
|
| Beginning of period | 221,258,836 | 226,654,284 |
|
| End of period (including distributions in excess of net investment | |
| income of $593,514 and $32,130, respectively) | $232,604,332 | $221,258,836 |
|
* Unaudited
The accompanying notes are an integral part of these financial statements.
29
Financial highlights (For a common share outstanding throughout the period)
| | | | | | | | | | | | | | |
| INVESTMENT OPERATIONS: | | LESS DISTRIBUTIONS: | | RATIOS AND SUPPLEMENTAL DATA: |
|
| | | | | | | | | | | | | Ratio | Ratio | |
| | | | Net realized | | | | | | | | | of expenses | of net investment | |
| | Net asset value, | | and unrealized | Total from | From | From | | | | Total return | Net assets, | to average | income (loss) | Portfolio |
| | beginning | Net investment | gain (loss) | investment | net investment | return | Total | Redemption | Net asset value, | at net asset | end of period | net assets | to average | turnover |
| Period ended | of period | income (loss) a | on investments | operations | income | of capital | distributions | fees e | end of period | value (%) b | (in thousands) | (%) c | net assets (%) | (%) |
|
| Class A | | | | | | | | | | | | | | |
| January 31, 2011 ** | $13.08 | .04 | 2.42 | 2.46 | (.08) | — | (.08) | — | $15.46 | 18.85 * | $193,640 | .62* | .28* | 47.42* |
| July 31, 2010 | 11.59 | .07 | 1.53 | 1.60 | (.10) | (.01) | (.11) | — | 13.08 | 13.80 | 184,136 | 1.26 d | .53 d | 106.49 |
| July 31, 2009 | 13.99 | .11 | (2.41) g | (2.30) | (.10) | — | (.10) | — | 11.59 | (16.26) g | 179,816 | 1.18 d | 1.04 d | 129.81 |
| July 31, 2008 | 16.74 | .08 | (2.78) | (2.70) | (.05) | — | (.05) | — | 13.99 | (16.16) | 271,560 | 1.24 d | .51 d | 118.70 |
| July 31, 2007 | 14.50 | .06 | 2.20 | 2.26 | (.02) | — | (.02) | — | 16.74 | 15.58 | 455,608 | 1.25 d | .40 d | 78.84 |
| July 31, 2006 | 14.49 | .06 f | (.01) | .05 | (.04) | — | (.04) | — | 14.50 | .35 f | 486,691 | 1.10 d,f,h | .44 d,f | 85.13 |
|
| Class B | | | | | | | | | | | | | | |
| January 31, 2011 ** | $12.28 | (.01) | 2.27 | 2.26 | — | — | — | — | $14.54 | 18.40 * | $17,920 | 1.00* | (.09)* | 47.42* |
| July 31, 2010 | 10.87 | (.02) | 1.43 | 1.41 | — e | — e | — e | — | 12.28 | 12.99 | 18,522 | 2.01 d | (.20) d | 106.49 |
| July 31, 2009 | 13.09 | .03 | (2.25) g | (2.22) | — | — | — | — | 10.87 | (16.96) g | 27,769 | 1.93 d | .31 d | 129.81 |
| July 31, 2008 | 15.73 | (.04) | (2.60) | (2.64) | — | — | — | — | 13.09 | (16.78) | 65,767 | 1.99 d | (.24) d | 118.70 |
| July 31, 2007 | 13.72 | (.05) | 2.06 | 2.01 | — | — | — | — | 15.73 | 14.65 | 146,984 | 2.00 d | (.35) d | 78.84 |
| July 31, 2006 | 13.77 | (.04) f | (.01) | (.05) | — | — | — | — | 13.72 | (.36) f | 234,490 | 1.85 d,f,h | (.31) d,f | 85.13 |
|
| Class C | | | | | | | | | | | | | | |
| January 31, 2011 ** | $12.33 | (.01) | 2.28 | 2.27 | — | — | — | — | $14.60 | 18.41 * | $12,203 | 1.00* | (.10)* | 47.42* |
| July 31, 2010 | 10.94 | (.03) | 1.45 | 1.42 | (.03) | — e | (.03) | — | 12.33 | 12.97 | 10,736 | 2.01 d | (.22) d | 106.49 |
| July 31, 2009 | 13.17 | .03 | (2.26) g | (2.23) | — | — | — | — | 10.94 | (16.93) g | 10,874 | 1.93 d | .29 d | 129.81 |
| July 31, 2008 | 15.83 | (.04) | (2.62) | (2.66) | — | — | — | — | 13.17 | (16.80) | 16,486 | 1.99 d | (.24) d | 118.70 |
| July 31, 2007 | 13.80 | (.05) | 2.08 | 2.03 | — | — | — | — | 15.83 | 14.71 | 26,731 | 2.00 d | (.35) d | 78.84 |
| July 31, 2006 | 13.85 | (.04) f | (.01) | (.05) | — | — | — | — | 13.80 | (.36) f | 30,016 | 1.85 d,f,h | (.31) d,f | 85.13 |
|
| Class M | | | | | | | | | | | | | | |
| January 31, 2011 ** | $12.59 | — e | 2.34 | 2.34 | (.01) | — | (.01) | — | $14.92 | 18.62 * | $4,369 | .88* | .03* | 47.42* |
| July 31, 2010 | 11.17 | — e | 1.47 | 1.47 | (.05) | — e | (.05) | — | 12.59 | 13.19 | 3,961 | 1.76 d | .03 d | 106.49 |
| July 31, 2009 | 13.44 | .05 | (2.30) g | (2.25) | (.02) | — | (.02) | — | 11.17 | (16.69) g | 4,254 | 1.68 d | .54 d | 129.81 |
| July 31, 2008 | 16.11 | — e | (2.67) | (2.67) | — | — | — | — | 13.44 | (16.57) | 7,030 | 1.74 d | .01 d | 118.70 |
| July 31, 2007 | 14.01 | (.02) | 2.12 | 2.10 | — | — | — | — | 16.11 | 14.99 | 11,300 | 1.75 d | (.10) d | 78.84 |
| July 31, 2006 | 14.03 | (.01) f | (.01) | (.02) | — | — | — | — | 14.01 | (.14) f | 12,956 | 1.60 d,f,h | (.06) d,f | 85.13 |
|
| Class R | | | | | | | | | | | | | | |
| January 31, 2011 ** | $13.02 | .02 | 2.42 | 2.44 | (.06) | — | (.06) | — | $15.40 | 18.75 * | $133 | .75* | .16* | 47.42* |
| July 31, 2010 | 11.55 | .04 | 1.52 | 1.56 | (.08) | (.01) | (.09) | — | 13.02 | 13.47 | 102 | 1.51 d | .28 d | 106.49 |
| July 31, 2009 | 13.92 | .09 | (2.40) g | (2.31) | (.06) | — | (.06) | — | 11.55 | (16.51) g | 103 | 1.43 d | .77 d | 129.81 |
| July 31, 2008 | 16.65 | .04 | (2.76) | (2.72) | (.01) | — | (.01) | — | 13.92 | (16.34) | 101 | 1.49 d | .27 d | 118.70 |
| July 31, 2007 | 14.44 | .02 | 2.19 | 2.21 | — | — | — | — | 16.65 | 15.31 | 286 | 1.50 d | .12 d | 78.84 |
| July 31, 2006 | 14.44 | .02 f | (.01) | .01 | (.01) | — | (.01) | — | 14.44 | .09 f | 272 | 1.35 d,f,h | .17 d,f | 85.13 |
|
| Class Y | | | | | | | | | | | | | | |
| January 31, 2011 ** | $13.16 | .06 | 2.44 | 2.50 | (.12) | — | (.12) | — | $15.54 | 19.04 * | $4,339 | .50* | .40* | 47.42* |
| July 31, 2010 | 11.66 | .10 | 1.54 | 1.64 | (.13) | (.01) | (.14) | — | 13.16 | 14.05 | 3,802 | 1.01 d | .78 d | 106.49 |
| July 31, 2009 | 14.10 | .14 | (2.43) g | (2.29) | (.15) | — | (.15) | — | 11.66 | (16.04) g | 3,838 | .93 d | 1.30 d | 129.81 |
| July 31, 2008 | 16.88 | .12 | (2.80) | (2.68) | (.10) | — | (.10) | — | 14.10 | (15.96) | 5,026 | .99 d | .76 d | 118.70 |
| July 31, 2007 | 14.62 | .11 | 2.21 | 2.32 | (.06) | — | (.06) | — | 16.88 | 15.88 | 71,184 | 1.00 d | .64 d | 78.84 |
| July 31, 2006 | 14.62 | .10 f | (.02) | .08 | (.08) | — | (.08) | — | 14.62 | .55 f | 80,374 | .85 d,f,h | .68 d,f | 85.13 |
|
See notes to financial highlights at the end of this section.
The accompanying notes are an integral part of these financial statements.
Financial highlights (Continued)
* Not annualized.
** Unaudited.
a Per share net investment income (loss) has been determined on the basis of the weighted average number of shares outstanding during the period.
b Total return assumes dividend reinvestment and does not reflect the effect of sales charges.
c Includes amounts paid through expense offset and brokerage/service arrangements (Note 2).
d Reflects an involuntary contractual expense limitation in effect during the period. For periods prior to July 31, 2010 certain fund expenses were waived in connection with the fund’s investment in Putnam Prime Money Market Fund. As a result of such limitation and/or waivers, the expenses of each class reflect a reduction of the following amounts:
| |
| | Percentage of |
| | average net assets |
|
| July 31, 2010 | 0.03% |
|
| July 31, 2009 | 0.27 |
|
| July 31, 2008 | 0.03 |
|
| July 31, 2007 | <0.01 |
|
| July 31, 2006 | <0.01 |
|
e Amount represents less than $0.01 per share.
f Reflects a non-recurring reimbursement from Putnam Investments relating to the calculation of certain amounts paid by the fund to Putnam in previous years for transfer agent services, which amounted to $0.01 per share and 0.07% of average net assets for the period ended July 31, 2006.
g Reflects a non-recurring litigation payment received by the fund from Tyco International, Ltd. which amounted to the following amounts per share outstanding on March 13, 2009:
| |
| | Per share |
|
| Class A | $0.15 |
|
| Class B | 0.14 |
|
| Class C | 0.14 |
|
| Class M | 0.14 |
|
| Class R | 0.15 |
|
| Class Y | 0.15 |
|
This payment resulted in an increase to total returns of 1.08% for the year ended July 31, 2009.
h Does not reflect reimbursements from Putnam Management related to changes in the calculation of fees pursuant to the fund’s management contract in connection with a settlement with the Securities and Exchange Commission (the SEC), which amounted to 0.01% of average net assets for the period ended July 31, 2006.
The accompanying notes are an integral part of these financial statements.
32
Notes to financial statements 1/31/11 (Unaudited)
Note 1: Significant accounting policies
Putnam Research Fund (the fund) is a diversified series of Putnam Investment Funds (the Trust), a Massachusetts business trust registered under the Investment Company Act of 1940, as amended, as an open-end management investment company. The objective of the fund is to seek capital appreciation by investing primarily in common stocks of large U.S. companies.
The fund offers class A, class B, class C, class M, class R and class Y shares. Class A and class M shares are sold with a maximum front-end sales charge of 5.75% and 3.50%, respectively, and generally do not pay a contingent deferred sales charge. Class B shares, which convert to class A shares after approximately eight years, do not pay a front-end sales charge and are subject to a contingent deferred sales charge if those shares are redeemed within six years of purchase. Class C shares have a one-year 1.00% contingent deferred sales charge and do not convert to class A shares. Class R shares, which are not available to all investors, are sold at net asset value. The expenses for class A, class B, class C, class M and class R shares may differ based on the distribution fee of each class, which is identified in Note 2. Class Y shares, which are sold at net asset value, are generally subject to the same expenses as class A, class B, class C, class M and class R shares, but do not bear a distribution fee. Class Y shares are not available to all investors.
A 1.00% redemption fee may apply on any shares that are redeemed (either by selling or exchanging into another fund) within 7 days of purchase. The redemption fee is accounted for as an addition to paid-in-capital.
Investment income, realized and unrealized gains and losses and expenses of the fund are borne pro-rata based on the relative net assets of each class to the total net assets of the fund, except that each class bears expenses unique to that class (including the distribution fees applicable to such classes). Each class votes as a class only with respect to its own distribution plan or other matters on which a class vote is required by law or determined by the Trustees. If the fund were liquidated, shares of each class would receive their pro-rata share of the net assets of the fund. In addition, the Trustees declare separate dividends on each class of shares.
In the normal course of business, the fund enters into contracts that may include agreements to indemnify another party under given circumstances. The fund’s maximum exposure under these arrangements is unknown as this would involve future claims that may be, but have not yet been, made against the fund. However, the fund’s management team expects the risk of material loss to be remote.
The following is a summary of significant accounting policies consistently followed by the fund in the preparation of its financial statements. The preparation of financial statements is in conformity with accounting principles generally accepted in the United States of America and requires management to make estimates and assumptions that affect the reported amounts of assets and liabilities in the financial statements and the reported amounts of increases and decreases in net assets from operations. Actual results could differ from those estimates. Subsequent events after the Statement of assets and liabilities date through the date that the financial statements were issued have been evaluated in the preparation of the financial statements. Unless otherwise noted, the “reporting period” represents the period from August 1, 2010 through January 31, 2011.
A) Security valuation Investments for which market quotations are readily available are valued at the last reported sales price on their principal exchange, or official closing price for certain markets, and are classified as Level 1 securities. If no sales are reported — as in the case of some securities traded over-the-counter — a security is valued at its last reported bid price and is generally categorized as a Level 2 security.
Many securities markets and exchanges outside the U.S. close prior to the close of the New York Stock Exchange and therefore the closing prices for securities in such markets or on such exchanges may not fully reflect events that occur after such close but before the close of the New York Stock Exchange. Accordingly, on certain days, the fund will fair value foreign equity securities taking into account multiple factors including movements in the U.S. securities markets, currency valuations and comparisons to the valuation of American Depository Receipts, exchange-traded funds and futures contracts. These securities, which will generally represent a transfer from a Level 1 to a Level 2 security, will be classified as Level 2. The number of days on which fair value prices will be used will depend on market activity and it is possible that fair value prices will be used by the fund to a significant extent. At the close of the reporting period, fair value pricing was used for certain foreign securities in the portfolio. Securities quoted in foreign currencies, if any, are translated into U.S. dollars at the current exchange rate.
33
To the extent a pricing service or dealer is unable to value a security or provides a valuation that Putnam Investment Management, LLC (Putnam Management), the fund’s manager, an indirect wholly-owned subsidiary of Putnam Investments, LLC, does not believe accurately reflects the security’s fair value, the security will be valued at fair value by Putnam Management. Certain investments, including certain restricted and illiquid securities and derivatives, are also valued at fair value following procedures approved by the Trustees. These valuations consider such factors as significant market or specific security events such as interest rate or credit quality changes, various relationships with other securities, discount rates, U.S. Treasury, U.S. swap and credit yields, index levels, convexity exposures and recovery rates. These securities are classified as Level 2 or as Level 3 depending on the priority of the significant inputs.
Such valuations and procedures are reviewed periodically by the Trustees. The fair value of securities is generally determined as the amount that the fund could reasonably expect to realize from an orderly disposition of such securities over a reasonable period of time. By its nature, a fair value price is a good faith estimate of the value of a security in a current sale and does not reflect an actual market price, which may be different by a material amount.
B) Joint trading account Pursuant to an exemptive order from the Securities and Exchange Commission (the SEC), the fund may transfer uninvested cash balances, including cash collateral received under security lending arrangements, into a joint trading account along with the cash of other registered investment companies and certain other accounts managed by Putnam Management. These balances may be invested in issues of short-term investments having maturities of up to 397 days for collateral received under security lending arrangements and up to 90 days for other cash investments.
C) Security transactions and related investment income Security transactions are recorded on the trade date (the date the order to buy or sell is executed). Gains or losses on securities sold are determined on the identified cost basis.
Interest income is recorded on the accrual basis. Dividend income, net of applicable withholding taxes, is recognized on the ex-dividend date except that certain dividends from foreign securities, if any, are recognized as soon as the fund is informed of the ex-dividend date. Non-cash dividends, if any, are recorded at the fair market value of the securities received. Dividends representing a return of capital or capital gains, if any, are reflected as a reduction of cost and/or as a realized gain. All premiums/discounts are amortized/accreted on a yield-to-maturity basis.
D) Foreign currency translation The accounting records of the fund are maintained in U.S. dollars. The market value of foreign securities, currency holdings, and other assets and liabilities is recorded in the books and records of the fund after translation to U.S. dollars based on the exchange rates on that day. The cost of each security is determined using historical exchange rates. Income and withholding taxes are translated at prevailing exchange rates when earned or incurred. The fund does not isolate that portion of realized or unrealized gains or losses resulting from changes in the foreign exchange rate on investments from fluctuations arising from changes in the market prices of the securities. Such gains and losses are included with the net realized and unrealized gain or loss on investments. Net realized gains and losses on foreign currency transactions represent net realized exchange gains or losses on closed forward currency contracts, disposition of foreign currencies, currency gains and losses realized between the trade and settlement dates on securities transactions and the difference between the amount of investment income and foreign withholding taxes recorded on the fund’s books and the U.S. dollar equivalent amounts actually received or paid. Net unrealized appreciation and depreciation of assets and liabilities in foreign currencies arise from changes in the value of open forward currency contracts and assets and liabilities other than investments at the period end, resulting from changes in the exchange rate. Investments in foreign securities involve certain risks, including those related to economic instability, unfavorable political developments, and currency fluctuations, not present with domestic investments.
E) Futures contracts The fund uses futures contracts to equitize cash and manage exposure to market risk. The potential risk to the fund is that the change in value of futures contracts may not correspond to the change in value of the hedged instruments. In addition, losses may arise from changes in the value of the underlying instruments if there is an illiquid secondary market for the contracts, if interest or exchange rates move unexpectedly or if the counterparty to the contract is unable to perform. With futures, there is minimal counterparty credit risk to the fund since futures are exchange traded and the exchange’s clearinghouse, as counterparty to all exchange traded futures, guarantees the futures against default. Risks may exceed amounts recognized on the Statement of assets and liabilities. When the contract is closed, the fund records a realized gain or loss equal to the difference between the value of the contract at the time it was opened and the value at the time it was closed.
34
Futures contracts are valued at the quoted daily settlement prices established by the exchange on which they trade. The fund and the broker agree to exchange an amount of cash equal to the daily fluctuation in the value of the futures contract. Such receipts or payments are known as “variation margin.” Futures contracts outstanding at period end, if any, are listed after the fund’s portfolio. The fund had an average number of contracts of approximately 25 on futures contracts for the reporting period.
F) Options contracts The fund uses options contracts to generate additional income for the portfolio and enhance returns on securities owned. The potential risk to the fund is that the change in value of options contracts may not correspond to the change in value of the hedged instruments. In addition, losses may arise from changes in the value of the underlying instruments if there is an illiquid secondary market for the contracts, if interest or exchange rates move unexpectedly or if the counterparty to the contract is unable to perform. Realized gains and losses on purchased options are included in realized gains and losses on investment securities. If a written call option is exercised, the premium originally received is recorded as an addition to sales proceeds. If a written put option is exercised, the premium originally received is recorded as a reduction to the cost of investments.
Exchange traded options are valued at the last sale price or, if no sales are reported, the last bid price for purchased options and the last ask price for written options. Options traded over-the-counter are valued using prices supplied by dealers. Written option contracts outstanding at period end, if any, are listed after the fund’s portfolio. The fund had an average contract amount of approximately 4,762 on purchased options contracts for the reporting period. See Note 3 for the volume of written options contracts activity for the reporting period.
G) Total return swap contracts The fund enters into total return swap contracts, which are arrangements to exchange a market linked return for a periodic payment, both based on a notional principal amount to gain exposure to specific sectors/industries. To the extent that the total return of the security, index or other financial measure underlying the transaction exceeds or falls short of the offsetting interest rate obligation, the fund will receive a payment from or make a payment to the counterparty. Total return swap contracts are marked to market daily based upon quotations from market makers and the change, if any, is recorded as an unrealized gain or loss. Payments received or made are recorded as realized gains or losses. Certain total return swap contracts may include extended effective dates. Payments related to these swap contracts are accrued based on the terms of the contract. The fund could be exposed to credit or market risk due to unfavorable changes in the fluctuation of interest rates or in the price of the underlying security or index, the possibility that there is no liquid market for these agreements or that the counterparty may default on its obligation to perform. The fund’s maximum risk of loss from counterparty risk is the fair value of the contract. This risk may be mitigated by having a master netting arrangement between the fund and the counterparty. Risk of loss may exceed amounts recognized on the Statement of assets and liabilities. Total return swap contracts outstanding at period end, if any, are listed after the fund’s portfolio. The fund had an average notional amount of approximately $353,000 on total return swap contracts for the reporting period.
H) Master agreements The fund is a party to ISDA (International Swap and Derivatives Association, Inc.) Master Agreements (Master Agreements) with certain counterparties that govern over-the-counter derivative and foreign exchange contracts entered into from time to time. The Master Agreements may contain provisions regarding, among other things, the parties’ general obligations, representations, agreements, collateral requirements, events of default and early termination. With respect to certain counterparties, in accordance with the terms of the Master Agreements, collateral posted to the fund is held in a segregated account by the fund’s custodian and with respect to those amounts which can be sold or repledged, are presented in the fund’s portfolio. Collateral pledged by the fund is segregated by the fund’s custodian and identified in the fund’s portfolio. Collateral can be in the form of cash or debt securities issued by the U.S. Government or related agencies or other securities as agreed to by the fund and the applicable counterparty. Collateral requirements are determined based on the fund’s net position with each counterparty. Termination events applicable to the fund may occur upon a decline in the fund’s net assets below a specified threshold over a certain period of time. Termination events applicable to counterparties may occur upon a decline in the counterparty’s long-term and short-term credit ratings below a specified level. In each case, upon occurrence, the other party may elect to terminate early and cause settlement of all derivative and foreign exchange contracts outstanding, including the payment of any losses and costs resulting from such early termination, as reasonably determined by the terminating party. Any decision by one or more of the fund’s counterparties to elect early termination could impact the fund’s future derivative activity. At the close of the reporting period, the fund did not have a net liability position on derivative contracts subject to the Master Agreements.
35
I) Securities lending The fund may lend securities, through its agent, to qualified borrowers in order to earn additional income. The loans are collateralized by cash in an amount at least equal to the market value of the securities loaned. The market value of securities loaned is determined daily and any additional required collateral is allocated to the fund on the next business day. The risk of borrower default will be borne by the fund’s agent; the fund will bear the risk of loss with respect to the investment of the cash collateral. Income from securities lending is included in investment income on the Statement of operations. Effective August 2010, cash collateral is invested in Putnam Cash Collateral Pool, LLC, a limited liability company managed by an affiliate of Putnam Management. Investments in Putnam Cash Collateral Pool, LLC are valued at its closing net asset value each business day. There are no management fees charged by Putnam Cash Collateral Pool, LLC. At the close of the reporting period, the fund had no securities out on loan.
J) Interfund lending Effective July 2010, the fund, along with other Putnam funds, may participate in an interfund lending program pursuant to an exemptive order issued by the SEC. This program allows the fund to borrow from or lend to other Putnam funds that permit such transactions. Interfund lending transactions are subject to each fund’s investment policies and borrowing and lending limits. Interest earned or paid on the interfund lending transaction will be based on the average of certain current market rates. During the reporting period, the fund did not utilize the program.
K) Line of credit Effective July 2010, the fund participates, along with other Putnam funds, in a $285 million unsecured committed line of credit and a $165 million unsecured uncommitted line of credit, both provided by State Street Bank and Trust Company (State Street). Borrowings may be made for temporary or emergency purposes, including the funding of shareholder redemption requests and trade settlements. Interest is charged to the fund based on the fund’s borrowing at a rate equal to the Federal Funds rate plus 1.25% for the committed line of credit and the Federal Funds rate plus 1.30% for the uncommitted line of credit. A closing fee equal to 0.03% of the committed line of credit and $100,000 for the uncommitted line of credit has been paid by the participating funds. In addition, a commitment fee of 0.15% per annum on any unutilized portion of the committed line of credit is allocated to the participating funds based on their relative net assets and paid quarterly. During the reporting period, the fund had no borrowings against these arrangements.
L) Federal taxes It is the policy of the fund to distribute all of its taxable income within the prescribed time period and otherwise comply with the provisions of the Internal Revenue Code of 1986, as amended (the Code), applicable to regulated investment companies. It is also the intention of the fund to distribute an amount sufficient to avoid imposition of any excise tax under Section 4982 of the Code. The fund is subject to the provisions of Accounting Standards Codification ASC 740 Income Taxes (ASC 740). ASC 740 sets forth a minimum threshold for financial statement recognition of the benefit of a tax position taken or expected to be taken in a tax return. The fund did not have a liability to record for any unrecognized tax benefits in the accompanying financial statements. No provision has been made for federal taxes on income, capital gains or unrealized appreciation on securities held nor for excise tax on income and capital gains. Each of the fund’s federal tax returns for the prior three fiscal years remains subject to examination by the Internal Revenue Service.
At July 31, 2010, the fund had a capital loss carryover of $421,907,911 available to the extent allowed by the Code to offset future net capital gain, if any. The amounts of the carryovers and the expiration dates are:
| | |
| Loss carryover | | Expiration |
|
| $289,150,448 | | July 31, 2011 |
|
| 81,950,908 | | July 31, 2017 |
|
| 50,806,555 | | July 31, 2018 |
|
Pursuant to federal income tax regulations applicable to regulated investment companies, the fund has elected to defer to its fiscal year ending July 31, 2011 $1,471,235 of losses recognized during the period November 1, 2009 to July 31, 2010.
The aggregate identified cost on a tax basis is $216,051,167, resulting in gross unrealized appreciation and depreciation of $24,994,291 and $8,559,945, respectively, or net unrealized appreciation of $16,434,346.
M) Distributions to shareholders Distributions to shareholders from net investment income are recorded by the fund on the ex-dividend date. Distributions from capital gains, if any, are recorded on the ex-dividend date and paid at least annually. The amount and character of income and gains to be distributed are determined in accordance with income tax regulations, which may differ from generally accepted accounting principles. Dividend sources are estimated at the time of declaration. Actual results may vary. Any non-taxable return of capital cannot be
36
determined until final tax calculations are completed after the end of the fund’s fiscal year. Reclassifications are made to the fund’s capital accounts to reflect income and gains available for distribution (or available capital loss carryovers) under income tax regulations.
N) Expenses of the Trust Expenses directly charged or attributable to any fund will be paid from the assets of that fund. Generally, expenses of the Trust will be allocated among and charged to the assets of each fund on a basis that the Trustees deem fair and equitable, which may be based on the relative assets of each fund or the nature of the services performed and relative applicability to each fund.
Note 2: Management fee, administrative services and other transactions
The fund pays Putnam Management a management fee (based on the fund’s average net assets and computed and paid monthly) at annual rates that may vary based on the average of the aggregate net assets of most open-end funds, as defined in the fund’s management contract, sponsored by Putnam Management. Such annual rates may vary as follows: 0.710% of the first $5 billion, 0.660% of the next $5 billion, 0.610% of the next $10 billion, 0.560% of the next $10 billion, 0.510% of the next $50 billion, 0.490% of the next $50 billion, 0.480% of the next $100 billion, and 0.475% of any excess thereafter.
Putnam Management has contractually agreed, through June 30, 2011, to waive fees or reimburse the fund’s expenses to the extent necessary to limit the cumulative expenses of the fund, exclusive of brokerage, interest, taxes, investment-related expenses, extraordinary expenses and payments under the fund’s investor servicing contract, investment management contract and distribution plans, on a fiscal year-to-date basis to an annual rate of 0.20% of the fund’s average net assets over such fiscal year-to-date period. During the reporting period, the fund’s expenses were not reduced as a result of this limit.
Putnam Investments Limited (PIL), an affiliate of Putnam Management, is authorized by the Trustees to manage a separate portion of the assets of the fund as determined by Putnam Management from time to time. Putnam Management pays a quarterly sub-management fee to PIL for its services at an annual rate of 0.35% of the average net assets of the portion of the fund managed by PIL.
The Putnam Advisory Company, LLC (PAC), an affiliate of Putnam Management, is authorized by the Trustees to manage a separate portion of the assets of the fund, as designated from time to time by Putnam Management or PIL. Putnam Management or PIL, as applicable, pays a quarterly sub-advisory fee to PAC for its services at the annual rate of 0.35% of the average net assets of the portion of the fund’s assets for which PAC is engaged as sub-adviser.
The fund reimburses Putnam Management an allocated amount for the compensation and related expenses of certain officers of the fund and their staff who provide administrative services to the fund. The aggregate amount of all such reimbursements is determined annually by the Trustees.
Custodial functions for the fund’s assets are provided by State Street. Custody fees are based on the fund’s asset level, the number of its security holdings and transaction volumes.
Putnam Investor Services, Inc., an affiliate of Putnam Management, provides investor servicing agent functions to the fund. Putnam Investor Services, Inc. received fees for investor servicing based on the fund’s retail asset level, the number of shareholder accounts in the fund and the level of defined contribution plan assets in the fund. Investor servicing fees will not exceed an annual rate of 0.375% of the fund’s average net assets. The amounts incurred for investor servicing agent functions during the reporting period are included in Investor servicing fees in the Statement of operations.
The fund has entered into expense offset arrangements with Putnam Investor Services, Inc. and State Street whereby Putnam Investor Services, Inc.’s and State Street’s fees are reduced by credits allowed on cash balances. The fund also reduced expenses through brokerage/service arrangements. For the reporting period, the fund’s expenses were reduced by $566 under the expense offset arrangements and by $9,218 under the brokerage/service arrangements.
Each independent Trustee of the fund receives an annual Trustee fee, of which $146, as a quarterly retainer, has been allocated to the fund, and an additional fee for each Trustees meeting attended. Trustees also are reimbursed for expenses they incur relating to their services as Trustees.
The fund has adopted a Trustee Fee Deferral Plan (the Deferral Plan) which allows the Trustees to defer the receipt of all or a portion of Trustees fees payable on or after July 1, 1995. The deferred fees remain invested in certain Putnam funds until distribution in accordance with the Deferral Plan.
37
The fund has adopted an unfunded noncontributory defined benefit pension plan (the Pension Plan) covering all Trustees of the fund who have served as a Trustee for at least five years and were first elected prior to 2004. Benefits under the Pension Plan are equal to 50% of the Trustee’s average annual attendance and retainer fees for the three years ended December 31, 2005. The retirement benefit is payable during a Trustee’s lifetime, beginning the year following retirement, for the number of years of service through December 31, 2006. Pension expense for the fund is included in Trustee compensation and expenses in the Statement of operations. Accrued pension liability is included in Payable for Trustee compensation and expenses in the Statement of assets and liabilities. The Trustees have terminated the Pension Plan with respect to any Trustee first elected after 2003.
The fund has adopted distribution plans (the Plans) with respect to its class A, class B, class C, class M and class R shares pursuant to Rule 12b-1 under the Investment Company Act of 1940. The purpose of the Plans is to compensate Putnam Retail Management Limited Partnership, a wholly-owned subsidiary of Putnam Investments, LLC and Putnam Retail Management GP, Inc., for services provided and expenses incurred in distributing shares of the fund. The Plans provide for payments by the fund to Putnam Retail Management Limited Partnership at an annual rate of up to 0.35%, 1.00%, 1.00%, 1.00% and 1.00% of the average net assets attributable to class A, class B, class C, class M and class R shares, respectively. The Trustees have approved payment by the fund at an annual rate of 0.25%, 1.00%, 1.00%, 0.75% and 0.50% of the average net assets attributable to class A, class B, class C, class M and class R shares, respectively.
For the reporting period, Putnam Retail Management Limited Partnership, acting as underwriter, received net commissions of $6,245 and $149 from the sale of class A and class M shares, respectively, and received $8,623 and $89 in contingent deferred sales charges from redemptions of class B and class C shares, respectively.
A deferred sales charge of up to 1.00% and 0.65% is assessed on certain redemptions of class A and class M shares, respectively. For the reporting period, Putnam Retail Management Limited Partnership, acting as underwriter, received no monies on class A and class M redemptions.
Note 3: Purchases and sales of securities
During the reporting period, cost of purchases and proceeds from sales of investment securities other than short-term investments aggregated $100,042,984 and $131,450,800, respectively. There were no purchases or proceeds from sales of long-term U.S. government securities.
Written option transactions during the reporting period are summarized as follows:
| | |
| | Contract amounts | Premiums received |
|
| Written options outstanding at the | | |
| beginning of the reporting period | 8,333 | $7,500 |
|
| Options opened | — | — |
| Options exercised | — | — |
| Options expired | (8,333) | (7,500) |
| Options closed | — | — |
|
| Written options outstanding at the | | |
| end of the reporting period | — | $— |
|
Note 4: Capital shares
At the close of the reporting period, there was an unlimited number of shares of beneficial interest authorized. Transactions in capital shares were as follows:
| | | | |
| | Six months ended 1/31/11 | Year ended 7/31/10 |
|
| Class A | Shares | Amount | Shares | Amount |
|
| Shares sold | 396,143 | $5,639,902 | 1,261,410 | $16,350,354 |
|
| Shares issued in connection with | | | | |
| reinvestment of distributions | 66,678 | 981,496 | 120,074 | 1,545,675 |
|
| | 462,821 | 6,621,398 | 1,381,484 | 17,896,029 |
|
| Shares repurchased | (2,021,124) | (28,377,063) | (2,818,508) | (36,471,822) |
|
| Net decrease | (1,558,303) | $(21,755,665) | (1,437,024) | $(18,575,793) |
|
38
| | | | |
| | Six months ended 1/31/11 | Year ended 7/31/10 |
|
| Class B | Shares | Amount | Shares | Amount |
|
| Shares sold | 41,551 | $554,665 | 110,268 | $1,331,384 |
|
| Shares issued in connection with | | | | |
| reinvestment of distributions | — | — | 341 | 4,147 |
|
| | 41,551 | 554,665 | 110,609 | 1,335,531 |
|
| Shares repurchased | (317,947) | (4,217,342) | (1,156,326) | (14,060,790) |
|
| Net decrease | (276,396) | $(3,662,677) | (1,045,717) | $(12,725,259) |
|
| |
| | Six months ended 1/31/11 | Year ended 7/31/10 |
|
| Class C | Shares | Amount | Shares | Amount |
|
| Shares sold | 45,884 | $632,531 | 30,749 | $381,710 |
|
| Shares issued in connection with | | | | |
| reinvestment of distributions | — | — | 2,105 | 25,677 |
|
| | 45,884 | 632,531 | 32,854 | 407,387 |
|
| Shares repurchased | (81,070) | (1,084,034) | (155,894) | (1,920,200) |
|
| Net decrease | (35,186) | $(451,503) | (123,040) | $(1,512,813) |
|
| |
| | Six months ended 1/31/11 | Year ended 7/31/10 |
|
| Class M | Shares | Amount | Shares | Amount |
|
| Shares sold | 3,493 | $47,254 | 9,842 | $125,634 |
|
| Shares issued in connection with | | | | |
| reinvestment of distributions | 264 | 3,749 | 1,504 | 18,704 |
|
| | 3,757 | 51,003 | 11,346 | 144,338 |
|
| Shares repurchased | (25,510) | (346,669) | (77,685) | (988,784) |
|
| Net decrease | (21,753) | $(295,666) | (66,339) | $(844,446) |
|
| |
| | Six months ended 1/31/11 | Year ended 7/31/10 |
|
| Class R | Shares | Amount | Shares | Amount |
|
| Shares sold | 2,245 | $32,472 | 2,304 | $30,135 |
|
| Shares issued in connection with | | | | |
| reinvestment of distributions | 33 | 480 | 59 | 756 |
|
| | 2,278 | 32,952 | 2,363 | 30,891 |
|
| Shares repurchased | (1,514) | (20,437) | (3,423) | (44,967) |
|
| Net increase (decrease) | 764 | $12,515 | (1,060) | $(14,076) |
|
| |
| | Six months ended 1/31/11 | Year ended 7/31/10 |
|
| Class Y | Shares | Amount | Shares | Amount |
|
| Shares sold | 12,450 | $180,998 | 33,464 | $431,018 |
|
| Shares issued in connection with | | | | |
| reinvestment of distributions | 2,214 | 32,747 | 3,184 | 41,199 |
|
| | 14,664 | 213,745 | 36,648 | 472,217 |
|
| Shares repurchased | (24,334) | (347,152) | (77,042) | (996,055) |
|
| Net decrease | (9,670) | $(133,407) | (40,394) | $(523,838) |
|
39
Note 5: Summary of derivative activity
The following is a summary of the market values of derivative instruments as of the close of the reporting period:
Market values of derivative instruments as of the close of the reporting period
| | | | |
| | Asset derivatives | Liability derivatives |
|
| Derivatives not | | | | |
| accounted for as | Statement of | | Statement of | |
| hedging instruments | assets and | | assets and | |
| under ASC 815 | liabilities location | Market value | liabilities location | Market value |
|
| | Receivables, Net | | | |
| | assets — Unrealized | | | |
| Equity contracts | appreciation | $204,943* | Payables | $— |
|
| Total | | $204,943 | | $— |
|
* Includes cumulative appreciation of futures contracts as reported in the fund’s portfolio. Only current day’s variation margin is reported within the Statement of assets and liabilities.
The following is a summary of realized and change in unrealized gains or losses of derivative instruments on the Statement of operations for the reporting period (see Note 1):
Amount of realized gain or (loss) on derivatives recognized in net gain or (loss) on investments
| | | | | |
| Derivatives not | | | | | |
| accounted for as | | | | | |
| hedging instruments | | | | | |
| under ASC 815 | Options | Warrants | Futures | Swaps | Total |
|
| Equity contracts | $(20,999) | $46,225 | $658,175 | $122,426 | $805,827 |
|
| Total | $(20,999) | $46,225 | $658,175 | $122,426 | $805,827 |
|
Change in unrealized appreciation or (depreciation) on derivatives recognized in net gain or (loss) on investments
| | | | | |
| Derivatives not | | | | | |
| accounted for as | | | | | |
| hedging instruments | | | | | |
| under ASC 815 | Options | Warrants | Futures | Swaps | Total |
|
| Equity contracts | $9,250 | $(1,495) | $33,576 | $(28,154) | $13,177 |
|
| Total | $9,250 | $(1,495) | $33,576 | $(28,154) | $13,177 |
|
Note 6: Investment in Putnam Money Market Liquidity Fund
The fund invested in Putnam Money Market Liquidity Fund, an open-end management investment company managed by Putnam Management. Investments in Putnam Money Market Liquidity Fund are valued at its closing net asset value each business day. Income distributions earned by the fund are recorded as interest income in the Statement of operations and totaled $6,824 for the reporting period. During the reporting period, cost of purchases and proceeds of sales of investments in Putnam Money Market Liquidity Fund aggregated $48,863,836 and $43,891,637, respectively. Management fees charged to Putnam Money Market Liquidity Fund have been waived by Putnam Management.
Note 7: Regulatory matters and litigation
In late 2003 and 2004, Putnam Management settled charges brought by the SEC and the Massachusetts Securities Division in connection with excessive short-term trading in Putnam funds. Distribution of payments from Putnam Management to certain open-end Putnam funds and their shareholders is expected to be completed in the next several months. These allegations and related matters have served as the general basis for certain lawsuits, including purported class action lawsuits against Putnam Management and, in a limited number of cases, some Putnam funds. Putnam Management believes that these lawsuits will have no material adverse effect on the funds or on Putnam Management’s ability to provide investment management services. In addition, Putnam Management has agreed to bear any costs incurred by the Putnam funds as a result of these matters.
40
Note 8: Market and credit risk
In the normal course of business, the fund trades financial instruments and enters into financial transactions where risk of potential loss exists due to changes in the market (market risk) or failure of the contracting party to the transaction to perform (credit risk). The fund may be exposed to additional credit risk that an institution or other entity with which the fund has unsettled or open transactions will default.
41
The Putnam family of funds
The following is a list of Putnam’s open-end mutual funds offered to the public. Investors should carefully consider the investment objective, risks, charges, and expenses of a fund before investing. For a prospectus, or a summary prospectus if available, containing this and other information for any Putnam fund or product, call your financial advisor at 1-800-225-1581 and ask for a prospectus. Please read the prospectus carefully before investing.
| |
| Growth | Value |
| Growth Opportunities Fund | Convertible Securities Fund |
| International Growth Fund | Prior to September 30, 2010, the fund was known as |
| Prior to January 1, 2010, the fund was known as | Putnam Convertible Income-Growth Trust |
| Putnam International New Opportunities Fund | Equity Income Fund |
| Multi-Cap Growth Fund | George Putnam Balanced Fund |
| Prior to September 1, 2010, the fund was known as | Prior to September 30, 2010, the fund was known as |
| Putnam New Opportunities Fund | The George Putnam Fund of Boston |
| Small Cap Growth Fund | The Putnam Fund for Growth and Income |
| Voyager Fund | International Value Fund |
| | Prior to January 1, 2010, the fund was known as |
| Blend | Putnam International Growth and Income Fund |
| Asia Pacific Equity Fund | Multi-Cap Value Fund |
| Capital Opportunities Fund | Prior to September 1, 2010, the fund was known as |
| Capital Spectrum Fund | Putnam Mid Cap Value Fund |
| Emerging Markets Equity Fund | Small Cap Value Fund |
| Equity Spectrum Fund | |
| Europe Equity Fund | Income |
| Global Equity Fund | American Government Income Fund |
| International Capital Opportunities Fund | Diversified Income Trust |
| International Equity Fund | Floating Rate Income Fund |
| Investors Fund | Global Income Trust |
| Multi-Cap Core Fund | High Yield Advantage Fund |
| Research Fund | High Yield Trust |
| Income Fund |
| | Money Market Fund* |
| | U.S. Government Income Trust |
* An investment in a money market fund is not insured or guaranteed by the Federal Deposit Insurance Corporation or any other government agency. Although the fund seeks to preserve the value of your investment at $1.00 per share, it is possible to lose money by investing in the fund.
42
| |
| Tax-free income | Asset allocation |
| AMT-Free Municipal Fund | Income Strategies Fund |
| Tax Exempt Income Fund | Putnam Asset Allocation Funds — three |
| Tax Exempt Money Market Fund* | investment portfolios that spread your |
| Tax-Free High Yield Fund | money across a variety of stocks, bonds, |
| | and money market investments. |
| State tax-free income funds: | |
| Arizona, California, Massachusetts, Michigan, | The three portfolios: |
| Minnesota, New Jersey, New York, Ohio, | Asset Allocation: Balanced Portfolio |
| and Pennsylvania | Asset Allocation: Conservative Portfolio |
| | Asset Allocation: Growth Portfolio |
| Absolute Return | |
| Absolute Return 100 Fund | Putnam RetirementReady® |
| Absolute Return 300 Fund | Putnam RetirementReady Funds — 10 |
| Absolute Return 500 Fund | investment portfolios that offer diversifi- |
| Absolute Return 700 Fund | cation among stocks, bonds, and money |
| | market instruments and adjust to become |
| Global Sector | more conservative over time based on a |
| Global Consumer Fund | target date for withdrawing assets. |
| Global Energy Fund | |
| Global Financials Fund | The 10 funds: |
| Global Health Care Fund | Putnam RetirementReady 2055 Fund |
| Global Industrials Fund | Putnam RetirementReady 2050 Fund |
| Global Natural Resources Fund | Putnam RetirementReady 2045 Fund |
| Global Sector Fund | Putnam RetirementReady 2040 Fund |
| Global Technology Fund | Putnam RetirementReady 2035 Fund |
| Global Telecommunications Fund | Putnam RetirementReady 2030 Fund |
| Global Utilities Fund | Putnam RetirementReady 2025 Fund |
| | Putnam RetirementReady 2020 Fund |
| | Putnam RetirementReady 2015 Fund |
| | Putnam RetirementReady Maturity Fund |
A short-term trading fee of 1% may apply to redemptions or exchanges from certain funds within the time period specified in the fund's prospectus.
Check your account balances and the most recent month-end performance in the Individual Investors section at putnam.com.
43
Services for shareholders
Investor services
Systematic investment plan Tell us how much you wish to invest regularly — weekly, semimonthly, or monthly — and the amount you choose will be transferred automatically from your checking or savings account. There’s no additional fee for this service, and you can suspend it at any time. This plan may be a great way to save for college expenses or to plan for your retirement.
Please note that regular investing does not guarantee a profit or protect against loss in a declining market. Before arranging a systematic investment plan, consider your financial ability to continue making purchases in periods when prices are low.
Systematic exchange You can make regular transfers from one Putnam fund to another Putnam fund. There are no additional fees for this service, and you can cancel or change your options at any time.
Dividends PLUS You can choose to have the dividend distributions from one of your Putnam funds automatically reinvested in another Putnam fund at no additional charge.
Free exchange privilege You can exchange money between Putnam funds free of charge, as long as they are the same class of shares. A signature guarantee is required if you are exchanging more than $500,000. The fund reserves the right to revise or terminate the exchange privilege.
Reinstatement privilege If you’ve sold Putnam shares or received a check for a dividend or capital gain, you may reinvest the proceeds with Putnam within 90 days of the transaction and they will be reinvested at the fund’s current net asset value — with no sales charge. However, reinstatement of class B shares may have special tax consequences. Ask your financial or tax representative for details.
Check-writing service You have ready access to many Putnam accounts. It’s as simple as writing a check, and there are no special fees or service charges. For more information about the check-writing service, call Putnam or visit our Web site.
Dollar cost averaging When you’re investing for long-term goals, it’s time, not timing, that counts. Investing on a systematic basis is a better strategy than trying to figure out when the markets will go up or down. This means investing the same amount of money regularly over a long period. This method of investing is called dollar cost averaging. When a fund’s share price declines, your investment dollars buy more shares at lower prices. When it increases, they buy fewer shares. Over time, you will pay a lower average price per share.
For more information
Visit the Individual Investors section at putnam.com A secure section of our Web site contains complete information on your account, including balances and transactions, updated daily. You may also conduct transactions, such as exchanges, additional investments, and address changes. Log on today to get your password.
Call us toll free at 1-800-225-1581 Ask a helpful Putnam representative or your financial advisor for details about any of these or other services, or see your prospectus.
44
Fund information
Founded over 70 years ago, Putnam Investments was built around the concept that a balance between risk and reward is the hallmark of a well-rounded financial program. We manage over 100 funds across income, value, blend, growth, asset allocation, absolute return, and global sector categories.
| | |
| Investment Manager | Charles B. Curtis | Mark C. Trenchard |
| Putnam Investment | Robert J. Darretta | Vice President and |
| Management, LLC | Paul L. Joskow | BSA Compliance Officer |
| One Post Office Square | Kenneth R. Leibler | |
| Boston, MA 02109 | Robert E. Patterson | Francis J. McNamara, III |
| | George Putnam, III | Vice President and |
| Investment Sub-Manager | Robert L. Reynolds | Chief Legal Officer |
| Putnam Investments Limited | W. Thomas Stephens | |
| 57–59 St James’s Street | | James P. Pappas |
| London, England SW1A 1LD | Officers | Vice President |
| | Robert L. Reynolds | |
| Investment Sub-Advisor | President | Judith Cohen |
| The Putnam Advisory | | Vice President, Clerk and |
| Company, LLC | Jonathan S. Horwitz | Assistant Treasurer |
| One Post Office Square | Executive Vice President, | |
| Boston, MA 02109 | Principal Executive | Michael Higgins |
| Officer, Treasurer and | Vice President, Senior Associate |
| Marketing Services | Compliance Liaison | Treasurer and Assistant Clerk |
| Putnam Retail Management | | |
| One Post Office Square | Steven D. Krichmar | Nancy E. Florek |
| Boston, MA 02109 | Vice President and | Vice President, Assistant Clerk, |
| | Principal Financial Officer | Assistant Treasurer and |
| Custodian | | Proxy Manager |
| State Street Bank | Janet C. Smith | |
| and Trust Company | Vice President, Assistant | Susan G. Malloy |
| | Treasurer and Principal | Vice President and |
| Legal Counsel | Accounting Officer | Assistant Treasurer |
| Ropes & Gray LLP | | |
| | Beth S. Mazor | |
| Trustees | Vice President | |
| John A. Hill, Chairman | | |
| Jameson A. Baxter, | Robert R. Leveille | |
| Vice Chairman | Vice President and | |
| Ravi Akhoury | Chief Compliance Officer | |
| Barbara M. Baumann | | |
This report is for the information of shareholders of Putnam Research Fund. It may also be used as sales literature when preceded or accompanied by the current prospectus, the most recent copy of Putnam’s Quarterly Performance Summary, and Putnam’s Quarterly Ranking Summary. For more recent performance, please visit putnam.com. Investors should carefully consider the investment objective, risks, charges, and expenses of a fund, which are described in its prospectus. For this and other information or to request a prospectus, or a summary prospectus if available, call 1-800-225-1581 toll free. Please read the prospectus carefully before investing. The fund’s Statement of Additional Information contains additional information about the fund’s Trustees and is available without charge upon request by calling 1-800-225-1581.
Item 2. Code of Ethics:
Not applicable
Item 3. Audit Committee Financial Expert:
Not applicable
Item 4. Principal Accountant Fees and Services:
Not applicable
Item 5. Audit Committee of Listed Registrants
Not applicable
Item 6. Schedule of Investments:
The registrant’s schedule of investments in unaffiliated issuers is included in the report to shareholders in Item 1 above.
Item 7. Disclosure of Proxy Voting Policies and Procedures For Closed-End Management Investment Companies:
Not applicable
Item 8. Portfolio Managers of Closed-End Investment Companies
Not Applicable
Item 9. Purchases of Equity Securities by Closed-End Management Investment Companies and Affiliated Purchasers:
Not applicable
Item 10. Submission of Matters to a Vote of Security Holders:
Not applicable
Item 11. Controls and Procedures:
(a) The registrant's principal executive officer and principal financial officer have concluded, based on their evaluation of the effectiveness of the design and operation of the registrant's disclosure controls and procedures as of a date within 90 days of the filing date of this report, that the design and operation of such procedures are generally effective to provide reasonable assurance that information required to be disclosed by the registrant in this report is recorded, processed, summarized and reported within the time periods specified in the Commission's rules and forms.
(b) Changes in internal control over financial reporting: Not applicable
Item 12. Exhibits:
(a)(1) Not applicable
(a)(2) Separate certifications for the principal executive officer and principal financial officer of the registrant as required by Rule 30a-2(a) under the Investment Company Act of 1940, as amended, are filed herewith.
(b) The certifications required by Rule 30a-2(b) under the Investment Company Act of 1940, as amended, are filed herewith.
Putnam Investment Funds
By (Signature and Title):
/s/Janet C. Smith
Janet C. Smith
Principal Accounting Officer
Date: March 31, 2011
Pursuant to the requirements of the Securities Exchange Act of 1934 and the Investment Company Act of 1940, this report has been signed below by the following persons on behalf of the registrant and in the capacities and on the dates indicated.
By (Signature and Title):
/s/Jonathan S. Horwitz
Jonathan S. Horwitz
Principal Executive Officer
Date: March 31, 2011
By (Signature and Title):
/s/Steven D. Krichmar
Steven D. Krichmar
Principal Financial Officer
Date: March 31, 2011