UNITED STATES
SECURITIES AND EXCHANGE COMMISSION
Washington, D.C. 20549
FORM 6-K
REPORT OF FOREIGN PRIVATE ISSUER
PURSUANT TO RULE 13a-16 OR 15d-16 UNDER
THE SECURITIES EXCHANGE ACT OF 1934
For the month of August, 2015
Commission File Number 0-99
PETRÓLEOS MEXICANOS
(Exact name of registrant as specified in its charter)
MEXICAN PETROLEUM
(Translation of registrant’s name into English)
United Mexican States
(Jurisdiction of incorporation or organization)
Avenida Marina Nacional No. 329
Colonia Petróleos Mexicanos
México, D.F. 11311
México
(Address of principal executive offices)
Indicate by check mark whether the registrant files or will file annual reports under cover of Form 20-F or Form 40-F.
Form 20-F x Form 40-F ¨
Indicate by check mark if the registrant is submitting the Form 6-K in paper as permitted by Regulation S-T Rule 101(b)(1).
Yes ¨ No x
Indicate by check mark if the registrant is submitting the Form 6-K in paper as permitted by Regulation S-T Rule 101(b)(7).
Yes ¨ No x
Indicate by check mark whether the registrant by furnishing the information contained in this form is also thereby furnishing the information to the Commission pursuant to Rule 12g3-2(b) under the Securities Exchange Act of 1934.
Yes ¨ No x
 |
July 28, 2015
Results of PEMEX1 as of June 30, 20152
Second Quarter 2015 (net of IEPS) | 2014 | 2015 | Variation | 2015 | Highlights | |||||||||||||||||
| (MXN billion) | (USD billion) | |||||||||||||||||||||
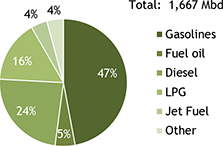
Total Sales | 424.0 | 309.7 | -27.0 | % | 19.9 | g | Total hydrocarbons production averaged 3.3 MMboed, and crude oil production decreased by 9.8%. | |||||||||||||||
Operating Income | 171.1 | 53.9 | -68.5 | % | 3.5 | g | The average price of the Mexican crude oil basket decreased by 44.4%, from USD 97.09 to USD 53.95. | |||||||||||||||
Net Income (Loss) | (52.3 | ) | (84.6 | ) | 61.8 | % | (5.4 | ) | g | EBITDA totaled MXN 130.7 billion (USD 8.4 billion). | ||||||||||||
Acronyms used: Special Tax on Production and Services (IEPS), thousand (M), million (MM), billion (MMM), thousand barrels per day (Mbd), thousand barrels of oil equivalent per day (Mboed), thousand cubic feet per day (Mcfd), thousand tons (Mt).
Uses and Sources of Funds as of June 30, 2015
(MXN million)
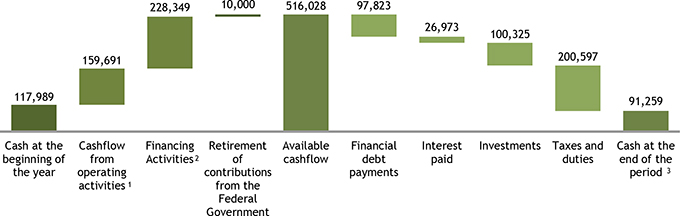
| (1) | Before taxes and duties. Calculated by adding accrued taxes and duties to revenues from operations from the statement of changes in financial position. |
| (2) | Excludes E&P Financed Public Works Contract Program. |
| (3) | Includes (i) a MXN 2,308 million effect from exploration expenses, investment in shares, dividend revenue and financial instruments available for sale and (ii) change of cash effect of MXN 3,527 million. |
| 1 | PEMEX refers to Petróleos Mexicanos, its Productive Subsidiary Companies, Affiliates, Subsidiary Entities and Subsidiary Companies. |
| 2 | PEMEX is providing this report to publish its preliminary financial and operational results for the second quarter of 2015. PEMEX encourages the reader to analyze this report together with the information provided in the Annexes hereto and the transcript of PEMEX’s conference call announcing its result of the second quarter of 2015. All comparisons are made against the same period of the previous year unless otherwise specified. This call is to take place on July 28, 2015. Annexes, transcripts and relevant documents related to this call can be found atwww.pemex.com/en/investors. |
PEMEX
Operating Results
PEMEX
Main Statistics of Production
| Second quarter (Apr.-Jun.) | ||||||||||||||||
| 2014 | 2015 | Change | ||||||||||||||
Upstream | ||||||||||||||||
Total hydrocarbons (Mboed) | 3,578 | 3,255 | -9.0 | % | (323 | ) | ||||||||||
Liquid hydrocarbons (Mbd) | 2,510 | 2,261 | -9.9 | % | (249 | ) | ||||||||||
Crude oil (Mbd) | 2,468 | 2,225 | -9.8 | % | (243 | ) | ||||||||||
Condensates (Mbd) | 42 | 36 | -14.6 | % | (6 | ) | ||||||||||
Natural gas (MMcfd)(1) | 6,524 | 6,282 | -3.7 | % | (241 | ) | ||||||||||
Downstream | ||||||||||||||||
Dry gas from plants (MMcfd)(2) | 3,593 | 3,276 | -8.8 | % | (317 | ) | ||||||||||
Natural gas liquids (Mbd) | 368 | 323 | -12.1 | % | (44 | ) | ||||||||||
Petroleum products (Mbd)(3) | 1,401 | 1,216 | -13.2 | % | (185 | ) | ||||||||||
Petrochemical products (Mt) | 1,366 | 1,249 | -8.5 | % | (116 | ) | ||||||||||
| (1) | Includes nitrogen. |
| (2) | Does not include dry gas produced by Pemex-Refining and used as fuel by this subsidiary entity. |
| (3) | Includes LPG from Pemex-Gas and Basic Petrochemicals, Pemex-Exploration and Production and Pemex-Refining. |
Exploration & Production 2Q15
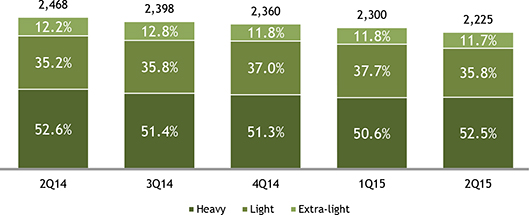
| Crude Oil Production | During the second quarter of 2015, total crude oil production averaged 2,225 Mbd, a 9.8%, or 243 Mbd decrease as compared to the same period of 2014. This variation was primarily due to:
• a 9.9% decrease in the production of heavy crude oil, as a result of the natural decline in production and an increase in the fractional water flow of wells in highly fractured deposits of the Cantarell business unit;
• an 8.4% decrease in production of light crude oil, primarily due to production deferrals at fields of the Abktatún-Pol-Chuc business unit, as a result of the incident that occurred at the Abkatún-A Permanente platform. By the end of the quarter, the decrease in production volume due to the pending restoration of the Abkatún-A Permanente platform was 20 Mbd; and
• a 13.6% decrease in extra-light crude oil production, primarily due to an increase in the fractional water flow of wells located in the Samaria-Luna business unit, a natural decline in production at the Costero field, as well as an increase in the fractional water flow with high salt concentration of wells in the Macuspana-Muspac business unit.
This decrease was partially offset by a 2.5% increase in production from the Litoral de Tabasco and Ku-Maloob-Zaap business units. |
| PEMEX Results Report as of June 30, 2015 | 2 / 26 |
www.pemex.com
PEMEX
Crude Oil Production (Mbd) | Crude Oil Production (Mbd) | |
 |  | |
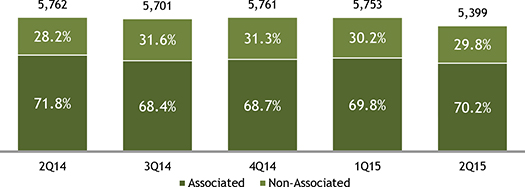
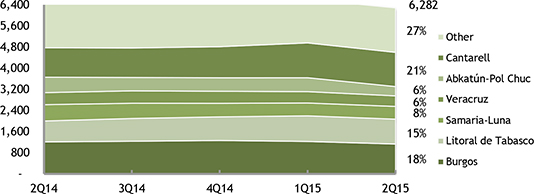
| Natural Gas Production | During the second quarter of 2015, natural gas production decreased by 6.3%3, as compared to the same quarter of 2014, from 5,762 to 5,399 MMcfd. This decrease was primarily driven by:
• an 8.4% decrease in the supply of associated gas, primarily caused by production deferrals at fields of the Abkatún-Pol-Chuc business unit, as a result of the incident that occurred at the Abkatún-A Permanente platform, as well as an increase in the fractional water flow of wells in highly fractured deposits of the Bellota-Jujo and Samaria Luna business units in the Southern region; and
• a marginal decrease in non-associated gas production during the period, primarily at the Veracruz and Macuspana business units of the Northern and Southern region, respectively. |
Natural Gas Production
(MMcfd)
| 3 | Does not include nitrogen. |
| PEMEX Results Report as of June 30, 2015 | 3 / 26 |
www.pemex.com
PEMEX
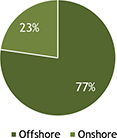
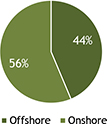
Natural Gas by Asset (MMcfd) | Natural Gas Production by Type of Field 2Q15 | |
 |  |
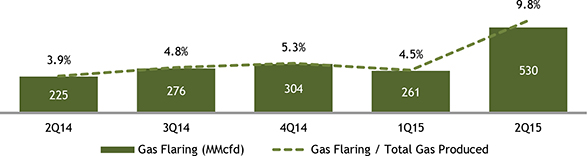
| Gas Flaring | During the second quarter of 2015, natural gas use as a percentage of production amounted to 90.2%.
Gas flaring increased by 135.3%, primarily as a result of the incident that occurred at the Abkatún-A Permanente platform, delays in the completion of works for gas utilization and problems with compression equipment located on marine rigs. |
Gas Flaring
| PEMEX Results Report as of June 30, 2015 | 4 / 26 |
www.pemex.com
PEMEX
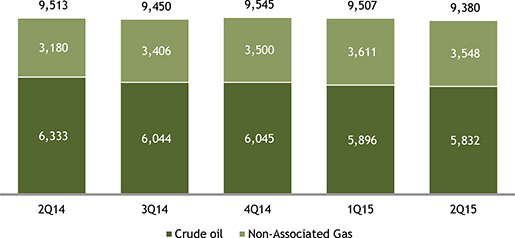
| Operational Infrastructure | During the second quarter of 2015, the average number of operating wells totaled 9,380, a 1.4% decrease as compared to the average number of operating wells during the same quarter of 2014.
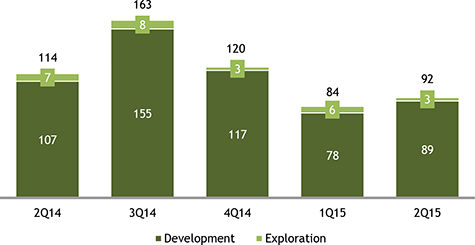
The completion of wells decreased by 19.3%, a decrease of 22 wells, of which 18 are development wells and 4 are exploration wells. This decrease was a result of a scheduled reduction of development activities at the Poza Rica-Altamira, Burgos and Veracruz business units in the Northern region, and a scheduled reduction of exploration activities at the Burgos and Southeastern Onshore Basins business units in the Northern and Southern region, respectively. |
| Average Number of Operating Wells | Average Operating Wells by Type of Field 2Q15 | |
 |  | |
Completed Wells
| PEMEX Results Report as of June 30, 2015 | 5 / 26 |
www.pemex.com
PEMEX
Average Number of Operating Drilling Rigs
Average Drilling Rigs by Type 2Q15 | ||
 | 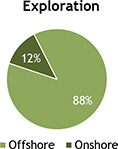 | |
| Seismic Information | During the second quarter of 2015, 3D seismic data acquisition increased by 106.0%, while 2D seismic data acquisition decreased by 80.0% as a result of a reduction in the areas assigned to PEMEX for exploration as part of the Round Zero process.
The two-dimensional acquisition efforts were focused on the Sur de Burgos 2D study, which acquired 177 km of 2D seismic data. In addition, PEMEX acquired 612 km2 of 3D seismic data by focusing its three-dimensional acquisition efforts on the Salsomera NE 3D and the Ku-Maloob-Zaap 3D 3C studies. |
Seismic Information
| PEMEX Results Report as of June 30, 2015 | 6 / 26 |
www.pemex.com
PEMEX
| Discoveries | As a result of the exploratory activities carried out during the second quarter of 2015, the Batsil -1 well located 102 km northwest of Ciudad del Carmen, Campeche, at water depths of 82 meters in the Litoral de Tabasco business unit, confirmed the existence of heavy crude oil. The initial production of the discovery well was above 1,190 bd.
In addition, the Cheek-1 well located 69 km northwest of Ciudad del Carmen, Campeche, at water depths of 28 meters in the Abkatún-Pol-Chuc business unit, confirmed the existence of light crude oil. The initial production of the discovery well was more than 2,100 bd.
The volume of hydrocarbon reserves in these deposits is currently being evaluated. Nevertheless, we would highlight that these discoveries are located in shallow waters near existing production complexes. Production is expected to commence approximately 16 months after a development plan is approved and corresponding authorizations are obtained, achieving a stable production platform six months later. |
Main Discoveries
As of June 30, 2015
Business Unit | Well | Geologic Age | Initial Production | Water Depth | Type of Hydrocarbons | |||||||||||||
| Oil & Condensates (bd) | Gas (MMcfd) | Meters | ||||||||||||||||
Litoral de Tabasco | Batsil-1 | Late Cretaceous | 1,198 | 0.5 | 82 | Heavy Crude Oil | ||||||||||||
Abkatún-Pol-Chuc | Cheek-1 | Cretaceous-Breccia | 2,148 | 1.6 | 28 | Light Crude Oil | ||||||||||||
Total | 3,346 | 2.1 | ||||||||||||||||
Other Information Related to E&P Activities
| Incidents | On April 1, 2015, an explosion occurred at the Abkatún-A Permanente processing platform in the Southwestern Marine region of the Gulf of Mexico. As a result of the incident, seven people died and 45 people were injured. PEMEX profoundly regrets the loss of human lives and the injuries suffered by workers due to this incident.
As of the date of this report, the root-cause analysis to determine the primary cause of the explosion continues to be conducted by the company ABSG.
On May 5, 2015, the Troll Solution jack-up, owned by Typhoon Offshore, tilted while positioning itself on the Caan-A platform, in the Campeche Sound, due to a failure of one of its legs. Hydrocarbons production was not affected, as Troll Solution is a mobile platform that provides only maintenance to wells.
Unfortunately, two workers from Typhoon Offshore died and a third one was injured. PEMEX profoundly regrets the loss of human lives and the injuries suffered by workers due to this incident.
On June 22, 2015, an oil and gas leak occurred at the Akal-H satellite platform in the Campeche Sound. There were no injuries to report and hydrocarbons production was not affected. |
| PEMEX Results Report as of June 30, 2015 | 7 / 26 |
www.pemex.com
PEMEX
Industrial Transformation 2Q15
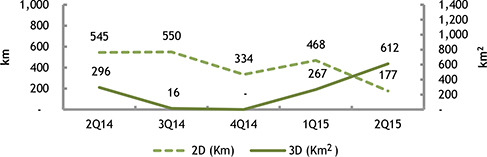
| Crude Oil Processing | During the second quarter of 2015, total crude oil processing decreased by 11.7%, to 1,058 Mbd, as compared to the same period of 2014, primarily due to scheduled maintenance cycles; non-scheduled maintenance and overhaul works and operational problems resulting from the quality of crude oil supplied by producing areas. As a result, PEMEX’s usage of its primary distillation capacity decreased by 8.4 percentage points.
The ratio of heavy crude oil to total crude oil processed by the National Refining System (NRS) increased by 2.5 percentage points, as part of an effort to take advantage of highly specialized equipment to convert residuals and maximize the output of gasoline. | |
Crude Oil Processing (Mbd)
| ||
| ||
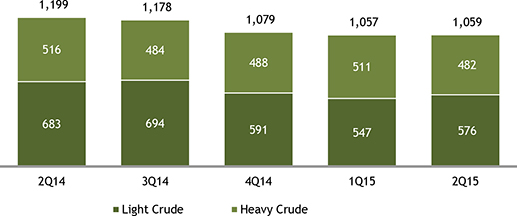
Production of Petroleum Products | During the second quarter of 2015, total petroleum products output decreased by 13.2%, as compared to the same period of 2014, from 1,401 to 1,216 Mbd, primarily due to a decrease in the amount of crude oil processed during this period. | |
Petroleum Products Production (Mbd)
| ||
| PEMEX Results Report as of June 30, 2015 | 8 / 26 |
www.pemex.com
PEMEX
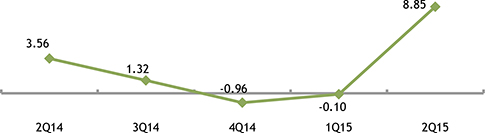
| Variable Refining Margin | During the second quarter of 2015, PEMEX’s NRS recorded a positive variable refining margin of USD 8.85 per barrel, as compared to USD 3.56 per barrel during the first quarter of 2014. This increase is primarily a result of processing a heavier crude oil mix. | |
Variable Refining Margin (USD /b)
| ||
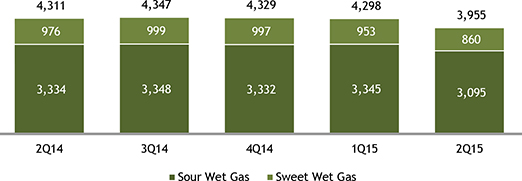
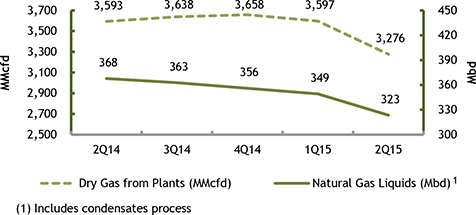
| Natural Gas Processing and Production | During the second quarter of 2015, natural gas processing decreased by 8.3%, to 3,955 MMcfd, as compared to the same period of 2014, in response to the decreased availability of sour and sweet wet gas from both the offshore and onshore regions. As a result, dry gas and natural gas liquids production decreased by 8.8% and 12.1%, respectively, as compared to the same period of 2014.
Condensates processing decreased by 15.7%, to 39.5 Mbd during the second quarter of 2015, as compared to the same period of 2014, primarily due to decreased availability of sour condensates in the Marine regions. | |
Natural Gas Processing (MMcfd)
| ||
 | ||
Dry Gas and Natural Gas Liquids Production
| ||
 | ||
| PEMEX Results Report as of June 30, 2015 | 9 / 26 |
www.pemex.com
PEMEX
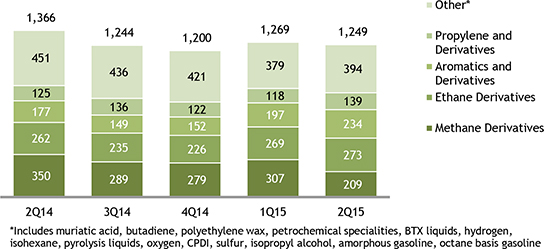
| Petrochemicals Production | During the second quarter of 2015, the production of petrochemical products decreased by 8.5%, or 116 Mt, as compared to the same period of 2014, primarily due to the following:
• a 140 Mt decrease in production in the methane derivatives chain, due to decreased output of carbon dioxide and ammonia, in response to a reduction in the supply of natural gas; and
• a 60 Mt decrease in production of other petrochemicals, primarily due to a decrease in production of octane gasoline, which resulted from an increase in the use of octane gasoline as an input in the production of additional high octane hydrocarbons.
This decrease was partially offset by:
• an 11 Mt increase in production in the ethane derivatives chain, mainly due to increased production at the Swing plant;
• a 57 Mt increase in production in the aromatics and derivatives chain, due to the increased production of high octane hydrocarbons; and
• a 13 Mt increase in production in the propylene and derivatives chain, mainly due to increased output of propylene, as a result of the stabilization of the acrylonitrile production plant. |
Petrochemicals Production
(Mt)
Industrial Transformation Projects
| NuStar Energy | On April 10, 2015, Petróleos Mexicanos announced a ten-year agreement between NuStar Energy L.P. (“NuStar”) and PMI, a subsidiary company of Petróleos Mexicanos, for the transportation and storage of naphtha.
Pursuant to the agreement, naphtha produced at the Reynosa-Burgos complex will be transported via NuStar’s Burgos-Valley pipeline system first to a terminal in Edinburg, Texas, and then to Transmontaigne’s terminal in Brownsville, Texas.
| |
| Maverick Terminal LLC | On April 21, 2015, Petróleos Mexicanos through its affiliate, PMI, signed an agreement for the storage of liquid fuels with Maverick Terminal LLC.
Pursuant to the agreement, four tanks will be installed in Brownsville, Texas, which will have an initial total capacity of 300 Mbd, with a capability of expansion of up to 700 Mbd. Operations are expected to start during the third quarter of 2015. |
| PEMEX Results Report as of June 30, 2015 | 10 / 26 |
www.pemex.com
PEMEX
| Pemex Gas Stations | As of June 30, 2015, a total of 11,006 PEMEX gas stations were registered, which is 98 more than the number registered as of June 30, 2014. |
Industrial Safety
| Frequency Index4 | During the second quarter of 2015, the accumulated frequency index for PEMEX personnel was 0.52 injuries per million man-hours worked (MMhh), which represents a 73.2% increase as compared to the same period of 2014, and is 30.0% higher than the International Association of Oil & Gas Producers (IOGP) standard for 2013, which was 0.40.
| |
| Severity Index5 | By the end of the second quarter of 2015, the accumulated severity index was 29 days lost per MMhh, a 59.1% increase as compared to the second quarter of 2014.
Petróleos Mexicanos continues to direct its efforts toward supporting the implementation of its Operational Reliability Program while focusing on strengthening its accident containment plan through the following methods: operational discipline, operational procedures and safety practices, training and development, process-risk assessment, effective audits and mechanical integrity, labor management, repair and maintenance management, operating windows, risk-based inspections and operational reliability oriented maintenance. Petróleos Mexicanos continues to evaluate the impact of these initiatives. |
Environmental Protection
| Sulfur Oxide Emissions | During the second quarter of 2015, sulfur oxide emissions increased by 9.5% as compared to the same period of 2014, primarily due to emissions produced as a result of the decline in wells that use nitrogen to increase its production, which resulted in an increase in the generation of sour gas with a high nitrogen content that is then burnt at the Northeastern Marine region and at the Akal C7/C8 Gas Processing Center.
| |
| Water Reuse | During the second quarter of 2015, the reuse of water increased by 2.0% as compared to the same period of 2014, primarily due to the decrease in the utilization rates of residual water treatment plants in the NRS.
| |
Safety, Health at Work & Environmental Protection Strategy for 2015-2025 | On May 28, 2015, PEMEX presented its Safety, Health at Work and Environmental Protection Strategy for 2015-2025 (SSPA, by its acronym in Spanish), which outlines actions to strengthen safety and reliability of operations in an efficient manner. |
| 4 | Refers to the number of accidents with incapacitating injuries per million man-hours worked (MMhh) with risk exposure during the relevant period of time. An incapacitating injury is an injury, functional damage or death that is caused, either immediately or subsequently, by a sudden event at work or during work-related activities. Man-hours worked with risk exposure represent the number of hours worked by all personnel, including overtime hours. |
| 5 | Refers to the total number of days lost per million man-hours worked with risk exposure during the relevant period of time. The number of days lost is based on medical leaves of absence for injuries stemming from accidents at work, plus the number of corresponding days on which compensation is paid for partial or total disability or death. |
| PEMEX Results Report as of June 30, 2015 | 11 / 26 |
www.pemex.com
PEMEX
Financial Results
PEMEX
Consolidated Income Statement
| Second quarter (Apr.-Jun.) | ||||||||||||||||||||
| 2014 | 2015 | Change | 2015 | |||||||||||||||||
| (MXN million) | (USD million) | |||||||||||||||||||
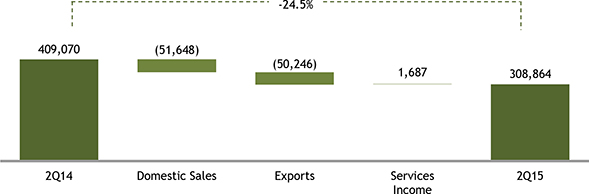
Total sales | 409,070 | 308,864 | -24.5 | % | (100,207 | ) | 19,840 | |||||||||||||
Domestic sales | 241,793 | 190,145 | -21.4 | % | (51,648 | ) | 12,214 | |||||||||||||
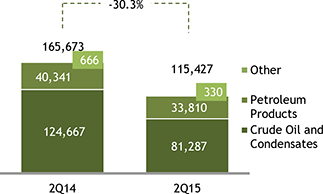
Exports | 165,673 | 115,427 | -30.3 | % | (50,246 | ) | 7,415 | |||||||||||||
Services income | 1,604 | 3,291 | 105.2 | % | 1,687 | 211 | ||||||||||||||
Cost of sales | 217,375 | 218,575 | 0.6 | % | 1,200 | 14,040 | ||||||||||||||
Gross income | 191,695 | 90,289 | -52.9 | % | (101,406 | ) | 5,800 | |||||||||||||
Other revenues (expenses) | 15,716 | 978 | -93.8 | % | (14,738 | ) | 63 | |||||||||||||
IEPS accrued | 14,974 | 831 | -94.4 | % | (14,143 | ) | 53 | |||||||||||||
Other | 742 | 147 | -80.2 | % | (595 | ) | 9 | |||||||||||||
Transportation and distribution expenses | 7,995 | 8,516 | 6.5 | % | 521 | 547 | ||||||||||||||
Administrative expenses | 28,325 | 28,825 | 1.8 | % | 500 | 1,852 | ||||||||||||||
Operating income (loss) | 171,091 | 53,926 | -68.5 | % | (117,165 | ) | 3,464 | |||||||||||||
Total interest expense | (11,004 | ) | (15,834 | ) | 43.9 | % | (4,830 | ) | (1,017 | ) | ||||||||||
Total interest income | 714 | 1,295 | 81.4 | % | 581 | 83 | ||||||||||||||
Income (cost) due to financial derivatives | 629 | 1,318 | 109.7 | % | 690 | 85 | ||||||||||||||
Foreign exchange profit (loss) | 3,506 | (28,731 | ) | (32,237 | ) | (1,846 | ) | |||||||||||||
Profit sharing in non-consolidated subsidiaries and affiliates | 692 | 1,168 | 68.8 | % | 476 | 75 | ||||||||||||||
Income before taxes and duties | 165,628 | 13,142 | -92.1 | % | (152,486 | ) | 844 | |||||||||||||
Taxes and duties | 217,923 | 97,772 | -55.1 | % | (120,151 | ) | 6,280 | |||||||||||||
Net income (loss) | (52,295 | ) | (84,630 | ) | 61.8 | % | (32,335 | ) | (5,436 | ) | ||||||||||
Other comprehensive results | 636 | (1,449 | ) | (2,085 | ) | (93 | ) | |||||||||||||
Investment in equity securities | 1,258 | (493 | ) | -139.2 | % | (1,751 | ) | (32 | ) | |||||||||||
Actuarial losses due to employee benefits | 18 | 0.0 | (18 | ) | 0 | |||||||||||||||
Conversion effect | (640 | ) | (956 | ) | 49.4 | % | (316 | ) | (61 | ) | ||||||||||
Comprehensive income (loss) | (51,660 | ) | (86,079 | ) | (34,420 | ) | (5,529 | ) | ||||||||||||
Income Statement from April 1 to June 30, 2015
| Sales | During the second quarter of 2015, total sales (including the amount of IEPS credit) decreased by 27.0%, or MXN 114.3 billion, as compared to the same period of 2014, primarily as a result of:
• 24.8%, or MXN 44.8 billion decrease in domestic sales of gasoline and diesel. The price effect on the domestic sales of gasoline and diesel had a negative impact of MXN 46.2 billion, while sales volume increased by USD 1.4 billion;
• 34.8%, or MXN 43.4 billion decrease in exports of crude oil and condensates, largely due to a decline in the prices of oil. The price effect on the exports of oil and condensates had a negative impact of MXN 41.6 billion, and sales volume decreased by MXN 1.8 billion. The Mexican crude oil basket decreased by USD 43.14, from USD 97.09 to USD 53.95 per barrel;
• 40.4%, or MXN 9.1 billion decrease in domestic sales of dry gas, mainly due to a decline in the prices of gas, and a decrease in sales volume. The Henry Hub price reference used decreased from USD 4.68 to USD 2.65 per million British Thermal Units (MMBtu). The price effect on the domestic sales of dry gas had a negative impact of MXN 6.5 billion, and sales volume decreased by MXN 2.6 billion;
• 63.1%, or MXN 8.0 billion decrease in domestic sales of fuel oil; and
• 16.2%, or MXN 6.5 billion decrease in exports of petroleum products, primarily as a result of lower prices. The price effect on the reduction of petroleum products’ exports had a negative impact of MXN 12.1 billion, and was partially offset by an increase in sales volume by MXN 5.6 billion. |
| PEMEX Results Report as of June 30, 2015 | 12 / 26 |
www.pemex.com
PEMEX
Sales Evolution
(MXN million)
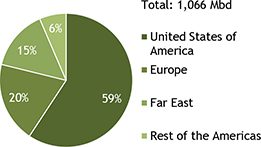
Exports (MXN million) | Crude Exports by Region 2Q15 | |
 |  | |
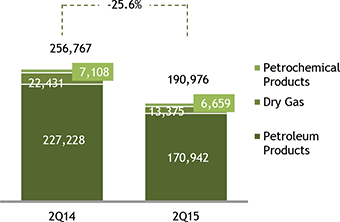
Domestic Sales including IEPS Credit (MXN million) | Domestic Sales of Petroleum Products 2Q15 | |
 |  | |
| PEMEX Results Report as of June 30, 2015 | 13 / 26 |
www.pemex.com
PEMEX
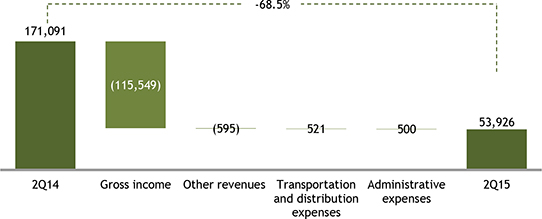
| Gross & Operating Income | During the second quarter of 2015, gross income, net of IEPS, decreased by 55.9%, or MXN 115.5 billion, as compared to the same period of 2014. It’s important to highlight that as of January 1, 2015, PEMEX’s tax regime was modified as established in the Hydrocarbons Revenue Law, which sets forth that direct taxes and duties should be recorded under the cost of sales: Hydrocarbon Extraction Duty, Hydrocarbon Exploration Duty, and Hydrocarbon Extraction Activity Tax.
In addition, operating income decreased by 68.5%, or MXN 117.2 billion, as compared to the same period of 2014, to MXN 53.9 billion. | |
Operating Income Evolution (MXN million) Net of IEPS
| ||
 |
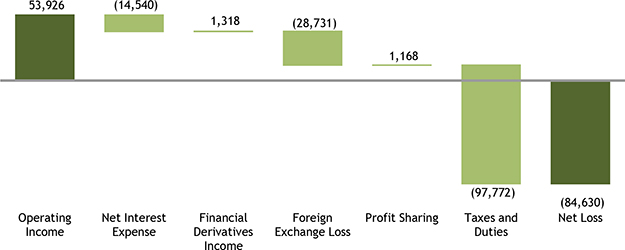
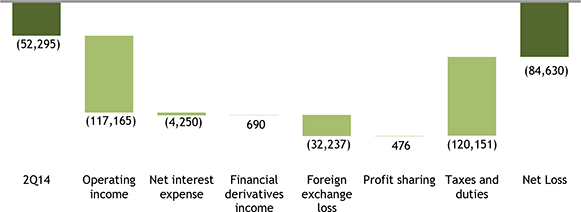
| Composition of Net Income (Loss) | During the second quarter of 2015, PEMEX recorded a net loss of MXN 84.6 billion, primarily as a result of:
• operating income of MXN 53.9 billion;
• net interest expense of MXN 14.5 billion;
• costs associated to financial derivatives of MXN 1.3 billion;
• a foreign exchange loss of MXN 28.7 billion; and
• taxes and duties of MXN 97.8 billion.
During the second quarter of 2015, the ratio of taxes and duties paid to operating income was 181.3%, as compared to 127.4% during the same period of 2014. We would highlight that based on the new fiscal regime applicable as of January 1, 2015, some of the taxes and duties are recorded under the cost of sales, therefore, operating income between the 2014 and 2015 periods is not entirely comparable.
Although since 2015, PEMEX has been subject to a new fiscal regime that is more in line with the rest of the oil and gas industry, PEMEX, as opposed to other companies, is still not able to deduct all of its operating costs and expenses in its calculation of taxes and duties. As a result, taxes and duties paid have consistently been greater than income before taxes and duties and operating income since 1998, except for 2006, when the cap on permitted deductions was updated.
It is therefore desirable that in the future, the fiscal regime applicable to PEMEX is one that is comparable to other companies in the oil and gas industry. In order to realize all of the expected benefits from the Energy Reform, it is of utmost importance that all players in the Mexican oil and gas industry operate under equal conditions. |
| PEMEX Results Report as of June 30, 2015 | 14 / 26 |
www.pemex.com
PEMEX
Composition of Net Income
(MXN million)
Evolution of Taxes and Duties
(MXN million)
| Evolution of Net Income (Loss) | The increase in net loss during the second quarter of 2015 is primarily explained by:
• a 68.5%, or MXN 117.2 billion decrease in operating income;
• a MXN 4.3 billion increase in net interest expense;
• a MXN 0.7 billion increase in costs associated to financial derivatives, mainly due to the depreciation of the U.S. dollar against currencies other than the Mexican peso in which Petróleos Mexicanos has entered into cross currency swaps;
• a MXN 32.2 billion foreign exchange loss, as a result of a 2.7% depreciation of the Mexican peso relative to the U.S. dollar during the second quarter of 2015, as compared to a 0.4% appreciation of the Mexican peso relative to the U.S. dollar during the same period of 2014; and
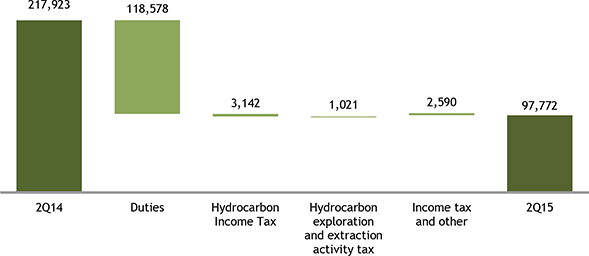
• a 55.1%, or MXN 120.2 billion decrease in taxes and duties, due to a decline in the production and price of the Mexican crude oil basket.
As a result of the aforementioned, PEMEX recorded a net loss of MXN 84.6 billion during the second quarter of 2015, as compared to MXN 52.3 billion during the same period of 2014. |
| PEMEX Results Report as of June 30, 2015 | 15 / 26 |
www.pemex.com
PEMEX
Evolution of Net Income (Loss)
(MXN million)
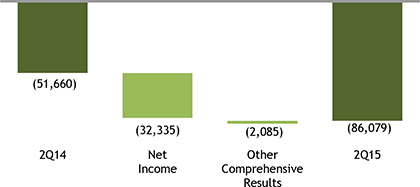
| Comprehensive Income (Loss) | During the second quarter of 2015, other comprehensive results decreased by MXN 2.1 billion, primarily as a result of a MXN 1.8 billion decrease in investment on assets available for sale, mainly from the sale of Repsol shares. As a result, the comprehensive loss amounted to MXN 86.1 billion. |
Evolution of Comprehensive Income
(MXN million)
| PEMEX Results Report as of June 30, 2015 | 16 / 26 |
www.pemex.com
PEMEX
Consolidated Balance Sheet as of June 30, 2015
PEMEX
Consolidated Balance Sheet
| As of December 31, | As of June 30, | |||||||||||||||||||
| 2014 | 2015 | Change | 2015 | |||||||||||||||||
| (MXN million) | (USD million) | |||||||||||||||||||
Total assets | 2,128,368 | 2,121,733 | -0.3 | % | (6,636 | ) | 136,292 | |||||||||||||
Current assets | 289,327 | 252,611 | -12.7 | % | (36,716 | ) | 16,227 | |||||||||||||
Cash and cash equivalents | 117,989 | 91,259 | -22.7 | % | (26,730 | ) | 5,862 | |||||||||||||
Accounts, notes receivable and other | 114,423 | 107,603 | -6.0 | % | (6,820 | ) | 6,912 | |||||||||||||
Inventories | 49,939 | 46,101 | -7.7 | % | (3,838 | ) | 2,961 | |||||||||||||
Financial assets available for sale | 5,415 | 5,507 | 1.7 | % | 92 | 354 | ||||||||||||||
Derivative financial instruments | 1,563 | 2,141 | 37.0 | % | 579 | 138 | ||||||||||||||
Permanent investment in shares of associates | 22,015 | 24,359 | 10.6 | % | 2,344 | 1,565 | ||||||||||||||
Property, plant and equipment | 1,783,374 | 1,814,181 | 1.7 | % | 30,807 | 116,536 | ||||||||||||||
Deferred taxes | 4,143 | 2,004 | -51.6 | % | (2,139 | ) | 129 | |||||||||||||
Restricted cash | 6,884 | 7,280 | 5.7 | % | 396 | 468 | ||||||||||||||
Other assets | 22,625 | 21,298 | -5.9 | % | (1,327 | ) | 1,368 | |||||||||||||
Total liabilities | 2,896,089 | 3,060,176 | 5.7 | % | 164,086 | 196,573 | ||||||||||||||
Current liabilities | 334,159 | 295,576 | -11.5 | % | (38,583 | ) | 18,987 | |||||||||||||
Short-term financial debt | 145,866 | 168,098 | 15.2 | % | 22,232 | 10,798 | ||||||||||||||
Suppliers | 116,178 | 58,569 | -49.6 | % | (57,609 | ) | 3,762 | |||||||||||||
Accounts and accrued expenses payable | 12,235 | 18,791 | 53.6 | % | 6,556 | 1,207 | ||||||||||||||
Derivative financial instruments | 17,460 | 21,533 | 23.3 | % | 4,073 | 1,383 | ||||||||||||||
Taxes and duties payable | 42,420 | 28,584 | -32.6 | % | (13,836 | ) | 1,836 | |||||||||||||
Long-term liabilities | 2,561,930 | 2,764,599 | 7.9 | % | 202,670 | 177,587 | ||||||||||||||
Long-term financial debt | 997,384 | 1,163,208 | 16.6 | % | 165,823 | 74,720 | ||||||||||||||
Reserve for employee benefits | 1,474,089 | 1,517,203 | 2.9 | % | 43,114 | 97,459 | ||||||||||||||
Reserve for diverse credits | 78,423 | 72,111 | -8.0 | % | (6,311 | ) | 4,632 | |||||||||||||
Other liabilities | 7,718 | 10,695 | 38.6 | % | 2,977 | 687 | ||||||||||||||
Deferred taxes | 4,316 | 1,383 | -68.0 | % | (2,933 | ) | 89 | |||||||||||||
Total equity | (767,721 | ) | (938,443 | ) | 22.2 | % | (170,722 | ) | (60,282 | ) | ||||||||||
Holding | (768,066 | ) | (938,672 | ) | 22.2 | % | (170,606 | ) | (60,296 | ) | ||||||||||
Certificates of contribution “A” | 134,605 | 144,605 | 7.4 | % | 10,000 | 9,289 | ||||||||||||||
Federal Government Contributions | 43,731 | 43,731 | 0.0 | % | — | 2,809 | ||||||||||||||
Legal Reserve | 1,002 | 1,002 | 0.0 | % | — | 64 | ||||||||||||||
Comprehensive accumulated results | (394,594 | ) | (390,150 | ) | -1.1 | % | 4,445 | (25,062 | ) | |||||||||||
Retained earnings (accumulated losses) | (552,809 | ) | (737,859 | ) | 33.5 | % | (185,051 | ) | (47,397 | ) | ||||||||||
From prior years | (287,606 | ) | (552,809 | ) | 92.2 | % | (265,203 | ) | (35,510 | ) | ||||||||||
For the year | (265,203 | ) | (185,051 | ) | -30.2 | % | 80,153 | (11,887 | ) | |||||||||||
Participation of non-holding entities | 345 | 229 | -33.7 | % | (116 | ) | 15 | |||||||||||||
Total liabilities and equity | 2,128,368 | 2,121,733 | -0.3 | % | (6,636 | ) | 136,292 | |||||||||||||
| PEMEX Results Report as of June 30, 2015 | 17 / 26 |
www.pemex.com
PEMEX
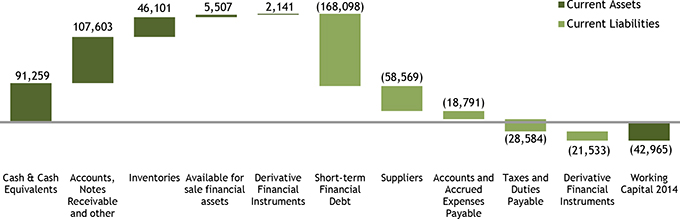
| Working Capital | As of June 30, 2015, working capital totaled MXN (43.0) billion, primarily as a result of a MXN 22.2 billion increase in short-term financial debt, a MXN 6.6 billion increase in accounts and accrued expenses payable, and a MXN 3.5 billion increase in derivate financial instruments –net-, which were partially offset by a MXN 57.6 billion reduction in suppliers. | |
Working Capital (MXN million)
| ||
 | ||
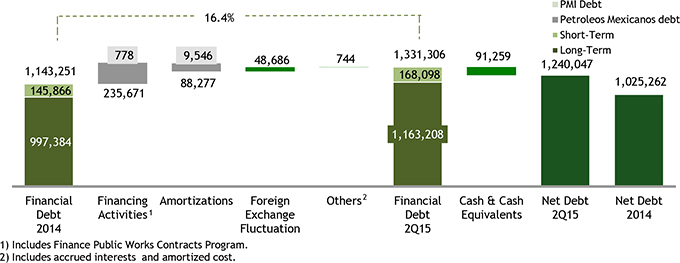
| Debt | Total financial debt increased by 16.4%, to MXN 1,331.3 billion (USD 85.5 billion), primarily due to the additional financing activities carried out during the period.
During 2015, Petróleos Mexicanos and PMI’s6 total financing activities amounted to MXN 236.4 billion (USD 15.2 billion). Total debt payments made during the period amounted to MXN 97.8 billion (USD 6.3 billion).
PEMEX’s financing strategy is intended to take advantage of financial markets with increased liquidity, maximize efficiencies with respect to reference curves, seize opportunities in select markets and maintain a diversified debt maturity profile.
| |
Financial Debt (MXN billion)
| ||
 | ||
| 6 | Refers to P.M.I. Holdings, B.V., P.M.I. Norteamérica, S.A. de C.V., Pemex Finance Ltd and Pro-Agroindustria, S.A. de C.V. |
| PEMEX Results Report as of June 30, 2015 | 18 / 26 |
www.pemex.com
PEMEX
Financial Debt Exposure as of June 30, 2015
| ||
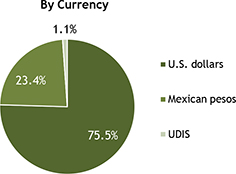 | 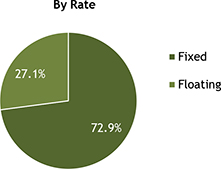 | |
Average Duration of Financial Debt Exposure (years)
| ||
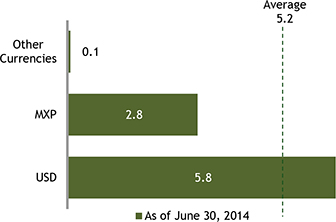 | 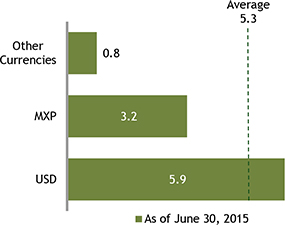 | |
| PEMEX Results Report as of June 30, 2015 | 19 / 26 |
www.pemex.com
PEMEX
Investment Activities
| Activity | During the first half of 2015, PEMEX spent MXN 199.7 billion (USD 13.2 billion)7 on investment activities, which represents 64.9% of the total investment of MXN 307.6 billion that were programmed for the year. These investments were allocated as follows:
• MXN 171.7 billion to Pemex-Exploration and Production8, MXN 24.1 billion of which were allocated to exploration;
• MXN 22.6 billion to Pemex-Refining;
• MXN 3.3 billion to Pemex-Gas and Basic Petrochemicals;
• MXN 1.4 billion to Pemex-Petrochemicals; and
• MXN 0.8 billion to Petróleos Mexicanos Corporate. |
Financing Activities
| Capital Markets | From April 1 to July 16, 2015, Petróleos Mexicanos issued a total of MXN 17.5 billion of short-termCertificados Bursátiles at fixed and floating rates and repaid MXN 12.5 billion.
On April 21, 2015, Petróleos Mexicanos issued the following series of securities for an aggregate amount of EUR 2.25 billion:
• EUR 1.0 billion, 1.875% Notes due in April 2022; and
• EUR 1.25 billion, 2.750% Notes due in April 2027.
On July 16, 2015, Petróleos Mexicanos issuedCertificados Bursátiles for an aggregate amount of approximately MXN 7.7 billion, in three tranches:
• MXN 650 million due in 2020, at a floating rate of TIIE9+15 basis points (PEMEX 14 reopening);
• MXN 6.1 billion due in 2026, at a fixed rate of 7.47% (PEMEX 14-2 reopening); and
• The equivalent of approximately MXN 971.6 million in UDIs (Investment Units) due in 2026, at a fixed rate of 3.94% (PEMEX 14U reopening).
| |
| ECAs | On July 22, 2015, Petróleos Mexicanos issued USD 525 million of its 2.46% Notes, due in 2025. These are structured bonds guaranteed by the U.S. Export Import Bank.
| |
| Syndicated Revolving Credit Lines | As of June 30, 2015, Petróleos Mexicanos holds syndicated revolving credit lines for liquidity management in the amounts of USD 4.5 billion and MXN 23.5 billion, of which USD 1.05 billion and MXN 3.5 billion are available. |
| 7 | Convenience translation has been made at the established average exchange rate for the second quarter of 2015, of MXN 15.1200 = USD 1.00. |
| 8 | Includes maintenance expenditures. |
| 9 | TIIE stands for Interbank Equilibrium Interest Rate in Spanish. |
| PEMEX Results Report as of June 30, 2015 | 20 / 26 |
www.pemex.com
PEMEX
PEMEX
Consolidated Statements of Cash Flows
| As of June 30, | ||||||||||||||||||||
| 2014 | 2015 | Change | 2015 | |||||||||||||||||
| (MXN million) | (USD million) | |||||||||||||||||||
Operating activities | ||||||||||||||||||||
Net income (loss) | (88,249 | ) | (185,176 | ) | 109.8 | % | (96,927 | ) | (11,895 | ) | ||||||||||
Items related to investing activities | 88,494 | 87,459 | -1.2 | % | (1,036 | ) | 5,618 | |||||||||||||
Depreciation and amortization | 73,174 | 77,652 | 6.1 | % | 4,478 | 4,988 | ||||||||||||||
Impairment of properties, plant and equipment | 8,678 | (3,013 | ) | (11,691 | ) | (194 | ) | |||||||||||||
Unsuccessful wells | 5,559 | 9,517 | 71.2 | % | 3,958 | 611 | ||||||||||||||
Retirement of property, plant and equipment | 2,597 | 4,070 | 56.7 | % | 1,473 | 261 | ||||||||||||||
Realized profit (loss) by investments in equity securities | 189 | — | (189 | ) | — | |||||||||||||||
Profit sharing in non-consolidated subsidiaries and affiliates | (1,827 | ) | (1,207 | ) | -33.9 | % | 620 | (78 | ) | |||||||||||
Dividends received | (504 | ) | (171 | ) | 333 | (11 | ) | |||||||||||||
Effects of net present value of reserve for well abandonment | 629 | 611 | (18 | ) | 39 | |||||||||||||||
Activities related to financing activities | 17,686 | 76,402 | 332.0 | % | 58,716 | 4,908 | ||||||||||||||
Amortization of primes, discounts, profits and debt issuance expenses | (997 | ) | (2,096 | ) | 110.2 | % | (1,099 | ) | (135 | ) | ||||||||||
Interest expense (income) | 21,824 | 29,812 | 36.6 | % | 7,989 | 1,915 | ||||||||||||||
Unrealized loss (gain) from foreign exchange fluctuations | (3,141 | ) | 48,686 | -1650.2 | % | 51,827 | 3,127 | |||||||||||||
Subtotal | 17,931 | (21,315 | ) | -218.9 | % | (39,247 | ) | (1,369 | ) | |||||||||||
Funds provided by (used in) operating activities | 5,257 | (19,591 | ) | -472.7 | % | (24,848 | ) | (1,258 | ) | |||||||||||
Financial instruments for negotiation | 1,087 | 3,495 | 221.4 | % | 2,407 | 224 | ||||||||||||||
Accounts and notes receivable | (8,363 | ) | (5,780 | ) | -30.9 | % | 2,583 | (371 | ) | |||||||||||
Inventories | 13,384 | 3,838 | -71.3 | % | (9,546 | ) | 247 | |||||||||||||
Other assets | (5,715 | ) | (5,914 | ) | 3.5 | % | (199 | ) | (380 | ) | ||||||||||
Accounts payable and accrued expenses | 2,205 | 6,556 | 197.3 | % | 4,351 | 421 | ||||||||||||||
Taxes paid | 15,944 | (1,461 | ) | -109.2 | % | (17,405 | ) | (94 | ) | |||||||||||
Suppliers | (47,714 | ) | (57,609 | ) | 20.7 | % | (9,895 | ) | (3,701 | ) | ||||||||||
Reserve for diverse credits | 1,211 | (5,036 | ) | -515.8 | % | (6,246 | ) | (323 | ) | |||||||||||
Reserve for employees benefits | 34,111 | 43,114 | 26.4 | % | 9,003 | 2,769 | ||||||||||||||
Deferred taxes | (894 | ) | (795 | ) | -11.1 | % | 99 | (51 | ) | |||||||||||
Net cash flow from operating activities | 23,188 | (40,906 | ) | -276.4 | % | (64,094 | ) | (2,628 | ) | |||||||||||
Investing activities | — | — | 0.0 | % | — | — | ||||||||||||||
Acquisition of property, plant and equipment | (92,594 | ) | (100,325 | ) | 8.3 | % | (7,731 | ) | (6,444 | ) | ||||||||||
Exploration expenses | (448 | ) | (2,276 | ) | 408.0 | % | (1,828 | ) | (146 | ) | ||||||||||
Investment in securities | (118 | ) | (31 | ) | 87 | (2 | ) | |||||||||||||
Dividends received | 336 | — | (336 | ) | — | |||||||||||||||
Financial instruments available for sale | 12,735 | — | (12,735 | ) | — | |||||||||||||||
Net cash flow from investing activities | (80,089 | ) | (102,633 | ) | 28.1 | % | (22,544 | ) | (6,593 | ) | ||||||||||
Cash needs related to financing activities | (56,901 | ) | (143,539 | ) | 152.3 | % | (86,638 | ) | (9,220 | ) | ||||||||||
Financing activities | ||||||||||||||||||||
Increase of contributions from the Federal Government | 2,000 | 10,000 | 400.0 | % | 8,000 | 642 | ||||||||||||||
Retirement of contributions from the Federal Government | (190 | ) | — | 190 | — | |||||||||||||||
Loans obtained from financial institutions | 177,846 | 228,348 | 28.4 | % | 50,503 | 14,668 | ||||||||||||||
Amortization of loans | (94,105 | ) | (97,823 | ) | 4.0 | % | (3,718 | ) | (6,284 | ) | ||||||||||
Interest paid | (20,468 | ) | (26,973 | ) | 31.8 | % | (6,505 | ) | (1,733 | ) | ||||||||||
Net cash flow from financing activities | 65,083 | 113,552 | 74.5 | % | 48,470 | 7,294 | ||||||||||||||
Net Increase (decrease) in cash and cash equivalents | 8,182 | (29,987 | ) | -466.5 | % | (38,168 | ) | (1,926 | ) | |||||||||||
Effect of change in cash value | (513 | ) | 3,257 | -734.9 | % | 3,770 | 209 | |||||||||||||
Cash and cash equiv. at the beginning of the period | 80,746 | 117,989 | 46.1 | % | 37,243 | 7,579 | ||||||||||||||
Cash and cash equivalents at the end of the period | 88,414 | 91,259 | 3.2 | % | 2,845 | 5,862 | ||||||||||||||
| PEMEX Results Report as of June 30, 2015 | 21 / 26 |
www.pemex.com
PEMEX
Other Relevant Information
| New Organic Statute | The Board of Directors of Petróleos Mexicanos adopted a new Organic Statute. The Statute was published in the Official Gazette of the Federation on April 28, 2015.
| |
| Corporate Reorganization | On June 1, 2015, the recently created productive state-owned subsidiaries, Pemex Exploration and Production and Pemex Cogeneration and Services, were formed and began operating. Moreover, the Corporate Office of Operations was transformed into the Corporate Office of Planning, Coordination and Performance.
The Board of Directors of PEMEX also appointed the following individuals to the positions indicated below:
Pemex Exploration and Production:
• Juan Javier Hinojosa, Director of Development and Production
• José Antonio Escalera, Director of Exploration
• Gustavo Hernández, Director of Operations
Pemex Cogeneration and Services:
• Eleazar Gómez, Director General of Pemex Cogeneration and Services;
Corporate Office of Planning, Coordination and Performance:
• Rodulfo Figueroa, Corporate Director of Planning, Coordination and Performance.
A Management Committee for Pemex Exploration and Production was created, which is presided by Juan Javier Hinojosa as Executive Director, with José Antonio Escalera and Gustavo Hernández, as additional members.
On July 3, 2015, the Board of Directors of each of Pemex Cogeneration and Services and Pemex Exploration and Production was installed, and the organic statute of each entity was also approved.
The Board of Directors of Pemex Cogeneration made the following appointments:
• Raquel Buenrostro, Planning and Development;
• Alberto Elizalde, Project Execution;
• Roberto Osegueda, Operations; and
• Rodrigo Sánchez, Sales.
In addition, the Board of Directors of Pemex Exploration and Production approved the following appointments:
• Miguel Angel Flores, Secretary to the Board of Directors of Pemex E&P;
• Patricia Zorrilla, Pro-Secretary of the Board of Directors of Pemex E&P;
• Ricardo Villegas, Deputy Director of Production (Shallow Waters);
• Félix Alvarado, Deputy Director of Production (Onshore Fields);
• José Luis Fong, Deputy Director of Production (Non-Conventional Fields);
• Plácido Reyes, Deputy Director of Production (Non-Associated Gas Fields);
• Eduardo Zavala, Deputy Director of Sustainable Development, Industrial Safety, Health and Environmental Protection;
• José Guadalupe de la Garza, Deputy Director of Reliability;
• Primo Luis Velazco, Deputy Director of Processing and Distribution of Hydrocarbons; and
• Luis Ramos, Deputy Director of Portfolio Management.
| |
| Crude Oil Exports to Asia | On May 14, 2015, Petróleos Mexicanos, through P.M.I. Comercio Internacional, and Hyundai Oilbank Co. Ltd. signed a contract for the supply of five million barrels (MMb) of Mexican crude oil (Maya heavy crude oil and Isthmus light crude oil), with an option for additional volume, to be processed at the Daesan Refinery in South Korea during the second half of 2015. This agreement is part of PEMEX’s business strategy to geographically diversify Mexican oil exports. |
| PEMEX Results Report as of June 30, 2015 | 22 / 26 |
www.pemex.com
PEMEX
In addition, on July 24, 2015, PEMEX and JX Nippon Oil and Energy Corporation (JX Nippon) signed a contract for the supply of 6 MMb of Isthmus light crude oil. The product will be shipped through six cargoes from the Salina Cruz maritime terminal located in the state Oaxaca, beginning in August 2015 and until January 2016. This is an additional contract to occasional cargoes shipped during the first six months of 2015.
| ||
| Comprehensive Insurance Policy | On June 23, 2015, PEMEX awarded Mapfre Tepeyac S.A., through a public bidding process, a contract to provide its comprehensive insurance policy. This two-year policy covers direct physical damage to all PEMEX assets, onshore and offshore, as well as any civil liability that may derive from the development of its operations.
In addition, Seguros Inbursa was awarded a contract to provide the civil liability policy for the Board of Directors of Petróleos Mexicanos, top management and executives.
The bidding process had the largest participation of insurance companies ever recorded for the comprehensive policy, totaling eight.
The total premium for both policies amounts to USD 427.9 million.
The cost for managing these policies will decrease from 2.78% for the 2013-2015 period, to 2.41% for the 2015-2017 period.
| |
| MOUs | The following table sets forth a brief description of the MOUs recently entered into by Petróleos Mexicanos: |
MOU
Counterparty | Date | Purpose | ||
| First Reserve | April 7, 2015 | • Explore new business opportunities with respect to a wide range of projects.
• Exchange of technical and operational knowledge and experience.
• The MOU contemplates an investment of up to USD 1.0 billion in potential projects related to infrastructure, shipping, cogeneration and processing, among others, in addition to the exchange of technical and operational knowledge and experience.
| ||
| Global Water Development Partners | May 12, 2015 | • Create a partnership to invest in environmentally sustainable water and wastewater treatment infrastructure for upstream and downstream facilities. |
| PEMEX Results Report as of June 30, 2015 | 23 / 26 |
www.pemex.com
PEMEX
Counterparty | Date | Purpose | ||
| Enel - Abengoa | May 12, 2015 | • Form a partnership aimed at the combined execution of the cogeneration project, which will provide power and steam to the Antonio Dovalí Jaime refinery of Salina Cruz, Oaxaca, and to the National Electricity System.
• Develop an efficient cogeneration plant with an estimated capacity of 517 megawatts of power and 850 tons per hour of steam production. | ||
| National Institute for Transparency, Information Access and Personal Data Protection (INAI) | May 14, 2015 | • Establish actions regarding access to public government information and personal data protection.
• Foster a culture of transparency in government actions.
• Promote accountability to the public. | ||
| The Consumer Affairs Bureau (PROFECO) | May 19, 2015 | • Exchange of confidential information, joint operations and redirection of efforts to protect consumers from gasoline theft at gas stations. | ||
| BlackRock | June 1, 2015 | • Accelerate the development and financing of strategic energy infrastructure projects of PEMEX. | ||
| Ministry of Agrarian, Land and Urban Development (SEDATU), through the Agrarian Prosecutor Office (PA) | July 22, 2015 | • Establish information, consulting and training mechanisms so that the exploration, extraction and distribution of hydrocarbon projects are developed with strict observance to the legal framework and full respect to the agrarian subjects.
• The PA will carry out advising and conciliatory efforts for the controversies that could derive from the relationship between PEMEX and the agrarian subjects. | ||
| PEMEX Results Report as of June 30, 2015 | 24 / 26 |
www.pemex.com
PEMEX
Counterparty | Date | Purpose | ||
| Instituto Tecnológico y de Estudios Superiores de Monterrey (ITESM) | July 23, 2015 | • Foster competitive development within the Mexican oil and gas industry.
• Conduct specialized research and consulting to benefits PEMEX’s development. Organize lectures, seminars, conferences, congresses, symposiums, round tables, etc. of common interest for both institutions.
• Provide postgraduate studies for PEMEX employees, who will assess and supervise the development of social service practices and internships of college students at the company.
| ||
| Government of the State of Puebla | July 27, 2015 | • Boost the production of methanol to oxygenate gasolines in the petrochemical complex Independencia. |
| Investigations of Alleged Acts of Extortion | On July 7, 2015, Petróleos Mexicanos announced the ongoing investigations related to a complaint filed by an employee of Pemex Exploration and Production about alleged acts of extortion by PEMEX employees towards Súper Pereyra, S.A. de C.V. The complaint is related to a public tender issued by Petróleos Mexicanos for the procurement of food and housing services at accommodation rigs located in the Campeche Sound.
Complaints were filed on June 25, 2015 by the Public Prosecutor of the Ministry of Public Function in coordination with Súper Pereyra. | |
| Agreement with the OECD | On July 20, 2015, Petróleos Mexicanos, through its Corporate Office of Procurement and Supply, signed an agreement with the Organization for Economic Cooperation and Development (OECD) that will enable PEMEX to adopt and promote best practices in procurement, and foster efficient management and transparency in its processes.
The agreement contemplated a comparative study of PEMEX’s procurement and supply business model, which will be conducted in three phases: i) analysis of the regulatory framework; ii) analysis of practices to promote transparency and ethics in procurement; and iii) review of PEMEX’s relationship with suppliers and contractors.
The agreement also considers the training of PEMEX personnel by the OECD on transparency and ethics issues, procurement procedures design and collusion-risk mitigation. | |
| Agreement with Conproca | On July 20, 2015, Petróleos Mexicanos and Conproca, S.A. de C.V. (Conproca), a consortium formed by SK Engineering & Construction Co. Ltd. and Siemens, A.G. (Siemens), reached a settlement agreement to put an end to the controversies derived from the revamp of the Héctor R. Lara Sosa refinery, in Cadereyta, Nuevo León, that began in 1997.
With the agreement, the parties settled all existing disputes, and decided to allocate the resources that Siemens will receive from Conproca to a trust fund to develop projects intended to fight corruption, promote environmental protection and social development, foster transparency, energy culture and fair market practices, and other projects determined by the trust’s Technical Committee, which will be formed by PEMEX and Siemens representatives. | |
| PEMEX Results Report as of June 30, 2015 | 25 / 26 |
www.pemex.com
PEMEX
If you would like to be included in our distribution list, please email the Investor Relations team atri@pemex.com or register onhttp://www.pemex.com/en/investors/Paginas/list-distribution-signup.aspx
If you would like to contact us, please call us at (52 55) 1944 9700, (52 55) 1944 9702, (52 55) 1944 8015 or send an email tori@pemex.com.
Follow us on: @PemexGlobal and @Pemex
| Julio Valle | Celina Torres | David Ocañas | Ana Lourdes Benavides | |||
| julio.alberto.valle@pemex.com | celina.torres@pemex.com | david.ocanas@pemex.com | ana.lourdes.benavides@pemex.com | |||
| Lucero Medina | Mariana López | Alejandro López | ||||
| lucero.angelica.medina@pemex.com | mariana.lopezm@pemex.com | alejandro.lopezm@pemex.com | ||||
Variations
Cumulative and quarterly variations are calculated comparing the period with the same one of the previous year; unless specified otherwise.
Rounding
Numbers may not total due to rounding.
Financial Information
Excluding budgetary and volumetric information, the financial information included in this report and the annexes hereto is based on unaudited consolidated financial statements prepared in accordance with International Financial Reporting Standards as issued by the International Accounting Standards Board (“IFRS”), which PEMEX has adopted effective January 1, 2012. For more information regarding the transition to IFRS, see Note 23 to the consolidated financial statements included in Petróleos Mexicanos’ 2012 Form 20-F filed with the Securities and Exchange Commission (SEC) and its Annual Report filed with the Comisión Nacional Bancaria y de Valores (CNBV).
EBITDA is a non-IFRS measure. We show a reconciliation of EBITDA to net income in Table 33 of the annexes to this report. Budgetary information is based on standards from Mexican governmental accounting; therefore, it does not include information from the subsidiary companies or affiliates of Petróleos Mexicanos.It is important to mention, that our current financing agreements do not include financial covenants or events of default that would be triggered as a result of our having negative equity.
Methodology
We might change the methodology of the information disclosed in order to enhance its quality and usefulness, and/or to comply with international standards and best practices.
Foreign Exchange Conversions
Convenience translations into U.S. dollars of amounts in Mexican pesos have been made at the exchange rate at close for the corresponding period, unless otherwise noted. Due to market volatility, the difference between the average exchange rate, the exchange rate at close and the spot exchange rate, or any other exchange rate used could be material. Such translations should not be construed as a representation that the Mexican peso amounts have been or could be converted into U.S. dollars at the foregoing or any other rate. It is important to note that we maintain our consolidated financial statements and accounting records in pesos. As of June 30, 2015, the exchange rate of MXN 15.5676 = USD 1.00 is used.
Fiscal Regime
Starting January 1, 2015, Petróleos Mexicanos’ fiscal regime is ruled by the Ley de Ingresos sobre Hidrocarburos (Hydrocarbons Income Law). Since January 1, 2006 and until December 31, 2014, PEP was subject to a fiscal regime governed by the Federal Duties Law, while the tax regimes of the other Subsidiary Entities were governed by the Federal Revenue Law.
The Special Tax on Production and Services (IEPS) applicable to automotive gasoline and diesel is established in the Production and Services Special Tax Law “Ley del Impuesto Especial sobre Producción y Servicios”. As an intermediary between the Ministry of Finance and Public Credit (SHCP) and the final consumer, PEMEX retains the amount of the IEPS and transfers it to the Mexican Government. The IEPS rate is calculated as the difference between the retail or “final price,” and the “producer price” of products. If the “final price” is higher than the “producer price,” the IEPS is paid by the final consumer. If the opposite occurs, the “negative IEPS” amount can be credited against certain of PEMEX’s tax liabilities and included in “Other income (expenses)” in its Income Statement.
PEMEX’s “producer price” is calculated by reference to that of an efficient refinery operating in the Gulf of Mexico. Until 2014, the “final price” or “retail price” was established by the SHCP. In 2015 the SHCP set a cap for retail price based on inflation expectations. In 2016 and 2017 the SHCP expects to apply the same system, and if competitive economic conditions are present, the retail price is expected to be determined by the market beginning in 2018.
Hydrocarbon Reserves
In accordance with the Hydrocarbons Law, published in the Official Gazette of the Federation on August 11, 2014, the National Hydrocarbons Commission (CNH) will establish and will manage the National Hydrocarbons Information Center, comprised by a system to obtain, safeguard, manage, use, analyze, keep updated and publish information and statistics related; which includes estimations, valuation studies and certifications.
As of January 1, 2010, the Securities and Exchange Commission (SEC) changed its rules to permit oil and gas companies, in their filings with the SEC, to disclose not only proved reserves, but also probable reserves and possible reserves. Nevertheless, any description of probable or possible reserves included herein may not meet the recoverability thresholds established by the SEC in its definitions. Investors are urged to consider closely the disclosure in our Form 20-F and our Annual Report to the CNBV and SEC, available athttp://www.pemex.com/.
Forward-looking Statements
This report contains forward-looking statements. We may also make written or oral forward-looking statements in our periodic reports to the CNBV and the SEC, in our annual reports, in our offering circulars and prospectuses, in press releases and other written materials and in oral statements made by our officers, directors or employees to third parties. We may include forward-looking statements that address, among other things, our:
| • | exploration and production activities, including drilling; |
| • | activities relating to import, export, refining, petrochemicals and transportation of petroleum, natural gas and oil products; |
| • | activities relating to the generation of electrical energy; |
| • | projected and targeted capital expenditures and other costs, commitments and revenues, and |
| • | liquidity and sources of funding. |
Actual results could differ materially from those projected in such forward-looking statements as a result of various factors that may be beyond our control. These factors include, but are not limited to:
| • | changes in international crude oil and natural gas prices; |
| • | effects on us from competition, including on our ability to hire and retain skilled personnel; |
| • | limitations on our access to sources of financing on competitive terms; |
| • | our ability to find, acquire or have the right to access additional hydrocarbons reserves and to develop the reserves that we obtain successfully; |
| • | uncertainties inherent in making estimates of oil and gas reserves, including recently discovered oil and gas reserves; |
| • | technical difficulties; |
| • | significant developments in the global economy; |
| • | significant economic or political developments in Mexico, including developments relating to the implementation of the laws that implement the new legal framework contemplated by the Energy Reform Decree (as described in our most recent Annual Report and Form 20-F); |
| • | developments affecting the energy sector; and |
| • | changes in our legal regime or regulatory environment, including tax and environmental regulations. |
Accordingly, you should not place undue reliance on these forward-looking statements. In any event, these statements speak only as of their dates, and we undertake no obligation to update or revise any of them, whether as a result of new information, future events or otherwise. These risks and uncertainties are more fully detailed in our most recent Annual Report filed with the CNBV and available through the Mexican Stock Exchange (http://www.bmv.com.mx/) and our most recent Form 20-F filing filed with the SEC (http://www.sec.gov/). These factors could cause actual results to differ materially from those contained in any forward-looking statement.
| PEMEX Results Report as of June 30, 2015 | 26 / 26 |
www.pemex.com

Annexes
PEMEX
Main Statistics of Production
| Second quarter (Apr.-Jun.) | Six months ending Jun. 30, | |||||||||||||||||||||||||||||||
| 2014 | 2015 | Change | 2014 | 2015 | Change | |||||||||||||||||||||||||||
Upstream | ||||||||||||||||||||||||||||||||
Total hydrocarbons (Mboed) | 3,578 | 3,255 | -9.0 | % | (323 | ) | 3,595 | 3,321 | -7.6 | % | (274 | ) | ||||||||||||||||||||
Liquid hydrocarbons (Mbd) | 2,510 | 2,261 | -9.9 | % | (249 | ) | 2,524 | 2,303 | -8.7 | % | (220 | ) | ||||||||||||||||||||
Crude oil (Mbd) | 2,468 | 2,225 | -9.8 | % | (243 | ) | 2,480 | 2,262 | -8.8 | % | (218 | ) | ||||||||||||||||||||
Condensates (Mbd) | 42 | 36 | -14.6 | % | (6 | ) | 44 | 41 | -6.5 | % | (3 | ) | ||||||||||||||||||||
Natural gas (MMcfd)(1) | 6,524 | 6,282 | -3.7 | % | (241 | ) | 6,523 | 6,442 | -1.2 | % | (81 | ) | ||||||||||||||||||||
Downstream | ||||||||||||||||||||||||||||||||
Dry gas from plants (MMcfd)(2) | 3,593 | 3,276 | -8.8 | % | (317 | ) | 3,632 | 3,436 | -5.4 | % | (196 | ) | ||||||||||||||||||||
Natural gas liquids (Mbd) | 368 | 323 | -12.1 | % | (44 | ) | 368 | 336 | -8.7 | % | (32 | ) | ||||||||||||||||||||
Petroleum products (Mbd)(3) | 1,401 | 1,216 | -13.2 | % | (185 | ) | 1,366 | 1,218 | -10.8 | % | (147 | ) | ||||||||||||||||||||
Petrochemical products (Mt) | 1,366 | 1,249 | -8.5 | % | (116 | ) | 2,806 | 2,518 | -10.3 | % | (288 | ) | ||||||||||||||||||||
| (1) | Includes nitrogen. |
| (2) | Does not include dry gas produced by Pemex-Refining and used as fuel by this subsidiary entity. |
| (3) | Includes LPG from Pemex-Gas and Basic Petrochemicals, Pemex-Exploration and Production and Pemex-Refining. |
PEMEX
Crude Oil Production by Type
| Second quarter (Apr.-Jun.) | Six months ending Jun. 30, | |||||||||||||||||||||||||||||||
| 2014 | 2015 | Change | 2014 | 2015 | Change | |||||||||||||||||||||||||||
Crude oil (Mbd) | 2,468 | 2,225 | -9.8 | % | (243 | ) | 2,480 | 2,262 | -8.8 | % | (218 | ) | ||||||||||||||||||||
Heavy | 1,297 | 1,169 | -9.9 | % | (129 | ) | 1,310 | 1,166 | -11.0 | % | (144 | ) | ||||||||||||||||||||
Light | 869 | 796 | -8.4 | % | (73 | ) | 863 | 830 | -3.8 | % | (32 | ) | ||||||||||||||||||||
Extra-light | 302 | 261 | -13.6 | % | (41 | ) | 306 | 265 | -13.4 | % | (41 | ) | ||||||||||||||||||||
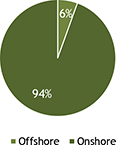
Offshore crude oil / total | 75.4 | % | 77.3 | % | 75.4 | % | 77.6 | % | ||||||||||||||||||||||||
| PEMEX Preliminary Results as of June 30, 2015 | 1 / 21 |
www.pemex.com
PEMEX
PEMEX
Crude Oil Production by Asset
| 2011 | 2012 | 2013 | 2014 | 2015 | ||||||||||||||||||||||||||||||||||||||||||||
| 1Q | 2Q | 3Q | 4Q | 1Q | 2Q | 3Q | 4Q | 1Q | 2Q | |||||||||||||||||||||||||||||||||||||||
| (Mbd) | ||||||||||||||||||||||||||||||||||||||||||||||||
Total | 2,553 | 2,548 | 2,544 | 2,516 | 2,506 | 2,523 | 2,492 | 2,468 | 2,398 | 2,360 | 2,300 | 2,225 | ||||||||||||||||||||||||||||||||||||
Northeastern Marine Region | 1,343 | 1,309 | 1,305 | 1,314 | 1,302 | 1,294 | 1,274 | 1,252 | 1,207 | 1,194 | 1,144 | 1,144 | ||||||||||||||||||||||||||||||||||||
Cantarell | 501 | 454 | 446 | 445 | 443 | 426 | �� | 414 | 397 | 358 | 332 | 304 | 282 | |||||||||||||||||||||||||||||||||||
Ku-Maloob-Zaap | 842 | 855 | 859 | 869 | 859 | 868 | 860 | 855 | 850 | 862 | 840 | 861 | ||||||||||||||||||||||||||||||||||||
Southwestern Marine Region | 561 | 585 | 586 | 581 | 595 | 608 | 604 | 610 | 622 | 642 | 646 | 576 | ||||||||||||||||||||||||||||||||||||
Abkatún-Pol Chuc | 276 | 266 | 281 | 288 | 299 | 306 | 300 | 296 | 292 | 309 | 309 | 239 | ||||||||||||||||||||||||||||||||||||
Litoral de Tabasco | 284 | 319 | 305 | 293 | 296 | 303 | 304 | 314 | 331 | 333 | 337 | 337 | ||||||||||||||||||||||||||||||||||||
Southern Region | 531 | 508 | 498 | 474 | 468 | 484 | 479 | 476 | 448 | 406 | 396 | 393 | ||||||||||||||||||||||||||||||||||||
Cinco Presidentes | 83 | 96 | 96 | 91 | 92 | 94 | 93 | 92 | 85 | 87 | 85 | 89 | ||||||||||||||||||||||||||||||||||||
Bellota-Jujo | 143 | 130 | 132 | 132 | 133 | 139 | 131 | 131 | 125 | 112 | 103 | 103 | ||||||||||||||||||||||||||||||||||||
Macuspana-Muspac(1) | 81 | 77 | 81 | 80 | 80 | 83 | 84 | 82 | 78 | 64 | 62 | 57 | ||||||||||||||||||||||||||||||||||||
Samaria-Luna | 223 | 205 | 190 | 170 | 163 | 168 | 171 | 171 | 160 | 143 | 146 | 145 | ||||||||||||||||||||||||||||||||||||
Northern Region | 119 | 145 | 155 | 146 | 142 | 137 | 133 | 130 | 120 | 117 | 113 | 112 | ||||||||||||||||||||||||||||||||||||
Burgos | 3 | 5 | 7 | 7 | 8 | 9 | 10 | 10 | — | — | — | — | ||||||||||||||||||||||||||||||||||||
Poza Rica-Altamira | 60 | 68 | 66 | 63 | 60 | 58 | 58 | 60 | 61 | 60 | 58 | 59 | ||||||||||||||||||||||||||||||||||||
Aceite Terciario del Golfo(2) | 53 | 69 | 74 | 67 | 63 | 60 | 54 | 49 | 47 | 46 | 44 | 42 | ||||||||||||||||||||||||||||||||||||
Veracruz | 3 | 4 | 8 | 9 | 10 | 10 | 11 | 11 | 12 | 12 | 11 | 11 | ||||||||||||||||||||||||||||||||||||
| (1) | The Macuspana-Muspac Asset was created in August 2011 and designated as a separate Asset in 2012. |
| (2) | The Aceite Terciario del Golfo Asset was created in 2008, when the fields that comprise it were divested from the Poza Rica-Altamira Asset. |
PEMEX
Natural Gas Production and Gas Flaring
| Second quarter (Apr.-Jun.) | Six months ending Jun. 30, | |||||||||||||||||||||||||||||||
| 2014 | 2015 | Change | 2014 | 2015 | Change | |||||||||||||||||||||||||||
Total (MMcfd)(1) | 5,762 | 5,399 | -6.3 | % | (363 | ) | 5,785 | 5,575 | -3.6 | % | (210 | ) | ||||||||||||||||||||
Associated | 4,137 | 3,789 | -8.4 | % | (348 | ) | 4,167 | 3,901 | -6.4 | % | (266 | ) | ||||||||||||||||||||
Non-associated | 1,624 | 1,609 | -0.9 | % | (15 | ) | 1,618 | 1,674 | 3.5 | % | 56 | |||||||||||||||||||||
Natural gas flaring (MMcfd) | 225 | 530 | 135.3 | % | 305 | 202 | 397 | 96.8 | % | 195 | ||||||||||||||||||||||
Gas flaring / total | 3.9 | % | 9.8 | % | 3.5 | % | 7.1 | % | ||||||||||||||||||||||||
| (1) | Does not include nitrogen. |
| PEMEX Preliminary Results as of June 30, 2015 | 2 / 21 |
www.pemex.com
PEMEX
PEMEX
Natural Gas Production by Asset
| 2011 | 2012 | 2013 | 2014 | 2015 | ||||||||||||||||||||||||||||||||||||||||||||
| 1Q | 2Q | 3Q | 4Q | 1Q | 2Q | 3Q | 4Q | 1Q | 2Q | |||||||||||||||||||||||||||||||||||||||
| (MMcfd) | ||||||||||||||||||||||||||||||||||||||||||||||||
Total(1) | 6,594 | 6,385 | 6,463 | 6,275 | 6,328 | 6,416 | 6,522 | 6,524 | 6,513 | 6,568 | 6,604 | 6,282 | ||||||||||||||||||||||||||||||||||||
Northeastern Marine Region | 1,406 | 1,334 | 1,356 | 1,386 | 1,425 | 1,480 | 1,601 | 1,674 | 1,706 | 1,785 | 1,831 | 1,835 | ||||||||||||||||||||||||||||||||||||
Cantarell | 1,075 | 1,004 | 1,014 | 1,007 | 1,006 | 1,001 | 1,075 | 1,117 | 1,116 | 1,175 | 1,317 | 1,294 | ||||||||||||||||||||||||||||||||||||
Ku-Maloob-Zaap | 331 | 330 | 342 | 379 | 418 | 479 | 526 | 557 | 590 | 610 | 514 | 542 | ||||||||||||||||||||||||||||||||||||
Southwestern Marine Region | 1,208 | 1,259 | 1,308 | 1,289 | 1,313 | 1,397 | 1,425 | 1,378 | 1,372 | 1,410 | 1,500 | 1,297 | ||||||||||||||||||||||||||||||||||||
Abkatún-Pol Chuc | 559 | 524 | 560 | 571 | 580 | 606 | 610 | 585 | 507 | 513 | 528 | 353 | ||||||||||||||||||||||||||||||||||||
Litoral Tabasco | 649 | 736 | 748 | 718 | 733 | 790 | 815 | 793 | 865 | 896 | 972 | 944 | ||||||||||||||||||||||||||||||||||||
Southern Region | 1,692 | 1,652 | 1,596 | 1,516 | 1,562 | 1,608 | 1,599 | 1,563 | 1,488 | 1,414 | 1,374 | 1,379 | ||||||||||||||||||||||||||||||||||||
Cinco Presidentes | 117 | 116 | 120 | 126 | 134 | 137 | 151 | 148 | 148 | 164 | 158 | 162 | ||||||||||||||||||||||||||||||||||||
Bellota-Jujo | 288 | 297 | 309 | 308 | 326 | 334 | 302 | 295 | 284 | 275 | 265 | 265 | ||||||||||||||||||||||||||||||||||||
Macuspana-Muspac(2) | 572 | 543 | 528 | 509 | 497 | 526 | 517 | 503 | 480 | 463 | 466 | 471 | ||||||||||||||||||||||||||||||||||||
Samaria-Luna | 716 | 696 | 639 | 572 | 604 | 611 | 629 | 617 | 576 | 512 | 485 | 481 | ||||||||||||||||||||||||||||||||||||
Northern Region | 2,288 | 2,139 | 2,203 | 2,083 | 2,029 | 1,931 | 1,897 | 1,909 | 1,948 | 1,960 | 1,899 | 1,772 | ||||||||||||||||||||||||||||||||||||
Burgos | 1,344 | 1,269 | 1,377 | 1,309 | 1,264 | 1,199 | 1,191 | 1,205 | 1,229 | 1,258 | 1,222 | 1,124 | ||||||||||||||||||||||||||||||||||||
Poza Rica-Altamira | 115 | 120 | 112 | 107 | 117 | 114 | 110 | 101 | 102 | 99 | 100 | 102 | ||||||||||||||||||||||||||||||||||||
Aceite Terciario del Golfo(3) | 112 | 149 | 168 | 171 | 168 | 161 | 154 | 149 | 148 | 147 | 147 | 145 | ||||||||||||||||||||||||||||||||||||
Veracruz | 717 | 601 | 546 | 496 | 480 | 457 | 442 | 454 | 469 | 456 | 429 | 400 | ||||||||||||||||||||||||||||||||||||
Nitrogen | ||||||||||||||||||||||||||||||||||||||||||||||||
Southern Region | 96 | 107 | 85 | 84 | 99 | 84 | 89 | 116 | 122 | 117 | 106 | 109 | ||||||||||||||||||||||||||||||||||||
Bellota-Jujo | 33 | 35 | 24 | 20 | 28 | 21 | 26 | 54 | 64 | 61 | 43 | 37 | ||||||||||||||||||||||||||||||||||||
Samaria-Luna | 63 | 72 | 62 | 64 | 71 | 62 | 63 | 62 | 58 | 56 | 63 | 71 | ||||||||||||||||||||||||||||||||||||
Northeastern Marine Region | 585 | 601 | 609 | 632 | 594 | 577 | 625 | 646 | 689 | 691 | 744 | 775 | ||||||||||||||||||||||||||||||||||||
Cantarell | 585 | 601 | 609 | 632 | 594 | 577 | 625 | 646 | 689 | 691 | 744 | 775 | ||||||||||||||||||||||||||||||||||||
| (1) | Includes nitrogen. |
| (2) | The Macuspana-Muspac Asset was created in August 2011 and designated as a separate Asset in 2012. |
| (3) | The Aceite Terciario del Golfo Asset was created in 2008; when the fields that comprise it were divested from the Poza Rica-Altamira Asset. |
PEMEX
Seismic Information
| Second quarter (Apr.-Jun.) | Six months ending Jun. 30, | |||||||||||||||||||||||||||||||
| 2014 | 2015 | Change | 2014 | 2015 | Change | |||||||||||||||||||||||||||
2D (km) | 545 | 177 | -67.5 | % | (368 | ) | 2,177 | 645 | -70.4 | % | (1,532 | ) | ||||||||||||||||||||
3D (km2) | 296 | 612 | 106.8 | % | 316 | 6,003 | 881 | -85.3 | % | (5,122 | ) | |||||||||||||||||||||
| PEMEX Preliminary Results as of June 30, 2015 | 3 / 21 |
www.pemex.com
PEMEX
PEMEX
Operating Offshore Platforms
| As of June 30, | ||||||||||||||||
| 2014 | 2015 | Change | ||||||||||||||
Offshore platforms | 256 | 257 | 0.4 | % | 1 | |||||||||||
Storage | 1 | 1 | 0.0 | % | — | |||||||||||
Compression | 10 | 9 | -10.0 | % | (1 | ) | ||||||||||
Control and service | 1 | 1 | 0.0 | % | — | |||||||||||
Linkage | 13 | 13 | 0.0 | % | — | |||||||||||
Measurement | 1 | 1 | 0.0 | % | — | |||||||||||
Drilling | 173 | 175 | 1.2 | % | 2 | |||||||||||
Production | 26 | 26 | 0.0 | % | — | |||||||||||
Telecommunications | 7 | 7 | 0.0 | % | — | |||||||||||
Treatment and pumping | 1 | 1 | 0.0 | % | — | |||||||||||
Housing | 23 | 23 | 0.0 | % | — | |||||||||||
PEMEX
Drilled and Operating Wells
| Second quarter (Apr.-Jun.) | Six months ending Jun. 30, | |||||||||||||||||||||||||||||||
| 2014 | 2015 | Change | 2014 | 2015 | Change | |||||||||||||||||||||||||||
Wells drilled | 114 | 92 | -19.3 | % | (22 | ) | 252 | 176 | -30.2 | % | (76 | ) | ||||||||||||||||||||
Development | 107 | 89 | -16.8 | % | (18 | ) | 239 | 167 | -30.1 | % | (72 | ) | ||||||||||||||||||||
Exploration | 7 | 3 | -57.1 | % | (4 | ) | 13 | 9 | -30.8 | % | (4 | ) | ||||||||||||||||||||
Operating wells | 9,513 | 9,380 | -1.4 | % | (133 | ) | 9,619 | 9,443 | -1.8 | % | (175 | ) | ||||||||||||||||||||
Crude oil | 6,333 | 5,832 | -7.9 | % | (501 | ) | 6,378 | 5,864 | -8.1 | % | (515 | ) | ||||||||||||||||||||
Non-associated gas | 3,180 | 3,548 | 11.6 | % | 368 | 3,240 | 3,579 | 10.5 | % | 339 | ||||||||||||||||||||||
| PEMEX Preliminary Results as of June 30, 2015 | 4 / 21 |
www.pemex.com
PEMEX
PEMEX
Average Operating Drilling Rigs
| Second quarter (Apr.-Jun.) | Six months ending Jun. 30, | |||||||||||||||||||||||||||||||
| 2014 | 2015 | Change | 2014 | 2015 | Change | |||||||||||||||||||||||||||
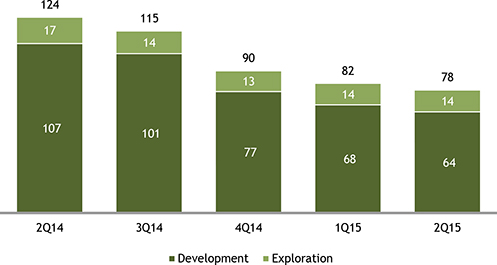
Total | 124 | 78 | -37.1 | % | (46 | ) | 118 | 82 | -30.5 | % | (36 | ) | ||||||||||||||||||||
Exploration | 17 | 14 | -17.6 | % | (3 | ) | 16 | 14 | -12.5 | % | (2 | ) | ||||||||||||||||||||
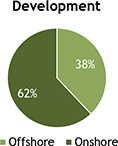
Development | 107 | 64 | -40.2 | % | (43 | ) | 102 | 68 | -33.3 | % | (34 | ) | ||||||||||||||||||||
PEMEX
Crude Oil Processing
| Second quarter (Apr.-Jun.) | Six months ending Jun. 30, | |||||||||||||||||||||||||||||||
| 2014 | 2015 | Change | 2014 | 2015 | Change | |||||||||||||||||||||||||||
Total processed (Mbd) | 1,199 | 1,058 | -11.7 | % | (140 | ) | 1,174 | 1,058 | -9.9 | % | (116 | ) | ||||||||||||||||||||
Light crude | 683 | 576 | -15.6 | % | (107 | ) | 664 | 563 | -15.2 | % | (101 | ) | ||||||||||||||||||||
Heavy crude | 516 | 482 | -6.5 | % | (34 | ) | 510 | 495 | -2.9 | % | (15 | ) | ||||||||||||||||||||
Light crude / Total processed | 57.0 | % | 54.5 | % | -4.4 | % | (2.5 | ) | 56.5 | % | 53.2 | % | -5.9 | % | (3.4 | ) | ||||||||||||||||
Heavy crude / Total processed | 43.0 | % | 45.5 | % | 5.9 | % | 2.5 | 43.5 | % | 46.8 | % | 7.7 | % | 3.4 | ||||||||||||||||||
Use of primary distillation capacity | 71.7 | % | 63.4 | % | -11.7 | % | (8.4 | ) | 70.7 | % | 63.4 | % | -10.3 | % | (7.3 | ) | ||||||||||||||||
PEMEX
Petroleum Products Production
| Second quarter (Apr.-Jun.) | Six months ending Jun. 30, | |||||||||||||||||||||||||||||||
| 2014 | 2015 | Change | 2014 | 2015 | Change | |||||||||||||||||||||||||||
Total production (Mbd) | 1,401 | 1,216 | -13.2 | % | (185 | ) | 1,366 | 1,218 | -10.8 | % | (147 | ) | ||||||||||||||||||||
Automotive gasolines | 453 | 395 | -12.8 | % | (58 | ) | 442 | 392 | -11.3 | % | (50 | ) | ||||||||||||||||||||
Fuel oil | 276 | 234 | -15.2 | % | (42 | ) | 258 | 220 | -15.1 | % | (39 | ) | ||||||||||||||||||||
Diesel | 307 | 263 | -14.2 | % | (43 | ) | 295 | 275 | -6.7 | % | (20 | ) | ||||||||||||||||||||
LPG | 210 | 176 | -16.3 | % | (34 | ) | 212 | 186 | -12.6 | % | (27 | ) | ||||||||||||||||||||
Jet Fuel | 59 | 46 | -20.8 | % | (12 | ) | 58 | 48 | -16.6 | % | (10 | ) | ||||||||||||||||||||
Other(1) | 97 | 101 | 4.7 | % | 5 | 101 | 98 | -2.6 | % | (3 | ) | |||||||||||||||||||||
| (1) | Includes paraffins, furfural extract, aeroflex, asphalt, lubricants, coke, cyclical light oil and other gasolines. |
Note: As of March 31, 2015 PEMEX had 10,908 service stations.
| PEMEX Preliminary Results as of June 30, 2015 | 5 / 21 |
www.pemex.com
PEMEX
PEMEX
Natural Gas Processing and Production
| Second quarter (Apr.-Jun.) | Six months ending Jun. 30, | |||||||||||||||||||||||||||||||
| 2014 | 2015 | Change | 2014 | 2015 | Change | |||||||||||||||||||||||||||
Natural gas processing (MMcfd) | 4,311 | 3,955 | -8.3 | % | (356 | ) | 4,347 | 4,125 | -5.1 | % | (222 | ) | ||||||||||||||||||||
Sour wet gas | 3,334 | 3,095 | -7.2 | % | (239 | ) | 3,373 | 3,219 | -4.6 | % | (154 | ) | ||||||||||||||||||||
Sweet wet gas | 976 | 860 | -11.9 | % | (117 | ) | 974 | 906 | -7.0 | % | (68 | ) | ||||||||||||||||||||
Condensates processing (Mbd) | 47 | 40 | -15.7 | % | (7 | ) | 49 | 45 | -7.3 | % | (4 | ) | ||||||||||||||||||||
Production | ||||||||||||||||||||||||||||||||
Dry gas from plants (MMcfd) | 3,593 | 3,276 | -8.8 | % | (317 | ) | 3,632 | 3,436 | -5.4 | % | (196 | ) | ||||||||||||||||||||
Natural gas liquids (Mbd) | 368 | 323 | -12.1 | % | (44 | ) | 368 | 336 | -8.7 | % | (32 | ) | ||||||||||||||||||||
| PEMEX Preliminary Results as of June 30, 2015 | 6 / 21 |
www.pemex.com
PEMEX
PEMEX
Production of Petrochemicals
| Second quarter (Apr.-Jun.) | Six months ending Jun. 30, | |||||||||||||||||||||||||||||||
| 2014 | 2015 | Change | 2014 | 2015 | Change | |||||||||||||||||||||||||||
Total production | 1,366 | 1,249 | -8.5 | % | (116 | ) | 2,806 | 2,518 | -10.3 | % | (288 | ) | ||||||||||||||||||||
Methane derivatives | 350 | 209 | -40.1 | % | (140 | ) | 710 | 516 | -27.2 | % | (193 | ) | ||||||||||||||||||||
Ammonia | 225 | 114 | -49.5 | % | (112 | ) | 471 | 335 | -28.9 | % | (136 | ) | ||||||||||||||||||||
Carbon dioxide | 79 | 54 | -32.3 | % | (26 | ) | 149 | 95 | -36.3 | % | (54 | ) | ||||||||||||||||||||
Methanol | 45 | 42 | -6.8 | % | (3 | ) | 90 | 87 | -3.5 | % | (3 | ) | ||||||||||||||||||||
Ethane derivatives | 262 | 273 | 4.3 | % | 11 | 544 | 542 | -0.4 | % | (2 | ) | |||||||||||||||||||||
Ethylene | 7 | — | — | — | 7 | N/D | — | — | ||||||||||||||||||||||||
Ethylene glycol | 41 | 45 | 10.0 | % | 4 | 81 | 89 | 10.7 | % | 9 | ||||||||||||||||||||||
Impure glycol | 1 | 1 | 12.9 | % | 0 | 1 | 2 | 20.8 | % | 0 | ||||||||||||||||||||||
Pure monoethylene glycol | 3 | 3 | -9.2 | % | (0 | ) | 6 | 5 | -14.2 | % | (1 | ) | ||||||||||||||||||||
Ethylene oxide | 66 | 62 | -6.6 | % | (4 | ) | 131 | 123 | -6.6 | % | (9 | ) | ||||||||||||||||||||
High density polyethylene | 42 | 38 | -10.9 | % | (5 | ) | 82 | 81 | -1.8 | % | (2 | ) | ||||||||||||||||||||
Low density polyethylene | 56 | 53 | -5.4 | % | (3 | ) | 123 | 108 | -12.3 | % | (15 | ) | ||||||||||||||||||||
Linear low density polyethylene | 46 | 72 | 56.5 | % | 26 | 113 | 135 | 19.8 | % | 22 | ||||||||||||||||||||||
Aromatics and derivatives | 177 | 234 | 32.0 | % | 57 | 342 | 431 | 25.9 | % | 89 | ||||||||||||||||||||||
Aromine 100 | 4 | 5 | 13.1 | % | 1 | 7 | 9 | 25.1 | % | 2 | ||||||||||||||||||||||
Benzene | 0 | 6 | 2569.5 | % | 6 | 0 | 7 | 1434.8 | % | 6 | ||||||||||||||||||||||
Styrene | 33 | 27 | -18.5 | % | (6 | ) | 66 | 61 | -7.9 | % | (5 | ) | ||||||||||||||||||||
Fluxoil | 1 | 1 | -19.4 | % | (0 | ) | 2 | 2 | -9.2 | % | (0 | ) | ||||||||||||||||||||
High octane hydrocarbon | 89 | 160 | 79.3 | % | 71 | 175 | 281 | 60.2 | % | 105 | ||||||||||||||||||||||
Toluene | 22 | 9 | -60.0 | % | (13 | ) | 37 | 22 | -40.8 | % | (15 | ) | ||||||||||||||||||||
Xylenes | 27 | 26 | -4.6 | % | (1 | ) | 54 | 49 | -8.0 | % | (4 | ) | ||||||||||||||||||||
Propylene and derivatives | 125 | 139 | 10.7 | % | 13 | 248 | 257 | 3.6 | % | 9 | ||||||||||||||||||||||
Hydrocyanic acid | 1.5 | 1.5 | 6.3 | % | 0 | 2 | 3 | 20.7 | % | 1 | ||||||||||||||||||||||
Acrylonitrile | 14 | 14 | 5.1 | % | 1 | 25 | 28 | 10.8 | % | 3 | ||||||||||||||||||||||
Propylene | 110 | 123 | 11.5 | % | 13 | 220 | 226 | 2.5 | % | 6 | ||||||||||||||||||||||
Other | 451 | 394 | -12.7 | % | (58 | ) | 963 | 772 | -19.8 | % | (190 | ) | ||||||||||||||||||||
Heptane | 1 | — | — | — | 2 | — | — | — | ||||||||||||||||||||||||
Hexane | 7 | 8 | 6.9 | % | 0 | 11 | 18 | 58.3 | % | 7 | ||||||||||||||||||||||
Pentanes | 4 | 5 | 23.4 | % | 1 | 8 | 9 | 14.5 | % | 1 | ||||||||||||||||||||||
Carbon black | 77 | 79 | 2.5 | % | 2 | 173 | 175 | 1.0 | % | 2 | ||||||||||||||||||||||
Butane | 8 | 9 | 5.2 | % | 0 | 15 | 16 | 9.4 | % | 1 | ||||||||||||||||||||||
Other | 354 | 293 | -17.0 | % | (60 | ) | 753 | 554 | -26.4 | % | (199 | ) | ||||||||||||||||||||
Note: “Other” includes muriatic acid, butadiene, polyethylene wax, petrochemical specialities, BTX liquids, hydrogen, isohexane, pyrolysis liquids, oxygen, CPDI, sulfur, isopropyl alcohol, amorphous gasoline, octane basis gasoline and heavy naphtha.
| PEMEX Preliminary Results as of June 30, 2015 | 7 / 21 |
www.pemex.com
PEMEX
PEMEX
Industrial Safety and Environmental Protection
| Second quarter (Apr.-Jun.) | Six months ending Jun. 30, | |||||||||||||||||||||||||||||||
| 2014 | 2015 | Change | 2014 | 2015 | Change | |||||||||||||||||||||||||||
Frequency index(1) | 0.30 | 0.52 | 73.2 | % | 0.22 | 0.35 | 0.50 | 42.0 | % | 0.15 | ||||||||||||||||||||||
Severity index(2) | 18 | 29 | 59.1 | % | 11 | 18 | 22 | 22.7 | % | 4 | ||||||||||||||||||||||
Sulfur oxide emissions (Mt) | 143 | 156 | 9.5 | % | 14 | 295 | 308 | 4.3 | % | 13 | ||||||||||||||||||||||
Reused water / Use | 0.138 | 0.141 | 2.0 | % | 0.003 | 0.146 | 0.139 | -5.1 | % | (0.007 | ) | |||||||||||||||||||||
| (1) | Number of lost-time injuries by MMmh risk exposure. |
| (2) | Total days lost by MMmh risk exposure. |
Note: MMmh stands for millon man-hours.
PEMEX
Volume of Domestic Sales
| Second quarter (Apr.-Jun.) | Six months ending Jun. 30, | |||||||||||||||||||||||||||||||
| 2014 | 2015 | Change | 2014 | 2015 | Change | |||||||||||||||||||||||||||
Dry natural gas (MMcfd) | 3,452 | 3,056 | -11.5 | % | (397 | ) | 3,434 | 3,151 | -8.2 | % | (283 | ) | ||||||||||||||||||||
Petroleum products (Mbd) | 1,703 | 1,667 | -2.1 | % | (36 | ) | 1,696 | 1,652 | -2.6 | % | (44 | ) | ||||||||||||||||||||
Automotive gasolines | 778 | 785 | 0.8 | % | 6 | 772 | 776 | 0.5 | % | 4 | ||||||||||||||||||||||
Fuel oil | 135 | 84 | -37.5 | % | (51 | ) | 115 | 70 | -38.9 | % | (45 | ) | ||||||||||||||||||||
Diesel | 393 | 396 | 0.8 | % | 3 | 385 | 385 | -0.1 | % | (0 | ) | |||||||||||||||||||||
LPG | 261 | 264 | 1.3 | % | 3 | 280 | 279 | -0.1 | % | (0 | ) | |||||||||||||||||||||
Jet fuel | 66 | 69 | 4.0 | % | 3 | 67 | 70 | 5.3 | % | 4 | ||||||||||||||||||||||
Other | 71 | 70 | -0.9 | % | (1 | ) | 78 | 71 | -8.1 | % | (6 | ) | ||||||||||||||||||||
Petrochemical products (Mt) | 1,042 | 970 | -6.9 | % | (72 | ) | 2,151 | 2,027 | -5.8 | % | (124 | ) | ||||||||||||||||||||
| PEMEX Preliminary Results as of June 30, 2015 | 8 / 21 |
www.pemex.com
PEMEX
PEMEX
Volume of Exports(1)
| Second quarter (Apr.-Jun.) | Six months ending Jun. 30, | |||||||||||||||||||||||||||||||
| 2014 | 2015 | Change | 2014 | 2015 | Change | |||||||||||||||||||||||||||
Crude oil (Mbd) | 1,081 | 1,066 | -1.4 | % | (15 | ) | 1,136 | 1,164 | 2.5 | % | 29 | |||||||||||||||||||||
Maya(2) | 879 | 745 | -15.3 | % | (134 | ) | 903 | 834 | -7.7 | % | (69 | ) | ||||||||||||||||||||
Istmo | 107 | 208 | 95.5 | % | 102 | 138 | 202 | 46.3 | % | 64 | ||||||||||||||||||||||
Olmeca | 95 | 113 | 18.3 | % | 17 | 95 | 129 | 35.9 | % | 34 | ||||||||||||||||||||||
Dry natural gas (MMcfd)(3) | 4 | 3 | -38.6 | % | (2 | ) | 4 | 3 | -37.7 | % | (2 | ) | ||||||||||||||||||||
Petroleum products (Mbd) | 159 | 197 | 24.1 | % | 38 | 193 | 216 | 11.6 | % | 23 | ||||||||||||||||||||||
Fuel oil | 100 | 118 | 17.4 | % | 17 | 125 | 139 | 10.8 | % | 14 | ||||||||||||||||||||||
Naftas | 59 | 63 | 7.7 | % | 5 | 63 | 66 | 4.7 | % | 3 | ||||||||||||||||||||||
Other | — | 16 | — | 16 | 5 | 11 | 114.3 | % | 6 | |||||||||||||||||||||||
Petrochemical products (Mt) | 118 | 83 | -30.2 | % | (36 | ) | 269 | 151 | -43.7 | % | (117 | ) | ||||||||||||||||||||
| (1) | Transactions conducted by PMI Group. |
| (2) | Includes Altamira. |
| (3) | Transactions conducted by Pemex-Gas and Basic Petrochemicals. |
PEMEX
Volume of Imports(1)
| Second quarter (Apr.-Jun.) | Six months ending Jun. 30, | |||||||||||||||||||||||||||||||
| 2014 | 2015 | Change | 2014 | 2015 | Change | |||||||||||||||||||||||||||
Dry natural gas (MMcfd)(2) | 1,406 | 1,332 | -5.3 | % | (74 | ) | 1,360 | 1,268 | -6.8 | % | (92 | ) | ||||||||||||||||||||
Petroleum products (Mbd) | 554 | 682 | 23.0 | % | 128 | 593 | 681 | 15.0 | % | 89 | ||||||||||||||||||||||
Automotive gasolines | 329 | 386 | 17.3 | % | 57 | 352 | 397 | 12.6 | % | 44 | ||||||||||||||||||||||
Fuel oil | 16 | 9 | -41.6 | % | (6 | ) | 13 | 7 | -43.9 | % | (6 | ) | ||||||||||||||||||||
Diesel | 118 | 148 | 25.6 | % | 30 | 119 | 141 | 18.4 | % | 22 | ||||||||||||||||||||||
LPG | 60 | 94 | 57.4 | % | 34 | 80 | 96 | 20.2 | % | 16 | ||||||||||||||||||||||
Jet fuel | 8 | 24 | 216.6 | % | 16 | 6 | 23 | 266.2 | % | 17 | ||||||||||||||||||||||
Naftas | 24 | 18 | -24.3 | % | (6 | ) | 21 | 15 | -29.6 | % | (6 | ) | ||||||||||||||||||||
Other | 0.5 | 2.9 | 524.4 | % | 2.4 | 0.5 | 1.7 | 270.9 | % | 1.2 | ||||||||||||||||||||||
Petrochemical products (Mt) | 88 | 77 | -11.6 | % | (10 | ) | 175 | 159 | -8.9 | % | (15 | ) | ||||||||||||||||||||
| (1) | Transactions conducted by PMI Group. |
| (2) | Transactions conducted by Pemex-Gas and Basic Petrochemicals. |
| PEMEX Preliminary Results as of June 30, 2015 | 9 / 21 |
www.pemex.com
PEMEX
PEMEX
Average Exchange Rates and Reference Data
| Second quarter (Apr.-Jun.) | Six months ending Jun. 30, | |||||||||||||||||||||||||||||||
| 2014 | 2015 | Change | 2014 | 2015 | Change | |||||||||||||||||||||||||||
Mexican crude oil basket (USD/b) | 97.09 | 53.95 | -44.4 | % | (43.14 | ) | 94.75 | 49.70 | -47.6 | % | (45.05 | ) | ||||||||||||||||||||
Regular gasoline in the USCGM (USD¢/gal) | 293.23 | 197.74 | -32.6 | % | (95.49 | ) | 281.07 | 176.38 | -37.2 | % | (104.70 | ) | ||||||||||||||||||||
LPG price by Decree (MXN/t) | 9.02 | 9.41 | 4.3 | % | 0.39 | 8.91 | 9.41 | 5.6 | % | 0.50 | ||||||||||||||||||||||
International reference LPG (MXN/t) | 9.48 | 6.58 | -30.6 | % | (2.90 | ) | 10.61 | 6.48 | -38.9 | % | (4.13 | ) | ||||||||||||||||||||
Natural gas (Henry Hub)(USD/MMBtu) | 4.68 | 2.65 | -43.4 | % | (2.03 | ) | 4.95 | 2.99 | -39.6 | % | (1.96 | ) | ||||||||||||||||||||
| Six months ending Jun. 30, | ||||||||||||||||
| 2014 | 2015 | Change | ||||||||||||||
MXN per USD | 13.0323 | 15.5676 | 19.5 | % | 2.54 | |||||||||||
PEMEX
Consolidated Income Statement
| Second quarter (Apr.-Jun.) | Six months ending Jun. 30, | |||||||||||||||||||||||||||||||||||||||
| 2014 | 2015 | Change | 2015 | 2014 | 2015 | Change | 2015 | |||||||||||||||||||||||||||||||||
| (MXN million) | (USD million) | (MXN million) | (USD million) | |||||||||||||||||||||||||||||||||||||
Total sales | 409,070 | 308,864 | -24.5 | % | (100,207 | ) | 19,840 | 816,004 | 588,363 | -27.9 | % | (227,641 | ) | 37,794 | ||||||||||||||||||||||||||
Domestic sales | 241,793 | 190,145 | -21.4 | % | (51,648 | ) | 12,214 | 472,837 | 360,890 | -23.7 | % | (111,947 | ) | 23,182 | ||||||||||||||||||||||||||
Exports | 165,673 | 115,427 | -30.3 | % | (50,246 | ) | 7,415 | 338,864 | 220,588 | -34.9 | % | (118,276 | ) | 14,170 | ||||||||||||||||||||||||||
Services income | 1,604 | 3,291 | 105.2 | % | 1,687 | 211 | 4,303 | 6,885 | 60.0 | % | 2,582 | 442 | ||||||||||||||||||||||||||||
Cost of sales | 217,375 | 218,575 | 0.6 | % | 1,200 | 14,040 | 427,707 | 413,078 | -3.4 | % | (14,629 | ) | 26,534 | |||||||||||||||||||||||||||
Gross income | 191,695 | 90,289 | -52.9 | % | (101,406 | ) | 5,800 | 388,298 | 175,285 | -54.9 | % | (213,012 | ) | 11,260 | ||||||||||||||||||||||||||
Other revenues (expenses) | 15,716 | 978 | -93.8 | % | (14,738 | ) | 63 | 32,894 | 2,317 | -93.0 | % | (30,577 | ) | 149 | ||||||||||||||||||||||||||
IEPS accrued | 14,974 | 831 | -94.4 | % | (14,143 | ) | 53 | 30,878 | 1,320 | -95.7 | % | (29,558 | ) | 85 | ||||||||||||||||||||||||||
Other | 742 | 147 | -80.2 | % | (595 | ) | 9 | 2,015 | 997 | -50.5 | % | (1,019 | ) | 64 | ||||||||||||||||||||||||||
Transportation and distribution expenses | 7,995 | 8,516 | 6.5 | % | 521 | 547 | 15,323 | 17,751 | 15.8 | % | 2,428 | 1,140 | ||||||||||||||||||||||||||||
Administrative expenses | 28,325 | 28,825 | 1.8 | % | 500 | 1,852 | 53,609 | 57,493 | 7.2 | % | 3,883 | 3,693 | ||||||||||||||||||||||||||||
Operating income (loss) | 171,091 | 53,926 | -68.5 | % | (117,165 | ) | 3,464 | 352,259 | 102,359 | -70.9 | % | (249,901 | ) | 6,575 | ||||||||||||||||||||||||||
Total interest expense | (11,004 | ) | (15,834 | ) | 43.9 | % | (4,830 | ) | (1,017 | ) | (21,986 | ) | (30,991 | ) | 41.0 | % | (9,005 | ) | (1,991 | ) | ||||||||||||||||||||
Total interest income | 714 | 1,295 | 81.4 | % | 581 | 83 | 1,228 | 3,057 | 148.9 | % | 1,829 | 196 | ||||||||||||||||||||||||||||
Income (cost) due to financial derivatives | 629 | 1,318 | 109.7 | % | 690 | 85 | 3,032 | (14,867 | ) | -590.4 | % | (17,899 | ) | (955 | ) | |||||||||||||||||||||||||
Foreign exchange profit (loss) | 3,506 | (28,731 | ) | (32,237 | ) | (1,846 | ) | 3,419 | (45,344 | ) | -1426.3 | % | (48,763 | ) | (2,913 | ) | ||||||||||||||||||||||||
Profit sharing in non-consolidated subsidiaries and affiliates | 692 | 1,168 | 68.8 | % | 476 | 75 | 1,827 | 1,207 | -33.9 | % | (620 | ) | 78 | |||||||||||||||||||||||||||
Income before taxes and duties | 165,628 | 13,142 | -92.1 | % | (152,486 | ) | 844 | 339,779 | 15,421 | -95.5 | % | (324,359 | ) | 991 | ||||||||||||||||||||||||||
Taxes and duties | 217,923 | 97,772 | -55.1 | % | (120,151 | ) | 6,280 | 428,028 | 200,597 | -53.1 | % | (227,431 | ) | 12,886 | ||||||||||||||||||||||||||
Net income (loss) | (52,295 | ) | (84,630 | ) | 61.8 | % | (32,335 | ) | (5,436 | ) | (88,249 | ) | (185,176 | ) | 109.8 | % | (96,927 | ) | (11,895 | ) | ||||||||||||||||||||
Other comprehensive results | 636 | (1,449 | ) | (2,085 | ) | (93 | ) | 634 | 4,454 | 602.4 | % | 3,820 | 286 | |||||||||||||||||||||||||||
Investment in equity securities | 1,258 | (493 | ) | -139.2 | % | (1,751 | ) | (32 | ) | 1,419 | (548 | ) | -138.6 | % | (1,966 | ) | (35 | ) | ||||||||||||||||||||||
Actuarial losses due to employee benefits | 18 | 0 | (18 | ) | 0 | 18 | — | -100.0 | % | (18 | ) | — | ||||||||||||||||||||||||||||
Conversion effect | (640 | ) | (956 | ) | 49.4 | % | (316 | ) | (61 | ) | (802 | ) | 5,002 | -723.8 | % | 5,804 | 321 | |||||||||||||||||||||||
Comprehensive income (loss) | (51,660 | ) | (86,079 | ) | (34,420 | ) | (5,529 | ) | (87,615 | ) | (180,722 | ) | 106.3 | % | (93,107 | ) | (11,609 | ) | ||||||||||||||||||||||
| PEMEX Preliminary Results as of June 30, 2015 | 10 / 21 |
www.pemex.com
PEMEX
PEMEX
Financial Ratios
| Second quarter (Apr.-Jun.) | Six months ending Jun. 30, | |||||||||||||||||||||||
| 2014 | 2015 | Change | 2014 | 2015 | Change | |||||||||||||||||||
Cost of sales / Total revenues (including negative IEPS credit) | 51.3 | % | 70.6 | % | 19.3 | 50.5 | % | 70.1 | % | 19.5 | ||||||||||||||
D&A / Operating costs & expenses | 14.0 | % | 15.9 | % | 1.9 | 14.7 | % | 15.9 | % | 1.2 | ||||||||||||||
Operating income / Total revenues (including negative IEPS credit) | 40.3 | % | 17.4 | % | (22.9 | ) | 41.6 | % | 17.4 | % | (24.2 | ) | ||||||||||||
Taxes and duties / Total revenues (including negative IEPS credit) | 51.4 | % | 31.6 | % | (19.8 | ) | 50.5 | % | 34.0 | % | (16.5 | ) | ||||||||||||
Earnings before Interest, Taxes Depreciation and Amortization (EBITDA) / Interest expense | 21.5 | 8.3 | (13.3 | ) | 22.1 | 8.1 | (14.1 | ) | ||||||||||||||||
PEMEX
Sales and Services Revenues
| Second quarter (Apr.-Jun.) | Six months ending Jun. 30, | |||||||||||||||||||||||||||||||||||||||
| 2014 | 2015 | Change | 2015 | 2014 | 2015 | Change | 2015 | |||||||||||||||||||||||||||||||||
| (MXN million) | (USD million) | (MXN million) | (USD million) | |||||||||||||||||||||||||||||||||||||
Total revenues from sales and services | 409,070 | 308,864 | -24.5 | % | (100,207 | ) | 19,840 | 816,004 | 588,363 | -27.9 | % | (227,641 | ) | 37,794 | ||||||||||||||||||||||||||
Domestic sales (including negative IEPS recovery) | 256,767 | 190,976 | -25.6 | % | (65,791 | ) | 12,268 | 503,715 | 362,210 | -28.1 | % | (141,506 | ) | 23,267 | ||||||||||||||||||||||||||
Domestic sales | 241,793 | 190,145 | -21.4 | % | (51,648 | ) | 12,214 | 472,837 | 360,890 | -23.7 | % | (111,947 | ) | 23,182 | ||||||||||||||||||||||||||
Dry gas | 22,431 | 13,375 | -40.4 | % | (9,056 | ) | 859 | 46,188 | 26,485 | -42.7 | % | (19,702 | ) | 1,701 | ||||||||||||||||||||||||||
Petroleum products (including negative IEPS recovery) | 227,228 | 170,942 | -24.8 | % | (56,286 | ) | 10,981 | 442,834 | 321,819 | -27.3 | % | (121,016 | ) | 20,672 | ||||||||||||||||||||||||||
Petroleum products | 212,254 | 170,111 | -19.9 | % | (42,143 | ) | 10,927 | 411,956 | 320,498 | -22.2 | % | (91,458 | ) | 20,588 | ||||||||||||||||||||||||||
IEPS | 14,974 | 831 | -94.4 | % | (14,143 | ) | 53 | 30,878 | 1,320 | -95.7 | % | (29,558 | ) | 85 | ||||||||||||||||||||||||||
Gasolines | 107,981 | 91,335 | -15.4 | % | (16,646 | ) | 5,867 | 210,610 | 167,630 | -20.4 | % | (42,980 | ) | 10,768 | ||||||||||||||||||||||||||
Fuel oil | 12,638 | 4,662 | -63.1 | % | (7,976 | ) | 299 | 20,904 | 7,790 | -62.7 | % | (13,114 | ) | 500 | ||||||||||||||||||||||||||
Diesel | 57,736 | 43,736 | -24.2 | % | (14,000 | ) | 2,809 | 111,235 | 82,713 | -25.6 | % | (28,522 | ) | 5,313 | ||||||||||||||||||||||||||
LPG | 18,107 | 18,442 | 1.8 | % | 335 | 1,185 | 37,308 | 39,313 | 5.4 | % | 2,005 | 2,525 | ||||||||||||||||||||||||||||
Jet fuel | 9,334 | 7,267 | -22.1 | % | (2,067 | ) | 467 | 19,058 | 13,782 | -27.7 | % | (5,276 | ) | 885 | ||||||||||||||||||||||||||
Other | 6,458 | 4,670 | -27.7 | % | (1,788 | ) | 300 | 12,841 | 9,271 | -27.8 | % | (3,570 | ) | 596 | ||||||||||||||||||||||||||
Petrochemical products | 7,108 | 6,659 | -6.3 | % | (449 | ) | 428 | 14,693 | 13,906 | -5.4 | % | (787 | ) | 893 | ||||||||||||||||||||||||||
Exports | 165,673 | 115,427 | -30.3 | % | (50,246 | ) | 7,415 | 338,864 | 220,588 | -34.9 | % | (118,276 | ) | 14,170 | ||||||||||||||||||||||||||
Crude oil and condensates | 124,667 | 81,287 | -34.8 | % | (43,379 | ) | 5,222 | 255,528 | 154,095 | -39.7 | % | (101,433 | ) | 9,898 | ||||||||||||||||||||||||||
Dry gas | 18 | 6 | -66.1 | % | (12 | ) | 0 | 37 | 13 | -64.3 | % | (24 | ) | 1 | ||||||||||||||||||||||||||
Petroleum products | 40,341 | 33,810 | -16.2 | % | (6,531 | ) | 2,172 | 82,296 | 66,080 | -19.7 | % | (16,216 | ) | 4,245 | ||||||||||||||||||||||||||
Petrochemical products | 586 | 248 | -57.7 | % | (338 | ) | 16 | 811 | 343 | -57.7 | % | (468 | ) | 22 | ||||||||||||||||||||||||||
Suphur | 62 | 76 | 22.2 | % | 14 | 5 | 192 | 57 | -70.5 | % | (135 | ) | 4 | |||||||||||||||||||||||||||
Services revenues | 1,604 | 3,291 | 105.2 | % | 1,687 | 211 | 4,303 | 6,885 | 60.0 | % | 2,582 | 442 | ||||||||||||||||||||||||||||
| PEMEX Preliminary Results as of June 30, 2015 | 11 / 21 |
www.pemex.com
PEMEX
PEMEX
Operating Costs and Expenses
| Second quarter (Apr.-Jun.) | Six months ending Jun. 30, | |||||||||||||||||||||||||||||||||||||||
| 2014 | 2015 | Change | 2015 | 2014 | 2015 | Change | 2015 | |||||||||||||||||||||||||||||||||
| (MXN million) | (USD million) | (MXN million) | (USD million) | |||||||||||||||||||||||||||||||||||||
Operating costs and expenses | 253,695 | 255,916 | 0.9 | % | 2,221 | 16,439 | 496,639 | 488,321 | -1.7 | % | (8,318 | ) | 31,368 | |||||||||||||||||||||||||||
Cost of sales | 217,375 | 218,575 | 0.6 | % | 1,200 | 14,040 | 427,707 | 413,078 | -3.4 | % | (14,629 | ) | 26,534 | |||||||||||||||||||||||||||
Operating expenses | 28,668 | 31,448 | 9.7 | % | 2,780 | 2,020 | 52,098 | 57,477 | 10 | % | 5,380 | 3,692 | ||||||||||||||||||||||||||||
Purchases for resale | 88,438 | 85,929 | -2.8 | % | (2,509 | ) | 5,520 | 187,804 | 155,118 | -17 | % | (32,686 | ) | 9,964 | ||||||||||||||||||||||||||
Hydrocarbon exploration duty | — | 494 | 494 | 32 | — | 494 | 494 | 32 | ||||||||||||||||||||||||||||||||
Hydrocarbon exploration activity tax | — | 645 | 645 | 41 | — | 645 | 645 | 41 | ||||||||||||||||||||||||||||||||
Hydrocarbon extraction duty | — | 26,584 | 26,584 | 1,708 | — | 26,584 | 26,584 | 1,708 | ||||||||||||||||||||||||||||||||
Hydrocarbon extraction activity tax | — | 1,396 | 1,396 | 90 | — | 1,396 | 1,396 | 90 | ||||||||||||||||||||||||||||||||
Other | 100,269 | 72,078 | -28.1 | % | (28,191 | ) | 4,630 | 187,805 | 171,363 | (16,442 | ) | 11,008 | ||||||||||||||||||||||||||||
Transportation and distribution expenses | 7,995 | 8,516 | 6.5 | % | 521 | 547 | 15,323 | 17,751 | 15.8 | % | 2,428 | 1,140 | ||||||||||||||||||||||||||||
Administrative expenses | 28,325 | 28,825 | 1.8 | % | 500 | 1,852 | 53,609 | 57,493 | 7.2 | % | 3,883 | 3,693 | ||||||||||||||||||||||||||||
Net cost for the period of employee benefits | 29,549 | 34,950 | 18.3 | % | 5,401 | 2,245 | 59,111 | 68,757 | 16.3 | % | 9,646 | 4,417 | ||||||||||||||||||||||||||||
Depreciation and amortization expenses | 35,604 | 40,681 | 14.3 | % | 5,078 | 2,613 | 73,174 | 77,652 | 6.1 | % | 4,478 | 4,988 | ||||||||||||||||||||||||||||
Note: “Other” includes depreciation, amortizations, impairment, net cost for the period of employee benefits, preservation and maintenance, exploration expenses, non-successful wells, inventories variation, subsidiary entities consolidation net effect.
PEMEX
Interest expense & interest income
| Second quarter (Apr.-Jun.) | Six months ending Jun. 30, | |||||||||||||||||||||||||||||||||||||||
| 2014 | 2015 | Change | 2015 | 2014 | 2015 | Change | 2015 | |||||||||||||||||||||||||||||||||
| (MXN million) | (USD million) | (MXN million) | (USD million) | |||||||||||||||||||||||||||||||||||||
Total interest expense | (14,082 | ) | (17,807 | ) | 26.4 | % | (3,725 | ) | (1,144 | ) | (27,171 | ) | (51,431 | ) | 89.3 | % | (24,261 | ) | (3,304 | ) | ||||||||||||||||||||
Interest expense | (11,004 | ) | (15,834 | ) | 43.9 | % | (4,830 | ) | (1,017 | ) | (21,986 | ) | (30,991 | ) | 41.0 | % | (9,005 | ) | (1,991 | ) | ||||||||||||||||||||
Income (cost) by financial derivatives | (3,079 | ) | (1,973 | ) | -35.9 | % | 1,106 | (127 | ) | (5,184 | ) | (20,440 | ) | 294.3 | % | (15,256 | ) | (1,313 | ) | |||||||||||||||||||||
Total interest income | 4,421 | 4,586 | 3.7 | % | 165 | 295 | 9,444 | 8,630 | -8.6 | % | (815 | ) | 554 | |||||||||||||||||||||||||||
Interest income | 714 | 1,295 | 81.4 | % | 581 | 83 | 1,228 | 3,057 | �� | 148.9 | % | 1,829 | 196 | |||||||||||||||||||||||||||
Income (cost) by financial derivatives | 3,707 | 3,291 | -11.2 | % | (416 | ) | 211 | 8,216 | 5,573 | -32.2 | % | (2,643 | ) | 358 | ||||||||||||||||||||||||||
PEMEX
Taxes and Duties
| Second quarter (Apr.-Jun.) | Six months ending Jun. 30, | |||||||||||||||||||||||||||||||||||||||
| 2014 | 2015 | Change | �� | 2015 | 2014 | 2015 | Change | 2015 | ||||||||||||||||||||||||||||||||
| (MXN million) | (USD million) | (MXN million) | (USD million) | |||||||||||||||||||||||||||||||||||||
Total taxes and duties | 217,923 | 97,772 | -55.1 | % | (120,151 | ) | 6,280 | 428,028 | 200,597 | -53.1 | % | (227,431 | ) | 12,886 | ||||||||||||||||||||||||||
Duties | 213,982 | 95,404 | -55.4 | % | (118,578 | ) | 6,128 | 421,658 | 195,258 | -53.7 | % | (226,400 | ) | 12,543 | ||||||||||||||||||||||||||
Ordinary hydrocarbons duty | 181,286 | — | (181,286 | ) | — | 357,227 | — | -100.0 | % | (357,227 | ) | — | ||||||||||||||||||||||||||||
Special hydrocarbons duty | 802 | — | (802 | ) | — | 1,582 | — | -100.0 | % | (1,582 | ) | — | ||||||||||||||||||||||||||||
Extraction of hydrocarbons duty | 1,020 | — | (1,020 | ) | — | 2,085 | — | -100.0 | % | (2,085 | ) | — | ||||||||||||||||||||||||||||
Duty on regulation and supervision in exploration and exploration of hydrocarbons | 96 | — | (96 | ) | — | 189 | — | -100.0 | % | (189 | ) | — | ||||||||||||||||||||||||||||
Duty for the Fund of Scientific and Technological | 2,069 | — | (2,069 | ) | — | 4,089 | — | -100.0 | % | (4,089 | ) | — | ||||||||||||||||||||||||||||
Research on Energy | ||||||||||||||||||||||||||||||||||||||||
Duty for oil monitoring | 9.6 | — | (9.6 | ) | — | 18.9 | — | -100.0 | % | (18.9 | ) | — | ||||||||||||||||||||||||||||
Hydrocarbons duty for the stabilization fund | 26,405 | — | (26,405 | ) | — | 52,689 | — | -100.0 | % | (52,689 | ) | — | ||||||||||||||||||||||||||||
Extraordinary duty on crude oil exports | 2,072 | — | (2,072 | ) | — | 3,391 | — | -100.0 | % | (3,391 | ) | — | ||||||||||||||||||||||||||||
Additional duty on hydrocarbons | 223 | — | (223 | ) | — | 386 | — | -100.0 | % | (386 | ) | — | ||||||||||||||||||||||||||||
Profit sharing duty | — | 106,571 | 106,571 | 6,846 | ||||||||||||||||||||||||||||||||||||
Hydrocarbon extraction duty | — | (10,920 | ) | (10,920 | ) | (701 | ) | |||||||||||||||||||||||||||||||||
Hydrocarbon exploration duty | — | (247 | ) | (247 | ) | (16 | ) | — | 195,258 | — | 195,258 | 12,543 | ||||||||||||||||||||||||||||
Hydrocarbon income tax | 3,142 | — | (3,142 | ) | — | — | — | — | — | — | ||||||||||||||||||||||||||||||
Hydrocarbon exploration and extraction activity tax | — | (1,021 | ) | (1,021 | ) | (66 | ) | |||||||||||||||||||||||||||||||||
Income tax and other | 799 | 3,389 | 324.3 | % | 2,590 | 218 | — | — | — | — | — | |||||||||||||||||||||||||||||
| PEMEX Preliminary Results as of June 30, 2015 | 12 / 21 |
www.pemex.com
PEMEX
PEMEX
Selected Indices
| As of June 30, | ||||||||||||||||
| Pemex - Exploration and Production | 2014 | 2015 | Change | 2015 | ||||||||||||
| (USD/boe) | ||||||||||||||||
Total sales / Hydrocarbons production (MXN/boe) | 914.6 | 590.9 | (323.7 | ) | 38.0 | |||||||||||
Operating income / Hydrocarbons production (MXN/boe) | 623.2 | 242.7 | (380.6 | ) | 15.6 | |||||||||||
Net income / Hydrocarbons production (MXN/boe) | (45.8 | ) | (204.3 | ) | (158.5 | ) | (13.1 | ) | ||||||||
Taxes and duties / Operating income (%) | 104.0 | % | 133.9 | % | 29.9 | |||||||||||
| PEMEX Preliminary Results as of June 30, 2015 | 13 / 21 |
www.pemex.com
PEMEX
PEMEX
Consolidated Balance Sheet
| As of December 31, | As of June 30, | |||||||||||||||||||
| 2014 | 2015 | Change | 2015 | |||||||||||||||||
| (MXN million) | (USD million) | |||||||||||||||||||
Total assets | 2,128,368 | 2,121,733 | -0.3 | % | (6,636 | ) | 136,292 | |||||||||||||
Current assets | 289,327 | 252,611 | -12.7 | % | (36,716 | ) | 16,227 | |||||||||||||
Cash and cash equivalents | 117,989 | 91,259 | -22.7 | % | (26,730 | ) | 5,862 | |||||||||||||
Accounts, notes receivable and other | 114,423 | 107,603 | -6.0 | % | (6,820 | ) | 6,912 | |||||||||||||
Inventories | 49,939 | 46,101 | -7.7 | % | (3,838 | ) | 2,961 | |||||||||||||
Available for sale financial assets | 5,415 | 5,507 | 1.7 | % | 92 | 354 | ||||||||||||||
Derivative financial instruments | 1,563 | 2,141 | 37.0 | % | 579 | 138 | ||||||||||||||
Permanent investment in shares of associates | 22,015 | 24,359 | 10.6 | % | 2,344 | 1,565 | ||||||||||||||
Property, plant and equipment | 1,783,374 | 1,814,181 | 1.7 | % | 30,807 | 116,536 | ||||||||||||||
Deferred taxes | 4,143 | 2,004 | -51.6 | % | (2,139 | ) | 129 | |||||||||||||
Restricted cash | 6,884 | 7,280 | 5.7 | % | 396 | 468 | ||||||||||||||
Other assets | 22,625 | 21,298 | -5.9 | % | (1,327 | ) | 1,368 | |||||||||||||
Total liabilities | 2,896,089 | 3,060,176 | 5.7 | % | 164,086 | 196,573 | ||||||||||||||
Current liabilities | 334,159 | 295,576 | -11.5 | % | (38,583 | ) | 18,987 | |||||||||||||
Short-term financial debt | 145,866 | 168,098 | 15.2 | % | 22,232 | 10,798 | ||||||||||||||
Suppliers | 116,178 | 58,569 | -49.6 | % | (57,609 | ) | 3,762 | |||||||||||||
Accounts and accrued expenses payable | 12,235 | 18,791 | 53.6 | % | 6,556 | 1,207 | ||||||||||||||
Derivative financial instruments | 17,460 | 21,533 | 23.3 | % | 4,073 | 1,383 | ||||||||||||||
Taxes and duties payable | 42,420 | 28,584 | -32.6 | % | (13,836 | ) | 1,836 | |||||||||||||
Long-term liabilities | 2,561,930 | 2,764,599 | 7.9 | % | 202,670 | 177,587 | ||||||||||||||
Long-term financial debt | 997,384 | 1,163,208 | 16.6 | % | 165,823 | 74,720 | ||||||||||||||
Reserve for employee benefits | 1,474,089 | 1,517,203 | 2.9 | % | 43,114 | 97,459 | ||||||||||||||
Reserve for diverse credits | 78,423 | 72,111 | -8.0 | % | (6,311 | ) | 4,632 | |||||||||||||
Other liabilities | 7,718 | 10,695 | 38.6 | % | 2,977 | 687 | ||||||||||||||
Deferred taxes | 4,316 | 1,383 | -68.0 | % | (2,933 | ) | 89 | |||||||||||||
Total equity | (767,721 | ) | (938,443 | ) | 22.2 | % | (170,722 | ) | (60,282 | ) | ||||||||||
Holding | (768,066 | ) | (938,672 | ) | 22.2 | % | (170,606 | ) | (60,296 | ) | ||||||||||
Certificates of contribution “A” | 134,605 | 144,605 | 7.4 | % | 10,000 | 9,289 | ||||||||||||||
Federal Government Contributions | 43,731 | 43,731 | 0.0 | % | — | 2,809 | ||||||||||||||
Legal Reserve | 1,002 | 1,002 | 0.0 | % | — | 64 | ||||||||||||||
Comprehensive accumulated results | (394,594 | ) | (390,150 | ) | -1.1 | % | 4,445 | (25,062 | ) | |||||||||||
Retained earnings (accumulated losses) | (552,809 | ) | (737,859 | ) | 33.5 | % | (185,051 | ) | (47,397 | ) | ||||||||||
From prior years | (287,606 | ) | (552,809 | ) | 92.2 | % | (265,203 | ) | (35,510 | ) | ||||||||||
For the year | (265,203 | ) | (185,051 | ) | -30.2 | % | 80,153 | (11,887 | ) | |||||||||||
Participation of non-holding entities | 345 | 229 | -33.7 | % | (116 | ) | 15 | |||||||||||||
Total liabilities and equity | 2,128,368 | 2,121,733 | -0.3 | % | (6,636 | ) | 136,292 | |||||||||||||
| PEMEX Preliminary Results as of June 30, 2015 | 14 / 21 |
www.pemex.com
PEMEX
PEMEX
Selected Financial Indices
| As of Dec. 31, | As of June 30, | |||||||||||
| 2014 | 2015 | Change | ||||||||||
Property, plant and equipment / Assets | 83.8 | % | 85.5 | % | 1.7 | |||||||
Financial debt / Total liabilities and equity | 53.7 | % | 62.7 | % | 9.0 | |||||||
Working capital (MXN million) | (44,832 | ) | (42,965 | ) | 1,867 | |||||||
PEMEX
Consolidated total financial debt
| As of Dec. 31, | As of June 30, | |||||||||||||||||||
| 2014 | 2015 | Change | 2015 | |||||||||||||||||
| (MXN million) | (USD million) | |||||||||||||||||||
Total financial debt | 1,143,251 | 1,331,306 | 16.4 | % | 188,055 | 85,518 | ||||||||||||||
Short-term | 145,866 | 168,098 | 15.2 | % | 22,232 | 10,798 | ||||||||||||||
Long-term | 997,384 | 1,163,208 | 16.6 | % | 165,823 | 74,720 | ||||||||||||||
Cash and cash equivalents | 117,989 | 91,259 | -22.7 | % | (26,730 | ) | 5,862 | |||||||||||||
Total net financial debt | 1,025,262 | 1,240,047 | 20.9 | % | 214,785 | 79,656 | ||||||||||||||
| PEMEX Preliminary Results as of June 30, 2015 | 15 / 21 |
www.pemex.com
PEMEX
PEMEX
Financial debt maturity profile
| As of June 30, 2015 | ||||||||
| (MXN million) | (USD million) | |||||||
Total financial debt | 1,331,306 | 85,518 | ||||||
In Mexican pesos | 320,060 | 20,559 | ||||||
2015 | 43,504 | 2,795 | ||||||
Janaury - June 2016 | 26,732 | 1,717 | ||||||
July 2016 - June 2017 | 12,536 | 805 | ||||||
July 2017 - June 2018 | 20,924 | 1,344 | ||||||
July 2018 - June 2019 | 19,052 | 1,224 | ||||||
July 2019 and forward | 197,312 | 12,675 | ||||||
Other currencies | 1,011,246 | 64,958 | ||||||
2015 | 83,169 | 5,342 | ||||||
Janaury - June 2016 | 14,693 | 944 | ||||||
July 2016 - June 2017 | 62,084 | 3,988 | ||||||
July 2017 - June 2018 | 77,158 | 4,956 | ||||||
July 2018 - June 2019 | 84,708 | 5,441 | ||||||
July 2019 and forward | 689,434 | 44,286 | ||||||
PEMEX
Exposure of Debt Principal(1)
| As of December 31, | As of June 30, | As of December 31, | As of June 30, | As of December 31, | As of June 30, | |||||||||||||||||||
| 2014 | 2015 | 2014 | 2015 | 2014 | 2015 | |||||||||||||||||||
| By currency | At fixed rate | At floating rate | ||||||||||||||||||||||
Total | 100.0 | % | 100.0 | % | 70.8 | % | 72.9 | % | 29.2 | % | 27.1 | % | ||||||||||||
USD | 74.7 | % | 75.5 | % | 78.0 | % | 79.5 | % | 22.0 | % | 20.5 | % | ||||||||||||
MXN | 24.2 | % | 23.4 | % | 47.2 | % | 50.2 | % | 52.8 | % | 49.8 | % | ||||||||||||
EUR | 0.0 | % | 0.0 | % | 100.0 | % | 100.0 | % | 0.0 | % | 0.0 | % | ||||||||||||
JPY | 0.0 | % | 0.0 | % | 0.0 | % | 0.0 | % | 100.0 | % | 100.0 | % | ||||||||||||
UDIs | 1.1 | % | 1.1 | % | 100.0 | % | 100.0 | % | 0.0 | % | 0.0 | % | ||||||||||||
| (1) | Includes derivative financial instruments. |
| PEMEX Preliminary Results as of June 30, 2015 | 16 / 21 |
www.pemex.com
PEMEX
PEMEX
Derivative Financial Instruments
| As of December 31, | As of June 30, | |||||||||||||||
| 2014 | 2015 | Change | 2015 | |||||||||||||
| (MXN million) | (USD million) | |||||||||||||||
Derivative financial instruments linked to debt and assets | ||||||||||||||||
Mark to market (MXN million) | (15,824 | ) | (18,809 | ) | (2,986 | ) | (1,208 | ) | ||||||||
Interest rate swaps | (180 | ) | (150 | ) | 30 | (10 | ) | |||||||||
Cross currency swaps | (13,722 | ) | (15,158 | ) | (1,437 | ) | (974 | ) | ||||||||
Extinguishing cross currency swaps | (1,922 | ) | (3,501 | ) | (1,579 | ) | (225 | ) | ||||||||
Face value (MXN million) | 186,664 | 227,035 | 40,371 | 14,584 | ||||||||||||
Interest rate swaps | 17,570 | 18,000 | 430 | 1,156 | ||||||||||||
Cross currency swaps | 152,222 | 191,188 | 38,966 | 12,281 | ||||||||||||
Extinguishing cross currency swaps | 16,873 | 17,847 | 974 | 1,146 | ||||||||||||
Natural gas derivative financial instruments | ||||||||||||||||
Mark to market (MXN million) | 3.6 | 3.6 | (0.1 | ) | 0.2 | |||||||||||
Long swaps | (36.9 | ) | (24.0 | ) | 12.8 | (1.5 | ) | |||||||||
Short swaps | 40.4 | 27.2 | (13.2 | ) | 1.7 | |||||||||||
Long options | 2 | 41 | 39 | 2.6 | ||||||||||||
Short options | (2 | ) | (41 | ) | (39 | ) | (2.6 | ) | ||||||||
Volume (MMBtu) | — | 16 | 16 | |||||||||||||
Long swaps | 3,173,172 | 2,915,199 | (257,973 | ) | ||||||||||||
Short swaps | (3,173,172 | ) | (2,915,199 | ) | 257,973 | |||||||||||
Long options | 2,554,450 | 9,543,328 | 6,988,878 | |||||||||||||
Short options | (2,554,450 | ) | (9,543,312 | ) | (6,988,862 | ) | ||||||||||
Propane derivative financial instruments | ||||||||||||||||
Mark to market (MXN million) | ||||||||||||||||
Long swaps | — | (512 | ) | (512 | ) | (33 | ) | |||||||||
Volume (Gallons) | ||||||||||||||||
Long swaps | — | 10 | 10 | |||||||||||||
Crude oil and petroleum products derivative financial instruments classified as cash and cash equivalents for accounting purposes due to high liquidity | ||||||||||||||||
Mark to market (MXN million) | 1,950 | (174 | ) | (2,124 | ) | (11 | ) | |||||||||
Stock market futures | 118 | (39 | ) | (157 | ) | (2 | ) | |||||||||
Stock market swaps | 1,832 | (136 | ) | (1,968 | ) | (9 | ) | |||||||||
Net volume (MM barrels) | (8.6 | ) | (8.2 | ) | 0.4 | |||||||||||
Stock market futures | (1.7 | ) | (0.7 | ) | 1.0 | |||||||||||
Stock market futures | (6.9 | ) | (7.5 | ) | (0.6 | ) | ||||||||||
Derivative financial instruments fo PMI | ||||||||||||||||
Mark to market (MXN million) | ||||||||||||||||
Interest rate swaps OTC markets | (70 | ) | (74 | ) | (4 | ) | (5 | ) | ||||||||
Face value (MXN million) | ||||||||||||||||
Interest rate swaps OTC markets | 1,693 | 1,670 | (23 | ) | 107 | |||||||||||
Note: the fair value of the Derivative Financial Instruments has been adjusted in accordance with International Financial Reporting Standards (IFRS).
| PEMEX Preliminary Results as of June 30, 2015 | 17 / 21 |
www.pemex.com
PEMEX
PEMEX
Consolidated Statements of Cash Flows
| As of June 30, | ||||||||||||||||||||
| 2014 | 2015 | Change | 2015 | |||||||||||||||||
| (MXN million) | (USD million) | |||||||||||||||||||
Operating activities | ||||||||||||||||||||
Net income (loss) | (88,249 | ) | (185,176 | ) | 109.8 | % | (96,927 | ) | (11,895 | ) | ||||||||||
Items related to investing activities | 88,494 | 87,459 | -1.2 | % | (1,036 | ) | 5,618 | |||||||||||||
Depreciation and amortization | 73,174 | 77,652 | 6.1 | % | 4,478 | 4,988 | ||||||||||||||
Impairment of properties, plant and equipment | 8,678 | (3,013 | ) | -134.7 | % | (11,691 | ) | (194 | ) | |||||||||||
Unsuccessful wells | 5,559 | 9,517 | 71.2 | % | 3,958 | 611 | ||||||||||||||
Retirement of property, plant and equipment | 2,597 | 4,070 | 56.7 | % | 1,473 | 261 | ||||||||||||||
Realized profit (loss) by investments in equity securities | 189 | — | (189 | ) | — | |||||||||||||||
Profit sharing in non-consolidated subsidiaries and affiliates | (1,827 | ) | (1,207 | ) | -33.9 | % | 620 | (78 | ) | |||||||||||
Dividends received | (504 | ) | (171 | ) | -66.0 | % | 333 | (11 | ) | |||||||||||
Effects of net present value of reserve for well abandonment | 629 | 611 | -2.9 | % | (18 | ) | 39 | |||||||||||||
Activities related to financing activities | 17,686 | 76,402 | 332.0 | % | 58,716 | 4,908 | ||||||||||||||
Amortization of primes, discounts, profits and debt issuance expenses | (997 | ) | (2,096 | ) | 110.2 | % | (1,099 | ) | (135 | ) | ||||||||||
Interest expense (income) | 21,824 | 29,812 | 36.6 | % | 7,989 | 1,915 | ||||||||||||||
Unrealized loss (gain) from foreign exchange fluctuations | (3,141 | ) | 48,686 | -1650.2 | % | 51,827 | 3,127 | |||||||||||||
Subtotal | 17,931 | (21,315 | ) | -218.9 | % | (39,247 | ) | (1,369 | ) | |||||||||||
Funds provided by (used in) operating activities | 5,257 | (19,591 | ) | -472.7 | % | (24,848 | ) | (1,258 | ) | |||||||||||
Financial instruments for negotiation | 1,087 | 3,495 | 221.4 | % | 2,407 | 224 | ||||||||||||||
Accounts and notes receivable | (8,363 | ) | (5,780 | ) | -30.9 | % | 2,583 | (371 | ) | |||||||||||
Inventories | 13,384 | 3,838 | -71.3 | % | (9,546 | ) | 247 | |||||||||||||
Other assets | (5,715 | ) | (5,914 | ) | 3.5 | % | (199 | ) | (380 | ) | ||||||||||
Accounts payable and accrued expenses | 2,205 | 6,556 | 197.3 | % | 4,351 | 421 | ||||||||||||||
Taxes paid | 15,944 | (1,461 | ) | -109.2 | % | (17,405 | ) | (94 | ) | |||||||||||
Suppliers | (47,714 | ) | (57,609 | ) | 20.7 | % | (9,895 | ) | (3,701 | ) | ||||||||||
Reserve for diverse credits | 1,211 | (5,036 | ) | -515.8 | % | (6,246 | ) | (323 | ) | |||||||||||
Reserve for employees benefits | 34,111 | 43,114 | 26.4 | % | 9,003 | 2,769 | ||||||||||||||
Deferred taxes | (894 | ) | (795 | ) | -11.1 | % | 99 | (51 | ) | |||||||||||
Net cash flow from operating activities | 23,188 | (40,906 | ) | -276.4 | % | (64,094 | ) | (2,628 | ) | |||||||||||
Investing activities | ||||||||||||||||||||
Acquisition of property, plant and equipment | (92,594 | ) | (100,325 | ) | 8.3 | % | (7,731 | ) | (6,444 | ) | ||||||||||
Exploration expenses | (448 | ) | (2,276 | ) | 408.0 | % | (1,828 | ) | (146 | ) | ||||||||||
Investment in securities | (118 | ) | (31 | ) | -73.7 | % | 87 | (2 | ) | |||||||||||
Dividends received | 336 | — | (336 | ) | — | |||||||||||||||
Financial instruments available for sale | 12,735 | — | (12,735 | ) | — | |||||||||||||||
Net cash flow from investing activities | (80,089 | ) | (102,633 | ) | 28.1 | % | (22,544 | ) | (6,593 | ) | ||||||||||
Cash needs related to financing activities | (56,901 | ) | (143,539 | ) | 152.3 | % | (86,638 | ) | (9,220 | ) | ||||||||||
Financing activities | ||||||||||||||||||||
Increase of contributions from the Federal Government | 2,000 | 10,000 | 400.0 | % | 8,000 | 642 | ||||||||||||||
Retirement of contributions from the Federal Government | (190 | ) | — | 190 | — | |||||||||||||||
Loans obtained from financial institutions | 177,846 | 228,348 | 28.4 | % | 50,503 | 14,668 | ||||||||||||||
Amortization of loans | (94,105 | ) | (97,823 | ) | 4.0 | % | (3,718 | ) | (6,284 | ) | ||||||||||
Interest paid | (20,468 | ) | (26,973 | ) | 31.8 | % | (6,505 | ) | (1,733 | ) | ||||||||||
Net cash flow from financing activities | 65,083 | 113,552 | 74.5 | % | 48,470 | 7,294 | ||||||||||||||
Net Increase (decrease) in cash and cash equivalents | 8,182 | (29,987 | ) | -466.5 | % | (38,168 | ) | (1,926 | ) | |||||||||||
Effect of change in cash value | (513 | ) | 3,257 | -734.9 | % | 3,770 | 209 | |||||||||||||
Cash and cash equiv. at the beginning of the period | 80,746 | 117,989 | 46.1 | % | 37,243 | 7,579 | ||||||||||||||
Cash and cash equivalents at the end of the period | 88,414 | 91,259 | 3.2 | % | 2,845 | 5,862 | ||||||||||||||
| PEMEX Preliminary Results as of June 30, 2015 | 18 / 21 |
www.pemex.com
PEMEX
PEMEX
EBITDA Reconciliation
| Second quarter (Apr.-Jun.) | ||||||||||||||||||||
| 2014 | 2015 | Change | 2015 | |||||||||||||||||
| (MXN million) | (USD million) | |||||||||||||||||||
Net loss | (52,295 | ) | (84,630 | ) | -61.8 | % | (32,335 | ) | (5,436 | ) | ||||||||||
+ Taxes and duties | 217,923 | 97,772 | -55.1 | % | (120,151 | ) | 6,280 | |||||||||||||
- Total interest expense | (11,004 | ) | (15,834 | ) | -43.9 | % | (4,830 | ) | (1,017 | ) | ||||||||||
- Total interest income | 714 | 1,295 | 81.4 | % | 581 | 83 | ||||||||||||||
- Income (cost) due to financial derivatives | 629 | 1,318 | 109.7 | % | 690 | 85 | ||||||||||||||
- Foreign exchange fluctuation | 3,506 | (28,731 | ) | -919.4 | % | (32,237 | ) | (1,846 | ) | |||||||||||
+ Depreciation and amortization | 35,604 | 40,681 | 14.3 | % | 5,078 | 2,613 | ||||||||||||||
+ Net cost for the period of employee benefits | 29,549 | 34,950 | 18.3 | % | 5,401 | 2,245 | ||||||||||||||
EBITDA | 236,935 | 130,725 | -44.8 | % | (106,210 | ) | 8,397 | |||||||||||||
| PEMEX Preliminary Results as of June 30, 2015 | 19 / 21 |
www.pemex.com
PEMEX
PEMEX
Business Segment Information
| Exploration and Production | Refining | Gas and Basic Petrochemicals | Petrochemicals | Commercial entities | Petróleos Mexicanos and Subsidiary Companies | Intersegment eliminations | Total | |||||||||||||||||||||||||
| (MXN million) | ||||||||||||||||||||||||||||||||
Six months ending Jun. 30, 2015 | ||||||||||||||||||||||||||||||||
Total sales | 355,149 | 309,855 | 96,621 | 20,835 | 391,549 | 36,145 | (621,790 | ) | 588,363 | |||||||||||||||||||||||
External clients | — | 280,028 | 66,956 | 13,906 | 220,588 | — | — | 581,478 | ||||||||||||||||||||||||
Intersegment | 355,149 | 27,621 | 28,393 | 6,433 | 170,531 | 619 | (588,746 | ) | — | |||||||||||||||||||||||
Revenues from services | — | 2,207 | 1,271 | 495 | 430 | 35,526 | (33,044 | ) | 6,885 | |||||||||||||||||||||||
Cost of sales | 187,473 | 328,407 | 90,567 | 20,062 | 378,174 | 3,232 | (594,837 | ) | 413,078 | |||||||||||||||||||||||
Gross income (loss) | 167,675 | (18,552 | ) | 6,054 | 772 | 13,376 | 32,913 | (26,953 | ) | 175,285 | ||||||||||||||||||||||
Other revenues (expenses) | 810 | 392 | 418 | 37 | 833 | 320 | (493 | ) | 2,317 | |||||||||||||||||||||||
Transportation and distribution expenses | — | 16,845 | 2,030 | 678 | 209 | 0 | (2,012 | ) | 17,751 | |||||||||||||||||||||||
Administrative expenses | 22,609 | 16,456 | 5,793 | 7,263 | 1,063 | 29,743 | (25,434 | ) | 57,493 | |||||||||||||||||||||||
Operating income (loss) | 145,877 | (51,461 | ) | (1,351 | ) | (7,131 | ) | 12,936 | 3,490 | (1 | ) | 102,359 | ||||||||||||||||||||
Total interest expense | (43,241 | ) | (5,623 | ) | (808 | ) | (103 | ) | (570 | ) | (42,332 | ) | 61,685 | (30,991 | ) | |||||||||||||||||
Total interest income | 8,032 | 48 | 1,270 | 11 | 562 | 54,812 | (61,678 | ) | 3,057 | |||||||||||||||||||||||
Income (cost) due to financial derivatives | — | — | 3 | — | (1,379 | ) | (13,490 | ) | — | (14,867 | ) | |||||||||||||||||||||
Foreign exchange profit (loss) | (37,820 | ) | (2,136 | ) | (23 | ) | (1 | ) | (17 | ) | (5,348 | ) | — | (45,344 | ) | |||||||||||||||||
Profit sharing in non-consolidated subsidiaries and affiliates | (382 | ) | — | 300 | — | 1,316 | (180,373 | ) | 180,346 | 1,207 | ||||||||||||||||||||||
Taxes and duties | 195,258 | — | 888 | — | 3,915 | 536 | — | 200,597 | ||||||||||||||||||||||||
Net income (loss) | (122,793 | ) | (59,172 | ) | (1,496 | ) | (7,224 | ) | 8,933 | (183,777 | ) | 180,353 | (185,176 | ) | ||||||||||||||||||
Depreciation and amortization | 66,238 | 5,877 | 3,630 | 1,459 | 42 | 408 | — | 77,652 | ||||||||||||||||||||||||
Cost of the reserve for employee benefits | 21,081 | 21,364 | 5,343 | 6,404 | 93 | 14,472 | — | 68,757 | ||||||||||||||||||||||||
Acquisition of wells, pipelines, properties, plant and equipment | — | — | — | — | — | — | — | — | ||||||||||||||||||||||||
As of June 30, 2015 | ||||||||||||||||||||||||||||||||
Total assets | 1,899,766 | 348,357 | 206,903 | 50,202 | 114,665 | 1,284,303 | (1,782,462 | ) | 2,121,733 | |||||||||||||||||||||||
Current assets | 510,437 | 57,320 | 102,125 | 10,220 | 95,397 | 549,328 | (1,072,217 | ) | 252,611 | |||||||||||||||||||||||
Investment in securities of associeted companies | 1,010 | 488 | 5,513 | — | 10,554 | (426,327 | ) | 433,119 | 24,359 | |||||||||||||||||||||||
Property, plant and equipment | 1,367,303 | 289,089 | 97,669 | 38,868 | 2,694 | 18,558 | — | 1,814,181 | ||||||||||||||||||||||||
Total liabilities | 1,826,088 | 895,214 | 144,518 | 156,542 | 67,142 | 2,186,253 | (2,215,581 | ) | 3,060,176 | |||||||||||||||||||||||
Current liabilities | 161,023 | 391,699 | 27,951 | 12,449 | 59,967 | 703,334 | (1,060,847 | ) | 295,576 | |||||||||||||||||||||||
Long-term liabilities | 1,665,065 | 503,515 | 116,567 | 144,092 | 7,175 | 1,482,919 | (1,154,735 | ) | 2,764,599 | |||||||||||||||||||||||
Long-term debt | 1,131,977 | 21,033 | 1,118 | 201 | 3,533 | 1,146,498 | (1,141,153 | ) | 1,163,208 | |||||||||||||||||||||||
Reserve for employee benefits | 461,832 | 476,399 | 114,544 | 143,700 | 771 | 319,956 | — | 1,517,203 | ||||||||||||||||||||||||
Equity | 73,678 | (546,857 | ) | 62,384 | (106,340 | ) | 47,523 | (901,950 | ) | 433,119 | (938,443 | ) | ||||||||||||||||||||
Six months ending Jun. 30, 2014 | ||||||||||||||||||||||||||||||||
Total sales | 595,060 | 416,916 | 129,790 | 23,065 | 553,710 | 35,249 | (937,786 | ) | 816,004 | |||||||||||||||||||||||
External clients | — | 373,678 | 84,466 | 14,693 | 338,864 | — | — | 811,701 | ||||||||||||||||||||||||
Intersegment | 595,060 | 41,159 | 45,324 | 8,372 | 214,463 | 32,987 | (937,366 | ) | — | |||||||||||||||||||||||
Revenues from services | — | 2,079 | — | — | 383 | 2,262 | (420 | ) | 4,303 | |||||||||||||||||||||||
Cost of sales | 167,603 | 468,757 | 122,545 | �� | 24,282 | 547,811 | 1,255 | (904,546 | ) | 427,707 | ||||||||||||||||||||||
Gross income (loss) | 427,457 | (51,842 | ) | 7,245 | (1,216 | ) | 5,899 | 33,994 | (33,240 | ) | 388,298 | |||||||||||||||||||||
Other revenues (expenses) | 2,445 | 29,145 | (523 | ) | 485 | 232 | 1,232 | (121 | ) | 32,894 | ||||||||||||||||||||||
Transportation and distribution expenses | — | 13,503 | 1,386 | 449 | 205 | 0 | (220 | ) | 15,323 | |||||||||||||||||||||||
Administrative expenses | 24,397 | 19,791 | 6,614 | 7,728 | 733 | 27,515 | (33,169 | ) | 53,609 | |||||||||||||||||||||||
Operating income (loss) | 405,505 | (55,990 | ) | (1,279 | ) | (8,908 | ) | 5,193 | 7,710 | 29 | 352,260 | |||||||||||||||||||||
Total interest expense | (24,799 | ) | (5,248 | ) | (155 | ) | (34 | ) | (514 | ) | (32,492 | ) | 41,256 | (21,986 | ) | |||||||||||||||||
Total interest income | 8,018 | 216 | 1,443 | 87 | 526 | 32,191 | (41,253 | ) | 1,228 | |||||||||||||||||||||||
Income (cost) due to financial derivatives | — | — | (1 | ) | — | (217 | ) | 3,250 | (0 | ) | 3,032 | |||||||||||||||||||||
Foreign exchange profit (loss) | 2,995 | 177 | (22 | ) | (0 | ) | (27 | ) | 295 | — | 3,419 | |||||||||||||||||||||
Profit sharing in non-consolidated subsidiaries and affiliates | 149 | — | 692 | — | 921 | (91,943 | ) | 92,008 | 1,827 | |||||||||||||||||||||||
Taxes and duties | 421,658 | — | (150 | ) | — | 1,265 | 5,255 | — | 428,028 | |||||||||||||||||||||||
Net income (loss) | (29,790 | ) | (60,846 | ) | 829 | (8,855 | ) | 4,617 | (86,243 | ) | 92,039 | (88,249 | ) | |||||||||||||||||||
Depreciation and amortization | 62,283 | 5,623 | 3,533 | 1,343 | 6 | 387 | — | 73,174 | ||||||||||||||||||||||||
Cost of the reserve for employee benefits | 18,273 | 18,464 | 4,515 | 5,594 | 80 | 12,185 | — | 59,111 | ||||||||||||||||||||||||
Acquisition of wells, pipelines, properties, plant and | — | — | — | — | — | — | — | — | ||||||||||||||||||||||||
equipment | ||||||||||||||||||||||||||||||||
As of December 31, 2014 | ||||||||||||||||||||||||||||||||
Total assets | 1,953,828 | 535,095 | 210,626 | 108,445 | 102,955 | 1,580,485 | (2,363,066 | ) | 2,128,368 | |||||||||||||||||||||||
Current assets | 579,202 | 255,407 | 105,122 | 68,243 | 83,346 | 505,950 | (1,307,942 | ) | 289,327 | |||||||||||||||||||||||
Investment in securities of associeted companies | 1,393 | 488 | 5,060 | — | 8,484 | 67,164 | (60,574 | ) | 22,015 | |||||||||||||||||||||||
Property, plant and equipment | 1,347,194 | 277,720 | 99,635 | 38,929 | 2,421 | 17,476 | — | 1,783,374 | ||||||||||||||||||||||||
Total liabilities | 1,694,873 | 828,577 | 145,191 | 148,149 | 67,267 | 2,314,525 | (2,302,492 | ) | 2,896,089 | |||||||||||||||||||||||
Current liabilities | 206,711 | 330,309 | 31,966 | 8,230 | 57,266 | 1,000,368 | (1,300,690 | ) | 334,159 | |||||||||||||||||||||||
Long-term liabilities | 1,488,161 | 498,268 | 113,225 | 139,920 | 10,001 | 1,314,157 | (1,001,802 | ) | 2,561,930 | |||||||||||||||||||||||
Long-term debt | 963,275 | 23,142 | 1,118 | 191 | 3,589 | 986,026 | (979,956 | ) | 997,384 | |||||||||||||||||||||||
Reserve for employee benefits | 448,888 | 463,144 | 110,913 | 139,554 | 641 | 310,949 | — | 1,474,089 | ||||||||||||||||||||||||
Equity | 258,956 | (293,482 | ) | 65,435 | (39,705 | ) | 35,689 | (734,040 | ) | (60,574 | ) | (767,721 | ) | |||||||||||||||||||
| PEMEX Preliminary Results as of June 30, 2015 | 20 / 21 |
www.pemex.com
PEMEX
Investor Relations (+52 55) 1944—9700 ri@pemex.com
|
 @PemexGlobal
| PEMEX Preliminary Results as of June 30, 2015 | 21 / 21 |
www.pemex.com
SIGNATURES
Pursuant to the requirements of the Securities Exchange Act of 1934, the registrant has duly caused this report to be signed on its behalf by the undersigned, thereunto duly authorized.
| Petróleos Mexicanos | ||
| By: | /s/ CARLOS CARAVEO SÁNCHEZ | |
| Carlos Caraveo Sánchez | ||
| Associate Managing Director of Finance | ||
Date: August 26, 2015
FORWARD-LOOKING STATEMENTS
This report contains words, such as “believe,” “expect,” “anticipate” and similar expressions that identify forward-looking statements, which reflect our views about future events and financial performance. We have made forward-looking statements that address, among other things, our:
| • | exploration and production activities, including drilling; |
| • | activities relating to import, export, refining, petrochemicals and transportation of petroleum, natural gas and oil products; |
| • | activities relating to the generation of electrical energy; |
| • | projected and targeted capital expenditures and other costs, commitments and revenues; and |
| • | liquidity and sources of funding. |
Actual results could differ materially from those projected in such forward-looking statements as a result of various factors that may be beyond our control. These factors include, but are not limited to:
| • | changes in international crude oil and natural gas prices; |
| • | effects on us from competition; |
| • | limitations on our access to sources of financing on competitive terms; |
| • | our ability to find, acquire or gain access to additional reserves and to develop the reserves that we obtain successfully; |
| • | uncertainties inherent in making estimates of oil and gas reserves, including recently discovered oil and gas reserves; |
| • | technical difficulties; |
| • | significant developments in the global economy; |
| • | significant economic or political developments in Mexico, including developments relating to the implementation of the laws that implement the new legal framework contemplated by theDecreto por el que se reforman y adicionan diversas disposiciones de la Constitución Política de los Estados Unidos Mexicanos, en Materia de Energía (Decree that amends and supplements various provisions of the Political Constitution of the United Mexican States relating to energy matters); |
| • | developments affecting the energy sector; and |
| • | changes in our legal regime or regulatory environment, including tax and environmental regulations. |
Accordingly, you should not place undue reliance on these forward-looking statements. In any event, these statements speak only as of their dates and we undertake no obligation to update or revise any of them, whether as a result of new information, future events or otherwise.