SECURITIES AND EXCHANGE COMMISSION
WASHINGTON, D.C. 20549
FORM 8-K
CURRENT REPORT
Pursuant to Section 13 or 15(d) of
the Securities Exchange Act of 1934
Date of Report (Date of earliest event reported): September 22, 2003
IBERIABANK CORPORATION
(Exact name of Registrant as Specified in Charter)
Louisiana (State or Other Jurisdiction of Incorporation) | | 0-25756 (Commission File Number) | | 72-1280718 (I.R.S. Employer Identification No.) |
200 West Congress Street, Lafayette, Louisiana 70501
(Address of Principal Executive Offices)
(337) 521-4003
Registrant’s telephone number, including area code
Not Applicable
(Former name or former address, if changed since last report)
Item 9. Regulation FD Disclosure
Presentation by management of the Registrant to United Kingdom institutional investors, September 22, 2003.

Investor Presentation
United Kingdom Visits
September 22-23, 2003

Presentation Outline
Forward Looking Statements
Safe Harbor
Statements contained in this presentation which are not historical facts and which pertain to future operating results of IBERIABANK Corporation and its subsidiaries constitute “forward-looking statements” within the meaning of the Private Securities Litigation Reform Act of 1995. These forward-looking statements involve significant risks and uncertainties. Actual results may differ materially from the results discussed in these forward-looking statements. Factors that might cause such a difference include, but are not limited to, those discussed in the Company’s periodic filings with the SEC.
Our Markets
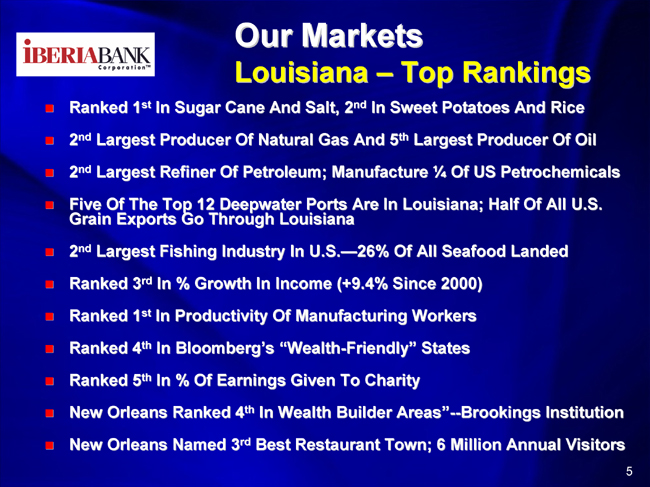
Our Markets
Louisiana – Top Rankings
| | • | | Ranked 1st In Sugar Cane And Salt, 2nd In Sweet Potatoes And Rice |
| | • | | 2nd Largest Producer Of Natural Gas And 5th Largest Producer Of Oil |
| | • | | 2nd Largest Refiner Of Petroleum; Manufacture ¼ Of US Petrochemicals |
| | • | | Five Of The Top 12 Deepwater Ports Are In Louisiana; Half Of All U.S. Grain Exports Go Through Louisiana |
| | • | | 2nd Largest Fishing Industry In U.S.—26% Of All Seafood Landed |
| | • | | Ranked 3rd In % Growth In Income (+9.4% Since 2000) |
| | • | | Ranked 1st In Productivity Of Manufacturing Workers |
| | • | | Ranked 4th In Bloomberg’s “Wealth-Friendly” States |
| | • | | Ranked 5th In % Of Earnings Given To Charity |
| | • | | New Orleans Ranked 4th In Wealth Builder Areas”—Brookings Institution |
| | • | | New Orleans Named 3rd Best Restaurant Town; 6 Million Annual Visitors |
[LOGO]
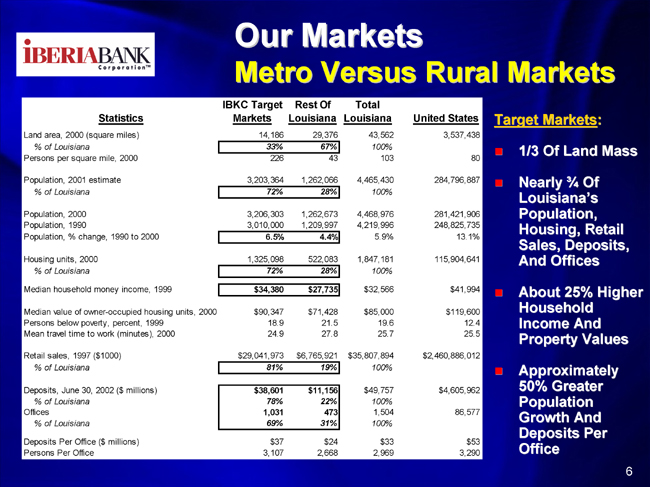
Our Markets
Metro Versus Rural Markets
| | | IBKC Target
Markets
| | | Rest Of
Louisiana
| | | Total
Louisiana
| | | United States
| |
Statistics
| | | | |
Land area, 2000 (square miles) | | | 14,186 | | | | 29,376 | | | | 43,562 | | | | 3,537,438 | |
% of Louisiana | | | 33 | % | | | 67 | % | | | 100 | % | | | | |
Persons per square mile, 2000 | | | 226 | | | | 43 | | | | 103 | | | | 80 | |
Population, 2001 estimate | | | 3,203,364 | | | | 1,262,066 | | | | 4,465,430 | | | | 284,796,887 | |
% of Louisiana | | | 72 | % | | | 28 | % | | | 100 | % | | | | |
Population, 2000 | | | 3,206,303 | | | | 1,262,673 | | | | 4,468,976 | | | | 281,421,906 | |
Population, 1990 | | | 3,010,000 | | | | 1,209,997 | | | | 4,219,996 | | | | 248,825,735 | |
Population, % change, 1990 to 2000 | | | 6.5 | % | | | 4.4 | % | | | 5.9 | % | | | 13.1 | % |
Housing units, 2000 | | | 1,325,098 | | | | 522,083 | | | | 1,847,181 | | | | 115,904,641 | |
% of Louisiana | | | 72 | % | | | 28 | % | | | 100 | % | | | | |
Median household money income, 1999 | | $ | 34,380 | | | $ | 27,735 | | | $ | 32,566 | | | $ | 41,994 | |
Median value of owner-occupied housing units, 2000 | | $ | 90,347 | | | $ | 71,428 | | | $ | 85,000 | | | $ | 119,600 | |
Persons below poverty, percent, 1999 | | | 18.9 | | | | 21.5 | | | | 19.6 | | | | 12.4 | |
Mean travel time to work (minutes), 2000 | | | 24.9 | | | | 27.8 | | | | 25.7 | | | | 25.5 | |
Retail sales, 1997 ($1000) | | $ | 29,041,973 | | | $ | 6,765,921 | | | $ | 35,807,894 | | | $ | 2,460,886,012 | |
% of Louisiana | | | 81 | % | | | 19 | % | | | 100 | % | | | | |
Deposits, June 30, 2002 ($ millions) | | $ | 38,601 | | | $ | 11,156 | | | $ | 49,757 | | | $ | 4,605,962 | |
% of Louisiana | | | 78 | % | | | 22 | % | | | 100 | % | | | | |
Offices | | | 1,031 | | | | 473 | | | | 1,504 | | | | 86,577 | |
% of Louisiana | | | 69 | % | | | 31 | % | | | 100 | % | | | | |
Deposits Per Office ($ millions) | | $ | 37 | | | $ | 24 | | | $ | 33 | | | $ | 53 | |
Persons Per Office | | | 3,107 | | | | 2,668 | | | | 2,969 | | | | 3,290 | |
Target Markets:
| | • | | Nearly ¾ Of Louisiana’s Population, Housing, Retail Sales, Deposits, And Offices |
| | • | | About 25% Higher Household Income And Property Values |
| | • | | Approximately 50% Greater Population Growth And Deposits Per Office |
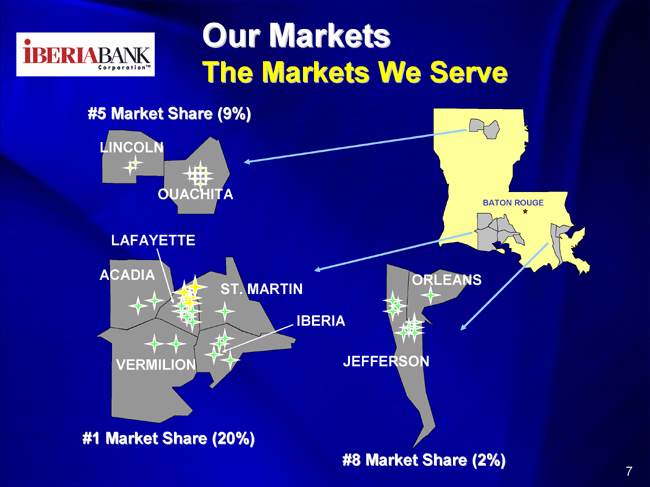
Our Markets
The Markets We Serve

Our Markets
Strategic Markets
| | • | | Focus On Markets With Greater Population Density And Income |
| | • | | Convenience-Based Distribution Strategy |
| | • | | Metro Market Credit Underwriting And Fee Structures |
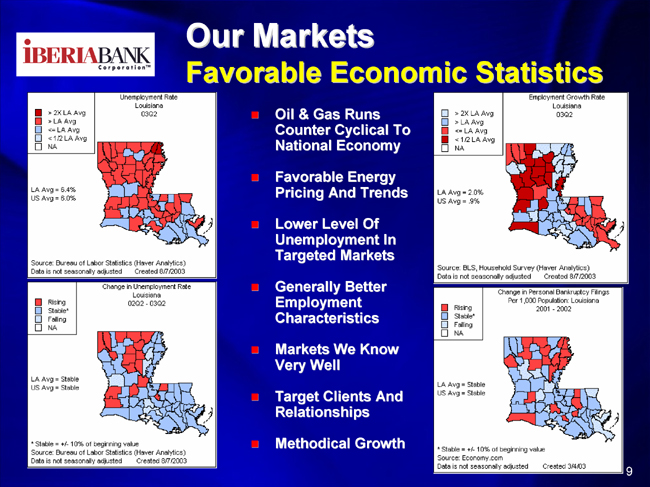
Our Markets
Favorable Economic Statistics
| | • | | Oil & Gas Runs Counter Cyclical To National Economy |
| | • | | Favorable Energy Pricing And Trends |
| | • | | Lower Level Of Unemployment In Targeted Markets |
| | • | | Generally Better Employment Characteristics |
| | • | | Markets We Know Very Well |
| | • | | Target Clients And Relationships |
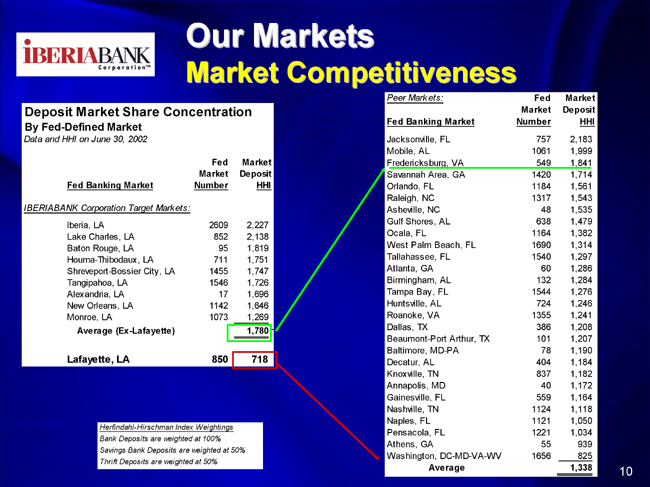
Our Markets
Market Competitiveness
Deposit Market Share Concentration
By Fed-Defined Market
Data and HHI on June 30, 2002
Fed Banking Market
| | Fed
Market
Number
| | Market Deposit HHI
|
IBERIABANK Corporation Target Markets: | | | | |
Iberia, LA | | 2609 | | 2,227 |
Lake Charles, LA | | 852 | | 2,138 |
Baton Rouge, LA | | 95 | | 1,819 |
Houma-Thibodaux, LA | | 711 | | 1,751 |
Shreveport-Bossier City, LA | | 1455 | | 1,747 |
Tangipahoa, LA | | 1546 | | 1,726 |
Alexandria, LA | | 17 | | 1,696 |
New Orleans, LA | | 1142 | | 1,646 |
Monroe, LA | | 1073 | | 1,269 |
| | | | |
|
Average (Ex-Lafayette) | | | | 1,780 |
| | | | |
|
Lafayette, LA | | 850 | | 718 |
Peer Markets:
Fed Banking Market
| | Fed
Market
Number
| | Market
Deposit
HHI
|
Jacksonville, FL | | 757 | | 2,183 |
Mobile, AL | | 1061 | | 1,999 |
Fredericksburg, VA | | 549 | | 1,841 |
Savannah Area, GA | | 1420 | | 1,714 |
Orlando, FL | | 1184 | | 1,561 |
Raleigh, NC | | 1317 | | 1,543 |
Asheville, NC | | 48 | | 1,535 |
Gulf Shores, AL | | 638 | | 1,479 |
Ocala, FL | | 1164 | | 1,382 |
West Palm Beach, FL | | 1690 | | 1,314 |
Tallahassee, FL | | 1540 | | 1,297 |
Atlanta, GA | | 60 | | 1,286 |
Birmingham, AL | | 132 | | 1,284 |
Tampa Bay, FL | | 1544 | | 1,276 |
Huntsville, AL | | 724 | | 1,246 |
Roanoke, VA | | 1355 | | 1,241 |
Dallas, TX | | 386 | | 1,208 |
Beaumont-Port Arthur, TX | | 101 | | 1,207 |
Baltimore, MD-PA | | 78 | | 1,190 |
Decatur, AL | | 404 | | 1,184 |
Knoxville, TN | | 837 | | 1,182 |
Annapolis, MD | | 40 | | 1,172 |
Gainesville, FL | | 559 | | 1,164 |
Nashville, TN | | 1124 | | 1,118 |
Naples, FL | | 1121 | | 1,050 |
Pensacola, FL | | 1221 | | 1,034 |
Athens, GA | | 55 | | 939 |
Washington, DC-MD-VA-WV | | 1656 | | 825 |
| | | | |
|
Average | | | | 1,338 |
| | | | |
|
Herfindahl-Hirschman Index Weightings
Bank Deposits are weighted at 100%
Savings Bank Deposits are weighted at 50%
Thrift Deposits are weighted at 50%

Strategic Direction
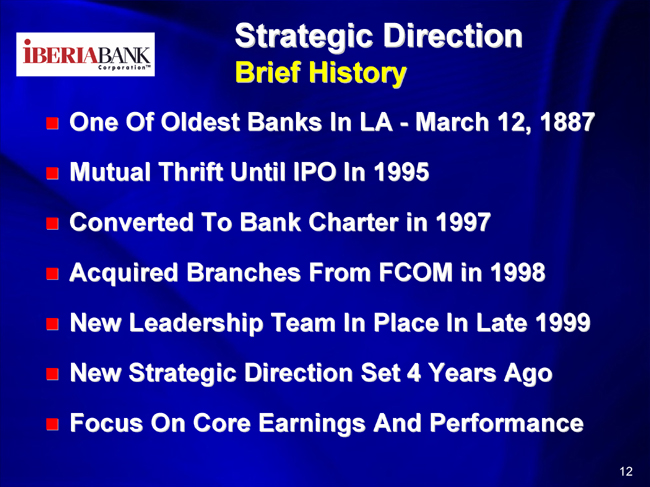
Strategic Direction
Brief History
| | • | | One Of Oldest Banks In LA—March 12, 1887 |
| | • | | Mutual Thrift Until IPO In 1995 |
| | • | | Converted To Bank Charter in 1997 |
| | • | | Acquired Branches From FCOM in 1998 |
| | • | | New Leadership Team In Place In Late 1999 |
| | • | | New Strategic Direction Set 4 Years Ago |
| | • | | Focus On Core Earnings And Performance |
Strategic Direction
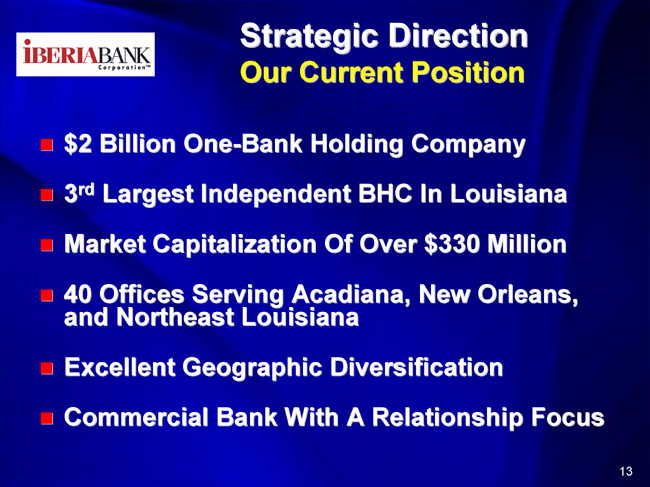
Our Current Position
| | • | | $2 Billion One-Bank Holding Company |
| | • | | 3rd Largest Independent BHC In Louisiana |
| | • | | Market Capitalization Of Over $330 Million |
| | • | | 40 Offices Serving Acadiana, New Orleans, and Northeast Louisiana |
| | • | | Excellent Geographic Diversification |
| | • | | Commercial Bank With A Relationship Focus |
Strategic Direction
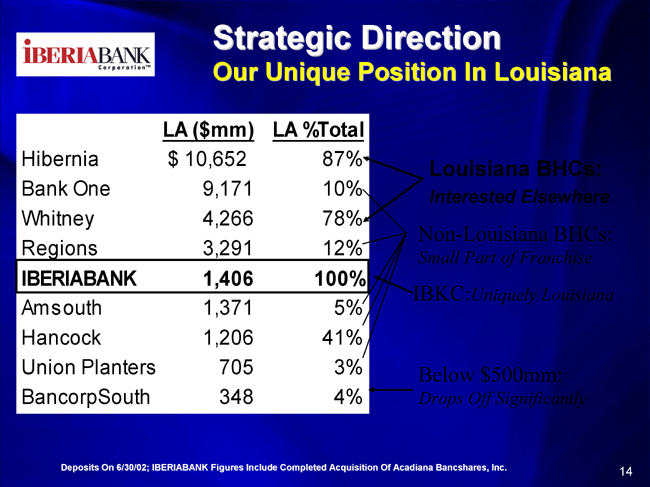
Our Unique Position In Louisiana
| | | LA
($mm)
| | LA
%Total
| |
Hibernia | | $ | 10,652 | | 87 | % |
Bank One | | | 9,171 | | 10 | % |
Whitney | | | 4,266 | | 78 | % |
Regions | | | 3,291 | | 12 | % |
IBERIABANK | | | 1,406 | | 100 | % |
Amsouth | | | 1,371 | | 5 | % |
Hancock | | | 1,206 | | 41 | % |
Union Planters | | | 705 | | 3 | % |
BancorpSouth | | | 348 | | 4 | % |
Deposits On 6/30/02; IBERIABANK Figures Include Completed Acquisition Of Acadiana Bancshares, Inc.

Strategic Direction
Underlying Focus
| | • | | Belief In The Power Of Progression |
| | • | | Predictability – Clients, Associates And Shareholders |
| | • | | Remain Disciplined And Conservative |
| | • | | Focus On People And Relationships, Less On Facilities And Products |
| | • | | Make The Right Kind Of Investments |
| | • | | Continuous Improvement—A Way Of Life |

Strategic Direction
Focusing On The People
| | • | | Rapidly Expanding Commercial And Private Banking/High Net Worth Franchise |
| | • | | Tremendous Strategic Hires |
| | • | | People Incented And “Wear Many Hats” |
| | • | | Outstanding Advisory Board In Place |
| | • | | Exceptional Growth In New Orleans |
| | • | | Focus On Taking Market Share — Selectively |
Strategic Direction
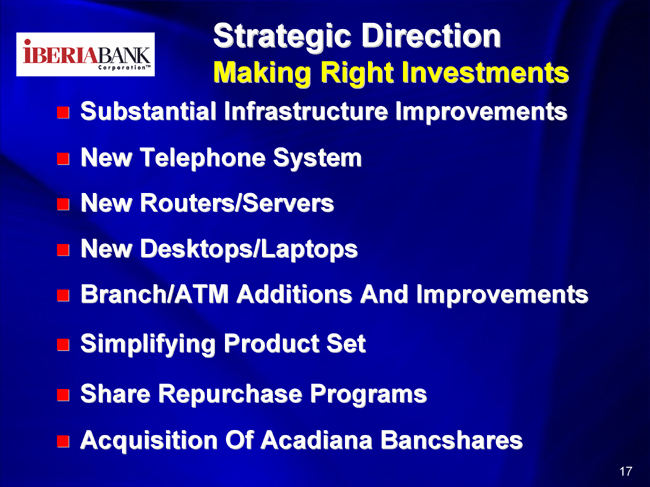
Making Right Investments
| | • | | Substantial Infrastructure Improvements |
| | • | | Branch/ATM Additions And Improvements |
| | • | | Simplifying Product Set |
| | • | | Share Repurchase Programs |
| | • | | Acquisition Of Acadiana Bancshares |

Our Current Paths

Our Current Paths
Loan Portfolio Transformation
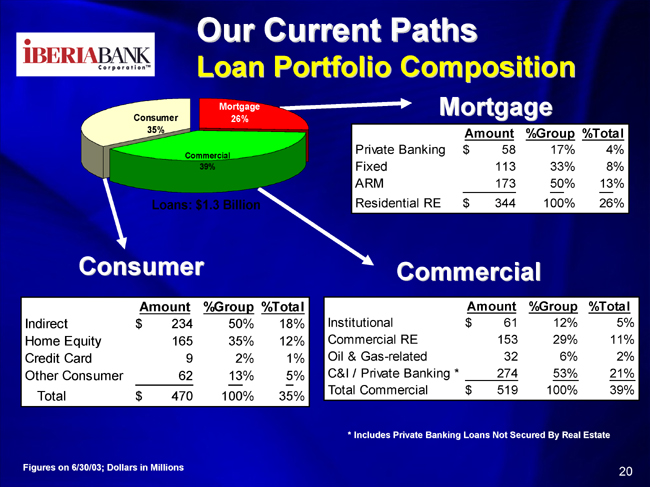
Loans: 1.3 Billion
Figures on 6/30/03
Our Current Paths
Loan Portfolio Composition
Mortgage
| | | Amount
| | %Group
| | | %Total
| |
Private Banking | | $ | 58 | | 17 | % | | 4 | % |
Fixed | | | 113 | | 33 | % | | 8 | % |
ARM | | | 173 | | 50 | % | | 13 | % |
| | |
|
| |
|
| |
|
|
Residential RE | | $ | 344 | | 100 | % | | 26 | % |
Consumer
| | | Amount
| | %Group
| | | %Total
| |
Indirect | | $ | 234 | | 50 | % | | 18 | % |
Home Equity | | | 165 | | 35 | % | | 12 | % |
Credit Card | | | 9 | | 2 | % | | 1 | % |
Other Consumer | | | 62 | | 13 | % | | 5 | % |
| | |
|
| |
|
| |
|
|
Total | | $ | 470 | | 100 | % | | 35 | % |
Commercial
| | | Amount
| | %Group
| | | %Total
| |
Institutional | | $ | 61 | | 12 | % | | 5 | % |
Commercial RE | | | 153 | | 29 | % | | 11 | % |
Oil & Gas-related | | | 32 | | 6 | % | | 2 | % |
C&I / Private Banking * | | | 274 | | 53 | % | | 21 | % |
| | |
|
| |
|
| |
|
|
Total Commercial | | $ | 519 | | 100 | % | | 39 | % |
| * | | Includes Private Banking Loans Not Secured By Real Estate |
Figures on 6/30/03; Dollars in Millions
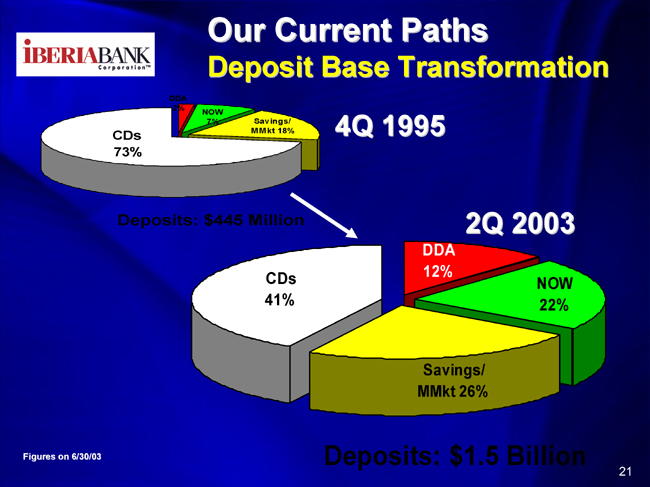
Our Current Paths
Deposit Base Transformation
Deposits: $1.5 Billion
Figures on 6/30/03
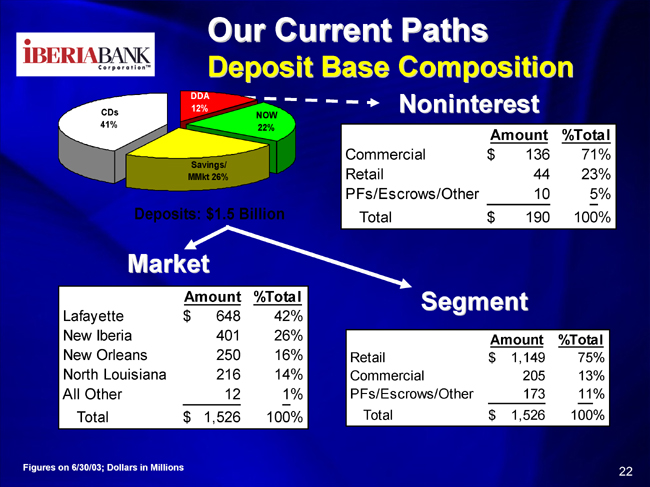
Our Current Paths
Deposit Base Composition
Noninterest
| | | Amount
| | % Total
| |
Commercial | | $ | 136 | | 71 | % |
Retail | | | 44 | | 23 | % |
PFs/Escrows/Other | | | 10 | | 5 | % |
| | |
|
| |
|
|
Total | | $ | 190 | | 100 | % |
Market
| | | Amount
| | % Total
| |
Lafayette | | $ | 648 | | 42 | % |
New Iberia | | | 401 | | 26 | % |
New Orleans | | | 250 | | 16 | % |
North Louisiana | | | 216 | | 14 | % |
All Other | | | 12 | | 1 | % |
| | |
|
| |
|
|
Total | | $ | 1,526 | | 100 | % |
Segment
| | | Amount
| | % Total
| |
Retail | | $ | 1,149 | | 75 | % |
Commercial | | | 205 | | 13 | % |
PFs/Escrows/Other | | | 173 | | 11 | % |
| | |
|
| |
|
|
Total | | $ | 1,526 | | 100 | % |
Figures on 6/30/03; Dollars in Millions

Continuous
Improvement
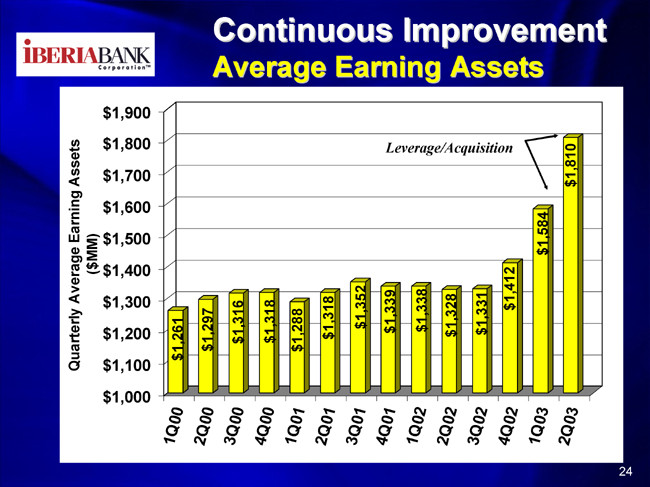
Continuous Improvement
Average Earning Assets

Continuous Improvement
Net Interest Margin (T/E)
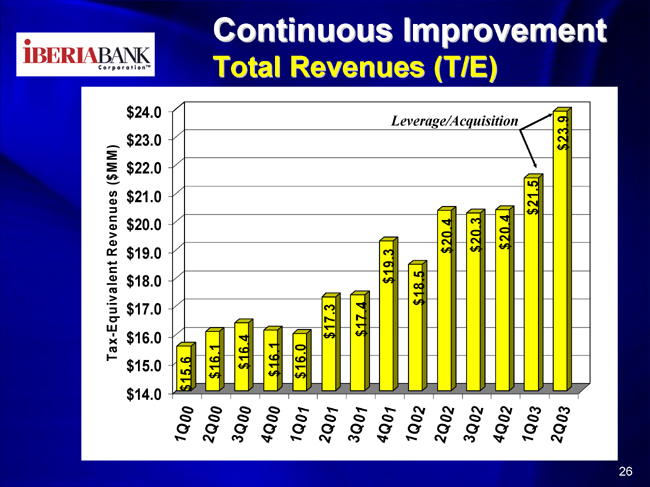
Continuous Improvement
Total Revenues (T/E)
Continuous Improvement
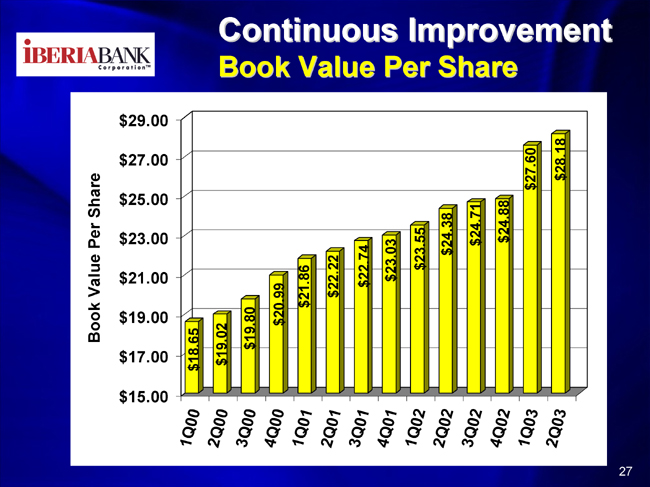
Book Value Per Share
Continuous Improvement
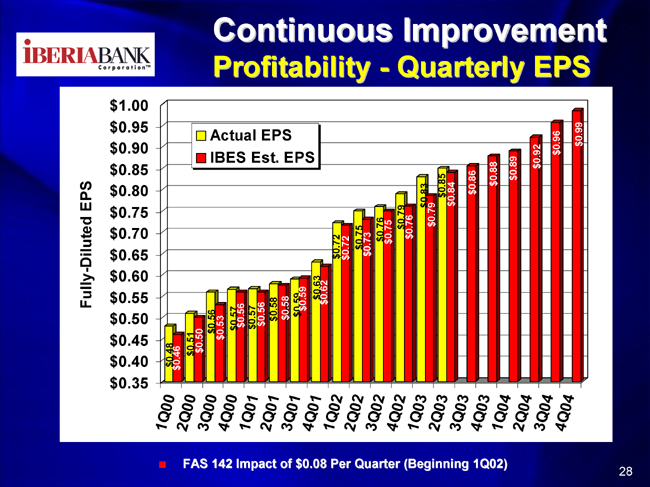
Profitability - Quarterly EPS
| | • | | FAS 142 Impact of $0.08 Per Quarter (Beginning 1Q02) |
Continuous Improvement
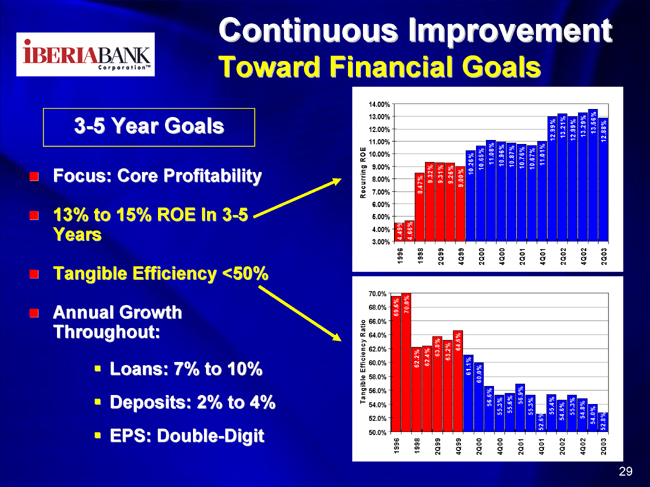
Toward Financial Goals
3-5 Year Goals
| | • | | Focus: Core Profitability |
| | • | | 13% to 15% ROE In 3-5 Years |
| | • | | Tangible Efficiency <50% |
| | • | | Annual Growth Throughout: |
Continuous Improvement
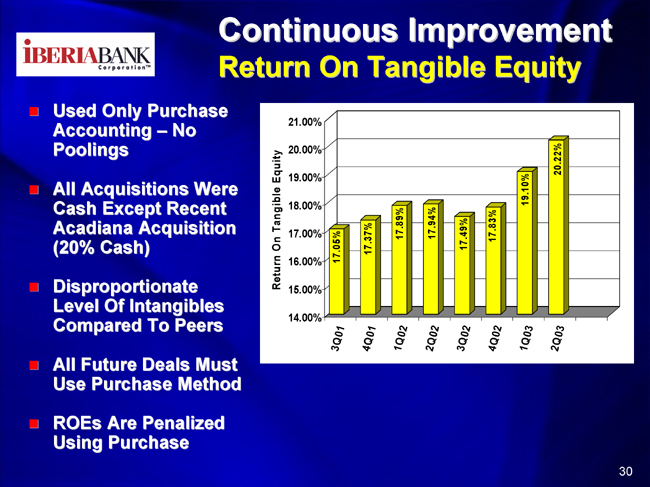
Return On Tangible Equity
| | • | | Used Only Purchase Accounting – No Poolings |
| | • | | All Acquisitions Were Cash Except Recent Acadiana Acquisition (20% Cash) |
| | • | | Disproportionate Level Of Intangibles Compared To Peers |
| | • | | All Future Deals Must Use Purchase Method |
| | • | | ROEs Are Penalized Using Purchase |
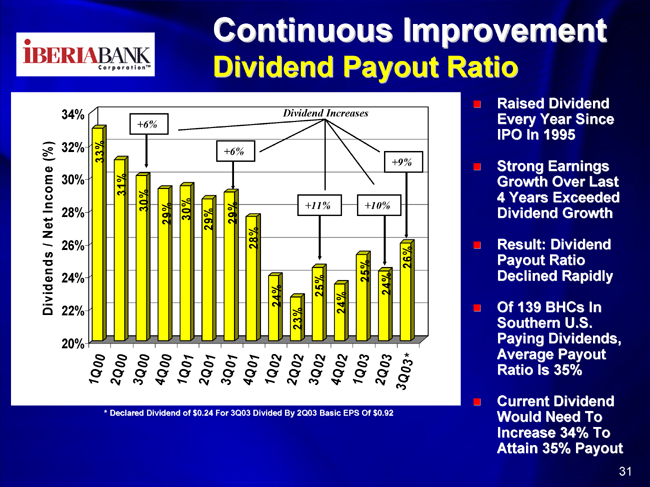
Continuous Improvement Dividend Payout Ratio
| | • | | Raised Dividend Every Year Since IPO In 1995 |
| | • | | Strong Earnings Growth Over Last 4 Years Exceeded Dividend Growth |
| | • | | Result: Dividend Payout Ratio Declined Rapidly |
| | • | | Of 139 BHCs In Southern U.S. Paying Dividends, Average Payout Ratio Is 35% |
| | • | | Current Dividend Would Need To Increase 34% To Attain 35% Payout |
| * | | Declared Dividend of $0.24 For 3Q03 Divided By 2Q03 Basic EPS Of $0.92 |

A Path Of Lower Risk
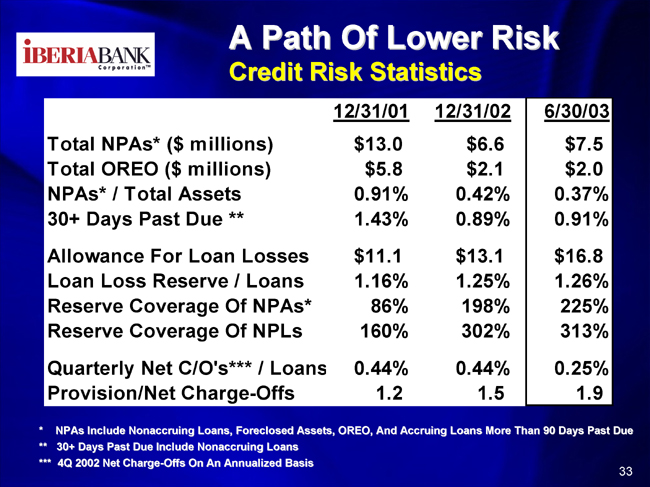
A Path Of Lower Risk Credit Risk Statistics
| | | 12/31/01
| | | 12/31/02
| | | 6/30/03
| |
Total NPAs* ($ millions) | | $ | 13.0 | | | $ | 6.6 | | | $ | 7.5 | |
Total OREO ($ millions) | | $ | 5.8 | | | $ | 2.1 | | | $ | 2.0 | |
NPAs* / Total Assets | | | 0.91 | % | | | 0.42 | % | | | 0.37 | % |
30+ Days Past Due ** | | | 1.43 | % | | | 0.89 | % | | | 0.91 | % |
| | | |
Allowance For Loan Losses | | $ | 11.1 | | | $ | 13.1 | | | $ | 16.8 | |
Loan Loss Reserve / Loans | | | 1.16 | % | | | 1.25 | % | | | 1.26 | % |
Reserve Coverage Of NPAs* | | | 86 | % | | | 198 | % | | | 225 | % |
Reserve Coverage Of NPLs | | | 160 | % | | | 302 | % | | | 313 | % |
| | | |
Quarterly Net C/O’s*** / Loans | | | 0.44 | % | | | 0.44 | % | | | 0.25 | % |
Provision/Net Charge-Offs | | | 1.2 | | | | 1.5 | | | | 1.9 | |
| * | | NPAs Include Nonaccruing Loans, Foreclosed Assets, OREO, And Accruing Loans More Than 90 Days Past Due |
| ** | | 30+ Days Past Due Include Nonaccruing Loans |
| *** | | 4Q 2002 Net Charge-Offs On An Annualized Basis |
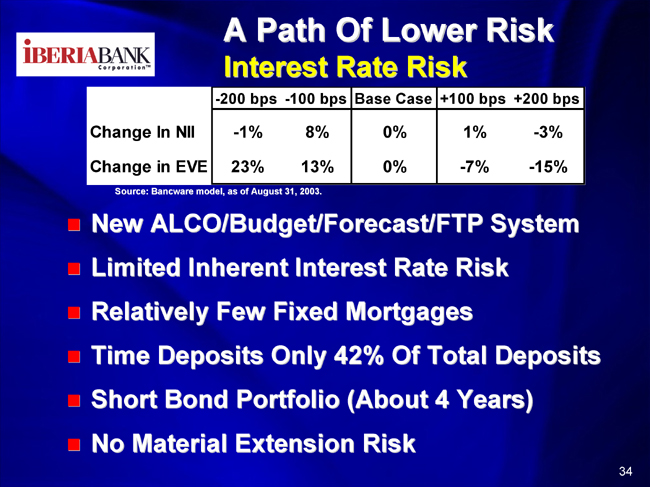
A Path Of Lower Risk Interest Rate Risk
| | | -200 bps
| | -100 bps
| | Base Case
| | +100 bps
| | +200 bps
|
Change In NII | | -1% | | 8% | | 0% | | 1% | | -3% |
Change in EVE | | 23% | | 13% | | 0% | | -7% | | -15% |
Source: Bancware model, as of August 31, 2003.
| | • | | New ALCO/Budget/Forecast/FTP System |
| | • | | Limited Inherent Interest Rate Risk |
| | • | | Relatively Few Fixed Mortgages |
| | • | | Time Deposits Only 42% Of Total Deposits |
| | • | | Short Bond Portfolio (About 4 Years) |
| | • | | No Material Extension Risk |
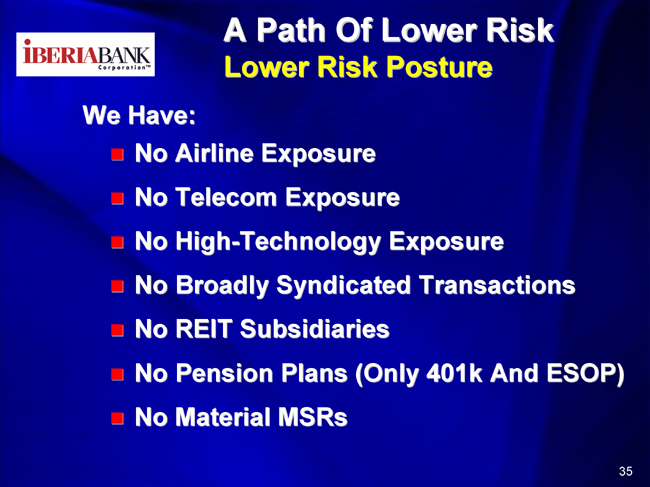
A Path Of Lower Risk Lower Risk Posture
We Have:
| | • | | No High-Technology Exposure |
| | • | | No Broadly Syndicated Transactions |
| | • | | No Pension Plans (Only 401k And ESOP) |

Investment Perspective
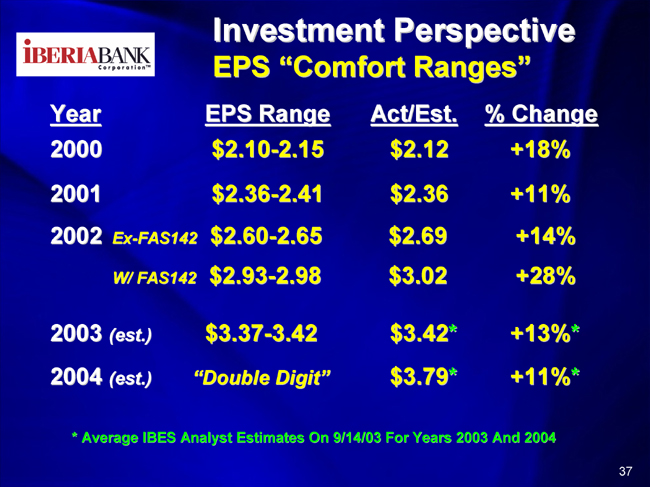
Investment Perspective EPS “Comfort Ranges”
Year
| | EPS Range
| | Act/Est
| | | % Change
| |
2000 | | $2.10-2.15 | | $2.12 | | | +18% | |
2001 | | $2.36-2.41 | | $2.36 | | | +11% | |
2002 Ex-FAS142 | | $2.60-2.65 | | $2.69 | | | +14% | |
W/ FAS142 | | $2.93-2.98 | | $3.02 | | | +28% | |
2003 (est.) | | $ 3.37-3.42 | | $3.42 | * | | +13% | * |
2004 (est.) | | “Double Digit” | | $3.79 | * | | +11% | * |
| * | | Average IBES Analyst Estimates On 9/14/03 For Years 2003 And 2004 |
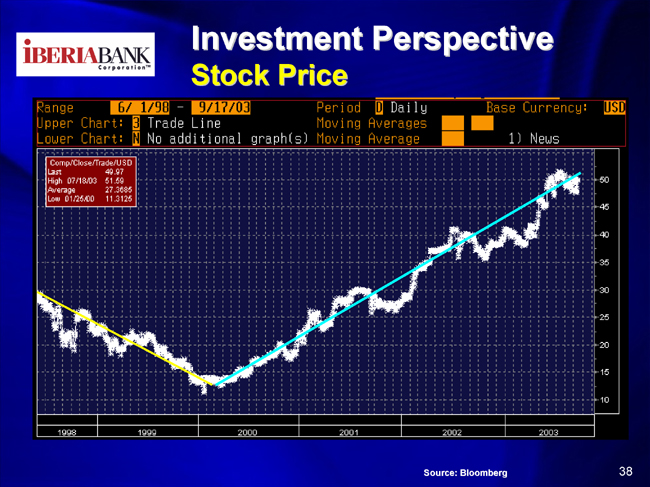
Investment Perspective Stock Price
Source: Bloomberg
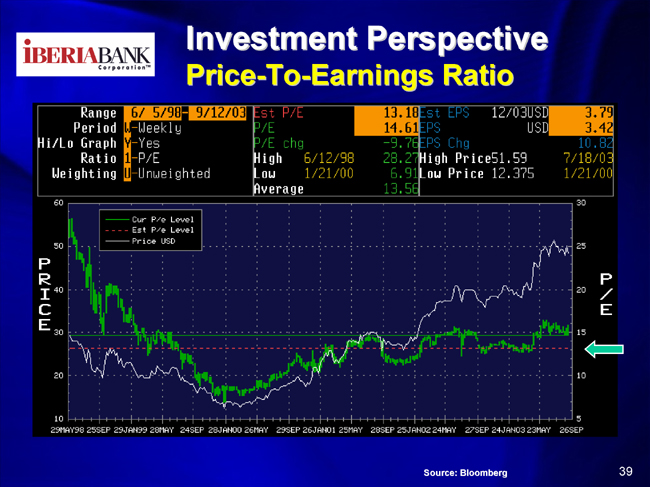
Investment Perspective Price-To-Earnings Ratio
Source: Bloomberg
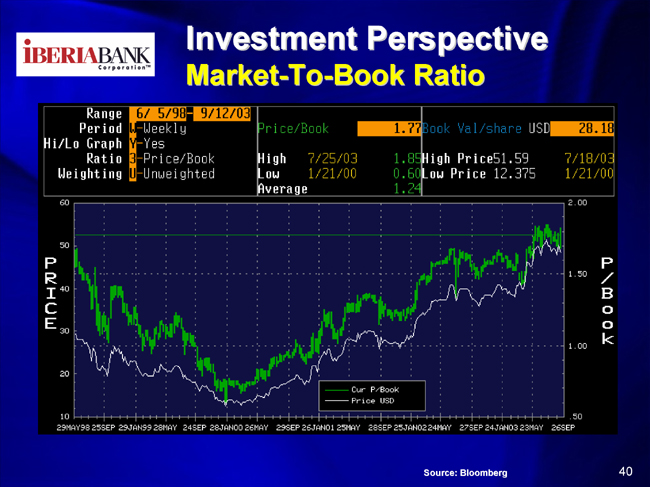
Investment Perspective Market-To-Book Ratio
Source: Bloomberg
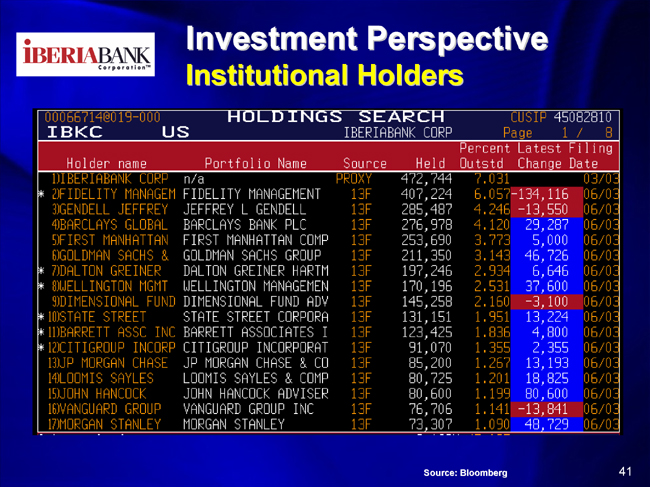
Investment Perspective Institutional Holders
Source: Bloomberg
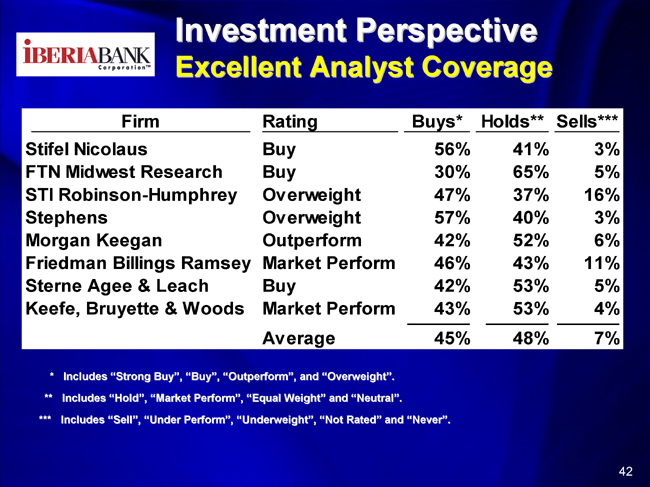
Investment Perspective Excellent Analyst Coverage
Firm
| | Rating
| | Buys*
| | Holds**
| | Sells***
|
Stifel Nicolaus | | Buy | | 56% | | 41% | | 3% |
FTN Midwest Research | | Buy | | 30% | | 65% | | 5% |
STI Robinson-Humphrey | | Overweight | | 47% | | 37% | | 16% |
Stephens | | Overweight | | 57% | | 40% | | 3% |
Morgan Keegan | | Outperform | | 42% | | 52% | | 6% |
Friedman Billings Ramsey | | Market Perform | | 46% | | 43% | | 11% |
Sterne Agee & Leach | | Buy | | 42% | | 53% | | 5% |
Keefe, Bruyette & Woods | | Market Perform | | 43% | | 53% | | 4% |
| | | | |
| |
| |
|
| | | Average | | 45% | | 48% | | 7% |
| * | | Includes “Strong Buy”, “Buy”, “Outperform”, and “Overweight”. |
| ** | | Includes “Hold”, “Market Perform”, “Equal Weight” and “Neutral”. |
| *** | | Includes “Sell”, “Under Perform”, “Underweight”, “Not Rated” and “Never”. |
Comparatives
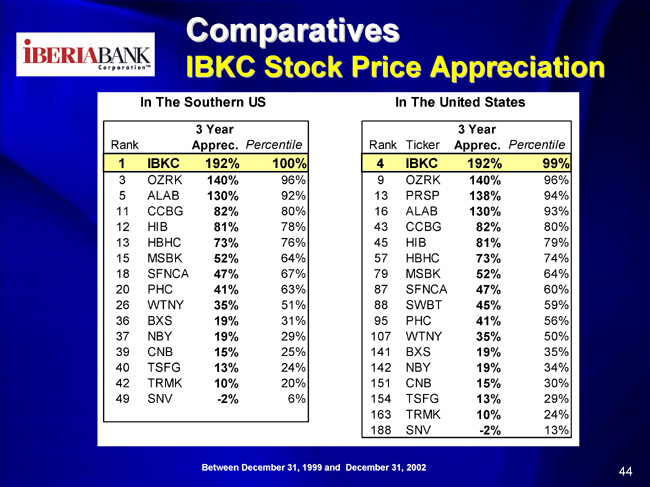
Comparatives IBKC Stock Price Appreciation
| In The Southern US | | | | In The United States |
Rank
| | | | 3 Year
Apprec.
| | Percentile
| | | | Rank
| | Ticker
| | 3 Year
Apprec.
| | Percentile
|
1 | | IBKC | | 192% | | 100% | | | | 4 | | IBKC | | 192% | | 99% |
3 | | OZRK | | 140% | | 96% | | | | 9 | | OZRK | | 140% | | 96% |
5 | | ALAB | | 130% | | 92% | | | | 13 | | PRSP | | 138% | | 94% |
11 | | CCBG | | 82% | | 80% | | | | 16 | | ALAB | | 130% | | 93% |
12 | | HIB | | 81% | | 78% | | | | 43 | | CCBG | | 82% | | 80% |
13 | | HBHC | | 73% | | 76% | | | | 45 | | HIB | | 81% | | 79% |
15 | | MSBK | | 52% | | 64% | | | | 57 | | HBHC | | 73% | | 74% |
18 | | SFNCA | | 47% | | 67% | | | | 79 | | MSBK | | 52% | | 64% |
20 | | PHC | | 41% | | 63% | | | | 87 | | SFNCA | | 47% | | 60% |
26 | | WTNY | | 35% | | 51% | | | | 88 | | SWBT | | 45% | | 59% |
36 | | BXS | | 19% | | 31% | | | | 95 | | PHC | | 41% | | 56% |
37 | | NBY | | 19% | | 29% | | | | 107 | | WTNY | | 35% | | 50% |
39 | | CNB | | 15% | | 25% | | | | 141 | | BXS | | 19% | | 35% |
40 | | TSFG | | 13% | | 24% | | | | 142 | | NBY | | 19% | | 34% |
42 | | TRMK | | 10% | | 20% | | | | 151 | | CNB | | 15% | | 30% |
49 | | SNV | | -2% | | 6% | | | | 154 | | TSFG | | 13% | | 29% |
| | | | | | | | | | | 163 | | TRMK | | 10% | | 24% |
| | | | | | | | | | | 188 | | SNV | | -2% | | 13% |
Between December 31, 1999 and December 31, 2002
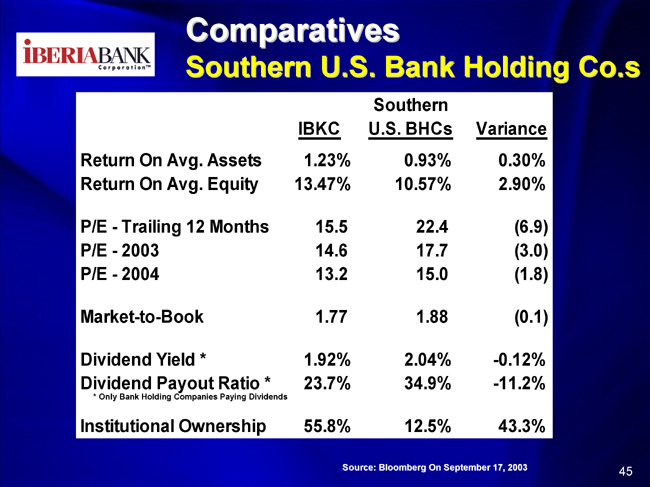
Comparatives Southern U.S. Bank Holding Co.s
| | | IBKC
| | Southern
U.S. BHCs
| | Variance
|
Return On Avg. Assets | | 1.23% | | 0.93% | | 0.30% |
Return On Avg. Equity | | 13.47% | | 10.57% | | 2.90% |
| | | |
P/E—Trailing 12 Months | | 15.5 | | 22.4 | | (6.9) |
P/E—2003 | | 14.6 | | 17.7 | | (3.0) |
P/E—2004 | | 13.2 | | 15.0 | | (1.8) |
| | | |
Market-to-Book | | 1.77 | | 1.88 | | (0.1) |
| | | |
Dividend Yield * | | 1.92% | | 2.04% | | -0.12% |
Dividend Payout Ratio * | | 23.7% | | 34.9% | | -11.2% |
*Only Bank Holding Companies Paying Dividends | | | | | | |
| | | |
Institutional Ownership | | 55.8% | | 12.5% | | 43.3% |
Source: Bloomberg On September 17, 2003

Southern BHCs 2003 P/E Ratios
Source: Bloomberg On September 17, 2003
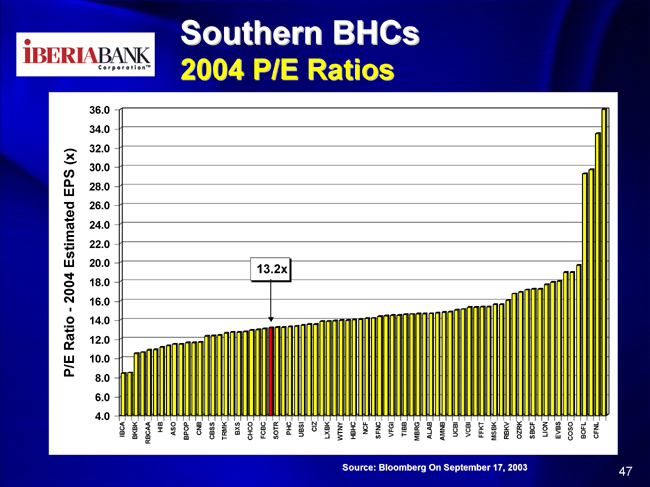
Southern BHCs 2004 P/E Ratios
Source: Bloomberg On September 17, 2003
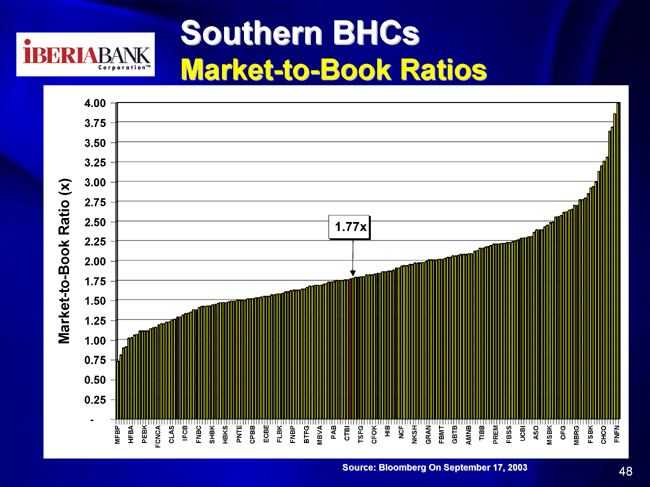
Southern BHCs Market-to-Book Ratios
Source: Bloomberg On September 17, 2003
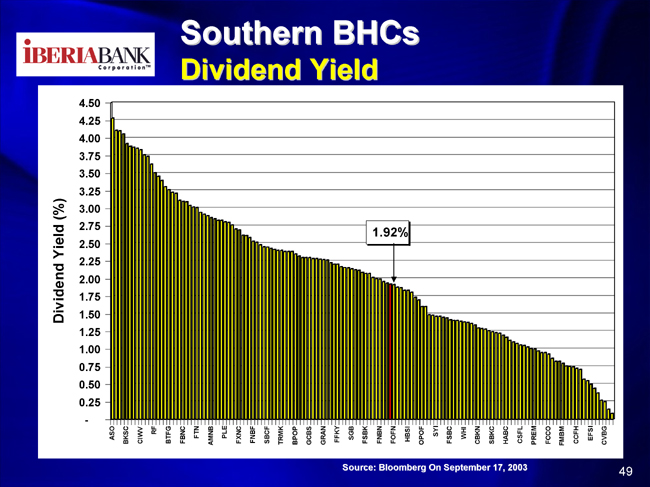
Southern BHCs Dividend Yield
Source: Bloomberg On September 17, 2003
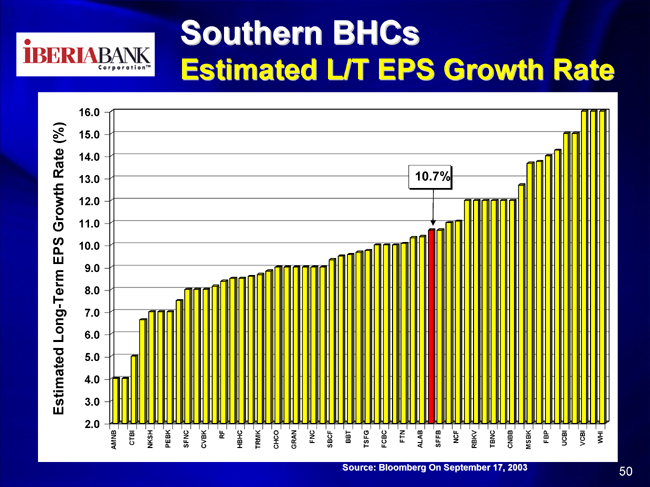
Southern BHCs Estimated L/T EPS Growth Rate
Source: Bloomberg On September 17, 2003
Summary Of IBKC
| | • | | Large Bank Resources & Small Bank Agility |
| | • | | People And Relationship Focused |
| | • | | Emphasis On Taking Market Share |
| | • | | Turnaround; Now Showing Growth Results |
| | • | | EPS/Stock Price Linkage – Shareholder Focus |
| | • | | Reducing Risk Posture In Many Ways |
| | • | | Building A Solid Platform For Future Growth |
| | • | | Tremendous Expansion Opportunities |

iBERIABANK
An Independent Louisiana BankTM

Appendix A
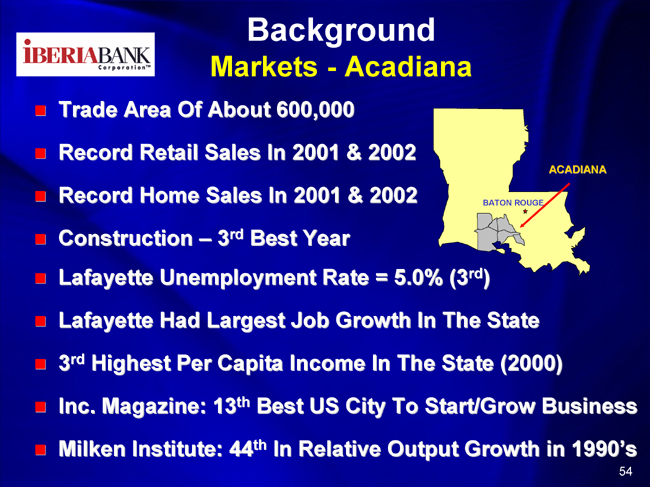
Background Markets—Acadiana
| | • | | Trade Area Of About 600,000 |
| | • | | Record Retail Sales In 2001 & 2002 |
| | • | | Record Home Sales In 2001 & 2002 |
| | • | | Construction – 3rd Best Year |
| | • | | Lafayette Unemployment Rate = 5.0% (3rd) |
| | • | | Lafayette Had Largest Job Growth In The State |
| | • | | 3rd Highest Per Capita Income In The State (2000) |
| | • | | Inc. Magazine: 13th Best US City To Start/Grow Business |
| | • | | Milken Institute: 44th In Relative Output Growth in 1990’s |
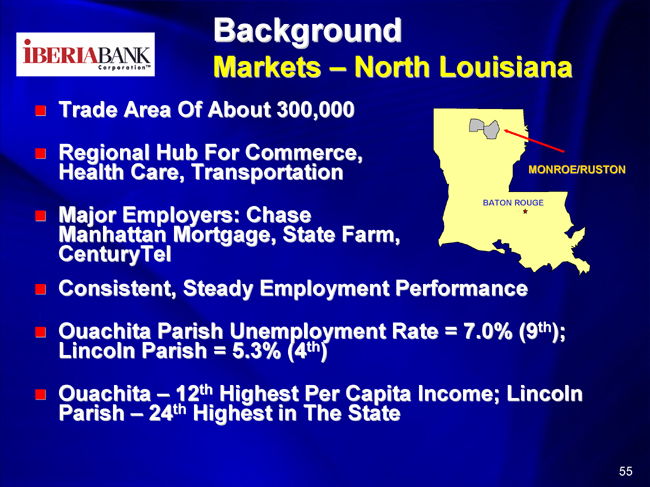
Background Markets – North Louisiana
| | • | | Trade Area Of About 300,000 |
| | • | | Regional Hub For Commerce, Health Care, Transportation |
| | • | | Major Employers: Chase Manhattan Mortgage, State Farm, CenturyTel |
| | • | | Consistent, Steady Employment Performance |
| | • | | Ouachita Parish Unemployment Rate = 7.0% (9th); Lincoln Parish = 5.3% (4th) |
| | • | | Ouachita – 12th Highest Per Capita Income; Lincoln Parish – 24th Highest in The State |
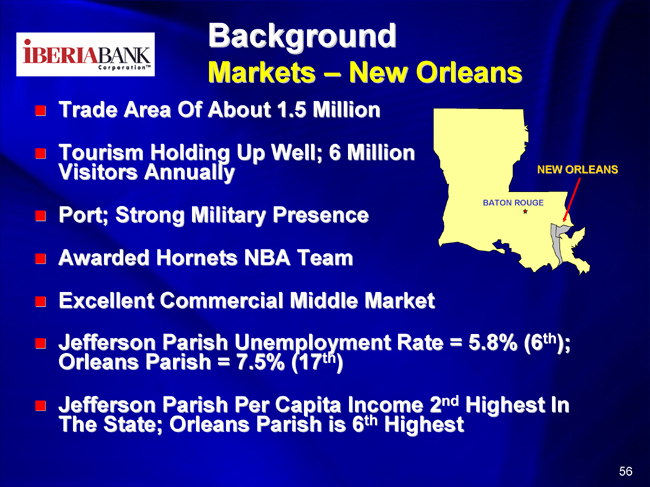
Background Markets – New Orleans
| | • | | Trade Area Of About 1.5 Million |
| | • | | Tourism Holding Up Well; 6 Million Visitors Annually |
| | • | | Port; Strong Military Presence |
| | • | | Awarded Hornets NBA Team |
| | • | | Excellent Commercial Middle Market |
| | • | | Jefferson Parish Unemployment Rate = 5.8% (6th); Orleans Parish = 7.5% (17th) |
| | • | | Jefferson Parish Per Capita Income 2nd Highest In The State; Orleans Parish is 6th Highest |
SIGNATURES
Pursuant to the requirements of the Securities Exchange Act of 1934, the Registrant has duly caused this report to be signed on its behalf by the undersigned hereunto duly authorized.
| IBERIABANK CORPORATION |
| |
By: | | /s/ Daryl G. Byrd
|
| | | Daryl G. Byrd President and Chief Executive Officer |
DATE: September 22, 2003