Investor Presentation
Gulf South Conference New Orleans
April 27, 2004

Presentation Outline
Strategic Direction
Our Markets
Quarterly Trends
Composition And Risk
Investment Perspective
Comparatives
Forward Looking Statements
Safe Harbor
Statements contained in this presentation which are not historical facts and which pertain to future operating results of IBERIABANK Corporation and its subsidiaries constitute “forward-looking statements” within the meaning of the Private Securities Litigation Reform Act of 1995. These forward-looking statements involve significant risks and uncertainties. Actual results may differ materially from the results discussed in these forward-looking statements. Factors that might cause such a difference include, but are not limited to, those discussed in the Company’s periodic filings with the SEC.
3

Strategic Direction
Strategic Direction
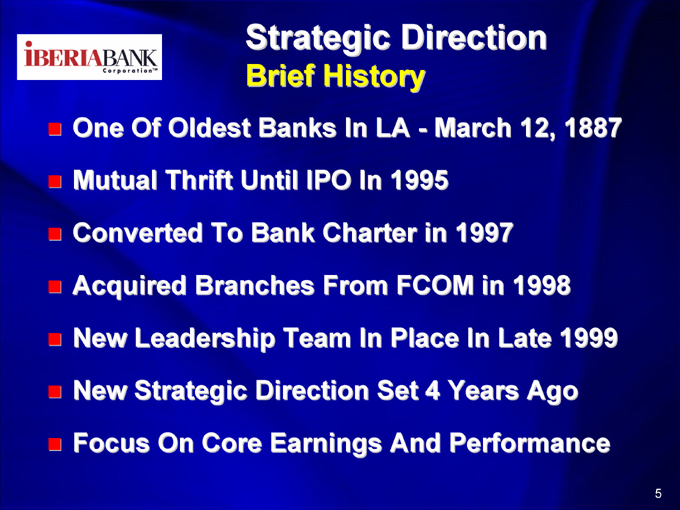
Brief History
One Of Oldest Banks In LA—March 12, 1887
Mutual Thrift Until IPO In 1995
Converted To Bank Charter in 1997
Acquired Branches From FCOM in 1998
New Leadership Team In Place In Late 1999
New Strategic Direction Set 4 Years Ago
Focus On Core Earnings And Performance
5
Strategic Direction
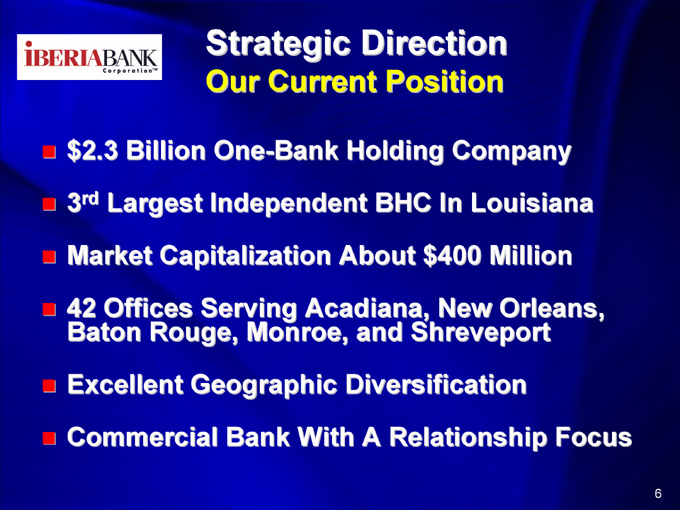
Our Current Position
$ 2.3 Billion One-Bank Holding Company
3rd Largest Independent BHC In Louisiana
Market Capitalization About $400 Million
42 Offices Serving Acadiana, New Orleans, Baton Rouge, Monroe, and Shreveport
Excellent Geographic Diversification
Commercial Bank With A Relationship Focus
6
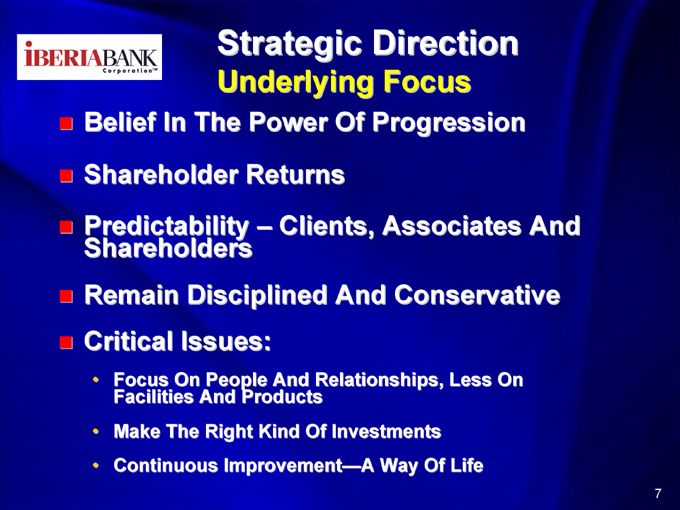
Strategic Direction
Underlying Focus
Belief In The Power Of Progression
Shareholder Returns
Predictability – Clients, Associates And Shareholders
Remain Disciplined And Conservative
Critical Issues:
• Focus On People And Relationships, Less On Facilities And Products
• Make The Right Kind Of Investments
• Continuous Improvement—A Way Of Life
7
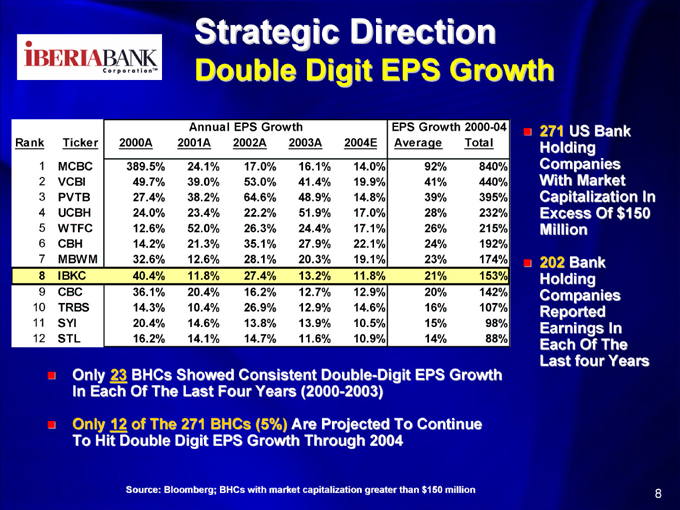
Strategic Direction
Double Digit EPS Growth
Annual EPS Growth EPS Growth 2000-04
Rank Ticker 2000A 2001A 2002A 2003A 2004E Average Total
1 MCBC 389.5% 24.1% 17.0% 16.1% 14.0% 92% 840%
2 VCBI 49.7% 39.0% 53.0% 41.4% 19.9% 41% 440%
3 PVTB 27.4% 38.2% 64.6% 48.9% 14.8% 39% 395%
4 UCBH 24.0% 23.4% 22.2% 51.9% 17.0% 28% 232%
5 WTFC 12.6% 52.0% 26.3% 24.4% 17.1% 26% 215%
6 CBH 14.2% 21.3% 35.1% 27.9% 22.1% 24% 192%
7 MBWM 32.6% 12.6% 28.1% 20.3% 19.1% 23% 174%
8 IBKC 40.4% 11.8% 27.4% 13.2% 11.8% 21% 153%
9 CBC 36.1% 20.4% 16.2% 12.7% 12.9% 20% 142%
10 TRBS 14.3% 10.4% 26.9% 12.9% 14.6% 16% 107%
11 SYI 20.4% 14.6% 13.8% 13.9% 10.5% 15% 98%
12 STL 16.2% 14.1% 14.7% 11.6% 10.9% 14% 88%
271 US Bank Holding Companies With Market Capitalization In Excess Of $150 Million
202 Bank Holding Companies Reported Earnings In Each Of The Last four Years
Only 23 BHCs Showed Consistent Double-Digit EPS Growth In Each Of The Last Four Years (2000-2003)
Only 12 of The 271 BHCs (5%) Are Projected To Continue To Hit Double Digit EPS Growth Through 2004
Source: Bloomberg; BHCs with market capitalization greater than $150 million
8
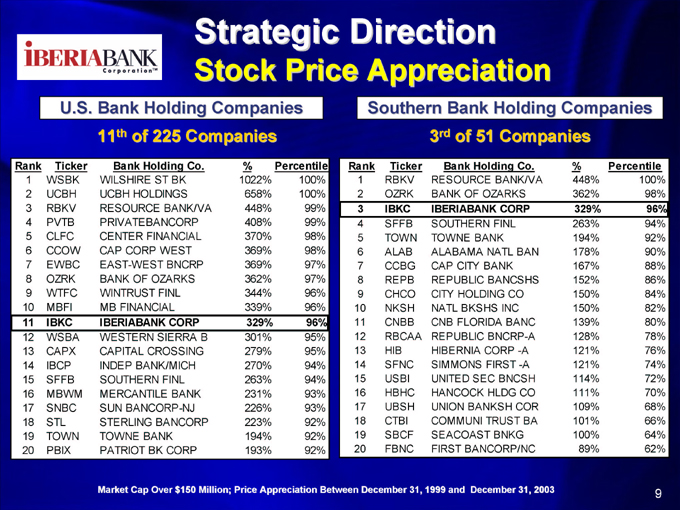
Strategic Direction
Stock Price Appreciation
U.S. Bank Holding Companies
11 of 225 Companies
Rank Ticker Bank Holding Co. % Percentile
1 WSBK WILSHIRE ST BK 1022% 100%
2 UCBH UCBH HOLDINGS 658% 100%
3 RBKV RESOURCE BANK/VA 448% 99%
4 PVTB PRIVATEBANCORP 408% 99%
5 CLFC CENTER FINANCIAL 370% 98%
6 CCOW CAP CORP WEST 369% 98%
7 EWBC EAST-WEST BNCRP 369% 97%
8 OZRK BANK OF OZARKS 362% 97%
9 WTFC WINTRUST FINL 344% 96%
10 MBFI MB FINANCIAL 339% 96%
11 IBKC IBERIABANK CORP 329% 96%
12 WSBA WESTERN SIERRA B 301% 95%
13 CAPX CAPITAL CROSSING 279% 95%
14 IBCP INDEP BANK/MICH 270% 94%
15 SFFB SOUTHERN FINL 263% 94%
16 MBWM MERCANTILE BANK 231% 93%
17 SNBC SUN BANCORP-NJ 226% 93%
18 STL STERLING BANCORP 223% 92%
19 TOWN TOWNE BANK 194% 92%
20 PBIX PATRIOT BK CORP 193% 92%
Southern Bank Holding Companies
3rd of 51 Companies
Rank Ticker Bank Holding Co. % Percentile
1 RBKV RESOURCE BANK/VA 448% 100%
2 OZRK BANK OF OZARKS 362% 98%
3 IBKC IBERIABANK CORP 329% 96%
4 SFFB SOUTHERN FINL 263% 94%
5 TOWN TOWNE BANK 194% 92%
6 ALAB ALABAMA NATL BAN 178% 90%
7 CCBG CAP CITY BANK 167% 88%
8 REPB REPUBLIC BANCSHS 152% 86%
9 CHCO CITY HOLDING CO 150% 84%
10 NKSH NATL BKSHS INC 150% 82%
11 CNBB CNB FLORIDA BANC 139% 80%
12 RBCAA REPUBLIC BNCRP-A 128% 78%
13 HIB HIBERNIA CORP -A 121% 76%
14 SFNC SIMMONS FIRST -A 121% 74%
15 USBI UNITED SEC BNCSH 114% 72%
16 HBHC HANCOCK HLDG CO 111% 70%
17 UBSH UNION BANKSH COR 109% 68%
18 CTBI COMMUNI TRUST BA 101% 66%
19 SBCF SEACOAST BNKG 100% 64%
20 FBNC FIRST BANCORP/NC 89% 62%
Market Cap Over $150 Million; Price Appreciation Between December 31, 1999 and December 31, 2003
9

Our Markets
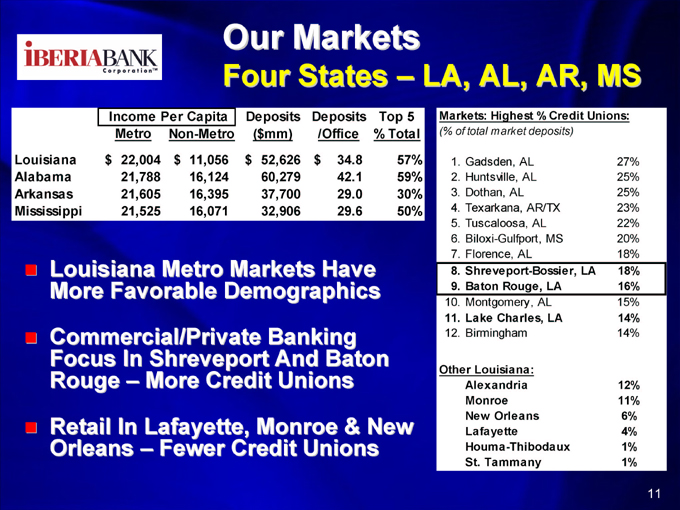
Our Markets
Four States – LA, AL, AR, MS
Income Per Capita Deposits Deposits Top 5
Metro Non-Metro ( $mm) /Office % Total
Louisiana $ 22,004 $ 11,056 $ 52,626 $ 34.8 57%
Alabama 21,788 16,124 60,279 42.1 59%
Arkansas 21,605 16,395 37,700 29.0 30%
Mississippi 21,525 16,071 32,906 29.6 50%
Markets: Highest % Credit Unions:
(% of total market deposits)
1. Gadsden, AL 27%
2. Huntsville, AL 25%
3. Dothan, AL 25%
4. Texarkana, AR/TX 23%
5. Tuscaloosa, AL 22%
6. Biloxi-Gulfport, MS 20%
7. Florence, AL 18%
8. Shreveport-Bossier, LA 18%
9. Baton Rouge, LA 16%
10. Montgomery, AL 15%
11. Lake Charles, LA 14%
12. Birmingham 14%
Other Louisiana:
Alexandria 12%
Monroe 11%
New Orleans 6%
Lafayette 4%
Houma-Thibodaux 1%
St. Tammany 1%
Louisiana Metro Markets Have More Favorable Demographics
Commercial/Private Banking Focus In Shreveport And Baton Rouge – More Credit Unions
Retail In Lafayette, Monroe & New Orleans – Fewer Credit Unions
11
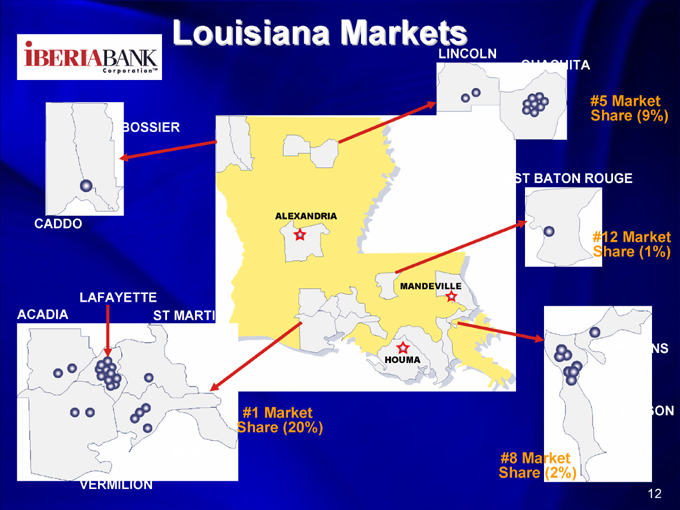
Louisiana Markets
LINCOLN
OUACHITA
BOSSIER
CADDO
LAFAYETTE
ACADIA
ST MARTIN
VERMILION
#1 Market Share (20%)
Market Share (9%)
BATON ROUGE
#12 Market Share (1%)
ORLEANS
JEFFERSON
#8 Market Share (2%)
ALEXANDRIA
MANDEVILLE
HOUMA
12
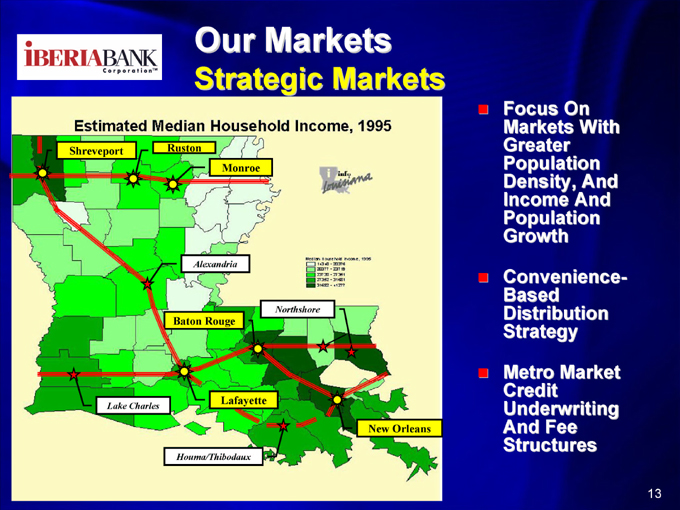
Our Markets
Strategic Markets
Focus On Markets With Greater
Population
Density, And
Income And
Population
Growth
Convenience-
Based
Distribution
Strategy
Metro Market
Credit
Underwriting
And Fee
Structures
13

Our Markets
Our Unique Position—Louisiana
LA ($mm) LA %Total
Hibernia $ 11,503 78%
Bank One/JPM 9,059 3%
Whitney 4,640 79%
Regions/UP 4,037 7%
IBERIABANK 1,595 100%
Amsouth 1,528 5%
Hancock 1,336 39%
Fidelity (Mutual) 586 100%
Louisiana BHCs:
Interested Elsewhere
Non-Louisiana BHCs:
Small Part of Franchise
IBKC:Uniquely Louisiana
Below $500mm:
Drops Off Significantly
Deposits On 6/30/03; Figures Include Pending Acquisitions
14
Our Markets
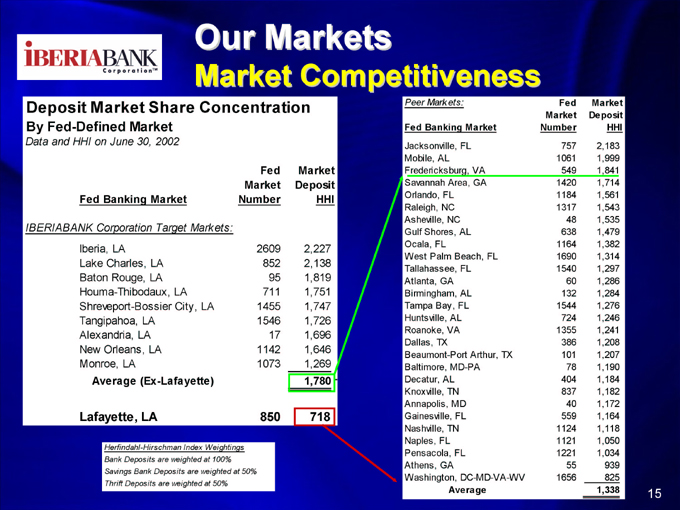
Market Competitiveness
Deposit Market Share Concentration
By Fed-Defined Market
Data and HHI on June 30, 2002
Fed Market
Market Deposit
Fed Banking Market Number HHI
IBERIABANK Corporation Target Markets:
Iberia, LA 2609 2,227
Lake Charles, LA 852 2,138
Baton Rouge, LA 95 1,819
Houma-Thibodaux, LA 711 1,751
Shreveport-Bossier City, LA 1455 1,747
Tangipahoa, LA 1546 1,726
Alexandria, LA 17 1,696
New Orleans, LA 1142 1,646
Monroe, LA 1073 1,269
Average (Ex-Lafayette) 1,780
Lafayette, LA 850 718
Peer Markets: Fed Market
Market Deposit
Fed Banking Market Number HHI
Jacksonville, FL 757 2,183
Mobile, AL 1061 1,999
Fredericksburg, VA 549 1,841
Savannah Area, GA 1420 1,714
Orlando, FL 1184 1,561
Raleigh, NC 1317 1,543
Asheville, NC 48 1,535
Gulf Shores, AL 638 1,479
Ocala, FL 1164 1,382
West Palm Beach, FL 1690 1,314
Tallahassee, FL 1540 1,297
Atlanta, GA 60 1,286
Birmingham, AL 132 1,284
Tampa Bay, FL 1544 1,276
Huntsville, AL 724 1,246
Roanoke, VA 1355 1,241
Dallas, TX 386 1,208
Beaumont-Port Arthur, TX 101 1,207
Baltimore, MD-PA 78 1,190
Decatur, AL 404 1,184
Knoxville, TN 837 1,182
Annapolis, MD 40 1,172
Gainesville, FL 559 1,164
Nashville, TN 1124 1,118
Naples, FL 1121 1,050
Pensacola, FL 1221 1,034
Athens, GA 55 939
Washington, DC-MD-VA-WV 1656 825
Average 1,338
Herfindahl-Hirschman Index Weightings Bank Deposits are weighted at 100% Savings Bank Deposits are weighted at 50% Thrift Deposits are weighted at 50%
15
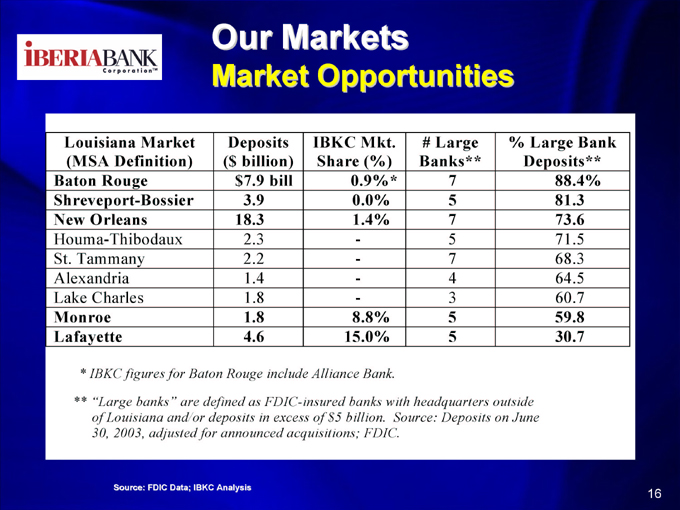
Our Markets
Market Opportunities
Louisiana Market Deposits IBKC Mkt. # Large % Large Bank
(MSA Definition) ($ billion) Share (%) Banks** Deposits**
Baton Rouge $7.9 bill 0.9%* 7 88.4%
Shreveport-Bossier 3.9 0.0% 5 81.3
New Orleans 18.3 1.4% 7 73.6
Houma-Thibodaux 2.3 - 5 71.5
St. Tammany 2.2 - 7 68.3
Alexandria 1.4 - 4 64.5
Lake Charles 1.8 - 3 60.7
Monroe 1.8 8.8% 5 59.8
Lafayette 4.6 15.0% 5 30.7
* IBKC figures for Baton Rouge include Alliance Bank.
** “Large banks” are defined as FDIC-insured banks with headquarters outside
of Louisiana and/or deposits in excess of $5 billion.
Source: Deposits on June 30, 2003, adjusted for announced acquisitions; FDIC.
Source: FDIC Data; IBKC Analysis
16
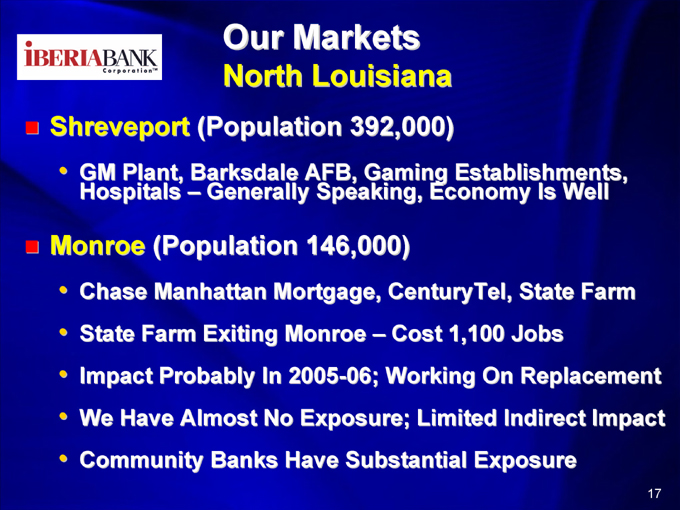
Our Markets
North Louisiana
Shreveport (Population 392,000)
• GM Plant, Barksdale AFB, Gaming Establishments, Hospitals – Generally Speaking, Economy Is Well
Monroe (Population 146,000)
• Chase Manhattan Mortgage, CenturyTel, State Farm
• State Farm Exiting Monroe – Cost 1,100 Jobs
• Impact Probably In 2005-06; Working On Replacement
• We Have Almost No Exposure; Limited Indirect Impact
• Community Banks Have Substantial Exposure
17
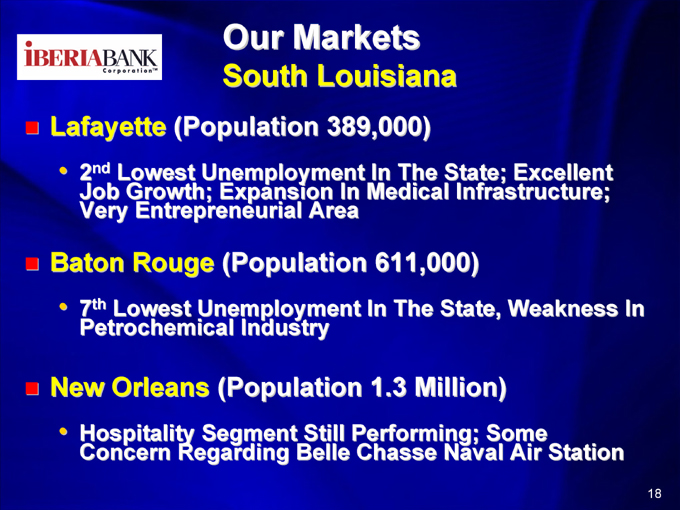
Our Markets
South Louisiana
Lafayette (Population 389,000)
• 2nd Lowest Unemployment In The State; Excellent Job Growth; Expansion In Medical Infrastructure; Very Entrepreneurial Area
Baton Rouge (Population 611,000)
• 7th Lowest Unemployment In The State, Weakness In Petrochemical Industry
New Orleans (Population 1.3 Million)
• Hospitality Segment Still Performing; Some Concern Regarding Belle Chasse Naval Air Station
18
Quarterly Trends
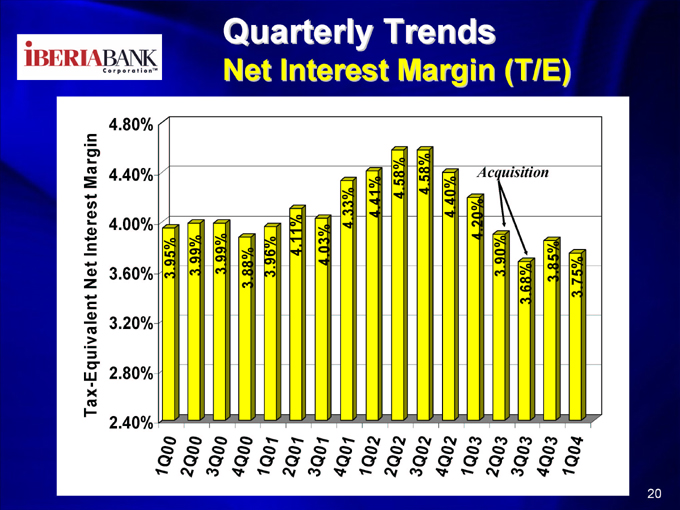
Quarterly Trends
Net Interest Margin (T/E)
Tax- Equivalent Net Interest Margin
2.40% 2.80% 3.20% 3.60% 4.00% 4.40% 4.80%
1Q00 3.95%
2Q00 3.99%
3Q00 3.99%
4Q0
0 3.88%
1Q01 3.96%
2Q01 4.11%
3Q0
1 4.03%
4Q01 4.33%
1Q0
2 4.41%
2Q02 4.58%
3Q02 4.58%
4Q02 4.40%
1Q03
4.20%
2Q03 3.90%
3Q03 3.68% Acquisition
4Q03
3.85%
1Q0
4 3.75%
20
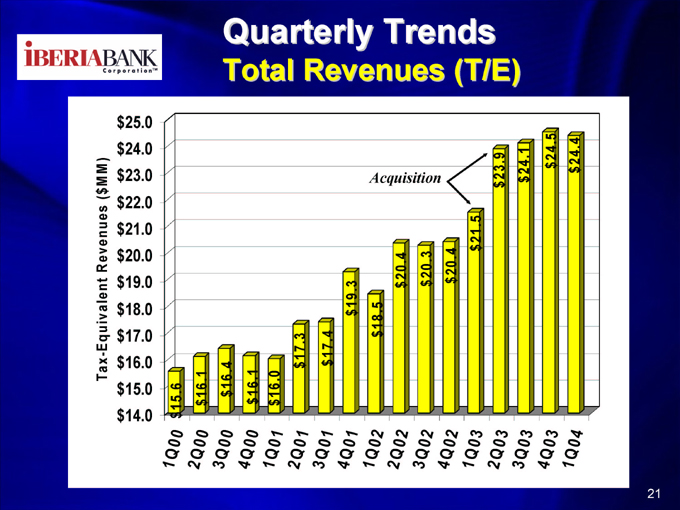
Quarterly Trends
Total Revenues (T/E)
Tax- Equivalent Revenues ($M M )
$ $ $ $ $ $ $ $ $ $ $ $
14.0 15.0 16.0 17.0 18.0 19.0 20.0 21.0 22.0 23.0 24.0 25.0
1Q00 $ 15.6
2Q00 $ 16.1
3Q00 $ 16.4
4Q0
0 $ 16.1
1Q01 $ 16.0
2Q01 $ 17.3
3Q0
1 $ 17.4
4Q01 $ 19.3
1Q0
2 $ 18.5
2Q02 $ 20.4
3Q02 $ 20.3 Acquisition
4Q02 $ 20.4
1Q03 $ 21.5
2Q03 $ 23.9
3Q03 $ 24.1
4Q03 $ 24.5
1Q04 $ 24.4
21
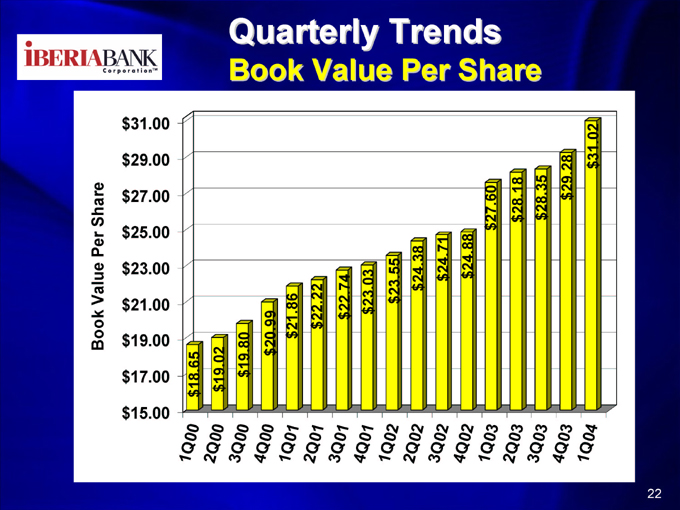
Quarterly Trends
Book Value Per Share
$ 31.00
$ 29.00
$ 27.00
$ 25.00
$ 23.00
$ 21.00
$ 19.00
$ 17.00
$ 15.00
Book Value Per Share
22
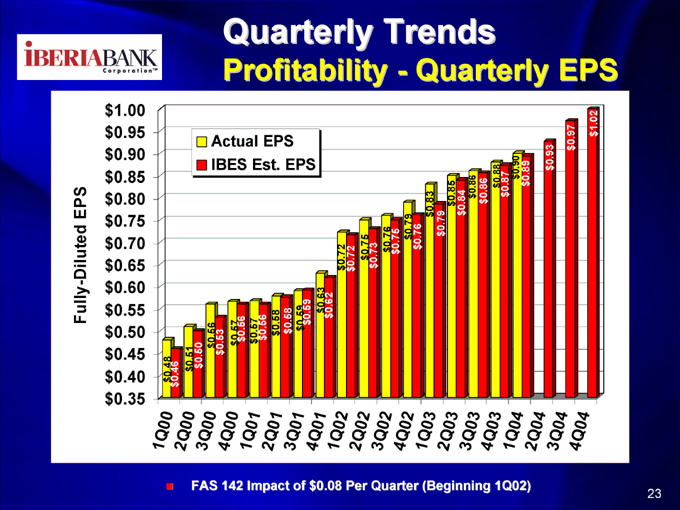
Quarterly Trends
Profitability—Quarterly EPS
$ 1.00
$ 0.95
$ 0.90
$ 0.85
$ 0.80
$ 0.75
$ 0.70
$ 0.65
$ 0.60
$ 0.55
$ 0.50
$ 0.45
$ 0.40
$ 0.35
Fully- Diluted EPS
Actual EPS IBES Est. EPS
FAS 142 Impact of $0.08 Per Quarter (Beginning 1Q02)
23
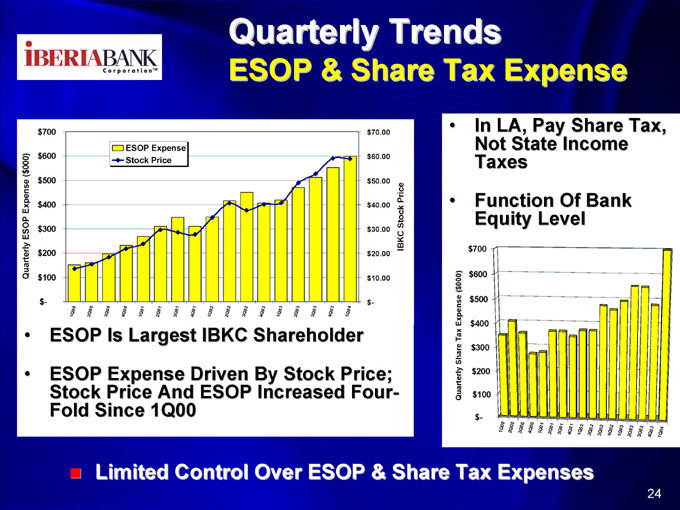
Quarterly Trends
ESOP & Share Tax Expense
ESOP Expense Stock Price
• ESOP Is Largest IBKC Shareholder
• ESOP Expense Driven By Stock Price; Stock Price And ESOP Increased FourFold Since 1Q
• In LA, Pay Share Tax, Not State Income Taxes
• Function Of Bank Equity Level $700 $600 $500 $400
Quarterly Share Tax Expense ($000) $300
Limited Control Over ESOP & Share Tax Expenses
24
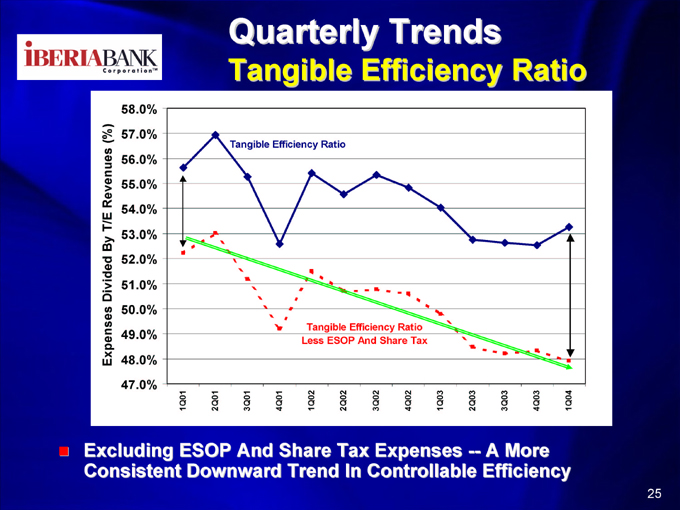
Quarterly Trends
Tangible Efficiency Ratio
(%) 57.0% Revenues 56.0% 55.0% 54.0% By T/E 53.0% 52.0%
Divided 51.0% 50.0%
Expenses 49.0% 48.0% 47.0%
Tangible Efficiency Ratio
Tangible Efficiency Ratio Less ESOP And Share Tax
Excluding ESOP And Share Tax Expenses — A More Consistent Downward Trend In Controllable Efficiency
25
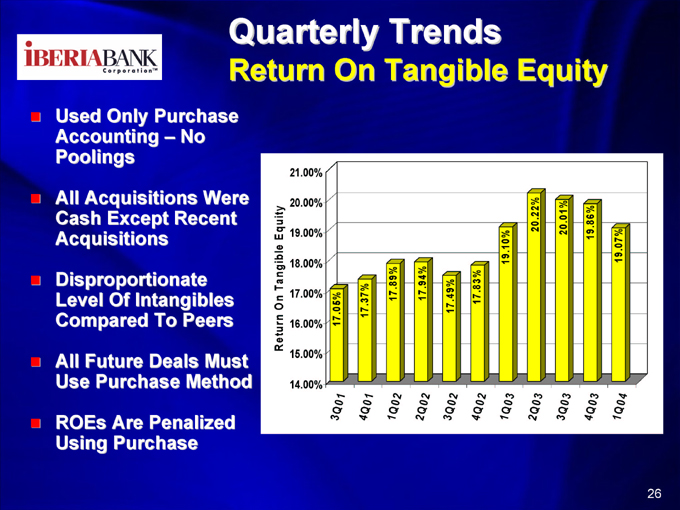
Quarterly Trends
Return On Tangible Equity
Used Only Purchase Accounting – No Poolings
All Acquisitions Were Cash Except Recent Acquisitions
Disproportionate Level Of Intangibles Compared To Peers
All Future Deals Must Use Purchase Method
ROEs Are Penalized Using Purchase
21.00%
20.00%
19.00%
18.00%
17.00%
16.00%
15.00%
14.00%
26

Composition And Risk
27
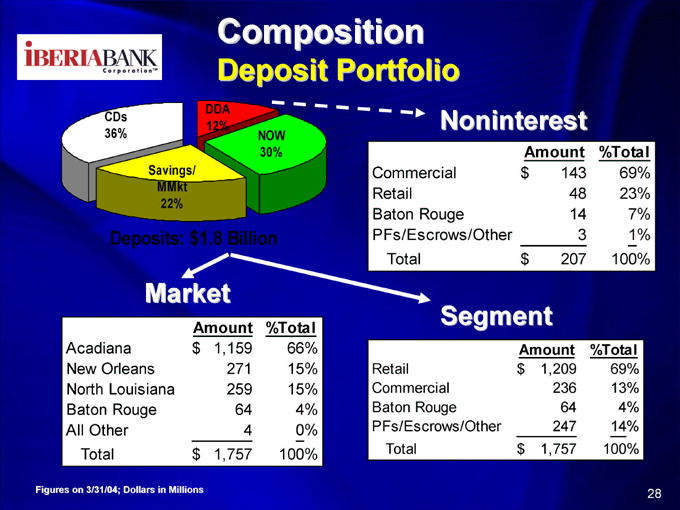
Composition
Deposit Portfolio
CDs 36%
DDA 12%
NOW 30%
Savings/ MMkt 22%
Deposits: $1.8 Billion
Market
Amount %Total
Acadiana $ 1,159 66%
New Orleans 271 15%
North Louisiana 259 15%
Baton Rouge 64 4%
All Other 4 0%
Total $ 1,757 100%
Noninterest
Amount %Total
Commercial $ 143 69%
Retail 48 23%
Baton Rouge 14 7%
PFs/Escrows/Other 3 1%
Total $ 207 100%
Segment
Amount %Total
Retail $ 1,209 69%
Commercial 236 13%
Baton Rouge 64 4%
PFs/Escrows/Other 247 14%
Total $ 1,757 100%
Figures on 3/31/04; Dollars in Millions
28
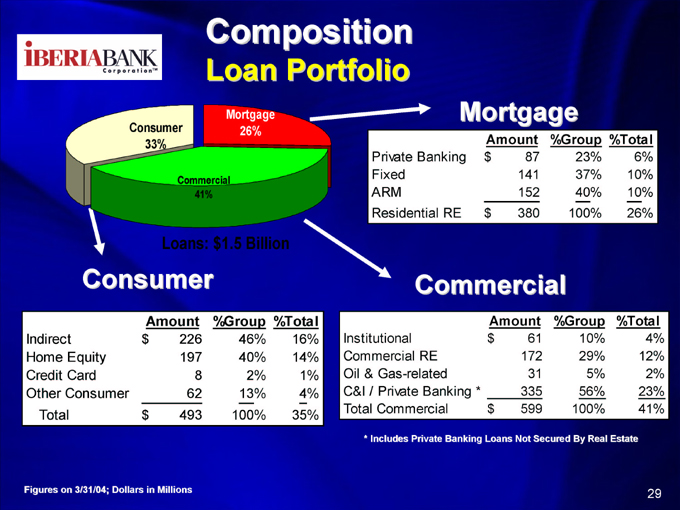
Composition
Loan Portfolio
Consumer 33%
Mortgage 26%
Commercial 41%
Loans: $1.5 Billion
Consumer
Amount %Group %Total
Indirect $ 226 46% 16%
Home Equity 197 40% 14%
Credit Card 8 2% 1%
Other Consumer 62 13% 4%
Total $ 493 100% 35%
Mortgage
Private Banking $ 87 23% 6%
Fixed 141 37% 10%
ARM 152 40% 10%
Residential RE $ 380 100% 26%
Commercial
Amount %Group %Total
Institutional $ 61 10% 4%
Commercial RE 172 29% 12%
Oil & Gas-related 31 5% 2%
C&I / Private Banking * 335 56% 23%
Total Commercial $ 599 100% 41%
* Includes Private Banking Loans Not Secured By Real Estate
Figures on 3/31/04; Dollars in Millions
29
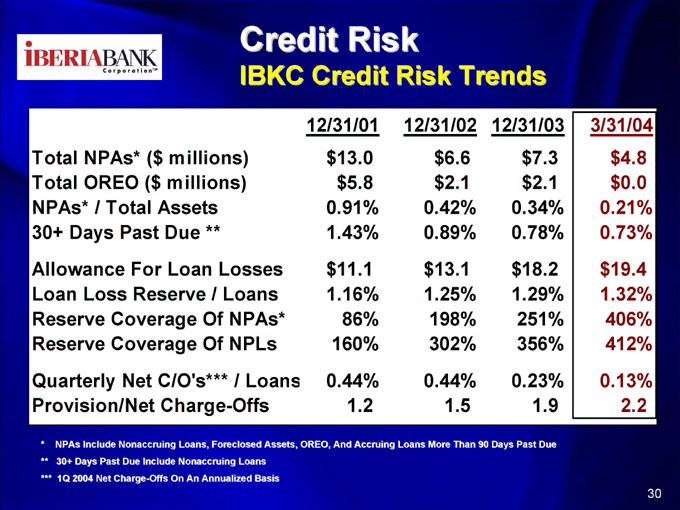
Credit Risk
IBKC Credit Risk Trends
12/31/01 12/31/02 12/31/03 3/31/04
Total NPAs* ($ millions) $ 13.0 $6.6 $ 7.3 $ 4.8
Total OREO ($ millions) $5.8 $2.1 $ 2.1 $ 0.0
NPAs* / Total Assets 0.91% 0.42% 0.34% 0.21%
30+ Days Past Due ** 1.43% 0.89% 0.78% 0.73%
Allowance For Loan Losses $ 11.1 $ 13.1 $ 18.2 $ 19.4
Loan Loss Reserve / Loans 1.16% 1.25% 1.29% 1.32%
Reserve Coverage Of NPAs* 86% 198% 251% 406%
Reserve Coverage Of NPLs 160% 302% 356% 412%
Quarterly Net C/O’s*** / Loans 0.44% 0.44% 0.23% 0.13%
Provision/Net Charge-Offs 1.2 1.5 1.9 2.2
* NPAs Include Nonaccruing Loans, Foreclosed Assets, OREO, And Accruing Loans More Than 90 Days Past Due
** 30+ Days Past Due Include Nonaccruing Loans *** 1Q 2004 Net Charge-Offs On An Annualized Basis
30
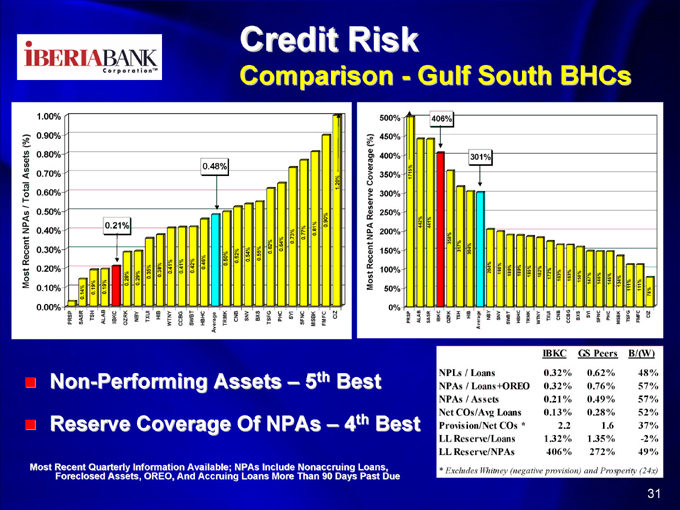
Credit Risk
Comparison—Gulf South BHCs
1.00%
(%) 0.90% Assets 0.80% 0.70%
0.60%
0.50% NPAs / Total 0.40% Recent 0.30%
Most 0.20% 0.10%
0.00%
Most Recent NPA Reserve Coverage (%)
0% 50% 100% 150% 200% 250% 300% 350% 400% 450% 500%
Non-Performing Assets – 5th Best
Reserve Coverage Of NPAs – 4th Best
IBKC GS Peers B/(W)
NPLs / Loans 0.32% 0.62% 48%
NPAs / Loans+OREO 0.32% 0.76% 57%
NPAs / Assets 0.21% 0.49% 57%
Net COs/Avg Loans 0.13% 0.28% 52%
Provision/Net COs * 2.2 1.6 37%
LL Reserve/Loans 1.32% 1.35% -2%
LL Reserve/NPAs 406% 272% 49%
* Excludes Whitney (negative provision) and Prosperity (24x)
Most Recent Quarterly Information Available; NPAs Include Nonaccruing Loans, Foreclosed Assets, OREO, And Accruing Loans More Than 90 Days Past Due
31
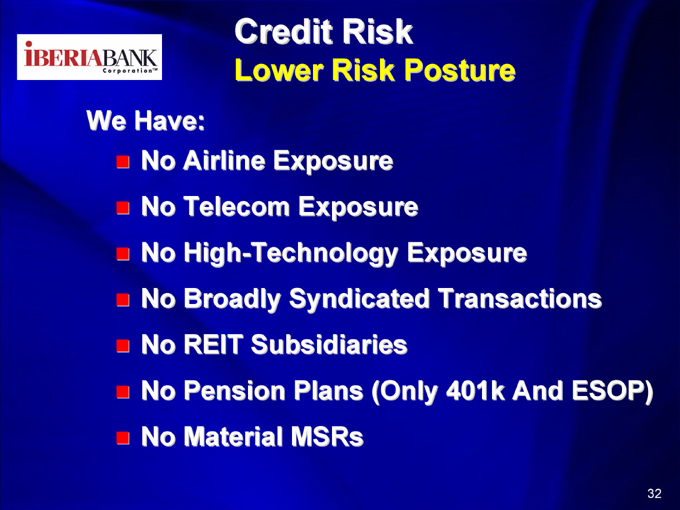
Credit Risk
Lower Risk Posture
We Have:
No Airline Exposure
No Telecom Exposure
No High-Technology Exposure
No Broadly Syndicated Transactions
No REIT Subsidiaries
No Pension Plans (Only 401k And ESOP)
No Material MSRs
32
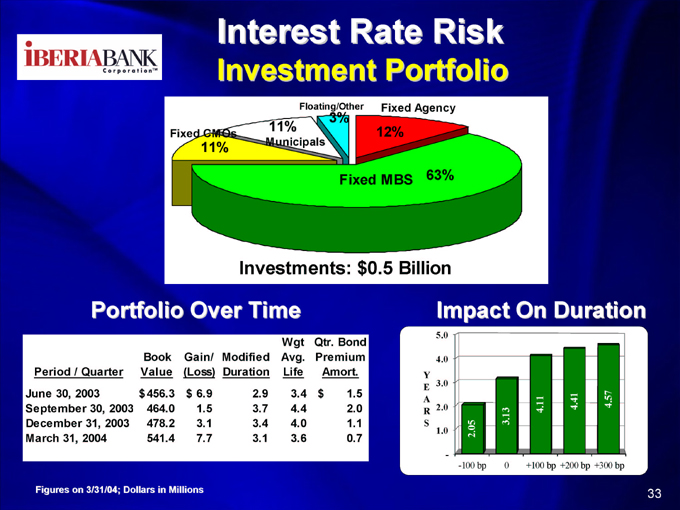
Interest Rate Risk
Investment Portfolio
Fixed CMOs
11%
11%
Municipals
Floating/Other
3%
Fixed Agency
12%
Fixed MBS 63%
Investments: $0.5 Billion
Portfolio Over Time
Book Gain/ Modified Avg. Premium
Period / Quarter Value (Loss) Duration Life Amort.
June 30, 2003 $ 456.3 $ 6.9 2.9 3.4 $ 1.5
September 30, 2003 464.0 1.5 3.7 4.4 2.0
December 31, 2003 478.2 3.1 3.4 4.0 1.1
March 31, 2004 541.4 7.7 3.1 3.6 0.7
Impact On Duration
5.0
4.0 Y E 3.0 A R 2.0 S
1.0
-
Figures on 3/31/04; Dollars in Millions
33
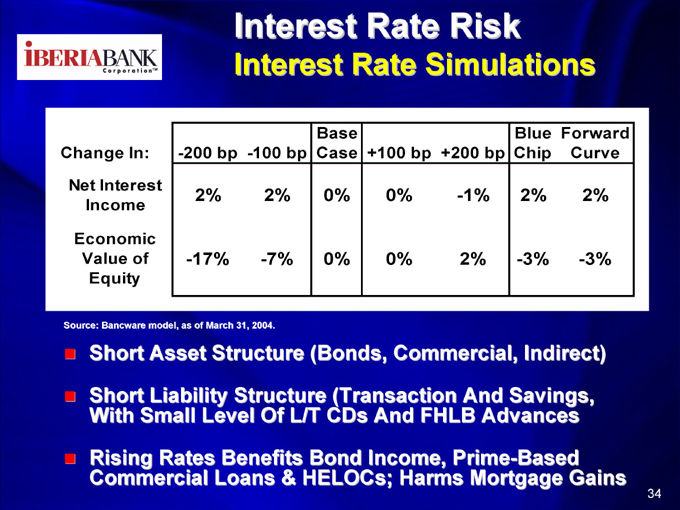
Interest Rate Risk
Interest Rate Simulations
Base Blue Forward Change In: -200 bp -100 bp Case +100 bp +200 bp Chip Curve
Net Interest
2% 2% 0% 0% -1% 2% 2%
Income
Economic
Value of -17% -7% 0% 0% 2% -3% -3%
Equity
Source: Bancware model, as of March 31, 2004.
Short Asset Structure (Bonds, Commercial, Indirect)
Short Liability Structure (Transaction And Savings, With Small Level Of L/T CDs And FHLB Advances
Rising Rates Benefits Bond Income, Prime-Based Commercial Loans & HELOCs; Harms Mortgage Gains
34

Investment Perspective
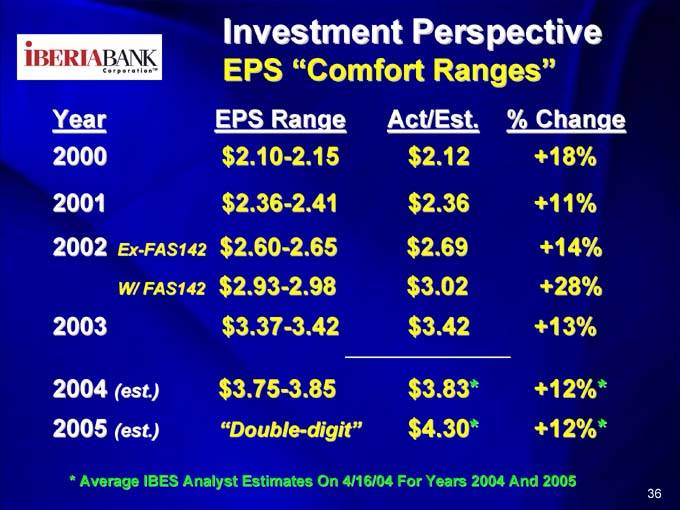
Investment Perspective
EPS “Comfort Ranges”
Year EPS Range Act/Est. % Change
2000 $2.10-2.15 $ 2.12 +18%
2001 $2.36-2.41 $ 2.36 +11%
2002 Ex-FAS142 $2.60-2.65 $ 2.69 +14%
W/ FAS142 $2.93-2.98 $ 3.02 +28%
2003 $3.37-3.42 $ 3.42 +13%
2004 (est.) $3.75-3.85 $3.83* +12%*
2005 (est.) “Double-digit” $4.30* +12%*
* Average IBES Analyst Estimates On 4/16/04 For Years 2004 And 2005
36
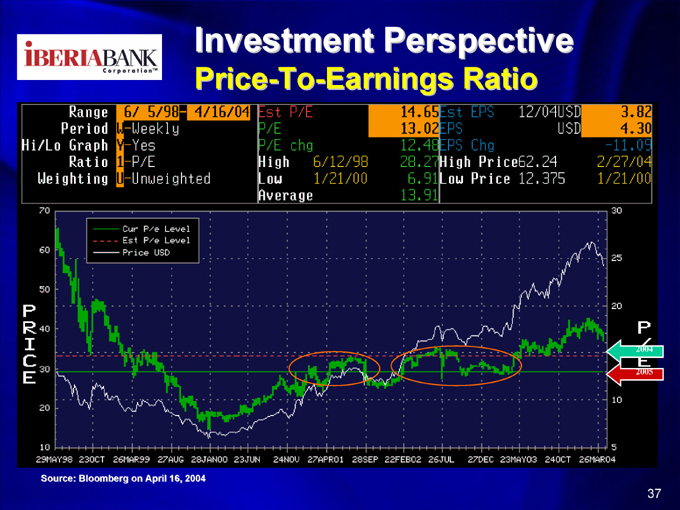
Investment Perspective
Price-To-Earnings Ratio
Source: Bloomberg on April 16, 2004
37
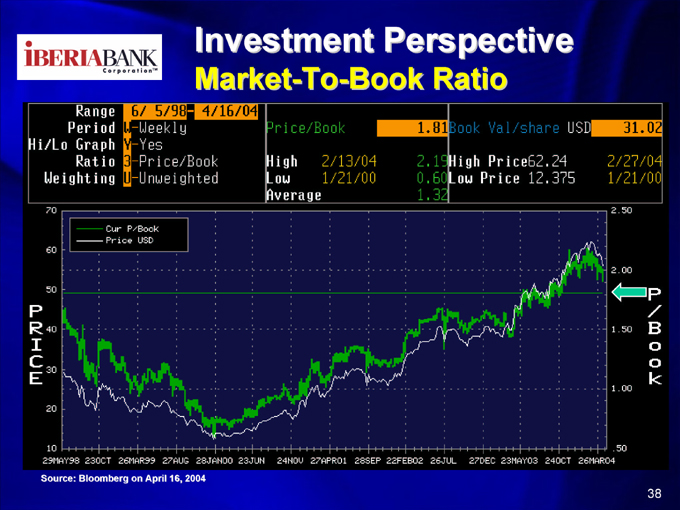
Investment Perspective
Market-To-Book Ratio
Source: Bloomberg on April 16, 2004
38
Investment Perspective
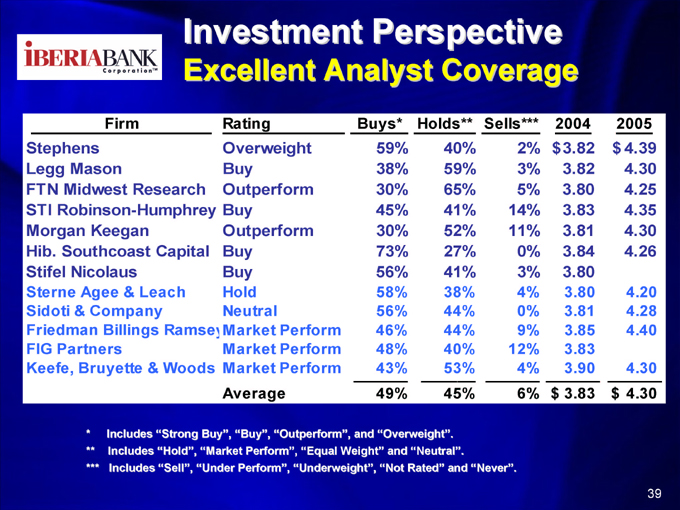
Excellent Analyst Coverage
Firm Rating Buys* Holds** Sells*** 2004 2005
Stephens Overweight 59% 40% 2% $ 3.82 $ 4.39
Legg Mason Buy 38% 59% 3% 3.82 4.30
FTN Midwest Research Outperform 30% 65% 5% 3.80 4.25
STI Robinson-Humphrey Buy 45% 41% 14% 3.83 4.35
Morgan Keegan Outperform 30% 52% 11% 3.81 4.30
Hib. Southcoast Capital Buy 73% 27% 0% 3.84 4.26
Stifel Nicolaus Buy 56% 41% 3% 3.80
Sterne Agee & Leach Hold 58% 38% 4% 3.80 4.20
Sidoti & Company Neutral 56% 44% 0% 3.81 4.28
Friedman Billings Ramse Market Perform 46% 44% 9% 3.85 4.40
FIG Partners Market Perform 48% 40% 12% 3.83
Keefe, Bruyette & Woods Market Perform ______ 43% ______ 53% ______ 4% ______ 3.90 ______ 4.30
Average 49% 45% 6% $ 3.83 $ 4.30
* Includes “Strong Buy”, “Buy”, “Outperform”, and “Overweight”.
** Includes “Hold”, “Market Perform”, “Equal Weight” and “Neutral”.
*** Includes “Sell”, “Under Perform”, “Underweight”, “Not Rated” and “Never”.
39
Comparatives
40
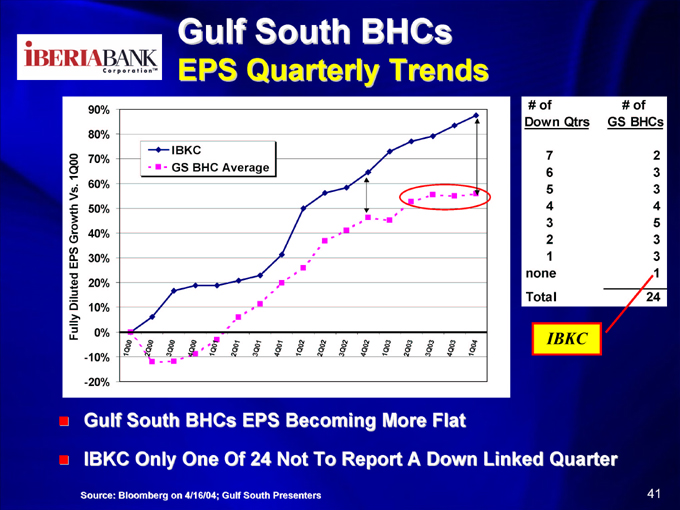
Gulf South BHCs
EPS Quarterly Trends
90%
80%
70% Vs. 1Q00 60% Growth 50% 40% EPS 30% Diluted 20% 10% Fully 0% -10%
-20%
IBKC
GS BHC Average
# of # of
Down Qtrs GS BHCs
7 2
6 3
5 3
4 4
3 5
2 3
1 3
none 1
Total 24
IBKC
Gulf South BHCs EPS Becoming More Flat
IBKC Only One Of 24 Not To Report A Down Linked Quarter
Source: Bloomberg on 4/16/04; Gulf South Presenters
41
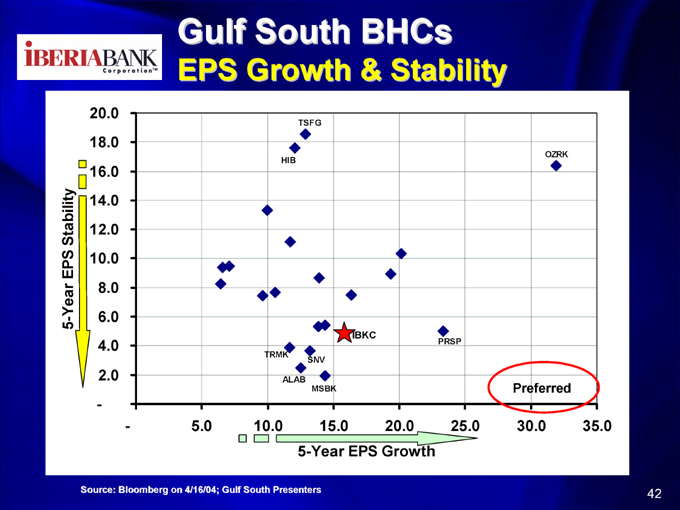
Gulf South BHCs
EPS Growth & Stability
20.0 18.0 16.0 Stability 14.0 12.0 10.0 8.0 5-Year EPS 6.0 4.0 2.0
5.0 10.0 15.0 20.0 25.0 30.0 35.0 5-Year EPS Growth
Source: Bloomberg on 4/16/04; Gulf South Presenters
42
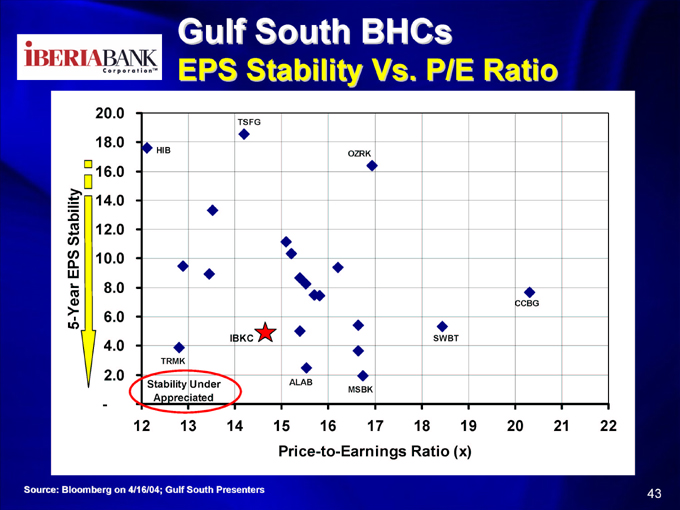
Gulf South BHCs
EPS Stability Vs. P/E Ratio
20.0 18.0 16.0 Stability 14.0 12.0 10.0 8.0 5-Year EPS 6.0 4.0 2.0 -
Source: Bloomberg on 4/16/04; Gulf South Presenters
43
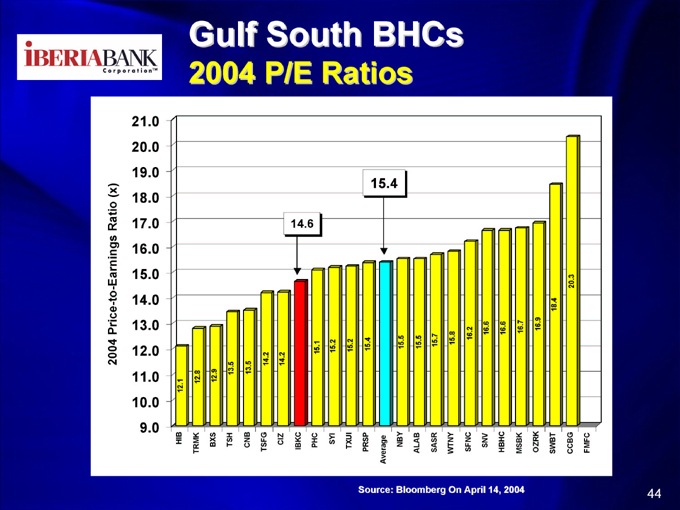
Gulf South BHCs
2004 P/E Ratios
21.0 20.0 19.0 18.0
Ratio (x) 17.0 Earnings 16.0
15.0 14.0 13.0
2004 Price-to- 12.0
11.0 10.0 9.0
Source: Bloomberg On April 14, 2004
44
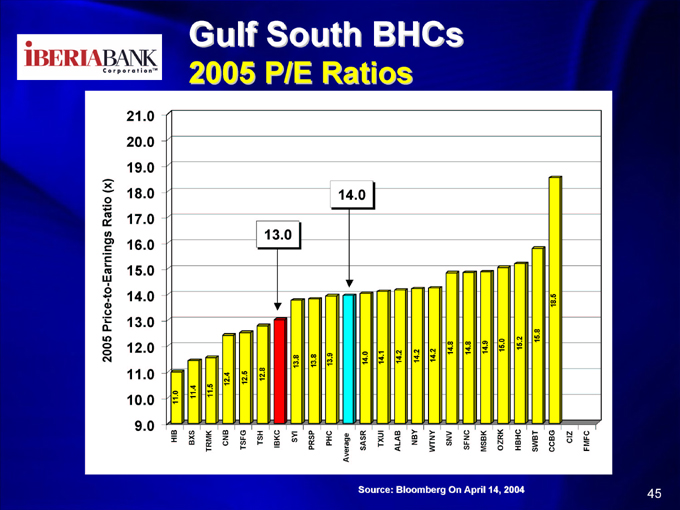
Gulf South BHCs
2005 P/E Ratios
21.0 20.0 19.0 18.0
Ratio (x) 17.0 Earnings 16.0
15.0 14.0 13.0
2005 Price-to- 12.0
11.0 10.0 9.0
Source: Bloomberg On April 14, 2004
45
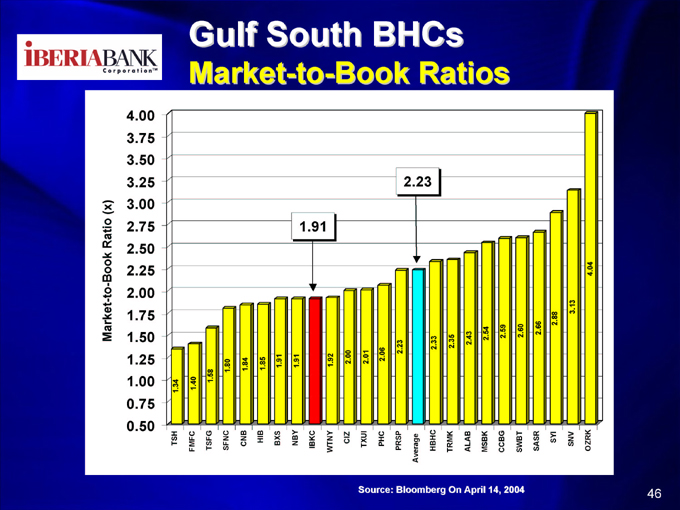
Gulf South BHCs
Market-to-Book Ratios
4.00 3.75 3.50 3.25 3.00 2.75 2.50 2.25 2.00
Market-to-Book Ratio (x) 1.75
1.50 1.25 1.00 0.75 0.50
Source: Bloomberg On April 14, 2004
46
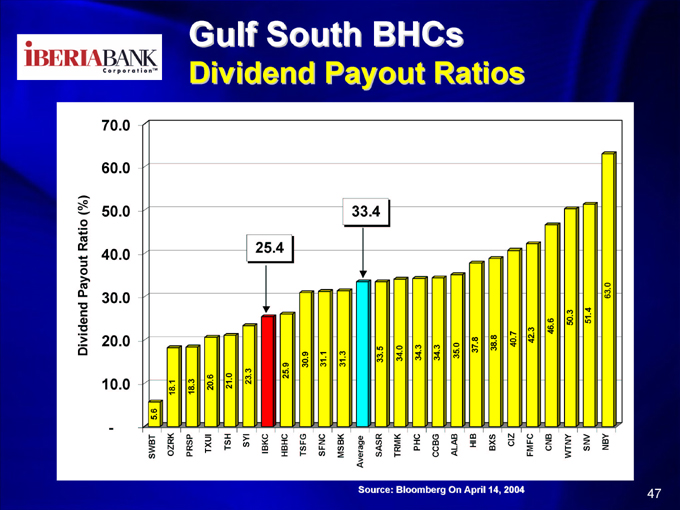
Gulf South BHCs
Dividend Payout Ratios
70.0
60.0
50.0
Payout Ratio (%) 40.0
30.0
Dividend
20.0 10.0 -
Source: Bloomberg On April 14, 2004
47
Summary Of IBKC
Large Bank Resources & Small Bank Agility
People And Relationship Focused
Emphasis On Taking Market Share
Turnaround; Now Growth; Double-Digit EPS
EPS/Stock Price Linkage—Shareholder Focus
Reducing Risk Posture In Many Ways
Building A Solid Platform For Future Growth
Tremendous Expansion Opportunities
48

Iberiabank
An Independent Louisiana Bank

Appendix A
50
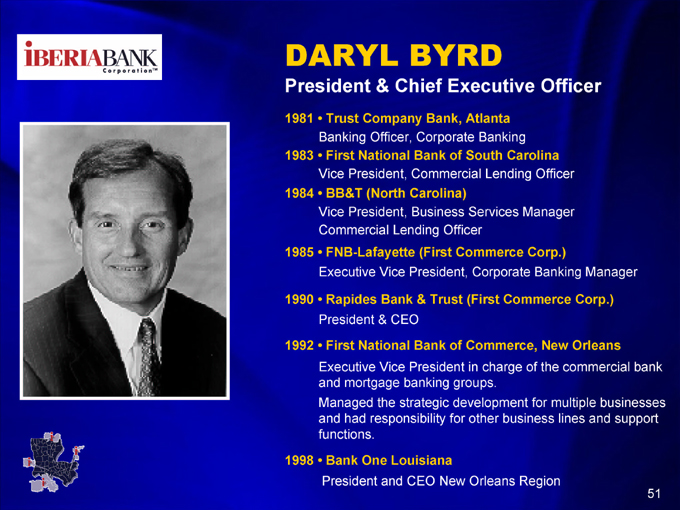
DARYL BYRD
President & Chief Executive Officer
1981 • Trust Company Bank, Atlanta
Banking Officer, Corporate Banking
1983 • First National Bank of South Carolina
Vice President, Commercial Lending Officer
1984 • BB&T (North Carolina)
Vice President, Business Services Manager Commercial Lending Officer
1985 • FNB-Lafayette (First Commerce Corp.)
Executive Vice President, Corporate Banking Manager
1990 • Rapides Bank & Trust (First Commerce Corp.)
President & CEO
1992 • First National Bank of Commerce, New Orleans
Executive Vice President in charge of the commercial bank and mortgage banking groups.
Managed the strategic development for multiple businesses and had responsibility for other business lines and support functions.
1998 • Bank One Louisiana
President and CEO New Orleans Region
51
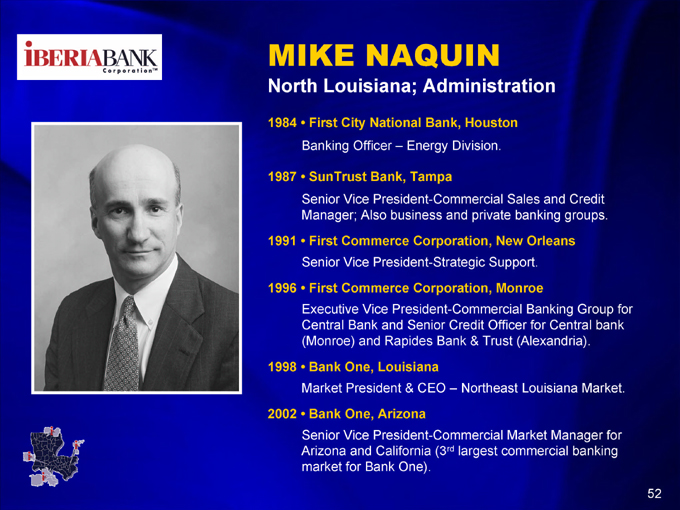
MIKE NAQUIN
North Louisiana; Administration
1984 • First City National Bank, Houston
Banking Officer – Energy Division.
1987 • SunTrust Bank, Tampa
Senior Vice President-Commercial Sales and Credit Manager; Also business and private banking groups.
1991 • First Commerce Corporation, New Orleans
Senior Vice President-Strategic Support.
1996 • First Commerce Corporation, Monroe
Executive Vice President-Commercial Banking Group for Central Bank and Senior Credit Officer for Central bank (Monroe) and Rapides Bank & Trust (Alexandria).
1998 • Bank One, Louisiana
Market President & CEO – Northeast Louisiana Market.
2002 • Bank One, Arizona
Senior Vice President-Commercial Market Manager for Arizona and California (3rd largest commercial banking market for Bank One).
52
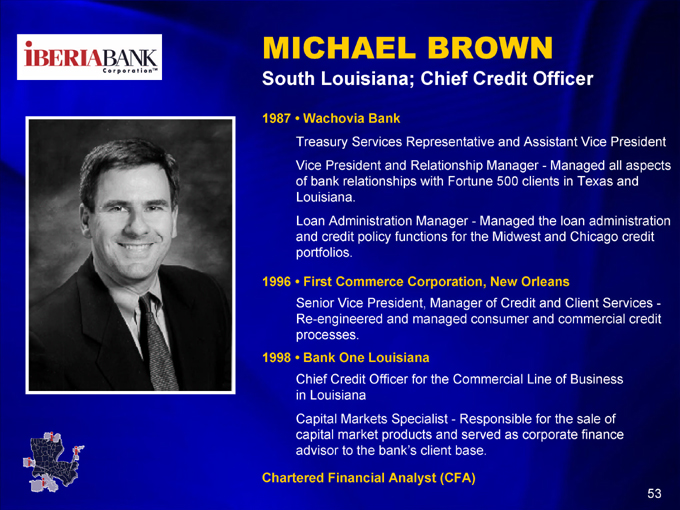
MICHAEL BROWN
South Louisiana; Chief Credit Officer
1987 • Wachovia Bank
Treasury Services Representative and Assistant Vice President Vice President and Relationship Manager—Managed all aspects of bank relationships with Fortune 500 clients in Texas and Louisiana.
Loan Administration Manager—Managed the loan administration and credit policy functions for the Midwest and Chicago credit portfolios.
1996 • First Commerce Corporation, New Orleans
Senior Vice President, Manager of Credit and Client Services -Re-engineered and managed consumer and commercial credit processes.
1998 • Bank One Louisiana
Chief Credit Officer for the Commercial Line of Business in Louisiana Capital Markets Specialist—Responsible for the sale of capital market products and served as corporate finance advisor to the bank’s client base.
Chartered Financial Analyst (CFA)
53
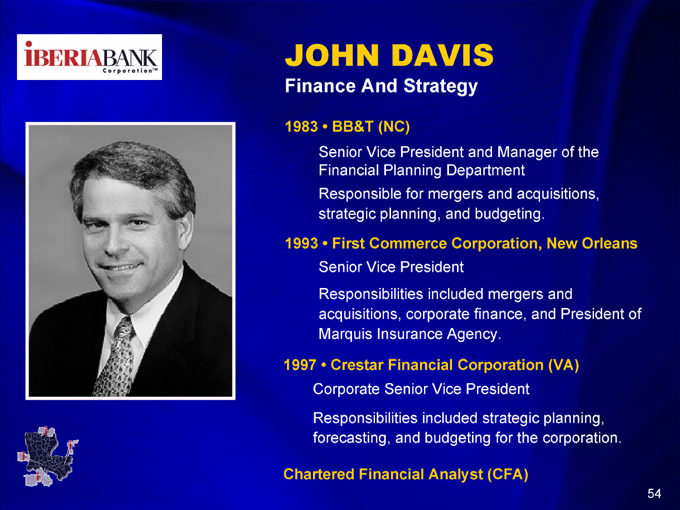
JOHN DAVIS
Finance And Strategy
1983 • BB&T (NC)
Senior Vice President and Manager of the Financial Planning Department Responsible for mergers and acquisitions, strategic planning, and budgeting.
1993 • First Commerce Corporation, New Orleans
Senior Vice President
Responsibilities included mergers and acquisitions, corporate finance, and President of Marquis Insurance Agency.
1997 • Crestar Financial Corporation (VA)
Corporate Senior Vice President
Responsibilities included strategic planning, forecasting, and budgeting for the corporation.
Chartered Financial Analyst (CFA)
54