UNITED STATES
SECURITIES AND EXCHANGE COMMISSION
Washington, D.C. 20549
FORM N-CSR
CERTIFIED SHAREHOLDER REPORT OF REGISTERED
MANAGEMENT INVESTMENT COMPANIES
Investment Company Act file number: 811-08894
JNL Series Trust
(Exact name of registrant as specified in charter)
1 Corporate Way, Lansing, Michigan 48951
(Address of principal executive offices)
225 West Wacker Drive, Suite 1200, Chicago, Illinois 60606
(Mailing address)
Steven J. Fredricks
Jackson National Asset Management, LLC
225 West Wacker Drive, Suite 1200
Chicago, Illinois 60606
(Name and address of agent for service)
Registrant's telephone number, including area code: (517) 381-5500
Date of Fiscal Year End: December 31
Date of Reporting Period: December 31, 2009
Form N-CSR is to be used by management investment companies to file reports with the Commission not later than 10 days after the transmission to stockholders of any report that is required to be transmitted to stockholders under Rule 30e-1 under the Investment Company Act of 1940 (17 CFR 270.30e-1). The Commission may use the information provided on Form N-CSR in its regulatory, disclosure review, inspection, and policymaking roles.
A registrant is required to disclose the information specified by Form N-CSR, and the Commission will make this information public. A registrant is not required to respond to the collection of information contained in Form N-CSR unless the Form displays a currently valid Office of Management and Budget (“OMB”) control number. Please direct comments concerning the accuracy of the information collection burden estimate and any suggestions for reducing the burden to Secretary, Securities and Exchange Commission, 450 Fifth Street, NW, Washington, DC 20549-0609. The OMB has reviewed this collection of information under the clearance requirements of 44 U.S.C. §3507.
Item 1. Report to Shareholders

ANNUAL REPORT
December 31, 2009
• JNL® Series Trust
• JNL Variable Fund LLC
This report is for the general information of qualified and non-qualified plan participants, as well as contract/policy owners of the PerspectiveSM, Perspective II®, Perspective AdvisorsSM, Perspective Advisors IISM, PerspectiveSM L Series, Perspective RewardsSM, CuriangardSM, Perspective AdvantageSM, Perspective Focus®, Perspective Investor VULSM, Ultimate Investor® VUL, Jackson AdvisorSM VUL, Defined Strategies®, Fifth Third Perspective, Retirement LatitudesSM, PerspectiveSM (New York), Perspective IISM (New York), Perspective Advisors IISM (New York), Perspective L SeriesSM (New York), CuriangardSM (New York), Perspective AdvisorsSM (New York), Perspective FocusSM (New York) and Perspective Investor VULSM (New York). Not all the portfolios are available in all of the products. JacksonSM is the marketing name for Jackson National Life Insurance Company® (Home Office: Lansing, Michigan) and Jackson National Life Insurance Company of New York® (Home Office: Purchase, New York).
Issued by Jackson National Life Insurance Company®
1 Corporate Way, Lansing, MI 48951
BUSINESS REPLY MAIL
FIRST-CLASS MAIL PERMIT NO. 600 LANSING, MI
POSTAGE WILL BE PAID BY ADDRESSEE
JACKSON NATIONAL LIFE PO BOX 24068
LANSING MI 48909-9979
President’s Letter to Shareholders
Dear Fellow Investor,
Enclosed is the annual report for the JNL Series Trust and JNL Variable Fund LLC for the year ended December 31, 2009, together with Management’s Discussion of Fund Performance for each of the Funds.
Most of the world’s countries, including the United States, entered 2009 with their economies in turmoil, and equity markets reacted accordingly. Both the Dow Jones Industrial Average (“Dow”) and the S&P 500® Index fell 25% from the beginning of 2009 to touch a 12-year low in March 2009. In late 2008 and early 2009, the U.S. and other countries around the globe implemented unprecedented economic stimulus programs to mitigate the freefall, and these efforts eventually had a stabilizing impact on the world’s financial markets. During the third quarter of 2009, the U.S. economy expanded at a 2.2% rate, marking the end of the longest U.S. recession since World War II, and there were indications that the gross domestic product continued to grow during the fourth quarter as well.
U.S. equity markets responded to the economic recovery by posting their highest annual gains since 2003. From their March lows, the Dow rose 63% and the S&P 500 Index climbed 68% to end the year up 23% and 26%, respectively. World markets rallied along with the U.S.; the MSCI World Index of 23 developed nations surged 73% from its low in March 2009 to post a 30% increase for the year, which also represented its biggest annual gain since 2003.
While market conditions certainly looked brighter at the end of 2009 than they did at the beginning of the year, the U.S. economy will continue to face many challenges in 2010. The U.S. unemployment rate stood at 10% at the end of 2009 and is not expected to improve much during 2010. The steep decline in U.S. housing prices greatly reduced the net worth of many Americans and, combined with continued high unemployment, is likely to constrain consumer spending. As the U.S. Federal Reserve begins its planned exit from some economic stimulus programs, interest rates on mortgages could increase and lead to a further decline in home sales and prices. Furthermore, U.S. small businesses are still experiencing tight credit conditions, which are impeding their growth, and economic experts are warning that the U.S. must take action to curb its national debt or risk sharply rising interest rates and a steep fall in the value of the dollar. Despite these headwinds, most economists expect the U.S. economy to expand modestly during 2010, and the International Monetary Fund estimates that the world economy will grow by more than 3%.
Jackson National Life Insurance Company® and Jackson National Life Insurance Company of New York® (collectively, Jackson®) offer 92 investment options in their variable insurance products to help you and your representative design a portfolio that features a diversified mix of investments based on your goals. During 2009, Jackson added two new total return funds — the JNL/Ivy Asset Strategy Fund and the JNL/Mellon Capital Management Global Alpha Fund — and four new institutional investment portfolios — the JNL Institutional Alt 20 Fund, the JNL Institutional Alt 35 Fund, the JNL Institutional Alt 50 Fund and the JNL Institutional Alt 65 Fund.
Recent events have undermined the confidence that Americans have in many of the country’s financial institutions. With disciplined business practices and demonstrated financial stability, Jackson has earned the trust of its customers. We thank you for your business and will continue to work hard to maintain your trust.

Mark D. Nerud
President and Chief Executive Officer
JNL Series Trust
JNL Variable Fund LLC
[Jackson National Asset Management, LLC Letterhead]
IMPORTANT NOTICE REGARDING DELIVERY OF SHAREHOLDER DOCUMENTS
Dear Client:
If you are a current member of a household with multiple variable products, and have not instructed Jackson otherwise, you currently receive only one copy of the following general documents: Prospectus, Annual and Semi-Annual Report, and other documents as permitted under applicable federal laws relating to Jackson’s variable products and their underlying investment options.
We will continue to send one such copy of these general documents unless and until we receive contrary instructions from you. This delivery policy does not apply to account statements, confirmation statements, or other documents reflecting transaction activity, which you will continue to receive individually.
You may choose to receive a separate copy of these general documents at any time by contacting us toll-free at 1-800-873-5654. Once we receive your request, we will start sending you separate copies within 30 days of receipt of your request.
If you would rather receive your prospectus and other documents via e-mail, please register for Jackson’s Green Delivery Program by visiting the www.Jackson.com. Our Go Paperless process is quick and easy for policyholders – just have your policy number available when you register.
Jackson appreciates your cooperation as we do our part to aid the environment by reducing the amount of paper we distribute. While we’re committed to providing you with the information you need in the format you prefer, we are always looking for new ways to operate more efficiently.
Variable Products issued by Jackson National Life Insurance Company® and distributed by Jackson National Life Distributors LLC, member FINRA. 800/873-5654
JNL Institutional Alt 20 Fund
JNL Institutional Alt 35 Fund
JNL Institutional Alt 50 Fund
JNL Institutional Alt 65 Fund
Jackson National Asset Management, LLC
Steven B. Young
Objective:
The investment objective of the JNL Institutional Alt 20 Fund, JNL Institutional Alt 35 Fund, JNL Institutional Alt 50 Fund and JNL Institutional Alt 65 Fund (collectively, “JNL Institutional Alt Funds” or “Funds”) is long-term growth of capital and income.
Each Fund seeks to achieve its objective by investing in Class A shares of a diversified group of other Funds (“Underlying Funds”). The Underlying Funds in which each Fund may invest are a separate series of JNL Series Trust and the JNL Variable Fund LLC. Each Fund has a target percentage allocation among the Underlying Funds that are categorized as primarily investing in traditional asset classes and non-traditional asset classes. The Underlying Funds available for investing in traditional asset classes are: JNL/Mellon Capital Management S&P 500 Index Fund, JNL/Mellon Capital Management S&P 400 MidCap Index Fund, JNL/Mellon Capital Management Small Cap Index Fund, JNL/Mellon Capital Management International Index Fund, JNL/Mellon Capital Management Bond Index Fund, JNL/Mellon Capital Management European 30 Fund, JNL/Mellon Capital Management Pacific Rim 30 Fund, JNL/S&P Competitive Advantage Fund, JNL/S&P Dividend Income & Growth Fund, JNL/S&P Intrinsic Value Fund, JNL/S&P Total Yield Fund, JNL/Mellon Capital Management JNL 5 Fund, JNL/Mellon Capital Management Select-Small Cap Fund, JNL/Mellon Capital Management 25 Fund, JNL/Mellon Capital Management S&P® 24 Fund, JNL/Mellon Capital Management DowSM Dividend Fund, JNL/Mellon Capital Management Nasdaq® 25 Fund, JNL/Mellon Capital Management Value Line® 30 Fund, JNL/Mellon Capital Management VIP Fund, JNL/Mellon Capital Management JNL Optimized 5 Fund, JNL/Mellon Capital Management S&P® SMid 60 Fund and JNL/Mellon Capital Management NYSE® International 25 Fund. The Underlying Funds available for investing in non-traditional asset classes are: JNL/AIM Global Real Estate Fund, JNL/Credit Suisse Commodity Securities Fund, JNL/Credit Suisse Long/Short Fund, JNL/Goldman Sachs Emerging Markets Debt Fund, JNL/Ivy Asset Strategy Fund, JNL/Lazard Emerging Markets Fund, JNL/Mellon Capital Management Global Alpha Fund, JNL/PIMCO Real Return Fund, JNL/PPM America High Yield Bond Fund and JNL/Red Rocks Listed Private Equity Fund. The performance and investment objectives of the Underlying Funds are discussed elsewhere in this report.
Portfolio Manager Commentary:
Early in 2009, capital markets continued to struggle from the consequences of the prior year’s credit crisis. Transition of political leadership in the U.S., temporary lack of clarity regarding key Cabinet appointments and uncertainty regarding policies to be introduced to help the U.S. recover from the crisis and economic recession compounded investor concern. As leadership roles were filled and stimulative policies enacted, equity markets, as well as other riskier asset classes hit bottom in early March. As the months progressed, economic indicators showed signs of improvement with most asset classes responding positively.
In general, investors’ renewed comfort with risk was evident in the progressively stronger returns for the riskier asset classes in the last three quarters of the year. Within the global bond markets, the broad Barclays Capital U.S. Aggregate Bond Index was up 5.93% for the year. Higher returns were realized in the Barclays Capital TIPS Index, which was up 11.41%, the emerging market debt market, as measured by the JPMorgan Government Bond Index-Emerging Markets (“GBI EM”) Global Diversified Bond Index, was up 21.98%, and the U.S. high yield bond market, as measured by the Merrill Lynch High Yield Master II Constrained Index, was up 58.10% for the year. Equities benefited as the S&P 500® Index increased 26.46% while the MSCI EAFE Index of developed markets rose 31.78%, and the MSCI Emerging Market Stock Index was up 78.51% for the year.
The April 6th, 2009 inception of the JNL Institutional Alt Funds benefited from the synchronized rebound in many asset classes following the March lows. The Fund allocations to the more traditional asset classes benefited from strong U.S. equity performance, particularly in the JNL/Mellon Capital Management Nasdaq® 25 Fund and the JNL/Mellon Capital Management S&P SMid 60 Fund. Equally strong returns came from the assets allocated to alternative investments including the JNL/Credit Suisse Commodity Securities Fund, the JNL/Lazard Emerging Markets Fund and the JNL/PPM America High Yield Bond Fund.
JNL Institutional Alt 20 Fund
For the period April 6, 2009 through December 31, 2009, the Fund underperformed one of its benchmark by posting a return of 27.30% for Class A shares compared to 42.44% for the MSCI All Country World Equity Index. The Fund outperformed its other benchmark, the Barclays Capital U.S. Aggregate Bond Index, which returned 6.23%.
The Fund allocates approximately 80% of its assets to Underlying Funds that invest primarily in traditional asset classes, allocating approximately 25% to 35% in fixed income securities, 30% to 40% in U.S. equity securities and 5% to 15% in international securities. In addition, the Fund allocates approximately 20% to Underlying Funds that invest primarily in non-traditional asset classes.
In the fourth quarter of 2009, the JNL/Mellon Capital Management Global Alpha Fund replaced the Fund’s investment in the JNL/Credit Suisse Long/Short Fund. While it only represents a 2% allocation, the intended affect is to seek an improvement in the complementary aspects among the investments within the overall Fund. The JNL/Mellon Capital Management Global Alpha Fund seeks to provide a positive return over most 12 months periods, a performance tendency complementary to that of the more volatile equity portfolios in the Fund.
At year end, the individual Fund allocations were in line with targets for the traditional investments, with U.S. stocks, international developed market stocks and U.S. bonds at 80%; and the alternative investments, with high yield and emerging market bonds, emerging market equities, global real estate, tactical strategies and listed private equity at 20%.
JNL Institutional Alt 35 Fund
For the period April 6, 2009 through December 31, 2009, the Fund underperformed one of its benchmark by posting a return of 32.40% for Class A shares compared to 42.44% for the MSCI All Country World Equity Index. The Fund outperformed its other benchmark, the Barclays Capital U.S. Aggregate Bond Index, which returned 6.23%.
The Fund allocates approximately 65% of its assets to Underlying Funds that invest primarily in traditional asset classes, allocating approximately 20% to 30% in fixed income securities, 25% to 35% in U.S. equity securities and 5% to 15% in international securities. In addition, the Fund allocates approximately 35% to Underlying Funds that invest primarily in non-traditional asset classes.
In the fourth quarter of 2009, numerous Fund changes took place within the alternative investment allocations, introducing two investment strategies and eliminating one. The JNL/Ivy Asset Strategy Fund and JNL/Mellon Capital Management Global Alpha Fund replaced the JNL/Credit Suisse Long/Short Fund. The intended affect is to provide modest tactical flexibility among asset classes and seek a more complementary mix of investments within the overall Fund.
The JNL/Ivy Asset Strategy Fund has flexibility to bias the portfolio toward asset classes that may benefit from ever-changing market cycles. The JNL/Ivy Asset Strategy Fund is expected to transition between stocks, bonds, cash, precious metals and currency markets. The JNL/Mellon Capital Management Global Alpha Fund seeks to provide a positive return over most 12 months periods, a performance tendency complementary to that of the more volatile equity portfolios in the Fund. Compared to the JNL/Credit Suisse Long/Short Fund, both the JNL/Ivy Asset Strategy Fund and the JNL/Mellon Capital Management Global Alpha Fund are expected to offer more complementary return patterns compared to other equity portfolios in the overall Fund.
At year end, the individual Fund allocations were in line with targets for the traditional investments with U.S. stocks, international developed market stocks and U.S. bonds at 65%; and the alternative investments with high yield and emerging market bonds, emerging market equities, global real estate, tactical strategies and listed private equity at 35%.
JNL Institutional Alt 50 Fund
For the period April 6, 2009 through December 31, 2009, the Fund underperformed one of its benchmarks by posting a return of 35.70% for Class A shares compared to 42.44% for the MSCI All Country World Equity Index. The Fund outperformed its other benchmark, the Barclays Capital U.S. Aggregate Bond Index, which returned 6.23%.
The Fund allocates approximately 50% of its assets to Underlying Funds that invest primarily in traditional asset classes, allocating approximately 15% to 25% in fixed income securities, 20% to 30% in U.S. equity securities and 0% to 10% in international securities. In addition, the Fund allocates approximately 50% to Underlying Funds that invest primarily in non-traditional asset classes.
In the fourth quarter of 2009, numerous Fund changes took place within the alternative investment allocations, introducing two investment strategies and eliminating one. The JNL/Ivy Asset Strategy Fund and JNL/Mellon Capital Management Global Alpha Fund replaced the JNL/Credit Suisse Long/Short Fund. The intended affect is to provide modest tactical flexibility among asset classes and seek a more complementary mix of investments within the overall Fund.
The JNL/Ivy Asset Strategy Fund has flexibility to bias the portfolio toward asset classes that may benefit from ever-changing market cycles. The JNL/Ivy Asset Strategy Fund is expected to transition between stocks, bonds, cash, precious metals and currency markets. The JNL/Mellon Capital Management Global Alpha Fund seeks to provide a positive return over most 12 months periods, a performance tendency complementary to that of the more volatile equity portfolios in the Fund. Compared to the JNL/Credit Suisse Long/Short Fund, both the JNL/Ivy Asset Strategy Fund and the JNL/Mellon Capital Management Global Alpha Fund are expected to offer more complementary return patterns compared to other equity portfolios in the overall Fund.
At year end, the individual Fund allocations were in line with targets for the traditional investments with U.S. stocks, international developed market stocks and U.S. bonds at 50%; and the alternative investments with high yield and emerging market bonds, emerging market equities, global real estate, tactical strategies and listed private equity at 50%.
JNL Institutional Alt 65 Fund
For the period April 6, 2009 through December 31, 2009, the Fund underperformed one of its benchmarks by posting a return of 39.70% for Class A shares compared to 42.44% for the MSCI All Country World Equity Index. The Fund outperformed its other benchmark, the Barclays Capital U.S. Aggregate Bond Index, which returned 6.23%.
The Fund allocates approximately 35% of its assets to Underlying Funds that invest primarily in traditional asset classes, allocating approximately 0% to 10% in fixed income securities, 15% to 25% in U.S. equity securities and 0% to 10% in international securities. In addition, the Fund allocates approximately 65% to Underlying Funds that invest primarily in non-traditional asset classes.
At the end of the third quarter, numerous Fund changes took place within the alternative investment allocations, introducing two investment strategies and eliminating one. The JNL/Ivy Asset Strategy Fund and JNL/Mellon Capital Management Global Alpha Fund replaced the JNL/Credit Suisse Long/Short Fund. The intended affect is to provide modest tactical flexibility among asset classes and seek a more complementary mix of investments within the overall Fund.
The JNL/Ivy Asset Strategy Fund has flexibility to bias the portfolio toward asset classes that may benefit from ever-changing market cycles. The JNL/Ivy Asset Strategy Fund is expected to transition between stocks, bonds, cash, precious metals and currency markets. The JNL/Mellon Capital Management Global Alpha Fund seeks to provide a positive return over most 12 months periods, a performance tendency complementary to that of the more volatile equity portfolios in the Fund. Compared to the JNL/Credit Suisse Long/Short Fund, both the JNL/Ivy Asset Strategy Fund and the JNL/Mellon Capital Management Global Alpha Fund are expected to offer more complementary return patterns compared to other equity portfolios in the overall Fund.
At year end, the individual Fund allocations were in line with targets for the traditional investments with U.S. stocks, international developed market stocks and U.S. bonds at 35%; and the alternative investments with high yield and emerging market bonds, emerging market equities, global real estate, tactical strategies and listed private equity at 65%.
JNL Institutional Alt 20 Fund Total Returns for Class A Shares | |
| Since Inception | 27.30% |
| (Inception date April 6, 2009) | |
JNL Institutional Alt 35 Fund Total Returns for Class A Shares | |
| Since Inception | 32.40% |
| (Inception date April 6, 2009) | |
JNL Institutional Alt 50 Fund Total Returns for Class A Shares | |
| Since Inception | 35.70% |
| (Inception date April 6, 2009) | |
JNL Institutional Alt 65 Fund Total Returns for Class A Shares | |
| Since Inception | 39.70% |
| (Inception date April 6, 2009) | |
Past performance is not predictive of future performance. Investment return and principal value will fluctuate so that an investor's shares, when redeemed, may be worth more or less than their original cost. Performance numbers are net of all Fund operating expenses, but do not reflect the deduction of insurance charges.
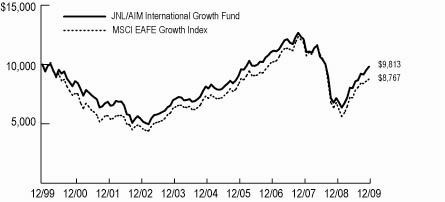
JNL/AIM International Growth Fund
Invesco AIM Capital Management , Inc.
Team Management
Objective:
The investment objective of the JNL/AIM International Growth Fund is long-term growth of capital.
Portfolio Manager Commentary:
For the year ended December 31, 2009, the Fund outperformed its benchmark by posting a return of 36.99% for Class A shares compared to 29.36% for the MSCI EAFE Growth Index.
Outperformance versus the Fund’s benchmark came from information technology (“IT”), utilities, healthcare and financial sectors. In each instance, favorable stock selection was a key contributor to the outperformance. Healthcare equipment and pharmaceutical industries were the main contributors in healthcare. While in the IT sector, the IT services and electronic equipment segments outperformed the benchmark.
In broad geographical terms, all regions in which the Fund was invested delivered double-digit gains during the year. Compared to the benchmark, Fund holdings in Asia outperformed versus the Asian component of the benchmark. The Fund’s holdings in Europe modestly lagged the benchmark component during the year. Exposure in emerging markets also helped as these markets saw staggering gains throughout the year. The Fund’s benchmark does not provide exposure to emerging markets.
In contrast, the Fund’s cash position was the largest detractor from performance during the year as equities rallied. The Fund’s cash exposure was not a strategic decision, but a fall-out of what occurred in economies and markets globally. While normal cash position is 5-6%, the Fund ran a much higher cash position during the year due to the lack of conviction in new investment opportunities. However, the cash exposure in the Fund came down significantly during the year and is now at approximately 8%. In addition, despite delivering double-digit gains in the materials sector, the Fund’s underweight exposure prevented the Fund from fully participating in this sector’s strength.
During the first few months of the year, global equity markets experienced declines as severe problems in the credit markets, a rapidly deteriorating housing market, rising energy and food prices and a deteriorating outlook for corporate earnings led to a global economic recession. Global equity markets began to recover some of the losses in early March as unprecedented, synchronized action by global policy makers improved the outlook for economic recovery. The vast majority of developed countries finished the year in positive territory, with emerging markets like China and Indonesia posting even larger gains.
All sectors delivered double-digit gains during the year and contributed positively to absolute results. The top three contributing sectors to Fund performance included consumer staples, healthcare and consumer discretionary. The top five companies that contributed to Fund performance were Anheuser-Busch InBev NV, Infosys Technologies Ltd., Nidec Corp., BHP Billiton Ltd. and Sonova Holding AG. Significant purchases during the year included Talisman Energy Inc., BG Group Plc, Koninklijke Ahold NV, Koninklijke KPN NV, CSL Ltd. and Hyundai Mobis. Significant sales during the year included Cap Gemini SA, Heineken Holding NV, Henkel AG & Co. KGaA, Porsche Automobil Holding SE and Telekomunikasi Indonesia Tbk PT.
Stock selection in the Fund is driven by the underlying fundamentals of a company versus any top down macroeconomic views. Therefore, the Fund’s exposure in the energy, industrial and healthcare sectors increased during the year due to a combination of new purchases and appreciation. Liquidations in the consumer discretionary and IT sectors led to a reduction in Fund’s exposure to these segments of the market.
At the end of the year, the Fund was overweight healthcare, energy, telecommunication services and IT. The Fund was underweight materials, financials, consumer staples, utilities, consumer discretionary and industrials.
JNL/AIM International Growth Fund (Class A)
Average Annual Total Returns for Class A Shares | |
| 1 year | 36.99% |
| 5 year | 3.80% |
| 10 year | -0.19% |
Average Annual Total Returns for Class B Shares | |
| 1 year | 39.94% |
| 5 year | 4.42% |
| 10 year | 5.61% |
Invesco AIM Capital Management, Inc. assumed portfolio management responsibility on December 3, 2007.
Past performance is not predictive of future performance. Investment return and principal value will fluctuate so that an investor's shares, when redeemed, may be worth more or less than their original cost. Performance numbers are net of all Fund operating expenses, but do not reflect the deduction of insurance charges.
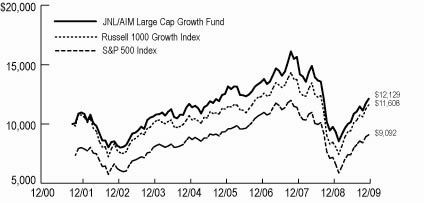
JNL/AIM Large Cap Growth Fund
Invesco AIM Capital Management, Inc.
Team Management
Objective:
The investment objective of the JNL/AIM Large Cap Growth Fund is long-term growth of capital.
Portfolio Manager Commentary:
For the year ended December 31, 2009, the Fund underperformed its benchmarks by posting a return of 24.29% for Class A shares compared to 26.46% for the S&P 500 Index and 37.21% for the Russell 1000® Growth Index. Much of the Fund’s underperformance was due to a more defensive position across and within sectors at the market inflection point as well as stock selection across sectors.
During the first two months of the year, equity markets experienced steep declines as severe problems in the credit markets, a rapidly deteriorating housing market, rising energy and food prices and a deteriorating outlook for corporate earnings led to a global economic recession. However, the U.S. economy began to show signs that the economic contraction was moderating, and equity markets reversed direction starting in March and continued for most of the remaining months in the year.
During the market decline, the Fund benefited from a more defensive posture, with overweight positions in less economically sensitive sectors such as healthcare, and underweight positions in more economically sensitive sectors such as consumer discretionary, energy and materials. Additionally, within sectors, the Fund benefited from higher exposure to less cyclical holdings. However, the Fund began to underperform the Russell 1000 Growth Index when equity markets hit a bottom and began to rebound in March 2009.
Fund underperformance was driven primarily by two factors. First, much of the Fund’s underperformance was driven by its defensive posture both within and across sectors, as more economically sensitive stocks outperformed following the March low. Second, the Fund underperformed because it did not own many of the lower quality, highly levered companies that outperformed during the market rebound. Our investment approach specifically avoids companies with these traits because over the long-term they tend to perform poorly.
Throughout the year, the Fund underperformed by the widest margin in the consumer discretionary sector, primarily due to stock selection. Much of the Fund’s underperformance was because it did not own many of the lower quality companies that performed strongly during the stock market rebound.
The Fund’s top five contributors included Apple Inc., Hewlett Packard Co., Microsoft Corp., International Business Machines Corp. and Adobe Systems Inc. The five largest purchases made during the year included BHP Billiton Ltd, EMC Corp., Goldman Sachs Group Inc., AmerisourceBergen Corp. and Medco Health Solutions Inc. The five largest complete sales made during the year included Lockheed Martin, Baxter International Inc., Wal-Mart Stores Inc., Raytheon Co. and Chubb Corp.
During the year, the most significant positioning changes included additions in more economically sensitive sectors including information technology, materials, consumer discretionary and energy. Purchases in these sectors were largely funded by reducing exposure to the more defensive sectors such as consumer staples and healthcare, as well as industrials and financials.
At year end, the Fund’s largest overweight positions included the information technology, energy and materials sectors. The Fund’s largest underweight positions included the consumer staples, consumer discretionary, utilities and financials sectors.
JNL/AIM Large Cap Growth Fund (Class A)
Average Annual Total Returns for Class A Shares | |
| 1 year | 24.29% |
| 5 year | 0.73% |
| Since Inception | 2.39% |
| (Inception date October 29, 2001) | |
Average Annual Total Returns for Class B Shares | |
| 1 year | 24.57% |
| 5 year | 0.94% |
| Since Inception | 1.88% |
| (Inception date March 5, 2004) | |
Past performance is not predictive of future performance. Investment return and principal value will fluctuate so that an investor's shares, when redeemed, may be worth more or less than their original cost. Performance numbers are net of all Fund operating expenses, but do not reflect the deduction of insurance charges.
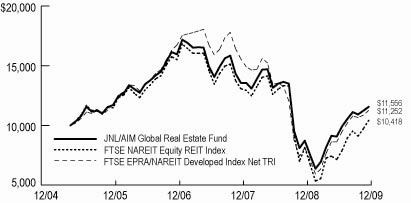
JNL/AIM Global Real Estate Fund
Invesco AIM Capital Management , Inc.
Team Management
Objective:
The investment objective of the JNL/AIM Global Real Estate Fund is high total return.
Portfolio Manager Commentary:
For the year ended December 31, 2009, the Fund underperformed one of its benchmarks by posting a return of 32.53% for Class A shares compared to 38.26% for the FTSE EPRA/NAREIT Developed Index Net TRI. The Fund outperformed its other benchmark, the FTSE NAREIT Equity REIT Index, which returned 27.99%.
A primary reason the Fund underperformed the FTSE EPRA/NAREIT Developed Index Net TRI is that the market rally since March 2009 favored riskier real estate investments. The Fund, on the other hand, focused on companies operating in better real estate markets, with higher quality real estate, better balance sheets and management teams.
In early 2009, equity markets experienced steep declines as credit markets froze and risk premiums rose dramatically in response to the global economic recession. As central banks coordinated easing efforts and companies cut costs aggressively, access to funding improved and market valuations in both the credit and equity markets recovered from the March lows. Real estate securities rallied as a result of improvements in the economy, and more importantly, improved capital availability. Although government programs have normalized credit markets, real estate companies have also taken significant action to recapitalize. In the U.S., real estate companies raised over $17 billion in new equity; globally, close to $51 billion was raised. With better access to capital, companies are expected to pay down debt or take advantage of discounted commercial real estate opportunities. However, real estate typically lags the economy and further improvements in GDP and employment will be needed for real estate fundamentals to fully recover.
Security selection in Japan, the UK and Singapore had the greatest negative impact on the Fund’s relative performance. A combination of security selection and an underweight in China relative to its global benchmark was also a detractor. On the positive side, holdings in U.S. REITs benefited Fund performance from a security selection and market allocation standpoint.
Top contributors to Fund performance for the year included Sun Hung Kai Properties Ltd., Hang Lung Properties Ltd., Simon Property Group Inc., Unibail-Rodamco SE and China Overseas Land & Investment Ltd. Conversely, Kimco Realty Corp., Nippon Building Fund Inc., Mitsubishi Estate Co. Ltd., Mitsui Fudosan Co. Ltd. and SEGRO Plc were top detractors from Fund performance.
Significant purchases during the year included: Hong Kong Land, the Fund increased this position in an effort to re-position portfolio weight from China towards Hong Kong; Goodman Group, an Australian-listed integrated industrial property development and service business which presented deeper value opportunities; and SEGRO Plc, a company that we believe is positioned to generate better earnings growth through the next UK cycle.
Significant sales during the year included: Federal Realty Investment Trust, the Fund reduced this position following outperformance within the shopping center sector. The proceeds were used to purchase another shopping center company with attractive earnings growth potential; Land Securities Group Plc, a relative value company within the UK, the proceeds of which were used to fund the purchase of SEGRO Plc; and Kimco Realty Corp., which was sold due to management changes, increased strategic risks and development projects which continue to pose risks for further writeoffs and additional funding.
One of the outcomes of the Fund’s comprehensive risk management approach is that it tends not to significantly overweight or underweight a sector, country or currency, relative to its benchmarks. The Fund assumes stock specific risk rather than sector risk. The Fund’s focus remains on companies with lower leverage because we think companies with better balance sheets will be able to negotiate a possible downturn better, as well as benefit from favorable acquisition opportunities in the marketplace.
JNL/AIM Global Real Estate Fund (Class A)
Average Annual Total Returns for Class A Shares | |
| 1 year | 32.53% |
| Since Inception | 3.15% |
| (Inception date May 2, 2005) | |
Average Annual Total Returns for Class B Shares | |
| 1 year | 32.86% |
| Since Inception | 3.36% |
| (Inception date May 2, 2005) | |
Past performance is not predictive of future performance. Investment return and principal value will fluctuate so that an investor's shares, when redeemed, may be worth more or less than their original cost. Performance numbers are net of all Fund operating expenses, but do not reflect the deduction of insurance charges.
JNL/AIM Small Cap Growth Fund
Invesco AIM Capital Management, Inc.
Team Management
Objective:
The investment objective of the JNL/AIM Small Cap Growth Fund is long-term growth of capital.
Portfolio Manager Commentary:
For the year ended December 31, 2009, the Fund outperformed its benchmark by posting a return of 34.80% for Class A shares compared to 34.47% for the Russell 2000® Growth Index. Positive outperformance verses its benchmark was driven by stock selection in the industrials, energy and telecommunications sectors. An overweight position in the energy and information technology sectors also contributed to outperformance. Underperformance verses its benchmark was concentrated in the consumer discretionary, consumer staples and materials sectors.
During the first two months of the year, equity markets experienced steep declines as severe problems in the credit markets, a rapidly deteriorating housing market, rising energy and food prices and a deteriorating outlook for corporate earnings led to a global economic recession. However, the U.S. economy began to show signs that the economic contraction was moderating, and equity markets reversed direction starting in March and continued for most of the remaining months in the year.
The Fund outperformed by the widest margin in the industrials sector, driven by stock selection. Outperformance in the energy sector was driven by stock selection and an overweight position. The Fund also outperformed in the telecommunication services sector, due to stock selection.
The Fund underperformed by the widest margin in the consumer discretionary sector. Within this sector, the leading detractor to performance was a for profit education services provider. This more defensive holding had weak performance as investors shifted into more economically sensitive holdings during the market rebound. Much of the remaining underperformance in the consumer discretionary sector was because the Fund did not own many of the more highly leveraged and/or cyclical companies that had the highest performance following the market inflection point.
The Fund’s top five contributors included Starent Networks Corp., Dril-Quip Inc., Tech Data Corp., SBA Communications Corp. and Quality Systems Inc. The five largest purchases made during the year included Sybase Inc., F5 Networks Inc., Corrections Corp. of America, Vistaprint Ltd. and Deckers Outdoor Corp. The five largest complete sales made during the year included Strayer Education Inc., DeVry Inc., Marvel Entertainment Inc., Varian Inc. and Bankrate Inc.
During the year, the most significant positioning changes included additions in more economically sensitive sectors including information technology, consumer discretionary and energy. Purchases in these sectors were largely funded by reducing exposure to the more defensive healthcare sector. All changes to the Fund were based on the Fund’s bottom-up stock selection process of identifying high quality growth companies trading at what we believe are attractive valuations.
At the close of the year, the Fund’s largest overweight positions included the energy and financials sectors. The Fund’s largest underweight positions included the healthcare, consumer staples and consumer discretionary sectors.
JNL/AIM Small Cap Growth Fund (Class A)

Average Annual Total Returns for Class A Shares | |
| 1 year | 34.80% |
| 5 year | 2.35% |
| Since Inception | 4.21% |
| (Inception date October 29, 2001) | |
Average Annual Total Returns for Class B Shares | |
| 1 year | 35.00% |
| 5 year | 2.57% |
| Since Inception | 2.59% |
| (Inception date March 5, 2004) | |
Past performance is not predictive of future performance. Investment return and principal value will fluctuate so that an investor's shares, when redeemed, may be worth more or less than their original cost. Performance numbers are net of all Fund operating expenses, but do not reflect the deduction of insurance charges.
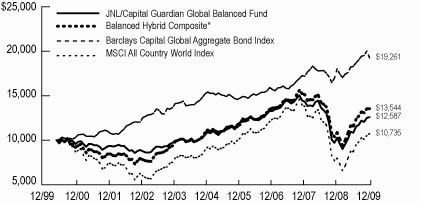
JNL/Capital Guardian Global Balanced Fund
Capital Guardian Trust Company
Team Management
Objective:
The investment objective of the JNL/Capital Guardian Global Balanced Fund is to seek income and capital growth, consistent with reasonable risk.
Portfolio Manager Commentary:
For the year ended December 31, 2009, the Fund underperformed one of its benchmarks by posting a return of 22.48% compared to 34.63% for the MSCI All Country World Index. The Fund outperformed its other benchmark, the Barclays Capital Global Aggregate Bond Index, which returned 6.93%.
Developed market equities rose during the year as represented by the 26% return of the S&P 500 Index. Emerging markets stocks delivered an astounding 79% return as represetned by the MSCI Emerging Markets Index. Credit markets also showed a spectacular return to health. A record $1 trillion in investment grade bonds was sold in primary markets as corporations sought to reduce balance sheet risk by converting shorter term bank debt to longer-term bonds and also build a cushion of reserve capital. The supply was met with equally strong demand. Against the backdrop of an investor hunt for yield reminiscent of the pre-crisis days, high yield bonds, as measured by the Merrill Lynch High Yield Master II Index, delivered a 58% total return, compared to 19% for investment grade bonds, as measured by the Barclays Capital U.S. Aggregate Corporate Index. In contrast, U.S. Treasuries provided a negative total return for the year.
The Fund maintained a greater than benchmark allocation to fixed income for most of 2009, which detracted from relative results.
The equity portion of the Fund had strong returns for the year. The selection of energy stocks was the largest contributor to returns. Asian coal producers, China Shenhua Energy Co. Ltd. and Banpu Public Co. Ltd., were among the stocks that rose sharply, propelled by a resurgence in demand in China and other Asian countries. The decision to hold fewer investments in utilities was supportive of relative results as the sector lagged cyclical areas of the market.
Stock selection in the materials sector was the largest detractor to relative returns particularly due to metals and mining holdings. Selection in information technology was negative as shares of Nintendo Co. Ltd. fell amid ongoing concerns about slowing demand for its Wii video game consoles. We remained selective in the Fund’s investments in financials which was detrimental as a sharp rally in this sector translated into higher returns for the riskier banks and insurers. Nevertheless, several of the Fund’s financial holdings had strong returns, including Goldman Sachs Group Inc., the top contributor to absolute returns, which benefited from resurgent capital markets. The Fund’s cash position was also a drag in a rising market.
Within the fixed income portion of the Fund, the decision to have few investments in the Japanese bond market and the yen currency was a positive factor. The resurgence of deflation and a rising fiscal deficit weighed on Japan’s government bonds and the currency. An overweight stance on the Australian dollar, a currency we favor because of its sensitivity to commodity price rises, also benefited the Fund. However, the underweight exposure to the British pound was a detractor. At a sector level, the less than benchmark investment in corporate bonds and overweight stance in Treasuries was also a negative contributor to relative returns.
Looking to 2010, we are focused on finding companies that will be able to reliably grow revenues beyond 2010 as the inventory cycle wanes and the benefits of monetary and fiscal policies gradually fade.
Within the fixed income portion of the Fund, we have an underweight in corporate bonds and an overweight in Treasuries. We expect the U.S. Federal Reserve to keep an accommodative monetary policy as long as unemployment remains elevated and inflation remains tame. Against this backdrop, Treasury yields may fluctuate within a wider range than in 2009, but we do not expect them to spike sharply higher.
JNL/Capital Guardian Global Balanced Fund (Class A)
Average Annual Total Returns for Class A Shares | |
| 1 year | 22.48% |
| 5 year | 2.95% |
| Since Inception | 2.41% |
| (Inception date May 1, 2000) | |
Average Annual Total Returns for Class B Shares | |
| 1 year | |
| 5 year | |
| Since Inception | |
| (Inception date March 5, 2004) | |
Capital Guardian Trust Company assumed portfolio management responsibility on December 3, 2007.
*Balanced Hybrid Composite is composed of 65% MSCI All Country World Index, 35% Barclays Capital Global Aggregate Bond Index.
Past performance is not predictive of future performance. Investment return and principal value will fluctuate so that an investor's shares, when redeemed, may be worth more or less than their original cost. Performance numbers are net of all Fund operating expenses, but do not reflect the deduction of insurance charges.
JNL/Capital Guardian Global Diversified Research Fund
Capital Guardian Trust Company
Team Management
Objective:
The investment objective of the JNL/Capital Guardian Global Diversified Research Fund is long-term growth of capital.
Portfolio Manager Commentary:
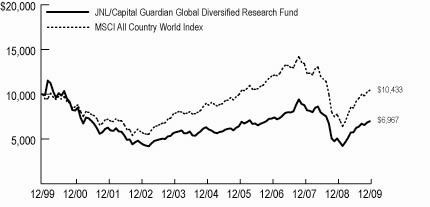
For the year ended December 31, 2009, the Fund outperformed its benchmark by posting a return of 38.32% compared to 34.63% for the MSCI All Country World Index.
Financial assets rebounded sharply in 2009 in an almost steady climb after touching a bottom in March. Developed market equities rose during the year as represented by the 26% return of the S&P 500 Index, while emerging markets stocks delivered an astounding 79% return as represented by the MSCI Emerging Markets Index, supported partly by the resumption of high single digit GDP growth in both China and India. Commodities rallied and gold touched an all time high. The U.S. dollar weakened against most currencies, falling sharply versus commodity linked currencies but rising slightly against the Japanese yen.
The Fund outpaced its benchmark for the year. The choice of energy stocks was the biggest contributor to Fund gains for the year. The Fund’s holding in Brazil’s Petròleo Brasileiro SA. was helped by new deepwater oil and natural gas discoveries. Canadian Natural Resources, which specializes in oil sands extraction, and China Shenhua Energy Co. Ltd. also contributed, as did Norway’s SeaDrill Ltd., an operator of deepwater oil rigs.
The choice of consumer discretionary stocks aided relative results. Automobile manufacturers and auto components companies benefited from sales increases boosted by government supported purchase initiatives. The underweight stance in the utilities sector, which typically lags in an economic recovery, helped. Within telecommunication services, another typically defensive area, stock choice and emphasis on companies with exposure to emerging markets mitigated some of the negative effects of being overweight the sector. American Tower Corp., which builds infrastructure for wireless telecommunications ended the year as the Fund’s largest holding and was a notable contributor.
Stock choice in the materials sector hurt Fund results. Commodity prices soared as economic conditions improved, lifting the values of Rio Tinto Ltd. and Vale S.A. Overseas Ltd., both iron ore miners. But the lack of exposure to some gold miners weighed on results, as these companies had additional support from increased buying by central banks. As financials rallied worldwide the Fund’s underweight position and stock choice in the sector, particularly among insurance firms and commercial banks, held back returns. Some financial holdings were major contributors, however, including investment bank Goldman Sachs Group Inc. and banks with ties to fast growing emerging markets, including Bank of China Ltd., HSBC Bank and BNP Paribas. Stock selection also detracted in information technology and industrials. Nintendo Co. Ltd. was pulled down by declining sales for its Wii gaming console, while airlines and machinery makers weighed on the industrials sector. The Fund’s cash position was also a drag in a rising market.
We continue to focus on companies best placed to maintain revenue growth, those with unique products or expertise, dominant positions in fast growing areas or the financial wherewithal to invest for future growth. This is reflected in our choice of technology and consumer related stocks. We have also found many such companies in the materials sector, where demand from emerging markets can be expected to remain strong. Among financials there are fewer opportunities. We have focused our investments in companies with ties to emerging economies and those whose superior risk controls and proven expertise in key areas of the capital markets have allowed them to boost their competitive strength.
JNL/Capital Guardian Global Diversified Research Fund (Class A)
Average Annual Total Returns for Class A Shares | |
| 1 year | 38.32% |
| 5 year | 2.07% |
| 10 year | -3.55% |
Average Annual Total Returns for ClassB Shares | |
| 1 year | 38.63% |
| 5 year | 2.28% |
| Since Inception | 2.96% |
| (Inception date March 5, 2004) | |
Capital Guardian Trust Company assumed portfolio management responsibility on December 3, 2007.
Past performance is not predictive of future performance. Investment return and principal value will fluctuate so that an investor's shares, when redeemed, may be worth more or less than their original cost. Performance numbers are net of all Fund operating expenses, but do not reflect the deduction of insurance charges.
JNL/Capital Guardian International Small Cap Fund
Capital Guardian Trust Company
Team Management
Objective:
The investment objective of the JNL/Capital Guardian International Small Cap Fund is long-term growth of capital and income.
Portfolio Manager Commentary:
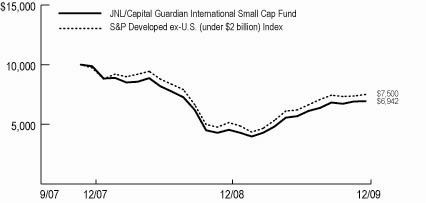
For the year ended December 31, 2009, the Fund outperformed its benchmark by posting a return of 52.93% compared to 45.70% for the S&P Developed ex-U.S. (under $2 billion) Index.
Stocks rebounded sharply in 2009 in an almost steady climb after touching a bottom in March. The energy and materials sectors led the market. Rising oil prices lifted energy stocks, while robust demand for base metals in China and India drove materials higher. Gold stocks rose as gold hit an all time high, boosted by central bank buying and demand from exchange traded funds (“ETFs”) tied to commodities. Cyclical sectors such as information technology and consumer discretionary did well, while the more defensive areas of consumer staples and healthcare lagged the market.
The Fund’s gains outpaced its benchmark. Stock selection in the materials sector was the largest contributor. Petropavlovsk Plc, formerly Peter Hambro Mining Plc (“Peter Hambro”), Russia’s third largest gold producer, rallied as gold prices soared to record levels and the company announced a production increase of nearly 30% and a joint iron ore venture with China’s XY Group. Aricom Plc was the top contributor overall as Peter Hambro reacquired the iron ore producer just six years after spinning it out.
In the information technology sector, Dialog Semiconductor Plc rose after lifting its earnings guidance for the year. Among industrials, online employment advertiser Seek Ltd. benefited as the economic downturn led to a significant migration of job ads from print to online. SMA Solar Technology SA gained on the potential increase in demand for solar products, and Dutch staffing firm Brunel International NV rose as market conditions improved.
Our selection of consumer related stocks was a positive factor as consumers began to regain their confidence and increase spending. In consumer staples, Brazilian retail pharmacy Drogasil SA rose on plans to add about 40 stores as the pharmaceutical industry withstood the country’s economic slump.
Several Japanese companies, including retailers Sundrug Co. Ltd. and ABC-Mart Inc. and boiler maker Miura Co. Ltd., were among the largest detractors as small cap stocks in Japan lagged most other markets. In the healthcare sector, shares of Hogy Medical Co. Ltd. and other device companies fell. Danish biotechnology company Genmab A/S was the largest detractor as the company said it would report a large loss in 2009 due to the absence of a milestone payment for its experimental leukemia drug Arzerra. The Fund’s cash position was the biggest drag in a rising equity market.
We reduced the Fund’s investments in Japan, eliminating Nakanishi Inc. and Micronics Japan Co. Ltd., while adding to investments in the UK and Canada. We added Iluka Resources Ltd. in the
materials sector, and also increased our investments in financials and information technology while decreasing our holdings in energy and healthcare.
Our largest areas of investment relative to the market continue to be information technology, consumer staples and healthcare. Several technology stocks should benefit from the onset of a new upgrade cycle. We remain more cautious on financials, particularly certain European banks due to the uncertain regulatory landscape and lack of growth opportunities. In Japan, we have hope that small-cap stocks will rebound as currency trends improve and the new Democratic Party enacts policies that should mostly favor smaller companies, especially those with strong ties to China.
JNL/Capital Guardian Internatonal Small Cap Fund (Class A)
Average Annual Total Returns for Class A Shares | |
| 1 year | 52.93% |
| Since Inception | -16.11% |
| (Inception date December 3, 2007) | |
Average Annual Total Returns for Class B Shares | |
| 1 year | 53.05% |
| Since Inception | -15.89% |
| (Inception date December 3, 2007) | |
Past performance is not predictive of future performance. Investment return and principal value will fluctuate so that an investor's shares, when redeemed, may be worth more or less than their original cost. Performance numbers are net of all Fund operating expenses, but do not reflect the deduction of insurance charges.
JNL/Capital Guardian U.S. Growth Equity Fund
Capital Guardian Trust Company
Team Management
Objective:
The investment objective of the JNL/Capital Guardian U.S. Growth Equity Fund is long-term growth of capital.
Portfolio Manager Commentary:
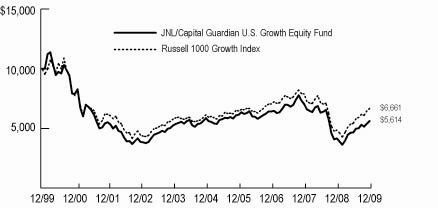
For the year ended December 31, 2009, the Fund underperformed its benchmark by posting a return of 34.91% compared to 37.21% for the Russell 1000 Growth Index.
Equity markets began the year in freefall. They hit bottom on March 9 and climbed steadily thereafter, ending the year substantially higher. The information technology, materials and consumer discretionary sectors led the market. Financials, which had the steepest declines during the crisis, more than doubled from their lows in March, but lagged for the calendar year.
Technology companies benefited from the weak dollar and the anticipation of a major upgrade cycle. Resurgent demand for raw materials from China triggered a surge in prices for commodities and materials companies. Consumer discretionary stocks were helped by improving economic data, including retail sales that held up better than had been feared and consumer confidence that perked up from depressed levels. Returns for healthcare stocks were restrained by uncertainty as Congress debated sweeping legislation.
The Fund appreciated in value but did not keep pace with its benchmark. Stock selection among industrials was the largest detractor to the Fund’s performance. First Solar Inc. had negative returns as investors worried about the level of government subsidies and the ability of its customers to finance projects. Iron Mountain Inc., which specializes in records management and is not as cyclical in nature as other industrials, also declined. Stock selection among financials overall was a negative factor. The Fund’s cash position was also a drag in a rising market.
On the positive side, shares of Goldman Sachs Group Inc., Google Inc., Cerner Corp. and Apple Inc. all more than doubled, helping Fund returns. Goldman Sachs benefited from resurgent capital markets. Google Inc. rose on gains in advertising revenue and hopes for its Android operating system for mobile devices. Cerner Corp. was helped by government incentives to digitize medical records. Apple Inc. experienced a surge in the popularity of its iPhone. American Tower Corp. also helped Fund results, benefiting from the growing ubiquity of mobile browsing and the need for carriers to upgrade wireless infrastructure. Deemphasizing consumer staples stocks helped results as the sector lagged the rally. Owning very little of Exxon Mobil Corp. was also a plus, as the stock posted negative returns for the year.
We added to the areas of materials, consumer staples and energy. This included purchases of Monsanto Co., Wal-Mart Stores Inc. and Schlumberger Ltd. We reduced the Fund’s exposure to consumer discretionary and industrial stocks, including Omnicom Group Inc. and United Parcel Service Inc. Within the technology sector we trimmed Yahoo! Inc. and Google Inc. while purchasing Juniper Networks Inc. In the area of healthcare we purchased Aetna Inc. and sold Genentech Inc. and Gilead Sciences Inc.
We have significant investments in media and retail companies, believing the diminished consumer spending consensus may be overly pessimistic. We are focused on finding companies that will be able to reliably grow revenues beyond 2010 as the inventory cycle wanes and the benefits of monetary and fiscal policies fade. The Fund owns companies that we believe fit this description in the areas of technology, where product cycles have revived revenue growth; healthcare, where we expect legislation to provide growth opportunities; and materials, where supply bottlenecks and rising global demand for specific products should lead to pricing power.
JNL/Capital Guardian U.S. Growth Equity Fund (Class A)
Average Annual Total Returns for Class A Shares | |
| 1 year | 34.91% |
| 5 year | -0.86% |
| 10 year | -5.61% |
Average Annual Total Returns for Class A Shares | |
| 1 year | 35.16% |
| 5 year | -0.66% |
| Since Inception | 0.40% |
| (Inception date March 5, 2004) | |
Capital Guardian Trust Company assumed portfolio management responsibility on December 3, 2007.
Past performance is not predictive of future performance. Investment return and principal value will fluctuate so that an investor's shares, when redeemed, may be worth more or less than their original cost. Performance numbers are net of all Fund operating expenses, but do not reflect the deduction of insurance charges.
JNL/Credit Suisse Commodity Securities Fund (formerly, JNL/Credit Suisse Global Natural Resources Fund)
Credit Suisse Asset Management, LLC
Jordan Low, Christopher Burton and Andrew B. Karsh
Objective:
The investment objective of the JNL/Credit Suisse Commodity Securities Fund is long-term capital growth.
Portfolio Manager Commentary:
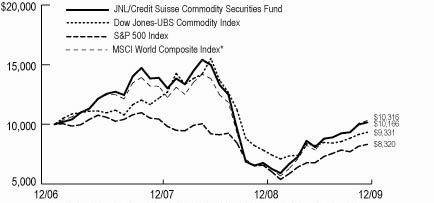
For the year ended December 31, 2009, the Fund outperformed its benchmarks by posting a return of 50.17% for Class A shares compared to 26.46% for the S&P 500 Index and 18.91% for the Dow Jones UBS-Commodity Index.
The equity portion of the Fund benefited from the pronounced global recovery in the markets and the higher beta of equities to raw materials. The valuation factor was the strongest contributor to active returns, best demonstrated by the steel industry. In general, material stocks, such as steel, performed better than energy stocks as they began 2009 at a much deeper discount to book and normalized earnings. The quality factor was the largest detractor to active returns as low quality names significantly outperformed high quality names. In general, low quality securities have greater bankruptcy risk than high quality securities. In the beginning of 2009, the risk of companies entering into bankruptcy increased until the market bottomed. This risk then dissipated as the economy recovered in the latter half of the year.
Following a market sell off in the second half of 2008, commodities delivered solid positive performance to investors in 2009. Signs of economic stabilization started to materialize in the spring and eventually turned into positive growth. This was generally supportive of commodity demand and prices, with particularly favorable returns for base metals and energy. Part of the performance of the commodities portion can be attributed to the strong gains of copper and zinc, up 98.31% and 129.98%, respectively. This is a result of low interest rates, a weaker U.S. dollar, and stockpiling of easily storable commodities by countries such as China.
Unprecedented government stimulus measures were a key factor in driving the beginning of the economic recovery in 2009. The impacts of such efforts are not instantaneous, nor do they merely create one time gains. The benefits will filter through the economy over time and we believe economic strength in the near to intermediate term may take investors by surprise. Commodity markets and other capital markets rationally began to price in these impacts with particular vigor in March 2009, while we believe their future benefits may be under appreciated. Looking at specific examples, the S&P 500 Index gained 26.46% for the year and the Dow Jones Industrial Average gained 22.68%. The commodities market also posted positive results, with the Dow Jones UBS-Commodity Index up 18.91% for the year. Yet, despite positive markets, the economy is still far from recovery as the unemployment rate was at 10.0% as of December 31, 2009, and the U.S. Federal Funds rate continues to be unchanged at 0.00% - 0.25%.
Equities of raw material extractors suffered disproportionately relative to their underlying commodities as markets bottomed. The oil and gas and paper and forest products sectors contributed to alpha while the chemicals sector detracted. Within commodities, the industrial metals sector was the leading contributor to performance, followed by precious metals. The livestock and energy sectors detracted from performance.
Of the equities portion of the Fund, Vale SA and Petroleo Barsileiro SA were the greatest contributors for the year, while Arcelormittal and Teck Cominco Ltd. were the greatest detractors. Within commodities, copper and zinc were the strongest commodities while natural gas and wheat were the weakest.
On June 12, 2009, the Fund converted from a fundamental bottom-up security selection strategy that only invested in natural resources equities to a quantitative strategy which provides exposure to both commodity related securities and a broad based commodities index. Thus, instead of holding only securities, the Fund also holds commodity-linked derivatives. When the Fund transitioned from a securities only Fund to a securities/commodities Fund on June 12, 2009, the asset breakdown was 75% securities and 25% commodities. Subsequently, when the name of the Fund was changed on September 28, 2009, the asset allocation was adjusted to 50% securities and 50% commodities.
For the equities portion of the Fund, the latter half of the year was marked by a beta rally, defined as the outperformance of stocks with high betas substantially outperforming beta adjusted market returns. Despite this trend of low quality stocks and high beta companies, we do not believe trading low quality stocks is sustainable and ultimately profitable. We believe that the first stage of the recovery trade is coming to an end. We feel that the beta of the markets should gradually become less important as investors begin to focus more on underlying fundamentals of companies. We also believe that balance sheet and earnings quality will be positively rewarded in 2010. Valuations of securities may be enhanced by considering momentum, as trends for the next business cycle begin to form.
Regarding commodities, official inflation expectations continue to be low and the bond market seems to still be pricing in a benign inflation environment, despite a modest increase in longer term yields of late. It is difficult to predict when inflation will pick up, but history suggests it can possibly pick up much quicker than is expected. Unprecedented government stimulus and swelling government debt loads in the U. S. and elsewhere are likely to eventually lead to inflation. We believe the push for real returns and inflation protection should be supportive of commodities. We continue to believe now is an excellent time to hold or increase allocations to commodities. Many commodity prices are below previous cycle highs and well below inflation adjusted highs. Amidst the prolonged uncertainty, we expect investors to maintain focus on exposure to hard assets. Additionally, we continue to believe in the role of commodities as a strategic player in investors’ portfolios, potentially reducing risk and enhancing returns.
JNL/Credit Suisse Commodity Securities Fund (Class A)
Average Annual Total Returns for Class A Shares | |
| 1 year | 50.17% |
| Since Inception | 0.56% |
| (Inception date January 16, 2007) | |
Average Annual Total Returns for Class B Shares | |
| 1 year | 50.34% |
| Since Inception | 0.75% |
| (Inception date January 16, 2007) | |
*MSCI World Composite Index is comprised of 50% MSCI Metals & Mining Index, 25% MSCI Oil & Gas Index, 15% MSCI Paper & Forest Index and 10% MSCI Chemicals Index.
Past performance is not predictive of future performance. Investment return and principal value will fluctuate so that an investor's shares, when redeemed, may be worth more or less than their original cost. Performance numbers are net of all Fund operating expenses, but do not reflect the deduction of insurance charges.
JNL/Credit Suisse Long/Short Fund
Credit Suisse Asset Management, LLC
Jordan Low
Objective:
The investment objective of the JNL/Credit Suisse Long/Short Fund is total return.
Portfolio Manager Commentary:
For the year ended December 31, 2009, the Fund underperformed its benchmark by posting a return of 24.86% for Class A shares compared to 26.46% for the S&P 500 Index. Underperformance for the Fund was mainly a result of the beta rally, defined as the outperformance of stocks with high betas substantially outperforming beta adjusted market returns, in the latter half of the year.
In general, the summer months of the third quarter were a difficult environment for individual stock selection, but a relatively good environment for taking directional or thematic bets due to the rapid shift from a bear market to a bull market. Positive performance from funds in the third and fourth quarter can be attributed to increased correlation between securities as we enter into this bull market at a rapid and unanticipated rate. In further detail, investors seeking high beta companies have been buying lower quality names, looking at factors such as poor credit quality, low earnings, bankruptcy risk and illiquidity. American International Group Inc. (“AIG”), Federal National Mortgage Association (“Fannie Mae”), and Federal Home Loan Mortgage Corporation (“Freddie Mac”) are prime examples of this effect. During these periods, we may experience temporary losses but we believe it is prudent to continue to trade as we can enter many positions at attractive prices and increase the potential for a strong autumn. We believe that our models are on the right track as the inception to date numbers have continued to outperform.
After a tumultuous 2008, market conditions in 2009 improved significantly with the S&P 500 Index up 26.46% for the year and the Dow Jones Industrial Average up 22.68%. Despite stronger markets, the economy is still far from recovery as the unemployment rate was at 10.0% as of December 31, 2009, and the U.S. Federal Funds rate continues to be unchanged at 0.00% - 0.25%.
The Fund had its greatest net overweights in the financials and consumer discretionary sectors. The long sleeve of the financials sector underperformed the benchmark, whereas the short sleeve of the sector outperformed. In contrast, the long holdings of the consumer discretionary sector contributed to alpha and the short holdings of the sector detracted from performance. The Fund was net short the consumer staples and information technology sectors, with the consumer discretionary sector adding to overall performance and the information technology sector detracting. On a net basis, the strongest sector for the year was the industrials sector and the weakest sector for the year was the financials sector.
Within the long sleeve of the Fund, the top three contributors were Apple Computer Inc., Western Digital Corp. and Bristol-Myers Squibb Co. The top three detractors were Exxon Mobil Corp., Allstate Corp. and Torchmark Corp. Within the short sleeve of the Fund, the top three contributors were Allegheny Technologies Inc., Lowe’s Cos. Inc. and Goodyear Tire & Rubber Co. The top three detractors were Freeport-McMoRan Copper & Gold Inc., Southwest Airlines Co. and Amazon.com Inc.
As of April 6, 2009, the Fund transitioned from a 120/20 strategy to a flexible 140/40 approach. Despite the adoption of a more flexible long/short ratio, there were no drastic changes in weightings during the year.
The latter half of the year was marked by a beta rally as described previously. Despite this trend of low quality stocks and high beta companies, we do not believe trading low quality stocks is sustainable and ultimately profitable. We believe that the first stage of the recovery trade is coming to an end. Beta of the markets should gradually become less important as investors begin to focus more on underlying fundamentals of companies. We also believe that balance sheet and earnings quality will be positively rewarded in 2010. Valuations of securities will be enhanced by considering momentum, as trends for the next business cycle begin to form.
JNL/Credit Suisse Long/Short Fund (Class A)

Average Annual Total Returns for Class A Shares | |
| 1 year | 24.86% |
| Since Inception | -5.57% |
| (Inception date January 16, 2007) | |
Average Annual Total Returns for Class B Shares | |
| 1 year | 25.07% |
| Since Inception | -5.37% |
| (Inception date January 16, 2007) | |
Past performance is not predictive of future performance. Investment return and principal value will fluctuate so that an investor's shares, when redeemed, may be worth more or less than their original cost. Performance numbers are net of all Fund operating expenses, but do not reflect the deduction of insurance charges.
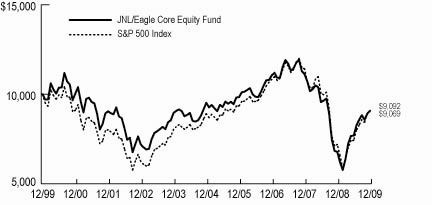
JNL/Eagle Core Equity Fund
Eagle Asset Management, Inc.
Team Management
Objective:
The investment objective of the JNL/Eagle Core Equity Fund is long-term growth through capital appreciation, and secondly, current income.
Portfolio Manager Commentary:
For the year ended December 31, 2009, the Fund outperformed its benchmark by posting a return of 33.83% for Class A shares compared to 26.46% for the S&P 500 Index.
The Fund’s strong relative performance reflected superior stock selection and sector allocation during a year that spanned the depth of the worst recession since the Great Depression and the stock market’s discounting of economic recovery. In response to relative valuation disparities and in anticipation of improved economic conditions, the Fund was positioned early in the year to participate in economically sensitive sectors by overweighting technology and consumer discretionary while underweighting the more stable consumer staples and utility sectors.
The stock market covered two phases during the year: a selloff phase lasting through early March, followed by a recovery phase that extended through year end. When the year began, investor confidence was overwhelmed by deepening recessionary conditions, disappointing earnings reports and guidance, continued financial system stress, uncertainty as to the effectiveness of government financial rescue and economic stimulus plans, and the higher tax and deficit implications of an particularly expansive fiscal 2010 federal budget proposal.
Stock prices turned higher in early March following comments by major bank CEOs indicating profitable operations during the first two months of the year. Market gains continued through September, supported initially by investors’ willingness to focus on early signs of encouragement which were gradually confirmed in data showing evidence of global economic stabilization and recovery. The rally stalled during October, however, on investor concerns over the sustainability of economic recovery following 3.5% third quarter real GDP growth when levels of monetary accommodation and fiscal stimulus programs are gradually removed. Investor sentiment turned positive again in early November as prospects of continued recovery following the third quarter real GDP rebound was supported by positive economic data. But in mid-November stock prices flattened out for several weeks following a warning by U.S. Federal Reserve Chairman Bernanke, of a weakened economic rebound due to high unemployment, tepid bank lending and problems in commercial real estate. Indices moved higher later in December on positive economic releases that included consumer spending, consumer confidence, holiday retail sales, durable goods and capital equipment orders, low core inflation and declining jobless claims.
Sectors that contributed to the Fund’s performance were telecommunication services, financials, energy, information technology, consumer discretionary, consumer staples, industrials and utilities. Sectors that detracted from the Fund’s performance were materials and healthcare. Companies that contributed to the Fund’s performance were Sprint Nextel Corp., Apple Inc., Macy’s Inc., Staples Inc. and Applied Materials Inc.
Significant purchases during the year included Macy’s Inc., Dell Inc., Adobe Systems Inc., Viacom Inc., Electronic Arts Inc. and UnitedHealth Group Inc. Significant sales during the year included Dell Inc., Adobe Systems Inc., CVS Caremark Corp., Intel Corp., Morgan Stanley, Sprint Nextel Corp. and American Express.
Percent changes in sector and cash weightings during the year were materials, up 3.0%; energy, up 2.8%; industrials, up 1.6%; financials, up 0.2%; consumer discretionary, unchanged; utilities, unchanged; telecommunication services, down -0.1%; healthcare, down -1.2%; information technology, down -1.2%; cash, down -2.2%; and consumer staples, down -2.9%.
Overall sector positioning continues to be more reflective of a dynamic process that seeks fundamentally attractive businesses selling at reasonable valuations than a macro based, top down strategy. Currently, this discipline has produced overweighted Fund positions in consumer discretionary and healthcare with below market exposure in consumer staples and utilities.
JNL/Eagle Core Equity Fund (Class A)
Average Annual Total Returns for Class A Shares | |
| 1 year | 33.83% |
| 5 year | -0.96% |
| 10 year | -0.97% |
Average Annual Total Returns for Class B Shares | |
| 1 year | 34.26% |
| 5 year | -0.74% |
| Since Inception | -0.16% |
| (Inception date March 5, 2004) | |
Past performance is not predictive of future performance. Investment return and principal value will fluctuate so that an investor's shares, when redeemed, may be worth more or less than their original cost. Performance numbers are net of all Fund operating expenses, but do not reflect the deduction of insurance charges.
JNL/Eagle SmallCap Equity Fund
Eagle Asset Management, Inc.
Bert L. Boksen & Eric Mintz
Objective:
The investment objective of the JNL/Eagle SmallCap Equity Fund is long-term capital appreciation.
Portfolio Manager Commentary:
For the year ended December 31, 2009, the Fund outperformed its benchmark by posting a return of 35.52% for Class A shares compared to 34.47% for the Russell 2000 Growth Index. Outperformance resulted from investments in more cyclical investments that participated in 2009’s strong rally. Growth outperformed value during the year and cyclicals were notable outperformers.
On an absolute basis, energy, materials, consumer staples, consumer discretionary and information technology were each up more than 50% in 2009. On a relative basis, energy, materials and consumer staples were positive contributors. On an absolute basis, financials traded down during the year; healthcare, financials and information technology detracted from relative returns.
Our strongest stocks for the year included Huntsman Advanced Materials LLC (“Huntsman”), Rovi Corp. (“Rovi”) and American Medical Systems Holdings Inc. (“American Medical Systems”). Chemical producer Huntsman remains our best overall stock for 2009. This highly cyclical company rose in anticipation of an economic recovery and due to its cost reduction program. Rovi, a provider of solutions that enable digital product protection, had strong performance due to excitement about a significant new contract, strong financial performance and increased guidance. American Medical Systems benefitted from increased new product flow, increased operational efficiency and the addition of new management.
Lagging stocks for the year were EMS Technologies Inc. (“EMS Technologies”), Thoratec Corp. (“Thoratec”) and Northwest Pipe Co. (“Northwest Pipe”). EMS Technologies declined on lower than expected earnings and muted guidance. The stock remains in the Fund as an important change in management has been implemented. Thoratec traded down slightly but it had a particularly strong effect overall due to its heavy weighting in the Fund. The stock remains in the Fund as the company is expected to outperform due to continued strong financial results and potential pipeline announcements. Northwest Pipe fell after the company pre-announced disappointing third quarter results and delayed filing its financial reports due to an ongoing investigation in accounting irregularities. The stock remains in the Fund due to favorable prospects for its end markets in 2010 and the belief that the stock’s current valuation more than adequately discounts the risks associated with an accounting restatement.
Significant purchases during the year included Varian Semiconductor Equipment Associates Inc., DTS Inc., Informatica Corp., ON Semiconductor Corp., FormFactor Inc., Coinstar Inc., Regal-Beloit Corp., Ritchie Bros. Auctioneers Inc., Landstar System Inc. and Teradyne Inc. Significant sales during the year included FTI Consulting Inc., WMS Industries Inc., Factset Research Systems Inc., Intrepid Potash Inc., John Wiley & Sons Inc., Corrections Corp. of America, Investment Technology Group Inc., Texas Industries Inc., ResMed Inc. and Ameron International Corp..
During the year, the Fund increased weightings in information technology in line with the appreciation of the benchmark. In financials, the Fund moved from an underweight position to a slight overweight and in industrials the Fund went from a significant underweight to an in line position. The Fund decreased weightings in healthcare from an overweight position to in line with the benchmark.
We believe that continued government stimulus, stabilization of home prices, strong growth from emerging markets and easy economic comparisons are expected to lead to further strength in equity markets. We believe government policy is expected to keep short-term rates low through the mid-term elections with some increase in long-term rates. Over the long-term, we believe government spending is expected to be somewhat inflationary and, therefore, the Fund has established a modest overweight in hard commodities.
JNL/Eagle SmallCap Equity Fund (Class A)
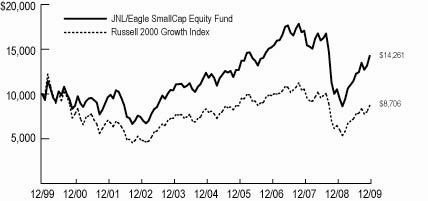
Average Annual Total Returns for Class A Shares | |
| 1 year | 35.52% |
| 5 year | 2.89% |
| 10 year | 3.61% |
Average Annual Total Returns for Class B Shares | |
| 1 year | 35.76% |
| 5 year | 3.10% |
| Since Inception | 4.22% |
| (Inception date March 5, 2004) | |
JNL/Franklin Templeton Global Growth Fund
Templeton Global Advisors Limited
Team Management
Objective:
The investment objective of the JNL/Franklin Templeton Global Growth Fund is long-term capital growth.
Portfolio Manager Commentary:
For the year ended December 31, 2009, the Fund outperformed its benchmark by posting a return of 31.06% for Class A shares compared to 29.99% for the MSCI World Index.
While the Fund’s recent bias towards well capitalized, cash generating stocks on the higher end of the quality spectrum was out of step with the equity market risk rally in 2009, the Fund benefited from our careful stock selection and preference for globally diversified businesses.
Equities entered 2009 pricing in a possible economic depression and systemic solvency crisis, scenarios that were ultimately averted by one of the most aggressive global policy responses in history. Central bankers lowered interest rates and expanded access to credit in 2009, boosting the fortunes of lower quality companies and emerging market stocks with intrinsic growth potential.
All regions and sectors delivered double digit absolute gains during the year under review. Asian holdings led regional performance as a result of both the Fund’s significant underweighting in the weak Japanese market and its overweighting in stronger emerging Asian markets. Overweighted positions in companies domiciled in some mature western European countries detracted from returns in 2009.
From a sector perspective, consumer discretionary had the Fund’s largest overweighting and also some of the best performing stocks. Retail and automotive stocks in particular rebounded as policymakers slashed borrowing costs and incentivized consumption. Information technology holdings also outperformed, and the Fund maintained above benchmark exposure to the sector. We believe many companies in this sector offer a superb balance sheet profile and an ability to generate tremendous amounts of free cash flow for growth, acquisitions or shareholder returns. The Fund also maintained an overweighting in the healthcare sector, though those holdings detracted from performance as the rally favored stocks more leveraged into an economic recovery. Still, fundamentals remain sound in select sector stocks and average valuations are near 15 year lows, creating what we believe are compelling current buying opportunities for long-term investors.
The materials sector was less fundamentally attractive to us within our disciplined valuation framework, where valuations are again approaching the inflated levels reached in the lead up to the financial crisis. The Fund’s materials underweighting detracted from performance in 2009 as commodities delivered their best annual gains on record. Resurgent financials also underperformed due to the Fund’s underweighting in a sector that remains fraught with balance sheet and regulatory risk. The Fund was rewarded, however, for its underweighting in the defensive consumer staples sector, where rising input costs and increasing competition from private label brands has made it difficult to find long-term bargains amid current valuations.
The Fund’s holdings in U.S. based clothing retailer Chico’s FAS Inc. and South Korean auto manufacturer Hyundai Motor Co. both more than tripled in value. Our technology holdings outperformed in 2009, led by South Korean electronics manufacturer Samsung Electronics Co. Ltd., which benefited from a cyclical demand recovery in the latter part of the year.
Notable acquisitions during the year included U.S. oil company Chevron Corp., U.S. cable operator Time Warner Cable Inc. and Bermudan reinsurer RenaissanceRe Holdings Inc. We also added to existing holdings in Swiss pharmaceutical company Roche Holding AG and UK telecommunications operators Vodafone Group Plc and Singapore Telecommunications Ltd. Notable liquidations included the Royal Bank of Scotland Group Plc and Finnish paper company UPM-Kymmene Oyj.
We believe continued leadership from the market’s riskiest stocks is most likely unsustainable; valuations of higher quality stocks remain depressed relative to low-quality stocks, creating discounted entry points into the investments that we believe are likely to survive an uncertain recovery and thrive in a more discriminating market environment.
JNL/Franklin Templeton Global Growth Fund (Class A)
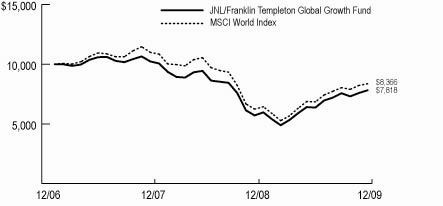
Average Annual Total Returns for Class A Shares | |
| 1 year | 31.06% |
| Since Inception | -7.99% |
| (Inception date January 16, 2007) | |
Average Annual Total Returns for Class B Shares | |
| 1 year | 31.21% |
| Since Inception | -7.78% |
| (Inception date January 16, 2007) | |
Past performance is not predictive of future performance. Investment return and principal value will fluctuate so that an investor's shares, when redeemed, may be worth more or less than their original cost. Performance numbers are net of all Fund operating expenses, but do not reflect the deduction of insurance charges.
JNL/Franklin Templeton Income Fund
Franklin Advisers, Inc.
Edward D. Perks & Charles B. Johnson
Objective:
The investment objective of JNL/Franklin Templeton Income Fund is to maximize income while maintaining prospects for capital appreciation.
Portfolio Manager Commentary:
For the year ended December 31, 2009, the Fund outperformed its benchmarks by posting a return of 32.92% for Class A shares compared to 26.46% for the S&P 500 Index and 5.93% for the Barclays Capital U.S. Aggregate Bond Index. An equity market rally, strong corporate bond performance and a heavier weighting in corporate bonds versus stocks were factors affecting the Fund’s performance.
During the year, long-term interest rates increased as the economy began to recover and the financial system moved away from the turmoil that engulfed markets beginning in the second half of 2008. Despite the modest increase in long-term interest rates during the year, corporate bonds rallied as credit spreads contracted from their extremely elevated levels on December 31, 2008.
Corporate bonds, particularly high yield bonds, surged during the year as companies that survived the credit crisis began to access the capital markets. One of the Fund’s largest holdings at the start of the year, Ford Motor Credit Co., advanced as automotive finance companies maintained access to funding. Additionally, the overall automotive sector improved partly due to government involvement through the “cash for clunkers” program, which helped stimulate auto industry sales. The Fund also benefited from the strong performance of other high yield issuers such as iStar Financial Inc., Tenet Healthcare Corp. and Charter Communications Holdings Inc.
Energy sector holdings also recovered sharply with strong gains realized by companies involved in the oil and gas production and pipeline business including Chesapeake Energy Corp., PetroHawk Energy Corp. and El Paso Corp. As the economy emerged from recession, commodity prices improved and helped drive positive results and, we believe, a more favorable outlook for companies in the sector.
With a strong recovery in credit and equity markets, convertible securities delivered substantial gains, and the Fund’s holdings in convertible bonds and convertible preferred stocks were strong contributors to overall performance. Real estate sector holdings Vornado Realty Trust and Duke Realty Corp. advanced as property and real estate financing markets began to recover. Technology holdings in Advanced Micro Devices Inc. and Maxim Integrated Products Inc. were strong as demand for semiconductors improved.
Although some common stock holdings, such as Southern Co., Pfizer Inc. and Ameren Corp., detracted from performance, other positions including Merck & Co. Inc., Canadian Oil Sands Trust and JPMorgan Chase & Co. delivered strong gains.
During the year, we bought new holdings in Ford Motor Credit Co. and HCA Inc. corporate bonds, Exxon Mobil Corp. common stock and Citigroup preferred stock. For many of our fixed income holdings, significant price increases provided us with an opportunity for profit taking, and we sold Sempra Energy, Dominion Resources Inc. and Illinois Power Corp. bonds.
The Fund began the year with a greater weighting in fixed income securities, largely corporate bonds, than in equities, and rapidly increased that weighting to take advantage of what we considered attractive valuations and a favorable risk adjusted return profile offered by the sector relative to other asset classes. As we ended the year, the Fund took advantage of several profit taking opportunities in corporate bonds, and thus shifted toward a more balanced portfolio of equity and fixed income securities.
JNL/Franklin Templeton Income Fund (Class A)
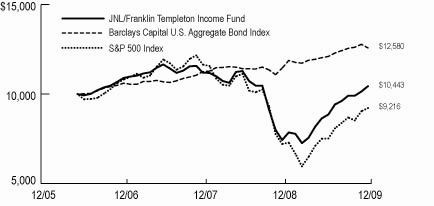
Average Annual Total Returns for Class A Shares | |
| 1 year | 32.92% |
| Since Inception | 1.19% |
| (Inception date May 1, 2006) | |
Average Annual Total Returns for Class B Shares | |
| 1 year | 33.07% |
| Since Inception | 1.39% |
| (Inception date May 1, 2006) | |
Past performance is not predictive of future performance. Investment return and principal value will fluctuate so that an investor's shares, when redeemed, may be worth more or less than their original cost. Performance numbers are net of all Fund operating expenses, but do not reflect the deduction of insurance charges.
JNL/Franklin Templeton Mutual Shares Fund
Franklin Mutual Advisers, LLC
Peter A. Langerman, Deborah A. Turner & F. David Segal
Objective:
The investment objective of the JNL/Franklin Templeton Mutual Shares Fund is capital appreciation, which may occasionally be short-term, and secondarily, income.
Portfolio Manager Commentary:
For the year ended December 31, 2009, the Fund outperformed its benchmark by posting a return of 26.74% for Class A shares compared to 26.46% for the S&P 500 Index.
Our inherent investment focus is on buying securities when they are trading at a meaningful discount to our analysis of intrinsic value and selling them as they trade close to that value. We also buy distressed securities and participate in merger arbitrage and privately negotiated transactions when we believe the investments can generate attractive risk adjusted returns. As a result, the Fund frequently contains sector and security allocations that are significantly different than those of its benchmark.
The Fund held some currency forwards and a few index puts throughout the year, and also sold some covered call options. The index puts the Fund owned were listed, exchange-traded broad index puts, and they were used to somewhat hedge a small portion of the Fund against systemic risk to the market. The index puts had a small negative impact on performance for the year. Currency forwards are used to somewhat hedge the currency risk of the Fund’s non-U.S. dollar security investments. As the U.S. dollar depreciated throughout the year versus most other major currencies, the hedges weighed on the Fund’s performance throughout the year. The Fund managers also sold some covered calls against a few stock positions, which had a minimal negative effect, offset of course by the increase in the prices of the Fund’s underlying stocks.
The year under review was remarkable for the extent of the stress imposed on and absorbed by the global economic infrastructure and the dramatic market rebound from historical lows. The global banking system’s survival came into question, home prices dropped precipitously and economic paralysis spread.
As the U.S. and other global economies climbed out of recession, the rebound in equity and credit markets was driven by a sequence of factors: the mere survival of the banking system; generally positive results of government “stress tests” of major financial institutions; signs of stabilization in the U.S. housing market; improving credit conditions; and resumption of economic activity.
As the stock market broadly rebounded in 2009, many Fund investments increased in value. Microsoft Corp. shares performed well as cost discipline throughout the company positioned it well for the rebound. Virgin Media Inc.’s management sought to improve efficiencies, and the company’s second quarter 2009 earnings reflected continued improvement in subscriber metrics and earnings growth. The Fund’s investment in International Paper Co. appreciated as the company expanded margins partly through productivity initiatives, helping it deliver strong operating results and free cash flow.
Some of the Fund’s investments did not fare as well and lost value during 2009. Eastman Kodak Co.’s stock depreciated as operational losses and revaluation of post retirement assets and liabilities significantly eroded its book value in the first quarter. Supermarket operator Kroger Co. did not perform well in 2009 as food price deflation in the second half of the year contributed to lower than expected operating earnings. The Fund’s Deutsche Post AG holdings declined in value during the time the Fund held them, primarily due to concerns about the negative outlook for global growth. In addition, concerns grew about Deutsche Bank AG’s ability to close the Deutsche Postbank AG sale and rumors of a dividend cut. The Fund sold its position prior to the dividend cut announcement in early 2009.
New Fund positions included common stock Wyeth, which was later liquidated as it was acquired by Pfizer Inc., Vodafone Group Plc, Altria Group Inc., Barclays Bank Plc, Cable & Wireless Plc, Pepsi Bottling Group Inc. and preferred stock of Citigroup. The Fund liquidated its positions in several holdings, the largest of which included the common stock of Comcast Corp., Qwest Communications International Inc., United Technologies Corp., Time Warner Inc. and Constellation Energy Group Inc.
The Fund began the year with slightly under 6% in cash and dropped down to as low as slightly more than 2% by the end of March, as the Fund became nearly fully invested. As securities appreciated, the Fund’s sector weightings changed a bit through year end, but none by more than 2% of the Fund’s total net assets with the exception of the Fund’s consumer discretionary sector weighting which dropped by approximately 4% over the course of the year as the Fund took profits on several related positions. The cash weighting, due to the sale of some equity holdings and appreciated distressed investments, as well as the completion of some merger arbitrage investments, increased to approximately 12% of the Fund’s total net assets by year end. Given the dramatic nature of the sell off in the equity markets, we anticipate continued opportunities in the area of undervalued equities as 2010 unfolds. Merger and acquisition activity increased over the latter part of 2009, and we expect it to accelerate further.
Formidable headwinds remain, as the reserve currency status of the U.S. dollar continues to be questioned, as does the ability of the U.S. Federal Reserve to scale back monetary stimulus without slowing the economic recovery. Imbalances and upheavals often generate mispriced securities, and that volatility should help us find value for our shareholders.
JNL/Franklin Templeton Mutual Shares Fund (Class A)

Average Annual Total Returns for Class A Shares | |
| 1 year | 26.74% |
| Since Inception | -7.72% |
| (Inception date January 16, 2007) | |
Average Annual Total Returns for Class B Shares | |
| 1 year | 27.00% |
| Since Inception | -7.55% |
| (Inception date January 16, 2007) | |
Past performance is not predictive of future performance. Investment return and principal value will fluctuate so that an investor's shares, when redeemed, may be worth more or less than their original cost. Performance numbers are net of all Fund operating expenses, but do not reflect the deduction of insurance charges.
JNL/Franklin Templeton Small Cap Value Fund
Franklin Advisory Services, LLC
Team Management
Objective:
The investment objective of the JNL/Franklin Templeton Small Cap Value Fund is long-term total return.
Portfolio Manager Commentary:
For the year ended December 31, 2009, the Fund outperformed its benchmark by posting a return of 33.80% for Class A shares compared with 27.68% for the Russell 2500TM Value Index.
During the 12 months under review, the equity markets hit a low in early March and quickly rebounded as investors began to see signs of economic recovery. In this environment, stock markets made strong gains for the year. Among small cap stocks, growth outpaced value as investor risk aversion began to subside. All major sectors in the Fund’s benchmark posted positive results, with the most significant gains in consumer discretionary, information technology and materials.
Contributors to Fund performance included the consumer discretionary sector, particularly the automobile industry. The industrials sector boosted performance with notable results in the building products and machinery industries. In the energy sector, the energy equipment and services industry helped results. The financials sector detracted from performance mainly due to holdings in the thrifts and mortgage finance industry.
Fund performance benefited from several consumer discretionary sector holdings, including Thor Industries Inc., Group 1 Automotive Inc., J.C. Penney Co. Inc. (“J.C. Penny”), Men’s Wearhouse Inc., La-Z-Boy Inc. and Autoliv Inc. Materials sector holdings Reliance Steel & Aluminum Co. and Westlake Chemical Corp. contributed to returns, as did industrials sector holding Universal Forest Products Inc.
Detractors from performance included several financials sector positions, including TrustCo Bank Corp., Montpelier Re Holdings Ltd., RLI Corp., StanCorp Financial Group Corp. and Corus Bankshares Inc. Industrials sector holdings Wabash National Corp., Gibraltar Industries Inc. and SkyWest Inc. detracted from results, as did General Maritime Corp. in the energy sector.
Significant purchases during the year included new positions in Pharmaceutical Product Development Inc., Gardner Denver Inc., J.C. Penney and Ceradyne Inc. Other significant purchases included adding to holdings in Protective Life Corp., Rowan Cos. Inc., Trinity Industries Inc. and Steris Corp. During the year, the Fund liquidated positions in Monaco Coach Corp., General Maritime Corp., Syncora Holdings Ltd. and Corus Bankshares Inc., among others.
The Fund will continue to invest in small cap companies we believe are selling below their underlying worth. Our strategy is to buy and hold fundamentally sound companies for five years or more on average. We purchase securities at what we consider attractive prices, often when they are out of favor with other investors. We select securities without regard to benchmark comparisons, and we aim for long-term results. We are confident that over time the market will provide opportunities for us to execute our strategy with success.
JNL/Franklin Templeton Small Cap Value Fund (Class A)
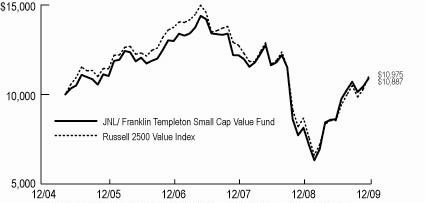
Average Annual Total Returns for Class A Shares | |
| 1 year | 33.80% |
| Since Inception | 1.84% |
| (Inception date May 2, 2005) | |
Average Annual Total Returns for Class B Shares | |
| 1 year | 33.96% |
| Since Inception | 2.04% |
| (Inception date May 2, 2005) | |
Past performance is not predictive of future performance. Investment return and principal value will fluctuate so that an investor's shares, when redeemed, may be worth more or less than their original cost. Performance numbers are net of all Fund operating expenses, but do not reflect the deduction of insurance charges.
JNL/Goldman Sachs Core Plus Bond Fund
Goldman Sachs Asset Management, L.P.
Team Management
Objective:
The primary investment objective of the JNL/Goldman Sachs Core Plus Bond Fund is to seek a high level of current income. As a secondary objective, the Fund seeks capital appreciation.
Portfolio Manager Commentary:
For the year ended December 31, 2009, the Fund outperformed its benchmark by posting a return of 14.16% for Class A shares compared to 5.93% for the Barclays Capital U.S. Aggregate Bond Index. The primary factors that influenced the Fund’s performance relative to its benchmark were an allocation to riskier assets, such as credit sensitive mortgages and corporate bonds.
The U.S. economy appears to be back on the road to recovery after suffering its worst recession in the post war era. The combination of improving financial conditions and stability in economic data led to a drastic increase in demand for risky assets during the year. All spread sectors significantly outperformed Treasuries in 2009. The largest outperforming sectors were high yield corporate bonds and commercial mortgage-backed securities (“CMBS”), which returned 58.21%, as measured by the Barclays Capital High Yield Index, and 28.45%, as measured by the Barclays Capital CMBS Index, respectively, in 2009. Many spread sectors have gained back their 2008 underperformance as liquidity and risk appetite returned to the market. Interest rates rose over the year, with the 2-year Treasuries increasing 37 basis points (“bps”) to 1.14% and 10-year Treasuries increasing 163 bps to 3.84%. Short-term rates remained anchored by the U.S. Federal Reserve Board (“Fed”), which continues to commit to an extended period of low interest rates.
Top-down strategies contributed to performance during the year. In addition, duration positioning positively impacted the Fund’s returns, as did cross sector positioning. With regard to our duration and yield curve positioning, the Fund’s fundamental short position in the long end of the curve contributed as rates rose across the curve. Cross sector positioning was also a key contributor. The Fund’s strategic and tactical overweight to spread sectors relative to the benchmark was a key driver of performance. An overweight exposure to credit sensitive mortgages contributed positively to performance as non-agency mortgages posted strong returns in both July and September. In addition, an overweight exposure to the corporate sector proved beneficial as the sector outperformed in 2009 as spreads tightened.
Bottom-up security selection in the securitized and government agency sectors were the primary contributors to the Fund’s performance. Security selection within the collateralized sector was positive, due to our focus on the most senior tranches of credit sensitive mortgages. Security selection within the government/agency sector also had a positive impact on performance, such as our preference for Treasury Inflation-Protected Securities (“TIPS”) and government-guaranteed securities. This was slightly offset by corporate security selection.
We are targeting a short duration position, as we expect a very large issuance of longer dated Treasuries. In addition, with the support from central bank buying greatly reduced, the risk of higher long dated yields remains. Within the mortgage sector, we are overweight non-agency mortgages and favor deeply distressed senior non-agency residential mortgage-backed securities. Specifically, we like senior tranche non-agency adjustable rate mortgages (“ARM”) backed by Alt-A and Option ARM collateral. We also favor corporates, as we believe spreads remain high relative to default and recovery rates. Within the corporate sector, we are negative on industries that are highly susceptible to a growth slowdown. Rather, we favor defensive sectors, such as energy, pipelines and cable, and are avoiding cyclical sectors, such as consumer products, retail and technology. We are overweight financials and focusing on large property and causality insurers and banks. Within banking, we are focusing on large money center banks.
JNL/Goldman Sachs Core Plus Bond Fund (Class A)
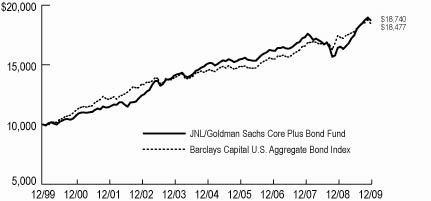
Average Annual Total Returns for Class A Shares | |
| 1 year | 14.16% |
| 5 year | 4.47% |
| 10 year | 6.48% |
Average Annual Total Returns for Class B Shares | |
| 1 year | 14.47% |
| 5 year | 4.71% |
| Since Inception | 4.94% |
| (Inception date March 5, 3004) | |
Goldman Sachs Asset Management, L.P. assumed portfolio management responsibility on April 30, 2007.
Past performance is not predictive of future performance. Investment return and principal value will fluctuate so that an investor's shares, when redeemed, may be worth more or less than their original cost. Performance numbers are net of all Fund operating expenses, but do not reflect the deduction of insurance charges.
JNL/Goldman Sachs Emerging Markets Debt Fund
Goldman Sachs Asset Management, L.P.
Team Management
Objective:
The investment objective of the JNL/Goldman Sachs Emerging Markets Debt Fund is a high level of total return consisting of income and capital appreciation.
Portfolio Manager Commentary:
For the year ended December 31, 2009, the Fund outperformed its benchmark by posting a return of 23.06% for Class A shares compared to 21.98% for the JPMorgan Government Bond Index-Emerging Markets (“GBI-EM”) Global Diversified Index.
Based on our proprietary factor based risk and attribution model and on a total return basis, contributors to performance included the Fund’s active currency exposure to the Brazilian real, the Peruvian new sol and the Indonesian rupiah. Also contributing to performance was its country and security selection of Russian and Turkish local market debt. Detractors from performance included the Fund’s country and security selection of local market debt from Mexico, Indonesia and Peru.
The Fund does not employ derivatives in order to gain leverage or to generate short term, tactical returns. Derivatives used in the Fund are used to gain access to markets and trade ideas in the most efficient manner. The performance of the derivatives themselves did not significantly result in contributors or detractors from the Fund’s performance, however derivatives may have been used as an implementation vehicle for trade ideas and those trades ideas would have contributed or detracted from the Fund’s performance.
Emerging market debt spreads on the JPMorgan Emerging Market Bond Index (“EMBI”) Global Diversified Index ended the year more than 300 basis points (“bps”) narrower, reaching their tightest levels since June 2008. The degree of spread tightening in 2009 was largely driven by original wide spread levels. In hindsight, 2009 was a year where being long beta did indeed deliver excess returns. The JPMorgan EMBI Global Diversified Index posted a 29.82% return during the year, its second best performance in history (1996 posted a 37.75% return). With spreads at 288 bps at the end of December, they were less than half of where they started 2009 (748 bps). With the degree of dispersion in spreads across countries much narrower today, with no imminent catalyst to break out of recent ranges, and with less obvious points of dislocation, we believe 2010 will demand even more fastidious emphasis on country and security selection to deliver excess returns.
In local markets, the JPMorgan GBI-EM Global Diversified Index posted a 21.98% return in 2009 (in unhedged USD terms). This gain was propelled by a 16.78% return from foreign exchange appreciation and bolstered by a 5.20% contribution from rate declines. Historically, looking at cumulative returns since the inception of the JPMorgan GBI-EM Global Diversified Index in 2002, foreign exchange has contributed 60-70% of overall returns and risk, with the residual driven by rates. We anticipate currency returns and risk will be the dominant determinant of overall local market exposure in the medium term, as the foreign exchange story should remain well underpinned by relative growth differentials, capital flows and carry, which all favor emerging markets over industrialized countries. In contrast, the rate story remains less compelling, given relative low excess risk premia and, as emerging market economies recover more quickly, monetary policy is likely to normalize ahead of monetary policy in the industrialized world. Still, we think there is room for rate declines in the near future, as some curves are pricing in more aggressive rate hikes than we think will materialize.
On a total return basis, the Fund’s country and security selection sectors detracted from performance while active currency exposure contributed to overall returns.
Our Fund has historically benefited from a bottom-up approach based on country and security selection and evaluating the disparity between fundamentals embedded in the price and our view on fundamentals. While global macro themes have also been important, country specific themes have played a driving role. We focus on the following themes: dominance of macro themes, flow of investment capital, rebalancing of external accounts across borders and trajectory of growth, to drive the basic strategy. The Fund management team is focusing on these themes to balance out bottom-up country views.
JNL/Goldman Sachs Emerging Markets Debt Fund (Class A)
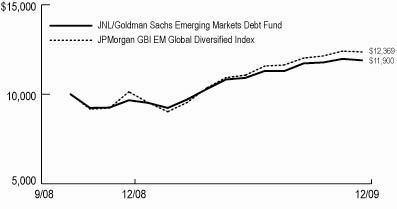
Average Annual Total Returns for Class A Shares | |
| 1 year | 23.06% |
| Since Inception | 15.12% |
| (Inception date October 6, 2008) | |
Average Annual Total Returns for Class B Shares | |
| 1 year | 23.38% |
| Since Inception | 15.36% |
| (Inception date October 6, 2008) | |
Past performance is not predictive of future performance. Investment return and principal value will fluctuate so that an investor's shares, when redeemed, may be worth more or less than their original cost. Performance numbers are net of all Fund operating expenses, but do not reflect the deduction of insurance charges.
JNL/Goldman Sachs Mid Cap Value Fund
Goldman Sachs Asset Management, L.P.
Team Management
Objective:
The investment objective of the JNL/Goldman Sachs Mid Cap Value Fund is long-term capital appreciation.
Portfolio Manager Commentary:
For the year ended December 31, 2009, the Fund underperformed its benchmark by posting a return of 32.65% for Class A shares compared to 34.21% for the Russell Mid Cap® Value Index.
Throughout this market cycle, a disciplined focus on quality, cash generating companies with strong balance sheets and disciplined management teams has led to strong, long term performance. The Fund’s quality biased approach served well as markets declined in the first quarter of 2009, but was challenged in the subsequent euphoric environment post March 9. Despite the extreme rally that was particularly pronounced in the mid cap space, the Fund’s strategy managed to outperform its benchmark for the fourth quarter and finished slightly below its benchmark for the year.
In 2009, U.S. equity markets oscillated between extremes of fear and exuberance. The credit crisis from 2008 spilled into the first quarter, as the nation’s financial system experienced an extremely challenging period. As governments around the world coordinated a response to the financial crisis, extinction risk was removed for many companies. Stocks rallied sharply off of the March 9th trough into the second and third quarters. Propelled by investors’ renewed appetite for risk, markets were driven by the most battered names from the first quarter. Markets continued to experience gains through the year end, albeit less pronounced. The economy showed encouraging signs of stabilization and improvement. However, despite some positive economic data, concerns about the elevated 10% unemployment rate, the U.S. Federal Reserve Board’s outlook on interest rates, and the strength of the U.S. dollar continue to weigh on the markets.
The S&P 500 Index returned 26.46% in 2009. All sectors ended the year in high positive territory, and growth stocks outpaced the gains of value stocks. Within the value space, mid cap stocks experienced the most dramatic rise in 2009, with gains of over 34% for the year. Market trends were particularly pronounced in the mid cap value index. Over 40% of the Fund’s benchmark consists of the consumer discretionary and financials sectors, which climbed over 148% and 91%, respectively, from their March 9th lows. These sectors contain some of the most credit or economic sensitive companies, including REITs, retailers, autos, media and hotels, many of which rebounded dramatically in the recent risk charged rally despite the absence of catalysts or improving fundamentals.
Stock selection was strong in energy and materials. In the energy sector, exploration and production companies Whiting Petroleum Corp.’s and Newfield Exploration Co.’s, shares were boosted by the announcement of a major acquisition in the industry signaling potential future consolidation, in addition to improving energy prices during the latter part of the quarter. Fund performance was boosted by stock selection in materials, driven by stocks tied to an economic recovery and with high operating leverage, such as specialty chemical producer Huntsman Corp.
Select holdings in consumer discretionary and technology detracted from performance. Shares retailers, including J.C. Penney Co. Inc. declined during the reporting period due to market concerns over consumer sales trends. Holdings in PPL Corp. and Entergy Corp. also detracted from performance. While both companies lagged due to a combination of cool weather, weak industrial sales and lower power prices, Entergy Corp. also delayed a spin-off of its nuclear business. Entergy Corp. was sold in the fourth quarter.
The Fund initiated positions in Boston Properties Inc. and Newfield Exploration Co. Boston Properties Inc. has a strong balance sheet and an experienced management team that we believe will effectively navigate through the current, challenging environment. Newfield Exploration Co. is an oil and gas company with operations in the U.S. Recently, the company has focused its strategy of divesting from its high cost, short lived assets and increased development of properties with long production lives and lower costs. In our view, the company is currently trading at an attractive valuation that does not reflect this transformation. H&R Block Inc. and Becton Dickinson & Co. were sold. We believed competitive pressures had been negatively impacting H&R Block Inc.’s pricing power and market share. Becton Dickinson & Co. hit our price target.
We believe that the current environment presents an opportunity to add great franchises to the Fund at compelling valuations, as many companies with strong balance sheets and disciplined management have lagged in the recent rally. Within financials, we continue to favor insurance companies such as, WR Berkley Corp., which provide the opportunity for pricing improvement and market share gains due to decreased competition. We also continue to favor asset managers and diversified financial services companies such as, Principal Financial Group Inc., who have strong capital positions and should benefit from an improving economic environment. In the energy space, we added to Whiting Petroleum Corp. and Dril-Quip Inc. to increase exposure to oil and oil service companies that we believe should benefit from the favorable near term supply and demand imbalance in oil.
During the fourth quarter, we took profits on select names that had benefited from the recent stock price strength. We reduced our exposure in consumer discretionary stocks, which included selling out of media stock Viacom Inc., which performed well during the quarter and the year. We trimmed our position in natural gas producer, Range Resources Corp., a former core energy holding. We took some profits on Newfield Exploration Co., which remains one of our highest conviction names.
Looking into the U.S. equity market in 2010, we anticipate finding ample opportunities to buy quality businesses at deeply discounted valuations. Many quality stocks are inexpensive relative to their lower quality peers; a valuation gap we expect to narrow over time as we enter into a more normalized environment. Earnings should accelerate due to economic improvement and unprecedented company level operating leverage driven by aggressive cost cutting. Low borrowing costs should be a further tailwind to earnings. As investors refocus on fundamentals, we believe that 2010 will be a fertile environment to generate alpha. We continue to anticipate increased stock level differentiation going forward, distinguishing quality companies with robust business models from those likely to remain challenged. We see prospects in select companies that are poised to benefit from an environment of lower competition, higher pricing and improved market share. We maintain our focus on quality companies trading at compelling valuations, and believe that this long term discipline will help us navigate volatile markets.
JNL/Goldman Sachs Mid Cap Value Fund (Class A)
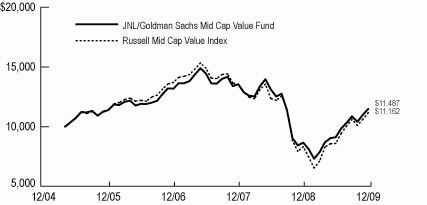
Average Annual Total Returns for Class A Shares | |
| 1 year | 32.65% |
| Since Inception | 3.02% |
| (Inception date May 2, 2005) | |
Average Annual Total Returns for Class B Shares | |
| 1 year | 33.09% |
| Since Inception | 3.23% |
| (Inception date May 2, 2005) | |
Past performance is not predictive of future performance. Investment return and principal value will fluctuate so that an investor's shares, when redeemed, may be worth more or less than their original cost. Performance numbers are net of all Fund operating expenses, but do not reflect the deduction of insurance charges.
JNL/Ivy Asset Strategy Fund
Ivy Investment Management Company
Michael L. Avery and Ryan F. Caldwell
Objective:
The investment objective of the JNL/Ivy Asset Strategy Fund is to seek high total return over the long-term.
Portfolio manager Commentary:
For the period September 28, 2009 through December 31, 2009, the Fund underperformed its benchmark by posting a return of 4.10% for Class A shares compared to 5.46% for the S&P 500 Index.
The Fund’s weaker performance during the period was attributable to an untimely underweight in consumer staples and industrials, and, to a lesser extent, technology stocks, which all performed well during the period. A slight underweight in financials also hampered performance.
On a positive note, the Fund benefited during the period due to a significantly greater exposure to the materials sector and a healthy relative overweight in selected consumer discretionary stocks. A strategic and meaningful underweight exposure in the healthcare sector, which struggled due to uncertainty surrounding healthcare reform and intense regulatory pressures, also boosted performance. Additionally beneficial was the Fund’s smaller relative stake in energy and telecommunication services stocks and its complete lack of exposure to utilities. Although the Fund was somewhat underweight in financials, better stock selection in this arena proved additive.
Superior stock selection in several other sectors worked to the Fund’s favor. Better picks in the overweight materials sector, along with choices in the consumer staples and healthcare sectors added meaningfully to performance.
In an attempt to increase the Fund’s exposure to China and participate in market gains while protecting shareholders from downside risks, the Fund established a position in equity option securities at approximately zero cost. This position protected shareholders from 5% downside while providing the opportunity to benefit if the market rose up to 15%. Because the market level at year-end was relatively unchanged from the time that the Fund entered into this position, these options expired with little benefit or cost to the Fund.
During the period, the U.S equity market extended the rebound that began in March, and global stocks did even better than U.S. equities, due to renewed strength in developed markets and a powerful rise in emerging markets that has, in fact, caused some market pundits to become concerned about a new asset bubble. Investors who regained their appetite for risk as recession concerns diminished, continued their reentry into global markets. The final quarter of 2009 saw improvements in rising home sales, better retail sales, strengthening industrial activity, less negative employment trends and continued low interest rates as the U.S. Federal Reserve (“Fed”) kept the Feds Fund rate accommodative.
Manufacturing indices from Europe to Asia are showing positive momentum and reflect broad manufacturing recovery. Auto sales in places such as China are surging as a burgeoning Chinese middle class demonstrates its growing buying power. Strong investment in infrastructure has also recovered, as have prices of commodities that support infrastructure build out. These trends benefited the Fund’s exposure to the materials and consumer discretionary sectors, in particular. Most notable during the period was the improving strength of the dollar, which became an issue in late November and early December. This was a seminal event in our view, driven by improving investor sentiment, the tendency for mangers and investors to rebalance their portfolios at year end, particularly outside the United States.
Sectors that contributed to performance during the period included energy, materials, consumer staples, healthcare, financials and information technology. Sectors that detracted from performance include industrials, consumer discretionary, telecommunication services and utilities.
The greatest individual contributors to the Fund’s performance during the period were gold bullion, China Life Insurance Co. Ltd., Visa Inc., Industrial & Commercial Bank of China and Hyundai Motor Co. The greatest individual detractors were Weatherford International Inc., Wynn Resorts Ltd., Sands China Ltd., Jacobs Engineering Group Inc. and Monsanto Co.
At year end, approximately 72% of the Fund’s assets were in equities, 15% was in gold bullion and the remaining 13% was net cash.
Average Annual Total Returns for Class A Shares | |
| Since Inception | 4.10% |
| (Inception date September 28, 2009) | |
Average Annual Total Returns for Class B Shares | |
| Since Inception | 4.10% |
| (Inception date September 28, 2009) | |
Past performance is not predictive of future performance. Investment return and principal value will fluctuate so that an investor's shares, when redeemed, may be worth more or less than their original cost. Performance numbers are net of all Fund operating expenses, but do not reflect the deduction of insurance charges.
JNL/JPMorgan International Value Fund
J.P. Morgan Investment Management Inc.
Jeroen Huysinga and Gert Woort-Menker
Objective:
The investment objective of the JNL/JPMorgan International Value Fund is to provide high total return from a portfolio of equity securities of foreign companies in developed and, to a lesser extent, developing markets.
Portfolio Manager Commentary:
For the year ended December 31, 2009, the Fund underperformed its benchmark by posting a return of 30.17% for Class A shares compared to 34.23% for the MSCI EAFE Value Index.
At the sector level, the Fund’s holdings in basic industries, transport services and consumer cyclicals contributed to outperformance, while underweights in banks, finance and insurance weighed on relative returns during the year.
Looking at regions, stocks in the emerging markets and a slight underweight in the UK added value, while holdings in Europe ex-UK and an underweight in the Pacific Rim detracted from performance.
2009 will long be remembered for how the global economy pulled back from the brink of collapse. Less than a year ago, investors were staring at the prospect of a systemic meltdown. Today, thanks in large part to policymakers’ aggressive response to the crisis, the global banking system has been stabilized, financial markets are functioning normally and the world economy is on the mend with most of the G7 nations having emerged from recession. Markets have responded positively to these developments. The Fund’s benchmark rose by more than 90% from its March 9 low, fuelled by the prospect of an economic pick up.
Nintendo Co. Ltd., the Japanese electronic game maker, had a difficult year, reporting a 52% year over year decline in earnings for the fiscal first half ended September 30. Weak consumer demand and increased competitive pressures undermined the company’s profits. Price cuts by rival gaming console makers Sony Corp. and Microsoft Corp., combined with a shortage of new blockbuster titles, have reduced sales of the Wii, forcing Nintendo Co. Ltd. to cut its own prices. Meanwhile, the DS handheld unit increasingly has contended with smart phones, which can download games online. Despite the difficult environment, the company remains profitable and has a rock solid balance sheet.
Hon Hai Precision Industry Co. (“Hon Hai”), the Taiwanese electronics contract manufacturer, performed well during the year. The stock surged on the back of better than expected earnings and signs of a turnaround in demand. Despite the severity of the downturn, Hon Hai generated a notable net profit in the first nine months of 2009, up from the previous year. In response to the economic crisis, management moved aggressively to cut costs through employee layoffs, consolidating facilities and curbing capital expenditures. In recent months, demand for PCs and cell phones have started to recover, which should benefit Hon Hai, one of the world’s most successful contract manufacturers of electronic products, a supplier of iPhones for Apple Inc. and PS3 gaming consoles and notebook computers for Sony Corp. and Hewlett-Packard Co.
The Fund is driven by a bottom-up strategy that seeks to add value by identifying the most attractive value stocks within each global sector. Stocks are purchased and sold based on valuation signals, as measured using a proprietary dividend discount model, and the existence of a timely catalyst that will unlock the stock’s inherent value.
Major transactions during the year included purchases of BP Plc, Siemens AG, Royal Dutch Shell Plc, ING Groep NV, Sumitomo Mitsui Financial Group Inc. and UniCredit SpA and sales of Honda Motor Co. Ltd., E.ON AG, Mitsubishi UFJ Financial Group Inc., Credit Suisse and Australia & New Zealand Banking Group Ltd. BP Plc, ING, Credit Suisse and Australia & New Zealand Banking Group Ltd. were bought and sold during the year.
Entering 2010, one may reflect on whether equity markets can continue to build on gains seen in 2009. It is certainly not out of the question. While funds have flowed out of cash in recent months, most have been diverted into fixed income instruments. Only a small portion has gone into equities. That suggests a significant amount of “fire power” remains and is capable of fuelling further gains in stocks. Whether that fire power is actually put to use, however, is a different matter.
While economic conditions will continue to improve, we believe that markets are reaching a point where further gains in share prices increasingly must be justified by evidence of improving
fundamentals. Much of the fiscal and monetary stimuli so instrumental in reviving activity are starting to ebb. Central banks in Australia, Norway and Israel already have begun to raise interest rates and key emerging markets, such as Brazil, China and India, are implementing administrative measures designed to pre-empt asset bubbles. The larger, developed economies are not at that point, but concerns about inflation and budget deficits will likely prompt more talk of “exit strategies” as the year progresses. The central question then becomes: can private demand take up the slack?
In such an environment, stock picking will be key. Companies that deliver earnings that justify their current valuations could see their stocks rise further. Those that cannot will be derated. To that end, we continue to focus on reasonably priced, well managed, profitable companies with solid balance sheets and strong market positions. We believe such firms are most likely to increase earnings even in the midst of a lackluster economic environment.
JNL/JPMorgan International Value Fund (Class A)
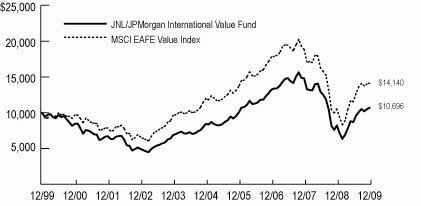
Average Annual Total Returns for Class A Shares | |
| 1 year | 30.17% |
| 5 year | 4.83% |
| 10 year | 0.68% |
Average Annual Total Returns for Class B Shares | |
| 1 year | 30.60% |
| 5 year | 5.08% |
| Since Inception | 6.85% |
| (Inception Date March 5, 2004) | |
Past performance is not predictive of future performance. Investment return and principal value will fluctuate so that an investor's shares, when redeemed, may be worth more or less than their original cost. Performance numbers are net of all Fund operating expenses, but do not reflect the deduction of insurance charges.
JNL/JPMorgan MidCap Growth Fund
J.P. Morgan Investment Management Inc.
Christopher M.V. Jones & Tim Parton
Objective:
The investment objective of the JNL/JPMorgan MidCap Growth Fund is to seek capital growth over the long-term.
Portfolio Manager Commentary:
For the year ended December 31, 2009, the Fund underperformed its benchmark by posting a return of 42.96% for Class A shares compared to 46.29% for the Russell Midcap® Growth Index.
Midcap growth managers in general had a difficult year, with only approximately one quarter outperforming the Russell Midcap Growth Index. The Fund, which seeks high quality growth companies, was negatively impacted as the smallest market capitalization, lowest priced, lowest quality and lowest growth stocks outperformed during the year.
2009 will certainly be remembered as one of the most volatile periods in U.S. equity market history. The onslaught of continuously poor economic data continued well into 2009 as the U.S. economy experienced a surge in unemployment claims, a wave of announcements on corporate layoffs and an extremely poor level of consumer confidence.
However, U.S. equity markets rebounded strongly from their March 2009 lows as investors began to realize that the banking system was not insolvent and that economic activity was not in a terminal freefall.
Stock selection in the financial services and healthcare sectors detracted from performance, while stock selection in the consumer discretionary sector and a portfolio underweight in the consumer staples sector benefited results.
At the individual stock level, Leap Wireless International Inc. was a top detractor from performance. The wireless communications carrier was hurt by growing competition in the prepaid wireless market and pricing pressures.
Among the contributors to performance was Amdocs Ltd., a provider of software and services to the communication services industry. The company benefited from stabilization in its discretionary business combined with strong recurring revenues.
Significant purchases during the year included Cognizant Technology Solutions Corp., Marvell Technology Group Ltd., UnitedHealth Group Inc., WW Grainger Inc. and Education Management Corp. The top five liquidated positions included ITT Educational Services Inc., Ecolab Inc., Harris Corp., Celgene Corp. and John Wiley & Sons Inc. Over the past year, the Fund increased its consumer discretionary and technology weightings and decreased those in the financial services and healthcare sectors.
The Fund employs a bottom-up approach, seeking to invest in dominant franchises with predictable business models deemed capable of achieving sustained above average growth. This approach has led to an overweight versus the Fund’s benchmark in the technology and consumer discretionary sectors and an underweight versus its benchmark in the consumer staples and utilities sectors.
JNL/JPMorgan MidCap Growth Fund (Class A)
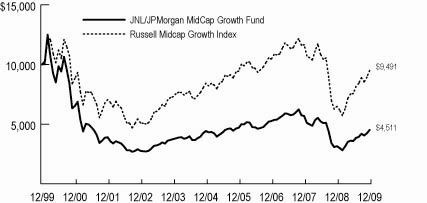
Average Annual Total Returns for Class A Shares | |
| 1 year | 42.96% |
| 5 year | 0.40% |
| 10 year | -7.65% |
Average Annual Total Returns for Class B Shares | |
| 1 year | 43.25% |
| 5 year | 0.60% |
| Since Inception | 2.55% |
| (Inception date March 5, 2004) | |
J.P. Morgan Investment Management Inc. assumed portfolio management responsibility on December 3, 2007.
Past performance is not predictive of future performance. Investment return and principal value will fluctuate so that an investor's shares, when redeemed, may be worth more or less than their original cost. Performance numbers are net of all Fund operating expenses, but do not reflect the deduction of insurance charges.
JNL/JPMorgan U.S. Government & Quality Bond Fund
J.P. Morgan Investment Management Inc.
Michael Sais
Objective:
The investment objective of the JNL/JPMorgan U.S. Government & Quality Bond Fund is to obtain a high level of current income.
Portfolio Manager Commentary:
For the year ended December 31, 2009, the Fund outperformed its benchmark by posting a return of 3.69% for Class A Shares compared to -2.20% for the Barclays Capital U.S. Government Bond Index.
The Fund’s concentration in agency and non-agency mortgage-backed securities (“MBS”) contributed to outperformance as the benchmark, composed solely of Treasury and agency securities, pulled back, especially late in the year. In contrast, the Treasury market, spread sectors, and particularly non-agency MBS and collateralized mortgage obligations (“CMOs”), tightened from the historic wide levels reached in late 2008. The government’s varied stimulus programs helped to return liquidity to the spread sectors, and agency MBS performed well as the U.S. Federal Reserve (“Fed”) continued its purchase program throughout the year, driving spreads tighter.
The contraction in spread levels from what had been historic wide levels drove the capital markets in 2009. For example, high yield markets, as measured by the Barclays Capital High Yield Index, were up 58.21% and the commercial mortgage-backed security (“CMBS”) sector, as measured by the Barclays Capital CMBS Index, returned 28.45% for the year.
With the Fed maintaining the historically low target of 0.0% - 0.25% throughout 2009, investors in search of yield ventured back into assets that offered more attractive returns. This shift in investment philosophy drove spread sectors to levels not seen since the summer of 2007.
The Fund’s concentration in agency and non-agency MBS contributed to performance as the benchmark, composed solely of Treasury and agency securities, trailed throughout the year, while mortgage spreads tightened considerably.
At the end of 2008, the Fund had approximately 16% invested in money market funds as a large amount of cash flowed into the Fund in December of that year. That cash was deployed throughout 2009 to increase allocations in Treasury debt and the MBS sector. Asset-backed security (“ABS”) and CMBS levels remained roughly the same as at the end of 2008 while the agency allocation was increased slightly during 2009.
JNL/JPMorgan U.S. Government & Quality Bond Fund (Class A)

Average Annual Total Returns for Class A Shares | |
| 1 year | 3.69% |
| 5 year | 4.43% |
| 10 year | 5.66% |
Average Annual Total Returns for Class B Shares | |
| 1 year | 3.92% |
| 5 year | 4.63% |
| Since Inception | 4.23% |
| (Inception date March 5, 2004) | |
J.P. Morgan Investment Management Inc. assumed portfolio management responsibility on April 30, 2007.
Past performance is not predictive of future performance. Investment return and principal value will fluctuate so that an investor's shares, when redeemed, may be worth more or less than their original cost. Performance numbers are net of all Fund operating expenses, but do not reflect the deduction of insurance charges.
JNL/Franklin Templeton Founding Strategy Fund
JNL/Mellon Capital Management 10 X 10 Fund
Jackson National Asset Management, LLC
Team Management
JNL/Franklin Templeton Founding Strategy Fund
Objective:
The investment objective of the JNL/Franklin Templeton Founding Strategy Fund is capital appreciation.
Portfolio Manager Commentary:
For the year ended December 31, 2009, the Fund outperformed its benchmarks by posting a return of 30.13% for Class A shares compared to the 26.46% return for the S&P 500 Index and 29.99% for the MSCI World Index. The Fund seeks to achieve its objective by investing approximately equal allocations (331/3%) in the following three Funds: JNL/Franklin Templeton Income Fund, JNL/Franklin Templeton Global Growth Fund and JNL/Franklin Templeton Mutual Shares Fund (“Underlying Funds”). The Underlying Funds performance contributed to the results of the Fund proportionally based on relative value to the Fund throughout the year. The Fund’s allocation to the Underlying Funds may be rebalanced when the actual allocations to the Underlying Funds approaches plus or minus 3% of the predetermined allocation percentages. For the year ended December 31, 2009, the average daily investment in each of the Underlying Funds was 34.4% for the JNL/Franklin Templeton Income Fund, 33.8% for the Franklin Templeton Global Growth Fund, and 31.8% for the JNL/Franklin Templeton Mutual Shares Fund. The performance and investment objectives of the Underlying Funds are discussed elsewhere in this report.
JNL/Franklin Templeton Founding Strategy Fund (Class A)
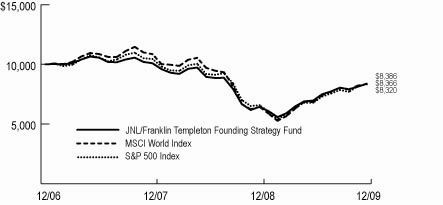
Average Annual Total Returns for Class A Shares | |
| 1 year | 30.13% |
| Since Inception | -5.78% |
| (Inception date January 16, 2007) | |
JNL/Mellon Capital Management 10 X 10 Fund
Objective:
The investment objective of the JNL/Mellon Capital Management 10 x 10 Fund is capital appreciation and income.
Portfolio Manager Commentary:
For the year ended December 31, 2009, the Fund underperformed its benchmark by posting a return of 24.59% for Class A shares compared to 28.34% for the Russell 3000® Index. The Fund seeks to achieve its objective by investing in the following Funds: JNL/Mellon Capital Management JNL 5 Fund, JNL/Mellon Capital Management S&P 500 Index Fund, JNL/Mellon Capital Management S&P 400 MidCap Index Fund, JNL/Mellon Capital Management Small Cap Index Fund, JNL/Mellon Capital Management International Index Fund and JNL/Mellon Capital Management Bond Index Fund (“Underlying Funds”). The Underlying Funds performance contributed to the results of the Fund proportionally based on the relative value to the Fund throughout the year. For the year ended December 31, 2009, the average daily investment in each of the Underlying Funds was 49.1% for the JNL/Mellon Capital Management JNL 5 Fund, 10.1% for the JNL/Mellon Capital Management S&P 500 Index Fund, 10.7% for the JNL/Mellon Capital Management S&P 400 MidCap Index Fund, 10.0% for the JNL/Mellon Capital Management Small Cap Index Fund, 10.2% for the JNL/Mellon Capital Management International Index Fund and 9.9% for the JNL/Mellon Capital Management Bond Index Fund. The Fund expects to rebalance its assets to the allocation percentages specified for each Underlying Fund every January. The performance and investment objectives of the Underlying Funds are discussed elsewhere in this report.
JNL/Mellon Capital Management 10 X 10 Fund (Class A)
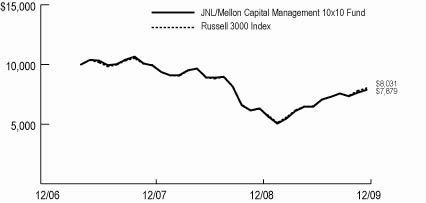
Average Annual Total Returns for Class A Shares | |
| 1 year | 24.59% |
| Since Inception | -8.54% |
| (Inception date April 30, 2007) | |
Past performance is not predictive of future performance. Investment return and principal value will fluctuate so that an investor's shares, when redeemed, may be worth more or less than their original cost. Performance numbers are net of all Fund operating expenses, but do not reflect the deduction of insurance charges.
JNL/Mellon Capital Management Index 5 Fund
JNL/S&P 4 Fund
Jackson National Asset Management, LLC
Team Management
JNL/Mellon Capital Management Index 5 Fund
Objective:
The investment objective of the JNL/Mellon Capital Management Index 5 Fund is capital appreciation.
Portfolio Manager Commentary:
For the year ended December 31, 2009, the Fund underperformed its benchmark by posting a return of 25.16% for Class A shares compared to 28.34% for the Russell 3000 Index. The Fund seeks to achieve its objective by investing in the following Funds: JNL/Mellon Capital Management S&P 500 Index Fund, JNL/Mellon Capital Management S&P 400 MidCap Index Fund, JNL/Mellon Capital Management Small Cap Index Fund, JNL/Mellon Capital Management International Index Fund and JNL/Mellon Capital Management Bond Index Fund (“Underlying Funds”). The Underlying Funds performance contributed to the results of the Fund proportionally based on the relative value to the Fund throughout the year. For the year ended December 31, 2009, the average daily investment in each of the Underlying Funds was 19.8% the JNL/Mellon Capital Management S&P 500 Index Fund, 21.0% for the JNL/Mellon Capital Management S&P 400 MidCap Index Fund, 19.6% for the JNL/Mellon Capital Management Small Cap Index Fund, 20.1% for the JNL/Mellon Capital Management International Index Fund and 19.5% for the JNL/Mellon Capital Management Bond Index Fund. The Fund rebalances its allocations to the Underlying Funds every January. The performance and investment objectives of each Underlying Fund are discussed elsewhere in this report.
JNL/Mellon Capital Management Index 5 Fund (Class A)
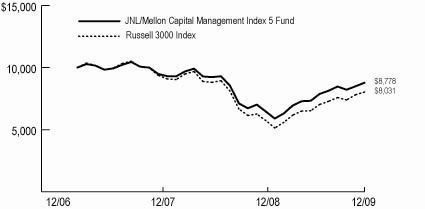
Average Annual Total Returns for Class A Shares | |
| 1 year | 25.16% |
| Since Inception | -4.76% |
| (Inception date April 30, 2007) | |
JNL/S&P 4 Fund
Investment Objective:
The investment objective of the JNL/S&P 4 Fund is capital appreciation.
Portfolio Manager Commentary:
For the year ended December 31, 2009, the Fund outperformed its benchmark by posting a return of 41.85% for Class A shares compared to 26.46% for the S&P 500 Index. The Fund seeks to achieve its objective by investing in the following Funds: JNL/S&P Competitive Advantage Fund, JNL/S&P Dividend Income & Growth Fund, JNL/ S&P Intrinsic Value Fund and JNL/ S&P Total Yield Fund (“Underlying Funds”). The Underlying Funds performance contributed to the results of the Fund proportionally based on the relative value to the Fund throughout the year. For the year ended December 31, 2009, the average daily investment in each of the Underlying Funds was 24.8% for the JNL/S&P Competitive Advantage Fund, 22.5% for the JNL/S&P Dividend Income & Growth Fund, 26.1% for the JNL/ S&P Intrinsic Value Fund and 26.6% for the JNL/ S&P Total Yield Fund. The Fund rebalances its allocations to the Underlying Funds every December. The performance and investment objectives of each Underlying Fund are discussed elsewhere in this report.
JNL/S&P 4 Fund (Class A)
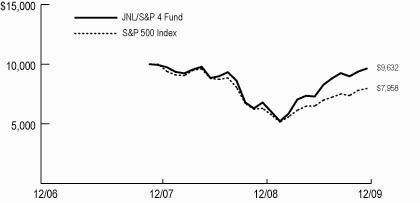
Average Annual Total Returns for Class A Shares | |
| 1 year | 41.85% |
| Since Inception | -1.79% |
| (Inception date December 3, 2007) | |
Past performance is not predictive of future performance. Investment return and principal value will fluctuate so that an investor's shares, when redeemed, may be worth more or less than their original cost. Performance numbers are net of all Fund operating expenses, but do not reflect the deduction of insurance charges.
JNL/Lazard Emerging Markets Fund
Lazard Asset Management LLC
Team Management
Objective:
The investment objective of the JNL/Lazard Emerging Markets Fund is long-term capital appreciation.
Portfolio Manager Commentary:
For the year ended December 31, 2009, the Fund underperformed its benchmark by posting a return of 71.74% for Class A shares compared to 78.51% for the MSCI Emerging Markets Index.
Stock selection in the financials, telecommunication services and energy sectors helped performance. An underweight position in China and an overweight exposure to Indonesia added to returns. Stock selection in the information technology and consumer discretionary sectors, as well as in Brazil, detracted from returns. The Fund’s cash position hurt performance as well.
During the first quarter of 2009, shares in the developing world experienced periods of considerable weakness caused by pessimistic sentiment over the outlook for global financial institutions. This period was followed by a significant rebound toward the end of the quarter, as shares rose due to value hunting by investors who were following signs of improvement in the credit markets. The Fund’s benchmark finished the quarter almost flat. Stocks in Latin America performed considerably better than those in Asia, and especially better than markets in Eastern Europe, the Middle East and Africa. Ongoing weakness and range constrained price action continued in commodity prices, as crude oil prices traded between $30 and $55 per barrel.
Emerging markets equities experienced an extraordinary recovery in the second quarter of 2009. Although stocks in the developing world experienced a respite in June, they rose very strongly in both April and May, as credit and global equity markets showed signs of improvement. The Fund’s benchmark increased by 33% over the quarter, as shares in Eastern Europe, the Middle East, Africa and Latin America performed better than those in Asia. Strong price action occurred in many commodities, and crude oil prices reached more than $70 per barrel by quarter end.
The impressive recovery continued through the third quarter of 2009. Although growth in the developing world slowed in August, it rose very strongly in both July and September, as credit and global equity markets, as well as investor sentiment, demonstrated significant signs of improvement. The Fund’s benchmark increased by almost 21% over the quarter, as shares in Eastern Europe and Latin America performed better than those in Asia. Remarkably, every sector and every country but Morocco rose over the quarter. Stable prices continued in many commodities, and crude oil prices remained at around $70 per barrel over the quarter.
Emerging markets equities finished a remarkably strong year positively, as the Fund’s benchmark ended the fourth quarter up almost 9%. Shares in Latin America performed the strongest, although markets in Eastern Europe also rose, while Asian stocks lagged. For the year as a whole, Latin American equities significantly outperformed shares in Eastern Europe, the Middle East, Africa and Asia.
By sector, consumer discretionary, materials and information technology outperformed the Fund’s benchmark. The utilities, healthcare, industrials and telecommunication services sectors were the weakest performers during the year.
Banco do Brasil SA, a Brazilian bank, performed well as loan growth recovered, asset quality deterioration seemed to approach a bottom and the local currency strengthened. Shares of LUKOIL OAO, a Russian oil and gas company, benefited from rising oil prices. Mobile Telesystems, a Russian telecommunications services company, helped performance due to the Russian ruble’s stabilization and investors’ focus on the company’s cash flow generation.
Shares of Satyam Computer Services Ltd., an Indian software company, were weak due to investor concerns over an alleged fraud. TAM SA, a Brazilian airline company, was weak due to increasing competition and the negative effect of fuel hedges. Shares of Turkcell Iletisim Hizmet AS, a Turkish telecommunication services company, fell over concerns that the weak macroeconomic conditions in Turkey and a weak currency would negatively affect margins.
Significant purchases and sales during the year included: In the consumer discretionary sector; a purchase of Truworths International Ltd. and sales of PT Astra International Tbk, Truworths International Ltd. and Hero Honda Motors Ltd. In the consumer staples sector; purchases of KT&G Corp., Tiger Brands Ltd. and Natura Cosmeticos SA and a sale of Amorepacific Corp. In the information technology sector; purchases of Cielo SA, NHN Corp. and NetEase.com and a sale of Satyam Computer Services Ltd. In the industrials sector; a purchase of Koc Holding AS and sales of TAM SA, Embraer Overseas Ltd. and Iochpe Maxion SA. In the materials sector; a purchase of Usinas Siderurgicas de Minas Gerais SA and a sale of Companhia Vale Do Rio Doce. In the financials sector; purchases of Standard Bank Group Ltd., Akbank T.A.S. and Commercial International Bank and sales of JHSF Participacoes SA and KB Financial Group Inc.
Significant changes in weightings from December 31, 2008 to December 31, 2009 were as follows: Consumer discretionary moved from a 4.4% overweight to a - -.05% underweight. Consumer staples increased from a 5.2% overweight to a 7.9% overweight. Financials decreased its underweight, from a - -6.6% underweight to a -2.0% underweight. Energy increased its underweight, from a -4.0% underweight to a -9.7% underweight. Industrials moved from a 1.5% overweight to a -.05% underweight. Information technology moved from a -1.8% underweight to a 3.0% overweight.
We continue to be reasonably optimistic about emerging markets in the medium and long-term, but are neutral in the short-term. While valuations are not excessive and many investors appear to want to increase their exposure to this asset class, it is markedly more expensive than it was 12 months ago. Therefore, we believe long term investors should maintain exposure to a conservative strategy in this arena, but not to be aggressive at this time.
JNL/Lazard Emerging Markets Fund (Class A)
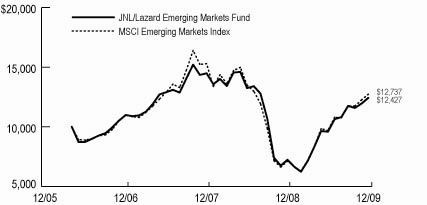
Average Annual Total Returns for Class A Shares | |
| 1 year | 71.74% |
| Since Inception | 6.10% |
| (Inception date May 1, 2006) | |
Average Annual Total Returns for Class B Shares | |
| 1 year | 71.96% |
| Since Inception | 6.30% |
| (Inception date May 1, 2006) | |
Past performance is not predictive of future performance. Investment return and principal value will fluctuate so that an investor's shares, when redeemed, may be worth more or less than their original cost. Performance numbers are net of all Fund operating expenses, but do not reflect the deduction of insurance charges.
JNL/Lazard Mid Cap Equity Fund
Lazard Asset Management, LLC
Team Management
Objective:
The investment objective of the JNL/Lazard Mid Cap Equity Fund is long-term capital appreciation.
Portfolio Manager Commentary:
For the year ended December 31, 2009, the Fund underperformed its benchmark by posting a return of 39.65% for Class A shares compared to 40.48% for the Russell Midcap® Index.
During the year, the Fund benefited from stock selection in the healthcare sector, as positions in Hospira Inc., Life Technologies Corp. and Warner Chilcott Corp. consistently exceeded earnings expectations. The Fund’s underweight position and stock selection in the financials sector contributed to performance. The Fund benefited from an underweight position in the utilities sector as well, as it lagged the overall market considerably. Stock selection in the information technology sector detracted from returns, as wholesale technology distributor Ingram Micro Inc., and software companies such as NeuStar Inc. and Symantec Corp., slightly lagged. Stock selection in the consumer staples sector hurt returns. Shares of Molson Coors Brewing Co. declined, despite its positive earnings for the most recent quarter, due to concerns over price competition in Canada. Stock selection in the industrials sector also detracted from returns.
Equities experienced a tremendous rally since the lows reached in March of 2009, as the economy recovered from one of the worst economic and financial crises in recent history. The events of 2009 largely eliminated the short term risk of systemic failure that we faced only a year ago. The U.S. Federal Reserve’s near zero interest rate policy, combined with a fiscal deficit of approximately 10% of U.S. GDP, transformed the economic freefall to moderate growth quite quickly. This, in turn, encouraged investors to buy into riskier assets. The economy appears to be pulling out of its recession, as it returned to growth following four consecutive quarters of contraction. The housing market also showed further signs of stabilization, as the U.S. government extended its tax incentive program and maintained low borrowing costs for homebuyers. However, the recovery in consumer activity, a primary driver of the economy in the U.S., remained uncertain amid the high unemployment rate. A deceleration of consumer credit volumes also pointed to the continued deleveraging of U.S. consumers.
By sector, materials, information technology, energy and consumer discretionary performed well on the back of an improving economic outlook. A strong recovery in commodity prices boosted confidence in many commodity producers. The information technology sector was a consistent and overall best performer throughout the year, as strong cash positions and profitability in many technology companies attracted investors in the midst of the economic downturn earlier in the year. In addition, computer hardware and semiconductor stocks rebounded due to the surprisingly resilient global PC market. Meanwhile, the consumer staples and utilities sectors underperformed, as investors rotated away from the more defensive sectors amid the improving economic outlook. Financial stocks rebounded sharply from their March lows, but lagged overall for the year, as the expected arrival of more normalized earnings levels for banks was pushed further back amid continued deterioration in the credit markets.
During the year, the Fund benefited from stock selection in the healthcare sector, as positions in Hospira Inc., Life Technologies Corp., and Warner Chilcott Corp. consistently exceeded earnings expectations. Hospira Inc., a specialty pharmaceuticals and medication delivery company, benefited from its management’s multi year cost reduction plan, which increased its margins. Life Technologies Corp. also benefited from cost savings efforts as a result of merger related synergies, and has experienced accelerated revenue growth. In addition to strong earnings during the year, Warner Chilcott Corp. rose sharply after announcing it would purchase Procter & Gamble’s global pharmaceuticals business. We view the deal favorably, as the purchase price was attractive and Warner Chilcott Corp. will likely realize immediate financial and strategic benefits.
The Fund’s underweight position and stock selection in the financials sector contributed to performance. Waddell & Reed Financial Inc. outperformed during the year, as the asset manager outperformed its peers due to strong performance across key products and a strong distribution network. The company’s most recent earnings were better than expected, benefiting from the management team’s operational improvement plan and a sharp rebound in equity markets. The Fund benefited from an opportunistic purchase of PNC Financial Services Group Inc. (“PNC”) as well after its sharp decline in the beginning of the year. PNC performed strongly following the lows reached in March and continued to do so following the completion of the U.S. government’s stress tests. The Fund sold the position as it reached the valuation target. Ameriprise Financial Inc. also performed well off of March lows and, more recently, as investors favorably viewed the news that it agreed to acquire the asset management unit of Columbia Management from Bank of America Corp.
The Fund benefited from an underweight position in the utilities sector as well, as it lagged the overall market considerably.
Conversely, stock selection in the information technology sector detracted from returns, as wholesale technology distributor Ingram Micro Inc., and software companies such as NeuStar Inc. and Symantec Corp., slightly lagged. Despite this, we currently continue to favor these technology holdings due to their low valuations, robust free cash flow generation and strong balance sheets. A low exposure to the semiconductors and semiconductor equipment segment also detracted from performance, as it was the best performing group in the sector due to an improving economic outlook.
Stock selection in the consumer staples sector hurt returns, as shares of Molson Coors Brewing Co. declined, despite its positive earnings for the most recent quarter, due to concerns over price competition in Canada.
Stock selection in the industrials sector also detracted from returns, as waste collection and disposal company Republic Services Inc. lagged due to continued soft volumes in both commercial and residential waste removal. However, the company’s pricing currently remains solid.
While conditions for investors have continued to improve throughout 2009, we believe we will see both new opportunities and uncertainties in the quarters and years ahead. This environment demands that managers rely on forward looking, fundamental research to make investment decisions. As the economy deleverages and recalibrates, we believe our focus on balance sheet strength, robust organic cash flows and the resulting operational flexibility will deliver strong results.
JNL/Lazard Mid Cap Equity Fund (Class A)
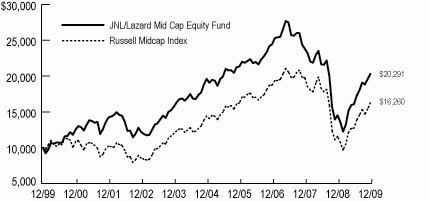
Average Annual Total Returns for Class A Shares | |
| 1 year | 39.65% |
| 5 year | 0.69% |
| 10 year | 7.33% |
Average Annual Total Returns for Class B Shares | |
| 1 year | 39.19% |
| 5 year | 0.75% |
| Since Inception | 3.12% |
| (Inception date March 5, 2004) | |
Past performance is not predictive of future performance. Investment return and principal value will fluctuate so that an investor's shares, when redeemed, may be worth more or less than their original cost. Performance numbers are net of all Fund operating expenses, but do not reflect the deduction of insurance charges.
JNL/M&G Global Basics Fund
M&G Investment Management Limited
Graham French
Objective:
The investment objective of the JNL/M&G Global Basics Fund is to maximize long-term capital growth.
Portfolio Manager Commentary:
For the year ended December 31, 2009, the Fund outperformed its benchmark by posting a return of 46.88% for Class A shares compared to 34.38% for the FTSE World Index.
During the latter stages of 2008 and the first few months of 2009, the Fund took advantage of the depressed valuations of many commodity stocks to continue to build up the Fund’s weighting in this area of the market. The Fund held an overweight position in commodity related stocks versus its benchmark during the year. This meant that the Fund was well placed to take advantage of the strong performance of commodity related stocks once prospects for the global economy improved and risk appetite returned. Good stock selection among basic material stocks was also a key driver of performance, in particular, comparatively large positions in Anglo-Irish oil and gas exploration group Tullow Oil Plc (“Tullow Oil”), French nickel mining firm Eramet, Anglo-African platinum mining business Lonmin Plc (“Lonmin”) and Australian metal recycler Sims Metal Management Ltd. Good stock selection among the Fund’s consumer related holdings also added performance, most notably positions in Starbucks, Wimm-Bill-Dann Foods OJSC, sugar products maker Agrana Beteiligungs AG and chicken producer Pilgrim’s Pride Corp.
Despite a treacherous start to the year, global equities enjoyed strong returns during 2009. As soon as signs emerged that the unprecedented monetary and fiscal stimulus measures employed by governments worldwide had saved the economy from a 1930’s style depression, investors demanded higher returning and higher yielding assets. Having been heavily sold at the height of the downturn, cyclical-led sectors with the greater exposure to any rebound in economic activity were the biggest beneficiaries of investors’ renewed appetite for risk. Commodity and industrial related stocks therefore achieved some of the biggest gains, spurred on by attractive demand fundamentals from emerging countries, such as China and India. Consumer related stocks with exposure to less mature markets also rose on the back of these much improved economic prospects.
The Fund’s relatively large overweight positions in basic materials contributed positively to performance. A comparatively big weighting in industrials also proved beneficial. On the downside, the Fund’s relatively large position in consumer related stocks detracted from performance, however, this was offset by good stock selection in this sector.
Holdings in South Africa based platinum producer Lonmin and Anglo-Irish oil & exploration Tullow Oil added value. Lonmin continued to benefit from the rebound in platinum prices, supported by the demand positive news that a platinum exchange-traded-fund would be launched in 2010. A long held position in oil business, Tullow Oil benefited from the rise in oil prices and a continuation of positive exploration newsflow from its African oilfields.
Although the Fund has significantly outperformed its benchmark during the year, there were, however, some disappointments, including drinks manufacturer Constellation Brands Inc (“Constellation Brands”). As well as being overlooked to a large extent in the cyclical driven rally of 2009, sentiment in Constellation Brands suffered because of problems at its wine division. Nevertheless, we believe in the long-term growth prospects for this company and think that it is a good quality business with a great product range, well placed to benefit from demand in Asia.
During the year, the Fund purchased K+S AG, a German potash manufacturer and a company we believe will be a major beneficiary of the urgent need for fertilizer from developing countries such as China due to rapid population growth. The Fund also purchased BHP Billiton Plc (“BHP Billiton”), a company who has some of the best assets in the world and promising growth prospects. Also importantly, BHP Billiton boasts a healthy balance sheet, the long-term value of which, we believe, is far from reflected in the share price of the business. Additions were made to several of the Fund’s consumer related holdings, including Singapore based conglomerate Fraser & Neave Ltd., food manufacturer Kerry Group Plc, high end hotel chain Hong Kong & Shanghai Hotels and UK consumer products manufacturer PZ Cussons Plc. While commodities and consumer related stocks continue to make up a core part of the Fund, we are finding an increasing number of opportunities among global services names. For example, the Fund established holdings in ports operator DP World Ltd., power supply business Aggreko Plc and security services group G4S Plc.
The Fund sold Santos Ltd. We believed that the strong performance of this oil and gas exploration company had left its valuation looking relatively expensive and disposed of this holding. Positions in chemicals manufacturer FMC Corp., BlueScope Steel Ltd. and Peabody Energy Corp., were also sold, freeing up assets to invest in more compelling opportunities.
There were no major shifts in the Fund’s investments, in particular in its sector and capitalization weightings, during the year. The Fund’s biggest sector weightings are still basic materials, consumer goods and industrials.
Reflecting our positive opinion of the structural and demographic changes taking place in the emerging world, the Fund has an overweight position in consumer related stocks. We believe that companies such as Unilever Plc, Colgate-Palmolive Co. and Starbucks Corp. are well placed to benefit from the growth of consumer spending in developing markets. These businesses are highly cash generative, should be able to fund their growth organically, and return cash to shareholders. The Fund also has a relatively large weighting in basic materials stocks, including mining businesses BHP Billiton, Eramet and Lonmin, as well as brick manufacturer Wienerberger AG, among others, and is therefore well placed to gain from the strong requirements for commodities from developing countries such as China. We are also finding an increasing number of opportunities among global services names, including security services group G4S Plc and energy provider Aggreko Plc, as mentioned above.
We believe strongly in the migration of economic power from west to east and think that companies, which understand this shift and are positioning themselves accordingly, will be the winners over the next decade. By continuing to select well managed good quality companies, which have attractive assets and are in sound financial health, as outlined above, we believe that the Fund will be able to reap the rewards of this exciting scenario and provide good performance over the long-term.
JNL/M&G Global Basics Fund (Class A)
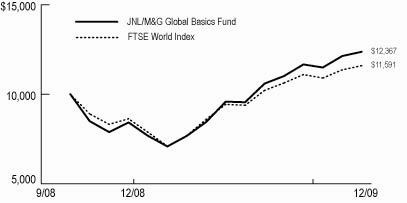
Average Annual Total Returns for Class A Shares | |
| 1 year | 46.88% |
| Since Inception | 18.76% |
| (Inception date October 6, 2008) | |
Average Annual Total Returns for Class B Shares | |
| 1 year | 47.19% |
| Since Inception | 19.08% |
| (Inception date October 6, 2008) | |
Past performance is not predictive of future performance. Investment return and principal value will fluctuate so that an investor's shares, when redeemed, may be worth more or less than their original cost. Performance numbers are net of all Fund operating expenses, but do not reflect the deduction of insurance charges.
JNL/M&G Global Leaders Fund
M&G Investment Management Limited
Aled Smith
Objective:
The investment objective of the JNL/M&G Global Leaders Fund is to maximize long-term total return (the combination of income and growth of capital).
Portfolio Manager Commentary:
For the year ended December 31, 2009, the Fund outperformed its benchmark by posting a return of 37.43% for Class A shares compared to 34.38% for the FTSE World Index.
From March 2009 onwards, global equities recovered from the low levels experienced in late 2008 and early 2009 following the collapse of Lehman Brothers. As a result of improved sentiment, stock correlations in the market fell and investors regained their appreciation for stock specific fundamentals. This provided a positive environment for the Fund’s stock picking approach. Consistent with this, performance was to a large extent driven by good stock selection, in particular within the industrial and consumer goods sectors.
Emerging markets strongly outperformed during the rally, which harmed the Fund’s relative performance somewhat. The Fund’s investment process has a bias towards developed markets where more mature companies undertaking self help initiatives are located. As discussed below, the Fund manager expects the allocation to emerging markets to rise in future periods.
With investors favoring risk, economically sensitive industries, such as technology, media and personal goods outperformed the market. The top performing sector was mining, which returned more than 60% over the year on the back of stronger metal prices. Banking stocks recovered as well, but towards the end of the year banks came under pressure from default fears in Dubai. Meanwhile, the healthcare, utilities and tobacco sectors lagged the market due to their more defensive characteristics. Over the year, emerging markets, including Brazil and Mexico, outperformed developed countries, with Japan particularly weak due to the strong Japanese yen and ongoing deflationary pressures.
The Fund’s outperformance was helped by good sector allocation, including overweight positions in the oil and gas and industrial sectors. The Fund’s underweight positions in financials and utilities also added value. Some of these gains were offset by an overweight position in healthcare companies, which underperformed more cyclical companies during the year.
The technology hardware and equipment sector featured prominently in the list of contributors as two out of three top performers came from that sector. Shares in U.S. based chipmaker Marvell Technology Group Ltd. benefited from the company’s sharply rising profits which it achieved on the back of lower expenses and higher sales. Meanwhile, growing demand for consumer discretionary products was a boost to Korean electronics manufacturer Samsung Electronics Co. Ltd., which has experienced higher sales of its televisions and mobile phones.
Another strong contribution came from Chinese industrial conglomerate Shanghai Industrial Holdings Ltd. Investors responded well to the company’s strategy of selling non-core assets and focusing on the core areas within infrastructure and medicine.
On the other hand, the Fund’s healthcare holdings detracted as the sector underperformed during the year, including pharmaceutical groups Astellas Pharma Inc., Daiichi Sankyo Co. Ltd. (“Daiichi Sankyo”) and Lonza AG (“Lonza”) as well as health data provider IMS Health Inc.
Positions were closed in stocks including Swiss pharmaceutical company Lonza and Dutch consumer electronics maker Koninklijke Philips Electronics NV (“Phillips Electronics”). The current external environment for Lonza, which manufactures active ingredients for the pharmaceutical industry, has become more difficult, which means that Lonza has not been able to achieve the high asset utilization rates required to support improved returns. Meanwhile, we were not convinced that the management team at Philips Electronics had sufficient resolve to carry out the changes required to drive a significant improvement in the company’s returns. Holdings in beverage bottler Coca-Cola Enterprises Inc., Malaysian bank AMMB Holdings Bhd and chemicals group DuPont Fabros Technology Inc. were sold after their shares reached fair value.
On the other hand, the Fund established a position in Japanese convenience store operator Lawson Inc. (“Lawson”) as, on our view that the company understands value creation by allocating capital to stores that can generate long-term returns. Other entrants to the Fund included Irish food business Kerry Group Plc (“Kerry”) and online auction company eBay Inc. (“eBay”). A recent management initiative at Kerry is looking to better integrate the group’s different segments, while eBay’s CEO John Donahoe has introduced a restructuring plan, which we believe will enhance returns.
Purchases in emerging markets included State Bank of India Ltd. and Energias Do Brasil SA, which were purchased in the second half of 2009. We expect more emerging market opportunities to present themselves as these markets mature. However, the Fund’s stock picking approach seeks to diversify country risk. As a result, it is unlikely that emerging markets, or any other geographic region, will become a significant overweight relative to the Fund’s benchmark.
The Fund’s exposure to consumer services, specifically retailers, was increased by adding to an existing holding in French supermarket chain Carrefour SA and by initiating positions in Lawson, eBay, department store Macy’s Inc. and tax returns company H&R Block Inc. On the other hand, the Fund’s weighting in consumer goods was decreased by closing holdings in the automobile sector, including Yamaha Motor Co. Ltd. and Hankook Tire Co. Ltd.
Another significant change to the Fund was a reduction in the overweight position in the healthcare sector. This was achieved by trimming the Fund’s holdings in drug makers Merck & Co. Inc. and Daiichi Sankyo and disposing of a holding in Smith & Nephew Plc, which makes products for the knee and hip replacement markets.
The Fund continues to have overweight positions in consumer services, industrial goods and technology while weightings in consumer goods and utilities are lower than the benchmark. However, the financials sector continues to be the Fund’s largest underweight as we remain uncomfortable with the level of obscurity surrounding the balance sheets of many financial companies. Nonetheless, we have taken investment opportunities within selected financials where we believe that the valuation margins are sufficient to compensate for the additional risk, including Swiss investment manager GAM Holding Ltd. and State Bank of India Ltd.
JNL/M&G Global Leaders Fund (Class A)

Average Annual Total Returns for Class A Shares | |
| 1 year | 37.43% |
| Since Inception | 11.86% |
| (Inception date October 6, 2008) | |
Average Annual Total Returns for Class B Shares | |
| 1 year | 37.70% |
| Since Inception | 12.07% |
| (Inception date October 6, 2008) | |
Past performance is not predictive of future performance. Investment return and principal value will fluctuate so that an investor's shares, when redeemed, may be worth more or less than their original cost. Performance numbers are net of all Fund operating expenses, but do not reflect the deduction of insurance charges.
JNL/Mellon Capital Management Funds
Mellon Capital Management Corporation
Team Management
JNL/Mellon Capital Management S&P 500 Index Fund
JNL/Mellon Capital Management S&P 400 MidCap Index Fund
JNL/Mellon Capital Management Small Cap Index Fund
JNL/Mellon Capital Management International Index Fund
JNL/Mellon Capital Management Bond Index Fund
The equity market recovered from a dismal 2008 to stage a rally that saw the best gains for most U.S. indices since 2003. The U.S. stock market got off to a slow start in 2009 on continued fallout from the credit crisis, with continued concerns about the growing unemployment rate, grim corporate earnings, and dismal home sales. Through March 9, the Dow Jones Industrial Average fell 24.8%, while the S&P 500 Index lost 24.6%. In mid March, investors were encouraged by reports that signaled improvements on consumer confidence, corporate earnings and housing sales, while Bank of America Corp., JPMorgan Chase & Co. and Citigroup Inc. forecasted profits in the first two months of 2009. Stocks continued to rally after consumer confidence soared above expectations, capital shortfalls at U.S. banks were smaller than expected, and employment numbers beat estimates. Later in the year, positive GDP numbers for most developed markets confirmed that the global recession was over. The S&P 500 Index gained 26.5% during 2009, while the Russell 3000 added 28.3%. Growth handily outperformed value across the capitalization spectrum. Among S&P 500 Index economic sectors, information technology soared 59.9%, followed by materials at 45.2% and consumer discretionary, which rose 38.8%.
International stocks also bounced back during 2009, in most cases outperforming the U.S. The MSCI EAFE Index rose 31.8% in U.S. dollar terms. The return of positive sentiment and risk appetite caused the U.S. dollar to fall versus most currencies during 2009, helping U.S. dollar based investors. The top performing country markets in U.S. dollar terms were Norway (87.1%), Australia (76.4%), and Singapore (74.0%). Ireland (12.3%), Finland (11.1%), and Japan (6.3%) were the worst performers.
The Barclays Capital U.S. Aggregate Bond Index, a measure of the overall domestic bond market, generated a total return of 5.9% in 2009. After the flight to quality during the latter half of 2008 and early 2009, spreads narrowed considerably, to levels seen prior to the credit crisis. The latter half of the year saw marked improvement in sentiment and economic fundamentals after
unprecedented government actions succeeded in reducing the fear that rippled through the financial system following the subprime meltdown, helped repair the credit markets, and bolstered investor and consumer confidence. The Treasury sector underperformed all spread sectors, falling -3.6% for the year. The longer end of the yield curve fell even more, with long Treasuries losing 12.9% and 20-year+ Treasuries tumbling 21.4%. The corporate and securitized sectors, commercial mortgaged-backed securities and asset-backed securities sectors, were the strongest performers.
JNL/Mellon Capital Management S&P 500 Index Fund
Objective: The investment objective of the JNL/Mellon Capital Management S&P 500 Index Fund is to match the performance of the S&P 500 Index.
Fund Specific Overview: For the year ended December 31, 2009, the Fund underperformed its benchmark by posting a return of 25.97% for Class A shares compared to 26.46% for the S&P 500 Index.
The Fund is an index fund. As such, its portfolio manager is not selecting specific stocks to own, but is trying to match the Fund’s overall stock weightings and characteristics to the S&P 500 Index stock weightings, while minimizing transaction costs.
Companies that contributed to the Fund’s performance included: Advanced Micro Devices Inc., a manufacturer of semiconductor products, was one of the Fund’s top performers as the company was able to pay down debt using a $1.2 billion dollar anti-competitive lawsuit settlement from its main competitor, Intel Corp. Tenet Healthcare Corp., a U.S. healthcare provider, gained as outpatient visits grew, pricing trends improved and bad debt expense decreased. XL Capital Ltd., a Bermuda based insurer, was one of the Fund’s best performers as the U.S. Treasury’s Troubled Asset Relief Program (“TARP”) boosted the value of its bond portfolio and the company stabilized its balance sheet.
Companies that detracted from the Fund’s performance included: M&I Marshall & Ilsley Bank, a diversified financial services company, was one of the Fund’s worst performers as the company took losses on homebuilder defaults and had their credit rating cut. Huntington Bankshares Inc., a provider of commercial and consumer banking services, was one of the Fund’s worst performers as the company cut its dividend to preserve capital and the company’s credit was downgraded by the credit rating agencies. Citigroup, a diversified financial service company with both corporate and consumer customers, was one of the Fund’s worst performers as the company received government monetary aid to help stabilize its operations.
JNL/Mellon Capital Management S&P 400 MidCap Index Fund
Objective: The investment objective of the JNL/Mellon Capital Management S&P 400 MidCap Index Fund is to match the performance of the S&P 400 MidCap Index.
Fund Specific Overview: For the year ended December 31, 2009, the Fund outperformed its benchmark by posting a return of 38.03% for Class A shares compared to 37.38%% for the S&P 400 MidCap Index.
The Fund is an index fund. As such, its portfolio manager is not selecting specific stocks to own, but is trying to match the Fund’s overall stock weightings and characteristics to the S&P 400 MidCap Index stock weightings, while minimizing transaction costs.
Companies that contributed to the Fund’s performance included: Louisiana-Pacific Corp., a manufacturer of building materials and engineered wood products, returned positively due to its cost cutting efforts and improved capital position. Temple-Inland Inc., a manufacturer of paper, corrugated packaging and building products, gained due to increased demand and prices for boxes. RF Micro Devices Inc., a high performance semiconductor manufacturer, was one of the Fund’s best performers as its cellular products gained market share.
Companies that detracted from the Fund’s performance included: Synovus Financial Corp., a southern U.S. financial services holding company, was one of the Fund’s worst performers as credit provisions and goodwill impairments hurt earnings. Cathay General Bancorp, the holding company for commercial bank Cathay Bank, was one of the Funds worst performers as the slowdown in residential housing increased credit costs and markdowns in related assets. Associated Banc-Corp, a diversified multi-bank holding company, returned negatively due to the poor economy and loan losses.
JNL/Mellon Capital Management Small Cap Index Fund
Objective: The investment objective of the JNL/Mellon Capital Management Small Cap Index Fund is to match the performance of the Russell 2000 Index.
Fund Specific Overview: For the year ended December 31, 2009, the Fund outperformed its benchmark by posting a return of 27.54% for Class A shares compared to 27.17%% for the Russell 2000 Index.
The Fund is an index fund. As such, its portfolio manager is not selecting specific stocks to own, but is trying to match the Fund’s overall stock weightings and characteristics to the Russell 2000 Index stock weightings, while minimizing transaction costs.
Companies that contributed to the Fund’s performance include: Dollar Thrifty Automotive Group Inc., the operator of Dollar and Thrifty vehicle rental systems, was one of the Fund’s best performers as the company was able to maintain rental pricing power and used vehicle residual values increased. Diedrich Coffee Inc., a specialty coffee distributor that also owns retail locations throughout the world, was one of the Fund’s best performers as the company restructured, turned its focus to specialty coffees and sold off non-related parts of the company. The company was the target of Green Mountain Coffee Roasters Inc. who offered a 23% premium for the company. Vanda Pharmaceuticals Inc., a biopharmaceutical company, gained due to the FDA approval for Fanapt, a drug used to treat schizophrenia.
Companies that detracted from the Fund’s performance included: Pacific Capital Bancorp, a California commercial bank holding company, fell due to the poor economy and the expense of raising capital. Sterling Financial Corp., a northwestern U.S. retail bank, fell as the deteriorating credit conditions caused it to announce a credit provision, goodwill impairment and eliminate its cash dividend. Repros Therapeutics Inc., a clinical stage biopharmaceutical company, fell after the company halted development of its drug Proellex due to adverse side effects resulting in patients during its clinical trials.
JNL/Mellon Capital Management Funds
Mellon Capital Management Corporation
Team Management
JNL/Mellon Capital Management International Index Fund
Objective: The investment objective of the JNL/Mellon Capital Management International Index Fund is to match the performance of the MSCI EAFE Index.
Fund Specific Overview: For the year ended December 31, 2009, the Fund underperformed its benchmark by posting a return of 29.28% for Class A shares compared to 31.78%% for the MSCI EAFE Index.
The Fund is an index fund. As such, its portfolio manager is not selecting specific stocks to own, but is trying to match the Fund’s overall stock weightings and characteristics to the MSCI EAFE Index stock weightings, while minimizing transaction costs.
Companies that contributed to the Fund’s performance included: Immoeast, a Central Europe real estate development company, was one of the Fund’s best performers as investors were found to restart some projects that were halted due to the credit crunch and a lack of funding. Infineon Technologies AG, the German semiconductor producer, fell as a result of the company’s decision to refocus its business by selling their wireless communication segment and retaining the automotive business. Kazakhmys Plc, a Kazakhstan based national resource company, gained steadily throughout the year as demand for mining from developing countries compensated for weaker demand in developed markets.
Companies that detracted from the Fund’s performance included: Japan Airlines Co. Ltd., a Japanese airline operator, struggled as legacy pension costs and lower demand for air travel pushed the company closer to bankruptcy. Volkswagen AG, a global carmaker, fell amid a bid to acquire a 50% stake in Porsche AG. Acom Co. Ltd., a Japanese consumer financing company, struggled with the current economy and tightened lending rules.
JNL/Mellon Capital Management Bond Index Fund
Objective: The investment objective of the JNL/Mellon Capital Management Bond Index Fund is to match the performance of the Barclay’s Capital U.S. Aggregate Bond Index.
Fund Specific Overview: For the year ended December 31, 2009, the Fund underperformed its benchmark by posting a return of 5.65% for Class A shares compared to 5.93% for the Barclays Capital U.S. Aggregate Bond Index.
The Fund is an index fund. As such, its portfolio manager is not selecting specific securities to own, but is trying to match the Fund’s overall weightings and characteristics to the Barclays Capital U.S. Aggregate Bond Index weightings, while minimizing transaction costs.
In 2009, the Fund underperformed its benchmark by 28 basis points, giving up some of the alpha from last year. Despite all the market volatility of 2008 and 2009, the Fund managed to closely track the index.
During the year, the market experienced dramatic spread tightening in all products especially in the more credit sensitive sectors. For example, excess returns over duration equivalent treasuries on Corporate, asset-backed securities (“ABS”) and commercial mortgage-backed securities (“CMBS”) returned close to 20%, 25% and 30% respectively. The spread tightening in the credit sector was driven predominantly by a lack of supply in the market combined with tremendous demand for corporate bonds. This combined to create conditions of illiquidity and difficulty in buying this sector. During the year, the Fund had a slight bias toward treasury securities. The Fund experienced a significant amount of cash contributions, and given the volatility and liquidity of the markets it was a bit challenging getting exposure to some of these higher spread products which detracted from performance.
During the first quarter of 2009, interest rates in the U.S. reversed the dramatic declines of the prior quarter and rose in January while the yield curve steepened. Yields continued to rise in February, and made a down turn in March as the U.S. Federal Reserve (“Fed”) announced a quantitative easing program aiming at driving down interest rates to boost the economy. The 10-year Treasury yield finished the quarter at 2.7%, while the 2-year Treasury yield closed at 0.8%. Among the sectors of the fixed income markets, high yield bonds posted strong returns as investors regained their risk appetite. The Barclays Capital U.S. Corporate High Yield Bond Index returned nearly 6.0%. The Treasury Inflation-Protected Securities (“TIPS”) sector also outperformed. The Barclays Capital U.S. TIPS Index returned 5.5%, reflecting growing concerns about inflation.
The Barclays Capital U.S. Aggregate Bond Index finished the quarter with a return of 0.1%. Within the Barclays Capital U.S. Aggregate Bond Index, the asset-backed sector delivered a strong return of 7.6%, following the announcement by the U.S. Treasury and the Fed to launch the Term Asset-Backed Securities Loan Facility (“TALF”), which is designed to support the purchases of certain AAA rated asset-backed securities and to stimulate the broader economy in the long term. Among the other sectors, Treasuries returned - -1.3%. Agencies and mortgage-backed securities returned -0.1% and 2.2%, respectively. CMBS were down -1.9%. Corporate bonds fell -1.9%, pulled down by extreme weakness of the financial institutions sub-sector, which was down -19.6%.
During the second quarter of 2009, in the U.S. bond markets, Treasury yields climbed in the second quarter as investors embraced riskier assets. The 10-year Treasury yield finished the quarter at 3.5%, an increase of 0.8% from the end of the first quarter. The 30-year Treasury yield also rose 0.8% to 4.3%. Credit spreads narrowed as economic reports continued to show slower deterioration of the economy and as investors feared that fiscal deficits and quantitative easing by the government would induce inflation in the long run. The Barclays Capital U.S. Corporate Investment Grade Bond Index returned 10.5% for the quarter, while the Barclays Capital U.S. Corporate High Yield moved up 23.1%.
Investors increased risk appetite helped all sectors to outperform Treasuries in the second quarter. Within the Barclays Capital U.S. Aggregate Bond Index, the CMBS sector delivered a considerable return of 12.5%, helped by the Fed’s announcement in May to include CMBS as eligible collateral under the TALF. The TALF also helped push up the demand for asset-backed securities; the sector finished the quarter with a 7.6% gain. On the other end of the spectrum, the U.S. Treasury sector was down - -3.0%. ABS and mortgage-backed securities (“MBS”) returned 0.1% and 0.7%, respectively. Overall, the Barclays Capital U.S. Aggregate Index returned 1.8% for the quarter.
During the third quarter of 2009, U.S. Treasury securities regained their appeal as investors’ concern about near term inflationary pressures was somewhat eased. The 10-year Treasury yield finished the quarter at 3.3%, a decrease of -0.2% from the end of the second quarter. The 30-year Treasury yield declined -0.3% to 4.0%. Credit spreads narrowed further in the third quarter. Demand for corporate bonds, particularly high yield bonds, continued to strengthen as improvements in global economic indicators stirred investor risk appetite. The Barclays Capital U.S. Corporate High Yield Index returned 14.2%.
Alleviation of inflation pressures and the federal government’s continued quantitative easing efforts drummed up demand in all fixed income sectors. Every sector within the Barclays Capital U.S. Aggregate Bond Index posted positive returns for the quarter. The CMBS sector topped the group, returning 12.7%, followed by the investment grade corporate sector, which was up 8.1%. The ABS sector finished the quarter with a 6.3% gain. The MBS sector gained 2.3%. The U.S. Treasury and agencies sectors, the worst performing sectors, returned 2.1% and 2.0%, respectively. Overall, the Barclays Capital U.S. Aggregate Index returned 3.7% for the quarter.
During the fourth quarter of 2009, treasury securities lost ground, with bond yields rising to multi month highs and the spread between the 2-year and 10-year notes hitting record high levels. The Barclays Capital Long Treasury Index was down - -5.3% during the quarter, as brighter economic prospects lifted expectation of inflation and concerns about the amount of debt the government needs to sell in order to fund the widening budget deficit weighted on the longer maturities. The 10-year yield rose by 0.5% to 3.8% as the yield curve steepened.
Spread sectors narrowed considerably during the quarter as evidence continued to mount that the U.S. and global recessions are over and economic recoveries have begun. The Federal Open Market Committee kept rates at near zero with the risk to growth remaining, but with the improvements in the economy, the committee indicated that most of the special liquidity facilities would expire on February 1st, and gave more details about the wind down of the various liquidity programs it has put in place over the last 15 months or so. Spread sectors outperformed during the quarter. CMBS was the top performing spread sector. In the corporate sector, financials were the best performer. The Barclays Capital U.S. Aggregate Index returned 0.2% for the quarter.
JNL/Mellon Capital Management Funds
Mellon Capital Management Corporation
Team Management
JNL/Mellon Capital Management S&P 500 Index Fund (Class A)
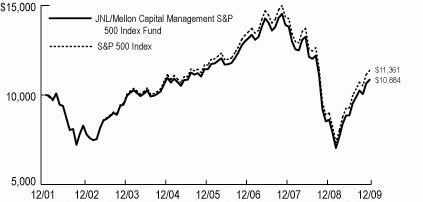
Average Annual Total Returns for Class A Shares | |
| 1 year | 25.97% |
| 5 year | -0.21% |
| Since Inception | 1.02% |
| (Inception date January 15, 2002) | |
Average Annual Total Returns for Class B Shares | |
| 1 year | 26.26% |
| 5 year | -0.03% |
| Since Inception | 0.97% |
| (Inception date March 5, 2004) | |
(Mellon Capital Management Corporation assumed portfolio management responsibility on February 17, 2004)
JNL/Mellon Capital Management S&P 400 MidCap Index Fund (Class A)
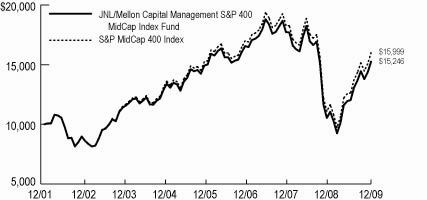
Average Annual Total Returns for Class A Shares | |
| 1 year | 38.03% |
| 5 year | 2.60% |
| Since Inception | 5.44% |
| (Inception date January 15, 2002) | |
Average Annual Total Returns for Class B Shares | |
| 1 year | 38.34% |
| 5 year | 2.79% |
| Since Inception | 3.82% |
| (Inception date March 5, 2004) | |
(Mellon Capital Management Corporation assumed portfolio management responsibility on February 17, 2004)
JNL/Mellon Capital Management Small Cap Index Fund (Class A)
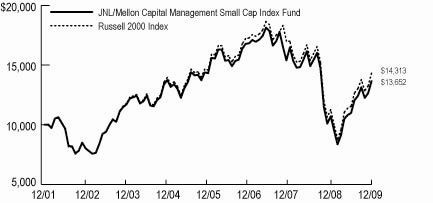
Average Annual Total Returns for Class A Shares | |
| 1 year | 27.54% |
| 5 year | -0.13% |
| Since Inception | 3.99% |
| (Inception date January 15, 2002) | |
Average Annual Total Returns for Class A Shares | |
| 1 year | 27.68% |
| 5 year | 0.06% |
| Since Inception | 1.58% |
| (Inception date March 5, 2004) | |
(Mellon Capital Management Corporation assumed portfolio management responsibility on February 17, 2004)
Past performance is not predictive of future performance. Investment return and principal value will fluctuate so that an investor's shares, when redeemed, may be worth more or less than their original cost. Performance numbers are net of all Fund operating expenses, but do not reflect the deduction of insurance charges.
JNL/Mellon Capital Management Funds
Mellon Capital Management Corporation
Team Management
JNL/Mellon Capital Management International Index Fund (Class A)
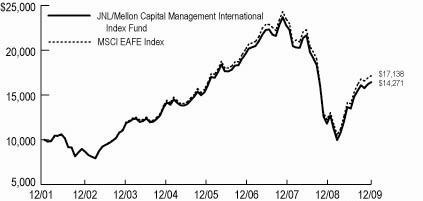
Average Annual Total Returns for Class A Shares | |
| 1 year | 29.28% |
| 5 year | 3.00% |
| Since Inception | 6.44% |
| (Inception date January 15, 2002) | |
Average Annual Total Returns for Class B Shares | |
| 1 year | 29.57% |
| 5 year | 3.20% |
| Since Inception | 5.05% |
| (Inception date March 5, 2004) | |
JNL/Mellon Capital Management Bond Index Fund (Class A)
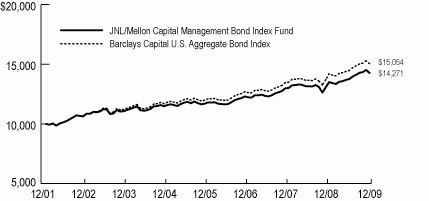
Average Annual Total Returns for Class A Shares | |
| 1 year | 5.65% |
| 5 year | 4.26% |
| Since Inception | 4.57% |
| (Inception date January 15, 2002) | |
Average Annual Total Returns for Class B Shares | |
| 1 year | 5.90% |
| 5 year | 4.48% |
| Since Inception | 4.07% |
| (Inception date March 5, 2004) | |
Past performance is not predictive of future performance. Investment return and principal value will fluctuate so that an investor's shares, when redeemed, may be worth more or less than their original cost. Performance numbers are net of all Fund operating expenses, but do not reflect the deduction of insurance charges.
JNL/Mellon Capital Management Funds
Mellon Capital Management Corporation
Team Management
JNL/Mellon Capital Management European 30 Fund
JNL/Mellon Capital Management Pacific Rim 30 Fund
JNL/Mellon Capital Management European 30 Fund
Objective: The investment objective of the JNL/Mellon Capital Management European 30 Fund is to provide capital appreciation.
Fund Specific Overview: For the year ended December 31, 2009, the Fund outperformed its benchmark by posting a return of 41.03% for Class A shares compared to 35.83% for the MSCI Europe Index.
Companies that contributed to the Fund’s performance include: Antofagasta, an operator and explorer for copper mines, became a top performer in the Fund as the company benefited from increased copper prices. DnB Nor Asa, a Norwegian commercial bank, rose due to its sound operations and increased capital. Mets Oyi, a global supplier of process industry machinery and systems, was one of the top performers of the Fund as customers began to discuss bigger projects and spending on industrial equipment began to show signs of a recovery.
Companies that detracted from the Fund’s performance include: Banco De Sabadell, a Spanish based retail and commercial bank, fell as late payments and defaults increased as a result of Spain’s high unemployment rate. France Telecom SA, a telecommunications services company to residential, professional and large business customers, fell as the ongoing economic slump forced customers to cut back on telecommunications services. Mobistar SA, a Belgian firm that offers mobile telephone services through a GSM network and fixed line services for international calls, had decreased performance due to the weak economy and increased competition.
JNL/Mellon Capital Management Pacific Rim 30 Fund
Objective: The investment objective of the JNL/Mellon Capital Management Pacific Rim 30 Fund is to provide capital appreciation.
Fund Specific Overview: For the year ended December 31, 2009, the Fund slightly underperformed its benchmark by posting a return of 24.15% for Class A shares compared to 24.18% for the MSCI Pacific Index.
Companies that contributed to the Fund’s performance include: Rio Tinto, an international mining company, gained as a result of the decline in value of the Australian dollar, which gave it an advantage over rivals in South Africa and India. Australia and New Zealand Banking Group, an international bank with activities in general banking, mortgage and installment lending, life insurance, leasing, hire purchase and general finance, was up as it was able to acquire strategic businesses in Asia and from subsidiaries of ING. These activities put the company in a better position to grow it’s business throughout Asia. Jardine Cycle and Carriage, a company which distributes, retails, and assembles motor vehicles, parts, and accessories, rose as analysts noted that the company’s position in the market gave it little exposure to the export market and the company’s balance sheet was extremely healthy and would allow it to participate in strategic acquisitions.
Companies that detracted from the Fund’s performance include: Tokuyama Corporation, a Japanese producer of cement and other construction materials, fell due to the weakened global demand for building materials and significant dilution due to an equity offering to finance a Malaysian plant. West Japan Railway, Japan’s third largest railway operator, fell on declining passenger numbers and a significant drop in Japan’s GDP. NTT Docomo Inc, a provider of various telecommunications services, had negative returns because of decreased sales and increased costs.
JNL/Mellon Capital Management European 30 Fund (Class A)
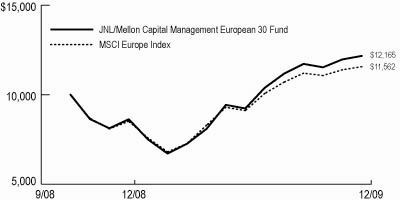
Average Annual Total Returns for Class A Shares | |
| 1 year | 41.03% |
| Since Inception | 17.19% |
| (Inception date October 6, 2008) | |
Average Annual Total Returns for Class B Shares | |
| 1 year | 41.27% |
| Since Inception | 17.39% |
| (Inception date October 6, 2008) | |
JNL/Mellon Capital Management Pacific Rim 30 Fund (Class A)
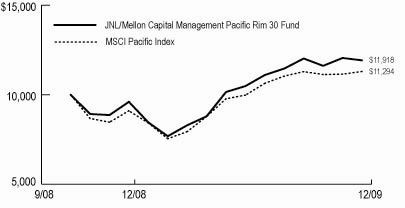
Average Annual Total Returns for Class A Shares | |
| 1 year | 24.15% |
| Since Inception | 15.26% |
| (Inception date October 6, 2008) | |
Average Annual Total Returns for Class B Shares | |
| 1 year | 24.49% |
| Since Inception | 15.52% |
| (Inception date October 6, 2008) | |
Past performance is not predictive of future performance. Investment return and principal value will fluctuate so that an investor's shares, when redeemed, may be worth more or less than their original cost. Performance numbers are net of all Fund operating expenses, but do not reflect the deduction of insurance charges.
JNL/Mellon Capital Management Global Alpha Fund
Mellon Capital Management Corporation
Team Management
Objective:
The investment objective of the JNL/Mellon Capital Management Global Alpha Fund is to seek total return.
Portfolio Manager Commentary:
For the period September 28, 2009 through December 31, 2009, the Fund underperformed its benchmark by posting a return of -1.20% for Class A shares compared to 0.02% for the Citigroup 1 Month Treasury Bill Index. The factors that caused underperformance during the period were losses in the currency and bond allocation components. The equity allocation component added alpha. Exchange-traded equity and bond futures, and currency forwards are used to implement the Fund’s strategy. However, their use has a very small impact on the performance as they are merely a more cost effective and highly liquid substitute for gaining market exposure. What impacts the Fund’s performance is the allocation among the developed equity, bond, and currency markets, as described below.
Evidence continued to mount that the U.S. and global recessions are over and economic recoveries have begun. The Organization for Economic Cooperation and Development doubled its growth forecast for the leading developed economies, saying the economies of the group’s 30 member countries will expand 1.9% next year and 2.5% in 2011. The third quarter gross domestic product report showed the U.S. economy expanded at an annualized rate of 3.5%. In a sign that the labor market may finally be healing, initial reports showed that November non-farm payrolls fell by 11,000 workers, far less than the 111,000 decline in jobs in October. For the eighth consecutive month, the Conference Board’s index of leading economic indicators rose. Existing home sales jumped again up 7.4% in November after jumping 10.1% in October as the overall economic picture continues to improve. Abroad, China’s industrial production grew more than economists had forecasted in November, a development that reaffirms the expectations of many economists that China will help lead the rest of the world in recovery. Data was mixed in the Euro area. Service and manufacturing industries grew at the fastest pace in two years in November. At the same time, Greece had its debt rating cut while Spain and the UK were facing the possibility of downgraded ratings. The UK economy has lagged; their third quarter 2009 GDP declined to -0.4%. As economies transition to growth, the next step for governments and central banks will be to remove the stimulative policies without harming the nascent growth. European Central Bank President Trichet said policymakers will withdraw emergency cash gradually in an effort to ensure the bank does not fuel inflation. The Federal Open Market Committee (“FOMC”) kept rates at near zero with the risk to growth remaining, but with the improvements in the economy, the FOMC indicated that most of the special liquidity facilities would expire on February 1st, and gave more details about the wind down of the various liquidity programs it has put in place over the last 15 months or so. Australia became the first G20 country to raise interest rates in more than a year. Norges Bank became the first European central bank to reverse its easing cycle as the Norwegian economy accelerated.
In general, the Fund uses derivatives as direct substitutes for developed market stock indices, government bonds, and currencies. The Fund employs derivatives because they have much lower trading costs. Some important points about the types of derivatives the Fund uses are as follows: 1) In almost all the markets covered by the Fund, the derivative is more liquid than the underlying physical securities. This is often the case for exchange traded futures on liquid developed markets. 2) The Fund limits derivatives use to futures and forwards which are among the simplest types of derivatives. They have linear payoffs, meaning a $1 price change in the underlying equals $1 in derivative profit and loss or mark-to-market. This is not the case for more exotic over the counter derivatives with embedded optionality and so called non-linear payoffs. 3) Most of the derivatives the Fund uses are exchange traded with daily mark-to-market and no counterparty credit risk. 4) For the over-the-counter derivatives, mostly currency forwards, the Fund minimizes counterparty credit exposure by rolling them quarterly and by trading only with the highest credit rated counterparties.
The largest volume of trading activity during the quarter was in the fixed income selection strategy component. The Fund purchased U.S. and Japanese bond futures. The term premium for U.S. bonds increased significantly as the rise in yields, combined with a relatively muted rise in cash expected returns against the global average, increased their attractiveness. The Fund pared its short in Japanese bond futures as the position was less attractive on a risk adjusted basis. The Fund sold Euro and UK bond futures after their term premiums decreased versus the global average. Euro bond yields rose less than the global average, while the rise in UK long-term inflation expectations narrowed the UK term premium. In the currency component, the Fund’s largest purchase was the euro after its monetary policy signal turned more positive. The Fund’s largest sales were the British pound and the Swiss franc. The British pound’s monetary policy signal was less attractive and the real rate signal became negative after inflation expectations rose in the UK. The Fund sold the Swiss franc against its euro purchase, as it was less attractive on the real rate and monetary policy signals and due to its high correlation with the euro.
Within the equity market selection strategy, the Fund’s largest overweight is in France (CAC 40 10 Euro Index Future), where stocks are attractively valued relative to bonds and to other country equity markets. Our largest equity futures position continues to be an underweight to Japan (TOPIX Index Future), where stocks are expensive relative to bonds, and we expect the lowest equity returns of any developed country. In the bond allocation strategy, the largest overweights are in U.S. and UK bond futures as they offer the largest term premiums. The Fund’s largest underweight remains in Japan, where the term premium is unattractive versus the global average. In the currency strategy, the Australian dollar and the Japanese yen are the Fund’s largest overweights. The Fund is overweight the Australian dollar because its short-term real interest rate is relatively high and it is expected to remain above the global average. The Japanese yen overweight is driven by the positive monetary policy signal. The Fund’s largest underweights are in the British pound and the U.S. dollar. Both the British pound and the U.S. dollar are relatively unattractive from a monetary policy standpoint, while the British pound also has a negative real interest rate.
Average Annual Total Returns for Class A Shares | |
| Since Inception | -1.20% |
| (Inception date September 28, 2009) | |
Average Annual Total Returns for Class B Shares | |
| Since Inception | -1.10% |
| (Inception date September 28, 2009) | |
Past performance is not predictive of future performance. Investment return and principal value will fluctuate so that an investor's shares, when redeemed, may be worth more or less than their original cost. Performance numbers are net of all Fund operating expenses, but do not reflect the deduction of insurance charges.
JNL/Oppenheimer Global Growth Fund
OppenheimerFunds, Inc.
Rajeev Bhaman
Objective:
The investment objective of the JNL/Oppenheimer Global Growth Fund is to seek capital appreciation.
Portfolio Manager Commentary:
For the year ended December 31, 2009, the Fund outperformed its benchmark by posting a return of 39.42% for Class A shares compared to 29.99% for the MSCI World Index.
The year began with near panic in the financial markets. For the first quarter of 2009, there was a very real fear that the world economy might be heading towards the conditions experienced during the Great Depression. As credit dried up and consumer confidence collapsed, global economic activity slowed dramatically or went into reverse as many large financial institutions disappeared or neared bankruptcy.
Central bankers and governments did not sit idly by. Last year, we maintained that with the help of government intervention, the financial system would stabilize, risk premiums would fall, loans would be made available to qualified businesses and consumers, and the global economy would largely recover. The scale of government intervention has been unprecedented, and while the long-term impacts are still to be assessed, we believe the “medicine” has clearly worked and we are now in the early stages of an economic recovery.
Given our relatively sanguine view last year that there would be a fairly robust market recovery sooner rather than later, we did not panic with regard to the Fund during this extreme market volatility. We instead stuck to our investment principles. As a result, we were able to produce results that were well ahead of the benchmark during the year.
Our approach is essentially bottom-up and based on a stock’s fundamentals. Sector and country allocation are also primarily driven by stock selection. We do not make changes to the Fund because of sweeping top-down asset or country allocation decisions. Although we tend to avoid jurisdictions where the legal structures appear inadequate to provide shareholder protection. Currently, we tend to favor securities located in open economies, such as the U.S., Japan and UK, which have high quality companies and feature significant innovation.
Our fundamental, bottom-up approach, which seeks long-term, sustainable and superior growth, has currently led us to focus on the information technology and consumer discretionary sectors. This is where we are finding the most companies with the characteristics we seek. Indeed, we had approximately 43% of the Fund invested in these two sectors at year end, compared to the benchmark’s roughly 20% allocation. So, it is particularly encouraging that these two sectors were the biggest positive contributors to performance during the year.
Within information technology, the biggest contributors were Telefonaktiebolaget LM Ericsson, our largest holding; Infosys Technologies Ltd., the Indian software company; U.S. based Juniper Networks Inc.; semiconductor firm MediaTek Inc.; internet service company eBay Inc.; and specialty glass and ceramics producer Corning Inc. All of these companies were among the top ten positive contributors to overall Fund performance. Among consumer discretionary companies, we had positive contributions from a wide array of holdings, such as retailers Hennes & Mauritz AB, which the Fund exited, and Tiffany & Co. Other contributors included Bayerische Motoren Werke (BMW) AG and luxury goods companies LVMH Louis Vuitton Moet Hennessy SA and Tod’s SpA.
Our other major overweight sector at year end was industrials. Industrials was a positive contributor to performance, with a particular strong showing by Assa Abloy AB, a Swedish company that is a leading manufacturer and supplier of locks. Our energy stock selection, which had detracted from Fund performance during the first half of the year, experienced a strong rebound and ended the year strongly outperforming the Fund’s benchmark. Technip SA, Europe’s second largest provider of oil field services, was the largest contributor to performance. The Fund also handily outperformed in the consumer staples sector as a result of better relative stock selection.
In contrast, materials, a sector where we were underweight at year end, detracted from performance. It was a roller coaster period for this sector. As the commodity and energy bubble burst, the sector was very weak through March 2009. But as prices recovered, materials was the top performing sector for the Fund’s benchmark in terms of total return. Thus, our substantial underweight in materials hurt relative performance. We are, however, maintaining our underweight position in materials as the fundamentals of supply and demand in a slow growth world do not appear to support another big run up in this sector.
At the country level, the stellar performance of technology stocks moved the U.S. into the top position in terms of positive contributors to performance. As a region, Europe was the top contributor to Fund performance, with solid contributors coming from France, Germany and Sweden, among others. Latin America also outperformed for the Fund, with Brazil and Mexico leading the way, as did Asia excluding Japan, primarily due to India and Taiwan providing the bulk of the returns. On the negative tack, our underweights in Australia and Canada detracted from overall performance, as did our overweight position to Japan.
The global outlook continues to be mixed as much of the global economy seems poised to transition from a state of “less bad” to sustained growth. On the positive side, we see some increases in investor participation and a return of risk appetite as economic data shows movement from the depressed levels of 2008 and the first quarter of 2009. We are encouraged by early signs of stabilization in the housing and employment markets and improvement in consumer confidence.
While the exact shape of recovery is yet unknown, we remain conservative in our assumptions: deleveraging, at least in the developed world and at both the personal and corporate levels, has a long way to run. This will restrain demand and, thus, growth. It is also clear that the crisis is putting considerable pressure on companies to adapt via cost cutting and aggressive competition. As a result, the gap between the strong and the weak will grow; hence, our emphasis is on picking and sticking with what we believe are winners. We are optimistic about the outlook for the Fund because of the quality of the companies we believe it holds and the compelling valuations on which those names continue to trade. We believe the Fund is well positioned to seek attractive returns without any heroic assumptions for the shape of the recovery.
JNL/Oppenheimer Global Growth Fund (Class A)

Average Annual Total Returns for Class A Shares | |
| 1 year | 39.42% |
| 5 year | 3.12% |
| Since Inception | 3.89% |
| (Inception date April 30, 2001) | |
Average Annual Total Returns for Class B Shares | |
| 1 year | 39.58% |
| 5 year | 3.34% |
| Since Inception | 4.81% |
| (Inception date March 5, 2004)) | |
Past performance is not predictive of future performance. Investment return and principal value will fluctuate so that an investor's shares, when redeemed, may be worth more or less than their original cost. Performance numbers are net of all Fund operating expenses, but do not reflect the deduction of insurance charges.
JNL/PAM Asia ex-Japan Fund
Prudential Asset Management (Singapore) Limited
Kannan Venkataramani
Objective:
The investment objective of the JNL/PAM Asia ex-Japan Fund is long-term total return.
Portfolio Manager Commentary:
For the year ended December 31, 2009, the Fund underperformed its benchmark by posting a return of 69.59% for Class A shares compared with 72.07% for the MSCI Asia ex-Japan Index.
Stock selection in the financial and utility sectors and asset allocation to utilities contributed to the Fund’s performance. However, stock selection in the consumer discretionary and energy sectors, allocation to consumer discretionary and the Fund’s cash position hurt Fund performance. Taiwan and Hong Kong contributed to the Fund, while Korea and India detracted from Fund performance.
The stock markets of Asia ex-Japan increased sharply during 2009 after experiencing large declines during the global financial crisis in 2008. Gains in 2009 occurred as international economies appeared to stabilize and begin recovering.
AAC Acoustic Technologies Holdings Inc. (“AAC”) and Sterlite Industries India Ltd. (“Sterlite”) were among the larger contributors to Fund performance. Each outperformed its domestic market as well as the region. We believe their valuations are attractive. We expect AAC’s margins to widen as prices rise for the equipment this China-based company manufactures for high end phones. We believe Sterlite is one of the world’s lowest cost producers of zinc, copper and aluminium.
In contrast, China Zhongwang Holdings Ltd. (“Zhongwang”) and Shinsegae Co. Ltd. (“Shinsegae”) were among the larger detractors from Fund performance. Each was an overweight that underperformed its domestic market as well as the region. We like them despite temporary setbacks. Zhongwang makes aluminium goods but was hit by profit taking and a news report that questioned information about company customers. Zhongwang rejected the news report as groundless. We expect the company to gain from Beijing’s economic stimulus spending. Shinsegae, an operator of department and discount stores in Korea, suffered because company sales appeared weak. We believe Shinsegae’s valuations are attractive.
Among its larger transactions, the Fund established new positions in Taiwan Semiconductor Manufacturing Co. Ltd. (“Taiwan Semiconductor”) and Samsung Fire & Marine Insurance Co. Ltd. (“Samsung Fire & Marine”). A stake in CNOOC Ltd. (“CNOOC”) was also raised. We are attracted to valuation and the dividend at Taiwan Semiconductor, a leading foundry. Samsung Fire & Marine is Korea’s biggest non-life insurer and seems to offer value for the long term. CNOOC is an offshore oil and gas company that is likely to benefit from China’s growing demand for energy. We estimate that the stock is cheap compared with other China energy stocks.
China, Indonesia and India were the Fund’s top weighted markets at year end. Led by these three countries, we believe Asia ex-Japan economic growth will exceed that of the world’s developed markets by around 3% annually in the coming years.
At year end, the Fund moved to neutral in utilities from underweight a year earlier on a belief that the industry had been left behind by a rally and had become attractive. The Fund moved to overweight in materials from underweight a year earlier by buying POSCO Inc., China Shanshui Cement Group Ltd. and Hindalco Industries Ltd. We believe these companies are attractively valued.
JNL/PAM Asia ex-Japan Fund (Class A)
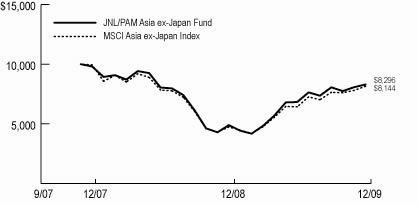
Average Annual Total Returns for Class A Shares | |
| 1 year | 69.59% |
| Since Inception | -8.60% |
| (Inception date December 3, 2007) | |
Average Annual Total Returns for Class B Shares | |
| 1 year | 69.80% |
| Since Inception | -8.40% |
| (Inception date December 3, 2007) | |
Past performance is not predictive of future performance. Investment return and principal value will fluctuate so that an investor's shares, when redeemed, may be worth more or less than their original cost. Performance numbers are net of all Fund operating expenses, but do not reflect the deduction of insurance charges.
Prudential Asset Management (Singapore) Limited is an indirect, wholly-owned subsidiary of Prudential Plc, a publicly ptraded company incorporated in the United Kingdom. Prudential Plc is not affiliated in any manner with Prudential Financial Inc., a company whose principal place of business is in the United States of America.
JNL/PAM China-India Fund
Prudential Asset Management (Singapore) Limited
DR Rao
Objective:
The investment objective of the JNL/PAM China-India Fund is long-term total return.
Portfolio Manager Commentary:
For the year ended December 31, 2009, the Fund outperformed one of its benchmarks by posting a return of 82.27% for Class A Shares compared to 62.29% for the MSCI China Index. The Fund underperformed its other benchmark, the MSCI India Index which returned 102.81%. Stock selection in China and Hong Kong benefited the Fund’s relative performance while stock selection in India and currency movements limited returns.
Asian equity markets started 2009 poorly. Global efforts to avoid an economic crisis paid dividends as an extended period of equity appreciation began in March. The rebound continued in the second and third quarter as stimulus measures by governments gained traction while macroeconomic and production data from China and India stabilized. China’s commitment to a loose monetary policy also stimulated markets. The fourth quarter saw a slowdown in equity gains on concerns of a pricing bubble.
Hong Kong based automobile and battery producer BYD Co. Ltd. (“BYD”) was the top contributor and reported that its 9-month earnings rose 201% due to strong domestic car sales. Off-benchmark AAC Acoustic Technologies Holdings Inc. price increased after being supported by positive earnings and guidance from handset brands such as Nokia Oyj and Apple Inc. The top Indian contributor was the Fund’s non-position in Reliance Communications Ltd. which declined because of poor financial results. Indian carmaker Maruti Suzuki India Ltd. was another contributor advancing on increased sales and competitive positioning. An overweight in China Unicom Hong Kong Ltd. and non-positions in Tencent Holdings Ltd. and Tata Consultancy Services Ltd detracted from performance.
Positions were established in China Resources Land Ltd., China Life Insurance Co. Ltd., Fosun International Ltd., Li Ning Co. Ltd., Sohu.com Inc., Sino-Ocean Land Holdings Ltd., Sinotrans Shipping Ltd., China Zhongwang Holdings Ltd., China Resources Cement Holdings Ltd., China Pacific Insurance (Group) Co. Ltd., Dr. Reddy’s Laboratories Ltd., Colgate-Palmolive India Ltd., Tata Steel Ltd., Hindalco Industries Ltd., Axis Bank Ltd., IVRCL Infrastructures & Projects Ltd., Sterlite Industries India Ltd., Mphasis Ltd., LIC Housing Finances Ltd., Reliance Industries Ltd., GVK Power & Infrastructure Ltd., Sun TV Network Ltd., Rural Electrification Corp. Ltd., OnMobile Global Ltd., Oil India Ltd. and Tata Motors Ltd.
The Fund sold out of positions in Housing Development Finance Corp., China Shipping Development Co. Ltd., Anhui Conch Cement Co. Ltd., Beijing Capital International Airport Co. Ltd., China Resources Power Holdings Co. Ltd., BYD Electronic International Co. Ltd., China Life Insurance Co. Ltd., Satyam Computer Services Ltd., Bharat Heavy Electricals Ltd., Hindustan Unilever Ltd., HDFC Bank Ltd., Tata Power Co. Ltd., NTPC Ltd., Cairn India Ltd., Larsen & Toubro Ltd. and Oil & Natural Gas Corp. Ltd.
During the year consumer discretionary shifted to an overweight while consumer staples went to an underweight position. The Fund ended the year underweight energy, industrials, healthcare, financials and telecommunications. Materials, information technology and utilities were overweight positions. The Fund ended the year underweighting China, Hong Kong and India. The Fund also has a cash position that will be deployed as deemed by the Fund’s Manager.
JNL/PAM China-India Fund (Class A)
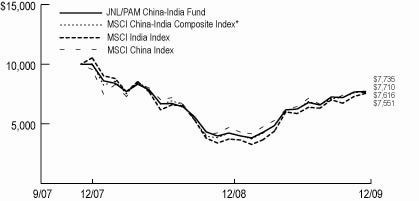
Average Annual Total Returns for Class A Shares | |
| 1 year | 82.27% |
| Since Inception | -11.77% |
| (Inception date December 3, 2007) | |
Average Annual Total Returns for Class B Shares | |
| 1 year | 82.55% |
| Since Inception | -11.61% |
| (Inception date December 3, 2007) | |
*MSCI Chin-India Index is comprised of 50% MSCI China Index and 50% MSCI India Index.
Past performance is not predictive of future performance. Investment return and principal value will fluctuate so that an investor's shares, when redeemed, may be worth more or less than their original cost. Performance numbers are net of all Fund operating expenses, but do not reflect the deduction of insurance charges.
Prudential Asset Management (Singapore) Limited is an indirect, wholly-owned subsidiary of Prudential Plc, a publicly ptraded company incorporated in the United Kingdom. Prudential Plc is not affiliated in any manner with Prudential Financial Inc., a company whose principal place of business is in the United States of America.
JNL/PIMCO Real Return Fund
Pacific Investment Management Company LLC
Mihir Worah
Objective:
The investment objective of the JNL/PIMCO Real Return Fund is to seek maximum real return, consistent with preservation of real capital and prudent investment management.
Portfolio Manager Commentary:
For the year ended December 31, 2009, the Fund outperformed its benchmark by posting a return of 17.25% for Class A shares compared to 11.41% for the Barclay’s Capital U.S. TIPS Index.
Main contributors to the Fund’s performance relative to its benchmark in 2009 include: Corporate bonds, especially exposure to financial companies and high yield credits, added to performance over the year and were among the best performing fixed income assets for all of 2009. Exposure to non-agency mortgage-backed securities (MBS) and high quality consumer asset-backed securities (ABS) added to annual performance as these bonds also rallied amid strong government policy support. Positions in inflation-linked bonds in Japan added to performance as these bonds gained from continued government support.
The following strategies negatively impacted the Fund’s performance: Above-index total duration stemming from U.S. nominal bonds was a negative impact to returns. Nominal interest rates rose during the year as investors’ risk appetites revived, crimping demand for Treasuries and other sovereign bonds. Underweight shorter maturity Treasury Inflation-Protected Securities (TIPS) was a negative impact to returns. Real yields declined on better than expected economic data, continued asset inflow into shorter maturities, and a general lack of liquidity across the TIPS curve.
The Fund management team invests in the following derivatives; financial future contracts, option contracts, forward foreign currency contracts and swap agreements, as a tool to manage credit, interest and currency exposure as well as to gain overall exposure to certain markets as part of its investment strategy. Money market futures positions added 1.20% to the Fund’s performance, especially in the U.S., as the U.S. Federal Reserve (“Fed”) indicated that short maturity rates would remain low for longer than markets had expected. The other derivatives held during the year did not have a significant impact on the Fund’s performance.
Policy responses to the financial crisis and economic downturn that began in the second half of 2008 helped to stabilize the global economy in 2009. Interest rates generally rose during the year as investors’ risk appetites revived, crimping demand for Treasuries and other sovereign bonds.
TIPS gained 11.41% in 2009 as represented by the Barclays Capital U.S. TIPS Index. Real yields declined across most of the maturity spectrum with the exception of long dated issues, where real rates rose only modestly. Real coupon helped returns as did positive inflation accruals despite cyclical disinflationary pressures. TIPS outperformed comparable maturity nominal bonds overall.
TIPS yields declined most for shorter maturities up through the 5-year sector, partly reflecting an increase in energy prices such as crude and crude products, but mostly a reaction to improved fourth quarter economic data, continued asset inflow into shorter maturities and a general lack of liquidity across the TIPS curve. TIPS gained despite continued near term disinflationary pressures weighing on market sentiment. The benchmark ten-year yields ended the year 71 basis points lower at 1.41%.
A striking feature of the U.S. economy as the year drew to a close was the record steepness in the Treasury yield curve. This steepening also occurred in government yield curves of other major developed economies. Additionally, corporate bonds, MBS and ABS gained and Treasuries fell during 2009 as government policies helped push investors out of cash and toward higher yielding, riskier assets.
During the year, significant changes in the Fund’s weightings included an increase in cash equivalents of +33%, and a decrease in MBS and non U.S. of -20% and -13%, respectively.
JNL/PIMCO Real Return Fund (Class A)
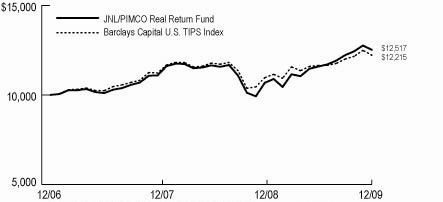
Average Annual Total Returns for Class A Shares | |
| 1 year | 17.25% |
| Since Inception | 7.89% |
| (Inception date January 16, 2007) | |
Average Annual Total Returns for Class A Shares | |
| 1 year | 17.76% |
| Since Inception | 8.18% |
| (Inception date January 16, 2007) | |
Past performance is not predictive of future performance. Investment return and principal value will fluctuate so that an investor's shares, when redeemed, may be worth more or less than their original cost. Performance numbers are net of all Fund operating expenses, but do not reflect the deduction of insurance charges.
JNL/PIMCO Total Return Bond Fund
Pacific Investment Management Company LLC
William H. Gross
Objective:
The investment objective of the JNL/PIMCO Total Return Bond Fund is to realize maximum total return, consistent with the preservation of capital and prudent investment management.
Portfolio Manager Commentary:
For the year ended December 31, 2009, the Fund outperformed its benchmark by posting a return of 15.45% for Class A shares compared to 5.93% for the Barclays Capital U.S. Aggregate Bond Index.
Main contributors to the Fund’s performance relative to its benchmark in 2009 included: An overweight to agency mortgage-backed securities (“MBS”), which enjoyed a powerful rally for all of 2009. The success of the U.S. Federal Reserve’s (“Fed”) MBS Purchase program drove yield premiums to their tightest levels ever. An overweight to non-Agency MBS and high quality consumer asset-backed bonds (“ABS”) added to annual performance as these bonds also rallied amid strong government policy support. Corporate bonds, especially an overweight to bonds of financial companies and high yield credits, added to performance over the year and were among the best performing fixed income assets for all of 2009. Municipal bonds were also strong performers, and added to annual performance. Municipal yield ratios relative to Treasuries moved closer to historical averages after widening dramatically last year. Exposure to Treasury Inflation-Protected Securities (“TIPS”) added to annual performance as real yields outperformed their nominal counterparts during the year. An allocation to emerging market (“EM”) bonds was positive for performance. Indices of EM bonds denominated both in U.S. dollars and local EM currencies delivered returns in excess of 20% in 2009. A major detractor from the Fund’s performance relative to the benchmark was an overweight to duration in the U.S. which detracted from returns as the U.S. Treasury market lagged most other developed bond markets in 2009.
The Fund management team invests in the following derivatives; financial future contracts, option contracts, forward foreign currency contracts and swap agreements, as a tool to manage credit, interest and currency exposure as well as to gain overall exposure to certain markets as part of its investment strategy. Money market futures positions added 2.55% to the Fund’s performance as the Fed indicated that short maturity rates would remain low for longer than markets had expected. The other derivatives held during the year did not have a significant impact on the Fund’s performance.
Policy responses to the financial crisis and economic downturn that began in the second half of 2008 helped to stabilize the global economy in 2009. Interest rates generally rose in the fourth quarter and for the full year as investors’ risk appetites revived, crimping demand for Treasuries and other sovereign bonds. The Barclays Capital U.S. Aggregate Index, a widely used index of U.S. high-grade bonds, returned 0.20% during the fourth quarter and 5.93% for all of 2009.
Initiatives such as the Fed’s purchase of mortgage and Treasury securities, the Fed’s commitment to hold short-term rates near zero and government support for consumer finance markets were major factors behind enhanced stability. The U.S. economy expanded in the third quarter and was expected to do so again in the final quarter amid a modest recovery in consumer spending and a slower rate of inventory draw down by businesses.
A striking feature of the U.S. economy as the year drew to a close was the record steepness in the Treasury yield curve. This steepening also occurred in government yield curves of other major developed economies. Additionally, corporate bonds, MBS and ABS gained and Treasuries fell during 2009 as government policies helped push investors out of cash and toward higher yielding, riskier assets.
During the year, significant changes in the Fund’s weightings included an increase in government securities and non U.S. of +19% and +13%, respectively, and a decrease in MBS of - -24%.
JNL/PIMCO Total Return Bond Fund (Class A)
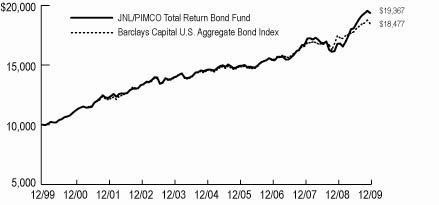
Average Annual Total Returns for Class A Shares | |
| 1 year | 15.45% |
| 5 year | 5.84% |
| 10 year | 6.83% |
Average Annual Total Returns for Class A Shares | |
| 1 year | 15.66% |
| 5 year | 6.04% |
| Since Inception | 5.60% |
| (Inception date March 5, 2004) | |
Past performance is not predictive of future performance. Investment return and principal value will fluctuate so that an investor's shares, when redeemed, may be worth more or less than their original cost. Performance numbers are net of all Fund operating expenses, but do not reflect the deduction of insurance charges.
JNL/PPM America Funds
PPM America, Inc.
Team Management
JNL/PPM America Mid Cap Value Fund
JNL/PPM America Small Cap Value Fund
JNL/PPM America Value Equity Fund
In 2009, the S&P 500 Index increased 26.46%, in contrast to a decline of -37.00% in 2008. The consensus view was that the U.S. exited one of the longest recessions (which started in December 2007) in its history. The U.S. Federal Reserve (“Fed”) Funds rate remained unchanged for all of 2009 at a rate of 0% - 0.25%. The Federal Open Market Committee believed economic conditions were likely to warrant exceptionally low short-term interest rates for an extended period. Additionally, inflation is forecasted to remain in check. Sector performance followed the typical textbook cycle in 2009. Early cyclical stocks outperformed in 2009 with the information technology (+61.7%) and consumer discretionary (+41.3%) sectors leading the way. The materials sector (+48.6%) took its place among the best performers as commodity prices increased globally. Traditional defensive sectors such as utilities (+11.9%) and telecommunication services (+8.9%), underperformed the broad market. Health care stocks (+19.7%) were weak for much of 2009 as Congress attempted to reform healthcare. Not surprising, given the strong technology performance in 2009, within the S&P 500 Index, the top five stock contributors included Apple Inc., Microsoft Corp., Google Inc., IBM and Cisco Systems Inc. The worst five stock contributors for the year included Exxon Mobil Corp., Citigroup, General Electric Co., Wells Fargo & Co. and Gilead Sciences Inc. Value based investment styles underperformed growth based investment styles by a sizable margin. The S&P 500/Citigroup Growth Index increased 31.57% whereas the S&P 500/Citigroup Value Index increased 21.18%. Overall market capitalization influenced 2009 equity returns. The largest 100 stocks in the S&P 500 Index returned 20.26% compared to 87.50% for the smallest 100 stocks. As the effect of the 2008 credit crisis eased, U.S. equity market volatility declined in 2009. The CBOE Volatility Index (“VIX”), an index measuring option market volatility, fell nearly 50% from a year earlier.
JNL/PPM America Mid Cap Value Fund
Objective: The investment objective of the JNL/PPM America Mid Cap Value Fund is long-term growth of capital.
Fund Specific Overview: For the year ended December 31, 2009, the Fund outperformed its benchmarks by posting a return of 47.38% for Class A shares compared to 34.21% for the Russell Mid Cap Value Index and 40.48% for the Russell Mid Cap Index. The Fund’s outperformance relative to the Russell Mid Cap Index can be primarily attributed to individual stock selection. The relative overweight position in the consumer discretionary sector and underweight position in the financials sector helped Fund performance. Even though the Fund had an overweight position in the information technology sector, individual stock selection detracted from Fund performance.
Companies that contributed to the Fund’s outperformance included independent oil and gas company, Newfield Exploration Co., cruise operator, Royal Caribbean Cruises Ltd., and metals service center, Reliance Steel & Aluminum Co. Improved economic and credit conditions have influenced all three companies positively in 2009. Companies that detracted from the Fund’s performance included healthcare services company, Res-Care Inc., holding company, Astoria Financial Corp., and energy company, Comstock Resources Inc.
New purchases during the year included Viacom Inc., Bally Technologies Inc., Edison International Inc. and Novell Inc. Sales included Sherwin-Williams Co., Apache Corp., Masco Corp. and Pinnacle West Capital Corp. Contract drilling company, ENSCO International Inc., purchased during the year, was sold when the company announced that it would reincorporate in the UK in late 2009. Healthcare services provider, IMS Health Inc., also purchased during the year, was sold after the company announced that it would be acquired by TPG Capital LP and the Canada Pension Plan Investment Board.
Relative to the Russell Mid Cap Index, the Fund’s overweight position in energy was reduced to an underweight. The Fund’s overweight position in industrials and significant underweight in utilities was reduced during the year. At year end, compared to the Russell Mid Cap Index, the Fund was overweight in the industrials, materials and consumer discretionary sectors and was underweight in the financials and information technology sectors.
We believe the market’s current valuation is attractive and that the Fund is inexpensive relative to the overall market. We continue to favor stocks within the industrials, materials and consumer discretionary sectors, which relative to the Russell Mid Cap Index are the Fund’s larger sector overweight positions at the end of the year. We believe these sectors are still very attractive on a long-term basis and offer significant upside potential using our normal 2 to 3 year investment time horizon.
JNL/PPM America Small Cap Value Fund
Objective: The investment objective of the JNL/PPM America Small Cap Value Fund is long-term growth of capital.
Fund Specific Overview: For the year ended December 31, 2009, the Fund outperformed its benchmarks by posting a return of 33.97% for Class A shares compared to 22.85% for the S&P Smallcap 600/Citigroup Value Index and 25.57% for the S&P Small Cap 600 Index. The Fund’s outperformance relative to the S&P Small Cap 600 Index can be primarily attributed to individual stock selection. The relative overweight position in the consumer discretionary sector and underweight in the financials sector helped Fund performance. The underweight position in the information technology sector detracted from Fund performance.
Companies that contributed to the Fund’s outperformance included technology company, Omnivision Technologies Inc., and consumer names, NBTY Inc., which specializes in nutritional supplements, and apparel/footwear company, Skechers U.S.A., Inc. All three companies are benefiting from sales and margin improvements despite a soft retail environment. Stock names that detracted from the Fund’s performance were recreational products company, JAKKS Pacific Inc., financial firm, Associated Banc-Corp., which was sold during period, and health care services company, Res-Care Inc.
Purchases during the year included Abercrombie & Fitch Co., Spirit AeroSystems Holdings Inc., Bally Technologies Inc., Apogee Enterprises Inc., Hain Celestial Group Inc. and Novell Inc. Sales during the year included Associated Banc-Corp., Macy’s, Newfield Exploration Co., Avnet Inc., Masco Corp., Pinnacle West Capital Corp. and Royal Caribbean Cruises Ltd. Healthcare services provider, IMS Health Inc., also purchased during the year, was sold after the company announced that it would be acquired by TPG Capital LP and the Canada Pension Plan Investment Board.
Relative to the S&P 600 Small Cap Index, the Fund increased its overweight position in the industrials and consumer staples sectors. The energy sector overweight was reduced to a modest underweight while the materials sector overweight position was also decreased during the year.
Compared to the S&P 600 Small Cap Index, at year end the Fund was overweight in the industrials, consumer discretionary and consumer staples sectors and was underweight in the information technology, healthcare and financials sectors.
We believe the market’s current valuation is attractive and that the Fund is inexpensive relative to the overall market. We continue to favor stocks within the industrials, consumer discretionary and consumer staples sectors, the Fund’s larger sector overweight positions, relative to the S&P 600 Small Cap Index, at the end of the year. We believe these sectors are still very attractive on a long-term basis and offer significant upside potential using our normal 2 to 3 year investment time horizon.
JNL/PPM America Value Equity Fund
Objective: The investment objective of the JNL/PPM America Value Equity Fund is long-term growth of capital.
Portfolio Manager Commentary: For the year ended December 31, 2009, the Fund outperformed its benchmarks by posting a return of 44.58% for Class A shares compared to 26.46% for the S&P 500 Index and 21.18% for the S&P 500/Citigroup Value Index. The Fund’s outperformance relative to the S&P 500 Index can be primarily attributed to individual stock selection. The relative overweight positions in the materials and consumer discretionary sectors helped Fund performance. The underweight position in the information technology sector detracted from Fund performance.
A diverse group of stocks including energy company, Newfield Exploration Co., managed healthcare name, CIGNA Corp., and global financial services company, Morgan Stanley, led Fund outperformance. Companies that detracted from Fund performance included Citigroup whose fundamentals weakened significantly and the stock was sold during the year, property/casualty insurance company, Allstate Insurance, a company impacted by the financial crisis, and steel company, Nucor Corp., a company who has seen little improvement in real demand.
New purchases included Microsoft Corp., Johnson & Johnson, Procter & Gamble Co., Edison International Inc. and Lockheed Martin Corp. Sales included Citigroup, Sherwin-Williams Co., Masco Corp. and E.I. DuPont de Nemours & Co. Contract drilling company, ENSCO International Inc., purchased during the year, was sold when the company announced that it would reincorporate in the UK in
JNL/PPM America Funds
PPM America, Inc.
Team Management
2009. Healthcare services provider, IMS Health Inc., also purchased during the year, was sold after the company announced that it would be acquired by TPG Capital LP and the Canada Pension Plan Investment Board.
Relative to the S&P 500 Index, the Fund reduced its significant underweight position in the healthcare and consumer staples sectors. The relative weight in the financials and consumer discretionary sector positions were reduced.
At year end the Fund was overweight, compared to the S&P 500 Index in the financials, consumer discretionary and materials sectors and was underweight in the information technology, consumer staples and healthcare sectors.
We believe the market’s current valuation is attractive and that the Fund is inexpensive relative to the overall market. We continue to favor stocks within the financials and consumer discretionary sectors, the Fund’s larger sector overweight positions relative to the S&P 500 Index at the end of the year. We believe these sectors are still very attractive on a long-term basis and offer significant upside potential using our normal 2 to 3 year investment time horizon.
JNL/PPM America Mid Cap Value Fund (Class A)
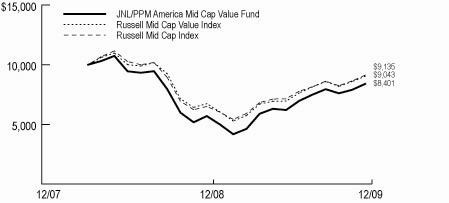
Average Annual Total Returns for Class A Shares | |
| 1 year | 47.38% |
| Since Inception | -9.46% |
| (Inception date March 31, 2008) | |
Average Annual Total Returns for Class A Shares | |
| 1 year | 47.82% |
| Since Inception | -9.25% |
| (Inception date March 31, 2008) | |
JNL/PPM America Small Cap Value Fund (Class A)
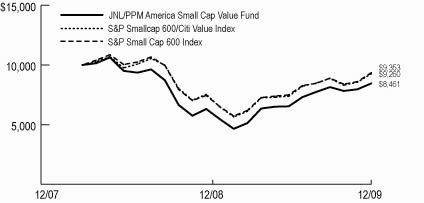
Average Annual Total Returns for Class A Shares | |
| 1 year | 33.97% |
| Since Inception | -9.09% |
| (Inception date March 31, 2008) | |
Average Annual Total Returns for Class B Shares | |
| 1 year | 34.30% |
| Since Inception | -8.89% |
| (Inception date March 31, 2008) | |
JNL/PPM America Value Equity Fund (Class A)
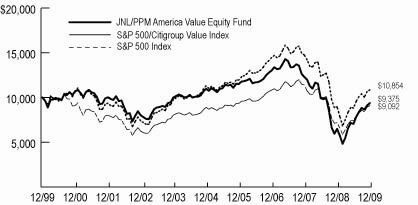
Average Annual Total Returns for Class A Shares | |
| 1 year | 44.58% |
| 5 year | -3.11% |
| 10 year | -0.64% |
Average Annual Total Returns for Class B Shares | |
| 1 year | 44.72% |
| 5 year | -2.90% |
| Since Inception | -1.65% |
| (Inception date March 5, 2004) | |
PPM America, Inc. assumed portfolio responsibility on January 16, 2007.
Past performance is not predictive of future performance. Investment return and principal value will fluctuate so that an investor's shares, when redeemed, may be worth more or less than their original cost. Performance numbers are net of all Fund operating expenses, but do not reflect the deduction of insurance charges.
JNL/PPM America High Yield Bond Fund
PPM America, Inc.
Anthony Balestrieri & Scott B. Richards
Objective:
The investment objective of the JNL/PPM America High Yield Bond Fund is to maximize current income. As a secondary objective, the Fund seeks capital appreciation.
Portfolio Manager Commentary:
For the year ended December 31, 2009, the Fund underperformed its benchmark by posting a return of 46.30% for Class A shares compared to 58.10% for the Merrill Lynch High Yield Master II Constrained Index.
The Fund performed well against the universe of actively managed portfolios, which on average trailed the record setting returns posted by high yield indices by very large margins. The Fund outperformed the average return for the Peer Group (Morningstar High Yield Variable Annuity Funds) by 106 basis points (“bps”).
Returns as measured by high yield indices set records in 2009. Actual high yield bond funds also generated outsized returns, but the average active manager lagged index returns by over 1000 bps and passive managers ETFs trailed by even larger margins. Large investor inflows, illiquid trading markets and significant index turnover were the major drivers of the dislocation between theoretical index results and the returns generated by actual funds.
The Fund was the beneficiary of strong investor inflows throughout most of the year and tripled in size during 2009. While the Fund was able to invest the monies fairly efficiently and maintain cash balances below 4-5% for most of the year, cash and cash substitutes significantly underperformed the broader high yield market and cost the Fund 561 bps versus its benchmark. High yield indices maintain zero cash balances and incur no trading costs.
The 2009 rally in high yield was led by the lower end of the quality spectrum. CCC rated securities generated returns of over 90% and the distressed sector was well over 135% in their respective Barclays Capital U.S. High Yield Index categories. The Fund’s strategy to generate sustainable current income by investing broadly in “core” high yield issues caused it to be underweight the most speculative “tail” section of the market, which in aggregate generated extraordinary returns this year.
The high yield market rallied dramatically through most of 2009 and generated record returns. The Merrill Lynch U.S. High Yield Master II Index, of which the Fund’s benchmark is a subset, was up over 57%, easily surpassing the previous record of 39% set in 1991. This year’s rebound started in December 2008 and after a brief pause in February, rallied consistently for the next ten months. The recovery was lead by the riskiest sectors of the high yield market as CCC-rated issues, the financial sector and high beta issues outperformed the broader market. The Merrill Lynch U.S. High Yield Master II Index yielded 19.6% with an option adjusted spread (“OAS”) of over 1800 bps at year end 2008, a year later those metrics plummeted to 9.1% and 639 bps respectively.
Investors continued to fuel the market rally throughout the year with strong and steady inflows into the sector. Mutual fund flows as measured by AMG Data Services were over $31 billion in 2009, a staggering 35% increase in assets. Strong investor demand resulted in large volumes of new issues for high yield companies, which used the capital market opportunity to extend maturities and increase financial liquidity. These balance sheet improvements in turn, lead to rapidly decreasing default rate expectations for 2010 for individual issuers and the market aggregates. Defaults in 2009 increased largely as expected to approximately 13%, but default forecasts for 2010 which were over 15% a year ago, plummeted this year and now show a consensus closer to 4%.
Attribution analysis, which compares the Fund to its benchmark, indicates the largest sources of underperformance came from cash and underweighted holdings in the most speculative issues in the banking, insurance and automobile industries which rebounded dramatically in 2009. Holdings in more defensive industries such as cable and utility sectors generally performed well, but failed to keep pace with the broader market. On an individual name basis, the largest detractors of relative performance generally included the most speculative names in the sector not owned or underweighted by the Fund. Three notable issuers - AIG Inc., CIT Group Inc., and Residential Capital LLC – accounted for over 170 bps of relative underperformance versus its benchmark.
Fund performance versus its benchmark was enhanced by the Fund’s overweighted investment in the homebuilder and telecommunication sectors and by superior security selection in the chemical, food and gas distribution industries. The Fund’s commercial mortgaged-backed securities (“CMBS”) and bank loan investments also enhanced relative performance during the year. On an individual name basis; Stone Container Finance Co., Harrah’s Entertainment Inc., HCA Inc. and chemical company, Ineos Group Holdings Plc, were the top contributors, adding over 210 bps in aggregate.
The Fund attempted to maintain a consistent and balanced portfolio throughout the year despite the rapid growth in assets experienced during the year. The Fund was an active participant in the new high yield issue market and despite diminished trading liquidity, utilized the secondary trading markets whenever attractive opportunities were available. During the year, the Fund increased its holdings in the banking, retailer and airline industries and reduced weightings in the utility, homebuilder and healthcare sectors.
The Fund holds a broadly diversified portfolio of high yield bonds across several dozen industry sectors. The Fund maintains a risk profile in line with the broad high yield universe and is consistent with our relatively constructive view of the market. The largest overweights in the Fund at year end include the cable, airline, media and telecommunications industries and our CMBS and investment grade financial holdings, which are not owned by its benchmark. The Fund’s most significant underweights include energy, healthcare and support services.
JNL/PPM America High Yield Bond Fund (Class A)

Average Annual Total Returns for Class A Shares | |
| 1 year | 46.30% |
| 5 year | 2.40% |
| 10 year | 4.99% |
| Average Annual Total Returns for Class B Shares | |
| 1 year | 46.58% |
| 5 year | 2.61% |
| Since Inception | 3.39% |
| (Inception date March 5, 2004) | |
PPM America, Inc. assumed portfolio responsibility on April 30, 2007.
Past performance is not predictive of future performance. Investment return and principal value will fluctuate so that an investor's shares, when redeemed, may be worth more or less than their original cost. Performance numbers are net of all Fund operating expenses, but do not reflect the deduction of insurance charges.
JNL/Red Rocks Listed Private Equity Fund
Red Rocks Capital LLC
Adam Goldman & Mark Sunderhuse
Objective:
The investment objective of the JNL/Red Rocks Listed Private Equity Fund is to seek maximum total return.
Portfolio Manager Commentary:
For the year ended December 31, 2009, the Fund underperformed its benchmark by posting a return of 40.33% for Class A shares compared to 61.65% for the S&P Listed Private Equity Index.
The Fund manager was cautious in selections of listed private equity names and purposefully avoided many names that were or still are a going concern. This hurt the Fund’s performance on a relative basis but the absolute return faired well versus the risk taken. In addition, the Fund manager focused on the ability of companies to fund their economic commitments and also paid close attention to valuation metrics.
The market conditions impacting private equity were threefold. Private equity companies were significantly limited in their ability to obtain leverage, to exit, or monetize their portfolio investments, and the valuation metrics used to value existing investments were substantially lower. Many of these factors improved in 2009, but more time will be needed for investors to regain confidence in the market and in private equity.
Net contributors to the Fund’s performance included KKR Private Equity Investors LLP, AP Alternative Assets LP, GP Investments Ltd., Wendel Investissement and Ratos AB. Net detractors to the Fund’s performance included Candover Investments PLC, Babcock & Brown Infrastructure Group, DeA Capital SPA, European Capital Ltd. and Capital Southwest Corp.
Significant purchases during the year included KKR Private Equity Investors LLP, Onex Corp. and 3i Group Plc. There were no significant sales during the year.
Looking to the new year, the Fund manager continues to seek out companies that exhibit the following consistent characteristics: companies that have lower debt levels; companies that can take advantage of the dislocated environment; companies that can access capital for new investments; and companies that can raise liquidity in existing investments.
JNL/Red Rocks Listed Private Equity Fund (Class A)

Average Annual Total Returns for Class A Shares | |
| 1 year | 40.33% |
| Since Inception | -13.65% |
| (Inception date October 6, 2008) | |
Average Annual Total Returns for Class B Shares | |
| 1 year | 40.62% |
| Since Inception | -13.49% |
| (Inception date October 6, 2008) | |
Past performance is not predictive of future performance. Investment return and principal value will fluctuate so that an investor's shares, when redeemed, may be worth more or less than their original cost. Performance numbers are net of all Fund operating expenses, but do not reflect the deduction of insurance charges.
JNL/S&P Funds
Standard & Poor’s Investment Advisory Services, LLC
Team Management
JNL/S&P Managed Conservative Fund
JNL/S&P Managed Moderate Fund
JNL/S&P Managed Moderate Growth Fund
JNL/S&P Managed Growth Fund
JNL/S&P Managed Aggressive Growth Fund
JNL/S&P Disciplined Moderate Fund
JNL/S&P Disciplined Moderate Growth Fund
JNL/S&P Disciplined Growth Fund
Investment Objective:
The investment objective of the JNL/S&P Managed Conservative Fund, the JNL/S&P Managed Moderate Growth Fund and the JNL/S&P Disciplined Moderate Growth Fund is capital growth and current income. The investment objective of the JNL/S&P Managed Moderate Fund, the JNL/S&P Managed Growth Fund and the JNL/S&P Disciplined Moderate Fund is to seek capital growth. Current income is a secondary objective. The investment objective of the JNL/S&P Managed Aggressive Growth Fund and the JNL/S&P Disciplined Growth Fund is capital growth.
Portfolio Manager Commentary:
For the year ended December 31, 2009, the JNL/S&P Managed Conservative Fund returned 13.53% and the JNL/S&P Managed Moderate Fund returned 18.63%. The JNL/S&P Managed Moderate Growth Fund returned 23.46%, the JNL/S&P Managed Growth Fund returned 28.06% and the JNL/S&P Managed Aggressive Growth Fund returned 31.05%. All five of the JNL/S&P Managed Funds outperformed the Barclays Capital U.S. Aggregate Bond Index which returned 5.93%. The JNL/S&P Managed Conservative Fund, the JNL/S&P Managed Moderate Fund, and the JNL/S&P Managed Moderate Growth Fund underperformed the S&P 500 Index which returned 26.46%, while the JNL/S&P Managed Growth Fund and the JNL/S&P Managed Aggressive Growth Fund outperformed the S&P 500 Index.
For the year ended December 31, 2009, the JNL/S&P Disciplined Moderate Fund returned 18.67%, the JNL/S&P Disciplined Moderate Growth Fund returned 22.77% and the JNL/S&P Disciplined Growth Fund returned 25.39%. All the funds outperformed the Barclays Capital U.S. Aggregate Bond Index which returned 5.93% and underperformed the S&P 500 Index, which returned 26.46%.
JNL/S&P Managed Conservative Fund
Aiding performance to the upside last year were allocations to JNL/T. Rowe Price Value Fund and JNL/AIM International Growth Fund relative to the S&P 500 Index as well as to JNL/PIMCO Real Return Fund, JNL/PIMCO Total Return Bond Fund and JNL/Goldman Sachs Core Plus Bond Fund vis-à-vis the Barclays Capital U.S. Aggregate Bond Index.
Detracting from performance last year were allocations to JNL/Select Value Fund and JNL/AIM Large Cap Growth Fund by comparison to the S&P 500 Index, JNL/Select Money Market Fund and JNL/JP Morgan U.S. Government and Quality Bond Fund relative to the Barclays Capital U.S. Aggregate Bond Index as well as having not allocated to JNL/Lazard Emerging Markets Fund, JNL/PAM Asia ex-Japan Fund and JNL/Capital Guardian International Small Cap Fund vis-à-vis the S&P 500 Index and JNL/PPM America High Yield Bond Fund in terms of the Barclays Capital U.S. Aggregate Bond Index.
JNL/S&P Managed Moderate Fund
JNL/S&P Managed Moderate Growth Fund
JNL/S&P Managed Growth Fund
Aiding performance to the upside last year were allocations to JNL/Lazard Emerging Markets Fund, JNL/T. Rowe Price Mid-Cap Growth Fund and JNL/T. Rowe Price Established Growth Fund relative to the S&P 500 Index as well as to JNL/PIMCO Real Return Fund, JNL/PIMCO Total Return Bond Fund and JNL/Goldman Sachs Core Plus Bond Fund vis-à-vis the Barclays Capital U.S. Aggregate Bond Index.
Detracting from performance last year were allocations to JNL/Select Value Fund and JNL/AIM Large Cap Growth Fund by comparison to the S&P 500 Index, JNL/Select Money Market Fund and JNL/JP Morgan U.S. Government and Quality Bond Fund relative to the Barclays Capital U.S. Aggregate Bond Index as well as having not allocated to JNL/PAM Asia ex-Japan Fund and JNL/PAM China-India Fund vis-à-vis the S&P 500 Index and JNL/PPM America High Yield Bond Fund in terms of the Barclays Capital U.S. Aggregate Bond Index.
JNL/S&P Managed Aggressive Growth Fund
Aiding performance to the upside last year were allocations to JNL/Lazard Emerging Markets Fund, JNL/T. Rowe Price Mid-Cap Growth Fund and JNL/T. Rowe Price Established Growth Fund relative to the S&P 500 Index as well as to JNL/PIMCO Real Return Fund and JNL/Goldman Sachs Emerging Market Debt Fund vis-à-vis the Barclays Capital U.S. Aggregate Bond Index.
Detracting from performance last year were allocations to JNL/Select Value Fund and JNL/AIM Large Cap Growth Fund by comparison to the S&P 500 Index, JNL/Select Money Market Fund and JNL/JP Morgan U.S. Government and Quality Bond Fund relative to the Barclays Capital U.S. Aggregate Bond Index as well as having not allocated to JNL/PAM China-India Fund vis-à-vis the S&P 500 Index and JNL/PPM America High Yield Bond Fund in terms of the Barclays Capital U.S. Aggregate Bond Index.
JNL/S&P Disciplined Moderate Fund
Aiding performance to the upside last year were allocations to JNL/Mellon Capital Management JNL Optimized 5 Fund and JNL/Mellon Capital Management S&P 400 MidCap Index Fund relative to the S&P 500 Index as well as to JNL/PIMCO Real Return Fund vis-à-vis the Barclays Capital U.S. Aggregate Bond Index.
Detracting from performance last year were allocations to JNL/Mellon Capital Management Select Small Cap Fund by comparison to the S&P 500 Index and JNL/Select Money Market Fund relative to the Barclays Capital U.S. Aggregate Bond Index as well as having not allocated to the JNL/Mellon Capital Management 25 Fund vis-à-vis the S&P 500 Index and JNL/Goldman Sachs Emerging Market Debt Fund vis-à-vis the Barclays Capital U.S. Aggregate Bond Index.
JNL/S&P Disciplined Moderate Growth Fund
JNL/S&P Disciplined Growth Fund
Aiding performance to the upside last year were allocations to JNL/Mellon Capital Management 25 Fund, JNL/Mellon Capital Management JNL Optimized 5 Fund and JNL/Mellon Capital Management S&P 400 MidCap Index Fund relative to the S&P 500 Index as well as to JNL/PIMCO Real Return Fund vis-à-vis the Barclays Capital U.S. Aggregate Bond Index.
Detracting from performance last year were allocations to JNL/Mellon Capital Management Select Small Cap Fund by comparison to the S&P 500 Index and JNL/Select Money Market Fund relative to the Barclays Capital U.S. Aggregate Bond Index as well as having not allocated to JNL/Goldman Sachs Emerging Market Debt Fund vis-à-vis the Barclays Capital U.S. Aggregate Bond Index.
2009 Market Overview
Despite a mildly shaky start to the fourth quarter of 2009, equity markets globally shook off initial jitters and, with the exception of Japan, demonstrated remarkable buoyancy during the October to December period, broadening their gains from the third quarter in the process. Meanwhile, emerging markets, combined with high yield and investment grade corporate fixed income markets worldwide complemented what they had achieved in the three prior quarters to attain significant positive performance. Positive performance was a result of resurgent investors’ risk appetites for yield that recompressed speculative and investment grade spreads to the disadvantage of U.S. Treasuries. Domestic and foreign real estate market returns recovered further from October to December, and the performance of commodities rebounded as well in the final quarter of 2009.
Three consecutive quarters of increasingly progressive, positive performance overturned a deeply unfavorable beginning of the year, testifying convincingly to the keenness of investors to abandon risk aversion and exploit lower market valuations to their financial advantage.
Although the U.S. housing market experienced some renewed unsteadiness, riskier investment appetites, combined with healthier corporate earnings and holiday demand trends to reinforce investor confidence, underpined capital market performance in the last quarter of 2009. High yield debt markets proceeded to lure investors, whose escalating distrust of the undisciplined fiscal practices of Western nations and dubious credit status of some high grade corporate issuers has encouraged them to pursue avenues of investment more deserving of their risk eagerness.
In spite of a feeble start to the fourth quarter, domestic stock markets retained their winning edge, posting solid single digit increases in performance, but underperforming many, if not most, of their mature and emerging competitors. Large capitalization stocks outdid their small and mid cap rivals for the quarter; yet, small cap, which were up 37.4%, prevailed for the year. Meanwhile, growth outdistanced value by 320 basis points during the quarter and 994 basis points for the year. In 2009, every sector re- corded positive performance to one extent or another. Those outperforming the S&P 500 Index included technology and consumer discretionary along with materials as
JNL/S&P Funds
Standard & Poor’s Investment Advisory Services, LLC
Team Management
other sectors did poorer than the S&P 500 Index. In surrendering 2.2% last quarter, financials saw their performance for the year depressed to 15.5%, a slight setback to an otherwise amazing comeback for the industry.
Market Outlook
As an ever so gradual economic revival proceeds to take shape globally, enduring concerns in the capital markets about its potential to strengthen sustainably in 2010 could limit the scope for further equity appreciation in the coming months. Evidence thus far of only patchy progress in the recovery of business activity worldwide spells little enthusiasm and incentives for taking additional risk in stock markets around the globe. Anticipated high unemployment levels should continue to restrain consumer spending, promote further cost streamlining, discourage capital investing and hamper top line corporate revenue growth to the disadvantage of company valuations and shareholder value. Rising joblessness aside, many mature economies, like core Euro-zone, U.S., Canada and UK, appear to have bottomed conclusively and already begun to rebound, albeit tediously. Even so, we remain unconvinced of the recovery’s sustainability in much of Western Europe and north of the Rio Grande.
Irrespective of the measures put in place by Western Europe’s governments and central banks to breathe life into domestic business activity in their respective economies, tentatively embryonic signs of a bottoming in the contraction have come to light thus far, indicating that a recovery in the Euro-zone, UK, Swiss and Scandinavian economies may start to consolidate some time in 2010. To date, the only source of economic impetus has emanated from expansionary credit and fiscal policies, which have reinvigorated internal demand somewhat. Yet, any restrengthening of the euro, sterling and Swiss franc would stand in the way of a more energetic economic rebound by deterring demand from overseas markets.
Deflation, despite an anomalously overstated fractional rebound of late in real activity, is expected to continue to plague the Japanese economy and overshadow other policy matters for quite some time to come. Foreign trade, Japan’s main engine of growth, may seem to have regained some momentum of late, as have some other economic indicators, but the strength of the yen, no matter what measures newly appointed Finance Minister Kan may employ to try to weaken the Japanese unit, should proceed to weigh on export competitiveness. Meantime, internal sources of macroeconomic activity are faring worse than their external counterparts, and prospects for a measurable rebound remain bleak since domestic demand is likely to stay sidelined for much of this year. As a result of dormant consumption patterns, output will remain sluggish and unemployment could increase further. Politically, the ruling Democratic Party of Japan appears helpless in the face of a dire economic situation insofar as we believe it lacks the effective wherewithal to rescue the nation from the psychological grip of declining prices.
While a significant divide persists between emerging and mature stock market performance, dubious and perhaps disingenuous market speculation of a disconnection, or decoupling, of the former from the latter distracts attention from the more pertinent topic of the variation in returns among emerging markets in 2009, a trend that is likely to last for the foreseeable future, with Latin America again edging out Central and Eastern Europe, Middle East and Africa and perhaps both surpassing Asia ex-Japan again.
Debt market performance, with returns of low quality having outshined those of high quality fixed income last year, could come undone if growing investor fatigue vis-à-vis unparalleled fiscal indiscipline by governments of mature markets were to exacerbate fears of insolvency. Steepening U.S .Treasury, UK gilt and Euro-zone yield curves are signaling a degree of gloom, but not outright doom as yet, for the mature government bond markets. Investors search for higher returns may have worked to the advantage of the emerging and high yielding fixed income markets, but the resurgent hunger for riskier debt instruments may be laying the foundation for the eventual emergence of yet another asset market bubble that, if it were to burst, could provoke yet another crisis, entailing, once again, a reversion in demand for more secure investments.
JNL/S&P Managed Conservative Fund (Class A)
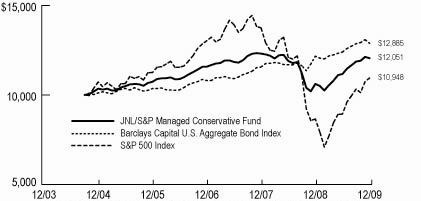
Average Annual Total Returns for Class A Shares | |
| 1 year | 13.53% |
| 5 year | 3.09% |
| Since Inception | 3.62% |
| (Inception date October 4, 2004) | |
JNL/S&P Managed Moderate Fund (Class A)
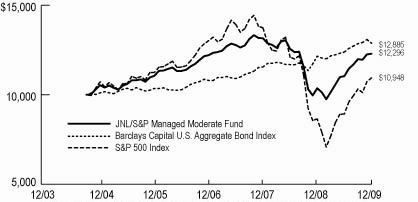
Average Annual Total Returns for Class A Shares | |
| 1 year | 18.63% |
| 5 year | 3.13% |
| Since Inception | 4.02% |
| (Inception date October 4, 2004) | |
Past performance is not predictive of future performance. Investment return and principal value will fluctuate so that an investor's shares, when redeemed, may be worth more or less than their original cost. Performance numbers are net of all Fund operating expenses, but do not reflect the deduction of insurance charges.
JNL/S&P Funds
Standard & Poor’s Investment Advisory Services, LLC
Team Management
JNL/S&P Managed Moderate Growth Fund (Class A)
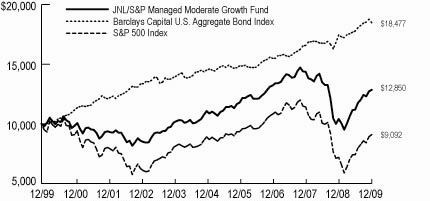
Average Annual Total Returns for Class A Shares | |
| 1 year | 23.46% |
| 5 year | 3.03% |
| 10 year | 2.54% |
JNL/S&P Managed Growth Fund (Class A)
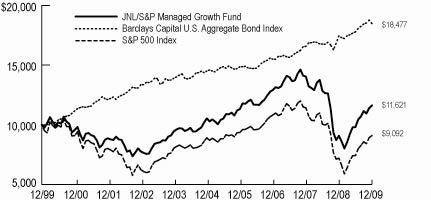
Average Annual Total Returns for Class A Shares | |
| 1 year | 28.06% |
| 5 year | 1.99% |
| 10 year | 1.51% |
JNL/S&P Managed Aggressive Growth Fund (Class A)
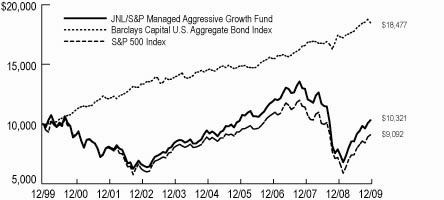
Average Annual Total Returns for Class A Shares | |
| 1 year | 31.05% |
| 5 year | 1.76% |
| 10 year | 0.32% |
Past performance is not predictive of future performance. Investment return and principal value will fluctuate so that an investor's shares, when redeemed, may be worth more or less than their original cost. Performance numbers are net of all Fund operating expenses, but do not reflect the deduction of insurance charges.
JNL/S&P Funds
Standard & Poor’s Investment Advisory Services, LLC
Team Management
JNL/S&P Disciplined Moderate Fund (Class A)

Average Annual Total Returns for Class A Shares | |
| 1 year | 18.67% |
| Since Inception | -2.35% |
| (Inception date January 16, 2007) | |
JNL/S&P Disciplined Moderate Growth Fund (Class A)

Average Annual Total Returns for Class A Shares | |
| 1 year | 22.77% |
| Since Inception | -5.18% |
| (Inception date January 16, 2007) | |
JNL/S&P Disciplined Growth Fund (Class A)
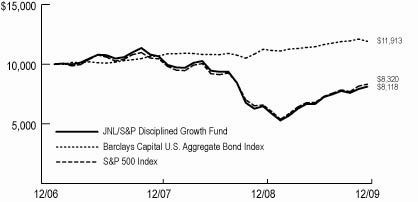
Average Annual Total Returns for Class A Shares | |
| 1 year | 25.39% |
| Since Inception | -6.81% |
| (Inception date January 16, 2007) | |
Past performance is not predictive of future performance. Investment return and principal value will fluctuate so that an investor's shares, when redeemed, may be worth more or less than their original cost. Performance numbers are net of all Fund operating expenses, but do not reflect the deduction of insurance charges.
JNL/S&P Funds
Standard & Poor’s Investment Advisory Services LLC
Massimo Santicchia
JNL/S&P Competitive Advantage Fund
JNL/S&P Dividend Income & Growth Fund
JNL/S&P Intrinsic Value Fund
JNL/S&P Total Yield Fund
Despite a mildly shaky start to the fourth quarter of 2009, equity markets globally shook off initial jitters and, with the exception of Japan, demonstrated remarkable buoyancy during the October to December period, broadening their gains from the third quarter in the process. Meanwhile, emerging markets, combined with high yield and investment grade corporate fixed income markets worldwide, complemented what they had achieved in the three prior quarters to attain significant positive performance. Positive performance was a result of resurgent investors’ risk appetites for yield that recompressed speculative and investment grade spreads to the disadvantage of U.S. Treasuries. Domestic and foreign real estate market returns recovered further from October to December, and the performance of commodities rebounded as well in the final quarter of 2009.
Three consecutive quarters of increasingly progressive, positive performance overturned a deeply unfavorable beginning of the year, testifying convincingly to the keenness of investors to abandon risk aversion and exploit lower market valuations to their financial advantage.
As we look forward to 2010, we believe that equity market performance will be more contained and differentiated across sectors, styles and market capitalization ranges. Our approach remains focused on seeking to construct concentrated portfolios with positive exposure to historically favorable alpha factors. We believe this disciplined approach has the potential to generate an overall performance which has limited relationship to traditional equity styles and economic sectors’ performance. Our positioning at the stock selection date emphasized a combination of what we believed to be high quality and value factors.
The Funds were rebalanced in early December based on the December 1, 2009 stock selection date.
JNL/S&P Competitive Advantage Fund
Objective: The investment objective of the JNL/S&P Competitive Advantage Fund is capital appreciation.
Fund Specific Overview: For the year ended December 31, 2009, the Fund outperformed its benchmark by posting a return of 44.22% for Class A shares compared to 26.46% for the S&P 500 Index.
The main alpha factors driving the performance of the Fund, return on invested capital and price to book, interacted positively to generate significant outperformance over the benchmark for the year. Historically, companies with high return on capital have shown a tendency to be more resilient to economic recessions and less sensitive to overall corporate earnings growth. This behavior was evident during the first quarter of 2009 when the Fund outperformed its benchmark by over 10%. As the market rebounded sharply over the following three quarters, the Fund kept up with the market thus showing almost full participation in up markets.
Attribution analysis indicates that for the year, both sector allocation and stock selection positively contributed to performance. Top contributors, with positive contribution, were stocks in the consumer discretionary, energy and consumer staples sectors. Bottom contributors, with negative contribution, were stocks in the industrials and technology sectors.
As of year end, the Fund was significantly overweighted in consumer discretionary and underweighted in financials, telecommunicaton and utilities. 50% of the stocks had an S&P Quality Rank of at least A- and 80% of at least B+.
JNL/S&P Dividend Income & Growth Fund
Objective: The investment objective of the JNL/S&P Dividend Income & Growth Fund is primarily capital appreciation with a secondary focus on current income.
Fund Specific Overview: For the year ended December 31, 2009, the Fund underperformed its benchmark by posting a return of 23.47% for Class A shares compared to 26.46% for the S&P 500 Index.
The main alpha factors driving the performance of the Fund, dividend yield, S&P Quality Rankings and S&P credit ratings, were out of favor, as investors moved towards riskier securities. Historically, companies with greater than average S&P Quality Rankings and S&P credit ratings have shown a tendency to be more resilient to economic recessions and less sensitive to overall corporate earnings growth. However, the Fund suffered a sharp drawdown in the first quarter of 2009 due to dislocation in the credit markets and the dividend yield’s difficulties in identifying potential value opportunities. As credit markets stabilized, the Fund rebounded in the following quarters in line with the overall market.
Attribution analysis indicates that for the year, the Fund’s underperformance was attributable to negative sector allocation effects despite positive stock selection effects. Top contributors, with positive contribution, were stocks in the consumer staples, consumer discretionary, financials and industrials sectors. Bottom contributors, with negative contribution were stocks in the technology, materials and utilities sectors.
As of year end, the Fund was significantly overweighted in telecommunication, materials and utilities and underweighted in technology and financials. 80% of the stocks had an S&P Quality Rank of at least A- and 97% of at least B+.
JNL/S&P Intrinsic Value Fund
Objective: The investment objective of the JNL/S&P Intrinsic Value Fund is capital appreciation.
Fund Specific Overview: For the year ended December 31, 2009, the Fund outperformed its benchmark by posting a return of 57.04% for Class A shares compared to 26.46% for the S&P 500 Index.
The main alpha factors driving the performance of the Fund, free cash flow and external financing, interacted positively to generate significant outperformance over the benchmark for the year. As the credit market crisis unfolded and the stock market crashed, many stocks in the Fund became extremely inexpensive on a number of valuation metrics. As the market rebounded from the March lows, the Fund significantly outperformed its benchmark.
Attribution analysis indicates that for the year both sector allocation and stock selection positively contributed to performance. Top contributors, with positive contribution, were stocks in the consumer discretionary, materials, health care, consumer staples and telecommunication sectors. The only negative contribution came from stocks in the technology sector.
As of year end, the Fund was significantly overweighted in industrials, health care, discretionary and staples, and underweighted in technology, financials, energy, telecommunication and materials. 30% of the stocks had an S&P Quality Rank of at least A- and 80% of at least B+.
JNL/S&P Funds
Standard & Poor’s Investment Advisory Services LLC
Massimo Santicchia
JNL/S&P Total Yield Fund
Objective: The investment objective of the JNL/S&P Total Yield Fund is capital appreciation.
Fund Specific Overview: For the year ended December 31, 2009, the Fund outperformed its benchmark by posting a return of 42.88% for Class A shares compared to 26.46% for the S&P 500 Index.
The main alpha factors driving the performance of the Fund, share buyback yield, dividend yield and debt buyback yield, interacted positively to generate significant outperformance over the benchmark for the year. As the credit market crisis unfolded and the stock market crashed, many stocks in the Fund became extremely inexpensive on a number of valuation metrics. As the market rebounded from the March lows, the Fund significantly outperformed its benchmark.
Attribution analysis indicates that for the year both sector allocation and stock selection positively contributed to performance. Top contributors, with positive contribution, were stocks in the consumer discretionary, healthcare, consumer staples, telecommunication and utilities sectors. Bottom contributors, with negative contribution were stocks in the financials, technology, energy, materials and industrials sectors.
As of year end, the Fund was significantly overweighted in financial, discretionary, industrials and staples, and underweighted in healthcare, utilities, telecommunication and energy. 30% of the stocks had an S&P Quality Rank of at least A- and 70% of at least B+.
JNL/S&P Competitive Advantage Fund (Class A)
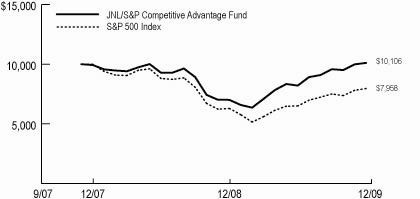
Average Annual Total Returns for Class A Shares | |
| 1 year | 44.22% |
| Since Inception | 0.51% |
| (Inception date December 3, 2007) | |
Average Annual Total Returns for Class B Shares | |
| 1 year | 44.70% |
| Since Inception | 0.58% |
| (Inception date December 3, 2007) | |
JNL/S&P Dividend Income & Growth Fund (Class A)

Average Annual Total Returns for Class A Shares | |
| 1 year | 23.47% |
| Since Inception | -5.25% |
| (Inception date December 3, 2007) | |
Average Annual Total Returns for Class B Shares | |
| 1 year | 23.79% |
| Since Inception | -5.06% |
| (Inception date December 3, 2007) | |
Past performance is not predictive of future performance. Investment return and principal value will fluctuate so that an investor's shares, when redeemed, may be worth more or less than their original cost. Performance numbers are net of all Fund operating expenses, but do not reflect the deduction of insurance charges.
JNL/S&P Funds
Standard & Poor’s Investment Advisory Services LLC
Massimo Santicchia
JNL/S&P Intrinsic Value Fund (Class A)
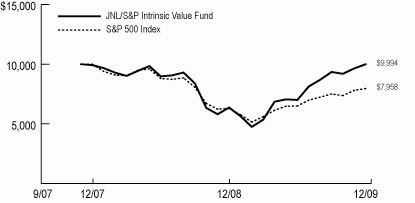
Average Annual Total Returns for Class A Shares | |
| 1 year | 57.04% |
| Since Inception | -0.03% |
| (Inception date December 3, 2007) | |
Average Annual Total Returns for Class B Shares | |
| 1 year | 57.84% |
| Since Inception | 0.34% |
| (Inception date December 3, 2007) | |
JNL/S&P Total Yield Fund (Class A)
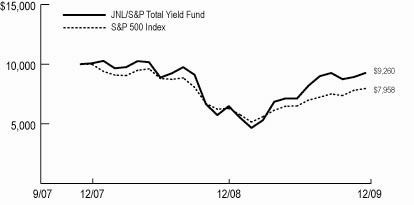
Average Annual Total Returns for Class A Shares | |
| 1 year | 42.88% |
| Since Inception | -3.63% |
| (Inception date December 3, 2007) | |
Average Annual Total Returns for Class B Shares | |
| 1 year | 43.04% |
| Since Inception | -3.49% |
| (Inception date December 3, 2007) | |
Past performance is not predictive of future performance. Investment return and principal value will fluctuate so that an investor's shares, when redeemed, may be worth more or less than their original cost. Performance numbers are net of all Fund operating expenses, but do not reflect the deduction of insurance charges.
JNL/Select Balanced Fund
Wellington Management Company, LLP
Edward P. Bousa, Christopher L. Gootkind, & John C. Keogh
Objective:
The investment objective of the JNL/Select Balanced Fund is reasonable income and long-term capital growth.
Portfolio Manager Commentary:
For the year ended December 31, 2009, the Fund outperformed one of its benchmarks by posting a return of 19.78% for Class A shares compared to 5.93% for the Barclays Capital U.S. Aggregate Bond Index. The Fund underperformed its other benchmark, the S&P 500 Index which returned 26.46%.
Even though the Fund underperformed the S&P 500 Index, the equity portion of the Fund slightly outperformed this benchmark. Positive stock selection within six out of the ten sectors boosted relative performance. Sector allocation decisions detracted from returns.
The fixed income portion also outperformed the Barclays Capital U.S. Aggregate Bond Index. Sector allocation was the primary driver of outperformance. The fixed income portfolio’s overweight to credit contributed to positive relative returns.
Throughout the year, extraordinary government measures helped to stabilize global economies and markets. As the year progressed, low interest rates, better than expected corporate earnings
and improving economic data provided a favorable backdrop for equities. Aided by the ongoing economic recovery and improved sentiment, non-Treasury fixed income sectors set the pace. Global government rates moved meaningfully higher, while credit spreads continued to narrow. Many sectors finished the year at or within basis points of the tightest levels of the year.
Within the equity portion of the Fund, security selection was particularly strong in healthcare, materials and consumer staples. Sector selection in technology, telecommunications and utilities detracted. A sizeable underweight to strong performing technology hurt relative returns.
The fixed income portfolio’s security selection within corporate bonds specifically the financials sector, including insurance, REITS, and large banks contributed to returns. Commercial mortgage-backed securities were a modest detractor.
The top three contributors to performance of the equity portfolio, on a relative basis, during the year were Schering-Plough Corp., International Paper Co. and Exxon Mobil Corp. Apple Inc., Google Inc. and Eli Lilly & Co. were the largest detractors.
The largest purchases during the year were in healthcare and financials. In healthcare, the Fund initiated positions in Pfizer Inc. and Johnson & Johnson as we looked to build positions at historically low valuations. In financials, the Fund added to Wells Fargo & Co. and initiated a position in Chubb Corp., where we continue to close our underweight position as the industry stabilizes and consolidates amid overly bearish sentiment. The largest sells were in healthcare and energy. In healthcare, the Fund eliminated Wyeth and Abbott Laboratories, as we sought to lock in gains for many strong performers. In energy, the Fund trimmed XTO Energy Inc. and eliminated Schlumberger Ltd., where we took profit and looked to upgrade the Fund.
The equity portion of the Fund remains focused on investing in areas of strong demand and avoiding areas of oversupply. Materials, especially metals, are starting to get speculative. We believe that government reform of healthcare appears to be less severe than feared. Valuations are low and remain positive. Quality stocks recovered somewhat in the quarter, but remain attractive.
We believe the U.S. economy is recovering and that government intervention has reduced systemic risk. We think that the recovery will be stronger than markets anticipate and sluggish housing and commercial real estate markets will remain headwinds.
JNL/Select Balanced Fund (Class A)
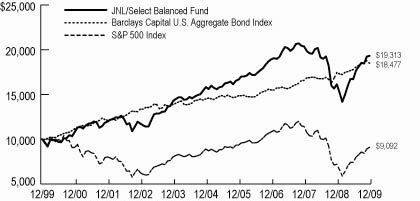
Average Annual Total Returns for Class A Shares | |
| 1 year | 19.78% |
| 5 year | 4.07% |
| 10 year | 6.80% |
Average Annual Total Returns for Class B Shares | |
| 1 year | 20.08% |
| 5 year | 4.30% |
| Since Inception | 4.81% |
| (Inception date March 5, 2004) | |
Wellington Management Company, LLP assumed portfolio management responsibility on October 4, 2004.
Past performance is not predictive of future performance. Investment return and principal value will fluctuate so that an investor's shares, when redeemed, may be worth more or less than their original cost. Performance numbers are net of all Fund operating expenses, but do not reflect the deduction of insurance charges.
JNL/Select Value Fund
Wellington Management Company, LLP
Karen H. Grimes, Ian R. Link, & W. Michael Reckmeyer III
Objective:
The investment objective of the JNL/Select Value Fund is long-term growth of capital.
Portfolio Manager Commentary:
For the year ended December 31, 2009, the Fund outperformed its benchmark by posting a return of 23.98% for Class A shares compared to 19.69% for the Russell 1000 Value Index. Relative outperformance was driven by a combination of stock selection and sector allocation, a residual of the Fund’s bottom-up process.
After a tumultuous start, U.S. equities finished 2009 near their highs for the year and recorded a third consecutive quarter of gains. Throughout the year, extraordinary government measures helped to stabilize global economies and markets, and as the year progressed, low interest rates, better than expected corporate earnings and improving economic data provided a favorable backdrop for equities. Growth stocks outpaced value for the year, while small cap stocks lagged their larger peers. Sector performance was almost universally positive. Materials, information technology and consumer discretionary stocks led the market higher, while telecommunications, energy and utilities lagged the broader market returns during the year.
Favorable security selection in industrials, energy and consumer staples aided returns. Less favorable results from information technology, consumer discretionary and utilities hurt performance relative to the benchmark. Our overweight to strong performing information technology and underweight to the weaker performing utilities and financials sectors also helped performance.
Citigroup, which was eliminated in January, and our positions in Goldman Sachs Group Inc. and Cliffs Natural Resources Inc., contributed to relative performance. ACE Ltd., International Paper Co. and Kroger Co. were the largest detractors from relative returns during the year. The largest purchases during the year were in financials, we added to positions in Bank of America Corp. and Wells Fargo & Co., as we continue to believe that many financial companies are discounting worst case scenarios despite positive inflection points, and as we believe the market leaders will enjoy the benefit of both synergies and less competition as the industry consolidates. The Fund continues to be constructive on energy, in general, and there was a fair amount of activity in the sector in terms of both purchases and sales as we sought to slightly increase beta, the Fund sold Total SA and added Baker Hughes Inc., and trimmed names that had performed well, such as, Newfield Exploration Co. The Fund sold some healthcare positions as a number of companies rebounded from excessively low valuations driven by healthcare reform uncertainty, while others benefitted from increased merger activity as companies sought to avoid patent cliffs and rebuild pipelines at low valuations. Among the healthcare names sold were Bristol-Myers Squibb Co., Wyeth, and Schering-Plough Corp.
The Fund is constructed on a stock by stock basis. Sector weights are a fall out of stock selection. Healthcare moved from an underweight to an overweight relative to the benchmark. The underweight to the utilities sector increased, largely due to market movement. The Fund’s overweights to information technology and consumer staples were reduced during the year.
At the end of the year, the Fund’s largest overweights relative to its benchmark were in information technology, healthcare and consumer staples. Utilities, financials and telecommunication services were the largest underweights.
JNL/Select Value Fund (Class A)

Average Annual Total Returns for Class A Shares | |
| 1 year | 23.98% |
| 5 year | 3.11% |
| Since Inception | 9.86% |
| (Inception date September 30, 2002) | |
Average Annual Total Returns for Class B Shares | |
| 1 year | 24.18% |
| 5 year | 3.32% |
| Since Inception | 4.41% |
| (Inception date March 5, 2004)) | |
Wellington Management Company, LLP assumed portfolio management responsibility on October 4, 2004.
Past performance is not predictive of future performance. Investment return and principal value will fluctuate so that an investor's shares, when redeemed, may be worth more or less than their original cost. Performance numbers are net of all Fund operating expenses, but do not reflect the deduction of insurance charges.
JNL/T. Rowe Price Established Growth Fund
T. Rowe Price Associates, Inc.
P. Robert Bartolo
Objective:
The investment objective of the JNL/T. Rowe Price Established Growth Fund is long-term growth of capital and increasing dividend income.
Portfolio Manager Commentary:
For the year ended December 31, 2009, the Fund outperformed its benchmarks by posting a return of 43.49% for Class A shares compared to 26.46% for the S&P 500 Index and 37.21% for the Russell 1000 Growth Index. The portfolio very significantly outperformed the S&P 500 Index as exceptionally strong stock selection and sector weighting contributed positively to relative results.
U.S. stocks were strong in 2009, with all sectors of the large cap market posting positive returns. In the first quarter, major indexes extended last year’s decline and plunged to 12 year lows as the economy contracted, unemployment surged, and the federal government intervened aggressively to provide liquidity to the credit markets, stabilize the banking sector, and stimulate the economy. From the low in early March, share prices then soared, as credit conditions improved, corporate earnings were generally better than expected, and the economy showed signs that it was emerging from recession.
Shares of information technology companies produced superior returns, thanks to attractive valuations, aggressive cost cutting, cash rich balance sheets and revenues that were not as bad as feared. Materials stocks soared with commodity prices, while consumer discretionary shares climbed as investors anticipated that the sector would benefit substantially from an economic recovery and increased consumer spending. Utilities and telecommunication services, two sectors often perceived as relatively safe havens in an economic downturn, trailed with modest gains. Energy stocks also lagged, even though oil prices rebounded sharply from the lows reached early in the year.
Relative to the S&P 500 Index benchmark, the information technology sector was the top contributor to relative gain. A sector overweight to this top performing group and favorable stock selection drove relative outperformance in the sector. Stock selection in healthcare contributed positively to relative performance, notably in the pharmaceuticals and healthcare providers and services industries. Stock selection also added value in the energy and telecommunication services sectors. The only sector to detract from relative performance during the period was materials, where stock selection in the chemicals industry was the primary reason for the performance shortfall.
Relative to the S&P 500 Index benchmark, the Fund’s largest sector changes included significantly reducing our underweight to financials, which are in much stronger shape after the government’s efforts to steady the U.S. financial system and bringing our healthcare overweight exposure down to more of a market weight given the uncertainty of the current regulatory overhaul. In addition, we added to our overweight position in information technology since we believe secular trends such as the rising availability of wireless Internet and growing popularity of smartphones and other devices will make mobile computing increasingly widespread and drive strong growth in the sector. Although we expect a modest improvement in consumer spending and high unemployment will keep a lid on credit dependent purchases, we moderately increased our sector overweight in consumer discretionary names by selectively investing in companies that we believe will lead the recovery.
We are generally optimistic that the worst of the global economic and market downturn is behind us, but believe the strength of the economic recovery is still uncertain. Numerous risks continue to weigh on the likelihood of a strong, sustainable recovery. New home construction is recovering, but a large supply of existing homes combined with tight financing conditions will temper the recovery. We believe non financial companies will focus more on paring debt rather than hiring new workers, which would impede a recovery in the jobs market. Finally, with unemployment likely to remain high into 2010, we expect households will continue to restrain their spending, which will keep personal savings rates high and further undercut worker demand. As we have stated in the past, we believe the U.S. economy is improving, but the transition from recession to recovery will be gradual as the drags on economic growth fade.
Our investment approach remains unchanged. We still seek to invest in high quality companies with strengthening balance sheets, seasoned management teams and superior growth prospects that we believe will successfully weather the sluggish recovery. Our mission is to select companies with potential for generating above average earnings and free cash flow, while maintaining an awareness of stock price valuations. We will continue to rely on the strength of our independent research and concentrate on the underlying fundamentals of our holdings, rather than on macroeconomic concerns or short-term market sentiment. We are confident that our philosophy can lead to consistent outperformance for our clients over the long term.
JNL/T. Rowe Price Established Growth Fund (Class A)
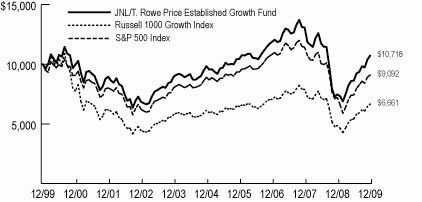
Average Annual Total Returns for Class A Shares | |
| 1 year | 43.49% |
| 5 year | 1.73% |
| 10 year | 0.70% |
Average Annual Total Returns for Class B Shares | |
| 1 year | 43.79% |
| 5 year | 1.92% |
| Since Inception | 2.64% |
| (Inception date March 5, 2004) | |
Past performance is not predictive of future performance. Investment return and principal value will fluctuate so that an investor's shares, when redeemed, may be worth more or less than their original cost. Performance numbers are net of all Fund operating expenses, but do not reflect the deduction of insurance charges.
JNL/T. Rowe Price Mid-Cap Growth Fund
T. Rowe Price Associates, Inc.
Brian W.H. Berghuis
Objective:
The investment objective of the JNL/T. Rowe Price Mid-Cap Growth Fund is long-term growth of capital.
Portfolio Manager Commentary:
For the year ended December 31, 2009, the Fund outperformed its benchmarks by posting a return of 46.93% for Class A shares compared to 37.38% for the S&P MidCap 400 Index and 46.29% for the Russell MidCap Growth Index. The Fund modestly outperformed the Russell MidCap Growth Index for the year, while turning in a robust absolute gain. Relative stock selection overall was positive, but showed a great amount of dispersion with particularly beneficial outcomes in some sectors while being weighed down by detrimental results in others. Sector allocations proved beneficial to relative results.
After a dismal start, U.S. stocks produced strong gains in 2009. While it was the best year for U.S. equities since 2003, the last decade was the worst for U.S. equities since the 1930s. In the first quarter of 2009, major large cap indexes plunged to 12 year lows as the economy contracted and unemployment surged. The federal government intervened aggressively to provide liquidity to the credit markets, stabilize the banking sector and stimulate the economy. From early March through the end of the year, share prices soared as credit market conditions improved, corporate earnings were generally better than expected, and the economy showed signs that it was emerging from the longest and deepest recession since the Great Depression.
As measured by Russell benchmarks, within the mid-cap space, growth stocks have outperformed value stocks for the year, though there was much volatility along the way with dominance by a particular style for short periods. Mid cap stocks outperformed both large caps and small caps during year, and have been especially strong recently. Sector results varied greatly during the year, though all sectors turned in significantly positive gains. The strongest performances in the benchmark were in the energy, information technology and materials sectors. The utilities sector was the weakest sector on an absolute basis. The telecommunication services, industrials and business services and consumer staples sectors posted relatively weak results as well, though all were up nearly 30%.
The largest detraction to relative returns for the year was within the information technology sector. Stock selection was accountable for the lackluster results. Holdings in the information technlogy services industry in particular negatively impacted relative results. Stock selection and an underweight position in the materials sector also weighed on relative performance. The energy sector was the top performer in the benchmark, and Fund holdings could not keep pace these returns. Stock selection in the sector detracted from relative results.
Stock selection in the consumer discretionary sector was the largest contributor to relative performance. An overweight in the internet catalog and retail industry also helped. Stock selection in the consumer staples sector further contributed to relative performance. Also, the consumer staples sector was one of the worst performing sectors within the Russell MidCap Growth Index, so a significant underweight to the sector was beneficial.
All sectors except for utilities positively impacted the Fund’s absolute performance during the year. The Fund’s consumer staples holdings posted the strongest absolute gain, followed by consumer discretionary and energy positions.
The Fund’s long term focus on areas of growth has not changed dramatically over the past year. The largest weighting increase in the Fund was in financials, though its remains underweight relative to the Russell MidCap Growth Index. The Fund’s increase primarily reflects an emphasis on commercial banks. We believe that banks are getting back in to the real business of banking, borrowing cheaply from depositors and lending at higher rates to borrowers. Now that many companies and individuals must turn again to banks for loans, we expect that banks will enjoy higher margins on their lending. Still, we should note that the future shape of the banking system is highly uncertain, and the Fund has made only small investments to date, using a basket approach to diversify our risk.
Another increase was in the consumer discretionary sector. While we have been somewhat cautious on the sector due to the constraints of housing weakness and high personal debt levels, it remains an important area of investment for the Fund, though the Fund is underweight against the Russell MidCap Growth Index. Our current strategy is to focus on firms that dominate their markets. The Fund has significant exposure to the hotels, restaurants and leisure group, and holds key names in the specialty retail internet and catalog retail and media industries.
The largest decrease in weighting was in the information technology sector, though it remains the largest overweight relative to the Russell MidCap Growth Index. We believe many companies in the sector possess excellent prospects, solid balance sheets and shareholder oriented management teams. We find that technology stocks are trading at reasonable valuations and remain confident in a number of catalysts to drive the sector higher. Following closely was a decrease in the industrials and business services sector, which mostly reflects a dampened view on defense spending.
We remain focused on the long term changes wrought by the 2008-2009 financial crisis, primarily the trend toward deleveraging, the drive by consumers and businesses to increase savings and pay down debt. Inflation and the potential devaluation of the dollar remain challenges for the economy, although probably not over the short term. That noted, we have positioned the Fund to benefit from a cyclical turn in the economy, which appears to be taking place. This stance has helped the Fund keep pace with the very strong gains in its benchmarks. Typically, we would not be surprised to lag somewhat during strong rallies given our focus on higher quality stocks, which are less likely to come roaring back after having suffered steep declines.
JNL/T. Rowe Price Mid-Cap Growth Fund (Class A)
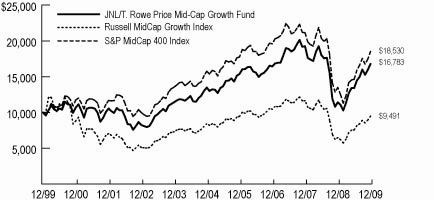
Average Annual Total Returns for Class A Shares | |
| 1 year | 46.93% |
| 5 year | 4.48% |
| 10 year | 5.31% |
Average Annual Total Returns for Class B Shares | |
| 1 year | 47.22% |
| 5 year | 4.69% |
| Since Inception | 6.10% |
| (Inception date March 5, 2004) | |
Past performance is not predictive of future performance. Investment return and principal value will fluctuate so that an investor's shares, when redeemed, may be worth more or less than their original cost. Performance numbers are net of all Fund operating expenses, but do not reflect the deduction of insurance charges.
JNL/T. Rowe Price Short-Term Bond Fund (formerly, JNL/Goldman Sachs Short Duration Bond Fund)
T. Rowe Price Associates, Inc.
Edward A. Wiese
Objective:
The investment objective of the JNL/T. Rowe Price Short-Term Bond Fund is a high level of income consistent with minimal fluctuation in principal value and liquidity.
Portfolio Manager Commentary:
For the year ended December 31, 2009, the Fund outperformed its benchmarks by posting a return of 7.64% for Class A shares compared to 0.78% for the Merrill Lynch 1-3 Year Treasury Index and 1.41% for the Barclays Capital 1-3 Year Government/Credit Index.
For the period January 1, 2009 through September 28, 2009, the Fund was sub-advised by Goldman Sachs Asset Management, L.P. During that time, the Fund outperformed its benchmark by posting a return of 6.94% for Class A shares compared to 0.66% for the Merrill Lynch 1-3 year Treasury Index.
T. Rowe Price Associates, Inc. replaced Goldman Sachs Asset Management, L.P. as the Fund’s sub-adviser on September 28, 2009. Since T. Rowe Price Associates, Inc. took over investment decision through the end of 2009, the Fund outperformed its benchmarks by posting a return of 0.65% for Class A shares compared to 0.08% the Merrill Lynch 1-3 year Treasury Index and 0.42% for the Barclay’s Capital 1-3 Year Government/Credit Index.
For period January 1, 2009 through September 28, 2009, the primary factors that influenced the Fund’s performance relative to its benchmark were an allocation to riskier assets, such as credit sensitive mortgages and corporate bonds.
Tactical management of the Fund’s duration and term structure contributed to returns during the earlier part of 2009. Specifically, the Fund held a short 20-year position that contributed to performance as investors became slightly more risk tolerant and yields rose from their December lows. Cross sector positioning relative to the benchmark was a significant contributor to returns
during the period ended September 25, 2009. The Fund’s overweight exposure to the corporate sector meaningfully contributed to returns, specifically during the second and third quarters, as liquidity returned to the credit markets. In April, corporates set a record for the best monthly performance on record. While the rally in corporates continued into the third quarter, though at a slower pace, the Barclays Capital Corporate Credit Index still managed to outperform duration matched Treasuries by 556 basis points (“bps”) during the quarter. The non-agency mortgage-backed securities (“MBS”) sector was a significant source of positive return, primarily in April. The sector carried its strong performance from the latter half of March into April, with prices rising generally 15-30% from the lows witnessed in February. Security selection of Prime and Alt-A super senior, credit enhanced, non-agency-backed adjustable rate mortgages was also a large contributor to returns. The non-agency MBS sector continued to perform well during the latter part of the period, in part due to anticipation of the Public Private Investment Program (“PPIP”) coming on line, as well as a variety of housing market indicators suggesting overall activity seems to be stabilizing. The Fund also benefitted from having exposure to various spread sectors. Specifically, during the third quarter, spreads across risk sectors continued to contract as excess liquidity from government policy and programs made itself present to the market.
For the period September 28, 2009 to December 31, 2009, the primary factors that influenced the Fund’s performance relative to the Barclays Capital 1-3 Year Government/Credit Index were the following: Sector allocations within the portfolio drove relative outperformance versus the benchmark. An out of benchmark allocation to MBS was the largest contributor to relative returns. An overweight to corporate bonds and an underweight to U.S. Treasuries aided performance as well. Security selection within the portfolio also aided relative results.
For the period September 28, 2009 to December 31, 2009, the greatest contributor to relative performance was the Fund’s nonbenchmark exposure to securitized sectors, particularly MBS. MBS rose steadily through the first two months, fueled by the U.S. Federal Reserve’s continued MBS purchase program, which supported favorable mortgage rates.
An overweight to investment grade corporate bonds also boosted relative returns, as all corporate sectors (industrials, financials and utilities) posted solid returns. An overweight to BBB rated bonds was the greatest factor in relative performance within the sector, and lower rated bonds also performed well. Security selection did offset some relative gain in the sector, as the Fund is more conservative than the benchmark.
Underweighting Treasuries also proved successful for the Fund. Investors began to pull out of Treasuries as economic data improved, and supply was pressured by news of heavy issuance to come. The Fund’s strategy favors an underweight to Treasuries in favor of higher yield prospects, such as investment grade corporate bonds and securitized sectors.
Due to the size of the Fund and the liquidity challenges in some of the relevant sectors, most Fund purchases occurred in the new issue market during the quarter. The Fund accumulated industrials during the quarter to meet its strategy’s overweight to that sector. In addition, the Fund opportunistically added financials in the new issue market because we believe financial spreads should eventually regain their spread relationship to industrials. Currently, financials trade with larger spreads than industrials due to the effects of the recent financial crisis.
Against the Barclays Capital 1-3 Year Government/Credit Index, the short-term bond strategy typically maintains a strategic overweight to corporate credit at the expense of low risk government related and Treasury sectors. The strategy also has an nonbenchmark allocation to securitized sectors, which is largely concentrated in agency MBS. We also have a smaller out of benchmark allocation to asset-backed securities (“ABS”) and AAA rated commercial mortgage-backed securities (“CMBS”).
This year, the strategy moved to a larger corporate overweight and took opportunistic securitized positions in reaction to large risk premium available at times in the sector. Our largest overweight within corporate bonds is to industrials, specifically, through telecommunications and noncyclical names. We also have increased our overweight to financials during the year, with the largest concentration in high quality banking names.
At the end of the year, the Fund’s weightings in comparison to the Barclays Capital 1-3 Year Government/Credit Index was overweight corporate bonds (19.3%), MBS (22.5%), ABS (3.7%) CMBS (.7%), international securities (.5%) and cash (5.4%); and underweight Treasuries (-45.4%) and Government securities (-7.0%).
JNL/T. Rowe Price Short-Term Bond Fund (Class A)
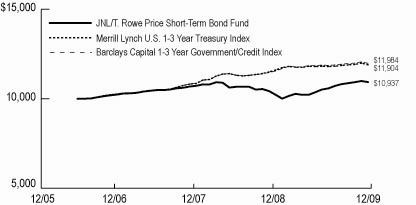
Average Annual Total Returns for Class A Shares | |
| 1 year | 7.64% |
| Since Inception | 2.47% |
| (Inception date May 1, 2006) | |
Average Annual Total Returns for Class B Shares | |
| 1 year | 7.74% |
| Since Inception | 2.68% |
| (Inception date May 1, 2006) | |
T. Rowe Price Associates, Inc. assumed portfolio management responsibility on September 28, 2009.
Past performance is not predictive of future performance. Investment return and principal value will fluctuate so that an investor's shares, when redeemed, may be worth more or less than their original cost. Performance numbers are net of all Fund operating expenses, but do not reflect the deduction of insurance charges.
JNL/T. Rowe Price Value Fund
T. Rowe Price Associates, Inc.
John Linehan, through December 31, 2009; Mark S. Finn effective December 31, 2009
Objective:
The investment objective of the JNL/T. Rowe Price Value Fund is to provide long-term capital appreciation by investing in common stocks believed to be undervalued. Income is a secondary objective.
Portfolio Manager Commentary:
For the year ended December 31, 2009, the Fund outperformed its benchmark by posting a return of 37.09% for Class A shares compared to 19.69% for the Russell 1000 Value Index.
After a dismal start, U.S. stocks produced strong gains in 2009. While it was the best year for U.S. equities since 2003, the last decade was the worst for U.S. equities since the 1930s. In the first quarter of 2009, major large cap indexes plunged to 12 year lows as the economy contracted and unemployment surged. The federal government intervened aggressively to provide liquidity to the credit markets, stabilize the banking sector and stimulate the economy. From early March through the end of the year, share prices soared as credit market conditions improved, corporate earnings were generally better than expected and the economy showed signs that it was emerging from the longest and deepest recession since the Great Depression.
As measured by various Russell indexes, growth stocks outperformed value stocks across all market capitalizations. All sectors in the large cap value universe, as measured by the Russell 1000 Value Index, produced positive returns in 2009. Materials was the strongest sector for the year as a result of higher commodity prices, which were driven up by the weak U.S. dollar. Shares of information technology companies produced powerful returns, thanks to attractive valuations, aggressive cost cutting, cash rich balance sheets, and better than expected revenues. Energy and telecommunication services were the weakest performing sectors in the Fund’s benchmark.
The consumer discretionary sector was the largest contributor to relative performance driven by an overweight position. Another contributor to relative performance was the energy sector due primarily to stock selection. The financials sector also supported relative outperformance driven by stock selection. The Fund’s overweight position to information technology, one of the best performing sectors in the Fund’s benchmark, also aided relative results. The largest negative influence on relative performance was stock selection in information technology, but this was more than offset by our overweight position. Group weighting in industrials and business services also had a slight negative impact that was outweighed by positive stock selection in the sector.
Companies that contributed to Fund performance were American Express Co., Microsoft Corp., Discovery Communications Inc. (“Discovery Communications”), MeadWestvaco Corp. and International Paper Co. Companies that detracted from Fund performance were Sunoco Inc., Citigroup Inc., Liberty Media Corp., Exxon Mobil Corp. and Omnicom Group Inc.
Significant purchases during the year included Aon Corp., which was a new purchase for the Fund, Weyerhaeuser Co. (“Weyerhaeuser”), AT&T Corp., Spectra Energy Corp. and Keycorp. Significant sales during the year included Wyeth, Dish Network Corp., Liberty Media Corp., Discovery Communications and Coca-Cola Enterprises Inc.
During the year, the largest weighting increase in the Fund was in financials. The Fund was a net purchaser adding to commercial banks and diversified financial services names with strong balance sheets that were more likely to benefit as the economy recovered.
Materials was the best performing sector for the year, but the Fund was also a net purchaser adding mostly to paper and forest products name, Weyerhaeuser, primarily early in the year given its attractive valuation and the fact that its timberland ownership provided some downside protection.
The largest decrease in weighting was in the consumer discretionary sector where the Fund was a net seller as valuations became less compelling.
The weight in healthcare decreased slightly during the year. The Fund was a net buyer of healthcare stocks mostly within the healthcare equipment and supplies and healthcare providers and services industries as uncertainty around industry reform pushed the stocks of some companies to attractive valuations.
We believe that there are very good opportunities to invest in high quality companies at attractive prices in a variety of market environments. In the current rally where investors seem to be favoring risk, the market has left many high quality, traditionally defensive companies behind. As a result, we find ourselves selling the more uncertain names whose risk reward profiles have diminished, in favor of the more stable names with attractive valuations. Additionally, at current levels, valuations favor larger cap stocks over their smaller cap counterparts. While no one knows what the future holds, we believe that this environment should be positive for the Fund’s performance given T. Rowe Price’s organizational focus on in house proprietary research and our bottom-up style of investing. Our focus will continue to be selecting stocks with valuation appeal, sound fundamentals and reasonable balance sheet integrity.
JNL/T. Rowe Price Value Fund (Class A)

Average Annual Total Returns for Class A Shares | |
| 1 year | 37.09% |
| 5 year | 0.95% |
| Since Inception | 4.14% |
| (Inception date May 1, 2000) | |
Average Annual Total Returns for Class B Shares | |
| 1 year | 37.46% |
| 5 year | 1.17% |
| Since Inception | 2.65% |
| (Inception date March 5, 2004) | |
Past performance is not predictive of future performance. Investment return and principal value will fluctuate so that an investor's shares, when redeemed, may be worth more or less than their original cost. Performance numbers are net of all Fund operating expenses, but do not reflect the deduction of insurance charges.
JNL Series Trust
Schedules of Investments (in thousands)
December 31, 2009
| Shares / Par (q) | Value | |||||
| JNL Institutional Alt 20 Fund (b) | ||||||
| INVESTMENT FUNDS - 100.0% | ||||||
| JNL/AIM Global Real Estate Fund (1.8%) (a) | 826 | $ | 6,218 | |||
| JNL/Credit Suisse Commodity Securities Fund (1.3%) (a) | 885 | 8,332 | ||||
| JNL/Goldman Sachs Emerging Markets | ||||||
| Debt Fund (2.0%) (a) | 326 | 3,874 | ||||
| JNL/Lazard Emerging Markets Fund (0.6%) (a) | 421 | 4,195 | ||||
| JNL/Mellon Capital Management Bond | ||||||
| Index Fund (7.6%) (a) | 5,317 | 60,556 | ||||
| JNL/Mellon Capital Management Global Alpha | ||||||
| Fund (6.2%) (a) | 391 | 3,862 | ||||
| JNL/Mellon Capital Management International | ||||||
| Index Fund (3.3%) (a) | 2,029 | 24,150 | ||||
| JNL/Mellon Capital Management Nasdaq® | ||||||
| 25 Fund (7.0%) (a) | 840 | 8,261 | ||||
| JNL/Mellon Capital Management S&P 24 Fund (17.8%) (a) | 2,827 | 24,677 | ||||
| JNL/Mellon Capital Management S&P SMid | ||||||
| 60 Fund (7.6%) (a) | 1,588 | 14,915 | ||||
| JNL/Mellon Capital Management Select Small-Cap | ||||||
| Fund (2.4%) (a) | 842 | 8,144 | ||||
| JNL/Mellon Capital Management Value Line | ||||||
| 30 Fund (2.9%) (a) | 1,698 | 18,321 | ||||
| JNL/PIMCO Real Return Fund (0.3%) (a) | 336 | 3,889 | ||||
| JNL/PPM America High Yield Bond Fund (0.7%) (a) | 666 | 4,099 | ||||
| JNL/Red Rocks Listed Private Equity Fund (2.7%) (a) | 754 | 6,055 | ||||
| Total Investment Funds (cost $190,551) | 199,548 | |||||
| Total Investments - 100.0% (cost $190,551) | 199,548 | |||||
| Other Assets and Liabilities, Net - 0.0% | (32) | |||||
| Total Net Assets - 100% | $ | 199,516 | ||||
| JNL Institutional Alt 35 Fund (b) | ||||||
| INVESTMENT FUNDS - 100.0% | ||||||
| JNL/AIM Global Real Estate Fund (4.7%) (a) | 2,120 | $ | 15,967 | |||
| JNL/Credit Suisse Commodity Securities Fund (4.0%) (a) | 2,729 | 25,683 | ||||
| JNL/Goldman Sachs Emerging Markets | ||||||
| Debt Fund (4.6%) (a) | 748 | 8,899 | ||||
| JNL/Ivy Asset Strategy Fund (3.2%) (a) | 592 | 6,160 | ||||
| JNL/Lazard Emerging Markets Fund (1.3%) (a) | 976 | 9,720 | ||||
| JNL/Mellon Capital Management Bond | ||||||
| Index Fund (8.4%) (a) | 5,835 | 66,461 | ||||
| JNL/Mellon Capital Management Global | ||||||
| Alpha Fund (14.3%) (a) | 901 | 8,898 | ||||
| JNL/Mellon Capital Management International | ||||||
| Index Fund (4.7%) (a) | 2,868 | 34,126 | ||||
| JNL/Mellon Capital Management Nasdaq | ||||||
| 25 Fund (8.0%) (a) | 966 | 9,495 | ||||
| JNL/Mellon Capital Management S&P 24 Fund (25.0%) (a) | 3,967 | 34,631 | ||||
| JNL/Mellon Capital Management S&P SMid | ||||||
| 60 Fund (10.1%) (a) | 2,105 | 19,762 | ||||
| JNL/Mellon Capital Management Select | ||||||
| Small-Cap Fund (2.8%) (a) | 965 | 9,334 | ||||
| JNL/Mellon Capital Management Value Line | ||||||
| 30 Fund (4.0%) (a) | 2,311 | 24,931 | ||||
| JNL/PPM America High Yield Bond Fund (2.2%) (a) | 2,051 | 12,612 | ||||
| JNL/Red Rocks Listed Private Equity Fund (9.8%) (a) | 2,726 | 21,887 | ||||
| Total Investment Funds (cost $291,050) | 308,566 | |||||
| Total Investments - 100.0% (cost $291,050) | 308,566 | |||||
| Other Assets and Liabilities, Net - 0.0% | (50) | |||||
| Total Net Assets - 100% | $ | 308,516 | ||||
| JNL Institutional Alt 50 Fund (b) | ||||||
| INVESTMENT FUNDS - 100.0% | ||||||
| JNL/AIM Global Real Estate Fund (9.8%) (a) | 4,454 | $ | 33,540 | |||
| JNL/Credit Suisse Commodity Securities Fund (4.1%) (a) | 2,789 | 26,245 | ||||
| JNL/Goldman Sachs Emerging Markets | ||||||
| Debt Fund (7.2%) (a) | 1,170 | 13,912 | ||||
| JNL/Ivy Asset Strategy Fund (7.4%) (a) | 1,383 | 14,401 | ||||
| JNL/Lazard Emerging Markets Fund (2.1%) (a) | 1,515 | 15,089 | ||||
| JNL/Mellon Capital Management Bond | ||||||
| Index Fund (7.7%) (a) | 5,372 | 61,192 | ||||
| JNL/Mellon Capital Management Global | ||||||
| Alpha Fund (33.6%) (a) | 2,110 | 20,842 | ||||
| JNL/Mellon Capital Management International | ||||||
| Index Fund (4.5%) (a) | 2,739 | 32,596 | ||||
| JNL/Mellon Capital Management Nasdaq | ||||||
| 25 Fund (6.3%) (a) | 754 | 7,417 | ||||
| JNL/Mellon Capital Management S&P 24 Fund (21.3%) (a) | 3,383 | 29,531 | ||||
| JNL/Mellon Capital Management S&P SMid | ||||||
| 60 Fund (9.8%) (a) | 2,042 | 19,172 | ||||
| JNL/Mellon Capital Management Select | ||||||
| Small-Cap Fund (2.2%) (a) | 755 | 7,304 | ||||
| JNL/Mellon Capital Management Value Line | ||||||
| 30 Fund (3.5%) (a) | 2,033 | 21,932 | ||||
| JNL/PPM America High Yield Bond Fund (2.6%) (a) | 2,399 | 14,755 | ||||
| JNL/Red Rocks Listed Private Equity Fund (19.5%) (a) | 5,435 | 43,646 | ||||
| Total Investment Funds (cost $343,652) | 361,574 | |||||
| Total Investments - 100.0% (cost $343,652) | 361,574 | |||||
| Other Assets and Liabilities, Net - 0.0% | (58) | |||||
| Total Net Assets - 100% | $ | 361,516 | ||||
| JNL Institutional Alt 65 Fund (b) | ||||||
| INVESTMENT FUNDS - 100.0% | ||||||
| JNL/AIM Global Real Estate Fund (7.6%) (a) | 3,437 | $ | 25,882 | |||
| JNL/Credit Suisse Commodity Securities Fund (3.0%) (a) | 2,017 | 18,976 | ||||
| JNL/Goldman Sachs Emerging Markets | ||||||
| Debt Fund (5.7%) (a) | 930 | 11,057 | ||||
| JNL/Ivy Asset Strategy Fund (7.0%) (a) | 1,316 | 13,700 | ||||
| JNL/Lazard Emerging Markets Fund (1.6%) (a) | 1,198 | 11,929 | ||||
| JNL/Mellon Capital Management Bond | ||||||
| Index Fund (2.5%) (a) | 1,710 | 19,472 | ||||
| JNL/Mellon Capital Management Global | ||||||
| Alpha Fund (35.5%) (a) | 2,229 | 22,022 | ||||
| JNL/Mellon Capital Management International | ||||||
| Index Fund (2.2%) (a) | 1,348 | 16,037 | ||||
| JNL/Mellon Capital Management Nasdaq | ||||||
| 25 Fund (4.0%) (a) | 478 | 4,703 | ||||
| JNL/Mellon Capital Management S&P 24 Fund (11.9%) (a) | 1,881 | 16,418 | ||||
| JNL/Mellon Capital Management S&P SMid | ||||||
| 60 Fund (5.0%) (a) | 1,030 | 9,674 | ||||
| JNL/Mellon Capital Management Select | ||||||
| Small-Cap Fund (1.4%) (a) | 480 | 4,643 | ||||
| JNL/Mellon Capital Management Value Line | ||||||
| 30 Fund (1.5%) (a) | 860 | 9,283 | ||||
| JNL/PPM America High Yield Bond Fund (1.2%) (a) | 1,141 | 7,016 | ||||
| JNL/Red Rocks Listed Private Equity Fund (17.5%) (a) | 4,862 | 39,038 | ||||
| Total Investment Funds (cost $219,509) | 229,850 | |||||
| Total Investments - 100.0% (cost $219,509) | 229,850 | |||||
| Other Assets and Liabilities, Net - 0.0% | (37) | |||||
| Total Net Assets - 100% | $ | 229,813 | ||||
| JNL/AIM International Growth Fund | ||||||
| COMMON STOCKS - 91.0% | ||||||
| CONSUMER DISCRETIONARY - 10.7% | ||||||
| Adidas AG | 69 | $ | 3,763 | |||
| Compass Group Plc | 881 | 6,332 | ||||
| Denso Corp. | 95 | 2,875 | ||||
| Esprit Holdings Ltd. | 415 | 2,750 | ||||
| Grupo Televisa SA - ADR | 224 | 4,642 | ||||
| Hyundai Mobis | 26 | 3,773 | ||||
| Informa Plc | 680 | 3,513 | ||||
| Li & Fung Ltd. | 574 | 2,373 | ||||
| Puma AG Rudolf Dassler Sport | 17 | 5,682 | ||||
| Reed Elsevier Plc | 478 | 3,952 | ||||
| Toyota Motor Corp. | 74 | 3,117 | ||||
| WPP Plc | 374 | 3,685 | ||||
| 46,457 | ||||||
| CONSUMER STAPLES - 14.4% | ||||||
| Anheuser-Busch InBev NV | 162 | 8,454 | ||||
| British American Tobacco Plc | 140 | 4,546 | ||||
| Danone SA | 46 | 2,827 | ||||
| Imperial Tobacco Group Plc | 318 | 10,075 | ||||
| Koninklijke Ahold NV | 369 | 4,900 | ||||
| Nestle SA | 201 | 9,775 | ||||
| Reckitt Benckiser Group Plc | 184 | 9,970 | ||||
| Tesco Plc | 1,003 | 6,934 | ||||
| Unilever NV (e) | 63 | 2,073 | ||||
| Woolworths Ltd. | 98 | 2,462 | ||||
| 62,016 | ||||||
| ENERGY - 9.0% | ||||||
| BG Group Plc | 273 | 4,955 | ||||
| Canadian Natural Resources Ltd. | 52 | 3,775 | ||||
| Cenovus Energy Inc. | 48 | 1,209 | ||||
| EnCana Corp. | 48 | 1,556 | ||||
| ENI SpA | 232 | 5,919 | ||||
| Petroleo Brasileiro SA - ADR | 94 | 3,965 | ||||
| Petroleum Geo-Services ASA (c) | 197 | 2,272 | ||||
| Suncor Energy Inc. | 121 | 4,312 | ||||
| Talisman Energy Inc. | 230 | 4,314 | ||||
| Total SA | 104 | 6,742 | ||||
| 39,019 | ||||||
| FINANCIALS - 6.5% | ||||||
| Akbank T.A.S. | 472 | 2,988 | ||||
| AXA SA | 157 | 3,717 | ||||
| BNP Paribas | 76 | 6,126 | ||||
| Deutsche Boerse AG | 21 | 1,751 | ||||
| Fairfax Financial Holdings Ltd. | 5 | 1,835 | ||||
| QBE Insurance Group Ltd. | 202 | 4,616 | ||||
| United Overseas Bank Ltd. | 496 | 6,909 | ||||
| 27,942 | ||||||
| HEALTH CARE - 17.8% | ||||||
| Bayer AG | 115 | 9,251 | ||||
| Cochlear Ltd. | 91 | 5,599 | ||||
| CSL Ltd. | 133 | 3,868 | ||||
| Fresenius Medical Care AG & Co. KGaA (e) | 54 | 2,881 | ||||
| Merck KGaA (e) | 47 | 4,354 | ||||
| Novartis AG | 40 | 2,162 | ||||
| Novo-Nordisk A/S - Class B | 105 | 6,700 | ||||
| Roche Holding AG | 69 | 11,654 | ||||
| Shire Plc | 466 | 9,102 | ||||
| Smith & Nephew Plc | 205 | 2,116 | ||||
| Sonova Holding AG | 57 | 6,948 | ||||
| Teva Pharmaceutical Industries Ltd. - ADR | 215 | 12,056 | ||||
| 76,691 | ||||||
| INDUSTRIALS - 11.7% | ||||||
| BAE Systems Plc | 603 | 3,501 | ||||
| Bharat Heavy Electricals Ltd. | 53 | 2,719 | ||||
| Bombardier Inc. - Class B | 684 | 3,134 | ||||
| Canadian National Railway Co. | 59 | 3,244 | ||||
| Capita Group Plc | 253 | 3,073 | ||||
| Fanuc Ltd. | 41 | 3,860 | ||||
| Finmeccanica SpA | 396 | 6,358 | ||||
| Hutchison Whampoa Ltd. | 765 | 5,234 | ||||
| Keppel Corp. Ltd. | 938 | 5,467 | ||||
| Komatsu Ltd. | 107 | 2,241 | ||||
| Singapore Technologies Engineering Ltd. (e) | 1,648 | 3,795 | ||||
| TNT NV | 178 | 5,505 | ||||
| Vestas Wind Systems A/S (c) | 36 | 2,216 | ||||
| 50,347 | ||||||
| INFORMATION TECHNOLOGY - 8.1% | ||||||
| Hoya Corp. | 163 | 4,343 | ||||
| Infosys Technologies Ltd. - ADR (e) | 147 | 8,113 | ||||
| Keyence Corp. | 18 | 3,650 | ||||
| MediaTek Inc. | 192 | 3,336 | ||||
| Nidec Corp. | 69 | 6,389 | ||||
| Nokia Oyj (e) | 133 | 1,708 | ||||
| SAP AG | 39 | 1,846 | ||||
| Taiwan Semiconductor Manufacturing Co. Ltd. | 2,848 | 5,741 | ||||
| 35,126 | ||||||
| MATERIALS - 4.1% | ||||||
| BHP Billiton Ltd. | 214 | 8,207 | ||||
| CRH Plc | 93 | 2,527 | ||||
| Syngenta AG | 26 | 7,176 | ||||
| 17,910 | ||||||
| TELECOMMUNICATION SERVICES - 7.3% | ||||||
| America Movil SAB de CV - ADR (e) | 164 | 7,713 | ||||
| Koninklijke KPN NV | 311 | 5,291 | ||||
| Philippine Long Distance Telephone Co. | 109 | 6,173 | ||||
| Telefonica SA | 183 | 5,135 | ||||
| Vodafone Group Plc | 3,132 | 7,269 | ||||
| 31,581 | ||||||
| UTILITIES - 1.4% | ||||||
| International Power Plc | 1,209 | 6,035 | ||||
| Total Common Stocks (cost $379,854) | 393,124 | |||||
| NON-U.S. GOVERNMENT AGENCY | ||||||
| ASSET-BACKED SECURITIES - 0.0% | ||||||
| Sigma Finance, Inc. (d) (f) (u) | $ | 1,173 | 50 | |||
| Total Non-U.S. Government Agency | ||||||
| Asset-Backed Securities (cost $1,173) | 50 | |||||
| SHORT TERM INVESTMENTS - 12.4% | ||||||
| Mutual Funds - 8.4% | ||||||
| JNL Money Market Fund, 0.07% (a) (h) | 36,147 | 36,147 | ||||
| Securities Lending Collateral - 4.0% | ||||||
| Securities Lending Cash Collateral Fund LLC, | ||||||
| 0.16% (a) (h) | 4,668 | 4,668 | ||||
| Securities Lending Liquidating Fund LLC, 0.36% (a) (h) | 12,768 | 12,741 | ||||
| 17,409 | ||||||
| Total Short Term Investments (cost $53,583) | 53,556 | |||||
| Total Investments - 103.4% (cost $434,610) | 446,730 | |||||
| Other Assets and Liabilities, Net - (3.4%) | (14,749) | |||||
| Total Net Assets - 100% | $ | 431,981 | ||||
| JNL/AIM Large Cap Growth Fund | ||||||
| COMMON STOCKS - 97.2% | ||||||
| CONSUMER DISCRETIONARY - 9.5% | ||||||
| Apollo Group Inc. - Class A (c) | 162 | $ | 9,805 | |||
| Dollar Tree Inc. (c) | 134 | 6,450 | ||||
| Gap Inc. | 316 | 6,617 | ||||
| J.C. Penney Co. Inc. | 286 | 7,622 | ||||
| Kohl's Corp. (c) | 112 | 6,031 | ||||
| Limited Brands Inc. | 435 | 8,376 | ||||
| Ross Stores Inc. | 193 | 8,238 | ||||
| Target Corp. | 124 | 6,003 | ||||
| 59,142 | ||||||
| CONSUMER STAPLES - 1.1% | ||||||
| Estee Lauder Cos. Inc. | 137 | 6,633 | ||||
| ENERGY - 8.6% | ||||||
| Diamond Offshore Drilling Inc. (e) | 62 | 6,130 | ||||
| Ensco International Plc - ADR | 152 | 6,068 | ||||
| FMC Technologies Inc. (c) | 176 | 10,189 | ||||
| National Oilwell Varco Inc. | 273 | 12,020 | ||||
| Occidental Petroleum Corp. | 239 | 19,435 | ||||
| 53,842 | ||||||
| FINANCIALS - 4.2% | ||||||
| BlackRock Inc. (e) | 31 | 7,094 | ||||
| Goldman Sachs Group Inc. | 77 | 13,037 | ||||
| TD Ameritrade Holding Corp. (c) | 302 | 5,846 | ||||
| 25,977 | ||||||
| HEALTH CARE - 15.5% | ||||||
| Abbott Laboratories | 93 | 5,032 | ||||
| AmerisourceBergen Corp. | 416 | 10,851 | ||||
| Amgen Inc. (c) | 308 | 17,415 | ||||
| Express Scripts Inc. (c) | 91 | 7,897 | ||||
| Gilead Sciences Inc. (c) | 142 | 6,153 | ||||
| Johnson & Johnson | 123 | 7,900 | ||||
| McKesson Corp. | 162 | 10,116 | ||||
| Medco Health Solutions Inc. (c) | 163 | 10,422 | ||||
| Quest Diagnostics Inc. | 95 | 5,708 | ||||
| UnitedHealth Group Inc. | 268 | 8,156 | ||||
| WellPoint Inc. (c) | 136 | 7,922 | ||||
| 97,572 | ||||||
| INDUSTRIALS - 10.4% | ||||||
| ABB Ltd. | 407 | 7,860 | ||||
| Cooper Industries Plc | 147 | 6,289 | ||||
| Fluor Corp. | 211 | 9,492 | ||||
| Goodrich Corp. | 116 | 7,436 | ||||
| Joy Global Inc. | 114 | 5,904 | ||||
| Norfolk Southern Corp. | 122 | 6,397 | ||||
| Union Pacific Corp. | 107 | 6,823 | ||||
| United Technologies Corp. | 105 | 7,270 | ||||
| URS Corp. (c) | 164 | 7,298 | ||||
| 64,769 | ||||||
| INFORMATION TECHNOLOGY - 39.7% | ||||||
| Accenture Plc | 341 | 14,155 | ||||
| Apple Inc. (c) | 168 | 35,472 | ||||
| BMC Software Inc. (c) | 251 | 10,063 | ||||
| Cisco Systems Inc. (c) | 482 | 11,533 | ||||
| Cognizant Technology Solutions Corp. (c) | 178 | 8,083 | ||||
| EMC Corp. (c) | 785 | 13,716 | ||||
| Flextronics International Ltd. (c) | 821 | 6,004 | ||||
| Google Inc. - Class A (c) | 19 | 11,748 | ||||
| Hewlett-Packard Co. | 441 | 22,715 | ||||
| International Business Machines Corp. | 124 | 16,171 | ||||
| Marvell Technology Group Ltd. (c) | 500 | 10,368 | ||||
| MasterCard Inc. | 30 | 7,764 | ||||
| Microsoft Corp. | 580 | 17,689 | ||||
| Netease.com - ADR (c) (e) | 166 | 6,241 | ||||
| Oracle Corp. | 650 | 15,963 | ||||
| Shanda Interactive Entertainment Ltd. - ADR (c) (e) | 152 | 7,986 | ||||
| Taiwan Semiconductor Manufacturing Co. Ltd. - ADR | 522 | 5,975 | ||||
| Texas Instruments Inc. | 355 | 9,245 | ||||
| Western Digital Corp. (c) | 235 | 10,385 | ||||
| Xilinx Inc. | 283 | 7,103 | ||||
| 248,379 | ||||||
| MATERIALS - 7.3% | ||||||
| BHP Billiton Ltd. - ADR | 351 | 26,889 | ||||
| Rio Tinto Plc - ADR | 33 | 7,186 | ||||
| Syngenta AG | 42 | 11,747 | ||||
| 45,822 | ||||||
| TELECOMMUNICATION SERVICES - 0.9% | ||||||
| America Movil SAB de CV - ADR | 115 | 5,398 | ||||
| Total Common Stocks (cost $540,006) | 607,534 | |||||
| NON-U.S. GOVERNMENT AGENCY | ||||||
| ASSET-BACKED SECURITIES - 0.0% | ||||||
| Sigma Finance, Inc. (d) (f) (u) | $ | 510 | 22 | |||
| Total Non-U.S. Government Agency | ||||||
| Asset-Backed Securities (cost $510) | 22 | |||||
| SHORT TERM INVESTMENTS - 5.4% | ||||||
| Mutual Funds - 2.8% | ||||||
| JNL Money Market Fund, 0.07% (a) (h) | 17,262 | 17,262 | ||||
| Securities Lending Collateral - 2.6% | ||||||
| Securities Lending Cash Collateral Fund LLC, | ||||||
| 0.16% (a) (h) | 11,846 | 11,846 | ||||
| Securities Lending Liquidating Fund LLC, 0.36% (a) (h) | 4,543 | 4,533 | ||||
| 16,379 | ||||||
| Total Short Term Investments (cost $33,651) | 33,641 | |||||
| Total Investments - 102.6% (cost $574,167) | 641,197 | |||||
| Other Assets and Liabilities, Net - (2.6%) | (16,454) | |||||
| Total Net Assets - 100% | $ | 624,743 | ||||
| JNL/AIM Global Real Estate Fund | ||||||
| COMMON STOCKS - 97.5% | ||||||
| CONSUMER DISCRETIONARY - 0.1% | ||||||
| Starwood Hotels & Resorts Worldwide Inc. | 11 | $ | 388 | |||
| FINANCIALS - 97.4% | ||||||
| Real Estate Investment Trusts – 66.3% | ||||||
| Diversified – REITS – 23.5% | ||||||
| Ascendas Real Estate Investment Trust | 1,442 | 2,265 | ||||
| BGP Holdings Plc (f) (u) | 5,552 | - | ||||
| British Land Co. Plc | 550 | 4,263 | ||||
| Canadian Real Estate Investment Trust | 76 | 1,974 | ||||
| CapitaCommercial Trust | 2,594 | 2,149 | ||||
| Cominar Real Estate Investment Trust | 49 | 908 | ||||
| Corio NV | 30 | 2,071 | ||||
| Derwent London Plc | 77 | 1,637 | ||||
| Dexus Property Group | 4,583 | 3,481 | ||||
| Digital Realty Trust Inc. (e) | 118 | 5,925 | ||||
| Eurocommercial Properties NV | 56 | 2,326 | ||||
| Gecina SA (e) | 19 | 2,092 | ||||
| Goodman Group | 7,487 | 4,241 | ||||
| Hammerson Plc | 383 | 2,622 | ||||
| Kenedix Realty Investment Corp. | - | 605 | ||||
| Klepierre (e) | 39 | 1,575 | ||||
| Land Securities Group Plc | 174 | 1,924 | ||||
| Liberty Property Trust | 99 | 3,179 | ||||
| Morguard Real Estate Investment Trust | 93 | 1,154 | ||||
| Segro Plc | 726 | 4,038 | ||||
| Shaftesbury Plc | 322 | 2,047 | ||||
| Stockland | 2,114 | 7,457 | ||||
| Suntec Real Estate Investment Trust | 1,332 | 1,276 | ||||
| Unibail-Rodamco SE | 47 | 10,354 | ||||
| United Urban Investment Corp. | - | 978 | ||||
| Vornado Realty Trust (e) | 101 | 7,081 | ||||
| Washington Real Estate Investment Trust (e) | 26 | 713 | ||||
| Wereldhave NV | 26 | 2,489 | ||||
| 80,824 | ||||||
| Industrial – REITS – 2.6% | ||||||
| AMB Property Corp. | 74 | 1,901 | ||||
| DCT Industrial Trust Inc. | 200 | 1,005 | ||||
| EastGroup Properties Inc. | 36 | 1,386 | ||||
| Hansteen Holdings Plc | 1,012 | 1,316 | ||||
| ProLogis | 217 | 2,973 | ||||
| ProLogis European Properties (c) | 61 | 374 | ||||
| 8,955 | ||||||
| Office – REITS – 8.2% | ||||||
| Alexandria Real Estate Equities Inc. (e) | 31 | 1,980 | ||||
| Boston Properties Inc. | 93 | 6,248 | ||||
| Commonwealth Property Office Fund (e) | 1,049 | 910 | ||||
| Great Portland Estates Plc | 332 | 1,537 | ||||
| Highwoods Properties Inc. (e) | 69 | 2,301 | ||||
| Icade SA | 16 | 1,499 | ||||
| Japan Real Estate Investment Corp. | - | 2,441 | ||||
| Kilroy Realty Corp. (e) | 68 | 2,098 | ||||
| Mack-Cali Realty Corp. | 69 | 2,368 | ||||
| Nippon Building Fund Inc. | - | 2,448 | ||||
| SL Green Realty Corp. | 86 | 4,320 | ||||
| 28,150 | ||||||
| Residential – REITS – 5.4% | ||||||
| American Campus Communities Inc. | 21 | 593 | ||||
| AvalonBay Communities Inc. (e) | 45 | 3,732 | ||||
| Camden Property Trust | 63 | 2,673 | ||||
| Equity Residential | 213 | 7,193 | ||||
| Essex Property Trust Inc. (e) | 43 | 3,618 | ||||
| Mid-America Apartment Communities Inc. | 12 | 599 | ||||
| 18,408 | ||||||
| Retail – REITS – 16.6% | ||||||
| Acadia Realty Trust | 81 | 1,374 | ||||
| CapitaMall Trust | 2,457 | 3,139 | ||||
| CFS Retail Property Trust (e) | 2,809 | 4,788 | ||||
| Federal Realty Investment Trust (e) | 22 | 1,510 | ||||
| Frontier Real Estate Investment Corp. | - | 405 | ||||
| Japan Retail Fund Investment Corp. (e) | - | 1,048 | ||||
| Link Real Estate Investment Trust | 778 | 1,985 | ||||
| Macerich Co. (e) | 80 | 2,880 | ||||
| Primaris Retail Real Estate Investment Trust | 92 | 1,410 | ||||
| Regency Centers Corp. | 89 | 3,134 | ||||
| RioCan Real Estate Investment Trust | 247 | 4,681 | ||||
| Simon Property Group Inc. (e) | 164 | 13,097 | ||||
| Tanger Factory Outlet Centers Inc. | 56 | 2,181 | ||||
| Vastned Retail NV | 30 | 2,008 | ||||
| Westfield Group | 1,184 | 13,267 | ||||
| 56,907 | ||||||
| Specialized – REITS – 10.0% | ||||||
| Big Yellow Group Plc (c) | 283 | 1,616 | ||||
| HCP Inc. | 91 | 2,793 | ||||
| Health Care REIT Inc. | 101 | 4,485 | ||||
| Host Hotels & Resorts Inc. (c) | 505 | 5,888 | ||||
| LaSalle Hotel Properties | 16 | 340 | ||||
| Nationwide Health Properties Inc. | 121 | 4,263 | ||||
| Public Storage | 81 | 6,573 | ||||
| Senior Housing Properties Trust | 127 | 2,775 | ||||
| Ventas Inc. | 127 | 5,570 | ||||
| 34,303 | ||||||
| REAL ESTATE MANAGEMENT | ||||||
| & DEVELOPMENT– 31.1% | ||||||
| Real Estate Operating Companies – 25.0% | ||||||
| Agile Property Holdings Ltd. | 1,154 | 1,675 | ||||
| Brookfield Properties Corp. | 90 | 1,093 | ||||
| CapitaLand Ltd. | 1,769 | 5,251 | ||||
| China Overseas Land & Investment Ltd. | 2,505 | 5,248 | ||||
| China Resources Land Ltd. | 1,710 | 3,849 | ||||
| City Developments Ltd. | 120 | 982 | ||||
| Gagfah Sa | 93 | 851 | ||||
| Glorious Property Holdings Ltd. (c) | 959 | 434 | ||||
| Guangzhou R&F Properties Co. Ltd. | 166 | 289 | ||||
| Hang Lung Properties Ltd. | 1,151 | 4,512 | ||||
| Henderson Land Development Co. Ltd. | 790 | 5,903 | ||||
| Hongkong Land Holdings Ltd. | 1,538 | 7,575 | ||||
| Kerry Properties Ltd. | 645 | 3,260 | ||||
| KWG Property Holding Ltd. | 915 | 698 | ||||
| Mitsui Fudosan Co. Ltd. (e) | 565 | 9,557 | ||||
| New World Development Ltd. | 1,106 | 2,253 | ||||
| Pebblebrook Hotel Trust (c) | 29 | 645 | ||||
| Retail Opportunity Investments Corp. (c) | 80 | 814 | ||||
| Sino Land Co. | 1,162 | 2,237 | ||||
| Sumitomo Realty & Development Co. Ltd. (e) | 338 | 6,383 | ||||
| Sun Hung Kai Properties Ltd. | 1,232 | 18,317 | ||||
| Unite Group Plc (c) | 414 | 2,003 | ||||
| Wharf Holdings Ltd. | 284 | 1,629 | ||||
| Yanlord Land Group Ltd. (e) | 292 | 446 | ||||
| 85,904 | ||||||
| Real Estate Services – 6.1% | ||||||
| AEON Mall Co. Ltd. | 57 | 1,095 | ||||
| Castellum AB | 333 | 3,385 | ||||
| Citycon Oyj | 361 | 1,524 | ||||
| Conwert Immobilien Invest SE (c) (e) | 129 | 1,581 | ||||
| Deutsche EuroShop AG | 40 | 1,361 | ||||
| Hufvudstaden AB | 99 | 753 | ||||
| Mitsubishi Estate Co. Ltd. | 629 | 10,047 | ||||
| Nomura Real Estate Holdings Inc. | 75 | 1,109 | ||||
| 20,855 | ||||||
| Total Common Stocks (cost $287,217) | 334,694 | |||||
| NON-U.S. GOVERNMENT AGENCY | ||||||
| ASSET-BACKED SECURITIES - 0.0% | ||||||
| Morgan Stanley Capital I REMIC, 5.77%, 10/15/42 (i) | $ | 330 | 118 | |||
| Sigma Finance, Inc. (d) (f) (u) | 1,085 | 46 | ||||
| 164 | ||||||
| Total Non-U.S. Government Agency | ||||||
| Asset-Backed Securities (cost $1,408) | 164 | |||||
| SHORT TERM INVESTMENTS - 8.1% | ||||||
| Mutual Funds - 2.6% | ||||||
| JNL Money Market Fund, 0.07% (a) (h) | 8,814 | 8,814 | ||||
| Securities Lending Collateral - 5.5% | ||||||
| Securities Lending Cash Collateral Fund LLC, | ||||||
| 0.16% (a) (h) | 5,818 | 5,818 | ||||
| Securities Lending Liquidating Fund LLC, 0.36% (a) (h) | 13,160 | 13,132 | ||||
| 18,950 | ||||||
| Total Short Term Investments (cost $27,791) | 27,764 | |||||
| Total Investments - 105.6% (cost $316,416) | 362,622 | |||||
| Other Assets and Liabilities, Net - (5.6%) | (19,267) | |||||
| Total Net Assets - 100% | $ | 343,355 | ||||
| JNL/AIM Small Cap Growth Fund * (y) | ||||||
| COMMON STOCKS - 94.8% | ||||||
| CONSUMER DISCRETIONARY - 13.9% | ||||||
| Big Lots Inc. (c) | 26 | $ | 749 | |||
| Deckers Outdoor Corp. (c) | 8 | 772 | ||||
| Jack in the Box Inc. (c) | 37 | 720 | ||||
| NetFlix Inc. (c) (e) | 13 | 744 | ||||
| PF Chang’s China Bistro Inc. (c) (e) | 24 | 903 | ||||
| TRW Automotive Holdings Corp. (c) | 32 | 759 | ||||
| Other Securities | 8,355 | |||||
| 13,002 | ||||||
| CONSUMER STAPLES - 1.5% | ||||||
| Church & Dwight Co. Inc. | 14 | 863 | ||||
| Other Securities | 509 | |||||
| 1,372 | ||||||
| ENERGY - 7.1% | ||||||
| Arena Resources Inc. (c) (e) | 18 | 794 | ||||
| Carrizo Oil & Gas Inc. (c) (e) | 28 | 749 | ||||
| Dril-Quip Inc. (c) | 22 | 1,230 | ||||
| FMC Technologies Inc. (c) (e) | 14 | 820 | ||||
| Other Securities | 2,966 | |||||
| 6,559 | ||||||
| FINANCIALS - 7.5% | ||||||
| Affiliated Managers Group Inc. (c) (e) | 11 | 757 | ||||
| Greenhill & Co. Inc. | 10 | 815 | ||||
| ProAssurance Corp. (c) (e) | 15 | 797 | ||||
| SVB Financial Group (c) | 20 | 820 | ||||
| Other Securities | 3,820 | |||||
| 7,009 | ||||||
| HEALTH CARE - 16.6% | ||||||
| American Medical Systems Holdings Inc. (c) | 39 | 750 | ||||
| Chemed Corp. | 19 | 913 | ||||
| Eclipsys Corp. (c) | 41 | 750 | ||||
| Mednax Inc. (c) | 16 | 963 | ||||
| Perrigo Co. | 19 | 762 | ||||
| United Therapeutics Corp. (c) | 17 | 915 | ||||
| VCA Antech Inc. (c) | 29 | 725 | ||||
| Other Securities | 9,606 | |||||
| 15,384 | ||||||
| INDUSTRIALS - 14.6% | ||||||
| Bucyrus International Inc. - Class A | 16 | 915 | ||||
| Corrections Corp. of America (c) | 37 | 901 | ||||
| CoStar Group Inc. (c) (e) | 24 | 1,023 | ||||
| HUB Group Inc. - Class A (c) (e) | 30 | 801 | ||||
| Knight Transportation Inc. (e) | 55 | 1,058 | ||||
| Regal-Beloit Corp. | 18 | 945 | ||||
| Tetra Tech Inc. (c) | 31 | 843 | ||||
| TransDigm Group Inc. | 25 | 1,204 | ||||
| Wabtec Corp. | 20 | 814 | ||||
| Other Securities | 5,105 | |||||
| 13,609 | ||||||
| INFORMATION TECHNOLOGY - 28.8% | ||||||
| Advanced Energy Industries Inc. (c) | 53 | 803 | ||||
| Ansys Inc. (c) | 17 | 726 | ||||
| Blackboard Inc. (c) (e) | 16 | 737 | ||||
| Cogent Inc. (c) | 68 | 709 | ||||
| CommVault Systems Inc. (c) | 30 | 707 | ||||
| F5 Networks Inc. (c) | 18 | 929 | ||||
| Global Payments Inc. | 16 | 866 | ||||
| Informatica Corp. (c) (e) | 49 | 1,255 | ||||
| Microsemi Corp. (c) | 40 | 710 | ||||
| Nice Systems Ltd. - ADR (c) | 27 | 838 | ||||
| ON Semiconductor Corp. (c) (e) | 84 | 739 | ||||
| Polycom Inc. (c) (e) | 38 | 956 | ||||
| Quality Systems Inc. | 19 | 1,221 | ||||
| Sybase Inc. (c) | 24 | 1,047 | ||||
| Tech Data Corp. (c) | 16 | 753 | ||||
| VistaPrint NV (c) (e) | 15 | 844 | ||||
| Other Securities | 12,945 | |||||
| 26,785 | ||||||
| MATERIALS - 2.8% | ||||||
| Grief Inc. | 18 | 950 | ||||
| Other Securities | 1,627 | |||||
| 2,577 | ||||||
| TELECOMMUNICATION SERVICES - 1.1% | ||||||
| SBA Communications Corp. (c) | 29 | 1,005 | ||||
| UTILITIES - 0.9% | ||||||
| ITC Holdings Corp. | 16 | 857 | ||||
| Total Common Stocks (cost $82,164) | 88,159 | |||||
| NON-U.S. GOVERNMENT AGENCY | ||||||
| ASSET-BACKED SECURITIES - 0.0% | ||||||
| Other Securities | 12 | |||||
| Total Non-U.S. Government Agency | ||||||
| Asset-Backed Securities (cost $289) | 12 | |||||
| SHORT TERM INVESTMENTS - 22.5% | ||||||
| Mutual Funds - 4.9% | ||||||
| JNL Money Market Fund, 0.07% (a) (h) | 4,526 | 4,526 | ||||
| Securities Lending Collateral - 17.6% | ||||||
| Securities Lending Cash Collateral Fund LLC, | ||||||
| 0.16% (a) (h) | 12,335 | 12,335 | ||||
| Securities Lending Liquidating Fund LLC, 0.36% (a) (h) | 3,995 | 3,987 | ||||
| 16,322 | ||||||
| Total Short Term Investments (cost $20,856) | 20,848 | |||||
| Total Investments - 117.3% (cost $103,309) | 109,019 | |||||
| Other Assets and Liabilities, Net - (17.3%) | (16,069) | |||||
| Total Net Assets - 100% | $ | 92,950 | ||||
| JNL/Capital Guardian Global Balanced Fund | ||||||
| COMMON STOCKS - 63.7% | ||||||
| CONSUMER DISCRETIONARY - 6.5% | ||||||
| Adidas AG | 15 | 813 | ||||
| Anhanguera Educacional Participacoes SA (c) (t) (u) | 34 | 487 | ||||
| B2W Compania Global Do Varejo | 5 | 137 | ||||
| BorgWarner Inc. | 10 | 345 | ||||
| Carnival Corp. (c) | 3 | 101 | ||||
| CBS Corp. - Class B | 61 | 854 | ||||
| Coach Inc. | 7 | 270 | ||||
| Daimler AG | 38 | 2,019 | ||||
| Discovery Communications Inc. - Class A (c) | 13 | 393 | ||||
| Hennes & Mauritz AB - Class B | 12 | 674 | ||||
| Home Depot Inc. | 27 | 772 | ||||
| Honda Motor Co. Ltd. | 14 | 479 | ||||
| Hyundai Mobis | 6 | 894 | ||||
| LG Electronics Inc. | 4 | 417 | ||||
| Li & Fung Ltd. | 120 | 496 | ||||
| Li Ning Co. Ltd. (e) | 275 | 1,041 | ||||
| Lowe's Cos. Inc. | 27 | 622 | ||||
| PT Astra International Tbk | 57 | 208 | ||||
| SES SA | 52 | 1,169 | ||||
| Strayer Education Inc. (e) | 2 | 361 | ||||
| Target Corp. | 61 | 2,936 | ||||
| Time Warner Cable Inc. (e) | 4 | 170 | ||||
| Toyota Motor Corp. | 22 | 907 | ||||
| Urban Outfitters Inc. (c) | 4 | 140 | ||||
| Vivendi SA | 11 | 327 | ||||
| Walt Disney Co. | 37 | 1,181 | ||||
| 18,213 | ||||||
| CONSUMER STAPLES - 8.0% | ||||||
| British American Tobacco Plc | 6 | 69 | ||||
| Coca-Cola Amatil Ltd. | 27 | 279 | ||||
| Coca-Cola Co. | 5 | 279 | ||||
| CP ALL PCL | 18 | 14 | ||||
| Danone SA | 14 | 871 | ||||
| General Mills Inc. | 3 | 212 | ||||
| Hypermarcas SA (c) (t) (u) | 11 | 252 | ||||
| Imperial Tobacco Group Plc | 42 | 1,329 | ||||
| Kraft Foods Inc. - Class A | 6 | 174 | ||||
| KT&G Corp. | 1 | 76 | ||||
| KT&G Corp. - GDR (t) (v) | 4 | 118 | ||||
| Lawson Inc. | 3 | 119 | ||||
| L'Oreal SA | 27 | 3,044 | ||||
| Magnit OAO (c) | 9 | 148 | ||||
| Marfrig Frigorificos e Comercio de Alimentos SA (t) (u) | 105 | 1,149 | ||||
| Metro AG | 9 | 525 | ||||
| Nestle SA | 32 | 1,570 | ||||
| PepsiCo Inc. | 15 | 906 | ||||
| Pernod-Ricard SA (e) | 24 | 2,024 | ||||
| Philip Morris International Inc. | 45 | 2,183 | ||||
| Procter & Gamble Co. | 40 | 2,426 | ||||
| Seven & I Holdings Co. Ltd. | 11 | 233 | ||||
| Shoppers Drug Mart Corp. (e) | 6 | 243 | ||||
| Tesco Plc | 200 | 1,381 | ||||
| Unilever NV | 6 | 196 | ||||
| United Spirits Ltd. | 32 | 852 | ||||
| Wal-Mart Stores Inc. | 29 | 1,534 | ||||
| Woolworths Ltd. | 6 | 156 | ||||
| 22,362 | ||||||
| ENERGY - 4.8% | ||||||
| BG Group Plc | 76 | 1,372 | ||||
| BP Plc | 71 | 689 | ||||
| Cameco Corp. | 40 | 1,278 | ||||
| Cenovus Energy Inc. | 14 | 346 | ||||
| Chevron Corp. | 8 | 577 | ||||
| China Shenhua Energy Co. Ltd. | 250 | 1,214 | ||||
| CNOOC Ltd. | 105 | 164 | ||||
| EnCana Corp. | 5 | 163 | ||||
| Gazprom OAO - ADR | 23 | 579 | ||||
| Marathon Oil Corp. | 22 | 681 | ||||
| Oil Search Ltd. | 29 | 161 | ||||
| Reliance Industries Ltd. | 20 | 457 | ||||
| Royal Dutch Shell Plc - Class A | 34 | 1,032 | ||||
| Sasol Ltd. | 43 | 1,732 | ||||
| Schlumberger Ltd. | 22 | 1,425 | ||||
| SeaDrill Ltd. (e) | 11 | 272 | ||||
| S-Oil Corp. | 4 | 169 | ||||
| Transocean Ltd. (c) | 9 | 761 | ||||
| Weatherford International Ltd. (c) | 17 | 298 | ||||
| 13,370 | ||||||
| FINANCIALS - 10.6% | ||||||
| ACE Ltd. | 3 | 156 | ||||
| Allianz SE | 5 | 575 | ||||
| Allstate Corp. | 40 | 1,202 | ||||
| AON Corp. | 6 | 219 | ||||
| AXA SA (t) (u) | 13 | 316 | ||||
| Banco Bilbao Vizcaya Argentaria SA | 81 | 1,472 | ||||
| Banco Bradesco SA - ADR | 41 | 897 | ||||
| Banco Santander SA | 16 | 268 | ||||
| Bank of China Ltd. (e) | 1,686 | 906 | ||||
| Bank of New York Mellon Corp. | 3 | 84 | ||||
| Bank Pekao SA (c) | 3 | 176 | ||||
| Barclays Plc (t) (u) | 162 | 721 | ||||
| Berkshire Hathaway Inc. - Class A (c) | - | 1,091 | ||||
| BlackRock Inc. (e) | 1 | 232 | ||||
| BNP Paribas (t) (u) | 13 | 1,028 | ||||
| BOC Hong Kong Holdings Ltd. | 85 | 190 | ||||
| Bumiputra-Commerce Holdings Bhd | 82 | 308 | ||||
| CapitaMalls Asia Ltd. (c) (t) (u) | 216 | 391 | ||||
| Charles Schwab Corp. | 19 | 356 | ||||
| CME Group Inc. | 1 | 235 | ||||
| DLF Ltd. (u) | 201 | 1,544 | ||||
| Goldman Sachs Group Inc. | 18 | 2,973 | ||||
| Grupo Financiero Inbursa SA | 440 | 1,301 | ||||
| Hong Kong Exchanges & Clearing Ltd. | 28 | 493 | ||||
| HSBC Holdings Plc | 218 | 2,498 | ||||
| Industrial & Commercial Bank of China | 2,376 | 1,957 | ||||
| Itau Unibanco Holding SA - ADR (e) | 15 | 338 | ||||
| JPMorgan Chase & Co. | 35 | 1,442 | ||||
| Link Real Estate Investment Trust | 166 | 424 | ||||
| Lloyds Banking Group Plc (c) | 445 | 364 | ||||
| MSCI Inc. (c) | 38 | 1,199 | ||||
| Muenchener Rueckversicherungs AG | 4 | 681 | ||||
| National Australia Bank Ltd. | 6 | 147 | ||||
| Onex Corp. | 4 | 92 | ||||
| Plum Creek Timber Co. Inc. (e) | 12 | 449 | ||||
| Progressive Corp. (c) | 72 | 1,290 | ||||
| Shinsei Bank Ltd. | 200 | 218 | ||||
| State Street Corp. | 3 | 144 | ||||
| UBS AG (c) (u) | 16 | 247 | ||||
| UniCredit SpA (c) | 352 | 1,183 | ||||
| Wharf Holdings Ltd. | 40 | 230 | ||||
| 30,037 | ||||||
| HEALTH CARE - 6.2% | ||||||
| Aetna Inc. | 17 | 548 | ||||
| Allergan Inc. | 4 | 246 | ||||
| Baxter International Inc. | 26 | 1,520 | ||||
| Bayer AG | 13 | 1,060 | ||||
| Celgene Corp. (c) | 25 | 1,409 | ||||
| Cerner Corp. (c) | 27 | 2,226 | ||||
| DaVita Inc. (c) | 19 | 1,122 | ||||
| Johnson & Johnson | 15 | 985 | ||||
| Medtronic Inc. | 10 | 418 | ||||
| Merck & Co. Inc. | 27 | 983 | ||||
| Novo-Nordisk A/S - Class B | 4 | 230 | ||||
| Roche Holding AG | 18 | 2,982 | ||||
| Shire Plc | 73 | 1,422 | ||||
| Shire Plc - ADR (e) | 3 | 158 | ||||
| Synthes Inc. | 1 | 144 | ||||
| Teva Pharmaceutical Industries Ltd. - ADR | 18 | 1,011 | ||||
| UnitedHealth Group Inc. | 29 | 881 | ||||
| 17,345 | ||||||
| INDUSTRIALS - 4.5% | ||||||
| Andritz AG | 9 | 518 | ||||
| Assa Abloy AB | 10 | 185 | ||||
| BAE Systems Plc | 74 | 427 | ||||
| British Airways Plc (c) (e) | 39 | 117 | ||||
| China Railway Construction Corp. Ltd. | 472 | 601 | ||||
| China Railway Group Ltd. (c) (e) | 177 | 137 | ||||
| Cia de Concessoes Rodoviarias | 43 | 984 | ||||
| Container Corp. of India Ltd. | 8 | 214 | ||||
| Cummins Inc. | 4 | 161 | ||||
| Danaher Corp. | 4 | 278 | ||||
| East Japan Railway Co. | 5 | 298 | ||||
| Emerson Electric Co. | 18 | 758 | ||||
| FedEx Corp. | 2 | 200 | ||||
| First Solar Inc. (c) (e) | 5 | 691 | ||||
| JetBlue Airways Corp. (c) | 48 | 262 | ||||
| Mitsubishi Corp. | 40 | 999 | ||||
| Mitsui OSK Lines Ltd. | 99 | 523 | ||||
| Norfolk Southern Corp. | 25 | 1,331 | ||||
| Orascom Construction Industries - GDR (t) (u) | 8 | 341 | ||||
| Parker Hannifin Corp. | 3 | 145 | ||||
| Qantas Airways Ltd. | 122 | 325 | ||||
| Siemens AG (e) | 17 | 1,520 | ||||
| SMC Corp. | 5 | 548 | ||||
| Sumitomo Corp. | 42 | 431 | ||||
| SunPower Corp. - Class A (c) | 4 | 92 | ||||
| Suntech Power Holdings Co. Ltd. - ADR (c) (e) | 9 | 150 | ||||
| Vestas Wind Systems A/S (c) | 6 | 342 | ||||
| 12,578 | ||||||
| INFORMATION TECHNOLOGY - 9.8% | ||||||
| Acer Inc. | 490 | 1,471 | ||||
| Adobe Systems Inc. (c) | 34 | 1,243 | ||||
| Agilent Technologies Inc. (c) | 7 | 224 | ||||
| Apple Inc. (c) | 7 | 1,392 | ||||
| ASML Holding NV | 42 | 1,461 | ||||
| Broadcom Corp. - Class A (c) (e) | 20 | 629 | ||||
| BYD Co. Ltd. (c) (e) | 19 | 162 | ||||
| Cielo SA (t) (u) | 4 | 37 | ||||
| Cisco Systems Inc. (c) | 54 | 1,295 | ||||
| Epistar Corp. | 24 | 90 | ||||
| Epistar Corp. - GDR (c) (f) (t) (u) | 6 | 113 | ||||
| Foxconn International Holdings Ltd. (c) | 127 | 146 | ||||
| Genpact Ltd. (c) | 25 | 370 | ||||
| Giant Interactive Group Inc. - ADR (e) | 12 | 82 | ||||
| Google Inc. - Class A (c) | 5 | 3,225 | ||||
| HON HAI Precision Industry Co. Ltd. - GDR | 39 | 377 | ||||
| International Business Machines Corp. | 11 | 1,453 | ||||
| Juniper Networks Inc. (c) (e) | 46 | 1,216 | ||||
| Keyence Corp. | 1 | 216 | ||||
| Maxim Integrated Products Inc. | 20 | 414 | ||||
| MediaTek Inc. | 16 | 278 | ||||
| Microchip Technology Inc. (e) | 8 | 232 | ||||
| Murata Manufacturing Co. Ltd. | 17 | 849 | ||||
| NetApp Inc. (c) | 6 | 199 | ||||
| Nidec Corp. | 2 | 203 | ||||
| Nintendo Co. Ltd. | 9 | 2,055 | ||||
| Oracle Corp. | 8 | 199 | ||||
| Oracle Corp. Japan (e) | 12 | 513 | ||||
| QUALCOMM Inc. | 21 | 976 | ||||
| Research In Motion Ltd. (c) | 2 | 156 | ||||
| Samsung Electronics Co. Ltd. - GDR | 1 | 256 | ||||
| SAP AG (e) | 15 | 729 | ||||
| Taiwan Semiconductor Manufacturing Co. Ltd. | 827 | 1,667 | ||||
| Taiwan Semiconductor Manufacturing Co. Ltd. - ADR | 12 | 137 | ||||
| TDK Corp. | 4 | 245 | ||||
| Tencent Holdings Ltd. | 18 | 398 | ||||
| Trend Micro Inc. (e) | 36 | 1,368 | ||||
| Visa Inc. - Class A | 14 | 1,181 | ||||
| Wistron Corp. | 86 | 167 | ||||
| 27,424 | ||||||
| MATERIALS - 5.6% | ||||||
| Air Liquide | 4 | 463 | ||||
| Allegheny Technologies Inc. (e) | 30 | 1,361 | ||||
| Anglo American Plc (c) | 12 | 521 | ||||
| AngloGold Ashanti Ltd. | 9 | 366 | ||||
| Barrick Gold Corp. | 27 | 1,075 | ||||
| China Shanshui Cement Group Ltd. | 549 | 398 | ||||
| Cliffs Natural Resources Inc. | 10 | 461 | ||||
| CRH Plc | 56 | 1,531 | ||||
| Harmony Gold Mining Co. Ltd (e) | 6 | 57 | ||||
| HeidelbergCement AG | 3 | 180 | ||||
| Holcim Ltd. (e) | 14 | 1,097 | ||||
| Inmet Mining Corp. | 4 | 237 | ||||
| Lafarge SA (t) (u) | 9 | 774 | ||||
| LG Chem Ltd. | 2 | 388 | ||||
| LG Chem Ltd. - GDR (c) (t) (v) | 2 | 157 | ||||
| MMC Norilsk Nickel - ADR (c) | 16 | 236 | ||||
| Monsanto Co. | 7 | 605 | ||||
| Nucor Corp. | 3 | 145 | ||||
| OCI Co. Ltd. | - | 79 | ||||
| Pretoria Portland Cement Co. Ltd. | 68 | 321 | ||||
| PT Indocement Tunggal Prakarsa Tbk | 9 | 13 | ||||
| Rio Tinto Plc | 6 | 318 | ||||
| Sappi Ltd. (c) | 115 | 556 | ||||
| Sappi Ltd. - ADR (c) (e) | 15 | 70 | ||||
| Semen Gresik Persero Tbk PT | 241 | 192 | ||||
| Shin-Etsu Chemical Co. Ltd. | 3 | 175 | ||||
| Stora Enso Oyj - Class R (c) (e) | 22 | 153 | ||||
| Sumitomo Chemical Co. Ltd. | 25 | 110 | ||||
| Syngenta AG | 4 | 1,231 | ||||
| UPM-Kymmene Oyj | 7 | 86 | ||||
| Vale SA - ADR | 6 | 156 | ||||
| Vulcan Materials Co. (e) | 33 | 1,722 | ||||
| Xstrata Plc (c) | 19 | 349 | ||||
| 15,583 | ||||||
| TELECOMMUNICATION SERVICES - 5.5% | ||||||
| America Movil SAB de CV - ADR | 4 | 193 | ||||
| American Tower Corp. (c) | 29 | 1,236 | ||||
| Bezeq Israeli Telecommunication Corp. Ltd. | 92 | 234 | ||||
| Bharti Airtel Ltd. | 76 | 540 | ||||
| France Telecom SA | 61 | 1,526 | ||||
| Koninklijke KPN NV | 143 | 2,422 | ||||
| Maxis Bhd (t) (u) | 298 | 467 | ||||
| MTN Group Ltd. | 13 | 208 | ||||
| Rogers Communications Inc. - Class B | 5 | 159 | ||||
| SK Telecom Co. Ltd. | 1 | 201 | ||||
| SK Telecom Co. Ltd. - ADR (e) | 16 | 265 | ||||
| SoftBank Corp. | 57 | 1,339 | ||||
| Taiwan Mobile Co. Ltd. | 109 | 212 | ||||
| Telefonos de Mexico SAB de CV | 50 | 42 | ||||
| Telefonos de Mexico SAB de CV - ADR (e) | 119 | 1,978 | ||||
| Telmex Internacional SAB de CV - ADR (e) | 112 | 1,981 | ||||
| Telstra Corp. Ltd. | 263 | 809 | ||||
| Turk Telekomunikasyon AS | 67 | 205 | ||||
| Turkcell Iletisim Hizmet AS | 11 | 78 | ||||
| Turkcell Iletisim Hizmet AS - ADR | 1 | 12 | ||||
| Verizon Communications Inc. | 38 | 1,246 | ||||
| 15,353 | ||||||
| UTILITIES - 2.2% | ||||||
| Centrais Eletricas Brasileiras SA | 10 | 208 | ||||
| Centrais Eletricas Brasileiras SA - ADR | 3 | 52 | ||||
| China Longyuan Power Group Corp. (c) (e) (t) (u) | 236 | 306 | ||||
| Companhia Energetica de Minas Gerais - ADR | 13 | 229 | ||||
| E.ON AG (e) | 28 | 1,178 | ||||
| Edison International | 4 | 146 | ||||
| Electricite de France SA | 21 | 1,252 | ||||
| Enersis SA - ADR | 1 | 27 | ||||
| Exelon Corp. | 3 | 161 | ||||
| GDF Suez | 16 | 695 | ||||
| National Grid Plc | 29 | 317 | ||||
| Tanjong Plc | 45 | 219 | ||||
| Veolia Environnement (e) | 44 | 1,457 | ||||
| 6,247 | ||||||
| Total Common Stocks (cost $161,366) | 178,512 | |||||
| PREFERRED STOCKS - 0.5% | ||||||
| INFORMATION TECHNOLOGY - 0.0% | ||||||
| ASAT Holdings Ltd., 13.00% (f) (s) (u) | 7 | - | ||||
| MATERIALS - 0.1% | ||||||
| Cia Vale do Rio Doce | 6 | 145 | ||||
| TELECOMMUNICATION SERVICES - 0.2% | ||||||
| Tele Norte Leste Participacoes SA | 22 | 466 | ||||
| UTILITIES - 0.2% | ||||||
| Cia Energetica de Sao Paulo | 61 | 838 | ||||
| Eletropaulo Metropolitana Eletricidade de Sao Paulo SA | 4 | 71 | ||||
| 909 | ||||||
| Total Preferred Stocks (cost $1,214) | 1,520 | |||||
| WARRANTS - 0.0% | ||||||
| ASAT Holdings Ltd. 07/24/11 (c) (f) (s) (u) | - | - | ||||
| Total Warrants (cost $0) | - | |||||
| NON-U.S. GOVERNMENT AGENCY | ||||||
| ASSET-BACKED SECURITIES - 0.0% | ||||||
| Sigma Finance, Inc. (d) (f) (u) | $ | 826 | 35 | |||
| Total Non-U.S. Government Agency | ||||||
| Asset-Backed Securities (cost $826) | 35 | |||||
| CORPORATE BONDS AND NOTES - 6.2% | ||||||
| CONSUMER DISCRETIONARY - 0.5% | ||||||
| Altegrity Inc., 10.50%, 11/01/15 (t) (u) | 200 | 178 | ||||
| Charter Communications Operating LLC, | ||||||
| 8.38%, 04/30/14 (d) (k) (t) (u) | 200 | 206 | ||||
| Comcast Corp., 5.88%, 02/15/18 | 250 | 265 | ||||
| Daimler Finance North America LLC, 5.88%, 03/15/11 | 355 | 371 | ||||
| Time Warner Inc., 5.88%, 11/15/16 | 250 | 270 | ||||
| Volvo AB, 5.00%, 05/31/17 | EUR | 150 | 209 | |||
| 1,499 | ||||||
| CONSUMER STAPLES - 0.3% | ||||||
| Anheuser-Busch InBev NV, 8.63%, 01/30/17 | EUR | 175 | 316 | |||
| Imperial Tobacco Finance Plc, 8.38%, 02/17/16 | EUR | 250 | 434 | |||
| Tesco Plc, 5.50%, 01/13/33 | GBP | 100 | 156 | |||
| 906 | ||||||
| ENERGY - 0.0% | ||||||
| Evergreen Energy Inc., 8.00%, 08/01/12 (s) (u) | 60 | 21 | ||||
| Petrobras International Finance Co., 6.88%, 01/20/20 | 85 | 87 | ||||
| 108 | ||||||
| FINANCIALS - 2.7% | ||||||
| Bank of America Corp., 5.75%, 12/01/17 | 480 | 492 | ||||
| BAT International Finance Plc, 8.13%, 11/15/13 (t) (u) | 150 | 173 | ||||
| DBS Bank Ltd. Singapore, 7.88%, 04/15/10 (t) (u) | 150 | 152 | ||||
| Depfa ACS Bank, 3.25%, 02/15/12 | EUR | 550 | 779 | |||
| Eurohypo AG, 4.50%, 01/21/13 | EUR | 100 | 152 | |||
| Ford Motor Credit Co. LLC, 8.00%, 12/15/16 | 175 | 175 | ||||
| Goldman Sachs Group Inc., 7.50%, 02/15/19 | 300 | 350 | ||||
| JPMorgan Chase & Co., 6.30%, 04/23/19 | 150 | 165 | ||||
| Liberty Mutual Group Inc., 7.50%, 08/15/36 (t) (u) | 350 | 320 | ||||
| Lloyds TSB Bank Plc, 6.38%, 06/17/16 | EUR | 500 | 778 | |||
| Merrill Lynch & Co. Inc., 4.63%, 09/14/18 | EUR | 250 | 319 | |||
| Muenchener Rueckversicherungs AG, | ||||||
| 6.75%, 06/21/23 | EUR | 150 | 229 | |||
| Nielsen Finance LLC, 10.00%, 08/01/14 | 200 | 208 | ||||
| ProLogis, 7.38%, 10/30/19 | 600 | 592 | ||||
| Rodamco Europe Finance BV, 3.75%, 12/12/12 | EUR | 200 | 293 | |||
| Royal Bank of Scotland Plc | ||||||
| 4.38%, 07/13/16 | EUR | 250 | 360 | |||
| 6.93%, 04/09/18 | EUR | 200 | 266 | |||
| Societe Generale, 5.75%, 04/20/16 (t) (u) | 150 | 152 | ||||
| Standard Chartered Bank, 6.40%, 09/26/17 (t) (u) | 300 | 312 | ||||
| Telecom Italia Finance SA, 7.75%, 01/24/33 | EUR | 150 | 248 | |||
| UniCredito Luxemburg Finance SA, | ||||||
| 6.00%, 10/31/17 (e) (t) (u) | 150 | 149 | ||||
| Westfield Europe Finance Plc | ||||||
| 3.63%, 06/27/12 | EUR | 400 | 568 | |||
| 5.50%, 06/27/17 | EUR | 150 | 229 | |||
| 7,461 | ||||||
| HEALTH CARE - 0.8% | ||||||
| AstraZeneca Plc, 5.90%, 09/15/17 (e) | 250 | 278 | ||||
| GlaxoSmithKline Capital Inc., 5.65%, 05/15/18 | 200 | 216 | ||||
| HCA Inc., 9.25%, 11/15/16 | 75 | 81 | ||||
| Pfizer Inc., 6.20%, 03/15/19 | 400 | 445 | ||||
| Roche Holdings Inc., 6.00%, 03/01/19 (t) (u) | 400 | 440 | ||||
| Schering-Plough Corp., 5.38%, 10/01/14 | EUR | 350 | 548 | |||
| Tenet Healthcare Corp., 8.88%, 07/01/19 (t) (u) | 200 | 216 | ||||
| 2,224 | ||||||
| INDUSTRIALS - 0.1% | ||||||
| General Electric Co., 5.00%, 02/01/13 | 200 | 212 | ||||
| INFORMATION TECHNOLOGY - 0.1% | ||||||
| NXP BV, 7.88%, 10/15/14 | 200 | 182 | ||||
| MATERIALS - 0.1% | ||||||
| Lafarge SA, 8.75%, 05/30/17 | GBP | 100 | 182 | |||
| TELECOMMUNICATION SERVICES - 1.1% | ||||||
| AT&T Inc., 5.80%, 02/15/19 | 600 | 640 | ||||
| AT&T Wireless Services Inc., 8.13%, 05/01/12 | 250 | 282 | ||||
| France Telecom SA | ||||||
| 7.75%, 03/01/11 (l) | 150 | 161 | ||||
| 7.50%, 03/14/11 | GBP | 150 | 259 | |||
| Koninklijke KPN NV, 4.75%, 01/17/17 | EUR | 200 | 295 | |||
| Qwest Communications International Inc., | ||||||
| 7.25%, 02/15/14 (k) | 100 | 100 | ||||
| Telecom Italia SpA, 8.25%, 03/21/16 | EUR | 150 | 261 | |||
| Telefonica Emisiones SAU, 5.88%, 07/15/19 | 400 | 429 | ||||
| Vodafone Group Plc, 4.75%, 06/14/16 | EUR | 350 | 522 | |||
| 2,949 | ||||||
| UTILITIES - 0.5% | ||||||
| Abu Dhabi National Energy Co., 6.17%, 10/25/17 | 300 | 288 | ||||
| AES Corp., 7.75%, 10/15/15 | 125 | 127 | ||||
| AES Panama SA, 6.35%, 12/12/16 (t) (u) | 300 | 295 | ||||
| Edison Mission Energy, 7.75%, 06/15/16 | 150 | 128 | ||||
| National Grid Plc, 6.30%, 08/01/16 | 300 | 326 | ||||
| Veolia Environnement, 5.25%, 06/03/13 (e) | 325 | 344 | ||||
| 1,508 | ||||||
| Total Corporate Bonds and Notes (cost $16,728) | 17,231 | |||||
| GOVERNMENT AND AGENCY OBLIGATIONS - 25.4% | ||||||
| GOVERNMENT SECURITIES - 22.3% | ||||||
| Sovereign - 16.0% | ||||||
| Argentina Government International Bond, | ||||||
| 7.00%, 10/03/15 (f) | 175 | 147 | ||||
| Brazil Notas do Tesouro Nacional Series F, | ||||||
| 10.00%, 01/01/17 | BRL | 410 | 212 | |||
| Brazilian Government International Bond | ||||||
| 12.50%, 01/05/16 | BRL | 300 | 194 | |||
| 12.50%, 01/05/22 | BRL | 250 | 162 | |||
| Canadian Government Bond | ||||||
| 4.50%, 06/01/15 | CAD | 1,100 | 1,134 | |||
| 4.50%, 06/01/15 | CAD | 100 | 103 | |||
| Colombia Government International Bond | ||||||
| 12.00%, 10/22/15 | COP | 411,000 | 247 | |||
| 9.85%, 06/28/27 | COP | 35,000 | 20 | |||
| Croatia Government International Bond, | ||||||
| 6.75%, 11/05/19 (t) (u) | 750 | 808 | ||||
| Denmark Government Bond, 5.00%, 11/15/13 | DKK | 11,975 | 2,517 | |||
| Dominican Republic International Bond, | ||||||
| 8.63%, 04/20/27 (t) (u) | 150 | 157 | ||||
| France Government Bond | ||||||
| 5.00%, 10/25/11 | EUR | 625 | 955 | |||
| 4.25%, 10/25/23 | EUR | 550 | 811 | |||
| Gabonese Republic, 8.20%, 12/12/17 | 200 | 209 | ||||
| German Treasury Bond | ||||||
| 4.75%, 06/11/10 | EUR | 1,400 | 2,045 | |||
| 4.00%, 01/04/37 | EUR | 100 | 140 | |||
| Indonesia Government Bond | ||||||
| 12.50%, 03/15/13 | IDR | 250,000 | 29 | |||
| 11.00%, 10/15/14 | IDR | 65,000 | 7 | |||
| 9.50%, 06/15/15 | IDR | 1,965,000 | 212 | |||
| 10.75%, 05/15/16 | IDR | 145,000 | 16 | |||
| 12.80%, 06/15/21 | IDR | 95,000 | 12 | |||
| Ireland Government Bond, 4.00%, 01/15/14 | EUR | 575 | 846 | |||
| Italy Buoni Poliennali Del Tesoro | ||||||
| 5.00%, 02/01/12 | EUR | 825 | 1,260 | |||
| 3.75%, 12/15/13 | EUR | 700 | 1,045 | |||
| 4.50%, 03/01/19 | EUR | 1,700 | 2,558 | |||
| Japan Government Bond | ||||||
| 1.10%, 03/21/11 | JPY | 140,000 | 1,521 | |||
| 1.50%, 09/20/14 | JPY | 125,000 | 1,407 | |||
| 1.70%, 09/20/17 | JPY | 280,000 | 3,183 | |||
| 2.30%, 12/20/35 | JPY | 50,000 | 542 | |||
| Korea Treasury Bond | ||||||
| 4.25%, 09/10/14 | KRW | 1,050,000 | 878 | |||
| 5.75%, 09/10/18 | KRW | 100,000 | 88 | |||
| Malaysia Government Bond | ||||||
| 5.09%, 04/30/14 | MYR | 2,325 | 718 | |||
| 3.74%, 02/27/15 | MYR | 200 | 58 | |||
| Mexican Bonos | ||||||
| 9.50%, 12/18/14 | MXN | 20,000 | 1,661 | |||
| 7.75%, 12/14/17 | MXN | 3,300 | 251 | |||
| Netherlands Government Bond, 3.25%, 07/15/15 | EUR | 1,250 | 1,844 | |||
| Norway Government Bond, 6.50%, 05/15/13 | NOK | 1,250 | 239 | |||
| Poland Government International Bond | ||||||
| 5.75%, 04/25/14 | PLN | 5,250 | 1,837 | |||
| 5.25%, 10/25/17 | PLN | 600 | 198 | |||
| 6.38%, 07/15/19 (e) | 250 | 272 | ||||
| Qatar Government International Bond, | ||||||
| 5.25%, 01/20/20 (t) (u) | 150 | 151 | ||||
| Queensland Treasury Corp., 6.00%, 10/14/15 | AUD | 2,500 | 2,263 | |||
| Republic of Argentina, 0.94%, 08/03/12 (i) | 325 | 112 | ||||
| Republic of Colombia, 7.38%, 01/27/17 | 100 | 113 | ||||
| Republic of Deutschland | ||||||
| 3.75%, 07/04/13 | EUR | 250 | 380 | |||
| 4.25%, 07/04/14 | EUR | 1,570 | 2,426 | |||
| 3.25%, 07/04/15 | EUR | 1,025 | 1,516 | |||
| 4.75%, 07/04/34 | EUR | 950 | 1,478 | |||
| Republic of El Salvador, 7.38%, 12/01/19 (t) (u) | 100 | 103 | ||||
| Republic of Iraq, 5.80%, 01/15/28 | 500 | 382 | ||||
| Republic of Turkey | ||||||
| 7.50%, 07/14/17 | 125 | 142 | ||||
| 7.50%, 11/07/19 | 150 | 169 | ||||
| Republic of Venezuela | ||||||
| 5.38%, 08/07/10 | 115 | 112 | ||||
| 9.38%, 01/13/34 | 260 | 175 | ||||
| Singapore Government Bond, 3.75%, 09/01/16 | SGD | 1,000 | 787 | |||
| Spanish Government Bond, 4.40%, 01/31/15 | EUR | 400 | 611 | |||
| Sweden Government Bond, 6.75%, 05/05/14 | SEK | 5,250 | 865 | |||
| Thailand Government Bond | ||||||
| 5.25%, 05/12/14 | THB | 4,950 | 160 | |||
| 3.63%, 05/22/15 | THB | 5,425 | 162 | |||
| Turkey Government International Bond | ||||||
| 10.00%, 02/15/12 | TRY | 225 | 167 | |||
| 16.00%, 03/07/12 | TRY | 350 | 262 | |||
| United Kingdom Treasury Bond | ||||||
| 4.50%, 03/07/19 | GBP | 775 | 1,292 | |||
| 4.25%, 06/07/32 | GBP | 300 | 471 | |||
| 44,842 | ||||||
| Treasury Inflation Index Securities - 0.6% | ||||||
| U.S. Treasury Inflation Indexed Note, 2.00%, 07/15/14 (r) | 1,305 | 1,549 | ||||
| U.S. Treasury Securities - 5.7% | ||||||
| U.S. Treasury Bond | ||||||
| 7.50%, 11/15/16 | 1,400 | 1,764 | ||||
| 5.25%, 02/15/29 | 1,000 | 1,083 | ||||
| 4.38%, 02/15/38 | 850 | 816 | ||||
| U.S. Treasury Note | ||||||
| 4.50%, 02/28/11 | 2,500 | 2,609 | ||||
| 2.75%, 02/28/13 | 4,500 | 4,636 | ||||
| 4.25%, 08/15/13 | 1,600 | 1,726 | ||||
| 4.25%, 11/15/13 | 2,450 | 2,647 | ||||
| 3.50%, 02/15/18 | 750 | 744 | ||||
| 16,025 | ||||||
| U.S. GOVERNMENT AGENCY | ||||||
| MORTGAGE-BACKED SECURITIES - 3.1% | ||||||
| Federal National Mortgage Association - 2.8% | ||||||
| Federal National Mortgage Association | ||||||
| 6.00%, 01/16/37, TBA (g) | 1,915 | 2,028 | ||||
| 5.50%, 03/01/37 | 911 | 955 | ||||
| 6.50%, 11/01/37 | 1,081 | 1,158 | ||||
| 5.50%, 01/01/39 | 3,676 | 3,853 | ||||
| 7,994 | ||||||
| Government National Mortgage Association - 0.3% | ||||||
| Government National Mortgage Association, | ||||||
| 4.50%, 11/20/39 | 849 | 849 | ||||
| Total Government and Agency Obligations (cost $70,224) | 71,259 | |||||
| SHORT TERM INVESTMENTS - 10.0% | ||||||
| Mutual Funds - 5.0% | ||||||
| JNL Money Market Fund, 0.07% (a) (h) | 13,868 | 13,868 | ||||
| Securities Lending Collateral - 5.0% | ||||||
| Securities Lending Cash Collateral Fund LLC, | ||||||
| 0.16% (a) (h) | 3,706 | 3,706 | ||||
| Securities Lending Liquidating Fund LLC, 0.36% (a) (h) | 10,418 | 10,396 | ||||
| 14,102 | ||||||
| Total Short Term Investments (cost $27,992) | 27,970 | |||||
| Total Investments - 105.8% (cost $278,350) | 296,527 | |||||
| Other Assets and Liabilities, Net - (5.8%) | (16,310) | |||||
| Total Net Assets - 100% | $ | 280,217 | ||||
| JNL/Capital Guardian Global | ||||||
| Diversified Research Fund * (y) | ||||||
| COMMON STOCKS - 94.9% | ||||||
| CONSUMER DISCRETIONARY - 7.1% | ||||||
| LG Electronics Inc. | 27 | $ | 2,846 | |||
| Lowe’s Cos. Inc. | 102 | 2,387 | ||||
| Target Corp. | 82 | 3,952 | ||||
| Toyota Motor Corp. | 56 | 2,354 | ||||
| Other Securities | 12,193 | |||||
| 23,732 | ||||||
| CONSUMER STAPLES - 10.4% | ||||||
| Coca-Cola Amatil Ltd. | 234 | 2,416 | ||||
| Coca-Cola Co. | 34 | 1,910 | ||||
| Imperial Tobacco Group Plc | 83 | 2,618 | ||||
| Kraft Foods Inc. - Class A | 86 | 2,348 | ||||
| Lawson Inc. | 61 | 2,678 | ||||
| PepsiCo Inc. | 54 | 3,277 | ||||
| Pernod-Ricard SA | 66 | 5,712 | ||||
| Procter & Gamble Co. | 38 | 2,322 | ||||
| Other Securities | 11,233 | |||||
| 34,514 | ||||||
| ENERGY - 11.1% | ||||||
| BG Group Plc | 322 | 5,825 | ||||
| Cenovus Energy Inc. | 99 | 2,505 | ||||
| Chevron Corp. | 31 | 2,402 | ||||
| China Shenhua Energy Co. Ltd. | 922 | 4,476 | ||||
| Gazprom OAO - ADR | 174 | 4,427 | ||||
| Royal Dutch Shell Plc - Class A | 156 | 4,732 | ||||
| Sasol Ltd. | 64 | 2,594 | ||||
| Schlumberger Ltd. | 36 | 2,337 | ||||
| Other Securities | 7,590 | |||||
| 36,888 | ||||||
| FINANCIALS - 18.3% | ||||||
| Banco Santander SA | 139 | 2,304 | ||||
| Bank of China Ltd. (e) | 6,845 | 3,678 | ||||
| BNP Paribas (u) | 60 | 4,796 | ||||
| Goldman Sachs Group Inc. | 28 | 4,728 | ||||
| HSBC Holdings Plc | 329 | 3,762 | ||||
| Industrial & Commercial Bank of China | 5,477 | 4,510 | ||||
| Link Real Estate Investment Trust | 940 | 2,398 | ||||
| Progressive Corp. (c) | 127 | 2,287 | ||||
| UBS AG (c) (u) | 162 | 2,520 | ||||
| Wharf Holdings Ltd. | 551 | 3,163 | ||||
| Other Securities | 26,828 | |||||
| 60,974 | ||||||
| HEALTH CARE - 9.0% | ||||||
| Allergan Inc. | 42 | 2,640 | ||||
| DaVita Inc. (c) | 41 | 2,408 | ||||
| Medtronic Inc. | 72 | 3,175 | ||||
| Roche Holding AG | 30 | 5,054 | ||||
| Shire Plc | 143 | 2,792 | ||||
| Other Securities | 13,819 | |||||
| 29,888 | ||||||
| INDUSTRIALS - 8.3% | ||||||
| China Railway Construction Corp. Ltd. | 938 | 1,195 | ||||
| China Railway Group Ltd. (c) (e) | 1,715 | 1,324 | ||||
| JetBlue Airways Corp. (c) | 439 | 2,391 | ||||
| Other Securities | 22,819 | |||||
| 27,729 | ||||||
| INFORMATION TECHNOLOGY - 13.1% | ||||||
| Google Inc. - Class A (c) | 6 | 3,596 | ||||
| Juniper Networks Inc. (c) | 91 | 2,424 | ||||
| Keyence Corp. | 12 | 2,413 | ||||
| Maxim Integrated Products Inc. | 126 | 2,566 | ||||
| Oracle Corp. | 71 | 1,745 | ||||
| Oracle Corp. Japan | 22 | 917 | ||||
| SAP AG | 49 | 2,325 | ||||
| Visa Inc. - Class A (e) | 37 | 3,193 | ||||
| Other Securities | 24,260 | |||||
| 43,439 | ||||||
| MATERIALS - 8.7% | ||||||
| Anglo American Plc (c) | 63 | 2,758 | ||||
| Inmet Mining Corp. | 41 | 2,494 | ||||
| Rio Tinto Plc | 54 | 2,955 | ||||
| Xstrata Plc (c) | 160 | 2,901 | ||||
| Other Securities | 17,961 | |||||
| 29,069 | ||||||
| TELECOMMUNICATION SERVICES - 6.5% | ||||||
| American Tower Corp. (c) | 158 | 6,827 | ||||
| France Telecom SA | 97 | 2,433 | ||||
| Koninklijke KPN NV | 160 | 2,709 | ||||
| Other Securities | 9,509 | |||||
| 21,478 | ||||||
| UTILITIES - 2.4% | ||||||
| Other Securities | 8,028 | |||||
| Total Common Stocks (cost $280,551) | 315,739 | |||||
| NON-U.S. GOVERNMENT AGENCY | ||||||
| ASSET-BACKED SECURITIES - 0.0% | ||||||
| Other Securities | 34 | |||||
| Total Non-U.S. Government Agency | ||||||
| Asset-Backed Securities (cost $810) | 34 | |||||
| CORPORATE BONDS AND NOTES - 0.1% | ||||||
| ENERGY - 0.1% | ||||||
| Other Securities | 299 | |||||
| Total Corporate Bonds and Notes (cost $153) | 299 | |||||
| SHORT TERM INVESTMENTS - 10.2% | ||||||
| Mutual Funds - 5.5% | ||||||
| JNL Money Market Fund, 0.07% (a) (h) | 18,355 | 18,355 | ||||
| Securities Lending Collateral - 4.7% | ||||||
| Securities Lending Cash Collateral Fund LLC, | ||||||
| 0.16% (a) (h) | 8,015 | 8,015 | ||||
| Securities Lending Liquidating Fund LLC, 0.36% (a) (h) | 7,677 | 7,661 | ||||
| 15,676 | ||||||
| Total Short Term Investments (cost $34,047) | 34,031 | |||||
| Total Investments - 105.2% (cost $315,561) | 350,103 | |||||
| Other Assets and Liabilities, Net - (5.2%) | (17,197) | |||||
| Total Net Assets - 100% | $ | 332,906 | ||||
| JNL/Capital Guardian International | ||||||
| Small Cap Fund * (y) | ||||||
| COMMON STOCKS - 90.2% | ||||||
| CONSUMER DISCRETIONARY - 14.2% | ||||||
| ABC-Mart Inc. | 52 | $ | 1,452 | |||
| DSG International Plc (c) | 1,638 | 965 | ||||
| Hyundai Department Store Co. Ltd. | 18 | 1,780 | ||||
| Inchcape Plc (c) | 2,187 | 1,054 | ||||
| JB Hi-Fi Ltd. | 58 | 1,173 | ||||
| Yell Group Plc (c) (e) (t) (u) | 1,568 | 995 | ||||
| Other Securities | 13,001 | |||||
| 20,420 | ||||||
| CONSUMER STAPLES - 10.2% | ||||||
| C&C Group Plc | 617 | 2,665 | ||||
| Davide Campari-Milano SpA | 313 | 3,281 | ||||
| Hite Brewery Co. Ltd. | 7 | 1,016 | ||||
| MARR SpA (e) | 147 | 1,259 | ||||
| Olam International Ltd. (e) (t) (u) | 511 | 961 | ||||
| Pigeon Corp. (e) | 33 | 1,297 | ||||
| Sundrug Co. Ltd. | 66 | 1,462 | ||||
| Other Securities | 2,838 | |||||
| 14,779 | ||||||
| ENERGY - 1.2% | ||||||
| Other Securities | 1,714 | |||||
| FINANCIALS - 12.4% | ||||||
| Bolsas y Mercados Espanoles SA (e) | 33 | 1,050 | ||||
| CapitaCommercial Trust (t) (u) | 1,264 | 1,047 | ||||
| Industrial Alliance Insurance & Financial Services Inc. | 39 | 1,189 | ||||
| Korean Reinsurance Co. | 190 | 1,604 | ||||
| Laurentian Bank of Canada | 42 | 1,696 | ||||
| Paragon Group Companies Plc | 485 | 1,026 | ||||
| Sumitomo Real Estate Sales Co. Ltd. | 32 | 1,340 | ||||
| Other Securities | 8,868 | |||||
| 17,820 | ||||||
| HEALTH CARE - 5.8% | ||||||
| Hogy Medical Co. Ltd. | 34 | 1,672 | ||||
| MANI Inc. | 16 | 945 | ||||
| Sysmex Corp. | 61 | 3,196 | ||||
| Other Securities | 2,586 | |||||
| 8,399 | ||||||
| INDUSTRIALS - 20.3% | ||||||
| Aecon Group Inc. | 115 | 1,638 | ||||
| Andritz AG | 19 | 1,119 | ||||
| Chiyoda Corp. (e) | 160 | 1,236 | ||||
| Cosel Co. Ltd. | 79 | 949 | ||||
| Kintetsu World Express Inc. | 39 | 1,011 | ||||
| MISUMI Group Inc. (e) | 99 | 1,699 | ||||
| Miura Co. Ltd. (e) | 91 | 2,312 | ||||
| S1 Corp. | 25 | 1,042 | ||||
| Seek Ltd. | 783 | 4,842 | ||||
| SMA Solar Technology SA | 11 | 1,498 | ||||
| Other Securities | 11,891 | |||||
| 29,237 | ||||||
| INFORMATION TECHNOLOGY - 11.5% | ||||||
| Dai-ichi Seiko Co. Ltd. | 27 | 1,152 | ||||
| Dialog Semiconductor Plc (c) (e) | 90 | 984 | ||||
| Hamamatsu Photonics KK (e) | 115 | 2,805 | ||||
| Kontron AG | 139 | 1,585 | ||||
| Wacom Co. Ltd. (e) | 1 | 2,500 | ||||
| Yamatake Corp. (e) | 77 | 1,715 | ||||
| Other Securities | 5,901 | |||||
| 16,642 | ||||||
| MATERIALS - 13.3% | ||||||
| Centerra Gold Inc. (c) | 58 | 593 | ||||
| Centerra Gold Inc. (c) (f) (u) | 71 | 728 | ||||
| China Shanshui Cement Group Ltd. | 1,309 | 950 | ||||
| Iluka Resources Ltd. (c) | 666 | 2,131 | ||||
| Inmet Mining Corp. | 18 | 1,113 | ||||
| Labrador Iron Ore Royalty Income Fund | 40 | 1,659 | ||||
| Minefinders Corp. (c) (e) | 160 | 1,657 | ||||
| Petropavlovsk Plc | 112 | 1,850 | ||||
| Platmin Ltd. (c) | 1,054 | 1,271 | ||||
| Uranium One Inc. (c) | 423 | 1,218 | ||||
| Other Securities | 5,984 | |||||
| 19,154 | ||||||
| TELECOMMUNICATION SERVICES - 0.8% | ||||||
| Freenet AG (c) | 82 | 1,108 | ||||
| UTILITIES - 0.5% | ||||||
| Other Securities | 773 | |||||
| Total Common Stocks (cost $122,102) | 130,046 | |||||
| PREFERRED STOCKS - 0.1% | ||||||
| HEALTH CARE - 0.1% | ||||||
| Other Securities | 181 | |||||
| Total Preferred Stocks (cost $244) | 181 | |||||
| INVESTMENT FUNDS - 0.9% | ||||||
| SPDR S&P International Small Cap ETF | 51 | 1,282 | ||||
| Total Investment Funds (cost $1,288) | 1,282 | |||||
| RIGHTS - 0.0% | ||||||
| Other Securities | 69 | |||||
| Total Rights (cost $0) | 69 | |||||
| WARRANTS - 0.1% | ||||||
| Minefinders Corp., 12/31/11 (c) | 19 | 110 | ||||
| Peter Hambro Mining Plc, 06/09/10 (c) | 10 | 19 | ||||
| Other Securities | 14 | |||||
| Total Warrants (cost $87) | 143 | |||||
| NON-U.S. GOVERNMENT AGENCY | ||||||
| ASSET-BACKED SECURITIES - 0.0% | ||||||
| Other Securities | 9 | |||||
| Total Non-U.S. Government Agency | ||||||
| Asset-Backed Securities (cost $212) | 9 | |||||
| CORPORATE BONDS AND NOTES - 0.1% | ||||||
| CONSUMER STAPLES - 0.1% | ||||||
| Olam International Ltd., 1.00%, 07/03/13 | 100 | 100 | ||||
| Total Corporate Bonds and Notes (cost $55) | 100 | |||||
| SHORT TERM INVESTMENTS - 16.6% | ||||||
| Mutual Funds - 9.1% | ||||||
| JNL Money Market Fund, 0.07% (a) (h) | 13,149 | 13,149 | ||||
| Securities Lending Collateral - 7.5% | ||||||
| Securities Lending Cash Collateral Fund LLC, | ||||||
| 0.16% (a) (h) | 8,483 | 8,483 | ||||
| Securities Lending Liquidating Fund LLC, 0.36% (a) (h) | 2,271 | 2,266 | ||||
| 10,749 | ||||||
| Total Short Term Investments (cost $23,903) | 23,898 | |||||
| Total Investments - 108.0% (cost $147,891) | 155,728 | |||||
| Other Assets and Liabilities, Net - (8.0%) | (11,506) | |||||
| Total Net Assets - 100% | $ | 144,222 | ||||
| JNL/Capital Guardian U.S. Growth | ||||||
| Equity Fund | ||||||
| COMMON STOCKS - 94.0% | ||||||
| CONSUMER DISCRETIONARY - 10.7% | ||||||
| Coach Inc. | 181 | $ | 6,608 | |||
| Lowe's Cos. Inc. | 343 | 8,030 | ||||
| Omnicom Group Inc. | 70 | 2,733 | ||||
| Scripps Networks Interactive Inc. | 79 | 3,266 | ||||
| Strayer Education Inc. (e) | 30 | 6,375 | ||||
| Target Corp. | 319 | 15,415 | ||||
| Time Warner Cable Inc. (e) | 79 | 3,286 | ||||
| Time Warner Inc. | 67 | 1,956 | ||||
| Urban Outfitters Inc. (c) (e) | 65 | 2,271 | ||||
| Viacom Inc. - Class B (c) | 319 | 9,487 | ||||
| 59,427 | ||||||
| CONSUMER STAPLES - 10.1% | ||||||
| Alberto-Culver Co. | 90 | 2,627 | ||||
| Avon Products Inc. | 115 | 3,607 | ||||
| Colgate-Palmolive Co. | 43 | 3,565 | ||||
| Costco Wholesale Corp. | 106 | 6,272 | ||||
| Energizer Holdings Inc. (c) | 29 | 1,759 | ||||
| PepsiCo Inc. | 276 | 16,805 | ||||
| Philip Morris International Inc. | 151 | 7,262 | ||||
| Procter & Gamble Co. | 76 | 4,614 | ||||
| Wal-Mart Stores Inc. | 184 | 9,819 | ||||
| 56,330 | ||||||
| ENERGY - 4.5% | ||||||
| Baker Hughes Inc. (e) | 25 | 1,000 | ||||
| Diamond Offshore Drilling Inc. | 14 | 1,358 | ||||
| EOG Resources Inc. | 21 | 2,053 | ||||
| Marathon Oil Corp. | 61 | 1,914 | ||||
| Schlumberger Ltd. | 211 | 13,708 | ||||
| Transocean Ltd. (c) | 39 | 3,254 | ||||
| Weatherford International Ltd. (c) | 89 | 1,596 | ||||
| 24,883 | ||||||
| FINANCIALS - 7.8% | ||||||
| Berkshire Hathaway Inc. - Class A (c) | - | 2,282 | ||||
| Charles Schwab Corp. | 384 | 7,225 | ||||
| CME Group Inc. | 4 | 1,344 | ||||
| Goldman Sachs Group Inc. | 89 | 14,993 | ||||
| Hudson City Bancorp Inc. (e) | 179 | 2,459 | ||||
| JPMorgan Chase & Co. | 189 | 7,859 | ||||
| Progressive Corp. (c) | 285 | 5,120 | ||||
| RenaissanceRe Holdings Ltd. | 34 | 1,807 | ||||
| 43,089 | ||||||
| HEALTH CARE - 18.3% | ||||||
| Aetna Inc. | 100 | 3,154 | ||||
| Allergan Inc. | 90 | 5,684 | ||||
| Baxter International Inc. | 231 | 13,567 | ||||
| Celgene Corp. (c) | 277 | 15,434 | ||||
| Cerner Corp. (c) (e) | 283 | 23,297 | ||||
| DaVita Inc. (c) | 184 | 10,802 | ||||
| Medtronic Inc. | 201 | 8,858 | ||||
| Merck & Co. Inc. | 56 | 2,039 | ||||
| Shire Plc - ADR (e) | 160 | 9,398 | ||||
| Teva Pharmaceutical Industries Ltd. - ADR | 90 | 5,062 | ||||
| UnitedHealth Group Inc. | 140 | 4,252 | ||||
| 101,547 | ||||||
| INDUSTRIALS - 7.6% | ||||||
| Cummins Inc. | 27 | 1,224 | ||||
| Danaher Corp. (e) | 70 | 5,287 | ||||
| Emerson Electric Co. | 57 | 2,407 | ||||
| FedEx Corp. (e) | 71 | 5,892 | ||||
| First Solar Inc. (c) (e) | 89 | 12,078 | ||||
| Illinois Tool Works Inc. | 105 | 5,015 | ||||
| Iron Mountain Inc. (c) | 122 | 2,777 | ||||
| Jacobs Engineering Group Inc. (c) | 39 | 1,448 | ||||
| Monster Worldwide Inc. (c) (e) | 132 | 2,293 | ||||
| WW Grainger Inc. (e) | 36 | 3,525 | ||||
| 41,946 | ||||||
| INFORMATION TECHNOLOGY - 26.8% | ||||||
| Adobe Systems Inc. (c) | 250 | 9,199 | ||||
| Apple Inc. (c) | 71 | 15,055 | ||||
| Broadcom Corp. - Class A (c) | 218 | 6,856 | ||||
| Cisco Systems Inc. (c) | 561 | 13,418 | ||||
| eBay Inc. (c) | 87 | 2,053 | ||||
| Google Inc. - Class A (c) | 39 | 24,426 | ||||
| International Business Machines Corp. | 23 | 3,024 | ||||
| Jabil Circuit Inc. | 86 | 1,494 | ||||
| Juniper Networks Inc. (c) (e) | 408 | 10,884 | ||||
| Maxim Integrated Products Inc. (e) | 133 | 2,708 | ||||
| NetApp Inc. (c) | 121 | 4,154 | ||||
| Nintendo Co. Ltd. - ADR | 121 | 3,605 | ||||
| Oracle Corp. | 376 | 9,227 | ||||
| Paychex Inc. (e) | 209 | 6,413 | ||||
| QUALCOMM Inc. | 383 | 17,699 | ||||
| Research In Motion Ltd. (c) | 89 | 6,031 | ||||
| Visa Inc. - Class A | 125 | 10,906 | ||||
| Yahoo! Inc. (c) | 96 | 1,614 | ||||
| 148,766 | ||||||
| MATERIALS - 6.3% | ||||||
| Allegheny Technologies Inc. (e) | 214 | 9,572 | ||||
| Cliffs Natural Resources Inc. | 84 | 3,876 | ||||
| Ecolab Inc. | 62 | 2,765 | ||||
| Monsanto Co. | 130 | 10,636 | ||||
| Vulcan Materials Co. (e) | 159 | 8,348 | ||||
| 35,197 | ||||||
| TELECOMMUNICATION SERVICES - 1.9% | ||||||
| American Tower Corp. (c) | 250 | 10,807 | ||||
| Total Common Stocks (cost $458,039) | 521,992 | |||||
| INVESTMENT FUNDS - 3.6% | ||||||
| iShares Russell 1000 Growth Fund | 400 | 19,940 | ||||
| Total Investment Funds (cost $19,690) | 19,940 | |||||
| NON-U.S. GOVERNMENT AGENCY | ||||||
| ASSET-BACKED SECURITIES - 0.0% | ||||||
| Sigma Finance, Inc. (d) (f) (u) | $ | 1051 | 45 | |||
| Total Non-U.S. Government Agency | ||||||
| Asset-Backed Securities (cost $1,051) | 45 | |||||
| SHORT TERM INVESTMENTS - 13.0% | ||||||
| Mutual Funds - 2.7% | ||||||
| JNL Money Market Fund, 0.07% (a) (h) | 14,662 | 14,662 | ||||
| Securities Lending Collateral - 10.3% | ||||||
| Securities Lending Cash Collateral Fund LLC, | ||||||
| 0.16% (a) (h) | 42,739 | 42,739 | ||||
| Securities Lending Liquidating Fund LLC, 0.36% (a) (h) | 14,570 | 14,539 | ||||
| 57,278 | ||||||
| Total Short Term Investments (cost $71,971) | 71,940 | |||||
| Total Investments - 110.6% (cost $550,751) | 613,917 | |||||
| Other Assets and Liabilities, Net - (10.6%) | (58,629) | |||||
| Total Net Assets - 100% | $ | 555,288 | ||||
| JNL/Credit Suisse Commodity | ||||||
| Securities Fund * (y) | ||||||
| COMMON STOCKS - 46.1% | ||||||
| ENERGY - 10.6% | ||||||
| BP Plc | 716 | $ | 6,937 | |||
| Chevron Corp. | 76 | 5,840 | ||||
| ConocoPhillips | 41 | 2,088 | ||||
| Exxon Mobil Corp. | 180 | 12,271 | ||||
| Occidental Petroleum Corp. | 29 | 2,386 | ||||
| Petroleo Brasileiro SA - Petrobras - ADR | 76 | 3,610 | ||||
| Royal Dutch Shell Plc - Class B | 135 | 3,955 | ||||
| Suncor Energy Inc. | 57 | 2,013 | ||||
| Total SA | 79 | 5,129 | ||||
| Other Securities | 23,536 | |||||
| 67,765 | ||||||
| MATERIALS - 35.5% | ||||||
| AK Steel Holding Corp. | 126 | 2,692 | ||||
| Alcoa Inc. | 143 | 2,300 | ||||
| Allegheny Technologies Inc. (e) | 62 | 2,767 | ||||
| Anglo American Plc (c) | 226 | 9,916 | ||||
| ArcelorMittal (e) | 153 | 7,045 | ||||
| Barrick Gold Corp. | 168 | 6,620 | ||||
| BASF SE | 50 | 3,133 | ||||
| BHP Billiton Plc | 1,034 | 33,321 | ||||
| Cliffs Natural Resources Inc. | 93 | 4,282 | ||||
| Freeport-McMoRan Copper & Gold Inc. | 73 | 5,872 | ||||
| Goldcorp Inc. | 132 | 5,203 | ||||
| International Paper Co. | 331 | 8,876 | ||||
| JFE Holdings Inc. | 107 | 4,215 | ||||
| MeadWestvaco Corp. | 103 | 2,942 | ||||
| Newcrest Mining Ltd. | 116 | 3,674 | ||||
| Newmont Mining Corp. | 75 | 3,547 | ||||
| Nippon Steel Corp. | 959 | 3,888 | ||||
| Nucor Corp. | 106 | 4,952 | ||||
| OJI Paper Co. Ltd. | 848 | 3,556 | ||||
| Rio Tinto Ltd. (e) | 78 | 5,221 | ||||
| Rio Tinto Plc | 240 | 13,163 | ||||
| Salzgitter AG | 30 | 2,971 | ||||
| Sino-Forest Corp. (c) | 148 | 2,738 | ||||
| Stora Enso Oyj - Class R (c) (e) | 416 | 2,915 | ||||
| Sumitomo Metal Industries Ltd. | 605 | 1,627 | ||||
| Sumitomo Metal Mining Co. Ltd. | 77 | 1,137 | ||||
| Svenska Cellulosa AB | 532 | 7,113 | ||||
| Teck Cominco Ltd. (c) | 85 | 2,971 | ||||
| United States Steel Corp. (e) | 126 | 6,954 | ||||
| UPM-Kymmene Oyj | 461 | 5,508 | ||||
| Vale SA - ADR (e) | 288 | 8,352 | ||||
| Weyerhaeuser Co. | 182 | 7,838 | ||||
| Xstrata Plc (c) | 269 | 4,867 | ||||
| Other Securities | 35,661 | |||||
| 227,837 | ||||||
| Total Common Stocks (cost $256,066) | 295,602 | |||||
| INVESTMENT FUNDS - 3.3% | ||||||
| Energy Select Sector SPDR Fund (e) | 91 | 5,211 | ||||
| Materials Select Sector SPDR Fund (e) | 491 | 16,193 | ||||
| Total Investment Funds (cost $21,006) | 21,404 | |||||
| RIGHTS - 0.0% | ||||||
| Other Securities | 5 | |||||
| Total Rights (cost $0) | 5 | |||||
| NON-U.S. GOVERNMENT AGENCY | ||||||
| ASSET-BACKED SECURITIES - 0.0% | ||||||
| Other Securities | 13 | |||||
| Total Non-U.S. Government Agency | ||||||
| Asset-Backed Securities (cost $317) | 13 | |||||
| CORPORATE BONDS AND NOTES - 12.9% | ||||||
| FINANCIALS - 12.9% | ||||||
| BNP Paribas Commodity Linked Note | ||||||
| 0.15%, 11/26/10 (f) (t) (v) | $ | 5,000 | 6,594 | |||
| 0.01%, 01/13/11 (f) (t) (v) | 14,000 | 19,365 | ||||
| Eksportfinans ASA Commodity Linked Note, | ||||||
| 0.03%, 11/15/10 (f) | 20,000 | 27,408 | ||||
| Societe Generale Commodity Linked Note | ||||||
| 0.46%, 07/12/10 (f) (t) (v) | 13,000 | 16,085 | ||||
| 0.23%, 01/06/11 (f) | 10,000 | 13,617 | ||||
| Total Corporate Bonds and Notes (cost $62,000) | 83,069 | |||||
| GOVERNMENT AND AGENCY OBLIGATIONS - 20.5% | ||||||
| GOVERNMENT SECURITIES - 6.0% | ||||||
| Sovereign - 6.0% | ||||||
| Svensk Exportkredit AB Commodity Linked Note | ||||||
| 0.01%, 07/19/10 (f) (i) | 20,000 | 25,408 | ||||
| 0.01%, 03/02/11 (f) | 12,000 | 13,287 | ||||
| 38,695 | ||||||
| U.S. GOVERNMENT AGENCY | ||||||
| MORTGAGE-BACKED SECURITIES - 14.5% | ||||||
| Federal Farm Credit Bank - 2.0% | ||||||
| Federal Farm Credit Bank | ||||||
| 0.28%, 06/22/11 (i) | 3,000 | 3,002 | ||||
| 0.53%, 01/13/12 (i) | 9,500 | 9,554 | ||||
| 12,556 | ||||||
| Federal Home Loan Bank - 6.8% | ||||||
| Federal Home Loan Bank | ||||||
| 0.52%, 06/01/10 | 5,000 | 5,008 | ||||
| 0.16%, 01/14/11 (i) | 15,000 | 14,992 | ||||
| 0.85%, 01/20/11 | 5,000 | 5,012 | ||||
| 0.95%, 02/03/11 | 5,000 | 5,016 | ||||
| 1.00%, 02/07/11 | 3,000 | 3,007 | ||||
| 1.00%, 02/28/11 | 3,000 | 3,010 | ||||
| 0.75%, 03/25/11 | 7,500 | 7,495 | ||||
| 43,540 | ||||||
| Federal Home Loan Mortgage Corp. - 5.7% | ||||||
| Federal Home Loan Mortgage Corp. | ||||||
| 1.93%, 02/11/10 | 7,000 | 7,011 | ||||
| 0.33%, 01/28/11 (i) | 6,858 | 6,867 | ||||
| 0.33%, 03/09/11 (i) | 10,000 | 10,016 | ||||
| 0.31%, 04/01/11 (i) | 10,000 | 10,014 | ||||
| 0.30%, 04/07/11 (i) | 2,500 | 2,503 | ||||
| 36,411 | ||||||
| Total Government and Agency Obligations (cost $124,543) | 131,202 | |||||
| SHORT TERM INVESTMENTS - 25.1% | ||||||
| Federal Home Loan Bank - 0.5% | ||||||
| Federal Home Loan Bank | ||||||
| 0.36%, 01/21/10 | 1,000 | 1,000 | ||||
| 0.18%, 02/16/10 | 2,000 | 2,000 | ||||
| 3,000 | ||||||
| Federal Home Loan Mortgage Corp. - 9.5% | ||||||
| Federal Home Loan Mortgage Corp. | ||||||
| 0.24%, 01/25/10 | 1,500 | 1,500 | ||||
| 0.13%, 01/28/10 | 29,000 | 29,000 | ||||
| 0.12%, 02/02/10 | 10,000 | 9,999 | ||||
| 0.13%, 02/16/10 | 4,000 | 4,000 | ||||
| 0.26%, 04/27/10 | 6,000 | 5,998 | ||||
| 0.22%, 06/14/10 | 10,000 | 9,993 | ||||
| 60,490 | ||||||
| Federal National Mortgage Association - 2.3% | ||||||
| Federal National Mortgage Association, | ||||||
| 0.12%, 02/10/10 | 15,000 | 14,999 | ||||
| Mutual Funds - 1.5% | ||||||
| JNL Money Market Fund, 0.07% (a) (h) | 9,840 | 9,840 | ||||
| Securities Lending Collateral - 7.8% | ||||||
| Securities Lending Cash Collateral Fund LLC, | ||||||
| 0.16% (a) (h) | 43,895 | 43,895 | ||||
| Securities Lending Liquidating Fund LLC, 0.36% (a) (h) | 6,032 | 6,019 | ||||
| 49,914 | ||||||
| U.S. Treasury Securities - 3.5% | ||||||
| U.S. Treasury Bill | ||||||
| 0.16%, 04/15/10 (e) | $ | 10,000 | 9,998 | |||
| 0.16%, 04/22/10 (e) | 10,000 | 9,998 | ||||
| 0.35%, 07/15/10 (e) | 2,500 | 2,497 | ||||
| 22,493 | ||||||
| Total Short Term Investments (cost $160,730) | 160,736 | |||||
| Total Investments - 107.9% (cost $624,662) | 692,031 | |||||
| Other Assets and Liabilities, Net - (7.9%) | (50,385) | |||||
| Total Net Assets - 100% | $ | 641,646 | ||||
| JNL/Credit Suisse Long/Short Fund * (y) | ||||||
| COMMON STOCKS - 126.3% | ||||||
| CONSUMER DISCRETIONARY - 18.7% | ||||||
| Big Lots Inc. (c) (n) | 37 | $ | 1,068 | |||
| Darden Restaurants Inc. (n) | 45 | 1,562 | ||||
| Kohl’s Corp. (c) (n) | 29 | 1,559 | ||||
| Leggett & Platt Inc. (n) | 62 | 1,258 | ||||
| Nike Inc. - Class B | 20 | 1,312 | ||||
| Ross Stores Inc. (n) | 21 | 880 | ||||
| Starbucks Corp. (c) | 72 | 1,649 | ||||
| Time Warner Inc. (n) | 95 | 2,770 | ||||
| Other Securities | 4,899 | |||||
| 16,957 | ||||||
| CONSUMER STAPLES - 10.5% | ||||||
| Colgate-Palmolive Co. (n) | 21 | 1,717 | ||||
| Estee Lauder Cos. Inc. (n) | 29 | 1,417 | ||||
| PepsiCo Inc. (n) | 44 | 2,650 | ||||
| Other Securities | 3,676 | |||||
| 9,460 | ||||||
| ENERGY - 9.2% | ||||||
| Apache Corp. (n) | 29 | 2,991 | ||||
| ConocoPhillips (n) | 21 | 1,057 | ||||
| Exxon Mobil Corp. | 29 | 1,984 | ||||
| Schlumberger Ltd. (n) | 19 | 1,224 | ||||
| Other Securities | 1,077 | |||||
| 8,333 | ||||||
| FINANCIALS - 17.9% | ||||||
| Capital One Financial Corp. (n) | 23 | 897 | ||||
| Goldman Sachs Group Inc. (n) | 16 | 2,735 | ||||
| JPMorgan Chase & Co. (n) | 102 | 4,241 | ||||
| Public Storage (n) | 23 | 1,897 | ||||
| State Street Corp. (n) | 24 | 1,062 | ||||
| Travelers Cos. Inc. | 32 | 1,596 | ||||
| U.S. Bancorp (n) | 44 | 979 | ||||
| Other Securities | 2,744 | |||||
| 16,151 | ||||||
| HEALTH CARE - 14.6% | ||||||
| Aetna Inc. (n) | 37 | 1,176 | ||||
| Amgen Inc. (c) (n) | 46 | 2,580 | ||||
| Humana Inc. (c) (n) | 60 | 2,651 | ||||
| Medtronic Inc. (n) | 31 | 1,358 | ||||
| Mylan Inc. (c) (n) | 70 | 1,286 | ||||
| Waters Corp. (c) | 27 | 1,645 | ||||
| Other Securities | 2,480 | |||||
| 13,176 | ||||||
| INDUSTRIALS - 11.5% | ||||||
| Fluor Corp. (n) | 31 | 1,401 | ||||
| ITT Corp. (n) | 32 | 1,612 | ||||
| Lockheed Martin Corp. (n) | 11 | 821 | ||||
| Raytheon Co. | 44 | 2,261 | ||||
| United Parcel Service Inc. - Class B | 23 | 1,297 | ||||
| Other Securities | 3,015 | |||||
| 10,407 | ||||||
| INFORMATION TECHNOLOGY - 32.8% | ||||||
| Apple Inc. (c) (n) | 10 | 2,088 | ||||
| EMC Corp. (c) (n) | 102 | 1,778 | ||||
| Google Inc. - Class A (c) (n) | 4 | 2,232 | ||||
| Intel Corp. (n) | 111 | 2,266 | ||||
| International Business Machines Corp. (n) | 12 | 1,532 | ||||
| MasterCard Inc. (n) | 4 | 896 | ||||
| Micron Technology Inc. (c) (n) | 210 | 2,218 | ||||
| Microsoft Corp. (n) | 110 | 3,341 | ||||
| NetApp Inc. (c) (n) | 41 | 1,400 | ||||
| QUALCOMM Inc. (n) | 32 | 1,471 | ||||
| Texas Instruments Inc. (n) | 104 | 2,713 | ||||
| VeriSign Inc. (c) (n) | 60 | 1,442 | ||||
| Western Digital Corp. (c) | 43 | 1,909 | ||||
| Other Securities | 4,420 | |||||
| 29,706 | ||||||
| MATERIALS - 3.1% | ||||||
| Eastman Chemical Co. (n) | 29 | 1,761 | ||||
| Other Securities | 1,077 | |||||
| 2,838 | ||||||
| TELECOMMUNICATION SERVICES - 2.0% | ||||||
| AT&T Inc. (n) | 60 | 1,690 | ||||
| Other Securities | 156 | |||||
| 1,846 | ||||||
| UTILITIES - 6.0% | ||||||
| Exelon Corp. (n) | 31 | 1,515 | ||||
| Public Service Enterprise Group Inc. (n) | 85 | 2,820 | ||||
| Other Securities | 1,072 | |||||
| 5,407 | ||||||
| Total Common Stocks (cost $109,026) | 114,281 | |||||
| SHORT TERM INVESTMENTS - 5.2% | ||||||
| Mutual Funds - 5.2% | ||||||
| JNL Money Market Fund, 0.07% (a) (h) | 4,692 | 4,692 | ||||
| Total Short Term Investments (cost $4,692) | 4,692 | |||||
| Total Investments - 131.5% (cost $113,718) | 118,973 | |||||
| Total Securities Sold Short - (31.7%) | ||||||
| (proceeds $27,298) | (28,666) | |||||
| Other Assets and Liabilities, Net - 0.2% | 146 | |||||
| Total Net Assets - 100% | $ | 90,453 | ||||
| Securities Sold Short | ||||||
| COMMON STOCKS – 31.7% | ||||||
| CONSUMER DISCRETIONARY - 4.4% | ||||||
| Lowe’s Cos. Inc. | 5 | $ | 115 | |||
| McDonald’s Corp. | 3 | 194 | ||||
| News Corp. - Class A | 7 | 92 | ||||
| Other Securities | 3,524 | |||||
| 3,925 | ||||||
| CONSUMER STAPLES - 2.7% | ||||||
| Altria Group Inc. | 6 | 126 | ||||
| Coca-Cola Co. | 2 | 137 | ||||
| Coca-Cola Enterprises Inc. | 3 | 57 | ||||
| CVS Caremark Corp. | 4 | 142 | ||||
| Kraft Foods Inc. - Class A | 4 | 117 | ||||
| Philip Morris International Inc. | 5 | 226 | ||||
| Wal-Mart Stores Inc. | 6 | 300 | ||||
| Other Securities | 1,338 | |||||
| 2,443 | ||||||
| ENERGY - 3.0% | ||||||
| Anadarko Petroleum Corp. | 2 | 112 | ||||
| Devon Energy Corp. | 2 | 110 | ||||
| EOG Resources Inc. | 1 | 97 | ||||
| Halliburton Co. | 3 | 96 | ||||
| Marathon Oil Corp. | 3 | 91 | ||||
| Occidental Petroleum Corp. | 2 | 187 | ||||
| Other Securities | 2,060 | |||||
| 2,753 | ||||||
| FINANCIALS - 4.5% | ||||||
| AFLAC Inc. | 2 | 93 | ||||
| CME Group Inc. | - | 101 | ||||
| MetLife Inc. | 3 | 110 | ||||
| Morgan Stanley | 5 | 133 | ||||
| PNC Financial Services Group Inc. | 2 | 95 | ||||
| Prudential Financial Inc. | 2 | 95 | ||||
| Simon Property Group Inc. | 1 | 112 | ||||
| Other Securities | 3,290 | |||||
| 4,029 | ||||||
| HEALTH CARE - 3.0% | ||||||
| Abbott Laboratories | 3 | 184 | ||||
| Eli Lilly & Co. | 3 | 121 | ||||
| Express Scripts Inc. | 1 | 86 | ||||
| Medco Health Solutions Inc. | 2 | 102 | ||||
| Thermo Fisher Scientific Inc. | 2 | 86 | ||||
| Other Securities | 2,104 | |||||
| 2,683 | ||||||
| INDUSTRIALS - 4.7% | ||||||
| 3M Co. | 2 | 165 | ||||
| Boeing Co. | 2 | 130 | ||||
| Burlington Northern Santa Fe Corp. | 1 | 99 | ||||
| Caterpillar Inc. | 2 | 120 | ||||
| Deere & Co. | 2 | 92 | ||||
| General Dynamics Corp. | 2 | 102 | ||||
| Honeywell International Inc. | 3 | 110 | ||||
| Union Pacific Corp. | 2 | 115 | ||||
| United Technologies Corp. | 3 | 187 | ||||
| Other Securities | 3,124 | |||||
| 4,244 | ||||||
| INFORMATION TECHNOLOGY - 4.2% | ||||||
| Automatic Data Processing Inc. | 2 | 90 | ||||
| Corning Inc. | 6 | 106 | ||||
| Dell Inc. | 6 | 90 | ||||
| eBay Inc. | 4 | 101 | ||||
| Hewlett-Packard Co. | 4 | 221 | ||||
| Other Securities | 3,186 | |||||
| 3,794 | ||||||
| MATERIALS - 2.5% | ||||||
| Dow Chemical Co. | 4 | 116 | ||||
| Freeport-McMoRan Copper & Gold Inc. | 2 | 120 | ||||
| Monsanto Co. | 1 | 90 | ||||
| Newmont Mining Corp. | 2 | 90 | ||||
| Praxair Inc. | 1 | 96 | ||||
| Other Securities | 1,789 | |||||
| 2,301 | ||||||
| TELECOMMUNICATION SERVICES - 0.5% | ||||||
| Verizon Communications Inc. | 7 | 244 | ||||
| Other Securities | 228 | |||||
| 472 | ||||||
| UTILITIES - 2.2% | ||||||
| Dominion Resources Inc. | 2 | 86 | ||||
| Duke Energy Corp. | 5 | 88 | ||||
| Southern Co. | 3 | 100 | ||||
| Other Securities | 1,748 | |||||
| 2,022 | ||||||
| Total Securities Sold Short - 31.7% | ||||||
| (proceeds $27,298) | $ | 28,666 | ||||
| JNL/Eagle Core Equity Fund | ||||||
| COMMON STOCKS - 91.1% | ||||||
| CONSUMER DISCRETIONARY - 15.3% | ||||||
| Comcast Corp. - Class A | 64 | $ | 1,078 | |||
| Home Depot Inc. | 49 | 1,411 | ||||
| Macy's Inc. | 114 | 1,917 | ||||
| Omnicom Group Inc. (e) | 67 | 2,610 | ||||
| Staples Inc. | 148 | 3,639 | ||||
| Viacom Inc. - Class B (c) | 75 | 2,220 | ||||
| 12,875 | ||||||
| CONSUMER STAPLES - 2.0% | ||||||
| Wal-Mart Stores Inc. | 32 | 1,684 | ||||
| ENERGY - 12.2% | ||||||
| BP Plc - ADR | 42 | 2,459 | ||||
| ConocoPhillips | 49 | 2,489 | ||||
| EOG Resources Inc. | 21 | 2,042 | ||||
| Exxon Mobil Corp. | 20 | 1,371 | ||||
| Schlumberger Ltd. | 30 | 1,950 | ||||
| 10,311 | ||||||
| FINANCIALS - 13.3% | ||||||
| Bank of America Corp. | 207 | 3,120 | ||||
| Goldman Sachs Group Inc. | 12 | 2,088 | ||||
| JPMorgan Chase & Co. | 39 | 1,645 | ||||
| MetLife Inc. | 35 | 1,240 | ||||
| Wells Fargo & Co. | 116 | 3,142 | ||||
| 11,235 | ||||||
| HEALTH CARE - 16.5% | ||||||
| Covidien Plc | 33 | 1,563 | ||||
| Genzyme Corp. (c) | 18 | 897 | ||||
| Johnson & Johnson | 48 | 3,122 | ||||
| Pfizer Inc. | 177 | 3,218 | ||||
| UnitedHealth Group Inc. | 111 | 3,371 | ||||
| Zimmer Holdings Inc. (c) | 30 | 1,776 | ||||
| 13,947 | ||||||
| INDUSTRIALS - 8.7% | ||||||
| General Electric Co. | 104 | 1,575 | ||||
| PACCAR Inc. (e) | 46 | 1,655 | ||||
| Tyco International Ltd. | 78 | 2,769 | ||||
| United Technologies Corp. | 19 | 1,329 | ||||
| 7,328 | ||||||
| INFORMATION TECHNOLOGY - 21.4% | ||||||
| Activision Blizzard Inc. (c) | 105 | 1,162 | ||||
| Apple Inc. (c) | 9 | 1,987 | ||||
| Applied Materials Inc. | 225 | 3,140 | ||||
| Autodesk Inc. (c) | 71 | 1,811 | ||||
| Cisco Systems Inc. (c) | 58 | 1,397 | ||||
| Electronic Arts Inc. (c) | 110 | 1,953 | ||||
| EMC Corp. (c) | 98 | 1,715 | ||||
| Microsoft Corp. | 97 | 2,945 | ||||
| Nortel Networks Corp. (c) | 6 | - | ||||
| Texas Instruments Inc. | 74 | 1,933 | ||||
| 18,043 | ||||||
| TELECOMMUNICATION SERVICES - 1.7% | ||||||
| Sprint Nextel Corp. (c) | 378 | 1,383 | ||||
| Total Common Stocks (cost $73,371) | 76,806 | |||||
| INVESTMENT FUNDS - 3.0% | ||||||
| Materials Select Sector SPDR Fund | 76 | 2,519 | ||||
| Total Investment Funds (cost $2,541) | 2,519 | |||||
| NON-U.S. GOVERNMENT AGENCY | ||||||
| ASSET-BACKED SECURITIES - 0.0% | ||||||
| Sigma Finance, Inc. (d) (f) (u) | $ | 2 | - | |||
| Total Non-U.S. Government Agency | ||||||
| Asset-Backed Securities (cost $2) | - | |||||
| SHORT TERM INVESTMENTS - 8.3% | ||||||
| Mutual Funds - 5.6% | ||||||
| JNL Money Market Fund, 0.07% (a) (h) | 4,732 | 4,732 | ||||
| Securities Lending Collateral - 2.7% | ||||||
| Securities Lending Cash Collateral Fund LLC, | ||||||
| 0.16% (a) (h) | 2,257 | 2,257 | ||||
| Total Short Term Investments (cost $6,989) | 6,989 | |||||
| Total Investments - 102.4% (cost $82,903) | 86,314 | |||||
| Other Assets and Liabilities, Net - (2.4%) | (2,028) | |||||
| Total Net Assets - 100% | $ | 84,286 | ||||
| JNL/Eagle SmallCap Equity Fund | ||||||
| COMMON STOCKS - 100.0% | ||||||
| CONSUMER DISCRETIONARY - 16.3% | ||||||
| American Axle & Manufacturing Holdings Inc. (c) | 348 | $ | 2,792 | |||
| Bally Technologies Inc. (c) (e) | 156 | 6,444 | ||||
| BJ's Restaurants Inc. (c) | 258 | 4,847 | ||||
| Choice Hotels International Inc. | 42 | 1,329 | ||||
| Coinstar Inc. (c) (e) | 173 | 4,797 | ||||
| Genesco Inc. (c) | 270 | 7,420 | ||||
| Shuffle Master Inc. (c) | 446 | 3,678 | ||||
| Sotheby's - Class A (e) | 152 | 3,412 | ||||
| Steak n Shake Co. (c) | 5 | 1,675 | ||||
| Universal Electronics Inc. (c) | 265 | 6,146 | ||||
| Vitamin Shoppe Inc. (c) | 132 | 2,945 | ||||
| 45,485 | ||||||
| CONSUMER STAPLES - 0.9% | ||||||
| Herbalife Ltd. | 65 | 2,635 | ||||
| ENERGY - 6.0% | ||||||
| Lufkin Industries Inc. | 110 | 8,035 | ||||
| OYO Geospace Corp. (c) | 114 | 4,893 | ||||
| Whiting Petroleum Corp. (c) | 53 | 3,813 | ||||
| 16,741 | ||||||
| FINANCIALS - 6.5% | ||||||
| Broadpoint Gleacher Securities Inc. (c) (e) | 208 | 927 | ||||
| Cash America International Inc. (e) | 245 | 8,560 | ||||
| Duff & Phelps Corp. - Class A | 121 | 2,217 | ||||
| First Commonwealth Financial Corp. | 220 | 1,025 | ||||
| optionsXpress Holdings Inc. | 99 | 1,525 | ||||
| Redwood Trust Inc. | 156 | 2,249 | ||||
| UMB Financial Corp. | 43 | 1,700 | ||||
| 18,203 | ||||||
| HEALTH CARE - 23.0% | ||||||
| Addus HomeCare Corp. (c) | 65 | 598 | ||||
| Amedisys Inc. (c) (e) | 90 | 4,348 | ||||
| American Medical Systems Holdings Inc. (c) | 337 | 6,492 | ||||
| BioMarin Pharmaceutical Inc. (c) (e) | 232 | 4,369 | ||||
| Bio-Rad Laboratories Inc. - Class A (c) | 26 | 2,523 | ||||
| Centene Corp. (c) | 151 | 3,200 | ||||
| Cubist Pharmaceuticals Inc. (c) | 78 | 1,480 | ||||
| Cutera Inc. (c) | 174 | 1,479 | ||||
| Eclipsys Corp. (c) | 288 | 5,332 | ||||
| Genoptix Inc. (c) (e) | 120 | 4,256 | ||||
| Icon Plc - ADR (c) | 144 | 3,135 | ||||
| Lincare Holdings Inc. (c) (e) | 95 | 3,540 | ||||
| MedAssets Inc. (c) | 161 | 3,415 | ||||
| Onyx Pharmaceuticals Inc. (c) | 94 | 2,744 | ||||
| Psychiatric Solutions Inc. (c) | 120 | 2,537 | ||||
| Regeneron Pharmaceuticals Inc. (c) | 87 | 2,094 | ||||
| Seattle Genetics Inc. (c) | 140 | 1,423 | ||||
| SurModics Inc. (c) (e) | 47 | 1,057 | ||||
| Thoratec Corp. (c) (e) | 283 | 7,609 | ||||
| Vital Images Inc. (c) | 121 | 1,542 | ||||
| Vivus Inc. (c) (e) | 136 | 1,253 | ||||
| 64,426 | ||||||
| INDUSTRIALS - 15.1% | ||||||
| A123 Systems Inc. (c) (e) | 135 | 3,023 | ||||
| Genco Shipping & Trading Ltd. (c) (e) | 106 | 2,368 | ||||
| Geo Group Inc. (c) | 266 | 5,814 | ||||
| GrafTech International Ltd. (c) (e) | 251 | 3,898 | ||||
| Landstar System Inc. | 118 | 4,567 | ||||
| MasTec Inc. (c) | 175 | 2,182 | ||||
| Monster Worldwide Inc. (c) (e) | 179 | 3,116 | ||||
| Northwest Pipe Co. (c) | 122 | 3,276 | ||||
| Regal-Beloit Corp. | 92 | 4,770 | ||||
| Ritchie Bros. Auctioneers Inc. (e) | 206 | 4,611 | ||||
| Waste Connections Inc. (c) | 136 | 4,547 | ||||
| 42,172 | ||||||
| INFORMATION TECHNOLOGY - 26.9% | ||||||
| Ansys Inc. (c) (e) | 137 | 5,944 | ||||
| Coherent Inc. (c) | 173 | 5,140 | ||||
| Compellent Technologies Inc. (c) (e) | 236 | 5,362 | ||||
| DTS Inc. (c) | 186 | 6,352 | ||||
| EMS Technologies Inc. (c) | 242 | 3,503 | ||||
| FormFactor Inc. (c) | 229 | 4,988 | ||||
| Informatica Corp. (c) (e) | 213 | 5,507 | ||||
| Netezza Corp. (c) | 274 | 2,663 | ||||
| Novell Inc. (c) | 326 | 1,351 | ||||
| ON Semiconductor Corp. (c) | 609 | 5,369 | ||||
| Quality Systems Inc. | 65 | 4,104 | ||||
| Radiant Systems Inc. (c) | 107 | 1,112 | ||||
| Rovi Corp. (c) | 218 | 6,934 | ||||
| Teradyne Inc. (c) (e) | 407 | 4,365 | ||||
| TIBCO Software Inc. (c) (e) | 560 | 5,389 | ||||
| Varian Semiconductor Equipment Associates Inc. (c) (e) | 197 | 7,077 | ||||
| 75,160 | ||||||
| MATERIALS - 5.3% | ||||||
| Huntsman Corp. | 807 | 9,106 | ||||
| Terra Industries Inc. | 175 | 5,632 | ||||
| 14,738 | ||||||
| Total Common Stocks (cost $238,918) | 279,560 | |||||
| NON-U.S. GOVERNMENT AGENCY | ||||||
| ASSET-BACKED SECURITIES - 0.0% | ||||||
| Sigma Finance, Inc. (d) (f) (u) | $ | 1272 | 54 | |||
| Total Non-U.S. Government Agency | ||||||
| Asset-Backed Securities (cost $1,272) | 54 | |||||
| SHORT TERM INVESTMENTS - 17.1% | ||||||
| Mutual Funds - 1.4% | ||||||
| JNL Money Market Fund, 0.07% (a) (h) | 3,885 | 3,885 | ||||
| Securities Lending Collateral - 15.7% | ||||||
| Securities Lending Cash Collateral Fund LLC, | ||||||
| 0.16% (a) (h) | 29,593 | 29,593 | ||||
| Securities Lending Liquidating Fund LLC, 0.36% (a) (h) | 14,413 | 14,383 | ||||
| 43,976 | ||||||
| Total Short Term Investments (cost $47,891) | 47,861 | |||||
| Total Investments - 117.1% (cost $288,081) | 327,475 | |||||
| Other Assets and Liabilities, Net - (17.1%) | (47,779) | |||||
| Total Net Assets - 100% | $ | 279,696 | ||||
| JNL/Franklin Templeton Founding | ||||||
| Strategy Fund (b) | ||||||
| INVESTMENT FUNDS - 100.0% | ||||||
| JNL/Franklin Templeton Global Growth Fund (76.3%) (a) | 37,530 | $ | 286,731 | |||
| JNL/Franklin Templeton Income Fund (39.2%) (a) | 30,706 | 285,255 | ||||
| JNL/Franklin Templeton Mutual Shares Fund (63.0%) (a) | 35,062 | 266,825 | ||||
| 838,811 | ||||||
| Total Investment Funds (cost $986,907) | 838,811 | |||||
| Total Investments - 100.0% (cost $986,907) | 838,811 | |||||
| Other Assets and Liabilities, Net - 0.0% | (52) | |||||
| Total Net Assets - 100% | $ | 838,759 | ||||
| JNL/Franklin Templeton Global Growth Fund | ||||||
| COMMON STOCKS - 93.1% | ||||||
| CONSUMER DISCRETIONARY - 17.5% | ||||||
| Accor SA | 38 | $ | 2,104 | |||
| Bayerische Motoren Werke AG | 55 | 2,517 | ||||
| Chico's FAS Inc. (c) | 184 | 2,587 | ||||
| Comcast Corp. - Class A | 30 | 506 | ||||
| Comcast Corp. - Special Class A | 307 | 4,923 | ||||
| Compagnie Generale des Etablissements Michelin (e) | 31 | 2,355 | ||||
| Compass Group Plc | 141 | 1,013 | ||||
| Expedia Inc. (c) | 87 | 2,236 | ||||
| Harley-Davidson Inc. | 64 | 1,614 | ||||
| Home Depot Inc. | 44 | 1,281 | ||||
| Hyundai Motor Co. | 40 | 4,145 | ||||
| Inditex SA (e) | 31 | 1,916 | ||||
| Kingfisher Plc | 800 | 2,960 | ||||
| News Corp. - Class A | 473 | 6,475 | ||||
| Pearson Plc | 201 | 2,890 | ||||
| Reed Elsevier NV | 171 | 2,104 | ||||
| Target Corp. | 41 | 1,977 | ||||
| Time Warner Cable Inc. | 68 | 2,809 | ||||
| Time Warner Inc. | 114 | 3,316 | ||||
| Toyota Motor Corp. | 75 | 3,142 | ||||
| USS Co. Ltd. | 19 | 1,175 | ||||
| Viacom Inc. - Class B (c) | 92 | 2,750 | ||||
| Vivendi SA | 183 | 5,464 | ||||
| Walt Disney Co. | 110 | 3,549 | ||||
| 65,808 | ||||||
| CONSUMER STAPLES - 2.0% | ||||||
| CVS Caremark Corp. | 59 | 1,915 | ||||
| Nestle SA | 44 | 2,151 | ||||
| Premier Foods Plc | 1,966 | 1,133 | ||||
| Tesco Plc | 360 | 2,489 | ||||
| 7,688 | ||||||
| ENERGY - 8.9% | ||||||
| Aker Solutions ASA | 50 | 654 | ||||
| BG Group Plc | 109 | 1,969 | ||||
| BP Plc | 520 | 5,035 | ||||
| Chevron Corp. | 29 | 2,219 | ||||
| El Paso Corp. | 172 | 1,691 | ||||
| ENI SpA | 150 | 3,828 | ||||
| Gazprom OAO - ADR | 61 | 1,545 | ||||
| Halliburton Co. | 64 | 1,937 | ||||
| Royal Dutch Shell Plc - Class B | 184 | 5,388 | ||||
| SBM Offshore NV | 74 | 1,470 | ||||
| StatoilHydro ASA | 69 | 1,727 | ||||
| Total SA | 95 | 6,149 | ||||
| 33,612 | ||||||
| FINANCIALS - 12.4% | ||||||
| ACE Ltd. | 38 | 1,934 | ||||
| American Express Co. | 66 | 2,661 | ||||
| Aviva Plc | 675 | 4,338 | ||||
| AXA SA | 69 | 1,643 | ||||
| Bank of New York Mellon Corp. | 67 | 1,876 | ||||
| Cheung Kong Holdings Ltd. | 122 | 1,568 | ||||
| DBS Group Holdings Ltd. | 207 | 2,252 | ||||
| HSBC Holdings Plc | 288 | 3,278 | ||||
| ICICI Bank Ltd. - ADR | 39 | 1,474 | ||||
| ING Groep NV (c) | 300 | 2,973 | ||||
| Intesa Sanpaolo SpA (c) | 580 | 2,620 | ||||
| JPMorgan Chase & Co. | 27 | 1,140 | ||||
| KB Financial Group Inc. - ADR (c) | 44 | 2,261 | ||||
| Muenchener Rueckversicherungs AG (e) | 19 | 3,029 | ||||
| Progressive Corp. (c) | 162 | 2,919 | ||||
| RenaissanceRe Holdings Ltd. | 30 | 1,616 | ||||
| Standard Life Plc | 310 | 1,083 | ||||
| Swire Pacific Ltd. | 153 | 1,850 | ||||
| Swiss Reinsurance | 37 | 1,810 | ||||
| Torchmark Corp. | 30 | 1,318 | ||||
| UBS AG (c) | 66 | 1,029 | ||||
| UniCredit SpA (c) | 571 | 1,920 | ||||
| 46,592 | ||||||
| HEALTH CARE - 16.5% | ||||||
| Abbott Laboratories | 28 | 1,506 | ||||
| Amgen Inc. (c) | 147 | 8,324 | ||||
| Biogen Idec Inc. (c) | 18 | 974 | ||||
| Boston Scientific Corp. (c) | 173 | 1,558 | ||||
| Bristol-Myers Squibb Co. | 61 | 1,537 | ||||
| Covidien Plc | 111 | 5,331 | ||||
| GlaxoSmithKline Plc | 274 | 5,829 | ||||
| Lonza Group AG | 25 | 1,768 | ||||
| Medtronic Inc. | 49 | 2,137 | ||||
| Merck & Co. Inc. | 125 | 4,573 | ||||
| Merck KGaA | 21 | 1,916 | ||||
| Novartis AG | 91 | 4,958 | ||||
| Pfizer Inc. | 329 | 5,990 | ||||
| Quest Diagnostics Inc. (e) | 64 | 3,866 | ||||
| Roche Holding AG | 30 | 5,041 | ||||
| Sanofi-Aventis SA | 84 | 6,644 | ||||
| 61,952 | ||||||
| INDUSTRIALS - 10.2% | ||||||
| Adecco SA (e) | 38 | 2,088 | ||||
| BAE Systems Plc | 319 | 1,849 | ||||
| Brambles Ltd. | 263 | 1,597 | ||||
| Deutsche Post AG | 130 | 2,515 | ||||
| Empresa Brasileira de Aeronautica SA - ADR (e) | 41 | 904 | ||||
| FedEx Corp. | 48 | 4,007 | ||||
| General Electric Co. | 143 | 2,164 | ||||
| Koninklijke Philips Electronics NV | 88 | 2,607 | ||||
| Randstad Holding NV (c) | 49 | 2,478 | ||||
| Shanghai Electric Group Co. Ltd. (e) | 2,294 | 1,055 | ||||
| Siemens AG | 58 | 5,331 | ||||
| Tyco International Ltd. | 133 | 4,760 | ||||
| United Parcel Service Inc. - Class B | 75 | 4,286 | ||||
| Wolseley Plc (c) | 140 | 2,820 | ||||
| 38,461 | ||||||
| INFORMATION TECHNOLOGY - 16.6% | ||||||
| Accenture Plc | 215 | 8,937 | ||||
| Cisco Systems Inc. (c) | 184 | 4,397 | ||||
| Dell Inc. (c) | 131 | 1,874 | ||||
| Flextronics International Ltd. (c) | 254 | 1,857 | ||||
| FUJIFILM Holdings Corp. | 49 | 1,487 | ||||
| Konica Minolta Holdings Inc. | 118 | 1,211 | ||||
| Microsoft Corp. | 310 | 9,452 | ||||
| Nintendo Co. Ltd. | 3 | 693 | ||||
| Oracle Corp. | 368 | 9,031 | ||||
| Samsung Electronics Co. Ltd. - GDR | 17 | 5,974 | ||||
| Samsung Electronics Co. Ltd. - GDR (s) (u) | 2 | 833 | ||||
| SAP AG | 74 | 3,501 | ||||
| Seagate Technology Inc. | 195 | 3,543 | ||||
| Taiwan Semiconductor Manufacturing Co. Ltd. - ADR | 417 | 4,772 | ||||
| Telefonaktiebolaget LM Ericsson - Class B | 189 | 1,749 | ||||
| Tyco Electronics Ltd. | 117 | 2,882 | ||||
| 62,193 | ||||||
| MATERIALS - 2.0% | ||||||
| Alcoa Inc. | 142 | 2,289 | ||||
| CRH Plc | 82 | 2,244 | ||||
| Svenska Cellulosa AB | 112 | 1,493 | ||||
| Vale SA - ADR (e) | 58 | 1,434 | ||||
| 7,460 | ||||||
| TELECOMMUNICATION SERVICES - 7.0% | ||||||
| AT&T Inc. | 37 | 1,033 | ||||
| China Telecom Corp. Ltd. - ADR (e) | 15 | 627 | ||||
| France Telecom SA | 186 | 4,645 | ||||
| Singapore Telecommunications Ltd. | 2,125 | 4,684 | ||||
| Sprint Nextel Corp. (c) | 480 | 1,758 | ||||
| Telefonica SA | 123 | 3,447 | ||||
| Telekom Austria AG | 160 | 2,285 | ||||
| Turkcell Iletisim Hizmet AS - ADR | 98 | 1,705 | ||||
| Vodafone Group Plc | 2,547 | 5,910 | ||||
| 26,094 | ||||||
| Total Common Stocks (cost $392,309) | 349,860 | |||||
| NON-U.S. GOVERNMENT AGENCY | ||||||
| ASSET-BACKED SECURITIES - 0.0% | ||||||
| Sigma Finance, Inc. (d) (f) (u) | $ | 527 | 22 | |||
| Total Non-U.S. Government Agency | ||||||
| Asset-Backed Securities (cost $527) | 22 | |||||
| SHORT TERM INVESTMENTS - 8.3% | ||||||
| Mutual Funds - 6.7% | ||||||
| JNL Money Market Fund, 0.07% (a) (h) | 25,086 | 25,086 | ||||
| Securities Lending Collateral - 1.6% | ||||||
| Securities Lending Cash Collateral Fund LLC, | ||||||
| 0.16% (a) (h) | 2,574 | 2,574 | ||||
| Securities Lending Liquidating Fund LLC, 0.36% (a) (h) | 3,290 | 3,283 | ||||
| 5,857 | ||||||
| Total Short Term Investments (cost $30,950) | 30,943 | |||||
| Total Investments - 101.4% (cost $423,786) | 380,825 | |||||
| Other Assets and Liabilities, Net - (1.4%) | (5,101) | |||||
| Total Net Assets - 100% | $ | 375,724 | ||||
| JNL/Franklin Templeton Income Fund * (y) | ||||||
| COMMON STOCKS - 29.9% | ||||||
| CONSUMER DISCRETIONARY - 0.8% | ||||||
| Other Securities | $ | 5,687 | ||||
| CONSUMER STAPLES - 0.4% | ||||||
| Other Securities | 2,626 | |||||
| ENERGY - 4.9% | ||||||
| Canadian Oil Sands Trust | 295 | 8,422 | ||||
| ConocoPhillips | 200 | 10,214 | ||||
| Exxon Mobil Corp. | 200 | 13,638 | ||||
| Other Securities | 3,438 | |||||
| 35,712 | ||||||
| FINANCIALS - 5.3% | ||||||
| Bank of America Corp. | 600 | 9,036 | ||||
| Capital One Financial Corp. (e) | 163 | 6,249 | ||||
| Citigroup Inc. | 894 | 2,961 | ||||
| iStar Financial Inc. (c) (e) | 85 | 217 | ||||
| JPMorgan Chase & Co. | 150 | 6,250 | ||||
| Wells Fargo & Co. | 300 | 8,087 | ||||
| Other Securities | 5,563 | |||||
| 38,363 | ||||||
| HEALTH CARE - 2.4% | ||||||
| Merck & Co. Inc. | 340 | 12,424 | ||||
| Other Securities | 4,958 | |||||
| 17,382 | ||||||
| INFORMATION TECHNOLOGY - 1.5% | ||||||
| Other Securities | 10,678 | |||||
| MATERIALS - 0.9% | ||||||
| Newmont Mining Corp. | 100 | 4,731 | ||||
| Other Securities | 1,969 | |||||
| 6,700 | ||||||
| TELECOMMUNICATION SERVICES - 2.0% | ||||||
| AT&T Inc. | 300 | 8,409 | ||||
| Other Securities | 6,661 | |||||
| 15,070 | ||||||
| UTILITIES - 11.7% | ||||||
| Ameren Corp. | 185 | 5,171 | ||||
| American Electric Power Co. Inc. | 148 | 5,138 | ||||
| Dominion Resources Inc. | 150 | 5,838 | ||||
| Duke Energy Corp. | 375 | 6,454 | ||||
| FPL Group Inc. | 100 | 5,282 | ||||
| PG&E Corp. | 180 | 8,037 | ||||
| Progress Energy Inc. | 115 | 4,716 | ||||
| Public Service Enterprise Group Inc. | 200 | 6,650 | ||||
| Southern Co. | 200 | 6,664 | ||||
| Xcel Energy Inc. | 350 | 7,431 | ||||
| Other Securities | 23,586 | |||||
| 84,967 | ||||||
| Total Common Stocks (cost $235,124) | 217,185 | |||||
| PREFERRED STOCKS - 5.7% | ||||||
| CONSUMER DISCRETIONARY - 0.1% | ||||||
| Other Securities | 565 | |||||
| ENERGY - 0.4% | ||||||
| SandRidge Energy Inc., Convertible Preferred, | ||||||
| 8.50% (p) (t) (v) | 13 | 1,851 | ||||
| Other Securities | 1,041 | |||||
| 2,892 | ||||||
| FINANCIALS - 4.8% | ||||||
| Bank of America Corp., Convertible Preferred, | ||||||
| 7.25%, Series L (p) | 8 | 6,918 | ||||
| Citigroup Inc. Convertible Preferred, 7.50%, 12/15/12 (c) | 90 | 9,391 | ||||
| GMAC Inc., 7.00% (callable at 1,000 beginning 12/31/11) (t) (v) | 2 | 1,217 | ||||
| Goldman Sachs Group Inc., Convertible Preferred | ||||||
| 9.00%, 08/20/10 | 60 | 2,703 | ||||
| 12.50%, 04/01/10 (t) (v) | 80 | 3,245 | ||||
| 10.55%, 07/21/10 | 40 | 2,481 | ||||
| Wells Fargo & Co., Convertible Preferred, 7.50%, Series L (p) | 3 | 2,754 | ||||
| Other Securities | 6,238 | |||||
| 34,947 | ||||||
| HEALTH CARE - 0.3% | ||||||
| Tenet Healthcare Corp., 7.00%, 10/01/12 | 2 | 2,014 | ||||
| UTILITIES - 0.1% | ||||||
| FPL Group Inc., 8.38% | 20 | 1,035 | ||||
| Total Preferred Stocks (cost $59,855) | 41,453 | |||||
| WARRANTS - 0.0% | ||||||
| Other Securities | 190 | |||||
| Total Warrants (cost $106) | 190 | |||||
| NON-U.S. GOVERNMENT AGENCY | ||||||
| ASSET-BACKED SECURITIES - 0.0% | ||||||
| Other Securities | 55 | |||||
| Total Non-U.S. Government Agency | ||||||
| Asset-Backed Securities (cost $1,285) | 55 | |||||
| CORPORATE BONDS AND NOTES - 54.1% | ||||||
| CONSUMER DISCRETIONARY - 9.7% | ||||||
| Cablevision Systems Corp. | ||||||
| 8.00%, 04/15/12 (e) (k) | $ | 4,500 | 4,759 | |||
| 8.63%, 09/15/17 (t) (v) | 1,000 | 1,041 | ||||
| CCH II LLC, 13.50%, 11/30/16 (t) (v) | 5,134 | 5,994 | ||||
| Clear Channel Communications Inc. Term Loan B, | ||||||
| 3.88%, 11/13/15 (i) (u) | 8,000 | 6,600 | ||||
| Clear Channel Worldwide Holdings Inc. | ||||||
| 9.25%, 12/15/17 (t) (v) | 400 | 408 | ||||
| 9.25%, 12/15/17 (t) (v) | 1,600 | 1,648 | ||||
| DISH DBS Corp., 7.75%, 05/31/15 (e) | 5,000 | 5,238 | ||||
| Dollar General Corp. | ||||||
| 10.63%, 07/15/15 (e) | 3,771 | 4,176 | ||||
| 11.88%, 07/15/17 | 1,373 | 1,586 | ||||
| Hertz Corp. | ||||||
| 8.88%, 01/01/14 | 7,000 | 7,158 | ||||
| 10.50%, 01/01/16 (e) | 1,250 | 1,334 | ||||
| Other Securities | 30,557 | |||||
| 70,499 | ||||||
| CONSUMER STAPLES - 0.6% | ||||||
| Other Securities | 3,917 | |||||
| ENERGY - 11.7% | ||||||
| Chesapeake Energy Corp. | ||||||
| 9.50%, 02/15/15 (e) | 2,500 | 2,744 | ||||
| 6.50%, 08/15/17 (e) | 4,000 | 3,920 | ||||
| 6.25%, 01/15/18 | 2,200 | 2,112 | ||||
| 7.25%, 12/15/18 | 5,000 | 5,038 | ||||
| El Paso Corp. | ||||||
| 12.00%, 12/12/13 | 1,600 | 1,876 | ||||
| 7.25%, 06/01/18 (e) | 4,100 | 4,051 | ||||
| 7.75%, 01/15/32 | 1,000 | 946 | ||||
| Petrohawk Energy Corp. | ||||||
| 10.50%, 08/01/14 | 2,000 | 2,185 | ||||
| 7.88%, 06/01/15 (e) | 3,200 | 3,232 | ||||
| SandRidge Energy Inc. | ||||||
| 3.88%, 04/01/14 (i) | 2,000 | 1,793 | ||||
| 9.88%, 05/15/16 (e) (t) (v) | 2,600 | 2,736 | ||||
| 8.00%, 06/01/18 (t) (v) | 1,000 | 982 | ||||
| Texas Competitive Electric Holdings Co. LLC, Term Loan | ||||||
| 3.73%, 10/24/14 (i) (u) | 4,560 | 3,715 | ||||
| 3.73%, 10/24/14 (i) (u) | 1,975 | 1,605 | ||||
| 3.75%, 10/24/14 (i) (u) | 370 | 301 | ||||
| Texas Competitive Electric Holdings Co. LLC | ||||||
| 10.25%, 11/01/15 (e) (k) | 10,000 | 8,100 | ||||
| 10.25%, 11/01/15 (k) | 3,000 | 2,430 | ||||
| 10.50%, 11/01/16 (e) | 4,907 | 3,460 | ||||
| Other Securities | 34,294 | |||||
| 85,520 | ||||||
| FINANCIALS - 13.1% | ||||||
| Bank of America Corp., | ||||||
| 8.13% (callable at 100 beginning 05/15/18) (p) | 1,000 | 963 | ||||
| Ford Motor Credit Co. LLC | ||||||
| 9.75%, 09/15/10 (k) | 2,000 | 2,064 | ||||
| 9.88%, 08/10/11 | 1,000 | 1,047 | ||||
| 7.25%, 10/25/11 | 2,000 | 2,020 | ||||
| 3.00%, 01/13/12 (i) | 6,000 | 5,580 | ||||
| 7.50%, 08/01/12 (e) | 3,000 | 3,025 | ||||
| 7.00%, 10/01/13 | 4,000 | 3,994 | ||||
| 8.00%, 06/01/14 (e) | 2,500 | 2,567 | ||||
| 8.70%, 10/01/14 | 5,000 | 5,227 | ||||
| 12.00%, 05/15/15 | 3,000 | 3,479 | ||||
| GMAC LLC | ||||||
| 7.75%, 01/19/10 (t) (v) | 5,000 | 4,998 | ||||
| 6.88%, 09/15/11 (t) (v) | 3,532 | 3,479 | ||||
| Host Hotels & Resorts LP | ||||||
| 6.88%, 11/01/14 (e) | 1,500 | 1,509 | ||||
| 6.38%, 03/15/15 | 3,500 | 3,430 | ||||
| 6.75%, 06/01/16 (e) | 1,000 | 995 | ||||
| 9.00%, 05/15/17 (e) (t) (v) | 600 | 649 | ||||
| iStar Financial Inc. | ||||||
| 0.75%, 10/01/12 (i) | 4,500 | 2,481 | ||||
| 8.63%, 06/01/13 | 5,000 | 3,200 | ||||
| JPMorgan Chase & Co., | ||||||
| 7.90%, (callable at 100 beginning 04/30/18) (p) | 11,500 | 11,862 | ||||
| Liberty Mutual Group Inc., 10.75%, 06/15/58 (e) (t) (v) | 5,000 | 5,300 | ||||
| RBS Global & Rexnord LLC, 9.50%, 08/01/14 | 1,250 | 1,253 | ||||
| UPC Germany GmbH | ||||||
| 8.13%, 12/01/17 (e) (t) (v) | 2,100 | 2,124 | ||||
| 8.13%, 12/01/17 (t) (v) | EUR | 2,750 | 4,020 | |||
| 9.63%, 12/01/19 (t) (v) | EUR | 1,500 | 2,171 | |||
| Wells Fargo Capital XIII, | ||||||
| 7.70% (callable at 100 beginning 03/26/13) (p) | 900 | 873 | ||||
| Wells Fargo Capital XV, | ||||||
| 9.75% (callable at 100 beginning 09/26/13) (p) | 5,000 | 5,350 | ||||
| Other Securities | 11,724 | |||||
| 95,384 | ||||||
| HEALTH CARE - 6.7% | ||||||
| Community Health Systems Inc., 8.88%, 07/15/15 | 5,000 | 5,175 | ||||
| HCA Inc. | ||||||
| 6.38%, 01/15/15 | 1,500 | 1,416 | ||||
| 6.50%, 02/15/16 | 1,500 | 1,425 | ||||
| 9.25%, 11/15/16 | 3,500 | 3,758 | ||||
| 8.50%, 04/15/19 (t) (v) | 5,000 | 5,388 | ||||
| 7.88%, 02/15/20 (t) (v) | 6,000 | 6,248 | ||||
| Tenet Healthcare Corp. | ||||||
| 7.38%, 02/01/13 (e) | 3,000 | 3,008 | ||||
| 9.25%, 02/01/15 (e) (k) | 5,000 | 5,325 | ||||
| 9.00%, 05/01/15 (t) (v) | 3,500 | 3,780 | ||||
| 10.00%, 05/01/18 (e) (t) (v) | 3,500 | 3,920 | ||||
| Other Securities | 9,451 | |||||
| 48,894 | ||||||
| INDUSTRIALS - 2.0% | ||||||
| RBS Global & Rexnord LLC | ||||||
| 9.50%, 08/01/14 (t) (v) | 1,978 | 1,983 | ||||
| 11.75%, 08/01/16 (e) | 1,500 | 1,485 | ||||
| Other Securities | 11,208 | |||||
| 14,676 | ||||||
| INFORMATION TECHNOLOGY - 3.5% | ||||||
| First Data Corp., Term Loan | ||||||
| 3.00%, 09/24/14 (i) (u) | 5 | 4 | ||||
| 3.00%, 09/24/14 (i) (u) | 93 | 83 | ||||
| 3.00%, 09/24/14 (i) (u) | 1,647 | 1,464 | ||||
| 3.00%, 09/24/14 (i) (u) | 215 | 191 | ||||
| 3.00%, 10/01/14 (i) (u) | 195 | 174 | ||||
| 3.00%, 10/01/14 (i) (u) | 1,870 | 1,666 | ||||
| 3.00%, 10/01/14 (i) (u) | 1,845 | 1,644 | ||||
| First Data Corp., 9.88%, 09/24/15 (e) | 5,500 | 5,129 | ||||
| Freescale Semiconductor Inc., | ||||||
| Term Loan, 12.50%, 12/15/14 (i) (u) | 3,864 | 3,985 | ||||
| Freescale Semiconductor Inc., 10.13%, 12/15/16 (e) | 850 | 684 | ||||
| Other Securities | 10,562 | |||||
| 25,586 | ||||||
| MATERIALS - 1.3% | ||||||
| Other Securities | 9,748 | |||||
| TELECOMMUNICATION SERVICES - 1.5% | ||||||
| Other Securities | 10,961 | |||||
| UTILITIES - 4.0% | ||||||
| Dynegy Holdings Inc. | ||||||
| 7.50%, 06/01/15 (e) | 10,000 | 9,350 | ||||
| 7.75%, 06/01/19 | 2,000 | 1,735 | ||||
| Energy Future Holdings Corp. | ||||||
| 10.88%, 11/01/17 (e) (k) | 4,000 | 3,270 | ||||
| 11.25%, 11/01/17 | 8,847 | 6,259 | ||||
| RRI Energy Inc., 7.88%, 06/15/17 (e) | 5,000 | 4,912 | ||||
| Other Securities | 3,712 | |||||
| 29,238 | ||||||
| Total Corporate Bonds and Notes (cost $399,778) | 394,423 | |||||
| SHORT TERM INVESTMENTS - 24.2% | ||||||
| Mutual Funds - 12.4% | ||||||
| JNL Money Market Fund, 0.07% (a) (h) | 90,379 | 90,379 | ||||
| Securities Lending Collateral - 11.8% | ||||||
| Securities Lending Cash Collateral Fund LLC, | ||||||
| 0.16% (a) (h) | 64,754 | 64,754 | ||||
| Securities Lending Liquidating Fund LLC, 0.36% (a) (h) | 21,149 | 21,105 | ||||
| 85,859 | ||||||
| Total Short Term Investments (cost $176,282) | 176,238 | |||||
| Total Investments - 113.9% (cost $872,430) | 829,544 | |||||
| Other Assets and Liabilities, Net - (13.9%) | (100,920) | |||||
| Total Net Assets - 100% | $ | 728,624 | ||||
| JNL/Franklin Templeton Mutual | ||||||
| Shares Fund * (y) | ||||||
| COMMON STOCKS - 82.9% | ||||||
| CONSUMER DISCRETIONARY - 6.3% | ||||||
| Mattel Inc. | 310 | $ | 6,200 | |||
| News Corp. - Class A | 680 | 9,316 | ||||
| Virgin Media Inc. (e) | 263 | 4,424 | ||||
| Other Securities | 6,824 | |||||
| 26,764 | ||||||
| CONSUMER STAPLES - 24.6% | ||||||
| Altria Group Inc. | 432 | 8,475 | ||||
| British American Tobacco Plc | 261 | 8,498 | ||||
| Cadbury Plc | 483 | 6,218 | ||||
| CVS Caremark Corp. | 363 | 11,676 | ||||
| Dr. Pepper Snapple Group Inc. | 230 | 6,496 | ||||
| General Mills Inc. | 47 | 3,332 | ||||
| Imperial Tobacco Group Plc | 270 | 8,534 | ||||
| Kraft Foods Inc. - Class A | 214 | 5,807 | ||||
| Kroger Co. | 228 | 4,680 | ||||
| Nestle SA | 158 | 7,657 | ||||
| Pepsi Bottling Group Inc. | 108 | 4,037 | ||||
| PepsiAmericas Inc. | 40 | 1,167 | ||||
| Pernod-Ricard SA (e) | 65 | 5,550 | ||||
| Reynolds American Inc. (e) | 57 | 3,035 | ||||
| Other Securities | 19,128 | |||||
| 104,290 | ||||||
| ENERGY - 6.0% | ||||||
| Marathon Oil Corp. | 168 | 5,234 | ||||
| Royal Dutch Shell Plc - Class A | 172 | 5,209 | ||||
| Transocean Ltd. (c) | 82 | 6,812 | ||||
| Other Securities | 8,053 | |||||
| 25,308 | ||||||
| FINANCIALS - 12.3% | ||||||
| ACE Ltd. | 73 | 3,676 | ||||
| Bank of America Corp. | 180 | 2,706 | ||||
| Barclays Plc | 845 | 3,766 | ||||
| Berkshire Hathaway Inc. - Class B (c) | 2 | 7,892 | ||||
| CIT Group Inc. (c) | 36 | 982 | ||||
| White Mountains Insurance Group Ltd. | 14 | 4,729 | ||||
| Other Securities | 28,393 | |||||
| 52,144 | ||||||
| HEALTH CARE - 4.4% | ||||||
| Becton Dickinson & Co. | 37 | 2,905 | ||||
| Novartis AG | 71 | 3,854 | ||||
| Tenet Healthcare Corp. (c) | 787 | 4,239 | ||||
| UnitedHealth Group Inc. | 164 | 4,988 | ||||
| Other Securities | 2,873 | |||||
| 18,859 | ||||||
| INDUSTRIALS - 7.2% | ||||||
| A P Moller - Maersk A/S Class B | 1 | 4,164 | ||||
| Orkla ASA | 724 | 7,122 | ||||
| Siemens AG (e) | 59 | 5,446 | ||||
| Tyco International Ltd. | 82 | 2,916 | ||||
| Other Securities | 10,774 | |||||
| 30,422 | ||||||
| INFORMATION TECHNOLOGY - 9.0% | ||||||
| Dell Inc. (c) | 353 | 5,063 | ||||
| LSI Corp. (c) | 747 | 4,492 | ||||
| Microsoft Corp. | 321 | 9,796 | ||||
| Motorola Inc. (c) | 455 | 3,530 | ||||
| Xerox Corp. | 373 | 3,154 | ||||
| Other Securities | 11,924 | |||||
| 37,959 | ||||||
| MATERIALS - 5.7% | ||||||
| Anglo American Plc (c) | 77 | 3,360 | ||||
| International Paper Co. | 133 | 3,570 | ||||
| Linde AG | 32 | 3,902 | ||||
| MeadWestvaco Corp. | 117 | 3,339 | ||||
| Weyerhaeuser Co. | 196 | 8,446 | ||||
| Other Securities | 1,388 | |||||
| 24,005 | ||||||
| TELECOMMUNICATION SERVICES - 3.5% | ||||||
| Cable & Wireless Plc | 1,672 | 3,818 | ||||
| Koninklijke KPN NV | 221 | 3,754 | ||||
| Vodafone Group Plc | 2,135 | 4,954 | ||||
| Other Securities | 2,380 | |||||
| 14,906 | ||||||
| UTILITIES - 3.9% | ||||||
| E.ON AG | 153 | 6,410 | ||||
| Exelon Corp. | 62 | 3,019 | ||||
| Other Securities | 7,166 | |||||
| 16,595 | ||||||
| Total Common Stocks (cost $370,343) | 351,252 | |||||
| PREFERRED STOCKS - 0.5% | ||||||
| FINANCIALS - 0.5% | ||||||
| Bank of America Corp., 10.00% | 135 | 2,011 | ||||
| Total Preferred Stocks (cost $2,024) | 2,011 | |||||
| CORPORATE BONDS AND NOTES - 4.2% | ||||||
| CONSUMER DISCRETIONARY - 0.7% | ||||||
| Other Securities | 3,033 | |||||
| ENERGY - 0.9% | ||||||
| Texas Competitive Electric Holdings Co. LLC, Term Loan | ||||||
| 3.75%, 10/10/14 (i) (u) | $ | 2,099 | 1,685 | |||
| 3.75%, 11/01/15 (i) (u) | 698 | 566 | ||||
| Texas Competitive Electric Holdings Co. LLC, | ||||||
| Term Loan B1, 3.75%, 10/10/14 (i) (u) | 1,438 | 1,169 | ||||
| Texas Competitive Electric Holdings Co. LLC, | ||||||
| Term Loan B2, 3.75%, 10/10/14 (i) (u) | 226 | 184 | ||||
| Other Securities | 246 | |||||
| 3,850 | ||||||
| FINANCIALS - 2.2% | ||||||
| CIT Group Inc., Term Loan | ||||||
| 9.50%, 01/20/12 (i) (u) | 1,541 | 1,583 | ||||
| 13.00%, 01/20/12 (i) (u) | 602 | 624 | ||||
| CIT Group Inc. | ||||||
| 7.00%, 05/01/13 | 176 | 164 | ||||
| 7.00%, 05/01/14 | 264 | 245 | ||||
| 7.00%, 05/01/15 | 264 | 236 | ||||
| 7.00%, 05/01/16 | 440 | 387 | ||||
| 7.00%, 05/01/17 | 616 | 535 | ||||
| Realogy Corp., Term Loan | ||||||
| 5.35%, 10/10/13 (i) (u) | 956 | 853 | ||||
| 3.28%, 10/10/13 (i) (u) | 1,451 | 1,294 | ||||
| 3.29%, 10/10/13 (i) (u) | 3,552 | 3,168 | ||||
| 13.50%, 10/15/17 (u) | 93 | 99 | ||||
| Other Securities | 285 | |||||
| 9,473 | ||||||
| INFORMATION TECHNOLOGY - 0.4% | ||||||
| Other Securities | 1,524 | |||||
| MATERIALS - 0.0% | ||||||
| Other Securities | 57 | |||||
| OTHER EQUITY INTERESTS - 0.0% | ||||||
| Other Securities | - | |||||
| Total Corporate Bonds and Notes (cost $18,586) | 17,937 | |||||
| SHORT TERM INVESTMENTS - 15.9% | ||||||
| Mutual Funds - 11.9% | ||||||
| JNL Money Market Fund, 0.07% (a) (h) | 50,580 | 50,580 | ||||
| Securities Lending Collateral - 4.0% | ||||||
| Securities Lending Cash Collateral Fund LLC, | ||||||
| 0.16% (a) (h) | 16,975 | 16,975 | ||||
| Total Short Term Investments (cost $67,555) | 67,555 | |||||
| Total Investments - 103.5% (cost $458,508) | 438,755 | |||||
| Other Assets and Liabilities, Net - (3.5%) | (14,901) | |||||
| Total Net Assets - 100% | $ | 423,854 | ||||
| JNL/Franklin Templeton Small Cap Value Fund | ||||||
| COMMON STOCKS - 89.8% | ||||||
| CONSUMER DISCRETIONARY - 18.8% | ||||||
| Autoliv Inc. (e) | 55 | $ | 2,386 | |||
| Brown Shoe Co. Inc. | 132 | 1,298 | ||||
| Brunswick Corp. | 111 | 1,407 | ||||
| Christopher & Banks Corp. | 125 | 952 | ||||
| DR Horton Inc. (e) | 106 | 1,153 | ||||
| Drew Industries Inc. (c) | 13 | 275 | ||||
| Ethan Allen Interiors Inc. (e) | 75 | 1,006 | ||||
| Fred's Inc. | 132 | 1,346 | ||||
| Gentex Corp. | 101 | 1,797 | ||||
| Group 1 Automotive Inc. (c) (e) | 67 | 1,885 | ||||
| Gymboree Corp. (c) (e) | 18 | 774 | ||||
| Hooker Furniture Corp. | 40 | 491 | ||||
| J.C. Penney Co. Inc. | 56 | 1,490 | ||||
| La-Z-Boy Inc. (c) | 139 | 1,324 | ||||
| M/I Homes Inc. (c) | 84 | 868 | ||||
| MDC Holdings Inc. | 35 | 1,074 | ||||
| Men's Wearhouse Inc. | 95 | 2,002 | ||||
| Pier 1 Imports Inc. (c) | 76 | 387 | ||||
| Regis Corp. | 57 | 883 | ||||
| Saks Inc. (c) (e) | 113 | 742 | ||||
| Thor Industries Inc. | 99 | 3,112 | ||||
| Timberland Co. - Class A (c) | 23 | 412 | ||||
| Tuesday Morning Corp. (c) (e) | 166 | 427 | ||||
| Warnaco Group Inc. (c) | 43 | 1,810 | ||||
| West Marine Inc. (c) | 120 | 967 | ||||
| Winnebago Industries Inc. (c) | 79 | 969 | ||||
| Zale Corp. (c) (e) | 85 | 231 | ||||
| 31,468 | ||||||
| CONSUMER STAPLES - 0.9% | ||||||
| Casey's General Stores Inc. | 49 | 1,551 | ||||
| ENERGY - 9.6% | ||||||
| Arch Coal Inc. | 23 | 512 | ||||
| Atwood Oceanics Inc. (c) | 43 | 1,531 | ||||
| Bristow Group Inc. (c) (e) | 53 | 2,022 | ||||
| CARBO Ceramics Inc. | 2 | 136 | ||||
| Global Industries Ltd. (c) (e) | 185 | 1,319 | ||||
| Helix Energy Solutions Group Inc. (c) | 105 | 1,230 | ||||
| Oil States International Inc. (c) | 45 | 1,768 | ||||
| Overseas Shipholding Group Inc. | 25 | 1,094 | ||||
| Rowan Cos. Inc. (c) | 117 | 2,653 | ||||
| Teekay Corp. | 38 | 889 | ||||
| Tidewater Inc. | 20 | 954 | ||||
| Unit Corp. (c) | 46 | 1,942 | ||||
| 16,050 | ||||||
| FINANCIALS - 12.9% | ||||||
| American National Insurance Co. | 12 | 1,470 | ||||
| Arthur J Gallagher & Co. (e) | 41 | 923 | ||||
| Aspen Insurance Holdings Ltd. | 96 | 2,453 | ||||
| Chemical Financial Corp. | 61 | 1,441 | ||||
| Erie Indemnity Co. - Class A | 33 | 1,303 | ||||
| Montpelier Re Holdings Ltd. | 127 | 2,205 | ||||
| Old Republic International Corp. | 240 | 2,410 | ||||
| Peoples Bancorp Inc. | 2 | 22 | ||||
| Protective Life Corp. | 183 | 3,022 | ||||
| RLI Corp. | 22 | 1,187 | ||||
| StanCorp Financial Group Inc. | 31 | 1,221 | ||||
| TrustCo Bank Corp. | 264 | 1,660 | ||||
| Validus Holdings Ltd. | 59 | 1,598 | ||||
| Zenith National Insurance Corp. | 25 | 750 | ||||
| 21,665 | ||||||
| HEALTH CARE - 4.3% | ||||||
| Mettler Toledo International Inc. (c) | 19 | 2,016 | ||||
| Pharmaceutical Product Development Inc. | 75 | 1,749 | ||||
| STERIS Corp. (e) | 56 | 1,566 | ||||
| Teleflex Inc. | 29 | 1,557 | ||||
| West Pharmaceutical Services Inc. | 12 | 486 | ||||
| 7,374 | ||||||
| INDUSTRIALS - 26.4% | ||||||
| ABM Industries Inc. (e) | 92 | 1,909 | ||||
| American Woodmark Corp. | 55 | 1,082 | ||||
| AO Smith Corp. | 14 | 599 | ||||
| Apogee Enterprises Inc. (e) | 102 | 1,422 | ||||
| Applied Industrial Technologies Inc. | 35 | 777 | ||||
| Astec Industries Inc. (c) | 31 | 841 | ||||
| Brady Corp. - Class A | 63 | 1,883 | ||||
| Briggs & Stratton Corp. (e) | 57 | 1,066 | ||||
| Carlisle Cos. Inc. (e) | 58 | 1,987 | ||||
| Ceradyne Inc. (c) (e) | 43 | 818 | ||||
| CIRCOR International Inc. | 24 | 615 | ||||
| CNH Global NV (c) | 12 | 297 | ||||
| EMCOR Group Inc. (c) | 38 | 1,030 | ||||
| Franklin Electric Co. Inc. (e) | 34 | 995 | ||||
| Gardner Denver Inc. | 44 | 1,876 | ||||
| Genesee & Wyoming Inc. - Class A (c) | 55 | 1,805 | ||||
| Gibraltar Industries Inc. (c) (e) | 137 | 2,147 | ||||
| Graco Inc. (e) | 63 | 1,786 | ||||
| Kansas City Southern (c) (e) | 23 | 756 | ||||
| Kennametal Inc. (e) | 69 | 1,786 | ||||
| Lincoln Electric Holdings Inc. | 30 | 1,598 | ||||
| Mine Safety Appliances Co. | 60 | 1,592 | ||||
| Mueller Industries Inc. | 74 | 1,828 | ||||
| Nordson Corp. (e) | 35 | 2,142 | ||||
| Powell Industries Inc. (c) | 7 | 218 | ||||
| Roper Industries Inc. (e) | 20 | 1,047 | ||||
| Simpson Manufacturing Co. Inc. (e) | 57 | 1,538 | ||||
| SkyWest Inc. | 104 | 1,753 | ||||
| Timken Co. | 21 | 498 | ||||
| Trinity Industries Inc. (e) | 127 | 2,213 | ||||
| Universal Forest Products Inc. (e) | 72 | 2,666 | ||||
| Wabash National Corp. (c) | 163 | 308 | ||||
| Watts Water Technologies Inc. (e) | 44 | 1,345 | ||||
| 44,223 | ||||||
| INFORMATION TECHNOLOGY - 3.4% | ||||||
| Benchmark Electronics Inc. (c) | 140 | 2,642 | ||||
| Cohu Inc. | 111 | 1,548 | ||||
| Diebold Inc. (e) | 8 | 213 | ||||
| Omnivision Technologies Inc. (c) | 16 | 225 | ||||
| Rofin-Sinar Technologies Inc. (c) | 46 | 1,091 | ||||
| 5,719 | ||||||
| MATERIALS - 10.7% | ||||||
| Airgas Inc. | 36 | 1,718 | ||||
| AptarGroup Inc. | 30 | 1,072 | ||||
| Cabot Corp. | 60 | 1,561 | ||||
| Gerdau AmeriSteel Corp. | 182 | 1,504 | ||||
| Glatfelter | 75 | 910 | ||||
| Reliance Steel & Aluminum Co. | 61 | 2,632 | ||||
| RPM International Inc. | 117 | 2,383 | ||||
| Steel Dynamics Inc. | 147 | 2,610 | ||||
| United States Steel Corp. (e) | 5 | 276 | ||||
| Westlake Chemical Corp. (e) | 129 | 3,212 | ||||
| 17,878 | ||||||
| UTILITIES - 2.8% | ||||||
| Atmos Energy Corp. | 23 | 662 | ||||
| Energen Corp. | 36 | 1,704 | ||||
| NV Energy Inc. | 190 | 2,352 | ||||
| 4,718 | ||||||
| Total Common Stocks (cost $151,030) | 150,646 | |||||
| NON-U.S. GOVERNMENT AGENCY | ||||||
| ASSET-BACKED SECURITIES - 0.0% | ||||||
| Sigma Finance, Inc. (d) (f) (u) | $ | 636 | 27 | |||
| Total Non-U.S. Government Agency | ||||||
| Asset-Backed Securities (cost $636) | 27 | |||||
| SHORT TERM INVESTMENTS - 22.8% | ||||||
| Mutual Funds - 10.4% | ||||||
| JNL Money Market Fund, 0.07% (a) (h) | 17,414 | 17,414 | ||||
| Securities Lending Collateral - 12.4% | ||||||
| Securities Lending Cash Collateral Fund LLC, | ||||||
| 0.16% (a) (h) | 12,512 | 12,512 | ||||
| Securities Lending Liquidating Fund LLC, 0.36% (a) (h) | 8,381 | 8,364 | ||||
| 20,876 | ||||||
| Total Short Term Investments (cost $38,307) | 38,290 | |||||
| Total Investments - 112.6% (cost $189,973) | 188,963 | |||||
| Other Assets and Liabilities, Net - (12.6%) | (21,137) | |||||
| Total Net Assets - 100% | $ | 167,826 | ||||
| JNL/Goldman Sachs Core Plus Bond Fund | ||||||
| COMMON STOCKS - 0.0% | ||||||
| CONSUMER DISCRETIONARY - 0.0% | ||||||
| Home Interior Gift Inc. (c) (f) (s) (u) | 491 | $ | 5 | |||
| INFORMATION TECHNOLOGY - 0.0% | ||||||
| Axiohm Transaction Solutions Inc. (c) (f) (s) (u) | 1 | - | ||||
| MATERIALS - 0.0% | ||||||
| Applied Extrusion Technologies Inc. - Class B (c) (f) (s) (u) | 2 | 4 | ||||
| Total Common Stocks (cost $379) | 9 | |||||
| PREFERRED STOCKS - 0.0% | ||||||
| FINANCIALS - 0.0% | ||||||
| TCR Holdings - Class B (f) | - | - | ||||
| TCR Holdings - Class C (f) | - | - | ||||
| TCR Holdings - Class D (f) | 1 | - | ||||
| TCR Holdings - Class E (f) | 1 | - | ||||
| Total Preferred Stocks (cost $0) | - | |||||
| NON-U.S. GOVERNMENT AGENCY | ||||||
| ASSET-BACKED SECURITIES - 10.8% | ||||||
| Adjustable Rate Mortgage Trust REMIC, | ||||||
| 3.39%, 04/25/35 (i) | $ | 375 | 314 | |||
| American Home Mortgage Assets Trust REMIC, | ||||||
| 1.24%, 02/25/47 (i) | 3,836 | 1,788 | ||||
| Amortizing Residential Collateral Trust REMIC, | ||||||
| 2.03%, 08/25/32 (i) | 71 | 20 | ||||
| Asset Backed Securities Corp. Home Equity REMIC, | ||||||
| 3.08%, 04/15/33 (i) | 49 | 13 | ||||
| Banc of America Commercial Mortgage Inc. REMIC | ||||||
| 5.63%, 07/10/46 | 3,500 | 3,279 | ||||
| 5.41%, 09/10/47 | 4,700 | 4,414 | ||||
| Banc of America Funding Corp. REMIC | ||||||
| 5.78%, 06/20/36 (i) | 2,256 | 1,428 | ||||
| 5.79%, 10/25/36 (i) | 376 | 368 | ||||
| 0.51%, 06/20/47 (i) | 1,700 | 332 | ||||
| Banc of America Mortgage Securities Inc. REMIC, | ||||||
| 4.79%, 09/25/35 (i) | 1,370 | 1,109 | ||||
| BCAP LLC Trust REMIC, 0.87%, 11/25/36 (i) | 551 | 496 | ||||
| Bear Stearns Adjustable Rate Mortgage Trust REMIC | ||||||
| 3.63%, 04/25/34 (i) | 403 | 355 | ||||
| 4.15%, 11/25/34 (i) | 1,167 | 1,099 | ||||
| Bear Stearns Alt-A Trust II REMIC, 5.99%, 09/25/47 (i) | 3,072 | 1,705 | ||||
| Carrington Mortgage Loan Trust REMIC, | ||||||
| 0.46%, 12/25/35 (i) | 143 | 136 | ||||
| Chase Mortgage Finance Corp. REMIC, | ||||||
| 4.09%, 02/25/37 (i) | 545 | 486 | ||||
| CIT Mortgage Loan Trust REMIC | ||||||
| 2.65%, 01/25/10 (f) (i) (t) (u) | 700 | 318 | ||||
| 1.92%, 09/25/24 (f) (i) (t) (u) | 1,280 | 480 | ||||
| 1.23%, 10/25/37 (f) (i) (t) (u) | 1,082 | 963 | ||||
| Citigroup Mortgage Loan Trust Inc. REMIC, | ||||||
| 3.54%, 12/25/35 (i) | 1,768 | 973 | ||||
| Commercial Mortgage Asset Trust REMIC, | ||||||
| 7.35%, 01/17/32 | 400 | 422 | ||||
| Conseco Financial Corp. REMIC, 7.07%, 01/15/29 | 217 | 218 | ||||
| Countrywide Alternative Loan Trust | ||||||
| REMIC, 2.04%, 09/25/35 (i) | 310 | 175 | ||||
| REMIC, 1.92%, 11/25/47 (i) | 4,665 | 1,867 | ||||
| Countrywide Asset-Backed Certificates REMIC, | ||||||
| 1.48%, 06/25/34 (i) | 198 | 32 | ||||
| Countrywide Home Equity Loan Trust REMIC, | ||||||
| 0.43%, 05/15/36 (i) (s) (u) | 1,271 | 224 | ||||
| Countrywide Home Loan Mortgage Pass-Through Trust | ||||||
| REMIC, 3.44%, 02/19/34 (i) | 544 | 477 | ||||
| REMIC, 3.62%, 11/20/34 (i) | 498 | 394 | ||||
| Credit Suisse Mortgage Capital Certificates | ||||||
| REMIC, 6.50%, 10/25/21 (s) (u) | 3,383 | 2,410 | ||||
| REMIC, 5.55%, 02/15/39 (i) | 3,060 | 3,014 | ||||
| REMIC, 5.47%, 09/15/39 | 6,000 | 5,139 | ||||
| Deutsche Bank Alternate Loan Trust REMIC, | ||||||
| 4.91%, 08/25/35 (i) | 792 | 623 | ||||
| Downey Savings & Loan Association Mortgage Loan Trust | ||||||
| REMIC, 1.46%, 03/19/46 (i) | 517 | 220 | ||||
| REMIC, 1.46%, 03/19/47 (i) | 517 | 185 | ||||
| First Horizon Asset Securities Inc. Pass-Through Trust | ||||||
| REMIC, 3.01%, 07/25/33 (i) | 200 | 176 | ||||
| First Union National Bank Commercial Mortgage Trust - | ||||||
| Interest Only REMIC, 0.63%, 05/17/32 (i) (s) (u) | 5,781 | 86 | ||||
| GMAC Mortgage Corp. Loan Trust | ||||||
| REMIC, 7.00%, 09/25/37 (e) (i) | 434 | 197 | ||||
| REMIC, 7.00%, 09/25/37 (i) | 377 | 198 | ||||
| GSMPS Mortgage Loan Trust, 0.46%, 02/25/35 (i) (t) (u) | 143 | 114 | ||||
| GSR Mortgage Loan Trust REMIC, 4.19%, 10/25/35 (i) | 696 | 521 | ||||
| Harborview Mortgage Loan Trust REMIC | ||||||
| 0.57%, 06/20/35 (i) | 1,355 | 914 | ||||
| 5.91%, 08/19/36 (i) | 2,507 | 1,542 | ||||
| HFC Home Equity Loan Asset Backed Certificates | ||||||
| REMIC, 1.43%, 11/20/36 (i) | 1,844 | 1,567 | ||||
| Impac CMB Trust REMIC, 0.87%, 03/25/35 (i) (s) (u) | 181 | 78 | ||||
| IndyMac Index Mortgage Loan Trust | ||||||
| REMIC, 0.85%, 06/25/34 (i) | 398 | 276 | ||||
| REMIC, 3.92%, 03/25/35 (i) | 706 | 447 | ||||
| REMIC, 5.15%, 08/25/35 (i) | 818 | 552 | ||||
| REMIC, 0.44%, 05/25/46 (i) | 1,195 | 617 | ||||
| JPMorgan Chase & Co. Mortgage Funding Trust | ||||||
| REMIC, 0.39%, 12/25/36 (i) | 3,481 | 1,639 | ||||
| JPMorgan Chase Commercial Mortgage Securities Corp. | ||||||
| REMIC, 4.94%, 08/15/42 (i) | 7,000 | 6,642 | ||||
| LB-UBS Commercial Mortgage Trust | ||||||
| 6.65%, 11/15/27 | 6,000 | 6,242 | ||||
| REMIC, 5.32%, 09/15/39 | 1,000 | 953 | ||||
| Lehman Mortgage Trust REMIC, 7.25%, 09/25/37 | 5,536 | 3,751 | ||||
| Lehman XS Trust | ||||||
| REMIC, 0.49%, 02/25/46 (i) | 2,505 | 1,301 | ||||
| REMIC, 1.08%, 09/25/47 (i) | 1,752 | 956 | ||||
| Luminent Mortgage Trust REMIC, 0.42%, 05/25/46 (i) | 710 | 314 | ||||
| MASTR Adjustable Rate Mortgages Trust | ||||||
| REMIC, 4.08%, 10/25/34 (i) | 323 | 244 | ||||
| REMIC, 3.94%, 12/25/34 (i) | 106 | 65 | ||||
| REMIC, 4.84%, 01/25/36 (i) | 975 | 786 | ||||
| REMIC, 1.74%, 12/25/46 (i) | 4,191 | 1,613 | ||||
| MASTR Seasoned Securities Trust REMIC, | ||||||
| 4.83%, 10/25/32 (i) | 383 | 330 | ||||
| Merit Securities Corp. REMIC, 1.73%, 09/28/32 (i) (t) (u) | 336 | 273 | ||||
| Merrill Lynch Alternative Note Asset Trust | ||||||
| REMIC, 0.42%, 07/25/37 (i) | 869 | 418 | ||||
| Mid-State Trust, 7.34%, 07/01/35 | 239 | 235 | ||||
| Morgan Stanley Capital I REMIC, 5.21%, 11/14/42 (i) | 1,500 | 1,479 | ||||
| Morgan Stanley Mortgage Loan Trust | ||||||
| REMIC, 3.93%, 08/25/34 (i) | 209 | 155 | ||||
| REMIC, 5.19%, 03/25/36 (i) | 1,931 | 1,188 | ||||
| REMIC, 0.35%, 10/25/36 (i) | 64 | 64 | ||||
| Residential Accredit Loans Inc. | ||||||
| REMIC, 6.51%, 10/25/37 (i) | 4,534 | 2,109 | ||||
| REMIC, 1.54%, 01/25/46 (i) | 1,458 | 774 | ||||
| Residential Funding Mortgage Securities I Inc. | ||||||
| REMIC, 4.03%, 08/25/35 (i) | 787 | 509 | ||||
| REMIC, 5.19%, 09/25/35 (i) | 1,224 | 1,006 | ||||
| Sail Net Interest Margin Notes | ||||||
| 7.75%, 04/27/33 (t) (u) | 6 | - | ||||
| 5.50%, 03/27/34 (t) (u) | 45 | - | ||||
| Sigma Finance, Inc. (d) (f) (u) | 340 | 14 | ||||
| Structured Adjustable Rate Mortgage Loan Trust | ||||||
| REMIC, 2.96%, 05/25/34 (i) | 688 | 603 | ||||
| REMIC, 3.25%, 09/25/34 (i) | 287 | 235 | ||||
| REMIC, 3.05%, 11/25/34 (i) | 1,340 | 1,085 | ||||
| Structured Asset Mortgage Investments Inc. | ||||||
| REMIC, 3.59%, 08/25/35 (i) | 123 | 70 | ||||
| Washington Mutual Alternative Mortgage | ||||||
| Pass-Through Certificates REMIC, 5.96%, 10/25/36 (i) | 137 | 134 | ||||
| Washington Mutual Mortgage Pass-Through Certificates | ||||||
| REMIC, 3.14%, 06/25/34 (i) | 932 | 859 | ||||
| REMIC, 5.05%, 12/25/35 (i) | 1,862 | 1,702 | ||||
| REMIC, 5.51%, 09/25/36 (i) | 1,587 | 1,119 | ||||
| REMIC, 0.46%, 04/25/45 (i) | 194 | 143 | ||||
| Wells Fargo Alternative Loan Trust REMIC, | ||||||
| 6.53%, 12/28/37 (i) | 3,652 | 2,352 | ||||
| Wells Fargo Mortgage Backed Securities Trust REMIC, | ||||||
| 5.24%, 04/25/36 (i) | 534 | 468 | ||||
| Total Non-U.S. Government Agency | ||||||
| Asset-Backed Securities (cost $115,883) | 84,591 | |||||
| CORPORATE BONDS AND NOTES - 36.1% | ||||||
| CONSUMER DISCRETIONARY - 1.0% | ||||||
| Comcast Cable Communications Holdings Inc., | ||||||
| 8.38%, 03/15/13 | 356 | 410 | ||||
| Comcast Corp., 5.50%, 03/15/11 | 375 | 392 | ||||
| Comcast Holdings Corp., 10.63%, 07/15/12 | 875 | 1,032 | ||||
| CSC Holdings Inc. | ||||||
| 7.63%, 04/01/11 | 250 | 258 | ||||
| 6.75%, 04/15/12 | 32 | 33 | ||||
| DirecTV Holdings LLC, 5.88%, 10/01/19 (t) (v) | 825 | 839 | ||||
| DISH DBS Corp., 6.63%, 10/01/14 | 575 | 580 | ||||
| Rainbow National Services LLC, 10.38%, 09/01/14 (t) (u) | 80 | 84 | ||||
| Reed Elsevier Capital Inc., 8.63%, 01/15/19 (l) | 1,125 | 1,369 | ||||
| Station Casinos Inc. | ||||||
| 6.50%, 02/01/14 (d) (s) (u) | 100 | - | ||||
| 6.88%, 03/01/16 (d) (s) (u) | 15 | - | ||||
| 7.75%, 08/15/16 (d) (s) (u) | 60 | 9 | ||||
| Thomson Reuters Corp., 6.50%, 07/15/18 | 1,375 | 1,554 | ||||
| Whirlpool Corp. | ||||||
| 8.00%, 05/01/12 | 400 | 433 | ||||
| 8.60%, 05/01/14 (l) | 500 | 566 | ||||
| 7,559 | ||||||
| CONSUMER STAPLES - 1.2% | ||||||
| Altria Group Inc., 9.70%, 11/10/18 | 1,350 | 1,669 | ||||
| Anheuser-Busch InBev Worldwide Inc. | ||||||
| 7.20%, 01/15/14 (t) (v) | 850 | 964 | ||||
| 4.13%, 01/15/15 (t) (v) | 2,125 | 2,158 | ||||
| 7.75%, 01/15/19 (t) (v) | 2,075 | 2,429 | ||||
| BAT International Finance Plc, 9.50%, 11/15/18 (t) (v) | 1,150 | 1,460 | ||||
| CVS Caremark Corp., 5.75%, 06/01/17 | 975 | 1,029 | ||||
| 9,709 | ||||||
| ENERGY - 2.8% | ||||||
| Canadian Natural Resources Ltd. | ||||||
| 5.15%, 02/01/13 | 900 | 958 | ||||
| 6.25%, 03/15/38 | 50 | 52 | ||||
| Chesapeake Energy Corp. | ||||||
| 6.63%, 01/15/16 | 275 | 272 | ||||
| 6.50%, 08/15/17 (e) | 275 | 270 | ||||
| DCP Midstream LLC, 9.75%, 03/15/19 (t) (v) | 1,625 | 1,999 | ||||
| Dolphin Energy Ltd., 5.89%, 06/15/19 (t) (v) | 832 | 840 | ||||
| El Paso Corp. | ||||||
| 7.88%, 06/15/12 (e) | 325 | 337 | ||||
| 7.80%, 08/01/31 | 33 | 31 | ||||
| 7.75%, 01/15/32 (e) | 515 | 487 | ||||
| Energy Transfer Partners LP, 5.95%, 02/01/15 | 2,000 | 2,119 | ||||
| Enterprise Products Operating LLC | ||||||
| 6.65%, 04/15/18 | 1,500 | 1,625 | ||||
| 7.03%, 01/15/68 | 775 | 711 | ||||
| Gulf South Pipeline Co. LP, 6.30%, 08/15/17 (t) (v) | 1,200 | 1,249 | ||||
| Magellan Midstream Partners LP, 6.40%, 07/15/18 | 1,775 | 1,886 | ||||
| Nexen Inc., 6.40%, 05/15/37 | 1,200 | 1,209 | ||||
| ONEOK Partners LP | ||||||
| 6.65%, 10/01/36 | 1,225 | 1,249 | ||||
| 6.85%, 10/15/37 | 375 | 392 | ||||
| Petroleos Mexica, 8.00%, 05/03/19 | 1,940 | 2,246 | ||||
| Southern Natural Gas Co., 5.90%, 04/01/17 (k) (t) (v) | 120 | 123 | ||||
| Suncor Energy Inc., 6.10%, 06/01/18 | 1,175 | 1,261 | ||||
| Williams Cos. Inc. | ||||||
| 7.13%, 09/01/11 | 50 | 53 | ||||
| 7.63%, 07/15/19 | 75 | 84 | ||||
| 7.88%, 09/01/21 | 100 | 115 | ||||
| 8.75%, 03/15/32 (k) | 1,075 | 1,286 | ||||
| XTO Energy Inc., 6.50%, 12/15/18 | 1,175 | 1,343 | ||||
| 22,197 | ||||||
| FINANCIALS - 26.7% | ||||||
| Achmea Hypotheekbank NV, 3.20%, 11/03/14 (t) (v) | 5,700 | 5,689 | ||||
| African Development Bank, 1.75%, 10/01/12 | 7,000 | 6,954 | ||||
| ANZ Capital Trust, | ||||||
| 4.48% (callable at 100 beginning 01/15/10) (p) (t) (v) | 1,075 | 1,075 | ||||
| ANZ National International Ltd., 3.25%, 04/02/12 (t) (v) | 6,000 | 6,180 | ||||
| Bank of America Corp. | ||||||
| 5.42%, 03/15/17 | 1,300 | 1,283 | ||||
| 5.75%, 12/01/17 | 225 | 230 | ||||
| 7.63%, 06/01/19 (e) | 525 | 607 | ||||
| Chubb Corp. | ||||||
| 6.50%, 05/15/38 | 375 | 413 | ||||
| 6.38%, 03/29/67 | 825 | 767 | ||||
| Citigroup Funding Inc. | ||||||
| 1.88%, 10/22/12 | 16,800 | 16,737 | ||||
| 1.88%, 11/15/12 | 3,300 | 3,291 | ||||
| Citigroup Inc. | ||||||
| 4.13%, 02/22/10 | 1,315 | 1,320 | ||||
| 2.13%, 04/30/12 | 1,900 | 1,920 | ||||
| 1.88%, 05/07/12 | 3,000 | 3,016 | ||||
| 6.38%, 08/12/14 | 1,800 | 1,884 | ||||
| 5.00%, 09/15/14 | 2,475 | 2,386 | ||||
| CNA Financial Corp., 7.25%, 11/15/23 | 1,500 | 1,412 | ||||
| College Loan Corp. Trust, 2.27%, 03/01/42 (i) (u) | 1,000 | 850 | ||||
| Credit Agricole SA, | ||||||
| 8.38% (callable at 100 beginning 10/13/19) (p) (t) (v) | 750 | 795 | ||||
| Discover Bank, 8.70%, 11/18/19 (t) (v) | 1,325 | 1,420 | ||||
| El Paso Performance-Linked Trust, 7.75%, 07/15/11 (t) (u) | 1,290 | 1,322 | ||||
| Endurance Specialty Holdings Ltd., 6.15%, 10/15/15 | 700 | 731 | ||||
| Enel Finance International SA, 5.13%, 10/07/19 (t) (v) | 1,750 | 1,761 | ||||
| Ford Motor Credit Co. LLC, 5.50%, 06/15/11 (i) | 600 | 594 | ||||
| General Electric Capital Corp. | ||||||
| 2.00%, 09/28/12 | 8,600 | 8,611 | ||||
| 2.63%, 12/28/12 | 6,500 | 6,620 | ||||
| GMAC LLC., 1.75%, 10/30/12 | 9,100 | 9,041 | ||||
| GMAC LLC, 6.88%, 09/15/11 | 3,400 | 3,364 | ||||
| HSBC Holdings Plc, 6.80%, 06/01/38 | 2,650 | 2,876 | ||||
| ING Capital Funding Trust III, | ||||||
| 8.44% (callable at 100 beginning 12/31/10) (p) | 1,075 | 924 | ||||
| International Lease Finance Corp., 4.95%, 02/01/11 | 700 | 648 | ||||
| John Deere Capital Corp., 2.88%, 06/19/12 | 5,950 | 6,131 | ||||
| JPMorgan Chase & Co. | ||||||
| 6.63%, 03/15/12 | 1,168 | 1,275 | ||||
| 7.25%, 02/01/18 | 1,475 | 1,693 | ||||
| 7.90%, (callable at 100 beginning 04/30/18) (p) | 2,050 | 2,114 | ||||
| JPMorgan Chase Bank NA, 6.00%, 10/01/17 | 2,100 | 2,248 | ||||
| Landwirtschaftliche Rentenbank | ||||||
| 5.25%, 07/02/12 | 4,500 | 4,862 | ||||
| 4.88%, 01/10/14 | 6,000 | 6,459 | ||||
| LeasePlan Corp. NV, 3.00%, 05/07/12 (t) (v) | 3,400 | 3,481 | ||||
| Merrill Lynch & Co. Inc. | ||||||
| 5.45%, 02/05/13 | 1,275 | 1,342 | ||||
| 6.05%, 05/16/16 | 1,125 | 1,135 | ||||
| 6.40%, 08/28/17 | 700 | 737 | ||||
| 6.88%, 04/25/18 | 2,125 | 2,290 | ||||
| MetLife Capital Trust X, 9.25%, 04/08/38 (t) (v) | 500 | 565 | ||||
| Morgan Stanley | ||||||
| 5.75%, 08/31/12 | 675 | 724 | ||||
| 5.95%, 12/28/17 | 825 | 851 | ||||
| 6.63%, 04/01/18 | 2,775 | 3,000 | ||||
| 7.30%, 05/13/19 | 425 | 477 | ||||
| 5.63%, 09/23/19 (e) | 925 | 932 | ||||
| MUFG Capital Finance 1 Ltd., | ||||||
| 6.35% (callable at 100 beginning 07/25/16) (p) | 1,310 | 1,192 | ||||
| PNC Bank NA, 6.88%, 04/01/18 | 975 | 1,035 | ||||
| PNC Funding Corp., 1.88%, 06/22/11 (e) | 5,300 | 5,354 | ||||
| ProLogis, 1.88%, 11/15/37 | 1,075 | 951 | ||||
| Resona Preferred Global Securities Cayman Ltd., | ||||||
| 7.19% (callable at 100 beginning 07/30/15) (p) (t) (v) | 1,525 | 1,247 | ||||
| Royal Bank of Scotland Group Plc, 1.50%, 03/30/12 (t) (u) | 7,500 | 7,427 | ||||
| Royal Bank of Scotland Plc | ||||||
| 2.63%, 05/11/12 (t) (v) | 6,100 | 6,187 | ||||
| 4.88%, 08/25/14 (t) (v) | 1,850 | 1,875 | ||||
| Simon Property Group LP, 10.35%, 04/01/19 | 1,650 | 2,073 | ||||
| SLM Corp., 5.13%, 08/27/12 | 1,500 | 1,406 | ||||
| Svensk Exportkredit AB, 3.25%, 09/16/14 | 1,300 | 1,300 | ||||
| Swiss Re Capital I LP, | ||||||
| 6.85% (callable at 100 beginning on 05/25/16) (p) (t) (v) | 1,175 | 950 | ||||
| Transatlantic Holdings Inc., 8.00%, 11/30/39 | 975 | 993 | ||||
| Travelers Cos. Inc., 6.25%, 03/15/37 (e) | 630 | 574 | ||||
| U.S. Bank NA, 4.38%, 02/28/17 | EUR | 700 | 964 | |||
| UBS AG New Jersey-Credit Linked Note | ||||||
| (Federative Republic of Brazil, 6.00%, 01/17/17, | ||||||
| Moody’s Rating Baa3) (f) (j) (t) (u) | BRL | 1,620 | 424 | |||
| US Central Federal Credit Union | ||||||
| 1.25%, 10/19/11 (e) (t) (v) | 18,100 | 18,096 | ||||
| 1.90%, 10/19/12 (t) (v) | 1,800 | 1,799 | ||||
| Wachovia Corp., 5.50%, 05/01/13 | 2,925 | 3,107 | ||||
| WEA Finance LLC | ||||||
| 7.50%, 06/02/14 (t) (u) | 475 | 535 | ||||
| 7.13%, 04/15/18 (t) (v) | 1,125 | 1,230 | ||||
| Wells Fargo Capital XIII, | ||||||
| 7.70% (callable at 100 beginning 03/26/13) (p) | 1,450 | 1,406 | ||||
| Western Corporate Federal Credit Union, 1.75%, 11/02/12 | 1,900 | 1,891 | ||||
| Westpac Banking Corp. | ||||||
| 1.90%, 12/14/12 (t) (u) | 4,900 | 4,860 | ||||
| 4.88%, 11/19/19 (e) | 4,325 | 4,269 | ||||
| White Mountains Re Group Inc., 6.38%, 03/20/17 (t) (u) | 1,275 | 1,197 | ||||
| ZFS Finance USA Trust I | ||||||
| 5.88%, 05/09/32 (t) (u) | 1,225 | 992 | ||||
| 6.15%, 12/15/65 (t) (v) | 725 | 660 | ||||
| 209,031 | ||||||
| HEALTH CARE - 0.6% | ||||||
| Boston Scientific Corp. | ||||||
| 4.50%, 01/15/15 | 950 | 952 | ||||
| 6.00%, 01/15/20 | 550 | 562 | ||||
| 7.00%, 11/15/35 (l) | 250 | 245 | ||||
| CareFusion Corp., 6.38%, 08/01/19 (t) (v) | 1,975 | 2,114 | ||||
| HCA Inc., 7.88%, 02/15/20 (e) (t) (v) | 500 | 521 | ||||
| 4,394 | ||||||
| INDUSTRIALS - 0.0% | ||||||
| Radnor Holdings Corp., 11.00%, 03/15/10 (d) (s) (u) | 125 | - | ||||
| Safety-Kleen Services Inc., 9.25%, 06/01/08 (d) (f) (u) | 375 | - | ||||
| - | ||||||
| INFORMATION TECHNOLOGY - 0.3% | ||||||
| Agilent Technologies Inc., 5.50%, 09/14/15 | 1,925 | 2,018 | ||||
| MATERIALS - 0.9% | ||||||
| Anglo American Capital Plc | ||||||
| 9.38%, 04/08/14 (t) (v) | 414 | 497 | ||||
| 9.38%, 04/08/19 (e) (t) (u) | 625 | 794 | ||||
| ArcelorMittal, 6.13%, 06/01/18 | 1,375 | 1,419 | ||||
| Dow Chemical Co. | ||||||
| 7.60%, 05/15/14 (l) | 1,625 | 1,849 | ||||
| 5.90%, 02/15/15 (e) | 750 | 806 | ||||
| International Paper Co., 7.95%, 06/15/18 | 625 | 721 | ||||
| Methanex Corp., 8.75%, 08/15/12 | 175 | 182 | ||||
| Owens Brockway Glass Container Inc., 8.25%, 05/15/13 (e) | 375 | 385 | ||||
| Smurfit Kappa Treasury Funding Ltd., 7.50%, 11/20/25 | 225 | 192 | ||||
| 6,845 | ||||||
| TELECOMMUNICATION SERVICES - 1.5% | ||||||
| AT&T Inc., 6.40%, 05/15/38 | 1,475 | 1,516 | ||||
| France Telecom SA, 7.75%, 03/01/11 (l) | 1,975 | 2,117 | ||||
| Qwest Capital Funding Inc., 7.25%, 02/15/11 | 1,075 | 1,091 | ||||
| Qwest Communications International Inc. | ||||||
| 7.50%, 02/15/14 | 255 | 256 | ||||
| 7.50%, 02/15/14 (k) | 80 | 80 | ||||
| Qwest Corp., 8.88%, 03/15/12 (e) (k) | 125 | 134 | ||||
| Sprint Capital Corp., 8.38%, 03/15/12 | 500 | 518 | ||||
| Telecom Italia Capital SA | ||||||
| 6.20%, 07/18/11 | 975 | 1,032 | ||||
| 7.00%, 06/04/18 | 1,175 | 1,293 | ||||
| 6.00%, 09/30/34 | 925 | 875 | ||||
| UBS Luxembourg SA for OJSC Vimpel Communications, | ||||||
| 8.25%, 05/23/16 | 100 | 102 | ||||
| Verizon Communications Inc., 6.40%, 02/15/38 (e) | 1,300 | 1,359 | ||||
| Verizon Wireless Capital LLC, 8.50%, 11/15/18 (e) | 575 | 713 | ||||
| VIP Finance Ireland Ltd. for OJSC Vimpel Communications, | ||||||
| 9.13%, 04/30/13 | 350 | 374 | ||||
| Windstream Corp., 8.63%, 08/01/16 | 180 | 183 | ||||
| 11,643 | ||||||
| UTILITIES - 1.1% | ||||||
| AES Corp. | ||||||
| 9.38%, 09/15/10 | 250 | 258 | ||||
| 8.88%, 02/15/11 | 50 | 52 | ||||
| Arizona Public Service Co., 8.75%, 03/01/19 | 1,700 | 1,981 | ||||
| Commonwealth Edison Co. | ||||||
| (insured by AMBAC Assurance Corp.), 5.88%, 02/01/33 | 550 | 545 | ||||
| FirstEnergy Corp., 7.38%, 11/15/31 | 1,065 | 1,154 | ||||
| Nevada Power Co., 7.13%, 03/15/19 | 1,175 | 1,312 | ||||
| NiSource Finance Corp., 10.75%, 03/15/16 (l) | 600 | 739 | ||||
| Pacific Gas & Electric Co. | ||||||
| 6.05%, 03/01/34 | 450 | 470 | ||||
| 5.80%, 03/01/37 | 300 | 304 | ||||
| Progress Energy Inc., 7.05%, 03/15/19 | 1,275 | 1,426 | ||||
| Pugent Sound Energy Inc., 6.97%, 06/01/67 | 675 | 595 | ||||
| 8,836 | ||||||
| Total Corporate Bonds and Notes (cost $276,317) | 282,232 | |||||
| GOVERNMENT AND AGENCY OBLIGATIONS - 46.3% | ||||||
| GOVERNMENT SECURITIES - 17.3% | ||||||
| Municipals - 0.4% | ||||||
| State of California Various Purpose Bond | ||||||
| 7.50%, 04/01/34 | 1,625 | 1,577 | ||||
| 7.55%, 04/01/39 | 1,325 | 1,284 | ||||
| 2,861 | ||||||
| Sovereign - 3.8% | ||||||
| Farmer Mac Guaranteed Notes Trust, | ||||||
| 5.13%, 04/19/17 (t) (v) | 2,100 | 2,189 | ||||
| Peru Government International Bond, 7.13%, 03/30/19 | 1,130 | 1,300 | ||||
| Province of Ontario, Canada | ||||||
| 4.10%, 06/16/14 | 1,100 | 1,148 | ||||
| 4.60%, 05/26/15 (e) | 1,475 | 1,561 | ||||
| Qatar Government International Bond | ||||||
| 5.15%, 04/09/14 | 290 | 304 | ||||
| 5.25%, 01/20/20 (e) (t) (v) | 4,350 | 4,383 | ||||
| Republic of Argentina, 7.00%, 10/03/15 (f) | 1,420 | 1,216 | ||||
| Societe Financement de l'Economie Francaise | ||||||
| 3.38%, 05/05/14 (l) (t) (v) | 4,500 | 4,588 | ||||
| 2.88%, 09/22/14 (t) (v) | 8,100 | 8,037 | ||||
| Tennessee Valley Authority | ||||||
| 4.38%, 06/15/15 (e) | 2,400 | 2,519 | ||||
| 5.98%, 04/01/36 | 1,250 | 1,329 | ||||
| United Mexican States, 6.05%, 01/11/40 | 1,000 | 961 | ||||
| 29,535 | ||||||
| Treasury Inflation Index Securities - 6.2% | ||||||
| U.S. Treasury Inflation Indexed Note | ||||||
| 4.25%, 01/15/10 (r) | 23,964 | 30,637 | ||||
| 0.88%, 04/15/10 (r) | 6,617 | 7,557 | ||||
| 1.63%, 01/15/15 (r) | 3,464 | 4,121 | ||||
| 2.00%, 01/15/16 (r) | 2,182 | 2,473 | ||||
| 2.50%, 07/15/16 (r) | 3,085 | 3,730 | ||||
| 48,518 | ||||||
| U.S. Treasury Securities - 6.9% | ||||||
| U.S. Treasury Bond | ||||||
| 4.25%, 11/15/17 | 10,400 | 10,900 | ||||
| 5.00%, 05/15/37 | 4,200 | 4,461 | ||||
| 4.25%, 05/15/39 (e) | 1,100 | 1,032 | ||||
| 4.38%, 11/15/39 | 8,900 | 8,519 | ||||
| U.S. Treasury Bond Principal Strip | ||||||
| 0.00%, 05/15/20 (j) | 3,300 | 2,130 | ||||
| 0.00%, 08/15/20 (e) (j) | 8,400 | 5,344 | ||||
| 0.00%, 05/15/21 (j) | 900 | 547 | ||||
| 0.00%, 11/15/21 (j) | 1,800 | 1,060 | ||||
| U.S. Treasury Note | ||||||
| 2.38%, 10/31/14 (e) | 8,200 | 8,111 | ||||
| 2.63%, 12/31/14 | 1,400 | 1,396 | ||||
| 4.00%, 08/15/18 | 5,300 | 5,413 | ||||
| 3.38%, 11/15/19 (e) | 5,700 | 5,483 | ||||
| 54,396 | ||||||
| U.S. GOVERNMENT AGENCY | ||||||
| MORTGAGE-BACKED SECURITIES - 29.0% | ||||||
| Federal Farm Credit Bank - 0.6% | ||||||
| Federal Farm Credit Bank, 4.88%, 12/16/15 (e) | 4,600 | 4,957 | ||||
| Federal Home Loan Bank - 0.3% | ||||||
| Federal Home Loan Bank, 5.50%, 07/15/36 (o) | 2,000 | 2,052 | ||||
| Federal Home Loan Mortgage Corp. - 8.0% | ||||||
| Federal Home Loan Mortgage Corp. | ||||||
| 1.75%, 07/27/11 (o) | 6,900 | 6,926 | ||||
| 4.50%, 04/02/14 | 5,000 | 5,376 | ||||
| 5.00%, 11/13/14 | 9,600 | 10,498 | ||||
| 5.00%, 12/01/35 | 269 | 276 | ||||
| 5.50%, 01/01/36 | 262 | 275 | ||||
| 5.50%, 01/01/36 | 48 | 50 | ||||
| 5.50%, 02/01/36 | 1 | 1 | ||||
| 6.00%, 11/01/36 | 20 | 22 | ||||
| 6.06%, 01/01/37 (i) | 1,726 | 1,827 | ||||
| 5.50%, 03/01/37 | 30 | 31 | ||||
| 5.50%, 04/01/37 | 11 | 12 | ||||
| 5.50%, 04/01/37 | 18 | 19 | ||||
| 5.50%, 04/01/37 | 21 | 22 | ||||
| 5.50%, 04/01/37 | 73 | 76 | ||||
| 5.50%, 06/01/37 | 14 | 15 | ||||
| 6.00%, 07/01/37 | 459 | 487 | ||||
| 6.00%, 09/01/37 | 25 | 27 | ||||
| 6.00%, 09/01/37 | 26 | 28 | ||||
| 6.00%, 11/01/37 | 21 | 23 | ||||
| 5.50%, 12/01/37 | 110 | 116 | ||||
| 5.50%, 12/01/37 | 22 | 23 | ||||
| 6.50%, 01/01/38 | 3,562 | 3,816 | ||||
| 5.50%, 02/01/38 | 253 | 265 | ||||
| 6.00%, 02/01/38 | 27 | 28 | ||||
| 6.00%, 02/01/38 | 29 | 31 | ||||
| 6.00%, 02/01/38 | 21 | 22 | ||||
| 5.50%, 04/01/38 | 88 | 92 | ||||
| 5.50%, 04/01/38 | 205 | 215 | ||||
| 6.00%, 04/01/38 | 22 | 23 | ||||
| 5.50%, 05/01/38 | 23 | 24 | ||||
| 5.50%, 05/01/38 | 61 | 63 | ||||
| 5.50%, 05/01/38 | 87 | 91 | ||||
| 6.00%, 05/01/38 | 3,296 | 3,498 | ||||
| 5.50%, 06/01/38 | 93 | 98 | ||||
| 5.50%, 06/01/38 | 206 | 216 | ||||
| 5.50%, 06/01/38 | 213 | 224 | ||||
| 5.50%, 06/01/38 | 12 | 13 | ||||
| 5.50%, 06/01/38 | 8 | 8 | ||||
| 5.50%, 06/01/38 | 66 | 69 | ||||
| 5.50%, 06/01/38 | 23 | 24 | ||||
| 5.50%, 06/01/38 | 239 | 251 | ||||
| 5.50%, 06/01/38 | 153 | 161 | ||||
| 5.50%, 06/01/38 | 162 | 170 | ||||
| 6.00%, 07/01/38 | 23 | 24 | ||||
| 6.00%, 07/01/38 | 144 | 153 | ||||
| 6.00%, 07/01/38 | 146 | 155 | ||||
| 6.00%, 09/01/38 | 42 | 45 | ||||
| 6.00%, 09/01/38 | 59 | 62 | ||||
| 5.50%, 10/01/38 | 75 | 79 | ||||
| 6.00%, 10/01/38 | 30 | 31 | ||||
| 6.00%, 10/01/38 | 22 | 23 | ||||
| 6.00%, 11/01/38 | 22 | 24 | ||||
| 6.00%, 11/01/38 | 3,404 | 3,616 | ||||
| 6.00%, 12/01/38 | 850 | 903 | ||||
| 6.50%, 12/01/38 | 1,869 | 2,002 | ||||
| 6.00%, 02/01/39 | 22 | 24 | ||||
| 5.50%, 04/01/39 | 13 | 14 | ||||
| 5.50%, 04/01/39 | 10 | 11 | ||||
| 5.00%, 05/01/39 | 578 | 593 | ||||
| 5.00%, 05/01/39 | 59 | 61 | ||||
| 5.00%, 06/01/39 | 1,058 | 1,086 | ||||
| 5.00%, 06/01/39 | 773 | 794 | ||||
| 5.00%, 06/01/39 | 1,452 | 1,490 | ||||
| 5.00%, 07/01/39 | 394 | 405 | ||||
| 5.00%, 07/01/39 | 293 | 301 | ||||
| 5.00%, 07/01/39 | 622 | 639 | ||||
| 5.00%, 07/01/39 | 44 | 45 | ||||
| 5.00%, 07/01/39 | 49 | 50 | ||||
| 5.00%, 08/01/39 | 81 | 83 | ||||
| 5.00%, 08/01/39 | 36 | 37 | ||||
| 5.00%, 08/01/39 | 90 | 93 | ||||
| 5.00%, 08/01/39 | 49 | 51 | ||||
| 5.00%, 08/01/39 | 58 | 59 | ||||
| 5.00%, 08/01/39 | 31 | 32 | ||||
| 4.50%, 09/01/39 | 2,964 | 2,960 | ||||
| 4.50%, 09/01/39 | 994 | 992 | ||||
| 5.00%, 09/01/39 | 53 | 54 | ||||
| 5.00%, 09/01/39 | 44 | 45 | ||||
| 5.00%, 09/01/39 | 124 | 127 | ||||
| 5.00%, 09/01/39 | 155 | 159 | ||||
| 5.00%, 09/01/39 | 157 | 162 | ||||
| 5.00%, 09/01/39 | 112 | 115 | ||||
| 5.00%, 09/01/39 | 146 | 150 | ||||
| 5.00%, 09/01/39 | 66 | 68 | ||||
| 5.00%, 09/01/39 | 41 | 42 | ||||
| 5.00%, 09/01/39 | 2,972 | 3,051 | ||||
| 4.50%, 10/01/39 | 200 | 200 | ||||
| 4.50%, 10/01/39 | 100 | 100 | ||||
| 5.00%, 10/01/39 | 145 | 149 | ||||
| 5.00%, 10/01/39 | 1,199 | 1,231 | ||||
| 5.00%, 10/01/39 | 1,494 | 1,534 | ||||
| 5.00%, 10/01/39 | 698 | 716 | ||||
| 5.00%, 11/01/39 | 1,595 | 1,637 | ||||
| REMIC, 1,156.50%, 06/15/21 (s) (u) | - | 1 | ||||
| REMIC, 0.00%, 08/15/35 | ||||||
| (0.00% until LIBOR reaches 6.50%) (i) (s) (u) | 15 | 14 | ||||
| REMIC, 0.00%, 09/15/35 | ||||||
| (0.00% until LIBOR reaches 7.00%) (i) (s) (u) | 453 | 369 | ||||
| REMIC, 0.00%, 04/15/37 | ||||||
| (0.00% until LIBOR reaches 6.75%) (i) (s) (u) | 212 | 164 | ||||
| 62,557 | ||||||
| Federal National Mortgage Association - 16.0% | ||||||
| Federal National Mortgage Association | ||||||
| 5.00%, 01/01/18 | 560 | 590 | ||||
| 5.00%, 02/01/18 | 610 | 643 | ||||
| 5.00%, 02/01/18 | 383 | 404 | ||||
| 5.00%, 03/01/18 | 771 | 816 | ||||
| 5.00%, 04/01/18 | 599 | 631 | ||||
| 5.00%, 05/01/18 | 644 | 679 | ||||
| 5.00%, 06/01/18 | 535 | 564 | ||||
| 5.00%, 06/01/18 | 742 | 782 | ||||
| 5.00%, 06/01/18 | 738 | 777 | ||||
| 5.00%, 06/01/18 | 692 | 730 | ||||
| 5.00%, 06/01/18 | 746 | 786 | ||||
| 5.00%, 06/01/18 | 634 | 668 | ||||
| 5.00%, 06/01/18 | 571 | 601 | ||||
| 5.00%, 06/01/18 | 638 | 672 | ||||
| 4.50%, 07/01/18 | 213 | 222 | ||||
| 4.50%, 07/01/18 | 282 | 294 | ||||
| 4.50%, 07/01/18 | 257 | 268 | ||||
| 5.00%, 07/01/18 | 552 | 582 | ||||
| 4.50%, 07/01/18 | 313 | 327 | ||||
| 4.50%, 09/01/18 | 301 | 313 | ||||
| 4.50%, 09/01/18 | 194 | 202 | ||||
| 4.50%, 09/01/18 | 470 | 490 | ||||
| 4.50%, 09/01/18 | 468 | 488 | ||||
| 4.50%, 09/01/18 | 221 | 230 | ||||
| 4.50%, 09/01/18 | 226 | 236 | ||||
| 4.50%, 09/01/18 | 206 | 215 | ||||
| 5.00%, 09/01/18 | 480 | 506 | ||||
| 5.00%, 09/01/18 | 751 | 792 | ||||
| 4.50%, 09/01/18 | 262 | 274 | ||||
| 5.00%, 10/01/18 | 490 | 517 | ||||
| 5.00%, 10/01/18 | 686 | 722 | ||||
| 5.00%, 10/01/18 | 526 | 554 | ||||
| 4.50%, 10/10/18 | 217 | 226 | ||||
| 4.50%, 10/10/18 | 232 | 241 | ||||
| 4.50%, 10/10/18 | 176 | 183 | ||||
| 5.00%, 11/01/18 | 558 | 587 | ||||
| 5.00%, 11/01/18 | 683 | 719 | ||||
| 5.00%, 11/01/18 | 537 | 566 | ||||
| 5.00%, 11/01/18 | 769 | 811 | ||||
| 5.00%, 11/01/18 | 583 | 614 | ||||
| 5.00%, 12/01/18 | 494 | 521 | ||||
| 5.00%, 12/01/18 | 461 | 486 | ||||
| 5.00%, 12/01/18 | 250 | 263 | ||||
| 5.00%, 12/01/18 | 515 | 542 | ||||
| 5.00%, 01/01/19 | 813 | 857 | ||||
| 5.00%, 01/01/19 | 606 | 638 | ||||
| 5.00%, 02/01/19 | 585 | 615 | ||||
| 6.50%, 02/01/19 | 2 | 2 | ||||
| 5.00%, 03/01/19 | 703 | 741 | ||||
| 5.00%, 03/01/19 | 537 | 565 | ||||
| 5.00%, 04/01/19 | 540 | 568 | ||||
| 5.00%, 04/01/19 | 504 | 531 | ||||
| 5.00%, 04/01/19 | 544 | 572 | ||||
| 5.00%, 04/01/19 | 509 | 535 | ||||
| 4.50%, 05/01/19 | 241 | 251 | ||||
| 4.50%, 05/01/19 | 91 | 95 | ||||
| 4.50%, 05/01/19 | 266 | 277 | ||||
| 4.50%, 05/01/19 | 236 | 245 | ||||
| 4.50%, 05/01/19 | 242 | 252 | ||||
| 4.50%, 05/01/19 | 199 | 207 | ||||
| 4.50%, 05/01/19 | 195 | 203 | ||||
| 4.50%, 05/01/19 | 295 | 307 | ||||
| 4.50%, 05/01/19 | 256 | 266 | ||||
| 4.50%, 05/01/19 | 234 | 243 | ||||
| 4.50%, 05/01/19 | 334 | 347 | ||||
| 4.50%, 05/01/19 | 341 | 356 | ||||
| 4.50%, 05/01/19 | 239 | 248 | ||||
| 5.00%, 05/01/19 | 602 | 633 | ||||
| 6.00%, 09/01/19 | 1,191 | 1,276 | ||||
| 0.00%, 10/09/19 (j) | 350 | 190 | ||||
| 6.00%, 12/01/20 | 1,485 | 1,592 | ||||
| 4.00%, 02/01/21, TBA (g) | 10,000 | 10,058 | ||||
| 6.00%, 11/01/21 | 474 | 507 | ||||
| 6.00%, 12/01/21 | 31 | 33 | ||||
| 6.00%, 02/01/23 | 557 | 595 | ||||
| 5.50%, 09/01/23 | 1,206 | 1,278 | ||||
| 5.50%, 09/01/23 | 1,616 | 1,713 | ||||
| 5.50%, 10/01/23 | 507 | 537 | ||||
| 6.00%, 12/01/23 | 102 | 109 | ||||
| 5.50%, 04/01/29 | 1 | 1 | ||||
| 8.00%, 08/01/29 | 2 | 2 | ||||
| 8.00%, 04/01/30 | 7 | 8 | ||||
| 8.00%, 07/01/30 | 12 | 14 | ||||
| 8.00%, 08/01/30 | 4 | 4 | ||||
| 8.00%, 10/01/30 | 53 | 61 | ||||
| 8.00%, 01/01/31 | 14 | 16 | ||||
| 8.00%, 01/01/31 | 13 | 15 | ||||
| 8.00%, 02/01/31 | 6 | 7 | ||||
| 6.00%, 03/01/32 | - | 1 | ||||
| 6.00%, 07/01/32 | 12 | 13 | ||||
| 7.00%, 07/01/32 | 20 | 22 | ||||
| 5.50%, 04/01/33 | 2,838 | 2,983 | ||||
| 6.00%, 05/01/33 | 45 | 48 | ||||
| 5.00%, 07/01/33 | 9 | 9 | ||||
| 5.50%, 07/01/33 | 11 | 11 | ||||
| 5.50%, 07/01/33 | 1,659 | 1,744 | ||||
| 5.00%, 08/01/33 | 147 | 151 | ||||
| 5.00%, 08/01/33 | 13 | 13 | ||||
| 5.00%, 08/01/33 | 38 | 39 | ||||
| 5.00%, 09/01/33 | 11 | 11 | ||||
| 5.50%, 09/01/33 | 16 | 17 | ||||
| 5.00%, 11/01/33 | 12 | 13 | ||||
| 5.50%, 12/01/33 | 10 | 11 | ||||
| 6.00%, 12/01/33 | 20 | 21 | ||||
| 5.00%, 01/01/34 | 12 | 13 | ||||
| 5.50%, 02/01/34 | 21 | 22 | ||||
| 5.50%, 04/01/34 | 3 | 3 | ||||
| 5.50%, 05/01/34 | 44 | 46 | ||||
| 5.50%, 06/01/34 | - | 1 | ||||
| 5.50%, 08/01/34 | 32 | 34 | ||||
| 5.50%, 10/01/34 | 2 | 2 | ||||
| 5.50%, 12/01/34 | 219 | 230 | ||||
| 6.00%, 12/01/34 | 5 | 5 | ||||
| 6.00%, 02/01/35 | 142 | 152 | ||||
| 5.00%, 03/01/35 | 17 | 18 | ||||
| 5.00%, 04/01/35 | 26 | 27 | ||||
| 5.50%, 04/01/35 | 77 | 81 | ||||
| 6.00%, 04/01/35 | 1,125 | 1,203 | ||||
| 6.00%, 04/01/35 | 27 | 29 | ||||
| 5.00%, 05/01/35 | 15 | 16 | ||||
| 5.00%, 06/01/35 | 305 | 314 | ||||
| 5.00%, 07/01/35 | 91 | 94 | ||||
| 5.00%, 07/01/35 | 26 | 27 | ||||
| 5.00%, 07/01/35 | 22 | 23 | ||||
| 5.00%, 07/01/35 | 27 | 27 | ||||
| 5.00%, 07/01/35 | 24 | 25 | ||||
| 5.00%, 07/01/35 | 22 | 22 | ||||
| 5.50%, 07/01/35 | 59 | 62 | ||||
| 5.50%, 07/01/35 | 1 | 1 | ||||
| 6.00%, 07/01/35 | 176 | 188 | ||||
| 5.00%, 08/01/35 | 16 | 16 | ||||
| 5.00%, 08/01/35 | 18 | 18 | ||||
| 5.00%, 08/01/35 | 27 | 28 | ||||
| 5.00%, 08/01/35 | 27 | 28 | ||||
| 5.50%, 08/01/35 | 3 | 4 | ||||
| 6.00%, 08/01/35 | 151 | 161 | ||||
| 6.00%, 08/01/35 | 2 | 2 | ||||
| 5.00%, 09/01/35 | 28 | 29 | ||||
| 5.00%, 09/01/35 | 25 | 26 | ||||
| 5.00%, 09/01/35 | 220 | 226 | ||||
| 5.00%, 09/01/35 | 32 | 33 | ||||
| 5.00%, 09/01/35 | 645 | 663 | ||||
| 5.00%, 09/01/35 | 188 | 193 | ||||
| 5.00%, 09/01/35 | 25 | 25 | ||||
| 5.00%, 09/01/35 | 29 | 30 | ||||
| 5.00%, 09/01/35 | 28 | 29 | ||||
| 5.00%, 09/01/35 | 20 | 21 | ||||
| 5.50%, 09/01/35 | 27 | 29 | ||||
| 5.00%, 10/01/35 | 27 | 28 | ||||
| 5.00%, 10/01/35 | 27 | 28 | ||||
| 2.52%, 11/01/35 (i) | 200 | 201 | ||||
| 5.00%, 11/01/35 | 19 | 20 | ||||
| 5.00%, 11/01/35 | 30 | 31 | ||||
| 6.00%, 11/01/35 | 116 | 123 | ||||
| 6.00%, 11/01/35 | 136 | 144 | ||||
| 6.00%, 11/01/35 | 276 | 293 | ||||
| 5.50%, 12/01/35 | 16 | 17 | ||||
| 6.00%, 01/01/36 | 510 | 543 | ||||
| 5.00%, 02/01/36 | 353 | 363 | ||||
| 5.50%, 02/01/36 | 1 | 1 | ||||
| 6.00%, 02/01/36 | 45 | 47 | ||||
| 6.00%, 03/01/36 | 61 | 65 | ||||
| 6.00%, 03/01/36 | 1 | 2 | ||||
| 6.00%, 03/01/36 | 99 | 106 | ||||
| 6.00%, 04/01/36 | 118 | 125 | ||||
| 2.90%, 05/01/36 (i) | 1,210 | 1,263 | ||||
| 3.03%, 05/01/36 (i) | 1,255 | 1,310 | ||||
| 6.00%, 06/01/36 | 52 | 55 | ||||
| 2.93%, 07/01/36 (i) | 1,188 | 1,241 | ||||
| 5.00%, 07/01/36 | 30 | 31 | ||||
| 3.02%, 08/01/36 (i) | 1,289 | 1,346 | ||||
| 6.00%, 08/01/36 | 87 | 93 | ||||
| 2.89%, 09/01/36 (i) | 1,271 | 1,333 | ||||
| 6.00%, 09/01/36 | 19 | 20 | ||||
| 6.00%, 10/01/36 | 18 | 19 | ||||
| 6.00%, 10/01/36 | 456 | 484 | ||||
| 6.00%, 11/01/36 | 122 | 130 | ||||
| 5.50%, 12/01/36 | 10 | 10 | ||||
| 5.50%, 12/01/36 | 19 | 20 | ||||
| 4.50%, 01/01/37, TBA (g) | 12,000 | 11,978 | ||||
| 5.50%, 01/01/37 | 4 | 4 | ||||
| 5.50%, 02/01/37 | 3 | 4 | ||||
| 5.50%, 02/01/37 | 11 | 12 | ||||
| 5.50%, 02/01/37 | 11 | 12 | ||||
| 5.50%, 03/01/37 | 14 | 15 | ||||
| 5.50%, 03/01/37 | 4 | 5 | ||||
| 5.50%, 03/01/37 | 7 | 8 | ||||
| 5.50%, 03/01/37 | 7 | 8 | ||||
| 5.50%, 03/01/37 | 18 | 19 | ||||
| 5.50%, 03/01/37 | 5 | 5 | ||||
| 5.50%, 04/01/37 | 10 | 10 | ||||
| 5.50%, 04/01/37 | 18 | 19 | ||||
| 5.50%, 04/01/37 | 69 | 73 | ||||
| 5.50%, 04/01/37 | 12 | 13 | ||||
| 5.50%, 04/01/37 | 22 | 23 | ||||
| 5.50%, 04/01/37 | 1 | 1 | ||||
| 5.50%, 04/01/37 | 6 | 6 | ||||
| 5.50%, 05/01/37 | 7 | 7 | ||||
| 5.50%, 05/01/37 | 44 | 47 | ||||
| 5.50%, 05/01/37 | 8 | 8 | ||||
| 5.50%, 06/01/37 | 49 | 51 | ||||
| 5.50%, 06/01/37 | 2 | 2 | ||||
| 6.00%, 06/01/37 | 46 | 49 | ||||
| 5.50%, 07/01/37 | 15 | 16 | ||||
| 5.50%, 07/01/37 | 19 | 20 | ||||
| 5.50%, 07/01/37 | 10 | 11 | ||||
| 5.50%, 08/01/37 | 37 | 39 | ||||
| 6.00%, 08/01/37 | 19 | 21 | ||||
| 6.00%, 08/01/37 | 22 | 23 | ||||
| 6.00%, 08/01/37 | 31 | 33 | ||||
| 6.00%, 09/01/37 | 86 | 91 | ||||
| 6.00%, 10/01/37 | 17 | 18 | ||||
| 6.00%, 10/01/37 | 20 | 21 | ||||
| 6.00%, 10/01/37 | 159 | 169 | ||||
| 5.50%, 11/01/37 | 17 | 18 | ||||
| 6.00%, 11/01/37 | 19 | 20 | ||||
| 6.00%, 11/01/37 | 38 | 40 | ||||
| 6.00%, 11/01/37 | 852 | 904 | ||||
| 5.50%, 12/01/37 | 1 | 1 | ||||
| 6.00%, 12/01/37 | 89 | 95 | ||||
| 6.00%, 12/01/37 | 130 | 138 | ||||
| 5.50%, 02/01/38 | 2 | 3 | ||||
| 6.00%, 02/01/38 | 142 | 151 | ||||
| 5.50%, 03/01/38 | 11 | 12 | ||||
| 5.50%, 03/01/38 | 17 | 17 | ||||
| 5.50%, 03/01/38 | 7 | 7 | ||||
| 5.50%, 03/01/38 | 6 | 6 | ||||
| 6.00%, 03/01/38 | 89 | 94 | ||||
| 5.50%, 04/01/38 | 107 | 112 | ||||
| 5.50%, 04/01/38 | 26 | 27 | ||||
| 5.50%, 04/01/38 | 52 | 55 | ||||
| 5.50%, 05/01/38 | 15 | 15 | ||||
| 5.50%, 05/01/38 | 10 | 10 | ||||
| 5.50%, 05/01/38 | 28 | 30 | ||||
| 5.50%, 05/01/38 | 14 | 14 | ||||
| 5.50%, 05/01/38 | 1 | 1 | ||||
| 5.50%, 05/01/38 | 2 | 3 | ||||
| 6.00%, 05/01/38 | 43 | 46 | ||||
| 5.50%, 06/01/38 | 1 | 1 | ||||
| 5.50%, 06/01/38 | 32 | 33 | ||||
| 5.50%, 06/01/38 | 3 | 3 | ||||
| 5.50%, 06/01/38 | 1 | 1 | ||||
| 5.50%, 06/01/38 | 34 | 36 | ||||
| 5.50%, 06/01/38 | 5 | 6 | ||||
| 5.50%, 06/01/38 | 2 | 2 | ||||
| 6.00%, 06/01/38 | 24 | 26 | ||||
| 6.00%, 06/01/38 | 38 | 40 | ||||
| 5.50%, 07/01/38 | 1 | 1 | ||||
| 5.50%, 07/01/38 | 1 | 1 | ||||
| 5.50%, 07/01/38 | 2 | 2 | ||||
| 5.50%, 07/01/38 | 4 | 4 | ||||
| 5.50%, 07/01/38 | 2 | 2 | ||||
| 5.50%, 07/01/38 | 8 | 8 | ||||
| 5.50%, 07/01/38 | 27 | 28 | ||||
| 6.00%, 07/01/38 | 86 | 91 | ||||
| 5.50%, 08/01/38 | 7 | 7 | ||||
| 5.50%, 08/01/38 | 4 | 4 | ||||
| 5.50%, 08/01/38 | 49 | 51 | ||||
| 6.00%, 08/01/38 | 35 | 37 | ||||
| 6.00%, 08/01/38 | 165 | 175 | ||||
| 5.50%, 09/01/38 | 7 | 7 | ||||
| 5.50%, 09/01/38 | 37 | 38 | ||||
| 5.50%, 09/01/38 | 17 | 17 | ||||
| 5.50%, 09/01/38 | 40 | 41 | ||||
| 5.50%, 09/01/38 | 17 | 18 | ||||
| 5.50%, 10/01/38 | 4 | 4 | ||||
| 5.50%, 10/01/38 | 52 | 54 | ||||
| 5.50%, 10/01/38 | 1 | 1 | ||||
| 6.00%, 10/01/38 | 30 | 31 | ||||
| 6.00%, 10/01/38 | 56 | 59 | ||||
| 6.00%, 11/01/38 | 31 | 33 | ||||
| 5.50%, 12/01/38 | 43 | 45 | ||||
| 5.50%, 12/01/38 | 19 | 20 | ||||
| 5.50%, 12/01/38 | 4 | 4 | ||||
| 5.50%, 12/01/38 | 11 | 12 | ||||
| 5.50%, 12/01/38 | 37 | 39 | ||||
| 5.50%, 12/01/38 | 15 | 16 | ||||
| 5.50%, 01/01/39 | 17 | 18 | ||||
| 5.50%, 01/01/39 | 10 | 10 | ||||
| 5.50%, 01/01/39 | 54 | 57 | ||||
| 5.50%, 01/01/39 | 31 | 33 | ||||
| 5.50%, 01/01/39 | 266 | 278 | ||||
| 5.50%, 01/01/39 | 41 | 43 | ||||
| 5.50%, 01/01/39 | 29 | 30 | ||||
| 5.50%, 01/01/39 | 66 | 69 | ||||
| 5.50%, 01/01/39 | 330 | 346 | ||||
| 5.50%, 01/01/39 | 19 | 20 | ||||
| 5.00%, 02/01/39 | 181 | 186 | ||||
| 5.00%, 02/01/39 | 38 | 39 | ||||
| 5.00%, 02/01/39 | 54 | 55 | ||||
| 5.00%, 02/01/39 | 42 | 44 | ||||
| 5.50%, 02/01/39 | 32 | 34 | ||||
| 5.50%, 02/01/39 | 41 | 43 | ||||
| 5.50%, 02/01/39 | 15 | 16 | ||||
| 5.50%, 02/01/39 | 33 | 35 | ||||
| 5.50%, 02/01/39 | 46 | 48 | ||||
| 6.00%, 02/01/39 | 11,473 | 12,170 | ||||
| 5.00%, 03/01/39 | 187 | 192 | ||||
| 5.00%, 03/01/39 | 40 | 41 | ||||
| 5.50%, 03/01/39 | 26 | 27 | ||||
| 5.50%, 03/01/39 | 133 | 139 | ||||
| 5.50%, 03/01/39 | 51 | 53 | ||||
| 5.00%, 04/01/39 | 25 | 25 | ||||
| 5.00%, 04/01/39 | 48 | 49 | ||||
| 5.50%, 04/01/39 | 24 | 25 | ||||
| 5.00%, 05/01/39 | 97 | 100 | ||||
| 5.00%, 05/01/39 | 49 | 50 | ||||
| 5.00%, 05/01/39 | 53 | 54 | ||||
| 5.00%, 05/01/39 | 56 | 58 | ||||
| 5.00%, 05/01/39 | 155 | 159 | ||||
| 5.00%, 05/01/39 | 97 | 100 | ||||
| 5.00%, 05/01/39 | 38 | 39 | ||||
| 5.00%, 05/01/39 | 31 | 32 | ||||
| 5.00%, 05/01/39 | 83 | 85 | ||||
| 5.00%, 05/01/39 | 65 | 67 | ||||
| 5.00%, 05/01/39 | 28 | 28 | ||||
| 5.00%, 05/01/39 | 91 | 93 | ||||
| 5.00%, 05/01/39 | 96 | 99 | ||||
| 5.00%, 05/01/39 | 75 | 77 | ||||
| 4.50%, 06/01/39 | 77 | 77 | ||||
| 4.50%, 06/01/39 | 75 | 75 | ||||
| 4.50%, 06/01/39 | 37 | 37 | ||||
| 5.00%, 06/01/39 | 55 | 57 | ||||
| 5.00%, 06/01/39 | 130 | 134 | ||||
| 5.00%, 06/01/39 | 51 | 53 | ||||
| 4.50%, 07/01/39 | 57 | 57 | ||||
| 4.50%, 07/01/39 | 36 | 36 | ||||
| 4.50%, 07/01/39 | 64 | 64 | ||||
| 4.50%, 07/01/39 | 68 | 68 | ||||
| 5.00%, 07/01/39 | 96 | 98 | ||||
| 5.00%, 07/01/39 | 51 | 52 | ||||
| 5.00%, 07/01/39 | 39 | 40 | ||||
| 5.00%, 07/01/39 | 99 | 101 | ||||
| 5.00%, 07/01/39 | 49 | 51 | ||||
| 5.00%, 07/01/39 | 100 | 102 | ||||
| 5.00%, 07/01/39 | 49 | 50 | ||||
| 5.00%, 07/01/39 | 64 | 66 | ||||
| 5.00%, 07/01/39 | 49 | 51 | ||||
| 5.00%, 07/01/39 | 62 | 64 | ||||
| 5.00%, 07/01/39 | 97 | 100 | ||||
| 4.50%, 08/01/39 | 51 | 51 | ||||
| 4.50%, 08/01/39 | 66 | 66 | ||||
| 4.50%, 08/01/39 | 35 | 35 | ||||
| 4.50%, 08/01/39 | 37 | 37 | ||||
| 4.50%, 08/01/39 | 42 | 42 | ||||
| 4.50%, 08/01/39 | 50 | 50 | ||||
| 4.50%, 08/01/39 | 98 | 97 | ||||
| 5.00%, 08/01/39 | 31 | 32 | ||||
| 5.00%, 08/01/39 | 49 | 51 | ||||
| 5.00%, 08/01/39 | 42 | 43 | ||||
| 5.00%, 08/01/39 | 22 | 23 | ||||
| 5.00%, 08/01/39 | 47 | 48 | ||||
| 5.00%, 08/01/39 | 51 | 53 | ||||
| 4.50%, 09/01/39 | 397 | 396 | ||||
| 5.00%, 09/01/39 | 43 | 44 | ||||
| 5.00%, 09/01/39 | 68 | 70 | ||||
| 5.00%, 09/01/39 | 592 | 609 | ||||
| 5.00%, 09/01/39 | 113 | 116 | ||||
| 5.00%, 09/01/39 | 24 | 24 | ||||
| 4.50%, 10/01/39 | 694 | 694 | ||||
| 4.50%, 10/01/39 | 696 | 696 | ||||
| 4.50%, 10/01/39 | 298 | 298 | ||||
| 5.00%, 10/01/39 | 80 | 82 | ||||
| 5.00%, 10/01/39 | 395 | 406 | ||||
| 5.00%, 10/01/39 | 78 | 80 | ||||
| 5.00%, 10/01/39 | 2,090 | 2,147 | ||||
| 5.00%, 10/01/39 | 99 | 102 | ||||
| 5.00%, 10/01/39 | 594 | 611 | ||||
| 5.00%, 10/01/39 | 100 | 102 | ||||
| 5.00%, 10/01/39 | 583 | 599 | ||||
| 5.00%, 10/01/39 | 934 | 960 | ||||
| 5.00%, 10/01/39 | 694 | 713 | ||||
| 5.00%, 11/01/39 | 697 | 716 | ||||
| 6.00%, 12/31/49 | 245 | 261 | ||||
| REMIC, 10.40%, 04/25/19 | 1 | 1 | ||||
| REMIC, 0.00%, 05/25/35 | ||||||
| (0.00% until LIBOR reaches 7.00%) (i) (s) (u) | 95 | 91 | ||||
| REMIC, 0.00%, 09/25/36 | ||||||
| (0.00% until LIBOR reaches 7.00%) (i) (s) (u) | 159 | 138 | ||||
| REMIC, 0.68%, 02/25/37 (i) | 4,795 | 4,696 | ||||
| REMIC, 1.07%, 04/25/48 (i) | 4,445 | 4,433 | ||||
| REMIC, 1.17%, 07/25/48 (i) | 4,890 | 4,887 | ||||
| 125,586 | ||||||
| Government National Mortgage Association - 4.1% | ||||||
| Government National Mortgage Association | ||||||
| 6.00%, 01/24/32, TBA (g) | 9,000 | 9,509 | ||||
| 5.50%, 01/01/34, TBA (g) | 1,000 | 1,048 | ||||
| 6.00%, 10/15/38 | 36 | 38 | ||||
| 6.00%, 11/15/38 | 61 | 65 | ||||
| 6.00%, 11/15/38 | 74 | 78 | ||||
| 6.00%, 12/15/38 | 22 | 23 | ||||
| 6.00%, 12/15/38 | 35 | 37 | ||||
| 6.00%, 12/15/38 | 643 | 681 | ||||
| 6.00%, 12/15/38 | 27 | 29 | ||||
| 6.00%, 12/15/38 | 581 | 615 | ||||
| 6.00%, 12/15/38 | 112 | 119 | ||||
| 6.00%, 01/15/39 | 95 | 100 | ||||
| 6.00%, 01/15/39 | 53 | 56 | ||||
| 6.00%, 01/15/39 | 24 | 26 | ||||
| 6.00%, 01/15/39 | 96 | 102 | ||||
| 6.00%, 01/15/39 | 37 | 39 | ||||
| 6.00%, 01/15/39 | 41 | 44 | ||||
| 6.00%, 01/15/39 | 101 | 107 | ||||
| 6.00%, 01/15/39 | 26 | 28 | ||||
| 6.00%, 01/15/39 | 41 | 44 | ||||
| 5.00%, 04/15/39 | 24 | 25 | ||||
| 5.00%, 04/15/39 | 31 | 31 | ||||
| 5.00%, 04/15/39 | 777 | 800 | ||||
| 5.00%, 04/15/39 | 150 | 155 | ||||
| 5.00%, 04/15/39 | 111 | 114 | ||||
| 5.00%, 05/15/39 | 58 | 60 | ||||
| 5.00%, 05/15/39 | 196 | 202 | ||||
| 5.00%, 05/15/39 | 968 | 997 | ||||
| 5.00%, 05/15/39 | 58 | 60 | ||||
| 5.00%, 05/15/39 | 304 | 313 | ||||
| 5.00%, 05/15/39 | 63 | 65 | ||||
| 5.00%, 05/15/39 | 42 | 43 | ||||
| 5.00%, 05/15/39 | 68 | 70 | ||||
| 5.00%, 05/15/39 | 69 | 71 | ||||
| 5.00%, 05/15/39 | 690 | 711 | ||||
| 5.00%, 05/15/39 | 788 | 812 | ||||
| 5.00%, 05/15/39 | 75 | 77 | ||||
| 5.00%, 05/15/39 | 164 | 169 | ||||
| 5.00%, 05/15/39 | 158 | 163 | ||||
| 5.00%, 05/15/39 | 111 | 114 | ||||
| 5.00%, 05/15/39 | 26 | 26 | ||||
| 5.00%, 05/15/39 | 38 | 39 | ||||
| 5.00%, 05/15/39 | 62 | 64 | ||||
| 5.00%, 05/15/39 | 286 | 294 | ||||
| 5.00%, 05/15/39 | 45 | 46 | ||||
| 4.50%, 06/15/39 | 197 | 198 | ||||
| 4.50%, 06/15/39 | 297 | 298 | ||||
| 5.00%, 06/15/39 | 265 | 273 | ||||
| 5.00%, 06/15/39 | 280 | 288 | ||||
| 5.00%, 06/15/39 | 477 | 491 | ||||
| 5.00%, 06/15/39 | 63 | 65 | ||||
| 5.00%, 06/15/39 | 166 | 171 | ||||
| 5.00%, 06/15/39 | 84 | 87 | ||||
| 5.00%, 06/15/39 | 169 | 174 | ||||
| 5.00%, 06/15/39 | 669 | 689 | ||||
| 5.00%, 06/15/39 | 1,277 | 1,316 | ||||
| 5.00%, 07/15/39 | 102 | 105 | ||||
| 5.00%, 07/15/39 | 990 | 1,020 | ||||
| 5.00%, 07/15/39 | 95 | 98 | ||||
| 5.00%, 07/15/39 | 27 | 28 | ||||
| 4.50%, 09/15/39 | 397 | 398 | ||||
| 5.00%, 09/15/39 | 1,986 | 2,046 | ||||
| 5.00%, 09/15/39 | 228 | 235 | ||||
| 5.00%, 09/15/39 | 25 | 26 | ||||
| 5.00%, 09/15/39 | 597 | 615 | ||||
| 5.00%, 09/15/39 | 80 | 83 | ||||
| 5.00%, 09/15/39 | 55 | 57 | ||||
| 5.00%, 09/15/39 | 281 | 290 | ||||
| 5.00%, 09/15/39 | 326 | 336 | ||||
| 4.50%, 10/15/39 | 100 | 100 | ||||
| 4.50%, 10/15/39 | 100 | 100 | ||||
| 4.50%, 10/15/39 | 199 | 200 | ||||
| 5.00%, 10/15/39 | 698 | 719 | ||||
| 5.00%, 10/15/39 | 498 | 514 | ||||
| 5.00%, 10/15/39 | 299 | 308 | ||||
| 5.00%, 10/15/39 | 298 | 307 | ||||
| 5.00%, 10/15/39 | 497 | 512 | ||||
| 5.00%, 10/15/39 | 1,196 | 1,233 | ||||
| 5.00%, 10/15/39 | 499 | 514 | ||||
| 5.00%, 10/15/39 | 199 | 205 | ||||
| 32,408 | ||||||
| Total Government and Agency Obligations (cost $358,852) | 362,870 | |||||
| SHORT TERM INVESTMENTS - 14.4% | ||||||
| Mutual Funds - 10.1% | ||||||
| JNL Money Market Fund, 0.07% (a) (h) | 79,220 | 79,220 | ||||
| Securities Lending Collateral - 4.3% | ||||||
| Securities Lending Cash Collateral Fund LLC, | ||||||
| 0.16% (a) (h) | 28,509 | 28,509 | ||||
| Securities Lending Liquidating Fund LLC, 0.36% (a) (h) | 5,248 | 5,237 | ||||
| 33,746 | ||||||
| Total Short Term Investments (cost $112,977) | 112,966 | |||||
| Total Investments - 107.6% (cost $864,408) | 842,668 | |||||
| Total Forward Sales Commitments - (2.1%) | ||||||
| (proceeds $16,699) | (16,410) | |||||
| Other Assets and Liabilities, Net - (5.5%) | (43,269) | |||||
| Total Net Assets - 100% | $ | 782,989 | ||||
| Forward Sales Commitments - 2.1% | ||||||
| U.S. GOVERNMENT AGENCY | ||||||
| MORTGAGE-BACKED SECURITIES - 2.1% | ||||||
| Federal Home Loan Mortgage Corp. - 1.3% | ||||||
| Federal Home Loan Mortgage Corp., | ||||||
| 5.00%, 01/01/34 | $ | 10,000 | $ | 10,253 | ||
| Federal National Mortgage Association - 0.8% | ||||||
| Federal National Mortgage Association, | ||||||
| 5.00%, 01/01/34 | 6,000 | 6,157 | ||||
| Total Forward Sales Commitments - 2.1% | ||||||
| (proceeds $16,699) | $ | 16,410 | ||||
| JNL/Goldman Sachs Emerging | ||||||
| Markets Debt Fund | ||||||
| CORPORATE BONDS AND NOTES - 8.2% | ||||||
| FINANCIALS - 8.2% | ||||||
| Barclays Bank Plc Credit Linked Note (Indonesia | ||||||
| Government, 10.00%, 07/15/17, | ||||||
| Moody's rating Ba2) (f) | IDR | 32,000,000 | $ | 3,669 | ||
| Hongkong & Shanghai Banking Corp. Credit Linked | ||||||
| Note (Indonesia Government, 10.75%, 05/15/16, | ||||||
| Moody rating Ba2) (f) | IDR | 36,000,000 | 4,092 | |||
| HSBC Regs Credit Linked Note | ||||||
| (Indonesia Government, 10.00%, 07/15/17, | ||||||
| Moody rating Ba2) (f) | IDR | 10,000,000 | 1,144 | |||
| JPMorgan Chase & Co., 6.00%, 10/10/12 (f) | PHP | 40,000 | 888 | |||
| JPMorgan Chase Bank Credit Linked Note | ||||||
| (Indonesia Government, 10.00%, 07/15/17, | ||||||
| Moody rating Ba2) (f) | $4,580 | 4,719 | ||||
| Red Arrow International Leasing Plc, | ||||||
| 8.38%, 06/30/12 | RUB | 41,672 | 1,351 | |||
| Total Corporate Bonds and Notes (cost $14,327) | 15,863 | |||||
| GOVERNMENT AND AGENCY OBLIGATIONS - 66.1% | ||||||
| GOVERNMENT SECURITIES - 66.1% | ||||||
| Sovereign - 66.1% | ||||||
| Brazil Notas do Tesouro Nacional | ||||||
| Series F, 10.00%, 01/01/17 | BRL | 30,000 | 15,540 | |||
| Colombia Government International Bond, | ||||||
| 9.85%, 06/28/27 | COP | 13,500,000 | 7,663 | |||
| Egypt Government Bond, 8.75%, 07/18/12 | EGP | 5,000 | 908 | |||
| Hungary Government International Bond, | ||||||
| 6.00%, 11/24/23 | HUF | 2,130,000 | 9,484 | |||
| Israel Government International Bond, | ||||||
| 7.00%, 04/29/11 | ILS | 12,900 | 3,771 | |||
| Malaysian Government Bond, | ||||||
| 3.74%, 02/27/15 | MYR | 28,100 | 8,175 | |||
| Mexican Bonos | ||||||
| 9.00%, 12/20/12 | MXN | 150,000 | 12,169 | |||
| 10.00%, 12/05/24 | MXN | 70,000 | 6,144 | |||
| Peru Government International Bond | ||||||
| 9.91%, 05/05/15 | PEN | 8,500 | 3,708 | |||
| 8.20%, 08/12/26 | PEN | 7,257 | 3,007 | |||
| Poland Government Bond, 5.25%, 04/25/13 | PLN | 38,475 | 13,409 | |||
| Poland Government Inflation Indexed Bond, | ||||||
| 3.00%, 08/24/16 (r) | PLN | 3,470 | 1,374 | |||
| Republic of South Africa Government Bond, | ||||||
| 13.50%, 09/15/15 | ZAR | 103,160 | 17,188 | |||
| Republic of Turkey, 10.00%, 02/15/12 | TRY | 14,267 | 11,959 | |||
| Thailand Government Bond, 3.63%, 05/22/15 | THB | 241,700 | 7,231 | |||
| Turkey Government International Bond, | ||||||
| 16.00%, 03/07/12 | TRY | 2,500 | 1,875 | |||
| Uruguay Government International Inflation Index Bond | ||||||
| 5.00%, 09/14/18 (r) | UYU | 37,606 | 2,830 | |||
| 3.70%, 06/26/37 (r) | UYU | 19,183 | 1,239 | |||
| Total Government and Agency Obligations (cost $124,091) | 127,674 | |||||
| SHORT TERM INVESTMENTS - 22.8% | ||||||
| Mutual Funds - 22.8% | ||||||
| JNL Money Market Fund, 0.07% (a) (h) | 44,096 | 44,096 | ||||
| Total Short Term Investments (cost $44,096) | 44,096 | |||||
| Total Investments - 97.1% (cost $182,514) | 187,633 | |||||
| Other Assets and Liabilities, Net - 2.9% | 5,610 | |||||
| Total Net Assets - 100% | $ | 193,243 | ||||
| JNL/Goldman Sachs Mid Cap Value Fund | ||||||
| COMMON STOCKS - 96.5% | ||||||
| CONSUMER DISCRETIONARY - 13.6% | ||||||
| CBS Corp. - Class B | 269 | $ | 3,778 | |||
| DISH Network Corp. | 304 | 6,306 | ||||
| Fossil Inc. (c) | 23 | 775 | ||||
| Harley-Davidson Inc. | 127 | 3,201 | ||||
| J.C. Penney Co. Inc. | 84 | 2,243 | ||||
| Johnson Controls Inc. | 84 | 2,289 | ||||
| Liberty Media Corp. - Interactive (c) | 240 | 2,604 | ||||
| Mohawk Industries Inc. (c) | 24 | 1,129 | ||||
| Newell Rubbermaid Inc. | 291 | 4,369 | ||||
| NVR Inc. (c) | 5 | 3,308 | ||||
| Snap-On Inc. | 36 | 1,529 | ||||
| Starwood Hotels & Resorts Worldwide Inc. | 60 | 2,181 | ||||
| TJX Cos. Inc. | 53 | 1,933 | ||||
| Urban Outfitters Inc. (c) (e) | 74 | 2,590 | ||||
| 38,235 | ||||||
| CONSUMER STAPLES - 2.8% | ||||||
| BJ's Wholesale Club Inc. (c) (e) | 59 | 1,925 | ||||
| Clorox Co. | 23 | 1,377 | ||||
| JM Smucker Co. | 27 | 1,646 | ||||
| Molson Coors Brewing Co. (e) | 66 | 2,993 | ||||
| 7,941 | ||||||
| ENERGY - 11.8% | ||||||
| Atlas Energy Inc. | 79 | 2,385 | ||||
| Concho Resources Inc. (c) | 70 | 3,160 | ||||
| Core Laboratories NV (e) | 15 | 1,743 | ||||
| Dril-Quip Inc. (c) (e) | 70 | 3,974 | ||||
| EXCO Resources Inc. | 128 | 2,727 | ||||
| Newfield Exploration Co. (c) | 169 | 8,151 | ||||
| Oil States International Inc. (c) | 83 | 3,277 | ||||
| Range Resources Corp. | 56 | 2,788 | ||||
| Whiting Petroleum Corp. (c) | 67 | 4,805 | ||||
| 33,010 | ||||||
| FINANCIALS - 27.5% | ||||||
| Alexandria Real Estate Equities Inc. (e) | 36 | 2,334 | ||||
| Arch Capital Group Ltd. (c) (e) | 34 | 2,468 | ||||
| AvalonBay Communities Inc. | 30 | 2,439 | ||||
| Boston Properties Inc. | 50 | 3,331 | ||||
| Comerica Inc. | 116 | 3,422 | ||||
| Digital Realty Trust Inc. (e) | 48 | 2,413 | ||||
| Douglas Emmett Inc. (e) | 126 | 1,789 | ||||
| Essex Property Trust Inc. (e) | 26 | 2,174 | ||||
| Everest Re Group Ltd. | 45 | 3,887 | ||||
| First Horizon National Corp. (c) | 101 | 1,349 | ||||
| Genworth Financial Inc. - Class A (c) | 176 | 1,997 | ||||
| Hartford Financial Services Group Inc. | 164 | 3,815 | ||||
| Host Hotels & Resorts Inc. (c) (e) | 287 | 3,354 | ||||
| Invesco Ltd. | 229 | 5,381 | ||||
| Janus Capital Group Inc. (e) | 139 | 1,869 | ||||
| Lincoln National Corp. | 56 | 1,397 | ||||
| M&T Bank Corp. (e) | 32 | 2,173 | ||||
| Marsh & McLennan Cos. Inc. | 179 | 3,957 | ||||
| Marshall & Ilsley Corp. | 371 | 2,020 | ||||
| Principal Financial Group Inc. | 178 | 4,280 | ||||
| Progressive Corp. (c) | 198 | 3,562 | ||||
| Raymond James Financial Inc. (e) | 80 | 1,913 | ||||
| SLM Corp. (c) | 329 | 3,709 | ||||
| SunTrust Banks Inc. | 150 | 3,038 | ||||
| WR Berkley Corp. | 236 | 5,815 | ||||
| XL Capital Ltd. - Class A | 181 | 3,323 | ||||
| 77,209 | ||||||
| HEALTH CARE - 5.1% | ||||||
| Aetna Inc. | 130 | 4,122 | ||||
| Biogen Idec Inc. (c) | 40 | 2,149 | ||||
| CR Bard Inc. | 35 | 2,751 | ||||
| Edwards Lifesciences Corp. (c) | 27 | 2,362 | ||||
| Kinetic Concepts Inc. (c) | 73 | 2,759 | ||||
| 14,143 | ||||||
| INDUSTRIALS - 8.4% | ||||||
| BE Aerospace Inc. (c) (e) | 73 | 1,726 | ||||
| Cooper Industries Plc | 45 | 1,900 | ||||
| Corrections Corp. of America (c) | 93 | 2,287 | ||||
| Cummins Inc. | 60 | 2,761 | ||||
| Eaton Corp. | 61 | 3,898 | ||||
| Fluor Corp. | 2 | 110 | ||||
| Kansas City Southern (c) | 60 | 2,006 | ||||
| Parker Hannifin Corp. | 52 | 2,790 | ||||
| Pentair Inc. | 52 | 1,690 | ||||
| Republic Services Inc. - Class A | 91 | 2,571 | ||||
| Ryder System Inc. | 46 | 1,894 | ||||
| 23,633 | ||||||
| INFORMATION TECHNOLOGY - 7.5% | ||||||
| Amphenol Corp. - Class A | 41 | 1,906 | ||||
| CommScope Inc. (c) | 162 | 4,307 | ||||
| IAC/InterActiveCorp. (c) (e) | 195 | 3,994 | ||||
| Lexmark International Inc. (c) | 44 | 1,141 | ||||
| ON Semiconductor Corp. (c) | 314 | 2,765 | ||||
| Parametric Technology Corp. (c) | 191 | 3,123 | ||||
| QLogic Corp. (c) | 102 | 1,918 | ||||
| Teradyne Inc. (c) (e) | 171 | 1,835 | ||||
| 20,989 | ||||||
| MATERIALS - 8.8% | ||||||
| Cliffs Natural Resources Inc. | 98 | 4,504 | ||||
| FMC Corp. (e) | 48 | 2,692 | ||||
| Huntsman Corp. | 364 | 4,111 | ||||
| International Paper Co. | 119 | 3,198 | ||||
| Pactiv Corp. (c) | 75 | 1,814 | ||||
| Terra Industries Inc. | 40 | 1,278 | ||||
| United States Steel Corp. (e) | 81 | 4,439 | ||||
| Vulcan Materials Co. (e) | 51 | 2,683 | ||||
| 24,719 | ||||||
| TELECOMMUNICATION SERVICES - 2.5% | ||||||
| CenturyTel Inc. | 58 | 2,089 | ||||
| Clearwire Corp. (c) (e) | 199 | 1,348 | ||||
| Sprint Nextel Corp. (c) | 972 | 3,559 | ||||
| 6,996 | ||||||
| UTILITIES - 8.5% | ||||||
| Alliant Energy Corp. | 47 | 1,408 | ||||
| CMS Energy Corp. (e) | 195 | 3,055 | ||||
| DPL Inc. | 115 | 3,178 | ||||
| Edison International | 109 | 3,783 | ||||
| FirstEnergy Corp. | 44 | 2,026 | ||||
| Great Plains Energy Inc. | 36 | 689 | ||||
| Northeast Utilities | 30 | 768 | ||||
| NV Energy Inc. | 133 | 1,650 | ||||
| Pinnacle West Capital Corp. | 24 | 881 | ||||
| PPL Corp. | 141 | 4,540 | ||||
| SCANA Corp. | 27 | 1,036 | ||||
| Xcel Energy Inc. | 44 | 943 | ||||
| 23,957 | ||||||
| Total Common Stocks (cost $243,249) | 270,832 | |||||
| RIGHTS - 0.0% | ||||||
| Clearwire Corp. (c) (e) | 49 | 20 | ||||
| Total Rights (cost $0) | 20 | |||||
| NON-U.S. GOVERNMENT AGENCY | ||||||
| ASSET-BACKED SECURITIES - 0.0% | ||||||
| Sigma Finance, Inc. (d) (f) (u) | 398 | 17 | ||||
| Total Non-U.S. Government Agency | ||||||
| Asset-Backed Securities (cost $398) | 17 | |||||
| SHORT TERM INVESTMENTS - 14.2% | ||||||
| Mutual Funds - 4.3% | ||||||
| JNL Money Market Fund, 0.07% (a) (h) | 12,147 | 12,147 | ||||
| Securities Lending Collateral - 9.9% | ||||||
| Securities Lending Cash Collateral Fund LLC, | ||||||
| 0.16% (a) (h) | 21,876 | 21,876 | ||||
| Securities Lending Liquidating Fund LLC, 0.36% (a) (h) | 5,796 | 5,784 | ||||
| 27,660 | ||||||
| Total Short Term Investments (cost $39,819) | 39,807 | |||||
| Total Investments - 110.7% (cost $283,466) | 310,676 | |||||
| Other Assets and Liabilities, Net - (10.7%) | (29,951) | |||||
| Total Net Assets - 100% | $ | 280,725 | ||||
| JNL/Ivy Asset Strategy Fund | ||||||
| COMMON STOCKS - 72.0% | ||||||
| CONSUMER DISCRETIONARY - 12.3% | ||||||
| Belle International Holdings Ltd. | 333 | $ | 386 | |||
| Ctrip.com International Ltd. - ADR (c) | 12 | 884 | ||||
| Hyundai Motor Co. | 60 | 6,190 | ||||
| Li & Fung Ltd. | 488 | 2,017 | ||||
| New Oriental Education & Technology Group - ADR (c) | 13 | 972 | ||||
| Sands China Ltd. (c) | 3,763 | 4,591 | ||||
| Starwood Hotels & Resorts Worldwide Inc. | 53 | 1,931 | ||||
| Wynn Macau Ltd. (c) | 1,008 | 1,241 | ||||
| Wynn Resorts Ltd. | 104 | 6,059 | ||||
| 24,271 | ||||||
| CONSUMER STAPLES - 2.7% | ||||||
| BRF - Brasil Foods SA - ADR | 13 | 691 | ||||
| Hengan International Group Co. Ltd. | 196 | 1,451 | ||||
| Philip Morris International Inc. | 42 | 2,005 | ||||
| Reckitt Benckiser Group Plc | 22 | 1,165 | ||||
| 5,312 | ||||||
| ENERGY - 8.1% | ||||||
| China Petroleum & Chemical Corp. | 2,094 | 1,845 | ||||
| China Shenhua Energy Co. Ltd. | 481 | 2,335 | ||||
| CNOOC Ltd. | 2,012 | 3,134 | ||||
| Halliburton Co. | 114 | 3,423 | ||||
| Schlumberger Ltd. | 36 | 2,346 | ||||
| SeaDrill Ltd. | 75 | 1,927 | ||||
| Weatherford International Ltd. (c) | 57 | 1,021 | ||||
| 16,031 | ||||||
| FINANCIALS - 17.8% | ||||||
| Annaly Capital Management Inc. | 169 | 2,936 | ||||
| Banco Santander Brasil SA - ADR | 150 | 2,084 | ||||
| China Life Insurance Co. Ltd. | 1,838 | 8,993 | ||||
| China Overseas Land & Investment Ltd. | 544 | 1,140 | ||||
| China Resources Land Ltd. | 242 | 545 | ||||
| Hong Kong Exchanges & Clearing Ltd. | 174 | 3,099 | ||||
| Industrial & Commercial Bank of China | 10,620 | 8,746 | ||||
| Renhe Commercial Holdings Co. Ltd. | 6,374 | 1,442 | ||||
| Standard Chartered Plc | 237 | 6,028 | ||||
| 35,013 | ||||||
| HEALTH CARE - 0.5% | ||||||
| Vertex Pharmaceuticals Inc. (c) | 22 | 943 | ||||
| INDUSTRIALS - 3.3% | ||||||
| A P Moller - Maersk A/S Class B | - | 2,329 | ||||
| Alstom SA | 22 | 1,570 | ||||
| China Communications Constructions Co. Ltd. | 219 | 208 | ||||
| Komatsu Ltd. | 112 | 2,335 | ||||
| 6,442 | ||||||
| INFORMATION TECHNOLOGY - 19.6% | ||||||
| Accenture Plc | 53 | 2,187 | ||||
| Acer Inc. | 72 | 216 | ||||
| Apple Inc. (c) | 20 | 4,122 | ||||
| Lenovo Group Ltd. | 1,248 | 773 | ||||
| MediaTek Inc. | 211 | 3,666 | ||||
| PMC - Sierra Inc. (c) | 184 | 1,592 | ||||
| QUALCOMM Inc. | 126 | 5,850 | ||||
| Redecard SA | 118 | 1,960 | ||||
| Samsung Electronics Co. Ltd. | 7 | 4,800 | ||||
| Taiwan Semiconductor Manufacturing Co. Ltd. | 4,716 | 9,505 | ||||
| Visa Inc. - Class A | 45 | 3,931 | ||||
| 38,602 | ||||||
| MATERIALS - 6.9% | ||||||
| ArcelorMittal | 67 | 3,112 | ||||
| Holcim Ltd. | 3 | 202 | ||||
| Lafarge SA | 2 | 191 | ||||
| Monsanto Co. | 32 | 2,583 | ||||
| Southern Copper Corp. | 74 | 2,419 | ||||
| Vale SA - ADR | 48 | 1,393 | ||||
| Xstrata Plc (c) | 200 | 3,611 | ||||
| 13,511 | ||||||
| TELECOMMUNICATION SERVICES - 0.8% | ||||||
| MTN Group Ltd. | 104 | 1,673 | ||||
| Total Common Stocks (cost $137,966) | 141,798 | |||||
| PRECIOUS METALS - 15.3% | ||||||
| Gold Bullion | 27,530 | 30,151 | ||||
| Total Bullion (cost $30,251) | 30,151 | |||||
| SHORT TERM INVESTMENTS - 14.8% | ||||||
| Mutual Funds - 14.8% | ||||||
| JNL Money Market Fund, 0.07% (a) (h) | 29,184 | 29,184 | ||||
| Total Short Term Investments (cost $29,184) | 29,184 | |||||
| Total Investments - 102.1% (cost $197,401) | 201,133 | |||||
| Other Assets and Liabilities, Net - (2.1%) | (4,156) | |||||
| Total Net Assets - 100% | $ | 196,977 | ||||
| JNL/JPMorgan International Value Fund | ||||||
| COMMON STOCKS - 97.0% | ||||||
| CONSUMER DISCRETIONARY - 8.1% | ||||||
| Aisin Seiki Co. Ltd. | 151 | $ | 4,373 | |||
| Compagnie Generale des Etablissements Michelin | 90 | 6,915 | ||||
| Daimler AG (e) | 152 | 8,113 | ||||
| GKN Plc (c) | 2,098 | 3,964 | ||||
| InterContinental Hotels Group Plc | 337 | 4,860 | ||||
| Nissan Motor Co. Ltd. (c) | 1,235 | 10,860 | ||||
| Sodexo SA (e) | 91 | 5,181 | ||||
| 44,266 | ||||||
| CONSUMER STAPLES - 4.7% | ||||||
| Anheuser-Busch InBev NV | 124 | 6,495 | ||||
| Imperial Tobacco Group Plc | 126 | 3,991 | ||||
| Japan Tobacco Inc. | 1 | 2,685 | ||||
| Koninklijke Ahold NV | 309 | 4,111 | ||||
| Unilever NV (e) | 256 | 8,349 | ||||
| 25,631 | ||||||
| ENERGY - 11.9% | ||||||
| BG Group Plc | 313 | 5,662 | ||||
| BP Plc | 1,731 | 16,776 | ||||
| Cairn Energy Plc (c) | 1,131 | 6,076 | ||||
| China Petroleum & Chemical Corp. | 2,478 | 2,183 | ||||
| China Shenhua Energy Co. Ltd. | 1,015 | 4,927 | ||||
| OMV AG | 94 | 4,139 | ||||
| Royal Dutch Shell Plc - Class A | 565 | 17,176 | ||||
| Santos Ltd. | 297 | 3,751 | ||||
| Total SA | 74 | 4,804 | ||||
| 65,494 | ||||||
| FINANCIALS - 27.8% | ||||||
| African Bank Investments Ltd. | 964 | 3,901 | ||||
| Banco Bilbao Vizcaya Argentaria SA | 430 | 7,849 | ||||
| Banco Santander SA | 992 | 16,439 | ||||
| Barclays Plc | 1,042 | 4,644 | ||||
| BNP Paribas | 132 | 10,557 | ||||
| China Bank Ltd. | 664 | 3,973 | ||||
| China Merchants Bank Co. Ltd. (e) | 2,349 | 6,110 | ||||
| China Resources Land Ltd. | 1,304 | 2,935 | ||||
| HSBC Holdings Plc | 1,343 | 15,372 | ||||
| ING Groep NV (c) | 1,096 | 10,846 | ||||
| KBC Groep NV (c) | 99 | 4,304 | ||||
| Legal & General Group Plc | 2,751 | 3,581 | ||||
| Lloyds Banking Group Plc (c) | 8,019 | 6,564 | ||||
| Mitsui Fudosan Co. Ltd. | 265 | 4,483 | ||||
| Muenchener Rueckversicherungs AG | 72 | 11,171 | ||||
| Societe Generale - Class A | 141 | 9,923 | ||||
| Sumitomo Mitsui Financial Group Inc. | 226 | 6,499 | ||||
| UBS AG (c) | 306 | 4,743 | ||||
| UniCredit SpA (c) | 2,744 | 9,221 | ||||
| Zurich Financial Services AG | 43 | 9,448 | ||||
| 152,563 | ||||||
| HEALTH CARE - 4.4% | ||||||
| Bayer AG | 66 | 5,333 | ||||
| GlaxoSmithKline Plc | 320 | 6,823 | ||||
| Sanofi-Aventis SA | 156 | 12,297 | ||||
| 24,453 | ||||||
| INDUSTRIALS - 13.0% | ||||||
| Cie de Saint-Gobain | 122 | 6,660 | ||||
| Cookson Group Plc (c) | 511 | 3,481 | ||||
| Hamburger Hafen und Logistik AG (e) | 68 | 2,624 | ||||
| Hutchison Whampoa Ltd. | 773 | 5,288 | ||||
| Kubota Corp. | 681 | 6,251 | ||||
| Marubeni Corp. | 976 | 5,394 | ||||
| Mitsubishi Corp. | 331 | 8,256 | ||||
| Mitsubishi Electric Corp. (c) | 881 | 6,547 | ||||
| Mitsui & Co. Ltd. | 402 | 5,708 | ||||
| Nippon Sheet Glass Co. Ltd. | 370 | 1,061 | ||||
| Nippon Yusen KK | 1,292 | 3,981 | ||||
| Ruukki Group Oyj (c) | 743 | 2,282 | ||||
| Siemens AG (e) | 106 | 9,797 | ||||
| Sumitomo Heavy Industries Ltd. | 808 | 4,092 | ||||
| 71,422 | ||||||
| INFORMATION TECHNOLOGY - 7.7% | ||||||
| ASML Holding NV | 176 | 6,051 | ||||
| FUJIFILM Holdings Corp. | 261 | 7,880 | ||||
| Fujitsu Ltd. | 851 | 5,524 | ||||
| HON HAI Precision Industry Co. Ltd. | 1,326 | 6,202 | ||||
| Nintendo Co. Ltd. | 22 | 5,352 | ||||
| Nokia Oyj | 357 | 4,574 | ||||
| Ricoh Co. Ltd. (e) | 468 | 6,709 | ||||
| 42,292 | ||||||
| MATERIALS - 6.3% | ||||||
| ArcelorMittal (e) | 208 | 9,605 | ||||
| First Quantum Minerals Ltd. | 31 | 2,389 | ||||
| Lafarge SA | 75 | 6,233 | ||||
| Lanxess AG | 168 | 6,359 | ||||
| Petropavlovsk Plc | 160 | 2,645 | ||||
| Rhodia SA (c) | 306 | 5,528 | ||||
| Sidenor Steel Production & Manufacturing Co. SA (c) | 315 | 2,039 | ||||
| 34,798 | ||||||
| TELECOMMUNICATION SERVICES - 6.1% | ||||||
| BT Group Plc | 1,879 | 4,097 | ||||
| Cable & Wireless Plc | 1,305 | 2,981 | ||||
| Koninklijke KPN NV | 488 | 8,286 | ||||
| Telekomunikasi Indonesia Tbk PT | 3,371 | 3,356 | ||||
| Vodafone Group Plc | 6,497 | 15,077 | ||||
| 33,797 | ||||||
| UTILITIES - 7.0% | ||||||
| Centrica Plc | 1,335 | 6,060 | ||||
| GDF Suez (e) | 277 | 12,039 | ||||
| National Grid Plc | 808 | 8,860 | ||||
| Perusahaan Gas Negara PT | 7,784 | 3,216 | ||||
| Snam Rete Gas SpA | 1,698 | 8,453 | ||||
| 38,628 | ||||||
| Total Common Stocks (cost $509,229) | 533,344 | |||||
| NON-U.S. GOVERNMENT AGENCY | ||||||
| ASSET-BACKED SECURITIES - 0.0% | ||||||
| Sigma Finance, Inc. (d) (f) (u) | $ | 1713 | 73 | |||
| Total Non-U.S. Government Agency | ||||||
| Asset-Backed Securities (cost $1,713) | 73 | |||||
| SHORT TERM INVESTMENTS - 7.5% | ||||||
| Mutual Funds - 2.6% | ||||||
| JNL Money Market Fund, 0.07% (a) (h) | 14,166 | 14,166 | ||||
| Securities Lending Collateral - 4.9% | ||||||
| Securities Lending Cash Collateral Fund LLC, | ||||||
| 0.16% (a) (h) | 15,172 | 15,172 | ||||
| Securities Lending Liquidating Fund LLC, 0.36% (a) (h) | 11,514 | 11,490 | ||||
| 26,662 | ||||||
| Total Short Term Investments (cost $40,852) | 40,828 | |||||
| Total Investments - 104.5% (cost $551,794) | 574,245 | |||||
| Other Assets and Liabilities, Net - (4.5%) (o) | (24,555) | |||||
| Total Net Assets - 100% | $ | 549,690 | ||||
| JNL/JPMorgan MidCap Growth Fund | ||||||
| COMMON STOCKS - 97.0% | ||||||
| CONSUMER DISCRETIONARY - 19.4% | ||||||
| Amazon.com Inc. (c) | 11 | $ | 1,520 | |||
| Bed Bath & Beyond Inc. (c) | 48 | 1,839 | ||||
| Carmax Inc. (c) | 48 | 1,171 | ||||
| Chico's FAS Inc. (c) | 85 | 1,193 | ||||
| Chipotle Mexican Grill Inc. - Class A (c) | 8 | 670 | ||||
| Dick's Sporting Goods Inc. (c) | 67 | 1,666 | ||||
| Discovery Communications Inc. - Class A (c) | 40 | 1,230 | ||||
| Education Management Corp. (c) | 89 | 1,957 | ||||
| Gentex Corp. | 104 | 1,852 | ||||
| Harley-Davidson Inc. | 44 | 1,116 | ||||
| J Crew Group Inc. (c) (e) | 35 | 1,575 | ||||
| Kohl's Corp. (c) | 22 | 1,186 | ||||
| Lamar Advertising Co. (c) | 54 | 1,688 | ||||
| Nordstrom Inc. | 42 | 1,578 | ||||
| Penn National Gaming Inc. (c) | 39 | 1,063 | ||||
| Phillips-Van Heusen Corp. | 22 | 883 | ||||
| Royal Caribbean Cruises Ltd. (c) (e) | 76 | 1,926 | ||||
| Sherwin-Williams Co. | 29 | 1,813 | ||||
| Staples Inc. (e) | 55 | 1,352 | ||||
| Starwood Hotels & Resorts Worldwide Inc. | 49 | 1,774 | ||||
| VF Corp. | 20 | 1,428 | ||||
| Williams-Sonoma Inc. | 63 | 1,318 | ||||
| 31,798 | ||||||
| CONSUMER STAPLES - 1.2% | ||||||
| Avon Products Inc. | 43 | 1,367 | ||||
| Whole Foods Market Inc. (c) | 22 | 609 | ||||
| 1,976 | ||||||
| ENERGY - 5.6% | ||||||
| Cabot Oil & Gas Corp. - Class A | 38 | 1,637 | ||||
| Cameron International Corp. (c) | 42 | 1,740 | ||||
| Forest Oil Corp. (c) (e) | 60 | 1,346 | ||||
| Noble Energy Inc. | 15 | 1,090 | ||||
| Oceaneering International Inc. (c) | 19 | 1,115 | ||||
| Southwestern Energy Co. (c) | 45 | 2,158 | ||||
| 9,086 | ||||||
| FINANCIALS - 9.9% | ||||||
| ACE Ltd. | 32 | 1,623 | ||||
| Apollo Global Management LLC (c) (f) (s) (u) | 73 | 440 | ||||
| BB&T Corp. (e) | 49 | 1,230 | ||||
| BlackRock Inc. (e) | 6 | 1,370 | ||||
| BOK Financial Corp. (e) | 24 | 1,121 | ||||
| HCC Insurance Holdings Inc. (e) | 41 | 1,147 | ||||
| IntercontinentalExchange Inc. (c) | 8 | 876 | ||||
| Moody's Corp. (e) | 52 | 1,388 | ||||
| MSCI Inc. (c) | 43 | 1,358 | ||||
| Northern Trust Corp. | 26 | 1,370 | ||||
| Och-Ziff Capital Management Group LLC | 87 | 1,189 | ||||
| T. Rowe Price Group Inc. | 33 | 1,770 | ||||
| TD Ameritrade Holding Corp. (c) | 71 | 1,381 | ||||
| 16,263 | ||||||
| HEALTH CARE - 13.3% | ||||||
| Alexion Pharmaceuticals Inc. (c) | 23 | 1,108 | ||||
| BioMarin Pharmaceutical Inc. (c) (e) | 66 | 1,247 | ||||
| Biovail Corp. | 77 | 1,072 | ||||
| Brookdale Senior Living Inc. (c) | 65 | 1,188 | ||||
| Cerner Corp. (c) (e) | 15 | 1,217 | ||||
| Covance Inc. (c) | 28 | 1,528 | ||||
| DaVita Inc. (c) | 27 | 1,562 | ||||
| DENTSPLY International Inc. (e) | 34 | 1,213 | ||||
| Express Scripts Inc. (c) | 24 | 2,049 | ||||
| Humana Inc. (c) (e) | 31 | 1,365 | ||||
| Illumina Inc. (c) (e) | 26 | 806 | ||||
| Life Technologies Corp. (c) | 14 | 726 | ||||
| Myriad Genetics Inc. (c) | 35 | 919 | ||||
| UnitedHealth Group Inc. | 92 | 2,801 | ||||
| VCA Antech Inc. (c) | 69 | 1,722 | ||||
| Zimmer Holdings Inc. (c) | 21 | 1,266 | ||||
| 21,789 | ||||||
| INDUSTRIALS - 17.6% | ||||||
| AECOM Technology Corp. (c) | 50 | 1,367 | ||||
| Canadian National Railway Co. | 28 | 1,506 | ||||
| Carlisle Cos. Inc. | 37 | 1,271 | ||||
| Corrections Corp. of America (c) | 69 | 1,691 | ||||
| Cummins Inc. | 27 | 1,258 | ||||
| Delta Air Lines Inc. (c) | 165 | 1,882 | ||||
| First Solar Inc. (c) (e) | 5 | 639 | ||||
| FTI Consulting Inc. (c) | 28 | 1,311 | ||||
| Goodrich Corp. | 20 | 1,285 | ||||
| Landstar System Inc. | 50 | 1,919 | ||||
| Lennox International Inc. | 43 | 1,663 | ||||
| McDermott International Inc. (c) | 52 | 1,252 | ||||
| Precision Castparts Corp. | 21 | 2,349 | ||||
| Robert Half International Inc. | 37 | 989 | ||||
| Roper Industries Inc. (e) | 36 | 1,910 | ||||
| Stericycle Inc. (c) | 27 | 1,476 | ||||
| Wabtec Corp. (e) | 35 | 1,421 | ||||
| Waste Connections Inc. (c) | 49 | 1,644 | ||||
| WW Grainger Inc. | 21 | 2,004 | ||||
| 28,837 | ||||||
| INFORMATION TECHNOLOGY - 26.8% | ||||||
| Alliance Data Systems Corp. (c) (e) | 24 | 1,550 | ||||
| Amdocs Ltd. (c) | 127 | 3,627 | ||||
| Amphenol Corp. - Class A | 55 | 2,529 | ||||
| Ansys Inc. (c) (e) | 35 | 1,527 | ||||
| Broadcom Corp. - Class A (c) | 50 | 1,585 | ||||
| Cadence Design Systems Inc. (c) | 206 | 1,235 | ||||
| Cognizant Technology Solutions Corp. (c) | 69 | 3,117 | ||||
| CommScope Inc. (c) | 45 | 1,191 | ||||
| Concur Technologies Inc. (c) (e) | 36 | 1,539 | ||||
| Dolby Laboratories Inc. - Class A (c) | 23 | 1,098 | ||||
| Equinix Inc. (c) (e) | 19 | 1,996 | ||||
| F5 Networks Inc. (c) | 33 | 1,759 | ||||
| Hewitt Associates Inc. - Class A (c) | 29 | 1,217 | ||||
| Lam Research Corp. (c) | 34 | 1,317 | ||||
| Marvell Technology Group Ltd. (c) | 140 | 2,903 | ||||
| MasterCard Inc. | 7 | 1,897 | ||||
| MEMC Electronic Materials Inc. (c) | 83 | 1,125 | ||||
| Microchip Technology Inc. (e) | 39 | 1,119 | ||||
| Micros Systems Inc. (c) | 27 | 835 | ||||
| NetApp Inc. (c) | 66 | 2,266 | ||||
| Nuance Communications Inc. (c) | 83 | 1,286 | ||||
| Salesforce.com Inc. (c) (e) | 17 | 1,269 | ||||
| Sybase Inc. (c) | 38 | 1,645 | ||||
| Tyco Electronics Ltd. | 57 | 1,407 | ||||
| Varian Semiconductor Equipment Associates Inc. (c) | 34 | 1,220 | ||||
| Western Union Co. | 81 | 1,522 | ||||
| 43,781 | ||||||
| MATERIALS - 2.2% | ||||||
| Freeport-McMoRan Copper & Gold Inc. | 12 | 980 | ||||
| Grief Inc. | 28 | 1,517 | ||||
| Praxair Inc. (e) | 14 | 1,148 | ||||
| 3,645 | ||||||
| TELECOMMUNICATION SERVICES - 1.0% | ||||||
| tw telecom inc. (c) | 92 | 1,577 | ||||
| Total Common Stocks (cost $136,129) | 158,752 | |||||
| NON-U.S. GOVERNMENT AGENCY | ||||||
| ASSET-BACKED SECURITIES - 0.0% | ||||||
| Sigma Finance, Inc. (d) (f) (u) | $ | 456 | 19 | |||
| Total Non-U.S. Government Agency | ||||||
| Asset-Backed Securities (cost $456) | 19 | |||||
| SHORT TERM INVESTMENTS - 14.7% | ||||||
| Mutual Funds - 3.2% | ||||||
| JNL Money Market Fund, 0.07% (a) (h) | 5,286 | 5,286 | ||||
| Securities Lending Collateral - 11.5% | ||||||
| Securities Lending Cash Collateral Fund LLC, | ||||||
| 0.16% (a) (h) | 13,130 | 13,130 | ||||
| Securities Lending Liquidating Fund LLC, 0.36% (a) (h) | 5,718 | 5,706 | ||||
| 18,836 | ||||||
| Total Short Term Investments (cost $24,134) | 24,122 | |||||
| Total Investments - 111.7% (cost $160,719) | 182,893 | |||||
| Other Assets and Liabilities, Net - (11.7%) | (19,089) | |||||
| Total Net Assets - 100% | $ | 163,804 | ||||
| JNL/JPMorgan U.S. Government & | ||||||
| Quality Bond Fund | ||||||
| NON-U.S. GOVERNMENT AGENCY | ||||||
| ASSET-BACKED SECURITIES - 3.5% | ||||||
| ACE Securities Corp. REMIC, 0.36%, 02/25/31 (i) | $ | 526 | $ | 394 | ||
| Banc of America Commercial Mortgage Inc. REMIC, | ||||||
| 6.62%, 03/11/32 (i) (t) (u) | 2,084 | 2,299 | ||||
| Commercial Mortgage Pass-Through Certificates REMIC, | ||||||
| 5.45%, 07/16/34 (t) (u) | 3,433 | 3,530 | ||||
| CompuCredit Acquired Portfolio Voltage Master Trust, | ||||||
| 0.40%, 09/15/18 (f) (i) (t) (u) | 674 | 506 | ||||
| Conseco Financial Corp. REMIC, 7.07%, 01/15/29 | 203 | 204 | ||||
| Countrywide Alternative Loan Trust REMIC | ||||||
| 0.44%, 07/20/46 (i) | 1,291 | 561 | ||||
| 0.43%, 12/20/46 (i) | 1,519 | 743 | ||||
| Countrywide Home Equity Loan Trust, 0.52%, 02/15/34 (i) | 696 | 302 | ||||
| IndyMac Seconds Asset Backed Trust REMIC, | ||||||
| 0.36%, 06/25/36 (i) (u) | 1,008 | 96 | ||||
| LB-UBS Commercial Mortgage Trust REMIC, | ||||||
| 5.35%, 11/15/38 | 2,520 | 2,310 | ||||
| MASTR Adjustable Rate Mortgages Trust REMIC, | ||||||
| 4.03%, 02/25/34 (i) | 817 | 699 | ||||
| Morgan Stanley Mortgage Loan Trust REMIC, | ||||||
| 3.39%, 10/25/34 (i) | 662 | 546 | ||||
| Nomura Asset Acceptance Corp. REMIC, | ||||||
| 6.50%, 03/25/34 (t) (v) | 5,163 | 4,961 | ||||
| Provident Funding Mortgage Loan Trust REMIC, | ||||||
| 3.90%, 10/25/35 (i) | 588 | 526 | ||||
| SACO I Inc. REMIC, 0.36%, 06/25/36 (i) (u) | 605 | 107 | ||||
| Sigma Finance, Inc. (d) (f) (u) | 2,177 | 93 | ||||
| Structured Asset Mortgage Investments Inc. REMIC, | ||||||
| 0.44%, 08/25/36 (i) | 1,638 | 792 | ||||
| Superior Wholesale Inventory Financing Trust, | ||||||
| 0.33%, 01/15/12 (i) | 1,800 | 1,800 | ||||
| Vendee Mortgage Trust REMIC, 6.75%, 02/15/31 | 3,084 | 3,145 | ||||
| Wells Fargo Mortgage Backed Securities Trust REMIC, | ||||||
| 6.00%, 06/25/37 | 1,126 | 928 | ||||
| Total Non-U.S. Government Agency | ||||||
| Asset-Backed Securities (cost $31,771) | 24,542 | |||||
| CORPORATE BONDS AND NOTES - 1.0% | ||||||
| FINANCIALS - 1.0% | ||||||
| General Electric Capital Corp., 3.00%, 12/09/11 | 2,500 | 2,577 | ||||
| Morgan Stanley, 3.25%, 12/01/11 | 2,500 | 2,593 | ||||
| Wells Fargo & Co., 3.00%, 12/09/11 (e) | 1,525 | 1,574 | ||||
| Total Corporate Bonds and Notes (cost $6,519) | 6,744 | |||||
| GOVERNMENT AND AGENCY OBLIGATIONS - 92.0% | ||||||
| GOVERNMENT SECURITIES - 27.7% | ||||||
| Sovereign - 1.9% | ||||||
| Financing Corp. Fico, 0.00%, 04/05/19 (j) | 5,000 | 3,236 | ||||
| Israel Government AID Bond, 0.00%, 11/01/21 (j) | 10,000 | 5,563 | ||||
| Tennessee Valley Authority Generic Strip, | ||||||
| 0.00%, 01/15/21 (j) | 7,368 | 4,225 | ||||
| 13,024 | ||||||
| Treasury Inflation Index Securities - 5.7% | ||||||
| U.S. Treasury Inflation Indexed Note | ||||||
| 2.38%, 04/15/11 (r) | 3,136 | 3,543 | ||||
| 2.50%, 07/15/16 (r) | 2,290 | 2,658 | ||||
| 1.38%, 07/15/18 (r) | 22,148 | 25,113 | ||||
| 2.00%, 01/15/26 (r) | 4,963 | 5,666 | ||||
| 2.38%, 01/15/27 (r) | 1,996 | 2,267 | ||||
| 39,247 | ||||||
| U.S. Treasury Securities - 20.1% | ||||||
| Residual Funding, Interest Only Strip, | ||||||
| 2.90%, 10/15/19 | 3,800 | 2,438 | ||||
| U.S. Treasury Bond | ||||||
| 8.88%, 08/15/17 | 8,000 | 10,905 | ||||
| 0.00%, 08/15/21 (j) | 25,000 | 14,918 | ||||
| 5.25%, 11/15/28 | 20,000 | 21,672 | ||||
| 5.25%, 02/15/29 | 10,000 | 10,834 | ||||
| 5.38%, 02/15/31 (e) | 13,000 | 14,365 | ||||
| U.S. Treasury Note | ||||||
| 4.63%, 02/15/17 (e) | 22,000 | 23,755 | ||||
| 4.75%, 08/15/17 | 15,000 | 16,276 | ||||
| 3.38%, 11/15/19 (e) | 25,000 | 24,047 | ||||
| 139,210 | ||||||
| U.S. GOVERNMENT AGENCY | ||||||
| MORTGAGE-BACKED SECURITIES - 64.3% | ||||||
| Federal Farm Credit Bank - 1.1% | ||||||
| Federal Farm Credit Bank, 5.75%, 12/07/28 | 7,000 | 7,667 | ||||
| Federal Home Loan Bank - 2.2% | ||||||
| Federal Home Loan Bank | ||||||
| 4.88%, 05/17/17 (e) | 10,000 | 10,693 | ||||
| 5.25%, 12/11/20 | 4,500 | 4,758 | ||||
| 15,451 | ||||||
| Federal Home Loan Mortgage Corp. - 24.2% | ||||||
| Federal Home Loan Mortgage Corp. | ||||||
| 7.00%, 07/01/11 | 1 | 1 | ||||
| 6.50%, 08/01/13 | 8 | 8 | ||||
| 8.00%, 07/01/20 | 23 | 25 | ||||
| 6.00%, 11/01/28 | 296 | 318 | ||||
| 7.00%, 04/01/29 | 68 | 75 | ||||
| 7.00%, 10/01/31 | 3 | 3 | ||||
| 7.00%, 11/01/31 | 4 | 4 | ||||
| 7.00%, 02/01/32 | 74 | 82 | ||||
| 7.00%, 03/01/32 | 74 | 81 | ||||
| 7.00%, 04/01/32 | 48 | 53 | ||||
| 7.00%, 04/01/32 | 8 | 9 | ||||
| 7.00%, 06/01/32 | 8 | 9 | ||||
| 7.00%, 06/01/32 | 4 | 4 | ||||
| 7.00%, 08/01/32 | 4 | 5 | ||||
| 5.00%, 08/01/33 | 1,232 | 1,269 | ||||
| 5.00%, 12/01/34 | 4,915 | 5,055 | ||||
| 5.21%, 12/01/35 (i) | 6,927 | 7,263 | ||||
| 5.82%, 01/01/37 (i) | 1,733 | 1,832 | ||||
| REMIC, 5.00%, 10/15/17 | 3,908 | 4,125 | ||||
| REMIC, 5.00%, 12/15/17 | 7,000 | 7,428 | ||||
| REMIC, 5.00%, 01/15/18 | 3,500 | 3,708 | ||||
| REMIC, 5.00%, 02/15/18 | 10,000 | 10,582 | ||||
| REMIC, 5.00%, 03/15/18 | 4,000 | 4,243 | ||||
| REMIC, 4.50%, 06/15/18 | 1,870 | 1,956 | ||||
| REMIC, 4.50%, 08/15/19 | 3,400 | 3,509 | ||||
| REMIC, 4.50%, 10/15/19 | 10,466 | 10,744 | ||||
| REMIC, 4.50%, 02/15/20 | 2,500 | 2,572 | ||||
| REMIC, 4.50%, 09/15/20 | 5,365 | 5,441 | ||||
| REMIC, 5.00%, 07/15/23 | 6,887 | 7,024 | ||||
| REMIC, 5.50%, 01/15/27 | 7,000 | 7,180 | ||||
| REMIC, 5.00%, 03/15/31 | 864 | 95 | ||||
| REMIC, 4.50%, 04/15/32 | 183 | 176 | ||||
| REMIC, 5.00%, 12/15/32 | 3,500 | 3,621 | ||||
| REMIC, 5.50%, 01/15/33 | 7,617 | 8,004 | ||||
| REMIC, 5.00%, 07/15/33 | 3,000 | 3,045 | ||||
| REMIC, 5.00%, 08/15/33 | 7,000 | 7,192 | ||||
| REMIC, 5.00%, 09/15/33 | 8,240 | 8,474 | ||||
| REMIC, 4.50%, 04/15/34 | 10,773 | 10,910 | ||||
| REMIC, 5.00%, 05/15/34 | 3,890 | 4,000 | ||||
| REMIC, 5.00%, 06/15/34 | 3,848 | 4,024 | ||||
| REMIC, 5.50%, 06/15/34 | 10,000 | 10,447 | ||||
| REMIC, 4.50%, 07/15/34 | 2,460 | 2,544 | ||||
| REMIC, 5.50%, 10/15/34 | 4,000 | 4,187 | ||||
| REMIC, 5.00%, 02/15/35 | 5,000 | 5,008 | ||||
| REMIC, 5.50%, 07/15/35 | 6,580 | 6,851 | ||||
| REMIC, 5.50%, 07/15/36 | 4,383 | 4,531 | ||||
| 167,717 | ||||||
| Federal National Mortgage Association - 28.1% | ||||||
| Federal National Mortgage Association | ||||||
| 12.00%, 01/01/16 | 27 | 31 | ||||
| 12.00%, 01/15/16 | - | 1 | ||||
| 12.50%, 01/15/16 | 5 | 6 | ||||
| 5.00%, 02/01/19 | 526 | 554 | ||||
| 0.00%, 10/09/19 (j) | 10,000 | 5,430 | ||||
| 10.50%, 08/01/20 | 4 | 5 | ||||
| 0.00%, 11/15/20 (j) | 9,000 | 5,241 | ||||
| 6.50%, 03/01/26 | 3 | 4 | ||||
| 7.00%, 05/01/26 | 8 | 8 | ||||
| 7.00%, 12/01/28 | 4 | 4 | ||||
| 7.00%, 12/01/28 | 4 | 5 | ||||
| 7.00%, 03/01/29 | 6 | 7 | ||||
| 8.00%, 07/01/29 | 1 | 1 | ||||
| 8.00%, 11/01/29 | 18 | 20 | ||||
| 8.00%, 12/01/29 | 17 | 19 | ||||
| 7.00%, 01/01/30 | 24 | 27 | ||||
| 8.00%, 01/01/30 | 26 | 29 | ||||
| 8.00%, 02/01/30 | 6 | 7 | ||||
| 8.00%, 05/01/30 | 1 | 1 | ||||
| 8.00%, 10/01/30 | 22 | 26 | ||||
| 8.00%, 01/01/31 | 61 | 70 | ||||
| 8.00%, 01/01/31 | 3 | 4 | ||||
| 6.00%, 02/01/31 | 208 | 223 | ||||
| 7.50%, 02/01/31 | 37 | 42 | ||||
| 8.00%, 02/01/31 | 11 | 12 | ||||
| 8.00%, 02/01/31 | 14 | 16 | ||||
| 8.00%, 03/01/31 | 9 | 10 | ||||
| 8.00%, 03/01/31 | 4 | 4 | ||||
| 8.00%, 03/01/31 | 4 | 4 | ||||
| 6.00%, 01/01/33 | 748 | 800 | ||||
| 5.50%, 02/01/35 | 8,943 | 9,400 | ||||
| 6.00%, 06/01/35 | 149 | 159 | ||||
| 5.00%, 09/01/35 | 156 | 160 | ||||
| 5.00%, 09/01/35 | 142 | 146 | ||||
| 6.00%, 10/01/35 | 283 | 301 | ||||
| 6.00%, 10/01/35 | 565 | 601 | ||||
| 6.00%, 10/01/35 | 37 | 39 | ||||
| 6.00%, 11/01/35 | 58 | 61 | ||||
| 6.00%, 11/01/35 | 460 | 490 | ||||
| 6.00%, 11/01/35 | 778 | 828 | ||||
| 5.00%, 12/01/35 | 446 | 459 | ||||
| 5.50%, 01/01/36 | 3,032 | 3,187 | ||||
| 6.00%, 02/01/36 | 335 | 356 | ||||
| 6.50%, 02/01/36 | 335 | 360 | ||||
| 6.50%, 02/01/36 | 948 | 1,018 | ||||
| 6.50%, 02/01/36 | 419 | 450 | ||||
| 5.00%, 03/01/36 | 10,903 | 11,210 | ||||
| 6.00%, 03/01/36 | 112 | 119 | ||||
| 6.00%, 03/01/36 | 327 | 348 | ||||
| 6.00%, 03/01/36 | 453 | 481 | ||||
| 6.50%, 03/01/36 | 2,048 | 2,198 | ||||
| 5.50%, 04/01/36 | 50 | 53 | ||||
| 5.50%, 04/01/36 | 556 | 583 | ||||
| 5.50%, 04/01/36 | 27 | 28 | ||||
| 5.50%, 04/01/36 | 128 | 134 | ||||
| 5.50%, 04/01/36 | 29 | 31 | ||||
| 5.50%, 04/01/36 | 210 | 220 | ||||
| 5.50%, 04/01/36 | 136 | 143 | ||||
| 5.50%, 04/01/36 | 442 | 464 | ||||
| 5.50%, 04/01/36 | 177 | 186 | ||||
| 5.50%, 04/01/36 | 197 | 206 | ||||
| 6.00%, 04/01/36 | 83 | 88 | ||||
| 6.00%, 04/01/36 | 338 | 359 | ||||
| 6.00%, 04/01/36 | 609 | 647 | ||||
| 5.50%, 05/01/36 | 240 | 252 | ||||
| 5.50%, 05/01/36 | 242 | 254 | ||||
| 5.50%, 05/01/36 | 110 | 115 | ||||
| 5.50%, 05/01/36 | 25 | 26 | ||||
| 5.50%, 05/01/36 | 59 | 62 | ||||
| 5.50%, 05/01/36 | 169 | 177 | ||||
| 5.50%, 05/01/36 | 153 | 160 | ||||
| 5.50%, 05/01/36 | 272 | 285 | ||||
| 5.50%, 05/01/36 | 438 | 459 | ||||
| 5.50%, 05/01/36 | 705 | 739 | ||||
| 5.50%, 05/01/36 | 158 | 166 | ||||
| 5.50%, 05/01/36 | 70 | 74 | ||||
| 5.50%, 05/01/36 | 436 | 457 | ||||
| 5.50%, 05/01/36 | 350 | 367 | ||||
| 5.50%, 05/01/36 | 21 | 22 | ||||
| 5.50%, 05/01/36 | 200 | 209 | ||||
| 6.00%, 05/01/36 | 113 | 120 | ||||
| 5.50%, 06/01/36 | 77 | 81 | ||||
| 5.50%, 06/01/36 | 57 | 60 | ||||
| 5.50%, 06/01/36 | 181 | 190 | ||||
| 5.50%, 06/01/36 | 507 | 532 | ||||
| 5.50%, 06/01/36 | 19 | 20 | ||||
| 5.50%, 06/01/36 | 18 | 19 | ||||
| 5.50%, 06/01/36 | 294 | 308 | ||||
| 5.50%, 06/01/36 | 126 | 132 | ||||
| 5.50%, 06/01/36 | 164 | 172 | ||||
| 5.50%, 06/01/36 | 623 | 653 | ||||
| 5.50%, 06/01/36 | 337 | 353 | ||||
| 6.00%, 06/01/36 | 194 | 206 | ||||
| 6.00%, 06/01/36 | 214 | 227 | ||||
| 6.00%, 06/01/36 | 239 | 254 | ||||
| 6.00%, 06/01/36 | 528 | 560 | ||||
| 6.00%, 06/01/36 | 364 | 387 | ||||
| 6.00%, 06/01/36 | 206 | 219 | ||||
| 5.50%, 07/01/36 | 441 | 463 | ||||
| 5.50%, 07/01/36 | 500 | 525 | ||||
| 5.50%, 07/01/36 | 315 | 331 | ||||
| 5.50%, 07/01/36 | 91 | 95 | ||||
| 5.50%, 07/01/36 | 99 | 104 | ||||
| 6.00%, 07/01/36 | 3,075 | 3,266 | ||||
| 6.00%, 07/01/36 | 206 | 218 | ||||
| 6.00%, 07/01/36 | 280 | 298 | ||||
| 6.00%, 07/01/36 | 273 | 290 | ||||
| 6.00%, 07/01/36 | 22,894 | 24,268 | ||||
| 5.50%, 08/01/36 | 348 | 364 | ||||
| 5.50%, 08/01/36 | 11 | 11 | ||||
| 6.00%, 08/01/36 | 150 | 160 | ||||
| 6.00%, 08/01/36 | 199 | 212 | ||||
| 6.00%, 08/01/36 | 327 | 347 | ||||
| 6.00%, 08/01/36 | 233 | 247 | ||||
| 6.00%, 09/01/36 | 246 | 261 | ||||
| 6.00%, 09/01/36 | 132 | 141 | ||||
| 5.50%, 10/01/36 | 2,371 | 2,486 | ||||
| 6.00%, 12/01/36 | 305 | 324 | ||||
| REMIC, 5.00%, 05/25/18 | 9,880 | 10,461 | ||||
| REMIC, 4.00%, 01/25/19 | 3,000 | 3,117 | ||||
| REMIC, 5.00%, 12/25/22 | 11,111 | 11,428 | ||||
| REMIC, 4.50%, 04/25/23 | 6,712 | 6,827 | ||||
| REMIC, 4.50%, 05/01/23 | 7,460 | 5,927 | ||||
| REMIC, 4.50%, 07/25/23 | 11,114 | 11,416 | ||||
| REMIC, 5.00%, 04/25/32 | 7,500 | 7,801 | ||||
| REMIC, 4.50%, 12/25/32 | 5,000 | 5,107 | ||||
| REMIC, 3.50%, 07/25/33 | 2,949 | 2,959 | ||||
| REMIC, 5.50%, 12/25/34 | 2,765 | 2,922 | ||||
| REMIC, 5.50%, 02/25/35 | 8,790 | 9,149 | ||||
| REMIC, 5.50%, 07/25/35 | 3,881 | 4,103 | ||||
| REMIC, 5.50%, 11/25/35 | 2,025 | 2,080 | ||||
| REMIC, 7.50%, 12/25/41 | 11,135 | 12,555 | ||||
| REMIC, 4.68%, 06/25/43 | 8,671 | 8,524 | ||||
| 195,228 | ||||||
| Government National Mortgage Association - 8.7% | ||||||
| Government National Mortgage Association | ||||||
| 13.50%, 07/15/10 | 5 | 5 | ||||
| 6.50%, 06/20/28 | 1,976 | 2,135 | ||||
| 6.00%, 04/15/29 | 3 | 4 | ||||
| 6.00%, 05/15/32 | 2 | 2 | ||||
| 6.00%, 07/15/32 | 1 | 1 | ||||
| 5.50%, 03/20/33 | 3,024 | 3,115 | ||||
| 6.00%, 01/15/34 | 22 | 23 | ||||
| 6.00%, 01/15/34 | 19 | 20 | ||||
| 6.00%, 06/15/34 | 5 | 5 | ||||
| 6.00%, 09/15/34 | 35 | 37 | ||||
| 6.00%, 09/15/34 | 109 | 116 | ||||
| 6.00%, 09/15/34 | 615 | 655 | ||||
| 6.00%, 04/15/35 | 220 | 234 | ||||
| 6.00%, 04/15/35 | 510 | 542 | ||||
| 6.00%, 05/15/35 | 509 | 540 | ||||
| 6.00%, 05/15/35 | 16 | 17 | ||||
| 6.00%, 06/15/35 | 20 | 21 | ||||
| 6.00%, 07/15/35 | 522 | 554 | ||||
| 6.00%, 07/15/35 | 637 | 675 | ||||
| 6.00%, 01/15/36 | 1,362 | 1,444 | ||||
| 4.50%, 06/20/39 | 10,000 | 9,591 | ||||
| REMIC, 6.50%, 06/16/31 | 3,514 | 3,816 | ||||
| REMIC, 5.00%, 09/20/32 | 7,000 | 7,300 | ||||
| REMIC, 5.50%, 09/20/33 | 5,636 | 5,959 | ||||
| REMIC, 6.00%, 12/16/33 | 2,864 | 2,908 | ||||
| REMIC, 5.50%, 12/20/34 | 10,000 | 10,553 | ||||
| REMIC, 5.00%, 11/20/36 | 3,926 | 4,081 | ||||
| REMIC, 5.50%, 01/20/37 | 4,816 | 4,998 | ||||
| REMIC, Interest Only, 6.50%, 11/20/34 | 883 | 69 | ||||
| REMIC, Interest Only, 6.17%, 05/16/38 (i) | 10,151 | 1,041 | ||||
| 60,461 | ||||||
| Total Government and Agency Obligations (cost $617,034) | 638,005 | |||||
| SHORT TERM INVESTMENTS - 13.3% | ||||||
| Mutual Funds - 2.9% | ||||||
| JNL Money Market Fund, 0.07% (a) (h) | 19,879 | 19,879 | ||||
| Securities Lending Collateral - 10.4% | ||||||
| Securities Lending Cash Collateral Fund LLC, | ||||||
| 0.16% (a) (h) | 28,994 | 28,994 | ||||
| Securities Lending Liquidating Fund LLC, 0.36% (a) (h) | 43,317 | 43,226 | ||||
| 72,220 | ||||||
| Total Short Term Investments (cost $92,190) | 92,099 | |||||
| Total Investments - 109.8% (cost $747,514) | 761,390 | |||||
| Other Assets and Liabilities, Net - (9.8%) | (67,809) | |||||
| Total Net Assets - 100% | $693,581 | |||||
| JNL/Lazard Emerging Markets Fund | ||||||
| COMMON STOCKS - 90.8% | ||||||
| CONSUMER DISCRETIONARY - 5.4% | ||||||
| Delek Automotive Systems Ltd. | 430 | $ | 4,804 | |||
| Desarrolladora Homex SAB de CV - ADR (c) (e) | 184 | 6,189 | ||||
| Grupo Televisa SA - ADR | 518 | 10,745 | ||||
| Truworths International Ltd. | 1,188 | 7,033 | ||||
| Woongjin Coway Co. Ltd. | 331 | 10,935 | ||||
| 39,706 | ||||||
| CONSUMER STAPLES - 13.5% | ||||||
| British American Tobacco Plc | 324 | 4,047 | ||||
| Eastern Tobacco | 172 | 3,566 | ||||
| Fomento Economico Mexicano SAB de CV - ADR | 223 | 10,673 | ||||
| Hite Brewery Co. Ltd. | 41 | 6,025 | ||||
| Indofood Sukses Makmur Tbk | 4,568 | 1,716 | ||||
| Kimberly-Clark de Mexico SAB de CV | 906 | 4,066 | ||||
| KT&G Corp. | 228 | 12,592 | ||||
| Magnit OAO - GDR (c) (f) | 373 | 5,840 | ||||
| Massmart Holdings Ltd. | 637 | 7,736 | ||||
| Natura Cosmeticos SA | 436 | 9,078 | ||||
| Oriflame Cosmetics SA (e) | 93 | 5,552 | ||||
| Shoprite Holdings Ltd. | 608 | 5,389 | ||||
| Souza Cruz SA | 377 | 12,475 | ||||
| Tiger Brands Ltd. | 474 | 11,009 | ||||
| 99,764 | ||||||
| ENERGY - 5.0% | ||||||
| Banpu Public Co. Ltd. | 418 | 7,242 | ||||
| LUKOIL OAO - ADR | 337 | 19,330 | ||||
| Oil & Gas Development Co. Ltd. | 442 | 579 | ||||
| Pakistan Petroleum Ltd. | 2,106 | 4,734 | ||||
| PT Tambang Batubara Bukit Asam Tbk | 2,911 | 5,301 | ||||
| 37,186 | ||||||
| FINANCIALS - 22.3% | ||||||
| Akbank T.A.S. | 2,169 | 13,746 | ||||
| Banco do Brasil SA | 1,359 | 23,151 | ||||
| Bank Mandiri Persero Tbk PT | 19,002 | 9,366 | ||||
| Bank of India | 440 | 3,619 | ||||
| Commercial International Bank | 675 | 6,726 | ||||
| Kasikornbank Public Co. Ltd. | 2,079 | 5,418 | ||||
| Nedbank Group Ltd. | 1,003 | 16,900 | ||||
| Punjab National Bank Ltd. | 719 | 13,973 | ||||
| Sanlam Ltd. | 6,247 | 19,299 | ||||
| Shinhan Financial Group Co. Ltd. (c) | 450 | 16,645 | ||||
| Standard Bank Group Ltd. | 971 | 13,453 | ||||
| Turkiye Is Bankasi SA | 5,168 | 21,735 | ||||
| 164,031 | ||||||
| INDUSTRIALS - 6.3% | ||||||
| Cia de Concessoes Rodoviarias | 377 | 8,629 | ||||
| KOC Holding AS | 2,784 | 8,228 | ||||
| Murray & Roberts Holdings Ltd. | 1,692 | 10,677 | ||||
| Orascom Construction Industries | 277 | 12,605 | ||||
| PLUS Expressways Bhd | 190 | 181 | ||||
| United Tractors Tbk PT | 3,519 | 5,764 | ||||
| 46,084 | ||||||
| INFORMATION TECHNOLOGY - 16.6% | ||||||
| Advanced Semiconductor Engineering Inc. | 6,314 | 5,667 | ||||
| Cielo SA | 2,477 | 21,794 | ||||
| HON HAI Precision Industry Co. Ltd. - GDR | 1,278 | 12,263 | ||||
| HTC Corp. | 731 | 8,376 | ||||
| Infosys Technologies Ltd. - ADR (e) | 109 | 6,008 | ||||
| Netease.com - ADR (c) (e) | 292 | 10,963 | ||||
| NHN Corp. (c) | 75 | 12,410 | ||||
| Redecard SA | 1,437 | 23,900 | ||||
| Samsung Electronics Co. Ltd. | 14 | 9,864 | ||||
| Taiwan Semiconductor Manufacturing Co. Ltd. - ADR | 957 | 10,948 | ||||
| 122,193 | ||||||
| MATERIALS - 9.6% | ||||||
| First Quantum Minerals Ltd. | 120 | 9,218 | ||||
| Grupo Mexico SAB de CV | 2,754 | 6,299 | ||||
| Israel Chemicals Ltd. (e) | 1,054 | 13,910 | ||||
| Jindal Steel & Power Ltd. | 487 | 7,332 | ||||
| Kumba Iron Ore Ltd. | 302 | 12,502 | ||||
| Pretoria Portland Cement Co. Ltd. | 1,763 | 8,317 | ||||
| Shougang Concord International Enterprises Co. Ltd. | 23,798 | 5,904 | ||||
| Uralkali - GDR | 349 | 7,325 | ||||
| 70,807 | ||||||
| TELECOMMUNICATION SERVICES - 11.3% | ||||||
| America Movil SAB de CV - ADR | 313 | 14,700 | ||||
| Cellcom Israel Ltd. | 121 | 3,889 | ||||
| Egyptian Co. for Mobile Services | 121 | 5,291 | ||||
| Mobile Telesystems - ADR | 311 | 15,180 | ||||
| Philippine Long Distance Telephone Co. - ADR | 325 | 18,389 | ||||
| PT Telekomunikasi Indonesia - ADR | 337 | 13,458 | ||||
| Turkcell Iletisim Hizmet AS | 1,765 | 12,468 | ||||
| 83,375 | ||||||
| UTILITIES - 0.8% | ||||||
| Companhia Energetica de Minas Gerais - ADR (e) | 320 | 5,772 | ||||
| Total Common Stocks (cost $559,598) | 668,918 | |||||
| PREFERRED STOCKS - 3.4% | ||||||
| MATERIALS - 2.6% | ||||||
| Fertilizantes Fosfatados SA | 312 | 2,954 | ||||
| Usinas Siderurgicas de Minas Gerais SA - Class A | 560 | 15,869 | ||||
| 18,823 | ||||||
| UTILITIES - 0.8% | ||||||
| AES Tiete SA | 147 | 1,692 | ||||
| Eletropaulo Metropolitana Eletricidade de Sao Paulo SA | 210 | 4,152 | ||||
| 5,844 | ||||||
| Total Preferred Stocks (cost $21,087) | 24,667 | |||||
| NON-U.S. GOVERNMENT AGENCY | ||||||
| ASSET-BACKED SECURITIES - 0.0% | ||||||
| Sigma Finance, Inc. (d) (f) (u) | $ | 782 | 33 | |||
| Total Non-U.S. Government Agency | ||||||
| Asset-Backed Securities (cost $782) | 33 | |||||
| SHORT TERM INVESTMENTS - 9.1% | ||||||
| Mutual Funds - 6.2% | ||||||
| JNL Money Market Fund, 0.07% (a) (h) | 46,043 | 46,043 | ||||
| Securities Lending Collateral - 2.9% | ||||||
| Securities Lending Cash Collateral Fund LLC, | ||||||
| 0.16% (a) (h) | 10,096 | 10,096 | ||||
| Securities Lending Liquidating Fund LLC, 0.36% (a) (h) | 10,966 | 10,943 | ||||
| 21,039 | ||||||
| Total Short Term Investments (cost $67,105) | 67,082 | |||||
| Total Investments - 103.3% (cost $648,572) | 760,700 | |||||
| Other Assets and Liabilities, Net - (3.3%) | (24,063) | |||||
| Total Net Assets - 100% | $ | 736,637 | ||||
| JNL/Lazard Mid Cap Equity Fund | ||||||
| COMMON STOCKS - 97.3% | ||||||
| CONSUMER DISCRETIONARY - 17.0% | ||||||
| American Eagle Outfitters Inc. | 108 | $ | 1,830 | |||
| Apollo Group Inc. - Class A (c) | 15 | 878 | ||||
| AutoZone Inc. (c) | 13 | 1,992 | ||||
| Burger King Holdings Inc. | 179 | 3,368 | ||||
| Cablevision Systems Corp. - Class A | 51 | 1,325 | ||||
| Family Dollar Stores Inc. | 142 | 3,949 | ||||
| Genuine Parts Co. | 86 | 3,257 | ||||
| J.C. Penney Co. Inc. (e) | 119 | 3,177 | ||||
| Mattel Inc. | 263 | 5,245 | ||||
| Viacom Inc. - Class B (c) | 102 | 3,041 | ||||
| 28,062 | ||||||
| CONSUMER STAPLES - 6.2% | ||||||
| Avon Products Inc. | 33 | 1,024 | ||||
| Campbell Soup Co. | 29 | 984 | ||||
| McCormick & Co. Inc. | 83 | 2,999 | ||||
| Molson Coors Brewing Co. (e) | 77 | 3,459 | ||||
| Ralcorp Holdings Inc. (c) | 28 | 1,642 | ||||
| 10,108 | ||||||
| ENERGY - 7.8% | ||||||
| Holly Corp. (e) | 125 | 3,191 | ||||
| Massey Energy Co. | 32 | 1,344 | ||||
| Patterson-UTI Energy Inc. | 84 | 1,294 | ||||
| Smith International Inc. | 30 | 823 | ||||
| Tidewater Inc. | 53 | 2,537 | ||||
| Valero Energy Corp. | 57 | 960 | ||||
| Williams Cos. Inc. | 131 | 2,764 | ||||
| 12,913 | ||||||
| FINANCIALS - 14.0% | ||||||
| Ameriprise Financial Inc. | 96 | 3,716 | ||||
| City National Corp. (e) | 62 | 2,836 | ||||
| Fifth Third Bancorp | 109 | 1,064 | ||||
| Hudson City Bancorp Inc. (e) | 105 | 1,436 | ||||
| Marsh & McLennan Cos. Inc. | 37 | 819 | ||||
| Northern Trust Corp. | 42 | 2,180 | ||||
| NYSE Euronext | 33 | 827 | ||||
| PartnerRe Ltd. | 21 | 1,583 | ||||
| Public Storage | 24 | 1,979 | ||||
| RenaissanceRe Holdings Ltd. | 46 | 2,445 | ||||
| St. Joe Co. (c) (e) | 74 | 2,135 | ||||
| UDR Inc. | 129 | 2,114 | ||||
| 23,134 | ||||||
| HEALTH CARE - 11.9% | ||||||
| CareFusion Corp. (c) | 98 | 2,446 | ||||
| Hospira Inc. (c) | 43 | 2,208 | ||||
| Life Technologies Corp. (c) | 46 | 2,428 | ||||
| Omnicare Inc. | 98 | 2,359 | ||||
| Talecris Biotherapeutics Holdings Corp. (c) | 153 | 3,403 | ||||
| Teleflex Inc. | 39 | 2,112 | ||||
| Warner Chilcott Plc (c) | 81 | 2,298 | ||||
| Zimmer Holdings Inc. (c) | 38 | 2,270 | ||||
| 19,524 | ||||||
| INDUSTRIALS - 11.7% | ||||||
| Corrections Corp. of America (c) | 125 | 3,061 | ||||
| Covanta Holding Corp. (c) | 139 | 2,516 | ||||
| Dover Corp. | 94 | 3,924 | ||||
| Foster Wheeler AG (c) | 49 | 1,448 | ||||
| Parker Hannifin Corp. | 45 | 2,403 | ||||
| Republic Services Inc. - Class A | 126 | 3,564 | ||||
| Spirit Aerosystems Holdings Inc. (c) | 118 | 2,349 | ||||
| 19,265 | ||||||
| INFORMATION TECHNOLOGY - 15.4% | ||||||
| Agilent Technologies Inc. (c) (e) | 38 | 1,178 | ||||
| Analog Devices Inc. | 53 | 1,667 | ||||
| BMC Software Inc. (c) | 55 | 2,197 | ||||
| DST Systems Inc. (c) | 45 | 1,968 | ||||
| Fidelity National Information Services Inc. | 104 | 2,445 | ||||
| Ingram Micro Inc. - Class A (c) | 206 | 3,597 | ||||
| Intuit Inc. (c) | 80 | 2,457 | ||||
| Juniper Networks Inc. (c) (e) | 40 | 1,061 | ||||
| NetApp Inc. (c) | 51 | 1,747 | ||||
| NeuStar Inc. - Class A (c) | 72 | 1,657 | ||||
| Symantec Corp. (c) | 189 | 3,372 | ||||
| VeriSign Inc. (c) | 87 | 2,111 | ||||
| 25,457 | ||||||
| MATERIALS - 9.7% | ||||||
| Air Products & Chemicals Inc. | 34 | 2,732 | ||||
| Ball Corp. | 113 | 5,827 | ||||
| Cliffs Natural Resources Inc. | 45 | 2,079 | ||||
| Compass Minerals International Inc. (e) | 34 | 2,291 | ||||
| Packaging Corp. of America | 65 | 1,491 | ||||
| RPM International Inc. | 79 | 1,608 | ||||
| 16,028 | ||||||
| UTILITIES - 3.6% | ||||||
| American Electric Power Co. Inc. | 97 | 3,385 | ||||
| Energen Corp. | 53 | 2,494 | ||||
| 5,879 | ||||||
| Total Common Stocks (cost $145,153) | 160,370 | |||||
| NON-U.S. GOVERNMENT AGENCY | ||||||
| ASSET-BACKED SECURITIES - 0.0% | ||||||
| Sigma Finance, Inc. (d) (f) (u) | $ | 525 | 22 | |||
| Total Non-U.S. Government Agency | ||||||
| Asset-Backed Securities (cost $525) | 22 | |||||
| SHORT TERM INVESTMENTS - 10.0% | ||||||
| Mutual Funds - 2.8% | ||||||
| JNL Money Market Fund, 0.07% (a) (h) | 4,587 | 4,587 | ||||
| Securities Lending Collateral - 7.2% | ||||||
| Securities Lending Cash Collateral Fund LLC, | ||||||
| 0.16% (a) (h) | 6,110 | 6,110 | ||||
| Securities Lending Liquidating Fund LLC, 0.36% (a) (h) | 5,875 | 5,862 | ||||
| 11,972 | ||||||
| Total Short Term Investments (cost $16,572) | 16,559 | |||||
| Total Investments - 107.3% (cost $162,250) | 176,951 | |||||
| Other Assets and Liabilities, Net - (7.3%) | (12,054) | |||||
| Total Net Assets - 100% | $ | 164,897 | ||||
| JNL/M&G Global Basics Fund | ||||||
| COMMON STOCKS - 93.7% | ||||||
| CONSUMER DISCRETIONARY - 7.6% | ||||||
| Compagnie des Alpes (e) | 7 | $ | 282 | |||
| Eastman Kodak Co. (c) (e) | 12 | 49 | ||||
| Hongkong & Shanghai Hotels | 449 | 655 | ||||
| Starbucks Corp. (c) | 32 | 729 | ||||
| Yum! Brands Inc. | 15 | 532 | ||||
| 2,247 | ||||||
| CONSUMER STAPLES - 22.6% | ||||||
| Agrana Beteiligungs AG (u) | 8 | 732 | ||||
| Baron de Ley SA (c) (u) | 4 | 171 | ||||
| Colgate-Palmolive Co. | 11 | 904 | ||||
| Constellation Brands Inc. - Class A (c) | 55 | 878 | ||||
| Corn Products International Inc. | 15 | 427 | ||||
| Elders Ltd. (c) | 19 | 27 | ||||
| Elizabeth Arden Inc. (c) | 14 | 205 | ||||
| Foster's Group Ltd. | 65 | 319 | ||||
| Kerry Group Plc | 26 | 761 | ||||
| Petra Foods Ltd. (u) | 5 | 4 | ||||
| Pilgrim's Pride Corp. (c) | 9 | 77 | ||||
| PZ Cussons Plc | 108 | 469 | ||||
| Unilever Plc | 38 | 1,236 | ||||
| Wimm-Bill-Dann Foods OJSC - ADR (c) | 23 | 548 | ||||
| 6,758 | ||||||
| ENERGY - 6.0% | ||||||
| Alliance Resource Partners LP | 7 | 317 | ||||
| Aquila Resources Ltd. (c) | 10 | 101 | ||||
| Chevron Corp. | 1 | 73 | ||||
| Tap Oil Ltd. (c) | 15 | 15 | ||||
| Tullow Oil Plc | 61 | 1,290 | ||||
| 1,796 | ||||||
| FINANCIALS - 2.0% | ||||||
| AMMB Holdings Bhd | 354 | 515 | ||||
| Australia & New Zealand Banking Group Ltd. | 4 | 88 | ||||
| 603 | ||||||
| HEALTH CARE - 4.8% | ||||||
| Ansell Ltd. | 83 | 806 | ||||
| Dentsply International Inc. | 16 | 566 | ||||
| Genus Plc | 7 | 72 | ||||
| 1,444 | ||||||
| INDUSTRIALS - 15.6% | ||||||
| Acuity Brands Inc. (e) | 11 | 399 | ||||
| Aggreko Plc | 30 | 448 | ||||
| DP World Ltd. | 98 | 42 | ||||
| European Aeronautic Defence & Space Co. NV | 39 | 784 | ||||
| Fraser and Neave Ltd. | 316 | 941 | ||||
| G4S Plc | 26 | 109 | ||||
| Noble Group Ltd. (e) | 345 | 792 | ||||
| QinetiQ Group Plc | 186 | 487 | ||||
| Tianjin Development Holdings | 30 | 22 | ||||
| United Technologies Corp. | 4 | 305 | ||||
| Wienerberger AG (c) | 18 | 338 | ||||
| 4,667 | ||||||
| MATERIALS - 35.1% | ||||||
| Aber Diamond Corp. (c) | 14 | 132 | ||||
| AMCOL International Corp. | 13 | 375 | ||||
| Arkema SA | 15 | 569 | ||||
| BHP Billiton Ltd. | 15 | 584 | ||||
| Eramet (e) | 4 | 1,136 | ||||
| Iluka Resources Ltd. (c) | 162 | 517 | ||||
| Imerys SA | 18 | 1,068 | ||||
| Johnson Matthey Plc | 39 | 953 | ||||
| K+S AG (e) | 5 | 283 | ||||
| Lonmin Plc (c) | 42 | 1,329 | ||||
| Minerals Technologies Inc. | 5 | 254 | ||||
| Panoramic Resources Ltd. | 40 | 82 | ||||
| Petropavlovsk Plc | 9 | 147 | ||||
| Resolute Mining Ltd. (c) | 34 | 32 | ||||
| Schnitzer Steel Industries Inc. - Class A | 5 | 258 | ||||
| Scotts Miracle-Gro Co. | 15 | 582 | ||||
| Sherritt International Corp. | 67 | 420 | ||||
| Sims Metal Management Ltd. | 59 | 1,152 | ||||
| St. Barbara Ltd. (c) | 112 | 30 | ||||
| Symrise AG | 26 | 566 | ||||
| 10,469 | ||||||
| Total Common Stocks (cost $23,774) | 27,984 | |||||
| PREFERRED STOCKS - 0.1% | ||||||
| INDUSTRIALS - 0.1% | ||||||
| Villeroy & Boch AG | 5 | 43 | ||||
| Total Preferred Stocks (cost $42) | 43 | |||||
| SHORT TERM INVESTMENTS - 9.1% | ||||||
| Mutual Funds - 3.7% | ||||||
| JNL Money Market Fund, 0.07% (a) (h) | 1,114 | 1,114 | ||||
| Securities Lending Collateral - 5.4% | ||||||
| Securities Lending Cash Collateral Fund LLC, | ||||||
| 0.16% (a) (h) | 1,607 | 1,607 | ||||
| Total Short Term Investments (cost $2,721) | 2,721 | |||||
| Total Investments - 102.9% (cost $26,537) | 30,748 | |||||
| Other Assets and Liabilities, Net - (2.9%) | (880) | |||||
| Total Net Assets - 100% | $ | 29,868 | ||||
| JNL/M&G Global Leaders Fund | ||||||
| COMMON STOCKS - 91.8% | ||||||
| CONSUMER DISCRETIONARY - 5.3% | ||||||
| H&R Block Inc. | 13 | $ | 290 | |||
| Home Depot Inc. | 10 | 301 | ||||
| Macy's Inc. | 10 | 164 | ||||
| Whirlpool Corp. | 2 | 177 | ||||
| 932 | ||||||
| CONSUMER STAPLES - 8.7% | ||||||
| Carrefour SA | 6 | 278 | ||||
| Heineken Holding NV | 6 | 257 | ||||
| Heineken NV | 2 | 89 | ||||
| Kerry Group Plc | 11 | 324 | ||||
| Lawson Inc. | 7 | 323 | ||||
| Metro AG | 4 | 249 | ||||
| 1,520 | ||||||
| ENERGY - 10.9% | ||||||
| Anadarko Petroleum Corp. | 5 | 287 | ||||
| BP Plc | 33 | 318 | ||||
| Forest Oil Corp. (c) | 10 | 220 | ||||
| Hess Corp. | 4 | 248 | ||||
| Marathon Oil Corp. | 7 | 206 | ||||
| Mariner Energy Inc. (c) | 12 | 138 | ||||
| Noble Corp. | 4 | 175 | ||||
| TransCanada Corp. (e) | 9 | 307 | ||||
| 1,899 | ||||||
| FINANCIALS - 14.7% | ||||||
| China Citic Bank (e) | 212 | 179 | ||||
| Credit Suisse Group AG | 5 | 271 | ||||
| HSBC Holdings Plc | 34 | 394 | ||||
| GAM Holding Ltd. | 16 | 200 | ||||
| ING Groep NV (c) | 32 | 320 | ||||
| JPMorgan Chase & Co. | 9 | 391 | ||||
| State Bank of India Ltd. | 2 | 205 | ||||
| Unum Group | 11 | 219 | ||||
| Wells Fargo & Co. | 14 | 375 | ||||
| 2,554 | ||||||
| HEALTH CARE - 10.6% | ||||||
| Astellas Pharma Inc. | 10 | 366 | ||||
| AstraZeneca Plc | 5 | 225 | ||||
| Daiichi Sankyo Co. Ltd. | 13 | 273 | ||||
| Kobayashi Pharmaceutical Co. Ltd. | 5 | 188 | ||||
| Merck & Co. Inc. | 11 | 392 | ||||
| Pfizer Inc. | 22 | 397 | ||||
| 1,841 | ||||||
| INDUSTRIALS - 15.2% | ||||||
| A P Moller - Maersk A/S Class B | - | 247 | ||||
| AGCO Corp. (c) (e) | 8 | 249 | ||||
| Hutchison Whampoa Ltd. | 40 | 274 | ||||
| Kennametal Inc. | 7 | 174 | ||||
| Nexans SA (e) | 2 | 192 | ||||
| Norfolk Southern Corp. | 6 | 289 | ||||
| Shanghai Industrial Holdings Ltd. | 37 | 188 | ||||
| Siemens AG | 3 | 236 | ||||
| Smiths Group Plc | 15 | 240 | ||||
| Spirit Aerosystems Holdings Inc. (c) | 10 | 193 | ||||
| Tianjin Development Holdings | 176 | 131 | ||||
| Timken Co. | 10 | 242 | ||||
| 2,655 | ||||||
| INFORMATION TECHNOLOGY - 15.6% | ||||||
| eBay Inc. (c) | 12 | 290 | ||||
| Google Inc. - Class A (c) | - | 272 | ||||
| Ingram Micro Inc. - Class A (c) | 14 | 239 | ||||
| Konica Minolta Holdings Inc. | 25 | 253 | ||||
| Marvell Technology Group Ltd. (c) | 12 | 245 | ||||
| Microsoft Corp. | 16 | 472 | ||||
| Parametric Technology Corp. (c) (e) | 14 | 224 | ||||
| SAP AG | 4 | 206 | ||||
| Yahoo! Inc. (c) | 15 | 243 | ||||
| Yokogawa Electric Corp. (e) | 31 | 275 | ||||
| 2,719 | ||||||
| MATERIALS - 5.2% | ||||||
| Anglo American Plc (c) | 6 | 262 | ||||
| Boral Ltd. | 11 | 58 | ||||
| Koninklijke DSM NV | 7 | 342 | ||||
| ThyssenKrupp AG | 6 | 245 | ||||
| 907 | ||||||
| TELECOMMUNICATION SERVICES - 3.6% | ||||||
| SK Telecom Co. Ltd. - ADR (e) | 16 | 254 | ||||
| Vodafone Group Plc | 162 | 377 | ||||
| 631 | ||||||
| UTILITIES - 2.0% | ||||||
| E.ON AG | 7 | 285 | ||||
| EDP - Energias do Brasil SA | 3 | 58 | ||||
| 343 | ||||||
| Total Common Stocks (cost $13,730) | 16,001 | |||||
| PREFERRED STOCKS - 2.1% | ||||||
| INFORMATION TECHNOLOGY - 2.1% | ||||||
| Samsung Electronics Co. Ltd. | 1 | 360 | ||||
| Total Preferred Stocks (cost $232) | 360 | |||||
| SHORT TERM INVESTMENTS - 8.5% | ||||||
| Mutual Funds - 4.8% | ||||||
| JNL Money Market Fund, 0.07% (a) (h) | 846 | 846 | ||||
| Securities Lending Collateral - 3.7% | ||||||
| Securities Lending Cash Collateral Fund LLC, | ||||||
| 0.16% (a) (h) | 637 | 637 | ||||
| Total Short Term Investments (cost $1,483) | 1,483 | |||||
| Total Investments - 102.4% (cost $15,445) | 17,844 | |||||
| Other Assets and Liabilities, Net - (2.4%) | (416) | |||||
| Total Net Assets - 100% | $ | 17,428 | ||||
| JNL/Mellon Capital Management | ||||||
| 10 X 10 Fund (b) | ||||||
| INVESTMENT FUNDS - 100.0% | ||||||
| JNL/Mellon Capital Management Bond | ||||||
| Index Fund (2.1%) (a) | 1,448 | $ | 16,493 | |||
| JNL/Mellon Capital Management | ||||||
| International Index Fund (2.8%) (a) | 1,694 | 20,164 | ||||
| JNL/Mellon Capital Management JNL 5 Fund (2.8%) (a) | 12,771 | 96,805 | ||||
| JNL/Mellon Capital Management S&P 400 | ||||||
| MidCap Index Fund (4.6%) (a) | 1,927 | 21,529 | ||||
| JNL/Mellon Capital Management S&P 500 | ||||||
| Index Fund (2.2%) (a) | 2,095 | 19,647 | ||||
| JNL/Mellon Capital Management Small Cap | ||||||
| Index Fund (4.2%) (a) | 1,979 | 19,866 | ||||
| Total Investment Funds (cost $202,536) | 194,504 | |||||
| Total Investments - 100.0% (cost $202,536) | 194,504 | |||||
| Other Assets and Liabilities, Net - 0.0% | (10) | |||||
| Total Net Assets - 100% | $ | 194,494 | ||||
| JNL/Mellon Capital Management | ||||||
| Index 5 Fund (b) | ||||||
| INVESTMENT FUNDS - 100.0% | ||||||
| JNL/Mellon Capital Management Bond | ||||||
| Index Fund (4.4%) (a) | 3,038 | $ | 34,600 | |||
| JNL/Mellon Capital Management International | ||||||
| Index Fund (5.9%) (a) | 3,555 | 42,300 | ||||
| JNL/Mellon Capital Management S&P 400 | ||||||
| MidCap Index Fund (9.6%) (a) | 4,043 | 45,166 | ||||
| JNL/Mellon Capital Management S&P 500 | ||||||
| Index Fund (4.6%) (a) | 4,394 | 41,218 | ||||
| JNL/Mellon Capital Management Small Cap | ||||||
| Index Fund (8.9%) (a) | 4,151 | 41,678 | ||||
| Total Investment Funds (cost $190,895) | 204,962 | |||||
| Total Investments - 100.0% (cost $190,895) | 204,962 | |||||
| Other Assets and Liabilities, Net - 0.0% | (11) | |||||
| Total Net Assets - 100% | $ | 204,951 | ||||
| JNL/Mellon Capital Management | ||||||
| European 30 Fund | ||||||
| COMMON STOCKS - 97.5% | ||||||
| CONSUMER STAPLES - 6.2% | ||||||
| Heineken Holding NV | 11 | $ | 469 | |||
| Tate & Lyle Plc | 51 | 358 | ||||
| 827 | ||||||
| ENERGY - 13.5% | ||||||
| BP Plc | 51 | 491 | ||||
| ENI SpA | 17 | 427 | ||||
| Royal Dutch Shell Plc - Class B | 15 | 431 | ||||
| Total SA | 7 | 462 | ||||
| 1,811 | ||||||
| FINANCIALS - 22.6% | ||||||
| Banco Bilbao Vizcaya Argentaria SA | 24 | 442 | ||||
| Banco de Sabadell SA | 52 | 290 | ||||
| DnB NOR ASA (c) | 57 | 623 | ||||
| Erste Group Bank AG | 9 | 319 | ||||
| Hannover Rueckversicherung AG (c) | 12 | 548 | ||||
| ING Groep NV (c) | 18 | 178 | ||||
| KBC Groep NV (c) | 5 | 214 | ||||
| Lloyds Banking Group Plc (c) | 88 | 72 | ||||
| Zurich Financial Services AG | 2 | 337 | ||||
| 3,023 | ||||||
| HEALTH CARE - 10.0% | ||||||
| AstraZeneca Plc | 9 | 421 | ||||
| Roche Holding AG | 3 | 425 | ||||
| Sanofi-Aventis SA | 6 | 484 | ||||
| 1,330 | ||||||
| INDUSTRIALS - 5.2% | ||||||
| Metso Oyj | 20 | 700 | ||||
| MATERIALS - 19.5% | ||||||
| Antofagasta Plc | 69 | 1,110 | ||||
| BHP Billiton Plc | 20 | 655 | ||||
| Lafarge SA | 4 | 355 | ||||
| SSAB Svenskt Stal AB - Class A | 29 | 491 | ||||
| 2,611 | ||||||
| TELECOMMUNICATION SERVICES - 15.2% | ||||||
| BT Group Plc | 141 | 307 | ||||
| France Telecom SA | 14 | 358 | ||||
| Mobistar SA | 5 | 368 | ||||
| Portugal Telecom SGPS SA | 43 | 522 | ||||
| Swisscom AG | 1 | 470 | ||||
| 2,025 | ||||||
| UTILITIES - 5.3% | ||||||
| Enel SpA | 50 | 291 | ||||
| RWE AG | 4 | 417 | ||||
| 708 | ||||||
| Total Common Stocks (cost $11,967) | 13,035 | |||||
| INVESTMENT FUNDS - 2.1% | ||||||
| Vanguard European ETF | 6 | 275 | ||||
| Total Investment Funds (cost $277) | 275 | |||||
| SHORT TERM INVESTMENTS - 2.0% | ||||||
| Mutual Funds - 2.0% | ||||||
| JNL Money Market Fund, 0.07% (a) (h) | 268 | 268 | ||||
| Total Short Term Investments (cost $268) | 268 | |||||
| Total Investments - 101.6% (cost $12,512) | 13,578 | |||||
| Other Assets and Liabilities, Net - (1.6%) | (212) | |||||
| Total Net Assets - 100% | $ | 13,366 | ||||
| JNL/Mellon Capital Management | ||||||
| Pacific Rim 30 Fund | ||||||
| COMMON STOCKS - 97.9% | ||||||
| CONSUMER DISCRETIONARY - 11.9% | ||||||
| Jardine Cycle & Carriage Ltd. | 50 | $ | 955 | |||
| Tabcorp Holdings Ltd. | 86 | 536 | ||||
| Yue Yuen Industrial Holdings Ltd. | 181 | 523 | ||||
| 2,014 | ||||||
| CONSUMER STAPLES - 3.8% | ||||||
| Metcash Ltd. | 157 | 629 | ||||
| ENERGY - 2.9% | ||||||
| Caltex Australia Ltd. (c) | 58 | 483 | ||||
| FINANCIALS - 15.1% | ||||||
| Australia & New Zealand Banking Group Ltd. | 38 | 772 | ||||
| Hang Seng Bank Ltd. | 33 | 478 | ||||
| United Overseas Bank Ltd. | 44 | 613 | ||||
| Westpac Banking Corp. | 30 | 670 | ||||
| 2,533 | ||||||
| HEALTH CARE - 4.9% | ||||||
| Astellas Pharma Inc. | 11 | 418 | ||||
| Daiichi Sankyo Co. Ltd. | 19 | 397 | ||||
| 815 | ||||||
| INDUSTRIALS - 25.0% | ||||||
| Central Japan Railway Co. | - | 355 | ||||
| Daiwa House Industry Co. Ltd. | 58 | 624 | ||||
| East Japan Railway Co. | 6 | 405 | ||||
| Kamigumi Co. Ltd. | 65 | 474 | ||||
| Nippon Express Co. Ltd. | 119 | 492 | ||||
| SembCorp Industries Ltd. | 267 | 698 | ||||
| Toll Holdings Ltd. (e) | 102 | 797 | ||||
| West Japan Railway Co. | - | 342 | ||||
| 4,187 | ||||||
| MATERIALS - 23.7% | ||||||
| Amcor Ltd. (e) | 99 | 549 | ||||
| BHP Billiton Ltd. | 20 | 768 | ||||
| Kansai Paint Co. Ltd. (e) | 77 | 646 | ||||
| Rio Tinto Ltd. | 7 | 463 | ||||
| Sims Metal Management Ltd. | 23 | 443 | ||||
| Taiyo Nippon Sanso Corp. | 61 | 649 | ||||
| Tokuyama Corp. | 81 | 453 | ||||
| 3,971 | ||||||
| TELECOMMUNICATION SERVICES - 5.2% | ||||||
| KDDI Corp. | - | 440 | ||||
| NTT DoCoMo Inc. | - | 436 | ||||
| 876 | ||||||
| UTILITIES - 5.4% | ||||||
| Hokuriku Electric Power Co. | 20 | 439 | ||||
| Tokyo Gas Co. Ltd. | 115 | 459 | ||||
| 898 | ||||||
| Total Common Stocks (cost $14,841) | 16,406 | |||||
| INVESTMENT FUNDS - 1.5% | ||||||
| Vanguard Pacific VIPERs | 5 | 257 | ||||
| Total Investment Funds (cost $260) | 257 | |||||
| SHORT TERM INVESTMENTS - 6.0% | ||||||
| Mutual Funds - 2.2% | ||||||
| JNL Money Market Fund, 0.07% (a) (h) | 367 | 367 | ||||
| Securities Lending Collateral - 3.8% | ||||||
| Securities Lending Cash Collateral Fund LLC, | ||||||
| 0.16% (a) (h) | 644 | 644 | ||||
| Total Short Term Investments (cost $1,011) | 1,011 | |||||
| Total Investments - 105.4% (cost $16,112) | 17,674 | |||||
| Other Assets and Liabilities, Net - (5.4%) | (913) | |||||
| Total Net Assets - 100% | $ | 16,761 | ||||
| JNL/Mellon Capital Management | ||||||
| S&P 500 Index Fund * (y) | ||||||
| COMMON STOCKS - 96.5% | ||||||
| CONSUMER DISCRETIONARY - 9.3% | ||||||
| Amazon.com Inc. (c) | 30 | $ | 3,995 | |||
| Comcast Corp. - Class A | 252 | 4,256 | ||||
| Home Depot Inc. | 150 | 4,349 | ||||
| McDonald’s Corp. | 95 | 5,960 | ||||
| Walt Disney Co. (e) | 170 | 5,491 | ||||
| Other Securities | 60,741 | |||||
| 84,792 | ||||||
| CONSUMER STAPLES - 11.0% | ||||||
| Altria Group Inc. | 183 | 3,596 | ||||
| Coca-Cola Co. | 205 | 11,675 | ||||
| Colgate-Palmolive Co. | 44 | 3,611 | ||||
| CVS Caremark Corp. | 125 | 4,021 | ||||
| Kraft Foods Inc. - Class A | 131 | 3,549 | ||||
| PepsiCo Inc. | 138 | 8,386 | ||||
| Philip Morris International Inc. | 169 | 8,120 | ||||
| Procter & Gamble Co. | 258 | 15,658 | ||||
| Wal-Mart Stores Inc. | 189 | 10,087 | ||||
| Other Securities | 31,131 | |||||
| 99,834 | ||||||
| ENERGY - 11.1% | ||||||
| Chevron Corp. | 177 | 13,653 | ||||
| ConocoPhillips | 131 | 6,698 | ||||
| Exxon Mobil Corp. | 420 | 28,633 | ||||
| Occidental Petroleum Corp. | 72 | 5,837 | ||||
| Schlumberger Ltd. | 106 | 6,908 | ||||
| Other Securities | 39,282 | |||||
| 101,011 | ||||||
| FINANCIALS - 13.9% | ||||||
| American Express Co. | 105 | 4,260 | ||||
| Bank of America Corp. | 878 | 13,226 | ||||
| Bank of New York Mellon Corp. (a) | 108 | 3,008 | ||||
| Citigroup Inc. | 1,698 | 5,620 | ||||
| Goldman Sachs Group Inc. | 46 | 7,701 | ||||
| JPMorgan Chase & Co. | 348 | 14,513 | ||||
| Morgan Stanley | 120 | 3,557 | ||||
| U.S. Bancorp | 169 | 3,806 | ||||
| Wells Fargo & Co. | 450 | 12,141 | ||||
| Other Securities | 58,327 | |||||
| 126,159 | ||||||
| HEALTH CARE - 12.2% | ||||||
| Abbott Laboratories | 137 | 7,383 | ||||
| Amgen Inc. (c) | 89 | 5,062 | ||||
| Bristol-Myers Squibb Co. | 153 | 3,872 | ||||
| Johnson & Johnson | 244 | 15,708 | ||||
| Medtronic Inc. | 98 | 4,303 | ||||
| Merck & Co. Inc. | 270 | 9,865 | ||||
| Pfizer Inc. | 713 | 12,975 | ||||
| Other Securities | 51,996 | |||||
| 111,164 | ||||||
| INDUSTRIALS - 9.8% | ||||||
| 3M Co. | 62 | 5,154 | ||||
| General Electric Co. | 941 | 14,239 | ||||
| United Parcel Service Inc. - Class B | 88 | 5,035 | ||||
| United Technologies Corp. | 83 | 5,754 | ||||
| Other Securities | 59,461 | |||||
| 89,643 | ||||||
| INFORMATION TECHNOLOGY - 19.1% | ||||||
| Apple Inc. (c) | 80 | 16,783 | ||||
| Cisco Systems Inc. (c) | 509 | 12,175 | ||||
| Google Inc. - Class A (c) | 21 | 13,213 | ||||
| Hewlett-Packard Co. | 210 | 10,796 | ||||
| Intel Corp. | 488 | 9,965 | ||||
| International Business Machines Corp. | 116 | 15,198 | ||||
| Microsoft Corp. | 683 | 20,824 | ||||
| Oracle Corp. | 346 | 8,482 | ||||
| QUALCOMM Inc. | 148 | 6,829 | ||||
| Other Securities | 60,042 | |||||
| 174,307 | ||||||
| MATERIALS - 3.5% | ||||||
| Monsanto Co. | 48 | 3,939 | ||||
| Other Securities | 27,714 | |||||
| 31,653 | ||||||
| TELECOMMUNICATION SERVICES - 3.0% | ||||||
| AT&T Inc. | 522 | 14,621 | ||||
| Verizon Communications Inc. | 251 | 8,319 | ||||
| Other Securities | 4,826 | |||||
| 27,766 | ||||||
| UTILITIES - 3.6% | ||||||
| Other Securities | 32,717 | |||||
| Total Common Stocks (cost $858,465) | 879,046 | |||||
| NON-U.S. GOVERNMENT AGENCY | ||||||
| ASSET-BACKED SECURITIES - 0.0% | ||||||
| Other Securities | 39 | |||||
| Total Non-U.S. Government Agency | ||||||
| Asset-Backed Securities (cost $743) | 39 | |||||
| SHORT TERM INVESTMENTS - 7.2% | ||||||
| Mutual Funds - 3.2% | ||||||
| JNL Money Market Fund, 0.07% (a) (h) | 29,658 | 29,658 | ||||
| Securities Lending Collateral - 3.7% | ||||||
| Securities Lending Cash Collateral Fund LLC, | ||||||
| 0.16% (a) (h) | 17,730 | 17,730 | ||||
| Securities Lending Liquidating Fund LLC, 0.36% (a) (h) | 15,587 | 15,555 | ||||
| 33,285 | ||||||
| U.S. Treasury Securities - 0.3% | ||||||
| Other Securities | 2,890 | |||||
| Total Short Term Investments (cost $65,866) | 65,833 | |||||
| Total Investments - 103.7% (cost $925,074) | 944,918 | |||||
| Other Assets and Liabilities, Net - (3.7%) | (33,640) | |||||
| Total Net Assets - 100% | $ | 911,278 | ||||
| JNL/Mellon Capital Management | ||||||
| S&P 400 MidCap Index Fund * (y) | ||||||
| COMMON STOCKS - 98.4% | ||||||
| CONSUMER DISCRETIONARY - 13.7% | ||||||
| Advance Auto Parts Inc. (e) | 49 | $ | 1,986 | |||
| BorgWarner Inc. | 61 | 2,010 | ||||
| Carmax Inc. (c) (e) | 115 | 2,786 | ||||
| Dollar Tree Inc. (c) | 46 | 2,209 | ||||
| NVR Inc. (c) | 3 | 2,188 | ||||
| Urban Outfitters Inc. (c) | 67 | 2,350 | ||||
| Other Securities | 51,585 | |||||
| 65,114 | ||||||
| CONSUMER STAPLES - 3.9% | ||||||
| Church & Dwight Co. Inc. | 36 | 2,204 | ||||
| Energizer Holdings Inc. (c) | 36 | 2,215 | ||||
| Other Securities | 14,305 | |||||
| 18,724 | ||||||
| ENERGY - 6.7% | ||||||
| Arch Coal Inc. (e) | 84 | 1,874 | ||||
| Cimarex Energy Co. | 43 | 2,292 | ||||
| Helmerich & Payne Inc. | 55 | 2,181 | ||||
| Newfield Exploration Co. (c) | 69 | 3,318 | ||||
| Plains Exploration & Production Co. (c) | 72 | 1,997 | ||||
| Pride International Inc. (c) | 90 | 2,884 | ||||
| Other Securities | 17,369 | |||||
| 31,915 | ||||||
| FINANCIALS - 18.9% | ||||||
| AMB Property Corp. (e) | 76 | 1,938 | ||||
| Eaton Vance Corp. | 61 | 1,852 | ||||
| Everest Re Group Ltd. | 31 | 2,680 | ||||
| Federal Realty Investment Trust (e) | 32 | 2,148 | ||||
| Liberty Property Trust | 58 | 1,869 | ||||
| Nationwide Health Properties Inc. | 58 | 2,046 | ||||
| New York Community Bancorp Inc. (e) | 215 | 3,123 | ||||
| SL Green Realty Corp. (e) | 40 | 2,011 | ||||
| Other Securities | 71,931 | |||||
| 89,598 | ||||||
| HEALTH CARE - 12.0% | ||||||
| Beckman Coulter Inc. | 36 | 2,351 | ||||
| Cerner Corp. (c) (e) | 35 | 2,893 | ||||
| Edwards Lifesciences Corp. (c) | 29 | 2,545 | ||||
| Henry Schein Inc. (c) (e) | 47 | 2,466 | ||||
| Hologic Inc. (c) | 134 | 1,939 | ||||
| ResMed Inc. (c) (e) | 39 | 2,031 | ||||
| Vertex Pharmaceuticals Inc. (c) (e) | 100 | 4,273 | ||||
| Other Securities | 38,419 | |||||
| 56,917 | ||||||
| INDUSTRIALS - 14.4% | ||||||
| AMETEK Inc. | 56 | 2,137 | ||||
| Bucyrus International Inc. - Class A | 39 | 2,195 | ||||
| Joy Global Inc. | 53 | 2,734 | ||||
| Manpower Inc. | 41 | 2,219 | ||||
| URS Corp. (c) | 44 | 1,937 | ||||
| Other Securities | 57,003 | |||||
| 68,225 | ||||||
| INFORMATION TECHNOLOGY - 15.0% | ||||||
| Ansys Inc. (c) | 46 | 1,998 | ||||
| Avnet Inc. (c) | 78 | 2,364 | ||||
| Cree Inc. (c) | 54 | 3,025 | ||||
| Equinix Inc. (c) (e) | 20 | 2,144 | ||||
| F5 Networks Inc. (c) | 41 | 2,177 | ||||
| Global Payments Inc. | 42 | 2,262 | ||||
| Lam Research Corp. (c) | 66 | 2,585 | ||||
| Lender Processing Services Inc. | 50 | 2,019 | ||||
| Other Securities | 52,351 | |||||
| 70,925 | ||||||
| MATERIALS - 6.3% | ||||||
| Lubrizol Corp. | 35 | 2,580 | ||||
| Martin Marietta Materials Inc. (e) | 23 | 2,068 | ||||
| Steel Dynamics Inc. | 112 | 1,981 | ||||
| Other Securities | 23,081 | |||||
| 29,710 | ||||||
| TELECOMMUNICATION SERVICES - 0.9% | ||||||
| Other Securities | 3,953 | |||||
| UTILITIES - 6.6% | ||||||
| MDU Resources Group Inc. | 97 | 2,296 | ||||
| National Fuel Gas Co. | 42 | 2,088 | ||||
| NSTAR | 55 | 2,037 | ||||
| OGE Energy Corp. | 50 | 1,852 | ||||
| Oneok Inc. | 55 | 2,436 | ||||
| Other Securities | 20,806 | |||||
| 31,515 | ||||||
| Total Common Stocks (cost $488,407) | 466,596 | |||||
| NON-U.S. GOVERNMENT AGENCY | ||||||
| ASSET-BACKED SECURITIES - 0.0% | ||||||
| Other Securities | 94 | |||||
| Total Non-U.S. Government Agency | ||||||
| Asset-Backed Securities (cost $2,206) | 94 | |||||
| SHORT TERM INVESTMENTS - 16.1% | ||||||
| Mutual Funds - 1.5% | ||||||
| JNL Money Market Fund, 0.07% (a) (h) | 7,170 | 7,170 | ||||
| Securities Lending Collateral - 14.5% | ||||||
| Securities Lending Cash Collateral Fund LLC, | ||||||
| 0.16% (a) (h) | 45,205 | 45,205 | ||||
| Securities Lending Liquidating Fund LLC, 0.36% (a) (h) | 23,499 | 23,450 | ||||
| 68,655 | ||||||
| U.S. Treasury Securities - 0.1% | ||||||
| Other Securities | 710 | |||||
| Total Short Term Investments (cost $76,584) | 76,535 | |||||
| Total Investments - 114.5% (cost $567,197) | 543,225 | |||||
| Other Assets and Liabilities, Net - (14.5%) | (68,905) | |||||
| Total Net Assets - 100% | $ | 474,320 | ||||
| JNL/Mellon Capital Management | ||||||
| Small Cap Index Fund * (y) | ||||||
| COMMON STOCKS - 96.7% | ||||||
| CONSUMER DISCRETIONARY - 13.4% | ||||||
| Bally Technologies Inc. (c) | 27 | $ | 1,123 | |||
| J Crew Group Inc. (c) (e) | 25 | 1,123 | ||||
| Tempur-Pedic International Inc. (c) | 38 | 888 | ||||
| Tractor Supply Co. (c) (e) | 18 | 952 | ||||
| Tupperware Brands Corp. | 31 | 1,453 | ||||
| Warnaco Group Inc. (c) | 23 | 966 | ||||
| Other Securities | 57,317 | |||||
| 63,822 | ||||||
| CONSUMER STAPLES - 3.3% | ||||||
| Chattem Inc. (c) | 9 | 882 | ||||
| Other Securities | 15,001 | |||||
| 15,883 | ||||||
| ENERGY - 4.9% | ||||||
| Arena Resources Inc. (c) (e) | 19 | 827 | ||||
| Atlas Energy Inc. | 32 | 953 | ||||
| Other Securities | 21,957 | |||||
| 23,737 | ||||||
| FINANCIALS - 19.5% | ||||||
| Assured Guaranty Ltd. (e) | 59 | 1,275 | ||||
| E*Trade Financial Corp. (c) | 750 | 1,312 | ||||
| FirstMerit Corp. (e) | 41 | 833 | ||||
| Highwoods Properties Inc. (e) | 35 | 1,181 | ||||
| MFA Financial Inc. | 140 | 1,029 | ||||
| National Retail Properties Inc. (e) | 40 | 850 | ||||
| Platinum Underwriters Holdings Ltd. | 26 | 980 | ||||
| ProAssurance Corp. (c) (e) | 17 | 890 | ||||
| Prosperity Bancshares Inc. (e) | 23 | 934 | ||||
| Stifel Financial Corp. (c) (e) | 15 | 892 | ||||
| Other Securities | 82,108 | |||||
| 92,284 | ||||||
| HEALTH CARE - 13.6% | ||||||
| Human Genome Sciences Inc. (c) (e) | 88 | 2,689 | ||||
| Onyx Pharmaceuticals Inc. (c) (e) | 31 | 907 | ||||
| Owens & Minor Inc. (e) | 21 | 895 | ||||
| Other Securities | 59,796 | |||||
| 64,287 | ||||||
| INDUSTRIALS - 15.3% | ||||||
| American Superconductor Corp. (c) | 21 | 865 | ||||
| CLARCOR Inc. | 26 | 828 | ||||
| EMCOR Group Inc. (c) (e) | 33 | 888 | ||||
| GrafTech International Ltd. (c) | 60 | 937 | ||||
| Nordson Corp. | 17 | 1,028 | ||||
| Regal-Beloit Corp. | 18 | 931 | ||||
| Tetra Tech Inc. (c) | 30 | 820 | ||||
| UAL Corp. (c) (e) | 80 | 1,032 | ||||
| Watson Wyatt Worldwide Inc. | 21 | 1,013 | ||||
| Other Securities | 64,247 | |||||
| 72,589 | ||||||
| INFORMATION TECHNOLOGY - 17.9% | ||||||
| 3Com Corp. (c) | 194 | 1,451 | ||||
| Atheros Communications Inc. (c) (e) | 32 | 1,094 | ||||
| Concur Technologies Inc. (c) (e) | 20 | 853 | ||||
| Informatica Corp. (c) (e) | 44 | 1,127 | ||||
| Jack Henry & Associates Inc. | 42 | 968 | ||||
| Palm Inc. (c) (e) | 83 | 829 | ||||
| Parametric Technology Corp. (c) (e) | 58 | 947 | ||||
| Polycom Inc. (c) (e) | 42 | 1,047 | ||||
| Skyworks Solutions Inc. (c) (e) | 84 | 1,189 | ||||
| Solera Holdings Inc. (e) | 35 | 1,249 | ||||
| TIBCO Software Inc. (c) | 88 | 847 | ||||
| Other Securities | 73,199 | |||||
| 84,800 | ||||||
| MATERIALS - 4.6% | ||||||
| Domtar Corp. (c) (e) | 20 | 1,132 | ||||
| Rock-Tenn Co. - Class A | 19 | 968 | ||||
| WR Grace & Co. (c) (e) | 36 | 916 | ||||
| Other Securities | 18,762 | |||||
| 21,778 | ||||||
| TELECOMMUNICATION SERVICES - 1.0% | ||||||
| Other Securities | 4,542 | |||||
| UTILITIES - 3.2% | ||||||
| Cleco Corp. | 30 | 828 | ||||
| Nicor Inc. | 23 | 953 | ||||
| Piedmont Natural Gas Co. Inc. (e) | 37 | 984 | ||||
| WGL Holdings Inc. (e) | 25 | 842 | ||||
| Other Securities | 11,376 | |||||
| 14,983 | ||||||
| Total Common Stocks (cost $462,764) | 458,705 | |||||
| RIGHTS - 0.0% | ||||||
| Other Securities | 3 | |||||
| Total Rights (cost $0) | 3 | |||||
| WARRANTS - 0.0% | ||||||
| Other Securities | - | |||||
| Total Warrants (cost $0) | - | |||||
| NON-U.S. GOVERNMENT AGENCY | ||||||
| ASSET-BACKED SECURITIES - 0.0% | ||||||
| Other Securities | 112 | |||||
| Total Non-U.S. Government Agency | ||||||
| Asset-Backed Securities (cost $2,096) | 112 | |||||
| SHORT TERM INVESTMENTS - 23.4% | ||||||
| Mutual Funds - 3.1% | ||||||
| JNL Money Market Fund, 0.07% (a) (h) | 14,720 | 14,720 | ||||
| Securities Lending Collateral - 20.1% | ||||||
| Securities Lending Cash Collateral Fund LLC, | ||||||
| 0.16% (a) (h) | 62,694 | 62,694 | ||||
| Securities Lending Liquidating Fund LLC, 0.36% (a) (h) | 32,507 | 32,439 | ||||
| 95,133 | ||||||
| U.S. Treasury Securities - 0.2% | ||||||
| U.S. Treasury Bill, 0.22%, 03/11/10 (o) | $ | 1,155 | 1,155 | |||
| Total Short Term Investments (cost $111,076) | 111,008 | |||||
| Total Investments - 120.1% (cost $575,936) | 569,828 | |||||
| Other Assets and Liabilities, Net - (20.1%) | (95,463) | |||||
| Total Net Assets - 100% | $ | 474,365 | ||||
| JNL/Mellon Capital Management | ||||||
| International Index Fund * (y) | ||||||
| COMMON STOCKS - 97.2% | ||||||
| CONSUMER DISCRETIONARY - 9.4% | ||||||
| Daimler AG | 64 | $ | 3,421 | |||
| Honda Motor Co. Ltd. | 117 | 3,978 | ||||
| Toyota Motor Corp. | 208 | 8,765 | ||||
| Other Securities | 53,602 | |||||
| 69,766 | ||||||
| CONSUMER STAPLES - 9.7% | ||||||
| British American Tobacco Plc | 142 | 4,614 | ||||
| Diageo Plc | 178 | 3,109 | ||||
| Nestle SA | 246 | 11,935 | ||||
| Tesco Plc | 563 | 3,893 | ||||
| Unilever NV (e) | 116 | 3,776 | ||||
| Other Securities | 44,679 | |||||
| 72,006 | ||||||
| ENERGY - 8.2% | ||||||
| BG Group Plc | 239 | 4,323 | ||||
| BP Plc | 1,328 | 12,872 | ||||
| ENI SpA | 185 | 4,719 | ||||
| Royal Dutch Shell Plc - Class A | 251 | 7,641 | ||||
| Royal Dutch Shell Plc - Class B | 191 | 5,595 | ||||
| Total SA | 150 | 9,669 | ||||
| Other Securities | 15,595 | |||||
| 60,414 | ||||||
| FINANCIALS - 24.8% | ||||||
| Allianz SE | 32 | 4,022 | ||||
| Australia & New Zealand Banking Group Ltd. | 178 | 3,629 | ||||
| Banco Bilbao Vizcaya Argentaria SA | 253 | 4,615 | ||||
| Banco Santander SA | 578 | 9,581 | ||||
| Barclays Plc | 810 | 3,611 | ||||
| BNP Paribas | 67 | 5,388 | ||||
| Commonwealth Bank of Australia | 108 | 5,268 | ||||
| Credit Suisse Group AG | 80 | 3,957 | ||||
| HSBC Holdings Plc | 1,229 | 14,063 | ||||
| Mitsubishi UFJ Financial Group Inc. | 890 | 4,386 | ||||
| Mitsubishi UFJ Lease & Finance Co. Ltd. (e) | 4 | 114 | ||||
| National Australia Bank Ltd. | 149 | 3,636 | ||||
| Prudential plc (a) | 180 | 1,858 | ||||
| Societe Generale - Class A | 45 | 3,137 | ||||
| Standard Chartered Plc | 143 | 3,630 | ||||
| UBS AG (c) | 253 | 3,922 | ||||
| UniCredit SpA (c) | 1,012 | 3,400 | ||||
| Westpac Banking Corp. | 209 | 4,720 | ||||
| Other Securities | 100,349 | |||||
| 183,286 | ||||||
| HEALTH CARE - 8.1% | ||||||
| AstraZeneca Plc | 103 | 4,833 | ||||
| Bayer AG | 59 | 4,712 | ||||
| GlaxoSmithKline Plc | 368 | 7,839 | ||||
| Novartis AG | 150 | 8,177 | ||||
| Roche Holding AG | 50 | 8,471 | ||||
| Sanofi-Aventis SA | 75 | 5,898 | ||||
| Other Securities | 20,381 | |||||
| 60,311 | ||||||
| INDUSTRIALS - 10.8% | ||||||
| ABB Ltd. | 157 | 3,025 | ||||
| Siemens AG | 58 | 5,378 | ||||
| Other Securities | 71,808 | |||||
| 80,211 | ||||||
| INFORMATION TECHNOLOGY - 4.7% | ||||||
| Canon Inc. | 76 | 3,226 | ||||
| Nokia Oyj (e) | 266 | 3,404 | ||||
| Other Securities | 28,004 | |||||
| 34,634 | ||||||
| MATERIALS - 10.2% | ||||||
| Anglo American Plc (c) | 93 | 4,092 | ||||
| BASF SE | 65 | 4,066 | ||||
| BHP Billiton Ltd. | 238 | 9,116 | ||||
| BHP Billiton Plc | 157 | 5,046 | ||||
| Rio Tinto Ltd. | 31 | 2,073 | ||||
| Rio Tinto Plc | 97 | 5,326 | ||||
| Other Securities | 45,452 | |||||
| 75,171 | ||||||
| TELECOMMUNICATION SERVICES - 5.6% | ||||||
| France Telecom SA | 132 | 3,293 | ||||
| Telefonica SA | 300 | 8,408 | ||||
| Vodafone Group Plc | 3,728 | 8,651 | ||||
| Other Securities | 21,328 | |||||
| 41,680 | ||||||
| UTILITIES - 5.7% | ||||||
| E.ON AG | 135 | 5,656 | ||||
| GDF Suez (e) | 88 | 3,834 | ||||
| RWE AG | 30 | 2,902 | ||||
| Other Securities | 29,666 | |||||
| 42,058 | ||||||
| Total Common Stocks (cost $728,105) | 719,537 | |||||
| PREFERRED STOCKS - 0.5% | ||||||
| CONSUMER DISCRETIONARY - 0.2% | ||||||
| Other Securities | 1,193 | |||||
| CONSUMER STAPLES - 0.1% | ||||||
| Other Securities | 800 | |||||
| HEALTH CARE - 0.1% | ||||||
| Other Securities | 399 | |||||
| INDUSTRIALS - 0.0% | ||||||
| Other Securities | 261 | |||||
| TELECOMMUNICATION SERVICES - 0.1% | ||||||
| Other Securities | 458 | |||||
| UTILITIES - 0.0% | ||||||
| RWE AG | 3 | 251 | ||||
| Total Preferred Stocks (cost $3,490) | 3,362 | |||||
| RIGHTS - 0.0% | ||||||
| Other Securities | - | |||||
| Total Rights (cost $0) | - | |||||
| WARRANTS - 0.0% | ||||||
| Other Securities | 5 | |||||
| Total Warrants (cost $0) | 5 | |||||
| NON-U.S. GOVERNMENT AGENCY | ||||||
| ASSET-BACKED SECURITIES - 0.0% | ||||||
| Other Securities | 73 | |||||
| Total Non-U.S. Government Agency | ||||||
| Asset-Backed Securities (cost $1,711) | 73 | |||||
| SHORT TERM INVESTMENTS - 6.1% | ||||||
| Mutual Funds - 2.1% | ||||||
| JNL Money Market Fund, 0.07% (a) (h) | 15,534 | 15,534 | ||||
| Securities Lending Collateral - 3.8% | ||||||
| Securities Lending Cash Collateral Fund LLC, | ||||||
| 0.16% (a) (h) | 11,595 | 11,595 | ||||
| Securities Lending Liquidating Fund LLC, 0.36% (a) (h) | 17,155 | 17,119 | ||||
| 28,714 | ||||||
| U.S. Treasury Securities - 0.2% | ||||||
| Other Securities | 1,135 | |||||
| Total Short Term Investments (cost $45,419) | 45,383 | |||||
| Total Investments - 103.8% (cost $778,725) | 768,360 | |||||
| Other Assets and Liabilities, Net - (3.8%) | (28,321) | |||||
| Total Net Assets - 100% | $ | 740,039 | ||||
| JNL/Mellon Capital Management | ||||||
| Bond Index Fund | ||||||
| NON-U.S. GOVERNMENT AGENCY | ||||||
| ASSET-BACKED SECURITIES - 3.4% | ||||||
| Banc of America Commercial Mortgage Inc. | ||||||
| REMIC, 5.12%, 07/11/43 | $ | 150 | $ | 155 | ||
| REMIC, 5.74%, 05/10/45 (i) | 1,500 | 1,474 | ||||
| REMIC, 5.77%, 05/10/45 (i) | 550 | 439 | ||||
| REMIC, 4.89%, 07/10/45 | 370 | 371 | ||||
| REMIC, 5.45%, 01/15/49 | 200 | 196 | ||||
| REMIC, 5.45%, 01/15/49 | 1,500 | 1,323 | ||||
| REMIC, 5.48%, 01/15/49 (i) | 350 | 245 | ||||
| Bear Stearns Commercial Mortgage Securities Inc. | ||||||
| REMIC, 5.72%, 06/11/40 (i) | 300 | 273 | ||||
| REMIC, 5.21%, 02/11/44 | 260 | 263 | ||||
| Capital Auto Receivables Asset Trust, 5.21%, 03/17/14 | 500 | 524 | ||||
| Capital One Multi-Asset Execution Trust, 4.70%, 06/15/15 | 1,000 | 1,057 | ||||
| Chase Issuance Trust, 4.65%, 12/17/12 | 95 | 98 | ||||
| Citigroup Commercial Mortgage Trust REMIC, | ||||||
| 5.25%, 04/15/40 (i) | 250 | 251 | ||||
| Citigroup/Deutsche Bank Commercial Mortgage Trust | ||||||
| REMIC, 5.62%, 10/15/48 | 250 | 238 | ||||
| REMIC, 5.65%, 10/15/48 | 500 | 388 | ||||
| Credit Suisse First Boston Mortgage Securities | ||||||
| Corp., 4.94%, 12/15/35 | 700 | 718 | ||||
| Credit Suisse Mortgage Capital Certificates | ||||||
| REMIC, 5.66%, 03/15/39 (i) | 1,500 | 1,295 | ||||
| REMIC, 5.38%, 02/15/40 | 250 | 202 | ||||
| REMIC, 5.45%, 01/15/49 (i) | 500 | 511 | ||||
| CS First Boston Mortgage Securities Corp. | ||||||
| REMIC, 5.42%, 05/15/36 (i) | 350 | 347 | ||||
| REMIC, 4.83%, 04/15/37 | 680 | 655 | ||||
| REMIC, 5.01%, 02/15/38 (i) | 800 | 785 | ||||
| REMIC, 5.10%, 08/15/38 (i) | 350 | 343 | ||||
| GE Capital Commercial Mortgage Corp., 6.07%, 06/10/38 | 750 | 786 | ||||
| GE Capital Commercial Mortgage Corp. | ||||||
| REMIC, 5.33%, 11/10/45 (i) | 200 | 163 | ||||
| Greenwich Capital Commercial Funding Corp. | ||||||
| REMIC, 4.57%, 08/10/42 | 500 | 490 | ||||
| GS Mortgage Securities Corp. II | ||||||
| REMIC, 5.56%, 11/10/39 | 400 | 350 | ||||
| REMIC, 5.81%, 08/10/45 (e) (i) | 850 | 730 | ||||
| JPMorgan Chase Commercial Mortgage Securities Corp. | ||||||
| REMIC, 5.82%, 05/12/34 | 84 | 87 | ||||
| REMIC, 4.45%, 01/12/38 | 400 | 403 | ||||
| REMIC, 4.88%, 01/12/38 (i) | 500 | 502 | ||||
| REMIC, 4.77%, 03/12/39 | 500 | 503 | ||||
| REMIC, 5.38%, 06/12/41 (i) | 850 | 856 | ||||
| REMIC, 4.74%, 07/15/42 | 500 | 478 | ||||
| REMIC, 4.98%, 07/15/42 (i) | 125 | 59 | ||||
| REMIC, 4.94%, 08/15/42 (i) | 278 | 264 | ||||
| REMIC, 5.42%, 01/15/49 | 250 | 211 | ||||
| REMIC, 5.75%, 02/12/49 (i) | 200 | 175 | ||||
| REMIC, 5.79%, 02/12/51 (i) | 521 | 454 | ||||
| LB-UBS Commercial Mortgage Trust | ||||||
| REMIC, 3.85%, 05/15/27 | 213 | 212 | ||||
| REMIC, 3.97%, 03/15/29 | 250 | 244 | ||||
| REMIC, 5.59%, 06/15/31 | 75 | 78 | ||||
| REMIC, 4.17%, 05/15/32 | 165 | 163 | ||||
| REMIC, 5.42%, 02/15/40 | 330 | 273 | ||||
| Merrill Lynch Countrywide Commercial Mortgage Trust, | ||||||
| 5.75%, 06/12/50 (i) | 1,782 | 1,700 | ||||
| Merrill Lynch Mortgage Trust REMIC, 5.74%, 08/12/43 (i) | 250 | 232 | ||||
| Merrill Lynch/Countrywide Commercial Mortgage Trust | ||||||
| REMIC, 5.46%, 02/12/39 (i) | 250 | 250 | ||||
| REMIC, 5.41%, 07/12/46 (i) | 200 | 182 | ||||
| REMIC, 5.17%, 12/12/49 | 200 | 177 | ||||
| Morgan Stanley Capital I | ||||||
| REMIC, 5.63%, 06/12/12 (i) | 400 | 404 | ||||
| REMIC, 5.63%, 03/12/17 (i) | 400 | 322 | ||||
| REMIC, 4.80%, 01/13/41 | 250 | 244 | ||||
| REMIC, 5.33%, 11/12/41 | 250 | 235 | ||||
| REMIC, 5.77%, 10/15/42 (i) | 270 | 267 | ||||
| Sigma Finance, Inc. (d) (f) (u) | 2,182 | 93 | ||||
| Wachovia Bank Commercial Mortgage Trust REMIC | ||||||
| 4.44%, 11/15/34 | 61 | 62 | ||||
| 5.22%, 01/15/41 | 100 | 98 | ||||
| 5.24%, 07/15/41 (i) | 250 | 248 | ||||
| 4.89%, 10/15/41 | 200 | 123 | ||||
| 4.90%, 10/15/41 (i) | 500 | 400 | ||||
| 5.12%, 07/15/42 (i) | 410 | 396 | ||||
| 5.25%, 12/15/43 | 500 | 483 | ||||
| 5.34%, 12/15/43 | 200 | 155 | ||||
| 5.35%, 12/15/44 (i) | 200 | 151 | ||||
| 5.42%, 01/15/45 (i) | 350 | 335 | ||||
| 5.99%, 06/15/45 (i) | 500 | 301 | ||||
| 5.57%, 10/15/48 | 250 | 231 | ||||
| 26,721 | ||||||
| Total Non-U.S. Government Agency | ||||||
| Asset-Backed Securities (cost $29,722) | 26,721 | |||||
| CORPORATE BONDS AND NOTES - 21.8% | ||||||
| CONSUMER DISCRETIONARY - 1.3% | ||||||
| CBS Corp., 7.88%, 07/30/30 | 125 | 135 | ||||
| Comcast Cable Communications Holdings Inc. | ||||||
| 8.38%, 03/15/13 | 357 | 412 | ||||
| 9.46%, 11/15/22 | 500 | 643 | ||||
| Comcast Corp. | ||||||
| 5.30%, 01/15/14 | 500 | 534 | ||||
| 6.50%, 01/15/15 | 50 | 56 | ||||
| 5.65%, 06/15/35 | 100 | 93 | ||||
| 6.50%, 11/15/35 | 100 | 104 | ||||
| 6.95%, 08/15/37 | 100 | 109 | ||||
| COX Communications Inc., 5.45%, 12/15/14 | 150 | 161 | ||||
| Daimler Finance North America LLC | ||||||
| 7.75%, 01/18/11 | 250 | 266 | ||||
| 6.50%, 11/15/13 | 100 | 110 | ||||
| 8.50%, 01/18/31 (e) | 50 | 61 | ||||
| Fortune Brands Inc., 5.38%, 01/15/16 | 250 | 249 | ||||
| Grupo Televisa SA, 6.63%, 03/18/25 | 100 | 99 | ||||
| Historic TW Inc., 6.63%, 05/15/29 | 100 | 104 | ||||
| Home Depot Inc. | ||||||
| 5.25%, 12/16/13 | 250 | 268 | ||||
| 5.88%, 12/16/36 | 250 | 241 | ||||
| Johnson Controls Inc., 5.50%, 01/15/16 | 250 | 254 | ||||
| Lowe's Cos. Inc., 5.50%, 10/15/35 | 150 | 147 | ||||
| McDonald's Corp., 5.35%, 03/01/18 | 300 | 322 | ||||
| News America Inc. | ||||||
| 5.30%, 12/15/14 | 175 | 189 | ||||
| 6.20%, 12/15/34 | 50 | 50 | ||||
| 6.40%, 12/15/35 | 100 | 103 | ||||
| 6.65%, 11/15/37 | 500 | 528 | ||||
| Omnicom Group Inc., 5.90%, 04/15/16 | 250 | 266 | ||||
| Target Corp. | ||||||
| 5.88%, 07/15/16 | 250 | 275 | ||||
| 7.00%, 07/15/31 | 100 | 112 | ||||
| 6.50%, 10/15/37 | 300 | 329 | ||||
| Thomson Reuters Corp., 6.50%, 07/15/18 | 500 | 565 | ||||
| Time Warner Cable Inc. | ||||||
| 6.20%, 07/01/13 | 700 | 769 | ||||
| 5.85%, 05/01/17 | 150 | 158 | ||||
| 8.75%, 02/14/19 | 169 | 206 | ||||
| 6.55%, 05/01/37 | 250 | 255 | ||||
| Time Warner Inc. | ||||||
| 6.75%, 04/15/11 | 250 | 265 | ||||
| 5.88%, 11/15/16 (e) | 350 | 378 | ||||
| 7.63%, 04/15/31 | 250 | 290 | ||||
| Viacom Inc. | ||||||
| 6.25%, 04/30/16 | 250 | 272 | ||||
| 5.63%, 09/15/19 (e) | 500 | 522 | ||||
| Walt Disney Co., 7.00%, 03/01/32 | 50 | 59 | ||||
| Yum! Brands Inc., 8.88%, 04/15/11 | 50 | 54 | ||||
| 10,013 | ||||||
| CONSUMER STAPLES - 1.5% | ||||||
| Altria Group Inc. | ||||||
| 8.50%, 11/10/13 (e) | 500 | 578 | ||||
| 9.70%, 11/10/18 | 500 | 618 | ||||
| Anheuser-Busch Cos. Inc., 5.05%, 10/15/16 | 100 | 102 | ||||
| Anheuser-Busch InBev Worldwide Inc., | ||||||
| 5.38%, 01/15/20 (t) (v) | 400 | 408 | ||||
| Archer-Daniels-Midland Co., 5.45%, 03/15/18 | 350 | 373 | ||||
| Bunge Ltd. Finance Corp., 5.35%, 04/15/14 | 75 | 77 | ||||
| Coca-Cola Co., 5.75%, 03/15/11 | 250 | 265 | ||||
| Coca-Cola Enterprises Inc. | ||||||
| 7.13%, 08/01/17 | 100 | 115 | ||||
| 8.50%, 02/01/22 | 250 | 321 | ||||
| ConAgra Foods Inc., 7.00%, 04/15/19 | 300 | 340 | ||||
| CVS Caremark Corp. | ||||||
| 5.75%, 08/15/11 | 350 | 373 | ||||
| 6.13%, 08/15/16 (e) | 250 | 269 | ||||
| 5.75%, 06/01/17 | 500 | 528 | ||||
| Diageo Capital Plc, 7.38%, 01/15/14 | 395 | 457 | ||||
| Diageo Investment Corp., 8.00%, 09/15/22 | 100 | 123 | ||||
| General Mills Inc. | ||||||
| 6.00%, 02/15/12 | 100 | 108 | ||||
| 5.65%, 09/10/12 | 500 | 544 | ||||
| Kimberly-Clark Corp., 5.63%, 02/15/12 | 250 | 269 | ||||
| Kraft Foods Inc. | ||||||
| 5.25%, 10/01/13 | 400 | 423 | ||||
| 6.50%, 11/01/31 | 100 | 100 | ||||
| 7.00%, 08/11/37 | 100 | 107 | ||||
| 6.88%, 02/01/38 | 150 | 157 | ||||
| Kroger Co. | ||||||
| 5.50%, 02/01/13 | 100 | 107 | ||||
| 7.50%, 04/01/31 | 150 | 175 | ||||
| Lorillard Tobacco Co., 8.13%, 06/23/19 | 500 | 550 | ||||
| Pepsi Bottling Group Inc., 7.00%, 03/01/29 | 75 | 88 | ||||
| PepsiCo Inc. | ||||||
| 5.15%, 05/15/12 | 300 | 323 | ||||
| 7.90%, 11/01/18 | 250 | 307 | ||||
| Philip Morris International Inc. | ||||||
| 6.88%, 03/17/14 | 500 | 567 | ||||
| 5.65%, 05/16/18 | 250 | 263 | ||||
| Procter & Gamble Co. | ||||||
| 4.95%, 08/15/14 | 150 | 163 | ||||
| 5.55%, 03/05/37 | 100 | 103 | ||||
| Reynolds American Inc., 7.63%, 06/01/16 | 250 | 273 | ||||
| Safeway Inc., 5.80%, 08/15/12 | 100 | 108 | ||||
| Sara Lee Corp., 6.25%, 09/15/11 | 75 | 80 | ||||
| Walgreen Co., 4.88%, 08/01/13 | 700 | 752 | ||||
| Wal-Mart Stores Inc. | ||||||
| 4.55%, 05/01/13 | 100 | 107 | ||||
| 5.80%, 02/15/18 | 350 | 388 | ||||
| 7.55%, 02/15/30 | 300 | 372 | ||||
| 6.20%, 04/15/38 | 300 | 331 | ||||
| 11,712 | ||||||
| ENERGY - 2.1% | ||||||
| Alberta Energy Co. Ltd., 7.38%, 11/01/31 | 100 | 113 | ||||
| Anadarko Petroleum Corp. | ||||||
| 5.95%, 09/15/16 | 100 | 108 | ||||
| 8.70%, 03/15/19 (e) | 500 | 622 | ||||
| 6.45%, 09/15/36 | 150 | 157 | ||||
| Apache Corp., 5.25%, 04/15/13 | 250 | 268 | ||||
| Canadian Natural Resources Ltd., 5.85%, 02/01/35 | 150 | 147 | ||||
| Cenovus Energy Inc., 4.50%, 09/15/14 (t) (v) | 800 | 826 | ||||
| Centerpoint Energy Transition Co. LLC, 5.17%, 08/01/19 | 741 | 804 | ||||
| Chevron Corp., 3.45%, 03/03/12 | 800 | 831 | ||||
| Conoco Funding Co., 7.25%, 10/15/31 | 75 | 87 | ||||
| ConocoPhillips | ||||||
| 6.65%, 07/15/18 | 75 | 85 | ||||
| 5.75%, 02/01/19 | 300 | 328 | ||||
| 6.50%, 02/01/39 | 300 | 333 | ||||
| ConocoPhillips Holding Co., 6.95%, 04/15/29 | 200 | 227 | ||||
| Devon Energy Corp., 7.95%, 04/15/32 | 100 | 127 | ||||
| Devon Financing Corp. ULC, 7.88%, 09/30/31 | 100 | 125 | ||||
| Enbridge Energy Partners LP, 7.50%, 04/15/38 | 200 | 228 | ||||
| EnCana Corp., 6.50%, 08/15/34 | 100 | 107 | ||||
| Energy Transfer Partners LP | ||||||
| 5.95%, 02/01/15 | 250 | 265 | ||||
| 7.50%, 07/01/38 | 200 | 219 | ||||
| Enterprise Products Operating LLC | ||||||
| 5.60%, 10/15/14 | 25 | 27 | ||||
| 6.88%, 03/01/33 | 25 | 26 | ||||
| Halliburton Co., 7.45%, 09/15/39 | 250 | 309 | ||||
| Hess Corp., 7.30%, 08/15/31 | 35 | 40 | ||||
| Husky Energy Inc., 7.25%, 12/15/19 | 500 | 578 | ||||
| Kinder Morgan Energy Partners LP | ||||||
| 5.85%, 09/15/12 | 225 | 242 | ||||
| 5.00%, 12/15/13 | 75 | 79 | ||||
| 6.00%, 02/01/17 | 150 | 157 | ||||
| 6.85%, 02/15/20 | 500 | 555 | ||||
| Marathon Oil Corp. | ||||||
| 6.13%, 03/15/12 | 200 | 215 | ||||
| 5.90%, 03/15/18 | 250 | 263 | ||||
| Nexen Inc. | ||||||
| 5.88%, 03/10/35 | 50 | 47 | ||||
| 6.40%, 05/15/37 | 100 | 101 | ||||
| Noble Energy Inc., 8.25%, 03/01/19 | 300 | 359 | ||||
| Occidental Petroleum Corp., 6.75%, 01/15/12 | 50 | 55 | ||||
| ONEOK Partners LP, 6.65%, 10/01/36 | 150 | 153 | ||||
| Pemex Project Funding Master Trust | ||||||
| 5.75%, 03/01/18 | 500 | 506 | ||||
| 6.63%, 06/15/35 (e) | 150 | 143 | ||||
| Petrobras International Finance Co. | ||||||
| 6.13%, 10/06/16 | 100 | 107 | ||||
| 5.88%, 03/01/18 | 150 | 151 | ||||
| 7.88%, 03/15/19 | 500 | 576 | ||||
| Petro-Canada, 7.00%, 11/15/28 | 75 | 81 | ||||
| Rowan Cos. Inc., 7.88%, 08/01/19 | 300 | 334 | ||||
| Shell International Finance BV | ||||||
| 5.63%, 06/27/11 | 250 | 266 | ||||
| 5.20%, 03/22/17 | 250 | 269 | ||||
| Southern Natural Gas Co., 5.90%, 04/01/17 (k) (t) (v) | 250 | 257 | ||||
| Spectra Energy Capital LLC, 8.00%, 10/01/19 | 250 | 293 | ||||
| StatoilHydro ASA, 5.25%, 04/15/19 | 500 | 530 | ||||
| Suncor Energy Inc. | ||||||
| 5.95%, 12/01/34 | 100 | 97 | ||||
| 6.50%, 06/15/38 | 300 | 315 | ||||
| TransCanada Pipelines Ltd. | ||||||
| 6.50%, 08/15/18 | 700 | 781 | ||||
| 6.20%, 10/15/37 | 100 | 106 | ||||
| Transocean Inc., 6.80%, 03/15/38 | 150 | 168 | ||||
| Valero Energy Corp. | ||||||
| 6.88%, 04/15/12 | 500 | 546 | ||||
| 7.50%, 04/15/32 | 100 | 103 | ||||
| Weatherford International Inc., 6.35%, 06/15/17 | 250 | 261 | ||||
| Williams Cos. Inc., 8.75%, 03/15/32 (k) | 250 | 299 | ||||
| XTO Energy Inc. | ||||||
| 4.90%, 02/01/14 | 475 | 510 | ||||
| 6.75%, 08/01/37 | 350 | 412 | ||||
| 16,324 | ||||||
| FINANCIALS - 9.5% | ||||||
| Aegon NV, 4.75%, 06/01/13 | 150 | 151 | ||||
| AFLAC Inc., 8.50%, 05/15/19 | 500 | 576 | ||||
| Allstate Corp. | ||||||
| 6.13%, 02/15/12 | 75 | 81 | ||||
| 5.35%, 06/01/33 | 75 | 70 | ||||
| 5.55%, 05/09/35 | 100 | 96 | ||||
| American Express Bank FSB, 5.55%, 10/17/12 | 1,000 | 1,069 | ||||
| American Express Co. | ||||||
| 4.88%, 07/15/13 | 250 | 261 | ||||
| 6.15%, 08/28/17 (e) | 250 | 261 | ||||
| 8.15%, 03/19/38 | 100 | 125 | ||||
| American International Group Inc. | ||||||
| 4.25%, 05/15/13 (k) | 500 | 462 | ||||
| 5.85%, 01/16/18 | 200 | 164 | ||||
| Ameriprise Financial Inc., 7.52%, 06/01/66 | 250 | 220 | ||||
| Asian Development Bank | ||||||
| 3.63%, 09/05/13 | 500 | 521 | ||||
| 4.25%, 10/20/14 | 250 | 264 | ||||
| 5.60%, 07/16/18 | 400 | 436 | ||||
| Assurant Inc., 6.75%, 02/15/34 | 100 | 90 | ||||
| AXA SA, 8.60%, 12/15/30 | 100 | 116 | ||||
| Bank of America Corp. | ||||||
| 3.13%, 06/15/12 (e) | 400 | 414 | ||||
| 4.88%, 09/15/12 | 150 | 157 | ||||
| 5.75%, 12/01/17 | 175 | 179 | ||||
| 5.65%, 05/01/18 | 1,000 | 1,016 | ||||
| 5.49%, 03/15/19 (e) | 200 | 189 | ||||
| Bank of America NA, 6.00%, 10/15/36 | 250 | 242 | ||||
| Barclays Bank Plc, 5.45%, 09/12/12 | 500 | 541 | ||||
| Barclays Bank Plc, | ||||||
| 6.86% (callable at 100 beginning 06/15/32) (p) (t) (v) | 50 | 41 | ||||
| BB&T Capital Trust I, 5.85%, 08/18/35 | 100 | 81 | ||||
| BB&T Capital Trust II, 6.75%, 06/07/36 | 150 | 143 | ||||
| BB&T Corp., 6.50%, 08/01/11 | 75 | 80 | ||||
| Bear Stearns Cos. Inc., 5.70%, 11/15/14 | 200 | 220 | ||||
| Berkshire Hathaway Finance Corp. | ||||||
| 4.60%, 05/15/13 | 100 | 106 | ||||
| 4.63%, 10/15/13 (e) | 250 | 267 | ||||
| 4.85%, 01/15/15 | 100 | 107 | ||||
| Berkshire Hathway Inc., 5.13%, 09/15/12 | 500 | 541 | ||||
| Boeing Capital Corp. | ||||||
| 6.10%, 03/01/11 | 250 | 264 | ||||
| 5.80%, 01/15/13 | 125 | 136 | ||||
| Boston Properties LP, 6.25%, 01/15/13 | 150 | 160 | ||||
| BP Capital Markets Plc, 5.25%, 11/07/13 | 400 | 436 | ||||
| Burlington Resources Finance Co., 7.20%, 08/15/31 | 100 | 115 | ||||
| Camden Property Trust, 5.00%, 06/15/15 | 100 | 97 | ||||
| Capital One Bank USA NA, 6.50%, 06/13/13 | 250 | 269 | ||||
| Capital One Capital V, 10.25%, 08/15/39 | 400 | 465 | ||||
| Capital One Financial Corp. | ||||||
| 5.70%, 09/15/11 | 250 | 263 | ||||
| 6.15%, 09/01/16 | 250 | 251 | ||||
| Caterpillar Financial Services Corp., 4.75%, 02/17/15 | 100 | 105 | ||||
| Chubb Corp., 5.20%, 04/01/13 | 100 | 106 | ||||
| Cincinnati Financial Corp., 6.13%, 11/01/34 | 100 | 88 | ||||
| Citigroup Funding Inc. | ||||||
| 1.38%, 05/05/11 (e) | 1,000 | 1,006 | ||||
| 1.88%, 10/22/12 | 1,000 | 996 | ||||
| Citigroup Inc. | ||||||
| 6.00%, 02/21/12 | 350 | 369 | ||||
| 2.13%, 04/30/12 | 1,000 | 1,011 | ||||
| 6.50%, 08/19/13 | 500 | 533 | ||||
| 5.00%, 09/15/14 | 400 | 386 | ||||
| 5.85%, 08/02/16 (e) | 250 | 245 | ||||
| 5.50%, 02/15/17 | 350 | 331 | ||||
| 6.00%, 08/15/17 | 250 | 250 | ||||
| 6.13%, 11/21/17 | 700 | 706 | ||||
| 8.50%, 05/22/19 | 350 | 404 | ||||
| 6.00%, 10/31/33 | 50 | 43 | ||||
| 8.13%, 07/15/39 | 600 | 677 | ||||
| Corp. Andina de Fomento, 6.88%, 03/15/12 | 150 | 161 | ||||
| Credit Suisse New York, 5.50%, 05/01/14 | 1,200 | 1,302 | ||||
| Credit Suisse USA Inc. | ||||||
| 6.13%, 11/15/11 | 100 | 108 | ||||
| 6.50%, 01/15/12 | 250 | 272 | ||||
| 5.13%, 08/15/15 | 200 | 213 | ||||
| 7.13%, 07/15/32 (e) | 100 | 117 | ||||
| Deutsche Bank Financial LLC, 5.38%, 03/02/15 (t) (v) | 250 | 261 | ||||
| Eksportfinans ASA, 5.00%, 02/14/12 | 500 | 533 | ||||
| ERP Operating LP | ||||||
| 5.25%, 09/15/14 | 250 | 254 | ||||
| 5.75%, 06/15/17 | 150 | 150 | ||||
| European Investment Bank | ||||||
| 3.13%, 07/15/11 (e) | 1,000 | 1,030 | ||||
| 2.00%, 02/10/12 | 1,600 | 1,617 | ||||
| 4.63%, 03/21/12 | 200 | 213 | ||||
| 1.75%, 09/14/12 | 600 | 598 | ||||
| 4.63%, 05/15/14 | 150 | 161 | ||||
| 4.88%, 02/16/16 | 250 | 269 | ||||
| 5.13%, 09/13/16 (e) | 500 | 544 | ||||
| Export-Import Bank of Korea | ||||||
| 8.13%, 01/21/14 | 500 | 580 | ||||
| 5.13%, 03/16/15 | 200 | 208 | ||||
| Fifth Third Bancorp, 6.25%, 05/01/13 (e) | 300 | 309 | ||||
| Fifth Third Capital Trust IV, 6.50%, 04/15/37 | 200 | 145 | ||||
| General Electric Capital Corp. | ||||||
| 1.63%, 01/07/11 (e) | 200 | 202 | ||||
| 5.00%, 11/15/11 | 300 | 317 | ||||
| 3.00%, 12/09/11 | 500 | 515 | ||||
| 5.88%, 02/15/12 (e) | 250 | 268 | ||||
| 5.25%, 10/19/12 | 400 | 426 | ||||
| 2.63%, 12/28/12 | 1,000 | 1,018 | ||||
| 5.45%, 01/15/13 | 1,000 | 1,063 | ||||
| 5.00%, 01/08/16 (e) | 100 | 101 | ||||
| 5.63%, 09/15/17 | 200 | 206 | ||||
| 5.63%, 05/01/18 (e) | 700 | 717 | ||||
| 6.75%, 03/15/32 | 850 | 867 | ||||
| 5.88%, 01/14/38 | 100 | 93 | ||||
| 6.38%, 11/15/67 | 500 | 434 | ||||
| Goldman Sachs Group Inc. | ||||||
| 1.63%, 07/15/11 | 300 | 303 | ||||
| 6.60%, 01/15/12 | 400 | 435 | ||||
| 3.25%, 06/15/12 | 400 | 416 | ||||
| 5.45%, 11/01/12 | 1,000 | 1,075 | ||||
| 5.25%, 04/01/13 (e) | 100 | 106 | ||||
| 5.13%, 01/15/15 | 200 | 210 | ||||
| 5.75%, 10/01/16 | 250 | 264 | ||||
| 6.25%, 09/01/17 | 200 | 214 | ||||
| 5.95%, 01/18/18 | 300 | 317 | ||||
| 6.15%, 04/01/18 | 75 | 80 | ||||
| 5.95%, 01/15/27 | 250 | 240 | ||||
| 6.13%, 02/15/33 | 850 | 854 | ||||
| 6.75%, 10/01/37 (e) | 200 | 206 | ||||
| Hartford Financial Services Group Inc. | ||||||
| 5.38%, 03/15/17 | 500 | 477 | ||||
| 6.10%, 10/01/41 | 75 | 60 | ||||
| HCP Inc., 6.00%, 01/30/17 | 150 | 141 | ||||
| HSBC Finance Capital Trust IX, 5.91%, 11/30/35 | 250 | 205 | ||||
| HSBC Finance Corp. | ||||||
| 5.25%, 01/14/11 | 500 | 518 | ||||
| 4.75%, 07/15/13 (e) | 1,000 | 1,041 | ||||
| HSBC Holdings Plc | ||||||
| 5.25%, 12/12/12 | 200 | 212 | ||||
| 7.63%, 05/17/32 | 150 | 160 | ||||
| 6.50%, 05/02/36 | 150 | 157 | ||||
| Inter-American Development Bank | ||||||
| 4.38%, 09/20/12 | 500 | 532 | ||||
| 5.13%, 09/13/16 | 250 | 273 | ||||
| International Bank for Reconstruction | ||||||
| & Development, 7.63%, 01/19/23 | 300 | 383 | ||||
| International Lease Finance Corp. | ||||||
| 5.75%, 06/15/11 | 250 | 230 | ||||
| 3.00%, 04/22/14 | 500 | 501 | ||||
| Japan Finance Corp., 2.00%, 06/24/11 | 500 | 506 | ||||
| John Deere Capital Corp. | ||||||
| 7.00%, 03/15/12 | 250 | 277 | ||||
| 5.75%, 09/10/18 | 500 | 542 | ||||
| JPMorgan Chase & Co. | ||||||
| 6.75%, 02/01/11 | 550 | 580 | ||||
| 1.65%, 02/23/11 | 600 | 607 | ||||
| 3.13%, 12/01/11 (e) | 500 | 517 | ||||
| 6.63%, 03/15/12 | 100 | 109 | ||||
| 5.38%, 10/01/12 | 1,000 | 1,082 | ||||
| 5.75%, 01/02/13 (e) | 100 | 107 | ||||
| 4.75%, 03/01/15 (e) | 250 | 260 | ||||
| 5.15%, 10/01/15 | 250 | 259 | ||||
| 6.40%, 10/02/17 | 500 | 545 | ||||
| 6.00%, 01/15/18 | 700 | 752 | ||||
| JPMorgan Chase Bank NA, 6.00%, 10/01/17 | 250 | 268 | ||||
| JPMorgan Chase Capital XV, 5.88%, 03/15/35 | 75 | 67 | ||||
| JPMorgan Chase Capital XX, 6.55%, 09/29/36 | 100 | 92 | ||||
| JPMorgan Chase Capital XXV, 6.80%, 10/01/37 | 600 | 596 | ||||
| KeyBank NA, 5.80%, 07/01/14 | 100 | 97 | ||||
| Korea Development Bank, 5.30%, 01/17/13 | 800 | 840 | ||||
| Kreditanstalt fuer Wiederaufbau | ||||||
| 4.63%, 01/20/11 | 250 | 259 | ||||
| 3.25%, 02/15/11 | 500 | 518 | ||||
| 2.25%, 04/16/12 | 600 | 609 | ||||
| 3.25%, 03/15/13 | 250 | 257 | ||||
| 3.50%, 05/16/13 | 400 | 417 | ||||
| 4.13%, 10/15/14 | 650 | 681 | ||||
| 4.88%, 01/17/17 | 500 | 534 | ||||
| 4.88%, 06/17/19 (e) | 500 | 528 | ||||
| 0.00%, 06/29/37 (j) | 500 | 123 | ||||
| Landwirtschaftliche Rentenbank | ||||||
| 5.25%, 07/15/11 (e) | 500 | 530 | ||||
| 1.88%, 09/24/12 | 500 | 499 | ||||
| Lehman Brothers Holdings Inc., 6.88%, 07/17/37 (d) | 250 | - | ||||
| Lincoln National Corp., 8.75%, 07/01/19 | 500 | 571 | ||||
| Marsh & McLennan Cos. Inc., 5.75%, 09/15/15 | 100 | 104 | ||||
| Marshall & Ilsley Bank, 6.38%, 09/01/11 | 100 | 96 | ||||
| MBNA Corp., 7.50%, 03/15/12 (e) | 100 | 109 | ||||
| Merrill Lynch & Co. Inc. | ||||||
| 6.05%, 08/15/12 | 500 | 536 | ||||
| 5.00%, 01/15/15 | 550 | 559 | ||||
| 6.05%, 05/16/16 | 250 | 252 | ||||
| 6.88%, 04/25/18 | 650 | 700 | ||||
| 7.75%, 05/14/38 | 400 | 439 | ||||
| MetLife Inc. | ||||||
| 6.13%, 12/01/11 | 500 | 538 | ||||
| 5.00%, 11/24/13 | 100 | 105 | ||||
| 7.72%, 02/15/19 (e) | 500 | 588 | ||||
| 5.70%, 06/15/35 | 100 | 99 | ||||
| 6.40%, 12/15/36 | 100 | 88 | ||||
| Morgan Stanley | ||||||
| 5.05%, 01/21/11 | 500 | 519 | ||||
| 5.75%, 08/31/12 | 500 | 536 | ||||
| 5.25%, 11/02/12 | 500 | 532 | ||||
| 4.75%, 04/01/14 | 450 | 453 | ||||
| 5.75%, 10/18/16 | 250 | 259 | ||||
| 5.45%, 01/09/17 | 350 | 354 | ||||
| 6.63%, 04/01/18 | 500 | 541 | ||||
| 7.25%, 04/01/32 | 25 | 28 | ||||
| National City Bank, 4.63%, 05/01/13 | 100 | 102 | ||||
| National Rural Utilities Cooperative | ||||||
| Finance Corp., 8.00%, 03/01/32 | 150 | 179 | ||||
| Nordic Invest Bank, 3.63%, 06/17/13 (e) | 600 | 625 | ||||
| Oesterreichische Kontrollbank AG | ||||||
| 4.75%, 11/08/11 | 250 | 264 | ||||
| 4.75%, 10/16/12 (e) | 650 | 695 | ||||
| ORIX Corp., 5.48%, 11/22/11 | 200 | 201 | ||||
| PNC Funding Corp., 5.25%, 11/15/15 | 250 | 257 | ||||
| Principal Life Income Funding Trusts, 5.10%, 04/15/14 | 150 | 153 | ||||
| ProLogis | ||||||
| 5.63%, 11/15/16 | 250 | 230 | ||||
| 7.38%, 10/30/19 | 200 | 197 | ||||
| Prudential Financial Inc. | ||||||
| 5.75%, 07/15/33 (e) | 400 | 364 | ||||
| 5.70%, 12/14/36 | 250 | 226 | ||||
| Realty Income Corp., 6.75%, 08/15/19 | 150 | 147 | ||||
| Regions Financial Corp., 7.75%, 11/10/14 (e) | 400 | 394 | ||||
| Royal Bank of Scotland Group Plc, 5.00%, 10/01/14 | 100 | 88 | ||||
| Simon Property Group LP | ||||||
| 5.75%, 12/01/15 | 400 | 408 | ||||
| 5.25%, 12/01/16 | 250 | 243 | ||||
| SLM Corp. | ||||||
| 5.00%, 10/01/13 | 50 | 46 | ||||
| 5.05%, 11/14/14 | 250 | 225 | ||||
| SunTrust Bank, 6.38%, 04/01/11 | 200 | 208 | ||||
| SunTrust Capital VIII, 6.10%, 12/15/36 | 99 | 69 | ||||
| Svensk Exportkredit AB, 5.13%, 03/01/17 | 200 | 211 | ||||
| Toll Brothers Finance Corp., 4.95%, 03/15/14 | 50 | 49 | ||||
| Transatlantic Holdings Inc., 5.75%, 12/14/15 | 200 | 196 | ||||
| Travelers Cos. Inc. | ||||||
| 6.25%, 03/15/37 (e) | 250 | 228 | ||||
| 6.25%, 06/15/37 | 150 | 159 | ||||
| U.S. Bank NA, 6.38%, 08/01/11 | 600 | 645 | ||||
| UBS AG Stamford | ||||||
| 5.88%, 07/15/16 | 250 | 253 | ||||
| 5.88%, 12/20/17 | 250 | 257 | ||||
| Wachovia Bank NA | ||||||
| 4.88%, 02/01/15 | 200 | 204 | ||||
| 6.00%, 11/15/17 | 250 | 262 | ||||
| 5.85%, 02/01/37 | 250 | 239 | ||||
| Wachovia Corp. | ||||||
| 5.30%, 10/15/11 | 300 | 318 | ||||
| 5.50%, 05/01/13 | 500 | 531 | ||||
| 5.25%, 08/01/14 | 250 | 259 | ||||
| Washington Mutual Bank, 5.13%, 01/15/15 (d) | 200 | 1 | ||||
| Wells Fargo & Co. | ||||||
| 5.30%, 08/26/11 | 500 | 530 | ||||
| 2.13%, 06/15/12 (e) | 300 | 303 | ||||
| 5.00%, 11/15/14 | 200 | 205 | ||||
| 5.63%, 12/11/17 | 300 | 312 | ||||
| Wells Fargo Bank NA | ||||||
| 6.45%, 02/01/11 | 100 | 106 | ||||
| 4.75%, 02/09/15 | 250 | 255 | ||||
| Wells Fargo Financial Inc., 5.50%, 08/01/12 | 250 | 268 | ||||
| Westpac Banking Corp., 2.25%, 11/19/12 | 300 | 299 | ||||
| 76,356 | ||||||
| HEALTH CARE - 1.4% | ||||||
| Abbott Laboratories | ||||||
| 5.88%, 05/15/16 | 250 | 276 | ||||
| 6.00%, 04/01/39 | 250 | 264 | ||||
| Aetna Inc., 6.63%, 06/15/36 | 150 | 154 | ||||
| Amgen Inc. | ||||||
| 5.85%, 06/01/17 | 200 | 219 | ||||
| 6.38%, 06/01/37 | 400 | 437 | ||||
| AstraZeneca Plc | ||||||
| 5.90%, 09/15/17 (e) | 250 | 278 | ||||
| 6.45%, 09/15/37 | 250 | 282 | ||||
| Baxter International Inc. | ||||||
| 4.00%, 03/01/14 | 500 | 516 | ||||
| 4.63%, 03/15/15 | 75 | 80 | ||||
| Bristol-Myers Squibb Co. | ||||||
| 5.45%, 05/01/18 | 150 | 160 | ||||
| 5.88%, 11/15/36 | 150 | 156 | ||||
| CIGNA Corp., 8.50%, 05/01/19 | 400 | 455 | ||||
| Covidien International Finance SA, 6.00%, 10/15/17 | 300 | 324 | ||||
| Eli Lilly & Co., 5.55%, 03/15/37 | 100 | 104 | ||||
| Express Scripts Inc., 5.25%, 06/15/12 | 200 | 213 | ||||
| Genentech Inc. | ||||||
| 4.75%, 07/15/15 | 50 | 54 | ||||
| 5.25%, 07/15/35 | 250 | 241 | ||||
| GlaxoSmithKline Capital Inc. | ||||||
| 4.38%, 04/15/14 | 150 | 157 | ||||
| 5.65%, 05/15/18 | 250 | 270 | ||||
| 5.38%, 04/15/34 | 150 | 146 | ||||
| Hospira Inc., 6.05%, 03/30/17 | 500 | 523 | ||||
| Humana Inc., 7.20%, 06/15/18 | 500 | 511 | ||||
| Johnson & Johnson, 5.95%, 08/15/37 | 250 | 275 | ||||
| Merck & Co. Inc., 4.75%, 03/01/15 (e) | 250 | 268 | ||||
| Novartis Capital Corp., 4.13%, 02/10/14 | 800 | 841 | ||||
| Pfizer Inc. | ||||||
| 4.45%, 03/15/12 (e) | 500 | 529 | ||||
| 6.20%, 03/15/19 | 500 | 556 | ||||
| Pharmacia Corp., 6.60%, 12/01/28 (k) | 50 | 55 | ||||
| Schering-Plough Corp. | ||||||
| 6.00%, 09/15/17 (e) | 250 | 278 | ||||
| 6.50%, 12/01/33 (e) (l) | 350 | 393 | ||||
| Teva Pharmaceutical Finance LLC, 6.15%, 02/01/36 | 150 | 155 | ||||
| Thermo Fisher Scientific Inc., 5.00%, 06/01/15 | 200 | 210 | ||||
| UnitedHealth Group Inc. | ||||||
| 5.38%, 03/15/16 | 250 | 257 | ||||
| 5.80%, 03/15/36 | 150 | 134 | ||||
| WellPoint Inc. | ||||||
| 5.00%, 01/15/11 | 250 | 258 | ||||
| 5.85%, 01/15/36 | 100 | 94 | ||||
| Wyeth | ||||||
| 6.95%, 03/15/11 (l) | 400 | 427 | ||||
| 5.50%, 03/15/13 (l) | 100 | 109 | ||||
| 6.45%, 02/01/24 | 100 | 111 | ||||
| 5.95%, 04/01/37 | 250 | 261 | ||||
| 11,031 | ||||||
| INDUSTRIALS - 1.3% | ||||||
| 3M Co., 5.70%, 03/15/37 (e) | 150 | 157 | ||||
| Boeing Co., 4.88%, 02/15/20 | 500 | 501 | ||||
| Burlington Northern Santa Fe Corp. | ||||||
| 5.90%, 07/01/12 | 150 | 163 | ||||
| 4.70%, 10/01/19 | 300 | 297 | ||||
| 6.15%, 05/01/37 | 100 | 105 | ||||
| Caterpillar Inc. | ||||||
| 7.90%, 12/15/18 | 500 | 610 | ||||
| 6.05%, 08/15/36 | 150 | 160 | ||||
| CSX Corp. | ||||||
| 6.75%, 03/15/11 | 50 | 53 | ||||
| 6.30%, 03/15/12 | 250 | 270 | ||||
| 7.38%, 02/01/19 | 300 | 343 | ||||
| Emerson Electric Co., 5.00%, 12/15/14 | 100 | 108 | ||||
| General Dynamics Corp., 4.25%, 05/15/13 | 250 | 264 | ||||
| General Electric Co., 5.00%, 02/01/13 | 800 | 846 | ||||
| Honeywell International Inc. | ||||||
| 6.13%, 11/01/11 | 100 | 109 | ||||
| 5.00%, 02/15/19 (e) | 500 | 518 | ||||
| Koninklijke Philips Electronics NV, 5.75%, 03/11/18 | 350 | 372 | ||||
| Lockheed Martin Corp., 6.15%, 09/01/36 | 175 | 185 | ||||
| Norfolk Southern Corp. | ||||||
| 5.90%, 06/15/19 | 300 | 320 | ||||
| 7.25%, 02/15/31 | 75 | 87 | ||||
| 7.05%, 05/01/37 | 100 | 118 | ||||
| Northrop Grumman Systems Corp. | ||||||
| 7.75%, 03/01/16 | 150 | 177 | ||||
| 5.05%, 08/01/19 | 210 | 214 | ||||
| 7.75%, 02/15/31 | 200 | 247 | ||||
| Paccar Inc., 6.89%, 02/15/14 | 700 | 790 | ||||
| Raytheon Co., 5.38%, 04/01/13 | 100 | 108 | ||||
| RR Donnelley & Sons Co. | ||||||
| 4.95%, 04/01/14 | 200 | 200 | ||||
| 5.50%, 05/15/15 | 50 | 48 | ||||
| Tyco International Group SA | ||||||
| 6.38%, 10/15/11 | 91 | 98 | ||||
| 6.00%, 11/15/13 | 500 | 548 | ||||
| Union Pacific Corp. | ||||||
| 5.70%, 08/15/18 | 250 | 262 | ||||
| 6.63%, 02/01/29 | 25 | 27 | ||||
| United Parcel Service Inc., 6.20%, 01/15/38 | 350 | 388 | ||||
| United Technologies Corp. | ||||||
| 6.35%, 03/01/11 | 75 | 79 | ||||
| 4.88%, 05/01/15 | 300 | 322 | ||||
| 6.13%, 02/01/19 | 250 | 276 | ||||
| 6.70%, 08/01/28 | 50 | 56 | ||||
| Waste Management Inc. | ||||||
| 6.38%, 11/15/12 | 500 | 550 | ||||
| 6.10%, 03/15/18 | 200 | 213 | ||||
| 10,189 | ||||||
| INFORMATION TECHNOLOGY - 0.7% | ||||||
| Amphenol Corp., 4.75%, 11/15/14 (e) | 600 | 600 | ||||
| Cisco Systems Inc. | ||||||
| 2.90%, 11/17/14 | 500 | 499 | ||||
| 5.50%, 02/22/16 | 250 | 274 | ||||
| 5.90%, 02/15/39 | 250 | 253 | ||||
| Fiserv Inc., 6.13%, 11/20/12 | 500 | 544 | ||||
| Hewlett-Packard Co. | ||||||
| 6.50%, 07/01/12 | 250 | 276 | ||||
| 4.50%, 03/01/13 | 800 | 848 | ||||
| International Business Machines Corp. | ||||||
| 5.70%, 09/14/17 | 300 | 328 | ||||
| 6.50%, 01/15/28 | 200 | 218 | ||||
| 5.60%, 11/30/39 | 330 | 332 | ||||
| Oracle Corp. | ||||||
| 5.00%, 01/15/11 | 250 | 260 | ||||
| 5.75%, 04/15/18 | 350 | 378 | ||||
| 6.13%, 07/08/39 | 300 | 315 | ||||
| Xerox Corp. | ||||||
| 6.88%, 08/15/11 | 150 | 160 | ||||
| 6.35%, 05/15/18 | 500 | 522 | ||||
| 5,807 | ||||||
| MATERIALS - 1.0% | ||||||
| Agrium Inc., 7.13%, 05/23/36 | 300 | 318 | ||||
| Air Products & Chemicals Inc., 4.38%, 08/21/19 | 400 | 396 | ||||
| Alcoa Inc. | ||||||
| 5.38%, 01/15/13 | 50 | 52 | ||||
| 5.55%, 02/01/17 | 200 | 199 | ||||
| 6.75%, 07/15/18 (e) | 300 | 306 | ||||
| ArcelorMittal, 9.85%, 06/01/19 | 500 | 647 | ||||
| Barrick Gold Corp., 5.95%, 10/15/39 | 300 | 293 | ||||
| BHP Billiton Finance USA Ltd., 4.80%, 04/15/13 | 100 | 106 | ||||
| CRH America Inc., 6.00%, 09/30/16 (e) | 250 | 261 | ||||
| Dow Chemical Co. | ||||||
| 6.13%, 02/01/11 | 550 | 573 | ||||
| 6.00%, 10/01/12 | 50 | 54 | ||||
| 7.38%, 11/01/29 | 500 | 546 | ||||
| EI Du Pont de Nemours & Co. | ||||||
| 4.75%, 11/15/12 | 100 | 107 | ||||
| 5.60%, 12/15/36 | 400 | 398 | ||||
| Freeport-McMoRan Copper & Gold Inc., 8.38%, 04/01/17 | 700 | 766 | ||||
| International Paper Co. | ||||||
| 7.95%, 06/15/18 | 150 | 173 | ||||
| 8.70%, 06/15/38 (e) | 300 | 365 | ||||
| Lafarge SA, 6.50%, 07/15/16 | 250 | 265 | ||||
| Newmont Mining Corp., 5.88%, 04/01/35 | 50 | 47 | ||||
| Potash Corp. of Saskatchewan Inc., 5.25%, 05/15/14 | 500 | 537 | ||||
| Praxair Inc., 3.95%, 06/01/13 | 100 | 104 | ||||
| Rio Tinto Alcan Inc. | ||||||
| 4.88%, 09/15/12 | 50 | 53 | ||||
| 6.13%, 12/15/33 | 25 | 25 | ||||
| Rio Tinto Finance USA Ltd., 5.88%, 07/15/13 | 800 | 863 | ||||
| Southern Copper Corp., 7.50%, 07/27/35 | 150 | 149 | ||||
| Vale Overseas Ltd. | ||||||
| 6.25%, 01/11/16 | 100 | 105 | ||||
| 6.25%, 01/23/17 | 150 | 156 | ||||
| 6.88%, 11/21/36 | 100 | 100 | ||||
| 7,964 | ||||||
| TELECOMMUNICATION SERVICES - 1.4% | ||||||
| America Movil SAB de CV, 6.38%, 03/01/35 (e) | 200 | 206 | ||||
| AT&T Corp., 8.00%, 11/15/31 (l) | 500 | 610 | ||||
| AT&T Inc. | ||||||
| 5.88%, 02/01/12 | 100 | 108 | ||||
| 4.95%, 01/15/13 | 750 | 800 | ||||
| 5.10%, 09/15/14 | 550 | 592 | ||||
| 6.15%, 09/15/34 | 350 | 346 | ||||
| 6.30%, 01/15/38 | 100 | 102 | ||||
| 6.55%, 02/15/39 | 250 | 263 | ||||
| AT&T Wireless Services Inc. | ||||||
| 7.88%, 03/01/11 (e) | 250 | 269 | ||||
| 8.75%, 03/01/31 | 108 | 140 | ||||
| BellSouth Capital Funding Corp., 7.88%, 02/15/30 | 100 | 114 | ||||
| BellSouth Corp., 5.20%, 09/15/14 | 100 | 107 | ||||
| British Telecommunications Plc, 9.63%, 12/15/30 (l) | 150 | 191 | ||||
| CenturyTel Inc., 6.00%, 04/01/17 | 250 | 257 | ||||
| Deutsche Telekom International Finance BV | ||||||
| 5.25%, 07/22/13 | 200 | 212 | ||||
| 5.75%, 03/23/16 | 250 | 265 | ||||
| 8.75%, 06/15/30 (l) | 100 | 129 | ||||
| Embarq Corp., 8.00%, 06/01/36 | 100 | 108 | ||||
| France Telecom SA | ||||||
| 7.75%, 03/01/11 (l) | 300 | 322 | ||||
| 8.50%, 03/01/31 (e) (l) | 250 | 333 | ||||
| GTE Corp. | ||||||
| 6.84%, 04/15/18 | 250 | 274 | ||||
| 6.94%, 04/15/28 | 50 | 51 | ||||
| Qwest Corp., 6.50%, 06/01/17 | 250 | 246 | ||||
| Rogers Communications Inc., 6.80%, 08/15/18 | 500 | 560 | ||||
| Southwestern Bell Telephone LP, 7.00%, 07/01/15 | 100 | 114 | ||||
| Telecom Italia Capital SA | ||||||
| 5.25%, 11/15/13 | 500 | 526 | ||||
| 4.95%, 09/30/14 | 100 | 104 | ||||
| 5.25%, 10/01/15 | 200 | 209 | ||||
| 6.38%, 11/15/33 | 50 | 49 | ||||
| 6.00%, 09/30/34 | 100 | 95 | ||||
| Telefonica Europe BV, 8.25%, 09/15/30 | 200 | 249 | ||||
| TELUS Corp., 8.00%, 06/01/11 | 140 | 152 | ||||
| Verizon Communications Inc. | ||||||
| 5.85%, 09/15/35 | 350 | 341 | ||||
| 6.90%, 04/15/38 | 300 | 333 | ||||
| Verizon Global Funding Corp., 7.75%, 12/01/30 | 200 | 235 | ||||
| Verizon New England Inc., 6.50%, 09/15/11 | 250 | 266 | ||||
| Verizon Wireless Capital LLC, 7.38%, 11/15/13 | 750 | 861 | ||||
| Vodafone Group Plc | ||||||
| 5.00%, 12/16/13 | 150 | 159 | ||||
| 5.38%, 01/30/15 | 100 | 107 | ||||
| 5.63%, 02/27/17 | 600 | 637 | ||||
| 11,042 | ||||||
| UTILITIES - 1.6% | ||||||
| Alabama Power Co., 6.00%, 03/01/39 | 250 | 263 | ||||
| Browning-Ferris Industries Inc., 7.40%, 09/15/35 | 95 | 105 | ||||
| CenterPoint Energy Resources Corp. | ||||||
| 7.75%, 02/15/11 | 150 | 159 | ||||
| 7.88%, 04/01/13 | 50 | 56 | ||||
| Consolidated Edison Co. of New York Inc., 5.30%, 03/01/35 | 250 | 235 | ||||
| Constellation Energy Group Inc. | ||||||
| 7.00%, 04/01/12 | 100 | 109 | ||||
| 7.60%, 04/01/32 | 150 | 163 | ||||
| Consumers Energy Co. | ||||||
| 5.50%, 08/15/16 | 25 | 26 | ||||
| 6.70%, 09/15/19 | 400 | 451 | ||||
| Detroit Edison Co., 5.60%, 06/15/18 | 250 | 264 | ||||
| Dominion Resources Inc., 7.00%, 06/15/38 | 200 | 230 | ||||
| Duke Energy Carolinas LLC | ||||||
| 5.63%, 11/30/12 | 150 | 164 | ||||
| 5.30%, 10/01/15 | 200 | 218 | ||||
| Duke Energy Corp., 6.30%, 02/01/14 | 700 | 770 | ||||
| Energy East Corp., 6.75%, 07/15/36 | 150 | 165 | ||||
| Enersis SA, 7.40%, 12/01/16 | 150 | 167 | ||||
| Exelon Generation Co. LLC | ||||||
| 5.35%, 01/15/14 | 150 | 158 | ||||
| 6.20%, 10/01/17 | 200 | 214 | ||||
| FirstEnergy Corp. | ||||||
| 6.45%, 11/15/11 | 6 | 6 | ||||
| 7.38%, 11/15/31 | 425 | 461 | ||||
| Florida Power & Light Co. | ||||||
| 5.63%, 04/01/34 | 100 | 100 | ||||
| 5.95%, 02/01/38 | 250 | 263 | ||||
| Florida Power Corp., 5.65%, 06/15/18 | 500 | 537 | ||||
| FPL Group Capital Inc., 6.00%, 03/01/19 (e) | 100 | 108 | ||||
| Indiana Michigan Power Co., 7.00%, 03/15/19 | 350 | 390 | ||||
| MidAmerican Energy Co., 6.75%, 12/30/31 | 50 | 56 | ||||
| MidAmerican Energy Holdings Co. | ||||||
| 5.88%, 10/01/12 | 100 | 109 | ||||
| 6.13%, 04/01/36 | 350 | 358 | ||||
| National Grid Plc, 6.30%, 08/01/16 | 150 | 163 | ||||
| Nevada Power Co., 7.13%, 03/15/19 | 250 | 279 | ||||
| NiSource Finance Corp. | ||||||
| 5.40%, 07/15/14 | 75 | 77 | ||||
| 6.80%, 01/15/19 | 300 | 321 | ||||
| Northern States Power Co. | ||||||
| 8.00%, 08/28/12 | 100 | 115 | ||||
| 5.25%, 03/01/18 | 500 | 524 | ||||
| Ohio Power Co., 6.00%, 06/01/16 | 250 | 265 | ||||
| Oncor Electric Delivery Co. | ||||||
| 6.38%, 01/15/15 | 150 | 164 | ||||
| 7.00%, 09/01/22 (e) | 150 | 167 | ||||
| Pacific Gas & Electric Co. | ||||||
| 4.80%, 03/01/14 | 250 | 265 | ||||
| 6.05%, 03/01/34 | 500 | 522 | ||||
| PacifiCorp, 5.75%, 04/01/37 | 150 | 152 | ||||
| Pepco Holdings Inc., 6.45%, 08/15/12 | 225 | 241 | ||||
| Progress Energy Inc. | ||||||
| 7.10%, 03/01/11 | 117 | 124 | ||||
| 7.75%, 03/01/31 | 150 | 176 | ||||
| PSEG Power LLC, 8.63%, 04/15/31 | 75 | 97 | ||||
| Public Service Co. of Colorado, 7.88%, 10/01/12 | 500 | 574 | ||||
| Puget Sound Energy Inc., 5.78%, 10/01/39 | 200 | 194 | ||||
| SCANA Corp., 6.88%, 05/15/11 | 75 | 79 | ||||
| Scottish Power Ltd., 5.38%, 03/15/15 | 50 | 53 | ||||
| Sempra Energy, 6.00%, 02/01/13 | 250 | 267 | ||||
| South Carolina Electric & Gas Co., 6.05%, 01/15/38 | 400 | 420 | ||||
| Southern California Edison Co. | ||||||
| 6.00%, 01/15/34 | 75 | 79 | ||||
| 5.95%, 02/01/38 | 400 | 420 | ||||
| Union Electric Co., 6.40%, 06/15/17 | 100 | 108 | ||||
| Veolia Environnement, 6.00%, 06/01/18 | 200 | 211 | ||||
| Virginia Electric & Power Co. | ||||||
| 5.95%, 09/15/17 | 250 | 270 | ||||
| 6.00%, 01/15/36 | 150 | 154 | ||||
| 12,786 | ||||||
| Total Corporate Bonds and Notes (cost $169,446) | 173,224 | |||||
| GOVERNMENT AND AGENCY OBLIGATIONS - 73.5% | ||||||
| GOVERNMENT SECURITIES - 29.3% | ||||||
| Municipals - 0.2% | ||||||
| Bay Area Toll Authority, 6.26%, 04/01/49 | 200 | 191 | ||||
| Dallas County Hospital District, Series C, 5.62%, 08/15/44 | 300 | 293 | ||||
| New Jersey State Turnpike Authority - Series B | ||||||
| (insured by AMBAC Assurance Corp.) 4.25%, 01/01/16 | 95 | 94 | ||||
| New Jersey State Turnpike Authority - Series B | ||||||
| (Prerefunded at 01/01/15, insured by AMBAC | ||||||
| Assurance Corp.) 4.25%, 01/01/16 | 5 | 5 | ||||
| State of California Various Purpose Bond, 7.50%, 04/01/34 | 500 | 485 | ||||
| State of Illinois, 5.10%, 06/01/33 | 700 | 583 | ||||
| 1,651 | ||||||
| Sovereign - 1.8% | ||||||
| Brazilian Government International Bond | ||||||
| 11.00%, 01/11/12 (e) | 315 | 372 | ||||
| 7.88%, 03/07/15 | 565 | 660 | ||||
| 8.88%, 04/15/24 | 135 | 176 | ||||
| 10.13%, 05/15/27 | 235 | 345 | ||||
| 7.13%, 01/20/37 (e) | 455 | 522 | ||||
| 11.00%, 08/17/40 | 300 | 400 | ||||
| Chile Government International Bond, 5.50%, 01/15/13 (e) | 100 | 110 | ||||
| Export Development Canada, 2.38%, 03/19/12 | 500 | 509 | ||||
| Financement-Quebec, 5.00%, 10/25/12 | 100 | 106 | ||||
| Hungary Government International Bond, | ||||||
| 4.75%, 02/03/15 (e) | 250 | 248 | ||||
| Hydro Quebec | ||||||
| 8.00%, 02/01/13 | 250 | 286 | ||||
| 7.50%, 04/01/16 | 100 | 118 | ||||
| 9.40%, 02/01/21 | 250 | 334 | ||||
| Israel Government International Bond | ||||||
| 4.63%, 06/15/13 | 75 | 79 | ||||
| 5.50%, 11/09/16 | 450 | 483 | ||||
| Italy Government International Bond | ||||||
| 5.63%, 06/15/12 (e) | 250 | 272 | ||||
| 4.38%, 06/15/13 (e) | 100 | 106 | ||||
| 6.88%, 09/27/23 | 450 | 509 | ||||
| 5.38%, 06/15/33 | 100 | 98 | ||||
| Japan Bank of International Cooperation, | ||||||
| 2.13%, 11/05/12 (t) (v) | 500 | 498 | ||||
| Malaysia Government Bond, 7.50%, 07/15/11 | 300 | 327 | ||||
| Mexico Government International Bond | ||||||
| 7.50%, 01/14/12 | 100 | 111 | ||||
| 6.38%, 01/16/13 (e) | 339 | 375 | ||||
| 5.88%, 01/15/14 (e) | 250 | 273 | ||||
| 6.63%, 03/03/15 | 93 | 103 | ||||
| 5.63%, 01/15/17 | 250 | 261 | ||||
| 7.50%, 04/08/33 | 250 | 287 | ||||
| 6.75%, 09/27/34 | 300 | 316 | ||||
| Peru Government International Bond, 7.13%, 03/30/19 (e) | 200 | 230 | ||||
| Poland Government International Bond, 5.00%, 10/19/15 | 650 | 683 | ||||
| Province of Manitoba, Canada, 5.00%, 02/15/12 | 250 | 267 | ||||
| Province of New Brunswick, Canada, 5.20%, 02/21/17 | 250 | 269 | ||||
| Province of Nova Scotia, Canada | ||||||
| 5.75%, 02/27/12 | 100 | 107 | ||||
| 8.75%, 04/01/22 | 250 | 328 | ||||
| Province of Ontario, Canada | ||||||
| 1.88%, 11/19/12 | 400 | 396 | ||||
| 4.50%, 02/03/15 | 100 | 106 | ||||
| 5.45%, 04/27/16 | 250 | 272 | ||||
| 4.00%, 10/07/19 (e) | 500 | 479 | ||||
| Province of Quebec, Canada | ||||||
| 6.13%, 01/22/11 (e) | 500 | 529 | ||||
| 4.60%, 05/26/15 | 250 | 265 | ||||
| 7.50%, 07/15/23 | 100 | 120 | ||||
| 7.13%, 02/09/24 | 250 | 294 | ||||
| Republic of Korea | ||||||
| 5.13%, 12/07/16 | 150 | 155 | ||||
| 5.63%, 11/03/25 | 250 | 252 | ||||
| Republic of Peru, 6.55%, 03/14/37 | 250 | 260 | ||||
| South Africa Government International Bond | ||||||
| 7.38%, 04/25/12 | 100 | 110 | ||||
| 6.50%, 06/02/14 | 200 | 219 | ||||
| Tennessee Valley Authority, 5.50%, 07/18/17 (e) | 1,000 | 1,090 | ||||
| 14,715 | ||||||
| U.S. Treasury Securities - 27.3% | ||||||
| U.S. Treasury Bond | ||||||
| 10.63%, 08/15/15 | 450 | 632 | ||||
| 7.50%, 11/15/16 | 840 | 1,059 | ||||
| 8.75%, 05/15/17 (e) | 645 | 872 | ||||
| 8.88%, 08/15/17 | 780 | 1,063 | ||||
| 4.25%, 11/15/17 (e) | 330 | 346 | ||||
| 9.13%, 05/15/18 (e) | 315 | 442 | ||||
| 8.88%, 02/15/19 (e) | 590 | 824 | ||||
| 8.13%, 08/15/19 | 1,900 | 2,557 | ||||
| 8.50%, 02/15/20 | 1,340 | 1,857 | ||||
| 8.75%, 08/15/20 | 910 | 1,287 | ||||
| 7.88%, 02/15/21 | 1,520 | 2,043 | ||||
| 8.13%, 05/15/21 | 1,200 | 1,642 | ||||
| 8.00%, 11/15/21 | 1,050 | 1,430 | ||||
| 7.25%, 08/15/22 | 1,000 | 1,295 | ||||
| 7.13%, 02/15/23 | 1,155 | 1,481 | ||||
| 6.25%, 08/15/23 | 595 | 711 | ||||
| 7.63%, 02/15/25 | 539 | 728 | ||||
| 6.88%, 08/15/25 | 730 | 927 | ||||
| 6.00%, 02/15/26 | 730 | 854 | ||||
| 6.75%, 08/15/26 | 2,000 | 2,523 | ||||
| 6.50%, 11/15/26 | 360 | 444 | ||||
| 6.63%, 02/15/27 | 545 | 681 | ||||
| 6.38%, 08/15/27 | 380 | 464 | ||||
| 6.13%, 11/15/27 | 305 | 363 | ||||
| 5.50%, 08/15/28 | 850 | 947 | ||||
| 5.25%, 11/15/28 | 570 | 618 | ||||
| 5.25%, 02/15/29 | 545 | 590 | ||||
| 6.13%, 08/15/29 | 405 | 486 | ||||
| 6.25%, 05/15/30 | 285 | 348 | ||||
| 5.38%, 02/15/31 | 350 | 386 | ||||
| 4.50%, 02/15/36 | 1,350 | 1,330 | ||||
| 4.75%, 02/15/37 | 1,440 | 1,472 | ||||
| 5.00%, 05/15/37 (e) | 900 | 956 | ||||
| 4.38%, 02/15/38 | 800 | 768 | ||||
| 4.50%, 05/15/38 | 740 | 725 | ||||
| 3.50%, 02/15/39 | 1,500 | 1,229 | ||||
| 4.25%, 05/15/39 | 2,580 | 2,420 | ||||
| 4.50%, 08/15/39 | 2,000 | 1,955 | ||||
| 4.38%, 11/15/39 | 2,500 | 2,393 | ||||
| U.S. Treasury Note | ||||||
| 4.25%, 01/15/11 (e) | 1,640 | 1,702 | ||||
| 0.88%, 01/31/11 | 3,000 | 3,009 | ||||
| 0.88%, 02/28/11 | 2,500 | 2,506 | ||||
| 4.50%, 02/28/11 | 2,838 | 2,962 | ||||
| 0.88%, 03/31/11 | 2,700 | 2,705 | ||||
| 4.75%, 03/31/11 | 2,000 | 2,098 | ||||
| 4.88%, 04/30/11 | 2,740 | 2,886 | ||||
| 0.88%, 05/31/11 | 500 | 501 | ||||
| 4.88%, 05/31/11 | 1,830 | 1,933 | ||||
| 1.13%, 06/30/11 | 2,000 | 2,008 | ||||
| 4.88%, 07/31/11 (e) | 2,655 | 2,820 | ||||
| 5.00%, 08/15/11 | 1,975 | 2,106 | ||||
| 1.00%, 08/31/11 | 3,200 | 3,202 | ||||
| 4.63%, 08/31/11 | 1,900 | 2,015 | ||||
| 4.50%, 09/30/11 (e) | 2,670 | 2,831 | ||||
| 4.63%, 10/31/11 | 1,050 | 1,118 | ||||
| 1.75%, 11/15/11 | 1,000 | 1,013 | ||||
| 4.50%, 11/30/11 | 2,200 | 2,342 | ||||
| 0.75%, 11/31/11 (e) | 3,000 | 2,980 | ||||
| 1.13%, 12/15/11 | 1,500 | 1,501 | ||||
| 1.00%, 12/31/11 | 2,500 | 2,493 | ||||
| 1.13%, 01/15/12 | 900 | 899 | ||||
| 4.75%, 01/31/12 | 1,720 | 1,846 | ||||
| 1.38%, 02/15/12 | 1,530 | 1,534 | ||||
| 4.88%, 02/15/12 | 1,725 | 1,856 | ||||
| 4.63%, 02/29/12 | 1,455 | 1,559 | ||||
| 4.50%, 03/31/12 | 1,600 | 1,712 | ||||
| 1.38%, 04/15/12 | 1,010 | 1,011 | ||||
| 4.50%, 04/30/12 (e) | 355 | 381 | ||||
| 4.75%, 05/31/12 (e) | 2,275 | 2,457 | ||||
| 4.88%, 06/30/12 (e) | 1,000 | 1,085 | ||||
| 4.63%, 07/31/12 (e) | 2,040 | 2,203 | ||||
| 4.13%, 08/31/12 | 1,850 | 1,978 | ||||
| 4.25%, 09/30/12 | 780 | 837 | ||||
| 3.88%, 10/31/12 | 1,230 | 1,309 | ||||
| 3.38%, 11/30/12 | 1,870 | 1,964 | ||||
| 3.63%, 12/31/12 | 1,050 | 1,110 | ||||
| 3.88%, 02/15/13 | 405 | 431 | ||||
| 2.75%, 02/28/13 | 990 | 1,020 | ||||
| 2.50%, 03/31/13 | 1,465 | 1,498 | ||||
| 3.13%, 04/30/13 | 995 | 1,037 | ||||
| 3.50%, 05/31/13 | 1,400 | 1,475 | ||||
| 3.38%, 06/30/13 | 2,000 | 2,099 | ||||
| 3.38%, 07/31/13 | 800 | 840 | ||||
| 3.13%, 08/31/13 | 1,940 | 2,016 | ||||
| 3.13%, 09/30/13 | 2,750 | 2,858 | ||||
| 2.75%, 10/31/13 | 3,270 | 3,349 | ||||
| 2.00%, 11/30/13 | 2,960 | 2,944 | ||||
| 1.50%, 12/31/13 | 1,200 | 1,168 | ||||
| 1.75%, 01/31/14 | 3,715 | 3,644 | ||||
| 4.00%, 02/15/14 | 2,480 | 2,652 | ||||
| 1.88%, 02/28/14 | 2,500 | 2,459 | ||||
| 1.75%, 03/31/14 | 2,050 | 2,001 | ||||
| 1.88%, 04/30/14 | 2,500 | 2,449 | ||||
| 4.75%, 05/15/14 | 3,400 | 3,741 | ||||
| 2.25%, 05/31/14 | 2,300 | 2,284 | ||||
| 2.63%, 06/30/14 | 2,500 | 2,518 | ||||
| 2.63%, 07/31/14 | 2,900 | 2,914 | ||||
| 4.25%, 08/15/14 | 2,000 | 2,158 | ||||
| 2.38%, 08/31/14 | 3,000 | 2,978 | ||||
| 2.38%, 09/30/14 | 3,000 | 2,975 | ||||
| 2.38%, 10/31/14 | 2,100 | 2,077 | ||||
| 4.25%, 11/15/14 | 1,090 | 1,174 | ||||
| 2.13%, 11/30/14 (e) | 2,500 | 2,441 | ||||
| 2.63%, 12/31/14 | 2,600 | 2,592 | ||||
| 4.00%, 02/15/15 | 1,750 | 1,860 | ||||
| 4.13%, 05/15/15 | 1,140 | 1,216 | ||||
| 4.25%, 08/15/15 | 2,020 | 2,162 | ||||
| 4.50%, 11/15/15 | 1,810 | 1,960 | ||||
| 4.50%, 02/15/16 | 1,480 | 1,596 | ||||
| 5.13%, 05/15/16 | 860 | 959 | ||||
| 3.25%, 05/31/16 | 1,485 | 1,491 | ||||
| 4.88%, 08/15/16 | 920 | 1,012 | ||||
| 3.00%, 09/30/16 | 1,500 | 1,472 | ||||
| 3.13%, 10/31/16 | 1,500 | 1,481 | ||||
| 4.63%, 11/15/16 | 450 | 487 | ||||
| 2.75%, 11/30/16 | 1,000 | 963 | ||||
| 3.25%, 12/31/16 | 2,000 | 1,983 | ||||
| 4.63%, 02/15/17 (e) | 1,000 | 1,080 | ||||
| 4.50%, 05/15/17 | 1,800 | 1,924 | ||||
| 4.75%, 08/15/17 | 290 | 315 | ||||
| 3.50%, 02/15/18 | 1,340 | 1,329 | ||||
| 3.88%, 05/15/18 | 2,600 | 2,640 | ||||
| 4.00%, 08/15/18 | 2,200 | 2,247 | ||||
| 3.75%, 11/15/18 | 2,250 | 2,250 | ||||
| 2.75%, 02/15/19 | 2,730 | 2,513 | ||||
| 3.13%, 05/15/19 | 3,500 | 3,315 | ||||
| 3.63%, 08/15/19 | 2,950 | 2,900 | ||||
| 3.38%. 11/15/19 (e) | 2,500 | 2,402 | ||||
| 216,969 | ||||||
| U.S. GOVERNMENT AGENCY | ||||||
| MORTGAGE-BACKED SECURITIES - 44.2% | ||||||
| Federal Home Loan Bank - 1.9% | ||||||
| Federal Home Loan Bank | ||||||
| 1.63%, 01/21/11 | 800 | 809 | ||||
| 4.63%, 02/18/11 | 500 | 522 | ||||
| 3.38%, 06/24/11 | 2,000 | 2,066 | ||||
| 3.63%, 07/01/11 | 2,100 | 2,182 | ||||
| 1.63%, 07/27/11 | 2,000 | 2,019 | ||||
| 5.38%, 08/19/11 | 500 | 534 | ||||
| 4.88%, 11/18/11 | 1,000 | 1,068 | ||||
| 5.75%, 05/15/12 | 1,125 | 1,236 | ||||
| 4.50%, 11/15/12 | 400 | 429 | ||||
| 3.88%, 06/14/13 (e) | 1,600 | 1,692 | ||||
| 4.50%, 09/16/13 (e) | 1,000 | 1,080 | ||||
| 5.25%, 06/18/14 (e) | 1,090 | 1,211 | ||||
| 4.75%, 12/16/16 | 300 | 322 | ||||
| 5.50%, 07/15/36 | 100 | 102 | ||||
| 15,272 | ||||||
| Federal Home Loan Mortgage Corp. - 14.3% | ||||||
| Federal Home Loan Mortgage Corp. | ||||||
| 4.13%, 02/24/11 | 500 | 519 | ||||
| 2.05%, 03/09/11 | 200 | 201 | ||||
| 5.63%, 03/15/11 | 1,000 | 1,058 | ||||
| 2.00%, 03/16/11 | 300 | 301 | ||||
| 5.13%, 04/18/11 | 1,260 | 1,330 | ||||
| 1.75%, 04/20/11 | 250 | 251 | ||||
| 6.00%, 06/15/11 | 1,800 | 1,930 | ||||
| 1.63%, 08/11/11 | 200 | 201 | ||||
| 1.50%, 08/24/11 | 800 | 803 | ||||
| 5.50%, 09/15/11 | 500 | 537 | ||||
| 5.75%, 01/15/12 | 1,150 | 1,252 | ||||
| 5.13%, 07/15/12 | 978 | 1,062 | ||||
| 4.63%, 10/25/12 | 300 | 323 | ||||
| 4.50%, 01/15/13 (e) | 1,150 | 1,235 | ||||
| 3.50%, 05/29/13 | 2,400 | 2,511 | ||||
| 4.50%, 07/15/13 (e) | 2,300 | 2,482 | ||||
| 4.88%, 11/15/13 | 500 | 547 | ||||
| 4.50%, 04/02/14 | 100 | 108 | ||||
| 6.50%, 06/01/14 | 48 | 51 | ||||
| 5.05%, 01/26/15 | 100 | 109 | ||||
| 4.38%, 07/17/15 | 300 | 320 | ||||
| 7.00%, 08/01/15 | 17 | 19 | ||||
| 7.00%, 11/01/15 | - | 1 | ||||
| 4.75%, 01/19/16 | 3,100 | 3,343 | ||||
| 5.13%, 10/18/16 | 620 | 679 | ||||
| 7.00%, 11/02/16 | 40 | 43 | ||||
| 6.00%, 12/01/16 | 29 | 31 | ||||
| 4.50%, 01/01/18 | 30 | 31 | ||||
| 5.50%, 04/01/18 | 16 | 17 | ||||
| 4.50%, 11/01/18 | 332 | 346 | ||||
| 4.50%, 11/01/18 | 352 | 365 | ||||
| 4.50%, 12/01/18 | 589 | 613 | ||||
| 6.00%, 02/01/19 | 126 | 135 | ||||
| 4.00%, 05/01/19 | 35 | 36 | ||||
| 5.00%, 07/01/19 | 76 | 80 | ||||
| 5.10%, 08/19/19 | 800 | 805 | ||||
| 5.50%, 01/01/20, TBA (g) | 1,000 | 1,057 | ||||
| 4.00%, 09/01/20 | 197 | 199 | ||||
| 4.50%, 09/01/20 | 438 | 454 | ||||
| 5.00%, 10/01/20 | 468 | 492 | ||||
| 5.50%, 11/01/20 | 538 | 573 | ||||
| 4.00%, 12/01/20 | 503 | 508 | ||||
| 5.50%, 12/01/20 | 40 | 42 | ||||
| 5.00%, 02/01/21 | 52 | 54 | ||||
| 6.00%, 07/21/21 | 137 | 147 | ||||
| 5.00%, 07/01/22 | 456 | 477 | ||||
| 4.50%, 09/01/22 | 652 | 672 | ||||
| 5.00%, 09/01/22 | 436 | 457 | ||||
| 5.00%, 11/01/22 | 972 | 1,018 | ||||
| 5.00%, 03/01/23 | 189 | 198 | ||||
| 4.50%, 05/01/23 | 6 | 6 | ||||
| 5.00%, 05/01/23 | 352 | 369 | ||||
| 4.50%, 07/01/23 | 488 | 499 | ||||
| 5.50%, 10/01/23 | 142 | 150 | ||||
| 5.50%, 10/01/23 | 344 | 364 | ||||
| 6.00%, 01/01/24 | 819 | 876 | ||||
| 4.50%, 05/01/24 | 256 | 263 | ||||
| 4.00%, 07/01/24 | 486 | 490 | ||||
| 4.50%, 07/01/24 | 471 | 484 | ||||
| 4.00%, 08/01/24 | 275 | 277 | ||||
| 4.00%, 09/01/24 | 588 | 593 | ||||
| 4.50%, 10/01/24 | 296 | 304 | ||||
| 4.50%, 10/01/24 | 704 | 725 | ||||
| 4.50%, 10/01/24 | 198 | 204 | ||||
| 4.00%, 11/01/24 | 587 | 592 | ||||
| 4.50%, 10/01/24 | 34 | 35 | ||||
| 4.50%, 11/01/24 | 605 | 623 | ||||
| 4.00%, 12/01/24 | 75 | 76 | ||||
| 4.00%, 01/01/25 | 650 | 655 | ||||
| 4.50%, 07/01/25 | 181 | 184 | ||||
| 4.50%, 10/01/25 | 259 | 264 | ||||
| 5.00%, 03/01/26 | 128 | 132 | ||||
| 6.00%, 09/01/26 | 500 | 536 | ||||
| 6.50%, 07/01/28 | 145 | 157 | ||||
| 5.50%, 11/01/28 | 775 | 816 | ||||
| 6.50%, 12/01/28 | 49 | 53 | ||||
| 6.00%, 02/01/29 | 8 | 9 | ||||
| 6.00%, 04/01/29 | 14 | 15 | ||||
| 6.00%, 04/01/29 | 13 | 14 | ||||
| 6.50%, 05/01/29 | 17 | 18 | ||||
| 6.00%, 07/01/29 | 18 | 20 | ||||
| 6.75%, 09/15/29 | 60 | 72 | ||||
| 6.50%, 03/01/31 | 20 | 21 | ||||
| 6.75%, 03/15/31 | 120 | 146 | ||||
| 6.00%, 05/01/31 | 65 | 70 | ||||
| 7.00%, 06/01/31 | 9 | 10 | ||||
| 7.50%, 11/01/31 | 114 | 128 | ||||
| 6.00%, 01/01/32 | 6 | 6 | ||||
| 6.00%, 02/01/32 | 58 | 62 | ||||
| 7.50%, 04/01/32 | 178 | 199 | ||||
| 6.00%, 06/01/32 | 5 | 5 | ||||
| 6.25%, 07/15/32 | 300 | 348 | ||||
| 5.50%, 10/01/32 | 650 | 685 | ||||
| 6.00%, 11/01/32 | 47 | 51 | ||||
| 6.00%, 12/01/32 | 6 | 7 | ||||
| 6.00%, 03/01/33 | 4 | 5 | ||||
| 5.50%, 04/01/33 | 162 | 171 | ||||
| 5.50%, 04/01/33 | 89 | 93 | ||||
| 6.00%, 04/01/33 | 5 | 5 | ||||
| 6.00%, 05/01/33 | 13 | 14 | ||||
| 6.00%, 05/01/33 | 30 | 32 | ||||
| 5.50%, 08/01/33 | 184 | 194 | ||||
| 5.00%, 09/01/33 | 1,825 | 1,879 | ||||
| 4.50%, 10/01/33 | 6 | 6 | ||||
| 5.50%, 10/01/33 | 853 | 897 | ||||
| 6.00%, 10/01/33 | 33 | 36 | ||||
| 5.50%, 11/01/33 | 371 | 390 | ||||
| 5.50%, 12/01/33 | 248 | 261 | ||||
| 5.50%, 12/01/33 | 37 | 39 | ||||
| 5.50%, 03/01/34 | 102 | 107 | ||||
| 5.00%, 05/01/34 | 551 | 567 | ||||
| 5.00%, 05/01/34 | 95 | 97 | ||||
| 6.00%, 07/01/34 | 189 | 202 | ||||
| 6.50%, 12/01/34 | 410 | 441 | ||||
| 5.00%, 02/01/35 | 612 | 641 | ||||
| 5.00%, 02/01/35 | 199 | 205 | ||||
| 5.50%, 04/01/35 | 349 | 367 | ||||
| 5.50%, 05/01/35 | 228 | 240 | ||||
| 5.00%, 06/01/35 | 304 | 312 | ||||
| 6.50%, 06/01/35 | 6 | 6 | ||||
| 5.00%, 07/01/35 | 803 | 825 | ||||
| 6.50%, 07/01/35 | 8 | 9 | ||||
| 5.00%, 11/01/35 | 1,786 | 1,835 | ||||
| 5.50%, 11/01/35 | 594 | 625 | ||||
| 4.37%, 12/01/35 (i) | 880 | 925 | ||||
| 4.50%, 12/01/35 | 313 | 314 | ||||
| 5.50%, 12/01/35 | 1,641 | 1,725 | ||||
| 6.00%, 12/01/35 | 901 | 960 | ||||
| 6.00%, 12/01/35 | 584 | 621 | ||||
| 4.50%, 01/01/36 | 322 | 322 | ||||
| 5.50%, 02/01/36 | 195 | 204 | ||||
| 6.00%, 02/01/36 | 433 | 460 | ||||
| 5.00%, 03/01/36 | 49 | 50 | ||||
| 5.50%, 03/01/36 | 19 | 20 | ||||
| 5.00%, 04/01/36 | 206 | 211 | ||||
| 5.00%, 04/01/36 | 680 | 698 | ||||
| 4.50%, 08/01/36 | 412 | 412 | ||||
| 6.50%, 08/01/36 | 412 | 442 | ||||
| 6.00%, 09/01/36 | 457 | 486 | ||||
| 6.00%, 09/01/36 | 79 | 84 | ||||
| 6.50%, 09/01/36 | 304 | 325 | ||||
| 7.00%, 11/01/36 | 41 | 45 | ||||
| 5.50%, 12/01/36 | 1,211 | 1,271 | ||||
| 5.50%, 12/01/36 | 884 | 927 | ||||
| 5.86%, 01/01/37 (i) | 116 | 123 | ||||
| 6.05%, 01/01/37 (i) | 502 | 537 | ||||
| 5.50%, 02/01/37 | 309 | 324 | ||||
| 5.65%, 02/01/37 (i) | 434 | 460 | ||||
| 6.00%, 02/01/37 | 554 | 589 | ||||
| 6.50%, 03/01/37 | 410 | 439 | ||||
| 6.00%, 04/16/37 | 100 | 99 | ||||
| 5.50%, 05/01/37 | 1,350 | 1,416 | ||||
| 6.00%, 05/01/37 | 1,794 | 1,908 | ||||
| 5.00%, 08/01/37 | 234 | 240 | ||||
| 6.00%, 08/01/37 | 844 | 897 | ||||
| 7.00%, 08/01/37 | 448 | 488 | ||||
| 6.50%, 09/01/37 | 372 | 398 | ||||
| 6.50%, 09/01/37 | 408 | 437 | ||||
| 6.50%, 09/01/37 | 273 | 293 | ||||
| 5.50%, 01/01/38 | 85 | 89 | ||||
| 6.00%, 03/01/38 | 58 | 61 | ||||
| 6.50%, 03/01/38 | 371 | 398 | ||||
| 5.00%, 04/01/38 | 520 | 533 | ||||
| 5.50%, 05/01/38 | 753 | 790 | ||||
| 5.50%, 06/01/38 | 347 | 364 | ||||
| 6.00%, 08/01/38 | 706 | 750 | ||||
| 5.50%, 09/01/38 | 809 | 849 | ||||
| 6.00%, 09/01/38 | 696 | 739 | ||||
| 6.00%, 09/01/38 | 890 | 944 | ||||
| 6.00%, 09/01/38 | 862 | 914 | ||||
| 6.00%, 10/01/38 | 30 | 31 | ||||
| 5.50%, 11/01/38 | 154 | 162 | ||||
| 6.00%, 11/01/38 | 910 | 966 | ||||
| 5.50%, 12/01/38 | 882 | 925 | ||||
| 5.50%, 12/01/38 | 574 | 602 | ||||
| 6.00%, 12/01/38 | 406 | 431 | ||||
| 4.50%, 01/01/39 | 460 | 459 | ||||
| 4.50%, 01/01/39 | 111 | 111 | ||||
| 4.50%, 01/01/39, TBA (g) | 2,000 | 1,995 | ||||
| 5.00%, 01/01/39 | 863 | 886 | ||||
| 5.00%, 01/01/39 | 2,892 | 2,969 | ||||
| 6.00%, 02/01/39 | 533 | 566 | ||||
| 6.00%, 02/01/39 | 290 | 308 | ||||
| 6.50%, 03/01/39 | 500 | 536 | ||||
| 4.50%, 04/01/39 | 1,868 | 1,865 | ||||
| 5.00%, 04/01/39 | 470 | 483 | ||||
| 5.00%, 05/01/39 | 307 | 315 | ||||
| 4.00%, 06/01/39 | 984 | 950 | ||||
| 4.50%, 06/01/39 | 396 | 396 | ||||
| 5.00%, 06/01/39 | 614 | 630 | ||||
| 4.00%, 07/01/39 | 692 | 668 | ||||
| 4.00%, 07/01/39 | 988 | 954 | ||||
| 4.50%, 07/01/39 | 1,577 | 1,575 | ||||
| 5.00%, 07/01/39 | 784 | 805 | ||||
| 5.00%, 08/01/39 | 413 | 424 | ||||
| 4.50%, 09/01/39 | 1,191 | 1,189 | ||||
| 4.50%, 09/01/39 | 1,989 | 1,986 | ||||
| 4.50%, 10/01/39 | 997 | 996 | ||||
| 5.00%, 10/01/39 | 996 | 1,022 | ||||
| 5.50%, 10/01/39 | 2,057 | 2,157 | ||||
| 4.50%, 11/01/39 | 499 | 499 | ||||
| 6.00%, 11/01/39 | 500 | 531 | ||||
| 4.00%, 12/01/39 | 500 | 483 | ||||
| 4.00%, 12/01/39 | 1,000 | 965 | ||||
| 4.00%, 12/01/39 | 799 | 771 | ||||
| 4.50%, 12/01/39 | 1,500 | 1,498 | ||||
| 5.00%, 12/01/39 | 2,000 | 2,052 | ||||
| 5.00%, 12/01/39 | 2,000 | 2,052 | ||||
| 113,931 | ||||||
| Federal National Mortgage Association - 22.4% | ||||||
| Federal National Mortgage Association | ||||||
| 2.00%, 02/11/11 | 200 | 200 | ||||
| 4.50%, 02/15/11 | 300 | 313 | ||||
| 5.50%, 03/15/11 | 1,300 | 1,374 | ||||
| 2.75%, 04/11/11 | 2,000 | 2,050 | ||||
| 5.13%, 04/15/11 | 500 | 528 | ||||
| 6.00%, 05/15/11 | 1,000 | 1,071 | ||||
| 3.38%, 05/19/11 | 2,000 | 2,070 | ||||
| 1.00%, 11/23/11 | 1,000 | 998 | ||||
| 2.00%, 01/09/12 (e) | 800 | 812 | ||||
| 5.00%, 02/16/12 | 750 | 807 | ||||
| 6.13%, 03/15/12 | 1,000 | 1,102 | ||||
| 1.75%, 08/10/12 | 2,500 | 2,499 | ||||
| 5.50%, 01/01/14 | 22 | 23 | ||||
| 3.38%, 03/10/14 | 800 | 804 | ||||
| 2.50%, 05/15/14 | 675 | 674 | ||||
| 3.30%, 07/30/14 | 1,000 | 1,005 | ||||
| 4.63%, 10/15/14 | 550 | 596 | ||||
| 5.00%, 04/15/15 (e) | 500 | 549 | ||||
| 4.38%, 10/15/15 | 390 | 415 | ||||
| 6.50%, 02/01/16 | 7 | 7 | ||||
| 5.00%, 03/15/16 (e) | 400 | 435 | ||||
| 5.50%, 04/01/16 | 7 | 7 | ||||
| 6.00%, 06/01/16 | 45 | 49 | ||||
| 6.50%, 09/01/16 | 8 | 9 | ||||
| 6.00%, 10/01/16 | 98 | 105 | ||||
| 6.50%, 10/01/16 | 16 | 17 | ||||
| 6.50%, 12/01/16 | 1 | 1 | ||||
| 4.88%, 12/15/16 | 500 | 541 | ||||
| 5.50%, 01/01/17 | 189 | 201 | ||||
| 5.50%, 01/01/17 | 86 | 91 | ||||
| 5.00%, 02/13/17 | 1,500 | 1,628 | ||||
| 5.50%, 03/01/17 | 19 | 20 | ||||
| 0.00%, 06/01/17 (j) | 1,250 | 908 | ||||
| 5.50%, 09/01/17 | 304 | 324 | ||||
| 5.00%, 10/01/17 | 28 | 30 | ||||
| 5.50%, 11/01/17 | 35 | 37 | ||||
| 5.00%, 01/01/18 | 132 | 139 | ||||
| 5.50%, 01/01/18 | 58 | 62 | ||||
| 5.00%, 02/01/18 | 1,092 | 1,151 | ||||
| 5.50%, 02/01/18 | 118 | 125 | ||||
| 4.50%, 03/01/18 | 434 | 453 | ||||
| 5.00%, 03/01/18 | 56 | 59 | ||||
| 5.00%, 05/01/18 | 18 | 19 | ||||
| 5.00%, 06/01/18 | 39 | 41 | ||||
| 4.00%, 07/01/18 | 260 | 267 | ||||
| 5.00%, 07/01/18 | 81 | 84 | ||||
| 5.00%, 07/01/18 | 50 | 53 | ||||
| 4.00%, 08/01/18 | 183 | 188 | ||||
| 5.00%, 08/01/18 | 31 | 33 | ||||
| 4.00%, 10/01/18 | 75 | 77 | ||||
| 4.50%, 11/01/18 | 232 | 242 | ||||
| 4.50%, 11/01/18 | 528 | 551 | ||||
| 5.00%, 11/01/18 | 724 | 763 | ||||
| 5.50%, 12/01/18 | 94 | 100 | ||||
| 5.50%, 03/01/19 | 23 | 24 | ||||
| 5.50%, 10/01/19 | 66 | 70 | ||||
| 4.50%, 01/01/20, TBA (g) | 500 | 514 | ||||
| 5.00%, 01/01/20, TBA (g) | 1,000 | 1,045 | ||||
| 4.50%, 07/01/20 | 484 | 503 | ||||
| 5.50%, 07/01/20 | 313 | 334 | ||||
| 5.00%, 11/01/20 | 218 | 230 | ||||
| 4.00%, 02/01/21, TBA (g) | 1,000 | 1,006 | ||||
| 4.50%, 03/01/21 | 107 | 110 | ||||
| 5.50%, 01/01/22 | 421 | 447 | ||||
| 4.50%, 02/01/22 | 321 | 331 | ||||
| 5.00%, 03/01/22 | 350 | 366 | ||||
| 5.00%, 03/01/22 | 190 | 199 | ||||
| 5.38%, 04/11/22 | 50 | 51 | ||||
| 6.00%, 06/01/22 | 518 | 553 | ||||
| 5.00%, 10/01/22 | 331 | 346 | ||||
| 4.50%, 02/01/23 | 268 | 276 | ||||
| 4.50%, 04/01/23 | 634 | 653 | ||||
| 5.50%, 07/01/23 | 27 | 28 | ||||
| 5.00%, 09/01/23 | 29 | 30 | ||||
| 5.50%, 10/01/23 | 200 | 212 | ||||
| 5.00%, 11/01/23 | 500 | 523 | ||||
| 5.50%, 12/01/23 | 207 | 219 | ||||
| 4.50%, 01/01/24 | 340 | 351 | ||||
| 5.00%, 03/01/24 | 610 | 639 | ||||
| 4.00%, 04/01/24 | 286 | 288 | ||||
| 4.50%, 04/01/24 | 367 | 378 | ||||
| 4.00%, 05/01/24 | 682 | 687 | ||||
| 4.50%, 05/01/24 | 491 | 506 | ||||
| 4.00%, 06/01/24 | 497 | 501 | ||||
| 4.00%, 06/01/24 | 387 | 389 | ||||
| 4.00%, 06/01/24 | 480 | 484 | ||||
| 4.50%, 06/01/24 | 54 | 55 | ||||
| 4.50%, 06/01/24 | 590 | 608 | ||||
| 4.00%, 07/01/24 | 387 | 390 | ||||
| 4.50%, 07/01/24 | 987 | 1,016 | ||||
| 5.00%, 05/01/26 | 642 | 665 | ||||
| 5.50%, 05/01/26 | 674 | 712 | ||||
| 6.00%, 09/01/26 | 135 | 144 | ||||
| 5.00%, 12/01/26 | 317 | 328 | ||||
| 5.95%, 06/07/27 | 100 | 104 | ||||
| 6.06%, 07/20/27 | 100 | 102 | ||||
| 6.25%, 05/15/29 | 225 | 257 | ||||
| 4.50%, 06/01/29 | 193 | 195 | ||||
| 5.00%, 06/01/29 | 1,232 | 1,275 | ||||
| 5.00%, 09/01/29 | 982 | 1,016 | ||||
| 7.13%, 01/15/30 | 570 | 719 | ||||
| 7.25%, 05/15/30 | 540 | 691 | ||||
| 6.63%, 11/15/30 | 290 | 349 | ||||
| 7.00%, 02/01/31 | 61 | 68 | ||||
| 6.00%, 04/01/31 | 38 | 40 | ||||
| 6.00%, 11/01/31 | 3 | 3 | ||||
| 5.50%, 01/01/32 | 152 | 160 | ||||
| 6.00%, 06/01/32 | 37 | 39 | ||||
| 6.50%, 07/01/32 | 52 | 56 | ||||
| 7.00%, 07/01/32 | 22 | 24 | ||||
| 6.00%, 02/01/33 | 156 | 166 | ||||
| 5.50%, 05/01/33 | 1,436 | 1,510 | ||||
| 5.50%, 06/01/33 | 1,320 | 1,388 | ||||
| 5.00%, 09/01/33 | 1,536 | 1,582 | ||||
| 5.50%, 10/01/33 | 1,310 | 1,377 | ||||
| 4.50%, 11/01/33 | 296 | 298 | ||||
| 4.50%, 11/01/33 | 424 | 427 | ||||
| 5.00%, 11/01/33 | 1,262 | 1,301 | ||||
| 5.50%, 11/01/33 | 274 | 288 | ||||
| 6.00%, 11/01/33 | 25 | 27 | ||||
| 6.00%, 12/01/33 | 323 | 345 | ||||
| 6.00%, 12/01/33 | 782 | 835 | ||||
| 6.00%, 12/01/33 | 42 | 45 | ||||
| 5.00%, 01/01/34, TBA (g) | 3,150 | 3,232 | ||||
| 5.50%, 01/01/34 | 120 | 126 | ||||
| 5.00%, 03/01/34 | 1,948 | 2,008 | ||||
| 5.00%, 04/01/34 | 130 | 134 | ||||
| 5.00%, 04/01/34 | 240 | 247 | ||||
| 5.00%, 05/01/34 | 681 | 701 | ||||
| 5.00%, 06/01/34 | 159 | 164 | ||||
| 5.50%, 07/01/34 | 716 | 752 | ||||
| 6.50%, 07/01/34 | 379 | 408 | ||||
| 6.00%, 08/01/34 | 315 | 336 | ||||
| 5.50%, 09/01/34 | 188 | 198 | ||||
| 5.50%, 12/01/34 | 824 | 866 | ||||
| 5.50%, 01/01/35 | 1,895 | 1,992 | ||||
| 5.50%, 02/01/35 | 2,222 | 2,336 | ||||
| 4.50%, 04/01/35 | 166 | 167 | ||||
| 5.00%, 04/01/35 | 240 | 247 | ||||
| 6.50%, 04/01/35 | 212 | 227 | ||||
| 4.62%, 05/01/35 (i) | 81 | 83 | ||||
| 4.77%, 05/01/35 (i) | 318 | 330 | ||||
| 5.50%, 08/01/35 | 543 | 571 | ||||
| 5.50%, 08/01/35 | 106 | 111 | ||||
| 4.50%, 10/01/35 | 264 | 265 | ||||
| 4.50%, 10/01/35 | 68 | 68 | ||||
| 4.86%, 10/01/35 (i) | 543 | 565 | ||||
| 6.00%, 10/01/35 | 1,541 | 1,640 | ||||
| 5.00%, 11/01/35 | 751 | 772 | ||||
| 5.00%, 11/01/35 | 1,397 | 1,436 | ||||
| 5.00%, 11/01/35 | 153 | 157 | ||||
| 5.50%, 12/01/35 | 323 | 339 | ||||
| 5.50%, 12/01/35 | 281 | 295 | ||||
| 7.00%, 12/01/35 | 6 | 6 | ||||
| 7.00%, 02/01/36 | 174 | 191 | ||||
| 5.50%, 03/01/36 | 617 | 647 | ||||
| 5.50%, 05/01/36 | 15 | 16 | ||||
| 6.00%, 06/01/36 | 547 | 581 | ||||
| 6.50%, 08/01/36 | 507 | 544 | ||||
| 7.00%, 09/01/36 | 193 | 212 | ||||
| 6.00%, 10/01/36 | 605 | 643 | ||||
| 6.50%, 10/01/36 | 1,377 | 1,478 | ||||
| 5.00%, 11/01/36 | 319 | 328 | ||||
| 5.50%, 11/01/36 | 751 | 788 | ||||
| 5.50%, 11/01/36 | 254 | 267 | ||||
| 6.00%, 11/01/36 | 834 | 886 | ||||
| 3.44%, 12/01/36 (i) | 436 | 450 | ||||
| 6.00%, 12/01/36 | 757 | 804 | ||||
| 6.50%, 12/01/36 | 284 | 304 | ||||
| 5.50%, 01/01/37, TBA (g) | 1,400 | 1,465 | ||||
| 6.50%, 01/01/37, TBA (g) | 1,000 | 1,071 | ||||
| 6.50%, 01/01/37 | 464 | 498 | ||||
| 6.50%, 01/01/37 | 538 | 578 | ||||
| 6.00%, 01/16/37, TBA (g) | 2,500 | 2,648 | ||||
| 5.46%, 02/01/37 (i) | 62 | 66 | ||||
| 5.50%, 02/01/37 | 633 | 663 | ||||
| 5.50%, 02/01/37 | 191 | 200 | ||||
| 5.55%, 02/01/37 (i) | 813 | 859 | ||||
| 5.64%, 02/01/37 (i) | 502 | 533 | ||||
| 6.00%, 02/01/37 | 593 | 629 | ||||
| 6.50%, 02/01/37 | 177 | 190 | ||||
| 5.50%, 03/01/37 | 211 | 222 | ||||
| 7.00%, 03/01/37 | 256 | 281 | ||||
| 5.00%, 04/01/37 | 498 | 512 | ||||
| 5.66%, 04/01/37 (i) | 175 | 186 | ||||
| 5.84%, 04/01/37 (i) | 1,558 | 1,653 | ||||
| 6.00%, 04/01/37 | 1,172 | 1,243 | ||||
| 7.00%, 04/01/37 | 208 | 228 | ||||
| 7.00%, 04/01/37 | 299 | 328 | ||||
| 5.50%, 05/01/37 | 354 | 371 | ||||
| 5.50%, 05/01/37 | 1,200 | 1,258 | ||||
| 6.00%, 06/01/37 | 935 | 992 | ||||
| 5.50%, 08/01/37 | 121 | 126 | ||||
| 6.00%, 08/01/37 | 324 | 344 | ||||
| 6.00%, 09/01/37 | 94 | 99 | ||||
| 5.50%, 10/01/37 | 287 | 300 | ||||
| 6.00%, 10/01/37 | 1,677 | 1,779 | ||||
| 6.50%, 10/01/37 | 473 | 508 | ||||
| 5.50%, 11/01/37 | 305 | 320 | ||||
| 5.50%, 11/01/37 | 516 | 541 | ||||
| 6.00%, 11/01/37 | 465 | 493 | ||||
| 6.00%, 11/01/37 | 968 | 1,027 | ||||
| 7.50%, 11/01/37 | 109 | 119 | ||||
| 5.50%, 12/01/37 | 118 | 124 | ||||
| 5.50%, 12/01/37 | 543 | 569 | ||||
| 5.50%, 12/01/37 | 300 | 314 | ||||
| 5.50%, 12/01/37 | 292 | 306 | ||||
| 6.00%, 12/01/37 | 961 | 1,020 | ||||
| 6.00%, 12/01/37 | 958 | 1,016 | ||||
| 5.00%, 01/01/38 | 206 | 211 | ||||
| 5.23%, 01/01/38 (i) | 1,777 | 1,871 | ||||
| 5.50%, 01/01/38 | 2,210 | 2,316 | ||||
| 5.50%, 01/01/38 | 327 | 343 | ||||
| 6.00%, 12/01/37 | 671 | 712 | ||||
| 5.00%, 02/01/38 | 401 | 412 | ||||
| 5.50%, 02/01/38 | 312 | 327 | ||||
| 5.50%, 02/01/38 | 382 | 400 | ||||
| 6.00%, 02/01/38 | 359 | 381 | ||||
| 7.00%, 02/01/38 | 385 | 422 | ||||
| 4.50%, 03/01/38 | 2,445 | 2,444 | ||||
| 5.00%, 03/01/38 | 42 | 43 | ||||
| 5.50%, 03/01/38 | 427 | 447 | ||||
| 5.50%, 03/01/38 | 635 | 666 | ||||
| 5.99%, 03/01/38 (i) | 1,000 | 1,069 | ||||
| 7.00%, 03/01/38 | 478 | 524 | ||||
| 5.00%, 04/01/38 | 93 | 96 | ||||
| 5.50%, 05/01/38 | 482 | 505 | ||||
| 6.00%, 05/01/38 | 734 | 779 | ||||
| 4.50%, 06/01/38 | 471 | 471 | ||||
| 4.50%, 06/01/38 | 495 | 494 | ||||
| 5.00%, 06/01/38 | 639 | 657 | ||||
| 5.50%, 07/01/38 | 289 | 302 | ||||
| 5.50%, 07/01/38 | 562 | 589 | ||||
| 6.00%, 07/01/38 | 1,118 | 1,186 | ||||
| 5.50%, 08/01/38 | 2,313 | 2,424 | ||||
| 5.50%, 08/01/38 | 835 | 875 | ||||
| 5.50%, 08/01/38 | 19 | 20 | ||||
| 6.00%, 08/01/38 | 757 | 802 | ||||
| 5.50%, 09/01/38 | 98 | 103 | ||||
| 6.00%, 09/01/38 | 234 | 248 | ||||
| 6.00%, 09/01/38 | 936 | 992 | ||||
| 6.50%, 09/01/38 | 804 | 862 | ||||
| 6.50%, 09/01/38 | 262 | 280 | ||||
| 5.50%, 10/01/38 | 461 | 483 | ||||
| 5.50%, 10/01/38 | 316 | 331 | ||||
| 5.50%, 10/01/38 | 23 | 24 | ||||
| 6.50%, 10/01/38 | 784 | 841 | ||||
| 5.50%, 10/14/38 | 49 | 51 | ||||
| 5.50%, 11/01/38 | 814 | 853 | ||||
| 5.50%, 11/01/38 | 420 | 440 | ||||
| 5.50%, 11/01/38 | 182 | 191 | ||||
| 5.50%, 11/01/38 | 22 | 24 | ||||
| 5.50%, 11/01/38 | 217 | 228 | ||||
| 5.50%, 11/01/38 | 459 | 481 | ||||
| 5.00%, 12/01/38 | 620 | 637 | ||||
| 5.50%, 12/01/38 | 267 | 280 | ||||
| 5.50%, 12/01/38 | 178 | 187 | ||||
| 5.50%, 12/01/38 | 20 | 21 | ||||
| 4.50%, 01/01/39 | 899 | 898 | ||||
| 5.50%, 01/01/39 | 291 | 305 | ||||
| 5.50%, 01/01/39 | 378 | 396 | ||||
| 5.50%, 01/01/39 | 1,841 | 1,929 | ||||
| 6.00%, 01/01/39 | 808 | 857 | ||||
| 4.00%, 02/01/39 | 40 | 38 | ||||
| 4.50%, 02/01/39 | 981 | 980 | ||||
| 5.00%, 02/01/39 | 1,050 | 1,078 | ||||
| 5.50%, 02/01/39 | 900 | 943 | ||||
| 4.00%, 03/01/39 | 651 | 629 | ||||
| 4.50%, 03/01/39 | 1,442 | 1,441 | ||||
| 5.00%, 03/01/39 | 2,746 | 2,821 | ||||
| 4.50%, 04/01/39 | 974 | 973 | ||||
| 5.00%, 04/01/39 | 192 | 197 | ||||
| 7.00%, 04/01/39 | 157 | 172 | ||||
| 4.00%, 05/01/39 | 976 | 943 | ||||
| 4.00%, 05/01/39 | 30 | 29 | ||||
| 4.00%, 06/01/39 | 668 | 646 | ||||
| 4.50%, 06/01/39 | 1,393 | 1,392 | ||||
| 5.00%, 06/01/39 | 1,955 | 2,008 | ||||
| 4.00%, 07/01/39 | 693 | 669 | ||||
| 4.48%, 07/01/39 (i) | 2,828 | 2,954 | ||||
| 4.50%, 07/01/39 | 2,000 | 1,998 | ||||
| 4.00%, 08/01/39 | 1,484 | 1,434 | ||||
| 4.50%, 08/01/39 | 2,475 | 2,473 | ||||
| 4.00%, 09/01/39 | 992 | 959 | ||||
| 5.00%, 09/01/39 | 2,960 | 3,041 | ||||
| 6.00%, 09/01/39 | 243 | 258 | ||||
| 4.50%, 11/01/39 | 2,597 | 2,595 | ||||
| 5.00%, 11/01/39 | 997 | 1,023 | ||||
| 5.50%, 12/01/39 | 331 | 346 | ||||
| 177,972 | ||||||
| Government National Mortgage Association - 5.6% | ||||||
| Government National Mortgage Association | ||||||
| 8.00%, 04/15/30 | 20 | 23 | ||||
| 8.50%, 06/15/30 | 6 | 7 | ||||
| 6.50%, 01/15/32 | 80 | 86 | ||||
| 4.50%, 01/24/32, TBA (g) | 1,000 | 1,001 | ||||
| 6.00%, 01/24/32, TBA (g) | 1,000 | 1,057 | ||||
| 6.00%, 05/15/32 | 91 | 96 | ||||
| 6.00%, 10/15/32 | 59 | 63 | ||||
| 6.00%, 01/15/33 | 115 | 122 | ||||
| 5.00%, 03/15/33 | 9 | 10 | ||||
| 5.00%, 05/15/33 | 10 | 10 | ||||
| 5.00%, 05/15/33 | 12 | 13 | ||||
| 5.00%, 05/15/33 | 9 | 9 | ||||
| 5.00%, 06/15/33 | 10 | 11 | ||||
| 5.50%, 07/15/33 | 253 | 267 | ||||
| 5.50%, 07/15/33 | 270 | 286 | ||||
| 5.00%, 08/15/33 | 8 | 9 | ||||
| 5.00%, 08/15/33 | 8 | 8 | ||||
| 5.00%, 08/15/33 | 8 | 8 | ||||
| 5.00%, 08/15/33 | 101 | 105 | ||||
| 5.00%, 08/15/33 | 14 | 14 | ||||
| 5.50%, 08/15/33 | 184 | 194 | ||||
| 5.50%, 09/15/33 | 51 | 54 | ||||
| 5.00%, 11/15/33 | 10 | 11 | ||||
| 6.50%, 12/15/33 | 155 | 166 | ||||
| 5.00%, 01/01/34, TBA (g) | 1,000 | 1,028 | ||||
| 5.50%, 01/01/34, TBA (g) | 1,000 | 1,048 | ||||
| 6.00%, 07/15/34 | 28 | 30 | ||||
| 6.00%, 08/15/34 | 341 | 363 | ||||
| 5.00%, 01/15/35 | 551 | 569 | ||||
| 5.00%, 03/15/35 | 181 | 187 | ||||
| 5.50%, 04/15/35 | 229 | 241 | ||||
| 6.00%, 05/15/35 | 11 | 12 | ||||
| 5.00%, 11/15/35 | 127 | 131 | ||||
| 5.50%, 11/15/35 | 365 | 384 | ||||
| 5.50%, 12/15/35 | 241 | 253 | ||||
| 5.50%, 02/15/36 | 294 | 309 | ||||
| 6.00%, 02/15/36 | 71 | 75 | ||||
| 5.50%, 03/15/36 | 122 | 128 | ||||
| 5.50%, 03/15/36 | 57 | 60 | ||||
| 6.50%, 03/15/36 | 89 | 95 | ||||
| 6.00%, 05/15/36 | 241 | 255 | ||||
| 5.50%, 06/15/36 | 165 | 174 | ||||
| 6.50%, 06/15/36 | 264 | 281 | ||||
| 7.00%, 11/15/36 | 195 | 213 | ||||
| 6.00%, 01/15/37 | 209 | 221 | ||||
| 6.00%, 04/15/37 | 359 | 380 | ||||
| 5.50%, 05/15/37 | 589 | 618 | ||||
| 5.50%, 05/15/37 | 356 | 374 | ||||
| 6.50%, 09/15/37 | 240 | 256 | ||||
| 6.00%, 11/15/37 | 225 | 238 | ||||
| 5.00%, 12/15/37 | 479 | 494 | ||||
| 6.00%, 12/15/37 | 376 | 398 | ||||
| 6.00%, 12/15/37 | 137 | 145 | ||||
| 6.50%, 02/15/38 | 177 | 188 | ||||
| 4.50%, 03/15/38 | 74 | 74 | ||||
| 5.50%, 03/15/38 | 539 | 566 | ||||
| 5.50%, 05/15/38 | 388 | 407 | ||||
| 5.00%, 06/15/38 | 3,183 | 3,279 | ||||
| 5.50%, 06/15/38 | 974 | 1,022 | ||||
| 5.50%, 06/15/38 | 27 | 28 | ||||
| 5.50%, 07/15/38 | 85 | 90 | ||||
| 5.50%, 07/15/38 | 75 | 78 | ||||
| 5.50%, 07/15/38 | 42 | 44 | ||||
| 6.50%, 07/15/38 | 653 | 695 | ||||
| 6.00%, 08/15/38 | 433 | 458 | ||||
| 6.00%, 08/15/38 | 762 | 806 | ||||
| 6.50%, 08/15/38 | 432 | 460 | ||||
| 5.50%, 09/15/38 | 1,449 | 1,521 | ||||
| 6.00%, 09/15/38 | 1,200 | 1,269 | ||||
| 6.00%, 09/15/38 | 553 | 586 | ||||
| 6.00%, 10/15/38 | 776 | 821 | ||||
| 5.50%, 11/15/38 | 793 | 832 | ||||
| 6.00%, 12/15/38 | 31 | 32 | ||||
| 5.50%, 01/15/39 | 533 | 559 | ||||
| 6.00%, 01/15/39 | 539 | 570 | ||||
| 4.50%, 02/15/39 | 199 | 199 | ||||
| 4.50%, 03/15/39 | 52 | 53 | ||||
| 4.50%, 04/15/39 | 1,078 | 1,080 | ||||
| 4.50%, 04/15/39 | 992 | 994 | ||||
| 4.50%, 04/15/39 | 522 | 523 | ||||
| 4.50%, 05/15/39 | 997 | 1,000 | ||||
| 4.50%, 05/15/39 | 515 | 516 | ||||
| 4.50%, 05/15/39 | 58 | 58 | ||||
| 4.50%, 06/15/39 | 724 | 726 | ||||
| 4.50%, 06/15/39 | 499 | 500 | ||||
| 5.00%, 06/15/39 | 1,446 | 1,490 | ||||
| 4.50%, 08/15/39 | 1,988 | 1,993 | ||||
| 5.00%, 09/15/39 | 1,498 | 1,543 | ||||
| 5.00%, 09/15/39 | 1,969 | 2,029 | ||||
| 5.50%, 09/15/39 | 500 | 525 | ||||
| 5.50%, 09/15/39 | 997 | 1,045 | ||||
| 4.50%, 11/15/39 | 500 | 501 | ||||
| 4.50%, 12/15/39 | 1,000 | 1,002 | ||||
| 4.50%, 12/15/39 | 1,000 | 1,002 | ||||
| 5.00%, 12/15/39 | 1,000 | 1,029 | ||||
| 44,783 | ||||||
| Total Government and Agency | ||||||
| Obligations (cost $578,511) | 585,293 | |||||
| SHORT TERM INVESTMENTS - 9.7% | ||||||
| Mutual Funds - 3.4% | ||||||
| JNL Money Market Fund, 0.07% (a) (h) | 26,989 | 26,989 | ||||
| Securities Lending Collateral - 6.3% | ||||||
| Securities Lending Cash Collateral Fund LLC, | ||||||
| 0.16% (a) (h) | 10,827 | 10,827 | ||||
| Securities Lending Liquidating Fund LLC, 0.36% (a) (h) | 39,557 | 39,475 | ||||
| 50,302 | ||||||
| Total Short Term Investments (cost $77,375) | 77,291 | |||||
| Total Investments - 108.4% (cost $855,054) | 862,529 | |||||
| Other Assets and Liabilities, Net - (8.4%) | (66,759) | |||||
| Total Net Assets - 100% | $ | 795,770 | ||||
| JNL/Mellon Capital Management | ||||||
| Global Alpha Fund | ||||||
| SHORT TERM INVESTMENTS - 106.6% | ||||||
| Commercial Paper - 16.3% | ||||||
| American Honda Finance Corp., 0.16%, 02/16/10 | $ | 400 | $ | 400 | ||
| Bank of Nova Scotia, 0.22%, 02/09/10 | 1,000 | 1,000 | ||||
| BNP Paribas, 0.30%, 04/08/10 | 900 | 899 | ||||
| Calyon North America Inc., 0.16%, 01/04/10 | 900 | 900 | ||||
| CBA Delaware Finance, 0.15%, 01/13/10 | 1,000 | 1,000 | ||||
| Intesa Funding LLC | ||||||
| 0.20%, 01/08/10 | 1,000 | 1,000 | ||||
| 0.20%, 02/16/10 | 600 | 600 | ||||
| Lloyds TSB Group Plc | ||||||
| 0.20%, 02/17/10 | 600 | 600 | ||||
| 0.21%, 03/19/10 | 1,200 | 1,199 | ||||
| Royal Bank of Canada, 0.21%, 01/25/10 | 900 | 900 | ||||
| Svenska Handelsbanken, 0.19%, 03/29/10 | 1,700 | 1,699 | ||||
| 10,197 | ||||||
| Federal Home Loan Bank - 16.8% | ||||||
| Federal Home Loan Bank | ||||||
| 0.03%, 01/05/10 | 1,000 | 1,000 | ||||
| 0.06%, 01/06/10 | 2,000 | 2,000 | ||||
| 0.10%, 01/13/10 | 3,000 | 3,000 | ||||
| 0.04%, 01/27/10 | 2,000 | 2,000 | ||||
| 0.02%, 02/10/10 | 1,500 | 1,500 | ||||
| 0.00%, 03/09/10 | 1,000 | 1,000 | ||||
| 10,500 | ||||||
| Federal Home Loan Mortgage Corp. - 18.5% | ||||||
| Federal Home Loan Mortgage Corp. | ||||||
| 0.03%, 01/04/10 | 1,000 | 1,000 | ||||
| 0.17%, 01/06/10 | 5,100 | 5,100 | ||||
| 0.13%, 01/28/10 | 1,000 | 1,000 | ||||
| 0.10%, 02/08/10 | 1,500 | 1,500 | ||||
| 0.06%, 02/18/10 | 900 | 900 | ||||
| 0.00%, 02/24/10 | 2,000 | 2,000 | ||||
| 11,500 | ||||||
| Federal National Mortgage Association - 17.0% | ||||||
| Federal National Mortgage Association | ||||||
| 0.03%, 01/04/10 | 105 | 105 | ||||
| 0.02%, 01/12/10 | 2,000 | 2,000 | ||||
| 0.02%, 01/13/10 | 900 | 900 | ||||
| 0.00%, 01/15/10 | 1,000 | 1,000 | ||||
| 0.01%, 01/19/10 | 95 | 95 | ||||
| 0.02%, 01/20/10 | 400 | 400 | ||||
| 0.05%, 01/29/10 | 2,000 | 2,000 | ||||
| 0.05%, 02/01/10 | 2,000 | 2,000 | ||||
| 0.00%, 02/08/10 | 105 | 105 | ||||
| 0.05%, 02/22/10 | 1,000 | 1,000 | ||||
| 0.23%, 03/10/10 | 1,000 | 1,000 | ||||
| 10,605 | ||||||
| Mutual Funds - 10.0% | ||||||
| JNL Money Market Fund, 0.07% (a) (h) | 6,240 | 6,240 | ||||
| U.S. Treasury Securities - 28.0% | ||||||
| U.S. Treasury Bill | ||||||
| 0.05%, 01/14/10 | 2,260 | 2,259 | ||||
| 0.01%, 01/21/10 | 860 | 860 | ||||
| 0.01%, 02/11/10 | 2,580 | 2,580 | ||||
| 0.26%, 02/25/10 | 9,600 | 9,600 | ||||
| 0.22%, 03/11/10 (o) | 2,155 | 2,155 | ||||
| 17,454 | ||||||
| Total Short Term Investments (cost $66,496) | 66,496 | |||||
| Total Investments - 106.6% (cost $66,496) | 66,496 | |||||
| Other Assets and Liabilities, Net - (6.6%) | (4,112) | |||||
| Total Net Assets - 100% | $ | 62,384 | ||||
| JNL/Oppenheimer Global Growth Fund | ||||||
| COMMON STOCKS - 96.9% | ||||||
| CONSUMER DISCRETIONARY - 14.8% | ||||||
| Bayerische Motoren Werke AG | 24 | $ | 1,085 | |||
| Bulgari SpA (e) | 206 | 1,698 | ||||
| Carnival Corp. (c) | 132 | 4,189 | ||||
| Grupo Televisa SA - ADR | 169 | 3,513 | ||||
| Inditex SA | 58 | 3,611 | ||||
| Lottomatica SpA | 24 | 477 | ||||
| LVMH Moet Hennessy Louis Vuitton SA | 56 | 6,330 | ||||
| McDonald's Corp. | 69 | 4,290 | ||||
| Shuffle Master Inc. (c) | 67 | 551 | ||||
| Sirius XM Radio Inc. (c) | 1,419 | 851 | ||||
| Sony Corp. | 148 | 4,307 | ||||
| Tiffany & Co. | 92 | 3,969 | ||||
| Tod's SpA | 30 | 2,262 | ||||
| Walt Disney Co. (e) | 146 | 4,692 | ||||
| Wire & Wireless India Ltd. (c) | 207 | 40 | ||||
| Zee Entertainment Enterprises Ltd. | 228 | 1,251 | ||||
| 43,116 | ||||||
| CONSUMER STAPLES - 11.6% | ||||||
| Cadbury Plc | 228 | 2,935 | ||||
| Cia de Bebidas das Americas - ADR | 22 | 2,211 | ||||
| Colgate-Palmolive Co. | 48 | 3,902 | ||||
| Diageo Plc | 90 | 1,570 | ||||
| Fomento Economico Mexicano SAB de CV | 853 | 4,101 | ||||
| Grupo Modelo SAB de CV | 421 | 2,339 | ||||
| Nestle SA | 41 | 1,996 | ||||
| Reckitt Benckiser Group Plc | 57 | 3,070 | ||||
| Seven & I Holdings Co. Ltd. | 46 | 944 | ||||
| Tesco Plc | 504 | 3,482 | ||||
| Unilever Plc | 95 | 3,067 | ||||
| Wal-Mart Stores Inc. | 75 | 4,029 | ||||
| 33,646 | ||||||
| ENERGY - 4.8% | ||||||
| Husky Energy Inc. | 76 | 2,181 | ||||
| Technip SA | 58 | 4,089 | ||||
| Total SA | 68 | 4,373 | ||||
| Transocean Ltd. (c) | 40 | 3,325 | ||||
| 13,968 | ||||||
| FINANCIALS - 13.5% | ||||||
| 3i Group Plc | 273 | 1,248 | ||||
| AFLAC Inc. | 75 | 3,464 | ||||
| Allianz SE | 33 | 4,132 | ||||
| Credit Suisse Group AG | 131 | 6,476 | ||||
| Fidelity National Financial Inc. - Class A | 101 | 1,359 | ||||
| HDFC Bank Ltd. | 15 | 536 | ||||
| HSBC Holdings Plc | 413 | 4,696 | ||||
| Investor AB - Class B | 171 | 3,185 | ||||
| SLM Corp. (c) | 310 | 3,497 | ||||
| Societe Generale - Class A | 35 | 2,432 | ||||
| Sumitomo Mitsui Financial Group Inc. (e) | 71 | 2,038 | ||||
| UBS AG (c) | 201 | 3,115 | ||||
| XL Capital Ltd. - Class A | 164 | 3,005 | ||||
| 39,183 | ||||||
| HEALTH CARE - 6.9% | ||||||
| Aetna Inc. | 110 | 3,474 | ||||
| Amylin Pharmaceuticals Inc. (c) | 39 | 558 | ||||
| Basilea Pharmaceutical AG (c) | 3 | 184 | ||||
| Bayer AG | 16 | 1,265 | ||||
| InterMune Inc. (c) | 35 | 450 | ||||
| NicOx SA (c) (e) | 21 | 172 | ||||
| Regeneron Pharmaceuticals Inc. (c) | 22 | 534 | ||||
| Roche Holding AG | 33 | 5,531 | ||||
| Sanofi-Aventis SA | 34 | 2,710 | ||||
| Seattle Genetics Inc. (c) | 80 | 813 | ||||
| Theravance Inc. (c) (e) | 60 | 787 | ||||
| WellPoint Inc. (c) | 59 | 3,451 | ||||
| 19,929 | ||||||
| INDUSTRIALS - 13.7% | ||||||
| 3M Co. | 52 | 4,291 | ||||
| Assa Abloy AB (e) | 240 | 4,624 | ||||
| Boeing Co. | 24 | 1,299 | ||||
| Emerson Electric Co. | 52 | 2,211 | ||||
| Empresa Brasileira de Aeronautica SA - ADR (e) | 98 | 2,165 | ||||
| European Aeronautic Defence & Space Co. NV (e) | 155 | 3,140 | ||||
| Fanuc Ltd. | 14 | 1,305 | ||||
| Koninklijke Philips Electronics NV | 125 | 3,715 | ||||
| Lockheed Martin Corp. | 20 | 1,492 | ||||
| Prysmian SPA | 51 | 899 | ||||
| Raytheon Co. (e) | 48 | 2,458 | ||||
| Secom Co. Ltd. | 44 | 2,077 | ||||
| Siemens AG (e) | 76 | 7,044 | ||||
| TNT NV | 101 | 3,114 | ||||
| 39,834 | ||||||
| INFORMATION TECHNOLOGY - 28.3% | ||||||
| Adobe Systems Inc. (c) | 105 | 3,866 | ||||
| Altera Corp. | 143 | 3,229 | ||||
| Automatic Data Processing Inc. | 93 | 3,987 | ||||
| Corning Inc. | 183 | 3,530 | ||||
| eBay Inc. (c) | 252 | 5,920 | ||||
| Hoya Corp. | 112 | 2,984 | ||||
| Infosys Technologies Ltd. | 102 | 5,658 | ||||
| Intuit Inc. (c) | 163 | 4,997 | ||||
| Juniper Networks Inc. (c) (e) | 215 | 5,739 | ||||
| Keyence Corp. | 10 | 2,119 | ||||
| Kyocera Corp. | 17 | 1,507 | ||||
| Linear Technology Corp. (e) | 25 | 776 | ||||
| Maxim Integrated Products Inc. | 145 | 2,941 | ||||
| MediaTek Inc. | 159 | 2,763 | ||||
| Microsoft Corp. | 192 | 5,848 | ||||
| Murata Manufacturing Co. Ltd. (e) | 63 | 3,136 | ||||
| Nidec Corp. | 19 | 1,720 | ||||
| Nintendo Co. Ltd. | 6 | 1,529 | ||||
| SAP AG | 104 | 4,943 | ||||
| Taiwan Semiconductor Manufacturing Co. Ltd. | 1,329 | 2,678 | ||||
| Tandberg ASA | 66 | 1,891 | ||||
| Telefonaktiebolaget LM Ericsson - Class B | 1,137 | 10,496 | ||||
| 82,257 | ||||||
| MATERIALS - 0.3% | ||||||
| Linde AG | 7 | 786 | ||||
| TELECOMMUNICATION SERVICES - 2.1% | ||||||
| KDDI Corp. | 1 | 3,232 | ||||
| Vodafone Group Plc | 1,178 | 2,733 | ||||
| 5,965 | ||||||
| UTILITIES - 0.9% | ||||||
| Fortum Oyj | 101 | 2,757 | ||||
| Total Common Stocks (cost $281,340) | 281,441 | |||||
| PREFERRED STOCKS - 0.6% | ||||||
| CONSUMER DISCRETIONARY - 0.6% | ||||||
| Bayerische Motoren Werke AG | 52 | 1,721 | ||||
| Total Preferred Stocks (cost $1,601) | 1,721 | |||||
| NON-U.S. GOVERNMENT AGENCY | ||||||
| ASSET-BACKED SECURITIES - 0.0% | ||||||
| Sigma Finance, Inc. (d) (f) (u) | $ | 753 | 32 | |||
| Total Non-U.S. Government Agency | ||||||
| Asset-Backed Securities (cost $753) | 32 | |||||
| CORPORATE BONDS AND NOTES - 0.1% | ||||||
| HEALTH CARE - 0.1% | ||||||
| Theravance Inc., 3.00%, 01/15/15 | 270 | 213 | ||||
| Total Corporate Bonds and Notes (cost $270) | 213 | |||||
| RIGHTS - 0.0% | ||||||
| Wire & Wireless India Ltd. (c) (f) | 207 | 46 | ||||
| Total Rights (cost $62) | 46 | |||||
| SHORT TERM INVESTMENTS - 9.2% | ||||||
| Mutual Funds - 2.4% | ||||||
| JNL Money Market Fund, 0.07% (a) (h) | 6,887 | 6,887 | ||||
| Securities Lending Collateral - 6.8% | ||||||
| Securities Lending Cash Collateral Fund LLC, | ||||||
| 0.16% (a) (h) | 11,438 | 11,438 | ||||
| Securities Lending Liquidating Fund LLC, 0.36% (a) (h) | 8,459 | 8,441 | ||||
| 19,879 | ||||||
| Total Short Term Investments (cost $26,784) | 26,766 | |||||
| Total Investments - 106.8% (cost $310,810) | 310,219 | |||||
| Other Assets and Liabilities, Net - (6.8%) | (19,740) | |||||
| Total Net Assets - 100% | $ | 290,479 | ||||
| JNL/PAM Asia ex-Japan Fund | ||||||
| COMMON STOCKS - 97.3% | ||||||
| CONSUMER DISCRETIONARY - 2.1% | ||||||
| Kangwon Land Inc. | 79 | $ | 1,115 | |||
| PT Astra International Tbk | 323 | 1,186 | ||||
| 2,301 | ||||||
| CONSUMER STAPLES - 4.8% | ||||||
| Hengan International Group Co. Ltd. (e) | 327 | 2,421 | ||||
| Shinsegae Co. Ltd. | 6 | 2,737 | ||||
| 5,158 | ||||||
| ENERGY - 4.4% | ||||||
| China Petroleum & Chemical Corp. | 1,190 | 1,048 | ||||
| CNOOC Ltd. | 1,782 | 2,776 | ||||
| PTT Public Company Ltd. | 126 | 933 | ||||
| 4,757 | ||||||
| FINANCIALS - 35.1% | ||||||
| AMMB Holdings Bhd | 823 | 1,198 | ||||
| ARA Asset Management Ltd. | 1,389 | 859 | ||||
| Bangkok Bank Public Co. Ltd. | 653 | 2,287 | ||||
| Bank of China Ltd. | 5,797 | 3,115 | ||||
| China Construction Bank Corp. (e) | 1,199 | 1,024 | ||||
| China Pacific Insurance Group Co. Ltd. (c) | 377 | 1,503 | ||||
| DBS Group Holdings Ltd. | 145 | 1,572 | ||||
| Franshion Properties China Ltd. (e) | 590 | 206 | ||||
| Hang Seng Bank Ltd. | 141 | 2,080 | ||||
| Henderson Land Development Co. Ltd. | 374 | 2,795 | ||||
| ICICI Bank Ltd. | 142 | 2,662 | ||||
| Infrastructure Development Finance Co. Ltd. | 318 | 1,049 | ||||
| KB Financial Group Inc. (c) | 51 | 2,622 | ||||
| Longfor Properties Co. Ltd. (c) | 56 | 63 | ||||
| Metropolitan Bank & Trust Co. | 1,315 | 1,273 | ||||
| Ping an Insurance Group Co. of China Ltd. | 294 | 2,552 | ||||
| PT Bank Rakyat Indonesia | 1,799 | 1,446 | ||||
| Samsung Fire & Marine Insurance Co. Ltd. | 12 | 2,116 | ||||
| Shui On Land Ltd. | 1,273 | 747 | ||||
| Unitech Ltd. | 672 | 1,182 | ||||
| Wharf Holdings Ltd. | 487 | 2,795 | ||||
| Yanlord Land Group Ltd. (e) | 939 | 1,437 | ||||
| Yuanta Financial Holding Co. Ltd. | 2,145 | 1,570 | ||||
| 38,153 | ||||||
| INDUSTRIALS - 8.7% | ||||||
| Aditya Birla Nuvo Ltd. | 27 | 500 | ||||
| Bakrie and Brothers Tbk PT (c) | 38,224 | 342 | ||||
| Far Eastern Textile Co. Ltd. | 1,168 | 1,460 | ||||
| Hutchison Whampoa Ltd. | 380 | 2,600 | ||||
| IVRCL Infrastructures & Projects Ltd. | 96 | 717 | ||||
| S1 Corp. | 31 | 1,279 | ||||
| SembCorp Industries Ltd. | 548 | 1,433 | ||||
| Suzlon Energy Ltd. | 555 | 1,070 | ||||
| 9,401 | ||||||
| INFORMATION TECHNOLOGY - 18.8% | ||||||
| AAC Acoustic Technologies Holdings Inc. | 1,560 | 2,561 | ||||
| Delta Electronics Inc. | 164 | 514 | ||||
| HON HAI Precision Industry Co. Ltd. | 740 | 3,463 | ||||
| Lite-On Technology Corp. | 595 | 894 | ||||
| MediaTek Inc. | 130 | 2,267 | ||||
| Powertech Technology Inc. | 400 | 1,355 | ||||
| Samsung Electronics Co. Ltd. | 4 | 3,062 | ||||
| Shanda Games Ltd. - ADR (c) (e) | 157 | 1,602 | ||||
| Sohu.com Inc. (c) | 32 | 1,804 | ||||
| Taiwan Semiconductor Manufacturing Co. Ltd. | 1,093 | 2,202 | ||||
| Wistron Corp. | 342 | 663 | ||||
| 20,387 | ||||||
| MATERIALS - 10.2% | ||||||
| China Shanshui Cement Group Ltd. | 2,029 | 1,473 | ||||
| China Zhongwang Holdings Ltd. (c) (e) | 1,919 | 1,529 | ||||
| Hindalco Industries Ltd. | 372 | 1,279 | ||||
| Huabao International Holdings Ltd. | 1,329 | 1,429 | ||||
| POSCO Inc. | 3 | 1,342 | ||||
| Sterlite Industries India Ltd. | 122 | 2,258 | ||||
| Taiwan Cement Corp. | 1,643 | 1,745 | ||||
| 11,055 | ||||||
| TELECOMMUNICATION SERVICES - 8.5% | ||||||
| Axiata Group Bhd (c) | 1,323 | 1,177 | ||||
| China Mobile Ltd. | 327 | 3,038 | ||||
| China Unicom Hong Kong Ltd. | 1,310 | 1,718 | ||||
| LG Dacom Corp. (f) | 107 | 1,679 | ||||
| Telekomunikasi Indonesia Tbk PT | 1,624 | 1,616 | ||||
| 9,228 | ||||||
| UTILITIES - 4.7% | ||||||
| GVK Power & Infrastructure Ltd. (c) | 1,658 | 1,648 | ||||
| Korea Electric Power Corp. (c) | 75 | 2,192 | ||||
| Tata Power Co. Ltd. | 43 | 1,251 | ||||
| 5,091 | ||||||
| Total Common Stocks (cost $91,585) | 105,531 | |||||
| NON-U.S. GOVERNMENT AGENCY | ||||||
| ASSET-BACKED SECURITIES - 0.0% | ||||||
| Sigma Finance, Inc. (d) (f) (u) | $ | 22 | 1 | |||
| Total Non-U.S. Government Agency | ||||||
| Asset-Backed Securities (cost $22) | 1 | |||||
| SHORT TERM INVESTMENTS - 6.0% | ||||||
| Mutual Funds - 2.7% | ||||||
| JNL Money Market Fund, 0.07% (a) (h) | 2,890 | 2,890 | ||||
| Securities Lending Collateral - 3.3% | ||||||
| Securities Lending Cash Collateral Fund LLC, | ||||||
| 0.16% (a) (h) | 3,147 | 3,147 | ||||
| Securities Lending Liquidating Fund LLC, 0.36% (a) (h) | 392 | 391 | ||||
| 3,538 | ||||||
| Total Short Term Investments (cost $6,429) | 6,428 | |||||
| Total Investments - 103.3% (cost $98,036) | 111,960 | |||||
| Other Assets and Liabilities, Net - (3.3%) | (3,550) | |||||
| Total Net Assets - 100% | $ | 108,410 | ||||
| JNL/PAM China-India Fund | ||||||
| COMMON STOCKS - 96.4% | ||||||
| CONSUMER DISCRETIONARY - 8.8% | ||||||
| Focus Media Holding Ltd. - ADR (c) (e) | 369 | $ | 5,847 | |||
| GOME Electrical Appliances Holdings Ltd. | 10,757 | 3,873 | ||||
| Li Ning Co. Ltd. (e) | 827 | 3,136 | ||||
| Maruti Suzuki India Ltd. | 134 | 4,455 | ||||
| Sun TV Network Ltd. | 458 | 3,352 | ||||
| 20,663 | ||||||
| CONSUMER STAPLES - 3.5% | ||||||
| Colgate-Palmolive India Ltd. | 234 | 3,314 | ||||
| ITC Ltd. | 901 | 4,838 | ||||
| 8,152 | ||||||
| ENERGY - 14.1% | ||||||
| Bharat Petroleum Corp. Ltd. | 198 | 2,705 | ||||
| China Petroleum & Chemical Corp. | 5,926 | 5,221 | ||||
| China Shenhua Energy Co. Ltd. | 872 | 4,230 | ||||
| CNOOC Ltd. | 3,816 | 5,945 | ||||
| Oil India Ltd. (c) | 116 | 3,092 | ||||
| Reliance Industries Ltd. | 508 | 11,859 | ||||
| 33,052 | ||||||
| FINANCIALS - 30.3% | ||||||
| Axis Bank Ltd. | 383 | 8,080 | ||||
| Bank of China Ltd. | 23,567 | 12,664 | ||||
| China Pacific Insurance Group Co. Ltd. (c) | 1,137 | 4,533 | ||||
| China Resources Land Ltd. | 882 | 1,985 | ||||
| Franshion Properties China Ltd. (e) | 5,324 | 1,863 | ||||
| ICICI Bank Ltd. | 534 | 10,014 | ||||
| Industrial & Commercial Bank of China | 16,645 | 13,707 | ||||
| Infrastructure Development Finance Co. Ltd. | 1,147 | 3,786 | ||||
| LIC Housing Finances Ltd. | 188 | 3,230 | ||||
| Ping an Insurance Group Co. of China Ltd. | 610 | 5,304 | ||||
| Rural Electrification Corp. Ltd. | 565 | 2,937 | ||||
| Sino-Ocean Land Holdings Ltd. | 2,894 | 2,656 | ||||
| 70,759 | ||||||
| HEALTH CARE - 1.4% | ||||||
| Dr. Reddy's Laboratories Ltd. | 136 | 3,321 | ||||
| INDUSTRIALS - 3.5% | ||||||
| IVRCL Infrastructures & Projects Ltd. | 531 | 3,970 | ||||
| Sinotrans Shipping Ltd. | 3,590 | 1,648 | ||||
| Tata Motors Ltd. - Class A | 239 | 2,539 | ||||
| 8,157 | ||||||
| INFORMATION TECHNOLOGY - 15.1% | ||||||
| AAC Acoustic Technologies Holdings Inc. | 3,048 | 5,004 | ||||
| BYD Co. Ltd. (c) (e) | 727 | 6,375 | ||||
| Infosys Technologies Ltd. | 180 | 10,020 | ||||
| Mphasis Ltd. | 309 | 4,778 | ||||
| OnMobile Global Ltd. (c) | 249 | 2,412 | ||||
| Sohu.com Inc. (c) | 64 | 3,643 | ||||
| Travelsky Technology Ltd. | 3,136 | 3,160 | ||||
| 35,392 | ||||||
| MATERIALS - 10.4% | ||||||
| China Resources Cement Holdings Ltd. (c) | 4,300 | 2,135 | ||||
| China Zhongwang Holdings Ltd. (c) (e) | 5,174 | 4,121 | ||||
| Fosun International Ltd. | 2,996 | 2,077 | ||||
| Hindalco Industries Ltd. | 1,292 | 4,442 | ||||
| Huabao International Holdings Ltd. | 2,237 | 2,405 | ||||
| Sterlite Industries India Ltd. | 363 | 6,689 | ||||
| Tata Steel Ltd. | 178 | 2,354 | ||||
| 24,223 | ||||||
| TELECOMMUNICATION SERVICES - 5.1% | ||||||
| Bharti Airtel Ltd. | 308 | 2,177 | ||||
| China Mobile Ltd. | 809 | 7,527 | ||||
| China Unicom Hong Kong Ltd. | 1,631 | 2,140 | ||||
| 11,844 | ||||||
| UTILITIES - 4.2% | ||||||
| GAIL India Ltd. | 635 | 5,628 | ||||
| GVK Power & Infrastructure Ltd. (c) | 4,137 | 4,112 | ||||
| 9,740 | ||||||
| Total Common Stocks (cost $193,300) | 225,303 | |||||
| NON-U.S. GOVERNMENT AGENCY ASSET-BACKED SECURITIES - 0.0% | ||||||
| Sigma Finance, Inc. (d) (f) (u) | $ | 40 | 2 | |||
| Total Non-U.S. Government Agency | ||||||
| Asset-Backed Securities (cost $40) | 2 | |||||
| SHORT TERM INVESTMENTS - 9.1% | ||||||
| Mutual Funds - 3.7% | ||||||
| JNL Money Market Fund, 0.07% (a) (h) | 8,553 | 8,553 | ||||
| Securities Lending Collateral - 5.4% | ||||||
| Securities Lending Cash Collateral Fund LLC, | ||||||
| 0.16% (a) (h) | 12,356 | 12,356 | ||||
| Securities Lending Liquidating Fund LLC, 0.36% (a) (h) | 470 | 469 | ||||
| 12,825 | ||||||
| Total Short Term Investments (cost $21,379) | 21,378 | |||||
| Total Investments - 105.5% (cost $214,719) | 246,683 | |||||
| Other Assets and Liabilities, Net - (5.5%) | (12,947) | |||||
| Total Net Assets - 100% | $ | 233,736 | ||||
| JNL/PIMCO Real Return Fund | ||||||
| PREFERRED STOCKS - 0.0% | ||||||
| FINANCIALS - 0.0% | ||||||
| Wells Fargo & Co., Convertible Preferred, 7.50%, Series L (p) | 1 | $ | 459 | |||
| Total Preferred Stocks (cost $500) | 459 | |||||
| NON-U.S. GOVERNMENT AGENCY | ||||||
| ASSET-BACKED SECURITIES - 11.3% | ||||||
| ACE Securities Corp. REMIC, 0.32%, 06/25/37 (i) | $ | 468 | 390 | |||
| American Express Credit Account Master Trust, | ||||||
| 0.23%, 01/15/13 (i) | 1,300 | 1,297 | ||||
| American Home Mortgage Assets REMIC, | ||||||
| 0.42%, 09/25/46 (i) | 5,577 | 2,693 | ||||
| Banc of America Commercial Mortgage Inc. REMIC, | ||||||
| 5.89%, 07/10/44 (i) | 2,000 | 1,820 | ||||
| Banc of America Large Loans Inc. REMIC, | ||||||
| 0.74%, 08/15/29 (i) (t) (v) | 1,543 | 1,361 | ||||
| BCAP LLC Trust REMIC, 0.40%, 01/25/37 (i) | 583 | 278 | ||||
| Bear Stearns Adjustable Rate Mortgage Trust | ||||||
| REMIC, 4.40%, 05/25/33 (i) | 117 | 112 | ||||
| REMIC, 4.37%, 02/25/34 (i) | 771 | 652 | ||||
| REMIC, 4.15%, 11/25/34 (i) | 817 | 769 | ||||
| REMIC, 3.56%, 01/25/35 (i) | 1,480 | 1,290 | ||||
| REMIC, 4.97%, 01/25/35 (i) | 735 | 672 | ||||
| REMIC, 2.18%, 03/25/35 (i) | 139 | 124 | ||||
| REMIC, 2.53%, 08/25/35 (i) | 134 | 117 | ||||
| REMIC, 2.56%, 08/25/35 (i) | 235 | 207 | ||||
| Bear Stearns Alt-A Trust | ||||||
| REMIC, 5.67%, 01/25/36 (i) | 1,036 | 609 | ||||
| REMIC, 4.07%, 08/25/36 (i) | 415 | 163 | ||||
| Bear Stearns Asset Backed Securities Trust | ||||||
| REMIC, 1.23%, 10/25/37 (i) | 1,188 | 749 | ||||
| Bear Stearns Structured Products Inc. | ||||||
| REMIC, 5.63%, 01/26/36 (i) | 1,155 | 712 | ||||
| REMIC, 5.67%, 12/26/46 (i) | 1,197 | 676 | ||||
| Capital Auto Receivables Asset Trust | ||||||
| 1.19%, 12/15/10 (i) (t) (v) | 644 | 645 | ||||
| 1.68%, 10/15/12 (i) | 12,200 | 12,291 | ||||
| Chase Issuance Trust | ||||||
| 0.63%, 09/17/12 (i) | 7,000 | 7,006 | ||||
| 0.68%, 09/17/12 (i) | 7,100 | 7,108 | ||||
| Chevy Chase Mortgage Funding Corp. REMIC, | ||||||
| 0.36%, 05/25/48 (i) (t) (v) | 1,190 | 480 | ||||
| Citigroup Mortgage Loan Trust Inc. | ||||||
| REMIC, 2.51%, 08/25/35 (i) | 151 | 134 | ||||
| REMIC, 4.25%, 08/25/35 (i) | 217 | 193 | ||||
| REMIC, 4.64%, 08/25/35 (i) | 1,078 | 407 | ||||
| REMIC, 0.31%, 01/25/37 (i) | 369 | 214 | ||||
| REMIC, 0.34%, 03/25/37 (i) | 385 | 326 | ||||
| REMIC, 0.29%, 05/25/37 (i) | 587 | 517 | ||||
| REMIC, 0.29%, 05/25/37 (i) | 757 | 546 | ||||
| REMIC, 5.98%, 09/25/37 (i) | 5,614 | 3,932 | ||||
| Countrywide Asset-Backed Certificates | ||||||
| REMIC, 0.41%, 09/25/36 (i) | 770 | 599 | ||||
| REMIC, 0.28%, 03/25/37 (i) | 33 | 32 | ||||
| REMIC, 0.33%, 09/25/37 (i) | 457 | 426 | ||||
| Countrywide Home Loan Mortgage Pass-Through Trust | ||||||
| REMIC, 3.97%, 08/25/34 (i) | 626 | 424 | ||||
| REMIC, 3.65%, 04/20/35 (i) | 805 | 759 | ||||
| Credit Suisse Mortgage Capital Certificates REMIC, | ||||||
| 5.86%, 02/25/37 (i) | 1,200 | 772 | ||||
| Credit-Based Asset Servicing and Securitization LLC | ||||||
| REMIC, 0.35%, 07/25/37 (i) (t) (v) | 596 | 406 | ||||
| CS First Boston Mortgage Securities Corp. REMIC, | ||||||
| 3.69%, 04/25/34 (i) | 818 | 720 | ||||
| Deutsche Bank Alternate Loan Trust REMIC, | ||||||
| 0.32%, 08/25/37 (i) | 403 | 383 | ||||
| First Franklin Mortgage Loan Asset Backed Certificates | ||||||
| REMIC, 0.28%, 11/25/36 (i) | 279 | 272 | ||||
| First Horizon Asset Securities Inc. Pass-Through Trust | ||||||
| REMIC, 3.15%, 07/25/33 (i) | 941 | 859 | ||||
| First NLC Trust REMIC, 0.30%, 08/25/37 (i) (t) (v) | 708 | 475 | ||||
| Ford Credit Auto Owner Trust | ||||||
| 0.36%, 09/15/10 (t) (v) | 1,031 | 1,031 | ||||
| 1.13%, 01/15/11 (i) | 539 | 539 | ||||
| 2.00%, 12/15/11 | 1,000 | 1,006 | ||||
| 2.73%, 01/15/12 (i) | 10,100 | 10,355 | ||||
| GE Capital Commercial Mortgage Corp. REMIC, | ||||||
| 4.71%, 05/10/43 | 400 | 402 | ||||
| GMAC Commercial Mortgage Securities Inc. REMIC, | ||||||
| 5.24%, 11/10/45 (i) | 2,000 | 1,939 | ||||
| Greenwich Capital Commercial Funding Corp. REMIC, | ||||||
| 5.44%, 03/10/39 | 4,000 | 3,534 | ||||
| GS Mortgage Securities Corp. II | ||||||
| 0.32%, 03/06/20 (i) (t) (v) | 426 | 406 | ||||
| 0.36%, 03/06/20 (i) (t) (v) | 2,000 | 1,862 | ||||
| Harborview Mortgage Loan Trust REMIC, | ||||||
| 3.51%, 04/19/34 (i) | 815 | 708 | ||||
| HFC Home Equity Loan Asset Backed Certificates, | ||||||
| 5.91%, 03/20/36 (i) | 2,672 | 2,694 | ||||
| HSI Asset Securitization Corp. Trust REMIC, | ||||||
| 0.29%, 05/25/37 (i) | 410 | 384 | ||||
| IndyMac Residential Asset Backed Trust | ||||||
| REMIC, 0.36%, 04/25/37 (i) | 344 | 327 | ||||
| REMIC, 0.31%, 07/25/37 (i) | 300 | 290 | ||||
| LB-UBS Commercial Mortgage Trust REMIC, | ||||||
| 5.42%, 02/15/40 | 6,200 | 5,134 | ||||
| Lehman Brothers Mortgage Loan Trust REMIC, | ||||||
| 0.32%, 06/25/37 (i) (t) (v) | 530 | 276 | ||||
| MASTR Adjustable Rate Mortgages Trust REMIC, | ||||||
| 3.06%, 12/25/33 (i) | 1,581 | 1,311 | ||||
| MASTR Asset Backed Securities Trust REMIC, | ||||||
| 0.31%, 05/25/37 (i) | 385 | 347 | ||||
| MBNA Credit Card Master Note Trust, 4.50%, 01/15/13 | 3,000 | 3,061 | ||||
| Merrill Lynch First Franklin Mortgage Loan Trust | ||||||
| REMIC, 0.29%, 06/25/37 (i) | 376 | 357 | ||||
| Merrill Lynch Mortgage Investors Inc. | ||||||
| REMIC, 3.63%, 02/25/33 (i) | 298 | 264 | ||||
| REMIC, 3.79%, 02/25/34 (i) | 689 | 671 | ||||
| MLCC Mortgage Investors Inc. REMIC, 4.25%, 10/25/35 (i) | 1,012 | 892 | ||||
| Morgan Stanley Capital I | ||||||
| REMIC, 0.29%, 05/25/37 (i) | 480 | 428 | ||||
| REMIC, 0.29%, 05/25/37 (i) | 500 | 396 | ||||
| Nationstar Home Equity Loan Trust | ||||||
| REMIC, 0.29%, 06/25/37 (i) | 449 | 436 | ||||
| Provident Funding Mortgage Loan Trust | ||||||
| REMIC, 3.11%, 08/25/33 (i) | 608 | 558 | ||||
| Residential Asset Mortgage Products Inc., | ||||||
| 0.31%, 02/25/37 (i) | 1,950 | 1,869 | ||||
| Residential Asset Securities Corp. REMIC, | ||||||
| 0.34%, 04/25/37 (i) | 320 | 302 | ||||
| Residential Asset Securitization Trust REMIC, | ||||||
| 5.50%, 06/25/33 | 343 | 342 | ||||
| Securitized Asset Backed Receivables LLC Trust | ||||||
| REMIC, 0.36%, 05/25/37 (i) | 582 | 406 | ||||
| SLC Student Loan Trust REMIC, 0.65%, 09/15/14 (i) | 88 | 88 | ||||
| SLM Student Loan Trust | ||||||
| 0.26%, 04/25/14 (i) | 1,313 | 1,312 | ||||
| 0.73%, 01/25/17 (i) | 3,100 | 3,091 | ||||
| 0.28%, 04/25/17 (i) | 564 | 564 | ||||
| 0.39%, 04/25/17 (i) | 430 | 426 | ||||
| 1.78%, 04/25/23 (i) | 10,575 | 10,992 | ||||
| REMIC, 0.32%, 04/25/19 (i) | 6,300 | 6,005 | ||||
| Soundview Home Equity Loan Trust REMIC, | ||||||
| 0.31%, 06/25/37 (i) | 4,798 | 3,899 | ||||
| Structured Adjustable Rate Mortgage Loan Trust | ||||||
| REMIC, 3.59%, 02/25/34 (i) | 1,036 | 873 | ||||
| Structured Asset Mortgage Investments Inc. | ||||||
| REMIC, 0.89%, 10/19/34 (i) | 48 | 38 | ||||
| REMIC, 0.33%, 09/25/47 (i) | 282 | 266 | ||||
| TBW Mortgage Backed Pass-Through Certificates | ||||||
| REMIC, 5.97%, 09/25/36 (i) | 498 | 263 | ||||
| Thornburg Mortgage Securities Trust | ||||||
| REMIC, 0.33%, 03/25/37 (i) | 2,018 | 1,923 | ||||
| REMIC, 0.33%, 03/25/37 (i) | 1,060 | 1,028 | ||||
| Wachovia Bank Commercial Mortgage Trust | ||||||
| REMIC, 0.31%, 06/15/20 (i) (t) (v) | 1,049 | 877 | ||||
| REMIC, 0.32%, 09/15/21 (i) (t) (v) | 1,859 | 1,584 | ||||
| Washington Mutual Mortgage Pass-Through Certificates | ||||||
| REMIC, 3.64%, 03/25/33 (i) | 207 | 189 | ||||
| REMIC, 2.91%, 06/25/33 (i) | 681 | 647 | ||||
| REMIC, 2.88%, 09/25/33 (i) | 770 | 763 | ||||
| REMIC, 1.54%, 08/25/46 (i) | 1,842 | 1,016 | ||||
| Wells Fargo Mortgage Backed Securities Trust | ||||||
| REMIC, 4.98%, 12/25/34 (i) | 976 | 944 | ||||
| Total Non-U.S. Government Agency | ||||||
| Asset-Backed Securities (cost $144,013) | 133,932 | |||||
| CORPORATE BONDS AND NOTES - 35.4% | ||||||
| CONSUMER DISCRETIONARY - 0.2% | ||||||
| Honda Auto Receivables Owner Trust, 1.50%, 08/15/11 | 400 | 402 | ||||
| JC Penney Corp. Inc., 7.95%, 04/01/17 | 1,300 | 1,420 | ||||
| Macy's Retail Holdings Inc., 7.45%, 07/15/17 (e) | 1,000 | 1,035 | ||||
| 2,857 | ||||||
| CONSUMER STAPLES - 0.1% | ||||||
| Reynolds American Inc., 0.95%, 06/15/11 (i) | 700 | 693 | ||||
| ENERGY - 0.4% | ||||||
| Gaz Capital SA, 7.34%, 04/11/13 (t) (v) | 300 | 314 | ||||
| Kinder Morgan Energy Partners LP, 5.70%, 01/05/16 | 5,000 | 4,800 | ||||
| 5,114 | ||||||
| FINANCIALS - 32.6% | ||||||
| Allstate Life Global Funding Trust, 5.38%, 04/30/13 | 2,500 | 2,669 | ||||
| American Express Bank FSB, 0.36%, 05/29/12 (i) | 800 | 779 | ||||
| American Express Centurion Bank, 0.31%, 07/13/10 (i) | 1,700 | 1,697 | ||||
| American Express Credit Co., 0.35%, 02/24/12 (i) | 1,700 | 1,661 | ||||
| American Express Credit Corp. | ||||||
| 1.63%, 05/27/10 (i) | 4,900 | 4,920 | ||||
| 0.39%, 06/16/11 (i) | 800 | 789 | ||||
| American Honda Finance Corp., 1.00%, 06/20/11 (i) (t) (v) | 8,700 | 8,701 | ||||
| American International Group Inc. | ||||||
| 0.36%, 10/18/11 (e) (i) | 1,000 | 904 | ||||
| 5.05%, 10/01/15 | 1,200 | 1,001 | ||||
| 5.85%, 01/16/18 | 1,100 | 903 | ||||
| 8.25%, 08/15/18 | 1,000 | 939 | ||||
| 8.18%, 05/15/58 | 4,700 | 3,102 | ||||
| ANZ National International Ltd. | ||||||
| 6.20%, 07/19/13 (t) (v) | 2,000 | 2,153 | ||||
| 0.71%, 08/19/14 (i) (t) (v) | 2,000 | 2,018 | ||||
| Australia & New Zealand Banking Group Ltd., | ||||||
| 0.53%, 06/18/12 (i) (t) (v) | 5,000 | 4,962 | ||||
| Bank of America Corp. | ||||||
| 0.37%, 08/15/11 (i) | 300 | 296 | ||||
| 7.38%, 05/15/14 (e) | 200 | 227 | ||||
| 5.38%, 06/15/14 (e) | 600 | 621 | ||||
| Bank of Scotland Plc, 4.88%, 04/15/11 (u) | 1,400 | 1,416 | ||||
| Barclays Bank Plc | ||||||
| 6.05%, 12/04/17 (e) (t) (v) | 2,000 | 2,035 | ||||
| 7.43% (callable at 100 on 12/15/17) (p) (t) (v) | 200 | 182 | ||||
| Caterpillar Financial Services Corp., 1.00%, 06/24/11 (i) | 7,700 | 7,764 | ||||
| Citibank NA, 1.38%, 08/10/11 (e) | 11,100 | 11,129 | ||||
| Citigroup Funding Inc., 1.33%, 05/07/10 (i) | 7,500 | 7,517 | ||||
| Citigroup Inc. | ||||||
| 6.50%, 01/18/11 | 9,800 | 10,248 | ||||
| 0.36%, 05/18/11 (i) | 1,100 | 1,081 | ||||
| 5.25%, 02/27/12 | 1,300 | 1,343 | ||||
| 5.30%, 10/17/12 | 1,000 | 1,042 | ||||
| 5.50%, 04/11/13 | 1,200 | 1,244 | ||||
| 6.13%, 05/15/18 (e) | 3,000 | 3,016 | ||||
| Commonwealth Bank of Australia | ||||||
| 0.67%, 07/12/13 (i) | 14,700 | 14,650 | ||||
| 0.75%, 06/25/14 (i) | 3,800 | 3,784 | ||||
| 0.53%, 09/17/14 (e) (i) (t) (v) | 3,800 | 3,788 | ||||
| Countrywide Home Loans Inc., 4.00%, 03/22/11 | 700 | 715 | ||||
| Dexia Credit Local, 0.90%, 09/23/11 (i) (t) (v) | 1,300 | 1,311 | ||||
| Ford Motor Credit Co. LLC | ||||||
| 7.25%, 10/25/11 | 1,850 | 1,868 | ||||
| 7.80%, 06/01/12 | 150 | 152 | ||||
| GATX Financial Corp., 5.80%, 03/01/16 | 1,000 | 964 | ||||
| General Electric Capital Corp. | ||||||
| 0.25%, 09/21/12 (i) | 15,200 | 15,201 | ||||
| 0.25%, 12/21/12 (i) | 34,600 | 34,613 | ||||
| Goldman Sachs Group Inc. | ||||||
| 0.35%, 06/28/10 (e) (i) | 4,600 | 4,602 | ||||
| 0.55%, 06/28/10 (i) | 1,700 | 1,702 | ||||
| 6.60%, 01/15/12 | 700 | 761 | ||||
| HBOS Plc, 6.75%, 05/21/18 (e) (t) (v) | 1,000 | 928 | ||||
| HSBC Finance Corp. | ||||||
| 0.33%, 03/12/10 (i) | 2,400 | 2,399 | ||||
| 0.52%, 05/10/10 (i) | 2,500 | 2,499 | ||||
| 0.49%, 08/09/11 (i) | 2,700 | 2,648 | ||||
| 0.55%, 04/24/12 (e) (i) | 3,602 | 3,474 | ||||
| 0.60%, 07/19/12 (i) | 1,200 | 1,157 | ||||
| International Lease Finance Corp., 6.63%, 11/15/13 (e) | 500 | 402 | ||||
| JPMorgan Chase & Co. | ||||||
| 0.42%, 01/17/11 (i) | 2,700 | 2,699 | ||||
| 6.95%, 08/10/12 | 1,100 | 1,229 | ||||
| 5.38%, 10/01/12 | 500 | 541 | ||||
| LeasePlan Corp. NV, 3.00%, 05/07/12 (t) (v) | 1,800 | 1,843 | ||||
| Lehman Brothers Holdings Inc. | ||||||
| 6.20%, 09/26/14 (d) | 200 | 39 | ||||
| 6.88%, 05/02/18 (d) | 1,200 | 249 | ||||
| 7.00%, 09/27/27 (d) | 100 | 20 | ||||
| Macquarie Bank Ltd., 4.10%, 12/17/13 (u) | 27,200 | 28,582 | ||||
| Marsh & McLennan Cos. Inc., 5.75%, 09/15/15 | 1,000 | 1,043 | ||||
| Merrill Lynch & Co. Inc. | ||||||
| 0.48%, 11/01/11 (i) | 3,800 | 3,730 | ||||
| 0.49%, 06/05/12 (i) | 1,000 | 970 | ||||
| 6.05%, 08/15/12 | 12,300 | 13,176 | ||||
| MetLife Global Funding Inc., 0.31%, 05/17/10 (i) (t) (v) | 1,000 | 999 | ||||
| Metropolitan Life Global Funding I | ||||||
| 1.00%, 06/25/10 (i) (t) (v) | 500 | 501 | ||||
| 2.16%, 06/10/11 (i) (t) (v) | 7,400 | 7,548 | ||||
| 1.38%, 09/17/12 (i) (t) (v) | 1,100 | 1,105 | ||||
| Morgan Stanley | ||||||
| 0.50%, 01/18/11 (i) | 2,000 | 1,991 | ||||
| 6.75%, 04/15/11 | 2,600 | 2,755 | ||||
| 0.50%, 01/09/12 (i) | 9,700 | 9,590 | ||||
| 0.60%, 06/20/12 (i) | 19,400 | 19,592 | ||||
| 1.05%, 03/01/13 (i) | EUR | 1,100 | 1,499 | |||
| 0.55%, 01/09/14 (i) | 5,300 | 5,060 | ||||
| 0.73%, 10/15/15 (i) | 1,000 | 938 | ||||
| 0.70%, 10/18/16 (i) | 1,000 | 926 | ||||
| National Australia Bank Ltd. | ||||||
| 5.35%, 06/12/13 (t) (v) | 1,700 | 1,830 | ||||
| 0.75%, 07/08/14 (i) (t) (v) | 1,900 | 1,892 | ||||
| New York Life Global Funding, 4.65%, 05/09/13 (t) (v) | 1,800 | 1,891 | ||||
| Pacific Life Global Funding, 5.15%, 04/15/13 (t) (v) | 500 | 522 | ||||
| Pearson Dollar Finance Plc, 5.70%, 06/01/14 (t) (v) | 1,000 | 1,056 | ||||
| ProLogis, 6.63%, 05/15/18 | 900 | 854 | ||||
| Royal Bank of Scotland Group Plc | ||||||
| 0.51%, 03/30/12 (e) (i) (t) (v) | 18,800 | 18,741 | ||||
| 7.09% (callable at 100 on 09/29/17) (p) | EUR | 100 | 71 | |||
| Royal Bank of Scotland Plc | ||||||
| 1.45%, 10/20/11 (t) (v) | 22,500 | 22,450 | ||||
| 1.40%, 04/23/12 | 400 | 404 | ||||
| Santander Perpetual SA Unipersonal, | ||||||
| 6.67% (callable at 100 beginning 10/24/17) (p) (t) (v) | 900 | 809 | ||||
| SLM Corp. | ||||||
| 1.08%, 04/26/11 (i) | EUR | 400 | 537 | |||
| 0.51%, 10/25/11 (i) | 1,400 | 1,311 | ||||
| Sovereign Bancorp Inc., 4.90%, 09/23/10 | 4,100 | 4,187 | ||||
| Svenska Handelsbanken AB, 1.25%, 09/14/12 (i) (t) (v) | 4,300 | 4,278 | ||||
| TransCapitalInvest Ltd., 7.70%, 08/07/13 (t) (v) | 1,500 | 1,615 | ||||
| UBS AG Stamford, 1.50%, 09/29/11 (i) | 7,100 | 7,082 | ||||
| US Central Federal Credit Union, 1.90%, 10/19/12 (t) (v) | 6,600 | 6,595 | ||||
| Wachovia Corp. | ||||||
| 0.38%, 10/15/11 (i) | 4,200 | 4,153 | ||||
| 0.41%, 04/23/12 (i) | 6,400 | 6,311 | ||||
| Wells Fargo & Co. | ||||||
| 4.38%, 01/31/13 | 800 | 831 | ||||
| 0.48%, 10/28/15 (e) (i) | 500 | 464 | ||||
| 7.98%, (callable at 100 beginning 03/15/18) (p) | 1,300 | 1,303 | ||||
| Wells Fargo Capital XIII, | ||||||
| 7.70% (callable at 100 beginning 03/26/13) (p) | 800 | 775 | ||||
| Western Corporate Federal Credit Union, 1.75%, 11/02/12 | 6,100 | 6,072 | ||||
| Westpac Banking Corp., 0.54%, 09/10/14 (i) (t) (v) | 700 | 700 | ||||
| 387,336 | ||||||
| HEALTH CARE - 0.2% | ||||||
| Roche Holdings Inc., 2.26%, 02/25/11 (i) (t) (v) | 1,700 | 1,736 | ||||
| UnitedHealth Group Inc., 4.88%, 02/15/13 | 100 | 105 | ||||
| 1,841 | ||||||
| INDUSTRIALS - 0.4% | ||||||
| PACCAR Inc., 1.43%, 09/14/12 (i) | 3,700 | 3,747 | ||||
| Waste Management Inc., 6.10%, 03/15/18 | 1,100 | 1,170 | ||||
| 4,917 | ||||||
| INFORMATION TECHNOLOGY - 0.4% | ||||||
| Seagate Technology Inc., 6.38%, 10/01/11 (e) | 5,000 | 5,088 | ||||
| MATERIALS - 0.5% | ||||||
| Dow Chemical Co. | ||||||
| 2.53%, 08/08/11 (i) | 4,000 | 4,071 | ||||
| 4.85%, 08/15/12 (e) | 1,000 | 1,051 | ||||
| Rexam Plc, 6.75%, 06/01/13 (t) (v) | 700 | 744 | ||||
| 5,866 | ||||||
| TELECOMMUNICATION SERVICES - 0.6% | ||||||
| Telefonica Emisiones SAU, 0.61%, 02/04/13 (i) | 4,641 | 4,569 | ||||
| Verizon Wireless Capital LLC, 2.87%, 05/20/11 (i) | 2,200 | 2,275 | ||||
| 6,844 | ||||||
| UTILITIES - 0.0% | ||||||
| American Electric Power Co. Inc., 5.25%, 06/01/15 | 500 | 518 | ||||
| Total Corporate Bonds and Notes (cost $419,301) | 421,074 | |||||
| GOVERNMENT AND AGENCY OBLIGATIONS - 85.0% | ||||||
| GOVERNMENT SECURITIES - 82.1% | ||||||
| Municipals - 0.1% | ||||||
| Tobacco Settlement Authority of West Virgina, | ||||||
| 7.47%, 06/01/47 | 480 | 383 | ||||
| Tobacco Settlement Financing Corp. New Jersey, | ||||||
| 4.75%, 06/01/34 | 1,000 | 697 | ||||
| Tobacco Settlement Funding Corp., 5.00%, 06/01/41 | 200 | 138 | ||||
| 1,218 | ||||||
| Sovereign - 2.0% | ||||||
| Bundesrepublic Deutschland, 3.75%, 01/04/15 | EUR | 8,700 | 13,189 | |||
| Societe Financement de l'Economie Francaise | ||||||
| 2.13%, 01/30/12 (t) (v) | 400 | 405 | ||||
| 0.45%, 07/16/12 (i) (t) (v) | 10,600 | 10,653 | ||||
| 24,247 | ||||||
| Treasury Inflation Index Securities - 80.0% | ||||||
| U.S. Treasury Inflation Indexed Note | ||||||
| 3.38%, 01/15/12 (r) | 3,278 | 4,297 | ||||
| 2.00%, 04/15/12, TBA (g) (r) | 63,726 | 66,594 | ||||
| 3.00%, 07/15/12 (r) | 16,411 | 21,200 | ||||
| 0.63%, 04/15/13 (o) (r) | 44,182 | 46,489 | ||||
| 1.88%, 07/15/13, TBA (g) (r) | 60,358 | 63,598 | ||||
| 1.88%, 07/15/13, TBA (g) (r) | 88,423 | 93,127 | ||||
| 1.25%, 04/15/14 (o) (r) | 42,728 | 44,234 | ||||
| 1.25%, 04/15/14, TBA (g) (r) | 10,216 | 10,559 | ||||
| 2.00%, 07/15/14 (r) | 9,447 | 11,299 | ||||
| 1.63%, 01/15/15, TBA (g) (r) | 54,603 | 61,344 | ||||
| 2.00%, 01/15/16 (r) | 27,202 | 31,860 | ||||
| 2.50%, 07/15/16 (r) | 34,815 | 39,634 | ||||
| 2.63%, 07/15/17 (r) | 19,859 | 21,451 | ||||
| 1.63%, 01/15/18 (r) | 37,280 | 38,661 | ||||
| 1.63%, 01/15/18, TBA (g) (r) | 13,829 | 14,157 | ||||
| 1.63%, 01/15/18, TBA (g) (r) | 11,664 | 11,940 | ||||
| 1.38%, 07/15/18 (r) | 8,556 | 9,844 | ||||
| 2.13%, 01/15/19 (e) (r) | 12,027 | 12,173 | ||||
| 2.38%, 01/15/25, TBA (g) (r) | 48,183 | 50,840 | ||||
| 2.00%, 01/15/26 (o) (r) | 17,588 | 19,799 | ||||
| 2.38%, 01/15/27 (r) | 42,373 | 44,559 | ||||
| 2.38%, 01/15/27, TBA (g) (r) | 32,166 | 33,850 | ||||
| 1.75%, 01/15/38 (r) | 50,271 | 49,593 | ||||
| 3.63%, 04/15/28 (r) | 103 | 132 | ||||
| 3.63%, 04/15/28, TBA (g) (r) | 51,475 | 63,623 | ||||
| 2.50%, 01/15/29, TBA (g) (r) | 35,971 | 35,855 | ||||
| 2.50%, 01/15/29, TBA (g) (r) | 10,071 | 10,802 | ||||
| 3.88%, 04/15/29 (r) | 29,958 | 40,781 | ||||
| 952,295 | ||||||
| U.S. GOVERNMENT AGENCY | ||||||
| MORTGAGE-BACKED SECURITIES - 2.9% | ||||||
| Federal Home Loan Mortgage Corp. - 1.1% | ||||||
| Federal Home Loan Mortgage Corp. | ||||||
| 0.21%, 08/05/11 (i) | 3 | 3 | ||||
| 6.70%, 07/01/36 (i) | 1,334 | 1,414 | ||||
| 6.59%, 09/01/36 (i) | 1,339 | 1,417 | ||||
| 6.61%, 10/01/36 (i) | 1,633 | 1,717 | ||||
| REMIC, 5.50%, 05/15/16 | 297 | 300 | ||||
| REMIC, 0.46%, 02/15/19 (i) | 3,248 | 3,249 | ||||
| REMIC, 0.38%, 07/15/19 (i) | 1,481 | 1,462 | ||||
| REMIC, 0.38%, 10/15/20 (i) | 1,566 | 1,543 | ||||
| REMIC, 5.00%, 05/15/27 | 782 | 796 | ||||
| REMIC, 1.83%, 10/25/44 (i) | 866 | 827 | ||||
| REMIC, 1.83%, 02/25/45 (i) | 640 | 591 | ||||
| 13,319 | ||||||
| Federal National Mortgage Association - 0.6% | ||||||
| Federal National Mortgage Association | ||||||
| 2.82%, 11/01/35 (i) | 399 | 405 | ||||
| 5.62%, 03/01/36 (i) | 734 | 773 | ||||
| 5.93%, 06/01/36 (i) | 424 | 452 | ||||
| REMIC, 5.00%, 02/25/17 | 518 | 532 | ||||
| REMIC, 1.03%, 02/25/36 (i) | 1,963 | 1,957 | ||||
| REMIC, 0.29%, 07/25/37 (i) | 1,163 | 1,051 | ||||
| REMIC, 0.43%, 11/27/37 (f) | 2,100 | 1,995 | ||||
| 7,165 | ||||||
| Government National Mortgage Association - 1.0% | ||||||
| Government National Mortgage Association, | ||||||
| 0.53%, 03/20/37 (i) | 12,318 | 12,077 | ||||
| Small Business Administration Participation Certificates - 0.2% | ||||||
| Small Business Administration Participation Certificates, | ||||||
| 5.29%, 12/01/27 | 1,660 | 1,765 | ||||
| Total Government and Agency Obligations (cost $1,026,412) | 1,012,086 | |||||
| SHORT TERM INVESTMENTS - 13.9% | ||||||
| Certificates of Deposit - 1.8% | ||||||
| Barclays Bank Plc, 1.07%, 03/22/11 | 11,800 | 11,789 | ||||
| Sanpaolo IMI SpA, 0.90%, 06/09/10 (i) | 9,300 | 9,299 | ||||
| 21,088 | ||||||
| Federal Home Loan Bank - 1.6% | ||||||
| Federal Home Loan Bank | ||||||
| 0.01%, 02/17/10 | 15,200 | 15,200 | ||||
| 0.09%, 02/19/10 | 4,400 | 4,400 | ||||
| 19,600 | ||||||
| Federal Home Loan Mortgage Corp. - 3.1% | ||||||
| Federal Home Loan Mortgage Corp. | ||||||
| 0.24%, 01/25/10 | 22,500 | 22,500 | ||||
| 0.06%, 02/18/10 | 12,100 | 12,098 | ||||
| 0.09%, 03/09/10 | 2,200 | 2,200 | ||||
| 36,798 | ||||||
| Federal National Mortgage Association - 3.4% | ||||||
| Federal National Mortgage Association | ||||||
| 0.05%, 02/01/10 | 15,500 | 15,499 | ||||
| 0.07%, 02/04/10 | 21,850 | 21,848 | ||||
| 0.02%, 02/24/10 | 3,000 | 3,000 | ||||
| 40,347 | ||||||
| Mutual Funds - 0.1% | ||||||
| JNL Money Market Fund, 0.07% (a) (h) | 963 | 963 | ||||
| Securities Lending Collateral - 3.8% | ||||||
| Securities Lending Cash Collateral Fund LLC, | ||||||
| 0.16% (a) (h) | 45,135 | 45,135 | ||||
| U.S. Treasury Securities - 0.1% | ||||||
| U.S. Treasury Bill | ||||||
| 0.04%, 03/18/10 (m) | 520 | 520 | ||||
| 0.19%, 03/25/10 (m) | 1,040 | 1,040 | ||||
| 1,560 | ||||||
| Total Short Term Investments (cost $165,504) | 165,491 | |||||
| Total Investments - 145.6% (cost $1,755,730) | 1,733,042 | |||||
| Other Assets and Liabilities, Net - (45.6%) (o) | (542,977) | |||||
| Total Net Assets - 100% | $ | 1,190,065 | ||||
| JNL/PIMCO Total Return Bond Fund | ||||||
| PREFERRED STOCKS - 0.2% | ||||||
| CONSUMER DISCRETIONARY - 0.0% | ||||||
| General Motors Corp., 5.25%, | ||||||
| Series B (callable at 25.55 beginning 02/19/10) (d) | 128 | $ | 730 | |||
| FINANCIALS - 0.2% | ||||||
| American International Group Inc., Convertible Preferred, | ||||||
| 8.50%, 08/01/11 | 44 | 495 | ||||
| DG Funding Trust, | ||||||
| 0.64% (callable at 10,000 beginning 02/18/10) (f) (p) (t) (u) | - | 3,709 | ||||
| 4,204 | ||||||
| Total Preferred Stocks (cost $5,205) | 4,934 | |||||
| NON-U.S. GOVERNMENT AGENCY | ||||||
| ASSET-BACKED SECURITIES - 6.5% | ||||||
| Access Group Inc., 1.58%, 10/27/25 (i) | $ | 8,159 | 8,399 | |||
| American Home Mortgage Investment Trust | ||||||
| REMIC, 2.23%, 02/25/45 (i) | 419 | 316 | ||||
| Amortizing Residential Collateral Trust | ||||||
| REMIC, 0.52%, 07/25/32 (i) | 15 | 14 | ||||
| Asset Backed Securities Corp. Home Equity | ||||||
| REMIC, 0.51%, 09/25/34 (i) | 294 | 245 | ||||
| Banc of America Commercial Mortgage Inc. | ||||||
| REMIC, 5.74%, 05/10/45 (i) | 2,000 | 1,965 | ||||
| REMIC, 5.66%, 06/10/49 (i) | 2,830 | 2,365 | ||||
| Banc of America Funding Corp. REMIC, 3.27%, 05/25/35 (i) | 605 | 569 | ||||
| Banc of America Mortgage Securities Inc. | ||||||
| REMIC, 6.50%, 10/25/31 | 88 | 86 | ||||
| REMIC, 6.50%, 09/25/33 | 39 | 39 | ||||
| Bank of America Auto Trust, 1.70%, 12/15/11 (t) (v) | 1,700 | 1,709 | ||||
| Bank of America Credit Card Trust, 0.81%, 04/15/13 (i) | 1,800 | 1,796 | ||||
| Bear Stearns Adjustable Rate Mortgage Trust | ||||||
| REMIC, 3.72%, 11/25/34 (i) | 1,672 | 1,414 | ||||
| REMIC, 4.15%, 11/25/34 (i) | 525 | 494 | ||||
| REMIC, 2.18%, 03/25/35 (i) | 4,813 | 4,310 | ||||
| Bear Stearns Alt-A Trust REMIC, 5.38%, 09/25/35 (i) | 486 | 325 | ||||
| Bear Stearns Commercial Mortgage Securities Inc. | ||||||
| REMIC, 5.33%, 02/11/44 | 300 | 259 | ||||
| Bear Stearns Structured Products Inc. | ||||||
| REMIC, 5.63%, 01/26/36 (i) | 1,444 | 890 | ||||
| REMIC, 5.67%, 12/26/46 (i) | 823 | 465 | ||||
| Chase Issuance Trust, 1.75%, 09/15/15 (i) | 12,800 | 13,176 | ||||
| Citigroup Mortgage Loan Trust Inc. | ||||||
| REMIC, 4.70%, 12/25/35 (i) | 239 | 213 | ||||
| REMIC, 0.29%, 05/25/37 (i) | 1,893 | 1,365 | ||||
| Commercial Mortgage Pass-Through Certificates | ||||||
| REMIC, 5.31%, 12/10/46 | 2,100 | 1,792 | ||||
| Countrywide Alternative Loan Trust REMIC, | ||||||
| 0.41%, 05/25/47 (i) | 955 | 477 | ||||
| Countrywide Asset-Backed Certificates REMIC, | ||||||
| 0.34%, 10/25/46 (i) | 181 | 176 | ||||
| Countrywide Financial Corp., 5.13%, 02/17/11 | 300 | 490 | ||||
| Countrywide Home Loan Mortgage Pass-Through Trust | ||||||
| REMIC, 3.51%, 11/25/34 (i) | 1,181 | 956 | ||||
| REMIC, 3.70%, 02/20/35 (i) | 2,056 | 1,684 | ||||
| REMIC, 5.25%, 02/20/36 (i) | 287 | 188 | ||||
| Credit Suisse Mortgage Capital Certificates | ||||||
| REMIC, 5.66%, 03/15/39 (i) | 200 | 173 | ||||
| REMIC, 5.70%, 09/15/40 (i) | 7,800 | 6,223 | ||||
| CS First Boston Mortgage Securities Corp. REMIC, | ||||||
| 0.88%, 03/25/32 (i) (t) (v) | 31 | 26 | ||||
| Equity One ABS Inc., 0.79%, 11/25/32 (i) | 195 | 142 | ||||
| First Franklin Mortgage Loan Asset Backed Certificates | ||||||
| REMIC, 0.27%, 01/25/38 (i) | 329 | 320 | ||||
| Ford Credit Auto Owner Trust, 2.00%, 12/15/11 | 700 | 704 | ||||
| GE Capital Commercial Mortgage Corp. REMIC, | ||||||
| 4.23%, 12/10/37 | 1,227 | 1,241 | ||||
| GreenPoint Mortgage Funding Trust REMIC, | ||||||
| 0.31%, 01/25/47 (i) | 678 | 588 | ||||
| Greenwich Capital Commercial Funding Corp. | ||||||
| REMIC, 5.44%, 03/10/39 | 1,000 | 884 | ||||
| REMIC, 4.80%, 08/10/42 (i) | 100 | 97 | ||||
| GS Mortgage Securities Corp. II | ||||||
| 0.32%, 03/06/20 (i) (t) (v) | 1,675 | 1,593 | ||||
| REMIC, 5.81%, 08/10/45 (e) (i) | 1,600 | 1,374 | ||||
| GSR Mortgage Loan Trust | ||||||
| REMIC, 3.34%, 09/25/35 (i) | 2,697 | 2,339 | ||||
| REMIC, 5.23%, 11/25/35 (i) | 1,461 | 1,212 | ||||
| Harborview Mortgage Loan Trust | ||||||
| REMIC, 0.45%, 05/19/35 (i) | 209 | 108 | ||||
| REMIC, 5.10%, 07/19/35 (i) | 997 | 692 | ||||
| HFC Home Equity Loan Asset Backed Certificates | ||||||
| REMIC, 0.52%, 01/20/34 (i) | 1,394 | 1,179 | ||||
| HSI Asset Securitization Corp. Trust | ||||||
| REMIC, 0.28%, 12/25/36 (i) | 173 | 125 | ||||
| IndyMac ARM Trust REMIC, 2.46%, 01/25/32 (i) | 1 | - | ||||
| IndyMac Index Mortgage Loan Trust | ||||||
| REMIC, 3.18%, 01/25/36 (i) | 1,079 | 673 | ||||
| REMIC, 0.32%, 11/25/46 (i) | 237 | 223 | ||||
| JPMorgan Chase & Co. Adjustable Rate Mortgage Trust | ||||||
| REMIC, 3.23%, 11/25/30 (i) | 3 | 3 | ||||
| REMIC, 4.46%, 02/25/33 (i) | 16 | 15 | ||||
| REMIC, 5.63%, 02/25/33 (i) | 27 | 27 | ||||
| REMIC, 4.99%, 04/25/33 (i) | 102 | 91 | ||||
| REMIC, 3.77%, 01/25/34 (i) | 317 | 280 | ||||
| JPMorgan Chase & Co. Alt-A Trust REMIC, | ||||||
| 5.31%, 05/25/35 (i) | 767 | 532 | ||||
| JPMorgan Chase Commercial Mortgage Securities Corp. | ||||||
| REMIC, 5.47%, 01/12/45 (i) | 700 | 662 | ||||
| REMIC, 5.33%, 05/15/47 (e) | 1,900 | 1,648 | ||||
| REMIC, 5.44%, 06/12/47 | 11,300 | 9,844 | ||||
| REMIC, 5.42%, 01/15/49 | 6,400 | 5,399 | ||||
| REMIC, 5.82%, 06/15/49 (i) | 100 | 97 | ||||
| REMIC, 5.79%, 02/12/51 (i) | 14,500 | 12,649 | ||||
| REMIC, 5.88%, 02/15/51 (i) | 700 | 606 | ||||
| JPMorgan Mortgage Acquisition Corp. | ||||||
| REMIC, 0.28%, 08/25/36 (i) | 12 | 12 | ||||
| REMIC, 0.28%, 06/25/37 (i) | 7,957 | 7,278 | ||||
| JPMorgan Mortgage Trust | ||||||
| 5.75%, 01/25/36 | 590 | 491 | ||||
| REMIC, 5.02%, 02/25/35 (i) | 561 | 516 | ||||
| Lehman Brothers Commercial Mortgage Trust | ||||||
| REMIC, 0.31%, 09/15/21 (i) (t) (v) | 174 | 162 | ||||
| Long Beach Mortgage Loan Trust | ||||||
| REMIC, 0.51%, 10/25/34 (i) | 34 | 26 | ||||
| MASTR Asset Backed Securities Trust | ||||||
| REMIC, 0.28%, 01/25/37 (i) | 581 | 189 | ||||
| REMIC, 0.31%, 05/25/37 (i) | 440 | 397 | ||||
| Mellon Residential Funding Corp. | ||||||
| REMIC, 2.61%, 10/20/29 (i) | 235 | 221 | ||||
| REMIC, 0.72%, 06/15/30 (i) | 530 | 446 | ||||
| Merrill Lynch Mortgage Investors Inc. | ||||||
| REMIC, 3.40%, 05/25/33 (i) | 791 | 732 | ||||
| REMIC, 0.44%, 02/25/36 (i) | 459 | 314 | ||||
| Merrill Lynch/Countrywide Commercial Mortgage Trust | ||||||
| REMIC, 5.96%, 07/12/17 (i) | 10,700 | 9,235 | ||||
| REMIC, 5.49%, 03/12/51 (i) | 1,500 | 1,220 | ||||
| Mid-State Trust REMIC, 8.33%, 04/01/30 | 11 | 11 | ||||
| MLCC Mortgage Investors Inc. | ||||||
| REMIC, 1.23%, 10/25/35 (i) | 225 | 184 | ||||
| REMIC, 0.48%, 11/25/35 (i) | 368 | 227 | ||||
| Morgan Stanley Asset-Backed Securities Capital I | ||||||
| REMIC, 0.27%, 01/25/37 (i) | 339 | 320 | ||||
| Morgan Stanley Capital I | ||||||
| REMIC, 0.29%, 10/15/20 (i) (t) (v) | 413 | 365 | ||||
| REMIC, 5.81%, 12/12/49 | 100 | 85 | ||||
| Park Place Securities Inc. REMIC, 0.54%, 10/25/34 (i) | 948 | 773 | ||||
| Prime Mortgage Trust | ||||||
| REMIC, 0.63%, 02/25/19 (i) | 16 | 15 | ||||
| REMIC, 0.63%, 02/25/34 (i) | 98 | 89 | ||||
| Saxon Asset Securities Trust REMIC, 0.29%, 11/25/36 (i) | - | - | ||||
| SBI Heloc Trust REMIC, 0.40%, 08/25/36 (i) (t) (v) | 143 | 129 | ||||
| Securitized Asset Backed Receivables LLC Trust | ||||||
| REMIC, 0.29%, 12/25/36 (i) | 435 | 208 | ||||
| Sequoia Mortgage Trust REMIC, 0.58%, 10/19/26 (i) | 94 | 70 | ||||
| SLM Student Loan Trust | ||||||
| 0.58%, 01/26/15 (i) | 518 | 517 | ||||
| 0.28%, 10/25/16 (i) | 681 | 680 | ||||
| 1.78%, 04/25/23 (i) | 12,059 | 12,535 | ||||
| REMIC, 0.27%, 10/27/14 (i) | 1,046 | 1,045 | ||||
| Structured Asset Mortgage Investments Inc. | ||||||
| REMIC, 0.89%, 09/19/32 (i) | 78 | 65 | ||||
| REMIC, 0.48%, 07/19/35 (i) | 925 | 758 | ||||
| REMIC, 0.36%, 03/25/37 (i) | 1,815 | 834 | ||||
| Structured Asset Securities Corp. | ||||||
| REMIC, 2.92%, 02/25/32 (i) | 3 | 2 | ||||
| REMIC, 0.52%, 01/25/33 (i) | 11 | 10 | ||||
| REMIC, 0.28%, 10/25/36 (i) | 298 | 282 | ||||
| Thornburg Mortgage Securities Trust | ||||||
| REMIC, 0.35%, 06/25/36 (i) | 2,725 | 2,672 | ||||
| REMIC, 0.34%, 12/25/36 (i) | 762 | 732 | ||||
| Vendee Mortgage Trust REMIC, 6.50%, 09/15/24 | 621 | 642 | ||||
| Wachovia Bank Commercial Mortgage Trust | ||||||
| REMIC, 0.31%, 06/15/20 (i) (t) (v) | 1,873 | 1,566 | ||||
| REMIC, 0.32%, 09/15/21 (i) (t) (v) | 7,635 | 6,504 | ||||
| REMIC, 5.51%, 04/15/47 | 1,000 | 802 | ||||
| Washington Mutual Mortgage Pass-Through Certificates | ||||||
| REMIC, 3.06%, 02/25/31 (i) | 14 | 11 | ||||
| REMIC, 1.94%, 08/25/42 (i) | 200 | 147 | ||||
| REMIC, 1.74%, 11/25/42 (i) | 120 | 79 | ||||
| REMIC, 0.52%, 10/25/45 (i) | 215 | 154 | ||||
| Wells Fargo Mortgage Backed Securities Trust | ||||||
| REMIC, 4.96%, 01/25/35 (i) | 1,343 | 1,228 | ||||
| REMIC, 4.95%, 03/25/36 (i) | 1,155 | 955 | ||||
| Total Non-U.S. Government Agency | ||||||
| Asset-Backed Securities (cost $167,643) | 153,881 | |||||
| CORPORATE BONDS AND NOTES - 27.2% | ||||||
| CONSUMER DISCRETIONARY - 0.5% | ||||||
| Ally Auto Receivables Trust, 1.32%, 03/15/12 (t) (v) | 2,300 | 2,304 | ||||
| Comcast Corp. | ||||||
| 5.88%, 02/15/18 | 400 | 425 | ||||
| 6.45%, 03/15/37 | 400 | 412 | ||||
| Princeton University, 5.70%, 03/01/39 (e) | 4,500 | 4,622 | ||||
| R.H. Donnelley Corp., Term Loan | ||||||
| 6.75%, 06/30/11 (i) (u) | 42 | 39 | ||||
| 6.75%, 06/30/11 (i) (u) | 31 | 29 | ||||
| 6.75%, 06/30/11 (i) (u) | 640 | 587 | ||||
| Target Corp., 5.13%, 01/15/13 | 3,000 | 3,257 | ||||
| 11,675 | ||||||
| CONSUMER STAPLES - 0.4% | ||||||
| Anheuser-Busch Cos. Inc., 5.50%, 01/15/18 | 100 | 101 | ||||
| Campbell Soup Co., 4.50%, 02/15/19 (e) | 6,800 | 6,805 | ||||
| Kraft Foods Inc. | ||||||
| 6.13%, 02/01/18 (e) | 1,400 | 1,472 | ||||
| 6.88%, 02/01/38 | 600 | 630 | ||||
| Philip Morris International Inc., 5.65%, 05/16/18 | 1,200 | 1,262 | ||||
| 10,270 | ||||||
| ENERGY - 1.3% | ||||||
| El Paso Corp. | ||||||
| 8.05%, 10/15/30 (e) | 600 | 565 | ||||
| 7.80%, 08/01/31 | 800 | 753 | ||||
| Gaz Capital SA, 6.21%, 11/22/16 (t) (v) | 300 | 287 | ||||
| Kinder Morgan Energy Partners LP, 5.95%, 02/15/18 | 6,400 | 6,779 | ||||
| Peabody Energy Corp., 7.88%, 11/01/26 | 500 | 508 | ||||
| Petrobras International Finance Co., 7.88%, 03/15/19 | 11,700 | 13,488 | ||||
| Petroleos Mexica, 8.00%, 05/03/19 | 6,500 | 7,524 | ||||
| Ras Laffan Liquefied Natural Gas Co. Ltd. III, | ||||||
| 5.84%, 09/30/27 (t) (v) | 500 | 499 | ||||
| 30,403 | ||||||
| FINANCIALS - 21.1% | ||||||
| Allstate Life Global Funding Trust, 5.38%, 04/30/13 | 1,900 | 2,027 | ||||
| American Express Bank FSB | ||||||
| 5.50%, 04/16/13 | 2,700 | 2,878 | ||||
| 6.00%, 09/13/17 | 300 | 311 | ||||
| American Express Centurion Bank, 6.00%, 09/13/17 (e) | 300 | 311 | ||||
| American Express Co., 7.00%, 03/19/18 | 2,100 | 2,313 | ||||
| American General Finance Corp. | ||||||
| 4.88%, 05/15/10 | 10,800 | 10,651 | ||||
| 6.90%, 12/15/17 | 2,400 | 1,666 | ||||
| American Honda Finance Corp., 0.33%, 02/09/10 (i) (t) (v) | 1,900 | 1,899 | ||||
| American International Group Inc. | ||||||
| 4.00%, 09/20/11 | EUR | 2,500 | 3,338 | |||
| 5.05%, 10/01/15 | 200 | 167 | ||||
| 5.85%, 01/16/18 | 18,100 | 14,852 | ||||
| 8.25%, 08/15/18 | 10,100 | 9,482 | ||||
| 6.25%, 05/01/36 | 6,800 | 5,049 | ||||
| 6.25%, 03/15/37 | 800 | 440 | ||||
| 8.18%, 05/15/58 | 4,400 | 2,904 | ||||
| ANZ National International Ltd., 6.20%, 07/19/13 (t) (v) | 2,200 | 2,368 | ||||
| Bank of America Corp. | ||||||
| 2.38%, 06/22/12 | 6,100 | 6,216 | ||||
| 6.50%, 08/01/16 | 10,500 | 11,290 | ||||
| 6.00%, 09/01/17 | 1,700 | 1,764 | ||||
| Bank of America NA | ||||||
| 0.53%, 06/15/16 (i) | 700 | 623 | ||||
| 6.00%, 10/15/36 | 600 | 580 | ||||
| Bank of New York Mellon Corp., 0.68%, 02/05/10 (i) | 7,400 | 7,404 | ||||
| Barclays Bank Plc | ||||||
| 5.45%, 09/12/12 | 10,700 | 11,571 | ||||
| 5.00%, 09/22/16 | 10,600 | 10,831 | ||||
| 6.05%, 12/04/17 (t) (v) | 1,600 | 1,628 | ||||
| 5.93% (callable at 100 on 12/15/16) (p) (t) (v) | 5,000 | 3,750 | ||||
| 7.43% (callable at 100 on 12/15/17) (p) (t) (v) | 15,000 | 13,650 | ||||
| BNP Paribas, | ||||||
| 5.19% (callable at 100 on 06/29/15) (p) (t) (v) | 4,100 | 3,380 | ||||
| Cemex 10 Capital SPV Ltd., | ||||||
| 6.72% (callable at 100 beginning 12/31/16) (e) (p) (t) (v) | 1,000 | 705 | ||||
| Chrysler Financial Co. LLC, Term Loan, | ||||||
| 4.24%, 08/03/14 (i) (u) | 3,910 | 3,822 | ||||
| Citibank NA, 1.88%, 06/04/12 (e) | 400 | 402 | ||||
| Citigroup Capital XXI, 8.30%, 12/21/57 | 9,800 | 9,432 | ||||
| Citigroup Funding Inc., 2.25%, 12/10/12 | 1,800 | 1,814 | ||||
| Citigroup Inc. | ||||||
| 2.13%, 04/30/12 | 5,400 | 5,457 | ||||
| 1.88%, 05/07/12 | 2,600 | 2,613 | ||||
| 5.50%, 08/27/12 | 1,500 | 1,567 | ||||
| 5.63%, 08/27/12 | 1,000 | 1,029 | ||||
| 5.30%, 10/17/12 | 600 | 625 | ||||
| 5.50%, 04/11/13 (e) | 13,900 | 14,411 | ||||
| 5.85%, 07/02/13 | 400 | 416 | ||||
| 5.50%, 10/15/14 (e) | 10,900 | 11,037 | ||||
| 6.00%, 08/15/17 | 2,200 | 2,199 | ||||
| 8.50%, 05/22/19 | 1,000 | 1,155 | ||||
| 6.13%, 08/25/36 | 1,700 | 1,458 | ||||
| Countrywide Financial Corp., 5.80%, 06/07/12 | 2,300 | 2,441 | ||||
| Credit Agricole SA | ||||||
| 0.30%, 05/28/10 (i) (t) (v) | 1,600 | 1,600 | ||||
| 8.38% (callable at 100 beginning 10/13/19) (p) (t) (v) | 15,500 | 16,430 | ||||
| Deutsche Bank AG London, 6.00%, 09/01/17 (e) | 3,000 | 3,271 | ||||
| Dexia Credit Local, 0.90%, 09/23/11 (i) (t) (v) | 5,600 | 5,647 | ||||
| ENEL Finance International SA, 6.25%, 09/15/17 (t) (v) | 4,700 | 5,168 | ||||
| Export-Import Bank of China, 4.88%, 07/21/15 (t) (v) | 200 | 213 | ||||
| Export-Import Bank of Korea, 5.88%, 01/14/15 | 9,700 | 10,409 | ||||
| Fifth Third Bancorp, 8.25%, 03/01/38 | 10,200 | 9,698 | ||||
| Ford Motor Credit Co. LLC | ||||||
| 7.88%, 06/15/10 | 1,000 | 1,015 | ||||
| 7.38%, 02/01/11 | 2,400 | 2,449 | ||||
| 7.00%, 10/01/13 | 500 | 499 | ||||
| Fortis Bank Nederland Holding, 3.00%, 04/17/12 | EUR | 500 | 733 | |||
| General Electric Capital Corp. | ||||||
| 3.00%, 12/09/11 (e) | 3,000 | 3,092 | ||||
| 2.20%, 06/08/12 | 6,700 | 6,794 | ||||
| 2.00%, 09/28/12 | 3,500 | 3,505 | ||||
| 0.45%, 01/08/16 (i) | 200 | 181 | ||||
| 5.50%, 09/15/67 | EUR | 6,100 | 6,739 | |||
| 6.38%, 11/15/67 | 3,200 | 2,776 | ||||
| GMAC LLC, 6.00%, 12/15/11 | 200 | 196 | ||||
| Goldman Sachs Group Inc. | ||||||
| 6.88%, 01/15/11 | 6,500 | 6,893 | ||||
| 5.63%, 01/15/17 | 2,200 | 2,247 | ||||
| 6.25%, 09/01/17 (e) | 4,400 | 4,719 | ||||
| 5.95%, 01/18/18 | 1,200 | 1,267 | ||||
| 6.15%, 04/01/18 | 600 | 642 | ||||
| 6.75%, 10/01/37 (e) | 6,300 | 6,476 | ||||
| HSBC Holdings Plc | ||||||
| 6.50%, 05/02/36 | 500 | 524 | ||||
| 6.50%, 09/15/37 | 700 | 731 | ||||
| International Lease Finance Corp., 5.55%, 09/05/12 | 4,200 | 3,497 | ||||
| JPMorgan Chase & Co. | ||||||
| 0.39%, 05/18/10 (i) | 5,600 | 5,603 | ||||
| 4.55%, 06/23/10 | 3,400 | 3,457 | ||||
| 0.48%, 08/15/11 (e) (i) | 100 | 100 | ||||
| 6.95%, 08/10/12 | 3,500 | 3,910 | ||||
| 6.00%, 01/15/18 | 1,200 | 1,290 | ||||
| 7.90%, (callable at 100 beginning 04/30/18) (p) | 4,200 | 4,332 | ||||
| JPMorgan Chase Bank NA, 6.00%, 10/01/17 | 4,100 | 4,390 | ||||
| JPMorgan Chase Capital XX, 6.55%, 09/29/36 | 300 | 275 | ||||
| LBG Capital No.1 Plc, | ||||||
| 8.50%, (callable at 100 on 05/15/20) (f) (p) (u) | 200 | 149 | ||||
| LeasePlan Corp. NV, 3.13%, 02/10/12 | EUR | 3,500 | 5,136 | |||
| Lehman Brothers Holdings Inc. | ||||||
| 3.29%, 11/24/08 (d) | 4,800 | 936 | ||||
| 3.26%, 12/23/08 (d) | 200 | 39 | ||||
| 1.52%, 04/03/09 (d) | 600 | 117 | ||||
| 0.71%, 11/10/09 (d) | 900 | 176 | ||||
| 0.54%, 11/16/09 (d) | 400 | 78 | ||||
| 0.53%, 05/25/10 (d) | 1,100 | 214 | ||||
| 0.73%, 07/18/11 (d) | 1,100 | 214 | ||||
| 5.63%, 01/24/13 (d) | 1,600 | 328 | ||||
| 6.20%, 09/26/14 (d) | 1,700 | 332 | ||||
| 6.88%, 05/02/18 (d) | 1,000 | 208 | ||||
| Merrill Lynch & Co. Inc. | ||||||
| 0.48%, 07/25/11 (i) | 1,900 | 1,871 | ||||
| 0.50%, 10/25/11 (i) | 13,600 | 13,603 | ||||
| 6.05%, 08/15/12 | 600 | 643 | ||||
| 6.40%, 08/28/17 | 1,900 | 2,000 | ||||
| MetLife Global Funding Inc., 0.31%, 05/17/10 (i) (t) (v) | 3,000 | 2,997 | ||||
| MetLife Inc., 6.40%, 12/15/36 | 500 | 438 | ||||
| Morgan Stanley | ||||||
| 2.37%, 05/14/10 (i) | 3,700 | 3,727 | ||||
| 6.60%, 04/01/12 | 2,500 | 2,720 | ||||
| 6.25%, 08/28/17 | 1,200 | 1,252 | ||||
| 5.95%, 12/28/17 | 1,800 | 1,857 | ||||
| National Australia Bank Ltd. | ||||||
| 0.73%, 02/08/10 (i) (t) (v) | 11,400 | 11,401 | ||||
| 5.35%, 06/12/13 (t) (v) | 1,900 | 2,045 | ||||
| National City Bank, 4.50%, 03/15/10 (e) | 5,000 | 5,031 | ||||
| Nationwide Life Global Funding I, 5.45%, 10/02/12 (t) (v) | 16,200 | 16,002 | ||||
| Northern Rock Plc, 5.63%, 06/22/17 (t) (u) | 16,000 | 15,028 | ||||
| Petroleum Export Ltd., 5.27%, 06/15/11 (t) (v) | 88 | 85 | ||||
| PNC Bank NA, 0.73%, 02/01/10 (i) | 8,600 | 8,585 | ||||
| Principal Life Income Funding Trusts, 5.30%, 04/24/13 (e) | 1,700 | 1,795 | ||||
| RBS Capital Trust I, | ||||||
| 4.71% (callable at 100 beginning 07/01/13) (p) | 800 | 392 | ||||
| Resona Bank Ltd., | ||||||
| 5.85% (callable at 100 beginning 04/15/16) (p) (t) (v) | 300 | 262 | ||||
| Royal Bank of Scotland Group Plc, | ||||||
| 6.99% (callable at 100 beginning 10/05/17) (p) (t) (v) | 2,100 | 1,166 | ||||
| Royal Bank of Scotland Plc | ||||||
| 0.67%, 04/08/11 (i) (t) (v) | 8,100 | 8,117 | ||||
| 3.00%, 12/09/11 (t) (v) | 3,800 | 3,893 | ||||
| 2.63%, 05/11/12 (t) (v) | 1,200 | 1,217 | ||||
| 4.88%, 08/25/14 (t) (v) | 400 | 405 | ||||
| Santander Perpetual SA Unipersonal, | ||||||
| 6.67% (callable at 100 beginning 10/24/17) (p) (t) (v) | 3,400 | 3,056 | ||||
| SLM Corp., 5.13%, 08/27/12 | 500 | 469 | ||||
| SMFG Preferred Capital Ltd., | ||||||
| 6.08% (callable at 100 beginning 01/25/17) (p) (t) (v) | 1,000 | 859 | ||||
| Sovereign Bancorp Inc., 4.90%, 09/23/10 | 5,000 | 5,106 | ||||
| State Street Capital Trust III, 8.25%, 03/15/42 | 1,700 | 1,741 | ||||
| State Street Capital Trust IV, 1.25%, 06/15/37 (i) | 200 | 135 | ||||
| Sumitomo Mitsui Banking Corp., | ||||||
| 5.63% (callable at 100 beginning 10/15/15) (p) (t) (v) | 1,500 | 1,430 | ||||
| Svenska Handelsbanken AB, 1.25%, 09/14/12 (i) (t) (v) | 17,000 | 16,912 | ||||
| Temasek Financial I Ltd., 4.30%, 10/25/19 (t) (v) | 1,800 | 1,761 | ||||
| TNK-BP Finance SA, 6.13%, 03/20/12 (t) (v) | 300 | 308 | ||||
| TransCapitalInvest Ltd., 8.70%, 08/07/18 (t) (v) | 800 | 917 | ||||
| UBS AG Stamford, 5.88%, 12/20/17 | 1,200 | 1,233 | ||||
| UBS Preferred Funding Trust V, | ||||||
| 6.24% (callable at 100 beginning 05/15/16) (p) | 10,000 | 7,825 | ||||
| USB Capital IX, | ||||||
| 6.19% (callable at 100 beginning 04/15/11) (p) | 200 | 161 | ||||
| Wachovia Corp. | ||||||
| 0.38%, 10/15/11 (i) | 3,200 | 3,164 | ||||
| 5.75%, 02/01/18 | 4,300 | 4,487 | ||||
| Wells Fargo & Co. | ||||||
| 0.71%, 01/29/10 (i) | 7,500 | 7,504 | ||||
| 7.98%, (callable at 100 beginning 03/15/18) (p) | 2,400 | 2,406 | ||||
| Westpac Banking Corp., 0.76%, 07/16/14 (i) (t) (v) | 1,000 | 1,006 | ||||
| ZFS Finance USA Trust I, 5.88%, 05/09/32 (t) (v) | 175 | 142 | ||||
| 499,775 | ||||||
| HEALTH CARE - 0.9% | ||||||
| Amgen Inc., 6.15%, 06/01/18 | 7,300 | 8,086 | ||||
| AstraZeneca Plc | ||||||
| 5.90%, 09/15/17 (e) | 600 | 667 | ||||
| 6.45%, 09/15/37 | 600 | 676 | ||||
| Novartis Capital Corp., 4.13%, 02/10/14 | 5,800 | 6,097 | ||||
| Roche Holdings Inc., 7.00%, 03/01/39 (e) (t) (v) | 3,600 | 4,355 | ||||
| UnitedHealth Group Inc., 4.88%, 02/15/13 | 1,600 | 1,674 | ||||
| 21,555 | ||||||
| INDUSTRIALS - 0.2% | ||||||
| Union Pacific Corp., 5.70%, 08/15/18 | 4,000 | 4,190 | ||||
| INFORMATION TECHNOLOGY - 1.2% | ||||||
| Dell Inc., 4.70%, 04/15/13 | 3,600 | 3,798 | ||||
| International Business Machines Corp., 5.70%, 09/14/17 | 13,200 | 14,432 | ||||
| Oracle Corp. | ||||||
| 4.95%, 04/15/13 | 4,200 | 4,507 | ||||
| 5.75%, 04/15/18 | 4,100 | 4,433 | ||||
| 27,170 | ||||||
| MATERIALS - 0.3% | ||||||
| Corp. Nacional del Cobre de Chile | ||||||
| 7.50%, 01/15/19 (e) (t) (v) | 1,900 | 2,228 | ||||
| 6.15%, 10/24/36 (t) (v) | 200 | 206 | ||||
| Nucor Corp., 5.75%, 12/01/17 | 2,400 | 2,580 | ||||
| Rohm & Haas Co., 6.00%, 09/15/17 | 900 | 929 | ||||
| Vale Overseas Ltd. | ||||||
| 6.25%, 01/23/17 | 300 | 313 | ||||
| 6.88%, 11/21/36 | 300 | 300 | ||||
| 6,556 | ||||||
| TELECOMMUNICATION SERVICES - 1.1% | ||||||
| AT&T Inc. | ||||||
| 0.38%, 02/05/10 (i) | 900 | 900 | ||||
| 4.95%, 01/15/13 | 2,000 | 2,133 | ||||
| 5.50%, 02/01/18 | 2,000 | 2,086 | ||||
| 6.30%, 01/15/38 | 1,400 | 1,422 | ||||
| Qwest Corp., 7.63%, 06/15/15 | 800 | 828 | ||||
| Telecom Italia Capital SA, 0.86%, 07/18/11 (i) | 1,900 | 1,892 | ||||
| Verizon Wireless Capital LLC | ||||||
| 2.87%, 05/20/11 (e) (i) | 4,900 | 5,066 | ||||
| 5.25%, 02/01/12 | 9,900 | 10,500 | ||||
| 24,827 | ||||||
| UTILITIES - 0.2% | ||||||
| Electricite de France SA | ||||||
| 5.50%, 01/26/14 (t) (v) | 1,600 | 1,739 | ||||
| 6.50%, 01/26/19 (t) (v) | 1,600 | 1,796 | ||||
| 6.95%, 01/26/39 (t) (v) | 1,600 | 1,892 | ||||
| Virginia Electric & Power Co., 6.35%, 11/30/37 | 200 | 218 | ||||
| 5,645 | ||||||
| Total Corporate Bonds and Notes (cost $632,145) | 642,066 | |||||
| GOVERNMENT AND AGENCY OBLIGATIONS - 45.9% | ||||||
| GOVERNMENT SECURITIES - 19.9% | ||||||
| Municipals - 1.9% | ||||||
| Buckeye Tobacco Settlement Financing Authority | ||||||
| (insured by AMBAC Assurance Corp.), | ||||||
| 5.88%, 06/01/30 | 1,000 | 849 | ||||
| Chicago Transit Authority | ||||||
| 6.30%, 12/01/21 | 200 | 209 | ||||
| 6.30%, 12/01/21 | 100 | 105 | ||||
| 6.90%, 12/01/40 | 2,000 | 2,122 | ||||
| 6.90%, 12/01/40 | 2,100 | 2,228 | ||||
| Golden State Tobacco Securitization Corp., | ||||||
| 5.75%, 06/01/47 | 6,900 | 5,116 | ||||
| Illinois Municipal Electric Agency, 6.83%, 02/01/35 | 1,800 | 1,842 | ||||
| Los Angeles Unified School District Municipal Bond - | ||||||
| Series A-1 (insured by FSA), 4.50%, 07/01/22 | 3,600 | 3,657 | ||||
| Los Angeles Unified School District Municipal Bond | ||||||
| (insured by National Public Finance Guarantee Corp), | ||||||
| 4.50%, 01/01/28 | 6,300 | 5,926 | ||||
| New Jersey State Turnpike Authority, 7.41%, 01/01/40 | 7,800 | 8,734 | ||||
| North Carolina Turnkpike Authority Series B, | ||||||
| 6.70%, 01/01/39 | 2,000 | 2,049 | ||||
| San Diego Tobacco Settlement Revenue | ||||||
| Funding Corp., 7.13%, 06/01/32 | 840 | 668 | ||||
| State of California, 5.00%, 12/01/37 | 3,000 | 2,702 | ||||
| State of California Various Purpose Bond | ||||||
| 7.50%, 04/01/34 | 600 | 582 | ||||
| 5.65%, 04/01/39 | 600 | 612 | ||||
| 7.55%, 04/01/39 | 600 | 581 | ||||
| State of Iowa, 6.75%, 06/01/34 | 4,100 | 4,173 | ||||
| State of Texas, 4.75%, 04/01/35 | 500 | 500 | ||||
| Tobacco Settlement Authority of Iowa, 6.50%, 06/01/23 | 240 | 202 | ||||
| Tobacco Settlement Authority of West Virgina, | ||||||
| 7.47%, 06/01/47 | 1,725 | 1,378 | ||||
| Washington State Municipal Bond | ||||||
| (insured by National Public Finance Guarantee Corp), | ||||||
| 0.00%, 12/01/20 (j) | 1,400 | 892 | ||||
| 45,127 | ||||||
| Sovereign - 0.4% | ||||||
| Brazilian Government International Bond | ||||||
| 12.50%, 01/05/22 | BRL | 1,300 | 843 | |||
| 10.25%, 01/10/28 | BRL | 800 | 459 | |||
| Societe Financement de l'Economie Francaise | ||||||
| 2.13%, 05/20/12 | EUR | 300 | 434 | |||
| 0.45%, 07/16/12 (i) (t) (v) | 2,000 | 2,010 | ||||
| 3.38%, 05/05/14 (l) (t) (v) | 4,200 | 4,282 | ||||
| South Africa Government International Bond, | ||||||
| 5.88%, 05/30/22 | 100 | 102 | ||||
| United Mexican States, 6.05%, 01/11/40 | 1,500 | 1,442 | ||||
| 9,572 | ||||||
| U.S. Treasury Securities - 17.6% | ||||||
| U.S. Treasury Bond | ||||||
| 5.38%, 02/15/31 | 2,400 | 2,652 | ||||
| 4.38%, 02/15/38 | 2,400 | 2,304 | ||||
| 4.50%, 05/15/38 | 600 | 588 | ||||
| 3.50%, 02/15/39 | 6,800 | 5,570 | ||||
| 4.25%, 05/15/39 (o) | 21,800 | 20,451 | ||||
| 4.50%, 08/15/39 | 5,000 | 4,887 | ||||
| 4.38%, 11/15/39 (o) | 20,600 | 19,718 | ||||
| U.S. Treasury Note | ||||||
| 1.00%, 07/31/11 (o) (e) | 229,500 | 229,850 | ||||
| 1.00%, 08/31/11 | 102,100 | 102,152 | ||||
| 1.00%, 10/31/11 | 2,800 | 2,797 | ||||
| 2.63%, 12/31/14 | 14,400 | 14,358 | ||||
| 2.75%, 11/30/16 | 9,700 | 9,339 | ||||
| 414,666 | ||||||
| U.S. GOVERNMENT AGENCY | ||||||
| MORTGAGE-BACKED SECURITIES - 26.0% | ||||||
| Federal Home Loan Bank - 0.0% | ||||||
| Federal Home Loan Bank, 1.00%, 12/28/11 | 800 | 797 | ||||
| Federal Home Loan Mortgage Corp. - 4.0% | ||||||
| Federal Home Loan Mortgage Corp. | ||||||
| 1.13%, 06/01/11 | 7,100 | 7,124 | ||||
| 1.13%, 12/15/11 (e) | 1,000 | 997 | ||||
| 6.00%, 03/01/16 | 17 | 18 | ||||
| 6.00%, 03/01/16 | 5 | 5 | ||||
| 6.00%, 03/01/16 | 14 | 15 | ||||
| 6.00%, 08/01/16 | 17 | 18 | ||||
| 6.00%, 08/01/26 | 2,359 | 2,529 | ||||
| 3.33%, 07/01/27 (i) | 1 | 1 | ||||
| 6.00%, 09/01/27 | 5,828 | 6,235 | ||||
| 6.00%, 01/16/31, TBA (g) | 39,000 | 41,352 | ||||
| 7.50%, 03/01/32 (f) | 182 | 183 | ||||
| 5.50%, 01/01/34, TBA (g) | 16,000 | 16,760 | ||||
| 5.50%, 12/01/36 | 594 | 623 | ||||
| 5.50%, 03/01/37 | 589 | 618 | ||||
| 6.00%, 04/01/38 | 54 | 58 | ||||
| 6.00%, 04/01/38 | 610 | 647 | ||||
| 6.00%, 04/01/38 | 142 | 152 | ||||
| 6.00%, 04/01/38 | 45 | 48 | ||||
| 6.00%, 04/01/38 | 282 | 302 | ||||
| 5.50%, 08/19/38 | 3,273 | 3,432 | ||||
| REMIC, 0.38%, 07/15/19 (i) | 1,428 | 1,410 | ||||
| REMIC, 0.38%, 08/15/19 | 3,260 | 3,215 | ||||
| REMIC, 7.00%, 05/15/23 | 319 | 347 | ||||
| REMIC, 0.68%, 11/15/30 (i) | 5 | 5 | ||||
| REMIC, 4.50%, 03/15/34 | 8,027 | 7,282 | ||||
| REMIC, 0.27%, 12/25/36 (i) | 2,002 | 1,936 | ||||
| REMIC, 1.83%, 02/25/45 (i) | 102 | 95 | ||||
| 95,407 | ||||||
| Federal National Mortgage Association - 20.8% | ||||||
| Federal National Mortgage Association | ||||||
| 6.00%, 04/01/16 | 19 | 20 | ||||
| 6.00%, 04/01/16 | 35 | 38 | ||||
| 6.00%, 04/01/16 | 48 | 51 | ||||
| 6.00%, 05/01/16 | 44 | 48 | ||||
| 6.00%, 08/01/16 | 27 | 29 | ||||
| 6.00%, 09/01/16 | 11 | 12 | ||||
| 6.00%, 11/01/16 | 17 | 18 | ||||
| 6.00%, 11/01/16 | 40 | 43 | ||||
| 5.50%, 12/01/16 | 72 | 77 | ||||
| 5.50%, 12/01/16 | 11 | 12 | ||||
| 5.50%, 12/01/16 | 38 | 40 | ||||
| 5.50%, 01/01/17 | 7 | 8 | ||||
| 5.50%, 01/01/17 | 28 | 30 | ||||
| 5.50%, 01/01/17 | 15 | 16 | ||||
| 6.00%, 02/01/17 | 2 | 2 | ||||
| 6.00%, 02/01/17 | 11 | 12 | ||||
| 5.50%, 03/01/17 | 46 | 49 | ||||
| 6.00%, 03/01/17 | 16 | 17 | ||||
| 6.00%, 03/01/17 | 9 | 10 | ||||
| 6.00%, 03/01/17 | 30 | 33 | ||||
| 6.00%, 04/01/17 | 3 | 3 | ||||
| 6.00%, 04/01/17 | 10 | 10 | ||||
| 6.00%, 04/01/17 | 38 | 41 | ||||
| 6.00%, 05/01/17 | 6 | 6 | ||||
| 6.00%, 05/01/17 | 9 | 10 | ||||
| 5.50%, 10/01/17 | 45 | 48 | ||||
| 6.00%, 10/01/17 | 43 | 46 | ||||
| 5.50%, 11/01/17 | 27 | 29 | ||||
| 5.50%, 11/01/17 | 2 | 2 | ||||
| 5.50%, 05/01/21 | 85 | 90 | ||||
| 5.50%, 06/01/21 | 24 | 25 | ||||
| 5.50%, 10/01/21 | 1,067 | 1,132 | ||||
| 5.50%, 03/01/22 | 143 | 151 | ||||
| 5.50%, 04/01/22 | 560 | 593 | ||||
| 5.50%, 04/01/22 | 105 | 111 | ||||
| 5.50%, 05/01/22 | 93 | 99 | ||||
| 5.50%, 05/01/22 | 135 | 143 | ||||
| 5.50%, 05/01/22 | 29 | 31 | ||||
| 5.50%, 06/01/22 | 40 | 42 | ||||
| 5.50%, 06/01/22 | 188 | 199 | ||||
| 5.50%, 09/01/22 | 168 | 178 | ||||
| 5.50%, 10/01/22 | 22 | 23 | ||||
| 5.50%, 12/01/22 | 131 | 139 | ||||
| 5.50%, 12/01/22 | 119 | 126 | ||||
| 5.50%, 01/01/23 | 371 | 394 | ||||
| 5.50%, 01/01/23 | 196 | 208 | ||||
| 5.50%, 02/01/23 | 261 | 277 | ||||
| 5.50%, 03/01/23 | 157 | 166 | ||||
| 5.50%, 04/01/23 | 318 | 337 | ||||
| 5.50%, 05/01/23 | 384 | 406 | ||||
| 5.50%, 06/01/23 | 144 | 152 | ||||
| 5.50%, 06/01/23 | 62 | 66 | ||||
| 5.50%, 07/01/23 | 388 | 410 | ||||
| 5.50%, 07/01/23 | 420 | 445 | ||||
| 5.50%, 07/01/23 | 256 | 271 | ||||
| 5.50%, 07/01/23 | 149 | 158 | ||||
| 5.50%, 08/01/23 | 140 | 148 | ||||
| 5.50%, 09/01/23 | 77 | 82 | ||||
| 5.50%, 09/01/23 | 451 | 477 | ||||
| 5.50%, 09/01/23 | 205 | 217 | ||||
| 5.50%, 12/01/23 | 1,363 | 1,443 | ||||
| 6.00%, 12/01/26 | 5,165 | 5,520 | ||||
| 6.00%, 02/01/27 | 2,868 | 3,065 | ||||
| 6.00%, 06/01/27 | 3,882 | 4,143 | ||||
| 6.00%, 08/01/27 | 5,300 | 5,657 | ||||
| 6.00%, 09/01/27 | 5,727 | 6,113 | ||||
| 6.00%, 10/01/27 | 5,430 | 5,797 | ||||
| 6.00%, 11/01/27 | 11,223 | 11,979 | ||||
| 6.50%, 07/01/29 | 1 | 1 | ||||
| 6.50%, 12/01/29 | 1 | 1 | ||||
| 5.50%, 11/01/32 | 57 | 60 | ||||
| 5.50%, 11/01/32 | 367 | 386 | ||||
| 5.50%, 11/01/32 | 463 | 487 | ||||
| 5.50%, 11/01/32 | 408 | 429 | ||||
| 6.00%, 01/01/33 | 1,463 | 1,568 | ||||
| 6.00%, 03/01/33 | 32 | 34 | ||||
| 5.50%, 05/01/33 | 1,640 | 1,724 | ||||
| 5.50%, 10/01/33 | 13 | 14 | ||||
| 5.50%, 11/01/33 | 16 | 17 | ||||
| 5.50%, 11/01/33 | 176 | 185 | ||||
| 5.50%, 11/01/33 | 356 | 374 | ||||
| 5.50%, 11/01/33 | 11 | 12 | ||||
| 5.50%, 12/01/33 | 169 | 177 | ||||
| 5.50%, 12/01/33 | 263 | 276 | ||||
| 5.00%, 01/01/34, TBA (g) | 49,000 | 50,279 | ||||
| 5.50%, 01/01/34 | 59 | 62 | ||||
| 5.50%, 02/01/34 | 506 | 532 | ||||
| 5.50%, 02/01/34 | 273 | 287 | ||||
| 5.50%, 02/01/34 | 225 | 236 | ||||
| 5.50%, 03/01/34 | 222 | 233 | ||||
| 5.50%, 03/01/34 | 1,305 | 1,376 | ||||
| 5.50%, 03/01/34 | 326 | 343 | ||||
| 5.50%, 04/01/34 | 3,653 | 3,848 | ||||
| 5.50%, 04/01/34 | 214 | 225 | ||||
| 5.50%, 04/01/34 | 12 | 12 | ||||
| 5.50%, 05/01/34 | 832 | 875 | ||||
| 5.50%, 06/01/34 | 1,408 | 1,480 | ||||
| 5.50%, 11/01/34 | 819 | 861 | ||||
| 5.50%, 12/01/34 | 26 | 27 | ||||
| 6.00%, 12/01/34 | 7 | 7 | ||||
| 2.73%, 01/01/35 (i) | 2,082 | 2,115 | ||||
| 5.50%, 01/01/35 | 4,507 | 4,737 | ||||
| 5.50%, 02/01/35 | 964 | 1,013 | ||||
| 6.00%, 07/01/35 | 261 | 277 | ||||
| 6.00%, 03/01/36 | 1,481 | 1,573 | ||||
| 5.50%, 04/01/36 | 16 | 17 | ||||
| 6.00%, 05/01/36 | 1,183 | 1,256 | ||||
| 6.00%, 06/01/36 | 1,083 | 1,151 | ||||
| 6.00%, 07/01/36 | 54 | 57 | ||||
| 6.00%, 08/01/36 | 77 | 82 | ||||
| 6.00%, 08/01/36 | 49 | 53 | ||||
| 6.00%, 08/01/36 | 431 | 458 | ||||
| 6.00%, 08/01/36 | 1,161 | 1,234 | ||||
| 6.00%, 08/01/36 | 433 | 460 | ||||
| 6.00%, 08/01/36 | 501 | 532 | ||||
| 6.00%, 09/01/36 | 3,732 | 3,964 | ||||
| 6.00%, 09/01/36 | 1,352 | 1,436 | ||||
| 6.00%, 09/01/36 | 956 | 1,016 | ||||
| 6.00%, 09/01/36 | 486 | 517 | ||||
| 6.00%, 09/01/36 | 303 | 322 | ||||
| 6.50%, 09/01/36 | 32 | 35 | ||||
| 5.50%, 10/01/36 | 711 | 746 | ||||
| 6.00%, 10/01/36 | 11,451 | 12,163 | ||||
| 6.00%, 10/01/36 | 755 | 802 | ||||
| 5.50%, 12/01/36 | 47 | 49 | ||||
| 5.50%, 12/01/36 | 2,418 | 2,536 | ||||
| 6.00%, 12/01/36 | 638 | 677 | ||||
| 5.50%, 01/01/37, TBA (g) | 8,000 | 8,374 | ||||
| 5.50%, 01/01/37 | 572 | 600 | ||||
| 5.50%, 01/01/37 | 2,054 | 2,154 | ||||
| 6.50%, 01/01/37, TBA (g) | 5,000 | 5,355 | ||||
| 6.00%, 01/16/37, TBA (g) | 108,000 | 114,379 | ||||
| 5.50%, 02/01/37 | 11,449 | 12,007 | ||||
| 5.50%, 02/01/37 | 4,158 | 4,357 | ||||
| 5.50%, 02/01/37 | 159 | 166 | ||||
| 6.00%, 02/01/37 | 825 | 876 | ||||
| 6.50%, 02/01/37 | 156 | 167 | ||||
| 6.50%, 02/01/37 | 176 | 189 | ||||
| 5.50%, 03/01/37 | 627 | 657 | ||||
| 6.00%, 03/01/37 | 289 | 307 | ||||
| 6.00%, 04/01/37 | 381 | 404 | ||||
| 6.00%, 05/01/37 | 104 | 110 | ||||
| 6.00%, 06/01/37 | 769 | 816 | ||||
| 6.00%, 06/01/37 | 2,461 | 2,611 | ||||
| 6.00%, 07/01/37 | 2,481 | 2,631 | ||||
| 6.00%, 07/01/37 | 34 | 36 | ||||
| 6.00%, 07/01/37 | 235 | 249 | ||||
| 6.00%, 08/01/37 | 556 | 589 | ||||
| 6.00%, 08/01/37 | 659 | 699 | ||||
| 6.00%, 08/01/37 | 197 | 209 | ||||
| 6.00%, 08/01/37 | 205 | 218 | ||||
| 6.00%, 08/01/37 | 811 | 860 | ||||
| 6.00%, 08/01/37 | 241 | 255 | ||||
| 6.00%, 08/01/37 | 528 | 560 | ||||
| 6.00%, 08/01/37 | 320 | 339 | ||||
| 6.00%, 08/01/37 | 180 | 191 | ||||
| 6.00%, 08/01/37 | 13,035 | 13,828 | ||||
| 6.00%, 08/01/37 | 802 | 850 | ||||
| 6.00%, 09/01/37 | 1,555 | 1,649 | ||||
| 6.00%, 09/01/37 | 693 | 736 | ||||
| 6.00%, 09/01/37 | 119 | 126 | ||||
| 6.00%, 09/01/37 | 683 | 724 | ||||
| 6.00%, 09/01/37 | 621 | 658 | ||||
| 6.00%, 09/01/37 | 681 | 723 | ||||
| 6.00%, 10/01/37 | 577 | 612 | ||||
| 6.00%, 10/01/37 | 240 | 254 | ||||
| 6.00%, 10/01/37 | 50 | 54 | ||||
| 6.00%, 10/01/37 | 826 | 877 | ||||
| 6.00%, 10/01/37 | 560 | 594 | ||||
| 6.00%, 10/01/37 | 91 | 97 | ||||
| 6.00%, 10/01/37 | 4,839 | 5,133 | ||||
| 6.00%, 10/01/37 | 163 | 173 | ||||
| 6.00%, 10/01/37 | 777 | 824 | ||||
| 6.50%, 10/01/37 | 40 | 43 | ||||
| 6.00%, 11/01/37 | 48 | 51 | ||||
| 6.00%, 11/01/37 | 5,753 | 6,103 | ||||
| 6.00%, 11/01/37 | 422 | 447 | ||||
| 6.00%, 11/01/37 | 596 | 632 | ||||
| 6.00%, 12/01/37 | 384 | 408 | ||||
| 6.00%, 12/01/37 | 475 | 504 | ||||
| 6.00%, 01/01/38 | 770 | 816 | ||||
| 6.00%, 01/01/38 | 202 | 214 | ||||
| 6.00%, 01/01/38 | 6,498 | 6,893 | ||||
| 6.50%, 03/01/38 | 74 | 79 | ||||
| 6.00%, 04/01/38 | 827 | 877 | ||||
| 6.00%, 05/01/38 | 814 | 863 | ||||
| 6.00%, 05/01/38 | 1,030 | 1,093 | ||||
| 6.00%, 06/01/38 | 868 | 920 | ||||
| 6.00%, 06/01/38 | 2,889 | 3,063 | ||||
| 6.00%, 06/01/38 | 180 | 191 | ||||
| 6.00%, 07/01/38 | 2,647 | 2,807 | ||||
| 6.00%, 08/01/38 | 839 | 889 | ||||
| 6.00%, 08/01/38 | 121 | 129 | ||||
| 6.00%, 08/01/38 | 1,353 | 1,435 | ||||
| 6.00%, 08/01/38 | 861 | 913 | ||||
| 6.00%, 08/01/38 | 6,325 | 6,706 | ||||
| 6.00%, 08/01/38 | 5,077 | 5,382 | ||||
| 6.00%, 09/01/38 | 3,990 | 4,230 | ||||
| 6.00%, 09/01/38 | 535 | 568 | ||||
| 6.00%, 09/01/38 | 2,447 | 2,595 | ||||
| 6.00%, 09/01/38 | 652 | 691 | ||||
| 6.00%, 09/01/38 | 13,565 | 14,382 | ||||
| 6.00%, 09/01/38 | 713 | 756 | ||||
| 6.00%, 10/01/38 | 653 | 692 | ||||
| 6.00%, 10/01/38 | 6,080 | 6,445 | ||||
| 6.00%, 10/01/38 | 514 | 545 | ||||
| 6.00%, 10/01/38 | 429 | 454 | ||||
| 5.50%, 10/14/38 | 5,360 | 5,621 | ||||
| 5.50%, 10/14/38 | 4,853 | 5,098 | ||||
| 5.50%, 10/14/38 (o) | 26,944 | 28,302 | ||||
| 6.00%, 11/01/38 | 607 | 643 | ||||
| 6.00%, 11/01/38 | 664 | 704 | ||||
| 6.00%, 11/01/38 | 725 | 769 | ||||
| 5.50%, 11/13/38 | 20,332 | 21,370 | ||||
| 5.50%, 11/13/38 | 3,429 | 3,604 | ||||
| 6.00%, 12/01/38 | 712 | 755 | ||||
| 6.00%, 01/01/39 | 610 | 647 | ||||
| 6.00%, 01/01/39 | 448 | 476 | ||||
| 1.94%, 09/01/40 (i) | 11 | 11 | ||||
| 1.74%, 06/01/43 (i) | 631 | 629 | ||||
| REMIC, 5.00%, 02/25/17 | 164 | 169 | ||||
| REMIC, 5.00%, 04/25/33 | 568 | 588 | ||||
| REMIC, 3.85%, 05/25/35 (i) | 182 | 181 | ||||
| REMIC, 0.29%, 07/25/37 (i) | 2,109 | 1,904 | ||||
| REMIC, 6.50%, 12/25/42 | 79 | 85 | ||||
| REMIC, 0.58%, 03/25/44 (i) | 630 | 595 | ||||
| 490,723 | ||||||
| Government National Mortgage Association - 0.1% | ||||||
| Government National Mortgage Association | ||||||
| 4.38%, 05/20/26 (i) | 71 | 73 | ||||
| 4.38%, 02/20/27 (i) | 6 | 7 | ||||
| 4.38%, 04/20/30 (i) | 9 | 9 | ||||
| 4.38%, 05/20/30 (i) | 7 | 7 | ||||
| 6.00%, 01/24/32, TBA (g) | 1,000 | 1,057 | ||||
| 3.75%, 02/20/32 (i) | 83 | 85 | ||||
| 4.00%, 02/20/32 (i) | 52 | 53 | ||||
| 1,291 | ||||||
| Small Business Administration Participation Certificates - 1.1% | ||||||
| Small Business Administration Participation Certificates | ||||||
| 7.45%, 08/01/10 | 4 | 4 | ||||
| 6.29%, 01/01/21 | 30 | 32 | ||||
| 5.13%, 09/01/23 | 56 | 59 | ||||
| 5.52%, 06/01/24 | 1,158 | 1,221 | ||||
| 5.29%, 12/01/27 | 996 | 1,059 | ||||
| 5.16%, 02/01/28 | 11,118 | 11,648 | ||||
| 5.49%, 03/01/28 | 10,803 | 11,446 | ||||
| 25,469 | ||||||
| Total Government and Agency Obligations (cost $1,078,842) | 1,083,052 | |||||
| SHORT TERM INVESTMENTS - 31.2% | ||||||
| Certificates of Deposit - 0.6% | ||||||
| Intesa Sanpaolo SpA, 2.38%, 12/21/12 | 15,200 | 15,066 | ||||
| Federal Home Loan Bank - 6.5% | ||||||
| Federal Home Loan Bank | ||||||
| 0.10%, 01/13/10 | 1,000 | 1,000 | ||||
| 0.03%, 01/15/10 | 4,000 | 4,000 | ||||
| 0.36%, 01/21/10 | 19,200 | 19,200 | ||||
| 0.05%, 01/22/10 | 42,900 | 42,898 | ||||
| 0.04%, 01/27/10 | 14,600 | 14,600 | ||||
| 0.06%, 02/03/10 | 22,000 | 21,999 | ||||
| 0.01%, 02/17/10 | 17,000 | 17,000 | ||||
| 0.09%, 02/19/10 | 33,900 | 33,898 | ||||
| 154,595 | ||||||
| Federal Home Loan Mortgage Corp. - 10.5% | ||||||
| Federal Home Loan Mortgage Corp. | ||||||
| 0.17%, 01/06/10 (o) | 663 | 663 | ||||
| 0.03%, 01/20/10 | 1,300 | 1,300 | ||||
| 0.04%, 01/21/10 | 6,500 | 6,500 | ||||
| 0.24%, 01/25/10 | 21,900 | 21,900 | ||||
| 0.06%, 02/18/10 | 11,400 | 11,399 | ||||
| 0.13%, 02/22/10 | 1,581 | 1,581 | ||||
| 0.13%, 02/23/10 | 55,889 | 55,887 | ||||
| 0.13%, 03/02/10 | 34,400 | 34,397 | ||||
| 0.09%, 03/05/10 | 9,000 | 8,999 | ||||
| 0.18%. 03/08/10 | 3,100 | 3,100 | ||||
| 0.22%, 03/22/10 | 13,700 | 13,699 | ||||
| 0.12%, 03/23/10 | 50,000 | 49,995 | ||||
| 0.16%, 03/23/10 | 13,300 | 13,299 | ||||
| 0.17%, 04/07/10 | 200 | 200 | ||||
| 0.18%, 04/12/10 | 24,000 | 23,992 | ||||
| 246,911 | ||||||
| Federal National Mortgage Association - 9.4% | ||||||
| Federal National Mortgage Association | ||||||
| 0.04%, 01/11/10 | 21,400 | 21,400 | ||||
| 0.05%, 02/01/10 | 23,600 | 23,599 | ||||
| 0.10%, 02/03/10 | 5,300 | 5,300 | ||||
| 0.07%, 02/04/10 | 18,600 | 18,599 | ||||
| 0.05%, 02/05/10 | 18,400 | 18,399 | ||||
| 0.14%, 02/23/10 | 68,911 | 68,909 | ||||
| 0.17%, 03/03/10 | 6,247 | 6,246 | ||||
| 0.23%, 03/10/10 | 3,000 | 3,000 | ||||
| 0.12%, 03/15/10 | 36,000 | 35,997 | ||||
| 0.12%, 03/17/10 | 14,000 | 13,999 | ||||
| 0.19%, 03/24/10 | 6,600 | 6,598 | ||||
| 0.19%, 04/21/10 | 1,200 | 1,200 | ||||
| 223,246 | ||||||
| Mutual Funds - 0.2% | ||||||
| JNL Money Market Fund, 0.07% (a) (h) | 4,480 | 4,480 | ||||
| Securities Lending Collateral - 3.1% | ||||||
| Securities Lending Cash Collateral Fund LLC, | ||||||
| 0.16% (a) (h) | 73,001 | 73,001 | ||||
| Treasury Securities - 0.9% | ||||||
| Japanese Treasury Bill, 0.00%, 03/29/10 | JPY | 710,000 | 7,624 | |||
| U.S. Treasury Bill | ||||||
| 0.22%, 03/11/10 (o) | $ | 340 | 340 | |||
| 0.19%, 03/25/10 (o) | 900 | 900 | ||||
| 0.05%, 04/01/10 (o) (e) | 13,102 | 13,100 | ||||
| 21,964 | ||||||
| Total Short Term Investments (cost $739,607) | 739,263 | |||||
| Total Investments - 111.0% (cost $2,623,442) | 2,623,196 | |||||
| Total Forward Sales Commitments - 2.2% | ||||||
| (proceeds $53,014) | (52,342) | |||||
| Other Assets and Liabilities, Net - (8.8%) (o) | (208,274) | |||||
| Total Net Assets - 100% | $ | 2,362,580 | ||||
| Forward Sales Commitments - 2.2% | ||||||
| U.S. GOVERNMENT AGENCY | ||||||
| MORTGAGE-BACKED SECURITIES – 2.2% | ||||||
| Federal National Mortgage Association - 0.3% | ||||||
| Federal National Mortgage Association, | ||||||
| 5.00%, 02/13/36 | $ | 8,000 | $ | 8,179 | ||
| Federal National Mortgage Association - 1.9% | ||||||
| Federal National Mortgage Association | ||||||
| 5.00%, 01/01/34 | 41,000 | 42,070 | ||||
| 5.50%, 01/01/37 | 2,000 | 2,093 | ||||
| 44,163 | ||||||
| Total Forward Sales Commitments - 2.2% | ||||||
| (proceeds $53,014) | $ | 52,342 | ||||
| JNL/PPM America High Yield Bond Fund | ||||||
| COMMON STOCKS - 0.9% | ||||||
| CONSUMER DISCRETIONARY - 0.4% | ||||||
| DISH Network Corp. | 100 | $ | 2,077 | |||
| Home Interior Gift Inc. (f) (s) (u) | 429 | 4 | ||||
| 2,081 | ||||||
| ENERGY - 0.3% | ||||||
| Chesapeake Energy Corp. | 14 | 371 | ||||
| Inergy LP | 30 | 1,070 | ||||
| 1,441 | ||||||
| INDUSTRIALS - 0.0% | ||||||
| Terex Corp. (c) | 1 | 10 | ||||
| INFORMATION TECHNOLOGY - 0.0% | ||||||
| Axiohm Transaction Solutions Inc. (c) (f) (s) (u) | 1 | - | ||||
| MATERIALS - 0.0% | ||||||
| Applied Extrusion Technologies Inc. - Class B (c) (f) (s) (u) | 3 | 6 | ||||
| TELECOMMUNICATION SERVICES - 0.2% | ||||||
| Manitoba Telecom Services Inc. (s) (u) | 1 | 17 | ||||
| Windstream Corp. | 100 | 1,099 | ||||
| 1,116 | ||||||
| Total Common Stocks (cost $4,408) | 4,654 | |||||
| PREFERRED STOCKS - 0.2% | ||||||
| CONSUMER DISCRETIONARY - 0.0% | ||||||
| ION Media Networks Inc., 12.00%, Series B, 08/31/13 (d) (f) | - | - | ||||
| FINANCIALS - 0.2% | ||||||
| Federal Home Loan Mortgage Corp., 8.38%, | ||||||
| Series Z (callable at 25 on 12/31/12) (d) (p) | 50 | 52 | ||||
| Federal National Mortgage Association, 8.25% | ||||||
| Series T (callable at 25 on 05/20/13) (d) (p) | 40 | 41 | ||||
| Federal National Mortgage Association, 8.25%, | ||||||
| Series S (callable at 25 beginning 12/31/10) (d) (p) | 19 | 21 | ||||
| GMAC Inc., 7.00% (callable at 1,000 beginning 12/31/11) (t) (v) | 1 | 668 | ||||
| Wells Fargo Capital XII, | ||||||
| 7.88% (callable at 25 beginning 03/15/13) (e) | 18 | 462 | ||||
| 1,244 | ||||||
| Total Preferred Stocks (cost $3,630) | 1,244 | |||||
| INVESTMENT FUNDS - 0.8% | ||||||
| Eaton Vance Senior Floating-Rate Trust | 75 | 1,094 | ||||
| Pimco Floating Rate Strategy Fund (e) | 200 | 1,976 | ||||
| Van Kampen Senior Income Trust | 400 | 1,688 | ||||
| Total Investment Funds (cost $3,124) | 4,758 | |||||
| NON-U.S. GOVERNMENT AGENCY | ||||||
| ASSET-BACKED SECURITIES - 3.2% | ||||||
| Ahold Lease USA Inc., 7.82%, 01/02/20 (k) | $ | 1,652 | 1,791 | |||
| Banc of America Commercial Mortgage Inc. | ||||||
| REMIC, 5.68%, 07/10/46 | 1,305 | 1,020 | ||||
| Bear Stearns Commercial Mortgage Securities | ||||||
| REMIC, 5.76%, 09/11/38 (i) | 1,000 | 636 | ||||
| REMIC, 5.58%, 09/11/41 (i) | 2,855 | 2,341 | ||||
| Citigroup Commercial Mortgage Trust | ||||||
| REMIC, 5.70%, 06/10/17 (i) | 1,905 | 1,373 | ||||
| REMIC, 5.73%, 03/15/49 (i) | 2,000 | 1,593 | ||||
| Citigroup/Deutsche Bank Commercial Mortgage Trust | ||||||
| REMIC, 5.69%, 10/15/48 | 1,000 | 579 | ||||
| Credit Suisse Mortgage Capital Certificates | ||||||
| REMIC, 5.55%, 02/15/39 (i) | 1,085 | 889 | ||||
| REMIC, 5.55%, 02/15/39 (i) | 550 | 327 | ||||
| REMIC, 5.72%, 06/15/39 (i) | 1,000 | 606 | ||||
| REMIC, 5.34%, 12/15/39 | 112 | 85 | ||||
| REMIC, 6.13%, 09/15/40 (i) | 2,000 | 1,006 | ||||
| CW Capital Cobalt Ltd. REMIC, 5.82%, 07/15/17 (i) | 1,000 | 460 | ||||
| Delta Air Lines Inc., 7.75%, 12/17/19 | 1,655 | 1,688 | ||||
| JPMorgan Chase & Co. Commercial Mortgage | ||||||
| Securities Inc. REMIC, 5.75%, 02/12/49 (i) | 1,387 | 1,005 | ||||
| JPMorgan Chase Commercial Mortgage Securities Corp. | ||||||
| REMIC, 5.76%, 09/11/38 (i) | 700 | 586 | ||||
| REMIC, 5.92%, 06/11/50 (i) | 359 | 259 | ||||
| Merrill Lynch/Countrywide Commercial Mortgage Trust | ||||||
| REMIC, 5.92%, 06/12/46 (i) | 515 | 418 | ||||
| Midwest Generation LLC, 8.56%, 01/02/16 | 693 | 700 | ||||
| Morgan Stanley Capital I | ||||||
| 5.77%, 10/15/42 (i) | 150 | 128 | ||||
| REMIC, 5.81%, 12/12/49 | 1,000 | 852 | ||||
| Sigma Finance, Inc. (d) (f) (u) | 746 | 32 | ||||
| Total Non-U.S. Government Agency | ||||||
| Asset-Backed Securities (cost $16,521) | 18,374 | |||||
| CORPORATE BONDS AND NOTES - 88.3% | ||||||
| CONSUMER DISCRETIONARY - 21.8% | ||||||
| AMC Entertainment Inc., 8.75%, 06/01/19 | 1,939 | 1,978 | ||||
| American Axle & Manufacturing Holdings Inc., | ||||||
| 9.25%, 01/15/17 (t) (v) | 2,400 | 2,436 | ||||
| Ameristar Casinos Inc., 9.25%, 06/01/14 (t) (v) | 1,231 | 1,277 | ||||
| Beazer Homes USA Inc. | ||||||
| 6.50%, 11/15/13 (e) | 538 | 425 | ||||
| 6.88%, 07/15/15 | 3,000 | 2,265 | ||||
| Belo Corp. | ||||||
| 8.00%, 11/15/16 | 393 | 404 | ||||
| 7.25%, 09/15/27 (e) | 3,000 | 2,370 | ||||
| Cablevision Systems Corp., 8.63%, 09/15/17 (t) (v) | 2,000 | 2,082 | ||||
| Caesars Entertainment Inc., 8.13%, 05/15/11 (e) | 1,000 | 1,000 | ||||
| CCH II LLC, 13.50%, 11/30/16 | 1,467 | 1,727 | ||||
| Cequel Communications Holdings I LLC, | ||||||
| 8.63%, 11/15/17 (t) (v) | 3,414 | 3,448 | ||||
| Clear Channel Communications Inc., 6.25%, 03/15/11 | 1,000 | 936 | ||||
| DirecTV Holdings LLC | ||||||
| 6.38%, 06/15/15 | 2,140 | 2,223 | ||||
| 5.88%, 10/01/19 (t) (v) | 1,068 | 1,086 | ||||
| DISH DBS Corp. | ||||||
| 6.63%, 10/01/14 | 1,000 | 1,009 | ||||
| 7.88%, 09/01/19 (e) | 2,538 | 2,662 | ||||
| Dollar General Corp., 11.88%, 07/15/17 | 1,373 | 1,586 | ||||
| Easton-Bell Sports Inc., 9.75%, 12/01/16 (t) (v) | 1,400 | 1,451 | ||||
| Goodyear Tire & Rubber Co., 10.50%, 05/15/16 (e) | 2,000 | 2,210 | ||||
| Hanesbrands Inc., 8.00%, 12/15/16 | 370 | 377 | ||||
| Harrah's Operating Co. Inc. | ||||||
| 5.38%, 12/15/13 | 4,500 | 3,420 | ||||
| 10.75%, 02/01/16 | 1,000 | 815 | ||||
| 10.00%, 12/15/18 (e) (t) (v) | 2,000 | 1,605 | ||||
| Harrah's Operating Escrow LLC, | ||||||
| 11.25%, 06/01/17 (e) (t) (v) | 1,291 | 1,351 | ||||
| Hertz Corp., 10.50%, 01/01/16 (e) | 1,500 | 1,601 | ||||
| Inergy LP, 8.75%, 03/01/15 | 336 | 345 | ||||
| Interpublic Group Cos. Inc., 10.00%, 07/15/17 | 3,793 | 4,210 | ||||
| J.C. Penney Co. Inc., 6.38%, 10/15/36 | 1,000 | 888 | ||||
| Jarden Corp., 7.50%, 05/01/17 | 1,000 | 998 | ||||
| Kabel Deutschland GmbH, 10.63%, 07/01/14 | 1,700 | 1,776 | ||||
| Lamar Media Corp., 9.75%, 04/01/14 | 444 | 490 | ||||
| Lennar Corp., 12.25%, 06/01/17 | 2,000 | 2,410 | ||||
| Levi Strauss & Co., 8.88%, 04/01/16 | 2,000 | 2,092 | ||||
| Macy's Retail Holdings Inc. | ||||||
| 6.63%, 04/01/11 | 500 | 516 | ||||
| 5.90%, 12/01/16 | 1,000 | 975 | ||||
| 6.65%, 07/15/24 | 500 | 455 | ||||
| 6.90%, 01/15/32 | 1,000 | 870 | ||||
| 6.70%, 07/15/34 | 1,000 | 870 | ||||
| MDC Partners Inc., 11.00%, 11/01/16 (e) (t) (v) | 4,279 | 4,450 | ||||
| Meritage Homes Corp., 6.25%, 03/15/15 | 2,000 | 1,840 | ||||
| MGM Mirage Inc. | ||||||
| 6.75%, 04/01/13 | 2,600 | 2,242 | ||||
| 7.63%, 01/15/17 (e) | 925 | 719 | ||||
| 11.13%, 11/15/17 (t) (v) | 810 | 897 | ||||
| 11.38%, 03/01/18 (t) (v) | 2,000 | 1,790 | ||||
| Mohawk Industries Inc., 6.88%, 01/15/16 (l) | 2,000 | 1,990 | ||||
| Neiman-Marcus Group Inc., 10.38%, 10/15/15 (e) | 4,205 | 4,121 | ||||
| Newsday Secured, Term Loan, 9.75%, 12/31/49 (s) (u) | 808 | 864 | ||||
| Nielsen Finance LLC, 12.50%, 08/01/16 (k) | 2,000 | 1,825 | ||||
| QVC Inc., 7.50%, 10/01/19 (t) (v) | 2,649 | 2,702 | ||||
| Royal Caribbean Cruises Ltd., 7.25%, 06/15/16 | 3,500 | 3,382 | ||||
| Sally Holdings LLC, 10.50%, 11/15/16 (e) | 1,500 | 1,612 | ||||
| Scientific Games International Inc. | ||||||
| 9.25%, 06/15/19 | 667 | 700 | ||||
| 9.25%, 06/15/19 (e) (t) (v) | 1,500 | 1,575 | ||||
| ServiceMaster Co., 10.75%, 07/15/15 (e) (t) (v) | 3,000 | 3,120 | ||||
| Sheraton Holding Corp., 7.38%, 11/15/15 | 1,000 | 1,034 | ||||
| Shingle Springs Tribal Gaming Authority, | ||||||
| 9.38%, 06/15/15 (t) (v) | 4,000 | 3,040 | ||||
| Sinclair Television Group Inc., 8.00%, 03/15/12 | 1,000 | 978 | ||||
| Sirius XM Radio Inc., 9.75%, 09/01/15 (t) (v) | 1,000 | 1,052 | ||||
| Standard Pacific Corp., 7.00%, 08/15/15 | 4,000 | 3,480 | ||||
| Station Casinos Inc. | ||||||
| 6.00%, 04/01/12 (d) | 90 | 14 | ||||
| 6.50%, 02/01/14 (d) | 1,000 | 5 | ||||
| 6.88%, 03/01/16 (d) | 2,175 | 11 | ||||
| 7.75%, 08/15/16 (d) | 690 | 108 | ||||
| 6.63%, 03/15/18 (d) | 50 | - | ||||
| Sun Media Corp., 7.63%, 02/15/13 | 967 | 881 | ||||
| Ticketmaster Entertainment Inc., 10.75%, 08/01/16 | 1,125 | 1,212 | ||||
| TL Acquisition Corp., 10.50%, 01/15/15 (k) (t) (v) | 3,000 | 2,869 | ||||
| Toys R US Inc., 7.38%, 10/15/18 | 1,000 | 915 | ||||
| TRW Automotive Inc., 7.00%, 03/15/14 (t) (v) | 1,500 | 1,470 | ||||
| Univision Communications Inc., 9.75%, 03/15/15 (t) (v) | 2,105 | 1,845 | ||||
| UPC Holding BV, 9.88%, 04/15/18 (t) (v) | 1,573 | 1,660 | ||||
| Valassis Communications Inc., 8.25%, 03/01/15 | 1,500 | 1,496 | ||||
| Videotron Ltee | ||||||
| 6.38%, 12/15/15 (e) | 1,000 | 978 | ||||
| 9.13%, 04/15/18 | 175 | 192 | ||||
| Virgin Media Finance Plc, 9.13%, 08/15/16 | 1,000 | 1,054 | ||||
| Virgin Media Inc., 6.50%, 11/15/16 (t) (v) | 1,000 | 1,185 | ||||
| WMG Acquisition Corp., 9.50%, 06/15/16 (t) (v) | 322 | 345 | ||||
| WMG Holdings Corp., 9.50%, 12/15/14 (e) (k) | 1,000 | 1,012 | ||||
| Wynn Las Vegas LLC, 6.63%, 12/01/14 (e) | 3,000 | 2,899 | ||||
| XM Satellite Radio Holdings Inc., 13.00%, 08/01/13 (t) (v) | 1,000 | 1,086 | ||||
| Yonkers Racing Corp, 11.38%, 07/15/16 (e) (t) (v) | 1,329 | 1,396 | ||||
| 124,685 | ||||||
| CONSUMER STAPLES - 5.6% | ||||||
| Altria Group Inc., 10.20%, 02/06/39 (l) | 1,000 | 1,334 | ||||
| ARAMARK Corp. | ||||||
| 3.78%, 02/01/15 (i) | 220 | 201 | ||||
| 8.50%, 02/01/15 (e) | 1,900 | 1,957 | ||||
| Constellation Brands Inc., 7.25%, 05/15/17 | 1,000 | 1,014 | ||||
| Del Monte Food Corp., 7.50%, 10/15/19 (t) (v) | 833 | 858 | ||||
| Dole Food Co. Inc. | ||||||
| 8.88%, 03/15/11 (e) | 1,480 | 1,491 | ||||
| 8.00%, 10/01/16 (t) (v) | 345 | 350 | ||||
| Freedom Group Inc., 10.25%, 08/01/15 (t) (v) | 571 | 606 | ||||
| Macy's Retail Holdings Inc., 6.38%, 03/15/37 | 1,000 | 845 | ||||
| New Albertson's Inc. | ||||||
| 7.75%, 06/15/26 | 1,000 | 895 | ||||
| 7.45%, 08/01/29 | 1,000 | 858 | ||||
| 8.00%, 05/01/31 | 1,000 | 908 | ||||
| Pinnacle Foods Finance LLC, 9.25%, 04/01/15 | 1,000 | 1,015 | ||||
| Rite Aid Corp. | ||||||
| 9.50%, 06/15/17 | 2,000 | 1,740 | ||||
| 10.25%, 10/15/19 (t) (v) | 3,000 | 3,165 | ||||
| Smithfield Foods Inc. | ||||||
| 10.00%, 07/15/14 (e) (t) (v) | 1,605 | 1,741 | ||||
| 7.75%, 07/01/17 (e) | 1,000 | 922 | ||||
| SUPERVALU Inc., 8.00%, 05/01/16 | 510 | 518 | ||||
| Tops Market LLC, 10.13%, 10/15/15 (t) (v) | 1,846 | 1,901 | ||||
| Toys R Us Property Co. I LLC, 10.75%, 07/15/17 (t) (v) | 3,000 | 3,285 | ||||
| Tyson Foods Inc., 10.50%, 03/01/14 | 929 | 1,061 | ||||
| Wendy's/Arby's Group Inc., 10.00%, 07/15/16 (e) | 2,896 | 3,157 | ||||
| Yankee Acquisition Corp. | ||||||
| 8.50%, 02/15/15 | 2,000 | 1,985 | ||||
| 9.75%, 02/15/17 | 250 | 246 | ||||
| 32,053 | ||||||
| ENERGY - 9.0% | ||||||
| Aquilex Holdings LLC, 11.13%, 12/15/16 (t) (v) | 3,225 | 3,217 | ||||
| Chesapeake Energy Corp. | ||||||
| 7.00%, 08/15/14 | 800 | 810 | ||||
| 9.50%, 02/15/15 (e) | 469 | 515 | ||||
| 6.63%, 01/15/16 | 50 | 50 | ||||
| 6.88%, 01/15/16 | 169 | 169 | ||||
| 6.25%, 01/15/18 | 1,435 | 1,378 | ||||
| 7.25%, 12/15/18 | 1,500 | 1,511 | ||||
| Cie Generale de Geophysique-Veritas, 9.50%, 05/15/16 | 1,500 | 1,605 | ||||
| Cloud Peak Energy Resources LLC, 8.50%, 12/15/19 (t) (v) | 1,176 | 1,200 | ||||
| Complete Production Services Inc., 8.00%, 15/15/16 | 2,275 | 2,244 | ||||
| Continental Resources Inc., 8.25%, 10/01/19 (t) (v) | 187 | 196 | ||||
| Denbury Resources Inc., 9.75%, 03/01/16 | 1,251 | 1,335 | ||||
| El Paso Corp. | ||||||
| 7.88%, 06/15/12 (e) | 1,000 | 1,036 | ||||
| 8.25%, 02/15/16 | 320 | 342 | ||||
| 7.80%, 08/01/31 | 3,460 | 3,257 | ||||
| 7.75%, 01/15/32 | 1,430 | 1,352 | ||||
| Enterprise Products Operating LLC | ||||||
| 8.38%, 08/01/16 (e) | 860 | 838 | ||||
| 7.03%, 01/15/68 | 1,000 | 918 | ||||
| Holly Corp., 9.88%, 06/15/17 (t) (v) | 1,000 | 1,052 | ||||
| Hornbeck Offshore Services Inc., 8.00%, 09/01/17 (t) (v) | 3,000 | 3,000 | ||||
| Linn Energy LLC, 9.88%, 07/01/18 | 1,000 | 1,062 | ||||
| MarkWest Energy Partners LP | ||||||
| 6.88%, 11/01/14 | 207 | 196 | ||||
| 8.75%, 04/15/18 | 1,517 | 1,563 | ||||
| PetroHawk Energy Corp. | ||||||
| 9.13%, 07/15/13 | 1,040 | 1,087 | ||||
| 10.50%, 08/01/14 | 198 | 216 | ||||
| 7.88%, 06/01/15 | 1,000 | 1,010 | ||||
| Pride International Inc., 7.38%, 07/15/14 | 2,000 | 2,065 | ||||
| Quicksilver Resources Inc. | ||||||
| 11.75%, 01/01/16 | 1,944 | 2,206 | ||||
| 7.13%, 04/01/16 | 728 | 679 | ||||
| Range Resources Corp. | ||||||
| 7.50%, 05/15/16 | 2,000 | 2,055 | ||||
| 7.25%, 05/01/18 | 294 | 300 | ||||
| SandRidge Energy Inc., 8.75%, 01/15/20 (t) (v) | 1,275 | 1,275 | ||||
| Stone Energy Corp., 8.25%, 12/15/11 | 1,250 | 1,245 | ||||
| Targa Resources Inc., 8.25%, 07/01/16 | 1,000 | 991 | ||||
| Tesoro Corp. | ||||||
| 6.50%, 06/01/17 | 2,000 | 1,860 | ||||
| 9.75%, 06/01/19 (e) | 378 | 391 | ||||
| Texas Competitive Electric Holdings Co. LLC, | ||||||
| Term Loan B, 3.73%, 06/30/11 (i) (s) (u) | 3,960 | 3,209 | ||||
| Texas Competitive Electric Holdings Co. LLC, | ||||||
| 10.25%, 11/01/15 (k) | 2,000 | 1,620 | ||||
| Valero Energy Corp., 9.38%, 03/15/19 (e) | 1,767 | 2,102 | ||||
| Whiting Petroleum Corp., 7.00%, 02/01/14 | 625 | 627 | ||||
| 51,784 | ||||||
| FINANCIALS - 13.9% | ||||||
| American General Finance Corp. | ||||||
| 6.50%, 09/15/17 | 1,000 | 689 | ||||
| 6.90%, 12/15/17 | 8,000 | 5,555 | ||||
| BAC Capital Trust VI, 5.63%, 03/08/35 (e) | 4,000 | 3,202 | ||||
| Bank of America Corp., | ||||||
| 8.00%, (callable at 100 on 01/30/18) (p) | 1,500 | 1,444 | ||||
| Capital One Capital VI, 8.88%, 05/15/40 | 3,852 | 4,102 | ||||
| Cemex Finance LLC, 9.50%, 12/14/16 (t) (v) | 445 | 466 | ||||
| CEVA Group Plc, 11.63%, 10/01/16 (e) (t) (v) | 1,500 | 1,539 | ||||
| Citigroup Inc. | ||||||
| 5.50%, 02/15/17 | 1,000 | 946 | ||||
| 8.50%, 05/22/19 | 802 | 926 | ||||
| Ford Motor Credit Co. LLC | ||||||
| 5.50%, 06/15/11 (i) | 1,070 | 1,059 | ||||
| 9.88%, 08/10/11 | 1,045 | 1,094 | ||||
| 7.25%, 10/25/11 | 4,000 | 4,040 | ||||
| 3.00%, 01/13/12 (i) | 358 | 332 | ||||
| 7.50%, 08/01/12 | 3,000 | 3,025 | ||||
| Genworth Financial Inc., 8.63%, 12/15/16 | 2,416 | 2,506 | ||||
| GMAC LLC | ||||||
| 6.88%, 09/15/11 (t) (v) | 2,000 | 1,970 | ||||
| 6.88%, 08/28/12 (e) (t) (v) | 4,061 | 3,980 | ||||
| 6.75%, 12/01/14 (t) (v) | 2,614 | 2,483 | ||||
| 8.00%, 11/01/31 (e) (t) (v) | 3,000 | 2,700 | ||||
| Hanson Australia Funding Ltd., 5.25%, 03/15/13 | 1,112 | 1,095 | ||||
| Hawker Beechcraft Acquisition Co. LLC | ||||||
| 8.50%, 04/01/15 (e) | 1,000 | 705 | ||||
| 9.75%, 04/01/17 (e) | 2,000 | 1,240 | ||||
| Host Hotels & Resorts LP, 7.13%, 11/01/13 (e) | 2,075 | 2,109 | ||||
| J.C. Penney Co. Inc., 6.88%, 10/15/15 | 1,000 | 1,055 | ||||
| JPMorgan Chase & Co., | ||||||
| 7.90%, (callable at 100 beginning 04/30/18) (p) | 2,983 | 3,077 | ||||
| Liberty Mutual Group Inc., 7.80%, 03/15/37 (t) (v) | 2,300 | 1,898 | ||||
| Newsday Term Loan, 10.50%, 08/01/13 (u) | 2,000 | 2,139 | ||||
| Nielsen Finance LLC | ||||||
| 10.00%, 08/01/14 | 1,500 | 1,564 | ||||
| 11.50%, 05/01/16 | 444 | 496 | ||||
| Petroplus Finance Ltd., 9.38%, 09/15/19 (e) (t) (v) | 1,179 | 1,173 | ||||
| Pinnacle Foods Finance LLC | ||||||
| 9.25%, 04/01/15 (t) (v) | 5,000 | 5,075 | ||||
| 10.63%, 04/01/17 | 1,000 | 1,040 | ||||
| PNC Preferred Funding Trust I, | ||||||
| 8.70% (callable at 100 beginning 03/15/13) (p) (t) (v) | 3,000 | 3,072 | ||||
| Smurfit Kappa Funding Plc, 7.75%, 04/01/15 | 575 | 553 | ||||
| Universal City Development Partners Ltd. | ||||||
| 8.88%, 11/15/15 (t) (v) | 842 | 824 | ||||
| 10.88%, 11/15/16 (t) (v) | 418 | 419 | ||||
| UnumProvident Finance Co. Plc, 6.85%, 11/15/15 (t) (v) | 1,000 | 1,018 | ||||
| UPC Germany GmbH, 8.13%, 12/01/17 (e) (t) (v) | 2,000 | 2,022 | ||||
| Washington Mutual Bank, 6.88%, 06/15/11 (d) | 1,500 | 8 | ||||
| WEA Finance LLC, 6.75%, 09/02/19 (e) (t) (v) | 2,694 | 2,893 | ||||
| Wells Fargo & Co., | ||||||
| 7.98%, (callable at 100 beginning 03/15/18) (p) | 1,000 | 1,002 | ||||
| Wells Fargo Capital XIII, | ||||||
| 7.70% (callable at 100 beginning 03/26/13) (p) | 2,000 | 1,940 | ||||
| Wind Acquisition Holdings Finance SpA, | ||||||
| 12.25%, 07/15/17 (t) (v) | 1,000 | 985 | ||||
| 79,460 | ||||||
| HEALTH CARE - 4.9% | ||||||
| Biomet Inc., 10.38%, 10/15/17 | 2,000 | 2,170 | ||||
| Community Health Systems Inc., 8.88%, 07/15/15 | 2,733 | 2,829 | ||||
| HCA Inc. | ||||||
| 6.25%, 02/15/13 | 3,700 | 3,598 | ||||
| 5.75%, 03/15/14 | 5,095 | 4,789 | ||||
| 6.50%, 02/15/16 | 2,000 | 1,900 | ||||
| HealthSouth Corp. | ||||||
| 10.75%, 06/15/16 | 2,000 | 2,175 | ||||
| 8.13%, 02/15/20 | 3,000 | 2,955 | ||||
| IASIS Healthcare LLC / IASIS Capital Corp., | ||||||
| 8.75%, 06/15/14 | 2,300 | 2,329 | ||||
| Talecris Biotherapeutics Holdings Corp., | ||||||
| 7.75%, 11/15/16 (t) (v) | 498 | 505 | ||||
| Tenet Healthcare Corp. | ||||||
| 7.38%, 02/01/13 | 1,500 | 1,504 | ||||
| 9.25%, 02/01/15 (k) | 1,000 | 1,065 | ||||
| 8.88%, 07/01/19 (t) (v) | 1,000 | 1,080 | ||||
| US Oncology Inc., 9.13%, 08/15/17 | 828 | 869 | ||||
| 27,768 | ||||||
| INDUSTRIALS - 7.2% | ||||||
| ACCO Brands Corp., 10.63%, 03/15/15 (t) (v) | 469 | 516 | ||||
| American Airlines Pass Through Trust, | ||||||
| 10.38%, 07/02/19 (e) | 1,390 | 1,536 | ||||
| BE Aerospace Inc., 8.50%, 07/01/18 | 1,500 | 1,590 | ||||
| Bombardier Inc. | ||||||
| 6.75%, 05/01/12 (e) (t) (v) | 1,000 | 1,032 | ||||
| 6.30%, 05/01/14 (t) (v) | 1,000 | 990 | ||||
| Delta Air Lines Inc., 12.25%, 03/15/15 (e) (t) (v) | 5,963 | 5,963 | ||||
| Hexion Specialty Chemicals Inc., 9.20%, 03/15/21 | 2,165 | 1,602 | ||||
| L-3 Communications Corp., 6.38%, 10/15/15 | 1,000 | 1,004 | ||||
| Masco Corp., 6.13%, 10/03/16 (e) | 3,000 | 2,859 | ||||
| Nalco Co., 8.88%, 11/15/13 | 1,732 | 1,784 | ||||
| Navistar International Corp., 8.25%, 11/01/21 | 1,053 | 1,079 | ||||
| Owens Corning, 9.00%, 06/15/19 | 1,383 | 1,542 | ||||
| Radnor Holdings Corp., 11.00%, 03/15/10 (d) (s) (u) | 100 | - | ||||
| Safety-Kleen Services Inc., 9.25%, 06/01/08 (d) (f) (u) | 125 | - | ||||
| Spirit Aerosystems Inc., 7.50%, 10/01/17 (t) (v) | 485 | 478 | ||||
| Stone Container Finance Co., 7.38%, 07/15/14 (d) | 1,375 | 1,294 | ||||
| Terex Corp., 10.88%, 06/01/16 | 2,000 | 2,230 | ||||
| Terra Capital Inc., 7.75%, 11/01/19 (t) (v) | 461 | 493 | ||||
| TransDigm Inc., 7.75%, 07/15/14 (s) (u) | 1,500 | 1,522 | ||||
| Trimas Corp., 9.75%, 12/15/17 (e) (t) (v) | 2,500 | 2,453 | ||||
| Triumph Group Inc., 8.00%, 11/15/17 (s) (u) | 1,000 | 1,009 | ||||
| TRW Automotive Inc., 8.88%, 12/01/17 (e) (t) (v) | 2,000 | 2,080 | ||||
| United Airlines Inc. | ||||||
| 10.40%, 11/01/16 (e) | 3,873 | 4,081 | ||||
| 9.75%, 01/15/17 | 1,445 | 1,474 | ||||
| USG Corp., 9.75%, 08/01/14 (t) (v) | 1,000 | 1,068 | ||||
| Wolseley Plc - Private Placement, | ||||||
| 5.32%, 11/17/20 (f) (s) (u) | 2,136 | 1,616 | ||||
| 41,295 | ||||||
| INFORMATION TECHNOLOGY - 3.4% | ||||||
| Advanced Micro Devices Inc., 8.13%, 12/15/17 (e) (t) (v) | 900 | 897 | ||||
| First Data Corp. | ||||||
| 9.88%, 09/24/15 (e) | 1,700 | 1,585 | ||||
| 10.55%, 09/24/15 | 2,106 | 1,869 | ||||
| Freescale Semiconductor Inc. | ||||||
| 8.88%, 12/15/14 (e) | 980 | 899 | ||||
| 10.13%, 12/15/16 (e) | 3,800 | 3,059 | ||||
| Hanson Ltd., 6.13%, 08/15/16 | 1,231 | 1,176 | ||||
| Sanmina-SCI Corp., 8.13%, 03/01/16 (e) | 683 | 681 | ||||
| Sungard Data Systems Inc. | ||||||
| 9.13%, 08/15/13 | 400 | 410 | ||||
| 10.63%, 05/15/15 (e) | 155 | 171 | ||||
| 10.25%, 08/15/15 (e) | 2,515 | 2,678 | ||||
| Unisys Corp., 8.00%, 10/15/12 (e) (f) | 1,000 | 1,342 | ||||
| Viasat Inc., 8.88%, 09/15/16 (t) (v) | 628 | 647 | ||||
| Viasystems Group Inc., 12.00%, 01/15/15 (e) (t) (v) | 3,000 | 3,214 | ||||
| West Corp., 9.50% 10/15/14 (e) | 1,000 | 1,015 | ||||
| 19,643 | ||||||
| MATERIALS - 8.4% | ||||||
| Allegheny Technologies Inc., 9.38%, 06/01/19 | 1,186 | 1,365 | ||||
| Anglo American Capital Plc, 9.38%, 04/08/19 (e) (t) (v) | 1,139 | 1,447 | ||||
| Berry Plastics Escrow LLC, 8.88%, 09/15/14 (e) (t) (v) | 3,000 | 2,918 | ||||
| Boise Paper Holdings LLC, 9.00%, 09/11/17 (t) (v) | 500 | 518 | ||||
| Bunge Ltd. Finance Co., 8.50%, 06/15/19 (l) | 1,330 | 1,516 | ||||
| Cascades Inc., 7.88%, 01/15/20 (t) (v) | 2,077 | 2,108 | ||||
| CRH America Inc., 8.13%, 07/15/18 (l) | 1,980 | 2,309 | ||||
| Domtar Corp. | ||||||
| 7.13%, 08/15/15 | 1,000 | 1,005 | ||||
| 10.75%, 06/01/17 (e) | 1,105 | 1,298 | ||||
| Dow Chemical Co., 8.55%, 05/15/19 (l) | 2,000 | 2,386 | ||||
| Freeport-McMoRan Copper & Gold Inc., 8.38%, 04/01/17 | 4,020 | 4,402 | ||||
| Georgia-Pacific LLC | ||||||
| 8.13%, 05/15/11 | 650 | 682 | ||||
| 8.25%, 05/01/16 (t) (v) | 294 | 312 | ||||
| Gerdau Holdings Inc., 7.00%, 01/20/20 (e) (t) (v) | 2,020 | 2,076 | ||||
| Goodman Global Group Inc., 0.00%, 12/15/14 (j) (t) (v) | 780 | 443 | ||||
| Graham Packaging Co. LP, 8.25%, 01/01/2017 (t) (v) | 1,000 | 988 | ||||
| Huntsman International LLC | ||||||
| 7.88%, 11/15/14 | 500 | 489 | ||||
| 7.38%, 01/01/15 (e) (k) | 2,000 | 1,920 | ||||
| JohnsonDiversey Inc., 8.25%, 11/15/19 (t) (v) | 767 | 777 | ||||
| Momentive Performance Materials Inc., | ||||||
| 9.75%, 12/01/14 (e) (k) | 3,000 | 2,888 | ||||
| NewPage Corp., 11.38%, 12/31/14 (t) (v) | 1,351 | 1,365 | ||||
| Owens-Brockway Glass Container Inc., 7.38%, 05/15/16 | 511 | 528 | ||||
| PE Paper Escrow GmbH, 12.00%, 08/01/14 (t) (v) | 533 | 589 | ||||
| Plastipak Holdings Inc., 10.63%, 08/15/19 (e) (t) (v) | 2,400 | 2,646 | ||||
| Sappi Papier Holding AG, 6.75%, 06/15/12 (t) (v) | 908 | 869 | ||||
| Steel Dynamics Inc., 6.75%, 04/01/15 | 2,000 | 1,982 | ||||
| Teck Resources Ltd., 10.75%, 05/15/19 | 3,191 | 3,813 | ||||
| Verso Paper Holdings LLC, 11.50%, 07/01/14 (e) (t) (v) | 2,000 | 2,200 | ||||
| Weyerhaeuser Co., 7.38%, 10/01/19 (e) | 2,253 | 2,354 | ||||
| 48,193 | ||||||
| TELECOMMUNICATION SERVICES - 10.0% | ||||||
| CC Holdings GS V LLC, 7.75%, 05/01/17 (t) (v) | 739 | 787 | ||||
| Cincinnati Bell Inc., 8.38%, 01/15/14 | 3,385 | 3,444 | ||||
| Clearwire Communications LLC, 12.00%, 12/01/15 (e) (t) (v) | 2,488 | 2,525 | ||||
| Cricket Communications Inc., 9.38%, 11/01/14 (e) | 2,000 | 2,010 | ||||
| Crown Castle International Corp. | ||||||
| 9.00%, 01/15/15 | 633 | 674 | ||||
| 7.13%, 11/01/19 | 1,658 | 1,641 | ||||
| Frontier Communications Corp. | ||||||
| 6.25%, 01/15/13 | 601 | 603 | ||||
| 8.25%, 05/01/14 (e) | 698 | 728 | ||||
| 8.13%, 10/01/18 | 882 | 893 | ||||
| 7.13%, 03/15/19 | 620 | 586 | ||||
| 7.88%, 01/15/27 | 590 | 543 | ||||
| 9.00%, 08/15/31 | 1,281 | 1,259 | ||||
| Inmarsat Finance Plc, 7.38%, 12/01/17 (e) (t) (v) | 781 | 799 | ||||
| Intelsat Bermuda Ltd., 11.25%, 02/04/17 (e) (k) (t) (v) | 4,500 | 4,511 | ||||
| Intelsat Corp., 9.25%, 08/15/14 | 1,000 | 1,028 | ||||
| Intelsat Ltd., 7.63%, 04/15/12 | 2,000 | 1,980 | ||||
| Intelsat Subsidiary Holding Co. Ltd., 8.88%, 01/15/15 | 3,449 | 3,570 | ||||
| Level 3 Financing Inc., 9.25%, 11/01/14 | 2,000 | 1,890 | ||||
| Nextel Communications Inc. | ||||||
| 6.88%, 10/31/13 | 371 | 360 | ||||
| 5.95%, 03/15/14 | 2,629 | 2,455 | ||||
| Nordic Telephone Co. Holdings ApS, 8.88%, | ||||||
| 05/01/16 (t) (v) | 945 | 999 | ||||
| Qwest Communications International Inc. | ||||||
| 7.50%, 02/15/14 | 2,325 | 2,334 | ||||
| 8.00%, 10/01/15 (t) (v) | 1,188 | 1,221 | ||||
| Sprint Capital Corp., 6.88%, 11/15/28 (e) | 7,665 | 6,372 | ||||
| Sprint Nextel Corp., 6.00%, 12/01/16 | 3,654 | 3,334 | ||||
| Telesat Canada | ||||||
| 11.00%, 11/01/15 | 2,000 | 2,170 | ||||
| 12.50%, 11/01/17 | 500 | 550 | ||||
| Virgin Media Finance Plc | ||||||
| 9.50%, 08/15/16 | 2,000 | 2,148 | ||||
| 8.38%, 10/15/19 | 319 | 328 | ||||
| Wind Acquisition Finance SA, 11.75%, 07/15/17 (t) (v) | 1,567 | 1,712 | ||||
| Windstream Corp. | ||||||
| 8.63%, 08/01/16 | 1,925 | 1,959 | ||||
| 7.88%, 11/01/17 (t) (v) | 2,000 | 1,975 | ||||
| 57,388 | ||||||
| UTILITIES - 4.1% | ||||||
| AES China Generating Co. Ltd., 8.25%, 06/26/10 | 155 | 149 | ||||
| AES Corp. | ||||||
| 9.75%, 04/15/16 (e) (t) (v) | 1,355 | 1,484 | ||||
| 8.00%, 10/15/17 | 2,000 | 2,052 | ||||
| CMS Energy Corp., 6.55%, 07/17/17 | 1,500 | 1,481 | ||||
| Dynegy Holdings Inc. | ||||||
| 7.75%, 06/01/19 | 3,500 | 3,036 | ||||
| 7.63%, 10/15/26 | 125 | 86 | ||||
| Edison Mission Energy | ||||||
| 7.50%, 06/15/13 | 170 | 160 | ||||
| 7.75%, 06/15/16 | 940 | 799 | ||||
| 7.00%, 05/15/17 (e) | 1,900 | 1,501 | ||||
| Energy Future Holdings Corp. | ||||||
| 10.88%, 11/01/17 (e) (k) | 3,500 | 2,861 | ||||
| 11.25%, 11/01/17 (d) | 3,180 | 2,250 | ||||
| Ipalco Enterprises Inc., 7.25%, 04/01/16 (t) (v) | 800 | 802 | ||||
| Mirant North America LLC, 7.38%, 12/31/13 | 1,780 | 1,760 | ||||
| NiSource Finance Corp., 10.75%, 03/15/16 (l) | 423 | 521 | ||||
| NRG Energy Inc., 7.38%, 02/01/16 | 3,000 | 3,004 | ||||
| RRI Energy Inc., 7.88%, 06/15/17 (e) | 1,500 | 1,474 | ||||
| 23,420 | ||||||
| Total Corporate Bonds and Notes (cost $475,166) | 505,689 | |||||
| SHORT TERM INVESTMENTS - 19.4% | ||||||
| Mutual Funds - 4.7% | ||||||
| JNL Money Market Fund, 0.07% (a) (h) | 27,030 | 27,030 | ||||
| Securities Lending Collateral - 14.7% | ||||||
| Securities Lending Cash Collateral Fund LLC, | ||||||
| 0.16% (a) (h) | 72,227 | 72,227 | ||||
| Securities Lending Liquidating Fund LLC, 0.36% (a) (h) | 11,672 | 11,647 | ||||
| 83,874 | ||||||
| Total Short Term Investments (cost $110,929) | 110,904 | |||||
| Total Investments - 112.8% (cost $613,778) | 645,623 | |||||
| Other Assets and Liabilities, Net - (12.8%) | (73,121) | |||||
| Total Net Assets - 100% | $ | 572,502 | ||||
| JNL/PPM America Mid Cap Value Fund | ||||||
| COMMON STOCKS - 99.3% | ||||||
| CONSUMER DISCRETIONARY - 18.2% | ||||||
| Abercrombie & Fitch Co. - Class A | 10 | $ | 345 | |||
| Bally Technologies Inc. (c) (e) | 5 | 219 | ||||
| BorgWarner Inc. | 12 | 392 | ||||
| Fortune Brands Inc. | 11 | 467 | ||||
| Liz Claiborne Inc. (c) (e) | 38 | 216 | ||||
| Macy's Inc. | 28 | 461 | ||||
| Newell Rubbermaid Inc. (e) | 27 | 404 | ||||
| Royal Caribbean Cruises Ltd. (c) (e) | 18 | 450 | ||||
| VF Corp. | 7 | 505 | ||||
| Viacom Inc. - Class B (c) | 7 | 204 | ||||
| 3,663 | ||||||
| CONSUMER STAPLES - 4.4% | ||||||
| Corn Products International Inc. | 17 | 488 | ||||
| NBTY Inc. (c) | 9 | 405 | ||||
| 893 | ||||||
| ENERGY - 5.6% | ||||||
| Comstock Resources Inc. (c) | 10 | 398 | ||||
| Hercules Offshore Inc. (c) (e) | 44 | 209 | ||||
| Newfield Exploration Co. (c) | 11 | 516 | ||||
| 1,123 | ||||||
| FINANCIALS - 11.9% | ||||||
| American Financial Group Inc. | 20 | 487 | ||||
| Astoria Financial Corp. (e) | 42 | 517 | ||||
| Hartford Financial Services Group Inc. | 15 | 351 | ||||
| Lincoln National Corp. | 21 | 527 | ||||
| Reinsurance Group of America Inc. | 11 | 505 | ||||
| 2,387 | ||||||
| HEALTH CARE - 6.4% | ||||||
| CIGNA Corp. | 14 | 494 | ||||
| Owens & Minor Inc. | 9 | 395 | ||||
| Res-Care Inc. (c) | 36 | 400 | ||||
| 1,289 | ||||||
| INDUSTRIALS - 25.6% | ||||||
| Belden Inc. | 9 | 189 | ||||
| Con-Way Inc. | 11 | 394 | ||||
| Esterline Technologies Corp. (c) | 11 | 444 | ||||
| GATX Corp. (e) | 14 | 397 | ||||
| Goodrich Corp. | 8 | 508 | ||||
| Kennametal Inc. | 19 | 500 | ||||
| Lincoln Electric Holdings Inc. | 9 | 486 | ||||
| SkyWest Inc. | 11 | 181 | ||||
| Spirit Aerosystems Holdings Inc. (c) | 25 | 495 | ||||
| Steelcase Inc. | 69 | 436 | ||||
| Terex Corp. (c) | 11 | 220 | ||||
| Textron Inc. (e) | 23 | 434 | ||||
| Watson Wyatt Worldwide Inc. | 10 | 470 | ||||
| 5,154 | ||||||
| INFORMATION TECHNOLOGY - 11.1% | ||||||
| Avnet Inc. (c) | 17 | 501 | ||||
| Computer Sciences Corp. (c) | 9 | 506 | ||||
| Ingram Micro Inc. - Class A (c) | 28 | 489 | ||||
| Novell Inc. (c) | 124 | 515 | ||||
| Omnivision Technologies Inc. (c) | 15 | 218 | ||||
| 2,229 | ||||||
| MATERIALS - 11.5% | ||||||
| Allegheny Technologies Inc. (e) | 10 | 466 | ||||
| Nucor Corp. | 5 | 210 | ||||
| Olin Corp. | 19 | 335 | ||||
| PPG Industries Inc. | 7 | 404 | ||||
| Reliance Steel & Aluminum Co. | 12 | 497 | ||||
| Steel Dynamics Inc. | 22 | 395 | ||||
| 2,307 | ||||||
| UTILITIES - 4.6% | ||||||
| Edison International | 14 | 494 | ||||
| Westar Energy Inc. | 20 | 441 | ||||
| 935 | ||||||
| Total Common Stocks (cost $16,869) | 19,980 | |||||
| NON-U.S. GOVERNMENT AGENCY | ||||||
| ASSET-BACKED SECURITIES - 0.0% | ||||||
| Sigma Finance, Inc. (d) (f) (u) | $ | 17 | 1 | |||
| Total Non-U.S. Government Agency | ||||||
| Asset-Backed Securities (cost $17) | 1 | |||||
| SHORT TERM INVESTMENTS - 11.7% | ||||||
| Mutual Funds - 1.9% | ||||||
| JNL Money Market Fund, 0.07% (a) (h) | 381 | 381 | ||||
| Securities Lending Collateral - 9.8% | ||||||
| Securities Lending Cash Collateral Fund LLC, | ||||||
| 0.16% (a) (h) | 1,970 | 1,970 | ||||
| Total Short Term Investments (cost $2,351) | 2,351 | |||||
| Total Investments - 111.0% (cost $19,237) | 22,332 | |||||
| Other Assets and Liabilities, Net - (11.0%) | (2,220) | |||||
| Total Net Assets - 100% | $ | 20,112 | ||||
| JNL/PPM America Small Cap Value Fund | ||||||
| COMMON STOCKS - 99.5% | ||||||
| CONSUMER DISCRETIONARY - 22.5% | ||||||
| Abercrombie & Fitch Co. - Class A | 5 | $ | 157 | |||
| Bally Technologies Inc. (c) | 10 | 405 | ||||
| Bob Evans Farms Inc. | 18 | 510 | ||||
| BorgWarner Inc. | 6 | 189 | ||||
| Columbia Sportswear Co. (e) | 13 | 508 | ||||
| Jakks Pacific Inc. (c) | 41 | 499 | ||||
| K-Swiss Inc. - Class A (c) (e) | 41 | 407 | ||||
| Liz Claiborne Inc. (c) (e) | 48 | 269 | ||||
| RC2 Corp. (c) | 34 | 497 | ||||
| Skechers U.S.A. Inc. - Class A (c) | 18 | 515 | ||||
| Superior Industries International Inc. (e) | 32 | 487 | ||||
| 4,443 | ||||||
| CONSUMER STAPLES - 9.6% | ||||||
| Corn Products International Inc. | 17 | 494 | ||||
| Del Monte Foods Co. | 44 | 493 | ||||
| Hain Celestial Group Inc. (c) | 30 | 502 | ||||
| NBTY Inc. (c) | 9 | 392 | ||||
| 1,881 | ||||||
| ENERGY - 5.0% | ||||||
| Comstock Resources Inc. (c) | 12 | 503 | ||||
| Hercules Offshore Inc. (c) (e) | 100 | 478 | ||||
| 981 | ||||||
| FINANCIALS - 12.0% | ||||||
| American Financial Group Inc. | 16 | 409 | ||||
| Astoria Financial Corp. (e) | 40 | 496 | ||||
| Delphi Financial Group Inc. | 22 | 499 | ||||
| Reinsurance Group of America Inc. | 10 | 453 | ||||
| SeaBright Insurance Holdings Inc. (c) (e) | 44 | 509 | ||||
| 2,366 | ||||||
| HEALTH CARE - 5.1% | ||||||
| Owens & Minor Inc. | 12 | 502 | ||||
| Res-Care Inc. (c) | 45 | 498 | ||||
| 1,000 | ||||||
| INDUSTRIALS - 28.4% | ||||||
| Apogee Enterprises Inc. (e) | 21 | 291 | ||||
| Belden Inc. | 22 | 480 | ||||
| Con-Way Inc. | 14 | 475 | ||||
| Esterline Technologies Corp. (c) | 12 | 501 | ||||
| GATX Corp. (e) | 17 | 489 | ||||
| GenCorp Inc. (c) | 66 | 465 | ||||
| Kennametal Inc. | 19 | 480 | ||||
| Lincoln Electric Holdings Inc. | 9 | 481 | ||||
| SkyWest Inc. | 29 | 487 | ||||
| Spirit Aerosystems Holdings Inc. (c) | 19 | 381 | ||||
| Steelcase Inc. (e) | 76 | 480 | ||||
| Terex Corp. (c) | 20 | 392 | ||||
| Watson Wyatt Worldwide Inc. | 4 | 204 | ||||
| 5,606 | ||||||
| INFORMATION TECHNOLOGY - 8.9% | ||||||
| Benchmark Electronics Inc. (c) | 26 | 492 | ||||
| Ingram Micro Inc. - Class A (c) | 15 | 263 | ||||
| Novell Inc. (c) | 123 | 509 | ||||
| Omnivision Technologies Inc. (c) | 34 | 490 | ||||
| 1,754 | ||||||
| MATERIALS - 5.5% | ||||||
| Olin Corp. | 29 | 499 | ||||
| Reliance Steel & Aluminum Co. (e) | 6 | 259 | ||||
| Steel Dynamics Inc. | 19 | 333 | ||||
| 1,091 | ||||||
| UTILITIES - 2.5% | ||||||
| Westar Energy Inc. | 22 | 485 | ||||
| Total Common Stocks (cost $16,859) | 19,607 | |||||
| NON-U.S. GOVERNMENT AGENCY | ||||||
| ASSET-BACKED SECURITIES - 0.0% | ||||||
| Sigma Finance, Inc. (d) (f) (u) | $ | 3 | - | |||
| Total Non-U.S. Government Agency | ||||||
| Asset-Backed Securities (cost $3) | - | |||||
| SHORT TERM INVESTMENTS - 11.4% | ||||||
| Mutual Funds - 0.6% | ||||||
| JNL Money Market Fund, 0.07% (a) (h) | 126 | 126 | ||||
| Securities Lending Collateral - 10.8% | ||||||
| Securities Lending Cash Collateral Fund LLC, | ||||||
| 0.16% (a) (h) | 2,128 | 2,128 | ||||
| Total Short Term Investments (cost $2,254) | 2,254 | |||||
| Total Investments - 110.9% (cost $19,116) | 21,861 | |||||
| Other Assets and Liabilities, Net - (10.9%) | (2,150) | |||||
| Total Net Assets - 100% | $ | 19,711 | ||||
| JNL/PPM America Value Equity Fund | ||||||
| COMMON STOCKS - 99.5% | ||||||
| CONSUMER DISCRETIONARY - 14.3% | ||||||
| Abercrombie & Fitch Co. - Class A | 24 | $ | 840 | |||
| Comcast Corp. - Class A | 134 | 2,261 | ||||
| Fortune Brands Inc. | 27 | 1,158 | ||||
| Home Depot Inc. | 54 | 1,568 | ||||
| Macy's Inc. (e) | 80 | 1,334 | ||||
| Newell Rubbermaid Inc. (e) | 89 | 1,333 | ||||
| Royal Caribbean Cruises Ltd. (c) (e) | 37 | 940 | ||||
| VF Corp. | 23 | 1,655 | ||||
| Viacom Inc. - Class B (c) | 77 | 2,290 | ||||
| 13,379 | ||||||
| CONSUMER STAPLES - 6.9% | ||||||
| Altria Group Inc. | 121 | 2,383 | ||||
| Archer-Daniels-Midland Co. | 74 | 2,304 | ||||
| Procter & Gamble Co. | 30 | 1,837 | ||||
| 6,524 | ||||||
| ENERGY - 10.7% | ||||||
| Apache Corp. | 25 | 2,528 | ||||
| Chevron Corp. | 30 | 2,333 | ||||
| ConocoPhillips | 35 | 1,808 | ||||
| Newfield Exploration Co. (c) | 36 | 1,722 | ||||
| Occidental Petroleum Corp. | 21 | 1,734 | ||||
| 10,125 | ||||||
| FINANCIALS - 20.7% | ||||||
| Allstate Corp. | 58 | 1,730 | ||||
| Bank of America Corp. | 134 | 2,012 | ||||
| Goldman Sachs Group Inc. | 13 | 2,110 | ||||
| Hartford Financial Services Group Inc. | 89 | 2,070 | ||||
| JPMorgan Chase & Co. | 56 | 2,313 | ||||
| Lincoln National Corp. | 91 | 2,257 | ||||
| Morgan Stanley | 79 | 2,338 | ||||
| Travelers Cos. Inc. | 47 | 2,318 | ||||
| Wells Fargo & Co. | 88 | 2,379 | ||||
| 19,527 | ||||||
| HEALTH CARE - 9.6% | ||||||
| CIGNA Corp. | 63 | 2,233 | ||||
| Johnson & Johnson | 36 | 2,306 | ||||
| Merck & Co. Inc. | 63 | 2,284 | ||||
| Pfizer Inc. | 123 | 2,232 | ||||
| 9,055 | ||||||
| INDUSTRIALS - 11.3% | ||||||
| Caterpillar Inc. (e) | 39 | 2,234 | ||||
| Goodrich Corp. | 39 | 2,486 | ||||
| Lockheed Martin Corp. | 24 | 1,823 | ||||
| Spirit Aerosystems Holdings Inc. (c) | 64 | 1,277 | ||||
| Terex Corp. (c) | 46 | 901 | ||||
| Textron Inc. (e) | 105 | 1,977 | ||||
| 10,698 | ||||||
| INFORMATION TECHNOLOGY - 12.8% | ||||||
| Avnet Inc. (c) | 32 | 971 | ||||
| Computer Sciences Corp. (c) | 29 | 1,651 | ||||
| Hewlett-Packard Co. | 45 | 2,323 | ||||
| Ingram Micro Inc. - Class A (c) | 53 | 921 | ||||
| Intel Corp. | 70 | 1,432 | ||||
| International Business Machines Corp. | 18 | 2,409 | ||||
| Microsoft Corp. | 77 | 2,357 | ||||
| 12,064 | ||||||
| MATERIALS - 6.1% | ||||||
| Allegheny Technologies Inc. (e) | 41 | 1,831 | ||||
| Nucor Corp. | 55 | 2,542 | ||||
| PPG Industries Inc. | 23 | 1,346 | ||||
| 5,719 | ||||||
| TELECOMMUNICATION SERVICES - 5.0% | ||||||
| AT&T Inc. | 85 | 2,385 | ||||
| Verizon Communications Inc. | 72 | 2,375 | ||||
| 4,760 | ||||||
| UTILITIES - 2.1% | ||||||
| Edison International | 57 | 1,972 | ||||
| Total Common Stocks (cost $75,503) | 93,823 | |||||
| NON-U.S. GOVERNMENT AGENCY | ||||||
| ASSET-BACKED SECURITIES - 0.0% | ||||||
| Sigma Finance, Inc. (d) (f) (u) | $ | 323 | 14 | |||
| Total Non-U.S. Government Agency | ||||||
| Asset-Backed Securities (cost $323) | 14 | |||||
| SHORT TERM INVESTMENTS - 6.4% | ||||||
| Mutual Funds - 0.7% | ||||||
| JNL Money Market Fund, 0.07% (a) (h) | 702 | 702 | ||||
| Securities Lending Collateral - 5.7% | ||||||
| Securities Lending Cash Collateral Fund LLC, | ||||||
| 0.16% (a) (h) | 3,188 | 3,188 | ||||
| Securities Lending Liquidating Fund LLC, 0.36% (a) (h) | 2,193 | 2,188 | ||||
| 5,376 | ||||||
| Total Short Term Investments (cost $6,083) | 6,078 | |||||
| Total Investments - 105.9% (cost $81,909) | 99,915 | |||||
| Other Assets and Liabilities, Net - (5.9%) | (5,580) | |||||
| Total Net Assets - 100% | $ | 94,335 | ||||
| JNL/Red Rocks Listed Private Equity Fund | ||||||
| COMMON STOCKS - 98.3% | ||||||
| DIVERSIFIED - 11.8% | ||||||
| Diversified Operations - 1.5% | ||||||
| Wendel Investissement (e) | 55 | $ | 3,377 | |||
| Holding Companies - Diversified - 10.3% | ||||||
| Ackermans & van Haaren NV (e) | 59 | 4,430 | ||||
| HAL Trust NV (e) | 80 | 8,223 | ||||
| Leucadia National Corp. (c) (e) | 436 | 10,372 | ||||
| FINANCIALS - 84.9% | 23,025 | |||||
| Closed - End Funds - 23.8% | ||||||
| AP Alternative Assets LP (c) (e) | 934 | 6,125 | ||||
| ARC Capital Holdings Ltd. (c) | 4,198 | 4,135 | ||||
| Candover Investments Plc (c) | 652 | 4,398 | ||||
| Conversus Capital LP (c) | 903 | 10,175 | ||||
| Electra Private Equity Plc (c) | 298 | 5,799 | ||||
| Graphite Enterprise Trust Plc | 1,002 | 4,934 | ||||
| HgCapital Trust Plc | 505 | 6,887 | ||||
| Princess Private Equity Holding Ltd. | 737 | 3,586 | ||||
| Private Equity Investor Plc (c) | 894 | 1,632 | ||||
| SVG Capital Plc (c) | 2,701 | 5,539 | ||||
| 53,210 | ||||||
| Diversified Financial Services - 13.7% | ||||||
| Brait SA (e) | 1,292 | 3,684 | ||||
| GP Investments Ltd. | 1,376 | 8,052 | ||||
| Intermediate Capital Group Plc | 1,081 | 4,782 | ||||
| KTB Securities Co. Ltd. (c) | 582 | 2,016 | ||||
| Onex Corp. | 538 | 12,116 | ||||
| 30,650 | ||||||
| Investment Companies - 25.9% | ||||||
| China Merchants China Direct Investments Ltd. (c) | 2,395 | 5,523 | ||||
| DeA Capital SpA (c) (e) | 1,828 | 3,310 | ||||
| Eurazeo (e) | 71 | 4,980 | ||||
| KKR Private Equity Investors LLP | 2,078 | 17,664 | ||||
| Investor AB - Class B | 309 | 5,753 | ||||
| Macquarie International Infrastructure Fund Ltd. (e) | 8,312 | 2,684 | ||||
| MVC Capital Inc. | 451 | 5,321 | ||||
| Prospect Capital Corp. (e) (u) | 365 | 4,315 | ||||
| Ratos AB - Class B | 333 | 8,620 | ||||
| 58,170 | ||||||
| Venture Capital - 21.5% | ||||||
| 3i Group Plc | 2,288 | 10,455 | ||||
| 3i Infrastructure Plc | 4,358 | 7,150 | ||||
| Altamir Amboise (c) (e) | 963 | 7,252 | ||||
| Deutsche Beteiligungs AG | 261 | 6,390 | ||||
| Dinamia Capital Privado Scr SA (e) | 321 | 4,649 | ||||
| Gimv NV | 178 | 9,338 | ||||
| IP Group Plc (c) | 3,223 | 2,968 | ||||
| 48,202 | ||||||
| INFORMATION TECHNOLOGY - 1.6% | ||||||
| Internet Capital Group Inc. (c) | 549 | 3,653 | ||||
| Total Common Stocks (cost $193,098) | 220,287 | |||||
| SHORT TERM INVESTMENTS - 5.9% | ||||||
| Mutual Funds - 2.8% | ||||||
| JNL Money Market Fund, 0.07% (a) (h) | 6,305 | 6,305 | ||||
| Securities Lending Collateral - 3.1% | ||||||
| Securities Lending Cash Collateral Fund LLC, | ||||||
| 0.16% (a) (h) | 6,877 | 6,877 | ||||
| Total Short Term Investments (cost $13,182) | 13,182 | |||||
| Total Investments - 104.2% (cost $206,280) | 233,469 | |||||
| Other Assets and Liabilities, Net - (4.2%) | (9,440) | |||||
| Total Net Assets - 100% | $ | 224,029 | ||||
| JNL/S&P Managed Conservative Fund (b) | ||||||
| INVESTMENT FUNDS - 93.4% | ||||||
| JNL/AIM International Growth Fund (3.3%) (a) | 1,559 | $ | 14,447 | |||
| JNL/AIM Large Cap Growth Fund (3.1%) (a) | 1,818 | 19,541 | ||||
| JNL/Capital Guardian Global Diversified | ||||||
| Research Fund (1.9%) (a) | 302 | 6,323 | ||||
| JNL/Capital Guardian U.S. Growth Equity Fund (3.7%) (a) | 1,088 | 20,517 | ||||
| JNL/Goldman Sachs Core Plus Bond Fund (12.7%) (a) | 8,534 | 99,680 | ||||
| JNL/Goldman Sachs Emerging Markets | ||||||
| Debt Fund (0.6%) (a) | 100 | 1,190 | ||||
| JNL/JPMorgan International Value Fund (2.4%) (a) | 1,874 | 13,435 | ||||
| JNL/JPMorgan U.S. Government & Quality | ||||||
| Bond Fund (9.8%) (a) | 5,488 | 67,998 | ||||
| JNL/PIMCO Real Return Fund (6.4%) (a) | 6,605 | 76,415 | ||||
| JNL/PIMCO Total Return Bond Fund (5.5%) (a) | 10,536 | 128,430 | ||||
| JNL/Select Value Fund (3.6%) (a) | 1,428 | 22,011 | ||||
| JNL/T. Rowe Price Short-Term Bond Fund (19.4%) (a) | 9,664 | 93,839 | ||||
| JNL/T. Rowe Price Value Fund (2.7%) (a) | 2,046 | 19,310 | ||||
| Total Investment Funds (cost $591,334) | 583,136 | |||||
| SHORT TERM INVESTMENTS - 6.6% | ||||||
| Mutual Funds - 6.6% | ||||||
| JNL/Select Money Market Fund, 0.00% (2.9%) (a) (h) | 40,921 | 40,921 | ||||
| Total Short Term Investments (cost $40,921) | 40,921 | |||||
| Total Investments - 100.0% (cost $632,255) | 624,057 | |||||
| Other Assets and Liabilities, Net - 0.0% | (99) | |||||
| Total Net Assets - 100% | $ | 623,958 | ||||
| JNL/S&P Managed Moderate Fund (b) | ||||||
| INVESTMENT FUNDS - 95.5% | ||||||
| JNL/AIM Global Real Estate Fund (1.5%) (a) | 701 | $ | 5,278 | |||
| JNL/AIM International Growth Fund (7.4%) (a) | 3,425 | 31,753 | ||||
| JNL/AIM Large Cap Growth Fund (9.0%) (a) | 5,198 | 55,875 | ||||
| JNL/Capital Guardian Global Diversified | ||||||
| Research Fund (5.5%) (a) | 870 | 18,207 | ||||
| JNL/Capital Guardian International Small | ||||||
| Cap Fund (0.5%) (a) | 98 | 671 | ||||
| JNL/Capital Guardian U.S. Growth Equity Fund (8.0%) (a) | 2,355 | 44,396 | ||||
| JNL/Credit Suisse Commodity Securities Fund (0.5%) (a) | 359 | 3,381 | ||||
| JNL/Goldman Sachs Core Plus Bond Fund (14.2%) (a) | 9,541 | 111,441 | ||||
| JNL/Goldman Sachs Emerging Markets | ||||||
| Debt Fund (3.3%) (a) | 540 | 6,426 | ||||
| JNL/Goldman Sachs Mid Cap Value Fund (7.8%) (a) | 2,495 | 21,355 | ||||
| JNL/JPMorgan International Value Fund (5.8%) (a) | 4,423 | 31,710 | ||||
| JNL/JPMorgan U.S. Government & Quality | ||||||
| Bond Fund (11.2%) (a) | 6,241 | 77,327 | ||||
| JNL/Lazard Emerging Markets Fund (2.7%) (a) | 2,004 | 19,960 | ||||
| JNL/Mellon Capital Management Oil & Gas | ||||||
| Sector Fund (1.2%) (a) | 263 | 5,955 | ||||
| JNL/Oppenheimer Global Growth Fund (1.4%) (a) | 456 | 4,172 | ||||
| JNL/PIMCO Real Return Fund (9.5%) (a) | 9,732 | 112,600 | ||||
| JNL/PIMCO Total Return Bond Fund (7.1%) (a) | 13,611 | 165,917 | ||||
| JNL/Select Value Fund (8.5%) (a) | 4,198 | 64,684 | ||||
| JNL/T. Rowe Price Established Growth Fund (1.7%) (a) | 856 | 15,569 | ||||
| JNL/T. Rowe Price Mid-Cap Growth Fund (2.8%) (a) | 951 | 22,616 | ||||
| JNL/T. Rowe Price Short-Term Bond Fund (22.7%) (a) | 11,322 | 109,939 | ||||
| JNL/T. Rowe Price Value Fund (6.3%) (a) | 4,871 | 45,982 | ||||
| Total Investment Funds (cost $1,004,280) | 975,214 | |||||
| SHORT TERM INVESTMENTS - 4.5% | ||||||
| Mutual Funds - 4.5% | ||||||
| JNL/Select Money Market Fund, 0.00% (4.1%) (a) (h) | 46,270 | 46,270 | ||||
| Total Short Term Investments (cost $46,270) | 46,270 | |||||
| Total Investments - 100.0% (cost $1,050,550) | 1,021,484 | |||||
| Other Assets and Liabilities, Net - 0.0% | (149) | |||||
| Total Net Assets - 100% | $ | 1,021,335 | ||||
| JNL/S&P Managed Moderate Growth Fund (b) | ||||||
| INVESTMENT FUNDS - 96.5% | �� | |||||
| JNL/AIM Global Real Estate Fund (2.4%) (a) | 1,071 | $ | 8,063 | |||
| JNL/AIM International Growth Fund (16.0%) (a) | 7,446 | 69,027 | ||||
| JNL/AIM Large Cap Growth Fund (21.0%) (a) | 12,212 | 131,281 | ||||
| JNL/Capital Guardian Global Diversified | ||||||
| Research Fund (6.5%) (a) | 1,029 | 21,521 | ||||
| JNL/Capital Guardian International Small | ||||||
| Cap Fund (10.7%) (a) | 2,271 | 15,557 | ||||
| JNL/Capital Guardian U.S. Growth Equity Fund (17.4%) (a) | 5,109 | 96,314 | ||||
| JNL/Credit Suisse Commodity Securities Fund (1.7%) (a) | 1,192 | 11,217 | ||||
| JNL/Eagle SmallCap Equity Fund (5.9%) (a) | 1,017 | 16,418 | ||||
| JNL/Franklin Templeton Small Cap Value Fund (5.2%) (a) | 996 | 8,682 | ||||
| JNL/Goldman Sachs Core Plus Bond Fund (18.3%) (a) | 12,274 | 143,362 | ||||
| JNL/Goldman Sachs Emerging Markets | ||||||
| Debt Fund (5.1%) (a) | 831 | 9,877 | ||||
| JNL/Goldman Sachs Mid Cap Value Fund (16.6%) (a) | 5,316 | 45,502 | ||||
| JNL/JPMorgan International Value Fund (17.1%) (a) | 13,093 | 93,879 | ||||
| JNL/JPMorgan MidCap Growth Fund (4.9%) (a) | 498 | 7,944 | ||||
| JNL/JPMorgan U.S. Government & Quality | ||||||
| Bond Fund (14.6%) (a) | 8,147 | 100,936 | ||||
| JNL/Lazard Emerging Markets Fund (6.7%) (a) | 4,965 | 49,456 | ||||
| JNL/Mellon Capital Management Oil & Gas | ||||||
| Sector Fund (1.9%) (a) | 413 | 9,359 | ||||
| JNL/Oppenheimer Global Growth Fund (5.9%) (a) | 1,881 | 17,190 | ||||
| JNL/PIMCO Real Return Fund (12.7%) (a) | 13,050 | 150,983 | ||||
| JNL/PIMCO Total Return Bond Fund (7.5%) (a) | 14,530 | 177,124 | ||||
| JNL/Select Value Fund (22.1%) (a) | 10,905 | 168,043 | ||||
| JNL/T. Rowe Price Established Growth Fund (10.4%) (a) | 5,222 | 94,942 | ||||
| JNL/T. Rowe Price Mid-Cap Growth Fund (6.4%) (a) | 2,199 | 52,311 | ||||
| JNL/T. Rowe Price Short-Term Bond Fund (18.6%) (a) | 9,294 | 90,243 | ||||
| JNL/T. Rowe Price Value Fund (17.0%) (a) | 13,064 | 123,323 | ||||
| Total Investment Funds (cost $1,808,709) | 1,712,554 | |||||
| SHORT TERM INVESTMENTS - 3.5% | ||||||
| Mutual Funds - 3.5% | ||||||
| JNL/Select Money Market Fund, 0.00% (a) (h) | 62,680 | 62,680 | ||||
| Total Short Term Investments (cost $62,680) | 62,680 | |||||
| Total Investments - 100.0% (cost $1,871,389) | 1,775,234 | |||||
| Other Assets and Liabilities, Net - 0.0% | (250) | |||||
| Total Net Assets - 100% | $ | 1,774,984 | ||||
| JNL/S&P Managed Growth Fund (b) | ||||||
| INVESTMENT FUNDS - 94.4% | ||||||
| JNL/AIM Global Real Estate Fund (5.0%) (a) | 2,270 | $ | 17,097 | |||
| JNL/AIM International Growth Fund (17.3%) (a) | 8,067 | 74,781 | ||||
| JNL/AIM Large Cap Growth Fund (21.6%) (a) | 12,520 | 134,594 | ||||
| JNL/Capital Guardian Global Diversified | ||||||
| Research Fund (7.4%) (a) | 1,180 | 24,688 | ||||
| JNL/Capital Guardian International Small | ||||||
| Cap Fund (13.6%) (a) | 2,885 | 19,762 | ||||
| JNL/Capital Guardian U.S. Growth Equity Fund (13.3%) (a) | 3,925 | 73,983 | ||||
| JNL/Credit Suisse Commodity Securities Fund (1.8%) (a) | 1,194 | 11,238 | ||||
| JNL/Eagle SmallCap Equity Fund (16.8%) (a) | 2,905 | 46,914 | ||||
| JNL/Franklin Templeton Small Cap Value Fund (9.0%) (a) | 1,733 | 15,116 | ||||
| JNL/Goldman Sachs Core Plus Bond Fund (5.3%) (a) | 3,536 | 41,304 | ||||
| JNL/Goldman Sachs Emerging Markets | ||||||
| Debt Fund (3.1%) (a) | 513 | 6,099 | ||||
| JNL/Goldman Sachs Mid Cap Value Fund (16.7%) (a) | 5,371 | 45,976 | ||||
| JNL/JPMorgan International Value Fund (14.9%) (a) | 11,381 | 81,598 | ||||
| JNL/JPMorgan MidCap Growth Fund (8.5%) (a) | 878 | 13,994 | ||||
| JNL/JPMorgan U.S. Government & Quality | ||||||
| Bond Fund (3.8%) (a) | 2,128 | 26,365 | ||||
| JNL/Lazard Emerging Markets Fund (6.0%) (a) | 4,444 | 44,259 | ||||
| JNL/Mellon Capital Management Oil & Gas | ||||||
| Sector Fund (1.2%) (a) | 265 | 6,010 | ||||
| JNL/Oppenheimer Global Growth Fund (15.7%) (a) | 4,991 | 45,622 | ||||
| JNL/PIMCO Real Return Fund (6.3%) (a) | 6,486 | 75,048 | ||||
| JNL/PIMCO Total Return Bond Fund (3.8%) (a) | 7,228 | 88,113 | ||||
| JNL/Select Value Fund (21.5%) (a) | 10,645 | 164,040 | ||||
| JNL/T. Rowe Price Established Growth Fund (14.7%) (a) | 7,396 | 134,457 | ||||
| JNL/T. Rowe Price Mid-Cap Growth Fund (8.1%) (a) | 2,794 | 66,479 | ||||
| JNL/T. Rowe Price Value Fund (19.1%) (a) | 14,720 | 138,955 | ||||
| Total Investment Funds (cost $1,518,133) | 1,396,492 | |||||
| SHORT TERM INVESTMENTS - 5.6% | ||||||
| Mutual Funds - 5.6% | ||||||
| JNL/Select Money Market Fund, 0.00% (a) (h) | 83,485 | 83,485 | ||||
| Total Short Term Investments (cost $83,485) | 83,485 | |||||
| Total Investments - 100.0% (cost $1,601,618) | 1,479,977 | |||||
| Other Assets and Liabilities, Net - 0.0% | (218) | |||||
| Total Net Assets - 100% | $ | 1,479,759 | ||||
| JNL/S&P Managed Aggressive | ||||||
| Growth Fund (b) | ||||||
| INVESTMENT FUNDS - 94.2% | ||||||
| JNL/AIM Global Real Estate Fund (1.8%) (a) | 802 | $ | 6,038 | |||
| JNL/AIM International Growth Fund (8.3%) (a) | 3,882 | 35,986 | ||||
| JNL/AIM Large Cap Growth Fund (8.6%) (a) | 4,970 | 53,432 | ||||
| JNL/Capital Guardian Global Diversified | ||||||
| Research Fund (3.0%) (a) | 483 | 10,097 | ||||
| JNL/Capital Guardian International Small | ||||||
| Cap Fund (7.0%) (a) | 1,488 | 10,190 | ||||
| JNL/Capital Guardian U.S. Growth Equity Fund (2.9%) (a) | 850 | 16,015 | ||||
| JNL/Credit Suisse Commodity Securities Fund (1.1%) (a) | 745 | 7,007 | ||||
| JNL/Eagle SmallCap Equity Fund (7.5%) (a) | 1,299 | 20,977 | ||||
| JNL/Franklin Templeton Small Cap Value Fund (6.7%) (a) | 1,288 | 11,228 | ||||
| JNL/Goldman Sachs Emerging Markets | ||||||
| Debt Fund (0.6%) (a) | 100 | 1,190 | ||||
| JNL/Goldman Sachs Mid Cap Value Fund (9.5%) (a) | 3,042 | 26,039 | ||||
| JNL/JPMorgan International Value Fund (6.5%) (a) | 4,980 | 35,707 | ||||
| JNL/JPMorgan MidCap Growth Fund (6.1%) (a) | 629 | 10,032 | ||||
| JNL/JPMorgan U.S. Government & Quality | ||||||
| Bond Fund (1.8%) (a) | 996 | 12,343 | ||||
| JNL/Lazard Emerging Markets Fund (2.4%) (a) | 1,767 | 17,604 | ||||
| JNL/Mellon Capital Management Oil & Gas | ||||||
| Sector Fund (0.8%) (a) | 181 | 4,102 | ||||
| JNL/Oppenheimer Global Growth Fund (10.5%) (a) | 3,324 | 30,380 | ||||
| JNL/PAM Asia ex-Japan Fund (5.1%) (a) | 673 | 5,482 | ||||
| JNL/PIMCO Real Return Fund (0.7%) (a) | 668 | 7,731 | ||||
| JNL/Select Value Fund (10.2%) (a) | 5,044 | 77,732 | ||||
| JNL/T. Rowe Price Established Growth Fund (7.4%) (a) | 3,721 | 67,644 | ||||
| JNL/T. Rowe Price Mid-Cap Growth Fund (3.4%) (a) | 1,164 | 27,685 | ||||
| JNL/T. Rowe Price Value Fund (7.5%) (a) | 5,788 | 54,639 | ||||
| Total Investment Funds (cost $616,664) | 549,280 | |||||
| SHORT TERM INVESTMENTS - 5.8% | ||||||
| Mutual Funds - 5.8% | ||||||
| JNL/Select Money Market Fund, 0.00% (3.0%) (a) (h) | 33,691 | 33,691 | ||||
| Total Short Term Investments (cost $33,691) | 33,691 | |||||
| Total Investments - 100.0% (cost $650,355) | 582,971 | |||||
| Other Assets and Liabilities, Net - 0.0% | (103) | |||||
| Total Net Assets - 100% | $ | 582,868 | ||||
| JNL/S&P Disciplined Moderate Fund (b) | ||||||
| INVESTMENT FUNDS - 92.7% | ||||||
| JNL/Mellon Capital Management Bond | ||||||
| Index Fund (4.3%) (a) | 3,025 | $ | 34,452 | |||
| JNL/Mellon Capital Management International | ||||||
| Index Fund (2.3%) (a) | 1,413 | 16,818 | ||||
| JNL/Mellon Capital Management JNL 5 Fund (0.3%) (a) | 1,311 | 9,936 | ||||
| JNL/Mellon Capital Management JNL Optimized | ||||||
| 5 Fund (2.2%) (a) | 1,294 | 10,314 | ||||
| JNL/Mellon Capital Management S&P 400 | ||||||
| MidCap Index Fund (1.1%) (a) | 471 | 5,256 | ||||
| JNL/Mellon Capital Management S&P 500 | ||||||
| Index Fund (5.0%) (a) | 4,828 | 45,290 | ||||
| JNL/Mellon Capital Management Small Cap | ||||||
| Index Fund (0.7%) (a) | 346 | 3,469 | ||||
| JNL/Mellon Capital Management VIP Fund (3.0%) (a) | 1,604 | 9,914 | ||||
| JNL/PIMCO Real Return Fund (1.7%) (a) | 1,786 | 20,661 | ||||
| Total Investment Funds (cost $152,961) | 156,110 | |||||
| NON-U.S. GOVERNMENT AGENCY | ||||||
| ASSET-BACKED SECURITIES - 0.0% | ||||||
| Sigma Finance, Inc. (d) (f) (u) | $ | 14 | 1 | |||
| Total Non-U.S. Government Agency | ||||||
| Asset-Backed Securities (cost $0) | 1 | |||||
| SHORT TERM INVESTMENTS - 7.3% | ||||||
| Mutual Funds - 7.3% | ||||||
| JNL/Select Money Market Fund, 0.00% (1.1%) (a) (h) | 12,370 | 12,370 | ||||
| Total Short Term Investments (cost $12,370) | 12,370 | |||||
| Total Investments - 100.0% (cost $165,331) | 168,481 | |||||
| Other Assets and Liabilities, Net - 0.0% | (26) | |||||
| Total Net Assets - 100% | $ | 168,455 | ||||
| JNL/S&P Disciplined Moderate | ||||||
| Growth Fund (b) | ||||||
| INVESTMENT FUNDS - 93.3% | ||||||
| JNL/Mellon Capital Management 25 Fund (2.9%) (a) | 1,159 | $ | 12,055 | |||
| JNL/Mellon Capital Management Bond | ||||||
| Index Fund (1.4%) (a) | 942 | 10,727 | ||||
| JNL/Mellon Capital Management International | ||||||
| Index Fund (4.3%) (a) | 2,585 | 30,760 | ||||
| JNL/Mellon Capital Management JNL 5 Fund (0.5%) (a) | 2,128 | 16,133 | ||||
| JNL/Mellon Capital Management JNL Optimized | ||||||
| 5 Fund (3.7%) (a) | 2,111 | 16,824 | ||||
| JNL/Mellon Capital Management S&P 400 MidCap | ||||||
| Index Fund (1.4%) (a) | 579 | 6,466 | ||||
| JNL/Mellon Capital Management S&P 500 | ||||||
| Index Fund (5.7%) (a) | 5,515 | 51,730 | ||||
| JNL/Mellon Capital Management Select | ||||||
| Small-Cap Fund (2.7%) (a) | 951 | 9,192 | ||||
| JNL/Mellon Capital Management Small Cap | ||||||
| Index Fund (1.3%) (a) | 632 | 6,349 | ||||
| JNL/Mellon Capital Management VIP Fund (4.9%) (a) | 2,624 | 16,216 | ||||
| JNL/PIMCO Real Return Fund (1.4%) (a) | 1,397 | 16,161 | ||||
| Total Investment Funds (cost $183,343) | 192,613 | |||||
| NON-U.S. GOVERNMENT AGENCY | ||||||
| ASSET-BACKED SECURITIES - 0.0% | ||||||
| Sigma Finance, Inc. (d) (f) (u) | $11 | - | ||||
| Total Non-U.S. Government Agency | ||||||
| Asset-Backed Securities (cost $0) | - | |||||
| SHORT TERM INVESTMENTS - 6.7% | ||||||
| Mutual Funds - 6.7% | ||||||
| JNL/Select Money Market Fund, 0.00% (1.2%) (a) (h) | 13,785 | 13,785 | ||||
| Total Short Term Investments (cost $13,785) | 13,785 | |||||
| Total Investments - 100.0% (cost $197,128) | 206,398 | |||||
| Other Assets and Liabilities, Net - 0.0% | (33) | |||||
| Total Net Assets - 100% | $ | 206,365 | ||||
| JNL/S&P Disciplined Growth Fund (b) | ||||||
| INVESTMENT FUNDS - 96.0% | ||||||
| JNL/Mellon Capital Management 25 Fund (1.2%) (a) | 455 | $ | 4,733 | |||
| JNL/Mellon Capital Management Bond | ||||||
| Index Fund (0.2%) (a) | 147 | 1,671 | ||||
| JNL/Mellon Capital Management International | ||||||
| Index Fund (2.3%) (a) | 1,369 | 16,290 | ||||
| JNL/Mellon Capital Management JNL 5 Fund (0.2%) (a) | 1,153 | 8,741 | ||||
| JNL/Mellon Capital Management JNL Optimized | ||||||
| 5 Fund (2.0%) (a) | 1,147 | 9,138 | ||||
| JNL/Mellon Capital Management S&P 400 | ||||||
| MidCap Index Fund (0.5%) (a) | 227 | 2,538 | ||||
| JNL/Mellon Capital Management S&P 500 | ||||||
| Index Fund (1.9%) (a) | 1,824 | 17,105 | ||||
| JNL/Mellon Capital Management Select | ||||||
| Small-Cap Fund (1.1%) (a) | 370 | 3,576 | ||||
| JNL/Mellon Capital Management Small Cap | ||||||
| Index Fund (0.5%) (a) | 248 | 2,492 | ||||
| JNL/Mellon Capital Management VIP Fund (2.7%) (a) | 1,419 | 8,769 | ||||
| JNL/PIMCO Real Return Fund (0.2%) (a) | 220 | 2,541 | ||||
| Total Investment Funds (cost $68,834) | 77,594 | |||||
| NON-U.S. GOVERNMENT AGENCY | ||||||
| ASSET-BACKED SECURITIES - 0.0% | ||||||
| Sigma Finance, Inc. (d) (f) (u) | $13 | 1 | ||||
| Total Non-U.S. Government Agency | ||||||
| Asset-Backed Securities (cost $0) | 1 | |||||
| SHORT TERM INVESTMENTS - 4.0% | ||||||
| Mutual Funds - 4.0% | ||||||
| JNL/Select Money Market Fund, 0.00% (0.3%) (a) (h) | 3,281 | 3,281 | ||||
| Total Short Term Investments (cost $3,281) | 3,281 | |||||
| Total Investments - 100.0% (cost $72,115) | 80,876 | |||||
| Other Assets and Liabilities, Net - 0.0% | (13) | |||||
| Total Net Assets - 100% | $ | 80,863 | ||||
| JNL/S&P Competitive Advantage Fund | ||||||
| COMMON STOCKS - 99.6% | ||||||
| CONSUMER DISCRETIONARY - 29.7% | ||||||
| Apollo Group Inc. - Class A (c) | 152 | $ | 9,224 | |||
| Best Buy Co. Inc. (e) | 195 | 7,680 | ||||
| Coach Inc. | 240 | 8,768 | ||||
| Family Dollar Stores Inc. | 274 | 7,623 | ||||
| Gap Inc. | 386 | 8,086 | ||||
| Scripps Networks Interactive Inc. | 216 | 8,944 | ||||
| Sherwin-Williams Co. | 136 | 8,407 | ||||
| Starbucks Corp. (c) | 391 | 9,022 | ||||
| TJX Cos. Inc. | 220 | 8,044 | ||||
| 75,798 | ||||||
| CONSUMER STAPLES - 9.7% | ||||||
| Kimberly-Clark Corp. | 127 | 8,089 | ||||
| PepsiCo Inc. | 132 | 8,042 | ||||
| Sysco Corp. | 308 | 8,609 | ||||
| 24,740 | ||||||
| ENERGY - 10.2% | ||||||
| Consol Energy Inc. | 181 | 9,018 | ||||
| Diamond Offshore Drilling Inc. | 83 | 8,179 | ||||
| FMC Technologies Inc. (c) | 151 | 8,719 | ||||
| 25,916 | ||||||
| FINANCIALS - 3.5% | ||||||
| Federated Investors Inc. - Class B (e) | 327 | 8,992 | ||||
| HEALTH CARE - 9.6% | ||||||
| Cardinal Health Inc. | 261 | 8,423 | ||||
| CR Bard Inc. | 102 | 7,948 | ||||
| Eli Lilly & Co. | 228 | 8,134 | ||||
| 24,505 | ||||||
| INDUSTRIALS - 10.3% | ||||||
| CH Robinson Worldwide Inc. | 150 | 8,823 | ||||
| Fluor Corp. | 198 | 8,926 | ||||
| United Parcel Service Inc. - Class B | 147 | 8,427 | ||||
| 26,176 | ||||||
| INFORMATION TECHNOLOGY - 20.0% | ||||||
| Automatic Data Processing Inc. | 193 | 8,280 | ||||
| Dell Inc. (c) | 614 | 8,820 | ||||
| Microsoft Corp. | 283 | 8,640 | ||||
| Paychex Inc. | 267 | 8,193 | ||||
| Teradata Corp. (c) | 275 | 8,648 | ||||
| Total System Services Inc. (e) | 483 | 8,344 | ||||
| 50,925 | ||||||
| MATERIALS - 6.6% | ||||||
| Ecolab Inc. | 186 | 8,315 | ||||
| Monsanto Co. | 103 | 8,402 | ||||
| 16,717 | ||||||
| Total Common Stocks (cost $233,587) | 253,769 | |||||
| NON-U.S. GOVERNMENT AGENCY | ||||||
| ASSET-BACKED SECURITIES - 0.0% | ||||||
| Sigma Finance, Inc. (d) (f) (u) | $307 | 13 | ||||
| Total Non-U.S. Government Agency | ||||||
| Asset-Backed Securities (cost $307) | 13 | |||||
| SHORT TERM INVESTMENTS - 3.3% | ||||||
| Mutual Funds - 0.3% | ||||||
| JNL Money Market Fund, 0.07% (a) (h) | 648 | 648 | ||||
| Securities Lending Collateral - 3.0% | ||||||
| Securities Lending Cash Collateral Fund LLC, | ||||||
| 0.16% (a) (h) | 4,198 | 4,198 | ||||
| Securities Lending Liquidating Fund LLC, 0.36% (a) (h) | 3,446 | 3,439 | ||||
| 7,637 | ||||||
| Total Short Term Investments (cost $8,292) | 8,285 | |||||
| Total Investments - 102.9% (cost $242,186) | 262,067 | |||||
| Other Assets and Liabilities, Net - (2.9%) | (7,322) | |||||
| Total Net Assets - 100% | $ | 254,745 | ||||
| JNL/S&P Dividend Income & Growth Fund | ||||||
| COMMON STOCKS - 99.6% | ||||||
| CONSUMER DISCRETIONARY - 13.7% | ||||||
| Home Depot Inc. | 281 | $ | 8,133 | |||
| McDonald's Corp. | 125 | 7,782 | ||||
| Snap-On Inc. | 215 | 9,081 | ||||
| VF Corp. | 107 | 7,824 | ||||
| 32,820 | ||||||
| CONSUMER STAPLES - 9.8% | ||||||
| Hershey Co. | 221 | 7,893 | ||||
| Kimberly-Clark Corp. | 117 | 7,485 | ||||
| Sysco Corp. | 285 | 7,972 | ||||
| 23,350 | ||||||
| ENERGY - 9.3% | ||||||
| Chevron Corp. | 100 | 7,713 | ||||
| Exxon Mobil Corp. | 104 | 7,093 | ||||
| Marathon Oil Corp. | 241 | 7,516 | ||||
| 22,322 | ||||||
| FINANCIALS - 10.4% | ||||||
| AvalonBay Communities Inc. | 107 | 8,783 | ||||
| Cincinnati Financial Corp. | 310 | 8,123 | ||||
| M&T Bank Corp. (e) | 121 | 8,066 | ||||
| 24,972 | ||||||
| HEALTH CARE - 9.8% | ||||||
| Bristol-Myers Squibb Co. | 319 | 8,063 | ||||
| Merck & Co. Inc. | 214 | 7,803 | ||||
| Pfizer Inc. | 420 | 7,635 | ||||
| 23,501 | ||||||
| INDUSTRIALS - 6.4% | ||||||
| Lockheed Martin Corp. | 99 | 7,486 | ||||
| Pitney Bowes Inc. | 342 | 7,786 | ||||
| 15,272 | ||||||
| INFORMATION TECHNOLOGY - 10.1% | ||||||
| Automatic Data Processing Inc. | 179 | 7,662 | ||||
| Harris Corp. | 175 | 8,318 | ||||
| Intel Corp. | 401 | 8,171 | ||||
| 24,151 | ||||||
| MATERIALS - 9.7% | ||||||
| Air Products & Chemicals Inc. | 95 | 7,679 | ||||
| Bemis Co. Inc. | 266 | 7,886 | ||||
| PPG Industries Inc. | 132 | 7,727 | ||||
| 23,292 | ||||||
| TELECOMMUNICATION SERVICES - 10.1% | ||||||
| AT&T Inc. | 290 | 8,117 | ||||
| CenturyTel Inc. | 220 | 7,968 | ||||
| Verizon Communications Inc. | 244 | 8,068 | ||||
| 24,153 | ||||||
| UTILITIES - 10.3% | ||||||
| Consolidated Edison Inc. | 182 | 8,262 | ||||
| Integrys Energy Group Inc. (e) | 199 | 8,350 | ||||
| Southern Co. | 243 | 8,091 | ||||
| 24,703 | ||||||
| Total Common Stocks (cost $228,869) | 238,536 | |||||
| NON-U.S. GOVERNMENT AGENCY | ||||||
| ASSET-BACKED SECURITIES - 0.0% | ||||||
| Sigma Finance, Inc. (d) (f) (u) | $311 | 13 | ||||
| Total Non-U.S. Government Agency | ||||||
| Asset-Backed Securities (cost $311) | 13 | |||||
| SHORT TERM INVESTMENTS - 4.8% | ||||||
| Mutual Funds - 0.5% | ||||||
| JNL Money Market Fund, 0.07% (a) (h) | 1,254 | 1,254 | ||||
| Securities Lending Collateral - 4.3% | ||||||
| Securities Lending Cash Collateral Fund LLC, | ||||||
| 0.16% (a) (h) | 6,135 | 6,135 | ||||
| Securities Lending Liquidating Fund LLC, 0.36% (a) (h) | 4,152 | 4,143 | ||||
| 10,278 | ||||||
| Total Short Term Investments (cost $11,541) | 11,532 | |||||
| Total Investments - 104.4% (cost $240,721) | 250,081 | |||||
| Other Assets and Liabilities, Net - (4.4%) | (10,531) | |||||
| Total Net Assets - 100% | $ | 239,550 | ||||
| JNL/S&P Intrinsic Value Fund | ||||||
| COMMON STOCKS - 99.4% | ||||||
| CONSUMER DISCRETIONARY - 23.6% | ||||||
| Comcast Corp. - Class A (e) | 534 | $ | 9,006 | |||
| Gap Inc. | 361 | 7,562 | ||||
| H&R Block Inc. | 387 | 8,753 | ||||
| Leggett & Platt Inc. | 398 | 8,121 | ||||
| Limited Brands Inc. (e) | 453 | 8,722 | ||||
| Sherwin-Williams Co. | 129 | 7,929 | ||||
| Target Corp. | 170 | 8,235 | ||||
| 58,328 | ||||||
| CONSUMER STAPLES - 12.9% | ||||||
| Hormel Foods Corp. | 209 | 8,036 | ||||
| Reynolds American Inc. | 157 | 8,296 | ||||
| Safeway Inc. | 352 | 7,485 | ||||
| Sara Lee Corp. | 653 | 7,952 | ||||
| 31,769 | ||||||
| HEALTH CARE - 23.5% | ||||||
| Aetna Inc. | 268 | 8,502 | ||||
| AmerisourceBergen Corp. | 320 | 8,347 | ||||
| Amgen Inc. (c) | 140 | 7,927 | ||||
| Coventry Health Care Inc. (c) | 350 | 8,507 | ||||
| Laboratory Corp. of America Holdings (c) | 108 | 8,116 | ||||
| McKesson Corp. | 128 | 8,008 | ||||
| UnitedHealth Group Inc. | 277 | 8,449 | ||||
| 57,856 | ||||||
| INDUSTRIALS - 22.8% | ||||||
| Dun & Bradstreet Corp. | 101 | 8,501 | ||||
| Equifax Inc. | 272 | 8,415 | ||||
| Lockheed Martin Corp. | 100 | 7,566 | ||||
| Masco Corp. (e) | 575 | 7,939 | ||||
| Northrop Grumman Corp. | 144 | 8,041 | ||||
| Parker Hannifin Corp. | 146 | 7,873 | ||||
| Raytheon Co. | 154 | 7,922 | ||||
| 56,257 | ||||||
| INFORMATION TECHNOLOGY - 13.2% | ||||||
| Fiserv Inc. (c) | 168 | 8,165 | ||||
| Harris Corp. | 176 | 8,367 | ||||
| International Business Machines Corp. | 62 | 8,158 | ||||
| Total System Services Inc. | 455 | 7,862 | ||||
| 32,552 | ||||||
| UTILITIES - 3.4% | ||||||
| Integrys Energy Group Inc. | 201 | 8,441 | ||||
| Total Common Stocks (cost $234,758) | 245,203 | |||||
| NON-U.S. GOVERNMENT AGENCY | ||||||
| ASSET-BACKED SECURITIES - 0.0% | ||||||
| Sigma Finance, Inc. (d) (f) (u) | $ | 564 | 24 | |||
| Total Non-U.S. Government Agency | ||||||
| Asset-Backed Securities (cost $564) | 24 | |||||
| SHORT TERM INVESTMENTS - 4.6% | ||||||
| Mutual Funds - 0.9% | ||||||
| JNL Money Market Fund, 0.07% (a) (h) | 2,119 | 2,119 | ||||
| Securities Lending Collateral - 3.7% | ||||||
| Securities Lending Cash Collateral Fund LLC, | ||||||
| 0.16% (a) (h) | 4,630 | 4,630 | ||||
| Securities Lending Liquidating Fund LLC, 0.36% (a) (h) | 4,465 | 4,455 | ||||
| 9,085 | ||||||
| Total Short Term Investments (cost $11,214) | 11,204 | |||||
| Total Investments - 104.0% (cost $246,536) | 256,431 | |||||
| Other Assets and Liabilities, Net - (4.0%) | (9,745) | |||||
| Total Net Assets - 100% | $ | 246,686 | ||||
| JNL/S&P Total Yield Fund | ||||||
| COMMON STOCKS - 100.0% | ||||||
| CONSUMER DISCRETIONARY - 29.1% | ||||||
| Comcast Corp. - Class A | 461 | $ | 7,770 | |||
| DR Horton Inc. (e) | 662 | 7,197 | ||||
| Gannett Co. Inc. | 689 | 10,228 | ||||
| Leggett & Platt Inc. (e) | 347 | 7,070 | ||||
| Mattel Inc. | 346 | 6,921 | ||||
| Meredith Corp. (e) | 264 | 8,132 | ||||
| Pulte Homes Inc. (c) (e) | 741 | 7,410 | ||||
| Washington Post Co. | 17 | 7,398 | ||||
| 62,126 | ||||||
| CONSUMER STAPLES - 16.1% | ||||||
| Dean Foods Co. (c) | 427 | 7,705 | ||||
| HJ Heinz Co. | 160 | 6,842 | ||||
| JM Smucker Co. | 116 | 7,159 | ||||
| Safeway Inc. | 303 | 6,457 | ||||
| SUPERVALU Inc. | 483 | 6,135 | ||||
| 34,298 | ||||||
| FINANCIALS - 25.6% | ||||||
| American Express Co. | 167 | 6,769 | ||||
| American International Group Inc. (c) (e) | 224 | 6,709 | ||||
| Bank of America Corp. | 434 | 6,535 | ||||
| Capital One Financial Corp. (e) | 182 | 6,971 | ||||
| Goldman Sachs Group Inc. | 41 | 6,955 | ||||
| Morgan Stanley | 219 | 6,484 | ||||
| ProLogis | 517 | 7,079 | ||||
| State Street Corp. | 161 | 7,029 | ||||
| 54,531 | ||||||
| INDUSTRIALS - 15.7% | ||||||
| Caterpillar Inc. | 116 | 6,595 | ||||
| General Electric Co. | 427 | 6,456 | ||||
| PACCAR Inc. | 181 | 6,578 | ||||
| Pitney Bowes Inc. | 298 | 6,789 | ||||
| Ryder System Inc. | 168 | 6,928 | ||||
| 33,346 | ||||||
| INFORMATION TECHNOLOGY - 10.2% | ||||||
| Fiserv Inc. (c) | 146 | 7,071 | ||||
| International Business Machines Corp. | 54 | 7,098 | ||||
| Xerox Corp. | 884 | 7,482 | ||||
| 21,651 | ||||||
| MATERIALS - 3.3% | ||||||
| International Paper Co. | 266 | 7,133 | ||||
| Total Common Stocks (cost $200,479) | 213,085 | |||||
| NON-U.S. GOVERNMENT AGENCY | ||||||
| ASSET-BACKED SECURITIES - 0.0% | ||||||
| Sigma Finance, Inc. (d) (f) (u) | $730 | 31 | ||||
| Total Non-U.S. Government Agency | ||||||
| Asset-Backed Securities (cost $730) | 31 | |||||
| SHORT TERM INVESTMENTS - 13.0% | ||||||
| Mutual Funds - 0.3% | ||||||
| JNL Money Market Fund, 0.07% (a) (h) | 616 | 616 | ||||
| Securities Lending Collateral - 12.7% | ||||||
| Securities Lending Cash Collateral Fund LLC, | ||||||
| 0.16% (a) (h) | 16,656 | 16,656 | ||||
| Securities Lending Liquidating Fund LLC, 0.36% (a) (h) | 10,418 | 10,396 | ||||
| 27,052 | ||||||
| Total Short Term Investments (cost $27,690) | 27,668 | |||||
| Total Investments - 113.0% (cost $228,899) | 240,784 | |||||
| Other Assets and Liabilities, Net - (13.0%) | (27,748) | |||||
| Total Net Assets - 100% | $ | 213,036 | ||||
| JNL/S&P 4 Fund (b) | ||||||
| INVESTMENT FUNDS - 100.0% | ||||||
| JNL/S&P Competitive Advantage Fund (60.7%) (a) | 15,497 | $ | 154,192 | |||
| JNL/S&P Dividend Income & Growth Fund (65.3%) (a) | 17,968 | 156,139 | ||||
| JNL/S&P Intrinsic Value Fund (64.5%) (a) | 16,248 | 158,414 | ||||
| JNL/S&P Total Yield Fund (74.5%) (a) | 17,439 | 158,696 | ||||
| Total Investment Funds (cost $528,371) | 627,441 | |||||
| Total Investments - 100.0% (cost $528,371) | 627,441 | |||||
| Other Assets and Liabilities, Net - 0.0% | (36) | |||||
| Total Net Assets - 100% | $ | 627,405 | ||||
| JNL/Select Balanced Fund | ||||||
| COMMON STOCKS - 64.4% | ||||||
| CONSUMER DISCRETIONARY - 4.5% | ||||||
| Comcast Corp. - Class A | 362 | $ | 6,102 | |||
| Gap Inc. | 173 | 3,622 | ||||
| Honda Motor Co. Ltd. - ADR | 78 | 2,631 | ||||
| Limited Brands Inc. | 192 | 3,688 | ||||
| Lowe's Cos. Inc. | 139 | 3,240 | ||||
| Staples Inc. | 250 | 6,150 | ||||
| Time Warner Inc. (e) | 143 | 4,163 | ||||
| Walt Disney Co. (e) | 122 | 3,944 | ||||
| 33,540 | ||||||
| CONSUMER STAPLES - 6.2% | ||||||
| CVS Caremark Corp. | 93 | 3,005 | ||||
| Kimberly-Clark Corp. | 67 | 4,249 | ||||
| PepsiCo Inc. | 128 | 7,807 | ||||
| Philip Morris International Inc. | 157 | 7,556 | ||||
| Procter & Gamble Co. | 87 | 5,287 | ||||
| Smithfield Foods Inc. (c) | 283 | 4,294 | ||||
| Unilever NV - NYS | 173 | 5,580 | ||||
| Wal-Mart Stores Inc. | 148 | 7,905 | ||||
| 45,683 | ||||||
| ENERGY - 9.5% | ||||||
| Anadarko Petroleum Corp. | 82 | 5,143 | ||||
| Baker Hughes Inc. (e) | 128 | 5,185 | ||||
| Cenovus Energy Inc. | 157 | 3,959 | ||||
| Chevron Corp. | 202 | 15,544 | ||||
| EnCana Corp. | 168 | 5,429 | ||||
| Exxon Mobil Corp. | 202 | 13,781 | ||||
| Marathon Oil Corp. | 245 | 7,661 | ||||
| Total SA - ADR | 176 | 11,271 | ||||
| XTO Energy Inc. | 48 | 2,245 | ||||
| 70,218 | ||||||
| FINANCIALS - 9.9% | ||||||
| ACE Ltd. | 145 | 7,298 | ||||
| Bank of America Corp. | 460 | 6,925 | ||||
| Chubb Corp. | 108 | 5,316 | ||||
| Goldman Sachs Group Inc. | 19 | 3,174 | ||||
| JPMorgan Chase & Co. | 234 | 9,755 | ||||
| M&T Bank Corp. (e) | 38 | 2,549 | ||||
| Marsh & McLennan Cos. Inc. | 144 | 3,175 | ||||
| MetLife Inc. | 205 | 7,247 | ||||
| PNC Financial Services Group Inc. (e) | 77 | 4,086 | ||||
| State Street Corp. | 56 | 2,443 | ||||
| Travelers Cos. Inc. | 56 | 2,797 | ||||
| UBS AG (c) | 222 | 3,446 | ||||
| Wells Fargo & Co. | 559 | 15,093 | ||||
| 73,304 | ||||||
| HEALTH CARE - 9.5% | ||||||
| Bristol-Myers Squibb Co. | 252 | 6,358 | ||||
| Cardinal Health Inc. | 143 | 4,610 | ||||
| Covidien Plc | 116 | 5,565 | ||||
| Eli Lilly & Co. (e) | 289 | 10,334 | ||||
| Johnson & Johnson | 127 | 8,174 | ||||
| Medtronic Inc. | 170 | 7,477 | ||||
| Merck & Co. Inc. | 355 | 12,967 | ||||
| Pfizer Inc. | 599 | 10,903 | ||||
| UnitedHealth Group Inc. | 129 | 3,926 | ||||
| 70,314 | ||||||
| INDUSTRIALS - 8.4% | ||||||
| Caterpillar Inc. | 46 | 2,644 | ||||
| Continental Airlines Inc. - Class B (c) | 177 | 3,174 | ||||
| Deere & Co. (e) | 152 | 8,238 | ||||
| FedEx Corp. | 54 | 4,540 | ||||
| General Dynamics Corp. | 81 | 5,501 | ||||
| Honeywell International Inc. | 130 | 5,100 | ||||
| Lockheed Martin Corp. | 76 | 5,696 | ||||
| Parker Hannifin Corp. | 87 | 4,677 | ||||
| Pentair Inc. | 213 | 6,873 | ||||
| Siemens AG - ADR | 50 | 4,585 | ||||
| United Parcel Service Inc. - Class B | 117 | 6,730 | ||||
| Waste Management Inc. | 118 | 3,990 | ||||
| 61,748 | ||||||
| INFORMATION TECHNOLOGY - 7.9% | ||||||
| Accenture Plc | 137 | 5,702 | ||||
| Analog Devices Inc. (e) | 120 | 3,780 | ||||
| AOL Inc. (c) | - | - | ||||
| Automatic Data Processing Inc. | 117 | 5,019 | ||||
| Avnet Inc. (c) | 96 | 2,898 | ||||
| Cisco Systems Inc. (c) | 193 | 4,608 | ||||
| Corning Inc. | 203 | 3,924 | ||||
| Hewlett-Packard Co. (e) | 89 | 4,605 | ||||
| International Business Machines Corp. | 114 | 14,975 | ||||
| Microsoft Corp. | 219 | 6,671 | ||||
| Texas Instruments Inc. | 227 | 5,910 | ||||
| 58,092 | ||||||
| MATERIALS - 3.2% | ||||||
| Agrium Inc. | 67 | 4,127 | ||||
| Barrick Gold Corp. | 104 | 4,099 | ||||
| BHP Billiton Ltd. - ADR | 42 | 3,224 | ||||
| International Paper Co. | 175 | 4,689 | ||||
| Owens-Illinois Inc. (c) | 102 | 3,356 | ||||
| Sonoco Products Co. | 150 | 4,399 | ||||
| 23,894 | ||||||
| TELECOMMUNICATION SERVICES - 2.5% | ||||||
| AT&T Inc. | 648 | 18,175 | ||||
| UTILITIES - 2.8% | ||||||
| Dominion Resources Inc. (e) | 233 | 9,084 | ||||
| Exelon Corp. | 100 | 4,902 | ||||
| PG&E Corp. | 143 | 6,385 | ||||
| 20,371 | ||||||
| Total Common Stocks (cost $424,747) | 475,339 | |||||
| PREFERRED STOCKS - 0.1% | ||||||
| FINANCIALS - 0.1% | ||||||
| Bank of America Corp., 10.00% | 56 | 828 | ||||
| Total Preferred Stocks (cost $833) | 828 | |||||
| NON-U.S. GOVERNMENT AGENCY | ||||||
| ASSET-BACKED SECURITIES - 1.1% | ||||||
| Banc of America Commercial Mortgage Inc. | ||||||
| REMIC, 5.12%, 07/11/43 | $ | 750 | 776 | |||
| REMIC, 5.74%, 05/10/45 (i) | 350 | 344 | ||||
| REMIC, 5.18%, 09/10/47 (i) | 1,200 | 1,178 | ||||
| Bank of America-First Union NB Commercial Mortgage | ||||||
| REMIC, 5.46%, 04/11/37 | 498 | 518 | ||||
| Carmax Auto Owner Trust, 4.79%, 02/15/13 | 500 | 521 | ||||
| Citibank Credit Card Issuance Trust, 5.65%, 09/20/19 | 750 | 812 | ||||
| Commercial Mortgage Acceptance Corp. | ||||||
| REMIC, 7.78%, 06/15/31 (i) | 71 | 71 | ||||
| Continental Airlines Inc., 5.98%, 04/19/22 | 280 | 270 | ||||
| GE Capital Commercial Mortgage Corp. | ||||||
| REMIC, 6.03%, 08/11/33 | 79 | 80 | ||||
| GS Mortgage Securities Corp. II REMIC, 4.75%, 07/10/39 | 900 | 871 | ||||
| JPMorgan Chase Commercial Mortgage Securities Corp. | ||||||
| REMIC, 5.46%, 03/11/39 (i) | 415 | 406 | ||||
| REMIC, 5.54%, 09/11/41 | 600 | 584 | ||||
| Marriott Vacation Club Trust, 5.36%, 10/20/28 (t) (v) | 45 | 44 | ||||
| Merrill Lynch Mortgage Trust REMIC, 5.05%, 07/12/38 (i) | 500 | 486 | ||||
| Morgan Stanley Dean Witter Capital I REMIC, | ||||||
| 5.98%, 01/15/39 | 560 | 586 | ||||
| Sigma Finance, Inc. (d) (f) (u) | 1,046 | 44 | ||||
| Southwest Airlines Co., 6.15%, 08/01/22 | 238 | 236 | ||||
| Total Non-U.S. Government Agency | ||||||
| Asset-Backed Securities (cost $8,788) | 7,827 | |||||
| CORPORATE BONDS AND NOTES - 9.0% | ||||||
| CONSUMER DISCRETIONARY - 0.6% | ||||||
| Comcast Corp., 6.55%, 07/01/39 (e) | 375 | 393 | ||||
| COX Communications Inc., 5.45%, 12/15/14 | 500 | 536 | ||||
| Daimler Finance North America LLC, 8.50%, 01/18/31 (e) | 300 | 369 | ||||
| Grupo Televisa SA, 6.63%, 01/15/40 (t) (v) | 375 | 371 | ||||
| Lowe's Cos. Inc., 6.65%, 09/15/37 | 420 | 479 | ||||
| News America Inc., 5.65%, 08/15/20 (e) (t) (v) | 195 | 203 | ||||
| Staples Inc., 9.75%, 01/15/14 (l) | 335 | 408 | ||||
| Time Warner Cable Inc. | ||||||
| 5.85%, 05/01/17 | 270 | 284 | ||||
| 5.00%, 02/01/20 | 500 | 485 | ||||
| Viacom Inc., 6.88%, 04/30/36 | 670 | 724 | ||||
| 4,252 | ||||||
| CONSUMER STAPLES - 0.3% | ||||||
| Anheuser-Busch InBev Worldwide Inc., | ||||||
| 6.88%, 11/15/19 (t) (v) | 480 | 536 | ||||
| CVS Caremark Corp. | ||||||
| 6.13%, 08/15/16 (e) | 400 | 431 | ||||
| 5.75%, 06/01/17 | 245 | 259 | ||||
| Kraft Foods Inc., 6.25%, 06/01/12 | 825 | 889 | ||||
| 2,115 | ||||||
| ENERGY - 0.3% | ||||||
| ConocoPhillips, 4.60%, 01/15/15 | 500 | 531 | ||||
| EOG Resources Inc., 5.63%, 06/01/19 | 190 | 202 | ||||
| Indianapolis Power & Light Co. (insured by | ||||||
| AMBAC Assurance Corp.), 6.60%, 06/01/37 (t) (v) | 500 | 530 | ||||
| PPL Electric Utilities Corp., 6.25%, 05/15/39 | 60 | 64 | ||||
| San Diego Gas & Electric Co., 6.00%, 06/01/39 | 100 | 107 | ||||
| Shell International Finance BV, 3.25%, 09/22/15 (e) | 550 | 550 | ||||
| StatoilHydro ASA, 5.25%, 04/15/19 | 215 | 228 | ||||
| 2,212 | ||||||
| FINANCIALS - 5.5% | ||||||
| Ace Capital Trust II, 9.70%, 04/01/30 | 525 | 590 | ||||
| American Express Centurion Bank, 6.00%, 09/13/17 | 850 | 881 | ||||
| ANZ National International Ltd., 2.38%, 12/21/12 (t) (v) | 260 | 258 | ||||
| ASIF Global Financing XIX, 4.90%, 01/17/13 (t) (v) | 500 | 460 | ||||
| AXA SA, 8.60%, 12/15/30 | 425 | 494 | ||||
| Bank of America Corp. | ||||||
| 6.50%, 08/01/16 | 600 | 645 | ||||
| 5.42%, 03/15/17 | 700 | 691 | ||||
| Bank of New York Mellon | ||||||
| 4.30%, 05/15/14 | 240 | 253 | ||||
| 5.45%, 05/15/19 | 500 | 525 | ||||
| Barclays Bank Plc, 6.75%, 5/22/19 | 320 | 357 | ||||
| Capital One Capital IV, 6.75%, 02/17/37 | 250 | 208 | ||||
| CDP Financial, 4.40%, 11/25/19 (t) (v) | 600 | 575 | ||||
| Charles Schwab Corp., 4.95%, 06/01/14 | 190 | 200 | ||||
| Citigroup Inc. | ||||||
| 5.50%, 10/15/14 (e) | 515 | 521 | ||||
| 8.50%, 05/22/19 | 400 | 462 | ||||
| 8.13%, 07/15/39 | 115 | 130 | ||||
| Credit Suisse USA Inc., 4.88%, 01/15/15 (e) | 345 | 361 | ||||
| Discover Financial Services, 6.45%, 06/12/17 | 90 | 84 | ||||
| Eaton Vance Corp., 6.50%, 10/02/17 | 160 | 165 | ||||
| EDP Finance BV, 4.90%, 10/01/19 (t) (v) | 390 | 387 | ||||
| Enel Finance International SA | ||||||
| 5.13%, 10/07/19 (t) (v) | 350 | 352 | ||||
| 6.80%, 09/15/37 (e) (t) (v) | 235 | 260 | ||||
| Everest Reinsurance Holdings Inc., 5.40%, 10/15/14 | 215 | 210 | ||||
| General Electric Capital Corp. | ||||||
| 3.00%, 12/09/11 | 5,000 | 5,154 | ||||
| 5.88%, 02/15/12 (e) | 1,000 | 1,071 | ||||
| 5.90%, 05/13/14 | 250 | 270 | ||||
| Goldman Sachs Group Inc. | ||||||
| 1.63%, 07/15/11 | 4,000 | 4,036 | ||||
| 5.63%, 01/15/17 | 1,350 | 1,379 | ||||
| Hartford Financial Services Group Inc., 6.10%, 10/01/41 | 700 | 559 | ||||
| HCP Inc., 6.00%, 01/30/17 | 365 | 344 | ||||
| HSBC Bank USA, 5.88%, 11/01/34 | 250 | 243 | ||||
| HSBC Finance Corp., 6.38%, 11/27/12 | 500 | 545 | ||||
| International Lease Finance Corp., 5.65%, 06/01/14 | 1,000 | 756 | ||||
| JPMorgan Chase & Co. | ||||||
| 3.70%, 01/20/15 | 600 | 602 | ||||
| 6.30%, 04/23/19 | 475 | 523 | ||||
| 6.40%, 05/15/38 | 425 | 468 | ||||
| Kimco Realty Corp., 5.78%, 03/15/16 | 345 | 341 | ||||
| Liberty Mutual Insurance Co., 7.88%, 10/15/26 (t) (v) | 475 | 449 | ||||
| Liberty Property LP, 6.63%, 10/01/17 | 225 | 218 | ||||
| Metropolitan Life Global Funding I, 2.88%, 09/17/12 (t) (v) | 600 | 605 | ||||
| Morgan Stanley | ||||||
| 2.00%, 09/22/11 | 5,000 | 5,077 | ||||
| 6.00%, 05/13/14 | 400 | 430 | ||||
| 5.38%, 10/15/15 | 170 | 176 | ||||
| 5.45%, 01/09/17 | 700 | 708 | ||||
| National Rural Utilities Cooperative Finance Corp., | ||||||
| 5.45%, 02/01/18 (e) | 1,000 | 1,044 | ||||
| Nordea Bank AB, 3.70%, 11/13/14 (t) (v) | 345 | 344 | ||||
| PNC Funding Corp., 5.40%, 06/10/14 | 525 | 561 | ||||
| ProLogis, 5.63%, 11/15/16 | 400 | 369 | ||||
| Prudential Financial Inc., 5.50%, 03/15/16 | 425 | 426 | ||||
| Realty Income Corp., 6.75%, 08/15/19 | 355 | 348 | ||||
| Simon Property Group LP, 6.10%, 05/01/16 | 325 | 332 | ||||
| Sovereign Bank, 8.75%, 05/30/18 | 450 | 520 | ||||
| Svenska Handelsbanken AB, 4.88%, 06/10/14 (t) (v) | 700 | 733 | ||||
| U.S. Bank NA, 4.95%, 10/30/14 (e) | 450 | 477 | ||||
| US Bancorp, 2.88%, 11/20/14 (e) | 500 | 488 | ||||
| Wachovia Corp., 5.25%, 08/01/14 | 500 | 518 | ||||
| WEA Finance LLC | ||||||
| 5.70%, 10/01/16 (t) (v) | 100 | 103 | ||||
| 7.13%, 04/15/18 (t) (v) | 350 | 383 | ||||
| Wells Fargo & Co., 3.75%, 10/01/14 | 575 | 573 | ||||
| 40,242 | ||||||
| HEALTH CARE - 0.3% | ||||||
| Amgen Inc., 6.15%, 06/01/18 | 425 | 471 | ||||
| Express Scripts Inc., 6.25%, 06/15/14 (e) | 160 | 175 | ||||
| Merck & Co. Inc., 4.00%, 06/30/15 | 370 | 386 | ||||
| Schering-Plough Corp., 5.30%, 12/01/13 (l) | 450 | 495 | ||||
| Thermo Fisher Scientific Inc., 3.25%, 11/18/14 (t) (v) | 140 | 137 | ||||
| UnitedHealth Group Inc., 5.50%, 11/15/12 | 500 | 534 | ||||
| 2,198 | ||||||
| INDUSTRIALS - 0.3% | ||||||
| Cargill Inc., 5.60%, 09/15/12 (t) (v) | 485 | 522 | ||||
| Deere & Co., 4.38%, 10/16/19 | 185 | 185 | ||||
| Pitney Bowes Inc., 5.75%, 09/15/17 | 385 | 413 | ||||
| Siemens Financieringsmaatschappij NV, | ||||||
| 5.75%, 10/17/16 (e) (t) (v) | 675 | 728 | ||||
| Southwest Airlines Co., 5.75%, 12/15/16 | 500 | 494 | ||||
| 2,342 | ||||||
| INFORMATION TECHNOLOGY - 0.4% | ||||||
| Cisco Systems Inc., 4.45%, 01/15/20 | 500 | 490 | ||||
| Dell Inc., 5.88%, 06/15/19 | 460 | 487 | ||||
| Fiserv Inc., 6.13%, 11/20/12 | 450 | 490 | ||||
| Hewlett-Packard Co., 5.25%, 03/01/12 | 350 | 375 | ||||
| Intuit Inc., 5.40%, 03/15/12 | 550 | 584 | ||||
| Oracle Corp., 6.13%, 07/08/39 | 500 | 525 | ||||
| Xerox Corp., 8.25%, 05/15/14 | 125 | 143 | ||||
| 3,094 | ||||||
| MATERIALS - 0.1% | ||||||
| Potash Corp. of Saskatchewan Inc., 4.88%, 03/30/20 | 675 | 666 | ||||
| TELECOMMUNICATION SERVICES - 0.7% | ||||||
| AT&T Inc. | ||||||
| 6.45%, 06/15/34 | 480 | 489 | ||||
| 6.80%, 05/15/36 (e) | 150 | 160 | ||||
| AT&T Wireless Services Inc., 7.88%, 03/01/11 | 750 | 806 | ||||
| BellSouth Corp., 6.55%, 06/15/34 | 300 | 308 | ||||
| BellSouth Telecommunications Inc., 7.00%, 12/01/95 | 70 | 69 | ||||
| Deutsche Telekom International Finance BV, | ||||||
| 8.75%, 06/15/30 (l) | 275 | 354 | ||||
| France Telecom SA, 4.38%, 07/08/14 | 230 | 240 | ||||
| Telecom Italia Capital SA, 5.25%, 10/01/15 | 675 | 706 | ||||
| Verizon Global Funding Corp., 7.75%, 12/01/30 | 500 | 587 | ||||
| Verizon Wireless Capital LLC, 5.55%, 02/01/14 | 500 | 543 | ||||
| Vodafone Group Plc, 5.45%, 06/10/19 | 600 | 621 | ||||
| 4,883 | ||||||
| UTILITIES - 0.5% | ||||||
| Abu Dhabi National Energy Co. | ||||||
| 5.62%, 10/25/12 (t) (v) | 250 | 255 | ||||
| 5.88%, 10/27/16 (t) (v) | 195 | 188 | ||||
| Atmos Energy Corp., 6.35%, 06/15/17 | 385 | 409 | ||||
| Colorado Public Service Co., 5.13%, 06/01/19 | 500 | 520 | ||||
| Consolidated Edison Co. of New York Inc., 5.30%, 12/01/16 | 250 | 260 | ||||
| MidAmerican Energy Co., 5.65%, 07/15/12 (e) | 500 | 540 | ||||
| MidAmerican Energy Holdings Co., 6.13%, 04/01/36 | 350 | 358 | ||||
| Niagara Mohawk Power Corp., 3.55%, 10/01/14 (t) (v) | 415 | 414 | ||||
| Pennsylvania Electric Co., 5.20%, 04/01/20 | 600 | 591 | ||||
| Southern California Edison Co., 5.55%, 01/15/37 (e) | 500 | 497 | ||||
| 4,032 | ||||||
| Total Corporate Bonds and Notes (cost $64,673) | 66,036 | |||||
| GOVERNMENT AND AGENCY OBLIGATIONS - 21.7% | ||||||
| GOVERNMENT SECURITIES - 11.4% | ||||||
| Municipals - 0.9% | ||||||
| Bay Area Toll Authority, 6.26%, 04/01/49 | 600 | 573 | ||||
| Dallas Area Rapid Transit | ||||||
| (insured by AMBAC Assurance Corp.), 6.00%, 12/01/44 | 650 | 666 | ||||
| Illinois State Toll Highway Municipal Bond, 6.18%, 01/01/34 | 565 | 561 | ||||
| Los Angeles Unified School District, 5.75%, 07/01/34 | 800 | 739 | ||||
| Maryland Transportation Authority, 5.89%, 07/01/43 | 265 | 265 | ||||
| Massachusetts School Building Authority, 5.72%, 08/15/39 | 500 | 491 | ||||
| New Jersey State Turnpike Authority, 7.41%, 01/01/40 | 205 | 230 | ||||
| New York, NJ, Port Authority Revenue | ||||||
| 5.86%, 12/01/24 | 180 | 187 | ||||
| 6.04%, 12/01/29 | 105 | 105 | ||||
| North Texas Tollway Authority, 6.72%, 01/01/49 | 600 | 623 | ||||
| Oregon School Boards Association | ||||||
| (insured by AMBAC Assurance Corp.), 4.76%, 06/30/28 | 420 | 355 | ||||
| San Antonio Texas Electric & Gas, 5.99%, 02/01/20 | 135 | 136 | ||||
| State of California, 6.20%, 10/01/19 | 275 | 265 | ||||
| University of California, 5.77%, 05/15/43 | 615 | 597 | ||||
| University of California, Series F, 6.58%, 05/15/49 | 370 | 360 | ||||
| University of Missouri, 5.96%, 11/01/39 | 360 | 368 | ||||
| 6,521 | ||||||
| Sovereign - 0.8% | ||||||
| Financing Corp. Fico | ||||||
| 0.00%, 12/06/13 (j) | 275 | 243 | ||||
| 0.00%, 12/27/13 (j) | 220 | 194 | ||||
| Province of Ontario, Canada, 4.00%, 10/07/19 (e) | 550 | 527 | ||||
| Qatar Government International Bond, | ||||||
| 4.00%, 01/20/15 (t) (v) | 425 | 426 | ||||
| Resolution Funding Corp. - Interest Only Strip, | ||||||
| 3.88%, 04/15/14 | 2,550 | 2,254 | ||||
| Tennessee Valley Authority, 4.38%, 06/15/15 (e) | 1,900 | 1,994 | ||||
| 5,638 | ||||||
| U.S. Treasury Securities - 9.7% | ||||||
| U.S. Treasury Bond, 4.25%, 05/15/39 | 1,000 | 938 | ||||
| U.S. Treasury Note | ||||||
| 2.38%, 08/31/10 | 2,000 | 2,026 | ||||
| 1.00%, 07/31/11 | 9,300 | 9,314 | ||||
| 1.00%, 09/30/11 | 36,500 | 36,490 | ||||
| 4.50%, 03/31/12 | 2,225 | 2,381 | ||||
| 1.38%, 05/15/12 (e) | 13,000 | 13,000 | ||||
| 4.75%, 05/31/12 | 2,000 | 2,160 | ||||
| 3.13%, 09/30/13 | 2,500 | 2,598 | ||||
| 1.88%, 02/28/14 | 2,000 | 1,967 | ||||
| 3.88%, 05/15/18 | 1,000 | 1,015 | ||||
| 71,889 | ||||||
| U.S. GOVERNMENT AGENCY | ||||||
| MORTGAGE-BACKED SECURITIES - 10.3% | ||||||
| Federal Home Loan Mortgage Corp. - 4.9% | ||||||
| Federal Home Loan Mortgage Corp. | ||||||
| 3.50%, 05/29/13 | 5,000 | 5,231 | ||||
| 5.50%, 10/01/16 | 152 | 162 | ||||
| 6.00%, 04/01/17 | 113 | 121 | ||||
| 5.00%, 10/01/17 | 138 | 145 | ||||
| 6.50%, 11/01/17 | 48 | 52 | ||||
| 5.00%, 01/01/18 | 58 | 61 | ||||
| 5.50%, 01/01/18 | 1 | 1 | ||||
| 5.00%, 04/01/18 | 76 | 80 | ||||
| 4.50%, 05/01/18 | 94 | 98 | ||||
| 5.00%, 05/01/18 | 146 | 154 | ||||
| 4.50%, 09/01/18 | 116 | 121 | ||||
| 4.50%, 11/01/18 | 76 | 78 | ||||
| 4.50%, 11/01/18 | 162 | 169 | ||||
| 5.50%, 11/01/18 | 76 | 81 | ||||
| 5.50%, 01/01/19 | 249 | 265 | ||||
| 4.50%, 03/01/19 | 707 | 734 | ||||
| 5.50%, 08/01/19 | 231 | 247 | ||||
| 5.00%, 05/01/21 | 1,093 | 1,149 | ||||
| 5.00%, 12/01/21 | 103 | 108 | ||||
| 5.00%, 02/01/23 | 65 | 69 | ||||
| 5.00%, 03/01/23 | 45 | 48 | ||||
| 5.00%, 05/01/23 | 191 | 200 | ||||
| 5.00%, 07/01/23 | 1,793 | 1,877 | ||||
| 5.00%, 07/01/23 | 1,032 | 1,080 | ||||
| 5.00%, 08/01/23 | 1,020 | 1,067 | ||||
| 7.00%, 11/01/30 | 112 | 124 | ||||
| 6.00%, 01/16/31, TBA (g) | 11,400 | 12,088 | ||||
| 7.00%, 02/01/31 | 38 | 42 | ||||
| 7.00%, 06/01/31 | 31 | 34 | ||||
| 7.00%, 10/01/32 | 103 | 114 | ||||
| 4.50%, 04/01/38 | 76 | 76 | ||||
| 4.50%, 09/01/38 | 72 | 72 | ||||
| 4.50%, 02/01/39 | 5,243 | 5,236 | ||||
| 4.50%, 02/01/39 | 1,162 | 1,161 | ||||
| 4.50%, 03/01/39 | 3,568 | 3,562 | ||||
| 35,907 | ||||||
| Federal National Mortgage Association - 4.7% | ||||||
| 5.00%, 11/01/17 | 59 | 62 | ||||
| 6.00%, 01/01/18 | 34 | 36 | ||||
| 5.00%, 02/01/18 | 276 | 291 | ||||
| 5.00%, 12/01/18 | 415 | 437 | ||||
| 5.00%, 03/01/21 | 406 | 426 | ||||
| 7.50%, 09/01/29 | 38 | 43 | ||||
| 7.00%, 10/01/33 | 283 | 312 | ||||
| 4.50%, 11/01/33 | 162 | 163 | ||||
| 4.50%, 12/01/33 | 316 | 318 | ||||
| 4.50%, 09/01/35 | 301 | 302 | ||||
| 4.50%, 09/01/35 | 732 | 735 | ||||
| 6.00%, 01/16/37, TBA (g) | 11,400 | 12,073 | ||||
| 4.50%, 02/01/39 | 8,219 | 8,212 | ||||
| 4.50%, 02/01/39 | 966 | 965 | ||||
| 4.50%, 03/01/39 | 8,173 | 8,166 | ||||
| 4.50%, 03/01/39 | 2,301 | 2,299 | ||||
| 34,840 | ||||||
| Government National Mortgage Association - 0.7% | ||||||
| Government National Mortgage Association | ||||||
| 6.50%, 04/15/26 | 40 | 43 | ||||
| 5.50%, 11/15/32 | 96 | 101 | ||||
| 7.00%, 01/15/33 | 40 | 44 | ||||
| 6.00%, 02/15/33 | 129 | 137 | ||||
| 6.00%, 03/15/33 | 40 | 42 | ||||
| 5.50%, 05/15/33 | 99 | 104 | ||||
| 7.00%, 05/15/33 | 20 | 22 | ||||
| 5.50%, 05/20/33 | 145 | 153 | ||||
| 5.00%, 06/20/33 | 80 | 83 | ||||
| 5.50%, 07/15/33 | 47 | 50 | ||||
| 5.00%, 10/15/33 | 225 | 233 | ||||
| 6.00%, 10/20/33 | 146 | 156 | ||||
| 6.00%, 04/15/34 | 13 | 14 | ||||
| 6.00%, 01/15/35 | 26 | 27 | ||||
| 5.50%, 02/15/36 | 20 | 21 | ||||
| 5.00%, 03/15/36 | 34 | 35 | ||||
| 5.00%, 06/15/37 | 80 | 83 | ||||
| 5.00%, 06/15/38 | 547 | 564 | ||||
| 5.00%, 06/15/38 | 861 | 887 | ||||
| 5.00%, 06/15/38 | 808 | 832 | ||||
| 5.00%, 07/15/38 | 45 | 46 | ||||
| 5.00%, 07/15/38 | 43 | 45 | ||||
| 5.00%, 09/15/38 | 1,713 | 1,765 | ||||
| REMIC, 7.50%, 09/16/35 | 23 | 26 | ||||
| 5,513 | ||||||
| Total Government and Agency Obligations (cost $159,558) | 160,308 | |||||
| SHORT TERM INVESTMENTS - 10.7% | ||||||
| Mutual Funds - 5.3% | ||||||
| JNL Money Market Fund, 0.07% (a) (h) | 39,129 | 39,129 | ||||
| Securities Lending Collateral - 5.4% | ||||||
| Securities Lending Cash Collateral Fund LLC, | ||||||
| 0.16% (a) (h) | 21,585 | 21,585 | ||||
| Securities Lending Liquidating Fund LLC, 0.36% (a) (h) | 18,094 | 18,056 | ||||
| 39,641 | ||||||
| Total Short Term Investments (cost $78,808) | 78,770 | |||||
| Total Investments - 107.0% (cost $737,407) | 789,108 | |||||
| Other Assets and Liabilities, Net - (7.0%) | (51,389) | |||||
| Total Net Assets - 100% | $ | 737,719 | ||||
| JNL/Select Money Market Fund | ||||||
| SHORT TERM INVESTMENTS - 99.8% | ||||||
| Certificates of Deposit - 26.6% | ||||||
| Bank Nova Scotia, 0.33%, 03/04/10 | $ | 15,000 | $ | 15,000 | ||
| Bank of America Corp., 0.61%, 01/06/10 | 13,000 | 13,000 | ||||
| Barclays Bank Plc, 0.43%, 05/05/10 | 11,900 | 11,900 | ||||
| BNP Paribas, 0.33%, 05/04/10 | 26,000 | 26,002 | ||||
| Calyon New York, 0.31%, 05/11/10 | 10,500 | 10,500 | ||||
| Calyon NY, 0.28%, 02/26/10 (i) | 13,000 | 12,994 | ||||
| Canadian Imperial Bank of New York, 0.42%, 05/26/10 (i) | 12,000 | 12,000 | ||||
| Citibank, 0.21%, 03/02/10 | 15,000 | 15,000 | ||||
| Commonwealth, 0.29%, 06/08/10 | 11,700 | 11,700 | ||||
| DNB Nor Bank ASA | ||||||
| 0.27%, 01/15/10 | 12,000 | 12,000 | ||||
| 0.27%, 06/09/10 | 14,000 | 14,000 | ||||
| Nordea Bank AB, 0.01%, 04/28/10 | 7,500 | 7,529 | ||||
| Nordea Bank Finland Plc, 0.28%, 04/07/10 | 18,000 | 18,000 | ||||
| Procter & Gamble Co., 0.29%, 05/07/10 (i) | 5,240 | 5,240 | ||||
| Procter & Gamble International Funding SCA, | ||||||
| 0.53%, 02/08/10 (i) | 6,000 | 6,000 | ||||
| Rabobank Nederland, 0.27%, 01/19/10 | 18,000 | 18,000 | ||||
| Societe Generale, 0.30%, 05/17/10 | 11,000 | 11,000 | ||||
| Societe Generale NY, 0.25%, 01/14/10 | 12,000 | 12,000 | ||||
| Svenska Handelsbanken | ||||||
| 0.31%, 05/13/10 | 10,000 | 10,000 | ||||
| 0.47%, 06/10/10 (i) | 7,500 | 7,500 | ||||
| Toronto-Dominion Bank NY | ||||||
| 0.52%, 01/25/10 | 13,500 | 13,500 | ||||
| 0.34%, 04/12/10 | 12,000 | 12,001 | ||||
| Toyota Motor Credit Corp., 1.53%, 01/29/10 (i) | 12,566 | 12,566 | ||||
| UBS AG Stamford, 0.57%, 04/21/10 | 8,000 | 8,000 | ||||
| UBS-NY, 0.86%, 03/02/10 | 10,000 | 10,000 | ||||
| 305,432 | ||||||
| Commercial Paper - 25.7% | ||||||
| Australia & New Zealand Banking Group Ltd., | ||||||
| 0.26%, 06/15/10 | 17,400 | 17,379 | ||||
| Bank of America Corp., 0.03%, 06/08/10 | 16,000 | 15,979 | ||||
| CAFCO LLC, 0.24%, 02/08/10 | 17,500 | 17,495 | ||||
| Chariot Funding LLC | ||||||
| 0.16%, 01/12/10 | 12,000 | 11,999 | ||||
| 0.18%, 02/12/10 | 4,700 | 4,699 | ||||
| Ciesco LLC, 0.24%, 01/25/10 | 19,200 | 19,197 | ||||
| Clipper Receivables Co., 0.23%, 01/02/10 | 18,000 | 17,999 | ||||
| CRC Funding LLC | ||||||
| 0.25%, 01/08/10 | 10,600 | 10,599 | ||||
| 0.25%, 01/12/10 | 10,600 | 10,599 | ||||
| Enterprise Funding | ||||||
| 0.19%, 02/10/10 | 11,500 | 11,498 | ||||
| 0.19%, 02/22/10 | 5,900 | 5,898 | ||||
| Falcon Asset Securitization Co. LLC, 0.16%, 01/20/10 | 17,300 | 17,299 | ||||
| General Electric Capital Corp., 0.21%, 01/19/10 | 25,000 | 24,997 | ||||
| HSBC Bank USA, 0.20%, 01/07/10 | 11,700 | 11,700 | ||||
| Jupiter Securitization Corp., 0.16%, 01/13/10 | 17,700 | 17,699 | ||||
| Kitty Hawk Funding Corp. | ||||||
| 0.16%, 01/06/10 | 7,200 | 7,200 | ||||
| 0.18%, 02/06/10 | 10,200 | 10,198 | ||||
| Park Avenue Receivables Company LLC | ||||||
| 0.15%, 01/05/10 | 13,700 | 13,700 | ||||
| 0.17%, 01/27/10 | 3,700 | 3,700 | ||||
| Ranger Funding Co. LLC, 0.19%, 01/25/10 | 7,300 | 7,299 | ||||
| Total Capital SA, 0.19%, 03/04/10 | 8,500 | 8,497 | ||||
| Westpac Banking Corp., 0.29%, 04/07/10 | 18,000 | 17,986 | ||||
| Yorktown Capital LLC | ||||||
| 0.16%, 01/14/10 | 6,100 | 6,100 | ||||
| 0.19%, 02/05/10 | 5,500 | 5,499 | ||||
| 295,215 | ||||||
| Federal Farm Credit Bank - 1.8% | ||||||
| Federal Farm Credit Bank 2.38%, 04/07/10 | 20,000 | 20,115 | ||||
| Federal Home Loan Bank - 13.8% | ||||||
| Federal Home Loan Bank | ||||||
| 0.30%, 01/08/10 | 25,000 | 24,999 | ||||
| 3.75%, 01/08/10 | 8,000 | 8,005 | ||||
| 0.31%, 01/13/10 | 20,000 | 19,998 | ||||
| 0.30%, 01/20/10 | 10,000 | 9,998 | ||||
| 0.30%, 01/22/10 | 20,000 | 19,997 | ||||
| 0.29%, 02/10/10 | 20,000 | 19,993 | ||||
| 0.26%, 02/24/10 | 25,000 | 24,990 | ||||
| 0.22%, 03/24/10 | 10,000 | 9,995 | ||||
| 0.20%, 04/07/10 | 20,000 | 19,989 | ||||
| 157,964 | ||||||
| Federal Home Loan Mortgage Corp. - 22.8% | ||||||
| Federal Home Loan Mortgage Corp. | ||||||
| 0.30%, 01/25/10 | 50,000 | 49,990 | ||||
| 0.14%, 02/04/10 (i) | 9,000 | 9,000 | ||||
| 0.29%, 02/08/10 | 25,000 | 24,992 | ||||
| 0.25%, 02/22/10 | 25,000 | 24,991 | ||||
| 3.13%, 02/12/10 | 10,000 | 10,033 | ||||
| 0.24%, 03/01/10 | 25,000 | 24,990 | ||||
| 0.21%, 03/15/10 | 22,000 | 21,991 | ||||
| 0.21%, 03/22/10 | 15,000 | 14,993 | ||||
| 0.24%, 03/23/10 | 16,000 | 15,991 | ||||
| 0.25%, 03/31/10 | 20,000 | 19,988 | ||||
| 0.20%, 04/07/10 | 25,000 | 24,987 | ||||
| 0.20%, 04/19/10 | 10,000 | 9,994 | ||||
| 0.19%, 05/04/10 | 10,000 | 9,995 | ||||
| 261,935 | ||||||
| Federal National Mortgage Association - 4.3% | ||||||
| Federal National Mortgage Association | ||||||
| 0.30%, 01/05/10 | 15,000 | 15,000 | ||||
| 0.29%, 02/10/10 | 20,000 | 19,994 | ||||
| 0.19%, 05/05/10 | 15,000 | 14,990 | ||||
| 49,984 | ||||||
| Mutual Funds - 0.0% | ||||||
| JPMorgan Prime Money Market Fund, 0.17% (h) | 98 | 98 | ||||
| Repurchase Agreement - 4.8% | ||||||
| Repurchase Agreement with Banc of America | ||||||
| Securities, 0.01% (Collateralized by $16,389 | ||||||
| Federal National Mortgage Association, 4.93%, due | ||||||
| 07/01/38, value $17,226, $18,797 Federal | ||||||
| National Mortgage Association, 2.50%, due 01/03/36, | ||||||
| value $19,626, $18,417 Federal National | ||||||
| Mortgage Association, 5.05%, due 01/01/39, value | ||||||
| $19,452) acquired on 12/31/09, due 01/04/10 | ||||||
| at $55,200 | $ | 55,200 | 55,200 | |||
| Total Short Term Investments (cost $1,145,943) | 1,145,943 | |||||
| Total Investments - 99.8% (cost $1,145,943) | ||||||
| Other Assets and Liabilities, Net - 0.2% | 1,145,943 | |||||
| Total Net Assets - 100% | 1,838 | |||||
| $ | 1,147,781 | |||||
| JNL/Select Value Fund | ||||||
| COMMON STOCKS - 96.5% | ||||||
| CONSUMER DISCRETIONARY - 9.7% | ||||||
| Coach Inc. | 147 | $ | 5,370 | |||
| Comcast Corp. - Class A | 649 | 10,945 | ||||
| Ford Motor Co. (c) | 406 | 4,059 | ||||
| Gap Inc. | 149 | 3,117 | ||||
| Home Depot Inc. | 282 | 8,152 | ||||
| Kohl's Corp. (c) | 119 | 6,428 | ||||
| Mattel Inc. | 392 | 7,840 | ||||
| Stanley Works (e) | 252 | 12,960 | ||||
| Staples Inc. | 340 | 8,356 | ||||
| Target Corp. | 155 | 7,507 | ||||
| 74,734 | ||||||
| CONSUMER STAPLES - 7.2% | ||||||
| CVS Caremark Corp. | 195 | 6,294 | ||||
| Dean Foods Co. (c) | 280 | 5,048 | ||||
| General Mills Inc. | 56 | 3,958 | ||||
| Kimberly-Clark Corp. | 119 | 7,601 | ||||
| Nestle SA - ADR | 187 | 9,039 | ||||
| PepsiCo Inc. | 143 | 8,719 | ||||
| Philip Morris International Inc. | 157 | 7,580 | ||||
| Sysco Corp. | 262 | 7,323 | ||||
| 55,562 | ||||||
| ENERGY - 17.3% | ||||||
| Apache Corp. | 103 | 10,596 | ||||
| Baker Hughes Inc. (e) | 290 | 11,735 | ||||
| BP Plc - ADR | 134 | 7,756 | ||||
| Chevron Corp. | 273 | 20,980 | ||||
| ConocoPhillips | 225 | 11,470 | ||||
| EOG Resources Inc. | 43 | 4,213 | ||||
| Exxon Mobil Corp. | 386 | 26,342 | ||||
| Hess Corp. | 130 | 7,865 | ||||
| Marathon Oil Corp. | 279 | 8,717 | ||||
| Occidental Petroleum Corp. | 233 | 18,930 | ||||
| XTO Energy Inc. | 117 | 5,465 | ||||
| 134,069 | ||||||
| FINANCIALS - 19.9% | ||||||
| ACE Ltd. | 287 | 14,475 | ||||
| Ameriprise Financial Inc. | 126 | 4,872 | ||||
| AON Corp. | 168 | 6,453 | ||||
| Bank of America Corp. | 795 | 11,971 | ||||
| Bank of New York Mellon Corp. | 260 | 7,282 | ||||
| Chubb Corp. | 204 | 10,033 | ||||
| Goldman Sachs Group Inc. | 109 | 18,387 | ||||
| JPMorgan Chase & Co. | 646 | 26,906 | ||||
| PNC Financial Services Group Inc. (e) | 263 | 13,889 | ||||
| Principal Financial Group Inc. | 125 | 3,000 | ||||
| UBS AG (c) | 222 | 3,449 | ||||
| Unum Group | 441 | 8,602 | ||||
| Wells Fargo & Co. | 946 | 25,533 | ||||
| 154,852 | ||||||
| HEALTH CARE - 11.7% | ||||||
| Abbott Laboratories | 170 | 9,194 | ||||
| Amgen Inc. (c) | 68 | 3,830 | ||||
| Baxter International Inc. | 164 | 9,606 | ||||
| Cardinal Health Inc. | 203 | 6,532 | ||||
| Covidien Plc | 178 | 8,520 | ||||
| Johnson & Johnson | 105 | 6,769 | ||||
| Merck & Co. Inc. | 282 | 10,301 | ||||
| Pfizer Inc. | 914 | 16,629 | ||||
| Teva Pharmaceutical Industries Ltd. - ADR | 132 | 7,405 | ||||
| UnitedHealth Group Inc. | 220 | 6,715 | ||||
| Zimmer Holdings Inc. (c) | 95 | 5,592 | ||||
| 91,093 | ||||||
| INDUSTRIALS - 10.0% | ||||||
| Boeing Co. | 121 | 6,544 | ||||
| Cummins Inc. | 170 | 7,805 | ||||
| General Electric Co. | 833 | 12,603 | ||||
| Illinois Tool Works Inc. | 149 | 7,131 | ||||
| Ingersoll-Rand Plc | 395 | 14,103 | ||||
| PACCAR Inc. (e) | 142 | 5,165 | ||||
| Precision Castparts Corp. | 32 | 3,564 | ||||
| Textron Inc. (e) | 392 | 7,368 | ||||
| United Parcel Service Inc. - Class B | 94 | 5,387 | ||||
| Waste Management Inc. | 230 | 7,783 | ||||
| 77,453 | ||||||
| INFORMATION TECHNOLOGY - 8.6% | ||||||
| Cisco Systems Inc. (c) | 515 | 12,327 | ||||
| Hewlett-Packard Co. | 233 | 12,017 | ||||
| Intel Corp. | 592 | 12,073 | ||||
| Maxim Integrated Products Inc. | 256 | 5,205 | ||||
| Microsoft Corp. | 425 | 12,943 | ||||
| Taiwan Semiconductor Manufacturing Co. Ltd. - ADR | 358 | 4,091 | ||||
| Texas Instruments Inc. | 324 | 8,433 | ||||
| 67,089 | ||||||
| MATERIALS - 5.6% | ||||||
| Agrium Inc. | 132 | 8,136 | ||||
| Cliffs Natural Resources Inc. (e) | 199 | 9,172 | ||||
| Dow Chemical Co. | 101 | 2,780 | ||||
| EI Du Pont de Nemours & Co. | 231 | 7,768 | ||||
| Mosaic Co. | 129 | 7,681 | ||||
| Rexam Plc - ADR (e) | 157 | 3,730 | ||||
| Steel Dynamics Inc. | 210 | 3,728 | ||||
| 42,995 | ||||||
| TELECOMMUNICATION SERVICES - 3.1% | ||||||
| AT&T Inc. | 626 | 17,534 | ||||
| Verizon Communications Inc. | 195 | 6,447 | ||||
| 23,981 | ||||||
| UTILITIES - 3.4% | ||||||
| Edison International | 196 | 6,827 | ||||
| Entergy Corp. | 95 | 7,783 | ||||
| Exelon Corp. | 106 | 5,180 | ||||
| FPL Group Inc. | 130 | 6,851 | ||||
| 26,641 | ||||||
| Total Common Stocks (cost $687,534) | 748,469 | |||||
| PREFERRED STOCKS - 0.5% | ||||||
| FINANCIALS - 0.5% | ||||||
| Bank of America Corp., 10.00% | 273 | 4,079 | ||||
| Total Preferred Stocks (cost $4,101) | 4,079 | |||||
| NON-U.S. GOVERNMENT AGENCY | ||||||
| ASSET-BACKED SECURITIES - 0.0% | ||||||
| Sigma Finance, Inc. (d) (f) (u) | $ | 631 | 27 | |||
| Total Non-U.S. Government Agency | ||||||
| Asset-Backed Securities (cost $631) | 27 | |||||
| SHORT TERM INVESTMENTS - 7.1% | ||||||
| Mutual Funds - 2.9% | ||||||
| JNL Money Market Fund, 0.07% (a) (h) | 22,516 | 22,516 | ||||
| Securities Lending Collateral - 4.2% | ||||||
| Securities Lending Cash Collateral Fund LLC, | ||||||
| 0.16% (a) (h) | 29,610 | 29,610 | ||||
| Securities Lending Liquidating Fund LLC, 0.36% (a) (h) | 2,976 | 2,970 | ||||
| 32,580 | ||||||
| Total Short Term Investments (cost $55,102) | 55,096 | |||||
| Total Investments - 104.1% (cost $747,368) | 807,671 | |||||
| Other Assets and Liabilities, Net - (4.1%) | (31,438) | |||||
| Total Net Assets - 100% | $ | 776,233 | ||||
| JNL/T. Rowe Price Established Growth Fund | ||||||
| COMMON STOCKS - 98.8% | ||||||
| CONSUMER DISCRETIONARY - 13.2% | ||||||
| Amazon.com Inc. (c) | 228 | $ | 30,617 | |||
| AutoZone Inc. (c) | 74 | 11,745 | ||||
| Carmax Inc. (c) (e) | 206 | 4,983 | ||||
| Carnival Corp. (c) | 64 | 2,038 | ||||
| Expedia Inc. (c) | 255 | 6,561 | ||||
| Kohl's Corp. (c) | 95 | 5,102 | ||||
| Lowe's Cos. Inc. | 371 | 8,687 | ||||
| Marriott International Inc. - Class A (e) | 292 | 7,957 | ||||
| McGraw-Hill Cos. Inc. | 237 | 7,949 | ||||
| MGM Mirage (c) (e) | 116 | 1,062 | ||||
| Nike Inc. - Class B | 105 | 6,937 | ||||
| O'Reilly Automotive Inc. (c) | 88 | 3,358 | ||||
| Priceline.com Inc. (c) | 19 | 4,239 | ||||
| Starbucks Corp. (c) | 433 | 9,985 | ||||
| Walt Disney Co. | 237 | 7,656 | ||||
| Wynn Macau Ltd. (c) (e) | 807 | 994 | ||||
| Yum! Brands Inc. (e) | 145 | 5,064 | ||||
| 124,934 | ||||||
| CONSUMER STAPLES - 3.2% | ||||||
| Costco Wholesale Corp. | 122 | 7,242 | ||||
| Nestle SA | 83 | 4,034 | ||||
| PepsiCo Inc. | 179 | 10,901 | ||||
| Procter & Gamble Co. | 128 | 7,777 | ||||
| 29,954 | ||||||
| ENERGY - 6.4% | ||||||
| Cameron International Corp. (c) | 152 | 6,354 | ||||
| EOG Resources Inc. | 76 | 7,346 | ||||
| Exxon Mobil Corp. | 52 | 3,553 | ||||
| Murphy Oil Corp. | 84 | 4,558 | ||||
| Petroleo Brasileiro SA - ADR | 299 | 12,683 | ||||
| Schlumberger Ltd. | 238 | 15,472 | ||||
| Smith International Inc. | 35 | 954 | ||||
| Suncor Energy Inc. | 264 | 9,325 | ||||
| 60,245 | ||||||
| FINANCIALS - 13.3% | ||||||
| American Express Co. | 207 | 8,396 | ||||
| Bank of America Corp. | 139 | 2,087 | ||||
| BlackRock Inc. (e) | 14 | 3,204 | ||||
| Charles Schwab Corp. (e) | 440 | 8,288 | ||||
| CME Group Inc. | 14 | 4,737 | ||||
| Franklin Resources Inc. (e) | 78 | 8,228 | ||||
| Goldman Sachs Group Inc. | 59 | 9,978 | ||||
| IntercontinentalExchange Inc. (c) (e) | 61 | 6,873 | ||||
| Invesco Ltd. | 401 | 9,408 | ||||
| JPMorgan Chase & Co. | 446 | 18,601 | ||||
| Morgan Stanley | 272 | 8,051 | ||||
| Northern Trust Corp. | 94 | 4,899 | ||||
| PNC Financial Services Group Inc. | 87 | 4,614 | ||||
| State Street Corp. | 65 | 2,817 | ||||
| Sun Life Financial Services of Canada Inc. | 167 | 4,822 | ||||
| TD Ameritrade Holding Corp. (c) | 272 | 5,275 | ||||
| U.S. Bancorp | 403 | 9,074 | ||||
| Wells Fargo & Co. | 258 | 6,969 | ||||
| 126,321 | ||||||
| HEALTH CARE - 12.9% | ||||||
| Allergan Inc. | 196 | 12,331 | ||||
| Celgene Corp. (c) | 85 | 4,705 | ||||
| Covidien Plc | 11 | 544 | ||||
| Express Scripts Inc. (c) | 218 | 18,803 | ||||
| Gilead Sciences Inc. (c) | 367 | 15,897 | ||||
| Illumina Inc. (c) (e) | 47 | 1,434 | ||||
| Intuitive Surgical Inc. (c) | 31 | 9,251 | ||||
| McKesson Corp. | 135 | 8,438 | ||||
| Medco Health Solutions Inc. (c) | 521 | 33,272 | ||||
| Stryker Corp. (e) | 115 | 5,772 | ||||
| Teva Pharmaceutical Industries Ltd. - ADR | 109 | 6,118 | ||||
| Vertex Pharmaceuticals Inc. (c) | 78 | 3,342 | ||||
| WellPoint Inc. (c) | 48 | 2,792 | ||||
| 122,699 | ||||||
| INDUSTRIALS - 8.7% | ||||||
| 3M Co. | 85 | 7,060 | ||||
| Danaher Corp. | 379 | 28,508 | ||||
| Deere & Co. | 68 | 3,694 | ||||
| Expeditors International Washington Inc. | 178 | 6,196 | ||||
| Fastenal Co. (e) | 74 | 3,069 | ||||
| FedEx Corp. | 70 | 5,816 | ||||
| McDermott International Inc. (c) | 152 | 3,654 | ||||
| PACCAR Inc. (e) | 147 | 5,332 | ||||
| Precision Castparts Corp. | 90 | 9,943 | ||||
| Republic Services Inc. - Class A | 144 | 4,079 | ||||
| Rockwell Automation Inc. | 73 | 3,406 | ||||
| Union Pacific Corp. | 25 | 1,598 | ||||
| 82,355 | ||||||
| INFORMATION TECHNOLOGY - 33.9% | ||||||
| Accenture Plc | 233 | 9,661 | ||||
| Apple Inc. (c) | 286 | 60,264 | ||||
| Autodesk Inc. (c) | 172 | 4,382 | ||||
| Automatic Data Processing Inc. | 142 | 6,085 | ||||
| Baidu.com - ADR (c) | 17 | 6,950 | ||||
| Broadcom Corp. - Class A (c) (e) | 153 | 4,824 | ||||
| Cielo SA | 305 | 2,683 | ||||
| Cisco Systems Inc. (c) | 506 | 12,104 | ||||
| Dolby Laboratories Inc. - Class A (c) (e) | 157 | 7,470 | ||||
| Google Inc. - Class A (c) | 89 | 55,054 | ||||
| Hewlett-Packard Co. | 72 | 3,683 | ||||
| Intel Corp. | 242 | 4,927 | ||||
| International Business Machines Corp. | 52 | 6,846 | ||||
| Juniper Networks Inc. (c) (e) | 344 | 9,166 | ||||
| Marvell Technology Group Ltd. (c) | 527 | 10,937 | ||||
| MasterCard Inc. | 48 | 12,236 | ||||
| McAfee Inc. (c) | 169 | 6,852 | ||||
| Microsoft Corp. | 601 | 18,339 | ||||
| QUALCOMM Inc. | 403 | 18,647 | ||||
| Salesforce.com Inc. (c) (e) | 71 | 5,245 | ||||
| Samsung Electronics Co. Ltd. | 4 | 2,408 | ||||
| Tencent Holdings Ltd. | 561 | 12,128 | ||||
| Toshiba Corp. (c) | 516 | 2,864 | ||||
| Visa Inc. - Class A | 327 | 28,634 | ||||
| Western Union Co. | 433 | 8,164 | ||||
| 320,553 | ||||||
| MATERIALS - 2.9% | ||||||
| Agnico-Eagle Mines Ltd. | 43 | 2,300 | ||||
| BHP Billiton Ltd. | 208 | 7,964 | ||||
| Monsanto Co. | 66 | 5,404 | ||||
| Praxair Inc. | 147 | 11,830 | ||||
| 27,498 | ||||||
| TELECOMMUNICATION SERVICES - 4.3% | ||||||
| American Tower Corp. (c) | 373 | 16,105 | ||||
| Crown Castle International Corp. (c) | 565 | 22,038 | ||||
| Leap Wireless International Inc. (c) | 76 | 1,328 | ||||
| MetroPCS Communications Inc. (c) (e) | 223 | 1,706 | ||||
| 41,177 | ||||||
| Total Common Stocks (cost $796,445) | 935,736 | |||||
| PREFERRED STOCKS - 0.4% | ||||||
| FINANCIALS - 0.4% | ||||||
| Bank of America Corp., 10.00% | 242 | 3,608 | ||||
| Total Preferred Stocks (cost $3,627) | 3,608 | |||||
| NON-U.S. GOVERNMENT AGENCY | ||||||
| ASSET-BACKED SECURITIES - 0.0% | ||||||
| Sigma Finance, Inc. (d) (f) (u) | $ | 1745 | 74 | |||
| Total Non-U.S. Government Agency | ||||||
| Asset-Backed Securities (cost $1,745) | 74 | |||||
| SHORT TERM INVESTMENTS - 5.5% | ||||||
| Mutual Funds - 0.9% | ||||||
| JNL Money Market Fund, 0.07% (a) (h) | 2,905 | 2,905 | ||||
| T. Rowe Price Reserves Investment Fund, 0.27% (a) (h) | 5,950 | 5,950 | ||||
| 8,855 | ||||||
| Securities Lending Collateral - 4.6% | ||||||
| Securities Lending Cash Collateral Fund LLC, | ||||||
| 0.16% (a) (h) | 19,181 | 19,181 | ||||
| Securities Lending Liquidating Fund LLC, 0.36% (a) (h) | 23,969 | 23,919 | ||||
| 43,100 | ||||||
| Total Short Term Investments (cost $52,005) | 51,955 | |||||
| Total Investments - 104.7% (cost $853,822) | 991,373 | |||||
| Other Assets and Liabilities, Net - (4.7%) | (44,517) | |||||
| Total Net Assets - 100% | $ | 946,856 | ||||
| JNL/T. Rowe Price Mid-Cap Growth Fund * (y) | ||||||
| COMMON STOCKS - 94.5% | ||||||
| CONSUMER DISCRETIONARY - 15.1% | ||||||
| Bed Bath & Beyond Inc. (c) | 193 | $ | 7,456 | |||
| Cablevision Systems Corp. - Class A | 287 | 7,410 | ||||
| Carmax Inc. (c) (e) | 398 | 9,652 | ||||
| Chipotle Mexican Grill Inc. - Class A (c) | 103 | 9,080 | ||||
| Discovery Communications Inc. - Class A (c) (e) | 165 | 5,061 | ||||
| Discovery Communications Inc. - Class C (c) | 188 | 4,986 | ||||
| Expedia Inc. (c) | 468 | 12,032 | ||||
| Lamar Advertising Co. (c) | 297 | 9,246 | ||||
| Marriott International Inc. - Class A (e) | 442 | 12,044 | ||||
| O’Reilly Automotive Inc. (c) | 171 | 6,519 | ||||
| Other Securities | 44,719 | |||||
| 128,205 | ||||||
| CONSUMER STAPLES - 2.0% | ||||||
| Shoppers Drug Mart Corp. | 179 | 7,741 | ||||
| Whole Foods Market Inc. (c) (e) | 331 | 9,086 | ||||
| 16,827 | ||||||
| ENERGY - 6.6% | ||||||
| Consol Energy Inc. | 165 | 8,217 | ||||
| FMC Technologies Inc. (c) (e) | 165 | 9,544 | ||||
| Ultra Petroleum Corp. (c) | 166 | 8,277 | ||||
| Other Securities | 30,190 | |||||
| 56,228 | ||||||
| FINANCIALS - 10.0% | ||||||
| Eaton Vance Corp. (e) | 221 | 6,721 | ||||
| MSCI Inc. (c) | 247 | 7,855 | ||||
| Other Securities | 70,017 | |||||
| 84,593 | ||||||
| HEALTH CARE - 17.2% | ||||||
| CareFusion Corp. (c) | 328 | 8,203 | ||||
| Cephalon Inc. (c) (e) | 162 | 10,110 | ||||
| CR Bard Inc. | 104 | 8,102 | ||||
| Edwards Lifesciences Corp. (c) | 110 | 9,554 | ||||
| Henry Schein Inc. (c) (e) | 165 | 8,679 | ||||
| Human Genome Sciences Inc. (c) | 271 | 8,293 | ||||
| Qiagen NV (c) (e) | 329 | 7,343 | ||||
| Vertex Pharmaceuticals Inc. (c) (e) | 163 | 6,985 | ||||
| Waters Corp. (c) | 123 | 7,621 | ||||
| Other Securities | 71,311 | |||||
| 146,201 | ||||||
| INDUSTRIALS - 16.6% | ||||||
| AMETEK Inc. | 315 | 12,046 | ||||
| Fastenal Co. (e) | 204 | 8,486 | ||||
| IDEX Corp. (e) | 247 | 7,694 | ||||
| IHS Inc. (c) (e) | 141 | 7,728 | ||||
| McDermott International Inc. (c) | 424 | 10,180 | ||||
| Robert Half International Inc. | 317 | 8,473 | ||||
| Rockwell Collins Inc. | 170 | 9,411 | ||||
| Roper Industries Inc. | 192 | 10,055 | ||||
| Other Securities | 67,096 | |||||
| 141,169 | ||||||
| INFORMATION TECHNOLOGY - 22.8% | ||||||
| Altera Corp. (e) | 381 | 8,622 | ||||
| Dolby Laboratories Inc. - Class A (c) (e) | 179 | 8,544 | ||||
| Factset Research Systems Inc. (e) | 108 | 7,114 | ||||
| Fiserv Inc. (c) | 165 | 7,999 | ||||
| FLIR Systems Inc. (c) (e) | 218 | 7,133 | ||||
| Global Payments Inc. | 246 | 13,250 | ||||
| JDS Uniphase Corp. (c) | 932 | 7,689 | ||||
| Juniper Networks Inc. (c) (e) | 432 | 11,521 | ||||
| Marvell Technology Group Ltd. (c) | 335 | 6,951 | ||||
| McAfee Inc. (c) | 203 | 8,236 | ||||
| Microchip Technology Inc. (e) | 261 | 7,585 | ||||
| Red Hat Inc. (c) | 303 | 9,363 | ||||
| Western Union Co. | 602 | 11,347 | ||||
| Xilinx Inc. | 328 | 8,219 | ||||
| Other Securities | 70,496 | |||||
| 194,069 | ||||||
| MATERIALS - 1.7% | ||||||
| Agnico-Eagle Mines Ltd. | 188 | 10,152 | ||||
| Other Securities | 4,449 | |||||
| 14,601 | ||||||
| TELECOMMUNICATION SERVICES - 1.6% | ||||||
| American Tower Corp. (c) | 234 | 10,111 | ||||
| Other Securities | 3,242 | |||||
| 13,353 | ||||||
| UTILITIES - 0.9% | ||||||
| Calpine Corp. (c) | 672 | 7,391 | ||||
| Total Common Stocks (cost $700,755) | 802,637 | |||||
| NON-U.S. GOVERNMENT AGENCY | ||||||
| ASSET-BACKED SECURITIES - 0.0% | ||||||
| Other Securities | 99 | |||||
| Total Non-U.S. Government Agency | ||||||
| Asset-Backed Securities (cost $2,339) | 99 | |||||
| SHORT TERM INVESTMENTS - 20.3% | ||||||
| Mutual Funds - 5.6% | ||||||
| JNL Money Market Fund, 0.07% (a) (h) | 4,417 | 4,417 | ||||
| T. Rowe Price Reserves Investment Fund, 0.27% (a) (h) | 42,724 | 42,724 | ||||
| 47,141 | ||||||
| Securities Lending Collateral - 14.7% | ||||||
| Securities Lending Cash Collateral Fund LLC, | ||||||
| 0.16% (a) (h) | 73,953 | 73,953 | ||||
| Securities Lending Liquidating Fund LLC, 0.36% (a) (h) | 50,994 | 50,887 | ||||
| 124,840 | ||||||
| Total Short Term Investments (cost $172,088) | 171,981 | |||||
| Total Investments - 114.8% (cost $875,182) | 974,717 | |||||
| Other Assets and Liabilities, Net - (14.8%) | (125,451) | |||||
| Total Net Assets - 100% | $ | 849,266 | ||||
| JNL/T. Rowe Price Short-Term Bond Fund | ||||||
| INVESTMENT FUNDS - 0.4% | ||||||
| T. Rowe Price Term Asset-Backed | ||||||
| Securities Loan Facility (a) (f) (s) (u) | 168 | $ | 1,702 | |||
| Total Investment Funds (cost $1,702) | 1,702 | |||||
| NON-U.S. GOVERNMENT AGENCY | ||||||
| ASSET-BACKED SECURITIES - 6.4% | ||||||
| BCAP LLC Trust REMIC, 0.87%, 11/25/36 (i) | $170 | 153 | ||||
| Chase Issuance Trust, 4.96%, 09/17/12 | 4,000 | 4,121 | ||||
| Citibank Credit Card Issuance Trust, 0.55%, 10/07/13 (i) | 2,350 | 2,262 | ||||
| CitiFinancial Auto Issuance Trust, 2.59%, 10/15/13 (t) (v) | 1,538 | 1,544 | ||||
| CNH Equipment Trust, 1.85%, 12/16/13 | 584 | 582 | ||||
| CS First Boston Mortgage Securities Corp. | ||||||
| REMIC, 6.53%, 06/15/34 | 3,444 | 3,579 | ||||
| Downey Savings & Loan Association Mortgage | ||||||
| Loan Trust REMIC, 0.43%, 11/19/37 (i) | 1,340 | 704 | ||||
| Ford Credit Auto Owner Trust | ||||||
| 1.51%, 01/15/14 | 1,990 | 1,979 | ||||
| 2.42%, 11/15/14 (i) | 1,823 | 1,801 | ||||
| GreenPoint Mortgage Funding Trust REMIC, | ||||||
| 0.41%, 09/25/46 (i) | 2,279 | 1,093 | ||||
| Harborview Mortgage Loan Trust | ||||||
| REMIC, 5.91%, 08/19/36 (i) | 1,504 | 925 | ||||
| REMIC, 0.42%, 08/21/36 (i) | 2,194 | 1,122 | ||||
| HFC Home Equity Loan Asset Backed Certificates | ||||||
| REMIC, 0.38%, 03/20/36 (i) | 2,053 | 1,806 | ||||
| John Deere Owner Trust, 1.57%, 10/15/13 | 715 | 714 | ||||
| JPMorgan Mortgage Trust REMIC, 5.06%, 07/25/35 (i) | 489 | 405 | ||||
| MMAF Equipment Finance LLC, 2.37%, 11/15/13 (f) | 1,572 | 1,572 | ||||
| Sigma Finance, Inc. (d) (f) (u) | 698 | 30 | ||||
| Structured Adjustable Rate Mortgage Loan Trust | ||||||
| REMIC, 6.00%, 11/25/37 (i) | 2,124 | 1,247 | ||||
| Structured Asset Securities Corp. REMIC, | ||||||
| 3.27%, 09/25/33 (i) | 874 | 777 | ||||
| Thornburg Mortgage Securities Trust | ||||||
| REMIC, 0.35%, 07/25/36 (i) | 1,835 | 1,781 | ||||
| Wells Fargo Mortgage Backed Securities Trust | ||||||
| REMIC, 4.34%, 04/25/35 (i) | 3,271 | 2,918 | ||||
| Total Non-U.S. Government Agency | ||||||
| Asset-Backed Securities (cost $36,718) | 31,115 | |||||
| CORPORATE BONDS AND NOTES - 50.9% | ||||||
| CONSUMER DISCRETIONARY - 2.5% | ||||||
| Comcast Cable Communications Holdings Inc., | ||||||
| 6.75%, 01/30/11 | 1,000 | 1,055 | ||||
| COX Communications Inc. | ||||||
| 4.63%, 01/15/10 | 750 | 751 | ||||
| 7.75%, 11/01/10 | 450 | 471 | ||||
| DirecTV Holdings LLC, 4.75%, 10/01/14 (t) (v) | 1,500 | 1,529 | ||||
| Rogers Cable Inc. | ||||||
| 6.25%, 06/15/13 | 325 | 356 | ||||
| 5.50%, 03/15/14 | 275 | 295 | ||||
| Staples Inc., 7.75%, 04/01/11 | 950 | 1,021 | ||||
| TCM Sub LLC, 3.55%, 01/15/15 (t) (v) | 1,870 | 1,832 | ||||
| Thomson Reuters Corp., 5.95%, 07/15/13 | 1,000 | 1,095 | ||||
| Time Warner Cable Inc., 5.40%, 07/02/12 | 2,200 | 2,351 | ||||
| Time Warner Inc. | ||||||
| 6.75%, 04/15/11 | 750 | 795 | ||||
| 6.88%, 05/01/12 | 485 | 531 | ||||
| 12,082 | ||||||
| CONSUMER STAPLES - 3.6% | ||||||
| Altria Group Inc., 8.50%, 11/10/13 | 1,750 | 2,022 | ||||
| Anheuser-Busch InBev Worldwide Inc. | ||||||
| 3.00%, 10/15/12 (t) (v) | 2,285 | 2,296 | ||||
| 7.20%, 01/15/14 (t) (v) | 1,100 | 1,248 | ||||
| Coca-Cola Amatil Ltd., 3.25%, 11/02/14 (t) (v) | 1,385 | 1,367 | ||||
| Coca-Cola Bottling Co. Consolidated, 5.00%, 11/15/10 | 2,000 | 2,113 | ||||
| CVS/Caremark Corp., 1.76%, 09/10/10 (i) | 825 | 832 | ||||
| Dr. Pepper Snapple Group Inc., 2.35%, 12/21/12 | 525 | 526 | ||||
| General Mills Inc., 6.00%, 02/15/12 | 1,400 | 1,512 | ||||
| Kroger Co., 6.75%, 04/15/12 | 625 | 683 | ||||
| SABMiller Plc, 6.20%, 07/01/11 (t) (v) | 2,090 | 2,212 | ||||
| Safeway Inc., 6.50%, 03/01/11 | 300 | 317 | ||||
| Wal-Mart Stores Inc., 3.20%, 05/15/14 | 2,000 | 2,037 | ||||
| 17,165 | ||||||
| ENERGY - 3.7% | ||||||
| Conoco Funding Co., 6.35%, 10/15/11 | 2,175 | 2,366 | ||||
| Devon Financing Corp. ULC, 6.88%, 09/30/11 | 1,800 | 1,955 | ||||
| Enterprise Products Operating LLC | ||||||
| 4.60%, 08/01/12 | 1,225 | 1,294 | ||||
| 6.38%, 02/01/13 | 675 | 730 | ||||
| Marathon Oil Corp., 6.50%, 02/15/14 | 1,000 | 1,106 | ||||
| MidAmerican Energy Holdings Co., 5.00%, 02/15/14 | 1,825 | 1,915 | ||||
| Plains All American Pipeline LP, 4.25%, 09/01/12 | 1,100 | 1,135 | ||||
| SeaRiver Maritime Inc., 0.00%, 09/01/12 (j) | 1,800 | 1,671 | ||||
| Texas Gas Transmission LLC, 5.50%, 04/01/13 (t) (v) | 2,355 | 2,476 | ||||
| Transocean Inc., 5.25%, 03/15/13 | 825 | 884 | ||||
| Williams Co. Inc., 6.38%, 10/01/10 (t) (v) | 725 | 738 | ||||
| XTO Energy Inc. | ||||||
| 5.90%, 08/01/12 | 600 | 657 | ||||
| 4.63%, 06/15/13 | 1,000 | 1,063 | ||||
| 17,990 | ||||||
| FINANCIALS - 29.1% | ||||||
| Abbey National Treasury Service Plc, | ||||||
| 3.88%, 11/10/14 (t) (v) | 1,825 | 1,831 | ||||
| American Express Centurion Bank, 5.55%, 10/17/12 | 1,500 | 1,604 | ||||
| ANZ National International Ltd. | ||||||
| 3.25%, 04/02/12 (e) (t) (v) | 3,700 | 3,811 | ||||
| 2.38%, 12/21/12 (t) (v) | 1,515 | 1,504 | ||||
| AXA Financial Inc., 7.75%, 08/01/10 | 2,115 | 2,195 | ||||
| Bank of America Corp., 7.38%, 05/15/14 | 1,100 | 1,248 | ||||
| Bank of the West, 2.15%, 03/27/12 | 3,100 | 3,140 | ||||
| Barclays Bank Plc, 2.50%, 01/23/13 | 2,595 | 2,592 | ||||
| BB&T Corp., 3.85%; 07/27/12 | 2,770 | 2,867 | ||||
| Charles Schwab Corp., 4.95%, 06/01/14 | 850 | 897 | ||||
| Citigroup Funding Inc., 2.13%, 07/12/12 | 1,200 | 1,209 | ||||
| Citigroup Inc. | ||||||
| 5.13%, 02/15/11 | 500 | 516 | ||||
| 2.13%, 04/30/12 | 4,800 | 4,851 | ||||
| 5.85%, 07/02/13 | 1,500 | 1,559 | ||||
| 6.38%, 08/12/14 | 1,000 | 1,047 | ||||
| Commonwealth Bank of Australia, 2.75%, 10/15/12 (t) (v) | 1,170 | 1,178 | ||||
| Countrywide Home Loans Inc., 4.00%, 03/22/11 | 1,150 | 1,174 | ||||
| Credit Suisse New York | ||||||
| 5.50%, 05/01/14 | 1,500 | 1,628 | ||||
| 3.45%, 07/02/12 | 1,275 | 1,311 | ||||
| Deutsche Bank AG, 5.38%, 10/12/12 | 2,055 | 2,218 | ||||
| Dexia Credit Local, 2.38%, 09/23/11 (t) (v) | 3,900 | 3,980 | ||||
| Enel Finance International SA, 3.88%, 10/07/14 (t) (v) | 1,150 | 1,164 | ||||
| General Electric Capital Corp. | ||||||
| 3.50%, 08/13/12 (e) | 1,920 | 1,960 | ||||
| 2.00%, 09/28/12 | 5,200 | 5,207 | ||||
| 5.25%, 10/19/12 | 1,500 | 1,596 | ||||
| 2.63%, 12/28/12 (e) | 4,400 | 4,481 | ||||
| 3.75%, 11/14/14 | 800 | 799 | ||||
| GMAC LLC, 2.20%, 12/19/12 | 1,500 | 1,509 | ||||
| Goldman Sachs Group Inc. | ||||||
| 3.63%, 08/01/12 | 800 | 824 | ||||
| 4.75%, 07/15/13 | 1,000 | 1,046 | ||||
| Greater Bay Bancorp, 5.13%, 04/15/10 | 750 | 759 | ||||
| GreenPoint Bank, 9.25%, 10/01/10 | 1,175 | 1,229 | ||||
| Japan Finance Corp., 2.00%, 06/24/11 | 1,600 | 1,619 | ||||
| John Deere Capital Corp. | ||||||
| 1.01%, 06/10/11 (i) | 1,800 | 1,817 | ||||
| 2.88%, 06/19/12 | 3,150 | 3,246 | ||||
| JPMorgan Chase & Co. | ||||||
| 6.95%, 08/10/12 (e) | 2,429 | 2,714 | ||||
| 4.65%, 06/01/14 | 885 | 932 | ||||
| Kreditanstalt fuer Wiederaufbau | ||||||
| 3.75%, 06/27/11 | 2,800 | 2,908 | ||||
| 4.75%, 05/15/12 | 4,500 | 4,822 | ||||
| Landeskreditbank Baden-Wuerttemberg | ||||||
| Foerderbank, 3.25%, 10/29/10 | 2,000 | 2,037 | ||||
| Landwirtschaftliche Rentenbank | ||||||
| 1.88%, 09/24/12 | 4,100 | 4,088 | ||||
| 4.13%, 07/15/13 | 2,600 | 2,741 | ||||
| LeasePlan Corp. NV, 3.00%, 05/07/12 (t) (v) | 1,900 | 1,945 | ||||
| Merrill Lynch & Co. Inc., 0.48%, 07/25/11 (i) | 1,250 | 1,231 | ||||
| Metropolitan Life Global Funding I | ||||||
| 2.88%, 09/17/12 (t) (v) | 1,000 | 1,008 | ||||
| 5.13%, 06/10/14 (t) (v) | 500 | 529 | ||||
| Morgan Stanley | ||||||
| 5.05%, 01/21/11 | 1,925 | 1,997 | ||||
| 4.20%, 11/20/14 | 265 | 265 | ||||
| National Australia Bank Ltd. | ||||||
| 8.60%, 05/19/10 | 1,500 | 1,546 | ||||
| 2.35%, 11/16/12 (t) (v) | 1,475 | 1,465 | ||||
| New York Life Global Funding, 2.25%, 12/14/12 (t) (v) | 2,415 | 2,401 | ||||
| Nordea Bank AB, 2.50%, 11/13/12 (t) (v) | 765 | 762 | ||||
| NRW Bank, 5.38%, 07/19/10 | 4,000 | 4,093 | ||||
| PACCAR Financial Corp., 1.95%, 12/17/12 | 775 | 767 | ||||
| Principal Financial Group Inc., 7.88%, 05/15/14 | 1,500 | 1,656 | ||||
| Prudential Financial Inc., 3.63%, 09/17/12 (e) | 2,400 | 2,436 | ||||
| Rabobank Nederland NV, 4.20%, 05/13/14 (e) (t) (v) | 1,150 | 1,190 | ||||
| Royal Bank of Scotland Plc, 2.63%, 05/11/12 (t) (v) | 5,200 | 5,274 | ||||
| Santander US Debt SA, 0.68%, 10/21/11 (i) (t) (v) | 2,220 | 2,223 | ||||
| Simon Property Group LP, 5.60%, 09/01/11 | 1,825 | 1,905 | ||||
| Suncorp-Metway Ltd., 1.50%, 04/15/11 (e) (i) (t) (v) | 6,400 | 6,494 | ||||
| U.S. Bank NA, 6.38%, 08/01/11 | 2,700 | 2,902 | ||||
| Wachovia Capital Trust III, | ||||||
| 5.80% (callable at 100 beginning 03/15/11) (p) | 425 | 325 | ||||
| WEA Finance LLC, 5.40%, 10/01/12 (t) (v) | 550 | 583 | ||||
| Wells Fargo & Co., 5.25%, 10/23/12 | 1,000 | 1,068 | ||||
| Westpac Banking Corp. | ||||||
| 0.58%, 10/21/11 (i) (t) (v) | 1,880 | 1,878 | ||||
| 3.25%, 12/16/11 (t) (v) | 4,200 | 4,336 | ||||
| Woodside Finance Ltd. | ||||||
| 6.70%, 08/01/11 (t) (v) | 300 | 318 | ||||
| 4.50%, 11/10/14 (t) (v) | 1,020 | 1,029 | ||||
| 141,484 | ||||||
| HEALTH CARE - 2.1% | ||||||
| Boston Scientific Corp., 4.50%, 01/15/15 | 670 | 671 | ||||
| Express Scripts Inc., 5.25%, 06/15/12 | 2,000 | 2,125 | ||||
| Roche Holdings Inc., 4.50%, 03/01/12 (t) (v) | 1,700 | 1,786 | ||||
| UnitedHealth Group Inc., 5.50%, 11/15/12 | 125 | 133 | ||||
| Watson Pharmaceuticals Inc., 5.00%, 08/15/14 | 1,500 | 1,531 | ||||
| WellPoint Inc. | ||||||
| 5.00%, 01/15/11 | 2,350 | 2,430 | ||||
| 6.80%, 08/01/12 | 1,500 | 1,655 | ||||
| 10,331 | ||||||
| INDUSTRIALS - 0.3% | ||||||
| Delta Air Lines Inc., 7.57%, 11/18/10 | 1,250 | 1,267 | ||||
| INFORMATION TECHNOLOGY - 1.3% | ||||||
| Cisco Systems Inc., 2.90%, 11/17/14 | 730 | 729 | ||||
| Hewlett Packard Co., 2.25%, 05/27/11 | 2,500 | 2,536 | ||||
| Oracle Corp., 5.00%, 01/15/11 | 1,000 | 1,040 | ||||
| Xerox Corp. | ||||||
| 5.50%, 05/15/12 | 1,100 | 1,163 | ||||
| 5.65%, 05/15/13 | 1,000 | 1,042 | ||||
| 6,510 | ||||||
| MATERIALS - 1.4% | ||||||
| ArcelorMittal, 5.38%, 06/01/13 | 880 | 929 | ||||
| Barrick Gold Corp., 6.13%, 09/15/13 | 1,750 | 1,924 | ||||
| BHP Billiton Finance USA Ltd., 4.80%, 04/15/13 | 375 | 399 | ||||
| Lafarge SA, 6.15%, 07/15/11 | 1,150 | 1,198 | ||||
| Rio Tinto Finance USA Ltd., 8.95%, 05/01/14 (l) | 2,000 | 2,397 | ||||
| 6,847 | ||||||
| TELECOMMUNICATION SERVICES - 4.2% | ||||||
| AT&T Inc., 7.30%, 11/15/11 (l) | 2,500 | 2,753 | ||||
| British Telecommunications Plc, 9.13%, 12/15/10 (l) | 1,300 | 1,393 | ||||
| Deutsche Telekom International Finance BV, | ||||||
| 8.50%, 06/15/10 (l) | 1,500 | 1,550 | ||||
| France Telecom SA, 7.75%, 03/01/11 (l) | 1,200 | 1,286 | ||||
| Koninklijke KPN NV, 8.00%, 10/01/10 | 2,350 | 2,468 | ||||
| Rogers Wireless Communications Inc., 6.38%, 03/01/14 | 900 | 996 | ||||
| Telecom Italia Capital SA, 5.25%, 11/15/13 | 1,500 | 1,578 | ||||
| Telefonica Emisiones SAU, 5.86%, 02/04/13 | 415 | 448 | ||||
| Telefonica Europe BV, 7.75%, 09/15/10 | 700 | 732 | ||||
| Verizon Virginia Inc., 4.63%, 03/15/13 | 2,780 | 2,887 | ||||
| Verizon Wireless Capital LLC | ||||||
| 3.75%, 05/20/11 | 1,125 | 1,160 | ||||
| 5.55%, 02/01/14 | 1,475 | 1,601 | ||||
| Vodafone Group Plc, 5.35%, 02/27/12 (e) | 1,650 | 1,760 | ||||
| 20,612 | ||||||
| UTILITIES - 2.7% | ||||||
| Abu Dhabi National Energy Co., 5.62%, 10/25/12 (t) (v) | 1,625 | 1,655 | ||||
| Appalachian Power Co., 5.65%, 08/15/12 | 1,750 | 1,873 | ||||
| CenterPoint Energy Resources Corp., 7.88%, 04/01/13 | 575 | 648 | ||||
| Commonwealth Edison Co., 4.74%, 08/15/10 | 1,150 | 1,175 | ||||
| Dominion Resources Inc., 5.70%, 09/17/12 | 1,020 | 1,102 | ||||
| Duke Energy Corp., 6.30%, 02/01/14 (e) | 1,575 | 1,732 | ||||
| Duke Energy Ohio Inc., 2.10%, 06/15/13 | 745 | 736 | ||||
| FirstEnergy Corp., 6.45%, 11/15/11 | 32 | 34 | ||||
| NiSource Finance Corp., 7.88%, 11/15/10 | 350 | 367 | ||||
| PPL Energy Supply LLC, 6.40%, 11/01/11 | 1,200 | 1,289 | ||||
| Progress Energy Inc., 6.05%, 03/15/14 | 875 | 958 | ||||
| PSEG Power LLC, 6.95%, 06/01/12 | 500 | 546 | ||||
| Southern California Edison Co., 0.68%, 10/21/11 (i) | 1,110 | 1,113 | ||||
| 13,228 | ||||||
| Total Corporate Bonds and Notes (cost $244,873) | 247,516 | |||||
| GOVERNMENT AND AGENCY OBLIGATIONS - 36.1% | ||||||
| GOVERNMENT SECURITIES - 9.0% | ||||||
| Sovereign - 4.6% | ||||||
| Kommunalbanken AS, 5.13%, 05/30/12 | 7,400 | 7,947 | ||||
| Mexican Bonos, 9.00%, 12/22/11 | MXN | 28,850 | 2,351 | |||
| Societe Financement de l'Economie Francaise | ||||||
| 1.50%, 10/29/10 (t) (v) | 10,100 | 10,147 | ||||
| 2.00%, 02/25/11 (t) (v) | 1,900 | 1,924 | ||||
| 22,369 | ||||||
| Treasury Inflation Index Securities - 2.3% | ||||||
| U.S. Treasury Inflation Indexed Note | ||||||
| 0.88%, 04/15/10 (r) | 7,774 | 8,931 | ||||
| 1.88%, 07/05/13 (r) | 1,730 | 2,107 | ||||
| 11,038 | ||||||
| U.S. Treasury Securities - 2.1% | ||||||
| U.S. Treasury Note | ||||||
| 1.38%, 09/15/12 (e) | 6,200 | 6,171 | ||||
| 2.38%, 08/31/14 | 4,000 | 3,971 | ||||
| 10,142 | ||||||
| U.S. GOVERNMENT AGENCY | ||||||
| MORTGAGE-BACKED SECURITIES - 27.1% | ||||||
| Federal Home Loan Bank - 2.4% | ||||||
| Federal Home Loan Bank, 3.25%, 03/11/11 | 11,200 | 11,534 | ||||
| Federal Home Loan Mortgage Corp. - 8.0% | ||||||
| Federal Home Loan Mortgage Corp. | ||||||
| 2.05%, 03/09/11 | 6,100 | 6,116 | ||||
| 1.75%, 07/27/11 | 3,900 | 3,915 | ||||
| 2.13%, 03/23/12 | 3,400 | 3,452 | ||||
| 1.75%, 06/15/12 | 2,100 | 2,109 | ||||
| 4.00%, 02/01/14 | 18 | 19 | ||||
| 4.00%, 03/01/14 | 21 | 22 | ||||
| 4.00%, 03/01/14 | 34 | 35 | ||||
| 4.00%, 03/01/14 | 25 | 25 | ||||
| 4.00%, 03/01/14 | 111 | 114 | ||||
| 4.00%, 03/01/14 | 26 | 27 | ||||
| 4.00%, 03/01/14 | 35 | 36 | ||||
| 4.00%, 03/01/14 | 32 | 33 | ||||
| 4.00%, 03/01/14 | 29 | 30 | ||||
| 4.00%, 04/01/14 | 15 | 16 | ||||
| 4.00%, 04/01/14 | 25 | 26 | ||||
| 4.00%, 04/01/14 | 20 | 21 | ||||
| 5.00%, 10/01/17 | 419 | 442 | ||||
| 5.00%, 10/01/17 | 522 | 550 | ||||
| 5.00%, 11/01/17 | 1,044 | 1,100 | ||||
| 5.00%, 01/01/18 | 1,710 | 1,803 | ||||
| 5.00%, 03/01/18 | 3,602 | 3,798 | ||||
| 5.00%, 03/01/18 | 514 | 542 | ||||
| 4.50%, 04/01/18 | 44 | 46 | ||||
| 5.00%, 06/01/18 | 495 | 522 | ||||
| 4.50%, 11/01/18 | 75 | 78 | ||||
| 4.50%, 05/01/19 | 107 | 111 | ||||
| 5.50%, 10/01/19 | 598 | 637 | ||||
| 5.50%, 01/01/20 | 384 | 409 | ||||
| 5.50%, 01/01/20 | 530 | 564 | ||||
| 4.50%, 04/01/20 | 254 | 265 | ||||
| 5.50%, 05/01/20 | 397 | 423 | ||||
| 5.50%, 07/01/20 | 355 | 378 | ||||
| 4.50%, 08/01/20 | 167 | 174 | ||||
| 2.74%, 09/01/33 (i) | 252 | 257 | ||||
| 3.35%, 09/01/33 (i) | 45 | 46 | ||||
| 2.61%, 10/01/34 (i) | 129 | 132 | ||||
| 2.66%, 11/01/34 (i) | 218 | 225 | ||||
| 3.18%, 11/01/34 (i) | 74 | 77 | ||||
| 3.31%, 11/01/34 (i) | 101 | 104 | ||||
| 3.35%, 11/01/34 (i) | 55 | 57 | ||||
| 2.99%, 01/01/35 (i) | 129 | 132 | ||||
| 3.79%, 02/01/35 (i) | 65 | 67 | ||||
| 3.98%, 02/01/35 (i) | 146 | 151 | ||||
| 4.07%, 02/01/35 (i) | 115 | 118 | ||||
| 4.17%, 02/01/35 (i) | 151 | 155 | ||||
| 4.19%, 02/01/35 (i) | 112 | 116 | ||||
| 4.32%, 02/01/35 (i) | 229 | 235 | ||||
| 4.32%, 02/01/35 (i) | 144 | 148 | ||||
| 3.83%, 06/01/35 (i) | 1,276 | 1,319 | ||||
| 5.15%, 09/01/35 (i) | 1,311 | 1,350 | ||||
| 3.43%, 10/01/35 (i) | 994 | 1,021 | ||||
| 3.00%, 11/01/35 (i) | 703 | 721 | ||||
| 3.44%, 03/01/36 (i) | 1,110 | 1,145 | ||||
| 5.00%, 09/01/38 | 742 | 762 | ||||
| REMIC, 5.00%, 10/15/21 | 2,278 | 2,394 | ||||
| REMIC, 0.00%, 03/15/37 | ||||||
| (0.00% until LIBOR reaches 7.25%) (i) (s) (u) | 160 | 157 | ||||
| 38,727 | ||||||
| Federal National Mortgage Association - 16.2% | ||||||
| Federal National Mortgage Association | ||||||
| 2.05%, 07/28/11 | 6,000 | 6,026 | ||||
| 5.50%, 01/01/17 | 78 | 83 | ||||
| 5.50%, 01/01/17 | 114 | 121 | ||||
| 5.50%, 01/01/17 | 53 | 56 | ||||
| 5.50%, 03/01/18 | 87 | 93 | ||||
| 5.50%, 12/01/18 | 451 | 480 | ||||
| 5.50%, 01/01/19 | 939 | 998 | ||||
| 5.50%, 05/01/19 | 480 | 511 | ||||
| 5.00%, 07/01/19 | 7,391 | 7,789 | ||||
| 5.00%, 12/01/19 | 5,822 | 6,134 | ||||
| 4.50%, 06/01/23 | 768 | 791 | ||||
| 4.50%, 09/01/24 | 4,293 | 4,421 | ||||
| 4.50%, 10/01/24 | 1,919 | 1,976 | ||||
| 4.50%, 10/01/24 | 671 | 691 | ||||
| 4.50%, 11/01/24 | 1,283 | 1,321 | ||||
| 4.50%, 12/01/24 | 1,639 | 1,688 | ||||
| 4.61%, 03/01/33 (i) | 9 | 10 | ||||
| 3.04%, 06/01/33 (i) | 913 | 942 | ||||
| 4.25%, 06/01/33 (i) | 98 | 98 | ||||
| 4.09%, 07/01/33 (i) | 69 | 71 | ||||
| 3.38%, 09/01/33 (i) | 7 | 7 | ||||
| 2.59%, 12/01/33 (i) | 1,229 | 1,264 | ||||
| 3.37%, 12/01/33 (i) | 8 | 8 | ||||
| 3.40%, 04/01/34 (i) | 9,134 | 9,371 | ||||
| 4.22%, 04/01/34 (i) | 29 | 30 | ||||
| 3.02%, 10/01/34 (i) | 40 | 41 | ||||
| 2.85%, 11/01/34 (i) | 1,235 | 1,275 | ||||
| 2.94%, 11/01/34 (i) | 14 | 14 | ||||
| 3.17%, 11/01/34 (i) | 326 | 334 | ||||
| 2.86%, 12/01/34 (i) | 136 | 139 | ||||
| 2.91%, 01/01/35 (i) | 49 | 50 | ||||
| 2.84%, 01/01/35 (i) | 148 | 152 | ||||
| 3.45%, 01/01/35 (i) | 175 | 181 | ||||
| 4.15%, 01/01/35 (i) | 191 | 198 | ||||
| 3.66%, 02/01/35 (i) | 451 | 454 | ||||
| 3.97%, 02/01/35 (i) | 90 | 93 | ||||
| 4.32%, 03/01/35 (i) | 197 | 203 | ||||
| 2.82%, 04/01/35 (i) | 1,147 | 1,159 | ||||
| 3.96%, 04/01/35 (i) | 765 | 789 | ||||
| 4.68%, 04/01/35 (i) | 277 | 286 | ||||
| 3.47%, 05/01/35 (i) | 1,289 | 1,325 | ||||
| 3.51%, 05/01/35 (i) | 673 | 689 | ||||
| 4.43%, 05/01/35 (i) | 169 | 176 | ||||
| 3.02%, 06/01/35 (i) | 1,127 | 1,149 | ||||
| 3.62%, 06/01/35 (i) | 1,042 | 1,078 | ||||
| 4.89%, 07/01/35 (i) | 1,113 | 1,145 | ||||
| 4.92%, 07/01/35 (i) | 1,058 | 1,106 | ||||
| 2.82%, 08/01/35 (i) | 1,476 | 1,526 | ||||
| 3.62%, 08/01/35 (i) | 982 | 1,016 | ||||
| 2.94%, 11/01/35 (i) | 1,135 | 1,156 | ||||
| 3.10%, 11/01/35 (i) | 817 | 840 | ||||
| 3.59%, 02/01/36 (i) | 891 | 921 | ||||
| 5.23%, 02/01/36 (i) | 1,554 | 1,606 | ||||
| 3.59%, 03/01/36 (i) | 1,128 | 1,163 | ||||
| 3.96%, 03/01/36 (i) | 817 | 842 | ||||
| REMIC, 5.00%, 08/25/19 | 8,561 | 9,057 | ||||
| REMIC, 5.00%, 11/25/21 | 3,149 | 3,306 | ||||
| REMIC, Interest Only, 2.70%, 08/25/35 (i) (s) (u) | 18 | 1 | ||||
| REMIC, 0.00%, 02/25/37 | ||||||
| (0.00% until LIBOR reaches 7.25%) (i) (s) (u) | 306 | 295 | ||||
| 78,745 | ||||||
| Government National Mortgage Association - 0.5% | ||||||
| Government National Mortgage Association | ||||||
| 7.00%, 12/15/17 | 1,771 | 1,911 | ||||
| 5.50%, 07/15/20 | 399 | 424 | ||||
| 2,335 | ||||||
| Total Government and Agency Obligations (cost $172,708) | 174,890 | |||||
| SHORT TERM INVESTMENTS - 8.1% | ||||||
| Mutual Funds - 5.6% | ||||||
| JNL Money Market Fund, 0.07% (a) (h) | 3,374 | 3,374 | ||||
| T. Rowe Price Reserves Investment Fund, 0.27% (a) (h) | 23,791 | 23,791 | ||||
| 27,165 | ||||||
| Securities Lending Collateral - 2.5% | ||||||
| Securities Lending Cash Collateral Fund LLC, | ||||||
| 0.16% (a) (h) | 1,818 | 1,818 | ||||
| Securities Lending Liquidating Fund LLC, 0.36% (a) (h) | 10,261 | 10,239 | ||||
| 12,057 | ||||||
| Total Short Term Investments (cost $39,244) | 39,222 | |||||
| Total Investments - 101.9% (cost $495,245) | 494,445 | |||||
| Other Assets and Liabilities, Net - (1.9%) | (9,402) | |||||
| Total Net Assets - 100% | $ | 485,043 | ||||
| JNL/T. Rowe Price Value Fund * (y) | ||||||
| COMMON STOCKS - 93.9% | ||||||
| CONSUMER DISCRETIONARY - 14.6% | ||||||
| Bed Bath & Beyond Inc. (c) | 243 | $ | 9,387 | |||
| Cablevision Systems Corp. - Class A | 385 | 9,936 | ||||
| Discovery Communications Inc. - Class C (c) | 333 | 8,818 | ||||
| Fortune Brands Inc. | 171 | 7,366 | ||||
| H&R Block Inc. | 309 | 6,990 | ||||
| Home Depot Inc. | 367 | 10,603 | ||||
| Kohl’s Corp. (c) | 144 | 7,766 | ||||
| Time Warner Cable Inc. (e) | 175 | 7,243 | ||||
| Time Warner Inc. | 290 | 8,451 | ||||
| Other Securities | 29,880 | |||||
| 106,440 | ||||||
| CONSUMER STAPLES - 5.0% | ||||||
| Kimberly-Clark Corp. | 106 | 6,753 | ||||
| Wal-Mart Stores Inc. | 145 | 7,750 | ||||
| Other Securities | 22,049 | |||||
| 36,552 | ||||||
| ENERGY - 13.7% | ||||||
| BJ Services Co. | 348 | 6,464 | ||||
| Consol Energy Inc. | 135 | 6,698 | ||||
| Exxon Mobil Corp. | 99 | 6,717 | ||||
| Murphy Oil Corp. | 164 | 8,862 | ||||
| Royal Dutch Shell Plc - ADR | 197 | 11,842 | ||||
| Schlumberger Ltd. | 158 | 10,284 | ||||
| Spectra Energy Corp. | 549 | 11,250 | ||||
| StatoilHydro ASA | 258 | 6,474 | ||||
| StatoilHydro ASA - ADR | 59 | 1,470 | ||||
| Total SA - ADR | 189 | 12,072 | ||||
| Other Securities | 17,878 | |||||
| 100,011 | ||||||
| FINANCIALS - 19.0% | ||||||
| American Express Co. | 257 | 10,430 | ||||
| Ameriprise Financial Inc. | 200 | 7,745 | ||||
| AON Corp. | 212 | 8,109 | ||||
| Bank of America Corp. | 1,041 | 15,677 | ||||
| First Horizon National Corp. (c) (e) | 550 | 7,370 | ||||
| JPMorgan Chase & Co. | 249 | 10,376 | ||||
| Lazard Ltd. - Class A | 230 | 8,733 | ||||
| SLM Corp. (c) | 598 | 6,744 | ||||
| St. Joe Co. (c) (e) | 311 | 8,970 | ||||
| Other Securities | 54,040 | |||||
| 138,194 | ||||||
| HEALTH CARE - 10.2% | ||||||
| Amgen Inc. (c) | 143 | 8,090 | ||||
| Covidien Plc | 179 | 8,572 | ||||
| Johnson & Johnson | 155 | 9,984 | ||||
| Medtronic Inc. | 202 | 8,884 | ||||
| Merck & Co. Inc. | 227 | 8,295 | ||||
| Pfizer Inc. | 515 | 9,368 | ||||
| Other Securities | 21,115 | |||||
| 74,308 | ||||||
| INDUSTRIALS - 10.4% | ||||||
| 3M Co. | 128 | 10,540 | ||||
| General Electric Co. | 717 | 10,841 | ||||
| Illinois Tool Works Inc. | 159 | 7,630 | ||||
| Southwest Airlines Co. | 1,087 | 12,424 | ||||
| Other Securities | 34,216 | |||||
| 75,651 | ||||||
| INFORMATION TECHNOLOGY - 10.1% | ||||||
| International Business Machines Corp. | 63 | 8,247 | ||||
| Microsoft Corp. | 532 | 16,221 | ||||
| Texas Instruments Inc. | 385 | 10,033 | ||||
| Tyco Electronics Ltd. | 300 | 7,365 | ||||
| Western Union Co. | 481 | 9,067 | ||||
| Other Securities | 22,342 | |||||
| 73,275 | ||||||
| MATERIALS - 4.8% | ||||||
| EI Du Pont de Nemours & Co. | 189 | 6,347 | ||||
| International Paper Co. | 277 | 7,418 | ||||
| Weyerhaeuser Co. | 274 | 11,820 | ||||
| Other Securities | 9,448 | |||||
| 35,033 | ||||||
| TELECOMMUNICATION SERVICES - 2.3% | ||||||
| AT&T Inc. | 311 | 8,703 | ||||
| Other Securities | 8,391 | |||||
| 17,094 | ||||||
| UTILITIES - 3.8% | ||||||
| Entergy Corp. | 113 | 9,207 | ||||
| NRG Energy Inc. (c) | 310 | 7,306 | ||||
| Other Securities | 11,036 | |||||
| 27,549 | ||||||
| Total Common Stocks (cost $682,357) | 684,107 | |||||
| PREFERRED STOCKS - 1.1% | ||||||
| FINANCIALS - 1.0% | ||||||
| Bank of America Corp., 10.00% | 121 | 1,808 | ||||
| Other Securities | 5,649 | |||||
| 7,457 | ||||||
| TELECOMMUNICATION SERVICES - 0.1% | ||||||
| Other Securities | 622 | |||||
| Total Preferred Stocks (cost $5,835) | 8,079 | |||||
| INVESTMENT FUNDS - 1.1% | ||||||
| T. Rowe Price Institutional Floating Rate Fund, 0.30% (a) (h) | 808 | 8,104 | ||||
| Total Investment Funds (cost $6,898) | 8,104 | |||||
| NON-U.S. GOVERNMENT AGENCY | ||||||
| ASSET-BACKED SECURITIES - 0.0% | ||||||
| Other Securities | 47 | |||||
| Total Non-U.S. Government Agency | ||||||
| Asset-Backed Securities (cost $1,103) | 47 | |||||
| CORPORATE BONDS AND NOTES - 0.9% | ||||||
| CONSUMER DISCRETIONARY - 0.6% | ||||||
| Other Securities | 4,209 | |||||
| MATERIALS - 0.3% | ||||||
| Other Securities | 2,226 | |||||
| Total Corporate Bonds and Notes (cost $4,024) | 6,435 | |||||
| SHORT TERM INVESTMENTS - 8.3% | ||||||
| Mutual Funds - 3.6% | ||||||
| JNL Money Market Fund, 0.07% (a) (h) | 9,543 | 9,543 | ||||
| T. Rowe Price Reserves Investment Fund, 0.27% (a) (h) | 16,472 | 16,472 | ||||
| 26,015 | ||||||
| Securities Lending Collateral - 4.7% | ||||||
| Securities Lending Cash Collateral Fund LLC, | ||||||
| 0.16% (a) (h) | 18,427 | 18,427 | ||||
| Securities Lending Liquidating Fund LLC, 0.36% (a) (h) | 15,901 | 15,867 | ||||
| 34,294 | ||||||
| Total Short Term Investments (cost $60,343) | 60,309 | |||||
| Total Investments - 105.3% (cost $760,560) | 767,081 | |||||
| Other Assets and Liabilities, Net - (5.3%) | (38,860) | |||||
| Total Net Assets - 100% | $ | 728,221 | ||||
See accompanying Notes to Financial Statements.
JNL Series Trust
Notes to the Schedules of Investments (dollar amounts in thousands)
December 31, 2009
| (a) | Investment in affiliate. | |||||||
| (b) | The Fund does not invest in the Underlying Affiliated Funds for the purpose of exercising management or control. At December 31, 2009, the percentage of shares outstanding held by each Fund in | |||||||
| the Underlying Affiliated Fund is presented parenthetically in the Schedules of Investments. Percentages reflecting 0.0% represent amounts less than 0.05%. | ||||||||
| (c) | Non-income producing security. | |||||||
| (d) | Issuer was in bankruptcy and/or was in default relating to principal and/or interest. | |||||||
| (e) | All or portion of the security was on loan. | |||||||
| (f) | Security fair valued in good faith in accordance with the procedures established by the Trust's Board of Trustees. Good faith fair valued securities may be classified as Level 2 or Level 3 | |||||||
| for Financial Accounting Standards Board ("FASB") Accounting Standards Codification ("ASC") Topic 820 "Fair Value Measurements and Disclosures" based on the applicable valuation inputs. | ||||||||
| See FASB ASC Topic 820 "Fair Value Measurements and Disclosures" in these Notes to the Schedules of Investments. | ||||||||
| (g) | Investment purchased on a delayed delivery basis. As of December 31, 2009, the total cost of investments purchased on a delayed delivery basis was as follows: JNL/Capital Guardian Global | |||||||
| Balanced Fund, $2,046; JNL/Goldman Sachs Core Plus Bond Fund $32,784; JNL/Mellon Capital Management Bond Index Fund $18,177; JNL/PIMCO Real Return Fund $517,453; | ||||||||
| JNL/PIMCO Total Return Bond Fund $239,586; and JNL/Select Balanced Fund $24,370. | ||||||||
| (h) | Yield changes daily to reflect current market conditions. Rate was the quoted yield as of December 31, 2009. | |||||||
| (i) | Variable rate security. Rate stated was in effect as of December 31, 2009. | |||||||
| (j) | Security issued with a zero coupon. Income is recognized through the accretion of discount. | |||||||
| (k) | Security is a "step-up" bond where the coupon may increase or step up at a future date. Rate stated was the coupon as of December 31, 2009. | |||||||
| (l) | The interest rate for this security is inversely affected by upgrades or downgrades to the credit rating of the issuer. | |||||||
| (m) | All or a portion of the securities or cash is segregated as collateral for swap agreements. As of December 31, 2009, total value of collateral in JNL/PIMCO Real Return Fund was $1,560. | |||||||
| (n) | All or a portion of the securities or cash is pledged as collateral for securities sold short. As of December 31, 2009, total value of collateral in JNL/Credit Suisse Long/Short Fund was $50,034. | |||||||
| (o) | All or a portion of the securities or cash is pledged as collateral for open futures contracts. As of December 31, 2009, total value of collateral was as follows: JNL/Goldman Sachs Core Plus Bond Fund | |||||||
| $3,531; JNL/JPMorgan International Value Fund $335; JNL/Mellon Capital Management Global Alpha Fund $2,155; JNL/Mellon Capital Management S&P 500 Index Fund $2,890; | ||||||||
| JNL/Mellon Capital Management S&P 400 MidCap Index Fund $710; JNL/Mellon Capital Management Small Cap Index Fund, $1,155; JNL/Mellon Capital Management International Index Fund, | ||||||||
| $1,135; JNL/PIMCO Real Return Fund $1,840; and JNL/PIMCO Total Return Bond Fund $10,012. | ||||||||
| (p) | Perpetual maturity security. Interest rate is fixed until the first call date and variable thereafter. | |||||||
| (q) | Par amounts are listed in United States Dollars unless otherwise noted. | |||||||
| (r) | Foreign or U.S. Treasury inflation indexed note, par amount is adjusted for inflation. | |||||||
| (s) | Security is restricted as to public resale. See Restricted table in these Notes to the Schedules of Investments and restricted security note in Note 3 of the Notes to the Financial Statements. | |||||||
| (t) | Rule 144A or Section 4(2) of the Securities Act of 1933, as amended, provides an exemption from the registration requirements for resale of this security to an institutional investor. | |||||||
| (u) | Illiquid security. At December 31, 2009, the aggregate value of illiquid securities and percentage of net assets were as follows: JNL/Capital Guardian Global Balanced Fund, $12,041 - 4.3%; | |||||||
| JNL/Capital Guardian Global Diversified Research Fund, $11,839 - 3.6%; JNL/Capital Guardian International Small Cap Fund, $7,330 - 5.1%; JNL/Franklin Templeton | ||||||||
| Global Growth Fund, $855 - 0.2%; JNL/Franklin Templeton Income Fund, $29,362 - 4.0%; JNL/Franklin Templeton Mutual Shares Fund, $17,664 - 4.2%; | ||||||||
| JNL/Goldman Sachs Core Plus Bond Fund, $24,240 - 3.1%; JNL/JPMorgan MidCap Growth Fund, $459 -0.3%; JNL/JPMorgan U.S. Government & Quality Bond Fund, $6,631 - 0.9%; | ||||||||
| JNL/M&G Global Basics Fund, $907 - 3.0%; JNL/Mellon Capital Management Small Cap Index Fund, $427 - 0.1%; JNL/PIMCO Real Return Fund, $29,998 - 2.5%; | ||||||||
| JNL/PIMCO Total Return Bond Fund, $23,363 - 1.0%; JNL/PPM America High Yield Bond Fund, $10,418 - 1.8%; JNL/Red Rocks Listed Private Equity Fund, $4,315 - 1.9%; | ||||||||
| JNL/T. Rowe Price Short-Term Bond Fund $2,185 - 0.4%; and JNL/T. Rowe Price Value Fund, $1,660 - 0.2%. At December 31, 2009, the only illiquid security held by some Funds was Sigma | ||||||||
| Finance, Inc. For Funds not listed in detail, the value of Sigma Finance, Inc. as a percentage of net assets was less than 0.03%. . | ||||||||
| (v) | Rule 144A or Section 4(2) liquid security, the Fund deemed this security to be liquid based on procedures approved by the Trust's Board of Trustees. As of December 31, 2009, the value of Rule 144A | |||||||
| and Section 4(2) liquid securities was as follows: JNL/Capital Guardian Global Balanced Fund, $275; JNL/Capital Guardian Global Diversified Research Fund, $1,035; JNL/Credit Suisse Commodity | ||||||||
| Securities Fund, $42,044; JNL/Franklin Templeton Income Fund $120,176; JNL/Goldman Sachs Core Plus Bond Fund $87,400; JNL/JPMorgan U.S. Government & Quality Bond Fund $4,961; | ||||||||
| JNL/Mellon Capital Management Bond Index Fund $2,291; JNL/PIMCO Real Return Fund $123,708; JNL/PIMCO Total Return Bond Fund $164,071; JNL/PPM America High Yield Bond Fund $157,736; | ||||||||
| JNL/Select Balanced Fund $9,263; and JNL/T. Rowe Price Short-Term Bond Fund, $75,657. | ||||||||
| (w) | Contingent distributions represent the right to receive additional distributions, if any, during the reorganization of the underlying company. | |||||||
| (x) | The Fund had an unfunded loan commitment relating to this security at December 31, 2009. See Unfunded Loan Commitments table on page 164 and Note 3 in the Notes to the Financial Statements. | |||||||
| (y) | For all items listed as "Other Securities" in this Summary Schedule of Investments, this represents issues not identified as top-fifty unaffiliated holdings in terms of value and issues or issuers not | |||||||
| exceeding one percent individually or in aggregate, respectively, as of December 31, 2009. In certain instances, securities for which footnotes listed above may otherwise apply are included in the | ||||||||
| Other Securities caption. | ||||||||
| * | A Summary Schedule of Investments is presented for this portfolio. For information on availability of a complete Schedule of Investments, refer to www.jackson.com, www.sec.gov, or call the | |||||||
| Shareholder Service Center at 1-800-873-5654. | ||||||||
| Currencies: | |||||||
| AUD - Australian Dollar | RUB - Russian Ruble | ||||||
| BRL - Brazilian Real | SEK - Swedish Krona | ||||||
| CAD - Canadian Dollar | SGD - Singapore Dollar | ||||||
| CHF - Swiss Franc | THB - Thai Baht | ||||||
| CLP - Chilean Peso | TRY - New Turkish Lira | ||||||
| CNY - Chinese Yuan | TWD - Taiwan Dollar | ||||||
| COP - Colombian Peso | USD - United States Dollar | ||||||
| DKK - Danish Krone | UYU - Uruguayan Peso | ||||||
| EGP - Egyptian Pound | ZAR - South African Rand | ||||||
| EUR - European Currency Unit (Euro) | Abbreviations: | ||||||
| GBP - British Pound | "-" Amount rounds to less than one thousand. | MIB - Milano Indice Borsa | |||||
| HKD - Hong Kong Dollar | ABS - Asset Backed Security | NYS - New York Registered Shares | |||||
| HUF - Hungarian Forint | ADR - American Depositary Receipt | REIT - Real Estate Investment Trust | |||||
| IDR - Indonesian Rupiah | AMBAC - AMBAC Indemnity Corp. | REMIC - Real Estate Mortgage Investment Conduit | |||||
| ILS - Israeli New Shekels | ASX - Australian Stock Exchange | SPDR - Standard & Poor's Depository Receipt | |||||
| INR - Indian Rupee | CAC - Cotation Assistee en Continu | TBA - To Be Announced (Securities purchased on a delayed delivery basis) | |||||
| JPY - Japanese Yen | CPI - Consumer Price Index | virt-x - a crossborder Recognized Investment Exchange | |||||
| KRW - Korean Won | DAX - Deutscher Aktienindex | Euro-Bobl - debt instrument issued by the Federal Republic of Germany with | |||||
| MXN - Mexican Peso | ETF - Exchange-Traded-Fund | a term of 4.5 to 5.5 years | |||||
| MYR - Malaysian Ringgit | FSA - Financial Security Assurance Inc. | Euro-Bund - debt instrument issued by the Federal Republic of Germany with | |||||
| NOK - Norwegian Krone | GDR - Global Depository Receipt | a term of 8.5 to 10.5 years | |||||
| NZD - New Zealand Dollar | IBEX - Iberia Index | ||||||
| PEN - Peruvian Nuevo Sol | LIBOR - London Interbank Offered Rate | ||||||
| PHP - Philippine Peso | MBIA - Municipal Bond Investors Assurance | ||||||
| PLN - Polish Zloty | MBS - Mortgage Backed Security | ||||||
See accompanying Notes to Financial Statements.
JNL Series Trust
Notes to the Schedules of Investments (continued) (dollar amounts in thousands)
December 31, 2009
Restricted Securities - Restricted securities are often purchased in private placement transactions and cannot be sold without prior registration unless the sale is pursuant to an exemption under the Securities Exchange Act of 1933, as amended. The following table details restricted securities as well as including Rule 144A securities that have not been deemed liquid, held by the Funds at December 31, 2009. | |||||||||||||
| Value | |||||||||||||
| Acquisition | End | Percent of | |||||||||||
| Date | Cost | of Period | Net Assets | ||||||||||
| JNL/Capital Guardian Global Balanced Fund | |||||||||||||
| AES Panama SA, 6.35%, 12/12/16 | 01/04/2008 | $ 297 | $ 295 | 0.1 | % | ||||||||
| Altegrity Inc., 10.50%, 11/01/15 | 07/27/2009 | 152 | 178 | 0.1 | |||||||||
| Anhanguera Educacional Participacoes SA | 12/10/2009 | 435 | 487 | 0.2 | |||||||||
| ASAT Holdings Ltd. 07/24/11 | 01/04/2008 | - | - | - | |||||||||
| ASAT Holdings Ltd., 13.00% | 07/28/2006 | 1 | - | - | |||||||||
| AXA SA | 11/28/2007 | 339 | 316 | 0.1 | |||||||||
| Barclays Plc | 12/21/2006 | 696 | 721 | 0.3 | |||||||||
| BAT International Finance Plc, 8.13%, 11/15/13 | 03/03/2009 | 161 | 173 | 0.1 | |||||||||
| BNP Paribas | 11/28/2007 | 1,103 | 1,028 | 0.4 | |||||||||
| CapitaMalls Asia Ltd. | 11/18/2009 | 334 | 391 | 0.1 | |||||||||
| Charter Communications Operating LLC, 8.38%, 04/30/14 | 12/13/2007 | 196 | 206 | 0.1 | |||||||||
| China Longyuan Power Group Corp. | 12/08/2009 | 251 | 306 | 0.1 | |||||||||
| Cielo SA | 06/29/2009 | 34 | 37 | - | |||||||||
| Croatia Government International Bond, 6.75%, 11/05/19 | 10/30/2009 | 753 | 808 | 0.3 | |||||||||
| DBS Bank Ltd. Singapore, 7.88%, 04/15/10 | 06/05/2008 | 151 | 152 | 0.1 | |||||||||
| Dominican Republic International Bond, 8.63%, 04/20/27 | 12/17/2009 | 158 | 157 | 0.1 | |||||||||
| Epistar Corp. | 09/18/2009 | 78 | 113 | - | |||||||||
| Evergreen Energy Inc., 8.00%, 08/01/12 | 07/25/2007 | 60 | 21 | - | |||||||||
| Hypermarcas SA | 07/16/2009 | 144 | 252 | 0.1 | |||||||||
| Lafarge SA | 11/28/2007 | 637 | 774 | 0.3 | |||||||||
| Liberty Mutual Group Inc., 7.50%, 08/15/36 | 08/06/2009 | 263 | 320 | 0.1 | |||||||||
| Marfrig Frigorificos e Comercio de Alimentos SA | 11/13/2009 | 1,128 | 1,149 | 0.4 | |||||||||
| Maxis Bhd | 11/11/2009 | 467 | 467 | 0.1 | |||||||||
| Orascom Construction Industries | 12/12/2007 | 732 | 341 | 0.1 | |||||||||
| Qatar Government International Bond, 5.25%, 01/20/20 | 11/18/2009 | 150 | 151 | - | |||||||||
| Republic of El Salvador, 7.38%, 12/01/19 | 11/23/2009 | 102 | 103 | - | |||||||||
| Roche Holdings Inc., 6.00%, 03/01/19 | 05/18/2009 | 419 | �� 440 | 0.2 | |||||||||
| Societe Generale, 5.75%, 04/20/16 | 08/07/2008 | 143 | 152 | 0.1 | |||||||||
| Standard Chartered Bank, 6.40%, 09/26/17 | 12/18/2007 | 299 | 312 | 0.1 | |||||||||
| Tenet Healthcare Corp., 8.88%, 07/01/19 | 06/01/2009 | 191 | 216 | 0.1 | |||||||||
| UBS AG | 07/19/2007 | 247 | 247 | - | |||||||||
| UniCredito Luxemburg Finance SA, 6.00%, 10/31/17 | 12/18/2007 | 148 | 149 | - | |||||||||
| $ 10,269 | $ 10,462 | 3.7 | % | ||||||||||
| JNL/Capital Guardian International Small Cap Fund | |||||||||||||
| 361 Degrees International Ltd. | 06/25/2009 | $ 452 | $ 525 | 0.4 | % | ||||||||
| BaWang International Group Holding Ltd. | 06/27/2009 | 269 | 492 | 0.3 | |||||||||
| CapitaCommercial Trust | 12/17/2008 | 804 | 1,047 | 0.7 | |||||||||
| CapitaMall Trust | 10/14/2008 | 214 | 306 | 0.2 | |||||||||
| Epistar Corp. | 09/18/2009 | 130 | 188 | 0.1 | |||||||||
| Gem Diamonds Ltd. | 12/06/2007 | 903 | 815 | 0.6 | |||||||||
| Liberty International Plc | 05/23/2009 | 44 | 74 | 0.1 | |||||||||
| Olam International Ltd. | 04/03/2008 | 812 | 961 | 0.7 | |||||||||
| Shaftesbury Plc | 12/06/2007 | 810 | 905 | 0.6 | |||||||||
| Yell Group Plc | 07/18/2008 | 1,208 | 995 | 0.7 | |||||||||
| $ 5,646 | $ 6,308 | 4.4 | % | ||||||||||
| JNL/Franklin Templeton Global Growth Fund | |||||||||||||
| Samsung Electronics Co. Ltd. | 09/08/2008 | $ 471 | $ 833 | 0.2 | % | ||||||||
| JNL/Franklin Templeton Mutual Shares Fund | |||||||||||||
| Cerberus Capital Management LP | 08/06/2007 | $ 888 | $ 178 | 0.1 | % | ||||||||
| Cerberus Capital Management LP | 08/06/2007 | 888 | 178 | 0.1 | |||||||||
| Cerberus Capital Management LP | 08/06/2007 | 444 | 89 | - | |||||||||
| Cerberus Capital Management LP 12.00%, 07/31/14 | 08/07/2007 | 780 | 156 | - | |||||||||
| Cerberus Capital Management LP 12.00%, 07/31/14 | 08/07/2007 | 390 | 78 | - | |||||||||
| Cerberus Capital Management LP 12.00%, 07/31/14 | 08/07/2007 | 780 | 156 | - | |||||||||
| Dana Corp. 6.50%, 03/01/10 | 02/04/2008 | 3 | 1 | - | |||||||||
| Dana Corp. 5.85%, 01/15/15 | 04/23/2008 | 5 | - | - | |||||||||
| Dana Corp. 7.00%, 03/15/28 | 02/04/2008 | 6 | - | - | |||||||||
| Harrah's Investment LP | 01/16/2008 | 39 | - | - | |||||||||
| $ 4,223 | $ 836 | 0.2 | % | ||||||||||
| JNL/Goldman Sachs Core Plus Bond Fund | |||||||||||||
| Applied Extrusion Technologies Inc. - Class B | 05/05/2005 | $ 42 | $ 4 | - | % | ||||||||
| Anglo American Capital Plc, 9.38%, 04/08/19 | 08/04/2009 | 717 | 794 | - | |||||||||
| Axiohm Transaction Solutions Inc. | 10/09/2001 | 153 | - | - | |||||||||
| CIT Mortgage Loan Trust REMIC, 2.65%, 01/25/10 | 10/11/2007 | 700 | 318 | - | |||||||||
| CIT Mortgage Loan Trust REMIC, 1.92%, 09/25/24 | 10/11/2007 | 1,280 | 480 | - | |||||||||
| CIT Mortgage Loan Trust REMIC, 1.23%, 10/25/37 | 10/11/2007 | 1,082 | 963 | 0.1 | |||||||||
| Countrywide Home Equity Loan Trust REMIC, 0.43%, 05/15/36 | 03/29/2006 | 1,271 | 224 | - | |||||||||
See accompanying Notes to Financial Statements.
JNL Series Trust
Notes to the Schedules of Investments (continued) (dollar amounts in thousands)
December 31, 2009
Restricted Securities (continued) | |||||||||||||
| Value | |||||||||||||
| Acquisition | End | Percent of | |||||||||||
| Date | Cost | of Period | Net Assets | ||||||||||
JNL/Goldman Sachs Core Plus Bond Fund (continued) | |||||||||||||
| Credit Suisse Mortgage Capital Certificates REMIC, 6.50%, 10/25/21 | 09/04/2008 | $ 2,290 | $ 2,410 | 0.2 | % | ||||||||
| El Paso Performance-Linked Trust, 7.75%, 07/15/11 | 07/13/2006 | 1,290 | 1,322 | 0.2 | |||||||||
| Federal Home Loan Mortgage Corp. REMIC, 0.00%, 08/15/35 (0.00% until LIBOR reaches 6.50%) | 08/18/2008 | 16 | 14 | - | |||||||||
| Federal Home Loan Mortgage Corp. REMIC, 0.00%, 09/15/35 (0.00% until LIBOR reaches 7.00%) | 05/30/2007 | 423 | 369 | - | |||||||||
| Federal Home Loan Mortgage Corp. REMIC, 0.00%, 04/15/37 (0.00% until LIBOR reaches 6.75%) | 05/16/2007 | 216 | 164 | - | |||||||||
| Federal Home Loan Mortgage Corp. REMIC, 1,156.50%, 06/15/21 | 02/29/2000 | - | 1 | - | |||||||||
| Federal National Mortgage Association REMIC, 0.00%, 05/25/35 (0.00% until LIBOR reaches 7.00%) | 05/30/2007 | 91 | 91 | - | |||||||||
| Federal National Mortgage Association REMIC, 0.00%, 09/25/36 (0.00% until LIBOR reaches 7.00%) | 05/30/2007 | 155 | 138 | - | |||||||||
| First Union National Bank Commercial Mortgage Trust - Interest Only REMIC, 0.63%, 05/17/32 . | 01/08/2003 | 99 | 86 | - | |||||||||
| GSMPS Mortgage Loan Trust, 0.46%, 02/25/35 | 12/10/2002 | 143 | 114 | �� - | |||||||||
| Home Interior Gift Inc. | 02/13/2006 | 184 | 5 | - | |||||||||
| Impac CMB Trust REMIC, 0.87%, 03/25/35 | 11/02/2006 | 181 | 78 | - | |||||||||
| Merit Securities Corp. REMIC, 1.73%, 09/28/32 | 12/10/2002 | 305 | 273 | - | |||||||||
| Radnor Holdings Corp., 11.00%, 03/15/10 | 11/13/2003 | 126 | - | - | |||||||||
| Rainbow National Services LLC, 10.38%, 09/01/14 | 01/05/2005 | 84 | 84 | - | |||||||||
| Royal Bank of Scotland Group Plc, 1.50%, 03/30/12 | 11/23/2009 | 7,496 | 7,427 | 0.8 | |||||||||
| Sail Net Interest Margin Notes, 7.75%, 04/27/33 | 05/23/2003 | 6 | - | - | |||||||||
| Sail Net Interest Margin Notes, 5.50%, 03/27/34 | 12/22/2004 | 45 | - | - | |||||||||
| Station Casinos Inc., 6.50%, 02/01/14 | 02/19/2009 | 100 | - | - | |||||||||
| Station Casinos Inc., 6.88%, 03/01/16 | 05/03/2005 | 15 | - | - | |||||||||
| Station Casinos Inc., 7.75%, 08/15/16 | 12/13/2006 | 60 | 9 | - | |||||||||
| UBS AG New Jersey-Credit Linked Note (Federative Republic of Brazil, 6.00%, 01/17/17, Moody’s Rating Baa3) | 11/05/2007 | 655 | 424 | - | |||||||||
| WEA Finance LLC, 7.50%, 06/02/14 | 05/27/2009 | 471 | 535 | 0.1 | |||||||||
| Westpac Banking Corp., 1.90%, 12/14/12 | 12/08/2009 | 4,897 | 4,860 | 0.6 | |||||||||
| White Mountains Re Group Inc., 6.38%, 03/20/17 | 05/11/2007 | 1,271 | 1,197 | 0.1 | |||||||||
| ZFS Finance USA Trust I, 5.88%, 05/09/32 | 05/04/2007 | 1,225 | 992 | 0.1 | |||||||||
| $ 27,089 | $ 23,376 | 2.2 | % | ||||||||||
| JNL/JPMorgan MidCap Growth Fund | |||||||||||||
| Apollo Global Management LLC | 11/02/2007 | $ 2,028 | $ 440 | 0.3 | % | ||||||||
| JNL/JPMorgan U.S. Government & Quality Bond Fund | |||||||||||||
| Banc of America Commercial Mortgage Inc. REMIC, 6.62%, 03/11/32 | 12/29/2006 | $ 2,210 | $ 2,299 | 0.3 | % | ||||||||
| Commercial Mortgage Pass-Through Certificates REMIC, 5.45%, 07/16/34 | 10/09/2003 | 3,546 | 3,530 | 0.5 | |||||||||
| CompuCredit Acquired Portfolio Voltage Master Trust, 0.40%, 09/15/18 | 09/15/2006 | 674 | 506 | 0.1 | |||||||||
| $ 6,430 | $ 6,335 | 0.9 | % | ||||||||||
| JNL/PIMCO Total Return Bond Fund | |||||||||||||
| DG Funding Trust, 0.64% (callable at 10,000 beginning 02/18/10) | 11/10/2003 | $ 4,427 | $ 3,709 | 0.2 | % | ||||||||
| Northern Rock Plc, 5.63%, 06/22/17 | 06/08/2009 | 13,837 | 15,028 | 0.6 | |||||||||
| $ 18,264 | $ 18,737 | 0.8 | % | ||||||||||
| JNL/PPM America High Yield Bond Fund | |||||||||||||
| Applied Extrusion Technologies Inc. - Class B | 05/05/2005 | $ 63 | $ 6 | - | % | ||||||||
| Axiohm Transaction Solutions Inc. | 07/30/2001 | 127 | - | - | |||||||||
| Home Interior Gift Inc. | 02/22/2006 | 174 | 4 | - | |||||||||
| Manitoba Telecom Services Inc. | 06/10/2005 | - | 17 | - | |||||||||
| Newsday Secured, Term Loan, 9.75%, 12/31/49 | 07/10/2008 | 800 | 864 | 0.1 | |||||||||
| Radnor Holdings Corp., 11.00%, 03/15/10 | 11/14/2003 | 100 | - | - | |||||||||
| Texas Competitive Electric Holdings Co. LLC, Term Loan B, 3.73%, 06/30/11 | 10/03/2008 | 3,479 | 3,209 | 0.6 | |||||||||
| TransDigm Inc., 7.75%, 07/15/14 | 10/01/2009 | 1,459 | 1,522 | 0.3 | |||||||||
| Triumph Group Inc., 8.00%, 11/15/17 | 11/11/2009 | 986 | 1,009 | 0.1 | |||||||||
| Wolseley Plc - Private Placement, 5.32%, 11/17/20 | 08/31/2009 | 1,400 | 1,616 | 0.3 | |||||||||
| $ 8,588 | $ 8,247 | 1.4 | % | ||||||||||
| JNL/T. Rowe Price Short-Term Bond Fund | |||||||||||||
| Federal Home Loan Mortgage Corp. REMIC, 0.00%, 03/15/37 (0.00% until LIBOR reaches 7.25%) | 09/05/2008 | $ 154 | $ 157 | - | % | ||||||||
| Federal National Mortgage Association REMIC, 0.00%, 02/25/37 (0.00% until LIBOR reaches 7.25%) | 04/10/2007 | 284 | 295 | 0.1 | |||||||||
| Federal National Mortgage Association REMIC, Interest Only, 2.70%, 08/25/35 | 07/06/2006 | 27 | 1 | - | |||||||||
| T Rowe Price Term Asset-Backed Securities Loan Facility | 10/16/2009 | 1,702 | 1,702 | 0.3 | |||||||||
| $ 2,167 | $ 2,155 | 0.4 | % | ||||||||||
| JNL/T. Rowe Price Value Fund | |||||||||||||
| CSC Holdings Inc., 8.50%, 04/15/14 | 01/09/2009 | $ 565 | $ 666 | 0.1 | % | ||||||||
| International Game Technology, 3.25%, 05/01/14 | 05/07/2009 | 777 | 947 | 0.1 | |||||||||
| $ 1,342 | $ 1,613 | 0.2 | % | ||||||||||
See accompanying Notes to Financial Statements.
JNL Series Trust
Notes to the Schedules of Investments (continued) (dollar amounts in thousands)
December 31, 2009
Investments in Affiliates - See Note 6 in the Notes to the Financial Statements for further discussion of investments in affiliates. The JNL/Mellon Capital Management S&P 500 Index Fund invested in
Bank of New York Mellon Corp., the parent company of its subadviser. The JNL/Mellon Capital Management International Index Fund invested in Prudential plc, the parent company of Jackson National Life
Insurance Company®. Prudential plc is not affiliated in any manner with Prudential Financial Inc., a company whose principal place of business is in the United States of America. The JNL/T. Rowe Price
Value Fund and JNL/T. Rowe Price Short-Term Bond Fund invested in the T. Rowe Price Institutional Floating Rate Fund and the T. Rowe Price Term Asset-Backed Securities Loan Facility, respectively,
which are affiliates of the Funds. The following table details each Fund's long-term investments in affiliates held at December 31, 2009.
| Beginning | Sales | Dividend | Realized | Ending | |||
| Affiliate | Value | Purchases | Proceeds | Income | Gain (Loss) | Value | |
| Bank of New York Mellon Corp. | $ 1,841 | $ 1,243 | $ 24 | $ 41 | $ (2) | $ 3,008 | |
| Prudential plc | 698 | 514 | - | 40 | - | 1,858 | |
| T. Rowe Price Institutional Floating Rate Fund | - | 8,076 | 1,427 | 467 | 249 | 8,104 | |
| T. Rowe Price Term Asset-Backed Securities Loan Facility | - | 9,688 | 8,025 | 7 | 39 | 1,702 |
The following table details cash management and securities lending collateral investments in affiliates held at December 31, 2009. Income received from the Securities Lending Cash Collateral Fund LLC
and the Securities Lending Liquidating Fund LLC is aggregated with income from securities lending when received from the custodian and each Fund's affiliated income is included in dividends from
affiliates on the Statements of Operations. Purchase and sales proceeds are not for shown for these investments. There was no realized gain or loss relating to transactions in these investments during the
year ended December 31, 2009.
| Securities Lending | Securities Lending Cash | |||||||||||
| JNL Money Market Fund | Liquidating Fund LLC | Collateral Fund LLC | ||||||||||
| Beginning | Ending | Ending | Dividend | Beginning | Ending | Ending | Ending | Ending | ||||
| Fund | Value | Amortized Cost | Value | Income | Value * | Amortized Cost | Value | Amortized Cost | Value | |||
| JNL/AIM International Growth Fund | $ 23,585 | $ 36,147 | $ 36,147 | $ 96 | $ 41,737 | $ 12,768 | $ 12,741 | $ 4,668 | $ 4,668 | |||
| JNL/AIM Large Cap Growth Fund | 22,106 | 17,262 | 17,262 | 79 | 14,056 | 4,543 | 4,533 | 11,846 | 11,846 | |||
| JNL/AIM Global Real Estate Fund | 2,774 | 8,814 | 8,814 | 14 | 30,808 | 13,160 | 13,132 | 5,818 | 5,818 | |||
| JNL/AIM Small Cap Growth Fund | 781 | 4,526 | 4,526 | 5 | 10,561 | 3,995 | 3,987 | 12,335 | 12,335 | |||
| JNL/Capital Guardian Global Balanced Fund | 4,282 | 13,868 | 13,868 | 17 | 37,998 | 10,418 | 10,396 | 3,706 | 3,706 | |||
| JNL/Capital Guardian Global Diversified Research Fund | 7,370 | 18,355 | 18,355 | 35 | 34,014 | 7,677 | 7,661 | 8,015 | 8,015 | |||
| JNL/Capital Guardian International Small Cap Fund | 4,061 | 13,149 | 13,149 | 17 | 7,218 | 2,271 | 2,266 | 8,483 | 8,483 | |||
| JNL/Capital Guardian U.S. Growth Equity Fund | 14,858 | 14,662 | 14,662 | 50 | 37,414 | 14,570 | 14,539 | 42,739 | 42,739 | |||
| JNL/Credit Suisse Commodity Securities Fund | 8,034 | 9,840 | 9,840 | 41 | 15,061 | 6,032 | 6,019 | 43,895 | 43,895 | |||
| JNL/Credit Suisse Long/Short Fund | 794 | 4,692 | 4,692 | 4 | - | - | - | - | - | |||
| JNL/Eagle Core Equity Fund | 3,368 | 4,732 | 4,732 | 16 | - | - | - | 2,257 | 2,257 | |||
| JNL/Eagle SmallCap Equity Fund | 7,399 | 3,885 | 3,885 | 14 | 46,266 | 14,413 | 14,383 | 29,593 | 29,593 | |||
| JNL/Franklin Templeton Global Growth Fund | 23,916 | 25,086 | 25,086 | 62 | 18,364 | 3,290 | 3,283 | 2,574 | 2,574 | |||
| JNL/Franklin Templeton Income Fund | 35,441 | 90,379 | 90,379 | 136 | 64,998 | 21,149 | 21,105 | 64,754 | 64,754 | |||
| JNL/Franklin Templeton Mutual Shares Fund | 27,085 | 50,580 | 50,580 | 101 | - | - | - | 16,975 | 16,975 | |||
| JNL/Franklin Templeton Small Cap Value Fund | 8,349 | 17,414 | 17,414 | 34 | 21,271 | 8,381 | 8,364 | 12,512 | 12,512 | |||
| JNL/Goldman Sachs Core Plus Bond Fund | 23,642 | 79,220 | 79,220 | 99 | 13,006 | 5,248 | 5,237 | 28,509 | 28,509 | |||
| JNL/Goldman Sachs Emerging Markets Debt Fund | 7,284 | 44,096 | 44,096 | 42 | - | - | - | - | - | |||
| JNL/Goldman Sachs Mid Cap Value Fund | 3,709 | 12,147 | 12,147 | 22 | 14,895 | 5,796 | 5,784 | 21,876 | 21,876 | |||
| JNL/Ivy Asset Strategy Fund | - | 29,184 | 29,184 | 4 | - | - | - | - | - | |||
| JNL/JPMorgan International Value Fund | 15,189 | 14,166 | 14,166 | 30 | 40,422 | 11,514 | 11,490 | 15,172 | 15,172 | |||
| JNL/JPMorgan MidCap Growth Fund | 1,819 | 5,286 | 5,286 | 11 | 14,505 | 5,718 | 5,706 | 13,130 | 13,130 | |||
| JNL/JPMorgan U.S. Government & Quality Bond Fund | 116,255 | 19,879 | 19,879 | 201 | 98,892 | 43,317 | 43,226 | 28,994 | 28,994 | |||
| JNL/Lazard Emerging Markets Fund | 12,801 | 46,043 | 46,043 | 63 | 26,411 | 10,966 | 10,943 | 10,096 | 10,096 | |||
| JNL/Lazard Mid Cap Equity Fund | 4,367 | 4,587 | 4,587 | 14 | 22,791 | 5,875 | 5,862 | 6,110 | 6,110 | |||
| JNL/M&G Global Basics Fund | 199 | 1,114 | 1,114 | 1 | - | - | - | 1,607 | 1,607 | |||
| JNL/M&G Global Leaders Fund | - | 846 | 846 | 1 | - | - | - | 637 | 637 | |||
| JNL/Mellon Capital Management European 30 Fund | 4 | 268 | 268 | - | - | - | - | - | - | |||
| JNL/Mellon Capital Management Pacific Rim 30 Fund | 3 | 367 | 367 | - | - | - | - | 644 | 644 | |||
| JNL/Mellon Capital Management S&P 500 Index Fund | 15,973 | 29,658 | 29,658 | 42 | 33,738 | 15,587 | 15,555 | 17,730 | 17,730 | |||
| JNL/Mellon Capital Management S&P 400 MidCap Index Fund | 9,083 | 7,170 | 7,170 | 19 | 73,845 | 23,499 | 23,450 | 45,205 | 45,205 | |||
| JNL/Mellon Capital Management Small Cap Index Fund | 8,174 | 14,720 | 14,720 | 17 | 62,038 | 32,507 | 32,439 | 62,694 | 62,694 | |||
| JNL/Mellon Capital Management International Index Fund | 10,184 | 15,534 | 15,534 | 29 | 51,649 | 17,155 | 17,119 | 11,595 | 11,595 | |||
| JNL/Mellon Capital Management Bond Index Fund | 11,087 | 26,989 | 26,989 | 37 | 94,577 | 39,557 | 39,475 | 10,827 | 10,827 | |||
| JNL/Mellon Capital Management Global Alpha Fund | - | 6,240 | 6,240 | 1 | - | - | - | - | - | |||
| JNL/Oppenheimer Global Growth Fund | 4,300 | 6,887 | 6,887 | 15 | 28,389 | 8,459 | 8,441 | 11,438 | 11,438 | |||
| JNL/PAM Asia ex-Japan Fund | 177 | 2,890 | 2,890 | 4 | 1,164 | 392 | 391 | 3,147 | 3,147 | |||
| JNL/PAM China-India Fund | 1,001 | 8,553 | 8,553 | 8 | 2,077 | 470 | 469 | 12,356 | 12,356 | |||
| JNL/PIMCO Real Return Fund | - | 963 | 963 | 8 | - | - | - | 45,135 | 45,135 | |||
| JNL/PIMCO Total Return Bond Fund | 11,920 | 4,480 | 4,480 | 40 | - | - | - | 73,001 | 73,001 | |||
| JNL/PPM America High Yield Bond Fund | 28,972 | 27,030 | 27,030 | 88 | 35,263 | 11,672 | 11,647 | 72,227 | 72,227 | |||
| JNL/PPM America Mid Cap Value Fund | 27 | 381 | 381 | 1 | - | - | - | 1,970 | 1,970 | |||
| JNL/PPM America Small Cap Value Fund | 57 | 126 | 126 | 1 | - | - | - | 2,128 | 2,128 | |||
| JNL/PPM America Value Equity Fund | 531 | 702 | 702 | 2 | 5,457 | 2,193 | 2,188 | 3,188 | 3,188 | |||
| JNL/Red Rocks Listed Private Equity Fund | 1,104 | 6,305 | 6,305 | 7 | - | - | - | 6,877 | 6,877 | |||
| JNL/S&P Competitive Advantage Fund | 1,120 | 648 | 648 | 5 | 12,091 | 3,446 | 3,439 | 4,198 | 4,198 | |||
| JNL/S&P Dividend Income & Growth Fund | 1,240 | 1,254 | 1,254 | 4 | 12,161 | 4,152 | 4,143 | 6,135 | 6,135 | |||
| JNL/S&P Intrinsic Value Fund | 1,101 | 2,119 | 2,119 | 5 | 15,613 | 4,465 | 4,455 | 4,630 | 4,630 | |||
| JNL/S&P Total Yield Fund | 1,373 | 616 | 616 | 4 | 27,845 | 10,418 | 10,396 | 16,656 | 16,656 | |||
| JNL/Select Balanced Fund | 4,183 | 39,129 | 39,129 | 103 | 51,546 | 18,094 | 18,056 | 21,585 | 21,585 | |||
| JNL/Select Value Fund | 20,121 | 22,516 | 22,516 | 67 | 7,097 | 2,976 | 2,970 | 29,610 | 29,610 | |||
| JNL/T. Rowe Price Established Growth Fund | 2,438 | 2,905 | 2,905 | 7 | 72,563 | 23,969 | 23,919 | 19,181 | 19,181 | |||
| JNL/T. Rowe Price Mid-Cap Growth Fund | 2,829 | 4,417 | 4,417 | 12 | 120,466 | 50,994 | 50,887 | 73,953 | 73,953 | |||
| JNL/T. Rowe Price Short-Term Bond Fund | 24,723 | 3,374 | 3,374 | 71 | 21,556 | 10,261 | 10,239 | 1,818 | 1,818 | |||
| JNL/T. Rowe Price Value Fund | 4,047 | 9,543 | 9,543 | 7 | 47,671 | 15,901 | 15,867 | 18,427 | 18,427 | |||
* At the beginning of the year, the investment in Securities Lending Liquidating Fund LLC was held in the Mellon GSL DBT II Collateral Fund. In addition, Mellon GSL Reinvestment Trust was an affiliated
investment for the Funds sub-advised by Mellon Capital Management Corporation and valued at $0.00 at December 31, 2008. It was not an affiliated investment at December 31, 2009. See note 3 to the
Financial Statements for further discussion of securities lending collateral transactions during the year.
See accompanying Notes to Financial Statements.
JNL Series Trust
Notes to the Schedules of Investments (continued)
December 31, 2009
Investments in Affiliates (in thousands) (continued) | |||||||||
| T. Rowe Price Reserves Investment Fund | |||||||||
| Beginning | Ending | Ending | Dividend | ||||||
| Fund | Value | Amortized Cost | Value | Income | |||||
| JNL/T. Rowe Price Established Growth Fund | $ 17,918 | $ 5,950 | $ 5,950 | $ 40 | |||||
| JNL/T. Rowe Price Mid-Cap Growth Fund | 22,841 | 42,725 | 42,725 | 116 | |||||
| JNL/T. Rowe Price Short-Term Bond Fund | - | 23,791 | 23,791 | 21 | |||||
| JNL/T. Rowe Price Value Fund | 4,672 | 16,472 | 16,472 | 45 | |||||
Schedule of Written Options (in thousands except contracts) | |||||||||
| Expiration Date | Exercise Price | Contracts | Value | ||||||
| JNL/PIMCO Real Return Fund | |||||||||
| Call Swaption, 3 month LIBOR versus 2.75% fixed | 04/21/2017 | N/A | 130 | $ (10) | |||||
| Call Swaption, 3 month LIBOR versus 2.80% fixed | 02/19/2017 | N/A | 190 | (3) | |||||
| Call Swaption, 3 month LIBOR versus 3.25% fixed | 02/19/2020 | N/A | 110 | (3) | |||||
| Call Swaption, 3 month LIBOR versus 3.25% fixed | 04/21/2020 | N/A | 262 | (44) | |||||
| Put Swaption, 3 month LIBOR versus 4.00% fixed | 04/21/2017 | N/A | 130 | (138) | |||||
| Put Swaption, 3 month LIBOR versus 4.00% fixed | 02/19/2020 | N/A | 331 | (546) | |||||
| Put Swaption, 3 month LIBOR versus 4.00% fixed | 02/19/2020 | N/A | 105 | (173) | |||||
| Put Swaption, 3 month LIBOR versus 4.25% fixed | 04/21/2020 | N/A | 262 | (495) | |||||
| Put Swaption, 3 month LIBOR versus 5.37% fixed | 09/22/2017 | N/A | 400 | (23) | |||||
| Put Swaption, 3 month LIBOR versus 5.50% fixed | 09/02/2015 | N/A | 240 | (44) | |||||
| Put Swaption, 3 month LIBOR versus 6.00% fixed | 09/02/2017 | N/A | 500 | (10) | |||||
| Put Swaption, 3 month LIBOR versus 6.00% fixed | 09/02/2017 | N/A | 1,000 | (19) | |||||
| U.S. 10-Year Treasury Note Future Call Option | 01/22/2010 | 119.00 | 192 | (6) | |||||
| U.S. 10-Year Treasury Note Future Call Option | 02/19/2010 | 119.00 | 2 | - | |||||
| U.S. 10-Year Treasury Note Future Call Option | 02/19/2010 | 120.00 | 129 | (6) | |||||
| U.S. 10-Year Treasury Note Future Put Option | 01/22/2010 | 116.00 | 192 | (210) | |||||
| U.S. 10-Year Treasury Note Future Put Option | 02/19/2010 | 114.00 | 15 | (9) | |||||
| U.S. 10-Year Treasury Note Future Put Option | 02/19/2010 | 115.00 | 131 | (127) | |||||
| 4,321 | $ (1,866) | ||||||||
| JNL/PIMCO Total Return Bond Fund | |||||||||
| Call Swaption, 3 month LIBOR versus 2.75% fixed | 04/21/2017 | N/A | 27 | $ (2) | |||||
| Call Swaption, 3 month LIBOR versus 2.80% fixed | 02/19/2017 | N/A | 340 | (5) | |||||
| Call Swaption, 3 month LIBOR versus 3.25% fixed | 02/19/2020 | N/A | 501 | (13) | |||||
| Call Swaption, 3 month LIBOR versus 3.25% fixed | 04/21/2020 | N/A | 495 | (82) | |||||
| Call Swaption, 3 month LIBOR versus 3.25% fixed | 04/21/2020 | N/A | 99 | (16) | |||||
| Eurodollar Future Call Option | 02/26/2010 | 125.00 | 15 | (2) | |||||
| Eurodollar Future Put Option | 02/26/2010 | 121.00 | 15 | (22) | |||||
| Put Swaption, 3 month LIBOR versus 4.00% fixed | 04/21/2017 | N/A | 27 | (29) | |||||
| Put Swaption, 3 month LIBOR versus 4.00% fixed | 02/19/2020 | N/A | 682 | (1,125) | |||||
| Put Swaption, 3 month LIBOR versus 4.00% fixed | 02/19/2020 | N/A | 501 | (827) | |||||
| Put Swaption, 3 month LIBOR versus 4.25% fixed | 04/21/2020 | N/A | 548 | (1,035) | |||||
| Put Swaption, 3 month LIBOR versus 4.25% fixed | 04/21/2020 | N/A | 25 | (47) | |||||
| Put Swaption, 3 month LIBOR versus 5.00% fixed | 04/21/2020 | N/A | 56 | (22) | |||||
| Put Swaption, 3 month LIBOR versus 5.00% fixed | 04/21/2020 | N/A | 67 | (26) | |||||
| Put Swaption, 3 month LIBOR versus 6.00% fixed | 09/02/2017 | N/A | 1,790 | (35) | |||||
| Put Swaption, 3 month LIBOR versus 6.00% fixed | 09/02/2017 | N/A | 3,700 | (72) | |||||
| Put Swaption, 3 month LIBOR versus 6.00% fixed | 09/02/2017 | N/A | 400 | (8) | |||||
| Put Swaption, 3 month LIBOR versus 6.00% fixed | 09/02/2020 | N/A | 200 | (82) | |||||
| Put Swaption, 3 month LIBOR versus 10.00% fixed | 07/12/2022 | N/A | 133 | (45) | |||||
| U.S. 10-Year Treasury Note Future Call Option | 01/22/2010 | 119.00 | 48 | (2) | |||||
| U.S. 10-Year Treasury Note Future Call Option | 02/19/2010 | 121.00 | 170 | (3) | |||||
| U.S. 10-Year Treasury Note Future Call Option | 02/19/2010 | 120.00 | 1,287 | (60) | |||||
| U.S. 10-Year Treasury Note Future Put Option | 01/22/2010 | 116.00 | 288 | (315) | |||||
| U.S. 10-Year Treasury Note Future Put Option | 02/19/2010 | 114.00 | 88 | (54) | |||||
| U.S. 10-Year Treasury Note Future Put Option | 02/19/2010 | 115.00 | 1,123 | (1,088) | |||||
| U.S. 10-Year Treasury Note Future Put Option | 02/19/2010 | 116.00 | 165 | (237) | |||||
| 12,790 | $ (5,254) | ||||||||
Summary of Written Options (in thousands except contracts) . | |||||||||
| JNL/Franklin Templeton Mutual Shares Fund | Contracts | Premiums | |||||||
| Options outstanding at December 31, 2008 | 136 | $ 22 | |||||||
| Options written during the period | 629 | 81 | |||||||
| Options expired during the period | (765) | (103) | |||||||
| Options outstanding at December 31, 2009 | - | $ - | |||||||
| JNL/PIMCO Real Return Fund | |||||||||
| Options outstanding at December 31, 2008 | 730 | $ 539 | |||||||
| Options written during the period | 14,837 | 3,863 | |||||||
| Options closed during the period | (2,235) | (395) | |||||||
| Options expired during the period | (9,011) | (2,099) | |||||||
| Options outstanding at December 31, 2009 | 4,321 | $ 1,908 | |||||||
| JNL/PIMCO Total Return Bond Fund | |||||||||
| Options outstanding at December 31, 2008 | 2,028 | $ 2,906 | |||||||
| Options written during the period | 29,063 | 9,160 | |||||||
| Options closed during the period | (1,373) | (2,341) | |||||||
| Options expired during the period | (16,928) | (4,697) | |||||||
| Options outstanding at December 31, 2009 | 12,790 | $ 5,028 | |||||||
See accompanying Notes to Financial Statements.
JNL Series Trust
Notes to the Schedules of Investments (continued)
December 31, 2009
| Schedule of Open Futures Contracts (in thousands except contracts) | ||||||||||||||
| Contracts | Unrealized | Contracts | Unrealized | |||||||||||
| Long/ | Appreciation/ | Long/ | Appreciation/ | |||||||||||
| Expiration | (Short) | (Depreciation) | Expiration | (Short) | (Depreciation) | |||||||||
| JNL/Goldman Sachs Core Plus Bond Fund | JNL/Mellon Capital Management Global Alpha Fund (continued) | |||||||||||||
| 90-Day Eurodollar Future | March 2010 | 52 | $ 99 | Canada Bond Future, 10-Year | March 2010 | 27 | $ (31) | |||||||
| 90-Day Eurodollar Future | January 2010 | 62 | 7 | DAX Index Future | March 2010 | 5 | 12 | |||||||
| 90-Day Eurodollar Future | September 2010 | (9) | 7 | Euro-Bund Future | March 2010 | (13) | 22 | |||||||
| Euro-Bobl Future | March 2010 | (4) | 7 | FTSE 100 Index Future | March 2010 | 22 | 31 | |||||||
| Euro-Bund Future | March 2010 | 195 | 7 | FTSE/MIB Index Future | March 2010 | 4 | 13 | |||||||
| U.K. Long Gilt Future | March 2010 | (189) | 7 | Hang Seng Index Future | January 2010 | (1) | (2) | |||||||
| U.S. Treasury Bond Future, 20-Year | March 2010 | 250 | 7 | IBEX 35 Index Future | January 2010 | 9 | 18 | |||||||
| U.S. Treasury Note Future, 10-Year | March 2010 | 323 | 7 | Japanese Government Bond Future, 10-Year | March 2010 | (174) | (60) | |||||||
| U.S. Treasury Note Future, 2-Year | March 2010 | 274 | 7 | S&P 500 E-Mini Index Future | March 2010 | (71) | (38) | |||||||
| U.S. Treasury Note Future, 5-Year | March 2010 | 120 | 7 | Topix Index Future | March 2010 | (47) | (70) | |||||||
| 7 | U.K. Long Gilt Future | March 2010 | 41 | (153) | ||||||||||
| JNL/JPMorgan International Value Fund | U.S. Treasury Note Future, 10-Year | March 2010 | 105 | (155) | ||||||||||
| Dow Jones Euro Stoxx 50 Index Future | March 2010 | 57 | $ (21) | $ (421) | ||||||||||
| FTSE 100 Index Future | March 2010 | 19 | (12) | JNL/PIMCO Real Return Fund | ||||||||||
| Topix Index Future | March 2010 | 13 | (23) | 3-Month Euro Euribor Future | June 2010 | 29 | $ 62 | |||||||
| $ (56) | 90-Day British Pound Sterling Future | June 2010 | 48 | 86 | ||||||||||
| JNL/Mellon Capital Management S&P 500 Index Fund | 90-Day Eurodollar Future | March 2010 | 521 | 900 | ||||||||||
| S&P 500 E-Mini Index Future | March 2010 | 595 | $ 452 | 90-Day Eurodollar Future | June 2010 | 364 | 488 | |||||||
| Euro-Bobl Future | March 2010 | 27 | (38) | |||||||||||
| JNL/Mellon Capital Management S&P 400 MidCap Index Fund | Euro-Bund Future | March 2010 | 35 | (83) | ||||||||||
| S&P MidCap 400 E-Mini Index Future | March 2010 | 116 | $ 55 | $ 1,415 | ||||||||||
| JNL/PIMCO Total Return Bond Fund | ||||||||||||||
| JNL/Mellon Capital Management Small Cap Index Fund | 3-Month Euro Euribor Future | March 2010 | 71 | $ 234 | ||||||||||
| Russell 2000 Mini Index Future | March 2010 | 258 | $ 628 | 90-Day British Pound Sterling Future | March 2010 | 19 | 49 | |||||||
| 90-Day British Pound Sterling Future | June 2010 | 40 | 87 | |||||||||||
| JNL/Mellon Capital Management International Index Fund | 90-Day British Pound Sterling Future | September 2010 | 40 | 74 | ||||||||||
| ASX SPI 200 Index Future | March 2010 | 14 | $ 52 | 90-Day British Pound Sterling Future | December 2010 | 15 | 17 | |||||||
| Dow Jones Euro Stoxx 50 Index Future | March 2010 | 156 | 89 | 90-Day Eurodollar Future | March 2010 | 1,309 | 2,675 | |||||||
| FTSE 100 Index Future | March 2010 | 46 | 43 | 90-Day Eurodollar Future | June 2010 | 1,583 | 1,198 | |||||||
| Topix Index Future | March 2010 | 47 | 17 | 90-Day Eurodollar Future | September 2010 | 70 | 188 | |||||||
| $ 201 | 90-Day Eurodollar Future | December 2010 | 175 | 242 | ||||||||||
| JNL/Mellon Capital Management Global Alpha Fund | Euro-Bobl Future | March 2010 | 578 | (823) | ||||||||||
| Amsterdam Exchange Index Future | January 2010 | 1 | $ 3 | Euro-Bund Future | March 2010 | 167 | (461) | |||||||
| ASX SPI 200 Index Future | March 2010 | (14) | (72) | U.S. Treasury Note Future, 10-Year | March 2010 | 405 | (1,593) | |||||||
| Australia Commonwealth Treasury Bond | U.S. Treasury Note Future, 2-Year | March 2010 | 1,566 | (1,584) | ||||||||||
| Future, 10-Year | March 2010 | 58 | (73) | U.S. Treasury Note Future, 5-Year | March 2010 | 3 | (9) | |||||||
| CAC 40 10 Euro Index Future | January 2010 | 96 | 134 | $ 294 | ||||||||||
Summary of Open Forward Foreign Currency Contracts (in thousand) | ||||||||||||||
| Currency | Settlement | Notional | Currency | Unrealized | Currency | Settlement | Notional | Currency | Unrealized | |||||
| Purchased/Sold | Date | Amount | Value | Gain/(Loss) | Purchased/Sold | Date | Amount | Value | Gain/(Loss) | |||||
| JNL/Capital Guardian Global Balanced Fund | JNL/Franklin Templeton Mutual Shares Fund (continued) | |||||||||||||
| EUR/GBP | 01/15/2010 | GBP | (175) | $ (283) | $ (5) | JPY/USD | 04/20/2010 | JPY | 6,500 | $ 70 | $ (2) | |||
| JPY/USD | 01/15/2010 | JPY | 527,034 | 5,662 | (338) | SGD/USD | 03/24/2010 | SGD | 172 | 122 | - | |||
| USD/CAD | 01/29/2010 | CAD | (77) | (74) | (1) | SGD/USD | 03/24/2010 | SGD | 103 | 74 | - | |||
| USD/EUR | 01/19/2010 | EUR | (1,170) | (1,679) | 30 | USD/AUD | 01/19/2010 | AUD | (880) | (790) | 23 | |||
| USD/EUR | 02/04/2010 | EUR | (2,195) | (3,149) | (3) | USD/AUD | 01/19/2010 | AUD | (74) | (66) | - | |||
| USD/EUR | 01/06/2010 | EUR | (2,220) | (3,186) | 116 | USD/CHF | 05/10/2010 | CHF | (3,100) | (3,002) | (83) | |||
| USD/GBP | 01/27/2010 | GBP | (506) | (816) | (4) | USD/CHF | 05/10/2010 | CHF | (3,154) | (3,054) | (84) | |||
| USD/GBP | 01/29/2010 | GBP | (31) | (51) | (1) | USD/CHF | 05/10/2010 | CHF | (105) | (102) | (4) | |||
| USD/JPY | 01/29/2010 | JPY | (7,530) | (81) | 1 | USD/CHF | 05/10/2010 | CHF | (989) | (958) | (24) | |||
| $ (3,657) | $ (205) | USD/CHF | 05/10/2010 | CHF | (113) | (109) | (3) | |||||||
| JNL/Capital Guardian Global Diversified Research Fund | USD/CHF | 05/10/2010 | CHF | (131) | (127) | (3) | ||||||||
| USD/GBP | 01/27/2010 | GBP | (1,462) | $ (2,360) | $ (13) | USD/CHF | 05/10/2010 | CHF | (226) | (219) | 1 | |||
| USD/CHF | 05/10/2010 | CHF | (130) | (126) | 1 | |||||||||
| JNL/Franklin Templeton Mutual Shares Fund | USD/CHF | 05/10/2010 | CHF | (110) | (107) | 1 | ||||||||
| AUD/USD | 01/19/2010 | AUD | 146 | $ 131 | $ (2) | USD/CHF | 05/10/2010 | CHF | (113) | (110) | 1 | |||
| AUD/USD | 01/19/2010 | AUD | 73 | 66 | (1) | USD/CHF | 05/10/2010 | CHF | (117) | (114) | 2 | |||
| AUD/USD | 01/19/2010 | AUD | 182 | 164 | (2) | USD/CHF | 05/10/2010 | CHF | (433) | (419) | 7 | |||
| CHF/USD | 05/10/2010 | CHF | 137 | 133 | (2) | USD/CHF | 05/10/2010 | CHF | (287) | (278) | 4 | |||
| EUR/USD | 01/14/2010 | EUR | 74 | 106 | (5) | USD/CHF | 05/10/2010 | CHF | (250) | (242) | 9 | |||
| EUR/USD | 01/14/2010 | EUR | 316 | 454 | (20) | USD/CHF | 05/10/2010 | CHF | (112) | (108) | 1 | |||
| EUR/USD | 01/14/2010 | EUR | 176 | 252 | (12) | USD/CHF | 05/10/2010 | CHF | (132) | (128) | (1) | |||
| EUR/USD | 01/14/2010 | EUR | 117 | 169 | (9) | USD/CHF | 05/10/2010 | CHF | (200) | (194) | (1) | |||
| EUR/USD | 01/14/2010 | EUR | 224 | 321 | (10) | USD/CHF | 05/10/2010 | CHF | (218) | (211) | (1) | |||
| EUR/USD | 01/14/2010 | EUR | 173 | 248 | (6) | USD/DKK | 04/23/2010 | DKK | (7,589) | (1,461) | 62 | |||
| EUR/USD | 01/14/2010 | EUR | 95 | 137 | (3) | USD/DKK | 04/23/2010 | DKK | (536) | (103) | 4 | |||
| EUR/USD | 01/14/2010 | EUR | 148 | 213 | (5) | USD/DKK | 04/23/2010 | DKK | (370) | (71) | 3 | |||
| EUR/USD | 01/14/2010 | EUR | 196 | 281 | (6) | USD/DKK | 04/23/2010 | DKK | (593) | (114) | 6 | |||
| EUR/USD | 01/14/2010 | EUR | 103 | 148 | (3) | USD/DKK | 04/23/2010 | DKK | (525) | (101) | 3 | |||
| JPY/USD | 04/20/2010 | JPY | 30,731 | 330 | (6) | USD/EUR | 01/14/2010 | EUR | (150) | (215) | 7 | |||
See accompanying Notes to Financial Statements.
JNL Series Trust
Notes to the Schedules of Investments (continued)
December 31, 2009
Summary of Open Forward Foreign Currency Contracts (in thousands) (continued) | ||||||||||||||
| Currency | Settlement | Notional | Currency | Unrealized | Currency | Settlement | Notional | Currency | Unrealized | |||||
| Purchased/Sold | Date | Amount | Value | Gain/(Loss) | Purchased/Sold | Date | Amount | Value | Gain/(Loss) | |||||
| JNL/Franklin Templeton Mutual Shares Fund (continued) | JNL/Goldman Sachs Core Plus Bond Fund (continued) | |||||||||||||
| USD/EUR | 01/14/2010 | EUR | (77) | $ (110) | $ 3 | EUR/NZD | 03/17/2010 | NZD | (2,772) | $ (2,007) | $ (55) | |||
| USD/EUR | 01/14/2010 | EUR | (32,058) | (45,995) | 1,358 | EUR/USD | 03/17/2010 | EUR | 1,698 | 2,435 | (64) | |||
| USD/EUR | 01/14/2010 | EUR | (252) | (362) | 11 | EUR/USD | 03/17/2010 | EUR | 1,997 | 2,865 | (46) | |||
| USD/EUR | 01/14/2010 | EUR | (183) | (262) | 8 | JPY/USD | 03/17/2010 | JPY | 243,075 | 2,612 | (105) | |||
| USD/EUR | 01/14/2010 | EUR | (183) | (262) | 10 | JPY/USD | 03/17/2010 | JPY | 246,011 | 2,644 | (94) | |||
| USD/EUR | 01/14/2010 | EUR | (155) | (223) | 9 | NOK/USD | 03/17/2010 | NOK | 22,890 | 3,950 | (20) | |||
| USD/EUR | 01/14/2010 | EUR | (154) | (221) | 9 | NOK/USD | 03/17/2010 | NOK | 5,000 | 863 | - | |||
| USD/EUR | 01/14/2010 | EUR | (380) | (545) | 23 | NZD/EUR | 03/17/2010 | EUR | (1,323) | (1,898) | 49 | |||
| USD/EUR | 01/14/2010 | EUR | (79) | (113) | 4 | NZD/EUR | 03/17/2010 | EUR | (801) | (1,149) | 25 | |||
| USD/EUR | 01/14/2010 | EUR | (566) | (813) | 27 | NZD/USD | 03/17/2010 | NZD | 9,951 | 7,204 | 23 | |||
| USD/EUR | 01/14/2010 | EUR | (166) | (239) | 8 | SEK/EUR | 03/17/2010 | EUR | (1,333) | (1,912) | 35 | |||
| USD/GBP | 01/13/2010 | GBP | (17,363) | (28,037) | 924 | USD/BRL | 01/19/2010 | BRL | (529) | (303) | (16) | |||
| USD/GBP | 01/13/2010 | GBP | (99) | (159) | 4 | USD/EUR | 03/17/2010 | EUR | (3,471) | (4,979) | 129 | |||
| USD/GBP | 01/13/2010 | GBP | (224) | (362) | 8 | USD/EUR | 03/17/2010 | EUR | (2,654) | (3,807) | 69 | |||
| USD/GBP | 01/13/2010 | GBP | (132) | (213) | 8 | USD/EUR | 03/17/2010 | EUR | (2,640) | (3,787) | 86 | |||
| USD/GBP | 01/13/2010 | GBP | (183) | (295) | 11 | USD/EUR | 03/17/2010 | EUR | (2,654) | (3,807) | 58 | |||
| USD/GBP | 01/13/2010 | GBP | (280) | (452) | 13 | USD/EUR | 03/17/2010 | EUR | (4,044) | (5,801) | 4 | |||
| USD/GBP | 01/13/2010 | GBP | (139) | (224) | 6 | USD/EUR | 03/17/2010 | EUR | (5,412) | (7,764) | (21) | |||
| USD/GBP | 01/13/2010 | GBP | (223) | (360) | 9 | USD/EUR | 03/17/2010 | EUR | (1,095) | (1,571) | (6) | |||
| USD/GBP | 01/13/2010 | GBP | (210) | (339) | 7 | USD/GBP | 03/17/2010 | GBP | (977) | (1,577) | (19) | |||
| USD/GBP | 01/13/2010 | GBP | (777) | (1,255) | 20 | USD/JPY | 03/17/2010 | JPY | (256,434) | (2,756) | 151 | |||
| USD/GBP | 01/13/2010 | GBP | (215) | (348) | 10 | USD/JPY | 03/17/2010 | JPY | (173,919) | (1,869) | 70 | |||
| USD/GBP | 01/13/2010 | GBP | (172) | (278) | 8 | USD/JPY | 03/17/2010 | JPY | (143,079) | (1,537) | 24 | |||
| USD/GBP | 01/13/2010 | GBP | (162) | (261) | 2 | $ (38,853) | $ 51 | |||||||
| USD/GBP | 01/13/2010 | GBP | (78) | (126) | 1 | JNL/Goldman Sachs Emerging Markets Debt Fund | ||||||||
| USD/GBP | 01/13/2010 | GBP | (199) | (321) | (1) | BRL/USD | 01/19/2010 | BRL | 3,000 | $ 1,716 | $ 34 | |||
| USD/GBP | 01/13/2010 | GBP | (143) | (232) | (3) | BRL/USD | 01/19/2010 | BRL | 3,349 | 1,915 | 1 | |||
| USD/GBP | 01/13/2010 | GBP | (298) | (481) | - | BRL/USD | 01/19/2010 | BRL | 3,331 | 1,905 | 42 | |||
| USD/JPY | 04/20/2010 | JPY | (148,783) | (1,599) | 36 | CLP/USD | 01/19/2010 | CLP | 1,262,929 | 2,491 | 157 | |||
| USD/JPY | 04/20/2010 | JPY | (5,300) | (57) | 2 | CLP/USD | 01/19/2010 | CLP | 173,408 | 342 | 27 | |||
| USD/JPY | 04/20/2010 | JPY | (18,261) | (196) | 10 | CNY/USD | 03/29/2010 | CNY | 14,971 | 2,195 | (15) | |||
| USD/JPY | 04/20/2010 | JPY | (16,010) | (172) | 3 | CNY/USD | 03/29/2010 | CNY | 774 | 113 | (1) | |||
| USD/JPY | 04/20/2010 | JPY | (12,000) | (129) | 1 | CNY/USD | 03/29/2010 | CNY | 2,410 | 353 | (3) | |||
| USD/KRW | 01/15/2010 | KRW | (70,110) | (60) | - | CNY/USD | 03/29/2010 | CNY | 3,500 | 513 | (4) | |||
| USD/KRW | 01/15/2010 | KRW | (348,675) | (299) | 1 | CNY/USD | 06/14/2010 | CNY | 21,655 | 3,179 | (39) | |||
| USD/KRW | 01/15/2010 | KRW | (173,663) | (149) | 1 | HUF/USD | 01/21/2010 | HUF | 485,075 | 2,572 | 8 | |||
| USD/KRW | 01/15/2010 | KRW | (105,102) | (90) | - | INR/USD | 01/19/2010 | INR | 272,876 | 5,858 | 225 | |||
| USD/KRW | 01/15/2010 | KRW | (141,570) | (122) | (2) | INR/USD | 01/19/2010 | INR | 26,103 | 560 | 19 | |||
| USD/KRW | 01/15/2010 | KRW | (129,360) | (111) | (1) | INR/USD | 01/19/2010 | INR | 15,480 | 332 | 2 | |||
| USD/KRW | 01/15/2010 | KRW | (24,261) | (21) | - | INR/USD | 01/19/2010 | INR | 10,714 | 230 | (3) | |||
| USD/KRW | 01/15/2010 | KRW | (60,579) | (52) | - | INR/USD | 01/19/2010 | INR | 50,000 | 1,073 | 5 | |||
| USD/KRW | 01/15/2010 | KRW | (115,670) | (99) | 1 | INR/USD | 01/19/2010 | INR | 23,136 | 497 | (4) | |||
| USD/KRW | 01/15/2010 | KRW | (57,650) | (49) | 1 | INR/USD | 01/19/2010 | INR | 78,032 | 1,675 | (14) | |||
| USD/KRW | 01/15/2010 | KRW | (117,000) | (100) | - | KRW/USD | 01/19/2010 | KRW | 13,098,252 | 11,243 | 383 | |||
| USD/NOK | 02/16/2010 | NOK | (33,600) | (5,805) | 140 | KRW/USD | 01/19/2010 | KRW | 572,390 | 491 | 10 | |||
| USD/NOK | 02/16/2010 | NOK | (703) | (121) | 4 | KRW/USD | 01/19/2010 | KRW | 293,073 | 252 | 3 | |||
| USD/NOK | 02/16/2010 | NOK | (680) | (117) | 3 | KRW/USD | 01/19/2010 | KRW | 773,850 | 664 | 4 | |||
| USD/NOK | 02/16/2010 | NOK | (1,300) | (225) | 8 | KRW/USD | 01/19/2010 | KRW | 639,216 | 549 | (3) | |||
| USD/NOK | 02/16/2010 | NOK | (1,900) | (328) | (2) | KRW/USD | 01/19/2010 | KRW | 700,000 | 601 | 14 | |||
| USD/NOK | 02/16/2010 | NOK | (1,023) | (177) | (1) | KRW/USD | 01/19/2010 | KRW | 200,000 | 172 | - | |||
| USD/SGD | 03/24/2010 | SGD | (1,583) | (1,127) | (7) | MYR/USD | 01/19/2010 | MYR | 7,935 | 2,316 | 42 | |||
| USD/SGD | 03/24/2010 | SGD | (98) | (70) | - | MYR/USD | 01/19/2010 | MYR | 696 | 203 | 3 | |||
| USD/SGD | 03/24/2010 | SGD | (163) | (116) | 1 | MYR/USD | 01/19/2010 | MYR | 679 | 198 | - | |||
| USD/SGD | 03/24/2010 | SGD | (95) | (68) | - | MYR/USD | 01/19/2010 | MYR | 1,500 | 438 | (3) | |||
| $ (103,457) | $ 2,533 | MYR/USD | 01/19/2010 | MYR | 1,682 | 491 | (10) | |||||||
| JNL/Goldman Sachs Core Plus Bond Fund | MYR/USD | 01/19/2010 | MYR | 5,687 | 1,660 | (29) | ||||||||
| AUD/EUR | 03/17/2010 | EUR | (533) | $ (765) | $ 4 | PHP/USD | 01/19/2010 | PHP | 70,000 | 1,512 | 53 | |||
| AUD/USD | 03/17/2010 | AUD | 7,769 | 6,936 | (124) | PHP/USD | 01/19/2010 | PHP | 11,820 | 255 | 6 | |||
| CAD/EUR | 03/17/2010 | EUR | (1,971) | (2,828) | 83 | PHP/USD | 01/19/2010 | PHP | 39,120 | 845 | 10 | |||
| CAD/EUR | 03/17/2010 | EUR | (1,322) | (1,897) | 49 | RUB/USD | 01/19/2010 | RUB | 59,760 | 1,967 | 56 | |||
| CAD/EUR | 03/17/2010 | EUR | (800) | (1,148) | 28 | RUB/USD | 01/19/2010 | RUB | 20,031 | 659 | (1) | |||
| CAD/JPY | 03/17/2010 | JPY | (178,013) | (1,913) | 56 | RUB/USD | 01/19/2010 | RUB | 40,069 | 1,319 | (8) | |||
| CAD/USD | 03/17/2010 | CAD | 7,206 | 6,874 | 19 | RUB/USD | 01/19/2010 | RUB | 52,703 | 1,735 | (57) | |||
| CHF/JPY | 03/17/2010 | JPY | (119,968) | (1,289) | 64 | RUB/USD | 01/19/2010 | RUB | 46,731 | 1,538 | (58) | |||
| EUR/AUD | 03/17/2010 | AUD | (2,216) | (1,978) | (33) | RUB/USD | 01/19/2010 | RUB | 33,907 | 1,116 | (53) | |||
| EUR/CAD | 03/17/2010 | CAD | (3,042) | (2,901) | (107) | RUB/USD | 01/19/2010 | RUB | 17,114 | 563 | 4 | |||
| EUR/CAD | 03/17/2010 | CAD | (4,173) | (3,981) | (90) | TRY/USD | 03/17/2010 | TRY | 5,696 | 3,756 | 12 | |||
| EUR/CHF | 03/17/2010 | CHF | (2,040) | (1,975) | (21) | TWD/USD | 01/19/2010 | TWD | 183,244 | 5,762 | 45 | |||
| EUR/GBP | 03/17/2010 | GBP | (2,829) | (4,567) | (93) | TWD/USD | 01/19/2010 | TWD | 13,451 | 423 | 2 | |||
| EUR/JPY | 03/17/2010 | JPY | (52,198) | (561) | 15 | TWD/USD | 01/19/2010 | TWD | 12,553 | 395 | (1) | |||
| EUR/NZD | 03/17/2010 | NZD | (1,880) | (1,361) | (40) | TWD/USD | 01/19/2010 | TWD | 7,890 | 248 | (1) | |||
| EUR/NZD | 03/17/2010 | NZD | (2,139) | (1,548) | (36) | TWD/USD | 01/19/2010 | TWD | 25,000 | 786 | 9 | |||
See accompanying Notes to Financial Statements.
JNL Series Trust
Notes to the Schedules of Investments (continued)
December 31, 2009
Summary of Open Forward Foreign Currency Contracts (in thousands) (continued) | ||||||||||||||
| Currency | Settlement | Notional | Currency | Unrealized | Currency | Settlement | Notional | Currency | Unrealized | |||||
| Purchased/Sold | Date | Amount | Value | Gain/(Loss) | Purchased/Sold | Date | Amount | Value | Gain/(Loss) | |||||
| JNL/Goldman Sachs Emerging Markets Debt Fund (continued) | JNL/Mellon Capital Management International Index Fund (continued) | |||||||||||||
| TWD/USD | 01/19/2010 | TWD | 15,912 | $ 500 | $ (1) | EUR/USD | 03/17/2010 | EUR | 687 | $ 985 | $ (7) | |||
| USD/BRL | 01/19/2010 | BRL | (3,000) | (1,716) | 7 | EUR/USD | 03/17/2010 | EUR | 268 | 384 | (1) | |||
| USD/CNY | 03/29/2010 | CNY | (21,655) | (3,175) | 19 | GBP/USD | 03/17/2010 | GBP | 1,603 | 2,588 | (11) | |||
| USD/INR | 01/19/2010 | INR | (143,103) | (3,072) | (9) | GBP/USD | 03/17/2010 | GBP | 826 | 1,333 | (5) | |||
| USD/KRW | 01/19/2010 | KRW | (1,300,370) | (1,116) | (26) | GBP/USD | 03/17/2010 | GBP | 208 | 336 | (3) | |||
| USD/KRW | 01/19/2010 | KRW | (6,770,982) | (5,812) | 12 | GBP/USD | 03/17/2010 | GBP | 157 | 254 | (2) | |||
| USD/RUB | 01/19/2010 | RUB | (163,339) | (5,376) | 193 | GBP/USD | 03/17/2010 | GBP | 158 | 255 | (2) | |||
| USD/TWD | 01/19/2010 | TWD | (62,062) | (1,952) | (21) | GBP/USD | 03/17/2010 | GBP | 319 | 514 | (3) | |||
| $ 47,957 | $ 1,043 | GBP/USD | 03/17/2010 | GBP | 157 | 254 | (4) | |||||||
| JNL/Ivy Asset Strategy Fund | GBP/USD | 03/17/2010 | GBP | 158 | 256 | - | ||||||||
| CNY/USD | 10/25/2010 | CNY | 12,600 | $ 1,850 | $ (52) | GBP/USD | 03/17/2010 | GBP | 156 | 251 | - | |||
| USD/EUR | 03/18/2010 | EUR | (2,700) | (3,873) | 52 | GBP/USD | 03/17/2010 | GBP | 309 | 499 | 1 | |||
| USD/GBP | 03/18/2010 | GBP | (5,800) | (9,362) | (27) | GBP/USD | 03/17/2010 | GBP | 262 | 424 | 4 | |||
| USD/JPY | 12/20/2010 | JPY | (161,400) | (1,736) | 74 | GBP/USD | 03/17/2010 | GBP | 106 | 171 | 2 | |||
| USD/ZAR | 03/18/2010 | ZAR | (10,800) | (1,447) | (47) | GBP/USD | 03/17/2010 | GBP | 160 | 257 | 3 | |||
| $ (14,568) | $ - | GBP/USD | 03/17/2010 | GBP | 214 | 346 | 3 | |||||||
| JNL/JPMorgan International Value Fund | GBP/USD | 03/17/2010 | GBP | 375 | 605 | 5 | ||||||||
| AUD/USD | 02/24/2010 | AUD | 36,660 | $ 32,803 | $ (748) | GBP/USD | 03/17/2010 | GBP | 54 | 86 | - | |||
| AUD/USD | 02/24/2010 | AUD | 5,496 | 4,917 | (131) | JPY/USD | 03/17/2010 | JPY | 382,736 | 4,113 | (242) | |||
| AUD/USD | 02/24/2010 | AUD | 2,470 | 2,210 | 43 | JPY/USD | 03/17/2010 | JPY | 197,167 | 2,119 | (125) | |||
| EUR/USD | 02/24/2010 | EUR | 2,674 | 3,836 | (164) | JPY/USD | 03/17/2010 | JPY | 26,415 | 284 | (16) | |||
| EUR/USD | 02/24/2010 | EUR | 2,090 | 2,999 | (114) | JPY/USD | 03/17/2010 | JPY | 26,085 | 280 | (12) | |||
| EUR/USD | 02/24/2010 | EUR | 3,803 | 5,455 | (239) | JPY/USD | 03/17/2010 | JPY | 53,130 | 571 | (30) | |||
| EUR/USD | 02/24/2010 | EUR | 3,540 | 5,079 | (152) | JPY/USD | 03/17/2010 | JPY | 26,520 | 285 | (11) | |||
| EUR/USD | 02/24/2010 | EUR | 1,704 | 2,445 | (34) | JPY/USD | 03/17/2010 | JPY | 35,300 | 379 | (15) | |||
| EUR/USD | 02/24/2010 | EUR | 2,237 | 3,210 | 6 | JPY/USD | 03/17/2010 | JPY | 26,910 | 289 | (10) | |||
| EUR/USD | 02/24/2010 | EUR | 2,125 | 3,049 | 5 | JPY/USD | 03/17/2010 | JPY | 26,805 | 288 | (9) | |||
| HKD/USD | 02/24/2010 | HKD | 22,238 | 2,869 | (3) | JPY/USD | 03/17/2010 | JPY | 26,760 | 288 | (8) | |||
| JPY/USD | 02/24/2010 | JPY | 1,646,835 | 17,694 | (847) | JPY/USD | 03/17/2010 | JPY | 71,320 | 766 | (14) | |||
| JPY/USD | 02/24/2010 | JPY | 340,807 | 3,662 | (193) | JPY/USD | 03/17/2010 | JPY | 9,015 | 97 | (1) | |||
| NOK/USD | 02/24/2010 | NOK | 18,194 | 3,142 | (100) | JPY/USD | 03/17/2010 | JPY | 27,045 | 291 | (5) | |||
| SEK/USD | 02/24/2010 | SEK | 76,787 | 10,757 | (430) | JPY/USD | 03/17/2010 | JPY | 18,290 | 197 | (3) | |||
| SGD/USD | 02/24/2010 | SGD | 7,492 | 5,333 | (74) | JPY/USD | 03/17/2010 | JPY | 64,015 | 688 | (10) | |||
| SGD/USD | 02/24/2010 | SGD | 4,047 | 2,880 | 1 | JPY/USD | 03/17/2010 | JPY | 27,135 | 292 | (1) | |||
| USD/CHF | 02/24/2010 | CHF | (7,296) | (7,061) | 174 | USD/AUD | 03/17/2010 | AUD | (21) | (19) | �� - | |||
| USD/EUR | 02/24/2010 | EUR | (18,588) | (26,667) | 1,154 | USD/AUD | 03/17/2010 | AUD | (1,775) | (1,585) | (24) | |||
| USD/EUR | 02/24/2010 | EUR | (1,943) | (2,787) | 122 | USD/EUR | 03/17/2010 | EUR | (146) | (210) | 6 | |||
| USD/EUR | 02/24/2010 | EUR | (3,651) | (5,238) | 267 | USD/EUR | 03/17/2010 | EUR | (5,170) | (7,417) | 2 | |||
| USD/EUR | 02/24/2010 | EUR | (2,434) | (3,493) | 88 | USD/EUR | 03/17/2010 | EUR | (269) | (386) | (2) | |||
| USD/EUR | 02/24/2010 | EUR | (2,418) | (3,469) | 4 | USD/EUR | 03/17/2010 | EUR | (388) | (557) | (1) | |||
| USD/GBP | 02/24/2010 | GBP | (11,558) | (18,659) | 520 | USD/GBP | 03/17/2010 | GBP | (102) | (164) | 1 | |||
| USD/GBP | 02/24/2010 | GBP | (3,519) | (5,680) | 129 | USD/GBP | 03/17/2010 | GBP | (2,820) | (4,552) | 3 | |||
| USD/GBP | 02/24/2010 | GBP | (3,723) | (6,010) | 57 | USD/GBP | 03/17/2010 | GBP | (90) | (146) | (2) | |||
| USD/HKD | 02/24/2010 | HKD | (31,499) | (4,064) | 3 | USD/GBP | 03/17/2010 | GBP | (215) | (348) | (5) | |||
| USD/JPY | 02/24/2010 | JPY | (328,989) | (3,535) | 122 | USD/JPY | 03/17/2010 | JPY | (32,163) | (346) | 21 | |||
| USD/JPY | 02/24/2010 | JPY | (471,358) | (5,064) | 244 | USD/JPY | 03/17/2010 | JPY | (451,060) | (4,847) | 171 | |||
| USD/JPY | 02/24/2010 | JPY | (618,800) | (6,649) | 367 | USD/JPY | 03/17/2010 | JPY | (23,929) | (257) | 4 | |||
| $ 13,964 | $ 77 | USD/JPY | 03/17/2010 | JPY | (36,760) | (395) | 3 | |||||||
| JNL/Mellon Capital Management International Index Fund | $ 16,390 | $ (591) | ||||||||||||
| AUD/USD | 03/17/2010 | AUD | 1,025 | $ 915 | $ (7) | |||||||||
| AUD/USD | 03/17/2010 | AUD | 528 | 471 | (3) | JNL/Mellon Capital Management Global Alpha Fund | ||||||||
| AUD/USD | 03/17/2010 | AUD | 233 | 208 | (2) | AUD/USD | 03/17/2010 | AUD | 2,495 | $ 2,228 | $ (22) | |||
| AUD/USD | 03/17/2010 | AUD | 467 | 416 | (3) | AUD/USD | 03/17/2010 | AUD | 2,329 | 2,079 | (23) | |||
| AUD/USD | 03/17/2010 | AUD | 233 | 208 | 3 | AUD/USD | 03/17/2010 | AUD | 3,493 | 3,119 | (24) | |||
| AUD/USD | 03/17/2010 | AUD | 116 | 104 | 2 | AUD/USD | 03/17/2010 | AUD | 546 | 487 | (3) | |||
| AUD/USD | 03/17/2010 | AUD | 116 | 103 | 2 | AUD/USD | 03/17/2010 | AUD | 312 | 279 | (1) | |||
| AUD/USD | 03/17/2010 | AUD | 117 | 105 | 2 | AUD/USD | 03/17/2010 | AUD | 702 | 627 | (4) | |||
| AUD/USD | 03/17/2010 | AUD | 119 | 106 | 2 | AUD/USD | 03/17/2010 | AUD | 243 | 217 | 3 | |||
| AUD/USD | 03/17/2010 | AUD | 241 | 215 | - | CAD/USD | 03/17/2010 | CAD | 54 | 52 | 1 | |||
| EUR/USD | 03/17/2010 | EUR | 5,297 | 7,600 | (185) | CAD/USD | 03/17/2010 | CAD | 95 | 91 | 1 | |||
| EUR/USD | 03/17/2010 | EUR | 226 | 323 | (9) | CAD/USD | 03/17/2010 | CAD | 122 | 117 | 1 | |||
| EUR/USD | 03/17/2010 | EUR | 256 | 368 | (9) | CHF/USD | 03/17/2010 | CHF | 4,301 | 4,163 | (38) | |||
| EUR/USD | 03/17/2010 | EUR | 544 | 780 | (16) | CHF/USD | 03/17/2010 | CHF | 510 | 494 | 3 | |||
| EUR/USD | 03/17/2010 | EUR | 432 | 620 | (9) | CHF/USD | 03/17/2010 | CHF | 291 | 282 | 2 | |||
| EUR/USD | 03/17/2010 | EUR | 288 | 414 | (6) | CHF/USD | 03/17/2010 | CHF | 656 | 635 | 3 | |||
| EUR/USD | 03/17/2010 | EUR | 292 | 419 | - | EUR/USD | 03/17/2010 | EUR | 1,460 | 2,095 | (61) | |||
| EUR/USD | 03/17/2010 | EUR | 347 | 498 | 1 | GBP/USD | 03/17/2010 | GBP | 312 | 504 | 2 | |||
| EUR/USD | 03/17/2010 | EUR | 488 | 700 | - | GBP/USD | 03/17/2010 | GBP | 593 | 958 | 8 | |||
| EUR/USD | 03/17/2010 | EUR | 642 | 921 | 3 | GBP/USD | 03/17/2010 | GBP | 890 | 1,436 | 12 | |||
| EUR/USD | 03/17/2010 | EUR | 206 | 296 | 1 | JPY/USD | 03/17/2010 | JPY | 290,223 | 3,119 | (121) | |||
| EUR/USD | 03/17/2010 | EUR | 266 | 381 | (1) | JPY/USD | 03/17/2010 | JPY | 142,521 | 1,531 | (82) | |||
| EUR/USD | 03/17/2010 | EUR | 295 | 423 | (2) | JPY/USD | 03/17/2010 | JPY | 72,421 | 778 | (46) | |||
See accompanying Notes to Financial Statements.
JNL Series Trust
Notes to the Schedules of Investments (continued)
December 31, 2009
Summary of Open Forward Foreign Currency Contracts (in thousands) (continued) | ||||||||||||||
| Currency | Settlement | Notional | Currency | Unrealized | Currency | Settlement | Notional | Currency | Unrealized | |||||
| Purchased/Sold | Date | Amount | Value | Gain/(Loss) | Purchased/Sold | Date | Amount | Value | Gain/(Loss) | |||||
| JNL/Mellon Capital Management Global Alpha Fund (continued) | JNL/PIMCO Real Return Fund (continued) | |||||||||||||
| JPY/USD | 03/17/2010 | JPY | 37,308 | $ 401 | $ (24) | USD/AUD | 01/11/2010 | AUD | (28) | $ (25) | $ 1 | |||
| NOK/USD | 03/17/2010 | NOK | 1,275 | 220 | (1) | USD/CNY | 03/29/2010 | CNY | (1,459) | (214) | 1 | |||
| NOK/USD | 03/17/2010 | NOK | 657 | 113 | - | USD/CNY | 03/29/2010 | CNY | (7,427) | (1,089) | 5 | |||
| NOK/USD | 03/17/2010 | NOK | 3,892 | 672 | 7 | USD/CNY | 03/29/2010 | CNY | (3,847) | (564) | 3 | |||
| NOK/USD | 03/17/2010 | NOK | 2,224 | 384 | 3 | USD/CNY | 03/29/2010 | CNY | (3,854) | (565) | 3 | |||
| NOK/USD | 03/17/2010 | NOK | 5,004 | 863 | 5 | USD/CNY | 03/29/2010 | CNY | (6,175) | (905) | 5 | |||
| NZD/USD | 03/17/2010 | NZD | 1,567 | 1,134 | 30 | USD/CNY | 03/29/2010 | CNY | (3,925) | (575) | 3 | |||
| NZD/USD | 03/17/2010 | NZD | 1,592 | 1,153 | 28 | USD/EUR | 01/26/2010 | EUR | (2,297) | (3,296) | 40 | |||
| NZD/USD | 03/17/2010 | NZD | 978 | 708 | 16 | USD/EUR | 01/26/2010 | EUR | (4,900) | (7,030) | (22) | |||
| NZD/USD | 03/17/2010 | NZD | 579 | 419 | 9 | USD/EUR | 01/26/2010 | EUR | (4,204) | (6,032) | (24) | |||
| NZD/USD | 03/17/2010 | NZD | 298 | 216 | 5 | USD/JPY | 01/14/2010 | JPY | (1,605,102) | (17,242) | 631 | |||
| EUR/USD | 03/17/2010 | EUR | 778 | 1,116 | (27) | USD/PHP | 04/16/2010 | PHP | (1,134) | (24) | - | |||
| USD/CAD | 03/17/2010 | CAD | (975) | (930) | (6) | $ 19,981 | $ (286) | |||||||
| USD/CAD | 03/17/2010 | CAD | (503) | (479) | (3) | JNL/PIMCO Total Return Bond Fund | ||||||||
| USD/CHF | 03/17/2010 | CHF | (457) | (442) | (5) | AUD/USD | 01/11/2010 | AUD | 2,797 | $ 2,514 | $ (72) | |||
| USD/CHF | 03/17/2010 | CHF | (977) | (946) | (5) | BRL/USD | 02/02/2010 | BRL | 17,221 | 9,818 | 869 | |||
| USD/EUR | 03/17/2010 | EUR | (223) | (320) | 4 | CAD/USD | 01/21/2010 | CAD | 2,062 | 1,967 | 31 | |||
| USD/EUR | 03/17/2010 | EUR | (390) | (559) | 7 | CNY/USD | 08/25/2010 | CNY | 19,617 | 2,880 | (7) | |||
| USD/EUR | 03/17/2010 | EUR | (501) | (719) | 10 | CNY/USD | 08/25/2010 | CNY | 80,820 | 11,867 | (133) | |||
| USD/EUR | 03/17/2010 | EUR | (589) | (845) | (4) | CNY/USD | 08/25/2010 | CNY | 33,343 | 4,896 | (104) | |||
| USD/EUR | 03/17/2010 | EUR | (1,002) | (1,437) | (4) | CNY/USD | 08/25/2010 | CNY | 465 | 68 | (2) | |||
| USD/EUR | 03/17/2010 | EUR | (668) | (958) | (3) | CNY/USD | 08/25/2010 | CNY | 1,850 | 272 | (6) | |||
| USD/GBP | 03/17/2010 | GBP | (346) | (559) | 3 | CNY/USD | 08/25/2010 | CNY | 465 | 68 | (2) | |||
| USD/GBP | 03/17/2010 | GBP | (1,556) | (2,511) | 29 | CNY/USD | 08/25/2010 | CNY | 1,171 | 172 | (4) | |||
| USD/GBP | 03/17/2010 | GBP | (1,739) | (2,807) | 49 | GBP/USD | 01/13/2010 | GBP | 1,000 | 1,615 | 20 | |||
| USD/GBP | 03/17/2010 | GBP | (1,405) | (2,267) | 22 | GBP/USD | 01/13/2010 | GBP | 528 | 853 | 8 | |||
| USD/GBP | 03/17/2010 | GBP | (2,575) | (4,157) | 36 | GBP/USD | 01/13/2010 | GBP | 108 | 174 | 2 | |||
| USD/GBP | 03/17/2010 | GBP | (606) | (978) | 5 | KRW/USD | 02/11/2010 | KRW | 2,917,968 | 2,503 | 23 | |||
| USD/GBP | 03/17/2010 | GBP | (702) | (1,134) | 5 | KRW/USD | 02/11/2010 | KRW | 2,720,609 | 2,334 | 45 | |||
| USD/GBP | 03/17/2010 | GBP | (779) | (1,258) | 7 | KRW/USD | 07/28/2010 | KRW | 82,064 | 70 | 1 | |||
| USD/JPY | 03/17/2010 | JPY | (24,565) | (264) | 11 | KRW/USD | 07/28/2010 | KRW | 88,288 | 75 | - | |||
| USD/JPY | 03/17/2010 | JPY | (14,037) | (151) | 6 | KRW/USD | 07/28/2010 | KRW | 146,777 | 125 | 1 | |||
| USD/JPY | 03/17/2010 | JPY | (31,584) | (339) | 14 | KRW/USD | 08/27/2010 | KRW | 535,468 | 456 | 1 | |||
| USD/NZD | 03/17/2010 | NZD | (161) | (116) | (1) | KRW/USD | 08/27/2010 | KRW | 372,441 | 317 | (2) | |||
| USD/NZD | 03/17/2010 | NZD | (281) | (204) | (2) | MYR/USD | 06/14/2010 | MYR | 10,082 | 2,926 | 26 | |||
| USD/NZD | 03/17/2010 | NZD | (362) | (262) | (3) | SGD/USD | 03/17/2010 | SGD | 95 | 68 | (1) | |||
| USD/SEK | 03/17/2010 | SEK | (5,166) | (724) | 4 | SGD/USD | 02/11/2010 | SGD | 132 | 94 | (1) | |||
| USD/SEK | 03/17/2010 | SEK | (2,661) | (373) | 2 | SGD/USD | 06/16/2010 | SGD | 294 | 209 | (2) | |||
| $ 6,951 | $ (160) | USD/AUD | 01/11/2010 | AUD | (36) | (32) | - | |||||||
| JNL/PIMCO Real Return Fund | USD/AUD | 01/11/2010 | AUD | (36) | (32) | - | ||||||||
| CNY/USD | 03/29/2010 | CNY | 3,148 | $ 461 | $ (4) | USD/EUR | 01/26/2010 | EUR | (13,261) | (19,026) | 231 | |||
| CNY/USD | 03/29/2010 | CNY | 3,271 | 480 | (5) | USD/EUR | 01/26/2010 | EUR | (1,817) | (2,607) | (14) | |||
| CNY/USD | 03/29/2010 | CNY | 5,250 | 770 | (9) | USD/EUR | 01/26/2010 | EUR | (800) | (1,148) | 1 | |||
| CNY/USD | 03/29/2010 | CNY | 2,187 | 321 | (3) | USD/GBP | 01/13/2010 | GBP | (4,155) | (6,709) | 201 | |||
| CNY/USD | 03/29/2010 | CNY | 29 | 4 | - | USD/JPY | 03/29/2010 | JPY | (710,000) | (7,630) | 301 | |||
| CNY/USD | 03/29/2010 | CNY | 460 | 67 | (1) | USD/JPY | 01/14/2010 | JPY | (185) | (2) | - | |||
| CNY/USD | 03/29/2010 | CNY | 4 | 1 | - | $ 9,155 | $ 1,411 | |||||||
| CNY/USD | 03/29/2010 | CNY | 12,339 | 1,809 | (15) | JNL/T.Rowe Price Short-Term Bond Fund | ||||||||
| CNY/USD | 06/07/2010 | CNY | 9,366 | 1,375 | (8) | CNY/USD | 12/22/2010 | CNY | 32,250 | $ 4,735 | $ (81) | |||
| CNY/USD | 06/07/2010 | CNY | 17,558 | 2,577 | (23) | |||||||||
| CNY/USD | 11/17/2010 | CNY | 1,427 | 210 | (5) | |||||||||
| CNY/USD | 11/17/2010 | CNY | 7,257 | 1,065 | (29) | |||||||||
| CNY/USD | 11/17/2010 | CNY | 3,751 | 551 | (16) | |||||||||
| CNY/USD | 11/17/2010 | CNY | 3,759 | 552 | (16) | |||||||||
| CNY/USD | 03/29/2010 | CNY | 6,022 | 883 | (27) | |||||||||
| CNY/USD | 03/29/2010 | CNY | 3,925 | 575 | (18) | |||||||||
| GBP/USD | 01/13/2010 | GBP | 328 | 530 | (16) | |||||||||
| JPY/USD | 01/14/2010 | JPY | 1,605,627 | 17,248 | (959) | |||||||||
| KRW/USD | 02/11/2010 | KRW | 1,929,760 | 1,655 | 55 | |||||||||
| KRW/USD | 02/11/2010 | KRW | 2,211,490 | 1,897 | 47 | |||||||||
| KRW/USD | 02/11/2010 | KRW | 2,203,350 | 1,890 | 40 | |||||||||
| KRW/USD | 02/11/2010 | KRW | 1,057,050 | 907 | 7 | |||||||||
| KRW/USD | 02/11/2010 | KRW | 1,429,500 | 1,226 | 26 | |||||||||
| KRW/USD | 07/28/2010 | KRW | 721,680 | 615 | 15 | |||||||||
| KRW/USD | 07/28/2010 | KRW | 2,492,700 | 2,124 | 24 | |||||||||
| MXN/USD | 04/22/2010 | MXN | 96,715 | 7,314 | 25 | |||||||||
| MXN/USD | 04/22/2010 | MXN | 23,938 | 1,810 | 58 | |||||||||
| MXN/USD | 04/22/2010 | MXN | 13,113 | 992 | (8) | |||||||||
| SGD/USD | 02/11/2010 | SGD | 6,398 | 4,555 | (45) | |||||||||
| SGD/USD | 02/11/2010 | SGD | 4,323 | 3,078 | (22) | |||||||||
See accompanying Notes to Financial Statements.
JNL Series Trust
Notes to the Schedules of Investments (continued)
December 31, 2009
Summary of Interest Rate Swap Agreements (in thousands) | ||||||||||
| Paying/ | Unrealized | |||||||||
| Receiving | Expiration | Notional | Appreciation/ | |||||||
| Counterparty | Floating Rate Index | Floating Rate | Fixed Rate | Date | Amount4 | (Depreciation) | ||||
| JNL/Goldman Sachs Core Plus Bond Fund | ||||||||||
| BNP Paribas | 6-Month EURIBOR | Receiving | 3.00% | 06/16/2015 | EUR | 1,310 | $ 8 | |||
| 6-Month EURIBOR | Receiving | 3.00% | 06/16/2015 | EUR | 160 | 1 | ||||
| Credit Suisse International | 3-Month LIBOR | Receiving | 4.25% | 12/17/2013 | 160 | - | ||||
| 3-Month LIBOR | Receiving | 4.25% | 06/16/2040 | 10,250 | 811 | |||||
| Deutsche Bank AG | 3-Month LIBOR | Receiving | 3.25% | 06/16/2017 | 7,300 | 187 | ||||
| 3-Month LIBOR | Receiving | 3.25% | 06/16/2017 | 6,500 | 163 | |||||
| 3-Month LIBOR | Paying | 4.57% | 09/04/2017 | 17,700 | (128) | |||||
| 3-Month LIBOR | Receiving | 3.75% | 06/16/2020 | 8,900 | 439 | |||||
| 3-Month LIBOR | Receiving | 4.71% | 09/04/2022 | 10,400 | 293 | |||||
| 6-Month EURIBOR | Paying | 4.00% | 06/16/2040 | EUR | 8,790 | (345) | ||||
| Brazil Interbank Deposit Rate | Paying | 11.74% | 01/02/2012 | BRL | 17,900 | 4 | ||||
| Brazil Interbank Deposit Rate | Paying | 11.80% | 01/02/2012 | BRL | 13,000 | (78) | ||||
| KRW 3-month CD Rate | Paying | 2.82% | 01/28/2011 | KRW | 2,437,000 | (19) | ||||
| KRW 3-month CD Rate | Paying | 3.87% | 06/12/2011 | KRW | 1,400,000 | - | ||||
| KRW 3-month CD Rate | Paying | 3.69% | 06/26/2011 | KRW | 7,020,000 | (19) | ||||
| KRW 3-month CD Rate | Paying | 3.62% | 07/06/2011 | KRW | 2,923,122 | (6) | ||||
| KRW 3-month CD Rate | Paying | 3.63% | 07/07/2011 | KRW | 4,883,824 | (10) | ||||
| JPMorgan Chase Bank N.A. | Brazil Interbank Deposit Rate | Paying | 11.76% | 01/02/2012 | BRL | 17,300 | 5 | |||
| KRW 3-month CD Rate | Paying | 3.66% | 07/08/2011 | KRW | 2,322,820 | (4) | ||||
| KRW 3-month CD Rate | Paying | 3.72% | 06/22/2011 | KRW | 6,700,000 | (14) | ||||
| KRW 3-month CD Rate | Paying | 2.83% | 01/28/2011 | KRW | 2,369,000 | (18) | ||||
| KRW 3-month CD Rate | Paying | 3.90% | 06/15/2011 | KRW | 2,300,000 | 1 | ||||
| $ 1,271 | ||||||||||
| JNL/Goldman Sachs Emerging Markets Debt Fund | ||||||||||
| Citibank N.A. | 6-Month Sinacofi Chile Interbank Rate | Paying | 5.24% | 12/15/2014 | CLP | 3,000,000 | $ 15 | |||
| Brazil Interbank Deposit Rate | Paying | 11.85% | 01/02/2012 | BRL | 40,700 | 26 | ||||
| KRW 3-month CD Rate | Paying | 3.95% | 08/26/2011 | KRW | 7,000,000 | 3 | ||||
| KRW 3-month CD Rate | Paying | 4.08% | 12/04/2013 | KRW | 1,900,000 | (24) | ||||
| Deutsche Bank AG | 1-Month Mexico Interbank TIIE 28 Day Rate | Paying | 6.18% | 12/17/2011 | MXN | 510,000 | (4) | |||
| 6-Month Sinacofi Chile Interbank Rate | Paying | 5.04% | 11/18/2014 | CLP | 1,780,000 | (13) | ||||
| Brazil Interbank Deposit Rate | Paying | 11.75% | 01/02/2012 | BRL | 32,500 | (8) | ||||
| KRW 3-month CD Rate | Paying | 3.40% | 06/09/2011 | KRW | 6,000,000 | (32) | ||||
| KRW 3-month CD Rate | Paying | 3.61% | 07/22/2011 | KRW | 2,180,000 | (7) | ||||
| $ (44) | ||||||||||
| JNL/PIMCO Real Return Fund | ||||||||||
| Barclays Bank PLC | 6-Month EURIBOR | Paying | 5.00% | 09/17/2010 | EUR | 2,900 | $ 187 | |||
| Brazil Interbank Deposit Rate | Paying | 10.68% | 01/02/2012 | BRL | 5,700 | (51) | ||||
| HSBC Bank USA, N.A. | Brazil Interbank Deposit Rate | Paying | 14.77% | 01/02/2012 | BRL | 300 | 12 | |||
| Merrill Lynch Capital Services Inc. | Brazil Interbank Deposit Rate | Paying | 14.77% | 01/02/2012 | BRL | 1,400 | 59 | |||
| Brazil Interbank Deposit Rate | Paying | 12.54% | 01/02/2012 | BRL | 15,300 | 289 | ||||
| Brazil Interbank Deposit Rate | Paying | 12.54% | 01/02/2012 | BRL | 5,000 | 104 | ||||
| UBS AG Stamford | Brazil Interbank Deposit Rate | Paying | 12.41% | 01/04/2010 | BRL | 1,000 | 14 | |||
| $ 614 | ||||||||||
| JNL/PIMCO Total Return Bond Fund | ||||||||||
| Barclays Bank PLC | Brazil Interbank Deposit Rate | Paying | 10.60% | 01/02/2012 | BRL | 1,500 | $ (9) | |||
| Brazil Interbank Deposit Rate | Paying | 11.36% | 01/04/2010 | BRL | 4,000 | 7 | ||||
| France CPI ex Tobacco | Paying | 2.10% | 10/15/2010 | EUR | 1,100 | 61 | ||||
| France CPI ex Tobacco | Paying | 2.10% | 10/15/2010 | EUR | 1,600 | 91 | ||||
| BNP Paribas SA | 6-Month EURIBOR | Paying | 4.50% | 03/18/2014 | EUR | 2,700 | 418 | |||
| Deutsche Bank AG | 3-Month Australian Bank Bill | Paying | 4.50% | 06/15/2011 | AUD | 20,700 | (128) | |||
| 3-Month Australian Bank Bill | Paying | 4.50% | 06/15/2011 | AUD | 1,800 | (15) | ||||
| 6-Month EURIBOR | Paying | 3.00% | 06/16/2015 | EUR | 38,400 | (266) | ||||
| 6-Month EURIBOR | Paying | 3.00% | 06/16/2015 | EUR | 21,600 | (182) | ||||
| 6-Month EURIBOR | Paying | 3.00% | 06/16/2015 | EUR | 81,100 | (847) | ||||
| Goldman Sachs Bank USA | Brazil Interbank Deposit Rate | Paying | 11.47% | 01/04/2010 | BRL | 1,000 | 3 | |||
| Brazil Interbank Deposit Rate | Paying | 10.84% | 01/02/2012 | BRL | 12,900 | (51) | ||||
| HSBC Bank USA, N.A. | Brazil Interbank Deposit Rate | Paying | 14.77% | 01/02/2012 | BRL | 300 | 11 | |||
| Brazil Interbank Deposit Rate | Paying | 10.61% | 01/02/2012 | BRL | 1,400 | (8) | ||||
| Merrill Lynch Capital Services Inc. | Brazil Interbank Deposit Rate | Paying | 11.98% | 01/02/2012 | BRL | 4,700 | 44 | |||
| Brazil Interbank Deposit Rate | Paying | 14.77% | 01/02/2012 | BRL | 300 | 11 | ||||
| Brazil Interbank Deposit Rate | Paying | 14.77% | 01/02/2012 | BRL | 500 | 21 | ||||
| Brazil Interbank Deposit Rate | Paying | 14.77% | 01/02/2012 | BRL | 200 | 8 | ||||
| Brazil Interbank Deposit Rate | Paying | 12.95% | 01/04/2010 | BRL | 1,400 | 32 | ||||
| Brazil Interbank Deposit Rate | Paying | 12.54% | 01/02/2012 | BRL | 6,600 | 149 | ||||
| Brazil Interbank Deposit Rate | Paying | 11.43% | 01/04/2010 | BRL | 2,600 | 7 | ||||
| Morgan Stanley Capital Services Inc. | 3-Month LIBOR | Paying | 3.00% | 12/16/2010 | 41,400 | 53 | ||||
| 3-Month LIBOR | Paying | 3.00% | 12/16/2010 | 53,600 | 139 | |||||
| Brazil Interbank Deposit Rate | Paying | 12.67% | 01/04/2010 | BRL | 1,600 | 27 | ||||
| Brazil Interbank Deposit Rate | Paying | 12.67% | 01/04/2010 | BRL | 1,600 | 27 | ||||
See accompanying Notes to Financial Statements.
JNL Series Trust
Notes to the Schedules of Investments (continued)
December 31, 2009
Summary of Interest Rate Swap Agreements (in thousands) (continued) | ||||||||||
| Paying/ | Unrealized | |||||||||
| Receiving | Expiration | Notional | Appreciation/ | |||||||
| Counterparty | Floating Rate Index | Floating Rate | Fixed Rate | Date | Amount4 | (Depreciation) | ||||
| JNL/PIMCO Total Return Bond Fund (continued) | ||||||||||
| Morgan Stanley Capital Services Inc. | Brazil Interbank Deposit Rate | Paying | 12.78% | 01/04/2010 | BRL | 1,800 | $ 37 | |||
| Brazil Interbank Deposit Rate | Paying | 12.78% | 01/04/2010 | BRL | 1,500 | 31 | ||||
| UBS AG Stamford | 6-Month Australian Bank Bill | Paying | 4.25% | 09/15/2011 | AUD | 15,500 | (265) | |||
| Brazil Interbank Deposit Rate | Paying | 12.41% | 01/04/2010 | BRL | 1,600 | 27 | ||||
| Brazil Interbank Deposit Rate | Paying | 12.41% | 01/04/2010 | BRL | 1,600 | 27 | ||||
| Brazil Interbank Deposit Rate | Paying | 10.58% | 01/02/2012 | BRL | 3,500 | (55) | ||||
| Brazil Interbank Deposit Rate | Paying | 10.58% | 01/02/2012 | BRL | 1,900 | (9) | ||||
| $ (604) | ||||||||||
Summary of Credit Default Swap Agreements (in thousands) | ||||||||||
| Reference | Fixed | Unrealized | ||||||||
| Obligation | Received/ | Expiration | Notional | Appreciation/ | ||||||
| Counterparty | Reference Obligation | Credit Rating 3 | Pay Rate 6 | Date | Amount4, 5 | Value | (Depreciation) | |||
| JNL/Goldman Sachs Core Plus Bond Fund | ||||||||||
Credit default swap agreements - purchase protection 2 | ||||||||||
| Bank of America N.A. | CDX.IG.13 | n/a | 1.00% | 12/20/2014 | $ 11,800 | $ (77) | $ (133) | |||
| Deutsche Bank AG | CDX.IG.13 | n/a | 1.00% | 12/20/2014 | 8,450 | (55) | (40) | |||
| Deutsche Bank AG | CDX.IG.13 | n/a | 1.00% | 12/20/2014 | 7,200 | (47) | (47) | |||
| $ 27,450 | $ (179) | $ (220) | ||||||||
| JNL/PIMCO Real Return Fund | ||||||||||
Credit default swap agreements - sell protection 1 | ||||||||||
| Deutsche Bank AG | American International Group Inc., 6.25%, 05/01/36 | A3 | 5.00% | 12/20/2013 | $ (8,300) | $ (189) | $ 655 | |||
Credit default swap agreements - purchase protection 2 | ||||||||||
| Morgan Stanley Capital Services Inc. | American Electric Power, 5.25%, 06/01/15 | n/a | 0.47% | 06/20/2015 | $ 500 | $ 1 | $ 1 | |||
| Deutsche Bank AG | CDX.HY-12 5 Year Index | n/a | 5.00% | 06/20/2014 | 11,844 | (81) | (670) | |||
| Deutsche Bank AG | CDX.IG-12 5 Year Index | n/a | 1.00% | 06/20/2014 | 1,190 | (9) | (78) | |||
| Goldman Sachs International | CDX.IG-12 5 Year Index | n/a | 1.00% | 06/20/2014 | 13,491 | (103) | (415) | |||
| Morgan Stanley Capital Services Inc. | CDX.IG-12 5 Year Index | n/a | 1.00% | 06/20/2014 | 7,638 | (58) | (369) | |||
| Morgan Stanley Capital Services Inc. | CDX.NA.HY-12 5 Year | n/a | 5.00% | 06/20/2014 | 1,786 | (12) | (109) | |||
| Citibank N.A. | GATX Corp., 5.80%, 03/01/16 | n/a | 1.07% | 03/20/2016 | 1,000 | 1 | 1 | |||
| BNP Paribas S.A. | International Lease Finance Corporation, 6.63%, 11/15/13 | n/a | 1.60% | 12/20/2013 | 500 | 103 | 103 | |||
| Deutsche Bank AG | JC Penney Corp.,Inc., 6.38%, 10/15/36 | n/a | 1.00% | 06/20/2017 | 1,400 | 43 | (47) | |||
| Deutsche Bank AG | Knight, Inc., 6.50%, 09/01/12 | n/a | 1.00% | 03/20/2016 | 2,000 | 76 | (15) | |||
| Morgan Stanley Capital Services Inc. | Knight, Inc., 6.50%, 09/01/12 | n/a | 1.00% | 03/20/2016 | 3,000 | 113 | (26) | |||
| Deutsche Bank AG | Macy's Corp., 7.45%, 07/15/17 | n/a | 2.10% | 09/20/2017 | 1,000 | (12) | (13) | |||
| Deutsche Bank AG | Marsh & McLennan Companies, Inc., 5.75%, 09/15/15 | n/a | 0.60% | 09/20/2015 | 1,000 | 5 | 5 | |||
| JPMorgan Chase Bank, N.A. | Pearson, 5.70%, 06/01/14 | n/a | 0.83% | 06/20/2014 | 1,000 | (17) | (17) | |||
| Morgan Stanley Capital Services Inc. | Prologis Trust, 5.50%, 03/01/13 | n/a | 1.32% | 06/20/2018 | 900 | 72 | 72 | |||
| Barclays Bank PLC | REXAM PLC, 6.75%, 06/01/13 | n/a | 1.45% | 06/20/2013 | 700 | (10) | (11) | |||
| Deutsche Bank AG | Seagate Technology HDD Holdings, 6.80%, 10/01/16 | n/a | 1.00% | 12/20/2011 | 5,000 | 58 | (6) | |||
| JPMorgan Chase Bank, N.A. | Waste Management Inc., 6.10%, 03/15/18 | n/a | 0.79% | 03/20/2018 | 1,100 | (9) | (9) | |||
| $ 55,049 | $ 161 | $ (1,603) | ||||||||
| JNL/PIMCO Total Return Bond Fund | ||||||||||
Credit default swap agreements - sell protection 1 | ||||||||||
| Deutsche Bank AG | CDX.EM-12 | Ba1 | 5.00% | 12/20/2014 | $ (1,500) | $ 159 | $ (6) | |||
| Citibank N.A. | CDX.HY-8 35-100% | Caa1 | 0.36% | 06/20/2012 | (4,815) | (1) | - | |||
| Citibank N.A. | CDX.HY-8 35-100% | Caa1 | 0.40% | 06/20/2012 | (963) | 1 | 1 | |||
| Deutsche Bank AG | CDX.IG-10 5 Year Index 30-100% | Baa2 | 0.53% | 06/20/2013 | (1,350) | 17 | 17 | |||
| Goldman Sachs International | CDX.IG-10 5 Year Index 30-100% | Baa2 | 0.46% | 06/20/2013 | (1,736) | 18 | 19 | |||
| Goldman Sachs International | CDX.IG-9 10 Year Index 30-100% | Baa2 | 0.55% | 12/20/2017 | (1,447) | 23 | 23 | |||
| Deutsche Bank AG | CDX.IG-9 5 Year Index 30-100% | Baa2 | 0.71% | 12/20/2012 | (7,137) | 119 | 120 | |||
| Merrill Lynch International | Federated Republic of Brazil, 12.25%, 03/06/30 | Baa3 | 1.95% | 04/20/2016 | (100) | 4 | 4 | |||
| Barclays Bank PLC | Ford Motor Credit Co. LLC, 7.00%, 10/01/13 | B3 | 5.65% | 09/20/2012 | (500) | 25 | 26 | |||
| Goldman Sachs International | Ford Motor Credit Co. LLC, 7.00%, 10/01/13 | B3 | 3.85% | 09/20/2012 | (200) | 1 | 1 | |||
| UBS AG Stamford | Ford Motor Credit Co. LLC, 7.00%, 10/01/13 | B3 | 6.20% | 09/20/2012 | (2,600) | 165 | 170 | |||
| Morgan Stanley Capital Services Inc. | Gazprom, 8.63%, 04/28/34 | Baa1 | 2.18% | 02/20/2013 | (700) | (2) | 3 | |||
| UBS AG Stamford | Gazprom, 8.63%, 04/28/34 | Baa1 | 2.18% | 02/20/2013 | (1,000) | (3) | 5 | |||
| Citibank N.A. | General Electric Capital Corp., 5.63%, 09/15/17 | Aa2 | 5.00% | 06/20/2011 | (1,000) | 54 | 100 | |||
| Citibank N.A. | General Electric Capital Corp., 5.63%, 09/15/17 | Aa2 | 4.33% | 12/20/2013 | (800) | 82 | 83 | |||
| Citibank N.A. | General Electric Capital Corp., 5.63%, 09/15/17 | Aa2 | 4.80% | 12/20/2013 | (600) | 72 | 73 | |||
| Deutsche Bank AG | General Electric Capital Corp., 5.63%, 09/15/17 | Aa2 | 1.00% | 03/20/2011 | (2,000) | (6) | 7 | |||
| Deutsche Bank AG | General Electric Capital Corp., 5.63%, 09/15/17 | Aa2 | 4.90% | 12/20/2013 | (1,100) | 136 | 138 | |||
| Goldman Sachs International | General Electric Capital Corp., 5.63%, 09/15/17 | Aa2 | 8.00% | 03/20/2011 | (1,000) | 82 | 85 | |||
| Morgan Stanley Capital Services Inc. | General Electric Capital Corp., 5.63%, 09/15/17 | Aa2 | 1.00% | 09/20/2011 | (1,300) | (8) | 10 | |||
| BNP Paribas SA | General Electric Capital Corp., 6.00%, 06/15/12 | Aa2 | 0.78% | 03/20/2011 | (700) | (4) | (4) | |||
| Citibank N.A. | General Electric Capital Corp., 6.00%, 06/15/12 | Aa2 | 1.10% | 03/20/2010 | (200) | - | - | |||
| Citibank N.A. | General Electric Capital Corp., 6.00%, 06/15/12 | Aa2 | 1.15% | 03/20/2010 | (100) | - | - | |||
| Deutsche Bank AG | General Electric Capital Corp., 6.00%, 06/15/12 | Aa2 | 0.80% | 06/20/2011 | (3,700) | (28) | (27) | |||
| Deutsche Bank AG | General Electric Capital Corp., 6.00%, 06/15/12 | Aa2 | 1.50% | 09/20/2011 | (300) | 1 | 1 | |||
See accompanying Notes to Financial Statements.
JNL Series Trust
Notes to the Schedules of Investments (continued)
December 31, 2009
Summary of Credit Default Swap Agreements (in thousands) (continued) | ||||||||||
| Reference | Fixed Rate | Unrealized | ||||||||
| Obligation | Received/ | Expiration | Notional | Appreciation/ | ||||||
| Counterparty | Reference Obligation | Credit Rating 3 | Paid 6 | Date | Amount4, 5 | Value | (Depreciation) | |||
| JNL/PIMCO Total Return Bond Fund (continued) | ||||||||||
Credit default swap agreements - sell protection (continued) 1 | ||||||||||
| Goldman Sachs International | General Electric Capital Corp., 6.00%, 06/15/12 | Aa2 | 0.90% | 12/20/2010 | $ (300) | $ - | $ - | |||
| Deutsche Bank AG | GMAC LLC, 6.88%, 08/28/12 | Ca | 4.00% | 09/20/2012 | (2,400) | 1 | 4 | |||
| Goldman Sachs International | GMAC LLC, 6.88%, 08/28/12 | Ca | 3.20% | 09/20/2012 | (100) | (2) | (2) | |||
| Credit Suisse International | Republic of Panama, 8.88%, 09/30/27 | Ba1 | 1.20% | 02/20/2017 | (200) | (3) | (2) | |||
| JPMorgan Chase Bank, N.A. | Republic of Panama, 8.88%, 09/30/27 | Ba1 | 1.25% | 01/20/2017 | (200) | (2) | (1) | |||
| Morgan Stanley Capital Services Inc. | Republic of Panama, 8.88%, 09/30/27 | Ba1 | 0.75% | 01/20/2012 | (200) | - | - | |||
| Citibank N.A. | SLM Corp., 5.13%, 08/27/12 | Ba1 | 4.85% | 03/20/2013 | (1,700) | 12 | 14 | |||
| JPMorgan Chase Bank, N.A. | United Mexican States, 7.50%, 04/08/33 | Baa1 | 0.92% | 03/20/2016 | (500) | (12) | (11) | |||
| Deutsche Bank AG | UK Gilt Treasury Bond, 4.25%, 06/07/32 | Aaa | 1.00% | 12/20/2014 | (700) | 7 | - | |||
| Morgan Stanley Capital Services Inc. | UK Gilt Treasury Bond, 4.25%, 06/07/32 | Aaa | 1.00% | 12/20/2014 | (300) | 3 | 1 | |||
| JPMorgan Chase Bank, N.A. | UK Gilt Treasury Bond, 4.25%, 06/07/32 | Aaa | 1.00% | 12/20/2014 | (200) | 2 | - | |||
| $ (43,648) | $ 913 | $ 852 | ||||||||
Summary of Total Return Swap Agreements (in thousands) | ||||||||||
| Paying/ | ||||||||||
| Receiving | Unrealized | |||||||||
| Reference Entity | Expiration | Notional | Appreciation/ | |||||||
| Counterparty | Reference Entity | Total Return | Date | Amount4 | (Depreciation) | |||||
| JNL/Goldman Sachs Emerging Markets Debt Fund | ||||||||||
| Deutsche Bank AG | * | Egyptian T-Bill, 0.00%, 02/02/2010 | Receiving | 02/02/2010 | EGP | 9,500 | $ 23 | |||
| HSBC Bank USA N.A. | * | Egyptian T-Bill, 0.00%, 02/23/2010 | Receiving | 02/23/2010 | EGP | 8,000 | 19 | |||
| $ 42 | ||||||||||
| JNL/Ivy Asset Strategy Fund | ||||||||||
| Morgan Stanley | * | India custom basket consisting of: Larsen & Toubro Ltd., | Receiving | 10/07/2010 | $ 8,624 | $ (2) | ||||
| ICI Bank Limited, Housing Development Finance | ||||||||||
| Corporation Ltd., HDFC Bank Ltd. | ||||||||||
| 1 | If the Fund is a seller of protection and a credit event occurs, as defined under the terms of that particular swap agreement, the Fund will either pay the buyer of protection an amount | |||||||||
| equal to the notional amount of the referenced obligation and take delivery of the referenced obligation or underlying securities comprising the referenced index or pay a net settlement amount in the | ||||||||||
| form of cash or securities equal to the notional amount of the swap agreement less the recovery value of the reference obligation or underlying securities comprising the referenced index. | ||||||||||
| 2 | If the Fund is a buyer of protection and a credit event occurs, as defined under the terms of that particular swap agreement, the Fund will either receive from the seller of protection an | |||||||||
| amount equal to the notional amount of the referenced obligation agreement and deliver the referenced obligation or underlying securities comprising the referenced index or receive a net settlement | ||||||||||
| amount in the form of cash or securities equal to the notional amount of the swap agreement less the recovery value of the referenced obligation or underlying securities comprising the | ||||||||||
| referenced index. | ||||||||||
| 3 | Reference obligation credit ratings are provided for instances when a Fund has sold protection. Moody's ratings are provided for instances when the underlying reference obligation consists | |||||||||
| of a single entity. For instances when the underlying reference obligation is an index, the rating is calculated based on a weighted average of the index constituents' credit ratings. | ||||||||||
| 4 | Notional amount is stated in USD unless otherwise noted. | |||||||||
| 5 | The maximum potential amount the Fund could be required to pay as a seller of credit protection or receive as a buyer of credit protection if a credit event occurs is limited to the total | |||||||||
| notional amount which is defined under the terms of each swap agreement. | ||||||||||
| 6 | If the Fund is a buyer of protection, the Fund pays the fixed rate. If the Fund is a seller of protection, the Fund receives the fixed rate. | |||||||||
| * | Swap agreement fair valued in good faith in accordance with procedures established by the Trust's Board of Trustees. Fair valued securities may be classified as Level 2 or | |||||||||
| Level 3 for FASB ASC Topic 820 disclosures based on the securities valuation inputs. See FASB ASC Topic 820 note on page 164. | ||||||||||
See accompanying Notes to Financial Statements.
JNL Series Trust
Notes to the Schedules of Investments (continued)
December 31, 2009
FASB ASC Topic 815, "Derivatives and Hedging" - The following is a summary of the fair valuations of each Fund's derivative instruments categorized by risk exposure. The derivative instruments outstanding as of year end as disclosed in these Notes to the Schedules of Investments and the amounts of realized and changes in unrealized gains and losses on derivative instruments during the year as disclosed in the Statements of Operations serve as indicators of the volume of derivative activity for the Funds. In addition, a summary of derivative activity is provided for those Funds which had substantial changes in volume of derivative activity during the year. See Note 4 in the Notes to Financial Statements for additional FASB ASC Topic 815 disclosures.
| JNL/Franklin Templeton Mutual Shares Fund | |||||||||||||
| Fair values of derivative instruments on the Statements of Assets and Liabilities as of December 31, 2009: | |||||||||||||
| Credit | Equity | Foreign Exchange | Interest Rate | Credit | Equity | Foreign Exchange | Interest Rate | ||||||
| Contracts | Contracts | Contracts | Contracts | Total | Contracts | Contracts | Contracts | Contracts | Total | ||||
| Assets: | Liabilities: | ||||||||||||
| Investments - unaffiliated, at value | $ - | $ - | $ - | $ - | $ - | Options written, at value | $ - | $ - | $ - | $ - | $ - | ||
| Forward foreign | Forward foreign | ||||||||||||
| currency contracts | - | - | 2,848 | - | 2,848 | currency contracts | - | - | 315 | - | 315 | ||
| $ - | $ - | $ 2,848 | $ - | $ 2,848 | $ - | $ - | $ 315 | $ - | $ 315 | ||||
| The effect of derivative instruments on the Statements of Operations for the year ended December 31, 2009: | |||||||||||||
| Net realized gain (loss) on: | Net change in unrealized appreciation or depreciation on: | ||||||||||||
| Foreign currency related items | $ - | $ - | $ (5,753) | $ - | $ (5,753) | Foreign currency related items | $ - | $ - | $ 2,409 | $ - | $ 2,409 | ||
| Option contracts | - | (854) | - | - | (854) | Option contracts | - | (16) | - | - | (16) | ||
| $ - | $ (854) | $ (5,753) | $ - | $ (6,607) | $ - | $ (16) | $ 2,409 | $ - | $ 2,393 | ||||
| JNL/Goldman Sachs Core Plus Bond Fund | |||||||||||||
| Fair values of derivative instruments on the Statements of Assets and Liabilities as of December 31, 2009: | |||||||||||||
| Credit | Equity | Foreign Exchange | Interest Rate | Credit | Equity | Foreign Exchange | Interest Rate | ||||||
| Contracts | Contracts | Contracts | Contracts | Total | Contracts | Contracts | Contracts | Contracts | Total | ||||
| Assets: | Liabilities: | ||||||||||||
| Forward foreign | Forward foreign | ||||||||||||
| currency contracts | $ - | $ - | $ 1,041 | $ - | $ 1,041 | currency contracts | $ - | $ - | $ 990 | $ - | $ 990 | ||
| Unrealized appreciation on | Unrealized depreciation on | ||||||||||||
| swap agreements | - | - | - | 1,912 | 1,912 | swap agreements | 220 | - | - | 641 | 861 | ||
| Variation margin | - | - | - | 2 | 2 | Variation margin | - | - | - | 492 | 492 | ||
| $ - | $ - | $ 1,041 | $ 1,914 | $ 2,955 | $ 220 | $ - | $ 990 | $ 1,133 | $ 2,343 | ||||
| The effect of derivative instruments on the Statements of Operations for the year ended December 31, 2009: | |||||||||||||
| Net realized gain (loss) on: | Net change in unrealized appreciation or depreciation on: | ||||||||||||
| Foreign currency related items | $ - | $ - | $ - | $ - | $ - | Foreign currency related items | $ - | $ - | $ (75) | $ - | $ (75) | ||
| Futures contracts | - | - | - | 5,445 | 5,445 | Futures contracts | - | - | - | (6,119) | (6,119) | ||
| Swap agreements | (1,785) | - | - | 5,926 | 4,141 | Swap agreements | 572 | - | - | 634 | 1,206 | ||
| $(1,785) | $ - | $ - | $ 11,371 | $ 9,586 | $ 572 | $ - | $ (75) | $ (5,485) | $ (4,988) | ||||
| JNL/Goldman Sachs Emerging Markets Debt Fund | |||||||||||||
| Fair values of derivative instruments on the Statements of Assets and Liabilities as of December 31, 2009: | |||||||||||||
| Credit | Equity | Foreign Exchange | Interest Rate | Credit | Equity | Foreign Exchange | Interest Rate | ||||||
| Contracts | Contracts | Contracts | Contracts | Total | Contracts | Contracts | Contracts | Contracts | Total | ||||
| Assets: | Liabilities: | ||||||||||||
| Forward foreign | Forward foreign | ||||||||||||
| currency contracts | $ - | $ - | $ 1,407 | $ - | $ 1,407 | currency contracts | $ - | $ - | $ 364 | $ - | $ 364 | ||
| Unrealized appreciation on | Unrealized depreciation on | ||||||||||||
| swap agreements | - | - | 42 | 44 | 86 | swap agreements | - | - | - | 88 | 88 | ||
| $ - | $ - | $ 1,449 | $ 44 | $ 1,493 | $ - | $ - | $ 364 | $ 88 | $ 452 | ||||
| The effect of derivative instruments on the Statements of Operations for the year ended December 31, 2009: | |||||||||||||
| Net realized gain (loss) on: | Net change in unrealized appreciation or depreciation on: | ||||||||||||
| Foreign currency related items | $ - | $ - | $ 3,163 | $ - | $ 3,163 | Foreign currency related items | $ - | $ - | $ 734 | $ - | $ 734 | ||
| Swap agreements | - | - | 78 | 413 | 491 | Swap agreements | - | - | 42 | (309) | (267) | ||
| $ - | $ - | $ 3,241 | $ 413 | $ 3,654 | $ - | $ - | $ 776 | $ (309) | $ 467 | ||||
During the year ended December 31, 2009, the JNL/Goldman Sachs Emerging Markets Debt Fund initiated transactions in total return swap agreements and increased the volume of activity in interest rate swaps agreements.
See accompanying Notes to Financial Statements
JNL Series Trust
Notes to the Schedules of Investments (continued) (dollar amounts in thousands)
December 31, 2009
FASB ASC Topic 815, "Derivatives and Hedging" (continued) | |||||||||||||
| JNL/Ivy Asset Strategy Fund | |||||||||||||
| Fair values of derivative instruments on the Statements of Assets and Liabilities as of December 31, 2009: | |||||||||||||
| Credit | Equity | Foreign Exchange | Interest Rate | Credit | Equity | Foreign Exchange | Interest Rate | ||||||
| Contracts | Contracts | Contracts | Contracts | Total | Contracts | Contracts | Contracts | Contracts | Total | ||||
| Assets: | Liabilities: | ||||||||||||
| Forward foreign | Forward foreign | ||||||||||||
| currency contracts | $ - | $ - | $ 126 | $ - | $ 126 | currency contracts | $ - | $ - | $ 126 | $ - | $ 126 | ||
| Unrealized appreciation on | Unrealized depreciation on | ||||||||||||
| swap agreements | - | - | - | - | - | swap agreements | - | 2 | - | - | 2 | ||
| $ - | $ - | $ 126 | $ - | $ 126 | $ - | $ 2 | $ 126 | $ - | $ 128 | ||||
| The effect of derivative instruments on the Statements of Operations for the year ended December 31, 2009: | |||||||||||||
| Net realized gain (loss) on: | Net change in unrealized appreciation or depreciation on: | ||||||||||||
| Foreign currency related items | $ - | $ - | $ (1) | $ - | $ (1) | Foreign currency related items | $ - | $ - | $ - | $ - | $ - | ||
| Futures contracts | - | (773) | - | - | (773) | Futures contracts | - | - | - | - | - | ||
| Option contracts | - | (130) | - | - | (130) | Option contracts | - | - | - | - | - | ||
| Swap agreements | - | (287) | - | - | (287) | Swap agreements | - | (2) | - | - | (2) | ||
| $ - | $ (1,190) | $ (1) | $ - | $ (1,191) | $ - | $ (2) | $ - | $ - | $ (2) | ||||
The JNL/Ivy Asset Strategy Fund’s inception was September 28, 2009. During the period ended December 31, 2009, the Fund initiated derivative positions in exchange traded futures contracts, options, forward
foreign currency contracts and total return swap agreements. As of December 31, 2009, the Fund’s only derivative exposure was forward foreign currency contracts and a total return swap on a basket of equities.
Over the course of the period, the Fund had long equity derivative exposure through options which expired before year end.
| JNL/JPMorgan International Value Fund | |||||||||||||
| Fair values of derivative instruments on the Statements of Assets and Liabilities as of December 31, 2009: | |||||||||||||
| Credit | Equity | Foreign Exchange | Interest Rate | Credit | Equity | Foreign Exchange | Interest Rate | ||||||
| Contracts | Contracts | Contracts | Contracts | Total | Contracts | Contracts | Contracts | Contracts | Total | ||||
| Assets: | Liabilities: | ||||||||||||
| Forward foreign | Forward foreign | ||||||||||||
| currency contracts | $ - | $ - | $ 3,306 | $ - | $ 3,306 | currency contracts | $ - | $ - | $ 3,229 | $ - | $ 3,229 | ||
| Variation margin | - | 4 | - | - | 4 | Variation margin | - | - | - | - | - | ||
| $ - | $ 4 | $ 3,306 | $ - | $ 3,310 | $ - | $ - | $ 3,229 | $ - | $ 3,229 | ||||
| The effect of derivative instruments on the Statements of Operations for the year ended December 31, 2009: | |||||||||||||
| Net realized gain (loss) on: | Net change in unrealized appreciation or depreciation on: | ||||||||||||
| Foreign currency related items | $ - | $ - | $ 6,013 | $ - | $ 6,013 | Foreign currency related items | $ - | $ - | $ (767) | $ - | $ (767) | ||
| Futures contracts | - | 423 | - | - | 423 | Futures contracts | - | (172) | - | - | (172) | ||
| $ - | $ 423 | $ 6,013 | $ - | $ 6,436 | $ - | $ (172) | $ (767) | $ - | $ (939) | ||||
| JNL/Mellon Capital Management International Index Fund | |||||||||||||
| Fair values of derivative instruments on the Statements of Assets and Liabilities as of December 31, 2009: | |||||||||||||
| Credit | Equity | Foreign Exchange | Interest Rate | Credit | Equity | Foreign Exchange | Interest Rate | ||||||
| Contracts | Contracts | Contracts | Contracts | Total | Contracts | Contracts | Contracts | Contracts | Total | ||||
| Assets: | Liabilities: | ||||||||||||
| Forward foreign | Forward foreign | ||||||||||||
| currency contracts | $ - | $ - | $ 245 | $ - | $ 245 | currency contracts | $ - | $ - | $ 836 | $ - | $ 836 | ||
| Variation margin | - | 27 | - | - | 27 | Variation margin | - | - | - | - | - | ||
| $ - | $ 27 | $ 245 | $ - | $ 272 | $ - | $ - | $ 836 | $ - | $ 836 | ||||
| The effect of derivative instruments on the Statements of Operations for the year ended December 31, 2009: | |||||||||||||
| Net realized gain (loss) on: | Net change in unrealized appreciation or depreciation on: | ||||||||||||
| Foreign currency related items | $ - | $ - | $ 1,514 | $ - | $ 1,514 | Foreign currency related items | $ - | $ - | $ (835) | $ - | $ (835) | ||
| Futures contracts | - | 4,502 | - | - | 4,502 | Futures contracts | - | (36) | - | - | (36) | ||
| $ - | $ 4,502 | $ 1,514 | $ - | $ 6,016 | $ - | $ (36) | $ (835) | $ - | $ (871) | ||||
| JNL/Mellon Capital Management Global Alpha Fund | |||||||||||||
| Fair values of derivative instruments on the Statements of Assets and Liabilities as of December 31, 2009: | |||||||||||||
| Credit | Equity | Foreign Exchange | Interest Rate | Credit | Equity | Foreign Exchange | Interest Rate | ||||||
| Contracts | Contracts | Contracts | Contracts | Total | Contracts | Contracts | Contracts | Contracts | Total | ||||
| Assets: | Liabilities: | ||||||||||||
| Forward foreign | Forward foreign | ||||||||||||
| currency contracts | $ - | $ - | $ 353 | $ - | $ 353 | currency contracts | $ - | $ - | $ 513 | $ - | $ 513 | ||
| Variation margin | - | 46 | - | 60 | 106 | Variation margin | - | 19 | - | 41 | 60 | ||
| $ - | $ 46 | $ 353 | $ 60 | $ 459 | $ - | $�� 19 | $ 513 | $ 41 | $ 573 | ||||
| The effect of derivative instruments on the Statements of Operations for the year ended December 31, 2009: | |||||||||||||
| Net realized gain (loss) on: | Net change in unrealized appreciation or depreciation on: | ||||||||||||
| Foreign currency related items | $ - | $ - | $ (124) | $ - | $ (124) | Foreign currency related items | $ - | $ - | $ (160) | $ - | $ (160) | ||
| Futures contracts | - | 153 | - | (34) | 119 | Futures contracts | - | 29 | - | (450) | (421) | ||
| $ - | $ 153 | $ (124) | $ (34) | $ (5) | $ - | $ 29 | $ (160) | $ (450) | $ (581) | ||||
The JNL/Mellon Capital Management Global Alpha Fund’s inception was September 28, 2009. The Fund invests in derivatives as direct substitutes for developed market stock indices, government bonds and currencies. The Fund initiated derivative positions in exchange traded futures contracts and forward foreign currency contracts. There were no significant changes in volume due to changes in investment strategy or objective. Changes in the positions of the Fund were a result of price movement and tactical trades.
See accompanying Notes to Financial Statements
JNL Series Trust
Notes to the Schedules of Investments (continued) (dollar amounts in thousands)
December 31, 2009
FASB ASC Topic 815, "Derivatives and Hedging" (continued) | |||||||||||||
| JNL/PIMCO Real Return Fund | |||||||||||||
| Fair values of derivative instruments on the Statements of Assets and Liabilities as of December 31, 2009: | |||||||||||||
| Credit | Equity | Foreign Exchange | Interest Rate | Credit | Equity | Foreign Exchange | Interest Rate | ||||||
| Contracts | Contracts | Contracts | Contracts | Total | Contracts | Contracts | Contracts | Contracts | Total | ||||
| Assets: | Liabilities: | ||||||||||||
| Investments - unaffiliated, at value | $ - | $ - | $ - | $ - | $ - | Options written, at value | $ - | $ - | $ - | $ 1,866 | $ 1,866 | ||
| Forward foreign | Forward foreign | ||||||||||||
| currency contracts | - | - | 989 | - | 989 | currency contracts | - | - | 1,275 | - | 1,275 | ||
| Unrealized appreciation on | Unrealized depreciation on | ||||||||||||
| swap agreements | 837 | - | - | 665 | 1,502 | swap agreements | 1,785 | - | - | 51 | 1,836 | ||
| Variation margin | - | - | - | 5 | 5 | Variation margin | - | - | - | 14 | 14 | ||
| $ 837 | $ - | $ 989 | $ 670 | $ 2,496 | $ 1,785 | $ - | $ 1,275 | $ 1,931 | $ 4,991 | ||||
| The effect of derivative instruments on the Statements of Operations for the year ended December 31, 2009: | |||||||||||||
| Net realized gain (loss) on: | Net change in unrealized appreciation or depreciation on: | ||||||||||||
| Foreign currency related items | $ - | $ - | $ (3,286) | $ - | $ (3,286) | Foreign currency related items | $ - | $ - | $ 2,499 | $ - | $ 2,499 | ||
| Futures contracts | - | - | - | 11,116 | 11,116 | Futures contracts | - | - | - | (8,242) | (8,242) | ||
| Option contracts | - | - | - | 1,617 | 1,617 | Option contracts | - | - | - | 1,030 | 1,030 | ||
| Swap agreements | 579 | - | - | (12,005) | (11,426) | Swap agreements | (8,818) | - | - | 29,466 | 20,648 | ||
| $ 579 | $ - | $ (3,286) | $ 728 | $ (1,979) | $ (8,818) | $ - | $ 2,499 | $ 22,254 | $ 15,935 | ||||
During the year ended December 31, 2009, overall trading volume for derivative investments for the JNL/PIMCO Real Return Fund was down, however the level of exposure to derivatives during the year did not
change substantially.
| JNL/PIMCO Total Return Bond Fund | |||||||||||||
| Fair values of derivative instruments on the Statements of Assets and Liabilities as of December 31, 2009: | |||||||||||||
| Credit | Equity | Foreign Exchange | Interest Rate | Credit | Equity | Foreign Exchange | Interest Rate | ||||||
| Contracts | Contracts | Contracts | Contracts | Total | Contracts | Contracts | Contracts | Contracts | Total | ||||
| Assets: | Liabilities: | ||||||||||||
| Investments - unaffiliated, at value | $ - | $ - | $ - | $ - | $ - | Options written, at value | $ - | $ - | $ - | $ 5,254 | $ 5,254 | ||
| Forward foreign | Forward foreign | ||||||||||||
| currency contracts | - | - | 1,761 | - | 1,761 | currency contracts | - | - | 350 | - | 350 | ||
| Unrealized appreciation on | Unrealized depreciation on | ||||||||||||
| swap agreements | 905 | - | - | 1,231 | 2,136 | swap agreements | 53 | - | - | 1,835 | 1,888 | ||
| Variation margin | - | - | - | 13 | 13 | Variation margin | - | - | - | 546 | 546 | ||
| $ 905 | $ - | $ 1,761 | $ 1,244 | $ 3,910 | $ 53 | $ - | $ 350 | $ 7,635 | $ 8,038 | ||||
| The effect of derivative instruments on the Statements of Operations for the year ended December 31, 2009: | |||||||||||||
| Net realized gain (loss) on: | Net change in unrealized appreciation or depreciation on: | ||||||||||||
| Foreign currency related items | $ - | $ - | $ (2,180) | $ - | $ (2,180) | Foreign currency related items | $ - | $ - | $ 4,410 | $ - | $ 4,410 | ||
| Futures contracts | - | - | - | 30,672 | 30,672 | Futures contracts | - | - | - | (26,238) | (26,238) | ||
| Option contracts | - | - | - | (631) | (631) | Option contracts | - | - | - | (751) | (751) | ||
| Swap agreements | (661) | - | - | (277) | (938) | Swap agreements | 4,227 | - | - | 16,909 | 21,136 | ||
| $ (661) | $ - | $ (2,180) | $ 29,764 | $26,923 | $ 4,227 | $ - | $ 4,410 | $ (10,080) | $ (1,443) | ||||
During the year ended December 31, 2009, overall trading volume for derivative investments in JNL/PIMCO Total Return Bond Fund was down, however the level of exposure to derivatives during the year did not change substantially.
| JNL/T. Rowe Price Short-Term Bond Fund | |||||||||||||
| Fair values of derivative instruments on the Statements of Assets and Liabilities as of December 31, 2009: | |||||||||||||
| Credit | Equity | Foreign Exchange | Interest Rate | Credit | Equity | Foreign Exchange | Interest Rate | ||||||
| Contracts | Contracts | Contracts | Contracts | Total | Contracts | Contracts | Contracts | Contracts | Total | ||||
| Assets: | Liabilities: | ||||||||||||
| Forward foreign | Forward foreign | ||||||||||||
| currency contracts | $ - | $ - | $ - | $ - | $ - | currency contracts | $ - | $ - | $ 81 | $ - | $ 81 | ||
| Unrealized appreciation on | Unrealized depreciation on | ||||||||||||
| swap agreements | - | - | - | - | - | swap agreements | - | - | - | - | - | ||
| Variation margin | - | - | - | - | - | Variation margin | - | - | - | - | - | ||
| $ - | $ - | $ - | $ - | $ - | $ - | $ - | $ 81 | $ - | $ 81 | ||||
| The effect of derivative instruments on the Statements of Operations for the year ended December 31, 2009: | |||||||||||||
| Net realized gain (loss) on: | Net change in unrealized appreciation or depreciation on: | ||||||||||||
| Foreign currency related items | $ - | $ - | $ - | $ - | $ - | Foreign currency related items | $ - | $ - | $ - | $ - | $ - | ||
| Futures contracts | - | - | - | 4,645 | 4,645 | Futures contracts | - | - | - | (3,095) | (3,095) | ||
| Swap agreements | - | - | - | (345) | (345) | Swap agreements | - | - | - | 1,371 | 1,371 | ||
| $ - | $ - | $ - | $ 4,300 | $ 4,300 | $ - | $ - | $ - | $ (1,724) | $ (1,724) | ||||
During the year ended December 31, 2009, the JNL/T. Rowe Price Short-Term Bond Fund changed its Sub-Adviser. The Fund exited derivative investments in interest rate swap agreements and futures contracts.
See accompanying Notes to Financial Statements
JNL Series Trust
Notes to the Schedules of Investments (continued) (dollar amounts in thousands)
December 31, 2009
Unfunded Loan Commitments - See Note 3 in the Notes to the Financial Statements for further discussion of unfunded loan commitments. The following table details unfunded loan commitments | |||||||||||||
| at December 31, 2009: | |||||||||||||
| Unfunded | |||||||||||||
| JNL/Franklin Templeton Mutual Shares Fund | Commitment | ||||||||||||
| Lyondell Chemical Co., Term Loan, 13.00%, 04/16/10 | $ 28 | ||||||||||||
| Realogy Corp., Term Loan, 5.35%, 10/10/13 | 592 | ||||||||||||
| $ 620 | |||||||||||||
FASB ASC Topic 820, “Fair Value Measurements and Disclosure” - This standard establishes a single authoritative definition of fair value, sets out a framework for measuring fair value and requires additional disclosures about fair value measurements. Various inputs are used in determining the value of a Fund’s investments under FASB ASC Topic 820 guidance. The inputs are summarized into three broad categories. Level 1 includes valuations based on quoted prices of identical securities in active markets including valuations for securities listed on a national or foreign stock exchange or investments in mutual funds. Level 2 includes valuations for which all significant inputs are observable, either directly or indirectly. Direct observable inputs include broker quotes, closing prices of similar securities in active markets, closing prices for identical or similar securities in non-active markets or corporate action or reorganization entitlement values. Indirect significant observable inputs include factors such as interest rates, yield curves, prepayment speeds or credit ratings. Level 2 includes valuations for fixed income securities priced by pricing services, broker quotes in active markets, securities lending collateral, securities subject to corporate actions, international equity securities priced by an independent statistical fair value pricing service, swap agreements valued by pricing services, or ADRs and GDRs for which quoted prices in active markets are not available. Level 3 includes valuations based on inputs that are unobservable and significant to the fair value measurement including Jackson National Asset Management, LLC’s (“Adviser”) own assumptions in determining the fair value of the investment. Inputs used to determine the fair value of Level 3 securities include security specific inputs such as: credit quality, credit rating spreads, issuer news, trading characteristics, call features or maturity; or industry specific inputs such as trading activity of similar markets or securities, changes in the security’s underlying index or comparable securities’ models. Level 3 valuations include securities that are priced based on single source broker quotes, where prices may be unavailable due to halted trading, restricted to resale due to market events, newly issued or for which reliable
quotes are not available. The inputs or methodology used for valuing securities are not necessarily an indication of the risk associated with investing in those securities. Please see Note 2 in the Notes to the Financial Statements for security valuation accounting policies.
The following table summarizes each Fund's investments in securities and other financial instruments as of December 31, 2009 by valuation level.
| Assets -Securities | Liabilities - Securities | ||||||||||||
| Level 1 | Level 2 | Level 3 | Total | Level 1 | Level 2 | Level 3 | Total | ||||||
| JNL Institutional Alt 20 Fund | |||||||||||||
| Investment Funds | $ 199,548 | $ - | $ - | $ 199,548 | $ - | $ - | $ - | $ - | |||||
| JNL Institutional Alt 35 Fund | |||||||||||||
| Investment Funds | $ 308,566 | $ - | $ - | $ 308,566 | $ - | $ - | $ - | $ - | |||||
| JNL Institutional Alt 50 Fund | |||||||||||||
| Investment Funds | $ 361,574 | $ - | $ - | $ 361,574 | $ - | $ - | $ - | $ - | |||||
| JNL Institutional Alt 65 Fund | |||||||||||||
| Investment Funds | $ 229,850 | $ - | $ - | $ 229,850 | $ - | $ - | $ - | $ - | |||||
| JNL/AIM International Growth Fund | |||||||||||||
| Common Stocks | $ 290,638 | $ 102,486 | $ - | $ 393,124 | $ - | $ - | $ - | $ - | |||||
| Non-U.S. Government Agency ABS | - | 50 | - | 50 | - | - | - | - | |||||
| Short-Term Securities | 36,147 | 17,409 | - | 53,556 | - | - | - | - | |||||
| Fund Total | $ 326,785 | $ 119,945 | $ - | $ 446,730 | $ - | $ - | $ - | $ - | |||||
| JNL/AIM Large Cap Growth Fund | |||||||||||||
| Common Stocks | $ 580,645 | $ 26,889 | $ - | $ 607,534 | $ - | $ - | $ - | $ - | |||||
| Non-U.S. Government Agency ABS | - | 22 | - | 22 | - | - | - | - | |||||
| Short-Term Securities | 17,262 | 16,379 | - | 33,641 | - | - | - | - | |||||
| Fund Total | $ 597,907 | $ 43,290 | $ - | $ 641,197 | $ - | $ - | $ - | $ - | |||||
| JNL/AIM Global Real Estate Fund | |||||||||||||
| Common Stocks | $ 189,060 | $ 145,634 | $ - | $ 334,694 | $ - | $ - | $ - | $ - | |||||
| Non-U.S. Government Agency ABS | - | 164 | - | 164 | - | - | - | - | |||||
| Short-Term Securities | 8,814 | 18,950 | - | 27,764 | - | - | - | - | |||||
| Fund Total | $ 197,874 | $ 164,748 | $ - | $ 362,622 | $ - | $ - | $ - | $ - | |||||
| JNL/AIM Small Cap Growth Fund | |||||||||||||
| Common Stocks | $ 88,159 | $ - | $ - | $ 88,159 | $ - | $ - | $ - | $ - | |||||
| Non-U.S. Government Agency ABS | - | 12 | - | 12 | - | - | - | - | |||||
| Short-Term Securities | 4,526 | 16,322 | - | 20,848 | - | - | - | - | |||||
| Fund Total | $ 92,685 | $ 16,334 | $ - | $ 109,019 | $ - | $ - | $ - | $ - | |||||
| JNL/Capital Guardian Global Balanced Fund | |||||||||||||
| Common Stocks | $ 142,886 | $ 35,626 | $ - | $ 178,512 | $ - | $ - | $ - | $ - | |||||
| Preferred Stocks | 1,520 | - | - | 1,520 | - | - | - | - | |||||
| Corporate Bond and Notes | - | 17,231 | - | 17,231 | - | - | - | - | |||||
| Non-U.S. Government Agency ABS | - | 35 | - | 35 | - | - | - | - | |||||
| Government and Agency Obligations | 2,889 | 68,223 | 147 | 71,259 | - | - | - | - | |||||
| Short-Term Securities | 13,868 | 14,102 | - | 27,970 | - | - | - | - | |||||
| Fund Total | $ 161,163 | $ 135,217 | $ 147 | $ 296,527 | $ - | $ - | $ - | $ - | |||||
| JNL/Capital Guardian Global Diversified Research Fund | |||||||||||||
| Common Stocks | $ 245,559 | $ 70,180 | $ - | $ 315,739 | $ - | $ - | $ - | $ - | |||||
| Corporate Bond and Notes | - | 299 | - | 299 | - | - | - | - | |||||
| Non-U.S. Government Agency ABS | - | 34 | - | 34 | - | - | - | - | |||||
| Short-Term Securities | 18,355 | 15,676 | - | 34,031 | - | - | - | - | |||||
| Fund Total | $ 263,914 | $ 86,189 | $ - | $ 350,103 | $ - | $ - | $ - | $ - | |||||
| JNL/Capital Guardian International Small Cap Fund | |||||||||||||
| Common Stocks | $ 64,179 | $ 65,855 | $ 12 | $ 130,046 | $ - | $ - | $ - | $ - | |||||
| Preferred Stocks | 181 | - | - | 181 | - | - | - | - | |||||
See accompanying Notes to Financial Statements.
JNL Series Trust
Notes to the Schedules of Investments (continued) (dollar amounts in thousands)
December 31, 2009
FASB ASC Topic 820 "Fair Value Measurements and Disclosure" (continued) | |||||||||||||
| Assets - Securities | Liabilities - Securities | ||||||||||||
| Level 1 | Level 2 | Level 3 | Total | Level 1 | Level 2 | Level 3 | Total | ||||||
| JNL/Capital Guardian International Small Cap Fund (continued) | |||||||||||||
| Investment Funds | $ 1,282 | $ - | $ - | $ 1,282 | $ - | $ - | $ - | $ - | |||||
| Corporate Bond and Notes | - | 100 | - | 100 | - | - | - | - | |||||
| Non-U.S. Government Agency ABS | - | 9 | - | 9 | - | - | - | - | |||||
| Rights | - | 69 | - | 69 | - | - | - | - | |||||
| Warrants | 143 | - | - | 143 | - | - | - | - | |||||
| Short-Term Securities | 13,149 | 10,749 | - | 23,898 | - | - | - | - | |||||
| Fund Total | $ 78,934 | $ 76,782 | $ 12 | $ 155,728 | $ - | $ - | $ - | $ - | |||||
| JNL/Capital Guardian U.S. Growth Equity Fund | |||||||||||||
| Common Stocks | $ 518,387 | $ 3,605 | $ - | $ 521,992 | $ - | $ - | $ - | $ - | |||||
| Investment Funds | 19,940 | - | - | 19,940 | - | - | - | - | |||||
| Non-U.S. Government Agency ABS | - | 45 | - | 45 | - | - | - | - | |||||
| Short-Term Securities | 14,662 | 57,278 | - | 71,940 | - | - | - | - | |||||
| Fund Total | $ 552,989 | $ 60,928 | $ - | $ 613,917 | $ - | $ - | $ - | $ - | |||||
| JNL/Credit Suisse Commodity Securities Fund | |||||||||||||
| Common Stocks | $ 260,817 | $ 34,785 | $ - | $ 295,602 | $ - | $ - | $ - | $ - | |||||
| Investment Funds | 21,404 | - | - | 21,404 | - | - | - | - | |||||
| Corporate Bond and Notes | - | 83,069 | - | 83,069 | - | - | - | �� - | |||||
| Non-U.S. Government Agency ABS | - | 13 | - | 13 | - | - | - | - | |||||
| Rights | - | 5 | - | 5 | - | - | - | - | |||||
| Government and Agency Obligations | - | 131,202 | - | 131,202 | - | - | - | - | |||||
| Short-Term Securities | 9,840 | 150,896 | - | 160,736 | - | - | - | - | |||||
| Fund Total | $ 292,061 | $ 399,970 | $ - | $ 692,031 | $ - | $ - | $ - | $ - | |||||
| JNL/Credit Suisse Long/Short Fund | |||||||||||||
| Common Stocks | $ 114,281 | $ - | $ - | $ 114,281 | $ (28,666) | $ - | $ - | $ (28,666) | |||||
| Short-Term Securities | 4,692 | - | - | 4,692 | - | - | - | - | |||||
| Fund Total | $ 118,973 | $ - | $ - | $ 118,973 | $ (28,666) | $ - | $ - | $ (28,666) | |||||
| JNL/Eagle Core Equity Fund | |||||||||||||
| Common Stocks | $ 76,806 | $ - | $ - | $ 76,806 | $ - | $ - | $ - | $ - | |||||
| Investment Funds | 2,519 | - | - | 2,519 | - | - | - | - | |||||
| Short-Term Securities | 4,732 | 2,257 | - | 6,989 | - | - | - | - | |||||
| Fund Total | $ 84,057 | $ 2,257 | $ - | $ 86,314 | $ - | $ - | $ - | $ - | |||||
| JNL/Eagle SmallCap Equity Fund | |||||||||||||
| Common Stocks | $ 279,560 | $ - | $ - | $ 279,560 | $ - | $ - | $ - | $ - | |||||
| Non-U.S. Government Agency ABS | - | 54 | - | 54 | - | - | - | - | |||||
| Short-Term Securities | 3,885 | 43,976 | - | 47,861 | - | - | - | - | |||||
| Fund Total | $ 283,445 | $ 44,030 | $ - | $ 327,475 | $ - | $ - | $ - | $ - | |||||
| JNL/Franklin Templeton Founding Strategy Fund | |||||||||||||
| Investment Funds | $ 838,811 | $ - | $ - | $ 838,811 | $ - | $ - | $ - | $ - | |||||
| JNL/Franklin Templeton Global Growth Fund | |||||||||||||
| Common Stocks | $ 321,725 | $ 28,135 | $ - | $ 349,860 | $ - | $ - | $ - | $ - | |||||
| Non-U.S. Government Agency ABS | - | 22 | - | 22 | - | - | - | - | |||||
| Short-Term Securities | 25,086 | 5,857 | - | 30,943 | - | - | - | - | |||||
| Fund Total | $ 346,811 | $ 34,014 | $ - | $ 380,825 | $ - | $ - | $ - | $ - | |||||
| JNL/Franklin Templeton Income Fund | |||||||||||||
| Common Stocks | $ 217,185 | $ - | $ - | $ 217,185 | $ - | $ - | $ - | $ - | |||||
| Preferred Stocks | 3,335 | 38,118 | - | 41,453 | - | - | - | - | |||||
| Corporate Bond and Notes | - | 394,423 | - | 394,423 | - | - | - | - | |||||
| Non-U.S. Government Agency ABS | - | 55 | - | 55 | - | - | - | - | |||||
| Warrants | 190 | - | - | 190 | - | - | - | - | |||||
| Short-Term Securities | 90,379 | 85,859 | - | 176,238 | - | - | - | - | |||||
| Fund Total | $ 311,089 | $ 518,455 | $ - | $ 829,544 | $ - | $ - | $ - | $ - | |||||
| JNL/Franklin Templeton Mutual Shares Fund | |||||||||||||
| Common Stocks | $ 338,172 | $ 12,115 | $ 965 | $ 351,252 | $ - | $ - | $ - | $ - | |||||
| Preferred Stocks | 2,011 | - | - | 2,011 | - | - | - | - | |||||
| Corporate Bond and Notes | - | 17,546 | 391 | 17,937 | - | - | - | - | |||||
| Short-Term Securities | 50,580 | 16,975 | - | 67,555 | - | - | - | - | |||||
| Fund Total | $ 390,763 | $ 46,636 | $ 1,356 | $ 438,755 | $ - | $ - | $ - | $ - | |||||
| JNL/Franklin Templeton Small Cap Value Fund | |||||||||||||
| Common Stocks | $ 150,646 | $ - | $ - | $ 150,646 | $ - | $ - | $ - | $ - | |||||
| Non-U.S. Government Agency ABS | - | 27 | - | 27 | - | - | - | - | |||||
| Short-Term Securities | 17,414 | 20,876 | - | 38,290 | - | - | - | - | |||||
| Fund Total | $ 168,060 | $ 20,903 | $ - | $ 188,963 | $ - | $ - | $ - | $ - | |||||
| JNL/Goldman Sachs Core Plus Bond Fund | |||||||||||||
| Common Stocks | $ - | $ - | $ 9 | $ 9 | $ - | $ - | $ - | $ - | |||||
| Corporate Bond and Notes | - | 281,808 | 424 | 282,232 | - | - | - | - | |||||
| Non-U.S. Government Agency ABS | - | 82,829 | 1,762 | 84,591 | - | - | - | - | |||||
| Government and Agency Obligations | - | 361,654 | 1,216 | 362,870 | - | (16,410) | - | (16,410) | |||||
| Short-Term Securities | 79,220 | 33,746 | - | 112,966 | - | - | - | - | |||||
| Fund Total | $ 79,220 | $ 760,037 | $ 3,411 | $ 842,668 | $ - | $ (16,410) | $ - | $ (16,410) | |||||
See accompanying Notes to Financial Statements.
JNL Series Trust
Notes to the Schedules of Investments (continued) (dollar amounts in thousands)
December 31, 2009
FASB ASC Topic 820 "Fair Value Measurements and Disclosure" (continued) | |||||||||||||
| Assets - Securities | Liabilities - Securities | ||||||||||||
| Level 1 | Level 2 | Level 3 | Total | Level 1 | Level 2 | Level 3 | Total | ||||||
| JNL/Goldman Sachs Emerging Markets Debt Fund | |||||||||||||
| Corporate Bond and Notes | $ - | $ 1,351 | $ 14,512 | $ 15,863 | $ - | $ - | $ - | $ - | |||||
| Government and Agency Obligations | - | 127,674 | - | 127,674 | - | - | - | - | |||||
| Short-Term Securities | 44,096 | - | - | 44,096 | - | - | - | - | |||||
| Fund Total | $ 44,096 | $ 129,025 | $ 14,512 | $ 187,633 | $ - | $ - | $ - | $ - | |||||
| JNL/Goldman Sachs Mid Cap Value Fund | |||||||||||||
| Common Stocks | $ 270,832 | $ - | $ - | $ 270,832 | $ - | $ - | $ - | $ - | |||||
| Non-U.S. Government Agency ABS | - | 17 | - | 17 | - | - | - | - | |||||
| Rights | 20 | - | - | 20 | - | - | - | - | |||||
| Short-Term Securities | 12,147 | 27,660 | - | 39,807 | - | - | - | - | |||||
| Fund Total . | $ 282,999 | $ 27,677 | $ - | $ 310,676 | $ - | $ - | $ - | $ - | |||||
| JNL/Ivy Asset Strategy Fund | |||||||||||||
| Common Stocks | $ 73,140 | $ 68,658 | $ - | $ 141,798 | $ - | $ - | $ - | $ - | |||||
| Precious Metals | 30,151 | - | - | 30,151 | |||||||||
| Short-Term Securities | 29,184 | - | - | 29,184 | - | - | - | - | |||||
| Fund Total | $ 132,475 | $ 68,658 | $ - | $ 201,133 | $ - | $ - | $ - | $ - | |||||
| JNL/JPMorgan International Value Fund | |||||||||||||
| Common Stocks | $ 395,747 | $ 137,597 | $ - | $ 533,344 | $ - | $ - | $ - | $ - | |||||
| Non-U.S. Government Agency ABS | - | 73 | - | 73 | - | - | - | - | |||||
| Short-Term Securities | 14,166 | 26,662 | - | 40,828 | - | - | - | - | |||||
| Fund Total | $ 409,913 | $ 164,332 | $ - | $ 574,245 | $ - | $ - | $ - | $ - | |||||
| JNL/JPMorgan MidCap Growth Fund | |||||||||||||
| Common Stocks | $ 158,312 | $ - | $ 440 | $ 158,752 | $ - | $ - | $ - | $ - | |||||
| Non-U.S. Government Agency ABS | - | 19 | - | 19 | - | - | - | - | |||||
| Short-Term Securities | 5,286 | 18,836 | - | 24,122 | - | - | - | - | |||||
| Fund Total | $ 163,598 | $ 18,855 | $ 440 | $ 182,893 | $ - | $ - | $ - | $ - | |||||
| JNL/JPMorgan U.S. Government & Quality Bond Fund | |||||||||||||
| Corporate Bond and Notes | $ - | $ 6,744 | $ - | $ 6,744 | $ - | $ - | $ - | $ - | |||||
| Non-U.S. Government Agency ABS | - | 24,036 | 506 | 24,542 | - | - | - | - | |||||
| Government and Agency Obligations | - | 638,005 | - | 638,005 | - | - | - | - | |||||
| Short-Term Securities | 19,879 | 72,220 | - | 92,099 | - | - | - | - | |||||
| Fund Total | $ 19,879 | $ 741,005 | $ 506 | $ 761,390 | $ - | $ - | $ - | $ - | |||||
| JNL/Lazard Emerging Markets Fund | |||||||||||||
| Common Stocks | $ 449,212 | $ 213,866 | $ 5,840 | $ 668,918 | $ - | $ - | $ - | $ - | |||||
| Preferred Stocks | 24,667 | - | - | 24,667 | - | - | - | - | |||||
| Non-U.S. Government Agency ABS | - | 33 | - | 33 | - | - | - | - | |||||
| Short-Term Securities | 46,043 | 21,039 | - | 67,082 | - | - | - | - | |||||
| Fund Total | $ 519,922 | $ 234,938 | $ 5,840 | $ 760,700 | $ - | $ - | $ - | $ - | |||||
| JNL/Lazard Mid Cap Equity Fund | |||||||||||||
| Common Stocks | $ 160,370 | $ - | $ - | $ 160,370 | $ - | $ - | $ - | $ - | |||||
| Non-U.S. Government Agency ABS | - | 22 | - | 22 | - | - | - | - | |||||
| Short-Term Securities | 4,587 | 11,972 | - | 16,559 | - | - | - | - | |||||
| Fund Total | $ 164,957 | $ 11,994 | $ - | $ 176,951 | $ - | $ - | $ - | $ - | |||||
| JNL/M&G Global Basics Fund | |||||||||||||
| Common Stocks | $ 21,302 | $ 6,682 | $ - | $ 27,984 | $ - | $ - | $ - | $ - | |||||
| Preferred Stocks | 43 | - | - | 43 | �� - | - | - | - | |||||
| Short-Term Securities | 1,114 | 1,607 | - | 2,721 | - | - | - | - | |||||
| Fund Total | $ 22,459 | $ 8,289 | $ - | $ 30,748 | $ - | $ - | $ - | $ - | |||||
| JNL/M&G Global Leaders Fund | |||||||||||||
| Common Stocks | $ 13,495 | $ 2,506 | $ - | $ 16,001 | $ - | $ - | $ - | $ - | |||||
| Preferred Stocks | - | 360 | - | 360 | - | - | - | - | |||||
| Short-Term Securities | 846 | 637 | - | 1,483 | - | - | - | - | |||||
| Fund Total | $ 14,341 | $ 3,503 | $ - | $ 17,844 | $ - | $ - | $ - | $ - | |||||
| JNL/Mellon Capital Management 10 X 10 Fund | |||||||||||||
| Investment Funds | $ 194,504 | $ - | $ - | $ 194,504 | $ - | $ - | $ - | $ - | |||||
| JNL/Mellon Capital Management Index 5 Fund | |||||||||||||
| Investment Funds | $ 204,962 | $ - | $ - | $ 204,962 | $ - | $ - | $ - | $ - | |||||
| JNL/Mellon Capital Management European 30 Fund | |||||||||||||
| Common Stocks | $ 13,035 | $ - | $ - | $ 13,035 | $ - | $ - | $ - | $ - | |||||
| Investment Funds | 275 | - | - | 275 | - | - | - | - | |||||
| Short-Term Securities | 268 | - | - | 268 | - | - | - | - | |||||
| Fund Total | $ 13,578 | $ - | $ - | $ 13,578 | $ - | $ - | $ - | $ - | |||||
| JNL/Mellon Capital Management Pacific Rim 30 Fund | |||||||||||||
| Common Stocks | $ - | $ 16,406 | $ - | $ 16,406 | $ - | $ - | $ - | $ - | |||||
| Investment Funds | 257 | - | - | 257 | - | - | - | - | |||||
| Short-Term Securities | 367 | 644 | - | 1,011 | - | - | - | - | |||||
| Fund Total | $ 624 | $ 17,050 | $ - | $ 17,674 | $ - | $ - | $ - | $ - | |||||
| JNL/Mellon Capital Management S&P 500 Index Fund | |||||||||||||
| Common Stocks | $ 879,046 | $ - | $ - | $ 879,046 | $ - | $ - | $ - | $ - | |||||
| Non-U.S. Government Agency ABS | - | 39 | - | 39 | - | - | - | - | |||||
| Short-Term Securities | 29,658 | 36,175 | - | 65,833 | - | - | - | - | |||||
| Fund Total | $ 908,704 | $ 36,214 | $ - | $ 944,918 | $ - | $ - | $ - | $ - | |||||
See accompanying Notes to Financial Statements.
JNL Series Trust
Notes to the Schedules of Investments (continued) (dollar amounts in thousands)
December 31, 2009
FASB ASC Topic 820 "Fair Value Measurements and Disclosure" (continued) | |||||||||||||
| Assets - Securities | Liabilities - Securities | ||||||||||||
| Level 1 | Level 2 | Level 3 | Total | Level 1 | Level 2 | Level 3 | Total | ||||||
| JNL/Mellon Capital Management S&P 400 MidCap Index Fund | |||||||||||||
| Common Stocks | $ 466,596 | $ - | $ - | $ 466,596 | $ - | $ - | $ - | $ - | |||||
| Non-U.S. Government Agency ABS | - | 94 | - | 94 | - | - | - | - | |||||
| Short-Term Securities | 7,170 | 69,365 | - | 76,535 | - | - | - | - | |||||
| Fund Total | $ 473,766 | $ 69,459 | $ - | $ 543,225 | $ - | $ - | $ - | $ - | |||||
| JNL/Mellon Capital Management Small Cap Index Fund | |||||||||||||
| Common Stocks | $ 458,705 | $ - | $ - | $ 458,705 | $ - | $ - | $ - | $ - | |||||
| Non-U.S. Government Agency ABS | - | 112 | - | 112 | - | - | - | - | |||||
| Rights | 3 | - | - | 3 | - | - | - | - | |||||
| Short-Term Securities | 14,720 | 96,288 | - | 111,008 | - | - | - | - | |||||
| Fund Total | $ 473,428 | $ 96,400 | $ - | $ 569,828 | $ - | $ - | $ - | $ - | |||||
| JNL/Mellon Capital Management International Index Fund | |||||||||||||
| Common Stocks | $ 480,802 | $ 238,735 | $ - | $ 719,537 | $ - | $ - | $ - | $ - | |||||
| Preferred Stocks | 3,362 | - | - | 3,362 | - | - | - | - | |||||
| Non-U.S. Government Agency ABS | - | 73 | - | 73 | �� - | - | - | - | |||||
| Warrants | 1 | 4 | - | 5 | - | - | - | - | |||||
| Short-Term Securities | 15,534 | 29,849 | - | 45,383 | - | - | - | - | |||||
| Fund Total | $ 499,700 | $ 268,660 | $ - | $ 768,360 | $ - | $ - | $ - | $ - | |||||
| JNL/Mellon Capital Management Bond Index Fund | |||||||||||||
| Corporate Bond and Notes | $ - | $ 173,224 | $ - | $ 173,224 | $ - | $ - | $ - | $ - | |||||
| Non-U.S. Government Agency ABS | - | 26,721 | - | 26,721 | - | - | - | - | |||||
| Government and Agency Obligations | - | 585,293 | - | 585,293 | - | - | - | - | |||||
| Short-Term Securities | 26,989 | 50,302 | - | 77,291 | - | - | - | - | |||||
| Fund Total | $ 26,989 | $ 835,540 | $ - | $ 862,529 | $ - | $ - | $ - | $ - | |||||
| JNL/Mellon Capital Management Global Alpha Fund | |||||||||||||
| Short-Term Securities | $ 6,240 | $ 60,256 | $ - | $ 66,496 | $ - | $ - | $ - | $ - | |||||
| JNL/Oppenheimer Global Growth Fund | |||||||||||||
| Common Stocks | $ 236,875 | $ 44,566 | $ - | $ 281,441 | $ - | $ - | $ - | $ - | |||||
| Preferred Stocks | 1,721 | - | - | 1,721 | - | - | - | - | |||||
| Corporate Bond and Notes | - | 213 | - | 213 | - | - | - | - | |||||
| Non-U.S. Government Agency ABS | - | 32 | - | 32 | - | - | - | - | |||||
| Rights | - | 46 | - | 46 | - | - | - | - | |||||
| Short-Term Securities | 6,887 | 19,879 | - | 26,766 | - | - | - | - | |||||
| Fund Total | $ 245,483 | $ 64,736 | $ - | $ 310,219 | $ - | $ - | $ - | $ - | |||||
| JNL/PAM Asia ex-Japan Fund | |||||||||||||
| Common Stocks | $ 3,489 | $ 102,042 | $ - | $ 105,531 | $ - | $ - | $ - | $ - | |||||
| Non-U.S. Government Agency ABS | - | 1 | - | 1 | - | - | - | - | |||||
| Short-Term Securities | 2,890 | 3,538 | - | 6,428 | - | - | - | - | |||||
| Fund Total | $ 6,379 | $ 105,581 | $ - | $ 111,960 | $ - | $ - | $ - | $ - | |||||
| JNL/PAM China-India Fund | |||||||||||||
| Common Stocks | $ 9,490 | $ 215,813 | $ - | $ 225,303 | $ - | $ - | $ - | $ - | |||||
| Non-U.S. Government Agency ABS | - | 2 | - | 2 | - | - | - | - | |||||
| Short-Term Securities | 8,553 | 12,825 | - | 21,378 | - | - | - | - | |||||
| Fund Total | $ 18,043 | $ 228,640 | $ - | $ 246,683 | $ - | $ - | $ - | $ - | |||||
| JNL/PIMCO Real Return Fund | |||||||||||||
| Preferred Stocks | $ 459 | $ - | $ - | $ 459 | $ - | $ - | $ - | $ - | |||||
| Corporate Bond and Notes | - | 421,074 | - | 421,074 | - | - | - | - | |||||
| Non-U.S. Government Agency ABS | - | 133,932 | - | 133,932 | - | - | - | - | |||||
| Government and Agency Obligations | - | 1,010,091 | 1,995 | 1,012,086 | - | - | - | - | |||||
| Short-Term Securities | 963 | 164,528 | - | 165,491 | - | - | - | - | |||||
| Fund Total | $ 1,422 | $ 1,729,625 | $ 1,995 | $ 1,733,042 | $ - | $ - | $ - | $ - | |||||
| JNL/PIMCO Total Return Bond Fund | |||||||||||||
| Preferred Stocks | $ - | $ 1,225 | $ 3,709 | $ 4,934 | $ - | $ - | $ - | $ - | |||||
| Corporate Bond and Notes | - | 641,917 | 149 | 642,066 | - | - | - | - | |||||
| Non-U.S. Government Agency ABS | - | 153,881 | - | 153,881 | - | - | - | - | |||||
| Government and Agency Obligations | - | 1,082,869 | 183 | 1,083,052 | - | (52,342) | - | (52,342) | |||||
| Short-Term Securities | 4,480 | 734,783 | - | 739,263 | - | - | - | - | |||||
| Fund Total | $ 4,480 | $ 2,614,675 | $ 4,041 | $ 2,623,196 | $ - | $ (52,342) | $ - | $ (52,342) | |||||
| JNL/PPM America High Yield Bond Fund | |||||||||||||
| Common Stocks | $ 4,644 | $ - | $ 10 | $ 4,654 | $ - | $ - | $ - | $ - | |||||
| Preferred Stocks | 53 | 1,191 | - | 1,244 | �� - | - | - | - | |||||
| Investment Funds | 4,758 | - | - | 4,758 | - | - | - | - | |||||
| Corporate Bond and Notes | - | 504,073 | 1,616 | 505,689 | - | - | - | - | |||||
| Non-U.S. Government Agency ABS | - | 18,374 | - | 18,374 | - | - | - | - | |||||
| Short-Term Securities | 27,030 | 83,874 | - | 110,904 | - | - | - | - | |||||
| Fund Total | $ 36,485 | $ 607,512 | $ 1,626 | $ 645,623 | $ - | $ - | $ - | $ - | |||||
| JNL/PPM America Mid Cap Value Fund | |||||||||||||
| Common Stocks | $ 19,980 | $ - | $ - | $ 19,980 | $ - | $ - | $ - | $ - | |||||
| Non-U.S. Government Agency ABS | - | 1 | - | 1 | - | - | - | - | |||||
| Short-Term Securities | 381 | 1,970 | - | 2,351 | - | - | - | - | |||||
| Fund Total | $ 20,361 | $ 1,971 | $ - | $ 22,332 | $ - | $ - | $ - | $ - | |||||
See accompanying Notes to Financial Statements.
JNL Series Trust
Notes to the Schedules of Investments (continued) (dollar amounts in thousands)
December 31, 2009
FASB ASC Topic 820 "Fair Value Measurements and Disclosure" (continued) | |||||||||||||
| Assets - Securities | Liabilities - Securities | ||||||||||||
| Level 1 | Level 2 | Level 3 | Total | Level 1 | Level 2 | Level 3 | Total | ||||||
| JNL/PPM America Small Cap Value Fund | |||||||||||||
| Common Stocks | $ 19,607 | $ - | $ - | $ 19,607 | $ - | $ - | $ - | $ - | |||||
| Short-Term Securities | 126 | 2,128 | - | 2,254 | - | - | - | - | |||||
| Fund Total | $ 19,733 | $ 2,128 | $ - | $ 21,861 | $ - | $ - | $ - | $ - | |||||
| JNL/PPM America Value Equity Fund | |||||||||||||
| Common Stocks | $ 93,823 | $ - | $ - | $ 93,823 | $ - | $ - | $ - | $ - | |||||
| Non-U.S. Government Agency ABS | - | 14 | - | 14 | - | - | - | - | |||||
| Short-Term Securities | 702 | 5,376 | - | 6,078 | - | - | - | - | |||||
| Fund Total | $ 94,525 | $ 5,390 | $ - | $ 99,915 | $ - | $ - | $ - | $ - | |||||
| JNL/Red Rocks Listed Private Equity Fund | |||||||||||||
| Common Stocks | $ 210,065 | $ 10,222 | $ - | $ 220,287 | $ - | $ - | $ - | $ - | |||||
| Short-Term Securities | 6,305 | 6,877 | - | 13,182 | - | - | - | - | |||||
| Fund Total | $ 216,370 | $ 17,099 | $ - | $ 233,469 | $ - | $ - | $ - | $ - | |||||
| JNL/S&P Managed Conservative Fund | |||||||||||||
| Investment Funds | $ 583,136 | $ - | $ - | $ 583,136 | $ - | $ - | $ - | $ - | |||||
| Short-Term Securities | 40,921 | - | - | 40,921 | - | - | - | - | |||||
| Fund Total | $ 624,057 | $ - | $ - | $ 624,057 | $ - | $ - | $ - | $ - | |||||
| JNL/S&P Managed Moderate Fund | |||||||||||||
| Investment Funds | $ 975,214 | $ - | $ - | $ 975,214 | $ - | $ - | $ - | $ - | |||||
| Short-Term Securities | 46,270 | - | - | 46,270 | - | - | - | - | |||||
| Fund Total | $ 1,021,484 | $ - | $ - | $ 1,021,484 | $ - | $ - | $ - | $ - | |||||
| JNL/S&P Managed Moderate Growth Fund | |||||||||||||
| Investment Funds | $ 1,712,554 | $ - | $ - | $ 1,712,554 | $ - | $ - | $ - | $ - | |||||
| Short-Term Securities | 62,680 | - | - | 62,680 | - | - | - | - | |||||
| Fund Total | $ 1,775,234 | $ - | $ - | $ 1,775,234 | $ - | $ - | $ - | $ - | |||||
| JNL/S&P Managed Growth Fund | |||||||||||||
| Investment Funds | $ 1,396,492 | $ - | $ - | $ 1,396,492 | $ - | $ - | $ - | $ - | |||||
| Short-Term Securities | 83,485 | - | - | 83,485 | - | - | - | - | |||||
| Fund Total | $ 1,479,977 | $ - | $ - | $ 1,479,977 | $ - | $ - | $ - | $ - | |||||
| JNL/S&P Managed Aggressive Growth Fund | |||||||||||||
| Investment Funds | $ 549,280 | $ - | $ - | $ 549,280 | $ - | $ - | $ - | $ - | |||||
| Short-Term Securities | 33,691 | - | - | 33,691 | - | - | - | - | |||||
| Fund Total | $ 582,971 | $ - | $ - | $ 582,971 | $ - | $ - | $ - | $ - | |||||
| JNL/S&P Disciplined Moderate Fund | |||||||||||||
| Investment Funds | $ 156,110 | $ - | $ - | $ 156,110 | $ - | $ �� - | $ - | $ - | |||||
| Non-U.S. Government Agency ABS | - | 1 | - | 1 | - | - | - | - | |||||
| Short-Term Securities | 12,370 | - | - | 12,370 | - | - | - | - | |||||
| Fund Total | $ 168,480 | $ 1 | $ - | $ 168,481 | $ - | $ - | $ - | $ - | |||||
| JNL/S&P Disciplined Moderate Growth Fund | |||||||||||||
| Investment Funds | $ 192,613 | $ - | $ - | $ 192,613 | $ - | $ - | $ - | $ - | |||||
| Short-Term Securities | 13,785 | - | - | 13,785 | - | - | - | - | |||||
| Fund Total | $ 206,398 | $ - | $ - | $ 206,398 | $ - | $ - | $ - | $ - | |||||
| JNL/S&P Disciplined Growth Fund | |||||||||||||
| Investment Funds | $ 77,594 | $ - | $ - | $ 77,594 | $ - | $ - | $ - | $ - | |||||
| Non-U.S. Government Agency ABS | - | 1 | - | 1 | - | - | - | - | |||||
| Short-Term Securities | 3,281 | - | - | 3,281 | - | - | - | - | |||||
| Fund Total | $ 80,875 | $ 1 | $ - | $ 80,876 | $ - | $ - | $ - | $ - | |||||
| JNL/S&P Competitive Advantage Fund | |||||||||||||
| Common Stocks | $ 253,769 | $ - | $ - | $ 253,769 | $ - | $ - | $ - | $ - | |||||
| Non-U.S. Government Agency ABS | - | 13 | - | 13 | - | - | - | - | |||||
| Short-Term Securities | 648 | 7,637 | - | 8,285 | - | - | - | - | |||||
| Fund Total | $ 254,417 | $ 7,650 | $ - | $ 262,067 | $ - | $ - | $ - | $ - | |||||
| JNL/S&P Dividend Income & Growth Fund | |||||||||||||
| Common Stocks | $ 238,536 | $ - | $ - | $ 238,536 | $ - | $ - | $ - | $ - | |||||
| Non-U.S. Government Agency ABS | - | 13 | - | 13 | - | - | - | - | |||||
| Short-Term Securities | 1,254 | 10,278 | - | 11,532 | - | - | - | - | |||||
| Fund Total | $ 239,790 | $ 10,291 | $ - | $ 250,081 | $ - | $ - | $ - | $ - | |||||
| JNL/S&P Intrinsic Value Fund | |||||||||||||
| Common Stocks | $ 245,203 | $ - | $ - | $ 245,203 | $ - | $ - | $ - | $ - | |||||
| Non-U.S. Government Agency ABS | - | 24 | - | 24 | - | - | - | - | |||||
| Short-Term Securities | 2,119 | 9,085 | - | 11,204 | - | - | - | - | |||||
| Fund Total | $ 247,322 | $ 9,109 | $ - | $ 256,431 | $ - | $ - | $ - | $ - | |||||
| JNL/S&P Total Yield Fund | |||||||||||||
| Common Stocks | $ 213,085 | $ - | $ - | $ 213,085 | $ - | $ - | $ - | $ - | |||||
| Non-U.S. Government Agency ABS | - | 31 | - | 31 | - | - | - | - | |||||
| Short-Term Securities | 616 | 27,052 | - | 27,668 | - | - | - | - | |||||
| Fund Total | $ 213,701 | $ 27,083 | $ - | $ 240,784 | $ - | $ - | $ - | $ - | |||||
| JNL/S&P 4 Fund | |||||||||||||
| Investment Funds | $ 627,441 | $ - | $ - | $ 627,441 | $ - | $ - | $ - | $ - | |||||
See accompanying Notes to Financial Statements.
JNL Series Trust
Notes to the Schedules of Investments (continued) (dollar amounts in thousands)
December 31, 2009
FASB ASC Topic 820 "Fair Value Measurements and Disclosure" (continued) | |||||||||||||
| Assets - Securities | Liabilities - Securities | ||||||||||||
| Level 1 | Level 2 | Level 3 | Total | Level 1 | Level 2 | Level 3 | Total | ||||||
| JNL/Select Balanced Fund | |||||||||||||
| Common Stocks | $ 472,115 | $ 3,224 | $ - | $ 475,339 | $ - | $ - | $ - | $ - | |||||
| Preferred Stocks | 828 | - | - | 828 | - | - | - | - | |||||
| Corporate Bond and Notes | - | 66,036 | - | 66,036 | - | - | - | - | |||||
| Non-U.S. Government Agency ABS | - | 7,827 | - | 7,827 | - | - | - | - | |||||
| Government and Agency Obligations | - | 160,308 | - | 160,308 | - | - | - | - | |||||
| Short-Term Securities | 39,129 | 39,641 | - | 78,770 | - | - | - | - | |||||
| Fund Total | $ 512,072 | $ 277,036 | $ - | $ 789,108 | $ - | $ - | $ - | $ - | |||||
| JNL/Select Money Market Fund | |||||||||||||
| Short-Term Securities | $ 98 | $ 1,145,845 | $ - | $ 1,145,943 | $ - | $ - | $ - | $ - | |||||
| JNL/Select Value Fund | |||||||||||||
| Common Stocks | $ 748,469 | $ - | $ - | $ 748,469 | $ - | $ - | $ - | $ - | |||||
| Preferred Stocks | 4,079 | - | - | 4,079 | - | - | - | - | |||||
| Non-U.S. Government Agency ABS | - | 27 | - | 27 | - | - | - | - | |||||
| Short-Term Securities | 22,516 | 32,580 | - | 55,096 | - | - | - | - | |||||
| Fund Total | $ 775,064 | $ 32,607 | $ - | $ 807,671 | $ - | $ - | $ - | $ - | |||||
| JNL/T. Rowe Price Established Growth Fund | |||||||||||||
| Common Stocks | $ 909,378 | $ 26,358 | $ - | $ 935,736 | $ - | $ - | $ - | $ - | |||||
| Preferred Stocks | 3,608 | - | - | 3,608 | - | - | - | - | |||||
| Non-U.S. Government Agency ABS | - | 74 | - | 74 | - | - | - | - | |||||
| Short-Term Securities | 8,855 | 43,100 | - | 51,955 | - | - | - | - | |||||
| Fund Total | $ 921,841 | $ 69,532 | $ - | $ 991,373 | $ - | $ - | $ - | $ - | |||||
| JNL/T. Rowe Price Mid-Cap Growth Fund | |||||||||||||
| Common Stocks | $ 802,637 | $ - | $ - | $ 802,637 | $ - | $ - | $ - | $ - | |||||
| Non-U.S. Government Agency ABS | - | 99 | - | 99 | - | - | - | - | |||||
| Short-Term Securities | 47,141 | 124,840 | - | 171,981 | - | - | - | - | |||||
| Fund Total | $ 849,778 | $ 124,939 | $ - | $ 974,717 | $ - | $ - | $ - | $ - | |||||
| JNL/T. Rowe Price Short-Term Bond Fund | |||||||||||||
| Investment Funds | $ - | $ - | $ 1,702 | $ 1,702 | $ - | $ - | $ - | $ - | |||||
| Corporate Bond and Notes | - | 247,516 | - | 247,516 | - | - | - | - | |||||
| Non-U.S. Government Agency ABS | - | 29,543 | 1,572 | 31,115 | - | - | - | - | |||||
| Government and Agency Obligations | - | 174,890 | - | 174,890 | - | - | - | - | |||||
| Short-Term Securities | 27,165 | 12,057 | - | 39,222 | - | - | - | - | |||||
| Fund Total | $ 27,165 | $ 464,006 | $ 3,274 | $ 494,445 | $ - | $ - | $ - | $ - | |||||
| JNL/T. Rowe Price Value Fund | |||||||||||||
| Common Stocks | $ 684,107 | $ - | $ - | $ 684,107 | $ - | $ - | $ - | $ - | |||||
| Preferred Stocks | 6,508 | 1,571 | - | 8,079 | - | - | - | - | |||||
| Investment Funds | 8,104 | - | - | 8,104 | - | - | - | - | |||||
| Corporate Bond and Notes | - | 6,435 | - | 6,435 | - | - | - | - | |||||
| Non-U.S. Government Agency ABS | - | 47 | - | 47 | - | - | - | - | |||||
| Short-Term Securities | 26,015 | 34,294 | - | 60,309 | - | - | - | - | |||||
| Fund Total | $ 724,734 | $ 42,347 | $ - | $ 767,081 | $ - | $ - | $ - | $ - | |||||
Assets - Other Financial Instruments1 | Liabilities - Other Financial Instruments1 | ||||||||||||
| Level 1 | Level 2 | Level 3 | Total | Level 1 | Level 2 | Level 3 | Total | ||||||
| JNL/Capital Guardian Global Balanced Fund | |||||||||||||
| Open Forward Foreign Currency Contracts | $ - | $ 147 | $ - | $ 147 | $ - | $ (352) | $ - | $ (352) | |||||
| JNL/Capital Guardian Global Diversified Research Fund | |||||||||||||
| Open Forward Foreign Currency Contracts | $ - | $ - | $ - | $ - | $ - | $ (13) | $ - | $ (13) | |||||
| JNL/Franklin Templeton Mutual Shares Fund | |||||||||||||
| Open Forward Foreign Currency Contracts | $ - | $ 2,848 | $ - | $ ,848 | $ - | $ (315) | $ - | $ (315) | |||||
| JNL/Goldman Sachs Core Plus Bond Fund | |||||||||||||
| Open Future Contracts | $ 711 | $ - | $ - | $ 711 | $ (2,848) | $ - | $ - | $ (2,848) | |||||
| Open Forward Foreign Currency Contracts | - | 1,041 | - | 1,041 | - | (990) | - | (990) | |||||
| Interest Rate Swap Agreements | - | 1,912 | - | 1,912 | - | (641) | - | (641) | |||||
| Credit Default Swap Agreements | - | - | - | - | - | (220) | - | (220) | |||||
| Fund Total | $ 711 | $ 2,953 | $ - | $ 3,664 | $ (2,848) | $ (1,851) | $ - | $ (4,699) | |||||
| JNL/Goldman Sachs Emerging Markets Debt Fund | |||||||||||||
| Open Forward Foreign Currency Contracts | $ - | $ 1,407 | $ - | $ 1,407 | $ - | $ (364) | $ - | $ (364) | |||||
| Interest Rate Swap Agreements | - | 44 | - | 44 | - | (88) | - | (88) | |||||
| Total Return Swap Agreements | - | - | 42 | 42 | - | - | - | - | |||||
| Fund Total | $ - | $ 1,451 | $ 42 | $ 1,493 | $ - | $ (452) | $ - | $ (452) | |||||
| JNL/Ivy Asset Strategy Fund | |||||||||||||
| Open Forward Foreign Currency Contracts | $ - | $ 126 | $ - | $ 126 | $ - | $ (126) | $ - | $ (126) | |||||
| Total Return Swap Agreements | - | - | - | - | - | (2) | - | (2) | |||||
| Fund Total | $ - | $ 126 | $ - | $ 126 | $ - | $ (128) | $ - | $ (128) | |||||
| JNL/JPMorgan International Value Fund | |||||||||||||
| Open Future Contracts | $ - | $ - | $ - | $ - | $ (56) | $ - | $ - | $ (56) | |||||
| Open Forward Foreign Currency Contracts | - | 3,306 | - | 3,306 | - | (3,229) | - | (3,229) | |||||
| Fund Total | $ - | $ 3,306 | $ - | $ 3,306 | $ (56) | $ (3,229) | $ - | $ (3,285) | |||||
| JNL/Mellon Capital Management S&P 500 Index Fund | |||||||||||||
| Open Future Contracts | $ 452 | $ - | $ - | $ 452 | $ - | $ - | $ - | $ - | |||||
See accompanying Notes to Financial Statements.
JNL Series Trust
Notes to the Schedules of Investments (continued) (dollar amounts in thousands)
December 31, 2009
FASB ASC Topic 820 "Fair Value Measurements and Disclosure" (continued) | |||||||||||||
Assets - Other Financial Instruments1 | Liabilities - Other Financial Instruments1 | ||||||||||||
| Level 1 | Level 2 | Level 3 | Total | Level 1 | Level 2 | Level 3 | Total | ||||||
| JNL/Mellon Capital Management S&P 400 MidCap Index Fund | |||||||||||||
| Open Future Contracts | $ 55 | $ - | $ - | $ 55 | $ - | $ - | $ - | $ - | |||||
| JNL/Mellon Capital Management Small Cap Index Fund | |||||||||||||
| Open Future Contracts | $ 628 | $ - | $ - | $ 628 | $ - | $ - | $ - | $ - | |||||
| JNL/Mellon Capital Management International Index Fund | |||||||||||||
| Open Future Contracts | $ 201 | $ - | $ - | $ 201 | $ - | $ - | $ - | $ - | |||||
| Open Forward Foreign Currency Contracts | - | 245 | - | 245 | - | (836) | - | (836) | |||||
| Fund Total | $ 201 | $ 245 | $ - | $ 446 | $ - | $ (836) | $ - | $ (836) | |||||
| JNL/Mellon Capital Management Global Alpha Fund | |||||||||||||
| Open Future Contracts | $ 233 | $ - | $ - | $ 233 | $ (654) | $ - | $ - | $ (654) | |||||
| Open Forward Foreign Currency Contracts | - | 353 | - | 353 | - | (513) | - | (513) | |||||
| Fund Total | $ 233 | $ 353 | $ - | $ 586 | $ (654) | $ (513) | $ - | $ (1,167) | |||||
| JNL/PIMCO Real Return Fund | |||||||||||||
| Written Options | $ - | $ - | $ - | $ - | $ (358) | $ (1,508) | $ - | $ (1,866) | |||||
| Open Future Contracts | 1,536 | - | - | 1,536 | (121) | - | - | (121) | |||||
| Open Forward Foreign Currency Contracts | - | 989 | - | 989 | - | (1,275) | - | (1,275) | |||||
| Interest Rate Swap Agreements | - | 665 | - | 665 | - | (51) | - | (51) | |||||
| Credit Default Swap Agreements | - | 837 | - | 837 | - | (1,785) | - | (1,785) | |||||
| Fund Total | $ 1,536 | $ 2,491 | $ - | $ 4,027 | $ (479) | $ (4,619) | $ - | $ (5,098) | |||||
| JNL/PIMCO Total Return Bond Fund | |||||||||||||
| Written Options | $ - | $ - | $ - | $ - | $ (1,781) | $ (3,473) | $ - | $ (5,254) | |||||
| Open Future Contracts | 4,764 | - | - | 4,764 | (4,470) | - | - | (4,470) | |||||
| Open Forward Foreign Currency Contracts | - | 1,761 | - | 1,761 | - | (350) | - | (350) | |||||
| Interest Rate Swap Agreements | - | 1,231 | - | 1,231 | - | (1,835) | - | (1,835) | |||||
| Credit Default Swap Agreements | - | 905 | - | 905 | - | (53) | - | (53) | |||||
| Fund Total | $ 4,764 | $ 3,897 | $ - | $ 8,661 | $ (6,251) | $ (5,711) | $ - | $ (11,962) | |||||
| JNL/T. Rowe Price Short - Term Bond Fund | |||||||||||||
| Open Forward Foreign Currency Contracts | $ - | $ - | $ - | $ - | $ - | $ (81) | $ - | $ 81) | |||||
1 Investments in other financial instruments are derivative instruments not reflected in the Schedules of Investments and include, but are not limited to forward foreign currency contracts, futures contracts, options ritten, and swap agreements. All derivatives, except for options written are reflected at the unrealized appreciation/(depreciation) on the instrument. Written options are reflected at value.
The following table is a reconciliation of Level 3 investments by category for which significant unobservable inputs were used to determine fair value:
| Total | Change In Unrealized | ||||||||||||
| Transfers | Transfers | Realized and | Appreciation/(Depreciation) | ||||||||||
| Balance at | Into Level | Out of | Change in | Balance at | during the Period | ||||||||
| Beginning of | 3 During | Level 3 During | Unrealized | End of | for Level 3 Investments | ||||||||
| Period | the Period | the Period | Gain/(Loss) | Purchases | (Sales) | Period | Held at End of Period2 | ||||||
| JNL/Capital Guardian Global Balanced Fund | |||||||||||||
| Common Stocks | $ 145 | $ - | $ - | $ (91) | $ 265 | $ (319) | $ - | $ - | |||||
| Government and Agency Obligations | 81 | - | (81) | 11 | 136 | - | 147 | 11 | |||||
| Fund Total Investments in Securities | $ 226 | $ - | $ (81) | $ (80) | $ 401 | $ (319) | $ 147 | $ 11 | |||||
| JNL/Capital Guardian Global Diversified Research Fund | |||||||||||||
| Corporate Bond and Notes | $ 150 | $ - | $ (150) | $ - | $ - | $ - | $ - | $ - | |||||
| Fund Total Investments in Securities | $ 150 | $ - | $ (150) | $ - | $ - | $ - | $ - | $ - | |||||
| JNL/Capital Guardian International Small Cap Fund | |||||||||||||
| Common Stocks | $ - | $ 16 | $ - | $ (4) | $ - | $ - | $ 12 | $ (4) | |||||
| Corporate Bond and Notes | 65 | - | (65) | - | - | - | - | - | |||||
| Fund Total Investments in Securities | $ 65 | $ 16 | $ (65) | $ (4) | $ - | $ - | $ 12 | $ (4) | |||||
| JNL/Franklin Templeton Global Growth Fund | |||||||||||||
| Common Stocks | $ 611 | $ - | $ - | $ (183) | $ - | $ (428) | $ - | $ - | |||||
| Fund Total Investments in Securities | $ 611 | $ - | $ - | $ (183) | $ - | $ (428) | $ - | $ - | |||||
| JNL/Franklin Templeton Income Fund | |||||||||||||
| Corporate Bond and Notes | $ 488 | $ - | $ - | $ 693 | $ 786 | $ (1,967) | $ - | $ - | |||||
| Fund Total Investments in Securities | $ 488 | $ - | $ - | $ 693 | $ 786 | $ (1,967) | $ - | $ - | |||||
| JNL/Franklin Templeton Mutual Shares Fund | |||||||||||||
| Common Stocks | $ 455 | $ - | $ - | $ (10) | $ 520 | $ - | $ 965 | $ (10) | |||||
| Preferred Stocks | 8 | - | - | 5 | - | (13) | - | - | |||||
| Corporate Bond and Notes | 647 | - | - | 481 | 1 | (738) | 391 | - | |||||
| Fund Total Investments in Securities | $ 1,110 | $ - | $ - | $ 476 | $ 521 | $ (751) | $ 1,356 | $ (10) | |||||
| JNL/Goldman Sachs Core Plus Bond Fund | |||||||||||||
| Common Stocks | $ 11 | $ - | $ - | $ (2) | $ - | $ - | $ 9 | $ - | |||||
| Corporate Bond and Notes | 454 | - | - | (30) | - | - | 424 | (30) | |||||
| Non-U.S. Government Agency ABS | 2,037 | - | - | 313 | - | (588) | 1,762 | 313 | |||||
| Government and Agency Obligations | - | - | - | 1,402 | 1,782 | (1,968) | 1,216 | 563 | |||||
| Fund Total Investments in Securities | $ 2,502 | $ - | $ - | $ 1,683 | $ 1,782 | $ (2,556) | $ 3,411 | $ 846 | |||||
Investments in Other Financial Instruments1 | |||||||||||||
| Interest Rate Swap Agreements | $ 177 | $ - | $ - | $ (177) | $ - | $ - | $ - | $ - | |||||
| Fund Total Investments in Other Financial Instruments | $ 177 | $ - | $ - | $ (177) | $ - | $ - | $ - | $ - | |||||
| JNL/Goldman Sachs Emerging Markets Debt Fund | |||||||||||||
| Corporate Bond and Notes | $ 2,697 | $ - | $ (1,055) | $ 1,511 | $ 12,035 | $ (676) | $ 14,512 | $ 2,140 | |||||
| Government and Agency Obligations | 3,617 | - | (2,412) | 279 | 1,562 | (3,046) | - | - | |||||
| Fund Total Investments in Securities | $ 6,314 | $ - | $ (3,467) | $ 1,790 | $ 13,597 | $ (3,722) | $ 14,512 | $ 2,140 | |||||
See accompanying Notes to Financial Statements.
JNL Series Trust
Notes to the Schedules of Investments (continued) (dollar amounts in thousands)
December 31, 2009
FASB ASC Topic 820 "Fair Value Measurements and Disclosure" (continued) | |||||||||||||
| Total | Change In Unrealized | ||||||||||||
| Transfers | Transfers | Realized and | Appreciation/(Depreciation) | ||||||||||
| Balance at | Into Level | Out of | Change in | Balance at | during the Period | ||||||||
| Beginning of | 3 During | Level 3 During | Unrealized | End of | for Level 3 Investments | ||||||||
| Period | the Period | the Period | Gain/(Loss) | Purchases | (Sales) | Period | Held at End of Period2 | ||||||
| JNL/Goldman Sachs Emerging Markets Debt Fund | |||||||||||||
Investments in Other Financial Instruments1 | |||||||||||||
| Interest Rate Swap Agreements | $ 221 | $ - | $ - | $ (221) | $ - | $ - | $ - | $ - | |||||
| Total Return Swap Agreements | - | - | - | 42 | �� - | - | 42 | 42 | |||||
| Fund Total Investments in Other Financial Instruments | $ 221 | $ - | $ - | $ (179) | $ - | $ - | $ 42 | $ 42 | |||||
| JNL/JPMorgan International Value Fund | |||||||||||||
| Common Stocks | $ 8,492 | $ - | $ - | $ (2,381) | $ 372 | $ (6,483) | $ - | $ - | |||||
| Fund Total Investments in Securities | $ 8,492 | $ - | $ - | $ (2,381) | $ 372 | $ (6,483) | $ - | $ - | |||||
| JNL/JPMorgan MidCap Growth Fund | |||||||||||||
| Common Stocks | $ 73 | $ - | $ - | $ 367 | $ - | $ - | $ 440 | $ 367 | |||||
| Fund Total Investments in Securities | $ 73 | $ - | $ - | $ 367 | $ - | $ - | $ 440 | $ 367 | |||||
| JNL/JPMorgan U.S. Government & Quality Bond Fund | |||||||||||||
| Non-U.S. Government Agency ABS | $ 847 | $ - | $ - | $ 67 | $ - | $ (408) | $ 506 | $ (22) | |||||
| Fund Total Investments in Securities | $ 847 | $ - | $ - | $ 67 | $ - | $ (408) | $ 506 | $ (22) | |||||
| JNL/Lazard Emerging Markets Fund | |||||||||||||
| Common Stocks | $ - | $ - | $ - | $ 961 | $ 4,879 | $ - | $ 5,840 | $ 961 | |||||
| Fund Total Investments in Securities | $ - | $ - | $ - | $ 961 | $ 4,879 | $ - | $ 5,840 | $ 961 | |||||
| JNL/Mellon Capital Management Pacific Rim 30 Fund | |||||||||||||
| Common Stocks | $ 121 | $ - | $ (121) | $ - | $ - | $ - | $ - | $ - | |||||
| Fund Total Investments in Securities | $ 121 | $ - | $ (121) | $ - | $ - | $ - | $ - | $ - | |||||
| JNL/Mellon Capital Management International Index Fund | |||||||||||||
| Common Stocks | $ 6,093 | $ - | $ (6,093) | $ - | $ - | $ - | $ - | $ - | |||||
| Fund Total Investments in Securities | $ 6,093 | $ - | $ (6,093) | $ - | $ - | $ - | $ - | $ - | |||||
| JNL/Mellon Capital Management Bond Index Fund | |||||||||||||
| Non-U.S. Government Agency ABS | $ 74 | $ - | $ - | $ (1) | $ - | $ (73) | $ - | $ - | |||||
| Fund Total Investments in Securities | $ 74 | $ - | $ - | $ (1) | $ - | $ (73) | $�� - | $ - | |||||
| JNL/Oppenheimer Global Growth Fund | |||||||||||||
| Common Stocks | $ 1,924 | $ - | $ (1,924) | $ - | $ - | $ - | $ - | $ - | |||||
| Fund Total Investments in Securities | $ 1,924 | $ - | $ (1,924) | $ - | $ - | $ - | $ - | $ - | |||||
| JNL/PAM China-India Fund | |||||||||||||
| Common Stocks | $ 230 | $ - | $ (230) | $ - | $ - | $ - | $ - | $ - | |||||
| Fund Total Investments in Securities | $ 230 | $ - | $ (230) | $ - | $ - | $ - | $ - | $ - | |||||
| JNL/PIMCO Real Return Fund | |||||||||||||
| Purchased Options | $ 5 | $ - | $ - | $ (5) | $ - | $ - | $ - | $ - | |||||
| Government and Agency Obligations | - | 1,785 | - | 210 | - | - | 1,995 | 210 | |||||
| Fund Total Investments in Securities | $ 5 | $ 1,785 | $ - | $ 205 | $ - | $ - | $ 1,995 | $ 210 | |||||
Investments in Other Financial Instruments1 | |||||||||||||
| Interest Rate Swap Agreements | $ (409) | $ - | $ 103 | $ 306 | $ - | $ - | $ - | $ - | |||||
| Fund Total Investments in Other Financial Instruments | $ (409) | $ - | $ 103 | $ 306 | $ - | $ - | $ - | $ - | |||||
| JNL/PIMCO Total Return Bond Fund | |||||||||||||
| Corporate Bond and Notes | $ - | $ - | $ - | $ - | $ 149 | $ - | $ 149 | $ - | |||||
| Preferred Stocks | - | 4,193 | - | (484) | - | - | 3,709 | (484) | |||||
| Purchased Options | 1,511 | - | - | (1,511) | - | - | - | - | |||||
| Government and Agency Obligations | 188 | - | - | (2) | - | (3) | 183 | (2) | |||||
| Fund Total Investments in Securities | $ 1,699 | $ 4,193 | $ - | $ (1,997) | $ 149 | $ (3) | $ 4,041 | $ (486) | |||||
Investments in Other Financial Instruments1 | |||||||||||||
| Interest Rate Swap Agreements | $ (1,209) | $ - | $ 70 | $ 1,139 | $ - | $ - | $ - | $ - | |||||
| Spread Lock Swap Agreements | �� 102 | - | - | (102) | - | - | - | - | |||||
| Fund Total Investments in Other Financial Instruments | $ (1,107) | $ - | $ 70 | $ 1,037 | $ - | $ - | $ - | $ - | |||||
| JNL/PPM America High Yield Bond Fund | |||||||||||||
| Common Stocks | $ 11 | $ - | $ - | $ (1) | $ - | $ - | $ 10 | $ - | |||||
| Corporate Bond and Notes | 147 | - | - | 238 | 1,388 | (157) | 1,616 | 228 | |||||
| Fund Total Investments in Securities | $ 158 | $ - | $ - | $ 237 | $ 1,388 | $ (157) | $ 1,626 | $ 228 | |||||
| JNL/Select Balanced Fund | |||||||||||||
| Corporate Bond and Notes | $ 188 | $ - | $ (188) | $ - | $ - | $ - | $ - | $ - | |||||
| Fund Total Investments in Securities | $ 188 | $ - | $ (188) | $ - | $ - | $ - | $ - | $ - | |||||
| JNL/T. Rowe Price Mid-Cap Growth Fund | |||||||||||||
| Common Stocks | $ 585 | $ - | $ (585) | $ - | $ - | $ - | $ - | $ - | |||||
| Warrants | 116 | - | - | (86) | - | (30) | - | - | |||||
| Fund Total Investments in Securities | $ 701 | $ - | $ (585) | $ (86) | $ - | $ (30) | $ - | $ - | |||||
| JNL/T. Rowe Price Short-Term Bond Fund | |||||||||||||
| Investment Funds | $ - | $ - | $ - | $ 39 | $ 9,688 | $ (8,025) | $ 1,702 | $ 6 | |||||
| Non-U.S. Government Agency ABS | 1,334 | - | - | (92) | 1,572 | (1,242) | 1,572 | - | |||||
| Fund Total Investments in Securities | $ 1,334 | $ - | $ - | $ (53) | $ 11,260 | $ (9,267) | $ 3,274 | $ - | |||||
| JNL/T. Rowe Price Value Fund | |||||||||||||
| Common Stocks - Financials | $ 1,203 | $ - | $ (1,203) | $ - | $ - | $ - | $ - | $ - | |||||
| Fund Total Investments in Securities | $ 1,203 | $ - | $ (1,203) | $ - | $ - | $ - | $ - | $ - | |||||
1 Investments in other financial instruments are derivative instruments not reflected in the Schedules of Investments and include, but are not limited to forward foreign currency contracts, futures contracts, options written, and swap agreements. All derivatives, except for options written are reflected at the unrealized appreciation/(depreciation) on the instrument. Written options are reflected at value.
2 The change in unrealized appreciation/(depreciation) for Level 3 investments held at December 31, 2009 is included in net change in unrealized appreciation or depreciation on investments and swap agreements in the Statements of Operations.
See accompanying Notes to Financial Statements.
JNL Series Trust
Notes to the Schedules of Investments (continued)
December 31, 2009
| Summary of Investments by Country (as a percentage of total long-term investments)* : | ||||||||||||||||||||||||||||
| JNL/Capital | JNL/Capital | JNL/Capital | JNL/Credit | JNL/Goldman | ||||||||||||||||||||||||
| JNL/AIM | JNL/AIM | JNL/AIM | Guardian | Guardian Global | Guardian | Suisse | JNL/Franklin | JNL/Franklin | Sachs | JNL/Goldman | JNL/Ivy | JNL/ | JNL/Lazard | |||||||||||||||
| International | Large Cap | Global | Global | Diversified | International | Commodity | Templeton | Templeton | Emerging | Sachs | Asset | JPMorgan | Emerging | |||||||||||||||
| Growth | Growth | Real Estate | Balanced | Research | Small Cap | Securities | Global | Mutual | Markets Debt | Core Plus | Strategy | International | Markets | |||||||||||||||
| Fund | Fund | Fund | Fund | Fund | Fund | Fund | Growth Fund | Shares Fund | Fund | Bond Fund | Fund | Value Fund | Fund | |||||||||||||||
| Argentina | - % | - % | - % | 0.1% | - % | - % | - % | - % | - % | - % | 0.2% | - % | - % | - % | ||||||||||||||
| Australia | 6.3 | 4.4 | 10.2 | 1.8 | 3.0 | 7.9 | 2.6 | 0.5 | 0.4 | - | 1.3 | - | 0.7 | - | ||||||||||||||
| Austria | - | - | 0.5 | 0.2 | - | 0.8 | 0.1 | 0.7 | - | - | - | - | 0.8 | - | ||||||||||||||
| Belgium | 2.2 | - | - | 0.1 | - | 1.2 | 0.3 | - | - | - | 0.5 | - | 2.0 | - | ||||||||||||||
| Bermuda | - | - | 2.3 | 0.1 | 0.1 | 1.2 | - | - | - | - | - | - | - | - | ||||||||||||||
| Brazil | 1.0 | - | - | 2.6 | 1.4 | 0.6 | 2.3 | 0.7 | - | 10.9 | - | 3.6 | - | 18.6 | ||||||||||||||
| Bulgaria | - | - | - | - | - | 0.1 | - | - | - | - | - | - | - | - | ||||||||||||||
| Canada | 5.9 | - | 3.4 | 1.9 | 3.0 | 12.8 | 5.3 | - | 0.6 | - | 0.9 | - | 0.4 | 1.3 | ||||||||||||||
| Cayman Islands - | - | 0.5 | - | - | - | - | - | - | - | 0.2 | - | - | - | |||||||||||||||
| Chile | - | - | - | - | - | - | - | - | - | - | - | - | - | - | ||||||||||||||
| China | - | 2.3 | 0.1 | 1.5 | 3.4 | 0.6 | - | 0.2 | - | - | - | 9.6 | 1.3 | 1.6 | ||||||||||||||
| Colombia | - | - | - | 0.1 | - | - | - | - | - | 5.3 | - | - | - | - | ||||||||||||||
| Croatia | - | - | - | 0.3 | - | - | - | - | - | - | - | - | - | - | ||||||||||||||
| Denmark | 2.3 | - | - | 1.2 | 0.4 | 0.4 | - | - | 1.7 | - | - | 1.4 | - | - | ||||||||||||||
| Dominican | ||||||||||||||||||||||||||||
| Republic | - | - | - | 0.1 | - | - | - | - | - | - | - | - | - | - | ||||||||||||||
| Egypt | - | - | - | 0.1 | - | - | - | - | - | 0.6 | - | - | - | 4.1 | ||||||||||||||
| Finland | 0.4 | - | 0.5 | 0.1 | 0.3 | 0.4 | 1.6 | - | - | - | - | - | 1.3 | - | ||||||||||||||
| France | 4.9 | - | 4.6 | 6.1 | 6.3 | 0.6 | 6.8 | 8.3 | 4.3 | - | 2.1 | 1.0 | 15.0 | - | ||||||||||||||
| Gabon | - | - | - | 0.1 | - | - | - | - | - | - | - | - | - | - | ||||||||||||||
| Germany | 7.5 | - | 0.4 | 6.5 | 4.2 | 5.7 | 1.7 | 5.4 | 6.2 | - | 1.6 | - | 8.1 | - | ||||||||||||||
| Greece | - | - | - | - | - | 0.2 | - | - | - | - | - | - | 0.4 | - | ||||||||||||||
| Guernsey | - | - | - | - | - | - | - | - | - | - | - | - | - | - | ||||||||||||||
| Hong Kong | 2.6 | - | 14.9 | 2.0 | 3.2 | 3.1 | - | 1.3 | 0.5 | 3.6 | - | 12.4 | 2.7 | 0.9 | ||||||||||||||
| Hungary | - | - | - | - | - | - | - | - | - | 6.6 | - | - | - | - | ||||||||||||||
| India | 2.8 | - | - | 1.3 | 1.2 | - | - | 0.4 | - | - | - | - | - | 4.5 | ||||||||||||||
| Indonesia | - | - | - | 0.3 | 0.1 | - | - | - | - | 5.8 | - | - | 1.2 | 5.1 | ||||||||||||||
| Iraq | - | - | - | 0.1 | - | - | - | - | - | - | - | - | - | - | ||||||||||||||
| Ireland | 0.6 | 2.3 | - | 1.2 | 0.7 | 2.0 | - | 4.7 | - | - | - | 1.3 | - | - | ||||||||||||||
| Israel | 3.1 | - | - | 0.5 | - | - | - | - | - | 2.6 | - | - | - | 3.3 | ||||||||||||||
| Italy | 3.1 | - | - | 2.3 | 0.3 | 3.4 | 0.3 | 2.4 | 0.5 | - | - | - | 3.3 | - | ||||||||||||||
| Japan | 6.7 | - | 10.8 | 6.9 | 8.3 | 27.9 | 4.0 | 2.2 | 1.3 | - | - | 1.4 | 18.7 | - | ||||||||||||||
| Jersey | - | - | - | - | - | - | - | - | - | - | - | - | - | - | ||||||||||||||
| Luxembourg | - | - | 0.4 | 0.7 | - | 0.3 | 1.3 | - | - | - | 0.5 | 1.8 | 1.8 | 0.8 | ||||||||||||||
| Macau | - | - | - | - | - | - | - | - | - | - | - | 3.4 | - | - | ||||||||||||||
| Malaysia | - | - | - | 0.7 | 0.5 | 0.1 | - | - | - | 5.7 | - | - | - | 0.6 | ||||||||||||||
| Mexico | 3.1 | 0.9 | - | 2.8 | 0.3 | - | - | - | - | 12.9 | 0.4 | - | - | 7.6 | ||||||||||||||
| Netherlands | 4.5 | - | 2.7 | 2.8 | 2.9 | 1.1 | 0.1 | 3.3 | 3.0 | - | 1.3 | - | 10.3 | - | ||||||||||||||
| New Zealand | - | - | - | - | - | - | - | - | - | - | 0.8 | - | - | - | ||||||||||||||
| Norway | 0.6 | - | - | 0.2 | 0.4 | 0.7 | 0.2 | 0.7 | 2.0 | - | - | 1.1 | - | - | ||||||||||||||
| Pakistan | - | - | - | - | - | - | - | - | - | - | - | - | - | 0.8 | ||||||||||||||
| Panama | - | - | - | 0.1 | - | - | - | - | - | - | - | - | - | - | ||||||||||||||
| Peru | - | - | - | - | - | - | - | - | - | 4.7 | 0.2 | - | - | - | ||||||||||||||
| Philippines | 1.6 | - | - | - | - | - | - | - | - | - | - | - | - | 2.7 | ||||||||||||||
| Poland | - | - | - | 0.9 | - | - | - | - | - | 10.3 | - | - | - | - | ||||||||||||||
| Portugal | - | - | - | - | - | - | 0.1 | - | - | - | - | - | - | - | ||||||||||||||
| Qatar | - | - | - | 0.1 | - | - | - | - | - | - | 0.6 | - | - | - | ||||||||||||||
| Russia | - | - | - | 0.4 | 1.4 | 0.2 | 0.6 | 0.4 | - | 0.9 | 0.1 | - | - | 6.9 | ||||||||||||||
| Singapore | 4.1 | - | 4.6 | 0.5 | - | 2.5 | - | 2.0 | 0.6 | - | - | - | - | - | ||||||||||||||
| South Africa | - | - | - | 1.2 | 1.5 | 1.0 | - | - | - | 12.1 | - | 1.0 | 0.7 | 16.1 | ||||||||||||||
| South Korea | 1.0 | - | - | 1.5 | 2.0 | 6.4 | - | 3.8 | 0.5 | - | - | 6.4 | - | 9.8 | ||||||||||||||
| Spain | 1.3 | - | - | 1.0 | 1.2 | 0.8 | 0.2 | 1.5 | 0.6 | - | - | - | 4.6 | - | ||||||||||||||
| Sweden | - | - | 1.2 | 0.7 | 0.5 | 0.5 | 8.7 | 0.9 | - | - | 0.2 | - | - | - | ||||||||||||||
| Switzerland | 9.6 | 3.2 | - | 2.8 | 2.8 | 1.3 | 0.2 | 8.1 | 6.5 | - | 0.1 | 0.1 | 2.7 | - | ||||||||||||||
| Taiwan | 2.3 | 1.0 | - | 1.7 | 1.6 | 0.1 | - | 1.4 | - | - | - | 7.8 | 1.2 | 5.4 | ||||||||||||||
| Thailand | - | - | - | 0.1 | - | - | - | - | - | 5.0 | - | - | - | 1.8 | ||||||||||||||
| Turkey | 0.8 | - | - | 0.4 | - | - | - | 0.5 | - | 9.6 | - | - | - | 8.1 | ||||||||||||||
| United Arab | ||||||||||||||||||||||||||||
| Emirates | - | - | - | 0.1 | - | - | - | - | - | - | 0.1 | - | - | - | ||||||||||||||
| United Kingdom 21.7 | 1.0 | 6.9 | 6.4 | 9.4 | 15.1 | 14.5 | 13.7 | 10.6 | - | 2.6 | 6.3 | 22.8 | - | |||||||||||||||
| United States | - | 84.9 | 36.0 | 37.3 | 39.6 | 1.0 | 49.1 | 36.9 | 60.7 | 0.6 | 86.3 | 41.4 | - | - | ||||||||||||||
| Uruguay | - | - | - | - | - | - | - | - | - | 2.8 | - | - | - | - | ||||||||||||||
| Venezuela | - | - | - | 0.1 | - | - | - | - | - | - | - | - | - | - | ||||||||||||||
| Total Long-Term | ||||||||||||||||||||||||||||
| Investments | 100.0% | 100.0% | 100.0% | 100.0% | 100.0% | 100.0% | 100.0% | 100.0% | 100.0% | 100.0% | 100.0% | 100.0% | 100.0% | 100.0% | ||||||||||||||
* The Funds presented in the table are those which had greater than 10% of long-term investments in non-U.S. securities at December 31, 2009.
See accompanying Notes to Financial Statement.
JNL Series Trust
Notes to the Schedules of Investments (continued)
December 31, 2009
| Summary of Investments by Country (as a percentage of total long-term investments)* : (continued) | |||||||||||||||||||||||||||||
| JNL/Mellon | JNL/Mellon | JNL/Mellon | |||||||||||||||||||||||||||
| JNL/M&G | JNL/M&G | Capital | Capital | Capital | JNL/ | JNL/PAM | JNL/PAM | JNL/PIMCO | JNL/Red | JNL/T. Rowe | |||||||||||||||||||
| Global | Global | Management | Management | Management | Oppenheimer | Asia | China- | Total Return | Rocks Listed | JNL/Select | JNL/Select | Price Short- | JNL/ T. Rowe | ||||||||||||||||
| Basics | Leaders | European 30 | Pacific Rim 30 | International | Global Growth | ex-Japan | India | Bond | Private Equity | Balanced | Value | Term | Price Value | ||||||||||||||||
| Fund | Fund | Fund | Fund | Index Fund | Fund | Fund | Fund | Fund | Fund | Fund | Fund | Bond Fund | Fund | ||||||||||||||||
| - | % | - | % | - | % | - | % | - | % | - | % | - | % | - | % | - | % | - | % | - | % | - | % | - | % | - | % | ||
| Australia | 13.4 | 0.4 | - | 36.7 | 8.4 | - | - | - | 0.8 | - | 0.5 | - | 3.4 | - | |||||||||||||||
| Austria | 3.8 | - | 2.4 | - | 0.3 | - | - | - | - | - | - | - | - | - | |||||||||||||||
| Belgium | - | - | 4.4 | - | 1.0 | - | - | - | - | 6.2 | - | - | 0.3 | - | |||||||||||||||
| Bermuda | - | 0.7 | - | - | - | 1.1 | - | - | - | 1.2 | - | 1.9 | - | 1.2 | |||||||||||||||
| Brazil | - | 0.4 | - | - | - | 1.5 | - | - | 0.1 | 3.7 | - | - | - | - | |||||||||||||||
| Bulgaria | - | - | - | - | - | - | - | - | - | - | - | - | - | - | |||||||||||||||
| Canada | 2.0 | 1.9 | - | - | - | 0.8 | - | - | - | 5.5 | 2.7 | 1.1 | 0.6 | - | |||||||||||||||
| Cayman Islands | - | - | - | - | - | - | - | - | 0.8 | 1.9 | - | - | 0.2 | - | |||||||||||||||
| Chile | - | - | - | - | - | - | - | - | 0.1 | - | - | - | - | - | |||||||||||||||
| China | - | 1.1 | - | - | - | - | 12.0 | 23.5 | - | - | - | - | - | - | |||||||||||||||
| Colombia | - | - | - | - | - | - | - | - | - | - | - | - | - | - | |||||||||||||||
| Croatia | - | - | - | - | - | - | - | - | - | - | - | - | - | - | |||||||||||||||
| Denmark | - | 1.5 | - | - | 0.9 | - | - | - | - | - | - | - | - | - | |||||||||||||||
| Dominican | |||||||||||||||||||||||||||||
| Republic | - | - | - | - | - | - | - | - | - | - | - | - | - | - | |||||||||||||||
| Egypt | - | - | - | - | - | - | - | - | - | - | - | - | - | - | |||||||||||||||
| Finland | - | - | 5.3 | - | 1.1 | 1.0 | - | - | - | - | - | - | - | - | |||||||||||||||
| France | 10.9 | 2.9 | 12.4 | - | 10.4 | 7.1 | - | - | 1.9 | 7.1 | 1.6 | - | 1.8 | 2.3 | |||||||||||||||
| Gabon | - | - | - | - | - | - | - | - | - | - | - | - | - | - | |||||||||||||||
| Germany | 3.2 | 7.5 | 7.2 | - | 8.1 | 7.4 | - | - | 0.4 | 2.9 | 0.6 | - | 5.0 | - | |||||||||||||||
| Greece | - | - | - | - | 0.5 | - | - | - | - | - | - | - | - | - | |||||||||||||||
| Guernsey | - | - | - | - | - | - | - | - | - | 14.3 | - | - | - | - | |||||||||||||||
| Hong Kong | 2.4 | 3.6 | - | 6.0 | 2.3 | - | 26.7 | 25.8 | - | 2.5 | - | - | - | - | |||||||||||||||
| Hungary | - | - | - | - | - | - | - | - | - | - | - | - | - | - | |||||||||||||||
| India | - | 1.3 | - | - | - | 2.7 | 12.9 | 50.7 | - | - | - | - | - | - | |||||||||||||||
| Indonesia | - | - | - | - | - | - | 4.3 | - | - | - | - | - | - | - | |||||||||||||||
| Iraq | - | - | - | - | - | - | - | - | - | - | - | - | - | - | |||||||||||||||
| Ireland | 2.7 | 2.0 | - | - | 0.3 | - | - | - | - | - | 1.6 | 1.1 | - | 1.2 | |||||||||||||||
| Israel | - | - | - | - | - | - | - | - | - | - | - | 1.0 | - | - | |||||||||||||||
| Italy | - | - | 5.4 | - | 3.4 | 1.9 | - | - | - | 1.5 | - | - | - | - | |||||||||||||||
| Japan | - | 10.2 | - | 42.2 | 20.7 | 9.5 | - | - | 0.1 | - | 0.4 | - | 0.4 | 0.5 | |||||||||||||||
| Jersey | - | - | - | - | 0.1 | - | - | - | - | 3.2 | - | - | - | - | |||||||||||||||
| Luxembourg | - | - | - | - | 0.6 | - | - | - | 0.3 | - | 0.1 | - | 0.6 | - | |||||||||||||||
| Macau | - | - | - | - | - | - | - | - | - | - | - | - | - | - | |||||||||||||||
| Malaysia | 1.8 | - | - | - | - | - | 2.3 | - | - | - | - | - | - | - | |||||||||||||||
| Mexico | - | - | - | - | - | 3.5 | - | - | 0.5 | - | 0.1 | - | 0.5 | - | |||||||||||||||
| Netherlands | 2.8 | 6.2 | 4.9 | - | 3.9 | 3.5 | - | - | 0.3 | 6.5 | 0.9 | - | 1.7 | 1.7 | |||||||||||||||
| New Zealand | - | - | - | - | 0.1 | - | - | - | - | - | - | - | 1.2 | - | |||||||||||||||
| Norway | - | - | 4.7 | - | 0.8 | 0.7 | - | - | - | - | - | - | 1.7 | 1.1 | |||||||||||||||
| Pakistan | - | - | - | - | - | - | - | - | - | - | - | - | - | - | |||||||||||||||
| Panama | - | - | - | - | - | - | - | - | - | - | - | - | - | - | |||||||||||||||
| Peru | - | - | - | - | - | - | - | - | - | - | - | - | - | - | |||||||||||||||
| Philippines | - | - | - | - | - | - | 1.2 | - | - | - | - | - | - | - | |||||||||||||||
| Poland | - | - | - | - | - | - | - | - | - | - | - | - | - | - | |||||||||||||||
| Portugal | - | - | 3.9 | - | 0.3 | - | - | - | - | - | - | - | - | - | |||||||||||||||
| Qatar | - | - | - | - | - | - | - | - | - | - | 0.1 | - | - | - | |||||||||||||||
| Russia | 2.0 | - | - | - | - | - | - | - | - | - | - | - | - | - | |||||||||||||||
| Singapore | 6.2 | - | - | 13.6 | 1.5 | - | 5.0 | - | 0.1 | - | - | - | - | - | |||||||||||||||
| South Africa | - | - | - | - | - | - | - | - | - | 1.7 | - | - | - | - | |||||||||||||||
| South Korea | - | 3.7 | - | - | - | - | 17.2 | - | 0.6 | 0.9 | - | - | - | - | |||||||||||||||
| Spain | 0.6 | - | 5.5 | - | 4.6 | 1.3 | - | - | 0.2 | 2.1 | - | - | 0.6 | - | |||||||||||||||
| Sweden | - | - | 3.7 | - | 2.5 | 6.5 | - | - | 0.9 | 6.5 | 0.2 | - | 0.2 | - | |||||||||||||||
| Switzerland | - | 3.9 | 9.3 | - | 7.8 | 6.1 | - | - | - | - | 1.5 | 3.6 | 0.6 | 1.8 | |||||||||||||||
| Taiwan | - | - | - | - | - | 1.9 | 15.3 | - | - | - | - | 0.5 | - | - | |||||||||||||||
| Thailand | - | - | - | - | - | - | 3.1 | - | - | - | - | - | - | - | |||||||||||||||
| Turkey | - | - | - | - | - | - | - | - | - | - | - | - | - | - | |||||||||||||||
| United Arab . | |||||||||||||||||||||||||||||
| Emirates | 0.2 | - | - | - | - | - | - | - | - | - | 0.1 | - | 0.4 | - | |||||||||||||||
| United Kingdom | 23.3 | 11.1 | 28.8 | - | 20.4 | 8.0 | - | - | 3.7 | 21.6 | 0.1 | 1.5 | 2.3 | 0.4 | |||||||||||||||
| United States | 24.7 | 41.6 | 2.1 | 1.5 | - | 35.5 | - | - | 89.2 | 10.7 | 89.5 | 89.3 | 78.5 | 89.8 | |||||||||||||||
| Uruguay | - | - | - | - | - | - | - | - | - | - | - | - | - | - | |||||||||||||||
| Venezuela | - | - | - | - | - | - | - | - | - | - | - | - | - | - | |||||||||||||||
| Total Long-Term | |||||||||||||||||||||||||||||
| Investments | 100.0% | 100.0% | 100.0% | 100.0% | 100.0% | 100.0% | 100.0% | 100.0% | 100.0% | 100.0% | 100.0% | 100.0% | 100.0% | 100.0% | |||||||||||||||
* The Funds presented in the table are those which had greater than 10% of long-term investments in non-U.S. securities at December 31, 2009.
See accompanying Notes to Financial Statement.
JNL Series Trust
Notes to the Schedules of Investments (continued)
December 31, 2009
| Summary of Investments by Sector (percentage of total investments): | ||||||||||||||||||
| Consumer | Consumer | Health | Information | Investment | ||||||||||||||
| Discretionary | Staples | Energy | Financials | Care | Industrials | Technology | Materials | Funds | ||||||||||
| JNL Institutional Alt 20 Fund | - | % | - | % | - | % | - | % | - | % | - | % | - | % | - | % | 100.0 | % |
| JNL Institutional Alt 35 Fund | - | - | - | - | - | - | - | - | 100.0 | |||||||||
| JNL Institutional Alt 50 Fund | - | - | - | - | - | - | - | - | 100.0 | |||||||||
| JNL Institutional Alt 60 Fund | - | - | - | - | - | - | - | - | 100.0 | |||||||||
| JNL/AIM International Growth Fund | 10.4 | 13.8 | 8.7 | 6.3 | 17.1 | 11.3 | 7.9 | 4.0 | - | |||||||||
| JNL/AIM Large Cap Growth Fund | 9.2 | 1.0 | 8.4 | 4.1 | 15.3 | 10.1 | 38.8 | 7.1 | - | |||||||||
| JNL/AIM Global Real Estate Fund | 0.1 | - | - | 92.2 | - | - | - | - | - | |||||||||
| JNL/AIM Small Cap Growth Fund | 11.9 | 1.3 | 6.0 | 6.4 | 14.1 | 12.5 | 24.6 | 2.4 | - | |||||||||
| JNL/Capital Guardian Global Balanced Fund | 6.6 | 7.8 | 4.5 | 12.7 | 6.6 | 4.3 | 9.3 | 5.4 | - | |||||||||
| JNL/Capital Guardian Global Diversified Research Fund | 6.8 | 9.9 | 10.7 | 17.4 | 8.5 | 7.9 | 12.4 | 8.3 | - | |||||||||
| JNL/Capital Guardian International Small Cap Fund | 13.1 | 9.6 | 1.1 | 11.4 | 5.5 | 18.8 | 10.7 | 12.4 | 0.8 | |||||||||
| JNL/Capital Guardian U.S. Growth Equity Fund | 9.7 | 9.2 | 4.1 | 7.0 | 16.5 | 6.8 | 24.3 | 5.7 | 3.2 | |||||||||
| JNL/Credit Suisse Commodity Securities Fund | - | - | 9.8 | 12.0 | - | - | - | 32.8 | 3.1 | |||||||||
| JNL/Credit Suisse Long/Short Fund | 14.2 | 8.0 | 7.0 | 13.6 | 11.1 | 8.7 | 25.0 | 2.4 | - | |||||||||
| JNL/Eagle Core Equity Fund | 14.9 | 2.0 | 11.9 | 13.0 | 16.2 | 8.5 | 20.9 | - | 2.9 | |||||||||
| JNL/Eagle SmallCap Equity Fund | 13.9 | 0.8 | 5.1 | 5.6 | 19.7 | 12.9 | 22.9 | 4.5 | - | |||||||||
| JNL/Franklin Templeton Founding Strategy Fund | - | - | - | - | - | - | - | - | 100.0 | |||||||||
| JNL/Franklin Templeton Global Growth Fund | 17.3 | 2.0 | 8.8 | 12.2 | 16.3 | 10.1 | 16.3 | 2.0 | - | |||||||||
| JNL/Franklin Templeton Income Fund | 9.3 | 0.8 | 15.0 | 20.3 | 8.2 | 1.8 | 4.4 | 2.0 | - | |||||||||
| JNL/Franklin Templeton Mutual Shares Fund | 6.8 | 23.6 | 6.3 | 15.0 | 4.3 | 6.9 | 9.0 | 5.5 | - | |||||||||
| JNL/Franklin Templeton Small Cap Value Fund | 16.7 | 0.8 | 8.5 | 11.5 | 3.9 | 23.4 | 3.0 | 9.5 | - | |||||||||
| JNL/Goldman Sachs Core Plus Bond Fund | 0.9 | 1.2 | 2.6 | 24.9 | 0.5 | - | 0.2 | 0.8 | - | |||||||||
| JNL/Goldman Sachs Emerging Markets Debt Fund | - | - | - | 8.5 | - | - | - | - | - | |||||||||
| JNL/Goldman Sachs Mid Cap Value Fund | 12.2 | 2.6 | 10.6 | 24.8 | 4.6 | 7.6 | 6.8 | 8.0 | - | |||||||||
| JNL/Ivy Asset Strategy Fund | 12.1 | 2.6 | 8.0 | 17.4 | 0.5 | 3.2 | 19.2 | 6.7 | - | |||||||||
| JNL/JPMorgan International Value Fund | 7.7 | 4.5 | 11.4 | 26.5 | 4.3 | 12.4 | 7.4 | 6.1 | - | |||||||||
| JNL/JPMorgan MidCap Growth Fund | 17.4 | 1.1 | 5.0 | 8.9 | 11.9 | 15.7 | 23.9 | 2.0 | - | |||||||||
| JNL/JPMorgan U.S. Government & Quality Bond Fund | - | - | - | 0.9 | - | - | - | - | - | |||||||||
| JNL/Lazard Emerging Markets Fund | 5.2 | 13.1 | 4.9 | 21.5 | - | 6.1 | 16.1 | 11.8 | - | |||||||||
| JNL/Lazard Mid Cap Equity Fund | 15.9 | 5.7 | 7.3 | 13.0 | 11.0 | 10.9 | 14.4 | 9.1 | - | |||||||||
| JNL/M&G Global Basics Fund | 7.3 | 22.0 | 5.8 | 2.0 | 4.7 | 15.4 | - | 34.0 | - | |||||||||
| JNL/M&G Global Leaders Fund | 5.2 | 8.5 | 10.7 | 14.3 | 10.3 | 14.9 | 17.3 | 5.1 | - | |||||||||
| JNL/Mellon Capital Management 10 X 10 Fund | - | - | - | - | - | - | - | - | 100.0 | |||||||||
| JNL/Mellon Capital Management Index 5 Fund | - | - | - | - | - | - | - | - | 100.0 | |||||||||
| JNL/Mellon Capital Management European 30 Fund | - | 6.1 | 13.3 | 22.3 | 9.8 | 5.2 | - | 19.2 | 2.0 | |||||||||
| JNL/Mellon Capital Management Pacific Rim 30 Fund | 11.4 | 3.6 | 2.7 | 14.3 | 4.6 | 23.7 | - | 22.4 | 1.5 | |||||||||
| JNL/Mellon Capital Management S&P 500 Index Fund | 9.0 | 10.6 | 10.7 | 13.4 | 11.8 | 9.5 | 18.3 | 3.3 | - | |||||||||
| JNL/Mellon Capital Management S&P 400 MidCap Index Fund | 12.0 | 3.4 | 5.9 | 16.4 | 10.5 | 12.6 | 13.1 | 5.5 | - | |||||||||
| JNL/Mellon Capital Management Small Cap Index Fund | 11.2 | 2.8 | 4.2 | 16.2 | 11.3 | 12.7 | 14.9 | 3.8 | - | |||||||||
| JNL/Mellon Capital Management International Index Fund | 9.2 | 9.5 | 7.9 | 23.9 | 7.9 | 10.4 | 4.5 | 9.8 | - | |||||||||
| JNL/Mellon Capital Management Bond Index Fund | 1.2 | 1.4 | 1.9 | 8.8 | 1.3 | 1.2 | 0.7 | 0.9 | - | |||||||||
| JNL/Mellon Capital Management Global Alpha Fund | - | - | - | - | - | - | - | - | - | |||||||||
| JNL/Oppenheimer Global Growth Fund | 14.5 | 10.8 | 4.5 | 12.6 | 6.5 | 12.8 | 26.6 | 0.3 | - | |||||||||
| JNL/PAM Asia ex-Japan Fund | 2.1 | 4.6 | 4.2 | 34.2 | - | 8.4 | 18.2 | 9.9 | - | |||||||||
| JNL/PAM China-India Fund | 8.4 | 3.3 | 13.4 | 28.8 | 1.3 | 3.3 | 14.3 | 9.8 | - | |||||||||
| JNL/PIMCO Real Return Fund | 0.2 | - | 0.3 | 22.4 | 0.1 | 0.3 | 0.3 | 0.3 | - | |||||||||
| JNL/PIMCO Total Return Bond Fund | 0.5 | 0.4 | 1.2 | 19.2 | 0.8 | 0.2 | 1.0 | 0.2 | - | |||||||||
| JNL/PPM America High Yield Bond Fund | 19.6 | 5.0 | 8.2 | 12.6 | 4.3 | 6.4 | 3.0 | 7.5 | 0.7 | |||||||||
| JNL/PPM America Mid Cap Value Fund | 16.4 | 4.0 | 5.0 | 10.7 | 5.8 | 23.1 | 10.0 | 10.3 | - | |||||||||
| JNL/PPM America Small Cap Value Fund | 20.3 | 8.6 | 4.5 | 10.8 | 4.6 | 25.7 | 8.0 | 5.0 | - | |||||||||
| JNL/PPM America Value Equity Fund | 13.4 | 6.5 | 10.1 | 19.5 | 9.1 | 10.7 | 12.1 | 5.7 | - | |||||||||
| JNL/Red Rocks Listed Private Equity Fund | - | - | - | 81.5 | - | 1.4 | 1.6 | - | - | |||||||||
| JNL/S&P Managed Conservative Fund | - | - | - | - | - | - | - | - | 93.4 | |||||||||
| JNL/S&P Managed Moderate Fund | - | - | - | - | - | - | - | - | 95.5 | |||||||||
| JNL/S&P Managed Moderate Growth Fund | - | - | - | - | - | - | - | - | 96.5 | |||||||||
| JNL/S&P Managed Growth Fund | - | - | - | - | - | - | - | - | 94.4 | |||||||||
| JNL/S&P Managed Aggressive Growth Fund | - | - | - | - | - | - | - | - | 94.2 | |||||||||
| JNL/S&P Disciplined Moderate Fund | - | - | - | - | - | - | - | - | 92.7 | |||||||||
| JNL/S&P Disciplined Moderate Growth Fund | - | - | - | - | - | - | - | - | 93.3 | |||||||||
| JNL/S&P Disciplined Growth Fund | - | - | - | - | - | - | - | - | 95.9 | |||||||||
| JNL/S&P Competitive Advantage Fund | 28.9 | 9.4 | 9.9 | 3.4 | 9.4 | 10.0 | 19.4 | 6.4 | - | |||||||||
| JNL/S&P Dividend Income & Growth Fund | 13.1 | 9.3 | 8.9 | 10.0 | 9.4 | 6.1 | 9.7 | 9.3 | - | |||||||||
| JNL/S&P Intrinsic Value Fund | 22.7 | 12.4 | - | - | 22.6 | 21.9 | 12.7 | - | - | |||||||||
| JNL/S&P Total Yield Fund | 25.8 | 14.2 | - | 22.7 | - | 13.8 | 9.0 | 3.0 | - | |||||||||
| JNL/S&P 4 Fund | - | - | - | - | - | - | - | - | 100.0 | |||||||||
| JNL/Select Balanced Fund | 4.8 | 6.1 | 9.2 | 14.5 | 9.1 | 8.1 | 7.8 | 3.1 | - | |||||||||
| JNL/Select Money Market Fund | - | - | - | - | - | - | - | - | - | |||||||||
| JNL/Select Value Fund | 9.3 | 6.9 | 16.6 | 19.6 | 11.3 | 9.6 | 8.3 | 5.3 | - | |||||||||
| JNL/T. Rowe Price Established Growth Fund | 12.6 | 3.0 | 6.1 | 13.1 | 12.4 | 8.3 | 32.3 | 2.8 | - | |||||||||
| JNL/T. Rowe Price Mid-Cap Growth Fund | 13.2 | 1.7 | 5.8 | 8.7 | 15.0 | 14.5 | 19.9 | 1.5 | - | |||||||||
| JNL/T. Rowe Price Short-Term Bond Fund | 2.4 | 3.5 | 3.6 | 28.6 | 2.1 | 0.3 | 1.3 | 1.4 | 0.3 | |||||||||
| JNL/T. Rowe Price Value Fund | 14.3 | 4.7 | 13.0 | 19.0 | 9.7 | 9.9 | 9.6 | 4.9 | 1.1 | |||||||||
See accompanying Notes to Financial Statement.
JNL Series Trust
Notes to the Schedules of Investments (continued)
December 31, 2009
Summary of Investments by Sector (percentage of total investments): (continued) | ||||||||||||||||||
| Non-U.S. | U.S. | |||||||||||||||||
| Government | Government | |||||||||||||||||
| Telecommunication | Government | Agency | Short-Term | Agency | Holding | Precious | Total | |||||||||||
| Services | Utilities | Securities | ABS | Investments | MBS | Companies | Metals | Investments | ||||||||||
| JNL Institutional Alt 20 Fund | - | % | - | % | - | % | - | % | - | % | - | % | - | % | - | % | 100.0 | % |
| JNL Institutional Alt 35 Fund | - | - | - | - | - | - | - | - | 100.0 | |||||||||
| JNL Institutional Alt 50 Fund | - | - | - | - | - | - | - | - | 100.0 | |||||||||
| JNL Institutional Alt 60 Fund | - | - | - | - | - | - | - | - | 100.0 | |||||||||
| JNL/AIM International Growth Fund | 7.1 | 1.4 | - | - | 12.0 | - | - | - | 100.0 | |||||||||
| JNL/AIM Large Cap Growth Fund | 0.8 | - | - | - | 5.2 | - | - | - | 100.0 | |||||||||
| JNL/AIM Global Real Estate Fund | - | - | - | - | 7.7 | - | - | - | 100.0 | |||||||||
| JNL/AIM Small Cap Growth Fund | 0.9 | 0.8 | - | - | 19.1 | - | - | - | 100.0 | |||||||||
| JNL/Capital Guardian Global Balanced Fund | 6.3 | 2.9 | 21.2 | - | 9.4 | - | 3.0 | - | - | 100.0 | ||||||||
| JNL/Capital Guardian Global Diversified Research Fund | 6.1 | 2.3 | - | - | 9.7 | - | - | - | 100.0 | |||||||||
| JNL/Capital Guardian International Small Cap Fund | 0.7 | 0.5 | - | - | 15.4 | - | - | - | 100.0 | |||||||||
| JNL/Capital Guardian U.S. Growth Equity Fund | 1.8 | - | - | - | 11.7 | - | - | - | 100.0 | |||||||||
| JNL/Credit Suisse Commodity Securities Fund | - | - | 5.6 | - | 23.3 | 13.4 | - | - | 100.0 | |||||||||
| JNL/Credit Suisse Long/Short Fund | 1.6 | 4.5 | - | - | 3.9 | - | - | - | 100.0 | |||||||||
| JNL/Eagle Core Equity Fund | 1.6 | - | - | - | 8.1 | - | - | - | 100.0 | |||||||||
| JNL/Eagle SmallCap Equity Fund | - | - | - | - | 14.6 | - | - | - | 100.0 | |||||||||
| JNL/Franklin Templeton Founding Strategy Fund | - | - | - | - | - | - | - | - | 100.0 | |||||||||
| JNL/Franklin Templeton Global Growth Fund | 6.9 | - | - | - | 8.1 | - | - | - | 100.0 | |||||||||
| JNL/Franklin Templeton Income Fund | 3.1 | 13.9 | - | - | 21.2 | - | - | - | 100.0 | |||||||||
| JNL/Franklin Templeton Mutual Shares Fund | 3.4 | 3.8 | - | - | 15.4 | - | - | - | 100.0 | |||||||||
| JNL/Franklin Templeton Small Cap Value Fund | - | 2.5 | - | - | 20.2 | - | - | - | 100.0 | |||||||||
| JNL/Goldman Sachs Core Plus Bond Fund | 1.4 | 1.0 | 16.1 | 10.0 | 13.4 | 27.0 | - | - | 100.0 | |||||||||
| JNL/Goldman Sachs Emerging Markets Debt Fund | - | - | 68.0 | - | 23.5 | - | - | - | 100.0 | |||||||||
| JNL/Goldman Sachs Mid Cap Value Fund | 2.3 | 7.7 | - | - | 12.8 | - | - | - | 100.0 | |||||||||
| JNL/Ivy Asset Strategy Fund | 0.8 | - | - | - | 14.5 | - | - | 15.0 | 100.0 | |||||||||
| JNL/JPMorgan International Value Fund | 5.9 | 6.7 | - | - | 7.1 | - | - | - | 100.0 | |||||||||
| JNL/JPMorgan MidCap Growth Fund | 0.9 | - | - | - | 13.2 | - | - | - | 100.0 | |||||||||
| JNL/JPMorgan U.S. Government & Quality Bond Fund | - | - | 25.1 | 3.2 | 12.1 | 58.7 | - | - | 100.0 | |||||||||
| JNL/Lazard Emerging Markets Fund | 11.0 | 1.5 | - | - | 8.8 | - | - | - | 100.0 | |||||||||
| JNL/Lazard Mid Cap Equity Fund | - | 3.3 | - | - | 9.4 | - | - | - | 100.0 | |||||||||
| JNL/M&G Global Basics Fund | - | - | - | - | 8.8 | - | - | - | 100.0 | |||||||||
| JNL/M&G Global Leaders Fund | 3.5 | 1.9 | - | - | 8.3 | - | - | - | 100.0 | |||||||||
| JNL/Mellon Capital Management 10 X 10 Fund | - | - | - | - | - | - | - | - | 100.0 | |||||||||
| JNL/Mellon Capital Management Index 5 Fund | - | - | - | - | - | - | - | - | 100.0 | |||||||||
| JNL/Mellon Capital Management European 30 Fund | 14.9 | 5.2 | - | - | 2.0 | - | - | - | 100.0 | |||||||||
| JNL/Mellon Capital Management Pacific Rim 30 Fund | 5.0 | 5.1 | - | - | 5.7 | - | - | - | 100.0 | |||||||||
| JNL/Mellon Capital Management S&P 500 Index Fund | 2.9 | 3.5 | - | - | 7.0 | - | - | - | 100.0 | |||||||||
| JNL/Mellon Capital Management S&P 400 MidCap Index Fund | 0.7 | 5.8 | - | - | 14.1 | - | - | - | 100.0 | |||||||||
| JNL/Mellon Capital Management Small Cap Index Fund | 0.8 | 2.6 | - | - | 19.5 | - | - | - | 100.0 | |||||||||
| JNL/Mellon Capital Management International Index Fund | 5.5 | 5.5 | - | - | 5.9 | - | - | - | 100.0 | |||||||||
| JNL/Mellon Capital Management Bond Index Fund | 1.3 | 1.5 | 27.0 | 3.1 | 9.0 | 40.7 | - | - | 100.0 | |||||||||
| JNL/Mellon Capital Management Global Alpha Fund | - | - | - | - | 100.0 | - | - | - | 100.0 | |||||||||
| JNL/Oppenheimer Global Growth Fund | 1.9 | 0.9 | - | - | 8.6 | - | - | - | 100.0 | |||||||||
| JNL/PAM Asia ex-Japan Fund | 8.2 | 4.5 | - | - | 5.7 | - | - | - | 100.0 | |||||||||
| JNL/PAM China-India Fund | 4.8 | 3.9 | - | - | 8.7 | - | - | - | 100.0 | |||||||||
| JNL/PIMCO Real Return Fund | 0.4 | - | 56.5 | 7.7 | 9.5 | 2.0 | - | - | 100.0 | |||||||||
| JNL/PIMCO Total Return Bond Fund | 0.9 | 0.2 | 17.9 | 5.9 | 28.2 | 23.4 | - | - | 100.0 | |||||||||
| JNL/PPM America High Yield Bond Fund | 9.1 | 3.6 | - | 2.8 | 17.2 | - | - | - | 100.0 | |||||||||
| JNL/PPM America Mid Cap Value Fund | - | 4.2 | - | - | 10.5 | - | - | - | 100.0 | |||||||||
| JNL/PPM America Small Cap Value Fund | - | 2.2 | - | - | 10.3 | - | - | - | 100.0 | |||||||||
| JNL/PPM America Value Equity Fund | 4.8 | 2.0 | - | - | 6.1 | - | - | - | 100.0 | |||||||||
| JNL/Red Rocks Listed Private Equity Fund | - | - | - | - | 5.6 | - | 9.9 | - | 100.0 | |||||||||
| JNL/S&P Managed Conservative Fund | - | - | - | - | 6.6 | - | - | - | 100.0 | |||||||||
| JNL/S&P Managed Moderate Fund | - | - | - | - | 4.5 | - | - | - | 100.0 | |||||||||
| JNL/S&P Managed Moderate Growth Fund | - | - | - | - | 3.5 | - | - | - | 100.0 | |||||||||
| JNL/S&P Managed Growth Fund | - | - | - | - | 5.6 | - | - | - | 100.0 | |||||||||
| JNL/S&P Managed Aggressive Growth Fund | - | - | - | - | 5.8 | - | - | - | 100.0 | |||||||||
JNL/S&P Disciplined Moderate Fund . | - | - | - | - | 7.3 | - | - | - | 100.0 | |||||||||
| JNL/S&P Disciplined Moderate Growth Fund | - | - | - | - | 6.7 | - | - | - | 100.0 | |||||||||
| JNL/S&P Disciplined Growth Fund | - | - | - | - | 4.1 | - | - | - | 100.0 | |||||||||
| JNL/S&P Competitive Advantage Fund | - | - | - | - | 3.2 | - | - | - | 100.0 | |||||||||
| JNL/S&P Dividend Income & Growth Fund | 9.7 | 9.9 | - | - | 4.6 | - | - | - | 100.0 | |||||||||
| JNL/S&P Intrinsic Value Fund | - | 3.3 | - | - | 4.4 | - | - | - | 100.0 | |||||||||
| JNL/S&P Total Yield Fund | - | - | - | - | 11.5 | - | - | - | 100.0 | |||||||||
| JNL/S&P 4 Fund | - | - | - | - | - | - | - | - | 100.0 | |||||||||
| JNL/Select Balanced Fund | 2.9 | 3.1 | 10.6 | 1.0 | 10.0 | 9.7 | - | - | 100.0 | |||||||||
| JNL/Select Money Market Fund | - | - | - | - | 100.0 | - | - | - | 100.0 | |||||||||
| JNL/Select Value Fund | 3.0 | 3.3 | - | - | 6.8 | - | - | - | 100.0 | |||||||||
| JNL/T. Rowe Price Established Growth Fund | 4.2 | - | - | - | 5.2 | - | - | - | 100.0 | |||||||||
| JNL/T. Rowe Price Mid-Cap Growth Fund | 1.4 | 0.8 | - | - | 17.5 | - | - | - | 100.0 | |||||||||
| JNL/T. Rowe Price Short-Term Bond Fund | 4.2 | 2.7 | 8.8 | 6.3 | 7.9 | 26.6 | - | - | 100.0 | |||||||||
| JNL/T. Rowe Price Value Fund | 2.3 | 3.6 | - | - | 7.9 | - | - | - | 100.0 | |||||||||
See accompanying Notes to Financial Statements.
JNL Series Trust
Statements of Assets and Liabilities (in thousands, except net asset value per share)
December 31, 2009
| JNL | JNL | JNL | JNL | JNL/AIM | JNL/AIM | JNL/AIM | ||||||||
| Institutional Alt | Institutional Alt | Institutional Alt | Institutional Alt | International | Large Cap | Global Real | ||||||||
| Assets | 20 Fund | 35 Fund | 50 Fund | 65 Fund | Growth Fund | Growth Fund | Estate Fund | |||||||
Investments - unaffiliated, at value (a) (d) | $ - | $ - | $ - | $ - | $ 393,174 | $ 607,556 | $ 334,858 | |||||||
Investments - affiliated, at value (b) | 199,548 | 308,566 | 361,574 | 229,850 | 53,556 | 33,641 | 27,764 | |||||||
Total investments, at value (c) | 199,548 | 308,566 | 361,574 | 229,850 | 446,730 | 641,197 | 362,622 | |||||||
| Cash | - | - | - | - | - | - | - | |||||||
Foreign currency (e) | - | - | - | - | 4,809 | 28 | 1,112 | |||||||
| Receivables: | ||||||||||||||
| Investment securities sold | - | - | - | - | 107 | - | 787 | |||||||
| Fund shares sold | 578 | 834 | 1,625 | 541 | 777 | 1,040 | 524 | |||||||
| Deposits with brokers | - | - | - | - | - | - | - | |||||||
| Dividends and interest | - | - | - | - | 259 | 240 | 1,173 | |||||||
| Forward foreign currency contracts | - | - | - | - | - | - | - | |||||||
| Variation margin | - | - | - | - | - | - | - | |||||||
| Foreign taxes recoverable | - | - | - | - | 126 | 45 | 6 | |||||||
| Other assets | - | - | - | - | - | - | - | |||||||
| Unrealized appreciation on swap agreements | - | - | - | - | - | - | - | |||||||
| Swap premiums paid | - | - | - | - | - | - | - | |||||||
| Unrealized appreciation on unfunded loan commitments | - | - | - | - | - | - | - | |||||||
| Total assets | 200,126 | 309,400 | 363,199 | 230,391 | 452,808 | 642,550 | 366,224 | |||||||
| Liabilities | ||||||||||||||
| Cash overdraft | - | - | - | - | 27 | - | 2 | |||||||
| Payables: | ||||||||||||||
| Advisory fees | 23 | 36 | 43 | 27 | 238 | 341 | 199 | |||||||
| Administrative fees | 8 | 12 | 14 | 9 | 53 | 52 | 42 | |||||||
| 12b-1 fee (Class A) | - | - | - | - | 71 | 103 | 56 | |||||||
| Investment securities purchased | 495 | 635 | 1,402 | 400 | 2,085 | - | 3,286 | |||||||
| Fund shares redeemed | 83 | 200 | 223 | 141 | 892 | 909 | 300 | |||||||
| Dividends | - | - | - | - | - | - | - | |||||||
| Dividends on securities sold short | - | - | - | - | - | - | - | |||||||
| Interest expense and brokerage charges | - | - | - | - | - | - | - | |||||||
| Trustee fees | 1 | 1 | 1 | 1 | 10 | 11 | 5 | |||||||
| Forward foreign currency contracts | - | - | - | - | - | - | - | |||||||
| Variation margin | - | - | - | - | - | - | - | |||||||
| Other expenses | - | - | - | - | 15 | 2 | 1 | |||||||
| Investment securities sold short / forward | ||||||||||||||
sales commitments, at value (f) | - | - | - | - | - | - | - | |||||||
Options written, at value (g) | - | - | - | - | - | - | - | |||||||
| Unrealized depreciation on swap agreements | - | - | - | - | - | - | - | |||||||
| Swap premiums received | - | - | - | - | - | - | - | |||||||
| Return of collateral for securities loaned | - | - | - | - | 17,436 | 16,389 | 18,978 | |||||||
| Total liabilities | 610 | 884 | 1,683 | 578 | 20,827 | 17,807 | 22,869 | |||||||
| Net assets | $ 199,516 | $ 308,516 | $ 361,516 | $ 229,813 | $ 431,981 | $ 624,743 | $ 343,355 | |||||||
| Net assets consist of: | ||||||||||||||
| Paid-in capital | $ 187,572 | $ 285,946 | $ 336,889 | $ 214,625 | $ 520,541 | $ 630,107 | $ 409,153 | |||||||
| Undistributed (excess of distributions over) | ||||||||||||||
| net investment income | 2,749 | 4,330 | 5,229 | 3,056 | 2,774 | 2,176 | 10,130 | |||||||
| Accumulated net realized gain (loss) | 198 | 724 | 1,476 | 1,791 | (103,601) | (74,573) | (122,146) | |||||||
| Net unrealized appreciation (depreciation) on | ||||||||||||||
| investments and foreign currency | 8,997 | 17,516 | 17,922 | 10,341 | 12,267 | 67,033 | 46,218 | |||||||
| $ 199,516 | $ 308,516 | $ 361,516 | $ 229,813 | $ 431,981 | $ 624,743 | $ 343,355 | ||||||||
| Class A | ||||||||||||||
| Net assets | $ 199,516 | $ 308,516 | $ 361,516 | $ 229,813 | $ 431,595 | $ 624,156 | $ 342,951 | |||||||
| Shares outstanding (no par value), | ||||||||||||||
| unlimited shares authorized | 15,672 | 23,293 | 26,650 | 16,455 | 46,534 | 58,047 | 45,539 | |||||||
| Net asset value per share | $ 12.73 | $ 13.24 | $ 13.57 | $ 13.97 | $ 9.27 | $ 10.75 | $ 7.53 | |||||||
| Class B | ||||||||||||||
| Net assets | n/a | n/a | n/a | n/a | $ 386 | $ 587 | $ 404 | |||||||
| Shares outstanding (no par value), | ||||||||||||||
| unlimited shares authorized | n/a | n/a | n/a | n/a | 40 | 54 | 53 | |||||||
| Net asset value per share | n/a | n/a | n/a | n/a | $ 9.68 | $ 10.82 | $ 7.58 | |||||||
(a) Investments - unaffiliated, at cost | $ - | $ - | $ - | $ - | $ 381,027 | $ 540,516 | $ 288,625 | |||||||
(b) Investments - affiliated, at cost | 190,551 | 291,050 | 343,652 | 219,509 | 53,583 | 33,651 | 27,791 | |||||||
(c) Total investments, at cost | $ 190,551 | $ 291,050 | $ 343,652 | $ 219,509 | $ 434,610 | $ 574,167 | $ 316,416 | |||||||
(d) Including value of securities on loan | - | - | - | - | 16,937 | 16,074 | 18,200 | |||||||
(e) Foreign currency cost | - | - | - | - | 4,664 | 29 | 1,106 | |||||||
(f) Proceeds from securities sold short / forward | ||||||||||||||
| sales commitments | - | - | - | - | - | - | - | |||||||
(g) Premiums from options written | - | - | - | - | - | - | - | |||||||
See accompanying Notes to Financial Statements.
JNL Series Trust
Statements of Assets and Liabilities (in thousands, except net asset value per share)
December 31, 2009
| JNL/Capital | JNL/Capital | JNL/Capital | JNL/Capital | JNL/Credit | ||||||||||
| JNL/AIM | Guardian | Guardian | Guardian | Guardian | Suisse | JNL/Credit | ||||||||
| Small Cap | Global Balanced | Global Diversified | International Small | U.S. Growth | Commodity | Suisse Long/ | ||||||||
| Assets | Growth Fund | Fund | Research Fund | Cap Fund | Equity Fund | Securities Fund | Short Fund | |||||||
Investments - unaffiliated, at value (a) (d) | $ 88,171 | $ 268,557 | $ 316,072 | $ 131,830 | $ 541,977 | $ 632,277 | $ 114,281 | |||||||
Investments - affiliated, at value (b) | 20,848 | 27,970 | 34,031 | 23,898 | 71,940 | 59,754 | 4,692 | |||||||
Total investments, at value (c) | 109,019 | 296,527 | 350,103 | 155,728 | 613,917 | 692,031 | 118,973 | |||||||
| Cash | - | - | - | - | - | 12 | - | |||||||
Foreign currency (e) | - | 2 | 17 | 14 | - | 3,516 | - | |||||||
| Receivables: | ||||||||||||||
| Investment securities sold | 36 | 608 | 2 | 141 | 75 | - | 3,794 | |||||||
| Fund shares sold | 506 | 354 | 455 | 204 | 1,258 | 1,517 | 92 | |||||||
| Deposits with brokers | - | - | - | - | - | - | - | |||||||
| Dividends and interest | 26 | 1,487 | 248 | 112 | 458 | 307 | 114 | |||||||
| Forward foreign currency contracts | - | 147 | - | - | - | - | - | |||||||
| Variation margin | - | - | - | - | - | - | - | |||||||
| Foreign taxes recoverable | - | 72 | 44 | 30 | 1 | 36 | - | |||||||
| Other assets | - | - | - | - | - | - | - | |||||||
| Unrealized appreciation on swap agreements | - | - | - | - | - | - | - | |||||||
| Swap premiums paid | - | - | - | - | - | - | - | |||||||
| Unrealized appreciation on unfunded loan commitments | - | - | - | - | - | - | - | |||||||
| Total assets | 109,587 | 299,197 | 350,869 | 156,229 | 615,709 | 697,419 | 122,973 | |||||||
| Liabilities | ||||||||||||||
| Cash overdraft | - | 4 | - | - | - | - | - | |||||||
| Payables: | ||||||||||||||
| Advisory fees | 64 | 152 | 198 | 113 | 300 | 342 | 60 | |||||||
| Administrative fees | 8 | 35 | 41 | 18 | 45 | 79 | 11 | |||||||
| 12b-1 fee (Class A) | 15 | 46 | 55 | 24 | 91 | 105 | 15 | |||||||
| Investment securities purchased | 71 | 3,363 | 1,678 | 20 | 2,076 | 3,192 | 3,205 | |||||||
| Fund shares redeemed | 147 | 898 | 280 | 1,077 | 591 | 2,119 | 534 | |||||||
| Dividends | - | - | - | - | - | - | - | |||||||
| Dividends on securities sold short | - | - | - | - | - | - | 22 | |||||||
| Interest expense and brokerage charges | - | - | - | - | - | - | 5 | |||||||
| Trustee fees | 2 | 5 | 5 | 1 | 7 | 7 | 2 | |||||||
| Forward foreign currency contracts | - | 352 | 13 | - | - | - | - | |||||||
| Variation margin | - | - | - | - | - | - | - | |||||||
| Other expenses | - | 1 | 1 | - | 2 | 2 | - | |||||||
| Investment securities sold short / forward | ||||||||||||||
sales commitments, at value (f) | - | - | - | - | - | - | 28,666 | |||||||
Options written, at value (g) | - | - | - | - | - | - | - | |||||||
| Unrealized depreciation on swap agreements | - | - | - | - | - | - | - | |||||||
| Swap premiums received | - | - | - | - | - | - | - | |||||||
| Return of collateral for securities loaned | 16,330 | 14,124 | 15,692 | 10,754 | 57,309 | 49,927 | - | |||||||
| Total liabilities | 16,637 | 18,980 | 17,963 | 12,007 | 60,421 | 55,773 | 32,520 | |||||||
| Net assets | $ 92,950 | $ 280,217 | $ 332,906 | $ 144,222 | $ 555,288 | $ 641,646 | $ 90,453 | |||||||
| Net assets consist of: | ||||||||||||||
| Paid-in capital | $ 91,592 | $ 314,243 | $ 470,963 | $ 161,205 | $ 743,454 | $ 695,162 | $ 92,540 | |||||||
| Undistributed (excess of distributions over) | ||||||||||||||
| net investment income | 22 | 3,071 | 2,000 | 459 | 1,985 | 2,536 | 670 | |||||||
| Accumulated net realized gain (loss) | (4,374) | (55,064) | (174,586) | (25,279) | (253,317) | (123,426) | (6,644) | |||||||
| Net unrealized appreciation (depreciation) on | ||||||||||||||
| investments and foreign currency | 5,710 | 17,967 | 34,529 | 7,837 | 63,166 | 67,374 | 3,887 | |||||||
| $ 92,950 | $ 280,217 | $ 332,906 | $ 144,222 | $ 555,288 | $ 641,646 | $ 90,453 | ||||||||
| Class A | ||||||||||||||
| Net assets | $ 92,793 | $ 279,806 | $ 332,577 | $ 144,004 | $ 554,978 | $ 641,108 | $ 90,306 | |||||||
| Shares outstanding (no par value), | ||||||||||||||
| unlimited shares authorized | 9,179 | 31,733 | 15,895 | 21,015 | 29,448 | 68,096 | 11,918 | |||||||
| Net asset value per share | $ 10.11 | $ 8.82 | $ 20.92 | $ 6.85 | $ 18.85 | $ 9.41 | $ 7.58 | |||||||
| Class B | ||||||||||||||
| Net assets | $ 157 | $ 411 | $ 329 | $ 218 | $ 310 | $ 538 | $ 147 | |||||||
| Shares outstanding (no par value), | ||||||||||||||
| unlimited shares authorized | 15 | 46 | 16 | 32 | 16 | 57 | 19 | |||||||
| Net asset value per share | $ 10.26 | $ 9.01 | $ 21.05 | $ 6.88 | $ 19.03 | $ 9.44 | $ 7.62 | |||||||
(a) Investments - unaffiliated, at cost | $ 82,453 | $ 250,358 | $ 281,514 | $ 123,988 | $ 478,780 | $ 564,895 | $ 109,026 | |||||||
(b) Investments - affiliated, at cost | 20,856 | 27,992 | 34,047 | 23,903 | 71,971 | 59,767 | 4,692 | |||||||
(c) Total investments, at cost | $ 103,309 | $ 278,350 | $ 315,561 | $ 147,891 | $ 550,751 | $ 624,662 | $ 113,718 | |||||||
(d) Including value of securities on loan | 15,724 | 13,511 | 14,928 | 10,261 | 55,352 | 48,894 | - | |||||||
(e) Foreign currency cost | - | 2 | 17 | 14 | - | 3,514 | - | |||||||
(f) Proceeds from securities sold short / forward | ||||||||||||||
| sales commitments | - | - | - | - | - | - | 27,298 | |||||||
(g) Premiums from options written | - | - | - | - | - | - | - | |||||||
See accompanying Notes to Financial Statements.
JNL Series Trust
Statements of Assets and Liabilities (in thousands, except net asset value per share)
December 31, 2009
| JNL/Franklin | JNL/Franklin | JNL/Franklin | ||||||||||||
| JNL/Eagle | JNL/Eagle | Templeton | Templeton | JNL/Franklin | Templeton | JNL/Franklin | ||||||||
| Core Equity | SmallCap | Founding | Global | Templeton | Mutual Shares | Templeton Small | ||||||||
| Assets | Fund | Equity Fund | Strategy Fund | Growth Fund | Income Fund | Fund | Cap Value Fund | |||||||
Investments - unaffiliated, at value (a) (d) | $ 79,325 | $ 279,614 | $ - | $ 349,882 | $ 653,306 | $ 371,200 | $ 150,673 | |||||||
Investments - affiliated, at value (b) | 6,989 | 47,861 | 838,811 | 30,943 | 176,238 | 67,555 | 38,290 | |||||||
Total investments, at value (c) | 86,314 | 327,475 | 838,811 | 380,825 | 829,544 | 438,755 | 188,963 | |||||||
| Cash | - | - | - | 2 | 58 | 16 | - | |||||||
Foreign currency (e) | - | - | - | 529 | - | 2,826 | - | |||||||
| Receivables: | ||||||||||||||
| Investment securities sold | - | - | 771 | 315 | 532 | 1,496 | - | |||||||
| Fund shares sold | 373 | 1,170 | 341 | 208 | 511 | 726 | 151 | |||||||
| Deposits with brokers | - | - | - | - | - | - | - | |||||||
| Dividends and interest | 53 | 88 | - | 441 | 7,540 | 647 | �� 130 | |||||||
| Forward foreign currency contracts | - | - | - | - | - | 2,848 | - | |||||||
| Variation margin | - | - | - | - | - | - | - | |||||||
| Foreign taxes recoverable | - | - | - | 109 | - | 83 | - | |||||||
| Other assets | - | - | - | - | - | - | - | |||||||
| Unrealized appreciation on swap agreements | - | - | - | - | - | - | - | |||||||
| Swap premiums paid | - | - | - | - | - | - | - | |||||||
| Unrealized appreciation on unfunded loan commitments | - | - | - | - | - | 40 | - | |||||||
| Total assets | 86,740 | 328,733 | 839,923 | 382,429 | 838,185 | 447,437 | 189,244 | |||||||
| Liabilities | ||||||||||||||
| Cash overdraft | - | - | - | - | - | - | - | |||||||
| Payables: | ||||||||||||||
| Advisory fees | 46 | 164 | - | 229 | 405 | 263 | 118 | |||||||
| Administrative fees | 7 | 23 | 35 | 47 | 60 | 35 | 14 | |||||||
| 12b-1 fee (Class A) | 14 | 46 | - | 62 | 121 | 70 | 28 | |||||||
| Investment securities purchased | - | 3,394 | - | 50 | 22,318 | 5,330 | - | |||||||
| Fund shares redeemed | 127 | 1,398 | 1,112 | 447 | 741 | 586 | 361 | |||||||
| Dividends | - | - | - | - | - | - | - | |||||||
| Dividends on securities sold short | - | - | - | - | - | - | - | |||||||
| Interest expense and brokerage charges | - | - | - | - | - | - | - | |||||||
| Trustee fees | 3 | 5 | 14 | 5 | 11 | 6 | 3 | |||||||
| Forward foreign currency contracts | - | - | - | - | - | 315 | - | |||||||
| Variation margin | - | - | - | - | - | - | - | |||||||
| Other expenses | - | 1 | 3 | 1 | 2 | 3 | 1 | |||||||
| Investment securities sold short / forward | ||||||||||||||
sales commitments, at value (f) | - | - | - | - | - | - | - | |||||||
Options written, at value (g) | - | - | - | - | - | - | - | |||||||
| Unrealized depreciation on swap agreements | - | - | - | - | - | - | - | |||||||
| Swap premiums received | - | - | - | - | - | - | - | |||||||
| Return of collateral for securities loaned | 2,257 | 44,006 | - | 5,864 | 85,903 | 16,975 | 20,893 | |||||||
| Total liabilities | 2,454 | 49,037 | 1,164 | 6,705 | 109,561 | 23,583 | 21,418 | |||||||
| Net assets | $ 84,286 | $ 279,696 | $ 838,759 | $ 375,724 | $ 728,624 | $ 423,854 | $ 167,826 | |||||||
| Net assets consist of: | ||||||||||||||
| Paid-in capital | $ 98,349 | $ 289,251 | $ 1,013,092 | $ 457,287 | $ 826,696 | $ 517,439 | $ 179,413 | |||||||
| Undistributed (excess of distributions over) | ||||||||||||||
| net investment income | 508 | 676 | 27,404 | 4,814 | 34,982 | (2,614) | 1,041 | |||||||
| Accumulated net realized gain (loss) | (17,982) | (49,625) | (53,641) | (43,411) | (90,154) | (73,739) | (11,618) | |||||||
| Net unrealized appreciation (depreciation) on | ||||||||||||||
| investments and foreign currency | 3,411 | 39,394 | (148,096) | (42,966) | (42,900) | (17,232) | (1,010) | |||||||
| $ 84,286 | $ 279,696 | $ 838,759 | $ 375,724 | $ 728,624 | $ 423,854 | $ 167,826 | ||||||||
| Class A | ||||||||||||||
| Net assets | $ 84,192 | $ 279,448 | $ 838,759 | $ 375,505 | $ 728,236 | $ 423,572 | $ 167,589 | |||||||
| Shares outstanding (no par value), | ||||||||||||||
| unlimited shares authorized | 12,820 | 17,309 | 101,979 | 49,139 | 78,366 | 55,679 | 19,223 | |||||||
| Net asset value per share | $ 6.57 | $ 16.14 | $ 8.22 | $ 7.64 | $ 9.29 | $ 7.61 | $ 8.72 | |||||||
| Class B | ||||||||||||||
| Net assets | $ 94 | $ 248 | n/a | $ 219 | $ 388 | $ 282 | $ 237 | |||||||
| Shares outstanding (no par value), | ||||||||||||||
| unlimited shares authorized | 14 | 15 | n/a | 29 | 43 | 37 | 27 | |||||||
| Net asset value per share | $ 6.85 | $ 16.40 | n/a | $ 7.65 | $ 8.98 | $ 7.64 | $ 8.68 | |||||||
(a) Investments - unaffiliated, at cost | $ 75,914 | $ 240,190 | $ - | $ 392,836 | $ 696,148 | $ 390,953 | $ 151,666 | |||||||
(b) Investments - affiliated, at cost | 6,989 | 47,891 | 986,907 | 30,950 | 176,282 | 67,555 | 38,307 | |||||||
(c) Total investments, at cost | $ 82,903 | $ 288,081 | $ 986,907 | $ 423,786 | $ 872,430 | $ 458,508 | $ 189,973 | |||||||
(d) Including value of securities on loan | 2,177 | 42,564 | - | 5,666 | 83,654 | 16,348 | 19,873 | |||||||
(e) Foreign currency cost | - | - | - | 532 | - | 2,885 | - | |||||||
(f) Proceeds from securities sold short / forward | ||||||||||||||
| sales commitments | - | - | - | - | - | - | - | |||||||
(g) Premiums from options written | - | - | - | - | - | - | - | |||||||
See accompanying Notes to Financial Statements.
JNL Series Trust
Statements of Assets and Liabilities (in thousands, except net asset value per share)
December 31, 2009
| JNL/Goldman | JNL/Goldman | JNL/ | JNL/JPMorgan | |||||||||||
| Sachs Core | Sachs Emerging | JNL/Goldman | Ivy Asset | JNL/JPMorgan | JNL/JPMorgan | U.S. Government | ||||||||
| Plus Bond | Markets Debt | Sachs Mid Cap | Strategy | International | Midcap | & Quality | ||||||||
| Assets | Fund | Fund | Value Fund | Fund | Value Fund | Growth Fund | Bond Fund | |||||||
Investments - unaffiliated, at value (a) (d) | $ 729,702 | $ 143,537 | $ 270,869 | $ 171,949 | $ 533,417 | $ 158,771 | $ 669,291 | |||||||
Investments - affiliated, at value (b) | 112,966 | 44,096 | 39,807 | 29,184 | 40,828 | 24,122 | 92,099 | |||||||
Total investments, at value (c) | 842,668 | 187,633 | 310,676 | 201,133 | 574,245 | 182,893 | 761,390 | |||||||
| Cash | - | - | - | - | - | - | - | |||||||
Foreign currency (e) | 4 | 290 | - | 312 | 1,354 | 6 | - | |||||||
| Receivables: | ||||||||||||||
| Investment securities sold | 60,312 | 274 | 943 | 2,785 | 930 | - | 346 | |||||||
| Fund shares sold | 1,159 | 466 | 522 | 2,195 | 1,096 | 181 | 1,500 | |||||||
| Deposits with brokers and counterparties | - | 3,168 | - | - | 335 | - | - | |||||||
| Dividends and interest | 5,669 | 2,164 | 343 | 187 | 741 | 68 | 3,899 | |||||||
| Forward foreign currency contracts | 1,041 | 1,407 | - | 126 | 3,306 | - | - | |||||||
| Variation margin | 2 | - | - | - | 4 | - | - | |||||||
| Foreign taxes recoverable | - | 123 | 2 | - | 94 | 6 | - | |||||||
| Other assets | - | - | - | - | - | - | 2 | |||||||
| Deposits from counterparties | 848 | - | - | - | - | - | - | |||||||
| Unrealized appreciation on swap agreements | 1,912 | 86 | - | - | - | - | - | |||||||
| Swap premiums paid | 463 | - | - | - | - | - | - | |||||||
| Unrealized appreciation on unfunded loan commitments | - | - | - | - | - | - | - | |||||||
| Total assets | 914,078 | 195,611 | 312,486 | 206,738 | 582,105 | 183,154 | 767,137 | |||||||
| Liabilities | ||||||||||||||
| Cash overdraft | - | - | - | - | - | - | - | |||||||
| Payables: | ||||||||||||||
| Advisory fees | 382 | 118 | 166 | 121 | 302 | 95 | 247 | |||||||
| Administrative fees | 66 | 24 | 23 | 20 | 69 | 13 | 59 | |||||||
| 12b-1 fee (Class A) | 131 | 31 | 45 | 27 | 91 | 27 | 118 | |||||||
| Investment securities purchased | 76,228 | 270 | 3,524 | 9,327 | 1,147 | 92 | - | |||||||
| Fund shares redeemed | 783 | 1,463 | 326 | 138 | 858 | 269 | 807 | |||||||
| Dividends | - | - | - | - | - | - | - | |||||||
| Dividends on securities sold short | - | - | - | - | - | - | - | |||||||
| Interest expense and brokerage charges | - | - | - | - | - | - | - | |||||||
| Trustee fees | 15 | 1 | 4 | - | 13 | 5 | 12 | |||||||
| Forward foreign currency contracts | 990 | 364 | - | 126 | 3,229 | - | - | |||||||
| Variation margin | 492 | - | - | - | - | - | - | |||||||
| Deposits from counterparties | 848 | - | - | - | - | - | - | |||||||
| Other expenses | 3 | 9 | 1 | - | 20 | 1 | 2 | |||||||
| Investment in forward sales | ||||||||||||||
commitments, at value (f) | 16,410 | - | - | - | - | - | - | |||||||
Options written, at value (g) | - | - | - | - | - | - | - | |||||||
| Unrealized depreciation on swap agreements | 861 | 88 | - | 2 | - | - | - | |||||||
| Swap premiums received | 123 | - | - | - | - | - | - | |||||||
| Return of collateral for securities loaned | 33,757 | - | 27,672 | - | 26,686 | 18,848 | 72,311 | |||||||
| Total liabilities | 131,089 | 2,368 | 31,761 | 9,761 | 32,415 | 19,350 | 73,556 | |||||||
| Net assets | $ 782,989 | $ 193,243 | $ 280,725 | $ 196,977 | $ 549,690 | $ 163,804 | $ 693,581 | |||||||
| Net assets consist of: | ||||||||||||||
| Paid-in capital | $ 768,226 | $ 179,685 | $ 312,058 | $ 195,374 | $ 713,728 | $ 313,359 | $ 656,840 | |||||||
| Undistributed (excess of distributions over) | ||||||||||||||
| net investment income | 24,797 | 5,800 | 1,423 | 26 | 14,697 | (5) | 24,719 | |||||||
| Accumulated net realized gain (loss) | 12,581 | 1,604 | (59,966) | (2,148) | (201,205) | (171,725) | (1,854) | |||||||
| Net unrealized appreciation (depreciation) on | ||||||||||||||
| investments and foreign currency | (22,615) | 6,154 | 27,210 | 3,725 | 22,470 | 22,175 | 13,876 | |||||||
| $ 782,989 | $ 193,243 | $ 280,725 | $ 196,977 | $ 549,690 | $ 163,804 | $ 693,581 | ||||||||
| Class A | ||||||||||||||
| Net assets | $ 782,744 | $ 193,046 | $ 275,024 | $ 196,774 | $ 549,144 | $ 163,690 | $ 693,017 | |||||||
| Shares outstanding (no par value), | ||||||||||||||
| unlimited shares authorized | 66,990 | 16,238 | 32,136 | 18,911 | 76,570 | 10,266 | 55,913 | |||||||
| Net asset value per share | $ 11.68 | $ 11.89 | $ 8.56 | $ 10.41 | $ 7.17 | $ 15.94 | $ 12.39 | |||||||
| Class B | ||||||||||||||
| Net assets | $ 245 | $ 197 | $ 5,701 | $ 203 | $ 546 | $ 114 | $ 564 | |||||||
| Shares outstanding (no par value), | ||||||||||||||
| unlimited shares authorized | 21 | 17 | 666 | $ 19 | 75 | 7 | 44 | |||||||
| Net asset value per share | $ 11.83 | $ 11.92 | $ 8.56 | $ 10.41 | $ 7.31 | $ 16.13 | $ 12.88 | |||||||
(a) Investments - unaffiliated, at cost | $ 751,431 | $ 138,418 | $ 243,647 | $ 168,217 | $ 510,942 | $ 136,585 | $ 655,324 | |||||||
(b) Investments - affiliated, at cost | 112,977 | 44,096 | 39,819 | 29,184 | 40,852 | 24,134 | 92,190 | |||||||
(c) Total investments, at cost | $ 864,408 | $ 182,514 | $ 283,466 | $ 197,401 | $ 551,794 | $ 160,719 | $ 747,514 | |||||||
(d) Including value of securities on loan | 32,876 | - | 28,007 | - | 25,592 | 18,230 | 70,596 | |||||||
(e) Foreign currency cost | 3 | 293 | - | 309 | 1,339 | 6 | - | |||||||
(f) Proceeds from forward sales commitments | 16,699 | - | - | - | - | - | - | |||||||
(g) Premiums from options written | - | - | - | - | - | - | - | |||||||
See accompanying Notes to Financial Statements.
JNL Series Trust
Statements of Assets and Liabilities (in thousands, except net asset value per share)
December 31, 2009
| JNL/Mellon | ||||||||||||||
| JNL/Mellon | JNL/Mellon | Capital | ||||||||||||
| JNL/Lazard | JNL/Lazard | JNL/M&G | JNL/M&G | Capital | Capital | Management | ||||||||
| Emerging | Mid Cap | Global Basics | Global Leaders | Management | Management | European 30 | ||||||||
| Assets | Markets Fund | Equity Fund | Fund | Fund | 10 X 10 Fund | Index 5 Fund | Fund | |||||||
Investments - unaffiliated, at value (a) (d) | $ 693,618 | $ 160,392 | $ 28,027 | $ 16,361 | $ - | $ - | $ 13,310 | |||||||
Investments - affiliated, at value (b) | 67,082 | 16,559 | 2,721 | 1,483 | 194,504 | 204,962 | 268 | |||||||
Total investments, at value (c) | 760,700 | 176,951 | 30,748 | 17,844 | 194,504 | 204,962 | 13,578 | |||||||
| Cash | 3,030 | - | - | - | - | - | - | |||||||
Foreign currency (e) | 1,278 | - | 66 | 201 | - | - | 9 | |||||||
| Receivables: | ||||||||||||||
| Investment securities sold | 2,212 | - | 393 | 8 | 54 | 30 | 98 | |||||||
| Fund shares sold | 1,710 | 212 | 1,401 | 15 | 64 | 85 | 72 | |||||||
| Deposits with brokers | - | - | - | - | - | - | - | |||||||
| Dividends and interest | 544 | 174 | 14 | 19 | - | - | 10 | |||||||
| Forward foreign currency contracts | - | - | - | - | - | - | - | |||||||
| Variation margin | - | - | - | - | - | - | - | |||||||
| Foreign taxes recoverable | 91 | - | 5 | 5 | - | - | 11 | |||||||
| Other assets | - | - | - | - | - | - | - | |||||||
| Unrealized appreciation on swap agreements | - | - | - | - | - | - | - | |||||||
| Swap premiums paid | - | - | - | - | - | - | - | |||||||
| Unrealized appreciation on unfunded loan commitments | - | - | - | - | - | - | - | |||||||
| Total assets | 769,565 | 177,337 | 32,627 | 18,092 | 194,622 | 205,077 | 13,778 | |||||||
| Liabilities | ||||||||||||||
| Cash overdraft | - | - | - | - | - | - | - | |||||||
| Payables: | ||||||||||||||
| Advisory fees | 528 | 99 | 20 | 12 | - | - | 4 | |||||||
| Administrative fees | 90 | 14 | 4 | 2 | 8 | 8 | 2 | |||||||
| 12b-1 fee (Class A) | 120 | 28 | 5 | 3 | - | - | 2 | |||||||
| Investment securities purchased | 10,136 | - | 1,098 | - | - | - | 367 | |||||||
| Fund shares redeemed | 982 | 309 | 25 | 10 | 117 | 115 | 37 | |||||||
| Dividends | - | - | - | - | - | - | - | |||||||
| Dividends on securities sold short | - | - | - | - | - | - | - | |||||||
| Interest expense and brokerage charges | - | - | - | - | - | - | - | |||||||
| Trustee fees | 8 | 5 | - | - | 2 | 2 | - | |||||||
| Forward foreign currency contracts | - | - | - | - | - | - | - | |||||||
| Variation margin | - | - | - | - | - | - | - | |||||||
| Other expenses | 2 | - | - | - | 1 | 1 | - | |||||||
| Investment securities sold short / forward | ||||||||||||||
sales commitments, at value (f) | - | - | - | - | - | - | - | |||||||
Options written, at value (g) | - | - | - | - | - | - | - | |||||||
| Unrealized depreciation on swap agreements | - | - | - | - | - | - | - | |||||||
| Swap premiums received | - | - | - | - | - | - | - | |||||||
| Return of collateral for securities loaned | 21,062 | 11,985 | 1,607 | 637 | - | - | - | |||||||
| Total liabilities | 32,928 | 12,440 | 2,759 | 664 | 128 | 126 | 412 | |||||||
| Net assets | $ 736,637 | $ 164,897 | $ 29,868 | $ 17,428 | $ 194,494 | $ 204,951 | $ 13,366 | |||||||
| Net assets consist of: | ||||||||||||||
| Paid-in capital | $ 716,529 | $ 235,339 | $ 25,811 | $ 15,201 | $ 217,519 | $ 195,111 | $ 12,466 | |||||||
| Undistributed (excess of distributions over) | ||||||||||||||
| net investment income | 4,989 | 928 | 8 | (8) | 4,449 | 2,895 | (76) | |||||||
| Accumulated net realized gain (loss) | (97,038) | �� | (86,071) | (161) | (165) | (19,442) | (7,122) | (91) | ||||||
| Net unrealized appreciation (depreciation) on | ||||||||||||||
| investments and foreign currency | 112,157 | 14,701 | 4,210 | 2,400 | (8,032) | 14,067 | 1,067 | |||||||
| $ 736,637 | $ 164,897 | $ 29,868 | $ 17,428 | $ 194,494 | $ 204,951 | $ 13,366 | ||||||||
| Class A | ||||||||||||||
| Net assets | $ 735,862 | $ 164,730 | $ 29,708 | $ 17,302 | $ 194,494 | $ 204,951 | $ 13,238 | |||||||
| Shares outstanding (no par value), | ||||||||||||||
| unlimited shares authorized | 73,889 | 17,418 | 2,420 | 1,516 | 27,045 | 24,434 | 1,171 | |||||||
| Net asset value per share | $ 9.96 | $ 9.46 | $ 12.27 | $ 11.41 | $ 7.19 | $ 8.39 | $ 11.30 | |||||||
| Class B | ||||||||||||||
| Net assets | $ 775 | $ 167 | $ 160 | $ 126 | n/a | n/a | $ 128 | |||||||
| Shares outstanding (no par value), | ||||||||||||||
| unlimited shares authorized | 78 | 18 | 13 | 11 | n/a | n/a | 11 | |||||||
| Net asset value per share | $ 9.98 | $ 9.53 | $ 12.30 | $ 11.42 | n/a | n/a | $ 11.31 | |||||||
(a) Investments - unaffiliated, at cost | $ 581,467 | $ 145,678 | $ 23,816 | $ 13,962 | $ - | $ - | $ 12,244 | |||||||
(b) Investments - affiliated, at cost | 67,105 | 16,572 | 2,721 | 1,483 | 202,536 | 190,895 | 268 | |||||||
(c) Total investments, at cost | $ 648,572 | $ 162,250 | $ 26,537 | $ 15,445 | $ 202,536 | $ 190,895 | $ 12,512 | |||||||
(d) Including value of securities on loan | 20,410 | 11,633 | 1,537 | 614 | - | - | - | |||||||
(e) Foreign currency cost | 1,245 | - | 66 | 200 | - | - | 9 | |||||||
(f) Proceeds from securities sold short / forward | ||||||||||||||
| sales commitments | - | - | - | - | - | - | - | |||||||
(g) Premiums from options written | - | - | - | - | - | - | - | |||||||
See accompanying Notes to Financial Statements.
JNL Series Trust
Statements of Assets and Liabilities (in thousands, except net asset value per share)
December 31, 2009
| JNL/Mellon | JNL/Mellon | JNL/Mellon | JNL/Mellon | JNL/Mellon | JNL/Mellon | JNL/Mellon | ||||||||
| Capital | Capital | Capital | Capital | Capital | Capital | Capital | ||||||||
| Management | Management | Management | Management | Management | Management | Management | ||||||||
| Pacific Rim 30 | S&P 500 | S&P 400 MidCap | Small Cap | International | Bond Index | Global Alpha | ||||||||
| Assets | Fund | Index Fund | Index Fund | Index Fund | Index Fund | Fund | Fund | |||||||
Investments - unaffiliated, at value (a) (d) | $ 16,663 | $ 878,967 | $ 467,400 | $ 459,975 | $ 722,254 | $ 785,238 | $ 60,256 | |||||||
Investments - affiliated, at value (b) | 1,011 | 65,951 | 75,825 | 109,853 | 46,106 | 77,291 | 6,240 | |||||||
Total investments, at value (c) | 17,674 | 944,918 | 543,225 | 569,828 | 768,360 | 862,529 | 66,496 | |||||||
| Cash | - | 3 | - | - | - | 6 | - | |||||||
Foreign currency (e) | 7 | - | - | - | 521 | - | - | |||||||
| Receivables: | ||||||||||||||
| Investment securities sold | - | - | 1,366 | - | - | 36,032 | 1 | |||||||
| Fund shares sold | 72 | 1,213 | 266 | 243 | 847 | 1,415 | 210 | |||||||
| Deposits with brokers | - | - | - | - | - | - | - | |||||||
| Dividends and interest | 15 | 1,189 | 450 | 552 | 728 | 6,725 | - | |||||||
| Forward foreign currency contracts | - | - | - | - | 245 | - | 353 | |||||||
| Variation margin | - | - | - | - | 27 | - | 106 | |||||||
| Foreign taxes recoverable | - | - | - | - | 190 | 6 | - | |||||||
| Other assets | - | - | - | - | - | - | - | |||||||
| Unrealized appreciation on swap agreements | - | - | - | - | - | - | - | |||||||
| Swap premiums paid | - | - | - | - | - | - | - | |||||||
| Unrealized appreciation on unfunded loan commitments | - | - | - | - | - | - | - | |||||||
| Total assets | 17,768 | 947,323 | 545,307 | 570,623 | 770,918 | 906,713 | 67,166 | |||||||
| Liabilities | ||||||||||||||
| Cash overdraft | - | - | - | - | - | - | - | |||||||
| Payables: | ||||||||||||||
| Advisory fees | 5 | 204 | 114 | 114 | 175 | 186 | 49 | |||||||
| Administrative fees | 3 | 76 | 39 | 39 | 92 | 66 | 7 | |||||||
| 12b-1 fee (Class A) | 3 | 151 | 78 | 78 | 120 | 132 | 10 | |||||||
| Investment securities purchased | 325 | 175 | 801 | - | - | 59,401 | 4,103 | |||||||
| Fund shares redeemed | 27 | 1,759 | 1,138 | 621 | 818 | 762 | 40 | |||||||
| Dividends | - | - | - | - | - | - | - | |||||||
| Dividends on securities sold short | - | - | - | - | - | - | - | |||||||
| Interest expense and brokerage charges | - | - | - | - | - | - | - | |||||||
| Trustee fees | - | 20 | 10 | 12 | 14 | 10 | - | |||||||
| Forward foreign currency contracts | - | - | - | - | 836 | - | 513 | |||||||
| Variation margin | - | 340 | 101 | 176 | - | - | 60 | |||||||
| Other expenses | - | 3 | 2 | 17 | 74 | 2 | - | |||||||
| Investment securities sold short / forward | ||||||||||||||
sales commitments, at value (f) | - | �� | - | - | - | - | - | - | ||||||
Options written, at value (g) | - | - | - | - | - | - | - | |||||||
| Unrealized depreciation on swap agreements | - | - | - | - | - | - | - | |||||||
| Swap premiums received | - | - | - | - | - | - | - | |||||||
| Return of collateral for securities loaned | 644 | 33,317 | 68,704 | 95,201 | 28,750 | 50,384 | - | |||||||
| Total liabilities | 1,007 | 36,045 | 70,987 | 96,258 | 30,879 | 110,943 | 4,782 | |||||||
| Net assets | $ 16,761 | $ 911,278 | $ 474,320 | $ 474,365 | $ 740,039 | $ 795,770 | $ 62,384 | |||||||
| Net assets consist of: | ||||||||||||||
| Paid-in capital | $ 15,335 | $ 917,551 | $ 504,521 | $ 497,382 | $ 757,812 | $ 779,886 | $ 62,730 | |||||||
| Undistributed (excess of distributions over) | ||||||||||||||
| net investment income | (18) | 619 | 4,045 | 3,772 | 3,094 | 9,215 | 147 | |||||||
| Accumulated net realized gain (loss) | (118) | (27,188) | (10,329) | (21,309) | (10,115) | (806) | 86 | |||||||
| Net unrealized appreciation (depreciation) on | ||||||||||||||
| investments and foreign currency | 1,562 | 20,296 | (23,917) | (5,480) | (10,752) | 7,475 | (579) | |||||||
| $ 16,761 | $ 911,278 | $ 474,320 | $ 474,365 | $ 740,039 | $ 795,770 | $ 62,384 | ||||||||
| Class A | ||||||||||||||
| Net assets | $ 16,625 | $ 900,282 | $ 469,779 | $ 470,449 | $ 721,755 | $ 793,123 | $ 62,275 | |||||||
| Shares outstanding (no par value), | ||||||||||||||
| unlimited shares authorized | 1,476 | 95,991 | 42,073 | 46,864 | 60,659 | 69,616 | 6,302 | |||||||
| Net asset value per share | $ 11.26 | $ 9.38 | $ 11.17 | $ 10.04 | $ 11.90 | $ 11.39 | $ 9.88 | |||||||
| Class B | ||||||||||||||
| Net assets | $ 136 | $ 10,996 | $ 4,541 | $ 3,916 | $ 18,284 | $ 2,647 | $ 109 | |||||||
| Shares outstanding (no par value), | ||||||||||||||
| unlimited shares authorized | 12 | 1,152 | 402 | 386 | 1,492 | 226 | 11 | |||||||
| Net asset value per share | $ 11.28 | $ 9.54 | $ 11.30 | $ 10.14 | $ 12.26 | $ 11.71 | $ 9.89 | |||||||
(a) Investments - unaffiliated, at cost | $ 15,101 | $ 858,665 | $ 491,323 | $ 466,015 | $ 732,750 | $ 777,679 | $ 60,256 | |||||||
(b) Investments - affiliated, at cost | 1,011 | 66,409 | 75,874 | 109,921 | 45,975 | 77,375 | 6,240 | |||||||
(c) Total investments, at cost | $ 16,112 | $ 925,074 | $ 567,197 | $ 575,936 | $ 778,725 | $ 855,054 | $ 66,496 | |||||||
(d) Including value of securities on loan | 615 | 32,161 | 66,281 | 91,226 | 27,368 | 49,249 | - | |||||||
(e) Foreign currency cost | 7 | - | - | - | 518 | - | - | |||||||
(f) Proceeds from securities sold short / forward | ||||||||||||||
| sales commitments | - | - | - | - | - | - | - | |||||||
(g) Premiums from options written | - | - | - | - | - | - | - | |||||||
See accompanying Notes to Financial Statements.
JNL Series Trust
Statements of Assets and Liabilities (in thousands, except net asset value per share)
December 31, 2009
| JNL/ | JNL/PPM | JNL/PPM | ||||||||||||
| Oppenheimer | JNL/PAM | JNL/PAM | JNL/PIMCO | JNL/PIMCO | America | America | ||||||||
| Global | Asia ex-Japan | China-India | Real Return | Total Return | High Yield | Mid Cap | ||||||||
| Assets | Growth Fund | Fund | Fund | Fund | Bond Fund | Bond Fund | Value Fund | |||||||
Investments - unaffiliated, at value (a) (d) | $ 283,453 | $ 105,532 | $ 225,305 | $ 1,686,944 | $ 2,545,715 | $ 534,719 | $ 19,981 | |||||||
Investments - affiliated, at value (b) | 26,766 | 6,428 | 21,378 | 46,098 | 77,481 | 110,904 | 2,351 | |||||||
Total investments, at value (c) | 310,219 | 111,960 | 246,683 | 1,733,042 | 2,623,196 | 645,623 | 22,332 | |||||||
| Cash | 4 | - | - | - | - | - | - | |||||||
Foreign currency (e) | - | 65 | 28 | 817 | 2,127 | - | - | |||||||
| Receivables: | ||||||||||||||
| Investment securities sold | 23 | 91 | 3,249 | 66,846 | 119,862 | 466 | - | |||||||
| Fund shares sold | 587 | 288 | 1,192 | 2,422 | 3,597 | 815 | 61 | |||||||
| Deposits with brokers | - | - | - | 240 | 356 | - | - | |||||||
| Dividends and interest | 283 | - | 28 | 2,306 | 14,142 | 10,896 | 28 | |||||||
| Forward foreign currency contracts | - | - | - | 989 | 1,761 | - | - | |||||||
| Variation margin | - | - | - | 5 | 13 | - | - | |||||||
| Foreign taxes recoverable | 24 | - | - | 10 | 7 | 2 | - | |||||||
| Other assets | - | - | - | - | - | - | - | |||||||
| Deposits from counterparties | - | - | - | 950 | 6,279 | - | - | |||||||
| Unrealized appreciation on swap agreements | - | - | - | 1,502 | 2,136 | - | - | |||||||
| Swap premiums paid | - | - | - | 1,532 | 1,985 | - | - | |||||||
| Unrealized appreciation on unfunded loan commitments | - | - | - | - | - | - | - | |||||||
| Total assets | 311,140 | 112,404 | 251,180 | 1,810,661 | 2,775,461 | 657,802 | 22,421 | |||||||
| Liabilities | ||||||||||||||
| Cash overdraft | - | - | - | 950 | 5,817 | 20 | - | |||||||
| Payables: | ||||||||||||||
| Advisory fees | 169 | 79 | 172 | 493 | 993 | 218 | 12 | |||||||
| Administrative fees | 36 | 13 | 38 | 99 | 199 | 47 | 2 | |||||||
| 12b-1 fee (Class A) | 48 | 17 | 38 | 199 | 395 | 94 | 3 | |||||||
| Investment securities purchased | 68 | 182 | 3,709 | 565,118 | 261,582 | - | 287 | |||||||
| Fund shares redeemed | 435 | 163 | 660 | 1,866 | 3,999 | 1,012 | 35 | |||||||
| Dividends | - | - | - | - | - | - | - | |||||||
| Dividends on securities sold short | - | - | - | - | - | - | - | |||||||
| Interest expense and brokerage charges | - | - | - | - | - | - | - | |||||||
| Trustee fees | 7 | 1 | 1 | 14 | 33 | 9 | - | |||||||
| Forward foreign currency contracts | - | - | - | 1,275 | 350 | - | - | |||||||
| Variation margin | - | - | - | 14 | 546 | - | - | |||||||
| Deposits from counterparties | - | - | - | 950 | 6,279 | - | - | |||||||
| Other expenses | 1 | - | - | 7 | 7 | 1 | - | |||||||
| Investment in forward sales | ||||||||||||||
commitments, at value (f) | - | - | - | - | 52,342 | - | - | |||||||
Options written, at value (g) | - | - | - | 1,866 | 5,254 | - | - | |||||||
| Unrealized depreciation on swap agreements | - | - | - | 1,836 | 1,888 | - | - | |||||||
| Swap premiums received | - | - | - | 774 | 196 | - | - | |||||||
| Return of collateral for securities loaned | 19,897 | 3,539 | 12,826 | 45,135 | 73,001 | 83,899 | 1,970 | |||||||
| Total liabilities | 20,661 | 3,994 | 17,444 | 620,596 | 412,881 | 85,300 | 2,309 | |||||||
| Net assets | $ 290,479 | $ 108,410 | $ 233,736 | $ 1,190,065 | $ 2,362,580 | $ 572,502 | $ 20,112 | |||||||
| Net assets consist of: | ||||||||||||||
| Paid-in capital | $ 299,926 | $ 99,269 | $ 200,956 | $ 1,162,371 | $ 2,321,378 | $ 611,885 | $ 22,104 | |||||||
| Undistributed (excess of distributions over) | ||||||||||||||
| net investment income | 2,177 | 133 | (94) | 23,571 | 16,042 | 2,997 | 2 | |||||||
| Accumulated net realized gain (loss) | (11,032) | (4,916) | 910 | 20,510 | 19,674 | (74,225) | (5,089) | |||||||
| Net unrealized appreciation (depreciation) on | ||||||||||||||
| investments and foreign currency | (592) | 13,924 | 31,964 | (16,387) | 5,486 | 31,845 | 3,095 | |||||||
| $ 290,479 | $ 108,410 | $ 233,736 | $ 1,190,065 | $ 2,362,580 | $ 572,502 | $ 20,112 | ||||||||
| Class A | ||||||||||||||
| Net assets | $ 289,972 | $ 108,276 | $ 233,497 | $ 1,189,828 | $ 2,348,470 | $ 566,513 | $ 20,020 | |||||||
| Shares outstanding (no par value), | ||||||||||||||
| unlimited shares authorized | 31,729 | 13,301 | 30,268 | 102,840 | 192,610 | 92,167 | 2,426 | |||||||
| Net asset value per share | $ 9.14 | $ 8.14 | $ 7.71 | $ 11.57 | $ 12.19 | $ 6.15 | $ 8.25 | |||||||
| Class B | ||||||||||||||
| Net assets | $ 507 | $ 134 | $ 239 | $ 237 | $ 14,110 | $ 5,989 | $ 92 | |||||||
| Shares outstanding (no par value), | ||||||||||||||
| unlimited shares authorized | 55 | 16 | 31 | 20 | 1,095 | 889 | 11 | |||||||
| Net asset value per share | $ 9.23 | $ 8.15 | $ 7.74 | $ 11.64 | $ 12.89 | $ 6.74 | $ 8.25 | |||||||
(a) Investments - unaffiliated, at cost | $ 284,026 | $ 91,607 | $ 193,340 | $ 1,698,348 | $ 2,543,076 | $ 502,849 | $ 16,886 | |||||||
(b) Investments - affiliated, at cost | 26,784 | 6,429 | 21,379 | 46,098 | 77,481 | 110,929 | 2,351 | |||||||
(c) Total investments, at cost | $ 310,810 | $ 98,036 | $ 214,719 | $ 1,744,446 | $ 2,620,557 | $ 613,778 | $ 19,237 | |||||||
(d) Including value of securities on loan | 19,192 | 3,324 | 12,286 | 44,174 | 71,632 | 80,084 | 1,895 | |||||||
(e) Foreign currency cost | - | 65 | 28 | 832 | 2,125 | - | - | |||||||
(f) Proceeds from forward sales commitments | - | - | - | - | 53,014 | - | - | |||||||
(g) Premiums from options written | - | - | - | 1,908 | 5,028 | - | - | |||||||
See accompanying Notes to Financial Statements.
JNL Series Trust
Statements of Assets and Liabilities (in thousands, except net asset value per share)
December 31, 2009
| JNL/PPM | JNL/S&P | JNL/S&P | JNL/S&P | |||||||||||
| America | JNL/PPM | JNL/Red Rocks | Managed | Managed | Managed | JNL/S&P | ||||||||
| Small Cap | America Value | Listed Private | Conservative | Moderate | Moderate | Managed | ||||||||
| Assets | Value Fund | Equity Fund | Equity Fund | Fund | Fund | Growth Fund | Growth Fund | |||||||
Investments - unaffiliated, at value (a) (d) | $ 19,607 | $ 93,837 | $ 220,287 | $ - | $ - | $ - | $ - | |||||||
Investments - affiliated, at value (b) | 2,254 | 6,078 | 13,182 | 624,057 | 1,021,484 | 1,775,234 | 1,479,977 | |||||||
Total investments, at value (c) | 21,861 | 99,915 | 233,469 | 624,057 | 1,021,484 | 1,775,234 | 1,479,977 | |||||||
| Cash | - | - | 1,304 | - | - | - | - | |||||||
Foreign currency (e) | - | - | 1,081 | - | - | - | - | |||||||
| Receivables: | ||||||||||||||
| Investment securities sold | 112 | - | 1,095 | - | - | - | - | |||||||
| Fund shares sold | 28 | 62 | 471 | 838 | 1,114 | 5,247 | 2,118 | |||||||
| Deposits with brokers | - | - | - | - | - | - | - | |||||||
| Dividends and interest | 24 | 145 | 234 | - | - | - | - | |||||||
| Forward foreign currency contracts | - | - | - | - | - | - | - | |||||||
| Variation margin | - | - | - | - | - | - | - | |||||||
| Foreign taxes recoverable | - | - | 40 | - | - | - | - | |||||||
| Other assets | - | - | - | 1 | - | - | - | |||||||
| Unrealized appreciation on swap agreements | - | - | - | - | - | - | - | |||||||
| Swap premiums paid | - | - | - | - | - | - | - | |||||||
| Unrealized appreciation on unfunded loan commitments | - | - | - | - | - | - | - | |||||||
| Total assets | 22,025 | 100,122 | 237,694 | 624,896 | 1,022,598 | 1,780,481 | 1,482,095 | |||||||
| Liabilities | ||||||||||||||
| Cash overdraft | - | - | - | - | - | - | - | |||||||
| Payables: | ||||||||||||||
| Advisory fees | 12 | 43 | 152 | 63 | 89 | 139 | 120 | |||||||
| Administrative fees | 2 | 8 | 27 | 26 | 43 | 73 | 62 | |||||||
| 12b-1 fee (Class A) | 2 | 16 | 36 | - | - | - | - | |||||||
| Investment securities purchased | 152 | 283 | 6,413 | 394 | 346 | 3,915 | 552 | |||||||
| Fund shares redeemed | 18 | 51 | 159 | 444 | 767 | 1,332 | 1,566 | |||||||
| Dividends | - | - | - | - | - | - | - | |||||||
| Dividends on securities sold short | - | - | - | - | - | - | - | |||||||
| Interest expense and brokerage charges | - | - | - | - | - | - | - | |||||||
| Trustee fees | - | 5 | 1 | 9 | 15 | 33 | 32 | |||||||
| Forward foreign currency contracts | - | - | - | - | - | - | - | |||||||
| Variation margin | - | - | - | - | - | - | - | |||||||
| Other expenses | - | - | - | 2 | 3 | 5 | 4 | |||||||
| Investment securities sold short / forward | ||||||||||||||
sales commitments, at value (f) | - | - | - | - | - | - | - | |||||||
Options written, at value (g) | - | - | - | - | - | - | - | |||||||
| Unrealized depreciation on swap agreements | - | - | - | - | - | - | - | |||||||
| Swap premiums received | - | - | - | - | - | - | - | |||||||
| Return of collateral for securities loaned | 2,128 | 5,381 | 6,877 | - | - | - | - | |||||||
| Total liabilities | 2,314 | 5,787 | 13,665 | �� 938 | 1,263 | 5,497 | 2,336 | |||||||
| Net assets | $ 19,711 | $ 94,335 | $ 224,029 | $ 623,958 | $ 1,021,335 | $ 1,774,984 | $ 1,479,759 | |||||||
| Net assets consist of: | ||||||||||||||
| Paid-in capital | $ 19,803 | $ 209,700 | $ 200,632 | $ 646,239 | $ 1,069,793 | $ 1,879,077 | $ 1,632,873 | |||||||
| Undistributed (excess of distributions over) | ||||||||||||||
| net investment income | 3 | 1,221 | (4,068) | 9,756 | 15,205 | 30,911 | 17,970 | |||||||
| Accumulated net realized gain (loss) | (2,840) | (134,592) | 277 | (23,839) | (34,597) | (38,849) | (49,443) | |||||||
| Net unrealized appreciation (depreciation) on | ||||||||||||||
| investments and foreign currency | 2,745 | 18,006 | 27,188 | (8,198) | (29,066) | (96,155) | (121,641) | |||||||
| $ 19,711 | $ 94,335 | $ 224,029 | $ 623,958 | $ 1,021,335 | $ 1,774,984 | $ 1,479,759 | ||||||||
| Class A | ||||||||||||||
| Net assets | $ 15,861 | $ 93,660 | $ 223,873 | $ 623,958 | $ 1,021,335 | $ 1,774,984 | $ 1,479,759 | |||||||
| Shares outstanding (no par value), | ||||||||||||||
| unlimited shares authorized | 1,894 | 8,953 | 27,886 | 60,339 | 98,106 | 168,403 | 152,327 | |||||||
| Net asset value per share | $ 8.37 | $ 10.46 | $ 8.03 | $ 10.34 | $ 10.41 | $ 10.54 | $ 9.71 | |||||||
| Class B | ||||||||||||||
| Net assets | $ 3,850 | $ 675 | $ 156 | n/a | n/a | n/a | n/a | |||||||
| Shares outstanding (no par value), | ||||||||||||||
| unlimited shares authorized | 459 | 64 | 19 | n/a | n/a | n/a | n/a | |||||||
| Net asset value per share | $ 8.38 | $ 10.50 | $ 8.04 | n/a | n/a | n/a | n/a | |||||||
(a) Investments - unaffiliated, at cost | $ 16,862 | $ 75,826 | $ 193,098 | $ - | $ - | $ - | $ - | |||||||
(b) Investments - affiliated, at cost | 2,254 | 6,083 | 13,182 | 632,255 | 1,050,550 | 1,871,389 | 1,601,618 | |||||||
(c) Total investments, at cost | $ 19,116 | $ 81,909 | $ 206,280 | $ 632,255 | $ 1,050,550 | $ 1,871,389 | $ 1,601,618 | |||||||
(d) Including value of securities on loan | 2,019 | 5,180 | 6,577 | - | - | - | - | |||||||
(e) Foreign currency cost | - | - | 1,077 | - | - | - | - | |||||||
(f) Proceeds from securities sold short / forward | ||||||||||||||
| sales commitments | - | - | - | - | - | - | - | |||||||
(g) Premiums from options written | - | - | - | - | - | - | - | |||||||
See accompanying Notes to Financial Statements.
JNL Series Trust
Statements of Assets and Liabilities (in thousands, except net asset value per share)
December 31, 2009
| JNL/S&P | JNL/S&P | JNL/S&P | ||||||||||||
| Managed | Disciplined | Disciplined | JNL/S&P | JNL/S&P | JNL/S&P | JNL/S&P | ||||||||
| Aggressive | Moderate | Moderate | Disciplined | Competitive | Dividend Income | Intrinsic | ||||||||
| Assets | Growth Fund | Fund | Growth Fund | Growth Fund | Advantage Fund | & Growth Fund | Value Fund | |||||||
Investments - unaffiliated, at value (a) (d) | $ - | $ 1 | $ - | $ 1 | $ 253,782 | $ 238,549 | $ 245,227 | |||||||
Investments - affiliated, at value (b) | 582,971 | 168,480 | 206,398 | 80,875 | 8,285 | 11,532 | 11,204 | |||||||
Total investments, at value (c) | 582,971 | 168,481 | 206,398 | 80,876 | 262,067 | 250,081 | 256,431 | |||||||
| Cash | - | - | - | - | 3 | - | 2 | |||||||
Foreign currency (e) | - | - | - | - | - | - | - | |||||||
| Receivables: | ||||||||||||||
| Adviser reimbursement | - | - | - | - | - | - | - | |||||||
| Investment securities sold | - | 172 | 494 | 12 | - | - | - | |||||||
| Fund shares sold | 820 | 111 | 361 | 33 | 1,067 | 544 | 1,641 | |||||||
| Deposits with brokers | - | - | - | - | - | - | - | |||||||
| Dividends and interest | - | - | - | - | 483 | 669 | 407 | |||||||
| Forward foreign currency contracts | - | - | - | - | - | - | - | |||||||
| Variation margin | - | - | - | - | - | - | - | |||||||
| Foreign taxes recoverable | - | - | - | - | - | - | - | |||||||
| Other assets | - | - | - | - | - | - | - | |||||||
| Unrealized appreciation on swap agreements | - | - | - | - | - | - | - | |||||||
| Swap premiums paid | - | - | - | - | - | - | - | |||||||
| Unrealized appreciation on unfunded loan commitments | - | - | - | - | - | - | - | |||||||
| Total assets | 583,791 | 168,764 | 207,253 | 80,921 | 263,620 | 251,294 | 258,481 | |||||||
| Liabilities | ||||||||||||||
| Cash overdraft | - | - | - | - | - | - | - | |||||||
| Payables: | ||||||||||||||
| Advisory fees | 60 | 18 | 22 | 9 | 86 | 79 | 82 | |||||||
| Administrative fees | 24 | 7 | 9 | 3 | 21 | 20 | 20 | |||||||
| 12b-1 fee (Class A) | - | - | - | - | 43 | 39 | 41 | |||||||
| Investment securities purchased | 205 | - | - | - | 778 | 1,047 | 2,104 | |||||||
| Fund shares redeemed | 616 | 283 | 855 | 45 | 300 | 271 | 450 | |||||||
| Dividends | - | - | - | - | - | - | - | |||||||
| Dividends on securities sold short | - | - | - | - | - | - | - | |||||||
| Interest expense and brokerage charges | - | - | - | - | - | - | - | |||||||
| Trustee fees | 16 | 1 | 2 | 1 | 2 | 1 | 2 | |||||||
| Forward foreign currency contracts | - | - | - | - | - | - | - | |||||||
| Variation margin | - | - | - | - | - | - | - | |||||||
| Other expenses | 2 | - | - | - | 1 | - | 1 | |||||||
| Investment securities sold short / forward | ||||||||||||||
sales commitments, at value (f) | - | - | - | - | - | - | - | |||||||
Options written, at value (g) | - | - | - | - | - | - | - | |||||||
| Unrealized depreciation on swap agreements | - | - | - | - | - | - | - | |||||||
| Swap premiums received | - | - | - | - | - | - | - | |||||||
| Return of collateral for securities loaned | - | - | - | - | 7,644 | 10,287 | 9,095 | |||||||
| Total liabilities | 923 | 309 | 888 | 58 | 8,875 | 11,744 | 11,795 | |||||||
| Net assets | $ 582,868 | $ 168,455 | $ 206,365 | $ 80,863 | $ 254,745 | $ 239,550 | $ 246,686 | |||||||
| Net assets consist of: | ||||||||||||||
| Paid-in capital | $ 693,280 | $ 168,508 | $ 210,626 | $ 81,254 | $ 224,022 | $ 218,895 | $ 209,475 | |||||||
| Undistributed (excess of distributions over) | ||||||||||||||
| net investment income | 4,931 | 2,774 | 3,418 | 1,408 | 2,217 | 4,709 | 2,231 | |||||||
| Accumulated net realized gain (loss) | (47,959) | (5,977) | (16,949) | (10,560) | 8,625 | 6,586 | 25,085 | |||||||
| Net unrealized appreciation (depreciation) on | ||||||||||||||
| investments and foreign currency | (67,384) | 3,150 | 9,270 | 8,761 | 19,881 | 9,360 | 9,895 | |||||||
| $ 582,868 | $ 168,455 | $ 206,365 | $ 80,863 | $ 254,745 | $ 239,550 | $ 246,686 | ||||||||
| Class A | ||||||||||||||
| Net assets | $ 582,868 | $ 168,455 | $ 206,365 | $ 80,863 | $ 254,695 | $ 239,392 | $ 246,578 | |||||||
| Shares outstanding (no par value), | ||||||||||||||
| unlimited shares authorized | 55,747 | 18,845 | 25,468 | 10,578 | 25,587 | 27,545 | 25,302 | |||||||
| Net asset value per share | $ 10.46 | $ 8.94 | $ 8.10 | $ 7.64 | $ 9.95 | $ 8.69 | $ 9.75 | |||||||
| Class B | ||||||||||||||
| Net assets | n/a | n/a | n/a | n/a | $ 50 | $ 158 | $ 108 | |||||||
| Shares outstanding (no par value), | ||||||||||||||
| unlimited shares authorized | n/a | n/a | n/a | n/a | 5 | 18 | 11 | |||||||
| Net asset value per share | n/a | n/a | n/a | n/a | $ 9.94 | $ 8.70 | $ 9.80 | |||||||
(a) Investments - unaffiliated, at cost | $ - | $ - | $ - | $ - | $ 233,894 | $ 229,180 | $ 235,322 | |||||||
(b) Investments - affiliated, at cost | 650,355 | 165,331 | 197,128 | 72,115 | 8,292 | 11,541 | 11,214 | |||||||
(c) Total investments, at cost | $ 650,355 | $ 165,331 | $ 197,128 | $ 72,115 | $ 242,186 | $ 240,721 | $ 246,536 | |||||||
(d) Including value of securities on loan | - | - | - | - | 7,373 | 9,996 | 8,779 | |||||||
(e) Foreign currency cost | - | - | - | - | - | - | - | |||||||
(f) Proceeds from securities sold short / forward | ||||||||||||||
| sales commitments | - | - | - | - | - | - | - | |||||||
(g) Premiums from options written | - | - | - | - | - | - | - | |||||||
See accompanying Notes to Financial Statements.
JNL Series Trust
Statements of Assets and Liabilities (in thousands, except net asset value per share)
December 31, 2009
| JNL/T. Rowe | JNL/T. Rowe | |||||||||||||
| JNL/S&P | JNL/Select | JNL/Select | Price | Price | ||||||||||
| Total | JNL/S&P 4 | Balanced | Money | JNL/Select | Established | Mid-Cap | ||||||||
| Assets | Yield Fund | Fund | Fund | Market Fund | Value Fund | Growth Fund | Growth Fund | |||||||
Investments - unaffiliated, at value (a) (d) | $ 213,116 | $ - | $ 710,338 | $ 1,145,943 | $ 752,575 | $ 939,418 | $ 802,736 | |||||||
Investments - affiliated, at value (b) | 27,668 | 627,441 | 78,770 | - | 55,096 | 51,955 | 171,981 | |||||||
Total investments, at value (c) | 240,784 | 627,441 | 789,108 | 1,145,943 | 807,671 | 991,373 | 974,717 | |||||||
| Cash | 1 | - | - | - | - | - | - | |||||||
Foreign currency (e) | - | - | - | - | - | 71 | - | |||||||
| Receivables: | ||||||||||||||
| Adviser reimbursement | - | - | - | 423 | - | - | - | |||||||
| Investment securities sold | - | 258 | 24,592 | - | 1,296 | - | 1,487 | |||||||
| Fund shares sold | 229 | 614 | 1,733 | 5,266 | 1,039 | 2,328 | 1,464 | |||||||
| Deposits with brokers | - | - | - | - | - | - | - | |||||||
| Dividends and interest | 335 | - | 2,123 | 743 | 1,027 | 536 | 190 | |||||||
| Forward foreign currency contracts | - | - | - | - | - | - | - | |||||||
| Variation margin | - | - | - | - | - | - | - | |||||||
| Foreign taxes recoverable | - | - | 49 | - | 25 | 8 | - | |||||||
| Other assets | - | - | - | - | - | - | - | |||||||
| Unrealized appreciation on swap agreements | - | - | - | - | - | - | - | |||||||
| Swap premiums paid | - | - | - | - | - | - | - | |||||||
| Unrealized appreciation on unfunded loan commitments | - | - | - | - | - | - | - | |||||||
| Total assets | 241,349 | 628,313 | 817,605 | 1,152,375 | 811,058 | 994,316 | 977,858 | |||||||
| Liabilities | ||||||||||||||
| Cash overdraft | - | - | - | - | - | - | - | |||||||
| Payables: | ||||||||||||||
| Advisory fees | 71 | - | 284 | 259 | 327 | 458 | 497 | |||||||
| Administrative fees | 18 | 26 | 61 | 98 | 65 | 78 | 70 | |||||||
| 12b-1 fee (Class A) | 36 | - | 123 | 196 | 128 | 152 | 135 | |||||||
| Investment securities purchased | 841 | - | 38,401 | - | 462 | 2,662 | 1,913 | |||||||
| Fund shares redeemed | 270 | 873 | 1,322 | 4,013 | 1,240 | 933 | 1,010 | |||||||
| Dividends | - | - | - | - | - | - | - | |||||||
| Dividends on securities sold short | - | - | - | - | - | - | - | |||||||
| Interest expense and brokerage charges | - | - | - | - | - | - | - | |||||||
| Trustee fees | 2 | 5 | 14 | 23 | 14 | 24 | 17 | |||||||
| Forward foreign currency contracts | - | - | - | - | - | - | - | |||||||
| Variation margin | - | - | - | - | - | - | - | |||||||
| Other expenses | 1 | 4 | 2 | 5 | 3 | 3 | 3 | |||||||
| Investment securities sold short / forward | ||||||||||||||
sales commitments, at value (f) | - | - | - | - | - | - | - | |||||||
Options written, at value (g) | - | - | - | - | - | - | - | |||||||
| Unrealized depreciation on swap agreements | - | - | - | - | - | - | - | |||||||
| Swap premiums received | - | - | - | - | - | - | - | |||||||
| Return of collateral for securities loaned | 27,074 | - | 39,679 | - | 32,586 | 43,150 | 124,947 | |||||||
| Total liabilities | 28,313 | 908 | 79,886 | 4,594 | 34,825 | 47,460 | 128,592 | |||||||
| Net assets | $ 213,036 | $ 627,405 | $ 737,719 | $ 1,147,781 | $ 776,233 | $ 946,856 | $ 849,266 | |||||||
| Net assets consist of: | ||||||||||||||
| Paid-in capital | $ 197,793 | $ 547,130 | $ 721,874 | $ 1,147,781 | $ 810,389 | $ 1,007,312 | $ 780,034 | |||||||
| Undistributed (excess of distributions over) | ||||||||||||||
| net investment income | 1,965 | (4) | 13,925 | (3) | 9,584 | 539 | (16) | |||||||
| Accumulated net realized gain (loss) | 1,393 | (18,791) | (49,781) | 3 | (104,043) | (198,548) | (30,288) | |||||||
| Net unrealized appreciation (depreciation) on | ||||||||||||||
| investments and foreign currency | 11,885 | 99,070 | 51,701 | - | 60,303 | 137,553 | 99,536 | |||||||
| $ 213,036 | $ 627,405 | $ 737,719 | $ 1,147,781 | $ 776,233 | $ 946,856 | $ 849,266 | ||||||||
| Class A | ||||||||||||||
| Net assets | $ 212,981 | $ 627,405 | $ 736,864 | $ 1,140,511 | $ 762,013 | $ 916,445 | $ 820,894 | |||||||
| Shares outstanding (no par value), | ||||||||||||||
| unlimited shares authorized | 23,410 | 65,706 | 49,080 | 1,140,508 | 49,439 | 50,415 | 34,510 | |||||||
| Net asset value per share | $ 9.10 | $ 9.55 | $ 15.01 | $ 1.00 | $ 15.41 | $ 18.18 | $ 23.79 | |||||||
| Class B | ||||||||||||||
| Net assets | $ 55 | n/a | $ 855 | $ 7,270 | $ 14,220 | $ 30,411 | $ 28,372 | |||||||
| Shares outstanding (no par value), | ||||||||||||||
| unlimited shares authorized | 6 | n/a | 56 | 7,270 | 908 | 1,655 | 1,173 | |||||||
| Net asset value per share | $ 9.11 | n/a | $ 15.29 | $ 1.00 | $ 15.65 | $ 18.37 | $ 24.19 | |||||||
(a) Investments - unaffiliated, at cost | $ 201,209 | $ - | $ 658,599 | $ 1,145,943 | $ 692,266 | $ 801,817 | $ 703,094 | |||||||
(b) Investments - affiliated, at cost | 27,690 | 528,371 | 78,808 | - | 55,102 | 52,005 | 172,088 | |||||||
(c) Total investments, at cost | $ 228,899 | $ 528,371 | $ 737,407 | $ 1,145,943 | $ 747,368 | $ 853,822 | $ 875,182 | |||||||
(d) Including value of securities on loan | 26,226 | - | 38,651 | - | 31,479 | 41,738 | 120,778 | |||||||
(e) Foreign currency cost | - | - | - | - | - | 69 | - | |||||||
(f) Proceeds from securities sold short / forward | ||||||||||||||
| sales commitments | - | - | - | - | - | - | - | |||||||
(g) Premiums from options written | - | - | - | - | - | - | - | |||||||
See accompanying Notes to Financial Statements.
JNL Series Trust
Statements of Assets and Liabilities (in thousands, except net asset value per share)
December 31, 2009
| JNL/T. Rowe | |||||
| Price Short- | JNL/T. Rowe | ||||
| Term Bond | Price | ||||
| Assets | Fund | Value Fund | |||
Investments - unaffiliated, at value (a) (d) | $ 453,521 | $ 698,667 | |||
Investments - affiliated, at value (b) | 40,924 | 68,414 | |||
Total investments, at value (c) | 494,445 | 767,081 | |||
| Cash | 49 | - | |||
Foreign currency (e) | - | - | |||
| Receivables: | |||||
| Investment securities sold | 74 | - | |||
| Fund shares sold | 859 | 1,519 | |||
| Deposits with brokers | - | - | |||
| Dividends and interest | 3,664 | 885 | |||
| Forward foreign currency contracts | - | - | |||
| Variation margin | - | - | |||
| Foreign taxes recoverable | 5 | 69 | |||
| Other assets | - | - | |||
| Unrealized appreciation on swap agreements | - | - | |||
| Swap premiums paid | - | - | |||
| Unrealized appreciation on unfunded loan commitments | - | - | |||
| Total assets | 499,096 | 769,554 | |||
| Liabilities | |||||
| Cash overdraft | - | - | |||
| Payables: | |||||
| Advisory fees | 174 | 394 | |||
| Administrative fees | 41 | 61 | |||
| 12b-1 fee (Class A) | 82 | 122 | |||
| Investment securities purchased | 898 | 5,190 | |||
| Fund shares redeemed | 688 | 1,220 | |||
| Dividends | - | - | |||
| Dividends on securities sold short | - | - | |||
| Interest expense and brokerage charges | - | - | |||
| Trustee fees | 8 | 16 | |||
| Forward foreign currency contracts | 81 | - | |||
| Variation margin | - | - | |||
| Other expenses | 2 | 2 | |||
| Investment securities sold short / forward | |||||
sales commitments, at value (f) | - | - | |||
Options written, at value (g) | - | - | |||
| Unrealized depreciation on swap agreements | - | - | |||
| Swap premiums received | - | - | |||
| Return of collateral for securities loaned | 12,079 | 34,328 | |||
| Total liabilities | 14,053 | 41,333 | |||
| Net assets | $ 485,043 | $ 728,221 | |||
| Net assets consist of: | |||||
| Paid-in capital | $ 496,511 | $ 798,563 | |||
| Undistributed (excess of distributions over) | |||||
| net investment income | 9,862 | 9,943 | |||
| Accumulated net realized gain (loss) | (20,439) | (86,805) | |||
| Net unrealized appreciation (depreciation) on | |||||
| investments and foreign currency | (891) | 6,520 | |||
| $ 485,043 | $ 728,221 | ||||
| Class A | |||||
| Net assets | $ 484,832 | $ 727,672 | |||
| Shares outstanding (no par value), | |||||
| unlimited shares authorized | 49,950 | 77,076 | |||
| Net asset value per share | $ 9.71 | $ 9.44 | |||
| Class B | |||||
| Net assets | $ 211 | $ 549 | |||
| Shares outstanding (no par value), | |||||
| unlimited shares authorized | 22 | 57 | |||
| Net asset value per share | $ 9.76 | $ 9.67 | |||
(a) Investments - unaffiliated, at cost | $ 454,299 | $ 693,319 | |||
(b) Investments - affiliated, at cost | 40,946 | 67,241 | |||
(c) Total investments, at cost | $ 495,245 | $ 760,560 | |||
(d) Including value of securities on loan | 11,824 | 33,077 | |||
(e) Foreign currency cost | - | - | |||
(f) Proceeds from securities sold short / forward | |||||
| sales commitments | - | - | |||
(g) Premiums from options written | - | - | |||
See accompanying Notes to Financial Statements.
JNL Series Trust
Statements of Operations (in thousands)
For the Year Ended December 31, 2009
| JNL | JNL | JNL | JNL | JNL/AIM | JNL/AIM | JNL/AIM | ||||||||
| Institutional Alt | Institutional Alt | Institutional Alt | Institutional Alt | International | Large Cap | Global Real | ||||||||
20 Fund (b) | 35 Fund (b) | 50 Fund (b) | 65 Fund (b) | Growth Fund | Growth Fund | Estate Fund | ||||||||
| Investment income | ||||||||||||||
Dividends (a) | $ 2,816 | $ 4,443 | $ 5,336 | $ 3,117 | $ 7,556 | $ 6,378 | $ 8,175 | |||||||
| Foreign taxes withheld | - | - | - | - | (909) | (78) | (477) | |||||||
| Interest | - | - | - | - | 825 | - | 19 | |||||||
| Securities lending | - | - | - | - | 330 | 195 | 217 | |||||||
| Total investment income | 2,816 | 4,443 | 5,336 | 3,117 | 7,802 | 6,495 | 7,934 | |||||||
| Expenses | ||||||||||||||
| Advisory fees | 82 | 135 | 151 | 94 | 2,041 | 3,034 | 1,468 | |||||||
| Administrative fees | 27 | 45 | 51 | 31 | 454 | 455 | 309 | |||||||
| 12b-1 fee (Class A) | - | - | - | - | 603 | 910 | 412 | |||||||
| Legal fees | - | - | - | - | 3 | 5 | 2 | |||||||
| Trustee fees | 1 | 2 | 2 | 1 | 11 | 16 | 7 | |||||||
| License fees | - | - | - | - | - | - | - | |||||||
| Dividends on securities sold short | - | - | - | - | - | - | - | |||||||
| Short holdings borrowing fees | - | - | - | - | - | - | - | |||||||
| Other expenses | 1 | 1 | 1 | 1 | 27 | 10 | 4 | |||||||
| Total expenses | 111 | 183 | 205 | 127 | 3,139 | 4,430 | 2,202 | |||||||
| Net investment income (loss) | 2,705 | 4,260 | 5,131 | 2,990 | 4,663 | 2,065 | 5,732 | |||||||
| Realized and unrealized gain (loss) | ||||||||||||||
| Net realized gain (loss) on: | ||||||||||||||
| Unaffiliated investments | - | - | - | - | (44,395) | (30,746) | (11,966) | |||||||
| Affiliated investments | 194 | 718 | 1,471 | 1,789 | - | - | - | |||||||
| Distributions from affiliated investment companies | 48 | 76 | 103 | 68 | - | - | - | |||||||
| Swaps agreements | - | - | - | - | - | - | - | |||||||
| Foreign currency related items | - | - | - | - | (257) | 116 | (564) | |||||||
| Futures contracts | - | �� - | - | - | - | - | - | |||||||
| Option contracts | - | - | - | - | - | - | - | |||||||
| Investment securities sold short | - | - | - | - | - | - | - | |||||||
| Brokerage commissions recaptured | - | - | - | - | 14 | 16 | 29 | |||||||
| Net change in unrealized appreciation or depreciation on: | ||||||||||||||
| Investments | 8,997 | 17,516 | 17,922 | 10,341 | 136,320 | 138,507 | 74,273 | |||||||
| Swap agreements | - | - | - | - | - | - | - | |||||||
| Foreign currency related items | - | - | - | - | 541 | 4 | 9 | |||||||
| Futures contracts | - | - | - | - | - | - | - | |||||||
| Option contracts | - | - | - | - | - | - | - | |||||||
| Investment securities sold short | - | - | - | - | - | - | - | |||||||
| Net realized and unrealized gain (loss) | 9,239 | 18,310 | 19,496 | 12,198 | 92,223 | 107,897 | 61,781 | |||||||
| Net increase (decrease) in net assets from operations | $ 11,944 | $ 22,570 | $ 24,627 | $ 15,188 | $ 96,886 | $ 109,962 | $ 67,513 | |||||||
(a) Dividends from affiliated investments | $ 2,816 | $ 4,443 | $ 5,336 | $ 3,117 | $ 149 | $ 202 | $ 45 | |||||||
| (b) Period from April 6, 2009 (commencement of operations) | ||||||||||||||
See accompanying Notes to Financial Statements.
JNL Series Trust
Statements of Operations (in thousands)
For the Year Ended December 31, 2009
| JNL/Capital | JNL/Capital | JNL/Capital | JNL/Capital | JNL/Credit | ||||||||||
| JNL/AIM | Guardian | Guardian | Guardian | Guardian | Suisse | JNL/Credit | ||||||||
| Small Cap | Global Balanced | Global Diversified | International Small | U.S. Growth | Commodity | Suisse Long/ | ||||||||
| Growth Fund | Fund | Research Fund | Cap Fund | Equity Fund | Securities Fund | Short Fund | ||||||||
| Investment income | ||||||||||||||
Dividends (a) | $ 505 | $ 3,015 | $ 4,674 | $ 1,618 | $ 5,136 | $ 7,671 | $ 1,743 | |||||||
| Foreign taxes withheld | - | (247) | (377) | (147) | (17) | (687) | - | |||||||
| Interest | - | 3,131 | 48 | 14 | - | 211 | - | |||||||
| Securities lending | 90 | 229 | 246 | 100 | 260 | 182 | - | |||||||
| Total investment income | 595 | 6,128 | 4,591 | 1,585 | 5,379 | 7,377 | 1,743 | |||||||
| Expenses | ||||||||||||||
| Advisory fees | 515 | 1,376 | 1,630 | 771 | 2,331 | 2,590 | 554 | |||||||
| Administrative fees | 61 | 317 | 333 | 122 | 347 | 578 | 104 | |||||||
| 12b-1 fee (Class A) | 121 | 423 | 444 | 162 | 694 | 770 | 138 | |||||||
| Legal fees | 1 | 2 | 2 | 1 | 4 | 4 | 1 | |||||||
| Trustee fees | 2 | 8 | 8 | 2 | 11 | 12 | 2 | |||||||
| License fees | - | - | - | - | - | - | - | |||||||
| Dividends on securities sold short | - | - | - | - | - | - | 202 | |||||||
| Short holdings borrowing fees | - | - | - | - | - | - | 58 | |||||||
| Other expenses | 1 | 12 | 7 | 2 | 5 | 13 | 4 | |||||||
| Total expenses | 701 | 2,138 | 2,424 | 1,060 | 3,392 | 3,967 | 1,063 | |||||||
| Net investment income (loss) | (106) | 3,990 | 2,167 | 525 | 1,987 | 3,410 | 680 | |||||||
| Realized and unrealized gain (loss) | ||||||||||||||
| Net realized gain (loss) on: | ||||||||||||||
| Unaffiliated investments | (602) | (27,759) | (41,538) | (11,620) | (53,070) | (97,891) | 17,529 | |||||||
| Affiliated investments | - | - | - | - | - | - | - | |||||||
| Distributions from affiliated investment companies | - | - | - | - | - | - | - | |||||||
| Swaps agreements | - | - | - | - | - | - | - | |||||||
| Foreign currency related items | - | (236) | (132) | 113 | - | (907) | - | |||||||
| Futures contracts | - | - | - | - | - | - | - | |||||||
| Option contracts | - | - | - | - | - | - | - | |||||||
| Investment securities sold short | - | - | - | - | - | - | (3,817) | |||||||
| Brokerage commissions recaptured | 4 | 13 | 21 | 1 | 21 | - | - | |||||||
| Net change in unrealized appreciation or depreciation on: | ||||||||||||||
| Investments | 19,603 | 68,304 | 109,236 | 42,879 | 164,017 | 248,981 | 7,681 | |||||||
| Swap agreements | - | - | - | - | - | - | - | |||||||
| Foreign currency related items | - | (82) | (10) | (497) | - | 33 | - | |||||||
| Futures contracts | - | - | - | - | - | - | - | |||||||
| Option contracts | - | - | - | - | - | - | - | |||||||
| Investment securities sold short | - | - | - | - | - | - | (1,735) | |||||||
| Net realized and unrealized gain (loss) | 19,005 | 40,240 | 67,577 | 30,876 | 110,968 | 150,216 | 19,658 | |||||||
| Net increase (decrease) in net assets from operations | $ 18,899 | $ 44,230 | $ 69,744 | $ 31,401 | $ 112,955 | $ 153,626 | $ 20,338 | |||||||
| �� | ||||||||||||||
(a) Dividends from affiliated investments | $ 20 | $ 41 | $ 58 | $ 46 | $ 119 | $ 97 | $ 4 | |||||||
See accompanying Notes to Financial Statements.
JNL Series Trust
Statements of Operations (in thousands)
For the Year Ended December 31, 2009
| JNL/Franklin | JNL/Franklin | JNL/Franklin | ||||||||||||
| JNL/Eagle | JNL/Eagle | Templeton | Templeton | JNL/Franklin | Templeton | JNL/Franklin | ||||||||
| Core Equity | SmallCap | Founding | Global Growth | Templeton | Mutual Shares | Templeton Small | ||||||||
| Fund | Equity Fund | Strategy Fund | Fund | Income Fund | Fund | Cap Value Fund | ||||||||
| Investment income | ||||||||||||||
Dividends (a) | $ 1,079 | $ 2,330 | $ 27,785 | $ 7,859 | $ 8,244 | $ 7,359 | $ 2,273 | |||||||
| Foreign taxes withheld | - | (7) | - | (609) | (56) | (443) | - | |||||||
| Interest | - | - | - | 7 | 31,941 | 1,055 | - | |||||||
| Securities lending | 5 | 432 | - | 226 | 426 | 25 | 130 | |||||||
| Total investment income | 1,084 | 2,755 | 27,785 | 7,483 | 40,555 | 7,996 | 2,403 | |||||||
| Expenses | ||||||||||||||
| Advisory fees | 392 | 1,459 | - | 2,075 | 3,726 | 2,313 | 1,000 | |||||||
| Administrative fees | 60 | 201 | 330 | 418 | 540 | 308 | 118 | |||||||
| 12b-1 fee (Class A) | 120 | 402 | - | 557 | 1,079 | 616 | 235 | |||||||
| Legal fees | 1 | 2 | 7 | 3 | 6 | 5 | 1 | |||||||
| Trustee fees | 2 | 7 | 24 | 10 | 19 | 11 | 4 | |||||||
| License fees | - | - | - | - | - | - | - | |||||||
| Dividends on securities sold short | - | - | - | - | - | 154 | - | |||||||
| Short holdings borrowing fees | - | - | - | - | - | 3 | - | |||||||
| Other expenses | 1 | 6 | 15 | 9 | 18 | 12 | 2 | |||||||
| Total expenses | 576 | 2,077 | 376 | 3,072 | 5,388 | 3,422 | 1,360 | |||||||
| Net investment income (loss) | 508 | 678 | 27,409 | 4,411 | 35,167 | 4,574 | 1,043 | |||||||
| Realized and unrealized gain (loss) | ||||||||||||||
| Net realized gain (loss) on: | ||||||||||||||
| Unaffiliated investments | (4,032) | (16,619) | - | (21,087) | (35,867) | (33,405) | (4,734) | |||||||
| Affiliated investments | - | - | (19,615) | - | - | - | - | |||||||
| Distributions from affiliated investment companies | - | - | - | - | - | - | - | |||||||
| Swaps agreements | - | - | - | - | - | - | - | |||||||
| Foreign currency related items | - | - | - | 592 | (34) | (5,713) | - | |||||||
| Futures contracts | - | - | - | - | - | - | - | |||||||
| Option contracts | - | - | - | - | - | (854) | - | |||||||
| Investment securities sold short | - | - | - | - | - | (874) | - | |||||||
| Brokerage commissions recaptured | 8 | 89 | - | 2 | 3 | - | - | |||||||
| Net change in unrealized appreciation or depreciation on: | ||||||||||||||
| Investments | 20,688 | 82,194 | 172,514 | 95,240 | 158,011 | 112,449 | 39,541 | |||||||
| Swap agreements | - | - | - | - | - | - | - | |||||||
| Foreign currency related items | - | - | - | (112) | (17) | 2,244 | - | |||||||
| Futures contracts | - | - | - | - | - | - | - | |||||||
| Option contracts | - | - | - | - | - | (16) | - | |||||||
| Investment securities sold short | - | - | - | - | - | - | - | |||||||
| Net realized and unrealized gain (loss) | 16,664 | 65,664 | 152,899 | 74,635 | 122,096 | 73,831 | 34,807 | |||||||
| Net increase (decrease) in net assets from operations | $ 17,172 | $ 66,342 | $ 180,308 | $ 79,046 | $ 157,263 | $ 78,405 | $ 35,850 | |||||||
(a) Dividends from affiliated investments | $ 20 | $ 89 | $ 27,785 | $ 101 | $ 231 | $ 126 | $ 51 | |||||||
See accompanying Notes to Financial Statements.
JNL Series Trust
Statements of Operations (in thousands)
For the Year Ended December 31, 2009
| JNL/Goldman | JNL/Goldman | JNL/ | JNL/JPMorgan | |||||||||||
| Sachs Core | Sachs Emerging | JNL/Goldman | Ivy Asset | JNL/JPMorgan | JNL/JPMorgan | U.S. Government | ||||||||
| Plus Bond | Markets Debt | Sachs Mid Cap | Strategy | International | Midcap | & Quality | ||||||||
| Fund | Fund | Value Fund | Fund (b) | Value Fund | Growth Fund | Bond Fund | ||||||||
| Investment income | ||||||||||||||
Dividends (a) | $ 99 | $ 42 | $ 4,289 | $ 443 | $ 14,190 | $ 832 | $ 201 | |||||||
| Foreign taxes withheld | - | (46) | (4) | (5) | (1,721) | (2) | - | |||||||
| Interest | 30,564 | 4,361 | - | - | 112 | - | 29,429 | |||||||
| Securities lending | 79 | 1 | 99 | - | 666 | 90 | 546 | |||||||
| Total investment income | 30,742 | 4,358 | 4,384 | 438 | 13,247 | 920 | 30,176 | |||||||
| Expenses | ||||||||||||||
| Advisory fees | 3,778 | 652 | 1,370 | 223 | 2,708 | 846 | 2,816 | |||||||
| Administrative fees | 641 | 130 | 189 | 37 | 608 | 121 | 669 | |||||||
| 12b-1 fee (Class A) | 1,282 | 174 | 367 | 50 | 810 | 242 | 1,336 | |||||||
| Legal fees | 7 | 1 | 2 | - | 5 | 1 | 8 | |||||||
| Trustee fees | 23 | 2 | 6 | - | 14 | 4 | 24 | |||||||
| License fees | - | - | - | - | - | - | - | |||||||
| Dividends on securities sold short | - | - | - | - | - | - | - | |||||||
| Short holdings borrowing fees | - | - | - | - | - | - | - | |||||||
| Other expenses | 16 | 10 | 4 | - | 17 | 3 | 15 | |||||||
| Total expenses | 5,747 | 969 | 1,938 | 310 | 4,162 | 1,217 | 4,868 | |||||||
| Net investment income (loss) | 24,995 | 3,389 | 2,446 | 128 | 9,085 | (297) | 25,308 | |||||||
| Realized and unrealized gain (loss) | ||||||||||||||
| Net realized gain (loss) on: | ||||||||||||||
| Unaffiliated investments | 6,340 | 2,838 | (19,619) | (958) | (66,119) | (20,444) | (1,365) | |||||||
| Affiliated investments | - | - | - | - | - | - | - | |||||||
| Distributions from affiliated investment companies | - | - | - | - | - | - | - | |||||||
| Swaps agreements | 4,141 | 491 | - | (287) | - | - | - | |||||||
| Foreign currency related items | 483 | 2,122 | - | (102) | 6,185 | - | - | |||||||
| Futures contracts | 5,445 | - | - | (773) | 423 | - | - | |||||||
| Option contracts | - | - | - | (130) | - | - | - | |||||||
| Investment securities sold short | - | - | - | - | - | - | - | |||||||
| Brokerage commissions recaptured | - | - | 88 | - | - | 12 | - | |||||||
| Net change in unrealized appreciation or depreciation on: | ||||||||||||||
| Investments | 47,104 | 5,061 | 75,527 | 3,732 | 163,632 | 65,912 | (1,382) | |||||||
| Swap agreements | 1,206 | (267) | - | (2) | - | - | - | |||||||
| Foreign currency related items | (47) | 720 | - | (5) | (722) | - | - | |||||||
| Futures contracts | (6,119) | - | - | - | (172) | - | - | |||||||
| Option contracts | - | - | - | - | - | - | - | |||||||
| Investment securities sold short | - | - | - | - | - | - | - | |||||||
| Net realized and unrealized gain (loss) | 58,553 | 10,965 | 55,996 | 1,475 | 103,227 | 45,480 | (2,747) | |||||||
| Net increase (decrease) in net assets from operations | $ 83,548 | $ 14,354 | $ 58,442 | $ 1,603 | $ 112,312 | $ 45,183 | $ 22,561 | |||||||
(a) Dividends from affiliated investments | $ 120 | $ 43 | $ 50 | $ 4 | $ 90 | $ 38 | $ 259 | |||||||
| (b) Period from September 28, 2009 (commencement of operations) | ||||||||||||||
See accompanying Notes to Financial Statements.
JNL Series Trust
Statements of Operations (in thousands)
For the Year Ended December 31, 2009
| JNL/Mellon | ||||||||||||||
| JNL/Mellon | JNL/Mellon | Capital | ||||||||||||
| JNL/Lazard | JNL/Lazard | JNL/M&G | JNL/M&G | Capital | Capital | Management | ||||||||
| Emerging | Mid Cap | Global Basics | Global Leaders | Management | Management | European 30 | ||||||||
| Markets Fund | Equity Fund | Fund | Fund | 10 X 10 Fund | Index 5 Fund | Fund | ||||||||
| Investment income | ||||||||||||||
Dividends (a) | $ 13,969 | $ 2,439 | $ 229 | $ 213 | $ 4,517 | $ 2,941 | $ 220 | |||||||
| Foreign taxes withheld | (991) | - | (14) | (17) | - | - | (28) | |||||||
| Interest | 1 | - | - | - | - | - | - | |||||||
| Securities lending | 275 | 80 | 2 | - | - | �� - | 3 | |||||||
| Total investment income | 13,254 | 2,519 | 217 | 196 | 4,517 | 2,941 | 195 | |||||||
| Expenses | ||||||||||||||
| Advisory fees | 3,689 | 961 | 110 | 80 | - | - | 20 | |||||||
| Administrative fees | 612 | 134 | 19 | 14 | 69 | 59 | 11 | |||||||
| 12b-1 fee (Class A) | 816 | 267 | 26 | 19 | - | - | 11 | |||||||
| Legal fees | 4 | 2 | - | - | 2 | 1 | - | |||||||
| Trustee fees | 12 | 5 | - | - | 5 | 4 | - | |||||||
| License fees | - | - | - | - | - | - | - | |||||||
| Dividends on securities sold short | - | - | - | - | - | - | - | |||||||
| Short holdings borrowing fees | - | - | - | - | - | - | - | |||||||
| Other expenses | 37 | 3 | 1 | 1 | 2 | 2 | - | |||||||
| Total expenses | 5,170 | 1,372 | 156 | 114 | 78 | 66 | 42 | |||||||
| Net investment income (loss) | 8,084 | 1,147 | 61 | 82 | 4,439 | 2,875 | 153 | |||||||
| Realized and unrealized gain (loss) | ||||||||||||||
| Net realized gain (loss) on: | ||||||||||||||
| Unaffiliated investments | (63,077) | (18,625) | 90 | 258 | - | - | 517 | |||||||
| Affiliated investments | - | - | - | - | (15,664) | (5,697) | - | |||||||
| Distributions from affiliated investment companies | - | - | - | - | 108 | 222 | - | |||||||
| Swaps agreements | - | - | - | - | - | - | - | |||||||
| Foreign currency related items | (2,528) | - | 24 | 1 | - | - | (3) | |||||||
| Futures contracts | - | - | - | - | - | - | - | |||||||
| Option contracts | - | - | - | - | - | - | - | |||||||
| Investment securities sold short | - | - | - | - | - | - | - | |||||||
| Brokerage commissions recaptured | 37 | 63 | - | - | - | - | - | |||||||
| Net change in unrealized appreciation or depreciation on: | ||||||||||||||
| Investments | 261,016 | 62,130 | 4,861 | 2,759 | 47,726 | 35,129 | 1,330 | |||||||
| Swap agreements | - | - | - | - | - | - | - | |||||||
| Foreign currency related items | 53 | - | - | 1 | - | - | 1 | |||||||
| Futures contracts | - | - | - | - | - | - | - | |||||||
| Option contracts | - | - | - | - | - | - | - | |||||||
| Investment securities sold short | - | - | - | - | - | - | - | |||||||
| Net realized and unrealized gain (loss) | 195,501 | 43,568 | 4,975 | 3,019 | 32,170 | 29,654 | 1,845 | |||||||
| Net increase (decrease) in net assets from operations | $ 203,585 | $ 44,715 | $ 5,036 | $ 3,101 | $ 36,609 | $ 32,529 | $ 1,998 | |||||||
(a) Dividends from affiliated investments | $ 83 | $ 24 | $ 3 | $ 2 | $ 4,517 | $ 2,941 | $ 3 | |||||||
See accompanying Notes to Financial Statements.
JNL Series Trust
Statements of Operations (in thousands)
For the Year Ended December 31, 2009
| JNL/Mellon | JNL/Mellon | JNL/Mellon | JNL/Mellon | JNL/Mellon | JNL/Mellon | JNL/Mellon | ||||||||
| Capital | Capital | Capital | Capital | Capital | Capital | Capital | ||||||||
| Management | Management | Management | Management | Management | Management | Management | ||||||||
| Pacific Rim 30 | S&P 500 | S&P 400 MidCap | Small Cap | International | Bond Index | Global Alpha | ||||||||
| Fund | Index Fund | Index Fund | Index Fund | Index Fund | Fund | Fund (b) | ||||||||
| Investment income | ||||||||||||||
Dividends (a) | $ 240 | $ 14,714 | $ 6,342 | $ 5,066 | $ 16,815 | $ 49 | $ 1 | |||||||
| Foreign taxes withheld | (5) | - | - | - | (1,734) | - | - | |||||||
| Interest | - | 2 | 1 | 11 | 1 | 22,167 | 8 | |||||||
| Securities lending | 1 | 441 | 502 | 816 | 774 | 494 | - | |||||||
| Total investment income | 236 | 15,157 | 6,845 | 5,893 | 15,856 | 22,710 | 9 | |||||||
| Expenses | ||||||||||||||
| Advisory fees | 32 | 1,780 | 1,012 | 1,009 | 1,489 | 1,559 | 118 | |||||||
| Administrative fees | 18 | 642 | 349 | 348 | 761 | 532 | 18 | |||||||
| 12b-1 fee (Class A) | 17 | 1,265 | 690 | 689 | 986 | 1,059 | 24 | |||||||
| Legal fees | - | 7 | 4 | 4 | 5 | 5 | - | |||||||
| Trustee fees | - | 22 | 12 | 12 | 17 | 18 | - | |||||||
| License fees | - | 85 | 43 | 48 | 225 | - | - | |||||||
| Dividends on securities sold short | - | - | - | - | - | - | - | |||||||
| Short holdings borrowing fees | - | - | - | - | - | - | - | |||||||
| Other expenses | - | 14 | 7 | 9 | 10 | 10 | - | |||||||
| Total expenses | 67 | �� 3,815 | 2,117 | 2,119 | 3,493 | 3,183 | 160 | |||||||
| Net investment income (loss) | 169 | 11,342 | 4,728 | 3,774 | 12,363 | 19,527 | (151) | |||||||
| Realized and unrealized gain (loss) | ||||||||||||||
| Net realized gain (loss) on: | ||||||||||||||
| Unaffiliated investments | 563 | (1,725) | (6,261) | (20,517) | (6,652) | (75) | - | |||||||
| Affiliated investments | - | (2) | - | - | - | - | - | |||||||
| Distributions from affiliated investment companies | - | - | - | - | - | - | - | |||||||
| Swaps agreements | - | - | - | - | - | - | - | |||||||
| Foreign currency related items | 10 | - | - | - | 1,703 | - | (116) | |||||||
| Futures contracts | - | 4,055 | 2,566 | 1,354 | 4,502 | - | 119 | |||||||
| Option contracts | - | - | - | - | - | - | - | |||||||
| Investment securities sold short | - | - | - | - | - | - | - | |||||||
| Brokerage commissions recaptured | - | - | - | 7 | - | - | - | |||||||
| Net change in unrealized appreciation or depreciation on: | ||||||||||||||
| Investments | 1,634 | 158,323 | 117,419 | 119,841 | 132,529 | 9,023 | - | |||||||
| Swap agreements | - | - | - | - | - | - | - | |||||||
| Foreign currency related items | - | - | - | - | (821) | - | (158) | |||||||
| Futures contracts | - | 69 | (140) | 536 | (36) | - | (421) | |||||||
| Option contracts | - | - | - | - | - | - | - | |||||||
| Investment securities sold short | - | - | - | - | - | - | - | |||||||
| Net realized and unrealized gain (loss) | 2,207 | 160,720 | 113,584 | 101,221 | 131,225 | 8,948 | (576) | |||||||
| Net increase (decrease) in net assets from operations | $ 2,376 | $ 172,062 | $ 118,312 | $ 104,995 | $ 143,588 | $ 28,475 | $ (727) | |||||||
(a) Dividends from affiliated investments | $ 2 | $ 528 | $ 521 | $ 834 | $ 843 | $ 532 | $ 1 | |||||||
(b) Period from September 28, 2009 (commencement of operations) | ||||||||||||||
See accompanying Notes to Financial Statements.
JNL Series Trust
Statements of Operations (in thousands)
For the Year Ended December 31, 2009
| JNL/ | JNL/PPM | JNL/PPM | ||||||||||||
| Oppenheimer | JNL/PAM | JNL/PAM | JNL/PIMCO | JNL/PIMCO | America | America | ||||||||
| Global | Asia ex-Japan | China-India | Real Return | Total Return | High Yield | Mid Cap | ||||||||
| Growth Fund | Fund | Fund | Fund | Bond Fund | Bond Fund | Value Fund | ||||||||
| Investment income | ||||||||||||||
Dividends (a) | $ 4,895 | $ 907 | $ 1,565 | $ 210 | $ 1,299 | $ 1,095 | $ 203 | |||||||
| Foreign taxes withheld | (440) | (93) | (176) | - | - | - | - | |||||||
| Interest | 8 | 1 | 24 | 29,689 | 82,866 | 33,981 | - | |||||||
| Securities lending | 312 | 71 | 77 | 68 | 192 | 229 | 1 | |||||||
| Total investment income | 4,775 | 886 | 1,490 | 29,967 | 84,357 | 35,305 | 204 | |||||||
| Expenses | ||||||||||||||
| Advisory fees | 1,486 | 462 | 971 | 4,282 | 8,710 | 1,720 | 84 | |||||||
| Administrative fees | 319 | 77 | 216 | 858 | 1,742 | 366 | 11 | |||||||
| 12b-1 fee (Class A) | 424 | 103 | 216 | 1,715 | 3,460 | 722 | 22 | |||||||
| Legal fees | 2 | - | 1 | 10 | 19 | 4 | - | |||||||
| Trustee fees | 7 | 1 | 3 | 31 | 60 | 12 | 1 | |||||||
| License fees | - | - | - | - | - | - | - | |||||||
| Dividends on securities sold short | - | - | - | - | - | - | - | |||||||
| Short holdings borrowing fees | - | - | - | - | - | - | - | |||||||
| Other expenses | 14 | 7 | 28 | 22 | 35 | 7 | - | |||||||
| Total expenses | 2,252 | 650 | 1,435 | 6,918 | 14,026 | 2,831 | 118 | |||||||
| Net investment income (loss) | 2,523 | 236 | 55 | 23,049 | 70,331 | 32,474 | 86 | |||||||
| Realized and unrealized gain (loss) | ||||||||||||||
| Net realized gain (loss) on: | ||||||||||||||
| Unaffiliated investments | (6,323) | 940 | 10,675 | 104,007 | 35,643 | (20,028) | (552) | |||||||
| Affiliated investments | - | - | - | - | - | - | - | |||||||
| Distributions from affiliated investment companies | - | - | - | - | - | - | - | |||||||
| Swaps agreements | - | - | - | (11,426) | (938) | - | - | |||||||
| Foreign currency related items | (203) | (104) | (312) | (2,430) | (2,080) | - | - | |||||||
| Futures contracts | - | - | - | 11,116 | 30,672 | - | - | |||||||
| Option contracts | - | - | - | 1,617 | (631) | - | - | |||||||
| Investment securities sold short | - | - | - | - | - | - | - | |||||||
| Brokerage commissions recaptured | - | - | - | - | - | - | 3 | |||||||
| Net change in unrealized appreciation or depreciation on: | ||||||||||||||
| Investments | 76,302 | 18,791 | 40,779 | (7,195) | 101,154 | 123,546 | 4,567 | |||||||
| Swap agreements | - | - | - | 20,648 | 21,136 | - | - | |||||||
| Foreign currency related items | 2 | - | 11 | 2,429 | 4,580 | - | - | |||||||
| Futures contracts | - | - | - | (8,242) | (26,238) | - | - | |||||||
| Option contracts | - | - | - | 988 | 7,335 | - | - | |||||||
| Investment securities sold short | - | - | - | - | - | - | - | |||||||
| Net realized and unrealized gain (loss) | 69,778 | 19,627 | 51,153 | 111,512 | 170,633 | 103,518 | 4,018 | |||||||
| Net increase (decrease) in net assets from operations | $ 72,301 | $ 19,863 | $ 51,208 | $ 134,561 | $ 240,964 | $ 135,992 | $ 4,104 | |||||||
(a) Dividends from affiliated investments | $ 64 | $ 60 | $ 43 | $ 76 | $ 231 | $ 145 | $ 2 | |||||||
See accompanying Notes to Financial Statements.
JNL Series Trust
Statements of Operations (in thousands)
For the Year Ended December 31, 2009
| JNL/PPM | JNL/S&P | JNL/S&P | JNL/S&P | |||||||||||
| America | JNL/PPM | JNL/Red Rocks | Managed | Managed | Managed | JNL/S&P | ||||||||
| Small Cap | America Value | Listed Private | Conservative | Moderate | Moderate | Managed | ||||||||
| Value Fund | Equity Fund | Equity Fund | Fund | Fund | Growth Fund | Growth Fund | ||||||||
| Investment income | ||||||||||||||
Dividends (a) | $ 203 | $ 1,838 | $ 2,026 | $ 14,282 | $ 19,804 | $ 29,035 | $ 17,693 | |||||||
| Foreign taxes withheld | - | - | (103) | - | - | - | - | |||||||
| Interest | - | - | 1 | - | - | - | - | |||||||
| Securities lending | 1 | 22 | 23 | - | - | - | - | |||||||
| Total investment income | 204 | # | 1,860 | 1,947 | 14,282 | 19,804 | 29,035 | 17,693 | ||||||
| �� | ||||||||||||||
| Expenses | ||||||||||||||
| Advisory fees | 94 | 407 | 778 | 637 | 827 | 1,263 | 1,079 | |||||||
| Administrative fees | 13 | 74 | 138 | 251 | 361 | 633 | 518 | |||||||
| 12b-1 fee (Class A) | 20 | 147 | 183 | - | - | - | - | |||||||
| Legal fees | - | 1 | 1 | 6 | 8 | 14 | 11 | |||||||
| Trustee fees | - | 3 | 2 | 18 | 25 | 44 | 36 | |||||||
| License fees | - | - | - | - | - | - | - | |||||||
| Dividends on securities sold short | - | - | - | - | - | - | - | |||||||
| Short holdings borrowing fees | - | - | - | - | - | - | - | |||||||
| Other expenses | - | 5 | 1 | 10 | 15 | 26 | 21 | |||||||
| Total expenses | 127 | 637 | 1,103 | 922 | 1,236 | 1,980 | 1,665 | |||||||
| Net investment income (loss) | 77 | 1,223 | 844 | 13,360 | 18,568 | 27,055 | 16,028 | |||||||
| Realized and unrealized gain (loss) | ||||||||||||||
| Net realized gain (loss) on: | ||||||||||||||
| Unaffiliated investments | (647) | (27,863) | 2,944 | - | - | - | - | |||||||
| Affiliated investments | - | - | - | (19,953) | (25,909) | (33,584) | (42,110) | |||||||
| Distributions from affiliated investment companies | - | - | - | 4,241 | 5,912 | 7,036 | 4,994 | |||||||
| Swaps agreements | - | - | - | - | - | - | - | |||||||
| Foreign currency related items | - | - | (57) | - | - | - | �� - | |||||||
| Futures contracts | - | - | - | - | - | - | - | |||||||
| Option contracts | - | - | - | - | - | - | - | |||||||
| Investment securities sold short | - | - | - | - | - | - | - | |||||||
| Brokerage commissions recaptured | 3 | 5 | - | - | - | - | - | |||||||
| Net change in unrealized appreciation or depreciation on: | ||||||||||||||
| Investments | 5,025 | 51,515 | 30,145 | 67,729 | 126,668 | 273,961 | 287,667 | |||||||
| Swap agreements | - | - | - | - | - | - | - | |||||||
| Foreign currency related items | - | - | - | - | - | - | - | |||||||
| Futures contracts | - | - | - | - | - | - | - | |||||||
| Option contracts | - | - | - | - | - | - | - | |||||||
| Investment securities sold short | - | - | - | - | - | - | - | |||||||
| Net realized and unrealized gain (loss) | 4,381 | 23,657 | 33,032 | 52,017 | 106,671 | 247,413 | 250,551 | |||||||
| Net increase (decrease) in net assets from operations | $ 4,458 | $ 24,880 | $ 33,876 | $ 65,377 | $ 125,239 | $ 274,468 | $ 266,579 | |||||||
(a) Dividends from affiliated investments | $ 2 | $ 6 | $ 30 | $ 14,282 | $ 19,804 | $ 29,035 | $ 17,693 | |||||||
See accompanying Notes to Financial Statements.
JNL Series Trust
Statements of Operations (in thousands)
For the Year Ended December 31, 2009
| JNL/S&P | JNL/S&P | JNL/S&P | ||||||||||||
| Managed | Disciplined | Disciplined | JNL/S&P | JNL/S&P | JNL/S&P | JNL/S&P | ||||||||
| Aggressive | Moderate | Moderate | Disciplined | Competitive | Dividend Income | Intrinsic | ||||||||
| Growth Fund | Fund | Growth Fund | Growth Fund | Advantage Fund | & Growth Fund | Value Fund | ||||||||
| Investment income | ||||||||||||||
Dividends (a) | $ 5,778 | $ 2,938 | $ 3,638 | $ 1,499 | $ 3,378 | $ 5,680 | $ 3,298 | |||||||
| Foreign taxes withheld | - | - | - | - | - | - | - | |||||||
| Interest | - | 1 | - | - | - | - | - | |||||||
| Securities lending | - | - | - | - | 87 | 73 | 77 | |||||||
| Total investment income | 5,778 | 2,939 | 3,638 | 1,499 | 3,465 | 5,753 | 3,375 | |||||||
| Expenses | ||||||||||||||
| Advisory fees | 589 | 130 | 159 | 64 | 695 | 581 | 638 | |||||||
| Administrative fees | 229 | 50 | 61 | 24 | 174 | 145 | 159 | |||||||
| 12b-1 fee (Class A) | - | - | - | - | 347 | 290 | 319 | |||||||
| Legal fees | 5 | 1 | 1 | - | 2 | 1 | 2 | |||||||
| Trustee fees | 17 | 3 | 4 | 2 | 6 | 5 | 5 | |||||||
| License fees | - | - | - | - | 21 | 18 | 19 | |||||||
| Dividends on securities sold short | - | - | - | - | - | - | - | |||||||
| Short holdings borrowing fees | - | - | - | - | - | - | - | |||||||
| Other expenses | 10 | 2 | 2 | 1 | 3 | 3 | 3 | |||||||
| Total expenses | 850 | 186 | 227 | 91 | 1,248 | 1,043 | 1,145 | |||||||
| Net investment income (loss) | 4,928 | 2,753 | 3,411 | 1,408 | 2,217 | 4,710 | 2,230 | |||||||
| Realized and unrealized gain (loss) | ||||||||||||||
| Net realized gain (loss) on: | ||||||||||||||
| Unaffiliated investments | - | - | - | - | 32,235 | 19,690 | 59,957 | |||||||
| Affiliated investments | (40,483) | (4,516) | (14,204) | (8,235) | - | - | - | |||||||
| Distributions from affiliated investment companies | 1,807 | 40 | 39 | 14 | - | - | - | |||||||
| Swaps agreements | - | - | - | - | - | - | - | |||||||
| Foreign currency related items | - | - | - | - | - | - | - | |||||||
| Futures contracts | - | - | - | - | - | - | - | |||||||
| Option contracts | - | - | - | - | - | - | - | |||||||
| Investment securities sold short | - | - | - | - | - | - | - | |||||||
| Brokerage commissions recaptured | - | - | - | - | - | - | - | |||||||
| Net change in unrealized appreciation or depreciation on: | ||||||||||||||
| Investments | 162,066 | 21,725 | 39,827 | 20,449 | 28,899 | 16,445 | 14,071 | |||||||
| Swap agreements | - | - | - | - | - | - | - | |||||||
| Foreign currency related items | - | - | - | - | - | - | - | |||||||
| Futures contracts | - | - | - | - | - | - | - | |||||||
| Option contracts | - | - | - | - | - | - | - | |||||||
| Investment securities sold short | - | - | - | - | - | - | - | |||||||
| Net realized and unrealized gain (loss) | 123,390 | 17,249 | 25,662 | 12,228 | 61,134 | 36,135 | 74,028 | |||||||
| Net increase (decrease) in net assets from operations | $ 128,318 | $ 20,002 | $ 29,073 | $ 13,636 | $ 63,351 | $ 40,845 | $ 76,258 | |||||||
(a) Dividends from affiliated investments | $ 5,778 | $ 2,938 | $ 3,638 | $ 1,499 | $ 92 | $ 76 | $ 82 | |||||||
See accompanying Notes to Financial Statements.
JNL Series Trust
Statements of Operations (in thousands)
For the Year Ended December 31, 2009
| JNL/T. Rowe | JNL/T. Rowe | |||||||||||||
| JNL/S&P | JNL/Select | JNL/Select | Price | Price | ||||||||||
| Total | JNL/S&P 4 | Balanced | Money | JNL/Select | Established | Mid-Cap | ||||||||
| Yield Fund | Fund | Fund | Market Fund | Value Fund | Growth Fund | Growth Fund | ||||||||
| Investment income | ||||||||||||||
Dividends (a) | $ 2,930 | $ 108 | $ 10,279 | $ 1 | $ 14,373 | $ 6,797 | $ 3,639 | |||||||
| Foreign taxes withheld | - | - | (114) | - | (58) | (130) | (29) | |||||||
| Interest | - | - | 7,573 | 8,141 | - | 1 | - | |||||||
| Securities lending | 138 | - | 400 | - | 59 | 335 | 951 | |||||||
| Total investment income | 3,068 | 108 | 18,138 | 8,142 | 14,374 | 7,003 | 4,561 | |||||||
| Expenses | ||||||||||||||
| Advisory fees | 614 | - | 2,586 | 3,363 | 3,012 | 4,092 | 4,278 | |||||||
| Administrative fees | 153 | 211 | 548 | 1,285 | 582 | 685 | 600 | |||||||
| 12b-1 fee (Class A) | 307 | - | 1,095 | 2,556 | 1,140 | 1,320 | 1,155 | |||||||
| Legal fees | 2 | 4 | 6 | 16 | 6 | 8 | 6 | |||||||
| Trustee fees | 5 | 14 | 19 | 51 | 21 | 24 | 21 | |||||||
| License fees | 19 | - | - | - | - | - | - | |||||||
| Dividends on securities sold short | - | - | - | - | - | - | - | |||||||
| Short holdings borrowing fees | - | - | - | - | - | - | - | |||||||
| Other expenses | 3 | 10 | 12 | 35 | 13 | 25 | 12 | |||||||
| Total expenses | 1,103 | 239 | 4,266 | 7,306 | 4,774 | 6,154 | 6,072 | |||||||
| Expense waiver (Class A) | - | - | - | (1,232) | - | - | - | |||||||
| Net expenses | 1,103 | 239 | 4,266 | 6,074 | 4,774 | 6,154 | 6,072 | |||||||
| Net investment income | 1,965 | (131) | 13,872 | 2,068 | 9,600 | 849 | (1,511) | |||||||
| Net realized gain (loss) on: | ||||||||||||||
| Unaffiliated investments | 40,287 | - | (24,539) | - | (61,230) | (92,849) | (16,199) | |||||||
| Affiliated investments | - | (10,383) | - | - | - | - | - | |||||||
| Distributions from affiliated investment companies | - | - | - | - | - | - | - | |||||||
| Swaps agreements | - | - | - | - | - | - | - | |||||||
| Foreign currency related items | - | - | - | - | - | (18) | - | |||||||
| Futures contracts | - | - | (46) | - | - | - | - | |||||||
| Option contracts | - | - | - | - | - | - | - | |||||||
| Investment securities sold short | - | - | - | - | - | - | - | |||||||
| Brokerage commissions recaptured | - | - | 22 | - | 28 | 17 | 19 | |||||||
| Net change in unrealized appreciation or depreciation on: | ||||||||||||||
| Investments | 12,192 | 173,760 | 116,411 | - | 187,290 | 341,594 | 249,683 | |||||||
| Swap agreements | - | - | - | - | - | - | - | |||||||
| Foreign currency related items | - | - | - | - | - | 1 | 1 | |||||||
| Futures contracts | - | - | - | - | - | - | - | |||||||
| Option contracts | - | - | - | - | - | - | - | |||||||
| Investment securities sold short | - | - | - | - | - | - | - | |||||||
| Net realized and unrealized gain (loss) | 52,479 | 163,377 | 91,848 | - | 126,088 | 248,745 | 233,504 | |||||||
| Net increase (decrease) in net assets from operations | $ 54,444 | $ 163,246 | $ 105,720 | $ 2,068 | $ 135,688 | $ 249,594 | $ 231,993 | |||||||
(a) Dividends from affiliated investments | $ 143 | $ 108 | $ 190 | $ - | $ 89 | $ 92 | $ 282 | |||||||
See accompanying Notes to Financial Statements.
JNL Series Trust
Statements of Operations (in thousands)
For the Year Ended December 31, 2009
| JNL/T. Rowe | ||||
| Price Short- | JNL/T. Rowe | |||
| Term | Price | |||
| Bond Fund | Value Fund | |||
| Investment income | ||||
Dividends (a) | $ 99 | $ 14,619 | ||
| Foreign taxes withheld | - | (175) | ||
| Interest | 12,265 | 208 | ||
| Securities lending | 142 | 348 | ||
| Total investment income | 12,506 | 15,000 | ||
| Expenses | ||||
| Advisory fees | 1,639 | 3,451 | ||
| Administrative fees | 379 | 524 | ||
| 12b-1 fee (Class A) | 757 | 1,048 | ||
| Legal fees | 4 | 6 | ||
| Trustee fees | 13 | 18 | ||
| License fees | - | - | ||
| Dividends on securities sold short | - | - | ||
| Short holdings borrowing fees | - | - | ||
| Other expenses | 8 | 11 | ||
| Total expenses | 2,800 | 5,058 | ||
| Expense waiver | - | - | ||
| Net expenses | 2,800 | 5,058 | ||
| Net investment income | 9,706 | 9,942 | ||
| Net realized gain (loss) on: | ||||
| Unaffiliated investments | (21,478) | (40,984) | ||
| Affiliated investments | 39 | 249 | ||
| Distributions from affiliated investment companies | - | - | ||
| Swaps agreements | (345) | - | ||
| Foreign currency related items | (7) | 9 | ||
| Futures contracts | �� 4,645 | - | ||
| Option contracts | - | - | ||
| Investment securities sold short | - | - | ||
| Brokerage commissions recaptured | - | 8 | ||
| Net change in unrealized appreciation or depreciation on: | ||||
| Investments | 35,764 | 204,681 | ||
| Swap agreements | 1,371 | - | ||
| Foreign currency related items | (81) | (1) | ||
| Futures contracts | (3,095) | - | ||
| Option contracts | - | - | ||
| Investment securities sold short | - | - | ||
| Net realized and unrealized gain (loss) | 16,813 | 163,962 | ||
| Net increase (decrease) in net assets from operations | $ 26,519 | $ 173,904 | ||
(a) Dividends from affiliated investments | $ 115 | $ 581 | ||
See accompanying Notes to Financial Statements.
JNL Series Trust
Statement of Cash Flows (in thousands)
For the Year Ended December 31, 2009
| JNL/Credit | ||
| Suisse Long/ | ||
| Short Fund | ||
| Cash flows from operating activities | ||
| Net increase in net assets from operations | $ 20,338 | |
| Adjustments to reconcile net increase in net assets from operations to net | ||
| cash flow used in operating activities: | ||
| Purchase of investment securities | (545,716) | |
| Proceeds from sales and maturities | 505,254 | |
| Net purchases of short-term investments | (3,898) | |
| Proceeds from securities sold short | 93,946 | |
| Purchases to cover securities sold short | (77,809) | |
| Increase in investment securities sold receivable | (3,057) | |
| Increase in investment securities purchased payable | 1,869 | |
| Increase in dividends and interest receivable | (19) | |
| Increase in accrued expenses | 49 | |
| Increase in dividends on securities sold short and interest payable . | 15 | |
| Change in unrealized appreciation (depreciation) on investments | (5,946) | |
| Net realized gain on investments | (13,712) | |
| Net cash flow used in operating activities | (28,686) | |
| Cash flows from financing activities | ||
| Net proceeds from capital share transactions | 28,686 | |
| Net cash flow provided by financing activities | 28,686 | |
| Net increase in cash | - | |
| Cash at beginning of year | - | |
| Cash at end of year | $ - | |
| Supplemental disclosure of operating activities: | ||
| Interest payments during the period were $58. | ||
| Supplemental disclosure of non-cash financing activities: | ||
| Reinvestment of distributions $570. | ||
See accompanying Notes to Financial Statements.
JNL Series Trust
Statements of Changes in Net Assets (in thousands)
For the Year Ended December 31, 2009
| JNL | JNL | JNL | JNL | JNL/AIM | JNL/AIM | JNL/AIM | ||||||||
| Institutional Alt | Institutional Alt | Institutional Alt | Institutional Alt | International | Large Cap | Global Real | ||||||||
| Operations | 20 Fund (b) | 35 Fund (b) | 50 Fund (b) | 65 Fund (b) | Growth Fund | Growth Fund | Estate Fund | |||||||
| Net investment income (loss) | $ 2,705 | $ 4,260 | $ 5,131 | $ 2,990 | $ 4,663 | $ 2,065 | $ 5,732 | |||||||
| Net realized gain (loss) | 242 | 794 | 1,574 | 1,857 | (44,638) | (30,614) | (12,501) | |||||||
| Net change in unrealized appreciation (depreciation) | 8,997 | 17,516 | 17,922 | 10,341 | 136,861 | 138,511 | 74,282 | |||||||
| Net increase (decrease) in net assets | ||||||||||||||
| from operations | 11,944 | 22,570 | 24,627 | 15,188 | 96,886 | 109,962 | 67,513 | |||||||
| Distributions to shareholders | ||||||||||||||
| From net investment income | ||||||||||||||
| Class A | - | - | - | - | (6,883) | (1,465) | (6,177) | |||||||
| Class B | - | - | - | - | (7) | (2) | (8) | |||||||
| From net realized gains | ||||||||||||||
| Class A | - | - | - | - | - | - | - | |||||||
| Class B | - | - | - | - | - | - | - | |||||||
| Total distributions to shareholders | - | - | - | - | (6,890) | (1,467) | (6,185) | |||||||
| Share transactions¹ | ||||||||||||||
| Proceeds from the sale of shares | ||||||||||||||
| Class A | 199,802 | 298,773 | 356,850 | 235,122 | 197,079 | (a) | 303,951 | 193,414 | ||||||
| Class B | - | - | - | - | 1,140 | (a) | 226 | 257 | ||||||
| Proceeds in connection with acquisition | ||||||||||||||
| Class A | - | - | - | - | - | - | - | |||||||
| Class B | - | - | - | - | - | - | - | |||||||
| Reinvestment of distributions | ||||||||||||||
| Class A | - | - | - | - | 6,883 | 1,465 | 6,177 | |||||||
| Class B | - | - | - | - | 7 | 2 | 8 | |||||||
| Cost of shares redeemed | ||||||||||||||
| Class A | (12,230) | (12,827) | (19,961) | (20,497) | (112,975) | (140,475) | (63,093) | |||||||
| Class B | - | - | - | - | (9,464) | (151) | (248) | |||||||
| Net increase (decrease) in net assets from | ||||||||||||||
| share transactions | 187,572 | 285,946 | 336,889 | 214,625 | 82,670 | 165,018 | 136,515 | |||||||
| Net increase (decrease) in net assets | 199,516 | 308,516 | 361,516 | 229,813 | 172,666 | 273,513 | 197,843 | |||||||
| Net assets beginning of year | - | - | - | - | 259,315 | 351,230 | 145,512 | |||||||
| Net assets end of year | $ 199,516 | $ 308,516 | $ 361,516 | $ 229,813 | $ 431,981 | $ 624,743 | $ 343,355 | |||||||
| Undistributed (excess of distributions over) | ||||||||||||||
| net investment income | $ 2,749 | $ 4,330 | $ 5,229 | $ 3,056 | $ 2,774 | $ 2,176 | $ 10,130 | |||||||
| ¹Share transactions | ||||||||||||||
| Shares sold | ||||||||||||||
| Class A | 16,682 | 24,301 | 28,185 | 17,990 | 24,272 | 32,611 | 29,777 | |||||||
| Class B | - | - | - | - | 160 | 24 | 43 | |||||||
| Shares issued in connection with acquisition | ||||||||||||||
| Class A | - | - | - | - | - | - | - | |||||||
| Class B | - | - | - | - | - | - | - | |||||||
| Reinvestment of distributions | ||||||||||||||
| Class A | - | - | - | - | 752 | 139 | 833 | |||||||
| Class B | - | - | - | - | 1 | - | 1 | |||||||
| Shares redeemed | ||||||||||||||
| Class A | (1,010) | (1,008) | (1,535) | (1,535) | (14,817) | (15,172) | (10,142) | |||||||
| Class B | - | - | - | - | (1,458) | (16) | (41) | |||||||
| Net increase (decrease) | ||||||||||||||
| Class A | 15,672 | 23,293 | 26,650 | 16,455 | 10,207 | 17,578 | 20,468 | |||||||
| Class B | - | - | - | - | (1,297) | 8 | 3 | |||||||
| Purchase and sales of investment securities | ||||||||||||||
| (excluding short-term securities): | ||||||||||||||
| Purchase of securities | $ 192,833 | $ 298,630 | $ 360,201 | $ 238,403 | $ 151,135 | $ 418,014 | $ 261,679 | |||||||
| Proceeds from sales of securities | 2,476 | 8,298 | 18,020 | 20,683 | 72,569 | 247,349 | 131,270 | |||||||
| (a) Amount includes $826 for Class A and $1 for Class B received in a class action settlement. | ||||||||||||||
| (b) Period from April 6, 2009 (commencement of operations) | ||||||||||||||
See accompanying Notes to Financial Statements.
JNL Series Trust
Statements of Changes in Net Assets (in thousands)
For the Year Ended December 31, 2009
| JNL/Capital | JNL/Capital | JNL/Capital | JNL/Capital | JNL/Credit | ||||||||||
| JNL/AIM | Guardian | Guardian | Guardian | Guardian | Suisse | JNL/Credit | ||||||||
| Small Cap | Global Balanced | Global Diversified | International Small | U.S. Growth | Commodity | Suisse Long/ | ||||||||
| Operations | Growth Fund | Fund | Research Fund | Cap Fund | Equity Fund | Securities Fund | Short Fund | |||||||
| Net investment income (loss) | $ (106) | $ 3,990 | $ 2,167 | $ 525 | $ 1,987 | $ 3,410 | $ 680 | |||||||
| Net realized gain (loss) | (598) | (27,982) | (41,649) | (11,506) | (53,049) | (98,798) | 13,712 | |||||||
| Net change in unrealized appreciation (depreciation) | 19,603 | 68,222 | 109,226 | 42,382 | 164,017 | 249,014 | 5,946 | |||||||
| Net increase (decrease) in net assets | ||||||||||||||
| from operations | 18,899 | 44,230 | 69,744 | 31,401 | 112,955 | 153,626 | 20,338 | |||||||
| Distributions to shareholders | ||||||||||||||
| From net investment income | ||||||||||||||
| Class A | - | (5,555) | (4,295) | (1,563) | (673) | (4,270) | (569) | |||||||
| Class B | - | (9) | (5) | (3) | (1) | (4) | (1) | |||||||
| From net realized gains | ||||||||||||||
| Class A | - | - | - | - | - | - | - | |||||||
| Class B | - | - | - | - | - | - | - | |||||||
| Total distributions to shareholders | - | (5,564) | (4,300) | (1,566) | (674) | (4,274) | (570) | |||||||
| Share transactions¹ | ||||||||||||||
| Proceeds from the sale of shares | ||||||||||||||
| Class A | 59,643 | 114,399 | 178,185 | (a) | 98,520 | 380,864 | 438,567 | 108,225 | ||||||
| Class B | 85 | 235 | 191 | (a) | 225 | 252 | 422 | 49 | ||||||
| Proceeds in connection with acquisition | ||||||||||||||
| Class A | - | - | - | - | - | - | - | |||||||
| Class B | - | - | - | - | - | - | - | |||||||
| Reinvestment of distributions | ||||||||||||||
| Class A | - | 5,555 | 4,295 | 1,563 | 673 | 4,270 | 569 | |||||||
| Class B | - | 9 | 5 | 3 | 1 | 4 | 1 | |||||||
| Cost of shares redeemed | ||||||||||||||
| Class A | (26,024) | (62,337) | (78,384) | (30,618) | (134,589) | (165,603) | (80,109) | |||||||
| Class B | (70) | (71) | (98) | (141) | (175) | (287) | (22) | |||||||
| Net increase (decrease) in net assets from | ||||||||||||||
| share transactions | 33,634 | 57,790 | 104,194 | 69,552 | 247,026 | 277,373 | 28,713 | |||||||
| Net increase (decrease) in net assets | 52,533 | 96,456 | 169,638 | 99,387 | 359,307 | 426,725 | 48,481 | |||||||
| Net assets beginning of year | 40,417 | 183,761 | 163,268 | 44,835 | 195,981 | 214,921 | 41,972 | |||||||
| Net assets end of year | $ 92,950 | $ 280,217 | $ 332,906 | $ 144,222 | $ 555,288 | $ 641,646 | $ 90,453 | |||||||
| Undistributed (excess of distributions over) | ||||||||||||||
| net investment income | $ 22 | $ 3,071 | $ 2,000 | $ 459 | $ 1,985 | $ 2,536 | $ 670 | |||||||
| ¹Share transactions | ||||||||||||||
| Shares sold | ||||||||||||||
| Class A | 6,848 | 14,311 | 9,514 | 16,053 | 23,918 | 55,480 | 16,819 | |||||||
| Class B | 9 | 28 | 10 | 35 | 15 | 54 | 7 | |||||||
| Shares issued in connection with acquisition | ||||||||||||||
| Class A | - | - | - | - | - | - | - | |||||||
| Class B | - | - | - | - | - | - | - | |||||||
| Reinvestment of distributions | ||||||||||||||
| Class A | - | 632 | 208 | 227 | 36 | 465 | 76 | |||||||
| Class B | - | 1 | - | - | - | 1 | - | |||||||
| Shares redeemed | ||||||||||||||
| Class A | (3,041) | (8,199) | (4,466) | (5,134) | (8,500) | (21,863) | (11,831) | |||||||
| Class B | (8) | (8) | (4) | (21) | (10) | (41) | (4) | |||||||
| Net increase (decrease) | ||||||||||||||
| Class A | 3,807 | 6,744 | 5,256 | 11,146 | 15,454 | 34,082 | 5,064 | |||||||
| Class B | 1 | 21 | 6 | 14 | 5 | 14 | 3 | |||||||
| Purchase and sales of investment securities | ||||||||||||||
| (excluding short-term securities): | ||||||||||||||
| Purchase of securities | $ 48,533 | $ 208,334 | (b) | $ 269,821 | $ 95,204 | $ 432,361 | $ 553,211 | (c) | $ 623,525 | |||||
| Proceeds from sales of securities | 19,168 | 158,946 | (b) | 178,580 | 35,100 | 183,673 | 379,145 | (c) | 599,200 | |||||
| (a) Amount includes $4,094 for Class A and $4 for Class B received in a class action settlement. | ||||||||||||||
| (b) Amount includes $18,592 and $14,646 of purchases and sales, respectively, of U.S. Government Securities. | ||||||||||||||
| (c) Amount includes $102,657 and $10,067 of purchases and sales, respectively, of U.S. Government Securities. | ||||||||||||||
See accompanying Notes to Financial Statements.
JNL Series Trust
Statements of Changes in Net Assets (in thousands)
For the Year Ended December 31, 2009
| JNL/Franklin | JNL/Franklin | JNL/Franklin | ||||||||||||
| JNL/Eagle | JNL/Eagle | Templeton | Templeton | JNL/Franklin | Templeton | JNL/Franklin | ||||||||
| Core Equity | SmallCap | Founding | Global Growth | Templeton | Mutual Shares | Templeton Small | ||||||||
| Operations | Fund | Equity Fund | Strategy Fund | Fund | Income Fund | Fund | Cap Value Fund | |||||||
| Net investment income (loss) | $ 508 | $ 678 | $ 27,409 | $ 4,411 | $ 35,167 | $ 4,574 | $ 1,043 | |||||||
| Net realized gain (loss) | (4,024) | (16,530) | (19,615) | (20,493) | (35,898) | (40,846) | (4,734) | |||||||
| Net change in unrealized appreciation (depreciation) | 20,688 | 82,194 | 172,514 | 95,128 | 157,994 | 114,677 | 39,541 | |||||||
| Net increase (decrease) in net assets | ||||||||||||||
| from operations | 17,172 | 66,342 | 180,308 | 79,046 | 157,263 | 78,405 | 35,850 | |||||||
| Distributions to shareholders | ||||||||||||||
| From net investment income | ||||||||||||||
| Class A | (841) | - | (449) | (5,599) | (38,686) | (13,019) | (1,068) | |||||||
| Class B | (1) | - | - | (3) | (22) | (9) | (2) | |||||||
| From net realized gains | ||||||||||||||
| Class A | - | - | - | - | - | - | - | |||||||
| Class B | - | - | - | - | - | - | - | |||||||
| Total distributions to shareholders | (842) | - | (449) | (5,602) | (38,708) | (13,028) | (1,070) | |||||||
| Share transactions¹ | ||||||||||||||
| Proceeds from the sale of shares | ||||||||||||||
| Class A | 49,060 | 141,233 | 253,297 | 136,522 | 290,493 | 172,726 | 91,804 | |||||||
| Class B | 30 | 209 | - | 105 | 179 | 183 | 195 | |||||||
| Proceeds in connection with acquisition | ||||||||||||||
| Class A | - | - | - | - | - | - | - | |||||||
| Class B | - | - | - | - | - | - | - | |||||||
| Reinvestment of distributions | ||||||||||||||
| Class A | 841 | - | 449 | 5,599 | 38,686 | 13,019 | 1,068 | |||||||
| Class B | 1 | - | - | 3 | 22 | 9 | 2 | |||||||
| Cost of shares redeemed | ||||||||||||||
| Class A | (24,636) | (92,166) | (175,647) | (76,035) | (151,675) | (83,452) | (46,420) | |||||||
| Class B | (122) | (213) | - | (90) | (97) | (119) | (141) | |||||||
| Net increase (decrease) in net assets from | ||||||||||||||
| share transactions | 25,174 | 49,063 | 78,099 | 66,104 | 177,608 | 102,366 | 46,508 | |||||||
| Net increase (decrease) in net assets | 41,504 | 115,405 | 257,958 | 139,548 | 296,163 | 167,743 | 81,288 | |||||||
| Net assets beginning of year | 42,782 | 164,291 | 580,801 | 236,176 | 432,461 | 256,111 | 86,538 | |||||||
| Net assets end of year | $ 84,286 | $ 279,696 | $ 838,759 | $ 375,724 | $ 728,624 | $ 423,854 | $ 167,826 | |||||||
| Undistributed (excess of distributions over) | ||||||||||||||
| net investment income | $ 508 | $ 676 | $ 27,404 | $ 4,814 | $ 34,982 | $ (2,614) | $ 1,041 | |||||||
| ¹Share transactions | ||||||||||||||
| Shares sold | ||||||||||||||
| Class A | 8,449 | 10,659 | 35,998 | 20,526 | 34,115 | 25,477 | 12,436 | |||||||
| Class B | 5 | 15 | - | 17 | 21 | 28 | 26 | |||||||
| Shares issued in connection with acquisition | ||||||||||||||
| Class A | - | - | - | - | - | - | - | |||||||
| Class B | - | - | - | - | - | - | - | |||||||
| Reinvestment of distributions | ||||||||||||||
| Class A | 129 | - | 55 | 742 | 4,196 | 1,731 | 124 | |||||||
| Class B | - | - | - | - | 2 | 1 | - | |||||||
| Shares redeemed | ||||||||||||||
| Class A | (4,361) | (7,124) | (25,914) | (11,965) | (18,406) | (12,807) | (6,499) | |||||||
| Class B | (18) | (15) | - | (14) | (12) | (19) | (20) | |||||||
| Net increase (decrease) | ||||||||||||||
| Class A | 4,217 | 3,535 | 10,139 | 9,303 | 19,905 | 14,401 | 6,061 | |||||||
| Class B | (13) | - | - | 3 | 11 | 10 | 6 | |||||||
| Purchase and sales of investment securities | ||||||||||||||
| (excluding short-term securities): | ||||||||||||||
| Purchase of securities | $ 43,233 | $ 182,856 | $ 136,470 | $ 82,118 | $ 359,517 | $ 235,025 | $ 39,513 | |||||||
| Proceeds from sales of securities | 19,574 | 132,564 | 31,392 | 13,688 | 224,260 | 156,534 | 2,534 | |||||||
See accompanying Notes to Financial Statements.
JNL Series Trust
Statements of Changes in Net Assets (in thousands)
For the Year Ended December 31, 2009
| JNL/Goldman | JNL/Goldman | JNL/ | JNL/JPMorgan | ||||||||||||
| Sachs Core | Sachs Emerging | JNL/Goldman | Ivy Asset | JNL/JPMorgan | JNL/JPMorgan | U.S. Government | |||||||||
| Plus Bond | Markets Debt | Sachs Mid Cap | Strategy | International | Midcap | & Quality | |||||||||
| Operations | Fund | Fund | Value Fund | Fund (a) | Value Fund | Growth Fund | Bond Fund | ||||||||
| Net investment income (loss) | $ 24,995 | $ 3,389 | $ 2,446 | $ 128 | $ 9,085 | $ (297) | $ 25,308 | ||||||||
| Net realized gain (loss) | 16,409 | 5,451 | (19,531) | (2,250) | (59,511) | (20,432) | (1,365) | ||||||||
| Net change in unrealized appreciation (depreciation) | 42,144 | 5,514 | 75,527 | 3,725 | 162,738 | 65,912 | (1,382) | ||||||||
| Net increase (decrease) in net assets | |||||||||||||||
| from operations | 83,548 | 14,354 | 58,442 | 1,603 | 112,312 | 45,183 | 22,561 | ||||||||
| Distributions to shareholders | |||||||||||||||
| From net investment income | |||||||||||||||
| Class A | (31,680) | (150) | (2,397) | - | (19,862) | - | (17,134) | ||||||||
| Class B | (10) | - | (63) | - | (21) | - | (14) | ||||||||
| From net realized gains | |||||||||||||||
| Class A | (2,939) | - | - | - | - | - | - | ||||||||
| Class B | (1) | - | - | - | - | - | - | ||||||||
| Total distributions to shareholders | (34,630) | (150) | (2,460) | - | (19,883) | - | (17,148) | ||||||||
| Share transactions¹ | |||||||||||||||
| Proceeds from the sale of shares | |||||||||||||||
| Class A | 339,012 | 177,813 | 160,445 | 200,801 | 232,300 | 58,582 | 396,612 | ||||||||
| Class B | 131 | 113 | 5,703 | 201 | 245 | 42 | 940 | ||||||||
| Proceeds in connection with acquisition | |||||||||||||||
| Class A | - | - | - | - | - | - | - | ||||||||
| Class B | - | - | - | - | - | - | - | ||||||||
| Reinvestment of distributions | |||||||||||||||
| Class A | 34,619 | 150 | 2,397 | - | 19,862 | - | 17,134 | ||||||||
| Class B | 11 | - | 63 | - | 21 | - | 14 | ||||||||
| Cost of shares redeemed | |||||||||||||||
| Class A | (204,572) | (28,066) | (76,420) | (5,626) | (141,732) | (31,970) | (406,987) | ||||||||
| Class B | (112) | (41) | (2,149) | (2) | (272) | (149) | (1,291) | ||||||||
| Net increase (decrease) in net assets from | |||||||||||||||
| share transactions | 169,089 | 149,969 | 90,039 | 195,374 | 110,424 | 26,505 | 6,422 | ||||||||
| Net increase (decrease) in net assets | 218,007 | 164,173 | 146,021 | 196,977 | 202,853 | 71,688 | 11,835 | ||||||||
| Net assets beginning of year | 564,982 | 29,070 | 134,704 | - | 346,837 | 92,116 | 681,746 | ||||||||
| Net assets end of year | $ 782,989 | $ 193,243 | $ 280,725 | $ 196,977 | $ 549,690 | $ 163,804 | $ 693,581 | ||||||||
| Undistributed (excess of distributions over) | |||||||||||||||
| net investment income | $ 24,797 | $ 5,800 | $ 1,423 | $ 26 | $ 14,697 | $ (5) | $ 24,719 | ||||||||
| ¹Share transactions | |||||||||||||||
| Shares sold | |||||||||||||||
| Class A | 29,330 | 15,714 | 22,084 | 19,460 | 36,818 | 4,488 | 31,731 | ||||||||
| Class B | 12 | 10 | 931 | 19 | 39 | 3 | 72 | ||||||||
| Shares issued in connection with acquisition | |||||||||||||||
| Class A | - | - | - | - | - | - | - | ||||||||
| Class B | - | - | - | - | - | - | - | ||||||||
| Reinvestment of distributions | |||||||||||||||
| Class A | 2,951 | 13 | 279 | - | 2,801 | - | 1,365 | ||||||||
| Class B | 1 | - | 7 | - | 3 | - | 1 | ||||||||
| Shares redeemed | |||||||||||||||
| Class A | (18,035) | (2,485) | (10,893) | (549) | (23,609) | (2,468) | (32,744) | ||||||||
| Class B | (10) | (3) | (310) | - | (46) | (10) | (100) | ||||||||
| Net increase (decrease) | |||||||||||||||
| Class A | 14,246 | 13,242 | 11,470 | 18,911 | 16,010 | 2,020 | 352 | ||||||||
| Class B | 3 | 7 | 628 | 19 | (4) | (7) | (27) | ||||||||
| Purchase and sales of investment securities | |||||||||||||||
| (excluding short-term securities): | |||||||||||||||
| Purchase of securities | $ 4,207,935 | (b) | $ 171,680 | $ 287,985 | $ 182,298 | $ 466,877 | $ 118,248 | $ 164,578 | (c) | ||||||
| Proceeds from sales of securities | 4,153,182 | (b) | 50,095 | 204,623 | 12,705 | 359,692 | 95,637 | 82,865 | (c) | ||||||
| (a) Period from September 28, 2009 (commencement of operations) | |||||||||||||||
| (b) Amounts include $1,534,531 and $1,568,551 of purchases and sales, respectively, of U.S. Government Securities. | |||||||||||||||
| (c) Amounts include $153,207 and $78,280 of purchases and sales, respectively, of U.S. Government Securities. | |||||||||||||||
See accompanying Notes to Financial Statements.
JNL Series Trust
Statements of Changes in Net Assets (in thousands)
For the Year Ended December 31, 2009
| JNL/Mellon | ||||||||||||||
| JNL/Mellon | JNL/Mellon | Capital | ||||||||||||
| JNL/Lazard | JNL/Lazard | JNL/M&G | JNL/M&G | Capital | Capital | Management | ||||||||
| Emerging | Mid Cap | Global Basics | Global Leaders | Management | Management | European 30 | ||||||||
| Operations | Markets Fund | Equity Fund | Fund | Fund | 10 X 10 Fund | Index 5 Fund | Fund | |||||||
| Net investment income (loss) | $ 8,084 | $ 1,147 | $ 61 | $ 82 | $ 4,439 | $ 2,875 | $ 153 | |||||||
| Net realized gain (loss) | (65,568) | (18,562) | 114 | 259 | (15,556) | (5,475) | 514 | |||||||
| Net change in unrealized appreciation (depreciation) | 261,069 | 62,130 | 4,861 | 2,760 | 47,726 | 35,129 | 1,331 | |||||||
| Net increase (decrease) in net assets | ||||||||||||||
| from operations | 203,585 | 44,715 | 5,036 | 3,101 | 36,609 | 32,529 | 1,998 | |||||||
| Distributions to shareholders | ||||||||||||||
| From net investment income | ||||||||||||||
| Class A | (9,731) | (1,100) | (76) | (94) | (6,552) | (1,700) | (254) | |||||||
| Class B | (11) | (1) | (1) | (1) | - | - | (3) | |||||||
| From net realized gains | ||||||||||||||
| Class A | - | - | (144) | - | (6,382) | (1,937) | (571) | |||||||
| Class B | - | - | (1) | - | - | - | (6) | |||||||
| Total distributions to shareholders | (9,742) | (1,101) | (222) | (95) | (12,934) | (3,637) | (834) | |||||||
| Share transactions¹ | ||||||||||||||
| Proceeds from the sale of shares | ||||||||||||||
| Class A | 481,395 | 53,958 | 29,137 | 11,004 | 109,190 | 147,279 | 14,684 | |||||||
| Class B | 639 | 386 | 152 | 11 | - | - | 7 | |||||||
| Proceeds in connection with acquisition | ||||||||||||||
| Class A | - | - | - | - | - | - | - | |||||||
| Class B | - | - | - | - | - | - | - | |||||||
| Reinvestment of distributions | ||||||||||||||
| Class A | 9,731 | 1,100 | 220 | 94 | 12,934 | 3,637 | 825 | |||||||
| Class B | 11 | 1 | 2 | 1 | - | - | 9 | |||||||
| Cost of shares redeemed | ||||||||||||||
| Class A | (160,488) | (59,254) | (9,114) | (1,273) | (51,675) | (35,266) | (5,462) | |||||||
| Class B | (338) | (2,200) | (130) | - | - | - | (2) | |||||||
| Net increase (decrease) in net assets from | ||||||||||||||
| share transactions | 330,950 | (6,009) | 20,267 | 9,837 | 70,449 | 115,650 | 10,061 | |||||||
| Net increase (decrease) in net assets | 524,793 | 37,605 | 25,081 | 12,843 | 94,124 | 144,542 | 11,225 | |||||||
| Net assets beginning of year | 211,844 | 127,292 | 4,787 | 4,585 | 100,370 | 60,409 | 2,141 | |||||||
| Net assets end of year | $ 736,637 | $ 164,897 | $ 29,868 | $ 17,428 | $ 194,494 | $ 204,951 | $ 13,366 | |||||||
| Undistributed (excess of distributions over) | ||||||||||||||
| net investment income | $ 4,989 | $ 928 | $ 8 | $ (8) | $ 4,449 | $ 2,895 | $ (76) | |||||||
| ¹Share transactions | ||||||||||||||
| Shares sold | ||||||||||||||
| Class A | 57,759 | 6,865 | 2,712 | 1,093 | 16,988 | 20,008 | 1,355 | |||||||
| Class B | 77 | 57 | 14 | 1 | - | - | - | |||||||
| Shares issued in connection with acquisition | ||||||||||||||
| Class A | - | - | - | - | - | - | - | |||||||
| Class B | - | - | - | - | - | - | - | |||||||
| Reinvestment of distributions | ||||||||||||||
| Class A | 987 | 118 | 18 | 8 | 1,814 | 439 | 74 | |||||||
| Class B | 1 | - | - | - | - | - | 1 | |||||||
| Shares redeemed | ||||||||||||||
| Class A | (20,848) | (7,929) | (868) | (124) | (7,975) | (4,864) | (497) | |||||||
| Class B | (40) | (344) | (11) | - | - | - | - | |||||||
| Net increase (decrease) | ||||||||||||||
| Class A | 37,898 | (946) | 1,862 | 977 | 10,827 | 15,583 | 932 | |||||||
| Class B | 38 | (287) | 3 | 1 | - | - | 1 | |||||||
| Purchase and sales of investment securities | ||||||||||||||
| (excluding short-term securities): | ||||||||||||||
| Purchase of securities | $ 484,878 | $ 101,301 | $ 23,880 | $ 12,217 | $ 77,320 | $ 124,183 | $ 13,012 | |||||||
| Proceeds from sales of securities | 187,620 | 107,944 | 5,358 | 3,478 | 15,253 | 9,065 | 3,674 | |||||||
See accompanying Notes to Financial Statements.
JNL Series Trust
Statements of Changes in Net Assets (in thousands)
For the Year Ended December 31, 2009
| JNL/Mellon | JNL/Mellon | JNL/Mellon | JNL/Mellon | JNL/Mellon | JNL/Mellon | JNL/Mellon | ||||||||
| Capital | Capital | Capital | Capital | Capital | Capital | Capital | ||||||||
| Management | Management | Management | Management | Management | Management | Management | ||||||||
| Pacific Rim 30 | S&P 500 | S&P 400 MidCap | Small Cap | International | Bond Index | Global Alpha | ||||||||
| Operations | Fund | Index Fund | Index Fund | Index Fund | Index Fund | Fund | Fund (a) | |||||||
| Net investment income (loss) | $ 169 | $ 11,342 | $ 4,728 | $ 3,774 | $ 12,363 | $ 19,527 | $ (151) | |||||||
| Net realized gain (loss) | 573 | 2,328 | (3,695) | (19,156) | (447) | (75) | 3 | |||||||
| Net change in unrealized appreciation (depreciation) | 1,634 | 158,392 | 117,279 | 120,377 | 131,672 | 9,023 | (579) | |||||||
| Net increase (decrease) in net assets | ||||||||||||||
| from operations | 2,376 | 172,062 | 118,312 | 104,995 | 143,588 | 28,475 | (727) | |||||||
| Distributions to shareholders | ||||||||||||||
| From net investment income | ||||||||||||||
| Class A | (195) | (11,083) | (4,488) | (3,292) | (15,267) | (19,791) | - | |||||||
| Class B | (2) | (149) | (51) | (32) | (411) | (67) | - | |||||||
| From net realized gains | ||||||||||||||
| Class A | (676) | - | - | (2,281) | (48) | (531) | - | |||||||
| Class B | (6) | - | - | (19) | (1) | (2) | - | |||||||
| Total distributions to shareholders | (879) | (11,232) | (4,539) | (5,624) | (15,727) | (20,391) | - | |||||||
| Share transactions¹ | ||||||||||||||
| Proceeds from the sale of shares | ||||||||||||||
| Class A | 17,843 | 419,298 | 194,952 | 185,703 | 372,062 | 570,482 | 67,200 | |||||||
| Class B | 16 | 4,296 | 2,561 | 2,009 | 12,456 | 1,618 | 110 | |||||||
| Proceeds in connection with acquisition | ||||||||||||||
| Class A | - | 94,890 | - | 63,228 | - | - | - | |||||||
| Class B | - | 259 | - | 171 | - | - | - | |||||||
| Reinvestment of distributions | ||||||||||||||
| Class A | 871 | 11,083 | 4,488 | 5,573 | 15,315 | 20,322 | - | |||||||
| Class B | 8 | 149 | 51 | 51 | 412 | 69 | - | |||||||
| Cost of shares redeemed | ||||||||||||||
| Class A | (6,869) | (240,768) | (126,638) | (123,990) | (158,550) | (184,946) | (4,199) | |||||||
| Class B | (2) | (4,801) | (1,906) | (1,494) | (5,141) | (694) | - | |||||||
| Net increase (decrease) in net assets from | ||||||||||||||
| share transactions | 11,867 | 284,406 | 73,508 | 131,251 | 236,554 | 406,851 | 63,111 | |||||||
| Net increase (decrease) in net assets | 13,364 | 445,236 | 187,281 | 230,622 | 364,415 | 414,935 | 62,384 | |||||||
| Net assets beginning of year | 3,397 | 466,042 | 287,039 | 243,743 | 375,624 | 380,835 | - | |||||||
| Net assets end of year | $ 16,761 | $ 911,278 | $ 474,320 | $ 474,365 | $ 740,039 | $ 795,770 | $ 62,384 | |||||||
| Undistributed (excess of distributions over) | ||||||||||||||
| net investment income | $ (18) | $ 619 | $ 4,045 | $ 3,772 | $ 3,094 | $ 9,215 | $ 147 | |||||||
| ¹Share transactions | ||||||||||||||
| Shares sold | ||||||||||||||
| Class A | 1,663 | 52,379 | 20,952 | 22,046 | 35,696 | 49,872 | 6,723 | |||||||
| Class B | 1 | 558 | 289 | 242 | 1,348 | 139 | 11 | |||||||
| Shares issued in connection with acquisition | ||||||||||||||
| Class A | - | 12,047 | - | 8,656 | - | - | - | |||||||
| Class B | - | 33 | - | 23 | - | - | - | |||||||
| Reinvestment of distributions | ||||||||||||||
| Class A | 77 | 1,188 | 400 | 573 | 1,301 | 1,772 | - | |||||||
| Class B | 1 | 16 | 4 | 5 | 34 | 6 | - | |||||||
| Shares redeemed | ||||||||||||||
| Class A | (608) | (30,260) | (14,100) | (14,694) | (15,598) | (16,298) | (421) | |||||||
| Class B | - | (618) | (207) | (170) | (536) | (60) | - | |||||||
| Net increase (decrease) | ||||||||||||||
| Class A | 1,132 | 35,354 | 7,252 | 16,581 | 21,399 | 35,346 | 6,302 | |||||||
| Class B | 2 | (11) | 86 | 100 | 846 | 85 | 11 | |||||||
| Purchase and sales of investment securities | ||||||||||||||
| (excluding short-term securities): | ||||||||||||||
| Purchase of securities | $ 15,169 | $ 302,812 | $ 119,362 | $ 173,230 | $ 246,482 | $ 922,816 | (b) | $ - | ||||||
| Proceeds from sales of securities | 4,091 | 27,617 | 49,119 | 57,318 | 11,057 | 523,179 | (b) | - | ||||||
| (a) Period from September 28, 2009 (commencement of operations) | ||||||||||||||
| (b) Amounts include $664,564 and $372,890 of purchases and sales, respectively, of U.S. Government Securities. | ||||||||||||||
See accompanying Notes to Financial Statements.
JNL Series Trust
Statements of Changes in Net Assets (in thousands)
For the Year Ended December 31, 2009
| JNL/ | JNL/PPM | JNL/PPM | ||||||||||||
| Oppenheimer | JNL/PAM | JNL/PAM | JNL/PIMCO | JNL/PIMCO | America | America | ||||||||
| Global | Asia ex-Japan | China-India | Real Return | Total Return | High Yield | Mid Cap | ||||||||
| Operations | Growth Fund | Fund | Fund | Fund | Bond Fund | Bond Fund | Value Fund | |||||||
| Net investment income (loss) | $ 2,523 | $ 236 | $ 55 | $ 23,049 | $ 70,331 | $ 32,474 | $ 86 | |||||||
| Net realized gain (loss) | (6,526) | 836 | 10,363 | 102,884 | 62,666 | (20,028) | (549) | |||||||
| Net change in unrealized appreciation (depreciation) | 76,304 | 18,791 | 40,790 | 8,628 | 107,967 | 123,546 | 4,567 | |||||||
| Net increase (decrease) in net assets | ||||||||||||||
| from operations | 72,301 | 19,863 | 51,208 | 134,561 | 240,964 | 135,992 | 4,104 | |||||||
| Distributions to shareholders | ||||||||||||||
| From net investment income | ||||||||||||||
| Class A | (3,556) | (5) | - | (26,832) | (52,191) | (32,079) | (76) | |||||||
| Class B | (7) | - | - | (6) | (321) | (315) | - | |||||||
| From net realized gains | ||||||||||||||
| Class A | (14,477) | - | - | - | (55,522) | - | - | |||||||
| Class B | (25) | - | - | - | (322) | - | - | |||||||
| Total distributions to shareholders | (18,065) | (5) | - | (26,838) | (108,356) | (32,394) | (76) | |||||||
| Share transactions¹ | ||||||||||||||
| Proceeds from the sale of shares | ||||||||||||||
| Class A | 102,650 | 120,875 | 234,537 | 819,629 | 1,301,149 | 483,716 | 21,759 | |||||||
| Class B | 136 | 62 | 429 | 378 | 5,965 | 2,730 | 8 | |||||||
| Proceeds in connection with acquisition | ||||||||||||||
| Class A | - | - | - | - | - | - | - | |||||||
| Class B | - | - | - | - | - | - | - | |||||||
| Reinvestment of distributions | ||||||||||||||
| Class A | 18,033 | 5 | - | 26,832 | 107,713 | 32,079 | 76 | |||||||
| Class B | 32 | - | - | 6 | 643 | 315 | - | |||||||
| Cost of shares redeemed | ||||||||||||||
| Class A | (60,924) | (40,143) | (78,162) | (428,252) | (517,672) | (239,406) | (10,826) | |||||||
| Class B | (108) | (31) | (331) | (539) | (3,457) | (1,820) | (2) | |||||||
| Net increase in net assets from share | ||||||||||||||
| transactions | 59,819 | 80,768 | 156,473 | 418,054 | 894,341 | 277,614 | 11,015 | |||||||
| Net increase in net assets | 114,055 | 100,626 | 207,681 | 525,777 | 1,026,949 | 381,212 | 15,043 | |||||||
| Net assets beginning of year | 176,424 | 7,784 | 26,055 | 664,288 | 1,335,631 | 191,290 | 5,069 | |||||||
| Net assets end of year | $ 290,479 | $ 108,410 | $ 233,736 | $ 1,190,065 | $ 2,362,580 | $ 572,502 | $ 20,112 | |||||||
| Undistributed (excess of distributions over) | ||||||||||||||
| net investment income | $ 2,177 | $ 133 | $ (94) | $ 23,571 | $ 13,156 | $ 2,997 | $ 2 | |||||||
| ¹Share transactions | ||||||||||||||
| Shares sold | ||||||||||||||
| Class A | 12,284 | 17,242 | 36,231 | 74,128 | 107,536 | 89,094 | 3,236 | |||||||
| Class B | 16 | 8 | 62 | 34 | 471 | 474 | 1 | |||||||
| Shares issued in connection with acquisition | ||||||||||||||
| Class A | - | - | - | - | - | - | - | |||||||
| Class B | - | - | - | - | - | - | - | |||||||
| Reinvestment of distributions | ||||||||||||||
| Class A | 1,990 | 1 | - | 2,311 | 8,793 | 5,275 | 9 | |||||||
| Class B | 4 | - | - | 1 | 50 | 47 | - | |||||||
| Shares redeemed | ||||||||||||||
| Class A | (7,695) | (5,551) | (12,099) | (39,314) | (43,458) | (44,372) | (1,711) | |||||||
| Class B | (13) | (4) | (47) | (49) | (274) | (307) | - | |||||||
| Net increase | - | |||||||||||||
| Class A | 6,579 | 11,692 | 24,132 | 37,125 | 72,871 | 49,997 | 1,534 | |||||||
| Class B | 7 | 4 | 15 | (14) | 247 | 214 | 1 | |||||||
| Purchase and sales of investment securities | ||||||||||||||
| (excluding short-term securities): | ||||||||||||||
| Purchase of securities | $ 83,055 | $ 97,816 | $ 224,610 | $ 10,624,029 | (a) | $ 10,623,069 | (b) | $ 433,423 | $ 20,878 | |||||
| Proceeds from sales of securities | 42,623 | 19,604 | 75,555 | 10,682,988 | (a) | 11,030,293 | (b) | 168,654 | 9,967 | |||||
| (a) Amounts include $9,056,244 and $9,110,195 of purchases and sales, respectively, of U.S. Government Securities. | ||||||||||||||
| (b) Amounts include $2,653,491 and $2,445,715 of purchases and sales, respectively, of U.S. Government Securities. | ||||||||||||||
See accompanying Notes to Financial Statements.
JNL Series Trust
Statements of Changes in Net Assets (in thousands)
For the Year Ended December 31, 2009
| JNL/PPM | JNL/S&P | JNL/S&P | JNL/S&P | |||||||||||
| America | JNL/PPM | JNL/Red Rocks | Managed | Managed | Managed | JNL/S&P | ||||||||
| Small Cap | America Value | Listed Private | Conservative | Moderate | Moderate | Managed | ||||||||
| Operations | Value Fund | Equity Fund | Equity Fund | Fund | Fund | Growth Fund | Growth Fund | |||||||
| Net investment income (loss) | $ 77 | $ 1,223 | $ 844 | $ 13,360 | $ 18,568 | $ 27,055 | $ 16,028 | |||||||
| Net realized gain (loss) | (644) | (27,858) | 2,887 | (15,712) | (19,997) | (26,548) | (37,116) | |||||||
| Net change in unrealized appreciation (depreciation) | 5,025 | 51,515 | 30,145 | 67,729 | 126,668 | 273,961 | 287,667 | |||||||
| Net increase (decrease) in net assets | ||||||||||||||
| from operations | 4,458 | 24,880 | 33,876 | 65,377 | 125,239 | 274,468 | 266,579 | |||||||
| Distributions to shareholders | ||||||||||||||
| From net investment income | ||||||||||||||
| Class A | (54) | (4,058) | (6,449) | (10,219) | (11,077) | (10,776) | (23,405) | |||||||
| Class B | (18) | (32) | (4) | - | - | - | - | |||||||
| From net realized gains | ||||||||||||||
| Class A | - | - | (322) | (5,948) | (11,102) | (40,252) | (44,252) | |||||||
| Class B | - | - | - | - | - | - | - | |||||||
| Total distributions to shareholders | (72) | (4,090) | (6,775) | (16,167) | (22,179) | (51,028) | (67,657) | |||||||
| Share transactions¹ | ||||||||||||||
| Proceeds from the sale of shares | ||||||||||||||
| Class A | 16,964 | 34,983 | 206,438 | 344,525 | 466,824 | 738,915 | 634,896 | |||||||
| Class B | 3,701 | 972 | 92 | - | - | - | - | |||||||
| Proceeds in connection with acquisition | ||||||||||||||
| Class A | - | - | - | - | 66,649 | 51,820 | 45,206 | |||||||
| Class B | - | - | - | - | - | - | - | |||||||
| Reinvestment of distributions | ||||||||||||||
| Class A | 54 | 4,058 | 6,771 | 16,167 | 22,179 | 51,028 | 67,657 | |||||||
| Class B | 18 | 32 | 4 | - | - | - | - | |||||||
| Cost of shares redeemed | ||||||||||||||
| Class A | (12,638) | (53,873) | (31,671) | (193,370) | (194,992) | (288,180) | (275,722) | |||||||
| Class B | (1,217) | (473) | (37) | - | - | - | - | |||||||
| Net increase in net assets from share | ||||||||||||||
| transactions | 6,882 | (14,301) | 181,597 | 167,322 | 360,660 | 553,583 | 472,037 | |||||||
| Net increase in net assets | 11,268 | 6,489 | 208,698 | 216,532 | 463,720 | 777,023 | 670,959 | |||||||
| Net assets beginning of year | 8,443 | 87,846 | 15,331 | 407,426 | 557,615 | 997,961 | 808,800 | |||||||
| Net assets end of year | $ 19,711 | $ 94,335 | $ 224,029 | $ 623,958 | $ 1,021,335 | $ 1,774,984 | $ 1,479,759 | |||||||
| Undistributed (excess of distributions over) | ||||||||||||||
| net investment income | $ 3 | $ 1,221 | $ (4,068) | $ 9,756 | $ 15,205 | $ 30,911 | $ 17,970 | |||||||
| ¹Share transactions | ||||||||||||||
| Shares sold | ||||||||||||||
| Class A | 2,378 | # | 4,183 | 28,778 | 34,656 | 47,654 | 75,284 | 70,313 | ||||||
| Class B | 625 | # | 110 | 12 | - | - | - | - | ||||||
| Shares issued in connection with acquisition | ||||||||||||||
| Class A | - | - | - | - | 6,456 | 4,985 | 4,691 | |||||||
| Class B | - | - | - | - | - | - | - | |||||||
| Reinvestment of distributions | ||||||||||||||
| Class A | 7 | 392 | 844 | 1,560 | 2,124 | 4,823 | 6,932 | |||||||
| Class B | 2 | 3 | 1 | - | - | - | - | |||||||
| Shares redeemed | ||||||||||||||
| Class A | (1,824) | (7,211) | (4,320) | (19,474) | (20,288) | (30,257) | (31,437) | |||||||
| Class B | (182) | (59) | (5) | - | - | - | - | |||||||
| Net increase | ||||||||||||||
| Class A | 561 | (2,636) | 25,302 | 16,742 | 35,946 | 54,835 | 50,499 | |||||||
| Class B | 445 | 54 | 8 | - | - | - | - | |||||||
| Purchase and sales of investment securities | ||||||||||||||
| (excluding short-term securities): | ||||||||||||||
| Purchase of securities | $ 21,035 | $ 46,689 | $ 203,304 | $ 195,704 | $ 379,679 | $ 563,493 | $ 450,556 | |||||||
| Proceeds from sales of securities | 14,201 | 63,884 | 30,438 | 55,830 | 46,920 | 60,414 | 84,540 | |||||||
See accompanying Notes to Financial Statements.
JNL Series Trust
Statements of Changes in Net Assets (in thousands)
For the Year Ended December 31, 2009
| JNL/S&P | JNL/S&P | JNL/S&P | ||||||||||||
| Managed | Disciplined | Disciplined | JNL/S&P | JNL/S&P | JNL/S&P | JNL/S&P | ||||||||
| Aggressive | Moderate | Moderate | Disciplined | Competitive | Dividend Income | Intrinsic | ||||||||
| Operations | Growth Fund | Fund | Growth Fund | Growth Fund | Advantage Fund | & Growth Fund | Value Fund | |||||||
| Net investment income (loss) | $ 4,928 | $ 2,753 | $ 3,411 | $ 1,408 | $ 2,217 | $ 4,710 | $ 2,230 | |||||||
| Net realized gain (loss) | (38,676) | (4,476) | (14,165) | (8,221) | 32,235 | 19,690 | 59,957 | |||||||
| Net change in unrealized appreciation (depreciation) | 162,066 | 21,725 | 39,827 | 20,449 | 28,899 | 16,445 | 14,071 | |||||||
| Net increase (decrease) in net assets | ||||||||||||||
| from operations | 128,318 | 20,002 | 29,073 | 13,636 | 63,351 | 40,845 | 76,258 | |||||||
| Distributions to shareholders | ||||||||||||||
| From net investment income | ||||||||||||||
| Class A | (11,203) | (2,845) | (3,991) | (1,712) | (27) | (57) | (46) | |||||||
| Class B | - | - | - | - | - | - | - | |||||||
| From net realized gains | ||||||||||||||
| Class A | (17,264) | (1,066) | (2,254) | (992) | - | - | - | |||||||
| Class B | - | - | - | - | - | - | - | |||||||
| Total distributions to shareholders | (28,467) | (3,911) | (6,245) | (2,704) | (27) | (57) | (46) | |||||||
| Share transactions¹ | ||||||||||||||
| Proceeds from the sale of shares | ||||||||||||||
| Class A | 214,398 | 117,823 | 137,951 | 64,478 | 203,923 | 152,566 | 177,653 | |||||||
| Class B | - | - | - | - | 245 | 146 | 570 | |||||||
| Proceeds in connection with acquisition | ||||||||||||||
| Class A | - | 1,090 | 570 | 537 | - | - | - | |||||||
| Class B | - | - | - | - | - | - | - | |||||||
| Reinvestment of distributions | ||||||||||||||
| Class A | 28,467 | 3,911 | 6,245 | 2,704 | 27 | 57 | 46 | |||||||
| Class B | - | - | - | - | - | - | - | |||||||
| Cost of shares redeemed | ||||||||||||||
| Class A | (174,566) | (28,522) | (35,681) | (23,921) | (102,965) | (55,322) | (103,954) | |||||||
| Class B | - | - | - | - | (222) | (134) | (519) | |||||||
| Net increase in net assets from share | ||||||||||||||
| transactions | 68,299 | 94,302 | 109,085 | 43,798 | 101,008 | 97,313 | 73,796 | |||||||
| Net increase in net assets | 168,150 | 110,393 | 131,913 | 54,730 | 164,332 | 138,101 | 150,008 | |||||||
| Net assets beginning of year | 414,718 | 58,062 | 74,452 | 26,133 | 90,413 | 101,449 | 96,678 | |||||||
| Net assets end of year | $ 582,868 | $ 168,455 | $ 206,365 | $ 80,863 | $ 254,745 | $ 239,550 | $ 246,686 | |||||||
| Undistributed (excess of distributions over) | ||||||||||||||
| net investment income | $ 4,931 | $ 2,774 | $ 3,418 | $ 1,408 | $ 2,217 | $ 4,709 | $ 2,231 | |||||||
| ¹Share transactions | ||||||||||||||
| Shares sold | ||||||||||||||
| Class A | 22,539 | 14,212 | 18,845 | 9,454 | 24,661 | 21,138 | 23,337 | |||||||
| Class B | - | - | - | - | 28 | 19 | 65 | |||||||
| Shares issued in connection with acquisition | ||||||||||||||
| Class A | - | 146 | 89 | 91 | - | - | - | |||||||
| Class B | - | - | - | - | - | - | - | |||||||
| Reinvestment of distributions | ||||||||||||||
| Class A | 2,709 | 439 | 775 | 357 | 2 | 6 | 5 | |||||||
| Class B | - | - | - | - | - | - | - | |||||||
| Shares redeemed | ||||||||||||||
| Class A | (18,923) | (3,471) | (5,171) | (3,466) | (12,186) | (7,997) | (13,612) | |||||||
| Class B | - | - | - | - | (25) | (18) | (59) | |||||||
| Net increase | ||||||||||||||
| Class A | 6,325 | 11,326 | 14,538 | 6,436 | 12,477 | 13,147 | 9,730 | |||||||
| Class B | - | - | - | - | 3 | 1 | 6 | |||||||
| Purchase and sales of investment securities | ||||||||||||||
| (excluding short-term securities): | ||||||||||||||
| Purchase of securities | $ 111,737 | $ 92,161 | $ 111,220 | $ 51,010 | $ 275,870 | $ 222,148 | $ 314,981 | |||||||
| Proceeds from sales of securities | 86,826 | 11,330 | 18,692 | 11,766 | 173,641 | 120,973 | 240,647 | |||||||
See accompanying Notes to Financial Statements.
JNL Series Trust
Statements of Changes in Net Assets (in thousands)
For the Year Ended December 31, 2009
| JNL/T. Rowe | JNL/T. Rowe | |||||||||||||
| JNL/S&P | JNL/Select | JNL/Select | Price | Price | ||||||||||
| Total | JNL/S&P 4 | Balanced | Money | JNL/Select | Established | Mid-Cap | ||||||||
| Operations | Yield Fund | Fund | Fund | Market Fund | Value Fund | Growth Fund | Growth Fund | |||||||
| Net investment income (loss) | $ 1,965 | $ (131) | $ 13,872 | $ 2,068 | $ 9,600 | $ 849 | $ (1,511) | |||||||
| Net realized gain (loss) | 40,287 | (10,383) | (24,563) | - | (61,202) | (92,850) | (16,180) | |||||||
| Net change in unrealized appreciation (depreciation) | 12,192 | 173,760 | 116,411 | - | 187,290 | 341,595 | 249,684 | |||||||
| Net increase (decrease) in net assets | ||||||||||||||
| from operations | 54,444 | 163,246 | 105,720 | 2,068 | 135,688 | 249,594 | 231,993 | |||||||
| Distributions to shareholders | ||||||||||||||
| From net investment income | ||||||||||||||
| Class A | (33) | (5,191) | (15,778) | (2,055) | (10,148) | (2,134) | - | |||||||
| Class B | - | - | (20) | (13) | (206) | (126) | - | |||||||
| From net realized gains | ||||||||||||||
| Class A | - | (5) | - | - | - | - | (136) | |||||||
| Class B | - | - | - | - | - | - | (4) | |||||||
| From return of capital | ||||||||||||||
| Class A | - | - | - | - | - | - | (281) | |||||||
| Class B | - | - | - | - | - | - | (10) | |||||||
| Total distributions to shareholders | (33) | (5,196) | (15,798) | (2,068) | (10,354) | (2,260) | (431) | |||||||
| Share transactions¹ | ||||||||||||||
| Proceeds from the sale of shares | ||||||||||||||
| Class A | 147,225 | 362,194 | 332,082 | 1,252,932 | 304,692 | 352,768 | 342,393 | |||||||
| Class B | 221 | - | 224 | 7,934 | 2,859 | 4,221 | 5,066 | |||||||
| Proceeds in connection with acquisition | ||||||||||||||
| Class A | - | - | - | - | - | - | - | |||||||
| Class B | - | - | - | - | - | - | - | |||||||
| Reinvestment of distributions | ||||||||||||||
| Class A | 33 | 5,196 | 15,778 | 2,055 | 10,148 | 2,134 | 417 | |||||||
| Class B | - | - | 20 | 13 | 206 | 126 | 14 | |||||||
| Cost of shares redeemed | ||||||||||||||
| Class A | (92,265) | (163,218) | (155,903) | (1,454,529) | (160,319) | (258,030) | (169,644) | |||||||
| Class B | (278) | - | (171) | (7,898) | (2,388) | (3,069) | (3,537) | |||||||
| Net increase (decrease) in net assets from | ||||||||||||||
| share transactions | 54,936 | 204,172 | 192,030 | (199,493) | 155,198 | 98,150 | 174,709 | |||||||
| Net increase (decrease) in net assets | 109,347 | 362,222 | 281,952 | (199,493) | 280,532 | 345,484 | 406,271 | |||||||
| Net assets beginning of year | 103,689 | 265,183 | 455,767 | 1,347,274 | 495,701 | 601,372 | 442,995 | |||||||
| Net assets end of year | $ 213,036 | $ 627,405 | $ 737,719 | $ 1,147,781 | $ 776,233 | $ 946,856 | $ 849,266 | |||||||
| Undistributed (excess of distributions over) | ||||||||||||||
| net investment income | $ 1,965 | $ (4) | $ 13,925 | $ (3) | $ 9,584 | $ 539 | $ (16) | |||||||
| ¹Share transactions | ||||||||||||||
| Shares sold | ||||||||||||||
| Class A | 19,966 | 47,871 | 24,199 | 1,252,931 | 22,529 | 23,009 | 17,145 | |||||||
| Class B | 26 | - | 16 | 7,934 | 220 | 303 | 275 | |||||||
| Shares issued in connection with acquisition | ||||||||||||||
| Class A | - | - | - | - | - | - | - | |||||||
| Class B | - | - | - | - | - | - | - | |||||||
| Reinvestment of distributions | ||||||||||||||
| Class A | 3 | 547 | 1,049 | 2,055 | 663 | 120 | 18 | |||||||
| Class B | - | - | 1 | 13 | 13 | 7 | 1 | |||||||
| Shares redeemed | ||||||||||||||
| Class A | (12,835) | (21,739) | (11,687) | (1,454,531) | (12,220) | (18,504) | (8,891) | |||||||
| Class B | (34) | - | (12) | (7,898) | (181) | (208) | (186) | |||||||
| Net increase (decrease) | ||||||||||||||
| Class A | 7,134 | 26,679 | 13,561 | (199,545) | 10,972 | 4,625 | 8,272 | |||||||
| Class B | (8) | - | 5 | 49 | 52 | 102 | 90 | |||||||
| Purchase and sales of investment securities | ||||||||||||||
| (excluding short-term securities): | ||||||||||||||
| Purchase of securities | $ 247,940 | $ 249,429 | $ 586,212 | (a) | $ 93,844 | (b) | $ 383,098 | $ 529,617 | $ 329,090 | |||||
| Proceeds from sales of securities | 191,272 | 50,560 | 423,934 | (a) | 28,355 | (b) | 234,591 | 420,991 | 180,890 | |||||
| (a) Amounts include $129,427 and $76,181 of purchases and sales, respectively, of U.S. Government Securities. | ||||||||||||||
| (b) Amounts include $68,035 and $20,000 of purchases and sales, respectively, of U.S. Government Securities. | ||||||||||||||
See accompanying Notes to Financial Statements.
JNL Series Trust
Statements of Changes in Net Assets (in thousands)
For the Year Ended December 31, 2009
| JNL/T. Rowe | ||||||
| Price Short- | JNL/T. Rowe | |||||
| Term Bond | Price | |||||
| Operations | Fund | Value Fund | ||||
| Net investment income (loss) | $ 9,706 | $ 9,942 | ||||
| Net realized gain (loss) | (17,146) | (40,718) | ||||
| Net change in unrealized appreciation (depreciation) | 33,959 | 204,680 | ||||
| Net increase (decrease) in net assets | ||||||
| from operations | 26,519 | 173,904 | ||||
| Distributions to shareholders | ||||||
| From net investment income | ||||||
| Class A | (13,181) | (9,641) | ||||
| Class B | (6) | (8) | ||||
| From net realized gains | ||||||
| Class A | (4,268) | - | ||||
| Class B | (2) | - | ||||
| Total distributions to shareholders | (17,457) | (9,649) | ||||
| Share transactions¹ | ||||||
| Proceeds from the sale of shares | ||||||
| Class A | 329,418 | 311,003 | ||||
| Class B | 197 | 155 | ||||
| Proceeds in connection with acquisition | ||||||
| Class A | - | - | ||||
| Class B | - | - | ||||
| Reinvestment of distributions | ||||||
| Class A | 17,449 | 9,641 | ||||
| Class B | 8 | 8 | ||||
| Cost of shares redeemed | ||||||
| Class A | (166,506) | (169,622) | ||||
| Class B | (44) | (140) | ||||
| Net increase (decrease) in net assets from | ||||||
| share transactions | 180,522 | 151,045 | ||||
| Net increase (decrease) in net assets | 189,584 | 315,300 | ||||
| Net assets beginning of year | 295,459 | 412,921 | ||||
| Net assets end of year | $ 485,043 | $ 728,221 | ||||
| Undistributed (excess of distributions over) | ||||||
| net investment income | $ 9,862 | $ 9,943 | ||||
| ¹Share transactions | ||||||
| Shares sold | ||||||
| Class A | 33,669 | 38,732 | ||||
| Class B | 20 | 19 | ||||
| Shares issued in connection with acquisition | ||||||
| Class A | - | - | ||||
| Class B | - | - | ||||
| Reinvestment of distributions | ||||||
| Class A | 1,791 | 1,024 | ||||
| Class B | 1 | 1 | ||||
| Shares redeemed | ||||||
| Class A | (17,057) | (21,802) | ||||
| Class B | (4) | (17) | ||||
| Net increase (decrease) | ||||||
| Class A | 18,403 | 17,954 | ||||
| Class B | 17 | 3 | ||||
| Purchase and sales of investment securities | ||||||
| (excluding short-term securities): | ||||||
| Purchase of securities | $ 665,800 | (a) | $ 239,152 | |||
| Proceeds from sales of securities | 500,591 | (a) | 101,689 | |||
| (a) Amounts include $277,934 and $262,256 of purchases and sales, respectively, of U.S. Government Securities. | ||||||
See accompanying Notes to Financial Statements.
JNL Series Trust
Statements of Changes in Net Assets (in thousands)
For the Year Ended December 31, 2008
| JNL/Capital | JNL/Capital | JNL/Capital | ||||||||||||
| JNL/AIM | JNL/AIM | JNL/AIM | JNL/AIM | Guardian | Guardian | Guardian | ||||||||
| International | Large Cap | Global Real | Small Cap | Global Balanced | Global Diversified | International Small | ||||||||
| Operations | Growth Fund | Growth Fund | Estate Fund | Growth Fund | Fund | Research Fund | Cap Fund | |||||||
| Net investment income (loss) | $ 8,027 | $ 1,333 | $ 5,211 | $ (169) | $ 5,109 | $ 4,378 | $ 1,158 | |||||||
| Net realized gain (loss) | (58,261) | (42,491) | (99,753) | (3,664) | (26,475) | (38,690) | (13,302) | |||||||
| Net change in unrealized appreciation (depreciation) | (137,221) | (171,446) | 7,586 | (22,846) | (52,765) | (80,501) | (33,658) | |||||||
| Net increase (decrease) in net assets | ||||||||||||||
| from operations | (187,455) | (212,604) | (86,956) | (26,679) | (74,131) | (114,813) | (45,802) | |||||||
| Distributions to shareholders | ||||||||||||||
| From net investment income | ||||||||||||||
| Class A | (1,550) | (670) | (3,995) | - | (2,469) | - | (89) | |||||||
| Class B | (58) | (2) | (9) | - | (3) | - | - | |||||||
| From net realized gains | ||||||||||||||
| Class A | (64,126) | (22,240) | (31,279) | (5,984) | (22,586) | - | - | |||||||
| Class B | (2,390) | (25) | (64) | (15) | (23) | - | - | |||||||
| Total distributions to shareholders | (68,124) | (22,937) | (35,347) | (5,999) | (25,081) | - | (89) | |||||||
| �� | ||||||||||||||
| Share transactions¹ | ||||||||||||||
| Proceeds from the sale of shares | ||||||||||||||
| Class A | 140,459 | 237,544 | 162,403 | 29,236 | 163,097 | 180,647 | 46,888 | |||||||
| Class B | 3,889 | 375 | 195 | 117 | 203 | 243 | 75 | |||||||
| Proceeds in connection with acquisition | ||||||||||||||
| Class A | - | - | - | - | - | - | - | |||||||
| Class B | - | - | - | - | - | - | - | |||||||
| Reinvestment of distributions | ||||||||||||||
| Class A | 65,676 | 22,910 | 35,274 | 5,984 | 25,055 | - | 89 | |||||||
| Class B | 2,448 | 27 | 73 | 15 | 26 | - | - | |||||||
| Cost of shares redeemed | ||||||||||||||
| Class A | (185,268) | (199,447) | (114,832) | (36,251) | (103,296) | (135,288) | (29,480) | |||||||
| Class B | (3,599) | (177) | (117) | (68) | (227) | (114) | (17) | |||||||
| Net increase (decrease) in net assets from | ||||||||||||||
| share transactions | 23,605 | 61,232 | 82,996 | (967) | 84,858 | 45,488 | 17,555 | |||||||
| Net increase (decrease) in net assets | (231,974) | (174,309) | (39,307) | (33,645) | (14,354) | (69,325) | (28,336) | |||||||
| Net assets beginning of year | 491,289 | 525,539 | 184,819 | 74,062 | 198,115 | 232,593 | 73,171 | |||||||
| Net assets end of year | $ 259,315 | $ 351,230 | $ 145,512 | $ 40,417 | $ 183,761 | $ 163,268 | $ 44,835 | |||||||
| Undistributed (excess of distributions over) | ||||||||||||||
| net investment income | $ 5,278 | $ 1,463 | $ 4,437 | $ 9 | $ 4,929 | $ 4,280 | $ 984 | |||||||
| ¹Share transactions | ||||||||||||||
| Shares sold | ||||||||||||||
| Class A | 11,072 | 19,076 | 14,048 | 2,435 | 15,041 | 8,148 | 6,506 | |||||||
| Class B | 281 | 30 | 18 | 10 | 18 | 10 | 9 | |||||||
| Shares issued in connection with acquisition | ||||||||||||||
| Class A | - | - | - | - | - | - | - | |||||||
| Class B | - | - | - | - | - | - | - | |||||||
| Reinvestment of distributions | ||||||||||||||
| Class A | 9,423 | 2,760 | 6,757 | 861 | 3,549 | - | 21 | |||||||
| Class B | 343 | 3 | 14 | 2 | 3 | - | - | |||||||
| Shares redeemed | ||||||||||||||
| Class A | (14,381) | (16,541) | (10,556) | (2,915) | (10,159) | (6,226) | (4,062) | |||||||
| Class B | (287) | (16) | (11) | (5) | (20) | (5) | (2) | |||||||
| Net increase (decrease) | ||||||||||||||
| Class A | 6,114 | 5,295 | 10,249 | 381 | 8,431 | 1,922 | 2,465 | |||||||
| Class B | 337 | 17 | 21 | 7 | 1 | 5 | 7 | |||||||
| Purchase and sales of investment securities | ||||||||||||||
| (excluding short-term securities): | ||||||||||||||
| Purchase of securities | $ 182,933 | $ 279,584 | $ 267,469 | $ 22,424 | $ 216,142 | (a) | $ 255,811 | $ 52,725 | ||||||
| Proceeds from sales of securities | 218,885 | 245,974 | 212,489 | 27,952 | 143,865 | (a) | 200,880 | 29,788 | ||||||
| (a) Amounts include $24,486 and $15,702 of purchases and sales, respectively, of U.S. Government Securities. | ||||||||||||||
See accompanying Notes to Financial Statements.
JNL Series Trust
Statements of Changes in Net Assets (in thousands)
For the Year Ended December 31, 2008
| JNL/Capital | JNL/Credit | JNL/Franklin | JNL/Franklin | |||||||||||
| Guardian | Suisse Global | JNL/Credit | JNL/Eagle | JNL/Eagle | Templeton | Templeton | ||||||||
| U.S. Growth | Natural Resources | Suisse Long/ | Core Equity | SmallCap | Founding | Global Growth | ||||||||
| Operations | Equity Fund | Fund | Short Fund | Fund | Equity Fund | Strategy Fund | Fund | |||||||
| Net investment income (loss) | $ 673 | $ 6,054 | $ 569 | $ 842 | $ (521) | $ (157) | $ 6,270 | |||||||
| Net realized gain (loss) | (26,369) | (26,746) | (18,626) | (10,340) | (30,589) | (32,948) | (23,160) | |||||||
| Net change in unrealized appreciation (depreciation) | (100,977) | (205,672) | (4,281) | (19,326) | (69,065) | (291,733) | (128,297) | |||||||
| Net increase (decrease) in net assets | ||||||||||||||
| from operations | (126,673) | (226,364) | (22,338) | (28,824) | (100,175) | (324,838) | (145,187) | |||||||
| Distributions to shareholders | ||||||||||||||
| From net investment income | ||||||||||||||
| Class A | (7) | (226) | - | (1,611) | - | (10,305) | (50) | |||||||
| Class B | - | (1) | - | (6) | - | - | - | |||||||
| From net realized gains | ||||||||||||||
| Class A | - | (12,906) | (3,574) | (16,524) | (10,749) | (391) | (23) | |||||||
| Class B | - | (16) | (8) | (52) | (11) | - | - | |||||||
| Total distributions to shareholders | (7) | (13,149) | (3,582) | (18,193) | (10,760) | (10,696) | (73) | |||||||
| Share transactions¹ | ||||||||||||||
| Proceeds from the sale of shares | ||||||||||||||
| Class A | 223,683 | 424,107 | 54,303 | 16,748 | 137,281 | 404,745 | 186,917 | |||||||
| Class B | 95 | 762 | 40 | 20 | 209 | - | 186 | |||||||
| Proceeds in connection with acquisition | ||||||||||||||
| Class A | - | - | - | - | - | - | - | |||||||
| Class B | - | - | - | - | - | - | - | |||||||
| Reinvestment of distributions | ||||||||||||||
| Class A | 7 | 13,132 | 3,574 | 18,135 | 10,749 | 10,696 | 73 | |||||||
| Class B | - | 17 | 8 | 58 | 11 | - | - | |||||||
| Cost of shares redeemed | ||||||||||||||
| Class A | (128,001) | (371,688) | (58,770) | (26,454) | (104,802) | (299,501) | (124,331) | |||||||
| Class B | (45) | (577) | (12) | (16) | (152) | - | (162) | |||||||
| Net increase (decrease) in net assets from | ||||||||||||||
| share transactions | 95,739 | 65,753 | (857) | 8,491 | 43,296 | 115,940 | 62,683 | |||||||
| Net increase (decrease) in net assets | (30,941) | (173,760) | (26,777) | (38,526) | (67,639) | (219,594) | (82,577) | |||||||
| Net assets beginning of year | 226,922 | 388,681 | 68,749 | 81,308 | 231,930 | 800,395 | 318,753 | |||||||
| Net assets end of year | $ 195,981 | $ 214,921 | $ 41,972 | $ 42,782 | $ 164,291 | $ 580,801 | $ 236,176 | |||||||
| Undistributed (excess of distributions over) | ||||||||||||||
| net investment income | $ 672 | $ 3,948 | $ 569 | $ 842 | $ (2) | $ 444 | $ 5,413 | |||||||
| ¹Share transactions | ||||||||||||||
| Shares sold | ||||||||||||||
| Class A | 10,987 | 35,695 | 6,806 | 1,475 | 7,717 | 46,575 | 23,484 | |||||||
| Class B | 4 | 69 | 5 | 2 | 12 | - | 24 | |||||||
| Shares issued in connection with acquisition | ||||||||||||||
| Class A | - | - | - | - | - | - | - | |||||||
| Class B | - | - | - | - | - | - | - | |||||||
| Reinvestment of distributions | ||||||||||||||
| Class A | - | 2,211 | 624 | 3,739 | 926 | 1,786 | 13 | |||||||
| Class B | - | 3 | 1 | 11 | 1 | - | - | |||||||
| Shares redeemed | ||||||||||||||
| Class A | (6,566) | (31,835) | (6,900) | (2,191) | (6,047) | (35,859) | (15,562) | |||||||
| Class B | (2) | (51) | (1) | (1) | (8) | - | (19) | |||||||
| Net increase (decrease) | ||||||||||||||
| Class A | 4,421 | 6,071 | 530 | 3,023 | 2,596 | 12,502 | 7,935 | |||||||
| Class B | 2 | 21 | 5 | 12 | 5 | - | 5 | |||||||
| Purchase and sales of investment securities | ||||||||||||||
| (excluding short-term securities): | ||||||||||||||
| Purchase of securities | $ 194,452 | $ 316,052 | $ 269,162 | $ 33,187 | $ 175,982 | $ 208,115 | $ 78,719 | |||||||
| Proceeds from sales of securities | 108,151 | 249,570 | 271,675 | 39,495 | 137,248 | 102,354 | 30,376 | |||||||
See accompanying Notes to Financial Statements.
JNL Series Trust
Statements of Changes in Net Assets (in thousands)
For the Year Ended December 31, 2008
| JNL/Franklin | JNL/Goldman | JNL/Goldman | JNL/Goldman | ||||||||||||
| JNL/Franklin | Templeton | JNL/Franklin | Sachs Core | Sachs Emerging | JNL/Goldman | Sachs Short | |||||||||
| Templeton | Mutual Shares | Templeton Small | Plus Bond | Markets Debt | Sachs Mid Cap | Duration | |||||||||
| Operations | Income Fund | Fund | Cap Value Fund | Fund | Fund (a) | Value Fund | Bond Fund | ||||||||
| Net investment income (loss) | $ 38,792 | $ 5,296 | $ 1,073 | $ 30,419 | $ 231 | $ 1,399 | $ 12,909 | ||||||||
| Net realized gain (loss) | (50,029) | (32,753) | (3,023) | 3,271 | (1,517) | (32,622) | 2,750 | ||||||||
| Net change in unrealized appreciation (depreciation) | (183,422) | (121,893) | (38,406) | (69,706) | 640 | (48,108) | (36,271) | ||||||||
| Net increase (decrease) in net assets | |||||||||||||||
| from operations | (194,659) | (149,350) | (40,356) | (36,016) | (646) | (79,331) | (20,612) | ||||||||
| Distributions to shareholders | |||||||||||||||
| From net investment income | |||||||||||||||
| Class A | (469) | - | (1,069) | (23,740) | - | (1,788) | (13,384) | ||||||||
| Class B | - | - | (2) | (9) | - | (4) | (2) | ||||||||
| From net realized gains | |||||||||||||||
| Class A | - | (889) | (9,377) | (9,323) | - | (23,871) | (1,296) | ||||||||
| Class B | - | (1) | (16) | (3) | - | (41) | - | ||||||||
| Total distributions to shareholders | (469) | (890) | (10,464) | (33,075) | - | (25,704) | (14,682) | ||||||||
| Share transactions¹ | |||||||||||||||
| Proceeds from the sale of shares | |||||||||||||||
| Class A | 352,567 | 196,069 | 72,025 | 337,478 | 30,418 | 135,693 | 389,083 | ||||||||
| Class B | 247 | 131 | 127 | 141 | 100 | 229 | 183 | ||||||||
| Proceeds in connection with acquisition | |||||||||||||||
| Class A | - | - | - | - | - | - | - | ||||||||
| Class B | - | - | - | - | - | - | - | ||||||||
| Reinvestment of distributions | |||||||||||||||
| Class A | 469 | 889 | 10,446 | 33,063 | - | 25,659 | 14,680 | ||||||||
| Class B | - | 1 | 18 | 12 | - | 45 | 2 | ||||||||
| Cost of shares redeemed | |||||||||||||||
| Class A | (275,425) | (135,400) | (45,622) | (350,721) | (802) | (91,410) | (384,308) | ||||||||
| Class B | (98) | (84) | (48) | (104) | - | (75) | (242) | ||||||||
| Net increase (decrease) in net assets from | |||||||||||||||
| share transactions | 77,760 | 61,606 | 36,946 | 19,869 | 29,716 | 70,141 | 19,398 | ||||||||
| Net increase (decrease) in net assets | (117,368) | (88,634) | (13,874) | (49,222) | 29,070 | (34,894) | (15,896) | ||||||||
| Net assets beginning of year | 549,829 | 344,745 | 100,412 | 614,204 | - | 169,598 | 311,355 | ||||||||
| Net assets end of year | $ 432,461 | $ 256,111 | $ 86,538 | $ 564,982 | $ 29,070 | $ 134,704 | $ 295,459 | ||||||||
| Undistributed (excess of distributions over) | |||||||||||||||
| net investment income | $ 38,603 | $ 11,596 | $ 1,069 | $ 31,413 | $ (999) | $ 1,437 | $ 13,166 | ||||||||
| ¹Share transactions | |||||||||||||||
| Shares sold | |||||||||||||||
| Class A | 36,687 | 23,339 | 7,218 | 28,602 | 3,082 | 12,007 | 37,701 | ||||||||
| Class B | 26 | 16 | 12 | 12 | 10 | 21 | 17 | ||||||||
| Shares issued in connection with acquisition | |||||||||||||||
| Class A | - | - | - | - | - | - | - | ||||||||
| Class B | - | - | - | - | - | - | - | ||||||||
| Reinvestment of distributions | |||||||||||||||
| Class A | 69 | 149 | 1,732 | 3,155 | - | 4,206 | 1,592 | ||||||||
| Class B | - | - | 3 | 1 | - | 8 | - | ||||||||
| Shares redeemed | |||||||||||||||
| Class A | (30,490) | (16,609) | (4,599) | (30,140) | (86) | (8,757) | (37,411) | ||||||||
| Class B | (11) | (10) | (5) | (9) | - | (7) | (23) | ||||||||
| Net increase (decrease) | |||||||||||||||
| Class A | 6,266 | 6,879 | 4,351 | 1,617 | 2,996 | 7,456 | 1,882 | ||||||||
| Class B | 15 | 6 | 10 | 4 | 10 | 22 | (6) | ||||||||
| Purchase and sales of investment securities | |||||||||||||||
| (excluding short-term securities): | |||||||||||||||
| Purchase of securities | $ 401,210 | $ 199,846 | $ 34,626 | $ 2,932,186 | (b) | $ 16,965 | $ 207,646 | $ 397,940 | (c) | ||||||
| Proceeds from sales of securities | 291,517 | 139,805 | 12,617 | 2,859,872 | (b) | 3,659 | 160,654 | 380,030 | (c) | ||||||
| (a) Period from October 6, 2008 (commencement of operations) | |||||||||||||||
| (b) Amounts include $1,602,828 and $1,537,025 of purchases and sales, respectively, of U.S. Government Securities. | |||||||||||||||
| (c) Amounts include $210,397 and $164,320 of purchases and sales, respectively, of U.S. Government Securities. | |||||||||||||||
See accompanying Notes to Financial Statements.
JNL Series Trust
Statements of Changes in Net Assets (in thousands)
For the Year Ended December 31, 2008
| JNL/JPMorgan | ||||||||||||||
| JNL/JPMorgan | JNL/JPMorgan | U.S. Government | JNL/Lazard | JNL/Lazard | JNL/M&G | JNL/M&G | ||||||||
| International | Midcap | & Quality | Emerging | Mid Cap | Global Basics | Global Leaders | ||||||||
| Operations | Value Fund | Growth Fund | Bond Fund | Markets Fund | Equity Fund | Fund (a) | Fund (a) | |||||||
| Net investment income (loss) | $ 18,388 | $ (416) | $ 17,254 | $ 11,204 | $ 2,864 | $ - | $ 8 | |||||||
| Net realized gain (loss) | (132,765) | (28,850) | 491 | (35,699) | (66,427) | (134) | (423) | |||||||
| Net change in unrealized appreciation (depreciation) | (185,531) | (47,211) | 10,639 | (177,464) | (22,233) | (651) | (360) | |||||||
| Net increase (decrease) in net assets | ||||||||||||||
| from operations | (299,908) | (76,477) | 28,384 | (201,959) | (85,796) | (785) | (775) | |||||||
| Distributions to shareholders | ||||||||||||||
| From net investment income | ||||||||||||||
| Class A | (10,646) | - | (11,658) | (2,181) | (2,278) | - | (4) | |||||||
| Class B | (15) | - | (18) | (3) | (44) | - | - | |||||||
| From net realized gains | ||||||||||||||
| Class A | (82,166) | - | - | (34,972) | (878) | - | - | |||||||
| Class B | (105) | - | - | (40) | (15) | - | - | |||||||
| Total distributions to shareholders | (92,932) | - | (11,676) | (37,196) | (3,215) | - | (4) | |||||||
| Share transactions¹ | ||||||||||||||
| Proceeds from the sale of shares | ||||||||||||||
| Class A | 235,719 | 44,553 | 728,264 | 294,894 | 63,385 | 5,523 | 5,671 | |||||||
| Class B | 443 | 71 | 814 | 330 | 1,443 | 100 | 100 | |||||||
| Proceeds in connection with acquisition | ||||||||||||||
| Class A | - | - | - | - | - | - | - | |||||||
| Class B | - | - | - | - | - | - | - | |||||||
| Reinvestment of distributions | ||||||||||||||
| Class A | 92,812 | - | 11,658 | 37,153 | 3,156 | - | 4 | |||||||
| Class B | 120 | - | 18 | 43 | 59 | - | - | |||||||
| Cost of shares redeemed | ||||||||||||||
| Class A | (316,802) | (60,465) | (341,413) | (293,409) | (97,204) | (51) | (411) | |||||||
| Class B | (159) | (28) | (103) | (225) | (1,648) | - | - | |||||||
| Net increase (decrease) in net assets from | ||||||||||||||
| share transactions | 12,133 | (15,869) | 399,238 | 38,786 | (30,809) | 5,572 | 5,364 | |||||||
| Net increase (decrease) in net assets | (380,707) | (92,346) | 415,946 | (200,369) | (119,820) | 4,787 | 4,585 | |||||||
| Net assets beginning of year | 727,544 | 184,462 | 265,800 | 412,213 | 247,112 | - | - | |||||||
| Net assets end of year | $ 346,837 | $ 92,116 | $ 681,746 | $ 211,844 | $ 127,292 | $ 4,787 | $ 4,585 | |||||||
| Undistributed (excess of distributions over) | ||||||||||||||
| net investment income | $ 19,228 | $ (3) | $ 17,145 | $ 9,177 | $ 980 | $ (1) | $ 4 | |||||||
| ¹Share transactions | ||||||||||||||
| Shares sold | ||||||||||||||
| Class A | 21,166 | 2,671 | 60,530 | 25,464 | 6,472 | 566 | 589 | |||||||
| Class B | 39 | 4 | 66 | 28 | 151 | 10 | 10 | |||||||
| Shares issued in connection with acquisition | ||||||||||||||
| Class A | - | - | - | - | - | - | - | |||||||
| Class B | - | - | - | - | - | - | - | |||||||
| Reinvestment of distributions | ||||||||||||||
| Class A | 16,875 | - | 964 | 6,428 | 469 | - | - | |||||||
| Class B | 22 | - | 2 | 7 | 8 | - | - | |||||||
| Shares redeemed | ||||||||||||||
| Class A | (28,136) | (3,605) | (28,557) | (24,370) | (9,801) | (8) | (50) | |||||||
| Class B | (14) | (2) | (8) | (19) | (171) | - | - | |||||||
| Net increase (decrease) | ||||||||||||||
| Class A | 9,905 | (934) | 32,937 | 7,522 | (2,860) | 558 | 539 | |||||||
| Class B | 47 | 2 | 60 | 16 | (12) | 10 | 10 | |||||||
| Purchase and sales of investment securities | ||||||||||||||
| (excluding short-term securities): | ||||||||||||||
| Purchase of securities | $ 483,819 | $ 145,921 | $ 363,340 | (b) | $ 231,028 | $ 155,701 | $ 5,628 | $ 6,447 | ||||||
| Proceeds from sales of securities | 548,717 | 159,079 | 51,738 | (b) | 214,482 | 180,884 | 320 | 1,058 | ||||||
| (a) Period from October 6, 2008 (commencement of operations) | ||||||||||||||
| (b) Amounts include $313,495 and $36,765 of purchases and sales, respectively, of U.S. Government Securities. | ||||||||||||||
See accompanying Notes to Financial Statements.
JNL Series Trust
Statements of Changes in Net Assets (in thousands)
For the Year Ended December 31, 2008
| JNL/Mellon | JNL/Mellon | JNL/Mellon | JNL/Mellon | JNL/Mellon | ||||||||||
| JNL/Mellon | JNL/Mellon | Capital | Capital | Capital | Capital | Capital | ||||||||
| Capital | Capital | Management | Management | Management | Management | Management | ||||||||
| Management | Management | European 30 | Pacific Rim 30 | S&P 500 | S&P 400 MidCap | Small Cap | ||||||||
| Operations | 10 X 10 Fund | Index 5 Fund | Fund (a) | Fund (a) | Index Fund | Index Fund | Index Fund | |||||||
| Net investment income (loss) | $ 2,854 | $ 1,596 | $ 9 | $ 5 | $ 10,230 | $ 5,086 | $ 2,934 | |||||||
| Net realized gain (loss) | 7,337 | 545 | - | (15) | (11,054) | 10,982 | 14,076 | |||||||
| Net change in unrealized appreciation (depreciation) | (52,162) | (19,500) | (264) | (72) | (256,679) | (183,919) | (143,751) | |||||||
| Net increase (decrease) in net assets | ||||||||||||||
| from operations | (41,971) | (17,359) | (255) | (82) | (257,503) | (167,851) | (126,741) | |||||||
| Distributions to shareholders | ||||||||||||||
| From net investment income | ||||||||||||||
| Class A | (1,083) | (619) | (9) | - | (9,697) | (4,084) | (4,041) | |||||||
| Class B | - | - | - | - | (216) | (45) | (46) | |||||||
| From net realized gains | ||||||||||||||
| Class A | (883) | (822) | - | - | - | (27,416) | (17,433) | |||||||
| Class B | - | - | - | - | - | (253) | (168) | |||||||
| Total distributions to shareholders | (1,966) | (1,441) | (9) | - | (9,913) | (31,798) | (21,688) | |||||||
| Share transactions¹ | ||||||||||||||
| Proceeds from the sale of shares | ||||||||||||||
| Class A | 122,639 | 66,518 | 2,307 | 3,394 | 286,855 | 162,660 | 132,316 | |||||||
| Class B | - | - | 100 | 102 | 6,946 | 2,329 | 1,647 | |||||||
| Proceeds in connection with acquisition | ||||||||||||||
| Class A | - | - | - | - | - | - | - | |||||||
| Class B | - | - | - | - | - | - | - | |||||||
| Reinvestment of distributions | ||||||||||||||
| Class A | 1,966 | 1,441 | 9 | - | 9,697 | 31,500 | 21,474 | |||||||
| Class B | - | - | - | - | 216 | 298 | 214 | |||||||
| Cost of shares redeemed | ||||||||||||||
| Class A | (37,981) | (18,672) | (11) | (17) | (233,323) | (176,572) | (126,424) | |||||||
| Class B | - | - | - | - | (4,016) | (1,638) | (952) | |||||||
| Net increase (decrease) in net assets from | ||||||||||||||
| share transactions | 86,624 | 49,287 | 2,405 | 3,479 | 66,375 | 18,577 | 28,275 | |||||||
| Net increase (decrease) in net assets | 42,687 | 30,487 | 2,141 | 3,397 | (201,041) | (181,072) | (120,154) | |||||||
| Net assets beginning of year | 57,683 | 29,922 | - | - | 667,083 | 468,111 | 363,897 | |||||||
| Net assets end of year | $ 100,370 | $ 60,409 | $ 2,141 | $ 3,397 | $ 466,042 | $ 287,039 | $ 243,743 | |||||||
| Undistributed (excess of distributions over) | ||||||||||||||
| net investment income | $ 6,552 | $ 1,699 | $ 1 | $ - | $ 853 | $ 4,207 | $ 3,322 | |||||||
| ¹Share transactions | ||||||||||||||
| Shares sold | ||||||||||||||
| Class A | 14,690 | 7,932 | 239 | 346 | 29,020 | 13,265 | 11,722 | |||||||
| Class B | - | - | 10 | 10 | 692 | 181 | 141 | |||||||
| Shares issued in connection with acquisition | ||||||||||||||
| Class A | - | - | - | - | - | - | - | |||||||
| Class B | - | - | - | - | - | - | - | |||||||
| Reinvestment of distributions | ||||||||||||||
| Class A | 332 | 223 | 1 | - | 1,286 | 3,923 | 2,774 | |||||||
| Class B | - | - | - | - | 28 | 37 | 27 | |||||||
| Shares redeemed | ||||||||||||||
| Class A | (4,620) | (2,296) | (1) | (2) | (22,757) | (13,800) | (10,899) | |||||||
| Class B | - | - | - | - | (416) | (134) | (85) | |||||||
| Net increase (decrease) | ||||||||||||||
| Class A | 10,402 | 5,859 | 239 | 344 | 7,549 | 3,388 | 3,597 | |||||||
| Class B | - | - | 10 | 10 | 304 | 84 | 83 | |||||||
| Purchase and sales of investment securities | ||||||||||||||
| (excluding short-term securities): | ||||||||||||||
| Purchase of securities | $ 116,086 | $ 62,126 | $ 2,392 | $ 3,475 | $ 90,725 | $ 112,060 | $ 100,496 | |||||||
| Proceeds from sales of securities | 18,374 | 10,552 | 3 | 15 | 37,003 | 116,803 | 87,901 | |||||||
| (a) Period from October 6, 2008 (commencement of operations) | ||||||||||||||
See accompanying Notes to Financial Statements.
JNL Series Trust
Statements of Changes in Net Assets (in thousands)
For the Year Ended December 31, 2008
| JNL/Mellon | JNL/Mellon | ||||||||||||||
| Capital | Capital | JNL/ | |||||||||||||
| Management | Management | Oppenheimer | JNL/PAM | JNL/PAM | JNL/PIMCO | JNL/PIMCO | |||||||||
| International | Bond Index | Global | Asia ex-Japan | China-India | Real Return | Total Return | |||||||||
| Operations | Index Fund | Fund | Growth Fund | Fund | Fund | Fund | Bond Fund | ||||||||
| Net investment income (loss) | $ 17,240 | $ 17,344 | $ 4,628 | $ 213 | $ 106 | $ 28,987 | $ 56,737 | ||||||||
| Net realized gain (loss) | (123) | 837 | 10,744 | (5,905) | (9,996) | (67,217) | 69,840 | ||||||||
| Net change in unrealized appreciation (depreciation) | (294,511) | (5,792) | (145,361) | (4,646) | (8,817) | (30,473) | (131,682) | ||||||||
| Net increase (decrease) in net assets | |||||||||||||||
| from operations | (277,394) | 12,389 | (129,989) | (10,338) | (18,707) | (68,703) | (5,105) | ||||||||
| Distributions to shareholders | |||||||||||||||
| From net investment income | |||||||||||||||
| Class A | (10,825) | (17,168) | (3,398) | (144) | - | (13,046) | (58,032) | ||||||||
| Class B | (200) | (71) | (8) | (1) | - | (6) | (425) | ||||||||
| From net realized gains | |||||||||||||||
| Class A | (11,253) | - | (31,514) | - | - | (32,424) | (51,695) | ||||||||
| Class B | (189) | - | (58) | - | - | (13) | (362) | ||||||||
| Total distributions to shareholders | (22,467) | (17,239) | (34,978) | (145) | - | (45,489) | (110,514) | ||||||||
| Share transactions¹ | |||||||||||||||
| Proceeds from the sale of shares | |||||||||||||||
| Class A | 252,302 | 253,223 | 85,028 | 23,771 | 86,510 | 1,209,517 | 1,015,376 | ||||||||
| Class B | 4,354 | 1,327 | 242 | 12 | 42 | 831 | 4,906 | ||||||||
| Proceeds in connection with acquisition | |||||||||||||||
| Class A | - | - | - | - | - | - | - | ||||||||
| Class B | - | - | - | - | - | - | - | ||||||||
| Reinvestment of distributions | |||||||||||||||
| Class A | 22,078 | 17,168 | 34,912 | 144 | - | 45,470 | 109,727 | ||||||||
| Class B | 389 | 71 | 66 | 1 | - | 19 | 787 | ||||||||
| Cost of shares redeemed | |||||||||||||||
| Class A | (255,954) | (236,007) | (152,092) | (17,506) | (46,775) | (874,327) | (722,351) | ||||||||
| Class B | (3,716) | (686) | (96) | - | (3) | (549) | (3,151) | ||||||||
| Net increase (decrease) in net assets from | |||||||||||||||
| share transactions | 19,453 | 35,096 | (31,940) | 6,422 | 39,774 | 380,961 | 405,294 | ||||||||
| Net increase (decrease) in net assets | (280,408) | 30,246 | (196,907) | (4,061) | 21,067 | 266,769 | 289,675 | ||||||||
| Net assets beginning of year | 656,032 | 350,589 | 373,331 | 11,845 | 4,988 | 397,519 | 1,045,956 | ||||||||
| Net assets end of year | $ 375,624 | $ 380,835 | $ 176,424 | $ 7,784 | $ 26,055 | $ 664,288 | $ 1,335,631 | ||||||||
| Undistributed (excess of distributions over) | |||||||||||||||
| net investment income | $ 4,692 | $ 9,564 | $ 3,418 | $ 5 | $ (45) | $ 26,657 | $ 11,511 | ||||||||
| ¹Share transactions | |||||||||||||||
| Shares sold | |||||||||||||||
| Class A | 18,127 | 22,480 | 6,896 | 3,207 | 13,295 | 105,603 | 83,388 | ||||||||
| Class B | 278 | 115 | 20 | 2 | 6 | 72 | 385 | ||||||||
| Shares issued in connection with acquisition | |||||||||||||||
| Class A | - | - | - | - | - | - | - | ||||||||
| Class B | �� - | - | - | - | - | - | - | ||||||||
| Reinvestment of distributions | |||||||||||||||
| Class A | 2,334 | 1,559 | 5,258 | 30 | - | 4,616 | 10,057 | ||||||||
| Class B | 40 | 6 | 10 | - | - | 2 | 68 | ||||||||
| Shares redeemed | |||||||||||||||
| Class A | (17,982) | (21,094) | (11,922) | (2,827) | (7,649) | (80,345) | (59,872) | ||||||||
| Class B | (256) | (59) | (8) | - | - | (51) | (250) | ||||||||
| Net increase (decrease) | |||||||||||||||
| Class A | 2,479 | 2,945 | 232 | 410 | 5,646 | 29,874 | 33,573 | ||||||||
| Class B | 62 | 62 | 22 | 2 | 6 | 23 | 203 | ||||||||
| Purchase and sales of investment securities | |||||||||||||||
| (excluding short-term securities): | |||||||||||||||
| Purchase of securities | $ 88,872 | $ 213,530 | (a) | $ 58,071 | $ 22,550 | $ 71,959 | $ 26,970,630 | (b) | $ 10,815,098 | (c) | |||||
| Proceeds from sales of securities | 77,565 | 185,984 | (a) | 115,833 | 16,098 | 34,515 | 26,268,513 | (b) | 9,914,863 | (c) | |||||
| (a) Amounts include $184,884 and $150,735 of purchases and sales, respectively, of U.S. Government Securities. | |||||||||||||||
| (b) Amounts include $16,643,122 and $15,358,073 of purchases and sales, respectively, of U.S. Government Securities. | |||||||||||||||
| (c) Amounts include $2,703,794 and $2,582,572 of purchases and sales, respectively, of U.S. Government Securities. | |||||||||||||||
See accompanying Notes to Financial Statements.
JNL Series Trust
Statements of Changes in Net Assets (in thousands)
For the Year Ended December 31, 2008
| JNL/PPM | JNL/PPM | JNL/PPM | JNL/S&P | JNL/S&P | |||||||||||
| America | America | America | JNL/PPM | JNL/Red Rocks | Managed | Managed | |||||||||
| High Yield | Mid Cap | Small Cap | America Value | Listed Private | Conservative | Moderate | |||||||||
| Operations | Bond Fund | Value Fund (a) | Value Fund (a) | Equity Fund | Equity Fund (b) | Fund | Fund | ||||||||
| Net investment income (loss) | $ 21,399 | $ 71 | $ 62 | $ 4,089 | $ 55 | $ 11,346 | $ 13,906 | ||||||||
| Net realized gain (loss) | (31,005) | (4,540) | (2,195) | (104,868) | (731) | 8,594 | 15,885 | ||||||||
| Net change in unrealized appreciation (depreciation) | (71,532) | (1,472) | (2,280) | (12,533) | (2,957) | (78,154) | (169,770) | ||||||||
| Net increase (decrease) in net assets | |||||||||||||||
| from operations | (81,138) | (5,941) | (4,413) | (113,312) | (3,633) | (58,214) | (139,979) | ||||||||
| Distributions to shareholders | |||||||||||||||
| From net investment income | |||||||||||||||
| Class A | (21,206) | (68) | (56) | (3,353) | (71) | (16,203) | (23,549) | ||||||||
| Class B | (356) | - | - | (3) | - | - | - | ||||||||
| From net realized gains | |||||||||||||||
| Class A | - | - | (1) | (17,111) | - | (6,118) | (13,815) | ||||||||
| Class B | - | - | - | (14) | - | - | - | ||||||||
| From return of capital | |||||||||||||||
| Class A | - | - | - | - | (6) | - | - | ||||||||
| Class B | - | - | - | - | - | - | - | ||||||||
| Total distributions to shareholders | (21,562) | (68) | (57) | (20,481) | (77) | (22,321) | (37,364) | ||||||||
| Share transactions¹ | |||||||||||||||
| Proceeds from the sale of shares | |||||||||||||||
| Class A | 179,547 | 25,796 | 17,109 | 163,995 | 19,718 | 427,225 | 419,106 | ||||||||
| Class B | 1,442 | 174 | 154 | 20 | 127 | - | - | ||||||||
| Proceeds in connection with acquisition | |||||||||||||||
| Class A | - | - | - | - | - | - | - | ||||||||
| Class B | - | - | - | - | - | - | - | ||||||||
| Reinvestment of distributions | |||||||||||||||
| Class A | 21,206 | 68 | 57 | 20,464 | 77 | 22,321 | 37,364 | ||||||||
| Class B | 356 | - | 17 | - | - | - | |||||||||
| Cost of shares redeemed | |||||||||||||||
| Class A | (214,980) | (14,891) | (4,387) | (182,630) | (864) | (226,340) | (242,982) | ||||||||
| Class B | (862) | (69) | (20) | (13) | (17) | - | - | ||||||||
| Net increase in net assets from share | |||||||||||||||
| transactions | (13,291) | 11,078 | 12,913 | 1,853 | 19,041 | 223,206 | 213,488 | ||||||||
| Net increase in net assets | (115,991) | 5,069 | 8,443 | (131,940) | 15,331 | 142,671 | 36,145 | ||||||||
| Net assets beginning of year | 307,281 | - | - | 219,786 | - | 264,755 | 521,470 | ||||||||
| Net assets end of year | $ 191,290 | $ 5,069 | $ 8,443 | $ 87,846 | $ 15,331 | $ 407,426 | $ 557,615 | ||||||||
| Undistributed (excess of distributions over) | |||||||||||||||
| net investment income | $ 2,964 | $ 3 | $ 6 | $ 4,088 | $ (21) | $ 3,816 | $ 4,108 | ||||||||
| ¹Share transactions | |||||||||||||||
| Shares sold | |||||||||||||||
| Class A | 29,187 | 2,675 | 1,856 | 10,630 | 2,720 | 39,066 | 37,456 | ||||||||
| Class B | 218 | 18 | 16 | 2 | 13 | - | - | ||||||||
| Shares issued in connection with acquisition | |||||||||||||||
| Class A | - | - | - | - | - | - | - | ||||||||
| Class B | - | - | - | - | - | - | - | ||||||||
| Reinvestment of distributions | |||||||||||||||
| Class A | 5,210 | 12 | 9 | 2,874 | 13 | 2,393 | 4,179 | ||||||||
| Class B | 80 | - | - | 2 | - | - | - | ||||||||
| Shares redeemed | |||||||||||||||
| Class A | (33,019) | (1,795) | (532) | (13,382) | (149) | (20,937) | (22,174) | ||||||||
| Class B | (122) | (8) | (2) | (1) | (2) | - | - | ||||||||
| Net increase | |||||||||||||||
| Class A | 1,378 | 892 | 1,333 | 122 | 2,584 | 20,522 | 19,461 | ||||||||
| Class B | 176 | 10 | 14 | 3 | 11 | - | - | ||||||||
| Purchase and sales of investment securities | |||||||||||||||
| (excluding short-term securities): | |||||||||||||||
| Purchase of securities | $ 173,871 | $ 24,683 | $ 18,372 | $ 177,319 | $ 18,720 | $ 342,237 | $ 383,355 | ||||||||
| Proceeds from sales of securities | 193,494 | 13,631 | 5,500 | 191,451 | 657 | 116,028 | 165,278 | ||||||||
| (a) Period from March 31, 2008 (commencement of operations) | |||||||||||||||
| (b) Period from October 6, 2008 (commencement of operations) | |||||||||||||||
See accompanying Notes to Financial Statements.
JNL Series Trust
Statements of Changes in Net Assets (in thousands)
For the Year Ended December 31, 2008
| JNL/S&P | JNL/S&P | JNL/S&P | JNL/S&P | ||||||||||||
| Managed | JNL/S&P | Managed | Disciplined | Disciplined | JNL/S&P | JNL/S&P | |||||||||
| Moderate | Managed | Aggressive | Moderate | Moderate | Disciplined | Competitive | |||||||||
| Operations | Growth Fund | Growth Fund | Growth Fund | Fund | Growth Fund | Growth Fund | Advantage Fund | ||||||||
| Net investment income (loss) | $ 17,971 | $ 9,032 | $ 2,885 | $ 1,412 | $ 1,487 | $ 531 | $ 1,368 | ||||||||
| Net realized gain (loss) | 61,838 | 76,784 | 48,276 | 1,046 | 2,035 | (141) | (23,610) | ||||||||
| Net change in unrealized appreciation (depreciation) | (468,487) | (551,524) | (322,737) | (18,161) | (29,539) | (11,189) | (8,858) | ||||||||
| Net increase (decrease) in net assets | |||||||||||||||
| from operations | (388,678) | (465,708) | (271,576) | (15,703) | (26,017) | (10,799) | (31,100) | ||||||||
| Distributions to shareholders | |||||||||||||||
| From net investment income | |||||||||||||||
| Class A | (28,008) | (6,051) | (2,182) | (633) | (803) | (364) | (1,309) | ||||||||
| Class B | - | - | - | - | - | - | - | ||||||||
| From net realized gains | |||||||||||||||
| Class A | (52,871) | (84,076) | (28,127) | (295) | (504) | (222) | - | ||||||||
| Class B | - | - | - | - | - | - | - | ||||||||
| Total distributions to shareholders | (80,879) | (90,127) | (30,309) | (928) | (1,307) | (586) | (1,309) | ||||||||
| Share transactions¹ | |||||||||||||||
| Proceeds from the sale of shares | |||||||||||||||
| Class A | 391,097 | 335,629 | 205,851 | 61,261 | 81,220 | 32,351 | 168,508 | ||||||||
| Class B | - | - | - | - | - | - | 212 | ||||||||
| Proceeds in connection with acquisition | |||||||||||||||
| Class A | - | - | - | - | - | - | - | ||||||||
| Class B | - | - | - | - | - | - | - | ||||||||
| Reinvestment of distributions | |||||||||||||||
| Class A | 80,879 | 90,127 | 30,309 | 928 | 1,307 | 586 | 1,309 | ||||||||
| Class B | - | - | - | - | - | - | - | ||||||||
| Cost of shares redeemed | |||||||||||||||
| Class A | (407,737) | (449,193) | (221,842) | (22,084) | (21,210) | (11,944) | (62,325) | ||||||||
| Class B | - | - | - | - | - | - | (275) | ||||||||
| Net increase in net assets from share | |||||||||||||||
| transactions | 64,239 | (23,437) | 14,318 | 40,105 | 61,317 | 20,993 | 107,429 | ||||||||
| Net increase in net assets | (405,318) | (579,272) | (287,567) | 23,474 | 33,993 | 9,608 | 75,020 | ||||||||
| Net assets beginning of year | 1,403,279 | 1,388,072 | 702,285 | 34,588 | 40,459 | 16,525 | 15,393 | ||||||||
| Net assets end of year | $ 997,961 | $ 808,800 | $ 414,718 | $ 58,062 | $ 74,452 | $ 26,133 | $ 90,413 | ||||||||
| Undistributed (excess of distributions over) | |||||||||||||||
| net investment income | $ 10,764 | $ 23,389 | $ 11,196 | $ 2,845 | $ 3,991 | $ 1,711 | $ 60 | ||||||||
| ¹Share transactions | |||||||||||||||
| Shares sold | |||||||||||||||
| Class A | 33,309 | 28,052 | 16,074 | 6,538 | 9,412 | 3,926 | 18,745 | ||||||||
| Class B | - | - | - | - | - | - | 23 | ||||||||
| Shares issued in connection with acquisition | |||||||||||||||
| Class A | - | - | - | - | - | - | - | ||||||||
| Class B | - | - | - | - | - | - | - | ||||||||
| Reinvestment of distributions | |||||||||||||||
| Class A | 9,254 | 11,452 | 3,652 | 124 | 200 | 97 | 188 | ||||||||
| Class B | - | - | - | - | - | - | - | ||||||||
| Shares redeemed | |||||||||||||||
| Class A | (35,267) | (37,957) | (17,482) | (2,374) | (2,475) | (1,432) | (7,365) | ||||||||
| Class B | - | - | - | - | - | - | (31) | ||||||||
| Net increase | |||||||||||||||
| Class A | 7,296 | 1,547 | 2,244 | 4,288 | 7,137 | 2,591 | 11,568 | ||||||||
| Class B | - | - | - | - | - | - | (8) | ||||||||
| Purchase and sales of investment securities | |||||||||||||||
| (excluding short-term securities): | |||||||||||||||
| Purchase of securities | $ 410,759 | $ 365,833 | $ 269,288 | $ 56,047 | $ 82,904 | $ 33,417 | $ 182,741 | ||||||||
| Proceeds from sales of securities | 346,372 | 404,719 | 243,493 | 12,971 | 16,706 | 10,226 | 72,417 | ||||||||
See accompanying Notes to Financial Statements.
JNL Series Trust
Statements of Changes in Net Assets (in thousands)
For the Year Ended December 31, 2008
| JNL/S&P | JNL/S&P | JNL/S&P | JNL/Select | JNL/Select | |||||||||||
| Dividend Income | Intrinsic | Total | JNL/S&P 4 | Balanced | Money | JNL/Select | |||||||||
| Operations | & Growth Fund | Value Fund | Yield Fund | Fund | Fund | Market Fund | Value Fund | ||||||||
| Net investment income (loss) | $ 2,776 | $ 1,457 | $ 1,630 | $ 4,545 | $ 15,743 | $ 21,222 | $ 10,351 | ||||||||
| Net realized gain (loss) | (13,052) | (34,011) | (38,869) | (7,757) | (24,187) | - | (42,775) | ||||||||
| Net change in unrealized appreciation (depreciation) | (6,995) | (4,031) | (232) | (74,452) | (113,591) | - | (187,374) | ||||||||
| Net increase (decrease) in net assets | |||||||||||||||
| from operations | (17,271) | (36,585) | (37,471) | (77,664) | (122,035) | 21,222 | (219,798) | ||||||||
| Distributions to shareholders | |||||||||||||||
| From net investment income | |||||||||||||||
| Class A | (2,627) | (1,331) | (1,586) | (12) | (12,853) | (21,073) | (234) | ||||||||
| Class B | (4) | - | (1) | - | (20) | (149) | (5) | ||||||||
| From net realized gains | |||||||||||||||
| Class A | (52) | (861) | (25) | - | (21,439) | - | (10,221) | ||||||||
| Class B | - | - | - | - | (30) | - | (228) | ||||||||
| Total distributions to shareholders | (2,683) | (2,192) | (1,612) | (12) | (34,342) | (21,222) | (10,688) | ||||||||
| Share transactions¹ | |||||||||||||||
| Proceeds from the sale of shares | |||||||||||||||
| Class A | 147,355 | 169,738 | 181,498 | 410,055 | 262,745 | 2,113,552 | 374,650 | ||||||||
| Class B | 45 | 553 | 23 | - | 259 | 9,457 | 4,053 | ||||||||
| Proceeds in connection with acquisition | |||||||||||||||
| Class A | - | - | - | - | - | - | - | ||||||||
| Class B | - | - | - | - | - | - | - | ||||||||
| Reinvestment of distributions | |||||||||||||||
| Class A | 2,679 | 2,192 | 1,611 | 12 | 34,292 | 21,073 | 10,455 | ||||||||
| Class B | 4 | - | 1 | - | 50 | 149 | 233 | ||||||||
| Cost of shares redeemed | |||||||||||||||
| Class A | (35,980) | (54,884) | (50,267) | (89,402) | (212,274) | (1,445,776) | (214,009) | ||||||||
| Class B | (1) | (504) | (1) | - | (104) | (7,002) | (2,899) | ||||||||
| Net increase in net assets from share | |||||||||||||||
| transactions | 114,102 | 117,095 | 132,865 | 320,665 | 84,968 | 691,453 | 172,483 | ||||||||
| Net increase in net assets | 94,148 | 78,318 | 93,782 | 242,989 | (71,409) | 691,453 | (58,003) | ||||||||
| Net assets beginning of year | 7,301 | 18,360 | 9,907 | 22,194 | 527,176 | 655,821 | 553,704 | ||||||||
| Net assets end of year | $ 101,449 | $ 96,678 | $ 103,689 | $ 265,183 | $ 455,767 | $ 1,347,274 | $ 495,701 | ||||||||
| Undistributed (excess of distributions over) | |||||||||||||||
| net investment income | $ �� 145 | $ 127 | $ 44 | $ 5,191 | $ 15,793 | $ (3) | $ 10,348 | ||||||||
| ¹Share transactions | |||||||||||||||
| Shares sold | |||||||||||||||
| Class A | 17,976 | 20,233 | 21,034 | 47,732 | 16,315 | 2,113,552 | 22,868 | ||||||||
| Class B | 7 | 60 | 4 | - | 16 | 9,457 | 241 | ||||||||
| Shares issued in connection with acquisition | |||||||||||||||
| Class A | - | - | - | - | - | - | - | ||||||||
| Class B | - | - | - | - | - | - | - | ||||||||
| Reinvestment of distributions | |||||||||||||||
| Class A | 383 | 354 | 252 | 2 | 2,795 | 21,073 | 835 | ||||||||
| Class B | - | - | - | - | 4 | 149 | 18 | ||||||||
| Shares redeemed | |||||||||||||||
| Class A | (4,698) | (6,857) | (5,984) | (10,943) | (13,580) | (1,445,776) | (13,084) | ||||||||
| Class B | - | (65) | - | - | (6) | (7,002) | (184) | ||||||||
| Net increase | |||||||||||||||
| Class A | 13,661 | 13,730 | 15,302 | 36,791 | 5,530 | 688,849 | 10,619 | ||||||||
| Class B | 7 | (5) | 4 | - | 14 | 2,604 | 75 | ||||||||
| Purchase and sales of investment securities | |||||||||||||||
| (excluding short-term securities): | |||||||||||||||
| Purchase of securities | $ 153,135 | $ 199,016 | $ 210,837 | $ 352,806 | $ 321,988 | (a) | $ 34,377 | $ 448,277 | |||||||
| Proceeds from sales of securities | 39,103 | 74,613 | 78,039 | 26,950 | 297,659 | (a) | 50,243 | 276,685 | |||||||
| (a) Amounts include $55,803 and $ 104,759 of purchases and sales, respectively, of U.S. Government Securities. | |||||||||||||||
See accompanying Notes to Financial Statements.
JNL Series Trust
Statements of Changes in Net Assets (in thousands)
For the Year Ended December 31, 2008
| JNL/T. Rowe | JNL/T. Rowe | ||||||
| Price | Price | JNL/T. Rowe | |||||
| Established | Mid-Cap | Price | |||||
| Operations | Growth Fund | Growth Fund | Value Fund | ||||
| Net investment income (loss) | $ 2,691 | $ (825) | $ 9,658 | ||||
| Net realized gain (loss) | (102,897) | (3,434) | (34,656) | ||||
| Net change in unrealized appreciation (depreciation) | (357,888) | (300,582) | (257,233) | ||||
| Net increase (decrease) in net assets | |||||||
| from operations | (458,094) | (304,841) | (282,231) | ||||
| Distributions to shareholders | |||||||
| From net investment income | |||||||
| Class A | (708) | - | (11,200) | ||||
| Class B | (34) | - | (12) | ||||
| From net realized gains | |||||||
| Class A | (6,220) | (42,076) | (67,068) | ||||
| Class B | (211) | (1,760) | (61) | ||||
| Total distributions to shareholders | (7,173) | (43,836) | (78,341) | ||||
| Share transactions¹ | |||||||
| Proceeds from the sale of shares | |||||||
| Class A | 261,503 | 267,239 | 202,486 | ||||
| Class B | 4,719 | 5,481 | 260 | ||||
| Proceeds in connection with acquisition | |||||||
| Class A | - | - | - | ||||
| Class B | - | - | - | ||||
| Reinvestment of distributions | |||||||
| Class A | 6,928 | 42,076 | 78,268 | ||||
| Class B | 245 | 1,760 | 73 | ||||
| Cost of shares redeemed | |||||||
| Class A | (280,805) | (247,108) | (215,448) | ||||
| Class B | (4,141) | (4,898) | (255) | ||||
| Net increase (decrease) in net assets from | |||||||
| share transactions | (11,551) | 64,550 | 65,384 | ||||
| Net increase (decrease) in net assets | (476,818) | (284,127) | (295,188) | ||||
| Net assets beginning of year | 1,078,190 | 727,122 | 708,109 | ||||
| Net assets end of year | $ 601,372 | $ 442,995 | $ 412,921 | ||||
| Undistributed (excess of distributions over) | |||||||
| net investment income | $ 1,969 | $ (10) | $ 9,641 | ||||
| ¹Share transactions | |||||||
| Shares sold | |||||||
| Class A | 14,333 | 10,479 | 16,943 | ||||
| Class B | 246 | 212 | 20 | ||||
| Shares issued in connection with acquisition | |||||||
| Class A | - | - | - | ||||
| Class B | - | - | - | ||||
| Reinvestment of distributions | |||||||
| Class A | 546 | 2,621 | 11,682 | ||||
| Class B | 19 | 108 | 10 | ||||
| Shares redeemed | |||||||
| Class A | (15,500) | (9,825) | (17,798) | ||||
| Class B | (232) | (202) | (19) | ||||
| Net increase (decrease) | |||||||
| Class A | (621) | 3,275 | 10,827 | ||||
| Class B | 33 | 118 | 11 | ||||
| Purchase and sales of investment securities | |||||||
| (excluding short-term securities): | |||||||
| Purchase of securities | $ 459,880 | $ 248,726 | $ 179,903 | ||||
| Proceeds from sales of securities | 464,523 | 218,647 | 171,452 | ||||
See accompanying Notes to Financial Statements.
JNL Series Trust
Financial Highlights
| Increase (Decrease) from | Distributions from | Ratio of Net | ||||||||||||||||||||||
| Net Asset | Investment Operations (e) | Net Realized | Supplemental Data | Ratio of | Investment | |||||||||||||||||||
| Value | Net | Net Realized | Total from | Distributions from | Gains on | Net Asset | Net Assets, | Expenses to | Income (Loss) | |||||||||||||||
| Beginning | Investment | & Unrealized | Investment | Net Investment | Investment | Value, End | Total | End of Period | Portfolio | Average Net | to Average | |||||||||||||
| Period Ended | of Period | Income (Loss) | Gains (Losses) | Operations | Income | Transactions | of Period | Return (b) | (in thousands) | Turnover (d) | Assets (c) | Net Assets (c) | ||||||||||||
JNL Alt Institutional Alt 20 Fund (h) | ||||||||||||||||||||||||
| Class A | ||||||||||||||||||||||||
04/06(a)-12/31/2009 | $ 10.00 | $ 0.45 | $ 2.28 | $ 2.73 | $ - | $ - | $ 12.73 | 27.30 % | $ 199,516 | 3% | 0.20 % | 4.93 % | ||||||||||||
JNL Alt Institutional Alt 35 Fund (h) | ||||||||||||||||||||||||
| Class A | ||||||||||||||||||||||||
04/06(a)-12/31/2009 | 10.00 | 0.44 | 2.80 | 3.24 | - | - | 13.24 | 32.40 | 308,516 | 6 | 0.20 | 4.72 | ||||||||||||
JNL Alt Institutional Alt 50 Fund (h) | ||||||||||||||||||||||||
| Class A | ||||||||||||||||||||||||
04/06(a)-12/31/2009 | 10.00 | 0.49 | 3.08 | 3.57 | - | - | 13.57 | 35.70 | 361,516 | 13 | 0.20 | 5.06 | ||||||||||||
JNL Alt Institutional Alt 65 Fund (h) | ||||||||||||||||||||||||
| Class A | ||||||||||||||||||||||||
04/06(a)-12/31/2009 | 10.00 | 0.47 | 3.50 | 3.97 | - | - | 13.97 | 39.70 | 229,813 | 24 | 0.20 | 4.80 | ||||||||||||
| JNL/AIM International Growth Fund | ||||||||||||||||||||||||
| Class A | ||||||||||||||||||||||||
| 12/31/2009 | 6.88 | 0.12 | 2.42 | 2.54 | (0.15) | - | 9.27 | 36.99 | (t) | 431,595 | 27 | 1.04 | 1.55 | |||||||||||
| 12/31/2008 | 15.74 | 0.27 | (6.68) | (6.41) | (0.06) | (2.39) | 6.88 | (40.94) | 249,897 | 53 | 1.03 | 2.10 | ||||||||||||
| 12/31/2007 | 14.55 | 0.30 | 1.10 | 1.40 | (0.21) | - | 15.74 | 9.70 | 475,302 | 105 | 1.03 | 1.90 | ||||||||||||
| 12/31/2006 | 12.03 | 0.18 | 2.55 | 2.73 | (0.21) | - | 14.55 | 22.67 | 259,811 | 12 | 1.06 | 1.35 | ||||||||||||
| 12/31/2005 | 11.04 | 0.14 | 1.04 | 1.18 | (0.19) | - | 12.03 | 10.69 | 201,554 | 71 | 1.08 | 1.25 | ||||||||||||
| Class B | ||||||||||||||||||||||||
| 12/31/2009 | 7.04 | 0.01 | 2.80 | 2.81 | (0.17) | - | 9.68 | 39.94 | (t) | 386 | 27 | 0.84 | 0.10 | |||||||||||
| 12/31/2008 | 15.99 | 0.29 | (6.79) | (6.50) | (0.06) | (2.39) | 7.04 | (40.85) | 9,418 | 53 | 0.83 | 2.27 | ||||||||||||
| 12/31/2007 | 14.82 | 0.33 | 1.14 | 1.47 | (0.30) | - | 15.99 | 9.96 | 15,987 | 105 | 0.83 | 2.08 | ||||||||||||
| 12/31/2006 | 12.08 | 0.13 | 2.64 | 2.77 | (0.03) | - | 14.82 | 22.97 | 14,618 | 12 | 0.85 | 0.88 | ||||||||||||
| 12/31/2005 | 11.06 | 0.16 | 1.05 | 1.21 | (0.19) | - | 12.08 | 10.94 | 134 | 71 | 0.87 | 1.46 | ||||||||||||
| JNL/AIM Large Cap Growth Fund | ||||||||||||||||||||||||
| Class A | ||||||||||||||||||||||||
| 12/31/2009 | 8.67 | 0.04 | 2.07 | 2.11 | (0.03) | - | 10.75 | 24.29 | 624,156 | 57 | 0.97 | 0.45 | ||||||||||||
| 12/31/2008 | 14.93 | 0.04 | (5.69) | (5.65) | (0.02) | (0.59) | 8.67 | (37.66) | 350,826 | 56 | 0.97 | 0.29 | ||||||||||||
| 12/31/2007 | 13.49 | 0.02 | 2.09 | 2.11 | (0.01) | (0.66) | 14.93 | 15.75 | 525,103 | 71 | 0.99 | 0.17 | ||||||||||||
| 12/31/2006 | 12.51 | 0.02 | 0.96 | 0.98 | 0.00 | (f) | - | 13.49 | 7.86 | 396,703 | 90 | 1.00 | 0.12 | |||||||||||
| 12/31/2005 | 11.67 | 0.00 | 0.84 | 0.84 | - | - | 12.51 | 7.23 | 361,417 | 101 | 1.01 | 0.03 | ||||||||||||
| Class B | ||||||||||||||||||||||||
| 12/31/2009 | 8.72 | 0.06 | 2.08 | 2.14 | (0.04) | - | 10.82 | 24.57 | 587 | 57 | 0.77 | 0.66 | ||||||||||||
| 12/31/2008 | 15.02 | 0.06 | (5.73) | (5.67) | (0.04) | (0.59) | 8.72 | (37.55) | 404 | 56 | 0.77 | 0.52 | ||||||||||||
| 12/31/2007 | 13.55 | 0.05 | 2.11 | 2.16 | (0.03) | (0.66) | 15.02 | 16.05 | 436 | 71 | 0.80 | 0.36 | ||||||||||||
| 12/31/2006 | 12.55 | 0.04 | 0.97 | 1.01 | (0.01) | - | 13.55 | 8.07 | 344 | 90 | 0.80 | 0.32 | ||||||||||||
| 12/31/2005 | 11.69 | 0.02 | 0.84 | 0.86 | - | - | 12.55 | 7.39 | 236 | 101 | 0.81 | 0.23 | ||||||||||||
| JNL/AIM Global Real Estate Fund | ||||||||||||||||||||||||
| Class A | ||||||||||||||||||||||||
| 12/31/2009 | 5.79 | 0.18 | 1.70 | 1.88 | (0.14) | - | 7.53 | 32.53 | 342,951 | 65 | 1.07 | 2.78 | ||||||||||||
| 12/31/2008 | 12.44 | 0.31 | (4.96) | (4.65) | (0.23) | (1.77) | 5.79 | (35.71) | 145,218 | 117 | 1.03 | 2.78 | ||||||||||||
| 12/31/2007 | 15.80 | 0.20 | (2.58) | (2.38) | (0.17) | (0.81) | 12.44 | (15.01) | 184,451 | 76 | 1.02 | 1.29 | ||||||||||||
| 12/31/2006 | 11.70 | 0.42 | 3.84 | 4.26 | (0.05) | (0.11) | 15.80 | 36.38 | 254,557 | 37 | 1.02 | 2.98 | ||||||||||||
05/02(a)-12/31/2005 | 10.00 | 0.21 | 1.49 | 1.70 | - | - | 11.70 | 17.00 | 79,209 | 36 | 1.05 | 3.37 | ||||||||||||
| Class B | ||||||||||||||||||||||||
| 12/31/2009 | 5.82 | 0.19 | 1.72 | 1.91 | (0.15) | - | 7.58 | 32.86 | 404 | 65 | 0.87 | 3.09 | ||||||||||||
| 12/31/2008 | 12.52 | 0.33 | (5.00) | (4.67) | (0.26) | (1.77) | 5.82 | (35.61) | 294 | 117 | 0.83 | 2.93 | ||||||||||||
| 12/31/2007 | 15.83 | 0.24 | (2.60) | (2.36) | (0.14) | (0.81) | 12.52 | (14.82) | 368 | 76 | 0.82 | 1.55 | ||||||||||||
| 12/31/2006 | 11.72 | 0.44 | 3.85 | 4.29 | (0.07) | (0.11) | 15.83 | 36.59 | 378 | 37 | 0.82 | 3.13 | ||||||||||||
05/02(a)-12/31/2005 | 10.00 | 0.23 | 1.49 | 1.72 | - | - | 11.72 | 17.20 | 146 | 36 | 0.85 | 3.57 | ||||||||||||
See accompanying Notes to Financial Statements.
JNL Series Trust
Financial Highlights
| Increase (Decrease) from | Distributions from | Ratio of Net | ||||||||||||||||||||||
| Net Asset | Investment Operations (e) | Net Realized | Supplemental Data | Ratio of | Investment | |||||||||||||||||||
| Value | Net | Net Realized | Total from | Distributions from | Gains on | Net Asset | Net Assets, | Expenses to | Income (Loss) | |||||||||||||||
| Beginning | Investment | & Unrealized | Investment | Net Investment | Investment | Value, End | Total | End of Period | Portfolio | Average Net | to Average | |||||||||||||
| Period Ended | of Period | Income (Loss) | Gains (Losses) | Operations | Income | Transactions | of Period | Return (b) | (in thousands) | Turnover (d) | Assets (c) | Net Assets (c) | ||||||||||||
| JNL/AIM Small Cap Growth Fund | ||||||||||||||||||||||||
| Class A | ||||||||||||||||||||||||
| 12/31/2009 | $ 7.50 | $ (0.02) | $ 2.63 | $ 2.61 | $ - | $ - | $ 10.11 | 34.80 % | $ 92,793 | 33% | 1.16 % | (0.17)% | ||||||||||||
| 12/31/2008 | 14.82 | (0.04) | (5.95) | (5.99) | - | (1.33) | 7.50 | (39.73) | 40,314 | 42 | 1.16 | (0.32) | ||||||||||||
| 12/31/2007 | 14.27 | (0.10) | 1.71 | 1.61 | - | (1.06) | 14.82 | 11.37 | 73,951 | 37 | 1.15 | (0.64) | ||||||||||||
| 12/31/2006 | 13.52 | (0.11) | 2.07 | 1.96 | - | (1.21) | 14.27 | 14.49 | 53,265 | 54 | 1.16 | (0.79) | ||||||||||||
| 12/31/2005 | 12.47 | (0.08) | 1.13 | 1.05 | - | - | 13.52 | 8.42 | 49,776 | 65 | 1.16 | (0.67) | ||||||||||||
| Class B | ||||||||||||||||||||||||
| 12/31/2009 | 7.60 | (0.00) | (f) | 2.66 | 2.66 | - | - | 10.26 | 35.00 | 157 | 33 | 0.96 | 0.01 | |||||||||||
| 12/31/2008 | 14.95 | (0.01) | (6.01) | (6.02) | - | (1.33) | 7.60 | (39.58) | 103 | 42 | 0.96 | (0.10) | ||||||||||||
| 12/31/2007 | 14.36 | (0.07) | 1.72 | 1.65 | - | (1.06) | 14.95 | 11.58 | 111 | 37 | 0.95 | (0.47) | ||||||||||||
| 12/31/2006 | 13.57 | (0.08) | 2.08 | 2.00 | - | (1.21) | 14.36 | 14.74 | 215 | 54 | 0.96 | (0.58) | ||||||||||||
| 12/31/2005 | 12.48 | (0.04) | 1.13 | 1.09 | - | - | 13.57 | 8.73 | 158 | 65 | 0.95 | (0.46) | ||||||||||||
| JNL/Capital Guardian Global Balanced Fund | ||||||||||||||||||||||||
| Class A | ||||||||||||||||||||||||
| 12/31/2009 | 7.35 | 0.15 | 1.50 | 1.65 | (0.18) | - | 8.82 | 22.48 | 279,806 | 78 | 1.01 | 1.88 | ||||||||||||
| 12/31/2008 | 11.95 | 0.25 | (3.67) | (3.42) | (0.12) | (1.06) | 7.35 | (28.29) | 183,572 | 70 | 1.01 | 2.37 | ||||||||||||
| 12/31/2007 | 11.92 | 0.20 | 0.72 | 0.92 | (0.14) | (0.75) | 11.95 | 7.96 | 197,825 | 155 | 0.98 | 1.60 | ||||||||||||
| 12/31/2006 | 11.03 | 0.18 | 1.01 | 1.19 | (0.10) | (0.20) | 11.92 | 10.79 | 162,743 | 62 | 1.02 | 1.55 | ||||||||||||
| 12/31/2005 | 10.02 | 0.12 | 0.89 | 1.01 | - | - | 11.03 | 10.09 | 127,908 | 83 | 1.01 | 1.22 | ||||||||||||
| Class B | ||||||||||||||||||||||||
| 12/31/2009 | 7.50 | 0.17 | 1.54 | 1.71 | (0.20) | - | 9.01 | 22.75 | 411 | 78 | 0.81 | 2.04 | ||||||||||||
| 12/31/2008 | 12.17 | 0.30 | (3.78) | (3.48) | (0.13) | (1.06) | 7.50 | (28.22) | 189 | 70 | 0.81 | 2.74 | ||||||||||||
| 12/31/2007 | 12.07 | 0.23 | 0.74 | 0.97 | (0.12) | (0.75) | 12.17 | 8.24 | 290 | 155 | 0.78 | 1.78 | ||||||||||||
| 12/31/2006 | 11.14 | 0.20 | 1.03 | 1.23 | (0.10) | (0.20) | 12.07 | 10.98 | 166 | 62 | 0.82 | 1.75 | ||||||||||||
| 12/31/2005 | 10.10 | 0.14 | 0.90 | 1.04 | - | - | 11.14 | 10.31 | 131 | 83 | 0.81 | 1.42 | ||||||||||||
| JNL/Capital Guardian Global Diversified Research Fund | ||||||||||||||||||||||||
| Class A | ||||||||||||||||||||||||
| 12/31/2009 | 15.33 | 0.17 | 5.70 | 5.87 | (0.28) | - | 20.92 | 38.32 | (u) | 332,577 | 85 | 1.09 | 0.97 | |||||||||||
| 12/31/2008 | 26.67 | 0.44 | (11.78) | (11.34) | - | - | 15.33 | (42.52) | 163,107 | 96 | 1.09 | 2.04 | ||||||||||||
| 12/31/2007 | 22.23 | (0.03) | 4.62 | 4.59 | (0.15) | - | 26.67 | 20.65 | 232,460 | 195 | 1.10 | (0.11) | ||||||||||||
| 12/31/2006 | 19.68 | 0.07 | 2.55 | 2.62 | (0.07) | - | 22.23 | 13.31 | 160,207 | 116 | 1.10 | 0.35 | ||||||||||||
| 12/31/2005 | 19.41 | 0.08 | 0.29 | 0.37 | (0.10) | - | 19.68 | 1.91 | 188,593 | 264 | 1.10 | 0.30 | ||||||||||||
| Class B | ||||||||||||||||||||||||
| 12/31/2009 | 15.41 | 0.21 | 5.74 | 5.95 | (0.31) | - | 21.05 | 38.63 | (u) | 329 | 85 | 0.89 | 1.19 | |||||||||||
| 12/31/2008 | 26.75 | 0.44 | (11.78) | (11.34) | - | - | 15.41 | (42.39) | 161 | 96 | 0.89 | 2.05 | ||||||||||||
| 12/31/2007 | 22.39 | 0.01 | 4.65 | 4.66 | (0.30) | - | 26.75 | 20.87 | 133 | 195 | 0.90 | 0.05 | ||||||||||||
| 12/31/2006 | 19.76 | 0.10 | 2.58 | 2.68 | (0.05) | - | 22.39 | 13.57 | 204 | 116 | 0.90 | 0.49 | ||||||||||||
| 12/31/2005 | 19.45 | 0.12 | 0.29 | 0.41 | (0.10) | - | 19.76 | 2.12 | 122 | 264 | 0.89 | 0.51 | ||||||||||||
| JNL/Capital Guardian International Small Cap Fund | ||||||||||||||||||||||||
| Class A | ||||||||||||||||||||||||
| 12/31/2009 | 4.53 | 0.04 | 2.36 | 2.40 | (0.08) | - | 6.85 | 52.93 | 144,004 | 46 | 1.31 | 0.65 | ||||||||||||
| 12/31/2008 | 9.87 | 0.14 | (5.47) | (5.33) | (0.01) | - | 4.53 | (54.00) | 44,755 | 53 | 1.31 | 1.88 | ||||||||||||
12/03(a) - 12/31/2007 | 10.00 | 0.00 | (0.13) | (0.13) | - | - | 9.87 | (1.30) | 73,063 | 2 | 1.30 | 0.22 | ||||||||||||
| Class B | ||||||||||||||||||||||||
| 12/31/2009 | 4.55 | 0.05 | 2.36 | 2.41 | (0.08) | - | 6.88 | 53.05 | 218 | 46 | 1.11 | 0.88 | ||||||||||||
| 12/31/2008 | 9.88 | 0.14 | (5.46) | (5.32) | (0.01) | - | 4.55 | (53.84) | 80 | 53 | 1.11 | 2.01 | ||||||||||||
12/03(a) - 12/31/2007 | 10.00 | 0.00 | (0.12) | (0.12) | - | - | 9.88 | (1.20) | 108 | 2 | 1.11 | 0.43 | ||||||||||||
See accompanying Notes to Financial Statements.
JNL Series Trust
Financial Highlights
| Increase (Decrease) from | Distributions from | Ratio of Net | ||||||||||||||||||||||
| Net Asset | Investment Operations (e) | Net Realized | Supplemental Data | Ratio of | Investment | |||||||||||||||||||
| Value | Net | Net Realized | Total from | Distributions from | Gains on | Net Asset | Net Assets, | Expenses to | Income (Loss) | |||||||||||||||
| Beginning | Investment | & Unrealized | Investment | Net Investment | Investment | Value, End | Total | End of Period | Portfolio | Average Net | to Average | |||||||||||||
| Period Ended | of Period | Income (Loss) | Gains (Losses) | Operations | Income | Transactions | of Period | Return (b) | (in thousands) | Turnover (d) | Assets (c) | Net Assets (c) | ||||||||||||
| JNL/Capital Guardian U.S. Growth Equity Fund | ||||||||||||||||||||||||
| Class A | ||||||||||||||||||||||||
| 12/31/2009 | $ 13.99 | $ 0.09 | $ 4.79 | $ 4.88 | $ (0.02) | $ - | $ 18.85 | 34.91 % | $ 554,978 | 55% | 0.98 % | 0.57 % | ||||||||||||
| 12/31/2008 | 23.68 | 0.06 | (9.75) | (9.69) | 0.00 | (f) | - | 13.99 | (40.92) | 195,824 | 47 | 0.99 | 0.29 | |||||||||||
| 12/31/2007 | 21.58 | 0.00 | 2.10 | 2.10 | - | - | 23.68 | 9.73 | 226,712 | 190 | 1.00 | (0.01) | ||||||||||||
| 12/31/2006 | 20.63 | (0.01) | 0.96 | 0.95 | - | - | 21.58 | 4.60 | 186,424 | 89 | 0.99 | (0.07) | ||||||||||||
| 12/31/2005 | 19.71 | (0.05) | 0.97 | 0.92 | - | - | 20.63 | 4.67 | 216,007 | 77 | 0.99 | (0.18) | ||||||||||||
| Class B | ||||||||||||||||||||||||
| 12/31/2009 | 14.11 | 0.12 | 4.84 | 4.96 | (0.04) | - | 19.03 | 35.16 | 310 | 55 | 0.78 | 0.73 | ||||||||||||
| 12/31/2008 | 23.88 | 0.09 | (9.84) | (9.75) | (0.02) | - | 14.11 | (40.81) | 157 | 47 | 0.79 | 0.47 | ||||||||||||
| 12/31/2007 | 21.72 | 0.04 | 2.12 | 2.16 | - | - | 23.88 | 9.94 | 210 | 190 | 0.80 | 0.19 | ||||||||||||
| 12/31/2006 | 20.71 | 0.02 | 0.99 | 1.01 | - | - | 21.72 | 4.88 | 173 | 89 | 0.80 | 0.12 | ||||||||||||
| 12/31/2005 | 19.75 | (0.01) | 0.97 | 0.96 | - | - | 20.71 | 4.86 | 140 | 77 | 0.79 | 0.02 | ||||||||||||
| JNL/Credit Suisse Commodity Securities Fund | ||||||||||||||||||||||||
| Class A | ||||||||||||||||||||||||
| 12/31/2009 | 6.31 | 0.07 | 3.09 | 3.16 | (0.06) | - | 9.41 | 50.17 | 641,108 | 108 | 1.03 | 0.88 | ||||||||||||
| 12/31/2008 | 13.90 | 0.20 | (7.35) | (7.15) | (0.01) | (0.43) | 6.31 | (51.30) | 214,651 | 71 | 1.04 | 1.67 | ||||||||||||
| 01/16(a) - 12/31/2007 | 10.00 | 0.07 | 3.83 | 3.90 | - | - | 13.90 | 39.00 | 388,379 | 51 | 1.05 | 0.57 | ||||||||||||
| Class B | ||||||||||||||||||||||||
| 12/31/2009 | 6.33 | 0.09 | 3.09 | 3.18 | (0.07) | - | 9.44 | 50.34 | 538 | 108 | 0.83 | 1.22 | ||||||||||||
| 12/31/2008 | 13.93 | 0.21 | (7.36) | (7.15) | (0.02) | (0.43) | 6.33 | (51.18) | 270 | 71 | 0.84 | 1.94 | ||||||||||||
| 01/16(a) - 12/31/2007 | 10.00 | 0.12 | 3.81 | 3.93 | - | - | 13.93 | 39.30 | 302 | 51 | 0.85 | 0.96 | ||||||||||||
| JNL/Credit Suisse Long/Short Fund | ||||||||||||||||||||||||
| Class A | ||||||||||||||||||||||||
| 12/31/2009 | 6.11 | 0.06 | 1.46 | 1.52 | (0.05) | - | 7.58 | 24.86 | 90,306 | 909 | 1.54 | (g) | 0.98 | |||||||||||
| 12/31/2008 | 10.85 | 0.09 | (4.22) | (4.13) | - | (0.61) | 6.11 | (37.68) | 41,879 | 455 | 1.59 | (g) | 0.98 | |||||||||||
01/16(a) - 12/31/2007 | 10.00 | (0.02) | 0.87 | 0.85 | - | - | 10.85 | 8.50 | 68,632 | 240 | 2.26 | (g) | (0.19) | |||||||||||
| Class B | ||||||||||||||||||||||||
| 12/31/2009 | 6.14 | 0.08 | 1.46 | 1.54 | (0.06) | - | 7.62 | 25.07 | 147 | 909 | 1.34 | (g) | 1.19 | |||||||||||
| 12/31/2008 | 10.87 | 0.11 | (4.23) | (4.12) | - | (0.61) | 6.14 | (37.51) | 93 | 455 | 1.39 | (g) | 1.22 | |||||||||||
01/16(a) - 12/31/2007 | 10.00 | 0.00 | 0.87 | 0.87 | - | - | 10.87 | 8.70 | 117 | 240 | 2.07 | (g) | (0.01) | |||||||||||
| JNL/Eagle Core Equity Fund | ||||||||||||||||||||||||
| Class A | ||||||||||||||||||||||||
| 12/31/2009 | 4.96 | 0.05 | 1.63 | 1.68 | (0.07) | - | 6.57 | 33.83 | 84,192 | 36 | 0.96 | 0.84 | ||||||||||||
| 12/31/2008 | 14.53 | 0.16 | (5.92) | (5.76) | (0.34) | (3.47) | 4.96 | (39.04) | 42,644 | 57 | 0.96 | 1.35 | ||||||||||||
| 12/31/2007 | 17.22 | 0.20 | (0.12) | 0.08 | (0.35) | (2.42) | 14.53 | 0.59 | 81,088 | 43 | 0.94 | 1.13 | ||||||||||||
| 12/31/2006 | 15.33 | 0.15 | 1.74 | 1.89 | 0.00 | (f) | - | 17.22 | 12.35 | 177,972 | 109 | 0.96 | 0.92 | |||||||||||
| 12/31/2005 | 14.96 | 0.14 | 0.36 | 0.50 | (0.13) | - | 15.33 | 3.37 | 244,280 | 106 | 0.96 | 0.77 | ||||||||||||
| Class B | ||||||||||||||||||||||||
| 12/31/2009 | 5.16 | 0.07 | 1.70 | 1.77 | (0.08) | - | 6.85 | 34.26 | 94 | 36 | 0.76 | 1.11 | ||||||||||||
| 12/31/2008 | 14.93 | 0.19 | (6.09) | (5.90) | (0.40) | (3.47) | 5.16 | (38.93) | 138 | 57 | 0.76 | 1.55 | ||||||||||||
| 12/31/2007 | 17.35 | 0.25 | (0.12) | 0.13 | (0.13) | (2.42) | 14.93 | 0.84 | 220 | 43 | 0.74 | 1.41 | ||||||||||||
| 12/31/2006 | 15.42 | 0.19 | 1.74 | 1.93 | 0.00 | (f) | - | 17.35 | 12.53 | 175 | 109 | 0.76 | 1.16 | |||||||||||
| 12/31/2005 | 15.02 | 0.17 | 0.36 | 0.53 | (0.13) | - | 15.42 | 3.56 | 140 | 106 | 0.76 | 0.97 | ||||||||||||
See accompanying Notes to Financial Statements.
JNL Series Trust
Financial Highlights
| Increase (Decrease) from | Distributions from | Ratio of Net | ||||||||||||||||||||||
| Net Asset | Investment Operations (e) | Net Realized | Supplemental Data | Ratio of | Investment | |||||||||||||||||||
| Value | Net | Net Realized | Total from | Distributions from | Gains on | Net Asset | Net Assets, | Expenses to | Income (Loss) | |||||||||||||||
| Beginning | Investment | & Unrealized | Investment | Net Investment | Investment | Value, End | Total | End of Period | Portfolio | Average Net | to Average | |||||||||||||
| Period Ended | of Period | Income (Loss) | Gains (Losses) | Operations | Income | Transactions | of Period | Return (b) | (in thousands) | Turnover (d) | Assets (c) | Net Assets (c) | ||||||||||||
| JNL/Eagle SmallCap Equity Fund | ||||||||||||||||||||||||
| Class A | ||||||||||||||||||||||||
| 12/31/2009 | $ 11.91 | $ 0.04 | $ 4.19 | $ 4.23 | $ - | $ - | $ 16.14 | 35.52 % | $ 279,448 | 67% | 1.03 % | 0.34 % | ||||||||||||
| 12/31/2008 | 20.73 | (0.04) | (7.93) | (7.97) | - | (0.85) | 11.91 | (38.34) | 164,108 | 69 | 1.03 | (0.25) | ||||||||||||
| 12/31/2007 | 22.19 | (0.11) | 2.65 | 2.54 | - | (4.00) | 20.73 | 12.14 | 231,713 | 81 | 1.03 | (0.45) | ||||||||||||
| 12/31/2006 | 20.13 | (0.15) | 4.17 | 4.02 | - | (1.96) | 22.19 | 20.03 | 199,096 | 68 | 1.05 | (0.67) | ||||||||||||
| 12/31/2005 | 19.97 | (0.15) | 0.66 | 0.51 | - | (0.35) | 20.13 | 2.52 | 159,471 | 57 | 1.06 | (0.72) | ||||||||||||
| Class B | ||||||||||||||||||||||||
| 12/31/2009 | 12.08 | 0.06 | 4.26 | 4.32 | - | - | 16.40 | 35.76 | 248 | 67 | 0.83 | 0.44 | ||||||||||||
| 12/31/2008 | 20.96 | (0.01) | (8.02) | (8.03) | - | (0.85) | 12.08 | (38.20) | 183 | 69 | 0.83 | (0.03) | ||||||||||||
| 12/31/2007 | 22.36 | (0.06) | 2.66 | 2.60 | - | (4.00) | 20.96 | 12.32 | 217 | 81 | 0.83 | (0.24) | ||||||||||||
| 12/31/2006 | 20.22 | (0.10) | 4.20 | 4.10 | - | (1.96) | 22.36 | 20.34 | 245 | 68 | 0.85 | (0.46) | ||||||||||||
| 12/31/2005 | 20.02 | (0.11) | 0.66 | 0.55 | - | (0.35) | 20.22 | 2.71 | 145 | 57 | 0.85 | (0.51) | ||||||||||||
JNL/Franklin Templeton Founding Strategy Fund (h) | ||||||||||||||||||||||||
| Class A | ||||||||||||||||||||||||
| 12/31/2009 | 6.32 | 0.29 | 1.61 | 1.90 | 0.00 | (f) | - | 8.22 | 30.13 | 838,759 | 5 | 0.06 | 4.15 | |||||||||||
| 12/31/2008 | 10.09 | 0.00 | (3.66) | (3.66) | (0.11) | 0.00 | (f) | 6.32 | (36.13) | 580,801 | 14 | 0.06 | (0.02) | |||||||||||
01/16(a) - 12/31/2007 | 10.00 | 0.24 | (0.15) | 0.09 | - | - | 10.09 | 0.90 | 800,395 | 9 | 0.05 | 2.42 | ||||||||||||
| JNL/Franklin Templeton Global Growth Fund | ||||||||||||||||||||||||
| Class A | ||||||||||||||||||||||||
| 12/31/2009 | 5.92 | 0.10 | 1.74 | 1.84 | (0.12) | - | 7.64 | 31.06 | 375,505 | 5 | 1.10 | 1.58 | ||||||||||||
| 12/31/2008 | 9.99 | 0.17 | (4.24) | (4.07) | 0.00 | (f) | 0.00 | (f) | 5.92 | (40.72) | 236,023 | 11 | 1.11 | 2.18 | ||||||||||
01/16(a) - 12/31/2007 | 10.00 | 0.11 | (0.05) | 0.06 | (0.06) | (0.01) | 9.99 | 0.63 | 318,542 | 3 | 1.10 | 1.15 | ||||||||||||
| Class B | ||||||||||||||||||||||||
| 12/31/2009 | 5.93 | 0.12 | 1.73 | 1.85 | (0.13) | - | 7.65 | 31.21 | 219 | 5 | 0.90 | 1.85 | ||||||||||||
| 12/31/2008 | 9.97 | 0.20 | (4.24) | (4.04) | 0.00 | (f) | 0.00 | (f) | 5.93 | (40.50) | 153 | 11 | 0.91 | 2.48 | ||||||||||
01/16(a) - 12/31/2007 | 10.00 | 0.16 | (0.08) | 0.08 | (0.10) | (0.01) | 9.97 | 0.82 | 211 | 3 | 0.90 | 1.58 | ||||||||||||
| JNL/Franklin Templeton Income Fund | ||||||||||||||||||||||||
| Class A | ||||||||||||||||||||||||
| 12/31/2009 | 7.39 | 0.55 | 1.88 | 2.43 | (0.53) | - | 9.29 | 32.92 | 728,236 | 39 | 1.00 | 6.51 | ||||||||||||
| 12/31/2008 | 10.53 | 0.66 | (3.79) | (3.13) | (0.01) | - | 7.39 | (29.74) | 432,233 | 56 | 1.00 | 7.05 | ||||||||||||
| 12/31/2007 | 10.70 | 0.60 | (0.40) | 0.20 | (0.35) | (0.02) | 10.53 | 1.85 | 549,659 | 21 | (i) | 1.02 | 5.45 | |||||||||||
05/01(a)-12/31/2006 | 10.00 | 0.34 | 0.64 | 0.98 | (0.26) | (0.02) | 10.70 | 9.78 | 64,653 | 43 | 1.10 | 4.85 | ||||||||||||
| Class B | ||||||||||||||||||||||||
| 12/31/2009 | 7.16 | 0.55 | 1.81 | 2.36 | (0.54) | - | 8.98 | 33.07 | 388 | 39 | 0.80 | 6.74 | ||||||||||||
| 12/31/2008 | 10.17 | 0.66 | (3.66) | (3.00) | (0.01) | - | 7.16 | (29.51) | 228 | 56 | 0.80 | 7.39 | ||||||||||||
| 12/31/2007 | 10.63 | 0.59 | (0.38) | 0.21 | (0.65) | (0.02) | 10.17 | 1.96 | 170 | 21 | (i) | 0.83 | 5.37 | |||||||||||
05/01(a)-12/31/2006 | 10.00 | 0.35 | 0.65 | 1.00 | (0.35) | (0.02) | 10.63 | 10.01 | 114 | 43 | 0.90 | 5.06 | ||||||||||||
| JNL/Franklin Templeton Mutual Shares Fund | ||||||||||||||||||||||||
| Class A | ||||||||||||||||||||||||
| 12/31/2009 | 6.20 | 0.10 | 1.55 | 1.65 | (0.24) | - | 7.61 | 26.74 | 423,572 | 61 | 1.11 | (j) | 1.48 | |||||||||||
| 12/31/2008 | 10.02 | 0.14 | (3.94) | (3.80) | - | (0.02) | 6.20 | (37.90) | 255,941 | 49 | 1.08 | (j) | 1.67 | |||||||||||
01/16(a) - 12/31/2007 | 10.00 | 0.16 | (0.14) | 0.02 | - | - | 10.02 | 0.20 | 344,535 | 33 | 1.07 | (j) | 1.60 | |||||||||||
| Class B | ||||||||||||||||||||||||
| 12/31/2009 | 6.22 | 0.12 | 1.56 | 1.68 | (0.26) | - | 7.64 | 27.00 | 282 | 61 | 0.91 | (j) | 1.79 | |||||||||||
| 12/31/2008 | 10.03 | 0.17 | (3.96) | (3.79) | - | (0.02) | 6.22 | (37.76) | 170 | 49 | 0.88 | (j) | 2.13 | |||||||||||
01/16(a) - 12/31/2007 | 10.00 | 0.13 | (0.10) | 0.03 | - | - | 10.03 | 0.30 | 210 | 33 | 0.86 | (j) | 1.29 | |||||||||||
See accompanying Notes to Financial Statements.
JNL Series Trust
Financial Highlights
| Increase (Decrease) from | Distributions from | Ratio of Net | ||||||||||||||||||||||
| Net Asset | Investment Operations (e) | Net Realized | Supplemental Data | Ratio of | Investment | |||||||||||||||||||
| Value | Net | Net Realized | Total from | Distributions from | Gains on | Net Asset | Net Assets, | Expenses to | Income (Loss) | |||||||||||||||
| Beginning | Investment | & Unrealized | Investment | Net Investment | Investment | Value, End | Total | End of Period | Portfolio | Average Net | to Average | |||||||||||||
| Period Ended | of Period | Income (Loss) | Gains (Losses) | Operations | Income | Transactions | of Period | Return (b) | (in thousands) | Turnover (d) | Assets (c) | Net Assets (c) | ||||||||||||
| JNL/Franklin Templeton Small Cap Value Fund | ||||||||||||||||||||||||
| Class A | ||||||||||||||||||||||||
| 12/31/2009 | $ 6.56 | $ 0.07 | $ 2.15 | $ 2.22 | $ (0.06) | $ - | $ 8.72 | 33.80 % | $ 167,589 | 2% | 1.16 % | 0.89 % | ||||||||||||
| 12/31/2008 | 11.38 | 0.11 | (3.97) | (3.86) | (0.10) | (0.86) | 6.56 | (33.23) | 86,399 | 14 | 1.16 | 1.10 | ||||||||||||
| 12/31/2007 | 12.86 | 0.11 | (0.90) | (0.79) | (0.09) | (0.60) | 11.38 | (6.14) | 100,289 | 26 | 1.16 | 0.80 | ||||||||||||
| 12/31/2006 | 11.03 | 0.08 | 1.88 | 1.96 | (0.02) | (0.11) | 12.86 | 17.71 | 130,608 | 6 | 1.16 | 0.67 | ||||||||||||
05/02(a)-12/31/2005 | 10.00 | 0.02 | 1.01 | 1.03 | - | - | 11.03 | 10.30 | 72,399 | 5 | 1.14 | 0.39 | ||||||||||||
| Class B | ||||||||||||||||||||||||
| 12/31/2009 | 6.53 | 0.08 | 2.14 | 2.22 | (0.07) | - | 8.68 | 33.96 | 237 | 2 | 0.96 | 1.09 | ||||||||||||
| 12/31/2008 | 11.35 | 0.13 | (3.97) | (3.84) | (0.12) | (0.86) | 6.53 | (33.06) | 139 | 14 | 0.96 | 1.33 | ||||||||||||
| 12/31/2007 | 12.89 | 0.13 | (0.89) | (0.76) | (0.18) | (0.60) | 11.35 | (5.89) | 123 | 26 | 0.96 | 0.96 | ||||||||||||
| 12/31/2006 | 11.04 | 0.11 | 1.87 | 1.98 | (0.02) | (0.11) | 12.89 | 17.93 | 239 | 6 | 0.95 | 0.88 | ||||||||||||
05/02(a)-12/31/2005 | 10.00 | 0.03 | 1.01 | 1.04 | - | - | 11.04 | 10.40 | 139 | 5 | 0.96 | 0.57 | ||||||||||||
| JNL/Goldman Sachs Core Plus Bond Fund | ||||||||||||||||||||||||
| Class A | ||||||||||||||||||||||||
| 12/31/2009 | 10.71 | 0.45 | 1.07 | 1.52 | (0.50) | (0.05) | 11.68 | 14.16 | 782,744 | 430 | (k) | 0.90 | 3.90 | |||||||||||
| 12/31/2008 | 12.01 | 0.55 | (1.18) | (0.63) | (0.48) | (0.19) | 10.71 | (5.17) | 564,785 | 462 | 0.90 | 4.76 | ||||||||||||
| 12/31/2007 | 11.60 | 0.57 | 0.23 | 0.80 | (0.39) | - | 12.01 | 6.91 | 614,033 | 186 | (k) | 0.91 | 4.79 | |||||||||||
| 12/31/2006 | 11.08 | 0.54 | (0.01) | 0.53 | (0.01) | - | 11.60 | 4.77 | 460,890 | 113 | (k) | 0.92 | 4.81 | |||||||||||
| 12/31/2005 | 11.47 | 0.44 | (0.14) | 0.30 | (0.48) | (0.21) | 11.08 | 2.62 | 338,943 | 97 | (k) | 0.93 | 4.44 | |||||||||||
| Class B | ||||||||||||||||||||||||
| 12/31/2009 | 10.83 | 0.48 | 1.09 | 1.57 | (0.52) | (0.05) | 11.83 | 14.47 | 245 | 430 | (k) | 0.70 | 4.14 | |||||||||||
| 12/31/2008 | 12.13 | 0.58 | (1.19) | (0.61) | (0.50) | (0.19) | 10.83 | (4.94) | 197 | 462 | 0.70 | 4.95 | ||||||||||||
| 12/31/2007 | 12.05 | 0.61 | 0.25 | 0.86 | (0.78) | - | 12.13 | 7.18 | 171 | 186 | (k) | 0.71 | 4.99 | |||||||||||
| 12/31/2006 | 11.49 | 0.58 | (0.01) | 0.57 | (0.01) | - | 12.05 | 4.94 | 259 | 113 | (k) | 0.72 | 5.01 | |||||||||||
| 12/31/2005 | 11.84 | 0.48 | (0.14) | 0.34 | (0.48) | (0.21) | 11.49 | 2.87 | 171 | 97 | (k) | 0.73 | 4.64 | |||||||||||
| JNL/Goldman Sachs Emerging Markets Debt Fund | ||||||||||||||||||||||||
| Class A | ||||||||||||||||||||||||
| 12/31/2009 | 9.67 | 0.44 | 1.79 | 2.23 | (0.01) | - | 11.89 | 23.06 | 193,046 | 94 | 1.11 | 3.89 | ||||||||||||
10/06(a)-12/31/2008 | 10.00 | 0.09 | (0.42) | (0.33) | - | - | 9.67 | (3.30) | 28,973 | 44 | 1.11 | 3.92 | ||||||||||||
| Class B | ||||||||||||||||||||||||
| 12/31/2009 | 9.67 | 0.47 | 1.79 | 2.26 | (0.01) | - | 11.92 | 23.38 | 197 | 94 | 0.91 | 4.23 | ||||||||||||
10/06(a)-12/31/2008 | 10.00 | 0.09 | (0.42) | (0.33) | - | - | 9.67 | (3.30) | 97 | 44 | 0.91 | 4.06 | ||||||||||||
| JNL/Goldman Sachs Mid Cap Value Fund | ||||||||||||||||||||||||
| Class A | ||||||||||||||||||||||||
| 12/31/2009 | 6.51 | 0.09 | 2.04 | 2.13 | (0.08) | - | 8.56 | 32.65 | 275,024 | 113 | 1.03 | 1.29 | ||||||||||||
| 12/31/2008 | 12.82 | 0.09 | (4.82) | (4.73) | (0.11) | (1.47) | 6.51 | (36.09) | 134,460 | 98 | 1.04 | 0.83 | ||||||||||||
| 12/31/2007 | 12.96 | 0.14 | 0.22 | 0.36 | (0.08) | (0.42) | 12.82 | 2.80 | 169,388 | 117 | 1.03 | 1.01 | ||||||||||||
| 12/31/2006 | 11.39 | 0.11 | 1.68 | 1.79 | (0.04) | (0.18) | 12.96 | 15.73 | 144,432 | 47 | 1.05 | 0.90 | ||||||||||||
05/02(a)-12/31/2005 | 10.00 | 0.06 | 1.33 | 1.39 | - | - | 11.39 | 13.90 | 85,789 | 34 | 1.06 | 1.02 | ||||||||||||
| Class B | ||||||||||||||||||||||||
| 12/31/2009 | 6.50 | 0.11 | 2.04 | 2.15 | (0.09) | - | 8.56 | 33.09 | 5,701 | 113 | 0.83 | 1.55 | ||||||||||||
| 12/31/2008 | 12.83 | 0.12 | (4.85) | (4.73) | (0.13) | (1.47) | 6.50 | (36.03) | 244 | 98 | 0.84 | 1.11 | ||||||||||||
| 12/31/2007 | 12.99 | 0.16 | 0.22 | 0.38 | (0.12) | (0.42) | 12.83 | 2.97 | 210 | 117 | 0.83 | 1.16 | ||||||||||||
| 12/31/2006 | 11.40 | 0.13 | 1.70 | 1.83 | (0.06) | (0.18) | 12.99 | 16.06 | 206 | 47 | 0.85 | 1.09 | ||||||||||||
05/02(a)-12/31/2005 | 10.00 | 0.07 | 1.33 | 1.40 | - | - | 11.40 | 14.00 | 151 | 34 | 0.86 | 1.22 | ||||||||||||
See accompanying Notes to Financial Statements.
JNL Series Trust
Financial Highlights
| Increase (Decrease) from | Distributions from | Ratio of Net | ||||||||||||||||||||||
| Net Asset | Investment Operations (e) | Net Realized | Supplemental Data | Ratio of | Investment | |||||||||||||||||||
| Value | Net | Net Realized | Total from | Distributions from | Gains on | Net Asset | Net Assets, | Expenses to | Income (Loss) | |||||||||||||||
| Beginning | Investment | & Unrealized | Investment | Net Investment | Investment | Value, End | Total | End of Period | Portfolio | Average Net | to Average | |||||||||||||
| Period Ended | of Period | Income (Loss) | Gains (Losses) | Operations | Income | Transactions | of Period | Return (b) | (in thousands) | Turnover (d) | Assets (c) | Net Assets (c) | ||||||||||||
| JNL/Ivy Asset Strategy Fund | ||||||||||||||||||||||||
| Class A | ||||||||||||||||||||||||
9/28 (a) - 12/31/2009 | $ 10.00 | $ 0.01 | $ 0.40 | $ 0.41 | $ - | $ - | $ 10.41 | 4.10 % | $ 196,774 | 16% | 1.25 % | 0.52 % | ||||||||||||
| Class B | ||||||||||||||||||||||||
9/28 (a) - 12/31/2009 | 10.00 | 0.01 | 0.40 | 0.41 | - | - | 10.41 | 4.10 | 203 | 16 | 1.05 | 0.47 | ||||||||||||
| JNL/JPMorgan International Value Fund | ||||||||||||||||||||||||
| Class A | ||||||||||||||||||||||||
| 12/31/2009 | 5.72 | 0.14 | 1.58 | 1.72 | (0.27) | - | 7.17 | 30.17 | 549,144 | 92 | 1.03 | 2.24 | ||||||||||||
| 12/31/2008 | 14.35 | 0.38 | (6.85) | (6.47) | (0.25) | (1.91) | 5.72 | (44.49) | 346,379 | 90 | 1.01 | 3.40 | ||||||||||||
| 12/31/2007 | 14.02 | 0.27 | 1.36 | 1.63 | (0.17) | (1.13) | 14.35 | 11.97 | 727,077 | 98 | 1.01 | 1.81 | ||||||||||||
| 12/31/2006 | 10.94 | 0.26 | 3.23 | 3.49 | (0.08) | (0.33) | 14.02 | 31.98 | 485,663 | 83 | 1.04 | 2.09 | ||||||||||||
| 12/31/2005 | 9.29 | 0.13 | 1.59 | 1.72 | (0.01) | (0.06) | 10.94 | 18.57 | 234,118 | 72 | 1.08 | 1.63 | ||||||||||||
| Class B | ||||||||||||||||||||||||
| 12/31/2009 | 5.82 | 0.16 | 1.62 | 1.78 | (0.29) | - | 7.31 | 30.60 | 546 | 92 | 0.83 | 2.51 | ||||||||||||
| 12/31/2008 | 14.57 | 0.39 | (6.95) | (6.56) | (0.28) | (1.91) | 5.82 | (44.44) | 458 | 90 | 0.81 | 3.55 | ||||||||||||
| 12/31/2007 | 14.23 | 0.31 | 1.38 | 1.69 | (0.22) | (1.13) | 14.57 | 12.23 | 467 | 98 | 0.81 | 2.01 | ||||||||||||
| 12/31/2006 | 11.07 | 0.28 | 3.29 | 3.57 | (0.08) | (0.33) | 14.23 | 32.27 | 390 | 83 | 0.84 | 2.14 | ||||||||||||
| 12/31/2005 | 9.37 | �� 0.15 | 1.62 | 1.77 | (0.01) | (0.06) | 11.07 | 18.90 | 165 | 72 | 0.87 | 1.84 | ||||||||||||
| JNL/JPMorgan MidCap Growth Fund | ||||||||||||||||||||||||
| Class A | ||||||||||||||||||||||||
| 12/31/2009 | 11.15 | (0.03) | 4.82 | 4.79 | - | - | 15.94 | 42.96 | 163,690 | 82 | 1.01 | (0.25) | ||||||||||||
| 12/31/2008 | 20.07 | (0.05) | (8.87) | (8.92) | - | - | 11.15 | (44.44) | 91,958 | 105 | 1.02 | (0.30) | ||||||||||||
| 12/31/2007 | 18.59 | (0.03) | 1.51 | 1.48 | - | - | 20.07 | 7.96 | 184,228 | 184 | 1.01 | (0.16) | ||||||||||||
| 12/31/2006 | 16.59 | (0.01) | 2.01 | 2.00 | - | - | 18.59 | 12.06 | 221,504 | 151 | 1.01 | (0.07) | ||||||||||||
| 12/31/2005 | 15.67 | (0.02) | 0.99 | 0.97 | (0.05) | - | 16.59 | 6.16 | 217,173 | 149 | 1.01 | (0.11) | ||||||||||||
| Class B | ||||||||||||||||||||||||
| 12/31/2009 | 11.26 | (0.01) | 4.88 | 4.87 | - | - | 16.13 | 43.25 | 114 | 82 | 0.81 | (0.05) | ||||||||||||
| 12/31/2008 | 20.22 | (0.01) | (8.95) | (8.96) | - | - | 11.26 | (44.31) | 158 | 105 | 0.82 | (0.08) | ||||||||||||
| 12/31/2007 | 18.70 | 0.01 | 1.51 | 1.52 | - | - | 20.22 | 8.13 | 234 | 184 | 0.81 | 0.03 | ||||||||||||
| 12/31/2006 | 16.65 | 0.02 | 2.03 | 2.05 | - | - | 18.70 | 12.31 | 163 | 151 | 0.81 | 0.14 | ||||||||||||
| 12/31/2005 | 15.70 | 0.01 | 0.99 | 1.00 | (0.05) | - | 16.65 | 6.34 | 128 | 149 | 0.80 | 0.10 | ||||||||||||
| JNL/JPMorgan U.S. Government & Quality Bond Fund | ||||||||||||||||||||||||
| Class A | ||||||||||||||||||||||||
| 12/31/2009 | 12.25 | 0.47 | (0.01) | 0.46 | (0.32) | - | 12.39 | 3.69 | 693,017 | 12 | 0.73 | 3.78 | ||||||||||||
| 12/31/2008 | 11.74 | 0.49 | 0.27 | 0.76 | (0.25) | - | 12.25 | 6.53 | 680,849 | 14 | 0.76 | 4.06 | ||||||||||||
| 12/31/2007 | 11.43 | 0.53 | 0.20 | 0.73 | (0.42) | - | 11.74 | 6.38 | 265,662 | 57 | (m) | 0.78 | 4.51 | |||||||||||
| 12/31/2006 | 11.07 | 0.46 | (0.10) | 0.36 | - | - | 11.43 | 3.25 | 235,088 | 114 | (m) | 0.79 | 4.16 | |||||||||||
| 12/31/2005 | 11.31 | 0.41 | (0.14) | 0.27 | (0.41) | (0.10) | 11.07 | 2.35 | 214,590 | 39 | (m) | 0.79 | 3.76 | |||||||||||
| Class B | ||||||||||||||||||||||||
| 12/31/2009 | 12.71 | 0.48 | 0.02 | 0.50 | (0.33) | - | 12.88 | 3.92 | 564 | 12 | 0.53 | 3.71 | ||||||||||||
| 12/31/2008 | 12.16 | 0.51 | 0.30 | 0.81 | (0.26) | - | 12.71 | 6.73 | 897 | 14 | 0.56 | 4.11 | ||||||||||||
| 12/31/2007 | 11.89 | 0.57 | 0.22 | 0.79 | (0.52) | - | 12.16 | 6.64 | 138 | 57 | (m) | 0.58 | 4.71 | |||||||||||
| 12/31/2006 | 11.50 | 0.50 | (0.11) | 0.39 | - | - | 11.89 | 3.39 | 140 | 114 | (m) | 0.59 | 4.36 | |||||||||||
| 12/31/2005 | 11.71 | 0.44 | (0.14) | 0.30 | (0.41) | (0.10) | 11.50 | 2.53 | 121 | 39 | (m) | 0.59 | 3.96 | |||||||||||
| JNL/Lazard Emerging Markets Fund | ||||||||||||||||||||||||
| Class A | ||||||||||||||||||||||||
| 12/31/2009 | 5.88 | 0.16 | 4.06 | 4.22 | (0.14) | - | 9.96 | 71.74 | 735,862 | 49 | 1.27 | 1.98 | ||||||||||||
| 12/31/2008 | 14.47 | 0.38 | (7.64) | (7.26) | (0.08) | (1.25) | 5.88 | (50.05) | 211,608 | 64 | 1.28 | 3.21 | ||||||||||||
| 12/31/2007 | 10.99 | 0.18 | 3.32 | 3.50 | (0.02) | - | 14.47 | 31.81 | 411,866 | 53 | 1.29 | 1.37 | ||||||||||||
05/01(a)-12/31/2006 | 10.00 | 0.10 | 0.89 | 0.99 | - | - | 10.99 | 9.90 | 88,626 | 28 | 1.35 | 1.52 | ||||||||||||
| Class B | ||||||||||||||||||||||||
| 12/31/2009 | 5.89 | 0.18 | 4.06 | 4.24 | (0.15) | - | 9.98 | 71.96 | 775 | 49 | 1.07 | 2.13 | ||||||||||||
| 12/31/2008 | 14.49 | 0.37 | (7.63) | (7.26) | (0.09) | (1.25) | 5.89 | (49.94) | 236 | 64 | 1.08 | 3.28 | ||||||||||||
| 12/31/2007 | 11.00 | 0.21 | 3.32 | 3.53 | (0.04) | - | 14.49 | 32.12 | 347 | 53 | 1.09 | 1.63 | ||||||||||||
05/01(a)-12/31/2006 | 10.00 | 0.11 | 0.89 | 1.00 | - | - | 11.00 | 10.00 | �� 150 | 28 | 1.16 | 1.69 | ||||||||||||
See accompanying Notes to Financial Statements.
JNL Series Trust
Financial Highlights
| Increase (Decrease) from | Distributions from | Ratio of Net | ||||||||||||||||||||||
| Net Asset | Investment Operations (e) | Net Realized | Supplemental Data | Ratio of | Investment | |||||||||||||||||||
| Value | Net | Net Realized | Total from | Distributions from | Gains on | Net Asset | Net Assets, | Expenses to | Income (Loss) | |||||||||||||||
| Beginning | Investment | & Unrealized | Investment | Net Investment | Investment | Value, End | Total | End of Period | Portfolio | Average Net | to Average | |||||||||||||
| Period Ended | of Period | Income (Loss) | Gains (Losses) | Operations | Income | Transactions | of Period | Return (b) | (in thousands) | Turnover (d) | Assets (c) | Net Assets (c) | ||||||||||||
| JNL/Lazard Mid Cap Equity Fund | ||||||||||||||||||||||||
| Class A | ||||||||||||||||||||||||
| 12/31/2009 | $ 6.82 | $ 0.07 | $ 2.63 | $ 2.70 | $ (0.06) | $ - | $ 9.46 | 39.65 % | $ 164,730 | 79% | 1.03 % | 0.86 % | ||||||||||||
| 12/31/2008 | 11.47 | 0.15 | (4.62) | (4.47) | (0.13) | (0.05) | 6.82 | (38.96) | 125,184 | 81 | 1.02 | 1.50 | ||||||||||||
| 12/31/2007 | 14.08 | 0.11 | (0.50) | (0.39) | (0.08) | (2.14) | 11.47 | (2.61) | 243,429 | 84 | 1.02 | 0.71 | ||||||||||||
| 12/31/2006 | 13.54 | 0.07 | 1.89 | 1.96 | (0.07) | (1.35) | 14.08 | 14.56 | 217,646 | 70 | 1.03 | 0.50 | ||||||||||||
| 12/31/2005 | 14.66 | 0.07 | 1.24 | 1.31 | (0.06) | (2.37) | 13.54 | 8.81 | 228,735 | 85 | 1.03 | 0.49 | ||||||||||||
| Class B | ||||||||||||||||||||||||
| 12/31/2009 | 6.90 | 0.05 | 2.65 | 2.70 | (0.07) | - | 9.53 | 39.19 | 167 | 79 | 0.83 | 0.61 | ||||||||||||
| 12/31/2008 | 11.62 | 0.17 | (4.69) | (4.52) | (0.15) | (0.05) | 6.90 | (38.88) | 2,108 | 81 | 0.82 | 1.70 | ||||||||||||
| 12/31/2007 | 14.23 | 0.14 | (0.51) | (0.37) | (0.10) | (2.14) | 11.62 | (2.44) | 3,683 | 84 | 0.82 | 0.92 | ||||||||||||
| 12/31/2006 | 13.61 | 0.10 | 1.90 | 2.00 | (0.03) | (1.35) | 14.23 | 14.77 | 3,093 | 70 | 0.83 | 0.68 | ||||||||||||
| 12/31/2005 | 14.70 | 0.10 | 1.24 | 1.34 | (0.06) | (2.37) | 13.61 | 8.99 | 253 | 85 | 0.83 | 0.69 | ||||||||||||
| JNL/M&G Global Basics Fund | ||||||||||||||||||||||||
| Class A | ||||||||||||||||||||||||
| 12/31/2009 | 8.42 | 0.05 | 3.89 | 3.94 | (0.03) | (0.06) | 12.27 | 46.88 | 29,708 | 43 | 1.21 | 0.47 | ||||||||||||
10/06(a)-12/31/2008 | 10.00 | - | (1.58) | (1.58) | - | - | 8.42 | (15.80) | 4,703 | 10 | 1.24 | (0.03) | ||||||||||||
| Class B | ||||||||||||||||||||||||
| 12/31/2009 | 8.43 | 0.08 | 3.89 | 3.97 | (0.04) | (0.06) | 12.30 | 47.19 | 160 | 43 | 1.01 | 0.75 | ||||||||||||
10/06(a)-12/31/2008 | 10.00 | - | (1.57) | (1.57) | - | - | 8.43 | (15.70) | 84 | 10 | 1.04 | 0.17 | ||||||||||||
| JNL/M&G Global Leaders Fund | ||||||||||||||||||||||||
| Class A | ||||||||||||||||||||||||
| 12/31/2009 | 8.35 | 0.09 | 3.03 | 3.12 | (0.06) | - | 11.41 | 37.43 | 17,302 | 39 | 1.21 | 0.87 | ||||||||||||
10/06(a)-12/31/2008 | 10.00 | 0.02 | (1.66) | (1.64) | (0.01) | - | 8.35 | (16.43) | 4,501 | 34 | 1.23 | 0.82 | ||||||||||||
| Class B | ||||||||||||||||||||||||
| 12/31/2009 | 8.35 | 0.12 | 3.03 | 3.15 | (0.08) | - | 11.42 | 37.70 | 126 | 39 | 1.01 | 1.25 | ||||||||||||
10/06(a)-12/31/2008 | 10.00 | 0.02 | (1.66) | (1.64) | (0.01) | - | 8.35 | (16.40) | 84 | 34 | 1.03 | 1.03 | ||||||||||||
JNL/Mellon Capital Management 10 X 10 Fund (h) | ||||||||||||||||||||||||
| Class A | ||||||||||||||||||||||||
| 12/31/2009 | 6.19 | 0.21 | 1.31 | 1.52 | (0.26) | (0.26) | 7.19 | 24.59 | 194,494 | 11 | 0.06 | 3.20 | ||||||||||||
| 12/31/2008 | 9.92 | 0.25 | (3.85) | (3.60) | (0.07) | (0.06) | 6.19 | (36.25) | 100,370 | 20 | 0.06 | 3.11 | ||||||||||||
04/30(a) - 12/31/2007 | 10.00 | 0.21 | (0.29) | (0.08) | - | - | 9.92 | (0.80) | 57,683 | 60 | 0.06 | 3.14 | ||||||||||||
JNL/Mellon Capital Management Index 5 Fund (h) | ||||||||||||||||||||||||
| Class A | ||||||||||||||||||||||||
| 12/31/2009 | 6.83 | 0.18 | 1.53 | 1.71 | (0.07) | (0.08) | 8.39 | 25.16 | 204,951 | 8 | 0.06 | 2.43 | ||||||||||||
| 12/31/2008 | 10.00 | 0.30 | (3.30) | (3.00) | (0.07) | (0.10) | 6.83 | (29.87) | 60,409 | 23 | 0.06 | 3.49 | ||||||||||||
04/30(a) - 12/31/2007 | 10.00 | 0.36 | (0.36) | - | - | - | 10.00 | 0.00 | 29,922 | 32 | 0.06 | 5.34 | ||||||||||||
| JNL/Mellon Capital Management European 30 Fund | ||||||||||||||||||||||||
| Class A | ||||||||||||||||||||||||
| 12/31/2009 | 8.59 | 0.29 | 3.23 | 3.52 | (0.25) | (0.56) | 11.30 | 41.03 | 13,238 | 65 | 0.78 | 2.76 | ||||||||||||
10/06(a)-12/31/2008 | 10.00 | 0.04 | (1.41) | (1.37) | (0.04) | - | 8.59 | (13.74) | 2,055 | - | 0.84 | 2.26 | ||||||||||||
| Class B | ||||||||||||||||||||||||
| 12/31/2009 | 8.59 | 0.35 | 3.19 | 3.54 | (0.26) | (0.56) | 11.31 | 41.27 | 128 | 65 | 0.58 | 3.65 | ||||||||||||
10/06(a)-12/31/2008 | 10.00 | 0.05 | (1.42) | (1.37) | (0.04) | - | 8.59 | 13.71 | 86 | - | 0.64 | 2.45 | ||||||||||||
| JNL/Mellon Capital Management Pacific Rim 30 Fund | ||||||||||||||||||||||||
| Class A | ||||||||||||||||||||||||
| 12/31/2009 | 9.60 | 0.21 | 2.11 | 2.32 | (0.15) | (0.51) | 11.26 | 24.15 | 16,625 | 47 | 0.78 | 1.95 | ||||||||||||
10/06(a)-12/31/2008 | 10.00 | 0.02 | (0.42) | (0.40) | - | - | 9.60 | (4.00) | 3,299 | - | 0.82 | 0.78 | ||||||||||||
| Class B | ||||||||||||||||||||||||
| 12/31/2009 | 9.60 | 0.26 | 2.09 | 2.35 | (0.16) | (0.51) | 11.28 | 24.49 | 136 | 47 | 0.58 | 2.54 | ||||||||||||
10/06(a)-12/31/2008 | 10.00 | 0.02 | (0.42) | (0.40) | - | - | 9.60 | (4.00) | 98 | - | 0.62 | 0.99 | ||||||||||||
See accompanying Notes to Financial Statements.
JNL Series Trust
Financial Highlights
| Increase (Decrease) from | Distributions from | Ratio of Net | ||||||||||||||||||||||
| Net Asset | Investment Operations (e) | Net Realized | Supplemental Data | Ratio of | Investment | |||||||||||||||||||
| Value | Net | Net Realized | Total from | Distributions from | Gains on | Net Asset | Net Assets, | Expenses to | Income (Loss) | |||||||||||||||
| Beginning | Investment | & Unrealized | Investment | Net Investment | Investment | Value, End | Total | End of Period | Portfolio | Average Net | to Average | |||||||||||||
| Period Ended | of Period | Income (Loss) | Gains (Losses) | Operations | Income | Transactions | of Period | Return (b) | (in thousands) | Turnover (d) | Assets (c) | Net Assets (c) | ||||||||||||
| JNL/Mellon Capital Management S&P 500 Index Fund | ||||||||||||||||||||||||
| Class A | ||||||||||||||||||||||||
| 12/31/2009 | $ 7.54 | $ 0.14 | $ 1.82 | $ 1.96 | $ (0.12) | $ - | $ 9.38 | 25.97 % | $ 900,282 | 4% | 0.60 % | 1.76 % | ||||||||||||
| 12/31/2008 | 12.36 | 0.19 | (4.84) | (4.65) | (0.17) | - | 7.54 | (37.64) | 457,126 | 7 | 0.60 | 1.80 | ||||||||||||
| 12/31/2007 | 12.06 | 0.18 | 0.40 | 0.58 | (0.16) | (0.12) | 12.36 | 4.90 | 656,286 | 3 | 0.59 | 1.45 | ||||||||||||
| 12/31/2006 | 10.68 | 0.16 | 1.45 | 1.61 | (0.15) | (0.08) | 12.06 | 15.08 | 559,179 | 1 | 0.60 | 1.42 | ||||||||||||
| 12/31/2005 | 10.66 | 0.13 | 0.34 | 0.47 | (0.12) | (0.33) | 10.68 | 4.37 | 427,375 | 14 | 0.61 | 1.30 | ||||||||||||
| Class B | ||||||||||||||||||||||||
| 12/31/2009 | 7.66 | 0.16 | 1.85 | 2.01 | (0.13) | - | 9.54 | 26.26 | 10,996 | 4 | 0.40 | 2.02 | ||||||||||||
| 12/31/2008 | 12.57 | 0.21 | (4.93) | (4.72) | (0.19) | - | 7.66 | (37.57) | 8,916 | 7 | 0.40 | 2.01 | ||||||||||||
| 12/31/2007 | 12.27 | 0.21 | 0.41 | 0.62 | (0.20) | (0.12) | 12.57 | 5.14 | 10,797 | 3 | 0.39 | 1.65 | ||||||||||||
| 12/31/2006 | 10.76 | 0.21 | 1.44 | 1.65 | (0.06) | (0.08) | 12.27 | 15.29 | 9,547 | 1 | 0.40 | 1.74 | ||||||||||||
| 12/31/2005 | 10.72 | 0.15 | 0.34 | 0.49 | (0.12) | (0.33) | 10.76 | 4.54 | 537 | 14 | 0.41 | 1.50 | ||||||||||||
| JNL/Mellon Capital Management S&P 400 MidCap Index Fund | ||||||||||||||||||||||||
| Class A | ||||||||||||||||||||||||
| 12/31/2009 | 8.17 | 0.13 | 2.98 | 3.11 | (0.11) | - | 11.17 | 38.03 | 469,779 | 14 | 0.61 | 1.35 | ||||||||||||
| 12/31/2008 | 14.78 | 0.17 | (5.75) | (5.58) | (0.13) | (0.90) | 8.17 | (37.58) | 284,426 | 30 | 0.61 | 1.35 | ||||||||||||
| 12/31/2007 | 14.96 | 0.17 | 0.93 | 1.10 | (0.05) | (1.23) | 14.78 | 7.45 | 464,641 | 25 | 0.60 | 1.06 | ||||||||||||
| 12/31/2006 | 14.21 | 0.14 | 1.24 | 1.38 | (0.13) | (0.50) | 14.96 | 9.69 | 381,163 | 10 | 0.61 | 0.97 | ||||||||||||
| 12/31/2005 | 13.28 | 0.09 | 1.51 | 1.60 | (0.10) | (0.57) | 14.21 | 11.98 | 288,486 | 15 | 0.61 | 0.82 | ||||||||||||
| Class B | ||||||||||||||||||||||||
| 12/31/2009 | 8.26 | 0.14 | 3.03 | 3.17 | (0.13) | - | 11.30 | 38.34 | 4,541 | 14 | 0.41 | 1.55 | ||||||||||||
| 12/31/2008 | 14.95 | 0.20 | (5.83) | (5.63) | (0.16) | (0.90) | 8.26 | (37.51) | 2,613 | 30 | 0.41 | 1.55 | ||||||||||||
| 12/31/2007 | 15.07 | 0.21 | 0.94 | 1.15 | (0.04) | (1.23) | 14.95 | 7.69 | 3,470 | 25 | 0.40 | 1.27 | ||||||||||||
| 12/31/2006 | 14.22 | 0.19 | 1.22 | 1.41 | (0.06) | (0.50) | 15.07 | 9.91 | 2,804 | 10 | 0.41 | 1.26 | ||||||||||||
| 12/31/2005 | 13.27 | 0.11 | 1.51 | 1.62 | (0.10) | (0.57) | 14.22 | 12.14 | 245 | 15 | 0.41 | 1.02 | ||||||||||||
| JNL/Mellon Capital Management Small Cap Index Fund | ||||||||||||||||||||||||
| Class A | ||||||||||||||||||||||||
| 12/31/2009 | 7.97 | 0.09 | 2.10 | 2.19 | (0.07) | (0.05) | 10.04 | 27.54 | 470,449 | 17 | 0.61 | 1.08 | ||||||||||||
| 12/31/2008 | 13.53 | 0.11 | (4.87) | (4.76) | (0.15) | (0.65) | 7.97 | (35.01) | 241,444 | 29 | 0.61 | 0.96 | ||||||||||||
| 12/31/2007 | 14.79 | 0.18 | (0.51) | (0.33) | (0.04) | (0.89) | 13.53 | (2.11) | 361,126 | 21 | 0.60 | 1.21 | ||||||||||||
| 12/31/2006 | 13.44 | 0.15 | 2.19 | 2.34 | (0.12) | (0.87) | 14.79 | 17.49 | 339,124 | 17 | 0.60 | 1.02 | ||||||||||||
| 12/31/2005 | 13.43 | 0.08 | 0.49 | 0.57 | (0.09) | (0.47) | 13.44 | 4.22 | 237,460 | 16 | 0.60 | 0.84 | ||||||||||||
| Class B | ||||||||||||||||||||||||
| 12/31/2009 | 8.05 | 0.11 | 2.11 | 2.22 | (0.08) | (0.05) | 10.14 | 27.68 | 3,916 | 17 | 0.41 | 1.30 | ||||||||||||
| 12/31/2008 | 13.66 | 0.14 | (4.92) | (4.78) | (0.18) | (0.65) | 8.05 | (34.83) | 2,299 | 29 | 0.41 | 1.17 | ||||||||||||
| 12/31/2007 | 14.86 | 0.21 | (0.50) | (0.29) | (0.02) | (0.89) | 13.66 | (1.84) | 2,771 | 21 | 0.40 | 1.41 | ||||||||||||
| 12/31/2006 | 13.42 | 0.20 | 2.16 | 2.36 | (0.05) | (0.87) | 14.86 | 17.66 | 2,714 | 17 | 0.40 | 1.33 | ||||||||||||
| 12/31/2005 | 13.39 | 0.10 | 0.49 | 0.59 | (0.09) | (0.47) | 13.42 | 4.38 | 248 | 16 | 0.40 | 1.04 | ||||||||||||
| JNL/Mellon Capital Management International Index Fund | ||||||||||||||||||||||||
| Class A | ||||||||||||||||||||||||
| 12/31/2009 | 9.41 | 0.25 | 2.50 | 2.75 | (0.26) | 0.00 | (f) | 11.90 | 29.28 | 721,755 | 2 | 0.69 | 2.43 | |||||||||||
| 12/31/2008 | 17.55 | 0.47 | (8.00) | (7.53) | (0.30) | (0.31) | 9.41 | (42.92) | 369,368 | 15 | 0.65 | 3.31 | ||||||||||||
| 12/31/2007 | 16.54 | 0.40 | 1.29 | 1.69 | (0.45) | (0.23) | 17.55 | 10.39 | 645,505 | 5 | 0.65 | 2.23 | ||||||||||||
| 12/31/2006 | 13.59 | 0.32 | 3.15 | 3.47 | (0.37) | (0.15) | 16.54 | 25.58 | 497,487 | 2 | 0.66 | 2.11 | ||||||||||||
| 12/31/2005 | 13.67 | 0.29 | 1.53 | 1.82 | (0.27) | (1.63) | 13.59 | 13.31 | 294,677 | 43 | 0.66 | 2.08 | ||||||||||||
| Class B | ||||||||||||||||||||||||
| 12/31/2009 | 9.68 | 0.30 | 2.56 | 2.86 | (0.28) | 0.00 | (f) | 12.26 | 29.57 | 18,284 | 2 | 0.49 | 2.83 | |||||||||||
| 12/31/2008 | 18.04 | 0.52 | (8.24) | (7.72) | (0.33) | (0.31) | 9.68 | (42.82) | 6,256 | 15 | 0.45 | 3.55 | ||||||||||||
| 12/31/2007 | 16.88 | 0.44 | 1.32 | 1.76 | (0.37) | (0.23) | 18.04 | 10.56 | 10,527 | 5 | 0.45 | 2.43 | ||||||||||||
| 12/31/2006 | 13.60 | 0.22 | 3.30 | 3.52 | (0.09) | (0.15) | 16.88 | 25.93 | 5,982 | 2 | 0.47 | 1.40 | ||||||||||||
| 12/31/2005 | 13.66 | 0.31 | 1.53 | 1.84 | (0.27) | (1.63) | 13.60 | 13.46 | 374 | 43 | 0.46 | 2.28 | ||||||||||||
See accompanying Notes to Financial Statements.
JNL Series Trust
Financial Highlights
| Increase (Decrease) from | Distributions from | Ratio of Net | ||||||||||||||||||||||
| Net Asset | Investment Operations (e) | Net Realized | Supplemental Data | Ratio of | Investment | |||||||||||||||||||
| Value | Net | Net Realized | Total from | Distributions from | Gains on | Net Asset | Net Assets, | Expenses to | Income (Loss) | |||||||||||||||
| Beginning | Investment | & Unrealized | Investment | Net Investment | Investment | Value, End | Total | End of Period | Portfolio | Average Net | to Average | |||||||||||||
| Period Ended | of Period | Income (Loss) | Gains (Losses) | Operations | Income | Transactions | of Period | Return (b) | (in thousands) | Turnover (d) | Assets (c) | Net Assets (c) | ||||||||||||
| JNL/Mellon Capital Management Bond Index Fund | ||||||||||||||||||||||||
| Class A | ||||||||||||||||||||||||
| 12/31/2009 | $ 11.07 | $ 0.42 | $ 0.21 | $ 0.63 | $ (0.30) | $ (0.01) | $ 11.39 | 5.65 % | $ 793,123 | 87% | (n) | 0.60 % | 3.67 % | |||||||||||
| 12/31/2008 | 11.16 | 0.52 | (0.10) | 0.42 | (0.51) | - | 11.07 | 3.79 | 379,239 | 51 | (n) | 0.61 | 4.60 | |||||||||||
| 12/31/2007 | 10.92 | 0.52 | 0.18 | 0.70 | (0.46) | - | 11.16 | 6.43 | 349,683 | 45 | (n) | 0.60 | 4.68 | |||||||||||
| 12/31/2006 | 10.75 | 0.48 | (0.09) | 0.39 | (0.22) | - | 10.92 | 3.64 | 247,489 | 65 | (n) | 0.61 | 4.42 | |||||||||||
| 12/31/2005 | 10.83 | 0.18 | 0.02 | 0.20 | (0.22) | (0.06) | 10.75 | 1.85 | 180,542 | 361 | 0.61 | 3.46 | ||||||||||||
| Class B | ||||||||||||||||||||||||
| 12/31/2009 | 11.36 | 0.46 | 0.21 | 0.67 | (0.31) | (0.01) | 11.71 | 5.90 | 2,647 | 87 | (n) | 0.40 | 3.92 | |||||||||||
| 12/31/2008 | 11.44 | 0.56 | (0.11) | 0.45 | (0.53) | - | 11.36 | 3.98 | 1,596 | 51 | (n) | 0.41 | 4.81 | |||||||||||
| 12/31/2007 | 11.05 | 0.55 | 0.19 | 0.74 | (0.35) | - | 11.44 | 6.68 | 906 | 45 | (n) | 0.41 | 4.88 | |||||||||||
| 12/31/2006 | 10.70 | 0.50 | (0.09) | 0.41 | (0.06) | - | 11.05 | 3.85 | 692 | 65 | (n) | 0.41 | 4.65 | |||||||||||
| 12/31/2005 | 10.76 | 0.20 | 0.02 | 0.22 | (0.22) | (0.06) | 10.70 | 2.04 | 147 | 361 | 0.41 | 3.66 | ||||||||||||
| JNL/Mellon Capital Management Global Alpha Fund | ||||||||||||||||||||||||
| Class A | ||||||||||||||||||||||||
9/28 (a) - 12/31/2009 | 10.00 | (0.03) | (0.09) | (0.12) | - | - | 9.88 | (1.20) | 62,275 | 0 | 1.35 | (1.28) | ||||||||||||
| Class B | ||||||||||||||||||||||||
9/28 (a) - 12/31/2009 | 10.00 | (0.03) | (0.08) | (0.11) | - | - | 9.89 | (1.10) | 109 | 0 | 1.15 | (1.09) | ||||||||||||
| JNL/Oppenheimer Global Growth Fund | ||||||||||||||||||||||||
| Class A | ||||||||||||||||||||||||
| 12/31/2009 | 7.00 | 0.10 | 2.65 | 2.75 | (0.12) | (0.49) | 9.14 | 39.42 | 289,972 | 21 | 1.06 | 1.19 | ||||||||||||
| 12/31/2008 | 14.97 | 0.21 | (6.42) | (6.21) | (0.17) | (1.59) | 7.00 | (40.86) | 176,084 | 22 | 1.06 | 1.71 | ||||||||||||
| 12/31/2007 | 15.25 | 0.13 | 0.81 | 0.94 | (0.12) | (1.10) | 14.97 | 6.33 | 372,934 | 31 | 1.05 | 0.79 | ||||||||||||
| 12/31/2006 | 13.53 | 0.08 | 2.21 | 2.29 | (0.07) | (0.50) | 15.25 | 16.96 | 349,246 | 30 | 1.06 | 0.58 | ||||||||||||
| 12/31/2005 | 11.92 | 0.08 | 1.56 | 1.64 | (0.03) | - | 13.53 | 13.74 | 289,390 | 27 | 1.06 | 0.74 | ||||||||||||
| Class B | ||||||||||||||||||||||||
| 12/31/2009 | 7.07 | 0.11 | 2.68 | 2.79 | (0.14) | (0.49) | 9.23 | 39.58 | 507 | 21 | 0.86 | 1.40 | ||||||||||||
| 12/31/2008 | 15.11 | 0.22 | (6.46) | (6.24) | (0.21) | (1.59) | 7.07 | (40.69) | 340 | 22 | 0.86 | 1.82 | ||||||||||||
| 12/31/2007 | 15.35 | 0.17 | 0.81 | 0.98 | (0.12) | (1.10) | 15.11 | 6.56 | 397 | 31 | 0.85 | 1.02 | ||||||||||||
| 12/31/2006 | 13.57 | 0.11 | 2.22 | 2.33 | (0.05) | (0.50) | 15.35 | 17.21 | 386 | 30 | 0.86 | 0.72 | ||||||||||||
| 12/31/2005 | 11.93 | 0.11 | 1.56 | 1.67 | (0.03) | - | 13.57 | 13.98 | 204 | 27 | 0.86 | 0.94 | ||||||||||||
| JNL/PAM Asia ex-Japan Fund | ||||||||||||||||||||||||
| Class A | ||||||||||||||||||||||||
| 12/31/2009 | 4.80 | 0.03 | 3.31 | 3.34 | 0.00 | (f) | - | 8.14 | 69.59 | 108,276 | 39 | 1.27 | 0.46 | |||||||||||
| 12/31/2008 | 9.80 | 0.12 | (5.03) | (4.91) | (0.09) | - | 4.80 | (50.09) | 7,727 | 132 | 1.29 | 1.66 | ||||||||||||
12/03(a) - 12/31/2007 | 10.00 | (0.01) | (0.19) | (0.20) | - | - | 9.80 | (2.00) | 11,747 | - | 1.30 | (0.67) | ||||||||||||
| Class B | ||||||||||||||||||||||||
| 12/31/2009 | 4.80 | 0.06 | 3.29 | 3.35 | 0.00 | (f) | - | 8.15 | 69.80 | 134 | 39 | 1.07 | 0.94 | |||||||||||
| 12/31/2008 | 9.80 | 0.13 | (5.02) | (4.89) | (0.11) | - | 4.80 | (49.92) | 57 | 132 | 1.09 | 1.73 | ||||||||||||
12/03(a) - 12/31/2007 | 10.00 | 0.00 | (0.20) | (0.20) | - | - | 9.80 | (2.00) | 98 | - | 1.10 | (0.47) | ||||||||||||
| JNL/PAM China-India Fund | ||||||||||||||||||||||||
| Class A | ||||||||||||||||||||||||
| 12/31/2009 | 4.23 | (0.00) | (f) | 3.48 | 3.48 | - | - | 7.71 | 82.27 | 233,497 | 73 | 1.33 | 0.05 | |||||||||||
| 12/31/2008 | 9.98 | 0.03 | (5.78) | (5.75) | - | - | 4.23 | (57.62) | 25,987 | 188 | 1.41 | 0.51 | ||||||||||||
12/03(a) - 12/31/2007 | 10.00 | (0.01) | (0.01) | (0.02) | - | - | 9.98 | (0.20) | 4,888 | - | 1.40 | (0.93) | ||||||||||||
| Class B | ||||||||||||||||||||||||
| 12/31/2009 | 4.24 | 0.03 | 3.47 | 3.50 | - | - | 7.74 | 82.55 | 239 | 73 | 1.13 | 0.40 | ||||||||||||
| 12/31/2008 | 9.98 | 0.03 | (5.77) | (5.74) | - | - | 4.24 | (57.52) | 68 | 188 | 1.21 | 0.52 | ||||||||||||
12/03(a) - 12/31/2007 | 10.00 | (0.01) | (0.01) | (0.02) | - | - | 9.98 | (0.20) | 100 | - | 1.20 | (0.74) | ||||||||||||
See accompanying Notes to Financial Statements.
JNL Series Trust
Financial Highlights
| Increase (Decrease) from | Distributions from | Ratio of Net | ||||||||||||||||||||||
| Net Asset | Investment Operations (e) | Net Realized | Supplemental Data | Ratio of | Investment | |||||||||||||||||||
| Value | Net | Net Realized | Total from | Distributions from | Gains on | Net Asset | Net Assets, | Expenses to | Income (Loss) | |||||||||||||||
| Beginning | Investment | & Unrealized | Investment | Net Investment | Investment | Value, End | Total | End of Period | Portfolio | Average Net | to Average | |||||||||||||
| Period Ended | of Period | Income (Loss) | Gains (Losses) | Operations | Income | Transactions | of Period | Return (b) | (in thousands) | Turnover (d) | Assets (c) | Net Assets (c) | ||||||||||||
| JNL/PIMCO Real Return Fund | ||||||||||||||||||||||||
| Class A | ||||||||||||||||||||||||
| 12/31/2009 | $ 10.10 | $ 0.30 | $ 1.44 | $ 1.74 | $ (0.27) | $ - | $ 11.57 | 17.25 % | $ 1,189,828 | 722% | 0.81 % | 2.69 % | ||||||||||||
| 12/31/2008 | 11.09 | 0.39 | (0.82) | (0.43) | (0.16) | (0.40) | 10.10 | (3.73) | 663,938 | 2,289 | 0.81 | 3.44 | ||||||||||||
01/16(a) - 12/31/2007 | 10.00 | 0.43 | 0.66 | 1.09 | - | - | 11.09 | 10.90 | 397,393 | 1,215 | (o) | 0.80 | 4.27 | |||||||||||
| Class B | ||||||||||||||||||||||||
| 12/31/2009 | 10.13 | 0.32 | 1.48 | 1.80 | (0.29) | - | 11.64 | 17.76 | 237 | 722 | 0.61 | 2.97 | ||||||||||||
| 12/31/2008 | 11.11 | 0.41 | (0.82) | (0.41) | (0.17) | (0.40) | 10.13 | (3.57) | 350 | 2,289 | 0.61 | 3.63 | ||||||||||||
01/16(a) - 12/31/2007 | 10.00 | 0.32 | 0.79 | 1.11 | - | - | 11.11 | 11.10 | 126 | 1,215 | (o) | 0.60 | 3.20 | |||||||||||
| JNL/PIMCO Total Return Bond Fund | ||||||||||||||||||||||||
| Class A | ||||||||||||||||||||||||
| 12/31/2009 | 11.07 | 0.48 | 1.24 | 1.72 | (0.29) | (0.31) | 12.19 | 15.45 | 2,348,470 | 177 | 0.81 | 4.04 | ||||||||||||
| 12/31/2008 | 12.04 | 0.51 | (0.48) | 0.03 | (0.53) | (0.47) | 11.07 | 0.40 | 1,325,740 | 660 | 0.81 | 4.22 | ||||||||||||
| 12/31/2007 | 11.66 | 0.54 | 0.42 | 0.96 | (0.56) | (0.02) | 12.04 | 8.25 | 1,037,811 | 119 | (p) | 0.80 | 4.54 | |||||||||||
| 12/31/2006 | 11.70 | 0.50 | (0.10) | 0.40 | (0.44) | 0.00 | (f) | 11.66 | 3.38 | 760,176 | 63 | (p) | 0.81 | 4.20 | ||||||||||
| 12/31/2005 | 11.96 | 0.27 | 0.02 | 0.29 | (0.33) | (0.22) | 11.70 | 2.40 | 571,892 | 183 | (p) | 0.81 | 3.15 | |||||||||||
| Class B | ||||||||||||||||||||||||
| 12/31/2009 | 11.67 | 0.53 | 1.30 | 1.83 | (0.30) | (0.31) | 12.89 | 15.66 | 14,110 | 177 | 0.61 | 4.21 | ||||||||||||
| 12/31/2008 | 12.64 | 0.56 | (0.51) | 0.05 | (0.55) | (0.47) | 11.67 | 0.57 | 9,891 | 660 | 0.61 | 4.40 | ||||||||||||
| 12/31/2007 | 12.22 | 0.59 | 0.45 | 1.04 | (0.60) | (0.02) | 12.64 | 8.53 | 8,145 | 119 | (p) | 0.61 | 4.74 | |||||||||||
| 12/31/2006 | 11.91 | 0.55 | (0.13) | 0.42 | (0.11) | 0.00 | (f) | 12.22 | 3.57 | 6,953 | 63 | (p) | 0.60 | 4.51 | ||||||||||
| 12/31/2005 | 12.15 | 0.29 | 0.02 | 0.31 | (0.33) | (0.22) | 11.91 | 2.52 | 174 | 183 | (p) | 0.60 | 3.36 | |||||||||||
| JNL/PPM America High Yield Bond Fund | ||||||||||||||||||||||||
| Class A | ||||||||||||||||||||||||
| 12/31/2009 | 4.46 | 0.50 | 1.56 | 2.06 | (0.37) | - | 6.15 | 46.30 | 566,513 | 50 | 0.78 | 8.87 | ||||||||||||
| 12/31/2008 | 7.43 | 0.59 | (2.93) | (2.34) | (0.63) | - | 4.46 | (30.75) | 188,010 | 78 | 0.79 | 8.82 | ||||||||||||
| 12/31/2007 | 8.22 | 0.66 | (0.75) | (0.09) | (0.70) | - | 7.43 | (1.10) | 303,282 | 95 | 0.78 | 7.92 | ||||||||||||
| 12/31/2006 | 7.95 | 0.62 | 0.21 | 0.83 | (0.56) | - | 8.22 | 10.51 | 365,753 | 62 | 0.80 | 7.49 | ||||||||||||
| 12/31/2005 | 8.51 | 0.62 | (0.48) | 0.14 | (0.62) | (0.08) | 7.95 | 1.69 | 276,421 | 33 | 0.81 | 7.39 | ||||||||||||
| �� | ||||||||||||||||||||||||
| Class B | ||||||||||||||||||||||||
| 12/31/2009 | 4.86 | 0.55 | 1.71 | 2.26 | (0.38) | - | 6.74 | 46.58 | 5,989 | 50 | 0.58 | 9.22 | ||||||||||||
| 12/31/2008 | 8.02 | 0.65 | (3.17) | (2.52) | (0.64) | - | 4.86 | (30.65) | 3,280 | 78 | 0.59 | 9.09 | ||||||||||||
| 12/31/2007 | 8.81 | 0.72 | (0.79) | (0.07) | (0.72) | - | 8.02 | (0.79) | 3,999 | 95 | 0.58 | 8.12 | ||||||||||||
| 12/31/2006 | 8.12 | 0.66 | 0.21 | 0.87 | (0.18) | - | 8.81 | 10.72 | 4,443 | 62 | 0.59 | 7.60 | ||||||||||||
| 12/31/2005 | 8.66 | 0.64 | (0.48) | 0.16 | (0.62) | (0.08) | 8.12 | 1.89 | 214 | 33 | 0.60 | 7.60 | ||||||||||||
| JNL/PPM America Mid Cap Value Fund | ||||||||||||||||||||||||
| Class A | ||||||||||||||||||||||||
| 12/31/2009 | 5.62 | 0.05 | 2.61 | 2.66 | (0.03) | - | 8.25 | 47.38 | 20,020 | 89 | 1.06 | 0.77 | ||||||||||||
| 03/31(a)-12/31/2008 | 10.00 | 0.07 | (4.37) | (4.30) | (0.08) | - | 5.62 | (43.00) | 5,011 | 154 | 1.06 | 1.05 | ||||||||||||
| Class B | ||||||||||||||||||||||||
| 12/31/2009 | 5.61 | 0.06 | 2.62 | 2.68 | (0.04) | - | 8.25 | 47.82 | 92 | 89 | 0.86 | 0.99 | ||||||||||||
| 03/31(a)-12/31/2008 | 10.00 | 0.08 | (4.38) | (4.30) | (0.09) | - | 5.61 | (42.94) | 58 | 154 | 0.86 | 1.28 | ||||||||||||
| JNL/PPM America Small Cap Value Fund | ||||||||||||||||||||||||
| Class A | ||||||||||||||||||||||||
| 12/31/2009 | 6.27 | 0.04 | 2.09 | 2.13 | (0.03) | - | 8.37 | 33.97 | 15,861 | 114 | 1.06 | 0.60 | ||||||||||||
| 03/31(a)-12/31/2008 | 10.00 | 0.06 | (3.75) | (3.69) | (0.04) | - | 6.27 | (36.85) | 8,356 | 66 | 1.06 | 1.02 | ||||||||||||
| Class B | ||||||||||||||||||||||||
| 12/31/2009 | 6.27 | 0.05 | 2.10 | 2.15 | (0.04) | - | 8.38 | 34.30 | 3,850 | 114 | 0.86 | 0.68 | ||||||||||||
| 03/31(a)-12/31/2008 | 10.00 | 0.07 | (3.75) | (3.68) | (0.05) | - | 6.27 | (36.75) | 87 | 66 | 0.86 | 1.15 | ||||||||||||
See accompanying Notes to Financial Statements.
JNL Series Trust
Financial Highlights
| Increase (Decrease) from | Distributions from | Ratio of Net | ||||||||||||||||||||||
| Net Asset | Investment Operations (e) | Net Realized | Supplemental Data | Ratio of | Investment | |||||||||||||||||||
| Value | Net | Net Realized | Total from | Distributions from | Gains on | Net Asset | Net Assets, | Expenses to | Income (Loss) | |||||||||||||||
| Beginning | Investment | & Unrealized | Investment | Net Investment | Investment | Value, End | Total | End of Period | Portfolio | Average Net | to Average | |||||||||||||
| Period Ended | of Period | Income (Loss) | Gains (Losses) | Operations | Income | Transactions | of Period | Return (b) | (in thousands) | Turnover (d) | Assets (c) | Net Assets (c) | ||||||||||||
| JNL/PPM America Value Equity Fund | ||||||||||||||||||||||||
| Class A | ||||||||||||||||||||||||
| 12/31/2009 | $ 7.57 | $ 0.14 | $ 3.23 | $ 3.37 | $ (0.48) | $ - | $ 10.46 | 44.58 % | $ 93,660 | 63% | 0.86 % | 1.65 % | ||||||||||||
| 12/31/2008 | 19.15 | 0.35 | (9.54) | (9.19) | (0.39) | (2.00) | 7.57 | (47.21) | 87,770 | 96 | 0.86 | 2.28 | ||||||||||||
| 12/31/2007 | 20.44 | 0.33 | (1.48) | (1.15) | (0.14) | - | 19.15 | (5.63) | 219,654 | 86 | 0.86 | 1.55 | ||||||||||||
| 12/31/2006 | 18.09 | 0.17 | 2.19 | 2.36 | (0.01) | - | 20.44 | 13.03 | 165,734 | 145 | 0.97 | 0.92 | ||||||||||||
| 12/31/2005 | 17.42 | 0.24 | 0.61 | 0.85 | (0.18) | - | 18.09 | 4.91 | 181,363 | 79 | 0.97 | 0.97 | ||||||||||||
| Class B | ||||||||||||||||||||||||
| 12/31/2009 | 7.62 | 0.16 | 3.24 | 3.40 | (0.52) | - | 10.50 | 44.72 | 675 | 63 | 0.66 | 1.61 | ||||||||||||
| 12/31/2008 | 19.30 | 0.37 | (9.61) | (9.24) | (0.44) | (2.00) | 7.62 | (47.07) | 76 | 96 | 0.66 | 2.53 | ||||||||||||
| 12/31/2007 | 20.60 | 0.37 | (1.48) | (1.11) | (0.19) | - | 19.30 | (5.36) | 132 | 86 | 0.66 | 1.75 | ||||||||||||
| 12/31/2006 | 18.20 | 0.22 | 2.18 | 2.40 | 0.00 | (f) | - | 20.60 | 13.21 | 129 | 145 | 0.77 | 1.14 | |||||||||||
| 12/31/2005 | 17.48 | 0.28 | 0.62 | 0.90 | (0.18) | - | 18.20 | 5.18 | 107 | 79 | 0.76 | 1.18 | ||||||||||||
JNL/Red Rocks Listed Private Equity Fund (h) | ||||||||||||||||||||||||
| Class A | ||||||||||||||||||||||||
| 12/31/2009 | 5.91 | 0.07 | 2.31 | 2.38 | (0.25) | (0.01) | 8.03 | 40.33 | 223,873 | 34 | 1.20 | 0.92 | ||||||||||||
10/06(a)-12/31/2008 | 10.00 | 0.04 | (4.10) | (4.06) | (0.03) | (s) | - | 5.91 | (40.56) | 15,265 | 6 | 1.22 | 2.55 | |||||||||||
| Class B | ||||||||||||||||||||||||
| 12/31/2009 | 5.91 | 0.09 | 2.31 | 2.40 | (0.26) | (0.01) | 8.04 | 40.62 | 156 | 34 | 1.00 | 1.36 | ||||||||||||
10/06(a)-12/31/2008 | 10.00 | 0.03 | (4.08) | (4.05) | (0.04) | (s) | - | 5.91 | (40.54) | 66 | 6 | 1.02 | 1.82 | |||||||||||
JNL/S&P Managed Conservative Fund (h) | ||||||||||||||||||||||||
| Class A | ||||||||||||||||||||||||
| 12/31/2009 | 9.35 | 0.26 | 1.00 | 1.26 | (0.17) | (0.10) | 10.34 | 13.53 | 623,958 | 11 | 0.18 | 2.66 | ||||||||||||
| 12/31/2008 | 11.47 | 0.32 | (1.90) | (1.58) | (0.39) | (0.15) | 9.35 | (13.75) | 407,426 | 30 | 0.19 | 2.95 | ||||||||||||
| 12/31/2007 | 11.29 | 0.34 | 0.37 | 0.71 | (0.27) | (0.26) | 11.47 | 6.30 | 264,755 | 54 | 0.18 | 2.92 | ||||||||||||
| 12/31/2006 | 10.70 | 0.20 | 0.64 | 0.84 | (0.18) | (0.07) | 11.29 | 7.85 | 137,126 | 39 | 0.19 | 1.82 | ||||||||||||
| 12/31/2005 | 10.35 | 0.26 | 0.13 | 0.39 | (0.03) | (0.01) | 10.70 | 3.73 | 80,642 | 16 | 0.19 | 3.54 | ||||||||||||
JNL/S&P Managed Moderate Fund (h) | ||||||||||||||||||||||||
| Class A | ||||||||||||||||||||||||
| 12/31/2009 | 8.97 | 0.25 | 1.43 | 1.68 | (0.12) | (0.12) | 10.41 | 18.63 | 1,021,335 | 6 | 0.17 | 2.57 | ||||||||||||
| 12/31/2008 | 12.21 | 0.26 | (2.85) | (2.59) | (0.41) | (0.24) | 8.97 | (21.24) | 557,615 | 28 | 0.18 | 2.36 | ||||||||||||
| 12/31/2007 | 11.90 | 0.28 | 0.64 | 0.92 | (0.29) | (0.32) | 12.21 | 7.74 | 521,470 | 30 | 0.19 | 2.26 | ||||||||||||
| 12/31/2006 | 11.04 | 0.17 | 0.97 | 1.14 | (0.13) | (0.15) | 11.90 | 10.39 | 314,249 | 35 | 0.19 | 1.44 | ||||||||||||
| 12/31/2005 | 10.54 | 0.24 | 0.29 | 0.53 | (0.02) | (0.01) | 11.04 | 4.99 | 157,719 | 11 | 0.18 | 3.13 | ||||||||||||
JNL/S&P Managed Moderate Growth Fund (h) | ||||||||||||||||||||||||
| Class A | ||||||||||||||||||||||||
| 12/31/2009 | 8.79 | 0.21 | 1.86 | 2.07 | (0.07) | (0.25) | 10.54 | 23.46 | 1,774,984 | 13 | 0.16 | 2.14 | ||||||||||||
| 12/31/2008 | 13.20 | 0.17 | (3.80) | (3.63) | (0.27) | (0.51) | 8.79 | (27.50) | 997,961 | 28 | 0.16 | 1.45 | ||||||||||||
| 12/31/2007 | 13.08 | 0.19 | 0.92 | 1.11 | (0.28) | (0.71) | 13.20 | 8.65 | 1,403,279 | 34 | 0.16 | 1.34 | ||||||||||||
| 12/31/2006 | 12.13 | 0.12 | 1.36 | 1.48 | (0.12) | (0.41) | 13.08 | 12.17 | 1,123,984 | 29 | 0.16 | 0.97 | ||||||||||||
| 12/31/2005 | 11.67 | 0.34 | 0.41 | 0.75 | (0.20) | (0.09) | 12.13 | 6.41 | 861,543 | 21 | 0.17 | 1.39 | ||||||||||||
JNL/S&P Managed Growth Fund (h) | ||||||||||||||||||||||||
| Class A | ||||||||||||||||||||||||
| 12/31/2009 | 7.94 | 0.14 | 2.09 | 2.23 | (0.16) | (0.30) | 9.71 | 28.06 | 1,479,759 | 8 | 0.16 | 1.55 | ||||||||||||
| 12/31/2008 | 13.84 | 0.10 | (5.00) | (4.90) | (0.07) | (0.93) | 7.94 | (35.36) | 808,800 | 32 | 0.16 | 0.80 | ||||||||||||
| 12/31/2007 | 13.62 | 0.12 | 1.05 | 1.17 | (0.24) | (0.71) | 13.84 | 8.70 | 1,388,072 | 34 | 0.15 | 0.86 | ||||||||||||
| 12/31/2006 | 12.56 | 0.07 | 1.71 | 1.78 | (0.07) | (0.65) | 13.62 | 14.15 | 1,246,802 | 34 | 0.16 | 0.53 | ||||||||||||
| 12/31/2005 | 12.23 | 0.30 | 0.61 | 0.91 | (0.13) | (0.45) | 12.56 | 7.44 | 1,059,806 | 32 | 0.16 | 0.62 | ||||||||||||
See accompanying Notes to Financial Statements.
JNL Series Trust
Financial Highlights
| Increase (Decrease) from | Distributions from | Ratio of Net | ||||||||||||||||||||||
| Net Asset | Investment Operations (e) | Net Realized | Supplemental Data | Ratio of | Investment | |||||||||||||||||||
| Value | Net | Net Realized | Total from | Distributions from | Gains on | Net Asset | Net Assets, | Expenses to | Income (Loss) | |||||||||||||||
| Beginning | Investment | & Unrealized | Investment | Net Investment | Investment | Value, End | Total | End of Period | Portfolio | Average Net | to Average | |||||||||||||
| Period Ended | of Period | Income (Loss) | Gains (Losses) | Operations | Income | Transactions | of Period | Return (b) | (in thousands) | Turnover (d) | Assets (c) | Net Assets (c) | ||||||||||||
JNL/S&P Managed Aggressive Growth Fund (h) | ||||||||||||||||||||||||
| Class A | ||||||||||||||||||||||||
| 12/31/2009 | $ 8.39 | $ 0.10 | $ 2.51 | $ 2.61 | $ (0.21) | $ (0.33) | $ 10.46 | 31.05 % | $ 582,868 | 19% | 0.19 % | 1.07 % | ||||||||||||
| 12/31/2008 | 14.89 | 0.06 | (5.90) | (5.84) | (0.05) | (0.61) | 8.39 | (39.16) | 414,718 | 42 | 0.18 | 0.50 | ||||||||||||
| 12/31/2007 | 13.91 | 0.08 | 1.19 | 1.27 | (0.24) | (0.05) | 14.89 | 9.17 | 702,285 | 46 | 0.17 | 0.56 | ||||||||||||
| 12/31/2006 | 12.80 | 0.04 | 1.95 | 1.99 | (0.04) | (0.84) | 13.91 | 15.57 | 672,325 | 33 | 0.17 | 0.28 | ||||||||||||
| 12/31/2005 | 11.89 | 0.25 | 0.76 | 1.01 | (0.10) | - | 12.80 | 8.48 | 657,320 | 35 | 0.18 | 0.22 | ||||||||||||
JNL/S&P Disciplined Moderate Fund (h) | ||||||||||||||||||||||||
| Class A | ||||||||||||||||||||||||
| 12/31/2009 | 7.72 | 0.23 | 1.21 | 1.44 | (0.16) | (0.06) | 8.94 | 18.67 | 168,455 | 12 | 0.19 | 2.75 | ||||||||||||
| 12/31/2008 | 10.70 | 0.27 | (3.12) | (2.85) | (0.09) | (0.04) | 7.72 | (26.60) | 58,062 | 27 | 0.19 | 2.91 | ||||||||||||
01/16(a) - 12/31/2007 | 10.00 | 0.48 | 0.22 | 0.70 | - | - | 10.70 | 7.00 | 34,588 | 31 | 0.18 | 4.75 | ||||||||||||
JNL/S&P Disciplined Moderate Growth Fund (h) | ||||||||||||||||||||||||
| Class A | ||||||||||||||||||||||||
| 12/31/2009 | 6.81 | 0.21 | 1.34 | 1.55 | (0.17) | (0.09) | 8.10 | 22.77 | 206,365 | 16 | 0.19 | 2.78 | ||||||||||||
| 12/31/2008 | 10.67 | 0.23 | (3.94) | (3.71) | (0.09) | (0.06) | 6.81 | (34.76) | 74,452 | 29 | 0.19 | 2.60 | ||||||||||||
01/16(a) - 12/31/2007 | 10.00 | 0.35 | 0.32 | 0.67 | - | - | 10.67 | 6.70 | 40,459 | 31 | 0.18 | 3.49 | ||||||||||||
JNL/S&P Disciplined Growth Fund (h) | ||||||||||||||||||||||||
| Class A | ||||||||||||||||||||||||
| 12/31/2009 | 6.31 | 0.20 | 1.40 | 1.60 | (0.17) | (0.10) | 7.64 | 25.39 | 80,863 | 24 | 0.19 | 2.87 | ||||||||||||
| 12/31/2008 | 10.65 | 0.22 | (4.40) | (4.18) | (0.10) | (0.06) | 6.31 | (39.21) | 26,133 | 48 | 0.19 | 2.55 | ||||||||||||
01/16(a) - 12/31/2007 | 10.00 | 0.36 | 0.29 | 0.65 | - | - | 10.65 | 6.50 | 16,525 | 28 | 0.19 | 3.58 | ||||||||||||
| JNL/S&P Competitive Advantage Fund | ||||||||||||||||||||||||
| Class A | ||||||||||||||||||||||||
| 12/31/2009 | 6.90 | 0.11 | 2.94 | 3.05 | 0.00 | (f) | - | 9.95 | 44.22 | 254,695 | 101 | 0.72 | 1.28 | |||||||||||
| 12/31/2008 | 9.92 | 0.16 | (3.08) | (2.92) | (0.10) | - | 6.90 | (29.40) | 90,399 | 97 | 0.71 | 1.81 | ||||||||||||
12/03(a) - 12/31/2007 | 10.00 | 0.01 | (0.08) | (0.07) | (0.01) | - | 9.92 | (0.74) | 15,294 | - | 0.70 | 1.46 | ||||||||||||
| Class B | ||||||||||||||||||||||||
| 12/31/2009 | 6.87 | 0.14 | 2.93 | 3.07 | 0.00 | (f) | - | 9.94 | 44.70 | 50 | 101 | 0.52 | 1.57 | |||||||||||
| 12/31/2008 | 9.92 | 0.15 | (3.08) | (2.93) | (0.12) | - | 6.87 | (29.59) | 14 | 97 | 0.51 | 1.61 | ||||||||||||
12/03(a) - 12/31/2007 | 10.00 | 0.01 | (0.08) | (0.07) | (0.01) | - | 9.92 | (0.67) | 99 | - | 0.47 | 1.93 | ||||||||||||
| JNL/S&P Dividend Income & Growth Fund | ||||||||||||||||||||||||
| Class A | ||||||||||||||||||||||||
| 12/31/2009 | 7.04 | 0.23 | 1.42 | 1.65 | 0.00 | (f) | - | 8.69 | 23.47 | 239,392 | 84 | 0.72 | 3.24 | |||||||||||
| 12/31/2008 | 9.77 | 0.35 | (2.89) | (2.54) | (0.19) | 0.00 | (f) | 7.04 | (25.93) | 101,329 | 64 | 0.71 | 4.47 | |||||||||||
12/03(a) - 12/31/2007 | 10.00 | 0.02 | (0.24) | (0.22) | (0.01) | - | 9.77 | (2.24) | 7,203 | - | 0.70 | 2.03 | ||||||||||||
| Class B | ||||||||||||||||||||||||
| 12/31/2009 | 7.03 | 0.25 | 1.42 | 1.67 | 0.00 | (f) | - | 8.70 | 23.79 | 158 | 84 | 0.52 | 3.40 | |||||||||||
| 12/31/2008 | 9.75 | 0.36 | (2.88) | (2.52) | (0.20) | 0.00 | (f) | 7.03 | (25.79) | 120 | 64 | 0.51 | 4.41 | |||||||||||
12/03(a) - 12/31/2007 | 10.00 | 0.03 | (0.26) | (0.23) | (0.02) | - | 9.75 | (2.28) | 98 | - | 0.47 | 3.29 | ||||||||||||
| JNL/S&P Intrinsic Value Fund | ||||||||||||||||||||||||
| Class A | ||||||||||||||||||||||||
| 12/31/2009 | 6.21 | 0.11 | 3.43 | 3.54 | 0.00 | (f) | - | 9.75 | 57.04 | 246,578 | 151 | 0.72 | 1.40 | |||||||||||
| 12/31/2008 | 9.91 | 0.15 | (3.70) | (3.55) | (0.09) | (0.06) | 6.21 | (35.84) | 96,643 | 98 | 0.71 | 1.88 | ||||||||||||
12/03(a) - 12/31/2007 | 10.00 | 0.02 | (0.10) | (0.08) | (0.01) | - | 9.91 | (0.81) | 18,261 | - | 0.70 | 2.06 | ||||||||||||
| Class B | ||||||||||||||||||||||||
| 12/31/2009 | 6.21 | 0.12 | 3.47 | 3.59 | 0.00 | (f) | - | 9.80 | 57.84 | 108 | 151 | 0.52 | 1.45 | |||||||||||
| 12/31/2008 | 9.91 | 0.14 | (3.68) | (3.54) | (0.10) | (0.06) | 6.21 | (35.73) | 35 | 98 | 0.51 | 1.55 | ||||||||||||
12/03(a) - 12/31/2007 | 10.00 | 0.02 | (0.09) | (0.07) | (0.02) | - | 9.91 | (0.71) | 99 | - | 0.48 | 2.37 | ||||||||||||
See accompanying Notes to Financial Statements.
JNL Series Trust
Financial Highlights
| Increase (Decrease) from | Distributions from | Ratio of Net | ||||||||||||||||||||||
| Net Asset | Investment Operations (e) | Net Realized | Supplemental Data | Ratio of | Investment | |||||||||||||||||||
| Value | Net | Net Realized | Total from | Distributions from | Gains on | Net Asset | Net Assets, | Expenses to | Income (Loss) | |||||||||||||||
| Beginning | Investment | & Unrealized | Investment | Net Investment | Investment | Value, End | Total | End of Period | Portfolio | Average Net | to Average | |||||||||||||
| Period Ended | of Period | Income (Loss) | Gains (Losses) | Operations | Income | Transactions | of Period | Return (b) | (in thousands) | Turnover (d) | Assets (c) | Net Assets (c) | ||||||||||||
| JNL/S&P Total Yield Fund | ||||||||||||||||||||||||
| Class A | ||||||||||||||||||||||||
| 12/31/2009 | $ 6.37 | $ 0.10 | $ 2.63 | $ 2.73 | $ 0.00 | (f) | $ - | $ 9.10 | 42.88 % | $ 212,981 | 126% | 0.72 % | 1.28 % | |||||||||||
| 12/31/2008 | 10.07 | 0.20 | (3.79) | (3.59) | (0.11) | 0.00 | (f) | 6.37 | (35.67) | 103,601 | 115 | 0.71 | 2.38 | |||||||||||
12/03(a) - 12/31/2007 | 10.00 | 0.01 | 0.06 | 0.07 | 0.00 | (f) | - | 10.07 | 0.74 | 9,806 | - | 0.70 | 1.26 | |||||||||||
| Class B | ||||||||||||||||||||||||
| 12/31/2009 | 6.37 | 0.11 | 2.63 | 2.74 | 0.00 | (f) | - | 9.11 | 43.04 | 55 | 126 | 0.52 | 1.50 | |||||||||||
| 12/31/2008 | 10.07 | 0.20 | (3.78) | (3.58) | (0.12) | 0.00 | (f) | 6.37 | (35.58) | 88 | 115 | 0.51 | 2.35 | |||||||||||
12/03(a) - 12/31/2007 | 10.00 | 0.01 | 0.07 | 0.08 | (0.01) | - | 10.07 | 0.81 | 101 | - | 0.48 | 1.64 | ||||||||||||
JNL/S&P 4 Fund (h) | ||||||||||||||||||||||||
| Class A | ||||||||||||||||||||||||
| 12/31/2009 | 6.79 | (0.00) | (f) | 2.84 | 2.84 | (0.08) | 0.00 | (f) | 9.55 | 41.85 | 627,405 | 12 | 0.06 | (0.03) | ||||||||||
| 12/31/2008 | 9.93 | 0.21 | (3.35) | (3.14) | 0.00 | (f) | - | 6.79 | (31.62) | 265,183 | 15 | 0.06 | 2.54 | |||||||||||
12/03(a) - 12/31/2007 | 10.00 | 0.02 | (0.09) | (0.07) | - | - | 9.93 | (0.70) | 22,194 | - | 0.05 | 2.85 | ||||||||||||
| JNL/Select Balanced Fund | ||||||||||||||||||||||||
| Class A | ||||||||||||||||||||||||
| 12/31/2009 | 12.81 | 0.34 | 2.19 | 2.53 | (0.33) | - | 15.01 | 19.78 | 736,864 | 54 | (q) | 0.78 | 2.53 | |||||||||||
| 12/31/2008 | 17.56 | 0.48 | (4.18) | (3.70) | (0.39) | (0.66) | 12.81 | (20.79) | 455,105 | 60 | (q) | 0.78 | 2.98 | |||||||||||
| 12/31/2007 | 17.35 | 0.48 | 0.81 | 1.29 | (0.37) | (0.71) | 17.56 | 7.49 | 526,511 | 41 | (q) | 0.78 | 2.62 | |||||||||||
| 12/31/2006 | 15.75 | 0.42 | 1.73 | 2.15 | (0.31) | (0.24) | 17.35 | 13.65 | 439,868 | 46 | (q) | 0.79 | 2.55 | |||||||||||
| 12/31/2005 | 17.12 | 0.34 | 0.58 | 0.92 | (0.38) | (1.91) | 15.75 | 5.30 | 396,350 | 42 | (q) | 0.79 | 2.22 | |||||||||||
| Class B | ||||||||||||||||||||||||
| 12/31/2009 | 13.03 | 0.38 | 2.24 | 2.62 | (0.36) | - | 15.29 | 20.08 | 855 | 54 | (q) | 0.58 | 2.74 | |||||||||||
| 12/31/2008 | 17.84 | 0.52 | (4.25) | (3.73) | (0.42) | (0.66) | 13.03 | (20.62) | 662 | 60 | (q) | 0.58 | 3.21 | |||||||||||
| 12/31/2007 | 17.39 | 0.52 | 0.81 | 1.33 | (0.17) | (0.71) | 17.84 | 7.73 | 665 | 41 | (q) | 0.58 | 2.83 | |||||||||||
| 12/31/2006 | 15.64 | 0.45 | 1.72 | 2.17 | (0.18) | (0.24) | 17.39 | 13.89 | 276 | 46 | (q) | 0.59 | 2.75 | |||||||||||
| 12/31/2005 | 16.98 | 0.37 | 0.58 | 0.95 | (0.38) | (1.91) | 15.64 | 5.52 | 198 | 42 | (q) | 0.59 | 2.42 | |||||||||||
| JNL/Select Money Market Fund | ||||||||||||||||||||||||
| Class A | ||||||||||||||||||||||||
| 12/31/2009 | 1.00 | 0.00 | (f) | - | 0.00 | (f) | 0.00 | (f) | - | 1.00 | 0.15 | (v) | 1,140,511 | n/a | 0.47 | (w) | 0.16 | (w) | ||||||
| 12/31/2008 | 1.00 | 0.02 | 0.00 | 0.02 | (0.02) | - | 1.00 | 2.20 | (r) | 1,340,054 | n/a | 0.57 | 2.08 | |||||||||||
| 12/31/2007 | 1.00 | 0.05 | 0.00 | 0.05 | (0.05) | - | 1.00 | 4.76 | 651,204 | n/a | 0.58 | 4.63 | ||||||||||||
| 12/31/2006 | 1.00 | 0.04 | 0.00 | 0.04 | (0.04) | - | 1.00 | 4.49 | 269,095 | n/a | 0.59 | 4.42 | ||||||||||||
| 12/31/2005 | 1.00 | 0.02 | 0.00 | 0.02 | (0.02) | - | 1.00 | 2.71 | 258,452 | n/a | 0.60 | 2.66 | ||||||||||||
| Class B | ||||||||||||||||||||||||
| 12/31/2009 | 1.00 | 0.00 | (f) | - | 0.00 | (f) | 0.00 | (f) | - | 1.00 | 0.21 | (v) | 7,270 | n/a | 0.37 | (w) | 0.24 | (w) | ||||||
| 12/31/2008 | 1.00 | 0.02 | 0.00 | 0.02 | (0.02) | - | 1.00 | 2.40 | (r) | 7,220 | n/a | 0.37 | 2.32 | |||||||||||
| 12/31/2007 | 1.00 | 0.05 | 0.00 | 0.05 | (0.05) | - | 1.00 | 4.97 | 4,617 | n/a | 0.38 | 4.84 | ||||||||||||
| 12/31/2006 | 1.00 | 0.05 | 0.00 | 0.05 | (0.05) | - | 1.00 | 4.70 | 2,955 | n/a | 0.39 | 4.80 | ||||||||||||
| 12/31/2005 | 1.00 | 0.02 | 0.00 | 0.02 | (0.02) | - | 1.00 | 2.91 | 469 | n/a | 0.40 | 2.88 | ||||||||||||
| JNL/Select Value Fund | ||||||||||||||||||||||||
| Class A | ||||||||||||||||||||||||
| 12/31/2009 | 12.60 | 0.22 | 2.80 | 3.02 | (0.21) | - | 15.41 | 23.98 | 762,013 | 42 | 0.82 | 1.64 | ||||||||||||
| 12/31/2008 | 19.33 | 0.32 | (6.76) | (6.44) | (0.01) | (0.28) | 12.60 | (33.35) | 484,751 | 54 | 0.83 | 1.97 | ||||||||||||
| 12/31/2007 | 19.42 | 0.29 | 1.22 | 1.51 | (0.26) | (1.34) | 19.33 | 7.90 | 538,410 | 41 | 0.83 | 1.39 | ||||||||||||
| 12/31/2006 | 16.90 | 0.25 | 3.28 | 3.53 | (0.31) | (0.70) | 19.42 | 20.86 | 481,805 | 34 | 0.84 | 1.37 | ||||||||||||
| 12/31/2005 | 16.71 | 0.17 | 1.20 | 1.37 | (0.20) | (0.98) | 16.90 | 8.15 | 277,461 | 29 | 0.86 | 1.41 | ||||||||||||
| Class B | ||||||||||||||||||||||||
| 12/31/2009 | 12.79 | 0.25 | 2.84 | 3.09 | (0.23) | - | 15.65 | 24.18 | 14,220 | 42 | 0.62 | 1.87 | ||||||||||||
| 12/31/2008 | 19.57 | 0.36 | (6.85) | (6.49) | (0.01) | (0.28) | 12.79 | (33.19) | 10,950 | 54 | 0.63 | 2.13 | ||||||||||||
| 12/31/2007 | 19.66 | 0.33 | 1.25 | 1.58 | (0.33) | (1.34) | 19.57 | 8.13 | 15,294 | 41 | 0.63 | 1.59 | ||||||||||||
| 12/31/2006 | 16.91 | 0.34 | 3.22 | 3.56 | (0.11) | (0.70) | 19.66 | 21.05 | 12,976 | 34 | 0.64 | 1.76 | ||||||||||||
| 12/31/2005 | 16.68 | 0.21 | 1.20 | 1.41 | (0.20) | (0.98) | 16.91 | 8.41 | 158 | 29 | 0.65 | 1.62 | ||||||||||||
See accompanying Notes to Financial Statements.
JNL Series Trust
Financial Highlights
| Increase (Decrease) from | Distributions from | Ratio of Net | ||||||||||||||||||||||
| Net Asset | Investment Operations (e) | Net Realized | Supplemental Data | Ratio of | Investment | |||||||||||||||||||
| Value | Net | Net Realized | Total from | Distributions from | Gains on | Net Asset | Net Assets, | Expenses to | Income (Loss) | |||||||||||||||
| Beginning | Investment | & Unrealized | Investment | Net Investment | Investment | Value, End | Total | End of Period | Portfolio | Average Net | to Average | |||||||||||||
| Period Ended | of Period | Income (Loss) | Gains (Losses) | Operations | Income | Transactions | of Period | Return (b) | (in thousands) | Turnover (d) | Assets (c) | Net Assets (c) | ||||||||||||
| JNL/T. Rowe Price Established Growth Fund | ||||||||||||||||||||||||
| Class A | ||||||||||||||||||||||||
| 12/31/2009 | $ 12.70 | $ 0.02 | $ 5.50 | $ 5.52 | $ (0.04) | $ - | $ 18.18 | 43.49 % | $ 916,445 | 62% | 0.91 % | 0.12 % | ||||||||||||
| 12/31/2008 | 22.49 | 0.06 | (9.69) | (9.63) | (0.02) | (0.14) | 12.70 | (42.85) | 581,447 | 54 | 0.90 | 0.30 | ||||||||||||
| 12/31/2007 | 21.84 | 0.09 | 2.16 | 2.25 | (0.08) | (1.52) | 22.49 | 10.12 | 1,043,708 | 56 | 0.88 | 0.40 | ||||||||||||
| 12/31/2006 | 19.44 | 0.09 | 2.57 | 2.66 | (0.09) | (0.17) | 21.84 | 13.70 | 750,771 | 46 | 0.90 | 0.46 | ||||||||||||
| 12/31/2005 | 18.36 | 0.04 | 1.08 | 1.12 | (0.04) | - | 19.44 | 6.09 | 732,553 | 41 | 0.91 | 0.24 | ||||||||||||
| Class B | ||||||||||||||||||||||||
| 12/31/2009 | 12.83 | 0.05 | 5.57 | 5.62 | (0.08) | - | 18.37 | 43.79 | 30,411 | 62 | 0.71 | 0.33 | ||||||||||||
| 12/31/2008 | 22.69 | 0.09 | (9.79) | (9.70) | (0.02) | (0.14) | 12.83 | (42.75) | 19,925 | 54 | 0.70 | 0.50 | ||||||||||||
| 12/31/2007 | 22.02 | 0.15 | 2.09 | 2.24 | (0.12) | (1.45) | 22.69 | 10.31 | 34,482 | 56 | 0.68 | 0.62 | ||||||||||||
| 12/31/2006 | 19.50 | 0.14 | 2.58 | 2.72 | (0.03) | (0.17) | 22.02 | 13.95 | 32,185 | 46 | 0.70 | 0.64 | ||||||||||||
| 12/31/2005 | 18.38 | 0.06 | 1.10 | 1.16 | (0.04) | - | 19.50 | 6.30 | 193 | 41 | 0.70 | 0.45 | ||||||||||||
| JNL/T. Rowe Price Mid-Cap Growth Fund | ||||||||||||||||||||||||
| Class A | ||||||||||||||||||||||||
| 12/31/2009 | 16.20 | (0.05) | 7.65 | 7.60 | - | (0.01) | (x) | 23.79 | 46.93 | 820,894 | 32 | 1.02 | (0.26) | |||||||||||
| 12/31/2008 | 30.37 | (0.04) | (12.33) | (12.37) | - | (1.80) | 16.20 | (40.68) | 425,184 | 37 | 1.02 | (0.14) | ||||||||||||
| 12/31/2007 | 29.05 | (0.01) | 4.97 | 4.96 | 0.00 | (f) | (3.64) | 30.37 | 17.26 | 697,484 | 45 | 1.02 | (0.04) | |||||||||||
| 12/31/2006 | 29.64 | 0.05 | 1.96 | 2.01 | (0.05) | (2.55) | 29.05 | 6.76 | 625,869 | 37 | 1.02 | 0.16 | ||||||||||||
| 12/31/2005 | 27.87 | (0.07) | 4.01 | 3.94 | - | (2.17) | 29.64 | 14.10 | 623,382 | 30 | 1.02 | (0.32) | ||||||||||||
| Class B | ||||||||||||||||||||||||
| 12/31/2009 | 16.44 | (0.01) | 7.77 | 7.76 | - | (0.01) | (x) | 24.19 | 47.22 | 28,372 | 32 | 0.82 | (0.05) | |||||||||||
| 12/31/2008 | 30.71 | 0.01 | (12.48) | (12.47) | - | (1.80) | 16.44 | (40.56) | 17,811 | 37 | 0.82 | 0.05 | ||||||||||||
| 12/31/2007 | 29.28 | 0.06 | 5.01 | 5.07 | 0.00 | (f) | (3.64) | 30.71 | 17.50 | 29,638 | 45 | 0.82 | 0.18 | |||||||||||
| 12/31/2006 | 29.76 | 0.03 | 2.05 | 2.08 | (0.01) | (2.55) | 29.28 | 6.97 | 24,998 | 37 | 0.81 | 0.08 | ||||||||||||
| 12/31/2005 | 27.92 | 0.01 | 4.00 | 4.01 | - | (2.17) | 29.76 | 14.32 | 276 | 30 | 0.82 | (0.12) | ||||||||||||
| JNL/T. Rowe Price Short-Term Bond Fund | ||||||||||||||||||||||||
| Class A | ||||||||||||||||||||||||
| 12/31/2009 | 9.36 | 0.25 | 0.47 | 0.72 | (0.28) | (0.09) | 9.71 | 7.64 | 484,832 | 102 | 0.74 | 2.56 | ||||||||||||
| 12/31/2008 | 10.49 | 0.40 | (1.04) | (0.64) | (0.45) | (0.04) | 9.36 | (5.97) | 295,409 | 134 | 0.74 | 3.86 | ||||||||||||
| 12/31/2007 | 10.31 | 0.49 | 0.01 | 0.50 | (0.32) | - | 10.49 | 4.82 | 311,237 | 73 | (l) | 0.75 | 4.62 | |||||||||||
05/01(a)-12/31/2006 | 10.00 | 0.31 | 0.00 | 0.31 | - | - | 10.31 | 3.10 | 327,071 | 109 | (l) | 0.74 | 4.52 | |||||||||||
| Class B | ||||||||||||||||||||||||
| 12/31/2009 | 9.41 | 0.26 | 0.47 | 0.73 | (0.29) | (0.09) | 9.76 | 7.74 | 211 | 102 | 0.54 | 2.57 | ||||||||||||
| 12/31/2008 | 10.53 | 0.42 | (1.03) | (0.61) | (0.47) | (0.04) | 9.41 | (5.66) | 50 | 134 | 0.54 | 4.05 | ||||||||||||
| 12/31/2007 | 10.33 | 0.50 | 0.01 | 0.51 | (0.31) | - | 10.53 | 4.95 | 118 | 73 | (l) | 0.55 | 4.74 | |||||||||||
05/01(a)-12/31/2006 | 10.00 | 0.32 | 0.01 | 0.33 | - | - | 10.33 | 3.30 | 103 | 109 | (l) | 0.54 | 4.72 | |||||||||||
See accompanying Notes to Financial Statements.
JNL Series Trust
Financial Highlights
| Increase (Decrease) from | Distributions from | Ratio of Net | ||||||||||||||||||||||
| Net Asset | Investment Operations (e) | Net Realized | Supplemental Data | Ratio of | Investment | |||||||||||||||||||
| Value | Net | Net Realized | Total from | Distributions from | Gains on | Net Asset | Net Assets, | Expenses to | Income (Loss) | |||||||||||||||
| Beginning | Investment | & Unrealized | Investment | Net Investment | Investment | Value, End | Total | End of Period | Portfolio | Average Net | to Average | |||||||||||||
| Period Ended | of Period | Income (Loss) | Gains (Losses) | Operations | Income | Transactions | of Period | Return (b) | (in thousands) | Turnover (d) | Assets (c) | Net Assets (c) | ||||||||||||
| JNL/T. Rowe Price Value Fund | ||||||||||||||||||||||||
| Class A | ||||||||||||||||||||||||
| 12/31/2009 | $ 6.98 | $ 0.15 | $ 2.44 | $ 2.59 | $ (0.13) | $ - | $ 9.44 | 37.09 % | $ 727,672 | 21% | 0.96 % | 1.89 % | ||||||||||||
| 12/31/2008 | 14.65 | 0.20 | (6.20) | (6.00) | (0.24) | (1.43) | 6.98 | (40.47) | 412,536 | 29 | 0.96 | 1.65 | ||||||||||||
| 12/31/2007 | 15.62 | 0.26 | (0.14) | 0.12 | (0.20) | (0.89) | 14.65 | 0.85 | 707,468 | 33 | 0.95 | 1.59 | ||||||||||||
| 12/31/2006 | 13.93 | 0.22 | 2.57 | 2.79 | (0.13) | (0.97) | 15.62 | 20.11 | 681,711 | 26 | 0.96 | 1.48 | ||||||||||||
| 12/31/2005 | 13.64 | 0.13 | 0.70 | 0.83 | (0.11) | (0.43) | 13.93 | 6.07 | 544,901 | 29 | 0.97 | 1.08 | ||||||||||||
| Class B | ||||||||||||||||||||||||
| 12/31/2009 | 7.14 | 0.17 | 2.50 | 2.67 | (0.14) | - | 9.67 | 37.46 | 549 | 21 | 0.76 | 2.16 | ||||||||||||
| 12/31/2008 | 14.95 | 0.23 | (6.34) | (6.11) | (0.27) | (1.43) | 7.14 | (40.39) | 385 | 29 | 0.76 | 1.85 | ||||||||||||
| 12/31/2007 | 15.83 | 0.29 | (0.14) | 0.15 | (0.14) | (0.89) | 14.95 | 1.03 | 641 | 33 | 0.75 | 1.73 | ||||||||||||
| 12/31/2006 | 14.03 | 0.26 | 2.58 | 2.84 | (0.07) | (0.97) | 15.83 | 20.30 | 391 | 26 | 0.76 | 1.71 | ||||||||||||
| 12/31/2005 | 13.69 | 0.17 | 0.71 | 0.88 | (0.11) | (0.43) | 14.03 | 6.42 | 281 | 29 | 0.77 | 1.28 | ||||||||||||
| (a) | Commencement of operations. |
| (b) | Total return assumes reinvestment of all distributions for the period. Total return is not annualized for periods less than one year and does not reflect payment of the expenses that apply to the variable accounts or any annuity charges. |
| (c) | Annualized for periods less than one year. |
| (d) | Portfolio turnover excludes dollar roll transactions. |
| (e) | Calculated using the average shares method for periods ended after December 31, 2005. |
| (f) | Amount represents less than $0.005. |
| (g) | Includes dividend expense and borrowing fees on securities sold short for JNL/Credit Suisse Long/Short Fund of 0.37%, 0.40% and 1.06% for Class A and B shares for the periods ended December 31, 2009, December 31, 2008 and December 31, 2007, respectively. |
| (h) | Ratios of net investment income and expenses to average net assets do not include the impact of the underlying Funds' expenses. |
| (i) | Portfolio turnover including dollar roll transactions for JNL/Franklin Templeton Income Fund was 34% for 2007. The Fund had no dollar roll transactions for periods ending after December 31, 2007. |
| (j) | Includes dividend expense and borrowing fees on securities sold short for JNL/Franklin Templeton Mutual Shares Fund of 0.05%, 0.01% and 0.01% for Class A and B shares for the periods ended December 31, 2009, December 31, 2008 and December 31, 2007, respectively. |
| (k) | Portfolio turnover including dollar roll transactions for JNL/Goldman Sachs Core Plus Bond Fund was 453%, 570%, 332%, and 484% in 2005, 2006, 2007, and 2009, respectively. The Fund had no dollar roll transactions for year ended December 31, 2008. |
| (l) | Portfolio turnover including dollar roll transactions for JNL/T. Rowe Price Short-Term Bond Fund was 118% and 78% for 2006 and 2007, respectively. The Fund had no dollar roll transactions for periods ending after December 31, 2007. |
| (m) | Portfolio turnover including dollar roll transactions for JNL/JPMorgan U.S. Government & Quality Bond Fund was 487%, 524%, and 217% in 2005, 2006, and 2007, respectively. The Fund had no dollar roll transactions for the periods ending after December 31, 2007. |
| (n) | Portfolio turnover including dollar roll transactions for JNL/Mellon Capital Management Bond Index Fund was 79% , 52%, 52% and 90% in 2006, 2007, 2008 and 2009, respectively. |
| (o) | Portfolio turnover including dollar roll transactions for JNL/PIMCO Real Return Fund was 1,340% in 2007. The Fund had no dollar roll transactions for periods ending after December 31, 2007. |
See accompanying Notes to Financial Statements.
JNL Series Trust
Notes to the Financial Statements
NOTE 1. ORGANIZATION
The JNL Series Trust ("Trust") is an open-end management investment company organized under the laws of the state of Massachusetts, by a Declaration of Trust, dated June 1, 1994. The Trust is registered with the U.S. Securities and Exchange Commission (“SEC”) under the Investment Company Act of 1940, as amended, (“1940 Act”), and the Securities Act of 1933, as amended. The Trust currently offers shares in seventy-two (72) separate funds (each a “Fund”, and collectively, "Funds"), each with its own investment objective:
| Adviser/Sub-Adviser: | Fund: (sub-Sub-Advisers are in parentheses) |
| AIM Capital Management, Inc. (effective | JNL/AIM International Growth Fund, JNL/AIM Large Cap Growth Fund, JNL/AIM Global Real Estate Fund (INVESCO |
| January 1, 2010, AIM Capital Management, Inc. | Asset Management Ltd.), JNL/AIM Small Cap Growth Fund |
| was consolidated into Invesco Advisers, Inc.) | |
| Capital Guardian Trust Company | JNL/Capital Guardian Global Balanced Fund, JNL/Capital Guardian Global Diversified Research Fund, JNL/Capital |
| Guardian International Small Cap Fund, JNL/Capital Guardian U.S. Growth Equity Fund | |
| Credit Suisse Asset Management, LLC | JNL/Credit Suisse Commodity Securities Fund and JNL/Credit Suisse Long/Short Fund |
| Eagle Asset Management, Inc. | JNL/Eagle Core Equity Fund and JNL/Eagle SmallCap Equity Fund |
| Templeton Global Advisors Limited | JNL/Franklin Templeton Global Growth Fund |
| Franklin Advisers, Inc. | JNL/Franklin Templeton Income Fund |
| Franklin Mutual Advisers, LLC | JNL/Franklin Templeton Mutual Shares Fund |
| Franklin Advisory Services, LLC | JNL/Franklin Templeton Small Cap Value Fund |
| Goldman Sachs Asset Management, L.P. | JNL/Goldman Sachs Core Plus Bond Fund (Goldman Sachs Asset Management International), JNL/Goldman Sachs |
| Emerging Markets Debt Fund, JNL/Goldman Sachs Mid Cap Value Fund | |
| Ivy Investment Management Company | JNL/Ivy Asset Strategy Fund |
| J.P. Morgan Investment Management Inc. | JNL/JPMorgan International Value Fund, JNL/JPMorgan MidCap Growth Fund, JNL/JPMorgan U.S. Government & |
| Quality Bond Fund | |
| Lazard Asset Management, LLC | JNL/Lazard Emerging Markets Fund and JNL/Lazard Mid Cap Equity Fund |
| M&G Investment Management Limited | JNL/M&G Global Basics Fund and JNL/M&G Global Leaders Fund |
| Mellon Capital Management Corporation | JNL/Mellon Capital Management European 30 Fund, JNL/Mellon Capital Management Pacific Rim 30 Fund, |
| JNL/Mellon Capital Management S&P 500 Index Fund, JNL/Mellon Capital Management S&P 400 MidCap Index Fund, | |
| JNL/Mellon Capital Management Small Cap Index Fund, JNL/Mellon Capital Management International Index Fund, | |
| JNL/Mellon Capital Management Bond Index Fund, JNL/Mellon Capital Management Global Alpha Fund | |
| OppenheimerFunds, Inc. | JNL/Oppenheimer Global Growth Fund |
| Pacific Investment Management Company LLC | JNL/PIMCO Real Return Fund and JNL/PIMCO Total Return Bond Fund |
| PPM America, Inc. | JNL/PPM America High Yield Bond Fund, JNL/PPM America Mid Cap Value Fund, JNL/PPM America Small Cap Value Fund, JNL/PPM America Value Equity Fund |
| Prudential Asset Management (Singapore) | JNL/PAM Asia ex-Japan Fund and JNL/PAM China-India Fund |
| Limited | |
| Red Rocks Capital LLC | JNL/Red Rocks Listed Private Equity Fund |
| Standard & Poor’s Investment Advisory | JNL/S&P Competitive Advantage Fund, JNL/S&P Dividend Income & Growth Fund, JNL/S&P Intrinsic Value Fund, |
| Services LLC | JNL/S&P Total Yield Fund (all co-Sub-Advised by Mellon Capital Management Corporation) |
| JNL/S&P Managed Conservative Fund, JNL/S&P Managed Moderate Fund, JNL/S&P Managed Moderate Growth | |
| Standard & Poor’s Investment Advisory | Fund, JNL/S&P Managed Growth Fund, JNL/S&P Managed Aggressive Growth Fund, JNL/S&P Disciplined Moderate |
| Services LLC | Fund, JNL/S&P Disciplined Moderate Growth Fund, JNL/S&P Disciplined Growth Fund; (all have a fund of funds |
| structure which invests in other affiliated underlying funds) the funds are collectively known as "JNL/S&P Funds" | |
| Wellington Management Company, LLP | JNL/Select Balanced Fund, JNL/Select Money Market Fund, JNL/Select Value Fund |
| T. Rowe Price Associates, Inc. | JNL/T. Rowe Price Established Growth Fund, JNL/T. Rowe Price Mid-Cap Growth Fund, JNL/T. Rowe Price |
| Short-Term Bond Fund, JNL/T. Rowe Price Value Fund | |
| Jackson National Asset Management, LLC, | JNL Institutional Alt 20 Fund, JNL Institutional Alt 35 Fund, JNL Institutional Alt 50 Fund, JNL Institutional Alt 65 Fund; |
| ("JNAM" or "Adviser") | the funds are collectively known as "JNL Institutional Alt Funds". JNL/Franklin Templeton Founding Strategy Fund, |
| JNL/Mellon Capital Management 10 x 10 Fund, JNL/Mellon Capital Management Index 5 Fund, JNL/S&P 4 Fund. | |
| All JNAM advised funds have a fund of funds structure. | |
The Trust consists of all diversified Funds for purposes of the 1940 Act, with the exception of the following non-diversified Funds: JNL/Goldman Sachs Emerging Markets Debt Fund, JNL/Lazard Mid Cap Equity Fund, JNL/Mellon Capital Management European 30 Fund, JNL/Mellon Capital Management Pacific Rim 30 Fund, JNL/M&G Global Basics Fund, JNL/M&G Global Leaders Fund, JNL/PAM Asia ex-Japan Fund, JNL/PAM China-India Fund, JNL/PIMCO Real Return Fund, JNL/Red Rocks Listed Private Equity Fund, JNL/S&P Funds, JNL/S&P 4 Fund, JNL/S&P Competitive Advantage Fund, JNL/S&P Dividend Income & Growth Fund, JNL/S&P Intrinsic Value Fund, and JNL/S&P Total Yield Fund.
The following fund acquisitions were effective April 6, 2009: JNL/Mellon Capital Management Small Cap Index Fund acquired JNL/Lazard Small Cap Equity Fund; JNL/Mellon Capital Management S&P 500 Index Fund acquired JNL/Mellon Capital Management Enhanced S&P 500 Stock Index Fund; JNL/S&P Disciplined Growth Fund acquired JNL/S&P Growth Retirement Strategy Fund; JNL/S&P Disciplined Moderate Growth Fund acquired JNL/S&P Moderate Growth Retirement Strategy Fund; and JNL/S&P Disciplined Moderate Fund acquired JNL/S&P Moderate Retirement Strategy Fund. The following fund acquisitions were effective September 28, 2009: JNL/Mellon Capital Management S&P 500 Index Fund acquired JNL/PPM America Core Equity Fund; JNL/S&P Managed Moderate Fund acquired JNL/S&P Retirement Income Fund; JNL/S&P
JNL Series Trust
Notes to the Financial Statements (continued)
Managed Moderate Growth Fund acquired JNL/S&P Retirement 2015 Fund; and JNL/S&P Managed Growth Fund acquired JNL/S&P Retirement 2020 Fund and JNL/S&P Retirement 2025 Fund. See Note 8 for additional information regarding these acquisitions.
Effective September 28, 2009, the sub-adviser for JNL/Goldman Sachs Short Duration Bond Fund was changed from Goldman Sachs Asset Management, L.P. to T. Rowe Price Associates, Inc. The name of the Fund was changed to JNL/T. Rowe Price Short-Term Bond Fund. Additionally, on that same day, in connection with a strategy change for the JNL/Credit Suisse Global Natural Resources Fund, the name of the Fund was changed to JNL/Credit Suisse Commodity Securities Fund.
Each Fund, except the JNL Institutional Alt Funds, JNL/S&P Funds, JNL/S&P 4 Fund, JNL/Franklin Templeton Founding Strategy Fund, JNL/Mellon Capital Management 10 x 10 Fund, and JNL/Mellon Capital Management Index 5 Fund, offers Class A and Class B shares. The two classes differ principally in applicable 12b-1 fees. Shareholders bear the common expenses of each Fund and earn income and realized gains/losses from each Fund pro rata based on the average daily net assets of each class, without discrimination between share classes. Each share class also has different voting rights on matters affecting a single class. No class has preferential dividend rights. Trust level expenses are allocated to the Funds based on the average daily net assets of each Fund.
JNAM is a wholly-owned subsidiary of Jackson National Life Insurance Company® ("Jackson") and an indirect wholly owned subsidiary of Prudential plc, a publicly traded company incorporated in the United Kingdom. Prudential plc is not affiliated in any manner with Prudential Financial Inc., a company whose principal place of business is in the United States of America. JNAM serves as investment adviser to each of the Funds. Shares are presently offered to Jackson, Jackson National Life Insurance Company of New York, and affiliated separate accounts to fund the benefits of variable annuity and variable life policies. Shares are also sold to qualified and non-qualified retirement plans as well as certain affiliated “funds of funds”.
NOTE 2. SIGNIFICANT ACCOUNTING POLICIES
The following is a summary of significant accounting policies consistently followed by the Trust in the preparation of its financial statements in conformity with accounting principles generally accepted in the United States of America (“GAAP”).
Security Valuation – The net asset value (“NAV”) of each Fund shall be determined as of the close of trading (generally, 4:00 PM Eastern Time) on each day the New York Stock Exchange (“NYSE”) is open for trading. Stocks traded on an exchange are generally valued at the official closing price of the exchange where the security is principally traded. If there is no official closing price for the security, the security is priced based on prices furnished by independent pricing services approved by the Trust’s Board of Trustees (“Board” or “Trustees”) and may be valued at the last quoted sale price on the exchange where the security is principally traded or final bid price in the absence of a sale. Stocks not listed on a national or foreign stock exchange are generally valued on the basis of prices furnished by approved pricing services and may be valued at the closing bid price on the over-the-counter market. Investments in mutual funds are valued at the NAV per share determined as of the close of the NYSE on the valuation date. The securities lending collateral funds, which provide daily liquidity, are valued as a practical expedient at the daily reported NAV of the funds as of the close of the NYSE on the valuation date. All securities in the JNL/Select Money Market Fund, as permitted by compliance with applicable provisions under Rule 2(a)-7 under the 1940 Act, and other short-term securities maturing within sixty (60) days are valued at amortized cost unless it is determined that such practice does not approximate market value. Debt securities are generally valued by approved pricing services. If pricing services are unable to provide valuations, debt securities are valued at the most recent bid quotation or evaluated price, as applicable, obtained from a broker/dealer or widely used quotation system. Commodity-linked structured notes and credit-linked notes are valued by pricing models using observable inputs or at the most recent bid quotation obtained from a broker/dealer. Options and futures contracts traded on a liquid exchange are valued at the last sales price as of the close of business on the local exchange. Options traded on an illiquid exchange are valued at the most recent bid quotation obtained from a broker/dealer. Forward foreign currency contracts are valued at the foreign currency exchange rate as of the close of the NYSE, unless the Adviser determine that such markets lack an appropriate level of liquidity at that time. In such instances, the Funds will generally utilize foreign currency exchange rates as of the close of the London Stock Exchange. Non-exchange traded derivatives such as options and swap agreements are generally valued by approved pricing services. If the pricing services are unable to provide valuations, non-exchange traded derivatives are valued at the most recent bid quotation or evaluated price, as applicable, obtained from a broker/dealer or by pricing models using observable inputs. Pricing services utilized to value debt and derivatives securities may use various pricing techniques which take into account appropriate factors such as: yield; credit quality; coupon rate; maturity; type of issue; trading characteristics; call features; credit ratings; and other data, as well as broker quotes.
Market quotations may not be readily available for certain investments or it may be determined that a quotation for an investment does not represent market value. In such instances, the investment is valued as determined in good faith using procedures adopted by the Board. Situations that may require an investment to be fair valued include instances where a security is thinly traded, halted or restricted as to resale. In addition, investments may be fair valued based on the occurrence of a significant event. Significant events may be specific to a particular issuer, such as mergers, restructurings or defaults. Alternatively, significant events may affect an entire market, such as natural disasters, government actions, and significant changes in value of U.S. securities markets. Under the procedures adopted by the Board, the Adviser may rely on pricing services or other sources to assist in determining the fair value of an investment. Factors considered to determine fair value may include the correlation with price movement of similar securities in the same or other markets; the type, cost and investment characteristics of the security; the business and financial condition of the issuer; and trading or other market data. The Trust has retained an independent statistical fair value pricing service to assist in the fair valuation process for securities traded in foreign markets in order to adjust for possible changes in value that may occur between the close of the foreign exchange and the time at which the NAVs are determined.
If an investment is valued at a fair value for purposes of calculating a Fund’s NAV, the value may be different from the last quoted price for the investment depending on the source and method used to determine the value. Although there can be no assurance, in general, the fair value of an investment is the amount the owner of such investment might reasonably expect to receive upon its current sale.
Please see the Notes to the Schedules of Investments, Financial Accounting Standards Board (“FASB”) Accounting Standards Codification (“ASC”) Topic 820, “Fair Value Measurements and Disclosure”, for expanded disclosure of fair value measurements.
Distributions to Shareholders – The amount and timing of distributions are determined in accordance with federal income tax regulations, which may differ from GAAP. The JNL/Select Money Market Fund declares dividends daily and pays dividends monthly. For all other Funds, dividends from net investment income are generally declared and paid annually, but may be paid more frequently to avoid excise tax. Distributions of net realized capital gains, if any, will be distributed at least annually, to the extent they exceed available capital loss carry forwards.
Federal Income Taxes – Each Fund is a separate taxpayer for federal income tax purposes. Each Fund intends to qualify as a regulated investment company and to distribute substantially all net investment income and net capital gains, if any, to its shareholders and otherwise comply with Subchapter M of the Internal Revenue Code of 1986, as amended, applicable to regulated investment companies. Therefore, no federal income tax provision is required. Under current tax law, interest and dividend income and capital gains paid by the Funds are not currently taxable to shareholders when left to accumulate within a variable annuity contract.
JNL Series Trust
Notes to the Financial Statements (continued)
Foreign Currency Translations - The accounting records of each Fund are maintained in U.S. dollars. Investment securities and other assets and liabilities denominated in a foreign currency are translated into U.S. dollars. Purchases and sales of investment securities, income receipts, and expense payments are translated into U.S. dollars at the respective exchange rates prevailing on the dates of such transactions. The Funds do not isolate that portion of the results of operations resulting from changes in foreign exchange rates on investments from the fluctuations arising from changes in market prices of foreign securities. Such fluctuations are included in net realized gain (loss) on investments and net change in unrealized appreciation or depreciation on investments. Net realized gains and losses on foreign currency related items are considered ordinary income for tax purposes and arise from sales of foreign currencies; currency gains or losses realized between the trade and settlement dates on securities transactions; the difference between the amounts of dividends, interest, and foreign withholding taxes recorded and the U.S. dollar equivalent of the amounts actually received or paid; and the realized gains or losses resulting from portfolio and transaction hedges. Net change in unrealized appreciation or depreciation on foreign currency related items arises from changes in the fair value of assets and liabilities, other than investments in securities, at period end resulting from changes in exchange rates.
Guarantees and Indemnifications – Under the Trust’s organizational documents, its officers and Trustees are indemnified against certain liabilities arising out of the performance of their duties to the Funds. In addition, certain of the Funds’ contracts with service providers contain general indemnification clauses. The Funds’ maximum exposure under these arrangements is unknown since the amount of any future claims that may be made against the Funds cannot be determined and the Funds have no historical basis for predicting the likelihood of any such claims.
Security Transactions and Investment Income - Security transactions are recorded on the trade date. Dividend income, net of applicable withholding taxes, is recorded on the ex-dividend date. Interest income, including level-yield amortization of discounts and premiums, is accrued daily. A Fund may place a debt obligation on non-accrual status and reduce related interest income by ceasing current accruals and writing off interest receivables when the collection of all or a portion of interest has become doubtful. A debt obligation is removed from non-accrual status when the issuer resumes interest payments or when collectibility of interest is reasonably assured. Realized gains and losses are determined on the specific identification basis.
Use of Estimates - The preparation of financial statements in conformity with GAAP requires management to make estimates and assumptions that affect the reported amounts of assets and liabilities and disclosure of contingent assets and liabilities at the date of the financial statements and the reported amounts of increases and decreases in net assets from operations during the reporting period. Actual results could differ from those estimates.
NOTE 3. SECURITIES AND OTHER INVESTMENTS
Commodity-Linked Structured Notes - A commodity-linked structured note is a debt security that contains a return component based on the movement of a commodity index or other measure. These notes typically pay periodic interest on the face value of the instrument and a formula based return tied to a commodity index return. These notes may be issued by U.S. and foreign banks, brokerage firms, insurance companies and other corporations. Performance of the particular commodity index will affect performance of the commodity-linked structured note. Commodity-linked structured notes are often leveraged, increasing the volatility of each note’s value relative to the change in the underlying index. They may be more volatile and less liquid than the underlying linked index and their value may be affected by the performance of commodities as well as other factors including liquidity, quality, maturity and other economic variables. Commodity-linked structured notes may have early redemption features based on advanced notice from the purchaser or automatic redemption triggered by a preset decline in the underlying commodity index. In addition to fluctuating in response to changes in the underlying commodity index, these notes are debt securities of the issuer and will be subject to credit and interest rate risks that typically affect debt securities.
Dollar Roll Transactions - A Fund may enter into mortgage dollar rolls in which a Fund sells mortgage-backed securities for delivery in the current month and simultaneously contracts to repurchase substantially similar (same type, coupon and maturity) securities on a specified future date. During the roll period, a Fund foregoes principal and interest paid on the mortgage-backed securities. A Fund is compensated by the interest earned on the cash proceeds of the initial sale and from negotiated fees paid by brokers offered as an inducement to the Fund to “roll over” its purchase commitments. A Fund may only enter into covered rolls. A “covered roll” is a type of dollar roll for which a Fund maintains offsetting positions in cash, U.S. Government securities, or other liquid assets which mature on or before the forward repurchase settlement date of the dollar roll transaction. Dollar roll transactions involve the risk that the market value of the securities sold by a Fund may decline below the repurchase price of those similar securities which the Fund is obligated to purchase or that the return earned by the Fund with the proceeds of a dollar roll may not exceed transaction costs.
Inflation-Indexed Bonds - A Fund may invest in inflation-indexed bonds which are fixed income securities whose principal value is periodically adjusted to the rate of inflation. The interest rate on these bonds is generally fixed at issuance at a rate lower than typical bonds. Over the life of an inflation-indexed bond, however, interest will be paid based on a principal value which is adjusted for inflation. Any increase in the principal amount of an inflation-indexed bond will be considered interest income, even though investors do not receive their principal until maturity.
Securities Lending and Securities Lending Collateral – A Fund may lend securities to certain brokers, dealers or other financial institutions in order to earn additional income. The borrowers pay the Funds’ securities lending agent negotiated lender fees and the Funds receive a fee equal to a percentage of the negotiated lender fees and the net income generated by the securities lending collateral held during each lending transaction. The securities lending agent is authorized to loan securities on behalf of the Funds to approved borrowers and is required to maintain collateral at least equal to the value of the securities loaned based on the previous day’s value of the securities loaned, marked to market daily. Any shortfalls are adjusted the next business day. In the event of bankruptcy or other default of the borrower, a Fund could experience delays in liquidating the loan collateral or recovering the loaned securities and incur expenses related to enforcing its rights. In addition, there could be a decline in the value of the collateral or in the value of the securities loaned while a Fund seeks to enforce its rights thereto and the Fund could experience subnormal levels of income or lack of access to income during that period. The Funds also bear the risk of any deficiency in the amount of collateral available for return to a borrower due to a loss in an approved investment.
The Bank of New York Mellon Corp. (“BNY Mellon”) served as the custodian and securities lending agent for the Funds through August 28, 2009. Prior to June 25, 2009, the Funds’ cash collateral was invested in the Mellon GSL DBT II Collateral Fund, a pooled investment fund constituting a series within a Delaware business trust sponsored by BNY Mellon and approved by the Adviser. During 2008, certain investments issued by Sigma Finance, Inc. in the Mellon GSL DBT II Collateral Fund defaulted and were segregated into Mellon GSL Reinvestment Trust II, a separate series within the same Delaware business trust. Sigma Finance, Inc. entered receivership in October 2008 and the majority of its assets were liquidated in December 2008. Each Fund settled the payable for the securities lending collateral attributable to the Mellon GSL Reinvestment Trust II by payment of an amount equal to the amortized cost for its respective interest in Sigma Finance, Inc. securities held. Each Fund’s investment in Sigma Finance, Inc. was fair valued at $0.0425 at December 31, 2009. The difference between the current value and the amortized cost of each Fund’s investment in Sigma Finance, Inc. has been included in net change in unrealized appreciation (depreciation) on investments in the Statements of Operations during the current and prior periods. The fair value and par value of the investment in Sigma Finance, Inc. are reported under Non-U.S. Government Agency Asset-Backed Securities in the Schedules of Investments.
On April 10, 2009, the assets in the Mellon GSL DBT II Collateral Fund with a maturity of greater than one day were segregated into the BNY Mellon SL DBT II Liquidating Fund, a pooled investment fund constituting a series within a Delaware business trust sponsored by BNY Mellon and approved by the Adviser. Each participant in the Mellon GSL DBT II Collateral Fund received units of the BNY Mellon SL DBT II Liquidating Fund based on their proportionate interest in Mellon GSL DBT II Collateral Fund as of the
JNL Series Trust
Notes to the Financial Statements (continued)
close of business on April 10, 2009. As assets in the BNY Mellon SL DBT II Liquidating Fund matured or were sold, the proceeds were invested in the Mellon GSL DBT II Collateral Fund and the participants’ ownership interests were transferred accordingly. On June 25, 2009, each Fund’s investment in the Mellon GSL DBT II Collateral Fund was transferred to the BNY Mellon Securities Lending Overnight Fund, a pooled investment fund constituting a series within a Delaware business trust sponsored by BNY Mellon and approved by the Adviser. From June 25 to August 28, 2009, as assets in the BNY Mellon SL DBT II Liquidating Fund matured or were sold, the proceeds were invested in the BNY Mellon Securities Lending Overnight Fund.
On August 31, 2009, JPMorgan Chase Bank, N.A. (“JPM Chase” or “Custodian”) began to provide custodian and securities lending services to the Trust. At that time, the Funds began investing cash collateral in the Securities Lending Cash Collateral Fund LLC, a limited liability company sponsored by the Adviser. Investments in BNY Mellon SL DBT II Liquidating Fund were redeemed in-kind and the assets were transferred to the newly organized Securities Lending Liquidating Fund LLC, a limited liability company sponsored by the Adviser. As the assets in the Securities Lending Liquidating Fund LLC mature or are liquidated, the proceeds are invested in the Securities Lending Cash Collateral Fund LLC. Although the Securities Lending Cash Collateral Fund LLC is not a registered fund under the 1940 Act, it typically invests in high quality U.S. dollar-denominated instruments that qualify at time of purchase as “eligible securities” within the meaning of Rule 2(a)-7 under the 1940 Act, which governs money market funds.
At December 31, 2009, the value of the Securities Lending Cash Collateral Fund LLC was $1.00 per unit and the value of the Securities Lending Liquidating Fund LLC was $0.9979 per unit. Values were determined using methodologies consistent with those previously described in Security Valuation. Each Fund is responsible for returning the full amount of collateral received for a particular loan when the borrower returns the applicable security. The difference between the current value and the amortized cost of each Fund’s collateral investments in the Securities Lending Liquidating Fund LLC represents a potential loss to be realized by the Fund in the event the investments do not mature or are otherwise disposed of at a price less than par. The difference between the current value and the amortized cost of each Fund’s investment in the Securities Lending Liquidating Fund LLC is an unrealized loss to the Funds and is included in net unrealized appreciation (depreciation) on investments in the Statements of Assets and Liabilities. The fair value and par value of the investment in the Securities Lending Cash Collateral Fund LLC and the Securities Lending Liquidating Fund LLC are reported under Securities Lending Collateral in the Schedules of Investments.
Repurchase Agreements - A Fund may invest in repurchase agreements. A repurchase agreement involves the purchase of a security by a Fund and a simultaneous agreement by the seller, generally a bank or broker-dealer, to repurchase that security back from the Fund at a specified price and date or upon demand. The underlying securities used as collateral for all repurchase agreements are held in safekeeping at the Fund’s Custodian or designated subcustodians under triparty repurchase agreements. The market value of the collateral must be equal to or exceed at all times the total amount of the repurchase obligations, including interest. Procedures for all repurchase agreements have been designed to monitor that the daily market value of the collateral is in excess of the repurchase agreement in the event of default. In the event of a default by the counterparty, realization of the collateral proceeds could be delayed, during which time the value of such collateral may decline.
Securities Sold Short - A Fund may enter into short sales transactions. A short sale is a transaction in which a Fund sells a security it does not own in anticipation of a decline in the market price of the security. Until the security is replaced, the Fund is required to pay the lender amounts equal to any dividend or interest which accrue during the period of the loan. To borrow the security, the Fund also may be required to pay a premium, which would increase the cost of the security sold. Until a Fund closes its short position or replaces the borrowed security, the Fund will: (a) maintain cash or liquid securities at such a level that the amount so maintained plus any amounts deposited with the broker as collateral will equal the current value of the security sold short; or (b) otherwise cover the Fund’s short position. The Fund is obligated to deliver securities at the market price at the time the short position is closed. Potential losses from short sales may be unlimited.
Unfunded Loan Commitments - A Fund may enter into certain credit agreements, all or a potion of which may be unfunded. The Fund is obligated to fund these loan commitments at the borrowers’ discretion. Funded portions of credit agreements are presented in the Schedules of Investments. Unfunded loan commitments are presented in the Notes to the Schedules of Investments. Unfunded loan commitments and funded portions of credit agreements are marked to market daily and any unrealized appreciation or (depreciation) is included in the Statements of Assets and Liabilities and the Statements of Operations.
Unregistered Securities - A Fund may own certain investment securities, which are unregistered and thus restricted to resale. Sometimes these securities are referred to as “private placements”. Unregistered securities may be deemed “illiquid” because there is no readily available market for sale of the securities. Many of these securities are valued by approved pricing services. These securities are sometimes valued in good faith using procedures adopted by the Board after giving due consideration to pertinent factors including recent private sales, market conditions and the issuer’s financial performance. Where future dispositions of the securities require registration under the Securities Act of 1933, as amended, the Funds have the right to include those securities in such registration generally without cost to the Funds. The Funds have no right to require registration of unregistered securities.
U.S. Government Agencies or Government-Sponsored Enterprises - Certain Funds may invest in U.S. government agencies or government sponsored enterprises. U.S. Government securities are obligations of and, in certain cases, guaranteed by, the U.S. government, its agencies or instrumentalities. Some U.S. Government securities, such as Treasury bills, notes and bonds, and securities guaranteed by the Government National Mortgage Association, are supported by the full faith and credit of the U.S. government; others, such as those of the Federal Home Loan Bank, are supported by the right of the issuer to borrow from the U.S. Department of the Treasury (the “U.S. Treasury”); others, such as those of the Federal National Mortgage Association (“FNMA” or “Fannie Mae”), are supported by the discretionary authority of the U.S. Government to purchase the agency’s obligations; and still others, such as those of the Student Loan Marketing Association, are supported only by the credit of the instrumentality. U.S. Government securities may include zero coupon securities, which do not distribute interest on a current basis and tend to be subject to greater risk than interest paying securities of similar maturities.
Government-related guarantors (i.e., guarantors who are not backed by the full faith and credit of the U.S. government) include FNMA and the Federal Home Loan Mortgage Corporation (“FHLMC” or “Freddie Mac”). FNMA purchases conventional (i.e., not insured or guaranteed by any government agency) residential mortgages from a list of approved seller/servicers which include state and federally chartered savings and loan associations, mutual savings banks, commercial banks and credit unions and mortgage bankers. Pass-through securities issued by FNMA are guaranteed as to timely payment of principal and interest by FNMA, but are not backed by the full faith and credit of the U.S. government. FHLMC issues Participation Certificates (“PCs”), which are pass-through securities, each representing an undivided interest in a pool of residential mortgages. FHLMC guarantees the timely payment of interest and ultimate collection of principal, but PCs are not backed by the full faith and credit of the U.S. government.
In September 2008, the Federal Housing Finance Agency (“FHFA”) placed FNMA and FHMLC into conservatorship. As the conservator, FHFA succeeded to all rights, titles, powers and privileges of FNMA and FHLMC and of any stockholder, officer or director of FNMA and FHLMC with respect to FNMA and FHLMC and each enterprise’s assets. In connection with the conservatorship, the U.S. Treasury entered into a Senior Preferred Stock Purchase Agreement with FNMA and FHLMC. This agreement contains various covenants that severely limit each enterprise’s operations. In exchange for entering into these agreements, the U.S. Treasury received senior preferred stock in each enterprise and warrants to purchase each enterprise’s common stock. The U.S. Treasury announced the creation of a new secured lending facility, which is available to FNMA and FHLMC as a liquidity backstop and the creation of a temporary program to purchase mortgage-backed securities issued by FNMA and FHLMC. FNMA and FHLMC are
JNL Series Trust
Notes to the Financial Statements (continued)
continuing to operate as going concerns while in conservatorship and each remain liable for all of its obligations, including its guaranty obligations, associated with its mortgage-backed securities.
Delayed-Delivery Securities - A Fund may purchase or sell securities on a delayed delivery basis, including To Be Announced (“TBA”) securities. These transactions involve a commitment by a Fund to purchase or sell securities for a predetermined price or yield, with payment and delivery taking place beyond the customary settlement period. In TBA transactions, a Fund commits to purchasing or selling securities for which all specific information is not yet known at the time of the trade, particularly the face amount and maturity date of the underlying security transactions. When delayed-delivery purchases are outstanding, the Fund is required to have sufficient cash and/or liquid securities to cover its commitments on these transactions. When purchasing a security on a delayed-delivery basis, the Fund assumes the rights of ownership of the security, including the risk of price and yield fluctuations, and considers such fluctuations when determining its NAV. A Fund may dispose of or renegotiate a delayed-delivery transaction after it is entered into, and may sell delayed-delivery securities before they are delivered, which may result in a capital gain or loss. When a Fund has sold a security on a delayed delivery basis, the Fund does not participate in future gains or losses with respect to the security. Securities purchased on a TBA basis are not settled until they are delivered to the Fund. In connection with TBA transactions, certain Funds may maintain a short position related to certain securities. In connection with these transactions, the Fund owns an equal amount of the securities or holds securities convertible (or exchangeable) into an equal amount of the securities, of the same issuer, as the position held short. Master Securities Forward Transaction Agreements (“Master Forward Agreements”) govern the consideration of factors surrounding the settlement of certain purchases and sales made on a delayed-delivery basis by and between the Fund and select counterparties. The Master Forward Agreements maintain provisions for, among other things, initiation and confirmation, payment and transfer, events of default, termination and maintenance of collateral.
Forward Sales Commitments – A Fund may purchase or sell forward sales commitments. A forward sales commitment involves a Fund entering into a contract to purchase or sell securities for a fixed price at a future date beyond the customary settlement period. The purchase of a forward sales commitment involves the risk of loss if the value of the security to be purchased declines before the settlement date while the sale of a forward sales commitment involves the risk that the value of the securities to be sold may increase before the settlement date. A Fund may dispose of or renegotiate forward sales commitments after they are entered into, and may sell these securities before they are delivered, which may result in capital gain or loss.
NOTE 4. FINANCIAL DERIVATIVE INSTRUMENTS
FASB ASC Topic 815, “Derivatives and Hedging" – This standard includes the requirement for enhanced qualitative disclosures about objectives and strategies for using derivative instruments and disclosures regarding credit related contingent features in derivative instruments; as well as requiring quantitative disclosures in the semi-annual and annual financial statements about fair value, gains and losses and volume of activity for derivative instruments. Information about these instruments is disclosed in the context of each instrument’s primary underlying risk exposure which is categorized as credit, equity price, interest rate, and foreign currency exchange rate risk. The objectives, strategies and underlying risks for each instrument held by the Funds are discussed in the following paragraphs. A tabular disclosure for each derivative instrument by risk category is presented in the Notes to the Schedules of Investments which references the location on the Statement of Assets and Liabilities and the realized and unrealized gain (loss) in the Statements of Operations for each derivative instrument.
Credit Linked Notes - A Fund may invest in credit linked notes in the normal course of pursuing its investment objectives. The Funds invest in credit linked notes to manage portfolio risk and to gain exposure to certain foreign markets. The value of a credit linked note is based on the price movements of a particular credit, known as a reference credit. Credit linked notes that the Funds invest in are listed instruments that provide the same return as the underlying reference credit. Credit linked notes are intended to replicate the economic effects that would apply had a Fund directly purchased the underlying reference asset or basket of assets. The Fund generally will receive a fixed or floating coupon and the note’s par value upon maturity. If a specified credit event occurs, such as default or declaring bankruptcy, the Fund will experience a delay in repayment or forego interest. The maximum potential risk of loss is limited to the par amount of the credit linked note plus any accrued interest. In effect, the Fund will receive a higher yield in exchange for assuming the risk of a specified credit event. The underlying entity and its credit rating, for each credit linked note, is presented parenthetically in the Schedules of Investments.
Forward Foreign Currency Contracts - A Fund may be subject to foreign currency exchange rate risk in the normal course of pursuing its investment objectives. A Fund may enter into forward foreign currency contracts, generally to hedge foreign currency exposure between trade date and settlement date on security purchases and sales, to minimize foreign currency exposure on portfolio securities denominated in foreign currencies or as part of its investment strategy. A forward foreign currency contract is an agreement between two parties to buy and sell a currency at a set price on a future date. The use of forward foreign currency contracts does not eliminate fluctuations in the underlying prices of a Fund’s portfolio securities, but it does establish a rate of exchange that can be achieved in the future. The value of a forward foreign currency contract fluctuates with changes in foreign currency exchange rates. Forward foreign currency contracts are marked-to-market daily and change in value is recorded by a Fund as unrealized gain or loss and as a receivable or payable from forward foreign currency contracts. Upon delivery or receipt of the currency, realized gain or loss is recorded which is equal to the difference between the value of the contract at the time it is opened and the value at the time it is closed. Forward foreign currency contracts involve market risk in excess of the receivable or payable related to forward foreign currency contracts on the Statements of Assets and Liabilities. Although contracts limit the risk of loss due to a decline in the value of the hedged currency, they also limit any potential gain that might result should the value of the currency increase. Additionally, a Fund could be exposed to the risk of a previously hedged position becoming unhedged if the counterparty to a contract is unable to meet the terms of the contract or if the value of the currency changes unfavorably to the U.S. dollar.
Futures Contracts - A Fund may be subject to equity price, interest rate and foreign currency exchange rate risk in the normal course of pursuing its investment objectives. A Fund may use futures contracts to manage its exposure to or hedge against changes in securities prices, interest rates and foreign currency rates or as an efficient means of adjusting overall exposure to certain markets as part of its investment strategy. Upon entering into a futures contract, the Fund is required to deposit with the broker or counterparty an amount of cash or cash equivalents equal to a certain percentage of the contract amount known as the "initial margin". The Fund receives from or pays to the counterparty an amount of cash equal to the daily fluctuation in the value of the contracts. Such receipts or payments, known as the "variation margin”, are recorded by the Fund until the contracts are terminated at which time realized gains and losses are recognized. Futures contracts involve to varying degrees, risk of loss in excess of the variation margin reflected in the Statements of Assets and Liabilities. The primary risks associated with the use of futures contracts are the imperfect correlation between the change in market value of the securities held by a Fund and the prices of the futures contracts and the possibility a Fund may not be able to enter into a closing transaction because of an illiquid market. With futures, there is minimal counterparty risk to a Fund since future contracts are exchange traded and the exchange's clearing house, as counterparty to all exchange traded futures, guarantees the future contracts against default.
Options Transactions – A Fund may be subject to equity price, interest rate and foreign currency exchange rate risk in the normal course of pursuing its investment objectives. A Fund may buy and sell (“write”) call and put options on securities, futures, currencies and swaps (“swaptions”) to manage its exposure to or hedge against changes in securities prices, interest rates, foreign currencies and swap valuations or as an efficient means of adjusting overall exposure to certain markets as part of its investment strategy. Swaptions are illiquid investments.
JNL Series Trust
Notes to the Financial Statements (continued)
When a Fund purchases an option, the premium paid by the Fund is recorded as an asset and is subsequently marked to market to reflect the current value of the option. Premiums paid for purchasing options which expire are treated as realized losses. Premiums paid for purchasing options which are exercised or closed are added to the cost basis of the underlying investment or offset against the proceeds of the underlying investment transaction to determine realized gain. Purchasing call options tends to increase a Fund’s exposure to the underlying instrument. Purchasing put options tends to decrease a Fund’s exposure to the underlying instrument. The risks associated with purchasing options are limited to premiums paid and the failure of the counterparty to honor its obligation under the contract.
When a Fund writes an option, the premium received by the Fund is recorded as a liability and is subsequently marked to market to reflect the current market value of the option. Premiums received from writing options which expire are treated as realized gains. Premiums received from writing options which are exercised or closed are added to the proceeds of the underlying investment transaction or reduce the cost basis of the underlying investment to determine the realized gain or loss. Writing call options tends to decrease a Fund’s exposure to the underlying instrument. Writing put options tends to increase a Fund’s exposure to the underlying instrument. The risk associated with writing an option that is exercised is that an unfavorable change in the price of the security underlying the option could result in a Fund buying the underlying security at a price different from the current value. There is also the risk a Fund may not be able to enter into a closing transaction because of an illiquid market. Options written by a Fund do not give rise to counterparty credit risk, as they obligate the Fund, not the counterparty, to perform.
Swap Agreements - Swap agreements are privately negotiated agreements between a Fund and a counterparty to exchange the return generated by one instrument for the return generated by another instrument. Swap agreements are illiquid investments. If a Fund transacts in swap agreements, they are party to International Swaps and Derivatives Association, Inc. Master Agreements (“ISDA Master Agreements”) with select counterparties that govern transactions, over-the-counter derivative and foreign exchange contracts, entered into by the Fund and those counterparties. The ISDA Master Agreements maintain provisions for general obligations, representations, agreements, collateral and events of default or termination. Events of termination include conditions that may entitle counterparties to elect to terminate early and cause settlement of all outstanding transactions under the applicable ISDA Master Agreement. Any election to early termination could be material to the financial statements. The amount of collateral exchanged is based on provisions within the ISDA Master Agreements and is determined by the net exposure with the counterparty and is not identified to a specific swap agreement. The collateral delivered for swap agreements as of December 31, 2009 for each Fund is included in deposits from counterparties in the Statements of Assets and Liabilities.
Swap agreements are marked to market daily and change in value is recorded by a Fund as unrealized gain or loss. Swap premiums paid or received at the beginning of the measurement period are reflected as such in the Statements of Assets and Liabilities and represent payments made or received upon entering into the swap agreement to compensate for differences between the stated terms of the swap agreement and prevailing market conditions relating to credit spreads, interest rates, currency exchange rates, and other relevant factors as appropriate. These upfront payments are recorded as realized gain or loss upon termination or maturity of the swap. A liquidation payment received or made at the termination of the swap is recorded as realized gain or loss. Net periodic payments received or paid by a Fund are included as part of realized gain (loss).
Entering into swap agreements involves, to varying degrees, elements of credit, market and documentation risk in excess of the amounts recognized in the Statements of Assets and Liabilities. Such risks involve the possibility that there will be no liquid market for these agreements, that there may be unfavorable changes in interest rates or value of underlying securities and that the counterparty to the agreements may default on its obligation to perform or disagree as to the meaning of contractual terms in the agreements. The credit risk associated with favorable contracts is reduced by master netting arrangements to the extent that if an event of default occurs, all amounts with the counterparty are terminated and settled on a net basis. A Fund’s overall exposure to credit risk subject to master netting arrangements can change substantially within a short period, as it is affected by each transaction subject to the arrangement.
Credit Default Swap Agreements –- A Fund may be subject to credit and foreign currency exchange rate risk in the normal course of pursuing its investment objectives. Credit default swap agreements involve one party making a stream of payments (referred to as the buyer of protection) to another party (the seller of protection) in exchange for the right to receive a specified return if a credit event occurs for the referenced entity, obligation or index. A credit event is defined under the terms of that particular swap agreement and may include, but is not limited to, underlying entity default, bankruptcy, write-down, principal shortfall, or interest shortfall.
A Fund may use credit default swap agreements on corporate issues or sovereign issues of an emerging country to provide a measure of protection against defaults of the issuers (i.e., to reduce risk where a Fund owns or has exposure to the referenced obligation) or to take an active long or short position with respect to the likelihood of a particular issuer’s default. Credit default swap agreements on corporate issues or sovereign issues of an emerging country involve one party making a stream of payments to another party in exchange for the right to receive a specified return in the event of a default or other credit event. If a credit event occurs and cash settlement is not elected, a variety of other deliverable obligations may be delivered in lieu of the specific referenced obligation. The ability to deliver other obligations may result in a cheapest-to-deliver option (the buyer of protection’s right to choose the deliverable obligation with the lowest value following a credit event).
A Fund may use credit default swap agreements on asset-backed securities to provide a measure of protection against defaults of the referenced obligation or to take an active long or short position with respect to the likelihood of a particular referenced obligation’s default. Credit default swap agreements on asset-backed securities involve one party making a stream of payments to another party in exchange for the right to receive a specified return in the event of a default or other credit event. Unlike credit default swaps on corporate issues or sovereign issues of an emerging country, deliverable obligations in most instances would be limited to the specific referenced obligation because performance for asset-backed securities can vary across deals. Prepayments, principal pay downs, and other write-down or loss events on the underlying mortgage loans will reduce the outstanding principal balance of the referenced obligation. These reductions may be temporary or permanent as defined under the terms of the swap agreement and the notional amount for the swap agreement will be adjusted by corresponding amounts.
A Fund may use credit default swap agreements on credit indices to hedge a portfolio of credit default swap agreements or bonds, to protect investors owning bonds against default and to speculate on changes in credit quality. Credit default swap agreements on credit indices involve one party making a stream of payments to another party in exchange for the right to receive a specified return in the event of a write-down, principal shortfall, interest shortfall or default of all or part of the referenced entities comprising the credit index. A credit index is a basket of credit instruments or exposures designed to represent some part of the credit market as a whole. These indices are made up of reference credits that are judged by a pool of dealers to be the liquid entities in the credit default swap market based on the index sector. Components of the indices may include, but are not limited to, investment grade securities, high yield securities, asset-backed securities and emerging market securities. These components can be determined based upon various credit ratings within each sector. Credit indices are traded using credit default swaps with standardized terms including a fixed spread and standard maturity dates. An index credit default swap references all the names in the index, and if there is a credit event, the credit event is settled based on that name’s weight in the index. The composition of the indices changes periodically, usually every six months, and for most indices, each name has an equal weight in the index.
A Fund can be either a seller or buyer of protection when entering into a credit default swap agreement. As a seller of protection, the Fund will generally receive from the buyer of protection a fixed rate of income throughout the term of the swap if there is no credit event. As a seller, the Fund adds leverage to its portfolio because, in addition to
JNL Series Trust
Notes to the Financial Statements (continued)
its total net assets, the Fund is subject to investment exposure on the notional amount of the swap. If a Fund is a seller of protection and a credit event occurs, as defined under the terms of that particular swap agreement, the Fund will either pay to the buyer of protection an amount equal to the notional amount of the swap and take delivery of the referenced obligation, other deliverable obligations or underlying securities comprising the referenced index or pay a net settlement amount in the form of cash or securities equal to the notional amount of the swap less the recovery value of the referenced obligation or underlying securities comprising the referenced index. If a Fund is a buyer of protection and a credit event occurs, as defined under the terms of that particular swap agreement, the Fund will either receive from the seller of protection an amount equal to the notional amount of the swap and deliver the referenced obligation, other deliverable obligations or underlying securities comprising the referenced index or receive a net settlement amount in the form of cash or securities equal to the notional amount of the swap less the recovery value of the referenced obligation or underlying securities comprising the referenced index. Until a credit event occurs, recovery values are determined by market makers considering either industry standard recovery rates or entity specific factors and considerations. When a credit event occurs, the recovery value is determined by a facilitated auction whereby a minimum number of allowable broker bids, together with a specified valuation method, are used to calculate the settlement value.
Either as a seller of protection or a buyer of protection of a credit default swap agreement, a Fund's maximum risk of loss from counterparty risk is the fair value of the agreement. This risk is mitigated by having a master netting arrangement between the Fund and the counterparty and by posting collateral by the counterparty to the Fund to cover the Fund's exposure to the counterparty. The maximum potential amount of future payments (undiscounted) that a Fund as a seller of protection could be required to make under a credit default swap agreement would be an amount equal to the notional amount of the agreement. Notional amounts of all credit default swap agreements outstanding as of December 31, 2009, for which the Fund is the seller of protection are disclosed in the Notes to the Schedules of Investments. These potential amounts would be partially offset by any recovery values of the respective referenced obligations, upfront payments received upon entering into the agreement or net amounts received from the settlement of buy protection credit default swap agreements entered into by the Fund for the same referenced entity or entities.
Interest Rate Swap Agreements - A Fund may be subject to interest rate and foreign currency exchange rate risk in the normal course of pursuing its investment objectives. A Fund may enter into interest rate swap agreements to hedge against the risk that the value of its fixed rate bond investments will decrease as interest rates rise and to maintain its ability to generate income at prevailing market rates. Interest rate swap agreements involve the exchange by a Fund with another party of their respective commitments to pay or receive interest with respect to the notional amount of principal. Forms of interest rate swap agreements may include: interest rate caps, under which, in return for a premium, one party agrees to make payments to the other party to the extent that interest rates exceed a specified rate, or “cap”; interest rate floors, under which, in return for a premium, one party agrees to make payments to the other party to the extent that interest rates fall below a specified rate, or “floor”; interest rate collars, under which a party sells a cap and purchases a floor or vice versa in an attempt to protect itself against interest rate movements exceeding given minimum or maximum levels; callable interest rate swaps, under which the counterparty may terminate the swap transaction in whole at zero cost by a predetermined date and time prior to the maturity date; forward spread locks, which allow the interest rate swap users to lock in the forward differential (or spread) between the interest rate swap rate and a specified benchmark; or basis swap, under which two parties can exchange variable interest rates based on different money markets.
A Fund's maximum risk of loss from counterparty credit risk for an interest rate swap agreement is the discounted net value of the cash flows to be received from or paid to the counterparty over the contract's remaining life, to the extent this amount is positive. This risk is mitigated by having a master netting arrangement between a Fund and the counterparty and by posting of collateral by the counterparty to the Fund to cover the Fund's exposure to the counterparty.
Total Return Swap Agreements - A Fund may be subject to equity price and interest rate risk in the normal course of pursuing its investment objectives. A Fund may enter into a total return swap agreement to manage its exposure to or hedge against changes in securities prices and interest rates or as an efficient means of adjusting overall exposure to certain markets as part of its investment strategy. Some total return swap agreements involve a commitment to pay periodic interest payments in exchange for a market-linked return based on a security or a basket of securities. To the extent the total return of the security, index or other financial measure underlying the transaction exceeds or falls short of the offsetting interest rate obligation, a Fund will receive a payment from or make a payment to the counterparty. A Fund's maximum risk of loss from counterparty credit risk for this type of total return swap agreement is the discounted net value of the cash flows to be received from or paid to the counterparty over the contract's remaining life, to the extent this amount is positive. Other total return swap agreements involve a right to receive the appreciation in value of a specified security, index or other instrument in return for a fee paid to the counterparty, which will typically be an agreed upon interest rate. To the extent the underlying asset declines in value over the term of the swap, a Fund may also be required to pay the value of that decline to the counterparty. A Fund's maximum risk of loss from counterparty credit risk for this type of total return swap agreement is the value of the underlying security, index or other financial instrument.
The counterparty credit risk for the total return swap agreement is mitigated by having a master netting arrangement between a Fund and the counterparty and by posting of collateral by the counterparty to the Fund to cover the Fund's exposure to the counterparty.
NOTE 5. OTHER INVESTMENT RISKS
Emerging Market Securities Risk – Investing in securities of emerging market countries generally involves greater risk than investing in foreign securities in developed markets. Emerging market countries typically have economic and political systems that are less fully developed and are likely to be less stable than those in more advanced countries. These risks include the potential for government intervention, adverse changes in earnings and business prospects, liquidity, credit and currency risks, and price volatility.
Foreign Securities Risk - Investing in securities of foreign companies and foreign governments generally involves special risks and considerations not typically associated with investing in U.S. companies and the U.S. government. These risks include the potential for revaluation of currencies, different accounting policies, and future adverse political and economic developments. Moreover, securities of many foreign companies and foreign governments and their markets may be less liquid and their prices may be more volatile than those of securities of comparable U.S. companies and the U.S. government.
Market, Credit and Counterparty Risk - In the normal course of business the Funds trade financial instruments and enter into financial transactions where the risk of potential loss exists due to changes in the market (“market risk”) or failure of the other party to a transaction to perform (“credit risk”). Similar to credit risk, the Funds may be exposed to counterparty risk, or the risk that an institution or other entity with which the Funds have unsettled or open transactions will default. For certain derivative contracts, the potential loss could exceed the value of the financial assets recorded in the financial statements. Financial assets, which potentially expose the Funds to credit risk, consist principally of investments and cash due from counterparties (“counterparty risk”). The extent of the Funds’ exposure to credit and counterparty risks in respect to these financial assets is incorporated within their carrying value as recorded in the Funds’ Statements of Assets and Liabilities.
Private Equity Companies Risk - There are inherent risks in investing in private equity companies, which encompass financial institutions or vehicles whose principal business is to invest in and lend capital to privately held companies. Generally, little public information exists for private and thinly traded companies, and there is a risk that investors may not be able to make a fully informed investment decision. In addition, private equity companies are subject to minimal regulation. In addition to the risks
JNL Series Trust
Notes to the Financial Statements (continued)
associated with the JNL/Red Rocks Listed Private Equity Fund’s direct investments, the Fund is also subject to the underlying risks which affect the listed private equity companies in which the Fund invests. Listed private equity companies are subject to various risks depending on their underlying investments, which could include, but are not limited to, additional liquidity, sector, non-U.S. security, currency, credit, managed portfolio and derivatives risks.
Real Estate Investment Risk – The JNL/AIM Global Real Estate Fund concentrates its assets in the real estate industry and an investment in the Fund will be closely linked to the performance of the real estate markets. Property values may fall due to increasing vacancies or declining rents resulting from economic, legal, cultural or technological developments. Many real estate companies, including real estate investment trusts (“REITs”), utilize leverage (and some may be highly leveraged), which increases investment risk and could adversely affect a real estate company’s operations and market value in periods of rising interest rates. The value of a Fund’s investment in REITs may be affected by the management skill of the persons managing the REIT. Because REITs have expenses of their own, the Fund will bear a proportional share of those expenses. Due to the fact that the Fund focuses its investments in REITs and other companies related to the real estate industry, the value of shares may rise and fall more than the value of shares of a fund that invests in a broader range of companies.
NOTE 6. INVESTMENT ADVISORY FEES AND TRANSACTIONS WITH AFFILIATES
Advisory Fee - The Trust has an investment advisory agreement with JNAM, whereby JNAM provides investment management services. Each Fund pays JNAM an annual fee, accrued daily and paid monthly, based on a specified percentage of the average daily net assets of each Fund. A portion of this fee is paid by JNAM to the sub-advisers as compensation for their services. The following is a schedule of the fees each Fund is currently obligated to pay JNAM:
| $0 to | $50M to | $100M to | $150M to | $200M to | $250M to | $300M to | $350M to | $500M to | $750M to | $1.0B to | Over | |
| (M - Millions; B - Billions) | $50M | $100M | $150M | $200M | $250M | $300M | $350M | $500M | $750M | $1.0B | $1.5B | $1.5B |
| JNL Institutional Alt Funds | 0.15% | 0.15% | 0.15% | 0.15% | 0.15% | 0.15% | 0.15% | 0.15% | 0.10% | 0.10% | 0.10% | 0.10% |
| JNL/AIM International Growth Fund | 0.70 | 0.70 | 0.70 | 0.65 | 0.65 | 0.65 | 0.65 | 0.65 | 0.60 | 0.60 | 0.60 | 0.60 |
| JNL/AIM Large Cap Growth Fund | 0.70 | 0.70 | 0.70 | 0.65 | 0.65 | 0.65 | 0.65 | 0.65 | 0.65 | 0.65 | 0.65 | 0.65 |
| JNL/AIM Global Real Estate Fund | 0.75 | 0.70 | 0.70 | 0.70 | 0.70 | 0.70 | 0.70 | 0.70 | 0.70 | 0.70 | 0.70 | 0.70 |
| JNL/AIM Small Cap Growth Fund | 0.85 | 0.85 | 0.85 | 0.85 | 0.85 | 0.85 | 0.80 | 0.80 | 0.80 | 0.80 | 0.80 | 0.80 |
| JNL/Capital Guardian Global Balanced Fund | 0.65 | 0.65 | 0.65 | 0.65 | 0.65 | 0.65 | 0.65 | 0.65 | 0.60 | 0.60 | 0.60 | 0.60 |
| JNL/Capital Guardian Global Diversified | ||||||||||||
| Research Fund | 0.75 | 0.75 | 0.75 | 0.70 | 0.70 | 0.70 | 0.70 | 0.70 | 0.65 | 0.60 | 0.60 | 0.60 |
| JNL/Capital Guardian International Small Cap Fund | 0.95 | 0.95 | 0.95 | 0.95 | 0.95 | 0.95 | 0.95 | 0.95 | 0.90 | 0.90 | 0.90 | 0.90 |
| JNL/Capital Guardian U.S. Growth Equity Fund | 0.70 | 0.70 | 0.70 | 0.65 | 0.65 | 0.65 | 0.65 | 0.65 | 0.60 | 0.55 | 0.55 | 0.55 |
| JNL/Credit Suisse Commodity Securities Fund | 0.70 | 0.70 | 0.70 | 0.70 | 0.70 | 0.70 | 0.60 | 0.60 | 0.60 | 0.60 | 0.60 | 0.60 |
| JNL/Credit Suisse Long/Short Fund | 0.80 | 0.80 | 0.80 | 0.80 | 0.80 | 0.80 | 0.75 | 0.75 | 0.75 | 0.75 | 0.75 | 0.75 |
| JNL/Eagle Core Equity Fund | 0.65 | 0.65 | 0.60 | 0.60 | 0.60 | 0.60 | 0.55 | 0.55 | 0.55 | 0.55 | 0.55 | 0.55 |
| JNL/Eagle SmallCap Equity Fund | 0.75 | 0.75 | 0.70 | 0.70 | 0.70 | 0.70 | 0.70 | 0.70 | 0.65 | 0.65 | 0.65 | 0.65 |
| JNL/Franklin Templeton Founding Strategy Fund | 0.00 | 0.00 | 0.00 | 0.00 | 0.00 | 0.00 | 0.00 | 0.00 | 0.00 | 0.00 | 0.00 | 0.00 |
| JNL/Franklin Templeton Global Growth Fund | 0.75 | 0.75 | 0.75 | 0.75 | 0.75 | 0.75 | 0.65 | 0.65 | 0.60 | 0.60 | 0.60 | 0.60 |
| JNL/Franklin Templeton Income Fund | 0.80 | 0.80 | 0.75 | 0.75 | 0.65 | 0.65 | 0.65 | 0.65 | 0.60 | 0.60 | 0.60 | 0.60 |
| JNL/Franklin Templeton Mutual Shares Fund | 0.75 | 0.75 | 0.75 | 0.75 | 0.75 | 0.75 | 0.75 | 0.75 | 0.70 | 0.70 | 0.70 | 0.70 |
| JNL/Franklin Templeton Small Cap Value Fund | 0.85 | 0.85 | 0.85 | 0.85 | 0.77 | 0.77 | 0.77 | 0.77 | 0.75 | 0.75 | 0.75 | 0.75 |
| JNL/Goldman Sachs Core Plus Bond Fund | 0.60 | 0.60 | 0.60 | 0.60 | 0.60 | 0.60 | 0.60 | 0.60 | 0.55 | 0.55 | 0.55 | 0.55 |
| JNL/Goldman Sachs Emerging Markets Debt Fund | 0.75 | 0.75 | 0.75 | 0.75 | 0.70 | 0.70 | 0.70 | 0.70 | 0.70 | 0.70 | 0.70 | 0.70 |
| JNL/Goldman Sachs Mid Cap Value Fund | 0.75 | 0.75 | 0.70 | 0.70 | 0.70 | 0.70 | 0.70 | 0.70 | 0.70 | 0.70 | 0.70 | 0.70 |
| JNL/Ivy Asset Strategy Fund | 0.90 | 0.90 | 0.90 | 0.90 | 0.90 | 0.90 | 0.90 | 0.90 | 0.85 | 0.85 | 0.85 | 0.85 |
| JNL/JPMorgan International Value Fund | 0.70 | 0.70 | 0.70 | 0.65 | 0.65 | 0.65 | 0.65 | 0.65 | 0.60 | 0.60 | 0.60 | 0.60 |
| JNL/JPMorgan MidCap Growth Fund | 0.70 | 0.70 | 0.70 | 0.70 | 0.70 | 0.65 | 0.65 | 0.65 | 0.65 | 0.60 | 0.60 | 0.55 |
| JNL/JPMorgan U.S. Government & Quality | ||||||||||||
| Bond Fund | 0.50 | 0.50 | 0.50 | 0.45 | 0.45 | 0.45 | 0.40 | 0.40 | 0.35 | 0.35 | 0.35 | 0.35 |
| JNL/Lazard Emerging Markets Fund | 1.00 | 1.00 | 0.90 | 0.90 | 0.90 | 0.85 | 0.85 | 0.85 | 0.85 | 0.85 | 0.85 | 0.85 |
| JNL/Lazard Mid Cap Equity Fund | 0.75 | 0.70 | 0.70 | 0.70 | 0.70 | 0.65 | 0.65 | 0.65 | 0.65 | 0.65 | 0.65 | 0.65 |
| JNL/M&G Global Basics Fund | 0.85 | 0.85 | 0.85 | 0.85 | 0.85 | 0.85 | 0.85 | 0.85 | 0.80 | 0.80 | 0.80 | 0.80 |
| JNL/M&G Global Leaders Fund | 0.85 | 0.85 | 0.85 | 0.85 | 0.85 | 0.85 | 0.85 | 0.85 | 0.80 | 0.80 | 0.80 | 0.80 |
| JNL/Mellon Capital Management 10 x 10 Fund | 0.00 | 0.00 | 0.00 | 0.00 | 0.00 | 0.00 | 0.00 | 0.00 | 0.00 | 0.00 | 0.00 | 0.00 |
| JNL/Mellon Capital Management Index 5 Fund | 0.00 | 0.00 | 0.00 | 0.00 | 0.00 | 0.00 | 0.00 | 0.00 | 0.00 | 0.00 | 0.00 | 0.00 |
| JNL/Mellon Capital Management European | ||||||||||||
| 30 Fund | 0.37 | 0.31 | 0.28 | 0.28 | 0.28 | 0.28 | 0.28 | 0.28 | 0.28 | 0.28 | 0.28 | 0.28 |
| JNL/Mellon Capital Management Pacific Rim | ||||||||||||
| 30 Fund | 0.37 | 0.31 | 0.28 | 0.28 | 0.28 | 0.28 | 0.28 | 0.28 | 0.28 | 0.28 | 0.28 | 0.28 |
| JNL/Mellon Capital Management S&P 500 | ||||||||||||
| Index Fund | 0.29 | 0.29 | 0.29 | 0.29 | 0.29 | 0.29 | 0.29 | 0.29 | 0.24 | 0.23 | 0.23 | 0.23 |
| JNL/Mellon Capital Management | ||||||||||||
| S&P 400 MidCap Index Fund | 0.29 | 0.29 | 0.29 | 0.29 | 0.29 | 0.29 | 0.29 | 0.29 | 0.24 | 0.23 | 0.23 | 0.23 |
| JNL/Mellon Capital Management Small Cap | ||||||||||||
| Index Fund | 0.29 | 0.29 | 0.29 | 0.29 | 0.29 | 0.29 | 0.29 | 0.29 | 0.24 | 0.23 | 0.23 | 0.23 |
| JNL/Mellon Capital Management | ||||||||||||
| International Index Fund | 0.30 | 0.30 | 0.30 | 0.30 | 0.30 | 0.30 | 0.30 | 0.30 | 0.25 | 0.24 | 0.24 | 0.24 |
| JNL/Mellon Capital Management Bond Index Fund | 0.30 | 0.30 | 0.30 | 0.30 | 0.30 | 0.30 | 0.30 | 0.30 | 0.25 | 0.24 | 0.24 | 0.24 |
JNL Series Trust
Notes to the Financial Statements (continued)
| $0 to | $50M to | $100M to | $150M to | $200M to | $250M to | $300M to | $350M to | $500M to | $750M to | $1.0B to | Over | |
| (M - Millions; B - Billions) | $50M | $100M | $150M | $200M | $250M | $300M | $350M | $500M | $750M | $1.0B | $1.5B | $1.5B |
| JNL/Mellon Capital Management Global | ||||||||||||
| Alpha Fund | 1.00% | 1.00% | 1.00% | 1.00% | 1.00% | 1.00% | 1.00% | 1.00% | 0.90% | 0.90% | 0.90% | 0.90% |
| JNL/Oppenheimer Global Growth Fund | 0.70 | 0.70 | 0.70 | 0.70 | 0.70 | 0.70 | 0.60 | 0.60 | 0.60 | 0.60 | 0.60 | 0.60 |
| JNL/PAM Asia ex-Japan Fund | 0.90 | 0.90 | 0.90 | 0.90 | 0.90 | 0.90 | 0.90 | 0.90 | 0.85 | 0.85 | 0.85 | 0.85 |
| JNL/PAM China-India Fund | 0.90 | 0.90 | 0.90 | 0.90 | 0.90 | 0.90 | 0.90 | 0.90 | 0.85 | 0.85 | 0.85 | 0.85 |
| JNL/PIMCO Real Return Fund | 0.50 | 0.50 | 0.50 | 0.50 | 0.50 | 0.50 | 0.50 | 0.50 | 0.50 | 0.50 | 0.475 | 0.475 |
| JNL/PIMCO Total Return Bond Fund | 0.50 | 0.50 | 0.50 | 0.50 | 0.50 | 0.50 | 0.50 | 0.50 | 0.50 | 0.50 | 0.50 | 0.50 |
| JNL/PPM America High Yield Bond Fund | 0.50 | 0.50 | 0.50 | 0.45 | 0.45 | 0.45 | 0.45 | 0.45 | 0.425 | 0.425 | 0.425 | 0.425 |
| JNL/PPM America Mid Cap Value Fund | 0.75 | 0.75 | 0.75 | 0.75 | 0.75 | 0.75 | 0.75 | 0.75 | 0.70 | 0.70 | 0.70 | 0.70 |
| JNL/PPM America Small Cap Value Fund | 0.75 | 0.75 | 0.75 | 0.75 | 0.75 | 0.75 | 0.75 | 0.75 | 0.70 | 0.70 | 0.70 | 0.70 |
| JNL/PPM America Value Equity Fund | 0.55 | 0.55 | 0.55 | 0.55 | 0.55 | 0.55 | 0.50 | 0.50 | 0.50 | 0.50 | 0.50 | 0.50 |
| JNL/Red Rocks Listed Private Equity Fund | 0.85 | 0.85 | 0.85 | 0.85 | 0.80 | 0.80 | 0.80 | 0.80 | 0.80 | 0.80 | 0.80 | 0.80 |
| JNL/S&P Funds | 0.13 | 0.13 | 0.13 | 0.13 | 0.13 | 0.13 | 0.13 | 0.13 | 0.08 | 0.08 | 0.08 | 0.08 |
| JNL/S&P Competitive Advantage Fund | 0.40 | 0.40 | 0.40 | 0.40 | 0.40 | 0.40 | 0.40 | 0.40 | 0.35 | 0.35 | 0.35 | 0.35 |
| JNL/S&P Dividend Income & Growth Fund | 0.40 | 0.40 | 0.40 | 0.40 | 0.40 | 0.40 | 0.40 | 0.40 | 0.35 | 0.35 | 0.35 | 0.35 |
| JNL/S&P Intrinsic Value Fund | 0.40 | 0.40 | 0.40 | 0.40 | 0.40 | 0.40 | 0.40 | 0.40 | 0.35 | 0.35 | 0.35 | 0.35 |
| JNL/S&P Total Yield Fund | 0.40 | 0.40 | 0.40 | 0.40 | 0.40 | 0.40 | 0.40 | 0.40 | 0.35 | 0.35 | 0.35 | 0.35 |
| JNL/S&P 4 Fund | 0.00 | 0.00 | 0.00 | 0.00 | 0.00 | 0.00 | 0.00 | 0.00 | 0.00 | 0.00 | 0.00 | 0.00 |
| JNL/Select Balanced Fund | 0.55 | 0.50 | 0.50 | 0.475 | 0.475 | 0.475 | 0.45 | 0.45 | 0.425 | 0.425 | 0.425 | 0.425 |
| JNL/Select Money Market Fund | 0.28 | 0.28 | 0.28 | 0.28 | 0.28 | 0.28 | 0.28 | 0.28 | 0.25 | 0.25 | 0.25 | 0.25 |
| JNL/Select Value Fund | 0.55 | 0.55 | 0.55 | 0.55 | 0.55 | 0.55 | 0.50 | 0.50 | 0.45 | 0.45 | 0.45 | 0.45 |
| JNL/T. Rowe Price Established Growth Fund | 0.65 | 0.65 | 0.65 | 0.60 | 0.60 | 0.60 | 0.60 | 0.60 | 0.55 | 0.55 | 0.55 | 0.55 |
| JNL/T. Rowe Price Mid-Cap Growth Fund | 0.75 | 0.75 | 0.75 | 0.70 | 0.70 | 0.70 | 0.70 | 0.70 | 0.70 | 0.70 | 0.70 | 0.70 |
| JNL/T. Rowe Price Short-Term Bond Fund | 0.45 | 0.45 | 0.45 | 0.45 | 0.45 | 0.40 | 0.40 | 0.40 | 0.40 | 0.40 | 0.40 | 0.40 |
| JNL/T. Rowe Price Value Fund | 0.70 | 0.70 | 0.70 | 0.65 | 0.65 | 0.65 | 0.65 | 0.65 | 0.60 | 0.60 | 0.60 | 0.60 |
Administrative Fee – JNAM also serves as the “Administrator” to the Funds. The Funds pay an administrative fee based on the average daily net assets of each Fund, accrued daily and paid monthly. The JNL Institutional Alt Funds, JNL/Franklin Templeton Founding Strategy Fund, JNL/Mellon Capital Management 10 x 10 Fund, JNL/Mellon Capital Management Index 5 Fund, JNL/S&P 4 Fund, and JNL/S&P Funds pay JNAM an annual administrative fee of 0.05%. The JNL/AIM Global Real Estate Fund, JNL/AIM International Growth Fund, JNL/Capital Guardian Global Balanced Fund, JNL/Capital Guardian Global Diversified Research Fund, JNL/Capital Guardian International Small Cap Fund, JNL/Credit Suisse Commodity Securities Fund, JNL/Credit Suisse Long/Short Fund, JNL/Franklin Templeton Global Growth Fund, JNL/Goldman Sachs Emerging Markets Debt Fund, JNL/Ivy Asset Strategy Fund, JNL/JPMorgan International Value Fund, JNL/Lazard Emerging Markets Fund, JNL/M&G Global Basics Fund, JNL/M&G Global Leaders Fund, JNL/Mellon Capital Management Global Alpha Fund, JNL/Mellon Capital Management International Index Fund, JNL/Oppenheimer Global Growth Fund, JNL/PAM Asia ex-Japan Fund and JNL/Red Rocks Listed Private Equity Fund pay JNAM an annual administration fee of 0.15%. The JNL/Mellon Capital Management European 30 Fund, JNL/Mellon Capital Management Pacific Rim 30 Fund and JNL/PAM China-India Fund pay JNAM an annual administration fee of 0.20%. All other Funds pay JNAM an annual administration fee of 0.10%.
In return for the administrative fee, JNAM provides or procures all necessary administrative functions and services for the operation of the Funds. In addition, JNAM, at its own expense, arranges for legal (except for litigation expenses incurred by the JNL/Franklin Templeton Mutual Shares Fund), audit, fund accounting, transfer agency, custody, printing and mailing, a portion of the Chief Compliance Officer costs, and all other services necessary for the operation of each Fund. Each Fund is responsible for trading expenses including brokerage commissions, interest and taxes, other non-operating expenses, registration fees, licensing costs, directors and officers insurance, the fees and expenses of the disinterested Trustees and independent legal counsel to the disinterested Trustees, and a portion of the costs associated with the Chief Compliance Officer.
12b-1 Fees - - The Funds, except for the JNL Institutional Alt Funds, JNL/Franklin Templeton Founding Strategy Fund, JNL/Mellon Capital Management 10 x 10 Fund, JNL/Mellon Capital Management Index 5 Fund, JNL/S&P 4 Fund, and JNL/S&P Funds, adopted a Distribution Plan under the provisions of Rule 12b-1 under the 1940 Act for the purpose of reimbursement of certain distribution and related service expenses from the sale and distribution of each Fund’s Class A shares (through the sale of variable insurance products funded by the Trust). Jackson National Life Distributors LLC ("JNLD"), a wholly-owned subsidiary of Jackson and an affiliate of JNAM, is the principal underwriter of the Funds, with responsibility for promoting sales of Fund shares. JNLD also is the principal underwriter of the variable insurance products issued by Jackson and its subsidiaries. The maximum 12b-1 fee allowed shall be 0.20% of the average daily net assets attributable to the Class A shares. Amounts charged pursuant to the Distribution Plan are reflected as 12b-1 fees (Class A) in the Statements of Operations.
Fee Waiver and Expense Reimbursements – Effective October 1, 2009, the Board approved a contractual expense limitation agreement to waive fees and reimburse expenses of the JNL/Select Money Market Fund to the extent necessary to limit operating expenses of each class of shares of the Fund (excluding brokerage expense, interest, taxes, and extraordinary expenses) to an annual rate as a percentage of average daily net assets equal to or less than the Fund’s net investment income by class for the period. Prior to the contractual expense limitation agreement, JNAM had voluntarily agreed to waive fees and reimburse expenses of the Fund through September 30, 2009. JNAM may seek future restitution from the Fund for fees waived and reimbursed after October 1, 2009. At December 31, 2009, the Fund was not entitled to this future restitution after December 31, 2012. At a meeting held on February 12, 2010, the Board approved extending this future restitution for fees waived and reimbursed to December 31, 2013. During the year ended December 31, 2009, the Adviser waived expenses for Class A shares of the Fund in the amount of $1,232 (in thousands). This amount is included in expense waiver in the Fund’s Statement of Operations. During the year ended December 31, 2009, JNAM did not receive any restitution for any expenses that had been previously waived or reimbursed. At December 31, 2009, the amount of potentially recoverable reimbursement was $1,106 (in thousands).
Affiliated Brokerage Commissions - During the year ended December 31, 2009, the following Funds paid brokerage fees to affiliates of their Fund on the execution of purchases and sales of portfolio investments (in thousands): JNL/Credit Suisse Commodity Securities Fund $8; JNL/Credit Suisse Long/Short Fund $19; JNL/Eagle SmallCap Equity Fund $1; JNL/Goldman Sachs Core Plus Bond Fund $5; JNL/Goldman Sachs Mid Cap Value Fund $33; and JNL/JPMorgan International Value Fund $1.
Deferred Compensation Plan – Effective January 1, 2007, the Funds adopted a Deferred Compensation Plan whereby disinterested Trustees may defer the receipt of all or a portion of their compensation. These deferred amounts, which remain as liabilities of the Funds, shall be treated as if invested and reinvested in shares of one or more
JNL Series Trust
Notes to the Financial Statements (continued)
affiliated funds offered by the Adviser at the discretion of the applicable Trustee. These amounts represent general, unsecured liabilities of the Funds and vary according to the total returns of the selected funds. Prior to January 1,2007, Trustees were able to defer the receipt of their compensation under a separate plan. Deferred amounts under this plan are credited at a rate of return of five percent (5%). Liabilities related to deferred balances are included in trustee fees payable in the Statements of Assets and Liabilities. Increases or decreases related to the changes in value of deferred balances are included in trustee fees set forth in the Statements of Operations.
Directed Brokerage Commissions - A sub-adviser may allocate a portion of a Fund’s equity security transactions (subject to obtaining best execution of each transaction) through certain designated broker-dealers which will rebate a portion of the brokerage commissions to that Fund. Any amount credited to the Fund is reflected as brokerage commissions recaptured in the Statements of Operations.
Investments in Affiliates - During the year ended December 31, 2009, certain Funds invested in money market funds, which are managed by JNAM or an affiliate of the Funds. The JNL Money Market Fund is offered as a cash management tool to the Funds and their affiliates and is not available for direct purchase by members of the public. In addition, the Custodian is an affiliate of the Funds for which J.P. Morgan Investment Management Inc. is the sub-adviser. Certain Funds participating in securities lending receive cash collateral, which is invested by the Custodian in the Securities Lending Cash Collateral Fund LLC and the Securities Lending Liquidating Fund LLC, which are affiliates of the Funds’ Adviser. JNAM serves as the Administrator for the Securities Lending Cash Collateral Fund LLC and Securities Lending Liquidating Fund LLC. The JNL Institutional Alt Funds, JNL/Franklin Templeton Founding Strategy Fund, JNL/Mellon Capital Management 10 x 10 Fund, JNL/Mellon Capital Management Index 5 Fund, JNL/S&P 4 Fund and JNL/S&P Funds invested solely in the Class A shares of other affiliated Funds of the Trust and the JNL Variable Funds LLC. The JNL/Mellon Capital Management International Index Fund invested in Prudential plc, the parent Company of Jackson. Prudential plc is not affiliated in any manner with Prudential Financial Inc., a company whose principal place of business is in the United States of America. The JNL/Mellon Capital Management S&P 500 Index Fund invested in Bank of New York Mellon Corp., the parent company of the Fund’s sub-adviser. The JNL/T. Rowe Price Established Growth Fund, JNL/T. Rowe Price Mid-Cap Growth Fund, JNL/T. Rowe Price Short-Term Bond Fund and JNL/T. Rowe Price Value Fund invested in T. Rowe Price Reserves Investment Fund; JNL/T. Rowe Price Value Fund invested in T. Rowe Price Institutional Floating Rate Fund; and JNL/T. Rowe Price Short-Term Bond Fund invested in T. Rowe Price Term Asset-Backed Opportunity Fund, LLC which are affiliates of each Fund’s sub-adviser. The total value and cost of such affiliated investments is disclosed separately in the Statements of Assets and Liabilities, and the associated income and realized gain (loss) are discloses separately in the Statements of Operations.
Sub-Adviser Affiliates - PPM America, Inc, an affiliate of JNAM, serves as a sub-adviser to JNL/PPM America High Yield Bond Fund, JNL/PPM America Mid Cap Value Fund, JNL/PPM America Small Cap Value Fund and JNL/PPM America Value Equity Fund. Prudential Asset Management (Singapore) Limited, an affiliate of JNAM, serves as a sub-adviser to JNL/PAM Asia ex-Japan Fund and JNL/PAM China-India Fund. M&G Investment Management Limited, an affiliate of JNAM, serves as a sub-adviser to JNL/M&G Global Basics Fund and JNL/M&G Global Leaders Fund.
NOTE 7. FEDERAL INCOME TAX MATTERS
The following information is presented on an income tax basis. Differences between amounts for financial statements and federal income tax purposes are primarily due to timing and character differences in recognizing certain gains and losses on investment transactions. Permanent differences between financial statement and federal income tax reporting are reclassified within the capital accounts based on their federal income tax treatment. These reclassifications have no impact on net assets. Temporary differences do not require reclassification.
At December 31, 2009, the following Funds had unused capital loss carryovers (in thousands) for U.S. federal income tax purposes, which may be used to offset future net realized capital gains. If not used, the capital loss carryovers will expire as follows:
| Year(s) of | Year(s) of | ||||||
| Amount | Expiration | Amount | Expiration | ||||
| JNL/AIM International Growth Fund | $96,662 | 2016-2017 | JNL/Mellon Capital Management S&P 500 Index Fund | $18,194 | 2016 | ||
| JNL/AIM Large Cap Growth Fund | 74,423 | 2016-2017 | JNL/Mellon Capital Management S&P 400 MidCap Index Fund | 7,167 | 2017 | ||
| JNL/AIM Global Real Estate Fund | 99,263 | 2016-2017 | JNL/Mellon Capital Management Small Cap Index Fund | 17,385 | 2017 | ||
| JNL/AIM Small Cap Growth Fund | 4,251 | 2016-2017 | JNL/Mellon Capital Management International Index Fund | 6,033 | 2017 | ||
| JNL/Capital Guardian Global Balanced Fund | 52,326 | 2016-2017 | JNL/Oppenheimer Global Growth Fund | 8,678 | 2017 | ||
| JNL/Capital Guardian Global Diversified Research Fund | 173,326 | 2010-2017 | JNL/PAM Asia ex-Japan Fund | 2,871 | 2016-2017 | ||
| JNL/Capital Guardian International Small Cap Fund | 23,292 | 2016-2017 | JNL/PPM America High Yield Bond Fund | 73,274 | 2010-2017 | ||
| JNL/Capital Guardian U.S. Growth Equity Fund | 244,208 | 2010-2017 | JNL/PPM America Mid Cap Value Fund | 3,060 | 2016-2017 | ||
| JNL/Credit Suisse Commodity Securities Fund | 117,362 | 2016-2017 | JNL/PPM America Small Cap Value Fund | 600 | 2016-2017 | ||
| JNL/Credit Suisse Long/Short Fund | 4,435 | 2016 | JNL/PPM America Value Equity Fund | 120,004 | 2016-2017 | ||
| JNL/Eagle Core Equity Fund | 16,895 | 2016-2017 | JNL/S&P Managed Conservative Fund | 13,545 | 2017 | ||
| JNL/Eagle SmallCap Equity Fund | 46,059 | 2016-2017 | JNL/S&P Managed Moderate Fund | 20,190 | 2016-2017 | ||
| JNL/Franklin Templeton Founding Strategy Fund | 9,243 | 2016 | JNL/S&P Managed Moderate Growth Fund | 27,986 | 2015-2017 | ||
| JNL/Franklin Templeton Global Growth Fund | 41,744 | 2016-2017 | JNL/S&P Managed Growth Fund | 25,433 | 2016-2017 | ||
| JNL/Franklin Templeton Income Fund | 85,503 | 2016-2017 | JNL/S&P Managed Aggressive Growth Fund | 22,000 | 2012-2017 | ||
| JNL/Franklin Templeton Mutual Shares Fund | 68,775 | 2016-2017 | JNL/S&P Disciplined Moderate Fund | 878 | 2017 | ||
| JNL/Franklin Templeton Small Cap Value Fund | 9,318 | 2016-2017 | JNL/S&P Disciplined Moderate Growth Fund | 1,672 | 2017 | ||
| JNL/Goldman Sachs Mid Cap Value Fund | 53,962 | 2016-2017 | JNL/S&P Disciplined Growth Fund | 425 | 2017 | ||
| JNL/JPMorgan International Value Fund | 193,746 | 2016-2017 | JNL/Select Balanced Fund | 47,113 | 2016-2017 | ||
| JNL/JPMorgan MidCap Growth Fund | 165,297 | 2010-2017 | JNL/Select Value Fund | 99,810 | 2016-2017 | ||
| JNL/JPMorgan U.S. Government & Quality Bond Fund | 1,850 | 2014-2017 | JNL/T. Rowe Price Established Growth Fund | 186,983 | 2016-2017 | ||
| JNL/Lazard Emerging Markets Fund | 84,372 | 2016-2017 | JNL/T. Rowe Price Mid-Cap Growth Fund | 25,313 | 2017 | ||
| JNL/Lazard Mid Cap Equity Fund | 82,465 | 2016-2017 | JNL/T. Rowe Price Short-Term Bond Fund | 20,447 | 2017 | ||
| JNL/M&G Global Leaders Fund | 56 | 2016-2017 | JNL/T. Rowe Price Value Fund | 78,342 | 2016-2017 | ||
JNL Series Trust
Notes to the Financial Statements (continued)
At December 31, 2009, the following Funds had capital, currency, and/or passive foreign investment company (“PFIC”) mark to market losses (in thousands) realized after October 31, 2009 (“Post-October” losses), which were deferred for tax purposes to the first day of the following fiscal year:
| Amount | Amount | |||||
| JNL/AIM International Growth Fund | $ 306 | JNL/Lazard Emerging Markets Fund | $ 669 | |||
| JNL/AIM Large Cap Growth Fund | 2 | JNL/M&G Global Leaders Fund | 2 | |||
| JNL/AIM Global Real Estate Fund | 73 | JNL/Mellon Capital Management European 30 Fund | 24 | |||
| JNL/Capital Guardian Global Balanced Fund | 704 | JNL/Mellon Capital Management Pacific Rim 30 Fund | 1 | |||
| JNL/Capital Guardian Global Diversified Research Fund | 1,054 | JNL/Mellon Capital Management International Index Fund | 1,504 | |||
| JNL/Capital Guardian International Small Cap Fund | 1,485 | JNL/Mellon Capital Management Bond Index Fund | 94 | |||
| JNL/Capital Guardian U.S. Growth Equity Fund | 680 | JNL/Mellon Capital Management Global Alpha Fund | 160 | |||
| JNL/Credit Suisse Commodity Securities Fund | 97 | JNL/Oppenheimer Global Growth Fund | 4 | |||
| JNL/Eagle Core Equity Fund | 415 | JNL/PAM Asia ex-Japan Fund | 7 | |||
| JNL/Eagle SmallCap Equity Fund | 80 | JNL/PAM China-India Fund | 80 | |||
| JNL/Franklin Templeton Global Growth Fund | 1,397 | JNL/PPM America High Yield Bond Fund | 923 | |||
| JNL/Franklin Templeton Income Fund | 4,686 | JNL/PPM America Value Equity Fund | 303 | |||
| JNL/Franklin Templeton Mutual Shares Fund | 2,616 | JNL/Red Rocks Listed Private Equity Fund | 13 | |||
| JNL/Franklin Templeton Small Cap Value Fund | 1,467 | JNL/S&P Managed Aggressive Growth Fund | 790 | |||
| JNL/Goldman Sachs Core Plus Bond Fund | 732 | JNL/S&P Dividend Income & Growth Fund | 7,722 | |||
| JNL/Goldman Sachs Mid Cap Value Fund | 683 | JNL/S&P Intrinsic Value Fund | 5,168 | |||
| JNL/Ivy Asset Strategy Fund | 1,758 | JNL/Select Value Fund | 687 | |||
| JNL/JPMorgan International Value Fund | 627 | JNL/T. Rowe Price Established Growth Fund | 3,718 | |||
| JNL/JPMorgan MidCap Growth Fund | 326 | JNL/T. Rowe Price Mid-Cap Growth Fund | 2 | |||
| JNL/JPMorgan U.S. Government & Quality Bond Fund | 5 | JNL/T. Rowe Price Short-Term Bond Fund | 88 |
To the extent there are differences between the amounts recognized for financial statements and federal income tax purposes that are permanent in nature, such amounts (in thousands) are reclassified within the capital accounts based on their federal income tax treatment as indicated below; temporary differences do not require reclassification. Permanent differences may include but are not limited to the following: expired capital loss carryforwards, foreign currency reclassifications, market discount or paydown reclassifications, reclassifications on the sale of PFIC or REIT securities, net operating losses, accounting treatment of notional principal contracts, and distribution adjustments. These reclassifications have no impact on net assets.
| Net Increase (Decrease) | |||||||
| Undistributed | Accumulated | ||||||
| Net Investment | Net Realized | Paid-in | |||||
| Income | Gain (Loss) | Capital | |||||
| JNL Institutional Alt 20 Fund | $ 44 | $ (44) | $ - | ||||
| JNL Institutional Alt 35 Fund | 70 | (70) | - | ||||
| JNL Institutional Alt 50 Fund | 98 | (98) | - | ||||
| JNL Institutional Alt 65 Fund | 66 | (66) | - | ||||
| JNL/AIM International Growth Fund | (277) | 277 | - | ||||
| JNL/AIM Large Cap Growth Fund | 115 | (115) | - | ||||
| JNL/AIM Global Real Estate Fund | 6,146 | (6,146) | - | ||||
| JNL/AIM Small Cap Growth Fund | 119 | 2 | (121) | ||||
| JNL/Capital Guardian Global Balanced Fund | (284) | 284 | - | ||||
| JNL/Capital Guardian Global Diversified Research Fund | (147) | 147 | - | ||||
| JNL/Capital Guardian International Small Cap Fund | 516 | (516) | - | ||||
| JNL/Capital Guardian U.S. Growth Equity Fund | - | 82,408 | (82,408) | ||||
| JNL/Credit Suisse Commodity Securities Fund | (548) | 548 | - | ||||
| JNL/Credit Suisse Long/Short Fund | (9) | 9 | - | ||||
| JNL/Franklin Templeton Global Growth Fund | 592 | (592) | - | ||||
| JNL/Franklin Templeton Income Fund | (179) | 179 | - | ||||
| JNL/Franklin Templeton Mutual Shares Fund | (5,756) | 5,756 | - | ||||
| JNL/Franklin Templeton Small Cap Value Fund | (1) | 1 | - | ||||
| JNL/Goldman Sachs Core Plus Bond Fund | 79 | (79) | - | ||||
| JNL/Goldman Sachs Emerging Markets Debt Fund | 3,560 | (3,560) | - | ||||
| JNL/Ivy Asset Strategy Fund | (102) | 102 | - | ||||
| JNL/JPMorgan International Value Fund | 6,267 | (6,267) | - | ||||
| JNL/JPMorgan MidCap Growth Fund | 295 | 142,496 | (142,791) | ||||
| JNL/JPMorgan U.S. Government & Quality Bond Fund | (586) | 586 | - | ||||
| JNL/Lazard Emerging Markets Fund | (2,530) | 2,530 | - | ||||
| JNL/Lazard Mid Cap Equity Fund | (98) | 98 | - | ||||
JNL Series Trust
Notes to the Financial Statements (continued)
| Net Increase (Decrease) | |||||||
| Undistributed | Accumulated | ||||||
| Net Investment | Net Realized | Paid-in | |||||
| Income | Gain (Loss) | Capital | |||||
| JNL/M&G Global Basics Fund | $ 25 | $ (25) | $ - | ||||
| JNL/M&G Global Leaders Fund | 1 | (1) | - | ||||
| JNL/Mellon Capital Management 10 X 10 Fund | 10 | (10) | - | ||||
| JNL/Mellon Capital Management Index 5 Fund | 21 | (21) | - | ||||
| JNL/Mellon Capital Management European 30 Fund | 27 | (27) | - | ||||
| JNL/Mellon Capital Management Pacific Rim 30 Fund | 10 | (10) | - | ||||
| JNL/Mellon Capital Management S&P 500 Index Fund | (121) | (15,645) | 15,766 | ||||
| JNL/Mellon Capital Management S&P 400 MidCap Index Fund | (351) | 351 | - | ||||
| JNL/Mellon Capital Management International Index Fund | 1,717 | (1,728) | 11 | ||||
| JNL/Mellon Capital Management Bond Index Fund | (18) | 18 | - | ||||
| JNL/Mellon Capital Management Global Alpha Fund | 298 | 83 | (381) | ||||
| JNL/Oppenheimer Global Growth Fund | (201) | 201 | - | ||||
| JNL/PAM Asia ex-Japan Fund | (103) | 103 | - | ||||
| JNL/PAM China-India Fund | (104) | 104 | - | ||||
| JNL/PIMCO Real Return Fund | 703 | (703) | - | ||||
| JNL/PIMCO Total Return Bond Fund | (12,257) | 7,320 | 4,937 | ||||
| JNL/PPM America High Yield Bond Fund | (47) | 15,532 | (15,485) | ||||
| JNL/PPM America Mid Cap Value Fund | (10) | - | 10 | ||||
| JNL/PPM America Small Cap Value Fund | (4) | - | 4 | ||||
| JNL/Red Rocks Listed Private Equity Fund | 1,562 | (1,562) | - | ||||
| JNL/S&P Managed Conservative Fund | 2,799 | (2,799) | - | ||||
| JNL/S&P Managed Moderate Fund | 3,606 | (6,859) | 3,253 | ||||
| JNL/S&P Managed Moderate Growth Fund | 3,868 | (6,106) | 2,238 | ||||
| JNL/S&P Managed Growth Fund | 1,958 | (4,101) | 2,143 | ||||
| JNL/S&P Managed Aggressive Growth Fund | 10 | (10) | - | ||||
| JNL/S&P Disciplined Moderate Fund | 21 | (21) | - | ||||
| JNL/S&P Disciplined Moderate Growth Fund | 7 | (7) | - | ||||
| JNL/S&P Disciplined Growth Fund | 1 | (1) | - | ||||
| JNL/S&P 4 Fund | 127 | - | (127) | ||||
| JNL/Select Balanced Fund | 58 | (58) | - | ||||
| JNL/Select Value Fund | (10) | 10 | - | ||||
| JNL/T. Rowe Price Established Growth Fund | (19) | 19 | - | ||||
| JNL/T. Rowe Price Mid-Cap Growth Fund | 1,505 | 291 | (1,796) | ||||
| JNL/T. Rowe Price Short-Term Bond Fund | 177 | (177) | - | ||||
| JNL/T. Rowe Price Value Fund | 9 | (9) | - | ||||
As of December 31, 2009, the cost of investments, components of net unrealized appreciation/(depreciation), undistributed net ordinary income and undistributed net long-term capital gains for U.S. federal income tax purposes (in thousands) were as follows:
| Tax | Gross | Gross | Net Unrealized | Undistributed | Undistributed | |||||||
| Cost of | Unrealized | Unrealized | Appreciation/ | Net Ordinary | Net Long-Term | |||||||
| Investments | Appreciation | Depreciation | (Depreciation) | Income* | Capital Gain | |||||||
| JNL Institutional Alt 20 Fund | $ 190,551 | $ 10,506 | $ (1,509) | $ 8,997 | $ 2,943 | $ 5 | ||||||
| JNL Institutional Alt 35 Fund | 291,050 | 19,566 | (2,050) | 17,516 | 5,048 | 6 | ||||||
| JNL Institutional Alt 50 Fund | 343,652 | 20,597 | (2,675) | 17,922 | 6,700 | 5 | ||||||
| JNL Institutional Alt 65 Fund | 219,510 | 11,949 | (1,609) | 10,340 | 4,847 | 2 | ||||||
| JNL/AIM International Growth Fund | 442,332 | 40,627 | (36,229) | 4,398 | 3,873 | - | ||||||
| JNL/AIM Large Cap Growth Fund | 574,319 | 87,523 | (20,645) | 66,878 | 2,187 | - | ||||||
| JNL/AIM Global Real Estate Fund | 351,727 | 23,084 | (12,189) | 10,895 | 22,638 | - | ||||||
| JNL/AIM Small Cap Growth Fund | 103,407 | 13,266 | (7,654) | 5,612 | - | - | ||||||
| JNL/Capital Guardian Global Balanced Fund | 280,965 | 25,490 | (9,928) | 15,562 | 3,461 | - | ||||||
| JNL/Capital Guardian Global Diversified Research Fund | 316,576 | 43,727 | (10,200) | 33,527 | 2,800 | - | ||||||
| JNL/Capital Guardian International Small Cap Fund | 150,130 | 18,427 | (12,829) | 5,598 | 2,199 | - | ||||||
| JNL/Capital Guardian U.S. Growth Equity Fund | 559,178 | 74,263 | (19,524) | 54,739 | 1,990 | - | ||||||
| JNL/Credit Suisse Commodity Securities Fund | 630,726 | 77,011 | (15,706) | 61,305 | 2,643 | - | ||||||
| JNL/Credit Suisse Long/Short Fund | 115,926 | 5,483 | (2,436) | 3,047 | 671 | - | ||||||
| JNL/Eagle Core Equity Fund | 83,575 | 9,150 | (6,411) | 2,739 | 509 | - | ||||||
* Undistributed net ordinary income consists of net taxable income derived from dividends, interest and net short-term capital gains, if any.
JNL Series Trust
Notes to the Financial Statements (continued)
| Tax | Gross | Gross | Net Unrealized | Undistributed | Undistributed | |||||||
| Cost of | Unrealized | Unrealized | Appreciation/ | Net Ordinary | Net Long-Term | |||||||
| Investments | Appreciation | Depreciation | (Depreciation) | Income* | Capital Gain | |||||||
| JNL/Eagle SmallCap Equity Fund | $ 291,567 | $ 54,778 | $ (18,870) | $ 35,908 | $ 680 | $ - | ||||||
| JNL/Franklin Templeton Founding Strategy Fund | 1,031,305 | (12,303) | (180,191) | (192,494) | 27,416 | - | ||||||
| JNL/Franklin Templeton Global Growth Fund | 424,938 | 30,920 | (75,033) | (44,113) | 5,699 | - | ||||||
| JNL/Franklin Templeton Income Fund | 872,412 | 42,878 | (85,746) | (42,868) | 35,008 | - | ||||||
| JNL/Franklin Templeton Mutual Shares Fund | 461,171 | 31,966 | (54,382) | (22,416) | 115 | - | ||||||
| JNL/Franklin Templeton Small Cap Value Fund | 190,806 | 23,260 | (25,103) | (1,843) | 1044 | - | ||||||
| JNL/Goldman Sachs Core Plus Bond Fund | 864,564 | 18,131 | (40,027) | (21,896) | 36086 | - | ||||||
| JNL/Goldman Sachs Emerging Markets Debt Fund | 182,519 | 6,627 | (1,513) | 5,114 | 7,784 | 243 | ||||||
| JNL/Goldman Sachs Mid Cap Value Fund | 288,788 | 32,082 | (10,194) | 21,888 | 1,427 | - | ||||||
| JNL/Ivy Asset Strategy Fund | 197,860 | 13,242 | (9,969) | 3,273 | 99 | - | ||||||
| JNL/JPMorgan International Value Fund | 558,706 | 60,291 | (44,752) | 15,539 | 14,931 | - | ||||||
| JNL/JPMorgan MidCap Growth Fund | 166,820 | 25,063 | (8,990) | 16,073 | - | - | ||||||
| JNL/JPMorgan U.S. Government & Quality Bond Fund | 747,514 | 26,241 | (12,365) | 13,876 | 24,729 | - | ||||||
| JNL/Lazard Emerging Markets Fund | 661,238 | 117,049 | (17,587) | 99,462 | 5,665 | - | ||||||
| JNL/Lazard Mid Cap Equity Fund | 165,857 | 19,694 | (8,600) | 11,094 | 933 | - | ||||||
| JNL/M&G Global Basics Fund | 27,049 | 4,113 | (414) | 3,699 | 91 | 270 | ||||||
| JNL/M&G Global Leaders Fund | 15,563 | 2,563 | (282) | 2,281 | 2 | - | ||||||
| JNL/Mellon Capital Management 10 X 10 Fund | 222,092 | 5,202 | (32,790) | (27,588) | 4,451 | 116 | ||||||
| JNL/Mellon Capital Management Index 5 Fund | 198,237 | 16,916 | (10,191) | 6,725 | 2,897 | 219 | ||||||
| JNL/Mellon Capital Management European 30 Fund | 12,750 | 1,207 | (379) | 828 | 95 | - | ||||||
| JNL/Mellon Capital Management Pacific Rim 30 Fund | 16,253 | 1,906 | (485) | 1,421 | 5 | - | ||||||
| JNL/Mellon Capital Management S&P 500 Index Fund | 933,559 | 56,585 | (45,226) | 11,359 | 580 | - | ||||||
| JNL/Mellon Capital Management S&P 400 | ||||||||||||
| MidCap Index Fund | 570,050 | 19,979 | (46,804) | (26,825) | 3,799 | - | ||||||
| JNL/Mellon Capital Management Small Cap Index Fund | 579,286 | 31,693 | (41,151) | (9,458) | 3,836 | - | ||||||
| JNL/Mellon Capital Management International Index Fund | 784,600 | 34,966 | (51,206) | (16,240) | 5,815 | - | ||||||
| JNL/Mellon Capital Management Bond Index Fund | 855,766 | 14,334 | (7,571) | 6,763 | 9,226 | - | ||||||
| JNL/Mellon Capital Management Global Alpha Fund | 66,496 | 1 | (1) | - | - | 43 | ||||||
| JNL/Oppenheimer Global Growth Fund | 313,798 | 35,727 | (39,306) | (3,579) | 2,821 | - | ||||||
| JNL/PAM Asia ex-Japan Fund | 100,080 | 14,926 | (3,046) | 11,880 | 140 | - | ||||||
| JNL/PAM China-India Fund | 217,312 | 34,771 | (5,400) | 29,371 | 2,465 | 1,023 | ||||||
| JNL/PIMCO Real Return Fund | 1,756,015 | 16,236 | (39,209) | (22,973) | 53,623 | 3,144 | ||||||
| JNL/PIMCO Total Return Bond Fund | 2,621,106 | 50,578 | (48,488) | 2,090 | 28,934 | 9,398 | ||||||
| JNL/PPM America High Yield Bond Fund | 613,805 | 48,560 | (16,742) | 31,818 | 3,004 | - | ||||||
| JNL/PPM America Mid Cap Value Fund | 21,266 | 1,482 | (416) | 1,066 | 2 | - | ||||||
| JNL/PPM America Small Cap Value Fund | 21,355 | 1,206 | (700) | 506 | 5 | - | ||||||
| JNL/PPM America Value Equity Fund | 96,194 | 8,421 | (4,700) | 3,721 | 1,224 | - | ||||||
| JNL/Red Rocks Listed Private Equity Fund | 213,240 | 24,790 | (4,561) | 20,229 | 2,715 | 472 | ||||||
| JNL/S&P Managed Conservative Fund | 642,548 | 12,266 | (30,757) | (18,491) | 9,764 | - | ||||||
| JNL/S&P Managed Moderate Fund | 1,064,956 | 35,313 | (78,785) | (43,472) | 15,218 | - | ||||||
| JNL/S&P Managed Moderate Growth Fund | 1,882,252 | 96,427 | (203,445) | (107,018) | 30,938 | - | ||||||
| JNL/S&P Managed Growth Fund | 1,625,628 | 65,797 | (211,448) | (145,651) | 17,998 | - | ||||||
| JNL/S&P Managed Aggressive Growth Fund | 675,523 | 10,047 | (102,599) | (92,552) | 4,942 | - | ||||||
| JNL/S&P Disciplined Moderate Fund | 170,430 | 8,500 | (10,449) | (1,949) | 2,774 | - | ||||||
| JNL/S&P Disciplined Moderate Growth Fund | 212,405 | 7,216 | (13,223) | (6,007) | 3,418 | - | ||||||
| JNL/S&P Disciplined Growth Fund | 82,251 | 1,483 | (2,858) | (1,375) | 1,410 | - | ||||||
| JNL/S&P Competitive Advantage Fund | 244,553 | 22,616 | (5,102) | 17,514 | 12,840 | 370 | ||||||
| JNL/S&P Dividend Income & Growth Fund | �� 242,867 | 13,503 | (6,289) | 7,214 | 21,151 | 13 | ||||||
| JNL/S&P Intrinsic Value Fund | 247,248 | 12,195 | (3,012) | 9,183 | 33,179 | 17 | ||||||
| JNL/S&P Total Yield Fund | 233,106 | 13,523 | (5,845) | 7,678 | 6,019 | 1,546 | ||||||
| JNL/S&P 4 Fund | 547,721 | 86,609 | (6,889) | 79,720 | - | 559 | ||||||
| JNL/Select Balanced Fund | 740,076 | 70,533 | (21,501) | 49,032 | 13,936 | - | ||||||
| JNL/Select Money Market Fund | 1,145,943 | - | - | - | 21 | - | ||||||
| JNL/Select Value Fund | 750,909 | 100,315 | (43,553) | 56,762 | 9,591 | - | ||||||
| JNL/T. Rowe Price Established Growth Fund | 861,671 | 157,023 | (27,321) | 129,702 | 563 | - | ||||||
| JNL/T. Rowe Price Mid-Cap Growth Fund | 880,158 | 150,064 | (55,505) | 94,559 | - | - | ||||||
| JNL/T. Rowe Price Short-Term Bond Fund | 495,245 | 5,759 | (6,559) | (800) | 9,875 | - | ||||||
| JNL/T. Rowe Price Value Fund | 769,023 | 97,570 | (99,512) | (1,942) | 9,956 | - | ||||||
* Undistributed net ordinary income consists of net taxable income derived from dividends, interest and net short-term capital gains, if any.
JNL Series Trust
Notes to the Financial Statements (continued)
The tax character of distributions paid (in thousands) during the period ended December 31, 2009 was as follows:
| Net Ordinary | Long-term | Net Ordinary | Long-term | ||||
| Income* | Capital Gain** | Income* | Capital Gain** | ||||
| JNL/AIM International Growth Fund | $ 8,057 | $ - | JNL/Mellon Capital Management Small Cap | ||||
| JNL/AIM Large Cap Growth Fund | 1,467 | - | Index Fund | $ 3,324 | 2,300 | ||
| JNL/AIM Global Real Estate Fund | 6,185 | - | JNL/Mellon Capital Management International | ||||
| JNL/Capital Guardian Global Balanced Fund | 5,564 | - | Index Fund | 15,689 | 49 | ||
| JNL/Capital Guardian Global Diversified | JNL/Mellon Capital Management Bond Index Fund | 20,350 | 41 | ||||
| Research Fund | 4,300 | - | JNL/Oppenheimer Global Growth Fund | 3,563 | 14,502 | ||
| JNL/Capital Guardian International Small Cap Fund | 1,566 | - | JNL/PAM Asia ex-Japan Fund | 5 | - | ||
| JNL/Capital Guardian U.S. Growth Equity Fund | 674 | - | JNL/PIMCO Real Return Fund | 26,838 | - | ||
| JNL/Credit Suisse Commodity Securities Fund | 4,274 | - | JNL/PIMCO Total Return Bond Fund | 108,793 | 4,500 | ||
| JNL/Credit Suisse Long/Short Fund | 570 | - | JNL/PPM America High Yield Bond Fund | 32,394 | - | ||
| JNL/Eagle Core Equity Fund | 842 | - | JNL/PPM America Mid Cap Value Fund | 86 | - | ||
| JNL/Franklin Templeton Founding Strategy Fund | 449 | - | JNL/PPM America Small Cap Value Fund | 77 | - | ||
| JNL/Franklin Templeton Global Growth Fund | 5,602 | - | JNL/PPM America Value Equity Fund | 4,090 | - | ||
| JNL/Franklin Templeton Income Fund | 38,708 | - | JNL/Red Rocks Listed Private Equity Fund | 6,775 | - | ||
| JNL/Franklin Templeton Mutual Shares Fund | 13,028 | - | JNL/S&P Managed Conservative Fund | 10,219 | 5,948 | ||
| JNL/Franklin Templeton Small Cap Value Fund | 1,070 | - | JNL/S&P Managed Moderate Fund | 11,077 | 11,102 | ||
| JNL/Goldman Sachs Core Plus Bond Fund | 31,690 | 2,940 | JNL/S&P Managed Moderate Growth Fund | 10,776 | 40,252 | ||
| JNL/Goldman Sachs Emerging Markets Debt Fund | 150 | - | JNL/S&P Managed Growth Fund | 23,405 | 44,252 | ||
| JNL/Goldman Sachs Mid Cap Value Fund | 2,460 | - | JNL/S&P Managed Aggressive Growth Fund | 11,203 | 17,264 | ||
| JNL/JPMorgan International Value Fund | 19,883 | - | JNL/S&P Disciplined Moderate Fund | 2,845 | 1,066 | ||
| JNL/JPMorgan U.S. Government & Quality | JNL/S&P Disciplined Moderate Growth Fund | 3,991 | 2,254 | ||||
| Bond Fund | 17,148 | - | JNL/S&P Disciplined Growth Fund | 1,712 | 992 | ||
| JNL/Lazard Emerging Markets Fund | 9,742 | - | JNL/S&P Competitive Advantage Fund | 27 | - | ||
| JNL/Lazard Mid Cap Equity Fund | 1,101 | - | JNL/S&P Dividend Income & Growth Fund | 57 | - | ||
| JNL/M&G Global Basics Fund | 186 | 36 | JNL/S&P Intrinsic Value Fund | 46 | - | ||
| JNL/M&G Global Leaders Fund | 95 | - | JNL/S&P Total Yield Fund | 33 | - | ||
| JNL/Mellon Capital Management 10 X 10 Fund | 6,552 | 6,382 | JNL/S&P 4 Fund | 5,196 | - | ||
| JNL/Mellon Capital Management Index 5 Fund | 1,700 | 1,937 | JNL/Select Balanced Fund | 15,798 | - | ||
| JNL/Mellon Capital Management European 30 Fund | 825 | 9 | JNL/Select Money Market Fund | 2,068 | - | ||
| JNL/Mellon Capital Management Pacific Rim 30 Fund | 868 | 11 | JNL/Select Value Fund | 10,354 | - | ||
| JNL/Mellon Capital Management S&P 500 Index Fund | 11,232 | - | JNL/T. Rowe Price Established Growth Fund | 2,260 | - | ||
| JNL/Mellon Capital Management S&P 400 | JNL/T. Rowe Price Mid-Cap Growth Fund | 291 | 140 | ||||
| MidCap Index Fund | 4,539 | - | JNL/T. Rowe Price Short-Term Bond Fund | 13,187 | 4,270 | ||
| JNL/T. Rowe Price Value Fund | 9,649 | - | |||||
* Undistributed net ordinary income consists of net taxable income derived from dividends, interest and net short-term capital gains, if any.
** The Funds designated as a long-term capital gain dividend, pursuant to the Internal Revenue Code Section 852(b)(3), the amount necessary to reduce earnings and profits
of the Funds related to net capital to zero for the year ended December 31, 2009.
The tax character of distributions paid (in thousands) during the period ended December 31, 2008 was as follows:
| Net Ordinary | Long-term | Net Ordinary | Long-term | ||||
| Income* | Capital Gain | Income* | Capital Gain | ||||
| JNL/AIM International Growth Fund | $ 3,542 | $ 64,582 | JNL/Franklin Templeton Mutual Shares Fund | $ 784 | $ 106 | ||
| JNL/AIM Large Cap Growth Fund | 672 | 22,265 | JNL/Franklin Templeton Small Cap Value Fund | 1,484 | 8,980 | ||
| JNL/AIM Global Real Estate Fund | 9,973 | 25,374 | JNL/Goldman Sachs Core Plus Bond Fund | 27,116 | 5,959 | ||
| JNL/AIM Small Cap Growth Fund | 383 | 5,616 | JNL/Goldman Sachs Mid Cap Value Fund | 6,567 | 19,137 | ||
| JNL/Capital Guardian Global Balanced Fund | 4,213 | 20,868 | JNL/JPMorgan International Value Fund | 45,607 | 47,325 | ||
| JNL/Capital Guardian International Small Cap Fund | 89 | - | JNL/JPMorgan U.S. Government & Quality Bond Fund | 11,676 | - | ||
| JNL/Capital Guardian U.S. Growth Equity Fund | 7 | - | JNL/Lazard Emerging Markets Fund | 22,924 | 14,272 | ||
| JNL/Credit Suisse Commodity Securities Fund | 13,149 | - | JNL/Lazard Mid Cap Equity Fund | 2,403 | 812 | ||
| JNL/Credit Suisse Long/Short Fund | 3,582 | - | JNL/M&G Global Leaders Fund | 4 | - | ||
| JNL/Eagle Core Equity Fund | 9,919 | 8,274 | JNL/Mellon Capital Management 10 x 10 Fund | 1,215 | 751 | ||
| JNL/Eagle SmallCap Equity Fund | 1,047 | 9,713 | JNL/Mellon Capital Management Index 5 Fund | 665 | 776 | ||
| JNL/Franklin Templeton Founding Strategy Fund | 10,451 | 245 | JNL/Mellon Capital Management European 30 Fund | 9 | - | ||
| JNL/Franklin Templeton Global Growth Fund | 73 | - | JNL/Mellon Capital Management S&P 500 Index Fund | 9,913 | - | ||
| JNL/Franklin Templeton Income Fund | 469 | - |
JNL Series Trust
Notes to the Financial Statements (continued)
| Net Ordinary | Long-term | Net Ordinary | Long-term | ||||
| Income* | Capital Gain | Income* | Capital Gain | ||||
| JNL/Mellon Capital Management S&P 400 MidCap | JNL/S&P Managed Moderate Growth Fund | $ 31,550 | $ 49,329 | ||||
| Index Fund | $ 5,690 | $ 26,108 | JNL/S&P Managed Growth Fund | 15,351 | 74,776 | ||
| JNL/Mellon Capital Management Small | JNL/S&P Managed Aggressive Growth Fund | 8,967 | 21,342 | ||||
| Cap Index Fund | 5,622 | 16,066 | JNL/S&P Disciplined Moderate Fund | 716 | 212 | ||
| JNL/Mellon Capital Management International | JNL/S&P Disciplined Moderate Growth Fund | 997 | 310 | ||||
| Index Fund | 11,025 | 11,442 | JNL/S&P Disciplined Growth Fund | 432 | 154 | ||
| JNL/Mellon Capital Management Bond Index Fund | 17,239 | - | JNL/S&P Competitive Advantage Fund | 1,309 | - | ||
| JNL/Oppenheimer Global Growth Fund | 3,766 | 31,212 | JNL/S&P Dividend Income & Growth Fund | 2,683 | - | ||
| JNL/PAM Asia ex-Japan Fund | 145 | - | JNL/S&P Intrinsic Value Fund | 2,192 | - | ||
| JNL/PIMCO Real Return Fund | 45,489 | - | JNL/S&P Total Yield Fund | 1,612 | - | ||
| JNL/PIMCO Total Return Bond Fund | 87,169 | 23,345 | JNL/S&P 4 Fund | 12 | - | ||
| JNL/PPM America High Yield Bond Fund | 21,562 | - | JNL/Select Balanced Fund | 16,194 | 18,148 | ||
| JNL/PPM America Mid Cap Value Fund | 68 | - | JNL/Select Money Market Fund | 21,222 | - | ||
| JNL/PPM America Small Cap Value Fund | 57 | - | JNL/Select Value Fund | 4,544 | 6,144 | ||
| JNL/PPM America Value Equity Fund | 15,058 | 5,423 | JNL/T. Rowe Price Established Growth Fund | 742 | 6,431 | ||
| JNL/Red Rocks Listed Private Equity Fund | 71 | - | JNL/T. Rowe Price Mid-Cap Growth Fund | 4,765 | 39,071 | ||
| JNL/S&P Managed Conservative Fund | 17,424 | 4,897 | JNL/T. Rowe Price Short-Term Bond Fund | 13,386 | 1,296 | ||
| JNL/S&P Managed Moderate Fund | 24,120 | 13,244 | JNL/T. Rowe Price Value Fund | 17,477 | 60,864 | ||
* Undistributed net ordinary income consists of net taxable income derived from dividends, interest and net short-term capital gains, if any.
FASB ASC Topic 740 “Income Taxes” provides guidance for how uncertain tax positions should be recognized, measured, presented and disclosed in the financial statements. FASB ASC Topic 740 requires the evaluation of tax positions taken or expected to be taken in the course of preparing each Fund’s tax return to determine whether the tax positions are “more-likely-than-not” of being sustained by the applicable tax authority. Tax positions not deemed to meet the “more-likely-than-not” threshold would be recorded as a tax expense in the current year. FASB ASC Topic 740 requires that management evaluate the tax positions taken in returns for 2006, 2007, 2008, and 2009, which remain subject to examination, by the Internal Revenue Service. These returns are not subject to examination by any other tax jurisdictions. Management completed an evaluation of the Funds’ tax positions and based on that evaluation, determined that no provision for federal income tax was required in the Funds’ financial statements during the period ended December 31, 2009.
NOTE 8. FUND ACQUISITIONS
The following table includes information (in thousands) relating to acquisitions that were completed on April 6, 2009 by a taxable exchange of Class A and B shares, as applicable, pursuant to a plan of reorganization approved by the Board on December 10, 2008. The purpose of the acquisitions was to combine Funds managed by the Adviser with comparable investment objectives and strategies. For financial reporting purposes, shares were issued at NAV based on the fair value of the assets received by the acquiring Funds.
| Net Assets of | Shares of | Net Assets of | Shares | ||||
| Acquiring Fund | Merger | Acquiring | Acquired Fund | Outstanding of | |||
| on Acquisition | Tax | Fund Issued | on Acquisition | Acquired Fund on | |||
| Acquiring Fund | Date | Status | In Exchange | Acquired Fund | Date | Acquisition Date | |
| JNL/Mellon Capital Management S&P 500 Index Fund | JNL/Mellon Capital Management Enhanced S&P 500 Stock Index Fund | ||||||
| Class A | $ 458,843 | Taxable | 6,599 | Class A | $ 46,613 | 11,520 | |
| Class B | 9,171 | Taxable | 20 | Class B | 142 | 36 | |
| JNL/Mellon Capital Management Small Cap Index Fund | JNL/Lazard Small Cap Equity Fund | ||||||
| Class A | 229,419 | Taxable | 8,656 | Class A | 63,228 | 10,966 | |
| Class B | 2,750 | Taxable | 23 | Class B | 171 | 29 | |
| JNL/S&P Disciplined Growth Fund | JNL/S&P Growth Retirement Strategy Fund | ||||||
| Class A | 30,247 | Taxable | 91 | Class A | 537 | 88 | |
| JNL/S&P Disciplined Moderate Growth Fund | JNL/S&P Moderate Growth Retirement Strategy Fund | ||||||
| Class A | 78,237 | Taxable | 89 | Class A | 570 | 88 | |
| JNL/S&P Disciplined Moderate Fund | JNL/S&P Moderate Retirement Strategy Fund | ||||||
| Class A | 69,545 | Taxable | 146 | Class A | 1,090 | 154 | |
JNL Series Trust
Notes to the Financial Statements (continued)
The following tables include information (in thousands) relating to acquisitions that were completed on September 28, 2009 by a tax free exchange of Class A and B shares, as applicable, pursuant to a plan of reorganization approved by the Board on June 11, 2009. The purpose of the acquisitions was to combine Funds managed by the Adviser with comparable investment objectives and strategies. For financial reporting purposes, shares were issued at NAV based on the fair value of the assets received by the acquiring Funds. However, the cost basis of the investments received from the acquired Funds was carried forward to align ongoing reporting of the acquiring Funds’ realized and unrealized gains and losses with amounts distributable to shareholders for tax purposes.
| Net Assets of | Shares of | Net Assets of | Shares | ||||
| Acquiring Fund | Merger | Acquiring | Acquired Fund | Outstanding of | |||
| on Acquisition | Tax | Fund Issued | on Acquisition | Acquired Fund on | |||
| Acquiring Fund | Date | Status | In Exchange | Acquired Fund | Date | Acquisition Date | |
| JNL/Mellon Capital Management S&P 500 Index Fund | JNL/PPM America Core Equity Fund | ||||||
| Class A | $ 744,712 | Tax Free | 5,448 | Class A | $ 48,277 | 3,286 | |
| Class B | 10,523 | Tax Free | 13 | Class B | 117 | 8 | |
| JNL/S&P Managed Moderate Fund | JNL/S&P Retirement Income Fund | ||||||
| Class A | 811,413 | Tax Free | 6,456 | Class A | 66,649 | 6,854 | |
| JNL/S&P Managed Growth Fund | JNL/S&P Retirement 2020 Fund | ||||||
| Class A | 1,212,298 | Tax Free | 3,049 | Class A | 29,382 | 3,299 | |
| JNL/S&P Retirement 2025 Fund | |||||||
| 1,642 | Class A | 15,824 | 1,815 | ||||
| JNL/S&P Managed Moderate Growth Fund | JNL/S&P Retirement 2015 Fund | ||||||
| Class A | 1,465,652 | Tax Free | 4,985 | Class A | 51,820 | 5,545 | |
The following information (in thousands) pertains to the acquired Funds involved in a tax free exchange immediately prior to such acquisition.
| Net Unrealized | Undistributed | Accumulated | Capital | |||
| Cost of | Value of | Appreciation/ | Net Investment | Net Realized | Loss | |
| Acquired Fund | Investments | Investments | (Depreciation) | Loss | Loss | Carryovers |
| JNL/PPM America Core Equity Fund | $ 49,465 | $ 48,369 | $ �� (1,096) | $ (2) | $ (115,674) | $ (112,790) |
| JNL/S&P Retirement Income Fund | 66,149 | 66,650 | 501 | (1) | (4,338) | (3,253) |
| JNL/S&P Retirement 2020 Fund | 29,122 | 29,383 | 261 | - | (1,768) | (1,163) |
| JNL/S&P Retirement 2025 Fund | 15,498 | 15,824 | 326 | - | (1,505) | (981) |
| JNL/S&P Retirement 2015 Fund | 53,045 | 51,821 | (1,224) | (1) | (3,384) | (2,238) |
The acquired Funds made liquidating distributions from ordinary income (in thousands) as follows:
| Ordinary | Long-Term | |
| Acquired Fund | Income | Capital Gains |
| JNL/Mellon Capital Management Enhanced S&P 500 Stock Index Fund | ||
Class A | $ 1,282 | $ - |
Class B | 4 | - |
| JNL/Lazard Small Cap Equity Fund | ||
Class A | 298 | - |
Class B | 1 | - |
| JNL/S&P Growth Retirement Strategy Fund | ||
Class A | 3 | - |
| JNL/S&P Moderate Growth Retirement Strategy Fund | ||
Class A | 4 | - |
| JNL/S&P Moderate Retirement Strategy Fund | ||
Class A | 16 | - |
| JNL/PPM America Core Equity Fund | ||
Class A | 3,081 | - |
Class B | 9 | - |
| JNL/S&P Retirement Income Fund | ||
Class A | 2,060 | 1,298 |
| JNL/S&P Retirement 2020 Fund | ||
Class A | 376 | 525 |
| JNL/S&P Retirement 2025 Fund | ||
Class A | 204 | 317 |
| JNL/S&P Retirement 2015 Fund | ||
Class A | 982 | - |
JNL Series Trust
Notes to the Financial Statements (continued)
Assuming the April 6 and September 28, 2009 acquisitions had been completed on January 1, 2009, the acquiring Funds’ pro forma results of operations (in thousands) for the year ended December 31, 2009, would have been:
| Net Change | ||||
| Net | Net | in Unrealized | Net Increase | |
| Investment | Realized | Appreciation/ | in Net Assets | |
| Acquiring Fund | Income | Loss | (Depreciation) | from Operations |
| JNL/Mellon Capital Management S&P 500 Index Fund | $ 12,208 | $ (49,787) | $ 212,835 | $ 175,256 |
| JNL/Mellon Capital Management Small Cap Index Fund | 3,905 | (44,443) | 141,469 | 100,931 |
| JNL/S&P Disciplined Growth Fund | 1,409 | (8,491) | 20,682 | 13,600 |
| JNL/S&P Disciplined Moderate Growth Fund | 3,413 | (14,332) | 39,967 | 29,048 |
| JNL/S&P Disciplined Moderate Fund | 2,759 | (4,682) | 21,869 | 19,946 |
| JNL/S&P Managed Moderate Fund | 18,495 | (23,133) | 137,168 | 132,530 |
| JNL/S&P Managed Growth Fund | 15,992 | (39,152) | 295,621 | 272,461 |
| JNL/S&P Managed Moderate Growth Fund | 27,008 | (28,054) | 283,856 | 282,810 |
Because the combined investment portfolios have been managed as a single integrated portfolio since the acquisitions were completed, it is not practicable to separate the amounts of net investment income and gain (loss) of the acquired Funds that have been included in the respective acquiring Funds' Statements of Operations since April 6 and September 28, 2009 for the respective acquisitions.
NOTE 9. SUBSEQUENT EVENTS
Management has evaluated subsequent events for the Funds through the date the financial statements are available to be issued, and has concluded there are no events
that require financial statement disclosure and/or adjustments to the financial statements.
In January 2010, the FASB issued Accounting Standards Update (“ASU”) No. 2010-06 "Improving Disclosures about Fair Value Measurements". ASU 2010-06 clarifies existing disclosure and requires additional disclosures regarding fair value measurements. Effective for interim and annual reporting periods beginning after December 15, 2009, entities will be required to disclose significant transfers into and out of Level 1 and 2 measurements in the fair value hierarchy and the reasons for those transfers. Effective for fiscal years beginning after December 15, 2010, and for interim periods within those fiscal years, entities will need to disclose information about purchases, sales, issuances and settlements of Level 3 securities on a gross basis, rather than as a net number as currently required. Management is currently evaluating the impact ASU No. 2010-06 will have on its financial statement disclosures.
Report of Independent Registered Public Accounting Firm
To the Shareholders and Board of Trustees
JNL Series Trust:
We have audited the accompanying statements of assets and liabilities, including the schedules of investments, of each series within JNL Series Trust (the “Funds”) as listed in Note 1 of the financial statements as of December 31, 2009, and the related statements of operations for the year or period then ended, the statement of cash flows for the year then ended with respect to JNL/Credit Suisse Long/Short Fund, the statements of changes in net assets for each of the years or periods indicated herein, and the financial highlights for each of the years or periods indicated herein. These financial statements and financial highlights are the responsibility of the Funds’ management. Our responsibility is to express an opinion on these financial statements and financial highlights based on our audits.
We conducted our audits in accordance with the standards of the Public Company Accounting Oversight Board (United States). Those standards require that we plan and perform the audit to obtain reasonable assurance about whether the financial statements and financial highlights are free of material misstatement. An audit includes examining, on a test basis, evidence supporting the amounts and disclosures in the financial statements. Our procedures included confirmation of securities owned as of December 31, 2009, by correspondence with the custodian and brokers or other appropriate auditing procedures. An audit also includes assessing the accounting principles used and significant estimates made by management, as well as evaluating the overall financial statement presentation. We believe that our audits provide a reasonable basis for our opinion.
In our opinion, the financial statements and financial highlights referred to above present fairly, in all material respects, the financial position of the Funds as of December 31, 2009, the results of their operations, JNL/Credit Suisse Long/Short Fund’s cash flows, changes in their net assets and the financial highlights for each of the years or periods indicated herein, in conformity with U.S. generally accepted accounting principles.
KPMG LLP
February 25, 2010
Disclosure of Fund Expenses (Unaudited)
Shareholders incur ongoing costs, which include costs for portfolio management, administrative services, 12b-1 fees (Class A shares of certain Funds) and other operating expenses. Operating expenses such as these are deducted from each Fund's gross income and directly reduce the final investment return. These expenses are expressed as a percentage of the Fund's average net assets; this percentage is known as the Fund's expense ratio. The examples below use the expense ratio and are intended to help the investor understand the ongoing costs (in dollars) of investing in a Fund and to compare these costs with the ongoing costs of investing in other mutual funds. The examples are based on an investment of $1,000 made at the beginning of the period shown and held for the entire period. The examples do not reflect the expenses of the variable insurance contracts or the separate account and the total expenses would be higher if they were included.
Expenses Using Actual Fund Return. This section provides information about the actual account values and actual expenses incurred by the Fund. Use the information in this section, together with the amount invested, to estimate the expenses paid over the period. Simply divide the account value by $1,000 (for example, an $8,600 account value divided by $1,000 = 8.6), then multiply the result by the number in the first section under the heading entitled "Expenses Paid During Period" to estimate the expenses paid during this period.
Expenses Using Hypothetical 5% Return. The information in this section can be used to compare each Fund's costs with those of other mutual funds. It assumes that the Fund had an annual 5% return before expenses during the year, but that the expense ratio for the period is unchanged. This example is useful in making comparisons because the SEC requires all mutual funds to make the 5% calculation.
| Expenses Using Actual Fund Return | Expenses Using Hypothetical 5% Return | ||||||||||||||
| Beginning | Expenses | Expenses | |||||||||||||
| Account | Account | Annualized | Paid | Account | Account | Annualized | Paid | ||||||||
| Value | Value | Expense | During | Value | Value | Expense | During | ||||||||
| 7/1/2009 | 12/31/2009 | Ratios | Period | 7/1/2009 | 12/31/2009 | Ratios | Period | ||||||||
| JNL Institutional Alt 20 Fund | |||||||||||||||
| Class A | $1,000.00 | $1,155.20 | 0.20 | % | $ 1.09 | $1,000.00 | $1,023.21 | 0.20 | % | $ 1.02 | |||||
| JNL Institutional Alt 35 Fund | |||||||||||||||
| Class A | 1,000.00 | 1,176.90 | 0.20 | 1.10 | 1,000.00 | 1,023.21 | 0.20 | 1.02 | |||||||
| JNL Institutional Alt 50 Fund | |||||||||||||||
| Class A | 1,000.00 | 1,187.20 | 0.20 | 1.10 | 1,000.00 | 1,023.21 | 0.20 | 1.02 | |||||||
| JNL Institutional Alt 65 Fund | |||||||||||||||
| Class A | 1,000.00 | 1,202.20 | 0.20 | 1.11 | 1,000.00 | 1,023.21 | 0.20 | 1.02 | |||||||
| JNL/AIM International Growth Fund | |||||||||||||||
| Class A | 1,000.00 | 1,224.00 | 1.03 | 5.77 | 1,000.00 | 1,014.91 | 1.03 | 5.23 | |||||||
| Class B | 1,000.00 | 1,225.30 | 0.83 | 4.66 | 1,000.00 | 1,016.91 | 0.83 | 4.22 | |||||||
| JNL/AIM Large Cap Growth Fund | |||||||||||||||
| Class A | 1,000.00 | 1,193.40 | 0.97 | 5.36 | 1,000.00 | 1,015.51 | 0.97 | 4.93 | |||||||
| Class B | 1,000.00 | 1,193.70 | 0.77 | 4.26 | 1,000.00 | 1,017.51 | 0.77 | 3.92 | |||||||
| JNL/AIM Global Real Estate Fund | |||||||||||||||
| Class A | 1,000.00 | 1,274.70 | 1.07 | 6.13 | 1,000.00 | 1,014.51 | 1.07 | 5.43 | |||||||
| Class B | 1,000.00 | 1,276.00 | 0.87 | 4.99 | 1,000.00 | 1,016.51 | 0.87 | 4.42 | |||||||
| JNL/AIM Small Cap Growth Fund | |||||||||||||||
| Class A | 1,000.00 | 1,196.50 | 1.16 | 6.42 | 1,000.00 | 1,013.61 | 1.16 | 5.89 | |||||||
| Class B | 1,000.00 | 1,197.20 | 0.96 | 5.32 | 1,000.00 | 1,015.61 | 0.96 | 4.88 | |||||||
| JNL/Capital Guardian Global Balanced Fund | |||||||||||||||
| Class A | 1,000.00 | 1,161.60 | 1.01 | 5.50 | 1,000.00 | 1,015.11 | 1.01 | 5.13 | |||||||
| Class B | 1,000.00 | 1,161.00 | 0.81 | 4.41 | 1,000.00 | 1,017.11 | 0.81 | 4.12 | |||||||
| JNL/Capital Guardian Global Diversified Research Fund | |||||||||||||||
| Class A | 1,000.00 | 1,213.80 | 1.08 | 6.03 | 1,000.00 | 1,014.41 | 1.08 | 5.48 | |||||||
| Class B | 1,000.00 | 1,214.50 | 0.88 | 4.91 | 1,000.00 | 1,016.41 | 0.88 | 4.47 | |||||||
| JNL/Capital Guardian International Small Cap Fund | |||||||||||||||
| Class A | 1,000.00 | 1,221.80 | 1.30 | 7.28 | 1,000.00 | 1,012.21 | 1.30 | 6.59 | |||||||
| Class B | 1,000.00 | 1,223.90 | 1.10 | 6.17 | 1,000.00 | 1,014.21 | 1.10 | 5.58 | |||||||
| JNL/Capital Guardian U.S. Growth Equity Fund | |||||||||||||||
| Class A | 1,000.00 | 1,205.20 | 0.97 | 5.39 | 1,000.00 | 1,015.51 | 0.97 | 4.93 | |||||||
| Class B | 1,000.00 | 1,206.20 | 0.77 | 4.28 | 1,000.00 | 1,017.51 | 0.77 | 3.92 | |||||||
| JNL/Credit Suisse Commodity Securities Fund | |||||||||||||||
| Class A | 1,000.00 | 1,256.70 | 1.02 | 5.80 | 1,000.00 | 1,015.01 | 1.02 | 5.18 | |||||||
| Class B | 1,000.00 | 1,258.80 | 0.82 | 4.67 | 1,000.00 | 1,017.01 | 0.82 | 4.17 | |||||||
| JNL/Credit Suisse Long/Short Fund | |||||||||||||||
| Class A | 1,000.00 | 1,212.90 | 1.51 | 8.42 | 1,000.00 | 1,010.11 | 1.51 | 7.65 | |||||||
| Class B | 1,000.00 | 1,213.10 | 1.31 | 7.31 | 1,000.00 | 1,012.11 | 1.31 | 6.64 | |||||||
Disclosure of Fund Expenses (Unaudited) (continued)
| Expenses Using Actual Fund Return | Expenses Using Hypothetical 5% Return | ||||||||||||||
| Beginning | Expenses | Expenses | |||||||||||||
| Account | Account | Annualized | Paid | Account | Account | Annualized | Paid | ||||||||
| Value | Value | Expense | During | Value | Value | Expense | During | ||||||||
| 7/1/2009 | 12/31/2009 | Ratios | Period | 7/1/2009 | 12/31/2009 | Ratios | Period | ||||||||
| JNL/Eagle Core Equity Fund | |||||||||||||||
| Class A | $1,000.00 | $1,181.10 | 0.96 | % | $ 5.28 | $1,000.00 | $1,015.61 | 0.96 | % | $ 4.88 | |||||
| Class B | 1,000.00 | 1,182.30 | 0.76 | 4.18 | 1,000.00 | 1,017.61 | 0.76 | 3.86 | |||||||
| JNL/Eagle SmallCap Equity Fund | |||||||||||||||
| Class A | 1,000.00 | 1,246.30 | 1.03 | 5.83 | 1,000.00 | 1,014.91 | 1.03 | 5.23 | |||||||
| Class B | 1,000.00 | 1,248.10 | 0.83 | 4.70 | 1,000.00 | 1,016.91 | 0.83 | 4.22 | |||||||
| JNL/Franklin Templeton Founding Strategy Fund | |||||||||||||||
| Class A | 1,000.00 | 1,204.20 | 0.06 | 0.33 | 1,000.00 | 1,024.61 | 0.06 | 0.31 | |||||||
| JNL/Franklin Templeton Global Growth Fund | |||||||||||||||
| Class A | 1,000.00 | 1,227.60 | 1.10 | 6.18 | 1,000.00 | 1,014.21 | 1.10 | 5.58 | |||||||
| Class B | 1,000.00 | 1,229.20 | 0.90 | 5.06 | 1,000.00 | 1,016.21 | 0.90 | 4.57 | |||||||
| JNL/Franklin Templeton Income Fund | |||||||||||||||
| Class A | 1,000.00 | 1,179.20 | 0.99 | 5.44 | 1,000.00 | 1,015.31 | 0.99 | 5.03 | |||||||
| Class B | 1,000.00 | 1,180.70 | 0.79 | 4.34 | 1,000.00 | 1,017.31 | 0.79 | 4.02 | |||||||
| JNL/Franklin Templeton Mutual Shares Fund | |||||||||||||||
| Class A | 1,000.00 | 1,212.60 | 1.09 | 6.08 | 1,000.00 | 1,014.31 | 1.09 | 5.53 | |||||||
| Class B | 1,000.00 | 1,213.50 | 0.89 | 4.97 | 1,000.00 | 1,016.31 | 0.89 | 4.52 | |||||||
| JNL/Franklin Templeton Small Cap Value Fund | |||||||||||||||
| Class A | 1,000.00 | 1,262.90 | 1.16 | 6.62 | 1,000.00 | 1,013.61 | 1.16 | 5.89 | |||||||
| Class B | 1,000.00 | 1,264.10 | 0.96 | 5.48 | 1,000.00 | 1,015.61 | 0.96 | 4.88 | |||||||
| JNL/Goldman Sachs Core Plus Bond Fund | |||||||||||||||
| Class A | 1,000.00 | 1,073.40 | 0.89 | 4.65 | 1,000.00 | 1,016.31 | 0.89 | 4.52 | |||||||
| Class B | 1,000.00 | 1,075.20 | 0.69 | 3.61 | 1,000.00 | 1,018.31 | 0.69 | 3.51 | |||||||
| JNL/Goldman Sachs Emerging Markets Debt Fund | |||||||||||||||
| Class A | 1,000.00 | 1,089.70 | 1.12 | 5.90 | 1,000.00 | 1,014.01 | 1.12 | 5.69 | |||||||
| Class B | 1,000.00 | 1,090.50 | 0.92 | 4.85 | 1,000.00 | 1,016.01 | 0.92 | 4.67 | |||||||
| JNL/Goldman Sachs Mid Cap Value Fund | |||||||||||||||
| Class A | 1,000.00 | 1,260.70 | 1.03 | 5.87 | 1,000.00 | 1,014.91 | 1.03 | 5.23 | |||||||
| Class B | 1,000.00 | 1,262.90 | 0.83 | 4.73 | 1,000.00 | 1,016.91 | 0.83 | 4.22 | |||||||
| JNL/Ivy Asset Strategy Fund* | |||||||||||||||
| Class A | 1,000.00 | 1,041.00 | 1.25 | 3.29 | 1,000.00 | 1,012.71 | 1.25 | 6.34 | |||||||
| Class B | 1,000.00 | 1,041.00 | 1.05 | 2.76 | 1,000.00 | 1,014.71 | 1.05 | 5.33 | |||||||
| JNL/JPMorgan International Value Fund | |||||||||||||||
| Class A | 1,000.00 | 1,230.70 | 1.02 | 5.74 | 1,000.00 | 1,015.01 | 1.02 | 5.18 | |||||||
| Class B | 1,000.00 | 1,233.90 | 0.82 | 4.62 | 1,000.00 | 1,017.01 | 0.82 | 4.17 | |||||||
| JNL/JPMorgan MidCap Growth Fund | |||||||||||||||
| Class A | 1,000.00 | 1,257.10 | 1.01 | 5.75 | 1,000.00 | 1,015.11 | 1.01 | 5.13 | |||||||
| Class B | 1,000.00 | 1,259.20 | 0.81 | 4.61 | 1,000.00 | 1,017.11 | 0.81 | 4.12 | |||||||
| JNL/JPMorgan U.S. Government and Quality Bond Fund | |||||||||||||||
| Class A | 1,000.00 | 1,023.60 | 0.73 | 3.72 | 1,000.00 | 1,017.91 | 0.73 | 3.71 | |||||||
| Class B | 1,000.00 | 1,024.70 | 0.53 | 2.70 | 1,000.00 | 1,019.91 | 0.53 | 2.70 | |||||||
| JNL/Lazard Emerging Markets Fund | |||||||||||||||
| Class A | 1,000.00 | 1,296.30 | 1.25 | 7.23 | 1,000.00 | 1,012.71 | 1.25 | 6.34 | |||||||
| Class B | 1,000.00 | 1,296.80 | 1.05 | 6.08 | 1,000.00 | 1,014.71 | 1.05 | 5.33 | |||||||
| JNL/Lazard Mid Cap Equity Fund | |||||||||||||||
| Class A | 1,000.00 | 1,261.50 | 1.02 | 5.81 | 1,000.00 | 1,015.01 | 1.02 | 5.18 | |||||||
| Class B | 1,000.00 | 1,263.70 | 0.82 | 4.68 | 1,000.00 | 1,017.01 | 0.82 | 4.17 | |||||||
| JNL/M&G Global Basics Fund | |||||||||||||||
| Class A | 1,000.00 | 1,295.00 | 1.21 | 7.00 | 1,000.00 | 1,013.11 | 1.21 | 6.14 | |||||||
| Class B | 1,000.00 | 1,296.60 | 1.01 | 5.85 | 1,000.00 | 1,015.11 | 1.01 | 5.13 | |||||||
| JNL/M&G Global Leaders Fund | |||||||||||||||
| Class A | 1,000.00 | 1,235.30 | 1.21 | 6.82 | 1,000.00 | 1,013.11 | 1.21 | 6.14 | |||||||
| Class B | 1,000.00 | 1,237.70 | 1.01 | 5.70 | 1,000.00 | 1,015.11 | 1.01 | 5.13 | |||||||
Disclosure of Fund Expenses (Unaudited) (continued)
| Expenses Using Actual Fund Return | Expenses Using Hypothetical 5% Return | ||||||||||||||
| Beginning | Expenses | Expenses | |||||||||||||
| Account | Account | Annualized | Paid | Account | Account | Annualized | Paid | ||||||||
| Value | Value | Expense | During | Value | Value | Expense | During | ||||||||
| 7/1/2009 | 12/31/2009 | Ratios | Period | 7/1/2009 | 12/31/2009 | Ratios | Period | ||||||||
| JNL/Mellon Capital Management 10 x 10 Fund | |||||||||||||||
| Class A | $1,000.00 | $1,220.20 | 0.06 | % | $ 0.34 | $1,000.00 | $1,024.61 | 0.06 | % | $ 0.31 | |||||
| JNL/Mellon Capital Management Index 5 Fund | |||||||||||||||
| Class A | 1,000.00 | 1,199.00 | 0.06 | 0.33 | 1,000.00 | 1,024.61 | 0.06 | 0.31 | |||||||
| JNL/Mellon Capital Management European 30 Fund | |||||||||||||||
| Class A | 1,000.00 | 1,318.20 | 0.78 | 4.56 | 1,000.00 | 1,017.41 | 0.78 | 3.97 | |||||||
| Class B | 1,000.00 | 1,319.00 | 0.58 | 3.39 | 1,000.00 | 1,019.41 | 0.58 | 2.95 | |||||||
| JNL/Mellon Capital Management Pacific Rim 30 Fund | |||||||||||||||
| Class A | 1,000.00 | 1,137.20 | 0.78 | 4.20 | 1,000.00 | 1,017.41 | 0.78 | 3.97 | |||||||
| Class B | 1,000.00 | 1,139.30 | 0.58 | 3.13 | 1,000.00 | 1,019.41 | 0.58 | 2.95 | |||||||
| JNL/Mellon Capital Management S&P 500 Index Fund | |||||||||||||||
| Class A | 1,000.00 | 1,224.00 | 0.59 | 3.31 | 1,000.00 | 1,019.31 | 0.59 | 3.00 | |||||||
| Class B | 1,000.00 | 1,224.20 | 0.39 | 2.19 | 1,000.00 | 1,021.31 | 0.39 | 1.99 | |||||||
| JNL/Mellon Capital Management S&P 400 MidCap Index Fund | |||||||||||||||
| Class A | 1,000.00 | 1,267.10 | 0.60 | 3.43 | 1,000.00 | 1,019.21 | 0.60 | 3.05 | |||||||
| Class B | 1,000.00 | 1,268.30 | 0.40 | 2.29 | 1,000.00 | 1,021.21 | 0.40 | 2.04 | |||||||
| JNL/Mellon Capital Management Small Cap Index Fund | |||||||||||||||
| Class A | 1,000.00 | 1,242.60 | 0.61 | 3.45 | 1,000.00 | 1,019.11 | 0.61 | 3.10 | |||||||
| Class B | 1,000.00 | 1,242.80 | 0.41 | 2.32 | 1,000.00 | 1,021.11 | 0.41 | 2.09 | |||||||
| JNL/Mellon Capital Management International Index Fund | |||||||||||||||
| Class A | 1,000.00 | 1,219.00 | 0.72 | 4.03 | 1,000.00 | 1,018.01 | 0.72 | 3.66 | |||||||
| Class B | 1,000.00 | 1,220.10 | 0.52 | 2.91 | 1,000.00 | 1,020.01 | 0.52 | 2.65 | |||||||
| JNL/Mellon Capital Management Bond Index Fund | |||||||||||||||
| Class A | 1,000.00 | 1,036.90 | 0.59 | 3.03 | 1,000.00 | 1,019.31 | 0.59 | 3.00 | |||||||
| Class B | 1,000.00 | 1,038.00 | 0.39 | 2.00 | 1,000.00 | 1,021.31 | 0.39 | 1.99 | |||||||
| JNL/Mellon Capital Management Global Alpha Fund* | |||||||||||||||
| Class A | 1,000.00 | 988.00 | 1.35 | 3.46 | 1,000.00 | 1,011.71 | 1.35 | 6.85 | |||||||
| Class B | 1,000.00 | 989.00 | 1.15 | 2.95 | 1,000.00 | 1,013.71 | 1.15 | 5.84 | |||||||
| JNL/Oppenheimer Global Growth Fund | |||||||||||||||
| Class A | 1,000.00 | 1,243.30 | 1.06 | 5.99 | 1,000.00 | 1,014.61 | 1.06 | 5.38 | |||||||
| Class B | 1,000.00 | 1,244.40 | 0.86 | 4.87 | 1,000.00 | 1,016.61 | 0.86 | 4.37 | |||||||
| JNL/PAM Asia ex-Japan Fund | |||||||||||||||
| Class A | 1,000.00 | 1,215.00 | 1.27 | 7.09 | 1,000.00 | 1,012.51 | 1.27 | 6.44 | |||||||
| Class B | 1,000.00 | 1,216.50 | 1.07 | 5.98 | 1,000.00 | 1,014.51 | 1.07 | 5.43 | |||||||
| JNL/PAM China-India Fund | |||||||||||||||
| Class A | 1,000.00 | 1,235.60 | 1.33 | 7.49 | 1,000.00 | 1,011.91 | 1.33 | 6.74 | |||||||
| Class B | 1,000.00 | 1,236.40 | 1.13 | 6.37 | 1,000.00 | 1,013.91 | 1.13 | 5.74 | |||||||
| JNL/PIMCO Real Return Fund | |||||||||||||||
| Class A | 1,000.00 | 1,080.50 | 0.81 | 4.25 | 1,000.00 | 1,017.11 | 0.81 | 4.12 | |||||||
| Class B | 1,000.00 | 1,082.50 | 0.61 | 3.20 | 1,000.00 | 1,019.11 | 0.61 | 3.10 | |||||||
| JNL/PIMCO Total Return Bond Fund | |||||||||||||||
| Class A | 1,000.00 | 1,071.30 | 0.81 | 4.23 | 1,000.00 | 1,017.11 | 0.81 | 4.12 | |||||||
| Class B | 1,000.00 | 1,072.10 | 0.61 | 3.19 | 1,000.00 | 1,019.11 | 0.61 | 3.10 | |||||||
| JNL/PPM America High Yield Bond Fund | |||||||||||||||
| Class A | 1,000.00 | 1,201.70 | 0.77 | 4.27 | 1,000.00 | 1,017.51 | 0.77 | 3.92 | |||||||
| Class B | 1,000.00 | 1,201.30 | 0.57 | 3.16 | 1,000.00 | 1,019.51 | 0.57 | 2.90 | |||||||
| JNL/PPM America Mid Cap Value Fund | |||||||||||||||
| Class A | 1,000.00 | 1,353.40 | 1.06 | 6.29 | 1,000.00 | 1,014.61 | 1.06 | 5.38 | |||||||
| Class B | 1,000.00 | 1,355.00 | 0.86 | 5.10 | 1,000.00 | 1,016.61 | 0.86 | 4.37 | |||||||
| JNL/PPM America Small Cap Value Fund | |||||||||||||||
| Class A | 1,000.00 | 1,294.30 | 1.06 | 6.13 | 1,000.00 | 1,014.61 | 1.06 | 5.38 | |||||||
| Class B | 1,000.00 | 1,295.50 | 0.86 | 4.98 | 1,000.00 | 1,016.61 | 0.86 | 4.37 | |||||||
| JNL/PPM America Value Equity Fund | |||||||||||||||
| Class A | 1,000.00 | 1,329.80 | 0.86 | 5.05 | 1,000.00 | 1,016.61 | 0.86 | 4.37 | |||||||
| Class B | 1,000.00 | 1,330.30 | 0.66 | 3.88 | 1,000.00 | 1,018.61 | 0.66 | 3.36 | |||||||
Disclosure of Fund Expenses (Unaudited) (continued)
| Expenses Using Actual Fund Return | Expenses Using Hypothetical 5% Return | ||||||||||||||
| Beginning | Expenses | Expenses | |||||||||||||
| Account | Account | Annualized | Paid | Account | Account | Annualized | Paid | ||||||||
| Value | Value | Expense | During | Value | Value | Expense | During | ||||||||
| 7/1/2009 | 12/31/2009 | Ratios | Period | 7/1/2009 | 12/31/2009 | Ratios | Period | ||||||||
| JNL/Red Rocks Listed Private Equity Fund | |||||||||||||||
| Class A | $1,000.00 | $1,247.10 | 1.20 | % | $ 6.80 | $1,000.00 | $1,013.21 | 1.20 | % | $ 6.09 | |||||
| Class B | 1,000.00 | 1,247.80 | 1.00 | 5.67 | 1,000.00 | 1,015.21 | 1.00 | 5.08 | |||||||
| JNL/S&P Managed Conservative Fund | |||||||||||||||
| Class A | 1,000.00 | 1,078.70 | 0.18 | 0.94 | 1,000.00 | 1,023.41 | 0.18 | 0.92 | |||||||
| JNL/S&P Managed Moderate Fund | |||||||||||||||
| Class A | 1,000.00 | 1,113.10 | 0.17 | 0.91 | 1,000.00 | 1,023.51 | 0.17 | 0.87 | |||||||
| JNL/S&P Managed Moderate Growth Fund | |||||||||||||||
| Class A | 1,000.00 | 1,148.30 | 0.15 | 0.81 | 1,000.00 | 1,023.71 | 0.15 | 0.77 | |||||||
| JNL/S&P Managed Growth Fund | |||||||||||||||
| Class A | 1,000.00 | 1,185.10 | 0.16 | 0.88 | 1,000.00 | 1,023.61 | 0.16 | 0.82 | |||||||
| JNL/S&P Managed Aggressive Growth Fund | |||||||||||||||
| Class A | 1,000.00 | 1,206.90 | 0.18 | 1.00 | 1,000.00 | 1,023.41 | 0.18 | 0.92 | |||||||
| JNL/S&P Disciplined Moderate Fund | |||||||||||||||
| Class A | 1,000.00 | 1,146.60 | 0.19 | 1.03 | 1,000.00 | 1,023.31 | 0.19 | 0.97 | |||||||
| JNL/S&P Disciplined Moderate Growth Fund | |||||||||||||||
| Class A | 1,000.00 | 1,194.40 | 0.19 | 1.05 | 1,000.00 | 1,023.31 | 0.19 | 0.97 | |||||||
| JNL/S&P Disciplined Growth Fund | |||||||||||||||
| Class A | 1,000.00 | 1,217.30 | 0.19 | 1.06 | 1,000.00 | 1,023.31 | 0.19 | 0.97 | |||||||
| JNL/S&P Competitive Advantage Fund | |||||||||||||||
| Class A | 1,000.00 | 1,231.60 | 0.72 | 4.05 | 1,000.00 | 1,018.01 | 0.72 | 3.66 | |||||||
| Class B | 1,000.00 | 1,234.90 | 0.52 | 2.93 | 1,000.00 | 1,020.01 | 0.52 | 2.65 | |||||||
| JNL/S&P Dividend Income & Growth Fund | |||||||||||||||
| Class A | 1,000.00 | 1,333.10 | 0.72 | 4.23 | 1,000.00 | 1,018.01 | 0.72 | 3.66 | |||||||
| Class B | 1,000.00 | 1,334.70 | 0.52 | 3.06 | 1,000.00 | 1,020.01 | 0.52 | 2.65 | |||||||
| JNL/S&P Intrinsic Value Fund | |||||||||||||||
| Class A | 1,000.00 | 1,427.80 | 0.72 | 4.41 | 1,000.00 | 1,018.01 | 0.72 | 3.66 | |||||||
| Class B | 1,000.00 | 1,433.00 | 0.52 | 3.19 | 1,000.00 | 1,020.01 | 0.52 | 2.65 | |||||||
| JNL/S&P Total Yield Fund | |||||||||||||||
| Class A | 1,000.00 | 1,300.20 | 0.72 | 4.17 | 1,000.00 | 1,018.01 | 0.72 | 3.66 | |||||||
| Class B | 1,000.00 | 1,299.80 | 0.52 | 3.01 | 1,000.00 | 1,020.01 | 0.52 | 2.65 | |||||||
| JNL/S&P 4 Fund | |||||||||||||||
| Class A | 1,000.00 | 1,321.20 | 0.06 | 0.35 | 1,000.00 | 1,024.61 | 0.06 | 0.31 | |||||||
| JNL/Select Balanced Fund | |||||||||||||||
| Class A | 1,000.00 | 1,156.30 | 0.77 | 4.18 | 1,000.00 | 1,017.51 | 0.77 | 3.92 | |||||||
| Class B | 1,000.00 | 1,158.20 | 0.57 | 3.10 | 1,000.00 | 1,019.51 | 0.57 | 2.90 | |||||||
| JNL/Select Money Market Fund | |||||||||||||||
| Class A | 1,000.00 | 1,000.00 | 0.37 | 1.87 | 1,000.00 | 1,021.51 | 0.37 | 1.89 | |||||||
| Class B | 1,000.00 | 1,000.10 | 0.37 | 1.87 | 1,000.00 | 1,021.51 | 0.37 | 1.89 | |||||||
| JNL/Select Value Fund | |||||||||||||||
| Class A | 1,000.00 | 1,206.30 | 0.82 | 4.56 | 1,000.00 | 1,017.01 | 0.82 | 4.17 | |||||||
| Class B | 1,000.00 | 1,207.80 | 0.62 | 3.45 | 1,000.00 | 1,019.01 | 0.62 | 3.16 | |||||||
| JNL/T. Rowe Price Established Growth Fund | |||||||||||||||
| Class A | 1,000.00 | 1,242.20 | 0.90 | 5.09 | 1,000.00 | 1,016.21 | 0.90 | 4.57 | |||||||
| Class B | 1,000.00 | 1,243.20 | 0.70 | 3.96 | 1,000.00 | 1,018.21 | 0.70 | 3.56 | |||||||
| JNL/T. Rowe Price Mid-Cap Growth Fund | |||||||||||||||
| Class A | 1,000.00 | 1,252.10 | 1.02 | 5.79 | 1,000.00 | 1,015.01 | 1.02 | 5.18 | |||||||
| Class B | 1,000.00 | 1,253.30 | 0.82 | 4.66 | 1,000.00 | 1,017.01 | 0.82 | 4.17 | |||||||
| JNL/T. Rowe Price Short-Term Bond Fund | |||||||||||||||
| Class A | 1,000.00 | 1,033.30 | 0.74 | 3.79 | 1,000.00 | 1,017.81 | 0.74 | 3.76 | |||||||
| Class B | 1,000.00 | 1,033.50 | 0.54 | 2.77 | 1,000.00 | 1,019.81 | 0.54 | 2.75 | |||||||
Disclosure of Fund Expenses (Unaudited) (continued)
| Expenses Using Actual Fund Return | Expenses Using Hypothetical 5% Return | ||||||||||||||
| Beginning | Expenses | Expenses | |||||||||||||
| Account | Account | Annualized | Paid | Account | Account | Annualized | Paid | ||||||||
| Value | Value | Expense | During | Value | Value | Expense | During | ||||||||
| 7/1/2009 | 12/31/2009 | Ratios | Period | 7/1/2009 | 12/31/2009 | Ratios | Period | ||||||||
| JNL/T. Rowe Price Value Fund | |||||||||||||||
| Class A | $1,000.00 | $1,247.50 | 0.96 | % | 5.44 | $1,000.00 | $1,015.61 | 0.96 | % | $ 4.88 | |||||
| Class B | 1,000.00 | 1,248.60 | 0.76 | 4.31 | 1,000.00 | 1,017.61 | 0.76 | 3.86 | |||||||
Expenses paid during the period are equal to the annualized expense ratio, multiplied by the average account value over the period, multiplied by the number of days in the period, then divided by the number of days in the most recent 12-month period (to reflect the most recent 6-month period). For Funds with less than 6- month’s operating history, the amounts reported under Expenses Using Hypothetical 5% Return are not comparable to the amounts reported in Expenses Using Actual Fund Return.
* Fund has less than 6-month’s operating history.
Additional Disclosures
Quarterly Portfolio Holdings
The Funds file a complete schedule of portfolio holdings with the U.S. Securities and Exchange Commission (“SEC”) for the first and third quarters of each fiscal year on Form N-Q. The Funds’ Forms N-Q are available on the SEC’s website at www.sec.gov. The Forms N-Q may be reviewed and copied at the SEC’s Public Reference Room in Washington, DC, and information on the operation of the Public Reference Room may be obtained by calling 800-SEC-0330. It is also available upon request from the Registrant by calling the Fund toll-free at 800-766-4683.
Proxy Voting Guidelines
A description of the policies and procedures used by the Funds to vote proxies relating to the portfolio securities and information on how the Funds voted proxies relating to portfolio securities during the 12-month period ended June 30, 2009 are available (1) without charge, upon request by calling 1-800-873-5654 (Annuity Service Center),1-800-599-5651 (NY Annuity Service Center) or 1-800-777-7799 (for contracts purchased through a bank or financial institution) or 1-888-464-7779 (for NY contracts purchased through a bank or financial institution), (2) by writing JNL Series Trust, P.O. Box 378002, Denver, Colorado 80237-8002 (3) on Jackson National Life Insurance Company’s or Jackson National Life Insurance Company of New York’s website at www.jackson.com, and (4) on the Securities and Exchange Commission’s website at www.sec.gov.
[THIS PAGE INTENTIONALLY LEFT BLANK]
Trustees and Officers of JNL Series Trust (“Trust”)
| Name, Address and (Age) | Position(s) Held with the Trust (Length of Time Served) | Number of Portfolios in Fund Complex to be Overseen by Trustee or Officer |
| Interested Trustee | ||
Mark D. Nerud (43) 1 1 Corporate Way Lansing, MI 48951 | Trustee 2 (1/2007 to present) President and Chief Executive Officer (12/2006 to present) | 94 |
Principal Occupation(s) During Past 5 Years: Chief Executive Officer of the Adviser (1/2010 to present); President of the Adviser (1/2007 to present); Chief Financial Officer of the Adviser (11/2000 to 1/2007) and Managing Board Member of the Adviser (11/2000 to 11/2003) (1/2007 to present); President and CEO of other Investment Companies advised by the Adviser (12/2006 to present); Vice President (8/1997 to 12/2006), Treasurer, Chief Financial Officer of other Investment Companies advised by the Adviser (12/2002 to 12/2006); Vice President – Fund Accounting & Administration of Jackson National Life Insurance Company (1/2000 to 12/2009) | ||
Other Directorships Held by Trustee: None | ||
| Disinterested Trustees | ||
Michael Bouchard (53) 1 Corporate Way Lansing, MI 48951 | Trustee 2 (12/2003 to present) | 94 |
Principal Occupation(s) During Past 5 Years: Sheriff, Oakland County, Michigan (1/1999 to present) | ||
Other Directorships Held by Trustee: None | ||
William J. Crowley, Jr. (64) 1 Corporate Way Lansing, MI 48951 | Trustee 2 (1/2007 to present) | 94 |
Principal Occupation(s) During Past 5 Years: Managing Partner (Baltimore Office) – Arthur Andersen LLP (1995 to 2002); Board Member of various corporate boards (2002 to present) | ||
Other Directorships Held by Trustee: Director of Alpha Natural Resources; Director of Foundation Coal Holdings, Inc. (from 12/2004 until 7/2009 when the company was acquired); Director of Bio Veris Corporation (from 5/2004 until 6/2007 when the company was acquired); Director of Provident Bankshares Corporation (from 5/2003 until 5/2009 when the company was acquired) | ||
Dominic D’Annunzio (71) 1 Corporate Way Lansing, MI 48951 | Chairman of the Board 2 (2/2004 to present) Trustee 2 (2/2002 to present) | 94 |
Principal Occupation(s) During Past 5 Years: Acting Commissioner of Insurance for the State of Michigan (1/1990 to 5/1990) and (8/1997 to 5/1998) | ||
Other Directorships Held by Trustee: None | ||
Michelle Engler (51) 1 Corporate Way Lansing, MI 48951 | Trustee 2 (12/2003 to present) | 94 |
Principal Occupation(s) During Past 5 Years: Attorney (1983 to present); First Lady of the State of Michigan (1990 to 2002) | ||
Other Directorships Held by Trustee: Director of Federal Home Loan Mortgage Corporation (2001 to 9/2008) | ||
1 Mr. Nerud is an “interested person” of the Trust due to his position with Jackson National Life Insurance Company®, which is the parent company of Jackson National Asset Management, LLC. |
2 The Chairman of the Board, interested and disinterested Trustees are elected to serve for an indefinite term. |
| Name, Address and (Age) | Position(s) Held with the Trust (Length of Time Served) | Number of Portfolios in Fund Complex to be Overseen by Trustee or Officer |
| Disinterested Trustees | ||
James Henry, Ph.D. (71) 1 Corporate Way Lansing, MI 48951 | Trustee 2 (1/2007 to present) | 94 |
Principal Occupation(s) During Past 5 Years: Dean Emeritus and Professor of Finance, Eli Broad College of Business and Graduate School of Management at Michigan State University (2001 to July 2009) | ||
Other Directorships Held by Trustee: None | ||
Richard McLellan (67) 1 Corporate Way Lansing, MI 48951 | Trustee 2 (12/1994 to present) | 94 |
Principal Occupation(s) During Past 5 Years: Member, Dykema Gossett PLLC (Law Firm) (1973 to 2007); Senior Counsel, Dykema Gossett PLLC (2007 to present) Adjunct Associate Professor, Michigan State University (2008 to present) | ||
Other Directorships Held by Trustee: Member of the Board of Directors of ITC Holdings Corp. (11/2007 to present) | ||
William R. Rybak (58) 1 Corporate Way Lansing, MI 48951 | Trustee 2 (1/2007 to present) | 94 |
Principal Occupation(s) During Past 5 Years: Board Member of various corporate boards (see below) (2002 to present) | ||
Other Directorships Held by Trustee: Chairman of the Board of Trustees of Lewis University; Member of the Board since 1982; Member of the Board of Directors of Howe Barnes Investments, Inc. since 2001; Member of the Boards of each of the Calamos Mutual Funds since 2002; Member of the Board of Directors of The PrivateBancorp since 2003; Chairman of the Board of Trustees of St. Coletta’s of Illinois; and Member of the Board since 2000 | ||
Patricia A. Woodworth (54) 1 Corporate Way Lansing, MI 48951 | Trustee 2 (1/2007 to present) | 94 |
Principal Occupation(s) During Past 5 Years: Vice President, Chief Financial Officer and Chief Operating Officer, The J. Paul Getty Trust (12/2007 to present); Executive Vice President for Finance and Administration, Chief Financial Officer, Art Institute of Chicago (2002 to 11/2007) | ||
Other Directorships Held by Trustee: None | ||
| Officers | ||
Karen J. Buiter (44) 1 Corporate Way Lansing, MI 48951 | Assistant Treasurer (12/2008 to present) | Not Applicable |
Principal Occupation(s) During Past 5 Years: Assistant Vice President – Fund Reporting of the Adviser (4/2008 to present); Assistant Treasurer of other Investment Companies advised by the Adviser (12/2008 to present); Treasurer of Henderson Global Funds (2/2004 to 3/2008); Assistant Controller of Code, Hennessy & Simmons LLC (2002 to 2004) | ||
Other Directorships Held by Trustee: Not Applicable | ||
Kelly L. Crosser (37) 1 Corporate Way Lansing, MI 48951 | Assistant Secretary (9/2007 to present) | Not Applicable |
Principal Occupation(s) During Past 5 Years: Assistant Secretary of other Investment Companies advised by the Adviser (9/2007 to present); Senior Compliance Analyst of Jackson National Life Insurance Company (4/2007 to present); Mutual Fund Compliance Analyst of Jackson National Life Insurance Company (2/2006 to 4/2007): Senior Paralegal of Jackson National Life Insurance Company (6/2004 to 2/2006) | ||
Other Directorships Held by Trustee: Not Applicable | ||
| Name, Address and (Age) | Position(s) Held with the Trust (Length of Time Served) | Number of Portfolios in Fund Complex to be Overseen by Trustee or Officer |
| Officers | ||
Steven J. Fredricks (39) 1 Corporate Way Lansing, MI 48951 | Chief Compliance Officer (1/2005 to present) | Not Applicable |
Principal Occupation(s) During Past 5 Years: Chief Compliance Officer of the Adviser and other Investment Companies advised by the Adviser (1/2005 to present); Attorney of Jackson National Life Insurance Company (2/2002 to 1/2005) | ||
Other Directorships Held by Trustee: Not Applicable | ||
Danielle A. Hernandez (29) 1 Corporate Way Lansing, MI 48951 | Anti-Money Laundering Officer (12/2007 to present) | Not Applicable |
Principal Occupation(s) During Past 5 Years: Senior Compliance Analyst of the Adviser (6/2009 to present); Compliance Analyst of the Adviser (08/2006 to 6/2009); Administrative Assistant of the Adviser (12/2005 To 08/2006); Executive Assistant at the U.S. House Of Representatives, Washington, D.C. (2002 To 2005) | ||
Other Directorships Held by Trustee: Not Applicable | ||
Daniel W. Koors (39) 1 Corporate Way Lansing, MI 48951 | Vice President, Treasurer and Chief Financial Officer (12/2006 to present) | Not Applicable |
Principal Occupation(s) During Past 5 Years: Senior Vice President of the Adviser (1/2009 to present) and Chief Financial Officer of the Adviser (1/2007 to present); Vice President of the Adviser (1/2007 to 12/2008); Vice President, Treasurer and Chief Financial Officer of other Investment Companies advised by the Adviser (12/2006 to present); Assistant Treasurer of other Investment Companies advised by the Adviser (9/2006 to 12/2006); Assistant Vice President – Fund Administration of Jackson National Life Insurance Company (8/2006 to 12/2009); Partner of Deloitte & Touche LLP (2003 to June 2006) | ||
Other Directorships Held by Trustee: Not Applicable | ||
Michael Piszczek (52) 1 Corporate Way Lansing, MI 48951 | Vice President (11/2007 to present) | Not Applicable |
Principal Occupation(s) During Past 5 Years: Vice President of other Investment Companies advised by the Adviser (11/2007 to present); Assistant Vice President – Tax of the Adviser (11/2007 to present); Assistant Vice President – Nuveen Investments (4/1999 to 8/2007); Assistant Vice President and Assistant Secretary – Nuveen Funds (4/1999 to 8/2007) | ||
Other Directorships Held by Trustee: Not Applicable | ||
Susan S. Rhee (38) 1 Corporate Way Lansing, MI 48951 | Vice President, Counsel and Secretary (2/2004 to present) | Not Applicable |
Principal Occupation(s) During Past 5 Years: Senior Vice President and General Counsel of the Adviser (1/2010 to present); Chief Legal Officer (7/2004 to 12/2009) and Secretary (11/2000 to present) of the Adviser; Vice President, Counsel, and Secretary of other Investment Companies advised by the Adviser (2/2004 to present); Assistant Vice President of Jackson National Life Insurance Company (8/2003 to 12/2009); Associate General Counsel of Jackson National Life Insurance Company (7/2001 to 12/2009) | ||
Other Directorships Held by Trustee: Not Applicable | ||
The Statement of Additional Information includes additional information about Fund Trustees and may be obtained at no charge by calling 1-800-873-5654 (Annuity and Life Service Center), 1-800-599-5651 (NY Annuity and Life Service Center), 1-800-777-7779 (for contracts purchased through a bank or financial institution) or 1-888-464-7779 (for NY contracts purchased through a bank or financial institution), by writing JNL Series Trust, P.O. Box 30314, Lansing, Michigan 48951 or by visiting www.jackson.com.
Trustees and Officers of JNL Series Trust (the “Trust”)
The interested Trustee and the Officers of the Trust (other than the Chief Compliance Officer, as described below) or the Adviser do not receive any compensation from the Trust for their services as Trustees or Officers. The following persons, who are disinterested Trustees of the Trust, and the Trust’s Chief Compliance Officer, received from the Trust the compensation amounts indicated for the services as such for the twelve-month period ended December 31, 2009:
| Trustee | Aggregate Compensation from the Trust1 | Pension or Retirement Benefits Accrued As Part of Trust Expenses | Estimated Annual Benefits Upon Retirement | Total Compensation from the Trust and Fund Complex |
| Michael Bouchard | $87,781 | $0 | $0 | $120,0004 |
| William J. Crowley, Jr. | $89,609 | $0 | $0 | $122,5005 |
Dominic D’Annunzio 3 | $111,555 | $0 | $0 | $152,5006 |
| Michelle Engler | $87,781 | $0 | $0 | $120,000 |
| James Henry | $89,609 | $0 | $0 | $122,500 |
| Richard McLellan | $98,753 | $0 | $0 | $135,000 |
| William R. Rybak | $85,220 | $0 | $0 | $116,500 |
| Patricia Woodworth | $100,582 | $0 | $0 | $137,5007 |
Steven J. Fredricks 2 | $168,813 | $0 | $0 | $230,775 |
| 1 | The fees paid to the independent Trustees are paid for combined service on the Boards of the Trust, JNL Investors Series Trust and JNL Variable Fund LLC (the “Fund Complex”). The fees are allocated to the Funds and affiliated investment companies on a pro-rata basis based on net assets. The total fees to all the independent Trustees is $1,026,500. |
| 2 | Mr. Fredricks’ compensation is paid by the Funds for his duties as the Chief Compliance Officer of the Fund Complex. The expense is allocated to the Funds and affiliated investment companies on a pro-rata basis based on net assets. |
| 3 | Mr. D’Annunzio is an ex officio (non-voting) member of the Governance Committee. Therefore, he does not receive any compensation as a member of the Governance Committee. |
| 4 | Amount includes $6,000 deferred by Mr. Bouchard. |
| 5 | Amount includes $73,500 deferred by Mr. Crowley. |
| 6 | Amount includes $76,250 deferred by Mr. D’Annunzio. |
| 7 | Amount includes $137,500 deferred by Ms. Woodworth. |
JNL SERIES TRUST
(“Trust”)
APPROVAL OF THE TRUST’S
INVESTMENT ADVISORY AND SUB-ADVISORY AGREEMENT
The Board of Trustees of the Funds (“Board”) oversees the management of each Fund and, as required by law, determines annually whether to approve the Trust’s advisory agreement with Jackson National Asset Management, LLC (“JNAM”) and each Fund’s sub-advisory agreement(s).
At a meeting on December 17-18, 2009, the Board, including all of the Independent Trustees, considered information relating to the amendment to the Trust’s investment advisory and management agreement with JNAM (“Agreement”), information relating to the approval of an investment sub-advisory agreement between JNAM and Franklin Templeton Institutional, LLC (“FTI”) to the Trust, and approval of the creation of six Feeder Funds with American Funds® (together, “Agreements” refers to the Agreement and applicable Sub-Advisory Agreement). In advance of the meeting, independent legal counsel for the Independent Trustees requested that certain information be provided to the Board relating to the Agreement and the Sub-Advisory Agreement. The Board received, and had the opportunity to review, this and other material, ask questions and request further information in connection with its consideration. At the conclusion of the Board’s discussion, the Board approved the FTI Sub-Advisory Agreement through May 1, 2012 and the Agreement through June 30, 2010.
In reviewing the Advisory Agreement and considering the information, the Board was advised by outside legal counsel to the Trust, and the Independent Trustees were advised by independent legal counsel. The Board considered the factors it deemed relevant: (1) the nature, quality and extent of the services to be provided, (2) the investment performance of each Fund, (3) its profitability, including an analysis of the cost of providing services and comparative expense information, (4) whether economies of scale may be realized as each Fund grows and whether the fee structure reflects the economies of scale for each Fund’s investors, and (5) other benefits that may accrue to JNAM through its relationship with the Trust. In its deliberations, the Board, in exercising its business judgment, did not identify any single factor that alone was responsible for the Board’s decision to approve the Advisory Agreement.
Before approving the Advisory Agreement and the Sub-Advisory Agreement, the Independent Trustees/Managers met in executive session with their independent legal counsel to consider the materials provided by JNAM and the terms of the Advisory Agreement and the Sub-Advisory Agreement. Based on its evaluation of those materials, the Board, including the interested and Independent Trustees, concluded that the Advisory Agreement is fair and reasonable and in the best interests of the shareholders of each Fund and that the Sub-Advisory Agreement is fair and reasonable and in the best interests of the shareholders of the applicable Fund. In reaching its conclusions, the Board considered the following:
Nature, Quality and Extent of Services
The Board examined the nature, quality and extent of the services to be provided by JNAM and the Sub-Adviser.
For each Fund, the Board considered the services to be provided by JNAM, including but not limited to the oversight of the Sub-Adviser pursuant to the “Manager of Managers” exemption, as well as the provision of recordkeeping and compliance services to the Funds. The Board also considered that JNAM would monitor the performance of the various organizations that would provide services to the Funds, including the Funds’ distributor, transfer agent, and custodian. With respect to JNAM’s oversight of the Sub-Adviser, the Board noted that JNAM would be responsible for screening and recommending new sub-advisers when appropriate, as well as monitoring and reporting to the Board on the performance and operations of the existing Sub-Advisers. The Board also considered the investment sub-advisory services to be provided by the Sub-Adviser. The Board considered JNAM’s evaluation of the Sub-Adviser, as well as JNAM’s recommendations, based on its review of the Sub-Adviser, to approve the Sub-Advisory Agreement.
The Board reviewed the qualifications, backgrounds and responsibilities of JNAM’s senior management that would be responsible for oversight of the Funds and each Sub-Adviser, and also reviewed the qualifications, backgrounds and responsibilities of the Sub-Adviser’s portfolio managers who would be responsible for the day-to-day management of each Fund. The Board reviewed information pertaining to JNAM’s and the Sub-Adviser’s organizational structure, senior management, financial stability, investment operations, and other relevant information pertaining to both JNAM and the Sub-Adviser. The Board considered compliance reports about JNAM and the Sub-Adviser from the Funds’ CCO.
Based on the foregoing, the Board concluded that (i) each Fund is likely to benefit from the nature, extent and quality of the services to be provided by JNAM under the Agreement and (ii) each Fund is likely to benefit from the nature, extent and quality of the services to be provided by the Sub-Adviser under the applicable Sub-Advisory Agreement.
Investment Performance of the Funds
The Board considered the performance of each Fund, including how the Fund performed versus the average performance of a group of comparable funds selected by an independent data service (“peer group”) and how the Fund performed versus its primary benchmark (“benchmark”) index. The performance periods considered by the Board ended on September 30, 2009 (unless otherwise noted). When available, the Board considered one-, five- and ten-year performance. The Board also considered that each of the JNL/American Funds discussed below are “feeder” Funds that will invest virtually all of their assets in a “master” fund offered by American Funds Insurance Series. As a result, the Board considered the performance of the applicable “master” fund.
New Funds (JNL Series Trust):
JNL/American Funds Blue Chip Income and Growth Fund. The Board considered the performance presented for the master fund outperformed its benchmark for the one- and five-year periods. The Board concluded it would be in the best interests of the Fund and its shareholders to approve the Agreements.
JNL/American Funds Global Bond Fund. The Board considered the performance presented for the master fund outperformed its benchmark for the one-year period. The Board concluded it would be in the best interests of the Fund and its shareholders to approve the Agreements.
JNL/American Funds Global Small Capitalization Fund. The Board considered the performance presented for the master fund outperformed its benchmark for the five-year period. The master fund underperformed its benchmark for the one- and ten-year periods. The Board also considered that the Fund outperformed the Lipper Global Small-Cap Funds Average for the one-, three-, five-, and ten-year periods ended September 30, 2009. The Board concluded that based upon the master fund’s five-year performance record and its performance against the peer group, it would be in the best interests of the Fund and its shareholders to approve the Agreements.
JNL/American Funds Growth-Income Fund. The Board considered the performance presented for the master fund outperformed its benchmark for the one-, five- and ten-year periods. The Board concluded it would be in the best interests of the Fund and its shareholders to approve the Agreements.
JNL/American Funds International Fund. The Board considered the performance presented for the master fund outperformed its benchmark for the one-, five- and ten-year periods. The Board concluded it would be in the best interests of the Fund and its shareholders to approve the Agreements.
JNL/American Funds New World Fund. The Board considered the performance presented for the master fund outperformed its benchmark for the one-, five- and ten-year periods. The Board concluded it would be in the best interests of the Fund and its shareholders to approve the Agreements.
Sub-Adviser Change (JNL Series Trust):
JNL/Franklin Templeton International Small Cap Growth Fund (formerly, JNL/Capital Guardian International Small Cap Fund). The Board could not consider Franklin Templeton’s performance as sub-adviser to the Fund because the transition from Capital Guardian to Franklin Templeton had not yet occurred. The Board, however, did consider information regarding Franklin Templeton’s capabilities and expenses. The Board also considered that the performance for a similarly managed strategy significantly outperformed its peer group for the one-, three-, and five-year periods. The Board concluded it would be in the best interests of the Fund and its shareholders to approve the Agreements.
Costs of Services
The Board reviewed the fees to be paid to JNAM, each master fund and with respect to the JNL/Franklin Templeton International Small Cap Growth Fund, the Fund’s Sub-Adviser. For the Funds, the Board reviewed fee and expense information as compared to that of comparable funds managed by other advisers. The Board also noted that JNAM does not manage any institutional accounts with which Fund’s fees could be compared. Using information provided by an independent data service, the Board evaluated the Funds’ proposed advisory fees compared to the average advisory fees for other funds similar in size, character and investment strategy (the “peer group”). While the Board also considered the JNL/Franklin Templeton International Small Cap Growth Fund’s proposed sub-advisory fee and compared that to the average sub-advisory fee of the peer group, the Board noted that the Fund’s sub-advisory fee would be paid by JNAM (not the Fund) and, therefore, would be neither a direct shareholder expense nor a direct influence on a Fund’s total expense ratio.
Further detail considered by the Board regarding the advisory and sub-advisory fees of each Fund is set forth below:
JNL Series Trust - New Funds:
JNL/American Funds Blue Chip Income and Growth Fund. The Board considered that the Feeder Fund’s advisory fees are lower than the peer group average (after the contractual waiver). The Board considered that the Feeder Fund’s estimated total expense ratio (excluding the Master Fund expenses and after the contractual waiver) is lower than the peer group average. The Board considered that the Feeder Fund’s estimated total expense ratio (including the Master Fund expenses and after the contractual waiver) is equal to the peer group average. The Board concluded that the advisory fees are fair, reasonable and in the best interest of the Fund and its shareholders in light of the services to be provided.
JNL/American Funds Global Bond Fund. The Board considered that the Feeder Fund’s advisory fees are lower than the peer group average (after the contractual waiver). The Board considered that the Feeder Fund’s estimated total expense ratio (excluding the Master Fund expenses and after the contractual waiver) is lower than the peer group average. The Board considered that the Feeder Fund’s estimated total expense ratio (including the Master Fund expenses and after the contractual waiver) is slightly higher than the peer group average. The Board concluded that, in light, in part, of the desirability of offering this Fund to JNL investors and the fact that the Fund cannot be accessed through a sub-advisory arrangement, the advisory fees are fair, reasonable and in the best interest of the Fund and its shareholders in light of the services to be provided.
JNL/American Funds Global Small Capitalization Fund. The Board considered that the Feeder Fund’s advisory fees are lower than the peer group average (after the contractual waiver). The Board considered that the Feeder Fund’s estimated total expense ratio (excluding the Master Fund expenses and after the contractual waiver) is lower than the peer group average. The Board considered that the Feeder Fund’s estimated total expense ratio (including the Master Fund expenses and after the contractual waiver) is slightly higher than the peer group average. The Board concluded that, in light, in part, of the desirability of offering this Fund to JNL investors and the fact that the Fund cannot be accessed through a sub-advisory arrangement, the advisory fees are fair, reasonable and in the best interest of the Fund and its shareholders in light of the services to be provided.
JNL/American Funds Growth-Income Fund. The Board considered that the Feeder Fund’s advisory fees and total expense ratio (both excluding and including the Master Fund expenses and after the contractual waiver) are lower than the peer group average. The Board concluded that the advisory fees are fair, reasonable and in the best interest of the Fund and its shareholders in light of the services to be provided.
JNL/American Funds International Fund. The Board considered that the Feeder Fund’s advisory fees and total expense ratio (both excluding and including the Master Fund expenses and after the contractual waiver) are lower than the peer group average. The Board concluded that the advisory fees are fair, reasonable and in the best interest of the Fund and its shareholders in light of the services to be provided.
JNL/American Funds New World Fund. The Board considered that the Feeder Fund’s advisory fees and total expense ratio (both excluding and including the Master Fund expenses and after the contractual waiver) are lower than the peer group average. The Board concluded that the advisory fees are fair, reasonable and in the best interest of the Fund and its shareholders in light of the services to be provided.
Sub-Adviser Change (JNL Series Trust):
JNL/Franklin Templeton International Small Cap Growth Fund (formerly, JNL/Capital Guardian International Small Cap Fund). The Board considered that the Fund’s advisory fees are higher than the peer group average. The Board also noted that the Fund’s estimated total expense ratio is slightly lower than that of the peer group average. The Board also considered that the Fund’s sub-advisory fees are higher than the peer group average. The Board concluded that the advisory and sub-advisory fees are fair, reasonable and in the best interest of the Fund and its shareholders in light of the services to be provided.
Economies of Scale
The Board considered whether each Fund’s proposed advisory fee reflects the potential for economies of scale for the benefit of Fund shareholders. Based on information provided by JNAM, the Board noted that the fee arrangement for each Fund contains breakpoints that decrease the fee rate as assets increase. The Board concluded that the advisory fees in some measure share economies of scale with shareholders.
Other Benefits to JNAM and the Sub-Advisers
In evaluating the benefits that may accrue to JNAM through its relationship with the Funds, the Board noted that JNAM and certain of its affiliates would serve the Funds in various capacities, including as adviser, administrator, transfer agent and distributor, and receive compensation from the Funds in connection with providing services to the Funds. The Board considered that each service to be provided to the Funds by JNAM or one of its affiliates would be pursuant to a written agreement, which the Board would evaluate periodically as required by law. The Board also noted that the sub-adviser would pay for portions of meetings organized by the Funds’ distributor to educate wholesalers about the Fund(s) that the sub-adviser would manage. The Board considered JNAM’s assertion that those meetings would not yield a profit to the Funds’ distributor, the sub-adviser would not be required to participate in the meetings and recommendations to hire or fire the sub-adviser would not be influenced by a sub-adviser’s willingness to participate in the meetings. In addition, certain affiliates of the sub-adviser participates in the sale of funds or insurance contracts and are compensated by the Funds’ distributor for its activities, in addition to payments for marketing and conferences. Also, certain affiliates of JNAM participate in the sale of shares of retail mutual funds advised by the sub-adviser and other unaffiliated entities and receive selling and other compensation from them in connection with those activities. The Board reviewed the monetary values of these transactions. Lastly, certain affiliates of JNAM may receive benefits under the federal income tax laws with respect to tax deductions and credits.
In evaluating the benefits that may accrue to the sub-adviser through its relationship with the Fund(s), the Board noted that the sub-advisers may receive indirect benefits in the form of soft dollar arrangements for portfolio securities trades placed with the Fund’s assets and may also develop additional investment advisory business with JNAM, the Funds or other clients of the sub-adviser as a result of its relationship with the Fund(s).
After full consideration of these and other factors, the Board concluded that approval of the Agreement and the Sub-Advisory Agreement was fair, reasonable and in the best interests of each Fund and its shareholders.
Supplement Dated October 5, 2009
To The Prospectus Dated April 6, 2009
JNL® Series Trust
Please note that the changes apply to your variable annuity and/or variable life product(s).
For the JNL/Franklin Templeton Income Fund, please add the following bullets to the section entitled “The Sub-Adviser and Portfolio Management”:
| · | Alex W. Peters, CFA (Vice President) has been a manager of the Fund since October 2009. Mr. Peters specializes in research analysis of the commercial real estate industry and analyzes debt and equity investments for the Core/Hybrid team. Mr. Peters has a bachelor’s degree from University of Washington and an M.B.A from University of San Francisco. |
| · | Matt Quinlan (Research Analyst) has been a manager of the Fund since October 2009. Prior to joining Franklin Templeton in 2005, Mr. Quinlan worked in investment banking at Citigroup where he covered the retail and consumer products industries. Mr. Quinlin earned his B.A. in history from UCLA and an M.B.A. in finance and strategy from The Anderson School at UCLA. |
This Supplement is dated October 5, 2009.
(To be used with JMV2731 09/09, VC4224 04/09, VC5869 04/09, VC5890 04/09, VC5995 04/09, VC3723 04/09, VC5825 04/09, VC5884 04/09, VC5885 04/09, VC3656 04/09, VC5526 04/09, VC3657 04/09, FVC4224FT 04/09, NV4224 04/09, NV3174CE 04/09, NV5526 04/09, NV3784 04/09, NV5869 04/09, NV5890 04/09, NV5825 04/09, HR105 04/09 and VC2440 04/09.)
CMX4336 10/09
Supplement Dated November 13, 2009
To The Prospectus Dated April 6, 2009
JNL® Series Trust
Please note that the changes apply to your variable annuity and/or variable life product(s).
For the JNL/Red Rocks Listed Private Equity Fund, please delete the first paragraph of the section entitled “The Sub-Adviser and Portfolio Management” and replace it with the following paragraph:
The Sub-Adviser and Portfolio Management. The Sub-Adviser to the JNL/Red Rocks Listed Private Equity Fund is Red Rocks Capital LLC (“RRC”) located at 25188 Genesee Trail Road, Suite 250, Golden, Colorado 80401. RRC is the creator, manager and owner of the Listed Private Equity Index, International Listed Private Equity Index and Global Listed Private Equity Index. RRC also has extensive investment experience and has developed proprietary research on the universe of Listed Private Equity Companies.
This Supplement is dated November 13, 2009.
(To be used with VC4224 04/09, VC5869 04/09, VC5890 04/09, VC5995 04/09, JMV2731 09/09, VC3723 04/09, VC5825 04/09, VC5884 04/09, VC5885 04/09, VC3656 04/09, VC5526 04/09, VC3657 04/09, FVC4224FT 04/09, NV4224 04/09, NV3174CE 04/09, NV5526 04/09, NV3784 04/09, NV5869 04/09, NV5890 04/09, HR105 04/09 and VC2440 04/09.)
CMX4603 11/09
Supplement Dated December 7, 2009
To The Prospectus Dated April 6, 2009
JNL® Series Trust
Please note that the changes apply to your variable annuity and/or variable life product(s).
Effective October 30, 2009, for the JNL/Capital Guardian Global Balanced Fund, please delete all references to Richard N. Havas.
Effective November 1, 2009, for the JNL/Capital Guardian Global Balanced Fund in the section entitled “The Sub-Adviser and Portfolio Management,” please insert the following paragraph:
Michael Cohen is a director and senior vice president of Capital International Limited, an affiliate of Capital Guardian, and has equity portfolio management responsibilities for Capital Guardian. Michael joined the Capital organization in 2000 as an investment analyst and later became a portfolio counselor for Capital Research and Management Company until the fall of 2009. Prior to this, he was a research analyst with both Schroders and Salomon Brothers in London. He received his MBA from the London Business School and his BA in accounting and economics from Tel Aviv University. He is based in London.
Effective November 1, 2009, for the JNL/Capital Guardian Global Diversified Research Fund, please delete the third, fourth and fifth paragraphs of the section entitled “The Sub-Adviser and Portfolio Management” and replace it with the following paragraphs:
G. Ernest Nutter serves as the research portfolio coordinator for the Fund.
Ernie Nutter is a vice president and investment analyst for Capital International Research, Inc., an affiliate of Capital Guardian. He joined the Capital organization in 2004 and brings over 28 years of research experience. For 13 years, he was managing director of mining research for RBC Capital Markets/Dominion Securities, Inc. Prior to that, he spent two years as the senior mining analyst for Dean Witter Reynolds (Canada), Inc.; one year as a mining analyst with Pemberton Securities, Inc.; one year as the senior mining analyst for Davidson Partners Limited; and 11 years as a project geologist with Westmin Resources/Western Mines. Mr. Nutter earned a BS in geology from Dalhousie University. Currently, he is a member of the Geological Association of Canada, the Canadian Institute of Mining and Metallurgy, and the Prospectors and Developers Association.
Effective October 30, 2009, for the JNL/Capital Guardian International Small Cap Fund, please delete all references to Richard N. Havas and Takeo Nakamura.
Effective November 18, 2009, for the JNL/Capital Guardian U.S. Growth Equity Fund, please delete all references to David I. Fisher.
This Supplement is dated December 7, 2009.
(To be used with VC4224 04/09, VC5869 04/09, VC5890 04/09, VC5995 04/09, JMV2731 09/09, VC3723 04/09, VC5825 04/09, VC5884 04/09, VC5885 04/09, VC3656 04/09, VC5526 04/09, VC3657 04/09, FVC4224FT 04/09, NV4224 04/09, NV3174CE 04/09, NV5526 04/09, NV3784 04/09, NV5869 04/09, NV5890 04/09, HR105 04/09 and VC2440 04/09.)
CMX4718 12/09
Supplement Dated February 16, 2010
To The Prospectus Dated April 6, 2009
JNL® Series Trust
Please note that the changes the changes apply to all contracts issued after May 1, 2010.
The JNL/AIM Small Cap Growth Fund, JNL/Credit Suisse Long/Short Fund, JNL/Franklin Templeton Global Growth Fund, JNL/Franklin Templeton Mutual Shares Fund, JNL/Franklin Templeton Small Cap Value Fund, JNL/Goldman Sachs Mid Cap Value Fund, JNL/JPMorgan MidCap Growth Fund, JNL/Lazard Mid Cap Equity Fund, and JNL/Oppenheimer Global Growth Fund (the “Funds”) will be closed to new contract holders effective May 1, 2010. The Funds are still available to contract holders who purchased their contract prior to May 1, 2010, even if the contract holder does not have a current allocation in the Funds. The Funds are also available to both new and existing contract holders as an underlying Fund of the JNL/S&P Managed Conservative Fund, JNL/S&P Managed Moderate Fund, JNL/S&P Managed Moderate Growth Fund, JNL/S&P Managed Growth Fund, and JNL/S&P Managed Aggressive Growth Fund.
The JNL/Mellon Capital Management European 30 Fund and JNL/Mellon Capital Management Pacific Rim 30 Fund (the “Funds”) will be closed to new contract holders effective May 1, 2010. The Funds are still available to contract holders who purchased their contract prior to May 1, 2010, even if the contract holder does not have a current allocation in the Funds. The Funds are also available to both new and existing contract holders as an underlying Fund of the JNL/S&P Managed Conservative Fund, JNL/S&P Managed Moderate Fund, JNL/S&P Managed Moderate Growth Fund, JNL/S&P Managed Growth Fund, JNL/S&P Managed Aggressive Growth Fund, JNL/S&P Disciplined Moderate Fund, JNL/S&P Disciplined Moderate Growth Fund, and JNL/S&P Disciplined Growth Fund.
This Supplement is dated February 16, 2010.
(To be used with VC5995 04/09.)
JMX5035 02/10
Supplement Dated February 16, 2010
To The Prospectus Dated April 6, 2009
JNL® Series Trust
Please note that the changes apply to your variable annuity and/or variable life product(s).
On December 17-18, 2009, Jackson National Asset Management, LLC recommended and the Board of Trustees of the JNL Series Trust (“Board”) approved the following changes that will be effective May 1, 2010.
Contract owners will be sent an Information Statement containing additional information on the change of sub-adviser for the JNL/Capital Guardian International Small Cap Fund.
A change of sub-adviser was approved for JNL/Capital Guardian International Small Cap Fund (“Fund”). The Fund will be sub-advised by Franklin Templeton Institutional, LLC. The name of the Fund will change to JNL/Franklin Templeton International Small Cap Growth Fund.
This Supplement is dated February 16, 2010.
(To be used with VC4224 04/09, VC5869 04/09, VC5890 04/09, VC5995 04/09, VC3723 04/09, VC5825 04/09, VC5884 04/09, VC5885 04/09, VC3656 04/09, VC5526 04/09, VC3657 04/09, FVC4224FT 04/09, NV4224 04/09, NV3174CE 04/09, NV5526 04/09, NV3784 04/09, NV5869 04/09, NV5890 04/09, NV5825 04/09, HR105 04/09 and VC2440 04/09.)
CMX5036 02/10
| JNL Series Trust | PRSRT STD | |
| JNL Variable Fund LLC | U.S. POSTAGE | |
| PAID | ||
| One Corporate Way | JACKSON NATIONAL ASSET | |
| Lansing, MI 48951 | MANAGEMENT | |
| L.L.C. |
VADV7338 02/10
Item 2. Code of Ethics.
As of the end of the period covered by this report, the registrant had adopted a code of ethics, as defined in Item 2 of Form N-CSR, applicable to its principal executive officer, principal financial officer, principal accounting officer or controller, or persons performing similar functions. There were no substantive amendments or any waivers to this code of ethics during the period covered by this report. A copy of this code of ethics is filed as Exhibit 12(a)(1) to this Form N-CSR.
Item 3. Audit Committee Financial Expert.
The registrant has named William J. Crowley, Jr. as an Audit Committee financial expert serving on its Audit Committee. William J. Crowley, Jr. is not an “interested person” of the Trust, as that term is defined by Section 2(a)(19) of the Investment Company Act of 1940, as amended, and is considered “independent” for purposes of this Item.
An “audit committee financial expert” is not an “expert” for any purpose, including for purposes of Section 11 of the Securities Act of 1933, as amended, as a result of being designated as an “audit committee financial expert.” Further, the designation of a person as an “audit committee financial expert” does not mean that the person has any greater duties, obligations, or liability than those imposed on the person without the “audit committee financial expert” designation. Similarly, the designation of a person as an “audit committee financial expert” does not affect the duties, obligations, or liability of any other member of the Audit Committee or Board of Trustees.
Item 4. Principal Accountant Fees and Services.
(a)-(d)
The administrator of the registrant is responsible for payment of all expenses associated with the annual audit and other required services of the independent registered accounting firm, and all expenses associated with the preparation and filing of the tax returns.
KPMG LLP (“KPMG”) was appointed by the Board of Trustees as the independent registered public accounting firm of the registrant for the fiscal years ended December 31, 2008 and December 31, 2009. The following table sets forth aggregate fees billed by KPMG for the respective period for professional services rendered to the registrant.
Fees for Services Rendered to the Registrant by KPMG
| Fiscal Year | Audit Fees | Audit-Related Fees | Tax Fees | All Other Fees |
| 2008 | $614,340 | $54,455 | $148,960 | $0 |
| 2009 | $607,173 | $22,545 | $160,000 | $0 |
The above Audit-Related Fees for 2008 and 2009 are the aggregate fees billed for professional services rendered by KPMG to the registrant for the services provided in connection with the registrant’s Rule 17f-2 security counts.
The above Tax Fees for 2008 and 2009 are the aggregate fees billed for professional services by KPMG to the registrant for tax compliance, tax advice, and tax return review.
Fees for Services Rendered to Adviser Entities by KPMG
The following table sets forth the amount of fees that were billed by KPMG for the respective period to any entity controlling, controlled by, or under common control with the investment adviser that provided ongoing services to the registrant (“Adviser Entities”) that were directly related to the registrant’s operations and financial reporting.
| Fiscal Year | Audit-Related Fees | Tax Fees | All Other Fees |
| 2008 | $49,000 | $0 | $0 |
| 2009 | $48,110 | $0 | $0 |
The above Audit-Related Fees are the aggregate fees billed to Adviser Entities for the performance of an internal control review pursuant to Statement of Auditing Standards No. 70 of the adviser and administrator of the registrant.
(e)(1) The Audit Committee is authorized to pre-approve non-audit services provided by the registrant's auditors, if they find it appropriate in light of their fiduciary duties and in the exercise of their good faith business judgment and compatible with the auditor’s independence. The Chairman of the Audit Committee is authorized to approve audit and non-audit services for newly established funds of the registrant on the same terms as the full Audit Committee previously had approved for the then existing Funds.
(e)(2) 0%
(f) Not applicable.
(g) As detailed in the tables above, the aggregate fees billed for all non-audit fees to the registrant and Adviser Entities for the fiscal year ended December 31, 2008 was $252,415. As detailed in the tables above, the aggregate fees billed for all non-audit fees to the registrant and Adviser Entities for the fiscal year ended December 31, 2009 was $230,655.
(h) For the fiscal years ended December 31, 2008 and December 31, 2009, the Audit Committee of the registrant’s Board of Trustees considered the provision of non-audit services that were rendered to the Adviser Entities that were not pre-approved pursuant to paragraph (c)(7)(ii) of Rule 2-01 of Regulation S-X and concluded that such services were compatible with maintaining KPMG’s independence.
Item 5. Audit Committee of Listed Registrants.
Not applicable.
Item 6. Schedule of Investments
(a) Below is a Schedule I – Investments in securities of unaffiliated issuers for the JNL/AIM Small Cap Growth Fund, the JNL/Capital Guardian Global Diversified Research Fund, the JNL/Capital Guardian International Small Cap Fund, the JNL/Credit Suisse Commodity Securities Fund, the JNL/Credit Suisse Long/Short Fund, the JNL/Franklin Templeton Income Fund, the JNL/Franklin Templeton Mutual Shares Fund, the JNL/Mellon Capital Management International Index Fund, the JNL/Mellon Capital Management S&P 400 MidCap Index Fund, the JNL/Mellon Capital Management S&P 500 Index Fund, the JNL/Mellon Capital Management Small Cap Index Fund, the JNL/T. Rowe Price Mid-Cap Growth Fund, and the JNL/T. Rowe Price Value Fund for which a summary schedule of investments was provided in the Annual Report, December 31, 2009, pursuant to §210.1212 of Regulation S-X.
JNL Series Trust
Schedules of Investments (in thousands)
December 31, 2009
December 31, 2009
| Shares / Par (q) | Value | |||||
| JNL/AIM Small Cap Growth Fund | ||||||
| COMMON STOCKS - 94.8% | ||||||
| CONSUMER DISCRETIONARY - 13.9% | ||||||
| Big Lots Inc. (c) | 26 | $ | 749 | |||
| Brinker International Inc. | 40 | 590 | ||||
| Buffalo Wild Wings Inc. (c) | 13 | 515 | ||||
| Choice Hotels International Inc. | 20 | 642 | ||||
| Darden Restaurants Inc. | 17 | 593 | ||||
| Deckers Outdoor Corp. (c) | 8 | 772 | ||||
| Group 1 Automotive Inc. (c) (e) | 20 | 568 | ||||
| Gymboree Corp. (c) | 14 | 621 | ||||
| HOT Topic Inc. (c) | 78 | 494 | ||||
| Jack in the Box Inc. (c) | 37 | 720 | ||||
| National CineMedia Inc. | 40 | 661 | ||||
| NetFlix Inc. (c) (e) | 13 | 744 | ||||
| Penn National Gaming Inc. (c) | 18 | 503 | ||||
| PF Chang's China Bistro Inc. (c) (e) | 24 | 903 | ||||
| Pool Corp. | 29 | 558 | ||||
| Tractor Supply Co. (c) | 11 | 601 | ||||
| TRW Automotive Holdings Corp. (c) | 32 | 759 | ||||
| Warnaco Group Inc. (c) | 15 | 627 | ||||
| Williams-Sonoma Inc. | 33 | 676 | ||||
| WMS Industries Inc. (c) | 18 | 706 | ||||
| 13,002 | ||||||
| CONSUMER STAPLES - 1.5% | ||||||
| Church & Dwight Co. Inc. | 14 | 863 | ||||
| Ralcorp Holdings Inc. (c) | 9 | 509 | ||||
| 1,372 | ||||||
| ENERGY - 7.1% | ||||||
| Arena Resources Inc. (c) (e) | 18 | 794 | ||||
| Bill Barrett Corp. (c) | 19 | 593 | ||||
| Carrizo Oil & Gas Inc. (c) (e) | 28 | 749 | ||||
| Dril-Quip Inc. (c) | 22 | 1,230 | ||||
| FMC Technologies Inc. (c) (e) | 14 | 820 | ||||
| Goodrich Petroleum Corp. (c) (e) | 24 | 575 | ||||
| Patterson-UTI Energy Inc. | 42 | 650 | ||||
| SandRidge Energy Inc. (c) (e) | 48 | 454 | ||||
| Whiting Petroleum Corp. (c) | 10 | 694 | ||||
| 6,559 | ||||||
| FINANCIALS - 7.5% | ||||||
| Affiliated Managers Group Inc. (c) (e) | 11 | 757 | ||||
| BioMed Realty Trust Inc. (e) | 39 | 611 | ||||
| Brown & Brown Inc. | 24 | 424 | ||||
| City National Corp. (e) | 12 | 527 | ||||
| Cullen/Frost Bankers Inc. (e) | 10 | 476 | ||||
| Federated Investors Inc. - Class B (e) | 24 | 673 | ||||
| Greenhill & Co. Inc. | 10 | 815 | ||||
| optionsXpress Holdings Inc. | 29 | 455 | ||||
| ProAssurance Corp. (c) (e) | 15 | 797 | ||||
| Stifel Financial Corp. (c) | 11 | 654 | ||||
| SVB Financial Group (c) | 20 | 820 | ||||
| 7,009 | ||||||
| HEALTH CARE - 16.6% | ||||||
| Acorda Therapeutics Inc. (c) | 23 | 582 | ||||
| AMAG Pharmaceuticals Inc. (c) (e) | 14 | 548 | ||||
| American Medical Systems Holdings Inc. (c) | 39 | 750 | ||||
| BioMarin Pharmaceutical Inc. (c) | 36 | 677 | ||||
| Biovail Corp. | 45 | 623 | ||||
| Chemed Corp. | 19 | 913 | ||||
| Eclipsys Corp. (c) | 41 | 750 | ||||
| Gen-Probe Inc. (c) | 12 | 521 | ||||
| Insulet Corp. (c) (e) | 32 | 464 | ||||
| inVentiv Health Inc. (c) | 37 | 600 | ||||
| Isis Pharmaceuticals Inc. (c) | 21 | 231 | ||||
| Martek Biosciences Corp. (c) (e) | 23 | 429 | ||||
| Medicis Pharmaceutical Corp. | 26 | 696 | ||||
| Mednax Inc. (c) | 16 | 963 | ||||
| Meridian Bioscience Inc. (e) | 28 | 605 | ||||
| Myriad Genetics Inc. (c) | 14 | 367 | ||||
| NuVasive Inc. (c) (e) | 13 | 404 | ||||
| OSI Pharmaceuticals Inc. (c) (e) | 12 | 371 | ||||
| Perrigo Co. | 19 | 762 | ||||
| PSS World Medical Inc. (c) (e) | 26 | 582 | ||||
| RehabCare Group Inc. (c) | 22 | 678 | ||||
| Techne Corp. | 9 | 618 | ||||
| United Therapeutics Corp. (c) | 17 | 915 | ||||
| VCA Antech Inc. (c) | 29 | 725 | ||||
| Zoll Medical Corp. (c) | 23 | 610 | ||||
| 15,384 | ||||||
| INDUSTRIALS - 14.6% | ||||||
| Bucyrus International Inc. - Class A | 16 | 915 | ||||
| Corrections Corp. of America (c) | 37 | 901 | ||||
| CoStar Group Inc. (c) (e) | 24 | 1,023 | ||||
| EnergySolutions Inc. | 75 | 636 | ||||
| Forward Air Corp. | 26 | 653 | ||||
| Fuel Tech Inc. (c) | 38 | 312 | ||||
| General Cable Corp. (c) | 21 | 625 | ||||
| Hexcel Corp. (c) | 38 | 493 | ||||
| HUB Group Inc. - Class A (c) (e) | 30 | 801 | ||||
| Kaydon Corp. | 14 | 504 | ||||
| Knight Transportation Inc. (e) | 55 | 1,058 | ||||
| Lindsay Corp. (e) | 11 | 456 | ||||
| Pike Electric Corp. (c) | 56 | 522 | ||||
| Quanta Services Inc. (c) | 19 | 390 | ||||
| Regal-Beloit Corp. | 18 | 945 | ||||
| Tetra Tech Inc. (c) | 31 | 843 | ||||
| TransDigm Group Inc. | 25 | 1,204 | ||||
| Wabtec Corp. | 20 | 814 | ||||
| Watsco Inc. | 10 | 514 | ||||
| 13,609 | ||||||
| INFORMATION TECHNOLOGY - 28.8% | ||||||
| Advanced Energy Industries Inc. (c) | 53 | 803 | ||||
| Alliance Data Systems Corp. (c) (e) | 11 | 687 | ||||
| Ansys Inc. (c) | 17 | 726 | ||||
| Aspen Technology Inc. (c) | 59 | 575 | ||||
| Blackboard Inc. (c) (e) | 16 | 737 | ||||
| Cabot Microelectronics Corp. (c) | 18 | 601 | ||||
| Cogent Inc. (c) | 68 | 709 | ||||
| Coherent Inc. (c) (e) | 18 | 544 | ||||
| CommVault Systems Inc. (c) | 30 | 707 | ||||
| Cymer Inc. (c) (e) | 12 | 455 | ||||
| F5 Networks Inc. (c) | 18 | 929 | ||||
| Global Payments Inc. | 16 | 866 | ||||
| GSI Commerce Inc. (c) | 26 | 671 | ||||
| Harmonic Inc. (c) | 90 | 570 | ||||
| Hittite Microwave Corp. (c) (e) | 17 | 705 | ||||
| Informatica Corp. (c) (e) | 49 | 1,255 | ||||
| Knot Inc. (c) | 59 | 591 | ||||
| Lawson Software Inc. (c) | 102 | 676 | ||||
| Manhattan Associates Inc. (c) (e) | 28 | 672 | ||||
| Micros Systems Inc. (c) | 22 | 695 | ||||
| Microsemi Corp. (c) | 40 | 710 | ||||
| Monolithic Power Systems Inc. (c) | 26 | 632 | ||||
| Nice Systems Ltd. - ADR (c) | 27 | 838 | ||||
| ON Semiconductor Corp. (c) (e) | 84 | 739 | ||||
| Open Text Corp. (c) | 17 | 684 | ||||
| Pegasystems Inc. (e) | - | 7 | ||||
| Polycom Inc. (c) (e) | 38 | 956 | ||||
| Power Integrations Inc. | 18 | 645 | ||||
| Quality Systems Inc. | 19 | 1,221 | ||||
| Quest Software Inc. (c) | 35 | 636 | ||||
| SonicWALL Inc. (c) | 77 | 584 | ||||
| SRA International Inc. - Class A (c) | 31 | 597 | ||||
| SuccessFactors Inc. (c) | 39 | 641 | ||||
| Sybase Inc. (c) | 24 | 1,047 | ||||
| Syntel Inc. (e) | 11 | 427 | ||||
| Tech Data Corp. (c) | 16 | 753 | ||||
| VistaPrint NV (c) (e) | 15 | 844 | ||||
| Websense Inc. (c) | 37 | 650 | ||||
| 26,785 | ||||||
| MATERIALS - 2.8% | ||||||
| Calgon Carbon Corp. (c) | 34 | 475 | ||||
| Carpenter Technology Corp. | 17 | 455 | ||||
| Grief Inc. | 18 | 950 | ||||
| Intrepid Potash Inc. (c) (e) | 24 | 697 | ||||
| 2,577 | ||||||
| TELECOMMUNICATION SERVICES - 1.1% | ||||||
| SBA Communications Corp. (c) | 29 | 1,005 | ||||
| UTILITIES - 0.9% | ||||||
| ITC Holdings Corp. | 16 | 857 | ||||
| Total Common Stocks (cost $82,164) | 88,159 | |||||
| NON-U.S. GOVERNMENT AGENCY | ||||||
| ASSET-BACKED SECURITIES - 0.0% | ||||||
| Sigma Finance, Inc. (d) (f) (u) | $ | 289 | 12 | |||
| Total Non-U.S. Government Agency | ||||||
| Asset-Backed Securities (cost $289) | 12 | |||||
| SHORT TERM INVESTMENTS - 22.5% | ||||||
| Mutual Funds - 4.9% | ||||||
| JNL Money Market Fund, 0.07% (a) (h) | 4,526 | 4,526 | ||||
| Securities Lending Collateral - 17.6% | ||||||
| Securities Lending Cash Collateral Fund LLC, | ||||||
| 0.16% (a) (h) | 12,335 | 12,335 | ||||
| Securities Lending Liquidating Fund LLC, 0.36% (a) (h) | 3,995 | 3,987 | ||||
| 16,322 | ||||||
| Total Short Term Investments (cost $20,856) | 20,848 | |||||
| Total Investments - 117.3% (cost $103,309) | 109,019 | |||||
| Other Assets and Liabilities, Net - (17.3%) | (16,069) | |||||
| Total Net Assets - 100% | $ | 92,950 | ||||
| JNL/Capital Guardian Global | ||||||
| Diversified Research Fund | ||||||
| COMMON STOCKS - 94.9% | ||||||
| CONSUMER DISCRETIONARY - 7.1% | ||||||
| Carnival Corp. (c) | 29 | $ | 919 | |||
| Daimler AG | 38 | 2,019 | ||||
| Discovery Communications Inc. - Class A (c) | 33 | 1,018 | ||||
| Gannett Co. Inc. | 83 | 1,228 | ||||
| Hyundai Mobis | 3 | 440 | ||||
| LG Electronics Inc. | 27 | 2,846 | ||||
| Lowe's Cos. Inc. | 102 | 2,387 | ||||
| PT Astra International Tbk | 105 | 384 | ||||
| Strayer Education Inc. (e) | 8 | 1,742 | ||||
| Target Corp. | 82 | 3,952 | ||||
| Time Warner Cable Inc. (e) | 37 | 1,523 | ||||
| Toyota Motor Corp. | 56 | 2,354 | ||||
| Urban Outfitters Inc. (c) | 29 | 1,011 | ||||
| Viacom Inc. - Class B (c) | 64 | 1,909 | ||||
| 23,732 | ||||||
| CONSUMER STAPLES - 10.4% | ||||||
| Coca-Cola Amatil Ltd. | 234 | 2,416 | ||||
| Coca-Cola Co. | 34 | 1,910 | ||||
| Danone SA | 28 | 1,747 | ||||
| General Mills Inc. | 27 | 1,884 | ||||
| Imperial Tobacco Group Plc | 83 | 2,618 | ||||
| Kraft Foods Inc. - Class A | 86 | 2,348 | ||||
| Lawson Inc. | 61 | 2,678 | ||||
| PepsiCo Inc. | 54 | 3,277 | ||||
| Pernod-Ricard SA | 66 | 5,712 | ||||
| Philip Morris International Inc. | 27 | 1,296 | ||||
| Procter & Gamble Co. | 38 | 2,322 | ||||
| Seven & I Holdings Co. Ltd. | 58 | 1,183 | ||||
| Unilever Plc | 61 | 1,977 | ||||
| Wal-Mart Stores Inc. | 29 | 1,539 | ||||
| Woolworths Ltd. | 64 | 1,607 | ||||
| 34,514 | ||||||
| ENERGY - 11.1% | ||||||
| BG Group Plc | 322 | 5,825 | ||||
| Cameco Corp. | 63 | 2,045 | ||||
| Cenovus Energy Inc. | 99 | 2,505 | ||||
| Chevron Corp. | 31 | 2,402 | ||||
| China Shenhua Energy Co. Ltd. | 922 | 4,476 | ||||
| Gazprom OAO - ADR | 174 | 4,427 | ||||
| Oil Search Ltd. | 225 | 1,235 | ||||
| Reliance Industries Ltd. | 48 | 1,122 | ||||
| Royal Dutch Shell Plc - Class A | 156 | 4,732 | ||||
| Sasol Ltd. | 64 | 2,594 | ||||
| Schlumberger Ltd. | 36 | 2,337 | ||||
| SeaDrill Ltd. | 48 | 1,240 | ||||
| Transocean Ltd. (c) | 10 | 787 | ||||
| Weatherford International Ltd. (c) | 65 | 1,161 | ||||
| 36,888 | ||||||
| FINANCIALS - 18.3% | ||||||
| Allstate Corp. | 52 | 1,565 | ||||
| AON Corp. | 42 | 1,610 | ||||
| AXA SA (u) | 76 | 1,800 | ||||
| Banco Bilbao Vizcaya Argentaria SA | 86 | 1,571 | ||||
| Banco Santander SA | 139 | 2,304 | ||||
| Bank of China Ltd. (e) | 6,845 | 3,678 | ||||
| Barclays Plc (u) | 247 | 1,101 | ||||
| BlackRock Inc. | 9 | 2,090 | ||||
| BNP Paribas (u) | 60 | 4,796 | ||||
| Bumiputra-Commerce Holdings Bhd | 270 | 1,010 | ||||
| Charles Schwab Corp. | 89 | 1,675 | ||||
| CME Group Inc. | 5 | 1,579 | ||||
| DLF Ltd. (u) | 125 | 961 | ||||
| Goldman Sachs Group Inc. | 28 | 4,728 | ||||
| Grupo Financiero Inbursa SA | 273 | 807 | ||||
| HSBC Holdings Plc | 329 | 3,762 | ||||
| Industrial & Commercial Bank of China | 5,477 | 4,510 | ||||
| Itau Unibanco Holding SA - ADR | 72 | 1,644 | ||||
| JPMorgan Chase & Co. | 54 | 2,229 | ||||
| Link Real Estate Investment Trust | 940 | 2,398 | ||||
| Muenchener Rueckversicherungs AG (e) | 15 | 2,269 | ||||
| National Australia Bank Ltd. | 47 | 1,148 | ||||
| Progressive Corp. (c) | 127 | 2,287 | ||||
| Shinsei Bank Ltd. | 723 | 788 | ||||
| State Street Corp. | 46 | 1,985 | ||||
| UBS AG (c) (u) | 162 | 2,520 | ||||
| UniCredit SpA (c) | 296 | 996 | ||||
| Wharf Holdings Ltd. | 551 | 3,163 | ||||
| 60,974 | ||||||
| HEALTH CARE - 9.0% | ||||||
| Allergan Inc. | 42 | 2,640 | ||||
| Baxter International Inc. | 34 | 1,989 | ||||
| Bayer AG | 25 | 1,999 | ||||
| Celgene Corp. (c) | 37 | 2,049 | ||||
| Cerner Corp. (c) (e) | 19 | 1,575 | ||||
| DaVita Inc. (c) | 41 | 2,408 | ||||
| Johnson & Johnson | 26 | 1,668 | ||||
| Medtronic Inc. | 72 | 3,175 | ||||
| Merck & Co. Inc. | 57 | 2,083 | ||||
| Novo-Nordisk A/S - Class B | 19 | 1,197 | ||||
| Roche Holding AG | 30 | 5,054 | ||||
| Shire Plc | 143 | 2,792 | ||||
| Synthes Inc. | 10 | 1,259 | ||||
| 29,888 | ||||||
| INDUSTRIALS - 8.3% | ||||||
| Assa Abloy AB | 78 | 1,511 | ||||
| BAE Systems Plc | 238 | 1,383 | ||||
| British Airways Plc (c) (e) | 368 | 1,110 | ||||
| China Railway Construction Corp. Ltd. | 938 | 1,195 | ||||
| China Railway Group Ltd. (c) (e) | 1,715 | 1,324 | ||||
| Cia de Concessoes Rodoviarias | 39 | 892 | ||||
| Cummins Inc. | 41 | 1,857 | ||||
| Danaher Corp. | 23 | 1,692 | ||||
| East Japan Railway Co. | 24 | 1,526 | ||||
| Emerson Electric Co. | 27 | 1,137 | ||||
| FedEx Corp. (e) | 25 | 2,070 | ||||
| First Solar Inc. (c) (e) | 6 | 839 | ||||
| JetBlue Airways Corp. (c) | 439 | 2,391 | ||||
| Mitsubishi Corp. | 47 | 1,166 | ||||
| Mitsui OSK Lines Ltd. | 204 | 1,078 | ||||
| Norfolk Southern Corp. | 27 | 1,421 | ||||
| Parker Hannifin Corp. | 24 | 1,266 | ||||
| Qantas Airways Ltd. | 468 | 1,249 | ||||
| Siemens AG | 20 | 1,852 | ||||
| Sumitomo Corp. | 76 | 770 | ||||
| 27,729 | ||||||
| INFORMATION TECHNOLOGY - 13.1% | ||||||
| Acer Inc. | 600 | 1,800 | ||||
| Adobe Systems Inc. (c) | 58 | 2,126 | ||||
| Apple Inc. (c) | 10 | 2,045 | ||||
| ASML Holding NV | 48 | 1,667 | ||||
| Cisco Systems Inc. (c) | 69 | 1,661 | ||||
| Foxconn International Holdings Ltd. (c) | 1,494 | 1,720 | ||||
| Google Inc. - Class A (c) | 6 | 3,596 | ||||
| Juniper Networks Inc. (c) | 91 | 2,424 | ||||
| Keyence Corp. | 12 | 2,413 | ||||
| Maxim Integrated Products Inc. | 126 | 2,566 | ||||
| Murata Manufacturing Co. Ltd. | 30 | 1,498 | ||||
| NetApp Inc. (c) | 53 | 1,826 | ||||
| Nidec Corp. | 17 | 1,526 | ||||
| Nintendo Co. Ltd. | 7 | 1,744 | ||||
| Oracle Corp. | 71 | 1,745 | ||||
| Oracle Corp. Japan | 22 | 917 | ||||
| QUALCOMM Inc. | 35 | 1,605 | ||||
| Samsung Electronics Co. Ltd. - GDR | 6 | 1,936 | ||||
| SAP AG | 49 | 2,325 | ||||
| Taiwan Semiconductor Manufacturing Co. Ltd. - ADR | 124 | 1,419 | ||||
| TDK Corp. | 28 | 1,687 | ||||
| Visa Inc. - Class A (e) | 37 | 3,193 | ||||
| 43,439 | ||||||
| MATERIALS - 8.7% | ||||||
| Air Products & Chemicals Inc. | 16 | 1,329 | ||||
| Allegheny Technologies Inc. | 32 | 1,446 | ||||
| Anglo American Plc (c) | 63 | 2,758 | ||||
| Barrick Gold Corp. | 40 | 1,571 | ||||
| Cliffs Natural Resources Inc. | 47 | 2,180 | ||||
| CRH Plc | 76 | 2,064 | ||||
| HeidelbergCement AG | 22 | 1,495 | ||||
| Inmet Mining Corp. | 41 | 2,494 | ||||
| LG Chem Ltd. - GDR (c) (t) (v) | 11 | 1,035 | ||||
| Monsanto Co. | 16 | 1,324 | ||||
| Rio Tinto Plc | 54 | 2,955 | ||||
| Shin-Etsu Chemical Co. Ltd. | 31 | 1,751 | ||||
| Stora Enso Oyj - Class R (c) | 121 | 847 | ||||
| Sumitomo Chemical Co. Ltd. | 250 | 1,097 | ||||
| Vale SA - ADR | 73 | 1,822 | ||||
| Xstrata Plc (c) | 160 | 2,901 | ||||
| 29,069 | ||||||
| TELECOMMUNICATION SERVICES - 6.5% | ||||||
| American Tower Corp. (c) | 158 | 6,827 | ||||
| Bharti Airtel Ltd. | 250 | 1,766 | ||||
| France Telecom SA | 97 | 2,433 | ||||
| Koninklijke KPN NV | 160 | 2,709 | ||||
| Maxis Bhd (u) | 400 | 627 | ||||
| MTN Group Ltd. | 138 | 2,209 | ||||
| Rogers Communications Inc. - Class B | 33 | 1,013 | ||||
| SoftBank Corp. | 94 | 2,214 | ||||
| Telstra Corp. Ltd. | 546 | 1,680 | ||||
| 21,478 | ||||||
| UTILITIES - 2.4% | ||||||
| E.ON AG | 34 | 1,438 | ||||
| Edison International | 48 | 1,666 | ||||
| Exelon Corp. | 17 | 841 | ||||
| GDF Suez | 36 | 1,564 | ||||
| National Grid Plc | 47 | 518 | ||||
| Veolia Environnement (e) | 60 | 2,001 | ||||
| 8,028 | ||||||
| Total Common Stocks (cost $280,551) | 315,739 | |||||
| NON-U.S. GOVERNMENT AGENCY | ||||||
| ASSET-BACKED SECURITIES - 0.0% | ||||||
| Sigma Finance, Inc. (d) (f) (u) | $ | 810 | 34 | |||
| Total Non-U.S. Government Agency | ||||||
| Asset-Backed Securities (cost $810) | 34 | |||||
| CORPORATE BONDS AND NOTES - 0.1% | ||||||
| ENERGY - 0.1% | ||||||
| Seadrill Ltd., 3.63%, 11/08/12 | 300 | 299 | ||||
| Total Corporate Bonds and Notes (cost $153) | 299 | |||||
| SHORT TERM INVESTMENTS - 10.2% | ||||||
| Mutual Funds - 5.5% | ||||||
| JNL Money Market Fund, 0.07% (a) (h) | 18,355 | 18,355 | ||||
| Securities Lending Collateral - 4.7% | ||||||
| Securities Lending Cash Collateral Fund LLC, | ||||||
| 0.16% (a) (h) | 8,015 | 8,015 | ||||
| Securities Lending Liquidating Fund LLC, 0.36% (a) (h) | 7,677 | 7,661 | ||||
| 15,676 | ||||||
| Total Short Term Investments (cost $34,047) | 34,031 | |||||
| Total Investments - 105.2% (cost $315,561) | 350,103 | |||||
| Other Assets and Liabilities, Net - (5.2%) | (17,197) | |||||
| Total Net Assets - 100% | $ | 332,906 | ||||
| JNL/Capital Guardian International | ||||||
| Small Cap Fund | ||||||
| COMMON STOCKS - 90.2% | ||||||
| CONSUMER DISCRETIONARY - 14.2% | ||||||
| 361 Degrees International Ltd. (e) (t) (u) | 899 | $ | 525 | |||
| ABC-Mart Inc. | 52 | 1,452 | ||||
| ANTA Sports Products Ltd. (e) | 203 | 299 | ||||
| Asics Corp. | 37 | 332 | ||||
| Bellway Plc | 3 | 37 | ||||
| Billabong International Ltd. | 76 | 744 | ||||
| Bloomsbury Publishing Plc | 221 | 451 | ||||
| Cheil Worldwide Inc. | 2 | 493 | ||||
| DSG International Plc (c) | 1,638 | 965 | ||||
| Eaga Plc | 363 | 842 | ||||
| ElringKlinger AG | 31 | 732 | ||||
| Exedy Corp. (e) | 18 | 371 | ||||
| Fairpoint Group Plc (c) | 137 | 132 | ||||
| Future Plc | 548 | 148 | ||||
| Gaming VC Holdings SA | 114 | 412 | ||||
| Greene King Plc | 140 | 919 | ||||
| Groupe Aeroplan Inc. | 77 | 797 | ||||
| Hankook Tire Co. Ltd. | 34 | 748 | ||||
| Hellenic Duty Free Shops SA | 33 | 287 | ||||
| Hyundai Department Store Co. Ltd. | 18 | 1,780 | ||||
| Inchcape Plc (c) | 2,187 | 1,054 | ||||
| JB Hi-Fi Ltd. | 58 | 1,173 | ||||
| Kingdom Hotel Investments - GDR (c) | 6 | 20 | ||||
| LG Fashion Corp. | 18 | 490 | ||||
| Marston's Plc | 396 | 562 | ||||
| MegaStudy Co. Ltd. | 3 | 550 | ||||
| Mothercare Plc | 59 | 654 | ||||
| Proto Corp. | 13 | 337 | ||||
| Rodriguez Group (c) (f) (u) | 9 | 12 | ||||
| Shimachu Co. Ltd. | 3 | 49 | ||||
| SJM Holdings Ltd. | 824 | 453 | ||||
| Sportech Plc (c) | 111 | 87 | ||||
| Sumitomo Rubber Industries Inc. (e) | 92 | 800 | ||||
| UTV Media Plc | 121 | 192 | ||||
| Xebio Co. Ltd. | 30 | 526 | ||||
| Yell Group Plc (c) (e) (t) (u) | 1,568 | 995 | ||||
| 20,420 | ||||||
| CONSUMER STAPLES - 10.2% | ||||||
| Ain Pharmaciez Inc. | 29 | 687 | ||||
| Barry Callebaut AG | - | 306 | ||||
| BaWang International Group Holding Ltd. (c) (t) (u) | 710 | 492 | ||||
| C&C Group Plc | 617 | 2,665 | ||||
| Davide Campari-Milano SpA | 313 | 3,281 | ||||
| Drogasil SA | 50 | 808 | ||||
| Hite Brewery Co. Ltd. | 7 | 1,016 | ||||
| MARR SpA (e) | 147 | 1,259 | ||||
| Milbon Co. Ltd. | - | 9 | ||||
| Olam International Ltd. (e) (t) (u) | 511 | 961 | ||||
| Pigeon Corp. (e) | 33 | 1,297 | ||||
| Sugi Holdings Co. Ltd. | 5 | 106 | ||||
| Sundrug Co. Ltd. | 66 | 1,462 | ||||
| Tassal Group Ltd. | 274 | 430 | ||||
| 14,779 | ||||||
| ENERGY - 1.2% | ||||||
| CIC Energy Corp. (c) | 20 | 29 | ||||
| Dockwise Ltd. (c) | 7 | 222 | ||||
| Flex LNG Ltd. (c) (u) | 196 | 207 | ||||
| Golar LNG Energy Ltd. (c) | 420 | 800 | ||||
| SeaDrill Ltd. (e) | 18 | 456 | ||||
| 1,714 | ||||||
| FINANCIALS - 12.4% | ||||||
| Aareal Bank AG (c) | 14 | 266 | ||||
| Aozora Bank Ltd. | 229 | 244 | ||||
| Ascendas Real Estate Investment Trust | 324 | 509 | ||||
| Banque Cantonale Vaudoise | 1 | 334 | ||||
| Bolsas y Mercados Espanoles SA (e) | 33 | 1,050 | ||||
| CapitaCommercial Trust (t) (u) | 1,264 | 1,047 | ||||
| CapitaMall Trust (t) (u) | 239 | 306 | ||||
| Close Brothers Group Plc | 81 | 903 | ||||
| Credit Saison Co. Ltd. | 26 | 295 | ||||
| Espirito Santo Financial Group SA | 16 | 335 | ||||
| Grainger Plc | 270 | 558 | ||||
| Hopewell Holdings Ltd. | 162 | 521 | ||||
| Industrial Alliance Insurance & Financial Services Inc. | 39 | 1,189 | ||||
| Iwai Securities Co. Ltd. | 25 | 170 | ||||
| kabu.com Securities Co. Ltd. | 1 | 927 | ||||
| Korean Reinsurance Co. | 190 | 1,604 | ||||
| Laurentian Bank of Canada | 42 | 1,696 | ||||
| Liberty International Plc (t) (u) | 9 | 74 | ||||
| Liontrust Asset Management Plc | 25 | 40 | ||||
| Mah Sing Group Berhad | 206 | 111 | ||||
| Orix JREIT Inc. | - | 629 | ||||
| Paragon Group Companies Plc | 485 | 1,026 | ||||
| Shaftesbury Plc (t) (u) | 142 | 905 | ||||
| Sparebank 1 Nord Norge | 15 | 282 | ||||
| SpareBank 1 SMN | - | - | ||||
| Sumitomo Real Estate Sales Co. Ltd. | 32 | 1,340 | ||||
| Tokyu Livable Inc. | 74 | 635 | ||||
| Van Lanschot NV | 8 | 422 | ||||
| Yanlord Land Group Ltd. (e) | 263 | 402 | ||||
| 17,820 | ||||||
| HEALTH CARE - 5.8% | ||||||
| As One Corp. | 21 | 375 | ||||
| Biovail Corp. | 22 | 305 | ||||
| Genmab A/S (c) (e) | 30 | 477 | ||||
| Hogy Medical Co. Ltd. | 34 | 1,672 | ||||
| MANI Inc. | 16 | 945 | ||||
| Nestor Healthcare Group Plc | 377 | 250 | ||||
| Omega Pharma SA | 17 | 863 | ||||
| Pharmstandard OJSC - GDR (c) | 15 | 316 | ||||
| Sysmex Corp. | 61 | 3,196 | ||||
| 8,399 | ||||||
| INDUSTRIALS - 20.3% | ||||||
| Aecon Group Inc. | 115 | 1,638 | ||||
| Amano Corp. | 75 | 644 | ||||
| Andritz AG | 19 | 1,119 | ||||
| Atkins (WS) Plc | 35 | 349 | ||||
| BFI Canada Ltd. | 40 | 641 | ||||
| Brunel International NV | 25 | 841 | ||||
| Chiyoda Corp. (e) | 160 | 1,236 | ||||
| Cosel Co. Ltd. | 79 | 949 | ||||
| Fenner Plc | 141 | 383 | ||||
| Fuji Machine Manufacturing Co. Ltd. | 18 | 218 | ||||
| Glory Ltd. | 16 | 365 | ||||
| Harmonic Drive Systems Inc. | - | 64 | ||||
| Hastie Group Ltd. (e) | 364 | 616 | ||||
| Kaba Holding AG (e) | 2 | 361 | ||||
| KCC Engineering & Construction Co. Ltd. | 17 | 585 | ||||
| Kintetsu World Express Inc. | 39 | 1,011 | ||||
| MISUMI Group Inc. (e) | 99 | 1,699 | ||||
| Miura Co. Ltd. (e) | 91 | 2,312 | ||||
| NovaCast AB - Class B (c) (u) | 34 | 66 | ||||
| Panalpina Welttransport Holding AG | 11 | 728 | ||||
| Pfleiderer AG (c) | 26 | 231 | ||||
| Pronexus Inc. | 30 | 180 | ||||
| Robert Walters Plc | 69 | 238 | ||||
| S1 Corp. | 25 | 1,042 | ||||
| Saft Groupe SA | 17 | 845 | ||||
| Sagami Railway Co. Ltd. (e) | 62 | 257 | ||||
| Sankyu Inc. | 150 | 772 | ||||
| Sato Corp. | 17 | 177 | ||||
| Seco Tools AB - Class B | 48 | 581 | ||||
| Seek Ltd. | 783 | 4,842 | ||||
| SMA Solar Technology SA | 11 | 1,498 | ||||
| Spirax-Sarco Engineering Plc | 38 | 759 | ||||
| Telegate AG | 5 | 70 | ||||
| Tocalo Co. Ltd. (e) | 20 | 329 | ||||
| Trafficmaster Plc (c) | 320 | 154 | ||||
| Uponor Oyj (e) | 28 | 592 | ||||
| WestJet Airlines Ltd. (c) | 70 | 845 | ||||
| 29,237 | ||||||
| INFORMATION TECHNOLOGY - 11.5% | ||||||
| Aixtron AG | 26 | 873 | ||||
| ARM Holdings Plc | 211 | 604 | ||||
| CSR Plc (c) | 55 | 361 | ||||
| Dai-ichi Seiko Co. Ltd. | 27 | 1,152 | ||||
| Dialog Semiconductor Plc (c) (e) | 90 | 984 | ||||
| Ebiquity Plc (c) | 45 | 39 | ||||
| Epistar Corp. - GDR (c) (f) (t) (u) | 10 | 188 | ||||
| Filtronic Plc | 283 | 165 | ||||
| Giant Interactive Group Inc. - ADR (e) | 12 | 86 | ||||
| Halma Plc | 120 | 469 | ||||
| Hamamatsu Photonics KK (e) | 115 | 2,805 | ||||
| Kingboard Laminates Holdings Ltd. | 1,204 | 830 | ||||
| Kontron AG | 139 | 1,585 | ||||
| Laird Plc | 45 | 91 | ||||
| Monitise Plc (c) | 802 | 220 | ||||
| Perfect World Co. Ltd. - ADR (c) | 5 | 193 | ||||
| Premier Farnell Plc | 127 | 354 | ||||
| Rotork Plc | 41 | 791 | ||||
| Sandvine Corp. (c) | 30 | 36 | ||||
| VTech Holdings Ltd. | 63 | 601 | ||||
| Wacom Co. Ltd. (e) | 1 | 2,500 | ||||
| Yamatake Corp. (e) | 77 | 1,715 | ||||
| 16,642 | ||||||
| MATERIALS - 13.3% | ||||||
| Aquarius Platinum Ltd. (c) (e) | 120 | 791 | ||||
| Banro Corp. (c) | 6 | 12 | ||||
| Banro Corp. (c) (e) | 125 | 242 | ||||
| Centerra Gold Inc. (c) | 58 | 593 | ||||
| Centerra Gold Inc. (c) (f) (u) | 71 | 728 | ||||
| China Shanshui Cement Group Ltd. | 1,309 | 950 | ||||
| Delta Plc | 378 | 855 | ||||
| Farallon Mining Ltd.(c) | 750 | 393 | ||||
| First Uranium Corp. (c) | 15 | 33 | ||||
| Fronteer Development Group Inc. (c) | 63 | 249 | ||||
| Gem Diamonds Ltd. (c) (t) (u) | 222 | 815 | ||||
| Great Basin Gold Ltd. (c) | 149 | 258 | ||||
| Hitachi Metals Ltd. | 42 | 404 | ||||
| Iluka Resources Ltd. (c) | 666 | 2,131 | ||||
| Incitec Pivot Ltd. | 167 | 528 | ||||
| Inmet Mining Corp. | 18 | 1,113 | ||||
| Katanga Mining Ltd. (c) | 74 | 50 | ||||
| Labrador Iron Ore Royalty Income Fund | 40 | 1,659 | ||||
| Minefinders Corp. (c) (e) | 160 | 1,657 | ||||
| Namakwa Diamonds Ltd. (c) | 95 | 48 | ||||
| New Gold Inc. (c) | 11 | 39 | ||||
| Noranda Income Fund | 172 | 419 | ||||
| Petropavlovsk Plc | 112 | 1,850 | ||||
| Platmin Ltd. (c) | 1,054 | 1,271 | ||||
| Polaris Minerals Corp. (c) | 34 | 54 | ||||
| Red Back Mining Inc. (c) | 30 | 426 | ||||
| Resin Systems Inc. (c) | 884 | 346 | ||||
| Uranium One Inc. (c) | 423 | 1,218 | ||||
| Whitemud Resources Inc. (c) | 50 | 22 | ||||
| 19,154 | ||||||
| TELECOMMUNICATION SERVICES - 0.8% | ||||||
| Freenet AG (c) | 82 | 1,108 | ||||
| UTILITIES - 0.5% | ||||||
| Elia System Operator SA | 18 | 717 | ||||
| Emp Distribuidora y Comercializadora Norta SA - ADR (c) | 7 | 56 | ||||
| 773 | ||||||
| Total Common Stocks (cost $122,102) | 130,046 | |||||
| PREFERRED STOCKS - 0.1% | ||||||
| HEALTH CARE - 0.1% | ||||||
| Biotest AG | 4 | 181 | ||||
| Total Preferred Stocks (cost $244) | 181 | |||||
| INVESTMENT FUNDS - 0.9% | ||||||
| SPDR S&P International Small Cap ETF | 51 | 1,282 | ||||
| Total Investment Funds (cost $1,288) | 1,282 | |||||
| RIGHTS - 0.0% | ||||||
| Golar LNG Energy Ltd. (c) (f) | 44 | 69 | ||||
| Total Rights (cost $0) | 69 | |||||
| WARRANTS - 0.1% | ||||||
| Banro Corp., 09/17/11 (c) | 22 | 14 | ||||
| Minefinders Corp., 12/31/11 (c) | 19 | 110 | ||||
| Peter Hambro Mining Plc, 06/09/10 (c) | 10 | 19 | ||||
| Total Warrants (cost $87) | 143 | |||||
| NON-U.S. GOVERNMENT AGENCY | ||||||
| ASSET-BACKED SECURITIES - 0.0% | ||||||
| Sigma Finance, Inc. (d) (f) (u) | $ | 212 | 9 | |||
| Total Non-U.S. Government Agency | ||||||
| Asset-Backed Securities (cost $212) | 9 | |||||
| CORPORATE BONDS AND NOTES - 0.1% | ||||||
| CONSUMER STAPLES - 0.1% | ||||||
| Olam International Ltd., 1.00%, 07/03/13 | 100 | 100 | ||||
| Total Corporate Bonds and Notes (cost $55) | 100 | |||||
| SHORT TERM INVESTMENTS - 16.6% | ||||||
| Mutual Funds - 9.1% | ||||||
| JNL Money Market Fund, 0.07% (a) (h) | 13,149 | 13,149 | ||||
| Securities Lending Collateral - 7.5% | ||||||
| Securities Lending Cash Collateral Fund LLC, | ||||||
| 0.16% (a) (h) | 8,483 | 8,483 | ||||
| Securities Lending Liquidating Fund LLC, 0.36% (a) (h) | 2,271 | 2,266 | ||||
| 10,749 | ||||||
| Total Short Term Investments (cost $23,903) | 23,898 | |||||
| Total Investments - 108.0% (cost $147,891) | 155,728 | |||||
| Other Assets and Liabilities, Net - (8.0%) | (11,506) | |||||
| Total Net Assets - 100% | $ | 144,222 | ||||
| JNL/Credit Suisse Commodity | ||||||
| Securities Fund | ||||||
| COMMON STOCKS - 46.1% | ||||||
| ENERGY - 10.6% | ||||||
| Anadarko Petroleum Corp. | 11 | $ | 657 | |||
| Apache Corp. | 9 | 909 | ||||
| ARC Energy Trust | 1 | 19 | ||||
| Arch Coal Inc. | 3 | 64 | ||||
| BG Group Plc | 109 | 1,980 | ||||
| BP Plc | 716 | 6,937 | ||||
| Cabot Oil & Gas Corp. - Class A | 1 | 53 | ||||
| Cairn Energy Plc (c) | 1 | 5 | ||||
| Caltex Australia Ltd. (c) | 1 | 11 | ||||
| Cameco Corp. | 3 | 90 | ||||
| Canadian Natural Resources Ltd. | 20 | 1,475 | ||||
| Canadian Oil Sands Trust | 2 | 56 | ||||
| Cenovus Energy Inc. | 18 | 447 | ||||
| Chesapeake Energy Corp. | 16 | 419 | ||||
| Chevron Corp. | 76 | 5,840 | ||||
| Cimarex Energy Co. | 1 | 72 | ||||
| ConocoPhillips | 41 | 2,088 | ||||
| Consol Energy Inc. | 2 | 95 | ||||
| Cosmo Oil Co. Ltd. | 7 | 15 | ||||
| Crescent Point Energy Corp. | 1 | 19 | ||||
| Denbury Resources Inc. (c) | 4 | 64 | ||||
| Devon Energy Corp. | 14 | 1,053 | ||||
| El Paso Corp. | 7 | 69 | ||||
| Enbridge Inc. | 12 | 574 | ||||
| EnCana Corp. | 18 | 576 | ||||
| ENI SpA | 69 | 1,764 | ||||
| EOG Resources Inc. | 8 | 739 | ||||
| Exxon Mobil Corp. | 180 | 12,271 | ||||
| Galp Energia SGPS SA | 37 | 649 | ||||
| Gazprom OAO - ADR | 77 | 1,977 | ||||
| Hellenic Petroleum SA | - | 1 | ||||
| Hess Corp. | 9 | 572 | ||||
| Idemitsu Kosan Co. Ltd. | - | 1 | ||||
| Imperial Oil Ltd. | 4 | 140 | ||||
| INPEX Corp. | - | 144 | ||||
| Japan Petroleum Exploration Co. | - | 3 | ||||
| Lundin Petroleum AB (c) (e) | - | 1 | ||||
| Marathon Oil Corp. | 14 | 438 | ||||
| Mongolia Energy Co. Ltd. (c) | 1 | 1 | ||||
| Murphy Oil Corp. | 3 | 138 | ||||
| Neste Oil Oyj | - | 2 | ||||
| Newfield Exploration Co. (c) | 3 | 159 | ||||
| Nexen Inc. | 11 | 275 | ||||
| Nippon Mining Holdings Inc. | 19 | 82 | ||||
| Nippon Oil Corp. | 15 | 70 | ||||
| Noble Energy Inc. | 3 | 222 | ||||
| Occidental Petroleum Corp. | 29 | 2,386 | ||||
| OMV AG | - | 4 | ||||
| Origin Energy Ltd. | 25 | 382 | ||||
| Peabody Energy Corp. | 6 | 281 | ||||
| PetroHawk Energy Corp. (c) | 3 | 78 | ||||
| Petroleo Brasileiro SA - Petrobras - ADR | 76 | 3,610 | ||||
| Pioneer Natural Resources Co. | 4 | 192 | ||||
| Plains Exploration & Production Co. (c) | 2 | 64 | ||||
| Range Resources Corp. | 6 | 288 | ||||
| Repsol YPF SA (e) | 37 | 987 | ||||
| Rosneft Oil Co. - GDR (c) | 156 | 1,345 | ||||
| Royal Dutch Shell Plc - Class B | 135 | 3,955 | ||||
| Santos Ltd. | 26 | 327 | ||||
| Saras SpA | - | 1 | ||||
| SBM Offshore NV | 2 | 37 | ||||
| Showa Shell Sekiyu KK (e) | - | 1 | ||||
| Southwestern Energy Co. (c) | 6 | 312 | ||||
| Spectra Energy Corp. | 16 | 334 | ||||
| StatoilHydro ASA | 15 | 370 | ||||
| Suncor Energy Inc. | 57 | 2,013 | ||||
| Sunoco Inc. | 1 | 35 | ||||
| Talisman Energy Inc. | 5 | 101 | ||||
| TonenGeneral Sekiyu KK (e) | - | 2 | ||||
| Total SA | 79 | 5,129 | ||||
| TransCanada Corp. (e) | 18 | 627 | ||||
| Tullow Oil Plc | 1 | 15 | ||||
| Valero Energy Corp. | 14 | 235 | ||||
| Williams Cos. Inc. | 14 | 303 | ||||
| Woodside Petroleum Ltd. | 13 | 548 | ||||
| XTO Energy Inc. | 12 | 567 | ||||
| 67,765 | ||||||
| MATERIALS - 35.5% | ||||||
| Acerinox SA (e) | 6 | 131 | ||||
| Agnico-Eagle Mines Ltd. | 11 | 621 | ||||
| Agrium Inc. | 6 | 402 | ||||
| Air Liquide | 8 | 899 | ||||
| Air Products & Chemicals Inc. | 8 | 615 | ||||
| AK Steel Holding Corp. | 126 | 2,692 | ||||
| Akzo Nobel NV | 8 | 526 | ||||
| Alcoa Inc. | 143 | 2,300 | ||||
| Allegheny Technologies Inc. (e) | 62 | 2,767 | ||||
| Alumina Ltd. (c) | 293 | 479 | ||||
| Anglo American Plc (c) | 226 | 9,916 | ||||
| Antofagasta Plc | 22 | 360 | ||||
| ArcelorMittal (e) | 153 | 7,045 | ||||
| Asahi Kasei Corp. | 21 | 105 | ||||
| Barrick Gold Corp. | 168 | 6,620 | ||||
| BASF SE | 50 | 3,133 | ||||
| BHP Billiton Plc | 1,034 | 33,321 | ||||
| BlueScope Steel Ltd. | 130 | 357 | ||||
| Celanese Corp. - Class A | 2 | 67 | ||||
| CF Industries Holdings Inc. | 2 | 193 | ||||
| Cliffs Natural Resources Inc. | 93 | 4,282 | ||||
| Commercial Metals Co. | 36 | 556 | ||||
| Daicel Chemical Industries Ltd. | - | 2 | ||||
| Daido Steel Co. Ltd. (e) | 44 | 163 | ||||
| Denki Kagaku Kogyo K K | 1 | 3 | ||||
| DIC Corp. | 1 | 2 | ||||
| Dow Chemical Co. | 62 | 1,710 | ||||
| Dowa Holdings Co. Ltd. (e) | 43 | 238 | ||||
| Eastman Chemical Co. | 3 | 160 | ||||
| Ecolab Inc. | 7 | 332 | ||||
| EI Du Pont de Nemours & Co. | 42 | 1,430 | ||||
| Eramet (e) | 1 | 173 | ||||
| Eurasian Natural Resources Corp. | 36 | 525 | ||||
| First Quantum Minerals Ltd. | 14 | 1,087 | ||||
| Fortescue Metals Group Ltd. (c) (e) | 195 | 773 | ||||
| Freeport-McMoRan Copper & Gold Inc. | 73 | 5,872 | ||||
| Givaudan SA | - | 50 | ||||
| Goldcorp Inc. | 132 | 5,203 | ||||
| Hitachi Chemical Co. Ltd. | - | 2 | ||||
| Hitachi Metals Ltd. | 25 | 241 | ||||
| Holmen AB | 20 | 523 | ||||
| Incitec Pivot Ltd. | 51 | 162 | ||||
| International Flavors & Fragrances Inc. | - | 14 | ||||
| International Paper Co. | 331 | 8,876 | ||||
| JFE Holdings Inc. | 107 | 4,215 | ||||
| Johnson Matthey Plc | 39 | 971 | ||||
| JSR Corp. | 1 | 29 | ||||
| K+S AG (e) | 4 | 225 | ||||
| Kaneka Corp. | - | 3 | ||||
| Kansai Paint Co. Ltd. (e) | - | 3 | ||||
| Kazakhmys Plc (c) | 10 | 206 | ||||
| Kinross Gold Corp. | 63 | 1,158 | ||||
| Kobe Steel Ltd. (c) | 451 | 818 | ||||
| Koninklijke DSM NV | 3 | 168 | ||||
| Kuraray Co. Ltd. | 1 | 6 | ||||
| Linde AG | 7 | 817 | ||||
| Lonmin Plc (c) | 13 | 397 | ||||
| Maruichi Steel Tube Ltd. (e) | - | 6 | ||||
| MeadWestvaco Corp. | 103 | 2,942 | ||||
| Mitsubishi Chemical Holdings Corp. | 9 | 36 | ||||
| Mitsubishi Gas Chemical Co. Inc. | 6 | 30 | ||||
| Mitsubishi Materials Corp. (c) | 183 | 448 | ||||
| Mitsubishi Rayon Co. Ltd. | 12 | 48 | ||||
| Mitsui Chemicals Inc. | 8 | 21 | ||||
| Mitsui Mining & Smelting Co. Ltd. (c) | 75 | 195 | ||||
| Monsanto Co. | 24 | 1,963 | ||||
| Mosaic Co. | 3 | 208 | ||||
| Newcrest Mining Ltd. | 116 | 3,674 | ||||
| Newmont Mining Corp. | 75 | 3,547 | ||||
| Nippon Paper Group Inc. | 73 | 1,851 | ||||
| Nippon Steel Corp. | 959 | 3,888 | ||||
| Nissan Chemical Industries Ltd. | - | 3 | ||||
| Nisshin Steel Co. Ltd. | 100 | 177 | ||||
| Nitto Denko Corp. | 7 | 237 | ||||
| Norsk Hydro ASA (c) | 61 | 512 | ||||
| Novozymes A/S (e) | - | 6 | ||||
| Nucor Corp. | 106 | 4,952 | ||||
| Nufarm Ltd. | 2 | 15 | ||||
| OJI Paper Co. Ltd. | 848 | 3,556 | ||||
| OneSteel Ltd. | 161 | 483 | ||||
| Orica Ltd. | 14 | 324 | ||||
| OSAKA Titanium Technologies Co. Ltd. (e) | 2 | 61 | ||||
| Outokumpu Oyj | 10 | 196 | ||||
| OZ Minerals Ltd. (c) | 456 | 487 | ||||
| Potash Corp of Saskatchewan Inc. | 9 | 1,017 | ||||
| PPG Industries Inc. | 8 | 454 | ||||
| Praxair Inc. | 12 | 943 | ||||
| Rautaruukki Oyj (e) | 6 | 128 | ||||
| Rio Tinto Ltd. (e) | 78 | 5,221 | ||||
| Rio Tinto Plc | 240 | 13,163 | ||||
| Salzgitter AG | 30 | 2,971 | ||||
| Shin-Etsu Chemical Co. Ltd. | 16 | 887 | ||||
| Showa Denko KK | 55 | 110 | ||||
| Sigma-Aldrich Corp. | 3 | 172 | ||||
| Sims Metal Management Ltd. | 21 | 412 | ||||
| Sino-Forest Corp. (c) | 148 | 2,738 | ||||
| Solvay SA | 1 | 129 | ||||
| SSAB Svenskt Stal AB - Class A | 5 | 82 | ||||
| SSAB Svenskt Stal AB - Class B | - | 5 | ||||
| Steel Dynamics Inc. | 22 | 392 | ||||
| Stora Enso Oyj - Class R (c) (e) | 416 | 2,915 | ||||
| Sumitomo Chemical Co. Ltd. | 60 | 263 | ||||
| Sumitomo Metal Industries Ltd. | 605 | 1,627 | ||||
| Sumitomo Metal Mining Co. Ltd. | 77 | 1,137 | ||||
| Svenska Cellulosa AB | 532 | 7,113 | ||||
| Syngenta AG | 4 | 1,255 | ||||
| Taiyo Nippon Sanso Corp. | - | 5 | ||||
| Teck Cominco Ltd. (c) | 85 | 2,971 | ||||
| Teijin Ltd. | 10 | 32 | ||||
| ThyssenKrupp AG (e) | 51 | 1,930 | ||||
| Tokuyama Corp. | - | 2 | ||||
| Tokyo Steel Manufacturing Co. Ltd. | 9 | 100 | ||||
| Toray Industries Inc. | 17 | 93 | ||||
| Tosoh Corp. | 5 | 14 | ||||
| Ube Industries Ltd. | 10 | 27 | ||||
| Umicore | 41 | 1,381 | ||||
| United States Steel Corp. (e) | 126 | 6,954 | ||||
| UPM-Kymmene Oyj | 461 | 5,508 | ||||
| Vale SA - ADR (e) | 288 | 8,352 | ||||
| Vedanta Resources Plc | 7 | 303 | ||||
| Voestalpine AG | 9 | 321 | ||||
| Wacker Chemie AG | - | 3 | ||||
| Weyerhaeuser Co. | 182 | 7,838 | ||||
| Xstrata Plc (c) | 269 | 4,867 | ||||
| Yamato Kogyo Co. Ltd. | 4 | 128 | ||||
| Yara International ASA | 1 | 64 | ||||
| 227,837 | ||||||
| Total Common Stocks (cost $256,066) | 295,602 | |||||
| INVESTMENT FUNDS - 3.3% | ||||||
| Energy Select Sector SPDR Fund (e) | 91 | 5,211 | ||||
| Materials Select Sector SPDR Fund (e) | 491 | 16,193 | ||||
| Total Investment Funds (cost $21,006) | 21,404 | |||||
| RIGHTS - 0.0% | ||||||
| Woodside Petroleum Ltd. (c) (f) | 1 | 5 | ||||
| Total Rights (cost $0) | 5 | |||||
| NON-U.S. GOVERNMENT AGENCY | ||||||
| ASSET-BACKED SECURITIES - 0.0% | ||||||
| Sigma Finance, Inc. (d) (f) (u) | $ | 317 | 13 | |||
| Total Non-U.S. Government Agency | ||||||
| Asset-Backed Securities (cost $317) | 13 | |||||
| CORPORATE BONDS AND NOTES - 12.9% | ||||||
| FINANCIALS - 12.9% | ||||||
| BNP Paribas Commodity Linked Note | ||||||
| 0.15%, 11/26/10 (f) (t) (v) | 5,000 | 6,594 | ||||
| 0.01%, 01/13/11 (f) (t) (v) | 14,000 | 19,365 | ||||
| Eksportfinans ASA Commodity Linked Note, | ||||||
| 0.03%, 11/15/10 (f) | 20,000 | 27,408 | ||||
| Societe Generale Commodity Linked Note | ||||||
| 0.46%, 07/12/10 (f) (t) (v) | 13,000 | 16,085 | ||||
| 0.23%, 01/06/11 (f) | 10,000 | 13,617 | ||||
| Total Corporate Bonds and Notes (cost $62,000) | 83,069 | |||||
| GOVERNMENT AND AGENCY OBLIGATIONS - 20.5% | ||||||
| GOVERNMENT SECURITIES - 6.0% | ||||||
| Sovereign - 6.0% | ||||||
| Svensk Exportkredit AB Commodity Linked Note | ||||||
| 0.01%, 07/19/10 (f) (i) | 20,000 | 25,408 | ||||
| 0.01%, 03/02/11 (f) | 12,000 | 13,287 | ||||
| 38,695 | ||||||
| U.S. GOVERNMENT AGENCY | ||||||
| MORTGAGE-BACKED SECURITIES - 14.5% | ||||||
| Federal Farm Credit Bank - 2.0% | ||||||
| Federal Farm Credit Bank | ||||||
| 0.28%, 06/22/11 (i) | 3,000 | 3,002 | ||||
| 0.53%, 01/13/12 (i) | 9,500 | 9,554 | ||||
| 12,556 | ||||||
| Federal Home Loan Bank - 6.8% | ||||||
| Federal Home Loan Bank | ||||||
| 0.52%, 06/01/10 | 5,000 | 5,008 | ||||
| 0.16%, 01/14/11 (i) | 15,000 | 14,992 | ||||
| 0.85%, 01/20/11 | 5,000 | 5,012 | ||||
| 0.95%, 02/03/11 | 5,000 | 5,016 | ||||
| 1.00%, 02/07/11 | 3,000 | 3,007 | ||||
| 1.00%, 02/28/11 | 3,000 | 3,010 | ||||
| 0.75%, 03/25/11 | 7,500 | 7,495 | ||||
| 43,540 | ||||||
| Federal Home Loan Mortgage Corp. - 5.7% | ||||||
| Federal Home Loan Mortgage Corp. | ||||||
| 1.93%, 02/11/10 | 7,000 | 7,011 | ||||
| 0.33%, 01/28/11 (i) | 6,858 | 6,867 | ||||
| 0.33%, 03/09/11 (i) | 10,000 | 10,016 | ||||
| 0.31%, 04/01/11 (i) | 10,000 | 10,014 | ||||
| 0.30%, 04/07/11 (i) | 2,500 | 2,503 | ||||
| 36,411 | ||||||
| Total Government and Agency Obligations (cost $124,543) | 131,202 | |||||
| SHORT TERM INVESTMENTS - 25.1% | ||||||
| Federal Home Loan Bank - 0.5% | ||||||
| Federal Home Loan Bank | ||||||
| 0.36%, 01/21/10 | 1,000 | 1,000 | ||||
| 0.18%, 02/16/10 | 2,000 | 2,000 | ||||
| 3,000 | ||||||
| Federal Home Loan Mortgage Corp. - 9.5% | ||||||
| Federal Home Loan Mortgage Corp. | ||||||
| 0.24%, 01/25/10 | 1,500 | 1,500 | ||||
| 0.13%, 01/28/10 | 29,000 | 29,000 | ||||
| 0.12%, 02/02/10 | 10,000 | 9,999 | ||||
| 0.13%, 02/16/10 | 4,000 | 4,000 | ||||
| 0.26%, 04/27/10 | 6,000 | 5,998 | ||||
| 0.22%, 06/14/10 | 10,000 | 9,993 | ||||
| 60,490 | ||||||
| Federal National Mortgage Association - 2.3% | ||||||
| Federal National Mortgage Association, | ||||||
| 0.12%, 02/10/10 | 15,000 | 14,999 | ||||
| Mutual Funds - 1.5% | ||||||
| JNL Money Market Fund, 0.07% (a) (h) | 9,840 | 9,840 | ||||
| Securities Lending Collateral - 7.8% | ||||||
| Securities Lending Cash Collateral Fund LLC, | ||||||
| 0.16% (a) (h) | 43,895 | 43,895 | ||||
| Securities Lending Liquidating Fund LLC, 0.36% (a) (h) | 6,032 | 6,019 | ||||
| 49,914 | ||||||
| U.S. Treasury Securities - 3.5% | ||||||
| U.S. Treasury Bill | ||||||
| 0.16%, 04/15/10 (e) | $ | 10,000 | 9,998 | |||
| 0.16%, 04/22/10 (e) | 10,000 | 9,998 | ||||
| 0.35%, 07/15/10 (e) | 2,500 | 2,497 | ||||
| 22,493 | ||||||
| Total Short Term Investments (cost $160,730) | 160,736 | |||||
| Total Investments - 107.9% (cost $624,662) | 692,031 | |||||
| Other Assets and Liabilities, Net - (7.9%) | (50,385) | |||||
| Total Net Assets - 100% | $ | 641,646 | ||||
| JNL/Credit Suisse Long/Short Fund | ||||||
| COMMON STOCKS - 126.3% | ||||||
| CONSUMER DISCRETIONARY - 18.7% | ||||||
| Aaron's Inc. | - | $ | 3 | |||
| Advance Auto Parts Inc. | 17 | 687 | ||||
| American Greetings Corp. (n) | - | 2 | ||||
| AutoNation Inc. (c) | - | 4 | ||||
| Big Lots Inc. (c) (n) | 37 | 1,068 | ||||
| Career Education Corp. (c) (n) | - | 5 | ||||
| Cinemark Holdings Inc. | - | 1 | ||||
| Comcast Corp. - Class A (n) | 26 | 433 | ||||
| Cooper Tire & Rubber Co. | - | 2 | ||||
| Darden Restaurants Inc. (n) | 45 | 1,562 | ||||
| DeVry Inc. | 4 | 204 | ||||
| DIRECTV - Class A (c) (n) | 11 | 380 | ||||
| Dollar Tree Inc. (c) (n) | 14 | 667 | ||||
| Eastman Kodak Co. (c) | 2 | 10 | ||||
| Gap Inc. (n) | 20 | 425 | ||||
| Gentex Corp. | 4 | 62 | ||||
| Hillenbrand Inc. | - | 2 | ||||
| J Crew Group Inc. (c) | 1 | 49 | ||||
| J.C. Penney Co. Inc. | 30 | 798 | ||||
| Kohl's Corp. (c) (n) | 29 | 1,559 | ||||
| Leggett & Platt Inc. (n) | 62 | 1,258 | ||||
| Limited Brands Inc. | 10 | 183 | ||||
| Macy's Inc. | 4 | 65 | ||||
| Mattel Inc. (n) | 3 | 64 | ||||
| Nike Inc. - Class B | 20 | 1,312 | ||||
| OfficeMax Inc. (c) | - | 1 | ||||
| Penske Auto Group Inc. (c) | - | 2 | ||||
| Rent-A-Center Inc. (c) | - | 2 | ||||
| Ross Stores Inc. (n) | 21 | 880 | ||||
| Sally Beauty Holdings Inc. (c) | - | 1 | ||||
| Starbucks Corp. (c) | 72 | 1,649 | ||||
| Superior Industries International Inc. | - | 2 | ||||
| Target Corp. | 8 | 406 | ||||
| Tempur-Pedic International Inc. (c) | - | 2 | ||||
| Timberland Co. - Class A (c) | - | 2 | ||||
| Time Warner Inc. (n) | 95 | 2,770 | ||||
| TJX Cos. Inc. | 2 | 66 | ||||
| Valassis Communications Inc. (c) | - | 2 | ||||
| Warnaco Group Inc. (c) (n) | 1 | 59 | ||||
| Williams-Sonoma Inc. | 15 | 308 | ||||
| 16,957 | ||||||
| CONSUMER STAPLES - 10.5% | ||||||
| Archer-Daniels-Midland Co. (n) | 15 | 474 | ||||
| Brown-Forman Corp. - Class B | 5 | 257 | ||||
| Chiquita Brands International Inc. (c) | - | 2 | ||||
| Colgate-Palmolive Co. (n) | 21 | 1,717 | ||||
| Costco Wholesale Corp. | 4 | 260 | ||||
| Estee Lauder Cos. Inc. (n) | 29 | 1,417 | ||||
| General Mills Inc. | 3 | 234 | ||||
| Hershey Co. | 17 | 612 | ||||
| Kimberly-Clark Corp. | 1 | 45 | ||||
| Mead Johnson Nutrition Co. | 2 | 79 | ||||
| PepsiCo Inc. (n) | 44 | 2,650 | ||||
| Procter & Gamble Co. (n) | 10 | 594 | ||||
| United Natural Foods Inc. (c) | - | 3 | ||||
| Universal Corp. | - | 5 | ||||
| Walgreen Co. | 22 | 789 | ||||
| Whole Foods Market Inc. (c) | 12 | 321 | ||||
| Winn-Dixie Stores Inc. (c) | - | 1 | ||||
| 9,460 | ||||||
| ENERGY - 9.2% | ||||||
| Apache Corp. (n) | 29 | 2,991 | ||||
| Chevron Corp. | 7 | 570 | ||||
| ConocoPhillips (n) | 21 | 1,057 | ||||
| Consol Energy Inc. | 4 | 184 | ||||
| Exxon Mobil Corp. | 29 | 1,984 | ||||
| Peabody Energy Corp. | 7 | 312 | ||||
| Rex Energy Corp. (c) | - | 1 | ||||
| SandRidge Energy Inc. (c) | - | 1 | ||||
| Schlumberger Ltd. (n) | 19 | 1,224 | ||||
| SEACOR Holdings Inc. (c) | - | 8 | ||||
| W&T Offshore Inc. | - | 1 | ||||
| 8,333 | ||||||
| FINANCIALS - 17.9% | ||||||
| Altisource Portfolio Solutions SA (c) | - | 6 | ||||
| American Express Co. | 2 | 89 | ||||
| Annaly Capital Management Inc. | 19 | 328 | ||||
| AON Corp. | 2 | 92 | ||||
| Bank of America Corp. | 1 | 14 | ||||
| Bank of New York Mellon Corp. (n) | 6 | 154 | ||||
| Blackstone Group LP | - | 1 | ||||
| Capital One Financial Corp. (n) | 23 | 897 | ||||
| Citigroup Inc. (n) | 165 | 547 | ||||
| Cousins Properties Inc. | - | - | ||||
| Cullen/Frost Bankers Inc. (n) | 6 | 325 | ||||
| E*Trade Financial Corp. (c) | 4 | 6 | ||||
| Employer Holdings Inc. | - | 2 | ||||
| First American Corp. | - | 7 | ||||
| FNB Corp. | - | 1 | ||||
| Genworth Financial Inc. - Class A (c) (n) | 23 | 259 | ||||
| Goldman Sachs Group Inc. (n) | 16 | 2,735 | ||||
| Hanover Insurance Group Inc. | - | 4 | ||||
| HCC Insurance Holdings Inc. | - | 3 | ||||
| Hudson City Bancorp Inc. (n) | 12 | 158 | ||||
| Huntington Bancshares Inc. | 6 | 22 | ||||
| Interactive Brokers Group Inc. (c) | - | 2 | ||||
| JPMorgan Chase & Co. (n) | 102 | 4,241 | ||||
| Loews Corp. (n) | 3 | 122 | ||||
| MBIA Inc. (c) | 1 | 5 | ||||
| Nelnet Inc. - Class A | - | 2 | ||||
| New York Community Bancorp Inc. | - | 1 | ||||
| NewAlliance Bancshares Inc. | - | 1 | ||||
| Ocwen Financial Corp. (c) | - | 1 | ||||
| PHH Corp. (c) | - | 2 | ||||
| Public Storage (n) | 23 | 1,897 | ||||
| Rayonier Inc. | 4 | 160 | ||||
| State Street Corp. (n) | 24 | 1,062 | ||||
| Travelers Cos. Inc. | 32 | 1,596 | ||||
| U.S. Bancorp (n) | 44 | 979 | ||||
| Wells Fargo & Co. (n) | 16 | 430 | ||||
| 16,151 | ||||||
| HEALTH CARE - 14.6% | ||||||
| Acorda Therapeutics Inc. (c) | - | 3 | ||||
| Aetna Inc. (n) | 37 | 1,176 | ||||
| Allergan Inc. | 2 | 120 | ||||
| American Medical Systems Holdings Inc. (c) | - | 2 | ||||
| Amgen Inc. (c) (n) | 46 | 2,580 | ||||
| Amsurg Corp. (c) | - | 2 | ||||
| Bio-Rad Laboratories Inc. - Class A (c) | 1 | 58 | ||||
| CIGNA Corp. | 6 | 198 | ||||
| Community Health Systems Inc. (c) | - | 4 | ||||
| Cubist Pharmaceuticals Inc. (c) | - | 2 | ||||
| Emeritus Corp. (c) | - | 2 | ||||
| Endo Pharmaceuticals Holdings Inc. (c) | - | 2 | ||||
| Gilead Sciences Inc. (c) | 3 | 126 | ||||
| Health Management Associates Inc. (c) | - | 1 | ||||
| Henry Schein Inc. (c) | 1 | 47 | ||||
| Humana Inc. (c) (n) | 60 | 2,651 | ||||
| Invacare Corp. | - | 2 | ||||
| Johnson & Johnson (n) | 6 | 354 | ||||
| Kinetic Concepts Inc. (c) | - | 4 | ||||
| Lincare Holdings Inc. (c) | 4 | 163 | ||||
| Medtronic Inc. (n) | 31 | 1,358 | ||||
| Merck & Co. Inc. | 22 | 803 | ||||
| Molina Healthcare Inc. (c) | - | 2 | ||||
| Mylan Inc. (c) (n) | 70 | 1,286 | ||||
| Myriad Pharmaceuticals Inc. (c) | 1 | 5 | ||||
| Omnicare Inc. | - | 2 | ||||
| PDL BioPharma Inc. | - | 1 | ||||
| Pfizer Inc. (n) | 11 | 199 | ||||
| Psychiatric Solutions Inc. (c) | - | 2 | ||||
| Valeant Pharmaceutical International (c) | - | 3 | ||||
| Waters Corp. (c) | 27 | 1,645 | ||||
| WellPoint Inc. (c) | 6 | 373 | ||||
| 13,176 | ||||||
| INDUSTRIALS - 11.5% | ||||||
| American Superconductor Corp. (c) | - | 4 | ||||
| Armstrong World Industries Inc. (c) | 2 | 78 | ||||
| Copart Inc. (c) | 5 | 187 | ||||
| Crane Co. | - | 3 | ||||
| Cubic Corp. | - | 4 | ||||
| Deluxe Corp. | - | 1 | ||||
| Donaldson Co. Inc. | 6 | 247 | ||||
| Emerson Electric Co. (n) | 17 | 720 | ||||
| EnerSys (c) | - | 2 | ||||
| Federal Signal Corp. | - | 1 | ||||
| FedEx Corp. | 5 | 434 | ||||
| Fluor Corp. (n) | 31 | 1,401 | ||||
| General Electric Co. (n) | 42 | 635 | ||||
| Hertz Global Holdings Inc. (c) | - | 1 | ||||
| Illinois Tool Works Inc. (n) | 13 | 605 | ||||
| ITT Corp. (n) | 32 | 1,612 | ||||
| Lincoln Electric Holdings Inc. | 1 | 43 | ||||
| Lockheed Martin Corp. (n) | 11 | 821 | ||||
| Manitowoc Co. Inc. | 1 | 12 | ||||
| Marten Transport Ltd. (c) | - | 2 | ||||
| Mine Safety Appliances Co. | - | 3 | ||||
| Nordson Corp. | - | 6 | ||||
| Oshkosh Corp. | - | 4 | ||||
| Raytheon Co. | 44 | 2,261 | ||||
| Rockwell Automation Inc. | - | 19 | ||||
| Sauer-Danfoss Inc. (c) | - | 1 | ||||
| Tennant Co. | - | 3 | ||||
| United Parcel Service Inc. - Class B | 23 | 1,297 | ||||
| 10,407 | ||||||
| INFORMATION TECHNOLOGY - 32.8% | ||||||
| Acxiom Corp. (c) | - | 1 | ||||
| ADTRAN Inc. | - | 2 | ||||
| Advent Software Inc. (c) | - | 4 | ||||
| AOL Inc. (c) (n) | 6 | 135 | ||||
| Apple Inc. (c) (n) | 10 | 2,088 | ||||
| Arris Group Inc. (c) | - | 1 | ||||
| AsiaInfo Holdings Inc. (c) | - | 3 | ||||
| Avid Technology Inc. (c) | - | 1 | ||||
| BMC Software Inc. (c) | 2 | 64 | ||||
| Checkpoint Systems Inc. (c) | - | 2 | ||||
| CSG Systems International Inc. (c) | - | 2 | ||||
| EMC Corp. (c) (n) | 102 | 1,778 | ||||
| Fidelity National Information Services Inc. | 6 | 150 | ||||
| Global Payments Inc. (n) | 13 | 676 | ||||
| Google Inc. - Class A (c) (n) | 4 | 2,232 | ||||
| Ingram Micro Inc. - Class A (c) | - | 2 | ||||
| Intel Corp. (n) | 111 | 2,266 | ||||
| International Business Machines Corp. (n) | 12 | 1,532 | ||||
| Intersil Corp. | - | 2 | ||||
| j2 Global Communications Inc. (c) | - | 2 | ||||
| Jabil Circuit Inc. | 30 | 526 | ||||
| Juniper Networks Inc. (c) | 5 | 125 | ||||
| MasterCard Inc. (n) | 4 | 896 | ||||
| Micron Technology Inc. (c) (n) | 210 | 2,218 | ||||
| Microsoft Corp. (n) | 110 | 3,341 | ||||
| NetApp Inc. (c) (n) | 41 | 1,400 | ||||
| Novell Inc. (c) | 3 | 12 | ||||
| Oracle Corp. (n) | 19 | 459 | ||||
| Paychex Inc. | 6 | 175 | ||||
| Pegasystems Inc. | - | 3 | ||||
| Polycom Inc. (c) | - | 5 | ||||
| QUALCOMM Inc. (n) | 32 | 1,471 | ||||
| Red Hat Inc. (c) (n) | 23 | 714 | ||||
| Silicon Laboratories Inc. (c) | - | 5 | ||||
| Sohu.com Inc. (c) | 4 | 218 | ||||
| STEC Inc. (c) | - | 2 | ||||
| Sun Microsystems Inc. (c) (n) | 20 | 183 | ||||
| Symantec Corp. (c) (n) | 33 | 592 | ||||
| Synaptics Inc. (c) | - | 3 | ||||
| SYNNEX Corp. (c) | - | 3 | ||||
| Syntel Inc. | - | 4 | ||||
| Teradata Corp. (c) | 5 | 170 | ||||
| Tessera Technologies Inc. (c) | - | 2 | ||||
| Texas Instruments Inc. (n) | 104 | 2,713 | ||||
| TiVo Inc. (c) | - | 1 | ||||
| Tyler Technologies Inc. (c) | - | 2 | ||||
| VeriFone Holdings Inc. (c) | - | 2 | ||||
| VeriSign Inc. (c) (n) | 60 | 1,442 | ||||
| VMware Inc. - Class A (c) | - | 4 | ||||
| Websense Inc. (c) | - | 2 | ||||
| Western Digital Corp. (c) | 43 | 1,909 | ||||
| Wright Express Corp. (c) | - | 3 | ||||
| Xilinx Inc. | 6 | 158 | ||||
| 29,706 | ||||||
| MATERIALS - 3.1% | ||||||
| Ashland Inc. | - | 4 | ||||
| Cabot Corp. | - | 3 | ||||
| CF Industries Holdings Inc. | 2 | 191 | ||||
| Eastman Chemical Co. (n) | 29 | 1,761 | ||||
| Ecolab Inc. (n) | 11 | 495 | ||||
| EI Du Pont de Nemours & Co. | - | 10 | ||||
| NL Industries Inc. | - | 1 | ||||
| Reliance Steel & Aluminum Co. | 8 | 354 | ||||
| Schweitzer-Mauduit International Inc. | - | 7 | ||||
| Steel Dynamics Inc. | 1 | 9 | ||||
| Westlake Chemical Corp. | - | 2 | ||||
| Worthington Industries Inc. | - | 1 | ||||
| 2,838 | ||||||
| TELECOMMUNICATION SERVICES - 2.0% | ||||||
| AT&T Inc. (n) | 60 | 1,690 | ||||
| Premiere Global Services Inc. (c) | - | 1 | ||||
| Qwest Communications International Inc. | 12 | 52 | ||||
| Sprint Nextel Corp. (c) (n) | 26 | 96 | ||||
| Syniverse Holdings Inc. (c) | - | 2 | ||||
| US Cellular Corp. (c) | - | 5 | ||||
| 1,846 | ||||||
| UTILITIES - 6.0% | ||||||
| American Water Works Co. Inc. | - | 2 | ||||
| CH Energy Group Inc. | - | 4 | ||||
| Edison International | 5 | 170 | ||||
| Exelon Corp. (n) | 31 | 1,515 | ||||
| Hawaiian Electric Industries Inc. | - | 2 | ||||
| NSTAR | 11 | 387 | ||||
| Ormat Technologies Inc. | - | 4 | ||||
| PNM Resources Inc. | - | 1 | ||||
| Public Service Enterprise Group Inc. (n) | 85 | 2,820 | ||||
| Sempra Energy | 9 | 502 | ||||
| 5,407 | ||||||
| Total Common Stocks (cost $109,026) | 114,281 | |||||
| SHORT TERM INVESTMENTS - 5.2% | ||||||
| Mutual Funds - 5.2% | ||||||
| JNL Money Market Fund, 0.07% (a) (h) | 4,692 | 4,692 | ||||
| Total Short Term Investments (cost $4,692) | 4,692 | |||||
| Total Investments - 131.5% (cost $113,718) | 118,973 | |||||
| Total Securities Sold Short - (31.7%) | ||||||
| (proceeds $27,298) | (28,666) | |||||
| Other Assets and Liabilities, Net - 0.2% | 146 | |||||
| Total Net Assets - 100% | $ | 90,453 | ||||
| Securities Sold Short | ||||||
| COMMON STOCKS – 31.7% | ||||||
| CONSUMER DISCRETIONARY - 4.4% | ||||||
| Abercrombie & Fitch Co. - Class A | 1 | $ | 45 | |||
| Aeropostale Inc. | - | 3 | ||||
| Amazon.com Inc. | 1 | 67 | ||||
| American Eagle Outfitters Inc. | 3 | 44 | ||||
| Apollo Group Inc. - Class A | 1 | 48 | ||||
| Autoliv Inc. | 1 | 43 | ||||
| AutoZone Inc. | - | 63 | ||||
| Bally Technologies Inc. | 1 | 41 | ||||
| Bed Bath & Beyond Inc. | 2 | 62 | ||||
| Best Buy Co. Inc. | 2 | 67 | ||||
| BorgWarner Inc. | 1 | 37 | ||||
| Burger King Holdings Inc. | 2 | 45 | ||||
| Carmax Inc. | 2 | 41 | ||||
| Carnival Corp. | - | 10 | ||||
| CBS Corp. - Class B | 5 | 65 | ||||
| Chico’s FAS Inc. | 3 | 41 | ||||
| Chipotle Mexican Grill Inc. - Class A | - | 26 | ||||
| Coach Inc. | 2 | 62 | ||||
| CTC Media Inc. | - | 3 | ||||
| Dick’s Sporting Goods Inc. | 2 | 37 | ||||
| DR Horton Inc. | 5 | 52 | ||||
| DreamWorks Animation SKG Inc. | 1 | 44 | ||||
| Expedia Inc. | 1 | 33 | ||||
| Family Dollar Stores Inc. | - | 3 | ||||
| Ford Motor Co. | 3 | 25 | ||||
| Fortune Brands Inc. | 1 | 60 | ||||
| GameStop Corp. - Class A | 2 | 42 | ||||
| Gannett Co. Inc. | 3 | 46 | ||||
| Genuine Parts Co. | 1 | 53 | ||||
| Goodyear Tire & Rubber Co. | 3 | 48 | ||||
| Guess? Inc. | 1 | 42 | ||||
| H&R Block Inc. | 3 | 61 | ||||
| HanesBrands Inc. | 1 | 31 | ||||
| Harley-Davidson Inc. | 2 | 55 | ||||
| Harman International Industries Inc. | 1 | 46 | ||||
| Hasbro Inc. | 2 | 48 | ||||
| Home Depot Inc. | 1 | 35 | ||||
| Interactive Data Corp. | 1 | 28 | ||||
| International Game Technology | 3 | 54 | ||||
| Interpublic Group of Cos. Inc. | 7 | 52 | ||||
| ITT Educational Services Inc. | - | 19 | ||||
| Jarden Corp. | 2 | 46 | ||||
| Johnson Controls Inc. | 3 | 79 | ||||
| KB Home | 1 | 10 | ||||
| Lennar Corp. | 4 | 45 | ||||
| Liberty Media - Starz | - | 6 | ||||
| Liberty Media Corp. - Interactive | 2 | 20 | ||||
| Lowe’s Cos. Inc. | 5 | 115 | ||||
| Marriott International Inc. - Class A | 1 | 36 | ||||
| McDonald’s Corp. | 3 | 194 | ||||
| McGraw-Hill Cos. Inc. | 2 | 64 | ||||
| Meredith Corp. | 1 | 43 | ||||
| New York Times Co. - Class A | 3 | 42 | ||||
| Newell Rubbermaid Inc. | 3 | 48 | ||||
| News Corp. - Class A | 7 | 92 | ||||
| Nordstrom Inc. | 1 | 45 | ||||
| Office Depot Inc. | 7 | 46 | ||||
| Omnicom Group Inc. | 2 | 70 | ||||
| O’Reilly Automotive Inc. | 2 | 57 | ||||
| Panera Bread Co. - Class A | 1 | 33 | ||||
| PetSmart Inc. | 2 | 40 | ||||
| Phillips-Van Heusen Corp. | 1 | 28 | ||||
| Polo Ralph Lauren Corp. | 1 | 40 | ||||
| Priceline.com Inc. | - | 44 | ||||
| Pulte Homes Inc. | 5 | 47 | ||||
| RadioShack Corp. | 2 | 43 | ||||
| Scripps Networks Interactive Inc. | 1 | 54 | ||||
| Service Corp. International | 4 | 32 | ||||
| Sherwin-Williams Co. | 1 | 55 | ||||
| Snap-On Inc. | 1 | 46 | ||||
| Stanley Works | 1 | 36 | ||||
| Staples Inc. | 3 | 84 | ||||
| Starwood Hotels & Resorts Worldwide Inc. | 2 | 55 | ||||
| Tiffany & Co. | 1 | 56 | ||||
| Tim Hortons Inc. | 1 | 27 | ||||
| Time Warner Cable Inc. | 2 | 70 | ||||
| Tupperware Brands Corp. | 1 | 37 | ||||
| Urban Outfitters Inc. | 1 | 46 | ||||
| VF Corp. | 1 | 60 | ||||
| Whirlpool Corp. | 1 | 49 | ||||
| WMS Industries Inc. | 1 | 37 | ||||
| Wyndham Worldwide Corp. | 2 | 43 | ||||
| Yum! Brands Inc. | 2 | 78 | ||||
| �� | 3,925 | |||||
| CONSUMER STAPLES - 2.7% | ||||||
| Altria Group Inc. | 6 | 126 | ||||
| Avon Products Inc. | 2 | 72 | ||||
| BJ’s Wholesale Club Inc. | 1 | 23 | ||||
| Campbell Soup Co. | 2 | 57 | ||||
| Church & Dwight Co. Inc. | 1 | 36 | ||||
| Clorox Co. | 1 | 61 | ||||
| Coca-Cola Co. | 2 | 137 | ||||
| Coca-Cola Enterprises Inc. | 3 | 57 | ||||
| ConAgra Foods Inc. | 3 | 69 | ||||
| Corn Products International Inc. | 2 | 44 | ||||
| CVS Caremark Corp. | 4 | 142 | ||||
| Dean Foods Co. | 2 | 38 | ||||
| Dr. Pepper Snapple Group Inc. | 2 | 57 | ||||
| Energizer Holdings Inc. | 1 | 37 | ||||
| Flowers Foods Inc. | 2 | 45 | ||||
| HJ Heinz Co. | - | 10 | ||||
| Hormel Foods Corp. | 1 | 46 | ||||
| JM Smucker Co. | 1 | 62 | ||||
| Kellogg Co. | 1 | 74 | ||||
| Kraft Foods Inc. - Class A | 4 | 117 | ||||
| Kroger Co. | 2 | 39 | ||||
| Lorillard Inc. | 1 | 72 | ||||
| McCormick & Co. Inc. | 2 | 54 | ||||
| Molson Coors Brewing Co. | 1 | 54 | ||||
| NBTY Inc. | 1 | 44 | ||||
| Pepsi Bottling Group Inc. | 2 | 56 | ||||
| PepsiAmericas Inc. | 1 | 41 | ||||
| Philip Morris International Inc. | 5 | 226 | ||||
| Reynolds American Inc. | 1 | 53 | ||||
| Sara Lee Corp. | 4 | 45 | ||||
| SUPERVALU Inc. | 3 | 36 | ||||
| Sysco Corp. | 3 | 75 | ||||
| Tyson Foods Inc. | 3 | 38 | ||||
| Wal-Mart Stores Inc. | 6 | 300 | ||||
| 2,443 | ||||||
| ENERGY - 3.0% | ||||||
| Alpha Natural Resources Inc. | 1 | 39 | ||||
| Anadarko Petroleum Corp. | 2 | 112 | ||||
| Arch Coal Inc. | 2 | 42 | ||||
| Atwood Oceanics Inc. | 1 | 32 | ||||
| Cabot Oil & Gas Corp. - Class A | 1 | 48 | ||||
| Cameron International Corp. | 2 | 63 | ||||
| Chesapeake Energy Corp. | 3 | 78 | ||||
| Cimarex Energy Co. | 1 | 42 | ||||
| CNX Gas Corp. | 1 | 21 | ||||
| Continental Resources Inc. | 1 | 43 | ||||
| Denbury Resources Inc. | 3 | 46 | ||||
| Devon Energy Corp. | 2 | 110 | ||||
| Diamond Offshore Drilling Inc. | 1 | 59 | ||||
| Dresser-Rand Group Inc. | 1 | 38 | ||||
| Dril-Quip Inc. | 1 | 45 | ||||
| El Paso Corp. | 6 | 60 | ||||
| Encore Acquisition Co. | 1 | 38 | ||||
| Ensco International Plc - ADR | 1 | 48 | ||||
| Enterprise Products Partners LP | 1 | 44 | ||||
| EOG Resources Inc. | 1 | 97 | ||||
| FMC Technologies Inc. | 1 | 58 | ||||
| Halliburton Co. | 3 | 96 | ||||
| Helmerich & Payne Inc. | 1 | 44 | ||||
| Hess Corp. | 1 | 79 | ||||
| Kinder Morgan Management LLC | - | 18 | ||||
| Marathon Oil Corp. | 3 | 91 | ||||
| Massey Energy Co. | 1 | 50 | ||||
| Murphy Oil Corp. | 1 | 65 | ||||
| Nabors Industries Ltd. | 2 | 53 | ||||
| National Oilwell Varco Inc. | 2 | 79 | ||||
| Newfield Exploration Co. | 1 | 43 | ||||
| Noble Energy Inc. | 1 | 64 | ||||
| Occidental Petroleum Corp. | 2 | 187 | ||||
| Oceaneering International Inc. | 1 | 47 | ||||
| Pioneer Natural Resources Co. | 1 | 53 | ||||
| Plains Exploration & Production Co. | - | 3 | ||||
| Pride International Inc. | 1 | 45 | ||||
| Range Resources Corp. | 1 | 55 | ||||
| Rowan Cos. Inc. | 2 | 45 | ||||
| Smith International Inc. | 2 | 54 | ||||
| Southwestern Energy Co. | 2 | 77 | ||||
| Spectra Energy Corp. | 3 | 68 | ||||
| St. Mary Land & Exploration Co. | 1 | 38 | ||||
| Sunoco Inc. | 2 | 47 | ||||
| Tesoro Corp. | 4 | 49 | ||||
| Valero Energy Corp. | 4 | 65 | ||||
| Whiting Petroleum Corp. | - | 7 | ||||
| Williams Cos. Inc. | 3 | 68 | ||||
| 2,753 | ||||||
| FINANCIALS - 4.5% | ||||||
| Affiliated Managers Group Inc. | 1 | 34 | ||||
| AFLAC Inc. | 2 | 93 | ||||
| Alexandria Real Estate Equities Inc. | 1 | 32 | ||||
| Allstate Corp. | 3 | 75 | ||||
| Ameriprise Financial Inc. | 2 | 66 | ||||
| Apartment Investment & Management Co. | 3 | 41 | ||||
| Arthur J Gallagher & Co. | 1 | 18 | ||||
| Assurant Inc. | 2 | 50 | ||||
| AvalonBay Communities Inc. | - | 25 | ||||
| BancorpSouth Inc. | 2 | 38 | ||||
| Bank of Hawaii Corp. | 1 | 42 | ||||
| BB&T Corp. | 3 | 79 | ||||
| Boston Properties Inc. | 1 | 60 | ||||
| Brown & Brown Inc. | 2 | 43 | ||||
| Charles Schwab Corp. | 4 | 75 | ||||
| Chubb Corp. | - | 20 | ||||
| Cincinnati Financial Corp. | 1 | 31 | ||||
| CME Group Inc. | - | 101 | ||||
| CNA Financial Corp. | - | 2 | ||||
| Comerica Inc. | 2 | 56 | ||||
| Commerce Bancshares Inc. | 1 | 20 | ||||
| Discover Financial Services | 4 | 59 | ||||
| Eaton Vance Corp. | 1 | 43 | ||||
| Endurance Specialty Holdings Ltd. | - | 11 | ||||
| Equity Residential | 2 | 61 | ||||
| Federal Realty Investment Trust | 1 | 41 | ||||
| Federated Investors Inc. - Class B | 2 | 52 | ||||
| Fidelity National Financial Inc. - Class A | 3 | 38 | ||||
| Fifth Third Bancorp | 6 | 59 | ||||
| First Horizon National Corp. | 4 | 51 | ||||
| First Niagara Financial Group Inc. | 3 | 35 | ||||
| FirstMerit Corp. | - | - | ||||
| Franklin Resources Inc. | 1 | 74 | ||||
| Greenhill & Co. Inc. | - | 32 | ||||
| Hartford Financial Services Group Inc. | 3 | 63 | ||||
| HCP Inc. | 2 | 61 | ||||
| Health Care REIT Inc. | 1 | 40 | ||||
| Host Hotels & Resorts Inc. | 5 | 58 | ||||
| IntercontinentalExchange Inc. | 1 | 67 | ||||
| Invesco Ltd. | 3 | 61 | ||||
| Janus Capital Group Inc. | 4 | 52 | ||||
| Jefferies Group Inc. | 2 | 40 | ||||
| KeyCorp | 9 | 50 | ||||
| Legg Mason Inc. | 2 | 57 | ||||
| Leucadia National Corp. | 2 | 55 | ||||
| Lincoln National Corp. | 2 | 52 | ||||
| Mack-Cali Realty Corp. | - | 3 | ||||
| Marsh & McLennan Cos. Inc. | 3 | 66 | ||||
| Marshall & Ilsley Corp. | 8 | 44 | ||||
| MetLife Inc. | 3 | 110 | ||||
| Moody’s Corp. | 2 | 48 | ||||
| Morgan Stanley | 5 | 133 | ||||
| MSCI Inc. | - | 3 | ||||
| NASDAQ OMX Group Inc. | 2 | 40 | ||||
| Nationwide Health Properties Inc. | 1 | 25 | ||||
| Navigators Group Inc. | - | 5 | ||||
| Northern Trust Corp. | 1 | 68 | ||||
| NYSE Euronext | 2 | 46 | ||||
| People’s United Financial Inc. | 3 | 45 | ||||
| Plum Creek Timber Co. Inc. | 1 | 49 | ||||
| PNC Financial Services Group Inc. | 2 | 95 | ||||
| Principal Financial Group Inc. | 2 | 55 | ||||
| Progressive Corp. | 4 | 67 | ||||
| ProLogis | 4 | 51 | ||||
| Prudential Financial Inc. | 2 | 95 | ||||
| Raymond James Financial Inc. | 2 | 38 | ||||
| Regency Centers Corp. | - | 4 | ||||
| Regions Financial Corp. | 10 | 55 | ||||
| Senior Housing Properties Trust | 2 | 42 | ||||
| Simon Property Group Inc. | 1 | 112 | ||||
| SLM Corp. | 5 | 52 | ||||
| SunTrust Banks Inc. | 3 | 61 | ||||
| T. Rowe Price Group Inc. | 1 | 75 | ||||
| TD Ameritrade Holding Corp. | 2 | 41 | ||||
| TFS Financial Corp. | - | 1 | ||||
| Torchmark Corp. | 1 | 48 | ||||
| Unum Group | 2 | 45 | ||||
| Ventas Inc. | 1 | 52 | ||||
| Waddell & Reed Financial Inc. - Class A | 1 | 34 | ||||
| Washington Federal Inc. | - | 6 | ||||
| Weingarten Realty Investors | - | 3 | ||||
| WR Berkley Corp. | 2 | 41 | ||||
| XL Capital Ltd. - Class A | 3 | 58 | ||||
| 4,029 | ||||||
| HEALTH CARE - 3.0% | ||||||
| Abbott Laboratories | 3 | 184 | ||||
| AmerisourceBergen Corp. | 2 | 57 | ||||
| Baxter International Inc. | 1 | 47 | ||||
| Beckman Coulter Inc. | 1 | 33 | ||||
| Becton Dickinson & Co. | 1 | 39 | ||||
| Biogen Idec Inc. | 1 | 75 | ||||
| Boston Scientific Corp. | 8 | 74 | ||||
| Cardinal Health Inc. | 2 | 68 | ||||
| CareFusion Corp. | 1 | 19 | ||||
| Celgene Corp. | 1 | 61 | ||||
| Cephalon Inc. | 1 | 37 | ||||
| Cerner Corp. | - | 33 | ||||
| Charles River Laboratories International Inc. | - | 7 | ||||
| Covance Inc. | 1 | 44 | ||||
| Coventry Health Care Inc. | 2 | 51 | ||||
| CR Bard Inc. | 1 | 39 | ||||
| DaVita Inc. | 1 | 59 | ||||
| Dentsply International Inc. | 2 | 56 | ||||
| Edwards Lifesciences Corp. | 1 | 43 | ||||
| Eli Lilly & Co. | 3 | 121 | ||||
| Express Scripts Inc. | 1 | 86 | ||||
| Forest Laboratories Inc. | 1 | 39 | ||||
| Gen-Probe Inc. | 1 | 43 | ||||
| Hospira Inc. | 1 | 61 | ||||
| Idexx Laboratories Inc. | 1 | 27 | ||||
| Intuitive Surgical Inc. | - | 61 | ||||
| King Pharmaceuticals Inc. | 4 | 45 | ||||
| Laboratory Corp. of America Holdings | 1 | 60 | ||||
| Life Technologies Corp. | 1 | 63 | ||||
| McKesson Corp. | 1 | 75 | ||||
| Medco Health Solutions Inc. | 2 | 102 | ||||
| Mednax Inc. | 1 | 42 | ||||
| Mettler Toledo International Inc. | - | 42 | ||||
| Millipore Corp. | 1 | 51 | ||||
| Patterson Cos. Inc. | 2 | 42 | ||||
| PerkinElmer Inc. | 3 | 51 | ||||
| Pharmaceutical Product Development Inc. | 2 | 47 | ||||
| Quest Diagnostics Inc. | 1 | 60 | ||||
| ResMed Inc. | 1 | 26 | ||||
| St. Jude Medical Inc. | 2 | 70 | ||||
| Techne Corp. | - | 7 | ||||
| Teleflex Inc. | 1 | 38 | ||||
| Tenet Healthcare Corp. | 6 | 34 | ||||
| Thermo Fisher Scientific Inc. | 2 | 86 | ||||
| UnitedHealth Group Inc. | 1 | 40 | ||||
| Universal Health Services Inc. | 1 | 31 | ||||
| Varian Medical Systems Inc. | 1 | 52 | ||||
| VCA Antech Inc. | 1 | 30 | ||||
| Watson Pharmaceuticals Inc. | 1 | 55 | ||||
| Zimmer Holdings Inc. | 1 | 70 | ||||
| 2,683 | ||||||
| INDUSTRIALS - 4.7% | ||||||
| 3M Co. | 2 | 165 | ||||
| AECOM Technology Corp. | 2 | 41 | ||||
| AGCO Corp. | 1 | 42 | ||||
| Alliant Techsystems Inc. | - | 18 | ||||
| AMETEK Inc. | 1 | 34 | ||||
| Avery Dennison Corp. | 1 | 51 | ||||
| BE Aerospace Inc. | - | 2 | ||||
| Boeing Co. | 2 | 130 | ||||
| Burlington Northern Santa Fe Corp. | 1 | 99 | ||||
| Carlisle Cos. Inc. | 1 | 31 | ||||
| Caterpillar Inc. | 2 | 120 | ||||
| CH Robinson Worldwide Inc. | 1 | 59 | ||||
| Cintas Corp. | 1 | 34 | ||||
| Corrections Corp. of America | 2 | 42 | ||||
| Covanta Holding Corp. | 2 | 43 | ||||
| CSX Corp. | 2 | 82 | ||||
| Cummins Inc. | 1 | 50 | ||||
| Danaher Corp. | 1 | 75 | ||||
| Deere & Co. | 2 | 92 | ||||
| Dover Corp. | 2 | 62 | ||||
| Dun & Bradstreet Corp. | 1 | 51 | ||||
| Eaton Corp. | 1 | 64 | ||||
| Equifax Inc. | 2 | 56 | ||||
| Expeditors International Washington Inc. | 2 | 63 | ||||
| Fastenal Co. | 1 | 54 | ||||
| Flowserve Corp. | - | 38 | ||||
| FTI Consulting Inc. | 1 | 33 | ||||
| General Dynamics Corp. | 2 | 102 | ||||
| Goodrich Corp. | 1 | 58 | ||||
| Harsco Corp. | 1 | 39 | ||||
| Honeywell International Inc. | 3 | 110 | ||||
| IDEX Corp. | 1 | 40 | ||||
| IHS Inc. | 1 | 38 | ||||
| Iron Mountain Inc. | 2 | 41 | ||||
| Jacobs Engineering Group Inc. | 1 | 49 | ||||
| JB Hunt Transport Services Inc. | 1 | 42 | ||||
| Joy Global Inc. | 1 | 41 | ||||
| Kansas City Southern | 1 | 40 | ||||
| KBR Inc. | 2 | 30 | ||||
| Kennametal Inc. | - | 5 | ||||
| Kirby Corp. | - | 3 | ||||
| L-3 Communications Holdings Inc. | 1 | 61 | ||||
| Landstar System Inc. | - | 4 | ||||
| Lennox International Inc. | 1 | 35 | ||||
| Manpower Inc. | 1 | 38 | ||||
| Masco Corp. | 4 | 51 | ||||
| Monster Worldwide Inc. | 3 | 44 | ||||
| MSC Industrial Direct Co. - Class A | 1 | 28 | ||||
| Norfolk Southern Corp. | 2 | 84 | ||||
| Northrop Grumman Corp. | 2 | 84 | ||||
| Orion Marine Group Inc. | - | 6 | ||||
| PACCAR Inc. | 2 | 69 | ||||
| Pall Corp. | 1 | 51 | ||||
| Parker Hannifin Corp. | 1 | 65 | ||||
| Pentair Inc. | 1 | 42 | ||||
| Pitney Bowes Inc. | 2 | 46 | ||||
| Precision Castparts Corp. | 1 | 77 | ||||
| Quanta Services Inc. | 2 | 50 | ||||
| Republic Services Inc. - Class A | 2 | 62 | ||||
| Robert Half International Inc. | 2 | 48 | ||||
| Rockwell Collins Inc. | 1 | 61 | ||||
| Roper Industries Inc. | 1 | 37 | ||||
| RR Donnelley & Sons Co. | 2 | 45 | ||||
| Ryder System Inc. | 1 | 45 | ||||
| Southwest Airlines Co. | 5 | 59 | ||||
| SPX Corp. | 1 | 33 | ||||
| Stericycle Inc. | 1 | 55 | ||||
| Textron Inc. | 3 | 53 | ||||
| Thomas & Betts Corp. | 1 | 29 | ||||
| Timken Co. | 2 | 38 | ||||
| TransDigm Group Inc. | 1 | 38 | ||||
| Union Pacific Corp. | 2 | 115 | ||||
| United Technologies Corp. | 3 | 187 | ||||
| Valmont Industries Inc. | - | 31 | ||||
| Waste Connections Inc. | 1 | 47 | ||||
| Waste Management Inc. | 2 | 81 | ||||
| Watson Wyatt Worldwide Inc. | - | 5 | ||||
| Woodward Governor Co. | 1 | 13 | ||||
| WW Grainger Inc. | 1 | 58 | ||||
| 4,244 | ||||||
| INFORMATION TECHNOLOGY - 4.2% | ||||||
| Adobe Systems Inc. | 2 | 85 | ||||
| Advanced Micro Devices Inc. | 6 | 56 | ||||
| Agilent Technologies Inc. | 2 | 68 | ||||
| Akamai Technologies Inc. | 2 | 56 | ||||
| Alliance Data Systems Corp. | 1 | 39 | ||||
| Altera Corp. | 2 | 54 | ||||
| Amphenol Corp. - Class A | 1 | 65 | ||||
| Analog Devices Inc. | 2 | 60 | ||||
| Applied Materials Inc. | 6 | 81 | ||||
| Arrow Electronics Inc. | 2 | 47 | ||||
| Autodesk Inc. | 2 | 58 | ||||
| Automatic Data Processing Inc. | 2 | 90 | ||||
| Avnet Inc. | - | 3 | ||||
| Broadcom Corp. - Class A | 2 | 69 | ||||
| Broadridge Financial Solutions Inc. | 2 | 36 | ||||
| Brocade Communications Systems Inc. | 5 | 40 | ||||
| CA Inc. | 3 | 58 | ||||
| Ciena Corp. | - | 1 | ||||
| Cisco Systems Inc. | 2 | 41 | ||||
| Citrix Systems Inc. | 1 | 58 | ||||
| Cognizant Technology Solutions Corp. | 2 | 68 | ||||
| Computer Sciences Corp. | 1 | 63 | ||||
| Compuware Corp. | 6 | 43 | ||||
| Convergys Corp. | - | 2 | ||||
| Corning Inc. | 6 | 106 | ||||
| Cree Inc. | 1 | 45 | ||||
| Dell Inc. | 6 | 90 | ||||
| Diebold Inc. | - | 6 | ||||
| Dolby Laboratories Inc. - Class A | 1 | 33 | ||||
| DST Systems Inc. | - | 4 | ||||
| eBay Inc. | 4 | 101 | ||||
| Electronic Arts Inc. | 3 | 59 | ||||
| F5 Networks Inc. | 1 | 48 | ||||
| Factset Research Systems Inc. | 1 | 33 | ||||
| Fiserv Inc. | 1 | 63 | ||||
| FLIR Systems Inc. | 2 | 49 | ||||
| Harris Corp. | 1 | 62 | ||||
| Hewitt Associates Inc. - Class A | 1 | 42 | ||||
| Hewlett-Packard Co. | 4 | 221 | ||||
| Intuit Inc. | 2 | 64 | ||||
| Jack Henry & Associates Inc. | - | 2 | ||||
| JDS Uniphase Corp. | - | 2 | ||||
| KLA-Tencor Corp. | 2 | 54 | ||||
| Lam Research Corp. | 1 | 27 | ||||
| Lender Processing Services Inc. | 1 | 41 | ||||
| Lexmark International Inc. | 2 | 49 | ||||
| Linear Technology Corp. | 2 | 49 | ||||
| LSI Corp. | 5 | 30 | ||||
| Mantech International Corp. - Class A | - | 5 | ||||
| Maxim Integrated Products Inc. | 2 | 32 | ||||
| McAfee Inc. | 2 | 61 | ||||
| MEMC Electronic Materials Inc. | 4 | 48 | ||||
| Microchip Technology Inc. | 2 | 46 | ||||
| Micros Systems Inc. | 1 | 28 | ||||
| Molex Inc. | 2 | 39 | ||||
| Motorola Inc. | 10 | 77 | ||||
| National Instruments Corp. | 1 | 38 | ||||
| National Semiconductor Corp. | 3 | 48 | ||||
| NCR Corp. | - | 1 | ||||
| Novellus Systems Inc. | 2 | 49 | ||||
| Nvidia Corp. | 3 | 64 | ||||
| ON Semiconductor Corp. | 4 | 37 | ||||
| PMC - Sierra Inc. | 1 | 5 | ||||
| QLogic Corp. | 2 | 42 | ||||
| SAIC Inc. | 2 | 34 | ||||
| Salesforce.com Inc. | 1 | 59 | ||||
| SanDisk Corp. | 2 | 58 | ||||
| Skyworks Solutions Inc. | 2 | 34 | ||||
| Sybase Inc. | 1 | 43 | ||||
| Synopsys Inc. | 2 | 42 | ||||
| Teradyne Inc. | 5 | 49 | ||||
| Total System Services Inc. | 3 | 48 | ||||
| Trimble Navigation Ltd. | 2 | 40 | ||||
| Varian Semiconductor Equipment Associates Inc. | 1 | 40 | ||||
| Visa Inc. - Class A | - | 27 | ||||
| Western Union Co. | 4 | 69 | ||||
| Xerox Corp. | 5 | 40 | ||||
| Yahoo! Inc. | 4 | 70 | ||||
| 3,794 | ||||||
| MATERIALS - 2.5% | ||||||
| Air Products & Chemicals Inc. | 1 | 81 | ||||
| Airgas Inc. | 1 | 52 | ||||
| AK Steel Holding Corp. | 2 | 45 | ||||
| Albemarle Corp. | 1 | 40 | ||||
| Alcoa Inc. | 5 | 76 | ||||
| Allegheny Technologies Inc. | 1 | 49 | ||||
| AptarGroup Inc. | - | 14 | ||||
| Ball Corp. | 1 | 57 | ||||
| Bemis Co. Inc. | 2 | 50 | ||||
| Celanese Corp. - Class A | 1 | 35 | ||||
| Cliffs Natural Resources Inc. | 1 | 51 | ||||
| Crown Holdings Inc. | 2 | 41 | ||||
| Dow Chemical Co. | 4 | 116 | ||||
| FMC Corp. | 1 | 50 | ||||
| Freeport-McMoRan Copper & Gold Inc. | 2 | 120 | ||||
| Grief Inc. | 1 | 43 | ||||
| Huntsman Corp. | 3 | 30 | ||||
| International Flavors & Fragrances Inc. | 1 | 49 | ||||
| International Paper Co. | 2 | 64 | ||||
| Intrepid Potash Inc. | 1 | 38 | ||||
| Martin Marietta Materials Inc. | 1 | 45 | ||||
| MeadWestvaco Corp. | 2 | 57 | ||||
| Monsanto Co. | 1 | 90 | ||||
| Mosaic Co. | 1 | 30 | ||||
| Newmont Mining Corp. | 2 | 90 | ||||
| Nucor Corp. | 2 | 75 | ||||
| Owens-Illinois Inc. | 2 | 56 | ||||
| Packaging Corp. of America | 2 | 44 | ||||
| Pactiv Corp. | 2 | 43 | ||||
| PPG Industries Inc. | 1 | 64 | ||||
| Praxair Inc. | 1 | 96 | ||||
| Rock-Tenn Co. - Class A | - | 5 | ||||
| RPM International Inc. | 1 | 24 | ||||
| Sealed Air Corp. | 2 | 46 | ||||
| Sigma-Aldrich Corp. | 1 | 45 | ||||
| Silgan Holdings Inc. | - | 12 | ||||
| Sonoco Products Co. | 2 | 44 | ||||
| Southern Copper Corp. | 1 | 36 | ||||
| Titanium Metals Corp. | 3 | 41 | ||||
| United States Steel Corp. | 1 | 61 | ||||
| Valspar Corp. | 1 | 33 | ||||
| Vulcan Materials Co. | 1 | 58 | ||||
| Walter Industries Inc. | 1 | 39 | ||||
| Weyerhaeuser Co. | 2 | 66 | ||||
| 2,301 | ||||||
| TELECOMMUNICATION SERVICES - 0.5% | ||||||
| American Tower Corp. | 2 | 78 | ||||
| CenturyTel Inc. | 2 | 62 | ||||
| Crown Castle International Corp. | - | 8 | ||||
| MetroPCS Communications Inc. | 7 | 50 | ||||
| NII Holdings Inc. - Class B | 1 | 30 | ||||
| Verizon Communications Inc. | 7 | 244 | ||||
| 472 | ||||||
| UTILITIES - 2.2% | ||||||
| AES Corp. | 4 | 57 | ||||
| AGL Resources Inc. | 1 | 36 | ||||
| Allegheny Energy Inc. | 2 | 45 | ||||
| Ameren Corp. | 2 | 50 | ||||
| American Electric Power Co. Inc. | 2 | 77 | ||||
| Aqua America Inc. | 2 | 30 | ||||
| Atmos Energy Corp. | 1 | 38 | ||||
| Calpine Corp. | - | 1 | ||||
| CenterPoint Energy Inc. | 3 | 48 | ||||
| CMS Energy Corp. | 3 | 47 | ||||
| Consolidated Edison Inc. | 1 | 64 | ||||
| Constellation Energy Group Inc. | 2 | 56 | ||||
| Dominion Resources Inc. | 2 | 86 | ||||
| DPL Inc. | 1 | 30 | ||||
| DTE Energy Co. | 1 | 52 | ||||
| Duke Energy Corp. | 5 | 88 | ||||
| Energen Corp. | 1 | 42 | ||||
| Entergy Corp. | 1 | 74 | ||||
| EQT Corp. | 1 | 53 | ||||
| FirstEnergy Corp. | 1 | 65 | ||||
| FPL Group Inc. | 1 | 74 | ||||
| Integrys Energy Group Inc. | 1 | 34 | ||||
| MDU Resources Group Inc. | 1 | 33 | ||||
| National Fuel Gas Co. | 1 | 30 | ||||
| NiSource Inc. | 3 | 45 | ||||
| Northeast Utilities | 2 | 49 | ||||
| OGE Energy Corp. | 1 | 44 | ||||
| Oneok Inc. | 1 | 45 | ||||
| Pepco Holdings Inc. | 3 | 42 | ||||
| PG&E Corp. | 2 | 76 | ||||
| Pinnacle West Capital Corp. | 1 | 51 | ||||
| Progress Energy Inc. | 2 | 70 | ||||
| Questar Corp. | 1 | 58 | ||||
| SCANA Corp. | 1 | 41 | ||||
| Southern Co. | 3 | 100 | ||||
| TECO Energy Inc. | 3 | 42 | ||||
| UGI Corp. | 2 | 36 | ||||
| Wisconsin Energy Corp. | 1 | 60 | ||||
| Xcel Energy Inc. | 3 | 53 | ||||
| 2,022 | ||||||
| Total Securities Sold Short - 31.7% | ||||||
(proceeds $27,298) | $ | 28,666 | ||||
| JNL/Franklin Templeton Income Fund | ||||||
| COMMON STOCKS - 29.9% | ||||||
| CONSUMER DISCRETIONARY - 0.8% | ||||||
| Charter Communications Inc. (c) | 58 | $ | 2,066 | |||
| Comcast Corp. - Class A | 100 | 1,686 | ||||
| Target Corp. | 40 | 1,935 | ||||
| 5,687 | ||||||
| CONSUMER STAPLES - 0.4% | ||||||
| Diageo Plc | 150 | 2,626 | ||||
| ENERGY - 4.9% | ||||||
| Callon Petroleum Co. (c) (e) | 41 | 62 | ||||
| Canadian Oil Sands Trust | 295 | 8,422 | ||||
| ConocoPhillips | 200 | 10,214 | ||||
| Exxon Mobil Corp. | 200 | 13,638 | ||||
| Spectra Energy Corp. | 165 | 3,376 | ||||
| 35,712 | ||||||
| FINANCIALS - 5.3% | ||||||
| Bank of America Corp. | 600 | 9,036 | ||||
| Barclays Plc | 150 | 669 | ||||
| Capital One Financial Corp. (e) | 163 | 6,249 | ||||
| Citigroup Inc. | 894 | 2,961 | ||||
| Duke Realty Corp. | 120 | 1,460 | ||||
| HSBC Holdings Plc | 300 | 3,434 | ||||
| iStar Financial Inc. (c) (e) | 85 | 217 | ||||
| JPMorgan Chase & Co. | 150 | 6,250 | ||||
| Wells Fargo & Co. | 300 | 8,087 | ||||
| 38,363 | ||||||
| HEALTH CARE - 2.4% | ||||||
| Abbott Laboratories | 32 | 1,738 | ||||
| Johnson & Johnson | 50 | 3,220 | ||||
| Merck & Co. Inc. | 340 | 12,424 | ||||
| 17,382 | ||||||
| INFORMATION TECHNOLOGY - 1.5% | ||||||
| Intel Corp. | 200 | 4,080 | ||||
| Maxim Integrated Products Inc. (e) | 200 | 4,060 | ||||
| Xerox Corp. (e) | 300 | 2,538 | ||||
| 10,678 | ||||||
| MATERIALS - 0.9% | ||||||
| Barrick Gold Corp. | 50 | 1,969 | ||||
| Newmont Mining Corp. | 100 | 4,731 | ||||
| 6,700 | ||||||
| TELECOMMUNICATION SERVICES - 2.0% | ||||||
| AT&T Inc. | 300 | 8,409 | ||||
| Verizon Communications Inc. | 110 | 3,644 | ||||
| Vodafone Group Plc | 1,300 | 3,017 | ||||
| 15,070 | ||||||
| UTILITIES - 11.7% | ||||||
| AGL Resources Inc. (e) | 100 | 3,647 | ||||
| Ameren Corp. | 185 | 5,171 | ||||
| American Electric Power Co. Inc. | 148 | 5,138 | ||||
| American Water Works Co. Inc. | 24 | 545 | ||||
| Consolidated Edison Inc. | 80 | 3,634 | ||||
| Dominion Resources Inc. | 150 | 5,838 | ||||
| Duke Energy Corp. | 375 | 6,454 | ||||
| FirstEnergy Corp. | 50 | 2,322 | ||||
| FPL Group Inc. | 100 | 5,282 | ||||
| NiSource Inc. | 40 | 615 | ||||
| PG&E Corp. | 180 | 8,037 | ||||
| Pinnacle West Capital Corp. | 100 | 3,658 | ||||
| Portland General Electric Co. (e) | 82 | 1,672 | ||||
| Progress Energy Inc. | 115 | 4,716 | ||||
| Public Service Enterprise Group Inc. | 200 | 6,650 | ||||
| Sempra Energy (e) | 76 | 4,249 | ||||
| Southern Co. | 200 | 6,664 | ||||
| TECO Energy Inc. | 200 | 3,244 | ||||
| Xcel Energy Inc. | 350 | 7,431 | ||||
| 84,967 | ||||||
| Total Common Stocks (cost $235,124) | 217,185 | |||||
| PREFERRED STOCKS - 5.7% | ||||||
| CONSUMER DISCRETIONARY - 0.1% | ||||||
| General Motors Corp., 6.25%, | ||||||
| Series C (callable at 25.83 beginning 07/20/10) (d) | 100 | 565 | ||||
| ENERGY - 0.4% | ||||||
| Callon Petroleum Co., 18.00% | 3 | 51 | ||||
| McMoRan Exploration Co., | ||||||
| 8.00% (callable at 1,000 beginning 06/15/14) (p) | 1 | 990 | ||||
| SandRidge Energy Inc., Convertible Preferred, 8.50% (p) (t) (v) | 13 | 1,851 | ||||
| 2,892 | ||||||
| FINANCIALS - 4.8% | ||||||
| Bank of America Corp., Convertible Preferred, | ||||||
| 7.25%, Series L (p) | 8 | 6,918 | ||||
| Citigroup Inc. Convertible Preferred, 7.50%, 12/15/12 (c) | 90 | 9,391 | ||||
| Credit Suisse, Convertible Preferred, 11.00%, 09/03/10 | 125 | 2,382 | ||||
| Deutsche Bank AG, 12.00% (t) (v) | 90 | 2,414 | ||||
| Federal Home Loan Mortgage Corp., | ||||||
| 8.38%, Series Z (callable at 25 on 12/31/12) (d) (p) | 186 | 195 | ||||
| Federal National Mortgage Association, 6.75%, | ||||||
| Series Q (callable at 25 beginning 09/30/10) (d) (p) | 100 | 91 | ||||
| Federal National Mortgage Association, 7.63%, | ||||||
| Series R (callable at 25 beginning 11/21/12) (d) (p) | 143 | 133 | ||||
| Federal National Mortgage Association, 8.25%, | ||||||
| Series S (callable at 25 beginning 12/31/10) (d) (p) | 65 | 71 | ||||
| Federal National Mortgage Association, | ||||||
| Convertible Preferred, 8.75%, 05/13/11 (d) | 91 | 162 | ||||
| Federal National Mortgage Association, | ||||||
| 5.38% (callable at 105,000 on 02/16/10) (d) (p) | - | 138 | ||||
| FelCor Lodging Trust Inc., Convertible Preferred, | ||||||
| 1.95%, Series A (p) | 60 | 652 | ||||
| GMAC Inc., 7.00% (callable at 1,000 beginning 12/31/11) (t) (v) | 2 | 1,217 | ||||
| Goldman Sachs Group Inc., Convertible Preferred | ||||||
| 9.00%, 08/20/10 | 60 | 2,703 | ||||
| 12.50%, 04/01/10 (t) (v) | 80 | 3,245 | ||||
| 10.55%, 07/21/10 | 40 | 2,481 | ||||
| Wells Fargo & Co., Convertible Preferred, 7.50%, Series L (p) | 3 | 2,754 | ||||
| 34,947 | ||||||
| HEALTH CARE - 0.3% | ||||||
| Tenet Healthcare Corp., 7.00%, 10/01/12 | 2 | 2,014 | ||||
| UTILITIES - 0.1% | ||||||
| FPL Group Inc., 8.38% | 20 | 1,035 | ||||
| Total Preferred Stocks (cost $59,855) | 41,453 | |||||
| WARRANTS - 0.0% | ||||||
| Charter Communications LLC, 11/30/14 (c) | 30 | 190 | ||||
| Total Warrants (cost $106) | 190 | |||||
| NON-U.S. GOVERNMENT AGENCY | ||||||
| ASSET-BACKED SECURITIES - 0.0% | ||||||
| Sigma Finance, Inc. (d) (f) (u) | $ | 1,285 | 55 | |||
| Total Non-U.S. Government Agency | ||||||
| Asset-Backed Securities (cost $1,285) | 55 | |||||
| CORPORATE BONDS AND NOTES - 54.1% | ||||||
| CONSUMER DISCRETIONARY - 9.7% | ||||||
| Bausch & Lomb Inc., Delayed Draw Term Loan | ||||||
| 3.50%, 04/26/15 (i) (u) | 36 | 34 | ||||
| 3.50%, 04/26/15 (i) (u) | 60 | 57 | ||||
| 3.50%, 04/26/15 (i) (u) | 11 | 11 | ||||
| 3.50%, 04/26/15 (i) (u) | 936 | 892 | ||||
| 3.50%, 04/26/15 (i) (u) | 120 | 114 | ||||
| Cablevision Systems Corp. | ||||||
| 8.00%, 04/15/12 (e) (k) | 4,500 | 4,759 | ||||
| 8.63%, 09/15/17 (t) (v) | 1,000 | 1,041 | ||||
| CBS Corp., 8.88%, 05/15/19 | 500 | 598 | ||||
| CCH II LLC, 13.50%, 11/30/16 (t) (v) | 5,134 | 5,994 | ||||
| Cequel Communications Holdings I LLC, | ||||||
| 8.63%, 11/15/17 (t) (v) | 1,500 | 1,515 | ||||
| Cinemark USA Inc., 8.63%, 06/15/19 (t) (v) | 800 | 832 | ||||
| Clear Channel Communications Inc. Term Loan B, | ||||||
| 3.88%, 11/13/15 (i) (u) | 8,000 | 6,600 | ||||
| Clear Channel Worldwide Holdings Inc. | ||||||
| 9.25%, 12/15/17 (t) (v) | 400 | 408 | ||||
| 9.25%, 12/15/17 (t) (v) | 1,600 | 1,648 | ||||
| Dex Media Inc. | ||||||
| 8.00%, 11/15/13 (d) | 2,250 | 568 | ||||
| 9.00%, 11/15/13 (d) | 5,000 | 1,262 | ||||
| DISH DBS Corp., 7.75%, 05/31/15 (e) | 5,000 | 5,238 | ||||
| Dollar General Corp. | ||||||
| 10.63%, 07/15/15 (e) | 3,771 | 4,176 | ||||
| 11.88%, 07/15/17 | 1,373 | 1,586 | ||||
| General Motors Corp., 8.38%, 07/15/33 (d) (e) | 1,200 | 324 | ||||
| Harrah's Operating Escrow LLC, 11.25%, 06/01/17 (e) (t) (v) | 750 | 785 | ||||
| Hertz Corp. | ||||||
| 8.88%, 01/01/14 | 7,000 | 7,158 | ||||
| 10.50%, 01/01/16 (e) | 1,250 | 1,334 | ||||
| Idearc Inc. Term Loan, 5.75%, 11/17/13 (d) (u) | 1,942 | 1,016 | ||||
| Jarden Corp., 8.00%, 05/01/16 | 400 | 413 | ||||
| JBS USA LLC, 11.63%, 05/01/14 (e) (t) (v) | 1,000 | 1,132 | ||||
| KB Home, 5.75%, 02/01/14 | 2,000 | 1,880 | ||||
| Lamar Media Corp., 9.75%, 04/01/14 | 1,600 | 1,766 | ||||
| Liberty Global Inc., 4.50%, 11/15/16 (t) (v) | 2,000 | 2,170 | ||||
| Limited Brands Inc., 8.50%, 06/15/19 (t) (v) | 1,000 | 1,088 | ||||
| MGM Mirage Inc., 6.75%, 04/01/13 | 2,900 | 2,501 | ||||
| R.H. Donnelley Corp. | ||||||
| 6.88%, 01/15/13 (d) | 2,500 | 234 | ||||
| 8.88%, 01/15/16 (d) | 5,500 | 516 | ||||
| 8.88%, 10/15/17 (d) | 4,000 | 375 | ||||
| Regal Cinemas Corp., 8.63%, 07/15/19 | 700 | 728 | ||||
| Univision Communications Inc. | ||||||
| 12.00%, 07/01/14 (t) (v) | 500 | 551 | ||||
| 9.75%, 03/15/15 (t) (v) | 3,947 | 3,458 | ||||
| US Investigations Services Inc., Term Loan, | ||||||
| 3.25%, 04/01/15 (i) (u) | 3,910 | 3,514 | ||||
| Wyndham Worldwide Corp., 9.88%, 05/01/14 | 2,000 | 2,223 | ||||
| 70,499 | ||||||
| CONSUMER STAPLES - 0.6% | ||||||
| Alliance One International Inc., 10.00%, 07/15/16 (t) (v) | 500 | 525 | ||||
| SUPERVALU Inc., 8.00%, 05/01/16 | 2,000 | 2,030 | ||||
| Wendy's/Arby's Group Inc., 10.00%, 07/15/16 (e) | 1,250 | 1,362 | ||||
| 3,917 | ||||||
| ENERGY - 11.7% | ||||||
| Antero Resources Finance Corp., | ||||||
| 9.38%, 12/01/17 (e) (t) (v) | 1,300 | 1,326 | ||||
| Arch Coal Inc., 8.75%, 08/01/16 (t) (v) | 1,200 | 1,269 | ||||
| Bill Barrett Corp., 9.88%, 07/15/16 | 400 | 426 | ||||
| Callon Petroleum Co., 13.00%, 09/15/16 | 1,500 | 1,118 | ||||
| Calpine Generating Co. LLC, 8.00%, 06/01/16 (e) (t) (v) | 1,750 | 1,802 | ||||
| Chesapeake Energy Corp. | ||||||
| 9.50%, 02/15/15 (e) | 2,500 | 2,744 | ||||
| 6.50%, 08/15/17 (e) | 4,000 | 3,920 | ||||
| 6.25%, 01/15/18 | 2,200 | 2,112 | ||||
| 7.25%, 12/15/18 | 5,000 | 5,038 | ||||
| El Paso Corp. | ||||||
| 12.00%, 12/12/13 | 1,600 | 1,876 | ||||
| 7.25%, 06/01/18 (e) | 4,100 | 4,051 | ||||
| 7.75%, 01/15/32 | 1,000 | 946 | ||||
| Expro Finance Luxembourg SCA, 8.50%, 12/15/16 (t) (v) | 2,700 | 2,680 | ||||
| Forest Oil Corp., 8.50%, 02/15/14 (t) (v) | 3,500 | 3,658 | ||||
| Mariner Energy Inc., 7.50%, 04/15/13 | 2,000 | 1,990 | ||||
| Newfield Exploration Co., 6.63%, 04/15/16 | 2,500 | 2,506 | ||||
| Petrohawk Energy Corp. | ||||||
| 10.50%, 08/01/14 | 2,000 | 2,185 | ||||
| 7.88%, 06/01/15 (e) | 3,200 | 3,232 | ||||
| Petroplus Finance Ltd., 7.00%, 05/01/17 (e) (t) (v) | 1,000 | 900 | ||||
| Pioneer Natural Resources Co. | ||||||
| 6.65%, 03/15/17 | 1,500 | 1,479 | ||||
| 6.88%, 05/01/18 | 2,000 | 1,979 | ||||
| Plains Exploration & Production Co. | ||||||
| 7.75%, 06/15/15 | 1,500 | 1,526 | ||||
| 10.00%, 03/01/16 (e) | 1,500 | 1,642 | ||||
| Quicksilver Resources Inc., 11.75%, 01/01/16 | 1,300 | 1,476 | ||||
| Sabine Pass LNG LP | ||||||
| 7.25%, 11/30/13 (e) | 1,350 | 1,225 | ||||
| 7.50%, 11/30/16 (e) | 2,500 | 2,081 | ||||
| SandRidge Energy Inc. | ||||||
| 3.88%, 04/01/14 (i) | 2,000 | 1,793 | ||||
| 9.88%, 05/15/16 (e) (t) (v) | 2,600 | 2,736 | ||||
| 8.00%, 06/01/18 (t) (v) | 1,000 | 982 | ||||
| SEACOR Holdings Inc., 7.38%, 10/01/19 | 1,000 | 1,012 | ||||
| SESI LLC, 6.88%, 06/01/14 | 1,370 | 1,349 | ||||
| Texas Competitive Electric Holdings Co. LLC, Term Loan | ||||||
| 3.73%, 10/24/14 (i) (u) | 4,560 | 3,715 | ||||
| 3.73%, 10/24/14 (i) (u) | 1,975 | 1,605 | ||||
| 3.75%, 10/24/14 (i) (u) | 370 | 301 | ||||
| Texas Competitive Electric Holdings Co. LLC | ||||||
| 10.25%, 11/01/15 (e) (k) | 10,000 | 8,100 | ||||
| 10.25%, 11/01/15 (k) | 3,000 | 2,430 | ||||
| 10.50%, 11/01/16 (e) | 4,907 | 3,460 | ||||
| W&T Offshore Inc., 8.25%, 6/15/14 (t) (v) | 3,000 | 2,850 | ||||
| 85,520 | ||||||
| FINANCIALS - 13.1% | ||||||
| AFLAC Inc., 8.50%, 05/15/19 | 700 | 806 | ||||
| Allison Term Loan | ||||||
| 3.00%, 08/07/14 (i) (u) | 165 | 152 | ||||
| 3.00%, 08/07/14 (i) (u) | 1,780 | 1,643 | ||||
| Bank of America Corp., | ||||||
| 8.13% (callable at 100 beginning 05/15/18) (p) | 1,000 | 963 | ||||
| Duke Realty Corp., 5.95%, 02/15/17 | 1,500 | 1,396 | ||||
| Duke Realty LP, 7.38%, 02/15/15 | 1,200 | 1,265 | ||||
| Felcor Lodging LP, 10.00%, 10/01/14 (t) (v) | 1,700 | 1,715 | ||||
| Ford Motor Credit Co. LLC | ||||||
| 9.75%, 09/15/10 (k) | 2,000 | 2,064 | ||||
| 9.88%, 08/10/11 | 1,000 | 1,047 | ||||
| 7.25%, 10/25/11 | 2,000 | 2,020 | ||||
| 3.00%, 01/13/12 (i) | 6,000 | 5,580 | ||||
| 7.50%, 08/01/12 (e) | 3,000 | 3,025 | ||||
| 7.00%, 10/01/13 | 4,000 | 3,994 | ||||
| 8.00%, 06/01/14 (e) | 2,500 | 2,567 | ||||
| 8.70%, 10/01/14 | 5,000 | 5,227 | ||||
| 12.00%, 05/15/15 | 3,000 | 3,479 | ||||
| GMAC LLC | ||||||
| 7.75%, 01/19/10 (t) (v) | 5,000 | 4,998 | ||||
| 6.88%, 09/15/11 (t) (v) | 3,532 | 3,479 | ||||
| HCP Inc., 6.70%, 01/30/18 | 1,500 | 1,455 | ||||
| Host Hotels & Resorts LP | ||||||
| 6.88%, 11/01/14 (e) | 1,500 | 1,509 | ||||
| 6.38%, 03/15/15 | 3,500 | 3,430 | ||||
| 6.75%, 06/01/16 (e) | 1,000 | 995 | ||||
| 9.00%, 05/15/17 (e) (t) (v) | 600 | 649 | ||||
| iStar Financial Inc. | ||||||
| 0.75%, 10/01/12 (i) | 4,500 | 2,481 | ||||
| 8.63%, 06/01/13 | 5,000 | 3,200 | ||||
| JPMorgan Chase & Co., | ||||||
| 7.90%, (callable at 100 beginning 04/30/18) (p) | 11,500 | 11,862 | ||||
| Liberty Mutual Group Inc., 10.75%, 06/15/58 (e) (t) (v) | 5,000 | 5,300 | ||||
| Petroplus Finance Ltd., 6.75%, 05/01/14 (t) (v) | 1,000 | 940 | ||||
| RBS Global & Rexnord LLC, 9.50%, 08/01/14 | 1,250 | 1,253 | ||||
| Reynolds Group Inc., 7.75%, 10/15/16 (e) (t) (v) | 1,250 | 1,278 | ||||
| UPC Germany GmbH | ||||||
| 8.13%, 12/01/17 (e) (t) (v) | 2,100 | 2,124 | ||||
| 8.13%, 12/01/17 (t) (v) | EUR | 2,750 | 4,020 | |||
| 9.63%, 12/01/19 (t) (v) | EUR | 1,500 | 2,171 | |||
| Vanguard Health Holding Co. I LLC, 11.25%, 10/01/15 (k) | 1,000 | 1,052 | ||||
| Washington Mutual Preferred Funding LLC, | ||||||
| 9.75%, (callable at 100 beginning 12/15/17) (d) (p) (t) (v) | 1,500 | 22 | ||||
| Wells Fargo Capital XIII, | ||||||
| 7.70% (callable at 100 beginning 03/26/13) (p) | 900 | 873 | ||||
| Wells Fargo Capital XV, | ||||||
| 9.75% (callable at 100 beginning 09/26/13) (p) | 5,000 | 5,350 | ||||
| 95,384 | ||||||
| HEALTH CARE - 6.7% | ||||||
| Community Health Systems Inc., 8.88%, 07/15/15 | 5,000 | 5,175 | ||||
| DaVita Inc. | ||||||
| 6.63%, 03/15/13 | 1,500 | 1,504 | ||||
| 7.25%, 03/15/15 | 600 | 602 | ||||
| HCA Inc. | ||||||
| 6.38%, 01/15/15 | 1,500 | 1,416 | ||||
| 6.50%, 02/15/16 | 1,500 | 1,425 | ||||
| 9.25%, 11/15/16 | 3,500 | 3,758 | ||||
| 8.50%, 04/15/19 (t) (v) | 5,000 | 5,388 | ||||
| 7.88%, 02/15/20 (t) (v) | 6,000 | 6,248 | ||||
| Quintiles Transnational Corp., 9.50%, 12/30/14 (t) (v) | 4,000 | 4,020 | ||||
| Talecris Biotherapeutics Holdings Corp., | ||||||
| 7.75%, 11/15/16 (t) (v) | 600 | 609 | ||||
| Tenet Healthcare Corp. | ||||||
| 7.38%, 02/01/13 (e) | 3,000 | 3,008 | ||||
| 9.25%, 02/01/15 (e) (k) | 5,000 | 5,325 | ||||
| 9.00%, 05/01/15 (t) (v) | 3,500 | 3,780 | ||||
| 10.00%, 05/01/18 (e) (t) (v) | 3,500 | 3,920 | ||||
| US Oncology Holdings Inc., 6.43%, 03/15/12 (i) | 2,905 | 2,716 | ||||
| 48,894 | ||||||
| INDUSTRIALS - 2.0% | ||||||
| Ceridian Corp., 11.25%, 11/15/15 (k) | 4,000 | 3,815 | ||||
| JohnsonDiversey Holdings Inc., 10.50%, 05/15/20 (t) (v) | 1,600 | 1,608 | ||||
| Navistar International Corp., 8.25%, 11/01/21 (e) | 1,500 | 1,538 | ||||
| Novelis Inc., Term Loan, 2.26%, 07/07/14 (i) (u) | 475 | 442 | ||||
| RBS Global & Rexnord LLC | ||||||
| 9.50%, 08/01/14 (t) (v) | 1,978 | 1,983 | ||||
| 11.75%, 08/01/16 (e) | 1,500 | 1,485 | ||||
| Terex Corp., 8.00%, 11/15/17 (e) | 2,000 | 1,925 | ||||
| United Rentals Inc., 7.75%, 11/15/13 (e) | 2,000 | 1,880 | ||||
| 14,676 | ||||||
| INFORMATION TECHNOLOGY - 3.5% | ||||||
| Advanced Micro Devices Inc. | ||||||
| 5.75%, 08/15/12 | 260 | 256 | ||||
| 5.75%, 08/15/12 (t) (v) | 1,041 | 1,027 | ||||
| 8.13%, 12/15/17 (t) (v) | 1,000 | 996 | ||||
| CEVA Group Plc, 10.00%, 09/01/14 (e) (t) (v) | 3,000 | 2,850 | ||||
| First Data Corp., Term Loan | ||||||
| 3.00%, 09/24/14 (i) (u) | 5 | 4 | ||||
| 3.00%, 09/24/14 (i) (u) | 93 | 83 | ||||
| 3.00%, 09/24/14 (i) (u) | 1,647 | 1,464 | ||||
| 3.00%, 09/24/14 (i) (u) | 215 | 191 | ||||
| 3.00%, 10/01/14 (i) (u) | 195 | 174 | ||||
| 3.00%, 10/01/14 (i) (u) | 1,870 | 1,666 | ||||
| 3.00%, 10/01/14 (i) (u) | 1,845 | 1,644 | ||||
| First Data Corp., 9.88%, 09/24/15 (e) | 5,500 | 5,129 | ||||
| Freescale Semiconductor Inc., | ||||||
| Term Loan, 12.50%, 12/15/14 (i) (u) | 3,864 | 3,985 | ||||
| Freescale Semiconductor Inc., 10.13%, 12/15/16 (e) | 850 | 684 | ||||
| Sanmina-SCI Corp. | ||||||
| 6.75%, 03/01/13 (e) | 1,200 | 1,184 | ||||
| 8.13%, 03/01/16 (e) | 1,500 | 1,496 | ||||
| Sungard Data Systems Inc., 10.63%, 05/15/15 (e) | 2,500 | 2,753 | ||||
| 25,586 | ||||||
| MATERIALS - 1.3% | ||||||
| Freeport-McMoRan Copper & Gold Inc., | ||||||
| 8.38%, 04/01/17 | 2,000 | 2,190 | ||||
| Ineos Group Holdings Plc, 7.88%, 02/15/16 (t) (v) | EUR | 3,250 | 2,949 | |||
| JohnsonDiversey Inc., 8.25%, 11/15/19 (t) (v) | 2,500 | 2,531 | ||||
| Nalco Co., 8.25%, 05/15/17 (t) (v) | 300 | 319 | ||||
| Teck Resources Ltd. | ||||||
| 9.75%, 05/15/14 | 800 | 923 | ||||
| 10.75%, 05/15/19 | 700 | 836 | ||||
| 9,748 | ||||||
| TELECOMMUNICATION SERVICES - 1.5% | ||||||
| CC Holdings GS V LLC, 7.75%, 05/01/17 (t) (v) | 1,100 | 1,172 | ||||
| Clearwire Communications LLC | ||||||
| 12.00%, 12/01/15 (e) (t) (v) | 2,000 | 2,030 | ||||
| 12.00%, 12/01/15 (t) (v) | 1,500 | 1,522 | ||||
| Cricket Communications Inc., 9.38%, 11/01/14 (e) | 1,000 | 1,005 | ||||
| Crown Castle International Corp., 9.00%, 01/15/15 | 1,000 | 1,065 | ||||
| Digicel Group Ltd., 8.88%, 01/15/15 (e) (t) (v) | 500 | 485 | ||||
| Qwest Corp., 8.38%, 05/01/16 | 1,600 | 1,716 | ||||
| Wind Acquisition Finance SA, 11.75%, 07/15/17 (t) (v) | 1,800 | 1,966 | ||||
| 10,961 | ||||||
| UTILITIES - 4.0% | ||||||
| CMS Energy Corp., 8.75%, 06/15/19 | 1,000 | 1,095 | ||||
| Dynegy Holdings Inc. | ||||||
| 7.50%, 06/01/15 (e) | 10,000 | 9,350 | ||||
| 7.75%, 06/01/19 | 2,000 | 1,735 | ||||
| Energy Future Holdings Corp. | ||||||
| 10.88%, 11/01/17 (e) (k) | 4,000 | 3,270 | ||||
| 11.25%, 11/01/17 | 8,847 | 6,259 | ||||
| Public Service Co. of New Mexico., 7.95%, 05/15/18 | 2,500 | 2,617 | ||||
| RRI Energy Inc., 7.88%, 06/15/17 (e) | 5,000 | 4,912 | ||||
| 29,238 | ||||||
| Total Corporate Bonds and Notes (cost $399,778) | 394,423 | |||||
| SHORT TERM INVESTMENTS - 24.2% | ||||||
| Mutual Funds - 12.4% | ||||||
| JNL Money Market Fund, 0.07% (a) (h) | 90,379 | 90,379 | ||||
| Securities Lending Collateral - 11.8% | ||||||
| Securities Lending Cash Collateral Fund LLC, | ||||||
| 0.16% (a) (h) | 64,754 | 64,754 | ||||
| Securities Lending Liquidating Fund LLC, 0.36% (a) (h) | 21,149 | 21,105 | ||||
| 85,859 | ||||||
| Total Short Term Investments (cost $176,282) | 176,238 | |||||
| Total Investments - 113.9% (cost $872,430) | 829,544 | |||||
| Other Assets and Liabilities, Net - (13.9%) | (100,920) | |||||
| Total Net Assets - 100% | $ | 728,624 | ||||
| JNL/Franklin Templeton Mutual Shares Fund | ||||||
| COMMON STOCKS - 82.9% | ||||||
| CONSUMER DISCRETIONARY - 6.3% | ||||||
| Cerberus Capital Management LP (f) (s) (u) | 888 | $ | 178 | |||
| Cerberus Capital Management LP (f) (s) (u) | 888 | 178 | ||||
| Cerberus Capital Management LP (f) (s) (u) | 444 | 89 | ||||
| Daimler AG | 39 | 2,102 | ||||
| Eastman Kodak Co. (c) (e) | 163 | 688 | ||||
| H&R Block Inc. | 34 | 776 | ||||
| Harrah's Investment LP (c) (f) (s) (u) | 39 | - | ||||
| Hillenbrand Inc. | 44 | 831 | ||||
| Mattel Inc. | 310 | 6,200 | ||||
| News Corp. - Class A | 680 | 9,316 | ||||
| Thomas Cook Group Plc | 121 | 448 | ||||
| Time Warner Cable Inc. | 37 | 1,534 | ||||
| Virgin Media Inc. (e) | 263 | 4,424 | ||||
| 26,764 | ||||||
| CONSUMER STAPLES - 24.6% | ||||||
| Altria Group Inc. | 432 | 8,475 | ||||
| British American Tobacco Plc | 261 | 8,498 | ||||
| Brown-Forman Corp. - Class B | 27 | 1,455 | ||||
| Cadbury Plc | 483 | 6,218 | ||||
| Carlsberg A/S | 28 | 2,080 | ||||
| Carrefour SA | 40 | 1,937 | ||||
| CVS Caremark Corp. | 363 | 11,676 | ||||
| Danone SA | 19 | 1,164 | ||||
| Dr. Pepper Snapple Group Inc. | 230 | 6,496 | ||||
| General Mills Inc. | 47 | 3,332 | ||||
| Imperial Tobacco Group Plc | 270 | 8,534 | ||||
| Japan Tobacco Inc. | 1 | 2,520 | ||||
| Kraft Foods Inc. - Class A | 214 | 5,807 | ||||
| Kroger Co. | 228 | 4,680 | ||||
| KT&G Corp. | 32 | 1,776 | ||||
| L'Oreal SA | 10 | 1,173 | ||||
| Lorillard Inc. | 16 | 1,261 | ||||
| Nestle SA | 158 | 7,657 | ||||
| Pepsi Bottling Group Inc. | 108 | 4,037 | ||||
| PepsiAmericas Inc. | 40 | 1,167 | ||||
| Pernod-Ricard SA (e) | 65 | 5,550 | ||||
| Philip Morris International Inc. | 49 | 2,339 | ||||
| Reynolds American Inc. (e) | 57 | 3,035 | ||||
| SUPERVALU Inc. (e) | 79 | 1,004 | ||||
| Wal-Mart Stores Inc. | 45 | 2,419 | ||||
| 104,290 | ||||||
| ENERGY - 6.0% | ||||||
| Baker Hughes Inc. | 29 | 1,186 | ||||
| Exterran Holdings Inc. (c) (e) | 46 | 985 | ||||
| Marathon Oil Corp. | 168 | 5,234 | ||||
| Noble Energy Inc. | 18 | 1,296 | ||||
| Pride International Inc. (c) | 55 | 1,741 | ||||
| Royal Dutch Shell Plc - Class A | 172 | 5,209 | ||||
| Total SA | 44 | 2,845 | ||||
| Transocean Ltd. (c) | 82 | 6,812 | ||||
| 25,308 | ||||||
| FINANCIALS - 12.3% | ||||||
| ACE Ltd. | 73 | 3,676 | ||||
| Alexander's Inc. (c) (e) | 8 | 2,435 | ||||
| Alleghany Corp. (c) | 5 | 1,357 | ||||
| Bank of America Corp. | 180 | 2,706 | ||||
| Barclays Plc | 845 | 3,766 | ||||
| Berkshire Hathaway Inc. - Class B (c) | 2 | 7,892 | ||||
| Bond Street Holding LLC (f) (u) | 26 | 520 | ||||
| CIT Group Inc. (c) | 36 | 982 | ||||
| Conseco Inc. (c) (e) | 97 | 485 | ||||
| Deutsche Bank AG | 29 | 2,057 | ||||
| Deutsche Bank AG (e) | 2 | 113 | ||||
| Deutsche Boerse AG | 35 | 2,903 | ||||
| Forestar Group Inc. (c) | 46 | 1,021 | ||||
| Guaranty Bancorp (c) | 49 | 64 | ||||
| Intesa Sanpaolo SpA (c) | 437 | 1,974 | ||||
| Link Real Estate Investment Trust | 746 | 1,903 | ||||
| Morgan Stanley | 80 | 2,376 | ||||
| Old Republic International Corp. (e) | 180 | 1,812 | ||||
| Societe Generale - Class A | 14 | 987 | ||||
| St. Joe Co. (c) (e) | 33 | 940 | ||||
| Travelers Cos. Inc. | 43 | 2,151 | ||||
| UBS AG (c) | 121 | 1,883 | ||||
| Wells Fargo & Co. | 46 | 1,250 | ||||
| White Mountains Insurance Group Ltd. | 14 | 4,729 | ||||
| Zurich Financial Services AG | 10 | 2,162 | ||||
| 52,144 | ||||||
| HEALTH CARE - 4.4% | ||||||
| Becton Dickinson & Co. | 37 | 2,905 | ||||
| Community Health Systems Inc. (c) | 60 | 2,130 | ||||
| MDS Inc. (c) | 95 | 743 | ||||
| Novartis AG | 71 | 3,854 | ||||
| Tenet Healthcare Corp. (c) | 787 | 4,239 | ||||
| UnitedHealth Group Inc. | 164 | 4,988 | ||||
| 18,859 | ||||||
| INDUSTRIALS - 7.2% | ||||||
| A P Moller - Maersk A/S Class B | 1 | 4,164 | ||||
| Burlington Northern Santa Fe Corp. | 29 | 2,833 | ||||
| Federal Signal Corp. | 96 | 575 | ||||
| GenCorp Inc. (c) | 59 | 411 | ||||
| Keppel Corp. Ltd. | 391 | 2,280 | ||||
| Orkla ASA | 724 | 7,122 | ||||
| Owens Corning Inc. (c) (e) | 103 | 2,648 | ||||
| Siemens AG (e) | 59 | 5,446 | ||||
| TNT NV | 66 | 2,027 | ||||
| Tyco International Ltd. | 82 | 2,916 | ||||
| 30,422 | ||||||
| INFORMATION TECHNOLOGY - 9.0% | ||||||
| Affiliated Computer Services Inc. - Class A (c) | 44 | 2,605 | ||||
| Dell Inc. (c) | 353 | 5,063 | ||||
| LSI Corp. (c) | 747 | 4,492 | ||||
| Maxim Integrated Products Inc. | 139 | 2,830 | ||||
| Microsoft Corp. | 321 | 9,796 | ||||
| Motorola Inc. (c) | 455 | 3,530 | ||||
| Nintendo Co. Ltd. | 9 | 2,151 | ||||
| Sun Microsystems Inc. (c) | 222 | 2,076 | ||||
| Tandberg ASA | 15 | 418 | ||||
| Tyco Electronics Ltd. | 75 | 1,844 | ||||
| Xerox Corp. | 373 | 3,154 | ||||
| 37,959 | ||||||
| MATERIALS - 5.7% | ||||||
| Anglo American Plc (c) | 77 | 3,360 | ||||
| Domtar Corp. (c) (e) | 25 | 1,388 | ||||
| International Paper Co. | 133 | 3,570 | ||||
| Linde AG | 32 | 3,902 | ||||
| MeadWestvaco Corp. | 117 | 3,339 | ||||
| Weyerhaeuser Co. | 196 | 8,446 | ||||
| 24,005 | ||||||
| TELECOMMUNICATION SERVICES - 3.5% | ||||||
| Cable & Wireless Plc | 1,672 | 3,818 | ||||
| Koninklijke KPN NV | 221 | 3,754 | ||||
| Telefonica SA | 85 | 2,380 | ||||
| Vodafone Group Plc | 2,135 | 4,954 | ||||
| 14,906 | ||||||
| UTILITIES - 3.9% | ||||||
| Babcock & Brown Infrastructure Group (c) | 402 | 1,484 | ||||
| E.ON AG | 153 | 6,410 | ||||
| Entergy Corp. | 25 | 2,045 | ||||
| Exelon Corp. | 62 | 3,019 | ||||
| GDF Suez | 52 | 2,253 | ||||
| NRG Energy Inc. (c) | 59 | 1,384 | ||||
| 16,595 | ||||||
| Total Common Stocks (cost $370,343) | 351,252 | |||||
| PREFERRED STOCKS - 0.5% | ||||||
| FINANCIALS - 0.5% | ||||||
| Bank of America Corp., 10.00% | 135 | 2,011 | ||||
| Total Preferred Stocks (cost $2,024) | 2,011 | |||||
| CORPORATE BONDS AND NOTES - 4.2% | ||||||
| CONSUMER DISCRETIONARY - 0.7% | ||||||
| Cerberus Capital Management LP | ||||||
| 12.00%, 07/31/14 (f) (s) (u) | $ | 780 | 156 | |||
| 12.00%, 07/31/14 (f) (s) (u) | 390 | 78 | ||||
| 12.00%, 07/31/14 (f) (s) (u) | 780 | 156 | ||||
| Charter Communications Inc., Incremental Term Loan, | ||||||
| 7.25%, 03/06/14 (i) (u) | 340 | 319 | ||||
| Charter Communications Operating LLC, Term Loan, | ||||||
| 4.25%, 03/06/14 (i) (u) | 1,994 | 1,936 | ||||
| Dana Corp. | ||||||
| 6.50%, 03/01/10 (f) (s) (u) | 72 | 1 | ||||
| 5.85%, 01/15/15 (f) (s) (u) | 65 | - | ||||
| 7.00%, 03/15/28 (f) (s) (u) | 115 | - | ||||
| Spectrum Brands Inc. Letter of Credit, | ||||||
| 1.50%, 04/01/13 (i) (u) | 4 | 4 | ||||
| Spectrum Brands Inc. Term Loan, | ||||||
| 8.50%, 04/01/13 (i) (u) | EUR | 219 | 307 | |||
| Spectrum Brands Inc. Term Loan B, | ||||||
| 8.75%, 04/01/13 (i) (u) | 70 | 70 | ||||
| Tropicana Entertainment LLC, 9.63%, 12/15/14 (d) | 1,130 | 6 | ||||
| 3,033 | ||||||
| ENERGY - 0.9% | ||||||
| Boston Generating LLC, Term Loan | ||||||
| 2.54%, 12/21/13 (i) (u) | 16 | 12 | ||||
| 2.54%, 12/21/13 (i) (u) | 56 | 43 | ||||
| Boston Generating LLC, Term Loan B, 2.50%, 12/21/13 (i) (u) | 246 | 191 | ||||
| Texas Competitive Electric Holdings Co. LLC, Term Loan | ||||||
| 3.75%, 10/10/14 (i) (u) | 2,099 | 1,685 | ||||
| 3.75%, 11/01/15 (i) (u) | 698 | 566 | ||||
| Texas Competitive Electric Holdings Co. LLC, | ||||||
| Term Loan B1, 3.75%, 10/10/14 (i) (u) | 1,438 | 1,169 | ||||
| Texas Competitive Electric Holdings Co. LLC, | ||||||
| Term Loan B2, 3.75%, 10/10/14 (i) (u) | 226 | 184 | ||||
| 3,850 | ||||||
| FINANCIALS - 2.2% | ||||||
| American General Finance Corp., 6.90%, 12/15/17 | 410 | 285 | ||||
| CIT Group Inc., Term Loan | ||||||
| 9.50%, 01/20/12 (i) (u) | 1,541 | 1,583 | ||||
| 13.00%, 01/20/12 (i) (u) | 602 | 624 | ||||
| CIT Group Inc. | ||||||
| 7.00%, 05/01/13 | 176 | 164 | ||||
| 7.00%, 05/01/14 | 264 | 245 | ||||
| 7.00%, 05/01/15 | 264 | 236 | ||||
| 7.00%, 05/01/16 | 440 | 387 | ||||
| 7.00%, 05/01/17 | 616 | 535 | ||||
| Realogy Corp., Term Loan | ||||||
| 5.35%, 10/10/13 (i) (u) | 956 | 853 | ||||
| 3.28%, 10/10/13 (i) (u) | 1,451 | 1,294 | ||||
| 3.29%, 10/10/13 (i) (u) | 3,552 | 3,168 | ||||
| 13.50%, 10/15/17 (u) | 93 | 99 | ||||
| 9,473 | ||||||
| INFORMATION TECHNOLOGY - 0.4% | ||||||
| First Data Corp., Term Loan, | ||||||
| 3.00%, 09/24/14 (i) (u) | 1,162 | 1,036 | ||||
| 3.00%, 09/24/14 (i) (u) | 110 | 98 | ||||
| 3.00%, 10/01/14 (i) (u) | 437 | 390 | ||||
| 1,524 | ||||||
| MATERIALS - 0.0% | ||||||
| Lyondell Chemical Co., Term Loan, | ||||||
| 13.00%, 04/06/10 (i) (u) (x) | 54 | 57 | ||||
| OTHER EQUITY INTERESTS - 0.0% | ||||||
| Northwest Airlines Corp., Contingent Distribution (f) (w) | 725 | - | ||||
| Total Corporate Bonds and Notes (cost $18,586) | 17,937 | |||||
| SHORT TERM INVESTMENTS - 15.9% | ||||||
| Mutual Funds - 11.9% | ||||||
| JNL Money Market Fund, 0.07% (a) (h) | 50,580 | 50,580 | ||||
| Securities Lending Collateral - 4.0% | ||||||
| Securities Lending Cash Collateral Fund LLC, | ||||||
| 0.16% (a) (h) | 16,975 | 16,975 | ||||
| Total Short Term Investments (cost $67,555) | 67,555 | |||||
| Total Investments - 103.5% (cost $458,508) | 438,755 | |||||
| Other Assets and Liabilities, Net - (3.5%) | (14,901) | |||||
| Total Net Assets - 100% | $ | 423,854 | ||||
| JNL/Mellon Capital Management | ||||||
| S&P 500 Index Fund | ||||||
| COMMON STOCKS - 96.5% | ||||||
| CONSUMER DISCRETIONARY - 9.3% | ||||||
| Abercrombie & Fitch Co. - Class A | 8 | $ | 275 | |||
| Amazon.com Inc. (c) | 30 | 3,995 | ||||
| Apollo Group Inc. - Class A (c) | 11 | 654 | ||||
| AutoNation Inc. (c) (e) | 8 | 159 | ||||
| AutoZone Inc. (c) | 3 | 420 | ||||
| Bed Bath & Beyond Inc. (c) | 24 | 911 | ||||
| Best Buy Co. Inc. (e) | 31 | 1,209 | ||||
| Big Lots Inc. (c) | 8 | 232 | ||||
| Black & Decker Corp. | 6 | 365 | ||||
| Carnival Corp. (c) | 38 | 1,208 | ||||
| CBS Corp. - Class B | 61 | 859 | ||||
| Coach Inc. | 29 | 1,045 | ||||
| Comcast Corp. - Class A | 252 | 4,256 | ||||
| Darden Restaurants Inc. | 12 | 422 | ||||
| DeVry Inc. | 5 | 308 | ||||
| DIRECTV - Class A (c) | 84 | 2,786 | ||||
| DR Horton Inc. | 23 | 246 | ||||
| Eastman Kodak Co. (c) (e) | 24 | 100 | ||||
| Expedia Inc. (c) | 18 | 462 | ||||
| Family Dollar Stores Inc. | 12 | 339 | ||||
| Ford Motor Co. (c) (e) | 288 | 2,882 | ||||
| Fortune Brands Inc. | 14 | 595 | ||||
| GameStop Corp. - Class A (c) (e) | 15 | 336 | ||||
| Gannett Co. Inc. | 20 | 292 | ||||
| Gap Inc. | 43 | 908 | ||||
| Genuine Parts Co. (e) | 14 | 515 | ||||
| Goodyear Tire & Rubber Co. (c) | 23 | 321 | ||||
| H&R Block Inc. | 31 | 695 | ||||
| Harley-Davidson Inc. | 20 | 503 | ||||
| Harman International Industries Inc. | 6 | 207 | ||||
| Hasbro Inc. | 11 | 353 | ||||
| Home Depot Inc. | 150 | 4,349 | ||||
| International Game Technology | 25 | 473 | ||||
| Interpublic Group of Cos. Inc. (c) (e) | 46 | 338 | ||||
| J.C. Penney Co. Inc. (e) | 22 | 573 | ||||
| Johnson Controls Inc. | 60 | 1,637 | ||||
| Kohl's Corp. (c) | 27 | 1,478 | ||||
| Leggett & Platt Inc. (e) | 15 | 301 | ||||
| Lennar Corp. | 14 | 175 | ||||
| Limited Brands Inc. | 24 | 455 | ||||
| Lowe's Cos. Inc. (e) | 130 | 3,044 | ||||
| Macy's Inc. | 37 | 618 | ||||
| Marriott International Inc. - Class A (e) | 22 | 603 | ||||
| Mattel Inc. | 32 | 632 | ||||
| McDonald's Corp. | 95 | 5,960 | ||||
| McGraw-Hill Cos. Inc. | 28 | 951 | ||||
| Meredith Corp. (e) | 3 | 107 | ||||
| New York Times Co. - Class A (c) | 8 | 96 | ||||
| Newell Rubbermaid Inc. (e) | 25 | 370 | ||||
| News Corp. - Class A | 201 | 2,753 | ||||
| Nike Inc. - Class B | 35 | 2,298 | ||||
| Nordstrom Inc. | 15 | 547 | ||||
| Office Depot Inc. (c) | 23 | 146 | ||||
| Omnicom Group Inc. | 28 | 1,094 | ||||
| O'Reilly Automotive Inc. (c) | 12 | 450 | ||||
| Polo Ralph Lauren Corp. (e) | 5 | 406 | ||||
| Priceline.com Inc. (c) | 4 | 846 | ||||
| Pulte Homes Inc. (c) | 26 | 259 | ||||
| RadioShack Corp. | 10 | 193 | ||||
| Ross Stores Inc. | 11 | 448 | ||||
| Scripps Networks Interactive Inc. | 7 | 305 | ||||
| Sears Holdings Corp. (c) (e) | 4 | 333 | ||||
| Sherwin-Williams Co. | 8 | 512 | ||||
| Snap-On Inc. | 6 | 236 | ||||
| Stanley Works | 7 | 365 | ||||
| Staples Inc. | 65 | 1,593 | ||||
| Starbucks Corp. (c) | 66 | 1,525 | ||||
| Starwood Hotels & Resorts Worldwide Inc. (e) | 16 | 581 | ||||
| Target Corp. | 67 | 3,217 | ||||
| Tiffany & Co. | 11 | 492 | ||||
| Time Warner Cable Inc. | 31 | 1,269 | ||||
| Time Warner Inc. | 103 | 3,010 | ||||
| TJX Cos. Inc. | 37 | 1,357 | ||||
| VF Corp. | 8 | 555 | ||||
| Viacom Inc. - Class B (c) | 54 | 1,617 | ||||
| Walt Disney Co. (e) | 170 | 5,491 | ||||
| Washington Post Co. | - | 219 | ||||
| Whirlpool Corp. (e) | 7 | 527 | ||||
| Wyndham Worldwide Corp. | 16 | 324 | ||||
| Wynn Resorts Ltd. | 6 | 343 | ||||
| Yum! Brands Inc. (e) | 42 | 1,463 | ||||
| 84,792 | ||||||
| CONSUMER STAPLES - 11.0% | ||||||
| Altria Group Inc. | 183 | 3,596 | ||||
| Archer-Daniels-Midland Co. | 58 | 1,800 | ||||
| Avon Products Inc. | 37 | 1,171 | ||||
| Brown-Forman Corp. - Class B | 9 | 508 | ||||
| Campbell Soup Co. | 17 | 573 | ||||
| Clorox Co. | 12 | 744 | ||||
| Coca-Cola Co. | 205 | 11,675 | ||||
| Coca-Cola Enterprises Inc. | 28 | 591 | ||||
| Colgate-Palmolive Co. | 44 | 3,611 | ||||
| ConAgra Foods Inc. | 39 | 891 | ||||
| Constellation Brands Inc. - Class A (c) | 17 | 274 | ||||
| Costco Wholesale Corp. | 39 | 2,302 | ||||
| CVS Caremark Corp. | 125 | 4,021 | ||||
| Dean Foods Co. (c) | 16 | 285 | ||||
| Dr. Pepper Snapple Group Inc. | 23 | 657 | ||||
| Estee Lauder Cos. Inc. | 10 | 506 | ||||
| General Mills Inc. | 29 | 2,063 | ||||
| Hershey Co. (e) | 15 | 544 | ||||
| HJ Heinz Co. | 28 | 1,211 | ||||
| Hormel Foods Corp. | 6 | 243 | ||||
| JM Smucker Co. | 11 | 673 | ||||
| Kellogg Co. | 23 | 1,225 | ||||
| Kimberly-Clark Corp. | 37 | 2,362 | ||||
| Kraft Foods Inc. - Class A | 131 | 3,549 | ||||
| Kroger Co. | 57 | 1,165 | ||||
| Lorillard Inc. | 14 | 1,141 | ||||
| McCormick & Co. Inc. | 11 | 409 | ||||
| Mead Johnson Nutrition Co. | 17 | 742 | ||||
| Molson Coors Brewing Co. | 14 | 647 | ||||
| Pepsi Bottling Group Inc. | 12 | 460 | ||||
| PepsiCo Inc. | 138 | 8,386 | ||||
| Philip Morris International Inc. | 169 | 8,120 | ||||
| Procter & Gamble Co. | 258 | 15,658 | ||||
| Reynolds American Inc. (e) | 15 | 785 | ||||
| Safeway Inc. | 36 | 776 | ||||
| Sara Lee Corp. | 63 | 765 | ||||
| SUPERVALU Inc. | 19 | 241 | ||||
| Sysco Corp. | 53 | 1,481 | ||||
| Tyson Foods Inc. | 27 | 326 | ||||
| Walgreen Co. | 87 | 3,210 | ||||
| Wal-Mart Stores Inc. | 189 | 10,087 | ||||
| Whole Foods Market Inc. (c) | 13 | 360 | ||||
| 99,834 | ||||||
| ENERGY - 11.1% | ||||||
| Anadarko Petroleum Corp. | 44 | 2,737 | ||||
| Apache Corp. | 30 | 3,096 | ||||
| Baker Hughes Inc. (e) | 27 | 1,093 | ||||
| BJ Services Co. | 25 | 462 | ||||
| Cabot Oil & Gas Corp. - Class A | 10 | 420 | ||||
| Cameron International Corp. (c) | 22 | 899 | ||||
| Chesapeake Energy Corp. | 58 | 1,489 | ||||
| Chevron Corp. | 177 | 13,653 | ||||
| ConocoPhillips | 131 | 6,698 | ||||
| Consol Energy Inc. | 16 | 788 | ||||
| Denbury Resources Inc. (c) (e) | 22 | 322 | ||||
| Devon Energy Corp. | 40 | 2,917 | ||||
| Diamond Offshore Drilling Inc. | 6 | 581 | ||||
| El Paso Corp. | 62 | 605 | ||||
| EOG Resources Inc. | 23 | 2,194 | ||||
| Exxon Mobil Corp. | 420 | 28,633 | ||||
| FMC Technologies Inc. (c) | 11 | 623 | ||||
| Halliburton Co. | 81 | 2,427 | ||||
| Hess Corp. | 26 | 1,579 | ||||
| Marathon Oil Corp. | 63 | 1,977 | ||||
| Massey Energy Co. | 7 | 299 | ||||
| Murphy Oil Corp. | 17 | 930 | ||||
| Nabors Industries Ltd. (c) (e) | 25 | 547 | ||||
| National Oilwell Varco Inc. | 37 | 1,652 | ||||
| Noble Energy Inc. | 16 | 1,110 | ||||
| Occidental Petroleum Corp. | 72 | 5,837 | ||||
| Peabody Energy Corp. | 24 | 1,088 | ||||
| Pioneer Natural Resources Co. | 10 | 482 | ||||
| Range Resources Corp. | 14 | 708 | ||||
| Rowan Cos. Inc. (c) | 9 | 214 | ||||
| Schlumberger Ltd. | 106 | 6,908 | ||||
| Smith International Inc. | 20 | 549 | ||||
| Southwestern Energy Co. (c) | 31 | 1,490 | ||||
| Spectra Energy Corp. | 58 | 1,190 | ||||
| Sunoco Inc. | 10 | 273 | ||||
| Tesoro Corp. | 13 | 172 | ||||
| Valero Energy Corp. | 51 | 849 | ||||
| Williams Cos. Inc. | 52 | 1,105 | ||||
| XTO Energy Inc. | 52 | 2,415 | ||||
| 101,011 | ||||||
| FINANCIALS - 13.9% | ||||||
| AFLAC Inc. | 42 | 1,937 | ||||
| Allstate Corp. | 48 | 1,445 | ||||
| American Express Co. | 105 | 4,260 | ||||
| American International Group Inc. (c) (e) | 11 | 332 | ||||
| Ameriprise Financial Inc. | 22 | 865 | ||||
| AON Corp. | 25 | 947 | ||||
| Apartment Investment & Management Co. (e) | 10 | 162 | ||||
| Assurant Inc. | 11 | 325 | ||||
| AvalonBay Communities Inc. | 7 | 558 | ||||
| Bank of America Corp. | 878 | 13,226 | ||||
| Bank of New York Mellon Corp. (a) | 108 | 3,008 | ||||
| BB&T Corp. | 61 | 1,550 | ||||
| Boston Properties Inc. | 12 | 838 | ||||
| Capital One Financial Corp. (e) | 40 | 1,526 | ||||
| CB Richard Ellis Group Inc. - Class A (c) | 21 | 287 | ||||
| Charles Schwab Corp. | 85 | 1,606 | ||||
| Chubb Corp. | 30 | 1,487 | ||||
| Cincinnati Financial Corp. (e) | 14 | 371 | ||||
| Citigroup Inc. | 1,698 | 5,620 | ||||
| CME Group Inc. | 6 | 1,999 | ||||
| Comerica Inc. | 14 | 416 | ||||
| Discover Financial Services | 48 | 711 | ||||
| E*Trade Financial Corp. (c) | 111 | 194 | ||||
| Equity Residential (e) | 25 | 835 | ||||
| Federated Investors Inc. - Class B | 8 | 234 | ||||
| Fifth Third Bancorp | 72 | 701 | ||||
| First Horizon National Corp. (c) (e) | 20 | 262 | ||||
| Franklin Resources Inc. (e) | 13 | 1,414 | ||||
| Genworth Financial Inc. - Class A (c) | 41 | 464 | ||||
| Goldman Sachs Group Inc. | 46 | 7,701 | ||||
| Hartford Financial Services Group Inc. | 35 | 805 | ||||
| HCP Inc. (e) | 26 | 808 | ||||
| Health Care REIT Inc. | 10 | 453 | ||||
| Host Hotels & Resorts Inc. (c) (e) | 54 | 632 | ||||
| Hudson City Bancorp Inc. (e) | 41 | 570 | ||||
| Huntington Bancshares Inc. | 59 | 214 | ||||
| IntercontinentalExchange Inc. (c) | 6 | 721 | ||||
| Invesco Ltd. | 37 | 880 | ||||
| Janus Capital Group Inc. (e) | 17 | 235 | ||||
| JPMorgan Chase & Co. | 348 | 14,513 | ||||
| KeyCorp (e) | 77 | 430 | ||||
| Kimco Realty Corp. | 32 | 434 | ||||
| Legg Mason Inc. (e) | 14 | 433 | ||||
| Leucadia National Corp. (c) | 16 | 386 | ||||
| Lincoln National Corp. | 26 | 637 | ||||
| Loews Corp. | 33 | 1,188 | ||||
| M&T Bank Corp. (e) | 7 | 470 | ||||
| Marsh & McLennan Cos. Inc. | 47 | 1,039 | ||||
| Marshall & Ilsley Corp. | 48 | 262 | ||||
| MetLife Inc. | 73 | 2,588 | ||||
| Moody's Corp. (e) | 17 | 449 | ||||
| Morgan Stanley | 120 | 3,557 | ||||
| NASDAQ OMX Group Inc. (c) | 12 | 247 | ||||
| Northern Trust Corp. | 21 | 1,101 | ||||
| NYSE Euronext | 23 | 577 | ||||
| People's United Financial Inc. | 30 | 495 | ||||
| Plum Creek Timber Co. Inc. (e) | 14 | 531 | ||||
| PNC Financial Services Group Inc. (e) | 41 | 2,180 | ||||
| Principal Financial Group Inc. | 29 | 692 | ||||
| Progressive Corp. (c) | 61 | 1,098 | ||||
| ProLogis | 43 | 595 | ||||
| Prudential Financial Inc. | 41 | 2,063 | ||||
| Public Storage | 12 | 994 | ||||
| Regions Financial Corp. | 101 | 533 | ||||
| Simon Property Group Inc. (e) | 26 | 2,036 | ||||
| SLM Corp. (c) | 41 | 458 | ||||
| State Street Corp. | 44 | 1,928 | ||||
| SunTrust Banks Inc. | 45 | 911 | ||||
| T. Rowe Price Group Inc. | 23 | 1,225 | ||||
| Torchmark Corp. | 7 | 324 | ||||
| Travelers Cos. Inc. | 48 | 2,413 | ||||
| U.S. Bancorp | 169 | 3,806 | ||||
| Unum Group (e) | 29 | 568 | ||||
| Ventas Inc. (e) | 14 | 603 | ||||
| Vornado Realty Trust (e) | 14 | 987 | ||||
| Wells Fargo & Co. | 450 | 12,141 | ||||
| XL Capital Ltd. - Class A | 29 | 534 | ||||
| Zions Bancorporation (e) | 10 | 134 | ||||
| 126,159 | ||||||
| HEALTH CARE - 12.2% | ||||||
| Abbott Laboratories | 137 | 7,383 | ||||
| Aetna Inc. | 38 | 1,206 | ||||
| Allergan Inc. | 28 | 1,736 | ||||
| AmerisourceBergen Corp. (e) | 26 | 666 | ||||
| Amgen Inc. (c) | 89 | 5,062 | ||||
| Baxter International Inc. | 53 | 3,127 | ||||
| Becton Dickinson & Co. | 21 | 1,654 | ||||
| Biogen Idec Inc. (c) | 25 | 1,345 | ||||
| Boston Scientific Corp. (c) | 131 | 1,180 | ||||
| Bristol-Myers Squibb Co. | 153 | 3,872 | ||||
| Cardinal Health Inc. | 32 | 1,043 | ||||
| CareFusion Corp. (c) | 16 | 400 | ||||
| Celgene Corp. (c) | 41 | 2,285 | ||||
| Cephalon Inc. (c) | 6 | 404 | ||||
| CIGNA Corp. | 25 | 868 | ||||
| Coventry Health Care Inc. (c) | 13 | 326 | ||||
| CR Bard Inc. | 9 | 667 | ||||
| DaVita Inc. (c) | 9 | 520 | ||||
| DENTSPLY International Inc. | 13 | 462 | ||||
| Eli Lilly & Co. (e) | 89 | 3,192 | ||||
| Express Scripts Inc. (c) | 25 | 2,123 | ||||
| Forest Laboratories Inc. (c) | 27 | 874 | ||||
| Genzyme Corp. (c) | 24 | 1,153 | ||||
| Gilead Sciences Inc. (c) | 80 | 3,444 | ||||
| Hospira Inc. (c) | 15 | 742 | ||||
| Humana Inc. (c) (e) | 16 | 681 | ||||
| IMS Health Inc. | 16 | 339 | ||||
| Intuitive Surgical Inc. (c) | 3 | 1,036 | ||||
| Johnson & Johnson | 244 | 15,708 | ||||
| King Pharmaceuticals Inc. (c) (e) | 22 | 274 | ||||
| Laboratory Corp. of America Holdings (c) | 10 | 732 | ||||
| Life Technologies Corp. (c) | 16 | 830 | ||||
| McKesson Corp. | 24 | 1,491 | ||||
| Medco Health Solutions Inc. (c) | 42 | 2,708 | ||||
| Medtronic Inc. | 98 | 4,303 | ||||
| Merck & Co. Inc. | 270 | 9,865 | ||||
| Millipore Corp. (c) | 5 | 350 | ||||
| Mylan Inc. (c) (e) | 26 | 486 | ||||
| Patterson Cos. Inc. (c) | 8 | 235 | ||||
| PerkinElmer Inc. | 11 | 218 | ||||
| Pfizer Inc. | 713 | 12,975 | ||||
| Quest Diagnostics Inc. | 14 | 849 | ||||
| St. Jude Medical Inc. (c) | 30 | 1,115 | ||||
| Stryker Corp. (e) | 25 | 1,277 | ||||
| Tenet Healthcare Corp. (c) | 35 | 190 | ||||
| Thermo Fisher Scientific Inc. (c) | 37 | 1,744 | ||||
| UnitedHealth Group Inc. | 103 | 3,131 | ||||
| Varian Medical Systems Inc. (c) | 11 | 519 | ||||
| Waters Corp. (c) | 8 | 504 | ||||
| Watson Pharmaceuticals Inc. (c) | 9 | 365 | ||||
| WellPoint Inc. (c) | 41 | 2,366 | ||||
| Zimmer Holdings Inc. (c) | 19 | 1,139 | ||||
| 111,164 | ||||||
| INDUSTRIALS - 9.8% | ||||||
| 3M Co. | 62 | 5,154 | ||||
| Avery Dennison Corp. | 10 | 382 | ||||
| Boeing Co. | 64 | 3,477 | ||||
| Burlington Northern Santa Fe Corp. | 23 | 2,310 | ||||
| Caterpillar Inc. | 56 | 3,164 | ||||
| CH Robinson Worldwide Inc. | 15 | 891 | ||||
| Cintas Corp. | 12 | 304 | ||||
| CSX Corp. | 35 | 1,703 | ||||
| Cummins Inc. | 18 | 834 | ||||
| Danaher Corp. | 23 | 1,745 | ||||
| Deere & Co. | 38 | 2,049 | ||||
| Dover Corp. | 16 | 680 | ||||
| Dun & Bradstreet Corp. | 5 | 388 | ||||
| Eaton Corp. | 15 | 948 | ||||
| Emerson Electric Co. | 67 | 2,863 | ||||
| Equifax Inc. | 12 | 366 | ||||
| Expeditors International Washington Inc. (e) | 19 | 646 | ||||
| Fastenal Co. (e) | 12 | 486 | ||||
| FedEx Corp. | 28 | 2,332 | ||||
| First Solar Inc. (c) (e) | 4 | 566 | ||||
| Flowserve Corp. | 5 | 450 | ||||
| Fluor Corp. | 16 | 731 | ||||
| General Dynamics Corp. | 34 | 2,349 | ||||
| General Electric Co. | 941 | 14,239 | ||||
| Goodrich Corp. | 11 | 700 | ||||
| Honeywell International Inc. | 67 | 2,637 | ||||
| Illinois Tool Works Inc. | 35 | 1,656 | ||||
| Iron Mountain Inc. (c) | 16 | 363 | ||||
| ITT Corp. | 16 | 817 | ||||
| Jacobs Engineering Group Inc. (c) | 11 | 396 | ||||
| L-3 Communications Holdings Inc. | 11 | 914 | ||||
| Lockheed Martin Corp. | 28 | 2,132 | ||||
| Masco Corp. | 31 | 428 | ||||
| Monster Worldwide Inc. (c) (e) | 10 | 172 | ||||
| Norfolk Southern Corp. | 33 | 1,727 | ||||
| Northrop Grumman Corp. | 28 | 1,550 | ||||
| PACCAR Inc. (e) | 32 | 1,147 | ||||
| Pall Corp. | 10 | 380 | ||||
| Parker Hannifin Corp. | 14 | 780 | ||||
| Pitney Bowes Inc. | 18 | 416 | ||||
| Precision Castparts Corp. | 12 | 1,347 | ||||
| Quanta Services Inc. (c) | 19 | 405 | ||||
| Raytheon Co. (e) | 34 | 1,747 | ||||
| Republic Services Inc. - Class A | 29 | 823 | ||||
| Robert Half International Inc. (e) | 13 | 353 | ||||
| Rockwell Automation Inc. (e) | 12 | 587 | ||||
| Rockwell Collins Inc. | 14 | 788 | ||||
| Roper Industries Inc. | 8 | 422 | ||||
| RR Donnelley & Sons Co. | 18 | 405 | ||||
| Ryder System Inc. (e) | 5 | 210 | ||||
| Southwest Airlines Co. | 68 | 776 | ||||
| Stericycle Inc. (c) | 7 | 408 | ||||
| Textron Inc. (e) | 23 | 433 | ||||
| Union Pacific Corp. | 45 | 2,850 | ||||
| United Parcel Service Inc. - Class B | 88 | 5,035 | ||||
| United Technologies Corp. | 83 | 5,754 | ||||
| Waste Management Inc. | 44 | 1,494 | ||||
| WW Grainger Inc. (e) | 6 | 534 | ||||
| 89,643 | ||||||
| INFORMATION TECHNOLOGY - 19.1% | ||||||
| Adobe Systems Inc. (c) (e) | 47 | 1,730 | ||||
| Advanced Micro Devices Inc. (c) | 49 | 477 | ||||
| Affiliated Computer Services Inc. - Class A (c) | 9 | 514 | ||||
| Agilent Technologies Inc. (c) | 31 | 966 | ||||
| Akamai Technologies Inc. (c) | 16 | 407 | ||||
| Altera Corp. (e) | 26 | 586 | ||||
| Amphenol Corp. - Class A | 16 | 723 | ||||
| Analog Devices Inc. | 26 | 806 | ||||
| Apple Inc. (c) | 80 | 16,783 | ||||
| Applied Materials Inc. | 120 | 1,667 | ||||
| Autodesk Inc. (c) | 20 | 515 | ||||
| Automatic Data Processing Inc. | 45 | 1,925 | ||||
| BMC Software Inc. (c) | 17 | 675 | ||||
| Broadcom Corp. - Class A (c) | 38 | 1,182 | ||||
| CA Inc. | 36 | 806 | ||||
| Cisco Systems Inc. (c) | 509 | 12,175 | ||||
| Citrix Systems Inc. (c) | 16 | 668 | ||||
| Cognizant Technology Solutions Corp. (c) | 26 | 1,193 | ||||
| Computer Sciences Corp. (c) | 13 | 765 | ||||
| Compuware Corp. (c) | 18 | 132 | ||||
| Corning Inc. | 139 | 2,686 | ||||
| Dell Inc. (c) | 154 | 2,211 | ||||
| eBay Inc. (c) | �� | 100 | 2,364 | |||
| Electronic Arts Inc. (c) | 28 | 505 | ||||
| EMC Corp. (c) | 181 | 3,157 | ||||
| Fidelity National Information Services Inc. | 28 | 660 | ||||
| Fiserv Inc. (c) | 13 | 635 | ||||
| FLIR Systems Inc. (c) (e) | 13 | 430 | ||||
| Google Inc. - Class A (c) | 21 | 13,213 | ||||
| Harris Corp. | 11 | 539 | ||||
| Hewlett-Packard Co. | 210 | 10,796 | ||||
| Intel Corp. | 488 | 9,965 | ||||
| International Business Machines Corp. | 116 | 15,198 | ||||
| Intuit Inc. (c) | 28 | 861 | ||||
| Jabil Circuit Inc. | 16 | 278 | ||||
| JDS Uniphase Corp. (c) | 17 | 141 | ||||
| Juniper Networks Inc. (c) (e) | 46 | 1,217 | ||||
| KLA-Tencor Corp. (e) | 15 | 543 | ||||
| Lexmark International Inc. (c) | 8 | 198 | ||||
| Linear Technology Corp. (e) | 20 | 597 | ||||
| LSI Corp. (c) | 57 | 343 | ||||
| MasterCard Inc. | 9 | 2,199 | ||||
| McAfee Inc. (c) | 14 | 560 | ||||
| MEMC Electronic Materials Inc. (c) | 18 | 249 | ||||
| Microchip Technology Inc. (e) | 16 | 470 | ||||
| Micron Technology Inc. (c) (e) | 78 | 820 | ||||
| Microsoft Corp. | 683 | 20,824 | ||||
| Molex Inc. | 12 | 249 | ||||
| Motorola Inc. (c) | 206 | 1,595 | ||||
| National Semiconductor Corp. (e) | 20 | 315 | ||||
| NetApp Inc. (c) | 30 | 1,042 | ||||
| Novell Inc. (c) | 29 | 121 | ||||
| Novellus Systems Inc. (c) | 9 | 208 | ||||
| Nvidia Corp. (c) | 50 | 935 | ||||
| Oracle Corp. | 346 | 8,482 | ||||
| Paychex Inc. (e) | 29 | 887 | ||||
| QLogic Corp. (c) | 10 | 191 | ||||
| QUALCOMM Inc. | 148 | 6,829 | ||||
| Red Hat Inc. (c) | 16 | 502 | ||||
| SAIC Inc. (c) | 26 | 487 | ||||
| Salesforce.com Inc. (c) (e) | 9 | 684 | ||||
| SanDisk Corp. (c) | 21 | 609 | ||||
| Sun Microsystems Inc. (c) | 69 | 648 | ||||
| Symantec Corp. (c) | 71 | 1,269 | ||||
| Tellabs Inc. (c) | 33 | 187 | ||||
| Teradata Corp. (c) | 15 | 478 | ||||
| Teradyne Inc. (c) | 13 | 142 | ||||
| Texas Instruments Inc. | 111 | 2,887 | ||||
| Total System Services Inc. | 18 | 305 | ||||
| VeriSign Inc. (c) | 17 | 405 | ||||
| Visa Inc. - Class A | 39 | 3,374 | ||||
| Western Digital Corp. (c) | 20 | 895 | ||||
| Western Union Co. | 61 | 1,152 | ||||
| Xerox Corp. | 80 | 673 | ||||
| Xilinx Inc. (e) | 24 | 608 | ||||
| Yahoo! Inc. (c) | 107 | 1,794 | ||||
| 174,307 | ||||||
| MATERIALS - 3.5% | ||||||
| Air Products & Chemicals Inc. | 19 | 1,527 | ||||
| Airgas Inc. | 7 | 346 | ||||
| AK Steel Holding Corp. | 9 | 186 | ||||
| Alcoa Inc. | 85 | 1,369 | ||||
| Allegheny Technologies Inc. (e) | 9 | 392 | ||||
| Ball Corp. (e) | 8 | 421 | ||||
| Bemis Co. Inc. | 9 | 264 | ||||
| CF Industries Holdings Inc. | 4 | 382 | ||||
| Cliffs Natural Resources Inc. | 11 | 507 | ||||
| Dow Chemical Co. | 101 | 2,794 | ||||
| Eastman Chemical Co. | 7 | 407 | ||||
| Ecolab Inc. | 21 | 950 | ||||
| EI Du Pont de Nemours & Co. | 81 | 2,721 | ||||
| FMC Corp. (e) | 6 | 351 | ||||
| Freeport-McMoRan Copper & Gold Inc. | 38 | 3,045 | ||||
| International Flavors & Fragrances Inc. | 7 | 286 | ||||
| International Paper Co. | 39 | 1,043 | ||||
| MeadWestvaco Corp. (e) | 16 | 455 | ||||
| Monsanto Co. | 48 | 3,939 | ||||
| Newmont Mining Corp. | 44 | 2,075 | ||||
| Nucor Corp. | 27 | 1,277 | ||||
| Owens-Illinois Inc. (c) | 15 | 487 | ||||
| Pactiv Corp. (c) | 12 | 301 | ||||
| PPG Industries Inc. | 15 | 869 | ||||
| Praxair Inc. | 27 | 2,205 | ||||
| Sealed Air Corp. | 15 | 326 | ||||
| Sigma-Aldrich Corp. | 11 | 541 | ||||
| Titanium Metals Corp. (c) | 7 | 89 | ||||
| United States Steel Corp. (e) | 13 | 695 | ||||
| Vulcan Materials Co. (e) | 11 | 604 | ||||
| Weyerhaeuser Co. | 19 | 799 | ||||
| 31,653 | ||||||
| TELECOMMUNICATION SERVICES - 3.0% | ||||||
| American Tower Corp. (c) | 35 | 1,530 | ||||
| AT&T Inc. | 522 | 14,621 | ||||
| CenturyTel Inc. | 27 | 969 | ||||
| Frontier Communications Corp. | 30 | 235 | ||||
| MetroPCS Communications Inc. (c) (e) | 23 | 176 | ||||
| Qwest Communications International Inc. | 131 | 550 | ||||
| Sprint Nextel Corp. (c) | 259 | 949 | ||||
| Verizon Communications Inc. | 251 | 8,319 | ||||
| Windstream Corp. (e) | 38 | 417 | ||||
| 27,766 | ||||||
| UTILITIES - 3.6% | ||||||
| AES Corp. (c) | 60 | 800 | ||||
| Allegheny Energy Inc. | 16 | 372 | ||||
| Ameren Corp. | 20 | 555 | ||||
| American Electric Power Co. Inc. | 41 | 1,444 | ||||
| CenterPoint Energy Inc. | 33 | 485 | ||||
| CMS Energy Corp. (e) | 19 | 293 | ||||
| Consolidated Edison Inc. | 25 | 1,123 | ||||
| Constellation Energy Group Inc. | 18 | 646 | ||||
| Dominion Resources Inc. | 53 | 2,074 | ||||
| DTE Energy Co. | 15 | 657 | ||||
| Duke Energy Corp. (e) | 116 | 1,999 | ||||
| Edison International | 29 | 1,019 | ||||
| Entergy Corp. | 17 | 1,394 | ||||
| EQT Corp. | 12 | 507 | ||||
| Exelon Corp. | 58 | 2,849 | ||||
| FirstEnergy Corp. | 27 | 1,233 | ||||
| FPL Group Inc. | 37 | 1,946 | ||||
| Integrys Energy Group Inc. (e) | 7 | 289 | ||||
| Nicor Inc. (e) | 4 | 160 | ||||
| NiSource Inc. | 26 | 396 | ||||
| Northeast Utilities | 16 | 421 | ||||
| Pepco Holdings Inc. (e) | 21 | 349 | ||||
| PG&E Corp. | 33 | 1,485 | ||||
| Pinnacle West Capital Corp. | 8 | 304 | ||||
| PPL Corp. | 34 | 1,094 | ||||
| Progress Energy Inc. | 25 | 1,031 | ||||
| Public Service Enterprise Group Inc. | 45 | 1,509 | ||||
| Questar Corp. | 15 | 615 | ||||
| SCANA Corp. | 10 | 370 | ||||
| Sempra Energy | 22 | 1,234 | ||||
| Southern Co. | 71 | 2,373 | ||||
| TECO Energy Inc. | 19 | 305 | ||||
| Wisconsin Energy Corp. | 10 | 514 | ||||
| Xcel Energy Inc. | 41 | 872 | ||||
| 32,717 | ||||||
| Total Common Stocks (cost $858,465) | 879,046 | |||||
| NON-U.S. GOVERNMENT AGENCY | ||||||
| ASSET-BACKED SECURITIES - 0.0% | ||||||
| Sigma Finance, Inc. (d) (f) (u) | $ | 915 | 39 | |||
| Total Non-U.S. Government Agency | ||||||
| Asset-Backed Securities (cost $743) | 39 | |||||
| SHORT TERM INVESTMENTS - 7.2% | ||||||
| Mutual Funds - 3.2% | ||||||
| JNL Money Market Fund, 0.07% (a) (h) | 29,658 | 29,658 | ||||
| Securities Lending Collateral - 3.7% | ||||||
| Securities Lending Cash Collateral Fund LLC, | ||||||
| 0.16% (a) (h) | 17,730 | 17,730 | ||||
| Securities Lending Liquidating Fund LLC, 0.36% (a) (h) | 15,587 | 15,555 | ||||
| 33,285 | ||||||
| U.S. Treasury Securities - 0.3% | ||||||
| U.S. Treasury Bill, 0.22%, 03/11/10 (o) | $ | 2,890 | 2,890 | |||
| Total Short Term Investments (cost $65,866) | 65,833 | |||||
| Total Investments - 103.7% (cost $925,074) | 944,918 | |||||
| Other Assets and Liabilities, Net - (3.7%) | (33,640) | |||||
| Total Net Assets - 100% | $ | 911,278 | ||||
| JNL/Mellon Capital Management | ||||||
| S&P 400 MidCap Index Fund | ||||||
| COMMON STOCKS - 98.4% | ||||||
| CONSUMER DISCRETIONARY - 13.7% | ||||||
| 99 Cents Only Stores (c) | 24 | $ | 318 | |||
| Aaron's Inc. (e) | 27 | 756 | ||||
| Advance Auto Parts Inc. (e) | 49 | 1,986 | ||||
| Aeropostale Inc. (c) | 34 | 1,145 | ||||
| American Eagle Outfitters Inc. | 108 | 1,829 | ||||
| American Greetings Corp. | 19 | 424 | ||||
| AnnTaylor Stores Corp. (c) | 30 | 410 | ||||
| Barnes & Noble Inc. (e) | 20 | 386 | ||||
| Bob Evans Farms Inc. | 15 | 441 | ||||
| BorgWarner Inc. | 61 | 2,010 | ||||
| Boyd Gaming Corp. (c) | 27 | 228 | ||||
| Brinker International Inc. | 51 | 766 | ||||
| Brink's Home Security Holdings Inc. (c) (e) | 24 | 779 | ||||
| Career Education Corp. (c) | 36 | 851 | ||||
| Carmax Inc. (c) (e) | 115 | 2,786 | ||||
| Cheesecake Factory Inc. (c) (e) | 31 | 678 | ||||
| Chico's FAS Inc. (c) | 92 | 1,299 | ||||
| Chipotle Mexican Grill Inc. - Class A (c) | 16 | 1,450 | ||||
| Coldwater Creek Inc. (c) (e) | 26 | 118 | ||||
| Collective Brands Inc. (c) | 33 | 761 | ||||
| Corinthian Colleges Inc. (c) (e) | 44 | 603 | ||||
| Dick's Sporting Goods Inc. (c) | 46 | 1,155 | ||||
| Dollar Tree Inc. (c) | 46 | 2,209 | ||||
| DreamWorks Animation SKG Inc. (c) | 39 | 1,564 | ||||
| Foot Locker Inc. | 81 | 907 | ||||
| Fossil Inc. (c) | 25 | 839 | ||||
| Gentex Corp. | 72 | 1,278 | ||||
| Guess? Inc. | 30 | 1,275 | ||||
| HanesBrands Inc. (c) | 49 | 1,191 | ||||
| Harte-Hanks Inc. | 18 | 192 | ||||
| International Speedway Corp. - Class A | 16 | 446 | ||||
| ITT Educational Services Inc. (c) (e) | 16 | 1,521 | ||||
| J Crew Group Inc. (c) (e) | 29 | 1,300 | ||||
| John Wiley & Sons Inc. | 21 | 899 | ||||
| KB Home | 37 | 506 | ||||
| Lamar Advertising Co. (c) | 28 | 862 | ||||
| Life Time Fitness Inc. (c) (e) | 22 | 543 | ||||
| LKQ Corp. (c) (e) | 73 | 1,438 | ||||
| Matthews International Corp. - Class A (e) | 15 | 541 | ||||
| MDC Holdings Inc. | 20 | 609 | ||||
| Mohawk Industries Inc. (c) | 29 | 1,387 | ||||
| NetFlix Inc. (c) (e) | 22 | 1,237 | ||||
| NVR Inc. (c) | 3 | 2,188 | ||||
| Panera Bread Co. - Class A (c) | 16 | 1,097 | ||||
| PetSmart Inc. (e) | 64 | 1,710 | ||||
| Phillips-Van Heusen Corp. | 27 | 1,092 | ||||
| Regis Corp. | 29 | 453 | ||||
| Rent-A-Center Inc. (c) | 34 | 611 | ||||
| Ryland Group Inc. | 22 | 440 | ||||
| Saks Inc. (c) (e) | 84 | 552 | ||||
| Scholastic Corp. | 13 | 377 | ||||
| Scientific Games Corp. - Class A (c) | 33 | 476 | ||||
| Service Corp. International | 132 | 1,079 | ||||
| Sotheby's - Class A (e) | 34 | 757 | ||||
| Strayer Education Inc. (e) | 7 | 1,544 | ||||
| Thor Industries Inc. | 18 | 561 | ||||
| Timberland Co. - Class A (c) | 23 | 412 | ||||
| Toll Brothers Inc. (c) (e) | 71 | 1,339 | ||||
| Tupperware Brands Corp. | 33 | 1,536 | ||||
| Under Armour Inc. - Class A (c) (e) | 19 | 515 | ||||
| Urban Outfitters Inc. (c) | 67 | 2,350 | ||||
| Warnaco Group Inc. (c) | 24 | 998 | ||||
| Wendy's/Arby's Group Inc. | 184 | 865 | ||||
| Williams-Sonoma Inc. | 55 | 1,141 | ||||
| WMS Industries Inc. (c) (e) | 27 | 1,098 | ||||
| 65,114 | ||||||
| CONSUMER STAPLES - 3.9% | ||||||
| Alberto-Culver Co. | 44 | 1,299 | ||||
| BJ's Wholesale Club Inc. (c) (e) | 29 | 947 | ||||
| Church & Dwight Co. Inc. | 36 | 2,204 | ||||
| Corn Products International Inc. | 39 | 1,137 | ||||
| Energizer Holdings Inc. (c) | 36 | 2,215 | ||||
| Flowers Foods Inc. (e) | 39 | 923 | ||||
| Green Mountain Coffee Roasters Inc. (c) (e) | 18 | 1,477 | ||||
| Hansen Natural Corp. (c) | 36 | 1,394 | ||||
| Lancaster Colony Corp. | 10 | 486 | ||||
| NBTY Inc. (c) | 32 | 1,398 | ||||
| PepsiAmericas Inc. | 29 | 853 | ||||
| Ralcorp Holdings Inc. (c) | 29 | 1,756 | ||||
| Ruddick Corp. (e) | 21 | 549 | ||||
| Smithfield Foods Inc. (c) | 73 | 1,111 | ||||
| Tootsie Roll Industries Inc. (e) | 14 | 382 | ||||
| Universal Corp. (e) | 13 | 593 | ||||
| 18,724 | ||||||
| ENERGY - 6.7% | ||||||
| Arch Coal Inc. (e) | 84 | 1,874 | ||||
| Atwood Oceanics Inc. (c) | 29 | 1,054 | ||||
| Bill Barrett Corp. (c) | 20 | 627 | ||||
| Cimarex Energy Co. | 43 | 2,292 | ||||
| Comstock Resources Inc. (c) | 24 | 983 | ||||
| Encore Acquisition Co. (c) | 29 | 1,384 | ||||
| Exterran Holdings Inc. (c) (e) | 33 | 699 | ||||
| Forest Oil Corp. (c) | 58 | 1,297 | ||||
| Frontier Oil Corp. | 53 | 633 | ||||
| Helix Energy Solutions Group Inc. (c) | 46 | 538 | ||||
| Helmerich & Payne Inc. | 55 | 2,181 | ||||
| Mariner Energy Inc. (c) | 53 | 617 | ||||
| Newfield Exploration Co. (c) | 69 | 3,318 | ||||
| Oceaneering International Inc. (c) | 28 | 1,666 | ||||
| Overseas Shipholding Group Inc. | 12 | 518 | ||||
| Patriot Coal Corp. (c) | 39 | 606 | ||||
| Patterson-UTI Energy Inc. | 80 | 1,224 | ||||
| Plains Exploration & Production Co. (c) | 72 | 1,997 | ||||
| Pride International Inc. (c) | 90 | 2,884 | ||||
| Quicksilver Resources Inc. (c) | 62 | 924 | ||||
| Southern Union Co. | 64 | 1,462 | ||||
| Superior Energy Services Inc. (c) | 41 | 988 | ||||
| Tidewater Inc. | 27 | 1,287 | ||||
| Unit Corp. (c) | 20 | 862 | ||||
| 31,915 | ||||||
| FINANCIALS - 18.9% | ||||||
| Affiliated Managers Group Inc. (c) (e) | 22 | 1,470 | ||||
| Alexandria Real Estate Equities Inc. (e) | 23 | 1,474 | ||||
| AMB Property Corp. (e) | 76 | 1,938 | ||||
| American Financial Group Inc. | 41 | 1,025 | ||||
| AmeriCredit Corp. (c) (e) | 50 | 951 | ||||
| Apollo Investment Corp. | 91 | 864 | ||||
| Arthur J Gallagher & Co. | 53 | 1,190 | ||||
| Associated Banc-Corp | 67 | 734 | ||||
| Astoria Financial Corp. | 43 | 530 | ||||
| BancorpSouth Inc. (e) | 38 | 896 | ||||
| Bank of Hawaii Corp. | 25 | 1,172 | ||||
| BRE Properties Inc. - Class A (e) | 28 | 935 | ||||
| Brown & Brown Inc. (e) | 61 | 1,101 | ||||
| Camden Property Trust | 33 | 1,412 | ||||
| Cathay General Bancorp (e) | 30 | 225 | ||||
| City National Corp. (e) | 23 | 1,026 | ||||
| Commerce Bancshares Inc. | 38 | 1,465 | ||||
| Corporate Office Properties Trust (e) | 30 | 1,109 | ||||
| Cousins Properties Inc. | 50 | 381 | ||||
| Cullen/Frost Bankers Inc. (e) | 31 | 1,555 | ||||
| Duke Realty Corp. | 116 | 1,415 | ||||
| Eaton Vance Corp. | 61 | 1,852 | ||||
| Equity One Inc. | 15 | 249 | ||||
| Essex Property Trust Inc. (e) | 15 | 1,265 | ||||
| Everest Re Group Ltd. | 31 | 2,680 | ||||
| Federal Realty Investment Trust (e) | 32 | 2,148 | ||||
| Fidelity National Financial Inc. - Class A | 120 | 1,609 | ||||
| First American Corp. | 52 | 1,726 | ||||
| First Niagara Financial Group Inc. | 98 | 1,359 | ||||
| FirstMerit Corp. (e) | 45 | 899 | ||||
| Fulton Financial Corp. (e) | 92 | 800 | ||||
| Hanover Insurance Group Inc. (e) | 25 | 1,132 | ||||
| HCC Insurance Holdings Inc. | 58 | 1,632 | ||||
| Highwoods Properties Inc. (e) | 37 | 1,231 | ||||
| Horace Mann Educators Corp. | 19 | 244 | ||||
| Hospitality Properties Trust | 64 | 1,518 | ||||
| International Bancshares Corp. | 27 | 514 | ||||
| Jefferies Group Inc. (c) | 61 | 1,454 | ||||
| Jones Lang LaSalle Inc. (e) | 22 | 1,312 | ||||
| Liberty Property Trust | 58 | 1,869 | ||||
| Macerich Co. (e) | 50 | 1,799 | ||||
| Mack-Cali Realty Corp. | 41 | 1,411 | ||||
| Mercury General Corp. | 19 | 728 | ||||
| MSCI Inc. (c) | 54 | 1,706 | ||||
| Nationwide Health Properties Inc. | 58 | 2,046 | ||||
| New York Community Bancorp Inc. (e) | 215 | 3,123 | ||||
| NewAlliance Bancshares Inc. (e) | 55 | 664 | ||||
| Old Republic International Corp. | 125 | 1,255 | ||||
| Omega Healthcare Investors Inc. (e) | 44 | 862 | ||||
| PacWest Bancorp | 15 | 312 | ||||
| Potlatch Corp. | 21 | 661 | ||||
| Protective Life Corp. | 43 | 711 | ||||
| Raymond James Financial Inc. (e) | 51 | 1,219 | ||||
| Rayonier Inc. | 41 | 1,737 | ||||
| Realty Income Corp. (e) | 54 | 1,402 | ||||
| Regency Centers Corp. (e) | 42 | 1,461 | ||||
| Reinsurance Group of America Inc. | 38 | 1,799 | ||||
| SEI Investments Co. | 67 | 1,179 | ||||
| Senior Housing Properties Trust | 66 | 1,445 | ||||
| SL Green Realty Corp. (e) | 40 | 2,011 | ||||
| StanCorp Financial Group Inc. (e) | 26 | 1,023 | ||||
| SVB Financial Group (c) (e) | 21 | 890 | ||||
| Synovus Financial Corp. | 254 | 520 | ||||
| TCF Financial Corp. (e) | 58 | 795 | ||||
| Trustmark Corp. (e) | 28 | 628 | ||||
| UDR Inc. | 79 | 1,305 | ||||
| Unitrin Inc. | 26 | 574 | ||||
| Valley National Bancorp | 77 | 1,086 | ||||
| Waddell & Reed Financial Inc. - Class A | 44 | 1,353 | ||||
| Washington Federal Inc. | 58 | 1,128 | ||||
| Webster Financial Corp. | 32 | 375 | ||||
| Weingarten Realty Investors | 54 | 1,072 | ||||
| Westamerica Bancorporation (e) | 15 | 812 | ||||
| Wilmington Trust Corp. (e) | 34 | 419 | ||||
| WR Berkley Corp. | 70 | 1,726 | ||||
| 89,598 | ||||||
| HEALTH CARE - 12.0% | ||||||
| Affymetrix Inc. (c) | 35 | 202 | ||||
| Beckman Coulter Inc. | 36 | 2,351 | ||||
| Bio-Rad Laboratories Inc. - Class A (c) | 10 | 965 | ||||
| Cerner Corp. (c) (e) | 35 | 2,893 | ||||
| Charles River Laboratories International Inc. (c) | 34 | 1,154 | ||||
| Community Health Systems Inc. (c) | 48 | 1,716 | ||||
| Covance Inc. (c) (e) | 33 | 1,812 | ||||
| Edwards Lifesciences Corp. (c) | 29 | 2,545 | ||||
| Endo Pharmaceuticals Holdings Inc. (c) | 61 | 1,249 | ||||
| Gen-Probe Inc. (c) | 25 | 1,082 | ||||
| Health Management Associates Inc. (c) | 129 | 939 | ||||
| Health Net Inc. (c) | 54 | 1,257 | ||||
| Henry Schein Inc. (c) (e) | 47 | 2,466 | ||||
| Hill-Rom Holdings Inc. | 31 | 755 | ||||
| Hologic Inc. (c) | 134 | 1,939 | ||||
| Idexx Laboratories Inc. (c) (e) | 30 | 1,624 | ||||
| Immucor Inc. (c) | 37 | 740 | ||||
| Kindred Healthcare Inc. (c) | 19 | 357 | ||||
| Kinetic Concepts Inc. (c) | 32 | 1,212 | ||||
| LifePoint Hospitals Inc. (c) | 28 | 894 | ||||
| Lincare Holdings Inc. (c) (e) | 35 | 1,313 | ||||
| Masimo Corp. (c) (e) | 27 | 823 | ||||
| Medicis Pharmaceutical Corp. (e) | 31 | 838 | ||||
| Mettler Toledo International Inc. (c) | 18 | 1,837 | ||||
| Omnicare Inc. | 62 | 1,498 | ||||
| OSI Pharmaceuticals Inc. (c) (e) | 29 | 903 | ||||
| Owens & Minor Inc. | 21 | 900 | ||||
| Perrigo Co. (e) | 42 | 1,663 | ||||
| Pharmaceutical Product Development Inc. | 61 | 1,438 | ||||
| Psychiatric Solutions Inc. (c) | 29 | 620 | ||||
| ResMed Inc. (c) (e) | 39 | 2,031 | ||||
| STERIS Corp. | 29 | 822 | ||||
| Techne Corp. | 19 | 1,326 | ||||
| Teleflex Inc. | 21 | 1,112 | ||||
| Thoratec Corp. (c) (e) | 28 | 765 | ||||
| United Therapeutics Corp. (c) | 25 | 1,295 | ||||
| Universal Health Services Inc. | 51 | 1,557 | ||||
| Valeant Pharmaceutical International (c) | 35 | 1,115 | ||||
| Varian Inc. (c) | 15 | 748 | ||||
| VCA Antech Inc. (c) | 44 | 1,107 | ||||
| Vertex Pharmaceuticals Inc. (c) (e) | 100 | 4,273 | ||||
| WellCare Health Plans Inc. (c) | 21 | 781 | ||||
| 56,917 | ||||||
| INDUSTRIALS - 14.4% | ||||||
| AECOM Technology Corp. (c) | 58 | 1,606 | ||||
| AGCO Corp. (c) (e) | 48 | 1,551 | ||||
| AirTran Holdings Inc. (c) (e) | 67 | 351 | ||||
| Alaska Air Group Inc. (c) | 18 | 618 | ||||
| Alexander & Baldwin Inc. (e) | 21 | 732 | ||||
| Alliant Techsystems Inc. (c) | 17 | 1,508 | ||||
| AMETEK Inc. | 56 | 2,137 | ||||
| BE Aerospace Inc. (c) (e) | 53 | 1,234 | ||||
| Brink's Co. | 24 | 582 | ||||
| Bucyrus International Inc. - Class A | 39 | 2,195 | ||||
| Carlisle Cos. Inc. | 32 | 1,091 | ||||
| Clean Harbors Inc. (c) | 12 | 709 | ||||
| Con-Way Inc. | 26 | 894 | ||||
| Copart Inc. (c) (e) | 35 | 1,280 | ||||
| Corporate Executive Board Co. | 18 | 414 | ||||
| Corrections Corp. of America (c) | 60 | 1,471 | ||||
| Crane Co. | 24 | 720 | ||||
| Deluxe Corp. (e) | 26 | 387 | ||||
| Donaldson Co. Inc. (e) | 40 | 1,705 | ||||
| Federal Signal Corp. | 27 | 162 | ||||
| FTI Consulting Inc. (c) | 27 | 1,269 | ||||
| GATX Corp. (e) | 23 | 665 | ||||
| Graco Inc. (e) | 31 | 884 | ||||
| Granite Construction Inc. | 17 | 571 | ||||
| Harsco Corp. | 42 | 1,344 | ||||
| Herman Miller Inc. (e) | 29 | 455 | ||||
| HNI Corp. (e) | 23 | 649 | ||||
| Hubbell Inc. - Class B | 31 | 1,450 | ||||
| IDEX Corp. (e) | 42 | 1,307 | ||||
| JB Hunt Transport Services Inc. | 46 | 1,469 | ||||
| JetBlue Airways Corp. (c) | 104 | 566 | ||||
| Joy Global Inc. | 53 | 2,734 | ||||
| Kansas City Southern (c) (e) | 50 | 1,658 | ||||
| KBR Inc. | 83 | 1,581 | ||||
| Kennametal Inc. | 42 | 1,096 | ||||
| Kirby Corp. (c) | 28 | 975 | ||||
| Korn/Ferry International (c) | 23 | 386 | ||||
| Landstar System Inc. | 26 | 998 | ||||
| Lennox International Inc. | 25 | 988 | ||||
| Lincoln Electric Holdings Inc. | 22 | 1,181 | ||||
| Manpower Inc. | 41 | 2,219 | ||||
| Mine Safety Appliances Co. | 16 | 425 | ||||
| MPS Group Inc. (c) | 49 | 668 | ||||
| MSC Industrial Direct Co. - Class A | 23 | 1,074 | ||||
| Navigant Consulting Inc. (c) | 27 | 394 | ||||
| Nordson Corp. | 17 | 1,031 | ||||
| Oshkosh Corp. | 46 | 1,718 | ||||
| Pentair Inc. | 51 | 1,648 | ||||
| Regal-Beloit Corp. | 19 | 995 | ||||
| Rollins Inc. | 22 | 425 | ||||
| Shaw Group Inc. (c) | 43 | 1,249 | ||||
| SPX Corp. | 26 | 1,399 | ||||
| Terex Corp. (c) | 56 | 1,113 | ||||
| Thomas & Betts Corp. (c) | 27 | 975 | ||||
| Timken Co. | 41 | 979 | ||||
| Trinity Industries Inc. (e) | 41 | 720 | ||||
| United Rentals Inc. (c) | 32 | 316 | ||||
| URS Corp. (c) | 44 | 1,937 | ||||
| Valmont Industries Inc. (e) | 10 | 783 | ||||
| Wabtec Corp. (e) | 25 | 1,010 | ||||
| Waste Connections Inc. (c) | 40 | 1,336 | ||||
| Watson Wyatt Worldwide Inc. | 22 | 1,054 | ||||
| Werner Enterprises Inc. | 21 | 422 | ||||
| Woodward Governor Co. | 30 | 762 | ||||
| 68,225 | ||||||
| INFORMATION TECHNOLOGY - 15.0% | ||||||
| 3Com Corp. (c) | 203 | 1,526 | ||||
| ACI Worldwide Inc. (c) | 18 | 312 | ||||
| Acxiom Corp. (c) | 40 | 539 | ||||
| ADC Telecommunications Inc. (c) | 50 | 309 | ||||
| ADTRAN Inc. (e) | 28 | 633 | ||||
| Advent Software Inc. (c) (e) | 8 | 340 | ||||
| Alliance Data Systems Corp. (c) (e) | 27 | 1,717 | ||||
| Ansys Inc. (c) | 46 | 1,998 | ||||
| AOL Inc. (c) | 56 | 1,303 | ||||
| Arrow Electronics Inc. (c) | 62 | 1,839 | ||||
| Atmel Corp. (c) | 236 | 1,087 | ||||
| Avnet Inc. (c) | 78 | 2,364 | ||||
| Broadridge Financial Solutions Inc. | 70 | 1,572 | ||||
| Cadence Design Systems Inc. (c) | 134 | 805 | ||||
| Ciena Corp. (c) (e) | 46 | 496 | ||||
| CommScope Inc. (c) | 49 | 1,292 | ||||
| Convergys Corp. (c) | 61 | 661 | ||||
| Cree Inc. (c) | 54 | 3,025 | ||||
| Diebold Inc. (e) | 33 | 945 | ||||
| Digital River Inc. (c) | 20 | 530 | ||||
| DST Systems Inc. (c) | 20 | 855 | ||||
| Equinix Inc. (c) (e) | 20 | 2,144 | ||||
| F5 Networks Inc. (c) | 41 | 2,177 | ||||
| Factset Research Systems Inc. (e) | 22 | 1,439 | ||||
| Fair Isaac Corp. (e) | 24 | 509 | ||||
| Fairchild Semiconductor International Inc. (c) | 65 | 646 | ||||
| Gartner Inc. - Class A (c) | 31 | 567 | ||||
| Global Payments Inc. | 42 | 2,262 | ||||
| Hewitt Associates Inc. - Class A (c) | 43 | 1,823 | ||||
| Informatica Corp. (c) (e) | 46 | 1,202 | ||||
| Ingram Micro Inc. - Class A (c) | 85 | 1,482 | ||||
| Integrated Device Technology Inc. (c) | 88 | 567 | ||||
| International Rectifier Corp. (c) | 36 | 792 | ||||
| Intersil Corp. (e) | 61 | 942 | ||||
| Itron Inc. (c) | 21 | 1,407 | ||||
| Jack Henry & Associates Inc. | 44 | 1,018 | ||||
| Lam Research Corp. (c) | 66 | 2,585 | ||||
| Lender Processing Services Inc. | 50 | 2,019 | ||||
| Mantech International Corp. - Class A (c) | 12 | 567 | ||||
| Mentor Graphics Corp. (c) | 50 | 444 | ||||
| Micros Systems Inc. (c) | 41 | 1,284 | ||||
| National Instruments Corp. (e) | 28 | 836 | ||||
| NCR Corp. (c) | 80 | 888 | ||||
| NeuStar Inc. - Class A (c) | 37 | 857 | ||||
| Palm Inc. (c) (e) | 83 | 830 | ||||
| Parametric Technology Corp. (c) | 61 | 1,002 | ||||
| Plantronics Inc. | 26 | 666 | ||||
| Polycom Inc. (c) (e) | 44 | 1,095 | ||||
| Quest Software Inc. (c) | 31 | 574 | ||||
| RF Micro Devices Inc. (c) | 135 | 642 | ||||
| Rovi Corp. (c) | 53 | 1,703 | ||||
| Semtech Corp. (c) | 32 | 553 | ||||
| Silicon Laboratories Inc. (c) (e) | 24 | 1,147 | ||||
| Solera Holdings Inc. | 36 | 1,302 | ||||
| SRA International Inc. - Class A (c) | 21 | 401 | ||||
| Sybase Inc. (c) | 42 | 1,835 | ||||
| Synopsys Inc. (c) | 76 | 1,684 | ||||
| Tech Data Corp. (c) | 26 | 1,233 | ||||
| Trimble Navigation Ltd. (c) | 62 | 1,574 | ||||
| ValueClick Inc. (c) | 42 | 428 | ||||
| Vishay Intertechnology Inc. (c) | 94 | 783 | ||||
| Zebra Technologies Corp. (c) | 31 | 868 | ||||
| 70,925 | ||||||
| MATERIALS - 6.3% | ||||||
| Albemarle Corp. (e) | 48 | 1,729 | ||||
| AptarGroup Inc. | 35 | 1,254 | ||||
| Ashland Inc. | 39 | 1,540 | ||||
| Cabot Corp. | 33 | 862 | ||||
| Carpenter Technology Corp. | 23 | 620 | ||||
| Commercial Metals Co. | 59 | 916 | ||||
| Cytec Industries Inc. | 25 | 921 | ||||
| Grief Inc. | 18 | 963 | ||||
| Louisiana-Pacific Corp. (c) (e) | 66 | 461 | ||||
| Lubrizol Corp. | 35 | 2,580 | ||||
| Martin Marietta Materials Inc. (e) | 23 | 2,068 | ||||
| Minerals Technologies Inc. | 10 | 538 | ||||
| Olin Corp. | 41 | 717 | ||||
| Packaging Corp. of America | 53 | 1,230 | ||||
| Reliance Steel & Aluminum Co. | 33 | 1,435 | ||||
| RPM International Inc. | 67 | 1,363 | ||||
| Scotts Miracle-Gro Co. | 23 | 922 | ||||
| Sensient Technologies Corp. | 25 | 645 | ||||
| Silgan Holdings Inc. | 14 | 801 | ||||
| Sonoco Products Co. | 52 | 1,518 | ||||
| Steel Dynamics Inc. | 112 | 1,981 | ||||
| Temple-Inland Inc. | 56 | 1,172 | ||||
| Terra Industries Inc. | 52 | 1,667 | ||||
| Valspar Corp. | 52 | 1,420 | ||||
| Worthington Industries Inc. | 30 | 387 | ||||
| 29,710 | ||||||
| TELECOMMUNICATION SERVICES - 0.9% | ||||||
| Cincinnati Bell Inc. (c) | 102 | 353 | ||||
| Syniverse Holdings Inc. (c) | 36 | 633 | ||||
| Telephone & Data Systems Inc. | 49 | 1,647 | ||||
| tw telecom inc. (c) | 77 | 1,320 | ||||
| 3,953 | ||||||
| UTILITIES - 6.6% | ||||||
| AGL Resources Inc. | 40 | 1,465 | ||||
| Alliant Energy Corp. | 57 | 1,736 | ||||
| Aqua America Inc. (e) | 71 | 1,239 | ||||
| Atmos Energy Corp. | 48 | 1,413 | ||||
| Black Hills Corp. (e) | 20 | 527 | ||||
| Cleco Corp. | 30 | 830 | ||||
| DPL Inc. | 62 | 1,714 | ||||
| Dynegy Inc. (c) | 252 | 456 | ||||
| Energen Corp. | 37 | 1,741 | ||||
| Great Plains Energy Inc. (e) | 70 | 1,362 | ||||
| Hawaiian Electric Industries Inc. (e) | 48 | 1,000 | ||||
| IDACORP Inc. | 24 | 759 | ||||
| MDU Resources Group Inc. | 97 | 2,296 | ||||
| National Fuel Gas Co. | 42 | 2,088 | ||||
| NSTAR | 55 | 2,037 | ||||
| NV Energy Inc. | 122 | 1,507 | ||||
| OGE Energy Corp. | 50 | 1,852 | ||||
| Oneok Inc. | 55 | 2,436 | ||||
| PNM Resources Inc. | 46 | 577 | ||||
| UGI Corp. | 56 | 1,366 | ||||
| Vectren Corp. | 42 | 1,041 | ||||
| Westar Energy Inc. | 57 | 1,230 | ||||
| WGL Holdings Inc. (e) | 25 | 843 | ||||
| 31,515 | ||||||
| Total Common Stocks (cost $488,407) | 466,596 | |||||
| NON-U.S. GOVERNMENT AGENCY | ||||||
| ASSET-BACKED SECURITIES - 0.0% | ||||||
| Sigma Finance, Inc. (d) (f) (u) | $ | 2,206 | 94 | |||
| Total Non-U.S. Government Agency | ||||||
| Asset-Backed Securities (cost $2,206) | 94 | |||||
| SHORT TERM INVESTMENTS - 16.1% | ||||||
| Mutual Funds - 1.5% | ||||||
| JNL Money Market Fund, 0.07% (a) (h) | 7,170 | 7,170 | ||||
| Securities Lending Collateral - 14.5% | ||||||
| Securities Lending Cash Collateral Fund LLC, | ||||||
| 0.16% (a) (h) | 45,205 | 45,205 | ||||
| Securities Lending Liquidating Fund LLC, 0.36% (a) (h) | 23,499 | 23,450 | ||||
| 68,655 | ||||||
| U.S. Treasury Securities - 0.1% | ||||||
| U.S. Treasury Bill, 0.22%, 03/11/10 (o) | $ | 710 | 710 | |||
| Total Short Term Investments (cost $76,584) | 76,535 | |||||
| Total Investments - 114.5% (cost $567,197) | 543,225 | |||||
| Other Assets and Liabilities, Net - (14.5%) | (68,905) | |||||
| Total Net Assets - 100% | $ | 474,320 | ||||
| JNL/Mellon Capital Management | ||||||
| Small Cap Index Fund | ||||||
| COMMON STOCKS - 96.7% | ||||||
| CONSUMER DISCRETIONARY - 13.4% | ||||||
| 1-800-Flowers.com Inc. (c) | 14 | $ | 38 | |||
| 99 Cents Only Stores (c) | 24 | 314 | ||||
| AFC Enterprises Inc. (c) | 12 | 97 | ||||
| Ambassadors Group Inc. | 9 | 117 | ||||
| American Apparel Inc. (c) | 16 | 48 | ||||
| American Axle & Manufacturing Holdings Inc. (c) (e) | 23 | 186 | ||||
| American Greetings Corp. | 19 | 418 | ||||
| American Public Education Inc. (c) | 9 | 308 | ||||
| America's Car-Mart Inc. (c) | 5 | 136 | ||||
| Amerigon Inc. (c) | 11 | 91 | ||||
| Ameristar Casinos Inc. | 12 | 183 | ||||
| AnnTaylor Stores Corp. (c) | 29 | 394 | ||||
| Arbitron Inc. (e) | 14 | 318 | ||||
| ArvinMeritor Inc. (c) | 37 | 411 | ||||
| Asbury Automotive Group Inc. (c) | 16 | 185 | ||||
| Ascent Media Corp. (c) | 7 | 180 | ||||
| Audiovox Corp. (c) | 9 | 64 | ||||
| Bally Technologies Inc. (c) | 27 | 1,123 | ||||
| Beazer Homes USA Inc. (c) | 22 | 107 | ||||
| Bebe Stores Inc. | 13 | 79 | ||||
| Belo Corp. | 46 | 252 | ||||
| Benihana Inc. - Class A (c) | 6 | 22 | ||||
| Big 5 Sporting Goods Corp. | 11 | 182 | ||||
| BJ's Restaurants Inc. (c) | 9 | 173 | ||||
| Blue Nile Inc. (c) | 6 | 407 | ||||
| Bluegreen Corp. (c) | 6 | 15 | ||||
| Blyth Inc. | 3 | 92 | ||||
| Bob Evans Farms Inc. | 16 | 451 | ||||
| Books-A-Million Inc. | 3 | 21 | ||||
| Borders Group Inc. (c) | 25 | 30 | ||||
| Bridgepoint Education Inc. (c) (e) | 7 | 105 | ||||
| Brookfield Homes Corp. (c) (e) | 6 | 48 | ||||
| Brown Shoe Co. Inc. | 20 | 193 | ||||
| Brunswick Corp. | 44 | 559 | ||||
| Buckle Inc. (e) | 12 | 365 | ||||
| Buffalo Wild Wings Inc. (c) (e) | 9 | 369 | ||||
| Build-A-Bear Workshop Inc. (c) | 9 | 42 | ||||
| Cabela's Inc. - Class A (c) (e) | 21 | 293 | ||||
| California Pizza Kitchen Inc. (c) (e) | 9 | 122 | ||||
| Callaway Golf Co. | 31 | 230 | ||||
| Capella Education Co. (c) (e) | 7 | 536 | ||||
| Caribou Coffee Co. Inc. (c) (e) | 3 | 24 | ||||
| Carmike Cinemas Inc. (c) | 5 | 37 | ||||
| Carrol's Restaurant Group Inc. (c) | 5 | 36 | ||||
| Carter's Inc. (c) | 28 | 748 | ||||
| Cato Corp. - Class A | 14 | 284 | ||||
| Cavco Industries Inc. (c) (e) | 3 | 108 | ||||
| CEC Entertainment Inc. (c) | 11 | 361 | ||||
| Charming Shoppes Inc. (c) (e) | 57 | 370 | ||||
| Cheesecake Factory Inc. (c) (e) | 30 | 653 | ||||
| Cherokee Inc. | 4 | 65 | ||||
| Childrens Place Retail Stores Inc. (c) (e) | 11 | 372 | ||||
| China Automotive Systems Inc. (c) (e) | 2 | 39 | ||||
| ChinaCast Education Corp. (c) | 15 | 115 | ||||
| Christopher & Banks Corp. | 18 | 139 | ||||
| Churchill Downs Inc. | 5 | 171 | ||||
| Cinemark Holdings Inc. | 15 | 219 | ||||
| Citi Trends Inc. (c) | 7 | 202 | ||||
| CKE Restaurants Inc. | 23 | 197 | ||||
| CKX Inc. (c) | 27 | 144 | ||||
| Coinstar Inc. (c) (e) | 15 | 424 | ||||
| Coldwater Creek Inc. (c) (e) | 27 | 120 | ||||
| Collective Brands Inc. (c) | 32 | 734 | ||||
| Columbia Sportswear Co. (e) | 6 | 222 | ||||
| Conn's Inc. (c) (e) | 4 | 26 | ||||
| Cooper Tire & Rubber Co. | 29 | 581 | ||||
| Core-Mark Holding Co. Inc. (c) (e) | 5 | 151 | ||||
| Corinthian Colleges Inc. (c) (e) | 39 | 537 | ||||
| CPI Corp. | 2 | 27 | ||||
| Cracker Barrel Old Country Store Inc. (e) | 11 | 436 | ||||
| Crocs Inc. (c) | 40 | 232 | ||||
| Crown Media Holdings Inc. (c) (e) | 5 | 8 | ||||
| CSS Industries Inc. | 4 | 69 | ||||
| Dana Holding Corp. (c) | 65 | 702 | ||||
| Deckers Outdoor Corp. (c) | 7 | 671 | ||||
| Denny's Corp. (c) | 45 | 98 | ||||
| Destination Maternity Corp. (c) (e) | 2 | 40 | ||||
| Dillard's Inc. - Class A (e) | 25 | 469 | ||||
| DineEquity Inc. (c) (e) | 9 | 211 | ||||
| Dolan Media Co. (c) | 15 | 152 | ||||
| Domino's Pizza Inc. (c) (e) | 18 | 149 | ||||
| Dorman Products Inc. (c) | 5 | 83 | ||||
| Dover Downs Gaming & Entertainment Inc. | 7 | 25 | ||||
| Dress Barn Inc. (c) | 28 | 655 | ||||
| Drew Industries Inc. (c) | 9 | 179 | ||||
| Drugstore.com Inc. (c) | 40 | 122 | ||||
| DSW Inc. (c) | 6 | 165 | ||||
| Eastman Kodak Co. (c) (e) | 131 | 553 | ||||
| Einstein Noah Restaurant Group Inc. (c) (e) | 2 | 23 | ||||
| Ethan Allen Interiors Inc. (e) | 12 | 160 | ||||
| EW Scripps Co. (c) | 13 | 90 | ||||
| Exide Technologies (c) | 26 | 182 | ||||
| FGX International Holdings Ltd. (c) | 7 | 134 | ||||
| Finish Line - Class A | 20 | 255 | ||||
| Fisher Communications Inc. (c) | 4 | 64 | ||||
| Fossil Inc. (c) | 23 | 767 | ||||
| Fred's Inc. | 21 | 211 | ||||
| Frisch's Restaurants Inc. | 1 | 24 | ||||
| Fuel Systems Solutions Inc. (c) | 7 | 293 | ||||
| Fuqi International Inc. (c) (e) | 7 | 118 | ||||
| Furniture Brands International Inc. (c) | 23 | 124 | ||||
| Gaiam Inc. (c) | 8 | 61 | ||||
| Gander Mountain Co. (c) | 2 | 11 | ||||
| Gaylord Entertainment Co. (c) (e) | 17 | 338 | ||||
| Genesco Inc. (c) | 12 | 319 | ||||
| G-III Apparel Group Ltd. (c) (e) | 7 | 149 | ||||
| Global Sources Ltd. (c) | 8 | 51 | ||||
| Grand Canyon Education Inc. (c) (e) | 7 | 138 | ||||
| Great Wolf Resorts Inc. (c) | 11 | 27 | ||||
| Group 1 Automotive Inc. (c) (e) | 12 | 348 | ||||
| Gymboree Corp. (c) | 14 | 618 | ||||
| Harte-Hanks Inc. | 18 | 192 | ||||
| Haverty Furniture Cos. Inc. | 8 | 115 | ||||
| Hawk Corp. (c) | 2 | 43 | ||||
| Helen of Troy Ltd. (c) | 15 | 372 | ||||
| hhgregg Inc. (c) (e) | 6 | 128 | ||||
| Hibbett Sports Inc. (c) (e) | 14 | 311 | ||||
| Hooker Furniture Corp. | 5 | 64 | ||||
| HOT Topic Inc. (c) | 21 | 132 | ||||
| Hovnanian Enterprises Inc. - Class A (c) (e) | 25 | 95 | ||||
| HSN Inc. (c) | 20 | 400 | ||||
| Iconix Brand Group Inc. (c) | 36 | 457 | ||||
| Interval Leisure Group Inc. (c) | 20 | 246 | ||||
| iRobot Corp. (c) | 9 | 160 | ||||
| Isle of Capri Casinos Inc. (c) | 8 | 59 | ||||
| J Crew Group Inc. (c) (e) | 25 | 1,123 | ||||
| Jack in the Box Inc. (c) | 28 | 547 | ||||
| Jackson Hewitt Tax Service Inc. (c) | 15 | 64 | ||||
| Jakks Pacific Inc. (c) | 13 | 160 | ||||
| Jo-Ann Stores Inc. (c) | 13 | 488 | ||||
| Jones Apparel Group Inc. | 42 | 669 | ||||
| Jos. A. Bank Clothiers Inc. (c) | 9 | 392 | ||||
| Journal Communications Inc. - Class A | 20 | 78 | ||||
| K12 Inc. (c) (e) | 12 | 238 | ||||
| Kenneth Cole Productions Inc. (c) (e) | 5 | 49 | ||||
| Kirkland's Inc. (c) | 6 | 112 | ||||
| Knology Inc. (c) | 14 | 150 | ||||
| Krispy Kreme Doughnuts Inc. (c) | 27 | 79 | ||||
| K-Swiss Inc. - Class A (c) | 12 | 123 | ||||
| Lakes Entertainment Inc. (c) | 8 | 21 | ||||
| Landry's Restaurants Inc. (c) (e) | 4 | 91 | ||||
| La-Z-Boy Inc. (c) (e) | 26 | 247 | ||||
| Leapfrog Enterprises Inc. (c) | 18 | 68 | ||||
| Learning Tree International Inc. (c) (e) | 5 | 59 | ||||
| Life Time Fitness Inc. (c) (e) | 20 | 489 | ||||
| LIN TV Corp. (c) | 17 | 75 | ||||
| Lincoln Educational Services Corp. (c) | 4 | 95 | ||||
| Lithia Motors Inc. - Class A (c) | 9 | 72 | ||||
| Live Nation Inc. (c) | 43 | 365 | ||||
| Liz Claiborne Inc. (c) (e) | 48 | 271 | ||||
| LodgeNet Interactive Corp. (c) | 9 | 50 | ||||
| Luby's Inc. (c) | 10 | 38 | ||||
| Lululemon Athletica Inc. (c) (e) | 20 | 600 | ||||
| Lumber Liquidators Inc. (c) (e) | 8 | 205 | ||||
| M/I Homes Inc. (c) | 9 | 89 | ||||
| Mac-Gray Corp. (c) | 6 | 63 | ||||
| Maidenform Brands Inc. (c) | 10 | 160 | ||||
| Marcus Corp. | 9 | 119 | ||||
| Marine Products Corp. (e) | 5 | 26 | ||||
| Martha Stewart Living Omnimedia Inc. (c) | 14 | 68 | ||||
| Matthews International Corp. - Class A (e) | 15 | 543 | ||||
| McCormick & Schmick's Seafood Restaurants Inc. (c) | 7 | 46 | ||||
| Mediacom Communications Corp. (c) | 18 | 81 | ||||
| Men's Wearhouse Inc. | 25 | 534 | ||||
| Meritage Homes Corp. (c) | 15 | 298 | ||||
| Midas Inc. (c) | 7 | 61 | ||||
| Modine Manufacturing Co. (c) | 17 | 197 | ||||
| Monarch Casino & Resort Inc. (c) (e) | 5 | 41 | ||||
| Monro Muffler Brake Inc. | 9 | 287 | ||||
| Morgans Hotel Group Co. (c) | 13 | 59 | ||||
| Movado Group Inc. | 8 | 80 | ||||
| Multimedia Games Inc. (c) | 14 | 85 | ||||
| National CineMedia Inc. | 21 | 345 | ||||
| National Presto Industries Inc. | 2 | 248 | ||||
| New York & Co. Inc. (c) | 11 | 49 | ||||
| NIVS IntelliMedia Technology Group Inc. (c) | 4 | 10 | ||||
| Nobel Learning Communities Inc. (c) | 2 | 14 | ||||
| NutriSystem Inc. (e) | 16 | 488 | ||||
| O'Charley's Inc. (c) | 9 | 60 | ||||
| OfficeMax Inc. (c) | 38 | 479 | ||||
| Orbitz Worldwide Inc. (c) | 20 | 147 | ||||
| Orient-Express Hotels Ltd. (c) (e) | 38 | 384 | ||||
| Outdoor Channel Holdings Inc. (c) | 6 | 38 | ||||
| Overstock.com Inc. (c) (e) | 7 | 100 | ||||
| Oxford Industries Inc. | 7 | 137 | ||||
| Pacific Sunwear of California Inc. (c) | 32 | 127 | ||||
| Papa John's International Inc. (c) | 10 | 241 | ||||
| Peets Coffee & Tea Inc. (c) | 6 | 192 | ||||
| PEP Boys-Manny Moe & Jack | 24 | 205 | ||||
| Perry Ellis International Inc. (c) | 6 | 88 | ||||
| PetMed Express Inc. (e) | 11 | 195 | ||||
| PF Chang's China Bistro Inc. (c) (e) | 12 | 458 | ||||
| Pier 1 Imports Inc. (c) | 52 | 264 | ||||
| Pinnacle Entertainment Inc. (c) | 31 | 277 | ||||
| Playboy Enterprises Inc. - Class B (c) | 12 | 38 | ||||
| Polaris Industries Inc. | 15 | 651 | ||||
| Pool Corp. | 24 | 467 | ||||
| Pre-Paid Legal Services Inc. (c) (e) | 3 | 142 | ||||
| PRIMEDIA Inc. | 12 | 44 | ||||
| Princeton Review Inc. (c) | 7 | 27 | ||||
| Quicksilver Inc. (c) | 62 | 126 | ||||
| Raser Technologies Inc. (c) | 25 | 31 | ||||
| RC2 Corp. (c) | 11 | 167 | ||||
| RCN Corp. (c) | 18 | 190 | ||||
| Reading International Inc. - Class A (c) (e) | 8 | 32 | ||||
| Red Lion Hotels Corp. (c) | 6 | 30 | ||||
| Red Robin Gourmet Burgers Inc. (c) | 7 | 131 | ||||
| Regis Corp. | 29 | 450 | ||||
| Rent-A-Center Inc. (c) | 32 | 570 | ||||
| Rentrak Corp. (c) | 5 | 87 | ||||
| Retail Ventures Inc. (c) | 15 | 136 | ||||
| Rex Stores Corp. (c) | 4 | 60 | ||||
| Ruby Tuesday Inc. (c) | 34 | 243 | ||||
| Rue21 Inc. (c) | 2 | 70 | ||||
| Ruth's Hospitality Group Inc. (c) (e) | 12 | 26 | ||||
| Ryland Group Inc. | 22 | 430 | ||||
| Saks Inc. (c) (e) | 59 | 385 | ||||
| Sally Beauty Holdings Inc. (c) | 48 | 367 | ||||
| Scholastic Corp. | 11 | 328 | ||||
| Sealy Corp. (c) (e) | 23 | 71 | ||||
| Shoe Carnival Inc. (c) | 4 | 88 | ||||
| Shuffle Master Inc. (c) | 27 | 221 | ||||
| Shutterfly Inc. (c) | 10 | 173 | ||||
| Sinclair Broadcast Group Inc. - Class A (c) | 19 | 77 | ||||
| Skechers U.S.A. Inc. - Class A (c) | 17 | 496 | ||||
| Skyline Corp. | 3 | 59 | ||||
| Smith & Wesson Holding Corp. (c) (e) | 32 | 130 | ||||
| Sonic Automotive Inc. (c) | 16 | 169 | ||||
| Sonic Corp. (c) | 31 | 313 | ||||
| Sotheby's - Class A (e) | 34 | 760 | ||||
| Spartan Motors Inc. | 16 | 88 | ||||
| Speedway Motorsports Inc. | 6 | 112 | ||||
| Sport Supply Group Inc. | 4 | 52 | ||||
| Stage Stores Inc. | 19 | 233 | ||||
| Stamps.com Inc. (c) | 6 | 58 | ||||
| Standard Motor Products Inc. (c) | 8 | 69 | ||||
| Standard-Pacific Corp. (c) | 50 | 188 | ||||
| Stanley Furniture Co. Inc. (c) (e) | 5 | 46 | ||||
| Steak n Shake Co. (c) (e) | 1 | 205 | ||||
| Stein Mart Inc. (c) | 12 | 128 | ||||
| Steiner Leisure Ltd. (c) (e) | 8 | 298 | ||||
| Steinway Musical Instruments Inc. (c) | 4 | 61 | ||||
| Steven Madden Ltd. (c) | 8 | 321 | ||||
| Stewart Enterprises Inc. - Class A (e) | 40 | 207 | ||||
| Stoneridge Inc. (c) | 7 | 66 | ||||
| Sturm Ruger & Co. Inc. (e) | 10 | 94 | ||||
| Superior Industries International Inc. | 11 | 170 | ||||
| Syms Corp. (c) (e) | 3 | 23 | ||||
| Systemax Inc. | 5 | 82 | ||||
| Talbots Inc. (c) (e) | 12 | 107 | ||||
| Tempur-Pedic International Inc. (c) | 38 | 888 | ||||
| Tenneco Inc. (c) | 27 | 487 | ||||
| Texas Roadhouse Inc. - Class A (c) (e) | 24 | 266 | ||||
| Ticketmaster Entertainment Inc. (c) | 19 | 233 | ||||
| Timberland Co. - Class A (c) | 21 | 385 | ||||
| Town Sports International Holdings Inc. (c) | 10 | 22 | ||||
| Tractor Supply Co. (c) (e) | 18 | 952 | ||||
| True Religion Apparel Inc. (c) | 13 | 232 | ||||
| Tuesday Morning Corp. (c) | 14 | 37 | ||||
| Tupperware Brands Corp. | 31 | 1,453 | ||||
| U.S. Auto Parts Network Inc. (c) (e) | 5 | 24 | ||||
| Ulta Salon Cosmetics & Fragrance Inc. (c) | 14 | 261 | ||||
| Under Armour Inc. - Class A (c) (e) | 17 | 458 | ||||
| Unifi Inc. (c) | 22 | 85 | ||||
| UniFirst Corp. | 7 | 347 | ||||
| Universal Electronics Inc. (c) | 7 | 159 | ||||
| Universal Technical Institute Inc. (c) | 9 | 188 | ||||
| Universal Travel Group (c) | 4 | 45 | ||||
| Vail Resorts Inc. (c) | 15 | 561 | ||||
| Valassis Communications Inc. (c) | 23 | 424 | ||||
| Value Line Inc. | 1 | 15 | ||||
| Vitacost.com Inc. (c) | 5 | 56 | ||||
| Vitamin Shoppe Inc. (c) | 3 | 76 | ||||
| Volcom Inc. (c) | 9 | 148 | ||||
| Warnaco Group Inc. (c) | 23 | 966 | ||||
| West Marine Inc. (c) | 6 | 51 | ||||
| Wet Seal Inc. (c) | 46 | 160 | ||||
| Weyco Group Inc. | 3 | 75 | ||||
| Winnebago Industries Inc. (c) (e) | 14 | 176 | ||||
| Wolverine World Wide Inc. | 24 | 652 | ||||
| Wonder Auto Technology Inc. (c) | 7 | 88 | ||||
| World Wrestling Entertainment Inc. (e) | 10 | 157 | ||||
| Youbet.com Inc. (c) | 13 | 38 | ||||
| Zale Corp. (c) (e) | 13 | 35 | ||||
| Zumiez Inc. (c) (e) | 10 | 121 | ||||
| 63,822 | ||||||
| CONSUMER STAPLES - 3.3% | ||||||
| AgFeed Industries Inc. (c) (e) | 13 | 64 | ||||
| Alico Inc. (e) | 2 | 46 | ||||
| Alliance One International Inc. (c) (e) | 43 | 209 | ||||
| American Dairy Inc. (c) (e) | 5 | 113 | ||||
| American Italian Pasta Co. (c) | 10 | 360 | ||||
| American Oriental Bioengineering Inc. (c) (e) | 30 | 139 | ||||
| Andersons Inc. | 9 | 225 | ||||
| Arden Group Inc. - Class A | 1 | 54 | ||||
| B&G Foods Inc. | 16 | 145 | ||||
| Bare Escentuals Inc. (c) | 33 | 402 | ||||
| Boston Beer Co. Inc. - Class A (c) | 4 | 193 | ||||
| Calavo Growers Inc. | 5 | 80 | ||||
| Cal-Maine Foods Inc. (e) | 7 | 231 | ||||
| Casey's General Stores Inc. (e) | 25 | 813 | ||||
| Central Garden & Pet Co. - Class A (c) | 31 | 304 | ||||
| Chattem Inc. (c) | 9 | 882 | ||||
| China Sky One Medical Inc. (c) (e) | 5 | 110 | ||||
| China-Biotics Inc. (c) | 3 | 48 | ||||
| Chiquita Brands International Inc. (c) | 22 | 399 | ||||
| Coca-Cola Bottling Co. Consolidated | 2 | 107 | ||||
| Darling International Inc. (c) | 42 | 353 | ||||
| Diamond Foods Inc. | 8 | 302 | ||||
| Diedrich Coffee Inc. (c) | 1 | 47 | ||||
| Dole Food Co. Inc. (c) (e) | 16 | 193 | ||||
| Elizabeth Arden Inc. (c) | 11 | 165 | ||||
| Farmer Bros. Co. | 3 | 61 | ||||
| Female Health Co. (c) | 7 | 33 | ||||
| Fresh Del Monte Produce Inc. (c) | 21 | 459 | ||||
| Great Atlantic & Pacific Tea Co. (c) (e) | 18 | 209 | ||||
| Griffin Land & Nurseries Inc. | 2 | 44 | ||||
| Hain Celestial Group Inc. (c) | 20 | 341 | ||||
| Harbinger Group Inc. (c) | 4 | 27 | ||||
| Heckmann Corp. (c) | 40 | 202 | ||||
| HQ Sustainable Maritime Industries Inc. (c) (e) | 4 | 30 | ||||
| Imperial Sugar Co. (e) | 6 | 100 | ||||
| Ingles Markets Inc. - Class A | 6 | 91 | ||||
| Inter Parfums Inc. | 8 | 96 | ||||
| J&J Snack Foods Corp. | 7 | 290 | ||||
| Lancaster Colony Corp. | 9 | 466 | ||||
| Lance Inc. | 14 | 371 | ||||
| Lifeway Foods Inc. (c) (e) | 2 | 26 | ||||
| Mannatech Inc. | 7 | 23 | ||||
| Medifast Inc. (c) | 7 | 205 | ||||
| Nash Finch Co. | 7 | 248 | ||||
| National Beverage Corp. | 5 | 70 | ||||
| Nu Skin Enterprises Inc. (e) | 25 | 669 | ||||
| Nutraceutical International Corp. (c) | 5 | 60 | ||||
| Oil-Dri Corp. of America | 2 | 35 | ||||
| Omega Protein Corp. (c) (e) | 10 | 43 | ||||
| Orchids Paper Products Co. (c) (e) | 2 | 43 | ||||
| Overhill Farms Inc. (c) | 7 | 34 | ||||
| Pantry Inc. (c) | 11 | 144 | ||||
| Prestige Brands Holdings Inc. (c) | 17 | 137 | ||||
| PriceSmart Inc. | 7 | 152 | ||||
| Revlon Inc. (c) | 8 | 142 | ||||
| Ruddick Corp. (e) | 21 | 540 | ||||
| Sanderson Farms Inc. | 10 | 435 | ||||
| Schiff Nutrition International Inc. | 5 | 42 | ||||
| Seneca Foods Corp. (c) | 4 | 100 | ||||
| Smart Balance Inc. (c) | 30 | 178 | ||||
| Spartan Stores Inc. | 11 | 151 | ||||
| Star Scientific Inc. (c) | 34 | 24 | ||||
| Susser Holdings Corp. (c) | 3 | 30 | ||||
| Synutra International Inc. (c) (e) | 8 | 111 | ||||
| Tootsie Roll Industries Inc. (e) | 12 | 338 | ||||
| TreeHouse Foods Inc. (c) | 15 | 598 | ||||
| United Natural Foods Inc. (c) | 21 | 559 | ||||
| Universal Corp. (e) | 13 | 575 | ||||
| USANA Health Sciences Inc. (c) | 3 | 94 | ||||
| Vector Group Ltd. | 20 | 279 | ||||
| Village Super Market Inc. | 3 | 77 | ||||
| WD-40 Co. | 8 | 274 | ||||
| Weis Markets Inc. | 5 | 191 | ||||
| Winn-Dixie Stores Inc. (c) (e) | 28 | 280 | ||||
| Zhongpin Inc. (c) | 11 | 172 | ||||
| 15,883 | ||||||
| ENERGY - 4.9% | ||||||
| Allis-Chalmers Energy Inc. (c) | 31 | 118 | ||||
| Alon USA Energy Inc. (e) | 5 | 31 | ||||
| Apco Oil And Gas International Inc. | 5 | 104 | ||||
| Approach Resources Inc. (c) | 6 | 43 | ||||
| Arena Resources Inc. (c) (e) | 19 | 827 | ||||
| Atlas Energy Inc. | 32 | 953 | ||||
| ATP Oil & Gas Corp. (c) | 17 | 318 | ||||
| Basic Energy Services Inc. (c) | 12 | 106 | ||||
| Berry Petroleum Co. - Class A (e) | 21 | 609 | ||||
| Bill Barrett Corp. (c) (e) | 19 | 582 | ||||
| Bolt Technology Corp. (c) | 5 | 51 | ||||
| Boots & Coots Inc. (c) | 34 | 57 | ||||
| BPZ Resources Inc. (c) | 47 | 450 | ||||
| Brigham Exploration Co. (c) | 46 | 627 | ||||
| Bristow Group Inc. (c) | 17 | 646 | ||||
| Bronco Drilling Co. Inc. (c) (e) | 12 | 62 | ||||
| Cal Dive International Inc. (c) | 21 | 159 | ||||
| CARBO Ceramics Inc. | 10 | 664 | ||||
| Carrizo Oil & Gas Inc. (c) (e) | 14 | 365 | ||||
| Cheniere Energy Inc. (c) (e) | 26 | 63 | ||||
| Clayton Williams Energy Inc. (c) | 3 | 96 | ||||
| Clean Energy Fuels Corp. (c) (e) | 17 | 269 | ||||
| Cloud Peak Energy Inc. (c) | 13 | 193 | ||||
| Complete Production Services Inc. (c) | 29 | 377 | ||||
| Contango Oil & Gas Co. (c) | 6 | 281 | ||||
| CREDO Petroleum Corp. (c) | 3 | 29 | ||||
| Crosstex Energy Inc. | 19 | 115 | ||||
| Cubic Energy Inc. (c) | 12 | 19 | ||||
| CVR Energy Inc. (c) | 11 | 76 | ||||
| Dawson Geophysical Co. (c) | 4 | 91 | ||||
| Delek US Holdings Inc. (e) | 6 | 39 | ||||
| Delta Petroleum Corp. (c) (e) | 90 | 93 | ||||
| DHT Maritime Inc. (e) | 24 | 89 | ||||
| Dril-Quip Inc. (c) | 14 | 800 | ||||
| Endeavour International Corp. (c) | 52 | 56 | ||||
| ENGlobal Corp. (c) | 14 | 43 | ||||
| Evergreen Energy Inc. (c) | 25 | 9 | ||||
| FX Energy Inc. (c) | 20 | 57 | ||||
| General Maritime Corp. (e) | 23 | 161 | ||||
| Geokinetics Inc. (c) | 3 | 27 | ||||
| GeoResources Inc. (c) | 3 | 44 | ||||
| Global Industries Ltd. (c) (e) | 49 | 350 | ||||
| GMX Resources Inc. (c) (e) | 13 | 177 | ||||
| Golar LNG Ltd. (c) | 16 | 200 | ||||
| Goodrich Petroleum Corp. (c) (e) | 13 | 304 | ||||
| Gran Tierra Energy Inc. (c) | 100 | 574 | ||||
| Green Plains Renewable Energy Inc. (c) | 4 | 63 | ||||
| Gulf Island Fabrication Inc. | 6 | 132 | ||||
| Gulfmark Offshore Inc. (c) | 12 | 329 | ||||
| Gulfport Energy Corp. (c) | 13 | 152 | ||||
| Harvest Natural Resources Inc. (c) | 17 | 91 | ||||
| Hercules Offshore Inc. (c) | 49 | 235 | ||||
| Hornbeck Offshore Services Inc. (c) | 12 | 273 | ||||
| International Coal Group Inc. (c) | 46 | 177 | ||||
| ION Geophysical Corp. (c) (e) | 55 | 327 | ||||
| Isramco Inc. (c) | - | 33 | ||||
| James River Coal Co. (c) | 14 | 263 | ||||
| Key Energy Services Inc. (c) | 60 | 531 | ||||
| Knightsbridge Tankers Ltd. | 8 | 112 | ||||
| Lufkin Industries Inc. | 7 | 536 | ||||
| Matrix Service Co. (c) | 12 | 131 | ||||
| McMoRan Exploration Co. (c) (e) | 39 | 311 | ||||
| Natural Gas Services Group Inc. (c) (e) | 6 | 114 | ||||
| Newpark Resources Inc. (c) | 42 | 177 | ||||
| Nordic American Tanker Shipping Ltd. | 21 | 616 | ||||
| Northern Oil and Gas Inc. (c) | 16 | 192 | ||||
| Oilsands Quest Inc. (c) | 119 | 136 | ||||
| OYO Geospace Corp. (c) | 2 | 89 | ||||
| Panhandle Oil and Gas Inc. | 3 | 90 | ||||
| Parker Drilling Co. (c) | 59 | 294 | ||||
| Patriot Coal Corp. (c) | 37 | 578 | ||||
| Penn Virginia Corp. | 22 | 472 | ||||
| Petroleum Development Corp. (c) | 10 | 184 | ||||
| PetroQuest Energy Inc. (c) (e) | 27 | 166 | ||||
| PHI Inc. (c) | 6 | 130 | ||||
| Pioneer Drilling Co. (c) | 22 | 175 | ||||
| PrimeEnergy Corp. (c) | - | 10 | ||||
| Rex Energy Corp. (c) | 12 | 141 | ||||
| Rosetta Resources Inc. (c) | 27 | 530 | ||||
| RPC Inc. (e) | 13 | 137 | ||||
| Ship Finance International Ltd. (e) | 23 | 309 | ||||
| Stone Energy Corp. (c) | 20 | 367 | ||||
| Sulphco Inc. (c) (e) | 31 | 21 | ||||
| Superior Well Services Inc. (c) | 8 | 118 | ||||
| Swift Energy Co. (c) | 18 | 435 | ||||
| Syntroleum Corp. (c) | 33 | 88 | ||||
| T-3 Energy Services Inc. (c) | 6 | 160 | ||||
| Teekay Tankers Ltd. (e) | 6 | 49 | ||||
| Tetra Technologies Inc. (c) | 37 | 412 | ||||
| TGC Industries Inc. (c) | 6 | 23 | ||||
| Toreador Resources Corp. (e) | 9 | 93 | ||||
| Union Drilling Inc. (c) | 7 | 41 | ||||
| Uranerz Energy Corp. (c) (e) | 20 | 26 | ||||
| Uranium Energy Corp. (c) (e) | 32 | 120 | ||||
| USEC Inc. (c) | 55 | 213 | ||||
| VAALCO Energy Inc. | 28 | 128 | ||||
| Vantage Drilling Co. (c) | 40 | 64 | ||||
| Venoco Inc. (c) | 10 | 130 | ||||
| W&T Offshore Inc. (e) | 17 | 200 | ||||
| Warren Resources Inc. (c) | 33 | 80 | ||||
| Western Refining Inc. (c) (e) | 22 | 103 | ||||
| Westmoreland Coal Co. (c) | 5 | 47 | ||||
| Willbros Group Inc. (c) (e) | 20 | 342 | ||||
| World Fuel Services Corp. (e) | 30 | 791 | ||||
| Zion Oil & Gas Inc. (c) (e) | 6 | 46 | ||||
| 23,737 | ||||||
| FINANCIALS - 19.5% | ||||||
| 1st Source Corp. | 7 | 114 | ||||
| Abington Bancorp Inc. | 11 | 75 | ||||
| Acadia Realty Trust | 20 | 342 | ||||
| Advance America Cash Advance Centers Inc. | 23 | 130 | ||||
| Agree Realty Corp. (e) | 4 | 89 | ||||
| Alexander's Inc. (c) | 1 | 321 | ||||
| Alliance Financial Corp. (e) | 2 | 49 | ||||
| Allied Capital Corp. (c) | 88 | 318 | ||||
| Ambac Financial Group Inc. (c) (e) | 132 | 110 | ||||
| American Campus Communities Inc. (e) | 25 | 714 | ||||
| American Capital Agency Corp. | 7 | 187 | ||||
| American Capital Ltd. (c) (e) | 142 | 347 | ||||
| American Equity Investment Life Holding Co. (e) | 30 | 225 | ||||
| American National Bankshares Inc. (e) | 3 | 59 | ||||
| American Physicians Capital Inc. | 4 | 135 | ||||
| American Physicians Service Group Inc. | 3 | 63 | ||||
| American Realty Investors Inc. (c) (e) | 1 | 15 | ||||
| American Safety Insurance Holdings Ltd. (c) | 5 | 72 | ||||
| Ameris Bancorp (e) | 7 | 47 | ||||
| Amerisafe Inc. (c) | 9 | 161 | ||||
| Ames National Corp. (e) | 3 | 64 | ||||
| Ampal American Israel (c) | 10 | 26 | ||||
| AmTrust Financial Services Inc. | 10 | 124 | ||||
| Anworth Mortgage Asset Corp. | 55 | 382 | ||||
| Apollo Commercial Real Estate Finance Inc. (c) | 4 | 65 | ||||
| Apollo Investment Corp. | 82 | 779 | ||||
| Ares Capital Corp. (e) | 51 | 638 | ||||
| Argo Group International Holdings Ltd. (c) | 15 | 438 | ||||
| Arrow Financial Corp. (e) | 4 | 110 | ||||
| Artio Global Investors Inc. (c) | 13 | 319 | ||||
| Ashford Hospitality Trust Inc. (c) (e) | 32 | 149 | ||||
| Asset Acceptance Capital Corp. (c) (e) | 7 | 44 | ||||
| Associated Estates Realty Corp. | 8 | 88 | ||||
| Assured Guaranty Ltd. (e) | 59 | 1,275 | ||||
| Astoria Financial Corp. (e) | 42 | 520 | ||||
| Auburn National Bancorporation Inc. (e) | 1 | 21 | ||||
| Avatar Holdings Inc. (c) | 3 | 57 | ||||
| Baldwin & Lyons Inc. - Class B | 4 | 93 | ||||
| BancFirst Corp. | 3 | 124 | ||||
| Banco Latinoamericano de Comercio Exterior SA (e) | 13 | 183 | ||||
| Bancorp Inc. (c) | 5 | 34 | ||||
| Bancorp Rhode Island Inc. (e) | 2 | 42 | ||||
| Bank Mutual Corp. | 22 | 152 | ||||
| Bank of Kentucky Financial Corp. | 1 | 26 | ||||
| Bank of Marin Bancorp. (e) | 3 | 88 | ||||
| Bank of the Ozarks Inc. | 7 | 192 | ||||
| BankFinancial Corp. | 10 | 99 | ||||
| Banner Corp. (e) | 8 | 22 | ||||
| Bar Harbor Bankshares | 1 | 35 | ||||
| Beneficial Mutual Bancorp Inc. (c) | 16 | 154 | ||||
| Berkshire Hills Bancorp Inc. | 6 | 133 | ||||
| BGC Partners Inc. | 21 | 98 | ||||
| BioMed Realty Trust Inc. | 48 | 753 | ||||
| BlackRock Kelso Capital Corp. | 7 | 59 | ||||
| Boston Private Financial Holdings Inc. (e) | 35 | 203 | ||||
| Bridge Bancorp Inc. (e) | 3 | 78 | ||||
| Broadpoint Gleacher Securities Inc. (c) (e) | 27 | 122 | ||||
| Brookline Bancorp Inc. | 30 | 300 | ||||
| Brooklyn Federal BanCorp Inc. | 1 | 10 | ||||
| Bryn Mawr Bank Corp. | 3 | 49 | ||||
| Calamos Asset Management Inc. | 10 | 113 | ||||
| California First National Bancorp. | 1 | 12 | ||||
| Camden National Corp. | 4 | 118 | ||||
| Cape Bancorp Inc. (c) (e) | 5 | 35 | ||||
| Capital City Bank Group Inc. | 5 | 74 | ||||
| Capital Southwest Corp. (e) | 1 | 110 | ||||
| CapLease Inc. (e) | 24 | 106 | ||||
| Capstead Mortgage Corp. | 32 | 440 | ||||
| Cardinal Financial Corp. | 13 | 116 | ||||
| Cardtronics Inc. (c) | 6 | 67 | ||||
| Care Investment Trust Inc. | 8 | 61 | ||||
| Cash America International Inc. | 15 | 522 | ||||
| Cathay General Bancorp (e) | 26 | 193 | ||||
| CBL & Associates Properties Inc. | 69 | 672 | ||||
| Cedar Shopping Centers Inc. | 19 | 129 | ||||
| Center Bancorp Inc. | 5 | 49 | ||||
| CenterState Banks of Florida Inc. | 8 | 85 | ||||
| Central Pacific Financial Corp. (c) (e) | 13 | 17 | ||||
| Century Bancorp. Inc. - Class A (e) | 2 | 35 | ||||
| Chemical Financial Corp. | 11 | 250 | ||||
| Cheviot Financial Corp. | 1 | 10 | ||||
| Chicopee Bancorp Inc. (c) | 3 | 36 | ||||
| China Housing & Land Development Inc. (c) (e) | 11 | 47 | ||||
| Citizens & Northern Corp. | 5 | 44 | ||||
| Citizens Holding Co. | 2 | 38 | ||||
| Citizens Inc. (c) | 17 | 111 | ||||
| Citizens Republic Bancorp Inc. (c) | 59 | 40 | ||||
| City Holdings Co. (e) | 8 | 266 | ||||
| Clifton Savings Bancorp Inc. | 5 | 45 | ||||
| CNA Surety Corp. (c) | 8 | 118 | ||||
| CNB Financial Corp. (e) | 4 | 61 | ||||
| CoBiz Financial Inc. | 10 | 48 | ||||
| Cogdell Spencer Inc. | 13 | 71 | ||||
| Cohen & Steers Inc. (e) | 8 | 184 | ||||
| Colonial Properties Trust | 31 | 363 | ||||
| Colony Financial Inc. | 6 | 120 | ||||
| Columbia Banking System Inc. | 15 | 236 | ||||
| Community Bank System Inc. (e) | 16 | 313 | ||||
| Community Trust Bancorp Inc. | 7 | 175 | ||||
| Compass Diversified Holdings | 11 | 143 | ||||
| CompuCredit Holdings Corp. (e) | 8 | 27 | ||||
| Conseco Inc. (c) | 93 | 463 | ||||
| Consolidated-Tomoka Land Co. (e) | 2 | 87 | ||||
| Cousins Properties Inc. | 38 | 288 | ||||
| Cowen Group Inc. - Class A (c) | 8 | 45 | ||||
| Crawford & Co. - Class B (c) | 11 | 44 | ||||
| Credit Acceptance Corp. (c) | 3 | 120 | ||||
| CreXus Investment Corp. (c) | 5 | 70 | ||||
| CVB Financial Corp. (e) | 43 | 374 | ||||
| Cypress Sharpridge Investments Inc. | 9 | 121 | ||||
| Danvers BanCorp Inc. (e) | 8 | 102 | ||||
| DCT Industrial Trust Inc. | 99 | 497 | ||||
| Delphi Financial Group Inc. | 23 | 522 | ||||
| Developers Diversified Realty Corp. | 76 | 703 | ||||
| Diamond Hill Investment Group Inc. | 1 | 78 | ||||
| DiamondRock Hospitality Co. | 59 | 498 | ||||
| Dime Community Bancshares Inc. | 12 | 141 | ||||
| Dollar Financial Corp. (c) | 11 | 269 | ||||
| Donegal Group Inc. | 5 | 81 | ||||
| Doral Financial Corp. (c) (e) | 2 | 6 | ||||
| Duff & Phelps Corp. - Class A | 8 | 149 | ||||
| DuPont Fabros Technology Inc. | 13 | 241 | ||||
| Dynex Capital Inc. | 5 | 43 | ||||
| E*Trade Financial Corp. (c) | 750 | 1,312 | ||||
| Eagle Bancorp Inc. (c) | 4 | 46 | ||||
| East West Bancorp Inc. (e) | 46 | 733 | ||||
| Eastern Insurance Holdings Inc. | 3 | 30 | ||||
| EastGroup Properties Inc. (e) | 13 | 488 | ||||
| Education Realty Trust Inc. | 30 | 145 | ||||
| eHealth Inc. (c) (e) | 12 | 190 | ||||
| EMC Insurance Group Inc. (e) | 3 | 56 | ||||
| Employer Holdings Inc. | 23 | 353 | ||||
| Encore Capital Group Inc. (c) | 7 | 118 | ||||
| Enstar Group Ltd. (c) | 3 | 253 | ||||
| Enterprise Bancorp Inc. (e) | 2 | 25 | ||||
| Enterprise Financial Services Corp. | 5 | 40 | ||||
| Entertainment Properties Trust (e) | 20 | 696 | ||||
| Epoch Holding Corp. | 6 | 61 | ||||
| Equity Lifestyle Properties Inc. (e) | 13 | 642 | ||||
| Equity One Inc. | 16 | 261 | ||||
| ESB Financial Corp. | 5 | 65 | ||||
| ESSA BanCorp Inc. | 7 | 81 | ||||
| Evercore Partners Inc. - Class A (e) | 6 | 192 | ||||
| Extra Space Storage Inc. (e) | 43 | 491 | ||||
| EZCORP Inc. - Class A (c) | 22 | 386 | ||||
| Farmers Capital Bank Corp. | 3 | 30 | ||||
| FBL Financial Group Inc. - Class A (e) | 7 | 132 | ||||
| FBR Capital Markets Corp. (c) | 9 | 58 | ||||
| FelCor Lodging Trust Inc. (c) | 32 | 115 | ||||
| Fifth Street Finance Corp. (e) | 15 | 160 | ||||
| Financial Federal Corp. | 13 | 365 | ||||
| Financial Institutions Inc. | 5 | 60 | ||||
| First Acceptance Corp. (c) (e) | 9 | 18 | ||||
| First Bancorp Inc. (e) | 11 | 160 | ||||
| First Bancorp Inc. Puerto Rico (e) | 38 | 87 | ||||
| First Busey Corp. (e) | 12 | 47 | ||||
| First California Financial Group Inc. (c) | 3 | 7 | ||||
| First Cash Financial Services Inc. (c) | 11 | 239 | ||||
| First Commonwealth Financial Corp. | 42 | 195 | ||||
| First Community Bancshares Inc. | 7 | 85 | ||||
| First Defiance Financial Corp. (e) | 4 | 40 | ||||
| First Financial Bancorp | 26 | 382 | ||||
| First Financial Bankshares Inc. (e) | 10 | 569 | ||||
| First Financial Corp. (e) | 6 | 170 | ||||
| First Financial Holdings Inc. (e) | 6 | 81 | ||||
| First Financial Northwest Inc. | 10 | 62 | ||||
| First Financial Service Corp. (e) | 2 | 16 | ||||
| First Industrial Realty Trust Inc. (c) | 21 | 108 | ||||
| First Marblehead Corp. (c) | 33 | 70 | ||||
| First Merchants Corp. | 10 | 57 | ||||
| First Mercury Financial Corp. | 7 | 101 | ||||
| First Midwest Bancorp Inc. | 25 | 272 | ||||
| First of Long Island Corp. (e) | 3 | 72 | ||||
| First Potomac Realty Trust | 13 | 163 | ||||
| First South Bancorp Inc. (e) | 4 | 40 | ||||
| FirstMerit Corp. (e) | 41 | 833 | ||||
| Flagstar Bancorp Inc. (c) (e) | 17 | 10 | ||||
| Flagstone Reinsurance Holdings Ltd. | 19 | 212 | ||||
| Flushing Financial Corp. | 16 | 178 | ||||
| FNB Corp. | 58 | 392 | ||||
| Forestar Group Inc. (c) (e) | 18 | 405 | ||||
| Fox Chase Bancorp Inc. (c) | 2 | 24 | ||||
| FPIC Insurance Group Inc. (c) | 4 | 137 | ||||
| Franklin Street Properties Corp. | 34 | 496 | ||||
| GAMCO Investors Inc. | 4 | 174 | ||||
| German American Bancorp Inc. (e) | 5 | 78 | ||||
| Getty Realty Corp. | 8 | 196 | ||||
| GFI Group Inc. | 31 | 144 | ||||
| Glacier Bancorp Inc. | 31 | 428 | ||||
| Gladstone Capital Corp. | 10 | 76 | ||||
| Gladstone Commercial Corp. | 4 | 50 | ||||
| Gladstone Investment Corp. | 11 | 49 | ||||
| Glimcher Realty Trust | 34 | 92 | ||||
| Government Properties Income Trust (e) | 6 | 141 | ||||
| Gramercy Capital Corp. (c) (e) | 22 | 58 | ||||
| Great Southern Bancorp Inc. (e) | 5 | 110 | ||||
| Greenlight Capital Re Ltd. (c) | 14 | 341 | ||||
| Guaranty Bancorp (c) | 25 | 33 | ||||
| Hallmark Financial Services Inc. (c) | 4 | 34 | ||||
| Hampton Roads Bankshares Inc. (e) | 8 | 14 | ||||
| Hancock Holding Co. | 14 | 605 | ||||
| Harleysville Group Inc. (e) | 6 | 198 | ||||
| Harleysville National Corp. | 21 | 133 | ||||
| Harris & Harris Group Inc. (c) | 11 | 52 | ||||
| Hatteras Financial Corp. (e) | 18 | 493 | ||||
| Healthcare Realty Trust Inc. | 29 | 620 | ||||
| Heartland Financial USA Inc. (e) | 6 | 89 | ||||
| Hercules Technology Growth Capital Inc. | 17 | 173 | ||||
| Heritage Financial Corp. | 2 | 34 | ||||
| Heritage Financial Group | 1 | 7 | ||||
| Hersha Hospitality Trust | 21 | 65 | ||||
| Highwoods Properties Inc. (e) | 35 | 1,181 | ||||
| Hilltop Holdings Inc. (c) (e) | 20 | 229 | ||||
| Home Bancorp Inc. (c) | 4 | 48 | ||||
| Home Bancshares Inc. | 9 | 220 | ||||
| Home Federal Bancorp Inc. (e) | 7 | 99 | ||||
| Home Properties Inc. | 16 | 765 | ||||
| Horace Mann Educators Corp. | 20 | 244 | ||||
| IberiaBank Corp. | 10 | 560 | ||||
| Independence Holding Co. | 4 | 21 | ||||
| Independent Bank Corp. (e) | 10 | 207 | ||||
| Infinity Property & Casualty Corp. | 7 | 276 | ||||
| Inland Real Estate Corp. | 35 | 284 | ||||
| International Assets Holding Corp. (c) | 6 | 88 | ||||
| International Bancshares Corp. | 26 | 500 | ||||
| Invesco Mortgage Capital Inc. | 5 | 111 | ||||
| Investors Bancorp Inc. (c) (e) | 24 | 265 | ||||
| Investors Real Estate Trust | 33 | 294 | ||||
| iStar Financial Inc. (c) (e) | 50 | 129 | ||||
| JMP Group Inc. | 6 | 61 | ||||
| Kansas City Life Insurance Co. | 2 | 64 | ||||
| Kayne Anderson Energy Development Co. | 5 | 71 | ||||
| KBW Inc. (c) | 17 | 465 | ||||
| Kearny Financial Corp. (e) | 9 | 86 | ||||
| Kentucky First Federal Bancorp. | 1 | 15 | ||||
| K-Fed Bancorp. (e) | 2 | 16 | ||||
| Kilroy Realty Corp. (e) | 22 | 666 | ||||
| Kite Realty Group Trust | 21 | 86 | ||||
| Knight Capital Group Inc. (c) | 47 | 717 | ||||
| Kohlberg Capital Corp. (e) | 10 | 44 | ||||
| LaBranche & Co. Inc. (c) | 26 | 74 | ||||
| Lakeland Bancorp Inc. | 10 | 62 | ||||
| Lakeland Financial Corp. | 6 | 101 | ||||
| LaSalle Hotel Properties (e) | 32 | 680 | ||||
| Legacy Bancorp Inc. (e) | 3 | 32 | ||||
| Lexington Realty Trust | 43 | 261 | ||||
| Life Partners Holdings Inc. (e) | 3 | 70 | ||||
| LTC Properties Inc. | 12 | 318 | ||||
| Maiden Holdings Ltd. | 24 | 172 | ||||
| Main Street Capital Corp. | 3 | 50 | ||||
| MainSource Financial Group Inc. (e) | 9 | 44 | ||||
| MarketAxess Holdings Inc. | 15 | 209 | ||||
| Max Capital Group Ltd. | 22 | 502 | ||||
| MB Financial Inc. | 25 | 501 | ||||
| MCG Capital Corp. (c) | 31 | 135 | ||||
| Meadowbrook Insurance Group Inc. | 29 | 212 | ||||
| Medallion Financial Corp. | 7 | 58 | ||||
| Medical Properties Trust Inc. | 41 | 409 | ||||
| Mercer Insurance Group Inc. | 2 | 45 | ||||
| Merchants Bancshares Inc. | 2 | 48 | ||||
| Meridian Interstate BanCorp Inc. (c) | 4 | 38 | ||||
| Metro Bancorp Inc. (c) (e) | 3 | 35 | ||||
| MF Global Ltd. (c) (e) | 48 | 333 | ||||
| MFA Financial Inc. | 140 | 1,029 | ||||
| MGIC Investment Corp. (c) (e) | 61 | 355 | ||||
| Mid-America Apartment Communities Inc. | 14 | 685 | ||||
| Midsouth Bancorp Inc. | 2 | 28 | ||||
| Mission West Properties Inc. | 12 | 83 | ||||
| Monmouth Real Estate Investment Corp. | 9 | 67 | ||||
| Montpelier Re Holdings Ltd. | 43 | 750 | ||||
| MVC Capital Inc. | 11 | 127 | ||||
| Nara Bancorp Inc. (c) | 13 | 152 | ||||
| NASB Financial Inc. (e) | 2 | 45 | ||||
| National Bankshares Inc. (e) | 4 | 102 | ||||
| National Financial Partners Corp. (c) | 20 | 163 | ||||
| National Health Investors Inc. | 13 | 470 | ||||
| National Interstate Corp. | 3 | 48 | ||||
| National Penn Bancshares Inc. | 64 | 371 | ||||
| National Retail Properties Inc. (e) | 40 | 850 | ||||
| National Western Life Insurance Co. | 1 | 192 | ||||
| Navigators Group Inc. (c) | 6 | 282 | ||||
| NBT Bancorp Inc. | 17 | 354 | ||||
| Nelnet Inc. - Class A | 9 | 156 | ||||
| NewAlliance Bancshares Inc. (e) | 52 | 625 | ||||
| NewStar Financial Inc. (c) | 13 | 52 | ||||
| NGP Capital Resources Co. | 11 | 92 | ||||
| Northeast Community Bancorp Inc. (e) | 3 | 17 | ||||
| Northfield Bancorp Inc. | 9 | 123 | ||||
| Northrim BanCorp Inc. | 3 | 47 | ||||
| NorthStar Realty Finance Corp. (e) | 30 | 103 | ||||
| Northwest Bancshares Inc. | 18 | 208 | ||||
| Norwood Financial Corp. | 1 | 24 | ||||
| NYMAGIC Inc. | 2 | 39 | ||||
| OceanFirst Financial Corp. | 4 | 47 | ||||
| Ocwen Financial Corp. (c) | 29 | 279 | ||||
| Ohio Valley Banc Corp. (e) | 2 | 38 | ||||
| Old National Bancorp (e) | 44 | 548 | ||||
| Old Point Financial Corp. (e) | 1 | 14 | ||||
| Old Second Bancorp Inc. (e) | 7 | 50 | ||||
| Omega Healthcare Investors Inc. | 40 | 780 | ||||
| Oppenheimer Holdings Inc. | 4 | 147 | ||||
| optionsXpress Holdings Inc. | 22 | 333 | ||||
| Oriental Financial Group Inc. (e) | 12 | 130 | ||||
| Oritani Financial Corp. | 5 | 72 | ||||
| Orrstown Financial Services Inc. | 3 | 92 | ||||
| Pacific Capital Bancorp (e) | 21 | 20 | ||||
| Pacific Continental Corp. | 6 | 69 | ||||
| PacWest Bancorp | 14 | 277 | ||||
| Park National Corp. (e) | 6 | 330 | ||||
| Parkway Properties Inc. | 10 | 218 | ||||
| Peapack Gladstone Financial Corp. | 4 | 53 | ||||
| PennantPark Investment Corp. | 11 | 101 | ||||
| Penns Woods Bancorp Inc. (e) | 2 | 55 | ||||
| Pennsylvania Real Estate Investment Trust (e) | 21 | 174 | ||||
| Pennymac Mortgage Investment Trust (c) | 8 | 135 | ||||
| Penson Worldwide Inc. (c) (e) | 9 | 83 | ||||
| Peoples Bancorp Inc. | 5 | 47 | ||||
| Peoples Financial Corp. (e) | 2 | 34 | ||||
| PHH Corp. (c) (e) | 28 | 443 | ||||
| Phoenix Cos. Inc. (c) | 60 | 168 | ||||
| Pico Holdings Inc. (c) | 11 | 376 | ||||
| Pinnacle Financial Partners Inc. (c) | 17 | 243 | ||||
| Piper Jaffray Cos. (c) | 10 | 504 | ||||
| Platinum Underwriters Holdings Ltd. | 26 | 980 | ||||
| PMA Capital Corp. (c) | 15 | 93 | ||||
| PMI Group Inc. (c) (e) | 34 | 85 | ||||
| Porter Bancorp Inc. (e) | 1 | 20 | ||||
| Portfolio Recovery Associates Inc. (c) | 8 | 351 | ||||
| Post Properties Inc. | 23 | 442 | ||||
| Potlatch Corp. | 19 | 617 | ||||
| PremierWest Bancorp (e) | 10 | 15 | ||||
| Presidential Life Corp. | 10 | 87 | ||||
| Primus Guaranty Ltd. (c) | 12 | 35 | ||||
| PrivateBancorp Inc. | 23 | 208 | ||||
| ProAssurance Corp. (c) (e) | 17 | 890 | ||||
| Prospect Capital Corp. (e) (u) | 27 | 315 | ||||
| Prosperity Bancshares Inc. (e) | 23 | 934 | ||||
| Provident Financial Services Inc. (e) | 31 | 325 | ||||
| Provident New York Bancorp | 18 | 156 | ||||
| Prudential Bancorp Inc. of Pennsylvania (e) | 2 | 17 | ||||
| PS Business Parks Inc. | 9 | 434 | ||||
| Pzena Investment Management Inc. (c) (e) | 4 | 32 | ||||
| QC Holdings Inc. | 2 | 8 | ||||
| Radian Group Inc. (e) | 43 | 311 | ||||
| RAIT Financial Trust (c) (e) | 31 | 41 | ||||
| Ramco-Gershenson Properties Trust | 14 | 135 | ||||
| Redwood Trust Inc. | 38 | 546 | ||||
| Renasant Corp. (e) | 10 | 138 | ||||
| Republic Bancorp Inc. - Class A | 4 | 91 | ||||
| Republic First Bancorp Inc. (c) | 3 | 14 | ||||
| Resource America Inc. - Class A | 6 | 24 | ||||
| Resource Capital Corp. | 13 | 65 | ||||
| Rewards Network Inc. | 3 | 36 | ||||
| RiskMetrics Group Inc. (c) (e) | 10 | 163 | ||||
| RLI Corp. (e) | 9 | 486 | ||||
| Rockville Financial Inc. (e) | 4 | 40 | ||||
| Roma Financial Corp. (e) | 4 | 53 | ||||
| S&T Bancorp Inc. (e) | 12 | 209 | ||||
| Safeguard Scientifics Inc. (c) (e) | 9 | 96 | ||||
| Safety Insurance Group Inc. | 7 | 239 | ||||
| Sanders Morris Harris Group Inc. | 9 | 48 | ||||
| Sandy Spring Bancorp Inc. (e) | 8 | 69 | ||||
| Santander BanCorp (c) | 2 | 28 | ||||
| Saul Centers Inc. | 3 | 108 | ||||
| SCBT Financial Corp. (e) | 6 | 165 | ||||
| SeaBright Insurance Holdings Inc. (c) | 10 | 117 | ||||
| Selective Insurance Group | 26 | 427 | ||||
| Shore Bancshares Inc. | 5 | 66 | ||||
| Sierra Bancorp | 4 | 32 | ||||
| Signature Bank (c) | 20 | 651 | ||||
| Simmons First National Corp. - Class A | 7 | 194 | ||||
| Smithtown Bancorp Inc. | 7 | 40 | ||||
| South Financial Group Inc. | 65 | 42 | ||||
| Southern Community Financial Corp. | 2 | 5 | ||||
| Southside Bancshares Inc. (e) | 6 | 121 | ||||
| Southwest Bancorp Inc. | 7 | 47 | ||||
| Sovran Self Storage Inc. | 12 | 413 | ||||
| Starwood Property Trust Inc. | 21 | 404 | ||||
| State Auto Financial Corp. | 7 | 124 | ||||
| State Bancorp. Inc. | 7 | 53 | ||||
| StellarOne Corp. | 11 | 107 | ||||
| Sterling Bancorp - NYS (e) | 8 | 59 | ||||
| Sterling Bancshares Inc. | 41 | 208 | ||||
| Sterling Financial Corp. / WA (c) (e) | 26 | 16 | ||||
| Stewart Information Services Corp. (e) | 8 | 90 | ||||
| Stifel Financial Corp. (c) (e) | 15 | 892 | ||||
| Strategic Hotels & Resorts Inc. (c) (e) | 36 | 66 | ||||
| Suffolk Bancorp (e) | 5 | 134 | ||||
| Sun Bancorp Inc. (c) | 6 | 24 | ||||
| Sun Communities Inc. | 8 | 154 | ||||
| Sunstone Hotel Investors Inc. (c) | 46 | 408 | ||||
| Susquehanna Bancshares Inc. (e) | 44 | 262 | ||||
| SVB Financial Group (c) | 19 | 805 | ||||
| SWS Group Inc. | 11 | 138 | ||||
| SY Bancorp Inc. | 6 | 138 | ||||
| Tanger Factory Outlet Centers Inc. | 20 | 787 | ||||
| Tejon Ranch Co. (c) (e) | 5 | 159 | ||||
| Territorial Bancorp Inc. (c) | 6 | 115 | ||||
| Teton Advisors Inc. (c) (f) | - | - | ||||
| Texas Capital Bancshares Inc. (c) | 18 | 246 | ||||
| Thomas Weisel Partners Group Inc. (c) | 10 | 38 | ||||
| TICC Capital Corp. | 12 | 71 | ||||
| Tompkins Financial Corp. | 4 | 167 | ||||
| Tower Bancorp Inc. | 2 | 56 | ||||
| Tower Group Inc. | 22 | 512 | ||||
| TowneBank (e) | 10 | 116 | ||||
| TradeStation Group Inc. (c) | 16 | 124 | ||||
| Transcontinental Realty Investors Inc. (c) (e) | 1 | 8 | ||||
| Tree.com Inc. (c) (e) | 3 | 26 | ||||
| Triangle Capital Corp. (e) | 3 | 40 | ||||
| Trico Bancshares (e) | 7 | 109 | ||||
| TrustCo Bank Corp. | 36 | 227 | ||||
| Trustmark Corp. (e) | 30 | 673 | ||||
| U.S. Global Investors Inc. | 6 | 76 | ||||
| UMB Financial Corp. | 16 | 617 | ||||
| UMH Properties Inc. | 4 | 33 | ||||
| Umpqua Holdings Corp. | 42 | 564 | ||||
| Union Bankshares Corp. | 10 | 123 | ||||
| United America Indemnity Ltd. (c) | 17 | 137 | ||||
| United Bankshares Inc. (e) | 19 | 375 | ||||
| United Community Banks Inc. (c) | 42 | 141 | ||||
| United Financial Bancorp Inc. | 7 | 97 | ||||
| United Fire & Casualty Co. | 10 | 190 | ||||
| United Security Bancshares / AL | 3 | 47 | ||||
| Universal Health Realty Income Trust | 6 | 177 | ||||
| Universal Insurance Holdings Inc. (e) | 6 | 33 | ||||
| Univest Corp. of Pennsylvania | 8 | 138 | ||||
| Urstadt Biddle Properties Inc. - Class A | 10 | 147 | ||||
| U-Store-It Trust | 41 | 301 | ||||
| ViewPoint Financial Group | 5 | 70 | ||||
| Virtus Investment Partners Inc. (c) | 3 | 49 | ||||
| Walter Investment Management Corp. | 9 | 130 | ||||
| Washington Banking Co. | 4 | 50 | ||||
| Washington Real Estate Investment Trust (e) | 29 | 804 | ||||
| Washington Trust Bancorp Inc. (e) | 7 | 103 | ||||
| Waterstone Financial Inc. (c) | 3 | 7 | ||||
| Webster Financial Corp. | 33 | 392 | ||||
| WesBanco Inc. | 12 | 142 | ||||
| West Bancorp Inc. | 8 | 37 | ||||
| Westamerica Bancorporation (e) | 15 | 811 | ||||
| Western Alliance Bancorp (c) | 23 | 87 | ||||
| Westfield Financial Inc. | 15 | 125 | ||||
| Westwood Holdings Group Inc. | 3 | 95 | ||||
| Wilber Corp. (e) | 3 | 19 | ||||
| Wilshire Bancorp Inc. (e) | 10 | 78 | ||||
| Winthrop Realty Trust | 6 | 65 | ||||
| Wintrust Financial Corp. | 12 | 376 | ||||
| World Acceptance Corp. (c) (e) | 8 | 282 | ||||
| WSFS Financial Corp. (e) | 3 | 74 | ||||
| Yadkin Valley Financial Corp. | 8 | 28 | ||||
| Zenith National Insurance Corp. | 18 | 542 | ||||
| 92,284 | ||||||
| HEALTH CARE - 13.6% | ||||||
| Abaxis Inc. (c) | 11 | 288 | ||||
| Abiomed Inc. (c) (e) | 15 | 133 | ||||
| Accelrys Inc. (c) | 13 | 74 | ||||
| Accuray Inc. (c) (e) | 19 | 104 | ||||
| Acorda Therapeutics Inc. (c) | 19 | 468 | ||||
| Acura Pharmaceuticals Inc. (c) (e) | 4 | 20 | ||||
| Adolor Corp. (c) (e) | 21 | 31 | ||||
| Affymax Inc. (c) | 6 | 157 | ||||
| Affymetrix Inc. (c) | 33 | 196 | ||||
| AGA Medical Holdings Inc. (c) | 5 | 76 | ||||
| Air Methods Corp. (c) | 5 | 172 | ||||
| Akorn Inc. (c) (e) | 30 | 54 | ||||
| Albany Molecular Research Inc. (c) | 11 | 100 | ||||
| Align Technology Inc. (c) | 29 | 525 | ||||
| Alkermes Inc. (c) (e) | 46 | 433 | ||||
| Alliance HealthCare Services Inc. (c) (e) | 12 | 70 | ||||
| Allied Healthcare International Inc. (c) | 20 | 58 | ||||
| Allion Healthcare Inc. (c) | 11 | 69 | ||||
| Allos Therapeutics Inc. (c) | 29 | 193 | ||||
| Almost Family Inc. (c) | 3 | 132 | ||||
| Alnylam Pharmaceuticals Inc. (c) | 18 | 325 | ||||
| Alphatec Holdings Inc. (c) | 14 | 75 | ||||
| AMAG Pharmaceuticals Inc. (c) (e) | 9 | 332 | ||||
| Amedisys Inc. (c) (e) | 13 | 648 | ||||
| America Service Group Inc. | 4 | 58 | ||||
| American Caresource Holdings Inc. (c) | 5 | 12 | ||||
| American Dental Partners Inc. (c) | 8 | 101 | ||||
| American Medical Systems Holdings Inc. (c) | 36 | 693 | ||||
| AMERIGROUP Corp. (c) | 26 | 694 | ||||
| AMICAS Inc. (c) | 16 | 85 | ||||
| Amicus Therapeutics Inc. (c) | 7 | 26 | ||||
| AMN Healthcare Services Inc. (c) | 16 | 141 | ||||
| Amsurg Corp. (c) | 15 | 333 | ||||
| Analogic Corp. | 6 | 236 | ||||
| AngioDynamics Inc. (c) | 11 | 185 | ||||
| Ardea Biosciences Inc. (c) | 7 | 103 | ||||
| Arena Pharmaceuticals Inc. (c) (e) | 48 | 172 | ||||
| Ariad Pharmaceuticals Inc. (c) | 60 | 136 | ||||
| ArQule Inc. (c) | 20 | 72 | ||||
| Array BioPharma Inc. (c) | 26 | 73 | ||||
| ARYx Therapeutics Inc. (c) | 9 | 30 | ||||
| Assisted Living Concepts Inc. (c) (e) | 5 | 125 | ||||
| athenahealth Inc. (c) (e) | 16 | 738 | ||||
| Atrion Corp. | 1 | 111 | ||||
| ATS Medical Inc. (c) | 25 | 80 | ||||
| Auxilium Pharmaceuticals Inc. (c) | 21 | 623 | ||||
| AVANIR Pharmaceuticals (c) | 32 | 61 | ||||
| AVI BioPharma Inc. (c) (e) | 55 | 80 | ||||
| BioCryst Pharmaceuticals Inc. (c) (e) | 11 | 71 | ||||
| Biodel Inc. (c) | 6 | 28 | ||||
| BioDelivery Sciences International Inc. (c) (e) | 4 | 17 | ||||
| BioMimetic Therapeutics Inc. (c) (e) | 7 | 85 | ||||
| Bio-Reference Labs Inc. (c) | 6 | 218 | ||||
| BioScrip Inc. (c) | 21 | 178 | ||||
| BioSpecifics Technologies Corp. (c) | 2 | 47 | ||||
| BMP Sunstone Corp. (c) (e) | 15 | 86 | ||||
| Bovie Medical Corp. (c) (e) | 9 | 70 | ||||
| Bruker Corp. (c) | 24 | 290 | ||||
| Cadence Pharmaceuticals Inc. (c) (e) | 13 | 121 | ||||
| Cambrex Corp. (c) | 16 | 91 | ||||
| Cantel Medical Corp. | 6 | 119 | ||||
| Capital Senior Living Corp. (c) | 11 | 58 | ||||
| Caraco Pharmaceutical Laboratories Ltd. (c) | 5 | 31 | ||||
| Cardiac Science Corp. (c) | 11 | 24 | ||||
| CardioNet Inc. (c) | 13 | 75 | ||||
| Cardiovascular Systems Inc. (c) | 4 | 19 | ||||
| Cardium Therapeutics Inc. (c) | 17 | 12 | ||||
| Catalyst Health Solutions Inc. (c) | 18 | 652 | ||||
| Celera Corp. (c) | 39 | 268 | ||||
| Cell Therapeutics Inc. (c) (e) | 244 | 279 | ||||
| Celldex Therapeutics Inc. (c) | 14 | 65 | ||||
| Centene Corp. (c) | 21 | 448 | ||||
| Cepheid Inc. (c) (e) | 29 | 367 | ||||
| Chelsea Therapeutics International Inc. (c) | 10 | 28 | ||||
| Chemed Corp. | 11 | 529 | ||||
| Chindex International Inc. (c) (e) | 6 | 85 | ||||
| Clarient Inc. (c) | 13 | 34 | ||||
| Clinical Data Inc. (c) (e) | 6 | 110 | ||||
| Computer Programs & Systems Inc. | 5 | 212 | ||||
| Conceptus Inc. (c) | 16 | 294 | ||||
| Conmed Corp. (c) | 15 | 338 | ||||
| Continucare Corp. (c) | 13 | 55 | ||||
| Cornerstone Therapeutics Inc. (c) | 3 | 18 | ||||
| Corvel Corp. (c) | 3 | 111 | ||||
| Cross Country Healthcare Inc. (c) | 15 | 144 | ||||
| CryoLife Inc. (c) | 13 | 83 | ||||
| Cubist Pharmaceuticals Inc. (c) | 28 | 532 | ||||
| Cumberland Pharmaceuticals Inc. (c) | 5 | 66 | ||||
| Curis Inc. (c) (e) | 28 | 91 | ||||
| Cutera Inc. (c) (e) | 6 | 50 | ||||
| Cyberonics Inc. (c) | 13 | 262 | ||||
| Cynosure Inc. (c) (e) | 6 | 67 | ||||
| Cypress Bioscience Inc. (c) | 18 | 104 | ||||
| Cytokinetics Inc. (c) | 20 | 57 | ||||
| Cytori Therapeutics Inc. (c) (e) | 13 | 81 | ||||
| Delcath Systems Inc. (c) | 10 | 52 | ||||
| DepoMed Inc. (c) | 25 | 82 | ||||
| DexCom Inc. (c) | 21 | 173 | ||||
| Dionex Corp. (c) | 9 | 658 | ||||
| Discovery Laboratories Inc. (c) | 29 | 18 | ||||
| Durect Corp. (c) | 39 | 96 | ||||
| Dyax Corp. (c) | 30 | 102 | ||||
| Eclipsys Corp. (c) | 27 | 508 | ||||
| Electro-Optical Sciences Inc. (c) (e) | 11 | 114 | ||||
| Emergency Medical Services Corp. (c) | 14 | 738 | ||||
| Emergent BioSolutions Inc. (c) | 8 | 103 | ||||
| Emeritus Corp. (c) (e) | 9 | 176 | ||||
| Endologix Inc. (c) (e) | 23 | 119 | ||||
| Ensign Group Inc. (e) | 5 | 78 | ||||
| EnteroMedics Inc. (c) | 7 | 4 | ||||
| Enzo Biochem Inc. (c) | 15 | 82 | ||||
| Enzon Pharmaceuticals Inc. (c) (e) | 22 | 233 | ||||
| eResearch Technology Inc. (c) | 20 | 121 | ||||
| ev3 Inc. (c) | 38 | 502 | ||||
| ExacTech Inc. (c) | 4 | 66 | ||||
| Exelixis Inc. (c) (e) | 55 | 402 | ||||
| Facet Biotech Corp. (c) (e) | 12 | 203 | ||||
| Genomic Health Inc. (c) | 7 | 129 | ||||
| Genoptix Inc. (c) (e) | 8 | 298 | ||||
| Gentiva Health Services Inc. (c) | 15 | 398 | ||||
| Geron Corp. (c) (e) | 44 | 243 | ||||
| Greatbatch Inc. (c) | 11 | 211 | ||||
| GTx Inc. (c) (e) | 9 | 38 | ||||
| Haemonetics Corp. (c) | 13 | 710 | ||||
| Halozyme Therapeutics Inc. (c) | 35 | 206 | ||||
| Hanger Orthopedic Group Inc. (c) | 13 | 176 | ||||
| Hansen Medical Inc. (c) | 13 | 39 | ||||
| Harvard Bioscience Inc. (c) | 11 | 39 | ||||
| Health Grades Inc. (c) | 10 | 45 | ||||
| HealthSouth Corp. (c) (e) | 43 | 807 | ||||
| HealthSpring Inc. (c) | 25 | 441 | ||||
| Healthways Inc. (c) | 17 | 304 | ||||
| HeartWare International Inc. (c) | 2 | 71 | ||||
| Hemispherx Biopharma Inc. (c) (e) | 56 | 31 | ||||
| Hi-Tech Pharmacal Co. Inc. (c) (e) | 4 | 101 | ||||
| HMS Holdings Corp. (c) | 13 | 613 | ||||
| Home Diagnostics Inc. (c) | 5 | 31 | ||||
| Human Genome Sciences Inc. (c) (e) | 88 | 2,689 | ||||
| ICU Medical Inc. (c) | 6 | 218 | ||||
| Idenix Pharmaceuticals Inc. (c) | 13 | 28 | ||||
| Idera Pharmaceuticals Inc. (c) (e) | 10 | 50 | ||||
| Immucor Inc. (c) | 34 | 695 | ||||
| Immunogen Inc. (c) (e) | 30 | 233 | ||||
| Immunomedics Inc. (c) | 33 | 106 | ||||
| Impax Laboratories Inc. (c) | 30 | 410 | ||||
| Incyte Corp. (c) (e) | 34 | 310 | ||||
| Infinity Pharmaceuticals Inc. (c) (e) | 8 | 49 | ||||
| Insmed Inc. (c) | 53 | 41 | ||||
| Inspire Pharmaceuticals Inc. (c) | 33 | 180 | ||||
| Insulet Corp. (c) (e) | 12 | 173 | ||||
| Integra LifeSciences Holdings Corp. (c) | 10 | 355 | ||||
| InterMune Inc. (c) | 19 | 246 | ||||
| Invacare Corp. (e) | 14 | 357 | ||||
| inVentiv Health Inc. (c) | 17 | 277 | ||||
| IPC The Hospitalist Co. Inc. (c) | 8 | 267 | ||||
| IRIS International Inc. (c) | 8 | 104 | ||||
| Isis Pharmaceuticals Inc. (c) | 45 | 502 | ||||
| Ista Pharmaceuticals Inc. (c) | 17 | 79 | ||||
| Javelin Pharmaceuticals Inc. (c) | 22 | 28 | ||||
| Kendle International Inc. (c) | 7 | 128 | ||||
| Kensey Nash Corp. (c) | 4 | 98 | ||||
| Kindred Healthcare Inc. (c) | 19 | 356 | ||||
| KV Pharmaceutical Co. - Class A (c) | 17 | 64 | ||||
| Landauer Inc. | 5 | 296 | ||||
| Lannett Co. Inc. (c) | 4 | 26 | ||||
| LCA-Vision Inc. (c) | 7 | 38 | ||||
| Lexicon Pharmaceuticals Inc. (c) | 37 | 62 | ||||
| LHC Group Inc. (c) | 8 | 255 | ||||
| Ligand Pharmaceuticals Inc. - Class B (c) | 53 | 116 | ||||
| Luminex Corp. (c) | 21 | 316 | ||||
| Magellan Health Services Inc. (c) | 17 | 700 | ||||
| MAKO Surgical Corp. (c) (e) | 9 | 96 | ||||
| MannKind Corp. (c) (e) | 31 | 268 | ||||
| MAP Pharmaceuticals Inc. (c) | 3 | 33 | ||||
| Martek Biosciences Corp. (c) (e) | 17 | 321 | ||||
| Masimo Corp. (c) | 25 | 751 | ||||
| Matrixx Initiatives Inc. (c) (e) | 4 | 18 | ||||
| Maxygen Inc. (c) | 11 | 69 | ||||
| MedAssets Inc. (c) (e) | 19 | 409 | ||||
| MedCath Corp. (c) (e) | 7 | 54 | ||||
| Medical Action Industries Inc. (c) | 7 | 117 | ||||
| Medicines Co. (c) | 25 | 207 | ||||
| Medicis Pharmaceutical Corp. | 29 | 777 | ||||
| Medidata Solutions Inc. (c) | 2 | 38 | ||||
| Medivation Inc. (c) (e) | 14 | 532 | ||||
| MedQuist Inc. (e) | 4 | 26 | ||||
| Merge Healthcare Inc. (c) | 11 | 37 | ||||
| Meridian Bioscience Inc. | 20 | 442 | ||||
| Merit Medical Systems Inc. (c) | 14 | 278 | ||||
| Metabolix Inc. (c) (e) | 9 | 101 | ||||
| Metropolitan Health Networks Inc. (c) (e) | 18 | 36 | ||||
| Micromet Inc. (c) (e) | 30 | 203 | ||||
| Micrus Endovascular Corp. (c) | 8 | 124 | ||||
| MiddleBrook Pharmaceuticals Inc. (c) (e) | 17 | 9 | ||||
| Molecular Insight Pharmaceuticals Inc. (c) (e) | 7 | 16 | ||||
| Molina Healthcare Inc. (c) | 6 | 143 | ||||
| Momenta Pharmaceuticals Inc. (c) | 18 | 222 | ||||
| MWI Veterinary Supply Inc. (c) | 5 | 192 | ||||
| Myriad Pharmaceuticals Inc. (c) | 11 | 53 | ||||
| Nabi Biopharmaceuticals (c) | 23 | 112 | ||||
| Nanosphere Inc. (c) | 7 | 42 | ||||
| National Healthcare Corp. | 4 | 156 | ||||
| National Research Corp. | 1 | 16 | ||||
| Natus Medical Inc. (c) | 13 | 195 | ||||
| Nektar Therapeutics (c) | 47 | 438 | ||||
| Neogen Corp. (c) (e) | 9 | 219 | ||||
| Neurocrine Biosciences Inc. (c) | 19 | 50 | ||||
| NeurogesX Inc. (c) (e) | 5 | 36 | ||||
| Nighthawk Radiology Holdings Inc. (c) | 10 | 44 | ||||
| NovaMed Inc. (c) (e) | 9 | 34 | ||||
| Novavax Inc. (c) (e) | 31 | 84 | ||||
| NPS Pharmaceuticals Inc. (c) | 22 | 76 | ||||
| NuVasive Inc. (c) (e) | 18 | 585 | ||||
| NxStage Medical Inc. (c) (e) | 12 | 103 | ||||
| Obagi Medical Products Inc. (c) | 9 | 114 | ||||
| Odyssey HealthCare Inc. (c) | 16 | 244 | ||||
| Omeros Corp. (c) | 3 | 23 | ||||
| Omnicell Inc. (c) | 15 | 174 | ||||
| OncoGenex Pharmaceutical Inc. (c) (e) | 3 | 56 | ||||
| Onyx Pharmaceuticals Inc. (c) (e) | 31 | 907 | ||||
| Opko Health Inc. (c) | 18 | 33 | ||||
| Optimer Pharmaceuticals Inc. (c) (e) | 14 | 161 | ||||
| OraSure Technologies Inc. (c) | 22 | 110 | ||||
| Orexigen Therapeutics Inc. (c) | 15 | 110 | ||||
| Orthofix International NV (c) | 8 | 253 | ||||
| Orthovita Inc. (c) (e) | 31 | 110 | ||||
| Osiris Therapeutics Inc. (c) (e) | 8 | 56 | ||||
| Owens & Minor Inc. (e) | 21 | 895 | ||||
| OXiGENE Inc. (c) (e) | 12 | 14 | ||||
| Pain Therapeutics Inc. (c) | 16 | 86 | ||||
| Palomar Medical Technologies Inc. (c) | 9 | 93 | ||||
| Par Pharmaceutical Cos. Inc. (c) | 18 | 479 | ||||
| Parexel International Corp. (c) | 29 | 413 | ||||
| PDL BioPharma Inc. | 58 | 400 | ||||
| Pharmasset Inc. (c) (e) | 10 | 203 | ||||
| PharMerica Corp. (c) | 16 | 249 | ||||
| Phase Forward Inc. (c) (e) | 22 | 340 | ||||
| Poniard Pharmaceuticals Inc. (c) (e) | 12 | 22 | ||||
| Pozen Inc. (c) | 13 | 81 | ||||
| Progenics Pharmaceuticals Inc. (c) (e) | 12 | 53 | ||||
| Protalix BioTherapeutics Inc. (c) (e) | 18 | 117 | ||||
| Providence Services Corp. (c) | 6 | 92 | ||||
| PSS World Medical Inc. (c) (e) | 29 | 653 | ||||
| Psychiatric Solutions Inc. (c) | 27 | 578 | ||||
| Questcor Pharmaceuticals Inc. (c) | 27 | 127 | ||||
| Quidel Corp. (c) | 12 | 168 | ||||
| RadNet Inc. (c) (e) | 14 | 28 | ||||
| Regeneron Pharmaceuticals Inc. (c) | 31 | 742 | ||||
| RehabCare Group Inc. (c) | 11 | 342 | ||||
| Repligen Corp. (c) | 14 | 56 | ||||
| Repros Therapeutics Inc. (c) | 4 | 3 | ||||
| Res-Care Inc. (c) | 12 | 131 | ||||
| Rigel Pharmaceuticals Inc. (c) | 26 | 250 | ||||
| Rochester Medical Corp. (c) | 4 | 48 | ||||
| Rockwell Medical Technologies Inc. (c) (e) | 6 | 48 | ||||
| RTI Biologics Inc. (c) | 26 | 98 | ||||
| Salix Pharmaceuticals Ltd. (c) | 26 | 660 | ||||
| Sangamo Biosciences Inc. (c) (e) | 19 | 114 | ||||
| Santarus Inc. (c) | 27 | 125 | ||||
| Savient Pharmaceuticals Inc. (c) | 30 | 404 | ||||
| Sciclone Pharmaceuticals Inc. (c) (e) | 16 | 37 | ||||
| Seattle Genetics Inc. (c) | 40 | 409 | ||||
| Select Medical Holdings Corp. (c) | 14 | 150 | ||||
| Sequenom Inc. (c) (e) | 29 | 120 | ||||
| SIGA Technologies Inc. (c) (e) | 13 | 77 | ||||
| Sirona Dental Systems Inc. (c) | 8 | 254 | ||||
| Skilled Healthcare Group Inc. (c) | 9 | 69 | ||||
| Somanetics Corp. (c) | 6 | 97 | ||||
| SonoSite Inc. (c) (e) | 9 | 210 | ||||
| Spectranetics Corp. (c) | 15 | 105 | ||||
| Spectrum Pharmaceuticals Inc. (c) (e) | 24 | 106 | ||||
| StemCells Inc. (c) (e) | 54 | 67 | ||||
| Stereotaxis Inc. (c) (e) | 15 | 57 | ||||
| STERIS Corp. (e) | 29 | 818 | ||||
| Sucampo Pharmaceuticals Inc. (c) | 4 | 18 | ||||
| Sun Healthcare Group Inc. (c) | 22 | 199 | ||||
| Sunrise Senior Living Inc. (c) | 25 | 80 | ||||
| SuperGen Inc. (c) | 31 | 82 | ||||
| SurModics Inc. (c) (e) | 7 | 168 | ||||
| Symmetry Medical Inc. (c) | 17 | 136 | ||||
| Synovis Life Technologies Inc. (c) | 5 | 71 | ||||
| Synta Pharmaceuticals Corp. (c) | 8 | 40 | ||||
| Theravance Inc. (c) | 27 | 354 | ||||
| Thoratec Corp. (c) (e) | 28 | 762 | ||||
| TomoTherapy Inc. (c) | 22 | 86 | ||||
| TranS1 Inc. (c) (e) | 6 | 25 | ||||
| Transcend Services Inc. (c) | 3 | 59 | ||||
| Triple-S Management Corp. (c) (e) | 10 | 182 | ||||
| Universal American Corp. (c) | 14 | 163 | ||||
| US Physical Therapy Inc. (c) | 6 | 104 | ||||
| Utah Medical Products Inc. | 1 | 42 | ||||
| Vanda Pharmaceuticals Inc. (c) | 13 | 150 | ||||
| Varian Inc. (c) | 14 | 711 | ||||
| Vascular Solutions Inc. (c) | 7 | 59 | ||||
| Vical Inc. (c) (e) | 24 | 80 | ||||
| ViroPharma Inc. (c) | 37 | 313 | ||||
| Virtual Radiologic Corp. (c) | 3 | 37 | ||||
| Vital Images Inc. (c) | 7 | 86 | ||||
| Vivus Inc. (c) (e) | 41 | 377 | ||||
| Volcano Corp. (c) (e) | 25 | 427 | ||||
| WellCare Health Plans Inc. (c) | 21 | 763 | ||||
| West Pharmaceutical Services Inc. (e) | 16 | 626 | ||||
| Wright Medical Group Inc. (c) | 19 | 369 | ||||
| XenoPort Inc. (c) | 15 | 285 | ||||
| Young Innovations Inc. | 3 | 72 | ||||
| Zoll Medical Corp. (c) | 10 | 264 | ||||
| ZymoGenetics Inc. (c) | 18 | 112 | ||||
| 64,287 | ||||||
| INDUSTRIALS - 15.3% | ||||||
| 3D Systems Corp. (c) | 8 | 95 | ||||
| AAON Inc. | 6 | 113 | ||||
| AAR Corp. (c) | 20 | 452 | ||||
| ABM Industries Inc. (e) | 22 | 463 | ||||
| Acacia Research Corp. (c) | 16 | 148 | ||||
| ACCO Brands Corp. (c) | 28 | 200 | ||||
| Aceto Corp. | 11 | 59 | ||||
| Actuant Corp. - Class A (e) | 34 | 632 | ||||
| Acuity Brands Inc. | 22 | 771 | ||||
| Administaff Inc. | 10 | 246 | ||||
| Advanced Battery Technologies Inc. (c) (e) | 29 | 114 | ||||
| Advisory Board Co. (c) | 8 | 237 | ||||
| AeroVironment Inc. (c) | 6 | 180 | ||||
| Air Transport Services Group Inc (c) | 29 | 76 | ||||
| Aircastle Ltd. | 22 | 220 | ||||
| AirTran Holdings Inc. (c) | 62 | 322 | ||||
| Alamo Group Inc. | 3 | 58 | ||||
| Alaska Air Group Inc. (c) | 18 | 636 | ||||
| Albany International Corp. | 13 | 292 | ||||
| Allegiant Travel Co. (c) (e) | 8 | 355 | ||||
| Altra Holdings Inc. (c) | 14 | 167 | ||||
| AMERCO (c) | 5 | 224 | ||||
| American Commercial Lines Inc. (c) (e) | 4 | 78 | ||||
| American Ecology Corp. | 8 | 144 | ||||
| American Railcar Industries Inc. | 4 | 47 | ||||
| American Reprographics Co. (c) | 17 | 121 | ||||
| American Science & Engineering Inc. | 5 | 353 | ||||
| American Superconductor Corp. (c) | 21 | 865 | ||||
| American Woodmark Corp. | 5 | 93 | ||||
| Ameron International Corp. | 5 | 288 | ||||
| Ampco-Pittsburgh Corp. | 4 | 124 | ||||
| Amrep Corp. (c) | 1 | 7 | ||||
| AO Smith Corp. | 11 | 466 | ||||
| APAC Customer Services Inc. (c) | 14 | 84 | ||||
| Apogee Enterprises Inc. (e) | 14 | 195 | ||||
| Applied Industrial Technologies Inc. | 21 | 456 | ||||
| Applied Signal Technology Inc. | 6 | 118 | ||||
| Argan Inc. (c) (e) | 3 | 46 | ||||
| Argon ST Inc. (c) | 6 | 138 | ||||
| Arkansas Best Corp. | 12 | 367 | ||||
| Ascent Solar Technologies Inc. (c) (e) | 7 | 36 | ||||
| Astec Industries Inc. (c) | 9 | 231 | ||||
| Astronics Corp. (c) (e) | 4 | 35 | ||||
| ATC Technology Corp. (c) | 9 | 224 | ||||
| Atlas Air Worldwide Holdings Inc. (c) | 10 | 355 | ||||
| Avis Budget Group Inc. (c) (e) | 50 | 656 | ||||
| AZZ Inc. (c) | 6 | 190 | ||||
| Badger Meter Inc. | 8 | 303 | ||||
| Baldor Electric Co. (e) | 23 | 637 | ||||
| Barnes Group Inc. (e) | 22 | 380 | ||||
| Barrett Business Services Inc. | 3 | 42 | ||||
| Beacon Roofing Supply Inc. (c) | 22 | 355 | ||||
| Belden Inc. | 23 | 514 | ||||
| Blount International Inc. (c) | 18 | 183 | ||||
| BlueLinx Holdings Inc. (c) (e) | 5 | 15 | ||||
| Bowne & Co. Inc. | 20 | 137 | ||||
| Brady Corp. - Class A | 23 | 700 | ||||
| Briggs & Stratton Corp. | 25 | 471 | ||||
| Broadwind Energy Inc. (c) (e) | 16 | 127 | ||||
| Builders FirstSource Inc. (c) (e) | 9 | 33 | ||||
| CAI International Inc. (c) | 5 | 43 | ||||
| Cascade Corp. | 5 | 129 | ||||
| CBIZ Inc. (c) | 21 | 165 | ||||
| CDI Corp. | 5 | 69 | ||||
| Celadon Group Inc. (c) | 10 | 110 | ||||
| Cenveo Inc. (c) | 28 | 245 | ||||
| Ceradyne Inc. (c) | 12 | 234 | ||||
| Chart Industries Inc. (c) | 15 | 241 | ||||
| Chase Corp. (e) | 3 | 32 | ||||
| China BAK Battery Inc. (c) (e) | 18 | 49 | ||||
| China Fire & Security Group Inc. (c) (e) | 7 | 97 | ||||
| CIRCOR International Inc. | 8 | 202 | ||||
| CLARCOR Inc. | 26 | 828 | ||||
| Clean Harbors Inc. (c) | 11 | 643 | ||||
| Colfax Corp. (c) | 11 | 134 | ||||
| Columbus Mckinnon Corp. (c) | 10 | 137 | ||||
| Comfort Systems USA Inc. | 18 | 227 | ||||
| COMSYS IT Partners Inc. (c) | 7 | 64 | ||||
| Consolidated Graphics Inc. (c) | 5 | 162 | ||||
| Cornell Cos. Inc. (c) (e) | 5 | 118 | ||||
| Corporate Executive Board Co. | 17 | 384 | ||||
| CoStar Group Inc. (c) (e) | 10 | 421 | ||||
| Courier Corp. | 5 | 69 | ||||
| CRA International Inc. (c) (e) | 5 | 137 | ||||
| Cubic Corp. | 8 | 299 | ||||
| Curtiss-Wright Corp. | 23 | 710 | ||||
| Deluxe Corp. | 26 | 384 | ||||
| Diamond Management & Technology Consultants Inc. (e) | 11 | 77 | ||||
| DigitalGlobe Inc. (c) | 7 | 181 | ||||
| Dollar Thrifty Automotive Group Inc. (c) | 13 | 330 | ||||
| Ducommun Inc. | 5 | 92 | ||||
| Duoyuan Printing Inc. (c) | 4 | 34 | ||||
| DXP Enterprises Inc. (c) | 4 | 47 | ||||
| Dycom Industries Inc. (c) | 18 | 148 | ||||
| Dynamex Inc. (c) | 5 | 82 | ||||
| Dynamic Materials Corp. | 6 | 124 | ||||
| DynCorp International Inc. (c) | 12 | 169 | ||||
| Eagle Bulk Shipping Inc. (c) (e) | 33 | 162 | ||||
| Eastern Co. | 3 | 35 | ||||
| EMCOR Group Inc. (c) (e) | 33 | 888 | ||||
| Encore Wire Corp. | 9 | 181 | ||||
| Ener1 Inc. (c) (e) | 22 | 141 | ||||
| Energy Conversion Devices Inc. (c) (e) | 22 | 230 | ||||
| Energy Recovery Inc. (c) (e) | 17 | 118 | ||||
| EnergySolutions Inc. | 37 | 316 | ||||
| EnerNOC Inc. (c) | 7 | 221 | ||||
| EnerSys (c) | 20 | 432 | ||||
| Ennis Inc. | 12 | 205 | ||||
| EnPro Industries Inc. (c) (e) | 9 | 249 | ||||
| ESCO Technologies Inc. | 13 | 457 | ||||
| Esterline Technologies Corp. (c) | 15 | 608 | ||||
| Evergreen Solar Inc. (c) (e) | 94 | 141 | ||||
| Exponent Inc. (c) | 6 | 177 | ||||
| Federal Signal Corp. | 23 | 139 | ||||
| Flanders Corp. (c) (e) | 7 | 33 | ||||
| Flow International Corp. (c) | 18 | 55 | ||||
| Force Protection Inc. (c) | 33 | 172 | ||||
| Forward Air Corp. (e) | 15 | 370 | ||||
| Franklin Covey Co. (c) | 6 | 36 | ||||
| Franklin Electric Co. Inc. | 11 | 331 | ||||
| FreightCar America Inc. (e) | 6 | 111 | ||||
| Fuel Tech Inc. (c) | 8 | 67 | ||||
| FuelCell Energy Inc. (c) (e) | 39 | 147 | ||||
| Furmanite Corp. (c) | 19 | 72 | ||||
| Fushi Copperweld Inc. (c) | 8 | 81 | ||||
| G&K Services Inc. - Class A | 9 | 220 | ||||
| Genco Shipping & Trading Ltd. (c) (e) | 13 | 297 | ||||
| GenCorp Inc. (c) | 27 | 188 | ||||
| Genesee & Wyoming Inc. - Class A (c) | 19 | 611 | ||||
| Geo Group Inc. (c) | 26 | 564 | ||||
| GeoEye Inc. (c) | 9 | 244 | ||||
| Gibraltar Industries Inc. (c) | 13 | 198 | ||||
| Global Defense Technology & Systems Inc. (c) | 2 | 37 | ||||
| Gorman-Rupp Co. (e) | 7 | 192 | ||||
| GP Strategies Corp. (c) | 7 | 52 | ||||
| GrafTech International Ltd. (c) | 60 | 937 | ||||
| Graham Corp. | 5 | 104 | ||||
| Granite Construction Inc. | 17 | 562 | ||||
| Great Lakes Dredge & Dock Corp. | 18 | 117 | ||||
| Greenbrier Cos. Inc. (e) | 8 | 84 | ||||
| Griffon Corp. (c) | 22 | 265 | ||||
| GT Solar International Inc. (c) (e) | 15 | 82 | ||||
| H&E Equipment Services Inc. (c) | 14 | 145 | ||||
| Harbin Electric Inc. (c) | 8 | 166 | ||||
| Hawaiian Holdings Inc. (c) | 27 | 189 | ||||
| Healthcare Services Group Inc. (e) | 21 | 454 | ||||
| Heartland Express Inc. (e) | 24 | 371 | ||||
| HEICO Corp. | 11 | 502 | ||||
| Heidrick & Struggles International Inc. (e) | 8 | 254 | ||||
| Heritage-Crystal Clean Inc. (c) (e) | 1 | 13 | ||||
| Herley Industries Inc. (c) | 6 | 87 | ||||
| Herman Miller Inc. (e) | 26 | 420 | ||||
| Hexcel Corp. (c) | 49 | 632 | ||||
| Hill International Inc. (c) (e) | 12 | 77 | ||||
| HNI Corp. (e) | 23 | 624 | ||||
| Horizon Lines Inc. - Class A | 14 | 79 | ||||
| Houston Wire & Cable Co. (e) | 8 | 99 | ||||
| HUB Group Inc. - Class A (c) | 19 | 504 | ||||
| Hurco Cos. Inc. (c) | 3 | 42 | ||||
| Huron Consulting Group Inc. (c) | 11 | 242 | ||||
| ICF International Inc. (c) | 4 | 109 | ||||
| ICT Group Inc. (c) | 5 | 74 | ||||
| II-VI Inc. (c) | 13 | 403 | ||||
| InnerWorkings Inc. (c) | 14 | 81 | ||||
| Insituform Technologies Inc. - Class A (c) | 20 | 448 | ||||
| Insteel Industries Inc. (e) | 9 | 118 | ||||
| Integrated Electrical Services Inc. (c) | 4 | 22 | ||||
| Interface Inc. | 25 | 204 | ||||
| Interline Brands Inc. (c) | 17 | 289 | ||||
| International Shipholding Corp. | 3 | 85 | ||||
| JetBlue Airways Corp. (c) | 127 | 694 | ||||
| John Bean Technologies Corp. | 14 | 234 | ||||
| Kadant Inc. (c) | 6 | 98 | ||||
| Kaman Corp. - Class A | 13 | 304 | ||||
| Kaydon Corp. (e) | 16 | 579 | ||||
| Kelly Services Inc. - Class A (c) | 12 | 147 | ||||
| Kforce Inc. (c) | 15 | 185 | ||||
| Kimball International Inc. - Class B | 17 | 146 | ||||
| Knight Transportation Inc. (e) | 29 | 558 | ||||
| Knoll Inc. | 23 | 237 | ||||
| Korn/Ferry International (c) | 23 | 375 | ||||
| K-Tron International Inc. (c) | 1 | 127 | ||||
| LaBarge Inc. (c) | 6 | 70 | ||||
| Ladish Co. Inc. (c) | 8 | 123 | ||||
| Lawson Products Inc. | 2 | 38 | ||||
| Layne Christensen Co. (c) | 10 | 288 | ||||
| LB Foster Co. (c) | 5 | 148 | ||||
| Lihua International Inc. (c) | 2 | 16 | ||||
| Lindsay Corp. (e) | 6 | 232 | ||||
| LMI Aerospace Inc. (c) | 4 | 52 | ||||
| LSI Industries Inc. | 9 | 75 | ||||
| M&F Worldwide Corp. (c) | 5 | 203 | ||||
| Marten Transport Ltd. (c) | 7 | 131 | ||||
| MasTec Inc. (c) | 27 | 332 | ||||
| McGrath RentCorp | 11 | 251 | ||||
| Metalico Inc. (c) (e) | 14 | 71 | ||||
| Met-Pro Corp. | 8 | 82 | ||||
| Michael Baker Corp. (c) | 4 | 152 | ||||
| Microvision Inc. (c) (e) | 40 | 128 | ||||
| Middleby Corp. (c) | 8 | 392 | ||||
| Miller Industries Inc. (c) | 4 | 51 | ||||
| Mine Safety Appliances Co. | 13 | 347 | ||||
| Mistras Group Inc. (c) | 3 | 49 | ||||
| Mobile Mini Inc. (c) (e) | 18 | 257 | ||||
| Moog Inc. - Class A (c) | 21 | 606 | ||||
| MPS Group Inc. (c) | 46 | 639 | ||||
| Mueller Industries Inc. | 19 | 467 | ||||
| Mueller Water Products Inc. | 78 | 408 | ||||
| Multi-Color Corp. | 5 | 57 | ||||
| MYR Group Inc. (c) | 9 | 157 | ||||
| NACCO Industries Inc. - Class A | 3 | 132 | ||||
| Navigant Consulting Inc. (c) | 25 | 379 | ||||
| NCI Building Systems Inc. (c) | 11 | 20 | ||||
| Nordson Corp. | 17 | 1,028 | ||||
| North American Galvanizing & Coating Inc. (c) (e) | 6 | 27 | ||||
| Northwest Pipe Co. (c) | 4 | 118 | ||||
| Odyssey Marine Exploration Inc. (c) (e) | 26 | 37 | ||||
| Old Dominion Freight Line Inc. (c) | 14 | 417 | ||||
| Omega Flex Inc. (e) | 1 | 13 | ||||
| On Assignment Inc. (c) | 19 | 135 | ||||
| Orbital Sciences Corp. (c) | 28 | 421 | ||||
| Orion Energy Systems Inc. (c) | 8 | 35 | ||||
| Orion Marine Group Inc. (c) | 13 | 275 | ||||
| Otter Tail Corp. (e) | 18 | 446 | ||||
| Pacer International Inc. (c) | 18 | 57 | ||||
| Patriot Transportation Holding Inc. (c) | 1 | 62 | ||||
| Perma-Fix Environmental Services Inc. (c) | 24 | 54 | ||||
| Pike Electric Corp. (c) | 8 | 70 | ||||
| PMFG Inc. (c) (e) | 7 | 116 | ||||
| Polypore International Inc. (c) | 10 | 125 | ||||
| Portec Rail Products Inc. | 3 | 32 | ||||
| Powell Industries Inc. (c) | 4 | 114 | ||||
| Power-One Inc. (c) (e) | 36 | 157 | ||||
| PowerSecure International Inc. (c) | 8 | 59 | ||||
| Preformed Line Products Co. | 1 | 44 | ||||
| Primoris Services Corp. (e) | 3 | 28 | ||||
| Quanex Building Products Corp. | 19 | 327 | ||||
| RailAmerica Inc. (c) | 9 | 110 | ||||
| Raven Industries Inc. | 8 | 265 | ||||
| RBC Bearings Inc. (c) | 11 | 262 | ||||
| Regal-Beloit Corp. | 18 | 931 | ||||
| Republic Airways Holdings Inc. (c) | 16 | 120 | ||||
| Resources Connection Inc. (c) | 23 | 485 | ||||
| Robbins & Myers Inc. | 13 | 301 | ||||
| Rollins Inc. | 21 | 413 | ||||
| RSC Holdings Inc. (c) | 23 | 160 | ||||
| Rush Enterprises Inc. - Class A (c) (e) | 16 | 190 | ||||
| Saia Inc. (c) | 6 | 93 | ||||
| SatCon Technology Corp. (c) (e) | 23 | 64 | ||||
| Sauer-Danfoss Inc. (c) | 7 | 84 | ||||
| Schawk Inc. (e) | 7 | 100 | ||||
| School Specialty Inc. (c) | 9 | 212 | ||||
| Seaboard Corp. | - | 217 | ||||
| Simpson Manufacturing Co. Inc. | 19 | 500 | ||||
| SkyWest Inc. | 27 | 464 | ||||
| SmartHeat Inc. (c) (e) | 6 | 81 | ||||
| Spherion Corp. (c) | 24 | 135 | ||||
| Standard Parking Corp. (c) | 4 | 57 | ||||
| Standard Register Co. | 8 | 42 | ||||
| Standex International Corp. | 7 | 132 | ||||
| Stanley Inc. (c) | 5 | 145 | ||||
| Steelcase Inc. | 35 | 225 | ||||
| Sterling Construction Co. Inc. (c) | 6 | 118 | ||||
| Sun Hydraulics Corp. (e) | 6 | 153 | ||||
| Sykes Enterprises Inc. (c) | 18 | 447 | ||||
| TAL International Group Inc. (e) | 7 | 94 | ||||
| Taser International Inc. (c) | 30 | 130 | ||||
| TBS International Ltd. (c) | 6 | 46 | ||||
| Team Inc. (c) | 9 | 167 | ||||
| Tecumseh Products Co. (c) (e) | 8 | 98 | ||||
| Teledyne Technologies Inc. (c) | 18 | 673 | ||||
| Tennant Co. | 10 | 251 | ||||
| Tetra Tech Inc. (c) | 30 | 820 | ||||
| Textainer Group Holdings Ltd. (e) | 5 | 77 | ||||
| Titan International Inc. (e) | 17 | 134 | ||||
| Titan Machinery Inc. (c) (e) | 6 | 68 | ||||
| Todd Shipyards Corp. | 3 | 43 | ||||
| Tredegar Corp. | 15 | 233 | ||||
| Trex Co. Inc. (c) | 7 | 138 | ||||
| TriMas Corp. (c) | 7 | 50 | ||||
| Triumph Group Inc. | 8 | 408 | ||||
| TrueBlue Inc. (c) | 22 | 321 | ||||
| Tutor Perini Corp. (c) (e) | 13 | 230 | ||||
| Twin Disc Inc. | 4 | 46 | ||||
| UAL Corp. (c) (e) | 80 | 1,032 | ||||
| Ultralife Corp. (c) | 6 | 26 | ||||
| Ultrapetrol Ltd. (c) | 13 | 63 | ||||
| United Capital Corp. (c) | 1 | 21 | ||||
| United Rentals Inc. (c) | 30 | 294 | ||||
| United Stationers Inc. (c) | 12 | 679 | ||||
| Universal Forest Products Inc. | 9 | 345 | ||||
| Universal Truckload Services Inc. | 3 | 50 | ||||
| US Airways Group Inc. (c) (e) | 83 | 401 | ||||
| USA Truck Inc. (c) | 3 | 43 | ||||
| Valence Technology Inc. (c) (e) | 25 | 23 | ||||
| Viad Corp. | 10 | 206 | ||||
| Vicor Corp. (c) | 9 | 85 | ||||
| Volt Information Sciences Inc. (c) | 6 | 59 | ||||
| VSE Corp. | 2 | 95 | ||||
| Waste Services Inc. (c) | 11 | 96 | ||||
| Watsco Inc. | 13 | 654 | ||||
| Watson Wyatt Worldwide Inc. | 21 | 1,013 | ||||
| Watts Water Technologies Inc. | 14 | 446 | ||||
| Werner Enterprises Inc. | 22 | 427 | ||||
| Willis Lease Finance Corp. (c) | 2 | 32 | ||||
| Woodward Governor Co. | 29 | 756 | ||||
| YRC Worldwide Inc. (c) (e) | 29 | 23 | ||||
| 72,589 | ||||||
| INFORMATION TECHNOLOGY - 17.9% | ||||||
| 3Com Corp. (c) | 194 | 1,451 | ||||
| 3PAR Inc. (c) (e) | 13 | 150 | ||||
| ACI Worldwide Inc. (c) | 18 | 308 | ||||
| Acme Packet Inc. (c) | 19 | 214 | ||||
| Actel Corp. (c) | 14 | 164 | ||||
| ActivIdentity Corp. (c) | 20 | 47 | ||||
| Actuate Corp. (c) | 22 | 94 | ||||
| Acxiom Corp. (c) | 33 | 449 | ||||
| Adaptec Inc. (c) | 58 | 195 | ||||
| ADC Telecommunications Inc. (c) | 47 | 295 | ||||
| ADTRAN Inc. (e) | 27 | 606 | ||||
| Advanced Analogic Technologies Inc. (c) | 21 | 83 | ||||
| Advanced Energy Industries Inc. (c) | 16 | 234 | ||||
| Advent Software Inc. (c) (e) | 8 | 319 | ||||
| Agilysys Inc. | 11 | 99 | ||||
| Airvana Inc. (c) | 12 | 90 | ||||
| American Software Inc. | 11 | 64 | ||||
| Amkor Technology Inc. (c) (e) | 56 | 399 | ||||
| Anadigics Inc. (c) | 30 | 125 | ||||
| Anaren Inc. (c) | 7 | 102 | ||||
| Ancestry.com Inc. (c) | 4 | 52 | ||||
| Anixter International Inc. (c) | 15 | 683 | ||||
| Applied Micro Circuits Corp. (c) | 33 | 244 | ||||
| Archipelago Learning Inc. (c) | 2 | 47 | ||||
| ArcSight Inc. (c) (e) | 9 | 237 | ||||
| Ariba Inc. (c) | 43 | 534 | ||||
| Arris Group Inc. (c) | 62 | 712 | ||||
| Art Technology Group Inc. (c) | 60 | 270 | ||||
| Aruba Networks Inc. (c) (e) | 30 | 324 | ||||
| AsiaInfo Holdings Inc. (c) (e) | 14 | 441 | ||||
| Atheros Communications Inc. (c) (e) | 32 | 1,094 | ||||
| ATMI Inc. (c) | 15 | 289 | ||||
| Avid Technology Inc. (c) (e) | 14 | 181 | ||||
| Bel Fuse Inc. - Class B | 5 | 117 | ||||
| Benchmark Electronics Inc. (c) | 33 | 622 | ||||
| BigBand Networks Inc. (c) | 17 | 57 | ||||
| Black Box Corp. | 8 | 235 | ||||
| Blackbaud Inc. | 22 | 523 | ||||
| Blackboard Inc. (c) | 15 | 700 | ||||
| Blue Coat Systems Inc. (c) | 19 | 551 | ||||
| Bottomline Technologies Inc. (c) | 12 | 206 | ||||
| Brightpoint Inc. (c) | 24 | 173 | ||||
| Brooks Automation Inc. (c) | 32 | 276 | ||||
| Cabot Microelectronics Corp. (c) | 12 | 379 | ||||
| CACI International Inc. - Class A (c) (e) | 15 | 734 | ||||
| Callidus Software Inc. (c) | 12 | 36 | ||||
| Cass Information Systems Inc. | 4 | 116 | ||||
| Cavium Networks Inc. (c) | 18 | 426 | ||||
| Ceva Inc. (c) | 11 | 138 | ||||
| Checkpoint Systems Inc. (c) | 19 | 292 | ||||
| China Information Security Technology Inc. (c) (e) | 13 | 78 | ||||
| China Security & Surveillance Technology Inc. (c) (e) | 20 | 151 | ||||
| China TransInfo Technology Corp. (c) | 4 | 33 | ||||
| Chordiant Software Inc. (c) | 14 | 37 | ||||
| Ciber Inc. (c) | 32 | 111 | ||||
| Cirrus Logic Inc. (c) | 32 | 219 | ||||
| Cogent Inc. (c) | 20 | 209 | ||||
| Cognex Corp. | 20 | 359 | ||||
| Cogo Group Inc. (c) | 12 | 87 | ||||
| Coherent Inc. (c) (e) | 11 | 321 | ||||
| Cohu Inc. | 11 | 154 | ||||
| Communications Systems Inc. | 3 | 34 | ||||
| CommVault Systems Inc. (c) | 21 | 500 | ||||
| Compellent Technologies Inc. (c) (e) | 8 | 178 | ||||
| Computer Task Group Inc. (c) | 7 | 53 | ||||
| comScore Inc. (c) | 11 | 198 | ||||
| Comtech Telecommunications Corp. (c) (e) | 14 | 482 | ||||
| Comverge Inc. (c) | 10 | 110 | ||||
| Concur Technologies Inc. (c) (e) | 20 | 853 | ||||
| Constant Contact Inc. (c) | 12 | 190 | ||||
| CPI International Inc. (c) | 4 | 55 | ||||
| Cray Inc. (c) | 17 | 111 | ||||
| CSG Systems International Inc. (c) | 18 | 343 | ||||
| CTS Corp. | 16 | 152 | ||||
| CyberSource Corp. (c) (e) | 34 | 677 | ||||
| Cymer Inc. (c) | 15 | 575 | ||||
| Daktronics Inc. | 16 | 145 | ||||
| DDi Corp. (c) | 6 | 31 | ||||
| DealerTrack Holdings Inc. (c) | 18 | 348 | ||||
| Deltek Inc. (c) | 5 | 42 | ||||
| DemandTec Inc. (c) (e) | 9 | 81 | ||||
| DG FastChannel Inc. (c) (e) | 11 | 300 | ||||
| Dice Holdings Inc. (c) | 7 | 48 | ||||
| Digi International Inc. (c) | 11 | 104 | ||||
| Digital River Inc. (c) (e) | 19 | 501 | ||||
| Diodes Inc. (c) | 16 | 335 | ||||
| DivX Inc. (c) | 15 | 85 | ||||
| Double-Take Software Inc. (c) | 8 | 83 | ||||
| DSP Group Inc. (c) | 12 | 67 | ||||
| DTS Inc. (c) | 9 | 307 | ||||
| Dynamics Research Corp. (c) | 4 | 41 | ||||
| Earthlink Inc. (e) | 52 | 430 | ||||
| Ebix Inc. (c) (e) | 3 | 155 | ||||
| Echelon Corp. (c) (e) | 17 | 194 | ||||
| Echo Global Logistics Inc. (c) (e) | 3 | 35 | ||||
| Electro Rent Corp. | 9 | 104 | ||||
| Electro Scientific Industries Inc. (c) | 13 | 140 | ||||
| Electronics for Imaging Inc. (c) | 25 | 328 | ||||
| eLoyalty Corp. (c) (e) | 3 | 20 | ||||
| Emcore Corp. (c) (e) | 36 | 38 | ||||
| EMS Technologies Inc. (c) | 8 | 112 | ||||
| Emulex Corp. (c) | 42 | 458 | ||||
| Entegris Inc. (c) | 67 | 354 | ||||
| Entropic Communications Inc. (c) | 28 | 85 | ||||
| Epicor Software Corp. (c) | 24 | 181 | ||||
| EPIQ Systems Inc. (c) | 16 | 225 | ||||
| ePlus Inc. (c) | 2 | 27 | ||||
| Euronet Worldwide Inc. (c) | 24 | 520 | ||||
| Exar Corp. (c) (e) | 16 | 115 | ||||
| ExlService Holdings Inc. (c) | 7 | 128 | ||||
| Extreme Networks (c) | 41 | 117 | ||||
| Fair Isaac Corp. (e) | 25 | 525 | ||||
| FalconStor Software Inc. (c) (e) | 18 | 74 | ||||
| FARO Technologies Inc. (c) | 8 | 169 | ||||
| FEI Co. (c) (e) | 19 | 442 | ||||
| FormFactor Inc. (c) | 24 | 523 | ||||
| Forrester Research Inc. (c) | 7 | 194 | ||||
| Fortinet Inc. (c) | 5 | 85 | ||||
| Gartner Inc. - Class A (c) | 29 | 522 | ||||
| Global Cash Access Holdings Inc. (c) | 19 | 143 | ||||
| Globecomm Systems Inc. (c) | 10 | 74 | ||||
| GSE Systems Inc. (c) | 7 | 39 | ||||
| GSI Commerce Inc. (c) | 14 | 361 | ||||
| GSI Technology Inc. (c) | 8 | 37 | ||||
| Hackett Group Inc. (c) (e) | 19 | 52 | ||||
| Harmonic Inc. (c) | 49 | 310 | ||||
| Harris Stratex Networks Inc. - Class A (c) | 29 | 203 | ||||
| Heartland Payment Systems Inc. | 19 | 246 | ||||
| Hittite Microwave Corp. (c) (e) | 10 | 427 | ||||
| Hughes Communications Inc. (c) | 4 | 108 | ||||
| i2 Technologies Inc. (c) | 7 | 143 | ||||
| ICx Technologies Inc. (c) (e) | 5 | 50 | ||||
| iGate Corp. | 11 | 112 | ||||
| Imation Corp. (c) | 14 | 122 | ||||
| Imergent Inc. | 4 | 21 | ||||
| Immersion Corp. (c) | 14 | 66 | ||||
| Infinera Corp. (c) (e) | 41 | 367 | ||||
| infoGROUP Inc. (c) | 16 | 128 | ||||
| Informatica Corp. (c) (e) | 44 | 1,127 | ||||
| Information Services Group Inc. (c) | 11 | 33 | ||||
| Infospace Inc. (c) | 17 | 141 | ||||
| Innodata Isogen Inc. (c) | 9 | 53 | ||||
| Insight Enterprises Inc. (c) | 22 | 248 | ||||
| Integral Systems Inc. (c) | 8 | 69 | ||||
| Interactive Intelligence Inc. (c) | 6 | 119 | ||||
| InterDigital Inc. (c) | 21 | 565 | ||||
| Intermec Inc. (c) | 30 | 390 | ||||
| Internap Network Services Corp. (c) | 26 | 122 | ||||
| Internet Brands Inc. (c) | 13 | 100 | ||||
| Internet Capital Group Inc. (c) | 18 | 120 | ||||
| Intevac Inc. (c) | 11 | 129 | ||||
| Ipass Inc. | 22 | 23 | ||||
| IPG Photonics Corp. (c) (e) | 11 | 180 | ||||
| Isilon Systems Inc. (c) | 12 | 81 | ||||
| Ixia (c) (e) | 16 | 119 | ||||
| IXYS Corp. (c) | 11 | 83 | ||||
| j2 Global Communications Inc. (c) (e) | 22 | 443 | ||||
| Jack Henry & Associates Inc. | 42 | 968 | ||||
| JDA Software Group Inc. (c) | 13 | 333 | ||||
| Kenexa Corp. (c) | 11 | 149 | ||||
| Keynote Systems Inc. | 7 | 79 | ||||
| Knot Inc. (c) (e) | 14 | 145 | ||||
| Kopin Corp. (c) | 32 | 134 | ||||
| Kulicke & Soffa Industries Inc. (c) | 36 | 194 | ||||
| KVH Industries Inc. (c) | 6 | 91 | ||||
| L-1 Identity Solutions Inc. (c) (e) | 35 | 264 | ||||
| Lattice Semiconductor Corp. (c) (e) | 53 | 144 | ||||
| Lawson Software Inc. (c) | 67 | 447 | ||||
| Limelight Networks Inc. (c) | 15 | 60 | ||||
| Lionbridge Technologies Inc. (c) | 25 | 58 | ||||
| Liquidity Services Inc. (c) | 8 | 79 | ||||
| Littelfuse Inc. (c) | 11 | 359 | ||||
| LivePerson Inc. (c) | 21 | 150 | ||||
| LogMeIn Inc. (c) | 4 | 84 | ||||
| LoopNet Inc. (c) | 10 | 95 | ||||
| Loral Space & Communications Inc. (c) | 5 | 157 | ||||
| Manhattan Associates Inc. (c) (e) | 11 | 264 | ||||
| Mantech International Corp. - Class A (c) | 11 | 516 | ||||
| Marchex Inc. - Class B | 13 | 67 | ||||
| MAXIMUS Inc. | 9 | 444 | ||||
| Maxwell Technologies Inc. (c) | 12 | 208 | ||||
| Measurement Specialties Inc. (c) (e) | 7 | 67 | ||||
| MEMSIC Inc. (c) | 7 | 23 | ||||
| Mentor Graphics Corp. (c) | 48 | 424 | ||||
| MercadoLibre Inc. (c) | 13 | 677 | ||||
| Mercury Computer Systems Inc. (c) | 12 | 129 | ||||
| Methode Electronics Inc. | 18 | 153 | ||||
| Micrel Inc. | 22 | 179 | ||||
| Microsemi Corp. (c) | 41 | 726 | ||||
| MicroStrategy Inc. - Class A (c) | 4 | 408 | ||||
| Microtune Inc. (c) (e) | 29 | 66 | ||||
| MIPS Technologies Inc. - Class A (c) (e) | 23 | 99 | ||||
| MKS Instruments Inc. (c) (e) | 25 | 435 | ||||
| ModusLink Global Solutions Inc. (c) | 22 | 205 | ||||
| MoneyGram International Inc. (c) | 43 | 123 | ||||
| Monolithic Power Systems Inc. (c) | 17 | 399 | ||||
| Monotype Imaging Holdings Inc. (c) | 10 | 91 | ||||
| Move Inc. (c) | 77 | 128 | ||||
| MTS Systems Corp. (e) | 8 | 234 | ||||
| Multi-Fineline Electronix Inc. (c) | 5 | 130 | ||||
| NCI Inc. (c) | 3 | 85 | ||||
| Ness Technologies Inc. (c) | 21 | 101 | ||||
| Net 1 UEPS Technologies Inc. (c) | 15 | 287 | ||||
| Netezza Corp. (c) (e) | 24 | 237 | ||||
| NetGear Inc. (c) | 18 | 381 | ||||
| NetLogic Microsystems Inc. (c) | 9 | 426 | ||||
| NetScout Systems Inc. (c) (e) | 13 | 185 | ||||
| NetSuite Inc. (c) (e) | 9 | 144 | ||||
| Network Equipment Technologies Inc. (c) | 13 | 52 | ||||
| Newport Corp. (c) | 17 | 153 | ||||
| NIC Inc. | 25 | 230 | ||||
| Novatel Wireless Inc. (c) | 15 | 118 | ||||
| NVE Corp. (c) | 2 | 97 | ||||
| Omnivision Technologies Inc. (c) | 25 | 359 | ||||
| Online Resources Corp. (c) (e) | 12 | 66 | ||||
| OpenTable Inc. (c) (e) | 1 | 33 | ||||
| Openwave Systems Inc. (c) | 42 | 97 | ||||
| Oplink Communications Inc. (c) | 10 | 157 | ||||
| OPNET Technologies Inc. | 6 | 72 | ||||
| Opnext Inc. (c) | 13 | 24 | ||||
| OSI Systems Inc. (c) | 7 | 200 | ||||
| Palm Inc. (c) (e) | 83 | 829 | ||||
| PAR Technology Corp. (c) (e) | 4 | 21 | ||||
| Parametric Technology Corp. (c) (e) | 58 | 947 | ||||
| Park Electrochemical Corp. | 10 | 268 | ||||
| ParkerVision Inc. (c) (e) | 14 | 26 | ||||
| PC Connection Inc. (c) | 5 | 32 | ||||
| PC Mall Inc. (c) | 6 | 29 | ||||
| PC-Tel Inc. (c) | 10 | 62 | ||||
| Pegasystems Inc. (e) | 7 | 242 | ||||
| Perficient Inc. (c) | 15 | 125 | ||||
| Pericom Semiconductor Corp. (c) | 12 | 138 | ||||
| Pervasive Software Inc. (c) | 7 | 33 | ||||
| Phoenix Technologies Ltd. (c) | 12 | 34 | ||||
| Photronics Inc. (c) | 29 | 128 | ||||
| Plantronics Inc. | 24 | 620 | ||||
| Plexus Corp. (c) | 20 | 568 | ||||
| PLX Technology Inc. (c) | 18 | 58 | ||||
| Polycom Inc. (c) (e) | 42 | 1,047 | ||||
| Power Integrations Inc. | 12 | 427 | ||||
| Powerwave Technologies Inc. (c) | 61 | 76 | ||||
| Progress Software Corp. (c) | 19 | 569 | ||||
| PROS Holdings Inc. (c) | 9 | 92 | ||||
| QAD Inc. | 6 | 38 | ||||
| Quality Systems Inc. | 11 | 721 | ||||
| Quantum Corp. (c) | 109 | 320 | ||||
| Quest Software Inc. (c) | 31 | 567 | ||||
| Rackspace Hosting Inc. (c) (e) | 32 | 676 | ||||
| Radiant Systems Inc. (c) | 13 | 136 | ||||
| Radisys Corp. (c) | 10 | 100 | ||||
| RAE Systems Inc. (c) | 18 | 20 | ||||
| RealNetworks Inc. (c) | 38 | 142 | ||||
| Renaissance Learning Inc. | 4 | 45 | ||||
| RF Micro Devices Inc. (c) (e) | 129 | 617 | ||||
| RightNow Technologies Inc. (c) (e) | 11 | 192 | ||||
| Rimage Corp. (c) | 4 | 77 | ||||
| Riverbed Technology Inc. (c) (e) | 27 | 613 | ||||
| Rofin-Sinar Technologies Inc. (c) | 14 | 330 | ||||
| Rogers Corp. (c) (e) | 8 | 232 | ||||
| Rosetta Stone Inc. (c) (e) | 3 | 59 | ||||
| Rubicon Technology Inc. (c) (e) | 7 | 136 | ||||
| Rudolph Technologies Inc. (c) | 15 | 101 | ||||
| S1 Corp. (c) | 25 | 161 | ||||
| Saba Software Inc. (c) (e) | 11 | 45 | ||||
| Sapient Corp. (c) | 43 | 355 | ||||
| SAVVIS Inc. (c) | 18 | 251 | ||||
| ScanSource Inc. (c) | 13 | 348 | ||||
| SeaChange International Inc. (c) | 15 | 99 | ||||
| Semtech Corp. (c) | 30 | 505 | ||||
| ShoreTel Inc. (c) | 22 | 125 | ||||
| Sigma Designs Inc. (c) (e) | 13 | 135 | ||||
| Silicon Graphics International Corp. (c) | 14 | 97 | ||||
| Silicon Image Inc. (c) | 34 | 87 | ||||
| Silicon Storage Technology Inc. (c) | 37 | 96 | ||||
| Skyworks Solutions Inc. (c) (e) | 84 | 1,189 | ||||
| Smart Modular Technologies WWH Inc. (c) | 17 | 110 | ||||
| Smith Micro Software Inc. (c) | 14 | 129 | ||||
| SolarWinds Inc. (c) (e) | 6 | 141 | ||||
| Solera Holdings Inc. (e) | 35 | 1,249 | ||||
| SonicWALL Inc. (c) | 25 | 193 | ||||
| Sonus Networks Inc. (c) | 108 | 227 | ||||
| Sourcefire Inc. (c) (e) | 11 | 307 | ||||
| Spectrum Control Inc. (c) | 6 | 52 | ||||
| SRA International Inc. - Class A (c) | 21 | 404 | ||||
| SRS Labs Inc. (c) | 5 | 38 | ||||
| Standard Microsystems Corp. (c) | 10 | 217 | ||||
| StarTek Inc. (c) | 5 | 39 | ||||
| STEC Inc. (c) (e) | 12 | 197 | ||||
| Stratasys Inc. (c) (e) | 10 | 165 | ||||
| SuccessFactors Inc. (c) | 19 | 307 | ||||
| Super Micro Computer Inc. (c) | 10 | 116 | ||||
| Supertex Inc. (c) | 5 | 154 | ||||
| support.com Inc. (c) | 26 | 68 | ||||
| Switch & Data Facilities Co. Inc. (c) | 10 | 208 | ||||
| Sycamore Networks Inc. | 10 | 207 | ||||
| Symmetricom Inc. (c) | 21 | 110 | ||||
| Symyx Technologies Inc. (c) | 16 | 88 | ||||
| Synaptics Inc. (c) (e) | 17 | 512 | ||||
| Synchronoss Technologies Inc. (c) | 10 | 153 | ||||
| SYNNEX Corp. (c) (e) | 10 | 304 | ||||
| Syntel Inc. | 6 | 234 | ||||
| Take-Two Interactive Software Inc. (c) (e) | 40 | 397 | ||||
| Taleo Corp. (c) | 18 | 424 | ||||
| Technitrol Inc. | 21 | 91 | ||||
| TechTarget Inc. (c) (e) | 4 | 23 | ||||
| Techwell Inc. (c) | 8 | 104 | ||||
| Tekelec (c) | 32 | 495 | ||||
| TeleCommunication Systems Inc. (c) | 18 | 175 | ||||
| TeleTech Holdings Inc. (c) | 16 | 321 | ||||
| Terremark Worldwide Inc. (c) (e) | 30 | 207 | ||||
| Tessera Technologies Inc. (c) | 24 | 551 | ||||
| THQ Inc. (c) | 32 | 161 | ||||
| TIBCO Software Inc. (c) | 88 | 847 | ||||
| Tier Technologies Inc. - Class B (c) | 8 | 60 | ||||
| TiVo Inc. (c) | 51 | 518 | ||||
| TNS Inc. (c) | 13 | 329 | ||||
| Travelzoo Inc. (c) | 2 | 29 | ||||
| Trident Microsystems Inc. (c) (e) | 29 | 55 | ||||
| TriQuint Semiconductor Inc. (c) | 72 | 431 | ||||
| TTM Technologies Inc. (c) | 21 | 238 | ||||
| Tyler Technologies Inc. (c) | 15 | 308 | ||||
| Ultimate Software Group Inc. (c) | 12 | 365 | ||||
| Ultratech Inc. (c) | 11 | 165 | ||||
| Unica Corp. (c) | 7 | 53 | ||||
| Unisys Corp. (c) (e) | 20 | 779 | ||||
| United Online Inc. | 41 | 296 | ||||
| Universal Display Corp. (c) (e) | 14 | 170 | ||||
| UTStarcom Inc. (c) (e) | 52 | 113 | ||||
| ValueClick Inc. (c) | 44 | 445 | ||||
| VASCO Data Security International Inc. (c) | 12 | 76 | ||||
| Veeco Instruments Inc. (c) | 18 | 594 | ||||
| VeriFone Holdings Inc. (c) | 36 | 583 | ||||
| ViaSat Inc. (c) | 13 | 419 | ||||
| Virage Logic Corp. (c) | 7 | 40 | ||||
| Virtusa Corp. (c) | 6 | 56 | ||||
| Vocus Inc. (c) (e) | 8 | 140 | ||||
| Volterra Semiconductor Corp. (c) | 11 | 214 | ||||
| Web.com Group Inc. (c) | 13 | 83 | ||||
| Websense Inc. (c) | 23 | 393 | ||||
| White Electronic Designs Corp. (c) | 10 | 47 | ||||
| Wright Express Corp. (c) | 19 | 596 | ||||
| X-Rite Inc. (c) | 12 | 26 | ||||
| Zixit Corp. (c) (e) | 28 | 47 | ||||
| Zoran Corp. (c) | 24 | 269 | ||||
| Zygo Corp. (c) | 7 | 44 | ||||
| 84,800 | ||||||
| MATERIALS - 4.6% | ||||||
| A. Schulman Inc. (e) | 12 | 234 | ||||
| AEP Industries Inc. (c) | 3 | 105 | ||||
| Allied Nevada Gold Corp. (c) (e) | 28 | 428 | ||||
| AM Castle & Co. | 8 | 107 | ||||
| AMCOL International Corp. (e) | 12 | 333 | ||||
| American Vanguard Corp. | 9 | 76 | ||||
| Arch Chemicals Inc. | 13 | 394 | ||||
| Balchem Corp. | 9 | 316 | ||||
| Boise Inc. (c) | 16 | 87 | ||||
| Brush Engineered Materials Inc. (c) | 10 | 180 | ||||
| Buckeye Technologies Inc. (c) | 19 | 189 | ||||
| BWAY Holdings Co. (c) | 4 | 74 | ||||
| Calgon Carbon Corp. (c) | 28 | 386 | ||||
| Century Aluminum Co. (c) | 26 | 421 | ||||
| China Green Agriculture Inc. (c) (e) | 6 | 87 | ||||
| China Precision Steel Inc. (c) (e) | 15 | 31 | ||||
| Clearwater Paper Corp. (c) | 6 | 321 | ||||
| Coeur d'Alene Mines Corp. (c) (e) | 38 | 683 | ||||
| Deltic Timber Corp. (e) | 5 | 232 | ||||
| Domtar Corp. (c) (e) | 20 | 1,132 | ||||
| Ferro Corp. | 39 | 320 | ||||
| General Moly Inc. (c) | 29 | 60 | ||||
| General Steel Holdings Inc. (c) | 6 | 28 | ||||
| Glatfelter | 22 | 262 | ||||
| Graphic Packaging Holding Co. (c) | 53 | 182 | ||||
| Hawkins Inc. (e) | 5 | 99 | ||||
| Haynes International Inc. | 6 | 187 | ||||
| HB Fuller Co. | 25 | 558 | ||||
| Headwaters Inc. (c) | 28 | 180 | ||||
| Hecla Mining Co. (c) (e) | 107 | 663 | ||||
| Horsehead Holding Corp. (c) (e) | 22 | 287 | ||||
| ICO Inc. | 13 | 92 | ||||
| Innophos Holdings Inc. | 9 | 199 | ||||
| Innospec Inc. | 11 | 114 | ||||
| Kaiser Aluminum Corp. | 8 | 318 | ||||
| KapStone Paper and Packaging Corp. (c) | 14 | 134 | ||||
| Koppers Holdings Inc. | 10 | 301 | ||||
| Landec Corp. (c) | 12 | 76 | ||||
| Louisiana-Pacific Corp. (c) | 53 | 372 | ||||
| LSB Industries Inc. (c) | 8 | 115 | ||||
| Minerals Technologies Inc. | 9 | 515 | ||||
| Myers Industries Inc. | 15 | 134 | ||||
| Neenah Paper Inc. | 8 | 105 | ||||
| NewMarket Corp. | 5 | 565 | ||||
| NL Industries Inc. | 4 | 25 | ||||
| Olin Corp. | 38 | 665 | ||||
| Olympic Steel Inc. | 4 | 139 | ||||
| OM Group Inc. (c) | 15 | 468 | ||||
| Omnova Solutions Inc. (c) | 22 | 137 | ||||
| Paramount Gold and Silver Corp. (c) (e) | 28 | 41 | ||||
| PolyOne Corp. (c) | 48 | 355 | ||||
| Quaker Chemical Corp. | 6 | 116 | ||||
| Rock-Tenn Co. - Class A | 19 | 968 | ||||
| Rockwood Holdings Inc. (c) | 24 | 568 | ||||
| RTI International Metals Inc. (c) | 15 | 386 | ||||
| Schweitzer-Mauduit International Inc. | 8 | 581 | ||||
| Sensient Technologies Corp. | 24 | 624 | ||||
| ShengdaTech Inc. (c) (e) | 15 | 91 | ||||
| Silgan Holdings Inc. | 13 | 776 | ||||
| Solutia Inc. (c) (e) | 60 | 759 | ||||
| Spartech Corp. | 15 | 157 | ||||
| Stepan Co. | 4 | 247 | ||||
| Stillwater Mining Co. (c) (e) | 21 | 197 | ||||
| STR Holdings Inc. (c) | 4 | 68 | ||||
| Sutor Technology Group Ltd. (c) | 7 | 17 | ||||
| Texas Industries Inc. | 12 | 403 | ||||
| United States Lime & Minerals Inc. (c) | 1 | 29 | ||||
| Universal Stainless & Alloy Products Inc. (c) | 4 | 67 | ||||
| US Concrete Inc. (c) | 18 | 16 | ||||
| US Gold Corp. (c) | 41 | 101 | ||||
| Wausau Paper Corp. | 21 | 243 | ||||
| Westlake Chemical Corp. (e) | 10 | 251 | ||||
| Worthington Industries Inc. | 29 | 385 | ||||
| WR Grace & Co. (c) (e) | 36 | 916 | ||||
| Zep Inc. | 10 | 176 | ||||
| Zoltek Cos. Inc. (c) (e) | 13 | 124 | ||||
| 21,778 | ||||||
| TELECOMMUNICATION SERVICES - 1.0% | ||||||
| AboveNet Inc. (c) | 6 | 396 | ||||
| Alaska Communications Systems Group Inc. | 21 | 168 | ||||
| Atlantic Tele-Network Inc. | 4 | 246 | ||||
| Cbeyond Inc. (c) (e) | 11 | 173 | ||||
| Cincinnati Bell Inc. (c) | 106 | 366 | ||||
| Cogent Communications Group Inc. (c) | 23 | 226 | ||||
| Consolidated Communications Holdings Inc. | 11 | 192 | ||||
| General Communication Inc. - Class A (c) | 21 | 132 | ||||
| Global Crossing Ltd. (c) | 14 | 194 | ||||
| HickoryTech Corp. | 6 | 51 | ||||
| inContact Inc. (c) | 12 | 35 | ||||
| Iowa Telecommunications Services Inc. | 15 | 259 | ||||
| Neutral Tandem Inc. (c) | 16 | 365 | ||||
| NTELOS Holdings Corp. | 14 | 254 | ||||
| PAETEC Holding Corp. (c) | 59 | 244 | ||||
| Premiere Global Services Inc. (c) | 29 | 240 | ||||
| Shenandoah Telecommunications Co. | 11 | 227 | ||||
| SureWest Communications (c) (e) | 7 | 74 | ||||
| Syniverse Holdings Inc. (c) | 33 | 583 | ||||
| USA Mobility Inc. | 11 | 117 | ||||
| 4,542 | ||||||
| UTILITIES - 3.2% | ||||||
| Allete Inc. (e) | 14 | 464 | ||||
| American States Water Co. | 9 | 322 | ||||
| Artesian Resources Corp. (e) | 3 | 50 | ||||
| Avista Corp. (e) | 27 | 576 | ||||
| Black Hills Corp. (e) | 20 | 522 | ||||
| Cadiz Inc. (c) | 6 | 72 | ||||
| California Water Service Group | 10 | 356 | ||||
| Central Vermont Public Service Corp. | 5 | 114 | ||||
| CH Energy Group Inc. | 8 | 330 | ||||
| Chesapeake Utilities Corp. (e) | 4 | 139 | ||||
| Cleco Corp. | 30 | 828 | ||||
| Connecticut Water Services Inc. | 4 | 95 | ||||
| Consolidated Water Co. Ltd. (e) | 7 | 102 | ||||
| El Paso Electric Co. (c) | 22 | 449 | ||||
| Empire District Electric Co. | 17 | 327 | ||||
| IDACORP Inc. (e) | 23 | 733 | ||||
| Laclede Group Inc. | 11 | 381 | ||||
| MGE Energy Inc. | 12 | 418 | ||||
| Middlesex Water Co. | 6 | 112 | ||||
| New Jersey Resources Corp. (e) | 21 | 790 | ||||
| Nicor Inc. | 23 | 953 | ||||
| Northwest Natural Gas Co. (e) | 13 | 582 | ||||
| NorthWestern Corp. | 18 | 457 | ||||
| Pennichuck Corp. | 2 | 40 | ||||
| Piedmont Natural Gas Co. Inc. (e) | 37 | 984 | ||||
| PNM Resources Inc. | 44 | 553 | ||||
| Portland General Electric Co. (e) | 38 | 769 | ||||
| SJW Corp. | 6 | 142 | ||||
| South Jersey Industries Inc. | 15 | 574 | ||||
| Southwest Gas Corp. | 22 | 621 | ||||
| Southwest Water Co. | 12 | 69 | ||||
| UIL Holdings Corp. | 14 | 405 | ||||
| UniSource Energy Corp. | 17 | 559 | ||||
| Unitil Corp. (e) | 5 | 124 | ||||
| US Geothermal Inc. (c) | 29 | 45 | ||||
| WGL Holdings Inc. (e) | 25 | 842 | ||||
| York Water Co. (e) | 6 | 84 | ||||
| 14,983 | ||||||
| Total Common Stocks (cost $462,764) | 458,705 | |||||
| RIGHTS - 0.0% | ||||||
| Builders FirstSource Inc. (c) (e) | 14 | 3 | ||||
| Flagstar Bancorp Inc. (c) (f) | 26 | - | ||||
| Total Rights (cost $0) | 3 | |||||
| WARRANTS - 0.0% | ||||||
| GreenHunter Energy Inc., 09/15/11 (c) (f) | - | - | ||||
| Lantronix Inc., 02/09/11 (c) (f) | - | - | ||||
| Pegasus Wireless Corp., 05/21/10 (c) (f) | 1 | - | ||||
| Total Warrants (cost $0) | - | |||||
| NON-U.S. GOVERNMENT AGENCY | ||||||
| ASSET-BACKED SECURITIES - 0.0% | ||||||
| Sigma Finance, Inc. (d) (f) (u) | $ | 2,630 | 112 | |||
| Total Non-U.S. Government Agency | ||||||
| Asset-Backed Securities (cost $2,096) | 112 | |||||
| SHORT TERM INVESTMENTS - 23.4% | ||||||
| Mutual Funds - 3.1% | ||||||
| JNL Money Market Fund, 0.07% (a) (h) | 14,720 | 14,720 | ||||
| Securities Lending Collateral - 20.1% | ||||||
| Securities Lending Cash Collateral Fund LLC, | ||||||
| 0.16% (a) (h) | 62,694 | 62,694 | ||||
| Securities Lending Liquidating Fund LLC, 0.36% (a) (h) | 32,507 | 32,439 | ||||
| 95,133 | ||||||
| U.S. Treasury Securities - 0.2% | ||||||
| U.S. Treasury Bill, 0.22%, 03/11/10 (o) | $ | 1,155 | 1,155 | |||
| Total Short Term Investments (cost $111,076) | 111,008 | |||||
| Total Investments - 120.1% (cost $575,936) | 569,828 | |||||
| Other Assets and Liabilities, Net - (20.1%) | (95,463) | |||||
| Total Net Assets - 100% | $ | 474,365 | ||||
| JNL/Mellon Capital Management | ||||||
| International Index Fund | ||||||
| COMMON STOCKS - 97.2% | ||||||
| CONSUMER DISCRETIONARY - 9.4% | ||||||
| ABC-Mart Inc. | 2 | $ | 56 | |||
| Accor SA | 11 | 579 | ||||
| Adidas AG | 14 | 753 | ||||
| Aisin Seiki Co. Ltd. | 14 | 402 | ||||
| Aristocrat Leisure Ltd. | 25 | 91 | ||||
| Asics Corp. | 11 | 99 | ||||
| Autogrill SpA (c) | 7 | 93 | ||||
| Bayerische Motoren Werke AG | 24 | 1,080 | ||||
| Benesse Corp. | 5 | 205 | ||||
| Billabong International Ltd. | 13 | 130 | ||||
| Bridgestone Corp. | 43 | 754 | ||||
| British Sky Broadcasting Group Plc | 82 | 742 | ||||
| Burberry Group Plc | 29 | 284 | ||||
| Canon Marketing Japan Inc. | 5 | 75 | ||||
| Carnival Plc (c) | 12 | 408 | ||||
| Carphone Warehouse Group Plc | 27 | 82 | ||||
| Casio Computer Co. Ltd. (e) | 16 | 127 | ||||
| Christian Dior SA | 4 | 450 | ||||
| Compagnie Financiere Richemont SA | 37 | 1,252 | ||||
| Compagnie Generale des Etablissements Michelin | 11 | 812 | ||||
| Compass Group Plc | 129 | 926 | ||||
| Crown Ltd. | 32 | 231 | ||||
| Daihatsu Motor Co. Ltd. | 12 | 120 | ||||
| Daimler AG | 64 | 3,421 | ||||
| Dena Co. Ltd. | - | 119 | ||||
| Denso Corp. | 34 | 1,025 | ||||
| Dentsu Inc. (e) | 12 | 283 | ||||
| Electrolux AB - Class B (c) | 16 | 387 | ||||
| Esprit Holdings Ltd. | 83 | 549 | ||||
| Eutelsat Communications Group SA | 7 | 223 | ||||
| Fairfax Media Ltd. (e) | 158 | 246 | ||||
| Fast Retailing Co. Ltd. | 3 | 620 | ||||
| Fiat SpA (c) (e) | 53 | 785 | ||||
| Fuji Heavy Industries Ltd. (c) | 41 | 200 | ||||
| Fuji Media Holdings Inc. | - | 22 | ||||
| Genting International Plc (c) (e) | 312 | 288 | ||||
| Gestevision Telecinco SA (e) | 7 | 100 | ||||
| Hakuhodo DY Holdings Inc. | 2 | 74 | ||||
| Harvey Norman Holdings Ltd. | 34 | 127 | ||||
| Hennes & Mauritz AB - Class B | 36 | 2,025 | ||||
| Hermes International SCA | 4 | 510 | ||||
| Home Retail Group Plc | 59 | 270 | ||||
| Honda Motor Co. Ltd. | 117 | 3,978 | ||||
| Husqvarna AB - Class B (c) | 27 | 200 | ||||
| Inditex SA | 15 | 947 | ||||
| InterContinental Hotels Group Plc | 18 | 265 | ||||
| Isetan Mitsukoshi Holdings Ltd. (e) | 25 | 223 | ||||
| Isuzu Motors Ltd. (c) | 79 | 148 | ||||
| J. Front Retailing Co. Ltd. | 37 | 164 | ||||
| Jardine Cycle & Carriage Ltd. | 8 | 150 | ||||
| JC Decaux SA (c) (e) | 5 | 112 | ||||
| Jupiter Telecommunications Co. Ltd. | - | 176 | ||||
| Kingfisher Plc | 165 | 611 | ||||
| Koito Manufacturing Co. Ltd. | 6 | 96 | ||||
| Lagardere SCA | 9 | 350 | ||||
| Li & Fung Ltd. | 158 | 652 | ||||
| Lifestyle International Holdings Ltd. | 48 | 88 | ||||
| Luxottica Group SpA | 8 | 211 | ||||
| LVMH Moet Hennessy Louis Vuitton SA | 17 | 1,961 | ||||
| M6-Metropole Television SA | 4 | 107 | ||||
| Makita Corp. | 8 | 275 | ||||
| Marks & Spencer Group Plc | 110 | 717 | ||||
| Marui Group Co. Ltd. | 14 | 83 | ||||
| Mazda Motor Corp. | 103 | 237 | ||||
| McDonald's Holdings Co. Japan Ltd. (e) | 5 | 86 | ||||
| Mediaset SpA | 51 | 423 | ||||
| Mitsubishi Motors Corp. (c) (e) | 262 | 364 | ||||
| Namco Bandai Holdings Inc. | 14 | 137 | ||||
| Next Plc | 14 | 467 | ||||
| NGK Spark Plug Co. Ltd. | 12 | 136 | ||||
| NHK Spring Co. Ltd. | 11 | 102 | ||||
| Nikon Corp. | 23 | 454 | ||||
| Nissan Motor Co. Ltd. (c) | 177 | 1,559 | ||||
| Nisshinbo Holdings Inc. | 10 | 93 | ||||
| Nitori Co. Ltd. | 3 | 201 | ||||
| NOK Corp. | 7 | 102 | ||||
| Nokian Renkaat Oyj (e) | 7 | 178 | ||||
| OPAP SA | 16 | 347 | ||||
| Oriental Land Co. Ltd. | 3 | 224 | ||||
| PagesJaunes Groupe SA (e) | 8 | 87 | ||||
| Panasonic Corp. | 140 | 2,019 | ||||
| Pearson Plc | 57 | 814 | ||||
| Peugeot SA (c) | 11 | 365 | ||||
| Pirelli & C. SpA (c) | 205 | 123 | ||||
| PPR SA | 5 | 660 | ||||
| Publicis Groupe | 8 | 341 | ||||
| Puma AG Rudolf Dassler Sport | - | 130 | ||||
| Rakuten Inc. | 1 | 398 | ||||
| Reed Elsevier NV | 52 | 643 | ||||
| Reed Elsevier Plc | 87 | 720 | ||||
| Renault SA (c) | 13 | 691 | ||||
| Rinnai Corp. | 3 | 126 | ||||
| Sands China Ltd. (c) | 139 | 169 | ||||
| Sankyo Co. Ltd. | 4 | 175 | ||||
| Sanoma Oyj (e) | 6 | 126 | ||||
| Sanyo Electric Co. Ltd. (c) | 126 | 233 | ||||
| Sega Sammy Holdings Inc. | 15 | 180 | ||||
| Sekisui Chemical Co. Ltd. | 29 | 180 | ||||
| Sekisui House Ltd. | 39 | 354 | ||||
| SES SA | 21 | 464 | ||||
| Shangri-La Asia Ltd. | 92 | 172 | ||||
| Sharp Corp. | 72 | 910 | ||||
| Shimamura Co. Ltd. | 2 | 153 | ||||
| Shimano Inc. | 5 | 186 | ||||
| Singapore Press Holdings Ltd. | 107 | 279 | ||||
| SKYCITY Entertainment Group Ltd. | 38 | 90 | ||||
| Societe Television Francaise 1 | 8 | 140 | ||||
| Sodexo SA (e) | 7 | 381 | ||||
| Sony Corp. | 72 | 2,080 | ||||
| Stanley Electric Co. Ltd. | 10 | 201 | ||||
| Sumitomo Rubber Industries Inc. (e) | 12 | 102 | ||||
| Suzuki Motor Corp. | 25 | 626 | ||||
| Swatch Group AG - Class B | 2 | 564 | ||||
| Swatch Group AG (e) | 3 | 144 | ||||
| Tabcorp Holdings Ltd. | 43 | 267 | ||||
| Takashimaya Co. Ltd. | 21 | 134 | ||||
| Tatts Group Ltd. (e) | 80 | 176 | ||||
| Television Broadcasts Ltd. | 17 | 82 | ||||
| Thomas Cook Group Plc | 64 | 238 | ||||
| Toho Co. Ltd. | 7 | 119 | ||||
| Toyoda Gosei Co. Ltd. | 5 | 142 | ||||
| Toyota Boshoku Corp. | 5 | 104 | ||||
| Toyota Industries Corp. | 13 | 388 | ||||
| Toyota Motor Corp. | 208 | 8,765 | ||||
| TUI AG (c) (e) | 8 | 70 | ||||
| TUI Travel Plc | 39 | 159 | ||||
| USS Co. Ltd. | 2 | 96 | ||||
| Vivendi SA | 87 | 2,596 | ||||
| Volkswagen AG (e) | 4 | 390 | ||||
| Volvo AB - Class A | 31 | 267 | ||||
| Volvo AB - Class B | 76 | 654 | ||||
| Whitbread Plc | 12 | 269 | ||||
| Wolters Kluwer NV | 19 | 419 | ||||
| WPP Plc | 90 | 883 | ||||
| Yamada Denki Co. Ltd. (e) | 6 | 426 | ||||
| Yamaha Corp. | 11 | 134 | ||||
| Yamaha Motor Co. Ltd. (c) | 14 | 182 | ||||
| Yue Yuen Industrial Holdings Ltd. | 45 | 131 | ||||
| 69,766 | ||||||
| CONSUMER STAPLES - 9.7% | ||||||
| AEON Co. Ltd. (e) | 47 | 378 | ||||
| Ajinomoto Co. Inc. | 47 | 443 | ||||
| Anheuser-Busch InBev NV | 51 | 2,678 | ||||
| Anheuser-Busch InBev NV- Strip VVPR | 13 | - | ||||
| Aryzta AG | 6 | 218 | ||||
| Asahi Breweries Ltd. | 27 | 488 | ||||
| Associated British Foods Plc | 24 | 318 | ||||
| Beiersdorf AG | 6 | 422 | ||||
| British American Tobacco Plc | 142 | 4,614 | ||||
| Cadbury Plc | 98 | 1,256 | ||||
| Carlsberg A/S | 8 | 556 | ||||
| Carrefour SA | 45 | 2,173 | ||||
| Casino Guichard Perrachon SA | 4 | 334 | ||||
| Coca-Cola Amatil Ltd. | 38 | 396 | ||||
| Coca-Cola Hellenic Bottling Co. SA | 12 | 282 | ||||
| Coca-Cola West Co. Ltd. | 4 | 78 | ||||
| Colruyt SA | 1 | 253 | ||||
| Danone SA | 39 | 2,403 | ||||
| Delhaize Group | 7 | 558 | ||||
| Diageo Plc | 178 | 3,109 | ||||
| FamilyMart Co. Ltd. | 5 | 133 | ||||
| Foster's Group Ltd. | 135 | 664 | ||||
| Golden Agri-Resources Ltd. (c) | 393 | 142 | ||||
| Goodman Fielder Ltd. | 83 | 121 | ||||
| Heineken Holding NV | 8 | 329 | ||||
| Heineken NV | 18 | 838 | ||||
| Henkel AG & Co. KGaA | 9 | 400 | ||||
| Imperial Tobacco Group Plc | 72 | 2,289 | ||||
| Ito En Ltd. (e) | 4 | 66 | ||||
| J Sainsbury Plc | 87 | 454 | ||||
| Japan Tobacco Inc. | - | 1,088 | ||||
| Jeronimo Martins SGPS SA | 14 | 145 | ||||
| Kao Corp. | 38 | 891 | ||||
| Kerry Group Plc | 10 | 286 | ||||
| Kesko Oyj | 5 | 160 | ||||
| Kikkoman Corp. (e) | 11 | 135 | ||||
| Kirin Holdings Co. Ltd. | 60 | 963 | ||||
| Koninklijke Ahold NV | 85 | 1,131 | ||||
| Lawson Inc. | 5 | 208 | ||||
| Lindt & Spruengli AG (e) | - | 197 | ||||
| L'Oreal SA | 17 | 1,907 | ||||
| MEIJI Holdings Co. Ltd. | 5 | 178 | ||||
| Metcash Ltd. | 52 | 209 | ||||
| Metro AG | 8 | 476 | ||||
| Nestle SA | 246 | 11,935 | ||||
| Nippon Meat Packers Inc. | 13 | 151 | ||||
| Nisshin Seifun Group Inc. (e) | 13 | 174 | ||||
| Nissin Foods Holdings Co. Ltd. | 5 | 157 | ||||
| Olam International Ltd. (e) | 88 | 165 | ||||
| Parmalat SpA | 115 | 321 | ||||
| Pernod-Ricard SA | 14 | 1,214 | ||||
| Reckitt Benckiser Group Plc | 43 | 2,340 | ||||
| SABMiller Plc | 67 | 1,979 | ||||
| Sapporo Holdings Ltd. (e) | 18 | 99 | ||||
| Seven & I Holdings Co. Ltd. | 55 | 1,125 | ||||
| Shiseido Co. Ltd. | 25 | 481 | ||||
| Suedzucker AG | 5 | 99 | ||||
| Swedish Match AB | 17 | 380 | ||||
| Tesco Plc | 563 | 3,893 | ||||
| Toyo Suisan Kaisha Ltd. | 6 | 138 | ||||
| Unicharm Corp. | 3 | 281 | ||||
| Unilever NV (e) | 116 | 3,776 | ||||
| Unilever Plc | 91 | 2,937 | ||||
| UNY Co. Ltd. | 13 | 92 | ||||
| Wesfarmers Ltd. | 83 | 2,298 | ||||
| Wilmar International Ltd. (e) | 90 | 409 | ||||
| WM Morrison Supermarkets Plc | 152 | 682 | ||||
| Woolworths Ltd. | 88 | 2,198 | ||||
| Yakult Honsha Co. Ltd. (e) | 7 | 219 | ||||
| Yamazaki Baking Co. Ltd. | 8 | 96 | ||||
| 72,006 | ||||||
| ENERGY - 8.2% | ||||||
| AMEC Plc | 23 | 294 | ||||
| Arrow Energy Ltd. (c) | 38 | 140 | ||||
| BG Group Plc | 239 | 4,323 | ||||
| BP Plc | 1,328 | 12,872 | ||||
| Cairn Energy Plc (c) | 97 | 521 | ||||
| Caltex Australia Ltd. (c) | 9 | 74 | ||||
| Cie Generale de Geophysique-Veritas (c) | 10 | 209 | ||||
| Cosmo Oil Co. Ltd. | 40 | 84 | ||||
| Energy Resources of Australia Ltd. | 4 | 95 | ||||
| ENI SpA | 185 | 4,719 | ||||
| Fugro NV | 5 | 262 | ||||
| Galp Energia SGPS SA | 11 | 193 | ||||
| Hellenic Petroleum SA | 7 | 79 | ||||
| Idemitsu Kosan Co. Ltd. | 2 | 88 | ||||
| INPEX Corp. | - | 439 | ||||
| Japan Petroleum Exploration Co. | 2 | 84 | ||||
| Lundin Petroleum AB (c) | 15 | 120 | ||||
| Mongolia Energy Co. Ltd. (c) | 231 | 118 | ||||
| Neste Oil Oyj | 9 | 162 | ||||
| Nippon Mining Holdings Inc. | 63 | 270 | ||||
| Nippon Oil Corp. | 86 | 399 | ||||
| OMV AG | 11 | 465 | ||||
| Origin Energy Ltd. | 63 | 944 | ||||
| Paladin Energy Ltd. (c) | 43 | 161 | ||||
| Petrofac Ltd. | 14 | 230 | ||||
| Repsol YPF SA (e) | 52 | 1,404 | ||||
| Royal Dutch Shell Plc - Class A | 251 | 7,641 | ||||
| Royal Dutch Shell Plc - Class B | 191 | 5,595 | ||||
| Saipem SpA | 19 | 659 | ||||
| Santos Ltd. | 60 | 752 | ||||
| SBM Offshore NV | 12 | 243 | ||||
| SeaDrill Ltd. (e) | 20 | 504 | ||||
| Showa Shell Sekiyu KK (e) | 12 | 99 | ||||
| StatoilHydro ASA | 80 | 2,004 | ||||
| Technip SA | 7 | 505 | ||||
| Tenaris SA | 34 | 731 | ||||
| TonenGeneral Sekiyu KK (e) | 18 | 150 | ||||
| Total SA | 150 | 9,669 | ||||
| Tullow Oil Plc | 57 | 1,208 | ||||
| Woodside Petroleum Ltd. | 38 | 1,617 | ||||
| WorleyParsons Ltd. | 11 | 288 | ||||
| 60,414 | ||||||
| FINANCIALS - 24.8% | ||||||
| 3i Group Plc | 68 | 313 | ||||
| 77 Bank Ltd. | 25 | 133 | ||||
| Acom Co. Ltd. (e) | 2 | 38 | ||||
| Admiral Group Plc | 12 | 236 | ||||
| Aegon NV | 109 | 710 | ||||
| AEON Credit Service Co. Ltd. (e) | 4 | 41 | ||||
| AEON Mall Co. Ltd. | 5 | 103 | ||||
| Aioi Insurance Co. Ltd. | 32 | 153 | ||||
| Allianz SE | 32 | 4,022 | ||||
| Alpha Bank AE (c) | 32 | 376 | ||||
| AMP Ltd. | 141 | 850 | ||||
| Anglo Irish Bank Corp. Plc (f) | 34 | 7 | ||||
| Aozora Bank Ltd. | 46 | 49 | ||||
| Ascendas Real Estate Investment Trust | 104 | 163 | ||||
| Assicurazioni Generali SpA (e) | 83 | 2,243 | ||||
| ASX Ltd. | 12 | 368 | ||||
| Australia & New Zealand Banking Group Ltd. | 178 | 3,629 | ||||
| Aviva Plc | 196 | 1,257 | ||||
| AXA Asia Pacific Holdings Ltd. | 71 | 413 | ||||
| AXA SA | 121 | 2,863 | ||||
| Baloise Holding AG | 3 | 279 | ||||
| Banca Carige SpA (e) | 46 | 124 | ||||
| Banca Monte dei Paschi di Siena SpA (e) | 156 | 276 | ||||
| Banca Popolare di Milano Scarl | 27 | 195 | ||||
| Banco Bilbao Vizcaya Argentaria SA | 253 | 4,615 | ||||
| Banco Comercial Portugues SA | 162 | 196 | ||||
| Banco de Sabadell SA | 65 | 364 | ||||
| Banco de Valencia SA (e) | 14 | 106 | ||||
| Banco Espirito Santo SA | 36 | 236 | ||||
| Banco Popolare SC (c) | 47 | 353 | ||||
| Banco Popular Espanol SA (e) | 59 | 436 | ||||
| Banco Santander SA | 578 | 9,581 | ||||
| Bank of Cyprus Public Co. Ltd. | 38 | 268 | ||||
| Bank of East Asia Ltd. | 104 | 408 | ||||
| Bank of Kyoto Ltd. | 22 | 178 | ||||
| Bank of Yokohama Ltd. | 89 | 406 | ||||
| Bankinter SA | 20 | 210 | ||||
| Barclays Plc | 810 | 3,611 | ||||
| Bendigo and Adelaide Bank Ltd. (e) | 24 | 212 | ||||
| BGP Holdings Plc (f) | 479 | - | ||||
| BNP Paribas | 67 | 5,388 | ||||
| BOC Hong Kong Holdings Ltd. | 266 | 598 | ||||
| British Land Co. Plc | 59 | 453 | ||||
| CapitaLand Ltd. (e) | 184 | 546 | ||||
| CapitaMall Trust | 165 | 211 | ||||
| CapitaMalls Asia Ltd. (c) | 93 | 168 | ||||
| CFS Retail Property Trust | 121 | 206 | ||||
| Cheung Kong Holdings Ltd. | 99 | 1,272 | ||||
| China Bank Ltd. | 52 | 311 | ||||
| Chinese Estates Holdings Ltd. | 49 | 83 | ||||
| Chugoku Bank Ltd. | 12 | 149 | ||||
| Chuo Mitsui Trust Holdings Inc. | 67 | 226 | ||||
| City Developments Ltd. | 37 | 303 | ||||
| CNP Assurances SA | 3 | 258 | ||||
| Commerzbank AG (c) (e) | 49 | 410 | ||||
| Commonwealth Bank of Australia | 108 | 5,268 | ||||
| Corio NV | 4 | 255 | ||||
| Credit Agricole SA (e) | 66 | 1,174 | ||||
| Credit Saison Co. Ltd. (e) | 11 | 127 | ||||
| Credit Suisse Group AG | 80 | 3,957 | ||||
| Criteria CaixaCorp SA | 57 | 268 | ||||
| Daiwa Securities Group Inc. | 120 | 604 | ||||
| Danske Bank A/S (c) | 32 | 722 | ||||
| DBS Group Holdings Ltd. | 123 | 1,333 | ||||
| Deutsche Bank AG | 42 | 2,983 | ||||
| Deutsche Boerse AG | 14 | 1,160 | ||||
| Deutsche Postbank AG (c) | 6 | 213 | ||||
| Dexia SA (c) | 36 | 230 | ||||
| Dexus Property Group | 350 | 266 | ||||
| DnB NOR ASA (c) (e) | 64 | 699 | ||||
| EFG Eurobank Ergasias SA (c) | 22 | 252 | ||||
| Erste Group Bank AG | 14 | 510 | ||||
| Eurazeo | 2 | 136 | ||||
| Exor SpA | 5 | 94 | ||||
| Fonciere Des Regions (e) | 2 | 154 | ||||
| Fondiaria-Sai SpA (e) | 4 | 70 | ||||
| Fortis (c) | 156 | 588 | ||||
| Fukuoka Financial Group Inc. | 51 | 178 | ||||
| GAM Holding Ltd. | 14 | 166 | ||||
| Gecina SA | 1 | 141 | ||||
| Goodman Group | 446 | 253 | ||||
| GPT Group | 626 | 337 | ||||
| Groupe Bruxelles Lambert SA | 6 | 552 | ||||
| Groupe Bruxelles Lambert SA - Strip VVPR | - | - | ||||
| Gunma Bank Ltd. | 27 | 138 | ||||
| Hachijuni Bank Ltd. | 32 | 189 | ||||
| Hammerson Plc | 49 | 337 | ||||
| Hang Lung Group Ltd. | 54 | 267 | ||||
| Hang Lung Properties Ltd. | 149 | 584 | ||||
| Hang Seng Bank Ltd. | 55 | 806 | ||||
| Hannover Rueckversicherung AG (c) | 4 | 194 | ||||
| Henderson Land Development Co. Ltd. | 77 | 575 | ||||
| Hiroshima Bank Ltd. | 36 | 140 | ||||
| Hokuhoku Financial Group Inc. | 91 | 186 | ||||
| Hong Kong Exchanges & Clearing Ltd. | 73 | 1,299 | ||||
| Hopewell Holdings Ltd. | 38 | 123 | ||||
| HSBC Holdings Plc | 1,229 | 14,063 | ||||
| Hysan Development Co. Ltd. | 42 | 119 | ||||
| Icade SA | 1 | 134 | ||||
| ICAP Plc | 36 | 251 | ||||
| IMMOEAST AG (c) (e) | 31 | 172 | ||||
| ING Groep NV (c) | 259 | 2,563 | ||||
| Insurance Australia Group Ltd. | 142 | 510 | ||||
| Intesa Sanpaolo SpA | 62 | 207 | ||||
| Intesa Sanpaolo SpA © | 548 | 2,475 | ||||
| Investec Plc | 30 | 208 | ||||
| Investor AB - Class B | 32 | 594 | ||||
| Iyo Bank Ltd. | 17 | 138 | ||||
| Jafco Co. Ltd. (e) | 2 | 56 | ||||
| Japan Prime Realty Investment Corp. | - | 77 | ||||
| Japan Real Estate Investment Corp. | - | 265 | ||||
| Japan Retail Fund Investment Corp. | - | 103 | ||||
| Joyo Bank Ltd. | 46 | 185 | ||||
| Julius Baer Group Ltd. | 14 | 508 | ||||
| KBC Groep NV (c) | 11 | 482 | ||||
| Kerry Properties Ltd. | 50 | 250 | ||||
| Klepierre (e) | 6 | 265 | ||||
| Land Securities Group Plc | 55 | 603 | ||||
| Legal & General Group Plc | 423 | 551 | ||||
| Lend Lease Corp. Ltd. | 30 | 279 | ||||
| Liberty International Plc | 34 | 280 | ||||
| Link Real Estate Investment Trust | 154 | 393 | ||||
| Lloyds Banking Group Plc (c) | 2,712 | 2,220 | ||||
| London Stock Exchange Group Plc | 11 | 126 | ||||
| Macquarie Group Ltd. (e) | 24 | 1,021 | ||||
| Man Group Plc | 119 | 595 | ||||
| Mapfre SA | 54 | 228 | ||||
| Marfin Investment Group SA | 42 | 120 | ||||
| Matsui Securities Co. Ltd. | 8 | 57 | ||||
| Mediobanca SpA (c) | 33 | 388 | ||||
| Mediolanum SpA (e) | 16 | 97 | ||||
| Mirvac Group | 198 | 277 | ||||
| Mitsubishi Estate Co. Ltd. | 84 | 1,342 | ||||
| Mitsubishi UFJ Financial Group Inc. | 890 | 4,386 | ||||
| Mitsubishi UFJ Lease & Finance Co. Ltd. (e) | 4 | 114 | ||||
| Mitsui Fudosan Co. Ltd. | 60 | 1,015 | ||||
| Mitsui Sumitomo Insurance Group Holdings Inc. | 30 | 772 | ||||
| Mizuho Financial Group Inc. | 973 | 1,751 | ||||
| Mizuho Securities Co. Ltd. | 38 | 115 | ||||
| Mizuho Trust & Banking Co. Ltd. (c) | 95 | 89 | ||||
| Muenchener Rueckversicherungs AG | 14 | 2,190 | ||||
| National Australia Bank Ltd. | 149 | 3,636 | ||||
| National Bank of Greece SA (c) | 43 | 1,126 | ||||
| Nationale A Portefeuille | 2 | 130 | ||||
| Natixis (c) | 59 | 301 | ||||
| New World Development Ltd. | 183 | 372 | ||||
| Nippon Building Fund Inc. | - | 274 | ||||
| Nipponkoa Insurance Co. Ltd. | 45 | 256 | ||||
| Nishi-Nippon City Bank Ltd. | 45 | 110 | ||||
| Nissay Dowa General Insurance Co. Ltd. | 12 | 58 | ||||
| Nomura Holdings Inc. | 254 | 1,889 | ||||
| Nomura Real Estate Holdings Inc. | 6 | 93 | ||||
| Nomura Real Estate Office Fund Inc. | - | 98 | ||||
| Nordea Bank AB (e) | 230 | 2,345 | ||||
| NTT Urban Development Corp. | - | 50 | ||||
| Old Mutual Plc (c) | 369 | 651 | ||||
| ORIX Corp. (e) | 7 | 489 | ||||
| Oversea-Chinese Banking Corp. Ltd. | 183 | 1,177 | ||||
| Pargesa Holding SA | 2 | 178 | ||||
| Piraeus Bank SA | 21 | 250 | ||||
| Pohjola Bank Plc | 10 | 110 | ||||
| Prudential plc (a) | 180 | 1,858 | ||||
| QBE Insurance Group Ltd. | 72 | 1,649 | ||||
| Raiffeisen International Bank Holding AG (e) | 4 | 203 | ||||
| Resolution Ltd. (c) | 197 | 284 | ||||
| Resona Holdings Inc. | 35 | 360 | ||||
| Royal Bank of Scotland Group Plc (c) | 1,217 | 574 | ||||
| RSA Insurance Group Plc | 244 | 475 | ||||
| Sampo Oyj | 29 | 717 | ||||
| Sapporo Hokuyo Holdings Inc. | 20 | 73 | ||||
| SBI Holdings Inc. | 1 | 225 | ||||
| Schroders Plc | 8 | 177 | ||||
| SCOR SE | 12 | 296 | ||||
| Segro Plc | 52 | 290 | ||||
| Senshu Ikeda Holdings Inc. (e) | 31 | 112 | ||||
| Seven Bank Ltd. | - | 74 | ||||
| Shinsei Bank Ltd. | 57 | 62 | ||||
| Shizuoka Bank Ltd. | 41 | 357 | ||||
| Singapore Exchange Ltd. | 62 | 365 | ||||
| Sino Land Co. | 113 | 217 | ||||
| Skandinaviska Enskilda Banken AB (c) | 106 | 659 | ||||
| Societe Generale - Class A | 45 | 3,137 | ||||
| Sompo Japan Insurance Inc. | 61 | 393 | ||||
| Sony Financial Holdings Inc. | - | 156 | ||||
| Standard Chartered Plc | 143 | 3,630 | ||||
| Standard Life Plc | 160 | 558 | ||||
| Stockland | 172 | 605 | ||||
| Sumitomo Mitsui Financial Group Inc. (e) | 65 | 1,872 | ||||
| Sumitomo Realty & Development Co. Ltd. (e) | 28 | 519 | ||||
| Sumitomo Trust & Banking Co. Ltd. | 103 | 506 | ||||
| Sun Hung Kai Properties Ltd. | 101 | 1,502 | ||||
| Suncorp-Metway Ltd. | 88 | 681 | ||||
| Suruga Bank Ltd. | 14 | 122 | ||||
| Svenska Handelsbanken - Class A | 34 | 975 | ||||
| Swedbank AB (c) | 44 | 440 | ||||
| Swire Pacific Ltd. | 54 | 653 | ||||
| Swiss Life Holding AG | 2 | 257 | ||||
| Swiss Reinsurance | 25 | 1,191 | ||||
| T&D Holdings Inc. | 16 | 329 | ||||
| Tokio Marine Holdings Inc. | 52 | 1,410 | ||||
| Tokyo Tatemono Co. Ltd. | 31 | 119 | ||||
| Tokyu Land Corp. | 30 | 111 | ||||
| Topdanmark A/S (c) | 1 | 132 | ||||
| TrygVesta AS | 2 | 110 | ||||
| UBS AG (c) | 253 | 3,922 | ||||
| Unibail-Rodamco SE | 6 | 1,389 | ||||
| UniCredit SpA (c) | 1,012 | 3,400 | ||||
| Unione di Banche Italiane SCPA (e) | 41 | 597 | ||||
| Unipol Gruppo Finanziario SpA (c) (e) | 54 | 74 | ||||
| United Overseas Bank Ltd. | 87 | 1,212 | ||||
| UOL Group Ltd. | 35 | 100 | ||||
| Vienna Insurance Group | 2 | 126 | ||||
| Westfield Group | 148 | 1,658 | ||||
| Westpac Banking Corp. | 209 | 4,720 | ||||
| Wharf Holdings Ltd. | 100 | 573 | ||||
| Wheelock & Co. Ltd. | 62 | 189 | ||||
| Wing Hang Bank Ltd. | 9 | 86 | ||||
| Yamaguchi Financial Group Inc. | 16 | 150 | ||||
| Zurich Financial Services AG | 10 | 2,297 | ||||
| 183,286 | ||||||
| HEALTH CARE - 8.1% | ||||||
| Actelion Ltd. (c) | 7 | 377 | ||||
| Alfresa Holdings Corp. | 3 | 99 | ||||
| Astellas Pharma Inc. | 32 | 1,204 | ||||
| AstraZeneca Plc | 103 | 4,833 | ||||
| Bayer AG | 59 | 4,712 | ||||
| BioMerieux SA | 1 | 108 | ||||
| Celesio AG | 5 | 138 | ||||
| Chugai Pharmaceutical Co. Ltd. | 15 | 282 | ||||
| Cie Generale d'Optique Essilor International SA (e) | 14 | 863 | ||||
| Cochlear Ltd. | 4 | 249 | ||||
| Coloplast A/S | 2 | 141 | ||||
| CSL Ltd. | 42 | 1,222 | ||||
| Daiichi Sankyo Co. Ltd. | 47 | 985 | ||||
| Dainippon Sumitomo Pharma Co. Ltd. | 11 | 116 | ||||
| Eisai Co. Ltd. | 18 | 651 | ||||
| Elan Corp. Plc (c) | 36 | 215 | ||||
| Fresenius Medical Care AG & Co. KGaA | 14 | 728 | ||||
| Fresenius SE | 2 | 116 | ||||
| Getinge AB - Class B | 15 | 280 | ||||
| GlaxoSmithKline Plc | 368 | 7,839 | ||||
| Grifols SA (e) | 9 | 159 | ||||
| H Lundbeck A/S | 4 | 73 | ||||
| Hisamitsu Pharmaceutical Co. Inc. (e) | 5 | 152 | ||||
| Ipsen SA | 2 | 106 | ||||
| kyowa Hakko Kirin Co. Ltd. | 18 | 187 | ||||
| Lonza Group AG | 3 | 229 | ||||
| Medipal Holdings Corp. | 10 | 120 | ||||
| Merck KGaA | 5 | 426 | ||||
| Mitsubishi Tanabe Pharma Corp. | 15 | 187 | ||||
| Nobel Biocare Holding AG | 9 | 299 | ||||
| Novartis AG | 150 | 8,177 | ||||
| Novo-Nordisk A/S - Class B | 31 | 1,985 | ||||
| Olympus Corp. | 15 | 484 | ||||
| Ono Pharmaceutical Co. Ltd. | 6 | 245 | ||||
| Orion Oyj | 6 | 122 | ||||
| Qiagen NV (c) | 16 | 370 | ||||
| Roche Holding AG | 50 | 8,471 | ||||
| Sanofi-Aventis SA | 75 | 5,898 | ||||
| Santen Pharmaceutical Co. Ltd. | 5 | 157 | ||||
| Shionogi & Co. Ltd. | 22 | 477 | ||||
| Shire Plc | 39 | 765 | ||||
| Smith & Nephew Plc | 64 | 657 | ||||
| Sonic Healthcare Ltd. | 25 | 348 | ||||
| Sonova Holding AG | 3 | 409 | ||||
| Straumann Holding AG | 1 | 149 | ||||
| Suzuken Co. Ltd. | 5 | 176 | ||||
| Synthes Inc. | 4 | 560 | ||||
| Sysmex Corp. | 3 | 136 | ||||
| Taisho Pharmaceutical Co. Ltd. | 9 | 155 | ||||
| Takeda Pharmaceutical Co. Ltd. | 53 | 2,201 | ||||
| Terumo Corp. | 12 | 711 | ||||
| Tsumura & Co. | 5 | 149 | ||||
| UCB SA (e) | 7 | 301 | ||||
| William Demant Holding AS (c) | 1 | 112 | ||||
| 60,311 | ||||||
| INDUSTRIALS - 10.8% | ||||||
| A P Moller - Maersk A/S Class A | - | 265 | ||||
| A P Moller - Maersk A/S Class B | - | 663 | ||||
| ABB Ltd. | 157 | 3,025 | ||||
| Abertis Infraestructuras SA | 20 | 447 | ||||
| ACS Actividades de Construccion y Servicios SA | 10 | 491 | ||||
| Adecco SA | 9 | 478 | ||||
| Aeroports de Paris (e) | 2 | 175 | ||||
| Air France-KLM (c) | 9 | 147 | ||||
| Alfa Laval AB (e) | 24 | 338 | ||||
| All Nippon Airways Co. Ltd. | 63 | 171 | ||||
| Alstom SA | 14 | 991 | ||||
| Amada Co. Ltd. | 24 | 150 | ||||
| Asahi Glass Co. Ltd. | 73 | 695 | ||||
| Asciano Group (c) | 187 | 304 | ||||
| Assa Abloy AB (e) | 21 | 415 | ||||
| Atlantia SpA | 18 | 475 | ||||
| Atlas Copco AB - Class A | 47 | 693 | ||||
| Atlas Copco AB - Class B | 28 | 361 | ||||
| Auckland International Airport Ltd. | 62 | 90 | ||||
| BAE Systems Plc | 252 | 1,465 | ||||
| Balfour Beatty Plc | 48 | 200 | ||||
| Bouygues SA | 16 | 838 | ||||
| Brambles Ltd. | 98 | 596 | ||||
| Brisa-Auto Estradas de Portugal SA | 13 | 137 | ||||
| British Airways Plc (c) | 42 | 128 | ||||
| Bunzl Plc | 24 | 266 | ||||
| Bureau Veritas SA | 3 | 170 | ||||
| Capita Group Plc | 45 | 545 | ||||
| Cathay Pacific Airways Ltd. | 80 | 149 | ||||
| Central Japan Railway Co. | - | 703 | ||||
| Chiyoda Corp. | 10 | 77 | ||||
| Cie de Saint-Gobain | 27 | 1,498 | ||||
| Cintra Concesiones de Infraestructuras de Transporte SA | 30 | 358 | ||||
| Cobham Plc | 81 | 330 | ||||
| ComfortDelgro Corp. Ltd. | 121 | 141 | ||||
| Cosco Corp. Singapore Ltd. | 76 | 64 | ||||
| CSR Ltd. | 116 | 187 | ||||
| Dai Nippon Printing Co. Ltd. | 39 | 497 | ||||
| Daikin Industries Ltd. | 17 | 668 | ||||
| Daito Trust Construction Co. Ltd. | 6 | 265 | ||||
| Daiwa House Industry Co. Ltd. | 37 | 398 | ||||
| Deutsche Lufthansa AG | 16 | 276 | ||||
| Deutsche Post AG | 60 | 1,169 | ||||
| DSV A/S (c) (e) | 16 | 281 | ||||
| East Japan Railway Co. | 24 | 1,531 | ||||
| Eiffage SA | 3 | 152 | ||||
| European Aeronautic Defence & Space Co. NV | 29 | 577 | ||||
| Experian Plc | 72 | 712 | ||||
| Fanuc Ltd. | 14 | 1,277 | ||||
| Finmeccanica SpA | 28 | 445 | ||||
| Firstgroup Plc | 32 | 219 | ||||
| Fomento de Construcciones y Contratas SA | 3 | 115 | ||||
| Fraport AG Frankfurt Airport Services Worldwide (e) | 2 | 128 | ||||
| Fraser and Neave Ltd. | 67 | 198 | ||||
| Fuji Electric Holdings Co. Ltd. (c) | 40 | 69 | ||||
| Furukawa Electric Co. Ltd. (e) | 42 | 175 | ||||
| G4S Plc | 87 | 368 | ||||
| Gamesa Corp. Tecnologica SA | 13 | 215 | ||||
| GEA Group AG | 10 | 231 | ||||
| Geberit AG (e) | 3 | 498 | ||||
| GS Yuasa Corp. (e) | 26 | 192 | ||||
| Hankyu Hanshin Holdings Inc. | 81 | 362 | ||||
| Hino Motors Ltd. (c) | 19 | 66 | ||||
| Hitachi Construction Machinery Co. Ltd. | 8 | 199 | ||||
| Hochtief AG | 3 | 213 | ||||
| Hong Kong Aircraft Engineering Co. Ltd. | 5 | 67 | ||||
| Hutchison Whampoa Ltd. | 152 | 1,040 | ||||
| Iberia Lineas Aereas de Espana | 35 | 95 | ||||
| IHI Corp. (c) | 88 | 140 | ||||
| Invensys Plc | 56 | 269 | ||||
| ITOCHU Corp. | 105 | 776 | ||||
| Japan Airlines Corp. (c) | 62 | 45 | ||||
| Japan Steel Works Ltd. | 24 | 306 | ||||
| JGC Corp. | 14 | 258 | ||||
| JS Group Corp. | 17 | 291 | ||||
| JTEKT Corp. | 14 | 185 | ||||
| Kajima Corp. | 59 | 119 | ||||
| Kamigumi Co. Ltd. | 19 | 139 | ||||
| Kawasaki Heavy Industries Ltd. | 96 | 244 | ||||
| Kawasaki Kisen Kaisha Ltd. (c) | 43 | 123 | ||||
| Keihin Electric Express Railway Co. Ltd. (e) | 33 | 243 | ||||
| Keio Corp. | 40 | 241 | ||||
| Keisei Electric Railway Co. Ltd. | 19 | 104 | ||||
| Keppel Corp. Ltd. | 92 | 536 | ||||
| Kinden Corp. | 10 | 85 | ||||
| Kintetsu Corp. (e) | 115 | 381 | ||||
| Komatsu Ltd. | 68 | 1,418 | ||||
| Kone Oyj | 11 | 466 | ||||
| Koninklijke Boskalis Westminster NV | 5 | 189 | ||||
| Koninklijke Philips Electronics NV | 69 | 2,053 | ||||
| Koninklijke Vopak NV | 2 | 186 | ||||
| Kubota Corp. | 78 | 716 | ||||
| Kuehne & Nagel International AG | 4 | 362 | ||||
| Kurita Water Industries Ltd. | 8 | 248 | ||||
| Legrand SA | 7 | 195 | ||||
| Leighton Holdings Ltd. | 10 | 349 | ||||
| Macquarie Airports | 55 | 150 | ||||
| Macquarie Infrastructure Group | 154 | 184 | ||||
| Man AG | 8 | 595 | ||||
| Marubeni Corp. | 119 | 658 | ||||
| Metso Oyj | 9 | 330 | ||||
| Minebea Co. Ltd. | 23 | 125 | ||||
| Mitsubishi Corp. | 90 | 2,254 | ||||
| Mitsubishi Electric Corp. (c) | 135 | 1,003 | ||||
| Mitsubishi Heavy Industries Ltd. (e) | 218 | 769 | ||||
| Mitsubishi Logistics Corp. (e) | 7 | 83 | ||||
| Mitsui & Co. Ltd. | 123 | 1,746 | ||||
| Mitsui Engineering & Shipbuilding Co. Ltd. (e) | 53 | 128 | ||||
| Mitsui OSK Lines Ltd. | 79 | 418 | ||||
| MTR Corp. (e) | 98 | 336 | ||||
| Neptune Orient Lines Ltd. | 66 | 77 | ||||
| NGK Insulators Ltd. (e) | 18 | 394 | ||||
| Nippon Express Co. Ltd. | 59 | 244 | ||||
| Nippon Sheet Glass Co. Ltd. | 42 | 120 | ||||
| Nippon Yusen KK | 103 | 317 | ||||
| Nissha Printing Co. Ltd. | 2 | 103 | ||||
| Noble Group Ltd. (e) | 110 | 252 | ||||
| NSK Ltd. | 34 | 250 | ||||
| NTN Corp. | 32 | 145 | ||||
| NWS Holdings Ltd. | 58 | 106 | ||||
| Obayashi Corp. | 47 | 160 | ||||
| Odakyu Electric Railway Co. Ltd. | 43 | 330 | ||||
| Orient Overseas International Ltd. | 15 | 69 | ||||
| Orkla ASA | 53 | 520 | ||||
| Panasonic Electric Works Co. Ltd. | 27 | 327 | ||||
| Prysmian SPA | 7 | 122 | ||||
| Qantas Airways Ltd. | 74 | 198 | ||||
| Randstad Holding NV (c) | 7 | 362 | ||||
| Renewable Energy Corp. AS (c) (e) | 21 | 165 | ||||
| Rolls-Royce Group Plc (c) | 133 | 1,035 | ||||
| Ryanair Holdings Plc (c) | 2 | 9 | ||||
| Sacyr Vallehermoso SA (e) | 6 | 72 | ||||
| Safran SA | 12 | 243 | ||||
| Sandvik AB | 70 | 851 | ||||
| Scania AB (e) | 22 | 287 | ||||
| Schindler Holding AG | 1 | 109 | ||||
| Schneider Electric SA (virt-x) | 17 | 1,969 | ||||
| Secom Co. Ltd. | 15 | 699 | ||||
| Securitas AB - Class B (e) | 21 | 204 | ||||
| SembCorp Industries Ltd. | 64 | 167 | ||||
| SembCorp Marine Ltd. | 53 | 139 | ||||
| Serco Group Plc | 34 | 289 | ||||
| SGS SA (e) | - | 518 | ||||
| Shimizu Corp. (e) | 42 | 151 | ||||
| Siemens AG | 58 | 5,378 | ||||
| Singapore Airlines Ltd. | 38 | 406 | ||||
| Singapore Technologies Engineering Ltd. | 95 | 219 | ||||
| Skanska AB | 28 | 478 | ||||
| SKF AB - Class B | 27 | 461 | ||||
| SMC Corp. | 4 | 423 | ||||
| Smiths Group Plc | 28 | 461 | ||||
| Societe BIC SA | 2 | 132 | ||||
| Societe Des Autoroutes Paris-Rhin-Rhone | 2 | 117 | ||||
| Sojitz Corp. | 82 | 156 | ||||
| Solarworld AG (e) | 6 | 124 | ||||
| Sumitomo Corp. | 79 | 802 | ||||
| Sumitomo Electric Industries Ltd. | 53 | 658 | ||||
| Sumitomo Heavy Industries Ltd. | 38 | 192 | ||||
| Taisei Corp. | 65 | 112 | ||||
| Thales SA | 6 | 328 | ||||
| THK Co. Ltd. | 9 | 158 | ||||
| TNT NV | 26 | 796 | ||||
| Tobu Railway Co. Ltd. (e) | 56 | 292 | ||||
| Tokyu Corp. | 81 | 323 | ||||
| Toll Holdings Ltd. | 46 | 356 | ||||
| Tomkins Plc | 59 | 183 | ||||
| Toppan Printing Co. Ltd. | 38 | 310 | ||||
| TOTO Ltd. | 17 | 108 | ||||
| Toyota Tsusho Corp. | 15 | 221 | ||||
| Transurban Group | 84 | 417 | ||||
| Ushio Inc. | 8 | 138 | ||||
| Vallourec SA | 4 | 741 | ||||
| Vestas Wind Systems A/S (c) | 14 | 867 | ||||
| Vinci SA | 31 | 1,769 | ||||
| Wartsila Oyj | 6 | 242 | ||||
| West Japan Railway Co. | - | 402 | ||||
| Wolseley Plc (c) | 20 | 403 | ||||
| Yamato Holdings Co. Ltd. | 28 | 388 | ||||
| Yangzijiang Shipbuilding Holdings Ltd. | 102 | 88 | ||||
| Zardoya Otis SA | 10 | 189 | ||||
| 80,211 | ||||||
| INFORMATION TECHNOLOGY - 4.7% | ||||||
| Advantest Corp. | 11 | 281 | ||||
| Alcatel-Lucent (c) | 167 | 571 | ||||
| ASM Pacific Technology Ltd. | 15 | 137 | ||||
| ASML Holding NV | 30 | 1,035 | ||||
| Atos Origin SA (c) | 3 | 148 | ||||
| Autonomy Corp. Plc (c) | 15 | 371 | ||||
| Brother Industries Ltd. | 15 | 170 | ||||
| Canon Inc. | 76 | 3,226 | ||||
| Cap Gemini SA | 11 | 486 | ||||
| Citizen Holdings Co. Ltd. (e) | 21 | 123 | ||||
| Computershare Ltd. | 30 | 307 | ||||
| Dassault Systemes SA | 5 | 264 | ||||
| Elpida Memory Inc. (c) | 12 | 199 | ||||
| Foxconn International Holdings Ltd. (c) | 138 | 159 | ||||
| FUJIFILM Holdings Corp. | 34 | 1,030 | ||||
| Fujitsu Ltd. | 133 | 863 | ||||
| Hirose Electric Co. Ltd. (e) | 2 | 231 | ||||
| Hitachi High-Technologies Corp. | 5 | 105 | ||||
| Hitachi Ltd. (c) | 319 | 981 | ||||
| Hoya Corp. | 30 | 790 | ||||
| Ibiden Co. Ltd. | 9 | 327 | ||||
| Indra Sistemas SA | 7 | 160 | ||||
| Infineon Technologies AG (c) (e) | 75 | 416 | ||||
| Itochu Techno-Solutions Corp. (e) | 2 | 56 | ||||
| Keyence Corp. | 3 | 603 | ||||
| Konami Corp. | 7 | 120 | ||||
| Konica Minolta Holdings Inc. | 34 | 350 | ||||
| Kyocera Corp. | 12 | 1,022 | ||||
| Logitech International SA (c) (e) | 13 | 227 | ||||
| Mabuchi Motor Co. Ltd. | 2 | 114 | ||||
| Mitsumi Electric Co. Ltd. | 5 | 92 | ||||
| Murata Manufacturing Co. Ltd. | 15 | 749 | ||||
| NEC Corp. | 186 | 481 | ||||
| Neopost SA | 2 | 186 | ||||
| Nidec Corp. | 8 | 721 | ||||
| Nintendo Co. Ltd. | 7 | 1,696 | ||||
| Nippon Electric Glass Co. Ltd. | 25 | 344 | ||||
| Nokia Oyj (e) | 266 | 3,404 | ||||
| Nomura Research Institute Ltd. | 7 | 138 | ||||
| NTT Data Corp. | - | 273 | ||||
| Obic Co. Ltd. | - | 72 | ||||
| Omron Corp. | 15 | 263 | ||||
| Oracle Corp. Japan | 3 | 108 | ||||
| Otsuka Corp. | 1 | 45 | ||||
| Ricoh Co. Ltd. | 48 | 688 | ||||
| Rohm Co. Ltd. | 7 | 451 | ||||
| Sage Group Plc | 96 | 340 | ||||
| SAP AG (e) | 61 | 2,888 | ||||
| Seiko Epson Corp. | 9 | 152 | ||||
| Shimadzu Corp. | 16 | 107 | ||||
| Shinko Electric Industries Co. Ltd. | 4 | 60 | ||||
| Square Enix Holdings Co. Ltd. | 4 | 93 | ||||
| STMicroelectronics NV (e) | 50 | 456 | ||||
| Sumco Corp. (e) | 8 | 136 | ||||
| TDK Corp. | 8 | 501 | ||||
| Telefonaktiebolaget LM Ericsson - Class B | 212 | 1,961 | ||||
| Tokyo Electron Ltd. | 12 | 790 | ||||
| Toshiba Corp. (c) | 287 | 1,593 | ||||
| Trend Micro Inc. (e) | 7 | 266 | ||||
| United Internet AG (c) | 9 | 116 | ||||
| Yahoo! Japan Corp. | 1 | 302 | ||||
| Yaskawa Electric Corp. (e) | 16 | 133 | ||||
| Yokogawa Electric Corp. | 18 | 157 | ||||
| 34,634 | ||||||
| MATERIALS - 10.2% | ||||||
| Acerinox SA (e) | 10 | 200 | ||||
| Air Liquide | 18 | 2,124 | ||||
| Air Water Inc. | 11 | 130 | ||||
| Akzo Nobel NV | 17 | 1,102 | ||||
| Alumina Ltd. (c) | 175 | 286 | ||||
| Amcor Ltd. | 86 | 478 | ||||
| Anglo American Plc (c) | 93 | 4,092 | ||||
| Antofagasta Plc | 29 | 458 | ||||
| ArcelorMittal | 61 | 2,818 | ||||
| Asahi Kasei Corp. | 87 | 436 | ||||
| BASF SE | 65 | 4,066 | ||||
| BHP Billiton Ltd. | 238 | 9,116 | ||||
| BHP Billiton Plc | 157 | 5,046 | ||||
| BlueScope Steel Ltd. | 133 | 367 | ||||
| Boral Ltd. | 41 | 220 | ||||
| Cimpor Cimentos de Portugal SGPS SA | 17 | 160 | ||||
| CRH Plc | 49 | 1,348 | ||||
| Daicel Chemical Industries Ltd. | 17 | 100 | ||||
| Daido Steel Co. Ltd. | 22 | 82 | ||||
| Denki Kagaku Kogyo K K | 32 | 143 | ||||
| Dowa Holdings Co. Ltd. (e) | 18 | 100 | ||||
| Eramet (e) | - | 125 | ||||
| Eurasian Natural Resources Corp. | 17 | 258 | ||||
| Fletcher Building Ltd. | 45 | 260 | ||||
| Fortescue Metals Group Ltd. (c) (e) | 90 | 357 | ||||
| Fresnillo Plc | 13 | 166 | ||||
| Givaudan SA | 1 | 443 | ||||
| HeidelbergCement AG | 10 | 699 | ||||
| Hitachi Chemical Co. Ltd. | 8 | 156 | ||||
| Hitachi Metals Ltd. | 13 | 125 | ||||
| Holcim Ltd. | 18 | 1,363 | ||||
| Holmen AB | 4 | 93 | ||||
| Imerys SA | 2 | 150 | ||||
| Incitec Pivot Ltd. | 114 | 361 | ||||
| Italcementi SpA (e) | 5 | 67 | ||||
| James Hardie Industries NV (c) | 29 | 219 | ||||
| JFE Holdings Inc. | 35 | 1,387 | ||||
| Johnson Matthey Plc | 16 | 386 | ||||
| JSR Corp. | 13 | 255 | ||||
| K+S AG | 12 | 709 | ||||
| Kaneka Corp. | 20 | 127 | ||||
| Kansai Paint Co. Ltd. | 14 | 117 | ||||
| Kazakhmys Plc (c) | 15 | 326 | ||||
| Kobe Steel Ltd. (c) | 177 | 321 | ||||
| Koninklijke DSM NV | 11 | 535 | ||||
| Kuraray Co. Ltd. | 24 | 283 | ||||
| Lafarge SA | 14 | 1,183 | ||||
| Linde AG | 11 | 1,306 | ||||
| Lonmin Plc (c) | 11 | 339 | ||||
| Maruichi Steel Tube Ltd. | 2 | 40 | ||||
| Mitsubishi Chemical Holdings Corp. | 86 | 366 | ||||
| Mitsubishi Gas Chemical Co. Inc. | 29 | 146 | ||||
| Mitsubishi Materials Corp. (c) | 72 | 176 | ||||
| Mitsubishi Rayon Co. Ltd. | 34 | 137 | ||||
| Mitsui Chemicals Inc. | 61 | 158 | ||||
| Mitsui Mining & Smelting Co. Ltd. (c) | 35 | 91 | ||||
| Newcrest Mining Ltd. | 35 | 1,095 | ||||
| Nippon Paper Group Inc. | 7 | 181 | ||||
| Nippon Steel Corp. | 364 | 1,476 | ||||
| Nissan Chemical Industries Ltd. | 9 | 128 | ||||
| Nisshin Steel Co. Ltd. (e) | 47 | 83 | ||||
| Nitto Denko Corp. | 12 | 431 | ||||
| Norsk Hydro ASA (c) | 49 | 410 | ||||
| Novozymes A/S | 3 | 323 | ||||
| Nufarm Ltd. | 12 | 115 | ||||
| OJI Paper Co. Ltd. | 61 | 256 | ||||
| OneSteel Ltd. | 90 | 270 | ||||
| Orica Ltd. | 26 | 604 | ||||
| Outokumpu Oyj | 8 | 156 | ||||
| OZ Minerals Ltd. (c) | 232 | 248 | ||||
| Randgold Resources Ltd. | 6 | 497 | ||||
| Rautaruukki Oyj (e) | 6 | 144 | ||||
| Rexam Plc | 64 | 302 | ||||
| Rio Tinto Ltd. | 31 | 2,073 | ||||
| Rio Tinto Plc | 97 | 5,326 | ||||
| Salzgitter AG | 3 | 282 | ||||
| Shin-Etsu Chemical Co. Ltd. | 29 | 1,649 | ||||
| Showa Denko KK | 97 | 193 | ||||
| Sims Metal Management Ltd. | 12 | 234 | ||||
| Solvay SA | 4 | 453 | ||||
| SSAB Svenskt Stal AB - Class A | 12 | 205 | ||||
| SSAB Svenskt Stal AB - Class B | 6 | 91 | ||||
| Stora Enso Oyj - Class R (c) (e) | 39 | 275 | ||||
| Sumitomo Chemical Co. Ltd. | 108 | 474 | ||||
| Sumitomo Metal Industries Ltd. | 242 | 651 | ||||
| Sumitomo Metal Mining Co. Ltd. | 37 | 546 | ||||
| Svenska Cellulosa AB | 41 | 549 | ||||
| Syngenta AG | 7 | 1,892 | ||||
| Taiheiyo Cement Corp. (c) | 49 | 56 | ||||
| Taiyo Nippon Sanso Corp. | 19 | 202 | ||||
| Teijin Ltd. | 68 | 220 | ||||
| ThyssenKrupp AG | 24 | 907 | ||||
| Titan Cement Co. SA | 4 | 117 | ||||
| Tokuyama Corp. | 19 | 106 | ||||
| Tokyo Steel Manufacturing Co. Ltd. (e) | 7 | 81 | ||||
| Toray Industries Inc. | 96 | 523 | ||||
| Tosoh Corp. | 37 | 102 | ||||
| Toyo Seikan Kaisha Ltd. | 11 | 169 | ||||
| Ube Industries Ltd. | 73 | 200 | ||||
| Umicore | 8 | 273 | ||||
| UPM-Kymmene Oyj | 37 | 437 | ||||
| Vedanta Resources Plc (e) | 10 | 412 | ||||
| Voestalpine AG | 8 | 292 | ||||
| Wacker Chemie AG | 1 | 184 | ||||
| Xstrata Plc (c) | 136 | 2,454 | ||||
| Yamato Kogyo Co. Ltd. | 3 | 98 | ||||
| Yara International ASA | 14 | 624 | ||||
| 75,171 | ||||||
| TELECOMMUNICATION SERVICES - 5.6% | ||||||
| Belgacom SA (e) | 11 | 401 | ||||
| BT Group Plc | 553 | 1,206 | ||||
| Cable & Wireless Plc | 186 | 425 | ||||
| Deutsche Telekom AG | 201 | 2,974 | ||||
| Elisa Oyj | 9 | 214 | ||||
| France Telecom SA | 132 | 3,293 | ||||
| Hellenic Telecommunications Organization SA | 17 | 250 | ||||
| Iliad SA (e) | 1 | 134 | ||||
| Inmarsat Plc | 32 | 356 | ||||
| KDDI Corp. | - | 1,102 | ||||
| Koninklijke KPN NV | 119 | 2,020 | ||||
| Millicom International Cellular SA | 5 | 399 | ||||
| Mobistar SA | 2 | 151 | ||||
| Nippon Telegraph & Telephone Corp. | 37 | 1,462 | ||||
| NTT DoCoMo Inc. | 1 | 1,530 | ||||
| PCCW Ltd. | 177 | 43 | ||||
| Portugal Telecom SGPS SA | 40 | 489 | ||||
| Singapore Telecommunications Ltd. | 569 | 1,253 | ||||
| SoftBank Corp. | 54 | 1,269 | ||||
| StarHub Ltd. | 45 | 68 | ||||
| Swisscom AG | 2 | 629 | ||||
| Tele2 AB | 22 | 334 | ||||
| Telecom Corp. of New Zealand Ltd. | 129 | 232 | ||||
| Telecom Italia SpA | 717 | 1,119 | ||||
| Telefonica SA | 300 | 8,408 | ||||
| Telekom Austria AG | 23 | 325 | ||||
| Telenor ASA (c) | 59 | 834 | ||||
| TeliaSonera AB | 160 | 1,165 | ||||
| Telstra Corp. Ltd. | 307 | 944 | ||||
| Vodafone Group Plc | 3,728 | 8,651 | ||||
| 41,680 | ||||||
| UTILITIES - 5.7% | ||||||
| A2A SpA (e) | 76 | 160 | ||||
| Acciona SA | 2 | 238 | ||||
| AGL Energy Ltd. | 31 | 387 | ||||
| BKW FMB Energie AG (e) | 1 | 63 | ||||
| Centrica Plc | 365 | 1,658 | ||||
| Cheung Kong Infrastructure Holdings Ltd. | 29 | 110 | ||||
| Chubu Electric Power Co. Inc. | 47 | 1,129 | ||||
| Chugoku Electric Power Co. Inc. (e) | 20 | 386 | ||||
| CLP Holdings Ltd. | 142 | 964 | ||||
| Contact Energy Ltd. | 18 | 81 | ||||
| Drax Group Plc | 26 | 177 | ||||
| E.ON AG | 135 | 5,656 | ||||
| EDP Renovaveis SA (c) | 14 | 130 | ||||
| Electric Power Development Co. Ltd. | 9 | 262 | ||||
| Electricite de France SA | 17 | 985 | ||||
| Enagas SA | 12 | 275 | ||||
| Enel SpA | 468 | 2,717 | ||||
| Energias de Portugal SA | 125 | 557 | ||||
| Fortum Oyj | 31 | 844 | ||||
| Gas Natural SDG SA | 15 | 326 | ||||
| GDF Suez (e) | 88 | 3,834 | ||||
| Hokkaido Electric Power Co. Inc. | 13 | 238 | ||||
| Hokuriku Electric Power Co. | 13 | 275 | ||||
| Hong Kong & China Gas Co. Ltd. | 277 | 695 | ||||
| Hongkong Electric Holdings Ltd. | 98 | 531 | ||||
| Iberdrola Renovables SA | 57 | 272 | ||||
| Iberdrola SA | 261 | 2,502 | ||||
| International Power Plc | 104 | 521 | ||||
| Kansai Electric Power Co. Inc. | 55 | 1,230 | ||||
| Kyushu Electric Power Co. Inc. | 27 | 548 | ||||
| National Grid Plc | 175 | 1,920 | ||||
| Osaka Gas Co. Ltd. | 133 | 448 | ||||
| Public Power Corp. SA (c) | 8 | 157 | ||||
| Red Electrica Corp. SA (e) | 8 | 426 | ||||
| RWE AG | 30 | 2,902 | ||||
| Scottish & Southern Energy Plc | 66 | 1,232 | ||||
| Severn Trent Plc | 16 | 288 | ||||
| Shikoku Electric Power Co. Inc. | 12 | 318 | ||||
| Snam Rete Gas SpA | 103 | 511 | ||||
| SP AusNet | 110 | 91 | ||||
| Suez Environnement SA | 19 | 440 | ||||
| Terna Rete Elettrica Nazionale SpA | 94 | 407 | ||||
| Toho Gas Co. Ltd. | 34 | 181 | ||||
| Tohoku Electric Power Co. Inc. | 30 | 595 | ||||
| Tokyo Electric Power Co. Inc. | 87 | 2,174 | ||||
| Tokyo Gas Co. Ltd. | 162 | 647 | ||||
| United Utilities Group Plc | 49 | 396 | ||||
| Veolia Environnement | 28 | 938 | ||||
| Verbund - Oesterreichische Elektrizitaetswirtschafts AG | 6 | 236 | ||||
| 42,058 | ||||||
| Total Common Stocks (cost $728,105) | 719,537 | |||||
| PREFERRED STOCKS - 0.5% | ||||||
| CONSUMER DISCRETIONARY - 0.2% | ||||||
| Bayerische Motoren Werke AG - PFD | 4 | 121 | ||||
| Porsche Automobil Holding SE | 6 | 377 | ||||
| Volkswagen AG | 7 | 695 | ||||
| 1,193 | ||||||
| CONSUMER STAPLES - 0.1% | ||||||
| Henkel AG & Co. KGaA | 13 | 669 | ||||
| Lindt & Spruengli AG | - | 131 | ||||
| 800 | ||||||
| HEALTH CARE - 0.1% | ||||||
| Fresenius SE | 6 | 399 | ||||
| INDUSTRIALS - 0.0% | ||||||
| Schindler Holding AG | 3 | 261 | ||||
| TELECOMMUNICATION SERVICES - 0.1% | ||||||
| Telecom Italia SpA - RNC | 413 | 458 | ||||
| UTILITIES - 0.0% | ||||||
| RWE AG | 3 | 251 | ||||
| Total Preferred Stocks (cost $3,490) | 3,362 | |||||
| RIGHTS - 0.0% | ||||||
| Dowa Mining Co. Ltd. (c) (f) | 10 | - | ||||
| Fortis - Rights (c) (f) | 101 | - | ||||
| Total Rights (cost $0) | - | |||||
| WARRANTS - 0.0% | ||||||
| Fonciere Des Regions, 12/31/10 (c) | 2 | 1 | ||||
| Mediobanca SpA, 03/24/11 (c) (f) | 29 | 4 | ||||
| Total Warrants (cost $0) | 5 | |||||
| NON-U.S. GOVERNMENT AGENCY | ||||||
| ASSET-BACKED SECURITIES - 0.0% | ||||||
| Sigma Finance, Inc. (d) (f) (u) | $ | 1,711 | 73 | |||
| Total Non-U.S. Government Agency | ||||||
| Asset-Backed Securities (cost $1,711) | 73 | |||||
| SHORT TERM INVESTMENTS - 6.1% | ||||||
| Mutual Funds - 2.1% | ||||||
| JNL Money Market Fund, 0.07% (a) (h) | 15,534 | 15,534 | ||||
| Securities Lending Collateral - 3.8% | ||||||
| Securities Lending Cash Collateral Fund LLC, | ||||||
| 0.16% (a) (h) | 11,595 | 11,595 | ||||
| Securities Lending Liquidating Fund LLC, 0.36% (a) (h) | 17,155 | 17,119 | ||||
| 28,714 | ||||||
| U.S. Treasury Securities - 0.2% | ||||||
| U.S. Treasury Bill, 0.22%, 03/11/10 (o) | $ | 1,135 | 1,135 | |||
| Total Short Term Investments (cost $45,419) | 45,383 | |||||
| Total Investments - 103.8% (cost $778,725) | 768,360 | |||||
| Other Assets and Liabilities, Net - (3.8%) | (28,321) | |||||
| Total Net Assets - 100% | $ | 740,039 | ||||
| JNL/T. Rowe Price Mid-Cap Growth Fund | ||||||
| COMMON STOCKS - 94.5% | ||||||
| CONSUMER DISCRETIONARY - 15.1% | ||||||
| Bed Bath & Beyond Inc. (c) | 193 | $ | 7,456 | |||
| Cablevision Systems Corp. - Class A | 287 | 7,410 | ||||
| Carmax Inc. (c) (e) | 398 | 9,652 | ||||
| Chipotle Mexican Grill Inc. - Class A (c) | 103 | 9,080 | ||||
| Choice Hotels International Inc. | 109 | 3,451 | ||||
| Coach Inc. | 150 | 5,480 | ||||
| Discovery Communications Inc. - Class A (c) (e) | 165 | 5,061 | ||||
| Discovery Communications Inc. - Class C (c) | 188 | 4,986 | ||||
| Dollar General Corp. (c) | 166 | 3,723 | ||||
| Education Management Corp. (c) | 88 | 1,937 | ||||
| Expedia Inc. (c) | 468 | 12,032 | ||||
| Gaylord Entertainment Co. (c) (e) | 154 | 3,042 | ||||
| Hyatt Hotels Corp. - Class A (c) | 47 | 1,395 | ||||
| J Crew Group Inc. (c) | 68 | 3,042 | ||||
| Lamar Advertising Co. (c) | 297 | 9,246 | ||||
| Liberty Media - Starz (c) | 83 | 3,830 | ||||
| Marriott International Inc. - Class A (e) | 442 | 12,044 | ||||
| O'Reilly Automotive Inc. (c) | 171 | 6,519 | ||||
| Panera Bread Co. - Class A (c) (e) | 44 | 2,947 | ||||
| Starbucks Corp. (c) | 167 | 3,851 | ||||
| Tim Hortons Inc. | 119 | 3,631 | ||||
| WABCO Holdings Inc. | 156 | 4,023 | ||||
| Wynn Resorts Ltd. (e) | 75 | 4,367 | ||||
| 128,205 | ||||||
| CONSUMER STAPLES - 2.0% | ||||||
| Shoppers Drug Mart Corp. | 179 | 7,741 | ||||
| Whole Foods Market Inc. (c) (e) | 331 | 9,086 | ||||
| 16,827 | ||||||
| ENERGY - 6.6% | ||||||
| Cameron International Corp. (c) | 110 | 4,598 | ||||
| CNX Gas Corp. (c) | 219 | 6,465 | ||||
| Consol Energy Inc. | 165 | 8,217 | ||||
| EOG Resources Inc. | 19 | 1,849 | ||||
| FMC Technologies Inc. (c) (e) | 165 | 9,544 | ||||
| Murphy Oil Corp. | 79 | 4,282 | ||||
| Peabody Energy Corp. | 109 | 4,928 | ||||
| Smith International Inc. | 215 | 5,842 | ||||
| Trican Well Service Ltd. | 166 | 2,226 | ||||
| Ultra Petroleum Corp. (c) | 166 | 8,277 | ||||
| 56,228 | ||||||
| FINANCIALS - 10.0% | ||||||
| AON Corp. | 162 | 6,211 | ||||
| Assurant Inc. | 109 | 3,213 | ||||
| E*Trade Financial Corp. (c) | 1,250 | 2,188 | ||||
| Eaton Vance Corp. (e) | 221 | 6,721 | ||||
| Fifth Third Bancorp | 408 | 3,978 | ||||
| Interactive Brokers Group Inc. (c) | 197 | 3,491 | ||||
| IntercontinentalExchange Inc. (c) | 57 | 6,401 | ||||
| Janus Capital Group Inc. (e) | 348 | 4,681 | ||||
| KeyCorp | 735 | 4,079 | ||||
| M&T Bank Corp. (e) | 57 | 3,813 | ||||
| Marshall & Ilsley Corp. | 734 | 4,000 | ||||
| MSCI Inc. (c) | 247 | 7,855 | ||||
| Principal Financial Group Inc. | 196 | 4,712 | ||||
| Raymond James Financial Inc. | 141 | 3,352 | ||||
| St. Joe Co. (c) (e) | 75 | 2,167 | ||||
| SunTrust Banks Inc. | 207 | 4,200 | ||||
| TCF Financial Corp. (e) | 137 | 1,866 | ||||
| TD Ameritrade Holding Corp. (c) | 326 | 6,318 | ||||
| WR Berkley Corp. | 217 | 5,347 | ||||
| 84,593 | ||||||
| HEALTH CARE - 17.2% | ||||||
| Alexion Pharmaceuticals Inc. (c) | 72 | 3,515 | ||||
| Allergan Inc. | 60 | 3,781 | ||||
| BioMarin Pharmaceutical Inc. (c) (e) | 140 | 2,633 | ||||
| CareFusion Corp. (c) | 328 | 8,203 | ||||
| Cephalon Inc. (c) (e) | 162 | 10,110 | ||||
| Cerner Corp. (c) (e) | 33 | 2,721 | ||||
| Covance Inc. (c) | 118 | 6,439 | ||||
| CR Bard Inc. | 104 | 8,102 | ||||
| DENTSPLY International Inc. (e) | 173 | 6,084 | ||||
| Edwards Lifesciences Corp. (c) | 110 | 9,554 | ||||
| Elan Corp. Plc - ADR (c) | 390 | 2,543 | ||||
| Henry Schein Inc. (c) (e) | 165 | 8,679 | ||||
| Human Genome Sciences Inc. (c) | 271 | 8,293 | ||||
| Humana Inc. (c) (e) | 97 | 4,257 | ||||
| Idexx Laboratories Inc. (c) (e) | 43 | 2,298 | ||||
| Illumina Inc. (c) (e) | 129 | 3,954 | ||||
| Intuitive Surgical Inc. (c) | 18 | 5,460 | ||||
| Millipore Corp. (c) | 54 | 3,907 | ||||
| Myriad Genetics Inc. (c) | 53 | 1,383 | ||||
| Onyx Pharmaceuticals Inc. (c) (e) | 66 | 1,948 | ||||
| OSI Pharmaceuticals Inc. (c) (e) | 136 | 4,220 | ||||
| Perrigo Co. (e) | 152 | 6,056 | ||||
| Qiagen NV (c) (e) | 329 | 7,343 | ||||
| Regeneron Pharmaceuticals Inc. (c) | 14 | 339 | ||||
| Theravance Inc. (c) | 109 | 1,425 | ||||
| Valeant Pharmaceutical International (c) (e) | 139 | 4,419 | ||||
| Vertex Pharmaceuticals Inc. (c) (e) | 163 | 6,985 | ||||
| Warner Chilcott Plc (c) | 138 | 3,929 | ||||
| Waters Corp. (c) | 123 | 7,621 | ||||
| 146,201 | ||||||
| INDUSTRIALS - 16.6% | ||||||
| A123 Systems Inc. (c) (e) | 39 | 875 | ||||
| Alliant Techsystems Inc. (c) | 45 | 3,972 | ||||
| AMETEK Inc. | 315 | 12,046 | ||||
| Danaher Corp. | 56 | 4,211 | ||||
| Fastenal Co. (e) | 204 | 8,486 | ||||
| First Solar Inc. (c) (e) | 13 | 1,760 | ||||
| Foster Wheeler AG (c) | 137 | 4,033 | ||||
| Gardner Denver Inc. | 104 | 4,406 | ||||
| Goodrich Corp. | 100 | 6,425 | ||||
| Harsco Corp. | 123 | 3,964 | ||||
| Hertz Global Holdings Inc. (c) (e) | 503 | 5,996 | ||||
| IDEX Corp. (e) | 247 | 7,694 | ||||
| IHS Inc. (c) (e) | 141 | 7,728 | ||||
| Manpower Inc. | 116 | 6,331 | ||||
| McDermott International Inc. (c) | 424 | 10,180 | ||||
| MSC Industrial Direct Co. - Class A | 96 | 4,512 | ||||
| Quanta Services Inc. (c) | 246 | 5,127 | ||||
| Robert Half International Inc. | 317 | 8,473 | ||||
| Rockwell Collins Inc. | 170 | 9,411 | ||||
| Roper Industries Inc. | 192 | 10,055 | ||||
| Southwest Airlines Co. | 353 | 4,035 | ||||
| Stericycle Inc. (c) | 48 | 2,648 | ||||
| SunPower Corp. - Class B (c) | 135 | 2,828 | ||||
| UTi Worldwide Inc. | 267 | 3,823 | ||||
| Verisk Analytics Inc. (c) | 71 | 2,150 | ||||
| 141,169 | ||||||
| INFORMATION TECHNOLOGY - 22.8% | ||||||
| Akamai Technologies Inc. (c) | 66 | 1,672 | ||||
| Altera Corp. (e) | 381 | 8,622 | ||||
| Autodesk Inc. (c) | 107 | 2,719 | ||||
| Cree Inc. (c) | 96 | 5,412 | ||||
| Dolby Laboratories Inc. - Class A (c) (e) | 179 | 8,544 | ||||
| Electronic Arts Inc. (c) | 358 | 6,354 | ||||
| Factset Research Systems Inc. (e) | 108 | 7,114 | ||||
| Fiserv Inc. (c) | 165 | 7,999 | ||||
| FLIR Systems Inc. (c) (e) | 218 | 7,133 | ||||
| Global Payments Inc. | 246 | 13,250 | ||||
| Intersil Corp. (e) | 360 | 5,522 | ||||
| JDS Uniphase Corp. (c) | 932 | 7,689 | ||||
| Juniper Networks Inc. (c) (e) | 432 | 11,521 | ||||
| Marvell Technology Group Ltd. (c) | 335 | 6,951 | ||||
| McAfee Inc. (c) | 203 | 8,236 | ||||
| MEMC Electronic Materials Inc. (c) | 184 | 2,506 | ||||
| Microchip Technology Inc. (e) | 261 | 7,585 | ||||
| Micros Systems Inc. (c) (e) | 180 | 5,585 | ||||
| National Semiconductor Corp. | 323 | 4,961 | ||||
| Palm Inc. (c) (e) | 163 | 1,637 | ||||
| PMC - Sierra Inc. (c) | 345 | 2,988 | ||||
| Red Hat Inc. (c) | 303 | 9,363 | ||||
| Rovi Corp. (c) | 163 | 5,195 | ||||
| SAIC Inc. (c) | 217 | 4,110 | ||||
| Salesforce.com Inc. (c) (e) | 57 | 4,205 | ||||
| Silicon Laboratories Inc. (c) | 53 | 2,562 | ||||
| Trimble Navigation Ltd. (c) | 203 | 5,116 | ||||
| Varian Semiconductor Equipment Associates Inc. (c) (e) | 149 | 5,346 | ||||
| VeriSign Inc. (c) (e) | 190 | 4,606 | ||||
| Western Union Co. | 602 | 11,347 | ||||
| Xilinx Inc. | 328 | 8,219 | ||||
| 194,069 | ||||||
| MATERIALS - 1.7% | ||||||
| Agnico-Eagle Mines Ltd. | 188 | 10,152 | ||||
| Franco-Nevada Corp. | 166 | 4,449 | ||||
| 14,601 | ||||||
| TELECOMMUNICATION SERVICES - 1.6% | ||||||
| American Tower Corp. (c) | 234 | 10,111 | ||||
| Crown Castle International Corp. (c) | 35 | 1,365 | ||||
| Leap Wireless International Inc. (c) | 107 | 1,877 | ||||
| 13,353 | ||||||
| UTILITIES - 0.9% | ||||||
| Calpine Corp. (c) | 672 | 7,391 | ||||
| Total Common Stocks (cost $700,755) | 802,637 | |||||
| NON-U.S. GOVERNMENT AGENCY | ||||||
| ASSET-BACKED SECURITIES - 0.0% | ||||||
| Sigma Finance, Inc. (d) (f) (u) | $ | 2,339 | 99 | |||
| Total Non-U.S. Government Agency | ||||||
| Asset-Backed Securities (cost $2,339) | 99 | |||||
| SHORT TERM INVESTMENTS - 20.3% | ||||||
| Mutual Funds - 5.6% | ||||||
| JNL Money Market Fund, 0.07% (a) (h) | 4,417 | 4,417 | ||||
| T. Rowe Price Reserves Investment Fund, 0.27% (a) (h) | 42,724 | 42,724 | ||||
| 47,141 | ||||||
| Securities Lending Collateral - 14.7% | ||||||
| Securities Lending Cash Collateral Fund LLC, | ||||||
| 0.16% (a) (h) | 73,953 | 73,953 | ||||
| Securities Lending Liquidating Fund LLC, 0.36% (a) (h) | 50,994 | 50,887 | ||||
| 124,840 | ||||||
| Total Short Term Investments (cost $172,088) | 171,981 | |||||
| Total Investments - 114.8% (cost $875,182) | 974,717 | |||||
| Other Assets and Liabilities, Net - (14.8%) | (125,451) | |||||
| Total Net Assets - 100% | $ | 849,266 | ||||
| JNL/T. Rowe Price Value Fund | ||||||
| COMMON STOCKS - 93.9% | ||||||
| CONSUMER DISCRETIONARY - 14.6% | ||||||
| Bed Bath & Beyond Inc. (c) | 243 | $ | 9,387 | |||
| Cablevision Systems Corp. - Class A | 385 | 9,936 | ||||
| Discovery Communications Inc. - Class C (c) | 333 | 8,818 | ||||
| Fortune Brands Inc. | 171 | 7,366 | ||||
| H&R Block Inc. | 309 | 6,990 | ||||
| Harley-Davidson Inc. | 171 | 4,309 | ||||
| Home Depot Inc. | 367 | 10,603 | ||||
| International Game Technology | 255 | 4,777 | ||||
| Kohl's Corp. (c) | 144 | 7,766 | ||||
| Liberty Media - Starz (c) | 21 | 979 | ||||
| Liberty Media Corp. - Capital (c) | 215 | 5,122 | ||||
| MGM Mirage (c) (e) | 416 | 3,794 | ||||
| Newell Rubbermaid Inc. | 285 | 4,270 | ||||
| Sherwin-Williams Co. | 20 | 1,258 | ||||
| Sony Corp. - ADR (e) | 114 | 3,306 | ||||
| Time Warner Cable Inc. (e) | 175 | 7,243 | ||||
| Time Warner Inc. | 290 | 8,451 | ||||
| TJX Cos. Inc. | 57 | 2,065 | ||||
| 106,440 | ||||||
| CONSUMER STAPLES - 5.0% | ||||||
| Altria Group Inc. | 226 | 4,427 | ||||
| Avon Products Inc. | 92 | 2,895 | ||||
| Kimberly-Clark Corp. | 106 | 6,753 | ||||
| Kraft Foods Inc. - Class A | 92 | 2,487 | ||||
| Philip Morris International Inc. | 101 | 4,867 | ||||
| Procter & Gamble Co. | 74 | 4,456 | ||||
| Sara Lee Corp. | 240 | 2,917 | ||||
| Wal-Mart Stores Inc. | 145 | 7,750 | ||||
| 36,552 | ||||||
| ENERGY - 13.7% | ||||||
| Baker Hughes Inc. (e) | 116 | 4,696 | ||||
| BJ Services Co. | 348 | 6,464 | ||||
| Chevron Corp. | 66 | 5,043 | ||||
| ConocoPhillips | 61 | 3,115 | ||||
| Consol Energy Inc. | 135 | 6,698 | ||||
| Exxon Mobil Corp. | 99 | 6,717 | ||||
| Murphy Oil Corp. | 164 | 8,862 | ||||
| Royal Dutch Shell Plc - ADR | 197 | 11,842 | ||||
| Schlumberger Ltd. | 158 | 10,284 | ||||
| Spectra Energy Corp. | 549 | 11,250 | ||||
| StatoilHydro ASA | 258 | 6,474 | ||||
| StatoilHydro ASA - ADR | 59 | 1,470 | ||||
| Sunoco Inc. | 193 | 5,024 | ||||
| Total SA - ADR | 189 | 12,072 | ||||
| 100,011 | ||||||
| FINANCIALS - 19.0% | ||||||
| AFLAC Inc. | 109 | 5,018 | ||||
| American Express Co. | 257 | 10,430 | ||||
| Ameriprise Financial Inc. | 200 | 7,745 | ||||
| AON Corp. | 212 | 8,109 | ||||
| Bank of America Corp. | 1,041 | 15,677 | ||||
| Berkshire Hathaway Inc. - Class A (c) | - | 3,472 | ||||
| Citigroup Inc. | 450 | 1,488 | ||||
| Fifth Third Bancorp | 132 | 1,287 | ||||
| First Horizon National Corp. (c) (e) | 550 | 7,370 | ||||
| Goldman Sachs Group Inc. | 30 | 5,065 | ||||
| JPMorgan Chase & Co. | 249 | 10,376 | ||||
| KeyCorp | 1,021 | 5,667 | ||||
| Lazard Ltd. - Class A | 230 | 8,733 | ||||
| Marsh & McLennan Cos. Inc. | 224 | 4,946 | ||||
| Morgan Stanley | 137 | 4,040 | ||||
| NYSE Euronext | 116 | 2,932 | ||||
| PNC Financial Services Group Inc. (e) | 28 | 1,478 | ||||
| SLM Corp. (c) | 598 | 6,744 | ||||
| St. Joe Co. (c) (e) | 311 | 8,970 | ||||
| State Street Corp. | 126 | 5,499 | ||||
| SunTrust Banks Inc. | 165 | 3,338 | ||||
| U.S. Bancorp | 186 | 4,176 | ||||
| Wells Fargo & Co. | 129 | 3,468 | ||||
| Willis Group Holdings Ltd. | 82 | 2,166 | ||||
| 138,194 | ||||||
| HEALTH CARE - 10.2% | ||||||
| Amgen Inc. (c) | 143 | 8,090 | ||||
| Cardinal Health Inc. | 158 | 5,104 | ||||
| CareFusion Corp. (c) | 229 | 5,715 | ||||
| CIGNA Corp. | 163 | 5,749 | ||||
| Covidien Plc | 179 | 8,572 | ||||
| Johnson & Johnson | 155 | 9,984 | ||||
| Medtronic Inc. | 202 | 8,884 | ||||
| Merck & Co. Inc. | 227 | 8,295 | ||||
| Pfizer Inc. | 515 | 9,368 | ||||
| WellPoint Inc. (c) | 78 | 4,547 | ||||
| 74,308 | ||||||
| INDUSTRIALS - 10.4% | ||||||
| 3M Co. | 128 | 10,540 | ||||
| Deere & Co. (e) | 68 | 3,678 | ||||
| General Electric Co. | 717 | 10,841 | ||||
| Honeywell International Inc. | 94 | 3,685 | ||||
| Illinois Tool Works Inc. | 159 | 7,630 | ||||
| Lockheed Martin Corp. | 18 | 1,356 | ||||
| Raytheon Co. | 111 | 5,693 | ||||
| Republic Services Inc. - Class A | 219 | 6,186 | ||||
| Southwest Airlines Co. | 1,087 | 12,424 | ||||
| Tyco International Ltd. | 146 | 5,191 | ||||
| Union Pacific Corp. | 89 | 5,655 | ||||
| Waste Management Inc. | 82 | 2,772 | ||||
| 75,651 | ||||||
| INFORMATION TECHNOLOGY - 10.1% | ||||||
| Alcatel-Lucent - ADR (c) | 984 | 3,267 | ||||
| Alcatel-Lucent (c) | 228 | 779 | ||||
| Analog Devices Inc. | 193 | 6,095 | ||||
| AOL Inc. (c) | - | - | ||||
| Dell Inc. (c) | 436 | 6,261 | ||||
| Electronic Arts Inc. (c) | 147 | 2,609 | ||||
| Intel Corp. | 55 | 1,112 | ||||
| International Business Machines Corp. | 63 | 8,247 | ||||
| Juniper Networks Inc. (c) | 83 | 2,219 | ||||
| Microsoft Corp. | 532 | 16,221 | ||||
| Texas Instruments Inc. | 385 | 10,033 | ||||
| Tyco Electronics Ltd. | 300 | 7,365 | ||||
| Western Union Co. | 481 | 9,067 | ||||
| 73,275 | ||||||
| MATERIALS - 4.8% | ||||||
| Alcoa Inc. | 170 | 2,734 | ||||
| EI Du Pont de Nemours & Co. | 189 | 6,347 | ||||
| International Paper Co. | 277 | 7,418 | ||||
| MeadWestvaco Corp. (e) | 170 | 4,867 | ||||
| United States Steel Corp. (e) | 34 | 1,847 | ||||
| Weyerhaeuser Co. | 274 | 11,820 | ||||
| 35,033 | ||||||
| TELECOMMUNICATION SERVICES - 2.3% | ||||||
| AT&T Inc. | 311 | 8,703 | ||||
| Qwest Communications International Inc. | 276 | 1,162 | ||||
| Sprint Nextel Corp. (c) (e) | 1,204 | 4,406 | ||||
| Vodafone Group Plc | 1,217 | 2,823 | ||||
| 17,094 | ||||||
| UTILITIES - 3.8% | ||||||
| CenterPoint Energy Inc. | 160 | 2,322 | ||||
| Entergy Corp. | 113 | 9,207 | ||||
| NiSource Inc. | 243 | 3,733 | ||||
| NRG Energy Inc. (c) | 310 | 7,306 | ||||
| Pinnacle West Capital Corp. (e) | 136 | 4,981 | ||||
| 27,549 | ||||||
| Total Common Stocks (cost $682,357) | 684,107 | |||||
| PREFERRED STOCKS - 1.1% | ||||||
| FINANCIALS - 1.0% | ||||||
| Bank of America Corp., 10.00% | 121 | 1,808 | ||||
| Citigroup Inc. | 9 | 949 | ||||
| Fifth Third Bancorp, Convertible Preferred, | ||||||
| 8.50%, Series G (p) | 40 | 4,700 | ||||
| 7,457 | ||||||
| TELECOMMUNICATION SERVICES - 0.1% | ||||||
| Lucent Technologies Capital Trust I, Convertible Preferred, | ||||||
| 7.75% (callable at 1,023 beginning 02/18/10) | 1 | 622 | ||||
| Total Preferred Stocks (cost $5,835) | 8,079 | |||||
| INVESTMENT FUNDS - 1.1% | ||||||
| T. Rowe Price Institutional Floating Rate Fund, 0.30% (a) (h) | 808 | 8,104 | ||||
| Total Investment Funds (cost $6,898) | 8,104 | |||||
| NON-U.S. GOVERNMENT AGENCY | ||||||
| ASSET-BACKED SECURITIES - 0.0% | ||||||
| Sigma Finance, Inc. (d) (f) (u) | $ | 1,103 | 47 | |||
| Total Non-U.S. Government Agency | ||||||
| Asset-Backed Securities (cost $1,103) | 47 | |||||
| CORPORATE BONDS AND NOTES - 0.9% | ||||||
| CONSUMER DISCRETIONARY - 0.6% | ||||||
| CSC Holdings Inc., 8.50%, 04/15/14 (t) (u) | 625 | 666 | ||||
| Ford Motor Co., 4.25%, 12/15/36 | 1,082 | 1,366 | ||||
| International Game Technology, 3.25%, 05/01/14 (t) (u) | 777 | 947 | ||||
| Newell Rubbermaid Inc., 5.50%, 03/15/14 | 651 | 1,230 | ||||
| 4,209 | ||||||
| MATERIALS - 0.3% | ||||||
| Alcoa Inc., 5.25%, 03/15/14 | 622 | 1,613 | ||||
| United States Steel Corp. 4.00%, 05/15/14 | 327 | 613 | ||||
| 2,226 | ||||||
| Total Corporate Bonds and Notes (cost $4,024) | 6,435 | |||||
| SHORT TERM INVESTMENTS - 8.3% | ||||||
| Mutual Funds - 3.6% | ||||||
| JNL Money Market Fund, 0.07% (a) (h) | 9,543 | 9,543 | ||||
| T. Rowe Price Reserves Investment Fund, 0.27% (a) (h) | 16,472 | 16,472 | ||||
| 26,015 | ||||||
| Securities Lending Collateral - 4.7% | ||||||
| Securities Lending Cash Collateral Fund LLC, | ||||||
| 0.16% (a) (h) | 18,427 | 18,427 | ||||
| Securities Lending Liquidating Fund LLC, 0.36% (a) (h) | 15,901 | 15,867 | ||||
| 34,294 | ||||||
| Total Short Term Investments (cost $60,343) | 60,309 | |||||
| Total Investments - 105.3% (cost $760,560) | 767,081 | |||||
| Other Assets and Liabilities, Net - (5.3%) | (38,860) | |||||
| Total Net Assets - 100% | $ | 728,221 | ||||
| JNL Series Trust |
Notes to the Schedules of Investments (dollar amounts in thousands) |
| December 31, 2009 |
| (a) | Investment in affiliate. |
| (b) | The Fund does not invest in the Underlying Affiliated Funds for the purpose of exercising management or control. At December 31, 2009, the percentage of shares outstanding held by each Fund in |
| the Underlying Affiliated Fund is presented parenthetically in the Schedules of Investments. Percentages reflecting 0.0% represent amounts less than 0.05%. | |
| (c) | Non-income producing security. |
| (d) | Issuer was in bankruptcy and/or was in default relating to principal and/or interest. |
| (e) | All or portion of the security was on loan. |
| (f) | Security fair valued in good faith in accordance with the procedures established by the Trust's Board of Trustees. Good faith fair valued securities may be classified as Level 2 or Level 3 |
| for Financial Accounting Standards Board ("FASB") Accounting Standards Codification ("ASC") Topic 820 "Fair Value Measurements and Disclosures" based on the applicable valuation inputs. | |
| See FASB ASC Topic 820 "Fair Value Measurements and Disclosures" in these Notes to the Schedules of Investments. | |
| (g) | Investment purchased on a delayed delivery basis. As of December 31, 2009, the total cost of investments purchased on a delayed delivery basis was as follows: JNL/Capital Guardian Global |
| Balanced Fund, $2,046; JNL/Goldman Sachs Core Plus Bond Fund $32,784; JNL/Mellon Capital Management Bond Index Fund $18,177; JNL/PIMCO Real Return Fund $517,453; | |
| JNL/PIMCO Total Return Bond Fund $239,586; and JNL/Select Balanced Fund $24,370. | |
| (h) | Yield changes daily to reflect current market conditions. Rate was the quoted yield as of December 31, 2009. |
| (i) | Variable rate security. Rate stated was in effect as of December 31, 2009. |
| (j) | Security issued with a zero coupon. Income is recognized through the accretion of discount. |
| (k) | Security is a "step-up" bond where the coupon may increase or step up at a future date. Rate stated was the coupon as of December 31, 2009. |
| (l) | The interest rate for this security is inversely affected by upgrades or downgrades to the credit rating of the issuer. |
| (m) | All or a portion of the securities or cash is segregated as collateral for swap agreements. As of December 31, 2009, total value of collateral in JNL/PIMCO Real Return Fund was $1,560. |
| (n) | All or a portion of the securities or cash is pledged as collateral for securities sold short. As of December 31, 2009, total value of collateral in JNL/Credit Suisse Long/Short Fund was $50,034. |
| (o) | All or a portion of the securities or cash is pledged as collateral for open futures contracts. As of December 31, 2009, total value of collateral was as follows: JNL/Goldman Sachs Core Plus Bond Fund |
| $3,531; JNL/JPMorgan International Value Fund $335; JNL/Mellon Capital Management Global Alpha Fund $2,155; JNL/Mellon Capital Management S&P 500 Index Fund $2,890; | |
| JNL/Mellon Capital Management S&P 400 MidCap Index Fund $710; JNL/Mellon Capital Management Small Cap Index Fund, $1,155; JNL/Mellon Capital Management International Index Fund, | |
| $1,135; JNL/PIMCO Real Return Fund $1,840; and JNL/PIMCO Total Return Bond Fund $10,012. | |
| (p) | Perpetual maturity security. Interest rate is fixed until the first call date and variable thereafter. |
| (q) | Par amounts are listed in United States Dollars unless otherwise noted. |
| (r) | Foreign or U.S. Treasury inflation indexed note, par amount is adjusted for inflation. |
| (s) | Security is restricted as to public resale. See Restricted table in these Notes to the Schedules of Investments and restricted security note in Note 3 of the Notes to the Financial Statements. |
| (t) | Rule 144A or Section 4(2) of the Securities Act of 1933, as amended, provides an exemption from the registration requirements for resale of this security to an institutional investor. |
| (u) | Illiquid security. At December 31, 2009, the aggregate value of illiquid securities and percentage of net assets were as follows: JNL/Capital Guardian Global Balanced Fund, $12,041 - 4.3%; |
| JNL/Capital Guardian Global Diversified Research Fund, $11,839 - 3.6%; JNL/Capital Guardian International Small Cap Fund, $7,330 - 5.1%; JNL/Franklin Templeton | |
| Global Growth Fund, $855 - 0.2%; JNL/Franklin Templeton Income Fund, $29,362 - 4.0%; JNL/Franklin Templeton Mutual Shares Fund, $17,664 - 4.2%; | |
| JNL/Goldman Sachs Core Plus Bond Fund, $24,240 - 3.1%; JNL/JPMorgan MidCap Growth Fund, $459 -0.3%; JNL/JPMorgan U.S. Government & Quality Bond Fund, $6,631 - 0.9%; | |
| JNL/M&G Global Basics Fund, $907 - 3.0%; JNL/Mellon Capital Management Small Cap Index Fund, $427 - 0.1%; JNL/PIMCO Real Return Fund, $29,998 - 2.5%; | |
| JNL/PIMCO Total Return Bond Fund, $23,363 - 1.0%; JNL/PPM America High Yield Bond Fund, $10,418 - 1.8%; JNL/Red Rocks Listed Private Equity Fund, $4,315 - 1.9%; | |
| JNL/T. Rowe Price Short-Term Bond Fund $2,185 - 0.4%; and JNL/T. Rowe Price Value Fund, $1,660 - 0.2%. At December 31, 2009, the only illiquid security held by some Funds was Sigma | |
| Finance, Inc. For Funds not listed in detail, the value of Sigma Finance, Inc. as a percentage of net assets was less than 0.03%. | |
| (v) | Rule 144A or Section 4(2) liquid security, the Fund deemed this security to be liquid based on procedures approved by the Trust's Board of Trustees. As of December 31, 2009, the value of Rule 144A |
| and Section 4(2) liquid securities was as follows: JNL/Capital Guardian Global Balanced Fund, $275; JNL/Capital Guardian Global Diversified Research Fund, $1,035; JNL/Credit Suisse Commodity | |
| Securities Fund, $42,044; JNL/Franklin Templeton Income Fund $120,176; JNL/Goldman Sachs Core Plus Bond Fund $87,400; JNL/JPMorgan U.S. Government & Quality Bond Fund $4,961; | |
| JNL/Mellon Capital Management Bond Index Fund $2,291; JNL/PIMCO Real Return Fund $123,708; JNL/PIMCO Total Return Bond Fund $164,071; JNL/PPM America High Yield Bond Fund $157,736; | |
| JNL/Select Balanced Fund $9,263; and JNL/T. Rowe Price Short-Term Bond Fund, $75,657. | |
| (w) | Contingent distributions represent the right to receive additional distributions, if any, during the reorganization of the underlying company. |
| (x) | The Fund had an unfunded loan commitment relating to this security at December 31, 2009. See Unfunded Loan Commitments table on page 164 and Note 3 in the Notes to the Financial Statements. |
| (y) | For all items listed as "Other Securities" in this Summary Schedule of Investments, this represents issues not identified as top-fifty unaffiliated holdings in terms of value and issues or issuers not |
| exceeding one percent individually or in aggregate, respectively, as of December 31, 2009. In certain instances, securities for which footnotes listed above may otherwise apply are included in the | |
| Other Securities caption. | |
| * | A Summary Schedule of Investments is presented for this portfolio. For information on availability of a complete Schedule of Investments, refer to www.jackson.com, www.sec.gov, or call the |
| Shareholder Service Center at 1-800-873-5654. |
| Currencies: | |||
| AUD - Australian Dollar | RUB - Russian Ruble | ||
| BRL - Brazilian Real | SEK - Swedish Krona | ||
| CAD - Canadian Dollar | SGD - Singapore Dollar | ||
| CHF - Swiss Franc | THB - Thai Baht | ||
| CLP - Chilean Peso | TRY - New Turkish Lira | ||
| CNY - Chinese Yuan | TWD - Taiwan Dollar | ||
| COP - Colombian Peso | USD - United States Dollar | ||
| DKK - Danish Krone | UYU - Uruguayan Peso | ||
| EGP - Egyptian Pound | ZAR - South African Rand | ||
| EUR - European Currency Unit (Euro) | Abbreviations: | ||
| GBP - British Pound | "-" Amount rounds to less than one thousand. | MIB - Milano Indice Borsa | |
| HKD - Hong Kong Dollar | ABS - Asset Backed Security | NYS - New York Registered Shares | |
| HUF - Hungarian Forint | ADR - American Depositary Receipt | REIT - Real Estate Investment Trust | |
| IDR - Indonesian Rupiah | AMBAC - AMBAC Indemnity Corp. | REMIC - Real Estate Mortgage Investment Conduit | |
| ILS - Israeli New Shekels | ASX - Australian Stock Exchange | SPDR - Standard & Poor's Depository Receipt | |
| INR - Indian Rupee | CAC - Cotation Assistee en Continu | TBA - To Be Announced (Securities purchased on a delayed delivery basis) | |
| JPY - Japanese Yen | CPI - Consumer Price Index | virt-x - a crossborder Recognized Investment Exchange | |
| KRW - Korean Won | DAX - Deutscher Aktienindex | Euro-Bobl - debt instrument issued by the Federal Republic of Germany with | |
| MXN - Mexican Peso | ETF - Exchange-Traded-Fund | a term of 4.5 to 5.5 years | |
| MYR - Malaysian Ringgit | FSA - Financial Security Assurance Inc. | Euro-Bund - debt instrument issued by the Federal Republic of Germany with | |
| NOK - Norwegian Krone | GDR - Global Depository Receipt | a term of 8.5 to 10.5 years | |
| NZD - New Zealand Dollar | IBEX - Iberia Index | ||
| PEN - Peruvian Nuevo Sol | LIBOR - London Interbank Offered Rate | ||
| PHP - Philippine Peso | MBIA - Municipal Bond Investors Assurance | ||
| PLN - Polish Zloty | MBS - Mortgage Backed Security | ||
See accompanying Notes to Financial Statements.
| JNL Series Trust |
Notes to the Schedules of Investments (continued) (dollar amounts in thousands) |
| December 31, 2009 |
Restricted Securities - Restricted securities are often purchased in private placement transactions and cannot be sold without prior registration unless the sale is pursuant to an exemption under the Securities Exchange Act of 1933, as amended. The following table details restricted securities as well as including Rule 144A securities that have not been deemed liquid, held by the Funds at December 31, 2009.
| Value | |||||||||||||
| Acquisition | End | Percent of | |||||||||||
| Date | Cost | of Period | Net Assets | ||||||||||
| JNL/Capital Guardian International Small Cap Fund | |||||||||||||
| 361 Degrees International Ltd. | 06/25/2009 | $ 452 | $ 525 | 0.4 | % | ||||||||
| BaWang International Group Holding Ltd. | 06/27/2009 | 269 | 492 | 0.3 | |||||||||
| CapitaCommercial Trust | 12/17/2008 | 804 | 1,047 | 0.7 | |||||||||
| CapitaMall Trust | 10/14/2008 | 214 | 306 | 0.2 | |||||||||
| Epistar Corp. | 09/18/2009 | 130 | 188 | 0.1 | |||||||||
| Gem Diamonds Ltd. | 12/06/2007 | 903 | 815 | 0.6 | |||||||||
| Liberty International Plc | 05/23/2009 | 44 | 74 | 0.1 | |||||||||
| Olam International Ltd. | 04/03/2008 | 812 | 961 | 0.7 | |||||||||
| Shaftesbury Plc | 12/06/2007 | 810 | 905 | 0.6 | |||||||||
| Yell Group Plc | 07/18/2008 | 1,208 | 995 | 0.7 | |||||||||
| $ 5,646 | $ 6,308 | 4.4 | % | ||||||||||
| JNL/Franklin Templeton Mutual Shares Fund | |||||||||||||
| Cerberus Capital Management LP | 08/06/2007 | $ 888 | $ 178 | 0.1 | % | ||||||||
| Cerberus Capital Management LP | 08/06/2007 | 888 | 178 | 0.1 | |||||||||
| Cerberus Capital Management LP | 08/06/2007 | 444 | 89 | - | |||||||||
| Cerberus Capital Management LP 12.00%, 07/31/14 | 08/07/2007 | 780 | 156 | - | |||||||||
| Cerberus Capital Management LP 12.00%, 07/31/14 | 08/07/2007 | 390 | 78 | - | |||||||||
| Cerberus Capital Management LP 12.00%, 07/31/14 | 08/07/2007 | 780 | 156 | - | |||||||||
| Dana Corp. 6.50%, 03/01/10 | 02/04/2008 | 3 | 1 | - | |||||||||
| Dana Corp. 5.85%, 01/15/15 | 04/23/2008 | 5 | - | - | |||||||||
| Dana Corp. 7.00%, 03/15/28 | 02/04/2008 | 6 | - | - | |||||||||
| Harrah's Investment LP | 01/16/2008 | 39 | - | - | |||||||||
| $ 4,223 | $ 836 | 0.2 | % | ||||||||||
| JNL/T. Rowe Price Value Fund | |||||||||||||
| CSC Holdings Inc., 8.50%, 04/15/14 | 01/09/2009 | $ 565 | $ 666 | 0.1 | % | ||||||||
| International Game Technology, 3.25%, 05/01/14 | 05/07/2009 | 777 | 947 | 0.1 | |||||||||
| $ 1,342 | $ 1,613 | 0.2 | % | ||||||||||
Summary of Written Options (in thousands except contracts) | |||||||||||||
| JNL/Franklin Templeton Mutual Shares Fund | Contracts | Premiums | |||||||||||
| Options outstanding at December 31, 2008 | 136 | $ 22 | |||||||||||
| Options written during the period | 629 | 81 | |||||||||||
| Options closed during the period | - | - | |||||||||||
| Options exercised during the period | - | - | |||||||||||
| Options expired during the period | (765) | (103) | |||||||||||
| Options outstanding at December 31, 2009 | - | $ - | |||||||||||
| JNL Series Trust |
Notes to the Schedules of Investments (continued) (dollar amounts in thousands) . |
| December 31, 2009 |
Investments in Affiliates - See Note 6 in the Notes to the Financial Statements for further discussion of investments in affiliates. The JNL/Mellon Capital Management S&P 500 Index Fund invested in Bank of New York Mellon Corp., the parent company of its subadviser. The JNL/Mellon Capital Management International Index Fund invested in Prudential plc, the parent company of Jackson National Life Insurance Company®. Prudential plc is not affiliated in any manner with Prudential Financial Inc., a company whose principal place of business is in the United States of America. The JNL/T. Rowe Price Value Fund invested in the T.Rowe Price Institutional Floating Rate Fund which is an affiliate of the Fund. The following table details each Fund's long-term investments in affiliates held at December 31, 2009.
| Beginning | Sales | Dividend | Realized | Ending | ||||||||||||||||||||
| Affiliate | Value | Purchases | Proceeds | Income | Gain (Loss) | Value | ||||||||||||||||||
| Bank of New York Mellon Corp. | $ | 1,841 | $ | 1,243 | $ | 24 | $ | 41 | $ | (2 | ) | $ | 3,008 | |||||||||||
| Prudential plc | 698 | 514 | - | 40 | - | 1,858 | ||||||||||||||||||
| T. Rowe Price Institutional Floating Rate Fund | - | 8,076 | 1,427 | 467 | 249 | 8,104 | ||||||||||||||||||
The following table details cash management and securities lending collateral investments in affiliates held at December 31, 2009. Dividend income received from the Securities Lending Cash Collateral Fund LLC and the Securities Lending Liquidating Fund LLC is aggregated with income from securities lending when received from the custodian and each Fund's affiliated income is included in dividends from affiliates on the Statements of Operations. Purchase and sales proceeds are not for shown for these investments. There was no realized gain or loss relating to transactions for these investments during the year ended December 31, 2009.
| Securities Lending Cash | Securities Lending Cash | |||||||||||
| JNL Money Market Fund | Collateral Fund LLC | Collateral Fund LLC | ||||||||||
| Beginning | Ending | Ending | Dividend | Beginning | Ending | Ending | Ending | Ending | ||||
| Fund | Value | Amortized Cost | Value | Income | Value * | Amortized Cost | Value | Amortized Cost | Value | |||
| JNL/AIM Small Cap Growth Fund | $ 781 | $ 4,526 | $ 4,526 | $ 5 | $ 10,561 | $ 3,995 | $ 3,987 | $ 12,335 | $ 12,335 | |||
| JNL/Capital Guardian Global Diversified Research Fund | 7,370 | 18,355 | 18,355 | 35 | 34,014 | 7,677 | 7,661 | 8,015 | 8,015 | |||
| JNL/Capital Guardian International Small Cap Fund | 4,061 | 13,149 | 13,149 | 17 | 7,218 | 2,271 | 2,266 | 8,483 | 8,483 | |||
| JNL/Credit Suisse Commodity Securities Fund | 8,034 | 9,840 | 9,840 | 41 | 15,061 | 6,032 | 6,019 | 43,895 | 43,895 | |||
| JNL/Credit Suisse Long/Short Fund | 794 | 4,692 | 4,692 | 4 | - | - | - | - | - | |||
| JNL/Franklin Templeton Income Fund | 35,441 | 90,379 | 90,379 | 136 | 64,998 | 21,149 | 21,105 | 64,754 | 64,754 | |||
| JNL/Franklin Templeton Mutual Shares Fund | 27,085 | 50,580 | 50,580 | 101 | - | - | - | 16,975 | 16,975 | |||
| JNL/Mellon Capital Management S&P 500 Index Fund | 15,973 | 29,658 | 29,658 | 42 | 33,738 | 15,587 | 15,555 | 17,730 | 17,730 | |||
| JNL/Mellon Capital Management S&P 400 MidCap Index Fund | 9,083 | 7,170 | 7,170 | 19 | 73,845 | 23,499 | 23,450 | 45,205 | 45,205 | |||
| JNL/Mellon Capital Management Small Cap Index Fund | 8,174 | 14,720 | 14,720 | 17 | 62,038 | 32,507 | 32,439 | 62,694 | 62,694 | |||
| JNL/Mellon Capital Management International Index Fund | 10,184 | 15,534 | 15,534 | 29 | 51,649 | 17,155 | 17,119 | 11,595 | 11,595 | |||
| JNL/T. Rowe Price Mid-Cap Growth Fund | 2,829 | 4,417 | 4,417 | 12 | 120,466 | 50,994 | 50,887 | 73,953 | 73,953 | |||
| JNL/T. Rowe Price Value Fund | 4,047 | 9,543 | 9,543 | 7 | 47,671 | 15,901 | 15,867 | 18,427 | 18,427 | |||
| T. Rowe Price Reserves Investment Fund | |||||
| Beginning | Ending | Ending | Dividend | ||
| Fund | Value | Amortized Cost | Value | Income | |
| JNL/T. Rowe Price Mid-Cap Growth Fund | $ 22,841 | $ 42,725 | $ 42,725 | $ 116 | |
| JNL/T. Rowe Price Value Fund | 4,672 | 16,472 | 16,472 | 45 | |
* At the beginning of the year, the investment in the Securities Lending Liquidating Fund LLC was held in the Mellon GSL DBT II Collateral Fund. In addition, Mellon GSL Reinvestment Trust was an affiliated investment for Funds sub-advised by Mellon Capital Management Corporation and valued at $0.00 at December 31, 2008. It was not an affiliated investment at December 31, 2009. See note 3 to the Financial Statements for further discussion of securities lending collateral transactions during the year.
| JNL Series Trust |
| Notes to the Schedules of Investments (continued) |
| December 31, 2009 |
| Schedule of Open Futures Contracts (in thousands except contracts) |
| Contracts | Unrealized | |||||
| Long/ | Appreciation/ | |||||
| Expiration | (Short) | (Depreciation) | ||||
| JNL/Mellon Capital Management S&P 500 Index Fund | ||||||
| S&P 500 E-Mini Index Future | March 2010 | 595 | $ 452 | |||
| JNL/Mellon Capital Management S&P 400 MidCap Index Fund | ||||||
| S&P MidCap 400 E-Mini Index Future | March 2010 | 116 | $ 55 | |||
| JNL/Mellon Capital Management Small Cap Index Fund | ||||||
| Russell 2000 Mini Index Future | March 2010 | 258 | $ 628 | |||
| JNL/Mellon Capital Management International Index Fund | ||||||
| ASX SPI 200 Index Future | March 2010 | 14 | $ 52 | |||
| Dow Jones Euro Stoxx 50 Index Future | March 2010 | 156 | 89 | |||
| FTSE 100 Index Future | March 2010 | 46 | 43 | |||
| Topix Index Future | March 2010 | 47 | 17 | |||
| $ 201 | ||||||
Summary of Open Forward Foreign Currency Contracts (in thousand) | ||||||||||||||
| Currency | Settlement | Notional | Currency | Unrealized | Currency | Settlement | Notional | Currency | Unrealized | |||||
| Purchased/Sold | Date | Amount | Value | Gain/(Loss) | Purchased/Sold | Date | Amount | Value | Gain/(Loss) | |||||
| JNL/Capital Guardian Global Diversified Research Fund | JNL/Franklin Templeton Mutual Shares Fund (continued) | |||||||||||||
| USD/GBP | 01/27/2010 | GBP | (1,462) | $ (2,360) | $ (13) | USD/DKK | 04/23/2010 | DKK | (525) | $ (101) | $ 3 | |||
| USD/EUR | 01/14/2010 | EUR | (150) | (215) | 7 | |||||||||
| JNL/Franklin Templeton Mutual Shares Fund | USD/EUR | 01/14/2010 | EUR | (77) | (110) | 3 | ||||||||
| AUD/USD | 01/19/2010 | AUD | 146 | $ 131 | $ (2) | USD/EUR | 01/14/2010 | EUR | (32,058) | (45,995) | 1,358 | |||
| AUD/USD | 01/19/2010 | AUD | 73 | 66 | (1) | USD/EUR | 01/14/2010 | EUR | (252) | (362) | 11 | |||
| AUD/USD | 01/19/2010 | AUD | 182 | 164 | (2) | USD/EUR | 01/14/2010 | EUR | (183) | (262) | 8 | |||
| CHF/USD | 05/10/2010 | CHF | 137 | 133 | (2) | USD/EUR | 01/14/2010 | EUR | (183) | (262) | 10 | |||
| EUR/USD | 01/14/2010 | EUR | 74 | 106 | (5) | USD/EUR | 01/14/2010 | EUR | (155) | (223) | 9 | |||
| EUR/USD | 01/14/2010 | EUR | 316 | 454 | (20) | USD/EUR | 01/14/2010 | EUR | (154) | (221) | 9 | |||
| EUR/USD | 01/14/2010 | EUR | 176 | 252 | (12) | USD/EUR | 01/14/2010 | EUR | (380) | (545) | 23 | |||
| EUR/USD | 01/14/2010 | EUR | 117 | 169 | (9) | USD/EUR | 01/14/2010 | EUR | (79) | (113) | 4 | |||
| EUR/USD | 01/14/2010 | EUR | 224 | 321 | (10) | USD/EUR | 01/14/2010 | EUR | (566) | (813) | 27 | |||
| EUR/USD | 01/14/2010 | EUR | 173 | 248 | (6) | USD/EUR | 01/14/2010 | EUR | (166) | (239) | 8 | |||
| EUR/USD | 01/14/2010 | EUR | 95 | 137 | (3) | USD/GBP | 01/13/2010 | GBP | (17,363) | (28,037) | 924 | |||
| EUR/USD | 01/14/2010 | EUR | 148 | 213 | (5) | USD/GBP | 01/13/2010 | GBP | (99) | (159) | 4 | |||
| EUR/USD | 01/14/2010 | EUR | 196 | 281 | (6) | USD/GBP | 01/13/2010 | GBP | (224) | (362) | 8 | |||
| EUR/USD | 01/14/2010 | EUR | 103 | 148 | (3) | USD/GBP | 01/13/2010 | GBP | (132) | (213) | 8 | |||
| JPY/USD | 04/20/2010 | JPY | 30,731 | 330 | (6) | USD/GBP | 01/13/2010 | GBP | (183) | (295) | 11 | |||
| JPY/USD | 04/20/2010 | JPY | 6,500 | 70 | (2) | USD/GBP | 01/13/2010 | GBP | (280) | (452) | 13 | |||
| SGD/USD | 03/24/2010 | SGD | 172 | 122 | - | USD/GBP | 01/13/2010 | GBP | (139) | (224) | 6 | |||
| SGD/USD | 03/24/2010 | SGD | 103 | 74 | - | USD/GBP | 01/13/2010 | GBP | (223) | (360) | 9 | |||
| USD/AUD | 01/19/2010 | AUD | (880) | (790) | 23 | USD/GBP | 01/13/2010 | GBP | (210) | (339) | 7 | |||
| USD/AUD | 01/19/2010 | AUD | (74) | (66) | - | USD/GBP | 01/13/2010 | GBP | (777) | (1,255) | 20 | |||
| USD/CHF | 05/10/2010 | CHF | (3,100) | (3,002) | (83) | USD/GBP | 01/13/2010 | GBP | (215) | (348) | 10 | |||
| USD/CHF | 05/10/2010 | CHF | (3,154) | (3,054) | (84) | USD/GBP | 01/13/2010 | GBP | (172) | (278) | 8 | |||
| USD/CHF | 05/10/2010 | CHF | (105) | (102) | (4) | USD/GBP | 01/13/2010 | GBP | (162) | (261) | 2 | |||
| USD/CHF | 05/10/2010 | CHF | (989) | (958) | (24) | USD/GBP | 01/13/2010 | GBP | (78) | (126) | 1 | |||
| USD/CHF | 05/10/2010 | CHF | (113) | (109) | (3) | USD/GBP | 01/13/2010 | GBP | (199) | (321) | (1) | |||
| USD/CHF | 05/10/2010 | CHF | (131) | (127) | (3) | USD/GBP | 01/13/2010 | GBP | (143) | (232) | (3) | |||
| USD/CHF | 05/10/2010 | CHF | (226) | (219) | 1 | USD/GBP | 01/13/2010 | GBP | (298) | (481) | - | |||
| USD/CHF | 05/10/2010 | CHF | (130) | (126) | 1 | USD/JPY | 04/20/2010 | JPY | (148,783) | (1,599) | 36 | |||
| USD/CHF | 05/10/2010 | CHF | (110) | (107) | 1 | USD/JPY | 04/20/2010 | JPY | (5,300) | (57) | 2 | |||
| USD/CHF | 05/10/2010 | CHF | (113) | (110) | 1 | USD/JPY | 04/20/2010 | JPY | (18,261) | (196) | 10 | |||
| USD/CHF | 05/10/2010 | CHF | (117) | (114) | 2 | USD/JPY | 04/20/2010 | JPY | (16,010) | (172) | 3 | |||
| USD/CHF | 05/10/2010 | CHF | (433) | (419) | 7 | USD/JPY | 04/20/2010 | JPY | (12,000) | (129) | 1 | |||
| USD/CHF | 05/10/2010 | CHF | (287) | (278) | 4 | USD/KRW | 01/15/2010 | KRW | (70,110) | (60) | - | |||
| USD/CHF | 05/10/2010 | CHF | (250) | (242) | 9 | USD/KRW | 01/15/2010 | KRW | (348,675) | (299) | 1 | |||
| USD/CHF | 05/10/2010 | CHF | (112) | (108) | 1 | USD/KRW | 01/15/2010 | KRW | (173,663) | (149) | 1 | |||
| USD/CHF | 05/10/2010 | CHF | (132) | (128) | (1) | USD/KRW | 01/15/2010 | KRW | (105,102) | (90) | - | |||
| USD/CHF | 05/10/2010 | CHF | (200) | (194) | (1) | USD/KRW | 01/15/2010 | KRW | (141,570) | (122) | (2) | |||
| USD/CHF | 05/10/2010 | CHF | (218) | (211) | (1) | USD/KRW | 01/15/2010 | KRW | (129,360) | (111) | (1) | |||
| USD/DKK | 04/23/2010 | DKK | (7,589) | (1,461) | 62 | USD/KRW | 01/15/2010 | KRW | (24,261) | (21) | - | |||
| USD/DKK | 04/23/2010 | DKK | (536) | (103) | 4 | USD/KRW | 01/15/2010 | KRW | (60,579) | (52) | - | |||
| USD/DKK | 04/23/2010 | DKK | (370) | (71) | 3 | USD/KRW | 01/15/2010 | KRW | (115,670) | (99) | 1 | |||
| USD/DKK | 04/23/2010 | DKK | (593) | (114) | 6 | USD/KRW | 01/15/2010 | KRW | (57,650) | (49) | 1 | |||
Summary of Open Forward Foreign Currency Contracts (in thousand) | ||||||||||||||
| Currency | Settlement | Notional | Currency | Unrealized | Currency | Settlement | Notional | Currency | Unrealized | |||||
| Purchased/Sold | Date | Amount | Value | Gain/(Loss) | Purchased/Sold | Date | Amount | Value | Gain/(Loss) | |||||
| JNL/Franklin Templeton Mutual Shares Fund (continued) | JNL/Mellon Capital Management International Index Fund (continued) | |||||||||||||
| USD/KRW | 01/15/2010 | KRW | (117,000) | $ (100) | $ - | JPY/USD | 03/17/2010 | JPY | 9,015 | $ 97 | $ (1) | |||
| USD/NOK | 02/16/2010 | NOK | (33,600) | (5,805) | 140 | JPY/USD | 03/17/2010 | JPY | 27,045 | 291 | (5) | |||
| USD/NOK | 02/16/2010 | NOK | (703) | (121) | 4 | JPY/USD | 03/17/2010 | JPY | 18,290 | 197 | (3) | |||
| USD/NOK | 02/16/2010 | NOK | (680) | (117) | 3 | JPY/USD | 03/17/2010 | JPY | 64,015 | 688 | (10) | |||
| USD/NOK | 02/16/2010 | NOK | (1,300) | (225) | 8 | JPY/USD | 03/17/2010 | JPY | 27,135 | 292 | (1) | |||
| USD/NOK | 02/16/2010 | NOK | (1,900) | (328) | (2) | USD/AUD | 03/17/2010 | AUD | (21) | (19) | - | |||
| USD/NOK | 02/16/2010 | NOK | (1,023) | (177) | (1) | USD/AUD | 03/17/2010 | AUD | (1,775) | (1,585) | (24) | |||
| USD/SGD | 03/24/2010 | SGD | (1,583) | (1,127) | (7) | USD/EUR | 03/17/2010 | EUR | (146) | (210) | 6 | |||
| USD/SGD | 03/24/2010 | SGD | (98) | (70) | - | USD/EUR | 03/17/2010 | EUR | (5,170) | (7,417) | 2 | |||
| USD/SGD | 03/24/2010 | SGD | (163) | (116) | 1 | USD/EUR | 03/17/2010 | EUR | (269) | (386) | (2) | |||
| USD/SGD | 03/24/2010 | SGD | (95) | (68) | - | USD/EUR | 03/17/2010 | EUR | (388) | (557) | (1) | |||
| $ (103,457) | $ 2,533 | USD/GBP | 03/17/2010 | GBP | (102) | (164) | 1 | |||||||
| JNL/Mellon Capital Management International Index Fund | USD/GBP | 03/17/2010 | GBP | (2,820) | (4,552) | 3 | ||||||||
| AUD/USD | 03/17/2010 | AUD | 1,025 | $ 915 | $ (7) | USD/GBP | 03/17/2010 | GBP | (90) | (146) | (2) | |||
| AUD/USD | 03/17/2010 | AUD | 528 | 471 | (3) | USD/GBP | 03/17/2010 | GBP | (215) | (348) | (5) | |||
| AUD/USD | 03/17/2010 | AUD | 233 | 208 | (2) | USD/JPY | 03/17/2010 | JPY | (32,163) | (346) | 21 | |||
| AUD/USD | 03/17/2010 | AUD | 467 | 416 | (3) | USD/JPY | 03/17/2010 | JPY | (451,060) | (4,847) | 171 | |||
| AUD/USD | 03/17/2010 | AUD | 233 | 208 | 3 | USD/JPY | 03/17/2010 | JPY | (23,929) | (257) | 4 | |||
| AUD/USD | 03/17/2010 | AUD | 116 | 104 | 2 | USD/JPY | 03/17/2010 | JPY | (36,760) | (395) | 3 | |||
| AUD/USD | 03/17/2010 | AUD | 116 | 103 | 2 | $ 16,390 | $ (591) | |||||||
| AUD/USD | 03/17/2010 | AUD | 117 | 105 | 2 | |||||||||
| AUD/USD | 03/17/2010 | AUD | 119 | 106 | 2 | |||||||||
| AUD/USD | 03/17/2010 | AUD | 241 | 215 | - | |||||||||
| EUR/USD | 03/17/2010 | EUR | 5,297 | 7,600 | (185) | |||||||||
| EUR/USD | 03/17/2010 | EUR | 226 | 323 | (9) | |||||||||
| EUR/USD | 03/17/2010 | EUR | 256 | 368 | (9) | |||||||||
| EUR/USD | 03/17/2010 | EUR | 544 | 780 | (16) | |||||||||
| EUR/USD | 03/17/2010 | EUR | 432 | 620 | (9) | |||||||||
| EUR/USD | 03/17/2010 | EUR | 288 | 414 | (6) | |||||||||
| EUR/USD | 03/17/2010 | EUR | 292 | 419 | - | |||||||||
| EUR/USD | 03/17/2010 | EUR | 347 | 498 | 1 | |||||||||
| EUR/USD | 03/17/2010 | EUR | 488 | 700 | - | |||||||||
| EUR/USD | 03/17/2010 | EUR | 642 | 921 | 3 | |||||||||
| EUR/USD | 03/17/2010 | EUR | 206 | 296 | 1 | |||||||||
| EUR/USD | 03/17/2010 | EUR | 266 | 381 | (1) | |||||||||
| EUR/USD | 03/17/2010 | EUR | 295 | 423 | (2) | |||||||||
| EUR/USD | 03/17/2010 | EUR | 687 | 985 | (7) | |||||||||
| EUR/USD | 03/17/2010 | EUR | 268 | 384 | (1) | |||||||||
| GBP/USD | 03/17/2010 | GBP | 1,603 | 2,588 | (11) | |||||||||
| GBP/USD | 03/17/2010 | GBP | 826 | 1,333 | (5) | |||||||||
| GBP/USD | 03/17/2010 | GBP | 208 | 336 | (3) | |||||||||
| GBP/USD | 03/17/2010 | GBP | 157 | 254 | (2) | |||||||||
| GBP/USD | 03/17/2010 | GBP | 158 | 255 | (2) | |||||||||
| GBP/USD | 03/17/2010 | GBP | 319 | 514 | (3) | |||||||||
| GBP/USD | 03/17/2010 | GBP | 157 | 254 | (4) | |||||||||
| GBP/USD | 03/17/2010 | GBP | 158 | 256 | - | |||||||||
| GBP/USD | 03/17/2010 | GBP | 156 | 251 | - | |||||||||
| GBP/USD | 03/17/2010 | GBP | 309 | 499 | 1 | |||||||||
| GBP/USD | 03/17/2010 | GBP | 262 | 424 | 4 | |||||||||
| GBP/USD | 03/17/2010 | GBP | 106 | 171 | 2 | |||||||||
| GBP/USD | 03/17/2010 | GBP | 160 | 257 | 3 | |||||||||
| GBP/USD | 03/17/2010 | GBP | 214 | 346 | 3 | |||||||||
| GBP/USD | 03/17/2010 | GBP | 375 | 605 | 5 | |||||||||
| GBP/USD | 03/17/2010 | GBP | 54 | 86 | - | |||||||||
| JPY/USD | 03/17/2010 | JPY | 382,736 | 4,113 | (242) | |||||||||
| JPY/USD | 03/17/2010 | JPY | 197,167 | 2,119 | (125) | |||||||||
| JPY/USD | 03/17/2010 | JPY | 26,415 | 284 | (16) | |||||||||
| JPY/USD | 03/17/2010 | JPY | 26,085 | 280 | (12) | |||||||||
| JPY/USD | 03/17/2010 | JPY | 53,130 | 571 | (30) | |||||||||
| JPY/USD | 03/17/2010 | JPY | 26,520 | 285 | (11) | |||||||||
| JPY/USD | 03/17/2010 | JPY | 35,300 | 379 | (15) | |||||||||
| JPY/USD | 03/17/2010 | JPY | 26,910 | 289 | (10) | |||||||||
| JPY/USD | 03/17/2010 | JPY | 26,805 | 288 | (9) | |||||||||
| JPY/USD | 03/17/2010 | JPY | 26,760 | 288 | (8) | |||||||||
| JPY/USD | 03/17/2010 | JPY | 71,320 | 766 | (14) | |||||||||
| JNL Series Trust |
Notes to the Schedules of Investments (continued) (dollar amounts in thousands) |
| December 31, 2009 |
FASB ASC Topic 815, "Derivatives and Hedging" - The following is a summary of the fair valuations of each Fund's derivative instruments categorized by risk exposure. The derivative instruments outstanding as of year end as disclosed in these Notes to the Schedules of Investments and the amounts of realized and changes in unrealized gains and losses on derivative instruments during the year as disclosed in the Statements of Operations serve as indicators of the volume of derivative activity for the Funds. In addition, a summary of derivative activity is provided for those Funds which had substantial changes in volume of derivative activity during the year. See Note 4 in the Notes to Financial Statements for additional FASB ASC Topic 815 disclosures.
| JNL/Franklin Templeton Mutual Shares Fund | |||||||||||||
| Fair values of derivative instruments on the Statements of Assets and Liabilities as of December 31, 2009: | |||||||||||||
| Credit | Equity | Foreign Exchange | Interest Rate | Credit | Equity | Foreign Exchange | Interest Rate | ||||||
| Contracts | Contracts | Contracts | Contracts | Total | Contracts | Contracts | Contracts | Contracts | Total | ||||
| Assets: | Liabilities: | ||||||||||||
| Investments - unaffiliated, at value | $ - | $ - | $ - | $ - | $ - | Options written, at value | $ - | $ - | $ - | $ - | $ - | ||
| Forward foreign | Forward foreign | ||||||||||||
| currency contracts | - | - | 2,848 | - | 2,848 | currency contracts | - | - | 315 | - | 315 | ||
| $ - | $ - | $ 2,848 | $ - | $ 2,848 | $ - | $ - | $ 315 | $ - | $ 315 | ||||
| The effect of derivative instruments on the Statements of Operations for the year ended December 31, 2009: | |||||||||||||
| Net realized gain (loss) on: | Net change in unrealized appreciation or depreciation on: | ||||||||||||
| Foreign currency related items | $ - | $ - | $ (5,753) | $ - | $ (5,753) | Foreign currency related items | $ - | $ - | $ 2,409 | $ - | $ 2,409 | ||
| Option contracts | - | (854) | - | - | (854) | Option contracts | - | (16) | - | - | (16) | ||
| $ - | $ (854) | $ (5,753) | $ - | $ (6,607) | $ - | $ (16) | $ 2,409 | $ - | $ 2,393 | ||||
| JNL/Mellon Capital Management International Index Fund | |||||||||||||
| Fair values of derivative instruments on the Statements of Assets and Liabilities as of December 31, 2009: | |||||||||||||
| Credit | Equity | Foreign Exchange | Interest Rate | Credit | Equity | Foreign Exchange | Interest Rate | ||||||
| Contracts | Contracts | Contracts | Contracts | Total | Contracts | Contracts | Contracts | Contracts | Total | ||||
| Assets: | Liabilities: | ||||||||||||
| Forward foreign | Forward foreign | ||||||||||||
| currency contracts | $ - | $ - | $ 245 | $ - | $ 245 | currency contracts | $ - | $ - | $ 836 | $ - | $ 836 | ||
| Variation margin* | - | 27 | - | - | 27 | Variation margin* | - | - | - | - | - | ||
| $ - | $ 27 | $ 245 | $ - | $ 272 | $ - | $ - | $ 836 | $ - | $ 836 | ||||
| The effect of derivative instruments on the Statements of Operations for the year ended December 31, 2009: | |||||||||||||
| Net realized gain (loss) on: | Net change in unrealized appreciation or depreciation on: | ||||||||||||
| Foreign currency related items | $ - | $ - | $ 1,514 | $ - | $ 1,514 | Foreign currency related items | $ - | $ - | $ (835) | $ - | $ (835) | ||
| Futures contracts | - | 4,502 | - | - | 4,502 | Futures contracts | - | (36) | - | - | (36) | ||
| $ - | $ 4,502 | $ 1,514 | $ - | $ 6,016 | $ - | $ (36) | $ (835) | $ - | $ (871) | ||||
| JNL Series Trust |
Notes to the Schedules of Investments (continued) (dollar amounts in thousands) |
| December 31, 2009 |
Unfunded Loan Commitments - See Note 3 in the Notes to the Financial Statements for further discussion of unfunded loan commitments. The following table details unfunded loan commitments |
| for the following Fund at December 31, 2009: |
| Unfunded | |||||||
| JNL/Franklin Templeton Mutual Shares Fund | Commitment | ||||||
| Lyondell Chemical Co., Term Loan, 13.00%, 04/16/10 | $ 28 | ||||||
| Realogy Corp., Term Loan, 5.35%, 10/10/13 | 592 | ||||||
| $ 620 | |||||||
FASB ASC Topic 820, “Fair Value Measurements and Disclosure” - This standard establishes a single authoritative definition of fair value, sets out a framework for measuring fair value and requires additional disclosures about fair value measurements. Various inputs are used in determining the value of a Fund’s investments under FASB ASC Topic 820 guidance. The inputs are summarized into three broad categories. Level 1 includes valuations based on quoted prices of identical securities in active markets including valuations for securities listed on a national or foreign stock exchange or investments in mutual funds. Level 2 includes valuations for which all significant inputs are observable, either directly or indirectly. Direct observable inputs include broker quotes, closing prices of similar securities in active markets, closing prices for identical or similar securities in non-active markets or corporate action or reorganization entitlement values. Indirect significant observable inputs include factors such as interest rates, yield curves, prepayment speeds or credit ratings. Level 2 includes valuations for fixed income securities priced by pricing services, broker quotes in active markets, securities lending collateral, securities subject to corporate actions, international equity securities priced by an independent statistical fair value pricing service, swap agreements valued by pricing services, or ADRs and GDRs for which quoted prices in active markets are not available. Level 3 includes valuations based on inputs that are unobservable and significant to the fair value measurement including Jackson National Asset Management, LLC’s (“Adviser”) own assumptions in determining the fair value of the investment. Inputs used to determine the fair value of Level 3 securities include security specific inputs such as: credit quality, credit rating spreads, issuer news, trading characteristics, call features or maturity; or industry specific inputs such as trading activity of similar markets or securities, changes in the security’s underlying index or comparable securities’ models. Level 3 valuations include securities that are priced based on single source broker quotes, where prices may be unavailable due to halted trading, restricted to resale due to market events, newly issued or for which reliable quotes are not available. The inputs or methodology used for valuing securities are not necessarily an indication of the risk associated with investing in those securities. Please see Note 2 in the Notes to the Financial Statements for security valuation accounting policies.
The following table summarizes each Fund's investments in securities and other financial instruments as of December 31, 2009 by valuation level.
| Assets - Securities | Liabilities - Securities | ||||||||||||
| Level 1 | Level 2 | Level 3 | Total | Level 1 | Level 2 | Level 3 | Total | ||||||
| JNL/AIM Small Cap Growth Fund | |||||||||||||
| Common Stocks | $ 88,159 | $ - | $ - | $ 88,159 | $ - | $ - | $ - | $ - | |||||
| Non-U.S. Government Agency ABS | - | 12 | - | 12 | - | - | - | - | |||||
| Short-Term Securities | 4,526 | 16,322 | - | 20,848 | - | - | - | - | |||||
| Fund Total | $ 92,685 | $ 16,334 | $ - | $ 109,019 | $ - | $ - | $ - | $ - | |||||
| JNL/Capital Guardian Global Diversified Research Fund | |||||||||||||
| Common Stocks | $ 245,559 | $ 70,180 | $ - | $ 315,739 | $ - | $ - | $ - | $ - | |||||
| Corporate Bond and Notes | - | 299 | - | 299 | - | - | - | - | |||||
| Non-U.S. Government Agency ABS | - | 34 | - | 34 | - | - | - | - | |||||
| Short-Term Securities | 18,355 | 15,676 | - | 34,031 | - | - | - | - | |||||
| Fund Total | $ 263,914 | $ 86,189 | $ - | $ 350,103 | $ - | $ - | $ - | $ - | |||||
| JNL/Capital Guardian International Small Cap Fund | |||||||||||||
| Common Stocks | $ 64,179 | $ 65,855 | $ 12 | $ 130,046 | $ - | $ - | $ - | $ - | |||||
| Preferred Stocks | 181 | - | - | 181 | - | - | - | - | |||||
| Investment Funds | 1,282 | - | - | 1,282 | - | - | - | - | |||||
| Corporate Bond and Notes | - | 100 | - | 100 | - | - | - | - | |||||
| Non-U.S. Government Agency ABS | - | 9 | - | 9 | - | - | - | - | |||||
| Rights | - | 69 | - | 69 | - | - | - | - | |||||
| Warrants | 143 | - | - | 143 | - | - | - | - | |||||
| Short-Term Securities | 13,149 | 10,749 | - | 23,898 | - | �� - | - | - | |||||
| Fund Total | $ 78,934 | $ 76,782 | $ 12 | $ 155,728 | $ - | $ - | $ - | $ - | |||||
| JNL/Credit Suisse Commodity Securities Fund | |||||||||||||
| Common Stocks | $ 260,817 | $ 34,785 | $ - | $ 295,602 | $ - | $ - | $ - | $ - | |||||
| Investment Funds | 21,404 | - | - | 21,404 | - | - | - | - | |||||
| Corporate Bond and Notes | - | 83,069 | - | 83,069 | - | - | - | - | |||||
| Non-U.S. Government Agency ABS | - | 13 | - | 13 | - | - | - | - | |||||
| Rights | - | 5 | - | 5 | - | - | - | - | |||||
| Government and Agency Obligations | - | 131,202 | - | 131,202 | - | - | - | - | |||||
| Short-Term Securities | 9,840 | 150,896 | - | 160,736 | - | - | - | - | |||||
| Fund Total | $ 292,061 | $ 399,970 | $ - | $ 692,031 | $ - | $ - | $ - | $ - | |||||
| JNL/Credit Suisse Long/Short Fund | |||||||||||||
| Common Stocks | $ 114,281 | $ - | $ - | $ 114,281 | $ (28,666) | $ - | $ - | $ (28,666) | |||||
| Short-Term Securities | 4,692 | - | - | 4,692 | - | - | - | - | |||||
| Fund Total | $ 118,973 | $ - | $ - | $ 118,973 | $ (28,666) | $ - | $ - | $ (28,666) | |||||
| JNL/Franklin Templeton Income Fund | |||||||||||||
| Common Stocks | $ 217,185 | $ - | $ - | $ 217,185 | $ - | $ - | $ - | $ - | |||||
| Preferred Stocks | 3,335 | 38,118 | - | 41,453 | - | - | - | - | |||||
| Corporate Bond and Notes | - | 394,423 | - | 394,423 | - | - | - | - | |||||
| Non-U.S. Government Agency ABS | - | 55 | - | 55 | - | - | - | - | |||||
| Warrants | 190 | - | - | 190 | - | - | - | - | |||||
| Short-Term Securities | 90,379 | 85,859 | - | 176,238 | - | - | - | - | |||||
| Fund Total | $ 311,089 | $ 518,455 | $ - | $ 829,544 | $ - | $ - | $ - | $ - | |||||
| JNL Series Trust |
Notes to the Schedules of Investments (continued) (dollar amounts in thousands) |
| December 31, 2009 |
FASB ASC Topic 820 "Fair Value Measurements and Disclosure" (continued) | |||||||||||||
| Assets - Securities | Liabilities - Securities | ||||||||||||
| Level 1 | Level 2 | Level 3 | Total | Level 1 | Level 2 | Level 3 | Total | ||||||
| JNL/Franklin Templeton Mutual Shares Fund | |||||||||||||
| Common Stocks | $ 338,172 | $ 12,115 | $ 965 | $ 351,252 | $ - | $ - | $ - | $ - | |||||
| Preferred Stocks | 2,011 | - | - | 2,011 | - | - | - | - | |||||
| Corporate Bond and Notes | - | 17,546 | 391 | 17,937 | - | - | - | - | |||||
| Short-Term Securities | 50,580 | 16,975 | - | 67,555 | - | - | - | - | |||||
| Fund Total | $ 390,763 | $ 46,636 | $ 1,356 | $ 438,755 | $ - | $ - | $ - | $ - | |||||
| JNL/Mellon Capital Management S&P 500 Index Fund | |||||||||||||
| Common Stocks | $ 879,046 | $ - | $ - | $ 879,046 | $ - | $ - | $ - | $ - | |||||
| Non-U.S. Government Agency ABS | - | 39 | - | 39 | - | - | - | - | |||||
| Short-Term Securities | 29,658 | 36,175 | - | 65,833 | - | - | - | - | |||||
| Fund Total | $ 908,704 | $ 36,214 | $ - | $ 944,918 | $ - | $ - | $ - | $ - | |||||
| JNL/Mellon Capital Management S&P 400 MidCap Index Fund | |||||||||||||
| Common Stocks | $ 466,596 | $ - | $ - | $ 466,596 | $ - | $ - | $ - | $ - | |||||
| Non-U.S. Government Agency ABS | - | 94 | - | 94 | - | - | - | - | |||||
| Short-Term Securities | 7,170 | 69,365 | - | 76,535 | - | - | - | - | |||||
| Fund Total | $ 473,766 | $ 69,459 | $ - | $ 543,225 | $ - | $ - | $ - | $ - | |||||
| JNL/Mellon Capital Management Small Cap Index Fund | |||||||||||||
| Common Stocks | $ 458,705 | $ - | $ - | $ 458,705 | $ - | $ - | $ - | $ - | |||||
| Non-U.S. Government Agency ABS | - | 112 | - | 112 | - | - | - | - | |||||
| Rights | 3 | - | - | 3 | - | - | - | - | |||||
| Short-Term Securities | 14,720 | 96,288 | - | 111,008 | - | - | - | - | |||||
| Fund Total | $ 473,428 | $ 96,400 | $ - | $ 569,828 | $ - | $ - | $ - | $ - | |||||
| JNL/Mellon Capital Management International Index Fund | |||||||||||||
| Common Stocks | $ 480,802 | $ 238,735 | $ - | $ 719,537 | $ - | $ - | $ - | $ - | |||||
| Preferred Stocks | 3,362 | - | - | 3,362 | - | - | - | - | |||||
| Non-U.S. Government Agency ABS | - | 73 | - | 73 | - | - | - | - | |||||
| Warrants | 1 | 4 | - | 5 | - | - | - | - | |||||
| Short-Term Securities | 15,534 | 29,849 | - | 45,383 | - | - | - | - | |||||
| Fund Total | $ 499,700 | $ 268,660 | $ - | $ 768,360 | $ - | $ - | $ - | $ - | |||||
| JNL/T. Rowe Price Mid-Cap Growth Fund | |||||||||||||
| Common Stocks | $ 802,637 | $ - | $ - | $ 802,637 | $ - | $ - | $ - | $ - | |||||
| Non-U.S. Government Agency ABS | - | 99 | - | 99 | - | - | - | - | |||||
| Short-Term Securities | 47,141 | 124,840 | - | 171,981 | - | - | - | - | |||||
| Fund Total | $ 849,778 | $ 124,939 | $ - | $ 974,717 | $ - | $ - | $ - | $ - | |||||
| JNL/T. Rowe Price Value Fund | |||||||||||||
| Common Stocks | $ 684,107 | $ - | $ - | $ 684,107 | $ - | $ - | $ - | $ - | |||||
| Preferred Stocks | 6,508 | 1,571 | - | 8,079 | - | - | - | - | |||||
| Investment Funds | 8,104 | - | - | 8,104 | - | - | - | - | |||||
| Corporate Bond and Notes | - | 6,435 | - | 6,435 | - | - | - | - | |||||
| Non-U.S. Government Agency ABS | - | 47 | - | 47 | - | - | - | - | |||||
| Short-Term Securities | 26,015 | 34,294 | - | 60,309 | - | - | - | - | |||||
| Fund Total | $ 724,734 | $ 42,347 | $ - | $ 767,081 | $ - | $ - | $ - | $ - | |||||
Assets - Other Financial Instruments1 | Liabilities - Other Financial Instruments1 | ||||||||||||
| Level 1 | Level 2 | Level 3 | Total | Level 1 | Level 2 | Level 3 | Total | ||||||
| JNL/Capital Guardian Global Diversified Research Fund | |||||||||||||
| Open Forward Foreign Currency Contracts | $ - | $ - | $ - | $ - | $ - | $ (13) | $ - | $ (13) | |||||
| JNL/Franklin Templeton Mutual Shares Fund | |||||||||||||
| Open Forward Foreign Currency Contracts | $ - | $ 2,848 | $ - | $ 2,848 | $ - | $ (315) | $ - | $ (315) | |||||
| JNL/Mellon Capital Management S&P 500 Index Fund | |||||||||||||
| Open Future Contracts | $ 452 | $ - | $ - | $ 452 | $ - | $ - | $ - | $ - | |||||
| JNL/Mellon Capital Management S&P 400 MidCap Index Fund | |||||||||||||
| Open Future Contracts | $ 55 | $ - | $ - | $ 55 | $ - | $ - | $ - | $ - | |||||
| JNL/Mellon Capital Management Small Cap Index Fund | |||||||||||||
| Open Future Contracts | $ 628 | $ - | $ - | $ 628 | $ - | $ - | $ - | $ - | |||||
| JNL/Mellon Capital Management International Index Fund | |||||||||||||
| Open Future Contracts | $ 201 | $ - | $ - | $ 201 | $ - | $ - | $ - | $ - | |||||
| Open Forward Foreign Currency Contracts | - | 245 | - | 245 | - | (836) | - | (836) | |||||
| Fund Total | $ 201 | $ 245 | $ - | $ 446 | $ - | $ (836) | $ - | $ (836) | |||||
1 Investments in other financial instruments are derivative instruments not reflected in the Schedules of Investments and include, but are not limited to forward foreign currency contracts, futures contracts, options written, and swap agreements. All derivatives, except for options written are reflected at the unrealized appreciation/(depreciation) on the instrument. Written options are reflected at value.
| JNL Series Trust |
Notes to the Schedules of Investments (continued) (dollar amounts in thousands) |
| December 31, 2009 |
The following table is a reconciliation of Level 3 investments by category for which significant unobservable inputs were used to determine fair value:
| Total | Change In Unrealized | ||||||||||||
| Transfers | Transfers | Realized and | Appreciation/(Depreciation) | ||||||||||
| Balance at | Into Level | Out of | Change in | Balance at | during the Period | ||||||||
| Beginning of | 3 During | Level 3 During | Unrealized | End of | for Level 3 Investments | ||||||||
| Period | the Period | the Period | Gain/(Loss) | Purchases | (Sales) | Period | Held at End of Period2 | ||||||
| JNL/Capital Guardian Global Diversified Research Fund | |||||||||||||
| Corporate Bond and Notes | $ 150 | $ - | $ (150) | $ - | $ - | $ - | $ - | $ - | |||||
| Fund Total Investments in Securities | $ 150 | $ - | $ (150) | $ - | $ - | $ - | $ - | $ - | |||||
| JNL/Capital Guardian International Small Cap Fund | |||||||||||||
| Common Stocks | $ - | $ 16 | $ - | $ (4) | $ - | $ - | $ 12 | $ (4) | |||||
| Corporate Bond and Notes | 65 | - | (65) | - | - | - | - | - | |||||
| Fund Total Investments in Securities | $ 65 | $ 16 | $ (65) | $ (4) | $ - | $ - | $ 12 | $ (4) | |||||
| JNL/Franklin Templeton Income Fund | |||||||||||||
| Corporate Bond and Notes | $ 488 | $ - | $ - | $ 693 | $ 786 | $ (1,967) | $ - | $ - | |||||
| Fund Total Investments in Securities | $ 488 | $ - | $ - | $ 693 | $ 786 | $ (1,967) | $ - | $ - | |||||
| JNL/Franklin Templeton Mutual Shares Fund | |||||||||||||
| Common Stocks | $ 455 | $ - | $ - | $ (10) | $ 520 | $ - | $ 965 | $ (10) | |||||
| Preferred Stocks | 8 | - | - | 5 | - | (13) | - | - | |||||
| Corporate Bond and Notes | 647 | - | - | 481 | 1 | (738) | 391 | - | |||||
| Fund Total Investments in Securities | $ 1,110 | $ - | $ - | $ 476 | $ 521 | $ (751) | $ 1,356 | $ (10) | |||||
| JNL/T. Rowe Price Mid-Cap Growth Fund | |||||||||||||
| Common Stocks | $ 585 | $ - | $ (585) | $ - | $ - | $ - | $ - | $ - | |||||
| Warrants | 116 | - | - | (86) | - | (30) | - | - | |||||
| Fund Total Investments in Securities | $ 701 | $ - | $ (585) | $ (86) | $ - | $ (30) | $ - | $ - | |||||
| JNL/T. Rowe Price Value Fund | |||||||||||||
| Common Stocks - Financials | $ 1,203 | $ - | $ (1,203) | $ - | $ - | $ - | $ - | $ - | |||||
| Fund Total Investments in Securities | $ 1,203 | $ - | $ (1,203) | $ - | $ - | $ - | $ - | $ - | |||||
1 Investments in other financial instruments are derivative instruments not reflected in the Schedules of Investments and include, but are not limited to forward foreign currency contracts, futures contracts, options written, and swap agreements. All derivatives, except for options written are reflected at the unrealized appreciation/(depreciation) on the instrument. Written options are reflected at value.
2 The change in unrealized appreciation/(depreciation) for Level 3 investments held at December 31, 2009 is included in net change in unrealized appreciation or depreciation on investments and swap agreements in the Statements of Operations.
| JNL Series Trust |
| Notes to the Schedules of Investments (continued) |
| December 31, 2009 |
Summary of Investments by Country (as a percentage of total long-term investments)*: | |||||||||||||
| JNL/Capital | JNL/Capital | JNL/Credit | JNL/Mellon | ||||||||||
| Guardian Global | Guardian | Suisse | JNL/Franklin | Capital | |||||||||
| Diversified | International | Commodity | Templeton | Management | JNL/ T. Rowe | ||||||||
| Research | Small Cap | Securities | Mutual | International | Price Value | ||||||||
| Fund | Fund | Fund | Shares Fund | Index Fund | Fund | ||||||||
| Australia | 3.0% | 7.9% | 2.6% | 0.4% | 8.4% | - | |||||||
| Austria | - | 0.8 | 0.1 | - | 0.3 | - | |||||||
| Belgium | - | 1.2 | 0.3 | - | 1.0 | - | |||||||
| Bermuda | 0.1 | 1.2 | - | - | - | 1.2% | |||||||
| Brazil | 1.4 | 0.6 | 2.3 | - | - | - | |||||||
| Bulgaria | - | 0.1 | - | - | - | - | |||||||
| Canada | 3.0 | 12.8 | 5.3 | 0.6 | - | - | |||||||
| China | 3.4 | 0.6 | - | - | - | - | |||||||
| Denmark | 0.4 | 0.4 | - | 1.7 | 0.9 | - | |||||||
| Finland | 0.3 | 0.4 | 1.6 | - | 1.1 | - | |||||||
| France | 6.3 | 0.6 | 6.8 | 4.3 | 10.4 | 2.3 | |||||||
| Germany | 4.2 | 5.7 | 1.7 | 6.2 | 8.1 | - | |||||||
| Greece | - | 0.2 | - | - | 0.5 | - | |||||||
| Hong Kong | 3.2 | 3.1 | - | 0.5 | 2.3 | - | |||||||
| India | 1.2 | - | - | - | - | - | |||||||
| Indonesia | 0.1 | - | - | - | - | - | |||||||
| Ireland | 0.7 | 2.0 | - | - | 0.3 | 1.2 | |||||||
| Italy | 0.3 | 3.4 | 0.3 | 0.5 | 3.4 | - | |||||||
| Japan | 8.3 | 27.9 | 4.0 | 1.3 | 20.7 | 0.5 | |||||||
| Jersey | - | - | - | - | 0.1 | - | |||||||
| Luxembourg | - | 0.3 | 1.3 | - | 0.6 | - | |||||||
| Malaysia | 0.5 | 0.1 | - | - | - | - | |||||||
| Mexico | 0.3 | - | - | - | - | - | |||||||
| Netherlands | 2.9 | 1.1 | 0.1 | 3.0 | 3.9 | 1.7 | |||||||
| New Zealand | - | - | - | - | 0.1 | - | |||||||
| Norway | 0.4 | 0.7 | 0.2 | 2.0 | 0.8 | 1.1 | |||||||
| Portugal | - | - | 0.1 | - | 0.3 | - | |||||||
| Russia | 1.4 | 0.2 | 0.6 | - | - | - | |||||||
| Singapore | - | 2.5 | - | 0.6 | 1.5 | - | |||||||
| South Africa | 1.5 | 1.0 | - | - | - | - | |||||||
| South Korea | 2.0 | 6.4 | - | 0.5 | - | - | |||||||
| Spain | 1.2 | 0.8 | 0.2 | 0.6 | 4.6 | - | |||||||
| Sweden | 0.5 | 0.5 | 8.7 | - | 2.5 | - | |||||||
| Switzerland | 2.8 | 1.3 | 0.2 | 6.5 | 7.8 | 1.8 | |||||||
| Taiwan | 1.6 | 0.1 | - | - | - | - | |||||||
| United Kingdom | 9.4 | 15.1 | 14.5 | 10.6 | 20.4 | 0.4 | |||||||
| United States | 39.6 | 1.0 | 49.1 | 60.7 | - | 89.8 | |||||||
| Total Long-Term | |||||||||||||
| Investments | 100.0% | 100.0% | 100.0% | 100.0% | 100.0% | 100.0% | |||||||
* The Funds presented in the table are those which had greater than 10% of long-term investments in non-U.S. securities at December 31, 2009.
| JNL Series Trust |
| Notes to the Schedules of Investments (continued) |
| December 31, 2009 |
| Summary of Investments by Sector (percentage of total investments): | ||||||||||||||||
| Consumer | Consumer | Health | Information | |||||||||||||
| Discretionary | Staples | Energy | Financials | Care | Industrials | Technology | Materials | |||||||||
| JNL/AIM Small Cap Growth Fund | 11.9 | % | 1.3 | % | 6.0 | % | 6.4 | % | 14.1 | % | 12.5 | % | 24.6 | % | 2.4 | % |
| JNL/Capital Guardian Global Diversified Research Fund | 6.8 | 9.9 | 10.7 | 17.4 | 8.5 | 7.9 | 12.4 | 8.3 | ||||||||
| JNL/Capital Guardian International Small Cap Fund | 13.1 | 9.6 | 1.1 | 11.4 | 5.5 | 18.8 | 10.7 | 12.4 | ||||||||
| JNL/Credit Suisse Commodity Securities Fund | - | - | 9.8 | 12.0 | - | - | - | 32.8 | ||||||||
| JNL/Credit Suisse Long/Short Fund | 14.2 | 8.0 | 7.0 | 13.6 | 11.1 | 8.7 | 25.0 | 2.4 | ||||||||
| JNL/Franklin Templeton Income Fund | 9.3 | 0.8 | 15.0 | 20.3 | 8.2 | 1.8 | 4.4 | 2.0 | ||||||||
| JNL/Franklin Templeton Mutual Shares Fund | 6.8 | 23.6 | 6.3 | 15.0 | 4.3 | 6.9 | 9.0 | 5.5 | ||||||||
| JNL/Mellon Capital Management S&P 500 Index Fund | 9.0 | 10.6 | 10.7 | 13.4 | 11.8 | 9.5 | 18.3 | 3.3 | ||||||||
| JNL/Mellon Capital Management S&P 400 MidCap Index Fund | 12.0 | 3.4 | 5.9 | 16.4 | 10.5 | 12.6 | 13.1 | 5.5 | ||||||||
| JNL/Mellon Capital Management Small Cap Index Fund | 11.2 | 2.8 | 4.2 | 16.2 | 11.3 | 12.7 | 14.9 | 3.8 | ||||||||
| JNL/Mellon Capital Management International Index Fund | 9.2 | 9.5 | 7.9 | 23.9 | 7.9 | 10.4 | 4.5 | 9.8 | ||||||||
| JNL/T. Rowe Price Mid-Cap Growth Fund | 13.2 | 1.7 | 5.8 | 8.7 | 15.0 | 14.5 | 19.9 | 1.5 | ||||||||
| JNL/T. Rowe Price Value Fund | 14.3 | 4.7 | 13.0 | 19.0 | 9.7 | 9.9 | 9.6 | 4.9 | ||||||||
| U.S. | ||||||||||||||
| Government | ||||||||||||||
| Investment | Telecommunication | Government | Short-Term | Agency | Total | |||||||||
| Funds | Services | Utilities | Securities | Investments | MBS | Investments | ||||||||
| JNL/AIM Small Cap Growth Fund | - | % | 0.9 | % | 0.8 | % | - | % | 19.1 | % | - | % | 100.0 | % |
| JNL/Capital Guardian Global Diversified Research Fund | - | 6.1 | 2.3 | - | 9.7 | - | 100.0 | |||||||
| JNL/Capital Guardian International Small Cap Fund | 0.8 | 0.7 | 0.5 | - | 15.4 | - | 100.0 | |||||||
| JNL/Credit Suisse Commodity Securities Fund | 3.1 | - | - | 5.6 | 23.3 | 13.4 | 100.0 | |||||||
| JNL/Credit Suisse Long/Short Fund | - | 1.6 | 4.5 | - | 3.9 | - | 100.0 | |||||||
| JNL/Franklin Templeton Income Fund | - | 3.1 | 13.9 | - | 21.2 | - | 100.0 | |||||||
| JNL/Franklin Templeton Mutual Shares Fund | - | 3.4 | 3.8 | - | 15.4 | - | 100.0 | |||||||
| JNL/Mellon Capital Management S&P 500 Index Fund | - | 2.9 | 3.5 | - | 7.0 | - | 100.0 | |||||||
| JNL/Mellon Capital Management S&P 400 MidCap Index Fund | - | 0.7 | 5.8 | - | 14.1 | - | 100.0 | |||||||
| JNL/Mellon Capital Management Small Cap Index Fund | - | 0.8 | 2.6 | - | 19.5 | - | 100.0 | |||||||
| JNL/Mellon Capital Management International Index Fund | - | 5.5 | 5.5 | - | 5.9 | - | 100.0 | |||||||
| JNL/T. Rowe Price Mid-Cap Growth Fund | - | 1.4 | 0.8 | - | 17.5 | - | 100.0 | |||||||
| JNL/T. Rowe Price Value Fund | 1.1 | 2.3 | 3.6 | - | 7.9 | - | 100.0 | |||||||
Report of Independent Registered Public Accounting Firm
To the Shareholders and Board of Trustees
JNL Series Trust:
We have audited, in accordance with the standards of the Public Company Accounting Oversight Board (United States), the financial statements of JNL/AIM Small Cap Growth Fund, JNL/Capital Guardian Global Diversified Research Fund, JNL/Capital Guardian International Small Cap Fund, JNL/Credit Suisse Commodity Securities Fund, JNL/Credit Suisse Long/Short Fund, JNL/Franklin Templeton Income Fund, JNL/Franklin Templeton Mutual Shares Fund, JNL/Mellon Capital Management S&P 500 Index Fund, JNL/Mellon Capital Management S&P 400 MidCap Index Fund, JNL/Mellon Capital Management Small Cap Index Fund, JNL/Mellon Capital Management International Index Fund, JNL/T. Rowe Price Mid-Cap Growth Fund and JNL/T. Rowe Price Value Fund (the “Funds”) as of and for the year ended December 31, 2009, and have issued our unqualified report thereon dated February 19, 2010 (which report and financial statements are included in Item 1 of this Certified Shareholder Report on Form N-CSR). Our audits included an audit of the Funds’ schedules of investments in securities (the “Schedules”) as of December 31, 2009 appearing in Item 6 of this Form N-CSR. These Schedules are the responsibility of the Funds’ management. Our responsibility is to express an opinion on these Schedules based on our audits.
In our opinion, the Schedules referred to above, when read in conjunction with the financial statements of the Funds referred to above, present fairly, in all material respects, the information set forth therein.
KPMG LLP
February 25, 2010
(b) Not applicable.
Item 7. Disclosure of Proxy Voting Policies and Procedures for Closed-End Management Investment Companies.
Not applicable.
Item 8. Portfolio Managers of Closed-End Management Investment Companies.
Not applicable.
Item 9. Purchases of Equity Securities by Closed-End Management Investment Company and Affiliated Purchasers.
Not applicable.
Item 10. Submission of Matters to a Vote of Security Holders.
No material changes have been made.
Item 11. Controls and Procedures.
| (a) | The registrant maintains disclosure controls and procedures that are designed to ensure that information required to be disclosed in the registrant's filings under the Securities Exchange Act of 1934, as amended, and the Investment Company Act of 1940, as amended, is recorded, processed, summarized, and reported within the periods specified in the rules and forms of the U.S. Securities and Exchange Commission. Such information is accumulated and communicated to the registrant's management, including its principal executive officer and principal financial officer, as appropriate, to allow timely decisions regarding required disclosure. The registrant's management, including the principal executive officer and the principal financial officer, recognizes that any set of controls and procedures, no matter how well designed and operated, can provide only reasonable assurance of achieving the desired control objectives. |
| Within ninety (90) days prior to the filing date of this report on Form N-CSR, the registrant had carried out an evaluation, under the supervision and with the participation of the registrant's management, including the registrant's principal executive officer and the registrant's principal financial officer, of the effectiveness of the design and operation of the registrant's disclosure controls and procedures. Based on such evaluation, the registrant's principal executive officer and principal financial officer concluded that the registrant's disclosure controls and procedures are effective. |
| (b) | There have been no significant changes in the registrant’s internal controls over financial reporting during the registrant’s second fiscal quarter of the period covered by this report that have materially affected, or are reasonably likely to materially affect, the registrant’s internal controls over financial reporting. There have been no significant changes in the registrant's internal controls or in other factors that could significantly affect the internal controls subsequent to the date of their evaluation in connection with the preparation of this report on Form N-CSR. |
Item 12. Exhibits
| (a) | (1) Code of Ethics (as defined in Item 2(b) of Form N-CSR) is attached hereto. |
| (2) The certifications required by Rule 30a-2(a) under the Investment Company Act of 1940, as amended, are attached hereto. | |
| (3) Not applicable. | |
| (b) | The certification required by Rule 30a-2(b) under the Investment Company Act of 1940, as amended, is attached hereto. |
SIGNATURES
Pursuant to the requirements of the Securities Exchange Act of 1934, as amended, and the Investment Company Act of 1940, as amended, the registrant has duly caused this report to be signed on its behalf by the undersigned, thereunto duly authorized.
| JNL Series Trust | |
| By: | /s/ Mark D. Nerud |
| Mark D. Nerud | |
| Principal Executive Officer | |
| Date: | March 10, 2010 |
Pursuant to the requirements of the Securities Exchange Act of 1934, as amended, and the Investment Company Act of 1940, as amended, this report has been signed below by the following persons on behalf of the registrant and in the capacities and on the dates indicated.
| By: | /s/ Mark D. Nerud |
| Mark D. Nerud | |
| Principal Executive Officer | |
| Date: | March 10, 2010 |
| By: | /s/ Daniel W. Koors |
| Daniel W. Koors | |
| Principal Financial Officer | |
| Date: | March 10, 2010 |
EXHIBIT LIST
| Exhibit 12(a)(1) | Code of Ethics (as defined in Item 2(b) of Form N-CSR). |
| Exhibit 12(a)(2) | Certification of the Principal Executive Officer required by Rule 30a-2(a) under the Investment Company Act of 1940, as amended. |
| Certification of the Principal Financial Officer required by Rule 30a-2(a) under the Investment Company Act of 1940, as amended. | |
| Exhibit 12(b) | Certification required by Rule 30a-2(b) under the Investment Company Act of 1940, as amended. |