UNITED STATES
SECURITIES AND EXCHANGE COMMISSION
Washington, D.C. 20549
FORM N-CSR
CERTIFIED SHAREHOLDER REPORT OF REGISTERED
MANAGEMENT INVESTMENT COMPANIES
Investment Company Act file number: 811-08894
JNL Series Trust
(Exact name of registrant as specified in charter)
1 Corporate Way, Lansing, Michigan 48951
(Address of principal executive offices)
225 West Wacker Drive, Suite 1200, Chicago, Illinois 60606
(Mailing address)
Steven J. Fredricks
Jackson National Asset Management, LLC
225 West Wacker Drive, Suite 1200
Chicago, Illinois 60606
(Name and address of agent for service)
Registrant’s telephone number, including area code: (312) 338-5800
Date of Fiscal Year End: December 31
Date of Reporting Period: December 31, 2010
Form N-CSR is to be used by management investment companies to file reports with the Commission not later than 10 days after the transmission to stockholders of any report that is required to be transmitted to stockholders under Rule 30e-1 under the Investment Company Act of 1940 (17 CFR 270.30e-1). The Commission may use the information provided on Form N-CSR in its regulatory, disclosure review, inspection, and policymaking roles.
A registrant is required to disclose the information specified by Form N-CSR, and the Commission will make this information public. A registrant is not required to respond to the collection of information contained in Form N-CSR unless the Form displays a currently valid Office of Management and Budget (“OMB”) control number. Please direct comments concerning the accuracy of the information collection burden estimate and any suggestions for reducing the burden to Secretary, Securities and Exchange Commission, 450 Fifth Street, NW, Washington, DC 20549-0609. The OMB has reviewed this collection of information under the clearance requirements of 44 U.S.C. §3507.
Item 1. Report to Shareholders

ANNUAL REPORT December 31, 2010
• JNL® Series Trust
• JNL Variable Fund LLC
This report is for the general information of qualified and non-qualified plan participants, as well as contract/policy owners of the PerspectiveSM, Perspective II®, Perspective AdvisorsSM, Perspective Advisors IISM, PerspectiveSM L Series, Perspective RewardsSM, CuriangardSM, Perspective AdvantageSM, Perspective Focus®, Perspective Investor VULSM, Ultimate Investor® VUL, Jackson AdvisorSM VUL, Defined Strategies®, Fifth Third Perspective, Retirement Latitudes®, PerspectiveSM (New York), Perspective IISM (New York), Perspective Advisors IISM (New York), Perspective L SeriesSM (New York), CuriangardSM (New York), Perspective Advisors (New York), Perspective Focus® (New York), Perspective Investor VUL (New York) and Perspective Rewards® (New York). Not all the portfolios are available in all of the products. Jackson® is the marketing name for Jackson National Life Insurance Company® (Home Office: Lansing, Michigan) and Jackson National Life Insurance Company of New York® (Home Office: Purchase, New York). | ||||
Issued by Jackson National Life Insurance Company® 1 Corporate Way, Lansing, MI 48951 |  | |||

1 Corporate Way
Lansing, MI 48951
Toll Free: 1-800-873-5654
IMPORTANT NOTICE REGARDING DELIVERY OF SHAREHOLDER DOCUMENTS
Dear Client:
If you are a current member of a household with multiple variable products, and have not instructed Jackson otherwise, you currently receive only one copy of the following general documents: Prospectus, Annual and Semi-Annual Report, and other documents as permitted under applicable federal laws relating to Jackson’s variable products and their underlying investment options.
We will continue to send one such copy of these general documents unless and until we receive contrary instructions from you. This delivery policy does not apply to account statements, confirmation statements, or other documents reflecting transaction activity, which you will continue to receive individually.
You may choose to receive a separate copy of these general documents at any time by contacting us toll-free at 1-800-873-5654. Once we receive your request, we will start sending you separate copies within 30 days of receipt of your request.
If you would rather receive your prospectus and other documents via e-mail, please register for Jackson’s Green Delivery Program by visiting the www.Jackson.com. Our Go Paperless process is quick and easy for policyholders – just have your policy number available when you register.
Jackson appreciates your cooperation as we do our part to aid the environment by reducing the amount of paper we distribute. While we’re committed to providing you with the information you need in the format you prefer, we are always looking for new ways to operate more efficiently.
Variable Products issued by Jackson National Life Insurance Company® and distributed by Jackson National Life Distributors LLC, member FINRA. 800/873-5654
President’s Letter
Dear Fellow Investor,
Enclosed is the annual report for the JNL Series Trust and JNL Variable Fund LLC for the year ended December 31, 2010, together with Management’s Discussion of Fund Performance for each of the “Funds”
After a volatile first half of the year and a challenging summer, U.S. markets rallied strongly during the last four months of 2010 to deliver double digit annual growth. Market performance was particularly strong during the month of December, when major indices hit two year highs. The Dow Jones Industrial Average finished the year up 14.1%, while the S&P500® Index rose 15.1% and the Nasdaq Composite Index climbed 18.0%. World markets rallied as well during 2010, with the MSCI World Index up 12.7% (net of dividends). The bond market also had a good year, with the overall market, as measured by the Barclays Capital U.S. Aggregate Bond Index, returning 6.5%, U.S. investment grade corporate bonds, as measured by the Barclays Capital U.S. Corporate Investment Grade Index, returning 9.0% and high-yield bonds, as measured by the Merrill Lynch High Yield Master II Constrained Index, returning 15.1%. |  |
Economic growth in the U.S. moderated during the first half of the year, with the nation’s gross domestic product (“GDP”) expanding at an annualized rate of 3.7% during the first quarter, down from 5.0% during the fourth quarter of 2009. Growth slowed further in the second quarter, when GDP expanded at only a 1.7% annualized rate. The U.S. economy rebounded in the third quarter, with GDP expanding by 2.6%, and the consensus estimate for GDP growth during the fourth quarter was 3.2%.
Despite historically low interest rates and temporary tax credits to encourage buying, the U.S. housing market continued to struggle during 2010. By November, home prices had fallen 26% from their peak in 2006, exceeding the fall in prices that occurred during the Great Depression.1 Unemployment also remained stubbornly high throughout the year, even though, according to the Bureau of Labor Statistics, the economy added an average of 94,000 jobs per month. By December, the unemployment rate fell to 9.4%, down from 9.9% in December 2009, and 9.8% in November 2010, but the decline was attributed to frustrated job seekers dropping out of the labor market, as the modest increase in jobs throughout the year was not enough to measurably shrink the unemployment rate.
Throughout 2010, the U.S. Federal Reserve (the “Fed”) kept its “Federal Funds Rate” target at the historically low range of 0-0.25%. With economic growth slowing and investors shaken by the market flash crash and the European debt crisis, the Fed decided that more action needed to be taken to ensure continued economic recovery. In August 2010, the Fed announced another round of quantitative easing, consisting of the purchase of $600 billion in Treasury instruments, with the goal of reducing long term interest rates. Interest rates bottomed in the fall when U.S. 2-year Treasury yields fell to a record low of 0.31% and 10-year yields fell to 2.33%, their lowest level of the year. However, as economic indicators improved and equity markets rallied toward the end of the year, the yield curve steepened and long term composite yields reached a six-month high of 4.23% in December.
Near the end of the year, the U.S. Congress passed bills extending current tax rates for most Americans and authorized an extension of un-employment benefits. These measures, along with the Fed’s anticipated bond purchases, are expected to bolster the economy during 2011.
Jackson National Life Insurance Company® and Jackson National Life Insurance Company of New York® (collectively, Jackson®) provide a broad range of 99 investment options across multiple asset classes, capitalizations and styles that you and your representative can use to create a personalized retirement income solution. During 2010, Jackson added one fund from the BlackRock Series Fund, Inc. and six funds from the American Funds Insurance Series® to its investment lineup. With $3.45 trillion in assets under management, BlackRock is the one of the world’s largest asset managers and now manages the JNL/BlackRock Global Allocation Fund and the JNL/BlackRock Commodity Securities Fund for Jackson. The newly added American Funds Insurance Series portfolios include both domestic and international equity options, plus a global bond fund.
At Jackson, we are dedicated to providing you with the tools and support you need to achieve your financial goals. Thank you for choosing Jackson for your investment needs.

Mark D. Nerud
President and Chief Executive Officer
JNL Series Trust
JNL Variable Fund LLC
1”Home Price Drops Exceed Great Depression: Zillow,” Reuters, January 11, 2011.
Supplement Dated February 22, 2011
To The Prospectus For
PERSPECTIVE II®; PERSPECTIVESM L SERIES; PERSPECTIVE ADVISORS II®; RETIREMENT
LATITUDESSM ; PERSPECTIVE REWARDS®; FIFTH THIRD PERSPECTIVE; PERSPECTIVESM;
PERSPECTIVE FOCUS®
Issued By JACKSON NATIONAL LIFE INSURANCE COMPANY®
Through JACKSON NATIONAL SEPARATE ACCOUNT – I
PERSPECTIVE ADVISORSSM
Issued By JACKSON NATIONAL LIFE INSURANCE COMPANY®
Through JACKSON NATIONAL SEPARATE ACCOUNT III
PERSPECTIVE INVESTOR VUL®
ULTIMATE INVESTOR® VUL
JACKSON ADVISORSM VUL
Issued By JACKSON NATIONAL LIFE INSURANCE COMPANY®
Through JACKSON NATIONAL SEPARATE ACCOUNT IV
PERSPECTIVE ADVANTAGESM
Issued By JACKSON NATIONAL LIFE INSURANCE COMPANY®
Through JACKSON NATIONAL SEPARATE ACCOUNT V
PERSPECTIVE II®; PERSPECTIVESM L SERIES; PERSPECTIVE ADVISORS II®;
PERSPECTIVE REWARDS®; PERSPECTIVESM; PERSPECTIVE FOCUS®
Issued By JACKSON NATIONAL LIFE INSURANCE COMPANY OF NEW YORK®
Through JNLNY SEPARATE ACCOUNT I
PERSPECTIVE ADVISORSSM
Issued By JACKSON NATIONAL LIFE INSURANCE COMPANY OF NEW YORK®
Through JNLNY SEPARATE ACCOUNT II
This supplement updates the above-referenced prospectuses. Please read and keep it together with your prospectus for future reference.
Effective February 22, 2011, the Investment Division of the Separate Account investing in the JNL/BlackRock Global Allocation Fund (the “JNL/BlackRock Investment Division”) has temporarily stopped accepting any additional allocations or transfers. All other Investment Divisions of the Separate Account remain available. Transfers include transfers pursuant to Dollar Cost Averaging, Dollar Cost Averaging Plus, Earnings Sweep and Rebalancing program (collectively referred to as “automatic program”) if available under your Contract/Policy.
If you have an automatic program with an allocation to the JNL/BlackRock Investment Division, you must choose a replacement Investment Division by April 22, 2011. All such transfers prior to receipt of your notification will be allocated to the JNL/Select Money Market Investment Division. You may reallocate the Contract/Policy value in the JNL/Select Money Market Investment Division to any other Investment Division. See the prospectus for the Contract/Policy for the Investment Divisions available to you.
If you have an application for a Contract/Policy pending and it includes an allocation to the JNL/BlackRock Investment Division, that allocation will be allocated to the JNL/Select Money Market Investment Division.
Current allocations to the JNL/BlackRock Investment Division will remain invested unless we receive instruction from you. You may continue to make transfers and withdrawals out of the JNL/BlackRock Investment Division in connection with the usual transactions under a Contract/Policy, such as partial withdrawals or withdrawals under a GMWB, if available. However, if you transfer out of the JNL/BlackRock Investment Division you will not be able to transfer back in until after such time as it may be reopened.
The decision to temporarily close the JNL/BlackRock Investment Division in this manner is attributable to the current unavailability of additional shares of the BlackRock Global Allocation Fund, a Master Fund, which is the sole investment of the JNL/BlackRock Global Allocation Fund, a Feeder Fund. We will notify you regarding the future availability of the JNL/BlackRock Investment Division.
 | JNL American Funds | |
| Capital Research and Management Company |
JNL/American Funds Blue Chip Income and Growth Fund
Portfolio Manager Commentary: For the period May 1, 2010 through December 31, 2010, the JNL/American Funds Blue Chip Income and Growth Fund underperformed its benchmark by posting a return of 3.90% for Class A shares compared to 6.09% for the S&P 500 Index.
The Fund seeks both income and capital appreciation through exclusive investment in the American Funds Insurance Series - Blue Chip Income and
Growth Fund Class 1 (“Master Fund”). The performance of the Fund is directly related to the performance of the Master Fund. The financial statements of the Master Fund, including the Schedule of Investments and portfolio manager commentary, are provided separately and should be read in conjunction with the Fund’s financial statements.
Total Return for Class A Shares* | ||
Since Inception 3.90% | ||
(Inception date May 3, 2010) | ||
Total Return for Class B Shares* | ||
Since Inception 4.10% | ||
(Inception date May 3, 2010) | ||
JNL/American Funds Global Bond Fund
Portfolio Manager Commentary: For the period May 1, 2010 through December 31, 2010, the JNL/American Funds Global Bond Fund under-performed its benchmark by posting a return of 4.50% for Class A shares compared to 5.90% for the Barclays Capital Global Aggregate Bond Index.
The Fund seeks a high level of total return through exclusive investment in the American Funds Insurance Series – Global Bond Fund Class 1
(“Master Fund”). The performance of the Fund is directly related to the performance of the Master Fund. The financial statements of the Master Fund, including the Schedule of Investments and portfolio manager commentary, are provided separately and should be read in conjunction with the Fund’s financial statements.
Total Return for Class A Shares* | ||
Since Inception 4.50% | ||
(Inception date May 3, 2010) | ||
Total Return for Class B Shares* | ||
Since Inception 4.70% | ||
(Inception date May 3, 2010) | ||
JNL/American Funds Global Small Capitalization Fund
Portfolio Manager Commentary: For the period May 1, 2010 through December 31, 2010, the JNL/American Funds Global Small Capitalization Fund underperformed its benchmarks by posting a return of 11.50% for Class A shares compared to 14.23% for the S&P Global <$3 Billion Index and 11.71% for the MSCI All Country World Small Cap Index.
The Fund seeks growth of capital over time through exclusive investment
in the American Funds Insurance Series – Global Small Capitalization Fund Class 1 (“Master Fund”). The performance of the Fund is directly related to the performance of the Master Fund. The financial statements of the Master Fund, including the Schedule of Investments and portfolio manager commentary, are provided separately and should be read in conjunction with the Fund’s financial statements.
Total Return for Class A Shares* | ||
Since Inception 11.50% | ||
(Inception date May 3, 2010) | ||
Total Return for Class B Shares* | ||
Since Inception 11.60% | ||
(Inception date May 3, 2010) | ||
Past performance is not predictive of future performance. Investment return and principal value will fluctuate so that an investor’s shares, when redeemed, may be worth more or less than their original cost. Performance numbers are net of all Fund operating expenses, but not do not reflect the deduction of insurance changes.
*The Fund’s investment adviser waived/reimbursed certain expenses of the Fund. Performance results shown reflect the waiver, without which they would have been lower.
| JNL American Funds (continued) | |
| Capital Research and Management Company |
JNL/American Funds Growth-Income Fund
Portfolio Manager Commentary: For the period May 1, 2010 through December 31, 2010, the JNL/American Funds Growth-Income Fund under-performed its benchmark by posting a return of 4.50% for Class A shares compared to 6.09% for the S&P 500 Index.
The Fund seeks capital appreciation and income through exclusive in-vestment in the American Funds Insurance Series – Growth-Income Fund
Class 1 (“Master Fund”). The performance of the Fund is directly related to the performance of the Master Fund. The financial statements of the Master Fund, including the Schedule of Investments and portfolio manager commentary, are provided separately and should be read in conjunction with the Fund’s financial statements.
Total Return for Class A Shares* | ||
Since Inception 4.50% | ||
(Inception date May 3, 2010) | ||
Total Return for Class B Shares* | ||
Since Inception 4.60% | ||
(Inception date May 3, 2010) | ||
JNL/American Funds International Fund
Portfolio Manager Commentary: For the period May 1, 2010 through December 31, 2010, the JNL/American Funds International Fund underperformed its benchmark by posting a return of 8.50% for Class A shares com-pared to 11.20% for the MSCI All Country World ex-USA Index.
The Fund seeks capital appreciation through exclusive investment in the American Funds Insurance Series – International Fund Class 1 (“Master
Fund”). The performance of the Fund is directly related to the performance of the Master Fund. The financial statements of the Master Fund, including the Schedule of Investments and portfolio manager commentary, are pro-vided separately and should be read in conjunction with the Fund’s financial statements.
Total Return for Class A Shares* | ||
Since Inception 8.50% | ||
(Inception date May 3, 2010) | ||
Total Return for Class B Shares* | ||
Since Inception 8.70% | ||
(Inception date May 3, 2010) | ||
JNL/American Funds New World Fund
Portfolio Manager Commentary: For the period May 1, 2010 through December 31, 2010, the JNL/American Funds New World Fund outperformed its benchmark by posting a return of 13.60% for Class A shares compared to 8.90% for the MSCI All Country World Index.
The Fund seeks capital appreciation through exclusive investment in the American Funds Insurance Series – New World Fund Class 1 (“Master
Fund”). The performance of the Fund is directly related to the performance of the Master Fund. The financial statements of the Master Fund, including the Schedule of Investments and portfolio manager commentary, are pro-vided separately and should be read in conjunction with the Fund’s financial statements.
Total Return for Class A Shares* | ||
Since Inception 13.60% | ||
(Inception date May 3, 2010) | ||
Total Return for Class B Shares* | ||
Since Inception 13.70% | ||
(Inception date May 3, 2010) | ||
Past performance is not predictive of future performance. Investment return and principal value will fluctuate so that an investor’s shares, when redeemed, may be worth more or less than their original cost. Performance numbers are net of all Fund operating expenses, but not do not reflect the deduction of insurance changes.
*The Fund’s investment adviser waived/reimbursed certain expenses of the Fund. Performance results shown reflect the waiver, without which they would have been lower.
 | JNL Institutional Funds | |
| Jackson National Asset Management, LLC |
Market Summary: For much of 2010 the capital markets wavered between significant periods of strength and weakness, as many world economies struggled to maintain a consistent pace of growth. The global equity bull market that began in March of 2009 continued into April 2010 until the sovereign debt crisis reached a climax in Europe and fears of a double dip recession dominated in May and June. In the U.S., the uncertainty regarding the midterm congressional elections compounded the market volatility only to evolve to a backdrop of emerging certainty in the closing 3 months of the year. While the sovereign debt crisis required bailouts of Greece and Ireland, bringing some calm to the global markets, the emerging economies generally continued their strong growth, more typical of an economic recovery pattern. U.S. equity markets rallied to end the year as the S&P 500 Index gained 10.76% for the final quarter, raising the year’s performance 15.06%. For most of the year, the strongest segment of the U.S. equity market was the smaller company Russell 2000 Index that rallied 10 percentage points more than its big cap counterparts for the year. Strength in the economically sensitive small cap companies suggests investors are convinced the economy is on firm footing. As well, except for the second quarter during the double dip recession fears, the most economically sensitive sectors within the S&P 500 Index (consumer discretionary, industrials, materials and energy) led the S&P 500 Index higher. | International developed market equities could not keep pace with U.S. stocks for the year, in large part due to the high debt levels in the Euro economies. The return of 7.75% for the popular Morgan Stanley Capital International (“MSCI”) EAFE Index was nearly half that of the U.S. stock market. Emerging stock markets though, whose economies are growing at 2 to 3 times the pace of developed economies, enjoyed strong returns of 18.88% for the year as measured by the MSCI Emerging Market Index. The global fixed income markets also reflected the ebb and flow of fears during the year with Treasuries fairing best during crisis periods surrounding the European sovereign debt crisis, but lagging during periods of confidence when investors looked to securities with higher return potential. Mostly un-interrupted during the year was the positive momentum in U.S. high yield bonds and emerging market debt as U.S. company balance sheets grew stronger and low debt levels combined with strong emerging country gross domestic product (“GDP”) growth bolstered government bond values. Both sectors achieved double digit returns for 2010 while other U.S. investment grade bonds recorded solid mid single digit returns. Other less traditional asset classes faired well led by listed private equity and real estate investment trusts (“REITS”), both gaining over 20% in 2010. Commodities and natural resource investments also enjoyed strong momentum along with renewed confidence in the global recovery.
|
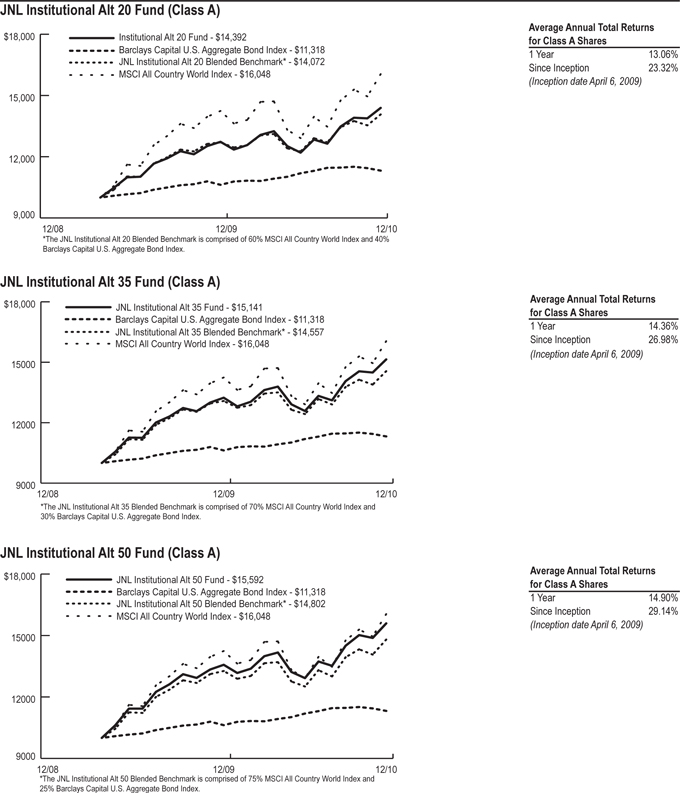
Fund Description: The investment objective of the JNL Institutional Alt 20 Fund, JNL Institutional Alt 35 Fund, JNL Institutional Alt 50 Fund and JNL Institutional Alt 65 Fund (collectively the “JNL Alt Funds”) is long-term growth of capital and income. Each Fund seeks to achieve its objective by investing in Class A shares of a diversified group of affiliated Funds (“Under-lying Funds”). The Underlying Funds in which each Fund may invest are a separate series of JNL Series Trust and the JNL Variable Fund, LLC. Each Fund has a target percentage allocation among the Underlying Funds that are categorized as investing in traditional asset classes and non-traditional asset classes. The Underlying Funds available for investing in traditional asset classes are: JNL/Mellon Capital Management S&P 500 Index Fund, JNL/Mellon Capital Management S&P 400 MidCap Index Fund, JNL/Mellon Capital Management Small Cap Index Fund, JNL/Mellon Capital Management International Index Fund, JNL/Mellon Capital Management Bond Index Fund, JNL/Mellon Capital Management European 30 Fund, JNL/Mellon Capital Management Pacific Rim 30 Fund, JNL/S&P Competitive Advantage Fund, JNL/S&P Dividend Income & Growth Fund, JNL/S&P Intrinsic Value Fund, JNL/S&P Total Yield Fund, JNL/Mellon Capital Management JNL 5 Fund, JNL/Mellon Capital Management Select-Small Cap Fund, JNL/Mellon Capital Management 25 Fund, JNL/Mellon Capital Management S&P® 24 Fund, JNL/Mellon Capital Management DowSM Dividend Fund, JNL/Mellon
| Capital Management Nasdaq® 25 Fund, JNL/Mellon Capital Management Value Line® 30 Fund, JNL/Mellon Capital Management VIP Fund, JNL/Mellon Capital Management JNL Optimized 5 Fund, JNL/Mellon Capital Management S&P® SMid 60 Fund and JNL/Mellon Capital Management NYSE® International 25 Fund. The Underlying Funds available for investing in non-traditional asset classes are: JNL/Invesco Global Real Estate Fund, JNL/BlackRock Commodity Securities Fund, JNL/Goldman Sachs U.S. Equity Flex Fund, JNL/Goldman Sachs Emerging Markets Debt Fund, JNL/Ivy As-set Strategy Fund, JNL/Lazard Emerging Markets Fund, JNL/Mellon Capital Management Global Alpha Fund, JNL/PIMCO Real Return Fund, JNL/PPM America High Yield Bond Fund and JNL/Red Rocks Listed Private Equity Fund. The performance and investment objectives of the Underlying Funds are discussed elsewhere in this report. One Fund change was implemented during the first quarter of 2010 for all four JNL Alt Funds. Following persistent underperformance relative to their benchmarks, the JNL/Mellon Capital Management Select Small-Cap was replaced with the JNL/Mellon Capital Management Small Cap Index Fund. During the fourth quarter, another Fund underwent a subadvisor change, introducing the JNL/BlackRock Commodity Series Fund to replace the JNL/Credit Suisse Commodity Securities Fund. There were no changes to target allocations during the year.
|
JNL Institutional Alt 20 Fund
Portfolio Manager Commentary: For the year ended December 31, 2010, the JNL Institutional Alt 20 Fund outperformed its benchmark by posting a return of 13.06% for Class A shares compared to 10.77% from a 60/40% blend of the MSCI All Country World Equity Index and the Barclays Capital U.S. Aggregate Bond Index. The Fund allocates approximately 80% of its assets to Underlying Funds that invest primarily in traditional asset classes, allocating approximately 25% to 35% in fixed income securities, 30% to 40% in U.S. equity securities and 5% to 15% in international securities. In addition, the Fund allocates approximately 20% to Underlying Funds that invest primarily in non-traditional asset classes. All Underlying Funds in the Fund enjoyed positive returns for the year. The strongest gains were focused in the equity oriented funds as well as | a number of the alternative investments. The top performing equity fund for the quarter and year was the JNL/Mellon Capital Management Small Cap Index Fund, up 16.14% and 26.32% in the respective time frames. Tied to the strength in the equity markets was the JNL/Red Rocks Listed Private Equity Fund, gaining 13.97% for the quarter and just over 26.32% for the year. Other less traditional investments like commodities, emerging market debt and emerging equity contributed to strong returns. The more subdued performance for the year was focused on higher quality bond investments like the JNL/ Mellon Capital Management Bond Index Fund. The fourth quarter in particular weighed on the year’s returns with a modest decline of -1.48%, but still achieved a constructive annual performance of 5.87%. |
 | JNL Institutional Funds (continued) | |
| Jackson National Asset Management, LLC |
JNL Institutional Alt 35 Fund
Portfolio Manager Commentary: For the year ended December 31, 2010, the JNL Institutional Alt 35 Fund outperformed its benchmark by posting a return of 14.36% for Class A shares compared to 11.31% from a 70/30% blend of the MSCI All Country World Equity Index and the Barclays Capital U.S. Aggregate Bond Index.
The Fund allocates approximately 65% of its assets to Underlying Funds that invest primarily in traditional asset classes, allocating approximately 20% to 30% in fixed income securities, 25% to 35% in U.S. equity securities and 5% to 15% in international securities. In addition, the Fund allocates approximately 35% to Underlying Funds that invest primarily in the non-traditional asset classes.
All Underlying Funds in the Fund enjoyed positive returns for the year. The strongest gains were focused in the equity oriented funds as well as a number of the alternative investments. The top performing equity fund for the quarter and year was the JNL/Mellon Capital Management Small Cap Index Fund, up 16.14% and 26.32% in the respective time frames. Tied to the strength in the equity markets was the JNL/Red Rocks Listed Private Equity Fund, gaining 13.97% for the quarter and just over 26.32% for the year. Other less traditional investments like commodities, emerging market debt and emerging equity contributed to strong returns.
The more subdued performance for the year was focused on higher quality bond investments like the JNL/ Mellon Capital Management Bond Index Fund. The fourth quarter in particular weighed on the year’s returns with a modest decline of -1.48%, but still achieved a constructive annual performance of 5.87%.
JNL Institutional Alt 50 Fund
Portfolio Manager Commentary: For the year ended December 31, 2010, the JNL Institutional Alt 50 Fund outperformed its benchmark by posting a return of 14.90% for Class A shares compared to 11.57% from a 75/25% blend of the MSCI All Country World Equity Index and the Barclays Capital U.S. Aggregate Bond Index.
The Fund allocates approximately 50% of its assets to Underlying Funds that invest primarily in traditional asset classes, allocating approximately 15% to 25% in fixed income securities, 20% to 30% in U.S. equity securities and 0% to 10% in international securities. In addition, the Fund allocates approximately 50% to Underlying Funds that invest primarily in non-traditional asset classes.
All Underlying Funds in the Fund enjoyed positive returns for the year. The strongest gains were focused in the equity oriented funds as well as a number of the alternative investments. The top performing equity fund for the quarter and year was the JNL/Mellon Capital Management Small Cap Index Fund, up 16.14% and 26.32% in the respective time frames. Tied to the strength in the equity markets was the JNL/Red Rocks Listed Private Equity Fund, gaining 13.97% for the quarter and just over 26.32% for the year. Other less traditional investments like commodities, emerging market debt and emerging equity contributed to strong returns.
The more subdued performance for the year was focused on higher quality bond investments like the JNL/ Mellon Capital Management Bond Index Fund. The fourth quarter in particular weighed on the year’s returns with a modest decline of -1.48%, but still achieved a constructive annual performance of 5.87%.
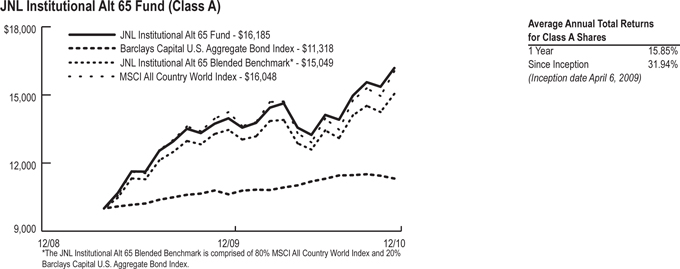
JNL Institutional Alt 65 Fund
Portfolio Manager Commentary: For the year ended December 31, 2010, the JNL Institutional Alt 65 Fund outperformed its benchmark by posting a return of 15.85% for Class A shares compared to 11.81% from an 80/20% blend of the MSCI All Country World Equity Index and the Barclays Capital U.S. Aggregate Bond Index.
The Fund allocates approximately 35% of its assets to Underlying Funds that invest primarily in traditional asset classes, allocating approximately 0% to 10% in fixed income securities, 15% to 25% in U.S. equity securities and 0% to 10% in international securities. In addition, the Fund allocates approximately 65% to Underlying Funds that invest primarily in non-traditional asset classes.
All Underlying Funds in the Fund enjoyed positive returns for the year. The strongest gains were focused in the equity oriented
funds as well as a number of the alternative investments. The top performing equity fund for the quarter and year was the JNL/Mellon Capital Management Small Cap Index Fund, up 16.14% and 26.32% in the respective time frames. Tied to the strength in the equity markets was the JNL/Red Rocks Listed Private Equity Fund, gaining 13.97% for the quarter and just over 26.32% for the year. The 15.85% 2010 gain for the Alt 65 Fund was positively influenced by greater exposure to other less traditional investments like commodities, emerging market debt and emerging equity contributed to strong returns.
The more subdued performance for the year was focused on higher quality bond investments like the JNL/ Mellon Capital Management Bond Index Fund. The fourth quarter in particular weighed on the year’s returns with a modest decline of -1.48%, but still achieved a constructive annual performance of 5.87%.
 | JNL Institutional Funds (continued) | |
| Jackson National Asset Management, LLC |
Past performance is not predictive of future performance. Investment return and principal value will fluctuate so that an investor’s shares, when redeemed, may be worth more or less than their original cost. Performance numbers are net of all Fund operating expenses, but not do not reflect the deduction of insurance changes
| JNL Institutional Funds (continued) | |
| Jackson National Asset Management, LLC |
Past performance is not predictive of future performance. Investment return and principal value will fluctuate so that an investor’s shares, when redeemed, may be worth more or less than their original cost. Performance numbers are net of all Fund operating expenses, but do not reflect the deduction of insurance changes.
 | JNL BlackRock Funds | |
| BlackRock Investment Management, LLC |
Market Summary: Commodities were markedly higher for 2010, with the Dow Jones UBS-Commodity Index rising 16.83% for the year. Two of the top three performing commodities during the year were to be found in the Agriculture sector. Cotton, whose prices rallied based in part on rising demand from Asian textile mills and diminishing supply levels, rose 98.16%. Coffee prices increased 66.99% over 2010, due to inclement weather in key markets and existing tight inventory levels causing prices to rise sharply. Silver reached multi-decade highs over the course of 2010, rising 81.83%, benefiting not only from an increase in industrial demand, but also from its usage as a store of value. Natural Gas was the year’s worst performer and one of two commodities to yield a negative return, declining 40.59%. As inventory levels rose, prices fell throughout the year.
Positive sentiment towards growth assets following the announcement
of quantitative easing (“QE2”) underpinned commodity markets over the fourth quarter. Commodity markets were further supported by a return of strong demand and a weakening U.S. dollar. Just as economic growth has shifted from developed to emerging markets, so too has commodities demand growth. In addition, adverse weather conditions continue to support agricultural commodity prices due to the simultaneous occurrence of the El Niño and La Niña weather patterns in 2010.
Energy and resources stocks were among the strongest performing groups in the fourth quarter. Within energy, investors favored higher beta segments, particularly coal and equipment and services, driving individual names and the overall sector higher. The metals and mining subgroup drove returns in materials, led by copper and gold names.
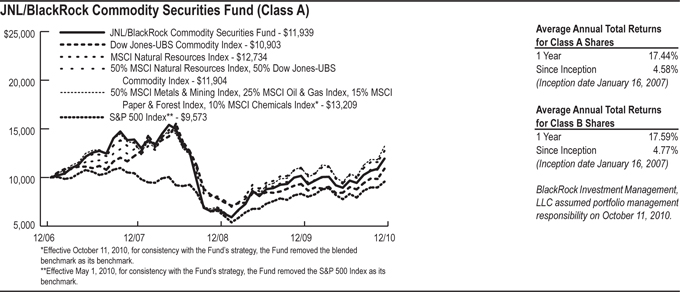
JNL/BlackRock Commodity Securities Fund (formerly, JNL/Credit Suisse Commodity Securities Fund)
Sector Weightings*:
Energy | 33.9 | % | ||
Commodity Indexed Structured Notes | 17.8 | |||
Materials | 4.9 | |||
Industrials | 0.1 | |||
Warrants | 0.0 | |||
Short Term Investments | 43.3 | |||
Total Investments | 100.0 | % | ||
*Total Investments at December 31, 2010 |
| |||
Portfolio Manager Commentary: For the year ended December 31, 2010, the Fund out-performed its benchmarks by posting a return of 17.44% for Class A shares compared to 15.06% for the S&P 500 Index, 16.83% for the Dow Jones-UBS Commodity Index and 16.20% for the MSCI Natural Resources Index.
The Fund offers a unique way to provide exposure to the energy and natural resources sectors by combining physical commodity exposure through investments in commodity linked notes with investments in energy and natural resource stocks. The Fund’s investments in commodity linked notes contain a return component that is based on the movement of commodity indices. The Fund’s exposure to commodity linked notes may be greater than the value of these investments.
For the period January 1, 2010 through October 10, 2010, the Fund was sub-advised by Credit Suisse Asset Management, LLC. During that time, the Fund underperformed one of its benchmarks by posting a return of 4.04% for Class A shares compared to 6.13% for the S&P 500 Index. The Fund outperformed its other benchmark, the Dow Jones-UBS Commodity Index, which posted a return of 3.85%.
BlackRock Investment Management, LLC replaced Credit Suisse Asset Management, LLC as the Fund’s Sub-Adviser on October 11, 2010. Since BlackRock Investment Management, LLC took over investment responsibilities through the end of 2010, the Fund outperformed its bench-mark by posting a return of 12.88% for Class A shares compared to 12.50% for the Dow Jones-UBS Commodity Index.
For the period during which the Fund was
sub-advised by Credit Suisse Asset Management, LLC: Commodities posted modest gains for the nine month period ending September 30, 2010, with the Dow Jones-UBS Commodity Index up 0.90%. Within the Dow Jones-UBS Commodity Index, precious metals was the top performing commodity sector, gaining 21.56%, due to a surge in performance in the third quarter. The strength of precious metals was a result of a combination of items: the fears of deteriorating flat currencies and the assumptions of further quantitative easing measures by the U.S. Federal Re-serve, as well as Central Banks around the world becoming net purchasers of precious metals. Agriculture, the second best performing sector, gained 10.08% for the period as a result of tightening supply schedules and increased demand from developing economies. Livestock finished higher, rising 7.27% – rising feed prices and the eventual oversupply such circumstances tend to foreshadow did not affect livestock prices during the period. Industrial metals also posted gains, increasing 3.37%, due to increased demand and alleviated fears of a double dip recession. Energy was the worst performing sector during the period. Energy fell 17.59% due mainly to natural gas’s poor performance resulting from plummeting demand and excessive inventory levels. All other commodities within the energy sector also posted negative results. The period’s best individual commodity was cotton, up 34.72%, and the worst performer was natural gas, down -39.22%.
Historically, commodity index returns have tended to exhibit long term positive returns with low correlations to other asset classes, creating potential risk/return benefits within a diversified portfolio. Over the course of the period, developing economies exhibited strong growth, while developed economies have been on the mend, growing at a tepid pace. The latter part of the period resulted in strong gains due to the confluence of increased demand and shrinking supply levels; demand for commodities of all varieties – barring energy – were sought and physical assets were stockpiled. Such bullish sentiments for the asset class were propelled higher by renewed investor confidence coupled with the threat of a
currency war amongst Group of Twenty (“G20”) participants.
For the period during which the Fund was sub-advised by BlackRock Investment Management, LLC: The Dow Jones-UBS Commodity Index rose 15.79% in the fourth quarter and positive performance was seen across all sectors. For the commodity markets, the soft commodity complex was the best performing sector in the fourth quarter, gaining 37.58%, while livestock was the laggard, up only 1.86%. Elsewhere, agriculture posted strong returns, rising 21.17%, precious metals gained 17.35%, industrial metals rose 12.45%, and energy was up 8.55%. The quarter’s best individual commodity was cotton, up 47.04%, and the worst performer was natural gas, down -2.26%.
The natural resources equity segment of the Fund had strong returns in the fourth quarter and outperformed its benchmark. On a relative basis, the Fund’s large underweight to integrated oil and gas names and choice of stocks within this group was the largest contributor to fourth quarter re-turns. The Fund held an average weight of 20% in integrated names, half the weight held in the benchmark. Not owning BP Plc, Total SA and ENI SpA helped returns, as these were some of the lower returning names in the Fund’s bench-mark. Another contributing factor to returns was the Fund’s overweight to equipment and services names, as this higher beta group had strong fourth quarter returns. Lastly, the Fund’s selection among exploration and production names added to returns, as the Fund overweighted a handful of names with strong returns and avoided some of the poor performers. The one exception in this group was the Fund’s position in EOG Re-sources Inc., which cost the Fund some ground after it declined sharply early in November after reporting third quarter losses. The Fund’s cash position created a drag on returns in a strong three month performance period for energy and resources stocks. Also detracting from returns was the Fund’s underweight position in the diversified metals and mining sub group, particularly not owning several strong performing copper names.
 | JNL BlackRock Funds (continued) | |
| BlackRock Investment Management, LLC |
JNL/BlackRock Global Allocation Fund
Portfolio Manager Commentary: For the period October 11, 2010 through December 31, 2010, the JNL/BlackRock Global Allocation Fund underperformed some of its benchmarks by posting a return of 3.50% for Class A shares compared to 6.14% for the Financial Times Stock Exchange (“FTSE”) World Index, 4.40% for the FTSE World Index (ex-U.S.) and 8.40% for the S&P 500 Index. The Fund outperformed its other benchmarks, the Bank of America Merrill Lynch Current 5 year U.S. Treasury Index, which returned -3.49%, and the Citigroup Non U.S. Dollar World Government Bond Index, which returned -3.35%.
The Fund seeks high total investment return through exclusive investment in the BlackRock Series Fund, Inc. - BlackRock Global Allocation Portfolio (“Master Fund”). The performance of the Fund is directly related to the performance of the Master Fund. The financial statements of the Master Fund, including the Schedule of Investments and portfolio manager commentary are provided separately and should be read in conjunction with the Fund’s financial statements.
Total Return for Class A Shares* | ||
Since Inception 3.50% | ||
(Inception date October 11, 2010) | ||
Total Return for Class B Shares* | ||
Since Inception 3.50% | ||
(Inception October 11, 2010) | ||
Past performance is not predictive of future performance. Investment return and principal value will fluctuate so that an investor’s shares, when redeemed, may be worth more or less than their original cost. Performance numbers are net of all Fund operating expenses, but not do not reflect the deduction of insurance changes.
*The Fund’s investment adviser waived/reimbursed certain expenses of the Fund. Performance results shown reflect the waiver, without which they would have been lower.
 | JNL Capital Guardian Funds | |
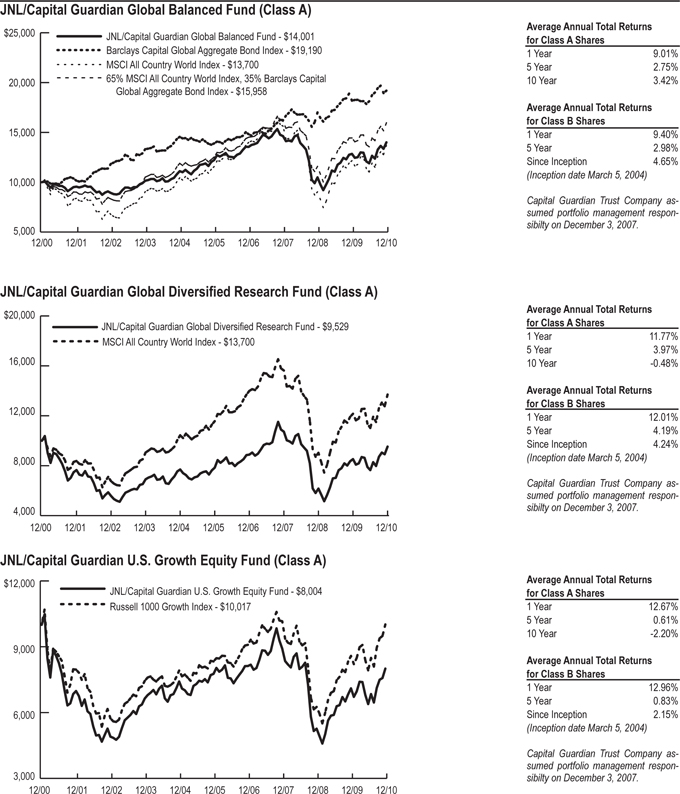
| Capital Guardian Trust Company |
Market Summary: Stocks overcame an acute sovereign debt crisis in Europe and modest growth in the major developed economies to deliver strong returns for the year. Coming on the heels of good returns in 2009, the gains lifted several major equity indices to levels prevailing before the Lehman Brothers bankruptcy in 2008. Most corporations beat consensus earnings estimates through a combination of cost cutting, financial discipline, inventory management and some revenue growth, which underpinned the equity market’s rise. The U.S. Federal Reserve (“Fed”) signaled in August that it would inject more money into the U.S. markets through the purchase of government debt, giving stocks an additional boost in the fourth quarter.
Emerging markets also racked up strong gains. Even as developed nations struggled, several developing economies continued to gain momentum. China, India, Brazil, Malaysia, Thailand and South Korea raised interest rates to stem inflationary pressures. The higher interest rates and faster
economic growth put upward pressure on several emerging markets’ currencies. China resisted international pressure to devalue the Chinese yuan and continued to register one of the strongest growth rates in the world. Chinese demand propelled commodities higher and lifted profits and share prices of several European luxury goods companies and automakers. Toward year end, economic data improved noticeably in the U.S., Germany and the UK. Cyclical areas of the market, including materials, industrials and consumer related stocks, outpaced other sectors by a significant margin.
Government bond yields fell in the major economies despite the backup in long term rates toward year end. Treasuries rallied for most of the year, bringing bond yields to historic lows before they retreated in the last two months as economic data improved. The Japanese yen strengthened while the euro lost ground against most currencies. The U.S. dollar rose against the euro and the British pound but lost value to most other currencies.
JNL/Capital Guardian Global Balanced Fund
Sector Weightings*:
Government Securities | 20.8 | % | ||
Financials | 12.8 | |||
Information Technology | 11.4 | |||
Consumer Discretionary | 8.0 | |||
Energy | 7.1 | |||
Industrials | 6.5 | |||
Materials | 6.4 | |||
Health Care | 5.5 | |||
Consumer Staples | 4.8 | |||
Telecommunication Services | 4.2 | |||
U.S. Government Agency Mortgage-Backed Securities | 2.7 | |||
Utilities | 1.8 | |||
Rights | 0.0 | |||
Short Term Investments | 8.0 | |||
Total Investments | 100.0 | % | ||
*Total Investments at December 31, 2010
Portfolio Manager Commentary: For the year ended December 31, 2010, the JNL/Capital Guardian Global Balanced Fund underperformed one of its benchmarks by posting a return of 9.01% compared to 12.66% for the MSCI All Country World Index. The Fund outperformed its other benchmark, the Barclays Capital Global Aggregate Bond Index, which returned 5.54%.
The Fund increased its allocation to equities in the second half of the year, which supported returns during that period. For the year, equities had strong returns. Consumer discretionary, information technology and industrials were the largest contributors to stock returns on an absolute basis. Germany’s Siemens AG was among the top contributors, as it benefited from rising exports and improving margins. Among technology stocks, network equipment provider Juniper Networks Inc. (“Juniper”) benefited from its diverse mix of customers and Japan’s SoftBank Corp. saw its market leadership consolidated, helped by its position as the sole provider of Apple Inc.’s (“Apple”) iPhone in Japan. Shares of Apple also rose sharply.
Energy stocks, particularly in the oil services area, made a large contribution to the Fund’s relative results. Schlumberger Ltd. (“Schlumberger”) gained as investors were encouraged by a continued improvement in its profit margins and its progress in integrating recent acquisitions. The decision to not invest in Brazil’s Petròlco Brasileiro SA (“Petrobras”) and to have only a small investment in BP Plc also supported relative results. Financials had mixed results. Investments in select Mexican and Russian banks
made strong gains, but Goldman Sachs Group Inc. (“Goldman Sachs”) delivered flat returns.
During the year, Russia’s Sberbank was one of the major purchases in the Fund. We believe that robust consumer growth and improving credit quality in Russia will continue to support the company’s growth. Among major sales, the investment in L’Oreal SA was significantly reduced as the stock has had a strong run and we believe valuations are no longer that attractive.
Within the bond portion of the Fund, country allocation was positive overall. The underweight stance in the Japanese bond market was supportive. Investment in Mexican bonds worked in the Fund’s favor as the economy started to improve. However, the less than index exposure to the UK was a drag on results. Currency returns were mixed. Low exposure to the Japanese yen was the biggest detractor as it surged against most currencies. An overweight stance on the Australian dollar was supportive and an underweight position in the euro also helped as it weakened amid the debt crisis in parts of the region.
Looking to the new year, the asset allocation team for the Fund has become incrementally more positive on equities.
 | JNL Capital Guardian Funds (continued) | |
Capital Guardian Trust Company |
JNL/Capital Guardian Global Diversified Research Fund
Sector Weightings*:
Financials | 15.6 | % | ||
Information Technology | 15.1 | |||
Energy | 14.3 | |||
Materials | 11.7 | |||
Consumer Discretionary | 8.1 | |||
Consumer Staples | 7.8 | |||
Health Care | 7.3 | |||
Industrials | 6.7 | |||
Telecommunication Services | 5.7 | |||
Utilities | 2.2 | |||
Short Term Investments | 5.5 | |||
Total Investments | 100.0 | % | ||
*Total Investments at December 31, 2010 |
| |||
Portfolio Manager Commentary: For the year ended December 31, 2010, the JNL/Capital Guardian Global Diversified Research Fund underperformed its benchmark by posting a return of 11.77% compared to 12.66% for the MSCI All Country World Index.
The selection of technology stocks was the biggest contributor to Fund gains, especially in the U.S. The sector saw a large divergence in the results of its constituents, and avoiding
most of the disappointments was a positive factor. NetApp Inc. benefited from rising corporate demand for its data storage services. Juniper, because of its diverse mix of customers, was also a strong contributor. The choice of health care stocks helped the Fund. Pharmaceutical company Novo-Nordisk A/S advanced as it delivered strong quarterly sales and raised its annual profit forecast.
Investments in energy and materials also helped the Fund. Energy stocks, particularly in the oil services area, made a large contribution to relative results. Shares of Halliburton Co. benefited from increased spending on energy infrastructure. Among materials stocks, the top contributors were Cliffs Natural Resources Inc. and LG Chem Ltd., which was partly supported by sustained demand for rechargeable batteries.
While Isuzu Motors Ltd. was the top contributor overall, supported by its strong presence in emerging markets, the Fund trimmed shares amid concerns about its valuation. Consumer discretionary stocks as a whole weighed on relative returns as DreamWorks Animation SKG Inc. (“DreamWorks”) declined significantly. Strayer
Education Inc. and other for profit education stocks were hurt by a report from the U.S. Department of Education that could limit federal funding. Several consumer staples companies also weighed on the Fund, including Imperial Tobacco Group Plc and General Mills Inc.
The selection of financials was the largest detractor to Fund returns as the sovereign debt crisis engulfed Europe, although the Fund’s less than benchmark exposure was positive. Shares of major European banks, such as BNP Paribas, fell amid fears about their level of exposure to the most highly indebted countries. In emerging markets, credit tightening measures in China weighed on shares of several large banks, including Industrial & Commercial Bank of China.
Looking to the new year, we see a number of attractive opportunities in technology companies, which should benefit from increased business investment. We believe consumer spending will also increase as personal income rises, boosting prospects for consumer related companies. With this in mind, we have added investments in a number of consumer related companies to the Fund in recent months.
JNL/Capital Guardian U.S. Growth Equity Fund
Sector Weightings*:
Information Technology | 25.7 | % | ||
Consumer Discretionary | 15.5 | |||
Energy | 12.1 | |||
Health Care | 11.8 | |||
Consumer Staples | 6.8 | |||
Materials | 6.3 | |||
Industrials | 6.3 | |||
Financials | 5.2 | |||
Telecommunication Services | 1.9 | |||
Short Term Investments | 8.4 | |||
Total Investments | 100.0 | % | ||
*Total Investments at December 31, 2010
Portfolio Manager Commentary: For the year ended December 31, 2010, the JNL/Capital Guardian U.S. Growth Equity Fund underperformed its benchmark by posting a return of 12.67% compared to 16.71% for the Russell 1000® Growth Index.
Several consumer discretionary stocks hurt returns. DreamWorks, a new position and the largest buy for the Fund in 2010, declined significantly. We remain confident in the company
because it is one of the few independent studios that has consistently produced strong titles.
Stock selection among financials was a negative factor, with Charles Schwab Corp. and Gold-man Sachs among the largest detractors. Stock selection and an underweight position in industrials hampered results, as did stock selection in materials. Vulcan Materials Co. declined as construction spending has taken longer to recover than had been anticipated.
On the positive side, energy stocks were among the largest contributors. An emphasis on equipment and services companies helped results, with shares of Schlumberger and Weatherford International Ltd. climbing by nearly a third. Both of those positions were added to during the year. Independent oil and gas producer Anadarko Petroleum Corp. rose with news of additional oil and natural gas discoveries, the growing view that its liability in the Gulf of Mexico spill would be limited.
Stock selection among information technology companies helped results. The sector saw a large divergence in the results of its constituents,
and avoiding most of the disappointments was a positive factor. Broadcom Corp. provided record earnings thanks to strong demand for its chips for mobile devices. Because of its mix of customers, shares of Juniper rose — but shares of competitor Cisco Systems Inc. declined after it predicted weaker revenue growth. The Fund’s position in Visa Inc. also fell after the Fed proposed a cap on fees banks can charge for debit card transactions and considered giving merchants other options to process transactions.
The largest sells during the year were DaVita Inc. (“DaVita”) and Baxter International Inc. (“Baxter”). Both were eliminated from the Fund. DaVita faces an uncertain influence on revenues from health care reform legislation. Baxter was sold on long term concerns about its plasma business.
Although equities appear reasonably valued, markets have risen quickly in a short period of time — so while the Fund reflects optimism over the long term, we believe caution is merited.
 | JNL Capital Guardian Funds (continued) | |
| Capital Guardian Trust Company |
Past performance is not predictive of future performance. Investment return and principal value will fluctuate so that an investor’s shares, when redeemed, may be worth more or less than their original cost. Performance numbers are net of all Fund operating expenses, but do not reflect the deduction of insurance changes.
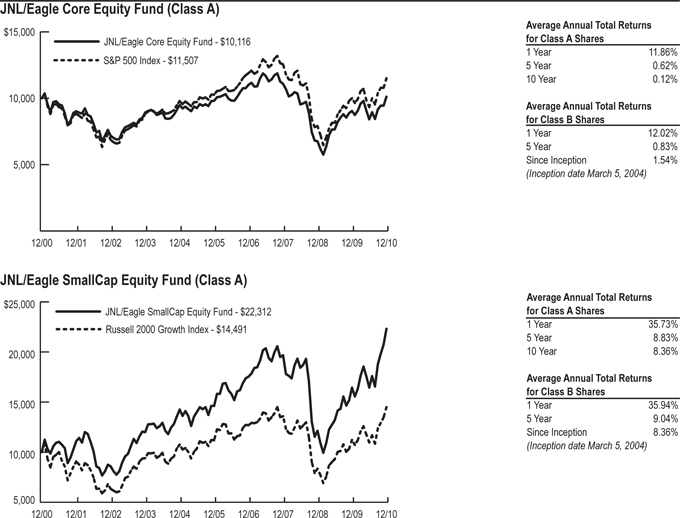
 | JNL Eagle Funds Eagle Asset Management, Inc. |
Market Summary: Major stock market indices posted strong gains during 2010, extending the rally that began in early March 2009 as investors were encouraged by: early signs of expansion later confirmed by broadening strength in economic data that allayed double dip recession concerns; easing worries over eurozone debt contagion; strong corporate earnings; low inflation and interest rates; positive reaction to Republican midterm election gains; and December’s passage of an $858 billion tax bill that extended Bush era tax cuts for all income brackets with an added 2% reduction in Social Security payroll taxes for 2011 . The stock rally was interrupted by periodic selloffs, however. For example, prices fell in January on concerns regarding the reversal of aggressive global central bank and government fiscal
stimulus programs to ward off deeper recessionary pressures. The selloff extended into February on rising default risks of weaker eurozone countries and global economic concerns, but stock prices rebounded as confidence grew that a debt crisis could be averted. From mid April highs, stocks sold off through early July, weighed down by mounting eurozone sovereign debt concerns and global economic recovery prospects, but recovered into August on strong earnings reports. From late August, when U.S. Federal Reserve (“Fed”) Chairman Ben Bernanke signaled a second round of quantitative easing (“QEII”), stock prices rallied through year end. The S&P 500 Index finished the year up 15.06%. The Russell 2000 Growth Index finished a strong year, up 29.09%, with its best quarter at the end of the year.
JNL/Eagle Core Equity Fund
Sector Weightings*:
Information Technology | 24.8 | % | ||
Financials | 16.8 | |||
Health Care | 12.5 | |||
Energy | 11.6 | |||
Consumer Discretionary | 10.4 | |||
Industrials | 8.7 | |||
Consumer Staples | 5.5 | |||
Investment Companies | 3.1 | |||
Telecommunication Services | 1.7 | |||
Short Term Investments | 4.9 | |||
Total Investments | 100.0 | % | ||
*Total Investments at December 31, 2010
Portfolio Manager Commentary: For the year ended December 31, 2010, the JNL/Eagle Core Equity Fund underperformed its benchmark by posting a return of 11.86% for Class A shares compared to 15.06% for the S&P 500 Index.
The Fund’s performance relative to its benchmark was held back by underperforming sectors including: underweighted financials; overweighted consumer discretionary; market weighted energy; underweighted consumer staples; overweighted information technology; and near market weighted telecommunication services. On the other hand, outperforming sectors included:
utilities due to no allocation to this weak market sector; and overweighted health care. Among the Fund’s strong performers were Macy’s Inc. (“Ma-cy’s”), a chain of mid to high range department stores; Apple Inc. (“Apple”), a manufacturer of electronics and computer software; energy corporation, ConocoPhillips; UnitedHealth Group Inc., a health care products and services provider; and QUALCOMM Inc. (“QUALCOMM”), a wireless telecommunications research and development company. Some of the Fund’s biggest detractors to performance were oil and gas company, BP Plc (“BP”); Applied Materials Inc.(“Applied Material”), a capital equipment producer; financial services company, Bank of America Corp. (“Bank of America”); Staples Inc., an office supply chain store; and Cisco Systems Inc., a manufacturer of consumer electronics.
Throughout the last fiscal year the Fund made some changes to its portfolio. The most significant purchases included holdings in Apple, QUALCOMM, Union Pacific Corp., Google Inc. and Intel Corp. The most significant sales included holdings in BP, Applied Materials, Bank of America, Macy’s and EOG Resources Inc. The most significant sector weighting changes came from lowering exposure to health care and consumer
discretionary and increasing exposure to information technology, financials and consumer staples.
With a generally favorable economic backdrop, we expect to show strong relative performance when earnings growth of deep cyclicals moderates, the timing of which is uncertain given the Fed’s extended period of monetary ease due to high unemployment. In addition, emerging markets appear to have accelerated back to previous growth norms and their growth characteristics favor the deepest cyclical businesses. China, in particular, is a wildcard with its economy imbalanced toward investment and exports, the mirror image of most developed countries, which is creating inflation pressures. When its economy slows, we believe the deep cyclicals will experience a sustained decline which we intend to avoid, along with market vulnerability of last year’s momentum driven smaller technology names. In summary, we have the Fund well diversified primarily in very large cap high quality equities where valuations are extremely attractive relative to bonds. We believe the economy will continue to slowly improve, and we remain positioned for economic expansion.
JNL/Eagle SmallCap Equity Fund
Sector Weightings*:
Information Technology | 24.3 | % | ||
Consumer Discretionary | 19.9 | |||
Health Care | 15.3 | |||
Industrials | 13.4 | |||
Energy | 6.8 | |||
Materials | 5.4 | |||
Financials | 4.6 | |||
Consumer Staples | 1.7 | |||
Short Term Investments | 8.6 | |||
Total Investments | 100.0 | % | ||
*Total Investments at December 31, 2010
Portfolio Manager Commentary: For the year ended December 31, 2010, the JNL/Eagle SmallCap Equity Fund outperformed its benchmark by posting a return of 35.73% for Class A shares compared to 29.09% for the Russell 2000 Growth Index.
The Fund had very strong absolute and relative returns, finishing ahead of its benchmark in
energy, consumer discretionary, information technology and materials. The top three stocks for the year were Rovi Corp., Riverbed Technology Inc. and TIBCO Software Inc. While the Fund had positive absolute returns across all sectors, financials and industrials were the Fund’s most significant underperforming sectors on a relative basis. The worst performing stocks during the year were FormFactor Inc., Compellent Technologies Inc. and Genoptix Inc.
The most significant sector weighting changes came from lowering exposure to health care (through the takeout of Psychiatric Solutions Inc. and sells of Eclipsys Corp., Amedisys Inc. and Lincare Holdings Inc.) and increasing exposure to consumer discretionary (through purchases of Gentex Corp., Steven Madden Ltd., Pinnacle Entertainment Inc. and Buffalo Wild Wings Inc.).
Small cap equities continued the sharp rally that began in late August broadly reflecting a surge in takeover activity; a rebound from overly
pessimistic sentiment earlier in the year; and a capitulation by the Obama administration on effective tax increases. Notably, the rally seemingly began following the Fed announcement of a second round of QEII. We believe the positive benefit to the stock market was an intended consequence of the Fed’s decision. With interest rates already so low, the Fed must believe pushing people out on the risk curve and bringing money back into the equity markets is the only way to improve consumer net worth and confidence.
Corporate America remains flush with cash; the bar for economic growth has been reset at lower levels; and investor sentiment remains generally pessimistic. With that said, given the strength of the rally, a short term correction, particularly in small caps would not surprise us. However, we believe most major indices should show solid gains for the full year.
 | JNL Eagle Funds (continued) Eagle Asset Management, Inc. |
Past performance is not predictive of future performance. Investment return and principal value will fluctuate so that an investor’s shares, when redeemed, may be worth more or less than their original cost. Performance numbers are net of all Fund operating expenses, but do not reflect the deduction of insurance changes.
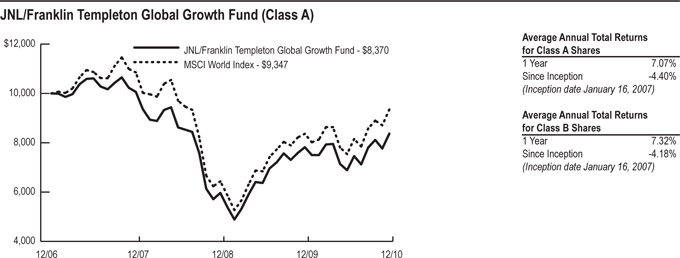
 | JNL Franklin Templeton Funds Templeton Global Advisors Limited |
Market Summary: The year under review was characterized by an uneven global economic recovery. Emerging markets led growth, as they were generally unconstrained by the debt overhang burdening western economies and benefited from strong intrinsic demand and significant capital inflows. Developed markets grew at a more subdued pace, underpinned by government sponsored liquidity enhancing measures. U.S. stocks rose as growth exceeded expectations, while European region stocks underperformed where sovereign debt concerns and austerity programs pressured the economic recovery.
Global equity markets responded favorably to signs of economic recovery. Commodities surged due to near term supply constraints and emerging market demand increases, as well as longer term fears that overly accommodative
monetary policies would ultimately have negative inflationary consequences. The U.S. dollar strengthened relative to the euro but weakened against the Japanese yen. In general, cyclical sectors performed better than traditionally defensive sectors. Health care performed poorly during a period when European governments undertaking fiscal austerity measures considered reducing pharmaceutical industry reimbursements and U.S. politicians debated sweeping health care reforms. Financials underperformed the MSCI World Index, pressured by European sovereign debt risk, capital adequacy concerns and regulatory tightening. Media benefited from rising demand for high speed internet and shifting brand management strategies and an improving advertising cycle. Auto manufacturers rallied due to rising international car demand.
JNL/Franklin Templeton Global Growth Fund
| Sector Weightings*: | ||||
Information Technology | 16.4 | % | ||
Consumer Discretionary | 16.2 | |||
Health Care | 14.7 | |||
Financials | 13.5 | |||
Industrials | 10.7 | |||
Energy | 9.9 | |||
Telecommunication Services | 6.9 | |||
Consumer Staples | 2.7 | |||
Materials | 2.0 | |||
Short Term Investments | 7.0 | |||
Total Investments | 100.0 | % | ||
*Total Investments at December 31, 2010
Portfolio Manager Commentary: For the year ended December 31, 2010, the JNL/Franklin Templeton Global Growth Fund underperformed its benchmark by posting a return of 7.07% for Class A shares compared to 11.76% for the MSCI World Index.
From a geographic perspective, the Fund’s Asian position contributed to relative performance, particularly India and South Korea, a country that is not in the MSCI World Index. German and Spanish holdings were also leading
contributors. Sector wise, overweighting in consumer discretionary contributed to relative performance, led by the media and automotive industries. The Fund’s underweighting in financials also added to relative returns.
Key detractors included underweighting and stock selection in the U.S. and overweighting and stock selection in Europe, notably France, Italy and the UK. Overweighting and stock selection in health care hurt relative performance. Stock selection in energy and materials also detracted.
Major contributors included U.S. cable operators, Comcast Corp. and Time Warner Inc., and content providers, Viacom Inc. and Walt Disney Co. Germany’s Bayerisch Moteren Werke AG and South Korea’s Hyundai Motor Co. performed well. U.S. software manufacturer Oracle Corp. was among the Fund’s leading contributors, but software giant Microsoft Corp. and networking solutions provider Cisco Systems Inc. lost value.
Among key detractors was French pharmaceuticals manufacturer Sanofi-Aventis SA (“Sanofi-Aventis”), which lagged as investors focused on impending patent expirations and the company’s hostile bid for Genzyme Corp. BP Plc,
the British energy producer at the center of the Gulf of Mexico oil spill, also hindered returns.
Among our significant purchases were shares of Sanofi-Aventis, Baker Hughes Inc., Bank of America Corp., Halliburton Co. and CVS Caremark Corp. Significant sales included shares of Oracle Corp., El Paso Corp., Accor SA and Harley-Davidson Inc.
The Fund made few major changes to sector weightings during the year. Financials and consumer staples rose slightly and health care declined.
At year end, we remain favorable toward the Fund’s holdings in Europe, in our view the world’s cheapest major equity region offering fundamentally strong corporate entities with globally diversified revenues. We also remain positive toward health care in general, which we see as the world’s cheapest sector, despite strengthening corporate fundamentals, significant restructuring potential and advantageous global demographics. In our view, however, materials’ current valuations leave little room for continued outperformance over the Fund’s long term investment horizon.
Past performance is not predictive of future performance. Investment return and principal value will fluctuate so that an investor’s shares, when redeemed, may be worth more or less than their original cost. Performance numbers are net of all Fund operating expenses, but do not reflect the deduction of insurance changes.
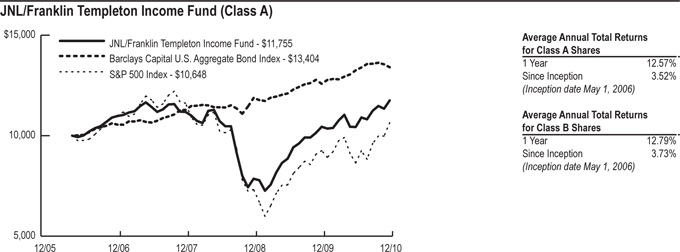
 | JNL Franklin Templeton Funds Franklin Advisers, Inc. |
Market Summary: During the year ended December 31, 2010, the U.S. economy advanced unevenly. Domestic equity markets fluctuated as investor confidence shifted with each release of encouraging or discouraging economic, regulatory and political news. Ultimately, stock markets made solid gains for the year. Fixed income markets experienced market volatility similar to that of equity markets as concerns about weak economic data
and potential spillover effects of the European debt crisis affected investor sentiment. U.S. Treasury prices rose as yields fell to very low levels during the year. In addition, healthy equity market performance and an improving economic outlook supported the high yield corporate bond market, which also produced solid results for the year.
JNL/Franklin Templeton Income Fund
Sector Weightings*:
Financials | 17.1 | % | ||
Energy | 15.7 | |||
Utilities | 11.6 | |||
Health Care | 9.3 | |||
Information Technology | 7.3 | |||
Consumer Discretionary | 5.8 | |||
Telecommunication Services | 3.6 | |||
Industrials | 3.6 | |||
Materials | 3.4 | |||
Consumer Staples | 1.3 | |||
Non-U.S. Government Agency | ||||
Asset-Backed Securities | 0.6 | |||
Government Securities | 0.5 | |||
Warrants | 0.0 | |||
Short Term Investments | 20.2 | |||
Total Investments | 100.0 | % | ||
*Total Investments at December 31, 2010
Portfolio Manager Commentary: For the year ended December 31, 2010, the JNL/Franklin Templeton Income Fund underperformed one of its benchmarks by posting a return of 12.57% for Class A shares compared to 15.06% for the S&P 500 Index. The Fund outperformed its other benchmark, the Barclays Capital U.S. Aggregate Bond Index, which returned 6.54%.
In the equity portfolio of the Fund, energy, utilities and financials were among significant contributors to Fund performance, while consumer discretionary hindered results.
Energy contributors included ConocoPhillips and Exxon Mobil Corp. (“Exxon”). In financials, Citigroup Inc., iStar Financial Inc. and Wells Fargo & Co. helped results. In utilities, Southern Co. performed well. Dex One Corp., in consumer discretionary, was a significant detractor from performance.
In energy, the Fund added to positions in integrated oil company Exxon and independent oil and gas producers Chesapeake Energy Corp. and SandRidge Energy Inc. The Fund initiated positions in integrated UK oil holding BP Plc and oilfield services companies Schlumberger Ltd. and Baker Hughes Inc. New health care positions were Pfizer Inc. and Swiss company Roche Holding AG. The Fund increased telecommunication services’ international exposure by adding to an existing position in UK company Vodafone Group Plc and initiating a position in Australian company Telstra Corp. Ltd. Sales included Capital One Financial Corp., Ameren Corp. and Devon Energy Corp.
The Fund increased exposure to several sectors
during the year, with some of the largest increases to energy, health care and telecommunication services. The Fund reduced exposure to financials and utilities.
In the fixed income portfolio of the Fund, generally, corporate bonds of finance, technology and energy companies were major contributors, while electric utilities detracted from performance.
Within financials, the Fund significantly increased exposure to second lien secured bonds from bank holding company CIT Group Inc. Within information technology, the Fund added investments across electronic payment company First Data Corp.’s capital structure by purchasing senior secured, senior unsecured and senior subordinated notes.
The Fund reduced holdings in energy, communications, consumer non cyclical and consumer cyclical and increased holdings in financials and technology.
We continue to stay focused on opportunities across the capital structure to help maximize income while maintaining prospects for long term capital appreciation from a wide range of securities including fixed income, equity and convertible securities.
Past performance is not predictive of future performance. Investment return and principal value will fluctuate so that an investor’s shares, when redeemed, may be worth more or less than their original cost. Performance numbers are net of all Fund operating expenses, but do not reflect the deduction of insurance changes.
 | JNL Franklin Templeton Funds Franklin Templeton Institutional, LLC |
Market Summary: The year under review was characterized by an uneven global economic recovery. Emerging market regions primarily led growth, as they were generally unconstrained by the debt overhang burdening western economies and benefited from strong intrinsic demand and significant capital inflows. Developed economies grew at a more subdued pace, with demand recovery and asset price reflation heavily underpinned by government sponsored liquidity enhancing measures.
Global equity markets responded favorably to signs of economic recovery with solid gains. Commodities surged due to near term supply constraints and emerging market demand increases, as well as longer term
fears that overly accommodative monetary policies would ultimately have negative inflationary consequences. The dollar strengthened relative to the euro, which declined as a result of the region’s fiscal crisis, but weakened against the Japanese yen, which hit multi decade highs amid persistent deflationary pressures. Meanwhile U.S. Treasuries and corporate bonds finished the year with gains despite Treasury price declines late in the year. However, critical economic fundamentals such as employment, home prices and credit creation remained substantially depressed at year end, leading many investors to question the true health of the global economy and the sustainability of the recovery.
JNL/Franklin Templeton International Small Cap Growth Fund (formerly, JNL/Capital Guardian International Small Cap Fund)
Sector Weightings*:
Industrials | 26.3 | % | ||
Consumer Discretionary | 21.7 | |||
Financials | 20.9 | |||
Consumer Staples | 8.4 | |||
Information Technology | 6.9 | |||
Health Care | 2.5 | |||
Short Term Investments | 13.3 | |||
Total Investments | 100.0 | % | ||
*Total Investments at December 31, 2010 |
| |||
Portfolio Manager Commentary: For the year ended December 31, 2010, the JNL/Franklin Templeton International Small Cap Growth Fund underperformed its benchmark by posting a return of 20.55% compared to 22.04% for the MSCI EAFE Small Cap Index.
For the period January 1, 2010 through May 2, 2010, the Fund was sub-advised by Capital Guardian Trust Company. During that time, the Fund underperformed its benchmark by posting a return of 2.92% for Class A shares compared to 6.55% for the MSCI EAFE Small Cap Index.
Franklin Templeton Institutional, LLC replaced Capital Guardian Trust Company as the Fund’s subadviser on May 3, 2010. Since Franklin Templeton Institutional, LLC took over investment responsibilities through the end of 2010, the Fund outperformed its benchmark by posting a return of 17.13% for Class A shares compared to 14.54% for the MSCI EAFE Small Cap Index.
For the period January 1, 2010 to May 2, 2010, the primary factors that influenced the Fund’s performance relative to its benchmark were the following:
The Fund’s selection of consumer related stocks hurt relative results as they pulled back after posting sharp gains in the prior quarter. Shares of Australian electronics retailer JB Hi-Fi Ltd. came under pressure after its CEO of 10 years unexpectedly stepped down, even as the company posted strong interim profits. Two Korean firms also weighed on the Fund: Hite Brewery Co. Ltd. (“Hite”) and Hankook Tire Co. Ltd. (“Han-kook”). Hite separated from a larger holding company and the brewery operation now consumes a great deal of working capital, leaving less cashflow
available to trim its debt burden. Shares of Hankook declined amid a strong Korean won and higher natural rubber prices. Elsewhere, the selection of energy stocks that had risen sharply in previous quarters detracted from returns, including SMA Solar Technology SA and Flex LNG Ltd. The Fund’s cash position was also a drag in a rising market. Within information technology, key detractors included Wacom Co. Ltd., Kontron AG and Daiichi Seiko Co. Ltd.
Stock selection in health care was the largest contributor, primarily due to Japanese medical device makers MANI Inc. and Sysmex Corp. During this period, the Fund managers believed companies in Japan continued to have a jump on Asian competitors in this area by combining various components of technology and science to produce high quality medical devices. Within financials, stock selection positively contributed also due to Japanese companies, including Aozora Bank Ltd. and Credit Saison Co. Ltd. Relative results were additionally helped by the less than index exposure to financials, one of the weaker sectors for the period.
In materials, Labrador Iron Ore Royalty benefited from higher iron ore prices and strong production and sales volume in the fourth quarter of 2009. The company is an established iron ore producer in North America and its unique structure provides investors with significant leverage to the iron ore market with comparatively low risk. Meanwhile, Iluka Resources Ltd. was another big gainer in the sector.
For the period May 3, 2010 to December 31, 2010, the primary factors that influenced the Fund’s performance relative to its benchmark were the following:
Stock selection in finance, commercial services and consumer services contributed to relative performance. Stock selection and overweighting in retail trade and stock selection and underweighting in process industries detracted from performance.
From a geographic perspective, stock selection in Asia Pacific (ex-Japan) and stock selection and overweighting in the UK helped performance, while stock selection in Europe and Japan hurt performance.
Significant individual Fund contributors included ARA Asset Management Ltd. (“ARA”), a real estate fund management company; Experian Plc, a global credit reporting agency; and Lancashire Holdings Ltd., an insurance provider. Major detractors included Daibiru Corp., a real estate property company; RHJ International (“RHJ”), a private equity firm; and Carpetright Plc, a flooring retailer.
Major Fund purchases included McBride Plc, QinetiQ Group Plc, RHJ and Jumbo SA. By year end, the Fund sold some shares of ARA and eliminated positions in Symrise AG, CTS Eventim AG, Wirecard AG, Kuehne & Nagel International AG and SKY Perfect JSAT Holdings Inc.
By sector, the Fund initiated exposure to distribution services and increased weightings in producer manufacturing, consumer nondurables, electronic technology and consumer durables. The Fund decreased weightings in commercial services, finance, retail trade, consumer services, process industries and transportation
Geographically, the Fund initiated a small position in emerging markets and increased its UK weighting. The Fund decreased weightings in Europe, Japan, North America and Asia Pacific (ex-Japan).
During the period, the U.S. dollar depreciated against most foreign currencies, which also helped the Fund’s performance because investments in securities with non U.S. currency exposure gained value as the U.S. dollar fell. However, one cannot expect the same result in future periods.
At year end, we continue to see opportunities specifically in Europe as we believe this region has some of the most attractive valuations globally. From a sector basis we are finding opportunities in consumer staples and industrials.
 | JNL Franklin Templeton Funds (continued) Franklin Templeton Institutional, LLC |
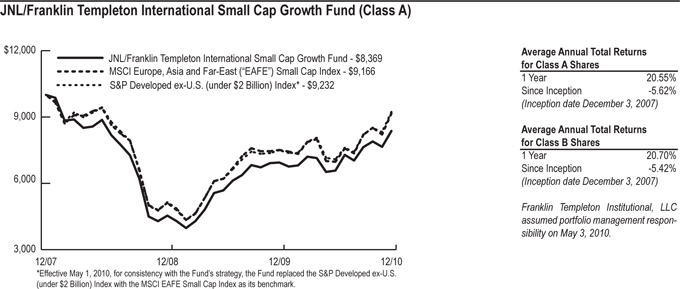
Past performance is not predictive of future performance. Investment return and principal value will fluctuate so that an investor’s shares, when redeemed, may be worth more or less than their original cost. Performance numbers are net of all Fund operating expenses, but do not reflect the deduction of insurance changes.
 | JNL Franklin Templeton Funds Franklin Mutual Advisers, LLC |
Market Summary: The year under review was characterized by an uneven global economic recovery. Emerging market regions primarily led growth, as they were generally unconstrained by the debt overhang burdening western economies and benefited from strong intrinsic demand and significant capital inflows. Developed economies grew at a more subdued pace, with demand recovery and asset price reflation heavily underpinned by government sponsored liquidity enhancing measures.
Global equity markets responded favorably to signs of economic recovery with solid gains. Commodities surged due to near term supply constraints and emerging market demand increases, as well as longer term
fears that overly accommodative monetary policies would ultimately have negative inflationary consequences. The dollar strengthened relative to the euro, which declined as a result of the region’s fiscal crisis, but weakened against the Japanese yen, which hit multi-decade highs amid persistent deflationary pressures. Meanwhile U.S. Treasuries and corporate bonds finished the year with gains despite Treasury price declines late in the year. However, critical economic fundamentals such as employment, home prices and credit creation remained substantially depressed at year end, leading many investors to question the true health of the global economy and the sustainability of the recovery.
JNL/Franklin Templeton Mutual Shares Fund
Sector Weightings*:
Consumer Staples | 22.2 | % | ||
Financials | 14.2 | |||
Health Care | 10.6 | |||
Information Technology | 9.9 | |||
Consumer Discretionary | 7.7 | |||
Energy | 7.2 | |||
Materials | 5.0 | |||
Industrials | 4.0 | |||
Utilities | 3.9 | |||
Telecommunication Services | 3.2 | |||
Other Equity Interests | 0.0 | |||
Short Term Investments | 12.1 | |||
Total Investments | 100.0 | % | ||
*Total Investments at December 31, 2010 |
| |||
Portfolio Manager Commentary: For the year ended December 31, 2010, the JNL/Franklin Templeton Mutual Shares Fund underperformed its benchmark by posting a return of 11.45% for Class A shares compared to 15.06% for the S&P 500 Index.
During the year, the Fund held currency forwards
to somewhat hedge the currency risk of the Fund’s non-U.S. dollar investments; the hedges aided the Fund’s performance.
Many Fund investments increased in value. Significant contributors to performance included UK based British American Tobacco, U.S. tobacco company Altria Group Inc. and Germany’s Volkswagen AG.
Some of the Fund’s investments, however, lost value during 2010. Detractors from Fund performance included Swiss incorporated deepwater drilling contractor Transocean Inc., German utility conglomerate E.ON AG and U.S. based Bank of America Corp.
Throughout 2010 we moved capital from positions that reached what we considered fair value to new, undervalued opportunities. We found opportunities in pharmaceutical firms Pfizer Inc. and Eli Lilly & Co. We also found some European telecommunications firms attractively valued. The Fund sold shares in Berkshire Hathaway Inc., Siemens AG and Dell Inc.
Equities remained the core of the Fund,
with sector weights remaining fairly consistent. The largest weight change was an increase in health care exposure. The Fund’s cash position decreased somewhat. Merger and acquisition (“M&A”) activity picked up, but merger arbitrage opportunities were often disappointing, and our weight in M&A investments remained moderate. Distressed debt in 2010 brought few new opportunities. The Fund’s investments in credit often performed well, but overall our exposure to credit declined as the market rallied.
We are optimistic about the M&A space in 2011, due to ongoing economic and market strength, combined with continuing accumulation of cash on corporate balance sheets and strong corporate earnings. In the distressed debt arena, we believe many leveraged buyouts from 2005 to 2007 appear to have unsustainable capital structures. We approach 2011 with our share of concerns; however, such challenges can help create company specific opportunities for the Fund.
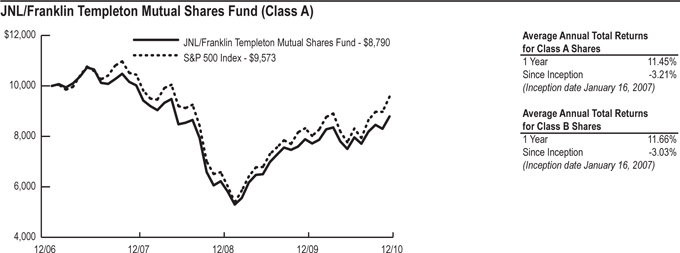
Past performance is not predictive of future performance. Investment return and principal value will fluctuate so that an investor’s shares, when redeemed, may be worth more or less than their original cost. Performance numbers are net of all Fund operating expenses, but do not reflect the deduction of insurance changes.
 | JNLFranklin Templeton Funds Franklin Advisory Services, LLC |
Market Summary: During the year ended December 31, 2010, domestic equity markets fluctuated as investor confidence shifted with each release of encouraging or discouraging economic, regulatory and political news. Ultimately, stock markets made solid gains for the year. Among small cap
stocks, growth outpaced value as investor risk aversion began to subside. As represented by the Russell 2500 Value Index, energy, materials and industrials outperformed, while telecommunication services, utilities and information technology underperformed.
JNL/Franklin Templeton Small Cap Value Fund
Sector Weightings*:
Industrials | 28.3 | % | ||
Consumer Discretionary | 17.6 | |||
Financials | 13.0 | |||
Energy | 11.5 | |||
Materials | 7.4 | |||
Health Care | 4.5 | |||
Information Technology | 3.3 | |||
Utilities | 2.7 | |||
Consumer Staples | 1.6 | |||
Short Term Investments | 10.1 | |||
Total Investments | 100.0 | % | ||
*Total Investments at December 31, 2010 |
| |||
Portfolio Manager Commentary: For the year ended December 31, 2010, the JNL/Franklin Templeton Small Cap Value Fund outperformed its benchmark by posting a return of 26.84% for Class A shares compared with 24.82% for the Russell 2500TM Value Index.
During the year, all sectors represented in the Fund helped performance, with industrials and
consumer discretionary among the most significant contributors. Other major contributors were financials, materials and energy. Individual holdings that boosted performance were industrials holdings Wabash National Corp., Nordson Corp., Trinity Industries Inc. and Gardner Denver Inc. In consumer discretionary, Autoliv Inc., Gentex Corp. and Group 1 Automotive Inc. helped results. Other contributors included Protective Life Corp., Westlake Chemical Corp. and Rowan Cos. Inc.
Individual detractors from performance included industrials holdings, Gibraltar Industries Inc. and Granite Construction Inc. (“Granite Construction”). Financials holding American National Insurance Co., energy holding Overseas Shipholding Group Inc. and information technology holding Benchmark Electronics Inc. (“Benchmark Electronics”) also hindered results.
Significant purchases during the year included new positions in Granite Construction, Lancaster Colony Corp., PNM Resources Inc. and Tower
Group Inc. Other significant purchases included adding to holdings in Benchmark Electronics, Bristow Group Inc., Regis Corp. and Tidewater Inc. Sales during the year included eliminating positions in Airgas Inc., Gerdau AmeriSteel Corp. and Gymboree Corp. Other major sales included reducing holdings in Erie Indemnity Co., Ethan Allen Interiors Inc. and Westlake Chemical Corp.
We will continue to invest in small cap companies that we believe are selling below their underlying worth. Our strategy is to buy and hold fundamentally sound companies for five years or more on average. We purchase securities at what we consider attractive prices, often when they are out of favor with other investors. We select securities without regard to benchmark comparisons, and we aim for long term results. We are confident that over time the market will provide opportunities for us to execute our strategy with success.
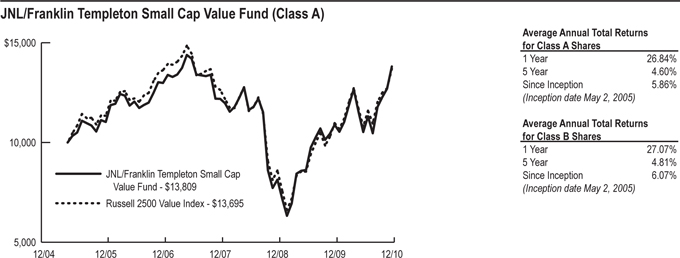
Past performance is not predictive of future performance. Investment return and principal value will fluctuate so that an investor’s shares, when redeemed, may be worth more or less than their original cost. Performance numbers are net of all Fund operating expenses, but do not reflect the deduction of insurance changes.
 | JNL Goldman Sachs Funds Goldman Sachs Asset Management, L.P. |
Market Summary: For the year, cyclical stocks led returns, as investors focused on the strong growth and demand from outside the developed markets. As a result, consumer discretionary (particularly auto stocks), industrials and materials outperformed. During 2010, the U.S. equity market significantly outperformed the MSCI World Index return of 11.76% , as investors gained confidence in the economic recovery. The Russell 1000 Value Index returned 15.51% during 2010, while the Russell Midcap Value Index returned 24.75% in 2010. Mergers and acquisitions helped boost the market, especially in the mid and small cap spaces. The year was marked by a challenging stock picking environment, as there was a high correlation among stock returns, with relatively small differences between winners and losers. The market was predominantly driven by macro concerns, with 2010 peak correlation among stocks at 82% above the long term average. Particularly in the value space, regulatory uncertainty was most pronounced, comprising over half of the benchmark (healthcare, financials and energy). Additional headwinds included higher yielding stocks meaningfully outperforming despite slower earnings growth and sometimes weaker fundamentals, a phenomenon that was also very prominent in the value space.
The global economy appears to have regained momentum after a mid-year slowdown that raised concerns about a double dip recession. All spread sectors outperformed Treasuries over the fiscal year. The largest outperforming sectors were commercial mortgage-backed securities (“CMBS”) and high yield bonds posting 15.0% and 9.7% in excess returns, respectively. Treasury yields ended 2010 lower on the year, driven by concerns
in the middle of the year about the global recovery and persistent fears of contagion from peripheral Europe. The two-year Treasury decreased 55 basis points (“bps”) to 0.59% and the 10-year Treasury decreased 55 bps to 3.29%. Short-term rates remained anchored by the U.S. Federal Reserve Board (the “Fed”) who reiterated its commitment to an extended period of low rates.
Local emerging debt posted a small negative return in the fourth quarter of 2010. The JPMorgan Government Bond Index-Emerging (“GBI-EM”) Markets Global Diversified Index (unhedged, in US dollars) returned -0.39% in the fourth quarter of 2010, including returns of -0.90% from interest rates and 0.51% from currency appreciation versus the U.S. dollar. The U.S. Dollar Index (“DXY”), an indicator of the general international value of the dollar, rose 0.39% and emerging market currencies on JPMorgan’s Emerging Local Markets Plus Index benchmark posted a positive return of 0.4%. On a market value weighted basis, South Africa (+6.26%), Brazil (+4.24%) and Russia (+0.81%) performed best, while Hungary (-5.47%), Turkey (-2.70%) and Colombia (-5.46%) underperformed. The South African rand appreciated on a combination of thin trading, a gold rally in the last week of 2010, and news that the country may be formally invited to join the annual meeting of the Brazil, Russia, India and China (“BRIC”) leaders in 2011. This performance may be at risk, however, from recent inflation prints suggesting possible further rate cuts. Meanwhile, Hungary underperformed on currency depreciation (the Hungarian forint shed 2.4% against the U.S. dollar) as well as peripheral eurozone sovereign risk.
JNL/Goldman Sachs Core Plus Bond Fund
Sector Weightings*:
U.S. Government Agency | ||||
Mortgage-Backed Securities | 33.4 | % | ||
Financials | 13.6 | |||
Non-U.S. Government Agency | ||||
Asset-Backed Securities | 9.4 | |||
Government Securities | 8.5 | |||
Energy | 1.8 | |||
Consumer Discretionary | 0.9 | |||
Consumer Staples | 0.8 | |||
Materials | 0.7 | |||
Telecommunication Services | 0.7 | |||
Health Care | 0.6 | |||
Utilities | 0.4 | |||
Industrials | 0.2 | |||
Information Technology | 0.1 | |||
Short Term Investments | 28.9 | |||
Total Investments | 100.0 | % | ||
*Total Investments at December 31, 2010
Portfolio Manager Commentary: For the year ended December 31, 2010, the JNL/Gold-man Sachs Core Plus Bond Fund outperformed its benchmark by posting a return of 7.63% for Class A shares compared to 6.54% for the Barclays Capital U.S. Aggregate Bond Index. The primary factors that influenced the Fund’s relative performance were an allocation to riskier assets such as credit sensitive mortgages and corporate bonds.
Top down strategies contributed to performance in 2010. Duration positioning negatively impacted the Fund’s returns while cross sector positioning positively contributed to performance over the year. The Fund’s duration and yield curve positioning detracted from performance throughout the year. Yields fell for most of the year, reversing in the fourth quarter as 10-year Treasury rates rose 78 bps. Cross sector positioning was a key contributor. The Fund’s strategic and tactical overweight to spread sectors relative to the benchmark was a significant driver of performance. An overweight exposure to credit sensitive mortgages contributed positively to performance as non-agency mortgages posted strong returns in 2010. In addition, an underweight exposure to mortgage-backed securities (“MBS”), primarily during the third quarter, proved beneficial as declining interest rates raised concerns about the potential for a wave of mortgage refinancing.
The Fund’s bottom up security selection also contributed to performance during the year. The securitized and corporate sectors were the primary contributor to the Fund’s performance. Security selection within the collateralized sector was positive, primarily due to the focus on the most senior tranches of option adjustablerate mortgages (“ARM’s”) and Alt-A collateral. The Fund’s focus on lower quality investment grade corporate
bonds also contributed to returns. Security selection within government/agencies as well as emerging market debt also contributed to excess returns over the year.
Derivatives are an integral part in the management of the mandate and therefore contributed to performance over the year. Derivatives allow the Fund to manage interest rate, credit and currency risks more effectively by allowing the Fund both to hedge and to apply active investment views with greater versatility and to afford greater risk management precision.
We anticipate moderate global growth in 2011, with continued improvement in the U.S. Our concerns are focused on the extent of the sell off in U.S. rates and the volume of short euro positions in the marketplace. Within the mortgage sector, we are increasing our overweight bias to agency MBS as valuations cheapened on rising government yields and volatility levels. We still hold a constructive view on non-agency MBS and we believe that valuations are generally attractive. Within the corporate sector, we continue to anticipate a period of slow growth and low inflation, conditions we consider positive for investment grade credit. We are overweight financials and focusing on large property and causality insurers and banks. Within banking, we are focusing on large money center banks.
 | JNL Goldman Sachs Funds (continued) Goldman Sachs Asset Management, L.P.
|
JNL/Goldman Sachs Emerging Markets Debt Fund
Sector Weightings*:
Sovereign Securities | 59.1 | % | ||
Financials | 7.0 | |||
U.S. Government Securities | 1.8 | |||
Energy | 1.1 | |||
Short Term Investments | 31.0 | |||
Total Investments | 100.0 | % | ||
*Total Investments at December 31, 2010
Portfolio Manager Commentary: For the year ended December 31, 2010, the JNL/Goldman Sachs Emerging Markets Debt Fund outperformed its benchmark by posting a return of 16.07% for Class A shares compared to 15.67% for the JPMorgan GBI-EM Global Diversified Index.
The Fund held derivatives during the year. The Fund does not employ derivatives to gain leverage but to gain access to otherwise inaccessible markets or for tax efficiency purposes.
The use of derivatives allow the Fund to manage interest rate, credit and currency risks more effectively by allowing to both hedge and apply active investment views with greater versatility. They also afford greater risk management precision. Derivatives allow the Fund to efficiently access desired markets, hedge unwanted risks and generally manage the spectrum of portfolio risks. Currency forwards are employed to gain currency exposure or hedge non base currency exposures back to base currency. Interest rate swaps and total return swaps may be employed to hedge risk and/or gain exposure to illiquid or high transaction cost local markets.
Credit linked notes are used to gain local market exposure to otherwise inaccessible cash markets. The Fund uses them as they are the most liquid and cost effective means of managing portfolio risk or gaining local market exposure as part of our security selection process.
Contributors to performance during the year included the Fund’s overweight to Argentine debt and country and security selection of Colombian local rates. Detractors from performance included country and security selection of Indonesian local rates and currency exposure to the Turkish lira and Thai baht. There were no significant changes to credit quality or weightings during the year.
Local emerging markets have become more liquid in recent years and the investor base has grown and become more diversified. Emerging market economies have undergone structural changes that promote macroeconomic stability and active debt management. As a result, inflows to local debt funds have become consistent and stem from strategic investors. We think that these trends could potentially be durable and are likely to persist in the future.
JNL/Goldman Sachs Mid Cap Value Fund
Sector Weightings*:
Financials | 27.3 | % | ||
Consumer Discretionary | 11.4 | |||
Energy | 10.7 | |||
Utilities | 10.2 | |||
Industrials | 9.0 | |||
Information Technology | 6.4 | |||
Health Care | 5.8 | |||
Materials | 5.1 | |||
Consumer Staples | 4.8 | |||
Telecommunication Services | 3.2 | |||
Short Term Investments | 6.1 | |||
Total Investments | 100.0 | % | ||
*Total Investments at December 31, 2010
Portfolio Manager Commentary: For the year ended December 31, 2010, the JNL/Goldman Sachs Mid Cap Value Fund underperformed its benchmark by posting a return of 24.40% for Class A shares compared to 24.75% for the Russell MidCap Value Index.
Information technology and materials were the two top contributing sectors to performance. In contrast, consumer discretionary and energy were the two largest detractors from performance. The Fund’s holdings in NBTY Inc. and McAfee Inc. were the two top contributors to performance. Holdings in Range Resources Corp. and DISH Network Corp. were the top two detractors from performance. During the year, the Fund initiated a position in Lear Corp. and Equity Residential, whereas positions in Whiting Petroleum Corp. and United States Steel Corp. were eliminated.
We believe there are many reasons to be constructive on the U.S. equity market in 2011. Valuations are compelling on both absolute and relative levels. Companies are exhibiting strong fundamentals, with improving corporate profits and balance sheets. We expect that management teams should be focused on capital redeployment through the forms of mergers and
acquisitions (“M&A”), buybacks and deleveraging of balance sheets, providing further catalysts. Recent government actions have created an environment that is more conducive for businesses to grow. Additionally, we believe that the coming year should be a fertile stock picking environment. The trends that were headwinds for stock picking in 2010 have started to reverse. The market is shifting its focus from the macro to the micro, company specific level, now that valuation and volatility levels have normalized. We expect greater stock level differentiation going forward, especially between high and low quality stocks now trading at comparable valuations; a recent pick up in M&A activity has been contributing to this trend. There has been a reduction of regulatory uncertainty with the passage of financial and health care reform, and with more clarity to be expected on drilling requirements and best practices in energy in 2011.
 | JNL Goldman Sachs Funds (continued) Goldman Sachs Asset Management, L.P.
|
JNL/Goldman Sachs U.S. Equity Flex Fund (formerly, JNL/Credit Suisse Long/Short Fund)
Sector Weightings*:
Financials | 19.9 | % | ||
Information Technology | 19.9 | |||
Consumer Discretionary | 12.7 | |||
Energy | 11.3 | |||
Industrials | 9.7 | |||
Consumer Staples | 8.6 | |||
Health Care | 8.2 | |||
Materials | 3.3 | |||
Utilities | 2.2 | |||
Telecommunication Services | -0.1 | |||
Short Term Investments | 4.3 | |||
Total Investments | 100.0 | % | ||
*Total Investments at December 31, 2010 |
| |||
Portfolio Manager Commentary: For the year ended December 31, 2010, the Fund underperformed its benchmark by posting a return of 8.70% for Class A shares compared to 15.06% for the S&P 500 Index
For the period January 1, 2010 through October 10, 2010, the Fund was sub-advised by Credit Suisse Asset Management, LLC. During that time, the Fund underperformed its benchmark by posting a return of 0.00% for Class A shares compared to 6.13% for the S&P 500 Index.
Goldman Sachs Asset Management, L.P. replaced Credit Suisse Asset Management, LLC as the Fund’s Sub-Adviser on October 11, 2010. Since Goldman Sachs Asset Management, L.P. took over investment responsibilities through the end of 2010, the Fund outperformed its benchmarks by posting a return of 8.70% for Class A shares compared to 8.42% for the S&P 500 Index.
For the period during which the Fund was sub-advised by Credit Suisse Asset Management, LLC, the Fund was based on a quantitative model with multiple signals such as price to equity ratio. These quantitative signals are grouped based on similar characteristics of growth, momentum, etc.,
thus forming a combination of signals known as factors. There are five factors within the Credit Suisse Asset Management, LLC’s Quantitative Equities Model. For the period January 1, 2010 to October 10, 2010, the Fund underperformed despite strong factor performance with four of the five factors posting positive results. Growth continued to perform well, while capital deployment served as the best performing factor for the year. Further outperformance was attributed to value and momentum; profitability was the year’s sole detractor to performance. Despite positive factor performance, quantitative models in particular were challenged by a prolonged period of high correlation and low volatility in 2010. During this period, the opportunity set to find alpha diminished, and transaction costs and risk led to underperformance. The Fund’s U.S. equities model suffered from an environment dominated by macroeconomic news and market movements. As the market oscillated between fears of a double dip recession and potential economic growth, there were less opportunities to identify individual stock outperformance.
Markets rose on a broad level as double dip recessionary fears were alleviated. Fairly robust economic data reports eased investor concerns about lackluster economic growth prospects and propelled stocks higher during the last month of the period. World equity prices were given a further boost once Fed Reserve Chairman Ben Bernanke’s statements following the September 21st Federal Open Market Committee meeting were released. Market participants cheered the Fed’s perceived anti deflationary policy, viewing the Fed’s market sentiment as one which would invite further quantitative easing measures.
For the period October 11, 2010 to December 31, 2010, materials and energy were the two top contributing sectors to performance, whereas telecommunication services and consumer
discretionary were the two largest detractors from performance. The Fund’s holdings in Huntsman Corp. and Newfield Exploration Co. were the two top contributors to performance. Holdings in Sprint Nextel Corp. and Boeing Co. were the top two detractors from performance. During the period, positions were initiated in Teva Pharmaceutical Industries and Schlumberger Ltd. and positions in Amgen Inc. and Hanesbrands Inc. were eliminated.
As the Fund’s current adviser, Goldman Sachs Asset Management, L.P. believes there are many reasons to be constructive on the U.S. equity market in 2011. Valuations are compelling on both absolute and relative levels. Companies are exhibiting strong fundamentals, with improving corporate profits and balance sheets. We expect that management teams should be focused on capital redeployment through the forms of mergers and acquisitions (“M&A”), buybacks and deleveraging of balance sheets, providing further catalysts. Recent government actions have created an environment that is more conducive for businesses to grow. Additionally, we believe that the coming year should be a fertile stock picking environment. The trends that were headwinds for stock picking in 2010 have started to reverse. The market is shifting its focus from the macro to the micro, company specific level, now that valuation and volatility levels have normalized. We expect greater stock level differentiation going forward, especially between high and low quality stocks now trading at comparable valuations; a recent pick up in M&A activity has been contributing to this trend. There has been a reduction of regulatory uncertainty with the passage of financial and health care reform, and with more clarity to be expected on drilling requirements and best practices in energy in 2011.
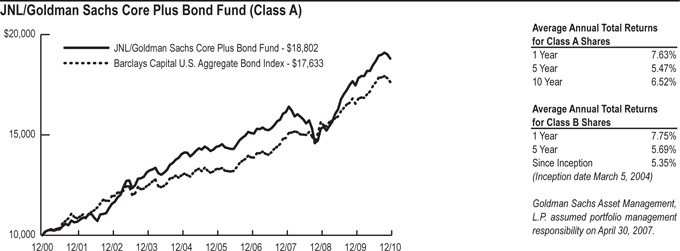
Past performance is not predictive of future performance. Investment return and principal value will fluctuate so that an investor’s shares, when redeemed, may be worth more or less than their original cost. Performance numbers are net of all Fund operating expenses, but not do not reflect the deduction of insurance changes.
 | JNL Goldman Sachs Funds (continued) Goldman Sachs Asset Management, L.P.
|
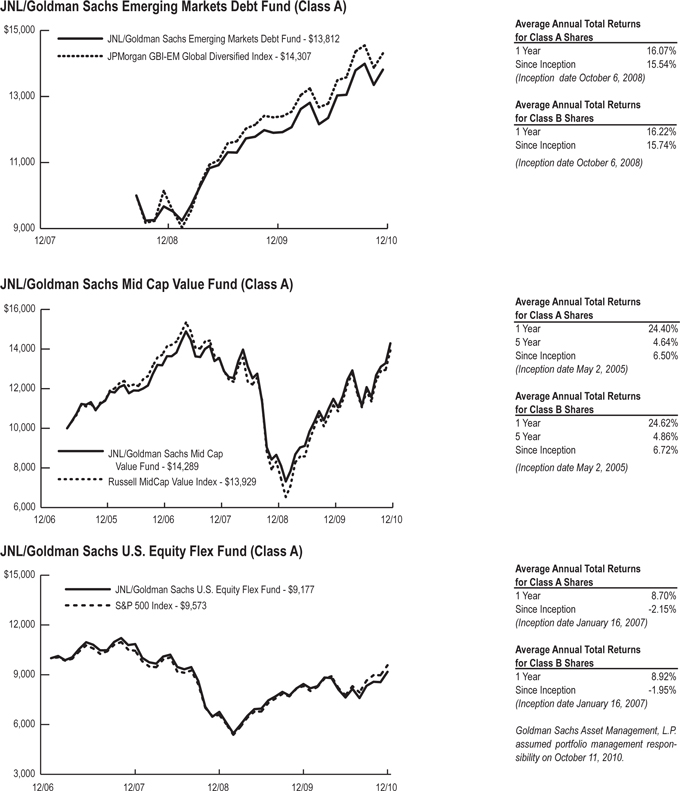
Past performance is not predictive of future performance. Investment return and principal value will fluctuate so that an investor’s shares, when redeemed, may be worth more or less than their original cost. Performance numbers are net of all Fund operating expenses, but not do not reflect the deduction of insurance changes.
 | JNL Invesco Funds Invesco Advisers, Inc.
|
Market Summary: Equity markets were choppy during the fiscal year as investors weighed the competing issues of solid corporate profits and soft macroeconomic data. Corporate earnings were largely positive, but often overshadowed by concerns about high unemployment, a lack of consumer spending, soft housing data and the possibility of additional U.S. Federal Reserve (“Fed”) accommodation. After rising through April, the major equity indices sold off precipitously in May as the sovereign debt crisis unfolded in the eurozone while U.S. economic indicators remained weak, prompting fears of a double dip recession. Uncertainty created by the debt crisis combined with subdued employment, consumer spending and housing data added to concerns that the recovery was slowing to a subnormal growth rate. Just as abruptly, however, the markets reversed course and rallied in September and October on modestly better economic news, ending the year with double digit gains. Returns from listed real estate were universally positive during the year, reflecting the current sentiment toward asset classes and equity sectors capable of delivering attractive yields.
After rallying for much of 2009 on prospects of improving global economic conditions, global equity markets faced headwinds in early 2010.
Notably, several southern European economies, including Greece, Spain, Portugal and Italy, faced solvency concerns amid massive fiscal deficits. But, not all news was bad. Equity markets seemed to shrug off some of the macroeconomic burdens that pulled them into double digit losses in the first half of 2010, ending the year with strong positive gains.
Looking to Asian markets, the message was pretty simple – growth fundamentals remain stronger here than in the West. Although the Funds’ managers see marginal differences in stock valuations, with slight premiums in some areas, they do not believe it is overly concerning. Emerging markets, the biggest winners in 2010, saw exports slow down during the latter half of the period. The deceleration in exports was offset, however, by strong growth in retail and auto sales, as well as strong housing markets within emerging economies. Turning to Europe, the European Central Bank (“ECB”) remained an interesting foil to the Fed, as ECB officials showed little sign they were willing to provide additional economic stimulus. Instead, they seem to be leaving the heavy global economic lifting to the Fed. As a result, we saw the slide in the euro’s value reverse during the first half of 2010.
JNL/Invesco Global Real Estate Fund (formerly, JNL/AIM Global Real Estate Fund)
| Sector Weightings*: | ||||
Financials | 93.5 | % | ||
Consumer Discretionary | 0.7 | |||
Short Term Investments | 5.8 | |||
Total Investments | 100.0 | % | ||
*Total Investments at December 31, 2010 | ||||
Portfolio Manager Commentary: For the year ended December 31, 2010, the JNL/Invesco Global Real Estate Fund underperformed its benchmark by posting a return of 17.15% for Class A shares compared to 20.40% for the FTSE European Public Real Estate Association/National Association of Real Estate Investment Trusts (“EPRA/NAREIT”) Developed Real Estate Index.
The Fund underperformance relative to its benchmark, was primarily the result of security selection within U.S. Real Estate Investment
Trusts (“REIT”). Additionally, security selection and an underweight to real estate securities in Sweden and Germany also negatively impacted the Fund’s relative performance. Holdings in Hong Kong also detracted from relative performance. Conversely, the Fund benefited from security selection in real estate securities in Singapore and the Netherlands. Market allocation to France and Australian Listed Property Trusts (“LPT”) were also relative contributors during the year.
Recent equity offerings and debt refinancing by Simon Property Group Inc. (“Simon Property”), a REIT which offered an attractive portfolio of top tier U.S. regional malls, covered near term debt maturities and provided necessary capital for future acquisition opportunities. Simon Property was among the top contributors to Fund performance
during the year. Conversely, a top detractor to performance included Henderson Land Development Co. Ltd. (“Henderson”), a property development company which experienced lack-luster performance following strong returns during the 2009 calendar year. Henderson focuses on high quality residential and commercial property development in Hong Kong and throughout mainland China.
At the end of the year and relative to the Fund’s benchmark, the Fund was modestly over-weight in Japan, Hong Kong, Netherlands and China. Conversely, the Fund was underweight in the U.S., Singapore and Canada. Additionally, the Fund no longer held exposure to Germany and Belgium, while its benchmark held modest exposure to these countries.
JNL/Invesco International Growth Fund (formerly, JNL/AIM International Growth Fund)
Sector Weightings*:
Consumer Discretionary | 16.9 | % | ||
Health Care | 13.0 | |||
Consumer Staples | 12.5 | |||
Energy | 9.9 | |||
Industrials | 9.6 | |||
Financials | 9.0 | |||
Information Technology | 7.6 | |||
Telecommunication Services | 5.4 | |||
Materials | 2.9 | |||
Utilities | 2.8 | |||
Short Term Investments | 10.4 | |||
Total Investments | 100.0 | % | ||
| *Total Investments at December 31, 2010 | ||||
Portfolio Manager Commentary: For the year ended December 31, 2010, the JNL/Invesco International Growth Fund outperformed its benchmark by posting a return of 12.31% for Class A shares compared to 12.25% for the MSCI EAFE Growth Index.
In this environment, the Fund managers continued to construct the Fund’s portfolio on a bottom up basis, selecting stocks on an individual basis. Meaningful outperformance versus the Fund’s benchmark came from health care, financials and consumer discretionary.
In health care, strong stock selection in the pharmaceuticals industry led to outperformance versus the Fund’s benchmark. Top contributors included Denmark based, leading insulin and diabetes care company Novo-Nordisk A/S, and UK global biopharmaceutical company SHIRE Plc. While in consumer discretionary, particular strength was seen in the media, specialty retail and automobile industries. Top stock level contributors included the world’s largest media company catering to a Spanish speaking audience, Mexican based Grupo Televisa SA, Europe’s leading home improvement retailer, UK based Kingfisher Plc and German auto manufacturer, Bayerische Moteren Werke AG.
In financials, a meaningful underweight exposure
versus the Fund’s benchmark was a key driver of outperformance. The Fund remains underweight to large European banks, investing more in higher quality, locally geared emerging market banks in China and Brazil.
In broad geographic terms, the Fund saw meaningful outperformance in Asia. Exposure in emerging Asian markets including Korea, India, the Philippines and Taiwan was the key driver of relative success in this region as emerging markets saw significant gains during the reporting period.
In contrast, despite delivering double digit gains in materials, the Fund’s continued under-weight exposure was a drag on relative results. The Fund managers question the ability of materials companies to maintain current return levels and are cautious on these companies’ ability to maintain capital discipline. Stock level detractors included French based global insurance giants AXA SA and Australian based QBE Insurance Group Ltd.
 | JNL Invesco Funds (continued) Invesco Advisers, Inc.
|
Stock selection in the Fund was driven by the underlying fundamentals of a company, not any top down macroeconomic views. That being said, the Fund managers belief in the strength of consumer growth outside the U.S. explains the Fund’s overweight exposure to consumer discretionary. Similarly, healthy technology spending over the last several months was supportive of the Fund’s overweight in information technology. The Fund’s overweight exposure in health care came down slightly, however the Fund still remains
overweight in this sector.
The Fund ended the year with the largest underweight positions in materials, industrials and consumer staples. The Fund’s underweight in financials narrowed over the year as the Fund managers added to select positions in the latter half of the year.
Following strong market performance in the second half of 2010, investor sentiment rose to the high end of historic norms supported by low interest rates, ample liquidity and improving global
gross domestic product (“GDP”) outlooks versus this time last year. At the same time, the risks of tighter monetary policy in robust emerging market economies and the lingering sovereign debt situation in Europe mean investors should be prepared for volatility. At the close of the reporting period, the Fund managers remained focused on investing according to their fundamentally driven investment process and maintaining their long term investment view.
JNL/Invesco Large Cap Growth Fund (formerly, JNL/AIM Large Cap Growth Fund)
Sector Weightings*:
Information Technology | 32.3 | % | ||
Consumer Discretionary | 13.5 | |||
Energy | 12.5 | |||
Industrials | 11.3 | |||
Health Care | 9.3 | |||
Materials | 8.7 | |||
Financials | 4.8 | |||
Consumer Staples | 2.6 | |||
Telecommunication Services | 2.2 | |||
Short Term Investments | 2.8 | |||
Total Investments | 100.0 | % | ||
| *Total Investments at December 31, 2010 | ||||
Portfolio Manager Commentary: For the year ended December 31, 2010, the JNL/Invesco Large Cap Growth Fund outperformed its bench-mark by posting a return of 17.41% for Class A shares compared to 16.71% for the Russell 1000 Growth Index.
Over the course of the year, the Fund outperformed by the widest margin in information
technology, largely due to stock selection. The leading contributor to performance was Apple Inc. (“Apple”). Apple continued to benefit from strong consumer demand for its innovative technology products, including the iPad tablet computer as well as a new version of the iPhone. Chinese internet services provider Baidu Inc. was also a key contributor to performance.
The Fund outperformed in industrials driven by stock selection. One of the leading contributors to performance was railroad operator Union Pacific Corp., which continued to benefit from improving volume trends, stronger pricing and operation efficiency.
Outperformance in consumer discretionary was due to stock selection. Two of the leading contributors to performance were clothing retailer Limited Brands Inc. and casino operator Las Vegas Sands Corp. These companies benefited from improving consumer spending trends.
The Fund underperformed by the widest margin in financials, driven by stock selection. Several
holdings detracted from performance, including investment banking holding Goldman Sachs Group Inc. The Fund sold this position due to deteriorating fundamentals.
The Fund also underperformed in materials due to stock selection. One of the weakest performing stocks in this sector was Syngenta AG, a company that produces crop protection products and seeds. The Fund sold this position due to deteriorating fundamentals. Underperformance in the telecommunications sector was due to stock selection and an overweight position.
At the close of the year, the Fund’s largest overweight positions included materials, energy and telecommunications. The largest absolute weight was in information technology. The Fund’s largest underweight positions included consumer staples and industrials. Sector weights are always a result of the Fund managers’ bottom up fundamental analysis.
JNL/Invesco Small Cap Growth Fund (formerly, JNL/AIM Small Cap Growth Fund)
Sector Weightings*:
Information Technology | 26.5 | % | ||
Consumer Discretionary | 16.0 | |||
Industrials | 13.1 | |||
Health Care | 13.1 | |||
Energy | 7.5 | |||
Financials | 5.4 | |||
Materials | 4.0 | |||
Consumer Staples | 1.7 | |||
Telecommunication Services | 1.0 | |||
Utilities | 0.7 | |||
Short Term Investments | 11.0 | |||
Total Investments | 100.0 | % | ||
| *Total Investments at December 31, 2010 | ||||
Portfolio Manager Commentary: For the year ended December 31, 2010, the JNL/Invesco Small Cap Growth Fund underperformed its benchmark by posting a return of 26.21% for Class A shares compared to 29.09% for the Russell 2000 Growth Index.
The Fund underperformed by the widest margin in information technology. Much of the
underperformance was a result of not owning several software and semiconductor stocks that had strong performance.
Underperformance in energy was due to stock selection. Exploration and production holdings Arena Resources Inc. (“Arena Resources”) and Goodrich Petroleum Corp. (“Goodrich Petroleum”) had weak performance given higher exposure to natural gas. While the Fund sold the position in Arena Resources, it continues to own Goodrich Petroleum.
Underperformance in industrials was also due to stock selection in the commercial and professional services industry group. Environmental services provider EnergySolutions Inc. was one of the leading detractors. This holding was sold due to deteriorating fundamentals. Additionally, some of the underperformance resulted from not owning several transportation holdings that had strong performance.
The Fund outperformed by the widest margin in consumer discretionary and health care. Outperformance in consumer discretionary was
driven by stock selection in the retailing and automobile and components industry groups. Key contributors to performance included movie subscription service provider Netflix Inc. (“Netflix”). and automotive components supplier TRW Automotive Holdings Corp. (“TRW”) While the Fund continues to own TRW, Netflix was sold due to concerns about high valuation levels.
Outperformance in health care was driven primarily by stock selection in the pharmaceuticals industry group. Several holdings including Biovail Corp. and OSI Pharmaceuticals Inc. benefited from strong price appreciation following the announcement that they would be acquired. The Fund sold the positions in both stocks, locking in gains for shareholders.
At the close of the year, the largest overweights versus the Fund’s benchmark included energy, semiconductors, banks and consumer services. The largest underweights included pharmaceuticals/ biotechnology/ life sciences; consumer durables and apparel; real estate; and commercial and professional services.
 | JNL Invesco Funds (continued) Invesco Advisers, Inc.
|
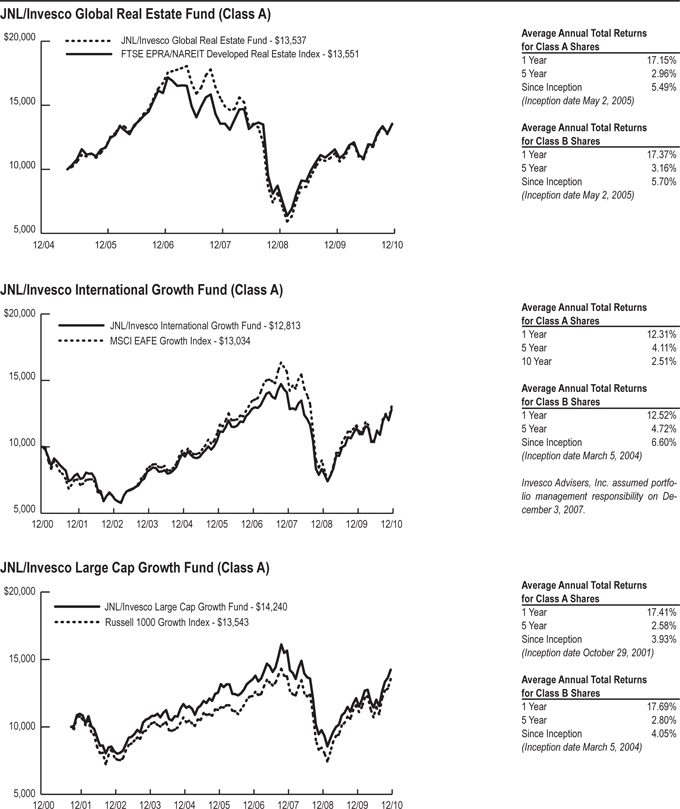
Past performance is not predictive of future performance. Investment return and principal value will fluctuate so that an investor’s shares, when redeemed, may be worth more or less than their original cost. Performance numbers are net of all Fund operating expenses, but not do not reflect the deduction of insurance changes.
 | JNL Invesco Funds (continued) Invesco Advisers, Inc.
|
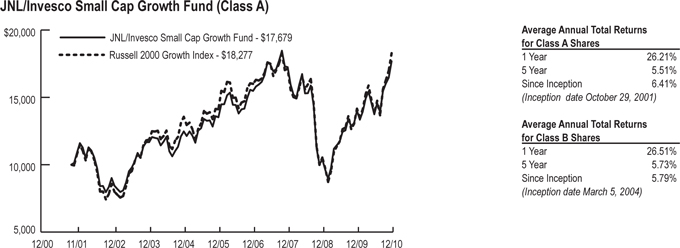
Past performance is not predictive of future performance. Investment return and principal value will fluctuate so that an investor’s shares, when redeemed, may be worth more or less than their original cost. Performance numbers are net of all Fund operating expenses, but not do not reflect the deduction of insurance changes.
 | JNL Ivy Asset Strategy Fund Ivy Investment Management Company
|
Market Summary: Economic conditions have improved dramatically over the last fiscal year. As the economic recovery gained momentum throughout 2010, investors rediscovered their appetite for risk. Stocks and bonds rallied as many economic indicators pointed to continued recovery and increasing stability in the U.S. economy. Investor confidence was further bolstered by stabilization of global credit markets and stronger than expected first and second quarter corporate profits. Optimism waned with the mid-year emergence of the European debt crisis and attendant fears of a double dip recession. That scenario, along with slowing U.S. economic growth and escalating concern about China’s ability to slow the pace of its economy, drove a sharp global correction. The tide seemed to turn in September, however, with slightly stronger economic data and optimism that mid-term elections
may drive more investor friendly changes in Washington. Stocks rallied in the third quarter and received an additional boost when President Obama signed into law a politically divisive tax deal that extended the Bush era tax cuts. As the year wound to a close, the U.S. Federal Reserve began a second phase of quantitative easing. The U.S. markets responded very favorably, as the major indexes posted impressive gains and Wall Street racked up its fourth largest profit for the year. The outlook for global markets in 2011 is also improving as many governments and central banks moved away from fiscal policies and began to work in their own self interests. Nonetheless, serious challenges remain. U.S. unemployment remains high and the housing market continues to struggle.
JNL/Ivy Asset Strategy Fund
Sector Weightings*:
Consumer Discretionary | 27.2 | % | ||
Information Technology | 13.7 | |||
Financials | 13.3 | |||
Precious Metals | 11.5 | |||
Energy | 8.1 | |||
Materials | 5.7 | |||
Industrials | 5.6 | |||
Consumer Staples | 2.7 | |||
Telecommunication Services | 0.8 | |||
Purchased Options | 0.7 | |||
Health Care | 0.2 | |||
Short Term Investments | 10.5 | |||
Total | 100.0 | % | ||
*Total Investments at December 31, 2010
Portfolio Manager Commentary: For the year ended December 31, 2010, the JNL/Ivy Asset Strategy Fund underperformed its benchmark by posting a return of 9.81% for Class A shares compared to 15.06% for the S&P 500 Index.
The Fund continues to use gold as a hedge against currency depreciation, which contributed significantly to performance during the year. The Fund also employed forward foreign currency contracts as a defensive hedge to back
the Fund’s base currency, the U.S. dollar. The purpose of this hedging strategy is to insulate the Fund from adverse currency movements. All currency exposures are marked to market daily and therefore the risks of the forwards are the same as the risk of the underlying currency. The Fund also used equity derivatives to help cushion volatility. However, given the strong performance of equities during the year, the derivatives ultimately restrained the Fund’s performance.
The Fund has little exposure to fixed income products and continues to favor the equity side of the ledger as gross and free cash flow yields and price-to-sales ratios remain very reasonable relative to their fixed income or corporate cousins.
All sectors contributed to the Fund’s absolute returns. Sectors that contributed the most to absolute performance during the quarter were industrials and consumer discretionary. Top individual holdings in absolute terms included gold bullion and Wynn Resorts Ltd., a Nevada-based operator of high end resorts and casinos. The Fund’s underweight exposure and untimely stock selection in health care detracted the most from performance. The Fund added to it’s energy and technology holdings. It remains geographically diverse,
with sector overweights in technology and consumer durables.
Looking forward, we are cautiously optimistic. We anticipate global gross domestic product (“GDP”) will be somewhere in the order of 5 to 6%. Broken out, we think China will see 8 to 9% GDP growth, with U.S. GDP reaching 3.5 to 4% during the first part of the year and winding down to 3% by year end. We anticipate the eurozone will likely grow about 1%, with Germany, its strongest economy, continuing to grow at accelerating rates. Here in the U.S., capital spending has returned with some vigor off a pretty low base, and we are seeing signs of company reinvestment that we believe will lead to positive inventory cycles. We think trade will be a positive contributor. Finally, we anticipate that U.S. interest rates will remain on hold, quite possibly through 2012, and the threat of inflation is real for some emerging markets, which will act as a governor on their returns.
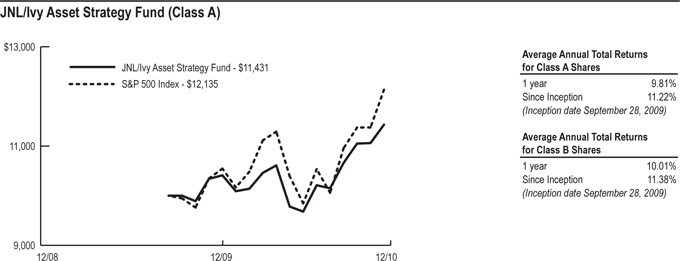
Past performance is not predictive of future performance. Investment return and principal value will fluctuate so that an investor’s shares, when redeemed, may be worth more or less than their original cost. Performance numbers are net of all Fund operating expenses, but not do not reflect the deduction of insurance changes.
 | JNL JPMorgan Funds J.P. Morgan Investment Management Inc.
|
Market Summary: Despite a year marred by various economic and political concerns, not to mention considerable market volatility, U.S. stocks managed to post healthy gains in 2010. A struggle between the macro and micro environment was the overriding theme in 2010, pulling the market violently in different directions for much of the year. It wasn’t until the U.S. Federal Reserve’s (the “Fed”) announcement in late August of further quantitative easing, by promising to buy some $600 billion of U.S. Treasuries, that the market began its relatively uninterrupted advance.
Generally favorable economic data helped drive continued spread contraction in non Treasury sectors. The Fed maintained its stance on interest
rates with a target of 0.00% to 0.25% throughout 2010 and investors continued to venture back into assets that offered more attractive returns.
Global equity markets were plagued by volatility throughout much of 2010. The sovereign debt crisis in Europe, combined with regulatory and economic uncertainty, weighed constantly on investor confidence. Despite all the gyrations, however, markets ultimately closed the year on a positive note thanks to strong corporate earnings, a resurgence in merger and acquisition activity, evidence of continued economic recovery and indications that policymakers would do what they could to keep the global recovery going.
JNL/JPMorgan International Value Fund
| Sector Weightings*: | ||||
Financials | 24.3 | % | ||
Industrials | 15.2 | |||
Telecommunication Services | 10.5 | |||
Energy | 8.6 | |||
Consumer Discretionary | 8.0 | |||
Information Technology | 7.5 | |||
Utilities | 6.8 | |||
Materials | 5.9 | |||
Health Care | 5.5 | |||
Consumer Staples | 2.4 | |||
Short Term Investments | 5.3 | |||
Total Investments | 100.0 | % | ||
*Total Investments at December 31, 2010 | ||||
Portfolio Manager Commentary: For the year ended December 31, 2010, the JNL/JPMorgan International Value Fund outperformed its benchmark by posting a return of 7.58% for Class A shares compared to 3.25% for the MSCI
EAFE Value Index.
At the sector level, the Fund’s holdings in industrial cyclicals and energy contributed most to performance, while consumer nondurables and health care weighed on returns during the year. Regionally, stock selection in Continental Europe and the United Kingdom benefited results, while Japan and an underweight in the Pacific Rim detracted. Currency forwards did not materially add or subtract value to the Fund due to the small position weightings, but is used for risk management purposes.
Lanxess AG, the German specialty chemical company, did well on the back of improving economic conditions, strong demand for synthetic rubber, tight cost controls and the operating leverage that usually characterizes many chemical companies. Lafarge SA, the French construction materials company, was a major detractor. Weak earnings and concerns about the company’s $15
billion debt burden – a result of its 2008 takeover of Orascom Construction’s cement operations – weighed on the stock, which was sold during the year.
The Fund purchased Toyota Motor Corp., Telefonica SA, Allianz SE, AXA SA, QBE Insurance Group Ltd. and KDDI Corp. The Fund sold Toyota Motor Corp., AXA SA, Banco Santander SA, UniCredit SpA, Mitsubishi Corp. and LG Electronics Inc.
Sector deviations are controlled and any changes in regional weights reflect bottom up stock selection decisions. The Fund lowered its overall weight in financials, but this was a result of stock selection decisions.
The Fund’s strategy remains unchanged. We continue to focus on identifying the most attractive ‘value’ names within each sector, utilizing the proprietary estimates and forecasts generated by our in house team of research analysts.
JNL/JPMorgan MidCap Growth Fund
Sector Weightings*
Information Technology | 26.6 | % | ||
Industrials | 18.0 | |||
Consumer Discretionary | 16.8 | |||
Health Care | 10.8 | |||
Financials | 9.3 | |||
Energy | 5.8 | |||
Materials | 3.2 | |||
Telecommunication Services | 0.8 | |||
Consumer Staples | 0.5 | |||
Short Term Investments | 8.2 | |||
Total Investments | 100.0 | % | ||
*Total Investments at December 31, 2010
Portfolio Manager Commentary: For the year ended December 31, 2010, the JNL/JPMorgan MidCap Growth Fund underperformed its benchmark by posting a return of 25.60% for Class A shares compared to 26.38% for the Russell Midcap Growth Index
For the year, the market’s performance was widespread as every industry sector posted positive returns, led by the more economically sensitive
consumer discretionary and industrials sectors. Lagging for the year were defensive utilities, and also health care, where the weight of regulatory concerns proved too great to overcome. Stock selection in producer durables and energy contributed to performance. Stock selection in financial services and technology detracted from performance.
Among the top contributors was Biovail Corp., a specialty pharmaceutical company, which benefitted from the merger announcement with Valeant Pharmaceuticals. Netflix Inc. reported strong quarterly results with positive subscriber retention from a rapid increase in online streaming utilization. Alternatively, Equinix Inc., a global network data center servicer, detracted after lowering its 2010 revenue guidance due to deeper pricing discounts to existing customers. Thoratec Corp., a manufacturer of mechanical supports for the heart, was also a major detractor following an announcement that a competitor’s experimental heart pump showed favorable results in trials, raising concerns that Thoratec could lose market
share.
Over the year the Fund made some changes to its portfolio. The most significant purchases included holdings in McDonald’s Corp., O’Reilly Automotive, W.W. Grainger Inc., Novo-Nordisk and Union Pacific Corp. The most significant sales included liquidating positions in MasterCard Inc., Visa Inc., Microsoft Corp., Hewlett-Packard and Colgate-Palmolive Co.
Over the past year, the Fund increased its consumer discretionary and producer durables weightings and decreased those in financial services and consumer staples.
We continue to have a constructive view on the market and economy as we enter 2011. Gross domestic product (“GDP”) estimates for fourth quarter have risen and 2011 estimates are now being revised upwards. While the average forecast is not calling for robust economic growth, we think it will be enough to continue rebuilding confidence, investments and ultimately job growth.
 | JNL JPMorgan Funds (continued) J.P. Morgan Investment Management Inc.
|
JNL/JPMorgan U.S. Government & Quality Bond Fund
Sector Weightings*:
U.S. Government Agency | ||||
Mortgage-Backed Securities | 55.4 | % | ||
Government Securities | 33.3 | |||
Non-U.S. Government Agency ABS | 3.5 | |||
Financials | 0.7 | |||
Short Term Investments | 7.1 | |||
Total Investments | 100.0 | % | ||
*Total Investments at December 31, 2010
Portfolio Manager Commentary: For the year ended December 31, 2010, the JNL/JPMorgan U.S. Government & Quality Bond Fund outperformed its benchmark by posting a return of 7.34% for Class A Shares compared to 5.52% for the Barclays Capital U.S. Government Bond Index.
The Fund’s concentration in agency and non-agency mortgage-backed securities (“MBS”) contributed to performance as the benchmark, composed solely of Treasury and agency securities, trailed throughout the year. Security
selection within both sectors also helped drive performance. Asset-backed securities (“ABS”) and commercial mortgage-backed securities (“CMBS”) positions continued to perform well over the year as both sectors posted strong returns over Treasuries.
Sector weightings remained fairly in line with their positioning at the end of 2009. The non-agency MBS position increased marginally over the year, while the agency collateralized mortgage obligation (“CMO”) allocation decreased marginally. Treasury and agency debt allocations were also slightly higher than at the end of 2009.
Our baseline scenario continues to be that economic growth will remain tepid. However, recent strength in global production surveys suggests there is upside risk to this forecast, despite eurozone sovereign debt concerns. In the U.S., the average work week and hours worked have paused from their recent pace of increase, suggesting significant hurdles remain before employment increases meaningfully. While job growth
should improve, the unemployment rate is likely to remain elevated above 9.0% through 2011. We also believe that core inflation will remain at the low end of the Fed comfort zone for the next year.
The Fed’s asset purchase program is not likely to be conditional on a short period of improved economic data. The Fed’s actions will probably continue to be driven by the employment gap, the inflation gap and inflation expectations. To date, the level of inflation expectations have reacted favorably to Fed purchases while the pace of realized inflation has remained disappointing. Even though consumer spending is showing preliminary signs of picking up, our expectation is that consumption will not be sufficient for the Fed to consider ending its purchase program earlier than planned.
Stronger economic growth in fourth quarter along with the additional fiscal stimulus from the tax cut extension has caused us to revise upward our GDP forecast for 2011 from 2.5 to 3.5%.
 | JNL JPMorgan Funds (continued) J.P. Morgan Investment Management Inc.
|
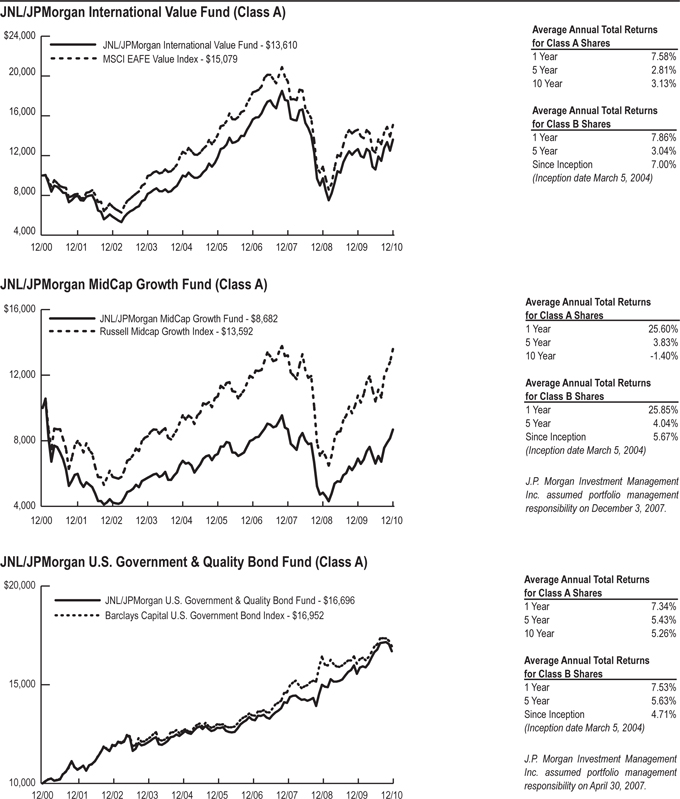
Past performance is not predictive of future performance. Investment return and principal value will fluctuate so that an investor’s shares, when redeemed, may be worth more or less than their original cost. Performance numbers are net of all Fund operating expenses, but not do not reflect the deduction of insurance changes.
 | Fund of Funds Jackson National Asset Management, LLC
|
JNL/Franklin Templeton Founding Strategy Fund
Portfolio Manager Commentary: For the year ended December 31, 2010, the JNL/Franklin Templeton Founding Strategy Fund underperformed its benchmarks by posting a return of 10.39% for Class A shares compared to the 15.06% return for the S&P 500 Index and 11.76% for the MSCI World Index. The investment objective of the Fund is capital appreciation. The Fund seeks to achieve its objective by investing approximately equal allocations in the three following Funds: JNL/Franklin Templeton Income Fund, JNL/Franklin Templeton Global Growth Fund and JNL/Franklin Templeton Mutual Shares Fund (“Underlying Funds”). The Underlying Funds performance
contributed to the results of the Fund proportionally based on relative value to the Fund throughout the year. For the year ended December 31, 2010, the average daily investment in each Underlying Fund was 34.79% for the JNL/Franklin Templeton Income Fund, 33.00% for the JNL/Franklin Templeton Global Growth Fund and 32.21% for the JNL/Franklin Templeton Mutual Shares Fund. The performance and investment objectives of the Underlying Funds are discussed elsewhere in this report.
JNL/Mellon Capital Management 10 x 10 Fund
Portfolio Manager Commentary: For the year ended December 31, 2010, the JNL/Mellon Capital Management 10 x 10 Fund underperformed its benchmark by posting a return of 16.43% for Class A shares compared to 16.93% for the Russell 3000 Index. The investment objective of the Fund is capital appreciation and income. The Fund seeks to achieve its objective by investing in the following Funds: JNL/Mellon Capital Management JNL 5 Fund, JNL/Mellon Capital Management S&P 500 Index Fund, JNL/Mellon Capital Management S&P 400 MidCap Index Fund, JNL/Mellon Capital Management Small Cap Index Fund, JNL/Mellon Capital Management International Index Fund and JNL/Mellon Capital Management Bond Index Fund (“Underlying Funds”). The Underlying Funds performance contributed
to the results of the Fund proportionally based on the relative value to the Fund throughout the year. For the year ended December 31, 2010, the average daily investment in each Underlying Fund was 49.98% for the JNL/Mellon Capital Management JNL 5 Fund, 9.85% for the JNL/Mellon Capital Management S&P 500 Index Fund, 10.40% for the JNL/Mellon Capital Management S&P 400 MidCap Index Fund, 10.29% for the JNL/Mellon Capital Management Small Cap Index Fund, 9.35% for the JNL/Mellon Capital Management International Index Fund and 10.13% for the JNL/Mellon Capital Management Bond Index Fund. The performance and investment objectives of the Underlying Funds are discussed elsewhere in this report.
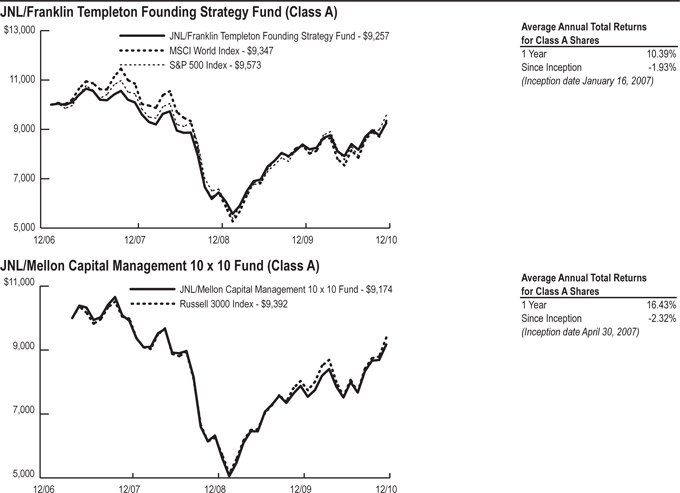
Past performance is not predictive of future performance. Investment return and principal value will fluctuate so that an investor’s shares, when redeemed, may be worth more or less than their original cost. Performance numbers are net of all Fund operating expenses, but not do not reflect the deduction of insurance changes.
 | Fund of Funds (continued) Jackson National Asset Management, LLC
|
JNL/Mellon Capital Management Index 5 Fund
Portfolio Manager Commentary: For the year ended December 31, 2010, the JNL/Mellon Capital Management Index 5 Fund underperformed its benchmark by posting a return of 15.78% for Class A shares compared to 16.93% for the Russell 3000 Index. The investment objective of the Fund is capital appreciation. The Fund seeks to achieve its objective by investing in the following Funds: JNL/Mellon Capital Management S&P 500 Index Fund, JNL/Mellon Capital Management S&P 400 MidCap Index Fund, JNL/Mellon Capital Management Small Cap Index Fund, JNL/Mellon Capital Management International Index Fund and JNL/Mellon Capital Management Bond Index Fund (“Underlying Funds”). The Underlying Funds performance contributed
to the results of the Fund proportionally based on the relative value to the Fund throughout the year. For the year ended December 31, 2010, the average daily investment in each Underlying Fund was 19.69% the JNL/Mellon Capital Management S&P 500 Index Fund, 20.79% for the JNL/Mellon Capital Management S&P 400 MidCap Index Fund, 20.58% for the JNL/Mellon Capital Management Small Cap Index Fund, 18.70% for the JNL/Mellon Capital Management International Index Fund and 20.24% for the JNL/Mellon Capital Management Bond Index Fund. The performance and investment objectives of each underlying Fund are discussed elsewhere in this report.
JNL/S&P 4 Fund
Portfolio Manager Commentary: For the year ended December 31, 2010, the JNL/S&P 4 Fund underperformed its benchmark by posting a return of 13.79% for Class A shares compared to 15.06% for the S&P 500 Index. The investment objective of the Fund is capital appreciation. The Fund seeks to achieve its objective by investing in the following Funds: JNL/S&P Competitive Advantage Fund, JNL/S&P Dividend Income & Growth Fund, JNL/S&P Intrinsic Value Fund and JNL/S&P Total Yield Fund (“Underlying Funds”). The Underlying Funds performance contributed to the results of
the Fund proportionally based on the relative value to the Fund throughout the year. For the year ended December 31, 2010, the average daily investment in each Underlying Fund was 24.22% for the JNL/S&P Competitive Advantage Fund, 25.37% for the JNL/S&P Dividend Income & Growth Fund, 25.35% for the JNL/S&P Intrinsic Value Fund and 25.06% for the JNL/S&P Total Yield Fund. The performance and investment objectives of each underlying Fund are discussed elsewhere in this report.
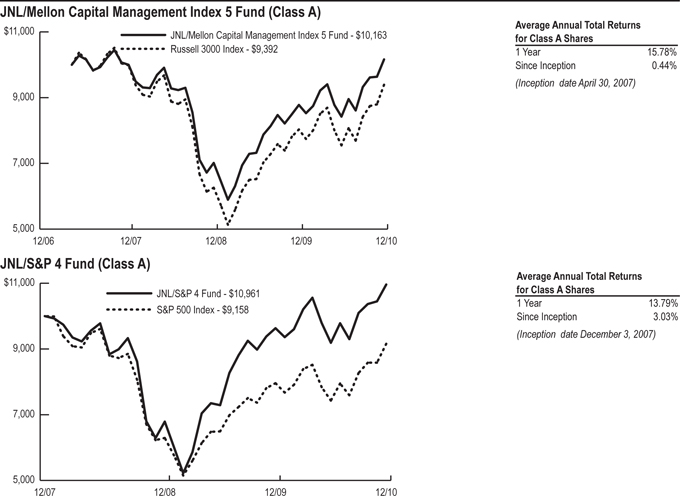
Past performance is not predictive of future performance. Investment return and principal value will fluctuate so that an investor’s shares, when redeemed, may be worth more or less than their original cost. Performance numbers are net of all Fund operating expenses, but not do not reflect the deduction of insurance changes.
 | JNL Lazard Funds Lazard Asset Management, LLC
|
Market Summary: The U.S. stock market posted robust returns in 2010 as economic growth continued to slowly improve. Although volatile, particularly in the second quarter, the Russell Midcap Index (“Russell Midcap”) gained 25.48% during the year. As 2010 progressed, the U.S. economy was healing, as gross domestic product (“GDP”) improved, many companies reported strong earnings and cash rich balance sheets, manufacturing expanded, exports reverted to levels seen before the financial crisis and retail sales returned to where they were before the recession began in 2007. In November, the U.S. Federal Reserve Board (the “Fed”) announced a second round of quantitative easing, which can be viewed as a means to increase demand and reduce the risk of deflation. In this round of easing, the Fed will purchase approximately $110 billion in short and long term Treasuries per month through the second quarter of 2011. However, concerns about the economy remain, as the unemployment rate continues to stagnate and home prices remain weak.
News from abroad also affected the market throughout the year, particularly geopolitical concerns about sovereign debt levels in Europe. Both Greece and Ireland agreed to rescue packages from the European Union and the International Monetary Fund (“IMF”); however, the bailouts have not fully stemmed fears of contagion in other eurozone countries. China raised interest rates twice in the fourth quarter, the first rate increases in nearly three years, which dampened investors’ sentiment.
Each sector in the Russell Midcap rose this year. Consumer discretionary and industrials, which are generally considered cyclicals, posted the largest gains in the Russell Midcap. Utilities and health care, typically seen as more defensive in nature, posted the lowest returns.
Despite intermittent periods of optimism, followed by concern about global growth, shares in emerging markets experienced a respectable 2010, largely due to the monetary policies of the world’s central banks. For example, the Fed engaged in another phase of quantitative easing towards year end. Considerable market weakness occurred due to fiscal crises in Greece early in the year and Ireland’s economic troubles in December. Although two countries, Hungary and the Czech Republic, finished lower over the year, all other major developing nations’ markets rose and demonstrated
considerable strength in many cases. Major rises were witnessed in markets such as Thailand, Chile, Colombia and Peru, despite political strife, earthquakes, and global economic instability. The MSCI Emerging Markets Index increased by 18.88% during the year, as shares in Asia considerably outperformed stocks in Eastern Europe or Latin America.
Across Asia, excellent performance in information technology aided Taiwanese shares, which recorded strong relative price movements in the region. Pakistani stocks rebounded powerfully following the devastating floods in the third quarter. Thai and Malaysian shares finished sharply higher despite ongoing political disharmony in Thailand and due to the prospect of greater capital markets activity, in the form of possible privatizations, in Malaysia. Indonesian and Philippine equities experienced a continuing period of strong performance. Chinese shares, harmed by concerns over real estate prices and industrial production, performed relatively poorly.
All Latin American markets witnessed significant rises over the year. Argentinean, Chilean and Peruvian shares were the best performers, helped by strong commodity prices and the aftermath of a debt renegotiation in Argentina. Mexican stocks also rose strongly, helped by the improving U.S. economic outlook. Brazilian shares rose by a more modest amount, held back by the record size of Petroleo Brasileiro SA – Petrobras’ secondary offering and despite the election of Dilma Rousseff as president.
Mixed performance was registered across most of Eastern Europe, the Middle East and Africa. Share prices rose sharply in South Africa and Russia towards year end as commodity prices rose and investor concerns over changes in the taxation treatment of oil in Russia appeared to dissipate. Despite buoyant economic conditions, Turkish stocks experienced considerable profit taking after a period of impressive performance, due to a weaker lira caused by a reduction in money market rates. Hungarian and Czech equities fell, and Polish shares finished modestly higher over the year as the European fiscal crises negatively impacted conditions.
All sectors in the MSCI Emerging Markets Index finished the year higher. Consumer discretionary, consumer staples, industrials, health care and materials outperformed the MSCI Emerging Markets Index. Utilities, energy and telecommunication services were the weakest performers over the year.
JNL/Lazard Emerging Markets Fund
Sector Weightings*:
| Financials | 22.2 | % | ||
| Information Technology | 17.6 | |||
| Materials | 15.5 | |||
| Consumer Staples | 10.8 | |||
Telecommunication Services | 8.8 | |||
| Industrials | 5.1 | |||
| Consumer Discretionary | 5.0 | |||
| Energy | 4.8 | |||
| Utilities | 1.3 | |||
| Short Term Investments | 8.9 | |||
| Total Investments | 100.0 | % | ||
*Total Investments at December 31, 2010
Portfolio Manager Commentary: For the year ended December 31, 2010, the JNL/Lazard Emerging Markets Fund outperformed its benchmark by posting a return of 21.91% for Class A
shares compared to 18.88% for the MSCI Emerging Markets Index
The Fund benefited from positive stock selection in 2010. Top contributors during the year included: HTC Corp., a Taiwanese smart phone designer and manufacturer, performed well on the successful introduction of new products; Souza Cruz SA, a Brazilian tobacco company, benefited from strong operating trends; and Kumba Iron Ore Ltd., a South African iron ore producer, rose on sharply higher iron ore prices. In addition, energy and financials added value as well as Brazil. A lower than benchmark exposure to energy and China helped performance while a higher than benchmark exposure to consumer staples also added value.
In contrast, a lower than benchmark exposure to Malaysia hurt performance. Stock selection
within telecommunication services, and within Korea, detracted from returns over the year including Hite Brewery Co. Ltd., a Korean beer producer, which experienced profit taking on expectation of lower volumes and concerns over corporate structure. Finally, shares of Redecard SA, a Brazilian credit card operator, declined on disappointing earnings results.
Despite recent strength, we continue to be reasonably optimistic about emerging markets, especially in the long term. Very considerable investor inflows and corporate issuance somewhat temper our enthusiasm for the immediate term. Therefore, we believe those with long term objective should maintain an exposure in this asset class, especially in more conservative strategies, and to consider adding on weakness.
 | JNL Lazard Funds (continued) Lazard Asset Management, LLC
|
JNL/Lazard Mid Cap Equity Fund
Sector Weightings*: | ||||
Consumer Discretionary | 15.2 | % | ||
Financials | 14.4 | |||
Industrials | 13.4 | |||
Information Technology | 13.1 | |||
Energy | 10.1 | |||
Materials | 8.3 | |||
Consumer Staples | 8.0 | |||
Health Care | 7.1 | |||
Utilities | 4.3 | |||
Short Term Investments | 6.1 | |||
Total Investments | 100.0 | % | ||
*Total Investments at December 31, 2010
Portfolio Manager Commentary: For the year ended December 31, 2010, the JNL/Lazard Mid Cap Equity Fund underperformed its benchmark by posting a return of 23.07% for Class A shares compared to 25.48% for the Russell Mid-Cap® Index
Stock selection in materials contributed to performance. Shares of Cliffs Natural Resources
Inc. (“Cliffs”), a coal and iron ore mining company, increased on the back of strong commodity process. Additionally, Cliffs benefited from a strong balance sheet and attractive free cash flow. Stock selection in financials also helped returns. Shares of Ameriprise Financial Inc., a leading financial planning and services firm, gained as the company integrated its acquisition of Columbia Asset Management LLC and margins increased in all divisions. We believe that while the company’s profitability has improved, it still has the ability to further increase. In contrast, stock selection in health care detracted from performance. Shares of Zimmer Holdings Inc. (“Zimmer”), one of the leading players in the orthopedic space, fell on softening demand as persistently high unemployment forced those without medical coverage to delay procedures. However, Zimmer has a strong product portfolio with well known brands in an industry with high barriers to entry. Stock selection in consumer staples also hurt returns. Ralcorp Holdings Inc. (“Ralcorp”), the largest private label
food company in the United States, lagged other consumer staples names on market worries about input cost inflation and the heavier than expected discounting of branded labels. However, we believe that Ralcorp’s profitability will improve as the structural growth of private label industry and pricing trends continue to improve.
As uncertainty regarding the outlook has decreased through 2010 and as investors have begun to reengage riskier assets such as equities, we see hope for continued good news. We believe the combination of improved visibility, fiscal stimulus, and monetary stimulus is likely to lead to meaningful economic growth in the U.S. in 2011, with potential for strength to be sustained into 2012. While we see strength in aggregate indicators, we expect substantial differentiation in performance amongst and within asset classes and different sectors.
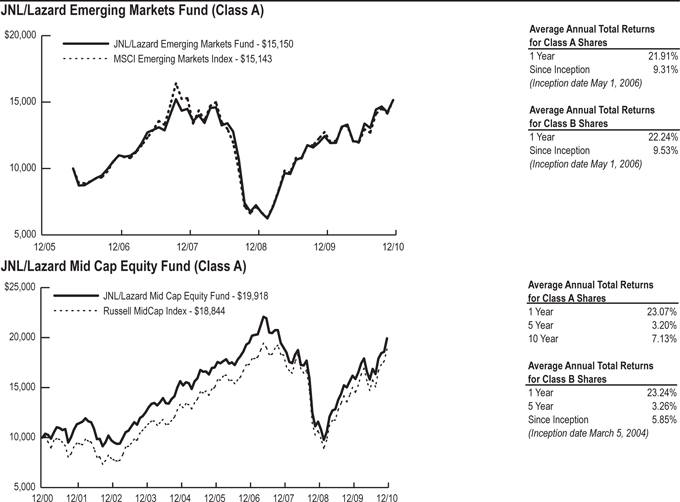
Past performance is not predictive of future performance. Investment return and principal value will fluctuate so that an investor’s shares, when redeemed, may be worth more or less than their original cost. Performance numbers are net of all Fund operating expenses, but not do not reflect the deduction of insurance changes.
 | JNL M&G Funds | |
| M&G Investment Management Limited |
Market Summary: The first half of 2010 was volatile, as investors’ concerns over the euro area sovereign risks led to periods of sharp falls in equity prices, followed by strong rallies. Government debt troubles in Greece escalated during the second quarter, culminating in a $1.2 trillion rescue package from the European Union and the International Monetary Fund in May. How-ever, the improved sentiment towards the peripheral eurozone was short lived and yields on sovereign debt from Ireland, Spain, Portugal and Italy continued to rise. The summer months were characterized by risk aversion as fears mounted that the worldwide economic recovery was losing steam.
This was based on U.S. data showing higher than expected new jobless claims and concerns over a slowdown in China. However, equities broke out of this lull to perform well in the second half of the year thanks to more robust economic figures from the U.S. and the announcement that the U.S. Federal Reserve would restart quantitative easing by purchasing assets worth $600 billion. In addition, quarterly earnings from many companies came out in line or above consensus estimates. Equities rallied towards the year end on the back of heightened recovery expectations, with investors less worried about the eurozone contagion risk and a double dip recession.
JNL/M&G Global Basics Fund
Sector Weightings*:
Materials | 32.8 | % | ||
Consumer Staples | 19.1 | |||
Industrials | 16.0 | |||
Energy | 7.9 | |||
Consumer Discretionary | 7.9 | |||
Health Care | 2.9 | |||
Financials | 2.6 | |||
Short Term Investments | 10.8 | |||
Total Investments | 100.0 | % | ||
*Total Investments at December 31, 2010 |
| |||
Portfolio Manager Commentary: For the year ended December 31, 2010, the JNL/M&G Global Basics Fund outperformed its benchmark by posting a return of 23.19% for Class A shares compared to 12.73% for the FTSE World Index.
The Fund performed well versus its bench-mark during a rollercoaster 12 months characterised by sharp falls and significant gains in global equity markets.
Against this backdrop, stock selection and sector positioning were both positive. Exposure to a number of stocks in the materials and consumer goods – areas where the Fund is significantly overweight – added value. In particular, the rising price of many commodities, including gold, silver, nickel and copper, contributed to the excellent return from miners. These included Australian mineral sands producer Iluka Resources Ltd. and UK listed silver and gold firm Hochschild Mining Plc (“Hochschild Mining”), a new addition during the year.
Gold and precious metals producers were a key focus of Fund management’s investment activity during the year, although the Fund’s gold weighting remains relatively small. Aside from Hochschild Mining, a position in Canadian company Centerra Gold Inc. was also initiated. These are value creating businesses that Fund management believes can produce profitable returns and sustainable production growth over the longer
term, irrespective of volatility in the price of gold. Outside raw materials, Fund management in-vested in a number of other new ideas, including U.S. businesses Fluor Corp., a globally diversified construction firm, and agricultural producer Monsanto Co. The Fund also invested in Boral Ltd., an Australian company that produces bricks, concrete and other building supplies. These are companies that Fund management believes are well positioned to benefit from increasing demand for their goods or services, particularly in less developed parts of the world. Furthermore, they help to illustrate the variety of “global basic” stocks that Fund management believes can add value to the Fund’s performance.
By investing in companies such as these, Fund management believes that the Fund can continue to reap the rewards from an ongoing multi generational shift in economic power from the more developed “West” to faster growing emerging markets in the “East”.
JNL/M&G Global Leaders Fund
Sector Weightings*:
Information Technology | 22.0 | % | ||
Financials | 17.2 | |||
Industrials | 16.4 | |||
Energy | 9.1 | |||
Materials | 7.7 | |||
Consumer Staples | 7.6 | |||
Health Care | 7.3 | |||
Consumer Discretionary | 4.2 | |||
Telecommunication Services | 3.9 | |||
Utilities | 1.2 | |||
Short Term Investments | 3.4 | |||
Total Investments | 100.0 | % | ||
*Total Investments at December 31, 2010 |
| |||
Portfolio Manager Commentary: For the year ended December 31, 2010, the JNL/M&G Global Leaders Fund outperformed its bench-mark by posting a return of 13.13% for Class A shares compared to 12.73% for the FTSE World Index.
The Fund’s outperformance was driven by good stock picking, especially within U.S. companies and oil & gas producers, where holdings in Mariner Energy Inc. (“Mariner”) and Forest Oil Corp. added value. They performed well thanks
to strong production and firmer oil prices. Shares in Mariner also benefited from news that the company would be taken over by rival Apache Corp. An overweight position in industrial goods & services was also helpful with shares in U.S. specialty steel product maker, Timken Co., rising due to a rebound in the automobile industry, one of the company’s main markets.
Conversely, stock selection within personal goods disappointed with a stake in U.S. clothing retailer The Jones Group Inc. detracting on the back of lower than expected results. U.S. tax preparation business H&R Block Inc. (“H&R Block”) came under pressure because of the resignation of its CEO while the company also continued to face difficulties posed by the persistently high U.S. unemployment rate. Both positions were closed.
During the year, Fund management established stakes in U.S. bank Citigroup Inc. (“Citigroup”) and life insurer Principal Financial Group Inc. (“Principal”), which reduced the Fund’s underweight in financials. Fund management expects Citigroup to experience higher returns due to the ongoing reorganization, which includes shedding noncore assets, while Principal
should benefit from its market leading position in bundled retirement plans. The Fund’s overweight in technology was further increased through investments in Hong Kong based China Communications Services Corp. Ltd. and U.S. listed QUALCOMM Inc. On the other hand, the Fund’s overweight in retailers was decreased by closing positions in above mentioned H&R Block, U.S. home improvement chain Home Depot Inc. and French supermarket operator Carrefour SA.
As confidence continues to return to stock markets, Fund management believes that the economic recovery is beginning to take on a self re-enforcing footing. While Fund management is conscious that risks remain, including a negative economic shock that could see a repeat of the risk aversion, Fund management considers this unlikely. As a result, microeconomic considerations should become more significant and thereby support the current downward trend in stock correlations. Ultimately Fund management believes that successful stock picking will be the key driver of returns and remains committed to a disciplined investment process focused on return on capital.
 | JNL M&G Funds (continued) | |
| M&G Investment Management Limited |
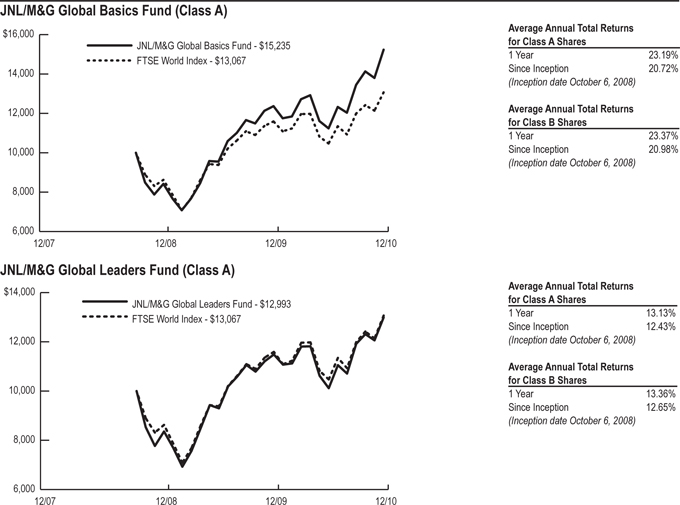
Past performance is not predictive of future performance. Investment return and principal value will fluctuate so that an investor’s shares, when redeemed, may be worth more or less than their original cost. Performance numbers are net of all Fund operating expenses, but not do not reflect the deduction of insurance changes.
 | JNL Mellon Capital Management Funds | |
| Mellon Capital Management Corporation |
Market Summary: On the heels of a strong fourth quarter, U.S. stocks finished 2010 with double digit returns for the second consecutive year. Stock prices benefited from optimism that economic growth will accelerate and bolster already strong corporate earnings and from the U.S Federal Reserve’s (“Fed”) decision to initiate a second round of quantitative easing. The S&P 500 Index rose 10.8% in the fourth quarter, and 15.1% for 2010. Small-cap stocks outperformed all capitalization sectors during 2010, as the Russell 2000 Index gained 26.9% during 2010, while growth stocks outperformed value. Consumer discretionary and industrials were the best performing sectors in
International markets also gained during 2010, though there was wide dispersion among developed country markets due to euro area sovereign debt concerns and the performance of the U.S. dollar. The U.S. dollar ex-perienced significant volatility during 2010, strengthening when investors searched for safe havens during the euro area sovereign problems and fall-
ing when investors set concerns aside and focused on economic growth. The MSCI EAFE Index returned 7.8% for 2010 in USD terms and 4.8% on a local basis. Outperformers on a local basis included Denmark (40.0%) and Sweden (25.9%). Greece (-41.0%), Spain (-16.5%) and Ireland (-12.4%) underperformed.
Despite a challenging fourth quarter, U.S. fixed income markets produced another solid year of performance. The Fed implemented another round of quantitative easing late in the year to keep interest rates low and stimulate the economy. However, investors sold Treasuries on concerns that adding more liquidity could prove inflationary, causing the 10-year Treasury yield to go from a 12-month low of 2.4% in October to 3.5% in mid December. The yield of the bellwether 10-year Treasury note fell for the entire year, from 3.9% to 3.3% at year end. The Barclays Capital U.S. Aggregate Bond Index gained 6.5% percent for 2010.
JNL/Mellon Capital Management European 30 Fund
Sector Weightings*:
Health Care | 25.7 | % | ||
Financials | 17.4 | |||
Telecommunication Services | 12.7 | |||
Utilities | 10.9 | |||
Energy | 9.1 | |||
Industrials | 7.9 | |||
Consumer Discretionary | 6.1 | |||
Materials | 4.0 | |||
Consumer Staples | 3.5 | |||
Investment Companies | 1.7 | |||
Short Term Investments | 1.0 | |||
Total Investments | 100.0 | % | ||
*Total Investments at December 31, 2010 |
| |||
Portfolio Manager Commentary: For the year ended December 31, 2010, the JNL/Mellon Capital Management European 30 Fund under-
performed its benchmark by posting a return of 2.13% for Class A shares compared to 3.88% for the MSCI Europe Index.
Companies that contributed to the Fund’s performance included: Societe BIC SA, a manufacturer of pens, pencils, lighters, shavers, and correcting fluid, gained as the company’s net sales for nine months were up 7.2% and earnings per share were up 33.9% compared to a year ago. Hannover Rueckversicherung AG (“Hannover”), Germany’s second largest reinsurer, gained during the year as Enstar Group Ltd., a Bermuda based insurance management provider, agreed to buy Clarendon National Insurance Co. from Hannover for $200 million.
Companies that detracted from the Fund’s performance included: Roche Holding AG, developer and manufacturer of pharmaceutical and
diagnostic products, slipped in its market position this year after a U.S. advisory panel urged authorities in July to revoke its label in advanced breast cancer treatment. Sales at the company were also hit by a sharp fall in demand for the influenza vaccination after last year’s swine flu pandemic abated. RWE AG (“RWE”), which generates, distributes, and trades electricity to municipal, industrial, commercial, and residential customers, lost as German prosecutors searched RWE in a raid of 230 offices and homes to investigate 180 million euros ($238 million) of tax evasion linked to emissions trading. In addition, the company is poised to cut dividends and in-vestment because proposed taxes on nuclear reactors will erode utilities’ profits.
JNL/Mellon Capital Management Pacific Rim 30 Fund
Sector Weightings*: | ||||
Utilities | 19.2 | % | ||
Telecommunication Services | 18.1 | |||
Consumer Staples | 15.6 | |||
Financials | 12.4 | |||
Industrials | 10.5 | |||
Health Care | 8.5 | |||
Consumer Discretionary | 5.3 | |||
Investment Companies | 3.3 | |||
Materials | 3.1 | |||
Short Term Investments | 4.0 | |||
Total Investments | 100.0 | % | ||
*Total Investments at December 31, 2010 |
| |||
Portfolio Manager Commentary: For the year ended December 31, 2010, the JNL/Mellon Capital Management Pacific Rim 30 Fund under
performed its benchmark by posting a return of 12.89% for Class A shares compared to 15.92% for the MSCI Pacific Index.
Companies that contributed to the Fund’s performance included: Hong Kong Aircraft Engineering Co. Ltd. (“HAECO”), Hong Kong’s largest aircraft service company maintaining and over-hauling commercial aircrafts, gained as travel demand rebounded and Swire Pacific Ltd offered HK$9.4 billion ($1.2 billion) to acquire the remaining shares of HAECO. CLP Holdings Ltd., Hong Kong’s largest power producer, gained amidst plans to bid for large coal fired plants in India and to sell shares in its local unit to fund projects to help reduce blackouts in the second most populous nation.
Companies that detracted from the Fund’s
performance included: Suzuken Co., Ltd., a subsidiary of Medca Japan Co. Ltd. which whole-sales and manufactures pharmaceutical products mainly to hospitals and practitioners, lost due to a reduction in the national health insurance drug price standard implemented in April 2010 and policies such as encouraging the use of generic pharmaceutical products to control medical expenses. Esprit Holdings Ltd., a worldwide clothier operating primarily in Europe, Asia Pacific and North America, lost because weaker consumer spending amidst a fragile economic recovery and rising unemployment drove sales down. The stock also fell when the company’s former chair-man, Michael Ying, sold his stake in the company in March.
 | JNL Mellon Capital Management Funds (continued) | |
| Mellon Capital Management Corporation |
JNL/Mellon Capital Management S&P 500 Index Fund
Sector Weightings*: | ||||
Information Technology | 18.4 | % | ||
Financials | 15.5 | |||
Energy | 11.7 | |||
Industrials | 10.7 | |||
Health Care | 10.6 | |||
Consumer Staples | 10.4 | |||
Consumer Discretionary | 10.4 | |||
Materials | 3.7 | |||
Utilities | 3.2 | |||
Telecommunication Services | 3.0 | |||
Diversified | 0.1 | |||
Short Term Investments | 2.3 | |||
Total Investments | 100.0 | % | ||
*Total Investments at December 31, 2010 |
| |||
Portfolio Manager Commentary: For the year ended December 31, 2010, the JNL/Mellon
Capital Management S&P 500 Index Fund under-performed its benchmark by posting a return of 14.44% for Class A shares compared to 15.06% for the S&P 500 Index. Fund performance tends to differ from that of the benchmark due to the Fund’s operating and management expenses.
The Fund is an index fund. As such, its port-folio manager is not selecting specific stocks to own, but is trying to match the Fund’s overall stock weightings and characteristics to the S&P 500 Index stock weightings, while minimizing transaction costs.
Companies that contributed to the Fund’s performance included: Cummins Inc., a leading manufacturer of diesel and natural gas engines, gained as a result of the company’s solid position in global markets, especially Latin American and Asia, and amidst reports of improving earnings
and plans to add more workers. Wynn Resorts Ltd., engaged in the development, ownership, and operation of destination casino resorts and an industry leader, gained as a result of a re-bound in Las Vegas and as gambling revenue in the Chinese territory soared.
Companies that detracted from the Fund’s performance included: H&R Block Inc, the biggest U.S. tax preparation firm, fell as the CEO quit and the company lost its financial ability to provide customers with refund loans in 2011. Dean Foods Co., a food and beverage company in the U.S., was down as a result of rising commodity prices and a decline in consumer spending, especially as shoppers opted for cheaper store brands instead of the company’s premium brands.
JNL/Mellon Capital Management S&P 400 MidCap Index Fund
Sector Weightings*: | ||||
Financials | 18.2 | % | ||
Industrials | 15.0 | |||
Information Technology | 14.5 | |||
Consumer Discretionary | 13.2 | |||
Health Care | 10.3 | |||
Materials | 6.3 | |||
Energy | 5.5 | |||
Utilities | 5.4 | |||
Consumer Staples | 3.3 | |||
Telecommunication Services | 0.7 | |||
Short Term Investments | 7.6 | |||
Total Investments | 100.0 | % | ||
*Total Investments at December 31, 2010 |
| |||
Portfolio Manager Commentary: For the year ended December 31, 2010, the JNL/Mellon Capital Management S&P 400 MidCap Index Fund underperformed its benchmark by posting
a return of 25.83% for Class A shares compared to 26.64%% for the S&P MidCap 400 Index. Fund performance tends to differ from that of the benchmark due to the Fund’s operating and management expenses.
The Fund is an index fund. As such, its port-folio manager is not selecting specific stocks to own, but is trying to match the Fund’s overall stock weightings and characteristics to the S&P 400 MidCap Index stock weightings, while minimizing transaction costs.
Companies that contributed to the Fund’s performance included: Atmel Corp., engaged in semiconductor integrated circuit products and capacitive touch solutions, was up as the company posted accelerated sales growth resulting from increased demand for chips to power wildly popular touch screens and other computer gear. Chipotle Mexican Grill Inc., engaged in the devel-
opment and operation of fast-casual, fresh Mexican food restaurants in the U.S. and Canada, gained as the recovering economy led to a rally in restaurant stocks. The company experienced accelerated sales growth and increased earnings as higher traffic led to gains in same store sales.
Companies that detracted from the Fund’s performance included: Navigant Consulting Inc., a specialty consulting firm with dispute, investigative, business and economic consulting services, declined as the recession weighing heavily on the consulting industry and when the company posted adjusted earnings missing analyst’s expectations. Comstock Resources Inc., engaged in the acquisition, development, production and exploration of oil and gas properties in the U.S., declined amid struggles to reach their production targets because of the mismanagement of its supply of equipment and drilling teams.
JNL/Mellon Capital Management Small Cap Index Fund
Sector Weightings*: | ||||
Financials | 18.0 | % | ||
Information Technology | 16.3 | |||
Industrials | 13.9 | |||
Consumer Discretionary | 12.2 | |||
Health Care | 10.8 | |||
Energy | 5.6 | |||
Materials | 5.0 | |||
Utilities | 2.6 | |||
Consumer Staples | 2.6 | |||
Telecommunication Services | 0.8 | |||
Warrants | 0.0 | |||
Short Term Investments | 12.2 | |||
Total Investments | 100.0 | % | ||
*Total Investments at December 31, 2010 |
| |||
Portfolio Manager Commentary: For the year ended December 31, 2010, the JNL/Mellon Capital Management Small Cap Index Fund underperformed its benchmark by posting a re-
turn of 26.32% for Class A shares compared to 26.86% for the Russell 2000 Index. Fund performance tends to differ from that of the benchmark due to the Fund’s operating and management expenses.
The Fund is an index fund. As such, its port-folio manager is not selecting specific stocks to own, but is trying to match the Fund’s overall stock weightings and characteristics to the Russell 2000 Index stock weightings, while minimizing transaction costs.
Companies that contributed to the Fund’s performance included: Acme Packet Inc., owning a 62% share of the market for session border controllers (“SBCs”) that enable interactive communications and data services across Internet protocol (“IP”) network borders worldwide, gained as a result of the fast growing market and a widening use of IP networks which are increasingly taking the place of traditional telephone networks
and being used to enable mobile technologies. Entropic Communications Inc. engaged in the de-sign, development, and marketing of systems solutions to enable connected home entertainment, rose in line with the increasing consumer demand for consistently cost effective and high performing video delivery technology.
Companies that detracted from the Fund’s performance included: Affymax Inc., a biopharmaceutical company engaged in the development of drugs for the treatment of serious and life threatening conditions, declined as a result of disappointing clinical results and a negative legal ruling on certain patents associated with the company’s experimental drug to treat anemia. First Bancorp Inc., provider of financial services and products in Puerto Rico, the U.S., and the British Virgin Islands, lost as problem loans mounted and the company continued to report quarterly losses and missed dividends.
| JNL Mellon Capital Management Funds (continued) | |
| Mellon Capital Management Corporation |

JNL/Mellon Capital Management International Index Fund
Sector Weightings*: | ||||
Financials | 22.0 | % | ||
Industrials | 11.7 | |||
Materials | 10.6 | |||
Consumer Discretionary | 9.7 | |||
Consumer Staples | 9.3 | |||
Health Care | 7.5 | |||
Energy | 7.3 | |||
Telecommunication Services | 5.0 | |||
Utilities | 4.7 | |||
Information Technology | 4.6 | |||
Short Term Investments | 7.6 | |||
Total Investments | 100.0 | % | ||
*Total Investments at December 31, 2010 |
| |||
Portfolio Manager Commentary: For the year ended December 31, 2010, the JNL/Mellon Capital Management International Index Fund underperformed its benchmark by posting a
return of 6.81% for Class A shares compared to 7.75% for the MSCI EAFE Index. Fund performance tends to differ from that of the benchmark due to the Fund’s operating and management expenses.
The Fund is an index fund. As such, its port-folio manager is not selecting specific stocks to own, but is trying to match the Fund’s overall stock weightings and characteristics to the MSCI EAFE Index stock weightings, while minimizing transaction costs.
Companies that contributed to the Fund’s performance included: Orient Overseas International Ltd., a Hong Kong based company that owns and leases container ships, terminals and trans-port logistics, gained as investor sentiment in the global economy and international trade continued to improve. Third quarter revenue grew by 65.5% over the previous year due to increases in ton-
nage and pricing power. Isuzu Motors Ltd., a Japan based manufacturing company that primarily produces commercial vehicles, gained as a significant rebound in earnings surprised analysts in early 2010. The company quickly emerged from the recession and raised guidance and forecasts.
Companies that detracted from the Fund’s performance included: The National Bank of Greece SA, a Greece based bank that offers a range of financial services, fell as Greek debt woes and concern over further contagion within the eurozone weighed on investor sentiment. Senshu Ikeda Holdings Inc., a holding company that owns and operates The Bank of Ikeda and The Senshu Bank, fell as the company lowered guidance and posted poor earnings as a result of credit related costs, a reversal of deferred assets and uncollectible receivables from a large credit line.
JNL/Mellon Capital Management Bond Index Fund
Sector Weightings*: | ||||
Government Securities | 39.5 | % | ||
U.S. Government Agency | ||||
Mortgage-Backed Securities | 30.0 | |||
Financials | 8.7 | |||
Non-U.S. Government Agency | ||||
Asset-Backed Securities | 2.6 | |||
Energy | 1.8 | |||
Consumer Discretionary | 1.4 | |||
Utilities | 1.4 | |||
Consumer Staples | 1.2 | |||
Telecommunication Services | 1.2 | |||
Health Care | 1.1 | |||
Industrials | 1.1 | |||
Materials | 1.0 | |||
Information Technology | 0.7 | |||
Short Term Investments | 8.3 | |||
Total Investments | 100.0 | % | ||
*Total Investments at December 31, 2010 |
| |||
Portfolio Manager Commentary: For the year ended December 31, 2010, the JNL/Mellon Capital Management Bond Index Fund under-performed its benchmark by posting a return of 5.87% for Class A shares compared to 6.54% for the Barclays Capital U.S. Aggregate Bond Index. Fund performance tends to differ from that of the benchmark due to the Fund’s operating and management expenses.
The Fund is an index fund. As such, its portfolio manager is not selecting specific securities to own, but is trying to match the Fund’s overall weightings and characteristics to the Barclays Capital U.S. Aggregate Bond Index weightings, while minimizing transaction costs.
The investment objective of the Fund is to match the performance of its benchmark. The Fund is constructed utilizing a combination of stratified sampling, characteristics matching, and replication in order to match the key performance driving characteristics of its benchmark.
The performance difference to its benchmark was driven largely by the heavy inflows into the Fund during the year. The Fund grew in assets under management by close to $500 million, finishing the year at slightly over $1.3 billion under management. The inflows generated 9 bps in transaction costs, which detracted from the Fund’s performance. The Fund also had to contest with continued volatility in the fixed income markets in 2010, driven largely by a combination of the European debt crisis and the continued concerns with the U.S. economy. The volatility helped drive Treasury yields lower which also drove the spread tightening across the fixed income sectors throughout the year. The credit sector for example, returned 8.47% for the year, due both to a tightening in treasury yields and corporations holding record cash balances and strong balance sheets.
JNL/Mellon Capital Management Global Alpha Fund
Sector Weightings*: | ||||
Short Term Investments** | 100.0 | % | ||
Total Investments | 100.0 | % | ||
*Total Investments at December 31, 2010 |
| |||
Portfolio Manager Commentary: For the year ended December 31, 2010, the JNL/Mellon Capital Management Global Alpha Fund out-performed its benchmark by posting a return of 6.00% for Class A shares compared to 0.12% for the Citigroup 1-Month Treasury Bill Index.
For 2010, the currency and bond allocation component strategies were the main alpha drivers. In the currency component, overweights to the Swedish krona, Swiss franc, and the Australian dollar were the largest alpha producers. Both the Swedish krona and Australian dollar outperformed the U.S. dollar after expectations for more
favorable economic climates in the global economy prompted investors to favor commodity and growth linked currencies, while interest rate hikes by the respective central banks also had positive impact on the currencies. The Swiss franc was another strong performer against the U.S. dollar after benefiting from its safe haven status as the euro tumbled due to sovereign concerns in the peripheral euro area countries. In the bond al-location component, an overweight to the U.S. and the Fund’s position in Japan were the largest alpha contributors. U.S. bonds outperformed for much of the year on flight to quality buying. The Fund’s positioning in Japanese bonds changed with the opportunities. The Fund held an under-weight during much of the year when Japanese bonds underperformed due to concerns about increasing supply and further quantitative easing.
The Fund was also able to capitalize on the rap-idly changing fundamentals by shifting its Japanese bond allocation which contributed alpha. Finally, the equity allocation component added modest alpha. An overweight to the UK and an underweight to Japan were the alpha drivers, while overweights to France and Spain detracted.
For the Fund’s strategy, we employ exchange traded stock and bond futures, which have the full backing of the respective exchange. We also employ over the counter (“OTC”) currency forwards to obtain long/short currency positions. Currency forward contracts are the most liquid and flexible means of obtaining currency exposure because of their customizable contract sizes and maturity dates. We employ derivatives because they have much lower trading costs.
** In general, the Fund uses derivatives as direct substitutites for investment in developed market stock indices, government bonds and currencies. Please refer to the Notes to the Schedules of Investments for the Fund’s derivative investments.
| JNL Mellon Capital Management Funds (continued) | |
| Mellon Capital Management Corporation |

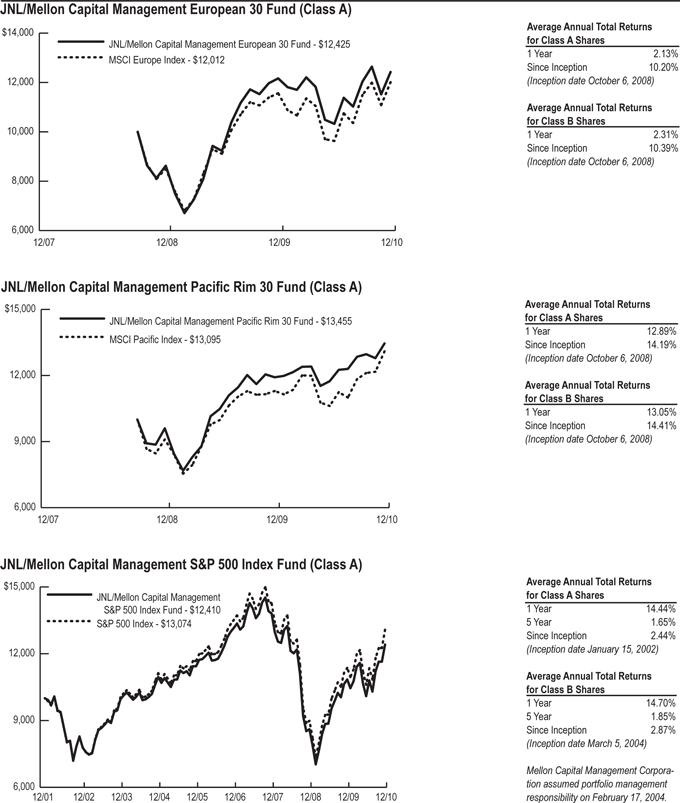
Past performance is not predictive of future performance. Investment return and principal value will fluctuate so that an investor’s shares, when redeemed, may be worth more or less than their original cost. Performance numbers are net of all Fund operating expenses, but not do not reflect the deduction of insurance changes.
 | JNL Mellon Capital Management Funds (continued) | |
| Mellon Capital Management Corporation |
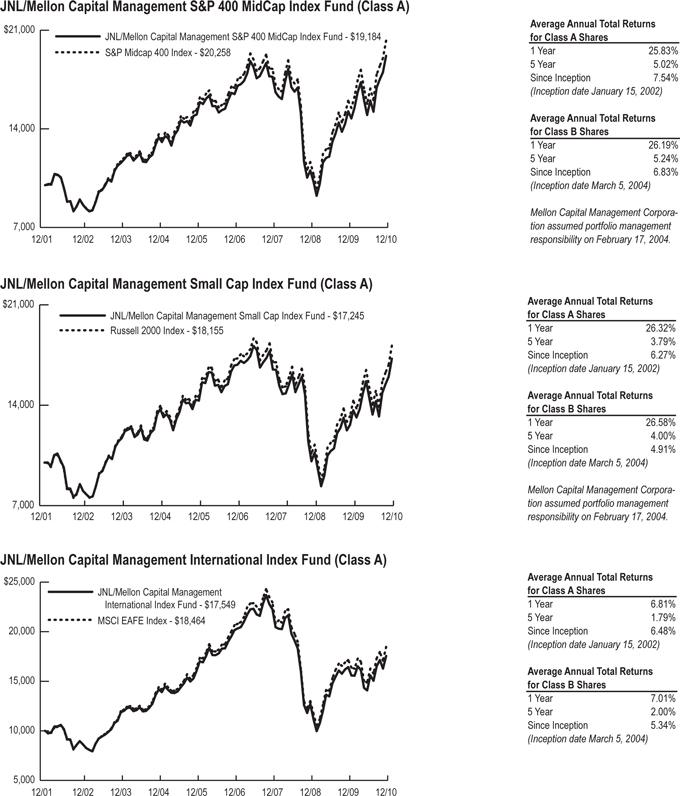
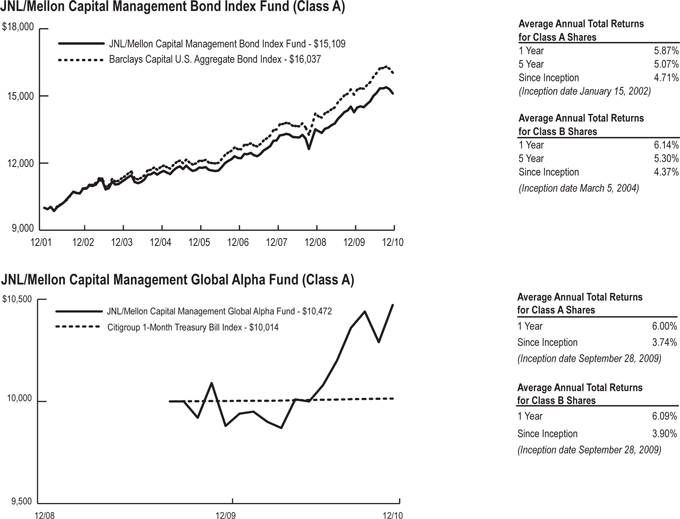
Past performance is not predictive of future performance. Investment return and principal value will fluctuate so that an investor’s shares, when redeemed, may be worth more or less than their original cost. Performance numbers are net of all Fund operating expenses, but not do not reflect the deduction of insurance changes.
 | JNL Oppenheimer Fund OppenheimerFunds, Inc. |
Market Summary: During the year, events on the global economic scale unfolded much as expected. There was a two speed recovery, with slow, subpar growth in the developed world and continued rapid growth in the emerging economies. We believe this is likely to persist for some time.
Growth rates in developed economies were hampered by efforts to significantly reduce heavy debt burdens as a result of years of overuse of leverage by both consumers and governments. Consumer debt in the U.S. generally continued to fall. Unemployment figures remained stubbornly high and housing markets in many economies, most significantly in the U. S.,
continued to struggle. Understandably, consumer confidence remained low. To add to the tumult, the eurozone’s debt crisis sent markets sharply lower over the spring and summer.
In contrast, emerging markets continued to witness very strong growth during the year. Indeed, growth was so strong that monetary policy tightened in order to rein in growth to sustainable levels and to keep a lid on inflation. High inflation, particularly in food prices, can put great pressure on economic, political and market stability in developing nations.
JNL/Oppenheimer Global Growth Fund
Sector Weightings*: | ||||
Information Technology | 27.0 | % | ||
Consumer Discretionary | 16.6 | |||
Financials | 14.7 | |||
Industrials | 13.5 | |||
Consumer Staples | 7.9 | |||
Health Care | 6.9 | |||
Energy | 3.5 | |||
Telecommunication Services | 2.1 | |||
Utilities | 0.8 | |||
Materials | 0.6 | |||
Short Term Investments | 6.4 | |||
Total Investments | 100.0 | % | ||
*Total Investments at December 31, 2010 |
| |||
Portfolio Manager Commentary: For the year ended December 31, 2010, the JNL/Oppenheimer Global Growth Fund outperformed its benchmark by posting a return of 15.38% for Class A shares compared to 11.76% for the MSCI World Index.
The Fund’s bottom up approach of investing led to overweight positions in information technology and consumer discretionary, where we have consistently found the most companies that have the potential to grow faster over the long term compared to the overall market. These two
sectors were the top two positive contributors to performance this year. Within information technology, the largest contributors were U.S. based companies, Intuit, Inc., Altera Corp. and Juniper Networks Inc.; the Indian business software and outsourcing giant Infosys Technologies Ltd.; and Swedish telecommunications giant, Telefonaktiebolaget LM Ericsson (“Ericsson”). In consumer discretionary, the greatest contributors to performance included French luxury goods group LVMH Moet Hennessy Louis Vuitton SA; cruise and vacation company Carnival Corp.; German automobile manufacturer Bayerische Motoren Werke AG (“BMW”); Spanish company Inditex SA, which is known worldwide for its Zara brand; and the Italian footwear manufacturer Tod’s SpA.
On the negative side, the greatest detractor from performance during the year was materials, where the Fund’s underweight position in the sector hurt performance. Despite the recent run up in some commodity prices, we do not foresee overall prices continuing to rise and, as a consequence, believe most materials stocks to be over-valued. We currently plan to remain underweight this sector. Energy also provided negative results due to investments in Transocean Ltd. (“Trans-ocean”) and Total SA.
At the country level, the U. S. was the strongest performer for the Fund closely followed by Germany. As a result of its exposure to BMW and electronics and electrical engineering company Siemens AG, the Fund outperformed its bench-mark. The Fund’s exposure to Sweden outper-formed with contributions from Ericsson and Assa Abloy AB. Switzerland was the greatest detractor to Fund performance because of poor showings by Credit Suisse Group AG and Transocean.
We believe the Fund is very well positioned at year end, and also believe our long term, thematic based investment process is well suited in the current environment. In our opinion, growth companies will become more valuable in a world where growth is a scarce commodity. We anticipate overall growth, particularly in the developed world, will continue to be subpar in the near term. We do not attempt to double guess the short term, but we are very confident in regard to the long term. Valuations are low by historic standards, particularly when measured against bonds. We are optimistic about the Fund’s holdings given present equity valuations.
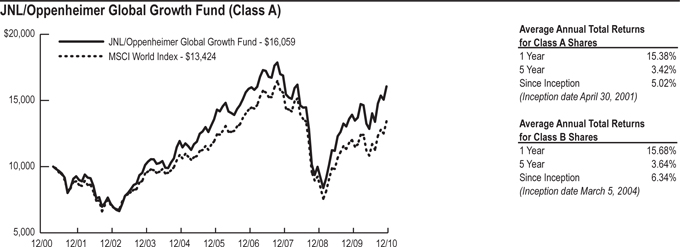
Past performance is not predictive of future performance. Investment return and principal value will fluctuate so that an investor’s shares, when redeemed, may be worth more or less than their original cost. Performance numbers are net of all Fund operating expenses, but not do not reflect the deduction of insurance changes.
JNL PAM Funds Prudential** Asset Management (Singapore) Limited |
Market Summary: The stock markets of Asia ex-Japan climbed sharply for a second consecutive year in 2010 following the global financial crisis of 2008. Generally upbeat perceptions of the U.S. and Chinese economies offset concern about Europe’s debt problems and lifted the region higher in 2010.
The China and India markets posted smaller price gains after their strong rebound in 2009. Both posted steady economic growth where consumption
remained strong. Containing price rises and normalizing interest rate were key issues for both markets in 2010. The Reserve Bank of India raised the policy rate six times, totaling 150 basis points (“bps”), while the Chinese government was under pressure to revalue the Chinese yuan to reflect its economic fundamentals and as a result, the People Bank of China upped its lending rate twice, a total of 50 bps.
JNL/PAM Asia ex-Japan Fund
Sector Weightings*: | ||||
Financials | 30.0 | % | ||
Information Technology | 19.5 | |||
Industrials | 13.0 | |||
Energy | 8.4 | |||
Materials | 8.0 | |||
Telecommunication Services | 6.4 | |||
Consumer Staples | 3.2 | |||
Utilities | 2.9 | |||
Consumer Discretionary | 2.5 | |||
Health Care | 1.7 | |||
Rights | 0.0 | |||
Warrants | 0.0 | |||
Short Term Investments | 4.4 | |||
Total Investments | 100.0 | % | ||
*Total Investments at December 31, 2010 |
| |||
Portfolio Manager Commentary: For the year ended December 31, 2010, the JNL/PAM Asia ex-Japan Fund underperformed its bench-mark by posting a return of 19.40% for Class A shares compared with 19.62% for the MSCI Asia ex-Japan Index.
Stock selection in financial, energy and consumer discretionary and asset allocation to energy contributed to the Fund’s performance. Stock selection in materials and utilities and a large cash position hurt the Fund. Among markets, China and Singapore were big contributors
to Fund performance. Korea and Hong Kong re-strained the Fund.
AAC Acoustic Technologies Holdings Inc. (“AAC”) and Metropolitan Bank & Trust Co. (“Metro Bank”) were among the larger contributors to the Fund’s performance. Each stock outperformed its domestic market as well as the regional benchmark. We expect Hong Kong listed AAC, a maker of telephone components, to benefit from rising demand for smart phones and tablet computers. In the Philippines, shares in Metro Bank, a commercial bank with a successful and expanding retail business, re-rated to well above long term valuations, in line with those of the banking sector.
In contrast, Shanda Games Ltd. (“Shanda”) and Sino-Ocean Land Holdings Ltd. (“Sino-Ocean”) were among the larger detractors from the Fund’s performance. Each underperformed its domestic market as well as the regional bench-mark. Shanda is a leading distributor in China of online games. Investors punished the stock as consumers turned a cold shoulder to Shanda’s existing line up of games, hurting earnings. We like the company’s position in the industry and believe that Shanda’s new product line will do well. Sino-Ocean is a real estate company active in Beijing. The stock price declined as China’s government worked to cool an overheated property
market. Sino-Ocean, however, has held a leading market share of all the space sold in Beijing since 2004. For these reasons, the Fund continues to hold these securities despite the temporary set-backs.
Among its larger transactions the Fund established new positions in Hyundai Engineering & Construction Co. Ltd. (“Hyundai Engineering”) and Korea Exchange Bank. A stake in Hutchison Whampoa Ltd. (“Hutchison Whampoa”) was also raised. Hyundai Engineering was purchased when the share price was weak. The company is active in petrochemical and refinery work in the Middle East and, in our view, has limited expo-sure to Korea’s weak market in residential property. We believe the assets of Korea Exchange Bank are among the best in that country’s banking industry. Hutchison Whampoa is a Hong Kong conglomerate active globally in ports, telecommunications and real estate.
At year end, China and India were the Fund’s top weighted markets. The Funds sector weights were close to benchmark. The Fund’s top positive bets included Samsung Fire & Marine Insurance Co. Ltd., Hutchison Whampoa and Shinsegae Co. Ltd. We believe Asia ex-Japan economic growth will exceed that of the world’s developed markets in the coming few years, led by China and India.
JNL/PAM China-India Fund
Sector Weightings*: | ||||
Financials | 30.2 | % | ||
Energy | 14.6 | |||
Information Technology | 11.7 | |||
Materials | 9.3 | |||
Consumer Discretionary | 8.5 | |||
Industrials | 4.7 | |||
Telecommunication Services | 4.6 | |||
Health Care | 2.8 | |||
Consumer Staples | 2.8 | |||
Utilities | 1.5 | |||
Short Term Investments | 9.3 | |||
Total Investments | 100.0 | % | ||
*Total Investments at December 31, 2010 |
| |||
Portfolio Manager Commentary: For the year ended December 31, 2010, the JNL/PAM China-India Fund outperformed one of its bench-marks by posting a return of 16.93% for Class A Shares, compared to 4.63% for the MSCI
China Index. The Fund underperformed its other benchmark, the MSCI India Index, which returned 20.95%.
Stock selection accounted for the bulk of the excess return. Axis Bank Ltd. (“Axis Bank”) was one of the top contributors to the Fund’s outperformance. Strong earnings expectations boosted AXIS Bank share price. The lack of exposure to China Life Insurance Co. Ltd, which underperformed the market, also lifted the Fund’s overall performance. Robust property sales, de-spite stricter rules, led to Evergrande Real Estate Group Ltd.’s price rise.
The Fund’s position in China Zhongwang Holdings Ltd. (“China Zhongwang”) and BYD Co. Ltd. (“BYD”) hurt performance. Share price of China Zhongwang weakened on fears of a new competitor entering into its market domain. BYD share price fell on slower than expected sell-through of its auto products. However, the
inventory issue resulting from the slower than expected sell-through has since improved. Lack of exposure to certain companies held by the Fund’s benchmark, such as, Tata Consultancy Services and Housing Development Finance Corporation Ltd. also detracted performance.
The Fund exited from Maruti Suzuk India Ltd., GVK Power & Infrastructure Ltd., IVRCL Infra-structures & Projects Ltd., Li Ning Co. Ltd., Bharat Petroleum Corp. Ltd., Tata Steel Ltd., Bharti Airtel Ltd. and China Resources Land Ltd. New names added included Mahindra & Mahindra Financial Services Ltd., a subsidiary of Mahindra & Mahindra Ltd. (“Mahindra & Mahindra”), Evergrande Real Estate Group Ltd., Oil & Natural Gas Corp. Ltd., Tata Motors Ltd., Xingda International Holdings Ltd., Bharat Heavy Electricals Ltd., Mundra Port and Special Economic Zone Ltd. and Mahindra & Mahindra.
**Prudential Asset Management (Singapore) Limited is an indirect, wholly-owned subsidiary of Prudential Plc, a publicly traded company incorporated in the United Kingdom. Prudential Plc is not affiliated in any manner with Prudential Finance Inc., a company who principal place of business is in the United States of America.
| JNL PAM Funds (continued) | ||
Prudential** Asset Management (Singapore) Limited
|
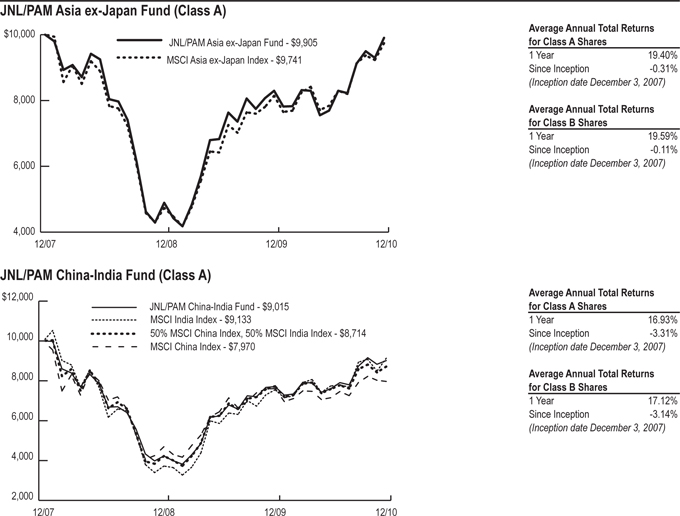
Past performance is not predictive of future performance. Investment return and principal value will fluctuate so that an investor’s shares, when redeemed, may be worth more or less than their original cost. Performance numbers are net of all Fund operating expenses, but not do not reflect the deduction of insurance changes.
**Prudential Asset Management (Singapore) Limited is an indirect, wholly-owned subsidiary of Prudential Plc, a publicly traded company incorporated in the United Kingdom. Prudential Plc is not affiliated in any manner with Prudential Finance Inc., a company who principal place of business is in the United States of America.
 | JNL PIMCO Funds | |
| Pacific Investment Management Company LLC |
Market Summary: At the start of 2010, investors sought the relative safety of U.S. bonds amid concern about sovereign debt risk, especially in Greece and other peripheral eurozone economies as growing budget shortfalls in Greece, Spain and Portugal raised fears that the region might derail the global economy’s recovery from the crisis that began in 2008. Policymakers wrestled with how long to sustain stimulus programs designed to mitigate the global recession but which threatened to undermine public finances or stoke inflation. While the Federal Reserve (“Fed”) kept its main policy rate unchanged, it concluded its $1.25 trillion agency mortgage purchase program in March and also ended the subscription period for purchasing consumer asset-backed securities.
After a steady declining trend throughout 2010, interest rates jumped in the fourth quarter in reaction to increased inflation expectations stemming from the combination of the Fed’s announcement of Quantitative Easing II and a surprise stimulus package involving corporate and individual tax breaks. Fixed income markets gave back some of their gains during the fourth quarter as a consequence.
Most credit sectors also performed well in 2010, driven in part by strengthening economic fundamentals and from the search for yields in excess of the extremely low riskless Treasury rates. Risk appetite accelerated after the announcement of the bailout package for euroland peripheral countries. Prices on asset classes such as commercial mortgage-backed securities and high yield corporate bonds increased significantly throughout the second half of the year.
Treasury Inflation Protected Securities (“TIPS”) gained 6.31% for the entire year as represented by the Barclays Capital U.S. TIPS Index. Over the year, the real yield curve steepened as shorter maturity real yields declined more than long dated yields. Real coupons hurt returns but positive inflation accruals more than compensated despite cyclical disinflationary pressures.
Breakeven inflation levels seesawed during the year, hitting lows in August before widening by year end across all maturities to the levels of the beginning of the year. Shorter maturity TIPS rallied during the latter half of the year largely on the declining strength of the U.S. dollar and its subsequent impact of a rise in commodity prices. Market inflation expectations increased markedly by year end following the tax cut extensions and its positive impact on potential consumer expenditures and negative impact of rising fiscal deficits.
JNL/PIMCO Real Return Fund
| Sector Weightings*: | ||||
Government Securities** | 54.3 | % | ||
Financials | 15.2 | |||
Non-U.S. Government Agency | ||||
Asset-Backed Securities | 6.2 | |||
U.S. Government Agency | ||||
Mortgage-Backed Securities | 0.9 | |||
Energy | 0.3 | |||
Telecommunication Services | 0.2 | |||
Materials | 0.2 | |||
Health Care | 0.2 | |||
Information Technology | 0.2 | |||
Consumer Discretionary | 0.1 | |||
Consumer Staples | 0.1 | |||
Industrials | 0.0 | |||
Short Term Investments | 22.1 | |||
Total Investments | 100.0 | % | ||
*Total Investments at December 31, 2010 | ||||
**The Funds weightings in TIPS was 50.9% of total investments, of this amount, 35.4% was invested in delayed delivery “To Be Announced” (“TBA”) and forward sales commitment securities.
Portfolio Manager Commentary: For the year ended December 31, 2010, the JNL/PIMCO Real Return Fund outperformed its benchmark by positing a return of 7.72% for Class A shares compared to 6.31% for the Barclay’s Capital U.S. TIPS Index.
The following is a summary of the positive contributors to the Fund’s performance relative to its benchmark in 2010:
| • | An overweight to duration, as U.S. interest rates fell. |
| • | A U.S. nominal yield curve position implemented via eurodollar futures, most of which rose in price. |
| • | Positions in bonds of financial companies, which outpaced the broader corporate market. |
| • | Modest holdings of non-agency mortgages amid strong demand for high quality bonds offering incremental yield. |
| • | Exposure to emerging market local bonds, particularly Brazil, primarily obtained through |
zero coupon swaps, added to returns on continued investor demand for higher yielding securities. |
| • | Exposure to a select basket of emerging market currencies, focused in Asia; the U.S. dollar continued its decline against most currencies. |
Conversely, an underweight to real yields relative to the benchmark detracted from returns as real yields also fell during the period.
During the year, the Fund’s increased its exposure to emerging markets +4%, high yield +2%, governments +2%, mortgage backed +1% and municipals +1%; while reducing exposure to corporates -3% and non U.S government agency asset-backed -1%. Net cash equivalents, including derivatives, moved from a +2% at the beginning of the year to -4% at year end.
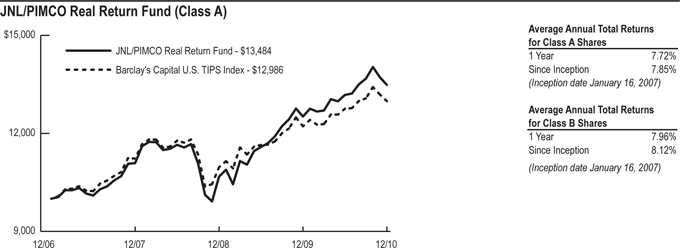
Past performance is not predictive of future performance. Investment return and principal value will fluctuate so that an investor’s shares, when redeemed, may be worth more or less than their original cost. Performance numbers are net of all Fund operating expenses, but not do not reflect the deduction of insurance changes.
 | JNL PIMCO Funds (continued) | |
| Pacific Investment Management Company LLC |
JNL/PIMCO Total Return Bond Fund
Sector Weightings*: | ||||
Government Securities | 37.9 | % | ||
U.S. Government Agency | ||||
Mortgage-Backed Securities | 29.0 | |||
Financials | 14.7 | |||
Non-U.S. Government Agency | ||||
Asset-Backed Securities | 4.3 | |||
Energy | 1.8 | |||
Utilities | 0.7 | |||
Telecommunication Services | 0.7 | |||
Information Technology | 0.6 | |||
Health Care | 0.5 | |||
Consumer Staples | 0.4 | |||
Materials | 0.3 | |||
Consumer Discretionary | 0.3 | |||
Industrials | 0.1 | |||
Short Term Investments | 8.7 | |||
Total Investments | 100.0 | % | ||
*Total Investments at December 31, 2010 |
Portfolio Manager Commentary: For the year ended December 31, 2010, the JNL/PIMCO Total Return Bond Fund outperformed its benchmark by positing a return of 7.57% for Class A shares compared to 6.54% for the Barclays Capital U.S. Aggregate Bond Index.
The following is a summary of the main contributors to the Fund’s performance relative to its benchmark in 2010:
| • | Tactical duration positioning in the U.S. was negative for the full year performance but was more than offset from interest rate expo- sure in Europe that added to performance as the 10-year Bund yield fell to end the year at 2.96%. |
| • | A curve steepening position in the U.S., implemented via eurodollar futures, added to returns as prices rose across most money market futures contracts during the year. |
| • | An underweight to agency mortgage-backed securities during the early part of the year detracted from returns as this sector outperformed like duration Treasuries. However, an overweight to this sector during the last quarter offset this negative impact. |
| • | An overweight to bonds of financial companies, which outpaced the broader corporate market. |
| • | Modest exposure to high yield bonds added to performance as the sector outperformed like duration |
Treasuries amid investor shift to- wards riskier assets. |
| • | An overweight to emerging markets, with an emphasis on local rates in Brazil, primarily obtained through zero coupon swaps, added to returns as rates fell in that country. |
| • | Exposure to a variety of foreign currencies, with an emphasis on the Brazilian real and a basket of Asian currencies, added to returns as these currencies appreciated relative to the U.S. dollar. |
| • | A modest exposure to Build America Bonds detracted from returns as taxable municipal supply spiked in the fourth quarter amid the rush by local governments to tap the federal government subsidy before it expired at the end of this year. |
During the year, the Fund increased its expo-sure to, mortgage-backed +20%, governments +11%, emerging markets +8%, high yield +2% and municipals +2%; while reducing exposure to non U.S government agency asset-backed -13% and corporates -2%. Net cash equivalents, including derivatives, moved from a 0% at the be-ginning of the year to -28% at year end.
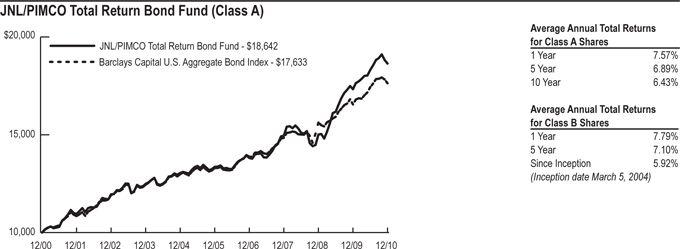
Past performance is not predictive of future performance. Investment return and principal value will fluctuate so that an investor’s shares, when redeemed, may be worth more or less than their original cost. Performance numbers are net of all Fund operating expenses, but not do not reflect the deduction of insurance changes.
 | JNL PPM America Funds | |
PPM America, Inc.
|
Market Summary: In 2010, the S&P 500 Index increased 15.1%. For each of the calendar quarters (excluding the second quarter when defensive stocks took leadership), the best performing sectors included economically cyclical areas such as consumer discretionary and industrials. For the full year, the best performing sectors included consumer discretionary, industrials and materials while the worst performing sectors included defensive areas including health care and utilities. Given the strong performance in consumer discretionary, it wasn’t surprising that two names in this sector were among the top five S&P 500 Index stock contributors for 2010. The top five stock contributors included Netflix Inc., F5 Networks Inc., Cummins Inc., Wynn Resorts Ltd. and American International Group Inc. The worst five stock contributors for 2010 were Dean Foods Co., H&R Block Inc., Apollo Group Inc., Diamond Offshore Drilling Inc. and PulteGroup Inc. Value based investment styles took an early lead in 2010, and then fell back but slightly outperformed growth based styles for the full year, as the S&P 500/Citigroup
Growth Index returned 15.0% compared to a return of 15.1% for the S&P 500/Citigroup Value Index. Smaller capitalized stocks outperformed larger sized stocks as the smallest 100 companies in the S&P 500 Index increased 26.8%, while the largest 100 companies in the S&P 500 Index increased 12.2% in 2010.
High yield bonds posted a strong fourth quarter and finished the year on strength. As measured by the Merrill Lynch High Yield Master II Constrained Index, total returns for the three months ended December 31, 2010 were 3.1%, bringing the total for the full year to 15.1%. Spreads tightened in the final months of the year as corporate earnings remained mostly positive, economic data showed some stabilization and investor risk appetites increased. While there was a slight setback in November, spreads tightened in the fourth quarter by 85 basis points (“bps”), more than enough to offset the recent rise in interest rates. For the full year, high yield bonds generated total returns comparable to the S&P 500 Index and significantly outperformed U.S. Treasury securities.
JNL/PPM America High Yield Bond Fund
Sector Weightings*: | ||||
Consumer Discretionary | 18.5 | % | ||
Financials | 10.5 | |||
Energy | 8.9 | |||
Industrials | 8.1 | |||
Materials | 7.2 | |||
Telecommunication Services | 6.5 | |||
Health Care | 5.6 | |||
Non-U.S. Government Agency | 3.5 | |||
Utilities | 3.0 | |||
Information Technology | 2.6 | |||
Consumer Staples | 2.5 | |||
Investment Companies | 0.6 | |||
Short Term Investments | 22.5 | |||
Total Investments | 100.0 | % | ||
| *Total Investments at December 31, 2010 |
Portfolio Manager Commentary: For the year ended December 31, 2010, the JNL/PPM America High Yield Bond Fund outperformed its benchmark by posting a return
of 15.63% for Class A shares compared to 15.07% for the Bank of America Merrill Lynch High Yield Master II Constrained Index.
Attribution analysis, which compares the Fund’s returns to its benchmark, reflects that investments in energy, electric utility and the airline industry were the largest contributors of positive relative performance. The Fund also held approximately 3% of its assets in commercial mortgage-backed securities and that sector contributed over 85 bps of relative performance. Underweighted positions and unfavorable security selection in banking, insurance and real estate industries detracted from performance relative to the Fund’s benchmark.
The Fund is highly diversified and thus on an individual security basis the sources of out performance came from dozens of different names, each of which contributed 4 to 10 bps individually. Included
in this list for 2010 was Freescale Semiconductor Inc., Delta Air Lines Inc., United Air Lines Inc., Beazer Homes USA Inc., GMAC LLC (now ALLY Bank) and EnergySolutions Inc. Holdings in Stone Container Finance Corp., Dish Network Corp. and RadNet Inc. detracted from relative returns as did the Fund’s avoidance of several distressed names such as istar Financial Inc., Residential Capital LLC and Realogy Corporation, all of which rallied significantly during the year.
Cash balances were the single largest drag on performance and cost the Fund 65 bps of return relative to its benchmark, which of course remains 100% theoretically invested at all times. This drag on performance was offset by strong, steady investor inflows throughout the year with total net assets growing 58% to a level over $900 million at year end.
JNL/PPM America Mid Cap Value Fund
Sector Weightings*: | ||||
Industrials | 24.7 | % | ||
Consumer Discretionary | 15.5 | |||
Financials | 14.0 | |||
Information Technology | 10.6 | |||
Materials | 10.1 | |||
Energy | 8.3 | |||
Health Care | 6.3 | |||
Utilities | 4.6 | |||
Consumer Staples | 2.4 | |||
Short Term Investments | 3.5 | |||
Total Investments | 100.0 | % | ||
*Total Investments at December 31, 2010 |
Portfolio Manager Commentary: For the year ended December 31, 2010, the JNL/PPM America Mid Cap Value Fund outperformed its benchmarks by posting a return of 29.58% for Class A shares compared to 24.75% for the Russell Mid Cap Value Index and 25.48% for the Russell Mid Cap Index.
The Fund’s outperformance relative to Russell Mid Cap Value Index can be primarily attributed to individual stock selection. Positive sector selection also favorably influenced relative performance, but the Fund’s sector weights remain the result of the Fund’s bottom up security selection process.
Positive sector influences on relative performance included an overweight in industrials and underweight in utilities. Negative sector influences on relative performance included an over-weight position in technology and an underweight in energy.
Positive security contributors to relative performance included information technology companies, OmniVision Technologies Inc. (“OmniVision Technologies”). and Novell Inc. (“Novell”), as well as consumer staples companies, Corn Products International Inc. and NBTY Inc. (“NBTY”). Stocks that detracted from Fund performance were financials companies, Reinsurance Group of America Inc., and Astoria Financial Corp. and energy companies, Comstock Resources Inc. (“Comstock”) and Hercules Offshore Inc. (“Hercules Offshore”).
Positions added to the Fund during the year included Allstate Corp., Fairchild Semiconductor International Inc. (“Fairchild Semiconductor”), Helix Energy Solutions Group Inc. (“Helix Energy”), LifePoint Hospitals Inc. (“Lifepoint Hospitals”), National Oilwell Varco Inc. (“National Oilwell”), Sketchers U.S.A. Inc. and Teradyne Inc.
(“Teradyne”). A position in Smith International Inc. (“Smith International”) was added and later sold when Schlumberger Ltd. (“Schlumberger”). and Smith International announced a merger in a stock for stock transaction. Several positions were sold in the Fund and included BorgWarner Inc. (“BorgWarner”), Fortune Brands Inc. (“For-tune Brands”), Hercules Offshore, Ingram Micro Inc. (“Ingram Micro”), NBTY, Newfield Exploration Co., Novell, Res-Care Inc. (“Res-Care”), and Towers Watson & Co. (“Towers & Watson”).
Relative to the Russell Mid Cap Value Index, the Fund’s overweight position in financials and materials increased. The Fund’s underweight position in consumer staples increased while the underweight in health care decreased.
Our view is that overall sentiment remains positive towards U.S. equities. We believe the market’s current valuation is attractive and that the Fund is inexpensive relative to the overall market. We continue to favor industrials, consumer discretionary and materials, the Fund’s largest sector overweights, relative to the Russell Mid Cap Value Index, at the end of December. We believe these sectors are still very attractive on a long term basis and offer significant upside potential using our normal 2 to 3 year investment time horizon.
 | JNL PPM America Funds (continued) PPM America, Inc. |
JNL/PPM America Small Cap Value Fund
Sector Weightings*: | ||||
Industrials | 26.9 | % | ||
Consumer Discretionary | 19.3 | |||
Information Technology | 12.8 | |||
Financials | 10.9 | |||
Energy | 8.5 | |||
Health Care | 4.5 | |||
Materials | 4.1 | |||
Consumer Staples | 3.5 | |||
Utilities | 1.4 | |||
Short Term Investments | 8.1 | |||
Total Investments | 100.0 | % | ||
*Total Investments at December 31, 2010
Portfolio Manager Commentary: For the year ended December 31, 2010, the JNL/PPM America Small Cap Value Fund outperformed its benchmark by posting a return of 27.71% for Class A shares compared to 24.72% for the S&P SmallCap 600/Citigroup Value Index.
The Fund’s outperformance relative to its benchmark was driven mainly by positive security selection. Positive sector selection also favorably influenced relative performance, but the Fund’s sector
weights remain the result of the Fund’s bottom up security selection process.
Positive sector influences on relative performance included an overweight in consumer discretionary and energy. Negative sector influences on relative performance included an over-weight position in consumer staples and a slight underweight in telecommunication services.
Positive security contributors to relative performance included information technology companies, OmniVision Technologies and Novell, as well as consumer staples companies, NBTY and Del Monte Foods Co. (“Del Monte”). Stocks that detracted from Fund performance were energy companies, Comstock and Hercules Offshore, and financials company, SeaBright Insurance Holdings Inc.
Positions added to the Fund during the year included Fairchild Semiconductor, Helix Energy, Independent Bank Corp., Lifepoint Hospitals, Patterson-UTI Energy Inc.
(“Patterson-UTI Energy”), SYNNEX Corp. and Teradyne. Several positions sold in the Fund included Abercrombie & Fitch Co., BorgWarner, Del Monte, Ingram Micro, NBTY, Res-Care and Towers Watson.
Relative to its benchmark, the Fund’s significant underweight position in information technology became a modest overweight. The overweight position in consumer staples declined significantly while the overweight position in energy increased.
Our view is that overall sentiment remains positive towards U.S. equities. We believe the market’s current valuation is attractive and that the Fund is inexpensive relative to the overall market. We continue to favor consumer discretionary and industrials, the Fund’s largest sector overweights, relative to its benchmark, at the end of December. We believe these sectors are still very attractive on a long term basis and offer significant upside potential using our normal 2 to 3 year investment time horizon.
JNL/PPM America Value Equity Fund
Sector Weightings*: | ||||
Financials | 23.1 | % | ||
Information Technology | 13.9 | |||
Consumer Discretionary | 13.0 | |||
Industrials | 11.1 | |||
Energy | 10.5 | |||
Health Care | 9.3 | |||
Consumer Staples | 7.0 | |||
Telecommunication Services | 4.4 | |||
Materials | 4.1 | |||
Utilities | 2.1 | |||
Short Term Investments | 1.5 | |||
Total Investments | 100.0 | % | ||
*Total Investments at December 31, 2010
Portfolio Manager Commentary: For the year ended December 31, 2010, the JNL/PPM America Value Equity Fund outperformed its benchmark by posting a return of 17.46% for Class A shares compared to 15.10% for the S&P 500/Citigroup Value Index.
The Fund’s outperformance relative to its benchmark was driven mainly by positive security selection. Positive sector selection also favorably
influenced relative performance, but the Fund’s sector weights remain the result of the Fund’s bottom up security selection process.
Positive sector influences on relative performance included an overweight position in consumer discretionary and underweight positions in health care and utilities. Negative sector influences on relative performance included overweight positions in energy and information technology.
Positive security contributors to relative performance included energy companies, National Oilwell and Smith International, as well as consumer discretionary companies, Royal Caribbean Cruises Ltd. and Macy’s Inc. Positive security selection in industrials company Caterpillar Inc., also helped relative performance. Stocks that detracted from performance were information technology companies, Hewlett-Packard Co. and Microsoft Corp., and financials companies, Morgan Stanley and Goldman Sachs Group Inc.
Positions added to the Fund during the year included CVS Caremark Corp., National Oilwell, Patterson-UTI Energy, Texas Instruments Inc. and
U.S. Bancorp. Smith International was sold when Schlumberger and Smith International announced a merger in a stock for stock transaction. Several other positions sold in the Fund included Fortune Brands, Ingram Micro and Newfield Exploration Co. Frontier Communications Corp., the result of a corporate action, was also sold.
Relative to its benchmark, the Fund’s under-weight position in health care went to a modest overweight. The Fund’s underweight position in energy increased substantially while the consumer staples underweight decreased.
Our view is that overall sentiment remains positive towards U.S. equities. We believe the market’s current valuation is attractive and that the Fund is inexpensive relative to the overall market. We continue to favor information technology and consumer discretionary, the Fund’s largest sector overweights, relative to its benchmark, at the end of December. We believe these sectors are still very attractive on a long term basis and offer significant upside potential using our normal 2 to 3 year investment time horizon.
 | JNL PPM America Funds (continued) | |
PPM America, Inc. |
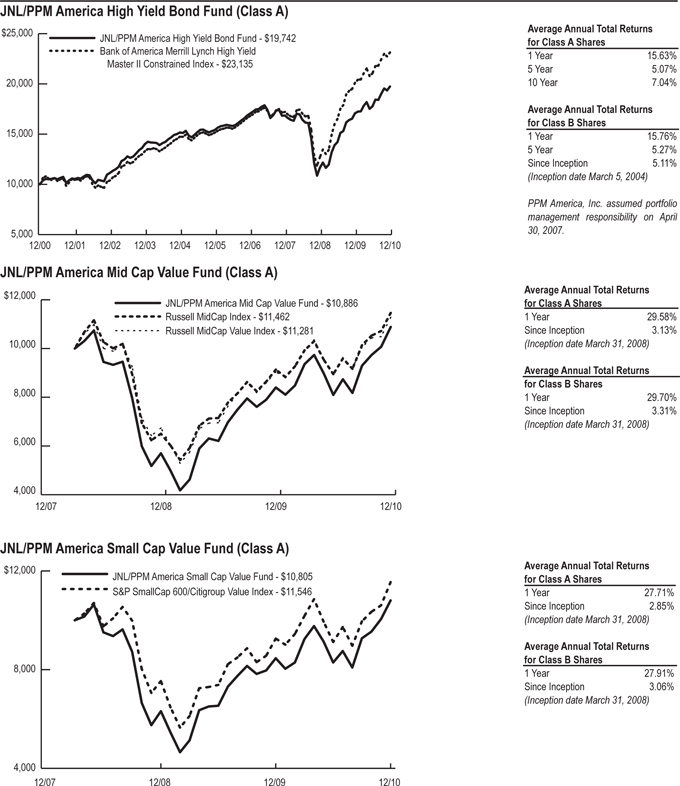
Past performance is not predictive of future performance. Investment return and principal value will fluctuate so that an investor’s shares, when redeemed, may be worth more or less than their original cost. Performance numbers are net of all Fund operating expenses, but not do not reflect the deduction of insurance changes.
 | JNL PPM America Funds (continued) | |
PPM America, Inc. |
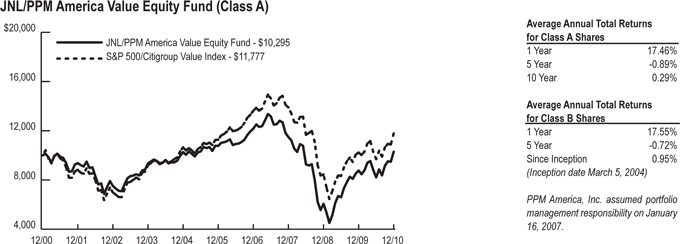
Past performance is not predictive of future performance. Investment return and principal value will fluctuate so that an investor’s shares, when redeemed, may be worth more or less than their original cost. Performance numbers are net of all Fund operating expenses, but not do not reflect the deduction of insurance changes.
 | JNL Red Rocks Fund Red Rocks Capital LLC |
Market Summary: In the private equity market, the following occurred in 2010 and continued into the year end: first, the pace of the recovery exceeded our expectations on a macroeconomic level and specifically within the private equity sector, including top line growth expectations; second, the
recovery on multiples paid on private equity transactions exceeded our expectations, due in part to the credit markets showing some stability in 2010; and third, private equity products’ relative and absolute performance when compared to most recognized global benchmarks exceeded expectations.
JNL/Red Rocks Listed Private Equity Fund
Sector Weightings*: | ||||
Financials | 80.1 | % | ||
Diversified | 12.9 | |||
Industrials | 2.1 | |||
Information Technology | 1.6 | |||
Rights | 0.1 | |||
Short Term Investments | 3.2 | |||
Total Investments | 100.0 | % | ||
*Total Investments at December 31, 2010
Portfolio Manager Commentary: For the year ended December 31, 2010, the JNL/Red Rocks Listed Private Equity Fund under-performed its benchmark by posting a return of 26.32% for Class A shares compared to 31.51% for the S&P Listed Private Equity Index.
The Fund exited six holdings and added nine companies during 2010. The Fund’s low turnover
emphasizes the belief that long term investments in private equity require patience. Additions during the year included Blackstone Group LP, Brookfield Asset Management Inc., Orkla ASA and HBM Bioventures AG. The prospects of these companies are promising and they provide Fund shareholders with additional diversification.
Contributors to performance for the year included KKR & Co. LP, Conversus Capital LP and Onex Corp. Detractors to performance for the year included GP Investments LTD, IP Group Plc and Dinamia Capital Privado Scr SA.
The private equity landscape appears well positioned for 2011. Deal activity is on the rise and we anticipate that mergers and acquisitions may have a solid year. Debt is available for transactions with reasonable terms. We see idled cash levels decreasing as deals get completed, including
select deals in the initial public offering market (those smaller in size and with less leverage). Time will tell if some of the larger deals, such as HCA Inc., Toys “R” Us Inc. and Nielsen Finance LLC can be completed.
Many global challenges still remain, including European sovereign debt, the U.S. housing market, various geopolitical issues and China with its growing pains. We will exercise prudence while examining new names and continually assess current holdings.
The Fund remains approximately 80% in-vested outside the U.S. Looking to the new year, we continue to evaluate the same attributes: valuation, leverage, the ability to monetize private investments and the ability to find and acquire promising private companies at reasonable prices.
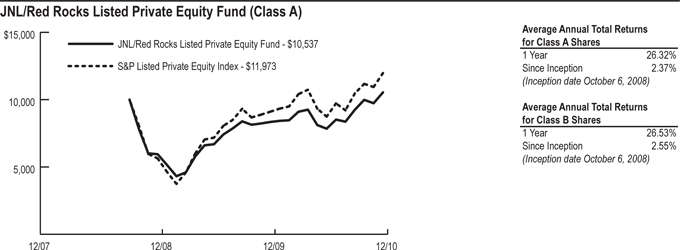
Past performance is not predictive of future performance. Investment return and principal value will fluctuate so that an investor’s shares, when redeemed, may be worth more or less than their original cost. Performance numbers are net of all Fund operating expenses, but not do not reflect the deduction of insurance changes.
 | JNL S&P Funds Standard & Poor’s Investment Advisory Services LLC |
Market Summary: Performance of capital markets worldwide improved considerably in 2010 although some investment avenues fared better than others. Risk eager investing resumed with a vengeance in the final quarter of 2010 despite setbacks to many such markets in November. The remaining three months of 2010 commenced with investors plainly exhibiting healthy appetites for riskier investment vehicles, but single digit gains earned in October surrendered to renewed risk aversion the next month as many, if not most, risky asset markets turned in disappointingly negative results as investors abandoned them in favor of safer alternatives amid recurrent fears of a default in the eurozone periphery. A surprise to the upside in December, due primarily to another enormous U.S. central bank credit injection, imbued investors with hope before year end. Steady, material improvement in corporate financial conditions (especially, cash flows) ordinarily would furnish a necessary and sufficient pretext for a sustained, perhaps potent rally in many developed shares markets | around the globe were it not for the protracted re-equilibration of vital macro-economic fundamentals – principally, housing demand, capital spending and employment markets – that might restrain any extension of the year end rally for an extended period. Intermittently upbeat news regarding the American and global economies, however, is scarcely adequate to inspire greater enthusiasm for stocks among investors. Furthermore, the ongoing financial crisis in the eurozone should persist in rankling capital market nerves, de-pressing sentiment now and then until the euro 16 countries come to terms with the root causes of the credit dilemma and resolve it once and for all. Apart from unnerving developments that may arise in the U.S. and Western Europe, it is believed that developing markets are likely to become another source of irritation to the financial markets as a result of which policies they adopt to thwart further currency appreciation and accelerating price pressures threatening them with a loss of competitiveness and, eventually, a slowdown in their economies. | |||
| JNL/S&P Managed Conservative Fund | ||||
Portfolio Manager Commentary: For the year ended December 31, 2010, the JNL/S&P Managed Conservative Fund outperformed one of its benchmarks by posting a return of 8.70% for Class A shares compared to 6.54% for the Barclays Capital U.S. Aggregate Bond Index. The Fund underperformed its other benchmark, the S&P 500 Index, which posted 15.06%. The investment objective for the Fund is capital growth and current income. Among the equity funds contributing to performance in 2010 relative to the S&P 500 Index were allocations to JNL/Invesco Large Cap Growth Fund and JNL/T. Rowe Price Established Growth Fund. Among the fixed income funds contributing to performance in 2010 relative to the Barclays Capital U.S. Aggregate Bond Index were allocations to | JNL/Goldman Sachs Emerging Markets Debt Fund, JNL/PIMCO Real Return Fund, JNL/Goldman Sachs Core Plus Bond Fund, JNL/PIMCO Total Return Bond Fund and JNL/JPMorgan U.S. Government & Quality Bond Fund. Among the equity funds that detracted from performance in 2010 relative to the S&P 500 Index were allocations to JNL/JPMorgan International Value Fund, JNL/Capital Guardian Global Diversified Research Fund, JNL/Eagle Core Equity Fund, JNL/Invesco International Growth Fund, JNL/Capital Guardian U.S. Growth Equity Fund and JNL/Select Value Fund. Among the fixed income funds detracting from performance in 2010 relative to the Barclays Capital U.S. Aggregate Bond Index was the allocation to JNL/T. Rowe Price Short-Term Bond Fund. | |||
| JNL/S&P Managed Moderate Fund | ||||
Portfolio Manager Commentary: For the year ended December 31, 2010, the JNL/S&P Managed Moderate Fund outperformed one of its benchmarks by posting a return of 11.30% for Class A shares compared to 6.54% for the Barclays Capital U.S. Aggregate Bond Index. The Fund underperformed its other benchmark, the S&P 500 Index, which posted 15.06%. The investment objective for the Fund is to seek capital growth. Current income is a secondary objective. Among the equity funds contributing to performance in 2010 relative to the S&P 500 Index were allocations to JNL/T. Rowe Price Mid-Cap Growth Fund, JNL/Goldman Sachs Mid Cap Value Fund, JNL/M&G Global Basics Fund and JNL/Lazard Emerging Markets Fund. Among the fixed income funds contributing to performance in 2010 relative to the Barclays Capital U.S. Aggregate Bond Index were allocations to | JNL/Goldman Sachs Emerging Markets Debt Fund, JNL/PIMCO Real Return Fund, JNL/Goldman Sachs Core Plus Bond Fund, JNL/PIMCO Total Return Bond Fund and JNL/JPMorgan U.S. Government & Quality Bond Fund. Among the equity funds that detracted from performance in 2010 relative to the S&P 500 Index were allocations to JNL/JPMorgan International Value Fund, JNL/Capital Guardian Global Diversified Research Fund, JNL/Invesco International Growth Fund, JNL/Capital Guardian U.S. Growth Equity Fund and JNL/Select Value Fund. Among the fixed income funds detracting from performance in 2010 relative to the Barclays Capital U.S. Aggregate Bond Index was the allocation to JNL/T. Rowe Price Short-Term Bond Fund. | |||
| JNL/S&P Managed Moderate Growth Fund | ||||
Portfolio Manager Commentary: For the year ended December 31, 2010, the JNL/S&P Managed Moderate Growth Fund outperformed one of its benchmarks by posting a return of 13.18% for Class A shares compared to 6.54% for the Barclays Capital U.S. Aggregate Bond Index. The Fund underperformed its other benchmark, the S&P 500 Index, which posted 15.06%. The investment objective for the Fund is capital growth and current income. Among the equity funds contributing to performance in 2010 relative to the S&P 500 Index were allocations to JNL/Eagle SmallCap Equity Fund, JNL/T. Rowe Price Mid-Cap Growth Fund, JNL/Franklin Templeton Small Cap Value Fund, JNL/JPMorgan MidCap Growth Fund, JNL/Goldman Sachs Mid Cap Value Fund, JNL/M&G Global Basics Fund and JNL/Lazard Emerging Markets Fund. | Among the fixed income funds contributing to performance in 2010 relative to the Barclays Capital U.S. Aggregate Bond Index were allocations to JNL/Goldman Sachs Emerging Markets Debt Fund, JNL/PIMCO Real Return Fund, JNL/Goldman Sachs Core Plus Bond Fund, JNL/PIMCO Total Return Bond Fund and JNL/JPMorgan U.S. Government & Quality Bond Fund. Among the equity funds detracting from performance in 2010 relative to the S&P 500 Index were allocations to JNL/JPMorgan International Value Fund, JNL/Capital Guardian Global Diversified Research Fund, JNL/Invesco International Growth Fund, JNL/Capital Guardian U.S. Growth Equity Fund and JNL/Select Value Fund. Among the fixed income funds detracting from performance in 2010 relative to the Barclays Capital U.S. Aggregate Bond Index was the allocation to JNL/T. Rowe Price Short-Term Bond Fund. | |||
 | JNL S&P Funds (continued) Standard & Poor’s Investment Advisory Services LLC |
| JNL/S&P Managed Growth Fund | ||||
Portfolio Manager Commentary: For the year ended December 31, 2010, the JNL/S&P Managed Growth Fund outperformed its benchmarks by posting a return of 16.12% for Class A shares compared to 15.06% for the S&P 500 Index and 6.54% for the Barclays Capital U.S. Aggregate Bond Index. The investment objective for the Fund is to seek capital growth. Current income is a secondary objective. Among the equity funds contributing to performance in 2010 relative to the S&P 500 Index were allocations to JNL/Eagle SmallCap Equity Fund, JNL/T. Rowe Price Mid-Cap Growth Fund, JNL/Franklin Templeton Small Cap Value Fund, JNL/JPMorgan MidCap Growth Fund, JNL/Goldman Sachs Mid Cap Value Fund, JNL/M&G Global Basics Fund and JNL/Lazard Emerging Markets Fund. | Among the fixed income funds contributing to performance in 2010 relative to the Barclays Capital U.S. Aggregate Bond Index were allocations to JNL/Goldman Sachs Emerging Markets Debt Fund, JNL/PIMCO Real Return Fund and JNL/PIMCO Total Return Bond Fund. Among the equity funds detracting from performance in 2010 relative to the S&P 500 Index were JNL/JPMorgan International Value Fund, JNL/Capital Guardian Global Diversified Research Fund, JNL/Eagle Core Equity Fund, JNL/Invesco International Growth Fund, JNL/Capital Guardian U.S. Growth Equity Fund and JNL/Select Value Fund. No fixed income funds to which allocations were made detracted from performance in 2010 relative to the Barclays Capital U.S. Aggregate Bond Index. | |||
| JNL/S&P Managed Aggressive Growth Fund | ||||
Portfolio Manager Commentary: For the year ended December 31, 2010, the JNL/S&P Managed Aggressive Growth Fund outperformed its benchmarks by posting a return of 17.09% for Class A shares compared to 15.06% for the S&P 500 Index and 6.54% for the Barclays Capital U.S. Aggregate Bond Index. The investment objective for the Fund is capital growth. Among the equity funds contributing to performance in 2010 relative to the S&P 500 Index were allocations to JNL/Eagle SmallCap Equity Fund, JNL/T. Rowe Price Mid-Cap Growth Fund, JNL/Franklin Templeton Small Cap Value Fund, JNL/JPMorgan MidCap Growth Fund, JNL/Goldman Sachs Mid Cap Value Fund, JNL/M&G Global Basics Fund and JNL/Lazard Emerging Markets Fund. | Among the fixed income funds contributing to performance in 2010 relative to the Barclays Capital U.S. Aggregate Bond Index were allocations to JNL/Goldman Sachs Emerging Markets Debt Fund, JNL/PPM America High Yield Bond Fund and JNL/PIMCO Real Return Fund. Among the equity funds detracting to performance in 2010 relative to the S&P 500 Index were allocations to JNL/JPMorgan International Value Fund, JNL/Capital Guardian Global Diversified Research Fund, JNL/Invesco International Growth Fund, JNL/Capital Guardian U.S. Growth Equity Fund and JNL/Select Value Fund. No fixed income funds to which allocations were made detracted from performance in 2010 relative to the Barclays Capital U.S. Aggregate Bond Index. | |||
| JNL/S&P Disciplined Moderate Fund | ||||
Portfolio Manager Commentary: For the year ended December 31, 2010, the JNL/S&P Disciplined Moderate Fund outperformed one of its benchmarks by posting a return of 11.10% for Class A shares compared to 6.54% for the Barclays Capital U.S. Aggregate Bond Index. The Fund underperformed its other benchmark, the S&P 500 Index, which posted 15.06%. The investment objective for the Fund is to seek capital growth. Current income is a secondary objective. Among the equity funds contributing to performance in 2010 relative to the S&P 500 Index were allocations to JNL/Mellon Capital Management Small Cap Index Fund, JNL/Mellon Capital Management S&P 400 MidCap Index Fund and JNL/Mellon Capital Management 25 Fund. | Among the fixed income funds contributing to performance in 2010 relative to the Barclays Capital U.S. Aggregate Bond Index were allocations to JNL/Goldman Sachs Emerging Markets Debt Fund and JNL/PIMCO Real Return Fund. Among the equity funds detracting from performance in 2010 relative to the S&P 500 Index were allocations to JNL/Mellon Capital Management International Index Fund and JNL/Mellon Capital Management JNL Optimized 5 Fund. Among the fixed income funds detracting from performance in 2010 relative to the Barclays Capital U.S. Aggregate Bond Index were allocations to JNL/Mellon Capital Management Bond Index Fund. | |||
| JNL/S&P Disciplined Moderate Growth Fund | ||||
Portfolio Manager Commentary: For the year ended December 31, 2010, the JNL/S&P Disciplined Moderate Growth Fund outperformed one of its benchmarks by posting a return of 13.29% for Class A shares compared to 6.54% for the Barclays Capital U.S. Aggregate Bond Index. The Fund underperformed its other benchmark, the S&P 500 Index, which posted 15.06%. The investment objective for the Fund is to seek capital growth and current income. Among the equity funds contributing to performance in 2010 relative to the S&P 500 Index were allocations to JNL/Mellon Capital Management Small Cap Index Fund, JNL/Mellon Capital Management S&P 400 MidCap Index Fund and JNL/Mellon Capital Management 25 Fund. | Among the fixed income funds contributing to performance in 2010 relative to the Barclays Capital U.S. Aggregate Bond Index were allocations to JNL/Goldman Sachs Emerging Markets Debt Fund and JNL/PIMCO Real Return Fund. Among the equity funds detracting from performance in 2010 relative to the S&P 500 Index were allocations to JNL/Mellon Capital Management International Index Fund and JNL/Mellon Capital Management JNL Optimized 5 Fund. Among the fixed income funds detracting from performance in 2010 relative to the Barclays Capital U.S. Aggregate Bond Index were allocations to JNL/Mellon Capital Management Bond Index Fund. | |||
 | JNL S&P Funds (continued) Standard & Poor’s Investment Advisory Services LLC |
| JNL/S&P Disciplined Growth Fund | ||||
Portfolio Manager Commentary: For the year ended December 31, 2010, the JNL/S&P Disciplined Growth Fund outperformed one of its bench-marks by posting a return of 12.74% for Class A shares compared to 6.54% for the Barclays Capital U.S. Aggregate Bond Index. The Fund underperformed its other benchmark, the S&P 500 Index, which posted 15.06%. The investment objective for the Fund is capital growth. Among the equity funds contributing to performance in 2010 relative to the S&P 500 Index were allocations to JNL/Mellon Capital Management Small Cap Index Fund, JNL/Mellon Capital Management S&P 400 MidCap Index Fund and JNL/Mellon Capital Management 25 Fund. Among the fixed income funds contributing to performance in 2010 relative | to the Barclays Capital U.S. Aggregate Bond Index were allocations to JNL/Goldman Sachs Emerging Markets Debt Fund and JNL/PIMCO Real Return Fund. Among the equity funds detracting from performance in 2010 relative to the S&P 500 Index were allocations to JNL/Mellon Capital Management International Index Fund and JNL/Mellon Capital Management JNL Optimized 5 Fund. Among the fixed income funds detracting from performance in 2010 relative to the Barclays Capital U.S. Aggregate Bond Index were allocations to JNL/Mellon Capital Management Bond Index Fund. | |||
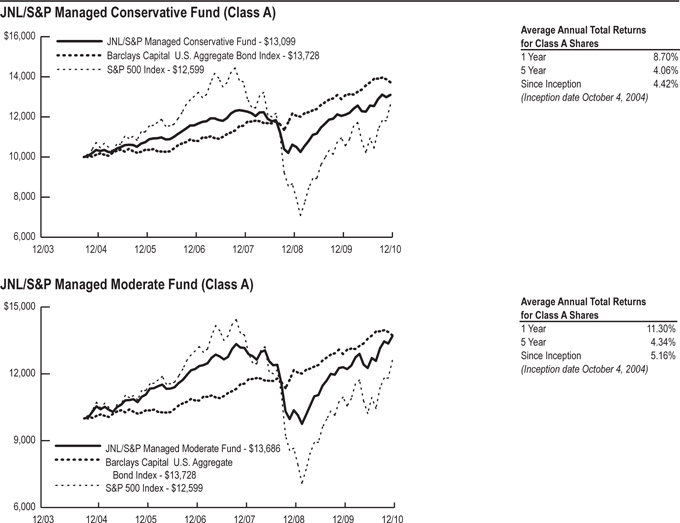
Past performance is not predictive of future performance. Investment return and principal value will fluctuate so that an investor’s shares, when redeemed, may be worth more or less than their original cost. Performance numbers are net of all Fund operating expenses, but not do not reflect the deduction of insurance changes.
 | JNL S&P Funds (continued) Standard & Poor’s Investment Advisory Services LLC |
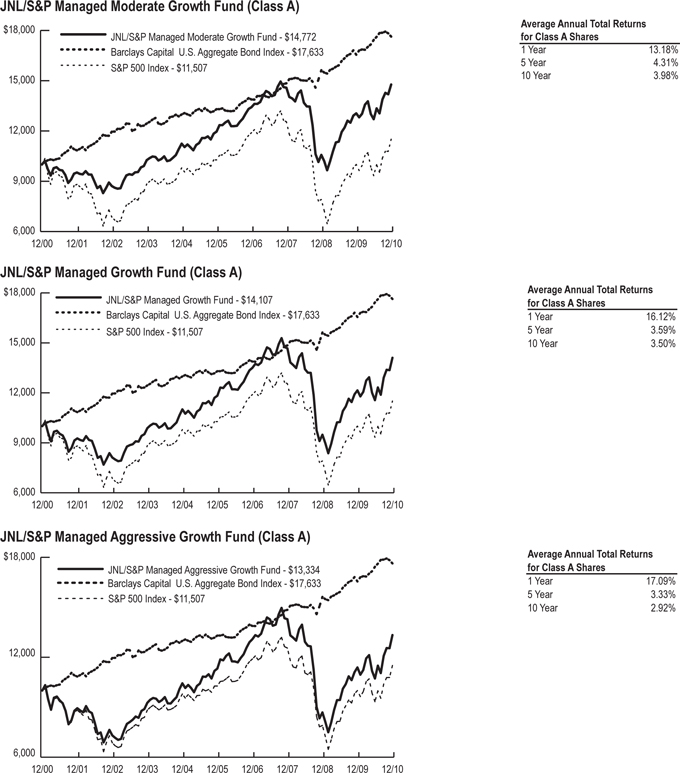
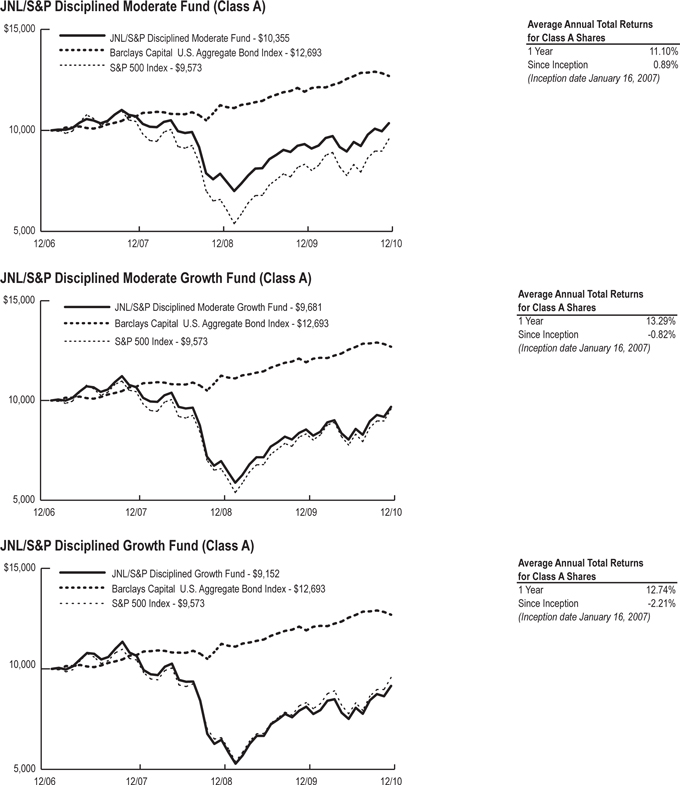
Past performance is not predictive of future performance. Investment return and principal value will fluctuate so that an investor’s shares, when redeemed, may be worth more or less than their original cost. Performance numbers are net of all Fund operating expenses, but not do not reflect the deduction of insurance changes.
 | JNL S&P Funds | |
| Standard & Poor’s Investment Advisory Services LLC |
Market Summary: Performance of capital markets worldwide improved considerably in 2010 although some investment avenues fared better than others. Risk eager investing resumed with a vengeance in the final quarter of last year despite setbacks to many such markets in November. The remaining three months of 2010 commenced with investors plainly exhibiting healthy appetites for riskier investment vehicles, but single digit gains earned in October surrendered to renewed risk aversion the next month as many, if not most, risky asset markets turned in disappointingly negative results as investors abandoned them in favor of safer alternatives amid recurrent fears of a default in the eurozone periphery. A surprise to the upside in December, due primarily to another enormous U.S. central bank credit injection, imbued investors with hope before year end.
Steady, material improvement in corporate financial conditions (especially, cash flows) ordinarily would furnish a necessary and sufficient pretext for a sustained, perhaps potent rally in many developed shares markets around the globe were it not for the protracted re-equilibration of vital macroeconomic fundamentals – principally, housing demand, capital spending and employment markets – that might restrain any extension of the year end rally into 2011. Intermittently upbeat news regarding the American and global economies, however, is scarcely adequate to inspire greater enthusiasm
for stocks among investors. Furthermore, the ongoing financial crisis in the eurozone should persist in rankling capital market nerves, depressing sentiment now and then until the euro 16 countries come to terms with the root causes of the credit dilemma and resolve it once and for all. Apart from unnerving developments that may arise in the U.S. and Western Europe, it is believed that developing markets are likely to become another source of irritation to the financial markets as a result of which policies they adopt to thwart further currency appreciation and accelerating price pressures threatening them with a loss of competitiveness and, eventually, a slowdown in their economies.
We believe that, as the economy moves through the business cycle from recovery to expansion, history indicates that the equity markets could still reward investors for holding shares. Nonetheless, our approach remains focused on seeking to design portfolios with positive exposure to historically favorable alpha factors. We believe this disciplined approach has the potential to generate an overall performance which has limited relationship to traditional equity styles and economic sectors’ performance. Our positioning at the stock selection date emphasized a combination of what we believed to be high quality and value factors.
JNL/S&P Competitive Advantage Fund
Sector Weightings*: | ||||
Information Technology | 31.8 | % | ||
Consumer Discretionary | 28.5 | |||
Industrials | 9.9 | |||
Health Care | 9.7 | |||
Materials | 6.9 | |||
Financials | 3.5 | |||
Energy | 3.2 | |||
Consumer Staples | 3.1 | |||
Short Term Investments | 3.4 | |||
Total Investments | 100.0 | % | ||
*Total Investments at December 31, 2010 |
| |||
Portfolio Manager Commentary: For the year ended December 31, 2010, the JNL/S&P
Competitive Advantage Fund underperformed its benchmark by posting a return of 12.63% for Class A shares compared to 15.06% for the S&P 500 Index.
In relation to the benchmark, the key sectors which detracted from the Fund’s performance were information technology, materials and energy mainly attributed to the negative effects from stock selection. The top contributing sectors were consumer discretionary, health care and industrials, attributed to positive effects from both asset allocation and stock selection.
The top contributors to the performance in 2010 were Family Dollar Stores Inc., Coach Inc. and FMC Technologies Inc. The bottom detractors
to the Fund’s performance in 2010 were Apollo Group Inc., Diamond Offshore Drilling Inc. and Monsanto Co.
The Fund has displayed an average return on invested capital well above that of the S&P 500 Index. Historically, companies with high return on invested capital have shown a tendency to be more resilient to economic recessions and less sensitive to overall corporate earnings growth. Based on since inception performance, the Fund’s returns tend to have a higher correlation with growth than with value stocks. As of year end, the Fund was significantly overweighted in consumer discretionary and technology stocks.
JNL/S&P Dividend Income & Growth Fund
Sector Weightings*:
Energy | 9.8 | % | ||
Financials | 9.7 | |||
Telecommunication Services | 9.7 | |||
Consumer Discretionary | 9.5 | |||
Health Care | 9.5 | |||
Materials | 9.5 | |||
Information Technology | 9.4 | |||
Industrials | 9.3 | |||
Utilities | 9.2 | |||
Consumer Staples | 9.1 | |||
Short Term Investments | 5.3 | |||
Total Investments | 100.0 | % | ||
*Total Investments at December 31, 2010 |
| |||
Portfolio Manager Commentary: For the year ended December 31, 2010, the JNL/S&P Dividend Income & Growth Fund outperformed its benchmark by posting a return of 18.24% for Class A shares compared to 15.06% for the S&P 500 Index.
In relation to the benchmark, the top contributing sectors were financials, utilities and materials, mainly attributed to positive effects from stock selection. The key sectors which detracted from the Fund’s performance were industrials, energy and consumer discretionary, mainly attributed to the negative stock selection effect.
The top contributors to the performance in 2010 were AvalonBay Communities Inc., PPG Industries Inc. and Snap-On Inc. The bottom
detractors to the Fund’s performance in 2010 were Harris Corp., Raytheon Co. and Lockheed Martin Corp.
As of year end, the Fund was comprised of companies with higher than average S&P Credit Ratings and S&P Quality Rankings. The Fund tends to hold large companies with a long history of steady earnings and dividend growth. In addition, this strategy tends to generate an average dividend yield well above that of the S&P 500 Index. Based on since inception performance, the Fund’s returns tend to have a higher correlation with value than with growth stocks. As of year end, the Fund was overweighted in materials, utilities and telecommunications stocks.
 | JNL S&P Funds (continued) | |
| Standard & Poor’s Investment Advisory Services LLC |
JNL/S&P Intrinsic Value Fund
Sector Weightings*:
Health Care | 34.8 | % | ||
Information Technology | 19.0 | |||
Consumer Discretionary | 16.1 | |||
Industrials | 12.7 | |||
Materials | 6.4 | |||
Telecommunication Services | 3.4 | |||
Utilities | 3.0 | |||
Short Term Investments | 4.6 | |||
Total Investments | 100.0 | % | ||
*Total Investments at December 31, 2010 |
| |||
Portfolio Manager Commentary: For the year ended December 31, 2010, the JNL/S&P Intrinsic Value Fund underperformed its benchmark
by posting a return of 14.39% for Class A shares compared to 15.06% for the S&P 500 Index.
In relation to the benchmark, the top contributing sectors were consumer staples, consumer discretionary and health care, mainly attributed to positive effects from both asset allocation and stock selection. The key sectors which detracted from the Fund’s performance were industrials, materials and information technology, mainly attributed to the negative stock selection effect.
The top contributors to the performance in 2010 were Limited Brands Inc., Parker-Hannifin Corp. and Hormel Foods Corp. The bottom detractors to the Fund’s performance in 2010 were H&R Block Inc., Masco Corp. and Total System
Services Inc.
As of year end, the Fund was comprised of companies with higher than average free cash flow yield. These companies tend to generate strong cash flow in excess of capital requirements and therefore are more likely to be able to finance growth, provide dividends, withstand earnings contractions and repurchase shares. Based on since inception performance the Fund’s returns tend to have a higher correlation with value than with growth stocks. As of year end, the Fund was overweighted in health care and industrials stocks.
JNL/S&P Total Yield Fund
Sector Weightings*:
Financials | 32.6 | % | ||
Consumer Discretionary | 25.3 | |||
Industrials | 12.8 | |||
Telecommunication Services | 6.7 | |||
Health Care | 6.2 | |||
Energy | 3.4 | |||
Consumer Staples | 3.2 | |||
Information Technology | 3.2 | |||
Materials | 3.2 | |||
Short Term Investments | 3.4 | |||
Total Investments | 100.0 | % | ||
*Total Investments at December 31, 2010 |
| |||
Portfolio Manager Commentary: For the year ended December 31, 2010, the JNL/S&P Total Yield Fund underperformed its benchmark by posting a return of 10.08% for Class A shares
compared to 15.06% for the S&P 500 Index.
In relation to the benchmark, the key sectors which detracted from the Fund’s performance were consumer discretionary, consumer staples and financials, mainly attributed to the negative effects from stock selection. The top contributing sectors were information technology, industrials and health care, mainly attributed to positive effects from both asset allocation and stock selection.
The top contributors to the performance in 2010 were Caterpillar Inc., PACCAR Inc. and Xerox Corp. The bottom detractors to the Fund’s performance in 2010 were Dean Foods Co., PulteGroup Inc. and SUPERVALU Inc.
As of year end, the Fund was comprised of companies with higher than average “total yield”. Total yield is calculated as the sum of the cash
dividend, net cash used for stock repurchases and net cash used to retire debt divided by the company’s market capitalization. As such, total yield is a broad measure of cash flow returned to shareholders and bondholders in the form of dividends, share buybacks or elimination of debt. This strategy seeks companies that are significantly reducing their debt and/or increasing their equity distributions. Based on since inception performance the Fund tends to have a higher correlation with value than with growth stocks. It has also displayed significant volatility during periods of economic duress and uncertainty. As of year end, the Fund was overweighted in financials and consumer discretionary stocks.
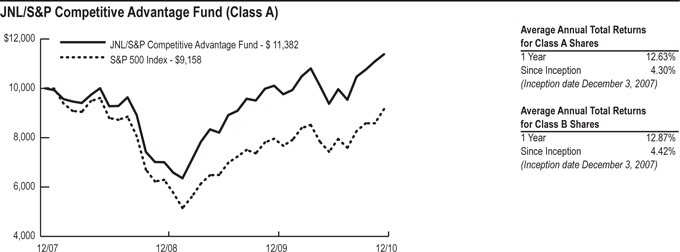
Past performance is not predictive of future performance. Investment return and principal value will fluctuate so that an investor’s shares, when redeemed, may be worth more or less than their original cost. Performance numbers are net of all Fund operating expenses, but not do not reflect the deduction of insurance changes.
 | JNL S&P Funds (continued) | |
| Standard & Poor’s Investment Advisory Services LLC |
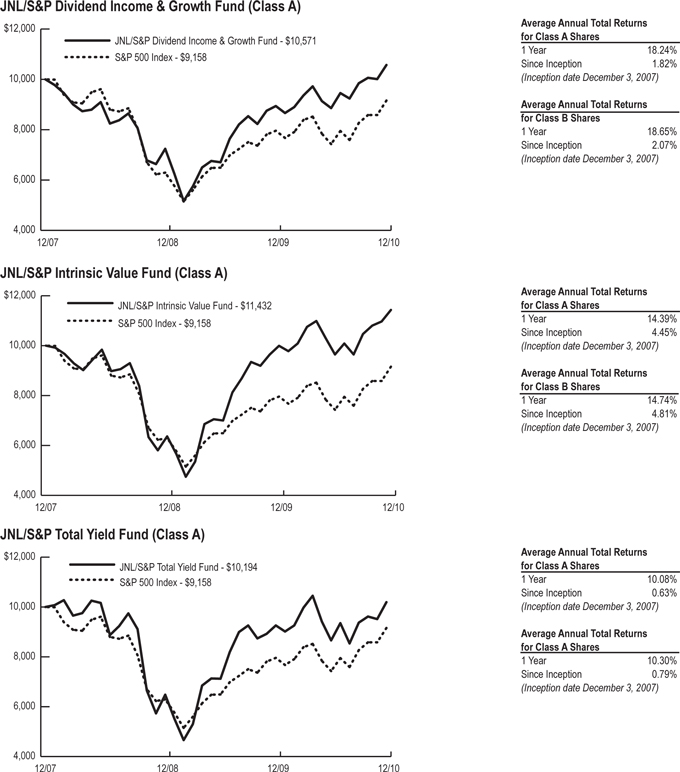
Past performance is not predictive of future performance. Investment return and principal value will fluctuate so that an investor’s shares, when redeemed, may be worth more or less than their original cost. Performance numbers are net of all Fund operating expenses, but not do not reflect the deduction of insurance changes.
 | JNL Select Funds | |
| Wellington Management Company, LLP |
Market Summary: Global equities were volatile during the year, moving higher early in the year on the back of strong corporate earnings and generally favorable economic data before succumbing in the second quarter to escalating global growth concerns and challenges in Europe. Equity markets rebounded in the third quarter and continued their ascent through the end of the year, as improving optimism about the global economy and a tidal wave of global liquidity outweighed investors’ concerns about sovereign debt troubles in Europe.
Monetary and fiscal policy in the U.S. remained very accommodative
during the year. The U.S. Federal Reserve (“Fed”) continued to hold the Federal Funds Rate in the 0.00% to 0.25% range during the year. In the fourth quarter, the Fed launched a second round of quantitative easing while the Obama administration announced an extension of the Bush era tax cuts. Fixed income markets gained during the year benefiting from tighter spreads and lower government yields. Credit sensitive sectors outperformed as investors sought out riskier assets and concerns over an economic slowdown faded.
JNL/Select Balanced Fund
Sector Weightings*:
Financials | 15.8 | % | ||
U.S. Government Agency Mortgage-Backed Securities | 10.4 | |||
Energy | 9.3 | |||
Information Technology | 8.8 | |||
Industrials | 8.6 | |||
Health Care | 8.0 | |||
Government Securities | 7.1 | |||
Consumer Discretionary | 5.5 | |||
Consumer Staples | 5.3 | |||
Utilities | 3.6 | |||
Materials | 2.8 | |||
Telecommunication Services | 2.7 | |||
Non-U.S. Government Agency Asset-Backed Securities | 1.1 | |||
Short Term Investments | 11.0 | |||
Total Investments | 100.0 | % | ||
*Total Investments at December 31, 2010 |
| |||
Portfolio Manager Commentary: For the year ended December 31, 2010, the JNL/Select Balanced Fund underperformed one of its bench-marks by posting a return of 10.83% for Class A shares compared to 15.06% for the S&P 500 Index. The Fund outperformed its other bench-mark, the Barclays Capital U.S. Aggregate Bond Index, which returned 6.54%.
The equity portfolio outperformed the S&P 500 Index during the year. Strong security selection within materials, industrials and financials contributed most to relative results, but was partially offset by negative stock selection within energy, consumer discretionary and telecommunication services. An overweight allocation
to industrials and an underweight allocation to information technology also contributed positively to performance.
Among the top contributors to relative performance within the equity portfolio were Deere & Co., Continental Airlines Inc. and Baker Hughes Inc. (“Baker Hughes”). Positions in Chevron Corp. (“Chevron”), AT&T Corp. and Comcast Corp. also bolstered absolute performance.
Total SA, Medtronic Inc. and Exelon Corp. were among the largest detractors from relative results within the equity portfolio, while not owning strong performing benchmark stock Apple Inc. also hurt relative results. Owning Bank of America Corp. (“Bank of America”) detracted from absolute performance.
The largest purchases within the equity port-folio during the year were in Exxon Mobil Corp., JP Morgan Chase & Co., Wells Fargo & Co. and Pfizer Inc. The largest sells for the year were the elimination of Texas Instruments Inc. (“Texas Instruments”) and Lockheed Martin Corp., and the trimming of the Fund’s position in Marathon Oil Corp.
During the year, the Fund trimmed exposure to industrials and energy; however, these sectors remain the largest overweight allocations. As of the end of the year, information technology remained the largest underweight allocation, although the underweight was reduced during the year.
The fixed income portfolio underperformed the Barclays Capital U.S. Aggregate Bond Index during the year. Duration and yield curve positioning was the main reason for underperformance.
Allocations to mortgage-backed securities (“MBS”) and commercial mortgage-backed securities (“CMBS”) also hurt results. The fixed income portfolio’s high quality bias within CMBS hurt relative results as riskier assets rallied. The fixed income portfolio benefited from its allocation to credit, specifically in financials and industrials issuers.
There were no significant changes to the fixed income portfolio’s credit quality during the year, and average credit quality remains the same as the previous year end.
During the year, the fixed income portfolio increased its allocation to credit and MBS, while reducing its allocation to U.S. Government and agency securities.
The November election should provide some upside for equity markets, as lower taxes and political gridlock are viewed positively. We see improved supply and demand scenarios in natural gas, regional banking and health care. Within the fixed income portfolio, we think that the U.S. economy will continue its recovery, despite housing and high unemployment remaining head-winds. The Fed will likely maintain its accommodative stance. We expect that short term rates and inflation will remain low; however, the tension between rising growth and excess capacity will drive rates going forward.
As of the end of the year, the Fund was positioned for moderate economic recovery as demand continues to pick up. Therefore, we have an overweight to equities relative to fixed income and cash.
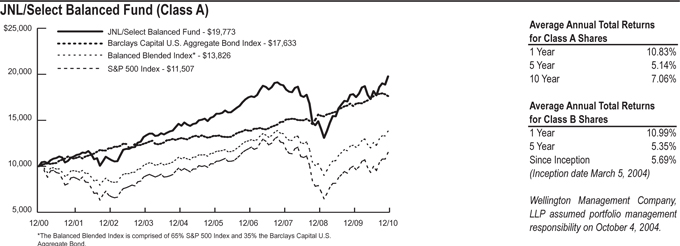
Past performance is not predictive of future performance. Investment return and principal value will fluctuate so that an investor’s shares, when redeemed, may be worth more or less than their original cost. Performance numbers are net of all Fund operating expenses, but not do not reflect the deduction of insurance changes.
 | JNL Select Funds (continued) | |
| Wellington Management Company, LLP |
JNL/Select Value Fund
Sector Weightings*:
Financials | 23.0 | % | ||
Energy | 12.6 | |||
Industrials | 11.1 | |||
Health Care | 11.0 | |||
Consumer Discretionary | 11.0 | |||
Information Technology | 9.4 | |||
Consumer Staples | 7.3 | |||
Materials | 6.1 | |||
Utilities | 3.0 | |||
Telecommunication Services | 2.8 | |||
Short Term Investments | 2.7 | |||
Total Investments | 100.0 | % | ||
*Total Investments at December 31, 2010 |
| |||
Portfolio Manager Commentary: For the year ended December 31, 2010, the JNL/Select Value Fund underperformed its benchmark by posting a return of 13.70% for Class A shares compared to 15.51% for the Russell 1000 Value Index.
Stock selection within energy, consumer staples, information technology and health care detracted most from the Fund’s relative performance during the year; however, this was partially offset by strong stock selection within materials and industrials. An underweight allocation to financials and utilities, and an overweight allocation
to materials contributed to relative results.
Cummins Inc. (“Cummins”), Cliffs Natural Resources Inc. (“Cliffs Natural Resources”) and PACCAR Inc. were the largest contributors to the Fund’s relative performance during the year. Not owning Berkshire Hathaway Inc. also aided relative results. Baker Hughes and Chevron were also strong performers, and helped the Fund’s absolute performance.
Dean Foods Co., Cisco Systems Inc. and Hewlett-Packard Co. were the largest detractors from the Fund’s relative performance during the year. Bank of America and Microsoft Corp. also hurt absolute results.
The largest purchases during the year included new positions in consumer related companies Tyco International Ltd. and Kraft Foods Inc. The Fund also established new positions in financial services firms Marsh & McLennan Cos. Inc., BlackRock Inc. and Credit Suisse Group AG.
The largest sales during the year included Cummins, Cliffs Natural Resources, and Agrium Inc., all of which were eliminated after strong price appreciation. The positions in Texas Instruments and Nestle SA were also eliminated.
The Fund is constructed on a stock by stock basis and as a result, sector weights are a fall out of stock selection. During the year, within
consumer discretionary, the Fund moved from an underweight to an overweight relative to the bench-mark. The Fund also increased its overweight allocations in materials and industrials. The Fund moved from an overweight allocation to an underweight in health care and consumer staples. As of the end of the year, information technology remained the largest overweight sector, and financials and utilities remained the Fund’s largest underweights relative to its benchmark.
Global growth continues to recover, led by emerging markets but with increasing contributions from developed economies. Policy risk remains a key concern, particularly in three areas: Europe (the mechanism for crisis resolution), the U.S. (long term debt reduction contrasted against potential further gridlock) and China (targeted tightening in the face of rising inflationary pressures). In the U.S., growth could surprise to the upside in 2011, with a positive implication for profits, capital spending and jobs. While macroeconomic trends inform our process, buy and sell decisions ultimately are driven by company fundamentals. We continue to focus our efforts on maximizing the Fund’s overall growth and dividend yield while minimizing valuation metrics.
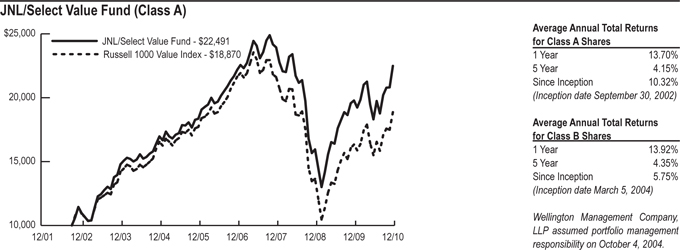
Past performance is not predictive of future performance. Investment return and principal value will fluctuate so that an investor’s shares, when redeemed, may be worth more or less than their original cost. Performance numbers are net of all Fund operating expenses, but not do not reflect the deduction of insurance changes.
 | JNL T. Rowe Price Funds T. Rowe Price Associates, Inc. |
Market Summary: Against a backdrop of healthy earnings, fortified balance sheets, and low borrowing costs for corporations, major U.S. equity indexes rose strongly in 2010, capping a second consecutive year of strong gains. Stocks produced robust returns through late April, extending the rally that started in March 2009, but fell sharply through early July due in part to a European debt crisis centered in Greece and a sluggish U.S. economic recovery. Equities rebounded briskly starting in late August as the economy showed signs of improvement and the U.S. Federal Reserve (“Fed”) signaled that it would purchase more Treasury securities in an attempt to keep long term interest rates low. The rally, which was supported by late year bipartisan legislation to extend for two years the Bush era tax cuts that were set to expire at the end of 2010, lifted major indexes in late December to their highest levels of the year. As measured by various Russell indexes, growth stocks fared better than value across all market capitalizations, especially among small caps. Despite the correction—traditionally defined as a pullback of at least 10%—in the second quarter, most major indices closed the year more than 85% above their March 2009 bottom.
In the large cap universe, as measured by the S&P 500 Index, all sectors produced positive returns in 2010. Based on total return data from S&P, consumer discretionary and industrials and business services shares performed best with robust gains. Investors perceived that companies in these sectors could benefit significantly from a stronger economic recovery. Materials and energy stocks also outperformed, lifted by rising commodity prices. For example, gold reached $1,400 per ounce, oil surpassed $90 per barrel, and gasoline averaged $3.00 per gallon nationwide by the end of the year. Telecommunication services, consumer staples, financials and information technology shares produced moderate gains but lagged the broad market. Health care and utilities—two sectors that tend to have low sensitivity to the health of the economy—were flat, as equity investors favored riskier investments. Within the Russell 1000 Value Index, consumer discretionary was the strongest sector for the period, although energy, industrials and business
services, and materials also turned in sizable returns. Traditionally defensive health care and utilities were the weakest performing sectors in the Russell 1000 Value Index. Small and mid cap stocks outperformed large cap shares over the last year. The S&P MidCap 400 Index and the small cap Russell 2000 Index returned 26.64% and 26.85%, respectively, versus 15.06% for the large cap S&P 500 Index.
All major U.S. fixed income sectors posted positive absolute returns during the year, and spread sectors outperformed duration matched Treasuries. Better economic data, very strong corporate earnings, extraordinary economic stimulus, and positive technical forces outweighed macroeconomic concerns stemming from dysfunctional European sovereign debt markets. Despite steep climbs in credit spreads in May and June related to Greece’s sovereign ballout, spreads in all major sectors tightened during the course of the year. Moreover, the lowest quality segments and most credit sensitive sectors performed best during the year.
One of the most important drivers supporting resiliency in credit spreads was the powerful technical tailwind that benefited bond markets during the year. Until late in the year, investment flows strongly favored debt securities over equities as most investors desired the relative safety and security of fixed rate debt. Additionally, outside of the corporate sector, the net supply of investment grade securities offering a spread to Treasuries was scarce. Lastly, with Treasury rates near all time lows for much of the year, investors consistently increased spread sector allocations to gain yield. This technical tailwind was evident in the market for commercial mortgage-backed securities (“CMBS”), which produced the best returns of any investment grade sector by far. Despite unimpressive fundamentals attached to commercial real estate, the sector outperformed other investment grade sectors on a consistent basis. The sector has virtually no new supply and demand is strong because there are few, if any, investment grade alternatives providing similar absolute yields.
JNL/T. Rowe Price Established Growth Fund
Sector Weightings*: | ||||
Information Technology | 30.6 | % | ||
Consumer Discretionary | 18.5 | |||
Industrials | 15.0 | |||
Energy | 8.6 | |||
Financials | 7.2 | |||
Health Care | 6.0 | |||
Materials | 5.3 | |||
Telecommunication Services | 3.7 | |||
Consumer Staples | 2.3 | |||
Short Term Investments | 2.8 | |||
Total Investments | 100.0 | % | ||
*Total Investments at December 31, 2010
Portfolio Manager Commentary: For the year ended December 31, 2010, the JNL/T. Rowe Price Established Growth Fund outperformed its benchmark by posting a return of 16.76% for Class A shares compared to 16.71% for the Russell 1000 Growth Index.
Favorable stock selection and sector weighting contributed positively to relative performance. Relative to the Fund’s benchmark, results in information technology were the primary contributor to relative performance due to positive stock selection. The Fund’s holdings in computers and peripherals and internet software and services contributed the most, relatively. Additionally, consumer discretionary was a top contributor based on stock selection, specifically in hotels, restaurants and leisure, as wells as, specialty retail. Stock selection and sector underweight also added value in health care. Conversely, financials
was the biggest detractor from relative results, as adverse stock selection, particularly in capital markets, drove sector weakness.
Significant contributors to the Fund’s performance during the year included Apple Inc., Amazon.com Inc., Baidu.com and Danaher Corp. Significant detractors from performance during the year included Visa Inc., Medco Health Solutions Inc., Nvidia Corp. and Petroleo Brasileiro SA.
Significant purchases during the year included Google Inc., FedEx Corp., Apple Inc., Corning Inc. and Amazon.com Inc. Significant sales during the year included Medco Health Solutions Inc., Microsoft Corp., Gilead Sciences Inc., Cisco Systems Inc. and Goldman Sachs Group Inc.
Relative to the Fund’s benchmark, significant relative sector weighting changes from December 31, 2009 to December 31, 2010 included: an increased overweight in consumer discretionary; a change from being underweight to overweight in industrials and business services, as well as a change from an underweight to a slight overweight in materials. Conversely, the Fund substantially decreased sector overweight in financials and also decreased sector underweight to consumer staples; the Fund also shifted from being overweight to underweight in energy.
We have a modestly positive view of the equities market for the near to medium term. We believe that earnings and cash flow will improve and that as confidence, which is now unduly low, rises, markets should perform well overall. We are particularly focused on exposure to emerging
markets, both directly and through multi nationals that sell to emerging market consumers, since we believe the underlying factors favoring emerging markets will persist. These positives include reduced sovereign debt risk, faster economic and earnings growth, and structural improvements in profitability at many companies. Wages are going up and companies are adding people spurring exceptionally positive increases in consumption growth in large markets such as China and India, as well as in Latin America. While there are downside risks to our core scenario, and short term corrections are always possible, we view an extended reversal of these trends as unlikely. Accordingly, we continue to view these markets as highly attractive sources of stock specific growth ideas.
There is also a good chance for multiple expansion in U.S. equities, as money that is currently sitting on the sidelines gets reallocated back into stocks. High levels of corporate cash could eventually lead to either capital expenditures or to more shareholder friendly maneuvers like share buybacks or dividends. Consumers are beginning to show more signs of regaining confidence and financial companies have been recapitalized. Though it varies greatly by region, home prices have broadly stabilized and even begun to rebound in certain markets. Unemployment remains persistently high, but some signs have begun to appear that show an improving employment picture. Additionally, there has been an abating mistrust in stocks as global growth
 | JNL T. Rowe Price Funds (continued) T. Rowe Price Associates, Inc. |
JNL/T. Rowe Price Established Growth Fund (continued)
improves and companies’ balance sheets have improved.
U.S. equities are attractively valued—particularly when compared with bonds—and corporate fundamentals appear very strong. The outcome of the U.S. midterm elections, which resulted in a divided Congress less likely to pass major radical policy initiatives and regulations, and the Fed announcements of additional quantitative easings should increase investor confidence levels. In order to capitalize on what we feel is an improving market environment, we remain focused on
companies in technology, consumer discretionary and also industrials and are strategically underweight in areas that offer less growth potential such as consumer staples and utilities.
Our core investment philosophy is to buy and hold high quality growth companies, especially those with a competitive advantage in their respective markets—companies that can generate sustainable double digit earnings and cash flow growth by participating in expanding markets, taking market share, or improving profitability faster than sales. We believe those companies
with solid balance sheets, seasoned, shareholder friendly management, and attractive prices will perform strongly regardless of overall economic conditions. Fundamental research is imperative in identifying these securities and it is also helpful in discerning between cyclical and secular growth. Looking forward, our goal is to continually improve the quality of the companies that we own, and we remain vigilant in managing risks relative to the potential return of our holdings.
JNL/T. Rowe Price Mid-Cap Growth Fund
Sector Weightings*: | ||||
Information Technology | 23.9 | % | ||
Industrials | 16.6 | |||
Health Care | 14.6 | |||
Consumer Discretionary | 13.8 | |||
Energy | 8.6 | |||
Financials | 7.3 | |||
Materials | 1.9 | |||
Consumer Staples | 1.6 | |||
Utilities | 1.0 | |||
Short Term Investments | 10.7 | |||
Total Investments | 100.0 | % | ||
*Total Investments at December 31, 2010
Portfolio Manager Commentary: For the year ended December 31, 2010, the JNL/T. Rowe Price Mid-Cap Growth Fund outperformed its benchmark by posting a return of 27.86% for Class A shares compared to 26.38% for the Russell MidCap Growth Index.
Overall, favorable stock selection significantly contributed to relative performance while sector weighting also added value. Relative to the Fund’s benchmark, superior stock selection within energy was the primary contributor to relative performance during the period as rising commodity prices bolstered sector returns. Health care was another notable contributor to performance as the Fund’s holdings in health care equipment and supplies and pharmaceuticals companies positively impacted relative returns. Stock selection in consumer discretionary also proved rewarding as holdings in the hotels, restaurant and leisure industry underpinned relative strength. Despite being the only sector in the index to post negative returns, stock selection in utilities proved effective and was further supported by an underweight to the traditionally defensive sector.
Financials was the primary detractor from relative results, as adverse stock selection, particularly in
capital markets, drove sector weakness.
Significant contributors to the Fund’s performance during the year included Chipotle Mexican Grill Inc., Edwards Lifesciences Corp., AMETEK Inc. and WABCO Holdings Inc. Significant detractors from performance during the year included Human Genome Sciences Inc., Global Payments Inc., Janus Capital Group Inc. and Vertex Pharmaceuticals Inc.
Significant purchases during the year included Range Resources Corp., Community Health Systems Inc., Nuance Communications Inc. and Solera Holdings Inc. Significant sales during the year included American Tower Corp., Perrigo Co., OSI Pharmaceuticals Inc., Intuitive Surgical Inc. and KeyCorp.
Relative to the Fund’s benchmark, significant relative sector weighting changes from December 31, 2009 to December 31, 2010, included: increasing the Fund’s sector underweight in consumer discretionary; going from slightly underweight to overweight positions in information technology and utilities, while doing the reverse in telecommunication services holdings by going from slightly overweight to having no exposure to the sector at the end of 2010; and slightly decreasing the Fund’s overweight positions in financials and health care.
In prior years, we have emphasized the important role central banks must play to intervene when credit becomes too easy and asset prices become inflated—a role former Fed Chairman William McChesney Martin likened to taking “away the punch bowl just when the party gets going.” We worry that, far from following Martin’s advice, his
successors are spiking the punch bowl through the addition of two potent spirits. The first of these is ZIRP, the zero interest rate policy, which is benefiting the largest borrowers—the government, banks, speculators and
large corporations. The policy has been much less favorable for the nation’s savers, particularly senior citizens who rely on income from savings accounts and certificates of deposit. The second spirit has been the new round of quantitative easing (“QE2”), which we view as a polite term for printing money and monetary debasement. As noted above, much of the intoxication from QE2 is occurring overseas—in Asian property markets, for example—as liquidity created by the program quickly flows to where returns are highest. The QE2 policy had led to resentment on the part of trading partners who have been burdened with surging inflation and new asset bubbles.
To be sure, the party on Wall Street in recent months has been less rollicking than it was at the height of the housing bubble. Mid cap valuations have risen but remain reasonable—and stocks in general appear attractive relative to bonds. Growth shares only modestly outperformed value stocks over the past year and remain relatively attractive, particularly among large caps. Still, we sense that a bit of intoxication is beginning to creep back into our market. Momentum investing has mounted a comeback among a narrow group of high growth stocks, most notably in hot areas such as cloud computing and social media.
While the Fund has benefited from this enthusiasm, we are intent on remaining the sober ones at the party, focused on companies with durable franchises that are likely to prosper over the long term. Thus, we are trimming positions in which valuations have become stretched and investing in companies that will benefit as the global economy restructures. We remain particularly focused on the U.S. manufacturing renaissance, which we still view as the best way out of our nation’s dependence on debt financed consumption.
 | JNL T. Rowe Price Funds (continued) T. Rowe Price Associates, Inc. |
JNL/T. Rowe Price Short-Term Bond Fund
Sector Weightings*: | ||||
U.S. Government Agency | ||||
Mortgage-Backed Securities | 23.4 | % | ||
Financials | 20.2 | |||
Non-U.S. Government Agency ABS | 12.9 | |||
Government Securities | 8.3 | |||
Energy | 4.0 | |||
Health Care | 4.0 | |||
Consumer Discretionary | 3.9 | |||
Consumer Staples | 3.7 | |||
Utilities | 3.3 | |||
Telecommunication Services | 2.8 | |||
Materials | 2.3 | |||
Information Technology | 2.0 | |||
Industrials | 1.7 | |||
Investment Companies | 0.3 | |||
Short Term Investments | 7.2 | |||
Total Investments | 100.0 | % | ||
*Total Investments at December 31, 2010
Portfolio Manager Commentary: For the year ended December 31, 2010, the JNL/T. Rowe Price Short-Term Bond Fund outperformed its benchmark by posting a return of 2.94% for Class A shares compared to 2.80% for the Barclays Capital 1-3 Year Government/Credit Index.
Sector allocations within the Fund drove relative outperformance against the Fund’s benchmark. The Fund’s overweight to investment grade corporate debt was the most significant contributor to relative returns. The Fund’s non
benchmark exposure to securitized sectors, especially mortgage backed securities (“MBS”), also contributed to outperformance. Lastly, an associated underweight to U.S. Treasury securities also contributed to relative outperformance. Al-most all spread sectors outperformed Treasuries during the year as better economic data and extraordinary amounts economic stimulus caused investors to rotate into riskier sectors.
The greatest contributor to relative performance was the Fund’s overweight allocation to investment grade corporate bonds. Corporate spreads tightened in response to consistently better than expected corporate earnings and a general improvement in economic data. Strong investor demand for corporate debt allowed companies to build substantial cash positions and issue debt at attractive interest rates. However, security selection within the sector detracted from returns during the year. Higher beta credits outperformed during the year, but the Fund’s holdings, especially in BBB rated corporates, tend to be less speculative with lower beta characteristics.
Non benchmark exposure to securitized sectors also added to relative returns over the year. Exposure to MBS especially aided relative performance. MBS benefitted from muted refinance rates, low originator supply, and strong demand in the fourth quarter from money managers and banking institutions.
The Fund’s strategic underweight to Treasuries also contributed to relative returns. This sector posted positive returns for the year but did not perform as well as spread sectors. Almost all spread sectors outperformed Treasuries during the year as better economic data and extraordinary amounts economic stimulus caused investors to rotate into riskier sectors.
Against its benchmark, the Fund’s strategy typically maintains a strategic overweight to spread sectors at the expense of low risk government related and Treasury sectors. To bring the Fund in line with the strategic target weights of the Fund’s investment strategy, the Fund rotated out of liquid, government related debt and into corporate credit during the course of the year. The Fund was particularly active in the new issue corporate market during the period given liquidity constraints in the secondary market for short term corporate credit. The Fund added to industrial names, which is the largest allocation and overweight within the sector.
Underweighting government related debt and Treasuries allows the Fund to build a yield advantage against the benchmark and leverage the strength of T. Rowe Price Associates, Inc.’s fundamental research platform.
JNL/T. Rowe Price Value Fund
Sector Weightings*: | ||||
Financials | 22.7 | % | ||
Energy | 16.4 | |||
Consumer Discretionary | 11.1 | |||
Information Technology | 10.1 | |||
Industrials | 9.7 | |||
Health Care | 9.2 | |||
Materials | 5.8 | |||
Utilities | 5.7 | |||
Consumer Staples | 3.7 | |||
Telecommunication Services | 2.3 | |||
Investment Companies | 0.4 | |||
Short Term Investments | 2.9 | |||
Total Investments | 100.0 | % | ||
*Total Investments at December 31, 2010
Portfolio Manager Commentary: For the year ended December 31, 2010, the JNL/T. Rowe Price Value Fund outperformed its benchmark by posting a return of 15.89% for Class A shares compared to 15.51% for the Russell 1000 Value Index.
During the year of outperformance, sector weight drove relative outperformance, while stock selection detracted slightly. The leading contributor to relative returns versus the Fund’s benchmark was stock selection and an overweight position to consumer discretionary, mostly within the media industry. Media companies typically generate strong cash flows, return cash to shareholders and/or own attractive assets that we feel are undervalued. An overweight position
to energy also aided relative performance, as the sector was particularly strong largely due to the
rising price of oil. Stock selection in industrials and business services and information technology detracted from relative performance.
Significant contributors to the Fund’s performance during the year included: Liberty Media Corp., Cablevision Systems Corp., Time Warner Cable Inc., Chevron Corp. and Murphy Oil Corp. Significant detractors from performance during the year included: H&R Block Inc., Bank of America Corp., St. Joe Co., NRG Energy Inc. and Total SA.
Significant purchases during the year included Pfizer Inc., Wells Fargo & Co., Chevron Corp., JPMorgan Chase & Co. and Nexen Inc. Significant sales during the year included Liberty Media Corp. Capital, Fortune Brands Inc., KeyCorp, Wal-Mart Stores Inc. and Ameriprise Financial Inc.
The largest weighting increase in the Fund was in financials. The Fund was a net purchaser adding to commercial banks and diversified financial services names with strong balance sheets that were more likely to benefit as the economy continues to recover. Energy was one of the best performing sectors for the year, and the Fund was also a net purchaser adding to a basket of names in the oil, gas and consumable fuels industry, favoring names with the ability to find and develop capacity and companies with natural gas exposure as the price of the commodity has lagged.
The Fund was also a net purchaser to utilities as valuations have become more attractive with weakened power demand, low natural gas prices and investors preferring higher growth sectors in the recent market rally. We prefer to invest in a mix of regulated and unregulated utilities with quality assets that operate in attractive markets and like the stable cash flows and higher dividend yields that utilities stocks tend to provide. The weight to consumer discretionary decreased the most since last year. The Fund was a net seller on strength as valuations in this sector have risen in the recent market rally, mostly reducing the Fund’s position to the household durables industry by eliminating positions in Fortune Brands Inc. and Newell Rubbermaid on strength.
Given strong market performance since the March 2009 bottom and current uncertainty about the future strength of the economic recovery, we believe that equity returns will be generated more by superior stock selection rather than by a broad, thematic approach to investing. We believe that this environment should be positive for the Fund’s performance given T. Rowe Price Associates, Inc.’s in house proprietary research and our fundamental style of investing. Our focus will continue to be on selecting stocks with valuation appeal, sound fundamentals and reasonable balance sheet integrity. As always, we will concentrate our efforts on making sound investment decisions in our ongoing attempt to enhance shareholder value.
 | JNL T. Rowe Price Funds (continued) T. Rowe Price Associates, Inc. |
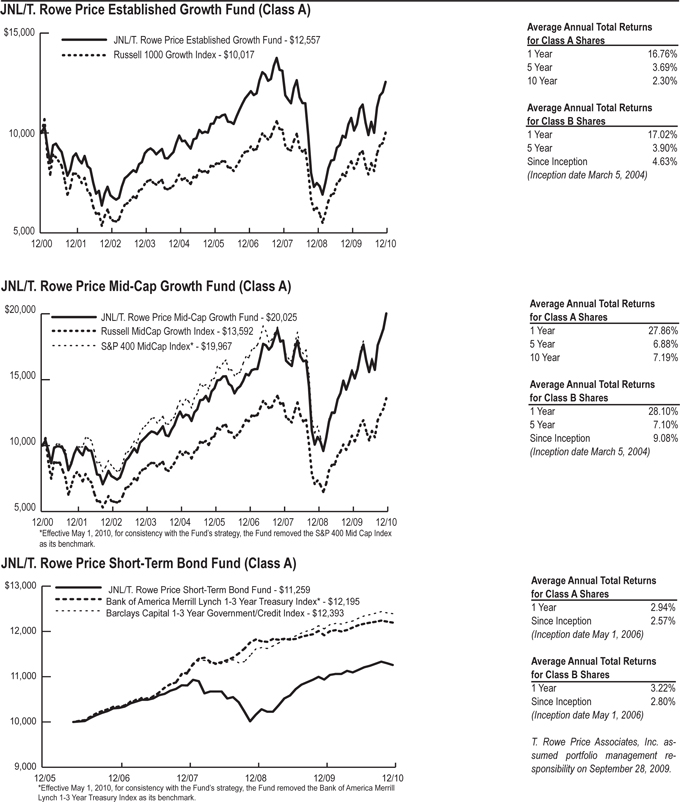
Past performance is not predictive of future performance. Investment return and principal value will fluctuate so that an investor’s shares, when redeemed, may be worth more or less than their original cost. Performance numbers are net of all Fund operating expenses, but not do not reflect the deduction of insurance changes.
 | JNL T. Rowe Price Funds (continued) T. Rowe Price Associates, Inc. |
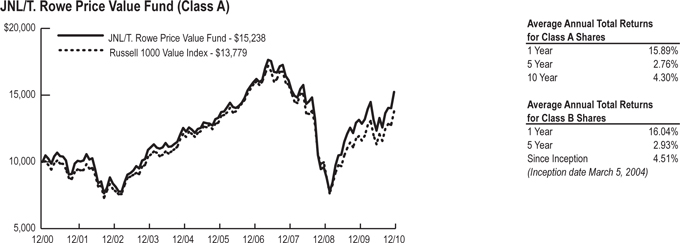
Past performance is not predictive of future performance. Investment return and principal value will fluctuate so that an investor’s shares, when redeemed, may be worth more or less than their original cost. Performance numbers are net of all Fund operating expenses, but not do not reflect the deduction of insurance changes.
JNL Series Trust
Schedules of Investments (in thousands)
December 31, 2010
| Shares/Par (p) | Value | |||||||
JNL/American Funds Blue Chip Income and Growth Fund |
| |||||||
INVESTMENT COMPANIES - 100.0% |
| |||||||
American Funds Insurance Series - Blue Chip Income and Growth Fund Class 1 | 16,117 | $ 149,079 | ||||||
Total Investment Companies (cost $138,368) | 149,079 | |||||||
Total Investments - 100.0% (cost $138,368) | 149,079 | |||||||
Other Assets and Liabilities, Net - (0.0%) | (74) | |||||||
Total Net Assets - 100.0% | $149,005 | |||||||
JNL/American Funds Global Bond Fund |
| |||||||
INVESTMENT COMPANIES - 100.0% |
| |||||||
American Funds Insurance Series - Global Bond Fund Class 1 | 8,916 | $ 105,387 | ||||||
Total Investment Companies (cost $106,562) | 105,387 | |||||||
Total Investments - 100.0% (cost $106,562) | 105,387 | |||||||
Other Assets and Liabilities, Net - (0.0%) | (46) | |||||||
Total Net Assets - 100.0% | $105,341 | |||||||
JNL/American Funds Global Small Capitalization Fund |
| |||||||
INVESTMENT COMPANIES - 100.0% |
| |||||||
American Funds Insurance Series - Global Small Capitalization Fund Class 1 | 3,737 | $ 80,981 | ||||||
Total Investment Companies (cost $73,034) | 80,981 | |||||||
Total Investments - 100.0% (cost $73,034) | 80,981 | |||||||
Other Assets and Liabilities, Net - (0.0%) | (34) | |||||||
Total Net Assets - 100.0% | $80,947 | |||||||
JNL/American Funds Growth-Income Fund |
| |||||||
INVESTMENT COMPANIES - 100.1% |
| |||||||
American Funds Insurance Series - Growth-Income Fund Class 1 | 5,065 | $ 174,607 | ||||||
Total Investment Companies (cost $161,578) | 174,607 | |||||||
Total Investments - 100.1% (cost $161,578) | 174,607 | |||||||
Other Assets and Liabilities, Net - (0.1%) | (90) | |||||||
Total Net Assets - 100.0% | $ 174,517 | |||||||
| Shares/Par (p) | Value | |||||||
JNL/American Funds International Fund |
| |||||||
INVESTMENT COMPANIES - 100.1% |
| |||||||
American Funds Insurance Series - International Fund Class 1 | 5,698 | $ 102,840 | ||||||
Total Investment Companies (cost $95,439) | 102,840 | |||||||
Total Investments - 100.1% (cost $95,439) | 102,840 | |||||||
Other Assets and Liabilities, Net - (0.1%) | (54) | |||||||
Total Net Assets - 100.0% | $ 102,786 | |||||||
JNL/American Funds New World Fund |
| |||||||
INVESTMENT COMPANIES - 100.0% |
| |||||||
American Funds Insurance Series - New World Fund Class 1 | 5,737 | $133,548 | ||||||
Total Investment Companies (cost $125,023) | 133,548 | |||||||
Total Investments - 100.0% (cost $125,023) | 133,548 | |||||||
Other Assets and Liabilities, Net - (0.0%) | (65) | |||||||
Total Net Assets - 100.0% | $ 133,483 | |||||||
JNL Institutional Alt 20 Fund (b) |
| |||||||
INVESTMENT COMPANIES - 100.0% |
| |||||||
JNL/BlackRock Commodity Securities Fund (2.7%) (a) | 2,421 | $ 26,681 | ||||||
JNL/Goldman Sachs Emerging Markets Debt Fund (1.6%) (a) | 886 | 12,093 | ||||||
JNL/Invesco Global Real Estate Fund (2.9%) (a) | 2,264 | 19,239 | ||||||
JNL/Lazard Emerging Markets Fund (1.0%) (a) | 1,094 | 13,222 | ||||||
JNL/Mellon Capital Management Bond Index Fund (13.4%) (a) | 15,260 | 179,003 | ||||||
JNL/Mellon Capital Management Global Alpha Fund (5.7%) (a) | 1,091 | 11,425 | ||||||
JNL/Mellon Capital Management International Index Fund (6.7%) (a) | 5,802 | 72,407 | ||||||
JNL/Mellon Capital Management Nasdaq 25 Fund (12.3%) (a) | 2,230 | 25,650 | ||||||
JNL/Mellon Capital Management S&P 24 Fund (21.2%) (a) | 7,673 | 77,881 | ||||||
JNL/Mellon Capital Management S&P SMid 60 Fund (12.3%) (a) | 4,117 | 46,642 | ||||||
JNL/Mellon Capital Management Small Cap Index Fund (3.7%) (a) | 2,104 | 26,534 | ||||||
JNL/Mellon Capital Management Value Line 30 Fund (7.4%) (a) | 4,593 | 60,357 | ||||||
JNL/PIMCO Real Return Fund (0.6%) (a) | 948 | 11,435 | ||||||
JNL/PPM America High Yield Bond Fund (1.4%) (a) | 1,859 | 12,397 | ||||||
JNL/Red Rocks Listed Private Equity Fund (3.1%) (a) | 2,003 | 20,169 | ||||||
Total Investment Companies (cost $553,914) | 615,135 | |||||||
See accompanying Notes to the Financial Statements.
JNL Series Trust
Schedules of Investments (in thousands)
December 31, 2010
| Shares/Par (p) | Value | |||||
Total Investments - 100.0% (cost $553,914) | 615,135 | |||||
Other Assets and Liabilities, Net - (0.0%) | (101) | |||||
Total Net Assets - 100.0% | $ 615,034 | |||||
JNL Institutional Alt 35 Fund (b) | ||||||
INVESTMENT COMPANIES - 100.0% | ||||||
JNL/BlackRock Commodity Securities Fund (7.6%) (a) | 6,874 | $ 75,754 | ||||
JNL/Goldman Sachs Emerging Markets Debt Fund (3.4%) (a) | 1,888 | 25,777 | ||||
JNL/Invesco Global Real Estate Fund (6.9%) (a) | 5,374 | 45,677 | ||||
JNL/Ivy Asset Strategy Fund (1.8%) (a) | 1,508 | 17,232 | ||||
JNL/Lazard Emerging Markets Fund (2.0%) (a) | 2,342 | 28,313 | ||||
JNL/Mellon Capital Management Bond Index Fund (13.7%) (a) | 15,546 | 182,361 | ||||
JNL/Mellon Capital Management Global Alpha Fund (12.1%) (a) | 2,324 | 24,329 | ||||
JNL/Mellon Capital Management International Index Fund (8.7%) (a) | 7,545 | 94,166 | ||||
JNL/Mellon Capital Management Nasdaq 25 Fund (13.0%) (a) | 2,373 | 27,289 | ||||
JNL/Mellon Capital Management S&P 24 Fund (27.5%) (a) | 9,964 | 101,135 | ||||
JNL/Mellon Capital Management S&P SMid 60 Fund (15.1%) (a) | 5,025 | 56,937 | ||||
JNL/Mellon Capital Management Small Cap Index Fund (3.9%) (a) | 2,236 | 28,191 | ||||
JNL/Mellon Capital Management Value Line 30 Fund (9.3%) (a) | 5,784 | 76,002 | ||||
JNL/PPM America High Yield Bond Fund (3.9%) (a) | 5,298 | 35,337 | ||||
JNL/Red Rocks Listed Private Equity Fund (10.4%) (a) | 6,663 | 67,092 | ||||
Total Investment Companies (cost $783,525) | 885,592 | |||||
Total Investments - 100.0% (cost $783,525) | 885,592 | |||||
Other Assets and Liabilities, Net - (0.0%) | (136) | |||||
Total Net Assets - 100.0% | $ 885,456 | |||||
JNL Institutional Alt 50 Fund (b) | ||||||
INVESTMENT COMPANIES - 100.0% | ||||||
JNL/BlackRock Commodity Securities Fund (8.0%) (a) | 7,288 | $ 80,309 | ||||
JNL/Goldman Sachs Emerging Markets Debt Fund (5.5%) (a) | 3,058 | 41,747 | ||||
JNL/Invesco Global Real Estate Fund (15.0%) (a) | 11,708 | 99,519 | ||||
JNL/Ivy Asset Strategy Fund (4.3%) (a) | 3,659 | 41,820 | ||||
JNL/Lazard Emerging Markets Fund (3.3%) (a) | 3,773 | 45,617 | ||||
JNL/Mellon Capital Management Bond Index Fund (13.1%) (a) | 14,829 | 173,946 | ||||
JNL/Mellon Capital Management Global Alpha Fund (29.4%) (a) | 5,652 | 59,179 | ||||
JNL/Mellon Capital Management International Index Fund (8.6%) (a) | 7,487 | 93,444 | ||||
JNL/Mellon Capital Management Nasdaq 25 Fund (10.5%) (a) | 1,918 | 22,056 | ||||
| Shares/Par (p) | Value | |||||
JNL/Mellon Capital Management S&P 24 Fund (24.3%) (a) | 8,789 | 89,206 | ||||
JNL/Mellon Capital Management S&P SMid 60 Fund (15.2%) (a) | 5,061 | 57,343 | ||||
JNL/Mellon Capital Management Small Cap Index Fund (3.2%) (a) | 1,808 | 22,794 | ||||
JNL/Mellon Capital Management Value Line 30 Fund (8.5%) (a) | 5,257 | 69,074 | ||||
JNL/PPM America High Yield Bond Fund (4.7%) (a) | 6,425 | 42,852 | ||||
JNL/Red Rocks Listed Private Equity Fund (21.6%) (a) | 13,791 | 138,877 | ||||
Total Investment Companies (cost $957,545) | 1,077,783 | |||||
Total Investments - 100.0% (cost$957,545) | 1,077,783 | |||||
Other Assets and Liabilities, Net - (0.0%) | (160) | |||||
Total Net Assets - 100.0% | $ 1,077,623 | |||||
JNL Institutional Alt 65 Fund (b) | ||||||
INVESTMENT COMPANIES - 100.0% | ||||||
JNL/BlackRock Commodity Securities Fund (6.1%) (a) | 5,570 | $ 61,376 | ||||
JNL/Goldman Sachs Emerging Markets Debt Fund (4.6%) (a) | 2,569 | 35,065 | ||||
JNL/Invesco Global Real Estate Fund (12.3%) (a) | 9,567 | 81,316 | ||||
JNL/Ivy Asset Strategy Fund (4.3%) (a) | 3,683 | 42,102 | ||||
JNL/Lazard Emerging Markets Fund (2.7%) (a) | 3,150 | 38,085 | ||||
JNL/Mellon Capital Management Bond Index Fund (4.4%) (a) | 5,010 | 58,766 | ||||
JNL/Mellon Capital Management Global Alpha Fund (33.1%) (a) | 6,353 | 66,518 | ||||
JNL/Mellon Capital Management International Index Fund (4.5%) (a) | 3,897 | 48,633 | ||||
JNL/Mellon Capital Management Nasdaq 25 Fund (7.1%) (a) | 1,288 | 14,811 | ||||
JNL/Mellon Capital Management S&P 24 Fund (14.2%) (a) | 5,155 | 52,324 | ||||
JNL/Mellon Capital Management S&P SMid 60 Fund (8.1%) (a) | 2,709 | 30,699 | ||||
JNL/Mellon Capital Management Small Cap Index Fund (2.1%) (a) | 1,215 | 15,322 | ||||
JNL/Mellon Capital Management Value Line 30 Fund (3.8%) (a) | 2,346 | 30,821 | ||||
JNL/PPM America High Yield Bond Fund (2.4%) (a) | 3,234 | 21,572 | ||||
JNL/Red Rocks Listed Private Equity Fund (20.4%) (a) | 13,020 | 131,114 | ||||
Total Investment Companies (cost $648,548) | 728,524 | |||||
Total Investments - 100.0% (cost $648,548) | 728,524 | |||||
Other Assets and Liabilities, Net - (0.0% ) | (114) | |||||
Total Net Assets - 100.0% | $ 728,410 | |||||
See accompanying Notes to the Financial Statements.
JNL Series Trust
Schedules of Investments (in thousands)
December 31, 2010
| Shares/Par (p) | Value | |||||
JNL/BlackRock Commodity Securities Fund * (x) | ||||||
COMMON STOCKS - 45.9% |
| |||||
ENERGY - 40.1% | ||||||
Anadarko Petroleum Corp. | 125 | $9,493 | ||||
Apache Corp. | 162 | 19,350 | ||||
Baker Hughes Inc. | 97 | 5,545 | ||||
Brigham Exploration Co. (c) | 197 | 5,359 | ||||
Cameron International Corp. (c) | 174 | 8,808 | ||||
Canadian Natural Resources Ltd. | 183 | 8,181 | ||||
Chevron Corp. | 139 | 12,648 | ||||
CNOOC Ltd. - ADR (e) | 27 | 6,343 | ||||
ConocoPhillips | 111 | 7,560 | ||||
Crew Energy Inc. (c) | 242 | 4,648 | ||||
Devon Energy Corp. | 165 | 12,971 | ||||
Dresser-Rand Group Inc. (c) | 182 | 7,744 | ||||
Dril-Quip Inc. (c) | 76 | 5,921 | ||||
EOG Resources Inc. | 193 | 17,682 | ||||
Exxon Mobil Corp. | 178 | 13,029 | ||||
FMC Technologies Inc. (c) | 138 | 12,291 | ||||
Halliburton Co. | 176 | 7,206 | ||||
Helmerich & Payne Inc. | 95 | 4,610 | ||||
Hess Corp. | 84 | 6,423 | ||||
Marathon Oil Corp. | 138 | 5,111 | ||||
Murphy Oil Corp. | 231 | 17,222 | ||||
National Oilwell Varco Inc. | 225 | 15,102 | ||||
Newfield Exploration Co. (c) | 67 | 4,818 | ||||
Noble Corp. | 138 | 4,934 | ||||
Noble Energy Inc. | 80 | 6,858 | ||||
Occidental Petroleum Corp. | 132 | 12,950 | ||||
Peabody Energy Corp. | 121 | 7,747 | ||||
Pride International Inc. (c) | 133 | 4,377 | ||||
Range Resources Corp. | 142 | 6,395 | ||||
Saipem SpA | 117 | 5,758 | ||||
Schlumberger Ltd. | 133 | 11,122 | ||||
Suncor Energy Inc. | 325 | 12,498 | ||||
Talisman Energy Inc. | 579 | 12,892 | ||||
Technip SA - ADR | 49 | 4,520 | ||||
Total SA - ADR | 100 | 5,366 | ||||
Transocean Ltd. (c) | 128 | 8,899 | ||||
Whiting Petroleum Corp. (c) | 46 | 5,443 | ||||
Other Securities | 73,193 | |||||
401,017 | ||||||
INDUSTRIALS - 0.1% | ||||||
Other Securities | 592 | |||||
MATERIALS - 5.7% | ||||||
Eldorado Gold Corp. | 406 | 7,560 | ||||
Goldcorp Inc. | 126 | 5,821 | ||||
Newcrest Mining Ltd. | 140 | 5,770 | ||||
Southern Copper Corp. | 136 | 6,635 | ||||
Vale SA - ADR (c) | 169 | 5,856 | ||||
Other Securities | 25,866 | |||||
| 57,508 | ||||||
Total Common Stocks (cost $386,991) | 459,117 | |||||
WARRANTS - 0.0% | ||||||
Other Securities | — | |||||
Total Warrants (cost $0) | — | |||||
| Shares/Par (p) | Value | |||||||
COMMODITY INDEXED STRUCTURED NOTES - 21.0% |
| |||||||
Bank of America Corp. - Series DJUB, Dow Jones-UBS Commodity Index 2 Month Forward Total Return linked note, 0.17%, 06/07/11 (i) (f) | $ | 7,000 | 11,348 | |||||
Bank of America Corp., Dow Jones-UBS Commodity Index linked note, 0.01%, 08/18/11 (i) (f) | 10,000 | 18,778 | ||||||
Bank of America Corp., Dow Jones-UBS Commodity Index linked note, 0.01%, 10/24/11 (i) (f) | 10,000 | 15,269 | ||||||
BNP Paribas, BNP Paribas Millennium Commodities Long/Short Excess Return Index linked note, 0.02%, 04/15/11 (r) (f) (i) | 14,000 | 27,651 | ||||||
Citigroup, Dow Jones-UBS Commodity Index Total Return linked note, 0.29%, 12/15/11 (f) (i) | 28,000 | 35,600 | ||||||
JP Morgan, Dow Jones-UBS Commodity Index Total Return linked note, 0.26%, 11/17/11 (f) (i) | 6,000 | 7,869 | ||||||
JP Morgan, Dow Jones-UBS Commodity Index Total Return linked note, 0.26%, 12/07/11 (f) (i) | 16,000 | 20,450 | ||||||
Societe Generale, Dow Jones-UBS Commodity Index Total Return linked note, 0.26%, 04/15/11 (i) (r) (f) | 10,000 | 19,192 | ||||||
Societe Generale, Dow Jones-UBS Commodity Index Total Return linked note, 0.26%, 08/19/11 (i) (r) (f) | 10,000 | 18,721 | ||||||
Svensk Exportkredit AB, Dow Jones-UBS Commodity Index 2 Month Forward Total Return linked note, 0.03%, 04/15/11 (i) (f) | 12,000 | 20,033 | ||||||
UBS, Dow Jones-UBS Commodity Index Total Return linked note, 0.26%, 12/30/11 (f) (i) | 7,500 | 10,193 | ||||||
UBS, Dow Jones-UBS Commodity Index Total Return linked note, 0.26%, 01/23/12 (f) (i) | 5,000 | 5,667 | ||||||
Total Commodity Indexed Structured Notes (cost $135,500) | 210,771 | |||||||
SHORT TERM INVESTMENTS - 51.1% |
| |||||||
Investment Company - 6.3% |
| |||||||
JNL Money Market Fund, 0.08% (a) (h) | 62,860 | 62,860 | ||||||
Securities Lending Collateral 17.7% |
| |||||||
Securities Lending Cash Collateral Fund LLC, 0.31% (a) (h) | 176,969 | 176,969 | ||||||
Securities Lending Liquidating Fund LLC, 0.66% (a) (h) | 698 | 687 | ||||||
| 177,656 | ||||||||
Treasury Securities 27.1% | ||||||||
U.S. Treasury Bill | ||||||||
0.13%, 03/24/11 (e) | $ | 10,000 | 9,997 | |||||
0.14%, 03/31/11 (e) | 261,050 | 260,964 | ||||||
| 270,961 | ||||||||
Total Short Term Investments (cost $511,488) | 511,477 | |||||||
Total Investments - 118.0% (cost $1,033,979) | 1,181,365 | |||||||
Other Assets and Liabilities, Net - (18.0%) | (180,433) | |||||||
Total Net Assets - 100.0% | $ | 1,000,932 | ||||||
See accompanying Notes to the Financial Statements.
JNL Series Trust
Schedules of Investments (in thousands)
December 31, 2010
| Shares/Par (p) | Value | |||||||
JNL/BlackRock Global Allocation Fund |
| |||||||
INVESTMENT COMPANIES - 100.0% |
| |||||||
BlackRock Global Allocation Portfolio (a) | 11,523 | $ | 179,646 | |||||
Total Investment Companies (cost $178,266) |
| 179,646 | ||||||
Total Investments - 100.0% (cost $178,266) |
| 179,646 | ||||||
Other Assets and Liabilities, Net - (0.0% ) |
| (66 | ) | |||||
Total Net Assets - 100.0% | $ | 179,580 | ||||||
JNL/Capital Guardian Global Balanced Fund * (x) |
| |||||||
COMMON STOCKS - 65.3% |
| |||||||
CONSUMER DISCRETIONARY - 7.6% |
| |||||||
Daimler AG (c) | 49 | $ | 3,328 | |||||
Denso Corp. | 64 | 2,197 | ||||||
GKN Plc | 557 | 1,929 | ||||||
Target Corp. | 74 | 4,426 | ||||||
Other Securities | 15,503 | |||||||
| 27,383 | ||||||||
CONSUMER STAPLES - 4.6% |
| |||||||
Danone SA | 33 | 2,103 | ||||||
Procter & Gamble Co. | 31 | 1,988 | ||||||
Other Securities | 12,471 | |||||||
| 16,562 | ||||||||
ENERGY - 7.4% | ||||||||
BG Group Plc | 102 | 2,059 | ||||||
Cameco Corp. | 83 | 3,356 | ||||||
Halliburton Co. | 48 | 1,952 | ||||||
Noble Energy Inc. | 26 | 2,204 | ||||||
Schlumberger Ltd. | 27 | 2,246 | ||||||
Weatherford International Ltd. (c) | 93 | 2,125 | ||||||
Other Securities | 12,681 | |||||||
| 26,623 | ||||||||
FINANCIALS - 11.0% | ||||||||
AIA Group Ltd. (c) (q) | 723 | 2,031 | ||||||
DLF Ltd. | 345 | 2,252 | ||||||
Grupo Financiero Inbursa SA | 440 | 1,932 | ||||||
HSBC Holdings Plc | 276 | 2,808 | ||||||
Sberbank - GDR (e) | 6 | 2,513 | ||||||
Other Securities | 28,031 | |||||||
| 39,567 | ||||||||
HEALTH CARE - 5.2% | ||||||||
Cerner Corp. (c) (e) | 21 | 2,027 | ||||||
Roche Holding AG | 22 | 3,219 | ||||||
Shire Plc | 96 | 2,305 | ||||||
Shire Plc - ADR (e) | 4 | 268 | ||||||
Other Securities | 11,011 | |||||||
| 18,830 | ||||||||
INDUSTRIALS - 6.6% | ||||||||
FedEx Corp. | 27 | 2,521 | ||||||
Siemens AG | 32 | 3,984 | ||||||
Other Securities | 17,035 | |||||||
| 23,540 | ||||||||
INFORMATION TECHNOLOGY - 11.7% |
| |||||||
Apple Inc. (c) | 7 | 2,129 | ||||||
| Shares/Par (p) | Value | |||||||
ASML Holding NV | 52 | 1,998 | ||||||
Google Inc. - Class A (c) | 5 | 2,732 | ||||||
International Business Machines Corp. | 16 | 2,348 | ||||||
Juniper Networks Inc. (c) | 127 | 4,685 | ||||||
Murata Manufacturing Co. Ltd. | 27 | 1,857 | ||||||
Nintendo Co. Ltd. | 13 | 3,649 | ||||||
Oracle Corp. | 35 | 1,105 | ||||||
Oracle Corp. Japan | 16 | 804 | ||||||
Samsung Electronics Co. Ltd. | 2 | 1,795 | ||||||
Samsung Electronics Co. Ltd. - GDR | 1 | 308 | ||||||
Other Securities | 18,697 | |||||||
| 42,107 | ||||||||
MATERIALS - 6.6% | ||||||||
CRH Plc | 90 | 1,874 | ||||||
Monsanto Co. | 41 | 2,876 | ||||||
Syngenta AG | 7 | 1,923 | ||||||
Other Securities | 16,833 | |||||||
| 23,506 | ||||||||
TELECOMMUNICATION SERVICES - 3.7% |
| |||||||
American Tower Corp. - Class A (c) | 41 | 2,102 | ||||||
SoftBank Corp. | 95 | 3,276 | ||||||
Other Securities | 7,736 | |||||||
| 13,114 | ||||||||
UTILITIES - 0.9% | ||||||||
Other Securities | 3,251 | |||||||
Total Common Stocks (cost $194,712) | 234,483 | |||||||
PREFERRED STOCKS - 0.4%
| ||||||||
INFORMATION TECHNOLOGY - 0.0% |
| |||||||
Other Securities | — | |||||||
MATERIALS - 0.1% | ||||||||
Other Securities
| 176 | |||||||
TELECOMMUNICATION SERVICES - 0.1% |
| |||||||
Other Securities
| 305 | |||||||
UTILITIES - 0.2% | ||||||||
Other Securities | 839 | |||||||
Total Preferred Stocks (cost $1,059) | 1,320 | |||||||
RIGHTS - 0.0% | ||||||||
Other Securities | 16 | |||||||
Total Rights (cost $0) | 16 | |||||||
CORPORATE BONDS AND NOTES - 5.7% |
| |||||||
CONSUMER DISCRETIONARY - 0.7% |
| |||||||
Other Securities | 2,482 | |||||||
CONSUMER STAPLES - 0.3% | ||||||||
Other Securities | 1,287 | |||||||
ENERGY - 0.0% | ||||||||
Other Securities | 89 | |||||||
FINANCIALS - 2.4% | ||||||||
Other Securities | 8,500 | |||||||
HEALTH CARE - 0.5% | ||||||||
Roche Holdings Inc., 6.00%, 03/01/19 (l) (q) | 400 | 465 | ||||||
Other Securities | 1,358 | |||||||
| 1,823 | ||||||||
See accompanying Notes to the Financial Statements.
JNL Series Trust
Schedules of Investments (in thousands)
December 31, 2010
| Shares/Par (p) | Value | |||||
INDUSTRIALS - 0.2% | ||||||
Other Securities | 624 | |||||
INFORMATION TECHNOLOGY - 0.2% | ||||||
Other Securities | 614 | |||||
MATERIALS - 0.1% | ||||||
Other Securities | 326 | |||||
TELECOMMUNICATION SERVICES - 0.6% | ||||||
Other Securities | 2,338 | |||||
UTILITIES - 0.7% | ||||||
Other Securities | 2,588 | |||||
Total Corporate Bonds and Notes (cost $20,419) | 20,671 | |||||
GOVERNMENT AND AGENCY OBLIGATIONS - 24.6% | ||||||
GOVERNMENT SECURITIES - 21.8% | ||||||
Sovereign - 16.0% | ||||||
Bundesrepublic Deutschland, 3.00%, | 3,600 | 4,835 | ||||
Canadian Government Bond | ||||||
4.50%, 06/01/15, CAD | 1,750 | 1,922 | ||||
4.25%, 06/01/18, CAD | 300 | 329 | ||||
Denmark Government Bond, 5.00%, | 11,975 | 2,365 | ||||
Japan Government Bond | ||||||
1.10%, 03/21/11, JPY | 105,000 | 1,296 | ||||
1.70%, 09/20/17, JPY | 325,000 | 4,277 | ||||
2.30%, 12/20/35, JPY | 50,000 | 655 | ||||
Korea Treasury Bond, 4.25%, 09/10/14, KRW | 2,550,000 | 2,268 | ||||
Malaysia Government Bond, 5.09%, | 9,325 | 3,199 | ||||
Mexican Bonos | ||||||
9.50%, 12/18/14, MXN | 29,000 | 2,628 | ||||
7.75%, 12/14/17, MXN | 3,800 | 327 | ||||
Poland Government Treasury International Bond | ||||||
5.75%, 04/25/14, PLN | 5,250 | 1,808 | ||||
5.25%, 10/25/17, PLN | 3,000 | 990 | ||||
6.38%, 07/15/19 | 650 | 728 | ||||
Queensland Treasury Corp., 6.00%, | 3,500 | 3,622 | ||||
Republic of Deutschland | ||||||
3.75%, 07/04/13, EUR | 250 | 357 | ||||
4.25%, 07/04/14, EUR | 1,570 | 2,299 | ||||
3.25%, 07/04/15, EUR | 825 | 1,172 | ||||
4.25%, 07/04/18, EUR | 2,625 | 3,881 | ||||
4.75%, 07/04/34, EUR | 950 | 1,514 | ||||
4.00%, 01/04/37, EUR | 100 | 145 | ||||
Sweden Government Bond, 6.75%, | 13,250 | 2,238 | ||||
United Kingdom Treasury Bond | ||||||
2.75%, 01/22/15, GBP | 200 | 320 | ||||
4.00%, 09/07/16, GBP | 400 | 672 | ||||
4.50%, 03/07/19, GBP | 375 | 639 | ||||
5.00%, 03/07/25, GBP | 400 | 700 | ||||
4.75%, 12/07/38, GBP | 350 | 596 | ||||
Other Securities | 11,620 | |||||
| 57,402 | ||||||
Treasury Inflation Index Securities - 0.5% | ||||||
U.S. Treasury Inflation Indexed Note, 2.00%, | 1,479 | 1,599 | ||||
Other Securities | 217 | |||||
| 1,816 | ||||||
U.S. Treasury Securities - 5.3% | ||||||
U.S. Treasury Bond | ||||||
5.25%, 02/15/29 | 1,000 | 1,147 | ||||
| Shares/Par (p) | Value | |||||||
4.38%, 02/15/38 | 1,650 | 1,667 | ||||||
U.S. Treasury Note | ||||||||
0.75%, 05/31/12 | 4,500 | 4,521 | ||||||
2.75%, 02/28/13 | 2,650 | 2,770 | ||||||
4.25%, 08/15/13 | 5,950 | 6,478 | ||||||
4.25%, 11/15/13 | 1,750 | 1,915 | ||||||
3.50%, 02/15/18 | 400 | 421 | ||||||
| 18,919 | ||||||||
U.S. GOVERNMENT AGENCY MORTGAGE-BACKED SECURITIES - 2.8% |
| |||||||
Federal National Mortgage Association - 2.2% |
| |||||||
Federal National Mortgage Association |
| |||||||
4.00%, 06/01/25 | 1,894 | 1,958 | ||||||
3.50%, 12/01/25 | 1,475 | 1,489 | ||||||
5.50%, 06/01/38, TBA (g) | 1,943 | 2,080 | ||||||
6.00%, 07/01/38 | 1,254 | 1,365 | ||||||
5.00%, 04/01/39 | 822 | 865 | ||||||
| 7,757 | ||||||||
Government National Mortgage Association - 0.6% |
| |||||||
Government National Mortgage Association | ||||||||
4.50%, 11/20/39 | 791 | 823 | ||||||
4.00%, 01/15/41, TBA (g) | 1,500 | 1,510 | ||||||
| 2,333 | ||||||||
Total Government and Agency Obligations |
| 88,227 | ||||||
SHORT TERM INVESTMENTS - 8.4% |
| |||||||
Investment Company - 4.5% |
| |||||||
JNL Money Market Fund, 0.08% (a) (h) | 16,241 | 16,241 | ||||||
Securities Lending Collateral 3.9% |
| |||||||
Securities Lending Cash Collateral Fund LLC, | 12,684 | 12,684 | ||||||
Securities Lending Liquidating Fund LLC, | 1,207 | 1,187 | ||||||
| 13,871 | ||||||||
Total Short Term Investments (cost $30,132) | 30,112 | |||||||
Total Investments - 104.4% (cost $331,784) |
| 374,829 | ||||||
Other Assets and Liabilities, Net - (4.4%) |
| (15,815 | ) | |||||
Total Net Assets - 100.0% | $ | 359,014 | ||||||
JNL/Capital Guardian Global Diversified Research Fund * (x) |
| |||||||
COMMON STOCKS - 96.6% |
| |||||||
CONSUMER DISCRETIONARY - 8.3% |
| |||||||
Comcast Corp. - Class A | 145 | $ | 3,190 | |||||
Daimler AG (c) | 51 | 3,443 | ||||||
Target Corp. | 82 | 4,913 | ||||||
Other Securities | 24,608 | |||||||
| 36,154 | ||||||||
CONSUMER STAPLES - 8.0% |
| |||||||
Coca-Cola Amatil Ltd. (e) | 348 | 3,865 | ||||||
Danone SA | 73 | 4,570 | ||||||
Imperial Tobacco Group Plc | 121 | 3,704 | ||||||
Pernod-Ricard SA | 66 | 6,247 | ||||||
Procter & Gamble Co. | 53 | 3,429 | ||||||
See accompanying Notes to the Financial Statements.
JNL Series Trust
Schedules of Investments (in thousands)
December 31, 2010
| Shares/Par (p) | Value | |||||||
Other Securities | 12,988 | |||||||
| 34,803 | ||||||||
ENERGY - 14.5% | ||||||||
BG Group Plc | 538 | 10,861 | ||||||
Cairn Energy Plc (c) | 475 | 3,110 | ||||||
Canadian Natural Resources Ltd. | 70 | 3,132 | ||||||
Cenovus Energy Inc. | 126 | 4,214 | ||||||
Chevron Corp. | 70 | 6,415 | ||||||
China Shenhua Energy Co. Ltd. - Class H | 922 | 3,867 | ||||||
Gazprom OAO - ADR | 174 | 4,383 | ||||||
Halliburton Co. | 88 | 3,577 | ||||||
Royal Dutch Shell Plc - Class A | 156 | 5,166 | ||||||
Other Securities | 18,765 | |||||||
| 63,490 | ||||||||
FINANCIALS - 16.0% | ||||||||
AIA Group Ltd. (c) (q) | 1,241 | 3,489 | ||||||
Bank of China Ltd. - Class H | 7,530 | 3,972 | ||||||
Goldman Sachs Group Inc. | 23 | 3,901 | ||||||
HSBC Holdings Plc | 385 | 3,906 | ||||||
Industrial & Commercial Bank of China – Class H | 5,235 | 3,900 | ||||||
Link REIT | 1,582 | 4,914 | ||||||
UBS AG (c) | 204 | 3,347 | ||||||
Wharf Holdings Ltd. | 551 | 4,239 | ||||||
Other Securities | 38,273 | |||||||
| 69,941 | ||||||||
HEALTH CARE - 7.5% | ||||||||
Allergan Inc. | 71 | 4,896 | ||||||
Bayer AG | 57 | 4,214 | ||||||
Novo-Nordisk A/S - Class B | 36 | 4,045 | ||||||
Shire Plc | 201 | 4,828 | ||||||
Other Securities | 14,804 | |||||||
| 32,787 | ||||||||
INDUSTRIALS - 6.9% | ||||||||
Siemens AG | 41 | 5,055 | ||||||
Other Securities | 24,938 | |||||||
| 29,993 | ||||||||
INFORMATION TECHNOLOGY - 15.4% |
| |||||||
Apple Inc. (c) | 13 | 4,064 | ||||||
ASML Holding NV | 95 | 3,684 | ||||||
ASML Holding NV - NYS | 14 | 548 | ||||||
Google Inc. - Class A (c) | 6 | 3,445 | ||||||
International Business Machines Corp. | 27 | 3,933 | ||||||
Keyence Corp. | 12 | 3,353 | ||||||
Maxim Integrated Products Inc. | 182 | 4,299 | ||||||
Oracle Corp. | 105 | 3,299 | ||||||
Oracle Corp. Japan | 22 | 1,079 | ||||||
QUALCOMM Inc. | 102 | 5,028 | ||||||
Samsung Electronics Co. Ltd. | 2 | 1,804 | ||||||
Samsung Electronics Co. Ltd. - GDR | 9 | 3,700 | ||||||
Visa Inc. - Class A | 55 | 3,836 | ||||||
Other Securities | 25,340 | |||||||
| 67,412 | ||||||||
MATERIALS - 11.9% | ||||||||
Anglo American Plc | 81 | 4,212 | ||||||
Cliffs Natural Resources Inc. | 47 | 3,690 | ||||||
Inmet Mining Corp. | 54 | 4,218 | ||||||
LG Chem Ltd. - GDR (c) (q) | 21 | 3,600 | ||||||
Newcrest Mining Ltd. | 81 | 3,354 | ||||||
Rio Tinto Plc | 54 | 3,776 | ||||||
Syngenta AG | 14 | 4,163 | ||||||
Xstrata Plc | 160 | 3,760 | ||||||
| Shares/Par (p) | Value | |||||||
Other Securities | 21,458 | |||||||
| 52,231 | ||||||||
TELECOMMUNICATION SERVICES - 5.8% |
| |||||||
American Tower Corp.- Class A (c) | 173 | 8,949 | ||||||
Koninklijke KPN NV | 295 | 4,309 | ||||||
Other Securities | 12,314 | |||||||
| 25,572 | ||||||||
UTILITIES - 2.3% | ||||||||
Other Securities | 9,934 | |||||||
Total Common Stocks (cost $351,384) | 422,317 | |||||||
CORPORATE BONDS AND NOTES - 0.1% |
| |||||||
ENERGY - 0.1% | ||||||||
Other Securities | 372 | |||||||
Total Corporate Bonds and Notes (cost $191) | 372 | |||||||
SHORT TERM INVESTMENTS - 5.6% |
| |||||||
Investment Company - 3.3% | ||||||||
JNL Money Market Fund, 0.08% (a) (h) | 14,275 | 14,275 | ||||||
Securities Lending Collateral 2.3% | ||||||||
Securities Lending Cash Collateral Fund LLC, 0.31% (a) (h) | 9,218 | 9,218 | ||||||
Securities Lending Liquidating Fund LLC, 0.66% (a) (h) | 889 | 874 | ||||||
| 10,092 | ||||||||
Total Short Term Investments (cost $24,382) | 24,367 | |||||||
Total Investments - 102.3% (cost $375,957) | 447,056 | |||||||
Other Assets and Liabilities, Net - (2.3%) | (9,848 | ) | ||||||
Total Net Assets - 100.0% | $ | 437,208 | ||||||
JNL/Capital Guardian U.S. Growth Equity Fund |
| |||||||
COMMON STOCKS - 94.1% |
| |||||||
CONSUMER DISCRETIONARY - 15.9% |
| |||||||
Coach Inc. | 331 | $ | 18,280 | |||||
Comcast Corp. - Class A | 600 | 13,173 | ||||||
DreamWorks Animation SKG Inc. - Class A (c) | 541 | 15,943 | ||||||
Lowe’s Cos. Inc. | 175 | 4,399 | ||||||
Scripps Networks Interactive Inc. - Class A | 176 | 9,093 | ||||||
Target Corp. | 406 | 24,401 | ||||||
Tiffany & Co. | 296 | 18,438 | ||||||
Time Warner Cable Inc. | 79 | 5,243 | ||||||
Time Warner Inc. | 67 | 2,160 | ||||||
Urban Outfitters Inc. (c) | 451 | 16,157 | ||||||
Viacom Inc. - Class B | 376 | 14,909 | ||||||
| 142,196 | ||||||||
CONSUMER STAPLES - 7.0% |
| |||||||
Alberto-Culver Co. | 108 | 4,011 | ||||||
Avon Products Inc. | 359 | 10,441 | ||||||
Colgate-Palmolive Co. | 67 | 5,361 | ||||||
General Mills Inc. | 151 | 5,367 | ||||||
PepsiCo Inc. | 282 | 18,449 | ||||||
Philip Morris International Inc. | 247 | 14,457 | ||||||
See accompanying Notes to the Financial Statements.
JNL Series Trust
Schedules of Investments (in thousands)
December 31, 2010
| Shares/Par (p) | Value | |||||||
Procter & Gamble Co. | 65 | 4,201 | ||||||
| 62,287 | ||||||||
ENERGY - 12.4% | ||||||||
Anadarko Petroleum Corp. | 169 | 12,886 | ||||||
Baker Hughes Inc. | 154 | 8,827 | ||||||
Cenovus Energy Inc. (e) | 191 | 6,349 | ||||||
Halliburton Co. | 261 | 10,648 | ||||||
Noble Energy Inc. | 101 | 8,729 | ||||||
Schlumberger Ltd. | 412 | 34,360 | ||||||
Transocean Ltd. (c) | 59 | 4,129 | ||||||
Weatherford International Ltd. (c) | 1,096 | 24,996 | ||||||
| 110,924 | ||||||||
FINANCIALS - 5.4% | ||||||||
Bank of New York Mellon Corp. | 122 | 3,675 | ||||||
Charles Schwab Corp. | 1,238 | 21,175 | ||||||
Goldman Sachs Group Inc. | 84 | 14,109 | ||||||
JPMorgan Chase & Co. | 124 | 5,264 | ||||||
Progressive Corp. | 209 | 4,151 | ||||||
| 48,374 | ||||||||
HEALTH CARE - 12.2% | ||||||||
Allergan Inc. | 209 | 14,325 | ||||||
Boston Scientific Corp. (c) | 1,151 | 8,710 | ||||||
Celgene Corp. (c) | 303 | 17,925 | ||||||
Cerner Corp. (c) (e) | 306 | 28,962 | ||||||
Medtronic Inc. | 335 | 12,418 | ||||||
Merck & Co. Inc. | 81 | 2,930 | ||||||
Shire Plc - ADR (e) | 214 | 15,496 | ||||||
Teva Pharmaceutical Industries Ltd. - ADR | 62 | 3,232 | ||||||
Universal Health Services Inc. - Class B | 110 | 4,785 | ||||||
| 108,783 | ||||||||
INDUSTRIALS - 6.4% | ||||||||
Danaher Corp. | 215 | 10,160 | ||||||
Emerson Electric Co. | 74 | 4,219 | ||||||
FedEx Corp. | 186 | 17,300 | ||||||
Illinois Tool Works Inc. | 179 | 9,537 | ||||||
Iron Mountain Inc. | 357 | 8,939 | ||||||
Jacobs Engineering Group Inc. (c) | 39 | 1,765 | ||||||
WW Grainger Inc. | 42 | 5,815 | ||||||
| 57,735 | ||||||||
INFORMATION TECHNOLOGY - 26.4% |
| |||||||
Akamai Technologies Inc. (c) | 121 | 5,712 | ||||||
Apple Inc. (c) | 85 | 27,547 | ||||||
Broadcom Corp. - Class A | 310 | 13,479 | ||||||
Cisco Systems Inc. (c) | 870 | 17,594 | ||||||
eBay Inc. (c) | 87 | 2,427 | ||||||
First Solar Inc. (c) (e) | 66 | 8,589 | ||||||
Google Inc. - Class A (c) | 60 | 35,638 | ||||||
International Business Machines Corp. | 29 | 4,227 | ||||||
Jabil Circuit Inc. | 331 | 6,652 | ||||||
Juniper Networks Inc. (c) (e) | 549 | 20,273 | ||||||
KLA-Tencor Corp. | 327 | 12,627 | ||||||
Maxim Integrated Products Inc. | 183 | 4,322 | ||||||
Nintendo Co. Ltd. - ADR (e) | 318 | 11,557 | ||||||
Oracle Corp. | 830 | 25,991 | ||||||
Paychex Inc. | 115 | 3,551 | ||||||
QUALCOMM Inc. | 457 | 22,632 | ||||||
Visa Inc. - Class A | 195 | 13,710 | ||||||
| 236,528 | ||||||||
MATERIALS - 6.4% | ||||||||
Allegheny Technologies Inc. | 255 | 14,060 | ||||||
Cliffs Natural Resources Inc. | 132 | 10,313 | ||||||
Ecolab Inc. | 132 | 6,646 | ||||||
| Shares/Par (p) | Value | |||||||
Monsanto Co. | 305 | 21,219 | ||||||
Vulcan Materials Co. (e) | 125 | 5,527 | ||||||
| 57,765 | ||||||||
TELECOMMUNICATION SERVICES - 2.0% |
| |||||||
American Tower Corp. - Class A (c) | 343 | 17,723 | ||||||
Total Common Stocks (cost $680,127) | 842,315 | |||||||
SHORT TERM INVESTMENTS - 8.7% |
| |||||||
Investment Company - 6.3% | ||||||||
JNL Money Market Fund, 0.08% (a) (h) | 55,757 | 55,757 | ||||||
Securities Lending Collateral 2.4% |
| |||||||
Securities Lending Cash Collateral Fund LLC, 0.31% (a) (h) | 20,019 | 20,019 | ||||||
Securities Lending Liquidating Fund LLC, 0.66% (a) (h) | 1,689 | 1,662 | ||||||
| 21,681 | ||||||||
Total Short Term Investments (cost $77,465) | 77,438 | |||||||
Total Investments - 102.8% (cost $757,592) | 919,753 | |||||||
Other Assets and Liabilities, Net - (2.8%) | (24,784 | ) | ||||||
Total Net Assets - 100.0% | $ | 894,969 | ||||||
JNL/Eagle Core Equity Fund |
| |||||||
COMMON STOCKS - 94.1% |
| |||||||
CONSUMER DISCRETIONARY - 10.6% |
| |||||||
Bed Bath & Beyond Inc. (c) | 88 | $ | 4,305 | |||||
Lowe’s Cos. Inc. | 288 | 7,215 | ||||||
Omnicom Group Inc. | 96 | 4,390 | ||||||
Staples Inc. | 248 | 5,650 | ||||||
| 21,560 | ||||||||
CONSUMER STAPLES - 5.7% |
| |||||||
Coca-Cola Co. | 63 | 4,155 | ||||||
PepsiCo Inc. | 56 | 3,685 | ||||||
Wal-Mart Stores Inc. | 69 | 3,714 | ||||||
| 11,554 | ||||||||
ENERGY - 11.9% | ||||||||
Chevron Corp. | 46 | 4,213 | ||||||
ConocoPhillips | 63 | 4,267 | ||||||
Exxon Mobil Corp. | 91 | 6,631 | ||||||
Schlumberger Ltd. | 65 | 5,466 | ||||||
Valero Energy Corp. | 154 | 3,566 | ||||||
| 24,143 | ||||||||
FINANCIALS - 17.2% | ||||||||
Annaly Capital Management Inc. | 199 | 3,570 | ||||||
Goldman Sachs Group Inc. | 27 | 4,542 | ||||||
Invesco Ltd. | 172 | 4,140 | ||||||
JPMorgan Chase & Co. | 198 | 8,409 | ||||||
MetLife Inc. | 146 | 6,494 | ||||||
Wells Fargo & Co. | 254 | 7,883 | ||||||
| 35,038 | ||||||||
HEALTH CARE - 12.8% | ||||||||
Johnson & Johnson | 59 | 3,671 | ||||||
Pfizer Inc. | 387 | 6,769 | ||||||
St. Jude Medical Inc. (c) | 167 | 7,130 | ||||||
UnitedHealth Group Inc. | 137 | 4,939 | ||||||
See accompanying Notes to the Financial Statements.
JNL Series Trust
Schedules of Investments (in thousands)
December 31, 2010
| Shares/Par | (p) | Value | ||||||
Zimmer Holdings Inc. (c) | 66 | 3,525 | ||||||
| 26,034 | ||||||||
INDUSTRIALS - 8.8% | ||||||||
Boeing Co. | 42 | 2,740 | ||||||
Tyco International Ltd. | 170 | 7,029 | ||||||
Union Pacific Corp. | 54 | 4,965 | ||||||
United Technologies Corp. | 42 | 3,293 | ||||||
| 18,027 | ||||||||
INFORMATION TECHNOLOGY - 25.4% |
| |||||||
Activision Blizzard Inc. | 323 | 4,022 | ||||||
Adobe Systems Inc. (c) | 164 | 5,048 | ||||||
Apple Inc. (c) | 19 | 6,207 | ||||||
Cisco Systems Inc. (c) | 96 | 1,937 | ||||||
EMC Corp. (c) | 215 | 4,914 | ||||||
Google Inc. - Class A (c) | 7 | 4,375 | ||||||
Hewlett-Packard Co. | 69 | 2,898 | ||||||
Intel Corp. | 239 | 5,018 | ||||||
Microsoft Corp. | 221 | 6,164 | ||||||
Oracle Corp. | 206 | 6,463 | ||||||
QUALCOMM Inc. | 94 | 4,660 | ||||||
| 51,706 | ||||||||
TELECOMMUNICATION SERVICES - 1.7% |
| |||||||
Sprint Nextel Corp. (c) | 826 | 3,494 | ||||||
Total Common Stocks (cost $171,016) | 191,556 | |||||||
INVESTMENT COMPANIES - 3.2% |
| |||||||
Materials Select Sector SPDR Fund (e) | 167 | 6,424 | ||||||
Total Investment Companies (cost $5,442) | 6,424 | |||||||
SHORT TERM INVESTMENTS - 5.0% |
| |||||||
Investment Company - 4.7% | ||||||||
JNL Money Market Fund, 0.08% (a) (h) | 9,525 | 9,525 | ||||||
Securities Lending Collateral 0.3% |
| |||||||
Securities Lending Cash Collateral Fund LLC, 0.31% (a) (h) | 714 | 714 | ||||||
Total Short Term Investments (cost $10,239) | 10,239 | |||||||
Total Investments - 102.3% (cost $186,697) | 208,219 | |||||||
Other Assets and Liabilities, Net - (2.3%) | (4,691 | ) | ||||||
Total Net Assets - 100.0% | $ | 203,528 | ||||||
JNL/Eagle SmallCap Equity Fund * (x) |
| |||||||
COMMON STOCKS - 99.0% |
| |||||||
CONSUMER DISCRETIONARY - 21.6% |
| |||||||
American Axle & Manufacturing Holdings Inc. (c) | 710 | $ | 9,135 | |||||
ArvinMeritor Inc. (c) | 455 | 9,339 | ||||||
Bally Technologies Inc. (c) | 231 | 9,748 | ||||||
BJ’s Restaurants Inc. (c) | 277 | 9,812 | ||||||
Chico’s FAS Inc. | 568 | 6,834 | ||||||
Genesco Inc. (c) | 455 | 17,059 | ||||||
Gentex Corp. | 214 | 6,326 | ||||||
Pinnacle Entertainment Inc. (c) | 419 | 5,877 | ||||||
Shuffle Master Inc. (c) | 928 | 10,624 | ||||||
Sotheby’s - Class A | 165 | 7,431 | ||||||
Universal Electronics Inc. (c) | 296 | 8,387 | ||||||
Vitamin Shoppe Inc. (c) | 401 | 13,491 | ||||||
| Shares/Par | (p) | Value | ||||||
Other Securities | 13,098 | |||||||
| 127,161 | ||||||||
CONSUMER STAPLES - 1.9% |
| |||||||
Herbalife Ltd. | 82 | 5,624 | ||||||
Other Securities | 5,410 | |||||||
| 11,034 | ||||||||
ENERGY - 7.4% |
| |||||||
Cloud Peak Energy Inc. (c) | 286 | 6,641 | ||||||
Lufkin Industries Inc. | 291 | 18,154 | ||||||
Oasis Petroleum Inc. (c) | 289 | 7,827 | ||||||
OYO Geospace Corp. (c) | 113 | 11,150 | ||||||
| 43,772 | ||||||||
FINANCIALS - 4.9% |
| |||||||
Cash America International Inc. | 265 | 9,803 | ||||||
Other Securities | 19,330 | |||||||
| 29,133 | ||||||||
HEALTH CARE - 16.5% |
| |||||||
Allscripts Healthcare Solutions Inc. (c) | 382 | 7,352 | ||||||
American Medical Systems Holdings Inc. (c) | 404 | 7,624 | ||||||
BioMarin Pharmaceutical Inc. (c) (e) | 218 | 5,871 | ||||||
Bruker Corp. (c) | 384 | 6,370 | ||||||
MedAssets Inc. (c) | 287 | 5,800 | ||||||
Quality Systems Inc. (e) | 123 | 8,620 | ||||||
Sirona Dental Systems Inc. (c) | 188 | 7,868 | ||||||
Thoratec Corp. (c) | 289 | 8,182 | ||||||
Other Securities | 39,801 | |||||||
| 97,488 | ||||||||
INDUSTRIALS - 14.5% |
| |||||||
FTI Consulting Inc. (c) | 158 | 5,889 | ||||||
Geo Group Inc. (c) | 451 | 11,128 | ||||||
GrafTech International Ltd. (c) | 591 | 11,722 | ||||||
JetBlue Airways Corp. (c) | 885 | 5,849 | ||||||
Regal-Beloit Corp. | 124 | 8,279 | ||||||
Triumph Group Inc. | 72 | 6,393 | ||||||
WABCO Holdings Inc. (c) | 203 | 12,381 | ||||||
Waste Connections Inc. | 321 | 8,850 | ||||||
Other Securities | 15,256 | |||||||
| 85,747 | ||||||||
INFORMATION TECHNOLOGY - 26.3% |
| |||||||
Ansys Inc. (c) | 175 | 9,090 | ||||||
Coherent Inc. (c) | 186 | 8,399 | ||||||
Compuware Corp. (c) | 752 | 8,778 | ||||||
DTS Inc. (c) | 240 | 11,767 | ||||||
EMS Technologies Inc. (c) | 336 | 6,647 | ||||||
Fortinet Inc. (c) (e) | 193 | 6,244 | ||||||
Informatica Corp. (c) (e) | 237 | 10,426 | ||||||
NetLogic Microsystems Inc. (c) | 206 | 6,483 | ||||||
Nice Systems Ltd. - ADR (c) | 185 | 6,458 | ||||||
Progress Software Corp. (c) | 160 | 6,772 | ||||||
Radiant Systems Inc. (c) | 342 | 6,683 | ||||||
Riverbed Technology Inc. (c) | 351 | 12,342 | ||||||
Rovi Corp. (c) | 248 | 15,409 | ||||||
SuccessFactors Inc. (c) | 218 | 6,306 | ||||||
Teradyne Inc. (c) | 421 | 5,912 | ||||||
TIBCO Software Inc. (c) | 548 | 10,793 | ||||||
Varian Semiconductor Equipment Associates Inc. (c) | 163 | 6,015 | ||||||
Veeco Instruments Inc. (c) (e) | 153 | 6,574 | ||||||
Other Securities | 3,978 | |||||||
| 155,076 | ||||||||
See accompanying Notes to the Financial Statements.
JNL Series Trust
Schedules of Investments (in thousands)
December 31, 2010
| Shares/Par | (p) | Value | ||||||
MATERIALS - 5.9% |
| |||||||
Huntsman Corp. | 700 | 10,929 | ||||||
Intrepid Potash Inc. (c) (e) | 177 | 6,611 | ||||||
Texas Industries Inc. (e) | 170 | 7,765 | ||||||
Other Securities | 9,323 | |||||||
| 34,628 | ||||||||
Total Common Stocks (cost $445,505) | 584,039 | |||||||
SHORT TERM INVESTMENTS - 9.4% |
| |||||||
Investment Company - 3.7% | ||||||||
JNL Money Market Fund, 0.08% (a) (h) | 21,944 | 21,944 | ||||||
Securities Lending Collateral 5.7% |
| |||||||
Securities Lending Cash Collateral Fund LLC, 0.31% (a) (h) | 31,617 | 31,617 | ||||||
Securities Lending Liquidating Fund LLC, 0.66% (a) (h) | 1,670 | 1,643 | ||||||
| 33,260 | ||||||||
Total Short Term Investments (cost $55,231) | 55,204 | |||||||
Total Investments - 108.4% (cost $500,736) | 639,243 | |||||||
Other Assets and Liabilities, Net - (8.4%) | (49,313 | ) | ||||||
Total Net Assets - 100.0% | $ | 589,930 | ||||||
JNL/Franklin Templeton Founding Strategy |
| |||||||
INVESTMENT COMPANIES - 100.0% |
| |||||||
JNL/Franklin Templeton Global Growth Fund (72.4%) (a) | 42,630 | $ | 344,448 | |||||
JNL/Franklin Templeton Income Fund (33.8%) (a) | 35,519 | 358,738 | ||||||
JNL/Franklin Templeton Mutual Shares Fund (56.2%) (a) | 39,488 | 334,863 | ||||||
Total Investment Companies (cost $1,098,998) | 1,038,049 | |||||||
Total Investments - 100.0% (cost $1,098,998) | 1,038,049 | |||||||
Other Assets and Liabilities, Net - (0.0% ) | (68 | ) | ||||||
Total Net Assets - 100.0% | $ | 1,037,981 | ||||||
JNL/Franklin Templeton Global Growth Fund * (x) |
| |||||||
COMMON STOCKS - 93.8% |
| |||||||
CONSUMER DISCRETIONARY - 16.3% |
| |||||||
Bayerische Motoren Werke AG | 54 | $ | 4,240 | |||||
Comcast Corp. - Class A | 30 | 670 | ||||||
Comcast Corp. - Special Class A | 395 | 8,213 | ||||||
Hyundai Motor Co. (c) | 38 | 5,793 | ||||||
Kingfisher Plc | 1,055 | 4,334 | ||||||
News Corp. - Class A | 497 | 7,229 | ||||||
Pearson Plc | 257 | 4,038 | ||||||
Time Warner Cable Inc. | 69 | 4,553 | ||||||
Time Warner Inc. | 116 | 3,719 | ||||||
Viacom Inc. - Class B | 113 | 4,475 | ||||||
Vivendi SA | 207 | 5,596 | ||||||
Walt Disney Co. | 112 | 4,194 | ||||||
| Shares/Par | (p) | Value | ||||||
Other Securities | 20,674 | |||||||
| 77,728 | ||||||||
CONSUMER STAPLES - 2.7% |
| |||||||
CVS Caremark Corp. | 129 | 4,473 | ||||||
Nestle SA | 78 | 4,594 | ||||||
Tesco Plc | 594 | 3,937 | ||||||
| 13,004 | ||||||||
ENERGY - 10.0% |
| |||||||
BP Plc (c) | 782 | 5,673 | ||||||
Chevron Corp. | 40 | 3,614 | ||||||
Halliburton Co. | 140 | 5,720 | ||||||
Royal Dutch Shell Plc - Class B | 233 | 7,691 | ||||||
Total SA | 116 | 6,168 | ||||||
Other Securities | 18,504 | |||||||
| 47,370 | ||||||||
FINANCIALS - 13.7% |
| |||||||
Aviva Plc | 752 | 4,610 | ||||||
HSBC Holdings Plc (e) | 413 | 4,231 | ||||||
ING Groep NV (c) | 427 | 4,157 | ||||||
KB Financial Group Inc. - ADR (c) | 89 | 4,720 | ||||||
Progressive Corp. | 194 | 3,859 | ||||||
Other Securities | 43,515 | |||||||
| 65,092 | ||||||||
HEALTH CARE - 14.8% |
| |||||||
Amgen Inc. (c) | 167 | 9,143 | ||||||
Covidien Plc | 125 | 5,708 | ||||||
GlaxoSmithKline Plc | 367 | 7,095 | ||||||
Medtronic Inc. | 99 | 3,678 | ||||||
Merck & Co. Inc. | 149 | 5,353 | ||||||
Novartis AG | 97 | 5,681 | ||||||
Pfizer Inc. | 434 | 7,599 | ||||||
Roche Holding AG | 31 | 4,610 | ||||||
Sanofi-Aventis SA | 135 | 8,630 | ||||||
Other Securities | 12,978 | |||||||
| 70,475 | ||||||||
INDUSTRIALS - 10.8% |
| |||||||
FedEx Corp. | 49 | 4,538 | ||||||
General Electric Co. | 279 | 5,102 | ||||||
Siemens AG | 59 | 7,319 | ||||||
Tyco International Ltd. | 146 | 6,060 | ||||||
United Parcel Service Inc. - Class B | 81 | 5,883 | ||||||
Wolseley Plc (c) | 142 | 4,538 | ||||||
Other Securities | 17,784 | |||||||
| 51,224 | ||||||||
INFORMATION TECHNOLOGY - 16.5% |
| |||||||
Accenture Plc - Class A | 241 | 11,676 | ||||||
Cisco Systems Inc. (c) | 250 | 5,063 | ||||||
Microsoft Corp. | 359 | 10,022 | ||||||
Oracle Corp. | 386 | 12,076 | ||||||
Samsung Electronics Co. Ltd. - GDR (q) | 19 | 8,206 | ||||||
SAP AG | 92 | 4,658 | ||||||
Taiwan Semiconductor Manufacturing Co. Ltd. - ADR | 408 | 5,118 | ||||||
Tyco Electronics Ltd. | 117 | 4,130 | ||||||
Other Securities | 17,805 | |||||||
| 78,754 | ||||||||
MATERIALS - 2.0% |
| |||||||
CRH Plc | 178 | 3,683 | ||||||
Other Securities | 5,750 | |||||||
| 9,433 | ||||||||
See accompanying Notes to the Financial Statements.
JNL Series Trust
Schedules of Investments (in thousands)
December 31, 2010
| Shares/Par | (p) | Value | ||||||
TELECOMMUNICATION SERVICES - 7.0% |
| |||||||
France Telecom SA | 250 | 5,208 | ||||||
Singapore Telecommunications Ltd. | 2,869 | 6,818 | ||||||
Vodafone Group Plc | 3,194 | 8,255 | ||||||
Other Securities | 12,851 | |||||||
| 33,132 | ||||||||
Total Common Stocks (cost $457,426) | 446,212 | |||||||
SHORT TERM INVESTMENTS - 7.1% |
| |||||||
Investment Company - 6.0% | ||||||||
JNL Money Market Fund, 0.08% (a) (h) | 28,349 | 28,349 | ||||||
Securities Lending Collateral 1.1% | ||||||||
Securities Lending Cash Collateral Fund LLC, 0.31% (a) (h) | 4,895 | 4,895 | ||||||
Securities Lending Liquidating Fund LLC, 0.66% (a) (h) | 381 | 375 | ||||||
| 5,270 | ||||||||
Total Short Term Investments (cost $33,625) | 33,619 | |||||||
Total Investments - 100.9% (cost $491,051) | 479,831 | |||||||
Other Assets and Liabilities, Net - (0.9%) | (4,090 | ) | ||||||
Total Net Assets - 100.0% | $ | 475,741 | ||||||
JNL/Franklin Templeton Income Fund * (x) |
| |||||||
COMMON STOCKS - 34.5% |
| |||||||
CONSUMER DISCRETIONARY - 0.7% |
| |||||||
Other Securities | $ | 7,761 | ||||||
CONSUMER STAPLES - 0.8% |
| |||||||
Other Securities | 8,631 | |||||||
ENERGY - 6.8% | ||||||||
BP Plc - ADR (c) | 150 | 6,625 | ||||||
Canadian Oil Sands Trust | 425 | 11,306 | ||||||
Chesapeake Energy Corp. | 90 | 2,332 | ||||||
ConocoPhillips | 200 | 13,620 | ||||||
Exxon Mobil Corp. | 300 | 21,936 | ||||||
Other Securities | 16,343 | |||||||
| 72,162 | ||||||||
FINANCIALS - 4.5% | ||||||||
Bank of America Corp. | 650 | 8,671 | ||||||
CIT Group Inc. (c) | 50 | 2,355 | ||||||
Citigroup Inc. (c) | 894 | 4,231 | ||||||
JPMorgan Chase & Co. | 200 | 8,484 | ||||||
Wells Fargo & Co. | 325 | 10,072 | ||||||
Other Securities | 13,680 | |||||||
| 47,493 | ||||||||
HEALTH CARE - 4.8% | ||||||||
Johnson & Johnson | 150 | 9,278 | ||||||
Merck & Co. Inc. | 500 | 18,020 | ||||||
Pfizer Inc. | 500 | 8,755 | ||||||
Roche Holding AG | 100 | 14,659 | ||||||
| 50,712 | ||||||||
INDUSTRIALS - 0.5% | ||||||||
Other Securities | 5,487 | |||||||
| Shares/Par | (p) | Value | ||||||
INFORMATION TECHNOLOGY - 1.7% |
| |||||||
Intel Corp. | 350 | 7,361 | ||||||
Other Securities | 10,788 | |||||||
| 18,149 | ||||||||
MATERIALS - 1.4% | ||||||||
Barrick Gold Corp. | 130 | 6,914 | ||||||
Newmont Mining Corp. | 110 | 6,757 | ||||||
Other Securities | 876 | |||||||
| 14,547 | ||||||||
TELECOMMUNICATION SERVICES - 2.7% |
| |||||||
AT&T Inc. | 300 | 8,814 | ||||||
Vodafone Group Plc | 3,000 | 7,755 | ||||||
Other Securities | 12,296 | |||||||
| 28,865 | ||||||||
UTILITIES - 10.6% | ||||||||
American Electric Power Co. Inc. | 170 | 6,117 | ||||||
Dominion Resources Inc. | 165 | 7,049 | ||||||
Duke Energy Corp. | 550 | 9,795 | ||||||
Entergy Corp. | 100 | 7,083 | ||||||
NextEra Energy Inc. | 170 | 8,838 | ||||||
PG&E Corp. | 220 | 10,525 | ||||||
Public Service Enterprise Group Inc. | 220 | 6,998 | ||||||
Sempra Energy | 120 | 6,298 | ||||||
Southern Co. | 380 | 14,527 | ||||||
Xcel Energy Inc. | 350 | 8,242 | ||||||
Other Securities | 27,653 | |||||||
| 113,125 | ||||||||
Total Common Stocks (cost $355,889) | 366,932 | |||||||
PREFERRED STOCKS - 4.6% |
| |||||||
CONSUMER DISCRETIONARY - 0.3% |
| |||||||
Other Securities | 3,227 | |||||||
ENERGY - 1.0% | ||||||||
Chesapeake Energy Corp., Convertible Preferred, 5.75% (m) (r) | 5 | 5,030 | ||||||
SandRidge Energy Inc., Convertible Preferred, 7.00% (m) (r) | 50 | 5,947 | ||||||
| 10,977 | ||||||||
FINANCIALS - 2.8% | ||||||||
Bank of America Corp., Convertible Preferred, 7.25%, Series L (m) | 10 | 9,438 | ||||||
Citigroup Inc., Convertible Preferred, 7.50% | 60 | 8,201 | ||||||
Wells Fargo & Co., Convertible Preferred, 7.50%, Series L (m) | 9 | 8,505 | ||||||
Other Securities | 3,638 | |||||||
| 29,782 | ||||||||
HEALTH CARE - 0.2% |
| |||||||
Tenet Healthcare Corp., 7.00% | 2 | 2,197 | ||||||
MATERIALS - 0.2% | ||||||||
Other Securities | 1,664 | |||||||
UTILITIES - 0.1% | ||||||||
NextEra Energy Inc., Convertible Preferred, 8.38% | 20 | 993 | ||||||
Total Preferred Stocks (cost $62,625) | 48,840 | |||||||
See accompanying Notes to the Financial Statements.
JNL Series Trust
Schedules of Investments (in thousands)
December 31, 2010
| Shares/Par (p) | Value | |||||||
WARRANTS - 0.0% | ||||||||
Other Securities | 251 | |||||||
Total Warrants (cost $106) | 251 | |||||||
NON-U.S. GOVERNMENT AGENCY ASSET-BACKED SECURITIES - 0.7% |
| |||||||
Banc of America Large Loan Inc. REMIC, 2.01%, 11/15/13 (i) (r) $ | 7,478 | 6,667 | ||||||
Dynegy Roseton Pass Through Trust, 7.67%, 11/08/16 (e) | 1,000 | 940 | ||||||
Total Non-U.S. Government Agency Asset- Backed Securities (cost $7,521) | 7,607 | |||||||
CORPORATE BONDS AND NOTES - 52.4% |
| |||||||
CONSUMER DISCRETIONARY - 5.7% |
| |||||||
Cablevision Systems Corp. | ||||||||
8.63%, 09/15/17 | 1,000 | 1,089 | ||||||
7.75%, 04/15/18 | 3,000 | 3,142 | ||||||
8.00%, 04/15/20 (e) | 3,000 | 3,210 | ||||||
CCH II LLC, 13.50%, 11/30/16 | 5,134 | 6,122 | ||||||
ClubCorp Club Operations Inc., 10.00%, 12/01/18 (r) | 5,000 | 4,750 | ||||||
Clubcorp Club Operations Inc. Term Loan B, 6.00%, 11/23/16 (i) | 5,000 | 5,050 | ||||||
UPC Germany GmbH, 8.13%, 12/01/17 (e) (r) | 2,100 | 2,195 | ||||||
Other Securities | 35,350 | |||||||
| 60,908 | ||||||||
CONSUMER STAPLES - 0.7% |
| |||||||
Other Securities | 7,014 | |||||||
ENERGY - 10.5% | ||||||||
Calpine Corp., 7.25%, 10/15/17 (r) | 1,000 | 1,000 | ||||||
Calpine Generating Co. LLC, 8.00%, 06/01/16 (r) | 1,750 | 1,859 | ||||||
Chesapeake Energy Corp. | ||||||||
9.50%, 02/15/15 (e) | 2,500 | 2,819 | ||||||
6.50%, 08/15/17 (e) | 4,000 | 4,020 | ||||||
6.88%, 08/15/18 | 1,600 | 1,624 | ||||||
7.25%, 12/15/18 | 5,000 | 5,175 | ||||||
SandRidge Energy Inc. | ||||||||
3.93%, 04/01/14 (e) (i) | 2,000 | 1,862 | ||||||
9.88%, 05/15/16 (r) | 2,600 | 2,749 | ||||||
8.00%, 06/01/18 (e) (r) | 2,500 | 2,537 | ||||||
8.75%, 01/15/20 (e) | 650 | 668 | ||||||
Texas Competitive Electric Holdings Co. LLC | ||||||||
10.25%, 11/01/15 (e) | 18,000 | 10,170 | ||||||
10.50%, 11/01/16 | 297 | 149 | ||||||
15.00%, 04/01/21 (e) (r) | 15,255 | 13,348 | ||||||
Texas Competitive Electric Holdings Co. LLC Term Loan | ||||||||
3.76%, 10/10/14 (i) | 2,977 | 2,302 | ||||||
3.76%, 10/10/14 (i) | 1,975 | 1,532 | ||||||
3.76%, 10/10/14 (i) | 4,560 | 3,537 | ||||||
3.79%, 10/10/14 (i) | 282 | 218 | ||||||
Texas Competitive Electric Holdings Co. LLC Term Loan B-1 | ||||||||
3.75%, 10/10/14 (i) | 4,987 | 3,868 | ||||||
3.76%, 10/10/14 (i) | 3,000 | 2,327 | ||||||
3.76%, 10/10/14 (i) | 2,486 | 1,928 | ||||||
Texas Competitive Electric Holdings Co. LLC Term Loan B-2, 3.76%, 10/10/14 (i) | 3,979 | 3,086 | ||||||
Texas Competitive Electric Holdings Co. LLC Term Loan B-3 | ||||||||
3.76%, 10/10/14 (i) | 1,990 | 1,540 | ||||||
| Shares/Par (p) | Value | |||||||
3.76%, 10/10/14 (i) | 2,985 | 2,310 | ||||||
Other Securities | 40,399 | |||||||
| 111,027 | ||||||||
FINANCIALS - 12.6% | ||||||||
Bank of America Corp., 8.13%, (callable at 100 beginning 05/15/18) (m) | 1,000 | 1,008 | ||||||
CEVA Group Plc | ||||||||
8.38%, 12/01/17 (r) | 3,400 | 3,434 | ||||||
11.50%, 04/01/18 (e) (r) | 3,600 | 3,888 | ||||||
CIT Group Inc. | ||||||||
7.00%, 05/01/14 (e) | 800 | 808 | ||||||
7.00%, 05/01/15 (e) | 12,000 | 12,030 | ||||||
7.00%, 05/01/16 (e) | 17,000 | 17,064 | ||||||
7.00%, 05/01/17 (e) | 12,000 | 12,030 | ||||||
Ford Motor Credit Co. LLC | ||||||||
8.00%, 06/01/14 (e) | 2,500 | 2,754 | ||||||
7.00%, 04/15/15 | 2,000 | 2,149 | ||||||
12.00%, 05/15/15 | 3,000 | 3,774 | ||||||
International Lease Finance Corp. | ||||||||
8.63%, 09/15/15 (e) (r) | 700 | 753 | ||||||
8.75%, 03/15/17 (r) | 2,000 | 2,145 | ||||||
8.88%, 09/01/17 (e) | 4,700 | 5,070 | ||||||
7.13%, 09/01/18 (r) | 7,000 | 7,437 | ||||||
iStar Financial Inc. | ||||||||
0.80%, 10/01/12 (i) | 4,500 | 4,005 | ||||||
8.63%, 06/01/13 | 5,000 | 4,650 | ||||||
JPMorgan Chase & Co., 7.90%, (callable at 100 beginning 04/30/18) (m) | 11,500 | 12,224 | ||||||
Petroplus Finance Ltd. | ||||||||
6.75%, 05/01/14 (r) | 3,500 | 3,220 | ||||||
7.00%, 05/01/17 (e) (r) | 3,000 | 2,655 | ||||||
9.38%, 09/15/19 (e) (r) | 2,000 | 1,850 | ||||||
UPC Germany GmbH | ||||||||
8.13%, 12/01/17 (r), EUR | 2,750 | 3,877 | ||||||
9.63%, 12/01/19 (r), EUR | 1,500 | 2,190 | ||||||
Wells Fargo Capital XIII, 7.70%, (callable at 100 beginning 03/26/13) (m) | 900 | 930 | ||||||
Wells Fargo Capital XV, 9.75%, (callable at 100 beginning 09/26/13) (m) | 5,000 | 5,562 | ||||||
Other Securities | 18,124 | |||||||
| 133,631 | ||||||||
HEALTH CARE - 5.8% | ||||||||
HCA Holdings Inc., 7.75%, 05/15/21 (e) (r) | 5,000 | 5,000 | ||||||
HCA Inc. | ||||||||
6.38%, 01/15/15 | 1,500 | 1,474 | ||||||
6.50%, 02/15/16 | 1,500 | 1,466 | ||||||
9.25%, 11/15/16 | 3,500 | 3,734 | ||||||
8.50%, 04/15/19 (e) | 6,000 | 6,570 | ||||||
7.88%, 02/15/20 | 6,000 | 6,420 | ||||||
Tenet Healthcare Corp. | ||||||||
9.25%, 02/01/15 (e) | 5,000 | 5,325 | ||||||
9.00%, 05/01/15 (e) | 3,500 | 3,885 | ||||||
10.00%, 05/01/18 (e) | 3,500 | 4,078 | ||||||
8.00%, 08/01/20 (e) (r) | 2,600 | 2,639 | ||||||
Other Securities | 21,175 | |||||||
| 61,766 | ||||||||
INDUSTRIALS - 3.7% | ||||||||
Hertz Corp. | ||||||||
8.88%, 01/01/14 | 10,000 | 10,225 | ||||||
10.50%, 01/01/16 | 1,250 | 1,319 | ||||||
RBS Global & Rexnord LLC | ||||||||
11.75%, 08/01/16 (e) | 1,500 | 1,609 | ||||||
8.50%, 05/01/18 (e) | 4,500 | 4,781 | ||||||
See accompanying Notes to the Financial Statements.
JNL Series Trust
Schedules of Investments (in thousands)
December 31, 2010
| Shares/Par (p) | Value | |||||||
Other Securities | 21,498 | |||||||
| 39,432 | ||||||||
INFORMATION TECHNOLOGY - 6.8% |
| |||||||
First Data Corp. | ||||||||
9.88%, 09/24/15 | 318 | 301 | ||||||
9.88%, 09/24/15 (e) | 1,896 | 1,806 | ||||||
11.25%, 03/31/16 (e) | 3,000 | 2,625 | ||||||
8.25%, 01/15/21 (r) | 2,816 | 2,703 | ||||||
12.63%, 01/15/21 (r) | 5,643 | 5,389 | ||||||
8.75%, 01/15/22 (r) (e) | 2,824 | 2,732 | ||||||
First Data Corp. Term Loan | ||||||||
3.01%, 09/24/14 (i) | 158 | 147 | ||||||
3.01%, 09/24/14 (i) | 1,699 | 1,574 | ||||||
3.01%, 09/24/14 (i) | 1,870 | 1,732 | ||||||
First Data Corp. Term Loan B-1, 3.01%, 09/24/14 (i) | 4,987 | 4,620 | ||||||
First Data Corp. Term Loan B-2, 3.01%, 09/24/14 (i) | 4,987 | 4,620 | ||||||
First Data Corp. Term Loan B-3 | ||||||||
3.01%, 09/24/14 (i) | 142 | 131 | ||||||
3.01%, 09/24/14 (i) | 1,647 | 1,526 | ||||||
3.01%, 09/24/14 (i) | 79 | 74 | ||||||
3.01%, 09/24/14 (i) | 2,992 | 2,772 | ||||||
Freescale Semiconductor Inc. | ||||||||
10.13%, 12/15/16 (e) | 3,000 | 3,157 | ||||||
10.13%, 03/15/18 (r) | 5,000 | 5,625 | ||||||
9.25%, 04/15/18 (r) | 4,000 | 4,400 | ||||||
10.75%, 08/01/20 (e) (r) | 9,500 | 10,355 | ||||||
Other Securities | 15,646 | |||||||
| 71,935 | ||||||||
MATERIALS - 2.4% |
| |||||||
FMG Resources August 2006 Pty Ltd. | ||||||||
7.00%, 11/01/15 (r) | 2,100 | 2,152 | ||||||
6.88%, 02/01/18 (e) (r) | 7,500 | 7,462 | ||||||
Other Securities | 15,619 | |||||||
| 25,233 | ||||||||
TELECOMMUNICATION SERVICES - 1.5% |
| |||||||
Other Securities | 16,272 | |||||||
UTILITIES - 2.7% |
| |||||||
Calpine Corp. | ||||||||
7.88%, 07/31/20 (r) | 800 | 810 | ||||||
7.50%, 02/15/21 (r) | 5,475 | 5,393 | ||||||
Dynegy Holdings Inc. | ||||||||
7.50%, 06/01/15 | 11,000 | 8,305 | ||||||
8.38%, 05/01/16 | 2,750 | 2,056 | ||||||
7.75%, 06/01/19 | 2,000 | 1,335 | ||||||
Other Securities | 10,993 | |||||||
| 28,892 | ||||||||
Total Corporate Bonds and Notes (cost $537,586) | 556,110 | |||||||
GOVERNMENT AND AGENCY OBLIGATIONS - 0.6% |
| |||||||
GOVERNMENT SECURITIES - 0.6% |
| |||||||
Municipals - 0.6% | ||||||||
State of California | ||||||||
7.95%, 03/01/36 | 2,500 | 2,564 | ||||||
7.60%, 11/01/40 | 3,480 | 3,624 | ||||||
Total Government and Agency Obligations (cost $6,016) | 6,188 | |||||||
| Shares/Par (p) | Value | |||||||
SHORT TERM INVESTMENTS - 23.5% |
| |||||||
Investment Company - 6.4% |
| |||||||
JNL Money Market Fund, 0.08% (a) (h) | 67,966 | 67,966 | ||||||
Securities Lending Collateral 17.1% |
| |||||||
Securities Lending Cash Collateral Fund LLC, | 179,145 | 179,145 | ||||||
Securities Lending Liquidating Fund LLC, | 2,450 | 2,410 | ||||||
| 181,555 | ||||||||
Total Short Term Investments (cost $249,561) | 249,521 | |||||||
Total Investments - 116.3% (cost $1,219,304) |
| 1,235,449 | ||||||
Other Assets and Liabilities, Net - (16.3%) |
| (173,309 | ) | |||||
Total Net Assets - 100.0% | $ | 1,062,140 | ||||||
JNL/Franklin Templeton International Small Cap Growth Fund |
| |||||||
COMMON STOCKS - 94.2% |
| |||||||
CONSUMER DISCRETIONARY - 23.6% |
| |||||||
Asatsu-DK Inc. (e) | 258 | $ | 7,016 | |||||
Carpetright Plc (e) | 826 | 10,291 | ||||||
Dignity Plc | 400 | 4,488 | ||||||
Headlam Group Plc | 804 | 3,930 | ||||||
JUMBO SA | 1,083 | 7,147 | ||||||
Paddy Power Plc | 72 | 2,939 | ||||||
Sankyo Co. Ltd. | 137 | 7,725 | ||||||
Vitec Group Plc | 764 | 6,965 | ||||||
| 50,501 | ||||||||
CONSUMER STAPLES - 9.2% |
| |||||||
Binggrae Co. Ltd. (c) | 64 | 3,178 | ||||||
C&C Group Plc | 32 | 145 | ||||||
McBride Plc | 3,282 | 9,620 | ||||||
Unihair Co. Ltd. (c) | 500 | 6,692 | ||||||
| 19,635 | ||||||||
FINANCIALS - 22.7% |
| |||||||
ARA Asset Management Ltd. | 6,589 | 7,958 | ||||||
Arch Capital Group Ltd. (c) | 61 | 5,380 | ||||||
Daibiru Corp. | 895 | 7,338 | ||||||
Fairfax Financial Holdings Ltd. | 17 | 6,828 | ||||||
Lancashire Holdings Ltd. | 665 | 5,731 | ||||||
RHJ International (c) | 1,179 | 9,766 | ||||||
Savills Plc | 950 | 5,718 | ||||||
| 48,719 | ||||||||
HEALTH CARE - 2.7% |
| |||||||
Genus Plc | 429 | 5,734 | ||||||
INDUSTRIALS - 28.6% |
| |||||||
DCC Plc | 218 | 6,882 | ||||||
De La Rue Plc | 611 | 7,809 | ||||||
Experian Plc | 657 | 8,172 | ||||||
Flughafen Wien AG | 67 | 4,584 | ||||||
HomeServe Plc | 916 | 6,328 | ||||||
Nexans SA | 98 | 7,694 | ||||||
Pfeiffer Vacuum Technology AG | 7 | 866 | ||||||
Prysmian SPA | 436 | 7,428 | ||||||
QinetiQ Group Plc | 2,024 | 4,102 | ||||||
Spirax-Sarco Engineering Plc | 135 | 4,057 | ||||||
See accompanying Notes to the Financial Statements.
JNL Series Trust
Schedules of Investments (in thousands)
December 31, 2010
| Shares/Par (p) | Value | |||||||
Wavin NV (c) | 212 | 3,234 | ||||||
| 61,156 | ||||||||
Information Technology - 7.4% | ||||||||
Neopost SA (e) | 101 | 8,828 | ||||||
Rotork Plc | 250 | 7,114 | ||||||
| 15,942 | ||||||||
Total Common Stocks (cost $179,400) | 201,687 | |||||||
Short Term Investments - 14.5% |
| |||||||
Investment Company - 3.7% | ||||||||
JNL Money Market Fund, 0.08% (a) (h) | 7,881 | 7,881 | ||||||
Securities Lending Collateral 10.8% | ||||||||
Securities Lending Cash Collateral Fund LLC, 0.31% (a) (h) | 22,859 | 22,859 | ||||||
Securities Lending Liquidating Fund LLC, 0.66% (a) (h) | 263 | 259 | ||||||
| 23,118 | ||||||||
Total Short Term Investments | 30,999 | |||||||
Total Investments - 108.7% | 232,686 | |||||||
Other Assets and Liabilities, Net - (8.7%) | (18,681 | ) | ||||||
Total Net Assets - 100.0% | $ | 214,005 | ||||||
JNL/Franklin Templeton Mutual Shares Fund * (x) (t) |
| |||||||
COMMON STOCKS - 86.5% |
| |||||||
CONSUMER DISCRETIONARY - 7.6% |
| |||||||
British Sky Broadcasting Group Plc | 393 | $ | 4,513 | |||||
Mattel Inc. | 175 | 4,450 | ||||||
News Corp. - Class A | 411 | 5,981 | ||||||
Time Warner Cable Inc. | 99 | 6,519 | ||||||
Time Warner Inc. | 204 | 6,560 | ||||||
Virgin Media Inc. (e) | 207 | 5,642 | ||||||
Other Securities | 11,539 | |||||||
| 45,204 | ||||||||
CONSUMER STAPLES - 22.6% |
| |||||||
Altria Group Inc. | 414 | 10,182 | ||||||
British American Tobacco Plc | 363 | 13,925 | ||||||
CVS Caremark Corp. | 526 | 18,301 | ||||||
Dr. Pepper Snapple Group Inc. | 153 | 5,380 | ||||||
General Mills Inc. | 128 | 4,569 | ||||||
Imperial Tobacco Group Plc | 327 | 10,045 | ||||||
Kraft Foods Inc. - Class A | 423 | 13,315 | ||||||
Kroger Co. | 320 | 7,158 | ||||||
Nestle SA | 175 | 10,272 | ||||||
Pernod-Ricard SA (e) | 86 | 8,122 | ||||||
Reynolds American Inc. | 159 | 5,170 | ||||||
Other Securities | 28,082 | |||||||
| 134,521 | ||||||||
ENERGY - 6.7% | ||||||||
Marathon Oil Corp. | 259 | 9,574 | ||||||
Royal Dutch Shell Plc | 247 | 8,151 | ||||||
Transocean Ltd. (c) | 113 | 7,858 | ||||||
Other Securities | 14,366 | |||||||
| 39,949 | ||||||||
| Shares/Par (p) | Value | |||||||
FINANCIALS - 12.6% | ||||||||
ACE Ltd. | 101 | 6,281 | ||||||
Bank of America Corp. | 468 | 6,242 | ||||||
Barclays Plc | 1,180 | 4,815 | ||||||
Morgan Stanley | 245 | 6,660 | ||||||
PNC Financial Services Group Inc. | 115 | 6,966 | ||||||
Wells Fargo & Co. | 281 | 8,709 | ||||||
White Mountains Insurance Group Ltd. | 17 | 5,751 | ||||||
Other Securities | 29,333 | |||||||
| 74,757 | ||||||||
HEALTH CARE - 10.8% | ||||||||
Alcon Inc. - ADR | 27 | 4,416 | ||||||
Eli Lilly & Co. | 263 | 9,232 | ||||||
Genzyme Corp. (c) | 94 | 6,669 | ||||||
Medtronic Inc. | 145 | 5,369 | ||||||
Pfizer Inc. | 570 | 9,978 | ||||||
Tenet Healthcare Corp. (c) | 787 | 5,262 | ||||||
UnitedHealth Group Inc. | 323 | 11,663 | ||||||
Other Securities | 11,708 | |||||||
| 64,297 | ||||||||
INDUSTRIALS - 4.1% | ||||||||
A P Moller - Maersk A/S - Class B | 1 | 7,107 | ||||||
Orkla ASA | 699 | 6,820 | ||||||
Owens Corning Inc. (c) | 140 | 4,354 | ||||||
Other Securities | 6,082 | |||||||
| 24,363 | ||||||||
INFORMATION TECHNOLOGY - 9.7% |
| |||||||
Hewlett-Packard Co. | 173 | 7,276 | ||||||
LSI Corp. (c) | 914 | 5,478 | ||||||
Maxim Integrated Products Inc. | 201 | 4,744 | ||||||
Microsoft Corp. | 462 | 12,887 | ||||||
Motorola Inc. (c) | 570 | 5,169 | ||||||
Motorola Mobility Holdings Inc. (When-issued shares) | (63) | (1,838 | ) | |||||
Xerox Corp. | 882 | 10,156 | ||||||
Other Securities | 13,818 | |||||||
| 57,690 | ||||||||
MATERIALS - 5.2% | ||||||||
International Paper Co. | 286 | 7,803 | ||||||
Linde AG | 48 | 7,355 | ||||||
Weyerhaeuser Co. | 499 | 9,442 | ||||||
Other Securities | 5,950 | |||||||
| 30,550 | ||||||||
TELECOMMUNICATION SERVICES - 3.3% |
| |||||||
Telefonica SA | 317 | 7,234 | ||||||
Vodafone Group Plc | 3,587 | 9,271 | ||||||
Other Securities | 3,080 | |||||||
| 19,585 | ||||||||
UTILITIES - 3.9% | ||||||||
E.ON AG | 205 | 6,234 | ||||||
Exelon Corp. | 121 | 5,047 | ||||||
Other Securities | 12,120 | |||||||
| 23,401 | ||||||||
Total Common Stocks (cost $491,475) |
| 514,317 | ||||||
CORPORATE BONDS AND NOTES - 3.1% |
| |||||||
CONSUMER DISCRETIONARY - 0.3% |
| |||||||
Other Securities | 1,579 | |||||||
See accompanying Notes to the Financial Statements.
JNL Series Trust
Schedules of Investments (in thousands)
December 31, 2010
| Shares/Par (p) | Value | |||||||
ENERGY - 0.6% | ||||||||
Other Securities | 3,686 | |||||||
FINANCIALS - 1.8% | ||||||||
Realogy Corp. Delay Draw Term Loan, 3.26%, 10/10/13 (i) | 1,617 | 1,524 | ||||||
Realogy Corp. Term Loan | ||||||||
1.47%, 10/10/13 (i) | 507 | 478 | ||||||
3.29%, 10/10/13 (i) | 3,770 | 3,554 | ||||||
Realogy Corp. Term Loan A, 13.50%, 10/15/17 (i) | 93 | 102 | ||||||
Other Securities | 5,301 | |||||||
| 10,959 | ||||||||
INFORMATION TECHNOLOGY - 0.4% |
| |||||||
Other Securities | 2,292 | |||||||
Total Corporate Bonds and Notes (cost $18,606) | 18,516 | |||||||
OTHER EQUITY INTERESTS - 0.0% |
| |||||||
Other Securities | — | |||||||
Total Other Equity Interests (cost $19) | — | |||||||
SHORT TERM INVESTMENTS - 12.3% |
| |||||||
Investment Company - 10.5% | ||||||||
JNL Money Market Fund, 0.08% (a) (h) | 62,650 | 62,650 | ||||||
Securities Lending Collateral 1.8% | ||||||||
Securities Lending Cash Collateral Fund LLC, 0.31% (a) (h) | 10,775 | 10,775 | ||||||
Total Short Term Investments (cost $73,425) | 73,425 | |||||||
Total Investments - 101.9% (cost $583,525) | 606,258 | |||||||
Other Assets and Liabilities, Net - (1.9%) | (11,193) | |||||||
Total Net Assets - 100.0% | $ | 595,065 | ||||||
JNL/Franklin Templeton Small Cap Value Fund * (x) |
| |||||||
COMMON STOCKS - 93.0% |
| |||||||
CONSUMER DISCRETIONARY - 18.2% |
| |||||||
Autoliv Inc. | 55 | $ | 4,342 | |||||
Gentex Corp. | 150 | 4,434 | ||||||
Group 1 Automotive Inc. (e) | 110 | 4,594 | ||||||
Men’s Wearhouse Inc. | 128 | 3,205 | ||||||
Regis Corp. | 170 | 2,829 | ||||||
Thor Industries Inc. | 159 | 5,403 | ||||||
Other Securities | 28,794 | |||||||
| 53,601 | ||||||||
CONSUMER STAPLES - 1.7% |
| |||||||
Lancaster Colony Corp. (e) | 55 | 3,129 | ||||||
Other Securities | 1,913 | |||||||
| 5,042 | ||||||||
ENERGY - 11.9% | ||||||||
Atwood Oceanics Inc. (c) | 95 | 3,561 | ||||||
Bristow Group Inc. (c) | 108 | 5,095 | ||||||
Oil States International Inc. (c) | 57 | 3,634 | ||||||
Rowan Cos. Inc. (c) | 140 | 4,891 | ||||||
Tidewater Inc. | 92 | 4,953 | ||||||
Unit Corp. (c) | 69 | 3,221 | ||||||
| Shares/Par (p) | Value | |||||
Other Securities | 9,731 | |||||
| 35,086 | ||||||
FINANCIALS - 13.4% | ||||||
Aspen Insurance Holdings Ltd. | 109 | 3,108 | ||||
Montpelier Re Holdings Ltd. | 138 | 2,748 | ||||
Old Republic International Corp. | 265 | 3,612 | ||||
Protective Life Corp. | 223 | 5,951 | ||||
StanCorp Financial Group Inc. | 64 | 2,880 | ||||
Tower Group Inc. | 121 | 3,098 | ||||
Validus Holdings Ltd. | 97 | 2,967 | ||||
Other Securities | 15,192 | |||||
| 39,556 | ||||||
HEALTH CARE - 4.6% | ||||||
Mettler Toledo International Inc. (c) | 21 | 3,100 | ||||
Pharmaceutical Product Development Inc. | 109 | 2,953 | ||||
STERIS Corp. | 90 | 3,289 | ||||
Teleflex Inc. | 53 | 2,830 | ||||
Other Securities | 1,475 | |||||
| 13,647 | ||||||
INDUSTRIALS - 29.3% | ||||||
ABM Industries Inc. | 135 | 3,556 | ||||
Astec Industries Inc. (c) | 79 | 2,551 | ||||
Brady Corp. - Class A | 88 | 2,866 | ||||
Carlisle Cos. Inc. | 81 | 3,207 | ||||
Gardner Denver Inc. | 52 | 3,572 | ||||
Genesee & Wyoming Inc. - Class A (c) | 65 | 3,452 | ||||
Graco Inc. | 88 | 3,456 | ||||
Granite Construction Inc. | 112 | 3,067 | ||||
Kennametal Inc. | 93 | 3,654 | ||||
Lincoln Electric Holdings Inc. | 42 | 2,739 | ||||
Mine Safety Appliances Co. | 82 | 2,562 | ||||
Mueller Industries Inc. | 123 | 4,012 | ||||
Nordson Corp. | 41 | 3,767 | ||||
Simpson Manufacturing Co. Inc. | 100 | 3,100 | ||||
SkyWest Inc. | 200 | 3,118 | ||||
Trinity Industries Inc. (e) | 170 | 4,518 | ||||
Universal Forest Products Inc. | 101 | 3,944 | ||||
Other Securities | 29,030 | |||||
| 86,171 | ||||||
INFORMATION TECHNOLOGY - 3.4% |
| |||||
Benchmark Electronics Inc. (c) | 251 | 4,563 | ||||
Cohu Inc. | 156 | 2,583 | ||||
Rofin-Sinar Technologies Inc. (c) | 82 | 2,917 | ||||
| 10,063 | ||||||
MATERIALS - 7.7% | ||||||
Cabot Corp. | 74 | 2,801 | ||||
Reliance Steel & Aluminum Co. | 81 | 4,160 | ||||
RPM International Inc. | 164 | 3,627 | ||||
Steel Dynamics Inc. | 222 | 4,055 | ||||
Westlake Chemical Corp. (e) | 67 | 2,912 | ||||
Other Securities | 5,051 | |||||
| 22,606 | ||||||
UTILITIES - 2.8% | ||||||
NV Energy Inc. | 265 | 3,721 | ||||
Other Securities | 4,579 | |||||
| 8,300 | ||||||
Total Common Stocks (cost $225,725) | 274,072 | |||||
See accompanying Notes to the Financial Statements.
JNL Series Trust
Schedules of Investments (in thousands)
December 31, 2010
| Shares/Par (p) | Value | |||||
SHORT TERM INVESTMENTS - 10.4% | ||||||
Investment Company - 6.8% | ||||||
JNL Money Market Fund, 0.08% (a) (h) | 20,020 | 20,020 | ||||
Securities Lending Collateral 3.6% | ||||||
Securities Lending Cash Collateral Fund LLC, 0.31% (a) (h) | 9,698 | 9,698 | ||||
Securities Lending Liquidating Fund LLC, 0.66% (a) (h) | 971 | 954 | ||||
| 10,652 | ||||||
Total Short Term Investments (cost $30,688) |
|
30,672 |
| |||
Total Investments - 103.4% (cost $256,413) | 304,744 | |||||
Other Assets and Liabilities, Net - (3.4%) | (10,144 | ) | ||||
Total Net Assets - 100.0% | $ | 294,600 | ||||
JNL/Goldman Sachs Core Plus Bond Fund |
| |||||
NON-U.S. GOVERNMENT AGENCY ASSET-BACKED SECURITIES - 13.2% | ||||||
Adjustable Rate Mortgage Trust REMIC, 2.88%, 04/25/35 (i) | $ 308 | $ | 273 | |||
American Home Mortgage Assets REMIC, 1.03%, 02/25/47 (i) | 3,414 | 1,693 | ||||
Amortizing Residential Collateral Trust REMIC, 2.06%, 08/25/32 (i) | 56 | 25 | ||||
Arkle Master Issuer Plc, 1.68%, 08/17/13 (i) (r) | 4,600 | 4,594 | ||||
Asset Backed Securities Corp. Home Equity REMIC, 3.11%, 04/15/33 (i) | 44 | 32 | ||||
Banc of America Funding Corp. REMIC | ||||||
5.63%, 06/20/36 (i) | 2,008 | 1,370 | ||||
5.79%, 10/25/36 (i) | 102 | 96 | ||||
0.54%, 06/20/47 (i) | 1,700 | 896 | ||||
Banc of America Mortgage Securities Inc. REMIC, 3.18%, 09/25/35 (i) | 1,112 | 947 | ||||
BCAP LLC Trust REMIC, 0.90%, 11/25/36 (i) | 140 | 134 | ||||
Bear Stearns Adjustable Rate Mortgage Trust REMIC | ||||||
2.61%, 04/25/34 (i) | 350 | 330 | ||||
3.61%, 11/25/34 (i) | 933 | 911 | ||||
Bear Stearns Alt-A Trust II REMIC, 5.51%, 09/25/47 (i) | 2,802 | 1,774 | ||||
Bear Stearns Mortgage Funding Trust REMIC, 0.42%, 12/25/36 (i) | 3,224 | 1,891 | ||||
Brazos Higher Education Authority Inc., 0.41%, 09/25/23 (i) | 4,187 | 4,163 | ||||
Brazos Higher Education Authority, Inc., 1.20%, 11/25/22 (f) (i) | 5,100 | 5,088 | ||||
Carrington Mortgage Loan Trust REMIC, 0.49%, 01/25/34 (i) | 83 | 82 | ||||
Chase Mortgage Finance Corp. REMIC, 2.90%, 02/25/37 (i) | 441 | 408 | ||||
CIT Mortgage Loan Trust REMIC | ||||||
1.71%, 09/25/24 (i) (q) | 1,280 | 685 | ||||
1.26%, 10/25/37 (i) (q) | 529 | 508 | ||||
1.51%, 10/25/37 (i) (q) | 700 | 498 | ||||
Citigroup Mortgage Loan Trust Inc. REMIC, 3.08%, 12/25/35 (i) | 1,542 | 1,015 | ||||
College Loan Corp. Trust, | 1,000 | 900 | ||||
Commercial Mortgage Asset Trust REMIC, 7.35%, 01/17/32 | 400 | 437 | ||||
| Shares/Par (p) | Value | |||||
Conseco Financial Corp. REMIC, 7.07%, 01/15/29 | 154 | 161 | ||||
Countrywide Alternative Loan Trust REMIC | ||||||
1.83%, 09/25/35 (i) | 282 | 185 | ||||
1.71%, 11/25/47 (i) | 4,482 | 2,475 | ||||
Countrywide Asset-Backed Certificates REMIC, 1.51%, 06/25/34 (i) | 198 | 56 | ||||
Countrywide Home Loan Mortgage Pass-Through Trust REMIC | ||||||
2.83%, 02/19/34 (i) | 444 | 385 | ||||
3.09%, 11/20/34 (i) | 430 | 369 | ||||
Credit Suisse Mortgage Capital Certificates REMIC | ||||||
6.50%, 10/25/21 | 2,721 | 2,071 | ||||
5.54%, 02/15/39 (i) | 3,060 | 3,293 | ||||
5.47%, 09/15/39 | 6,000 | 6,293 | ||||
Deutsche Bank Alternate Loan Trust REMIC, 2.00%, 08/25/35 (i) | 437 | 345 | ||||
Downey Savings & Loan Association Mortgage Loan Trust REMIC, 1.25%, 03/19/46 (i) | 468 | 272 | ||||
Education Funding Capital Trust I, 0.46%, 12/15/22 (i) | 1,518 | 1,506 | ||||
Educational Secvices of America Inc., 1.14%, 07/25/23 (i) | 1,722 | 1,723 | ||||
FDIC Structured Sale Guaranteed Notes REMIC, 0.81%, 03/02/48 (i) (q) | 798 | 799 | ||||
First Horizon Asset Securities Inc. REMIC, 2.77%, 12/25/34 (i) | 170 | 160 | ||||
First Union National Bank Commercial Mortgage Trust, Interest Only REMIC, 05/17/32 (i) (q) | 1,928 | 65 | ||||
GMAC Mortgage Corp. Loan Trust REMIC | ||||||
7.00%, 09/25/37 (i) | 307 | 222 | ||||
7.00%, 09/25/37 (i) | 386 | 260 | ||||
Goal Capital Funding Trust, 0.98%, 05/25/48 (i) | 1,644 | 1,638 | ||||
Granite Mortgages Plc | ||||||
1.38%, 01/20/44 (i), EUR | 1,125 | 1,409 | ||||
0.44%, 09/20/44 (i) | 320 | 300 | ||||
1.16%, 09/20/44 (i), EUR | 433 | 543 | ||||
Greenwich Capital Commercial Funding Corp. REMIC, 5.44%, 03/10/39 (e) | 6,500 | 6,848 | ||||
GS Mortgage Securities Corp. II REMIC, 5.81%, 08/10/45 (i) (e) | 3,600 | 3,763 | ||||
GSMPS Mortgage Loan Trust, 0.49%, 02/25/35 (i) (q) | 113 | 100 | ||||
GSR Mortgage Loan Trust REMIC, 3.04%, 10/25/35 (i) | 620 | 460 | ||||
Harborview Mortgage Loan Trust REMIC | ||||||
0.60%, 06/20/35 (i) | 1,175 | 967 | ||||
5.20%, 08/19/36 (i) | 2,068 | 1,324 | ||||
Holmes Master Issuer Plc REMIC, 1.67%, 10/15/54 (i) (r) | 2,000 | 2,000 | ||||
HSBC Home Equity Loan Trust REMIC, 1.46%, 11/20/36 (i) | 1,547 | 1,428 | ||||
Impac CMB Trust REMIC, 0.90%, 03/25/35 (i) | 160 | 97 | ||||
IndyMac Index Mortgage Loan Trust REMIC | ||||||
0.88%, 06/25/34 (i) | 335 | 216 | ||||
2.77%, 03/25/35 (i) | 614 | 471 | ||||
2.64%, 08/25/35 (i) | 703 | 561 | ||||
0.47%, 05/25/46 (i) | 1,055 | 636 | ||||
JPMorgan Chase Commercial Mortgage Securities Corp. REMIC, 4.94%, 08/15/42 (i) | 7,000 | 7,418 | ||||
LB-UBS Commercial Mortgage Trust 6.65%, 11/15/27 | 3,612 | 3,621 | ||||
REMIC, 5.37%, 09/15/39 | 1,000 | 1,070 | ||||
Lehman Mortgage Trust REMIC, 7.25%, 09/25/37 | 5,149 | 2,831 | ||||
See accompanying Notes to the Financial Statements.
JNL Series Trust
Schedules of Investments (in thousands)
December 31, 2010
| Shares/Par (p) | Value | |||||||
Lehman XS Trust REMIC | ||||||||
0.52%, 02/25/46 (i) | 2,201 | 1,347 | ||||||
1.11%, 09/25/47 (i) | 1,577 | 1,019 | ||||||
Luminent Mortgage Trust REMIC, 0.45%, 05/25/46 (i) | 631 | 360 | ||||||
MASTR Adjustable Rate Mortgages Trust REMIC | ||||||||
3.66%, 10/25/34 (i) | 288 | 241 | ||||||
3.57%, 12/25/34 (i) | 92 | 69 | ||||||
3.13%, 01/25/36 (i) | 741 | 647 | ||||||
1.53%, 12/25/46 (i) | 3,969 | 1,393 | ||||||
MASTR Seasoned Securities Trust REMIC, 4.17%, 10/25/32 (i) | 316 | 284 | ||||||
Merit Securities Corp. REMIC, 1.76%, 09/28/32 (i) (q) | 227 | 204 | ||||||
Merrill Lynch Alternative Note Asset Trust REMIC, 0.45%, 07/25/37 (i) | 794 | 463 | ||||||
Mid-State Trust, 7.34%, 07/01/35 | 220 | 230 | ||||||
Morgan Stanley Capital I REMIC, 5.19%, 11/14/42 (i) | 1,500 | 1,615 | ||||||
Morgan Stanley Mortgage Loan Trust REMIC | ||||||||
2.93%, 08/25/34 (i) | 177 | 146 | ||||||
3.30%, 03/25/36 (i) | 1,763 | 1,069 | ||||||
NCUA Guaranteed Notes | ||||||||
0.61%, 12/07/20 (i) | 2,500 | 2,503 | ||||||
REMIC, 0.64%, 11/06/17 (i) | 4,812 | 4,811 | ||||||
REMIC, 2.65%, 01/01/18 | 4,478 | 4,360 | ||||||
REMIC, 0.72%, 10/07/20 (i) | 2,620 | 2,617 | ||||||
REMIC, 1.84%, 10/07/20 | 928 | 918 | ||||||
Northstar Education Finance Inc., 0.39%, 10/28/26 (i) | 465 | 462 | ||||||
Permanent Master Issuer Plc, 0.86%, 04/15/20, GBP | 2,000 | 3,015 | ||||||
Residential Accredit Loans Inc. REMIC | ||||||||
6.27%, 11/25/37 (i) | 4,249 | 2,122 | ||||||
1.33%, 01/25/46 (i) | 1,281 | 736 | ||||||
Residential Funding Mortgage Securities I Inc. REMIC | ||||||||
3.03%, 08/25/35 (i) | 705 | 532 | ||||||
5.21%, 09/25/35 (i) | 945 | 834 | ||||||
Silverstone Master Issuer PLC, 1.68%, 01/21/55 (i) (r) | 4,800 | 4,805 | ||||||
Structured Adjustable Rate Mortgage Loan Trust REMIC | ||||||||
2.60%, 05/25/34 (i) | 630 | 591 | ||||||
2.72%, 09/25/34 (i) | 262 | 228 | ||||||
2.74%, 11/25/34 (i) | 1,248 | 1,072 | ||||||
Structured Asset Mortgage Investments Inc. REMIC, 2.69%, 08/25/35 (i) | 92 | 77 | ||||||
U.S. Education Loan Trust LLC, 0.43%, 03/01/25 (i) | 798 | 791 | ||||||
Wachovia Bank Commercial Mortgage Trust, 5.77%, 07/15/45 (i) | 6,000 | 6,454 | ||||||
Washington Mutual Mortgage Pass-Through Certificates REMIC | ||||||||
2.71%, 06/25/34 (i) | 792 | 766 | ||||||
2.67%, 12/25/35 (i) | 1,072 | 1,039 | ||||||
5.36%, 09/25/36 (i) | 1,416 | 1,141 | ||||||
0.49%, 04/25/45 (i) | 171 | 143 | ||||||
Wells Fargo Alternative Loan Trust REMIC, 6.20%, 12/25/37 (i) | 3,200 | 2,449 | ||||||
Wells Fargo Mortgage Backed Securities Trust REMIC, 2.90%, 04/25/36 (i) | 321 | 292 | ||||||
Total Non-U.S. Government Agency Asset- Backed Securities (cost $158,686) | 138,936 | |||||||
| Shares/Par (p) | Value | |||||||
CORPORATE BONDS AND NOTES - 27.7% |
| |||||||
CONSUMER DISCRETIONARY - 1.3% |
| |||||||
Comcast Cable Communications Holdings Inc., 8.38%, 03/15/13 | 356 | 405 | ||||||
Comcast Holdings Corp., 10.63%, 07/15/12 | 875 | 991 | ||||||
CSC Holdings Inc., 7.63%, 04/01/11 | 250 | 253 | ||||||
DirecTV Holdings LLC | ||||||||
5.88%, 10/01/19 | 825 | 897 | ||||||
6.35%, 03/15/40 | 650 | 684 | ||||||
DISH DBS Corp., 6.63%, 10/01/14 | 575 | 597 | ||||||
NBC Universal Inc, 4.38%, 04/01/21 (e) (r) | 3,675 | 3,567 | ||||||
Reed Elsevier Capital Inc., 8.63%, 01/15/19 | 1,761 | 2,239 | ||||||
Rensselaer Polytechnic Institute, 5.60%, 09/01/20 | 2,300 | 2,372 | ||||||
Whirlpool Corp. | ||||||||
8.00%, 05/01/12 (l) | 400 | 431 | ||||||
8.60%, 05/01/14 (l) | 500 | 577 | ||||||
WPP Finance Co.Ltd., 8.00%, 09/15/14 (l) | 778 | 895 | ||||||
| 13,908 | ||||||||
CONSUMER STAPLES - 1.1% | ||||||||
Altria Group Inc., 9.70%, 11/10/18 (l) | 1,425 | 1,880 | ||||||
Anheuser-Busch InBev Worldwide Inc. | ||||||||
7.20%, 01/15/14 (r) | 850 | 972 | ||||||
4.13%, 01/15/15 (e) | 1,750 | 1,843 | ||||||
7.75%, 01/15/19 (r) | 1,325 | 1,649 | ||||||
BAT International Finance Plc, 9.50%, 11/15/18 (r) | 1,150 | 1,513 | ||||||
CVS Caremark Corp., 5.75%, 06/01/17 | 975 | 1,085 | ||||||
Kraft Foods Inc. | ||||||||
6.13%, 08/23/18 | 1,125 | 1,286 | ||||||
6.50%, 02/09/40 (e) | 1,025 | 1,149 | ||||||
| 11,377 | ||||||||
ENERGY - 2.5% | ||||||||
Anadarko Petroleum Corp., 6.38%, 09/15/17 | 2,176 | 2,370 | ||||||
BP Capital Markets Plc, 3.88%, 03/10/15 (e) | 1,125 | 1,160 | ||||||
Canadian Natural Resources Ltd., 5.15%, 02/01/13 | 900 | 970 | ||||||
Chesapeake Energy Corp., 6.50%, 08/15/17 (e) | 275 | 276 | ||||||
DCP Midstream LLC, 9.75%, 03/15/19 (r) | 1,600 | 2,068 | ||||||
Dolphin Energy Ltd., 5.89%, 06/15/19 (r) | 775 | 830 | ||||||
El Paso Corp. | ||||||||
7.88%, 06/15/12 (e) | 325 | 342 | ||||||
7.80%, 08/01/31 | 33 | 33 | ||||||
7.75%, 01/15/32 (e) | 515 | 512 | ||||||
El Paso Pipeline Partners Operating Co. LLC, 6.50%, 04/01/20 | 400 | 420 | ||||||
Energy Transfer Partners LP, 5.95%, 02/01/15 | 2,000 | 2,194 | ||||||
Enterprise Products Operating LLC | ||||||||
6.65%, 04/15/18 | 1,125 | 1,292 | ||||||
7.03%, 01/15/68 (e) | 775 | 804 | ||||||
Gulf South Pipeline Co., 6.30%, 08/15/17 (r) | 1,200 | 1,350 | ||||||
Nexen Inc., 7.50%, 07/30/39 | 900 | 979 | ||||||
Petroleos Mexicanos, 8.00%, 05/03/19 | 1,940 | 2,338 | ||||||
Southern Natural Gas Co., 5.90%, 04/01/17 (r) | 120 | 129 | ||||||
Suncor Energy Inc., 6.10%, 06/01/18 | 1,175 | 1,351 | ||||||
TransCanada PipeLines Ltd., 6.35%, 05/15/67 | 1,375 | 1,358 | ||||||
Transocean Inc. | ||||||||
4.95%, 11/15/15 | 750 | 775 | ||||||
6.50%, 11/15/20 | 2,550 | 2,707 | ||||||
Williams Cos. Inc., 8.75%, 03/15/32 (e) | 1,075 | 1,315 | ||||||
Williams Partners LP, 5.25%, 03/15/20 | 1,050 | 1,088 | ||||||
| 26,661 | ||||||||
See accompanying Notes to the Financial Statements.
JNL Series Trust
Schedules of Investments (in thousands)
December 31, 2010
| Shares/Par (p) | Value | |||||||
FINANCIALS - 19.1% | ||||||||
Achmea Hypotheekbank NV, 3.20%, 11/03/14 (r) | 5,700 | 5,930 | ||||||
Ally Financial Inc., 6.88%, 09/15/11 (e) | 3,400 | 3,488 | ||||||
ANZ National International Ltd., 3.25%, 04/02/12 (e) (r) | 6,000 | 6,173 | ||||||
Australia & New Zealand Banking Group Ltd., 3.20%, 12/15/11 (e) (r) | 4,300 | 4,401 | ||||||
Bank of America Corp. | ||||||||
5.42%, 03/15/17 | 1,300 | 1,288 | ||||||
5.63%, 07/01/20 (e) | 2,225 | 2,268 | ||||||
5.88%, 01/05/21 (e) | 1,675 | 1,733 | ||||||
BBVA Bancomer SA, 7.25%, 04/22/20 (r) | 2,125 | 2,248 | ||||||
Bear Stearns Cos. Inc., 7.25%, 02/01/18 (e) | 1,475 | 1,748 | ||||||
BRFkredit AS, 2.05%, 04/15/13 (r) | 8,300 | 8,440 | ||||||
Canadian Imperial Bank of Commerce | ||||||||
2.00%, 02/04/13 (r) | 4,100 | 4,173 | ||||||
2.60%, 07/02/15 (e) (r) | 1,400 | 1,408 | ||||||
Capital One Capital III, 7.69%, 08/15/36 (i) | 1,125 | 1,125 | ||||||
Chubb Corp., 6.38%, 03/29/67 | 825 | 860 | ||||||
Cie de Financement Foncier | ||||||||
1.63%, 07/23/12 (e) (r) | 3,800 | 3,818 | ||||||
2.13%, 04/22/13 (r) | 800 | 807 | ||||||
Citigroup Inc. | ||||||||
6.38%, 08/12/14 | 1,325 | 1,464 | ||||||
5.00%, 09/15/14 | 2,475 | 2,560 | ||||||
5.38%, 08/09/20 (e) | 2,525 | 2,624 | ||||||
Credit Agricole SA, 8.38%, (callable at 100 beginning 10/13/19) (m) (r) | 750 | 771 | ||||||
Credit Suisse New York, 4.38%, 08/05/20 | 800 | 785 | ||||||
Danske Bank A/S, 2.50%, 05/10/12 (r) | 2,000 | 2,049 | ||||||
Deutsche Bank AG Credit Linked Note (Egyptian Treasury Bill, 0.00%, 04/05/11, Moody rating N/A) (f) (r), EGP | 57,900 | 9,731 | ||||||
Developer Diversified Realty Corp., 7.50%, 04/01/17 | 1,250 | 1,396 | ||||||
Discover Bank, 8.70%, 11/18/19 | 1,325 | 1,560 | ||||||
DnB NOR Boligkreditt, 2.10%, 10/14/15 (i) (e) (r) | 4,600 | 4,375 | ||||||
El Paso Performance-Linked Trust, 7.75%, 07/15/11 (q) | 1,290 | 1,321 | ||||||
Endurance Specialty Holdings Ltd., 6.15%, 10/15/15 | 700 | 735 | ||||||
ENEL Finance International SA, 5.13%, 10/07/19 (e) (r) | 1,300 | 1,288 | ||||||
Fifth Third Bancorp, 0.39%, 05/17/13 (i) | 1,325 | 1,274 | ||||||
FIH Erhvervsbank A/S, 2.00%, 06/12/13 (r) | 3,800 | 3,863 | ||||||
First Niagara Financial Group Inc., 6.75%, 03/19/20 | 925 | 963 | ||||||
Ford Motor Credit Co. LLC, 5.55%, 06/15/11 (e) (i) | 600 | 609 | ||||||
HSBC Bank USA, 4.88%, 08/24/20 | 1,775 | 1,764 | ||||||
HSBC Bank USA Credit Linked Note (Nota Do Tesouro Nacional, 6.00%, 08/15/40, Moody rating N/A) (f) (i), BRL | 4,840 | 6,222 | ||||||
HSBC Holdings Plc, 6.80%, 06/01/38 | 2,650 | 2,865 | ||||||
ING Bank NV, 2.50%, 01/14/16 (q) | 5,100 | 4,975 | ||||||
International Lease Finance Corp., 8.25%, 12/15/20 | 1,250 | 1,288 | ||||||
JPMorgan Chase & Co. 7.90% (callable at 100 beginning 04/30/18) (m) | 2,050 | 2,179 | ||||||
4.40%, 07/22/20 | 625 | 615 | ||||||
JPMorgan Chase Capital XX, 6.55%, 09/29/36 (i) | 1,650 | 1,660 | ||||||
Kreditanstalt fuer Wiederaufbau, 3.25%, 02/15/11 (e) | 9,100 | 9,130 | ||||||
| Shares/Par (p) | Value | |||||||
Landwirtschaftliche Rentenbank, 4.88%, 01/10/14 | 6,000 | 6,594 | ||||||
LeasePlan Corp. NV, 3.00%, 05/07/12 (r) | 3,400 | 3,493 | ||||||
Liberty Property LP, 4.75%, 10/01/20 | 2,350 | 2,325 | ||||||
Lloyds TSB Bank Plc, 6.50%, 09/14/20 (r) | 1,525 | 1,403 | ||||||
Merrill Lynch & Co. Inc. | ||||||||
6.05%, 05/16/16 | 1,125 | 1,159 | ||||||
6.40%, 08/28/17 (e) | 700 | 740 | ||||||
MetLife Capital Trust X, 9.25%, 04/08/38 (r) | 500 | 588 | ||||||
Morgan Stanley | ||||||||
5.75%, 08/31/12 | 675 | 722 | ||||||
5.95%, 12/28/17 | 825 | 873 | ||||||
6.63%, 04/01/18 | 2,775 | 3,010 | ||||||
MUFG Capital Finance 1 Ltd., 6.35%, (callable at 100 beginning 07/25/16) (m) | 1,310 | 1,320 | ||||||
Northwestern Mutual Life Insurance Co., 6.06%, 03/30/40 (e) (r) | 2,175 | 2,402 | ||||||
Panhandle-Plains Higher Education Authority Inc. REMIC, 1.49%, 10/01/35 (i) | 3,000 | 3,023 | ||||||
PNC Bank NA, 6.88%, 04/01/18 | 975 | 1,114 | ||||||
PNC Funding Corp., 1.88%, 06/22/11 | 5,300 | 5,341 | ||||||
ProLogis, 1.88%, 11/15/37 (e) | 1,075 | 1,063 | ||||||
Prudential Financial Inc. | ||||||||
3.88%, 01/14/15 | 2,450 | 2,528 | ||||||
4.50%, 11/15/20 (e) | 1,550 | 1,516 | ||||||
Resona Preferred Global Securities Cayman Ltd., 7.19%, (callable at 100 beginning 07/30/15) (m) (r) | 1,525 | 1,514 | ||||||
Royal Bank of Scotland Group Plc, 1.50%, 03/30/12 (r) | 7,500 | 7,565 | ||||||
Royal Bank of Scotland Plc, 4.88%, 08/25/14 (r) | 1,850 | 1,895 | ||||||
Simon Property Group LP | ||||||||
10.35%, 04/01/19 | 1,650 | 2,256 | ||||||
4.38%, 03/01/21 (e) | 825 | 815 | ||||||
Smurfit Kappa Treasury Funding Ltd., 7.50%, 11/20/25 | 225 | 208 | ||||||
Sparebanken 1 Boligkreditt, 1.25%, 10/25/13 (e) (r) | 8,000 | 7,946 | ||||||
Stadshypotek AB, 1.45%, 09/30/13 (e) (r) | 7,200 | 7,194 | ||||||
Swedbank AB | ||||||||
3.00%, 12/22/11 (r) | 300 | 307 | ||||||
2.80%, 02/10/12 (r) | 4,300 | 4,392 | ||||||
Transatlantic Holdings Inc., 8.00%, 11/30/39 | 975 | 998 | ||||||
UBS AG New Jersey-Credit Linked Note (Federative Republic of Brazil, 6.00%, 01/17/17, Moody rating Ba1) (q), BRL | 1,620 | 443 | ||||||
WEA Finance LLC | ||||||||
7.50%, 06/02/14 (r) | 475 | 539 | ||||||
7.13%, 04/15/18 (r) | 900 | 1,035 | ||||||
Westpac Banking Corp., 1.90%, 12/14/12 (e) (r) | 4,900 | 4,983 | ||||||
Westpac Securities NZ Ltd., 2.50%, 05/25/12 (r) | 800 | 819 | ||||||
ZFS Finance USA Trust I, 5.88%, 05/09/32 (e) (q) | 1,225 | 1,195 | ||||||
| 201,292 | ||||||||
HEALTH CARE - 0.8% | ||||||||
Boston Scientific Corp. | ||||||||
4.50%, 01/15/15 | 2,050 | 2,093 | ||||||
7.00%, 11/15/35 (l) | 250 | 251 | ||||||
Covidien International Finance SA, 4.20%, 06/15/20 | 1,175 | 1,175 | ||||||
HCA Inc., 7.88%, 02/15/20 | 500 | 535 | ||||||
Hospira Inc., 5.60%, 09/15/40 | 1,150 | 1,130 | ||||||
Life Technologies Corp. | ||||||||
6.00%, 03/01/20 | 1,160 | 1,242 | ||||||
See accompanying Notes to the Financial Statements.
JNL Series Trust
Schedules of Investments (in thousands)
December 31, 2010
| Shares/Par (p) | Value | |||||||
5.00%, 01/15/21 | 2,425 | 2,402 | ||||||
| 8,828 | ||||||||
INDUSTRIALS - 0.3% |
| |||||||
General Electric Co., | 750 | 810 | ||||||
TransDigm Inc., 7.75%, | 2,125 | 2,199 | ||||||
| 3,009 | ||||||||
INFORMATION TECHNOLOGY - 0.2% |
| |||||||
Agilent Technologies Inc., | 1,925 | 2,091 | ||||||
MATERIALS - 1.0% |
| |||||||
Anglo American Capital Plc | ||||||||
9.38%, 04/08/14 (r) | 414 | 498 | ||||||
9.38%, 04/08/19 (e) (r) | 625 | 841 | ||||||
ArcelorMittal, 6.13%, 06/01/18 (e) | 1,375 | 1,465 | ||||||
Dow Chemical Co. | ||||||||
7.60%, 05/15/14 (l) | 1,625 | 1,874 | ||||||
5.90%, 02/15/15 | 750 | 830 | ||||||
Freeport-McMoRan Copper & Gold Inc., 8.38%, 04/01/17 | 1,950 | 2,157 | ||||||
International Paper Co., | 625 | 744 | ||||||
Methanex Corp., 8.75%, | 175 | 184 | ||||||
Radnor Holdings Corp., | 125 | — | ||||||
Teck Resources Ltd., 10.75%, 05/15/19 | 1,425 | 1,853 | ||||||
| 10,446 | ||||||||
TELECOMMUNICATION SERVICES - 0.9% |
| |||||||
AT&T Inc., 6.40%, 05/15/38 | 1,475 | 1,568 | ||||||
Qwest Communications International Inc., 7.50%, 02/15/14 | 255 | 258 | ||||||
Qwest Corp. | ||||||||
8.88%, 03/15/12 | 125 | 135 | ||||||
8.38%, 05/01/16 | 750 | 889 | ||||||
Sprint Capital Corp., 8.38%, 03/15/12 | 500 | 529 | ||||||
Telecom Italia Capital SA | ||||||||
6.20%, 07/18/11 | 975 | 1,001 | ||||||
7.00%, 06/04/18 | 1,175 | 1,244 | ||||||
6.00%, 09/30/34 | 925 | 768 | ||||||
Telemar Norte Leste SA, 5.50%, 10/23/20 (e) (r) | 1,000 | 962 | ||||||
Verizon Communications Inc., 6.40%, 02/15/38 (e) | 1,300 | 1,438 | ||||||
Verizon Wireless Capital LLC, 8.50%, 11/15/18 (e) | 575 | 752 | ||||||
Windstream Corp., 8.63%, 08/01/16 | 180 | 189 | ||||||
| 9,733 | ||||||||
UTILITIES - 0.5% |
| |||||||
Arizona Public Service Co., 8.75%, 03/01/19 | 1,700 | 2,129 | ||||||
Nevada Power Co., 7.13%, 03/15/19 | 1,175 | 1,384 | ||||||
Progress Energy Inc., 7.05%, 03/15/19 | 1,275 | 1,513 | ||||||
Puget Sound Energy Inc., 6.97%, 06/01/67 | 675 | 664 | ||||||
| 5,690 | ||||||||
Total Corporate Bonds and Notes (cost $282,885) | 293,035 | |||||||
GOVERNMENT AND AGENCY OBLIGATIONS - 60.9% |
| |||||||
GOVERNMENT SECURITIES - 11.9% |
| |||||||
Federal Home Loan Mortgage Corp. - 0.7% (w) | ||||||||
Federal Home Loan Mortgage Corp., 5.25%, 04/18/16 | 6,000 | 6,863 | ||||||
Federal National Mortgage Association - 0.2% (w) | ||||||||
Federal National Mortgage Association, 5.50%, 05/01/38 | 2,133 | 2,284 | ||||||
| Shares/Par (p) | Value | |||||||
Municipals - 1.9% | ||||||||
Connecticut State Health & Educational Facility Authority, 5.00%, 07/01/42 | 975 | 987 | ||||||
Missouri Higher Education Loan Authority, 1.23%, 11/26/32 (i) | 3,183 | 3,199 | ||||||
New York State Dormitory Authority, 5.00%, 07/01/40 | 200 | 201 | ||||||
Northstar Education Finance Inc. Student Loan Asset-Backed Note, 0.48%, 04/29/19 (i) | 6,000 | 5,928 | ||||||
State of California | ||||||||
7.95%, 03/01/36 | 1,290 | 1,323 | ||||||
7.63%, 03/01/40 | 3,475 | 3,626 | ||||||
State of California Various Purpose Bond | ||||||||
7.50%, 04/01/34 | 1,625 | 1,681 | ||||||
7.55%, 04/01/39 | 1,325 | 1,374 | ||||||
State of Illinois, Transit Improvements, GO, 7.35%, 07/01/35 | 1,525 | 1,494 | ||||||
| 19,813 | ||||||||
Sovereign - 3.2% | ||||||||
Brazilian Government International Bond, 4.88%, 01/22/21 | 2,210 | 2,254 | ||||||
Farmer Mac Guaranteed Notes Trust, 5.13%, 04/19/17 (r) | 2,100 | 2,285 | ||||||
Mexican Bonos | ||||||||
10.00%, 12/05/24, MXN | 32,972 | 3,328 | ||||||
8.50%, 11/18/38, MXN | 14,248 | 1,228 | ||||||
Peruvian Government International Bond, 5.63%, 11/18/50 | 290 | 268 | ||||||
Province of Quebec, Canada, 4.60%, 05/26/15 (e) | 1,475 | 1,619 | ||||||
Qatar Government International Bond | ||||||||
5.15%, 04/09/14 | 290 | 311 | ||||||
5.25%, 01/20/20 (r) | 4,350 | 4,589 | ||||||
Republic of Argentina, 2.84%, 12/15/35 (i), EUR | 14,840 | 2,489 | ||||||
Republic of South Africa Government Bond | ||||||||
8.00%, 12/21/18, ZAR | 15,720 | 2,376 | ||||||
6.75%, 03/31/21, ZAR | 35,860 | 4,912 | ||||||
Swedish Housing Finance Corp., 3.13%, 03/23/12 (r) | 1,100 | 1,130 | ||||||
Tennessee Valley Authority | ||||||||
4.38%, 06/15/15 | 2,400 | 2,635 | ||||||
5.98%, 04/01/36 | 1,250 | 1,445 | ||||||
4.63%, 09/15/60 (e) | 800 | 748 | ||||||
United Mexican States, 6.05%, 01/11/40 | 1,000 | 1,022 | ||||||
Venezuela Government International Bond | ||||||||
5.75%, 02/26/16 | 1,180 | 832 | ||||||
7.75%, 10/13/19 | 530 | 359 | ||||||
9.00%, 05/07/23 | 80 | 55 | ||||||
8.25%, 10/13/24 | 490 | 319 | ||||||
| 34,204 | ||||||||
Treasury Inflation Index Securities - 2.4% |
| |||||||
U.S. Treasury Inflation Indexed Note | ||||||||
2.38%, 04/15/11 (n) (o) | 6,281 | 6,337 | ||||||
3.00%, 07/15/12 (n) | 6,082 | 6,460 | ||||||
1.25%, 07/15/20 (n) | 3,510 | 3,594 | ||||||
2.38%, 01/15/25 - 01/15/27 (n) | 7,695 | 8,561 | ||||||
| 24,952 | ||||||||
U.S. Treasury Securities - 3.5% | ||||||||
U.S. Treasury Bond | ||||||||
0.00%,05/15/21 (e) (j) | 900 | 617 | ||||||
0.00%,11/15/21 (j) | 1,800 | 1,197 | ||||||
5.00%, 05/15/37 | 4,500 | 5,021 | ||||||
4.25%, 05/15/39 - 11/15/40 | 20,200 | 19,879 | ||||||
4.38%, 11/15/39 - 05/15/40 | 2,400 | 2,413 | ||||||
See accompanying Notes to the Financial Statements.
JNL Series Trust
Schedules of Investments (in thousands)
December 31, 2010
| Shares/Par (p) | Value | |||||||
U.S.Treasury Bond Strip Principal, 0.00%, 05/15/30 (e) (j) | 19,500 | 8,258 | ||||||
| 37,385 | ||||||||
U.S. GOVERNMENT AGENCY MORTGAGE-BACKED SECURITIES - 49.0% |
| |||||||
Federal Home Loan Mortgage Corp. - 9.8% |
| |||||||
Federal Home Loan Mortgage Corp. | ||||||||
3.00%, 01/15/26, TBA (g) | 1,000 | 978 | ||||||
5.00%, 12/01/35 | 208 | 220 | ||||||
5.50%, 01/01/36 - 01/01/40 | 8,598 | 9,175 | ||||||
5.98%, 01/01/37 (i) | 888 | 939 | ||||||
6.00%, 09/01/37 - 11/01/38 | 3,198 | 3,536 | ||||||
6.50%, 01/01/38 - 12/01/38 | 4,542 | 5,137 | ||||||
4.50%, 09/01/39 - 10/01/39 | 2,836 | 2,930 | ||||||
4.00%, 01/15/41, TBA (g) | 18,000 | 17,868 | ||||||
4.50%, 01/15/41, TBA (g) | 6,000 | 6,148 | ||||||
5.00%, 01/15/41, TBA (g) | 22,000 | 23,073 | ||||||
5.50%, 01/15/41, TBA (g) | 31,000 | 33,034 | ||||||
REMIC, 1,156.50%,06/15/21 (q) | — | — | ||||||
REMIC, 0.00%,09/15/35 (0.00% until LIBOR reaches 7.00%) (i) (q) | 163 | 158 | ||||||
REMIC, 0.00%,04/15/37 (0.00% until LIBOR reaches 6.75%) (i) (q) | 29 | 29 | ||||||
| 103,225 | ||||||||
Federal National Mortgage Association - 36.2% |
| |||||||
Federal National Mortgage Association | ||||||||
5.00%, 03/01/18 - 09/01/40 | 7,273 | 7,721 | ||||||
4.50%, 05/01/18 - 11/01/40 | 6,142 | 6,392 | ||||||
6.50%, 02/01/19 | 2 | 2 | ||||||
6.00%, 09/01/19 - 11/01/38 | 18,310 | 19,951 | ||||||
5.50%, 09/01/23 - 10/01/39 | 16,041 | 17,227 | ||||||
3.00%, 01/15/26 - 02/15/26 , TBA (g) | 49,000 | 47,848 | ||||||
4.00%, 01/15/26, TBA (g) | 23,000 | 23,686 | ||||||
5.00%, 01/15/26, TBA (g) | 18,000 | 19,097 | ||||||
3.50%, 02/15/26, TBA (g) | 44,000 | 44,179 | ||||||
8.00%, 08/01/29 - 02/01/31 | 91 | 105 | ||||||
7.00%, 07/01/32 | 12 | 13 | ||||||
2.33%, 11/01/35 (i) | 93 | 95 | ||||||
2.61%, 05/01/36 (i) | 553 | 566 | ||||||
2.75%, 05/01/36 (i) | 554 | 574 | ||||||
2.79%, 08/01/36 (i) | 577 | 596 | ||||||
2.64%, 09/01/36 (i) | 573 | 587 | ||||||
4.00%, 10/01/39 - 01/01/41 | 45,999 | 45,808 | ||||||
4.50%, 01/01/40 - 01/15/41 , TBA (g) | 83,000 | 85,192 | ||||||
3.50%, 01/01/41 - 01/01/41 | 7,000 | 6,692 | ||||||
5.50%, 01/15/41, TBA (g) | 53,000 | 56,702 | ||||||
REMIC, 10.40%, 04/25/19 | 1 | 1 | ||||||
| 383,034 | ||||||||
Government National Mortgage Association - 3.0% |
| |||||||
Government National Mortgage Association | ||||||||
3.95%, 07/15/25 | 1,100 | 1,105 | ||||||
6.00%, 06/15/34 - 01/15/39 | 944 | 1,051 | ||||||
4.50%, 06/15/39 - 10/15/39 | 280 | 294 | ||||||
5.00%, 07/15/39 | 88 | 95 | ||||||
3.50%, 01/15/41, TBA (g) | 22,000 | 21,182 | ||||||
5.00%, 01/15/41, TBA (g) | 7,000 | 7,441 | ||||||
4.50%, 02/15/41, TBA (g) | 1,000 | 1,036 | ||||||
| 32,204 | ||||||||
Total Government and Agency Obligations (cost $639,546) | 643,964 | |||||||
COMMON STOCKS - 0.0% | ||||||||
CONSUMER DISCRETIONARY - 0.0% |
| |||||||
Home Interior Gift Inc. (c) (f) (q) | 491 | — | ||||||
| Shares/Par (p) | Value | |||||||
MATERIALS - 0.0% | ||||||||
Applied Extrusion Technologies Inc. – Class B (c) (f) (q) | 2 | — | ||||||
Total Common Stocks (cost $226) | — | |||||||
SHORT TERM INVESTMENTS - 40.5% |
| |||||||
Investment Company 33.8% | ||||||||
JNL Money Market Fund, 0.08% (a) (h) | 356,880 | 356,880 | ||||||
Securities Lending Collateral 6.7% |
| |||||||
Securities Lending Cash Collateral Fund LLC, 0.31% (a) (h) | 70,316 | 70,316 | ||||||
Securities Lending Liquidating Fund LLC, 0.66% (a) (h) | 608 | 597 | ||||||
| 70,913 | ||||||||
Total Short Term Investments (cost $427,803) | 427,793 | |||||||
Total Investments - 142.3% (cost $1,509,146) | 1,503,728 | |||||||
Total Forward Sales Commitments - (2.2)% (proceeds $23,214) | (23,595 | ) | ||||||
Other Assets and Liabilities, Net - (40.1%) (o) | (423,474 | ) | ||||||
Total Net Assets - 100.0% | $ | 1,056,659 | ||||||
Forward Sales Commitments - 2.2% |
| |||||||
U.S. GOVERNMENT AGENCY MORTGAGE-BACKED SECURITIES - 2.2% |
| |||||||
Federal National Mortgage Association - 2.2% | ||||||||
Federal National Mortgage Association, 3.50%, 01/15/41 , TBA (g) | $ | 7,000 | $ | 6,685 | ||||
Federal National Mortgage Association, 4.00%, 01/15/41 , TBA (g) | 17,000 | 16,910 | ||||||
Total Forward Sales Commitments - 2.2% (proceeds $23,214) | $ | 23,595 | ||||||
JNL/Goldman Sachs Emerging Markets Debt Fund |
| |||||||
CORPORATE BONDS AND NOTES - 7.8% |
| |||||||
ENERGY - 1.1% | ||||||||
Gazprom Via Gaz Capital SA | ||||||||
5.09%, 11/29/15 (r) | $ | 1,510 | $ | 1,544 | ||||
9.25%, 04/23/19 | 4,950 | 6,082 | ||||||
Petroleos de Venezuela SA, 8.50%, 11/02/17 | 1,150 | 769 | ||||||
| 8,395 | ||||||||
FINANCIALS - 6.7% | ||||||||
Barclays Bank Plc-Credit Linked Note (Indonesia Government, 10.00%, 07/15/17, Moody rating Ba2) (f) (q), IDR | 82,000,000 | 10,662 | ||||||
Credit Suisse Nassau-Credit Linked Note (Nota Do Tesouro Nacional, 6.00%, 08/15/40, Moody rating N/A) (f) (q), BRL | 2,300 | 2,958 | ||||||
Deutsche Bank AG-Credit Linked Note (Indonesia Government,10.75%, 5/15/2016, Moody rating Ba2) (f) (q), IDR | 20,500,000 | 2,680 | ||||||
Hongkong & Shanghai Banking Corp.-Credit Linked Note (Indonesia Government, 10.00%, 07/15/17, Moody rating Ba2) (f) (q), IDR | 65,000,000 | 8,624 | ||||||
See accompanying Notes to the Financial Statements.
JNL Series Trust
Schedules of Investments (in thousands)
December 31, 2010
| Shares/Par (p) | Value | |||||||
Hongkong & Shanghai Banking Corp.-Credit Linked Note (Indonesia Government, 10.75%, 05/15/16, Moody rating Ba2) (f) (q), IDR | 91,000,000 | 11,751 | ||||||
JPMorgan Chase & Co., 6.00%, 10/10/12 (q), PHP | 40,000 | 966 | ||||||
JPMorgan Chase & Co.-Credit Linked Note (Indonesia Government, 10.00%, 07/15/17, Moody rating Ba2) (f) (q), IDR | 16,100,000 | 2,039 | ||||||
JPMorgan Chase & Co.-Credit Linked Note (Indonesia Government, 11.00%, 11/15/20, Moody rating Ba2) (f) (q), IDR | 20,000,000 | 2,780 | ||||||
Red Arrow International Leasing Plc, 8.38%, 06/30/12, RUB | 22,726 | 744 | ||||||
RSHB Capital SA, 7.50%, 03/25/13, RUB | 244,200 | 7,984 | ||||||
| 51,188 | ||||||||
Total Corporate Bonds and Notes (cost $54,606) |
|
59,583 |
| |||||
GOVERNMENT AND AGENCY OBLIGATIONS - 58.3% |
| |||||||
GOVERNMENT SECURITIES - 58.3% |
| |||||||
Sovereign - 56.6% | ||||||||
Brazil Notas do Tesouro Nacional, 10.00%, 01/01/12 - 01/01/17, BRL | 40,482 | 22,725 | ||||||
Brazil Notas do Tesouro Nacional, 10.00%, 01/01/21, BRL | 27,250 | 14,466 | ||||||
Chile Government International Bond, 5.50%, 08/05/20, CLP | 589,500 | 1,288 | ||||||
Colombia Government International Bond | ||||||||
7.75%, 04/14/21, COP | 16,275,000 | 10,066 | ||||||
9.85%, 06/28/27, COP | 17,063,000 | 12,553 | ||||||
Egypt Government International Bond, 8.75%, 07/18/12, EGP | 5,000 | 858 | ||||||
Hungary Government International Bond | ||||||||
5.50%, 02/12/14 - 02/12/16 , HUF | 3,912,000 | 17,112 | ||||||
8.00%, 02/12/15, HUF | 6,686,000 | 32,314 | ||||||
Indonesia Government Bond | ||||||||
11.00%, 11/15/20, IDR | 25,400,000 | 3,427 | ||||||
10.50%, 08/15/30, IDR | 138,800,000 | 17,029 | ||||||
Malaysia Government Bond | ||||||||
3.74%, 02/27/15, MYR | 53,875 | 17,737 | ||||||
4.38%, 11/29/19, MYR | 57,700 | 19,267 | ||||||
Mexican Bonos | ||||||||
9.00%, 12/20/12, MXN | 179,048 | 15,534 | ||||||
8.00%, 06/11/20, MXN | 62,510 | 5,421 | ||||||
10.00%, 12/05/24 - 11/20/36 , MXN | 182,763 | 18,408 | ||||||
8.50%, 11/18/38, MXN | 57,619 | 4,966 | ||||||
Mexico Cetes, 0.00%, 02/10/11 (j), MXN | 162,640 | 13,106 | ||||||
Nota Do Tesouro Nacional | ||||||||
10.00%, 01/01/14, BRL | 10,725 | 6,118 | ||||||
6.00%, 08/15/40, BRL | 14,300 | 18,383 | ||||||
Peru Government International Bond, 9.91%, 05/05/15, PEN | 7,234 | 3,126 | ||||||
Philippine Government Bond, 4.95%, 01/15/21, PHP | 94,000 | 2,262 | ||||||
Republic of Argentina | ||||||||
2.84%, 12/15/35 (i), EUR | 35,700 | 5,987 | ||||||
3.72%, 12/15/35, ARS | 179,420 | 6,574 | ||||||
Republic of South Africa Government Bond | ||||||||
13.50%, 09/15/15, ZAR | 22,500 | 4,238 | ||||||
8.00%, 12/21/18, ZAR | 17,540 | 2,651 | ||||||
6.75%, 03/31/21, ZAR | 233,220 | 31,945 | ||||||
10.50%, 12/21/26, ZAR | 224,460 | 40,620 | ||||||
Thailand Government Bond | ||||||||
3.63%, 05/22/15, THB | 1,101,700 | 37,142 | ||||||
4.13%, 11/18/16, THB | 380,000 | 13,085 | ||||||
| Shares/Par (p) | Value | |||||
Turkey Government Bond 0.00%,08/08/12 (j), TRY | 39,250 | 22,786 | ||||
11.00%, 08/06/14, TRY | 5,775 | 4,111 | ||||
Venezuela Government International Bond | ||||||
7.75%, 10/13/19 | 570 | 386 | ||||
8.25%, 10/13/24 | 9,720 | 6,318 | ||||
| 432,009 | ||||||
Treasury Inflation Index Securities - 1.7% | ||||||
Poland Government Treasury Inflation Indexed Bond, 3.00%, 08/24/16 (n), PLN | 37,620 | 12,906 | ||||
Total Government and Agency Obligations (cost $429,621) | 444,915 | |||||
SHORT TERM INVESTMENTS - 29.6% | ||||||
Investment Company 27.7% | ||||||
JNL Money Market Fund, 0.08% (a) (h) | 211,959 | 211,959 | ||||
Treasury Securities 1.9% | ||||||
Bank of Thailand Treasury Bill | ||||||
0.06%, 08/04/11, THB | 127,500 | 4,175 | ||||
0.07%, 10/06/11, THB | 107,000 | 3,496 | ||||
0.07%, 11/03/11, THB | 145,000 | 4,729 | ||||
0.06%, 04/21/11, THB | 60,000 | 1,979 | ||||
| 14,379 | ||||||
Total Short Term Investments (cost $226,198) | 226,338 | |||||
Total Investments - 95.7% (cost $710,425) | 730,836 | |||||
Other Assets and Liabilities, Net - 4.3% (o) | 32,498 | |||||
Total Net Assets - 100.0% | $ | 763,334 | ||||
JNL/Goldman Sachs Mid Cap Value Fund * (x) |
| |||||
COMMON STOCKS - 96.8% | ||||||
CONSUMER DISCRETIONARY - 11.8% | ||||||
CBS Corp. - Class B | 457 | $ | 8,698 | |||
DISH Network Corp. - Class A (c) | 368 | 7,230 | ||||
Lear Corp. (c) | 86 | 8,474 | ||||
Liberty Media Corp. - Interactive (c) | 396 | 6,250 | ||||
Newell Rubbermaid Inc. | 326 | 5,919 | ||||
TRW Automotive Holdings Corp. (c) | 98 | 5,180 | ||||
Other Securities | 17,819 | |||||
| 59,570 | ||||||
CONSUMER STAPLES - 4.9% | ||||||
ConAgra Foods Inc. | 211 | 4,769 | ||||
JM Smucker Co. | 120 | 7,867 | ||||
Other Securities | 12,297 | |||||
| 24,933 | ||||||
ENERGY - 11.0% | ||||||
Alpha Natural Resources Inc. (c) | 99 | 5,915 | ||||
Cameron International Corp. (c) | 121 | 6,126 | ||||
Forest Oil Corp. (c) | 219 | 8,317 | ||||
Newfield Exploration Co. (c) | 194 | 14,003 | ||||
QEP Resources Inc. | 180 | 6,552 | ||||
Range Resources Corp. | 100 | 4,511 | ||||
Weatherford International Ltd. (c) | 357 | 8,144 | ||||
Other Securities | 2,353 | |||||
| 55,921 | ||||||
See accompanying Notes to the Financial Statements.
JNL Series Trust
Schedules of Investments (in thousands)
December 31, 2010
| Shares/Par (p) | Value | |||||||
FINANCIALS - 28.2% | ||||||||
Boston Properties Inc. | 61 | 5,269 | ||||||
Equity Residential | 163 | 8,460 | ||||||
Everest Re Group Ltd. | 96 | 8,126 | ||||||
Fifth Third Bancorp | 532 | 7,806 | ||||||
Genworth Financial Inc. - Class A (c) | 409 | 5,377 | ||||||
Hartford Financial Services Group Inc. | 273 | 7,229 | ||||||
Host Hotels & Resorts Inc. | 292 | 5,223 | ||||||
Invesco Ltd. | 313 | 7,527 | ||||||
Marsh & McLennan Cos. Inc. | 196 | 5,366 | ||||||
MFA Financial Inc. | 554 | 4,523 | ||||||
Principal Financial Group Inc. | 331 | 10,778 | ||||||
SLM Corp. (c) | 513 | 6,463 | ||||||
SunTrust Banks Inc. | 258 | 7,625 | ||||||
Ventas Inc. | 102 | 5,364 | ||||||
WR Berkley Corp. | 208 | 5,705 | ||||||
XL Group Plc | 228 | 4,974 | ||||||
Other Securities | 36,658 | |||||||
| 142,473 | ||||||||
HEALTH CARE - 6.0% | ||||||||
Aetna Inc. | 220 | 6,708 | ||||||
Biogen Idec Inc. (c) | 108 | 7,272 | ||||||
Kinetic Concepts Inc. (c) | 114 | 4,793 | ||||||
Other Securities | 11,494 | |||||||
| 30,267 | ||||||||
INDUSTRIALS - 9.3% | ||||||||
Eaton Corp. | 52 | 5,243 | ||||||
Kansas City Southern (c) | 98 | 4,674 | ||||||
Parker Hannifin Corp. | 65 | 5,575 | ||||||
Pentair Inc. | 173 | 6,309 | ||||||
Other Securities | 25,434 | |||||||
| 47,235 | ||||||||
INFORMATION TECHNOLOGY - 6.6% |
| |||||||
Adobe Systems Inc. (c) | 164 | 5,040 | ||||||
BMC Software Inc. (c) | 105 | 4,939 | ||||||
ON Semiconductor Corp. (c) | 472 | 4,667 | ||||||
Other Securities | 18,552 | |||||||
| 33,198 | ||||||||
MATERIALS - 5.2% | ||||||||
Huntsman Corp. | 456 | 7,125 | ||||||
Other Securities | 19,330 | |||||||
| 26,455 | ||||||||
TELECOMMUNICATION SERVICES - 3.3% |
| |||||||
CenturyLink Inc. | 165 | 7,623 | ||||||
Sprint Nextel Corp. (c) | 1,696 | 7,175 | ||||||
Other Securities | 1,825 | |||||||
| 16,623 | ||||||||
UTILITIES - 10.5% | ||||||||
CMS Energy Corp. | 314 | 5,835 | ||||||
Northeast Utilities | 149 | 4,762 | ||||||
PPL Corp. | 207 | 5,440 | ||||||
SCANA Corp. (e) | 146 | 5,925 | ||||||
Sempra Energy | 96 | 5,030 | ||||||
Xcel Energy Inc. | 348 | 8,188 | ||||||
Other Securities | 18,201 | |||||||
| 53,381 | ||||||||
Total Common Stocks (cost $414,505) | 490,056 | |||||||
| Shares/Par (p) | Value | |||||||
SHORT TERM INVESTMENTS - 6.3% | ||||||||
Investment Company - 4.6% | ||||||||
JNL Money Market Fund, 0.08% (a) (h) | 23,029 | 23,029 | ||||||
Securities Lending Collateral 1.7% |
| |||||||
Securities Lending Cash Collateral Fund LLC, 0.31% (a) (h) | 8,112 | 8,112 | ||||||
Securities Lending Liquidating Fund LLC, 0.66% (a) (h) | 672 | 661 | ||||||
| 8,773 | ||||||||
Total Short Term Investments (cost $31,813) | 31,802 | |||||||
Total Investments - 103.1% (cost $446,318) | 521,858 | |||||||
Other Assets and Liabilities, Net - (3.1%) |
| (15,767) | ||||||
Total Net Assets - 100.0% | $ | 506,091 | ||||||
JNL/Goldman Sachs U.S. Equity Flex Fund * (x) |
| |||||||
COMMON STOCKS - 126.2% |
| |||||||
CONSUMER DISCRETIONARY - 18.9% |
| |||||||
CBS Corp. - Class B (o) | 105 | $ | 2,008 | |||||
Comcast Corp. - Class A (o) | 117 | 2,561 | ||||||
DISH Network Corp. - Class A (c) (o) | 123 | 2,413 | ||||||
Ford Motor Co. (c) (o) | 106 | 1,778 | ||||||
General Motors Co. (c) (o) | 41 | 1,525 | ||||||
Guess? Inc. | 25 | 1,174 | ||||||
Johnson Controls Inc. | 29 | 1,105 | ||||||
Lear Corp. (c) | 25 | 2,501 | ||||||
Liberty Media Corp. - Interactive (c) (o) | 70 | 1,108 | ||||||
Newell Rubbermaid Inc. (o) | 77 | 1,396 | ||||||
Target Corp. | 24 | 1,455 | ||||||
Other Securities | 2,793 | |||||||
| 21,817 | ||||||||
CONSUMER STAPLES - 9.5% |
| |||||||
General Mills Inc. (o) | 72 | 2,558 | ||||||
PepsiCo Inc. (o) | 23 | 1,534 | ||||||
Procter & Gamble Co. (o) | 20 | 1,305 | ||||||
Unilever NV - NYS (o) | 44 | 1,375 | ||||||
Wal-Mart Stores Inc. (o) | 33 | 1,800 | ||||||
Other Securities | 2,442 | |||||||
| 11,014 | ||||||||
ENERGY - 15.0% | ||||||||
Forest Oil Corp. (c) (o) | 51 | 1,933 | ||||||
Halliburton Co. (o) | 33 | 1,366 | ||||||
Newfield Exploration | 56 | 4,022 | ||||||
Occidental Petroleum Corp. (o) | 39 | 3,803 | ||||||
Range Resources Corp. (o) | 43 | 1,916 | ||||||
Schlumberger Ltd. | 22 | 1,867 | ||||||
Weatherford International | 81 | 1,838 | ||||||
Other Securities | 538 | |||||||
| 17,283 | ||||||||
FINANCIALS - 23.2% | ||||||||
AFLAC Inc. (o) | 36 | 2,003 | ||||||
Bank of America Corp. (o) | 194 | 2,595 | ||||||
Bank of New York Mellon Corp. (o) | 53 | 1,614 | ||||||
Franklin Resources Inc. | 13 | 1,401 | ||||||
Invesco Ltd. (o) | 62 | 1,492 | ||||||
JPMorgan Chase & Co. (o) | 102 | 4,322 | ||||||
See accompanying Notes to the Financial Statements.
JNL Series Trust
Schedules of Investments (in thousands)
December 31, 2010
| Shares/Par (p) | Value | |||||||
Prudential Financial Inc. (o) | 37 | 2,195 | ||||||
State Street Corp. | 27 | 1,266 | ||||||
SunTrust Banks Inc. | 44 | 1,291 | ||||||
Travelers Cos. Inc. (o) | 39 | 2,156 | ||||||
U.S. Bancorp (o) | 97 | 2,624 | ||||||
Other Securities | 3,793 | |||||||
| 26,752 | ||||||||
HEALTH CARE - 13.6% | ||||||||
Baxter International Inc. (o) | 59 | 2,981 | ||||||
Biogen Idec Inc. (c) (o) | 38 | 2,521 | ||||||
Johnson & Johnson (o) | 42 | 2,602 | ||||||
Merck & Co. Inc. (o) | 88 | 3,170 | ||||||
Teva Pharmaceutical Industries Ltd. - ADR (o) | 43 | 2,233 | ||||||
WellPoint Inc. (c) | 23 | 1,312 | ||||||
Other Securities | 871 | |||||||
| 15,690 | ||||||||
INDUSTRIALS - 11.7% | ||||||||
Boeing Co. (o) | 40 | 2,588 | ||||||
Emerson Electric Co. (o) | 40 | 2,264 | ||||||
General Electric Co. (o) | 198 | 3,627 | ||||||
Honeywell International Inc. (o) | 77 | 4,072 | ||||||
Other Securities | 975 | |||||||
| 13,526 | ||||||||
INFORMATION TECHNOLOGY - 24.1% |
| |||||||
Adobe Systems Inc. (c) (o) | 69 | 2,123 | ||||||
Apple Inc. (c) (o) | 14 | 4,655 | ||||||
BMC Software Inc. (c) (o) | 26 | 1,242 | ||||||
Cisco Systems Inc. (c) (o) | 68 | 1,383 | ||||||
EMC Corp. (c) (o) | 139 | 3,192 | ||||||
Google Inc. - Class A (c) | 6 | 3,475 | ||||||
Microsoft Corp. (o) | 123 | 3,445 | ||||||
Oracle Corp. (o) | 100 | 3,116 | ||||||
Parametric Technology Corp. (c) (o) | 53 | 1,183 | ||||||
QUALCOMM Inc. (o) | 34 | 1,705 | ||||||
Texas Instruments Inc. (o) | 43 | 1,401 | ||||||
Other Securities | 917 | |||||||
| 27,837 | ||||||||
MATERIALS - 4.4% | ||||||||
Dow Chemical Co. (o) | 40 | 1,353 | ||||||
Freeport-McMoRan Copper & Gold Inc. | 12 | 1,418 | ||||||
Huntsman Corp. (o) | 144 | 2,254 | ||||||
| 5,025 | ||||||||
TELECOMMUNICATION SERVICES - 2.6% |
| |||||||
Sprint Nextel Corp. (c) (o) | 588 | 2,489 | ||||||
Other Securities | 555 | |||||||
| 3,044 | ||||||||
UTILITIES - 3.2% | ||||||||
Entergy Corp. | 18 | 1,264 | ||||||
PG&E Corp. | 29 | 1,370 | ||||||
Other Securities | 1,092 | |||||||
| 3,726 | ||||||||
Total Common Stocks (cost $133,023) | 145,714 | |||||||
SHORT TERM INVESTMENTS - 4.3% |
| |||||||
Investment Company - 4.3% |
| |||||||
JNL Money Market Fund, | 4,931 | 4,931 | ||||||
Total Short Term Investments | 4,931 | |||||||
| Shares/Par (p) | Value | |||||||
Total Investments - 130.5% | 150,645 | |||||||
Total Securities Sold Short - (30.5)% (proceeds $32,863) | (35,216) | |||||||
Other Assets and Liabilities, | (25) | |||||||
Total Net Assets - 100.0% | $ | 115,404 | ||||||
Securities Sold Short - 30.5% | ||||||||
COMMON STOCKS - 30.5% |
| |||||||
CONSUMER DISCRETIONARY - 6.2% |
| |||||||
AutoNation Inc. | 21 | $ | 601 | |||||
Buckle Inc. | 12 | 467 | ||||||
Gentex Corp. | 19 | 558 | ||||||
Genuine Parts Co. | 6 | 295 | ||||||
Gildan Activewear Inc. | 11 | 319 | ||||||
Harman International Industries Inc. | 8 | 373 | ||||||
Hibbett Sports Inc. | 10 | 383 | ||||||
KB Home | 23 | 314 | ||||||
NetFlix Inc. | 4 | 643 | ||||||
New York Times Co. - Class A | 150 | 1,467 | ||||||
Penske Auto Group Inc. | 28 | 495 | ||||||
Pool Corp. | 13 | 283 | ||||||
Starwood Hotels & Resorts Worldwide Inc. | 10 | 609 | ||||||
Toll Brothers Inc. | 20 | 382 | ||||||
| 7,189 | ||||||||
CONSUMER STAPLES - 0.9% |
| |||||||
Campbell Soup Co. | 16 | 544 | ||||||
Kimberly-Clark Corp. | 9 | 553 | ||||||
| 1,097 | ||||||||
ENERGY - 3.6% | ||||||||
Marathon Oil Corp. | 52 | 1,938 | ||||||
Noble Corp. | 32 | 1,142 | ||||||
Transocean Ltd. | 16 | 1,132 | ||||||
| 4,212 | ||||||||
FINANCIALS - 3.2% | ||||||||
ACE Ltd. | 6 | 391 | ||||||
eHealth Inc. | 37 | 528 | ||||||
Jefferies Group Inc. | 23 | 619 | ||||||
MetLife Inc. | 8 | 349 | ||||||
T. Rowe Price Group Inc. | 10 | 670 | ||||||
TCF Financial Corp. | 73 | 1,088 | ||||||
Other Securities | 44 | |||||||
| 3,689 | ||||||||
HEALTH CARE - 5.4% | ||||||||
Align Technology Inc. | 37 | 714 | ||||||
AMERIGROUP Corp. | 13 | 577 | ||||||
Bristol-Myers Squibb Co. | 31 | 829 | ||||||
Centene Corp. | 23 | 586 | ||||||
Intuitive Surgical Inc. | 2 | 611 | ||||||
NuVasive Inc. | 18 | 455 | ||||||
Perrigo Co. | 14 | 880 | ||||||
Pfizer Inc. | 49 | 854 | ||||||
Stryker Corp. | 13 | 692 | ||||||
| 6,198 | ||||||||
INDUSTRIALS - 2.1% | ||||||||
General Dynamics Corp. | 5 | 346 | ||||||
Joy Global Inc. | 9 | 753 | ||||||
Northrop Grumman Corp. | 9 | 568 | ||||||
Precision Castparts Corp. | 5 | 710 | ||||||
| 2,377 | ||||||||
See accompanying Notes to the Financial Statements.
JNL Series Trust
Schedules of Investments (in thousands)
December 31, 2010
| Shares/Par (p) | Value | |||||||
INFORMATION TECHNOLOGY - 4.2% |
| |||||||
Novellus Systems Inc. | 40 | 1,299 | ||||||
Red Hat Inc. | 28 | 1,300 | ||||||
SAIC Inc. | 43 | 685 | ||||||
SAP AG - ADR | 17 | 858 | ||||||
Tech Data Corp. | 16 | 709 | ||||||
| 4,851 | ||||||||
MATERIALS - 1.0% | ||||||||
EI Du Pont de Nemours & Co. | 23 | 1,158 | ||||||
TELECOMMUNICATION SERVICES - 2.8% |
| |||||||
Telefonos de Mexico SAB de CV - ADR | 58 | 933 | ||||||
US Cellular Corp. | 20 | 1,006 | ||||||
Verizon Communications Inc. | 16 | 589 | ||||||
Windstream Corp. | 49 | 680 | ||||||
| 3,208 | ||||||||
UTILITIES - 1.1% | ||||||||
Exelon Corp. | 18 | 737 | ||||||
Piedmont Natural Gas Co. Inc. | 18 | 500 | ||||||
| 1,237 | ||||||||
Total Securities Sold Short - 30.5% (proceeds $32,863) |
| $ | 35,216 | |||||
JNL/Invesco Global Real Estate Fund * (x) |
| |||||||
COMMON STOCKS - 98.3% |
| |||||||
CONSUMER DISCRETIONARY - 0.7% |
| |||||||
Other Securities | $ | 5,021 | ||||||
FINANCIALS - 97.6% | ||||||||
Real Estate Investment Trusts - 66.9% |
| |||||||
Diversified - REITS - 21.1% |
| |||||||
British Land Co. Plc | 787 | 6,437 | ||||||
Corio NV | 111 | 7,151 | ||||||
Digital Realty Trust Inc. (e) | 179 | 9,216 | ||||||
Goodman Group | 14,771 | 9,820 | ||||||
Hammerson Plc | 734 | 4,774 | ||||||
Land Securities Group Plc | 795 | 8,358 | ||||||
Liberty Property Trust | 212 | 6,766 | ||||||
Stockland | 3,437 | 12,654 | ||||||
Unibail-Rodamco SE (c) | 66 | 13,048 | ||||||
Vornado Realty Trust | 153 | 12,745 | ||||||
Other Securities | 48,758 | |||||||
| 139,727 | ||||||||
Industrial - REITS - 2.3% |
| |||||||
ProLogis | 870 | 12,562 | ||||||
Other Securities | 2,801 | |||||||
| 15,363 | ||||||||
Office - REITS - 9.5% |
| |||||||
Alexandria Real Estate Equities Inc. | 80 | 5,895 | ||||||
Boston Properties Inc. | 86 | 7,366 | ||||||
Highwoods Properties Inc. | 169 | 5,376 | ||||||
Japan Real Estate Investment Corp. | 1 | 7,003 | ||||||
Nippon Building Fund | — | 5,011 | ||||||
SL Green Realty Corp. | 96 | 6,507 | ||||||
Other Securities | 25,446 | |||||||
| 62,604 | ||||||||
Residential - REITS - 7.0% |
| |||||||
AvalonBay Communities Inc. | 46 | 5,205 | ||||||
Camden Property Trust | 188 | 10,169 | ||||||
Equity Residential | 146 | 7,597 | ||||||
| Shares/Par (p) | Value | |||||||
Essex Property Trust Inc. (e) | 80 | 9,178 | ||||||
UDR Inc. | 207 | 4,857 | ||||||
Other Securities | 9,477 | |||||||
| 46,483 | ||||||||
Retail - REITS - 18.4% |
| |||||||
CFS Retail Property Trust | 4,470 | 8,047 | ||||||
Kimco Realty Corp. | 714 | 12,877 | ||||||
Link REIT | 2,127 | 6,607 | ||||||
Macerich Co. | 199 | 9,407 | ||||||
Primaris Retail Real Estate Investment Trust | 241 | 4,744 | ||||||
Regency Centers Corp. | 221 | 9,339 | ||||||
RioCan Real Estate Investment Trust | 232 | 5,138 | ||||||
Simon Property Group Inc. | 285 | 28,306 | ||||||
Westfield Group | 1,469 | 14,392 | ||||||
Other Securities | 22,782 | |||||||
| 121,639 | ||||||||
Specialized - REITS - 8.6% |
| |||||||
Health Care REIT Inc. | 244 | 11,645 | ||||||
Host Hotels & Resorts Inc. | 834 | 14,907 | ||||||
Nationwide Health Properties Inc. | 169 | 6,147 | ||||||
Senior Housing Properties Trust | 290 | 6,364 | ||||||
Other Securities | 17,916 | |||||||
| 56,979 | ||||||||
Real Estate Management & Development - 30.7% |
| |||||||
Real Estate Operating Companies - 25.2% |
| |||||||
Agile Property Holdings Ltd. | 3,654 | 5,378 | ||||||
Brookfield Properties Corp. | 309 | 5,457 | ||||||
CapitaLand Ltd. | 3,190 | 9,222 | ||||||
China Overseas Land & Investment Ltd. (e) | 4,381 | 8,105 | ||||||
Hang Lung Properties Ltd. | 1,839 | 8,600 | ||||||
Hongkong Land Holdings Ltd. (e) | 1,844 | 13,314 | ||||||
Hysan Development Co. Ltd. | 1,092 | 5,142 | ||||||
Keppel Land Ltd. (e) | 1,579 | 5,906 | ||||||
Kerry Properties Ltd. | 990 | 5,158 | ||||||
Mitsui Fudosan Co. Ltd. | 956 | 18,999 | ||||||
Sino Land Co. | 3,840 | 7,183 | ||||||
Sumitomo Realty & Development Co. Ltd. | 396 | 9,421 | ||||||
Sun Hung Kai Properties Ltd. | 1,888 | 31,358 | ||||||
Wharf Holdings Ltd. | 1,428 | 10,986 | ||||||
Other Securities | 22,402 | |||||||
| 166,631 | ||||||||
Real Estate Services - 5.5% |
| |||||||
Mitsubishi Estate Co. Ltd. | 1,062 | 19,627 | ||||||
Other Securities | 16,777 | |||||||
| 36,404 | ||||||||
Total Common Stocks (cost $577,810) | 650,851 | |||||||
SHORT TERM INVESTMENTS - 6.0% |
| |||||||
Investment Company - 1.3% |
| |||||||
JNL Money Market Fund, 0.08% (a) (h) | 8,743 | 8,743 | ||||||
Securities Lending Collateral - 4.7% | ||||||||
Securities Lending Cash Collateral Fund LLC, 0.31% (a) (h) | 29,376 | 29,376 | ||||||
Securities Lending Liquidating Fund LLC, 0.66% (a) (h) | 1,525 | 1,500 | ||||||
| 30,876 | ||||||||
Total Short Term Investments (cost $39,644) | 39,619 | |||||||
Total Investments - 104.3% | 690,470 | |||||||
Other Assets and Liabilities, Net - (4.3%) | (28,682 | ) | ||||||
Total Net Assets - 100.0% | $ | 661,788 | ||||||
See accompanying Notes to the Financial Statements.
JNL Series Trust
Schedules of Investments (in thousands)
December 31, 2010
| Shares/Par (p) | Value | |||||||
JNL/Invesco International Growth Fund * (x) |
| |||||||
COMMON STOCKS - 93.4% |
| |||||||
CONSUMER DISCRETIONARY - 17.6% |
| |||||||
Adidas AG | 112 | $ | 7,378 | |||||
Bayerische Motoren Werke AG | 110 | 8,635 | ||||||
Compass Group Plc | 1,163 | 10,538 | ||||||
Grupo Televisa SA - ADR (c) | 234 | 6,066 | ||||||
Hyundai Mobis (c) | 38 | 9,398 | ||||||
Puma AG Rudolf Dassler Sport | 17 | 5,554 | ||||||
Reed Elsevier Plc | 676 | 5,710 | ||||||
Yamada Denki Co. Ltd. | 93 | 6,298 | ||||||
Other Securities | 44,135 | |||||||
| 103,712 | ||||||||
CONSUMER STAPLES - 13.0% |
| |||||||
Anheuser-Busch InBev NV | 164 | 9,395 | ||||||
British American Tobacco Plc | 190 | 7,312 | ||||||
Imperial Tobacco Group Plc | 344 | 10,562 | ||||||
Koninklijke Ahold NV | 432 | 5,708 | ||||||
Nestle SA | 206 | 12,046 | ||||||
Reckitt Benckiser Group Plc | 99 | 5,445 | ||||||
Tesco Plc | 1,176 | 7,795 | ||||||
Other Securities | 18,442 | |||||||
| 76,705 | ||||||||
ENERGY - 10.3% | ||||||||
BG Group Plc | 368 | 7,438 | ||||||
Canadian Natural Resources Ltd. | 122 | 5,446 | ||||||
Gazprom OAO - ADR | 246 | 6,222 | ||||||
Royal Dutch Shell Plc - B Shares | 180 | 5,923 | ||||||
Suncor Energy Inc. | 142 | 5,484 | ||||||
WorleyParsons Ltd. (e) | 292 | 7,983 | ||||||
Other Securities | 22,317 | |||||||
| 60,813 | ||||||||
FINANCIALS - 9.4% | ||||||||
Banco Bradesco SA - ADR (e) | 431 | 8,744 | ||||||
BNP Paribas | 98 | 6,222 | ||||||
Industrial & Commercial Bank of China | 11,144 | 8,301 | ||||||
Julius Baer Group Ltd. | 117 | 5,462 | ||||||
United Overseas Bank Ltd. | 474 | 6,722 | ||||||
Other Securities | 19,651 | |||||||
| 55,102 | ||||||||
HEALTH CARE - 13.5% | ||||||||
Bayer AG | 78 | 5,768 | ||||||
Cochlear Ltd. (e) | 92 | 7,532 | ||||||
CSL Ltd. | 156 | 5,782 | ||||||
Novartis AG | 144 | 8,474 | ||||||
Novo-Nordisk A/S | 92 | 10,311 | ||||||
Roche Holding AG | 80 | 11,779 | ||||||
Shire Plc | 442 | 10,642 | ||||||
Teva Pharmaceutical Industries Ltd. - ADR | 226 | 11,785 | ||||||
Other Securities | 7,617 | |||||||
| 79,690 | ||||||||
INDUSTRIALS - 10.0% | ||||||||
Fanuc Ltd. | 69 | 10,501 | ||||||
Hutchison Whampoa Ltd. | 620 | 6,381 | ||||||
Keppel Corp. Ltd. | 1,100 | 9,703 | ||||||
Nidec Corp. | 127 | 12,755 | ||||||
TNT NV | 209 | 5,522 | ||||||
Other Securities | 14,062 | |||||||
| 58,924 | ||||||||
| Shares/Par (p) | Value | |||||||
INFORMATION TECHNOLOGY - 7.9% |
| |||||||
Canon Inc. (e) | 108 | 5,522 | ||||||
Infosys Technologies Ltd. - ADR | 115 | 8,717 | ||||||
Keyence Corp. | 21 | 5,938 | ||||||
Taiwan Semiconductor Manufacturing Co. Ltd. | 3,319 | 8,083 | ||||||
Other Securities | 18,207 | |||||||
| 46,467 | ||||||||
MATERIALS - 3.0% | ||||||||
BHP Billiton Ltd. (e) | 251 | 11,624 | ||||||
Syngenta AG | 21 | 6,086 | ||||||
| 17,710 | ||||||||
TELECOMMUNICATION SERVICES - 5.7% |
| |||||||
America Movil SAB de CV - ADR | 193 | 11,038 | ||||||
Philippine Long Distance Telephone Co. | 108 | 6,277 | ||||||
Vodafone Group Plc | 3,062 | 7,916 | ||||||
Other Securities | 8,036 | |||||||
| 33,267 | ||||||||
UTILITIES - 3.0% | ||||||||
Centrica Plc | 1,512 | 7,817 | ||||||
International Power Plc | 1,418 | 9,672 | ||||||
| 17,489 | ||||||||
Total Common Stocks | 549,879 | |||||||
SHORT TERM INVESTMENTS - 10.9% |
| |||||||
Investment Company - 6.4% |
| |||||||
JNL Money Market Fund, 0.08% (a) (h) | 37,733 | 37,733 | ||||||
Securities Lending Collateral 4.5% |
| |||||||
Securities Lending Cash Collateral Fund LLC, 0.31% (a) (h) | 24,856 | 24,856 | ||||||
Securities Lending Liquidating Fund LLC, 0.66% (a) (h) | 1,479 | 1,455 | ||||||
| 26,311 | ||||||||
Total Short Term Investments |
| 64,044 | ||||||
Total Investments - 104.3% (cost $535,873) |
| 613,923 | ||||||
Other Assets and Liabilities, Net - (4.3%) |
| (25,430) | ||||||
Total Net Assets - 100.0% | $ | 588,493 | ||||||
JNL/Invesco Large Cap Growth Fund * (x) |
| |||||||
COMMON STOCKS - 97.5% | ||||||||
CONSUMER DISCRETIONARY - 13.5% |
| |||||||
Amazon.com Inc. (c) | 64 | $ | 11,511 | |||||
Comcast Corp. - Class A | 779 | 17,107 | ||||||
DirecTV - Class A (c) | 231 | 9,227 | ||||||
Ford Motor Co. (c) | 487 | 8,174 | ||||||
Las Vegas Sands Corp. (c) | 183 | 8,423 | ||||||
Limited Brands Inc. | 447 | 13,747 | ||||||
Ross Stores Inc. | 124 | 7,821 | ||||||
Starwood Hotels & Resorts Worldwide Inc. | 147 | 8,948 | ||||||
Other Securities | 38,435 | |||||||
| 123,393 | ||||||||
CONSUMER STAPLES - 2.7% |
| |||||||
Mead Johnson Nutrition Co. | 261 | 16,226 | ||||||
Other Securities | 7,908 | |||||||
| 24,134 | ||||||||
See accompanying Notes to the Financial Statements.
JNL Series Trust
Schedules of Investments (in thousands)
December 31, 2010
| Shares/Par (p) | Value | |||||||
ENERGY - 12.5% | ||||||||
Cameron International Corp. (c) | 203 | 10,275 | ||||||
EOG Resources Inc. | 146 | 13,301 | ||||||
Halliburton Co. | 446 | 18,213 | ||||||
National Oilwell Varco Inc. | 158 | 10,650 | ||||||
Peabody Energy Corp. | 256 | 16,405 | ||||||
Schlumberger Ltd. | 223 | 18,611 | ||||||
Transocean Ltd. (c) | 191 | 13,242 | ||||||
Weatherford International Ltd. (c) | 586 | 13,366 | ||||||
| 114,063 | ||||||||
FINANCIALS - 4.8% | ||||||||
Ameriprise Financial Inc. | 227 | 13,089 | ||||||
Franklin Resources Inc. | 95 | 10,515 | ||||||
JPMorgan Chase & Co. | 223 | 9,477 | ||||||
Other Securities | 10,487 | |||||||
| 43,568 | ||||||||
HEALTH CARE - 9.4% | ||||||||
Baxter International Inc. | 175 | 8,881 | ||||||
Covidien Plc | 198 | 9,059 | ||||||
Gilead Sciences Inc. (c) | 449 | 16,279 | ||||||
Hospira Inc. (c) | 241 | 13,408 | ||||||
Other Securities | 37,662 | |||||||
| 85,289 | ||||||||
INDUSTRIALS - 11.4% | ||||||||
CH Robinson Worldwide Inc. | 135 | 10,842 | ||||||
Deere & Co. | 135 | 11,238 | ||||||
Goodrich Corp. | 213 | 18,745 | ||||||
Honeywell International Inc. | 174 | 9,265 | ||||||
Ingersoll-Rand Plc | 318 | 14,952 | ||||||
Union Pacific Corp. | 172 | 15,924 | ||||||
WW Grainger Inc. | 64 | 8,857 | ||||||
Other Securities | 13,806 | |||||||
| 103,629 | ||||||||
INFORMATION TECHNOLOGY - 32.3% |
| |||||||
Apple Inc. (c) | 213 | 68,569 | ||||||
Baidu.com - ADR (c) | 202 | 19,534 | ||||||
Broadcom Corp. - Class A | 201 | 8,772 | ||||||
Cisco Systems Inc. (c) | 539 | 10,896 | ||||||
Citrix Systems Inc. (c) | 148 | 10,138 | ||||||
Cognizant Technology Solutions Corp. – Class A (c) | 152 | 11,121 | ||||||
EMC Corp. (c) | 917 | 21,002 | ||||||
Google Inc. - Class A (c) | 39 | 23,166 | ||||||
Oracle Corp. | 701 | 21,931 | ||||||
QUALCOMM Inc. | 233 | 11,535 | ||||||
Rovi Corp. (c) | 292 | 18,109 | ||||||
Salesforce.com Inc. (c) | 69 | 9,062 | ||||||
Visa Inc. - Class A | 401 | 28,188 | ||||||
Xilinx Inc. | 310 | 8,977 | ||||||
Other Securities | 23,685 | |||||||
| 294,685 | ||||||||
MATERIALS - 8.7% | ||||||||
Barrick Gold Corp. | 291 | 15,476 | ||||||
Monsanto Co. | 472 | 32,850 | ||||||
Potash Corp. of Saskatchewan Inc. (c) | 156 | 24,223 | ||||||
Other Securities | 7,036 | |||||||
| 79,585 | ||||||||
TELECOMMUNICATION SERVICES - 2.2% |
| |||||||
America Movil SAB de CV - ADR | 151 | 8,655 | ||||||
| Shares/Par (p) | Value | |||||||
American Tower Corp. - Class A (c) | 228 | 11,773 | ||||||
| 20,428 | ||||||||
Total Common Stocks | 888,774 | |||||||
SHORT TERM INVESTMENTS - 2.7% |
| |||||||
Investment Company - 2.0% | ||||||||
JNL Money Market Fund, 0.08% (a) (h) | 18,815 | 18,815 | ||||||
Securities Lending Collateral 0.7% | ||||||||
Securities Lending Cash Collateral Fund LLC, 0.31% (a) (h) | 5,726 | 5,726 | ||||||
Securities Lending Liquidating Fund LLC, 0.66% (a) (h) | 526 | 518 | ||||||
| 6,244 | ||||||||
Total Short Term Investments | 25,059 | |||||||
Total Investments - 100.2% | 913,833 | |||||||
Other Assets and Liabilities, | (2,120) | |||||||
Total Net Assets - 100.0% | $ | 911,713 | ||||||
JNL/Invesco Small Cap Growth Fund * (x) |
| |||||||
COMMON STOCKS - 97.0% | ||||||||
CONSUMER DISCRETIONARY - 17.4% |
| |||||||
Dick’s Sporting Goods Inc. (c) | 33 | $ | 1,247 | |||||
DSW Inc. - Class A (c) | 30 | 1,162 | ||||||
Foot Locker Inc. | 62 | 1,215 | ||||||
Group 1 Automotive Inc. (e) | 32 | 1,350 | ||||||
Penn National Gaming Inc. (c) | 40 | 1,402 | ||||||
PF Chang’s China Bistro Inc. (e) | 31 | 1,526 | ||||||
Tenneco Inc. (c) | 30 | 1,240 | ||||||
Tractor Supply Co. | 30 | 1,456 | ||||||
TRW Automotive Holdings Corp. (c) | 42 | 2,212 | ||||||
Williams-Sonoma Inc. | 43 | 1,534 | ||||||
Other Securities | 11,829 | |||||||
| 26,173 | ||||||||
CONSUMER STAPLES - 1.9% | ||||||||
Other Securities | 2,869 | |||||||
ENERGY - 8.2% | ||||||||
Carrizo Oil & Gas Inc. (c) | 37 | 1,289 | ||||||
Dresser-Rand Group Inc. (c) | 28 | 1,176 | ||||||
Dril-Quip Inc. (c) | 17 | 1,297 | ||||||
FMC Technologies Inc. (c) | 16 | 1,434 | ||||||
Frontier Oil Corp. (c) | 66 | 1,190 | ||||||
James River Coal Co. (c) | 46 | 1,155 | ||||||
Patterson-UTI Energy Inc. | 56 | 1,205 | ||||||
SandRidge Energy Inc. (c) (e) | 175 | 1,283 | ||||||
Other Securities | 2,340 | |||||||
| 12,369 | ||||||||
FINANCIALS - 5.9% | ||||||||
Affiliated Managers Group Inc. (c) | 15 | 1,473 | ||||||
ProAssurance Corp. (c) | 19 | 1,173 | ||||||
SVB Financial Group (c) | 26 | 1,379 | ||||||
Other Securities | 4,921 | |||||||
| 8,946 | ||||||||
HEALTH CARE - 14.3% | ||||||||
Allscripts Healthcare Solutions Inc. (c) | 64 | 1,238 | ||||||
BioMarin Pharmaceutical Inc. (c) | 48 | 1,281 | ||||||
Chemed Corp. | 22 | 1,414 | ||||||
See accompanying Notes to the Financial Statements.
JNL Series Trust
Schedules of Investments (in thousands)
December 31, 2010
| Shares/Par (p) | Value | |||||
Other Securities | 17,509 | |||||
| 21,442 | ||||||
INDUSTRIALS - 14.3% | ||||||
Corrections Corp. of America (c) | 48 | 1,215 | ||||
CoStar Group Inc. (c) (e) | 26 | 1,524 | ||||
HUB Group Inc. - Class A (c) | 39 | 1,386 | ||||
Knight Transportation Inc. (e) | 69 | 1,317 | ||||
Regal - Beloit Corp. | 24 | 1,604 | ||||
TransDigm Group Inc. (c) | 33 | 2,349 | ||||
Wabtec Corp. | 26 | 1,393 | ||||
WESCO International Inc. (c) | 23 | 1,188 | ||||
Other Securities | 9,469 | |||||
| 21,445 | ||||||
INFORMATION TECHNOLOGY - 28.8% |
| |||||
Ciena Corp. (c) (e) | 80 | 1,694 | ||||
F5 Networks Inc. (c) | 10 | 1,244 | ||||
Finisar Corp. (c) | 53 | 1,584 | ||||
Hittite Microwave Corp. (c) (e) | 23 | 1,376 | ||||
Informatica Corp. (c) (e) | 50 | 2,182 | ||||
Lawson Software Inc. (c) | 149 | 1,380 | ||||
Micros Systems Inc. (c) | 30 | 1,298 | ||||
Microsemi Corp. (c) | 65 | 1,488 | ||||
NetGear Inc. (c) | 35 | 1,175 | ||||
Nice Systems Ltd. - ADR (c) | 36 | 1,246 | ||||
Polycom Inc. (c) | 51 | 1,971 | ||||
Quest Software Inc. (c) | 55 | 1,516 | ||||
SuccessFactors Inc. (c) | 51 | 1,479 | ||||
Teradyne Inc. (c) | 86 | 1,202 | ||||
Other Securities | 22,547 | |||||
| 43,382 | ||||||
MATERIALS - 4.4% | ||||||
Grief Inc. - Class A | 23 | 1,439 | ||||
Intrepid Potash Inc. (c) (e) | 33 | 1,229 | ||||
Rockwood Holdings Inc. (c) | 30 | 1,183 | ||||
Other Securities | 2,698 | |||||
| 6,549 | ||||||
TELECOMMUNICATION SERVICES - 1.1% | ||||||
SBA Communications Corp. (c) | 39 | 1,591 | ||||
UTILITIES - 0.7% | ||||||
Other Securities | 1,101 | |||||
Total Common Stocks (cost $116,684) | 145,867 | |||||
SHORT TERM INVESTMENTS - 12.0% |
| |||||
Investment Company - 3.0% | ||||||
JNL Money Market Fund, 0.08% (a) (h) | 4,579 | 4,579 | ||||
Securities Lending Collateral 9.0% | ||||||
Securities Lending Cash Collateral Fund LLC, 0.31% (a) (h) | 13,000 | 13,000 | ||||
Securities Lending Liquidating Fund LLC, 0.66% (a) (h) | 463 | 456 | ||||
| 13,456 | ||||||
Total Short Term Investments (cost $18,042) | 18,035 | |||||
Total Investments - 109.0% (cost $134,726) | 163,902 | |||||
Other Assets and Liabilities, Net - (9.0%) | (13,489) | |||||
Total Net Assets - 100.0% | $ 150,413 | |||||
| Shares/Par (p) | Value | |||||
JNL/Ivy Asset Strategy Fund * (x) |
| |||||
COMMON STOCKS - 71.1% |
| |||||
CONSUMER DISCRETIONARY - 22.2% |
| |||||
Bayerische Motoren Werke AG | 113 | $8,850 | ||||
CBS Corp. - Class B | 411 | 7,828 | ||||
Compagnie Financiere Richemont SA | 247 | 14,531 | ||||
Hyundai Motor Co. (c) | 165 | 25,146 | ||||
Las Vegas Sands Corp. (c) | 151 | 6,952 | ||||
Li & Fung Ltd. | 1,758 | 10,200 | ||||
LVMH Moet Hennessy Louis Vuitton SA | 82 | 13,423 | ||||
Nike Inc. - Class B | 104 | 8,918 | ||||
Sands China Ltd. (c) (r) | 14,327 | 31,482 | ||||
Starwood Hotels & Resorts Worldwide Inc. | 355 | 21,577 | ||||
Wynn Macau Ltd. (c) | 8,389 | 18,780 | ||||
Wynn Resorts Ltd. | 463 | 48,084 | ||||
Other Securities | 1,402 | |||||
| 217,173 | ||||||
CONSUMER STAPLES - 2.7% | ||||||
Hengan International Group Co. Ltd. | 666 | 5,745 | ||||
Mead Johnson Nutrition Co. | 145 | 9,001 | ||||
Philip Morris International Inc. | 198 | 11,560 | ||||
| 26,306 | ||||||
ENERGY - 8.0% | ||||||
ConocoPhillips | 311 | 21,159 | ||||
Halliburton Co. | 504 | 20,576 | ||||
Schlumberger Ltd. | 235 | 19,635 | ||||
SeaDrill Ltd. | 356 | 12,139 | ||||
Other Securities | 4,211 | |||||
| 77,720 | ||||||
FINANCIALS - 13.1% | ||||||
AIA Group Ltd. (c) (r) | 4,234 | 11,903 | ||||
Banco Santander Brasil SA - ADR | 770 | 10,473 | ||||
Banco Santander SA | 885 | 9,426 | ||||
BOC Hong Kong Holdings Ltd. | 2,093 | 7,121 | ||||
China Life Insurance Co. Ltd. | 1,486 | 6,070 | ||||
China Pacific Insurance Group Co. Ltd. | 4,230 | 17,577 | ||||
Credit Suisse Group AG | 115 | 4,632 | ||||
Goldman Sachs Group Inc. | 29 | 4,910 | ||||
HDFC Bank Ltd. | 65 | 3,432 | ||||
ICICI Bank Ltd. | 526 | 13,465 | ||||
Itau Unibanco Holding SA - ADR (c) | 390 | 9,373 | ||||
Standard Chartered Plc | 843 | 22,675 | ||||
Other Securities | 6,838 | |||||
| 127,895 | ||||||
HEALTH CARE - 0.2% | ||||||
Other Securities | 1,703 | |||||
INDUSTRIALS - 4.9% | ||||||
Cathay Pacific Airways Ltd. (c) | 1,206 | 3,328 | ||||
Cummins Inc. | 99 | 10,902 | ||||
Tata Motors Ltd. | 333 | 9,746 | ||||
Volvo AB - Class B (c) | 566 | 9,969 | ||||
Other Securities | 13,701 | |||||
| 47,646 | ||||||
INFORMATION TECHNOLOGY - 13.5% |
| |||||
Apple Inc. (c) (o) | 97 | 31,272 | ||||
ASML Holding NV | 172 | 6,654 | ||||
Baidu.com - ADR (c) | 180 | 17,385 | ||||
Cognizant Technology Solutions Corp. – Class A (c) | 303 | 22,236 | ||||
First Solar Inc. (c) | 70 | 9,058 | ||||
Juniper Networks Inc. (c) | 211 | 7,779 | ||||
See accompanying Notes to the Financial Statements.
JNL Series Trust
Schedules of Investments (in thousands)
December 31, 2010
| Shares/Par (p) | Value | |||||
NetApp Inc. (c) | 324 | 17,813 | ||||
Oracle Corp. | 278 | 8,704 | ||||
Tencent Holdings Ltd. | 435 | 9,455 | ||||
Other Securities | 1,901 | |||||
| 132,257 | ||||||
MATERIALS - 5.7% | ||||||
Freeport-McMoRan Copper & Gold Inc. | 164 | 19,683 | ||||
PTT Chemical PCL - NVDR (c) (r) | 1,328 | 6,474 | ||||
Rio Tinto Ltd. | 71 | 6,189 | ||||
Vale SA - ADR (c) | 303 | 10,457 | ||||
Xstrata Plc | 533 | 12,506 | ||||
| 55,309 | ||||||
TELECOMMUNICATION SERVICES - 0.8% |
| |||||
China Mobile Ltd. | 803 | 7,975 | ||||
Total Common Stocks (cost $574,321) | 693,984 | |||||
PREFERRED STOCKS - 5.3% | ||||||
CONSUMER DISCRETIONARY - 4.7% |
| |||||
Volkswagen AG | 238 | 38,776 | ||||
Volkswagen AG Rights, Convertible Preferred (r) | 42 | 6,853 | ||||
| 45,629 | ||||||
INDUSTRIALS - 0.6% | ||||||
Volvo (r) | 350 | 6,168 | ||||
Total Preferred Stocks (cost $34,494) | 51,797 | |||||
OPTIONS - 0.7% | ||||||
Other Securities | 6,638 | |||||
Total Options (cost $6,529) | 6,638 | |||||
PRECIOUS METALS - 11.3% | ||||||
Gold Bullion | 77,973 | 110,710 | ||||
Total Precious Metals (cost $96,856) | 110,710 | |||||
SHORT TERM INVESTMENTS - 10.4% |
| |||||
Investment Company - 10.4% | ||||||
JNL Money Market Fund, 0.08% (a) (h) | 100,979 | 100,979 | ||||
Total Short Term Investments (cost $100,979) | 100,979 | |||||
Total Investments - 98.8% (cost $813,179) | 964,108 | |||||
Other Assets and Liabilities, Net - 1.2% | 11,737 | |||||
Total Net Assets - 100.0% | $975,845 | |||||
JNL/JPMorgan International Value Fund * (x) | ||||||
COMMON STOCKS - 95.7% | ||||||
CONSUMER DISCRETIONARY - 6.8% |
| |||||
Daimler AG (c) | 101 | $6,838 | ||||
InterContinental Hotels Group Plc | 327 | 6,342 | ||||
Nissan Motor Co. Ltd. | 1,231 | 11,643 | ||||
Sodexo SA | 89 | 6,145 | ||||
Other Securities | 10,013 | |||||
| 40,981 | ||||||
CONSUMER STAPLES - 2.5% | ||||||
Unilever NV | 257 | 8,007 | ||||
| Shares/Par (p) | Value | |||||
Other Securities | 7,258 | |||||
| 15,265 | ||||||
ENERGY - 8.8% | ||||||
BP Plc (c) | 1,948 | 14,136 | ||||
JX Holdings Inc. | 1,034 | 6,996 | ||||
Royal Dutch Shell Plc - A Shares | 791 | 26,359 | ||||
Other Securities | 6,069 | |||||
| 53,560 | ||||||
FINANCIALS - 24.9% | ||||||
Allianz SE | 97 | 11,567 | ||||
Banco Bilbao Vizcaya Argentaria SA (e) | 599 | 6,107 | ||||
Barclays Plc | 1,868 | 7,619 | ||||
BNP Paribas | 152 | 9,656 | ||||
DnB NOR ASA | 602 | 8,469 | ||||
Erste Group Bank AG | 132 | 6,216 | ||||
HSBC Holdings Plc | 1,069 | 10,848 | ||||
ING Groep NV (c) | 1,091 | 10,614 | ||||
QBE Insurance Group Ltd. | 477 | 8,853 | ||||
Societe Generale | 110 | 5,912 | ||||
Sumitomo Mitsui Financial Group Inc. | 438 | 15,515 | ||||
Sun Hung Kai Properties Ltd. | 356 | 5,913 | ||||
Zurich Financial Services AG | 38 | 9,945 | ||||
Other Securities | 34,106 | |||||
| 151,340 | ||||||
HEALTH CARE - 5.7% | ||||||
Bayer AG | 144 | 10,654 | ||||
GlaxoSmithKline Plc | 527 | 10,189 | ||||
Sanofi-Aventis SA | 213 | 13,596 | ||||
| 34,439 | ||||||
INDUSTRIALS - 15.6% | ||||||
East Japan Railway Co. | 90 | 5,808 | ||||
Hutchison Whampoa Ltd. | 830 | 8,543 | ||||
Koninklijke Philips Electronics NV | 213 | 6,527 | ||||
Mitsubishi Electric Corp. | 691 | 7,220 | ||||
Mitsui & Co. Ltd. | 500 | 8,229 | ||||
Orkla ASA | 626 | 6,111 | ||||
Schneider Electric SA | 55 | 8,291 | ||||
Siemens AG | 97 | 12,049 | ||||
Other Securities | 32,168 | |||||
| 94,946 | ||||||
INFORMATION TECHNOLOGY- 7.7% |
| |||||
FUJIFILM Holdings Corp. | 253 | 9,116 | ||||
Fujitsu Ltd. | 927 | 6,423 | ||||
Nokia Oyj | 608 | 6,302 | ||||
Ricoh Co. Ltd. | 463 | 6,751 | ||||
Samsung Electronics Co. Ltd. | 9 | 7,612 | ||||
Other Securities | 10,381 | |||||
| 46,585 | ||||||
MATERIALS - 6.0% | ||||||
First Quantum Minerals Ltd. (e) | 80 | 8,687 | ||||
Rhodia SA | 278 | 9,178 | ||||
Other Securities | 18,680 | |||||
| 36,545 | ||||||
TELECOMMUNICATION SERVICES - 10.7% | ||||||
BT Group Plc | 2,478 | 6,986 | ||||
KDDI Corp. | 1 | 8,454 | ||||
Koninklijke KPN NV | 456 | 6,660 | ||||
Nippon Telegraph & Telephone Corp. | 145 | 6,590 | ||||
Telefonica SA | 623 | 14,223 | ||||
Vodafone Group Plc | 6,583 | 17,017 | ||||
See accompanying Notes to the Financial Statements.
JNL Series Trust
Schedules of Investments (in thousands)
December 31, 2010
| Shares/Par (p) | Value | |||||
Other Securities | 5,309 | |||||
| 65,239 | ||||||
UTILITIES - 7.0% | ||||||
Centrica Plc | 1,642 | 8,487 | ||||
GDF Suez | 402 | 14,428 | ||||
International Power Plc | 853 | 5,823 | ||||
National Grid Plc | 1,014 | 8,740 | ||||
Other Securities | 5,268 | |||||
| 42,746 | ||||||
Total Common Stocks (cost $528,248) | 581,646 | |||||
PREFERRED STOCKS - 1.5% | ||||||
CONSUMER DISCRETIONARY - 1.5% |
| |||||
Volkswagen AG | 55 | 9,019 | ||||
Total Preferred Stocks (cost $5,333) | 9,019 | |||||
SHORT TERM INVESTMENTS - 5.4% |
| |||||
Investment Company - 1.8% | ||||||
JNL Money Market Fund, 0.08% (a) (h) | 11,098 | 11,098 | ||||
Securities Lending Collateral 3.6% | ||||||
Securities Lending Cash Collateral Fund LLC, 0.31% (a) (h) | 20,804 | 20,804 | ||||
Securities Lending Liquidating Fund LLC, | 1,334 | 1,312 | ||||
| 22,116 | ||||||
Total Short Term Investments (cost $33,236) | 33,214 | |||||
Total Investments - 102.6% (cost $566,817) | 623,879 | |||||
Other Assets and Liabilities, Net - (2.6%) | (15,934) | |||||
Total Net Assets - 100.0% | $607,945 | |||||
JNL/JPMorgan Mid Cap Growth Fund * (x) |
| |||||
COMMON STOCKS - 97.6% | ||||||
CONSUMER DISCRETIONARY - 17.8% |
| |||||
Coach Inc. | 59 | $3,280 | ||||
Dick’s Sporting Goods Inc. (c) | 70 | 2,617 | ||||
Gentex Corp. | 98 | 2,887 | ||||
Harley-Davidson Inc. | 103 | 3,564 | ||||
Harman International Industries Inc. (c) | 56 | 2,574 | ||||
Lamar Advertising Co. - Class A (c) | 100 | 3,980 | ||||
Scripps Networks Interactive Inc. - Class A | 52 | 2,675 | ||||
Sotheby’s - Class A (e) | 53 | 2,385 | ||||
Starwood Hotels & Resorts Worldwide Inc. | 43 | 2,638 | ||||
Other Securities | 14,819 | |||||
| 41,419 | ||||||
CONSUMER STAPLES - 0.5% | ||||||
Other Securities | 1,229 | |||||
ENERGY - 6.1% | ||||||
Cameron International Corp. (c) | 60 | 3,055 | ||||
Concho Resources Inc. (c) | 50 | 4,366 | ||||
Forest Oil Corp. (c) | 67 | 2,540 | ||||
Newfield Exploration Co. (c) | 32 | 2,293 | ||||
Other Securities | 2,009 | |||||
| 14,263 | ||||||
| Shares/Par (p) | Value | |||||
FINANCIALS - 9.9% | ||||||
Invesco Ltd. | 120 | 2,880 | ||||
Lazard Ltd. - Class A | 60 | 2,382 | ||||
T. Rowe Price Group Inc. | 53 | 3,443 | ||||
Other Securities | 14,310 | |||||
| 23,015 | ||||||
HEALTH CARE - 11.5% | ||||||
Alexion Pharmaceuticals Inc. (c) | 27 | 2,183 | ||||
Brookdale Senior Living Inc. (c) | 106 | 2,272 | ||||
Coventry Health Care Inc. (c) | 103 | 2,714 | ||||
DaVita Inc. (c) | 41 | 2,842 | ||||
Lincare Holdings Inc. | 107 | 2,863 | ||||
Thoratec Corp. (c) | 81 | 2,297 | ||||
Valeant Pharmaceuticals International Inc. | 159 | 4,484 | ||||
Other Securities | 7,127 | |||||
| 26,782 | ||||||
INDUSTRIALS - 19.1% | ||||||
Avis Budget Group Inc. (c) (e) | 147 | 2,287 | ||||
Carlisle Cos. Inc. | 66 | 2,639 | ||||
Cummins Inc. | 54 | 5,900 | ||||
Delta Air Lines Inc. (c) | 219 | 2,763 | ||||
Goodrich Corp. | 35 | 3,082 | ||||
Hubbell Inc. - Class B | 42 | 2,538 | ||||
Precision Castparts Corp. | 16 | 2,184 | ||||
Rockwell Automation Inc. | 42 | 3,012 | ||||
Stericycle Inc. (c) | 32 | 2,586 | ||||
Wabtec Corp. (e) | 52 | 2,724 | ||||
WW Grainger Inc. | 29 | 3,950 | ||||
Other Securities | 10,770 | |||||
| 44,435 | ||||||
INFORMATION TECHNOLOGY - 28.3% |
| |||||
Agilent Technologies Inc. (c) | 102 | 4,205 | ||||
Amphenol Corp. - Class A | 66 | 3,487 | ||||
Broadcom Corp. - Class A | 57 | 2,499 | ||||
Cognizant Technology Solutions Corp. – | 39 | 2,829 | ||||
F5 Networks Inc. (c) | 25 | 3,202 | ||||
Juniper Networks Inc. (c) | 73 | 2,691 | ||||
Marvell Technology Group Ltd. (c) | 173 | 3,207 | ||||
Microchip Technology Inc. (e) | 68 | 2,333 | ||||
Micros Systems Inc. (c) | 77 | 3,395 | ||||
NetApp Inc. (c) | 84 | 4,622 | ||||
Red Hat Inc. (c) | 50 | 2,292 | ||||
Salesforce.com Inc. (c) | 21 | 2,719 | ||||
Tyco Electronics Ltd. | 102 | 3,604 | ||||
Varian Semiconductor Equipment Associates | 66 | 2,455 | ||||
Other Securities | 22,209 | |||||
| 65,749 | ||||||
MATERIALS - 3.5% | ||||||
Grief Inc. - Class A | 38 | 2,340 | ||||
Sherwin-Williams Co. | 43 | 3,559 | ||||
Other Securities | 2,097 | |||||
| 7,996 | ||||||
TELECOMMUNICATION SERVICES - 0.9% |
| |||||
Other Securities | 2,036 | |||||
Total Common Stocks (cost $179,851) | 226,924 | |||||
SHORT TERM INVESTMENTS - 8.6% |
| |||||
Investment Company - 2.2% | ||||||
JNL Money Market Fund, 0.08% (a) (h) | 5,111 | 5,111 | ||||
See accompanying Notes to the Financial Statements.
JNL Series Trust
Schedules of Investments (in thousands)
December 31, 2010
| Shares/Par (p) | Value | |||||
Securities Lending Collateral 6.4% | ||||||
Securities Lending Cash Collateral Fund LLC, 0.31% (a) (h) | 14,378 | 14,378 | ||||
Securities Lending Liquidating Fund LLC, 0.66% (a) (h) | 663 | 652 | ||||
| 15,030 | ||||||
Total Short Term Investments (cost $20,152) | 20,141 | |||||
Total Investments - 106.2% (cost $200,003) |
| 247,065 | ||||
Other Assets and Liabilities, Net - (6.2%) |
| (14,494) | ||||
Total Net Assets - 100.0% | $232,571 | |||||
JNL/JPMorgan U.S. Government & Quality Bond Fund | ||||||
NON-U.S. GOVERNMENT AGENCY ASSET-BACKED | ||||||
ACE Securities Corp. REMIC, 0.39%, 02/25/31 (i) | $389 $ | 293 | ||||
AH Mortgage Advance Trust REMIC, 4.21%, 05/10/11 (r) | 2,219 | 2,227 | ||||
Banc of America Commercial Mortgage Inc. REMIC, 6.41%, 09/11/36 (i) (q) | 2,023 | 2,219 | ||||
Commercial Mortgage Pass-Through Certificates REMIC, 5.45%, 07/16/34 (q) | 2,748 | 2,760 | ||||
CompuCredit Acquired Portfolio Voltage Master Trust, | 462 | 419 | ||||
Conseco Financial Corp. REMIC, 7.07%, 01/15/29 | 145 | 151 | ||||
Countrywide Alternative Loan Trust REMIC | ||||||
0.47%, 07/20/46 (i) | 1,204 | 563 | ||||
0.46%, 12/20/46 (i) | 1,433 | 747 | ||||
Countrywide Home Equity Loan Trust, 0.55%, 02/15/34 (i) | 602 | 370 | ||||
Credit Suisse First Boston Mortgage Securities Corp. REMIC, | 1,154 | 1,185 | ||||
IndyMac Seconds Asset Backed Trust REMIC, 0.39%, 06/25/36 (i) | 965 | 115 | ||||
LB-UBS Commercial Mortgage Trust REMIC, 5.35%, 11/15/38 | 2,520 | 2,664 | ||||
MASTR Adjustable Rate Mortgages Trust REMIC, 2.61%, 02/25/34 (i) | 738 | 640 | ||||
Morgan Stanley Mortgage Loan Trust REMIC, 2.79%, 10/25/34 (i) | 610 | 574 | ||||
NCUA Guaranteed Notes, 1.60%, 02/01/17 | 2,441 | 2,391 | ||||
Nomura Asset Acceptance Corp. REMIC, 6.50%, 03/25/34 (r) | 4,754 | 4,775 | ||||
Provident Funding Mortgage Loan Trust REMIC, 2.83%, 10/25/35 (i) | 498 | 468 | ||||
SACO I Inc. REMIC, 0.52%, 06/25/36 (i) | 441 | 141 | ||||
Structured Asset Mortgage Investments Inc. REMIC, 0.47%, 08/25/36 (i) | 1,483 | 926 | ||||
Vendee Mortgage Trust REMIC, | 2,810 | 3,086 | ||||
Wells Fargo Mortgage Backed Securities Trust REMIC | ||||||
5.50%, 04/25/22 | 5,319 | 5,491 | ||||
6.00%, 06/25/37 | 911 | 848 | ||||
Total Non-U.S. Government Agency Asset-Backed Securities | 33,053 | |||||
| Shares/Par (p) | Value | |||||
CORPORATE BONDS AND NOTES - 0.7% | ||||||
FINANCIALS - 0.7% | ||||||
General Electric Capital Corp., 3.00%, 12/09/11 | 2,500 | 2,560 | ||||
Morgan Stanley, 3.25%, 12/01/11 | 2,500 | 2,565 | ||||
Wells Fargo & Co., 3.00%, 12/09/11 (e) | 1,525 | 1,562 | ||||
Total Corporate Bonds and Notes | 6,687 | |||||
GOVERNMENT AND AGENCY OBLIGATIONS - 91.3% | ||||||
GOVERNMENT SECURITIES - 34.3% |
| |||||
Federal Farm Credit Bank - 0.9% (w) |
| |||||
Federal Farm Credit Bank, 5.75%, 12/07/28 | 7,000 | 8,052 | ||||
Federal Home Loan Bank - 1.8% (w) |
| |||||
Federal Home Loan Bank | ||||||
4.88%, 05/17/17 (e) | 10,000 | 11,273 | ||||
5.25%, 12/11/20 | 4,500 | 5,031 | ||||
| 16,304 | ||||||
Federal National Mortgage Association - 2.3% (w) | ||||||
Federal National Mortgage Association, 0.00%, 10/09/19 - 11/15/20 (j) | 33,000 | 21,117 | ||||
| 21,117 | ||||||
Sovereign - 3.2% | ||||||
Financing Corp. Fico, 0.00%, 04/05/19 (j) | 5,000 | 3,751 | ||||
Israel Government AID Bond, 0.00%, 11/01/21 (j) | 10,000 | 6,382 | ||||
Residual Funding Strip Principal, 0.00%, 10/15/19 (j) | 3,800 | 2,800 | ||||
Residual Funding Strip Principal, 0.00%, 07/15/20 - 01/15/30 (j) | 12,410 | 7,057 | ||||
Tennessee Valley Authority Generic Strip, 0.00%, 01/15/21 - 07/15/21 (j) | 14,487 | 9,242 | ||||
| 29,232 | ||||||
Treasury Inflation Index Securities - 2.7% |
| |||||
U.S. Treasury Inflation Indexed Note | ||||||
1.38%, 07/15/18 (n) | 15,214 | 16,032 | ||||
2.00%, 01/15/26 (n) | 5,708 | 6,061 | ||||
2.38%, 01/15/27 (n) | 2,180 | 2,423 | ||||
| 24,516 | ||||||
U.S. Treasury Securities - 23.4% |
| |||||
U.S. Treasury Bond | ||||||
0.00%,08/15/21 (e) (j) | 25,000 | 16,816 | ||||
5.25%, 11/15/28 - 02/15/29 | 30,000 | 34,391 | ||||
5.38%, 02/15/31 | 13,000 | 15,176 | ||||
U.S. Treasury Note | ||||||
4.63%, 02/15/17 (e) | 22,000 | 24,769 | ||||
4.75%, 08/15/17 | 17,000 | 19,278 | ||||
3.38%, 11/15/19 | 75,000 | 76,564 | ||||
2.63%, 08/15/20 | 30,000 | 28,441 | ||||
| 215,435 | ||||||
U.S. GOVERNMENT AGENCY MORTGAGE-BACKED | ||||||
Federal Home Loan Mortgage Corp. - 21.9% | ||||||
Federal Home Loan Mortgage Corp. | ||||||
7.00%, 07/01/11 - 08/01/32 | 244 | 278 | ||||
6.50%, 08/01/13 | 4 | 5 | ||||
8.00%, 07/01/20 | 18 | 20 | ||||
6.00%, 11/01/28 | 213 | 234 | ||||
5.00%, 08/01/33 - 12/01/34 | 4,995 | 5,307 | ||||
5.22%, 12/01/35 (i) | 4,237 | 4,493 | ||||
5.59%, 01/01/37 (i) | 495 | 522 | ||||
REMIC, 5.00%, 10/15/17 - 02/15/35 | 90,171 | 95,907 | ||||
REMIC, 4.50%, 06/15/18 - 07/15/34 | 34,202 | 36,269 | ||||
REMIC, 5.50%, 01/15/27 - 07/15/40 | 47,180 | 50,929 | ||||
REMIC, 4.00%, 06/15/36 | 5,000 | 4,765 | ||||
See accompanying Notes to the Financial Statements.
JNL Series Trust
Schedules of Investments (in thousands)
December 31, 2010
| Shares/Par (p) | Value | |||||
REMIC, 6.00%, 07/15/37 | 2,000 | 2,187 | ||||
| 200,916 | ||||||
Federal National Mortgage Association - 28.3% | ||||||
Federal National Mortgage Association |
| |||||
12.50%, 09/20/15 - 01/15/16 | 3 | 4 | ||||
12.00%, 01/01/16 - 01/15/16 | 20 | 24 | ||||
5.00%, 02/01/19 - 12/01/39 | 32,322 | 34,394 | ||||
11.50%, 09/01/19 | — | — | ||||
10.50%, 08/01/20 | 4 | 4 | ||||
4.00%, 02/01/25 - 09/01/25 | 26,279 | 27,167 | ||||
6.50%, 03/01/26 - 03/01/36 | 2,293 | 2,557 | ||||
7.00%, 05/01/26 - 01/01/30 | 21 | 24 | ||||
8.00%, 07/01/29 - 03/01/31 | 158 | 182 | ||||
6.00%, 02/01/31 - 12/01/36 | 27,910 | 30,427 | ||||
7.50%, 02/01/31 | 29 | 33 | ||||
5.50%, 02/01/35 - 10/01/36 | 18,629 | 20,100 | ||||
REMIC, 5.00%, 05/25/18 - 09/25/39 | 37,209 | 39,498 | ||||
REMIC, 4.00%, 01/25/19 - 04/25/30 | 28,000 | 26,950 | ||||
REMIC, 4.50%, 04/25/23 - 02/25/40 | 27,826 | 29,112 | ||||
REMIC, 3.50%, 07/25/33 | 2,127 | 2,198 | ||||
REMIC, 5.50%, 12/25/34 - 11/25/35 | 16,337 | 17,879 | ||||
REMIC, 11.00%, 02/25/40 (i) | 1,148 | 1,126 | ||||
REMIC, 7.50%, 12/25/41 | 10,220 | 11,548 | ||||
REMIC, 4.68%, 06/25/43 | 7,882 | 8,149 | ||||
REMIC, 6.00%, 12/25/49 | 2,953 | 3,254 | ||||
Federal National Mortgage Association Strip Principal REMIC, 0.00%, 04/25/36 (j) | 6,450 | 5,558 | ||||
| 260,188 | ||||||
Government National Mortgage Association - 6.8% | ||||||
Government National Mortgage Association | ||||||
6.00%, 04/15/29 - 01/15/36 | 3,516 | 3,911 | ||||
REMIC, 6.50%, 06/20/28 - 06/16/31 | 4,601 | 4,978 | ||||
REMIC, 5.00%, 09/20/32 - 11/20/36 | 10,621 | 11,346 | ||||
REMIC, 5.50%, 03/20/33 - 02/16/38 | 25,903 | 27,966 | ||||
REMIC, 6.00%, 12/16/33 | 3,041 | 3,237 | ||||
REMIC, 4.50%, 06/20/39 | 10,000 | 10,121 | ||||
Government National Mortgage Association | ||||||
Interest Only REMIC | ||||||
6.50%, 11/20/34 | 425 | 25 | ||||
6.14%, 05/16/38 (i) | 8,146 | 1,221 | ||||
| 62,805 | ||||||
Total Government and Agency Obligations (cost $797,999) | 838,565 | |||||
SHORT TERM INVESTMENTS - 7.3% | ||||||
Investment Company 3.9% | ||||||
JNL Money Market Fund, 0.08% (a) (h) | 36,257 | 36,257 | ||||
Securities Lending Collateral 3.4% | ||||||
Securities Lending Cash Collateral Fund LLC, 0.31% (a) (h) | 26,408 | 26,408 | ||||
Securities Lending Liquidating Fund LLC, 0.66% (a) (h) | 5,019 | 4,936 | ||||
| 31,344 | ||||||
Total Short Term Investments (cost $67,683) | 67,601 | |||||
Total Investments - 102.9% (cost $908,299) | 945,906 | |||||
Other Assets and Liabilities, | (27,049) | |||||
Total Net Assets - 100.0% | $918,857 | |||||
| Shares/Par (p) | Value | |||||
JNL/Lazard Emerging Markets Fund * (x) | ||||||
COMMON STOCKS - 93.5% | ||||||
CONSUMER DISCRETIONARY - 5.2% | ||||||
Grupo Televisa SA - ADR (c) | 710 | $18,400 | ||||
Hyundai Mobis (c) | 64 | 16,118 | ||||
Truworths International Ltd. | 1,412 | 15,354 | ||||
Woongjin Coway Co. Ltd. (c) | 421 | 14,950 | ||||
Other Securities | 7,607 | |||||
| 72,429 | ||||||
CONSUMER STAPLES - 11.4% | ||||||
Fomento Economico Mexicano SAB de | 248 | 13,841 | ||||
KT&G Corp. (c) | 388 | 22,136 | ||||
Massmart Holdings Ltd. | 589 | 13,113 | ||||
Natura Cosmeticos SA (c) | 662 | 19,010 | ||||
Shoprite Holdings Ltd. | 843 | 12,745 | ||||
Souza Cruz SA (c) | 257 | 13,978 | ||||
Tiger Brands Ltd. | 474 | 13,942 | ||||
Other Securities | 49,693 | |||||
| 158,458 | ||||||
ENERGY - 4.4% | ||||||
Banpu PCL | 550 | 14,359 | ||||
LUKOIL OAO - ADR | 333 | 18,828 | ||||
Other Securities | 28,139 | |||||
| 61,326 | ||||||
FINANCIALS - 23.4% | ||||||
Akbank T.A.S. | 2,820 | 15,673 | ||||
Banco do Brasil SA (c) | 2,770 | 52,436 | ||||
Bank of India | 1,414 | 14,279 | ||||
China Construction Bank Corp. | 15,768 | 14,140 | ||||
Commercial International Bank | 1,830 | 14,941 | ||||
Korea Life Insurance Co. Ltd. | 2,668 | 18,647 | ||||
OTP Bank Rt (c) (e) | 706 | 17,038 | ||||
Punjab National Bank Ltd. | 993 | 27,124 | ||||
Sanlam Ltd. | 4,604 | 19,515 | ||||
Shinhan Financial Group Co. Ltd. (c) | 894 | 41,590 | ||||
Standard Bank Group Ltd. | 793 | 12,954 | ||||
Turkiye Is Bankasi SA | 9,528 | 33,941 | ||||
Other Securities | 43,367 | |||||
| 325,645 | ||||||
INDUSTRIALS - 5.4% | ||||||
Murray & Roberts Holdings Ltd. | 2,114 | 12,894 | ||||
Orascom Construction Industries | 379 | 18,721 | ||||
Other Securities | 42,990 | |||||
| 74,605 | ||||||
INFORMATION TECHNOLOGY - 18.6% | ||||||
Cielo SA | 4,401 | 35,660 | ||||
HON HAI Precision Industry Co. Ltd. - GDR | 2,565 | 20,699 | ||||
MediaTek Inc. | 1,590 | 22,767 | ||||
Netease.com - ADR (c) (e) | 381 | 13,762 | ||||
NHN Corp. (c) | 134 | 26,841 | ||||
Redecard SA | 2,523 | 31,994 | ||||
Samsung Electronics Co. Ltd. | 40 | 33,212 | ||||
Taiwan Semiconductor Manufacturing Co. Ltd. - ADR | 2,190 | 27,464 | ||||
Other Securities | 45,325 | |||||
| 257,724 | ||||||
MATERIALS - 14.6% | ||||||
Cia Siderurgica Nacional SA - ADR (e) | 1,250 | 20,844 | ||||
First Quantum Minerals Ltd. (e) | 223 | 24,200 | ||||
See accompanying Notes to the Financial Statements.
JNL Series Trust
Schedules of Investments (in thousands)
December 31, 2010
| Shares/Par (p) | Value | |||
Grupo Mexico SAB de CV (c) (e) | 5,940 | 24,333 | ||
Jindal Steel & Power Ltd. | 920 | 14,646 | ||
Kumba Iron Ore Ltd. (e) | 406 | 26,195 | ||
Pretoria Portland Cement Co. Ltd. | 2,668 | 14,156 | ||
Uralkali - GDR (e) | 541 | 19,884 | ||
Vale SA - ADR (c) | 1,359 | 46,967 | ||
Other Securities | 11,090 | |||
| 202,315 | ||||
TELECOMMUNICATION SERVICES - 9.3% | ||||
America Movil SAB de CV - ADR | 366 | 20,958 | ||
Mobile Telesystems - ADR | 948 | 19,792 | ||
Philippine Long Distance Telephone | 442 | 25,761 | ||
PT Telekomunikasi Indonesia - ADR (e) | 760 | 27,082 | ||
Turkcell Iletisim Hizmet AS | 4,392 | 30,009 | ||
Other Securities | 5,277 | |||
| 128,879 | ||||
UTILITIES - 1.2% | ||||
Companhia Energetica de Minas | 981 | 16,279 | ||
Total Common Stocks (cost $1,061,461) | 1,297,660 | |||
PREFERRED STOCKS - 2.7% | ||||
ENERGY - 0.7% | ||||
Other Securities | 9,548 | |||
MATERIALS - 1.8% | ||||
Usinas Siderurgicas de Minas Gerais SA, | 2,024 | 23,365 | ||
Other Securities | 1,362 | |||
| 24,727 | ||||
UTILITIES - 0.2% | ||||
Other Securities | 3,052 | |||
Total Preferred Stocks | 37,327 | |||
SHORT TERM INVESTMENTS - 9.3% | ||||
Investment Company - 4.3% | ||||
JNL Money Market Fund, | 60,363 | 60,363 | ||
Securities Lending Collateral 5.0% | ||||
Securities Lending Cash Collateral Fund LLC, | 68,109 | 68,109 | ||
Securities Lending Liquidating Fund LLC, | 1,270 | 1,249 | ||
| 69,358 | ||||
Total Short Term Investments | 129,721 | |||
Total Investments - 105.5% | 1,464,708 | |||
Other Assets and Liabilities, | (76,679) | |||
Total Net Assets - 100.0% | $1,388,029 | |||
JNL/Lazard Mid Cap Equity Fund * (x) | ||||
COMMON STOCKS - 94.9% | ||||
CONSUMER DISCRETIONARY - 15.4% | ||||
AutoZone Inc. (c) | 14 | $3,816 | ||
Darden Restaurants Inc. | 57 | 2,656 | ||
DeVry Inc. | 56 | 2,677 | ||
International Game Technology | 184 | 3,250 | ||
| Shares/Par (p) | Value | |||
Lear Corp. (c) | 33 | 3,267 | ||
Mattel Inc. | 162 | 4,125 | ||
Newell Rubbermaid Inc. | 295 | 5,370 | ||
Stanley Black & Decker Inc. | 32 | 2,167 | ||
TJX Cos. Inc. | 49 | 2,166 | ||
Other Securities | 3,534 | |||
| 33,028 | ||||
CONSUMER STAPLES - 8.1% | ||||
Avon Products Inc. | 95 | 2,758 | ||
Campbell Soup Co. | 77 | 2,676 | ||
Molson Coors Brewing Co. - Class B | 119 | 5,967 | ||
Ralcorp Holdings Inc. (c) | 70 | 4,525 | ||
Other Securities | 1,438 | |||
| 17,364 | ||||
ENERGY - 10.2% | ||||
Arch Coal Inc. | 61 | 2,146 | ||
EQT Corp. | 63 | 2,829 | ||
Murphy Oil Corp. | 32 | 2,371 | ||
Rowan Cos. Inc. (c) | 74 | 2,587 | ||
Tidewater Inc. | 48 | 2,584 | ||
Williams Cos. Inc. | 113 | 2,803 | ||
Other Securities | 6,577 | |||
| 21,897 | ||||
FINANCIALS - 14.6% | ||||
Ameriprise Financial Inc. | 101 | 5,784 | ||
City National Corp. | 71 | 4,326 | ||
Fifth Third Bancorp | 145 | 2,129 | ||
Invesco Ltd. | 145 | 3,486 | ||
Macerich Co. | 50 | 2,354 | ||
NYSE Euronext | 80 | 2,386 | ||
PartnerRe Ltd. | 32 | 2,539 | ||
UDR Inc. | 91 | 2,133 | ||
Other Securities | 6,090 | |||
| 31,227 | ||||
HEALTH CARE - 7.2% | ||||
CareFusion Corp. (c) | 113 | 2,909 | ||
Hospira Inc. (c) | 55 | 3,035 | ||
Life Technologies Corp. (c) | 45 | 2,485 | ||
Warner Chilcott Plc - Class A (c) | 119 | 2,687 | ||
Zimmer Holdings Inc. (c) | 55 | 2,942 | ||
Other Securities | 1,451 | |||
| 15,509 | ||||
INDUSTRIALS - 13.2% | ||||
Corrections Corp. of America (c) | 123 | 3,072 | ||
Dover Corp. | 124 | 7,225 | ||
Equifax Inc. | 115 | 4,098 | ||
Foster Wheeler AG (c) | 87 | 2,996 | ||
Parker Hannifin Corp. | 40 | 3,443 | ||
Rockwell Collins Inc. | 80 | 4,684 | ||
Other Securities | 2,674 | |||
| 28,192 | ||||
INFORMATION TECHNOLOGY - 13.4% | ||||
Analog Devices Inc. | 111 | 4,163 | ||
BMC Software Inc. (c) | 80 | 3,771 | ||
Ingram Micro Inc. - Class A (c) | 218 | 4,164 | ||
Intuit Inc. (c) | 44 | 2,164 | ||
Symantec Corp. (c) | 171 | 2,868 | ||
Teradyne Inc. (c) | 168 | 2,354 | ||
Xilinx Inc. | 120 | 3,472 | ||
Other Securities | 5,659 | |||
| 28,615 | ||||
See accompanying Notes to the Financial Statements.
JNL Series Trust
Schedules of Investments (in thousands)
December 31, 2010
| Shares/Par (p) | Value | |||||
MATERIALS - 8.4% | ||||||
Ball Corp. | 90 | 6,118 | ||||
Cliffs Natural Resources Inc. | 34 | 2,629 | ||||
Compass Minerals International Inc. | 39 | 3,473 | ||||
Eastman Chemical Co. | 28 | 2,354 | ||||
Other Securities | 3,441 | |||||
| 18,015 | ||||||
UTILITIES - 4.4% | ||||||
Allegheny Energy Inc. | 87 | 2,109 | ||||
American Electric Power Co. Inc. | 124 | 4,443 | ||||
Energen Corp. | 60 | 2,910 | ||||
| 9,462 | ||||||
Total Common Stocks (cost $169,065) | 203,309 | |||||
PREFERRED STOCKS - 0.5% | ||||||
INDUSTRIALS - 0.5% | ||||||
Other Securities | 1,015 | |||||
Total Preferred Stocks (cost $1,015) | 1,015 | |||||
SHORT TERM INVESTMENTS - 6.1% |
| |||||
Investment Company - 5.2% | ||||||
JNL Money Market Fund, 0.08% (a) (h) | 11,284 | 11,284 | ||||
Securities Lending Collateral 0.9% |
| |||||
Securities Lending Cash Collateral Fund LLC, 0.31% (a) (h) | 1,230 | 1,230 | ||||
Securities Lending Liquidating Fund LLC, 0.66% (a) (h) | 681 | 670 | ||||
| 1,900 | ||||||
Total Short Term Investments (cost $13,195) | 13,184 | |||||
Total Investments - 101.5% (cost $183,275) | 217,508 | |||||
Other Assets and Liabilities, Net - (1.5%) | (3,279) | |||||
Total Net Assets - 100.0% | $214,229 | |||||
JNL/M&G Global Basics Fund | ||||||
COMMON STOCKS - 96.9% |
| |||||
CONSUMER DISCRETIONARY - 8.6% |
| |||||
Compagnie des Alpes (e) | 47 | $1,483 | ||||
Compagnie Financiere Richemont SA | 33 | 1,936 | ||||
Hongkong & Shanghai Hotels | 2,460 | 4,216 | ||||
Starbucks Corp. | 143 | 4,591 | ||||
Yum! Brands Inc. | 94 | 4,626 | ||||
| 16,852 | ||||||
CONSUMER STAPLES - 20.8% | ||||||
Agrana Beteiligungs AG | 39 | 4,107 | ||||
Baron de Ley SA (c) | 16 | 987 | ||||
Colgate-Palmolive Co. | 64 | 5,168 | ||||
Corn Products International Inc. | 49 | 2,250 | ||||
Elizabeth Arden Inc. (c) | 68 | 1,560 | ||||
HJ Heinz Co. | 5 | 229 | ||||
Kellogg Co. | 2 | 92 | ||||
Kerry Group Plc | 128 | 4,274 | ||||
Kirin Holdings Co. Ltd. | 159 | 2,224 | ||||
Marico Ltd. | 321 | 860 | ||||
Nestle SA | 44 | 2,590 | ||||
Petra Foods Ltd. | 176 | 230 | ||||
| Shares/Par (p) | Value | |||||
Pilgrim’s Pride Corp. (c) | 153 | 1,083 | ||||
PZ Cussons Plc | 709 | 4,432 | ||||
Unilever Plc | 204 | 6,245 | ||||
Wimm-Bill-Dann Foods OJSC - ADR (e) | 130 | 4,299 | ||||
| 40,630 | ||||||
ENERGY - 8.6% | ||||||
Aquila Resources Ltd. (c) (e) | 496 | 5,000 | ||||
Chevron Corp. | 49 | 4,503 | ||||
Equatorial Resources Ltd. (c) | 142 | 503 | ||||
Nexus Energy Ltd. (c) | 1,867 | 849 | ||||
Tap Oil Ltd. (c) | 259 | 220 | ||||
Tullow Oil Plc | 295 | 5,801 | ||||
| 16,876 | ||||||
FINANCIALS - 2.8% | ||||||
AMMB Holdings Bhd (c) | 2,409 | 5,490 | ||||
HEALTH CARE - 3.1% | ||||||
Ansell Ltd. | 417 | 5,403 | ||||
Genus Plc | 27 | 363 | ||||
Mesoblast Ltd. (c) (e) | 70 | 333 | ||||
| 6,099 | ||||||
INDUSTRIALS - 17.4% | ||||||
Acuity Brands Inc. (e) | 50 | 2,907 | ||||
Aggreko Plc | 35 | 816 | ||||
All America Latina Logistica SA | 172 | 1,550 | ||||
DP World Ltd. | 3,699 | 2,330 | ||||
Fluor Corp. | 53 | 3,538 | ||||
Fraser and Neave Ltd. | 1,764 | 8,811 | ||||
G4S Plc | 938 | 3,723 | ||||
Noble Group Ltd. (e) | 3,144 | 5,317 | ||||
United Technologies Corp. | 42 | 3,323 | ||||
Wienerberger AG (c) (e) | 84 | 1,599 | ||||
| 33,914 | ||||||
MATERIALS - 35.6% | ||||||
AMCOL International Corp. | 59 | 1,826 | ||||
Anatolia Minerals Development Ltd. (c) | 155 | 1,203 | ||||
Boral Ltd. | 706 | 3,486 | ||||
Centerra Gold Inc. | 148 | 2,951 | ||||
Cudeco Ltd. (c) | 171 | 797 | ||||
Eramet | 16 | 5,572 | ||||
Harry Winston Diamond Corp. (c) | 72 | 839 | ||||
Hochschild Mining Plc | 333 | 3,318 | ||||
Iluka Resources Ltd. (c) | 742 | 6,934 | ||||
Imerys SA | 83 | 5,515 | ||||
Johnson Matthey Plc | 15 | 479 | ||||
K+S AG | 77 | 5,800 | ||||
Lonmin Plc (c) | 191 | 5,869 | ||||
Monsanto Co. | 45 | 3,155 | ||||
Newmont Mining Corp. | 2 | 123 | ||||
OZ Minerals Ltd. | 707 | 1,243 | ||||
Panoramic Resources Ltd. (e) | 316 | 831 | ||||
Resolute Mining Ltd. (c) | 685 | 1,002 | ||||
Scotts Miracle-Gro Co. - Class A (e) | 71 | 3,600 | ||||
SEMAFO Inc. (c) | 69 | 748 | ||||
Sherritt International Corp. (e) | 488 | 4,154 | ||||
Sims Metal Management Ltd. (e) | 192 | 4,236 | ||||
St. Barbara Ltd. (c) | 193 | 402 | ||||
Symrise AG | 168 | 4,589 | ||||
Uralkali - GDR | 9 | 336 | ||||
White Energy Co. Ltd. (c) | 186 | 657 | ||||
| 69,665 | ||||||
Total Common Stocks (cost $149,769) | 189,526 | |||||
See accompanying Notes to the Financial Statements.
JNL Series Trust
Schedules of Investments (in thousands)
December 31, 2010
| Shares/Par (p) | Value | |||||
PREFERRED STOCKS - 0.1% |
| |||||
INDUSTRIALS - 0.1% | ||||||
Villeroy & Boch AG | 26 | 164 | ||||
Total Preferred Stocks (cost $189) | 164 | |||||
SHORT TERM INVESTMENTS - 11.8% | ||||||
Investment Company - 2.9% | ||||||
JNL Money Market Fund, 0.08% (a) (h) | 5,571 | 5,571 | ||||
Securities Lending Collateral 8.9% | ||||||
Securities Lending Cash Collateral Fund LLC, 0.31% (a) (h) | 17,479 | 17,479 | ||||
Total Short Term Investments (cost $23,050) | 23,050 | |||||
Total Investments - 108.8% (cost $173,008) | 212,740 | |||||
Other Assets and Liabilities, Net - (8.8%) | (17,226) | |||||
Total Net Assets - 100.0% | $195,514 | |||||
JNL/M&G Global Leaders Fund |
| |||||
COMMON STOCKS - 96.3% |
| |||||
CONSUMER DISCRETIONARY - 4.3% |
| |||||
Macy’s Inc. | 16 | $408 | ||||
MGM Resorts International (c) (e) | 11 | 164 | ||||
Orient-Express Hotels Ltd. - Class A (c) | 12 | 157 | ||||
Time Warner Cable Inc. | 8 | 548 | ||||
| 1,277 | ||||||
CONSUMER STAPLES - 7.8% | ||||||
Foster’s Group Ltd. | 73 | 424 | ||||
Heineken Holding NV | 5 | 224 | ||||
Kerry Group Plc | 17 | 565 | ||||
Kobayashi Pharmaceutical Co. Ltd. | 7 | 325 | ||||
Lawson Inc. | 6 | 281 | ||||
Metro AG | 7 | 515 | ||||
| 2,334 | ||||||
ENERGY - 9.3% | ||||||
Anadarko Petroleum Corp. | 9 | 701 | ||||
BP Plc (c) | 56 | 409 | ||||
Forest Oil Corp. (c) | 13 | 505 | ||||
Hess Corp. | 7 | 543 | ||||
Talisman Energy Inc. | 28 | 627 | ||||
| 2,785 | ||||||
FINANCIALS - 17.6% | ||||||
Citigroup Inc. (c) | 151 | 713 | ||||
GAM Holding Ltd. (c) | 29 | 478 | ||||
HSBC Holdings Plc | 48 | 491 | ||||
ING Groep NV (c) | 36 | 354 | ||||
JPMorgan Chase & Co. | 13 | 552 | ||||
Krung Thai Bank PCL | 704 | 403 | ||||
Principal Financial Group Inc. | 14 | 445 | ||||
State Bank of India Ltd. - GDR | 3 | 366 | ||||
UBS AG (c) | 27 | 440 | ||||
Unum Group | 18 | 443 | ||||
Wells Fargo & Co. | 19 | 601 | ||||
| 5,286 | ||||||
HEALTH CARE - 7.5% | ||||||
Astellas Pharma Inc. | 17 | 638 | ||||
AstraZeneca Plc | 8 | 382 | ||||
| Shares/Par (p) | Value | |||||
Merck & Co. Inc. | 14 | 503 | ||||
Pfizer Inc. | 41 | 725 | ||||
| 2,248 | ||||||
INDUSTRIALS - 16.9% | ||||||
ABM Industries Inc. | 17 | 445 | ||||
AGCO Corp. (c) | 11 | 552 | ||||
Hutchison Whampoa Ltd. | 63 | 648 | ||||
ITT Corp. | 5 | 255 | ||||
Nexans SA | 4 | 302 | ||||
Norfolk Southern Corp. | 7 | 442 | ||||
Shanghai Industrial Holdings Ltd. (e) | 76 | 329 | ||||
Siemens AG | 4 | 497 | ||||
Spirit Aerosystems Holdings Inc. (c) | 14 | 291 | ||||
Timken Co. | 12 | 578 | ||||
UTi Worldwide Inc. | 13 | 284 | ||||
Vallourec SA | 4 | 425 | ||||
| 5,048 | ||||||
INFORMATION TECHNOLOGY - 19.7% |
| |||||
Atmel Corp. (c) | 19 | 229 | ||||
eBay Inc. (c) | 26 | 732 | ||||
Ingram Micro Inc. - Class A (c) | 22 | 410 | ||||
Konica Minolta Holdings Inc. | 41 | 424 | ||||
Marvell Technology Group Ltd. (c) | 22 | 408 | ||||
Microsoft Corp. | 29 | 821 | ||||
Nomura Research Institute Ltd. | 13 | 291 | ||||
Parametric Technology Corp. (c) | 23 | 518 | ||||
QUALCOMM Inc. | 14 | 668 | ||||
SAP AG | 9 | 436 | ||||
Yahoo! Inc. (c) | 29 | 486 | ||||
Yokogawa Electric Corp. (c) | 60 | 477 | ||||
| 5,900 | ||||||
MATERIALS - 7.9% | ||||||
Anglo American Plc | 10 | 532 | ||||
Boral Ltd. | 106 | 522 | ||||
Koninklijke DSM NV | 12 | 670 | ||||
Sherritt International Corp. (e) | 22 | 186 | ||||
ThyssenKrupp AG | 11 | 463 | ||||
| 2,373 | ||||||
TELECOMMUNICATION SERVICES - 4.0% |
| |||||
China Communication Services Corp. Ltd. (e) | 452 | 269 | ||||
SK Telecom Co. Ltd. - ADR (e) | 27 | 499 | ||||
Vodafone Group Plc | 166 | 428 | ||||
| 1,196 | ||||||
UTILITIES - 1.3% | ||||||
EDP - Energias do Brasil SA | 16 | 378 | ||||
Total Common Stocks (cost $24,471) | 28,825 | |||||
PREFERRED STOCKS - 2.8% |
| |||||
INFORMATION TECHNOLOGY - 2.8% |
| |||||
Samsung Electronics Co. Ltd. | 1 | 849 | ||||
Total Preferred Stocks (cost $592) | 849 | |||||
SHORT TERM INVESTMENTS - 3.5% |
| |||||
Securities Lending Collateral 3.5% | ||||||
Securities Lending Cash Collateral Fund LLC, 0.31% (a) (h) | 1,053 | 1,053 | ||||
Total Short Term Investments (cost $1,053) | 1,053 | |||||
See accompanying Notes to the Financial Statements.
JNL Series Trust
Schedules of Investments (in thousands)
December 31, 2010
| Shares/Par (p) | Value | |||||
Total Investments - 102.6% (cost $26,116) | 30,727 | |||||
Other Assets and Liabilities, Net - (2.6%) | (789) | |||||
Total Net Assets - 100.0% | $ 29,938 | |||||
JNL/Mellon Capital Management 10 x 10 Fund (b) | ||||||
INVESTMENT COMPANIES - 100.0% |
| |||||
JNL/Mellon Capital Management Bond Index | ||||||
Fund (1.8%) (a) | 2,009 | $23,569 | ||||
JNL/Mellon Capital Management International Index Fund (2.2%) (a) | 1,882 | 23,489 | ||||
JNL/Mellon Capital Management JNL 5 Fund (3.7%) (a) | 14,937 | 129,950 | ||||
JNL/Mellon Capital Management S&P 400 MidCap Index Fund (4.1%) (a) | 1,998 | 27,689 | ||||
JNL/Mellon Capital Management S&P 500 Index Fund (1.9%) (a) | 2,375 | 25,149 | ||||
JNL/Mellon Capital Management Small Cap Index Fund (3.9%) (a) | 2,198 | 27,714 | ||||
Total Investment Companies (cost $226,982) | 257,560 | |||||
Total Investments - 100.0% | 257,560 | |||||
Other Assets and Liabilities, Net - (0.0% ) | (15) | |||||
Total Net Assets - 100.0% | $257,545 | |||||
JNL/Mellon Capital Management Index 5 Fund (b) | ||||||
INVESTMENT COMPANIES - 100.0% | ||||||
JNL/Mellon Capital Management Bond Index Fund (4.6%) (a) | 5,235 | $61,409 | ||||
JNL/Mellon Capital Management International Index Fund (5.6%) (a) | 4,904 | 61,204 | ||||
JNL/Mellon Capital Management S&P 400 MidCap Index Fund (10.8%) (a) | 5,205 | 72,145 | ||||
JNL/Mellon Capital Management S&P 500 Index Fund (4.9%) (a) | 6,188 | 65,528 | ||||
JNL/Mellon Capital Management Small Cap Index Fund (10.1%) (a) | 5,727 | 72,213 | ||||
Total Investment Companies | 332,499 | |||||
Total Investments - 100.0% (cost $275,702) | 332,499 | |||||
Other Assets and Liabilities, Net - (0.0% ) | (18) | |||||
Total Net Assets - 100.0% | $332,481 | |||||
JNL/Mellon Capital Management European 30 Fund | ||||||
COMMON STOCKS - 98.0% | ||||||
CONSUMER DISCRETIONARY - 6.1% |
| |||||
Next Plc | 18 | $ 568 | ||||
Vivendi SA | 21 | 561 | ||||
| 1,129 | ||||||
| Shares/Par (p) | Value | |||||
CONSUMER STAPLES - 3.6% | ||||||
Colruyt SA | 13 | 653 | ||||
ENERGY - 9.1% | ||||||
BP Plc (c) | 64 | 465 | ||||
Royal Dutch Shell Plc - B Shares | 21 | 700 | ||||
Total SA | 10 | 509 | ||||
| 1,674 | ||||||
FINANCIALS - 17.5% | ||||||
CNP Assurances SA | 26 | 461 | ||||
Hannover Rueckversicherung AG | 13 | 706 | ||||
Legal & General Group Plc | 467 | 705 | ||||
Topdanmark A/S (c) | 5 | 605 | ||||
Zurich Financial Services AG | 3 | 733 | ||||
| 3,210 | ||||||
HEALTH CARE - 25.9% | ||||||
AstraZeneca Plc | 13 | 602 | ||||
Celesio AG | 24 | 605 | ||||
GlaxoSmithKline Plc | 29 | 563 | ||||
H Lundbeck A/S | 34 | 647 | ||||
Novartis AG | 11 | 668 | ||||
Roche Holding AG | 4 | 535 | ||||
Sanofi-Aventis SA | 8 | 502 | ||||
Smith & Nephew Plc | 60 | 634 | ||||
| 4,756 | ||||||
INDUSTRIALS - 8.0% | ||||||
Balfour Beatty Plc | 146 | 710 | ||||
Societe BIC SA | 9 | 755 | ||||
| 1,465 | ||||||
MATERIALS - 4.0% | ||||||
Svenska Cellulosa AB | 46 | 733 | ||||
TELECOMMUNICATION SERVICES - 12.8% | ||||||
France Telecom SA | 25 | 517 | ||||
Koninklijke KPN NV | 37 | 533 | ||||
Mobistar SA | 9 | 586 | ||||
Swisscom AG | 2 | 713 | ||||
| 2,349 | ||||||
UTILITIES - 11.0% | ||||||
Enel SpA | 107 | 535 | ||||
Gas Natural SDG SA (e) | 29 | 442 | ||||
RWE AG | 6 | 426 | ||||
Snam Rete Gas SpA | 125 | 621 | ||||
| 2,024 | ||||||
Total Common Stocks (cost $17,982) | 17,993 | |||||
INVESTMENT COMPANIES - 1.8% |
| |||||
Vanguard European ETF | 6 | 318 | ||||
Total Investment Companies | 318 | |||||
SHORT TERM INVESTMENTS - 1.0% |
| |||||
Investment Company - 0.4% | ||||||
JNL Money Market Fund, 0.08% (a) (h) | 79 | 79 | ||||
Securities Lending Collateral 0.6% | ||||||
Securities Lending Cash Collateral Fund LLC, 0.31% (a) (h) | 112 | 112 | ||||
Total Short Term Investments | 191 | |||||
See accompanying Notes to the Financial Statements.
JNL Series Trust
Schedules of Investments (in thousands)
December 31, 2010
| Shares/Par (p) | Value | |||||
Total Investments - 100.8% (cost $18,494) | 18,502 | |||||
Other Assets and Liabilities, Net - (0.8%) | (143) | |||||
Total Net Assets - 100.0% | $18,359 | |||||
JNL/Mellon Capital Management Pacific Rim | ||||||
COMMON STOCKS - 96.1% | ||||||
CONSUMER DISCRETIONARY - 5.5% | ||||||
Esprit Holdings Ltd. | 171 | $812 | ||||
Tabcorp Holdings Ltd. | 183 | 1,333 | ||||
| 2,145 | ||||||
CONSUMER STAPLES - 16.2% | ||||||
FamilyMart Co. Ltd. | 39 | 1,460 | ||||
Foster’s Group Ltd. | 232 | 1,345 | ||||
Metcash Ltd. (e) | 285 | 1,200 | ||||
Nisshin Seifun Group Inc. | 85 | 1,069 | ||||
Woolworths Ltd. | 46 | 1,257 | ||||
| 6,331 | ||||||
FINANCIALS - 12.8% | ||||||
Bank of Yokohama Ltd. | 253 | 1,305 | ||||
China Bank Ltd. | 193 | 1,252 | ||||
Hang Seng Bank Ltd. | 78 | 1,274 | ||||
Stockland | 323 | 1,189 | ||||
| 5,020 | ||||||
HEALTH CARE - 8.9% | ||||||
Alfresa Holdings Corp. | 29 | 1,282 | ||||
Chugai Pharmaceutical Co. Ltd. (e) | 61 | 1,124 | ||||
Suzuken Co. Ltd. | 35 | 1,061 | ||||
| 3,467 | ||||||
INDUSTRIALS - 10.8% | ||||||
East Japan Railway Co. | 18 | 1,182 | ||||
Hong Kong Aircraft Engineering Co. Ltd. | 88 | 1,472 | ||||
Sumitomo Corp. | 113 | 1,591 | ||||
| 4,245 | ||||||
MATERIALS - 3.2% | ||||||
Sims Metal Management Ltd. | 57 | 1,268 | ||||
TELECOMMUNICATION SERVICES - 18.8% | ||||||
KDDI Corp. | — | 1,251 | ||||
Nippon Telegraph & Telephone Corp. | 29 | 1,330 | ||||
NTT DoCoMo Inc. | 1 | 1,433 | ||||
Singapore Telecommunications Ltd. | 517 | 1,229 | ||||
Telecom Corp. of New Zealand Ltd. | 626 | 1,058 | ||||
Telstra Corp. Ltd. | 369 | 1,053 | ||||
| 7,354 | ||||||
UTILITIES - 19.9% | ||||||
Cheung Kong Infrastructure Holdings Ltd. | 301 | 1,379 | ||||
CLP Holdings Ltd. | 170 | 1,376 | ||||
Hokuriku Electric Power Co. | 53 | 1,294 | ||||
Hongkong Electric Holdings Ltd. | 211 | 1,327 | ||||
Tokyo Electric Power Co. Inc. | 46 | 1,117 | ||||
Tokyo Gas Co. Ltd. | 288 | 1,275 | ||||
| 7,768 | ||||||
Total Common Stocks | 37,598 | |||||
| Shares/Par (p) | Value | |||||
INVESTMENT COMPANIES - 3.4% | ||||||
Vanguard Pacific Vipers | 23 | 1,330 | ||||
Total Investment Companies (cost $1,341) | 1,330 | |||||
SHORT TERM INVESTMENTS - 4.1% | ||||||
Investment Company - 0.3% | ||||||
JNL Money Market Fund, 0.08% (a) (h) | 134 | 134 | ||||
Securities Lending Collateral 3.8% | ||||||
Securities Lending Cash Collateral Fund LLC, | 1,475 | 1,475 | ||||
Total Short Term Investments (cost $1,609) | 1,609 | |||||
Total Investments - 103.6% (cost $38,409) | 40,537 | |||||
Other Assets and Liabilities, Net - (3.6%) | (1,402) | |||||
Total Net Assets - 100.0% | $39,135 | |||||
JNL/Mellon Capital Management S&P 500 | ||||||
COMMON STOCKS - 98.6% | ||||||
CONSUMER DISCRETIONARY - 10.5% | ||||||
Amazon.com Inc. (c) | 41 | $7,342 | ||||
Comcast Corp. - Class A | 323 | 7,097 | ||||
Ford Motor Co. (c) | 433 | 7,269 | ||||
Home Depot Inc. | 190 | 6,659 | ||||
McDonald’s Corp. | 122 | 9,388 | ||||
Time Warner Cable Inc. | 41 | 2,706 | ||||
Time Warner Inc. | 129 | 4,136 | ||||
Walt Disney Co. | 219 | 8,225 | ||||
Other Securities | 88,004 | |||||
| 140,826 | ||||||
CONSUMER STAPLES - 10.5% |
| |||||
Altria Group Inc. | 241 | 5,931 | ||||
Coca-Cola Co. | 269 | 17,660 | ||||
Coca-Cola Enterprises Inc. | 38 | 945 | ||||
CVS Caremark Corp. | 157 | 5,473 | ||||
Kraft Foods Inc. - Class A | 202 | 6,354 | ||||
PepsiCo Inc. | 184 | 12,047 | ||||
Philip Morris International Inc. | 210 | 12,296 | ||||
Procter & Gamble Co. | 324 | 20,856 | ||||
Wal-Mart Stores Inc. | 227 | 12,247 | ||||
Other Securities | 47,164 | |||||
| 140,973 | ||||||
ENERGY - 11.8% | ||||||
Chevron Corp. | 232 | 21,196 | ||||
ConocoPhillips | 170 | 11,585 | ||||
Exxon Mobil Corp. | 584 | 42,686 | ||||
Occidental Petroleum Corp. | 94 | 9,215 | ||||
Schlumberger Ltd. | 158 | 13,193 | ||||
Other Securities | 60,712 | |||||
| 158,587 | ||||||
FINANCIALS - 15.7% | ||||||
Bank of America Corp. | 1,166 | 15,558 | ||||
Bank of New York Mellon | 143 | 4,327 | ||||
Berkshire Hathaway Inc. - Class B (c) | 200 | 16,032 | ||||
Citigroup Inc. (c) | 3,360 | 15,891 | ||||
Goldman Sachs Group Inc. | 60 | 10,012 | ||||
JPMorgan Chase & Co. | 453 | 19,204 | ||||
See accompanying Notes to the Financial Statements.
JNL Series Trust
Schedules of Investments (in thousands)
December 31, 2010
| Shares/Par (p) | Value | |||||
U.S. Bancorp | 222 | 5,980 | ||||
Wells Fargo & Co. | 607 | 18,813 | ||||
Other Securities | 105,015 | |||||
| 210,832 | ||||||
HEALTH CARE - 10.7% | ||||||
Abbott Laboratories | 179 | 8,553 | ||||
Amgen Inc. (c) | 109 | 6,007 | ||||
Johnson & Johnson | 318 | 19,656 | ||||
Merck & Co. Inc. | 357 | 12,855 | ||||
Pfizer Inc. | 930 | 16,283 | ||||
Other Securities | 79,578 | |||||
| 142,932 | ||||||
INDUSTRIALS - 10.8% | ||||||
3M Co. | 82 | 7,117 | ||||
Boeing Co. | 85 | 5,559 | ||||
Caterpillar Inc. | 73 | 6,872 | ||||
General Electric Co. | 1,235 | 22,582 | ||||
United Parcel Service Inc. - Class B | 115 | 8,314 | ||||
United Technologies Corp. | 107 | 8,415 | ||||
Other Securities | 85,962 | |||||
| 144,821 | ||||||
INFORMATION TECHNOLOGY - 18.5% | ||||||
Apple Inc. (c) | 106 | 34,219 | ||||
Cisco Systems Inc. (c) | 643 | 13,000 | ||||
Google Inc. - Class A (c) | 29 | 17,132 | ||||
Hewlett-Packard Co. | 264 | 11,098 | ||||
Intel Corp. | 643 | 13,532 | ||||
International Business Machines Corp. | 144 | 21,120 | ||||
Microsoft Corp. | 872 | 24,339 | ||||
Oracle Corp. | 448 | 14,036 | ||||
QUALCOMM Inc. | 186 | 9,222 | ||||
Other Securities | 90,458 | |||||
| 248,156 | ||||||
MATERIALS - 3.8% | ||||||
Freeport-McMoRan Copper & Gold Inc. | 55 | 6,552 | ||||
Other Securities | 44,029 | |||||
| 50,581 | ||||||
TELECOMMUNICATION SERVICES - 3.1% |
| |||||
AT&T Inc. | 683 | 20,075 | ||||
Verizon Communications Inc. | 327 | 11,697 | ||||
Other Securities | 9,281 | |||||
| 41,053 | ||||||
UTILITIES - 3.2% | ||||||
Other Securities | 43,331 | |||||
Total Common Stocks | 1,322,092 | |||||
SHORT TERM INVESTMENTS - 2.3% |
| |||||
Investment Company - 1.2% | ||||||
JNL Money Market Fund, | 16,641 | 16,641 | ||||
Securities Lending Collateral 1.0% | ||||||
Securities Lending Cash Collateral Fund LLC, 0.31% (a) (h) | 11,362 | 11,362 | ||||
Securities Lending Liquidating Fund LLC, 0.66% (a) (h) | 1,807 | 1,777 | ||||
| 13,139 | ||||||
Treasury Securities 0.1% | ||||||
Other Securities | 1,295 | |||||
Total Short Term Investments (cost $31,104) | 31,075 | |||||
| Shares/Par (p) | Value | |||||
Total Investments - 100.9% (cost $1,194,276) |
| 1,353,167 | ||||
Other Assets and Liabilities, Net - (0.9%) |
| (11,867) | ||||
Total Net Assets - 100.0% | $1,341,300 | |||||
JNL/Mellon Capital Management S&P 400 MidCap Index Fund * (x) | ||||||
COMMON STOCKS - 98.1% |
| |||||
CONSUMER DISCRETIONARY - 14.0% |
| |||||
Advance Auto Parts Inc. | 50 | $3,300 | ||||
BorgWarner Inc. (c) | 67 | 4,882 | ||||
Chipotle Mexican Grill Inc. - Class A (c) | 18 | 3,904 | ||||
Dollar Tree Inc. (c) | 74 | 4,166 | ||||
PetSmart Inc. | 70 | 2,780 | ||||
Other Securities | 74,709 | |||||
| 93,741 | ||||||
CONSUMER STAPLES - 3.5% | ||||||
Church & Dwight Co. Inc. | 42 | 2,914 | ||||
Energizer Holdings Inc. (c) | 42 | 3,054 | ||||
Other Securities | 17,785 | |||||
| 23,753 | ||||||
ENERGY - 5.8% | ||||||
Arch Coal Inc. | 96 | 3,381 | ||||
Cimarex Energy Co. | 50 | 4,448 | ||||
Plains Exploration & Production Co. (c) | 83 | 2,674 | ||||
Pride International Inc. (c) | 104 | 3,442 | ||||
Other Securities | 25,032 | |||||
| 38,977 | ||||||
FINANCIALS - 19.4% | ||||||
Affiliated Managers Group Inc. (c) | 31 | 3,037 | ||||
AMB Property Corp. | 100 | 3,169 | ||||
Everest Re Group Ltd. | 32 | 2,756 | ||||
Federal Realty Investment Trust | 37 | 2,846 | ||||
Macerich Co. | 77 | 3,657 | ||||
MSCI Inc. - Class A (c) | 71 | 2,747 | ||||
Nationwide Health Properties Inc. | 75 | 2,727 | ||||
New York Community Bancorp Inc. | 258 | 4,870 | ||||
SL Green Realty Corp. | 46 | 3,136 | ||||
Other Securities | 100,997 | |||||
| 129,942 | ||||||
HEALTH CARE - 10.9% | ||||||
Beckman Coulter Inc. | 41 | 3,092 | ||||
Edwards Lifesciences Corp. (c) | 68 | 5,474 | ||||
Henry Schein Inc. (c) | 55 | 3,362 | ||||
Hologic Inc. (c) | 154 | 2,904 | ||||
Mettler Toledo International Inc. (c) | 19 | 2,946 | ||||
Perrigo Co. | 49 | 3,120 | ||||
ResMed Inc. (c) (e) | 90 | 3,108 | ||||
Vertex Pharmaceuticals Inc. (c) | 121 | 4,222 | ||||
Other Securities | 44,848 | |||||
| 73,076 | ||||||
INDUSTRIALS - 15.9% | ||||||
AGCO Corp. (c) (e) | 55 | 2,799 | ||||
AMETEK Inc. | 95 | 3,727 | ||||
Bucyrus International Inc. - Class A | 48 | 4,296 | ||||
Donaldson Co. Inc. | 45 | 2,647 | ||||
Joy Global Inc. | 61 | 5,313 | ||||
Kansas City Southern (c) | 61 | 2,915 | ||||
KBR Inc. | 89 | 2,697 | ||||
See accompanying Notes to the Financial Statements.
JNL Series Trust
Schedules of Investments (in thousands)
December 31, 2010
| Shares/Par (p) | Value | |||
Manpower Inc. | 48 | 3,038 | ||
Other Securities | 79,360 | |||
| 106,792 | ||||
INFORMATION TECHNOLOGY - 15.3% | ||||
Ansys Inc. (c) | 54 | 2,813 | ||
Atmel Corp. (c) | 272 | 3,351 | ||
Avnet Inc. (c) | 90 | 2,979 | ||
Cree Inc. (c) (e) | 64 | 4,239 | ||
Lam Research Corp. (c) | 73 | 3,778 | ||
Riverbed Technology Inc. (c) | 87 | 3,069 | ||
Rovi Corp. (c) | 62 | 3,870 | ||
Skyworks Solutions Inc. (c) | 109 | 3,115 | ||
Trimble Navigation Ltd. (c) | 71 | 2,847 | ||
Other Securities | 72,942 | |||
| 103,003 | ||||
MATERIALS - 6.7% | ||||
Albemarle Corp. | 54 | 3,032 | ||
Lubrizol Corp. | 39 | 4,161 | ||
Other Securities | 37,654 | |||
| 44,847 | ||||
TELECOMMUNICATION SERVICES - 0.8% | ||||
Other Securities | 5,145 | |||
UTILITIES - 5.8% | ||||
National Fuel Gas Co. | 49 | 3,201 | ||
NSTAR | 62 | 2,595 | ||
OGE Energy Corp. | 58 | 2,636 | ||
Other Securities | 30,261 | |||
| 38,693 | ||||
Total Common Stocks (cost $575,619) | 657,969 | |||
SHORT TERM INVESTMENTS - 8.1% | ||||
Investment Company - 1.8% | ||||
JNL Money Market Fund, | 12,073 | 12,073 | ||
Securities Lending Collateral 6.1% | ||||
Securities Lending Cash Collateral Fund LLC, 0.31% (a) (h) | 38,464 | 38,464 | ||
Securities Lending Liquidating Fund LLC, 0.66% (a) (h) | 2,723 | 2,677 | ||
| 41,141 | ||||
Treasury Securities 0.2% | ||||
Other Securities | 940 | |||
Total Short Term Investments (cost $54,199) | 54,154 | |||
Total Investments - 106.2% | 712,123 | |||
Other Assets and Liabilities, | (41,313) | |||
Total Net Assets - 100.0% | $670,810 | |||
JNL/Mellon Capital Management Small Cap Index Fund * (x) | ||||
COMMON STOCKS - 97.9% | ||||
CONSUMER DISCRETIONARY - 13.6% | ||||
Dana Holding Corp. (c) | 84 | $1,447 | ||
Deckers Outdoor Corp. (c) | 23 | 1,847 | ||
Polaris Industries Inc. | 19 | 1,458 | ||
Sotheby’s - Class A | 40 | 1,807 | ||
Tenneco Inc. (c) | 35 | 1,445 | ||
| Shares/Par (p) | Value | |||||
Warnaco Group Inc. (c) | 26 | 1,434 | ||||
Other Securities | 87,929 | |||||
| 97,367 | ||||||
CONSUMER STAPLES - 2.9% | ||||||
Other Securities | 20,350 | |||||
ENERGY - 6.3% | ||||||
Berry Petroleum Co. - Class A (e) | 30 | 1,315 | ||||
Brigham Exploration Co. (c) | 70 | 1,899 | ||||
Complete Production Services Inc. (c) | 47 | 1,379 | ||||
Dril-Quip Inc. (c) | 20 | 1,582 | ||||
World Fuel Services Corp. | 40 | 1,460 | ||||
Other Securities | 37,198 | |||||
| 44,833 | ||||||
FINANCIALS - 20.1% | ||||||
American Capital Ltd. (c) | 204 | 1,540 | ||||
Apollo Investment Corp. | 116 | 1,289 | ||||
BioMed Realty Trust Inc. | 77 | 1,430 | ||||
CBL & Associates Properties Inc. | 83 | 1,450 | ||||
Entertainment Properties Trust | 28 | 1,292 | ||||
FirstMerit Corp. | 64 | 1,267 | ||||
Highwoods Properties Inc. | 42 | 1,337 | ||||
MFA Financial Inc. | 164 | 1,341 | ||||
National Retail Properties Inc. (e) | 50 | 1,326 | ||||
Omega Healthcare Investors Inc. | 58 | 1,306 | ||||
Stifel Financial Corp. (c) | 21 | 1,273 | ||||
SVB Financial Group (c) | 25 | 1,316 | ||||
Other Securities | 127,244 | |||||
| 143,411 | ||||||
HEALTH CARE - 12.0% | ||||||
AMERIGROUP Corp. (c) | 31 | 1,363 | ||||
Onyx Pharmaceuticals Inc. (c) | 38 | 1,388 | ||||
Salix Pharmaceuticals Ltd. (c) | 34 | 1,606 | ||||
STERIS Corp. | 36 | 1,298 | ||||
Other Securities | 80,316 | |||||
| 85,971 | ||||||
INDUSTRIALS - 15.4% | ||||||
Acuity Brands Inc. (e) | 26 | 1,505 | ||||
Baldor Electric Co. | 28 | 1,734 | ||||
CLARCOR Inc. | 30 | 1,271 | ||||
GrafTech International Ltd. (c) | 72 | 1,434 | ||||
Nordson Corp. | 20 | 1,878 | ||||
Woodward Governor Co. | 37 | 1,374 | ||||
Other Securities | 101,208 | |||||
| 110,404 | ||||||
INFORMATION TECHNOLOGY - 18.2% | ||||||
Acme Packet Inc. (c) | 26 | 1,397 | ||||
ADTRAN Inc. | 37 | 1,353 | ||||
Ariba Inc. (c) | 54 | 1,269 | ||||
Finisar Corp. (c) (e) | 45 | 1,347 | ||||
Jack Henry & Associates Inc. | 50 | 1,459 | ||||
Parametric Technology Corp. (c) | 68 | 1,533 | ||||
Rackspace Hosting Inc. (c) (e) | 58 | 1,824 | ||||
Riverbed Technology Inc. (c) | 75 | 2,649 | ||||
TIBCO Software Inc. (c) | 99 | 1,959 | ||||
VeriFone Holdings Inc. (c) | 51 | 1,971 | ||||
Other Securities | 113,297 | |||||
| 130,058 | ||||||
MATERIALS - 5.6% | ||||||
Coeur d’Alene Mines Corp. (c) | 53 | 1,445 | ||||
Hecla Mining Co. (c) (e) | 151 | 1,697 | ||||
Solutia Inc. (c) | 73 | 1,679 | ||||
See accompanying Notes to the Financial Statements.
JNL Series Trust
Schedules of Investments (in thousands)
December 31, 2010
| Shares/Par (p) | Value | |||||
Thompson Creek Metals Co. Inc. (c) | 97 | 1,429 | ||||
WR Grace & Co. (c) | 44 | 1,532 | ||||
Other Securities | 32,113 | |||||
| 39,895 | ||||||
TELECOMMUNICATION SERVICES - 0.9% |
| |||||
Syniverse Holdings Inc. (c) | 42 | 1,292 | ||||
Other Securities | 5,414 | |||||
| 6,706 | ||||||
UTILITIES - 2.9% | ||||||
Nicor Inc. | 27 | 1,326 | ||||
Other Securities | 19,551 | |||||
| 20,877 | ||||||
Total Common Stocks | 699,872 | |||||
WARRANTS - 0.0% | ||||||
Other Securities | — | |||||
Total Warrants (cost $0) | — | |||||
SHORT TERM INVESTMENTS - 13.6% | ||||||
Investment Company - 1.8% | ||||||
JNL Money Market Fund, 0.08% (a) (h) | 12,878 | 12,878 | ||||
Securities Lending Collateral 11.7% | ||||||
Securities Lending Cash Collateral Fund LLC, 0.31% (a) (h) | 79,415 | 79,415 | ||||
Securities Lending Liquidating Fund LLC, 0.66% (a) (h) | 3,767 | 3,705 | ||||
| 83,120 | ||||||
Treasury Securities 0.1% | ||||||
Other Securities | 895 | |||||
Total Short Term Investments (cost $96,955) | 96,893 | |||||
Total Investments - 111.5% (cost $676,575) | 796,765 | |||||
Other Assets and Liabilities, | (81,946) | |||||
Total Net Assets - 100.0% | $ | 714,819 | ||||
JNL/Mellon Capital Management International Index Fund * (x) | ||||||
COMMON STOCKS - 96.3% | ||||||
CONSUMER DISCRETIONARY -9.9% | ||||||
Daimler AG (c) | 87 $ | 5,882 | ||||
Honda Motor Co. Ltd. (e) | 157 | 6,177 | ||||
Toyota Motor Corp. | 264 | 10,408 | ||||
Other Securities | 84,725 | |||||
| 107,192 | ||||||
CONSUMER STAPLES - 9.6% | ||||||
British American Tobacco Plc | 192 | 7,358 | ||||
Diageo Plc | 241 | 4,450 | ||||
Nestle SA | 332 | 19,441 | ||||
Tesco Plc | 771 | 5,108 | ||||
Unilever NV | 157 | 4,873 | ||||
Unilever Plc | 123 | 3,779 | ||||
Other Securities | 59,825 | |||||
| 104,834 | ||||||
ENERGY - 7.6% | ||||||
BG Group Plc | 325 | 6,558 | ||||
| Shares/Par (p) | Value | |||||
BP Plc (c) | 1,801 | 13,069 | ||||
ENI SpA | 250 | 5,480 | ||||
Royal Dutch Shell Plc - A Shares | 340 | 11,331 | ||||
Royal Dutch Shell Plc - B Shares | 259 | 8,526 | ||||
Total SA | 203 | 10,734 | ||||
Other Securities | 27,274 | |||||
| 82,972 | ||||||
FINANCIALS - 23.1% | ||||||
Allianz SE | 44 | 5,182 | ||||
Australia & New Zealand Banking Group Ltd. | 246 | 5,869 | ||||
Banco Bilbao Vizcaya Argentaria SA (e) | 411 | 4,186 | ||||
Banco Santander SA | 789 | 8,409 | ||||
Barclays Plc | 1,100 | 4,487 | ||||
BNP Paribas | 92 | 5,854 | ||||
Commonwealth Bank of Australia (e) | 149 | 7,716 | ||||
Credit Suisse Group AG | 108 | 4,362 | ||||
Deutsche Bank AG | 90 | 4,676 | ||||
HSBC Holdings Plc | 1,686 | 17,120 | ||||
Mitsubishi UFJ Financial Group Inc. | 1,223 | 6,593 | ||||
National Australia Bank Ltd. | 205 | 4,968 | ||||
Prudential plc (a) | 245 | 2,552 | ||||
Standard Chartered Plc | 224 | 6,022 | ||||
Sumitomo Mitsui Financial Group Inc. | 129 | 4,575 | ||||
UBS AG (c) | 349 | 5,738 | ||||
Westpac Banking Corp. | 287 | 6,518 | ||||
Other Securities | 145,993 | |||||
| 250,820 | ||||||
HEALTH CARE - 7.8% | ||||||
AstraZeneca Plc | 138 | 6,266 | ||||
Bayer AG | 79 | 5,857 | ||||
GlaxoSmithKline Plc | 498 | 9,624 | ||||
Novartis AG | 202 | 11,905 | ||||
Novo-Nordisk A/S | 40 | 4,535 | ||||
Roche Holding AG | 67 | 9,874 | ||||
Sanofi-Aventis SA | 101 | 6,435 | ||||
Teva Pharmaceutical Industries Ltd. | 90 | 4,715 | ||||
Other Securities | 26,088 | |||||
| 85,299 | ||||||
INDUSTRIALS - 12.3% | ||||||
ABB Ltd. (c) | 211 | 4,703 | ||||
Siemens AG | 79 | 9,821 | ||||
Other Securities | 119,093 | |||||
| 133,617 | ||||||
INFORMATION TECHNOLOGY - 4.8% | ||||||
Canon Inc. (e) | 109 | 5,594 | ||||
SAP AG | 83 | 4,190 | ||||
Other Securities | 42,601 | |||||
| 52,385 | ||||||
MATERIALS - 11.1% | ||||||
Anglo American Plc | 127 | 6,585 | ||||
BASF SE | 88 | 7,069 | ||||
BHP Billiton Ltd. (e) | 322 | 14,891 | ||||
BHP Billiton Plc | 212 | 8,418 | ||||
Rio Tinto Ltd. (e) | 42 | 3,665 | ||||
Rio Tinto Plc | 139 | 9,721 | ||||
Xstrata Plc | 198 | 4,641 | ||||
Other Securities | 66,302 | |||||
| 121,292 | ||||||
TELECOMMUNICATION SERVICES - 5.2% | ||||||
Telefonica SA | 394 | 8,992 | ||||
Vodafone Group Plc | 5,054 | 13,065 | ||||
See accompanying Notes to the Financial Statements.
JNL Series Trust
Schedules of Investments (in thousands)
December 31, 2010
| Shares/Par (p) | Value | |||||
Other Securities | 34,775 | |||||
| 56,832 | ||||||
UTILITIES - 4.9% | ||||||
E.ON AG | 173 | 5,267 | ||||
GDF Suez | 119 | 4,267 | ||||
Other Securities | 43,428 | |||||
| 52,962 | ||||||
Total Common Stocks (cost $1,002,987) | 1,048,205 | |||||
PREFERRED STOCKS - 0.6% | ||||||
CONSUMER DISCRETIONARY - 0.2% | ||||||
Other Securities | 3,641 | |||||
CONSUMER STAPLES - 0.1% | ||||||
Other Securities | 1,325 | |||||
HEALTH CARE - 0.1% | ||||||
Other Securities | 651 | |||||
INDUSTRIALS - 0.1% | ||||||
Other Securities | 548 | |||||
TELECOMMUNICATION SERVICES - 0.1% | ||||||
Other Securities | 604 | |||||
UTILITIES - 0.0% | ||||||
Other Securities | 250 | |||||
Total Preferred Stocks | 7,019 | |||||
OTHER EQUITY INTERESTS - 0.0% | ||||||
Other Securities | — | |||||
Total Other Equity Interests (cost $0) | — | |||||
SHORT TERM INVESTMENTS - 8.0% | ||||||
Investment Company - 2.6% | ||||||
JNL Money Market Fund, 0.08% (a) (h) | 28,075 | 28,075 | ||||
Securities Lending Collateral 5.2% | ||||||
Securities Lending Cash Collateral Fund LLC, 0.31% (a) (h) | 54,516 | 54,516 | ||||
Securities Lending Liquidating Fund LLC, 0.66% (a) (h) | 1,988 | 1,955 | ||||
| 56,471 | ||||||
Treasury Securities 0.2% | ||||||
Other Securities | 1,709 | |||||
Total Short Term Investments (cost $86,288) | 86,255 | |||||
Total Investments - 104.9% (cost $1,094,723) | 1,141,479 | |||||
Other Assets and Liabilities, Net - (4.9%) | (53,192) | |||||
Total Net Assets - 100.0% | $1,088,287 | |||||
JNL/Mellon Capital Management Bond Index Fund | ||||||
NON-U.S. GOVERNMENT AGENCY ASSET-BACKED SECURITIES - 2.8% | ||||||
Banc of America Commercial Mortgage Inc. REMIC | ||||||
5.74%, 05/10/45 (i) | $ | 1,500 | $1,642 | |||
5.77%, 05/10/45 (i) | 550 | 577 | ||||
4.89%, 07/10/45 | 370 | 380 | ||||
| Shares/Par (p) | Value | |||||
5.45%, 01/15/49 | 200 | 208 | ||||
5.45%, 01/15/49 | 1,500 | 1,565 | ||||
5.48%, 01/15/49 (i) | 350 | 342 | ||||
Bear Stearns Commercial Mortgage Securities Inc. REMIC | ||||||
5.72%, 05/11/17 (i) | 300 | 320 | ||||
5.12%, 02/11/41 (i) | 1,150 | 1,216 | ||||
5.54%, 10/12/41 | 1,250 | 1,346 | ||||
5.21%, 02/11/44 | 260 | 266 | ||||
Capital One Multi-Asset Execution Trust, | ||||||
4.70%, 06/15/15 | 1,000 | 1,059 | ||||
Centerpoint Energy Transition Co. LLC | ||||||
Secured Transition Bond, 5.17%, 08/01/19 | 741 | 828 | ||||
Citibank Credit Card Issuance Trust, 5.30%, 03/15/16 | 900 | 1,009 | ||||
Citigroup Commercial Mortgage Trust REMIC, | ||||||
5.25%, 04/15/40 (i) | 204 | 212 | ||||
Citigroup/Deutsche Bank Commercial Mortgage Trust REMIC | ||||||
5.32%, 03/11/12 | 1,000 | 1,037 | ||||
5.62%, 10/15/48 | 250 | 268 | ||||
5.65%, 10/15/48 | 500 | 477 | ||||
Commercial Mortgage Loan Trust REMIC, 6.01%, 12/10/49 (i) | 750 | 713 | ||||
Continental Airlines Inc. Pass Through Trust - Class A, 4.75%, 01/12/21 | 300 | 300 | ||||
Credit Suisse First Boston Mortgage Securities Corp. REMIC, 4.94%, 12/15/35 | 700 | 735 | ||||
Credit Suisse Mortgage Capital Certificates REMIC, 5.38%, 02/15/40 | 250 | 254 | ||||
CS First Boston Mortgage Securities Corp. REMIC | ||||||
5.01%, 01/15/12 (i) | 800 | 850 | ||||
5.42%, 05/15/36 (i) | 350 | 373 | ||||
5.10%, 08/15/38 (i) | 350 | 363 | ||||
Delta Air Lines Pass-Through Trust - Class A, | ||||||
6.82%, 02/10/24 (i) | 406 | 431 | ||||
GE Capital Commercial Mortgage Corp. | ||||||
REMIC, 5.32%, 11/10/45 (i) | 200 | 200 | ||||
Greenwich Capital Commercial Funding Corp. REMIC | ||||||
4.57%, 01/10/12 | 500 | 511 | ||||
5.28%, 04/10/37 (i) | 1,000 | 1,009 | ||||
GS Mortgage Securities Corp. II REMIC | ||||||
5.56%, 11/10/39 | 400 | 424 | ||||
5.81%, 08/10/45 (e) (i) | 850 | 889 | ||||
JPMorgan Chase & Co. Commercial Mortgage Securities Inc. REMIC, 5.74%, 05/12/17 (i) | 1,000 | 989 | ||||
JPMorgan Chase Commercial Mortgage Securities Corp. REMIC | ||||||
5.17%, 08/12/40 (i) | 403 | 419 | ||||
5.36%, 06/12/41 (i) | 850 | 909 | ||||
4.88%, 01/15/42 | 750 | 782 | ||||
4.74%, 07/15/42 | 500 | 522 | ||||
4.78%, 07/15/42 | 500 | 505 | ||||
4.94%, 08/15/42 (i) | 278 | 295 | ||||
5.42%, 01/15/49 (e) | 250 | 260 | ||||
5.74%, 02/12/49 (i) | 200 | 212 | ||||
5.79%, 02/12/51 (i) | 521 | 555 | ||||
LB-UBS Commercial Mortgage Trust REMIC | ||||||
3.85%, 05/15/27 | 138 | 142 | ||||
3.97%, 03/15/29 | 250 | 255 | ||||
5.59%, 06/15/31 | 75 | 78 | ||||
4.17%, 05/15/32 | 165 | 172 | ||||
5.66%, 03/15/39 (i) | 750 | 806 | ||||
5.42%, 02/15/40 | 330 | 347 | ||||
5.87%, 09/15/45 (i) | 2,000 | 2,104 | ||||
See accompanying Notes to the Financial Statements.
JNL Series Trust
Schedules of Investments (in thousands)
December 31, 2010
| Shares/Par (p) | Value | |||||
Merrill Lynch Mortgage Trust REMIC, 5.74%, 08/12/43 (i) | 250 | 269 | ||||
Merrill Lynch/Countrywide Commercial Mortgage Trust REMIC | ||||||
5.47%, 02/12/39 (i) | 250 | 260 | ||||
5.41%, 07/12/46 (i) | 200 | 211 | ||||
5.17%, 12/12/49 | 200 | 207 | ||||
5.75%, 06/12/50 (i) | 532 | 558 | ||||
Morgan Stanley Capital I REMIC | ||||||
5.60%, 06/12/12 (i) | 390 | 405 | ||||
5.60%, 03/12/17 (i) | 400 | 395 | ||||
4.80%, 01/13/41 | 250 | 262 | ||||
5.33%, 11/12/41 | 250 | 265 | ||||
5.73%, 10/15/42 (i) | 270 | 296 | ||||
Nissan Auto Receivables Owner Trust, 5.05%, 11/17/14 | 750 | 786 | ||||
Wachovia Bank Commercial Mortgage Trust REMIC | ||||||
4.44%, 11/15/34 | 43 | 43 | ||||
5.22%, 01/15/41 | 100 | 106 | ||||
5.31%, 07/15/41 (i) | 250 | 269 | ||||
4.89%, 10/15/41 | 200 | 195 | ||||
4.90%, 10/15/41 (i) | 500 | 512 | ||||
5.12%, 07/15/42 (i) | 410 | 440 | ||||
5.25%, 12/15/43 | 500 | 508 | ||||
5.36%, 12/15/44 (i) | 200 | 187 | ||||
5.42%, 01/15/45 (i) | 350 | 375 | ||||
5.99%, 06/15/45 (i) | 500 | 440 | ||||
5.57%, 10/15/48 | 250 | 262 | ||||
5.31%, 11/15/48 | 1,082 | 1,128 | ||||
Total Non-U.S. Government Agency Asset- Backed Securities | 37,535 | |||||
CORPORATE BONDS AND NOTES - 21.1% | ||||||
CONSUMER DISCRETIONARY - 1.6% |
| |||||
Ace INA Holdings Inc., 5.88%, 06/15/14 | 500 | 561 | ||||
CBS Corp., 5.75%, 04/15/20 (e) | 700 | 744 | ||||
Comcast Cable Communications Holdings Inc. | ||||||
8.38%, 03/15/13 | 357 | 406 | ||||
9.46%, 11/15/22 | 500 | 692 | ||||
Comcast Corp. | ||||||
5.30%, 01/15/14 | 500 | 545 | ||||
6.50%, 01/15/15 | 50 | 57 | ||||
5.15%, 03/01/20 (e) | 1,000 | 1,050 | ||||
5.65%, 06/15/35 | 100 | 97 | ||||
6.50%, 11/15/35 | 100 | 107 | ||||
6.95%, 08/15/37 | 100 | 113 | ||||
COX Communications Inc., 5.45%, 12/15/14 | 150 | 165 | ||||
Daimler Finance North America LLC | ||||||
6.50%, 11/15/13 | 100 | 113 | ||||
8.50%, 01/18/31 (e) | 550 | 735 | ||||
Diageo Capital Plc, 4.83%, 07/15/20 (e) | 895 | 944 | ||||
DirecTV Holdings LLC | ||||||
3.55%, 03/15/15 (e) | 200 | 203 | ||||
4.60%, 02/15/21 | 200 | 197 | ||||
6.00%, 08/15/40 (e) | 200 | 201 | ||||
Discovery Communications LLC | ||||||
3.70%, 06/01/15 (e) | 100 | 104 | ||||
5.63%, 08/15/19 | 100 | 110 | ||||
5.05%, 06/01/20 (e) | 200 | 212 | ||||
6.35%, 06/01/40 | 100 | 108 | ||||
Fortune Brands Inc., 5.38%, 01/15/16 | 250 | 259 | ||||
Grupo Televisa SA, 6.63%, 03/18/25 | 100 | 112 | ||||
Hasbro Inc., 6.35%, 03/15/40 | 300 | 304 | ||||
Historic TW Inc., 6.63%, 05/15/29 | 100 | 110 | ||||
| Shares/Par (p) | Value | |||||
Home Depot Inc. | ||||||
5.25%, 12/16/13 | 250 | 274 | ||||
5.40%, 03/01/16 | 500 | 560 | ||||
5.88%, 12/16/36 | 250 | 260 | ||||
Johnson Controls Inc., 5.50%, 01/15/16 | 250 | 273 | ||||
Lowe’s Cos. Inc. | ||||||
4.63%, 04/15/20 (e) | 100 | 105 | ||||
5.50%, 10/15/35 | 150 | 151 | ||||
5.80%, 04/15/40 | 100 | 106 | ||||
McDonald’s Corp., 5.35%, 03/01/18 | 300 | 337 | ||||
NBC Universal Inc. | ||||||
2.10%, 04/01/14 (r) | 500 | 499 | ||||
5.15%, 04/30/20 (r) | 200 | 207 | ||||
6.40%, 04/30/40 (r) | 200 | 212 | ||||
News America Inc. | ||||||
5.30%, 12/15/14 | 175 | 193 | ||||
5.65%, 08/15/20 (e) | 300 | 336 | ||||
6.20%, 12/15/34 | 50 | 53 | ||||
6.40%, 12/15/35 | 100 | 107 | ||||
6.65%, 11/15/37 | 500 | 554 | ||||
Omnicom Group Inc., 5.90%, 04/15/16 | 250 | 279 | ||||
Reed Elsevier Capital Inc., 8.63%, 01/15/19 | 500 | 636 | ||||
Target Corp. | ||||||
5.88%, 07/15/16 | 250 | 289 | ||||
7.00%, 07/15/31 | 100 | 120 | ||||
6.50%, 10/15/37 | 300 | 350 | ||||
Thomson Reuters Corp., 6.50%, 07/15/18 | 500 | 583 | ||||
Time Warner Cable Inc. | ||||||
6.20%, 07/01/13 | 700 | 777 | ||||
5.85%, 05/01/17 (e) | 150 | 167 | ||||
8.75%, 02/14/19 | 169 | 215 | ||||
6.55%, 05/01/37 (e) | 250 | 268 | ||||
7.30%, 07/01/38 | 300 | 351 | ||||
6.75%, 06/15/39 (e) | 300 | 331 | ||||
Time Warner Inc. | ||||||
3.15%, 07/15/15 | 200 | 203 | ||||
5.88%, 11/15/16 | 350 | 395 | ||||
4.70%, 01/15/21 (e) | 200 | 204 | ||||
7.63%, 04/15/31 | 250 | 304 | ||||
6.20%, 03/15/40 (e) | 400 | 425 | ||||
6.10%, 07/15/40 (e) | 200 | 210 | ||||
Toll Brothers Finance Corp., 4.95%, 03/15/14 | 50 | 51 | ||||
Viacom Inc. | ||||||
6.25%, 04/30/16 | 250 | 285 | ||||
5.63%, 09/15/19 (e) | 500 | 556 | ||||
7.88%, 07/30/30 | 125 | 148 | ||||
Walt Disney Co. | ||||||
6.38%, 03/01/12 | 500 | 533 | ||||
7.00%, 03/01/32 | 50 | 61 | ||||
Yale University, 2.90%, 10/15/14 (e) | 300 | 309 | ||||
Yum! Brands Inc., 6.88%, 11/15/37 (e) | 200 | 227 | ||||
| 20,753 | ||||||
CONSUMER STAPLES - 1.3% | ||||||
Altria Group Inc. | ||||||
8.50%, 11/10/13 (l) | 500 | 592 | ||||
9.70%, 11/10/18 (l) | 500 | 660 | ||||
9.25%, 08/06/19 (e) (l) | 100 | 131 | ||||
9.95%, 11/10/38 (l) | 100 | 141 | ||||
10.20%, 02/06/39 (l) | 100 | 145 | ||||
Anheuser-Busch Cos. Inc. | ||||||
4.95%, 01/15/14 (e) | 200 | 215 | ||||
5.05%, 10/15/16 | 100 | 108 | ||||
6.45%, 09/01/37 | 200 | 229 | ||||
Anheuser-Busch InBev Worldwide Inc. | ||||||
3.00%, 10/15/12 | 100 | 103 | ||||
5.38%, 01/15/20 (e) | 400 | 433 | ||||
Archer-Daniels-Midland Co., 5.45%, 03/15/18 | 350 | 389 | ||||
See accompanying Notes to the Financial Statements.
JNL Series Trust
Schedules of Investments (in thousands)
December 31, 2010
| Shares/Par (p) | Value | |||||
Bottling Group LLC, 6.95%, 03/15/14 | 200 | 232 | ||||
Bunge Ltd. Finance Corp., 5.35%, 04/15/14 | 75 | 79 | ||||
Coca-Cola Co., 0.75%, 11/15/13 | 600 | 592 | ||||
ConAgra Foods Inc., 7.00%, 04/15/19 | 300 | 346 | ||||
CVS Caremark Corp. | ||||||
6.13%, 08/15/16 | 250 | 284 | ||||
5.75%, 06/01/17 | 500 | 556 | ||||
Diageo Investment Corp., 8.00%, 09/15/22 | 100 | 125 | ||||
General Mills Inc. | ||||||
6.00%, 02/15/12 | 100 | 105 | ||||
5.65%, 09/10/12 | 500 | 538 | ||||
H.J. Heinz Finance Co., 6.75%, 03/15/32 | 100 | 110 | ||||
Kellogg Co. | ||||||
5.13%, 12/03/12 | 200 | 214 | ||||
4.00%, 12/15/20 | 400 | 394 | ||||
Kimberly-Clark Corp., 5.63%, 02/15/12 | 250 | 263 | ||||
Kraft Foods Inc. | ||||||
6.25%, 06/01/12 | 183 | 196 | ||||
5.25%, 10/01/13 | 400 | 437 | ||||
4.13%, 02/09/16 | 100 | 105 | ||||
6.13%, 02/01/18 | 300 | 343 | ||||
5.38%, 02/10/20 | 100 | 108 | ||||
6.50%, 11/01/31 (e) | 100 | 111 | ||||
7.00%, 08/11/37 | 300 | 351 | ||||
6.88%, 02/01/38 | 150 | 174 | ||||
6.88%, 01/26/39 | 100 | 117 | ||||
6.50%, 02/09/40 (e) | 100 | 112 | ||||
Kroger Co. | ||||||
5.50%, 02/01/13 | 100 | 108 | ||||
6.40%, 08/15/17 | 200 | 230 | ||||
7.50%, 04/01/31 (e) | 150 | 181 | ||||
Lorillard Tobacco Co., 8.13%, 06/23/19 (l) | 500 | 556 | ||||
Pepsi Bottling Group Inc., 7.00%, 03/01/29 | 75 | 92 | ||||
PepsiCo Inc. | ||||||
5.15%, 05/15/12 | 300 | 317 | ||||
4.65%, 02/15/13 | 800 | 861 | ||||
7.90%, 11/01/18 (e) | 55 | 71 | ||||
3.13%, 11/01/20 | 300 | 282 | ||||
5.50%, 01/15/40 | 300 | 317 | ||||
Philip Morris International Inc. | ||||||
6.88%, 03/17/14 | 500 | 576 | ||||
5.65%, 05/16/18 | 250 | 282 | ||||
Procter & Gamble Co. | ||||||
4.95%, 08/15/14 | 150 | 167 | ||||
5.55%, 03/05/37 | 100 | 109 | ||||
Reynolds American Inc., 7.63%, 06/01/16 (e) | 250 | 291 | ||||
Safeway Inc. | ||||||
5.80%, 08/15/12 | 100 | 108 | ||||
6.35%, 08/15/17 | 500 | 558 | ||||
The Proctor And Gamble Co., 4.70%, | ||||||
02/15/19 (e) | 500 | 541 | ||||
Wal-Mart Stores Inc. | ||||||
4.55%, 05/01/13 | 100 | 108 | ||||
2.25%, 07/08/15 | 300 | 298 | ||||
5.80%, 02/15/18 | 350 | 402 | ||||
4.13%, 02/01/19 (e) | 300 | 309 | ||||
3.63%, 07/08/20 | 300 | 292 | ||||
7.55%, 02/15/30 | 300 | 387 | ||||
6.20%, 04/15/38 | 300 | 342 | ||||
4.88%, 07/08/40 | 300 | 286 | ||||
Walgreen Co., 4.88%, 08/01/13 | 700 | 765 | ||||
| 17,874 | ||||||
ENERGY - 1.9% | ||||||
Alberta Energy Co. Ltd., 7.38%, 11/01/31 | 100 | 115 | ||||
Ameren Energy Generating Co., 7.00%, 04/15/18 (e) | 205 | 202 | ||||
| Shares/Par (p) | Value | |||||
Anadarko Petroleum Corp. | ||||||
5.95%, 09/15/16 | 100 | 107 | ||||
8.70%, 03/15/19 (e) | 500 | 611 | ||||
6.45%, 09/15/36 | 150 | 150 | ||||
Apache Corp. | ||||||
5.25%, 04/15/13 | 250 | 272 | ||||
3.63%, 02/01/21 | 400 | 386 | ||||
BP Capital Markets Plc | ||||||
5.25%, 11/07/13 | 400 | 433 | ||||
3.13%, 10/01/15 | 500 | 500 | ||||
Burlington Resources Finance Co., 7.20%, 08/15/31 | 100 | 119 | ||||
Canadian Natural Resources Ltd. | ||||||
5.85%, 02/01/35 | 150 | 156 | ||||
6.25%, 03/15/38 (e) | 300 | 331 | ||||
Cenovus Energy Inc., 4.50%, 09/15/14 | 800 | 857 | ||||
CenterPoint Energy Resources Corp. | ||||||
7.88%, 04/01/13 | 50 | 57 | ||||
6.63%, 11/01/37 | 200 | 222 | ||||
Chevron Corp., 3.45%, 03/03/12 | 800 | 826 | ||||
Conoco Funding Co., 7.25%, 10/15/31 | 75 | 93 | ||||
ConocoPhillips | ||||||
6.65%, 07/15/18 | 75 | 90 | ||||
5.75%, 02/01/19 | 300 | 342 | ||||
6.00%, 01/15/20 | 300 | 349 | ||||
6.50%, 02/01/39 | 300 | 357 | ||||
ConocoPhillips Holding Co., 6.95%, 04/15/29 | 200 | 246 | ||||
Devon Energy Corp., 7.95%, 04/15/32 | 100 | 133 | ||||
Devon Financing Corp. ULC, 7.88%, 09/30/31 (e) | 100 | 132 | ||||
Enbridge Energy Partners LP, 7.50%, 04/15/38 | 200 | 240 | ||||
Encana Corp., 6.50%, 08/15/34 | 100 | 109 | ||||
Energy Transfer Partners LP | ||||||
5.95%, 02/01/15 | 250 | 274 | ||||
7.50%, 07/01/38 (e) | 200 | 233 | ||||
Enterprise Products Operating LLC | ||||||
4.60%, 08/01/12 | 425 | 446 | ||||
5.60%, 10/15/14 | 25 | 28 | ||||
3.70%, 06/01/15 | 100 | 103 | ||||
5.25%, 01/31/20 | 300 | 312 | ||||
6.88%, 03/01/33 | 25 | 28 | ||||
6.45%, 09/01/40 (e) | 100 | 108 | ||||
EOG Resources Inc., 4.40%, 06/01/20 | 200 | 201 | ||||
Halliburton Co., 7.45%, 09/15/39 | 250 | 321 | ||||
Hess Corp. | ||||||
7.30%, 08/15/31 | 35 | 42 | ||||
5.60%, 02/15/41 | 400 | 397 | ||||
Husky Energy Inc., 7.25%, 12/15/19 (e) | 500 | 594 | ||||
Kinder Morgan Energy Partners LP | ||||||
5.85%, 09/15/12 | 225 | 241 | ||||
5.00%, 12/15/13 | 75 | 81 | ||||
6.00%, 02/01/17 | 150 | 166 | ||||
6.85%, 02/15/20 (e) | 500 | 573 | ||||
6.50%, 09/01/39 | 200 | 207 | ||||
Magellan Midstream Partners LP, 4.25%, 02/01/21 | 300 | 289 | ||||
Marathon Oil Corp. | ||||||
6.13%, 03/15/12 | 200 | 211 | ||||
5.90%, 03/15/18 | 250 | 283 | ||||
Nabors Industries Inc., 6.15%, 02/15/18 | 300 | 320 | ||||
Nexen Inc. | ||||||
5.20%, 03/10/15 | 200 | 212 | ||||
5.88%, 03/10/35 (e) | 50 | 46 | ||||
6.40%, 05/15/37 | 100 | 97 | ||||
Noble Energy Inc., 8.25%, 03/01/19 | 300 | 375 | ||||
Noble Holding International Ltd. | ||||||
3.45%, 08/01/15 | 200 | 204 | ||||
6.20%, 08/01/40 | 200 | 214 | ||||
See accompanying Notes to the Financial Statements.
JNL Series Trust
Schedules of Investments (in thousands)
December 31, 2010
| Shares/Par (p) | Value | |||||
Occidental Petroleum Corp., 6.75%, 01/15/12 | 50 | 53 | ||||
ONEOK Partners LP, 6.65%, 10/01/36 | 150 | 163 | ||||
Pemex Project Funding Master Trust | ||||||
5.75%, 03/01/18 | 500 | 535 | ||||
6.63%, 06/15/35 (e) | 150 | 153 | ||||
Petro-Canada, 7.00%, 11/15/28 | 75 | 83 | ||||
Petrobras International Finance Co. | ||||||
6.13%, 10/06/16 | 100 | 110 | ||||
5.88%, 03/01/18 | 150 | 160 | ||||
7.88%, 03/15/19 | 500 | 591 | ||||
6.88%, 01/20/40 (e) | 400 | 420 | ||||
Petroleos Mexicanos, 5.50%, 01/21/21 | 500 | 506 | ||||
Plains All American Pipeline LP | ||||||
3.95%, 09/15/15 | 300 | 310 | ||||
6.50%, 05/01/18 | 100 | 112 | ||||
6.70%, 05/15/36 | 100 | 104 | ||||
Rowan Cos. Inc., 7.88%, 08/01/19 | 300 | 348 | ||||
Shell International Finance BV | ||||||
5.20%, 03/22/17 | 250 | 277 | ||||
4.38%, 03/25/20 | 300 | 315 | ||||
6.38%, 12/15/38 | 200 | 237 | ||||
5.50%, 03/25/40 | 300 | 321 | ||||
Southern Natural Gas Co., 5.90%, 04/01/17 (r) | 250 | 268 | ||||
Spectra Energy Capital LLC, 8.00%, 10/01/19 | 250 | 305 | ||||
StatoilHydro ASA, 5.25%, 04/15/19 | 500 | 557 | ||||
Suncor Energy Inc. | ||||||
5.95%, 12/01/34 | 100 | 101 | ||||
6.50%, 06/15/38 | 300 | 333 | ||||
Total Capital SA | ||||||
3.00%, 06/24/15 | 400 | 408 | ||||
2.30%, 03/15/16 (e) | 500 | 488 | ||||
TransCanada Pipelines Ltd. | ||||||
6.50%, 08/15/18 | 700 | 826 | ||||
3.80%, 10/01/20 | 400 | 390 | ||||
6.20%, 10/15/37 | 100 | 110 | ||||
Transocean Inc. | ||||||
4.95%, 11/15/15 | 500 | 517 | ||||
6.80%, 03/15/38 | 150 | 154 | ||||
Valero Energy Corp. | ||||||
6.88%, 04/15/12 | 500 | 532 | ||||
7.50%, 04/15/32 | 100 | 106 | ||||
Weatherford International Inc., 6.35%, 06/15/17 | 250 | 277 | ||||
Weatherford International Ltd. Bermuda, 5.13%, 09/15/20 | 400 | 398 | ||||
Williams Cos. Inc., 8.75%, 03/15/32 | 186 | 228 | ||||
Williams Partners LP | ||||||
3.80%, 02/15/15 (e) | 100 | 103 | ||||
5.25%, 03/15/20 | 100 | 104 | ||||
6.30%, 04/15/40 | 200 | 208 | ||||
| 25,252 | ||||||
FINANCIALS - 9.4% | ||||||
Aegon NV, 4.75%, 06/01/13 | 150 | 157 | ||||
AFLAC Inc., 8.50%, 05/15/19 (e) | 500 | 618 | ||||
Allstate Corp. | ||||||
6.13%, 02/15/12 | 75 | 79 | ||||
6.75%, 05/15/18 | 300 | 347 | ||||
7.45%, 05/16/19 | 300 | 364 | ||||
5.35%, 06/01/33 | 75 | 74 | ||||
5.55%, 05/09/35 | 100 | 101 | ||||
Ally Financial Inc., 2.20%, 12/19/12 | 500 | 514 | ||||
American Express Bank FSB, 5.55%, 10/17/12 | 1,000 | 1,070 | ||||
American Express Centurion Bank, 5.55%, 10/17/12 | 300 | 321 | ||||
American Express Co. | ||||||
4.88%, 07/15/13 | 250 | 267 | ||||
6.15%, 08/28/17 (e) | 250 | 282 | ||||
8.15%, 03/19/38 | 100 | 135 | ||||
| Shares/Par (p) | Value | |||||
American Express Credit Corp., 2.75%, 09/15/15 | 500 | 492 | ||||
American International Group Inc. | ||||||
4.25%, 05/15/13 | 500 | 517 | ||||
5.85%, 01/16/18 | 200 | 206 | ||||
6.40%, 12/15/20 | 500 | 525 | ||||
Ameriprise Financial Inc., 7.52%, 06/01/66 | 250 | 260 | ||||
Asian Development Bank | ||||||
3.63%, 09/05/13 | 500 | 532 | ||||
4.25%, 10/20/14 | 250 | 274 | ||||
5.59%, 07/16/18 | 400 | 461 | ||||
6.38%, 10/01/28 | 210 | 245 | ||||
Assurant Inc., 6.75%, 02/15/34 | 100 | 98 | ||||
AXA SA, 8.60%, 12/15/30 (e) | 100 | 112 | ||||
Bank of America Corp. | ||||||
2.10%, 04/30/12 | 400 | 408 | ||||
3.13%, 06/15/12 | 650 | 673 | ||||
4.88%, 09/15/12 (e) | 150 | 157 | ||||
4.88%, 01/15/13 | 200 | 208 | ||||
4.90%, 05/01/13 | 200 | 209 | ||||
4.75%, 08/15/13 | 200 | 208 | ||||
7.38%, 05/15/14 (e) | 200 | 222 | ||||
4.50%, 04/01/15 | 500 | 508 | ||||
3.70%, 09/01/15 (e) | 600 | 595 | ||||
6.50%, 08/01/16 | 300 | 326 | ||||
5.75%, 12/01/17 | 675 | 702 | ||||
5.65%, 05/01/18 | 1,000 | 1,022 | ||||
5.49%, 03/15/19 | 200 | 195 | ||||
Bank of America NA, 6.00%, 10/15/36 | 250 | 236 | ||||
Bank of Nova Scotia | ||||||
2.38%, 12/17/13 | 172 | 177 | ||||
2.05%, 10/07/15 (e) | 500 | 488 | ||||
Bank One Corp., 7.63%, 10/15/26 | 500 | 597 | ||||
Barclays Bank Plc | ||||||
5.45%, 09/12/12 | 500 | 536 | ||||
5.20%, 07/10/14 | 1,000 | 1,080 | ||||
3.90%, 04/07/15 (e) | 500 | 516 | ||||
BB&T Capital Trust I, 5.85%, 08/18/35 | 100 | 93 | ||||
BB&T Capital Trust II, 6.75%, 06/07/36 | 150 | 149 | ||||
BB&T Corp., 5.20%, 12/23/15 | 300 | 323 | ||||
Bear Stearns Cos. Inc. | ||||||
5.70%, 11/15/14 | 200 | 220 | ||||
6.40%, 10/02/17 | 500 | 570 | ||||
Berkshire Hathaway Finance Corp. | ||||||
4.60%, 05/15/13 | 100 | 108 | ||||
4.63%, 10/15/13 | 250 | 271 | ||||
4.85%, 01/15/15 | 100 | 109 | ||||
Berkshire Hathaway Inc., 5.13%, 09/15/12 | 500 | 536 | ||||
BlackRock Inc., 3.50%, 12/10/14 | 200 | 207 | ||||
BNP Paribas LLC, 2.13%, 12/21/12 | 500 | 508 | ||||
Boeing Capital Corp. | ||||||
5.80%, 01/15/13 (e) | 125 | 136 | ||||
3.25%, 10/27/14 | 300 | 313 | ||||
Boston Properties LP, 5.63%, 11/15/20 | 200 | 213 | ||||
Camden Property Trust, 5.00%, 06/15/15 | 100 | 106 | ||||
Capital One Bank USA NA, 6.50%, 06/13/13 | 250 | 274 | ||||
Capital One Capital III, 7.69%, 08/15/36 (i) | 100 | 100 | ||||
Capital One Capital V, 10.25%, 08/15/39 | 400 | 428 | ||||
Capital One Financial Corp., 6.15%, 09/01/16 (e) | 250 | 271 | ||||
Caterpillar Financial Services Corp. | ||||||
1.55%, 12/20/13 | 450 | 450 | ||||
4.75%, 02/17/15 | 100 | 109 | ||||
2.75%, 06/24/15 | 200 | 203 | ||||
Caterpillar Inc., 7.30%, 05/01/31 | 92 | 116 | ||||
Chubb Corp., 5.20%, 04/01/13 | 100 | 108 | ||||
Cincinnati Financial Corp., 6.13%, 11/01/34 | 100 | 94 | ||||
See accompanying Notes to the Financial Statements.
JNL Series Trust
Schedules of Investments (in thousands)
December 31, 2010
| Shares/Par (p) | Value | |||||
Citigroup Funding Inc. | ||||||
1.88%, 10/22/12 | 1,000 | 1,020 | ||||
1.88%, 11/15/12 | 1,000 | 1,020 | ||||
Citigroup Inc. | ||||||
6.00%, 02/21/12 (e) | 350 | 367 | ||||
2.13%, 04/30/12 (e) | 1,000 | 1,020 | ||||
5.50%, 04/11/13 | 500 | 532 | ||||
6.50%, 08/19/13 | 500 | 549 | ||||
5.00%, 09/15/14 | 400 | 414 | ||||
6.01%, 01/15/15 | 500 | 549 | ||||
4.75%, 05/19/15 | 500 | 524 | ||||
5.85%, 08/02/16 | 250 | 268 | ||||
5.50%, 02/15/17 | 350 | 362 | ||||
6.00%, 08/15/17 | 250 | 271 | ||||
6.13%, 11/21/17 | 700 | 767 | ||||
6.13%, 05/15/18 | 400 | 438 | ||||
8.50%, 05/22/19 | 350 | 434 | ||||
6.00%, 10/31/33 | 50 | 47 | ||||
8.13%, 07/15/39 | 600 | 763 | ||||
CommonWealth REIT, 6.25%, 08/15/16 | 500 | 522 | ||||
ConocoPhillips Canada Funding Co. I, 5.63%, 10/15/16 | 300 | 341 | ||||
Corp. Andina de Fomento | ||||||
6.88%, 03/15/12 | 150 | 160 | ||||
3.75%, 01/15/16 | 200 | 198 | ||||
Credit Suisse AG, 5.40%, 01/14/20 (e) | 300 | 306 | ||||
Credit Suisse New York | ||||||
5.50%, 05/01/14 | 1,200 | 1,316 | ||||
3.50%, 03/23/15 | 500 | 512 | ||||
Credit Suisse USA Inc. | ||||||
6.50%, 01/15/12 | 250 | 264 | ||||
5.50%, 08/15/13 | 450 | 493 | ||||
5.13%, 08/15/15 (e) | 200 | 218 | ||||
7.13%, 07/15/32 (e) | 100 | 120 | ||||
Deutsche Bank AG London | ||||||
4.88%, 05/20/13 | 450 | 482 | ||||
3.45%, 03/30/15 (e) | 500 | 512 | ||||
Deutsche Bank Financial LLC, 5.38%, 03/02/15 | 250 | 268 | ||||
Discover Bank, 7.00%, 04/15/20 | 300 | 323 | ||||
Duke Realty LP, 7.38%, 02/15/15 | 150 | 167 | ||||
Eksportfinans ASA, 3.00%, 11/17/14 | 500 | 516 | ||||
ERP Operating LP | ||||||
5.25%, 09/15/14 | 250 | 273 | ||||
5.75%, 06/15/17 | 150 | 164 | ||||
European Bank for Reconstruction & Development, 2.75%, 04/20/15 (e) | 500 | 513 | ||||
European Investment Bank | ||||||
2.00%, 02/10/12 | 1,600 | 1,625 | ||||
4.63%, 03/21/12 | 200 | 210 | ||||
1.75%, 09/14/12 | 600 | 611 | ||||
1.88%, 06/17/13 (e) | 500 | 509 | ||||
1.25%, 09/17/13 (e) | 500 | 500 | ||||
4.63%, 05/15/14 | 150 | 165 | ||||
3.13%, 06/04/14 | 500 | 526 | ||||
2.75%, 03/23/15 (e) | 400 | 412 | ||||
1.63%, 09/01/15 (e) | 600 | 585 | ||||
4.88%, 02/16/16 | 250 | 279 | ||||
5.13%, 09/13/16 | 500 | 565 | ||||
5.13%, 05/30/17 (e) | 500 | 564 | ||||
2.88%, 09/15/20 | 600 | 563 | ||||
Export-Import Bank of Korea | ||||||
8.13%, 01/21/14 | 500 | 572 | ||||
5.13%, 03/16/15 | 200 | 211 | ||||
Fidelity National Financial Inc., 6.60%, 05/15/17 | 400 | 399 | ||||
Fifth Third Bancorp, 6.25%, 05/01/13 | 300 | 325 | ||||
Fifth Third Capital Trust IV, 6.50%, 04/15/37 | 200 | 190 | ||||
Franklin Resources Inc., 3.13%, 05/20/15 | 300 | 306 | ||||
| Shares/Par (p) | Value | |||||
General Electric Capital Corp. | ||||||
5.88%, 02/15/12 | 250 | 263 | ||||
2.20%, 06/08/12 | 1,000 | 1,022 | ||||
6.00%, 06/15/12 | 200 | 214 | ||||
2.00%, 09/28/12 | 500 | 511 | ||||
5.25%, 10/19/12 | 400 | 428 | ||||
2.63%, 12/28/12 | 1,000 | 1,037 | ||||
2.80%, 01/08/13 | 200 | 204 | ||||
5.45%, 01/15/13 (e) | 1,000 | 1,075 | ||||
1.88%, 09/16/13 | 500 | 500 | ||||
3.50%, 06/29/15 (e) | 500 | 509 | ||||
5.00%, 01/08/16 (e) | 600 | 640 | ||||
5.63%, 09/15/17 (e) | 200 | 219 | ||||
5.63%, 05/01/18 | 700 | 763 | ||||
5.50%, 01/08/20 (e) | 200 | 214 | ||||
6.75%, 03/15/32 (e) | 850 | 962 | ||||
5.88%, 01/14/38 | 400 | 415 | ||||
6.88%, 01/10/39 (e) | 800 | 925 | ||||
Genworth Financial Inc., 7.70%, 06/15/20 | 350 | 370 | ||||
Goldman Sachs Group Inc. | ||||||
6.60%, 01/15/12 | 400 | 423 | ||||
3.25%, 06/15/12 (e) | 400 | 415 | ||||
5.45%, 11/01/12 | 1,000 | 1,070 | ||||
5.25%, 04/01/13 (e) | 100 | 107 | ||||
4.75%, 07/15/13 | 275 | 293 | ||||
6.00%, 05/01/14 (e) | 500 | 551 | ||||
5.13%, 01/15/15 | 200 | 215 | ||||
3.70%, 08/01/15 | 500 | 509 | ||||
5.75%, 10/01/16 | 250 | 272 | ||||
6.25%, 09/01/17 | 200 | 221 | ||||
5.95%, 01/18/18 | 300 | 325 | ||||
6.15%, 04/01/18 | 375 | 413 | ||||
7.50%, 02/15/19 (e) | 100 | 117 | ||||
5.38%, 03/15/20 | 400 | 413 | ||||
5.95%, 01/15/27 | 250 | 240 | ||||
6.13%, 02/15/33 (e) | 850 | 901 | ||||
6.75%, 10/01/37 | 200 | 204 | ||||
Hartford Financial Services Group Inc. | ||||||
5.38%, 03/15/17 | 500 | 509 | ||||
6.10%, 10/01/41 | 75 | 71 | ||||
HCP Inc., 6.00%, 01/30/17 | 150 | 157 | ||||
Health Care REIT Inc., 6.13%, 04/15/20 | 400 | 421 | ||||
Hospitality Properties Trust, 5.63%, 03/15/17 | 500 | 497 | ||||
HSBC Bank USA | ||||||
4.88%, 08/24/20 | 300 | 298 | ||||
7.00%, 01/15/39 | 340 | 387 | ||||
HSBC Finance Capital Trust IX, 5.91%, 11/30/35 | 250 | 230 | ||||
HSBC Finance Corp., 4.75%, 07/15/13 (e) | 1,000 | 1,055 | ||||
HSBC Holdings Plc | ||||||
5.25%, 12/12/12 | 500 | 532 | ||||
7.63%, 05/17/32 | 150 | 165 | ||||
6.50%, 05/02/36 | 150 | 157 | ||||
HSBC USA Inc., 5.00%, 09/27/20 | 500 | 484 | ||||
ICICI Bank Ltd., 6.63%, 10/03/12 (r) | 200 | 214 | ||||
Inter-American Development Bank | ||||||
4.38%, 09/20/12 | 500 | 531 | ||||
1.75%, 10/22/12 | 490 | 500 | ||||
1.63%, 07/15/13 | 400 | 407 | ||||
5.13%, 09/13/16 | 250 | 285 | ||||
3.88%, 02/14/20 | 200 | 210 | ||||
International Bank for Reconstruction & Development | ||||||
2.00%, 04/02/12 | 1,000 | 1,020 | ||||
0.80%, 07/13/12 | 500 | 502 | ||||
1.75%, 07/15/13 | 350 | 358 | ||||
2.38%, 05/26/15 | 200 | 205 | ||||
7.63%, 01/19/23 | 300 | 411 | ||||
See accompanying Notes to the Financial Statements.
JNL Series Trust
Schedules of Investments (in thousands)
December 31, 2010
| Shares/Par (p) | Value | |||||||
International Business Machines International Group Capital LLC, 5.05%, 10/22/12 |
| 300 |
|
| 322 |
| ||
International Lease Finance Corp. 3.00%, 04/22/14 |
| 500 |
|
| 527 |
| ||
6.75%, 09/01/16 (r) | 300 | 320 | ||||||
Japan Bank of International Cooperation, 2.13%, 11/05/12 | 500 | 509 | ||||||
Jefferies Group Inc. | ||||||||
6.45%, 06/08/27 | 100 | 96 | ||||||
6.25%, 01/15/36 | 500 | 448 | ||||||
John Deere Capital Corp. | ||||||||
7.00%, 03/15/12 | 250 | 268 | ||||||
1.88%, 06/17/13 | 200 | 202 | ||||||
5.75%, 09/10/18 | 500 | 566 | ||||||
JPMorgan Chase & Co. | ||||||||
6.63%, 03/15/12 | 100 | 106 | ||||||
2.20%, 06/15/12 | 500 | 512 | ||||||
5.38%, 10/01/12 | 1,500 | 1,610 | ||||||
2.13%, 12/26/12 | 500 | 514 | ||||||
5.75%, 01/02/13 | 600 | 650 | ||||||
4.75%, 03/01/15 | 250 | 267 | ||||||
5.15%, 10/01/15 | 250 | 264 | ||||||
5.55%, 01/22/17 | 500 | 531 | ||||||
6.00%, 01/15/18 | 700 | 782 | ||||||
JPMorgan Chase Bank NA, 6.00%, 10/01/17 | 250 | 277 | ||||||
JPMorgan Chase Capital XX, 6.55%, 09/29/36 (i) | 100 | 101 | ||||||
JPMorgan Chase Capital XXV, 6.80%, 10/01/37 (e) | 600 | 619 | ||||||
KeyBank NA, 5.80%, 07/01/14 | 100 | 107 | ||||||
Korea Development Bank, 5.30%, 01/17/13 | 800 | 848 | ||||||
Kreditanstalt fuer Wiederaufbau | ||||||||
2.25%, 04/16/12 | 1,100 | 1,122 | ||||||
1.25%, 06/15/12 (e) | 500 | 504 | ||||||
1.88%, 01/14/13 (e) | 200 | 204 | ||||||
3.25%, 03/15/13 | 250 | 262 | ||||||
3.50%, 05/16/13 | 400 | 422 | ||||||
1.38%, 07/15/13 | 500 | 504 | ||||||
4.13%, 10/15/14 | 650 | 707 | ||||||
2.75%, 10/21/14 (e) | 500 | 519 | ||||||
2.63%, 03/03/15 (e) | 500 | 514 | ||||||
5.13%, 03/14/16 | 500 | 564 | ||||||
4.88%, 01/17/17 (e) | 500 | 558 | ||||||
4.88%, 06/17/19 | 500 | 554 | ||||||
2.75%, 09/08/20 | 500 | 465 | ||||||
0.00%,06/29/37 (j) | 500 | 133 | ||||||
Landwirtschaftliche Rentenbank | ||||||||
1.88%, 09/24/12 | 500 | 508 | ||||||
3.25%, 03/15/13 (e) | 500 | 523 | ||||||
Lincoln National Corp., 8.75%, 07/01/19 | 500 | 625 | ||||||
Marsh & McLennan Cos. Inc., 5.75%, 09/15/15 | 100 | 108 | ||||||
MBNA Corp., 7.50%, 03/15/12 | 100 | 106 | ||||||
Merrill Lynch & Co. Inc. | ||||||||
6.05%, 08/15/12 | 500 | 529 | ||||||
5.00%, 01/15/15 (e) | 550 | 573 | ||||||
6.05%, 05/16/16 | 250 | 258 | ||||||
6.88%, 04/25/18 | 650 | 711 | ||||||
6.75%, 06/01/28 | 800 | 805 | ||||||
7.75%, 05/14/38 | 400 | 415 | ||||||
MetLife Inc. | ||||||||
5.00%, 11/24/13 | 100 | 108 | ||||||
7.72%, 02/15/19 | 500 | 614 | ||||||
5.70%, 06/15/35 | 100 | 102 | ||||||
6.40%, 12/15/36 (i) | 100 | 94 | ||||||
Morgan Stanley | ||||||||
6.60%, 04/01/12 | 300 | 320 | ||||||
1.95%, 06/20/12 | 400 | 408 | ||||||
5.75%, 08/31/12 | 500 | 535 | ||||||
| Shares/Par (p) | Value | |||||||
5.25%, 11/02/12 (e) | 500 | 533 | ||||||
4.75%, 04/01/14 | 450 | 461 | ||||||
6.00%, 04/28/15 | 500 | 541 | ||||||
5.75%, 10/18/16 | 250 | 267 | ||||||
5.45%, 01/09/17 | 350 | 363 | ||||||
6.63%, 04/01/18 | 500 | 542 | ||||||
7.30%, 05/13/19 (e) | 300 | 338 | ||||||
5.63%, 09/23/19 | 300 | 306 | ||||||
5.50%, 01/26/20 | 500 | 504 | ||||||
7.25%, 04/01/32 | 25 | 29 | ||||||
MUFG Capital Finance 1 Ltd., 6.35%, (callable at 100 beginning 07/25/16) (m) | 250 | 252 | ||||||
National City Bank, 4.63%, 05/01/13 | 100 | 106 | ||||||
National Rural Utilities Cooperative Finance Corp. | ||||||||
7.25%, 03/01/12 | 500 | 536 | ||||||
10.38%, 11/01/18 | 200 | 276 | ||||||
8.00%, 03/01/32 | 150 | 190 | ||||||
NB Capital Trust II, 7.83%, 12/15/26 | 100 | 100 | ||||||
Nomura Holdings Inc, 6.70%, 03/04/20 | 400 | 428 | ||||||
Nordic Investment Bank, 3.63%, 06/17/13 | 600 | 636 | ||||||
Oesterreichische Kontrollbank AG | ||||||||
4.75%, 10/16/12 | 650 | 694 | ||||||
1.75%, 03/11/13 (e) | 300 | 304 | ||||||
PNC Funding Corp. | ||||||||
5.25%, 11/15/15 | 250 | 268 | ||||||
6.70%, 06/10/19 | 500 | 576 | ||||||
Principal Life Income Funding Trusts, 5.10%, 04/15/14 | 150 | 162 | ||||||
ProLogis, 6.25%, 03/15/17 | 400 | 417 | ||||||
Prudential Financial Inc. | ||||||||
5.38%, 06/21/20 (e) | 200 | 209 | ||||||
5.75%, 07/15/33 (e) | 400 | 390 | ||||||
5.70%, 12/14/36 | 250 | 248 | ||||||
6.63%, 06/21/40 (e) | 200 | 223 | ||||||
Realty Income Corp., 6.75%, 08/15/19 | 150 | 170 | ||||||
Royal Bank of Canada, 2.10%, 07/29/13 | 200 | 204 | ||||||
Royal Bank of Scotland Group Plc | ||||||||
5.00%, 10/01/14 | 100 | 96 | ||||||
6.40%, 10/21/19 | 200 | 201 | ||||||
Royal Bank of Scotland Plc | ||||||||
4.88%, 03/16/15 | 300 | 307 | ||||||
3.95%, 09/21/15 (e) | 500 | 492 | ||||||
Simon Property Group LP | ||||||||
5.75%, 12/01/15 | 400 | 444 | ||||||
5.25%, 12/01/16 | 250 | 270 | ||||||
6.75%, 02/01/40 | 100 | 114 | ||||||
SLM Corp. | ||||||||
5.00%, 10/01/13 | 520 | 521 | ||||||
5.05%, 11/14/14 | 250 | 239 | ||||||
8.00%, 03/25/20 | 100 | 101 | ||||||
SunTrust Capital VIII, 6.10%, 12/01/66 | 99 | 91 | ||||||
Teco Finance Inc., 5.15%, 03/15/20 | 200 | 207 | ||||||
Toyota Motor Credit Corp., 3.20%, 06/17/15 | 500 | 516 | ||||||
Transatlantic Holdings Inc., 5.75%, 12/14/15 | 200 | 210 | ||||||
Travelers Cos. Inc., 6.25%, 06/15/37 (e) | 150 | 167 | ||||||
Travelers Property Casualty Corp., 6.38%, | ||||||||
03/15/33 | 400 | 446 | ||||||
UBS AG Stamford | ||||||||
5.88%, 07/15/16 | 250 | 269 | ||||||
5.88%, 12/20/17 | 250 | 275 | ||||||
4.88%, 08/04/20 | 500 | 509 | ||||||
US Bancorp | ||||||||
1.38%, 09/13/13 | 580 | 580 | ||||||
2.45%, 07/27/15 | 800 | 795 | ||||||
US Bank, 4.80%, 04/15/15 | 500 | 539 | ||||||
Validus Holding Ltd., 8.88%, 01/26/40 | 500 | 533 | ||||||
Wachovia Bank NA | ||||||||
4.88%, 02/01/15 (e) | 200 | 212 | ||||||
See accompanying Notes to the Financial Statements.
JNL Series Trust
Schedules of Investments (in thousands)
December 31, 2010
| Shares/Par (p) | Value | |||||
6.00%, 11/15/17 (e) | 250 | 277 | ||||
5.85%, 02/01/37 | 250 | 252 | ||||
6.60%, 01/15/38 | 300 | 330 | ||||
Wachovia Corp. | ||||||
5.50%, 05/01/13 | 500 | 544 | ||||
5.25%, 08/01/14 | 250 | 267 | ||||
5.63%, 10/15/16 | 500 | 544 | ||||
Wells Fargo & Co. | ||||||
2.13%, 06/15/12 (e) | 300 | 307 | ||||
4.95%, 10/16/13 (e) | 700 | 750 | ||||
5.00%, 11/15/14 | 200 | 212 | ||||
3.63%, 04/15/15 (e) | 400 | 415 | ||||
5.63%, 12/11/17 | 300 | 332 | ||||
Wells Fargo Bank NA, 4.75%, 02/09/15 | 250 | 265 | ||||
Wells Fargo Financial Inc., 5.50%, 08/01/12 | 250 | 267 | ||||
Westpac Banking Corp. | ||||||
2.25%, 11/19/12 (e) | 300 | 307 | ||||
4.20%, 02/27/15 | 500 | 525 | ||||
| 124,646 | ||||||
HEALTH CARE - 1.2% | ||||||
Abbott Laboratories | ||||||
5.88%, 05/15/16 | 250 | 289 | ||||
6.00%, 04/01/39 | 550 | 621 | ||||
Aetna Inc., 6.63%, 06/15/36 | 150 | 165 | ||||
Amgen Inc. | ||||||
5.85%, 06/01/17 | 200 | 228 | ||||
6.38%, 06/01/37 | 400 | 458 | ||||
AstraZeneca Plc | ||||||
5.90%, 09/15/17 | 250 | 290 | ||||
6.45%, 09/15/37 | 250 | 297 | ||||
Baxter International Inc. | ||||||
4.00%, 03/01/14 | 500 | 532 | ||||
4.63%, 03/15/15 | 75 | 82 | ||||
4.25%, 03/15/20 | 500 | 514 | ||||
Becton Dickinson and Co., 3.25%, 11/12/20 | 300 | 282 | ||||
Bristol-Myers Squibb Co. | ||||||
5.45%, 05/01/18 (e) | 150 | 170 | ||||
5.88%, 11/15/36 | 67 | 75 | ||||
Celgene Corp., 3.95%, 10/15/20 | 300 | 285 | ||||
Covidien International Finance SA, 6.00%, 10/15/17 | 300 | 341 | ||||
Eli Lilly & Co. | ||||||
5.20%, 03/15/17 | 500 | 554 | ||||
5.55%, 03/15/37 | 100 | 105 | ||||
Express Scripts Inc., 5.25%, 06/15/12 | 200 | 211 | ||||
Genentech Inc. | ||||||
4.75%, 07/15/15 | 50 | 55 | ||||
5.25%, 07/15/35 | 250 | 253 | ||||
GlaxoSmithKline Capital Inc. | ||||||
4.85%, 05/15/13 | 375 | 407 | ||||
4.38%, 04/15/14 | 150 | 162 | ||||
5.65%, 05/15/18 | 250 | 286 | ||||
5.38%, 04/15/34 | 150 | 155 | ||||
Hospira Inc., 6.05%, 03/30/17 | 500 | 560 | ||||
Humana Inc., 7.20%, 06/15/18 (l) | 500 | 565 | ||||
Johnson & Johnson | ||||||
3.80%, 05/15/13 | 500 | 531 | ||||
5.95%, 08/15/37 (e) | 250 | 292 | ||||
Medtronic Inc., 4.45%, 03/15/20 (e) | 700 | 727 | ||||
Merck & Co. Inc. | ||||||
4.75%, 03/01/15 | 250 | 275 | ||||
6.00%, 09/15/17 | 250 | 292 | ||||
6.50%, 12/01/33 (e) (l) | 350 | 418 | ||||
6.55%, 09/15/37 | 300 | 365 | ||||
Novartis Capital Corp., 4.13%, 02/10/14 | 800 | 854 | ||||
Pfizer Inc. 4.45%, 03/15/12 | 500 | 522 | ||||
| Shares/Par (p) | Value | |||||
5.35%, 03/15/15 | 100 | 112 | ||||
6.20%, 03/15/19 | 500 | 586 | ||||
Pharmacia Corp., 6.60%, 12/01/28 | 50 | 58 | ||||
Teva Pharmaceutical Finance LLC, 6.15%, 02/01/36 | 150 | 169 | ||||
Thermo Fisher Scientific Inc., 5.00%, 06/01/15 | 200 | 218 | ||||
UnitedHealth Group Inc. | ||||||
5.38%, 03/15/16 | 250 | 275 | ||||
6.00%, 02/15/18 | 400 | 454 | ||||
5.80%, 03/15/36 | 150 | 152 | ||||
WellPoint Inc. | ||||||
5.25%, 01/15/16 | 300 | 330 | ||||
4.35%, 08/15/20 | 200 | 198 | ||||
5.85%, 01/15/36 | 100 | 103 | ||||
5.80%, 08/15/40 (e) | 200 | 204 | ||||
Wyeth | ||||||
5.50%, 03/15/13 (l) | 100 | 109 | ||||
5.50%, 02/15/16 | 500 | 566 | ||||
6.45%, 02/01/24 | 100 | 118 | ||||
5.95%, 04/01/37 | 250 | 277 | ||||
| 16,147 | ||||||
INDUSTRIALS - 1.2% | ||||||
3M Co., 5.70%, 03/15/37 | 150 | 164 | ||||
Boeing Co., 4.88%, 02/15/20 | 500 | 538 | ||||
Browning-Ferris Industries Inc., 7.40%, 09/15/35 | 95 | 112 | ||||
Burlington Northern Santa Fe Corp. | ||||||
5.90%, 07/01/12 | 150 | 160 | ||||
4.70%, 10/01/19 | 300 | 314 | ||||
6.15%, 05/01/37 | 100 | 108 | ||||
5.75%, 05/01/40 | 400 | 414 | ||||
Canadian National Railway Co., 5.55%, 03/01/19 | 400 | 452 | ||||
Caterpillar Inc. | ||||||
7.90%, 12/15/18 (e) | 500 | 644 | ||||
6.05%, 08/15/36 | 150 | 170 | ||||
CSX Corp. | ||||||
6.30%, 03/15/12 | 250 | 265 | ||||
7.38%, 02/01/19 | 300 | 362 | ||||
6.00%, 10/01/36 | 200 | 208 | ||||
Emerson Electric Co. | ||||||
4.50%, 05/01/13 | 414 | 446 | ||||
5.00%, 12/15/14 | 100 | 111 | ||||
GE Capital Trust I, 6.38%, 11/15/67 | 500 | 494 | ||||
General Dynamics Corp., 4.25%, 05/15/13 | 250 | 269 | ||||
General Electric Co., 5.00%, 02/01/13 | 800 | 855 | ||||
Honeywell International Inc., 5.00%, 02/15/19 | 500 | 547 | ||||
Ingersoll-Rand Global Holding Co. Ltd., 6.88%, 08/15/18 | 200 | 230 | ||||
Koninklijke Philips Electronics NV, 5.75%, 03/11/18 | 350 | 392 | ||||
Lockheed Martin Corp. | ||||||
6.15%, 09/01/36 | 175 | 190 | ||||
5.72%, 06/01/40 (e) (r) | 200 | 209 | ||||
Norfolk Southern Corp. | ||||||
5.90%, 06/15/19 | 300 | 340 | ||||
7.25%, 02/15/31 | 75 | 90 | ||||
7.05%, 05/01/37 | 100 | 119 | ||||
Northrop Grumman Corp., 5.05%, 08/01/19 | 210 | 224 | ||||
PACCAR Inc., 6.88%, 02/15/14 (e) | 700 | 803 | ||||
Pitney Bowes Inc., 5.75%, 09/15/17 | 500 | 526 | ||||
Raytheon Co., 3.13%, 10/15/20 | 500 | 461 | ||||
Republic Services Inc., 5.00%, 03/01/20 (e) | 300 | 316 | ||||
RR Donnelley & Sons Co. | ||||||
4.95%, 04/01/14 | 200 | 205 | ||||
5.50%, 05/15/15 | 50 | 51 | ||||
Tyco Electronics Group SA, 6.00%, 10/01/12 (l) | 300 | 323 | ||||
See accompanying Notes to the Financial Statements.
JNL Series Trust
Schedules of Investments (in thousands)
December 31, 2010
| Shares/Par (p) | Value | |||||
Tyco International Group SA, 6.00%, 11/15/13 | 500 | 555 | ||||
Union Pacific Corp. | ||||||
7.00%, 02/01/16 | 500 | 589 | ||||
5.70%, 08/15/18 | 250 | 281 | ||||
6.63%, 02/01/29 | 25 | 28 | ||||
5.78%, 07/15/40 | 300 | 302 | ||||
United Parcel Service Inc. | ||||||
3.13%, 01/15/21 | 500 | 464 | ||||
6.20%, 01/15/38 | 350 | 411 | ||||
United Technologies Corp. | ||||||
4.88%, 05/01/15 | 300 | 332 | ||||
6.13%, 02/01/19 (e) | 250 | 292 | ||||
6.70%, 08/01/28 | 50 | 59 | ||||
5.70%, 04/15/40 (e) | 500 | 545 | ||||
Waste Management Inc. | ||||||
6.38%, 11/15/12 (e) | 500 | 545 | ||||
6.10%, 03/15/18 | 200 | 224 | ||||
| 15,739 | ||||||
INFORMATION TECHNOLOGY - 0.7% | ||||||
Adobe Systems Inc., 4.75%, 02/01/20 | 300 | 307 | ||||
Agilent Technologies Inc., 5.00%, 07/15/20 (e) | 200 | 203 | ||||
Amphenol Corp., 4.75%, 11/15/14 | 600 | 641 | ||||
Cisco Systems Inc. | ||||||
2.90%, 11/17/14 | 500 | 519 | ||||
5.50%, 02/22/16 | 250 | 285 | ||||
5.90%, 02/15/39 (e) | 250 | 277 | ||||
Dell Inc. | ||||||
4.70%, 04/15/13 | 200 | 215 | ||||
5.40%, 09/10/40 (e) | 200 | 184 | ||||
EnCana Corp., 6.50%, 02/01/38 | 300 | 325 | ||||
Fiserv Inc., 6.13%, 11/20/12 | 500 | 541 | ||||
Harris Corp., 4.40%, 12/15/20 | 500 | 500 | ||||
Hewlett-Packard Co. | ||||||
6.50%, 07/01/12 | 250 | 271 | ||||
4.50%, 03/01/13 | 800 | 856 | ||||
International Business Machines Corp. | ||||||
1.00%, 08/05/13 | 500 | 498 | ||||
5.70%, 09/14/17 | 300 | 344 | ||||
6.50%, 01/15/28 | 200 | 235 | ||||
5.60%, 11/30/39 | 330 | 359 | ||||
Microsoft Corp., 1.63%, 09/25/15 | 500 | 488 | ||||
Oracle Corp. | ||||||
5.75%, 04/15/18 | 350 | 400 | ||||
3.88%, 07/15/20 (r) | 300 | 298 | ||||
6.13%, 07/08/39 (e) | 300 | 337 | ||||
5.38%, 07/15/40 (e) (r) | 500 | 506 | ||||
Western Union Co., 5.25%, 04/01/20 | 500 | 514 | ||||
Xerox Corp., 6.35%, 05/15/18 (e) | 500 | 564 | ||||
| 9,667 | ||||||
MATERIALS - 1.1% | ||||||
Agrium Inc., 7.13%, 05/23/36 | 300 | 345 | ||||
Air Products & Chemicals Inc., 4.38%, 08/21/19 | 400 | 402 | ||||
Alcoa Inc. | ||||||
5.38%, 01/15/13 | 50 | 53 | ||||
5.55%, 02/01/17 (e) | 200 | 208 | ||||
6.75%, 07/15/18 (e) | 300 | 327 | ||||
ArcelorMittal | ||||||
9.85%, 06/01/19 | 500 | 632 | ||||
7.00%, 10/15/39 (l) | 200 | 208 | ||||
Barrick Gold Corp., 5.95%, 10/15/39 | 300 | 318 | ||||
BHP Billiton Finance USA Ltd. | ||||||
4.80%, 04/15/13 | 100 | 108 | ||||
5.50%, 04/01/14 | 100 | 111 | ||||
5.25%, 12/15/15 | 90 | 100 | ||||
5.40%, 03/29/17 | 200 | 221 | ||||
CRH America Inc., 6.00%, 09/30/16 | 250 | 267 | ||||
| Shares/Par (p) | Value | |||||
Dow Chemical Co. | ||||||
6.00%, 10/01/12 | 50 | 54 | ||||
7.60%, 05/15/14 (l) | 250 | 288 | ||||
2.50%, 02/15/16 | 500 | 480 | ||||
8.55%, 05/15/19 (l) | 250 | 313 | ||||
7.38%, 11/01/29 | 500 | 601 | ||||
Eastman Chemical Co., 3.00%, 12/15/15 | 500 | 494 | ||||
EI Du Pont de Nemours & Co. | ||||||
4.75%, 11/15/12 | 100 | 107 | ||||
5.60%, 12/15/36 (e) | 400 | 430 | ||||
4.90%, 01/15/41 (e) | 500 | 488 | ||||
Freeport-McMoRan Copper & Gold Inc., 8.38%, 04/01/17 | 700 | 774 | ||||
International Paper Co. | ||||||
7.95%, 06/15/18 | 150 | 179 | ||||
8.70%, 06/15/38 | 300 | 378 | ||||
Lafarge SA, 6.50%, 07/15/16 | 250 | 266 | ||||
Newmont Mining Corp. | ||||||
5.88%, 04/01/35 | 50 | 52 | ||||
6.25%, 10/01/39 | 400 | 435 | ||||
Nucor Corp., 5.00%, 06/01/13 | 500 | 540 | ||||
Plum Creek Timberlands LP, 4.70%, 03/15/21 (e) | 400 | 381 | ||||
Potash Corp. of Saskatchewan Inc., 5.25%, 05/15/14 | 500 | 547 | ||||
PPG Industries Inc., 3.60%, 11/15/20 | 400 | 372 | ||||
Praxair Inc. | ||||||
3.95%, 06/01/13 | 100 | 106 | ||||
5.38%, 11/01/16 | 500 | 567 | ||||
Rio Tinto Alcan Inc. | ||||||
4.88%, 09/15/12 | 50 | 53 | ||||
6.13%, 12/15/33 | 425 | 454 | ||||
Rio Tinto Finance USA Ltd. | ||||||
1.88%, 11/02/15 | 500 | 481 | ||||
3.50%, 11/02/20 | 800 | 759 | ||||
RPM International Inc., 6.13%, 10/15/19 | 200 | 207 | ||||
Southern Copper Corp., 7.50%, 07/27/35 | 150 | 166 | ||||
Vale Overseas Ltd. | ||||||
6.25%, 01/11/16 | 100 | 111 | ||||
6.25%, 01/23/17 | 150 | 167 | ||||
8.25%, 01/17/34 | 500 | 622 | ||||
6.88%, 11/21/36 | 100 | 110 | ||||
| 14,282 | ||||||
TELECOMMUNICATION SERVICES - 1.2% | ||||||
America Movil SAB de CV | ||||||
3.63%, 03/30/15 | 200 | 206 | ||||
5.00%, 03/30/20 (e) | 500 | 520 | ||||
6.38%, 03/01/35 (e) | 200 | 219 | ||||
AT&T Corp., 8.00%, 11/15/31 (l) | 17 | 21 | ||||
AT&T Inc. | ||||||
5.88%, 02/01/12 | 100 | 105 | ||||
4.95%, 01/15/13 | 750 | 804 | ||||
5.10%, 09/15/14 | 550 | 602 | ||||
2.50%, 08/15/15 | 500 | 498 | ||||
5.80%, 02/15/19 | 500 | 563 | ||||
6.15%, 09/15/34 | 350 | 362 | ||||
6.30%, 01/15/38 | 300 | 317 | ||||
6.55%, 02/15/39 | 250 | 272 | ||||
5.35%, 09/01/40 (e) (r) | 705 | 663 | ||||
AT&T Wireless Services Inc, 8.13%, 05/01/12 | 200 | 219 | ||||
BellSouth Capital Funding Corp., 7.88%, 02/15/30 | 100 | 121 | ||||
BellSouth Corp., 5.20%, 09/15/14 | 100 | 109 | ||||
British Telecommunications Plc, 9.88%, 12/15/30 (l) | 150 | 200 | ||||
CenturyTel Inc., 6.00%, 04/01/17 | 250 | 257 | ||||
See accompanying Notes to the Financial Statements.
JNL Series Trust
Schedules of Investments (in thousands)
December 31, 2010
| Shares/Par (p) | Value | |||||
Deutsche Telekom International |
| |||||
5.25%, 07/22/13 (e) | 200 | 217 | ||||
5.75%, 03/23/16 (e) | 250 | 280 | ||||
8.75%, 06/15/30 (l) | 300 | 403 | ||||
Embarq Corp., 8.00%, 06/01/36 | 100 | 109 | ||||
France Telecom SA, 8.50%, 03/01/31 (l) | 250 | 340 | ||||
GTE Corp. | ||||||
6.84%, 04/15/18 | 250 | 283 | ||||
6.94%, 04/15/28 | 50 | 56 | ||||
Qwest Corp. | ||||||
8.38%, 05/01/16 | 500 | 593 | ||||
6.50%, 06/01/17 | 250 | 271 | ||||
7.25%, 09/15/25 | 110 | 116 | ||||
Rogers Communications Inc., 6.80%, 08/15/18 | 500 | 601 | ||||
Southwestern Bell Telephone LP, 7.00%, 07/01/15 | 100 | 115 | ||||
Telecom Italia Capital SA | ||||||
5.25%, 11/15/13 | 500 | 521 | ||||
6.18%, 06/18/14 (e) | 300 | 319 | ||||
4.95%, 09/30/14 | 100 | 102 | ||||
5.25%, 10/01/15 | 200 | 205 | ||||
6.38%, 11/15/33 | 50 | 43 | ||||
6.00%, 09/30/34 | 100 | 83 | ||||
Telefonica Emisiones SAU | ||||||
3.73%, 04/27/15 | 100 | 99 | ||||
5.88%, 07/15/19 | 500 | 511 | ||||
5.13%, 04/27/20 (e) | 100 | 96 | ||||
Telefonica Europe BV, 8.25%, 09/15/30 | 200 | 232 | ||||
Verizon Communications Inc. | ||||||
5.25%, 04/15/13 | 200 | 217 | ||||
5.55%, 02/15/16 | 200 | 224 | ||||
8.75%, 11/01/18 (e) | 350 | 457 | ||||
6.35%, 04/01/19 (e) | 500 | 577 | ||||
5.85%, 09/15/35 | 350 | 362 | ||||
6.90%, 04/15/38 | 300 | 350 | ||||
Verizon Florida LLC, 6.86%, 02/01/28 | 200 | 207 | ||||
Verizon Global Funding Corp., 7.75%, 12/01/30 (e) | 200 | 248 | ||||
Verizon Wireless Capital LLC | ||||||
7.38%, 11/15/13 | 750 | 869 | ||||
8.50%, 11/15/18 | 150 | 196 | ||||
Vodafone Group Plc | ||||||
5.00%, 12/16/13 (e) | 150 | 163 | ||||
5.38%, 01/30/15 | 100 | 110 | ||||
5.63%, 02/27/17 | 600 | 670 | ||||
7.88%, 02/15/30 | 200 | 249 | ||||
| 16,552 | ||||||
UTILITIES - 1.5% | ||||||
Alabama Power Co., 6.00%, 03/01/39 | 250 | 277 | ||||
Ameren Energy Generating Co., 6.30%, 04/01/20 (e) | 150 | 146 | ||||
Consolidated Edison Co. of New York Inc. | ||||||
4.45%, 06/15/20 (e) | 200 | 207 | ||||
5.30%, 03/01/35 | 250 | 244 | ||||
5.85%, 03/15/36 | 300 | 315 | ||||
5.70%, 06/15/40 | 200 | 213 | ||||
Constellation Energy Group Inc., 7.60%, 04/01/32 | 150 | 170 | ||||
Consumers Energy Co. | ||||||
5.50%, 08/15/16 | 25 | 28 | ||||
6.70%, 09/15/19 | 400 | 477 | ||||
Detroit Edison Co., 5.60%, 06/15/18 | 250 | 271 | ||||
Dominion Resources Inc. | ||||||
8.88%, 01/15/19 | 350 | 454 | ||||
7.00%, 06/15/38 (e) | 200 | 241 | ||||
Duke Energy Carolinas LLC | ||||||
5.63%, 11/30/12 | 150 | 163 | ||||
| Shares/Par (p) | Value | |||||
5.30%, 10/01/15 | 200 | 224 | ||||
5.30%, 02/15/40 | 300 | 304 | ||||
Duke Energy Corp., 6.30%, 02/01/14 | 700 | 780 | ||||
Enersis SA, 7.40%, 12/01/16 | 150 | 169 | ||||
Exelon Corp., 4.90%, 06/15/15 | 200 | 213 | ||||
Exelon Generation Co. LLC | ||||||
5.35%, 01/15/14 | 150 | 162 | ||||
6.20%, 10/01/17 | 200 | 224 | ||||
5.20%, 10/01/19 | 500 | 523 | ||||
First Energy Solutions Corp., 6.80%, 08/15/39 | 200 | 194 | ||||
FirstEnergy Corp., 7.38%, 11/15/31 | 425 | 448 | ||||
Florida Power & Light Co. | ||||||
5.63%, 04/01/34 | 100 | 105 | ||||
5.95%, 02/01/38 | 250 | 277 | ||||
Florida Power Corp. | ||||||
5.65%, 06/15/18 | 500 | 565 | ||||
4.55%, 04/01/20 (e) | 300 | 313 | ||||
FPL Group Capital Inc., 6.00%, 03/01/19 | 100 | 111 | ||||
Georgia Power Co. | ||||||
1.30%, 09/15/13 | 500 | 501 | ||||
4.25%, 12/01/19 | 300 | 309 | ||||
Iberdrola USA Inc, 6.75%, 07/15/36 (e) | 150 | 153 | ||||
Indiana Michigan Power Co., 7.00%, 03/15/19 | 350 | 413 | ||||
Kentucky Utilities Co., 5.13%, 11/01/40 (r) | 300 | 294 | ||||
LG&E and KU Energy LLC, 3.75%, 11/15/20 (r) | 300 | 286 | ||||
MidAmerican Energy Co. | ||||||
5.65%, 07/15/12 | 100 | 107 | ||||
6.75%, 12/30/31 | 50 | 58 | ||||
MidAmerican Energy Holdings Co. | ||||||
5.88%, 10/01/12 | 100 | 108 | ||||
6.13%, 04/01/36 | 350 | 378 | ||||
National Grid Plc, 6.30%, 08/01/16 (e) | 150 | 171 | ||||
Nevada Power Co., 7.13%, 03/15/19 | 250 | 295 | ||||
NiSource Finance Corp. | ||||||
5.40%, 07/15/14 | 75 | 82 | ||||
6.80%, 01/15/19 | 300 | 347 | ||||
Northern States Power Co. | ||||||
8.00%, 08/28/12 | 100 | 111 | ||||
5.25%, 03/01/18 | 500 | 552 | ||||
Ohio Power Co., 6.00%, 06/01/16 | 250 | 281 | ||||
Oncor Electric Delivery Co. | ||||||
6.38%, 01/15/15 | 150 | 170 | ||||
7.00%, 09/01/22 | 150 | 176 | ||||
Pacific Gas & Electric Co. | ||||||
4.80%, 03/01/14 | 250 | 269 | ||||
6.05%, 03/01/34 | 500 | 547 | ||||
PacifiCorp | ||||||
7.70%, 11/15/31 | 450 | 577 | ||||
5.75%, 04/01/37 | 150 | 160 | ||||
Panhandle Eastern Pipeline Co. LP, 6.20%, 11/01/17 | 500 | 533 | ||||
Progress Energy Inc., 7.75%, 03/01/31 | 150 | 188 | ||||
PSEG Power LLC | ||||||
2.50%, 04/15/13 | 300 | 306 | ||||
8.63%, 04/15/31 (e) | 75 | 96 | ||||
Public Service Co. of Colorado, 7.88%, 10/01/12 | 500 | 557 | ||||
Public Service Electric & Gas Co., 5.50%, 03/01/40 | 200 | 208 | ||||
Puget Sound Energy Inc., 5.76%, 10/01/39 | 200 | 200 | ||||
San Diego Gas & Electric Co., 5.35%, 05/15/40 | 200 | 204 | ||||
Scottish Power Ltd., 5.38%, 03/15/15 | 50 | 53 | ||||
Sempra Energy, 6.00%, 02/01/13 | 250 | 271 | ||||
South Carolina Electric & Gas Co., 6.05%, 01/15/38 | 400 | 432 | ||||
Southern California Edison Co. | ||||||
6.00%, 01/15/34 | 75 | 82 | ||||
5.95%, 02/01/38 | 400 | 440 | ||||
See accompanying Notes to the Financial Statements.
JNL Series Trust
Schedules of Investments (in thousands)
December 31, 2010
| Shares/Par (p) | Value | |||||
Southwestern Electric Power Co. | ||||||
6.45%, 01/15/19 | 400 | 439 | ||||
6.20%, 03/15/40 | 200 | 201 | ||||
TransAlta Corp., 6.50%, 03/15/40 | 300 | 306 | ||||
Union Electric Co., 6.40%, 06/15/17 | 100 | 113 | ||||
Veolia Environnement, 6.00%, 06/01/18 | 200 | 224 | ||||
Virginia Electric & Power Co. | ||||||
5.95%, 09/15/17 | 250 | 287 | ||||
6.00%, 01/15/36 | 150 | 164 | ||||
| 19,467 | ||||||
Total Corporate Bonds and Notes (cost $270,306) | 280,379 | |||||
GOVERNMENT AND AGENCY OBLIGATIONS - 75.1% | ||||||
GOVERNMENT SECURITIES - 42.7% | ||||||
Federal Farm Credit Bank - 0.3% (w) | ||||||
Federal Farm Credit Bank | ||||||
2.13%, 06/18/12 | 1,000 | 1,023 | ||||
1.88%, 12/07/12 | 500 | 512 | ||||
1.75%, 02/21/13 | 500 | 509 | ||||
3.88%, 10/07/13 | 500 | 539 | ||||
2.12%, 09/08/16 | 400 | 386 | ||||
2.95%, 12/13/18 | 200 | 194 | ||||
| 3,163 | ||||||
Federal Home Loan Bank - 1.2% (w) | ||||||
Federal Home Loan Bank | ||||||
5.75%, 05/15/12 | 1,125 | 1,206 | ||||
1.13%, 05/18/12 | 500 | 504 | ||||
0.60%, 07/20/12 | 350 | 349 | ||||
0.88%, 08/22/12 | 1,000 | 1,005 | ||||
1.75%, 08/22/12 | 1,000 | 1,019 | ||||
1.63%, 09/26/12 (e) | 1,000 | 1,018 | ||||
4.50%, 11/15/12 | 400 | 428 | ||||
1.63%, 11/21/12 | 1,000 | 1,018 | ||||
0.55%, 12/03/12 | 500 | 499 | ||||
1.50%, 01/16/13 | 1,000 | 1,016 | ||||
3.88%, 06/14/13 (e) | 1,600 | 1,714 | ||||
1.88%, 06/21/13 | 1,000 | 1,023 | ||||
4.50%, 09/16/13 (e) | 1,000 | 1,092 | ||||
3.63%, 10/18/13 | 1,000 | 1,068 | ||||
5.25%, 06/18/14 | 1,090 | 1,237 | ||||
5.00%, 12/21/15 | 500 | 559 | ||||
5.38%, 05/18/16 | 500 | 574 | ||||
4.75%, 12/16/16 (e) | 300 | 335 | ||||
5.65%, 04/20/22 | 125 | 133 | ||||
5.50%, 07/15/36 | 400 | 441 | ||||
| 16,238 | ||||||
Federal Home Loan Mortgage Corp. - 1.9% (w) | ||||||
Federal Home Loan Mortgage Corp. | ||||||
5.75%, 01/15/12 | 1,150 | 1,212 | ||||
2.13%, 03/23/12 - 10/29/13 | 2,250 | 2,291 | ||||
5.13%, 07/15/12 - 10/18/16 | 1,598 | 1,749 | ||||
1.13%, 07/27/12 - 01/14/13 | 1,200 | 1,209 | ||||
0.70%, 10/25/12 | 500 | 498 | ||||
4.63%, 10/25/12 | 300 | 322 | ||||
4.50%, 01/15/13 - 04/02/14 | 2,265 | 2,457 | ||||
1.80%, 02/25/13 | 600 | 601 | ||||
1.63%, 04/15/13 | 500 | 509 | ||||
3.50%, 05/29/13 | 1,400 | 1,487 | ||||
1.40%, 07/26/13 | 500 | 500 | ||||
1.15%, 09/03/13 | 250 | 249 | ||||
1.20%, 09/24/13 - 04/28/14 | 750 | 745 | ||||
4.13%, 09/27/13 (e) | 2,000 | 2,167 | ||||
4.88%, 11/15/13 | 500 | 554 | ||||
1.45%, 02/24/14 | 250 | 250 | ||||
5.05%, 01/26/15 | 100 | 112 | ||||
| Shares/Par (p) | Value | |||||
2.88%, 02/09/15 | 1,000 | 1,041 | ||||
4.38%, 07/17/15 | 300 | 331 | ||||
2.25%, 08/12/15 | 250 | 250 | ||||
4.75%, 01/19/16 | 2,100 | 2,350 | ||||
5.25%, 04/18/16 | 1,000 | 1,144 | ||||
3.00%, 07/14/16 | 250 | 250 | ||||
3.75%, 03/27/19 (e) | 2,000 | 2,070 | ||||
5.00%, 04/29/25 | 250 | 252 | ||||
6.75%, 09/15/29 | 60 | 76 | ||||
6.75%, 03/15/31 (e) | 120 | 154 | ||||
6.25%, 07/15/32 | 600 | 733 | ||||
6.00%, 04/16/37 | 100 | 104 | ||||
| 25,667 | ||||||
Federal National Mortgage Association - 3.0% (w) | ||||||
Federal National Mortgage Association | ||||||
2.00%, 01/09/12 - 03/28/16 | 3,150 | 3,154 | ||||
0.88%, 01/12/12 - 11/08/13 | 1,500 | 1,498 | ||||
5.00%, 02/16/12 - 09/01/35 | 4,054 | 4,453 | ||||
6.13%, 03/15/12 | 1,000 | 1,067 | ||||
1.30%, 05/25/12 | 500 | 502 | ||||
1.13%, 07/30/12 | 1,000 | 1,009 | ||||
1.75%, 08/10/12 (e) | 1,500 | 1,528 | ||||
0.85%, 08/17/12 | 250 | 250 | ||||
4.38%, 09/15/12 - 10/15/15 | 1,290 | 1,386 | ||||
0.70%, 10/19/12 | 250 | 249 | ||||
0.50%, 10/30/12 | 1,500 | 1,496 | ||||
0.55%, 11/01/12 | 500 | 498 | ||||
1.80%, 02/08/13 - 03/15/13 | 900 | 905 | ||||
1.75%, 05/07/13 - 11/17/15 | 1,750 | 1,774 | ||||
1.38%, 07/19/13 | 300 | 301 | ||||
1.50%, 07/19/13 - 09/08/14 | 1,200 | 1,195 | ||||
1.40%, 07/26/13 | 150 | 150 | ||||
1.25%, 07/29/13 - 10/28/14 | 790 | 789 | ||||
1.35%, 08/16/13 | 250 | 250 | ||||
1.00%, 09/20/13 - 04/25/14 | 2,250 | 2,240 | ||||
0.75%, 12/18/13 | 1,500 | 1,483 | ||||
2.75%, 02/05/14 (e) | 900 | 941 | ||||
2.75%, 03/13/14 | 2,000 | 2,090 | ||||
2.50%, 05/15/14 | 675 | 700 | ||||
1.55%, 08/12/14 - 10/27/15 | 600 | 586 | ||||
4.63%, 10/15/14 | 550 | 612 | ||||
2.63%, 11/20/14 | 1,000 | 1,038 | ||||
3.00%, 02/17/15 | 112 | 112 | ||||
1.63%, 10/26/15 (e) | 1,000 | 975 | ||||
4.88%, 12/15/16 | 500 | 561 | ||||
0.00%,06/01/17 (j) | 1,250 | 1,015 | ||||
5.38%, 04/11/22 | 50 | 53 | ||||
5.78%, 06/07/22 | 250 | 267 | ||||
4.00%, 09/30/25 | 100 | 95 | ||||
5.95%, 06/07/27 | 100 | 102 | ||||
6.25%, 05/15/29 | 525 | 644 | ||||
7.13%, 01/15/30 | 1,270 | 1,681 | ||||
7.25%, 05/15/30 (e) | 540 | 727 | ||||
6.63%, 11/15/30 | 690 | 871 | ||||
6.00%, 04/18/36 | 200 | 216 | ||||
Principal Only, 0.00%,10/09/19 (j) | 800 | 505 | ||||
| 39,968 | ||||||
Municipals - 0.7% | ||||||
American Municipal Power-Ohio Inc., | 400 | 412 | ||||
Bay Area Toll Authority, 6.26%, 04/01/49 | 200 | 198 | ||||
Chicago Transit Authority, 6.90%, 12/01/40 | 500 | 495 | ||||
City of New York, 5.97%, 03/01/36 | 200 | 197 | ||||
Commonwealth of Massachusetts, Ad Valorem Property Tax, GO, 4.91%, 05/01/29 | 300 | 280 | ||||
Cook County, Illinois, 6.23%, 11/15/34 | 200 | 191 | ||||
See accompanying Notes to the Financial Statements.
JNL Series Trust
Schedules of Investments (in thousands)
December 31, 2010
| Shares/Par (p) | Value | |||||
Dallas Convention Center Hotel Development Corp., 7.09%, 01/01/42 |
| 200 |
| 201 | ||
Dallas County Hospital District, Series C, 5.62%, 08/15/44 | 300 | 304 | ||||
Dallas Independent School District, 6.45%, 02/15/35 | 300 | 313 | ||||
Indianapolis Local Public Improvement Bond Bank, 6.12%, 01/15/40 | 200 | 208 | ||||
Los Angeles Unified School District, 5.75%, 07/01/34 | 300 | 280 | ||||
Los Angeles Unified School District, Ad | ||||||
Valorem Property Tax, GO, 5.76%, 07/01/29 | 200 | 190 | ||||
Metropolitan Transportation Authority, Transit | ||||||
6.55%, 11/15/31 | 200 | 196 | ||||
6.65%, 11/15/39 | 150 | 147 | ||||
Municipal Electric Authority of Georgia, 7.06%, 04/01/57 | 400 | 367 | ||||
New Jersey Economic Development Authority (insured by National Public Finance Guarantee Corp), 7.43%, 02/15/29 | 200 | 214 | ||||
New Jersey State Turnpike Authority, 7.10%, 01/01/41 | 500 | 542 | ||||
New Jersey State Turnpike Authority (insured by AMBAC Assurance Corp.), | 95 | 98 | ||||
New Jersey State Turnpike Authority (Prerefunded at 01/01/15, insured by AMBAC Assurance��Corp.), Series B, 4.25%, 01/01/16 | 5 | 5 | ||||
New York City Municipal Water Finance Authority, 6.01%, 06/15/42 | 200 | 200 | ||||
New York Dormitory Authority, RB, 5.60%, 03/15/40 | 200 | 197 | ||||
New York, NJ, Port Authority Revenue, 6.04%, 12/01/29 | 200 | 199 | ||||
Ohio State University, College & University Revenue, 4.91%, 06/01/40 | 400 | 362 | ||||
Oregon State Department of Transportation, 5.83%, 11/15/34 | 300 | 306 | ||||
State of California | ||||||
7.63%, 03/01/40 | 300 | 313 | ||||
7.60%, 11/01/40 | 300 | 312 | ||||
State of California Various Purpose Bond, 7.50%, 04/01/34 | 500 | 517 | ||||
State of Connecticut, 5.09%, 10/01/30 | 250 | 236 | ||||
State of Connecticut, Ad Valorem Property Tax, GO, Series A, 5.85%, 03/15/32 | 200 | 205 | ||||
State of Georgia, GO, Series H, 4.50%, 11/01/25 | 300 | 296 | ||||
State of Illinois, 5.10%, 06/01/33 | 700 | 524 | ||||
State of Texas, 5.52%, 04/01/39 | 465 | 473 | ||||
State of Texas, Series A, 4.68%, 04/01/40 | 400 | 364 | ||||
University of California, 6.55%, 05/15/48 | 300 | 293 | ||||
| 9,635 | ||||||
Sovereign - 1.8% | ||||||
Brazilian Government International Bond | ||||||
11.00%, 01/11/12 - 08/17/40 | 615 | 749 | ||||
10.50%, 07/14/14 | 400 | 509 | ||||
7.88%, 03/07/15 | 565 | 675 | ||||
5.88%, 01/15/19 | 200 | 222 | ||||
8.88%, 04/15/24 | 135 | 186 | ||||
10.13%, 05/15/27 | 235 | 360 | ||||
7.13%, 01/20/37 (e) | 455 | 543 | ||||
Canadian Government Bond, 2.38%, 09/10/14 | 500 | 516 | ||||
Chile Government International Bond, 5.50%, 01/15/13 | 100 | 108 | ||||
| Shares/Par (p) | Value | |||||
Eksportfinans ASA, 5.00%, 02/14/12 | 500 | 524 | ||||
Export Development Canada | ||||||
2.38%, 03/19/12 | 500 | 511 | ||||
2.25%, 05/28/15 | 200 | 203 | ||||
Federal Republic of Brazil, 12.25%, 03/06/30 (e) | 220 | 398 | ||||
Financement-Quebec, 5.00%, 10/25/12 (e) | 100 | 107 | ||||
Hungary Government International Bond, 4.75%, 02/03/15 (e) | 250 | 244 | ||||
Hydro Quebec | ||||||
8.00%, 02/01/13 | 250 | 284 | ||||
7.50%, 04/01/16 | 100 | 123 | ||||
9.40%, 02/01/21 | 250 | 358 | ||||
Israel Government International Bond | ||||||
4.63%, 06/15/13 | 75 | 80 | ||||
5.50%, 11/09/16 | 450 | 510 | ||||
7.25%, 12/15/28 | 200 | 240 | ||||
Italy Government International Bond | ||||||
5.63%, 06/15/12 | 250 | 263 | ||||
4.38%, 06/15/13 (e) | 500 | 520 | ||||
4.50%, 01/21/15 | 1,000 | 1,027 | ||||
6.88%, 09/27/23 | 450 | 496 | ||||
5.38%, 06/15/33 | 500 | 470 | ||||
Japan Finance Corp., 2.88%, 02/02/15 (e) | 500 | 512 | ||||
Mexico Government International Bond | ||||||
7.50%, 01/14/12 - 04/08/33 (e) | 350 | 414 | ||||
6.38%, 01/16/13 (e) | 339 | 370 | ||||
5.88%, 01/15/14 | 250 | 277 | ||||
6.63%, 03/03/15 | 93 | 107 | ||||
5.63%, 01/15/17 | 250 | 276 | ||||
5.13%, 01/15/20 | 300 | 313 | ||||
8.30%, 08/15/31 (e) | 300 | 396 | ||||
6.75%, 09/27/34 | 300 | 337 | ||||
Panama Government International Bond, 6.70%, 01/26/36 | 400 | 446 | ||||
Peru Government International Bond | ||||||
7.13%, 03/30/19 (e) | 200 | 239 | ||||
8.75%, 11/21/33 | 200 | 274 | ||||
Poland Government Treasury International Bond, 5.00%, 10/19/15 (e) | 650 | 690 | ||||
Province of British Columbia, Canada, 2.85%, 06/15/15 | 200 | 206 | ||||
Province of Manitoba, Canada | ||||||
5.00%, 02/15/12 | 250 | 262 | ||||
2.63%, 07/15/15 | 500 | 509 | ||||
Province of New Brunswick, Canada, 5.20%, 02/21/17 | 250 | 279 | ||||
Province of Nova Scotia, Canada | ||||||
5.75%, 02/27/12 | 100 | 106 | ||||
8.75%, 04/01/22 | 250 | 350 | ||||
Province of Ontario, Canada | ||||||
1.88%, 11/19/12 (e) | 700 | 713 | ||||
4.10%, 06/16/14 | 500 | 540 | ||||
4.50%, 02/03/15 | 100 | 109 | ||||
2.70%, 06/16/15 | 300 | 305 | ||||
5.45%, 04/27/16 | 250 | 284 | ||||
4.00%, 10/07/19 (e) | 500 | 514 | ||||
4.40%, 04/14/20 (e) | 200 | 209 | ||||
Province of Quebec, Canada | ||||||
4.60%, 05/26/15 | 500 | 549 | ||||
7.50%, 07/15/23 | 100 | 132 | ||||
7.13%, 02/09/24 (e) | 250 | 320 | ||||
Republic of Korea | ||||||
5.13%, 12/07/16 | 150 | 161 | ||||
5.63%, 11/03/25 | 250 | 266 | ||||
Republic of Peru, 6.55%, 03/14/37 (e) | 250 | 274 | ||||
Republic of South Africa Government Bond 7.38%, 04/25/12 | 100 | 108 | ||||
See accompanying Notes to the Financial Statements.
JNL Series Trust
Schedules of Investments (in thousands)
December 31, 2010
| Shares/Par (p) | Value | |||||
6.50%, 06/02/14 | 200 | 225 | ||||
5.50%, 03/09/20 | 200 | 213 | ||||
Svensk Exportkredit AB, 5.13%, 03/01/17 | 200 | 222 | ||||
Tennessee Valley Authority | ||||||
5.50%, 07/18/17 | 1,000 | 1,152 | ||||
5.25%, 09/15/39 | 500 | 529 | ||||
United Mexican States, 6.05%, 01/11/40 | 300 | 307 | ||||
| 23,721 | ||||||
U.S. Treasury Securities - 33.8% | ||||||
U.S. Treasury Bond | ||||||
10.63%, 08/15/15 | 450 | 626 | ||||
7.25%, 05/15/16 - 08/15/22 | 2,400 | 3,098 | ||||
7.50%, 11/15/16 - 11/15/24 | 1,140 | 1,524 | ||||
8.75%, 05/15/17 - 08/15/20 | 1,555 | 2,215 | ||||
8.88%, 08/15/17 | 780 | 1,083 | ||||
9.13%, 05/15/18 (e) | 315 | 451 | ||||
8.88%, 02/15/19 (e) | 590 | 849 | ||||
8.13%, 08/15/19 - 05/15/21 | 3,100 | 4,350 | ||||
8.50%, 02/15/20 | 1,340 | 1,917 | ||||
7.88%, 02/15/21 | 1,420 | 1,981 | ||||
8.00%, 11/15/21 | 2,350 | 3,324 | ||||
7.13%, 02/15/23 | 1,255 | 1,686 | ||||
6.25%, 08/15/23 - 05/15/30 | 2,880 | 3,662 | ||||
7.63%, 02/15/25 | 539 | 764 | ||||
6.88%, 08/15/25 | 410 | 548 | ||||
6.00%, 02/15/26 | 730 | 903 | ||||
6.75%, 08/15/26 | 870 | 1,155 | ||||
6.50%, 11/15/26 | 260 | 338 | ||||
6.63%, 02/15/27 | 545 | 717 | ||||
6.38%, 08/15/27 | 380 | 489 | ||||
6.13%, 11/15/27 | 1,495 | 1,878 | ||||
5.50%, 08/15/28 | 850 | 1,002 | ||||
5.25%, 11/15/28 - 02/15/29 | 1,215 | 1,393 | ||||
5.38%, 02/15/31 | 1,700 | 1,984 | ||||
4.50%, 02/15/36 - 08/15/39 | 6,765 | 6,965 | ||||
4.75%, 02/15/37 | 1,545 | 1,660 | ||||
5.00%, 05/15/37 | 1,450 | 1,618 | ||||
4.38%, 02/15/38 - 05/15/40 | 8,650 | 8,701 | ||||
3.50%, 02/15/39 | 2,300 | 1,982 | ||||
4.25%, 05/15/39 - 11/15/40 | 4,880 | 4,805 | ||||
4.63%, 02/15/40 | 4,355 | 4,562 | ||||
3.88%, 08/15/40 | 3,450 | 3,178 | ||||
U.S. Treasury Note | ||||||
1.13%, 01/15/12 - 06/15/13 | 6,430 | 6,487 | ||||
0.88%, 01/31/12 - 02/29/12 | 8,500 | 8,549 | ||||
4.75%, 01/31/12 - 08/15/17 | 7,085 | 7,693 | ||||
1.38%, 02/15/12 - 05/15/13 | 32,094 | 32,547 | ||||
4.88%, 02/15/12 (e) | 1,725 | 1,811 | ||||
4.63%, 02/29/12 - 02/15/17 | 5,645 | 6,212 | ||||
1.00%, 03/31/12 - 07/15/13 | 10,250 | 10,324 | ||||
4.50%, 03/31/12 - 05/15/17 | 7,800 | 8,600 | ||||
0.75%, 05/31/12 - 12/15/13 | 8,500 | 8,488 | ||||
1.88%, 06/15/12 - 10/31/17 | 15,400 | 15,315 | ||||
0.63%, 06/30/12 - 12/31/12 | 10,700 | 10,725 | ||||
4.88%, 06/30/12 - 08/15/16 | 1,920 | 2,115 | ||||
1.50%, 07/15/12 - 12/31/13 | 4,700 | 4,774 | ||||
1.75%, 08/15/12 - 07/31/15 | 13,390 | 13,599 | ||||
4.38%, 08/15/12 | 1,900 | 2,020 | ||||
0.38%, 08/31/12 - 10/31/12 | 9,000 | 8,979 | ||||
4.13%, 08/31/12 - 05/15/15 | 3,490 | 3,808 | ||||
4.25%, 09/30/12 - 11/15/17 | 14,280 | 15,672 | ||||
3.88%, 10/31/12 - 05/15/18 | 3,635 | 3,890 | ||||
4.00%, 11/15/12 - 02/15/15 | 6,130 | 6,642 | ||||
0.50%, 11/30/12 (e) | 3,000 | 2,996 | ||||
3.38%, 11/30/12 - 11/15/19 | 9,670 | 10,016 | ||||
3.63%, 12/31/12 - 02/15/20 | 14,100 | 14,750 | ||||
2.75%, 02/28/13 - 02/15/19 | 17,240 | 17,493 | ||||
| Shares/Par (p) | Value | |||||
2.50%, 03/31/13 - 06/30/17 | 6,665 | 6,822 | ||||
3.13%, 04/30/13 - 05/15/19 | 18,970 | 19,728 | ||||
3.50%, 05/31/13 - 05/15/20 | 9,740 | 10,112 | ||||
3.38%, 06/30/13 (e) | 1,750 | 1,863 | ||||
0.75%, 09/15/13, TBA (g) | 3,000 | 2,990 | ||||
0.50%, 10/15/13, TBA (g) | 3,000 | 2,966 | ||||
0.50%, 11/15/13 | 3,000 | 2,961 | ||||
2.00%, 11/30/13 | 2,570 | 2,646 | ||||
2.25%, 05/31/14 - 11/30/17 | 7,550 | 7,659 | ||||
2.63%, 06/30/14 - 08/15/20 | 20,685 | 20,983 | ||||
2.38%, 08/31/14 - 07/31/17 | 16,600 | 17,017 | ||||
2.13%, 11/30/14 - 12/31/15 | 11,000 | 11,176 | ||||
2.50%, 04/30/15, TBA (g) | 3,900 | 4,032 | ||||
1.25%, 08/31/15 | 2,800 | 2,723 | ||||
1.25%, 09/30/15 (e) | 3,000 | 2,911 | ||||
1.25%, 10/31/15, TBA (g) | 3,000 | 2,903 | ||||
1.38%, 11/30/15, TBA (g) | 3,000 | 2,915 | ||||
5.13%, 05/15/16 | 860 | 991 | ||||
3.25%, 05/31/16 - 03/31/17 | 9,485 | 9,946 | ||||
3.25%, 06/30/16 (e) | 2,000 | 2,109 | ||||
3.00%, 08/31/16 - 02/28/17 | 7,500 | 7,768 | ||||
4.00%, 08/15/18 (e) | 2,200 | 2,384 | ||||
3.75%, 11/15/18 | 4,265 | 4,537 | ||||
2.63%, 11/15/20 (e) | 4,700 | 4,433 | ||||
| 449,488 | ||||||
U.S. GOVERNMENT AGENCY MORTGAGE-BACKED SECURITIES - 32.4% | ||||||
Federal Home Loan Mortgage Corp. - 9.8% | ||||||
Federal Home Loan Mortgage Corp. | ||||||
6.50%, 06/01/14 - 03/01/39 | 4,510 | 5,014 | ||||
7.00%, 08/01/15 - 08/01/37 | 368 | 415 | ||||
6.00%, 12/01/16 - 11/01/39 | 14,647 | 15,960 | ||||
4.50%, 01/01/18 - 09/01/40 | 32,240 | 33,249 | ||||
5.50%, 04/01/18 - 10/01/39 | 22,220 | 23,788 | ||||
4.00%, 04/01/19 - 11/01/40 | 14,273 | 14,482 | ||||
5.00%, 07/01/19 - 07/01/40 | 25,032 | 26,364 | ||||
4.00%, 01/15/26 - 01/15/41 , TBA (g) | 4,200 | 4,207 | ||||
5.00%, 01/15/26 - 08/01/40 , TBA (g) | 2,525 | 2,653 | ||||
7.50%, 11/01/31 - 04/01/32 | 187 | 214 | ||||
5.81%, 01/01/37 (i) | 62 | 66 | ||||
6.02%, 01/01/37 (i) | 242 | 260 | ||||
5.63%, 02/01/37 (i) | 335 | 360 | ||||
4.50%, 01/15/41, TBA (g) | 1,800 | 1,844 | ||||
5.50%, 01/15/41, TBA (g) | 1,500 | 1,598 | ||||
6.50%, 01/15/41, TBA (g) | 500 | 554 | ||||
| 131,028 | ||||||
Federal National Mortgage Association - 16.1% | ||||||
Federal National Mortgage Association | ||||||
5.50%, 01/01/14 - 01/01/40 | 36,787 | 39,532 | ||||
6.00%, 01/01/16 - 09/01/39 | 21,398 | 23,374 | ||||
6.50%, 09/01/16 - 12/01/38 | 6,787 | 7,584 | ||||
5.00%, 10/01/17 - 06/01/40 | 41,128 | 43,471 | ||||
4.50%, 02/01/18 - 10/01/40 | 43,816 | 45,279 | ||||
4.00%, 07/01/18 - 12/01/40 | 25,053 | 25,292 | ||||
3.50%, 08/01/25 - 12/01/40 | 3,191 | 3,174 | ||||
4.00%, 01/15/26 - 01/15/41 , TBA (g) | 5,100 | 5,151 | ||||
5.00%, 01/15/26 - 08/01/40 , TBA (g) | 3,500 | 3,700 | ||||
7.00%, 02/01/31 - 04/01/39 | 1,275 | 1,443 | ||||
2.79%, 05/01/35 (i) | 210 | 219 | ||||
2.80%, 05/01/35 (i) | 68 | 71 | ||||
2.89%, 10/01/35 (i) | 356 | 372 | ||||
5.39%, 02/01/37 (i) | 36 | 38 | ||||
5.51%, 02/01/37 (i) | 383 | 405 | ||||
5.62%, 02/01/37 (i) | 248 | 264 | ||||
5.57%, 04/01/37 (i) | 86 | 91 | ||||
5.82%, 04/01/37 (i) | 649 | 688 | ||||
See accompanying Notes to the Financial Statements.
JNL Series Trust
Schedules of Investments (in thousands)
December 31, 2010
| Shares/Par (p) | Value | |||||
7.50%, 11/01/37 | 47 | 54 | ||||
5.27%, 01/01/38 (i) | 733 | 776 | ||||
5.67%, 03/01/38 (i) | 708 | 754 | ||||
6.00%, 12/01/38, TBA (g) | 1,000 | 1,094 | ||||
4.41%, 07/01/39 (i) | 2,114 | 2,241 | ||||
3.81%, 12/01/39 (i) | 710 | 743 | ||||
3.72%, 02/01/40 (i) | 1,787 | 1,865 | ||||
3.39%, 03/01/40 (i) | 926 | 958 | ||||
4.21%, 03/01/40 (i) | 785 | 814 | ||||
3.12%, 06/01/40 (i) | 395 | 403 | ||||
3.25%, 07/01/40 (i) | 957 | 985 | ||||
3.56%, 08/01/40 (i) | 451 | 461 | ||||
4.50%, 01/15/41, TBA (g) | 1,700 | 1,745 | ||||
5.50%, 01/15/41, TBA (g) | 800 | 856 | ||||
| 213,897 | ||||||
Government National Mortgage Association - 6.5% | ||||||
Government National Mortgage Association | ||||||
5.50%, 01/15/24 - 07/15/40 | 10,951 | 11,868 | ||||
4.00%, 08/15/24 - 11/15/40 | 5,913 | 6,009 | ||||
8.00%, 04/15/30 | 19 | 23 | ||||
8.50%, 06/15/30 - 12/15/30 | 6 | 7 | ||||
6.50%, 01/15/32 - 10/15/38 | 1,811 | 2,044 | ||||
6.00%, 05/15/32 - 12/15/39 | 7,052 | 7,784 | ||||
5.00%, 03/15/33 - 07/20/40 | 22,599 | 24,103 | ||||
7.00%, 11/15/36 | 136 | 152 | ||||
4.50%, 03/15/38 - 09/15/40 | 24,736 | 25,746 | ||||
4.50%, 01/15/41, TBA (g) | 4,900 | 5,087 | ||||
5.00%, 01/15/41, TBA (g) | 1,500 | 1,595 | ||||
5.50%, 01/15/41, TBA (g) | 1,100 | 1,189 | ||||
6.00%, 01/15/41, TBA (g) | 500 | 550 | ||||
6.50%, 01/15/41, TBA (g) | 500 | 563 | ||||
| 86,720 | ||||||
Total Government and Agency Obligations | 999,525 | |||||
SHORT TERM INVESTMENTS - 8.9% | ||||||
Investment Company 3.3% | ||||||
JNL Money Market Fund, 0.08% (a) (h) | 44,153 | 44,153 | ||||
Securities Lending Collateral 5.6% | ||||||
Securities Lending Cash Collateral Fund LLC, 0.31% (a) (h) | 70,234 | 70,234 | ||||
Securities Lending Liquidating Fund LLC, 0.66% (a) (h) | 4,583 | 4,508 | ||||
| 74,742 | ||||||
Total Short Term Investments (cost $118,970) | 118,895 | |||||
Total Investments - 107.9% | 1,436,334 | |||||
Other Assets and Liabilities, Net - (7.9%) | (104,770) | |||||
Total Net Assets - 100.0% | $1,331,564 | |||||
JNL/Mellon Capital Management Global Alpha Fund | ||||||
SHORT TERM INVESTMENTS - 98.7% | ||||||
Commercial Paper 0.5% | ||||||
Nordea Bank AB, 0.44%, 01/14/11 | $ | 1,000 | $1,000 | |||
Federal Home Loan Bank 13.6% (w) | ||||||
Federal Home Loan Bank | ||||||
0.09%, 01/14/11 | 20,300 | 20,299 | ||||
0.10%, 01/18/11 | 1,000 | 1,000 | ||||
| Shares/Par (p) | Value | |||||
0.02%, 01/24/11 | 5,000 | 5,000 | ||||
0.03%, 01/26/11 | 1,000 | 1,000 | ||||
| 27,299 | ||||||
Federal Home Loan Mortgage Corp. 27.1% (w) |
| |||||
Federal Home Loan Mortgage Corp. | ||||||
0.07%, 01/05/11 | 13,500 | 13,500 | ||||
0.10%, 01/18/11 - 01/28/11 | 2,500 | 2,500 | ||||
0.13%, 01/18/11 | 6,500 | 6,500 | ||||
0.16%, 01/31/11 - 02/14/11 | 27,100 | 27,096 | ||||
0.11%, 03/02/11 | 5,000 | 4,999 | ||||
| 54,595 | ||||||
Federal National Mortgage Association 20.9% (w) |
| |||||
Federal National Mortgage Association | ||||||
0.10%, 01/12/11 | 1,000 | 1,000 | ||||
0.12%, 01/18/11 | 3,899 | 3,899 | ||||
0.13%, 01/18/11 - 01/19/11 | 14,600 | 14,599 | ||||
0.08%, 01/19/11 | 7,500 | 7,500 | ||||
0.15%, 01/26/11 | 10,000 | 9,999 | ||||
0.11%, 02/17/11 | 5,000 | 4,999 | ||||
| 41,996 | ||||||
Investment Company 1.8% | ||||||
JNL Money Market Fund, 0.08% (a) (h) | 3,593 | 3,593 | ||||
Treasury Securities 34.8% | ||||||
U.S. Treasury Bill | ||||||
0.13%, 03/24/11 (o) | $ | 8,600 | 8,597 | |||
0.13%, 01/13/11 | 5,580 | 5,580 | ||||
0.13%, 02/10/11 | 11,050 | 11,048 | ||||
0.11%, 01/06/11 | 2,000 | 2,000 | ||||
0.16%, 01/20/11 | 26,720 | 26,718 | ||||
0.04%, 01/27/11 | 12,000 | 12,000 | ||||
0.14%, 02/03/11 | 4,000 | 3,999 | ||||
| 69,942 | ||||||
Total Short Term Investments (cost $198,424) | 198,425 | |||||
Total Investments - 98.7% | 198,425 | |||||
Other Assets and Liabilities, Net - 1.3% | 2,689 | |||||
Total Net Assets - 100.0% | $201,114 | |||||
JNL/Oppenheimer Global Growth Fund * (x) | ||||||
COMMON STOCKS - 96.7% | ||||||
CONSUMER DISCRETIONARY - 16.1% | ||||||
Bayerische Motoren Werke AG | 11 | $840 | ||||
Carnival Corp. | 158 | 7,267 | ||||
Grupo Televisa SA - ADR (c) | 198 | 5,125 | ||||
Inditex SA | 70 | 5,221 | ||||
LVMH Moet Hennessy Louis Vuitton SA | 46 | 7,590 | ||||
McDonald’s Corp. | 83 | 6,343 | ||||
Sony Corp. | 184 | 6,581 | ||||
Tiffany & Co. | 121 | 7,533 | ||||
Walt Disney Co. | 171 | 6,414 | ||||
Other Securities | 11,753 | |||||
| 64,667 | ||||||
CONSUMER STAPLES - 8.3% | ||||||
Cia de Bebidas das Americas - ADR | 133 | 4,122 | ||||
Colgate-Palmolive Co. | 69 | 5,570 | ||||
Fomento Economico Mexicano SAB de CV (e) | 975 | 5,453 | ||||
Nestle SA | 76 | 4,464 | ||||
Unilever Plc | 164 | 5,014 | ||||
See accompanying Notes to the Financial Statements.
JNL Series Trust
Schedules of Investments (in thousands)
December 31, 2010
| Shares/Par (p) | Value | |||||
Wal-Mart Stores Inc. | 90 | 4,861 | ||||
Other Securities | 3,826 | |||||
| 33,310 | ||||||
ENERGY - 3.7% | ||||||
Technip SA (e) | 59 | 5,458 | ||||
Total SA | 85 | 4,503 | ||||
Transocean Ltd. (c) | 69 | 4,812 | ||||
| 14,773 | ||||||
FINANCIALS - 15.4% | ||||||
AFLAC Inc. | 69 | 3,882 | ||||
Allianz SE | 46 | 5,446 | ||||
Banco Bilbao Vizcaya Argentaria SA (e) | 389 | 3,967 | ||||
Credit Suisse Group AG | 214 | 8,635 | ||||
Dai-Ichi Life Insurance Co. Ltd. | 3 | 4,805 | ||||
Goldman Sachs Group Inc. | 26 | 4,308 | ||||
HSBC Holdings Plc (e) | 532 | 5,452 | ||||
Investor AB - Class B | 201 | 4,309 | ||||
UBS AG (c) | 315 | 5,173 | ||||
Other Securities | 16,046 | |||||
| 62,023 | ||||||
HEALTH CARE - 7.2% | ||||||
Aetna Inc. | 149 | 4,556 | ||||
WellPoint Inc. (c) | 88 | 4,999 | ||||
Zimmer Holdings Inc. (c) | 78 | 4,186 | ||||
Other Securities | 15,101 | |||||
| 28,842 | ||||||
INDUSTRIALS - 14.1% | ||||||
3M Co. | 62 | 5,357 | ||||
Assa Abloy AB | 229 | 6,458 | ||||
European Aeronautic Defence & Space Co. NV (c) | 205 | 4,781 | ||||
Koninklijke Philips Electronics NV | 171 | 5,239 | ||||
Siemens AG | 95 | 11,826 | ||||
Other Securities | 23,236 | |||||
| 56,897 | ||||||
INFORMATION TECHNOLOGY - 28.3% | ||||||
Adobe Systems Inc. (c) | 156 | 4,812 | ||||
Altera Corp. | 220 | 7,845 | ||||
Corning Inc. | 199 | 3,837 | ||||
eBay Inc. (c) | 364 | 10,123 | ||||
Infosys Technologies Ltd. | 91 | 7,032 | ||||
Intuit Inc. (c) | 150 | 7,407 | ||||
Juniper Networks Inc. (c) (e) | 228 | 8,432 | ||||
Keyence Corp. | 14 | 3,983 | ||||
Maxim Integrated Products Inc. | 208 | 4,922 | ||||
Microsoft Corp. | 243 | 6,797 | ||||
Murata Manufacturing Co. Ltd. | 77 | 5,361 | ||||
SAP AG | 134 | 6,809 | ||||
Taiwan Semiconductor Manufacturing Co. Ltd. | 1,925 | 4,687 | ||||
Telefonaktiebolaget LM Ericsson | 1,399 | 16,218 | ||||
Other Securities | 15,434 | |||||
| 113,699 | ||||||
MATERIALS - 0.6% | ||||||
Other Securities | 2,666 | |||||
TELECOMMUNICATION SERVICES - 2.2% | ||||||
KDDI Corp. | 1 | 3,887 | ||||
Vodafone Group Plc | 1,531 | 3,957 | ||||
Other Securities | 969 | |||||
| 8,813 | ||||||
| Shares/Par | (p) | Value | ||||
UTILITIES - 0.8% | ||||||
Other Securities | 3,396 | |||||
Total Common Stocks (cost $342,455) |
| 389,086 | ||||
PREFERRED STOCKS - 1.3% | ||||||
CONSUMER DISCRETIONARY - 1.3% | ||||||
Bayerische Motoren Werke AG | 100 | 5,129 | ||||
Total Preferred Stocks (cost $3,617) | 5,129 | |||||
SHORT TERM INVESTMENTS - 6.7% | ||||||
Investment Company - 1.8% | ||||||
JNL Money Market Fund, 0.08% (a) (h) | 7,173 | 7,173 | ||||
Securities Lending Collateral 4.9% | ||||||
Securities Lending Cash Collateral Fund LLC, 0.31% (a) (h) | 18,929 | 18,929 | ||||
Securities Lending Liquidating Fund LLC, 0.66% (a) (h) | 980 | 964 | ||||
| 19,893 | ||||||
Total Short Term Investments (cost $27,082) | 27,066 | |||||
Total Investments - 104.7% (cost $373,154) |
| 421,281 | ||||
Other Assets and Liabilities, Net - (4.7%) | (19,029) | |||||
Total Net Assets - 100.0% | $ 402,252 | |||||
JNL/PAM Asia ex-Japan Fund * (x) | ||||||
COMMON STOCKS - 99.2% | ||||||
CONSUMER DISCRETIONARY - 2.6% | ||||||
Other Securities | $ 3,887 | |||||
CONSUMER STAPLES - 3.3% | ||||||
Shinsegae Co. Ltd. (c) | 7 | 3,833 | ||||
Other Securities | 1,195 | |||||
| 5,028 | ||||||
ENERGY - 8.7% | ||||||
Banpu Public Co. Ltd. | 95 | 2,505 | ||||
Cairn India Ltd. (c) | 249 | 1,854 | ||||
China Petroleum & Chemical Corp. | 2,546 | 2,437 | ||||
China Shenhua Energy Co. Ltd. | 411 | 1,722 | ||||
CNOOC Ltd. | 1,440 | 3,416 | ||||
Other Securities | 1,239 | |||||
| 13,173 | ||||||
FINANCIALS - 31.1% | ||||||
AIA Group Ltd. (c) | 502 | 1,410 | ||||
AMMB Holdings Bhd (c) | 1,127 | 2,568 | ||||
Bangkok Bank PCL | 400 | 2,025 | ||||
Bank of China Ltd. | 9,372 | 4,944 | ||||
China Construction Bank Corp. | 3,404 | 3,053 | ||||
China Pacific Insurance Group Co. Ltd. (e) | 779 | 3,237 | ||||
DBS Group Holdings Ltd. | 285 | 3,184 | ||||
Global Logistic Properties Ltd. (c) | 795 | 1,338 | ||||
Hana Financial Group Inc. | 47 | 1,800 | ||||
Hang Seng Bank Ltd. | 169 | 2,780 | ||||
Henderson Land Development Co. Ltd. (c) (e) | 452 | 3,082 | ||||
Infrastructure Development Finance Co. Ltd. | 505 | 2,063 | ||||
Korea Exchange Bank | 197 | 2,040 | ||||
Metropolitan Bank & Trust Co. | 791 | 1,293 | ||||
Samsung Fire & Marine Insurance Co. Ltd. | 22 | 4,297 | ||||
See accompanying Notes to the Financial Statements.
JNL Series Trust
Schedules of Investments (in thousands)
December 31, 2010
| Shares/Par (p) | Value | |||||
Sino-Ocean Land Holdings Ltd. (e) | 2,272 | 1,488 | ||||
Wharf Holdings Ltd. | 180 | 1,384 | ||||
Yuanta Financial Holding Co. Ltd. | 2,567 | 1,919 | ||||
Other Securities | 3,019 | |||||
| 46,924 | ||||||
HEALTH CARE - 1.8% | ||||||
Ranbaxy Laboratories Ltd. (c) | 203 | 2,721 | ||||
INDUSTRIALS - 13.5% | ||||||
Far Eastern New Century Corp | 1,747 | 2,959 | ||||
Hutchison Whampoa Ltd. | 501 | 5,157 | ||||
Hyundai Engineering & Construction Co. Ltd. (c) | 55 | 3,527 | ||||
SembCorp Industries Ltd. | 802 | 3,212 | ||||
Tata Motors Ltd. | 129 | 2,262 | ||||
Other Securities | 3,284 | |||||
| 20,401 | ||||||
INFORMATION TECHNOLOGY - 20.2% |
| |||||
AAC Acoustic Technologies Holdings Inc. | 1,236 | 3,300 | ||||
Acer Inc. | 478 | 1,478 | ||||
Foxconn Technology Co. Ltd. | 676 | 2,711 | ||||
HON HAI Precision Industry Co. Ltd. | 1,078 | 4,345 | ||||
Largan Precision Co. Ltd. | 63 | 1,567 | ||||
Mphasis Ltd. | 167 | 2,516 | ||||
Samsung Electronics Co. Ltd. | 8 | 6,508 | ||||
Shanda Games Ltd. - ADR (c) (e) | 256 | 1,648 | ||||
Taiwan Semiconductor Manufacturing Co. Ltd. | 1,285 | 3,128 | ||||
Wistron Corp. | 1,060 | 2,160 | ||||
Other Securities | 1,133 | |||||
| 30,494 | ||||||
MATERIALS - 8.3% | ||||||
China Shanshui Cement Group Ltd. | 3,436 | 2,454 | ||||
Hindalco Industries Ltd. | 355 | 1,959 | ||||
Taiwan Fertilizer Co. Ltd. | 392 | 1,466 | ||||
Xingda International Holdings Ltd. | 1,438 | 1,554 | ||||
Other Securities | 5,064 | |||||
| 12,497 | ||||||
TELECOMMUNICATION SERVICES - 6.6% | ||||||
Axiata Group Bhd (c) | 1,584 | 2,438 | ||||
China Mobile Ltd. | 170 | 1,683 | ||||
China Unicom Hong Kong Ltd. | 2,682 | 3,836 | ||||
Telekomunikasi Indonesia Tbk PT | 1,725 | 1,522 | ||||
Other Securities | 454 | |||||
| 9,933 | ||||||
UTILITIES - 3.1% | ||||||
GVK Power & Infrastructure Ltd. (c) | 1,454 | 1,319 | ||||
Korea Electric Power Corp. (c) | 123 | 3,266 | ||||
| 4,585 | ||||||
Total Common Stocks (cost $128,635) | 149,643 | |||||
RIGHTS - 0.0% | ||||||
Metropolitan Bank & Trust Co. (c) (f) | 82 | 42 | ||||
Total Rights (cost $0) | 42 | |||||
WARRANTS - 0.0% | ||||||
Henderson Land Development Co. Ltd. (c) | 77 | 18 | ||||
Total Warrants (cost $0) | 18 | |||||
| Shares/Par (p) | Value | |||||
SHORT TERM INVESTMENTS - 4.6% | ||||||
Investment Company - 1.2% | ||||||
JNL Money Market Fund, 0.08% (a) (h) | 1,752 | 1,752 | ||||
Securities Lending Collateral 3.4% |
| |||||
Securities Lending Cash Collateral Fund LLC, 0.31% (a) (h) | 5,075 | 5,075 | ||||
Securities Lending Liquidating Fund LLC, 0.66% (a) (h) | 45 | 44 | ||||
| 5,119 | ||||||
Total Short Term Investments (cost $6,872) | 6,871 | |||||
Total Investments - 103.8% (cost $135,507) | 156,574 | |||||
Other Assets and Liabilities, Net - (3.8%) | (5,741) | |||||
Total Net Assets - 100.0% | $ 150,833 | |||||
JNL/PAM China-India Fund | ||||||
COMMON STOCKS - 94.7% | ||||||
CONSUMER DISCRETIONARY - 8.9% |
| |||||
BYD Co. Ltd. (e) | 841 | $ 4,419 | ||||
Focus Media Holding Ltd. - ADR (c) | 489 | 10,730 | ||||
GOME Electrical Appliances Holdings Ltd. (c) (e) | 8,810 | 3,174 | ||||
Mahindra & Mahindra Ltd. | 444 | 7,735 | ||||
Shenzhou International Group Holdings Ltd. | 1,324 | 1,535 | ||||
Sun TV Network Ltd. | 565 | 6,642 | ||||
| 34,235 | ||||||
CONSUMER STAPLES - 2.9% | ||||||
Colgate-Palmolive India Ltd. | 325 | 6,317 | ||||
ITC Ltd. | 1,218 | 4,759 | ||||
| 11,076 | ||||||
ENERGY - 15.2% | ||||||
China Petroleum & Chemical Corp. (e) | 8,224 | 7,872 | ||||
China Shenhua Energy Co. Ltd. | 1,845 | 7,738 | ||||
CNOOC Ltd. | 5,121 | 12,149 | ||||
Oil & Natural Gas Corp. Ltd. | 233 | 6,702 | ||||
Oil India Ltd. | 136 | 4,286 | ||||
Reliance Industries Ltd. | 841 | 19,914 | ||||
| 58,661 | ||||||
FINANCIALS - 31.5% | ||||||
Axis Bank Ltd. | 111 | 3,358 | ||||
Bank of China Ltd. | 51,762 | 27,304 | ||||
China Pacific Insurance Group Co. Ltd. (e) | 2,017 | 8,383 | ||||
Evergrande Real Estate Group Ltd. | 15,691 | 7,631 | ||||
Franshion Properties China Ltd. (e) | 13,604 | 4,095 | ||||
ICICI Bank Ltd. | 577 | 14,771 | ||||
Industrial & Commercial Bank of China | 20,534 | 15,296 | ||||
Infrastructure Development Finance Co. Ltd. | 1,912 | 7,807 | ||||
LIC Housing Finances Ltd. | 1,368 | 5,979 | ||||
Mahindra & Mahindra Financial Services Ltd. | 507 | 8,397 | ||||
Ping an Insurance Group Co. of China Ltd. | 780 | 8,720 | ||||
Rural Electrification Corp. Ltd. | 1,029 | 6,883 | ||||
Sino-Ocean Land Holdings Ltd. (e) | 4,017 | 2,630 | ||||
| 121,254 | ||||||
HEALTH CARE - 3.0% | ||||||
Dr. Reddy’s Laboratories Ltd. | 307 | 11,412 | ||||
See accompanying Notes to the Financial Statements.
JNL Series Trust
Schedules of Investments (in thousands)
December 31, 2010
| Shares/Par | (p) | Value | ||||
INDUSTRIALS - 4.9% | ||||||
Bharat Heavy Electricals Ltd. | 74 | 3,856 | ||||
Mundra Port and Special Economic Zone Ltd. | 506 | 1,629 | ||||
Sinotrans Shipping Ltd. (e) | 5,012 | 1,896 | ||||
Tata Motors Ltd. | 228 | 6,663 | ||||
Tata Motors Ltd. - Class A | 288 | 5,054 | ||||
| 19,098 | ||||||
INFORMATION TECHNOLOGY - 12.2% |
| |||||
AAC Acoustic Technologies Holdings Inc. | 1,016 | 2,712 | ||||
Infosys Technologies Ltd. | 288 | 22,177 | ||||
Mphasis Ltd. | 480 | 7,220 | ||||
OnMobile Global Ltd. (c) | 295 | 1,893 | ||||
Sohu.com Inc. (c) | 134 | 8,489 | ||||
Travelsky Technology Ltd. | 4,250 | 4,440 | ||||
| 46,931 | ||||||
MATERIALS - 9.7% | ||||||
China Resources Cement Holdings Ltd. (c) | 8,560 | 6,498 | ||||
China Zhongwang Holdings Ltd. (e) | 9,769 | 5,442 | ||||
Fosun International Ltd. | 4,755 | 3,493 | ||||
Hindalco Industries Ltd. | 1,945 | 10,742 | ||||
Huabao International Holdings Ltd. | 3,160 | 5,114 | ||||
Sterlite Industries India Ltd. | 497 | 2,074 | ||||
Xingda International Holdings Ltd. | 3,768 | 4,072 | ||||
| 37,435 | ||||||
TELECOMMUNICATION SERVICES - 4.8% |
| |||||
China Mobile Ltd. | 774 | 7,687 | ||||
China Unicom Hong Kong Ltd. (e) | 7,675 | 10,980 | ||||
| 18,667 | ||||||
UTILITIES - 1.6% | ||||||
GAIL India Ltd. | 523 | 5,997 | ||||
Total Common Stocks (cost $315,064) | 364,766 | |||||
SHORT TERM INVESTMENTS - 9.7% |
| |||||
Investment Company - 5.3% | ||||||
JNL Money Market Fund, 0.08% (a) (h) | 20,481 | 20,481 | ||||
Securities Lending Collateral 4.4% |
| |||||
Securities Lending Cash Collateral Fund LLC, 0.31% (a) (h) | 16,822 | 16,822 | ||||
Securities Lending Liquidating Fund LLC, 0.66% (a) (h) | 55 | 55 | ||||
| 16,877 | ||||||
Total Short Term Investments (cost $37,358) | 37,358 | |||||
Total Investments - 104.4% (cost $352,422) | 402,124 | |||||
Other Assets and Liabilities, Net - (4.4%) | (16,790) | |||||
Total Net Assets - 100.0% | $385,334 | |||||
JNL/PIMCO Real Return Fund | ||||||
NON-U.S. GOVERNMENT AGENCY ASSET-BACKED SECURITIES - 10.5% | ||||||
ACE Securities Corp. REMIC, 0.35%, 06/25/37 (i) | $ | 163 | $159 | |||
American General Mortgage Loan Trust REMIC, 5.15%, 03/25/40 (i) (r) | 4,107 | 4,268 | ||||
American Home Mortgage Assets REMIC, 0.45%, 09/25/46 (i) | 4,928 | 2,708 | ||||
| Shares/Par | (p) | Value | ||||
American Money Management Corp., 0.51%, 05/03/18 (f) (i) (r) | 500 | 470 | ||||
Aquilae CLO Plc, 1.34%, | 2,366 | 2,805 | ||||
ARES CLO Funds, 0.53%, | 1,484 | 1,398 | ||||
Arkle Master Issuer Plc 0.37%, 02/17/52 (i) (r) | 14,700 | 14,542 | ||||
REMIC, 1.43%, 05/17/60 (i) (r) | 4,000 | 3,981 | ||||
Arran Residential Mortgages Funding Plc, 2.20%, 05/16/47 (f) (r), EUR | 800 | 1,068 | ||||
Banc of America Commercial Mortgage Inc. REMIC, 5.89%, 07/10/44 (i) | 2,000 | 2,136 | ||||
Banc of America Large Loan Inc. REMIC 5.64%, 07/17/17 (i) (r) | 600 | 639 | ||||
5.62%, 06/24/50 (i) (r) | 1,100 | 1,174 | ||||
Banc of America Large Loans Inc. REMIC, 0.77%, 08/15/29 (i) (r) | 1,075 | 1,000 | ||||
Banc of America Mortgage Securities Inc. REMIC, 2.87%, 06/25/35 (i) | 381 | 331 | ||||
Bear Stearns Adjustable Rate Mortgage Trust REMIC | 92 | 91 | ||||
3.20%, 02/25/34 (i) | 652 | 580 | ||||
3.61%, 11/25/34 (i) | 653 | 638 | ||||
3.14%, 01/25/35 (i) | 1,256 | 1,153 | ||||
5.00%, 01/25/35 (i) | 510 | 475 | ||||
2.93%, 03/25/35 (i) | 108 | 103 | ||||
3.06%, 03/25/35 (i) | 739 | 606 | ||||
2.33%, 08/25/35 (i) | 113 | 108 | ||||
2.43%, 08/25/35 (i) | 193 | 182 | ||||
Bear Stearns Alt-A Trust REMIC 2.81%, 01/25/36 (i) | 923 | 507 | ||||
2.99%, 08/25/36 (i) | 370 | 190 | ||||
Bear Stearns Asset Backed Securities Trust REMIC, 1.26%, 08/25/37 (i) | 1,085 | 717 | ||||
Bear Stearns Commercial Mortgage Securities Inc. Principal Only REMIC, 0.00%, | 2,200 | 2,185 | ||||
Bear Stearns Structured Products Inc. REMIC 2.36%, 01/26/36 (i) | 1,031 | 673 | ||||
5.34%, 12/26/46 (i) | 1,053 | 737 | ||||
Capital Auto Receivables Asset Trust, 1.71%, 10/15/12 (i) | 6,084 | 6,109 | ||||
Chase Mortgage Finance Corp. REMIC, 2.90%, 02/25/37 (i) | 221 | 204 | ||||
Chevy Chase Mortgage Funding Corp. REMIC, 0.39%, 05/25/48 (i) (r) | 1,020 | 464 | ||||
Citigroup Mortgage Loan Trust Inc. REMIC | ||||||
2.51%, 08/25/35 (i) | 131 | 123 | ||||
2.56%, 08/25/35 (i) | 176 | 158 | ||||
2.93%, 08/25/35 (i) | 895 | 472 | ||||
0.34%, 01/25/37 (i) | 255 | 201 | ||||
0.32%, 05/25/37 (i) | 353 | 335 | ||||
5.87%, 09/25/37 (i) | 2,956 | 2,137 | ||||
0.32%, 08/25/45 (i) | 578 | 477 | ||||
College Loan Corp. Trust, 0.54%, 01/25/24 (i) | 800 | 797 | ||||
Commercial Mortgage Pass Through Certificates REMIC, 3.16%, 11/10/15 (r) | 1,697 | 1,701 | ||||
Countrywide Asset-Backed Certificates REMIC 0.44%, 09/25/36 (i) | 658 | 557 | ||||
0.36%, 09/25/37 (i) | 278 | 268 | ||||
Countrywide Home Loan Mortgage Pass-Through Trust REMIC | ||||||
2.98%, 08/25/34 (i) | 542 | 396 | ||||
3.07%, 04/20/35 (i) | 658 | 627 | ||||
Credit Suisse Mortgage Capital Certificates REMIC | ||||||
5.38%, 11/15/16 (r) | 1,000 | 1,039 | ||||
5.86%, 02/25/37 (i) | 1,131 | 657 |
See accompanying Notes to the Financial Statements.
JNL Series Trust
Schedules of Investments (in thousands)
December 31, 2010
| Shares/Par | (p) | Value | ||||
5.47%, 09/19/39 (f) (r) | 1,400 | 1,481 | ||||
Credit-Based Asset Servicing and Securitization LLC REMIC, 0.38%, 07/25/37 (i) (r) | 388 | 348 | ||||
CS First Boston Mortgage Securities Corp. REMIC, 2.74%, 04/25/34 (i) | 676 | 659 | ||||
Deutsche Bank Alternate Loan Trust REMIC, 0.35%, 08/25/37 (i) | 47 | 47 | ||||
Deutsche Mortgage Securities Inc., 1.51%, 06/25/47 (i) (r) | 926 | 924 | ||||
First Franklin Mortgage Loan Asset Backed Certificates REMIC, 0.31%, 11/25/36 (i) | 105 | 104 | ||||
First NLC Trust REMIC, 0.33%, 08/25/37 (i) (r) | 550 | 375 | ||||
Ford Credit Auto Owner Trust, 2.76%, 05/15/13 (i) | 6,975 | 7,055 | ||||
Gallatin Funding Ltd., 0.54%, 08/15/17 (f) (i) (r) | 1,200 | 1,111 | ||||
GE Capital Commercial Mortgage Corp. REMIC, 4.71%, 05/10/43 | 94 | 94 | ||||
GMAC Commercial Mortgage Securities Inc. REMIC, 5.24%, 11/10/45 (i) | 2,000 | 2,122 | ||||
Gracechurch Mortgage Financing Plc, 0.36%, 11/20/56 (i) (r) | 446 | 438 | ||||
Granite Master Issuer Plc 0.30%, 12/20/54 (i) | 1,268 | 1,178 | ||||
0.35%, 12/20/54 (i) | 275 | 256 | ||||
0.36%, 12/20/54 (i) | 385 | 359 | ||||
Greenwich Capital Commercial Funding Corp. REMIC, 5.44%, 03/10/39 (e) | 4,000 | 4,214 | ||||
GS Mortgage Securities Corp. REMIC, 4.59%, 08/12/43 (r) | 4,300 | 4,342 | ||||
GS Mortgage Securities Corp. II 0.35%, 03/06/20 (i) (r) | 424 | 413 | ||||
0.39%, 03/06/20 (i) (r) | 3,100 | 2,986 | ||||
GSR Mortgage Loan Trust REMIC, 3.04%, 01/25/35 (i) | 526 | 494 | ||||
Harborview Mortgage Loan Trust REMIC, 2.86%, 04/19/34 (i) | 723 | 702 | ||||
HSBC Home Equity Loan Trust REMIC 0.41%, 03/20/36 (i) | 1,884 | 1,765 | ||||
5.91%, 03/20/36 (i) | 870 | 874 | ||||
HSI Asset Securitization Corp. REMIC, 0.32%, 05/25/37 (i) | 193 | 189 | ||||
Indymac Index Mortgage Loan Trust REMIC, 2.82%, 03/25/35 (i) | 1,192 | 1,018 | ||||
IndyMac Index Mortgage Loan Trust REMIC, 5.06%, 11/25/35 (i) | 1,631 | 1,433 | ||||
IndyMac Residential Asset Backed Trust REMIC 0.39%, 04/25/37 (i) | 143 | 141 | ||||
0.34%, 07/25/37 (i) | 10 | 10 | ||||
JP Morgan Mortgage Trust REMIC | ||||||
3.10%, 08/25/35 (i) | 872 | 753 | ||||
3.15%, 08/25/35 (i) | 603 | 530 | ||||
5.42%, 09/25/35 (i) | 245 | 229 | ||||
5.54%, 07/27/37 (r) | 1,402 | 1,203 | ||||
JPMorgan Chase Commercial Mortgage Securities Corp. REMIC, 3.01%, 07/25/35 (i) | 556 | 530 | ||||
Landmark CDO Ltd., 0.60%, 06/01/17 (f) (i) (q) | 4,534 | 4,253 | ||||
LB-UBS Commercial Mortgage Trust REMIC, 5.42%, 02/15/40 | 6,200 | 6,511 | ||||
Lehman Brothers Mortgage Loan Trust REMIC, 0.35%, 06/25/37 (i) (r) | 458 | 190 | ||||
Magnolia Funding Ltd., 3.00%, 04/20/17 (r), EUR | 758 | 1,005 | ||||
MASTR Adjustable Rate Mortgages Trust REMIC, 2.61%, 12/25/33 (i) | 1,311 | 1,186 | ||||
MASTR Asset Backed Securities Trust REMIC, 0.34%, 05/25/37 (i) | 233 | 225 |
| Shares/Par | (p) | Value | ||||
Merrill Lynch First Franklin Mortgage Loan Trust REMIC, 0.32%, 07/25/37 (i) | 134 | 133 | ||||
Merrill Lynch Mortgage Investors Inc. REMIC 2.35%, 02/25/33 (i) | 280 | 262 | ||||
2.89%, 02/25/34 (i) | 605 | 572 | ||||
MLCC Mortgage Investors Inc. REMIC, 4.25%, 10/25/35 (i) | 832 | 712 | ||||
Morgan Stanley Capital I REMIC, 0.32%, 05/25/37 (i) | 332 | 288 | ||||
Nationstar Home Equity Loan Trust REMIC, 0.32%, 06/25/37 (i) | 277 | 272 | ||||
Nautique Funding Ltd. - Series 2006-1A, 0.54%, 04/15/20 (f) (i) (r) | 481 | 432 | ||||
Navigare Funding CLO Ltd., 0.54%, 05/20/19 (f) (i) (r) | 500 | 461 | ||||
Navigator CDO Ltd., 1.14%, 11/15/15 (f) (i) (r) | 992 | 958 | ||||
NCUA Guaranteed Notes REMIC | ||||||
0.72%, 10/07/20 (i) | 4,367 | 4,362 | ||||
0.82%, 12/08/20 (f) (i) | 4,900 | 4,885 | ||||
Nelnet Student Loan Trust, 0.99%, 07/25/18 (i) | 1,100 | 1,108 | ||||
New York Life Investment Management Flatiron CLO Ltd., 0.51%, 08/08/20 (f) (i) (q) | 500 | 464 | ||||
Provident Funding Mortgage Loan Trust REMIC, 2.77%, 08/25/33 (i) | 496 | 469 | ||||
RBSCF Trust REMIC, 6.01%, 08/16/17 (i) (r) | 1,700 | 1,816 | ||||
Residential Asset Mortgage Products Inc. REMIC, 0.34%, 02/25/27 (i) | 206 | 205 | ||||
Residential Asset Securities Corp. REMIC, 0.37%, 02/25/30 (i) | 141 | 138 | ||||
Residential Asset Securitization Trust REMIC, 5.50%, 06/25/33 | 255 | 259 | ||||
SLM Student Loan Trust | ||||||
0.74%, 01/25/17 (i) | 3,100 | 3,104 | ||||
0.29%, 04/25/17 (i) | 89 | 89 | ||||
0.40%, 04/25/17 (i) | 264 | 264 | ||||
1.91%, 12/15/17 (i) (r) | 2,306 | 2,306 | ||||
1.79%, 04/25/23 (i) | 9,581 | 9,890 | ||||
1.11%, 10/25/23 (i), EUR | 2,700 | 3,375 | ||||
REMIC, 0.33%, 04/25/19 (i) | 6,300 | 6,066 | ||||
STRU BC-1270 FA, 01/28/41 (f) | 8,900 | 8,896 | ||||
Structured Adjustable Rate Mortgage Loan Trust REMIC, 2.77%, 02/25/34 (i) | 951 | 902 | ||||
Structured Asset Mortgage Investments Inc. REMIC | ||||||
0.59%, 10/19/34 (i) | 45 | 41 | ||||
0.36%, 04/25/37 (i) | 64 | 64 | ||||
Swan 2010-1, 6.13%, 04/25/41, AUD | 807 | 818 | ||||
Symphony CLO Ltd., 0.53%, 05/15/19 (f) (i) (q) | 2,200 | 1,993 | ||||
TBW Mortgage Backed Pass-Through Certificates REMIC, 5.97%, 09/25/36 (i) | 485 | 137 | ||||
Thornburg Mortgage Securities Trust REMIC | ||||||
0.36%, 03/25/37 (i) | 1,632 | 1,592 | ||||
0.36%, 03/25/37 (i) | 849 | 829 | ||||
Vornado DP LLC, 4.00%, 09/13/20 (r) | 4,600 | 4,460 | ||||
Wachovia Bank Commercial Mortgage Trust REMIC 0.34%, 06/15/20 (i) (r) | 1,026 | 959 | ||||
0.35%, 09/15/21 (i) (r) | 1,428 | 1,391 | ||||
5.09%, 08/15/41 (i) | 1,000 | 1,060 | ||||
Washington Mutual Alternative Mortgage Pass- Through Certificates REMIC, 5.26%, 12/25/35 (i) | 545 | 489 | ||||
Washington Mutual Mortgage Pass-Through Certificates REMIC | ||||||
2.37%, 03/25/33 (i) | 184 | 174 | ||||
2.70%, 06/25/33 (i) | 594 | 567 | ||||
2.78%, 09/25/33 (i) | 634 | 637 | ||||
5.50%, 08/25/35 (i) | 618 | 574 |
See accompanying Notes to the Financial Statements.
JNL Series Trust
Schedules of Investments (in thousands)
December 31, 2010
| Shares/Par (p) | Value | |||||
1.33%, 08/25/46 (i) | 1,639 | 1,074 | ||||
1.10%, 05/25/47 (i) | 770 | 508 | ||||
Wells Fargo Mortgage Backed Securities Trust REMIC 4.97%, 12/25/34 (i) | 677 | 662 | ||||
3.29%, 04/25/36 (i) | 2,349 | 2,042 | ||||
Wood Street CLO BV, 1.39%, 03/29/21 (f) (i) (r), EUR | 596 | 733 | ||||
Total Non-U.S. Government Agency Asset- Backed Securities (cost $190,724) | 187,585 | |||||
CORPORATE BONDS AND NOTES - 27.6% |
| |||||
CONSUMER DISCRETIONARY - 0.1% | ||||||
Macy’s Retail Holdings Inc., 7.45%, 07/15/17 | 1,000 | 1,100 | ||||
Videotron Ltee, 6.88%, 01/15/14 | 1,400 | 1,417 | ||||
| 2,517 | ||||||
CONSUMER STAPLES - 0.1% | ||||||
Reynolds American Inc., 1.00%, | 700 | 701 | ||||
WM Wrigley Jr. Co., 1.68%, 06/28/11 (i) (r) | 1,500 | 1,500 | ||||
| 2,201 | ||||||
ENERGY - 0.5% | ||||||
Gaz Capital SA, 7.34%, 04/11/13 (r) | 300 | 326 | ||||
Gazprom Via Gaz Capital SA, 5.09%, 11/29/15 (q) | 1,600 | 1,636 | ||||
Kinder Morgan Energy Partners LP, 5.70%, 01/05/16 | 5,000 | 5,062 | ||||
Petroleos Mexicanos, 5.50%, 01/21/21 | 1,200 | 1,215 | ||||
| 8,239 | ||||||
FINANCIALS - 25.6% | ||||||
Achmea Hypotheekbank NV, 3.20%, | ||||||
11/03/14 (r) | 4,000 | 4,162 | ||||
Ally Financial Inc. | ||||||
7.25%, 03/02/11 (e) | 1,300 | 1,306 | ||||
5.38%, 06/06/11 | 500 | 503 | ||||
6.88%, 09/15/11 | 500 | 514 | ||||
1.75%, 10/30/12 | 8,700 | 8,854 | ||||
American Express Bank FSB, 0.39%, | ||||||
05/29/12 (e) (i) | 800 | 796 | ||||
American Express Credit Corp., 0.38%, | ||||||
02/24/12 (i) | 1,700 | 1,695 | ||||
American International Group Inc. | ||||||
0.40%, 10/18/11 (i) | 1,000 | 992 | ||||
5.05%, 10/01/15 | 1,200 | 1,232 | ||||
5.85%, 01/16/18 | 1,100 | 1,134 | ||||
8.25%, 08/15/18 | 1,000 | 1,152 | ||||
8.18%, 05/15/58 | 4,700 | 5,005 | ||||
ANZ National International Ltd. | ||||||
6.20%, 07/19/13 (r) | 2,000 | 2,202 | ||||
0.72%, 08/19/14 (i) (r) | 2,000 | 2,014 | ||||
Australia & New Zealand Banking Group Ltd., 0.58%, 06/18/12 (i) (r) | 5,000 | 5,007 | ||||
Banco Mercantil del Norte SA, 4.38%, 07/19/15 (e) (r) | 3,900 | 3,958 | ||||
Banco Santander Brazil SA, 0.00%, 12/28/11 (f) (j) (q) | 600 | 585 | ||||
Bank of America Corp., 5.38%, 06/15/14 | 600 | 631 | ||||
Bank of Montreal, 2.85%, 06/09/15 (r) | 5,500 | 5,587 | ||||
Bank of Scotland Plc, 4.88%, 04/15/11 | 1,400 | 1,415 | ||||
Barclays Bank Plc | ||||||
7.43% (callable at 100 beginning 12/15/17) (m) (r) | 200 | 196 | ||||
6.05%, 12/04/17 (r) | 2,000 | 2,052 | ||||
BPCE SA, 2.38%, 10/04/13 (r) | 2,700 | 2,690 | ||||
| Shares/Par (p) | Value | |||||
Citibank NA, 1.38%, 08/10/11 | 11,100 | 11,167 | ||||
Citigroup Funding Inc., 1.88%, 10/22/12 (e) | 20,100 | 20,503 | ||||
Citigroup Inc. | ||||||
5.25%, 02/27/12 | 1,300 | 1,355 | ||||
5.30%, 10/17/12 (e) | 1,000 | 1,059 | ||||
5.50%, 04/11/13 | 1,200 | 1,278 | ||||
0.57%, 11/05/14 (i) | 800 | 761 | ||||
Commonwealth Bank of Australia | ||||||
0.71%, 07/12/13 (i) (r) | 14,700 | 14,726 | ||||
0.80%, 06/25/14 (i) (r) | 3,800 | 3,817 | ||||
0.58%, 09/17/14 (i) (r) | 3,800 | 3,787 | ||||
Countrywide Financial Corp., 5.80%, 06/07/12 (e) | 7,000 | 7,365 | ||||
DanFin Funding Ltd., 0.99%, 07/16/13 (i) (r) | 5,800 | 5,793 | ||||
Dexia Credit Local | ||||||
0.95%, 09/23/11 (i) (r) | 1,300 | 1,303 | ||||
0.70%, 03/05/13 (i) (r) | 3,100 | 3,090 | ||||
0.77%, 04/29/14 (i) (r) | 18,700 | 18,627 | ||||
FIH Erhvervsbank A/S, 2.00%, 06/12/13 (r) | 800 | 813 | ||||
Ford Motor Credit Co. LLC | ||||||
7.25%, 10/25/11 | 3,150 | 3,256 | ||||
7.80%, 06/01/12 | 650 | 691 | ||||
7.00%, 10/01/13 | 2,200 | 2,359 | ||||
General Electric Capital Corp. | ||||||
0.30%, 09/21/12 (i) | 15,200 | 15,205 | ||||
0.30%, 12/21/12 (i) | 34,600 | 34,606 | ||||
2.63%, 12/28/12 | 6,700 | 6,949 | ||||
Goldman Sachs Group Inc., 0.47%, 02/06/12 (i) | 700 | 699 | ||||
HSBC Finance Corp. | ||||||
0.56%, 04/24/12 (e) (i) | 3,602 | 3,585 | ||||
0.64%, 07/19/12 (i) | 1,200 | 1,191 | ||||
ING Bank NV | ||||||
0.92%, 01/13/12 (i) (r) | 7,700 | 7,695 | ||||
1.61%, 10/18/13 (i) (r) | 4,100 | 4,094 | ||||
International Lease Finance Corp. | ||||||
0.63%, 07/01/11 (i) | 2,000 | 1,968 | ||||
6.38%, 03/25/13 | 700 | 718 | ||||
5.63%, 09/20/13 | 1,100 | 1,106 | ||||
6.63%, 11/15/13 | 500 | 511 | ||||
6.50%, 09/01/14 (r) | 1,000 | 1,060 | ||||
6.75%, 09/01/16 (r) | 900 | 961 | ||||
7.13%, 09/01/18 (r) | 1,700 | 1,806 | ||||
LeasePlan Corp. NV, 3.00%, 05/07/12 (r) | 5,300 | 5,445 | ||||
Lehman Brothers Holdings Inc. | ||||||
6.20%, 09/26/14 (c) (d) | 200 | 46 | ||||
6.88%, 05/02/18 (c) (d) | 1,200 | 297 | ||||
7.00%, 09/27/27 (c) (d) | 100 | 23 | ||||
Macquarie Bank Ltd. | ||||||
2.60%, 01/20/12 (r) | 900 | 917 | ||||
4.10%, 12/17/13 (e) | 27,200 | 29,196 | ||||
Marsh & McLennan Cos. Inc., 5.75%, 09/15/15 | 1,000 | 1,076 | ||||
Merrill Lynch & Co. Inc. | ||||||
0.53%, 06/05/12 (i) | 1,000 | 991 | ||||
6.05%, 08/15/12 (e) | 16,100 | 17,048 | ||||
1.76%, 09/27/12 (i), EUR | 600 | 776 | ||||
5.45%, 07/15/14 (e) | 200 | 210 | ||||
Metropolitan Life Global Funding I, 1.43%, | ||||||
09/17/12 (i) (r) | 1,100 | 1,118 | ||||
Morgan Stanley | ||||||
1.15%, 12/01/11 (i) | 2,000 | 2,016 | ||||
0.55%, 01/09/12 (i) | 9,700 | 9,692 | ||||
1.36%, 03/01/13 (i), EUR | 2,100 | 2,681 | ||||
2.79%, 05/14/13 (i) | 2,600 | 2,694 | ||||
0.60%, 01/09/14 (i) | 5,300 | 5,114 | ||||
0.77%, 10/15/15 (i) | 1,000 | 938 | ||||
0.74%, 10/18/16 (i) | 1,000 | 924 | ||||
National Australia Bank Ltd. 5.35%, 06/12/13 (r) | 1,700 | 1,841 | ||||
See accompanying Notes to the Financial Statements.
JNL Series Trust
Schedules of Investments (in thousands)
December 31, 2010
| Shares/Par (p) | Value | |||||
0.80%, 07/08/14 (i) (r) | 1,900 | 1,920 | ||||
New York Life Global Funding, 4.65%, 05/09/13 (r) | 1,800 | 1,936 | ||||
NIBC Bank NV, 2.80%, 12/02/14 (r) | 15,100 | 15,564 | ||||
Pacific Life Global Funding, 5.15%, 04/15/13 (r) | 500 | 535 | ||||
Pearson Dollar Finance Plc, 5.70%, 06/01/14 (r) | 1,000 | 1,084 | ||||
Racers Trust, 0.53%, 07/25/17 (f) (i) (q) | 997 | 978 | ||||
Royal Bank of Scotland Group Plc, 0.55%, 03/30/12 (i) (r) | 18,800 | 18,789 | ||||
Royal Bank of Scotland Plc | ||||||
1.45%, 10/20/11 (r) | 15,300 | 15,386 | ||||
3.00%, 12/09/11 (r) | 1,600 | 1,633 | ||||
1.19%, 04/23/12 (i) | 400 | 404 | ||||
2.70%, 08/23/13 (i) | 19,700 | 20,003 | ||||
Santander US Debt SA Unipersonal, 1.10%, 03/30/12 (i) (r) | 12,700 | 12,552 | ||||
SLM Corp. | ||||||
1.38%, 04/26/11 (i), EUR | 400 | 525 | ||||
0.52%, 10/25/11 (i) | 1,400 | 1,380 | ||||
5.38%, 01/15/13 | 400 | 408 | ||||
5.05%, 11/14/14 | 600 | 573 | ||||
Svenska Handelsbanken AB, 1.30%, 09/14/12 (i) (r) | 4,300 | 4,314 | ||||
TransCapitalInvest Ltd., 7.70%, 08/07/13 (r) (e) | 1,500 | 1,667 | ||||
UBS AG Stamford | ||||||
1.38%, 02/23/12 (i) | 4,000 | 4,027 | ||||
2.25%, 08/12/13 | 7,100 | 7,161 | ||||
Wachovia Corp. | ||||||
0.42%, 04/23/12 (i) | 6,400 | 6,392 | ||||
2.06%, 05/01/13 (i) | 4,200 | 4,318 | ||||
Wells Fargo & Co. | ||||||
7.98% (callable at 100 beginning | ||||||
03/15/18) (m) | 1,300 | 1,371 | ||||
0.49%, 10/28/15 (e) (i) | 500 | 482 | ||||
Wells Fargo Capital XIII, 7.70%, (callable at 100 beginning 03/26/13) (m) | 800 | 827 | ||||
Western Corporate Federal Credit Union, 1.75%, 11/02/12 | 5,400 | 5,498 | ||||
Westpac Banking Corp. | ||||||
3.59%, 08/14/14 (r) | 4,400 | 4,690 | ||||
0.58%, 09/10/14 (i) (r) | 700 | 701 | ||||
Westpac Securities NZ Ltd., 2.50%, 05/25/12 (r) | 2,700 | 2,763 | ||||
| 458,510 | ||||||
HEALTH CARE - 0.3% | ||||||
Amgen Inc., 0.13%, 02/01/11 | 700 | 699 | ||||
HCA Inc., 7.25%, 09/15/20 (e) | 4,700 | 4,912 | ||||
| 5,611 | ||||||
INDUSTRIALS - 0.1% | ||||||
GATX Financial Corp., 5.80%, 03/01/16 | 1,000 | 1,081 | ||||
INFORMATION TECHNOLOGY - 0.3% | ||||||
Seagate Technology Inc., 6.38%, 10/01/11 | 5,000 | 5,131 | ||||
MATERIALS - 0.3% | ||||||
Dow Chemical Co. | ||||||
2.54%, 08/08/11 (i) | 4,000 | 4,043 | ||||
4.85%, 08/15/12 | 1,000 | 1,054 | ||||
Rexam Plc, 6.75%, 06/01/13 (r) | 700 | 763 | ||||
| 5,860 | ||||||
TELECOMMUNICATION SERVICES - 0.3% |
| |||||
Telefonica Emisiones SAU, 0.62%, 02/04/13 (i) | 4,641 | 4,559 | ||||
| Shares/Par | (p) | Value | ||||
Verizon Wireless Capital LLC, 3.75%, 05/20/11 | 1,300 | 1,316 | ||||
| 5,875 | ||||||
Total Corporate Bonds and Notes (cost $487,930) | 495,025 | |||||
GOVERNMENT AND AGENCY OBLIGATIONS - 93.1% | ||||||
GOVERNMENT SECURITIES - 91.6% | ||||||
Federal Home Loan Mortgage Corp. - 1.7% (w) |
| |||||
Federal Home Loan Mortgage Corp., 0.21%, 12/21/11 - 12/29/11 (i) | 31,300 | 31,290 | ||||
| 31,290 | ||||||
Federal National Mortgage Association - 2.3% (w) | ||||||
Federal National Mortgage Association | ||||||
0.75%, 12/18/13 (e) | 21,300 | 21,062 | ||||
1.25%, 03/14/14 | 7,100 | 7,060 | ||||
4.02%, 02/11/15 | 3,400 | 3,414 | ||||
6.00%, 03/09/20 | 6,700 | 6,947 | ||||
5.38%, 04/11/22 | 1,100 | 1,160 | ||||
6.28%, 06/15/27 | 1,000 | 1,048 | ||||
| 40,691 | ||||||
Municipals - 0.1% | ||||||
Illinois Student Assistance Commission, 0.77%, 04/25/17 (i) | 1,500 | 1,497 | ||||
Tobacco Settlement Authority of West Virgina, 7.47%, 06/01/47 | 475 | 329 | ||||
Tobacco Settlement Financing Corp., 4.75%, 06/01/34 | 1,000 | 605 | ||||
Tobacco Settlement Funding Corp., 5.00%, 06/01/41 | 200 | 119 | ||||
| 2,550 | ||||||
Sovereign - 1.7% | ||||||
Australia Government Bond | ||||||
3.00%, 09/20/25, AUD | 10,800 | 11,785 | ||||
2.50%, 09/20/30, AUD | 800 | 789 | ||||
New South Wales Treasury Corp., 2.75%, 11/20/25, AUD | 6,100 | 6,239 | ||||
Societe Financement de l’Economie Francaise | ||||||
2.13%, 01/30/12 (e) (r) | 400 | 406 | ||||
0.49%, 07/16/12 (i) (r) | 10,600 | 10,616 | ||||
| 29,835 | ||||||
Treasury Inflation Index Securities - 85.8% |
| |||||
Australian Government Treasury Inflation | ||||||
Indexed Bond, 4.00%, 08/20/20 (s), AUD | 1,300 | 2,151 | ||||
U.S. Treasury Inflation Indexed Note | ||||||
2.38%, 04/15/11 (n) | 9,366 | 9,449 | ||||
3.38%, 01/15/12 (n) | 11,578 | 12,104 | ||||
2.00%, 04/15/12 (n) (o) | 50,226 | 52,050 | ||||
3.00%, 07/15/12 (n) | 27,065 | 28,748 | ||||
0.63%, 04/15/13 (n) (o) | 46,253 | 47,652 | ||||
1.88%, 07/15/13, TBA (g) (n) | 96,394 | 102,788 | ||||
2.00%, 01/15/14 - 01/15/26 (n) | 50,538 | 54,321 | ||||
1.25%, 04/15/14 (e) (n) | 41,854 | 44,016 | ||||
2.00%, 07/15/14 - 01/15/26, TBA (g) (n) | 89,333 | 95,776 | ||||
1.63%, 01/15/15 - 01/15/18 , TBA (g) (n) | 150,826 | 161,044 | ||||
1.63%, 01/15/15 - 01/15/18 (n) | 15,021 | 16,070 | ||||
1.88%, 07/15/15 (n) (o) | 73,425 | 79,539 | ||||
2.00%, 01/15/16, TBA (g) (o) | 97,209 | 105,851 | ||||
2.50%, 07/15/16 - 01/15/29 , TBA (g) (n) | 94,025 | 106,155 | ||||
2.50%, 07/15/16 - 01/15/29 (n) | 977 | 1,105 | ||||
2.63%, 07/15/17 (n) | 32,186 | 36,629 | ||||
1.88%, 07/15/19 (n) | 9,833 | 10,692 | ||||
1.38%, 01/15/20 - 01/15/20 , TBA (g) (n) | 64,255 | 66,774 | ||||
1.38%, 01/15/20 (n) | 5,542 | 5,760 | ||||
1.25%, 07/15/20 - 07/15/20 , TBA (g) (n) | 31,900 | 32,662 | ||||
2.38%, 01/15/25 - 01/15/27 , TBA (g) (n) | 135,222 | 150,395 | ||||
See accompanying Notes to the Financial Statements.
JNL Series Trust
Schedules of Investments (in thousands)
December 31, 2010
| Shares/Par | (p) | Value | ||||
2.00%, 01/15/26, TBA (g) (n) (o) | 13,043 | 13,849 | ||||
2.38%, 01/15/27 (n) (o) | 50,179 | 55,765 | ||||
1.75%, 01/15/28, TBA (g) (n) | 48,032 | 48,895 | ||||
1.75%, 01/15/28 (n) (o) | 647 | 659 | ||||
3.63%, 04/15/28, TBA (g) (n) | 72,125 | 93,103 | ||||
3.63%, 04/15/28 (n) (o) | 206 | 265 | ||||
3.88%, 04/15/29, TBA (g) (n) | 38,589 | 51,754 | ||||
2.13%, 02/15/40, TBA (g) (n) | 39,188 | 41,478 | ||||
2.13%, 02/15/40 (n) | 11,920 | 12,617 | ||||
| 1,540,116 | ||||||
U.S. GOVERNMENT AGENCY MORTGAGE-BACKED | ||||||
SECURITIES - 1.5% | ||||||
Federal Home Loan Mortgage Corp. - 0.2% | ||||||
Federal Home Loan Mortgage Corp. | ||||||
6.61%, 07/01/36 (i) | 651 | 684 | ||||
6.32%, 09/01/36 (i) | 564 | 593 | ||||
6.54%, 10/01/36 (i) | 719 | 760 | ||||
REMIC, 1.54%, 10/25/44 (i) | 763 | 745 | ||||
REMIC, 1.54%, 02/25/45 (i) | 567 | 558 | ||||
| 3,340 | ||||||
Federal National Mortgage Association - 0.7% | ||||||
Federal National Mortgage Association | ||||||
4.50%, 04/01/23 - 04/01/24 | 10,939 | 11,486 | ||||
2.40%, 11/01/35 (i) | 174 | 180 | ||||
5.57%, 03/01/36 (i) | 380 | 406 | ||||
5.86%, 06/01/36 (i) | 148 | 159 | ||||
REMIC, 5.00%, 02/25/17 | 234 | 238 | ||||
REMIC, 1.06%, 02/25/36 (i) | 895 | 894 | ||||
REMIC, 0.32%, 07/25/37 (i) | 578 | 571 | ||||
| 13,934 | ||||||
Government National Mortgage Association - 0.5% | ||||||
Government National Mortgage Association REMIC, 0.56%, 03/20/37 (i) | 8,647 | 8,606 | ||||
Small Business Administration Participation Certificates - 0.1% | ||||||
Small Business Administration Participation Certificates, 5.29%, 12/01/27 | 1,440 | 1,555 | ||||
Total Government and Agency Obligations (cost $1,693,074) | 1,671,917 | |||||
PREFERRED STOCKS - 0.0% | ||||||
FINANCIALS - 0.0% | ||||||
Wells Fargo & Co., Convertible Preferred, 7.50%, Series L (m) | 1 | 500 | ||||
Total Preferred Stocks (cost $500) | 500 | |||||
SHORT TERM INVESTMENTS - 37.3% |
| |||||
Certificates of Deposit 0.7% | ||||||
Barclays Bank Plc, 1.40%, 12/16/11 (i) | $ | 11,800 | 11,799 | |||
Federal Home Loan Bank 8.5% (w) | ||||||
Federal Home Loan Bank | ||||||
0.06%, 01/07/11 | 135,000 | 134,999 | ||||
0.14%, 02/11/11 | 18,000 | 17,997 | ||||
| 152,996 | ||||||
Federal Home Loan Mortgage Corp. 7.7% (w) |
| |||||
Federal Home Loan Mortgage Corp. | ||||||
0.01%, 01/03/11 | 61,400 | 61,400 | ||||
0.12%, 01/24/11 | 1,200 | 1,200 | ||||
0.05%, 01/28/11 | 3,400 | 3,400 | ||||
0.17%, 03/14/11 | 11,100 | 11,098 | ||||
0.21%, 06/06/11 - 06/13/11 | 60,400 | 60,358 | ||||
| 137,456 | ||||||
| Shares/Par (p) | Value | |||
Federal National Mortgage Association 13.4% (w) | ||||
Federal National Mortgage Association | ||||
0.07%, 01/18/11 | 6,200 | 6,200 | ||
0.12%, 02/01/11 | 210,800 | 210,778 | ||
0.16%, 03/23/11 | 23,700 | 23,695 | ||
| 240,673 | ||||
Investment Company 0.0% | 400 | 400 | ||
Securities Lending Collateral 2.3% Securities Lending Cash Collateral Fund LLC, 0.31% (a) (h) | 41,966 | 41,966 | ||
Treasury Securities 4.7% | ||||
Japan Treasury Bill, 01/31/11, JPY | 6,710,000 | 82,637 | ||
U.S. Treasury Bill | ||||
0.17%, 05/26/11 (o) | $320 | 320 | ||
0.17%, 06/09/11 (o) | 610 | 609 | ||
0.18%, 06/16/11 (o) | 300 | 300 | ||
| 83,866 | ||||
Total Short Term Investments (cost $669,149) | 669,156 | |||
Total Investments - 168.5% | 3,024,183 | |||
Total Forward Sales Commitments - (0.1)% (proceeds $1,538) | (1,540) | |||
Other Assets and Liabilities, Net - (68.4%) (o) | (1,227,557) | |||
Total Net Assets - 100.0% | $ | 1,795,086 | ||
Forward Sales Commitments - 0.1% | ||||
GOVERNMENT AND AGENCY OBLIGATIONS - 0.1% | ||||
Treasury Inflation Index Securities - 0.1% | ||||
U.S. Treasury Inflation Indexed Note, 1.25%, 07/15/20 (n) | $1,504 $ | 1,540 | ||
Total Forward Sales Commitments - 0.1% (proceeds $1,538) | $ | 1,540 | ||
JNL/PIMCO Total Return Bond Fund | ||||
NON-U.S. GOVERNMENT AGENCY ASSET-BACKED SECURITIES - 6.1% | ||||
Access Group Inc., 1.59%, 10/27/25 (i) | $7,230 $ | 7,391 | ||
Ally Auto Receivables Trust, 1.32%, 03/15/12 (r) | 847 | 848 | ||
American Home Mortgage Investment Trust | ||||
REMIC, 2.26%, 02/25/45 (i) | 360 | 321 | ||
Amortizing Residential Collateral Trust REMIC, 0.84%, 07/25/32 (i) | 15 | 14 | ||
Arran Residential Mortgages Funding Plc | ||||
2.20%, 05/16/47 (f) (r), EUR | 1,800 | 2,404 | ||
2.40%, 05/16/47, EUR | 4,800 | 6,384 | ||
Asset Backed Securities Corp. Home Equity REMIC, 0.54%, 09/25/34 (i) | 294 | 268 | ||
Banc of America Commercial Mortgage Inc. REMIC | ||||
5.74%, 05/10/45 (i) | 2,000 | 2,190 | ||
5.66%, 06/10/49 (i) | 2,830 | 2,905 | ||
Banc of America Funding Corp. REMIC, | ||||
2.86%, 05/25/35 (i) | 507 | 492 | ||
Banc of America Large Loan Inc. REMIC, | ||||
2.01%, 11/15/13 (i) (r) | 997 | 889 | ||
See accompanying Notes to the Financial Statements.
JNL Series Trust
Schedules of Investments (in thousands)
December 31, 2010
| Shares/Par (p) | Value | |||||
Banc of America Mortgage Securities Inc. REMIC | ||||||
6.50%, 10/25/31 | 63 | 64 | ||||
6.50%, 09/25/33 | 31 | 32 | ||||
Bear Stearns Adjustable Rate Mortgage REMIC | ||||||
3.52%, 11/25/30 (i) | 3 | 3 | ||||
3.10%, 02/25/33 (i) | 14 | 13 | ||||
5.67%, 02/25/33 (i) | 16 | 16 | ||||
2.85%, 04/25/33 (i) | 79 | 76 | ||||
3.11%, 01/25/34 (i) | 291 | 278 | ||||
Bear Stearns Adjustable Rate Mortgage Trust REMIC | ||||||
3.11%, 11/25/34 (i) | 1,560 | 1,315 | ||||
3.61%, 11/25/34 (i) | 420 | 410 | ||||
2.93%, 03/25/35 (i) | 3,734 | 3,562 | ||||
Bear Stearns Alt-A Trust REMIC | ||||||
2.88%, 05/25/35 (i) | 690 | 536 | ||||
2.95%, 09/25/35 (i) | 437 | 332 | ||||
Bear Stearns Commercial Mortgage Securities Inc. REMIC | ||||||
5.33%, 02/11/44 | 300 | 308 | ||||
5.47%, 01/12/45 (i) | 700 | 747 | ||||
Bear Stearns Structured Products Inc. REMIC | ||||||
2.36%, 01/26/36 (i) | 1,289 | 841 | ||||
5.34%, 12/26/46 (i) | 724 | 507 | ||||
Chase Issuance Trust, 1.80%, 09/15/15 (i) | 12,800 | 13,218 | ||||
Citigroup Mortgage Loan Trust Inc. REMIC | ||||||
2.68%, 12/25/35 (i) | 197 | 188 | ||||
0.32%, 08/25/45 (i) | 1,444 | 1,192 | ||||
Commercial Mortgage Pass-Through Certificates REMIC, 5.31%, 12/10/46 | 2,100 | 2,190 | ||||
Countrywide Alternative Loan Trust REMIC, | ||||||
0.44%, 05/25/47 (i) | 873 | 504 | ||||
Countrywide Asset-Backed Certificates REMIC, | ||||||
0.37%, 09/25/26 (i) | 22 | 22 | ||||
Countrywide Home Loan Mortgage Pass-Through Trust REMIC | ||||||
3.12%, 11/25/34 (i) | 1,056 | 850 | ||||
2.92%, 02/20/35 (i) | 1,791 | 1,550 | ||||
5.75%, 12/25/35 | 10,154 | 9,261 | ||||
3.02%, 02/20/36 (i) | 242 | 193 | ||||
Credit Suisse Mortgage Capital Certificates REMIC | ||||||
5.66%, 03/15/39 (i) | 200 | 210 | ||||
5.70%, 09/15/40 (i) | 7,800 | 8,008 | ||||
CS First Boston Mortgage Securities Corp. REMIC, 0.88%, 03/25/32 (i) (r) | 24 | 21 | ||||
Equity One ABS Inc., 0.82%, 11/25/32 (i) | 172 | 153 | ||||
First American Alternative Mortgage Securities REMIC, 2.57%, 09/25/35 (i) | 528 | 389 | ||||
First Horizon Asset Securities Inc. REMIC | ||||||
2.88%, 10/25/35 (i) | 3,341 | 2,713 | ||||
5.68%, 02/25/36 (i) | 3,999 | 3,755 | ||||
GE Capital Commercial Mortgage Corp. REMIC, 4.23%, 12/10/37 | 329 | 332 | ||||
Granite Master Issuer Plc | ||||||
0.35%, 12/17/54 (i) | 3,193 | 2,971 | ||||
0.36%, 12/20/54 (i) | 18,112 | 16,854 | ||||
REMIC, 0.33%, 12/20/54 (i) (r) | 1,459 | 1,357 | ||||
GreenPoint Mortgage Funding Trust REMIC, 0.34%, 01/25/47 (i) | 327 | 314 | ||||
Greenwich Capital Commercial Funding Corp. REMIC 5.44%, 03/10/39 (e) | 1,000 | 1,054 | ||||
4.80%, 08/10/42 (i) | 100 | 106 | ||||
GS Mortgage Securities Corp. II, 0.35%, 03/06/20 (i) (r) | 1,664 | 1,623 | ||||
GSR Mortgage Loan Trust REMIC 2.82%, 09/25/35 (i) | 2,312 | 2,206 | ||||
| Shares/Par (p) | Value | |||||
5.19%, 11/25/35 (i) | 1,122 | 1,089 | ||||
Harborview Mortgage Loan Trust REMIC 0.48%, 05/19/35 (i) | 193 | 125 | ||||
2.96%, 07/19/35 (i) | 896 | 710 | ||||
HSBC Home Equity Loan Trust REMIC, 0.55%, 01/20/34 (i) | 1,250 | 1,140 | ||||
HSI Asset Securitization Corp. REMIC, 0.31%, 12/25/36 (i) | 51 | 50 | ||||
IndyMac ARM Trust REMIC, 1.96%, 01/25/32 (i) | 1 | — | ||||
IndyMac Index Mortgage Loan Trust REMIC, 2.59%, 01/25/36 (i) | 923 | 571 | ||||
JPMorgan Chase Commercial Mortgage Securities Corp. REMIC | ||||||
4.07%, 09/15/20 (r) | 4,600 | 4,374 | ||||
5.34%, 05/15/47 | 1,900 | 1,972 | ||||
5.44%, 06/12/47 | 11,300 | 11,842 | ||||
5.42%, 01/15/49 (e) | 6,400 | 6,656 | ||||
5.79%, 02/12/51 (i) | 14,500 | 15,444 | ||||
5.88%, 02/15/51 (i) | 700 | 741 | ||||
JPMorgan Mortgage Trust REMIC | ||||||
5.04%, 02/25/35 (i) | 388 | 388 | ||||
5.75%, 01/25/36 | 474 | 428 | ||||
Long Beach Mortgage Loan Trust REMIC, 0.54%, 10/25/34 (i) | 34 | 28 | ||||
MASTR Asset Backed Securities Trust REMIC | ||||||
0.31%, 01/25/37 (i) | 542 | 172 | ||||
0.34%, 05/25/37 (i) | 266 | 257 | ||||
Mellon Residential Funding Corp. REMIC | ||||||
2.61%, 10/20/29 (i) | 193 | 178 | ||||
0.74%, 06/15/30 (i) | 404 | 393 | ||||
Merrill Lynch Mortgage Investors Inc. REMIC | ||||||
2.46%, 05/25/33 (i) | 675 | 669 | ||||
0.47%, 02/25/36 (i) | 441 | 338 | ||||
Merrill Lynch/Countrywide Commercial Mortgage | ||||||
Trust REMIC | ||||||
5.96%, 07/12/17 (i) | 10,700 | 11,516 | ||||
5.49%, 03/12/51 (i) | 1,500 | 1,529 | ||||
Mid-State Trust REMIC, 8.33%, 04/01/30 | 9 | 9 | ||||
MLCC Mortgage Investors Inc. REMIC | ||||||
1.26%, 10/25/35 (i) | 199 | 172 | ||||
0.51%, 11/25/35 (i) | 344 | 307 | ||||
Morgan Stanley Asset-Backed Securities Capital I REMIC, 0.30%, 01/25/37 (i) | 182 | 176 | ||||
Morgan Stanley Capital I REMIC | ||||||
0.32%, 10/15/20 (i) (r) | 385 | 370 | ||||
5.81%, 12/12/49 | 100 | 107 | ||||
Morgan Stanley Re-REMIC Trust REMIC, 5.81%, 04/12/17 (i) (r) | 800 | 855 | ||||
Park Place Securities Inc. REMIC, 0.57%, 10/25/34 (i) | 299 | 295 | ||||
Prime Mortgage Trust REMIC | ||||||
0.66%, 02/25/19 (i) | 10 | 10 | ||||
0.66%, 02/25/34 (i) | 77 | 70 | ||||
Securitized Asset Backed Receivables LLC Trust REMIC, 0.32%, 12/25/36 (i) | 344 | 131 | ||||
Sequoia Mortgage Trust REMIC, 0.61%, 10/19/26 (i) | 82 | 71 | ||||
SLM Student Loan Trust | ||||||
0.59%, 01/25/15 (i) | 313 | 313 | ||||
0.29%, 10/25/16 (i) | 213 | 213 | ||||
2.91%, 12/16/19 (i) (r) | 1,000 | 1,000 | ||||
1.79%, 04/25/23 (i) | 10,926 | 11,278 | ||||
Structured Asset Mortgage Investments Inc. REMIC | ||||||
0.92%, 09/19/32 (i) | 76 | 67 | ||||
0.51%, 07/19/35 (i) | 871 | 808 | ||||
0.39%, 03/25/37 (i) | 1,657 | 1,012 | ||||
See accompanying Notes to the Financial Statements.
JNL Series Trust
Schedules of Investments (in thousands)
December 31, 2010
| Shares/Par | (p) | Value | ||||
Structured Asset Securities Corp. REMIC | ||||||
2.68%, 02/25/32 (i) | 3 | 2 | ||||
0.55%, 01/25/33 (i) | 10 | 9 | ||||
0.31%, 10/25/36 (i) | 82 | 82 | ||||
Thornburg Mortgage Securities Trust REMIC | ||||||
0.38%, 08/25/11 (i) | 2,130 | 2,110 | ||||
0.37%, 12/25/36 (i) | 610 | 602 | ||||
Vendee Mortgage Trust REMIC, 6.50%, 09/15/24 | 553 | 582 | ||||
Wachovia Bank Commercial Mortgage Trust REMIC | ||||||
0.34%, 06/15/20 (i) (r) | 1,832 | 1,713 | ||||
0.35%, 09/15/21 (i) (r) | 5,864 | 5,713 | ||||
Washington Mutual Mortgage Pass-Through Certificates REMIC | ||||||
2.20%, 02/25/31 (i) | 1 | 1 | ||||
1.73%, 08/25/42 (i) | 177 | 160 | ||||
1.53%, 11/25/42 (i) | 100 | 88 | ||||
0.55%, 10/25/45 (i) | 193 | 163 | ||||
Wells Fargo Mortgage Backed Securities Trust REMIC | ||||||
4.91%, 01/25/35 (i) | 1,023 | 1,028 | ||||
3.42%, 03/25/36 (i) | 975 | 862 | ||||
2.90%, 04/25/36 (i) | 5,272 | 4,583 | ||||
Total Non-U.S. Government Agency Asset- Backed Securities | 199,952 | |||||
CORPORATE BONDS AND NOTES - 28.7% |
| |||||
CONSUMER DISCRETIONARY - 0.3% | ||||||
Comcast Corp. | ||||||
5.88%, 02/15/18 (e) | 400 | 444 | ||||
6.45%, 03/15/37 (e) | 400 | 427 | ||||
Ford Motor Co. Term Loan B, 3.04%, 12/15/13 (i) | 3,000 | 2,999 | ||||
Princeton University, 5.70%, 03/01/39 | 4,500 | 4,831 | ||||
Target Corp., 5.13%, 01/15/13 | 3,000 | 3,247 | ||||
| 11,948 | ||||||
CONSUMER STAPLES - 0.5% | ||||||
Altria Group Inc., 4.13%, 09/11/15 | 2,500 | 2,614 | ||||
Anheuser-Busch Cos. Inc., 5.50%, 01/15/18 | 100 | 110 | ||||
Campbell Soup Co., 4.50%, 02/15/19 | 6,800 | 7,187 | ||||
Kraft Foods Inc. | ||||||
2.63%, 05/08/13 (e) | 3,000 | 3,085 | ||||
6.13%, 02/01/18 (e) | 1,400 | 1,599 | ||||
6.88%, 02/01/38 | 600 | 697 | ||||
Philip Morris International Inc., 5.65%, 05/16/18 (e) | 1,200 | 1,353 | ||||
| 16,645 | ||||||
ENERGY - 2.6% | ||||||
Chesapeake Energy Corp., 2.25%, 12/15/38 | 900 | 701 | ||||
El Paso Corp. | ||||||
8.05%, 10/15/30 | 600 | 609 | ||||
7.80%, 08/01/31 | 800 | 796 | ||||
Gaz Capital SA | ||||||
6.21%, 11/22/16 (r) | 300 | 318 | ||||
9.25%, 04/23/19 | 7,900 | 9,708 | ||||
Gazprom - White Nights, 10.50%, 03/25/14 | 300 | 359 | ||||
Gazprom International SA, 7.20%, 02/01/20 | 116 | 123 | ||||
Gazprom OAO, 9.63%, 03/01/13 | 200 | 227 | ||||
Kinder Morgan Energy Partners LP, 5.95%, 02/15/18 | 6,400 | 7,048 | ||||
Korea Hydro & Nuclear Power Co. Ltd., 6.25%, 06/17/14 (r) | 3,300 | 3,622 | ||||
| Shares/Par | (p) | Value | ||||
Odebrecht Drilling Norbe VIII/IX Ltd., 6.35%, 06/30/21 (e) (r) | 1,000 | 1,040 | ||||
Peabody Energy Corp., 7.88%, 11/01/26 | 500 | 543 | ||||
Petrobras International Finance Co. | ||||||
5.88%, 03/01/18 | 1,300 | 1,384 | ||||
8.38%, 12/10/18 (e) | 700 | 851 | ||||
7.88%, 03/15/19 | 16,800 | 19,860 | ||||
Petroleos Mexicanos | ||||||
8.00%, 05/03/19 | 6,500 | 7,832 | ||||
5.50%, 01/21/21 | 6,900 | 6,986 | ||||
Petroleum Export Ltd. Term Loan B, 5.00%, 12/20/12 (f) (i) | 4,900 | 4,886 | ||||
Ras Laffan Liquefied Natural Gas Co. Ltd. III, 5.84%, 09/30/27 (r) | 500 | 517 | ||||
Shell International Finance BV, 5.50%, 03/25/40 (e) | 1,300 | 1,393 | ||||
Total Capital SA, 4.45%, 06/24/20 | 1,000 | 1,037 | ||||
Transocean Inc. | ||||||
4.95%, 11/15/15 | 700 | 723 | ||||
1.50%, 12/15/37 (e) | 13,900 | 13,691 | ||||
| 84,254 | ||||||
FINANCIALS - 21.0% | ||||||
Allstate Life Global Funding Trust, 5.38%, 04/30/13 (e) | 1,900 | 2,069 | ||||
Ally Financial Inc. | ||||||
6.88%, 09/15/11 | 500 | 513 | ||||
6.00%, 12/15/11 | 200 | 204 | ||||
6.88%, 08/28/12 (e) | 2,400 | 2,508 | ||||
7.50%, 12/31/13 | 10,000 | 10,725 | ||||
8.30%, 02/12/15 | 1,400 | 1,540 | ||||
6.25%, 12/01/17 (e) (q) | 5,000 | 5,000 | ||||
7.50%, 09/15/20 (e) (r) | 1,900 | 1,993 | ||||
8.00%, 11/01/31 (e) | 10,000 | 10,775 | ||||
American Express Bank FSB | ||||||
5.50%, 04/16/13 (r) | 2,700 | 2,910 | ||||
6.00%, 09/13/17 | 300 | 334 | ||||
American Express Centurion Bank, 6.00%, 09/13/17 (e) | 300 | 334 | ||||
American Express Co., 7.00%, 03/19/18 | 2,100 | 2,446 | ||||
American General Finance Corp. | ||||||
0.55%, 12/15/11 (e) (i) | 10,300 | 9,646 | ||||
4.88%, 07/15/12 (e) | 500 | 471 | ||||
6.90%, 12/15/17 (e) | 1,900 | 1,534 | ||||
American General Finance Corp. Term Loan, | ||||||
7.25%, 04/16/15 (i) | 1,000 | 1,017 | ||||
American International Group Inc. | ||||||
4.00%, 09/20/11, EUR | 2,500 | 3,335 | ||||
5.05%, 10/01/15 | 200 | 205 | ||||
5.85%, 01/16/18 | 19,700 | 20,313 | ||||
8.25%, 08/15/18 | 10,100 | 11,636 | ||||
6.25%, 05/01/36 (e) | 6,800 | 6,527 | ||||
6.25%, 03/15/37 (i) | 800 | 707 | ||||
8.18%, 05/15/58 (e) | 4,400 | 4,685 | ||||
ANZ National International Ltd., 6.20%, 07/19/13 (r) | 2,200 | 2,422 | ||||
Banco Nac De Desen Econo, 4.13%, 09/15/17 (r), EUR | 1,000 | 1,287 | ||||
Banco Santander Chile SA, 1.54%, 04/20/12 (i) (r) | 4,500 | 4,498 | ||||
Bank of America Corp. | ||||||
4.50%, 04/01/15 | 3,400 | 3,456 | ||||
6.50%, 08/01/16 | 10,500 | 11,393 | ||||
6.00%, 09/01/17 | 1,700 | 1,782 | ||||
5.65%, 05/01/18 | 9,300 | 9,502 | ||||
Bank of America NA | ||||||
0.58%, 06/15/16 (i) | 700 | 625 | ||||
6.00%, 10/15/36 | 600 | 566 | ||||
See accompanying Notes to the Financial Statements.
JNL Series Trust
Schedules of Investments (in thousands)
December 31, 2010
| Shares/Par | (p) | Value | ||||
Bank of China Hong Kong Ltd., 5.55%, 02/11/20 (e) (r) | 800 | 836 | ||||
Bank of Montreal, 2.85%, 06/09/15 (r) | 1,800 | 1,828 | ||||
Bank of Nova Scotia, 1.65%, 10/29/15 (r) | 2,200 | 2,103 | ||||
Barclays Bank Plc 5.93% (callable at 100 beginning 12/15/16) (m) (r) | 5,000 | 4,450 | ||||
7.43% (callable at 100 beginning 12/15/17) (m) (r) | 15,000 | 14,662 | ||||
5.45%, 09/12/12 | 10,700 | 11,467 | ||||
5.00%, 09/22/16 (e) | 10,600 | 11,217 | ||||
6.05%, 12/04/17 (r) | 1,600 | 1,641 | ||||
Bear Stearns Cos. Inc., 6.95%, 08/10/12 | 3,500 | 3,818 | ||||
BNP Paribas, 5.19%, (callable at 100 beginning 06/29/15) (m) (r) | 4,100 | 3,731 | ||||
BPCE SA, 2.38%, 10/04/13 (r) | 900 | 897 | ||||
Cemex 10 Capital SPV Ltd., 6.72%, (callable at 100 beginning 12/31/16) (m) (r) | 1,000 | 698 | ||||
Citigroup Capital XXI, 8.30%, 12/21/57 (e) | 9,800 | 10,192 | ||||
Citigroup Inc. | ||||||
5.50%, 08/27/12 | 1,500 | 1,590 | ||||
5.63%, 08/27/12 | 1,000 | 1,049 | ||||
5.30%, 10/17/12 | 600 | 635 | ||||
5.50%, 04/11/13 | 13,900 | 14,801 | ||||
5.85%, 07/02/13 | 400 | 432 | ||||
5.50%, 10/15/14 | 10,900 | 11,744 | ||||
6.00%, 08/15/17 | 2,200 | 2,386 | ||||
8.50%, 05/22/19 (e) | 1,000 | 1,241 | ||||
6.13%, 08/25/36 | 1,700 | 1,629 | ||||
Countrywide Financial Corp. | 300 | 469 | ||||
5.80%, 06/07/12 (e) | 2,300 | 2,420 | ||||
Credit Agricole SA, 8.38%, (callable at 100 beginning 10/13/19) (m) (r) | 15,500 | 15,926 | ||||
Deutsche Bank AG London, | 3,000 | 3,361 | ||||
Dexia Credit Local | 5,600 | 5,615 | ||||
0.77%, 04/29/14 (e) (i) (r) | 8,300 | 8,268 | ||||
ENEL Finance International SA, 6.25%, 09/15/17 (r) | 4,700 | 5,133 | ||||
Export-Import Bank of Korea | ||||||
5.88%, 01/14/15 | 9,700 | 10,504 | ||||
5.13%, 06/29/20 | 1,400 | 1,442 | ||||
FCE Bank Plc, 7.13%, 01/16/12, EUR | 4,000 | 5,479 | ||||
Fibria Overseas Finance Ltd., 7.50%, 05/04/20 (e) (r) | 7,400 | 7,770 | ||||
Fifth Third Bancorp, 8.25%, 03/01/38 | 10,200 | 11,739 | ||||
FIH Erhvervsbank A/S, 0.67%, 06/13/13 (i) (r) | 31,900 | 31,868 | ||||
Ford Motor Credit Co. LLC | ||||||
7.38%, 02/01/11 (e) | 2,400 | 2,407 | ||||
7.80%, 06/01/12 | 500 | 532 | ||||
7.50%, 08/01/12 | 2,800 | 2,977 | ||||
7.00%, 10/01/13 | 500 | 536 | ||||
5.63%, 09/15/15 | 10,000 | 10,355 | ||||
Fortis Bank Nederland Holding, 3.00%, 04/17/12, EUR | 500 | 683 | ||||
Gazprom - White Nights, | 1,000 | 1,197 | ||||
General Electric Capital Corp. | ||||||
0.50%, 01/08/16 (e) (i) | 100 | 94 | ||||
5.50%, 09/15/67 (r), EUR | 6,100 | 7,010 | ||||
6.38%, 11/15/67 | 3,200 | 3,168 | ||||
GMAC LLC, 6.88%, 08/28/12 | 100 | 104 | ||||
Goldman Sachs Group Inc. | ||||||
6.88%, 01/15/11 (e) | 95 | 95 | ||||
1.39%, 05/23/16 (i), EUR | 400 | 482 | ||||
5.63%, 01/15/17 | 1,800 | 1,903 | ||||
6.25%, 09/01/17 (e) | 4,400 | 4,856 | ||||
5.95%, 01/18/18 (e) | 1,200 | 1,302 |
| Shares/Par | (p) | Value | ||||
6.15%, 04/01/18 | 600 | 661 | ||||
6.75%, 10/01/37 | 6,300 | 6,441 | ||||
HSBC Holdings Plc | ||||||
6.50%, 05/02/36 | 500 | 522 | ||||
6.50%, 09/15/37 | 700 | 733 | ||||
ING Bank NV, 1.10%, 03/30/12 (i) (r) | 21,700 | 21,625 | ||||
International Lease Finance Corp. | ||||||
4.95%, 02/01/11 | 725 | 725 | ||||
1.43%, 08/15/11 (i), EUR | 2,800 | 3,646 | ||||
5.55%, 09/05/12 (e) | 4,200 | 4,247 | ||||
6.75%, 09/01/16 (r) | 1,900 | 2,028 | ||||
JPMorgan Chase & Co. | ||||||
7.90% (callable at 100 beginning | ||||||
04/30/18) (m) | 4,200 | 4,465 | ||||
1.26%, 09/26/13 (i), EUR | 100 | 130 | ||||
6.00%, 01/15/18 | 1,200 | 1,340 | ||||
JPMorgan Chase Bank NA, 6.00%, 10/01/17 | 4,100 | 4,545 | ||||
JPMorgan Chase Capital XX, 6.55%, 09/29/36 (i) | 300 | 302 | ||||
Korea Development Bank, 8.00%, 01/23/14 | 1,200 | 1,370 | ||||
Korea Housing Finance Corp., 4.13%, 12/15/15 (r) | 2,900 | 2,924 | ||||
LBG Capital No.1 Plc, 8.50%, (callable at 100 beginning 12/17/21) (f) (m) | 200 | 177 | ||||
LeasePlan Corp. NV, 3.13%, 02/10/12, EUR | 3,500 | 4,769 | ||||
Lehman Brothers Holdings Inc. | ||||||
0.00%,11/24/08 (c) (d) | 4,800 | 1,098 | ||||
0.00%,12/23/08 (c) (d) | 200 | 46 | ||||
0.00%,04/03/09 (c) (d) | 600 | 137 | ||||
0.00%,11/10/09 (c) (d) | 900 | 206 | ||||
0.00%,11/16/09 (c) (d) | 400 | 91 | ||||
0.00%,04/15/11 (c) (d) | 1,100 | 252 | ||||
0.00%,07/18/11 (c) (d) | 1,100 | 252 | ||||
5.63%, 01/24/13 (c) (d) | 1,600 | 392 | ||||
6.20%, 09/26/14 (c) (d) | 1,700 | 393 | ||||
6.88%, 05/02/18 (c) (d) | 1,000 | 247 | ||||
Merrill Lynch & Co. Inc. | ||||||
6.05%, 08/15/12 (e) | 600 | 635 | ||||
6.40%, 08/28/17 (e) | 1,900 | 2,009 | ||||
MetLife Inc., 6.40%, 12/15/36 (i) | 500 | 470 | ||||
Metropolitan Life Global Funding I, 0.69%, 07/13/11 (i) (r) | 14,500 | 14,516 | ||||
Morgan Stanley | ||||||
6.60%, 04/01/12 | 2,500 | 2,664 | ||||
2.79%, 05/14/13 (i) | 1,500 | 1,554 | ||||
6.25%, 08/28/17 | 1,200 | 1,293 | ||||
5.95%, 12/28/17 | 1,800 | 1,904 | ||||
7.30%, 05/13/19 (e) | 200 | 225 | ||||
National Australia Bank Ltd., 5.35%, 06/12/13 (r) | 1,900 | 2,058 | ||||
Nationwide Building Society, 4.65%, 02/25/15 (e) (r) | 3,500 | 3,529 | ||||
Nationwide Life Global Funding I, 5.45%, 10/02/12 (r) | 16,200 | 16,699 | ||||
Northern Rock Plc, 5.63%, 06/22/17 (q) | 16,000 | 16,322 | ||||
Ohio National Financial Services Inc., 6.38%, 04/30/20 (r) | 900 | 937 | ||||
Pacific LifeCorp., 6.00%, 02/10/20 (r) | 900 | 946 | ||||
Petroleum Export Ltd., 5.27%, 06/15/11 (r) | 35 | 35 | ||||
Principal Life Income Funding Trusts, 5.30%, 04/24/13 (e) | 1,700 | 1,840 | ||||
RBS Capital Trust I, 4.71%, (callable at 100 beginning 07/01/13) (m) | 800 | 522 | ||||
Resona Bank Ltd., 5.85%, (callable at 100 | 300 | 300 | ||||
Royal Bank of Scotland Group Plc, 6.99%, (callable at 100 beginning 10/05/17) | 2,100 | 1,617 |
See accompanying Notes to the Financial Statements.
JNL Series Trust
Schedules of Investments (in thousands)
December 31, 2010
| Shares/Par (p) | Value | |||||
Royal Bank of Scotland Plc | ||||||
0.69%, 04/08/11 (i) (r) | 8,100 | 8,103 | ||||
1.45%, 10/20/11 (r) | 22,900 | 23,029 | ||||
3.00%, 12/09/11 (r) | 6,700 | 6,839 | ||||
2.63%, 05/11/12 (r) | 2,100 | 2,150 | ||||
4.88%, 08/25/14 (r) | 400 | 410 | ||||
3.95%, 09/21/15 (e) | 500 | 492 | ||||
RZD Capital Ltd., 5.74%, 04/03/17 | 1,500 | 1,559 | ||||
Santander US Debt SA Unipersonal | ||||||
1.10%, 03/30/12 (i) (r) | 13,100 | 12,948 | ||||
2.99%, 10/07/13 (r) | 8,800 | 8,549 | ||||
SLM Corp. | ||||||
5.40%, 10/25/11 | 5,324 | 5,418 | ||||
5.13%, 08/27/12 | 500 | 510 | ||||
3.13%, 09/17/12, EUR | 2,500 | 3,227 | ||||
1.36%, 06/17/13 (i), EUR | 1,250 | 1,481 | ||||
8.45%, 06/15/18 (e) | 3,400 | 3,534 | ||||
5.63%, 08/01/33 (e) | 800 | 628 | ||||
State Bank of India, 4.50%, 07/27/15 (e) (r) | 2,500 | 2,556 | ||||
State Street Capital Trust III, 8.25%, (callable at 100 beginning 03/15/13) (m) | 1,700 | 1,727 | ||||
State Street Capital Trust IV, 1.30%, | ||||||
06/15/37 (i) | 200 | 150 | ||||
Stone Street Trust, 5.90%, 12/15/15 (r) | 7,000 | 7,258 | ||||
Svenska Handelsbanken AB, 1.30%, | ||||||
09/14/12 (i) (r) | 17,000 | 17,057 | ||||
Sydney Airport Finance Co. Pty Ltd., 5.13%, 02/22/21 (l) (r) | 500 | 482 | ||||
Temasek Financial I Ltd., 4.30%, 10/25/19 (e) (r) | 1,800 | 1,834 | ||||
TNK-BP Finance SA, 6.13%, 03/20/12 (r) | 300 | 313 | ||||
TransCapitalInvest Ltd., 8.70%, 08/07/18 (e) (r) | 800 | 990 | ||||
UBS AG Stamford | ||||||
1.38%, 02/23/12 (i) | 2,600 | 2,618 | ||||
5.88%, 12/20/17 | 1,200 | 1,320 | ||||
UBS Preferred Funding Trust V, 6.24%, (callable at 100 beginning 05/15/16) (m) | 10,000 | 9,600 | ||||
USB Capital IX, 6.19%, (callable at 100 beginning 04/15/11) (m) | 200 | 154 | ||||
VEB Finance Ltd., 6.90%, 07/09/20 (e) (r) | 23,500 | 24,616 | ||||
Vnesheconombank Via VEB Finance Ltd., 5.45%, 11/22/17 (q) | 1,100 | 1,097 | ||||
Wachovia Corp. | ||||||
0.42%, 10/15/11 (i) | 3,200 | 3,202 | ||||
5.75%, 02/01/18 (e) | 4,300 | 4,774 | ||||
Wells Fargo & Co., 7.98%, (callable at 100 beginning 03/15/18) (m) | 2,400 | 2,532 | ||||
Westpac Banking Corp. | ||||||
0.77%, 07/16/14 (i) (r) | 1,000 | 1,005 | ||||
3.59%, 08/14/14 (r) | 1,800 | 1,919 | ||||
ZFS Finance USA Trust I, 5.88%, 05/09/32 (r) | 175 | 171 | ||||
| 685,791 | ||||||
HEALTH CARE - 0.7% | ||||||
Amgen Inc., 6.15%, 06/01/18 | 7,300 | 8,514 | ||||
AstraZeneca Plc | ||||||
5.90%, 09/15/17 | 600 | 695 | ||||
6.45%, 09/15/37 | 600 | 712 | ||||
Novartis Capital Corp., 4.13%, 02/10/14 | 5,800 | 6,190 | ||||
Roche Holdings Inc., 7.00%, 03/01/39 (l) (r) | 3,600 | 4,540 | ||||
UnitedHealth Group Inc., 4.88%, 02/15/13 | 1,600 | 1,703 | ||||
| 22,354 | ||||||
INDUSTRIALS - 0.2% | ||||||
CSN Islands XI Corp., 6.88%, 09/21/19 (e) (r) | 700 | 756 | ||||
CSN Resources SA, 6.50%, 07/21/20 (e) (r) | 700 | 738 | ||||
Noble Group Ltd., 4.88%, 08/05/15 (e) (r) | 1,000 | 1,030 | ||||
| Shares/Par (p) | Value | |||||
Union Pacific Corp., 5.70%, 08/15/18 | 4,000 | 4,490 | ||||
| 7,014 | ||||||
INFORMATION TECHNOLOGY - 0.9% | ||||||
Dell Inc., 4.70%, 04/15/13 | 3,600 | 3,865 | ||||
International Business Machines Corp., 5.70%, 09/14/17 | 13,200 | 15,150 | ||||
Oracle Corp. | ||||||
4.95%, 04/15/13 | 4,200 | 4,576 | ||||
5.75%, 04/15/18 | 4,100 | 4,690 | ||||
| 28,281 | ||||||
MATERIALS - 0.5% | ||||||
Alcoa Inc., 6.15%, 08/15/20 (e) | 2,900 | 2,978 | ||||
Corp. Nacional del Cobre de Chile | ||||||
7.50%, 01/15/19 (r) | 1,900 | 2,313 | ||||
6.15%, 10/24/36 (e) (r) | 200 | 218 | ||||
Gerdau Holdings Inc., 5.75%, 01/30/21 (e) (r) | 900 | 902 | ||||
Nucor Corp., 5.75%, 12/01/17 (e) | 2,400 | 2,704 | ||||
Rio Tinto Alcan Inc., 4.88%, 09/15/12 | 4,300 | 4,545 | ||||
Rohm & Haas Co., 6.00%, 09/15/17 (e) | 900 | 985 | ||||
Vale Overseas Ltd. | ||||||
6.25%, 01/23/17 (e) | 300 | 335 | ||||
6.88%, 11/21/36 | 300 | 330 | ||||
| 15,310 | ||||||
TELECOMMUNICATION SERVICES - 1.0% | ||||||
AT&T Inc. | ||||||
4.95%, 01/15/13 | 2,000 | 2,143 | ||||
5.50%, 02/01/18 | 2,000 | 2,222 | ||||
6.30%, 01/15/38 | 1,400 | 1,477 | ||||
Qtel International Finance Ltd. | ||||||
3.38%, 10/14/16 (r) | 300 | 286 | ||||
4.75%, 02/16/21 (r) | 200 | 191 | ||||
Qwest Corp., 7.63%, 06/15/15 | 800 | 902 | ||||
Telecom Italia Capital SA, 0.90%, 07/18/11 (i) | 6,900 | 6,883 | ||||
TELUS Corp., 8.00%, 06/01/11 | 2,528 | 2,597 | ||||
Verizon Wireless Capital LLC | ||||||
2.88%, 05/20/11 (i) | 4,900 | 4,949 | ||||
5.25%, 02/01/12 | 9,900 | 10,362 | ||||
| 32,012 | ||||||
UTILITIES - 1.0% | ||||||
Centrais Eletricas Brasileiras SA, 6.88%, 07/30/19 (r) | 5,000 | 5,650 | ||||
CMS Energy Corp., 5.05%, 02/15/18 | 2,300 | 2,274 | ||||
Electricite de France SA | ||||||
5.50%, 01/26/14 (r) | 1,600 | 1,756 | ||||
6.50%, 01/26/19 (r) | 1,600 | 1,867 | ||||
6.95%, 01/26/39 (r) | 1,600 | 1,893 | ||||
Entergy Corp., 3.63%, 09/15/15 (l) | 5,200 | 5,143 | ||||
Majapahit Holding BV | ||||||
8.00%, 08/07/19 (e) (r) | 2,200 | 2,571 | ||||
7.75%, 01/20/20 (r) | 5,000 | 5,763 | ||||
NRG Energy Inc., 8.25%, 09/01/20 (e) (r) | 3,500 | 3,588 | ||||
NV Energy Inc., 6.25%, 11/15/20 | 1,800 | 1,809 | ||||
Virginia Electric & Power Co., 6.35%, 11/30/37 | 200 | 229 | ||||
| 32,543 | ||||||
Total Corporate Bonds and Notes (cost $892,931) | 936,152 | |||||
| GOVERNMENT AND AGENCY OBLIGATIONS - 97.4% | ||||||
GOVERNMENT SECURITIES - 54.3% | ||||||
Federal Home Loan Bank - 0.1% (w) | ||||||
Federal Home Loan Bank, 0.88%, 12/27/13 | 1,500 | 1,487 | ||||
See accompanying Notes to the Financial Statements.
JNL Series Trust
Schedules of Investments (in thousands)
December 31, 2010
| Shares/Par (p) | Value | |||||
Federal Home Loan Mortgage Corp. - 2.4% (w) | ||||||
Federal Home Loan Mortgage Corp. | ||||||
0.52%, 11/26/12 | 11,700 | 11,662 | ||||
4.50%, 01/15/13 - 01/15/14 | 13,900 | 14,992 | ||||
3.50%, 05/29/13 | 2,500 | 2,655 | ||||
4.13%, 09/27/13 | 1,000 | 1,084 | ||||
0.88%, 10/28/13 (e) | 5,100 | 5,073 | ||||
4.88%, 11/15/13 | 3,300 | 3,658 | ||||
2.50%, 01/07/14 (e) | 4,200 | 4,368 | ||||
5.00%, 01/30/14 - 04/18/17 | 3,600 | 4,047 | ||||
2.50%, 04/23/14 | 6,400 | 6,631 | ||||
3.00%, 07/28/14 (e) | 3,900 | 4,105 | ||||
4.38%, 07/17/15 | 6,000 | 6,618 | ||||
1.75%, 09/10/15 | 10,600 | 10,419 | ||||
5.25%, 04/18/16 | 600 | 686 | ||||
5.50%, 07/18/16 | 1,800 | 2,085 | ||||
| 78,083 | ||||||
Federal National Mortgage Association - 7.2% (w) | ||||||
Federal National Mortgage Association | ||||||
0.63%, 09/24/12 | 4,400 | 4,404 | ||||
0.50%, 10/30/12 | 17,400 | 17,331 | ||||
1.75%, 02/22/13 | 3,300 | 3,370 | ||||
1.00%, 09/23/13 (e) | 19,900 | 19,870 | ||||
1.13%, 09/30/13 | 18,100 | 18,139 | ||||
4.63%, 10/15/13 (e) | 6,000 | 6,586 | ||||
2.88%, 12/11/13 | 900 | 946 | ||||
0.75%, 12/18/13 (e) (o) | 74,600 | 73,767 | ||||
2.75%, 02/05/14 (e) | 3,300 | 3,448 | ||||
2.75%, 03/13/14 | 4,200 | 4,390 | ||||
4.13%, 04/15/14 | 19,800 | 21,594 | ||||
2.50%, 05/15/14 | 4,200 | 4,358 | ||||
3.00%, 09/16/14 | 3,600 | 3,792 | ||||
4.63%, 10/15/14 | 3,900 | 4,338 | ||||
4.38%, 10/15/15 | 3,400 | 3,742 | ||||
1.63%, 10/26/15 (e) | 36,000 | 35,088 | ||||
5.00%, 03/15/16 - 05/11/17 | 6,000 | 6,773 | ||||
4.88%, 12/15/16 | 300 | 336 | ||||
5.38%, 06/12/17 (e) | 1,000 | 1,151 | ||||
6.00%, 10/01/37 - 06/01/39 | 2,178 | 2,370 | ||||
| 235,793 | ||||||
Municipals - 3.0% | ||||||
Bay Area Toll Authority, Toll Bridge Revenue, | 3,400 | 3,438 | ||||
Buckeye Tobacco Settlement Financing | 1,000 | 724 | ||||
California Infrastructure & Economic Development Bank, 6.49%, 05/15/49 | 1,000 | 993 | ||||
California State University, 6.43%, 11/01/30 | 1,400 | 1,412 | ||||
Calleguas - Las Virgenes Public Financing Authority, 5.94%, 07/01/40 | 1,100 | 1,070 | ||||
Chicago Transit Authority | ||||||
6.30%, 12/01/21 - 12/01/21 | 300 | 319 | ||||
6.20%, 12/01/40 | 1,000 | 912 | ||||
6.90%, 12/01/40 - 12/01/40 | 4,100 | 4,063 | ||||
City of North Las Vegas Nevada, Ad Valorem Property Tax, GO, 6.57%, 06/01/40 | 9,200 | 8,836 | ||||
County of Clark NV, 6.82%, 07/01/45 | 1,600 | 1,564 | ||||
Golden State Tobacco Securitization Corp., 5.75%, 06/01/47 | 6,900 | 4,638 | ||||
Illinois Municipal Electric Agency, | 1,800 | 1,861 | ||||
Irvine Ranch Water District Series B, | 16,800 | 16,847 | ||||
Los Angeles Unified School District, | 3,100 | 3,211 | ||||
| Shares/Par (p) | Value | |||
Los Angeles Unified School District (insured by National Public Finance Guarantee Corp), 4.50%, 01/01/28 | 6,300 | 5,595 | ||
Los Angeles Unified School District Series A-1 (insured by Assured Guaranty Municipal Corp.), 4.50%, 07/01/22 | 3,600 | 3,527 | ||
New Jersey State Turnpike Authority, | 7,800 | 8,561 | ||
New York State Dormitory Authority, | 4,700 | 4,374 | ||
North Carolina Turnpike Authority, Series B, 6.70%, 01/01/39 | 2,000 | 2,081 | ||
Pennsylvania Economic Development Financing Authority, 6.53%, 06/15/39 | 1,900 | 1,846 | ||
Port Authority of New York & New Jersey, | 1,100 | 1,063 | ||
San Diego Tobacco Settlement Revenue Funding Corp., 7.13%, 06/01/32 | 815 | 621 | ||
State of California, 7.95%, 03/01/36 | 600 | 615 | ||
State of California Various Purpose Bond | ||||
7.50%, 04/01/34 | 600 | 621 | ||
5.65%, 04/01/39 | 600 | 634 | ||
7.55%, 04/01/39 | 600 | 622 | ||
State of Illinois | ||||
4.07%, 01/01/14 | 2,400 | 2,416 | ||
6.90%, 03/01/35 | 1,000 | 929 | ||
6.73%, 04/01/35 | 900 | 826 | ||
State of Iowa, 6.75%, 06/01/34 | 4,100 | 4,304 | ||
State of Texas, 4.75%, 04/01/35 | 500 | 485 | ||
Texas State Transportation Commission, Highway Revenue Tolls, RB, Series B, 5.18%, 04/01/30 | 1,000 | 991 | ||
Tobacco Settlement Authority of Iowa, | 225 | 206 | ||
Tobacco Settlement Authority of West Virgina, 7.47%, 06/01/47 | 1,700 | 1,178 | ||
Washington State Convention Center Public Facilities District, 6.79%, 07/01/40 | 5,600 | 5,470 | ||
Washington State Municipal Bond (insured by National Public Finance Guarantee Corp), 0.00%, 12/01/20 (j) | 1,400 | 930 | ||
| 97,783 | ||||
Sovereign - 1.8% | ||||
Brazil Notas do Tesouro Nacional, 10.00%, 01/01/12 - 01/01/17, BRL | 2,662 | 1,473 | ||
Canada Housing Trust No. 1 | ||||
2.75%, 12/15/15 (q), CAD | 4,000 | 4,035 | ||
3.35%, 12/15/20, CAD | 7,000 | 7,002 | ||
Canadian Government Bond | ||||
2.50%, 09/01/13, CAD | 7,600 | 7,767 | ||
2.00%, 12/01/14, CAD | 5,500 | 5,491 | ||
4.50%, 06/01/15, CAD | 700 | 769 | ||
3.00%, 12/01/15, CAD | 800 | 826 | ||
Export-Import Bank of China, | 200 | 215 | ||
Mexican Bonos, 6.00%, 06/18/15, MXN | 24,700 | 1,983 | ||
Panama Government International Bond, | 400 | 462 | ||
Province of Ontario, Canada | ||||
4.30%, 03/08/17, CAD | 1,200 | 1,284 | ||
4.20%, 03/08/18, CAD | 300 | 317 | ||
5.50%, 06/02/18, CAD | 700 | 796 | ||
4.40%, 06/02/19, CAD | 2,400 | 2,545 | ||
4.70%, 06/02/37, CAD | 6,100 | 6,448 | ||
4.60%, 06/02/39, CAD | 1,700 | 1,779 | ||
Province of Quebec, Canada, 4.50%, 12/01/16, CAD | 100 | 108 | ||
See accompanying Notes to the Financial Statements.
JNL Series Trust
Schedules of Investments (in thousands)
December 31, 2010
| Shares/Par (p) | Value | |||||
Republic of Korea, 4.38%, 08/10/15 | 7,200 | 7,409 | ||||
Republic of South Africa Government Bond, 5.88%, 05/30/22 | 100 | 107 | ||||
Societe Financement de l’Economie Francaise | ||||||
2.13%, 05/20/12, EUR | 300 | 407 | ||||
0.49%, 07/16/12 (i) (r) | 2,000 | 2,003 | ||||
3.38%, 05/05/14 (r) | 4,200 | 4,423 | ||||
United Mexican States, 6.05%, 01/11/40 | 1,500 | 1,534 | ||||
| 59,183 | ||||||
Treasury Inflation Index Securities - 3.5% | ||||||
U.S. Treasury Inflation Indexed Note | ||||||
1.25%, 07/15/20 (n) | 10,630 | 10,885 | ||||
2.38%, 01/15/25 (n) | 10,327 | 11,491 | ||||
2.00%, 01/15/26 (n) | 17,411 | 18,487 | ||||
2.38%, 01/15/27 (n) (o) | 15,617 | 17,356 | ||||
1.75%, 01/15/28 (n) (o) | 39,671 | 40,384 | ||||
3.63%, 04/15/28 (n) (o) | 270 | 349 | ||||
2.50%, 01/15/29 (n) | 12,326 | 13,986 | ||||
3.88%, 04/15/29 (n) | 1,996 | 2,676 | ||||
| 115,614 | ||||||
U.S. Treasury Securities - 36.3% | ||||||
U.S. Treasury Note | ||||||
0.50%, 11/30/12 (e) (o) | 356,600 | 356,140 | ||||
1.13%, 06/15/13 | 15,900 | 16,030 | ||||
1.00%, 07/15/13 | 52,700 | 52,959 | ||||
0.75%, 08/15/13 | 30,500 | 30,438 | ||||
0.75%, 09/15/13, TBA (g) | 102,500 | 102,172 | ||||
0.50%, 10/15/13, TBA (g) (o) | 319,600 | 316,030 | ||||
0.50%, 11/15/13, TBA (g) (o) | 28,300 | 27,935 | ||||
0.75%, 12/15/13 (e) (o) | 233,700 | 232,039 | ||||
2.38%, 09/30/14 - 10/31/14 | 8,100 | 8,387 | ||||
2.13%, 11/30/14 | 12,600 | 12,907 | ||||
2.63%, 12/31/14 | 4,400 | 4,588 | ||||
2.50%, 04/30/15, TBA (g) | 18,900 | 19,539 | ||||
1.88%, 06/30/15 (o) | 4,225 | 4,242 | ||||
| 1,183,406 | ||||||
U.S. GOVERNMENT AGENCY MORTGAGE-BACKED | ||||||
SECURITIES - 43.1% | ||||||
Federal Home Loan Mortgage Corp. - 3.6% | 41,047 | 44,531 | ||||
Federal Home Loan Mortgage Corp. | ||||||
6.00%, 03/01/16 - 11/01/38 | ||||||
2.78%, 07/01/27 (i) | 1 | 1 | ||||
7.50%, 03/01/32 (f) | 180 | 179 | ||||
5.50%, 12/01/36 - 08/15/40 | 22,637 | 24,147 | ||||
4.50%, 09/01/38 - 09/01/40 | 22,476 | 23,057 | ||||
4.50%, 01/15/41, TBA (g) | 10,000 | 10,247 | ||||
REMIC, 0.41%, 07/15/19 (i) | 998 | 996 | ||||
REMIC, 2.62%, 08/15/19 (i) | 2,342 | 2,335 | ||||
REMIC, 7.00%, 05/15/23 | 262 | 294 | ||||
REMIC, 0.71%, 11/15/30 (i) | 4 | 4 | ||||
REMIC, 4.50%, 03/15/34 | 8,396 | 8,320 | ||||
REMIC, 0.30%, 12/25/36 (i) | 1,688 | 1,678 | ||||
REMIC, 1.54%, 02/25/45 (i) | 91 | 89 | ||||
| 115,878 | ||||||
Federal National Mortgage Association - 38.8% | ||||||
| Shares/Par (p) | Value | |||||
Federal National Mortgage Association | ||||||
6.00%, 05/01/16 - 08/01/40 | 132,606 | 144,347 | ||||
5.50%, 04/01/22 - 10/01/39 | 44,709 | 47,989 | ||||
4.00%, 01/15/26 - 01/15/41 , TBA (g) | 131,900 | 131,692 | ||||
4.50%, 01/15/26 - 01/15/41 , TBA (g) | 529,000 | 544,230 | ||||
5.50%, 02/15/26 - 01/15/41 , TBA (g) | 66,400 | 71,049 | ||||
6.50%, 07/01/29 - 03/01/38 | 4,802 | 5,343 | ||||
4.50%, 05/01/34 - 10/01/40 | 100,249 | 103,012 | ||||
2.53%, 01/01/35 (i) | 1,726 | 1,768 | ||||
5.00%, 03/01/35 - 07/01/40 | 7,809 | 8,238 | ||||
5.50%, 08/01/37 (o) | 19,667 | 21,150 | ||||
4.00%, 11/01/39 - 09/01/40 | 3,960 | 3,945 | ||||
1.74%, 09/01/40 (i) | 10 | 10 | ||||
5.00%, 01/15/41, TBA (g) | 158,600 | 166,728 | ||||
6.00%, 01/15/41, TBA (g) | 8,000 | 8,695 | ||||
1.54%, 06/01/43 (i) | 545 | 546 | ||||
REMIC, 5.00%, 02/25/17 - 04/25/33 | 524 | 559 | ||||
REMIC, 2.63%, 05/25/35 (i) | 126 | 130 | ||||
REMIC, 0.71%, 09/25/35 (i) | 4,117 | 4,111 | ||||
REMIC, 0.57%, 04/25/37 (i) | 2,051 | 2,052 | ||||
REMIC, 0.32%, 07/25/37 (i) | 1,048 | 1,034 | ||||
REMIC, 6.50%, 12/25/42 | 72 | 82 | ||||
REMIC, 0.61%, 03/25/44 (i) | 518 | 500 | ||||
| 1,267,210 | ||||||
Government National Mortgage Association - 0.0% | ||||||
Government National Mortgage Association | ||||||
3.38%, 05/20/26 - 05/20/30 (i) | 87 | 89 | ||||
2.75%, 02/20/32 (i) | 66 | 68 | ||||
3.00%, 02/20/32 (i) | 45 | 46 | ||||
6.00%, 01/15/41, TBA (g) | 1,000 | 1,099 | ||||
| 1,302 | ||||||
Small Business Administration Participation Certificates - 0.7% | ||||||
Small Business Administration Participation Certificates | ||||||
6.29%, 01/01/21 | 26 | 28 | ||||
5.13%, 09/01/23 | 49 | 52 | ||||
5.52%, 06/01/24 | 1,010 | 1,082 | ||||
5.29%, 12/01/27 | 864 | 933 | ||||
5.16%, 02/01/28 | 9,990 | 10,607 | ||||
5.49%, 03/01/28 | 9,232 | 9,925 | ||||
| 22,627 | ||||||
Total Government and Agency Obligations (cost $3,181,117) | 3,178,366 | |||||
PREFERRED STOCKS - 0.1% | ||||||
CONSUMER DISCRETIONARY - 0.0% | ||||||
Motors Liquidation Co., 5.25% (c) (d) | 128 | 1,050 | ||||
FINANCIALS - 0.1% | ||||||
American International Group Inc., Convertible Preferred | 44 | 384 | ||||
DG Funding Trust, 0.68%, (callable at 10,000 beginning 09/30/10) (f) (i) (m) (q) | — | 3,191 | ||||
| 3,575 | ||||||
Total Preferred Stocks (cost $5,205) | 4,625 | |||||
SHORT TERM INVESTMENTS - 12.5% | ||||||
Certificates of Deposit 0.5% | ||||||
Intesa Sanpaolo SpA, 2.38%, 12/21/12 | $ | 15,200 | 15,255 | |||
Investment Company 0.5% | ||||||
JNL Money Market Fund, 0.08% (a) (h) | 15,624 | 15,624 | ||||
Securities Lending Collateral 5.8% | ||||||
Securities Lending Cash Collateral Fund LLC, 0.31% (a) (h) | 189,445 | 189,445 | ||||
Treasury Securities 5.7% | ||||||
Japan Treasury Bill | ||||||
0.11%, 01/24/11, JPY | 13,110,000 | 161,461 | ||||
0.00%,03/14/11, JPY | 660,000 | 8,127 | ||||
U.S. Treasury Bill | ||||||
0.13%, 02/17/11 (o) | $ | 853 | 853 | |||
0.18%, 06/16/11 (e) | 2,000 | 1,998 | ||||
See accompanying Notes to the Financial Statements.
JNL Series Trust
Schedules of Investments (in thousands)
December 31, 2010
| Shares/Par (p) | Value | |||
0.17%, 06/02/11 (e) (o) | 14,557 | 14,548 | ||
| 186,987 | ||||
Total Short Term Investments (cost $405,856) | 407,311 | |||
Total Investments - 144.8% | 4,726,406 | |||
Total Forward Sales Commitments - (1.5)% | ||||
(proceeds $50,312) | (49,840) | |||
Other Assets and Liabilities, Net - (43.3%) (o) | (1,412,417) | |||
Total Net Assets - 100.0% | $3,264,149 | |||
Forward Sales Commitments - 1.5% | ||||
GOVERNMENT AND AGENCY OBLIGATIONS - 1.5% | ||||
U.S. Treasury Securities - 1.5% | ||||
U.S. Treasury Note, 0.75%, 09/15/13 | $50,000 | $49,840 | ||
Total Forward Sales Commitments - 1.5% | ||||
(proceeds $50,312) | $49,840 | |||
JNL/PPM America High Yield Bond Fund | ||||
NON-U.S. GOVERNMENT AGENCY | ||||
SECURITIES - 4.2% | ||||
Ahold Lease USA Inc., 7.82%, 01/02/20 (k) | $1,602 | $1,853 | ||
American Airlines Pass Through Trust, 10.38%, 07/02/19 (e) | 1,371 | 1,618 | ||
Banc of America Commercial Mortgage Inc. REMIC | 1,305 | 1,315 | ||
5.48%, 01/15/49 (i) | 3,000 | 2,932 | ||
Bear Stearns CMBS REMIC, 5.92%, | ||||
06/11/50 (i) | 359 | 366 | ||
Bear Stearns Commercial Mortgage Securities Inc. REMIC, 5.76%, 09/11/38 (i) | 1,000 | 957 | ||
Citigroup Commercial Mortgage Trust REMIC | ||||
5.70%, 06/10/17 (i) | 1,905 | 1,890 | ||
5.73%, 03/15/49 (i) | 2,000 | 2,073 | ||
Citigroup/Deutsche Bank Commercial Mortgage Trust REMIC, 5.69%, 10/15/48 | 1,000 | 885 | ||
Credit Suisse Mortgage Capital Certificates REMIC | ||||
5.54%, 02/15/39 (i) | 1,085 | 1,099 | ||
5.54%, 02/15/39 (i) | 550 | 525 | ||
5.72%, 06/15/39 (i) | 1,000 | 851 | ||
5.34%, 12/15/39 | 112 | 111 | ||
6.13%, 09/15/40 (i) | 2,000 | 1,115 | ||
CW Capital Cobalt Ltd. REMIC | ||||
5.82%, 07/15/17 (i) | 1,000 | 704 | ||
5.29%, 08/15/48 | 4,000 | 2,855 | ||
Delta Air Lines Inc. Pass Through Trust, 7.75%, 06/17/21 (e) | 1,616 | 1,789 | ||
JP Morgan Chase Commercial Mortgage Securities Corp. REMIC, 6.06%, 08/15/17 (i) | 3,684 | 3,740 | ||
JPMorgan Chase & Co. Commercial Mortgage Securities Inc. REMIC, 5.74%, 05/12/17 (i) | 1,387 | 1,372 | ||
JPMorgan Chase Commercial Mortgage Securities Corp. REMIC 5.50%, 02/12/17 (i) | 2,000 | 1,734 | ||
5.87%, 04/15/45 (i) | 4,000 | 3,630 | ||
Merrill Lynch/Countrywide Commercial Mortgage Trust REMIC, 5.91%, | 515 | 540 | ||
Morgan Stanley Capital I REMIC, 5.73%, 10/15/42 (i) | 150 | 155 | ||
| Shares/Par (p) | Value | |||
United Air Lines Inc. Pass-Through Trust, 10.40%, 11/01/16 (e) | 3,657 | 4,224 | ||
Total Non-U.S. Government Agency Asset- | ||||
Backed Securities (cost $29,629) | 38,333 | |||
CORPORATE BONDS AND NOTES - 87.0% | ||||
CONSUMER DISCRETIONARY - 22.2% | ||||
Affinion Group Inc., 11.63%, 11/15/15 (r) | 4,000 | 4,150 | ||
Allbritton Communications Co., 8.00%, 05/15/18 | 2,929 | 2,958 | ||
AMC Entertainment Holdings Inc., 9.75%, 12/01/20 (e) (r) | 3,429 | 3,566 | ||
Ameristar Casinos Inc., 9.25%, 06/01/14 | 1,231 | 1,317 | ||
Beazer Homes USA Inc., 9.13%, 05/15/19 (e) (r) | 4,909 | 4,664 | ||
Belo Corp. | ||||
8.00%, 11/15/16 | 393 | 423 | ||
7.25%, 09/15/27 (e) | 3,000 | 2,602 | ||
Boyd Gaming Corp., 9.13%, 12/01/18 (e) (r) | 3,183 | 3,143 | ||
Bresnan Broadband Holdings LLC, 8.00%, 12/15/18 (e) (r) | 495 | 510 | ||
Cablevision Systems Corp. | ||||
8.63%, 09/15/17 | 1,000 | 1,089 | ||
7.75%, 04/15/18 | 512 | 536 | ||
8.00%, 04/15/20 (e) | 313 | 335 | ||
CCH II LLC, 13.50%, 11/30/16 | 1,467 | 1,749 | ||
CCO Holdings LLC | ||||
7.88%, 04/30/18 (e) | 2,105 | 2,179 | ||
8.13%, 04/30/20 (e) | 1,000 | 1,052 | ||
Cequel Communications Holdings I LLC, 8.63%, 11/15/17 (e) (r) | 4,433 | 4,632 | ||
CKE Restaurants Inc., 11.38%, 07/15/18 (e) | 3,364 | 3,726 | ||
Cooper-Standard Automotive Inc., 8.50%, 05/01/18 (e) (r) | 820 | 869 | ||
DISH DBS Corp., 7.88%, 09/01/19 | 1,538 | 1,607 | ||
Diversey Inc., 8.25%, 11/15/19 | 767 | 832 | ||
Dollar General Corp., 11.88%, 07/15/17 | 1,373 | 1,593 | ||
Easton-Bell Sports Inc., 9.75%, 12/01/16 | 1,400 | 1,536 | ||
Entravision Communications Corp., 8.75%, 08/01/17 (e) (r) | 660 | 696 | ||
Ford Motor Co., 7.45%, 07/16/31 (e) | 4,000 | 4,285 | ||
Giraffe Acquisition Corp., 9.13%, 12/01/18 (e) (r) | 2,000 | 2,085 | ||
Hanesbrands Inc. | ||||
8.00%, 12/15/16 (e) | 370 | 397 | ||
6.38%, 12/15/20 (r) | 1,100 | 1,045 | ||
Harrah’s Operating Co. Inc. | ||||
5.38%, 12/15/13 | 4,500 | 4,219 | ||
10.75%, 02/01/16 (e) | 1,000 | 958 | ||
11.25%, 06/01/17 (e) | 1,291 | 1,452 | ||
10.00%, 12/15/18 (e) | 2,000 | 1,825 | ||
Insight Communications Co. Inc., 9.38%, 07/15/18 (r) | 1,333 | 1,420 | ||
Interactive Data Corp., 10.25%, 08/01/18 (r) | 730 | 799 | ||
Interpublic Group Cos. Inc., 10.00%, 07/15/17 | 3,793 | 4,438 | ||
J.C. Penney Co. Inc. | ||||
6.88%, 10/15/15 | 1,000 | 1,053 | ||
5.65%, 06/01/20 (e) | 2,488 | 2,382 | ||
6.38%, 10/15/36 | 511 | 465 | ||
Jarden Corp., 6.13%, 11/15/22 (e) | 857 | 818 | ||
Lear Corp. | ||||
7.88%, 03/15/18 | 1,591 | 1,702 | ||
8.13%, 03/15/20 (e) | 955 | 1,039 | ||
Lennar Corp., 12.25%, 06/01/17 | 2,000 | 2,410 | ||
Levi Strauss & Co. | ||||
8.88%, 04/01/16 (e) | 2,000 | 2,110 | ||
See accompanying Notes to the Financial Statements.
JNL Series Trust
Schedules of Investments (in thousands)
December 31, 2010
| Shares/Par (p) | Value | |||||
7.63%, 05/15/20 (e) | 1,812 | 1,871 | ||||
Libbey Glass Inc., 10.00%, 02/15/15 (r) | 577 | 620 | ||||
Live Nation Entertainment Inc., 8.13%, 05/15/18 (e) (r) | 574 | 581 | ||||
Macy’s Retail Holdings Inc. | ||||||
6.63%, 04/01/11 (e) | 500 | 506 | ||||
5.90%, 12/01/16 | 1,000 | 1,067 | ||||
6.65%, 07/15/24 | 500 | 495 | ||||
6.90%, 01/15/32 | 1,000 | 998 | ||||
6.38%, 03/15/37 | 1,000 | 980 | ||||
MCE Finance Ltd., 10.25%, 05/15/18 (e) | 3,000 | 3,439 | ||||
MDC Partners Inc., 11.00%, 11/01/16 | 2,279 | 2,513 | ||||
Meritage Homes Corp., 6.25%, 03/15/15 | 2,000 | 2,010 | ||||
MGM Resorts International | ||||||
6.75%, 04/01/13 (e) | 2,600 | 2,584 | ||||
7.63%, 01/15/17 (e) | 925 | 865 | ||||
11.13%, 11/15/17 | 810 | 932 | ||||
11.38%, 03/01/18 (e) | 2,000 | 2,170 | ||||
9.00%, 03/15/20 (e) (r) | 329 | 362 | ||||
Michaels Stores Inc., 7.75%, 11/01/18 (e) (r) | 2,000 | 1,995 | ||||
NCL Corp. Ltd., 9.50%, 11/15/18 (r) | 920 | 948 | ||||
Neiman-Marcus Group Inc., 10.38%, 10/15/15 | 4,205 | 4,442 | ||||
Newsday Secured Term Loan | ||||||
10.50%, 08/01/13 (q) | 2,000 | 2,142 | ||||
10.50%, 12/31/49 (q) | 808 | 866 | ||||
Nielsen Finance LLC | ||||||
11.50%, 05/01/16 | 444 | 513 | ||||
12.50%,08/01/16 (k) | 2,000 | 2,100 | ||||
Petco Animal Supplies Inc., 9.25%, | 3,125 | 3,293 | ||||
Phillips-Van Heusen Corp., 7.38%, 05/15/20 | 320 | 340 | ||||
Pinnacle Entertainment Inc., 8.75%, | 3,424 | 3,544 | ||||
QVC Inc., 7.50%, 10/01/19 (r) | 2,649 | 2,788 | ||||
Regal Entertainment Group, 9.13%, | 1,104 | 1,176 | ||||
Reynolds Group Inc. | ||||||
7.13%, 04/15/19 (r) | 948 | 965 | ||||
9.00%, 04/15/19 (r) | 1,538 | 1,594 | ||||
Royal Caribbean Cruises Ltd., 7.25%, 06/15/16 | 3,500 | 3,771 | ||||
Sally Holdings LLC, 10.50%, 11/15/16 (e) | 1,500 | 1,654 | ||||
Scientific Games International Inc., 9.25%, 06/15/19 (e) | 2,167 | 2,237 | ||||
Seminole Indian Tribe of Florida, 7.75%, | 2,583 | 2,667 | ||||
ServiceMaster Co., 10.75%, 07/15/15 (e) (r) | 3,000 | 3,210 | ||||
Sheraton Holding Corp., 7.38%, 11/15/15 | 1,000 | 1,125 | ||||
Shingle Springs Tribal Gaming Authority, 9.38%, 06/15/15 (r) | 4,000 | 2,760 | ||||
Sinclair Television Group Inc., 8.38%, | 1,739 | 1,796 | ||||
Sirius XM Radio Inc. | ||||||
8.75%, 04/01/15 (r) | 3,000 | 3,247 | ||||
9.75%, 09/01/15 (e) (r) | 1,000 | 1,122 | ||||
Standard Pacific Corp. | ||||||
8.38%, 05/15/18 (r) | 2,000 | 2,000 | ||||
8.38%, 05/15/18 | 983 | 983 | ||||
8.38%, 01/15/21 (r) | 8,000 | 7,760 | ||||
Station Casinos Inc. | ||||||
6.00%, 04/01/12 (c) (d) | 90 | — | ||||
6.50%, 02/01/14 (c) (d) | 1,000 | — | ||||
6.88%, 03/01/16 (c) (d) | 2,175 | — | ||||
7.75%, 08/15/16 (c) (d) | 690 | — | ||||
6.63%, 03/15/18 (c) (d) | 50 | — | ||||
Sun Media Corp., 7.63%, 02/15/13 | 967 | 969 | ||||
Tenneco Inc. | ||||||
7.75%, 08/15/18 (e) (r) | 508 | 538 | ||||
6.88%, 12/15/20 (e) (r) | 2,211 | 2,261 | ||||
| Shares/Par (p) | Value | |||||||
Ticketmaster Entertainment Inc., 10.75%, 08/01/16 | 1,125 | 1,218 | ||||||
TRW Automotive Inc. | ||||||||
7.00%, 03/15/14 (e) (r) | 1,500 | 1,605 | ||||||
8.88%, 12/01/17 (r) | 2,000 | 2,240 | ||||||
Universal City Development Partners Ltd. | ||||||||
8.88%, 11/15/15 | 842 | 895 | ||||||
10.88%, 11/15/16 | 418 | 457 | ||||||
Univision Communications Inc. | ||||||||
7.88%, 11/01/20 (e) (r) | 3,447 | 3,619 | ||||||
8.50%, 05/15/21 (e) (r) | 4,355 | 4,409 | ||||||
UPC Germany GmbH, 8.13%, 12/01/17 (e) (r) | 2,000 | 2,090 | ||||||
Videotron Ltee, 6.38%, 12/15/15 | 1,000 | 1,023 | ||||||
Viking Acquisition Inc., 9.25%, 11/01/18 (r) | 2,000 | 1,985 | ||||||
Virgin Media Inc., 6.50%, 11/15/16 | 1,000 | 1,655 | ||||||
Visant Corp., 10.00%, 10/01/17 (e) (r) | 4,000 | 4,250 | ||||||
WMG Holdings Corp., 9.50%, | 1,000 | 958 | ||||||
Wynn Las Vegas LLC | ||||||||
7.88%, 05/01/20 (e) | 2,000 | 2,140 | ||||||
7.75%, 08/15/20 (e) | 3,680 | 3,984 | ||||||
Yonkers Racing Corp, 11.38%, 07/15/16 (r) | 1,196 | 1,317 | ||||||
| 201,310 | ||||||||
CONSUMER STAPLES - 2.8% | ||||||||
Altria Group Inc., 10.20%, 02/06/39 (l) | 1,000 | 1,445 | ||||||
Constellation Brands Inc., 7.25%, 05/15/17 | 1,000 | 1,059 | ||||||
Del Monte Corp., 7.50%, 10/15/19 | 833 | 971 | ||||||
Dole Food Co. Inc., 8.00%, 10/01/16 (r) | 345 | 364 | ||||||
Michael Foods Inc., 9.75%, 07/15/18 (r) | 900 | 983 | ||||||
New Albertson’s Inc. | ||||||||
7.75%, 06/15/26 | 1,000 | 770 | ||||||
8.00%, 05/01/31 | 1,000 | 750 | ||||||
Pinnacle Foods Finance LLC, 9.25%, 04/01/15 | 2,000 | 2,082 | ||||||
Rite Aid Corp. | ||||||||
9.50%, 06/15/17 (e) | 1,000 | 850 | ||||||
10.25%, 10/15/19 | 2,000 | 2,078 | ||||||
8.00%, 08/15/20 (e) | 3,000 | 3,124 | ||||||
Smithfields Foods Inc., 10.00%, 07/15/14 (r) | 1,605 | 1,850 | ||||||
Spectrum Brands Inc., 9.50%, 06/15/18 (r) | 2,070 | 2,274 | ||||||
Toys R Us Property Co. I LLC, 10.75%, 07/15/17 | 3,000 | 3,420 | ||||||
Tyson Foods Inc., 10.50%, 03/01/14 | 929 | 1,099 | ||||||
Yankee Acquisition Corp. | ||||||||
8.50%, 02/15/15 | 2,000 | 2,080 | ||||||
9.75%, 02/15/17 | 250 | 261 | ||||||
| 25,460 | ||||||||
ENERGY - 10.8% | ||||||||
Aquilex Holdings LLC, 11.13%, 12/15/16 | 3,225 | 3,265 | ||||||
Arch Coal Inc., 7.25%, 10/01/20 | 1,302 | 1,374 | ||||||
Chaparral Energy Inc., 9.88%, | 3,636 | 3,836 | ||||||
Chesapeake Energy Corp., 6.88%, | 1,824 | 1,851 | ||||||
Cie Generale de Geophysique-Veritas, 9.50%, 05/15/16 (e) | 1,500 | 1,635 | ||||||
Cloud Peak Energy Resources LLC, 8.50%, 12/15/19 | 3,582 | 3,922 | ||||||
Concho Resources Inc., 7.00%, 01/15/21 | 5,000 | 5,125 | ||||||
Consol Energy Inc. | ||||||||
8.00%, 04/01/17 (r) | 718 | 765 | ||||||
8.25%, 04/01/20 (r) | 1,191 | 1,286 | ||||||
Denbury Resources Inc., 9.75%, 03/01/16 | 1,251 | 1,395 | ||||||
El Paso Corp. | ||||||||
8.25%, 02/15/16 | 320 | 371 | ||||||
7.80%, 08/01/31 | 2,460 | 2,447 | ||||||
7.75%, 01/15/32 (e) | 1,430 | 1,422 | ||||||
El Paso Pipeline Partners Operating Co. LLC, 6.50%, 04/01/20 |
| 7,000 |
|
| 7,344 |
| ||
See accompanying Notes to the Financial Statements.
JNL Series Trust
Schedules of Investments (in thousands)
December 31, 2010
| Shares/Par (p) | Value | |||||
Enterprise Products Operating LLC | ||||||
8.38%, 08/01/66 (e) | 860 | 923 | ||||
7.03%, 01/15/68 (e) | 3,700 | 3,839 | ||||
Gibson Energy ULC, 10.00%, 01/15/18 | 2,900 | 2,943 | ||||
Hilcorp Energy Co., 8.00%, | 2,000 | 2,118 | ||||
Holly Corp., 9.88%, 06/15/17 | 1,000 | 1,090 | ||||
Hornbeck Offshore Services Inc., 8.00%, | 3,000 | 3,060 | ||||
Linn Energy LLC | ||||||
8.63%, 04/15/20 (r) | 2,811 | 3,029 | ||||
7.75%, 02/01/21 (e) (r) | 3,000 | 3,075 | ||||
MarkWest Energy Partners LP, 8.75%, 04/15/18 | 1,517 | 1,642 | ||||
Newfield Exploration Co., 6.88%, 02/01/20 | 3,430 | 3,610 | ||||
NXP BV, 9.75%, 08/01/18 (r) | 2,000 | 2,250 | ||||
Overseas Shipholding Group Inc, 7.50%, 02/15/24 | 3,000 | 2,603 | ||||
Petrohawk Energy Corp. | ||||||
10.50%, 08/01/14 | 198 | 226 | ||||
7.88%, 06/01/15 (e) | 1,000 | 1,041 | ||||
PetroHawk Energy Corp., 7.25%, 08/15/18 | 1,391 | 1,405 | ||||
Precision Drilling Corp., 6.63%, | 1,650 | 1,679 | ||||
Pride International Inc., 6.88%, 08/15/20 | 2,970 | 3,081 | ||||
QEP Resources Inc., 6.88%, 03/01/21 | 1,160 | 1,218 | ||||
Quicksilver Resources Inc. | ||||||
11.75%, 01/01/16 | 1,944 | 2,265 | ||||
7.13%, 04/01/16 | 728 | 697 | ||||
Range Resources Corp. | ||||||
7.50%, 05/15/16 | 2,000 | 2,075 | ||||
7.25%, 05/01/18 | 294 | 310 | ||||
6.75%, 08/01/20 | 1,494 | 1,541 | ||||
SandRidge Energy Inc., 8.75%, 01/15/20 (e) | 1,275 | 1,310 | ||||
Stone Energy Corp., 8.63%, 02/01/17 (e) | 2,658 | 2,698 | ||||
Targa Resources Partners LP, 8.25%, 07/01/16 | 1,000 | 1,055 | ||||
Teekay Corp., 8.50%, 01/15/20 | 459 | 500 | ||||
Tesoro Corp. | ||||||
6.50%, 06/01/17 (e) | 2,000 | 2,005 | ||||
9.75%, 06/01/19 (e) | 378 | 419 | ||||
Texas Competitive Electric Holdings Co. LLC | ||||||
10.25%, 11/01/15 (e) | 2,000 | 1,120 | ||||
15.00%, 04/01/21 (e) (r) | 2,000 | 1,750 | ||||
Texas Competitive Electric Holdings Co. LLC | ||||||
Term Loan, 3.76%, 06/30/11 (i) (q) | 3,909 | 3,026 | ||||
Valero Energy Corp., 9.38%, 03/15/19 | 1,767 | 2,193 | ||||
| 97,834 | ||||||
FINANCIALS - 12.1% | ||||||
Abengoa Finance SAU, 8.88%, 11/01/17 (r) | 6,483 | 5,997 | ||||
Ally Financial Inc. | ||||||
6.88%, 08/28/12 (e) | 2,061 | 2,154 | ||||
6.75%, 12/01/14 | 3,000 | 3,157 | ||||
8.30%, 02/12/15 (e) | 3,688 | 4,057 | ||||
8.00%, 11/01/31 (e) | 2,000 | 2,155 | ||||
American General Finance Corp. | ||||||
6.50%, 09/15/17 | 1,000 | 788 | ||||
6.90%, 12/15/17 | 5,000 | 4,037 | ||||
American General Finance Corp. Term Loan, 7.25%, 04/16/15 (i) (q) | 2,444 | 2,485 | ||||
BAC Capital Trust VI, 5.63%, 03/08/35 | 4,000 | 3,387 | ||||
Bank of America Corp., 8.00%, (callable at 100 beginning 01/30/18) (m) | 1,500 | 1,512 | ||||
Capital One Capital VI, 8.88%, 05/15/40 | 3,852 | 4,011 | ||||
CIT Group Inc., 7.00%, 05/01/17 (e) | 7,000 | 7,017 | ||||
Citigroup Capital XXI, 8.30%, 12/21/57 | 2,050 | 2,132 | ||||
Citigroup Inc. | ||||||
5.50%, 02/15/17 | 1,000 | 1,035 | ||||
8.50%, 05/22/19 | 802 | 996 | ||||
CNO Financial Group Inc., 9.00%, 01/15/18 (r) | 1,242 | 1,292 | ||||
| Shares/Par (p) | Value | |||||
Ford Motor Credit Co. LLC | ||||||
5.55%, 06/15/11 (e) (i) | 1,070 | 1,086 | ||||
9.88%, 08/10/11 | 1,045 | 1,088 | ||||
3.04%, 01/13/12 (i) | 358 | 361 | ||||
7.50%, 08/01/12 | 3,000 | 3,190 | ||||
5.63%, 09/15/15 | 5,000 | 5,177 | ||||
8.13%, 01/15/20 (e) | 1,053 | 1,225 | ||||
Genworth Financial Inc., 8.63%, | 1,416 | 1,592 | ||||
International Lease Finance Corp. | ||||||
5.63%, 09/20/13 | 1,396 | 1,403 | ||||
5.65%, 06/01/14 (e) | 4,604 | 4,569 | ||||
8.63%, 09/15/15 (e) (r) | 2,988 | 3,212 | ||||
8.75%, 03/15/17 (r) | 6,179 | 6,627 | ||||
8.88%, 09/01/17 (e) | 4,644 | 5,010 | ||||
8.25%, 12/15/20 | 3,003 | 3,093 | ||||
JPMorgan Chase & Co., 7.90%, (callable at 100 beginning 04/30/18) (m) | 2,983 | 3,171 | ||||
Liberty Mutual Group Inc., 7.80%, | 2,300 | 2,265 | ||||
Nielsen Finance LLC, 7.75%, | 3,019 | 3,125 | ||||
Petroplus Finance Ltd., 9.38%, | 1,179 | 1,091 | ||||
Pinnacle Foods Finance LLC | ||||||
10.63%, 04/01/17 (e) | 1,000 | 1,070 | ||||
8.25%, 09/01/17 (e) | 2,000 | 2,045 | ||||
PNC Preferred Funding Trust III, 8.70%, (callable at 100 beginning | 3,000 | 3,185 | ||||
Smurfit Kappa Group Term Loan, 6.75%, 02/10/16 (i) (q) | 2,786 | 2,837 | ||||
UnumProvident Finance Co. Plc, 6.85%, 11/15/15 (r) | 1,000 | 1,109 | ||||
Washington Mutual Bank, 6.88%, | 1,500 | 2 | ||||
WEA Finance LLC, 6.75%, 09/02/19 (r) | 2,694 | 3,001 | ||||
Wells Fargo & Co., 7.98%, (callable at 100 beginning 03/15/18) (m) | 1,000 | 1,055 | ||||
Wells Fargo Capital XIII, 7.70%, (callable at 100 beginning 03/26/13) (m) | 2,000 | 2,068 | ||||
| 109,869 | ||||||
HEALTH CARE - 6.5% | ||||||
Alere Inc., 8.63%, 10/01/18 (r) | 4,174 | 4,237 | ||||
American Renal Holdings, 8.38%, 05/15/18 (r) | 427 | 438 | ||||
Biomet Inc., 10.38%, 10/15/17 | 2,000 | 2,185 | ||||
Community Health Systems Inc., 8.88%, 07/15/15 (e) | 2,733 | 2,870 | ||||
DaVita Inc., 6.38%, 11/01/18 (e) | 1,499 | 1,491 | ||||
Endo Pharmaceuticals Holdings Inc., 7.00%, 12/15/20 (r) | 1,760 | 1,795 | ||||
HCA Inc. | ||||||
6.25%, 02/15/13 | 2,234 | 2,279 | ||||
5.75%, 03/15/14 | 3,561 | 3,508 | ||||
6.50%, 02/15/16 | 4,000 | 3,910 | ||||
HealthSouth Corp. | ||||||
10.75%, 06/15/16 | 2,000 | 2,155 | ||||
7.25%, 10/01/18 | 1,700 | 1,734 | ||||
8.13%, 02/15/20 (e) | 2,000 | 2,150 | ||||
IASIS Health Care LLC, 8.75%, 06/15/14 | 2,300 | 2,360 | ||||
Mylan Inc., 7.88%, 07/15/20 (r) | 2,216 | 2,388 | ||||
Omnicare Inc., 7.75%, 06/01/20 | 1,436 | 1,479 | ||||
Phibro Animal Health Corp., 9.25%, | 1,400 | 1,442 | ||||
RadNet Inc., 10.38%, 04/01/18 (r) | 5,000 | 4,675 | ||||
Res-Care Inc., 10.75%, 01/15/19 (r) | 3,555 | 3,662 | ||||
Talecris Biotherapeutics Holdings Corp., 7.75%, 11/15/16 | 498 | 540 | ||||
Tenet Healthcare Corp., 8.00%, | 3,000 | 3,045 | ||||
US Oncology Inc., 9.13%, 08/15/17 | 828 | 1,020 | ||||
Valeant Pharmaceuticals International 6.75%, 10/01/17 (r) | 812 | 808 | ||||
See accompanying Notes to the Financial Statements.
JNL Series Trust
Schedules of Investments (in thousands)
December 31, 2010
| Shares/Par (p) | Value | |||||
6.88%, 12/01/18 (r) | 4,356 | 4,323 | ||||
Vanguard Health Holding Co. II LLC | ||||||
8.00%, 02/01/18 (e) | 2,679 | 2,746 | ||||
8.00%, 02/01/18 (r) (e) | 2,000 | 2,040 | ||||
| 59,280 | ||||||
INDUSTRIALS - 9.8% | ||||||
ACCO Brands Corp., 10.63%, 03/15/15 | 469 | 528 | ||||
Air Canada, 9.25%, 08/01/15 (r) (e) | 3,000 | 3,150 | ||||
Aircastle Ltd., 9.75%, 08/01/18 (e) | 5,000 | 5,462 | ||||
ARAMARK Corp. | ||||||
3.79%, 02/01/15 (i) | 220 | 215 | ||||
8.50%, 02/01/15 (e) | 1,900 | 1,986 | ||||
ArvinMeritor Inc., 10.63%, | 2,500 | 2,812 | ||||
BE Aerospace Inc., 8.50%, 07/01/18 | 1,500 | 1,643 | ||||
Bombardier Inc., 7.50%, | 2,730 | 2,928 | ||||
Case New Holland Inc., 7.88%, 12/01/17 (r) | 3,925 | 4,288 | ||||
Delta Air Lines Inc., 12.25%, 03/15/15 (r) (e) | 4,963 | 5,596 | ||||
Dyncorp International Inc., 10.38%, | 1,619 | 1,659 | ||||
EnergySolutions Inc., 10.75%, 08/15/18 (r) | 5,150 | 5,620 | ||||
FGI Operating Co. Inc., 10.25%, 08/01/15 (e) | 571 | 600 | ||||
Hertz Corp., 10.50%, 01/01/16 | 1,500 | 1,583 | ||||
International Wire Group Inc., 9.75%, | 3,000 | 3,135 | ||||
L-3 Communications Corp. | ||||||
5.88%, 01/15/15 | 3,000 | 3,056 | ||||
6.38%, 10/15/15 | 1,000 | 1,030 | ||||
Liberty Tire Recycling, 11.00%, 10/01/16 (r) | 2,000 | 2,145 | ||||
Manitowoc Co. Inc. | ||||||
9.50%, 02/15/18 (e) | 1,429 | 1,565 | ||||
8.50%, 11/01/20 | 1,782 | 1,893 | ||||
Masco Corp. | ||||||
6.13%, 10/03/16 (e) | 2,000 | 2,044 | ||||
7.13%, 03/15/20 (e) | 644 | 674 | ||||
Novelis Inc., 8.75%, 12/15/20 (r) | 7,000 | 7,262 | ||||
Oshkosh Corp., 8.50%, 03/01/20 | 720 | 790 | ||||
Owens Corning, 9.00%, 06/15/19 | 1,383 | 1,623 | ||||
RBS Global & Rexnord LLC, 8.50%, | 3,256 | 3,459 | ||||
Spirit Aerosystems Inc., 7.50%, 10/01/17 | 485 | 504 | ||||
Terex Corp., 10.88%, 06/01/16 | 2,000 | 2,323 | ||||
Tower Automotive Holdings USA LLC, 10.63%, 09/01/17 (r) (e) | 3,000 | 3,225 | ||||
Trans Union LLC, 11.38%, | 2,006 | 2,287 | ||||
TransDigm Inc. | ||||||
7.75%, 07/15/14 | 1,500 | 1,560 | ||||
7.75%, 12/15/18 (r) (e) | 2,941 | 3,044 | ||||
Trimas Corp., 9.75%, 12/15/17 (e) | 2,500 | 2,737 | ||||
United Air Lines Inc., 12.00%, 11/01/13 (r) | 2,000 | 2,205 | ||||
United Rentals North America Inc., 8.38%, 09/15/20 (e) | 1,923 | 1,957 | ||||
Western Express Inc., 12.50%, 04/15/15 (r) | 3,000 | 2,655 | ||||
| 89,243 | ||||||
INFORMATION TECHNOLOGY - 3.2% | ||||||
Advanced Micro Devices Inc., 7.75%, | 363 | 377 | ||||
First Data Corp. | ||||||
9.88%, 09/24/15 | 171 | 163 | ||||
10.55%, 09/24/15 | 235 | 223 | ||||
8.25%, 01/15/21 (r) | 1,813 | 1,741 | ||||
12.63%, 01/15/21 (e) (r) | 1,813 | 1,731 | ||||
Freescale Semiconductor Inc. | ||||||
10.13%, 12/15/16 (e) | 3,800 | 4,000 | ||||
10.75%, 08/01/20 (e) (r) | 2,000 | 2,180 | ||||
Jabil Circuit Inc., 5.63%, 12/15/20 | 2,430 | 2,387 | ||||
Sanmina-SCI Corp., 8.13%, 03/01/16 (e) | 683 | 690 | ||||
Seagate HDD Cayman, 7.75%, 12/15/18 (r) | 4,734 | 4,793 | ||||
| Shares/Par (p) | Value | |||||
SunGard Data Systems Inc. | ||||||
10.25%, 08/15/15 (e) | 2,515 | 2,644 | ||||
7.38%, 11/15/18 (e) (r) | 2,000 | 2,010 | ||||
Unisys Corp. | ||||||
12.75%, 10/15/14 (r) | 499 | 590 | ||||
14.25%, 09/15/15 (r) | 401 | 478 | ||||
UPC Holding BV, 9.88%, | 1,573 | 1,722 | ||||
Viasat Inc., 8.88%, 09/15/16 | 628 | 669 | ||||
Viasystems Group Inc., 12.00%, 01/15/15 (r) | 2,000 | 2,235 | ||||
| 28,633 | ||||||
MATERIALS - 8.6% | ||||||
Allegheny Technologies Inc., 9.38%, 06/01/19 | 1,186 | 1,386 | ||||
Ardagh Packaging Finance Plc, 9.13%, | 833 | 866 | ||||
Atkore International Inc., 9.88%, 01/01/18 (r) | 4,000 | 4,160 | ||||
Ball Corp., 5.75%, 05/15/21 | 410 | 397 | ||||
Berry Plastics Corp. | ||||||
9.50%, 05/15/18 (e) | 2,000 | 2,005 | ||||
9.75%, 01/15/21 (e) (r) | 2,000 | 1,980 | ||||
Building Materials Corp. of America | ||||||
6.88%, 08/15/18 (e) (r) | 1,582 | 1,566 | ||||
7.00%, 02/15/20 (r) | 658 | 676 | ||||
7.50%, 03/15/20 (e) (r) | 1,172 | 1,193 | ||||
BWAY Holdings Co., 10.00%, 06/15/18 (e) (r) | 967 | 1,043 | ||||
BWAY Parent Co. Inc., 10.13%, 11/01/15 (r) | 3,000 | 3,030 | ||||
Cemex Finance LLC, 9.50%, 12/14/16 (e) (r) | 6,417 | 6,618 | ||||
FMG Resources August 2006 Pty Ltd. | ||||||
7.00%, 11/01/15 (r) | 2,193 | 2,248 | ||||
6.88%, 02/01/18 (e) (r) | 3,934 | 3,914 | ||||
Georgia-Pacific LLC | ||||||
7.13%, 01/15/17 (r) | 4,000 | 4,260 | ||||
5.40%, 11/01/20 (r) | 1,646 | 1,627 | ||||
Gerdau Holdings Inc., 7.00%, 01/20/20 (e) (r) | 2,020 | 2,222 | ||||
Graphic Packaging International Corp., 7.88%, 10/01/18 (e) | 475 | 498 | ||||
Hanson Ltd., 6.13%, 08/15/16 | 1,231 | 1,256 | ||||
Hexion Specialty Chemicals Inc., 9.20%, 03/15/21 (e) | 2,165 | 1,986 | ||||
Hexion US Finance Corp. | ||||||
8.88%, 02/01/18 (e) | 1,641 | 1,754 | ||||
9.00%, 11/15/20 (r) | 2,000 | 2,115 | ||||
Huntsman International LLC | ||||||
7.38%, 01/01/15 | 2,000 | 2,045 | ||||
8.63%, 03/15/20 (e) | 769 | 836 | ||||
8.63%, 03/15/21 (e) (r) | 1,684 | 1,819 | ||||
Ineos Finance Plc, 9.00%, | 708 | 753 | ||||
Ineos Group Holdings Plc, 8.50%, 02/15/16 (e) (r) | 2,000 | 1,905 | ||||
LBI Escrow Corp., 8.00%, | 4,683 | 5,181 | ||||
Mercer International Inc., 9.50%, 12/01/17 (r) | 2,000 | 2,055 | ||||
Momentive Performance Materials Inc., 9.00%, 01/15/21 (r) | 3,000 | 3,165 | ||||
Omnova Solutions Inc., 7.88%, | 3,066 | 3,089 | ||||
Owens-Illinois Inc., 7.80%, 05/15/18 | 2,000 | 2,125 | ||||
Plastipak Holdings Inc., 10.63%, 08/15/19 (r) | 2,400 | 2,697 | ||||
Radnor Holdings Corp., 11.00%, 04/15/11 (c) (d) (f) (q) | 100 | — | ||||
Smurfit Kappa Funding Plc, 7.75%, 04/01/15 | 575 | 589 | ||||
Steel Dynamics Inc., 6.75%, 04/01/15 (e) | 2,000 | 2,025 | ||||
Stone Container Finance Co., 7.38%, 07/15/14 (c) (d) (f) | 1,375 | — | ||||
Verso Paper Holdings LLC | ||||||
11.50%, 07/01/14 (e) | 2,000 | 2,195 | ||||
11.38%, 08/01/16 (e) | 1,000 | 1,002 | ||||
| 78,281 | ||||||
See accompanying Notes to the Financial Statements.
JNL Series Trust
Schedules of Investments (in thousands)
December 31, 2010
| Shares/Par (p) | Value | |||||
TELECOMMUNICATION SERVICES - 7.5% | ||||||
Buccaneer Merger Sub Inc., 9.13%, 01/15/19 (r) | 1,960 | 2,024 | ||||
Cincinnati Bell Inc., 8.75%, | 2,312 | 2,167 | ||||
Clearwire Communications LLC | ||||||
12.00%, 12/01/15 (r) | 3,488 | 3,758 | ||||
12.00%, 12/01/17 (e) (r) | 2,667 | 2,760 | ||||
Frontier Communications Corp. | ||||||
8.25%, 04/15/17 (e) | 938 | 1,029 | ||||
8.13%, 10/01/18 (e) | 882 | 968 | ||||
7.13%, 03/15/19 | 620 | 637 | ||||
8.50%, 04/15/20 | 3,244 | 3,544 | ||||
Inmarsat Finance Plc, 7.38%, | 781 | 820 | ||||
Intelsat Jackson Holding Ltd., 7.25%, 10/15/20 (e) (r) | 1,990 | 2,010 | ||||
Intelsat Luxembourg SA, 11.25%, 02/04/17 | 7,500 | 8,175 | ||||
ITC Deltacom Inc., 10.50%, 04/01/16 | 3,000 | 3,262 | ||||
Level 3 Financing Inc. | ||||||
9.25%, 11/01/14 | 1,000 | 993 | ||||
10.00%, 02/01/18 | 3,000 | 2,880 | ||||
Nextel Communications Inc. | ||||||
6.88%, 10/31/13 (e) | 371 | 372 | ||||
5.95%, 03/15/14 | 2,629 | 2,583 | ||||
PAETEC Escrow Corp., 9.88%, | 2,000 | 2,055 | ||||
Qwest Communications International Inc. | ||||||
8.00%, 10/01/15 | 1,188 | 1,277 | ||||
7.13%, 04/01/18 (r) | 1,844 | 1,909 | ||||
Sprint Capital Corp., 6.88%, 11/15/28 (e) | 6,665 | 5,832 | ||||
Sprint Nextel Corp., 6.00%, 12/01/16 | 2,654 | 2,564 | ||||
Telesat Canada | ||||||
11.00%, 11/01/15 | 2,000 | 2,245 | ||||
12.50%, 11/01/17 (e) | 500 | 589 | ||||
Virgin Media Finance Plc | ||||||
9.50%, 08/15/16 (e) | 2,000 | 2,260 | ||||
8.38%, 10/15/19 (e) | 2,319 | 2,534 | ||||
West Corp., 7.88%, 01/15/19 (r) (e) | 5,488 | 5,584 | ||||
Wind Acquisition Finance SA, 11.75%, 07/15/17 (r) | 1,113 | 1,255 | ||||
Windstream Corp., 7.75%, 10/15/20 (e) | 2,000 | 2,060 | ||||
| 68,146 | ||||||
UTILITIES - 3.5% | ||||||
AES Corp. | ||||||
9.75%, 04/15/16 | 1,355 | 1,514 | ||||
8.00%, 10/15/17 | 2,000 | 2,115 | ||||
Calpine Corp., 7.88%, 07/31/20 (e) (r) | 5,000 | 5,062 | ||||
CMS Energy Corp., 6.55%, 07/17/17 | 1,500 | 1,595 | ||||
Dynegy Holdings Inc. | ||||||
7.75%, 06/01/19 | 3,500 | 2,336 | ||||
7.63%, 10/15/26 | 125 | 74 | ||||
Edison Mission Energy | ||||||
7.75%, 06/15/16 (e) | 940 | 808 | ||||
7.00%, 05/15/17 | 1,900 | 1,506 | ||||
Energy Future Holdings Corp. | ||||||
10.88%, 11/01/17 (e) | 688 | 478 | ||||
11.25%, 11/01/17 | 703 | 422 | ||||
10.00%, 12/01/20 | 3,380 | 3,486 | ||||
GenOn Energy Term Loan B, 6.00%, 09/20/17 (i) | 3,190 | 3,223 | ||||
GenOn Escrow Corp., 9.88%, | 3,956 | 3,926 | ||||
Ipalco Enterprises Inc., 7.25%, | 800 | 854 | ||||
NRG Energy Inc., 7.38%, 02/01/16 | 3,000 | 3,075 | ||||
RRI Energy Inc., 7.88%, 06/15/17 | 1,500 | 1,454 | ||||
| 31,928 | ||||||
Total Corporate Bonds and Notes (cost $743,547) | 789,984 | |||||
| Shares/Par (p) | Value | |||||
COMMON STOCKS - 1.7% | ||||||
CONSUMER DISCRETIONARY - 0.3% | ||||||
DISH Network Corp. - Class A (c) | 150 | 2,949 | ||||
Home Interior Gift Inc. (c) (f) (q) | 429 | — | ||||
| 2,949 | ||||||
CONSUMER STAPLES - 0.3% | ||||||
B&G Foods Inc. | 200 | 2,746 | ||||
ENERGY - 0.3% | ||||||
Chesapeake Energy Corp. | 14 | 371 | ||||
Inergy LP | 50 | 1,962 | ||||
| 2,333 | ||||||
HEALTH CARE - 0.3% | ||||||
DaVita Inc. (c) | 35 | 2,432 | ||||
MATERIALS - 0.1% | ||||||
Applied Extrusion Technologies Inc. - Class B (c) (f) (q) | 3 | — | ||||
Smurfit-Stone Container Corp. (c) | 42 | 1,087 | ||||
| 1,087 | ||||||
TELECOMMUNICATION SERVICES - 0.4% | ||||||
Manitoba Telecom Services Inc. (q) | 1 | 15 | ||||
Windstream Corp. | 240 | 3,346 | ||||
| 3,361 | ||||||
Total Common Stocks (cost $13,031) | 14,908 | |||||
PREFERRED STOCKS - 0.7% | ||||||
FINANCIALS - 0.7% | ||||||
Ally Financial Inc., 7.00%, (callable at 1000 beginning 12/31/11) (m) (r) | 1 | 958 | ||||
Citigroup Capital XIII, 7.88%, (callable at 25 on 10/30/15) (m) | 191 | 5,140 | ||||
Federal Home Loan Mortgage Corp., 8.38%, (callable at 25 beginning 12/31/12), Series Z (c) (d) (m) | 50 | 31 | ||||
Federal National Mortgage Association, 8.25%, (callable at 25 beginning 05/20/13), Series T (c) (d) (m) | 40 | 21 | ||||
Federal National Mortgage Association, 8.25%, (callable at 25 beginning 12/31/10), Series S (c) (d) (m) | 19 | 11 | ||||
Wells Fargo Capital XII, 7.88%, (callable at 25 beginning 03/15/13) (m) | 18 | 483 | ||||
Total Preferred Stocks (cost $8,412) | 6,644 | |||||
INVESTMENT COMPANIES - 0.7% | ||||||
Eaton Vance Senior Floating-Rate Trust | 100 | 1,622 | ||||
Invesco Van Kampen Senior Income Trust | 400 | 1,876 | ||||
Pimco Floating Rate Strategy Fund | 267 | 2,640 | ||||
Total Investment Companies | 6,138 | |||||
OTHER EQUITY INTERESTS - 0.0% | ||||||
Wind Acquisition Escrow, | 1,071 | — | ||||
Wind Acquisition Escrow, 07/23/47 (f) (u) | 1,567 | — | ||||
Total Other Equity Interests (cost $0) | — | |||||
SHORT TERM INVESTMENTS - 27.4% | ||||||
Investment Company 3.9% | ||||||
JNL Money Market Fund, 0.08% (a) (h) | 35,569 | 35,569 | ||||
See accompanying Notes to the Financial Statements.
JNL Series Trust
Schedules of Investments (in thousands)
December 31, 2010
| Shares/Par (p) | Value | |||
Securities Lending Collateral 23.5% | ||||
Securities Lending Cash Collateral Fund LLC, 0.31% (a) (h) | 212,212 | 212,212 | ||
Securities Lending Liquidating Fund LLC, 0.66% (a) (h) | 1,353 | 1,331 | ||
| 213,543 | ||||
Total Short Term Investments (cost $249,134) | 249,112 | |||
Total Investments - 121.7% | 1,105,119 | |||
Other Assets and Liabilities, | (197,419) | |||
Total Net Assets - 100.0% | $907,700 | |||
JNL/PPM America Mid Cap Value Fund | ||||
COMMON STOCKS - 99.3% | ||||
CONSUMER DISCRETIONARY - 16.0% | ||||
Abercrombie & Fitch Co. - Class A | 27 | $1,550 | ||
Bally Technologies Inc. (c) | 34 | 1,443 | ||
Liz Claiborne Inc. (c) (e) | 114 | 816 | ||
Macy’s Inc. | 85 | 2,155 | ||
Newell Rubbermaid Inc. | 119 | 2,162 | ||
Royal Caribbean Cruises Ltd. (c) | 18 | 855 | ||
Skechers U.S.A. Inc. - Class A (c) | 86 | 1,728 | ||
VF Corp. | 25 | 2,129 | ||
Viacom Inc. - Class B | 24 | 955 | ||
| 13,793 | ||||
CONSUMER STAPLES - 2.5% | ||||
Corn Products International Inc. | 46 | 2,121 | ||
ENERGY - 8.5% | ||||
Comstock Resources Inc. (c) | 72 | 1,768 | ||
Helix Energy Solutions Group Inc. (c) | 143 | 1,736 | ||
National Oilwell Varco Inc. | 26 | 1,775 | ||
Patterson-UTI Energy Inc. | 98 | 2,106 | ||
| 7,385 | ||||
FINANCIALS - 14.4% | ||||
Allstate Corp. | 55 | 1,741 | ||
American Financial Group Inc. | 66 | 2,128 | ||
Astoria Financial Corp. (e) | 154 | 2,139 | ||
Hartford Financial Services Group Inc. | 82 | 2,167 | ||
Lincoln National Corp. | 79 | 2,183 | ||
Reinsurance Group of America Inc. | 40 | 2,127 | ||
| 12,485 | ||||
HEALTH CARE - 6.4% | ||||
CIGNA Corp. | 59 | 2,160 | ||
LifePoint Hospitals Inc. (c) | 46 | 1,705 | ||
Owens & Minor Inc. | 58 | 1,701 | ||
| 5,566 | ||||
INDUSTRIALS - 25.4% | ||||
Belden Inc. | 23 | 836 | ||
Con-Way Inc. | 47 | 1,719 | ||
Esterline Technologies Corp. (c) | 32 | 2,174 | ||
GATX Corp. | 48 | 1,690 | ||
Goodrich Corp. | 25 | 2,167 | ||
Kennametal Inc. | 54 | 2,135 | ||
Lincoln Electric Holdings Inc. | 32 | 2,115 | ||
SkyWest Inc. | 51 | 801 | ||
Spirit Aerosystems Holdings Inc. (c) | 104 | 2,164 | ||
Steelcase Inc. - Class A | 180 | 1,899 | ||
| Shares/Par (p) | Value | |||||
Terex Corp. (c) | 68 | 2,095 | ||||
Textron Inc. | 92 | 2,165 | ||||
| 21,960 | ||||||
INFORMATION TECHNOLOGY - 10.9% | ||||||
Avnet Inc. (c) | 64 | 2,127 | ||||
Computer Sciences Corp. | 44 | 2,168 | ||||
Fairchild Semiconductor International Inc. (c) | 138 | 2,150 | ||||
Omnivision Technologies Inc. (c) | 28 | 814 | ||||
Teradyne Inc. (c) | 153 | 2,145 | ||||
| 9,404 | ||||||
MATERIALS - 10.4% | ||||||
Allegheny Technologies Inc. | 23 | 1,269 | ||||
Nucor Corp. | 19 | 815 | ||||
Olin Corp. | 58 | 1,188 | ||||
PPG Industries Inc. | 22 | 1,825 | ||||
Reliance Steel & Aluminum Co. | 42 | 2,141 | ||||
Steel Dynamics Inc. | 94 | 1,720 | ||||
| 8,958 | ||||||
UTILITIES - 4.8% | ||||||
Edison International | 56 | 2,162 | ||||
Westar Energy Inc. (e) | 78 | 1,967 | ||||
| 4,129 | ||||||
Total Common Stocks (cost $76,113) | 85,801 | |||||
SHORT TERM INVESTMENTS - 3.6% | ||||||
Investment Company - 1.0% | ||||||
JNL Money Market Fund, 0.08% (a) (h) | 864 | 864 | ||||
Securities Lending Collateral 2.6% | ||||||
Securities Lending Cash Collateral Fund LLC, 0.31% (a) (h) | 2,262 | 2,262 | ||||
Total Short Term Investments (cost $3,126) | 3,126 | |||||
Total Investments - 102.9% | 88,927 | |||||
Other Assets and Liabilities, | (2,508) | |||||
Total Net Assets - 100.0% | $86,419 | |||||
JNL/PPM America Small Cap Value Fund | ||||||
COMMON STOCKS - 99.6% | ||||||
CONSUMER DISCRETIONARY - 20.9% | ||||||
Bally Technologies Inc. (c) | 40 | $1,679 | ||||
Bob Evans Farms Inc. | 51 | 1,668 | ||||
Columbia Sportswear Co. (e) | 28 | 1,670 | ||||
Jakks Pacific Inc. (c) | 92 | 1,675 | ||||
K-Swiss Inc. - Class A (c) | 52 | 654 | ||||
Liz Claiborne Inc. (c) (e) | 235 | 1,684 | ||||
RC2 Corp. (c) | 78 | 1,689 | ||||
Skechers U.S.A. Inc. - Class A (c) (e) | 87 | 1,740 | ||||
Superior Industries International Inc. (e) | 78 | 1,655 | ||||
| 14,114 | ||||||
CONSUMER STAPLES - 3.8% | ||||||
Corn Products International Inc. | 20 | 897 | ||||
Hain Celestial Group Inc. (c) (e) | 61 | 1,651 | ||||
| 2,548 | ||||||
ENERGY - 9.2% | ||||||
Comstock Resources Inc. (c) | 74 | 1,805 | ||||
Helix Energy Solutions Group Inc. (c) | 112 | 1,361 | ||||
See accompanying Notes to the Financial Statements.
JNL Series Trust
Schedules of Investments (in thousands)
December 31, 2010
| Shares/Par | (p) | Value | ||||
Hercules Offshore Inc. (c) | 443 | 1,531 | ||||
Patterson-UTI Energy Inc. | 70 | 1,508 | ||||
| 6,205 | ||||||
FINANCIALS - 11.8% | ||||||
American Financial Group Inc. | 18 | 578 | ||||
Astoria Financial Corp. (e) | 125 | 1,732 | ||||
Delphi Financial Group Inc. - Class A | 58 | 1,678 | ||||
Independent Bank Corp. | 61 | 1,637 | ||||
Reinsurance Group of America Inc. | 12 | 618 | ||||
SeaBright Insurance Holdings Inc. | 185 | 1,709 | ||||
| 7,952 | ||||||
HEALTH CARE - 4.9% | ||||||
LifePoint Hospitals Inc. (c) | 45 | 1,646 | ||||
Owens & Minor Inc. | 57 | 1,669 | ||||
| 3,315 | ||||||
INDUSTRIALS - 29.1% | ||||||
Apogee Enterprises Inc. | 127 | 1,714 | ||||
Belden Inc. | 45 | 1,642 | ||||
Con-Way Inc. | 47 | 1,704 | ||||
Esterline Technologies Corp. (c) | 25 | 1,687 | ||||
GATX Corp. (e) | 48 | 1,704 | ||||
GenCorp Inc. (c) | 328 | 1,697 | ||||
Kennametal Inc. | 42 | 1,657 | ||||
Lincoln Electric Holdings Inc. | 25 | 1,645 | ||||
SkyWest Inc. | 105 | 1,634 | ||||
Spirit Aerosystems Holdings Inc. (c) | 49 | 1,026 | ||||
Steelcase Inc. - Class A | 165 | 1,739 | ||||
Terex Corp. (c) | 59 | 1,828 | ||||
| 19,677 | ||||||
INFORMATION TECHNOLOGY - 13.9% | ||||||
Benchmark Electronics Inc. (c) | 94 | 1,707 | ||||
Fairchild Semiconductor International Inc. (c) | 109 | 1,698 | ||||
Novell Inc. (c) | 198 | 1,172 | ||||
Omnivision Technologies Inc. (c) | 50 | 1,484 | ||||
SYNNEX Corp. (c) | 53 | 1,666 | ||||
Teradyne Inc. (c) | 120 | 1,679 | ||||
| 9,406 | ||||||
MATERIALS - 4.5% | ||||||
Olin Corp. | 82 | 1,674 | ||||
Reliance Steel & Aluminum Co. | 13 | 649 | ||||
Steel Dynamics Inc. | 37 | 677 | ||||
| 3,000 | ||||||
UTILITIES - 1.5% | ||||||
Westar Energy Inc. (e) | 40 | 1,009 | ||||
Total Common Stocks (cost $59,263) | 67,226 | |||||
SHORT TERM INVESTMENTS - 8.8% | ||||||
Investment Company - 0.9% | ||||||
JNL Money Market Fund, 0.08% (a) (h) | 634 | 634 | ||||
Securities Lending Collateral 7.9% | ||||||
Securities Lending Cash Collateral Fund LLC, 0.31% (a) (h) |
| 5,332 |
| 5,332 | ||
Total Short Term Investments (cost $5,966) | 5,966 | |||||
Total Investments - 108.4% (cost $65,229) | 73,192 | |||||
Other Assets and Liabilities, Net - (8.4%) | (5,660) | |||||
Total Net Assets - 100.0% | $67,532 | |||||
| Shares/Par | (p) | Value | ||||
JNL/PPM America Value Equity Fund | ||||||
COMMON STOCKS - 99.8% | ||||||
CONSUMER DISCRETIONARY - 13.2% | ||||||
Abercrombie & Fitch Co. - Class A | 19 | $1,107 | ||||
Comcast Corp. - Class A | 130 | 2,858 | ||||
Home Depot Inc. | 33 | 1,164 | ||||
Macy’s Inc. | 70 | 1,758 | ||||
Newell Rubbermaid Inc. | 108 | 1,958 | ||||
Royal Caribbean Cruises Ltd. (c) | 27 | 1,246 | ||||
VF Corp. | 24 | 2,042 | ||||
Viacom Inc. - Class B | 72 | 2,856 | ||||
| 14,989 | ||||||
CONSUMER STAPLES - 7.0% | ||||||
Altria Group Inc. | 115 | 2,829 | ||||
Archer-Daniels-Midland Co. | 85 | 2,566 | ||||
CVS Caremark Corp. | 36 | 1,252 | ||||
Procter & Gamble Co. | 21 | 1,376 | ||||
| 8,023 | ||||||
ENERGY - 10.7% | ||||||
Apache Corp. | 22 | 2,635 | ||||
Chevron Corp. | 31 | 2,865 | ||||
ConocoPhillips | 31 | 2,091 | ||||
National Oilwell Varco Inc. | 26 | 1,735 | ||||
Occidental Petroleum Corp. | 18 | 1,746 | ||||
Patterson-UTI Energy Inc. | 50 | 1,078 | ||||
| 12,150 | ||||||
FINANCIALS - 23.4% | ||||||
Allstate Corp. | 62 | 1,973 | ||||
Bank of America Corp. | 218 | 2,906 | ||||
Goldman Sachs Group Inc. | 16 | 2,657 | ||||
Hartford Financial Services Group Inc. | 111 | 2,948 | ||||
JPMorgan Chase & Co. | 70 | 2,969 | ||||
Lincoln National Corp. | 98 | 2,720 | ||||
Morgan Stanley | 102 | 2,770 | ||||
Travelers Cos. Inc. | 47 | 2,602 | ||||
U.S. Bancorp | 84 | 2,271 | ||||
Wells Fargo & Co. | 91 | 2,826 | ||||
| 26,642 | ||||||
HEALTH CARE - 9.4% | ||||||
CIGNA Corp. | 78 | 2,845 | ||||
Johnson & Johnson | 36 | 2,220 | ||||
Merck & Co. Inc. | 79 | 2,833 | ||||
Pfizer Inc. | 160 | 2,803 | ||||
| 10,701 | ||||||
INDUSTRIALS - 11.2% | ||||||
Caterpillar Inc. | 30 | 2,828 | ||||
Goodrich Corp. | 26 | 2,281 | ||||
Lockheed Martin Corp. | 36 | 2,545 | ||||
Spirit Aerosystems Holdings Inc. (c) | 74 | 1,546 | ||||
Terex Corp. (c) | 43 | 1,341 | ||||
Textron Inc. (e) | 96 | 2,260 | ||||
| 12,801 | ||||||
INFORMATION TECHNOLOGY - 14.1% | ||||||
Avnet Inc. (c) | 35 | 1,160 | ||||
Computer Sciences Corp. | 47 | 2,336 | ||||
Hewlett-Packard Co. | 69 | 2,888 | ||||
Intel Corp. | 136 | 2,864 | ||||
International Business Machines Corp. | 19 | 2,818 | ||||
Microsoft Corp. | 101 | 2,828 | ||||
See accompanying Notes to the Financial Statements.
JNL Series Trust
Schedules of Investments (in thousands)
December 31, 2010
| Shares/Par (p) | Value | |||
Texas Instruments Inc. | 37 | 1,186 | ||
| 16,080 | ||||
MATERIALS - 4.2% | ||||
Allegheny Technologies Inc. | 20 | 1,109 | ||
Nucor Corp. | 52 | 2,274 | ||
PPG Industries Inc. | 16 | 1,371 | ||
| 4,754 | ||||
TELECOMMUNICATION SERVICES - 4.5% | ||||
AT&T Inc. | 77 | 2,248 | ||
Verizon Communications Inc. | 81 | 2,887 | ||
| 5,135 | ||||
UTILITIES - 2.1% | ||||
Edison International | 63 | 2,432 | ||
Total Common Stocks (cost $87,552) | 113,707 | |||
SHORT TERM INVESTMENTS - 1.5% | ||||
Investment Company - 0.2% | ||||
JNL Money Market Fund, 0.08% (a) (h) | 233 | 233 | ||
Securities Lending Collateral 1.3% | ||||
Securities Lending Cash Collateral Fund LLC, 0.31% (a) (h) | 1,201 | 1,201 | ||
Securities Lending Liquidating Fund LLC, 0.66% (a) (h) | 254 | 250 | ||
| 1,451 | ||||
Total Short Term Investments (cost $1,688) | 1,684 | |||
Total Investments - 101.3% | 115,391 | |||
Other Assets and Liabilities, Net - (1.3%) | (1,433) | |||
Total Net Assets - 100.0% | $113,958 | |||
JNL/Red Rocks Listed Private Equity Fund | ||||
COMMON STOCKS - 96.9% | ||||
DIVERSIFIED - 8.2% | ||||
Diversified Operations - 8.2% | ||||
Ackermans & van Haaren NV | 154 | $12,858 | ||
HAL Trust NV | 171 | 21,504 | ||
Wendel Investissement | 203 | 18,701 | ||
FINANCIALS - 85.0% | ||||
Closed - End Funds - 25.5% | ||||
AP Alternative Assets LP | 2,040 | 18,013 | ||
ARC Capital Holdings Ltd. (c) | 10,710 | 13,575 | ||
Candover Investments Plc (c) | 643 | 6,660 | ||
Castle Private Equity Ltd. (c) | 335 | 2,906 | ||
Conversus Capital LP (c) | 1,509 | 27,182 | ||
Electra Private Equity Plc (c) | 899 | 23,434 | ||
Graphite Enterprise Trust Plc | 2,160 | 9,968 | ||
HBM BioVentures AG - Class A (c) | 292 | 13,286 | ||
HgCapital Trust Plc | 856 | 13,428 | ||
Princess Private Equity Holding Ltd. (c) (e) | 1,530 | 13,063 | ||
Standard Life European Private Equity Trust Plc | 246 | 536 | ||
SVG Capital Plc (c) | 6,636 | 21,809 | ||
| 163,860 | ||||
Diversified Financial Services - 23.9% | ||||
Blackstone Group LP | 1,745 | 24,692 | ||
Brookfield Asset Management Inc. - Class A | 414 | 13,782 | ||
GP Investments Ltd. - BDR (c) | 2,250 | 9,962 | ||
| Shares/Par | (p) | Value | ||||
Intermediate Capital Group Plc | 5,090 | 26,418 | ||||
KKR & Co. LP | 2,932 | 41,635 | ||||
Onex Corp. | 1,139 | 34,629 | ||||
Safeguard Scientifics Inc. (c) | 139 | 2,369 | ||||
| 153,487 | ||||||
Diversified Operations - 4.7% | ||||||
Leucadia National Corp. | 1,040 | 30,347 | ||||
Investment Companies - 15.2% | ||||||
China Merchants China Direct Investments Ltd. | 4,820 | 10,604 | ||||
DeA Capital SpA (c) (e) | 3,214 | 4,894 | ||||
Eurazeo | 366 | 27,140 | ||||
Investor AB | 847 | 18,124 | ||||
MVC Capital Inc. | 550 | 8,030 | ||||
Ratos AB Series B | 685 | 25,326 | ||||
THL Credit Inc. (e) | 310 | 4,028 | ||||
| 98,146 | ||||||
Venture Capital - 15.7% | ||||||
3i Group Plc | 7,385 | 37,823 | ||||
Altamir Amboise (c) (e) | 1,740 | 14,928 | ||||
Deutsche Beteiligungs AG | 385 | 10,848 | ||||
Dinamia Capital Privado Scr SA | 432 | 5,072 | ||||
Gimv NV | 317 | 17,313 | ||||
IP Group Plc (c) | 5,398 | 2,567 | ||||
Jafco Co. Ltd. | 427 | 12,345 | ||||
| 100,896 | ||||||
INDUSTRIALS - 2.1% | ||||||
Orkla ASA | 1,375 | 13,412 | ||||
INFORMATION TECHNOLOGY - 1.6% | ||||||
Internet Capital Group Inc. (c) | 730 | 10,381 | ||||
Total Common Stocks (cost $513,004) | 623,592 | |||||
RIGHTS - 0.1% | ||||||
HgCapital Trust Plc (c) | 153 | 250 | ||||
Total Rights (cost $0) | 250 | |||||
SHORT TERM INVESTMENTS - 3.2% |
| |||||
Mutual Funds 3.2% | ||||||
JNL Money Market Fund, 0.08% (a) (h) | 20,746 | 20,746 | ||||
Securities Lending Collateral - 0.0% | ||||||
Securities Lending Cash Collateral Fund LLC, 0.31% (a) (h) | 65 | 65 | ||||
Total Short Term Investments | 20,811 | |||||
Total Investments - 100.2% | 644,653 | |||||
Other Assets and Liabilities, Net - (0.2%) | (1,368) | |||||
Total Net Assets - 100.0% | $643,285 | |||||
JNL/S&P Managed Conservative Fund (b) | ||||||
INVESTMENT COMPANIES - 100.0% | ||||||
JNL/Capital Guardian Global Diversified Research Fund (2.4%) (a) |
| 445 |
| $10,330 | ||
JNL/Capital Guardian U.S. Growth Equity Fund (3.8%) (a) |
| 1,588 |
| 33,641 | ||
JNL/Eagle Core Equity Fund (15.9%) (a) | 4,400 | 32,250 | ||||
JNL/Goldman Sachs Core Plus Bond Fund (14.3%) (a) |
| 12,448 |
| 151,121 | ||
JNL/Goldman Sachs Emerging Markets Debt Fund (4.0%) (a) |
| 2,221 |
| 30,318 | ||
See accompanying Notes to the Financial Statements.
JNL Series Trust
Schedules of Investments (in thousands)
December 31, 2010
| Shares/Par (p) | Value | |||
JNL/Invesco International Growth Fund (3.9%) (a) | 2,199 | 22,739 | ||
JNL/Invesco Large Cap Growth Fund (3.6%) (a) | 2,610 | 32,864 | ||
JNL/JPMorgan International Value Fund (3.5%) (a) | 2,789 | 20,970 | ||
JNL/JPMorgan U.S. Government & Quality Bond Fund (11.1%) (a) | 7,880 | 101,966 | ||
JNL/PIMCO Real Return Fund (7.2%) (a) | 10,693 | 128,957 | ||
JNL/PIMCO Total Return Bond Fund (4.4%) (a) | 11,641 | 143,771 | ||
JNL/Select Value Fund (3.3%) (a) | 2,163 | 37,576 | ||
JNL/T. Rowe Price Established Growth Fund (2.3%) (a) | 1,616 | 34,298 | ||
JNL/T. Rowe Price Value Fund (3.1%) (a) | 3,264 | 35,384 | ||
JNL/T. Rowe Short-Term Bond Fund (18.7%) (a) | 16,552 | 163,529 | ||
Total Investment Companies (cost $942,351) | 979,714 | |||
Total Investments - 100.0% (cost $942,351) | 979,714 | |||
Other Assets and Liabilities, Net - (0.0% ) | (146) | |||
Total Net Assets - 100.0% | $979,568 | |||
JNL/S&P Managed Moderate Fund (b) | ||||
INVESTMENT COMPANIES - 100.0% | ||||
JNL/BlackRock Commodity Securities Fund (0.4%) (a) | 360 | $3,971 | ||
JNL/Capital Guardian Global Diversified Research Fund (7.2%) (a) | 1,351 | 31,382 | ||
JNL/Capital Guardian U.S. Growth Equity Fund (10.1%) (a) | 4,246 | 89,965 | ||
JNL/Franklin Templeton International Small Cap Growth Fund (0.4%) (a) | 99 | 809 | ||
JNL/Goldman Sachs Core Plus Bond Fund (16.1%) (a) | 14,027 | 170,288 | ||
JNL/Goldman Sachs Emerging Markets Debt Fund (6.6%) (a) | 3,717 | 50,733 | ||
JNL/Goldman Sachs Mid Cap Value Fund (8.6%) (a) | 4,119 | 43,664 | ||
JNL/Invesco Global Real Estate Fund (0.9%) (a) | 728 | 6,183 | ||
JNL/Invesco International Growth Fund (6.0%) (a) | 3,415 | 35,315 | ||
JNL/Invesco Large Cap Growth Fund (10.3%) (a) | 7,441 | 93,676 | ||
JNL/JPMorgan International Value Fund (5.6%) (a) | 4,504 | 33,867 | ||
JNL/JPMorgan U.S. Government & Quality Bond Fund (13.4%) (a) | 9,505 | 122,993 | ||
JNL/Lazard Emerging Markets Fund (2.6%) (a) | 2,943 | 35,581 | ||
JNL/M&G Global Basics Fund (18.8%) (a) | 2,451 | 36,719 | ||
JNL/Mellon Capital Management Oil & Gas Sector Fund (1.1%) (a) | 265 | 7,093 | ||
JNL/Oppenheimer Global Growth Fund (1.2%) (a) | 460 | 4,814 | ||
JNL/PIMCO Real Return Fund (10.3%) (a) | 15,276 | 184,226 | ||
JNL/PIMCO Total Return Bond Fund (5.7%) (a) | 15,155 | 187,168 | ||
JNL/Select Value Fund (9.7%) (a) | 6,416 | 111,451 | ||
JNL/T. Rowe Price Established Growth Fund (6.0%) (a) | 4,268 | 90,571 | ||
JNL/T. Rowe Price Mid-Cap Growth Fund (3.3%) (a) | 1,555 | 46,317 | ||
JNL/T. Rowe Price Value Fund (8.0%) (a) | 8,399 | 91,048 | ||
| Shares/Par (p) | Value | |||
JNL/T. Rowe Short-Term Bond Fund (21.5%) (a) | 18,977 | 187,495 | ||
Total Investment Companies (cost $1,560,485) | 1,665,329 | |||
Total Investments - 100.0% | 1,665,329 | |||
Other Assets and Liabilities, Net - (0.0%) | (231) | |||
Total Net Assets - 100.0% | $1,665,098 | |||
JNL/S&P Managed Moderate Growth Fund (b) | ||||
INVESTMENT COMPANIES - 100.0% | ||||
JNL/BlackRock Commodity Securities Fund (1.3%) (a) | 1,195 | $13,173 | ||
JNL/Capital Guardian Global Diversified Research Fund (9.5%) (a) | 1,784 | 41,432 | ||
JNL/Capital Guardian U.S. Growth Equity Fund (19.0%) (a) | 8,036 | 170,274 | ||
JNL/Eagle SmallCap Equity Fund (3.8%) (a) | 1,018 | 22,271 | ||
JNL/Franklin Templeton International Small Cap Growth Fund (8.8%) (a) | 2,295 | 18,754 | ||
JNL/Franklin Templeton Small Cap Value Fund (3.7%) (a) | 999 | 11,013 | ||
JNL/Goldman Sachs Core Plus Bond Fund (19.2%) (a) | 16,723 | 203,013 | ||
JNL/Goldman Sachs Emerging Markets Debt Fund (11.3%) (a) | 6,321 | 86,288 | ||
JNL/Goldman Sachs Mid Cap Value Fund (18.3%) (a) | 8,727 | 92,508 | ||
JNL/Invesco Global Real Estate Fund (1.4%) (a) | 1,111 | 9,445 | ||
JNL/Invesco International Growth Fund (19.1%) (a) | 10,855 | 112,241 | ||
JNL/Invesco Large Cap Growth Fund (23.8%) (a) | 17,218 | 216,768 | ||
JNL/JPMorgan International Value Fund (18.7%) (a) | 15,098 | 113,538 | ||
JNL/JPMorgan MidCap Growth Fund (4.3%) (a) | 498 | 9,978 | ||
JNL/JPMorgan U.S. Government & Quality Bond Fund (16.1%) (a) | 11,449 | 148,154 | ||
JNL/Lazard Emerging Markets Fund (6.3%) (a) | 7,191 | 86,943 | ||
JNL/M&G Global Basics Fund (21.9%) (a) | 2,863 | 42,886 | ||
JNL/Mellon Capital Management Oil & Gas Sector Fund (1.7%) (a) | 417 | 11,147 | ||
JNL/Oppenheimer Global Growth Fund (4.9%) (a) | 1,894 | 19,833 | ||
JNL/PIMCO Real Return Fund (12.9%) (a) | 19,147 | 230,909 | ||
JNL/PIMCO Total Return Bond Fund (5.0%) (a) | 13,304 | 164,304 | ||
JNL/Select Value Fund (24.6%) (a) | 16,344 | 283,890 | ||
JNL/T. Rowe Price Established Growth Fund (12.5%) (a) | 8,910 | 189,076 | ||
JNL/T. Rowe Price Mid-Cap Growth Fund (7.4%) (a) | 3,473 | 103,412 | ||
JNL/T. Rowe Price Value Fund (25.3%) (a) | 26,545 | 287,747 | ||
JNL/T. Rowe Short-Term Bond Fund (19.8%) (a) | 17,468 | 172,581 | ||
Total Investment Companies (cost $2,683,260) | 2,861,578 | |||
See accompanying Notes to the Financial Statements.
JNL Series Trust
Schedules of Investments (in thousands)
December 31, 2010
| Shares/Par (p) | Value | |||||
Total Investments - 100.0% (cost $2,683,260) |
| 2,861,578 | ||||
Other Assets and Liabilities, Net - (0.0% ) |
| (387) | ||||
Total Net Assets - 100.0% | $2,861,191 | |||||
JNL/S&P Managed Growth Fund (b) | ||||||
INVESTMENT COMPANIES - 100.0% | ||||||
JNL/BlackRock Commodity Securities Fund (1.3%) (a) | 1,198 | $13,198 | ||||
JNL/Capital Guardian Global Diversified Research Fund (8.3%) (a) | 1,569 | 36,440 | ||||
JNL/Capital Guardian U.S. Growth Equity Fund (17.1%) (a) | 7,200 | 152,579 | ||||
JNL/Eagle Core Equity Fund (26.0%) (a) | 7,212 | 52,862 | ||||
JNL/Eagle SmallCap Equity Fund (13.9%) (a) | 3,752 | 82,088 | ||||
JNL/Franklin Templeton International Small Cap Growth Fund (11.1%) (a) | 2,916 | 23,823 | ||||
JNL/Franklin Templeton Small Cap Value Fund (6.5%) (a) | 1,740 | 19,173 | ||||
JNL/Goldman Sachs Core Plus Bond Fund (3.2%) (a) | 2,791 | 33,882 | ||||
JNL/Goldman Sachs Emerging Markets Debt Fund (8.4%) (a) | 4,696 | 64,098 | ||||
JNL/Goldman Sachs Mid Cap Value Fund (14.7%) (a) | 7,029 | 74,512 | ||||
JNL/Invesco Global Real Estate Fund (3.0%) (a) | 2,356 | 20,028 | ||||
JNL/Invesco International Growth Fund (15.2%) (a) | 8,651 | 89,457 | ||||
JNL/Invesco Large Cap Growth Fund (23.4%) (a) | 16,913 | 212,929 | ||||
JNL/JPMorgan International Value Fund (13.5%) (a) | 10,912 | 82,056 | ||||
JNL/JPMorgan MidCap Growth Fund (7.6%) (a) | 878 | 17,576 | ||||
JNL/JPMorgan U.S. Government & Quality Bond Fund (3.1%) (a) | 2,187 | 28,301 | ||||
JNL/Lazard Emerging Markets Fund (5.4%) (a) | 6,166 | 74,544 | ||||
JNL/M&G Global Basics Fund (24.0%) (a) | 3,132 | 46,924 | ||||
JNL/Mellon Capital Management Oil & Gas Sector Fund (1.1%) (a) | 267 | 7,159 | ||||
JNL/Oppenheimer Global Growth Fund (16.2%) (a) | 6,234 | 65,266 | ||||
JNL/PIMCO Real Return Fund (6.4%) (a) | 9,526 | 114,888 | ||||
JNL/PIMCO Total Return Bond Fund (2.4%) (a) | 6,333 | 78,211 | ||||
JNL/Select Value Fund (19.7%) (a) | 13,116 | 227,817 | ||||
JNL/T. Rowe Price Established Growth Fund (14.4%) (a) | 10,235 | 217,195 | ||||
JNL/T. Rowe Price Mid-Cap Growth Fund (7.3%) (a) | 3,445 | 102,607 | ||||
JNL/T. Rowe Price Value Fund (17.9%) (a) | 18,774 | 203,506 | ||||
Total Investment Companies (cost $1,974,371) | 2,141,119 | |||||
Total Investments - 100.0% (cost $1,974,371) |
| 2,141,119 | ||||
Other Assets and Liabilities, Net - (0.0% ) |
| (303) | ||||
Total Net Assets - 100.0% | $2,140,816 | |||||
| Shares/Par (p) | Value | |||
JNL/S&P Managed Aggressive Growth Fund (b) | ||||
INVESTMENT COMPANIES - 100.0% | ||||
JNL/BlackRock Commodity Securities Fund (0.8%) (a) | 747 | $8,229 | ||
JNL/Capital Guardian Global Diversified Research Fund (3.1%) (a) | 581 | 13,491 | ||
JNL/Capital Guardian U.S. Growth Equity Fund (3.2%) (a) | 1,341 | 28,419 | ||
JNL/Eagle SmallCap Equity Fund (5.8%) (a) | 1,561 | 34,151 | ||
JNL/Franklin Templeton International Small Cap Growth Fund (6.7%) (a) | 1,767 | 14,438 | ||
JNL/Franklin Templeton Small Cap Value Fund (4.8%) (a) | 1,292 | 14,242 | ||
JNL/Goldman Sachs Emerging Markets Debt Fund (2.0%) (a) | 1,140 | 15,556 | ||
JNL/Goldman Sachs Mid Cap Value Fund (7.5%) (a) | 3,560 | 37,735 | ||
JNL/Invesco Global Real Estate Fund (1.1%) (a) | 832 | 7,073 | ||
JNL/Invesco International Growth Fund (5.8%) (a) | 3,309 | 34,216 | ||
JNL/Invesco Large Cap Growth Fund (8.0%) (a) | 5,820 | 73,280 | ||
JNL/JPMorgan International Value Fund (5.5%) (a) | 4,450 | 33,468 | ||
JNL/JPMorgan MidCap Growth Fund (5.4%) (a) | 629 | 12,600 | ||
JNL/Lazard Emerging Markets Fund (2.4%) (a) | 2,754 | 33,291 | ||
JNL/M&G Global Basics Fund (12.8%) (a) | 1,665 | 24,946 | ||
JNL/Mellon Capital Management Oil & Gas Sector Fund (0.7%) (a) | 183 | 4,886 | ||
JNL/Oppenheimer Global Growth Fund (10.0%) (a) | 3,844 | 40,249 | ||
JNL/PIMCO Real Return Fund (1.9%) (a) | 2,858 | 34,469 | ||
JNL/PPM America High Yield Bond Fund (2.4%) (a) | 3,203 | 21,362 | ||
JNL/Select Value Fund (8.5%) (a) | 5,621 | 97,634 | ||
JNL/T. Rowe Price Established Growth Fund (5.9%) (a) | 4,218 | 89,499 | ||
JNL/T. Rowe Price Mid-Cap Growth Fund (2.9%) (a) | 1,371 | 40,841 | ||
JNL/T. Rowe Price Value Fund (6.6%) (a) | 6,893 | 74,718 | ||
Total Investment Companies (cost $735,196) | 788,793 | |||
Total Investments -100.0% (cost $735,196) | 788,793 | |||
Other Assets and Liabilities, Net - (0.0% ) | (129) | |||
Total Net Assets - 100.0% | $788,664 | |||
JNL/S&P Disciplined Moderate Fund (b) | ||||
INVESTMENT COMPANIES - 100.0% | ||||
JNL/Goldman Sachs Emerging Markets Debt Fund (1.3%) (a) | 736 | $10,042 | ||
JNL/Mellon Capital Management Bond Index Fund (5.1%) (a) | 5,747 | 67,419 | ||
JNL/Mellon Capital Management International Index Fund (4.8%) (a) | 4,212 | 52,569 | ||
JNL/Mellon Capital Management JNL Optimized 5 Fund (3.7%) (a) | 2,096 | 18,638 | ||
JNL/Mellon Capital Management S&P 400 MidCap Index Fund (2.0%) (a) | 956 | 13,246 | ||
See accompanying Notes to the Financial Statements.
JNL Series Trust
Schedules of Investments (in thousands)
December 31, 2010
| Shares/Par (p) | Value | |||
JNL/Mellon Capital Management S&P 500 Index Fund (9.9%) (a) | 12,540 | 132,795 | ||
JNL/Mellon Capital Management Small Cap Index Fund (1.5%) (a) | 865 | 10,904 | ||
JNL/PIMCO Real Return Fund (2.3%) (a) | 3,389 | 40,876 | ||
Total Investment Companies (cost $312,551) | 346,489 | |||
Total Investments - 100.0% | 346,489 | |||
Other Assets and Liabilities, | (56) | |||
Total Net Assets - 100.0% | $ 346,433 | |||
JNL/S&P Disciplined Moderate Growth Fund (b) | ||||
INVESTMENT COMPANIES - 100.0% | ||||
JNL/Goldman Sachs Emerging Markets Debt Fund (1.3%) (a) | 741 $ | 10,111 | ||
JNL/Mellon Capital Management 25 Fund (4.0%) (a) | 1,754 | 21,931 | ||
JNL/Mellon Capital Management Bond Index Fund (1.4%) (a) | 1,584 | 18,578 | ||
JNL/Mellon Capital Management International Index Fund (6.5%) (a) | 5,671 | 70,777 | ||
JNL/Mellon Capital Management JNL Optimized 5 Fund (4.7%) (a) | 2,625 | 23,341 | ||
JNL/Mellon Capital Management S&P 400 MidCap Index Fund (4.8%) (a) | 2,301 | 31,887 | ||
JNL/Mellon Capital Management S&P 500 Index Fund (11.8%) (a) | 14,964 | 158,466 | ||
JNL/Mellon Capital Management Small Cap Index Fund (2.3%) (a) | 1,303 | 16,437 | ||
JNL/PIMCO Real Return Fund (1.4%) (a) | 2,042 | 24,625 | ||
Total Investment Companies | 376,153 | |||
Total Investments - 100.0% (cost $324,940) | 376,153 | |||
Other Assets and Liabilities, Net - (0.0% ) | (61) | |||
Total Net Assets - 100.0% | $ 376,092 | |||
JNL/S&P Disciplined Growth Fund (b) | ||||
INVESTMENT COMPANIES - 100.0% | ||||
JNL/Goldman Sachs Emerging Markets Debt Fund (0.4%) (a) | 198 $ | 2,701 | ||
JNL/Mellon Capital Management 25 Fund (1.5%) (a) | 649 | 8,112 | ||
JNL/Mellon Capital Management Bond Index Fund (0.4%) (a) | 465 | 5,453 | ||
JNL/Mellon Capital Management International Index Fund (3.1%) (a) | 2,669 | 33,316 | ||
JNL/Mellon Capital Management JNL Optimized 5 Fund (2.4%) (a) | 1,324 | 11,768 | ||
JNL/Mellon Capital Management S&P 400 MidCap Index Fund (1.7%) (a) | 833 | 11,553 | ||
JNL/Mellon Capital Management S&P 500 Index Fund (4.1%) (a) | 5,240 | 55,487 | ||
JNL/Mellon Capital Management Small Cap Index Fund (0.7%) (a) | 402 | 5,069 | ||
| Shares/Par (p) | Value | |||
JNL/PIMCO Real Return Fund (0.2%) (a) | 335 | 4,039 | ||
Total Investment Companies (cost $117,474) | 137,498 | |||
Total Investments - 100.0% (cost $117,474) | 137,498 | |||
Other Assets and Liabilities, Net -(0.0% ) | (22) | |||
Total Net Assets - 100.0% | $ 137,476 | |||
JNL/S&P Competitive Advantage Fund | ||||
COMMON STOCKS - 99.8% | ||||
CONSUMER DISCRETIONARY - 29.4% | ||||
Apollo Group Inc. - Class A (c) | 282 | $11,122 | ||
Best Buy Co. Inc. | 222 | 7,617 | ||
DeVry Inc. | 223 | 10,700 | ||
Family Dollar Stores Inc. | 193 | 9,574 | ||
Gap Inc. | 444 | 9,837 | ||
RadioShack Corp. | 514 | 9,512 | ||
Ross Stores Inc. | 146 | 9,252 | ||
Starbucks Corp. | 316 | 10,144 | ||
TJX Cos. Inc. | 212 | 9,414 | ||
| 87,172 | ||||
CONSUMER STAPLES - 3.2% | ||||
Sysco Corp. | 327 | 9,615 | ||
ENERGY - 3.3% | ||||
Southwestern Energy Co. (c) | 262 | 9,813 | ||
FINANCIALS - 3.6% | ||||
Federated Investors Inc. - Class B (e) | 404 | 10,570 | ||
HEALTH CARE - 10.0% | ||||
Eli Lilly & Co. | 285 | 9,970 | ||
Gilead Sciences Inc. (c) | 262 | 9,509 | ||
Varian Medical Systems Inc. (c) | 145 | 10,079 | ||
| 29,558 | ||||
INDUSTRIALS - 10.3% | ||||
Lockheed Martin Corp. | 141 | 9,841 | ||
Rockwell Collins Inc. | 171 | 9,953 | ||
WW Grainger Inc. | 77 | 10,587 | ||
| 30,381 | ||||
INFORMATION TECHNOLOGY - 32.9% | ||||
Apple Inc. (c) | 31 | 9,929 | ||
Intel Corp. | 449 | 9,451 | ||
International Business Machines Corp. | 68 | 9,936 | ||
Lexmark International Inc. - Class A (c) | 262 | 9,120 | ||
MasterCard Inc. - Class A | 40 | 8,975 | ||
Microsoft Corp. | 380 | 10,606 | ||
Paychex Inc. | 336 | 10,372 | ||
Teradata Corp. (c) | 235 | 9,683 | ||
Texas Instruments Inc. | 299 | 9,701 | ||
Western Digital Corp. (c) | 283 | 9,605 | ||
| 97,378 | ||||
MATERIALS - 7.1% | ||||
Ecolab Inc. | 200 | 10,100 | ||
Sherwin-Williams Co. | 130 | 10,912 | ||
| 21,012 | ||||
Total Common Stocks (cost $279,029) | 295,499 | |||
See accompanying Notes to the Financial Statements.
JNL Series Trust
Schedules of Investments (in thousands)
December 31, 2010
| Shares/Par (p) | Value | |||||||
SHORT TERM INVESTMENTS - 3.5% |
| |||||||
Investment Company - 0.2% | ||||||||
JNL Money Market Fund, 0.08% (a) (h) | 613 | 613 | ||||||
Securities Lending Collateral 3.3% | ||||||||
Securities Lending Cash Collateral Fund LLC, 0.31% (a) (h) | 9,324 | 9,324 | ||||||
Securities Lending Liquidating Fund LLC, 0.66% (a) (h) | 400 | 393 | ||||||
| 9,717 | ||||||||
Total Short Term Investments (cost $10,337) | 10,330 | |||||||
Total Investments - 103.3% (cost $289,366) | 305,829 | |||||||
Other Assets and Liabilities, Net - (3.3%) | (9,738 | ) | ||||||
Total Net Assets - 100.0% | $ | 296,091 | ||||||
JNL/S&P Dividend Income & Growth Fund |
| |||||||
COMMON STOCKS - 99.7% | ||||||||
CONSUMER DISCRETIONARY - 10.0% |
| |||||||
Home Depot Inc. | 460 | $ | 16,127 | |||||
McDonald’s Corp. | 178 | 13,627 | ||||||
VF Corp. (e) | 168 | 14,452 | ||||||
| 44,206 | ||||||||
CONSUMER STAPLES - 9.6% |
| |||||||
Clorox Co. | 223 | 14,142 | ||||||
Kimberly-Clark Corp. | 223 | 14,070 | ||||||
Sysco Corp. | 476 | 13,995 | ||||||
| 42,207 | ||||||||
ENERGY - 10.4% | ||||||||
Chevron Corp. | 172 | 15,661 | ||||||
Exxon Mobil Corp. | 200 | 14,610 | ||||||
Marathon Oil Corp. | 415 | 15,375 | ||||||
| 45,646 | ||||||||
FINANCIALS - 10.3% | ||||||||
Kimco Realty Corp. | 834 | 15,049 | ||||||
M&T Bank Corp. | 181 | 15,719 | ||||||
Public Storage | 143 | 14,502 | ||||||
| 45,270 | ||||||||
HEALTH CARE - 10.0% | ||||||||
Bristol-Myers Squibb Co. | 551 | 14,581 | ||||||
Merck & Co. Inc. | 403 | 14,532 | ||||||
Pfizer Inc. | 848 | 14,847 | ||||||
| 43,960 | ||||||||
INDUSTRIALS - 9.8% | ||||||||
Lockheed Martin Corp. | 203 | 14,193 | ||||||
Pitney Bowes Inc. | 633 | 15,316 | ||||||
Raytheon Co. | 299 | 13,841 | ||||||
| 43,350 | ||||||||
INFORMATION TECHNOLOGY - 9.9% |
| |||||||
Automatic Data Processing Inc. | 312 | 14,432 | ||||||
Intel Corp. | 654 | 13,756 | ||||||
Microsoft Corp. | 551 | 15,391 | ||||||
| 43,579 | ||||||||
MATERIALS - 9.9% | ||||||||
Air Products & Chemicals Inc. | 160 | 14,570 | ||||||
| Shares/Par (p) | Value | |||||||
PPG Industries Inc. | 177 | 14,895 | ||||||
Praxair Inc. | 151 | 14,416 | ||||||
| 43,881 | ||||||||
TELECOMMUNICATION SERVICES - 10.2% |
| |||||||
AT&T Inc. | 500 | 14,694 | ||||||
CenturyLink Inc. (e) | 323 | 14,926 | ||||||
Verizon Communications Inc. | 434 | 15,533 | ||||||
| 45,153 | ||||||||
UTILITIES - 9.6% | ||||||||
Consolidated Edison Inc. | 286 | 14,156 | ||||||
PPL Corp. | 547 | 14,397 | ||||||
Southern Co. | 366 | 14,000 | ||||||
| 42,553 | ||||||||
Total Common Stocks (cost $402,064) | 439,805 | |||||||
SHORT TERM INVESTMENTS - 5.6% |
| |||||||
Investment Company - 1.1% | ||||||||
JNL Money Market Fund, 0.08% (a) (h) | 5,012 | 5,012 | ||||||
Securities Lending Collateral 4.5% | ||||||||
Securities Lending Cash Collateral Fund LLC, 0.31% (a) (h) | 19,295 | 19,295 | ||||||
Securities Lending Liquidating Fund LLC, 0.66% (a) (h) | 481 | 473 | ||||||
| 19,768 | ||||||||
Total Short Term Investments (cost $24,788) | 24,780 | |||||||
Total Investments - 105.3% (cost $426,852) | 464,585 | |||||||
Other Assets and Liabilities, Net-(5.3%) | (23,493 | ) | ||||||
Total Net Assets - 100.0% | $ | 441,092 | ||||||
JNL/S&P Intrinsic Value Fund |
| |||||||
COMMON STOCKS - 100.0% | ||||||||
CONSUMER DISCRETIONARY - 16.9% |
| |||||||
GameStop Corp.- Class A (c) | 512 | $ | 11,712 | |||||
H&R Block Inc. (e) | 810 | 9,651 | ||||||
RadioShack Corp. | 553 | 10,221 | ||||||
VF Corp. | 123 | 10,605 | ||||||
Washington Post Co. - Class B (e) | 27 | 11,886 | ||||||
| 54,075 | ||||||||
HEALTH CARE - 36.5% | ||||||||
Abbott Laboratories | 219 | 10,507 | ||||||
Aetna Inc. | 340 | 10,384 | ||||||
AmerisourceBergen Corp. | 327 | 11,158 | ||||||
Amgen Inc. (c) | 194 | 10,627 | ||||||
Cardinal Health Inc. | 283 | 10,860 | ||||||
CIGNA Corp. | 274 | 10,036 | ||||||
Humana Inc. (c) | 180 | 9,843 | ||||||
Medtronic Inc. | 301 | 11,159 | ||||||
Quest Diagnostics Inc. | 205 | 11,039 | ||||||
UnitedHealth Group Inc. | 276 | 9,964 | ||||||
Zimmer Holdings Inc. (c) | 205 | 10,992 | ||||||
| 116,569 | ||||||||
INDUSTRIALS - 13.3% | ||||||||
General Dynamics Corp. | 154 | 10,950 | ||||||
L-3 Communications Holdings Inc. | 145 | 10,223 | ||||||
Pitney Bowes Inc. | 465 | 11,239 | ||||||
See accompanying Notes to the Financial Statements.
JNL Series Trust
Schedules of Investments (in thousands)
December 31, 2010
| Shares/Par (p) | Value | |||||
Raytheon Co. | 221 | 10,220 | ||||
| 42,632 | ||||||
INFORMATION TECHNOLOGY - 19.9% | ||||||
Dell Inc. (c) | 772 | 10,454 | ||||
Fiserv Inc. (c) | 184 | 10,799 | ||||
Harris Corp. | 231 | 10,444 | ||||
Microsoft Corp. | 405 | 11,294 | ||||
Symantec Corp. (c) | 607 | 10,164 | ||||
Total System Services Inc. (e) | 676 | 10,396 | ||||
| 63,551 | ||||||
MATERIALS - 6.6% | ||||||
Ball Corp. | 155 | 10,535 | ||||
MeadWestvaco Corp. | 411 | 10,741 | ||||
| 21,276 | ||||||
TELECOMMUNICATION SERVICES - 3.6% | ||||||
Verizon Communications Inc. | 319 | 11,399 | ||||
UTILITIES - 3.2% | ||||||
Entergy Corp. | 143 | 10,141 | ||||
Total Common Stocks (cost $314,799) | 319,643 | |||||
SHORT TERM INVESTMENTS - 4.8% |
| |||||
Investment Company - 0.4% |
| |||||
JNL Money Market Fund, | 1,339 | 1,339 | ||||
Securities Lending Collateral 4.4% | ||||||
Securities Lending Cash Collateral Fund LLC, | 13,666 | 13,666 | ||||
Securities Lending Liquidating Fund LLC, 0.66% (a) (h) | 517 | 509 | ||||
| 14,175 | ||||||
Total Short Term Investments (cost $15,522) | 15,514 | |||||
Total Investments - 104.8% | 335,157 | |||||
Other Assets and Liabilities, Net - (4.8%) | (15,440) | |||||
Total Net Assets - 100.0% | $319,717 | |||||
JNL/S&P Total Yield Fund |
| |||||
COMMON STOCKS - 99.9% |
| |||||
CONSUMER DISCRETIONARY - 26.1% |
| |||||
DR Horton Inc. | 871 | $10,389 | ||||
Gannett Co. Inc. | 667 | 10,065 | ||||
Gap Inc. | 409 | 9,066 | ||||
H&R Block Inc. | 695 | 8,277 | ||||
Limited Brands Inc. | 260 | 7,986 | ||||
O’Reilly Automotive Inc. (c) | 145 | 8,783 | ||||
RadioShack Corp. | 474 | 8,767 | ||||
Washington Post Co. - Class B (e) | 23 | 10,193 | ||||
| 73,526 | ||||||
CONSUMER STAPLES - 3.3% |
| |||||
SUPERVALU Inc. | 968 | 9,317 | ||||
ENERGY - 3.5% | ||||||
ConocoPhillips | 145 | 9,897 | ||||
FINANCIALS - 33.7% | ||||||
American Express Co. | 200 | 8,581 | ||||
Bank of America Corp. | 791 | 10,546 | ||||
Capital One Financial Corp. | 232 | 9,891 | ||||
| Shares/Par (p) | Value | |||||
Chubb Corp. | 153 | 9,150 | ||||
Citigroup Inc. (c) | 2,060 | 9,743 | ||||
Goldman Sachs Group Inc. | 55 | 9,314 | ||||
JPMorgan Chase & Co. | 231 | 9,818 | ||||
Legg Mason Inc. | 265 | 9,618 | ||||
State Street Corp. | 200 | 9,276 | ||||
Vornado Realty Trust | 107 | 8,935 | ||||
| 94,872 | ||||||
HEALTH CARE - 6.4% |
| |||||
Biogen Idec Inc. (c) | 137 | 9,168 | ||||
WellPoint Inc. (c) | 157 | 8,923 | ||||
| 18,091 | ||||||
INDUSTRIALS - 13.3% | ||||||
General Electric Co. | 552 | 10,103 | ||||
L-3 Communications Holdings Inc. | 124 | 8,768 | ||||
Northrop Grumman Corp. | 142 | 9,187 | ||||
Textron Inc. | 391 | 9,247 | ||||
| 37,305 | ||||||
INFORMATION TECHNOLOGY - 3.3% | ||||||
Fiserv Inc. (c) | 158 | 9,262 | ||||
MATERIALS - 3.3% | ||||||
MeadWestvaco Corp. | 352 | 9,211 | ||||
TELECOMMUNICATION SERVICES - 7.0% | ||||||
Sprint Nextel Corp. (c) | 2,314 | 9,787 | ||||
Verizon Communications Inc. | 273 | 9,775 | ||||
| 19,562 | ||||||
Total Common Stocks (cost $271,555) | $ 281,043 | |||||
SHORT TERM INVESTMENTS - 3.6% |
| |||||
Investment Company - 0.2% | ||||||
JNL Money Market Fund, 0.08% (a) (h) | 518 | 518 | ||||
Securities Lending Collateral 3.4% | ||||||
Securities Lending Cash Collateral Fund LLC, 0.31% (a) (h) | 8,344 | 8,344 | ||||
Securities Lending Liquidating Fund LLC, 0.66% (a) (h) | 1,207 | 1,187 | ||||
| 9,531 | ||||||
Total Short Term Investments (cost $10,069) | 10,049 | |||||
Total Investments - 103.5% (cost $281,624) | 291,092 | |||||
Other Assets and Liabilities, Net - (3.5%) | (9,890) | |||||
Total Net Assets - 100.0% | $ 281,202 | |||||
JNL/S&P 4 Fund (b) | ||||||
INVESTMENT COMPANIES - 100.0% | ||||||
JNL/S&P Competitive Advantage Fund (70.0%) (a) | 19,369 | $207,247 | ||||
JNL/S&P Dividend Income & Growth Fund (48.3%) (a) | 21,826 | 213,020 | ||||
JNL/S&P Intrinsic Value Fund (65.5%) (a) | 21,026 | 209,632 | ||||
JNL/S&P Total Yield Fund (76.1%) (a) | 21,981 | 214,095 | ||||
Total Investment Companies (cost $697,160) | 843,994 | |||||
See accompanying Notes to the Financial Statements.
JNL Series Trust
Schedules of Investments (in thousands)
December 31, 2010
| Shares/Par (p) | Value | |||||
Total Investments - 100.0% (cost $697,160) |
| 843,994 | ||||
Other Assets and Liabilities, Net - (0.0% ) |
| (49) | ||||
Total Net Assets - 100.0% |
| $ 843,945 | ||||
JNL/Select Balanced Fund * (x) | ||||||
COMMON STOCKS - 66.1% |
| |||||
CONSUMER DISCRETIONARY - 5.1% | ||||||
Comcast Corp. - Class A | 613 | $13,462 | ||||
Lowe’s Cos. Inc. | 417 | 10,466 | ||||
News Corp. - Class A | 673 | 9,796 | ||||
Staples Inc. | 454 | 10,342 | ||||
Other Securities | 21,354 | |||||
| 65,420 | ||||||
CONSUMER STAPLES - 5.0%. | ||||||
CVS Caremark Corp. | 235 | 8,181 | ||||
PepsiCo Inc. | 236 | 15,385 | ||||
Philip Morris International Inc. | 206 | 12,034 | ||||
Procter & Gamble Co. | 138 | 8,877 | ||||
Unilever NV - NYS | 290 | 9,109 | ||||
Wal-Mart Stores Inc. | 143 | 7,734 | ||||
Other Securities | 3,408 | |||||
| 64,728 | ||||||
ENERGY - 9.6% | ||||||
Anadarko Petroleum Corp. | 193 | 14,706 | ||||
Baker Hughes Inc. | 193 | 11,051 | ||||
Chevron Corp. | 353 | 32,220 | ||||
Exxon Mobil Corp. | 462 | 33,745 | ||||
Occidental Petroleum Corp. | 119 | 11,684 | ||||
Other Securities | 20,680 | |||||
| 124,086 | ||||||
FINANCIALS - 11.5% | ||||||
ACE Ltd. | 227 | 14,118 | ||||
Bank of America Corp. | 841 | 11,216 | ||||
Goldman Sachs Group Inc. | 34 | 5,768 | ||||
JPMorgan Chase & Co. | 614 | 26,050 | ||||
MetLife Inc. | 330 | 14,683 | ||||
PNC Financial Services Group Inc. | 195 | 11,853 | ||||
Wells Fargo & Co. | 1,034 | 32,056 | ||||
Other Securities | 33,182 | |||||
| 148,926 | ||||||
HEALTH CARE - 8.2% | ||||||
Cardinal Health Inc. | 249 | 9,528 | ||||
Eli Lilly & Co. | 443 | 15,537 | ||||
Johnson & Johnson | 258 | 15,945 | ||||
Medtronic Inc. | 335 | 12,421 | ||||
Merck & Co. Inc. | 548 | 19,764 | ||||
Pfizer Inc. | 1,500 | 26,258 | ||||
Other Securities | 6,858 | |||||
| 106,311 | ||||||
INDUSTRIALS - 8.9% | ||||||
Cooper Industries Plc | 194 | 11,326 | ||||
Deere & Co. | 133 | 11,021 | ||||
General Dynamics Corp. | 146 | 10,360 | ||||
General Electric Co. | 662 | 12,104 | ||||
Pentair Inc. | 281 | 10,270 | ||||
Siemens AG - ADR | 82 | 10,139 | ||||
United Parcel Service Inc. - Class B | 126 | 9,152 | ||||
| Shares/Par (p) | Value | |||||
Other Securities | 40,696 | |||||
| 115,068 | ||||||
INFORMATION TECHNOLOGY - 9.0% | ||||||
Accenture Plc - Class A | 208 | 10,066 | ||||
Analog Devices Inc. | 230 | 8,656 | ||||
Automatic Data Processing Inc. | 194 | 8,997 | ||||
Cisco Systems Inc. (c) | 443 | 8,956 | ||||
International Business Machines Corp. | 161 | 23,614 | ||||
Microsoft Corp. | 466 | 13,013 | ||||
QUALCOMM Inc. | 200 | 9,883 | ||||
Other Securities | 33,064 | |||||
| 116,249 | ||||||
MATERIALS - 3.1% | ||||||
Dow Chemical Co. | 268 | 9,143 | ||||
Other Securities | 30,130 | |||||
| 39,273 | ||||||
TELECOMMUNICATION SERVICES - 2.5% | ||||||
AT&T Inc. | 1,105 | 32,468 | ||||
UTILITIES - 3.2% | ||||||
Dominion Resources Inc. (e) | 231 | 9,868 | ||||
Exelon Corp. | 239 | 9,952 | ||||
PG&E Corp. | 189 | 9,023 | ||||
Other Securities | 12,538 | |||||
Total Common Stocks (cost $743,676) | 41,381 | |||||
| 853,910 | ||||||
NON-U.S. GOVERNMENT AGENCY ASSET-BACKED SECURITIES - 1.1% | ||||||
Banc of America Commercial Mortgage Inc. REMIC | ||||||
5.12%, 07/11/43 | $ | 750 | 773 | |||
5.74%, 05/10/45 (i) | 350 | 383 | ||||
5.20%, 09/10/47 (i) | 1,200 | 1,289 | ||||
Bank of America-First Union NB Commercial Mortgage REMIC, 5.46%, 04/11/37 | 440 | 445 | ||||
Bear Stearns Commercial Mortgage Securities Inc. REMIC | ||||||
5.72%, 09/11/38 (i) | 540 | 589 | ||||
5.54%, 10/12/41 | 545 | 587 | ||||
Other Securities | 10,655 | |||||
Total Non-U.S. Government Agency Asset-Backed Securities (cost $14,116) | 14,721 | |||||
CORPORATE BONDS AND NOTES - 9.8% | ||||||
CONSUMER DISCRETIONARY - 0.8% |
| |||||
Comcast Corp. | ||||||
6.50%, 01/15/17 (e) | 750 | 865 | ||||
6.55%, 07/01/39 | 375 | 408 | ||||
Lowe’s Cos. Inc., 6.65%, 09/15/37 | 420 | 492 | ||||
Staples Inc., 9.75%, 01/15/14 (l) | 335 | 406 | ||||
Other Securities | 8,695 | |||||
| 10,866 | ||||||
CONSUMER STAPLES - 0.7% | ||||||
CVS Caremark Corp. | ||||||
6.13%, 08/15/16 | 400 | 454 | ||||
5.75%, 06/01/17 | 245 | 273 | ||||
PepsiCo Inc., 3.13%, 11/01/20 | 1,800 | 1,692 | ||||
Wal-Mart Stores Inc., 3.63%, 07/08/20 | 2,300 | 2,238 | ||||
Other Securities | 4,254 | |||||
| 8,911 | ||||||
See accompanying Notes to the Financial Statements.
JNL Series Trust
Schedules of Investments (in thousands)
December 31, 2010
| Shares/Par (p) | Value | |||||
ENERGY - 0.4% | ||||||
Occidental Petroleum Corp., 4.10%, 02/01/21 | 941 | 956 | ||||
Other Securities | 4,410 | |||||
| 5,366 | ||||||
FINANCIALS - 5.5% | ||||||
Bank of America Corp. | ||||||
6.50%, 08/01/16 | 2,000 | 2,170 | ||||
5.42%, 03/15/17 | 700 | 694 | ||||
7.63%, 06/01/19 | 800 | 921 | ||||
General Electric Capital Corp. | ||||||
3.00%, 12/09/11 | 5,000 | 5,120 | ||||
5.88%, 02/15/12 | 1,000 | 1,052 | ||||
5.90%, 05/13/14 | 250 | 277 | ||||
2.25%, 11/09/15 | 1,000 | 961 | ||||
5.63%, 09/15/17 (e) | 1,700 | 1,864 | ||||
Goldman Sachs Group Inc. | ||||||
1.63%, 07/15/11 | 4,000 | 4,029 | ||||
5.35%, 01/15/16 | 1,700 | 1,826 | ||||
5.63%, 01/15/17 | 1,350 | 1,428 | ||||
JPMorgan Chase & Co. | ||||||
3.70%, 01/20/15 | 600 | 621 | ||||
3.40%, 06/24/15 | 1,800 | 1,836 | ||||
6.30%, 04/23/19 | 475 | 541 | ||||
6.40%, 05/15/38 (e) | 425 | 482 | ||||
MetLife Global Funding I Inc., 2.50%, 09/29/15 (r) | 1,200 | 1,183 | ||||
Wachovia Corp. | ||||||
5.25%, 08/01/14 | 500 | 533 | ||||
5.75%, 06/15/17 | 1,500 | 1,661 | ||||
Wells Fargo & Co., 3.75%, 10/01/14 (e) | 575 | 600 | ||||
Other Securities | 43,538 | |||||
| 71,337 | ||||||
HEALTH CARE - 0.5% | ||||||
Schering-Plough, 5.30%, 12/01/13 (l) | 450 | 500 | ||||
Merck & Co. Inc., 4.00%, 06/30/15 | 370 | 397 | ||||
Pfizer Inc., 6.20%, 03/15/19 | 700 | 820 | ||||
Other Securities | 4,243 | |||||
| 5,960 | ||||||
INDUSTRIALS - 0.3% | ||||||
Deere & Co., 4.38%, 10/16/19 | 185 | 193 | ||||
United Parcel Service Inc., 4.88%, 11/15/40 (e) | 370 | 358 | ||||
Other Securities | 3,932 | |||||
| 4,483 | ||||||
INFORMATION TECHNOLOGY - 0.5% | ||||||
Cisco Systems Inc., 4.45%, 01/15/20 | 500 | 524 | ||||
International Business Machines Corp., 2.00%, 01/05/16 | 1,300 | 1,271 | ||||
Microsoft Corp., 4.50%, 10/01/40 (e) | 650 | 609 | ||||
Other Securities | 3,463 | |||||
| 5,867 | ||||||
MATERIALS - 0.0% | ||||||
Other Securities | 222 | |||||
TELECOMMUNICATION SERVICES - 0.4% | ||||||
AT&T Inc. | ||||||
2.50%, 08/15/15 | 500 | 498 | ||||
6.45%, 06/15/34 | 480 | 509 | ||||
6.80%, 05/15/36 | 150 | 166 | ||||
Other Securities | 3,525 | |||||
| 4,698 | ||||||
| Shares/Par (p) | Value | |||||
UTILITIES - 0.7% | ||||||
Other Securities | 8,673 | |||||
Total Corporate Bonds and Notes (cost $123,005) | 126,383 | |||||
GOVERNMENT AND AGENCY OBLIGATIONS - 19.0% | ||||||
GOVERNMENT SECURITIES - 7.7% | ||||||
Federal Home Loan Mortgage Corp. - 0.4% (w) | ||||||
Federal Home Loan Mortgage Corp., 3.50%, 05/29/13 | 5,000 | 5,311 | ||||
MUNICIPALS - 0.7% | ||||||
Other Securities | 9,377 | |||||
SOVEREIGN - 0.5% | ||||||
Other Securities | 5,981 | |||||
U.S. TREASURY SECURITIES - 6.1% | ||||||
U.S. Treasury Bond | ||||||
4.25%, 05/15/39 | 1,000 | 985 | ||||
4.38%, 11/15/39 | 2,438 | 2,451 | ||||
4.63%, 02/15/40 | 5,100 | 5,342 | ||||
U.S. Treasury Note | ||||||
0.88%, 04/30/11 | 6,100 | 6,114 | ||||
1.00%, 09/30/11 | 15,500 | 15,584 | ||||
4.50%, 03/31/12 (e) | 2,225 | 2,339 | ||||
1.38%, 05/15/12 | 13,000 | 13,173 | ||||
4.75%, 05/31/12 | 2,000 | 2,122 | ||||
3.13%, 09/30/13 | 2,500 | 2,652 | ||||
1.88%, 02/28/14 | 2,000 | 2,048 | ||||
1.75%, 07/31/15 | 7,000 | 6,978 | ||||
1.25%, 10/31/15, TBA (g) | 5,000 | 4,839 | ||||
3.88%, 05/15/18 | 1,000 | 1,076 | ||||
3.63%, 02/15/20 | 12,915 | 13,403 | ||||
| 79,106 | ||||||
U.S. GOVERNMENT AGENCY MORTGAGE-BACKED SECURITIES - 11.3% | ||||||
Federal Home Loan Mortgage Corp. - 2.9% | ||||||
Federal Home Loan Mortgage Corp. | ||||||
6.00%, 04/01/17 | 84 | 91 | ||||
6.50%, 11/01/17 | 34 | 37 | ||||
4.50%, 05/01/18 | 60 | 63 | ||||
4.50%, 09/01/18 | 88 | 93 | ||||
4.50%, 11/01/18 | 57 | 60 | ||||
4.50%, 11/01/18 | 127 | 134 | ||||
4.50%, 03/01/19 | 496 | 523 | ||||
7.00%, 11/01/30 | 98 | 112 | ||||
7.00%, 06/01/31 | 28 | 32 | ||||
7.00%, 10/01/32 | 48 | 55 | ||||
6.00%, 07/01/35 | 225 | 245 | ||||
6.00%, 01/01/36 | 927 | 1,011 | ||||
6.00%, 03/01/37 | 90 | 98 | ||||
6.00%, 09/01/37 | 1,089 | 1,197 | ||||
4.50%, 04/01/38 | 58 | 59 | ||||
4.50%, 09/01/38 | 52 | 53 | ||||
4.50%, 02/01/39 | 712 | 731 | ||||
4.50%, 02/01/39 | 4,843 | 4,976 | ||||
4.50%, 03/01/39 | 2,948 | 3,024 | ||||
6.00%, 12/01/39 | 642 | 697 | ||||
6.00%, 12/01/39 | 155 | 168 | ||||
6.00%, 12/01/39 | 1,158 | 1,262 | ||||
4.00%, 01/15/41, TBA (g) | 23,500 | 23,327 | ||||
| 38,048 | ||||||
Federal National Mortgage Association - 8.0% | ||||||
Federal National Mortgage Association | ||||||
6.00%, 01/01/18 | 29 | 32 | ||||
4.88%, 09/01/19 | 99 | 105 | ||||
4.21%, 11/01/19 | 30 | 30 | ||||
See accompanying Notes to the Financial Statements.
JNL Series Trust
Schedules of Investments (in thousands)
December 31, 2010
| Shares/Par (p) | Value | |||||
3.74%, 07/01/20 | 249 | 246 | ||||
4.04%, 07/01/20 | 100 | 100 | ||||
4.21%, 07/01/20 | 249 | 253 | ||||
4.21%, 07/01/20 | 249 | 253 | ||||
3.75%, 08/01/20 | 149 | 147 | ||||
3.99%, 08/01/20 | 249 | 249 | ||||
4.03%, 08/01/20 | 100 | 100 | ||||
3.43%, 09/01/20 | 150 | 144 | ||||
3.54%, 09/01/20 | 25 | 24 | ||||
3.55%, 09/01/20 | 249 | 242 | ||||
3.56%, 09/01/20 | 58 | 56 | ||||
3.59%, 09/01/20 | 130 | 126 | ||||
3.61%, 09/01/20 | 15 | 15 | ||||
3.65%, 09/01/20 | 25 | 24 | ||||
3.68%, 09/01/20 | 56 | 55 | ||||
3.68%, 09/01/20 | 110 | 108 | ||||
3.68%, 09/01/20 | 35 | 34 | ||||
3.69%, 09/01/20 | 50 | 49 | ||||
3.70%, 09/01/20 | 40 | 39 | ||||
3.73%, 09/01/20 | 50 | 49 | ||||
3.74%, 09/01/20 | 25 | 25 | ||||
3.81%, 09/01/20 | 50 | 49 | ||||
3.83%, 09/01/20 | 25 | 25 | ||||
3.93%, 09/01/20 | 199 | 199 | ||||
3.50%, 10/01/20 | 50 | 48 | ||||
3.66%, 10/01/20 | 125 | 122 | ||||
3.74%, 10/01/20 | 50 | 49 | ||||
3.50%, 01/15/26, TBA (g) | 6,500 | 6,545 | ||||
5.00%, 06/01/28 | 308 | 324 | ||||
5.00%, 07/01/28 | 235 | 247 | ||||
7.50%, 09/01/29 | 29 | 34 | ||||
7.00%, 10/01/33 | 178 | 203 | ||||
4.50%, 11/01/33 | 142 | 146 | ||||
4.50%, 12/01/33 | 265 | 274 | ||||
4.50%, 09/01/35 | 546 | 564 | ||||
4.50%, 09/01/35 | 196 | 202 | ||||
6.00%, 11/01/37 | 626 | 683 | ||||
5.50%, 03/01/38 | 4,434 | 4,747 | ||||
5.00%, 04/01/38 | 7,628 | 8,026 | ||||
6.00%, 09/01/38 | 123 | 134 | ||||
5.50%, 11/01/38 | 2,570 | 2,752 | ||||
4.50%, 02/01/39 | 6,523 | 6,703 | ||||
4.50%, 02/01/39 | 643 | 661 | ||||
4.50%, 03/01/39 | 1,891 | 1,943 | ||||
4.50%, 03/01/39 | 6,110 | 6,278 | ||||
5.50%, 06/01/39 | 1,747 | 1,874 | ||||
5.00%, 06/01/40 | 543 | 571 | ||||
5.00%, 06/01/40 | 562 | 591 | ||||
5.00%, 06/01/40 | 297 | 312 | ||||
5.00%, 07/01/40 | 299 | 314 | ||||
5.00%, 07/01/40 | 1,286 | 1,353 | ||||
5.00%, 08/01/40 | 493 | 519 | ||||
3.50%, 01/15/41, TBA (g) | 9,500 | 9,072 | ||||
5.00%, 01/15/41, TBA (g) | 12,000 | 12,615 | ||||
5.50%, 01/15/41, TBA (g) | 14,000 | 14,978 | ||||
6.00%, 01/15/41, TBA (g) | 9,000 | 9,782 | ||||
6.50%, 01/15/41, TBA (g) | 6,500 | 7,223 | ||||
| 102,667 | ||||||
Government National Mortgage Association - 0.4% | ||||||
Other Securities | 4,968 | |||||
Total Government and Agency Obligations (cost $244,518) | 245,458 | |||||
SHORT TERM INVESTMENTS - 12.0% | ||||||
Investment Company - 10.1% | ||||||
JNL Money Market Fund, 0.08% (a) (h) | 130,095 | 130,095 | ||||
| Shares/Par (p) | Value | |||||
Securities Lending Collateral 1.9% | ||||||
Securities Lending Cash Collateral Fund LLC, 0.31% (a) (h) | 21,829 | 21,829 | ||||
Securities Lending Liquidating Fund LLC, 0.66% (a) (h) | 2,097 | 2,062 | ||||
| 23,891 | ||||||
Total Short Term Investments (cost $154,021) | 153,986 | |||||
Total Investments - 108.0% (cost $1,279,336) |
| 1,394,458 | ||||
Other Assets and Liabilities, Net - (8.0%) |
| (103,255) | ||||
Total Net Assets - 100.0% | $1,291,203 | |||||
JNL/Select Money Market Fund | ||||||
CORPORATE BONDS AND NOTES - 4.2% | ||||||
FINANCIALS - 4.2% | ||||||
Bank of America Bank Note, 0.30%, 03/08/11 | $ | 8,000 | $8,000 | |||
Goldman Sachs Group Inc. | ||||||
5.00%, 01/15/11 | 4,500 | 4,508 | ||||
6.88%, 01/15/11 | 4,500 | 4,511 | ||||
National Australia Bank Ltd., 0.29%, 01/27/11 (i) (r) | 7,800 | 7,800 | ||||
Wachovia Corp., 5.35%, 03/15/11 | 2,250 | 2,273 | ||||
Wells Fargo & Co., 0.74%, 01/24/11 (i) | 3,000 | 3,001 | ||||
Total Corporate Bonds and Notes (cost $30,093) | 30,093 | |||||
SHORT TERM INVESTMENTS - 95.8% | ||||||
Certificates of Deposit 28.0% | ||||||
Bank of Montreal | ||||||
0.35%, 10/26/11 | 10,000 | 10,000 | ||||
0.33%, 05/31/11 | 8,000 | 8,000 | ||||
Bank of Nova Scotia | ||||||
0.79%, 05/12/11 (i) | 2,850 | 2,856 | ||||
0.35%, 06/27/11 | 3,700 | 3,700 | ||||
0.30%, 02/25/11 | 9,200 | 9,200 | ||||
Barclays Bank Plc | ||||||
0.76%, 10/25/11 | 7,500 | 7,500 | ||||
0.46%, 02/11/11 | 7,500 | 7,500 | ||||
0.60%, 07/01/11 | 2,000 | 2,000 | ||||
BNP Paribas | ||||||
0.38%, 04/08/11 | 5,000 | 5,000 | ||||
0.50%, 01/11/11 | 8,400 | 8,400 | ||||
Citibank NA | ||||||
0.36%, 03/23/11 | 4,500 | 4,500 | ||||
0.28%, 01/10/11 | 10,100 | 10,100 | ||||
0.26%, 02/22/11 | 3,300 | 3,300 | ||||
Credit Agricole SA | ||||||
0.50%, 03/03/11 | 5,900 | 5,900 | ||||
0.32%, 01/25/11 | 5,800 | 5,800 | ||||
DnB NOR Bank ASA | ||||||
0.35%, 11/07/11 (i) | 4,000 | 4,000 | ||||
0.48%, 11/22/11 | 3,800 | 3,800 | ||||
0.35%, 02/16/11 | 8,200 | 8,200 | ||||
Nordea Bank Finland Plc, 0.33%, 02/28/11 | 8,700 | 8,700 | ||||
Rabobank Nederland NV | ||||||
0.33%, 11/07/11 (i) | 4,000 | 4,000 | ||||
0.33%, 03/08/11 | 5,100 | 5,100 | ||||
Royal Bank of Canada, 0.26%, 02/24/11 | 8,800 | 8,800 | ||||
Royal Bank of Scotland Plc | ||||||
0.49%, 03/01/11 | 7,800 | 7,800 | ||||
0.33%, 01/21/11 | 5,800 | 5,800 | ||||
Societe Generale NY, 0.40%, 03/15/11 | 7,800 | 7,800 | ||||
See accompanying Notes to the Financial Statements.
JNL Series Trust
Schedules of Investments (in thousands)
December 31, 2010
| Shares/Par (p) | Value | |||||||
Svenska Handels NY | ||||||||
0.30%, 04/15/11 | 7,400 | 7,400 | ||||||
0.26%, 01/05/11 | 7,700 | 7,700 | ||||||
Toronto-Dominion Bank NY | ||||||||
0.33%, 10/28/11 (i) | 5,500 | 5,500 | ||||||
0.32%, 05/24/11 | 5,900 | 5,900 | ||||||
UBS AG Stamford | ||||||||
0.53%, 07/15/11 | 1,500 | 1,500 | ||||||
0.51%, 11/23/11 (i) | 4,700 | 4,700 | ||||||
0.34%, 03/02/11 | 9,200 | 9,200 | ||||||
| 199,656 | ||||||||
Commercial Paper 21.0% | ||||||||
Bank of America NA | ||||||||
0.30%, 01/11/11 | 8,000 | 7,999 | ||||||
0.25%, 01/28/11 | 4,200 | 4,199 | ||||||
Cargill Inc. | ||||||||
0.24%, 01/04/11 | 8,000 | 8,000 | ||||||
0.24%, 01/11/11 | 3,000 | 3,000 | ||||||
Chariot Funding LLC | ||||||||
0.24%, 01/18/11 (r) | 4,100 | 4,099 | ||||||
0.26%, 02/17/11 (r) | 4,300 | 4,298 | ||||||
Ciesco LLC | ||||||||
0.27%, 02/08/11 (r) | 5,000 | 4,999 | ||||||
0.27%, 03/07/11 (r) | 5,900 | 5,897 | ||||||
CRC Funding LLC, 0.30%, 01/10/11 (r) | 7,000 | 6,999 | ||||||
Falcon Asset Securitization Co. LLC | ||||||||
0.25%, 01/04/11 (r) | 5,700 | 5,700 | ||||||
0.23%, 01/13/11 (r) | 3,000 | 3,000 | ||||||
0.25%, 01/19/11 (r) | 2,200 | 2,200 | ||||||
General Electric Capital Corp. | ||||||||
0.26%, 04/04/11 | 3,000 | 2,998 | ||||||
0.32%, 06/14/11 | 14,300 | 14,279 | ||||||
Johnson & Johnson, 0.15%, 01/04/11 (r) | 7,300 | 7,300 | ||||||
Jupiter Securitization Corp., 0.25%, | ||||||||
01/12/11 (r) | 8,000 | 7,999 | ||||||
Market Street Funding | ||||||||
0.30%, 01/11/11 | 3,000 | 3,000 | ||||||
0.27%, 03/04/11 (r) | 5,800 | 5,797 | ||||||
0.29%, 01/10/11 (r) | 3,000 | 3,000 | ||||||
New York Life Capital, 0.24%, 01/06/11 | 3,000 | 3,000 | ||||||
Old Line Funding LLC | ||||||||
0.23%, 01/07/11 (r) | 4,800 | 4,800 | ||||||
0.26%, 03/15/11 (r) | 4,000 | 3,998 | ||||||
Procter & Gamble Co., 0.25%, 04/06/11 (r) | 6,400 | 6,396 | ||||||
Toyota Motor Credit Corp. | ||||||||
0.22%, 01/19/11 | 6,600 | 6,599 | ||||||
0.31%, 04/01/11 (r) | 8,500 | 8,493 | ||||||
Windmill Funding LLC | ||||||||
0.26%, 01/06/11 (r) | 8,600 | 8,600 | ||||||
0.26%, 01/18/11 (r) | 1,900 | 1,900 | ||||||
0.25%, 01/24/11 (r) | 1,300 | 1,300 | ||||||
| 149,849 | ||||||||
Federal Home Loan Bank 5.2% (w) |
| |||||||
Federal Home Loan Bank | ||||||||
0.34%, 02/16/11 | 2,200 | 2,199 | ||||||
0.40%, 12/12/11 | 15,000 | 14,999 | ||||||
0.41%, 12/12/11 | 8,000 | 8,000 | ||||||
0.45%, 12/16/11 - 12/23/11 | 11,995 | 11,995 | ||||||
| 37,193 | ||||||||
Federal Home Loan Mortgage Corp. 2.1% (w) |
| |||||||
Federal Home Loan Mortgage Corp. | ||||||||
0.31%, 01/10/11 | 2,000 | 2,000 | ||||||
0.33%, 01/10/11 | 3,595 | 3,595 | ||||||
0.37%, 02/18/11 | 1,000 | 1,000 | ||||||
| Shares/Par (p) | Value | |||||||
0.27%, 03/01/11 | 8,000 | 7,996 | ||||||
| 14,591 | ||||||||
Federal National Mortgage Association 2.8% (w) |
| |||||||
Federal National Mortgage Association | ||||||||
0.25%, 01/05/11 | 6,700 | 6,700 | ||||||
0.33%, 01/18/11 | 7,700 | 7,699 | ||||||
0.36%, 02/14/11 | 5,400 | 5,397 | ||||||
| 19,796 | ||||||||
Investment Company 0.0% | ||||||||
JPMorgan Prime Money Market Fund, 0.06% (h) | 77 | 77 | ||||||
Repurchase Agreements 36.7% |
| |||||||
Repurchase Agreement with Bank of America Securities, 0.20% (Collateralized by $96,027 Federal Home Loan Mortgage Corp., 5.00%, due 07/01/35, value $96,409, $45,206 Federal National Mortgage Association, 4.50%, due 09/01/40, value $45,371) acquired on 12/31/2010, due 01/03/2011 at $139,002 | $ | 139,000 | 139,000 | |||||
Repurchase Agreement with UBS Securities, 0.20% (Collateralized by $125,057 Federal Home Loan Mortgage Corp., 3.50% - 4.00%, due 06/01/25 - 12/01/40, value $125,460) acquired on 12/31/2010, due 01/03/2011 at $123,002 | 123,000 | 123,000 | ||||||
| 262,000 | ||||||||
Total Short Term Investments (cost $683,162) |
| 683,162 | ||||||
Total Investments - 100.0% (cost $713,255) |
| 713,255 | ||||||
Other Assets and Liabilities, Net - (0.0% ) |
| (3 | ) | |||||
Total Net Assets - 100.0% | $ | 713,252 | ||||||
JNL/Select Value Fund * (x) |
| |||||||
COMMON STOCKS - 97.8% |
| |||||||
CONSUMER DISCRETIONARY - 11.0% |
| |||||||
Comcast Corp. - Class A | 814 | $ | 17,891 | |||||
Home Depot Inc. | 357 | 12,513 | ||||||
Kohl’s Corp. (c) | 298 | 16,166 | ||||||
Mattel Inc. | 497 | 12,636 | ||||||
Stanley Black & Decker Inc. | 319 | 21,298 | ||||||
Target Corp. | 234 | 14,064 | ||||||
Other Securities | 32,969 | |||||||
| 127,537 | ||||||||
CONSUMER STAPLES - 7.3% |
| |||||||
CVS Caremark Corp. | 438 | 15,215 | ||||||
Kraft Foods Inc. - Class A | 447 | 14,079 | ||||||
Molson Coors Brewing Co. - Class B | 221 | 11,082 | ||||||
PepsiCo Inc. | 195 | 12,726 | ||||||
Philip Morris International Inc. | 225 | 13,140 | ||||||
Sysco Corp. | 453 | 13,330 | ||||||
Other Securities | 5,025 | |||||||
| 84,597 | ||||||||
ENERGY - 12.7% | ||||||||
Apache Corp. | 119 | 14,141 | ||||||
Baker Hughes Inc. | 258 | 14,750 | ||||||
Chevron Corp. | 371 | 33,845 | ||||||
ConocoPhillips | 235 | 15,990 | ||||||
See accompanying Notes to the Financial Statements.
JNL Series Trust
Schedules of Investments (in thousands)
December 31, 2010
| Shares/Par (p) | Value | |||||||
Exxon Mobil Corp. | 220 | 16,057 | ||||||
Marathon Oil Corp. | 312 | 11,561 | ||||||
Occidental Petroleum Corp. | 255 | 24,966 | ||||||
Other Securities | 14,861 | |||||||
| 146,171 | ||||||||
FINANCIALS - 23.1% | ||||||||
ACE Ltd. | 360 | 22,410 | ||||||
Bank of America Corp. | 1,182 | 15,761 | ||||||
Bank of New York Mellon Corp. | 404 | 12,196 | ||||||
BlackRock Inc. | 68 | 12,864 | ||||||
Chubb Corp. | 233 | 13,908 | ||||||
Goldman Sachs Group Inc. | 117 | 19,691 | ||||||
JPMorgan Chase & Co. | 818 | 34,683 | ||||||
Marsh & McLennan Cos. Inc. | 608 | 16,623 | ||||||
PNC Financial Services Group Inc. | 392 | 23,820 | ||||||
U.S. Bancorp | 423 | 11,416 | ||||||
Unum Group | 512 | 12,401 | ||||||
Wells Fargo & Co. | 1,310 | 40,600 | ||||||
Other Securities | 30,094 | |||||||
| 266,467 | ||||||||
HEALTH CARE - 11.1% | ||||||||
Amgen Inc. (c) | 216 | 11,842 | ||||||
Baxter International Inc. | 224 | 11,314 | ||||||
Johnson & Johnson | 182 | 11,226 | ||||||
Merck & Co. Inc. | 357 | 12,866 | ||||||
Pfizer Inc. | 1,546 | 27,067 | ||||||
Teva Pharmaceutical Industries Ltd. - ADR (e) | 272 | 14,179 | ||||||
UnitedHealth Group Inc. | 350 | 12,639 | ||||||
Other Securities | 27,089 | |||||||
| 128,222 | ||||||||
INDUSTRIALS - 11.1% | ||||||||
General Electric Co. | 1,416 | 25,902 | ||||||
Illinois Tool Works Inc. | 232 | 12,410 | ||||||
Ingersoll-Rand Plc | 435 | 20,498 | ||||||
Textron Inc. (e) | 496 | 11,721 | ||||||
Tyco International Ltd. | 400 | 16,576 | ||||||
Other Securities | 41,305 | |||||||
| 128,412 | ||||||||
INFORMATION TECHNOLOGY - 9.4% |
| |||||||
Analog Devices Inc. | 331 | 12,473 | ||||||
Cisco Systems Inc. (c) | 652 | 13,194 | ||||||
Intel Corp. | 729 | 15,335 | ||||||
Microsoft Corp. | 615 | 17,157 | ||||||
Xilinx Inc. (e) | 465 | 13,484 | ||||||
Other Securities | 36,946 | |||||||
| 108,589 | ||||||||
MATERIALS - 6.2% | ||||||||
Dow Chemical Co. | 389 | 13,263 | ||||||
EI Du Pont de Nemours & Co. | 229 | 11,423 | ||||||
Mosaic Co. | 157 | 11,988 | ||||||
Steel Dynamics Inc. | 803 | 14,693 | ||||||
Other Securities | 19,955 | |||||||
| 71,322 | ||||||||
TELECOMMUNICATION SERVICES - 2.8% |
| |||||||
AT&T Inc. | 1,104 | 32,445 | ||||||
UTILITIES - 3.1% | ||||||||
Entergy Corp. | 157 | 11,092 | ||||||
Other Securities | 24,191 | |||||||
| 35,283 | ||||||||
Total Common Stocks (cost $980,095) | 1,129,045 | |||||||
| Shares/Par (p) | Value | |||||||
SHORT TERM INVESTMENTS - 2.7% |
| |||||||
Investment Company - 2.3% | ||||||||
JNL Money Market Fund, 0.08% (a) (h) | 26,760 | 26,760 | ||||||
Securities Lending Collateral 0.4% |
| |||||||
Securities Lending Cash Collateral Fund LLC, 0.31% (a) (h) | 4,560 | 4,560 | ||||||
Securities Lending Liquidating Fund LLC, 0.66% (a) (h) | 344 | 338 | ||||||
| 4,898 | ||||||||
Total Short Term Investments (cost $31,664) | 31,658 | |||||||
Total Investments - 100.5% (cost $1,011,759) |
| 1,160,703 | ||||||
Other Assets and Liabilities, Net - (0.5%) |
| (5,378 | ) | |||||
Total Net Assets - 100.0% | $ | 1,155,325 | ||||||
JNL/T.Rowe Price Established Growth Fund * (x) |
| |||||||
COMMON STOCKS - 98.8% |
| |||||||
CONSUMER DISCRETIONARY - 18.7% |
| |||||||
Amazon.com Inc. (c) | 350 | $ | 62,964 | |||||
Coach Inc. | 359 | 19,856 | ||||||
Marriott International Inc. - Class A | 415 | 17,247 | ||||||
Nike Inc. - Class B | 172 | 14,692 | ||||||
Priceline.com Inc. (c) | 34 | 13,551 | ||||||
Starbucks Corp. | 678 | 21,775 | ||||||
Starwood Hotels & Resorts Worldwide Inc. | 205 | 12,466 | ||||||
Walt Disney Co. | 381 | 14,280 | ||||||
Other Securities | 105,274 | |||||||
| 282,105 | ||||||||
CONSUMER STAPLES - 2.4% |
| |||||||
Costco Wholesale Corp. | 161 | 11,604 | ||||||
Other Securities | 24,057 | |||||||
| 35,661 | ||||||||
ENERGY - 8.7% | ||||||||
Cameron International Corp. (c) | 240 | 12,155 | ||||||
EOG Resources Inc. | 163 | 14,909 | ||||||
FMC Technologies Inc. (c) | 130 | 11,532 | ||||||
Occidental Petroleum Corp. | 170 | 16,716 | ||||||
Peabody Energy Corp. | 168 | 10,762 | ||||||
Schlumberger Ltd. | 327 | 27,288 | ||||||
Suncor Energy Inc. | 407 | 15,580 | ||||||
Other Securities | 22,820 | |||||||
| 131,762 | ||||||||
FINANCIALS - 7.3% | ||||||||
American Express Co. | 450 | 19,327 | ||||||
Franklin Resources Inc. | 194 | 21,564 | ||||||
IntercontinentalExchange Inc. (c) | 104 | 12,392 | ||||||
Invesco Ltd. | 580 | 13,947 | ||||||
JPMorgan Chase & Co. | 449 | 19,051 | ||||||
Other Securities | 24,529 | |||||||
| 110,810 | ||||||||
HEALTH CARE - 6.1% | ||||||||
Express Scripts Inc. (c) | 498 | 26,895 | ||||||
McKesson Corp. | 215 | 15,097 | ||||||
Other Securities | 49,878 | |||||||
| 91,870 | ||||||||
See accompanying Notes to the Financial Statements.
JNL Series Trust
Schedules of Investments (in thousands)
December 31, 2010
| Shares/Par (p) | Value | |||||||
INDUSTRIALS - 15.2% |
| |||||||
3M Co. | 157 | 13,515 | ||||||
Danaher Corp. | 951 | 44,845 | ||||||
Emerson Electric Co. | 249 | 14,247 | ||||||
Expeditors International Washington Inc. | 233 | 12,727 | ||||||
Fastenal Co. (e) | 251 | 15,031 | ||||||
FedEx Corp. | 291 | 27,047 | ||||||
Precision Castparts Corp. | 130 | 18,125 | ||||||
Union Pacific Corp. | 154 | 14,270 | ||||||
United Parcel Service Inc. - Class B | 199 | 14,451 | ||||||
Other Securities | 56,361 | |||||||
| 230,619 | ||||||||
INFORMATION TECHNOLOGY - 31.2% |
| |||||||
Accenture Plc - Class A | 307 | 14,896 | ||||||
Apple Inc. (c) | 348 | 112,089 | ||||||
Baidu.com - ADR (c) | 292 | 28,158 | ||||||
Broadcom Corp. - Class A | 372 | 16,201 | ||||||
Corning Inc. | 1,043 | 20,141 | ||||||
Dolby Laboratories Inc. - Class A (c) (e) | 222 | 14,804 | ||||||
eBay Inc. (c) | 473 | 13,155 | ||||||
Google Inc. - Class A (c) | 132 | 78,107 | ||||||
Juniper Networks Inc. (c) | 553 | 20,413 | ||||||
MasterCard Inc. - Class A | 78 | 17,548 | ||||||
QUALCOMM Inc. | 614 | 30,402 | ||||||
Tencent Holdings Ltd. | 539 | 11,712 | ||||||
Visa Inc. - Class A | 412 | 29,018 | ||||||
Other Securities | 64,860 | |||||||
| 471,504 | ||||||||
MATERIALS - 5.4% |
| |||||||
BHP Billiton Ltd. (e) | 312 | 14,424 | ||||||
Freeport-McMoRan Copper & Gold Inc. | 99 | 11,913 | ||||||
Praxair Inc. | 348 | 33,204 | ||||||
Other Securities | 21,724 | |||||||
| 81,265 | ||||||||
TELECOMMUNICATION SERVICES - 3.8% |
| |||||||
American Tower Corp. - Class A (c) | 473 | 24,411 | ||||||
Crown Castle International Corp. (c) | 753 | 32,996 | ||||||
| 57,407 | ||||||||
Total Common Stocks (cost $1,155,560) | 1,493,003 | |||||||
PREFERRED STOCKS - 0.2% |
| |||||||
CONSUMER DISCRETIONARY - 0.2% |
| |||||||
Other Securities | 3,407 | |||||||
Total Preferred Stocks (cost $3,407) | 3,407 | |||||||
SHORT TERM INVESTMENTS - 2.8% |
| |||||||
Investment Companies - 1.4% |
| |||||||
JNL Money Market Fund, 0.08% (a) (h) | 250 | 250 | ||||||
T. Rowe Price Reserves Investment Fund, | 21,210 | 21,210 | ||||||
Securities Lending Collateral 1.4% |
| |||||||
Securities Lending Cash Collateral Fund LLC, | 18,620 | 18,620 | ||||||
Securities Lending Liquidating Fund LLC, | 2,778 | 2,732 | ||||||
| 21,351 | ||||||||
Total Short Term Investments (cost $42,858) | 42,812 | |||||||
| Shares/Par (p) | Value | |||||||
Total Investments - 101.8% (cost $1,201,825) |
| 1,539,222 | ||||||
Other Assets and Liabilities, Net - (1.8%) |
| (27,593 | ) | |||||
Total Net Assets - 100.0% |
| $ | 1,511,629 | |||||
JNL/T.Rowe Price Mid-Cap Growth Fund * (x) |
| |||||||
COMMON STOCKS - 95.5% |
| |||||||
CONSUMER DISCRETIONARY - 14.8% |
| |||||||
Cablevision Systems Corp. - Class A | 405 | $ | 13,705 | |||||
Carmax Inc. (c) | 499 | 15,908 | ||||||
Chipotle Mexican Grill Inc. - Class A (c) | 83 | 17,651 | ||||||
Discovery Communications Inc. - Class A (c) | 205 | 8,548 | ||||||
Discovery Communications Inc. - Class C (c) | 237 | 8,696 | ||||||
Dollar General Corp. (c) (e) | 538 | 16,500 | ||||||
Expedia Inc. | 549 | 13,774 | ||||||
Lamar Advertising Co. - Class A (c) | 405 | 16,135 | ||||||
Liberty Media Corp. - Starz (c) | 104 | 6,914 | ||||||
Liberty Media Corp. - Interactive (c) | 617 | 9,730 | ||||||
Marriott International Inc. - Class A | 413 | 17,156 | ||||||
O’Reilly Automotive Inc. (c) | 218 | 13,172 | ||||||
Other Securities | 49,709 | |||||||
| 207,598 | ||||||||
CONSUMER STAPLES - 1.7% |
| |||||||
Shoppers Drug Mart Corp. (e) | 308 | 12,245 | ||||||
Whole Foods Market Inc. (c) | 241 | 12,192 | ||||||
| 24,437 | ||||||||
ENERGY - 9.2% | ||||||||
Consol Energy Inc. | 326 | 15,889 | ||||||
FMC Technologies Inc. (c) | 157 | 13,959 | ||||||
McDermott International Inc. (c) | 835 | 17,276 | ||||||
Range Resources Corp. | 309 | 13,899 | ||||||
Other Securities | 67,924 | |||||||
| 128,947 | ||||||||
FINANCIALS - 7.8% | ||||||||
MSCI Inc. - Class A (c) | 329 | 12,818 | ||||||
Other Securities | 96,227 | |||||||
| 109,045 | ||||||||
HEALTH CARE - 15.6% | ||||||||
Cephalon Inc. (c) | 208 | 12,838 | ||||||
Community Health Systems Inc. (c) | 378 | 14,126 | ||||||
Covance Inc. (c) | 277 | 14,241 | ||||||
CR Bard Inc. | 138 | 12,664 | ||||||
Edwards Lifesciences Corp. (c) | 173 | 13,985 | ||||||
Henry Schein Inc. (c) | 224 | 13,751 | ||||||
Illumina Inc. (c) (e) | 193 | 12,225 | ||||||
Waters Corp. (c) | 173 | 13,444 | ||||||
Other Securities | 112,122 | |||||||
| 219,396 | ||||||||
INDUSTRIALS - 17.7% | ||||||||
AMETEK Inc. | 594 | 23,315 | ||||||
Fastenal Co. (e) | 266 | 15,936 | ||||||
Gardner Denver Inc. | 239 | 16,448 | ||||||
Hertz Global Holdings Inc. (c) (e) | 1,104 | 15,997 | ||||||
IHS Inc. - Class A (c) (e) | 242 | 19,454 | ||||||
Quanta Services Inc. (c) | 690 | 13,745 | ||||||
Robert Half International Inc. | 397 | 12,148 | ||||||
Roper Industries Inc. | 241 | 18,420 | ||||||
WABCO Holdings Inc. (c) | 225 | 13,709 | ||||||
See accompanying Notes to the Financial Statements.
JNL Series Trust
Schedules of Investments (in thousands)
December 31, 2010
| Shares/Par (p) | Value | |||||||
Other Securities | 99,687 | |||||||
| 248,859 | ||||||||
INFORMATION TECHNOLOGY - 25.6% |
| |||||||
Altera Corp. | 352 | 12,524 | ||||||
Dolby Laboratories Inc. - Class A (c) (e) | 208 | 13,874 | ||||||
Factset Research Systems Inc. | 139 | 13,033 | ||||||
Fiserv Inc. (c) | 294 | 17,217 | ||||||
Global Payments Inc. | 370 | 17,098 | ||||||
JDS Uniphase Corp. (c) | 1,258 | 18,216 | ||||||
Juniper Networks Inc. (c) | 386 | 14,251 | ||||||
Nuance Communications | 689 | 12,526 | ||||||
Red Hat Inc. (c) | 320 | 14,608 | ||||||
Rovi Corp. (c) | 242 | 15,006 | ||||||
Solera Holdings Inc. | 276 | 14,164 | ||||||
Trimble Navigation Ltd. (c) | 311 | 12,418 | ||||||
Western Union Co. | 759 | 14,095 | ||||||
Xilinx Inc. | 448 | 12,983 | ||||||
Other Securities | 156,975 | |||||||
| 358,988 | ||||||||
MATERIALS - 2.1% | ||||||||
Agnico-Eagle Mines Ltd. | 237 | 18,178 | ||||||
Other Securities | 10,854 | |||||||
| 29,032 | ||||||||
UTILITIES - 1.0% | ||||||||
Calpine Corp. (c) | 1,103 | 14,714 | ||||||
Total Common Stocks | 1,341,016 | |||||||
SHORT TERM INVESTMENTS - 11.4% |
| |||||||
Investment Companies - 4.7% |
| |||||||
JNL Money Market Fund, 0.08% (a) (h) | 4,056 | 4,056 | ||||||
T. Rowe Price Reserves Investment Fund, | 62,363 | 62,363 | ||||||
Securities Lending Collateral 6.7% |
| |||||||
Securities Lending Cash Collateral Fund LLC, 0.31% (a) (h) | 88,427 | 88,427 | ||||||
Securities Lending Liquidating Fund LLC, 0.66% (a) (h) | 5,908 | 5,811 | ||||||
| 94,238 | ||||||||
Total Short Term Investments | 160,657 | |||||||
Total Investments - 106.9% (cost $1,181,512) | 1,501,673 | |||||||
Other Assets and Liabilities, Net - (6.9%) | (96,713) | |||||||
Total Net Assets - 100.0% | $ | 1,404,961 | ||||||
JNL/T.Rowe Price Short-Term Bond Fund |
| |||||||
NON-U.S. GOVERNMENT AGENCY ASSET-BACKED SECURITIES - 12.9% |
| |||||||
Ally Auto Receivables Trust | ||||||||
1.45%, 05/15/14 | $ | 1,815 | $ | 1,826 | ||||
1.38%, 07/15/14 | 3,119 | 3,136 | ||||||
American Express Credit Account Master Trust, 5.55%, 01/15/14 | 875 | 894 | ||||||
AmeriCredit Automobile Receivables Trust | ||||||||
0.97%, 01/15/13 | 1,620 | 1,620 | ||||||
3.72%, 11/17/14 | 355 | 366 | ||||||
Banc of America Commercial Mortgage Inc. REMIC | ||||||||
4.63%, 12/10/42 | 680 | 710 | ||||||
| Shares/Par (p) | Value | |||||||
4.62%, 07/10/43 | 3,200 | 3,311 | ||||||
Bank of America Auto Trust | ||||||||
0.75%, 06/15/12 (r) | 1,166 | 1,167 | ||||||
1.31%, 07/15/14 | 3,520 | 3,548 | ||||||
BCAP LLC Trust REMIC, 0.90%, 11/25/36 (i) | 43 | 41 | ||||||
Cabela’s Master Credit Card Trust | ||||||||
5.26%, 10/15/14 (r) | 300 | 309 | ||||||
1.71%, 01/16/18 (i) (r) | 1,700 | 1,752 | ||||||
CarMax Auto Owner Trust | ||||||||
4.79%, 02/15/13 | 780 | 799 | ||||||
1.56%, 07/15/14 | 1,325 | 1,335 | ||||||
1.41%, 02/16/15 | 2,490 | 2,507 | ||||||
2.04%, 10/15/15 | 2,420 | 2,432 | ||||||
3.75%, 12/15/15 | 660 | 675 | ||||||
4.88%, 08/15/16 | 420 | 430 | ||||||
Chase Issuance Trust, 5.12%, 10/15/14 | 4,345 | 4,666 | ||||||
Chrysler Financial Lease Trust REMIC, 1.78%, 06/15/11 (r) | 1,492 | 1,494 | ||||||
Citibank Credit Card Issuance Trust, 0.58%, 10/07/13 (i) | 2,350 | 2,341 | ||||||
CitiFinancial Auto Issuance Trust | ||||||||
2.59%, 10/15/13 (r) | 1,538 | 1,562 | ||||||
3.15%, 08/15/16 (r) | 3,690 | 3,799 | ||||||
CNH Equipment Trust | ||||||||
1.85%, 12/16/13 | 584 | 589 | ||||||
1.54%, 07/15/14 | 2,000 | 2,016 | ||||||
1.03%, 11/17/14 | 1,630 | 1,629 | ||||||
3.00%, 08/17/15 | 2,445 | 2,519 | ||||||
Commercial Mortgage Loan Trust REMIC, 6.01%, 09/10/12 (i) | 2,451 | 2,550 | ||||||
CS First Boston Mortgage Securities Corp. REMIC | ||||||||
5.01%, 01/15/12 (i) | 1,455 | 1,546 | ||||||
6.53%, 06/15/34 | 1,483 | 1,491 | ||||||
Discover Card Master Trust | ||||||||
1.56%, 12/15/14 (i) | 3,500 | 3,546 | ||||||
0.91%, 09/15/15 (i) | 3,090 | 3,106 | ||||||
Ford Credit Auto Owner Trust | ||||||||
1.51%, 01/15/14 | 1,990 | 2,005 | ||||||
0.98%, 10/15/14 | 2,500 | 2,507 | ||||||
2.42%, 11/15/14 | 1,823 | 1,872 | ||||||
8.14%, 02/15/16 (r) | 415 | 463 | ||||||
Ford Credit Floorplan Master Owner Trust | ||||||||
4.20%, 02/15/17 (r) | 438 | 463 | ||||||
REMIC, 1.50%, 09/15/15 | 3,700 | 3,670 | ||||||
GE Capital Credit Card Master Note Trust, 2.21%, 06/15/16 | 3,770 | 3,833 | ||||||
GE Equipment Midticket LLC, 0.94%, 07/14/14 (r) | 2,710 | 2,704 | ||||||
GS Auto Loan Trust, 5.48%, 12/15/14 | 2,715 | 2,775 | ||||||
Harborview Mortgage Loan Trust REMIC, 5.20%, 08/19/36 (i) | 1,241 | 795 | ||||||
Honda Auto Receivables Owner Trust | ||||||||
1.25%, 10/21/13 | 1,680 | 1,689 | ||||||
1.34%, 03/18/14 | 1,890 | 1,904 | ||||||
1.98%, 05/23/16 | 545 | 555 | ||||||
HSBC Home Equity Loan Trust REMIC, 0.41%, 03/20/36 (i) | 1,696 | 1,588 | ||||||
John Deere Owner Trust, 1.57%, 10/15/13 | 715 | 720 | ||||||
JP Morgan Chase Commercial Mortgage Securities Corp. REMIC, 4.68%, 07/15/42 | 1,225 | 1,271 | ||||||
JPMorgan Mortgage Trust REMIC, 2.91%, 07/25/35 (i) | 402 | 355 | ||||||
MMAF Equipment Finance LLC, 2.37%, 11/15/13 (r) | 1,572 | 1,589 | ||||||
Morgan Stanley Capital I REMIC | ||||||||
4.99%, 08/13/42 | 1,565 | 1,657 | ||||||
6.28%, 01/11/43 (i) | 2,430 | 2,660 | ||||||
See accompanying Notes to the Financial Statements.
JNL Series Trust
Schedules of Investments (in thousands)
December 31, 2010
| Shares/Par (p) | Value | |||||||
Navistar Financial Corp. Owner Trust, 1.08%, 03/18/14 (r) | 1,425 | 1,423 | ||||||
Nissan Auto Lease Trust, 3.51%, 11/17/14 | 880 | 892 | ||||||
Sequoia Mortgage Trust REMIC, 3.75%, 02/25/40 (i) | 362 | 367 | ||||||
Structured Adjustable Rate Mortgage Loan Trust REMIC, 6.00%, | 1,885 | 974 | ||||||
Structured Asset Securities Corp. REMIC, 2.74%, 09/25/33 (i) | 804 | 670 | ||||||
Thornburg Mortgage Securities Trust REMIC, 0.38%, 07/25/36 (i) | 1,547 | 1,534 | ||||||
Toyota Auto Receivables Owner | 1,385 | 1,394 | ||||||
USAA Auto Owner Trust | ||||||||
1.30%, 06/16/14 | 1,120 | 1,127 | ||||||
2.14%, 09/15/15 | 895 | 913 | ||||||
Volkswagen Auto Loan Enhanced Trust, 0.66%, 05/21/12 | 967 | 967 | ||||||
Wachovia Bank Commercial Mortgage Trust REMIC, 4.94%, 04/15/42 | 670 | 712 | ||||||
Wells Fargo Mortgage Backed Securities Trust REMIC, 2.91%, 04/25/35 (i) | 2,715 | 2,566 | ||||||
World Financial Network Credit Card Master Trust | ||||||||
3.79%, 05/15/16 | 570 | 589 | ||||||
4.66%, 05/15/17 | 3,640 | 3,861 | ||||||
Total Non-U.S. Government Agency Asset- Backed Securities | 112,776 | |||||||
CORPORATE BONDS AND NOTES - 47.8% |
| |||||||
CONSUMER DISCRETIONARY - 3.9% |
| |||||||
Anglo American Capital Plc, 2.15%, | 2,040 | 2,058 | ||||||
Comcast Cable Communications Holdings Inc., 6.75%, 01/30/11 | 2,470 | 2,482 | ||||||
COX Communications Inc. | ||||||||
6.75%, 03/15/11 | 2,200 | 2,226 | ||||||
5.45%, 12/15/14 | 2,100 | 2,312 | ||||||
Daimler Finance North America LLC, 7.75%, 01/18/11 | 2,925 | 2,934 | ||||||
DirecTV Holdings LLC, 4.75%, 10/01/14 | 3,735 | 3,981 | ||||||
Home Depot Inc., 5.20%, 03/01/11 | 1,370 | 1,380 | ||||||
Lowe’s Companies Inc., 2.13%, 04/15/16 | 1,620 | 1,584 | ||||||
NBC Universal Inc., 2.10%, 04/01/14 (r) | 3,010 | 3,001 | ||||||
Staples Inc. | ||||||||
7.75%, 04/01/11 (l) | 2,140 | 2,174 | ||||||
9.75%, 01/15/14 (l) | 1,000 | 1,212 | ||||||
TCM Sub LLC, 3.55%, 01/15/15 (r) | 3,250 | 3,317 | ||||||
Thomson Reuters Corp., 5.95%, 07/15/13 | 1,000 | 1,110 | ||||||
Time Warner Cable Inc., 5.40%, 07/02/12 | 3,870 | 4,109 | ||||||
| 33,880 | ||||||||
CONSUMER STAPLES - 3.7% |
| |||||||
Altria Group Inc., 8.50%, 11/10/13 (l) | 2,465 | 2,918 | ||||||
Anheuser-Busch InBev Worldwide Inc. | ||||||||
3.00%, 10/15/12 | 3,830 | 3,952 | ||||||
7.20%, 01/15/14 (r) | 1,100 | 1,258 | ||||||
BAT International Finance Plc, 8.13%, | 2,950 | 3,446 | ||||||
Church & Dwight Co. Inc., 3.35%, 12/15/15 | 800 | 803 | ||||||
Coca-Cola Amatil Ltd., 3.25%, | 1,385 | 1,407 | ||||||
Coca-Cola Bottling Co., 5.00%, 11/15/12 | 2,000 | 2,119 | ||||||
Coca-Cola Co., 0.75%, 11/15/13 | 4,215 | 4,160 | ||||||
Coca-Cola Enterprises Inc., 1.13%, 11/12/13 | 2,160 | 2,139 | ||||||
General Mills Inc., 6.00%, 02/15/12 | 1,400 | 1,476 | ||||||
Kraft Foods Inc. | ||||||||
6.25%, 06/01/12 | 433 | 463 | ||||||
| Shares/Par (p) | Value | |||||||
2.63%, 05/08/13 | 1,130 | 1,162 | ||||||
Kroger Co. | ||||||||
6.80%, 04/01/11 | 885 | 898 | ||||||
6.75%, 04/15/12 | 625 | 667 | ||||||
7.50%, 01/15/14 | 700 | 807 | ||||||
SABMiller Plc, 6.20%, 07/01/11 (r) | 2,090 | 2,144 | ||||||
Safeway Inc. | ||||||||
6.50%, 03/01/11 | 300 | 302 | ||||||
5.80%, 08/15/12 | 2,080 | 2,239 | ||||||
| 32,360 | ||||||||
ENERGY - 4.0% |
| |||||||
Canadian Natural Resources Ltd. | ||||||||
5.45%, 10/01/12 | 565 | 606 | ||||||
5.15%, 02/01/13 | 1,620 | 1,746 | ||||||
CenterPoint Energy Resources Corp., 7.88%, 04/01/13 | 1,575 | 1,780 | ||||||
Devon Financing Corp. ULC, 6.88%, 09/30/11 | 1,800 | 1,880 | ||||||
Enterprise Products Operating LLC | ||||||||
4.60%, 08/01/12 | 1,785 | 1,873 | ||||||
6.38%, 02/01/13 | 675 | 736 | ||||||
Korea Hydro & Nuclear Power Co. Ltd., 3.13%, 09/16/15 (r) | 1,275 | 1,236 | ||||||
Marathon Oil Corp., 6.50%, 02/15/14 | 1,110 | 1,250 | ||||||
MidAmerican Energy Holdings Co., 5.00%, 02/15/14 | 1,825 | 1,962 | ||||||
Nabors Industries Inc., 5.38%, 08/15/12 | 910 | 961 | ||||||
Noble Holding International Ltd., 3.45%, 08/01/15 | 370 | 378 | ||||||
Occidental Petroleum Corp., 1.45%, 12/13/13 | 3,300 | 3,314 | ||||||
Plains All American Pipeline LP, 4.25%, 09/01/12 | 3,090 | 3,222 | ||||||
SeaRiver Maritime Inc., 0.00%, 09/01/12 (j) | 1,800 | 1,731 | ||||||
Shell International Finance BV, 1.88%, 03/25/13 | 2,615 | 2,654 | ||||||
Texas Gas Transmission LLC, 5.50%, | 2,355 | 2,532 | ||||||
Transocean Inc., 5.25%, 03/15/13 (e) | 2,185 | 2,304 | ||||||
Weatherford International Inc., 5.95%, 06/15/12 | 2,965 | 3,140 | ||||||
Williams Partners LP, 3.80%, 02/15/15 | 1,496 | 1,546 | ||||||
| 34,851 | ||||||||
FINANCIALS - 20.2% |
| |||||||
Allstate Corp., 6.13%, 02/15/12 | 2,400 | 2,528 | ||||||
American Express Bank FSB, 5.55%, 10/17/12 | 1,375 | 1,471 | ||||||
American Express Centurion Bank, 5.55%, 10/17/12 | 1,500 | 1,604 | ||||||
American Honda Finance Corp., 2.38%, 03/18/13 (r) | 1,260 | 1,281 | ||||||
ANZ National International Ltd., 2.38%, 12/21/12 (r) | 1,515 | 1,538 | ||||||
Australia & New Zealand Banking Group Ltd., 2.40%, 01/11/13 (r) | 730 | 742 | ||||||
Banco Bradesco SA, 4.10%, 03/23/15 (r) | 1,115 | 1,138 | ||||||
Bank of Nova Scotia | ||||||||
2.25%, 01/22/13 | 925 | 944 | ||||||
2.38%, 12/17/13 | 3,280 | 3,379 | ||||||
Barclays Bank Plc, 5.20%, 07/10/14 | 4,385 | 4,736 | ||||||
BB&T Corp., 3.85%, 07/27/12 | 2,770 | 2,882 | ||||||
Bear Stearns Cos. Inc., 6.95%, 08/10/12 | 2,429 | 2,650 | ||||||
BPCE SA, 2.38%, 10/04/13 (r) | 4,125 | 4,110 | ||||||
Caterpillar Financial Services Corp., 4.85%, 12/07/12 | 3,270 | 3,508 | ||||||
Charles Schwab Corp., 4.95%, 06/01/14 | 850 | 924 | ||||||
Citigroup Inc. | ||||||||
5.13%, 02/14/11 | 155 | 156 | ||||||
5.50%, 04/11/13 | 2,150 | 2,289 | ||||||
5.85%, 07/02/13 | 1,500 | 1,619 | ||||||
See accompanying Notes to the Financial Statements.
JNL Series Trust
Schedules of Investments (in thousands)
December 31, 2010
| Shares/Par (p) | Value | |||||||
6.38%, 08/12/14 | 1,000 | 1,105 | ||||||
Commonwealth Bank of Australia, 2.75%, 10/15/12 (r) | 1,170 | 1,200 | ||||||
Countrywide Home Loans Inc., 4.00%, 03/22/11 | 1,150 | 1,158 | ||||||
Credit Suisse New York, 3.45%, 07/02/12 | 1,275 | 1,322 | ||||||
Crown Castle Towers LLC, 4.52%, | 1,515 | 1,574 | ||||||
Deutsche Bank AG London, 5.38%, 10/12/12 | 3,090 | 3,321 | ||||||
Enel Finance International SA, 3.88%, | 2,420 | 2,461 | ||||||
ERAC USA Finance Co. | ||||||||
8.00%, 01/15/11 (r) | 1,435 | 1,439 | ||||||
5.80%, 10/15/12 (r) | 3,492 | 3,744 | ||||||
2.75%, 07/01/13 (r) | 1,030 | 1,048 | ||||||
Fifth Third Bancorp, 6.25%, 05/01/13 | 2,495 | 2,704 | ||||||
General Electric Capital Corp. | ||||||||
3.50%, 08/13/12 | 4,410 | 4,569 | ||||||
2.00%, 09/28/12 | 5,200 | 5,312 | ||||||
3.75%, 11/14/14 | 800 | 827 | ||||||
2.25%, 11/09/15 | 2,200 | 2,115 | ||||||
Goldman Sachs Group Inc. | ||||||||
3.63%, 08/01/12 | 2,550 | 2,632 | ||||||
4.75%, 07/15/13 | 1,000 | 1,065 | ||||||
5.25%, 10/15/13 | 2,375 | 2,570 | ||||||
HSBC Bank Plc, 1.63%, 08/12/13 (r) | 2,005 | 2,008 | ||||||
HSBC Holdings Plc, 5.25%, 12/12/12 | 1,640 | 1,744 | ||||||
Intesa Sanpaolo SpA, 3.63%, 08/12/15 (r) | 2,850 | 2,755 | ||||||
John Deere Capital Corp. | ||||||||
1.05%, 06/10/11 (i) | 1,800 | 1,806 | ||||||
4.95%, 12/17/12 | 2,610 | 2,815 | ||||||
JPMorgan Chase & Co. | ||||||||
0.94%, 02/26/13 (i) | 2,310 | 2,320 | ||||||
4.65%, 06/01/14 | 885 | 945 | ||||||
KeyCorp, 3.75%, 08/13/15 | 1,960 | 1,967 | ||||||
Kilroy Realty LP, 5.00%, 11/03/15 | 2,045 | 2,030 | ||||||
Kreditanstalt fuer Wiederaufbau, 4.75%, 05/15/12 | 4,500 | 4,748 | ||||||
LeasePlan Corp. NV, 3.00%, 05/07/12 (r) | 1,900 | 1,952 | ||||||
Lloyds TSB Bank Plc., 4.38%, 01/12/15 (r) | 1,750 | 1,750 | ||||||
Merrill Lynch & Co. Inc. | ||||||||
0.49%, 07/25/11 (i) | 1,250 | 1,249 | ||||||
5.45%, 02/05/13 | 1,530 | 1,614 | ||||||
MetLife Inc. | ||||||||
5.38%, 12/15/12 | 995 | 1,066 | ||||||
1.54%, 08/06/13 (i) | 2,220 | 2,254 | ||||||
Metropolitan Life Global Funding I | ||||||||
2.88%, 09/17/12 (r) | 1,000 | 1,025 | ||||||
2.50%, 01/11/13 (r) | 730 | 746 | ||||||
5.13%, 06/10/14 (r) | 500 | 544 | ||||||
Morgan Stanley | ||||||||
5.05%, 01/21/11 | 1,925 | 1,930 | ||||||
5.63%, 01/09/12 | 3,195 | 3,336 | ||||||
4.20%, 11/20/14 | 265 | 271 | ||||||
National Australia Bank Ltd., 2.35%, | 1,475 | 1,503 | ||||||
National Rural Utilities Cooperative Finance Corp. | ||||||||
7.25%, 03/01/12 | 665 | 713 | ||||||
2.63%, 09/16/12 | 1,070 | 1,100 | ||||||
1.13%, 11/01/13 | 1,235 | 1,221 | ||||||
New York Life Global Funding, 2.25%, | 2,415 | 2,474 | ||||||
Nordea Bank AB | ||||||||
2.50%, 11/13/12 (r) | 765 | 782 | ||||||
1.75%, 10/04/13 (r) | 2,795 | 2,781 | ||||||
PACCAR Financial Corp. | ||||||||
1.95%, 12/17/12 | 1,620 | 1,650 | ||||||
2.05%, 06/17/13 | 970 | 987 | ||||||
| Shares/Par (p) | Value | |||||||
Principal Financial Group Inc., 7.88%, | 1,500 | 1,728 | ||||||
Prudential Financial Inc. | ||||||||
3.63%, 09/17/12 | 3,080 | 3,197 | ||||||
2.75%, 01/14/13 | 490 | 499 | ||||||
Rabobank Nederland NV, 4.20%, | 1,150 | 1,223 | ||||||
Regions Financial Corp., 5.75%, 06/15/15 | 1,330 | 1,302 | ||||||
Royal Bank of Scotland Plc | ||||||||
2.63%, 05/11/12 (r) | 5,200 | 5,323 | ||||||
3.40%, 08/23/13 | 2,645 | 2,672 | ||||||
Santander US Debt SA Unipersonal, 2.49%, 01/18/13 (r) | 1,800 | 1,742 | ||||||
Santander US Debt SA Unipersonal, 2.99%, 10/07/13 (r) | 2,300 | 2,234 | ||||||
Simon Property Group LP, 4.20%, 02/01/15 | 540 | 565 | ||||||
SLM Corp., 5.13%, 08/27/12 (e) | 2,810 | 2,868 | ||||||
Societe Generale, 2.50%, 01/15/14 (e) (r) | 3,110 | 3,107 | ||||||
Standard Chartered Plc, 3.85%, 04/27/15 (r) | 1,840 | 1,894 | ||||||
U.S. Bank NA, 6.38%, 08/01/11 | 2,700 | 2,790 | ||||||
UBS AG Stamford | ||||||||
1.38%, 02/23/12 (i) | 1,475 | 1,485 | ||||||
2.25%, 08/12/13 | 1,900 | 1,916 | ||||||
US Bancorp, 2.00%, 06/14/13 | 1,810 | 1,837 | ||||||
Ventas Realty LP, 3.13%, 11/30/15 | 1,220 | 1,175 | ||||||
Wachovia Capital Trust III, 5.80%, (callable at 100 beginning 03/15/11) (m) | 425 | 369 | ||||||
WEA Finance LLC, 5.40%, 10/01/12 (r) | 550 | 583 | ||||||
Wells Fargo & Co., 5.25%, 10/23/12 | 1,435 | 1,538 | ||||||
Westpac Banking Corp., 2.10%, 08/02/13 | 3,250 | 3,283 | ||||||
Woodside Finance Ltd. | ||||||||
6.70%, 08/01/11 (r) | 300 | 310 | ||||||
4.50%, 11/10/14 (r) | 1,020 | 1,072 | ||||||
| 176,463 | ||||||||
HEALTH CARE - 4.0% |
| |||||||
AmerisourceBergen Corp., 5.63%, 09/15/12 | 3,435 | 3,669 | ||||||
Boston Scientific Corp. | ||||||||
4.25%, 01/12/11 | 2,555 | 2,557 | ||||||
4.50%, 01/15/15 | 1,650 | 1,685 | ||||||
Cardinal Health Inc. | ||||||||
6.75%, 02/15/11 | 1,762 | 1,773 | ||||||
5.50%, 06/15/13 | 2,265 | 2,453 | ||||||
Celgene Corp., 2.45%, 10/15/15 | 1,720 | 1,671 | ||||||
Express Scripts Inc., 5.25%, 06/15/12 | 3,455 | 3,647 | ||||||
Life Technologies Corp. | ||||||||
3.38%, 03/01/13 | 2,695 | 2,756 | ||||||
3.50%, 01/15/16 | 1,910 | 1,904 | ||||||
Medco Health Solutions Inc., 2.75%, 09/15/15 | 1,280 | 1,270 | ||||||
Novartis Capital Corp., 1.90%, 04/24/13 | 3,000 | 3,048 | ||||||
Teva Pharmaceutical Finance III LLC, 1.50%, 06/15/12 | 1,865 | 1,882 | ||||||
Watson Pharmaceuticals Inc., 5.00%, 08/15/14 | 1,500 | 1,612 | ||||||
WellPoint Inc. | ||||||||
5.00%, 01/15/11 | 2,350 | 2,354 | ||||||
6.80%, 08/01/12 | 2,230 | 2,422 | ||||||
| 34,703 | ||||||||
INDUSTRIALS - 1.7% |
| |||||||
Allied Waste Industries Inc., 5.75%, 02/15/11 | 2,475 | 2,487 | ||||||
CSX Corp. | ||||||||
6.30%, 03/15/12 | 220 | 233 | ||||||
5.75%, 03/15/13 | 1,350 | 1,472 | ||||||
GATX Corp., 4.75%, 10/01/12 | 1,970 | 2,064 | ||||||
Northrop Grumman Systems Corp., 7.13%, 02/15/11 | 2,225 | 2,241 | ||||||
Republic Services Inc., 6.75%, 08/15/11 | 875 | 903 | ||||||
Southwest Airlines Co., 6.50%, 03/01/12 | 3,805 | 3,984 | ||||||
See accompanying Notes to the Financial Statements.
JNL Series Trust
Schedules of Investments (in thousands)
December 31, 2010
| Shares/Par (p) | Value | |||||||
Waste Management Inc., 6.38%, 11/15/12 | 1,083 | 1,181 | ||||||
| 14,565 | ||||||||
INFORMATION TECHNOLOGY - 2.0% |
| |||||||
Agilent Technologies Inc., 2.50%, 07/15/13 | 630 | 637 | ||||||
Broadcom Corp., 1.50%, 11/01/13 (r) | 1,065 | 1,058 | ||||||
Hewlett Packard Co., 2.25%, 05/27/11 | 2,500 | 2,521 | ||||||
International Business Machines Corp., 1.00%, 08/05/13 | 5,000 | 4,982 | ||||||
Microsoft Corp., 0.88%, 09/27/13 | 3,970 | 3,948 | ||||||
Oracle Corp., 5.00%, 01/15/11 | 1,000 | 1,002 | ||||||
Xerox Corp. | ||||||||
5.50%, 05/15/12 | 2,085 | 2,202 | ||||||
5.65%, 05/15/13 | 1,000 | 1,084 | ||||||
| 17,434 | ||||||||
MATERIALS - 2.3% | ||||||||
ArcelorMittal, 5.38%, 06/01/13 | 1,350 | 1,435 | ||||||
Barrick Gold Corp., 6.13%, 09/15/13 | 1,750 | 1,959 | ||||||
BHP Billiton Finance USA Ltd. | ||||||||
5.13%, 03/29/12 | 655 | 689 | ||||||
4.80%, 04/15/13 | 375 | 406 | ||||||
CRH America Inc., 5.30%, 10/15/13 | 980 | 1,052 | ||||||
Dow Chemical Co. | ||||||||
6.00%, 10/01/12 | 1,451 | 1,563 | ||||||
2.50%, 02/15/16 | 2,615 | 2,511 | ||||||
Lafarge SA, 6.15%, 07/15/11 | 3,370 | 3,458 | ||||||
Praxair Inc., 2.13%, 06/14/13 | 2,425 | 2,477 | ||||||
Rio Tinto Finance USA Ltd., 8.95%, 05/01/14 (l) | 3,905 | 4,728 | ||||||
| 20,278 | ||||||||
TELECOMMUNICATION SERVICES - 2.7% |
| |||||||
America Movil SAB de CV, 3.63%, 03/30/15 (e) | 1,580 | 1,625 | ||||||
American Tower Corp., 4.63%, 04/01/15 | 1,605 | 1,677 | ||||||
AT&T Corp., 7.30%, 11/15/11 (l) | 2,500 | 2,641 | ||||||
Rogers Cable Inc. | ||||||||
6.25%, 06/15/13 | 1,070 | 1,189 | ||||||
5.50%, 03/15/14 | 275 | 300 | ||||||
Rogers Wireless Communications Inc., 6.38%, 03/01/14 | 900 | 1,011 | ||||||
Telecom Italia Capital SA | ||||||||
6.20%, 07/18/11 | 2,575 | 2,643 | ||||||
5.25%, 11/15/13 | 1,500 | 1,563 | ||||||
Telefonica Emisiones SAU | ||||||||
5.98%, 06/20/11 | 230 | 235 | ||||||
5.86%, 02/04/13 | 415 | 443 | ||||||
2.58%, 04/26/13 | 2,590 | 2,592 | ||||||
Verizon Virginia Inc., 4.63%, 03/15/13 | 4,870 | 5,143 | ||||||
Verizon Wireless Capital LLC, 3.75%, 05/20/11 | 1,125 | 1,139 | ||||||
Vodafone Group Plc, 5.35%, 02/27/12 | 1,650 | 1,730 | ||||||
| 23,931 | ||||||||
UTILITIES - 3.3% | ||||||||
Abu Dhabi National Energy Co., 5.62%, 10/25/12 (r) | 1,625 | 1,700 | ||||||
Allegheny Energy Supply, 8.25%, 04/15/12 (q) | 890 | 955 | ||||||
Appalachian Power Co., 5.65%, 08/15/12 | 1,750 | 1,866 | ||||||
Dominion Resources Inc. | ||||||||
5.70%, 09/17/12 | 1,020 | 1,098 | ||||||
2.25%, 09/01/15 | 1,275 | 1,257 | ||||||
Duke Energy Corp., 6.30%, 02/01/14 | 1,575 | 1,754 | ||||||
Duke Energy Ohio Inc., 2.10%, 06/15/13 | 745 | 759 | ||||||
FirstEnergy Corp., 6.45%, 11/15/11 | 32 | 33 | ||||||
Florida Gas Transmission Co. LLC, 4.00%, 07/15/15 (r) | 640 | 661 | ||||||
Georgia Power Co., 1.30%, 09/15/13 | 1,850 | 1,853 | ||||||
Great Plains Energy Inc., 2.75%, 08/15/13 | 1,365 | 1,379 | ||||||
| Shares/Par (p) | Value | |||||||
Kentucky Utilities Co., 1.63%, 11/01/15 (r) | 915 | 878 | ||||||
Nevada Power Co., 8.25%, 06/01/11 | 2,015 | 2,076 | ||||||
NiSource Finance Corp., 6.15%, 03/01/13 | 1,355 | 1,478 | ||||||
Northeast Utilities, 5.65%, 06/01/13 | 2,775 | 3,015 | ||||||
PPL Energy Supply LLC, 6.40%, 11/01/11 | 1,200 | 1,256 | ||||||
Progress Energy Inc., 6.05%, 03/15/14 | 875 | 972 | ||||||
PSEG Power LLC | ||||||||
6.95%, 06/01/12 | 1,020 | 1,100 | ||||||
2.50%, 04/15/13 | 2,535 | 2,586 | ||||||
Southern California Edison Co., 0.69%, 10/21/11 (i) | 1,110 | 1,113 | ||||||
Southern Co., 5.30%, 01/15/12 | 1,250 | 1,308 | ||||||
| 29,097 | ||||||||
Total Corporate Bonds and Notes (cost $412,607) | 417,562 | |||||||
GOVERNMENT AND AGENCY OBLIGATIONS - 31.7% |
| |||||||
GOVERNMENT SECURITIES - 8.3% |
| |||||||
Federal Home Loan Mortgage Corp. - 2.4% (w) |
| |||||||
Federal Home Loan Mortgage Corp. | ||||||||
1.75%, 06/15/12 - 09/10/15 | 11,680 | 11,554 | ||||||
0.88%, 10/28/13 | 9,530 | 9,480 | ||||||
| 21,034 | ||||||||
Federal National Mortgage Association - 0.4% (w) | ||||||||
Federal National Mortgage Association, 1.00%, 09/23/13 | 3,015 | 3,010 | ||||||
Sovereign - 2.1% | ||||||||
Canada Housing Trust, 4.00%, 06/15/12, CAD | 6,310 | 6,559 | ||||||
Kommunalbanken AS, 5.13%, 05/30/12 | 7,400 | 7,860 | ||||||
Mexican Bonos, 9.00%, 12/22/11, MXN | 48,575 | 4,099 | ||||||
| 18,518 | ||||||||
Treasury Inflation Index Securities - 0.7% |
| |||||||
U.S. Treasury Inflation Indexed Note | ||||||||
1.88%, 07/15/13 (n) | 2,024 | 2,159 | ||||||
0.50%, 04/15/15 (n) | 4,219 | 4,312 | ||||||
| 6,471 | ||||||||
U.S. Treasury Securities - 2.7% |
| |||||||
U.S. Treasury Note, 1.00%, 07/31/11 | 23,000 | 23,102 | ||||||
U.S. GOVERNMENT AGENCY MORTGAGE-BACKED SECURITIES - 23.4% |
| |||||||
Federal Home Loan Mortgage Corp. - 3.4% |
| |||||||
Federal Home Loan Mortgage Corp. | ||||||||
4.00%, 02/01/14 - 07/01/25 | 2,013 | 2,075 | ||||||
5.00%, 10/01/17 - 09/01/38 | 13,730 | 14,550 | ||||||
4.50%, 04/01/18 - 08/01/25 | 2,789 | 2,925 | ||||||
5.50%, 10/01/19 - 07/01/20 | 1,738 | 1,878 | ||||||
2.57%, 09/01/33 (i) | 224 | 233 | ||||||
2.92%, 09/01/33 (i) | 35 | 36 | ||||||
2.37%, 10/01/34 (i) | 102 | 106 | ||||||
2.50%, 11/01/34 (i) | 185 | 192 | ||||||
2.72%, 11/01/34 (i) | 63 | 66 | ||||||
2.90%, 11/01/34 (i) | 89 | 93 | ||||||
2.97%, 11/01/34 (i) | 49 | 51 | ||||||
2.90%, 01/01/35 (i) | 100 | 103 | ||||||
2.48%, 02/01/35 (i) | 113 | 116 | ||||||
2.62%, 02/01/35 (i) | 189 | 198 | ||||||
2.68%, 02/01/35 (i) | 56 | 59 | ||||||
2.69%, 02/01/35 (i) | 85 | 88 | ||||||
2.71%, 02/01/35 (i) | 115 | 120 | ||||||
2.80%, 02/01/35 (i) | 113 | 117 | ||||||
3.05%, 02/01/35 (i) | 97 | 101 | ||||||
2.67%, 06/01/35 (i) | 1,101 | 1,148 | ||||||
2.66%, 09/01/35 (i) | 1,054 | 1,098 | ||||||
2.87%, 10/01/35 (i) | 777 | 812 | ||||||
2.50%, 11/01/35 (i) | 568 | 593 | ||||||
See accompanying Notes to the Financial Statements.
JNL Series Trust
Schedules of Investments (in thousands)
December 31, 2010
| Shares/Par (p) | Value | |||||
2.51%, 03/01/36 (i) | 1,013 | 1,063 | ||||
REMIC, 5.00%, 10/15/21 | 1,571 | 1,666 | ||||
| 29,487 | ||||||
Federal National Mortgage Association - 19.8% | ||||||
Federal National Mortgage Association | ||||||
5.50%, 01/01/17 - 12/01/36 | 15,321 | 16,459 | ||||
5.00%, 07/01/19 - 05/01/23 | 10,489 | 11,220 | ||||
4.50%, 06/01/23 - 09/01/25 | 48,695 | 51,299 | ||||
4.00%, 02/01/25 - 11/01/25 | 44,875 | 46,440 | ||||
3.50%, 12/01/25 | 11,199 | 11,302 | ||||
2.52%, 03/01/33 (i) | 6 | 7 | ||||
2.03%, 06/01/33 (i) | 73 | 75 | ||||
2.59%, 06/01/33 (i) | 802 | 836 | ||||
2.61%, 07/01/33 (i) | 55 | 58 | ||||
2.91%, 09/01/33 (i) | 6 | 6 | ||||
2.32%, 12/01/33 (i) | 2 | 2 | ||||
2.54%, 12/01/33 (i) | 916 | 941 | ||||
2.63%, 04/01/34 (i) | 7,146 | 7,465 | ||||
2.69%, 04/01/34 (i) | 19 | 20 | ||||
2.64%, 10/01/34 (i) | 31 | 32 | ||||
2.59%, 11/01/34 (i) | 9 | 9 | ||||
2.69%, 11/01/34 (i) | 225 | 235 | ||||
2.71%, 11/01/34 (i) | 1,014 | 1,062 | ||||
2.66%, 12/01/34 (i) | 94 | 98 | ||||
2.63%, 01/01/35 (i) | 133 | 138 | ||||
2.67%, 01/01/35 - 06/01/35 (i) | 772 | 808 | ||||
2.76%, 01/01/35 (i) | 107 | 112 | ||||
2.87%, 01/01/35 (i) | 105 | 109 | ||||
2.53%, 02/01/35 (i) | 342 | 358 | ||||
2.79%, 02/01/35 (i) | 69 | 72 | ||||
2.35%, 03/01/35 (i) | 104 | 107 | ||||
2.20%, 04/01/35 (i) | 759 | 781 | ||||
2.81%, 04/01/35 (i) | 209 | 219 | ||||
2.86%, 04/01/35 (i) | 508 | 534 | ||||
2.31%, 05/01/35 (i) | 866 | 893 | ||||
2.46%, 05/01/35 (i) | 401 | 411 | ||||
2.58%, 05/01/35 - 11/01/35 (i) | 685 | 716 | ||||
2.68%, 06/01/35 (i) | 836 | 874 | ||||
2.79%, 07/01/35 (i) | 713 | 747 | ||||
2.84%, 07/01/35 (i) | 867 | 908 | ||||
2.13%, 08/01/35 (i) | 1,402 | 1,443 | ||||
2.58%, 08/01/35 (i) | 730 | 763 | ||||
2.49%, 11/01/35 (i) | 1,076 | 1,120 | ||||
2.97%, 02/01/36 (i) | 763 | 798 | ||||
5.18%, 02/01/36 (i) | 1,002 | 1,046 | ||||
2.66%, 03/01/36 (i) | 850 | 889 | ||||
2.68%, 03/01/36 (i) | 612 | 638 | ||||
6.00%, 01/01/38 | 1,941 | 2,112 | ||||
REMIC, 5.00%, 08/25/19 - 11/25/21 | 8,490 | 9,052 | ||||
| 173,214 | ||||||
Government National Mortgage Association - 0.2% | ||||||
Government National Mortgage Association | ||||||
7.00%, 12/15/17 | 1,119 | 1,187 | ||||
5.50%, 07/15/20 | 316 | 343 | ||||
| 1,530 | ||||||
Total Government and Agency Obligations (cost $273,952) | 276,366 | |||||
INVESTMENT COMPANIES - 0.3% | ||||||
T. Rowe Price Term Asset-Backed Securities Loan Facility (a) (f) (q) | 258 | 2,543 | ||||
Total Investment Companies | 2,543 | |||||
| Shares/Par (p) | Value | |||||
SHORT TERM INVESTMENTS - 7.2% | ||||||
Certificates of Deposit 0.1% | ||||||
Intesa Sanpaolo SpA, 2.38%, 12/21/12 | $ | 860 | 862 | |||
Investment Companies - 6.5% | ||||||
JNL Money Market Fund, 0.08% (a) (h) | 6,234 | 6,234 | ||||
T. Rowe Price Reserves Investment Fund, 0.27% (a) (h) | 50,383 | 50,383 | ||||
Securities Lending Collateral 0.6% | ||||||
Securities Lending Cash Collateral Fund LLC, 0.31% (a) (h) | 4,064 | 4,064 | ||||
Securities Lending Liquidating Fund LLC, 0.66% (a) (h) | 1,189 | 1,170 | ||||
| 5,234 | ||||||
Total Short Term Investments | 62,713 | |||||
Total Investments - 99.9% | 871,960 | |||||
Other Assets and Liabilities, Net - 0.1% | 1,020 | |||||
Total Net Assets - 100.0% | $872,980 | |||||
JNL/T.Rowe Price Value Fund * (x) | ||||||
COMMON STOCKS - 96.5% | ||||||
CONSUMER DISCRETIONARY - 11.1% | ||||||
Cablevision Systems Corp. - Class A | 351 | $11,885 | ||||
Discovery Communications | 335 | 12,280 | ||||
Kohl’s Corp. (c) | 204 | 11,107 | ||||
Time Warner Cable Inc. | 193 | 12,711 | ||||
Time Warner Inc. | 441 | 14,197 | ||||
Other Securities | 64,490 | |||||
| 126,670 | ||||||
CONSUMER STAPLES - 3.8% | ||||||
Other Securities | 43,057 | |||||
ENERGY - 16.6% | ||||||
Baker Hughes Inc. | 230 | 13,171 | ||||
Chevron Corp. | 278 | 25,386 | ||||
Consol Energy Inc. | 227 | 11,054 | ||||
El Paso Corp. | 853 | 11,736 | ||||
Exxon Mobil Corp. | 132 | 9,659 | ||||
Murphy Oil Corp. | 199 | 14,806 | ||||
Nexen Inc. | 566 | 12,952 | ||||
Peabody Energy Corp. | 189 | 12,073 | ||||
Royal Dutch Shell Plc - ADR | 223 | 14,919 | ||||
Schlumberger Ltd. | 178 | 14,871 | ||||
Spectra Energy Corp. | 664 | 16,598 | ||||
Other Securities | 31,378 | |||||
| 188,603 | ||||||
FINANCIALS - 21.7% | ||||||
American Express Co. | 233 | 10,005 | ||||
AON Corp. | 289 | 13,274 | ||||
Bank of America Corp. | 1,061 | 14,150 | ||||
CIT Group Inc. (c) | 218 | 10,244 | ||||
Citigroup Inc. (c) | 2,173 | 10,277 | ||||
JPMorgan Chase & Co. | 585 | 24,799 | ||||
Lazard Ltd. - Class A | 293 | 11,578 | ||||
Moody’s Corp. | 497 | 13,182 | ||||
Morgan Stanley | 416 | 11,322 | ||||
Regions Financial Corp. | 1,443 | 10,099 | ||||
U.S. Bancorp | 403 | 10,880 | ||||
Wells Fargo & Co. | 847 | 26,255 | ||||
See accompanying Notes to the Financial Statements.
JNL Series Trust
Schedules of Investments (in thousands)
December 31, 2010
| Shares/Par (p) | Value | |||||
Other Securities | 80,978 | |||||
| 247,043 | ||||||
HEALTH CARE - 9.3% | ||||||
Covidien Plc | 352 | 16,086 | ||||
Johnson & Johnson | 171 | 10,576 | ||||
Merck & Co. Inc. | 362 | 13,039 | ||||
Pfizer Inc. | 1,851 | 32,406 | ||||
Other Securities | 34,095 | |||||
| 106,202 | ||||||
INDUSTRIALS - 9.9% | ||||||
3M Co. | 131 | 11,271 | ||||
Fluor Corp. | 144 | 9,535 | ||||
General Electric Co. | 1,101 | 20,143 | ||||
Honeywell International Inc. | 215 | 11,424 | ||||
Illinois Tool Works Inc. | 229 | 12,239 | ||||
Southwest Airlines Co. | 1,000 | 12,981 | ||||
Other Securities | 34,538 | |||||
| 112,131 | ||||||
INFORMATION TECHNOLOGY - 10.2% | ||||||
Applied Materials Inc. | 924 | 12,984 | ||||
International Business Machines Corp. | 104 | 15,190 | ||||
Microsoft Corp. | 603 | 16,825 | ||||
Texas Instruments Inc. | 442 | 14,375 | ||||
Tyco Electronics Ltd. | 305 | 10,786 | ||||
Other Securities | 45,719 | |||||
| 115,879 | ||||||
MATERIALS - 5.8% | ||||||
International Paper Co. | 592 | 16,118 | ||||
United States Steel Corp. (e) | 181 | 10,568 | ||||
Weyerhaeuser Co. | 677 | 12,808 | ||||
Other Securities | 26,825 | |||||
| 66,319 | ||||||
TELECOMMUNICATION SERVICES - 2.4% | ||||||
AT&T Inc. | 457 | 13,429 | ||||
Other Securities | 13,351 | |||||
| 26,780 | ||||||
UTILITIES - 5.7% | ||||||
AES Corp. (c) | 1,061 | 12,925 | ||||
Entergy Corp. | 145 | 10,292 | ||||
NRG Energy Inc. (c) | 501 | 9,789 | ||||
PPL Corp. | 364 | 9,588 | ||||
Other Securities | 21,836 | |||||
| 64,430 | ||||||
Total Common Stocks | 1,097,114 | |||||
PREFERRED STOCKS - 1.3% | ||||||
Financials - 1.2% | ||||||
Citigroup Inc., Convertible Preferred, 7.50% | 57 | 7,805 | ||||
Other Securities | 5,869 | |||||
| 13,674 | ||||||
UTILITIES - 0.1% | ||||||
PPL Corp., Convertible Preferred, 9.50% | 27 | 1,455 | ||||
Total Preferred Stocks | 15,129 | |||||
| Shares/Par (p) | Value | |||||
INVESTMENT COMPANIES - 0.4% | ||||||
T. Rowe Price Institutional Floating Rate Fund (a) | 410 | 4,227 | ||||
Total Investment Companies (cost $3,698) | 4,227 | |||||
CORPORATE BONDS AND NOTES - 0.2% | ||||||
CONSUMER DISCRETIONARY - 0.1% | ||||||
Other Securities | 1,162 | |||||
MATERIALS - 0.1% | ||||||
United States Steel Corp., 4.00%, 05/15/14 (e) | 327 | 634 | ||||
Total Corporate Bonds and Notes (cost $1,348) | 1,796 | |||||
SHORT TERM INVESTMENTS - 2.9% | ||||||
Investment Companies - 1.7% | ||||||
JNL Money Market Fund, 0.08% (a) (h) | 4,638 | 4,638 | ||||
T. Rowe Price Reserves Investment Fund, 0.27% (a) (h) | 14,447 | 14,447 | ||||
Securities Lending Collateral 1.2% | ||||||
Securities Lending Cash Collateral Fund LLC, 0.31% (a) (h) | 12,419 | 12,419 | ||||
Securities Lending Liquidating Fund LLC, 0.66% (a) (h) | 1,843 | 1,812 | ||||
| 14,231 | ||||||
Total Short Term Investments | 33,316 | |||||
Total Investments - 101.3% | 1,151,582 | |||||
Other Assets and Liabilities, | (14,806) | |||||
Total Net Assets - 100.0% | $1,136,776 | |||||
See accompanying Notes to the Financial Statements.
JNL Series Trust
Notes to Schedules of Investments (in thousands)
December 31, 2010
| (a) | Investment in affiliate. |
| (b) | The Fund does not invest in the Underlying Affiliated Funds for the purpose of exercising management or control. At December 31, 2010, the percentage of shares outstanding held by each Fund in the Underlying Affiliated Fund is presented parenthetically in the Schedules of Investments. Percentages reflecting 0.0% represent amounts less than 0.05%. |
| (c) | Non-income producing security. |
| (d) | Issuer was in bankruptcy and/or was in default relating to principal and/or interest. |
| (e) | All or portion of the security was on loan. |
| (f) | Security fair valued in good faith in accordance with the procedures established by the Trust’s Board of Trustees (“Board”). Good faith fair valued securities may be classified as Level 2 or Level 3 for Financial Accounting Standards Board (“FASB”) Accounting Standards Codification (“ASC”) Topic 820 “Fair Value Measurements and Disclosures” based on the applicable valuation inputs. See FASB ASC Topic 820 “Fair Value Measurements and Disclosures” in these Notes to the Schedules of Investments. |
| (g) | Investment purchased on a delayed delivery basis. As of December 31, 2010, the total payable for investments purchased on a delayed delivery basis was as follows: JNL/Capital Guardian Global Balanced Fund $2,464; JNL/Goldman Sachs Core Plus Bond Fund $670,588; JNL/Mellon Capital Management Bond Index Fund $61,410; JNL/PIMCO Real Return Fund $1,134,441; JNL/PIMCO Total Return Bond Fund $1,337,924; and JNL/Select Balanced Fund $88,570. |
| (h) | Yield changes daily to reflect current market conditions. Rate was the quoted yield as of December 31, 2010. |
| (i) | Variable rate security. Rate stated was in effect as of December 31, 2010. |
| (j) | Security issued with a zero coupon. Income is recognized through the accretion of discount. |
| (k) | Security is a “step-up” bond where the coupon may increase or step up at a future date. Rate stated was the coupon as of December 31, 2010. |
| (l) | The interest rate for this security is inversely affected by upgrades or downgrades to the credit rating of the issuer. |
| (m) | Perpetual maturity security. Interest rate is fixed until the first call date and variable thereafter. |
| (n) | Foreign or U.S. Treasury inflation indexed note, par amount is adjusted for inflation. |
| (o) | All or a portion of the security or cash is pledged or segregated collateral. See Pledged or Segregated Collateral in these Notes to the Schedules of Investments. |
| (p) | Par amounts are listed in United States Dollars unless otherwise noted. Options are quoted in unrounded number of contracts. Gold bullion is quoted in unrounded ounces. |
| (q) | Restricted Security. Restricted as to public resale. Restricted security or Rule 144A or Section 4(2) of the Securities Act of 1933, as amended, provides an exemption from the registration requirements for resale of the security to an institutional investor. See Restricted Securities in these Notes to the Schedules of Investments. |
| (r) | Rule 144A or Section 4(2) liquid security. Rule 144A or Section 4(2) of the Securities Act of 1933, as amended, provides an exemption from the registration requirements for resale of this security to an institutional investor. The sub-adviser deemed this security to be liquid based on procedures approved by the Board. As of December 31, 2010, the value of Rule 144A and Section 4(2) liquid securities was as follows: JNL/BlackRock Commodity Securities Fund, $65,564; JNL/Franklin Templeton Income Fund, $222,828; JNL/Goldman Sachs Core Plus Bond Fund, $139,332; JNL/Goldman Sachs Emerging Markets Debt Fund, $1,544; JNL/Ivy Asset Strategy Fund, $64,378; JNL/JPMorgan U.S. Government & Quality Bond Fund, $7,002; JNL/Mellon Capital Management Bond Index Fund, $3,976; JNL/PIMCO Real Return Fund, $264,167; JNL/PIMCO Total Return Bond Fund, $380,356; JNL/PPM America High Yield Bond Fund, $332,830; JNL/Select Balanced Fund, $23,897; JNL/Select Money Market Fund, $105,072; and JNL/T. Rowe Price Short-Term Bond Fund, $97,504. |
| (s) | Foreign or U.S. Treasury inflation indexed note, par amount is not adjusted for inflation. |
| (t) | The Fund had an unfunded loan commitment at December 31, 2010. See Unfunded Loan Commitments in these Notes to Schedules of Investments. |
| (u) | Contingent distributions represent the right to receive additional distributions, if any, during the reorganization of the underlying company. |
| (v) | The counterparty for the over-the-counter options transactions were CSI, GSC and MSC. |
| (w) | The securities in this category are a direct debt of the agency and not collateralized by mortgages. |
| (x) | For all items listed as “Other Securities” in this Summary Schedule of Investments, this represents issues not identified as top-fifty unaffiliated holdings in terms of value and issues or issuers not exceeding one percent individually or in aggregate, respectively, as of December 31, 2010. In certain instances, securities for which footnotes listed above may otherwise apply are included in the Other Securities caption. |
| * | A Summary Schedule of Investments is presented for this portfolio. For information on availability of a complete Schedule of Investments, refer to www.jackson.com, www.sec.gov, or call the Shareholder Service Center at 1-800-873-5654. |
Currencies:
ARS - Argentine Peso | EUR - European Currency Unit (Euro) | MYR - Malaysian Ringgit | TRY - New Turkish Lira | |||
AUD - Australian Dollar | GBP - British Pound | NOK - Norwegian Krone | TWD - Taiwan Dollar | |||
BRL - Brazilian Real | HKD - Hong Kong Dollar | NZD - New Zealand Dollar | USD - United States Dollar | |||
CAD - Canadian Dollar | HUF - Hungarian Forint | PEN - Peruvian Nuevo Sol | ZAR - South African Rand | |||
CHF - Swiss Franc | IDR - Indonesian Rupiah | PHP - Philippine Peso | ||||
CLP - Chilean Peso | ILS - Israeli New Shekels | PLN - Polish Zloty | ||||
CNY - Chinese Yuan | INR - Indian Rupee | RUB - Russian Ruble | ||||
COP - Colombian Peso | JPY - Japanese Yen | SEK - Swedish Krona | ||||
DKK - Danish Krone | KRW - Korean Won | SGD - Singapore Dollar | ||||
EGP - Egyptian Pound | MXN - Mexican Peso | THB - Thai Baht |
Abbreviations:
“-” Amount rounds to less than one thousand | CDX - Credit Default Swap Index | |
ABS - Asset Backed Security | CLO - Collateralized Loan Obligation | |
ADR - American Depositary Receipt | CPI - Consumer Price Index | |
AMBAC - AMBAC Indemnity Corp. | CPURNSA - CPI Urban Consumers Index Non-Seasonably | |
ASX - Australian Stock Exchange | Adjusted | |
BDR - Brazilian Depository Receipt | DAX - Deutscher Aktienindex | |
CAC - Cotation Assistee en Continu | ETF - Exchange-Traded Fund | |
CDO - Collateralized Debt Obligation |
See accompanying Notes to the Financial Statements.
JNL Series Trust
Notes to Schedules of Investments (in thousands)
December 31, 2010
Abbreviations (continued): | ||
Euro-Bobl - debt instrument issued by the Federal Republic of | RB - Revenue Bond | |
Germany with a term of 4.5 to 5.5 years | REIT - Real Estate Investment Trust | |
Euro-Bund - debt instrument issued by the Federal Republic of | REMIC - Real Estate Mortgage Investment Conduit | |
Germany with a term of 8.5 to 10.5 years | RSP - Risparmio Shares | |
FDR - Fiduciary Depository Receipt | SDR - Swedish Depository Receipt | |
FTSE - Financial Times and the London Stock Exchange | SPDR - Standard & Poor’s Depository Receipt | |
GDR - Global Depository Receipt | SPI - Schedule Performance Index | |
GO - General Obligation | TBA - To Be Announced (Securities purchased on a delayed | |
HSCEI - Hang Seng China Enterprises Index | delivery basis) | |
IBEX - Iberia Index | TSX - Toronto Stock Exchange | |
KOSPI - Korea Composite Stock Price Index | TAIEX - Taiwan Stock Exchange Capitalization Weighted Stock | |
LIBOR - London Interbank Offered Rate | Index | |
MBS - Mortgage Backed Security | virt-x - a cross border recognized investment exchange | |
MIB - Milano Indice Borsa | VVPR - Voter-Verified Paper Record | |
NYS - New York Registered Shares |
Restricted Securities - Restricted securities are often purchased in private placement transactions and cannot be sold without prior registration unless the sale is pursuant to an exemption under the Securities Exchange Act of 1933, as amended. The following table details restricted securities, including Rule 144A securities that have not been deemed liquid, held by the Funds at December 31, 2010.
| Initial Acquisition Date | Cost | Ending Value | Percent of Net Assets | |||||||||||||
JNL/BlackRock Commodity Securities Fund | ||||||||||||||||
Uranium Energy Corp. | 11/02/2010 | $ | 1,243 | $ | 2,209 | 0.2 % | ||||||||||
Uranium Energy Corp. Warrant | 10/22/2010 | — | — | — | ||||||||||||
| $ | 1,243 | $ | 2,209 | 0.2 % | ||||||||||||
JNL/Capital Guardian Global Balanced Fund | ||||||||||||||||
AES Panama SA, 6.35%, 12/21/16 | 01/04/2008 | $ | 298 | $ | 322 | 0.1 % | ||||||||||
AIA Group Ltd. | 10/25/2010 | 1,962 | 2,031 | 0.6 | ||||||||||||
ASAT Holdings Ltd., 13.00% | 07/28/2006 | 1 | — | — | ||||||||||||
Agricultural Bank of China- Class H | 07/09/2010 | 361 | 433 | 0.1 | ||||||||||||
Altegrity Inc., 10.50%, 11/01/15 | 07/27/2009 | 158 | 205 | 0.1 | ||||||||||||
BNP Paribas | 11/28/2007 | 705 | 609 | 0.2 | ||||||||||||
Croatia Government International Bond, 6.75%, 11/05/19 | 10/30/2009 | 630 | 654 | 0.2 | ||||||||||||
Dominican Republic International Bond, 8.63%, 04/20/27 | 12/17/2009 | 158 | 168 | 0.1 | ||||||||||||
Dubai Electricity & Water Authority, 6.38%, 10/21/16 | 10/15/2010 | 100 | 97 | — | ||||||||||||
Dubai Electricity & Water Authority, 7.38%, 10/21/20 | 10/15/2010 | 125 | 117 | — | ||||||||||||
E.ON International Finance BV, 5.80%, 04/30/18 | 01/14/2010 | 542 | 565 | 0.2 | ||||||||||||
Egypt Government International Bond, 5.75%, 04/29/20 | 11/04/2010 | 136 | 129 | — | ||||||||||||
First Data Corp., 8.25%, 01/15/21 | 12/22/2009 | 86 | 96 | — | ||||||||||||
First Data Corp., 8.75%, 01/15/22 | 12/22/2009 | 87 | 96 | — | ||||||||||||
First Data Corp., 12.63%, 01/15/21 | 12/22/2009 | 167 | 192 | 0.1 | ||||||||||||
Georgia Gulf Corp., 9.00%, 01/15/17 | 10/11/2010 | 321 | 326 | 0.1 | ||||||||||||
KT&G Corp. - GDR | 09/14/2006 | 118 | 122 | — | ||||||||||||
LG Chem Ltd. - GDR | 09/08/2009 | 134 | 276 | 0.1 | ||||||||||||
Liberty Mutual Group Inc., 7.50%, 08/15/36 | 08/06/2009 | 263 | 348 | 0.1 | ||||||||||||
Michaels Stores Inc., 7.75%, 11/01/18 | 12/15/2010 | 247 | 249 | 0.1 | ||||||||||||
Roche Holdings Inc., 6.00%, 03/01/19 | 05/19/2009 | 417 | 465 | 0.1 | ||||||||||||
Societe Generale, 5.75%, 04/20/16 | 08/07/2008 | 144 | 159 | — | ||||||||||||
Standard Chartered Bank, 6.40%, 09/26/17 | 12/18/2007 | 299 | 321 | 0.1 | ||||||||||||
TransDigm Inc., 7.75%, 12/15/18 | 12/02/2010 | 400 | 414 | 0.1 | ||||||||||||
UniCredit SpA | 09/09/2009 | 1,205 | 764 | 0.2 | ||||||||||||
| $ | 9,064 | $ | 9,158 | 2.6 % | ||||||||||||
JNL/Capital Guardian Global Diversified Research Fund | ||||||||||||||||
AIA Group Ltd. | 10/25/2010 | $ | 3,449 | $ | 3,489 | 0.8 % | ||||||||||
BNP Paribas | 10/08/2008 | 1,326 | 1,609 | 0.4 | ||||||||||||
LG Chem Ltd. - GDR | 12/17/2009 | 2,024 | 3,600 | 0.8 | ||||||||||||
| $ | 6,799 | $ | 8,698 | 2.0 % | ||||||||||||
JNL/Franklin Templeton Global Growth Fund | ||||||||||||||||
Samsung Electronics Co. Ltd. - GDR | 02/06/2007 | $ | 5,972 | $ | 8,206 | 1.7 % | ||||||||||
See accompanying Notes to the Financial Statements.
JNL Series Trust
Notes to Schedules of Investments (in thousands)
December 31, 2010
| Restricted Securities | ||||||||||||||||
Initial Acquisition Date | Cost | Ending Value | Percent of Net Assets | |||||||||||||
JNL/Franklin Templeton Mutual Shares Fund | ||||||||||||||||
Cerberus Capital Management LP | 08/06/2007 | $ | 999 | $ | 809 | 0.1 % | ||||||||||
Cerberus Capital Management LP | 08/06/2007 | 999 | 809 | 0.1 | ||||||||||||
Cerberus Capital Management LP | 08/06/2007 | 500 | 405 | 0.1 | ||||||||||||
Cerberus Capital Management LP, 12.00%, 07/31/14 | 08/06/2007 | 780 | 632 | 0.1 | ||||||||||||
Cerberus Capital Management LP, 12.00%, 07/31/14 | 08/06/2007 | 780 | 631 | 0.1 | ||||||||||||
Cerberus Capital Management LP, 12.00%, 07/31/14 | 08/06/2007 | 390 | 316 | 0.1 | ||||||||||||
Harrah’s Investment LP | 11/16/2008 | 39 | 16 | — | ||||||||||||
| $ | 4,487 | $ | 3,618 | 0.6 % | ||||||||||||
JNL/Goldman Sachs Emerging Markets Debt Fund | ||||||||||||||||
Barclays Bank Plc-Credit Linked Note (Indonesia Government, 10.00%, 07/15/17, Moody rating Ba2) | 06/04/2009 | $ | 9,078 | $ | 10,662 | 1.4 % | ||||||||||
Credit Suisse Nassau-Credit Linked Note (Nota Do Tesouro Nacional, 6.00%, 08/15/40, Moody rating N/A) | 11/16/2010 | 2,856 | 2,958 | 0.4 | ||||||||||||
Deutsche Bank AG-Credit Linked Note (Indonesia Government,10.75%, 5/15/2016, Moody rating Ba2) | 01/26/2010 | 2,417 | 2,680 | 0.4 | ||||||||||||
Hongkong & Shanghai Banking Corp.-Credit Linked Note (Indonesia Government, 10.00%, 07/15/17, Moody rating Ba2) | 07/24/2009 | 7,261 | 8,624 | 1.1 | ||||||||||||
Hongkong & Shanghai Banking Corp.-Credit Linked Note (Indonesia Government, 10.75%, 05/15/16, Moody rating Ba2) | 11/16/2009 | 10,417 | 11,751 | 1.5 | ||||||||||||
JPMorgan Chase & Co., 6.00%, 10/10/12 | 08/07/2009 | 818 | 966 | 0.1 | ||||||||||||
JPMorgan Chase & Co.-Credit Linked Note (Indonesia Government, 10.00%, 07/15/17, Moody rating Ba2) | 03/08/2010 | 1,907 | 2,039 | 0.3 | ||||||||||||
JPMorgan Chase & Co.-Credit Linked Note (Indonesia Government, 11.00%, 11/15/20, Moody rating Ba2) | 04/16/2010 | 2,632 | 2,780 | 0.4 | ||||||||||||
| $ | 37,386 | $ | 42,460 | 5.6 % | ||||||||||||
JNL/Goldman Sachs Core Plus Bond Fund | ||||||||||||||||
Applied Extrusion Technologies Inc.- Class B | 05/05/2005 | $ | 42 | $ | — | — % | ||||||||||
CIT Mortgage Loan Trust REMIC, 1.26%, 10/25/37 | 10/11/2007 | 529 | 508 | 0.1 | ||||||||||||
CIT Mortgage Loan Trust REMIC, 1.51%, 10/25/37 | 10/11/2007 | 700 | 498 | — | ||||||||||||
CIT Mortgage Loan Trust REMIC, 1.71%, 09/25/24 | 10/11/2007 | 1,280 | 685 | 0.1 | ||||||||||||
College Loan Corp. Trust, 1.61%, 03/01/42 | 08/26/2009 | 812 | 900 | 0.1 | ||||||||||||
El Paso Performance-Linked Trust, 7.75%, 07/15/11 | 07/13/2006 | 1,290 | 1,321 | 0.1 | ||||||||||||
FDIC Structured Sale Guaranteed Notes REMIC, 0.81%, 03/02/48 | 03/08/2010 | 798 | 799 | 0.1 | ||||||||||||
Federal Home Loan Mortgage Corp. REMIC, 06/15/21 | 02/29/2000 | — | — | — | ||||||||||||
Federal Home Loan Mortgage Corp. REMIC, 09/15/35 (0.00% until LIBOR reaches 7.00%) | 05/30/2007 | 153 | 158 | — | ||||||||||||
Federal Home Loan Mortgage Corp. REMIC, 04/15/37 (0.00% until LIBOR reaches 6.75%) | 05/16/2007 | 30 | 29 | — | ||||||||||||
First Union National Bank Commercial Mortgage Trust, Interest Only REMIC,1.11%, 05/17/32 | 01/08/2003 | 83 | 65 | — | ||||||||||||
GSMPS Mortgage Loan Trust, 0.49%, 02/25/35 | 05/08/2006 | 113 | 100 | — | ||||||||||||
Home Interior Gift Inc. | 02/22/2006 | 184 | — | — | ||||||||||||
ING Bank NV, 2.50%, 01/14/16 | 11/18/2010 | 5,083 | 4,975 | 0.5 | ||||||||||||
Merit Securities Corp. REMIC, 1.76%, 09/28/32 | 12/10/2002 | 206 | 204 | — | ||||||||||||
Radnor Holdings Corp., 11.00%, 04/15/11 | 11/13/2003 | 126 | — | — | ||||||||||||
TransDigm Inc., 7.75%, 12/15/18 | 12/02/2010 | 2,125 | 2,199 | 0.2 | ||||||||||||
UBS AG New Jersey-Credit Linked Note (Federative Republic of Brazil, 6.00%, 01/17/17, Moody rating Ba1) | 11/28/2007 | 683 | 443 | — | ||||||||||||
ZFS Finance USA Trust I, 5.88%, 05/09/32 | 05/04/2007 | 1,225 | 1,195 | 0.1 | ||||||||||||
| $ | 15,462 | $ | 14,079 | 1.3 % | ||||||||||||
JNL/JPMorgan Mid Cap Growth Fund | ||||||||||||||||
Apollo Global Management LLC | 11/02/2007 | $ | 2,028 | $ | 587 | 0.3 % | ||||||||||
JNL/JPMorgan U.S. Government & Quality Bond Fund | ||||||||||||||||
Banc of America Commercial Mortgage Inc. REMIC, 6.41%, 09/11/36 | 12/29/2006 | $ | 2,143 | $ | 2,219 | 0.2 % | ||||||||||
Commercial Mortgage Pass-Through Certificates REMIC, 5.45%, 07/16/34 | 03/20/2003 | 2,837 | 2,760 | 0.3 | ||||||||||||
CompuCredit Acquired Portfolio Voltage Master Trust, 0.43%, 09/15/18 | 09/18/2006 | 462 | 419 | 0.1 | ||||||||||||
| $ | 5,442 | $ | 5,398 | 0.6 % | ||||||||||||
JNL/Lazard Mid Cap Equity Fund | ||||||||||||||||
Better Place | 04/23/2010 | $ | 1,015 | $ | 1,015 | 0.5 % | ||||||||||
See accompanying Notes to the Financial Statements.
JNL Series Trust
Notes to Schedules of Investments (in thousands)
December 31, 2010
| Restricted Securities | ||||||||||||||||
Initial Acquisition Date | Cost | Ending Value | Percent of Net Assets | |||||||||||||
JNL/PIMCO Real Return Fund | ||||||||||||||||
Banco Santander Brazil SA, 12/28/11 | 12/21/2010 | $ | 585 | $ | 585 | — % | ||||||||||
Gazprom Via Gaz Capital SA, 5.09%, 11/29/15 | 11/18/2010 | 1,600 | 1,636 | 0.1 | ||||||||||||
Landmark CDO Ltd., 0.60%, 06/01/17 | 10/29/2010 | 4,291 | 4,253 | 0.2 | ||||||||||||
New York Life Investment Management Flatiron CLO Ltd., 0.51%, 08/08/20 | 08/12/2010 | 466 | 464 | — | ||||||||||||
Racers Trust, 0.53%, 07/25/17 | 06/08/2010 | 952 | 978 | 0.1 | ||||||||||||
Symphony CLO Ltd., 0.53%, 05/15/19 | 06/28/2010 | 2,025 | 1,993 | 0.1 | ||||||||||||
| $ | 9,919 | $ | 9,909 | 0.5 % | ||||||||||||
JNL/PIMCO Total Return Bond Fund | ||||||||||||||||
Ally Financial Inc., 6.25%, 12/01/17 | 11/16/2010 | $ | 4,931 | $ | 5,000 | 0.2 % | ||||||||||
Canada Housing Trust No. 1, 2.75%, 12/15/15 | 12/17/2010 | 3,967 | 4,035 | 0.1 | ||||||||||||
DG Funding Trust, 0.68% (callable at 10,000 beginning 09/30/10) | 11/10/2003 | 4,427 | 3,191 | 0.1 | ||||||||||||
Northern Rock Plc, 5.63%, 06/22/17 | 06/08/2009 | 14,059 | 16,322 | 0.5 | ||||||||||||
Vnesheconombank Via VEB Finance Ltd., 5.45%, 11/22/17 | 11/11/2010 | 1,100 | 1,097 | — | ||||||||||||
| $ | 28,484 | $ | 29,645 | 0.9 % | ||||||||||||
JNL/PPM America High Yield Bond Fund | ||||||||||||||||
American General Finance Corp. Term Loan, 7.25%, 04/16/15 | 04/20/2010 | $ | 2,412 | $ | 2,485 | 0.3 % | ||||||||||
Applied Extrusion Technologies Inc.- Class B | 05/05/2005 | 63 | — | — | ||||||||||||
Home Interior Gift Inc. | 02/22/2006 | 174 | — | — | ||||||||||||
Manitoba Telecom Services Inc. | 06/10/2005 | — | 15 | — | ||||||||||||
Newsday Secured Term Loan, 10.50%, 08/01/13 | 12/03/2009 | 2,081 | 2,142 | 0.2 | ||||||||||||
Newsday Secured Term Loan, 10.50%, 12/31/49 | 07/15/2008 | 800 | 866 | 0.1 | ||||||||||||
Radnor Holdings Corp., 11.00%, 04/15/11 | 11/13/2003 | 100 | — | — | ||||||||||||
Smurfit Kappa Group Term Loan, 6.75%, 02/10/16 | 02/11/2010 | 2,760 | 2,837 | 0.3 | ||||||||||||
Texas Competitive Electric Holdings Co. LLC Term Loan, 3.76%, 06/30/11 | 10/30/2008 | 3,745 | 3,026 | 0.3 | ||||||||||||
| $ | 12,135 | $ | 11,371 | 1.2 % | ||||||||||||
JNL/T.Rowe Price Established Growth Fund | ||||||||||||||||
Groupon Inc. | 12/17/2010 | $ | 3,407 | $ | 3,407 | 0.2 % | ||||||||||
JNL/T.Rowe Price Short-Term Bond Fund | ||||||||||||||||
Allegheny Energy Supply, 8.25%, 04/15/12 | 09/03/2010 | $ | 954 | $ | 955 | 0.1 % | ||||||||||
T. Rowe Price Term Asset-Backed Securities Loan Facility | 10/16/2009 | 2,836 | 2,543 | 0.3 | ||||||||||||
| $ | 3,790 | $ | 3,498 | 0.4 % | ||||||||||||
Investments in Affiliates - See Note 6 in the Notes to the Financial Statements for further discussion of investments in affiliates. During the year ended December 31, 2010, certain Funds invested in money market funds, which are managed by Jackson National Asset Management, LLC (“Adviser”) or an affiliate of the Funds. The JNL Money Market Fund is offered as a cash management tool to the Funds and their affiliates and is not available for direct purchase by members of the public. Certain Funds participating in securities lending receive cash collateral, which is invested by the Custodian in the Securities Lending Cash Collateral Fund LLC and the Securities Lending Liquidating Fund LLC, which are affiliates of the Funds’ Adviser. The fair value and par value of the investment in the Securities Lending Cash Collateral Fund LLC and the Securities Lending Liquidating Fund LLC are reported under Securities Lending Collateral in the Schedules of Investments. Income received from the Securities Lending Cash Collateral Fund LLC and the Securities Lending Liquidating Fund LLC is aggregated with income from securities lending when received from the custodian and each Fund’s affiliated income is included in the income from affiliates on the Statements of Operations. The JNL/BlackRock Global Allocation Fund (“BlackRock Feeder Fund”) invests primarily all of its investable assets in the BlackRock Global Allocation Portfolio (“BlackRock Master Fund”). Due to its ownership of more than 5% of the shares of the BlackRock Master Fund, the BlackRock Feeder Fund may be deemed an affiliated person thereof under the Investment Company Act of 1940. The JNL/Mellon Capital Management S&P 500 Index Fund invested in Bank of New York Mellon Corp., the parent company of its sub-adviser. The JNL/Mellon Capital Management International Index Fund invested in Prudential plc, the parent company of Jackson National Life Insurance Company® and the Funds’ Adviser. Prudential plc is not affiliated in any manner with Prudential Financial Inc., a company whose principal place of business is in the United States of America. The JNL/T. Rowe Price Value Fund invested in the T. Rowe Price Institutional Floating Rate Fund which is an affiliate of the Fund. The JNL/T. Rowe Price Short-Term Bond Fund invested in the T. Rowe Price Term Asset-Backed Securities Loan Facility which is an affiliate of the Fund.
The following table details each Fund’s long-term investments in affiliates held at December 31, 2010.
| Fund | Affiliate | Value Beginning of Period | Purchases | Sales Proceeds | Dividend Income | Realized Gain (Loss) | Value End of Period | |||||||||||||||||||
JNL/BlackRock Global Allocation Fund | BlackRock Global Allocation Portfolio | $ | - | $ | 181,946 | $ | 3,676 | $ | 2,176 | $ | (3 | ) | $ | 179,646 | ||||||||||||
JNL/Mellon Capital Management S&P 500 Index Fund | Bank of New York Mellon Corp. | 3,008 | 1,042 | 35 | 45 | (2 | ) | 4,327 | ||||||||||||||||||
JNL/Mellon Capital Management International Index Fund | Prudential plc | 1,858 | 595 | - | 66 | - | 2,552 | |||||||||||||||||||
See accompanying Notes to the Financial Statements.
JNL Series Trust
Notes to Schedules of Investments (in thousands)
December 31, 2010
| Investments in Affiliates | ||||||||||||||||||||||||||
| Fund | Affiliate | Value Beginning of Period | Purchases | Sales Proceeds | Dividend Income | Realized Gain (Loss) | Value End of Period | |||||||||||||||||||
JNL/T. Rowe Price Short-Term Bond Fund | T. Rowe Price Term Asset-Backed Securities Loan Facility | $ | 1,702 | $ | 6,187 | $ | 5,241 | $ | 840 | $ | 188 | $ | 2.543 | |||||||||||||
JNL/T. Rowe Price Value Fund | T. Rowe Price Institutional Floating Rate Fund | 8,104 | 307 | 4,432 | 346 | 860 | 4,227 | |||||||||||||||||||
The following table details cash management investments in affiliates held at December 31, 2010. There was no realized gain or loss relating to transactions in these investments during the year ended December 31, 2010.
| JNL Money Market Fund | ||||||||||||
| Fund | Beginning Amortized Cost | Ending Amortized Cost | Dividend Income | |||||||||
JNL/BlackRock Commodity Securities Fund | $ | 9,840 | $ | 62,860 | $ | 21 | ||||||
JNL/Capital Guardian Global Balanced Fund | 13,868 | 16,241 | 6 | |||||||||
JNL/Capital Guardian Global Diversified Research Fund | 18,355 | 14,275 | 8 | |||||||||
JNL/Capital Guardian U.S. Growth Equity Fund | 14,662 | 55,757 | 22 | |||||||||
JNL/Eagle Core Equity Fund | 4,732 | 9,525 | 7 | |||||||||
JNL/Eagle SmallCap Equity Fund | 3,885 | 21,944 | 5 | |||||||||
JNL/Franklin Templeton Global Growth Fund | 25,086 | 28,349 | 15 | |||||||||
JNL/Franklin Templeton Income Fund | 90,379 | 67,966 | 40 | |||||||||
JNL/Franklin Templeton International Small Cap Growth Fund | 13,149 | 7,881 | 6 | |||||||||
JNL/Franklin Templeton Mutual Shares Fund | 50,580 | 62,650 | 28 | |||||||||
JNL/Franklin Templeton Small Cap Value Fund | 17,414 | 20,020 | 10 | |||||||||
JNL/Goldman Sachs Core Plus Bond Fund | 79,220 | 356,880 | 115 | |||||||||
JNL/Goldman Sachs Emerging Markets Debt Fund | 44,096 | 211,959 | 61 | |||||||||
JNL/Goldman Sachs Mid Cap Value Fund | 12,147 | 23,029 | 8 | |||||||||
JNL/Goldman Sachs U.S. Equity Flex Fund | 4,692 | 4,931 | 2 | |||||||||
JNL/Invesco International Growth Fund | 36,147 | 37,733 | 19 | |||||||||
JNL/Invesco Large Cap Growth Fund | 17,262 | 18,815 | 27 | |||||||||
JNL/Invesco Global Real Estate Fund | 8,814 | 8,743 | 6 | |||||||||
JNL/Invesco Small Cap Growth Fund | 4,526 | 4,579 | 2 | |||||||||
JNL/Ivy Asset Strategy Fund | 29,184 | 100,979 | 39 | |||||||||
JNL/JPMorgan International Value Fund | 14,166 | 11,098 | 7 | |||||||||
JNL/JPMorgan MidCap Growth Fund | 5,286 | 5,111 | 3 | |||||||||
JNL/JPMorgan U.S. Government & Quality Bond Fund | 19,879 | 36,257 | 34 | |||||||||
JNL/Lazard Emerging Markets Fund | 46,043 | 60,363 | 32 | |||||||||
JNL/Lazard Mid Cap Equity Fund | 4,587 | 11,284 | 4 | |||||||||
JNL/M&G Global Basics Fund | 1,114 | 5,571 | 3 | |||||||||
JNL/M&G Global Leaders Fund | 846 | - | - | |||||||||
JNL/Mellon Capital Management European 30 Fund | 268 | 79 | - | |||||||||
JNL/Mellon Capital Management Pacific Rim 30 Fund | 367 | 134 | - | |||||||||
JNL/Mellon Capital Management S&P 500 Index Fund | 29,658 | 16,641 | 17 | |||||||||
JNL/Mellon Capital Management S&P 400 MidCap Index Fund | 7,170 | 12,073 | 8 | |||||||||
JNL/Mellon Capital Management Small Cap Index Fund | 14,720 | 12,878 | 7 | |||||||||
JNL/Mellon Capital Management International Index Fund | 15,534 | 28,075 | 11 | |||||||||
JNL/Mellon Capital Management Bond Index Fund | 26,989 | 44,153 | 20 | |||||||||
JNL/Mellon Capital Management Global Alpha Fund | 6,240 | 3,593 | 5 | |||||||||
JNL/Oppenheimer Global Growth Fund | 6,887 | 7,173 | 4 | |||||||||
JNL/PAM Asia ex-Japan Fund | 2,890 | 1,752 | 1 | |||||||||
JNL/PAM China-India Fund | 8,553 | 20,481 | 6 | |||||||||
JNL/PIMCO Real Return Fund | 963 | 400 | 3 | |||||||||
JNL/PIMCO Total Return Bond Fund | 4,480 | 15,624 | 11 | |||||||||
JNL/PPM America High Yield Bond Fund | 27,030 | 35,569 | 23 | |||||||||
JNL/PPM America Mid Cap Value Fund | 381 | 864 | 1 | |||||||||
JNL/PPM America Small Cap Value Fund | 126 | 634 | - | |||||||||
JNL/PPM America Value Equity Fund | 702 | 233 | - | |||||||||
JNL/Red Rocks Listed Private Equity Fund | 6,305 | 20,746 | 6 | |||||||||
JNL/S&P Competitive Advantage Fund | 648 | 613 | 1 | |||||||||
JNL/S&P Dividend Income & Growth Fund | 1,254 | 5,012 | 2 | |||||||||
JNL/S&P Intrinsic Value Fund | 2,119 | 1,339 | 1 | |||||||||
JNL/S&P Total Yield Fund | 616 | 518 | 1 | |||||||||
JNL/Select Balanced Fund | 39,129 | 130,095 | 51 | |||||||||
JNL/Select Value Fund | 22,516 | 26,760 | 14 | |||||||||
JNL/T. Rowe Price Established Growth Fund | 2,905 | 250 | 1 | |||||||||
JNL/T. Rowe Price Mid-Cap Growth Fund | 4,417 | 4,056 | 3 | |||||||||
JNL/T. Rowe Price Short-Term Bond Fund | 3,374 | 6,234 | 4 | |||||||||
JNL/T. Rowe Price Value Fund | 9,543 | 4,638 | 2 | |||||||||
See accompanying Notes to the Financial Statements.
JNL Series Trust
Notes to Schedules of Investments (in thousands)
December 31, 2010
Investments in Affiliates
| T. Rowe Price Reserves Investment Fund | ||||||||||||
| Fund | Beginning Amortized Cost | Ending Amortized Cost | Dividend Income | |||||||||
JNL/T. Rowe Price Established Growth Fund | $ | 5,950 | $ | 21,210 | $ | 30 | ||||||
JNL/T. Rowe Price Mid-Cap Growth Fund | 42,725 | 62,363 | 143 | |||||||||
JNL/T. Rowe Price Short-Term Bond Fund | 23,791 | 50,383 | 83 | |||||||||
JNL/T. Rowe Price Value Fund | 16,472 | 14,447 | 37 | |||||||||
Unfunded Loan Commitments – See Note 3 in the Notes to the Financial Statements for further discussion of unfunded commitments. The following table details unfunded loan commitments at December 31, 2010.
| JNL/Franklin Templeton Mutual Shares Fund | Unfunded Commitment | |||
Realogy Corp. Term Loan Revolver, 0.00%, 10/10/13 | $ | 582 | ||
FASB ASC Topic 820, “Fair Value Measurements and Disclosure” - This standard establishes a single authoritative definition of fair value, sets out a framework for measuring fair value and requires additional disclosures about fair value measurements. Various inputs are used in determining the value of a Fund’s investments under FASB ASC Topic 820 guidance. The inputs are summarized into three broad categories. Level 1 includes valuations based on quoted prices of identical securities in active markets, including valuations for securities listed on a national or foreign stock exchange, investments in mutual funds or securities lending collateral, which are valued as a practical expedient at its daily reported net asset value (“NAV”). Level 2 includes valuations for which all significant inputs are observable, either directly or indirectly. Direct observable inputs include broker quotes, closing prices of similar securities in active markets, closing prices for identical or similar securities in non-active markets or corporate action or reorganization entitlement values. Indirect significant observable inputs include factors such as interest rates, yield curves, prepayment speeds or credit ratings. Level 2 includes valuations for fixed income securities priced by pricing services, broker quotes in active markets, securities subject to corporate actions, securities valued at amortized cost, international equity securities priced by an independent statistical fair value pricing service, swap agreements valued by pricing services, or ADRs and GDRs for which quoted prices in active markets are not available. Level 3 includes valuations based on inputs that are unobservable and significant to the fair value measurement including the Adviser’s own assumptions in determining the fair value of the investment. Inputs used to determine the fair value of Level 3 securities include security specific inputs such as: credit quality, credit rating spreads, issuer news, trading characteristics, call features or maturity; or industry specific inputs such as: trading activity of similar markets or securities, or changes in the security’s underlying index or comparable securities’ models. Level 3 valuations include securities that are priced based on single source broker quotes, where prices may be unavailable due to halted trading, restricted to resale due to market events, newly issued or for which reliable quotes are not available. The inputs or methodology used for valuing securities are not necessarily an indication of the risk associated with investing in those securities. Please see Note 2 in the Notes to the Financial Statements for security valuation accounting policies.
FASB ASC Topic 820, “Fair Value Measurements and Disclosure”
The following table summarizes each Fund’s investments in securities and other financial instruments as of December 31, 2010 by valuation level.
| Assets - Securities | Liabilities - Securities | |||||||||||||||||||||||||||||||||||
| Level 1 | Level 2 | Level 3 | Total | Level 1 | Level 2 | Level 3 | Total | |||||||||||||||||||||||||||||
JNL/American Funds Blue Chip Income and Growth Fund |
| |||||||||||||||||||||||||||||||||||
Investment Companies | $ | 149,079 | $ | – | $ | – | $ | 149,079 | $ | – | $ | – | $ | – | $ | – | ||||||||||||||||||||
Fund Total | $ | 149,079 | $ | – | $ | – | $ | 149,079 | $ | – | $ | – | $ | – | $ | – | ||||||||||||||||||||
JNL/American Funds Global Bond Fund |
| |||||||||||||||||||||||||||||||||||
Investment Companies | $ | 105,387 | $ | – | $ | – | $ | 105,387 | $ | – | $ | – | $ | – | $ | – | ||||||||||||||||||||
Fund Total | $ | 105,387 | $ | – | $ | – | $ | 105,387 | $ | – | $ | – | $ | – | $ | – | ||||||||||||||||||||
JNL/American Funds Global Small Capitalization Fund |
| |||||||||||||||||||||||||||||||||||
Investment Companies | $ | 80,981 | $ | – | $ | – | $ | 80,981 | $ | – | $ | – | $ | – | $ | – | ||||||||||||||||||||
Fund Total | $ | 80,981 | $ | – | $ | – | $ | 80,981 | $ | – | $ | – | $ | – | $ | – | ||||||||||||||||||||
JNL/American Funds Growth-Income Fund |
| |||||||||||||||||||||||||||||||||||
Investment Companies | $ | 174,607 | $ | – | $ | – | $ | 174,607 | $ | – | $ | – | $ | – | $ | – | ||||||||||||||||||||
Fund Total | $ | 174,607 | $ | – | $ | – | $ | 174,607 | $ | – | $ | – | $ | – | $ | – | ||||||||||||||||||||
JNL/American Funds International Fund |
| |||||||||||||||||||||||||||||||||||
Investment Companies | $ | 102,840 | $ | – | $ | – | $ | 102,840 | $ | – | $ | – | $ | – | $ | – | ||||||||||||||||||||
Fund Total | $ | 102,840 | $ | – | $ | – | $ | 102,840 | $ | – | $ | – | $ | – | $ | – | ||||||||||||||||||||
JNL/American Funds New World Fund |
| |||||||||||||||||||||||||||||||||||
Investment Companies | $ | 133,548 | $ | – | $ | – | $ | 133,548 | $ | – | $ | – | $ | – | $ | – | ||||||||||||||||||||
Fund Total | $ | 133,548 | $ | – | $ | – | $ | 133,548 | $ | – | $ | – | $ | – | $ | – | ||||||||||||||||||||
JNL Institutional Alt 20 Fund |
| |||||||||||||||||||||||||||||||||||
Investment Companies | $ | 615,135 | $ | – | $ | – | $ | 615,135 | $ | – | $ | – | $ | – | $ | – | ||||||||||||||||||||
Fund Total | $ | 615,135 | $ | – | $ | – | $ | 615,135 | $ | – | $ | – | $ | – | $ | – | ||||||||||||||||||||
See accompanying Notes to the Financial Statements.
JNL Series Trust
Notes to Schedules of Investments (in thousands)
December 31, 2010
FASB ASC Topic 820, “Fair Value Measurements and Disclosure”
| Assets - Securities | Liabilities - Securities | |||||||||||||||||||||||||||||||||||
| Level 1 | Level 2 | Level 3 | Total | Level 1 | Level 2 | Level 3 | Total | |||||||||||||||||||||||||||||
JNL Institutional Alt 35 Fund | ||||||||||||||||||||||||||||||||||||
Investment Companies | $ | 885,592 | $ | – | $ | – | $ | 885,592 | $ | – | $ | – | $ | – | $ | – | ||||||||||||||||||||
Fund Total | $ | 885,592 | $ | – | $ | – | $ | 885,592 | $ | – | $ | – | $ | – | $ | – | ||||||||||||||||||||
JNL Institutional Alt 50 Fund | ||||||||||||||||||||||||||||||||||||
Investment Companies | $ | 1,077,783 | $ | – | $ | – | $ | 1,077,783 | $ | – | $ | – | $ | – | $ | – | ||||||||||||||||||||
Fund Total | $ | 1,077,783 | $ | – | $ | – | $ | 1,077,783 | $ | – | $ | – | $ | – | $ | – | ||||||||||||||||||||
JNL Institutional Alt 65 Fund | ||||||||||||||||||||||||||||||||||||
Investment Companies | $ | 728,524 | $ | – | $ | – | $ | 728,524 | $ | – | $ | – | $ | – | $ | – | ||||||||||||||||||||
Fund Total | $ | 728,524 | $ | – | $ | – | $ | 728,524 | $ | – | $ | – | $ | – | $ | – | ||||||||||||||||||||
JNL/BlackRock Commodity Securities Fund |
| |||||||||||||||||||||||||||||||||||
Common Stocks | $ | 453,359 | $ | 5,758 | $ | – | $ | 459,117 | $ | – | $ | – | $ | – | $ | – | ||||||||||||||||||||
Commodity Indexed Structured Notes | – | 210,771 | – | 210,771 | – | – | – | – | ||||||||||||||||||||||||||||
Short Term Securities | 240,516 | 270,961 | – | 511,477 | – | – | – | – | ||||||||||||||||||||||||||||
Fund Total | $ | 693,875 | $ | 487,490 | $ | – | $ | 1,181,365 | $ | – | $ | – | $ | – | $ | – | ||||||||||||||||||||
JNL/BlackRock Global Allocation Fund | ||||||||||||||||||||||||||||||||||||
Investment Companies | $ | 179,646 | $ | – | $ | – | $ | 179,646 | $ | – | $ | – | $ | – | $ | – | ||||||||||||||||||||
Fund Total | $ | 179,646 | $ | – | $ | – |
| $ | 179,646 | $ | – | $ | – | $ | – | $ | – | |||||||||||||||||||
JNL/Capital Guardian Global Balanced Fund |
| |||||||||||||||||||||||||||||||||||
Common Stocks | $ | 171,044 | $ | 63,439 | $ | – | $ | 234,483 | $ | – | $ | – | $ | – | $ | – | ||||||||||||||||||||
Preferred Stocks | 1,320 | – | – | 1,320 | – | – | – | – | ||||||||||||||||||||||||||||
Rights | 16 | – | – | 16 | – | – | – | – | ||||||||||||||||||||||||||||
Corporate Bonds and Notes | – | 20,671 | – | 20,671 | – | – | – | – | ||||||||||||||||||||||||||||
Government and Agency Obligations | – | 88,227 | – | 88,227 | – | – | – | – | ||||||||||||||||||||||||||||
Short Term Securities | 30,112 | – | – | 30,112 | – | – | – | – | ||||||||||||||||||||||||||||
Fund Total | $ | 202,492 | $ | 172,337 | $ | – | $ | 374,829 | $ | – | $ | – | $ | – | $ | – | ||||||||||||||||||||
JNL/Capital Guardian Global Diversified Research Fund |
| |||||||||||||||||||||||||||||||||||
Common Stocks | $ | 333,250 | $ | 89,067 | $ | – | $ | 422,317 | $ | – | $ | – | $ | – | $ | – | ||||||||||||||||||||
Corporate Bonds and Notes | – | 372 | – | 372 | – | – | – | – | ||||||||||||||||||||||||||||
Short Term Securities | 24,367 | – | – | 24,367 | – | – | – | – | ||||||||||||||||||||||||||||
Fund Total | $ | 357,617 | $ | 89,439 | $ | – | $ | 447,056 | $ | – | $ | – | $ | – | $ | – | ||||||||||||||||||||
JNL/Capital Guardian U.S. Growth Equity Fund |
| |||||||||||||||||||||||||||||||||||
Common Stocks | $ | 842,315 | $ | – | $ | – | $ | 842,315 | $ | – | $ | – | $ | – | $ | – | ||||||||||||||||||||
Short Term Securities | 77,438 | – | – | 77,438 | – | – | – | – | ||||||||||||||||||||||||||||
Fund Total | $ | 919,753 | $ | – | $ | – | $ | 919,753 | $ | – | $ | – | $ | – | $ | – | ||||||||||||||||||||
JNL/Eagle Core Equity Fund | ||||||||||||||||||||||||||||||||||||
Common Stocks | $ | 191,556 | $ | – | $ | – | $ | 191,556 | $ | – | $ | – | $ | – | $ | – | ||||||||||||||||||||
Investment Companies | 6,424 | – | – | 6,424 | – | – | – | – | ||||||||||||||||||||||||||||
Short Term Securities | 10,239 | – | – | 10,239 | – | – | – | – | ||||||||||||||||||||||||||||
Fund Total | $ | 208,219 | $ | – | $ | – | $ | 208,219 | $ | – | $ | – | $ | – | $ | – | ||||||||||||||||||||
JNL/Eagle SmallCap Equity Fund | ||||||||||||||||||||||||||||||||||||
Common Stocks | $ | 584,039 | $ | – | $ | – | $ | 584,039 | $ | – | $ | – | $ | – | $ | – | ||||||||||||||||||||
Short Term Securities | 55,204 | – | – | 55,204 | – | – | – | – | ||||||||||||||||||||||||||||
Fund Total | $ | 639,243 | $ | – | $ | – | $ | 639,243 | $ | – | $ | – | $ | – | $ | – | ||||||||||||||||||||
JNL/Franklin Templeton Founding Strategy Fund |
| |||||||||||||||||||||||||||||||||||
Investment Companies | $ | 1,038,049 | $ | – | $ | – | $ | 1,038,049 | $ | – | $ | – | $ | – | $ | – | ||||||||||||||||||||
Fund Total | $ | 1,038,049 | $ | – | $ | – | $ | 1,038,049 | $ | – | $ | – | $ | – | $ | – | ||||||||||||||||||||
JNL/Franklin Templeton Global Growth Fund |
| |||||||||||||||||||||||||||||||||||
Common Stocks | $ | 361,547 | $ | 84,665 | $ | – | $ | 446,212 | $ | – | $ | – | $ | – | $ | – | ||||||||||||||||||||
Short Term Securities | 33,620 | – | – | 33,619 | – | – | – | – | ||||||||||||||||||||||||||||
Fund Total | $ | 395,167 | $ | 84,665 | $ | – | $ | 479,831 | $ | – | $ | – | $ | – | $ | – | ||||||||||||||||||||
JNL/Franklin Templeton Income Fund | ||||||||||||||||||||||||||||||||||||
Common Stocks | $ | 349,609 | $ | 17,323 | $ | – | $ | 366,932 | $ | – | $ | – | $ | – | $ | – | ||||||||||||||||||||
Preferred Stocks | 13,880 | 34,960 | – | 48,840 | – | – | – | – | ||||||||||||||||||||||||||||
Warrants | 251 | – | – | 251 | – | – | – | – | ||||||||||||||||||||||||||||
Non-U.S. Government Agency ABS | – | 7,607 | – | 7,607 | – | – | – | – | ||||||||||||||||||||||||||||
Corporate Bonds and Notes | – | 556,103 | 7 | 556,110 | – | – | – | – | ||||||||||||||||||||||||||||
Government and Agency Obligations | – | 6,188 | – | 6,188 | – | – | – | – | ||||||||||||||||||||||||||||
Short Term Securities | 249,521 | – | – | 249,521 | – | – | – | – | ||||||||||||||||||||||||||||
Fund Total | $ | 613,261 | $ | 622,181 | $ | 7 | $ | 1,235,449 | $ | – | $ | – | $ | – | $ | – | ||||||||||||||||||||
JNL/Franklin Templeton International Small Cap Growth Fund |
| |||||||||||||||||||||||||||||||||||
Common Stocks | $ | 160,039 | $ | 41,648 | $ | – | $ | 201,687 | $ | – | $ | – | $ | – | $ | – | ||||||||||||||||||||
Short Term Securities | 30,999 | – | – | 30,999 | – | – | – | – | ||||||||||||||||||||||||||||
Fund Total | $ | 191,038 | $ | 41,648 | $ | – | $ | 232,686 | $ | – | $ | – | $ | – | $ | – | ||||||||||||||||||||
See accompanying Notes to the Financial Statements.
JNL Series Trust
Notes to Schedules of Investments (in thousands)
December 31, 2010
FASB ASC Topic 820, “Fair Value Measurements and Disclosure”
| Assets - Securities | Liabilities - Securities | |||||||||||||||||||||||||||||||
| Level 1 | Level 2 | Level 3 | Total | Level 1 | Level 2 | Level 3 | Total | |||||||||||||||||||||||||
JNL/Franklin Templeton Mutual Shares Fund | ||||||||||||||||||||||||||||||||
Common Stocks | $ | 438,991 | $ | 70,748 | $ | 4,578 | $ | 514,317 | $ | – | $ | – | $ | – | $ | – | ||||||||||||||||
Corporate Bonds and Notes1 | – | 16,937 | 1,579 | 18,516 | – | (565) | – | (565) | ||||||||||||||||||||||||
Short Term Securities | 73,425 | – | – | 73,425 | – | – | – | – | ||||||||||||||||||||||||
Fund Total | $ | 512,416 | $ | 87,685 | $ | 6,157 | $ | 606,258 | $ | – | $ | (565) | $ | – | $ | (565) | ||||||||||||||||
JNL/Franklin Templeton Small Cap Value Fund | ||||||||||||||||||||||||||||||||
Common Stocks | $ | 274,072 | $ | – | $ | – | $ | 274,072 | $ | – | $ | – | $ | – | $ | – | ||||||||||||||||
Short Term Securities | 30,672 | – | – | 30,672 | – | – | – | – | ||||||||||||||||||||||||
Fund Total | $ | 304,744 | $ | – | $ | – | $ | 304,744 | $ | – | $ | – | $ | – | $ | – | ||||||||||||||||
JNL/Goldman Sachs Core Plus Bond Fund | ||||||||||||||||||||||||||||||||
Non-U.S. Government Agency ABS | $ | – | $ | 133,848 | $ | 5,088 | $ | 138,936 | $ | – | $ | – | $ | – | $ | – | ||||||||||||||||
Corporate Bonds and Notes | – | 293,035 | – | 293,035 | – | – | – | – | ||||||||||||||||||||||||
Government and Agency Obligations | – | 643,964 | – | 643,964 | – | (23,595) | – | (23,595) | ||||||||||||||||||||||||
Short Term Securities | 427,793 | – | – | 427,793 | – | – | – | – | ||||||||||||||||||||||||
Fund Total | $ | 427,793 | $ | 1,070,847 | $ | 5,088 | $ | 1,503,728 | $ | – | $ | (23,595) | $ | – | $ | (23,595) | ||||||||||||||||
JNL/Goldman Sachs Emerging Markets Debt Fund | ||||||||||||||||||||||||||||||||
Corporate Bonds and Notes | $ | – | $ | 56,903 | $ | 2,680 | $ | 59,583 | $ | – | $ | – | $ | – | $ | – | ||||||||||||||||
Government and Agency Obligations | – | 444,915 | – | 444,915 | – | – | – | – | ||||||||||||||||||||||||
Short Term Securities | 211,959 | 14,379 | – | 226,338 | – | – | – | – | ||||||||||||||||||||||||
Fund Total | $ | 211,959 | $ | 516,197 | $ | 2,680 | $ | 730,836 | $ | – | $ | – | $ | – | $ | – | ||||||||||||||||
JNL/Goldman Sachs MidCap Value Fund | ||||||||||||||||||||||||||||||||
Common Stocks | $ | 490,056 | $ | – | $ | – | $ | 490,056 | $ | – | $ | – | $ | – | $ | – | ||||||||||||||||
Short Term Securities | 31,802 | – | – | 31,802 | – | – | – | – | ||||||||||||||||||||||||
Fund Total | $ | 521,858 | $ | – | $ | – | $ | 521,858 | $ | – | $ | – | $ | – | $ | – | ||||||||||||||||
JNL/Goldman Sachs U.S. Equity Flex Fund | ||||||||||||||||||||||||||||||||
Common Stocks | $ | 145,714 | $ | – | $ | – | $ | 145,714 | $ | (35,216) | $ | – | $ | – | $ | (35,216) | ||||||||||||||||
Short Term Securities | 4,931 | – | – | 4,931 | – | – | – | – | ||||||||||||||||||||||||
Fund Total | $ | 150,645 | $ | – | $ | – | $ | 150,645 | $ | (35,216) | $ | – | $ | – | $ | (35,216) | ||||||||||||||||
JNL/Invesco Global Real Estate Fund | ||||||||||||||||||||||||||||||||
Common Stocks | $ | 556,534 | $ | 94,317 | $ | – | $ | 650,851 | $ | – | $ | – | $ | – | $ | – | ||||||||||||||||
Short Term Securities | 39,619 | – | – | 39,619 | – | – | – | – | ||||||||||||||||||||||||
Fund Total | $ | 596,153 | $ | 94,317 | $ | – | $ | 690,470 | $ | – | $ | – | $ | – | $ | – | ||||||||||||||||
JNL/Invesco International Growth Fund | ||||||||||||||||||||||||||||||||
Common Stocks | $ | 377,831 | $ | 172,048 | $ | – | $ | 549,879 | $ | – | $ | – | $ | – | $ | – | ||||||||||||||||
Short Term Securities | 64,044 | – | – | 64,044 | – | – | – | – | ||||||||||||||||||||||||
Fund Total | $ | 441,875 | $ | 172,048 | $ | – | $ | 613,923 | $ | – | $ | – | $ | – | $ | – | ||||||||||||||||
JNL/Invesco Large Cap Growth Fund | ||||||||||||||||||||||||||||||||
Common Stocks | $ | 888,774 | $ | – | $ | – | $ | 888,774 | $ | – | $ | – | $ | – | $ | – | ||||||||||||||||
Short Term Securities | 25,059 | – | – | 25,059 | – | – | – | – | ||||||||||||||||||||||||
Fund Total | $ | 913,833 | $ | – | $ | – | $ | 913,833 | $ | – | $ | – | $ | – | $ | – | ||||||||||||||||
JNL/Invesco Small Cap Growth Fund | ||||||||||||||||||||||||||||||||
Common Stocks | $ | 145,867 | $ | – | $ | – | $ | 145,867 | $ | – | $ | – | $ | – | $ | – | ||||||||||||||||
Short Term Securities | 18,035 | – | – | 18,035 | – | – | – | – | ||||||||||||||||||||||||
Fund Total | $ | 163,902 | $ | – | $ | – | $ | 163,902 | $ | – | $ | – | $ | – | $ | – | ||||||||||||||||
JNL/Ivy Asset Strategy Fund | ||||||||||||||||||||||||||||||||
Common Stocks | $ | 605,782 | $ | 88,202 | $ | – | $ | 693,984 | $ | – | $ | – | $ | – | $ | – | ||||||||||||||||
Preferred Stocks | 13,021 | 38,776 | – | 51,797 | – | – | – | – | ||||||||||||||||||||||||
Options Purchased | 601 | – | 6,037 | 6,638 | – | – | – | – | ||||||||||||||||||||||||
Precious Metals | 110,710 | – | – | 110,710 | – | – | – | – | ||||||||||||||||||||||||
Short Term Securities | 100,979 | – | – | 100,979 | – | – | – | – | ||||||||||||||||||||||||
Fund Total | $ | 831,093 | $ | 126,978 | $ | 6,037 | $ | 964,108 | $ | – | $ | – | $ | – | $ | – | ||||||||||||||||
JNL/JPMorgan International Value Fund | ||||||||||||||||||||||||||||||||
Common Stocks | $ | 329,211 | $ | 252,435 | $ | – | $ | 581,646 | $ | – | $ | – | $ | – | $ | – | ||||||||||||||||
Preferred Stocks | – | 9,019 | – | 9,019 | – | – | – | – | ||||||||||||||||||||||||
Short Term Securities | 33,214 | – | – | 33,214 | – | – | – | – | ||||||||||||||||||||||||
Fund Total | $ | 362,425 | $ | 261,454 | $ | – | $ | 623,879 | $ | – | $ | – | $ | – | $ | – | ||||||||||||||||
JNL/JPMorgan Mid Cap Growth Fund | ||||||||||||||||||||||||||||||||
Common Stocks | $ | 226,337 | $ | – | $ | 587 | $ | 226,924 | $ | – | $ | – | $ | – | $ | – | ||||||||||||||||
Short Term Securities | 20,141 | – | – | 20,141 | – | – | – | – | ||||||||||||||||||||||||
Fund Total | $ | 246,478 | $ | – | $ | 587 | $ | 247,065 | $ | – | $ | – | $ | – | $ | – | ||||||||||||||||
JNL/JPMorgan U.S. Government & Quality Bond Fund | ||||||||||||||||||||||||||||||||
Non-U.S. Government Agency ABS | $ | – | $ | 33,053 | $ | – | $ | 33,053 | $ | – | $ | – | $ | – | $ | – | ||||||||||||||||
Corporate Bonds and Notes | – | 6,687 | – | 6,687 | – | – | – | – | ||||||||||||||||||||||||
Government and Agency Obligations | – | 838,565 | – | 838,565 | – | – | – | – | ||||||||||||||||||||||||
Short Term Securities | 67,601 | – | – | 67,601 | – | – | – | – | ||||||||||||||||||||||||
Fund Total | $ | 67,601 | $ | 878,305 | $ | – | $ | 945,906 | $ | – | $ | – | $ | – | $ | – | ||||||||||||||||
See accompanying Notes to the Financial Statements.
JNL Series Trust
Notes to Schedules of Investments (in thousands)
December 31, 2010
FASB ASC Topic 820, “Fair Value Measurements and Disclosure”
| Assets - Securities | Liabilities - Securities | |||||||||||||||||||||||||||||||
| Level 1 | Level 2 | Level 3 | Total | Level 1 | Level 2 | Level 3 | Total | |||||||||||||||||||||||||
JNL/Lazard Emerging Markets Fund | ||||||||||||||||||||||||||||||||
Common Stocks | $ | 1,022,578 | $ | 275,082 | $ | – | $ | 1,297,660 | $ | – | $ | – | $ | – | $ | – | ||||||||||||||||
Preferred Stocks | 37,327 | – | – | 37,327 | – | – | – | – | ||||||||||||||||||||||||
Short Term Securities | 129,721 | – | – | 129,721 | – | – | – | – | ||||||||||||||||||||||||
Fund Total | $ | 1,189,626 | $ | 275,082 | $ | – | $ | 1,464,708 | $ | – | $ | – | $ | – | $ | – | ||||||||||||||||
JNL/Lazard Mid Cap Equity Fund | ||||||||||||||||||||||||||||||||
Common Stocks | $ | 203,309 | $ | – | $ | – | $ | 203,309 | $ | – | $ | – | $ | – | $ | – | ||||||||||||||||
Preferred Stocks | – | – | 1,015 | 1,015 | – | – | – | – | ||||||||||||||||||||||||
Short Term Securities | 13,184 | – | – | 13,184 | – | – | – | – | ||||||||||||||||||||||||
Fund Total | $ | 216,493 | $ | – | $ | 1,015 | $ | 217,508 | $ | – | $ | – | $ | – | $ | – | ||||||||||||||||
JNL/M&G Global Basics Fund | ||||||||||||||||||||||||||||||||
Common Stocks | $ | 165,300 | $ | 24,226 | $ | – | $ | 189,526 | $ | – | $ | – | $ | – | $ | – | ||||||||||||||||
Preferred Stocks | 164 | – | – | 164 | – | – | – | – | ||||||||||||||||||||||||
Short Term Securities | 23,050 | – | – | 23,050 | – | – | – | – | ||||||||||||||||||||||||
Fund Total | $ | 188,514 | $ | 24,226 | $ | – | $ | 212,740 | $ | – | $ | – | $ | – | $ | – | ||||||||||||||||
JNL/M&G Global Leaders Fund | ||||||||||||||||||||||||||||||||
Common Stocks | $ | 23,156 | $ | 5,669 | $ | – | $ | 28,825 | $ | – | $ | – | $ | – | $ | – | ||||||||||||||||
Preferred Stocks | – | 849 | – | 849 | – | – | – | – | ||||||||||||||||||||||||
Short Term Securities | 1,053 | – | – | 1,053 | – | – | – | – | ||||||||||||||||||||||||
Fund Total | $ | 24,209 | $ | 6,518 | $ | – | $ | 30,727 | $ | – | $ | – | $ | – | $ | – | ||||||||||||||||
JNL/Mellon Capital Management 10 x 10 Fund | ||||||||||||||||||||||||||||||||
Investment Companies | $ | 257,560 | $ | – | $ | – | $ | 257,560 | $ | – | $ | – | $ | – | $ | – | ||||||||||||||||
Fund Total | $ | 257,560 | $ | – | $ | – | $ | 257,560 | $ | – | $ | – | $ | – | $ | – | ||||||||||||||||
JNL/Mellon Capital Management Index 5 Fund | ||||||||||||||||||||||||||||||||
Investment Companies | $ | 332,499 | $ | – | $ | – | $ | 332,499 | $ | – | $ | – | $ | – | $ | – | ||||||||||||||||
Fund Total | $ | 332,499 | $ | – | $ | – | $ | 332,499 | $ | – | $ | – | $ | – | $ | – | ||||||||||||||||
JNL/Mellon Capital Management European 30 Fund | ||||||||||||||||||||||||||||||||
Common Stocks | $ | 10,023 | $ | 7,970 | $ | – | $ | 17,993 | $ | – | $ | – | $ | – | $ | – | ||||||||||||||||
Investment Companies | 318 | – | – | 318 | – | – | – | – | ||||||||||||||||||||||||
Short Term Securities | 191 | – | – | 191 | – | – | – | – | ||||||||||||||||||||||||
Fund Total | $ | 10,532 | $ | 7,970 | $ | – | $ | 18,502 | $ | – | $ | – | $ | – | $ | – | ||||||||||||||||
JNL/Mellon Capital Management Pacific Rim 30 Fund | ||||||||||||||||||||||||||||||||
Common Stocks | $ | 18,572 | $ | 19,026 | $ | – | $ | 37,598 | $ | – | $ | – | $ | – | $ | – | ||||||||||||||||
Investment Companies | 1,330 | – | – | 1,330 | – | – | – | – | ||||||||||||||||||||||||
Short Term Securities | 1,609 | – | – | 1,609 | – | – | – | – | ||||||||||||||||||||||||
Fund Total | $ | 21,511 | $ | 19,026 | $ | – | $ | 40,537 | $ | – | $ | – | $ | – | $ | – | ||||||||||||||||
JNL/Mellon Capital Management S&P 500 Index Fund | ||||||||||||||||||||||||||||||||
Common Stocks | $ | 1,322,092 | $ | – | $ | – | $ | 1,322,092 | $ | – | $ | – | $ | – | $ | – | ||||||||||||||||
Short Term Securities | 29,780 | 1,295 | – | 31,075 | – | – | – | – | ||||||||||||||||||||||||
Fund Total | $ | 1,351,872 | $ | 1,295 | $ | – | $ | 1,353,167 | $ | – | $ | – | $ | – | $ | – | ||||||||||||||||
JNL/Mellon Capital Management S&P 400 MidCap Index Fund | ||||||||||||||||||||||||||||||||
Common Stocks | $ | 657,969 | $ | – | $ | – | $ | 657,969 | $ | – | $ | – | $ | – | $ | – | ||||||||||||||||
Short Term Securities | 53,214 | 940 | – | 54,154 | – | – | – | – | ||||||||||||||||||||||||
Fund Total | $ | 711,184 | $ | 940 | $ | – | $ | 712,123 | $ | – | $ | – | $ | – | $ | – | ||||||||||||||||
JNL/Mellon Capital Management Small Cap Index Fund | ||||||||||||||||||||||||||||||||
Common Stocks | $ | 699,827 | $ | – | $ | 45 | $ | 699,872 | $ | – | $ | – | $ | – | $ | – | ||||||||||||||||
Short Term Securities | 95,998 | 895 | – | 96,893 | – | – | – | – | ||||||||||||||||||||||||
Fund Total | $ | 795,825 | $ | 895 | $ | 45 | $ | 796,765 | $ | – | $ | – | $ | – | $ | – | ||||||||||||||||
JNL/Mellon Capital Management International Index Fund | ||||||||||||||||||||||||||||||||
Common Stocks | $ | 523,101 | $ | 525,104 | $ | – | $ | 1,048,205 | $ | – | $ | – | $ | – | $ | – | ||||||||||||||||
Preferred Stocks | – | 7,019 | – | 7,019 | – | – | – | – | ||||||||||||||||||||||||
Short Term Securities | 84,545 | 1,710 | – | 86,255 | – | – | – | – | ||||||||||||||||||||||||
Fund Total | $ | 607,646 | $ | 533,833 | $ | – | $ | 1,141,479 | $ | – | $ | – | $ | – | $ | – | ||||||||||||||||
JNL/Mellon Capital Management Bond Index Fund | ||||||||||||||||||||||||||||||||
Non-U.S. Government Agency ABS | $ | – | $ | 37,535 | $ | – | $ | 37,535 | $ | – | $ | – | $ | – | $ | – | ||||||||||||||||
Corporate Bonds and Notes | – | 280,379 | – | 280,379 | – | – | – | – | ||||||||||||||||||||||||
Government and Agency Obligations | – | 999,525 | – | 999,525 | – | – | – | – | ||||||||||||||||||||||||
Short Term Securities | 118,895 | – | – | 118,895 | – | – | – | – | ||||||||||||||||||||||||
| �� | ||||||||||||||||||||||||||||||||
Fund Total | $ | 118,895 | $ | 1,317,439 | $ | – | $ | 1,436,334 | $ | – | $ | – | $ | – | $ | – | ||||||||||||||||
JNL/Mellon Capital Management Global Alpha Fund | ||||||||||||||||||||||||||||||||
Short Term Securities | $ | 3,593 | $ | 194,832 | $ | – | $ | 198,425 | $ | – | $ | – | $ | – | $ | – | ||||||||||||||||
Fund Total | $ | 3,593 | $ | 194,832 | $ | – | $ | 198,425 | $ | – | $ | – | $ | – | $ | – | ||||||||||||||||
JNL/Oppenheimer Global Growth Fund | ||||||||||||||||||||||||||||||||
Common Stocks | $ | 242,189 | $ | 146,897 | $ | – | $ | 389,086 | $ | – | $ | – | $ | – | $ | – | ||||||||||||||||
Preferred Stocks | – | 5,129 | – | 5,129 | – | – | – | – | ||||||||||||||||||||||||
Short Term Securities | 27,066 | – | – | 27,066 | – | – | – | – | ||||||||||||||||||||||||
Fund Total | $ | 269,255 | $ | 152,026 | $ | – | $ | 421,281 | $ | – | $ | – | $ | – | $ | – | ||||||||||||||||
See accompanying Notes to the Financial Statements.
JNL Series Trust
Notes to Schedules of Investments (in thousands)
December 31, 2010
FASB ASC Topic 820, “Fair Value Measurements and Disclosure”
| Assets - Securities | Liabilities - Securities | |||||||||||||||||||||||||||||||
| Level 1 | Level 2 | Level 3 | Total | Level 1 | Level 2 | Level 3 | Total | |||||||||||||||||||||||||
JNL/PAM Asia ex-Japan Fund | ||||||||||||||||||||||||||||||||
Common Stocks | $ | 107,976 | $ | 41,667 | $ | - | $ | 149,643 | $ | - | $ | - | $ | - | $ | - | ||||||||||||||||
Rights | - | 42 | - | 42 | - | - | - | - | ||||||||||||||||||||||||
Warrants | 18 | - | - | 18 | - | - | - | - | ||||||||||||||||||||||||
Short Term Securities | 6,871 | - | - | 6,871 | - | - | - | - | ||||||||||||||||||||||||
Fund Total | $ | 114,865 | $ | 41,709 | $ | - | $ | 156,574 | $ | - | $ | - | $ | - | $ | - | ||||||||||||||||
JNL/PAM China-India Fund | ||||||||||||||||||||||||||||||||
Common Stocks | $ | 364,766 | $ | - | $ | - | $ | 364,766 | $ | - | $ | - | $ | - | $ | - | ||||||||||||||||
Short Term Securities | 37,358 | - | - | 37,358 | - | - | - | - | ||||||||||||||||||||||||
Fund Total | $ | 402,124 | $ | - | $ | - | $ | 402,124 | $ | - | $ | - | $ | - | $ | - | ||||||||||||||||
JNL/PIMCO Real Return Fund | ||||||||||||||||||||||||||||||||
Non-U.S. Government Agency ABS | $ | - | $ | 153,991 | $ | 33,594 | $ | 187,585 | $ | - | $ | - | $ | - | $ | - | ||||||||||||||||
Corporate Bonds and Notes | - | 493,463 | 1,562 | 495,025 | - | - | - | - | ||||||||||||||||||||||||
Government and Agency Obligations | - | 1,671,917 | - | 1,671,917 | - | (1,540) | - | (1,540) | ||||||||||||||||||||||||
Preferred Stocks | 500 | - | - | 500 | - | - | - | - | ||||||||||||||||||||||||
Reverse Repurchase Agreements | - | - | - | - | - | (114,399) | (114,399) | |||||||||||||||||||||||||
Short Term Securities | 42,366 | 626,790 | - | 669,156 | - | - | - | - | ||||||||||||||||||||||||
Fund Total | $ | 42,866 | $ | 2,946,161 | $ | 35,156 | $ | 3,024,183 | $ | - | $ | (115,939) | $ | - | $ | (115,939) | ||||||||||||||||
JNL/PIMCO Total Return Bond Fund | ||||||||||||||||||||||||||||||||
Non-U.S. Government Agency ABS | $ | - | $ | 197,548 | $ | 2,404 | $ | 199,952 | $ | - | $ | - | $ | - | $ | - | ||||||||||||||||
Corporate Bonds and Notes | - | 931,089 | 5,063 | 936,152 | - | - | - | - | ||||||||||||||||||||||||
Government and Agency Obligations | - | 3,178,187 | 179 | 3,178,366 | - | (49,840) | - | (49,840) | ||||||||||||||||||||||||
Preferred Stocks | 384 | 1,050 | 3,191 | 4,625 | - | - | - | - | ||||||||||||||||||||||||
Reverse Repurchase Agreements | - | - | - | - | - | (110,203) | - | (110,203) | ||||||||||||||||||||||||
Short Term Securities | 205,069 | 202,242 | - | 407,311 | - | - | - | - | ||||||||||||||||||||||||
Fund Total | $ | 205,453 | $ | 4,510,116 | $ | 10,837 | $ | 4,726,406 | $ | - | $ | (160,043) | $ | - | $ | (160,043) | ||||||||||||||||
JNL/PPM America High Yield Bond Fund | ||||||||||||||||||||||||||||||||
Common Stocks | $ | 14,908 | $ | - | $ | - | $ | 14,908 | $ | - | $ | - | $ | - | $ | - | ||||||||||||||||
Preferred Stocks | 5,686 | 958 | - | 6,644 | - | - | - | - | ||||||||||||||||||||||||
Investment Companies | 6,138 | - | - | 6,138 | - | - | - | - | ||||||||||||||||||||||||
Non-U.S. Government Agency ABS | - | 38,333 | - | 38,333 | - | - | - | - | ||||||||||||||||||||||||
Corporate Bonds and Notes | - | 789,984 | - | 789,984 | - | - | - | - | ||||||||||||||||||||||||
Short Term Securities | 249,112 | - | - | 249,112 | - | - | - | - | ||||||||||||||||||||||||
Fund Total | $ | 275,844 | $ | 829,275 | $ | - | $ | 1,105,119 | $ | - | $ | - | $ | - | $ | - | ||||||||||||||||
JNL/PPM America Mid Cap Value Fund | ||||||||||||||||||||||||||||||||
Common Stocks | $ | 85,801 | $ | - | $ | - | $ | 85,801 | $ | - | $ | - | $ | - | $ | - | ||||||||||||||||
Short Term Securities | 3,126 | - | - | 3,126 | - | - | - | - | ||||||||||||||||||||||||
Fund Total | $ | 88,927 | $ | - | $ | - | $ | 88,927 | $ | - | $ | - | $ | - | $ | - | ||||||||||||||||
JNL/PPM America Small Cap Value Fund | ||||||||||||||||||||||||||||||||
Common Stocks | $ | 67,226 | $ | - | $ | - | $ | 67,226 | $ | - | $ | - | $ | - | $ | - | ||||||||||||||||
Short Term Securities | 5,966 | - | - | 5,966 | - | - | - | - | ||||||||||||||||||||||||
Fund Total | $ | 73,192 | $ | - | $ | - | $ | 73,192 | $ | - | $ | - | $ | - | $ | - | ||||||||||||||||
JNL/PPM America Value Equity Fund | ||||||||||||||||||||||||||||||||
Common Stocks | $ | 113,707 | $ | - | $ | - | $ | 113,707 | $ | - | $ | - | $ | - | $ | - | ||||||||||||||||
Short Term Securities | 1,684 | - | - | 1,684 | - | - | - | - | ||||||||||||||||||||||||
Fund Total | $ | 115,391 | $ | - | $ | - | $ | 115,391 | $ | - | $ | - | $ | - | $ | - | ||||||||||||||||
JNL/Red Rocks Listed Private Equity Fund | ||||||||||||||||||||||||||||||||
Common Stocks | $ | 549,490 | $ | 74,102 | $ | - | $ | 623,592 | $ | - | $ | - | $ | - | $ | - | ||||||||||||||||
Rights | 250 | - | - | 250 | - | - | - | - | ||||||||||||||||||||||||
Short Term Securities | 20,811 | - | - | 20,811 | - | - | - | - | ||||||||||||||||||||||||
Fund Total | $ | 570,551 | $ | 74,102 | $ | - | $ | 644,653 | $ | - | $ | - | $ | - | $ | - | ||||||||||||||||
JNL/S&P Managed Conservative Fund | ||||||||||||||||||||||||||||||||
Investment Companies | $ | 979,714 | $ | - | $ | - | $ | 979,714 | $ | - | $ | - | $ | - | $ | - | ||||||||||||||||
Fund Total | $ | 979,714 | $ | - | $ | - | $ | 979,714 | $ | - | $ | - | $ | - | $ | - | ||||||||||||||||
JNL/S&P Managed Moderate Fund | ||||||||||||||||||||||||||||||||
Investment Companies | $ | 1,665,329 | $ | - | $ | - | $ | 1,665,329 | $ | - | $ | - | $ | - | $ | - | ||||||||||||||||
Fund Total | $ | 1,665,329 | $ | - | $ | - | $ | 1,665,329 | $ | - | $ | - | $ | - | $ | - | ||||||||||||||||
JNL/S&P Managed Moderate Growth Fund | ||||||||||||||||||||||||||||||||
Investment Companies | $ | 2,861,578 | $ | - | $ | - | $ | 2,861,578 | $ | - | $ | - | $ | - | $ | - | ||||||||||||||||
Fund Total | $ | 2,861,578 | $ | - | $ | - | $ | 2,861,578 | $ | - | $ | - | $ | - | $ | - | ||||||||||||||||
JNL/S&P Managed Growth Fund | ||||||||||||||||||||||||||||||||
Investment Companies | $ | 2,141,119 | $ | - | $ | - | $ | 2,141,119 | $ | - | $ | - | $ | - | $ | - | ||||||||||||||||
Fund Total | $ | 2,141,119 | $ | - | $ | - | $ | 2,141,119 | $ | - | $ | - | $ | - | $ | - | ||||||||||||||||
JNL/S&P Managed Aggressive Growth Fund | ||||||||||||||||||||||||||||||||
Investment Companies | $ | 788,793 | $ | - | $ | - | $ | 788,793 | $ | - | $ | - | $ | - | $ | - | ||||||||||||||||
Fund Total | $ | 788,793 | $ | - | $ | - | $ | 788,793 | $ | - | $ | - | $ | - | $ | - | ||||||||||||||||
See accompanying Notes to the Financial Statements.
JNL Series Trust
Notes to Schedules of Investments (in thousands)
December 31, 2010
FASB ASC Topic 820, “Fair Value Measurements and Disclosure”
| Assets - Securities | Liabilities - Securities | |||||||||||||||||||||||||||||||
| Level 1 | Level 2 | Level 3 | Total | Level 1 | Level 2 | Level 3 | Total | |||||||||||||||||||||||||
JNL/S&P Disciplined Moderate Fund | ||||||||||||||||||||||||||||||||
Investment Companies | $ | 346,489 | $ | – | $ | – | $ | 346,489 | $ | – | $ | – | $ | – | $ | – | ||||||||||||||||
Fund Total | $ | 346,489 | $ | – | $ | – | $ | 346,489 | $ | – | $ | – | $ | – | $ | – | ||||||||||||||||
JNL/S&P Disciplined Moderate Growth Fund | ||||||||||||||||||||||||||||||||
Investment Companies | $ | 376,153 | $ | – | $ | – | $ | 376,153 | $ | – | $ | – | $ | – | $ | – | ||||||||||||||||
Fund Total | $ | 376,153 | $ | – | $ | – | $ | 376,153 | $ | – | $ | – | $ | – | $ | – | ||||||||||||||||
JNL/S&P Disciplined Growth Fund | ||||||||||||||||||||||||||||||||
Investment Companies | $ | 137,498 | $ | – | $ | – | $ | 137,498 | $ | – | $ | – | $ | – | $ | – | ||||||||||||||||
Fund Total | $ | 137,498 | $ | – | $ | – | $ | 137,498 | $ | – | $ | – | $ | – | $ | – | ||||||||||||||||
JNL/S&P Competitive Advantage Fund | ||||||||||||||||||||||||||||||||
Common Stocks | $ | 295,499 | $ | – | $ | – | $ | 295,499 | $ | – | $ | – | $ | – | $ | – | ||||||||||||||||
Short Term Securities | 10,330 | – | – | 10,330 | – | – | – | – | ||||||||||||||||||||||||
Fund Total | $ | 305,829 | $ | – | $ | – | $ | 305,829 | $ | – | $ | – | $ | – | $ | – | ||||||||||||||||
JNL/S&P Dividend Income & Growth Fund | ||||||||||||||||||||||||||||||||
Common Stocks | $ | 439,805 | $ | – | $ | – | $ | 439,805 | $ | – | $ | – | $ | – | $ | – | ||||||||||||||||
Short Term Securities | 24,780 | – | – | 24,780 | – | – | – | – | ||||||||||||||||||||||||
Fund Total | $ | 464,585 | $ | – | $ | – | $ | 464,585 | $ | – | $ | – | $ | – | $ | – | ||||||||||||||||
JNL/S&P Intrinsic Value Fund | ||||||||||||||||||||||||||||||||
Common Stocks | $ | 319,643 | $ | – | $ | – | $ | 319,643 | $ | – | $ | – | $ | – | $ | – | ||||||||||||||||
Short Term Securities | 15,514 | – | – | 15,514 | – | – | – | – | ||||||||||||||||||||||||
Fund Total | $ | 335,157 | $ | – | $ | – | $ | 335,157 | $ | – | $ | – | $ | – | $ | – | ||||||||||||||||
JNL/S&P Total Yield Fund | ||||||||||||||||||||||||||||||||
Common Stocks | $ | 281,043 | $ | – | $ | – | $ | 281,043 | $ | – | $ | – | $ | – | $ | – | ||||||||||||||||
Short Term Securities | 10,049 | – | – | 10,049 | – | – | – | – | ||||||||||||||||||||||||
Fund Total | $ | 291,092 | $ | – | $ | – | $ | 291,092 | $ | – | $ | – | $ | – | $ | – | ||||||||||||||||
JNL/S&P 4 Fund | ||||||||||||||||||||||||||||||||
Investment Companies | $ | 843,994 | $ | – | $ | – | $ | 843,994 | $ | – | $ | – | $ | – | $ | – | ||||||||||||||||
Fund Total | $ | 843,994 | $ | – | $ | – | $ | 843,994 | $ | – | $ | – | $ | – | $ | – | ||||||||||||||||
JNL/Select Balanced Fund | ||||||||||||||||||||||||||||||||
Common Stocks | $ | 853,910 | $ | – | $ | – | $ | 853,910 | $ | – | $ | – | $ | – | $ | – | ||||||||||||||||
Non-U.S. Government Agency ABS | – | 14,721 | – | 14,721 | – | – | – | – | ||||||||||||||||||||||||
Corporate Bonds and Notes | – | 126,383 | – | 126,383 | – | – | – | – | ||||||||||||||||||||||||
Government and Agency Obligations | – | 245,458 | – | 245,458 | – | – | – | – | ||||||||||||||||||||||||
Short Term Securities | 153,986 | – | – | 153,986 | – | – | – | – | ||||||||||||||||||||||||
Fund Total | $ | 1,007,896 | $ | 386,562 | $ | – | $ | 1,394,458 | $ | – | $ | – | $ | – | $ | – | ||||||||||||||||
JNL/Select Money Market Fund | ||||||||||||||||||||||||||||||||
Corporate Bonds and Notes | $ | – | $ | 30,093 | $ | – | $ | 30,093 | $ | – | $ | – | $ | – | $ | – | ||||||||||||||||
Short Term Securities | 77 | 683,085 | – | 683,162 | – | – | – | – | ||||||||||||||||||||||||
Fund Total | $ | 77 | $ | 713,178 | $ | – | $ | 713,255 | $ | – | $ | – | $ | – | $ | – | ||||||||||||||||
JNL/Select Value Fund | ||||||||||||||||||||||||||||||||
Common Stocks | $ | 1,129,045 | $ | – | $ | – | $ | 1,129,045 | $ | – | $ | – | $ | – | $ | – | ||||||||||||||||
Short Term Securities | 31,658 | – | – | 31,658 | – | – | – | – | ||||||||||||||||||||||||
Fund Total | $ | 1,160,703 | $ | – | $ | – | $ | 1,160,703 | $ | – | $ | – | $ | – | $ | – | ||||||||||||||||
JNL/T.Rowe Price Established Growth Fund | ||||||||||||||||||||||||||||||||
Common Stocks | $ | 1,486,911 | $ | 6,092 | $ | – | $ | 1,493,003 | $ | – | $ | – | $ | – | $ | – | ||||||||||||||||
Preferred Stocks | – | – | 3,407 | 3,407 | – | – | – | – | ||||||||||||||||||||||||
Short Term Securities | 42,812 | – | – | 42,812 | – | – | – | – | ||||||||||||||||||||||||
Fund Total | $ | 1,529,723 | $ | 6,092 | $ | 3,407 | $ | 1,539,222 | $ | – | $ | – | $ | – | $ | – | ||||||||||||||||
JNL/T.Rowe Price Mid-Cap Growth Fund | ||||||||||||||||||||||||||||||||
Common Stocks | $ | 1,341,016 | $ | – | $ | – | $ | 1,341,016 | $ | – | $ | – | $ | – | $ | – | ||||||||||||||||
Short Term Securities | 160,657 | – | – | 160,657 | – | – | – | – | ||||||||||||||||||||||||
Fund Total | $ | 1,501,674 | $ | – | $ | – | $ | 1,501,673 | $ | – | $ | – | $ | – | $ | – | ||||||||||||||||
JNL/T.Rowe Price Short-Term Bond Fund | ||||||||||||||||||||||||||||||||
Non-U.S. Government Agency ABS | $ | – | $ | 112,776 | $ | – | $ | 112,776 | $ | – | $ | – | $ | – | $ | – | ||||||||||||||||
Corporate Bonds and Notes | – | 417,562 | – | 417,562 | – | – | – | – | ||||||||||||||||||||||||
Government and Agency Obligations | – | 276,366 | – | 276,366 | – | – | – | – | ||||||||||||||||||||||||
Investment Companies | – | – | 2,543 | 2,543 | – | – | – | – | ||||||||||||||||||||||||
Short Term Securities | 61,850 | 863 | – | 62,713 | – | – | – | – | ||||||||||||||||||||||||
Fund Total | $ | 61,850 | $ | 807,567 | $ | 2,543 | $ | 871,960 | $ | – | $ | – | $ | – | $ | – | ||||||||||||||||
See accompanying Notes to the Financial Statements.
JNL Series Trust
Notes to Schedules of Investments (in thousands)
December 31, 2010
FASB ASC Topic 820, “Fair Value Measurements and Disclosure”
| Assets - Securities | Liabilities - Securities | |||||||||||||||||||||||||||||||
| Level 1 | Level 2 | Level 3 | Total | Level 1 | Level 2 | Level 3 | Total | |||||||||||||||||||||||||
JNL/T.Rowe Price Value Fund | ||||||||||||||||||||||||||||||||
Common Stocks | $ | 1,097,114 | $ | – | $ | – | $ | 1,097,114 | $ | – | $ | – | $ | – | $ | – | ||||||||||||||||
Preferred Stocks | 5,870 | 9,259 | – | 15,129 | – | – | – | – | ||||||||||||||||||||||||
Investment Companies | 4,227 | – | – | 4,227 | – | – | – | – | ||||||||||||||||||||||||
Corporate Bonds and Notes | – | 1,796 | – | 1,796 | – | – | – | – | ||||||||||||||||||||||||
Short Term Securities | 33,316 | – | – | 33,316 | – | – | – | – | ||||||||||||||||||||||||
Fund Total | $ | 1,140,527 | $ | 11,055 | $ | – | $ | 1,151,582 | $ | – | $ | – | $ | – | $ | – | ||||||||||||||||
1Unfunded loan commitments in the JNL/Franklin Templeton Mutual Shares Fund are not reflected in the Schedules of Investments. The unfunded loan commitments and unrealized appreciation on these commitments are included in payable for investment securities purchased and other assets, respectively, in the Statements of Assets and Liabilities.
| Assets - Other Financial Instruments1 | Liabilities - Other Financial Instruments1 | |||||||||||||||||||||||||||||||
| Level 1 | Level 2 | Level 3 | Total | Level 1 | Level 2 | Level 3 | Total | |||||||||||||||||||||||||
JNL/Capital Guardian Global Balanced Fund | ||||||||||||||||||||||||||||||||
Open Forward Foreign Currency Contracts | $ | - | $ | 284 | $ | - | $ | 284 | $ | - | $ | (147) | $ | - | $ | (147) | ||||||||||||||||
JNL/Franklin Templeton Mutual Shares Fund | ||||||||||||||||||||||||||||||||
Open Forward Foreign Currency Contracts | $ | - | $ | 1,605 | $ | - | $ | 1,605 | $ | - | $ | (3,350) | $ | - | $ | (3,350) | ||||||||||||||||
JNL/Goldman Sachs Core Plus Bond Fund | ||||||||||||||||||||||||||||||||
Open Futures Contracts | $ | 451 | $ | - | $ | - | $ | 451 | $ | (1,959) | $ | - | $ | - | $ | (1,959) | ||||||||||||||||
Open Forward Foreign Currency Contracts | - | 2,020 | - | 2,020 | - | (2,807) | - | (2,807) | ||||||||||||||||||||||||
Interest Rate Swap Agreements | - | 9,619 | - | 9,619 | - | (7,515) | - | (7,515) | ||||||||||||||||||||||||
Credit Default Swap Agreements | - | 149 | - | 149 | - | - | - | - | ||||||||||||||||||||||||
Fund Total | $ | 451 | $ | 11,788 | $ | - | $ | 12,239 | $ | (1,959) | $ | (10,322) | $ | - | $ | (12,281) | ||||||||||||||||
JNL/Goldman Sachs Emerging Markets Debt Fund | ||||||||||||||||||||||||||||||||
Open Forward Foreign Currency Contracts | $ | - | $ | 9,706 | $ | - | $ | 9,706 | $ | - | $ | (10,386) | $ | - | $ | (10,386) | ||||||||||||||||
Interest Rate Swap Agreements | - | 5,489 | - | 5,489 | - | (1,425) | - | (1,425) | ||||||||||||||||||||||||
Total Return Swap Agreements | - | 285 | - | 285 | - | (24) | - | (24) | ||||||||||||||||||||||||
Fund Total | $ | - | $ | 15,480 | $ | - | $ | 15,480 | $ | - | $ | (11,835) | $ | - | $ | (11,835) | ||||||||||||||||
JNL/Ivy Asset Strategy Fund | ||||||||||||||||||||||||||||||||
Written Options | $ | - | $ | - | $ | - | $ | - | $ | (225) | $ | - | $ | (1,583) | $ | (1,808) | ||||||||||||||||
Open Forward Foreign Currency Contracts | - | - | - | - | - | (3,797) | - | (3,797) | ||||||||||||||||||||||||
Total Return Swap Agreements | - | 15 | - | 15 | - | (41) | - | (41) | ||||||||||||||||||||||||
Fund Total | $ | - | $ | 15 | $ | - | $ | 15 | $ | (225) | $ | (3,838) | $ | (1,583) | $ | (5,646) | ||||||||||||||||
JNL/JPMorgan International Value Fund | ||||||||||||||||||||||||||||||||
Open Forward Foreign Currency Contracts | $ | - | $ | 5,552 | $ | - | $ | 5,552 | $ | - | $ | (1,290) | $ | - | $ | (1,290) | ||||||||||||||||
JNL/Mellon Capital Management S&P 500 Index Fund | ||||||||||||||||||||||||||||||||
Open Futures Contracts | $ | 104 | $ | - | $ | - | $ | 104 | $ | - | $ | - | $ | - | $ | - | ||||||||||||||||
JNL/Mellon Capital Management S&P 400 MidCap Index Fund | ||||||||||||||||||||||||||||||||
Open Futures Contracts | $ | 71 | $ | - | $ | - | $ | 71 | $ | - | $ | - | $ | - | $ | - | ||||||||||||||||
JNL/Mellon Capital Management Small Cap Index Fund | ||||||||||||||||||||||||||||||||
Open Futures Contracts | $ | 118 | $ | - | $ | - | $ | 118 | $ | - | $ | - | $ | - | $ | - | ||||||||||||||||
JNL/Mellon Capital Management International Index Fund | ||||||||||||||||||||||||||||||||
Open Futures Contracts | $ | 32 | $ | - | $ | - | $ | 32 | $ | (237) | $ | - | $ | - | $ | (237) | ||||||||||||||||
Open Forward Foreign Currency Contracts | - | 921 | - | 921 | - | (452) | - | (452) | ||||||||||||||||||||||||
Fund Total | $ | 32 | $ | 921 | $ | - | $ | 953 | $ | (237) | $ | (452) | $ | - | $ | (689) | ||||||||||||||||
JNL/Mellon Capital Management Global Alpha Fund | ||||||||||||||||||||||||||||||||
Open Futures Contracts | $ | 695 | $ | - | $ | - | $ | 695 | $ | (2,709) | $ | - | $ | - | $ | (2,709) | ||||||||||||||||
Open Forward Foreign Currency Contracts | - | 4,209 | - | 4,209 | - | (1,440) | - | (1,440) | ||||||||||||||||||||||||
Fund Total | $ | 695 | $ | 4,209 | $ | - | $ | 4,904 | $ | (2,709) | $ | (1,440) | $ | - | $ | (4,149) | ||||||||||||||||
JNL/PIMCO Real Return Fund | ||||||||||||||||||||||||||||||||
Written Options | $ | - | $ | - | $ | - | $ | - | $ | (1,082) | $ | (2,736) | $ | (985) | $ | (4,803) | ||||||||||||||||
Open Futures Contracts | 238 | - | - | 238 | (43) | - | - | (43) | ||||||||||||||||||||||||
Open Forward Foreign Currency Contracts | - | 1,070 | - | 1,070 | - | (1,294) | - | (1,294) | ||||||||||||||||||||||||
Interest Rate Swap Agreements | - | 1,731 | - | 1,731 | - | (28) | - | (28) | ||||||||||||||||||||||||
Credit Default Swap Agreements | - | 1,689 | - | 1,689 | - | (822) | - | (822) | ||||||||||||||||||||||||
Fund Total | $ | 238 | $ | 4,490 | $ | - | $ | 4,728 | $ | (1,125) | $ | (4,880) | $ | (985) | $ | (6,990) | ||||||||||||||||
JNL/PIMCO Total Return Bond Fund | ||||||||||||||||||||||||||||||||
Written Options | $ | - | $ | - | $ | - | $ | - | $ | (656) | $ | (6,755) | $ | (2,227) | $ | (9,638) | ||||||||||||||||
Open Futures Contracts | 1,055 | - | - | 1,055 | (3,583) | - | - | (3,583) | ||||||||||||||||||||||||
Open Forward Foreign Currency Contracts | - | 4,866 | - | 4,866 | - | (3,345) | - | (3,345) | ||||||||||||||||||||||||
Interest Rate Swap Agreements | - | 3,270 | - | 3,270 | - | (1,176) | - | (1,176) | ||||||||||||||||||||||||
Credit Default Swap Agreements | - | 3,443 | - | 3,443 | - | (209) | - | (209) | ||||||||||||||||||||||||
Fund Total | $ | 1,055 | $ | 11,579 | $ | - | $ | 12,634 | $ | (4,239) | $ | (11,485) | $ | (2,227) | $ | (17,951) | ||||||||||||||||
1Investments in other financial instruments are derivative instruments not reflected in the Schedules of Investments and include, but are not limited to forward foreign currency contracts, futures contracts, options written and swap agreements. Options purchased are included in Investments in Securities. All derivatives, except for written options, are reflected at the unrealized appreciation/(depreciation) on the instrument. Written options are reflected at value.
See accompanying Notes to the Financial Statements.
JNL Series Trust
Notes to Schedules of Investments (in thousands)
December 31, 2010
| FASB ASC Topic 820, “Fair Value Measurements and Disclosure” | ||||||||||||||||||||||||||||||||
| Assets - Other Financial Instruments1 | Liabilities - Other Financial Instruments1 | |||||||||||||||||||||||||||||||
| Level 1 | Level 2 | Level 3 | Total | Level 1 | Level 2 | Level 3 | Total | |||||||||||||||||||||||||
JNL/T. Rowe Price Short-Term Bond Fund | ||||||||||||||||||||||||||||||||
Open Forward Foreign Currency Contracts | $ | - | $ | - | $ | - | $ | - | $ | - | $ | (88 | ) | $ | - | $ | (88 | ) | ||||||||||||||
1Investments in other financial instruments are derivative instruments not reflected in the Schedules of Investments and include, but are not limited to forward foreign currency contracts, futures contracts, options written and swap agreements. Options purchased are included in Investments in Securities. All derivatives, except for written options, are reflected at the unrealized appreciation/(depreciation) on the instrument. Written options are reflected at value.
Significant transfers between Level 1 and Level 2 valuations during the year ended December 31, 2010, related to certain Fund’s using an independent statistical fair value model pricing service to value certain foreign securities as described in Note 2 in the Notes to the Financial Statements. In instances when criteria constituting a significant event exists and foreign investments are valued using an independent statistical fair value pricing service, they are considered Level 2 valuations. In the absence of the existence of such criteria, the same foreign investments are generally valued using market prices from the applicable exchange and are considered Level 1 valuations. Significant event criteria existed as of December 31, 2009 and December 31, 2010, and therefore, certain foreign investments were valued as Level 2 valuations. In addition, securities lending collateral funds which were valued as a Level 2 at December 31, 2009, were valued as a Level 1 at December 31, 2010. There were no significant transfers into or out of Level 3.
The following table is a rollforward of Level 3 investments by category for which significant unobservable inputs were used to determine fair value during the year ended December 31, 2010:
Balance at Beginning of Period | Transfers Into Level 3 During the Period | Transfers Out of Level 3 | Total Realized and Change in Unrealized Gain/(Loss) | Purchases | (Sales) | Balance at End of Period | Change In Unrealized (Depreciation) During the Period For Level 3 End of Period2 | |||||||||||||||||||||||||
JNL/Capital Guardian Global Balanced Fund |
| |||||||||||||||||||||||||||||||
Government and Agency Obligations | $ | 147 | $ | - | $ | - | $ | 28 | $ | 428 | $ | (603) | $ | - | $ | - | ||||||||||||||||
Fund Total Investments in Securities | $ | 147 | $ | - | $ | - | $ | 28 | $ | 428 | $ | (603) | $ | - | $ | - | ||||||||||||||||
JNL/Franklin Templeton Income Fund |
| |||||||||||||||||||||||||||||||
Corporate Bond and Notes | $ | - | $ | 14 | $ | - | $ | (7) | $ | - | $ | - | $ | 7 | $ | (7) | ||||||||||||||||
Fund Total Investments in Securities | $ | - | $ | 14 | $ | - | $ | (7) | $ | - | $ | - | $ | 7 | $ | (7) | ||||||||||||||||
JNL/Franklin Templeton International Small Cap Growth Fund |
| |||||||||||||||||||||||||||||||
Common Stocks | $ | 12 | $ | - | $ | - | $ | 59 | $ | - | $ | (71) | $ | - | $ | - | ||||||||||||||||
Fund Total Investments in Securities | $ | 12 | $ | - | $ | - | $ | 59 | $ | - | $ | (71) | $ | - | $ | - | ||||||||||||||||
JNL/Franklin Templeton Mutual Shares Fund |
| |||||||||||||||||||||||||||||||
Common Stocks | $ | 965 | $ | - | $ | - | $ | 1,105 | $ | 2,508 | $ | - | $ | 4,578 | $ | 1,118 | ||||||||||||||||
Corporate Bond and Notes | 391 | - | - | 1,188 | - | - | 1,579 | 1,188 | ||||||||||||||||||||||||
Fund Total Investments in Securities | $ | 1,356 | $ | - | $ | - | $ | 2,293 | $ | 2,508 | $ | - | $ | 6,157 | $ | 2,306 | ||||||||||||||||
JNL/Goldman Sachs Core Plus Bond Fund |
| |||||||||||||||||||||||||||||||
Non-U.S. Government Agency ABS | $ | 1,762 | $ | - | $ | (1,762) | $ | - | $ | 5,088 | $ | - | $ | 5,088 | $ | - | ||||||||||||||||
Corporate Bond and Notes | 424 | - | (424) | - | - | - | - | - | ||||||||||||||||||||||||
Government and Agency Obligations | 1,216 | - | - | (60) | - | (1,156) | - | - | ||||||||||||||||||||||||
Common Stocks | 9 | - | - | (9) | - | - | - | - | ||||||||||||||||||||||||
Fund Total Investments in Securities | $ | 3,411 | $ | - | $ | (2,186) | $ | (69) | $ | 5,088 | $ | (1,156) | $ | 5,088 | $ | - | ||||||||||||||||
JNL/Goldman Sachs Emerging Markets Debt Fund |
| |||||||||||||||||||||||||||||||
Corporate Bond and Notes | $ | 14,512 | $ | - | $ | (9,793) | $ | 295 | $ | 2,456 | $ | (4,790) | $ | 2,680 | $ | 225 | ||||||||||||||||
Fund Total Investments in Securities | $ | 14,512 | $ | - | $ | (9,793) | $ | 295 | $ | 2,456 | $ | (4,790) | $ | 2,680 | $ | 225 | ||||||||||||||||
Investments in Other Financial Instruments1 | ||||||||||||||||||||||||||||||||
Total Return Swap Agreements | $ | 42 | $ | - | $ | - | $ | 404 | $ | - | $ | - | $ | 446 | $ | - | ||||||||||||||||
Fund Total Investments in Other Financial Instruments | $ | 42 | $ | - | $ | - | $ | 404 | $ | - | $ | - | $ | 446 | $ | - | ||||||||||||||||
JNL/Ivy Asset Strategy Fund |
| |||||||||||||||||||||||||||||||
Options Purchased | $ | - | $ | - | $ | - | $ | 12 | $ | 6,025 | $ | - | $ | 6,037 | $ | 12 | ||||||||||||||||
Fund Total Investments in Securities | $ | - | $ | - | $ | - | $ | 12 | $ | 6,025 | $ | - | $ | 6,037 | $ | 12 | ||||||||||||||||
Investments in Other Financial Instruments1 | ||||||||||||||||||||||||||||||||
Written Options | $ | - | $ | - | $ | - | $ | (333) | $ | - | $ | (1,250) | $ | (1,583) | $ | (333) | ||||||||||||||||
Fund Total Investments in Other Financial Instruments | $ | - | $ | - | $ | - | $ | (333) | $ | - | $ | (1.250) | $ | (1,583) | $ | (333) | ||||||||||||||||
JNL/JPMorgan MidCap Growth Fund |
| |||||||||||||||||||||||||||||||
Common Stocks | $ | 440 | $ | - | $ | 147 | $ | - | $ | - | $ | - | $ | 587 | $ | 147 | ||||||||||||||||
Fund Total Investments in Securities | $ | 440 | $ | - | $ | 147 | $ | - | $ | - | $ | - | $ | 587 | $ | 147 | ||||||||||||||||
JNL/JPMorgan U.S. Government & Quality Bond Fund |
| |||||||||||||||||||||||||||||||
Non-U.S. Government Agency ABS | $ | 506 | $ | - | $ | (506) | $ | - | $ | - | $ | - | $ | - | $ | - | ||||||||||||||||
Fund Total Investments in Securities | $ | 506 | $ | - | $ | (506) | $ | - | $ | - | $ | - | $ | - | $ | - | ||||||||||||||||
See accompanying Notes to the Financial Statements.
JNL Series Trust
Notes to Schedules of Investments (in thousands)
December 31, 2010
FASB ASC Topic 820, “Fair Value Measurements and Disclosure”
Balance at Beginning | Transfers Into Level 3 During the Period | Transfers Out During the Period | Total Realized Unrealized Gain/(Loss) | Purchases | (Sales) | Balance at End of Period | Change In Unrealized Appreciation/ (Depreciation) During the Period For Level 3 Investments held at End of Period2 | |||||||||||||||||||||||||
JNL/Lazard Emerging Markets Fund |
| |||||||||||||||||||||||||||||||
Common Stocks | $ | 5,840 | $ | - | $ | (5,840) | $ | - | $ | - | $ | - | $ | - | $ | - | ||||||||||||||||
Fund Total Investments in Securities | $ | 5,840 | $ | - | $ | (5,840) | $ | - | $ | - | $ | - | $ | - | $ | - | ||||||||||||||||
JNL/Lazard Mid Cap Equity Fund |
| |||||||||||||||||||||||||||||||
Preferred Stocks | $ | - | $ | - | $ | - | $ | - | $ | 1,015 | $ | - | $ | 1,015 | $ | - | ||||||||||||||||
Fund Total Investments in Securities | $ | - | $ | - | $ | - | $ | - | $ | 1,015 | $ | - | $ | 1,015 | $ | - | ||||||||||||||||
JNL/Mellon Capital Management Small Cap Index Fund |
| |||||||||||||||||||||||||||||||
Common Stocks | $ | - | $ | - | $ | - | $ | 20 | $ | 25 | $ | - | $ | 45 | $ | 20 | ||||||||||||||||
Fund Total Investments in Securities | $ | - | $ | - | $ | - | $ | 20 | $ | 25 | $ | - | $ | 45 | $ | 20 | ||||||||||||||||
JNL/Mellon Capital Management International Index Fund |
| |||||||||||||||||||||||||||||||
Common Stocks | $ | - | $ | 7 | $ | - | $ | (7) | $ | - | $ | - | $ | - | $ | (7) | ||||||||||||||||
Fund Total Investments in Securities | $ | - | $ | 7 | $ | - | $ | (7) | $ | - | $ | - | $ | - | $ | (7) | ||||||||||||||||
JNL/PIMCO Real Return Fund |
| |||||||||||||||||||||||||||||||
Non-U.S. Government Agency ABS | $ | - | $ | - | $ | - | $ | (10) | $ | 33,812 | $ | (208) | $ | 33,594 | $ | (13) | ||||||||||||||||
Corporate Bond and Notes | - | - | - | 29 | 1,536 | (3) | 1,562 | 29 | ||||||||||||||||||||||||
Government and Agency Obligations | 1,995 | - | (1,995) | - | - | - | - | - | ||||||||||||||||||||||||
Fund Total Investments in Securities | $ | 1,995 | $ | - | $ | (1,995) | $ | 19 | $ | 35,348 | $ | (211) | $ | 35,156 | $ | 16 | ||||||||||||||||
Investments in Other Financial Instruments1 Written Options | $ | - | $ | - | $ | - | $ | (344) | $ | - | $ | (641) | $ | (985) | $ | (344) | ||||||||||||||||
Fund Total Investments in Other Financial Instruments | $ | - | $ | - | $ | - | $ | (344) | $ | - | $ | (641) | $ | (985) | $ | (344) | ||||||||||||||||
JNL/PIMCO Total Return Bond Fund |
| |||||||||||||||||||||||||||||||
Non-U.S. Government Agency ABS | $ | - | $ | - | $ | - | $ | (7) | $ | 2,411 | $ | - | $ | 2,404 | $ | (7) | ||||||||||||||||
Corporate Bond and Notes | 149 | - | - | 14 | 4,900 | - | 5,063 | 14 | ||||||||||||||||||||||||
Government and Agency Obligations | 183 | - | - | (1) | - | (3) | 179 | (1) | ||||||||||||||||||||||||
Preferred Stocks | 3,709 | - | - | (518) | - | - | 3,191 | (518) | ||||||||||||||||||||||||
Fund Total Investments in Securities | $ | 4,041 | $ | - | $ | - | $ | (512) | $ | 7,311 | $ | (3) | $ | 10,837 | $ | (512) | ||||||||||||||||
Investments in Other Financial Instruments1 Written Options | $ | - | $ | - | $ | - | $ | (773) | $ | - | $ | (1,454) | $ | (2,227) | $ | (733) | ||||||||||||||||
Fund Total Investments in Other Financial Instruments | $ | - | $ | - | $ | - | $ | (773) | $ | - | $ | (1,454) | $ | (2,227) | $ | (733) | ||||||||||||||||
JNL/PPM America High Yield Bond Fund |
| |||||||||||||||||||||||||||||||
Corporate Bond and Notes | $ | 1,616 | $ | - | $ | - | $ | 423 | $ | - | $ | (2,039) | $ | - | $ | - | ||||||||||||||||
Common Stocks | 10 | - | - | (10) | - | - | - | (10) | ||||||||||||||||||||||||
Fund Total Investments in Securities | $ | 1,626 | $ | - | $ | - | $ | 413 | $ | - | $ | (2,039) | $ | - | $ | (10) | ||||||||||||||||
JNL/T. Rowe Price Established Growth Fund |
| |||||||||||||||||||||||||||||||
Preferred Stocks | $ | - | $ | - | $ | - | $ | - | $ | 3,407 | $ | - | $ | 3,407 | $ | - | ||||||||||||||||
Fund Total Investments in Securities | $ | - | $ | - | $ | - | $ | - | $ | 3,407 | $ | - | $ | 3,407 | $ | - | ||||||||||||||||
JNL/T. Rowe Price Short-Term Bond Fund |
| |||||||||||||||||||||||||||||||
Non-U.S. Government Agency ABS | $ | 1,572 | $ | - | $ | (1,572) | $ | - | $ | - | $ | - | $ | - | $ | - | ||||||||||||||||
Investment Companies | 1,702 | - | - | (105) | 6,187 | (5,241) | 2,543 | (274) | ||||||||||||||||||||||||
Fund Total Investments in Securities | $ | 3,274 | $ | - | $ | (1,572) | $ | (105) | $ | 6,187 | $ | (5,241) | $ | 2,543 | $ | (274) | ||||||||||||||||
1Investments in other financial instruments are derivative instruments not reflected in the Schedules of Investments and include forward foreign currency contracts, futures contracts, options written and swap agreements. Options purchased are included in Investments in Securities. All derivatives, except for options written are reflected at the unrealized appreciation/(depreciation) on the instrument. Written options are reflected at value.
2The change in unrealized appreciation/(depreciation) for Level 3 investments held at December 31, 2010 is included in net change in unrealized appreciation or depreciation in the Statements of Operations.
See accompanying Notes to the Financial Statements.
JNL Series Trust
Notes to Schedules of Investments (in thousands, except contracts)
December 31, 2010
Schedule of Written Options
Expiration Date | Exercise Price | Contracts | Value | |||||||||||
Exchange-Traded Futures Options | ||||||||||||||
JNL/PIMCO Real Return Fund | ||||||||||||||
Eurodollar Future Call Option | 09/19/2011 | 99.38 | 479 | $ | (281) | |||||||||
Eurodollar Future Put Option | 09/19/2011 | 99.38 | 479 | (198) | ||||||||||
U.S. 10-year Treasury Note Future Call Option | 01/21/2011 | 129.00 | 97 | (1) | ||||||||||
U.S. 10-year Treasury Note Future Call Option | 02/18/2011 | 125.00 | 388 | (167) | ||||||||||
U.S. 10-year Treasury Note Future Put Option | 01/21/2011 | 124.00 | 97 | (352) | ||||||||||
U.S. 10-year Treasury Note Future Put Option | 02/18/2011 | 115.00 | 194 | (83) | ||||||||||
| 1,734 | $ | (1,082) | ||||||||||||
JNL/PIMCO Total Return Bond Fund | ||||||||||||||
Eurodollar Future Call Option | 09/19/2011 | 99.38 | 656 | $ | (385) | |||||||||
Eurodollar Future Put Option | 09/19/2011 | 99.38 | 656 | (271) | ||||||||||
| 1,312 | $ | (656) | ||||||||||||
Index Options | ||||||||||||||
JNL/Ivy Asset Strategy Fund | ||||||||||||||
** Euro Stoxx 50 Index Put Option | 02/18/2011 | 2,450.00 | 799 | $ | (174) | |||||||||
** Euro Stoxx 50 Index Put Option | 02/18/2011 | 2,500.00 | 612 | (168) | ||||||||||
** Euro Stoxx 50 Index Put Option | 02/18/2011 | 2,550.00 | 821 | (294) | ||||||||||
** Euro Stoxx 50 Index Put Option | 03/18/2011 | 2,450.00 | 824 | (336) | ||||||||||
** Euro Stoxx 50 Index Put Option | 03/18/2011 | 2,500.00 | 1,218 | (611) | ||||||||||
Euro Stoxx 50 Index Put Option | 03/18/2011 | 2,500.00 | 211 | (107) | ||||||||||
Euro Stoxx 50 Index Put Option | 03/18/2011 | 2,450.00 | 284 | (118) | ||||||||||
| 4,769 | $ | (1,808) | ||||||||||||
JNL/PIMCO Real Return Fund | ||||||||||||||
CDX.IG-15 5 Year Call Option | 06/15/2011 | 0.80 | 11 | $ | (4) | |||||||||
CDX.IG-15 5 Year Call Option | 03/16/2011 | 0.80 | 22 | (4) | ||||||||||
CDX.IG-15 5 Year Call Option | 01/19/2011 | 0.80 | 26 | (2) | ||||||||||
CDX.IG-15 5 Year Put Option | 03/16/2011 | 1.70 | 14 | — | ||||||||||
CDX.IG-15 5 Year Put Option | 06/15/2011 | 1.20 | 11 | (4) | ||||||||||
CDX.IG-15 5 Year Put Option | 03/16/2011 | 1.30 | 22 | (2) | ||||||||||
CDX.IG-15 5 Year Put Option | 06/15/2011 | 1.20 | 16 | (6) | ||||||||||
iTraxx Europe Series 14 Version 1 Call Option | 03/16/2011 | 0.90 | 34 | (8) | ||||||||||
iTraxx Europe Series 14 Version 1 Put Option | 03/16/2011 | 1.80 | 14 | (1) | ||||||||||
iTraxx Europe Series 14 Version 1 Put Option | 03/16/2011 | 1.60 | 34 | (6) | ||||||||||
iTraxx Europe Series 14 Version 1 Put Option | 03/16/2011 | 1.60 | 16 | (3) | ||||||||||
iTraxx Europe Series 14 Version 1 Put Option | 01/19/2011 | 1.30 | 50 | (4) | ||||||||||
iTraxx Europe Series 14 Version 1 Put Option | 01/19/2011 | 1.30 | 23 | (2) | ||||||||||
| 293 | $ | (46) | ||||||||||||
JNL/PIMCO Total Return Bond Fund | ||||||||||||||
iTraxx Europe Series 14 Version 1 Call Option | 03/16/2011 | 0.90 | 10 | $ | (2) | |||||||||
iTraxx Europe Series 14 Version 1 Put Option | 03/16/2011 | 1.60 | 10 | (2) | ||||||||||
| 20 | $ | (4) | ||||||||||||
Inflation Floor | ||||||||||||||
JNL/PIMCO Real Return Fund | ||||||||||||||
Floor - CPURNSA Index Option | 03/10/2020 | 215.95 | 29 | $ | (29) | |||||||||
Floor - CPURNSA Index Option | 03/12/2020 | 215.95 | 46 | (46) | ||||||||||
Floor - CPURNSA Index Option | 10/13/2020 | 218.01 | 298 | (305) | ||||||||||
Floor - CPURNSA Index Option | 09/29/2020 | 217.97 | 31 | (30) | ||||||||||
| 404 | $ | (410) | ||||||||||||
JNL/PIMCO Total Return Bond Fund | ||||||||||||||
Floor - CPURNSA Index Option | 09/29/2020 | 217.97 | 64 | $ | (61) | |||||||||
Floor - CPURNSA Index Option | 03/10/2020 | 215.95 | 19 | (19) | ||||||||||
Floor - CPURNSA Index Option | 03/12/2020 | 215.95 | 18 | (18) | ||||||||||
| 101 | $ | (98) | ||||||||||||
Interest Rate Swaptions* | ||||||||||||||
JNL/PIMCO Real Return Fund | ||||||||||||||
Call Swaption, 3 month LIBOR versus 1.25% fixed | 02/16/2016 | N/A | 355 | $ | — | |||||||||
See accompanying Notes to the Financial Statements.
JNL Series Trust
Notes to Schedules of Investments (in thousands, except contracts)
December 31, 2010
Schedule of Written Options
| Expiration Date | Exercise Price | Contracts | Value | |||||||||||||||||
Interest Rate Swaptions* (continued) |
| |||||||||||||||||||
JNL/PIMCO Real Return Fund (continued) | ||||||||||||||||||||
Call Swaption, 3 month LIBOR versus 1.25% fixed | 02/16/2016 | N/A | 141 | $ | — | |||||||||||||||
Put Swaption, 3 month LIBOR versus 1.80% fixed | 02/16/2016 | N/A | 355 | (827) | ||||||||||||||||
Put Swaption, 3 month LIBOR versus 1.80% fixed | 02/16/2016 | N/A | 141 | (329) | ||||||||||||||||
Put Swaption, 3 month LIBOR versus 3.00% fixed | 06/18/2012 | N/A | 172 | (225) | ||||||||||||||||
Put Swaption, 3 month LIBOR versus 3.00% fixed | 06/18/2012 | N/A | 587 | (768) | ||||||||||||||||
Put Swaption, 3 month LIBOR versus 3.00% fixed | 06/18/2012 | N/A | 100 | (131) | ||||||||||||||||
| 1,851 | $ | (2,280) | ||||||||||||||||||
JNL/PIMCO Total Return Bond Fund | ||||||||||||||||||||
Put Swaption, 3 month LIBOR versus 10.00% fixed | 07/10/2012 | N/A | 133 | $ | (3) | |||||||||||||||
Put Swaption, 3 month LIBOR versus 2.25% fixed | 09/24/2012 | N/A | 849 | (1,183) | ||||||||||||||||
Put Swaption, 3 month LIBOR versus 2.25% fixed | 09/24/2012 | N/A | 41 | (57) | ||||||||||||||||
Put Swaption, 3 month LIBOR versus 2.25% fixed | 09/24/2012 | N/A | 739 | (1,030) | ||||||||||||||||
Put Swaption, 3 month LIBOR versus 2.75% fixed | 06/18/2012 | N/A | 828 | (1,289) | ||||||||||||||||
Put Swaption, 3 month LIBOR versus 3.00% fixed | 06/18/2012 | N/A | 418 | (547) | ||||||||||||||||
Put Swaption, 3 month LIBOR versus 3.00% fixed | 06/18/2012 | N/A | 705 | (922) | ||||||||||||||||
Put Swaption, 3 month LIBOR versus 3.00% fixed | 06/18/2012 | N/A | 679 | (888) | ||||||||||||||||
Put Swaption, 3 month LIBOR versus 3.00% fixed | 06/18/2012 | N/A | 329 | (430) | ||||||||||||||||
Put Swaption, 3 month LIBOR versus 4.00% fixed | 07/13/2011 | N/A | 84 | (153) | ||||||||||||||||
Put Swaption, 3 month LIBOR versus 4.00% fixed | 07/13/2011 | N/A | 83 | (151) | ||||||||||||||||
| 4,888 | $ | (6,653) | ||||||||||||||||||
Straddle Options | ||||||||||||||||||||
JNL/PIMCO Real Return Fund | ||||||||||||||||||||
** OTC 1- Year vs. 1- Year Forward Volatility Agreement | 10/11/2011 | N/A | 115 | $ | (93) | |||||||||||||||
** OTC 1- Year vs. 2- Year Forward Volatility Agreement | 11/14/2011 | N/A | 284 | (477) | ||||||||||||||||
** OTC 1- Year vs. 2- Year Forward Volatility Agreement | 10/11/2011 | N/A | 247 | (415) | ||||||||||||||||
| 646 | $ | (985) | ||||||||||||||||||
JNL/PIMCO Total Return Bond Fund | ||||||||||||||||||||
** OTC 1- Year vs. 1- Year Forward Volatility Agreement | 10/11/2011 | N/A | 205 | $ | (166) | |||||||||||||||
** OTC 1- Year vs. 2- Year Forward Volatility Agreement | 11/14/2011 | N/A | 553 | (929) | ||||||||||||||||
** OTC 1- Year vs. 2- Year Forward Volatility Agreement | 10/11/2011 | N/A | 673 | (1,132) | ||||||||||||||||
| 1,431 | $ | (2,227) | ||||||||||||||||||
* Swaptions are illiquid investments.
** Written options fair valued in good faith in accordance with procedures established by the Board. Fair valued securities may be classified as Level 2 or Level 3 for FASB ASC Topic 820 disclosures based on the applicable valuation inputs. See FASB ASC Topic 820 note in these Notes to the Schedule of Investments.
Summary of Written Options | Contracts | Premiums | ||||||
JNL/Ivy Asset Strategy Fund | ||||||||
Options outstanding at December 31, 2009 | — | $ | — | |||||
Options written during the period | (37,109,778) | (3,936) | ||||||
Options closed during the period | 37,103,293 | 1,177 | ||||||
Options expired during the period | 1,716 | 1,325 | ||||||
Options outstanding at December 31, 2010 | (4,769) | $ | (1,434) | |||||
JNL/PIMCO Real Return Fund | ||||||||
Options outstanding at December 31, 2009 | (4,321) | $ | (1,908) | |||||
Options written during the period | (2,657,443) | (7,004) | ||||||
Options closed during the period | 1,656 | 601 | ||||||
Options expired during the period | 2,655,180 | 5,081 | ||||||
Options outstanding at December 31, 2010 | (4,928) | $ | (3,230) | |||||
JNL/PIMCO Total Return Bond Fund | ||||||||
Options outstanding at December 31, 2009 | (12,790) | $ | (5,028) | |||||
Options written during the period | (46,517) | (13,518) | ||||||
Options closed during the period | 893 | 328 | ||||||
Options expired during the period | 50,662 | 11,594 | ||||||
Options outstanding at December 31, 2010 | (7,752) | $ | (6,624) | |||||
See accompanying Notes to the Financial Statements.
JNL Series Trust
Notes to Schedules of Investments (in thousands, except contracts)
December 31, 2010
Schedule of Open Futures Contracts
| Expiration | Contracts Long / (Short) | Unrealized Appreciation / (Depreciation) | ||||||||
JNL/Goldman Sachs Core Plus Bond Fund |
| |||||||||
3-Month Euro Euribor Future | March 2011 | (6) | $ | (2) | ||||||
Euro-Bobl Future | March 2011 | 314 | 45 | |||||||
Euro-Bund Future | March 2011 | 204 | 28 | |||||||
Japanese Government Bond Future, 10-Year | March 2011 | (7) | (64) | |||||||
U.K. Long Gilt Future | March 2011 | (3) | — | |||||||
U.S. Treasury Note Future, 10-Year | March 2011 | 411 | 8 | |||||||
U.S. Treasury Note Future, 2-Year | March 2011 | 67 | (32) | |||||||
U.S. Treasury Note Future, 30-Year | March 2011 | 242 | 370 | |||||||
U.S. Treasury Note Future, 5-Year | March 2011 | 1,116 | (1,861) | |||||||
| $ | (1,508) | |||||||||
JNL/Mellon Capital Management Global Alpha Fund |
| |||||||||
Amsterdam Exchange Index Future | January 2011 | 104 | $ | 93 | ||||||
ASX SPI 200 Index Future | March 2011 | (55) | 48 | |||||||
Australia Commonwealth Treasury Bond Future, 10-Year | March 2011 | 179 | 174 | |||||||
CAC 40 10 Euro Index Future | January 2011 | 179 | (210) | |||||||
Canadian Bond Future, 10-Year | March 2011 | (102) | (109) | |||||||
DAX Index Future | March 2011 | (18) | 46 | |||||||
Euro-Bund Future | March 2011 | 48 | 52 | |||||||
FTSE 100 Index Future | March 2011 | 208 | 282 | |||||||
FTSE/MIB Index Future | March 2011 | 35 | (60) | |||||||
Hang Seng Index Future | January 2011 | (84) | (242) | |||||||
IBEX 35 Index Future | January 2011 | 19 | (33) | |||||||
Japanese Government Bond Future, 10-Year | March 2011 | (283) | (404) | |||||||
S&P 500 E-Mini Index Future | March 2011 | (106) | (155) | |||||||
S&P/TSX 60 Index Future | March 2011 | (94) | (172) | |||||||
Topix Index Future | March 2011 | (9) | (19) | |||||||
U.K. Long Gilt Future | March 2011 | (172) | (26) | |||||||
U.S. Treasury Note Future, 10-Year | March 2011 | 554 | (1,279) | |||||||
| $ | (2,014) | |||||||||
JNL/Mellon Capital Management International Index Fund |
| |||||||||
ASX SPI 200 Index Future | March 2011 | 26 | $ | (27) | ||||||
Euro Stoxx 50 Index Future | March 2011 | 296 | (210) | |||||||
FTSE 100 Index Future | March 2011 | 97 | 21 | |||||||
Topix Index Future | March 2011 | 74 | 11 | |||||||
| $ | (205) | |||||||||
JNL/Mellon Capital Management S&P 400 Mid Cap Index Fund |
| |||||||||
S&P MidCap 400 E-Mini Index Future | March 2011 | 145 | $ | 71 | ||||||
JNL/Mellon Capital Management S&P 500 Index Fund |
| |||||||||
S&P 500 E-Mini Index Future | March 2011 | 301 | $ | 104 | ||||||
JNL/Mellon Capital Management Small Cap Index Fund |
| |||||||||
Russell 2000 Mini Index Future | March 2011 | 183 | $ | 118 | ||||||
JNL/PIMCO Real Return Fund |
| |||||||||
90-Day Eurodollar Future | June 2011 | 155 | $ | 10 | ||||||
90-Day Eurodollar Future | March 2012 | 164 | (43) | |||||||
90-Day Eurodollar Future | March 2011 | 720 | 228 | |||||||
| $ | 195 | |||||||||
JNL/PIMCO Total Return Bond Fund |
| |||||||||
90-Day Eurodollar Future | June 2013 | 28 | $ | (71) | ||||||
| Expiration | Contracts Long / (Short) | Unrealized Appreciation / (Depreciation) | ||||||||
JNL/PIMCO Total Return Bond Fund (continued) |
| |||||||||
90-Day Eurodollar Future | September 2013 | 98 | $ | (275 | ) | |||||
90-Day Eurodollar Future | March 2013 | 161 | (387 | ) | ||||||
90-Day Eurodollar Future | December 2012 | 243 | (500 | ) | ||||||
90-Day Eurodollar Future | September 2011 | 289 | 151 | |||||||
90-Day Eurodollar Future | December 2011 | 477 | (71 | ) | ||||||
90-Day Eurodollar Future | June 2012 | 536 | (455 | ) | ||||||
90-Day Eurodollar Future | September 2013 | 633 | (1,038 | ) | ||||||
90-Day Eurodollar Future | March 2012 | 764 | (313 | ) | ||||||
90-Day Eurodollar Future | June 2011 | 1,065 | 411 | |||||||
90-Day Eurodollar Future | March 2011 | 3,684 | 493 | |||||||
LIFFE London Sterling Interest Rate Future, 90-Day | March 2012 | 53 | (33 | ) | ||||||
LIFFE London Sterling Interest Rate Future, 90-Day | June 2012 | 54 | (46 | ) | ||||||
LIFFE London Sterling Interest Rate Future, | September 2012 | 54 | (59 | ) | ||||||
LIFFE London Sterling Interest Rate Future, 90-Day | December 2011 | 55 | (22 | ) | ||||||
U.S. Treasury Note Future, 5-Year | March 2011 | 190 | (313) | |||||||
| $ | (2,528) | |||||||||
See accompanying Notes to the Financial Statements.
JNL Series Trust
Notes to Schedules of Investments (in thousands)
December 31, 2010
Schedule of Open Forward Foreign Currency Contracts
Purchased/ Sold | Settlement Date | Counter- Party | Notional Amount | Value | Unrealized (Loss) | |||||||||||||||||||
JNL/Capital Guardian Global Balanced Fund |
| |||||||||||||||||||||||
EUR/USD | 01/11/2011 | BNY | EUR | 2,225 | $ | 2,973 | $ | 24 | ||||||||||||||||
JPY/EUR | 01/18/2011 | BNY | EUR | (2,300) | (3,074) | 80 | ||||||||||||||||||
JPY/USD | 01/11/2011 | BOA | JPY | 763,837 | 9,409 | 159 | ||||||||||||||||||
USD/CAD | 01/28/2011 | BOA | CAD | (137) | (138) | (2) | ||||||||||||||||||
USD/EUR | 01/11/2011 | BNY | EUR | (2,225) | (2,973) | (11) | ||||||||||||||||||
USD/EUR | 01/24/2011 | BNY | EUR | (3,205) | (4,283) | (65) | ||||||||||||||||||
USD/HUF | 01/28/2011 | BNY | HUF | (29,355) | (141) | (3) | ||||||||||||||||||
USD/JPY | 01/11/2011 | BOA | JPY | (83,973) | (1,034) | (35) | ||||||||||||||||||
USD/PLN | 01/28/2011 | BOA | PLN | (1,347) | (454) | (10) | ||||||||||||||||||
| $ | 285 | $ | 137 | |||||||||||||||||||||
JNL/Franklin Templeton Mutual Shares Fund |
| |||||||||||||||||||||||
CHF/USD | 05/10/2011 | DUB | CHF | 192 | $ | 206 | $ | 13 | ||||||||||||||||
CHF/USD | 05/10/2011 | DUB | CHF | 401 | 430 | 28 | ||||||||||||||||||
CHF/USD | 05/10/2011 | DUB | CHF | 280 | 300 | 14 | ||||||||||||||||||
CHF/USD | 05/10/2011 | BOA | CHF | 318 | 340 | 10 | ||||||||||||||||||
CHF/USD | 05/10/2011 | BOA | CHF | 199 | 213 | 7 | ||||||||||||||||||
CHF/USD | 05/10/2011 | SSB | CHF | 185 | 198 | — | ||||||||||||||||||
DKK/USD | 01/24/2011 | SSB | DKK | 466 | 84 | (1) | ||||||||||||||||||
DKK/USD | 01/24/2011 | SSB | DKK | 456 | 82 | (3) | ||||||||||||||||||
DKK/USD | 01/24/2011 | SSB | DKK | 900 | 161 | (8) | ||||||||||||||||||
DKK/USD | 01/24/2011 | SSB | DKK | 305 | 55 | (2) | ||||||||||||||||||
DKK/USD | 01/24/2011 | BOA | DKK | 1,050 | 188 | (4) | ||||||||||||||||||
DKK/USD | 01/24/2011 | SSB | DKK | 583 | 105 | 3 | ||||||||||||||||||
DKK/USD | 01/24/2011 | DUB | DKK | 700 | 125 | 4 | ||||||||||||||||||
DKK/USD | 01/24/2011 | DUB | DKK | 645 | 116 | (1) | ||||||||||||||||||
EUR/USD | 01/18/2011 | SSB | EUR | 186 | 249 | (10) | ||||||||||||||||||
EUR/USD | 01/18/2011 | BOA | EUR | 355 | 474 | (22) | ||||||||||||||||||
EUR/USD | 01/18/2011 | DUB | EUR | 433 | 579 | (22) | ||||||||||||||||||
EUR/USD | 01/18/2011 | DUB | EUR | 490 | 655 | (25) | ||||||||||||||||||
EUR/USD | 01/18/2011 | DUB | EUR | 1,431 | 1,912 | (96) | ||||||||||||||||||
EUR/USD | 01/18/2011 | DUB | EUR | 495 | 662 | (28) | ||||||||||||||||||
EUR/USD | 01/18/2011 | BOA | EUR | 312 | 417 | (10) | ||||||||||||||||||
EUR/USD | 01/18/2011 | BOA | EUR | 234 | 313 | (8) | ||||||||||||||||||
EUR/USD | 01/18/2011 | DUB | EUR | 640 | 855 | (14) | ||||||||||||||||||
EUR/USD | 01/18/2011 | BOA | EUR | 320 | 428 | (7) | ||||||||||||||||||
EUR/USD | 01/18/2011 | DUB | EUR | 312 | 417 | (8) | ||||||||||||||||||
EUR/USD | 01/18/2011 | SSB | EUR | 229 | 305 | (5) | ||||||||||||||||||
EUR/USD | 01/18/2011 | BOA | EUR | 279 | 373 | (7) | ||||||||||||||||||
EUR/USD | 01/18/2011 | BOA | EUR | 320 | 428 | (6) | ||||||||||||||||||
EUR/USD | 01/18/2011 | SSB | EUR | 319 | 426 | (8) | ||||||||||||||||||
EUR/USD | 01/18/2011 | DUB | EUR | 214 | 286 | (2) | ||||||||||||||||||
EUR/USD | 01/18/2011 | SSB | EUR | 217 | 290 | (3) | ||||||||||||||||||
EUR/USD | 01/18/2011 | BOA | EUR | 232 | 311 | (3) | ||||||||||||||||||
EUR/USD | 01/18/2011 | BOA | EUR | 373 | 499 | (5) | ||||||||||||||||||
EUR/USD | 01/18/2011 | DUB | EUR | 640 | 855 | (13) | ||||||||||||||||||
EUR/USD | 01/18/2011 | BCL | EUR | 480 | 641 | (5) | ||||||||||||||||||
EUR/USD | 01/18/2011 | BOA | EUR | 320 | 428 | (6) | ||||||||||||||||||
EUR/USD | 01/18/2011 | DUB | EUR | 819 | 1,094 | (12) | ||||||||||||||||||
EUR/USD | 01/18/2011 | BOA | EUR | 160 | 214 | (3) | ||||||||||||||||||
EUR/USD | 01/18/2011 | DUB | EUR | 980 | 1,310 | (27) | ||||||||||||||||||
EUR/USD | 01/18/2011 | DUB | EUR | 137 | 183 | (3) | ||||||||||||||||||
EUR/USD | 01/18/2011 | DUB | EUR | 1,024 | 1,369 | (27) | ||||||||||||||||||
EUR/USD | 01/18/2011 | BOA | EUR | 175 | 234 | (5) | ||||||||||||||||||
EUR/USD | 01/18/2011 | SSB | EUR | 57 | 76 | — | ||||||||||||||||||
EUR/USD | 01/18/2011 | DUB | EUR | 75 | 100 | 2 | ||||||||||||||||||
EUR/USD | 01/18/2011 | BOA | EUR | 198 | 265 | 7 | ||||||||||||||||||
EUR/USD | 01/18/2011 | DUB | EUR | 120 | �� | 160 | 4 | |||||||||||||||||
GBP/USD | 02/14/2011 | DUB | GBP | 190 | 296 | (5) | ||||||||||||||||||
GBP/USD | 02/14/2011 | BCL | GBP | 95 | 148 | (3) | ||||||||||||||||||
GBP/USD | 02/14/2011 | BOA | GBP | 190 | 296 | (7) | ||||||||||||||||||
Purchased/ Sold | Settlement Date | Counter- Party | Notional Amount | Value | Unrealized Gain/ (Loss) | |||||||||||||||
JNL/Franklin Templeton Mutual Shares Fund (continued) |
| |||||||||||||||||||
NOK/USD | 02/16/2011 | SSB | NOK | 675 | $ | 115 | $ | — | ||||||||||||
NOK/USD | 02/16/2011 | DUB | NOK | 609 | 104 | 1 | ||||||||||||||
NOK/USD | 02/16/2011 | DUB | NOK | 847 | 145 | 2 | ||||||||||||||
NOK/USD | 02/16/2011 | DUB | NOK | 717 | 123 | 1 | ||||||||||||||
NOK/USD | 02/16/2011 | DUB | NOK | 699 | 120 | 1 | ||||||||||||||
NOK/USD | 02/16/2011 | SSB | NOK | 1,184 | 202 | 1 | ||||||||||||||
NOK/USD | 02/16/2011 | SSB | NOK | 1,177 | 201 | 1 | ||||||||||||||
NOK/USD | 02/16/2011 | SSB | NOK | 661 | 113 | — | ||||||||||||||
NOK/USD | 02/16/2011 | DUB | NOK | 1,077 | 184 | 2 | ||||||||||||||
NOK/USD | 02/16/2011 | DUB | NOK | 879 | 150 | 6 | ||||||||||||||
NOK/USD | 02/16/2011 | DUB | NOK | 2,300 | 393 | 24 | ||||||||||||||
NOK/USD | 02/16/2011 | SSB | NOK | 800 | 137 | 11 | ||||||||||||||
USD/CHF | 05/10/2011 | DUB | CHF | (6,489 | ) | (6,952 | ) | (221 | ) | |||||||||||
USD/CHF | 05/10/2011 | SSB | CHF | (4,060 | ) | (4,350 | ) | (140 | ) | |||||||||||
USD/CHF | 05/10/2011 | DUB | CHF | (216 | ) | (232 | ) | (14 | ) | |||||||||||
USD/CHF | 05/10/2011 | SSB | CHF | (150 | ) | (161 | ) | (7 | ) | |||||||||||
USD/DKK | 01/24/2011 | BOA | DKK | (14,926 | ) | (2,676 | ) | (107 | ) | |||||||||||
USD/DKK | 01/24/2011 | DUB | DKK | (882 | ) | (158 | ) | (2 | ) | |||||||||||
USD/DKK | 01/24/2011 | SSB | DKK | (500 | ) | (90 | ) | (5 | ) | |||||||||||
USD/EUR | 01/18/2011 | DUB | EUR | (217 | ) | (289 | ) | 6 | ||||||||||||
USD/EUR | 01/18/2011 | DUB | EUR | (181 | ) | (241 | ) | 4 | ||||||||||||
USD/EUR | 01/18/2011 | BOA | EUR | (618 | ) | (826 | ) | 30 | ||||||||||||
USD/EUR | 01/18/2011 | DUB | EUR | (219 | ) | (293 | ) | 1 | ||||||||||||
USD/EUR | 01/18/2011 | DUB | EUR | (219 | ) | (293 | ) | (1 | ) | |||||||||||
USD/EUR | 01/18/2011 | SSB | EUR | (228 | ) | (305 | ) | 1 | ||||||||||||
USD/EUR | 01/18/2011 | SSB | EUR | (20,029 | ) | (26,764 | ) | (1,303 | ) | |||||||||||
USD/EUR | 01/18/2011 | SSB | EUR | (378 | ) | (505 | ) | (9 | ) | |||||||||||
USD/EUR | 01/18/2011 | DUB | EUR | (21,940 | ) | (29,318 | ) | (625 | ) | |||||||||||
USD/EUR | 01/18/2011 | BOA | EUR | (621 | ) | (829 | ) | (33 | ) | |||||||||||
USD/EUR | 01/18/2011 | SSB | EUR | (119 | ) | (159 | ) | (4 | ) | |||||||||||
USD/GBP | 02/14/2011 | DUB | GBP | (210 | ) | (327 | ) | 12 | ||||||||||||
USD/GBP | 02/14/2011 | BOA | GBP | (270 | ) | (421 | ) | 18 | ||||||||||||
USD/GBP | 02/14/2011 | SSB | GBP | (24,835 | ) | (38,707 | ) | 1,383 | ||||||||||||
USD/GBP | 02/14/2011 | DUB | GBP | (181 | ) | (282 | ) | 5 | ||||||||||||
USD/GBP | 02/14/2011 | DUB | GBP | (188 | ) | (293 | ) | (1 | ) | |||||||||||
USD/GBP | 02/14/2011 | SSB | GBP | (193 | ) | (300 | ) | (4 | ) | |||||||||||
USD/GBP | 02/14/2011 | SSB | GBP | (193 | ) | (300 | ) | 1 | ||||||||||||
USD/JPY | 04/20/2011 | BCL | JPY | (201,784 | ) | (2,488 | ) | 1 | ||||||||||||
USD/JPY | 04/20/2011 | DUB | JPY | (10,400 | ) | (128 | ) | 1 | ||||||||||||
USD/JPY | 04/20/2011 | DUB | JPY | (6,139 | ) | (76 | ) | (1 | ) | |||||||||||
USD/JPY | 04/20/2011 | DUB | JPY | (4,163 | ) | (51 | ) | (1 | ) | |||||||||||
USD/JPY | 04/20/2011 | DUB | JPY | (6,508 | ) | (80 | ) | (2 | ) | |||||||||||
USD/JPY | 04/20/2011 | BOA | JPY | (3,216 | ) | (40 | ) | (1 | ) | |||||||||||
USD/JPY | 04/20/2011 | DUB | JPY | (7,043 | ) | (87 | ) | (2 | ) | |||||||||||
USD/NOK | 02/16/2011 | SSB | NOK | (1,848 | ) | (316 | ) | (5 | ) | |||||||||||
USD/NOK | 02/16/2011 | BOA | NOK | (1,700 | ) | (291 | ) | (1 | ) | |||||||||||
USD/NOK | 02/16/2011 | DUB | NOK | (1,600 | ) | (274 | ) | (3 | ) | |||||||||||
USD/NOK | 02/16/2011 | DUB | NOK | (35,832 | ) | (6,128 | ) | (387 | ) | |||||||||||
USD/NOK | 02/16/2011 | DUB | NOK | (1,920 | ) | (328 | ) | (21 | ) | |||||||||||
USD/NOK | 02/16/2011 | SSB | NOK | (1,574 | ) | (269 | ) | (13 | ) | |||||||||||
USD/NOK | 02/16/2011 | SSB | NOK | (1,900 | ) | (325 | ) | (13 | ) | |||||||||||
| $ | (103,814 | ) | $ | (1,745 | ) | |||||||||||||||
JNL/Goldman Sachs Core Plus Bond Fund |
| |||||||||||||||||||
AUD/EUR | 03/16/2011 | WBC | EUR | (1,319 | ) | $ | (1,762 | ) | $ | 58 | ||||||||||
AUD/USD | 03/16/2011 | WBC | AUD | 2,790 | 2,828 | 186 | ||||||||||||||
AUD/USD | 03/16/2011 | WBC | AUD | 1,117 | 1,132 | 71 | ||||||||||||||
AUD/USD | 03/16/2011 | WBC | AUD | 1,861 | 1,886 | 116 | ||||||||||||||
AUD/USD | 03/16/2011 | WBC | AUD | 1,792 | 1,817 | 68 | ||||||||||||||
CAD/EUR | 03/16/2011 | DUB | EUR | (1,644 | ) | (2,196 | ) | 11 | ||||||||||||
CAD/EUR | 03/16/2011 | RBS | EUR | (1,346 | ) | (1,798 | ) | 12 | ||||||||||||
See accompanying Notes to the Financial Statements.
JNL Series Trust
Notes to Schedules of Investments (in thousands)
December 31, 2010
Schedule of Open Forward Foreign Currency Contracts
Purchased/ Sold | Settlement Date | Counter- Party | Notional Amount | Value | Unrealized Gain/ (Loss) | |||||||||||||||
JNL/Goldman Sachs Core Plus Bond Fund (continued) |
| |||||||||||||||||||
CAD/EUR | 03/16/2011 | RBC | EUR | (1,324) | $ | (1,769) | $ | 26 | ||||||||||||
CAD/EUR | 03/16/2011 | RBC | EUR | (1,320) | (1,763) | 19 | ||||||||||||||
CAD/USD | 03/16/2011 | RBC | CAD | 1,812 | 1,819 | 45 | ||||||||||||||
CHF/EUR | 03/16/2011 | HSB | EUR | (1,368) | (1,828) | 97 | ||||||||||||||
CHF/EUR | 03/16/2011 | UBS | EUR | (1,347) | (1,800) | 79 | ||||||||||||||
CHF/EUR | 03/16/2011 | RBC | EUR | (2,639) | (3,526) | 68 | ||||||||||||||
EUR/CAD | 03/16/2011 | JPM | CAD | (2,191) | (2,201) | (20) | ||||||||||||||
EUR/CAD | 03/16/2011 | RBC | CAD | (1,768) | (1,776) | (5) | ||||||||||||||
EUR/CHF | 03/16/2011 | UBS | CHF | (1,763) | (1,887) | (92) | ||||||||||||||
EUR/CHF | 03/16/2011 | RBS | CHF | (1,752) | (1,875) | (87) | ||||||||||||||
EUR/CHF | 03/16/2011 | JPM | CHF | (1,705) | (1,825) | (51) | ||||||||||||||
EUR/GBP | 03/16/2011 | HSB | GBP | (1,123) | (1,749) | 41 | ||||||||||||||
EUR/GBP | 03/16/2011 | JPM | GBP | (1,140) | (1,776) | 11 | ||||||||||||||
EUR/SEK | 03/16/2011 | CIT | SEK | (12,108) | (1,796) | (22) | ||||||||||||||
EUR/USD | 03/16/2011 | UBS | EUR | 191 | 255 | 7 | ||||||||||||||
EUR/USD | 03/16/2011 | �� | JPM | EUR | 1,370 | 1,830 | 38 | |||||||||||||
EUR/USD | 03/16/2011 | JPM | EUR | 1,092 | 1,459 | 23 | ||||||||||||||
EUR/USD | 03/16/2011 | WBC | EUR | 1,348 | 1,801 | 19 | ||||||||||||||
EUR/USD | 03/16/2011 | HSB | EUR | 2,671 | 3,568 | 8 | ||||||||||||||
EUR/USD | 03/16/2011 | CIT | EUR | 1,339 | 1,789 | (2) | ||||||||||||||
EUR/USD | 03/16/2011 | RBC | EUR | 1,342 | 1,793 | 16 | ||||||||||||||
EUR/USD | 03/16/2011 | CSI | EUR | 1,333 | 1,781 | 11 | ||||||||||||||
EUR/USD | 03/16/2011 | JPM | EUR | 2,647 | 3,536 | — | ||||||||||||||
EUR/USD | 03/16/2011 | CIT | EUR | 2,634 | 3,519 | (23) | ||||||||||||||
GBP/EUR | 03/16/2011 | DUB | EUR | (1,360) | (1,817) | (31) | ||||||||||||||
GBP/EUR | 03/16/2011 | HSB | EUR | (1,331) | (1,778) | (11) | ||||||||||||||
GBP/USD | 01/20/2011 | JPM | GBP | 1,347 | 2,099 | 5 | ||||||||||||||
GBP/USD | 03/16/2011 | MSC | GBP | 755 | 1,177 | 6 | ||||||||||||||
GBP/USD | 03/16/2011 | RBC | GBP | 683 | 1,064 | (6) | ||||||||||||||
GBP/USD | 03/16/2011 | UBS | GBP | 1,135 | 1,769 | (15) | ||||||||||||||
GBP/USD | 03/16/2011 | WBC | GBP | 471 | 734 | (7) | ||||||||||||||
JPY/AUD | 03/16/2011 | DUB | AUD | (1,086) | (1,101) | (24) | ||||||||||||||
JPY/USD | 03/16/2011 | UBS | JPY | 150,197 | 1,851 | 60 | ||||||||||||||
JPY/USD | 03/16/2011 | CSI | JPY | 697,008 | 8,591 | 96 | ||||||||||||||
MXN/USD | 01/21/2011 | DUB | MXN | 16,390 | 1,326 | 20 | ||||||||||||||
MXN/USD | 01/21/2011 | CIT | MXN | 28,182 | 2,279 | 15 | ||||||||||||||
NOK/EUR | 03/16/2011 | JPM | EUR | (2,577) | (3,442) | 124 | ||||||||||||||
NOK/JPY | 03/16/2011 | JPM | JPY | (92,070) | (1,135) | (11) | ||||||||||||||
NZD/AUD | 03/16/2011 | DUB | AUD | (1,795) | (1,819) | 1 | ||||||||||||||
NZD/USD | 03/16/2011 | CIT | NZD | 1,438 | 1,114 | 50 | ||||||||||||||
NZD/USD | 03/16/2011 | DUB | NZD | 2,482 | 1,923 | 84 | ||||||||||||||
SEK/EUR | 03/16/2011 | BCL | EUR | (652) | (871) | 19 | ||||||||||||||
SEK/EUR | 03/16/2011 | HSB | EUR | (1,344) | (1,796) | 27 | ||||||||||||||
SEK/NOK | 03/16/2011 | HSB | NOK | (6,665) | (1,138) | (12) | ||||||||||||||
USD/BRL | 01/18/2011 | RBC | BRL | (529) | (318) | (8) | ||||||||||||||
USD/BRL | 01/18/2011 | UBS | BRL | (8,700) | (5,223) | (236) | ||||||||||||||
USD/CHF | 03/16/2011 | UBS | CHF | (4,129) | (4,420) | (309) | ||||||||||||||
USD/CHF | 03/16/2011 | UBS | CHF | (1,705) | (1,825) | (70) | ||||||||||||||
USD/EUR | 03/16/2011 | RBS | EUR | (1,368) | (1,828) | (37) | ||||||||||||||
USD/EUR | 03/16/2011 | UBS | EUR | (1,364) | (1,822) | (33) | ||||||||||||||
USD/EUR | 03/16/2011 | UBS | EUR | (1,371) | (1,832) | (42) | ||||||||||||||
USD/EUR | 03/16/2011 | CSI | EUR | (1,357) | (1,813) | (41) | ||||||||||||||
USD/EUR | 03/16/2011 | JPM | EUR | (1,357) | (1,813) | (31) | ||||||||||||||
USD/EUR | 03/16/2011 | RBS | EUR | (2,695) | (3,600) | (42) | ||||||||||||||
USD/EUR | 03/16/2011 | RBC | EUR | (1,355) | (1,810) | (20) | ||||||||||||||
USD/EUR | 03/16/2011 | CIT | EUR | (1,338) | (1,787) | (16) | ||||||||||||||
USD/EUR | 03/16/2011 | JPM | EUR | (7,321) | (9,781) | (98) | ||||||||||||||
USD/EUR | 03/16/2011 | HSB | EUR | (1,315) | (1,757) | (6) | ||||||||||||||
USD/EUR | 03/16/2011 | JPM | EUR | (7,399) | (9,886) | (206) | ||||||||||||||
USD/GBP | 01/20/2011 | JPM | GBP | (1,926) | (3,003) | 18 | ||||||||||||||
USD/JPY | 03/16/2011 | RBC | JPY | (150,318) | (1,853) | (60) | ||||||||||||||
Purchased/ Sold | Settlement Date | Counter- Party | Notional Amount | Value | Unrealized Gain/ (Loss) | |||||||||||||
JNL/Goldman Sachs Core Plus Bond Fund (continued) |
| |||||||||||||||||
USD/JPY | 03/16/2011 | CSI | JPY | (265,955) | $ | (3,278 | ) | $ | (98 | ) | ||||||||
USD/JPY | 03/16/2011 | UBS | JPY | (147,660) | (1,820 | ) | (39 | ) | ||||||||||
USD/JPY | 03/16/2011 | JPM | JPY | (697,008) | (8,591 | ) | (241 | ) | ||||||||||
USD/MXN | 01/21/2011 | JPM | MXN | (81,869) | (6,621 | ) | (1 | ) | ||||||||||
USD/MXN | 01/21/2011 | DUB | MXN | (15,852) | (1,282 | ) | (11 | ) | ||||||||||
USD/MXN | 01/21/2011 | DUB | MXN | (8,572) | (693 | ) | (2 | ) | ||||||||||
USD/ZAR | 01/31/2011 | DUB | ZAR | (48,281) | (7,299 | ) | (276 | ) | ||||||||||
| $ | (75,439 | ) | $ | (787 | ) | |||||||||||||
JNL/Goldman Sachs Emerging Markets Debt Fund |
| |||||||||||||||||
BRL/USD | 01/18/2011 | CSI | BRL | 9,284 | $ | 5,574 | $ | 139 | ||||||||||
BRL/USD | 01/18/2011 | HSB | BRL | 3,933 | 2,361 | 34 | ||||||||||||
BRL/USD | 01/18/2011 | HSB | BRL | 12,078 | 7,252 | 50 | ||||||||||||
BRL/USD | 01/18/2011 | HSB | BRL | 6,403 | 3,844 | 115 | ||||||||||||
BRL/USD | 01/18/2011 | BOA | BRL | 3,444 | 2,068 | 81 | ||||||||||||
BRL/USD | 01/18/2011 | HSB | BRL | 12,923 | 7,759 | 347 | ||||||||||||
BRL/USD | 01/18/2011 | BCL | BRL | 12,960 | 7,781 | 369 | ||||||||||||
BRL/USD | 01/18/2011 | HSB | BRL | 22,440 | 13,473 | 622 | ||||||||||||
BRL/USD | 01/18/2011 | UBS | BRL | 2,725 | 1,636 | 74 | ||||||||||||
CLP/USD | 01/18/2011 | HSB | CLP | 2,048,850 | 4,373 | 23 | ||||||||||||
CLP/USD | 01/18/2011 | RBC | CLP | 364,479 | 778 | 23 | ||||||||||||
CNY/USD | 01/18/2011 | MSC | CNY | 6,204 | 941 | 8 | ||||||||||||
CNY/USD | 03/17/2011 | UBS | CNY | 6,204 | 941 | 4 | ||||||||||||
CNY/USD | 03/17/2011 | RBS | CNY | 24,517 | 3,720 | (14 | ) | |||||||||||
CNY/USD | 03/17/2011 | BCL | CNY | 146,096 | 22,166 | 450 | ||||||||||||
CNY/USD | 03/17/2011 | HSB | CNY | 68,484 | 10,391 | 125 | ||||||||||||
COP/USD | 01/18/2011 | RBC | COP | 24,053,388 | 12,574 | (797 | ) | |||||||||||
IDR/USD | 01/18/2011 | RBC | IDR | 25,984,250 | 2,878 | 3 | ||||||||||||
IDR/USD | 01/18/2011 | BCL | IDR | 20,041,680 | 2,219 | 2 | ||||||||||||
IDR/USD | 01/18/2011 | RBC | IDR | 33,356,820 | 3,694 | — | ||||||||||||
IDR/USD | 01/18/2011 | DUB | IDR | 12,645,675 | 1,400 | 5 | ||||||||||||
IDR/USD | 01/18/2011 | BCL | IDR | 15,847,101 | 1,755 | 1 | ||||||||||||
IDR/USD | 01/18/2011 | HSB | IDR | 27,746,364 | 3,073 | (42 | ) | |||||||||||
IDR/USD | 01/18/2011 | BCL | IDR | 60,365,445 | 6,685 | (26 | ) | |||||||||||
ILS/USD | 03/16/2011 | JPM | ILS | 27,900 | 7,855 | 172 | ||||||||||||
INR/USD | 01/18/2011 | DUB | INR | 268,465 | 5,989 | 54 | ||||||||||||
INR/USD | 01/18/2011 | CIT | INR | 311,868 | 6,957 | (9 | ) | |||||||||||
INR/USD | 01/18/2011 | RBC | INR | 313,488 | 6,993 | (28 | ) | |||||||||||
INR/USD | 01/18/2011 | BCL | INR | 322,217 | 7,188 | (14 | ) | |||||||||||
INR/USD | 01/18/2011 | BCL | INR | 163,689 | 3,651 | (13 | ) | |||||||||||
INR/USD | 01/18/2011 | HSB | INR | 168,822 | 3,766 | 45 | ||||||||||||
INR/USD | 01/18/2011 | UBS | INR | 33,615 | 750 | 17 | ||||||||||||
JPY/USD | 03/16/2011 | RBC | JPY | 308,880 | 3,807 | 128 | ||||||||||||
KRW/USD | 01/18/2011 | RBC | KRW | 7,726,997 | 6,803 | (74 | ) | |||||||||||
KRW/USD | 01/18/2011 | RBC | KRW | 8,063,691 | 7,099 | (122 | ) | |||||||||||
KRW/USD | 01/18/2011 | HSB | KRW | 11,320,867 | 9,967 | (267 | ) | |||||||||||
KRW/USD | 01/18/2011 | CIT | KRW | 8,135,546 | 7,163 | (166 | ) | |||||||||||
KRW/USD | 01/18/2011 | BCL | KRW | 7,773,859 | 6,844 | (115 | ) | |||||||||||
KRW/USD | 01/18/2011 | BCL | KRW | 2,345,788 | 2,065 | (10 | ) | |||||||||||
MXN/USD | 03/16/2011 | DUB | MXN | 200,948 | 16,185 | 184 | ||||||||||||
MXN/USD | 03/16/2011 | MSC | MXN | 275,378 | 22,179 | 94 | ||||||||||||
MYR/USD | 01/18/2011 | MSC | MYR | 25,309 | 8,199 | 162 | ||||||||||||
MYR/USD | 01/18/2011 | HSB | MYR | 129,498 | 41,953 | 436 | ||||||||||||
MYR/USD | 01/18/2011 | HSB | MYR | 40,232 | 13,034 | 129 | ||||||||||||
PEN/USD | 01/18/2011 | DUB | PEN | 11,117 | 3,960 | 17 | ||||||||||||
PEN/USD | 01/18/2011 | RBC | PEN | 8,719 | 3,106 | (14 | ) | |||||||||||
PEN/USD | 01/18/2011 | DUB | PEN | 5,369 | 1,912 | 3 | ||||||||||||
PEN/USD | 04/11/2011 | HSB | PEN | 2,127 | 755 | — | ||||||||||||
PHP/USD | 01/18/2011 | HSB | PHP | 301,756 | 6,889 | 12 | ||||||||||||
PHP/USD | 01/18/2011 | CIT | PHP | 50,280 | 1,148 | (7 | ) | |||||||||||
PHP/USD | 01/18/2011 | HSB | PHP | 302,431 | 6,904 | (203 | ) | |||||||||||
See accompanying Notes to the Financial Statements.
JNL Series Trust
Notes to Schedules of Investments (in thousands)
December 31, 2010
Schedule of Open Forward Foreign Currency Contracts
Purchased/ Sold | Settlement Date | Counter- Party | Notional Amount | Value | Unrealized Gain/(Loss) | |||||||||||
JNL/Goldman Sachs Emerging Markets Debt Fund (continued) | ||||||||||||||||
PHP/USD | 01/18/2011 | RBC | PHP | 155,328 | $ | 3,546 | $(118) | |||||||||
PHP/USD | 01/18/2011 | MSC | PHP | 136,893 | 3,125 | (9) | ||||||||||
PHP/USD | 01/18/2011 | BCL | PHP | 47,362 | 1,081 | 15 | ||||||||||
PLN/EUR | 03/16/2011 | RBC | EUR | (2,759) | (3,686) | 52 | ||||||||||
PLN/USD | 03/16/2011 | BCL | PLN | 162,900 | 54,778 | 1,511 | ||||||||||
PLN/USD | 03/16/2011 | BCL | PLN | 11,009 | 3,702 | 119 | ||||||||||
PLN/USD | 03/16/2011 | BCL | PLN | 15,100 | 5,078 | 154 | ||||||||||
PLN/USD | 03/16/2011 | DUB | PLN | 34,532 | 11,612 | 319 | ||||||||||
RUB/USD | 01/18/2011 | BCL | RUB | 517,000 | 16,905 | (237) | ||||||||||
RUB/USD | 01/18/2011 | CIT | RUB | 517,499 | 16,921 | (227) | ||||||||||
RUB/USD | 01/18/2011 | BCL | RUB | 110,481 | 3,612 | 36 | ||||||||||
RUB/USD | 01/18/2011 | HSB | RUB | 222,248 | 7,267 | 30 | ||||||||||
RUB/USD | 01/18/2011 | BCL | RUB | 219,663 | 7,183 | (39) | ||||||||||
RUB/USD | 01/18/2011 | CIT | RUB | 416,039 | 13,604 | 197 | ||||||||||
RUB/USD | 01/18/2011 | BCL | RUB | 230,887 | 7,550 | 93 | ||||||||||
RUB/USD | 01/18/2011 | HSB | RUB | 115,142 | 3,765 | 36 | ||||||||||
RUB/USD | 01/18/2011 | RBC | RUB | 114,881 | 3,756 | 27 | ||||||||||
RUB/USD | 01/18/2011 | DUB | RUB | 295,284 | 9,655 | 218 | ||||||||||
RUB/USD | 01/18/2011 | HSB | RUB | 114,653 | 3,749 | 63 | ||||||||||
SGD/USD | 03/16/2011 | HSB | SGD | 8,736 | 6,808 | 152 | ||||||||||
SGD/USD | 03/16/2011 | BOA | SGD | 969 | 755 | 18 | ||||||||||
TRY/USD | 03/16/2011 | HSB | TRY | 50,291 | 32,288 | (784) | ||||||||||
TRY/USD | 03/16/2011 | RBC | TRY | 2,705 | 1,736 | (49) | ||||||||||
TRY/USD | 03/16/2011 | MSC | TRY | 8,883 | 5,703 | (95) | ||||||||||
TRY/USD | 03/16/2011 | HSB | TRY | 6,418 | 4,121 | (59) | ||||||||||
TRY/USD | 03/16/2011 | HSB | TRY | 7,954 | 5,106 | 57 | ||||||||||
TRY/USD | 03/16/2011 | HSB | TRY | 11,033 | 7,083 | (290) | ||||||||||
TRY/USD | 03/16/2011 | HSB | TRY | 6,637 | 4,261 | (173) | ||||||||||
TWD/USD | 01/18/2011 | DUB | TWD | 209,810 | 7,199 | 322 | ||||||||||
TWD/USD | 01/18/2011 | HSB | TWD | 211,871 | 7,270 | 304 | ||||||||||
TWD/USD | 01/18/2011 | DUB | TWD | 218,725 | 7,505 | 303 | ||||||||||
TWD/USD | 01/18/2011 | RBC | TWD | 220,396 | 7,562 | 235 | ||||||||||
TWD/USD | 01/18/2011 | RBC | TWD | 213,104 | 7,312 | 220 | ||||||||||
TWD/USD | 01/18/2011 | MSC | TWD | 42,845 | 1,470 | 52 | ||||||||||
TWD/USD | 01/18/2011 | HSB | TWD | 207,873 | 7,133 | 422 | ||||||||||
TWD/USD | 04/11/2011 | RBC | TWD | 337,987 | 11,624 | 259 | ||||||||||
USD/BRL | 01/18/2011 | BCL | BRL | (12,097) | (7,263) | (242) | ||||||||||
USD/BRL | 01/18/2011 | HSB | BRL | (12,433) | (7,465) | (228) | ||||||||||
USD/BRL | 01/18/2011 | RBC | BRL | (8,745) | (5,251) | (196) | ||||||||||
USD/BRL | 01/18/2011 | RBC | BRL | (6,256) | (3,756) | (92) | ||||||||||
USD/BRL | 01/18/2011 | DUB | BRL | (3,159) | (1,897) | (46) | ||||||||||
USD/BRL | 01/18/2011 | HSB | BRL | (6,408) | (3,848) | (119) | ||||||||||
USD/BRL | 01/18/2011 | RBC | BRL | (6,488) | (3,896) | (132) | ||||||||||
USD/BRL | 01/18/2011 | RBC | BRL | (6,527) | (3,919) | (155) | ||||||||||
USD/BRL | 01/18/2011 | RBC | BRL | (4,714) | (2,830) | (125) | ||||||||||
USD/CLP | 01/18/2011 | DUB | CLP | (735,893) | (1,571) | (50) | ||||||||||
USD/CLP | 01/18/2011 | MLP | CLP | (1,740,797) | (3,715) | (139) | ||||||||||
USD/CNY | 01/18/2011 | UBS | CNY | (6,204) | (941) | (9) | ||||||||||
USD/EUR | 03/16/2011 | BCL | EUR | (2,764) | (3,693) | (11) | ||||||||||
USD/EUR | 03/16/2011 | RBC | EUR | (3,143) | (4,199) | (3) | ||||||||||
USD/EUR | 03/16/2011 | DUB | EUR | (1,377) | (1,840) | 2 | ||||||||||
USD/EUR | 03/16/2011 | JPM | EUR | (18,589) | (24,835) | (338) | ||||||||||
USD/HUF | 03/16/2011 | BCL | HUF | (3,575,390) | (17,053) | (280) | ||||||||||
USD/IDR | 01/18/2011 | BCL | IDR | (46,989,880) | (5,204) | 20 | ||||||||||
USD/IDR | 01/18/2011 | HSB | IDR | (17,381,540) | (1,925) | 2 | ||||||||||
USD/INR | 01/18/2011 | HSB | INR | (340,405) | (7,593) | (122) | ||||||||||
USD/INR | 01/18/2011 | RBC | INR | (262,334) | (5,852) | (34) | ||||||||||
USD/INR | 01/18/2011 | HSB | INR | (164,257) | (3,664) | — | ||||||||||
USD/JPY | 03/16/2011 | HSB | JPY | (305,243) | (3,762) | (76) | ||||||||||
USD/JPY | 03/16/2011 | RBC | JPY | (304,298) | (3,751) | (65) | ||||||||||
USD/KRW | 01/18/2011 | DUB | KRW | (4,147,065) | (3,651) | (24) | ||||||||||
Purchased/ Sold | Settlement Date | Counter- Party | Notional Amount | Value | Unrealized Gain/(Loss) | |||||||||||
JNL/Goldman Sachs Emerging Markets Debt Fund (continued) | ||||||||||||||||
USD/KRW | 01/18/2011 | RBC | KRW | (11,090,239 | ) | $ | (9,764 | ) | $114 | |||||||
USD/KRW | 01/18/2011 | RBC | KRW | (4,101,273 | ) | (3,611 | ) | 17 | ||||||||
USD/KRW | 01/18/2011 | BCL | KRW | (4,090,962 | ) | (3,602 | ) | 18 | ||||||||
USD/KRW | 01/18/2011 | BCL | KRW | (5,050,565 | ) | (4,446 | ) | 57 | ||||||||
USD/KRW | 01/18/2011 | RBC | KRW | (8,424,938 | ) | (7,417 | ) | (39) | ||||||||
USD/KRW | 01/18/2011 | RBC | KRW | (8,461,706 | ) | (7,450 | ) | (107) | ||||||||
USD/MXN | 02/10/2011 | MSC | MXN | (160,978 | ) | (13,001 | ) | 110 | ||||||||
USD/MXN | 03/16/2011 | RBC | MXN | (30,163 | ) | (2,429 | ) | (6) | ||||||||
USD/MXN | 03/16/2011 | HSB | MXN | (9,209 | ) | (742 | ) | (5) | ||||||||
USD/MYR | 01/18/2011 | HSB | MYR | (11,331 | ) | (3,671 | ) | (43) | ||||||||
USD/MYR | 01/18/2011 | BCL | MYR | (11,307 | ) | (3,663 | ) | (43) | ||||||||
USD/MYR | 01/18/2011 | DUB | MYR | (18,476 | ) | (5,985 | ) | (19) | ||||||||
USD/MYR | 01/18/2011 | BCL | MYR | (11,737 | ) | (3,802 | ) | (18) | ||||||||
USD/MYR | 01/18/2011 | HSB | MYR | (23,231 | ) | (7,526 | ) | (140) | ||||||||
USD/MYR | 01/18/2011 | RBC | MYR | (11,992 | ) | (3,885 | ) | (67) | ||||||||
USD/PHP | 01/18/2011 | DUB | PHP | (78,694 | ) | (1,797 | ) | (27) | ||||||||
USD/PHP | 01/18/2011 | RBC | PHP | (328,759 | ) | (7,505 | ) | (93) | ||||||||
USD/PLN | 03/16/2011 | BCL | PLN | (3,602 | ) | (1,211 | ) | (31) | ||||||||
USD/RUB | 01/18/2011 | HSB | RUB | (222,047 | ) | (7,260 | ) | (107) | ||||||||
USD/RUB | 01/18/2011 | RBC | RUB | (151,124 | ) | (4,941 | ) | (77) | ||||||||
USD/RUB | 01/18/2011 | HSB | RUB | (224,289 | ) | (7,334 | ) | (86) | ||||||||
USD/RUB | 01/18/2011 | DUB | RUB | (232,158 | ) | (7,591 | ) | (232) | ||||||||
USD/RUB | 01/18/2011 | HSB | RUB | (232,400 | ) | (7,599 | ) | (213) | ||||||||
USD/TRY | 03/16/2011 | HSB | TRY | (11,480 | ) | (7,370 | ) | (7) | ||||||||
USD/TWD | 01/18/2011 | RBC | TWD | (337,987 | ) | (11,597 | ) | (308) | ||||||||
USD/TWD | 01/18/2011 | RBC | TWD | (160,664 | ) | (5,513 | ) | (241) | ||||||||
USD/TWD | 01/18/2011 | HSB | TWD | (160,220 | ) | (5,498 | ) | (238) | ||||||||
USD/TWD | 01/18/2011 | RBC | TWD | (110,392 | ) | (3,788 | ) | (168) | ||||||||
USD/TWD | 01/18/2011 | DUB | TWD | (110,592 | ) | (3,795 | ) | (167) | ||||||||
USD/TWD | 01/18/2011 | BCL | TWD | (110,606 | ) | (3,795 | ) | (145) | ||||||||
USD/TWD | 01/18/2011 | HSB | TWD | (110,588 | ) | (3,795 | ) | (145) | ||||||||
USD/TWD | 01/18/2011 | HSB | TWD | (223,576 | ) | (7,671 | ) | (293) | ||||||||
USD/ZAR | 03/16/2011 | RBC | ZAR | (112,925 | ) | (16,969 | ) | (795) | ||||||||
ZAR/USD | 03/16/2011 | RBC | ZAR | 25,423 | 3,820 | 133 | ||||||||||
ZAR/USD | 03/16/2011 | UBS | ZAR | 12,486 | 1,876 | 52 | ||||||||||
| $ | 316,895 | $(680) | ||||||||||||||
JNL/Ivy Asset Strategy Fund | ||||||||||||||||
CNY/USD | 06/28/2012 | CIT | CNY | 1,610 | $ | 245 | $(3) | |||||||||
CNY/USD | 06/28/2012 | CIT | CNY | 4,600 | 699 | (10) | ||||||||||
CNY/USD | 06/28/2012 | CIT | CNY | 1,900 | 289 | (3) | ||||||||||
CNY/USD | 06/28/2012 | CIT | CNY | 4,490 | 682 | (8) | ||||||||||
EUR/USD | 03/24/2011 | MSC | EUR | 6,070 | 8,109 | (223) | ||||||||||
EUR/USD | 03/24/2011 | MSC | EUR | 5,430 | 7,254 | (204) | ||||||||||
USD/EUR | 03/22/2011 | MSC | EUR | (8,800 | ) | (11,757 | ) | (212) | ||||||||
USD/EUR | 03/22/2011 | MSC | EUR | (12,300 | ) | (16,432 | ) | (261) | ||||||||
USD/EUR | 03/24/2011 | NSI | EUR | (29,500 | ) | (39,410 | ) | (819) | ||||||||
USD/EUR | 03/24/2011 | MSC | EUR | (11,500 | ) | (15,363 | ) | (1,194) | ||||||||
USD/EUR | 03/28/2011 | GSC | EUR | (31,470 | ) | (42,041 | ) | (860) | ||||||||
| $ | (107,725 | ) | $(3,797) | |||||||||||||
JNL/JPMorgan International Value Fund | ||||||||||||||||
AUD/USD | 02/28/2011 | CSI | AUD | 42,388 | $ | 43,051 | $1,910 | |||||||||
AUD/USD | 02/28/2011 | UBS | AUD | 2,270 | 2,306 | 21 | ||||||||||
CHF/EUR | 02/28/2011 | RBS | EUR | (2,871 | ) | (3,836 | ) | 248 | ||||||||
CHF/EUR | 02/28/2011 | BNP | EUR | (6,558 | ) | (8,762 | ) | 397 | ||||||||
CHF/JPY | 02/28/2011 | CSI | JPY | (676,532 | ) | (8,338 | ) | 209 | ||||||||
EUR/GBP | 02/28/2011 | SSB | GBP | (1,490 | ) | (2,322 | ) | 30 | ||||||||
EUR/USD | 02/28/2011 | RBS | EUR | 2,484 | 3,318 | (51) | ||||||||||
EUR/USD | 02/28/2011 | BCL | EUR | 1,765 | 2,358 | 4 | ||||||||||
EUR/USD | 02/28/2011 | BCL | EUR | 1,968 | 2,629 | 30 | ||||||||||
See accompanying Notes to the Financial Statements.
JNL Series Trust
Notes to Schedules of Investments (in thousands)
December 31, 2010
Schedule of Open Forward Foreign Currency Contracts
Purchased/ Sold | Settlement Date | Counter- Party | Notional Amount | Value | Unrealized Gain/ (Loss) | |||||||||||||||
JNL/JPMorgan International Value Fund (continued) |
| |||||||||||||||||||
GBP/EUR | 02/28/2011 | HSB | EUR | (1,574) | $ | (2,103) | $ | (25) | ||||||||||||
GBP/USD | 02/28/2011 | GSC | GBP | 2,091 | 3,258 | (68) | ||||||||||||||
HKD/USD | 02/28/2011 | SSB | HKD | 19,079 | 2,456 | 2 | ||||||||||||||
JPY/GBP | 02/28/2011 | DUB | GBP | (862) | (1,343) | 14 | ||||||||||||||
JPY/USD | 02/28/2011 | DUB | JPY | 2,456,882 | 30,279 | 814 | ||||||||||||||
SEK/USD | 02/28/2011 | UBS | SEK | 105,180 | 15,609 | 420 | ||||||||||||||
SGD/CAD | 02/28/2011 | SSB | CAD | (2,102) | (2,112) | 28 | ||||||||||||||
SGD/USD | 02/28/2011 | RBS | SGD | 4,238 | 3,302 | 63 | ||||||||||||||
USD/CAD | 02/28/2011 | RBS | CAD | (5,400) | (5,425) | (137) | ||||||||||||||
USD/CHF | 02/28/2011 | RBS | CHF | (4,091) | (4,378) | (234) | ||||||||||||||
USD/EUR | 02/28/2011 | UBS | EUR | (960) | (1,282) | 1 | ||||||||||||||
USD/GBP | 02/28/2011 | MLP | GBP | (34,712) | (54,095) | 1,153 | ||||||||||||||
USD/GBP | 02/28/2011 | BCL | GBP | (3,517) | (5,482) | (14) | ||||||||||||||
USD/HKD | 02/28/2011 | DUB | HKD | (40,481) | (5,210) | 11 | ||||||||||||||
USD/JPY | 02/28/2011 | DUB | JPY | (429,395) | (5,292) | (126) | ||||||||||||||
USD/JPY | 02/28/2011 | SSB | JPY | �� | (408,780) | (5,038) | (122) | |||||||||||||
USD/JPY | 02/28/2011 | UBS | JPY | (178,639) | (2,202) | (67) | ||||||||||||||
USD/JPY | 02/28/2011 | DUB | JPY | (109,806) | (1,353) | (29) | ||||||||||||||
USD/NOK | 02/28/2011 | UBS | NOK | (38,428) | (6,568) | (220) | ||||||||||||||
| $ | (16,575) | $ | 4,262 | |||||||||||||||||
JNL/Mellon Capital Management Global Alpha Fund |
| |||||||||||||||||||
AUD/USD | 03/16/2011 | DUB | AUD | 8,075 | $ | 8,185 | $ | 321 | ||||||||||||
AUD/USD | 03/16/2011 | RBS | AUD | 7,703 | 7,808 | 275 | ||||||||||||||
AUD/USD | 03/16/2011 | UBS | AUD | 10,964 | 11,114 | 479 | ||||||||||||||
AUD/USD | 03/16/2011 | HSB | AUD | 302 | 306 | 8 | ||||||||||||||
AUD/USD | 03/16/2011 | UBS | AUD | 302 | 306 | 7 | ||||||||||||||
AUD/USD | 03/16/2011 | BOA | AUD | 302 | 306 | 8 | ||||||||||||||
AUD/USD | 03/16/2011 | RBS | AUD | 453 | 459 | 12 | ||||||||||||||
AUD/USD | 03/16/2011 | DUB | AUD | 151 | 153 | 4 | ||||||||||||||
AUD/USD | 03/16/2011 | BCL | AUD | 243 | 246 | 8 | ||||||||||||||
AUD/USD | 03/16/2011 | RBS | AUD | 113 | 115 | 4 | ||||||||||||||
AUD/USD | 03/16/2011 | HSB | AUD | 421 | 427 | 14 | ||||||||||||||
AUD/USD | 03/16/2011 | DUB | AUD | 522 | 529 | 18 | ||||||||||||||
AUD/USD | 03/16/2011 | DUB | AUD | 115 | 116 | 5 | ||||||||||||||
AUD/USD | 03/16/2011 | UBS | AUD | 114 | 116 | 4 | ||||||||||||||
CAD/USD | 03/16/2011 | RBS | CAD | 10,273 | 10,316 | 147 | ||||||||||||||
CAD/USD | 03/16/2011 | BOA | CAD | 632 | 634 | 9 | ||||||||||||||
CAD/USD | 03/16/2011 | UBS | CAD | 505 | 508 | 9 | ||||||||||||||
CAD/USD | 03/16/2011 | BCL | CAD | 253 | 254 | 4 | ||||||||||||||
CAD/USD | 03/16/2011 | HSB | CAD | 505 | 508 | 9 | ||||||||||||||
CAD/USD | 03/16/2011 | DUB | CAD | 632 | 634 | 11 | ||||||||||||||
CAD/USD | 03/16/2011 | BCL | CAD | 7,439 | 7,470 | 121 | ||||||||||||||
CAD/USD | 03/16/2011 | RBS | CAD | 509 | 511 | 8 | ||||||||||||||
CAD/USD | 03/16/2011 | DUB | CAD | 170 | 170 | 3 | ||||||||||||||
CAD/USD | 03/16/2011 | HSB | CAD | 339 | 341 | 4 | ||||||||||||||
CAD/USD | 03/16/2011 | BOA | CAD | 339 | 341 | 5 | ||||||||||||||
CAD/USD | 03/16/2011 | UBS | CAD | 339 | 341 | 4 | ||||||||||||||
CAD/USD | 03/16/2011 | BCL | CAD | 63 | 63 | 1 | ||||||||||||||
CAD/USD | 03/16/2011 | DUB | CAD | 135 | 136 | 1 | ||||||||||||||
CAD/USD | 03/16/2011 | HSB | CAD | 109 | 109 | 1 | ||||||||||||||
CAD/USD | 03/16/2011 | DUB | CAD | 30 | 30 | — | ||||||||||||||
CAD/USD | 03/16/2011 | RBS | CAD | 29 | 29 | — | ||||||||||||||
CAD/USD | 03/16/2011 | UBS | CAD | 30 | 30 | — | ||||||||||||||
CAD/USD | 03/16/2011 | UBS | CAD | 859 | 863 | 21 | ||||||||||||||
CAD/USD | 03/16/2011 | BCL | CAD | 2,578 | 2,589 | 63 | ||||||||||||||
CHF/USD | 03/16/2011 | RBS | CHF | 135 | 145 | 8 | ||||||||||||||
CHF/USD | 03/16/2011 | BOA | CHF | 949 | 1,015 | 54 | ||||||||||||||
CHF/USD | 03/16/2011 | BCL | CHF | 235 | 251 | 14 | ||||||||||||||
CHF/USD | 03/16/2011 | UBS | CHF | 759 | 812 | 44 | ||||||||||||||
CHF/USD | 03/16/2011 | HSB | CHF | 122 | 131 | 7 | ||||||||||||||
Purchased/ Sold | Settlement Date | Counter- Party | Notional Amount | Value | Unrealized Gain/ (Loss) | |||||||||||||||
JNL/Mellon Capital Management Global Alpha Fund (continued) |
| |||||||||||||||||||
CHF/USD | 03/16/2011 | HSB | CHF | 267 | $ | 286 | $ | 16 | ||||||||||||
CHF/USD | 03/16/2011 | DUB | CHF | 949 | 1,015 | 56 | ||||||||||||||
CHF/USD | 03/16/2011 | BCL | CHF | 379 | 406 | 21 | ||||||||||||||
CHF/USD | 03/16/2011 | UBS | CHF | 4,951 | 5,300 | 277 | ||||||||||||||
CHF/USD | 03/16/2011 | DUB | CHF | 300 | 322 | 9 | ||||||||||||||
CHF/USD | 03/16/2011 | RBS | CHF | 901 | 964 | 27 | ||||||||||||||
CHF/USD | 03/16/2011 | UBS | CHF | 601 | 643 | 18 | ||||||||||||||
CHF/USD | 03/16/2011 | BOA | CHF | 601 | 643 | 18 | ||||||||||||||
CHF/USD | 03/16/2011 | HSB | CHF | 601 | 643 | 18 | ||||||||||||||
CHF/USD | 03/16/2011 | UBS | CHF | 270 | 289 | 6 | ||||||||||||||
CHF/USD | 03/16/2011 | BCL | CHF | 810 | 867 | 21 | ||||||||||||||
CHF/USD | 03/16/2011 | UBS | CHF | 1,544 | 1,653 | 35 | ||||||||||||||
CHF/USD | 03/16/2011 | UBS | CHF | 276 | 295 | 6 | ||||||||||||||
GBP/USD | 03/16/2011 | BCL | GBP | 464 | 724 | (1) | ||||||||||||||
GBP/USD | 03/16/2011 | HSB | GBP | 807 | 1,257 | (2) | ||||||||||||||
GBP/USD | 03/16/2011 | DUB | GBP | 999 | 1,557 | (1) | ||||||||||||||
GBP/USD | 03/16/2011 | RBS | GBP | 216 | 337 | — | ||||||||||||||
GBP/USD | 03/16/2011 | UBS | GBP | 219 | 341 | — | ||||||||||||||
GBP/USD | 03/16/2011 | DUB | GBP | 219 | 342 | 1 | ||||||||||||||
GBP/USD | 03/16/2011 | BCL | GBP | 3,077 | 4,795 | 32 | ||||||||||||||
GBP/USD | 03/16/2011 | UBS | GBP | 1,026 | 1,598 | 9 | ||||||||||||||
GBP/USD | 03/16/2011 | BCL | GBP | 73 | 113 | 2 | ||||||||||||||
GBP/USD | 03/16/2011 | BCL | GBP | 2,244 | 3,497 | 46 | ||||||||||||||
GBP/USD | 03/16/2011 | UBS | GBP | 1,199 | 1,869 | 31 | ||||||||||||||
GBP/USD | 03/16/2011 | RBS | GBP | 680 | 1,059 | 18 | ||||||||||||||
GBP/USD | 03/16/2011 | UBS | GBP | 736 | 1,147 | 15 | ||||||||||||||
GBP/USD | 03/16/2011 | BOA | GBP | 3,488 | 5,435 | 55 | ||||||||||||||
JPY/USD | 03/16/2011 | DUB | JPY | 173,423 | 2,138 | 72 | ||||||||||||||
JPY/USD | 03/16/2011 | DUB | JPY | 14,678 | 181 | 7 | ||||||||||||||
JPY/USD | 03/16/2011 | RBS | JPY | 14,483 | 179 | 6 | ||||||||||||||
JPY/USD | 03/16/2011 | BCL | JPY | 31,079 | 383 | 13 | ||||||||||||||
JPY/USD | 03/16/2011 | HSB | JPY | 53,972 | 665 | 22 | ||||||||||||||
JPY/USD | 03/16/2011 | DUB | JPY | 66,859 | 824 | 27 | ||||||||||||||
JPY/USD | 03/16/2011 | UBS | JPY | 14,639 | 180 | 6 | ||||||||||||||
JPY/USD | 03/16/2011 | RBS | JPY | 84,935 | 1,047 | 30 | ||||||||||||||
JPY/USD | 03/16/2011 | BCL | JPY | 56,624 | 698 | 21 | ||||||||||||||
JPY/USD | 03/16/2011 | BCL | JPY | 404,654 | 4,988 | 168 | ||||||||||||||
JPY/USD | 03/16/2011 | HSB | JPY | 99,091 | 1,221 | 38 | ||||||||||||||
JPY/USD | 03/16/2011 | UBS | JPY | 42,468 | 524 | 16 | ||||||||||||||
NOK/USD | 03/16/2011 | RBS | NOK | 2,821 | 482 | 6 | ||||||||||||||
NOK/USD | 03/16/2011 | DUB | NOK | 940 | 161 | 2 | ||||||||||||||
NOK/USD | 03/16/2011 | BOA | NOK | 1,880 | 321 | 3 | ||||||||||||||
NOK/USD | 03/16/2011 | UBS | NOK | 1,880 | 321 | 2 | ||||||||||||||
NOK/USD | 03/16/2011 | HSB | NOK | 1,880 | 321 | 3 | ||||||||||||||
NOK/USD | 03/16/2011 | UBS | NOK | 1,193 | 204 | 5 | ||||||||||||||
NOK/USD | 03/16/2011 | BCL | NOK | 3,580 | 611 | 14 | ||||||||||||||
NZD/USD | 03/16/2011 | UBS | NZD | 4,583 | 3,551 | 143 | ||||||||||||||
NZD/USD | 03/16/2011 | BCL | NZD | 303 | 235 | 11 | ||||||||||||||
NZD/USD | 03/16/2011 | DUB | NZD | 143 | 111 | 6 | ||||||||||||||
NZD/USD | 03/16/2011 | RBS | NZD | 141 | 109 | 5 | ||||||||||||||
NZD/USD | 03/16/2011 | HSB | NZD | 526 | 408 | 19 | ||||||||||||||
NZD/USD | 03/16/2011 | DUB | NZD | 651 | 505 | 23 | ||||||||||||||
NZD/USD | 03/16/2011 | UBS | NZD | 143 | 111 | 5 | ||||||||||||||
SEK/USD | 03/16/2011 | UBS | SEK | 21,786 | 3,231 | 61 | ||||||||||||||
SEK/USD | 03/16/2011 | RBS | SEK | 24,127 | 3,578 | 79 | ||||||||||||||
SEK/USD | 03/16/2011 | BOA | SEK | 10,676 | 1,583 | 40 | ||||||||||||||
SEK/USD | 03/16/2011 | HSB | SEK | 8,541 | 1,267 | 37 | ||||||||||||||
SEK/USD | 03/16/2011 | UBS | SEK | 8,541 | 1,267 | 41 | ||||||||||||||
SEK/USD | 03/16/2011 | BCL | SEK | 4,270 | 633 | 18 | ||||||||||||||
SEK/USD | 03/16/2011 | DUB | SEK | 10,676 | 1,583 | 46 | ||||||||||||||
SEK/USD | 03/16/2011 | BCL | SEK | 45,004 | 6,674 | 178 | ||||||||||||||
See accompanying Notes to the Financial Statements.
JNL Series Trust
Notes to Schedules of Investments (in thousands)
December 31, 2010
Schedule of Open Forward Foreign Currency Contracts
Purchased/ Sold | Settlement Date | Counter- Party | Notional Amount | Value | Unrealized Gain/ (Loss) | |||||||||||||
JNL/Mellon Capital Management Global Alpha Fund (continued) |
| |||||||||||||||||
SEK/USD | 03/16/2011 | HSB | SEK | 2,859 | $ | 424 | $ | 5 | ||||||||||
SEK/USD | 03/16/2011 | DUB | SEK | 1,430 | 212 | 3 | ||||||||||||
SEK/USD | 03/16/2011 | BOA | SEK | 2,859 | 424 | 5 | ||||||||||||
SEK/USD | 03/16/2011 | RBS | SEK | 4,289 | 636 | 9 | ||||||||||||
SEK/USD | 03/16/2011 | UBS | SEK | 2,859 | 424 | 5 | ||||||||||||
SEK/USD | 03/16/2011 | BCL | SEK | 3,745 | 555 | 8 | ||||||||||||
SEK/USD | 03/16/2011 | DUB | SEK | 8,055 | 1,195 | 17 | ||||||||||||
SEK/USD | 03/16/2011 | HSB | SEK | 6,503 | 964 | 13 | ||||||||||||
SEK/USD | 03/16/2011 | RBS | SEK | 1,745 | 259 | 4 | ||||||||||||
SEK/USD | 03/16/2011 | UBS | SEK | 1,764 | 262 | 4 | ||||||||||||
SEK/USD | 03/16/2011 | DUB | SEK | 1,769 | 262 | 5 | ||||||||||||
SEK/USD | 03/16/2011 | UBS | SEK | 5,127 | 760 | 10 | ||||||||||||
SEK/USD | 03/16/2011 | BCL | SEK | 15,381 | 2,281 | 29 | ||||||||||||
USD/AUD | 03/16/2011 | UBS | AUD | (387 | ) | (392 | ) | (10 | ) | |||||||||
USD/AUD | 03/16/2011 | BCL | AUD | (552 | ) | (560 | ) | (24 | ) | |||||||||
USD/AUD | 03/16/2011 | RBS | AUD | (828 | ) | (840 | ) | (35 | ) | |||||||||
USD/AUD | 03/16/2011 | UBS | AUD | (414 | ) | (420 | ) | (19 | ) | |||||||||
USD/AUD | 03/16/2011 | HSB | AUD | (966 | ) | (980 | ) | (45 | ) | |||||||||
USD/AUD | 03/16/2011 | BCL | AUD | (1,160 | ) | (1,176 | ) | (31 | ) | |||||||||
USD/CHF | 03/16/2011 | BCL | CHF | (683 | ) | (731 | ) | (20 | ) | |||||||||
USD/CHF | 03/16/2011 | HSB | CHF | (1,186 | ) | (1,269 | ) | (35 | ) | |||||||||
USD/CHF | 03/16/2011 | DUB | CHF | (1,469 | ) | (1,572 | ) | (43 | ) | |||||||||
USD/CHF | 03/16/2011 | UBS | CHF | (322 | ) | (344 | ) | (10 | ) | |||||||||
USD/CHF | 03/16/2011 | DUB | CHF | (322 | ) | (345 | ) | (12 | ) | |||||||||
USD/CHF | 03/16/2011 | RBS | CHF | (318 | ) | (340 | ) | (11 | ) | |||||||||
USD/EUR | 03/16/2011 | UBS | EUR | (215 | ) | (288 | ) | (5 | ) | |||||||||
USD/EUR | 03/16/2011 | BCL | EUR | (646 | ) | (863 | ) | (12 | ) | |||||||||
USD/EUR | 03/16/2011 | BCL | EUR | (2,645 | ) | (3,534 | ) | (56 | ) | |||||||||
USD/EUR | 03/16/2011 | UBS | EUR | (881 | ) | (1,177 | ) | (22 | ) | |||||||||
USD/EUR | 03/16/2011 | RBS | EUR | (803 | ) | (1,073 | ) | (21 | ) | |||||||||
USD/EUR | 03/16/2011 | UBS | EUR | (206 | ) | (275 | ) | (3 | ) | |||||||||
USD/EUR | 03/16/2011 | UBS | EUR | (1,421 | ) | (1,899 | ) | (37 | ) | |||||||||
USD/EUR | 03/16/2011 | UBS | EUR | (1,137 | ) | (1,519 | ) | (17 | ) | |||||||||
USD/EUR | 03/16/2011 | BOA | EUR | (4,085 | ) | (5,457 | ) | (91 | ) | |||||||||
USD/EUR | 03/16/2011 | BOA | EUR | (1,627 | ) | (2,174 | ) | (19 | ) | |||||||||
USD/EUR | 03/16/2011 | UBS | EUR | (1,645 | ) | (2,198 | ) | (18 | ) | |||||||||
USD/EUR | 03/16/2011 | UBS | EUR | (1,302 | ) | (1,739 | ) | (22 | ) | |||||||||
USD/EUR | 03/16/2011 | HSB | EUR | (1,302 | ) | (1,739 | ) | (20 | ) | |||||||||
USD/EUR | 03/16/2011 | BCL | EUR | (651 | ) | (869 | ) | (8 | ) | |||||||||
USD/EUR | 03/16/2011 | DUB | EUR | (1,627 | ) | (2,174 | ) | (27 | ) | |||||||||
USD/EUR | 03/16/2011 | RBS | EUR | (1,769 | ) | (2,363 | ) | 5 | ||||||||||
USD/EUR | 03/16/2011 | UBS | EUR | (1,179 | ) | (1,575 | ) | 8 | ||||||||||
USD/EUR | 03/16/2011 | BOA | EUR | (1,179 | ) | (1,575 | ) | 9 | ||||||||||
USD/EUR | 03/16/2011 | HSB | EUR | (1,179 | ) | (1,575 | ) | 8 | ||||||||||
USD/EUR | 03/16/2011 | DUB | EUR | (590 | ) | (788 | ) | 1 | ||||||||||
USD/EUR | 03/16/2011 | BCL | EUR | (1,218 | ) | (1,628 | ) | (7 | ) | |||||||||
USD/EUR | 03/16/2011 | DUB | EUR | (2,621 | ) | (3,502 | ) | (13 | ) | |||||||||
USD/EUR | 03/16/2011 | HSB | EUR | (2,116 | ) | (2,827 | ) | (9 | ) | |||||||||
USD/EUR | 03/16/2011 | RBS | EUR | (568 | ) | (758 | ) | (6 | ) | |||||||||
USD/EUR | 03/16/2011 | DUB | EUR | (575 | ) | (769 | ) | (8 | ) | |||||||||
USD/EUR | 03/16/2011 | UBS | EUR | (574 | ) | (767 | ) | (5 | ) | |||||||||
USD/GBP | 03/16/2011 | DUB | GBP | (5,805 | ) | (9,045 | ) | 41 | ||||||||||
USD/GBP | 03/16/2011 | RBS | GBP | (10,146 | ) | (15,810 | ) | 219 | ||||||||||
USD/GBP | 03/16/2011 | BCL | GBP | (3,753 | ) | (5,849 | ) | 81 | ||||||||||
USD/GBP | 03/16/2011 | UBS | GBP | (4,836 | ) | (7,535 | ) | 95 | ||||||||||
USD/JPY | 03/16/2011 | UBS | JPY | (38,076 | ) | (469 | ) | (13 | ) | |||||||||
USD/JPY | 03/16/2011 | BCL | JPY | (114,228 | ) | (1,408 | ) | (41 | ) | |||||||||
USD/JPY | 03/16/2011 | HSB | JPY | (50,777 | ) | (626 | ) | (16 | ) | |||||||||
USD/JPY | 03/16/2011 | RBS | JPY | (76,165 | ) | (939 | ) | (26 | ) | |||||||||
USD/JPY | 03/16/2011 | DUB | JPY | (25,388 | ) | (313 | ) | (9 | ) | |||||||||
USD/JPY | 03/16/2011 | BOA | JPY | (50,777 | ) | (626 | ) | (16 | ) | |||||||||
Purchased/ Sold | Settlement Date | Counter- Party | Notional Amount | Value | Unrealized Gain/ (Loss) | |||||||||||||
JNL/Mellon Capital Management Global Alpha Fund (continued) |
| |||||||||||||||||
USD/JPY | 03/16/2011 | UBS | JPY | (50,777) | $ | (626) | $ | (15) | ||||||||||
USD/NOK | 03/16/2011 | BOA | NOK | (40,004) | (6,832) | (174) | ||||||||||||
USD/NOK | 03/16/2011 | BOA | NOK | (4,058) | (693) | (21) | ||||||||||||
USD/NOK | 03/16/2011 | HSB | NOK | (3,246) | (554) | (19) | ||||||||||||
USD/NOK | 03/16/2011 | UBS | NOK | (3,246) | (554) | (19) | ||||||||||||
USD/NOK | 03/16/2011 | DUB | NOK | (4,058) | (693) | (23) | ||||||||||||
USD/NOK | 03/16/2011 | BCL | NOK | (1,623) | (277) | (9) | ||||||||||||
USD/NOK | 03/16/2011 | HSB | NOK | (19,704) | (3,365) | (103) | ||||||||||||
USD/NZD | 03/16/2011 | BCL | NZD | (2,540) | (1,968) | (90) | ||||||||||||
USD/NZD | 03/16/2011 | UBS | NZD | (847) | (656) | (30) | ||||||||||||
USD/NZD | 03/16/2011 | RBS | NZD | (368) | (285) | (9) | ||||||||||||
USD/NZD | 03/16/2011 | HSB | NZD | (430) | (333) | (13) | ||||||||||||
USD/NZD | 03/16/2011 | UBS | NZD | (184) | (143) | (5) | ||||||||||||
USD/NZD | 03/16/2011 | BCL | NZD | (246) | (190) | (7) | ||||||||||||
USD/NZD | 03/16/2011 | BOA | NZD | (426) | (330) | (11) | ||||||||||||
USD/NZD | 03/16/2011 | UBS | NZD | (426) | (330) | (11) | ||||||||||||
USD/NZD | 03/16/2011 | DUB | NZD | (213) | (165) | (6) | ||||||||||||
USD/NZD | 03/16/2011 | RBS | NZD | (639) | (495) | (18) | ||||||||||||
USD/NZD | 03/16/2011 | HSB | NZD | (426) | (330) | (11) | ||||||||||||
| $ | 29,254 | $ | 2,769 | |||||||||||||||
JNL/Mellon Capital Management International Index Fund |
| |||||||||||||||||
AUD/USD | 03/16/2011 | CCI | AUD | 118 | $ | 120 | $ | 5 | ||||||||||
AUD/USD | 03/16/2011 | DUB | AUD | 1,264 | 1,281 | 57 | ||||||||||||
AUD/USD | 03/16/2011 | CCI | AUD | 1,264 | 1,281 | 59 | ||||||||||||
AUD/USD | 03/16/2011 | DUB | AUD | 119 | 121 | 4 | ||||||||||||
AUD/USD | 03/16/2011 | CSI | AUD | 358 | 363 | 12 | ||||||||||||
AUD/USD | 03/16/2011 | CCI | AUD | 119 | 121 | 4 | ||||||||||||
AUD/USD | 03/16/2011 | CSI | AUD | 120 | 121 | 5 | ||||||||||||
AUD/USD | 03/16/2011 | CCI | AUD | 238 | 241 | 7 | ||||||||||||
AUD/USD | 03/16/2011 | CCI | AUD | 118 | 120 | 3 | ||||||||||||
AUD/USD | 03/16/2011 | CCI | AUD | 238 | 242 | 6 | ||||||||||||
AUD/USD | 03/16/2011 | CCI | AUD | 478 | 485 | 4 | ||||||||||||
AUD/USD | 03/16/2011 | BOA | AUD | 119 | 121 | 1 | ||||||||||||
EUR/USD | 03/16/2011 | CCI | EUR | 7,947 | 10,617 | 85 | ||||||||||||
EUR/USD | 03/16/2011 | CCI | EUR | 224 | 300 | 3 | ||||||||||||
EUR/USD | 03/16/2011 | CCI | EUR | 284 | 379 | 4 | ||||||||||||
EUR/USD | 03/16/2011 | DUB | EUR | 57 | 76 | — | ||||||||||||
EUR/USD | 03/16/2011 | CSI | EUR | 200 | 267 | — | ||||||||||||
EUR/USD | 03/16/2011 | CSI | EUR | 743 | 993 | 1 | ||||||||||||
EUR/USD | 03/16/2011 | CCI | EUR | 398 | 532 | 5 | ||||||||||||
EUR/USD | 03/16/2011 | CSI | EUR | 427 | 570 | 6 | ||||||||||||
EUR/USD | 03/16/2011 | CCI | EUR | 564 | 753 | 11 | ||||||||||||
EUR/USD | 03/16/2011 | CCI | EUR | 511 | 682 | 12 | ||||||||||||
EUR/USD | 03/16/2011 | CCI | EUR | 402 | 537 | 11 | ||||||||||||
EUR/USD | 03/16/2011 | CGM | EUR | 201 | 269 | 6 | ||||||||||||
EUR/USD | 03/16/2011 | CCI | EUR | 658 | 879 | 14 | ||||||||||||
EUR/USD | 03/16/2011 | CCI | EUR | 650 | 868 | 12 | ||||||||||||
EUR/USD | 03/16/2011 | CCI | EUR | 282 | 377 | 6 | ||||||||||||
EUR/USD | 03/16/2011 | BOA | EUR | 341 | 455 | 2 | ||||||||||||
EUR/USD | 03/16/2011 | BOA | EUR | 391 | 523 | — | ||||||||||||
GBP/USD | 03/16/2011 | CCI | GBP | 116 | 181 | (2) | ||||||||||||
GBP/USD | 03/16/2011 | BCL | GBP | 4,503 | 7,017 | (98) | ||||||||||||
GBP/USD | 03/16/2011 | CCI | GBP | 232 | 361 | (4) | ||||||||||||
GBP/USD | 03/16/2011 | CSI | GBP | 176 | 274 | (3) | ||||||||||||
GBP/USD | 03/16/2011 | CSI | GBP | 468 | 729 | (2) | ||||||||||||
GBP/USD | 03/16/2011 | CCI | GBP | 352 | 548 | (1) | ||||||||||||
GBP/USD | 03/16/2011 | CSI | GBP | 234 | 364 | 2 | ||||||||||||
GBP/USD | 03/16/2011 | CCI | GBP | 408 | 636 | 2 | ||||||||||||
GBP/USD | 03/16/2011 | CCI | GBP | 293 | 456 | 3 | ||||||||||||
GBP/USD | 03/16/2011 | CCI | GBP | 354 | 552 | 7 | ||||||||||||
See accompanying Notes to the Financial Statements.
JNL Series Trust
Notes to Schedules of Investments (in thousands)
December 31, 2010
Schedule of Open Forward Foreign Currency Contracts
Purchased/ Sold | Settlement Date | Counter- Party | Notional Amount | Value | Unrealized Gain/ | |||||||||||||
JNL/Mellon Capital Management International Index Fund (continued) |
| |||||||||||||||||
GBP/USD | 03/16/2011 | CGM | GBP | 60 | $ | 93 | $ | 1 | ||||||||||
GBP/USD | 03/16/2011 | CCI | GBP | 893 | 1,392 | 17 | ||||||||||||
GBP/USD | 03/16/2011 | CCI | GBP | 179 | 278 | 3 | ||||||||||||
GBP/USD | 03/16/2011 | BOA | GBP | 179 | 279 | 3 | ||||||||||||
GBP/USD | 03/16/2011 | BOA | GBP | 475 | 739 | 3 | ||||||||||||
JPY/USD | 03/16/2011 | CCI | JPY | 35,140 | 433 | 15 | ||||||||||||
JPY/USD | 03/16/2011 | DUB | JPY | 223,993 | 2,761 | 93 | ||||||||||||
JPY/USD | 03/16/2011 | BCL | JPY | 522,650 | 6,442 | 217 | ||||||||||||
JPY/USD | 03/16/2011 | CCI | JPY | 26,685 | 329 | 10 | ||||||||||||
JPY/USD | 03/16/2011 | DUB | JPY | 8,880 | 109 | 3 | ||||||||||||
JPY/USD | 03/16/2011 | CSI | JPY | 17,920 | 221 | 6 | ||||||||||||
JPY/USD | 03/16/2011 | CSI | JPY | 63,105 | 778 | 25 | ||||||||||||
JPY/USD | 03/16/2011 | CCI | JPY | 36,080 | 445 | 16 | ||||||||||||
JPY/USD | 03/16/2011 | CSI | JPY | 36,120 | 445 | 15 | ||||||||||||
JPY/USD | 03/16/2011 | CCI | JPY | 36,080 | 445 | 13 | ||||||||||||
JPY/USD | 03/16/2011 | CCI | JPY | 45,000 | 555 | 16 | ||||||||||||
JPY/USD | 03/16/2011 | CGM | JPY | 54,330 | 670 | 16 | ||||||||||||
JPY/USD | 03/16/2011 | CCI | JPY | 54,120 | 667 | 13 | ||||||||||||
JPY/USD | 03/16/2011 | CCI | JPY | 45,250 | 558 | 5 | ||||||||||||
JPY/USD | 03/16/2011 | CCI | JPY | 18,090 | 223 | 2 | ||||||||||||
JPY/USD | 03/16/2011 | BOA | JPY | 27,270 | 336 | 1 | ||||||||||||
USD/AUD | 03/16/2011 | CCI | AUD | (2,153) | (2,182) | (88) | ||||||||||||
USD/EUR | 03/16/2011 | CCI | EUR | (5,859) | (7,827) | (73) | ||||||||||||
USD/GBP | 03/16/2011 | CCI | GBP | (3,942) | (6,143) | 69 | ||||||||||||
USD/JPY | 03/16/2011 | CCI | JPY | (500,519) | (6,169) | (181) | ||||||||||||
| $ | 30,689 | $ | 469 | |||||||||||||||
JNL/PIMCO Real Return Fund |
| |||||||||||||||||
BRL/USD | 03/02/2011 | CIT | BRL | 13,709 | $ | 8,155 | $ | 116 | ||||||||||
CAD/USD | 02/17/2011 | DUB | CAD | 6,042 | 6,071 | 72 | ||||||||||||
CAD/USD | 02/17/2011 | BNP | CAD | 3,161 | 3,176 | 30 | ||||||||||||
CAD/USD | 02/17/2011 | MSC | CAD | 3,166 | 3,181 | 40 | ||||||||||||
CAD/USD | 02/17/2011 | BOA | CAD | 3,724 | 3,742 | 67 | ||||||||||||
CNY/USD | 01/10/2011 | MSC | CNY | 2,722 | 413 | 3 | ||||||||||||
CNY/USD | 01/10/2011 | MSC | CNY | 4,848 | 736 | 6 | ||||||||||||
CNY/USD | 01/10/2011 | JPM | CNY | 11,360 | 1,724 | 21 | ||||||||||||
CNY/USD | 01/10/2011 | DUB | CNY | 7,862 | 1,193 | 19 | ||||||||||||
CNY/USD | 11/15/2011 | JPM | CNY | 26,142 | 3,973 | (97) | ||||||||||||
CNY/USD | 02/13/2012 | DUB | CNY | 26,791 | 4,071 | (65) | ||||||||||||
EUR/USD | 01/25/2011 | DUB | EUR | 552 | 738 | (30) | ||||||||||||
EUR/USD | 01/25/2011 | CIT | EUR | 552 | 738 | (29) | ||||||||||||
INR/USD | 03/09/2011 | DUB | INR | 85,937 | 1,900 | — | ||||||||||||
INR/USD | 03/09/2011 | DUB | INR | 60,845 | 1,345 | (5) | ||||||||||||
INR/USD | 03/09/2011 | CIT | INR | 30,648 | 677 | (3) | ||||||||||||
INR/USD | 03/09/2011 | CIT | INR | 15,600 | 345 | — | ||||||||||||
INR/USD | 03/09/2011 | CIT | INR | 84,187 | 1,861 | (9) | ||||||||||||
INR/USD | 03/09/2011 | DUB | INR | 27,420 | 606 | (4) | ||||||||||||
INR/USD | 03/09/2011 | JPM | INR | 52,744 | 1,166 | (4) | ||||||||||||
INR/USD | 03/09/2011 | CIT | INR | 11,270 | 249 | (1) | ||||||||||||
INR/USD | 03/09/2011 | DUB | INR | 10,166 | 225 | — | ||||||||||||
INR/USD | 03/09/2011 | CIT | INR | 20,363 | 450 | — | ||||||||||||
INR/USD | 03/09/2011 | CIT | INR | 10,426 | 230 | — | ||||||||||||
INR/USD | 03/09/2011 | UBS | INR | 10,197 | 225 | — | ||||||||||||
INR/USD | 03/09/2011 | CIT | INR | 26,268 | 581 | (1) | ||||||||||||
INR/USD | 03/09/2011 | JPM | INR | 104,905 | 2,319 | 29 | ||||||||||||
INR/USD | 03/09/2011 | BOA | INR | 10,084 | 223 | 9 | ||||||||||||
INR/USD | 03/09/2011 | JPM | INR | 70,065 | 1,549 | 63 | ||||||||||||
INR/USD | 03/09/2011 | CIT | INR | 63,180 | 1,397 | 47 | ||||||||||||
INR/USD | 03/09/2011 | DUB | INR | 63,207 | 1,397 | 47 | ||||||||||||
KRW/USD | 01/19/2011 | UBS | KRW | 6,319,230 | 5,563 | 13 | ||||||||||||
KRW/USD | 01/19/2011 | DUB | KRW | 452,000 | 398 | (2) | ||||||||||||
Purchased/ Sold | Settlement Date | Counter- Party | Notional Amount | Value | Unrealized Gain/ (Loss) | |||||||||||||
JNL/PIMCO Real Return Fund (continued) |
| |||||||||||||||||
KRW/USD | 01/19/2011 | CIT | KRW | 565,750 | $ | 498 | $ | (2) | ||||||||||
KRW/USD | 01/19/2011 | DUB | KRW | 1,342,080 | 1,181 | (18) | ||||||||||||
KRW/USD | 05/09/2011 | CIT | KRW | 823,805 | 722 | (8) | ||||||||||||
KRW/USD | 05/09/2011 | DUB | KRW | 1,655,220 | 1,450 | (20) | ||||||||||||
KRW/USD | 05/09/2011 | CIT | KRW | 2,441,930 | 2,140 | (15) | ||||||||||||
KRW/USD | 05/09/2011 | CIT | KRW | 1,711,000 | 1,499 | (26) | ||||||||||||
KRW/USD | 05/09/2011 | CIT | KRW | 455,000 | 399 | (1) | ||||||||||||
KRW/USD | 05/09/2011 | DUB | KRW | 681,900 | 597 | (2) | ||||||||||||
KRW/USD | 05/09/2011 | UBS | KRW | 227,640 | 199 | (1) | ||||||||||||
KRW/USD | 05/09/2011 | CIT | KRW | 2,477,200 | 2,171 | (23) | ||||||||||||
KRW/USD | 05/09/2011 | JPM | KRW | 2,783,400 | 2,439 | (15) | ||||||||||||
KRW/USD | 05/09/2011 | CIT | KRW | 2,682,857 | 2,351 | (45) | ||||||||||||
KRW/USD | 05/09/2011 | JPM | KRW | 8,679,060 | 7,605 | 111 | ||||||||||||
PHP/USD | 02/07/2011 | CIT | PHP | 11,053 | 252 | 2 | ||||||||||||
PHP/USD | 02/07/2011 | CIT | PHP | 28,665 | 654 | 5 | ||||||||||||
PHP/USD | 02/07/2011 | CIT | PHP | 30,611 | 699 | (1) | ||||||||||||
PHP/USD | 02/07/2011 | CIT | PHP | 60,956 | 1,392 | (8) | ||||||||||||
PHP/USD | 02/07/2011 | DUB | PHP | 21,790 | 498 | (2) | ||||||||||||
PHP/USD | 02/07/2011 | CIT | PHP | 38,419 | 877 | (6) | ||||||||||||
PHP/USD | 02/07/2011 | UBS | PHP | 7,142 | 163 | (1) | ||||||||||||
PHP/USD | 02/07/2011 | DUB | PHP | 11,011 | 251 | (2) | ||||||||||||
PHP/USD | 06/15/2011 | CIT | PHP | 21,940 | 500 | 1 | ||||||||||||
PHP/USD | 06/15/2011 | CIT | PHP | 23,300 | 531 | — | ||||||||||||
PHP/USD | 06/15/2011 | DUB | PHP | 10,603 | 241 | 1 | ||||||||||||
PHP/USD | 06/15/2011 | CIT | PHP | 42,461 | 967 | 7 | ||||||||||||
PHP/USD | 06/15/2011 | JPM | PHP | 22,628 | 515 | (1) | ||||||||||||
PHP/USD | 06/15/2011 | DUB | PHP | 110,386 | 2,514 | (3) | ||||||||||||
PHP/USD | 06/15/2011 | CIT | PHP | 87,500 | 1,993 | (7) | ||||||||||||
SGD/USD | 02/24/2011 | UBS | SGD | 2,859 | 2,228 | 38 | ||||||||||||
SGD/USD | 02/24/2011 | UBS | SGD | 723 | 563 | 10 | ||||||||||||
SGD/USD | 02/24/2011 | CIT | SGD | 2,675 | 2,085 | 38 | ||||||||||||
SGD/USD | 03/09/2011 | DUB | SGD | 4,042 | 3,150 | 80 | ||||||||||||
USD/AUD | 01/28/2011 | BOA | AUD | (4,877) | (4,972) | (329) | ||||||||||||
USD/CNY | 01/10/2011 | DUB | CNY | (26,791) | (4,065) | (36) | ||||||||||||
USD/EUR | 01/04/2011 | JPM | EUR | (388) | (518) | (2) | ||||||||||||
USD/EUR | 01/06/2011 | CIT | EUR | (10,667) | (14,254) | 194 | ||||||||||||
USD/EUR | 01/25/2011 | BNP | EUR | (2,280) | (3,047) | (14) | ||||||||||||
USD/EUR | 01/25/2011 | BNP | EUR | (3,910) | (5,225) | (52) | ||||||||||||
USD/EUR | 01/25/2011 | BNP | EUR | (2,370) | (3,167) | (27) | ||||||||||||
USD/EUR | 01/25/2011 | MSC | EUR | (2,340) | (3,127) | (33) | ||||||||||||
USD/EUR | 01/25/2011 | BOA | EUR | (2,800) | (3,742) | (59) | ||||||||||||
USD/EUR | 01/25/2011 | BNP | EUR | (2,006) | (2,681) | (56) | ||||||||||||
USD/EUR | 01/25/2011 | MSC | EUR | (388) | (518) | (5) | ||||||||||||
USD/GBP | 03/21/2011 | DUB | GBP | (465) | (725) | 1 | ||||||||||||
USD/JPY | 01/14/2011 | DUB | JPY | (9,187) | (113) | (4) | ||||||||||||
USD/JPY | 01/31/2011 | CIT | JPY | (6,710,000) | (82,672) | (96) | ||||||||||||
USD/KRW | 01/19/2011 | JPM | KRW | (8,679,060) | (7,641) | (124) | ||||||||||||
| $ | (32,526) | $ | (224) | |||||||||||||||
JNL/PIMCO Total Return Bond Fund |
| |||||||||||||||||
AUD/USD | 01/28/2011 | BOA | AUD | 4,891 | $ | 4,986 | $ | 330 | ||||||||||
AUD/USD | 01/28/2011 | BNP | AUD | 4,100 | 4,180 | 126 | ||||||||||||
BRL/USD | 03/02/2011 | CIT | BRL | 83,706 | 49,793 | 710 | ||||||||||||
BRL/USD | 09/02/2011 | BOA | BRL | 1,303 | 754 | 54 | ||||||||||||
BRL/USD | 09/02/2011 | MSC | BRL | 1,302 | 754 | 54 | ||||||||||||
CAD/USD | 02/17/2011 | DUB | CAD | 53,367 | 53,625 | 639 | ||||||||||||
CAD/USD | 02/17/2011 | BOA | CAD | 602 | 605 | 11 | ||||||||||||
CAD/USD | 02/17/2011 | BNP | CAD | 349 | 351 | 8 | ||||||||||||
CNY/USD | 11/15/2011 | JPM | CNY | 22,631 | 3,439 | (78) | ||||||||||||
CNY/USD | 11/15/2011 | CIT | CNY | 115,099 | 17,492 | (314) | ||||||||||||
IDR/USD | 04/15/2011 | MSC | IDR | 9,090,000 | 993 | (7) | ||||||||||||
See accompanying Notes to the Financial Statements.
JNL Series Trust
Notes to Schedules of Investments (in thousands)
December 31, 2010
Schedule of Open Forward Foreign Currency Contracts
Purchased/ Sold | Settlement Date | Counter- Party | Notional Amount | Value | Unrealized (Loss) | |||||||||||||
JNL/PIMCO Total Return Bond Fund (continued) |
| |||||||||||||||||
IDR/USD | 04/15/2011 | JPM | IDR | 25,844,000 | $ | 2,823 | $ | 23 | ||||||||||
IDR/USD | 07/27/2011 | JPM | IDR | 60,433,400 | 6,512 | (72 | ) | |||||||||||
IDR/USD | 07/27/2011 | BNP | IDR | 23,625,000 | 2,546 | 46 | ||||||||||||
INR/USD | 01/12/2011 | JPM | INR | 45,680 | 1,020 | 20 | ||||||||||||
INR/USD | 01/12/2011 | MSC | INR | 45,700 | 1,021 | 21 | ||||||||||||
INR/USD | 01/12/2011 | CIT | INR | 77,316 | 1,727 | 27 | ||||||||||||
INR/USD | 05/09/2011 | BOA | INR | 46,450 | 1,015 | 15 | ||||||||||||
INR/USD | 05/09/2011 | JPM | INR | 168,696 | 3,686 | 65 | ||||||||||||
JPY/USD | 01/14/2011 | JPM | JPY | 21,041 | 259 | 9 | ||||||||||||
JPY/USD | 01/14/2011 | CIT | JPY | 21,041 | 259 | 9 | ||||||||||||
JPY/USD | 01/14/2011 | BNP | JPY | 33,040 | 407 | 10 | ||||||||||||
JPY/USD | 01/14/2011 | BNP | JPY | 107,660 | 1,326 | 47 | ||||||||||||
JPY/USD | 01/14/2011 | BNP | JPY | 356,041 | 4,386 | 154 | ||||||||||||
JPY/USD | 01/14/2011 | BNP | JPY | 142,552 | 1,756 | 63 | ||||||||||||
JPY/USD | 01/14/2011 | UBS | JPY | 25,125 | 309 | 9 | ||||||||||||
JPY/USD | 01/14/2011 | BNP | JPY | 125,831 | 1,550 | 49 | ||||||||||||
JPY/USD | 01/14/2011 | UBS | JPY | 67,060 | 826 | 17 | ||||||||||||
JPY/USD | 01/14/2011 | MSC | JPY | 223,826 | 2,757 | 19 | ||||||||||||
KRW/USD | 01/19/2011 | MSC | KRW | 1,139,100 | 1,003 | 3 | ||||||||||||
KRW/USD | 01/19/2011 | MSC | KRW | 790,720 | 696 | (4 | ) | |||||||||||
KRW/USD | 01/19/2011 | MSC | KRW | 565,300 | 498 | (2 | ) | |||||||||||
KRW/USD | 01/19/2011 | MSC | KRW | 1,017,360 | 896 | (4 | ) | |||||||||||
KRW/USD | 01/19/2011 | MSC | KRW | 1,130,250 | 995 | (5 | ) | |||||||||||
KRW/USD | 01/19/2011 | MSC | KRW | 560,125 | 493 | (7 | ) | |||||||||||
KRW/USD | 01/19/2011 | MSC | KRW | 444,176 | 391 | (9 | ) | |||||||||||
KRW/USD | 01/19/2011 | JPM | KRW | 498,896 | 439 | 6 | ||||||||||||
KRW/USD | 01/19/2011 | JPM | KRW | 496,600 | 437 | 4 | ||||||||||||
KRW/USD | 01/19/2011 | JPM | KRW | 502,666 | 443 | 9 | ||||||||||||
KRW/USD | 01/19/2011 | CIT | KRW | 577,050 | 508 | 8 | ||||||||||||
KRW/USD | 01/19/2011 | MSC | KRW | 1,035,990 | 912 | 12 | ||||||||||||
KRW/USD | 01/19/2011 | MSC | KRW | 460,640 | 406 | 6 | ||||||||||||
KRW/USD | 01/19/2011 | MSC | KRW | 575,550 | 507 | 7 | ||||||||||||
KRW/USD | 01/19/2011 | MSC | KRW | 576,040 | 507 | 7 | ||||||||||||
KRW/USD | 01/19/2011 | MSC | KRW | 1,259,060 | 1,108 | 8 | ||||||||||||
KRW/USD | 05/09/2011 | CIT | KRW | 787,000 | 690 | (12 | ) | |||||||||||
KRW/USD | 05/09/2011 | MSC | KRW | 1,010,817 | 886 | (14 | ) | |||||||||||
KRW/USD | 05/09/2011 | MSC | KRW | 1,009,017 | 884 | (16 | ) | |||||||||||
KRW/USD | 05/09/2011 | CIT | KRW | 1,139,100 | 998 | (10 | ) | |||||||||||
KRW/USD | 05/09/2011 | JPM | KRW | 1,280,000 | 1,122 | (7 | ) | |||||||||||
KRW/USD | 05/09/2011 | CIT | KRW | 1,233,773 | 1,081 | (21 | ) | |||||||||||
KRW/USD | 05/09/2011 | CIT | KRW | 448,800 | 393 | (7 | ) | |||||||||||
KRW/USD | 05/09/2011 | JPM | KRW | 446,560 | 391 | (9 | ) | |||||||||||
KRW/USD | 05/09/2011 | CIT | KRW | 447,520 | 392 | (8 | ) | |||||||||||
KRW/USD | 05/09/2011 | JPM | KRW | 445,240 | 390 | (10 | ) | |||||||||||
KRW/USD | 05/09/2011 | JPM | KRW | 449,080 | 394 | (7 | ) | |||||||||||
KRW/USD | 05/09/2011 | CIT | KRW | 447,400 | 392 | (8 | ) | |||||||||||
KRW/USD | 05/09/2011 | CIT | KRW | 445,040 | 390 | (10 | ) | |||||||||||
KRW/USD | 05/09/2011 | CIT | KRW | 450,000 | 394 | (6 | ) | |||||||||||
KRW/USD | 05/09/2011 | BOA | KRW | 569,150 | 499 | (1 | ) | |||||||||||
KRW/USD | 05/09/2011 | JPM | KRW | 568,250 | 498 | (2 | ) | |||||||||||
KRW/USD | 05/09/2011 | JPM | KRW | 914,080 | 801 | 1 | ||||||||||||
KRW/USD | 05/09/2011 | JPM | KRW | 454,400 | 398 | (2 | ) | |||||||||||
KRW/USD | 05/09/2011 | JPM | KRW | 340,110 | 298 | (2 | ) | |||||||||||
KRW/USD | 05/09/2011 | CIT | KRW | 342,060 | 300 | — | ||||||||||||
KRW/USD | 05/09/2011 | JPM | KRW | 463,880 | 406 | 6 | ||||||||||||
KRW/USD | 05/09/2011 | JPM | KRW | 11,629,523 | 10,190 | 149 | ||||||||||||
KRW/USD | 05/09/2011 | UBS | KRW | 464,600 | 407 | 7 | ||||||||||||
MXN/USD | 02/22/2011 | MSC | MXN | 6,350 | 512 | 12 | ||||||||||||
MXN/USD | 02/22/2011 | CIT | MXN | 5,077 | 410 | 10 | ||||||||||||
MXN/USD | 02/22/2011 | MSC | MXN | 6,347 | 512 | 12 | ||||||||||||
MXN/USD | 02/22/2011 | MSC | MXN | 7,615 | 614 | 14 | ||||||||||||
Purchased/ Sold | Settlement Date | Counter- Party | Notional Amount | Value | Unrealized (Loss) | |||||||||||||||
JNL/PIMCO Total Return Bond Fund (continued) |
| |||||||||||||||||||
MXN/USD | 02/22/2011 | MSC | MXN | 7,614 | $ | 614 | $ | 14 | ||||||||||||
MXN/USD | 02/22/2011 | MSC | MXN | 7,505 | 606 | 6 | ||||||||||||||
MXN/USD | 02/22/2011 | MSC | MXN | 7,511 | 606 | 6 | ||||||||||||||
MXN/USD | 02/22/2011 | MSC | MXN | 6,252 | 504 | 4 | ||||||||||||||
MXN/USD | 02/22/2011 | UBS | MXN | 6,303 | 509 | 9 | ||||||||||||||
MXN/USD | 02/22/2011 | JPM | MXN | 6,300 | 508 | 8 | ||||||||||||||
MXN/USD | 02/22/2011 | MSC | MXN | 6,292 | 508 | 8 | ||||||||||||||
MXN/USD | 02/22/2011 | BOA | MXN | 5,033 | 406 | 6 | ||||||||||||||
MXN/USD | 02/22/2011 | MSC | MXN | 2,486 | 201 | 1 | ||||||||||||||
MXN/USD | 02/22/2011 | MSC | MXN | 2,486 | 201 | 1 | ||||||||||||||
MXN/USD | 02/22/2011 | MSC | MXN | 3,714 | 300 | — | ||||||||||||||
MXN/USD | 02/22/2011 | JPM | MXN | 3,709 | 299 | (1 | ) | |||||||||||||
MXN/USD | 02/22/2011 | JPM | MXN | 1,280 | 103 | — | ||||||||||||||
MXN/USD | 02/22/2011 | MSC | MXN | 3,692 | 298 | (2 | ) | |||||||||||||
MXN/USD | 02/22/2011 | MSC | MXN | 3,712 | 300 | (1 | ) | |||||||||||||
MXN/USD | 02/22/2011 | MSC | MXN | 3,700 | 299 | (2 | ) | |||||||||||||
MXN/USD | 02/22/2011 | CIT | MXN | 4,922 | 397 | (3 | ) | |||||||||||||
MXN/USD | 02/22/2011 | MSC | MXN | 4,944 | 399 | (1 | ) | |||||||||||||
MXN/USD | 02/22/2011 | CIT | MXN | 9,854 | 795 | (5 | ) | |||||||||||||
MXN/USD | 02/22/2011 | CIT | MXN | 4,958 | 400 | — | ||||||||||||||
MXN/USD | 02/22/2011 | MSC | MXN | 2,494 | 201 | 1 | ||||||||||||||
MXN/USD | 02/22/2011 | MSC | MXN | 2,495 | 201 | 1 | ||||||||||||||
MXN/USD | 02/22/2011 | MSC | MXN | 6,242 | 504 | 4 | ||||||||||||||
MXN/USD | 02/22/2011 | CIT | MXN | 2,477 | 200 | — | ||||||||||||||
MXN/USD | 02/22/2011 | MSC | MXN | 4,956 | 400 | — | ||||||||||||||
MXN/USD | 02/22/2011 | MSC | MXN | 6,203 | 501 | 1 | ||||||||||||||
MXN/USD | 02/22/2011 | MSC | MXN | 5,013 | 404 | 4 | ||||||||||||||
MXN/USD | 02/22/2011 | MSC | MXN | 8,806 | 711 | 11 | ||||||||||||||
MXN/USD | 02/22/2011 | MSC | MXN | 3,771 | 304 | 4 | ||||||||||||||
MXN/USD | 02/22/2011 | MSC | MXN | 3,772 | 304 | 4 | ||||||||||||||
MXN/USD | 02/22/2011 | UBS | MXN | 12,474 | 1,007 | 7 | ||||||||||||||
MXN/USD | 02/22/2011 | MSC | MXN | 16,237 | 1,310 | 10 | ||||||||||||||
MXN/USD | 02/22/2011 | UBS | MXN | 7,430 | 600 | (1 | ) | |||||||||||||
MXN/USD | 02/22/2011 | MSC | MXN | 7,432 | 600 | — | ||||||||||||||
MXN/USD | 02/22/2011 | BOA | MXN | 41,525 | 3,351 | 117 | ||||||||||||||
MXN/USD | 02/22/2011 | CIT | MXN | 6,089 | 491 | 32 | ||||||||||||||
MXN/USD | 02/22/2011 | CIT | MXN | 14,348 | 1,158 | 58 | ||||||||||||||
MXN/USD | 02/22/2011 | MSC | MXN | 5,213 | 421 | 21 | ||||||||||||||
MXN/USD | 02/22/2011 | MSC | MXN | 7,705 | 622 | 22 | ||||||||||||||
MXN/USD | 02/22/2011 | MSC | MXN | 7,702 | 621 | 21 | ||||||||||||||
MXN/USD | 02/22/2011 | CIT | MXN | 12,829 | 1,035 | 35 | ||||||||||||||
MXN/USD | 02/22/2011 | DUB | MXN | 5,094 | 411 | 11 | ||||||||||||||
MXN/USD | 02/22/2011 | UBS | MXN | 6,366 | 514 | 14 | ||||||||||||||
MXN/USD | 02/22/2011 | MSC | MXN | 11,469 | 925 | 26 | ||||||||||||||
MXN/USD | 02/22/2011 | MSC | MXN | 3,810 | 307 | 7 | ||||||||||||||
MXN/USD | 02/22/2011 | MSC | MXN | 7,614 | 614 | 14 | ||||||||||||||
MXN/USD | 02/22/2011 | CIT | MXN | 3,809 | 307 | 7 | ||||||||||||||
MXN/USD | 02/22/2011 | JPM | MXN | 5,078 | 410 | 10 | ||||||||||||||
MXN/USD | 02/22/2011 | MSC | MXN | 6,332 | 511 | 11 | ||||||||||||||
MXN/USD | 02/22/2011 | MSC | MXN | 12,657 | 1,021 | 21 | ||||||||||||||
MYR/USD | 02/07/2011 | JPM | MYR | 2,160 | 699 | (1 | ) | |||||||||||||
MYR/USD | 02/07/2011 | CIT | MYR | 1,610 | 521 | 1 | ||||||||||||||
MYR/USD | 02/07/2011 | DUB | MYR | 3,440 | 1,113 | 4 | ||||||||||||||
MYR/USD | 02/07/2011 | JPM | MYR | 5,032 | 1,628 | 7 | ||||||||||||||
MYR/USD | 02/07/2011 | JPM | MYR | 3,103 | 1,004 | 4 | ||||||||||||||
PHP/USD | 02/07/2011 | JPM | PHP | 26,118 | 596 | (4 | ) | |||||||||||||
PHP/USD | 02/07/2011 | JPM | PHP | 19,093 | 436 | 3 | ||||||||||||||
PHP/USD | 02/07/2011 | CIT | PHP | 19,110 | 436 | 3 | ||||||||||||||
PHP/USD | 02/07/2011 | CIT | PHP | 19,123 | 437 | 3 | ||||||||||||||
PHP/USD | 04/15/2011 | CIT | PHP | 21,375 | 488 | (12 | ) | |||||||||||||
PHP/USD | 04/15/2011 | JPM | PHP | 21,340 | 487 | (13 | ) | |||||||||||||
See accompanying Notes to the Financial Statements.
JNL Series Trust
Notes to Schedules of Investments (in thousands)
December 31, 2010
Schedule of Open Forward Foreign Currency Contracts
Purchased/ Sold | Settlement Date | Counter- Party | Notional Amount | Value | Unrealized Gain/ (Loss) | |||||||||||
JNL/PIMCO Total Return Bond Fund (continued) |
| |||||||||||||||
PHP/USD | 04/15/2011 | JPM | PHP | 26,250 | $ | 599 | $ | (1 | ) | |||||||
PHP/USD | 04/15/2011 | CIT | PHP | 26,166 | 597 | (3 | ) | |||||||||
PHP/USD | 04/15/2011 | BOA | PHP | 22,000 | 502 | 2 | ||||||||||
PHP/USD | 06/15/2011 | CIT | PHP | 18,760 | 427 | 1 | ||||||||||
PHP/USD | 06/15/2011 | CIT | PHP | 19,900 | 453 | — | ||||||||||
PHP/USD | 06/15/2011 | JPM | PHP | 19,354 | 441 | (1 | ) | |||||||||
PHP/USD | 06/15/2011 | DUB | PHP | 94,415 | 2,150 | (3 | ) | |||||||||
PHP/USD | 06/15/2011 | JPM | PHP | 43,200 | 984 | (16 | ) | |||||||||
PHP/USD | 06/15/2011 | DUB | PHP | 25,926 | 590 | (10 | ) | |||||||||
PHP/USD | 06/15/2011 | CIT | PHP | 38,430 | 875 | (25 | ) | |||||||||
PHP/USD | 06/15/2011 | JPM | PHP | 21,770 | 496 | (4 | ) | |||||||||
PHP/USD | 06/15/2011 | JPM | PHP | 40,320 | 918 | 18 | ||||||||||
PHP/USD | 06/15/2011 | JPM | PHP | 22,460 | 511 | 11 | ||||||||||
PHP/USD | 11/15/2011 | CIT | PHP | 38,790 | 883 | (17 | ) | |||||||||
PHP/USD | 11/15/2011 | CIT | PHP | 34,716 | 790 | (10 | ) | |||||||||
PHP/USD | 11/15/2011 | CIT | PHP | 36,975 | 842 | (9 | ) | |||||||||
PHP/USD | 11/15/2011 | DUB | PHP | 37,443 | 852 | 2 | ||||||||||
PHP/USD | 11/15/2011 | JPM | PHP | 22,050 | 502 | 2 | ||||||||||
PHP/USD | 11/15/2011 | CIT | PHP | 21,945 | 499 | (1 | ) | |||||||||
PHP/USD | 11/15/2011 | CIT | PHP | 17,820 | 406 | 6 | ||||||||||
PHP/USD | 11/15/2011 | JPM | PHP | 17,748 | 404 | 4 | ||||||||||
PHP/USD | 11/15/2011 | CIT | PHP | 22,105 | 503 | 3 | ||||||||||
SGD/USD | 01/14/2011 | JPM | SGD | 480 | 374 | 8 | ||||||||||
SGD/USD | 01/14/2011 | JPM | SGD | 480 | 374 | 7 | ||||||||||
SGD/USD | 01/14/2011 | JPM | SGD | 484 | 377 | 10 | ||||||||||
SGD/USD | 01/14/2011 | JPM | SGD | 659 | 513 | 13 | ||||||||||
SGD/USD | 02/24/2011 | MSC | SGD | 2,622 | 2,043 | 43 | ||||||||||
SGD/USD | 02/24/2011 | MSC | SGD | 129 | 100 | — | ||||||||||
SGD/USD | 02/24/2011 | CIT | SGD | 257 | 200 | — | ||||||||||
SGD/USD | 03/09/2011 | JPM | SGD | 514 | 401 | 1 | ||||||||||
SGD/USD | 03/09/2011 | JPM | SGD | 386 | 301 | 1 | ||||||||||
SGD/USD | 03/09/2011 | JPM | SGD | 1,426 | 1,111 | 11 | ||||||||||
SGD/USD | 03/09/2011 | JPM | SGD | 2,103 | 1,639 | 38 | ||||||||||
SGD/USD | 03/09/2011 | MSC | SGD | 1,586 | 1,236 | 36 | ||||||||||
SGD/USD | 06/09/2011 | DUB | SGD | 1,200 | 935 | 15 | ||||||||||
SGD/USD | 06/09/2011 | DUB | SGD | 658 | 513 | 7 | ||||||||||
SGD/USD | 06/09/2011 | JPM | SGD | 1,162 | 905 | 5 | ||||||||||
SGD/USD | 06/09/2011 | JPM | SGD | 773 | 602 | 2 | ||||||||||
SGD/USD | 06/09/2011 | CIT | SGD | 515 | 401 | 1 | ||||||||||
SGD/USD | 06/09/2011 | CIT | SGD | 386 | 301 | 1 | ||||||||||
SGD/USD | 06/09/2011 | JPM | SGD | 450 | 351 | 1 | ||||||||||
SGD/USD | 06/09/2011 | JPM | SGD | 1,820 | 1,418 | 18 | ||||||||||
SGD/USD | 06/09/2011 | JPM | SGD | 905 | 705 | 5 | ||||||||||
SGD/USD | 06/09/2011 | JPM | SGD | 655 | 510 | 10 | ||||||||||
TWD/USD | 04/06/2011 | DUB | TWD | 2,500 | 86 | 4 | ||||||||||
TWD/USD | 04/06/2011 | BOA | TWD | 3,523 | 121 | 5 | ||||||||||
TWD/USD | 04/06/2011 | JPM | TWD | 3,615 | 124 | 5 | ||||||||||
USD/AUD | 01/28/2011 | BNP | AUD | (20) | (20 | ) | (1 | ) | ||||||||
USD/EUR | 01/06/2011 | CIT | EUR | (29,895) | (39,949 | ) | 498 | |||||||||
USD/EUR | 01/25/2011 | CIT | EUR | (146) | (195 | ) | 7 | |||||||||
USD/EUR | 01/25/2011 | CIT | EUR | (1,156) | (1,545 | ) | 46 | |||||||||
USD/EUR | 01/25/2011 | DUB | EUR | (250) | (334 | ) | (3 | ) | ||||||||
USD/EUR | 01/25/2011 | JPM | EUR | (207) | (277 | ) | (5 | ) | ||||||||
USD/EUR | 01/25/2011 | JPM | EUR | (63) | (84 | ) | (2 | ) | ||||||||
USD/EUR | 01/25/2011 | BNP | EUR | (325) | (434 | ) | (8 | ) | ||||||||
USD/EUR | 01/25/2011 | BNP | EUR | (3,483) | (4,654 | ) | (90 | ) | ||||||||
USD/EUR | 01/25/2011 | BOA | EUR | (63) | (84 | ) | (1 | ) | ||||||||
USD/EUR | 01/25/2011 | JPM | EUR | (800) | (1,069 | ) | — | |||||||||
USD/EUR | 01/25/2011 | JPM | EUR | (700) | (935 | ) | (9 | ) | ||||||||
USD/EUR | 01/25/2011 | JPM | EUR | (800) | (1,069 | ) | (12 | ) | ||||||||
USD/EUR | 01/25/2011 | JPM | EUR | (996) | (1,331 | ) | 5 | |||||||||
Purchased/ Sold | Settlement Date | Counter- Party | Notional Amount | Value | Unrealized Gain/ (Loss) | |||||||||||
JNL/PIMCO Total Return Bond Fund (continued) |
| |||||||||||||||
USD/EUR | 01/25/2011 | BNP | EUR | (800) | $ | (1,069 | ) | $ | (9) | |||||||
USD/EUR | 01/25/2011 | MSC | EUR | (600) | (802 | ) | (8) | |||||||||
USD/EUR | 01/25/2011 | BOA | EUR | (1,593) | (2,129 | ) | (33) | |||||||||
USD/EUR | 01/25/2011 | BNP | EUR | (300) | (401 | ) | (7) | |||||||||
USD/EUR | 01/25/2011 | BNP | EUR | (686) | (917 | ) | (19) | |||||||||
USD/EUR | 01/25/2011 | UBS | EUR | (612) | (818 | ) | (15) | |||||||||
USD/EUR | 01/25/2011 | MSC | EUR | (499) | (667 | ) | (5) | |||||||||
USD/GBP | 03/21/2011 | DUB | GBP | (2,289) | (3,567 | ) | 4 | |||||||||
USD/INR | 01/12/2011 | JPM | INR | (168,696) | (3,767 | ) | (78) | |||||||||
USD/JPY | 01/14/2011 | DUB | JPY | (1,518,250) | (18,702 | ) | (658) | |||||||||
USD/JPY | 01/24/2011 | JPM | JPY | (6,440,000) | (79,339 | ) | (543) | |||||||||
USD/JPY | 01/24/2011 | DUB | JPY | (6,670,000) | (82,172 | ) | (608) | |||||||||
USD/JPY | 03/14/2011 | CIT | JPY | (660,000) | (8,135 | ) | (227) | |||||||||
USD/KRW | 01/19/2011 | JPM | KRW | (11,629,523) | (10,238 | ) | (166) | |||||||||
USD/SGD | 01/14/2011 | JPM | SGD | (2,103) | (1,638 | ) | (38) | |||||||||
ZAR/USD | 01/28/2011 | JPM | ZAR | 37,406 | 5,657 | 226 | ||||||||||
ZAR/USD | 01/28/2011 | MSC | ZAR | 5,574 | 843 | 43 | ||||||||||
ZAR/USD | 01/28/2011 | JPM | ZAR | 5,578 | 844 | 44 | ||||||||||
ZAR/USD | 01/28/2011 | JPM | ZAR | 8,012 | 1,212 | 112 | ||||||||||
ZAR/USD | 04/28/2011 | JPM | ZAR | 6,970 | 1,041 | 41 | ||||||||||
ZAR/USD | 04/28/2011 | MSC | ZAR | 6,977 | 1,042 | 42 | ||||||||||
ZAR/USD | 09/13/2011 | MSC | ZAR | 2,280 | 337 | 37 | ||||||||||
ZAR/USD | 09/13/2011 | UBS | ZAR | 5,320 | 787 | 87 | ||||||||||
| $ | 18,389 | $ | 1,521 | |||||||||||||
JNL/T.Rowe Price Short-Term Bond Fund |
| |||||||||||||||
CNY/USD | 12/16/2011 | JPM | CNY | 55,585 | $ | 8,448 | $ | (88 | ) | |||||||
See accompanying Notes to the Financial Statements.
JNL Series Trust
Notes to Schedules of Investments (in thousands)
December 31, 2010
| Schedule of Interest Rate Swap Agreements | ||||||||||||||||||||
| Counterparty | Floating Rate Index | Paying/Receiving Floating Rate | Fixed Rate | Expiration Date | Notional Amount1 | Unrealized Appreciation / (Depreciation) | ||||||||||||||
| JNL/Goldman Sachs Core Plus Bond Fund | ||||||||||||||||||||
BBP | 6-Month EURIBOR | Paying | 4.26% | 04/23/2020 | EUR | 14,860 | $ | 48 | ||||||||||||
BBP | 6-Month EURIBOR | Paying | 4.27% | 05/12/2020 | EUR | 3,690 | 12 | |||||||||||||
BBP | 6-Month EURIBOR | Paying | 4.27% | 05/14/2020 | EUR | 6,280 | 21 | |||||||||||||
BBP | 6-Month EURIBOR | Receiving | 4.09% | 04/23/2040 | EUR | 4,450 | (185 | ) | ||||||||||||
BBP | 6-Month EURIBOR | Receiving | 3.94% | 05/12/2040 | EUR | 1,030 | (15 | ) | ||||||||||||
BBP | 6-Month EURIBOR | Receiving | 3.94% | 05/14/2040 | EUR | 1,880 | (26 | ) | ||||||||||||
BBP | British Pound 6-Month LIBOR | Receiving | 2.59% | 11/03/2015 | GBP | 5,130 | (12 | ) | ||||||||||||
BBP | British Pound 6-Month LIBOR | Paying | 3.49% | 11/03/2020 | GBP | 8,840 | 1 | |||||||||||||
BBP | British Pound 6-Month LIBOR | Receiving | 3.87% | 11/03/2025 | GBP | 4,450 | (22 | ) | ||||||||||||
BOA | 3-Month LIBOR | Receiving | 1.63% | 11/05/2014 | 46,700 | 851 | ||||||||||||||
BOA | 3-Month LIBOR | Receiving | 2.12% | 11/23/2014 | 40,400 | 398 | ||||||||||||||
BOA | 3-Month LIBOR | Paying | 2.75% | 11/05/2017 | 39,000 | (1,496 | ) | |||||||||||||
BOA | 3-Month LIBOR | Paying | 3.59% | 11/23/2019 | 36,100 | (845 | ) | |||||||||||||
BOA | 3-Month LIBOR | Receiving | 3.57% | 11/05/2022 | 10,700 | 591 | ||||||||||||||
BOA | 3-Month LIBOR | Receiving | 3.16% | 02/15/2026 | 8,600 | 697 | ||||||||||||||
BOA | 3-Month LIBOR | Receiving | 4.21% | 11/23/2027 | 13,000 | 355 | ||||||||||||||
BOA | 3-Month LIBOR | Receiving | 3.75% | 06/15/2041 | 4,900 | 381 | ||||||||||||||
CIT | 6-Month EURIBOR | Paying | 2.10% | 11/05/2015 | EUR | 6,250 | (154 | ) | ||||||||||||
CIT | 6-Month EURIBOR | Paying | 4.29% | 04/23/2020 | EUR | 14,850 | 70 | |||||||||||||
CIT | 6-Month EURIBOR | Paying | 4.35% | 05/14/2020 | EUR | 9,920 | 76 | |||||||||||||
CIT | 6-Month EURIBOR | Receiving | 4.12% | 04/23/2040 | EUR | 4,460 | (213 | ) | ||||||||||||
CIT | 6-Month EURIBOR | Receiving | 4.04% | 05/14/2040 | EUR | 2,920 | (100 | ) | ||||||||||||
CIT | British Pound 6-Month LIBOR | Paying | 1.75% | 06/15/2014 | GBP | 7,150 | 13 | |||||||||||||
CST | 3-Month LIBOR | Receiving | 4.25% | 12/17/2013 | 160 | (6 | ) | |||||||||||||
CST | 6-Month EURIBOR | Paying | 3.76% | 08/06/2020 | EUR | 4,050 | (99 | ) | ||||||||||||
CST | 6-Month EURIBOR | Receiving | 3.63% | 08/06/2040 | EUR | 1,100 | 44 | |||||||||||||
CST | British Pound 6-Month LIBOR | Paying | 1.50% | 06/15/2013 | GBP | 3,940 | 23 | |||||||||||||
CST | British Pound 6-Month LIBOR | Paying | 1.75% | 06/15/2014 | GBP | 5,680 | (17 | ) | ||||||||||||
DUB | 3-Month LIBOR | Receiving | 1.65% | 11/02/2014 | 94,600 | 1,681 | ||||||||||||||
DUB | 3-Month LIBOR | Receiving | 1.75% | 06/15/2016 | 23,000 | 585 | ||||||||||||||
DUB | 3-Month LIBOR | Paying | 2.75% | 11/02/2017 | 79,100 | (3,023 | ) | |||||||||||||
DUB | 3-Month LIBOR | Receiving | 2.25% | 06/15/2018 | 11,800 | (113 | ) | |||||||||||||
DUB | 3-Month LIBOR | Receiving | 2.51% | 10/15/2020 | 5,500 | 373 | ||||||||||||||
DUB | 3-Month LIBOR | Receiving | 2.75% | 06/15/2021 | 11,700 | (21 | ) | |||||||||||||
DUB | 3-Month LIBOR | Receiving | 2.75% | 06/15/2021 | 11,700 | (58 | ) | |||||||||||||
DUB | 3-Month LIBOR | Receiving | 2.75% | 06/15/2021 | 14,900 | (100 | ) | |||||||||||||
DUB | 3-Month LIBOR | Receiving | 2.75% | 06/15/2021 | 11,700 | 9 | ||||||||||||||
DUB | 3-Month LIBOR | Receiving | 3.54% | 11/02/2022 | 21,700 | 1,242 | ||||||||||||||
DUB | 3-Month LIBOR | Receiving | 3.09% | 02/15/2026 | 8,300 | 745 | ||||||||||||||
DUB | 3-Month LIBOR | Paying | 3.75% | 06/15/2041 | 4,500 | (94 | ) | |||||||||||||
DUB | 3-Month LIBOR | Receiving | 3.75% | 06/15/2041 | 10,000 | 689 | ||||||||||||||
DUB | 6-Month EURIBOR | Receiving | 2.25% | 06/15/2016 | EUR | 1,290 | 7 | |||||||||||||
DUB | Brazil Interbank Deposit Rate | Paying | 11.45% | 01/02/2012 | BRL | 22,510 | (51 | ) | ||||||||||||
DUB | Brazil Interbank Deposit Rate | Paying | 11.51% | 01/02/2012 | BRL | 56,000 | (110 | ) | ||||||||||||
DUB | KRW 3-month CD Rate | Paying | 2.82% | 01/28/2011 | KRW | 2,437,000 | — | |||||||||||||
DUB | KRW 3-month CD Rate | Paying | 3.87% | 06/12/2011 | KRW | 1,400,000 | 6 | |||||||||||||
DUB | KRW 3-month CD Rate | Paying | 3.69% | 06/26/2011 | KRW | 7,020,000 | 22 | |||||||||||||
DUB | KRW 3-month CD Rate | Paying | 3.62% | 07/06/2011 | KRW | 2,923,122 | 15 | |||||||||||||
DUB | KRW 3-month CD Rate | Paying | 3.63% | 07/07/2011 | KRW | 4,883,824 | 25 | |||||||||||||
JPM | 3-Month LIBOR | Paying | 3.75% | 06/15/2041 | 5,500 | (121 | ) | |||||||||||||
JPM | 6-Month EURIBOR | Paying | 3.65% | 08/07/2020 | EUR | 3,750 | (113 | ) | ||||||||||||
JPM | 6-Month EURIBOR | Paying | 3.53% | 08/10/2020 | EUR | 7,570 | (279 | ) | ||||||||||||
JPM | 6-Month EURIBOR | Receiving | 3.54% | 08/07/2040 | EUR | 1,030 | 58 | |||||||||||||
JPM | 6-Month EURIBOR | Receiving | 3.42% | 08/10/2040 | EUR | 2,070 | 165 | |||||||||||||
JPM | Brazil Interbank Deposit Rate | Paying | 12.26% | 01/02/2013 | BRL | 55,160 | 28 | |||||||||||||
JPM | Brazil Interbank Deposit Rate | Paying | 12.19% | 01/02/2013 | BRL | 12,240 | (1 | ) | ||||||||||||
JPM | British Pound 6-Month LIBOR | Paying | 1.75% | 06/15/2014 | GBP | 1,440 | (18 | ) | ||||||||||||
JPM | KRW 3-month CD Rate | Paying | 2.83% | 01/28/2011 | KRW | 2,369,000 | 1 | |||||||||||||
JPM | KRW 3-month CD Rate | Paying | 3.90% | 06/15/2011 | KRW | 2,300,000 | 10 | |||||||||||||
JPM | KRW 3-month CD Rate | Paying | 3.72% | 06/22/2011 | KRW | 6,700,000 | 23 | |||||||||||||
JPM | KRW 3-month CD Rate | Paying | 3.66% | 07/08/2011 | KRW | 2,322,820 | 12 | |||||||||||||
See accompanying Notes to the Financial Statements.
JNL Series Trust
Notes to Schedules of Investments (in thousands)
December 31, 2010
| Schedule of Interest Rate Swap Agreements | ||||||||||||||||||||||||||
| Counterparty | Floating Rate Index | Paying/Receiving Floating Rate | Fixed Rate | Expiration Date | Notional Amount1 | Unrealized Appreciation / (Depreciation) | ||||||||||||||||||||
| JNL/Goldman Sachs Core Plus Bond Fund (continued) | ||||||||||||||||||||||||||
RBC | 3-Month Canadian Bankers Acceptance Rate | Receiving | 2.14% | 11/03/2015 | CAD | 7,080 | $ | 124 | ||||||||||||||||||
RBC | 3-Month Canadian Bankers Acceptance Rate | Receiving | 2.11% | 11/04/2015 | CAD | 10,730 | 201 | |||||||||||||||||||
RBC | 6-Month EURIBOR | Paying | 2.12% | 11/08/2015 | EUR | 9,430 | (223 | ) | ||||||||||||||||||
RBS | British Pound 6-Month LIBOR | Paying | 1.50% | 06/15/2013 | GBP | 14,790 | 17 | |||||||||||||||||||
| $ | 2,104 | |||||||||||||||||||||||||
JNL/Goldman Sachs Emerging Markets Debt Fund |
| |||||||||||||||||||||||||
BOA | 3-Month South Africa Johannesburg Interbank Rate | Paying | 7.42% | 02/13/2012 | ZAR | 200,000 | $ | 657 | ||||||||||||||||||
BOA | 3-Month South Africa Johannesburg Interbank Rate | Paying | 7.02% | 04/09/2012 | ZAR | 100,000 | 292 | |||||||||||||||||||
DUB | 3-Month South Africa Johannesburg Interbank Rate | Paying | 7.36% | 02/01/2012 | ZAR | 195,300 | 625 | |||||||||||||||||||
CIT | 6-Month Poland Warsaw Interbank Rate | Paying | 4.60% | 06/28/2012 | PLN | 75,000 | 565 | |||||||||||||||||||
DUB | 6-Month Poland Warsaw Interbank Rate | Paying | 4.89% | 03/12/2012 | PLN | 56,649 | 605 | |||||||||||||||||||
DUB | 6-Month Poland Warsaw Interbank Rate | Paying | 4.75% | 03/22/2012 | PLN | 85,000 | 815 | |||||||||||||||||||
DUB | 6-Month Poland Warsaw Interbank Rate | Paying | 4.43% | 06/14/2012 | PLN | 29,000 | 191 | |||||||||||||||||||
DUB | 6-Month Poland Warsaw Interbank Rate | Paying | 4.41% | 06/14/2012 | PLN | 100,000 | 645 | |||||||||||||||||||
DUB | 6-Month Poland Warsaw Interbank Rate | Paying | 4.58% | 06/29/2012 | PLN | 79,810 | 590 | |||||||||||||||||||
DUB | 6-Month Poland Warsaw Interbank Rate | Paying | 4.66% | 09/28/2012 | PLN | 157,870 | (4 | ) | ||||||||||||||||||
CIT | 6-Month Sinacofi Chile Interbank Rate | Paying | 5.24% | 12/15/2014 | CLP | 3,000,000 | (11 | ) | ||||||||||||||||||
DUB | 6-Month Sinacofi Chile Interbank Rate | Paying | 2.65% | 03/19/2012 | CLP | 6,000,000 | (256 | ) | ||||||||||||||||||
DUB | 6-Month Sinacofi Chile Interbank Rate | Paying | 4.03% | 07/29/2012 | CLP | 12,050,000 | (17 | ) | ||||||||||||||||||
DUB | 6-Month Sinacofi Chile Interbank Rate | Paying | 4.19% | 08/20/2012 | CLP | 4,300,000 | (9 | ) | ||||||||||||||||||
DUB | 6-Month Sinacofi Chile Interbank Rate | Paying | 4.15% | 08/20/2012 | CLP | 2,900,000 | (12 | ) | ||||||||||||||||||
DUB | 6-Month Sinacofi Chile Interbank Rate | Paying | 4.12% | 09/04/2012 | CLP | 6,733,000 | (33 | ) | ||||||||||||||||||
DUB | 6-Month Sinacofi Chile Interbank Rate | Paying | 5.04% | 11/18/2014 | CLP | 1,780,000 | (26 | ) | ||||||||||||||||||
JPM | 6-Month Sinacofi Chile Interbank Rate | Paying | 4.95% | 04/20/2015 | CLP | 3,000,000 | (80 | ) | ||||||||||||||||||
BBP | Brazil Interbank Deposit Rate | Paying | 11.34% | 01/02/2012 | BRL | 230,610 | (599 | ) | ||||||||||||||||||
DUB | Brazil Interbank Deposit Rate | Paying | 11.77% | 01/02/2012 | BRL | 150,000 | 73 | |||||||||||||||||||
DUB | Brazil Interbank Deposit Rate | Paying | 11.52% | 01/02/2012 | BRL | 178,100 | (342 | ) | ||||||||||||||||||
DUB | Brazil Interbank Deposit Rate | Paying | 11.51% | 01/02/2012 | BRL | 18,000 | (36 | ) | ||||||||||||||||||
BOA | Mexican Interbank Rate | Paying | 7.48% | 12/17/2020 | MXN | 286,510 | 257 | |||||||||||||||||||
DUB | Mexican Interbank Rate | Paying | 7.56% | 12/04/2020 | MXN | 119,510 | 174 | |||||||||||||||||||
| $ | 4,064 | |||||||||||||||||||||||||
JNL/PIMCO Real Return Fund | ||||||||||||||||||||||||||
BCL | Brazil Interbank Deposit Rate | Paying | 10.68% | 01/02/2012 | BRL | 5,700 | $ | (1 | ) | |||||||||||||||||
HSB | Brazil Interbank Deposit Rate | Paying | 14.77% | 01/02/2012 | BRL | 300 | 17 | |||||||||||||||||||
JPM | Brazil Interbank Deposit Rate | Paying | 11.25% | 01/02/2012 | BRL | 6,000 | (17 | ) | ||||||||||||||||||
JPM | Brazil Interbank Deposit Rate | Paying | 12.17% | 01/02/2013 | BRL | 28,900 | 111 | |||||||||||||||||||
MLC | Brazil Interbank Deposit Rate | Paying | 12.54% | 01/02/2012 | BRL | 5,000 | 168 | |||||||||||||||||||
MLC | Brazil Interbank Deposit Rate | Paying | 12.54% | 01/02/2012 | BRL | 15,300 | 474 | |||||||||||||||||||
MLC | Brazil Interbank Deposit Rate | Paying | 14.77% | 01/02/2012 | BRL | 1,400 | 81 | |||||||||||||||||||
MSS | Brazil Interbank Deposit Rate | Paying | 11.63% | 01/02/2012 | BRL | 4,300 | 21 | |||||||||||||||||||
MSS | Brazil Interbank Deposit Rate | Paying | 11.60% | 01/02/2012 | BRL | 50,000 | 363 | |||||||||||||||||||
MSS | Brazil Interbank Deposit Rate | Paying | 11.98% | 01/02/2013 | BRL | 7,000 | 37 | |||||||||||||||||||
UBS | Brazil Interbank Deposit Rate | Paying | 12.07% | 01/02/2013 | BRL | 45,300 | 459 | |||||||||||||||||||
DUB | British Pound Retail Price Index | Paying | 3.45% | 09/15/2012 | GBP | 1,000 | (10 | ) | ||||||||||||||||||
| $ | 1,703 | |||||||||||||||||||||||||
JNL/PIMCO Total Return Bond Fund | ||||||||||||||||||||||||||
DUB | 3-Month Australian Bank Bill | Paying | 4.50% | 06/15/2011 | AUD | 20,700 | $ | (75 | ) | |||||||||||||||||
DUB | 3-Month Australian Bank Bill | Paying | 4.50% | 06/15/2011 | AUD | 1,800 | (9 | ) | ||||||||||||||||||
BOA | 3-Month LIBOR | Receiving | 4.25% | 06/15/2041 | 9,000 | (114 | ) | |||||||||||||||||||
MSS | 3-Month LIBOR | Receiving | 4.25% | 06/15/2041 | 6,100 | (21 | ) | |||||||||||||||||||
MSS | 3-Month LIBOR | Receiving | 4.25% | 06/15/2041 | 30,200 | (573 | ) | |||||||||||||||||||
MSS | 3-Month LIBOR | Receiving | 4.25% | 06/15/2041 | 12,700 | (168 | ) | |||||||||||||||||||
STA | 6-Month Australian Bank Bill | Paying | 4.25% | 09/15/2011 | AUD | 15,500 | (212 | ) | ||||||||||||||||||
BCL | Brazil Interbank Deposit Rate | Paying | 10.60% | 01/02/2012 | BRL | 1,500 | 3 | |||||||||||||||||||
CST | Brazil Interbank Deposit Rate | Paying | 12.48% | 01/02/2013 | BRL | 2,000 | 8 | |||||||||||||||||||
GSB | Brazil Interbank Deposit Rate | Paying | 10.84% | 01/02/2012 | BRL | 12,900 | 60 | |||||||||||||||||||
HSB | Brazil Interbank Deposit Rate | Paying | 10.61% | 01/02/2012 | BRL | 1,400 | 3 | |||||||||||||||||||
HSB | Brazil Interbank Deposit Rate | Paying | 14.77% | 01/02/2012 | BRL | 300 | 16 | |||||||||||||||||||
JPM | Brazil Interbank Deposit Rate | Paying | 12.07% | 01/02/2013 | BRL | 6,400 | (3 | ) | ||||||||||||||||||
See accompanying Notes to the Financial Statements.
JNL Series Trust
Notes to Schedules of Investments (in thousands)
December 31, 2010
| Schedule of Interest Rate Swap Agreements | ||||||||||||||||||||||||||
| Counterparty | Floating Rate Index | Paying/Receiving Floating Rate | Fixed Rate | Expiration Date | Notional Amount1 | Unrealized Appreciation / (Depreciation) | ||||||||||||||||||||
| JNL/PIMCO Total Return Bond Fund (continued) | ||||||||||||||||||||||||||
JPM | Brazil Interbank Deposit Rate | Paying | 12.17% | 01/02/2013 | BRL | 30,000 | $ | 113 | ||||||||||||||||||
JPM | Brazil Interbank Deposit Rate | Paying | 12.17% | 01/02/2013 | BRL | 49,800 | 198 | |||||||||||||||||||
JPM | Brazil Interbank Deposit Rate | Paying | 12.17% | 01/02/2013 | BRL | 2,000 | 8 | |||||||||||||||||||
JPM | Brazil Interbank Deposit Rate | Paying | 12.07% | 01/02/2013 | BRL | 10,800 | 2 | |||||||||||||||||||
JPM | Brazil Interbank Deposit Rate | Paying | 12.20% | 01/02/2014 | BRL | 9,900 | 84 | |||||||||||||||||||
JPM | Brazil Interbank Deposit Rate | Paying | 12.20% | 01/02/2014 | BRL | 6,700 | 59 | |||||||||||||||||||
MLC | Brazil Interbank Deposit Rate | Paying | 11.98% | 01/02/2012 | BRL | 4,700 | 92 | |||||||||||||||||||
MLC | Brazil Interbank Deposit Rate | Paying | 12.54% | 01/02/2012 | BRL | 6,600 | 236 | |||||||||||||||||||
MLC | Brazil Interbank Deposit Rate | Paying | 14.77% | 01/02/2012 | BRL | 500 | 29 | |||||||||||||||||||
MLC | Brazil Interbank Deposit Rate | Paying | 14.77% | 01/02/2012 | BRL | 200 | 11 | |||||||||||||||||||
MLC | Brazil Interbank Deposit Rate | Paying | 11.14% | 01/02/2012 | BRL | 73,100 | 645 | |||||||||||||||||||
MLC | Brazil Interbank Deposit Rate | Paying | 10.99% | 01/02/2012 | BRL | 2,000 | 8 | |||||||||||||||||||
MLC | Brazil Interbank Deposit Rate | Paying | 10.99% | 01/02/2012 | BRL | 4,600 | 21 | |||||||||||||||||||
MLC | Brazil Interbank Deposit Rate | Paying | 10.99% | 01/02/2012 | BRL | 15,000 | 61 | |||||||||||||||||||
MLC | Brazil Interbank Deposit Rate | Paying | 14.77% | 01/02/2012 | BRL | 300 | 16 | |||||||||||||||||||
MLC | Brazil Interbank Deposit Rate | Paying | 11.90% | 01/02/2013 | BRL | 2,700 | (1 | ) | ||||||||||||||||||
MLC | Brazil Interbank Deposit Rate | Paying | 11.90% | 01/02/2013 | BRL | 19,800 | 120 | |||||||||||||||||||
MLC | Brazil Interbank Deposit Rate | Paying | 11.90% | 01/02/2013 | BRL | 6,000 | 22 | |||||||||||||||||||
MLC | Brazil Interbank Deposit Rate | Paying | 11.90% | 01/02/2013 | BRL | 10,400 | 17 | |||||||||||||||||||
MLC | Brazil Interbank Deposit Rate | Paying | 11.90% | 01/02/2013 | BRL | 19,900 | 8 | |||||||||||||||||||
MSS | Brazil Interbank Deposit Rate | Paying | 11.63% | 01/02/2012 | BRL | 3,700 | 15 | |||||||||||||||||||
MSS | Brazil Interbank Deposit Rate | Paying | 11.63% | 01/02/2012 | BRL | 27,600 | 106 | |||||||||||||||||||
MSS | Brazil Interbank Deposit Rate | Paying | 11.63% | 01/02/2012 | BRL | 38,000 | 135 | |||||||||||||||||||
MSS | Brazil Interbank Deposit Rate | Paying | 11.98% | 01/02/2013 | BRL | 10,100 | 37 | |||||||||||||||||||
MSS | Brazil Interbank Deposit Rate | Paying | 12.59% | 01/02/2013 | BRL | 86,800 | 762 | |||||||||||||||||||
MSS | Brazil Interbank Deposit Rate | Paying | 12.59% | 01/02/2013 | BRL | 22,600 | 110 | |||||||||||||||||||
MSS | Brazil Interbank Deposit Rate | Paying | 11.89% | 01/02/2014 | BRL | 6,300 | 3 | |||||||||||||||||||
MSS | Brazil Interbank Deposit Rate | Paying | 11.89% | 01/02/2014 | BRL | 10,500 | 7 | |||||||||||||||||||
UBS | Brazil Interbank Deposit Rate | Paying | 10.58% | 01/02/2012 | BRL | 3,500 | 22 | |||||||||||||||||||
UBS | Brazil Interbank Deposit Rate | Paying | 10.58% | 01/02/2012 | BRL | 1,900 | 12 | |||||||||||||||||||
JPM | Mexican Interbank Rate | Paying | 7.33% | 01/28/2015 | MXN | 73,400 | 221 | |||||||||||||||||||
| $ | 2,094 | |||||||||||||||||||||||||
1Notional amount is stated in USD unless otherwise noted.
See accompanying Notes to the Financial Statements.
JNL Series Trust
Notes to Schedules of Investments (in thousands)
December 31, 2010
Schedule of Credit Default Swap Agreements
| Counterparty | Reference Obligation | Implied Credit Spread 4 | Fixed Received / Pay Rate 6 | Expiration Date | Notional Amount 1, 5 | Value | Unrealized Appreciation / (Depreciation) | |||||||||||||||||||
JNL/Goldman Sachs Core Plus Bond Fund |
| |||||||||||||||||||||||||
Credit default swap agreements - sell protection2 |
| |||||||||||||||||||||||||
DUB | CDX.NA.HY.15 | 4.30 | % | 5.00% | 12/20/2015 | $ | (12,000 | ) | $ | 353 | $ | 25 | ||||||||||||||
JPM | CDX.NA.HY.15 | 4.30 | % | 5.00% | 12/20/2015 | (12,000 | ) | 353 | 7 | |||||||||||||||||
DUB | Metlife Inc., 5.00%, 06/15/2015 | 1.44 | % | 1.00% | 03/20/2015 | (2,000 | ) | (35 | ) | 41 | ||||||||||||||||
DUB | Metlife Inc., 5.00%, 06/15/2015 | 1.56 | % | 1.00% | 09/20/2015 | (1,000 | ) | (24 | ) | 35 | ||||||||||||||||
JPM | Prudential Financial Inc., 4.50%, 07/15/2013 | 1.29 | % | 1.00% | 06/20/2015 | (825 | ) | (10 | ) | 41 | ||||||||||||||||
| $ | (27,825 | ) | $ | 637 | $ | 149 | ||||||||||||||||||||
JNL/PIMCO Real Return Fund |
| |||||||||||||||||||||||||
Credit default swap agreements - sell protection2 |
| |||||||||||||||||||||||||
DUB | American International Group Inc., 6.25%, 05/01/2036 | 1.28 | % | 5.00% | 12/20/2013 | $ | (8,300 | ) | $ | 895 | $ | 1,572 | ||||||||||||||
DUB | CDX.EM-14 | 2.00 | % | 5.00% | 12/20/2015 | (3,800 | ) | 519 | (41 | ) | ||||||||||||||||
MSS | CDX.EM-14 | 2.00 | % | 5.00% | 12/20/2015 | (27,700 | ) | 3,779 | (154 | ) | ||||||||||||||||
STA | CDX.EM-14 | 2.00 | % | 5.00% | 12/20/2015 | (2,800 | ) | 382 | (15 | ) | ||||||||||||||||
BNP | CDX.NA.IG.15 | 0.85 | % | 1.00% | 12/20/2015 | (5,900 | ) | 41 | (9 | ) | ||||||||||||||||
DUB | Federated Republic of Brazil, 12.25%, 03/06/2030 | 1.40 | % | 1.00% | 06/20/2020 | (4,200 | ) | (135 | ) | 3 | ||||||||||||||||
JPM | Federated Republic of Brazil, 12.25%, 03/06/2030 | 1.40 | % | 1.00% | 06/20/2015 | (1,600 | ) | (2 | ) | 15 | ||||||||||||||||
BOA | French Republic, 4.25%, 04/25/2019 | 1.00 | % | 0.25% | 06/20/2015 | (2,800 | ) | (90 | ) | (37 | ) | |||||||||||||||
BOA | French Republic, 4.25%, 04/25/2019 | 1.06 | % | 0.25% | 12/20/2015 | (2,800 | ) | (107 | ) | (50 | ) | |||||||||||||||
BOA | French Republic, 4.25%, 04/25/2019 | 1.06 | % | 0.25% | 12/20/2015 | (3,900 | ) | (149 | ) | (42 | ) | |||||||||||||||
CIT | French Republic, 4.25%, 04/25/2019 | 1.06 | % | 0.25% | 12/20/2015 | (1,800 | ) | (69 | ) | (19 | ) | |||||||||||||||
DUB | French Republic, 4.25%, 04/25/2019 | 1.00 | % | 0.25% | 06/20/2015 | (1,100 | ) | (35 | ) | — | ||||||||||||||||
JPM | French Republic, 4.25%, 04/25/2019 | 1.00 | % | 0.25% | 06/20/2015 | (1,700 | ) | (55 | ) | 4 | ||||||||||||||||
JPM | French Republic, 4.25%, 04/25/2019 | 1.06 | % | 0.25% | 12/20/2015 | (1,100 | ) | (42 | ) | (20 | ) | |||||||||||||||
DUB | ING N.V., 4.00%, 09/18/2013 | 1.67 | % | 1.40% | 06/20/2011 | (2,700 | ) | (5 | ) | (3 | ) | |||||||||||||||
BOA | Japanese Government Bond, 2.00%, 03/21/2022 | 0.69 | % | 1.00% | 12/20/2015 | (4,800 | ) | 71 | (40 | ) | ||||||||||||||||
BOA | Japanese Government Bond, 2.00%, 03/21/2022 | 0.69 | % | 1.00% | 12/20/2015 | (1,600 | ) | 24 | (10 | ) | ||||||||||||||||
DUB | Japanese Government Bond, 2.00%, 03/21/2022 | 0.69 | % | 1.00% | 12/20/2015 | (1,700 | ) | 25 | (10 | ) | ||||||||||||||||
JPM | Japanese Government Bond, 2.00%, 03/21/2022 | 0.69 | % | 1.00% | 12/20/2015 | (1,600 | ) | 24 | (9 | ) | ||||||||||||||||
DUB | Petrobras International Finance Co., 8.38%, 12/10/2018 | 1.16 | % | 1.00% | 09/20/2012 | (500 | ) | (1 | ) | 5 | ||||||||||||||||
BOA | Republic of Italy, 6.88%, 09/27/2023 | 1.56 | % | 1.00% | 06/20/2011 | (300 | ) | (1 | ) | 3 | ||||||||||||||||
DUB | Republic of Italy, 6.88%, 09/27/2023 | 2.34 | % | 1.00% | 06/20/2015 | (400 | ) | (22 | ) | (13 | ) | |||||||||||||||
DUB | Republic of Italy, 6.88%, 09/27/2023 | 2.37 | % | 1.00% | 12/20/2015 | (4,000 | ) | (244 | ) | (106 | ) | |||||||||||||||
BOA | UK Gilt Treasury Bond, 4.25%, 06/07/2032 | 0.67 | % | 1.00% | 06/20/2015 | (2,900 | ) | 42 | 5 | |||||||||||||||||
CST | UK Gilt Treasury Bond, 4.25%, 06/07/2032 | 0.71 | % | 1.00% | 12/20/2015 | (4,500 | ) | 61 | (47 | ) | ||||||||||||||||
DUB | UK Gilt Treasury Bond, 4.25%, 06/07/2032 | 0.67 | % | 1.00% | 06/20/2015 | (2,700 | ) | 39 | 13 | |||||||||||||||||
DUB | UK Gilt Treasury Bond, 4.25%, 06/07/2032 | 0.67 | % | 1.00% | 06/20/2015 | (1,100 | ) | 16 | 10 | |||||||||||||||||
DUB | UK Gilt Treasury Bond, 4.25%, 06/07/2032 | 0.71 | % | 1.00% | 12/20/2015 | (1,700 | ) | 23 | (17 | ) | ||||||||||||||||
| $ | (100,000 | ) | $ | 4,984 | $ | 988 | ||||||||||||||||||||
Credit default swap agreements - purchase protection3 |
| |||||||||||||||||||||||||
CIT | GATX Corp., 5.80%, 03/01/2016 | n/a | 1.07% | 03/20/2016 | $ | 1,000 | $ | 22 | $ | 22 | ||||||||||||||||
BNP | International Lease Finance Corporation, 6.63%, 11/15/2013 | n/a | 1.60% | 12/20/2013 | 500 | 11 | 10 | |||||||||||||||||||
DUB | Knight, Inc., 6.50%, 09/01/2012 | n/a | 1.00% | 03/20/2016 | 2,000 | 79 | (10 | ) | ||||||||||||||||||
MSC | Knight, Inc., 6.50%, 09/01/2012 | n/a | 1.00% | 03/20/2016 | 3,000 | 119 | (19 | ) | ||||||||||||||||||
DUB | Macy’s Corp., 7.45%, 07/15/2017 | n/a | 2.10% | 09/20/2017 | 1,000 | (36 | ) | (37 | ) | |||||||||||||||||
DUB | Marsh & McLennan Companies, Inc., 5.75%, 09/15/2015 | n/a | 0.60% | 09/20/2015 | 1,000 | 29 | 27 | |||||||||||||||||||
JPM | Pearson, 5.70%, 06/01/2014 | n/a | 0.83% | 06/20/2014 | 1,000 | (12 | ) | (12 | ) | |||||||||||||||||
BCL | REXAM PLC, 6.75%, 06/01/2013 | n/a | 1.45% | 06/20/2013 | 700 | (16 | ) | (16 | ) | |||||||||||||||||
DUB | Seagate Technology HDD Holdings, 6.80%, 10/01/2016 | n/a | 1.00% | 12/20/2011 | 5,000 | (25 | ) | (86 | ) | |||||||||||||||||
| $ | 15,200 | $ | 171 | $ | (121 | ) | ||||||||||||||||||||
JNL/PIMCO Total Return Bond Fund |
| |||||||||||||||||||||||||
Credit default swap agreements - sell protection2 |
| |||||||||||||||||||||||||
DUB | CDX.EM-12 | 1.88 | % | 5.00% | 12/20/2014 | $ | (1,500 | ) | $ | 175 | $ | 12 | ||||||||||||||
DUB | CDX.EM-13 | 1.95 | % | 5.00% | 06/20/2015 | (12,500 | ) | 1,580 | (86 | ) | ||||||||||||||||
MSS | CDX.EM.13 | 1.95 | % | 5.00% | 06/20/2015 | (4,100 | ) | 518 | 36 | |||||||||||||||||
BOA | CDX.EM.14 | 2.00 | % | 5.00% | 12/20/2015 | (5,000 | ) | 682 | (49 | ) | ||||||||||||||||
CIT | CDX.EM.14 | 2.00 | % | 5.00% | 12/20/2015 | (3,000 | ) | 409 | (5 | ) | ||||||||||||||||
DUB | CDX.EM.14 | 2.00 | % | 5.00% | 12/20/2015 | (7,900 | ) | 1,078 | 77 | |||||||||||||||||
JPM | CDX.EM.14 | 2.00 | % | 5.00% | 12/20/2015 | (1,700 | ) | 232 | 8 | |||||||||||||||||
MSS | CDX.EM.14 | 2.00 | % | 5.00% | 12/20/2015 | (3,300 | ) | 450 | 33 | |||||||||||||||||
See accompanying Notes to the Financial Statements.
JNL Series Trust
Notes to Schedules of Investments (in thousands)
December 31, 2010
Schedule of Credit Default Swap Agreements
| Counterparty | Reference Obligation | Implied Credit Spread4 | Fixed Received / Pay Rate6 | Expiration Date | Notional Amount1,5 | Value | Unrealized Appreciation / (Depreciation) | |||||||||||||||||||
JNL/PIMCO Total Return Bond Fund (continued) |
| |||||||||||||||||||||||||
Credit default swap agreements - sell protection2 (continued) |
| |||||||||||||||||||||||||
STA | CDX.EM.14 | 2.00 | % | 5.00% | 12/20/2015 | $ | (2,000 | ) | $ | 273 | $ | (6 | ) | |||||||||||||
CIT | CDX.HY-8 35-100% | 0.07 | % | 0.40% | 06/20/2012 | (963 | ) | 5 | 5 | |||||||||||||||||
CIT | CDX.HY-8 35-100% | 0.07 | % | 0.36% | 06/20/2012 | (4,815 | ) | 20 | 21 | |||||||||||||||||
DUB | CDX.HY.15 | 4.30 | % | 5.00% | 12/20/2015 | (26,500 | ) | 780 | 426 | |||||||||||||||||
MSS | CDX.HY.15 | 4.30 | % | 5.00% | 12/20/2015 | (5,800 | ) | 171 | 213 | |||||||||||||||||
STA | CDX.HY.15 | 4.30 | % | 5.00% | 12/20/2015 | (3,200 | ) | 94 | 124 | |||||||||||||||||
DUB | CDX.IG-10 30-100% | 0.16 | % | 0.53% | 06/20/2013 | (1,350 | ) | 12 | 12 | |||||||||||||||||
GSI | CDX.IG-10 30-100% | 0.16 | % | 0.46% | 06/20/2013 | (1,736 | ) | 13 | 13 | |||||||||||||||||
DUB | CDX.IG-9 30-100% | 0.10 | % | 0.71% | 12/20/2012 | (7,137 | ) | 86 | 88 | |||||||||||||||||
GSI | CDX.IG-9 30-100% | 0.38 | % | 0.55% | 12/20/2017 | (1,447 | ) | 16 | 16 | |||||||||||||||||
BNP | CDX.IG.15 | 0.85 | % | 1.00% | 12/20/2015 | (6,500 | ) | 45 | 41 | |||||||||||||||||
JPM | CDX.IG.15 | 0.85 | % | 1.00% | 12/20/2015 | (20,300 | ) | 141 | 98 | |||||||||||||||||
MSS | CDX.IG.15 | 0.85 | % | 1.00% | 12/20/2015 | (4,800 | ) | 33 | 25 | |||||||||||||||||
CIT | CDX.NA.HY.15 | 4.30 | % | 5.00% | 12/20/2015 | (600 | ) | 18 | 20 | |||||||||||||||||
CIT | CDX.NA.HY.15 | 4.30 | % | 5.00% | 12/20/2015 | (4,600 | ) | 135 | 240 | |||||||||||||||||
JPM | CDX.NA.HY.15 | 4.30 | % | 5.00% | 12/20/2015 | (16,400 | ) | 483 | 348 | |||||||||||||||||
BOA | CDX.NA.IG.15 | 0.85 | % | 1.00% | 12/20/2015 | (70,100 | ) | 488 | 525 | |||||||||||||||||
CIT | CDX.NA.IG.15 | 0.85 | % | 1.00% | 12/20/2015 | (14,900 | ) | 104 | 141 | |||||||||||||||||
DUB | CDX.NA.IG.15 | 0.85 | % | 1.00% | 12/20/2015 | (21,500 | ) | 150 | 212 | |||||||||||||||||
STA | CDX.NA.IG.15 | 0.85 | % | 1.00% | 12/20/2015 | (9,200 | ) | 64 | (4 | ) | ||||||||||||||||
DUB | Federated Republic of Brazil, 12.25%, 03/06/2030 | 1.03 | % | 1.00% | 06/20/2015 | (500 | ) | (1 | ) | 4 | ||||||||||||||||
DUB | Federated Republic of Brazil, 12.25%, 03/06/2030 | 1.03 | % | 1.00% | 06/20/2015 | (2,000 | ) | (3 | ) | 18 | ||||||||||||||||
JPM | Federated Republic of Brazil, 12.25%, 03/06/2030 | 1.06 | % | 1.00% | 09/20/2015 | (2,000 | ) | (5 | ) | 12 | ||||||||||||||||
MLI | Federated Republic of Brazil, 12.25%, 03/06/2030 | 1.12 | % | 1.95% | 04/20/2016 | (100 | ) | 4 | 5 | |||||||||||||||||
MSC | Federated Republic of Brazil, 12.25%, 03/06/2030 | 1.03 | % | 1.00% | 06/20/2015 | (600 | ) | (1 | ) | 5 | ||||||||||||||||
STA | Federated Republic of Brazil, 12.25%, 03/06/2030 | 1.06 | % | 1.00% | 09/20/2015 | (1,000 | ) | (3 | ) | 5 | ||||||||||||||||
STA | French Republic, 4.25%, 04/25/2019 | 1.06 | % | 0.25% | 12/20/2015 | (2,400 | ) | (91 | ) | (43 | ) | |||||||||||||||
BNP | General Electric Capital Corp., 6.00%, 06/15/2012 | 0.52 | % | 0.78% | 03/20/2011 | (700 | ) | — | 1 | |||||||||||||||||
BOA | General Electric Capital Corp., 5.63%, 09/15/2017 | 1.33 | % | 1.00% | 12/20/2015 | (2,400 | ) | (37 | ) | 7 | ||||||||||||||||
BOA | General Electric Capital Corp., 5.63%, 09/15/2017 | 1.33 | % | 1.00% | 12/20/2015 | (2,400 | ) | (37 | ) | 6 | ||||||||||||||||
CIT | General Electric Capital Corp., 5.63%, 09/15/2017 | 0.52 | % | 5.00% | 06/20/2011 | (1,000 | ) | 21 | 53 | |||||||||||||||||
CIT | General Electric Capital Corp., 5.63%, 09/15/2017 | 1.06 | % | 4.33% | 12/20/2013 | (800 | ) | 76 | 77 | |||||||||||||||||
CIT | General Electric Capital Corp., 5.63%, 09/15/2017 | 1.06 | % | 4.80% | 12/20/2013 | (600 | ) | 65 | 66 | |||||||||||||||||
DUB | General Electric Capital Corp., 5.63%, 09/15/2017 | 0.52 | % | 1.00% | 03/20/2011 | (2,000 | ) | 2 | 14 | |||||||||||||||||
DUB | General Electric Capital Corp., 6.00%, 06/15/2012 | 0.52 | % | 0.80% | 06/20/2011 | (3,700 | ) | 5 | 6 | |||||||||||||||||
DUB | General Electric Capital Corp., 6.00%, 06/15/2012 | 0.52 | % | 1.50% | 09/20/2011 | (300 | ) | 2 | 2 | |||||||||||||||||
DUB | General Electric Capital Corp., 5.63%, 09/15/2017 | 1.06 | % | 4.90% | 12/20/2013 | (1,100 | ) | 123 | 125 | |||||||||||||||||
DUB | General Electric Capital Corp., 5.63%, 09/15/2017 | 1.36 | % | 1.00% | 03/20/2016 | (100 | ) | (2 | ) | 4 | ||||||||||||||||
GSI | General Electric Capital Corp., 5.63%, 09/15/2017 | 0.52 | % | 8.00% | 03/20/2011 | (1,000 | ) | 16 | 19 | |||||||||||||||||
MSC | General Electric Capital Corp., 5.63%, 09/15/2017 | 0.52 | % | 1.00% | 09/20/2011 | (1,300 | ) | 5 | 22 | |||||||||||||||||
DUB | Japan 20 Year Government Bond, 2.00%, 03/21/2022 | 0.59 | % | 1.00% | 03/20/2015 | (500 | ) | 8 | 2 | |||||||||||||||||
JPM | Japan 20 Year Government Bond, 2.00%, 03/21/2022 | 0.59 | % | 1.00% | 03/20/2015 | (900 | ) | 15 | 3 | |||||||||||||||||
BNP | Merrill Lynch & Co., 5.00%, 01/15/2015 | 0.82 | % | 1.00% | 09/20/2011 | (1,900 | ) | 3 | 4 | |||||||||||||||||
BOA | People’s Republic of China, 4.75%, 10/29/2013 | 0.61 | % | 1.00% | 06/20/2015 | (2,800 | ) | 48 | (1 | ) | ||||||||||||||||
BOA | People’s Republic of China, 4.75%, 10/29/2013 | 0.61 | % | 1.00% | 06/20/2015 | (1,000 | ) | 17 | (1 | ) | ||||||||||||||||
DUB | Republic of Indonesia, 6.75%, 03/10/2014 | 1.22 | % | 1.00% | 09/20/2015 | (500 | ) | (5 | ) | 6 | ||||||||||||||||
MSC | Republic of Panama, 8.88%, 09/30/2027 | 0.53 | % | 0.75% | 01/20/2012 | (200 | ) | 1 | 1 | |||||||||||||||||
STA | U.S. Treasury Bond, 4.88%, 08/15/2016 | 0.38 | % | 0.25% | 09/20/2015 | (11,100 | ) | (90 | ) | 72 | ||||||||||||||||
DUB | UK Gilt Treasury Bond, 4.25%, 06/07/2032 | 0.62 | % | 1.00% | 12/20/2014 | (700 | ) | 10 | 4 | |||||||||||||||||
DUB | UK Gilt Treasury Bond, 4.25%, 06/07/2032 | 0.67 | % | 1.00% | 06/20/2015 | (4,900 | ) | 71 | 11 | |||||||||||||||||
JPM | UK Gilt Treasury Bond, 4.25%, 06/07/2032 | 0.62 | % | 1.00% | 12/20/2014 | (200 | ) | 3 | 2 | |||||||||||||||||
JPM | UK Gilt Treasury Bond, 4.25%, 06/07/2032 | 0.64 | % | 1.00% | 03/20/2015 | (2,700 | ) | 40 | 24 | |||||||||||||||||
JPM | UK Gilt Treasury Bond, 4.25%, 06/07/2032 | 0.64 | % | 1.00% | 03/20/2015 | (1,300 | ) | 19 | 11 | |||||||||||||||||
JPM | UK Gilt Treasury Bond, 4.25%, 06/07/2032 | 0.67 | % | 1.00% | 06/20/2015 | (7,900 | ) | 114 | 18 | |||||||||||||||||
JPM | UK Gilt Treasury Bond, 4.25%, 06/07/2032 | 0.71 | % | 1.00% | 12/20/2015 | (1,000 | ) | 14 | (10 | ) | ||||||||||||||||
MSC | UK Gilt Treasury Bond, 4.25%, 06/07/2032 | 0.62 | % | 1.00% | 12/20/2014 | (300 | ) | 5 | 2 | |||||||||||||||||
MSC | UK Gilt Treasury Bond, 4.25%, 06/07/2032 | 0.67 | % | 1.00% | 06/20/2015 | (4,900 | ) | 71 | 11 | |||||||||||||||||
BOA | United Mexican States, 7.50%, 04/08/2033 | 1.08 | % | 1.00% | 09/20/2015 | (300 | ) | (1 | ) | 3 | ||||||||||||||||
CIT | United Mexican States, 7.50%, 04/08/2033 | 1.08 | % | 1.00% | 09/20/2015 | (700 | ) | (2 | ) | 7 | ||||||||||||||||
DUB | United Mexican States, 7.50%, 04/08/2033 | 1.02 | % | 1.00% | 03/20/2015 | (3,600 | ) | (2 | ) | 77 | ||||||||||||||||
See accompanying Notes to the Financial Statements.
JNL Series Trust
Notes to Schedules of Investments (in thousands)
December 31, 2010
Schedule of Credit Default Swap Agreements
| Counterparty | Reference Obligation | Implied Credit Spread4 | Fixed Received/ Pay Rate6 | Expiration Date | Notional Amount1,5 | Value | Unrealized Appreciation / (Depreciation) | |||||||||||||||||||
JNL/PIMCO Total Return Bond Fund (continued) |
| |||||||||||||||||||||||||
Credit default swap agreements - sell protection 2 (continued) |
| |||||||||||||||||||||||||
JPM | United Mexican States, 7.50%, 04/08/2033 | 1.13 | % | 0.92 | % | 03/20/2016 | $ | (500 | ) | $ | (5 | ) | $ | (4 | ) | |||||||||||
| $ | (336,748 | ) | $ | 8,728 | $ | 3,234 | ||||||||||||||||||||
1Notional amount is stated in USD unless otherwise noted.
2If the Fund is a seller of protection and a credit event occurs, as defined under the terms of that particular swap agreement, the Fund will either (i) pay the buyer of protection an amount equal to the notional amount of the referenced obligation and take delivery of the referenced obligation or underlying securities comprising the referenced index or (ii) pay a net settlement amount in the form of cash or securities equal to the notional amount of the swap agreement less the recovery value of the reference obligation or underlying securities comprising the referenced index.
3If the Fund is a buyer of protection and a credit event occurs, as defined under the terms of that particular swap agreement, the Fund will either (i) receive from the seller of protection an amount equal to the notional amount of the referenced obligation agreement and deliver the referenced obligation or underlying securities comprising the referenced index or (ii) receive a net settlement amount in the form of cash or securities equal to the notional amount of the swap agreement less the recovery value of the referenced obligation or underlying securities comprising the referenced index.
4Implied credit spreads, represented in absolute terms, utilized in determining the value of credit default swap agreements on corporate issues, sovereign issues of an emerging market country, credit indices or U.S. municipal issues serve as an indicator of the current status of the payment/performance risk and represent the likelihood or risk of default for the credit derivative. The implied credit spread of a particular referenced entity reflects the cost of buying/selling protection and may include upfront payments required to be made to enter into the agreement. Wider credit spreads represent a deterioration of the referenced entity’s credit soundness and a greater likelihood or risk of default or other credit event occurring as defined under the terms of the agreement.
5The maximum potential amount the Fund could be required to pay as a seller of credit protection or receive as a buyer of credit protection if a credit event occurs is limited to the total notional amount which is defined under the terms of each swap agreement.
6If the Fund is a buyer of protection, the Fund pays the fixed rate. If the Fund is a seller of protection, the Fund receives the fixed rate.
See accompanying Notes to the Financial Statements.
JNL Series Trust
Notes to Schedules of Investments (in thousands)
December 31, 2010
Schedule of Total Return Swap Agreements
| Counterparty | Reference Entity | Paying/ Receiving Reference Entity Total Return | Expiration Date | Notional Amount1 | Unrealized Appreciation / (Depreciation) | |||||||||||||||||
JNL/Goldman Sachs Emerging Markets Debt Fund |
| |||||||||||||||||||||
CGM | * Egyptian T-Bill, 0.00%, 02/08/2011 | N/A | 02/10/2011 | EGP | 31,000 | $ | (24 | ) | ||||||||||||||
DUB | * Egyptian T-Bill, 0.00%, 02/01/2011 | N/A | 02/01/2011 | EGP | 73,000 | 285 | ||||||||||||||||
| $ | 261 | |||||||||||||||||||||
JNL/Ivy Asset Strategy Fund |
| |||||||||||||||||||||
GSC | * Brazil Bovespa Index February 2011 Future | N/A | 02/17/2011 | BRL | — | $ | (4 | ) | ||||||||||||||
GSC | * Brazil Bovespa Index February 2011 Future | N/A | 02/17/2011 | BRL | — | (37 | ) | |||||||||||||||
GSC | * Brazil Bovespa Index February 2011 Future | N/A | 02/17/2011 | BRL | — | 4 | ||||||||||||||||
MSC | * Brazil Bovespa Index February 2011 Future | N/A | 02/17/2011 | BRL | — | 11 | ||||||||||||||||
| $ | (26 | ) | ||||||||||||||||||||
1Notional amount is stated in USD unless otherwise noted.
* Swap agreement fair valued in good faith in accordance with procedures established by the Board. Fair valued securities may be classified as Level 2 or Level 3 for FASB ASC Topic 820 disclosures based on the applicable valuation inputs. See FASB ASC Topic 820 note in these Notes to the Schedule of Investments.
Counterparty
| Abbreviations
| |
BANCAMERICA SECURITIES/BANK OF AMERICA NA | BOA | |
BARCLAYS CAPITAL INC. | BCL | |
BARCLAYS BANK PLC | BBP | |
BNP PARIBAS SECURITIES | BNP | |
BNY CAPITAL MARKETS | BNY | |
CITIBANK, INC. | CIT | |
CITICORP SECURITIES, INC. | CCI | |
CITIGROUP GLOBAL MARKETS(FRMRLY SALOMON) | CGM | |
CREDIT SUISSE INTERNATIONAL | CST | |
CREDIT SUISSE SECURITIES, LLC | CSI | |
DEUTSCHE BANK ALEX BROWN INC. | DUB | |
GOLDMAN SACHS & CO. | GSC | |
GOLDMAN SACHS BANK USA | GSB | |
GOLDMAN SACHS INTERNATIONAL | GSI | |
HSBC SECURITIES, INC. | HSB | |
J.P. MORGAN | JPM | |
J.P. MORGAN SECURITIES, INC. | JPM | |
MERRILL LYNCH CAPITAL SERVICES | MLC | |
MERRILL LYNCH INTERNATIONAL | MLI | |
MERRILL LYNCH PROFESSIONAL CLEARING CORP | MLP | |
MERRILL LYNCH, PIERCE, FENNER, & SMITH | MLP | |
MORGAN STANLEY & CO., INCORPORATED | MSC | |
MORGAN STANLEY CAPITAL SERVICES INC. | MSS | |
NOMURA SECURITIES INTERNATIONAL, INC. | NSI | |
ROYAL BANK OF CANADA | RBC | |
ROYAL BANK OF SCOTLAND | RBS | |
STATE STREET BROKERAGE SERVICES, INC. | SSB | |
UBS SECURITIES LLC | UBS | |
UBS AG STAMFORD | STA | |
WESTPAC BANKING CORPORATION | WBC |
See accompanying Notes to the Financial Statements.
JNL Series Trust
Notes to Schedules of Investments (in thousands)
December 31, 2010
Pledged or Segregated Collateral – The following table summarizes cash and securities collateral pledged for futures contracts and reverse repurchase agreements or segregated for securities sold short, swap agreements and delayed delivery securities:
| Futures Contracts | Reverse Repurchase | Securities Sold Short | Swap Agreements | Delayed Delivery | Total Pledged or Segregated | |||||||||||||||||||||||||||
| Pledged Cash | Pledged Securities | Segregated Securities | Segregated Securities | Segregated or Pledged Cash | Segregated Securities | Segregated Securities | Cash and Securities | |||||||||||||||||||||||||
JNL/Goldman Sachs Core Plus Bond Fund | $ | - | $ | 3,935 | $ | - | $ | - | $ | 1,174 | $ | - | $ | - | $ | 5,109 | ||||||||||||||||
JNL/Goldman Sachs Emerging Markets Debt Fund | - | - | - | - | 750 | - | - | 750 | ||||||||||||||||||||||||
JNL/Goldman Sachs U.S. Equity Flex Fund | - | - | - | 107,241 | - | - | - | 107,241 | ||||||||||||||||||||||||
JNL/Ivy Asset Strategy Fund | - | - | - | - | - | 832 | - | 832 | ||||||||||||||||||||||||
JNL/Mellon Capital Management S&P 500 Index Fund | - | 1,295 | - | - | - | - | - | 1,295 | ||||||||||||||||||||||||
JNL/Mellon Capital Management S&P 400 Mid Cap Index Fund | - | 940 | - | - | - | - | - | 940 | ||||||||||||||||||||||||
JNL/Mellon Capital Management Small Cap Index Fund | - | 895 | - | - | - | - | - | 895 | ||||||||||||||||||||||||
JNL/Mellon Capital Management International Index Fund | - | 1,709 | - | - | - | - | - | 1,709 | ||||||||||||||||||||||||
JNL/Mellon Capital Management Global Alpha Fund | - | 8,597 | - | - | - | - | - | 8,597 | ||||||||||||||||||||||||
JNL/PIMCO Real Return Fund | 29 | 2,576 | 114,235 | - | - | 1,749 | 570 | 119,159 | ||||||||||||||||||||||||
JNL/PIMCO Total Return Bond Fund | 10 | 6,973 | 110,305 | - | - | 1,918 | - | 119,206 | ||||||||||||||||||||||||
Reverse Repurchase Agreements – The average daily balance of reverse repurchase agreements (in thousands) and the weighted average interest rate for the year ended December 31, 2010 were as follows: JNL/PIMCO Real Return Fund, $140,231, 0.24% and JNL/PIMCO Total Return Bond Fund, $75,254, 0.19%.
At December 31, 2010 reverse repurchase agreements outstanding were as follows:
| Repurchase Amount | Counterparty | Interest Rate | Maturity Date | |||||||||||
JNL/PIMCO Real Return Fund | $ | 57,947 | CSI | 0.24% | 1/28/2011 | |||||||||
| 56,452 | CGM | 0.25% | 2/28/2011 | |||||||||||
JNL/PIMCO Total Return Bond Fund | 27,840 | BNP | 0.25% | 1/12/2011 | ||||||||||
| 82,363 | DUB | 0.25% | 1/21/2011 | |||||||||||
See accompanying Notes to the Financial Statements.
JNL Series Trust
Notes to the Schedules of Investments (in thousands)
December 31, 2010
FASB ASC Topic 815, “Derivatives and Hedging” – The following is a summary of the fair valuations of each Fund’s derivative instruments categorized by risk exposure. The derivative instruments outstanding as of December 31, 2010, as disclosed in these Notes to the Schedules of Investments and the amounts of realized and changes in unrealized gains and losses on derivative instruments during the year ended December 31, 2010, as disclosed in the Statements of Operations, serve as indicators of the volume of derivative activity for the Funds. See Note 4 in the Notes to Financial Statements for additional FASB ASC Topic 815 disclosures.
JNL/Goldman Sachs Core Plus Bond Fund
Fair values of derivative instruments on the Statements of Assets and Liabilities as of December 31, 2010:
| Credit Contracts | Equity Contracts | Foreign Exchange Contracts | Interest Rate Contracts | Total | Credit Contracts | Equity Contracts | Foreign Exchange Contracts | Interest Rate Contracts | Total | |||||||||||||||||||||||||||||||||||||
Assets: | Liabilities: | |||||||||||||||||||||||||||||||||||||||||||||
Forward foreign currency contracts | $ | - | $ | - | $ | 2,020 | $ | - | $ | 2,020 | Forward foreign currency contracts | $ | - | $ | - | $ | 2,807 | $ | - | $ | 2,807 | |||||||||||||||||||||||||
Swap premiums paid | 707 | - | - | 5,004 | 5,711 | Swap premiums received | 162 | - | - | 1,129 | 1,291 | |||||||||||||||||||||||||||||||||||
Unrealized appreciation on swap agreements | 149 | - | - | 9,619 | 9,768 | Unrealized depreciation on swap agreements | - | - | - | 7,515 | 7,515 | |||||||||||||||||||||||||||||||||||
Variation margin | - | - | - | 825 | 825 | Variation margin | - | - | - | 3 | 3 | |||||||||||||||||||||||||||||||||||
| $ | 856 | $ | - | $ | 2,020 | $ | 15,448 | $ | 18,324 | $ | 162 | $ | - | $ | 2,807 | $ | 8,647 | $ | 11,616 | |||||||||||||||||||||||||||
The effect of derivative instruments on the Statements of Operations for the year ended December 31, 2010: | ||||||||||||||||||||||||||||||||||||||||||||||
Net realized gain (loss) on: |
| Net change in unrealized appreciation or depreciation on: |
| |||||||||||||||||||||||||||||||||||||||||||
Foreign currency related items | $ | - | $ | - | $ | (2,136 | ) | $ | - | $ | (2,136 | ) | Foreign currency related items | $ | - | $ | - | $ | (838 | ) | $ | - | $ | (838 | ) | |||||||||||||||||||||
Futures contracts | - | - | - | 5,883 | 5,883 | Futures contracts | - | - | - | 629 | 629 | |||||||||||||||||||||||||||||||||||
Swap agreements | 192 | - | - | 72 | 264 | Swap agreements | 437 | - | - | 914 | 1,351 | |||||||||||||||||||||||||||||||||||
| $ | 192 | $ | - | $ | (2,136 | ) | $ | 5,955 | $ | 4,011 | $ | 437 | $ | - | $ | (838 | ) | $ | 1,543 | $ | 1,142 | |||||||||||||||||||||||||
| JNL/Goldman Sachs Emerging Markets Debt Fund | ||||||||||||||||||||||||||||||||||||||||||||||
Fair values of derivative instruments on the Statements of Assets and Liabilities as of December 31, 2010: | ||||||||||||||||||||||||||||||||||||||||||||||
| Credit Contracts | Equity Contracts | Foreign Exchange Contracts | Interest Rate Contracts | Total | Credit Contracts | Equity Contracts | Foreign Exchange Contracts | Interest Rate Contracts | Total | |||||||||||||||||||||||||||||||||||||
Assets: | Liabilities: | |||||||||||||||||||||||||||||||||||||||||||||
Forward foreign currency contracts | $ | - | $ | - | $ | 9,706 | $ | - | $ | 9,706 | Forward foreign currency contracts | $ | - | $ | - | $ | 10,386 | $ | - | $ | 10,386 | |||||||||||||||||||||||||
Swap premiums paid | - | - | - | 17,509 | 17,509 | Swap premiums received | - | - | - | - | - | |||||||||||||||||||||||||||||||||||
Unrealized appreciation on swap agreements | - | - | - | 5,774 | 5,774 | Unrealized depreciation on swap agreements | - | - | - | 1,449 | 1,449 | |||||||||||||||||||||||||||||||||||
| $ | - | $ | - | $ | 9,706 | $ | 23,283 | $ | 32,989 | $ | - | $ | - | $ | 10,386 | $ | 1,449 | $ | 11,835 | |||||||||||||||||||||||||||
The effect of derivative instruments on the Statements of Operations for the year ended December 31, 2010: | ||||||||||||||||||||||||||||||||||||||||||||||
Net realized gain (loss) on: |
| Net change in unrealized appreciation or depreciation on: |
| |||||||||||||||||||||||||||||||||||||||||||
Foreign currency related items | $ | - | $ | - | $ | 4,191 | $ | - | $ | 4,191 | Foreign currency related items | $ | - | $ | - | $ | (1,723 | ) | $ | - | $ | (1,723 | ) | |||||||||||||||||||||||
Swap agreements | - | - | - | (1,048 | ) | (1,048 | ) | Swap agreements | - | - | - | 4,339 | 4,339 | |||||||||||||||||||||||||||||||||
| $ | - | $ | - | $ | 4,191 | $ | (1,048 | ) | $ | 3,143 | $ | - | $ | - | $ | (1,723 | ) | $ | 4,339 | $ | 2,616 | |||||||||||||||||||||||||
| JNL/Ivy Asset Strategy Fund | ||||||||||||||||||||||||||||||||||||||||||||||
Fair values of derivative instruments on the Statements of Assets and Liabilities as of December 31, 2010: | ||||||||||||||||||||||||||||||||||||||||||||||
| Credit Contracts | Equity Contracts | Foreign Exchange Contracts | Interest Rate Contracts | Total | Credit Contracts | Equity Contracts | Foreign Exchange Contracts | Interest Rate Contracts | Total | |||||||||||||||||||||||||||||||||||||
Assets: | Liabilities: | |||||||||||||||||||||||||||||||||||||||||||||
Investments - unaffiliated, at value | $ | - | $ | 6,638 | $ | - | $ | - | $ | 6,638 | Options written, at value | $ | - | $ | 1,808 | $ | - | $ | - | $ | 1,808 | |||||||||||||||||||||||||
Forward foreign currency contracts | - | - | - | - | - | Forward foreign currency contracts | - | - | 3,797 | - | 3,797 | |||||||||||||||||||||||||||||||||||
Unrealized appreciation on | - | Unrealized depreciation on | - | 41 | - | - | 41 | |||||||||||||||||||||||||||||||||||||||
swap agreements | - | 15 | - | - | 15 | swap agreements | - | - | - | - | - | |||||||||||||||||||||||||||||||||||
Variation margin | - | - | - | - | - | Variation margin | $ | - | $ | 1,849 | $ | 3,797 | $ | - | $ | 5,646 | ||||||||||||||||||||||||||||||
| $ | - | $ | 6,653 | $ | - | $ | - | $ | 6,653 | |||||||||||||||||||||||||||||||||||||
The effect of derivative instruments on the Statements of Operations for the year ended December 31, 2010: | ||||||||||||||||||||||||||||||||||||||||||||||
Net realized gain (loss) on: |
| Net change in unrealized appreciation or depreciation on: |
| |||||||||||||||||||||||||||||||||||||||||||
Foreign currency related items | $ | - | $ | - | $ | (2,051 | ) | $ | - | $ | (2,051 | ) | Foreign currency related items | $ | - | $ | - | $ | (3,797 | ) | $ | - | $ | (3,797 | ) | |||||||||||||||||||||
Futures contracts | - | (55,537 | ) | - | - | (55,537 | ) | Futures contracts † | - | - | - | - | - | |||||||||||||||||||||||||||||||||
Option contracts | - | (6,668 | ) | (130 | ) | - | (6,798 | ) | Option contracts* † | - | (265 | ) | - | - | (265 | ) | ||||||||||||||||||||||||||||||
Swap agreements | - | 524 | - | - | 524 | Swap agreements | - | (24 | ) | - | - | (24 | ) | |||||||||||||||||||||||||||||||||
| $ | - | $ | (61,681 | ) | $ | (2,181 | ) | $ | - | $ | (63,862 | ) | $ | - | $ | (289 | ) | $ | (3,797 | ) | $ | - | $ | (4,086 | ) | |||||||||||||||||||||
| JNL/JPMorgan International Value Fund | ||||||||||||||||||||||||||||||||||||||||||||||
Fair values of derivative instruments on the Statements of Assets and Liabilities as of December 31, 2010: | ||||||||||||||||||||||||||||||||||||||||||||||
| Credit Contracts | Equity Contracts | Foreign Exchange Contracts | Interest Rate Contracts | Total | Credit Contracts | Equity Contracts | Foreign Exchange Contracts | Interest Rate Contracts | Total | |||||||||||||||||||||||||||||||||||||
Assets: | Liabilities: | |||||||||||||||||||||||||||||||||||||||||||||
Forward foreign currency contracts | $ | - | $ | - | $ | 5,552 | $ | - | $ | 5,552 | Forward foreign currency contracts | $ | - | $ | - | $ | 1,290 | $ | - | $ | 1,290 | |||||||||||||||||||||||||
Variation margin | - | - | - | - | - | Variation margin | - | - | - | - | - | |||||||||||||||||||||||||||||||||||
| $ | - | $ | - | $ | 5,552 | $ | - | $ | 5,552 | $ | - | $ | - | $ | 1,290 | $ | - | $ | 1,290 | |||||||||||||||||||||||||||
The effect of derivative instruments on the Statements of Operations for the year ended December 31, 2010: | ||||||||||||||||||||||||||||||||||||||||||||||
Net realized gain (loss) on: |
| Net change in unrealized appreciation or depreciation on: |
| |||||||||||||||||||||||||||||||||||||||||||
Foreign currency related items | $ | - | $ | - | $ | 5,819 | $ | - | $ | 5,819 | Foreign currency related items | $ | - | $ | - | $ | 4,185 | $ | - | $ | 4,185 | |||||||||||||||||||||||||
Futures contracts | - | 171 | - | - | 171 | Futures contracts | - | 56 | - | - | 56 | |||||||||||||||||||||||||||||||||||
| $ | - | $ | 171 | $ | 5,819 | $ | - | $ | 5,990 | $ | - | $ | 56 | $ | 4,185 | $ | - | $ | 4,241 | |||||||||||||||||||||||||||
† The Fund did not hold any open derivative instruments in this category at December 31, 2009.
* Includes change in unrealized appreciation (depreciation) on purchased and written options. Unrealized appreciation (depreciation) on purchased options is located in net change in unrealized appreciation (depreciation) on investments . in the Statements of Operations. Unrealized appreciation (depreciation) on written options is located in net change in unrealized appreciation (depreciation) on written options contracts on the Statement of Operations.
See accompanying Notes to the Financial Statements.
JNL Series Trust
Notes to the Schedules of Investments (in thousands)
December 31, 2010
FASB ASC Topic 815, “Derivatives and Hedging”
JNL/Mellon Capital Management International Index Fund
Fair values of derivative instruments on the Statements of Assets and Liabilities as of December 31, 2010:
| Credit Contracts | Equity Contracts | Foreign Exchange | Interest Rate Contracts | Total | Credit Contracts | Equity Contracts | Foreign Exchange | Interest Rate Contracts | Total | |||||||||||||||||||||||||||||||||
Assets: | Liabilities: | |||||||||||||||||||||||||||||||||||||||||
Forward foreign currency contracts | $ | - | $ | - | $ | 921 | $ | - | $ | 921 | Forward foreign currency contracts | $ | - | $ | - | $ | 452 | $ | - | $452 | ||||||||||||||||||||||
Variation margin | - | - | - | - | - | Variation margin | - | 100 | - | - | 100 | |||||||||||||||||||||||||||||||
| $ | - | $ | - | $ | 921 | $ | - | $ | 921 | $ | - | $ | 100 | $ | 452 | $ | - | $552 | ||||||||||||||||||||||||
The effect of derivative instruments on the Statements of Operations for the year ended December 31, 2010: | ||||||||||||||||||||||||||||||||||||||||||
Net realized gain (loss) on: |
| Net change in unrealized appreciation or depreciation on: | ||||||||||||||||||||||||||||||||||||||||
Foreign currency related items | $ | - | $ | - | $ | (219 | ) | $ | - | $ | (219 | ) | Foreign currency related items | $ | - | $ | - | $ | 1,060 | $ | - | $1,060 | ||||||||||||||||||||
Futures contracts | - | 609 | - | - | 609 | Futures contracts | - | (406 | ) | - | - | (406) | ||||||||||||||||||||||||||||||
| $ | - | $ | 609 | $ | (219 | ) | $ | - | $ | 390 | $ | - | $ | (406 | ) | $ | 1,060 | $ | - | $654 | ||||||||||||||||||||||
JNL/Mellon Capital Management Global Alpha Fund | ||||||||||||||||||||||||||||||||||||||||||
Fair values of derivative instruments on the Statements of Assets and Liabilities as of December 31, 2010: | ||||||||||||||||||||||||||||||||||||||||||
| Credit Contracts | Equity Contracts | Foreign Exchange Contracts | Interest Rate Contracts | Total | Credit Contracts | Equity Contracts | Foreign Exchange Contracts | Interest Rate Contracts | Total | |||||||||||||||||||||||||||||||||
Assets: | Liabilities: | |||||||||||||||||||||||||||||||||||||||||
Forward foreign currency contracts | $ | - | $ | - | $ | 4,209 | $ | - | $ | 4,209 | Forward foreign currency contracts | $ | - | $ | - | $ | 1,440 | $ | - | $1,440 | ||||||||||||||||||||||
Variation margin | - | 111 | - | 336 | 447 | Variation margin | - | 306 | - | 247 | 553 | |||||||||||||||||||||||||||||||
| $ | - | $ | 111 | $ | 4,209 | $ | 336 | $ | 4,656 | $ | - | $ | 306 | $ | 1,440 | $ | 247 | $1,993 | ||||||||||||||||||||||||
The effect of derivative instruments on the Statements of Operations for the year ended December 31, 2010: | ||||||||||||||||||||||||||||||||||||||||||
Net realized gain (loss) on: |
| Net change in unrealized appreciation or depreciation on: | ||||||||||||||||||||||||||||||||||||||||
Foreign currency related items | $ | - | $ | - | $ | 2,847 | $ | - | $ | 2,847 | Foreign currency related items | $ | - | $ | - | $ | 2,929 | $ | - | $2,929 | ||||||||||||||||||||||
Futures contracts | - | 860 | - | 4,908 | 5,768 | Futures contracts | - | (451 | ) | - | (1,142 | ) | (1,593) | |||||||||||||||||||||||||||||
| $ | - | $ | 860 | $ | 2,847 | $ | 4,908 | $ | 8,615 | $ | - | $ | (451 | ) | $ | 2,929 | $ | (1,142 | ) | $1,336 | ||||||||||||||||||||||
JNL/PIMCO Real Return Fund | ||||||||||||||||||||||||||||||||||||||||||
Fair values of derivative instruments on the Statements of Assets and Liabilities as of December 31, 2010: | ||||||||||||||||||||||||||||||||||||||||||
| Credit Contracts | Equity Contracts | Foreign Exchange Contracts | Interest Rate Contracts | Total | Credit Contracts | Equity Contracts | Foreign Exchange Contracts | Interest Rate Contracts | Total | |||||||||||||||||||||||||||||||||
Assets: | Liabilities: | |||||||||||||||||||||||||||||||||||||||||
Investments - unaffiliated, at value | $ | - | $ | - | $ | - | $ | - | $ | - | Options written, at value | $ | 46 | $ | - | $ | - | $ | 4,757 | $4,803 | ||||||||||||||||||||||
Forward foreign currency contracts | - | - | 1,070 | - | 1,070 | Forward foreign currency contracts | - | - | 1,294 | - | 1,294 | |||||||||||||||||||||||||||||||
Swap premiums paid | 4,923 | - | - | 327 | 5,250 | Swap premiums received | 612 | - | - | 218 | 830 | |||||||||||||||||||||||||||||||
Unrealized appreciation on swap agreements | 1,689 | - | - | 1,731 | 3,420 | Unrealized depreciation on swap agreements | 822 | - | - | 28 | 850 | |||||||||||||||||||||||||||||||
Variation margin | - | - | - | 56 | 56 | Variation margin | - | - | - | - | - | |||||||||||||||||||||||||||||||
| $ | 6,612 | $ | - | $ | 1,070 | $ | 2,114 | $ | 9,796 | $ | 1,480 | $ | - | $ | 1,294 | $ | 5,003 | $7,777 | ||||||||||||||||||||||||
The effect of derivative instruments on the Statements of Operations for the year ended December 31, 2010: | ||||||||||||||||||||||||||||||||||||||||||
Net realized gain (loss) on: |
| Net change in unrealized appreciation or depreciation on: | ||||||||||||||||||||||||||||||||||||||||
Foreign currency related items | $ | - | $ | - | $ | (3,447 | ) | $ | - | $ | (3,447 | ) | Foreign currency related items | $ | - | $ | - | $ | 62 | $ | - | $62 | ||||||||||||||||||||
Futures contracts | - | - | - | 3,162 | 3,162 | Futures contracts | - | - | - | (1,220 | ) | (1,220) | ||||||||||||||||||||||||||||||
Written option contracts | 78 | - | 236 | 4,842 | 5,156 | Written option contracts | 72 | - | - | (1,687 | ) | (1,615) | ||||||||||||||||||||||||||||||
Swap agreements | (483 | ) | - | - | (5,020 | ) | (5,503 | ) | Swap agreements | 1,988 | - | - | 1,125 | 3,113 | ||||||||||||||||||||||||||||
| $ | (405 | ) | $ | - | $ | (3,211 | ) | $ | 2,984 | $ | (632 | ) | $ | 2,060 | $ | - | $ | 62 | $ | (1,782 | ) | $340 | ||||||||||||||||||||
JNL/PIMCO Total Return Bond Fund |
| |||||||||||||||||||||||||||||||||||||||||
Fair values of derivative instruments on the Statements of Assets and Liabilities as of December 31, 2010: | ||||||||||||||||||||||||||||||||||||||||||
| Credit Contracts | Equity Contracts | Foreign Exchange Contracts | Interest Rate Contracts | Total | Credit Contracts | Equity Contracts | Foreign Exchange Contracts | Interest Rate Contracts | Total | |||||||||||||||||||||||||||||||||
Assets: | Liabilities: | |||||||||||||||||||||||||||||||||||||||||
Investments - unaffiliated, at value | $ | - | $ | - | $ | - | $ | - | $ | - | Options written, at value | $ | 4 | $ | - | $ | - | $ | 9,634 | $9,638 | ||||||||||||||||||||||
Forward foreign currency contracts | - | - | 4,866 | - | 4,866 | Forward foreign currency contracts | - | - | 3,345 | - | 3,345 | |||||||||||||||||||||||||||||||
Swap premiums paid | 5,787 | - | - | 935 | 6,722 | Swap premiums received | 419 | - | - | 214 | 633 | |||||||||||||||||||||||||||||||
Unrealized appreciation on swap agreements | 3,443 | - | - | 3,270 | 6,713 | Unrealized depreciation on swap agreements | 209 | - | - | 1,176 | 1,385 | |||||||||||||||||||||||||||||||
Variation margin | - | - | - | 812 | 812 | Variation margin | - | - | - | - | - | |||||||||||||||||||||||||||||||
| $ | 9,230 | $ | - | $ | 4,866 | $ | 5,017 | $ | 19,113 | $ | 632 | $ | - | $ | 3,345 | $ | 11,024 | $15,001 | ||||||||||||||||||||||||
The effect of derivative instruments on the Statements of Operations for the year ended December 31, 2010: | ||||||||||||||||||||||||||||||||||||||||||
Net realized gain (loss) on: |
| Net change in unrealized appreciation or depreciation on: | ||||||||||||||||||||||||||||||||||||||||
Foreign currency related items | $ | - | $ | - | $ | (2,679 | ) | $ | - | $ | (2,679 | ) | Foreign currency related items | $ | - | $ | - | $ | 110 | $ | - | $110 | ||||||||||||||||||||
Futures contracts | - | - | - | 36,193 | 36,193 | Futures contracts | - | - | - | (2,822 | ) | (2,822) | ||||||||||||||||||||||||||||||
Written option contracts | 86 | - | 215 | 10,353 | 10,654 | Written option contracts | 6 | - | - | (2,795 | ) | (2,789) | ||||||||||||||||||||||||||||||
Swap agreements | 3,502 | - | - | (9,509 | ) | (6,007 | ) | Swap agreements | 2,345 | - | - | 5,792 | 8,137 | |||||||||||||||||||||||||||||
| $ | 3,588 | $ | - | $ | (2,464 | ) | $ | 37,037 | $ | 38,161 | $ | 2,351 | $ | - | $ | 110 | $ | 175 | $2,636 | |||||||||||||||||||||||
See accompanying Notes to the Financial Statements.
JNL Series Trust
Notes to the Schedules of Investments (in thousands)
December 31, 2010
Summary of Investments by Country (as a percentage of total long-term investments)* :
| JNL/BlackRock Commodity Securities Fund | JNL/Capital Guardian Global Balanced Fund | JNL/Capital Guardian Global Diversified Research Fund | JNL/Franklin Templeton Global Growth Fund | JNL/Franklin Templeton Income Fund | JNL/Franklin Templeton International Small Cap Growth Fund | JNL/Franklin Templeton Mutual Shares Fund | JNL/Goldman Sachs Core Plus Bond Fund | |||||||||||||||||||||||||
Argentina | – | % | 0.1 | % | – | % | – | % | – | % | – | % | – | % | 0.2 | % | ||||||||||||||||
Australia | 1.2 | 2.3 | 3.2 | 0.3 | 1.4 | – | – | 1.0 | ||||||||||||||||||||||||
Austria | – | 0.3 | – | 0.5 | – | 2.3 | – | – | ||||||||||||||||||||||||
Barbados | 0.4 | – | – | – | – | – | – | – | ||||||||||||||||||||||||
Belgium | – | 0.2 | – | – | – | 4.8 | – | – | ||||||||||||||||||||||||
Bermuda | – | 0.3 | 0.1 | – | – | 5.5 | 0.4 | – | ||||||||||||||||||||||||
Brazil | 1.6 | 1.9 | 1.2 | 0.7 | – | – | – | 0.3 | ||||||||||||||||||||||||
Canada | 13.3 | 2.9 | 4.7 | – | 2.3 | 3.4 | 0.5 | 1.3 | ||||||||||||||||||||||||
Cayman Islands | – | 0.2 | – | – | 0.2 | – | – | 0.3 | ||||||||||||||||||||||||
China | 0.5 | 1.6 | 3.3 | 0.4 | – | – | – | – | ||||||||||||||||||||||||
Colombia | – | 0.1 | – | – | – | – | – | – | ||||||||||||||||||||||||
Croatia | – | 0.2 | – | – | – | – | – | – | ||||||||||||||||||||||||
Denmark | – | 1.2 | 1.0 | – | – | – | 1.8 | 1.4 | ||||||||||||||||||||||||
Dominican Republic | – | 0.1 | – | – | – | – | – | – | ||||||||||||||||||||||||
Egypt | – | – | – | – | – | – | – | – | ||||||||||||||||||||||||
Finland | – | 0.4 | 1.3 | – | – | – | – | – | ||||||||||||||||||||||||
France | 11.3 | 2.5 | 4.8 | 7.3 | – | 8.2 | 3.8 | 0.5 | ||||||||||||||||||||||||
Germany | – | 7.7 | 3.9 | 5.2 | 0.8 | 0.4 | 3.8 | 2.4 | ||||||||||||||||||||||||
Greece | 0.1 | – | – | – | – | 3.5 | – | – | ||||||||||||||||||||||||
Hong Kong | 0.9 | 2.3 | 4.2 | 1.7 | – | – | 0.4 | – | ||||||||||||||||||||||||
Hungary | – | 0.3 | – | – | – | – | – | – | ||||||||||||||||||||||||
India | – | 2.1 | 0.9 | 0.7 | – | – | – | – | ||||||||||||||||||||||||
Indonesia | – | 0.4 | 0.3 | – | – | – | – | – | ||||||||||||||||||||||||
Iraq | – | 0.1 | – | – | – | – | – | – | ||||||||||||||||||||||||
Ireland | – | 0.8 | 0.4 | 5.2 | – | 4.9 | – | – | ||||||||||||||||||||||||
Israel | – | 0.2 | – | – | – | – | – | – | ||||||||||||||||||||||||
Italy | 0.9 | 0.8 | – | 1.9 | – | 3.7 | 0.3 | 0.4 | ||||||||||||||||||||||||
Japan | – | 9.8 | 9.2 | 2.5 | – | 14.3 | 1.4 | 0.3 | ||||||||||||||||||||||||
Luxembourg | – | 0.5 | – | – | – | – | – | 0.3 | ||||||||||||||||||||||||
Malaysia | – | 1.3 | 0.3 | – | – | – | – | – | ||||||||||||||||||||||||
Mexico | – | 1.9 | 0.3 | – | – | – | – | 1.0 | ||||||||||||||||||||||||
Netherlands | – | 1.9 | 3.2 | 4.8 | 0.1 | 1.6 | 1.9 | 1.4 | ||||||||||||||||||||||||
New Zealand | – | – | – | – | – | – | – | 0.7 | ||||||||||||||||||||||||
Norway | – | 0.4 | 0.4 | 0.6 | – | – | 1.3 | 1.2 | ||||||||||||||||||||||||
Panama | – | 0.1 | – | – | – | – | – | – | ||||||||||||||||||||||||
Peru | – | – | – | – | – | – | – | – | ||||||||||||||||||||||||
Poland | – | 1.5 | – | – | – | – | – | – | ||||||||||||||||||||||||
Qatar | – | – | – | – | – | – | – | 0.5 | ||||||||||||||||||||||||
Russian Federation | – | 1.3 | 1.0 | 0.5 | – | – | – | – | ||||||||||||||||||||||||
Singapore | – | 0.6 | 0.5 | 2.0 | – | 4.0 | – | – | ||||||||||||||||||||||||
South Africa | – | 0.9 | 0.8 | – | 0.2 | – | – | 0.7 | ||||||||||||||||||||||||
South Korea | – | 2.7 | 2.1 | 4.2 | – | 1.6 | – | – | ||||||||||||||||||||||||
Spain | – | 0.2 | – | 1.2 | 0.6 | – | 1.4 | – | ||||||||||||||||||||||||
Sweden | 3.0 | 1.2 | 0.7 | 1.0 | – | – | – | 1.2 | ||||||||||||||||||||||||
Switzerland | 0.7 | 2.6 | 2.8 | 8.5 | 2.3 | – | 6.1 | 0.2 | ||||||||||||||||||||||||
Taiwan | – | 0.6 | 0.5 | 1.1 | – | – | – | – | ||||||||||||||||||||||||
Thailand | – | 0.1 | – | – | – | – | – | – | ||||||||||||||||||||||||
Turkey | – | 0.2 | – | 0.5 | – | – | – | – | ||||||||||||||||||||||||
United Arab Emirates | – | 0.2 | – | – | – | – | – | 0.1 | ||||||||||||||||||||||||
United Kingdom | 0.3 | 6.7 | 11.0 | 12.2 | 4.1 | 41.8 | 9.4 | 2.9 | ||||||||||||||||||||||||
United States | 65.8 | 36.2 | 37.9 | 37.0 | 88.0 | – | 67.5 | 81.6 | ||||||||||||||||||||||||
Venezuela | – | 0.1 | – | – | – | – | – | 0.1 | ||||||||||||||||||||||||
Total Long-Term Investments | 100.0 | % | 100.0 | % | 100.0 | % | 100.0 | % | 100.0 | % | 100.0 | % | 100.0 | % | 100.0 | % | ||||||||||||||||
*The Funds presented in the table are those which had greater than 10% of long-term investments in non-U.S securities at December 31, 2010.
JNL Series Trust
Notes to the Schedules of Investments (in thousands)
December 31, 2010
Summary of Investments by Country (as a percentage of total long-term investments)* : |
| |||||||||||||||||||||||||||||||||||
| JNL/Goldman Sachs Emerging Markets Debt Fund | JNL/Invesco Global Real Estate Fund | JNL/Invesco International Growth Fund | JNL/Invesco Large Cap Growth Fund | JNL/Ivy Asset Strategy Fund | JNL/JPMorgan International Value Fund | JNL/Lazard Emerging Markets Fund | JNL/M&G Global Basics Fund | JNL/M&G Global Leaders Fund | ||||||||||||||||||||||||||||
Argentina | 2.5 | % | – | % | – | % | – | % | – | % | – | % | – | % | – | % | – | % | ||||||||||||||||||
Australia | – | 8.9 | 7.5 | – | 0.7 | 1.5 | – | 16.8 | 3.2 | |||||||||||||||||||||||||||
Austria | – | 0.3 | – | – | – | 1.1 | – | 3.0 | – | |||||||||||||||||||||||||||
Bahamas | 0.6 | – | – | – | – | – | – | – | – | |||||||||||||||||||||||||||
Belgium | – | – | 1.7 | – | – | 0.9 | – | – | – | |||||||||||||||||||||||||||
Bermuda | – | 2.0 | – | 1.7 | – | – | – | – | 0.5 | |||||||||||||||||||||||||||
Brazil | 12.2 | 0.3 | 2.5 | – | 3.5 | – | 21.5 | 0.8 | 1.3 | |||||||||||||||||||||||||||
Canada | – | 3.6 | 5.5 | 4.5 | – | 1.5 | 1.8 | 5.2 | 2.7 | |||||||||||||||||||||||||||
Cayman Islands | – | 0.8 | – | 2.2 | 2.0 | – | – | – | – | |||||||||||||||||||||||||||
Chile | 0.3 | – | – | – | – | – | – | – | – | |||||||||||||||||||||||||||
China | – | – | 1.5 | – | 4.8 | – | 2.1 | – | – | |||||||||||||||||||||||||||
Colombia | 4.5 | – | – | – | – | – | – | – | – | |||||||||||||||||||||||||||
Denmark | – | – | 1.9 | – | 0.3 | – | – | – | – | |||||||||||||||||||||||||||
Egypt | 0.2 | – | – | – | – | – | 3.3 | – | – | |||||||||||||||||||||||||||
European Union | – | – | – | – | 0.6 | – | – | – | – | |||||||||||||||||||||||||||
Finland | – | 0.5 | – | – | – | 2.1 | – | – | – | |||||||||||||||||||||||||||
France | – | 3.9 | 5.3 | – | 1.6 | 12.2 | – | 6.6 | 2.5 | |||||||||||||||||||||||||||
Germany | 0.5 | – | 6.9 | – | 6.3 | 10.0 | – | 5.6 | 6.4 | |||||||||||||||||||||||||||
Hong Kong | 4.0 | 14.5 | 1.8 | – | 6.2 | 3.3 | 0.6 | 2.2 | 4.2 | |||||||||||||||||||||||||||
Hungary | 9.8 | – | – | – | – | – | 1.3 | – | – | |||||||||||||||||||||||||||
India | – | – | 2.1 | – | 3.4 | – | 5.0 | 0.5 | 1.2 | |||||||||||||||||||||||||||
Indonesia | 6.2 | – | – | – | – | – | 5.1 | – | – | |||||||||||||||||||||||||||
Ireland | – | – | – | 1.0 | – | – | – | 2.3 | 1.9 | |||||||||||||||||||||||||||
Israel | – | – | 2.2 | 0.6 | – | – | – | – | – | |||||||||||||||||||||||||||
Italy | – | 0.2 | – | – | 0.1 | 0.9 | – | – | – | |||||||||||||||||||||||||||
Japan | – | 12.1 | 10.2 | – | – | 20.7 | – | 1.2 | 8.2 | |||||||||||||||||||||||||||
Luxembourg | 1.5 | – | – | – | – | 0.9 | 0.8 | – | – | |||||||||||||||||||||||||||
Macau | – | – | – | – | 5.8 | – | – | – | – | |||||||||||||||||||||||||||
Malaysia | 7.3 | – | – | – | – | – | 0.6 | 2.9 | – | |||||||||||||||||||||||||||
Malta | – | – | – | – | – | – | – | – | – | |||||||||||||||||||||||||||
Mexico | 11.4 | – | 3.8 | 1.0 | – | – | 7.0 | – | – | |||||||||||||||||||||||||||
Netherlands | – | 2.2 | 5.1 | – | 0.8 | 9.9 | – | – | 4.2 | |||||||||||||||||||||||||||
Norway | – | – | – | – | 1.4 | 2.5 | – | – | – | |||||||||||||||||||||||||||
Pakistan | – | – | – | – | – | – | 1.3 | – | – | |||||||||||||||||||||||||||
Peru | 0.6 | – | – | – | – | – | – | – | – | |||||||||||||||||||||||||||
Philippines | 0.4 | – | 1.1 | – | – | – | 1.9 | – | – | |||||||||||||||||||||||||||
Poland | 2.6 | – | – | – | – | – | – | – | – | |||||||||||||||||||||||||||
Russian Federation | 1.7 | – | 1.1 | – | – | – | 5.2 | 2.4 | – | |||||||||||||||||||||||||||
Singapore | – | 4.4 | 3.0 | – | – | 0.9 | – | 7.6 | – | |||||||||||||||||||||||||||
South Africa | 15.8 | – | – | – | – | 0.9 | 11.7 | – | – | |||||||||||||||||||||||||||
South Korea | – | – | 2.6 | – | 2.9 | 1.3 | 14.4 | – | 4.5 | |||||||||||||||||||||||||||
Spain | – | – | – | – | 1.1 | 3.4 | – | 0.5 | – | |||||||||||||||||||||||||||
Sweden | – | 0.7 | 1.6 | – | 1.9 | – | – | – | – | |||||||||||||||||||||||||||
Switzerland | – | 0.7 | 8.0 | 0.3 | 2.2 | 2.5 | – | 2.4 | 3.1 | |||||||||||||||||||||||||||
Taiwan | – | – | 2.4 | – | – | 0.9 | 7.9 | – | – | |||||||||||||||||||||||||||
Thailand | 10.0 | – | – | – | 0.8 | – | 1.8 | – | 1.4 | |||||||||||||||||||||||||||
Turkey | 5.3 | – | 0.9 | – | – | – | 6.7 | – | – | |||||||||||||||||||||||||||
United Arab Emirates | – | – | – | – | – | – | – | 1.2 | – | |||||||||||||||||||||||||||
United Kingdom | – | 5.5 | 20.8 | – | 4.1 | 22.6 | – | 16.4 | 7.6 | |||||||||||||||||||||||||||
United States | 1.1 | 39.4 | 0.5 | 88.7 | 49.5 | – | – | 22.4 | 47.1 | |||||||||||||||||||||||||||
Venezuela | 1.5 | – | – | – | – | – | – | – | – | |||||||||||||||||||||||||||
Total Long-Term Investments | 100.0 | % | 100.0 | % | 100.0 | % | 100.0 | % | 100.0 | % | 100.0 | % | 100.0 | % | 100.0 | % | 100.0 | % | ||||||||||||||||||
* The Funds presented in the table are those which had greater than 10% of long-term investments in non-U.S securities at December 31, 2010.
JNL Series Trust
Notes to the Schedules of Investments (in thousands)
December 31, 2010
Summary of Investments by Country (as a percentage of total long-term investments)* :
| JNL/Mellon Capital Management European 30 Fund | JNL/Mellon Capital Management Pacific Rim 30 Fund | JNL/Mellon Capital Management International Index Fund | JNL/Oppenheimer Global Growth Fund | JNL/PAM Asia ex-Japan Fund | JNL/PAM China-India Fund | JNL/PIMCO Real Return Fund | JNL/PIMCO Total Return Bond Fund | |||||||||||||||||||||||||
Australia | – | % | 22.2 | % | 8.8 | % | – | % | – | % | – | % | 3.8 | % | 0.1 | % | ||||||||||||||||
Austria | – | – | 0.3 | – | – | – | – | – | ||||||||||||||||||||||||
Belgium | 6.8 | – | 0.9 | – | – | – | – | – | ||||||||||||||||||||||||
Bermuda | – | – | – | 0.9 | – | – | – | – | ||||||||||||||||||||||||
Brazil | – | – | – | 2.0 | – | – | – | 0.8 | ||||||||||||||||||||||||
Canada | – | – | – | – | – | – | 0.3 | 1.2 | ||||||||||||||||||||||||
Cayman Islands | – | – | – | – | – | – | 0.2 | 0.6 | ||||||||||||||||||||||||
Chile | – | – | – | – | – | – | – | 0.2 | ||||||||||||||||||||||||
China | – | – | – | – | 12.1 | 30.8 | – | – | ||||||||||||||||||||||||
Cyprus | – | – | – | – | – | – | – | – | ||||||||||||||||||||||||
Denmark | 6.8 | – | 1.0 | – | – | – | 0.3 | 0.7 | ||||||||||||||||||||||||
Egypt | – | – | – | – | – | – | – | – | ||||||||||||||||||||||||
European Monetary Unit | – | – | – | – | – | – | – | – | ||||||||||||||||||||||||
European Union | – | – | – | – | – | – | – | 0.1 | ||||||||||||||||||||||||
Finland | – | – | 1.1 | 0.9 | – | – | – | – | ||||||||||||||||||||||||
France | 18.1 | – | 9.0 | 5.1 | – | – | 1.6 | 1.1 | ||||||||||||||||||||||||
Germany | 9.5 | – | 8.2 | 9.3 | – | – | – | 0.1 | ||||||||||||||||||||||||
Greece | – | – | 0.2 | – | – | – | – | – | ||||||||||||||||||||||||
Guernsey | – | – | 0.1 | – | – | – | – | – | ||||||||||||||||||||||||
Hong Kong | – | 19.6 | 2.7 | – | 23.9 | 19.2 | – | – | ||||||||||||||||||||||||
India | – | – | – | 2.3 | 12.3 | 50.0 | – | 0.1 | ||||||||||||||||||||||||
Indonesia | – | – | – | – | 3.1 | – | – | – | ||||||||||||||||||||||||
Ireland | – | – | 0.2 | – | – | – | 0.1 | 0.6 | ||||||||||||||||||||||||
Israel | – | – | 0.8 | – | – | – | – | – | ||||||||||||||||||||||||
Italy | 6.3 | – | 2.5 | 2.3 | – | – | – | 0.3 | ||||||||||||||||||||||||
Japan | – | 48.9 | 22.0 | 11.8 | – | – | – | – | ||||||||||||||||||||||||
Jeresy | – | – | 0.1 | – | – | – | – | – | ||||||||||||||||||||||||
Luxembourg | – | – | 0.5 | – | – | – | 0.1 | – | ||||||||||||||||||||||||
Macau | – | – | 0.1 | – | – | – | – | – | ||||||||||||||||||||||||
Malaysia | – | – | – | – | 3.3 | – | – | – | ||||||||||||||||||||||||
Malta | – | – | – | – | – | – | – | – | ||||||||||||||||||||||||
Mauritius | – | – | – | – | – | – | – | – | ||||||||||||||||||||||||
Mexico | – | – | – | 3.7 | – | – | 0.2 | 0.4 | ||||||||||||||||||||||||
Mongolia | – | – | – | – | 0.6 | – | – | – | ||||||||||||||||||||||||
Netherlands | 6.7 | – | 4.6 | 3.2 | – | – | 1.6 | 0.9 | ||||||||||||||||||||||||
New Zealand | – | 2.7 | 0.1 | – | – | – | 0.3 | 0.1 | ||||||||||||||||||||||||
Norway | – | – | 0.9 | – | – | – | – | – | ||||||||||||||||||||||||
Panama | – | – | – | – | – | – | – | – | ||||||||||||||||||||||||
Philippines | – | – | – | – | 0.9 | – | – | – | ||||||||||||||||||||||||
Portugal | – | – | 0.3 | – | – | – | – | – | ||||||||||||||||||||||||
Qatar | – | – | – | – | – | – | – | – | ||||||||||||||||||||||||
Russian Federation | – | – | – | – | – | – | 0.1 | 0.3 | ||||||||||||||||||||||||
Singapore | – | 3.2 | 1.7 | – | 5.2 | – | – | – | ||||||||||||||||||||||||
South Africa | – | – | – | – | – | – | – | – | ||||||||||||||||||||||||
South Korea | – | – | – | 0.2 | 21.1 | – | – | 0.6 | ||||||||||||||||||||||||
Spain | 2.4 | – | 3.3 | 2.3 | – | – | 0.7 | 0.5 | ||||||||||||||||||||||||
Sweden | 4.0 | – | 3.2 | 6.8 | – | – | 0.2 | 0.4 | ||||||||||||||||||||||||
Switzerland | 14.5 | – | 8.1 | 5.2 | – | – | 0.5 | 0.4 | ||||||||||||||||||||||||
Taiwan | – | – | – | 2.0 | 14.5 | – | – | – | ||||||||||||||||||||||||
Thailand | – | – | – | – | 3.0 | – | – | – | ||||||||||||||||||||||||
United Kingdom | 23.2 | – | 19.3 | 4.2 | – | – | 2.7 | 3.3 | ||||||||||||||||||||||||
United States | 1.7 | 3.4 | – | 37.8 | – | – | 87.3 | 87.2 | ||||||||||||||||||||||||
Total Long-Term Investments | 100.0 | % | 100.0 | % | 100.0 | % | 100.0 | % | 100.0 | % | 100.0 | % | 100.0 | % | 100.0 | % | ||||||||||||||||
* The Funds presented in the table are those which had greater than 10% of long-term investments in non-U.S securities at December 31, 2010.
JNL Series Trust
Notes to the Schedules of Investments
December 31, 2010
Summary of Investments by Country (as a percentage of total long-term investments)* :
| JNL/PPM America High Yield Bond Fund | JNL/Red Rocks Listed Private Equity Fund | JNL/T.Rowe Price Short- Term Bond Fund | ||||||||||
Australia | 1.1 % | – % | 2.0 % | |||||||||
Belgium | – | 4.8 | – | |||||||||
Bermuda | 1.7 | – | 0.4 | |||||||||
Brazil | 0.3 | 1.6 | 0.1 | |||||||||
Canada | 2.7 | 7.8 | 2.3 | |||||||||
Cayman Islands | 1.0 | 2.2 | – | |||||||||
France | 0.2 | 9.7 | 1.3 | |||||||||
Germany | 0.2 | 1.7 | 1.4 | |||||||||
Guernsey | – | 9.3 | – | |||||||||
Hong Kong | – | 1.7 | – | |||||||||
Ireland | 0.2 | – | – | |||||||||
Israel | – | – | 0.2 | |||||||||
Italy | 0.1 | 0.8 | 1.2 | |||||||||
Japan | – | 2.0 | – | |||||||||
Luxembourg | 0.2 | – | 0.2 | |||||||||
Mexico | 0.8 | – | 0.7 | |||||||||
Netherlands | 0.5 | 3.4 | 0.7 | |||||||||
New Zealand | – | – | 0.2 | |||||||||
Norway | – | 2.2 | 1.0 | |||||||||
South Korea | – | – | 0.2 | |||||||||
Spain | 0.7 | 0.8 | 0.9 | |||||||||
Sweden | – | 7.0 | 0.4 | |||||||||
Switzerland | 0.1 | 2.6 | 1.0 | |||||||||
United Arab Emirates | – | – | 0.2 | |||||||||
United Kingdom | 0.9 | 22.9 | 3.6 | |||||||||
United States | 89.3 | 19.5 | 82.0 | |||||||||
Total Long-Term Investments | 100.0 % | 100.0 % | 100.0 % | |||||||||
* The Funds presented in the table are those which had greater than 10% of long-term investments in non-U.S securities at December 31, 2010.
JNL Series Trust
Statements of Assets and Liabilities (in thousands, except net asset value per share)
December 31, 2010
| JNL/American Funds Blue Chip Income and Growth Fund | JNL/American Funds Global Bond Fund | JNL/American Funds Global Small Capitalization Fund | JNL/American Funds Growth- Income Fund | JNL/American Funds International Fund | JNL/American Funds New World Fund | JNL Institutional Alt 20 Fund | ||||||||||||||||||||||
| Assets | ||||||||||||||||||||||||||||
Investments - unaffiliated, at value (a) (d) | $ | 149,079 | $ | 105,387 | $ | 80,981 | $ | 174,607 | $ | 102,840 | $ | 133,548 | $ | - | ||||||||||||||
Investments - affiliated, at value (b) | - | - | - | - | - | - | 615,135 | |||||||||||||||||||||
Repurchase agreements (a) | - | - | - | - | - | - | - | |||||||||||||||||||||
Total investments, at value (c) | 149,079 | 105,387 | 80,981 | 174,607 | 102,840 | 133,548 | 615,135 | |||||||||||||||||||||
Cash | - | - | - | - | - | - | - | |||||||||||||||||||||
Foreign currency (e) | - | - | - | - | - | - | - | |||||||||||||||||||||
Receivable for investments sold | - | - | - | - | - | - | - | |||||||||||||||||||||
Receivable for fund shares sold | 1,020 | 417 | 328 | 897 | 481 | 685 | 599 | |||||||||||||||||||||
Receivable from adviser | 51 | 45 | 37 | 51 | 42 | 80 | - | |||||||||||||||||||||
Receivable for dividends and interest | - | - | - | - | - | - | - | |||||||||||||||||||||
Receivable for variation margin | - | - | - | - | - | - | - | |||||||||||||||||||||
Receivable for deposits with brokers | - | - | - | - | - | - | - | |||||||||||||||||||||
Receivable for deposits with counterparties | - | - | - | - | - | - | - | |||||||||||||||||||||
Unrealized appreciation on forward foreign currency contracts | - | - | - | - | - | - | - | |||||||||||||||||||||
Unrealized appreciation on swap agreements | - | - | - | - | - | - | - | |||||||||||||||||||||
Swap premiums paid | - | - | - | - | - | - | - | |||||||||||||||||||||
Other assets | - | - | - | - | - | - | - | |||||||||||||||||||||
Total assets | 150,150 | 105,849 | 81,346 | 175,555 | 103,363 | 134,313 | 615,734 | |||||||||||||||||||||
Liabilities | ||||||||||||||||||||||||||||
Cash overdraft | - | - | - | - | - | - | - | |||||||||||||||||||||
Payable for reverse repurchase agreements | - | - | - | - | - | - | - | |||||||||||||||||||||
Payable for advisory fees | 79 | 58 | 46 | 89 | 65 | 105 | 72 | |||||||||||||||||||||
Payable for administrative fees | 17 | 12 | 9 | 19 | 12 | 15 | 25 | |||||||||||||||||||||
Payable for 12b-1 fee (Class A) | 28 | 20 | 16 | 32 | 19 | 25 | - | |||||||||||||||||||||
Payable for investment securities purchased | 984 | 374 | 297 | 841 | 453 | 613 | 412 | |||||||||||||||||||||
Payable for fund shares redeemed | 36 | 43 | 31 | 56 | 28 | 72 | 187 | |||||||||||||||||||||
Payable for dividends on securities sold short | - | - | - | - | - | - | - | |||||||||||||||||||||
Payable for interest expense and brokerage charges | - | - | - | - | - | - | - | |||||||||||||||||||||
Payable for trustee fees | 1 | 1 | - | - | - | - | 3 | |||||||||||||||||||||
Payable for other expenses | - | - | - | 1 | - | - | 1 | |||||||||||||||||||||
Payable for variation margin | - | - | - | - | - | - | - | |||||||||||||||||||||
Payable for deposits from counterparties | - | - | - | - | - | - | - | |||||||||||||||||||||
Investment in securities sold short/forward sales commitments, at value (f) | - | - | - | - | - | - | - | |||||||||||||||||||||
Options written, at value (g) | - | - | - | - | - | - | - | |||||||||||||||||||||
Unrealized depreciation on forward foreign currency contracts | - | - | - | - | - | - | - | |||||||||||||||||||||
Unrealized depreciation on swap agreements | - | - | - | - | - | - | - | |||||||||||||||||||||
Swap premiums received | - | - | - | - | - | - | - | |||||||||||||||||||||
Payable upon return of securities loaned | - | - | - | - | - | - | - | |||||||||||||||||||||
Total liabilities | 1,145 | 508 | 399 | 1,038 | 577 | 830 | 700 | |||||||||||||||||||||
Net assets | $ | 149,005 | $ | 105,341 | $ | 80,947 | $ | 174,517 | $ | 102,786 | $ | 133,483 | $ | 615,034 | ||||||||||||||
Net assets consist of: | ||||||||||||||||||||||||||||
Paid-in capital | $ | 136,715 | $ | 103,994 | $ | 72,570 | $ | 159,758 | $ | 94,018 | $ | 123,690 | $ | 545,261 | ||||||||||||||
Undistributed (excess of distributions over) net investment income | 1,893 | 2,372 | 419 | 1,730 | 1,241 | 1,268 | 7,819 | |||||||||||||||||||||
Accumulated net realized gain (loss) | (314 | ) | 150 | 11 | - | 126 | - | 733 | ||||||||||||||||||||
Net unrealized appreciation (depreciation) on investments and foreign currency | 10,711 | (1,175 | ) | 7,947 | 13,029 | 7,401 | 8,525 | 61,221 | ||||||||||||||||||||
| $ | 149,005 | $ | 105,341 | $ | 80,947 | $ | 174,517 | $ | 102,786 | $ | 133,483 | $ | 615,034 | |||||||||||||||
Class A | ||||||||||||||||||||||||||||
Net assets | $ | 148,996 | $ | 105,262 | $ | 80,924 | $ | 174,494 | $ | 102,766 | $ | 133,465 | $ | 615,034 | ||||||||||||||
Shares outstanding (no par value), unlimited shares authorized | 14,341 | 10,074 | 7,260 | 16,703 | 9,470 | 11,750 | 42,940 | |||||||||||||||||||||
Net asset value per share | $ | 10.39 | $ | 10.45 | $ | 11.15 | $ | 10.45 | $ | 10.85 | $ | 11.36 | $ | 14.32 | ||||||||||||||
Class B | ||||||||||||||||||||||||||||
Net assets | $ | 9 | $ | 79 | $ | 23 | $ | 23 | $ | 20 | $ | 18 | n/a | |||||||||||||||
Shares outstanding (no par value), unlimited shares authorized | 1 | 8 | 2 | 2 | 2 | 2 | n/a | |||||||||||||||||||||
Net asset value per share | $ | 10.41 | $ | 10.47 | $ | 11.16 | $ | 10.46 | $ | 10.87 | $ | 11.37 | n/a | |||||||||||||||
(a) Investments - unaffiliated, at cost | $ | 138,368 | $ | 106,562 | $ | 73,034 | $ | 161,578 | $ | 95,439 | $ | 125,023 | $ | - | ||||||||||||||
(b) Investments - affiliated, at cost | - | - | - | - | - | - | 553,914 | |||||||||||||||||||||
(c) Total investments, at cost | $ | 138,368 | $ | 106,562 | $ | 73,034 | $ | 161,578 | $ | 95,439 | $ | 125,023 | $ | 553,914 | ||||||||||||||
(d) Including value of securities on loan | - | - | - | - | - | - | - | |||||||||||||||||||||
(e) Foreign currency cost | - | - | - | - | - | - | - | |||||||||||||||||||||
(f) Proceeds from securities sold short/forward sales commitments | - | - | - | - | - | - | - | |||||||||||||||||||||
(g) Premiums from options written | - | - | - | - | - | - | - | |||||||||||||||||||||
See accompanying Notes to Financial Statements.
JNL Series Trust
Statements of Assets and Liabilities (in thousands, except net asset value per share)
December 31, 2010
| JNL Institutional Alt 35 Fund | JNL Institutional Alt 50 Fund | JNL Institutional Alt 65 Fund | JNL/BlackRock Commodity Securities Fund | JNL/BlackRock Global Allocation Fund | JNL/Capital Guardian Global Balanced Fund | JNL/Capital Guardian Global Diversified Research Fund | ||||||||||||||||||||||
Assets | ||||||||||||||||||||||||||||
Investments - unaffiliated, at value (a) (d) | $ | - | $ | - | $ | - | $ | 940,849 | $ | - | $ | 344,717 | $ | 422,689 | ||||||||||||||
Investments - affiliated, at value (b) | 885,592 | 1,077,783 | 728,524 | 240,516 | 179,646 | 30,112 | 24,367 | |||||||||||||||||||||
Repurchase agreements (a) | - | - | - | - | - | - | - | |||||||||||||||||||||
Total investments, at value (c) | 885,592 | 1,077,783 | 728,524 | 1,181,365 | 179,646 | 374,829 | 447,056 | |||||||||||||||||||||
Cash | - | - | - | 132 | - | 26 | 43 | |||||||||||||||||||||
Foreign currency (e) | - | - | - | 34 | - | 5 | - | |||||||||||||||||||||
Receivable for investments sold | - | - | - | 3,509 | - | 9 | - | |||||||||||||||||||||
Receivable for fund shares sold | 1,702 | 2,077 | 1,186 | 1,793 | 2,145 | 77 | 449 | |||||||||||||||||||||
Receivable from adviser | - | - | - | - | 73 | - | - | |||||||||||||||||||||
Receivable for dividends and interest | - | - | - | 282 | - | 1,914 | 535 | |||||||||||||||||||||
Receivable for variation margin | - | - | - | - | - | - | - | |||||||||||||||||||||
Receivable for deposits with brokers | - | - | - | - | - | - | - | |||||||||||||||||||||
Receivable for deposits with counterparties | - | - | - | - | - | - | - | |||||||||||||||||||||
Unrealized appreciation on forward foreign currency contracts | - | - | - | - | - | 284 | - | |||||||||||||||||||||
Unrealized appreciation on swap agreements | - | - | - | - | - | - | - | |||||||||||||||||||||
Swap premiums paid | - | - | - | - | - | - | - | |||||||||||||||||||||
Other assets | - | - | - | - | - | - | - | |||||||||||||||||||||
Total assets | 887,294 | 1,079,860 | 729,710 | 1,187,115 | 181,864 | 377,144 | 448,083 | |||||||||||||||||||||
Liabilities | ||||||||||||||||||||||||||||
Cash overdraft | - | - | - | - | - | - | - | |||||||||||||||||||||
Payable for reverse repurchase agreements | - | - | - | - | - | - | - | |||||||||||||||||||||
Payable for advisory fees | 93 | 108 | 80 | 504 | 100 | 194 | 261 | |||||||||||||||||||||
Payable for administrative fees | 36 | 44 | 29 | 119 | 17 | 45 | 54 | |||||||||||||||||||||
Payable for 12b-1 fee (Class A) | - | - | - | 159 | 22 | 59 | 73 | |||||||||||||||||||||
Payable for investment securities purchased | 1,414 | 1,672 | 849 | 7,000 | 2,055 | 3,579 | 55 | |||||||||||||||||||||
Payable for fund shares redeemed | 288 | 405 | 337 | 719 | 90 | 194 | 306 | |||||||||||||||||||||
Payable for dividends on securities sold short | - | - | - | - | - | - | - | |||||||||||||||||||||
Payable for interest expense and brokerage charges | - | - | - | - | - | - | - | |||||||||||||||||||||
Payable for trustee fees | 5 | 6 | 4 | 13 | - | 8 | 9 | |||||||||||||||||||||
Payable for other expenses | 2 | 2 | 1 | 2 | - | 13 | 10 | |||||||||||||||||||||
Payable for variation margin | - | - | - | - | - | - | - | |||||||||||||||||||||
Payable for deposits from counterparties | - | - | - | - | - | - | - | |||||||||||||||||||||
Investment securities sold short/forward sales commitments, at value (f) | - | - | - | - | - | - | - | |||||||||||||||||||||
Options written, at value (g) | - | - | - | - | - | - | - | |||||||||||||||||||||
Unrealized depreciation on forward foreign currency contracts | - | - | - | - | - | 147 | - | |||||||||||||||||||||
Unrealized depreciation on swap agreements | - | - | - | - | - | - | - | |||||||||||||||||||||
Swap premiums received | - | - | - | - | - | - | - | |||||||||||||||||||||
Return of collateral for securities loaned | - | - | - | 177,667 | - | 13,891 | 10,107 | |||||||||||||||||||||
Total liabilities | 1,838 | 2,237 | 1,300 | 186,183 | 2,284 | 18,130 | 10,875 | |||||||||||||||||||||
Net assets | $ | 885,456 | $ | 1,077,623 | $ | 728,410 | $ | 1,000,932 | $ | 179,580 | $ | 359,014 | $ | 437,208 | ||||||||||||||
Net assets consist of: | ||||||||||||||||||||||||||||
Paid-in capital | $ | 771,427 | $ | 942,370 | $ | 638,738 | $ | 920,587 | $ | 176,125 | $ | 367,136 | $ | 465,915 | ||||||||||||||
Undistributed (excess of distributions over) net investment income | 10,500 | 12,800 | 7,039 | 5,979 | 2,078 | 3,863 | 2,921 | |||||||||||||||||||||
Accumulated net realized gain (loss) | 1,462 | 2,215 | 2,657 | (73,017 | ) | (3 | ) | (55,194 | ) | (102,735 | ) | |||||||||||||||||
Net unrealized appreciation (depreciation) on investments and foreign currency | 102,067 | 120,238 | 79,976 | 147,383 | 1,380 | 43,209 | 71,107 | |||||||||||||||||||||
| $ | 885,456 | $ | 1,077,623 | $ | 728,410 | $ | 1,000,932 | $ | 179,580 | $ | 359,014 | $ | 437,208 | |||||||||||||||
Class A | ||||||||||||||||||||||||||||
Net assets | $ | 885,456 | $ | 1,077,623 | $ | 728,410 | $ | 1,000,238 | $ | 179,560 | $ | 358,593 | $ | 436,897 | ||||||||||||||
Shares outstanding (no par value), unlimited shares authorized | 58,816 | 69,581 | 45,336 | 90,784 | 17,352 | 37,658 | 18,808 | |||||||||||||||||||||
Net asset value per share | $ | 15.05 | $ | 15.49 | $ | 16.07 | $ | 11.02 | $ | 10.35 | $ | 9.52 | $ | 23.23 | ||||||||||||||
Class B | ||||||||||||||||||||||||||||
Net assets | n/a | n/a | n/a | $ | 694 | $ | 20 | $ | 421 | $ | 311 | |||||||||||||||||
Shares outstanding (no par value), unlimited shares authorized | n/a | n/a | n/a | 63 | 2 | 43 | 13 | |||||||||||||||||||||
Net asset value per share | n/a | n/a | n/a | $ | 11.06 | $ | 10.35 | $ | 9.75 | $ | 23.40 | |||||||||||||||||
(a) Investments - unaffiliated, at cost | $ | - | $ | - | $ | - | $ | 793,452 | $ | - | $ | 301,652 | $ | 351,575 | ||||||||||||||
(b) Investments - affiliated, at cost | 783,525 | 957,545 | 648,548 | 240,527 | 178,266 | 30,132 | 24,382 | |||||||||||||||||||||
(c) Total investments, at cost | $ | 783,525 | $ | 957,545 | $ | 648,548 | $ | 1,033,979 | $ | 178,266 | $ | 331,784 | $ | 375,957 | ||||||||||||||
(d) Including value of securities on loan | - | - | - | 177,133 | - | 13,346 | 9,714 | |||||||||||||||||||||
(e) Foreign currency cost | - | - | - | 35 | - | 5 | - | |||||||||||||||||||||
(f) Proceeds from securities sold short/forward sales commitments | - | - | - | - | - | - | - | |||||||||||||||||||||
(g) Premiums from options written | - | - | - | - | - | - | - | |||||||||||||||||||||
See accompanying Notes to Financial Statements.
JNL Series Trust
Statements of Assets and Liabilities (in thousands, except net asset value per share)
December 31, 2010
| JNL/Capital Guardian U.S. Growth Equity Fund | JNL/Eagle Core Equity Fund | JNL/Eagle SmallCap Equity Fund | JNL/Franklin Templeton Founding Strategy Fund | JNL/Franklin Templeton Global Growth Fund | JNL/ Franklin Templeton Income Fund | JNL/Franklin Templeton International Small Cap Growth Fund | ||||||||||||||||||||||
Assets | ||||||||||||||||||||||||||||
Investments - unaffiliated, at value (a) (d) | $ | 842,315 | $ | 197,980 | $ | 584,039 | $ | - | $ | 446,212 | $ | 985,928 | $ | 201,687 | ||||||||||||||
Investments - affiliated, at value (b) | 77,438 | 10,239 | 55,204 | 1,038,049 | 33,619 | 249,521 | 30,999 | |||||||||||||||||||||
Repurchase agreements (a) | - | - | - | - | - | - | - | |||||||||||||||||||||
Total investments, at value (c) | 919,753 | 208,219 | 639,243 | 1,038,049 | 479,831 | 1,235,449 | 232,686 | |||||||||||||||||||||
Cash | 32 | - | - | - | 4 | 95 | - | |||||||||||||||||||||
Foreign currency (e) | - | - | - | - | 595 | 11 | 2,837 | |||||||||||||||||||||
Receivable for investments sold | - | - | - | - | - | 2,736 | 251 | |||||||||||||||||||||
Receivable for fund shares sold | 1,746 | 342 | 1,238 | 1,537 | 859 | 1,180 | 346 | |||||||||||||||||||||
Receivable from adviser | - | - | - | - | - | - | - | |||||||||||||||||||||
Receivable for dividends and interest | 688 | 246 | 136 | - | 675 | 9,990 | 1,749 | |||||||||||||||||||||
Receivable for variation margin | - | - | - | - | - | - | - | |||||||||||||||||||||
Receivable for deposits with brokers | - | - | - | - | - | - | - | |||||||||||||||||||||
Receivable for deposits with counterparties | - | - | - | - | - | - | - | |||||||||||||||||||||
Unrealized appreciation on forward foreign currency contracts | - | - | - | - | - | - | - | |||||||||||||||||||||
Unrealized appreciation on swap agreements | - | - | - | - | - | - | - | |||||||||||||||||||||
Swap premiums paid | - | - | - | - | - | - | - | |||||||||||||||||||||
Other assets | - | - | - | - | - | - | - | |||||||||||||||||||||
Total assets | 922,219 | 208,807 | 640,617 | 1,039,586 | 481,964 | 1,249,461 | 237,869 | |||||||||||||||||||||
Liabilities | ||||||||||||||||||||||||||||
Cash overdraft | - | - | - | - | - | - | - | |||||||||||||||||||||
Payable for reverse repurchase agreements | - | - | - | - | - | - | - | |||||||||||||||||||||
Payable for advisory fees | 464 | 105 | 328 | - | 282 | 567 | 166 | |||||||||||||||||||||
Payable for administrative fees | 74 | 17 | 47 | 43 | 59 | 87 | 26 | |||||||||||||||||||||
Payable for 12b-1 fee (Class A) | 147 | 33 | 93 | - | 79 | 175 | 35 | |||||||||||||||||||||
Payable for investment securities purchased | 4,132 | 4,259 | 16,352 | 256 | - | 3,910 | 430 | |||||||||||||||||||||
Payable for fund shares redeemed | 709 | 145 | 570 | 1,281 | 507 | 966 | 81 | |||||||||||||||||||||
Payable for dividends on securities sold short | - | - | - | - | - | - | - | |||||||||||||||||||||
Payable for interest expense and brokerage charges | - | - | - | - | - | - | - | |||||||||||||||||||||
Payable for trustee fees | 14 | 5 | 9 | 22 | 10 | 19 | 3 | |||||||||||||||||||||
Payable for other expenses | 2 | 1 | 1 | 3 | 10 | 2 | 1 | |||||||||||||||||||||
Payable for variation margin | - | - | - | - | - | - | - | |||||||||||||||||||||
Payable for deposits from counterparties | - | - | - | - | - | - | - | |||||||||||||||||||||
Investment securities sold short/forward sales commitments, at value (f) | - | - | - | - | - | - | - | |||||||||||||||||||||
Options written, at value (g) | - | - | - | - | - | - | - | |||||||||||||||||||||
Unrealized depreciation on forward foreign currency contracts | - | - | - | - | - | - | - | |||||||||||||||||||||
Unrealized depreciation on swap agreements | - | - | - | - | - | - | - | |||||||||||||||||||||
Swap premiums received | - | - | - | - | - | - | - | |||||||||||||||||||||
Return of collateral for securities loaned | 21,708 | 714 | 33,287 | - | 5,276 | 181,595 | 23,122 | |||||||||||||||||||||
Total liabilities | 27,250 | 5,279 | 50,687 | 1,605 | 6,223 | 187,321 | 23,864 | |||||||||||||||||||||
Net assets | $ | 894,969 | $ | 203,528 | $ | 589,930 | $ | 1,037,981 | $ | 475,741 | $ | 1,062,140 | $ | 214,005 | ||||||||||||||
Net assets consist of: | ||||||||||||||||||||||||||||
Paid-in capital | $ | 837,495 | $ | 196,806 | $ | 476,891 | $ | 1,145,637 | $ | 531,807 | $ | 1,088,551 | $ | 200,503 | ||||||||||||||
Undistributed (excess of distributions over) net investment income | 1,458 | 1,252 | 92 | 15,748 | 4,626 | 49,325 | 3,211 | |||||||||||||||||||||
Accumulated net realized gain (loss) | (106,145 | ) | (16,052 | ) | (25,560 | ) | (62,455 | ) | (49,492 | ) | (91,879 | ) | (12,019 | ) | ||||||||||||||
Net unrealized appreciation (depreciation) on investments and foreign currency | 162,161 | 21,522 | 138,507 | (60,949 | ) | (11,200 | ) | 16,143 | 22,310 | |||||||||||||||||||
| $ | 894,969 | $ | 203,528 | $ | 589,930 | $ | 1,037,981 | $ | 475,741 | $ | 1,062,140 | $ | 214,005 | |||||||||||||||
Class A | ||||||||||||||||||||||||||||
Net assets | $ | 894,742 | $ | 203,409 | $ | 589,399 | $ | 1,037,981 | $ | 475,458 | $ | 1,061,794 | $ | 213,824 | ||||||||||||||
Shares outstanding (no par value), unlimited shares authorized | 42,215 | 27,742 | 26,940 | 117,604 | 58,809 | 105,127 | 26,181 | |||||||||||||||||||||
Net asset value per share | $ | 21.19 | $ | 7.33 | $ | 21.88 | $ | 8.83 | $ | 8.08 | $ | 10.10 | $ | 8.17 | ||||||||||||||
Class B | ||||||||||||||||||||||||||||
Net assets | $ | 227 | $ | 119 | $ | 531 | n/a | $ | 283 | $ | 346 | $ | 181 | |||||||||||||||
Shares outstanding (no par value), unlimited shares authorized | 11 | 15 | 24 | n/a | 35 | 36 | 22 | |||||||||||||||||||||
Net asset value per share | $ | 21.43 | $ | 7.65 | $ | 22.25 | n/a | $ | 8.10 | $ | 9.76 | $ | 8.21 | |||||||||||||||
(a) Investments - unaffiliated, at cost | $ | 680,127 | $ | 176,458 | $ | 445,505 | $ | - | $ | 457,426 | $ | 969,743 | $ | 179,400 | ||||||||||||||
(b) Investments - affiliated, at cost | 77,465 | 10,239 | 55,231 | 1,098,998 | 33,625 | 249,561 | 31,003 | |||||||||||||||||||||
(c) Total investments, at cost | $ | 757,592 | $ | 186,697 | $ | 500,736 | $ | 1,098,998 | $ | 491,051 | $ | 1,219,304 | $ | 210,403 | ||||||||||||||
(d) Including value of securities on loan | 21,146 | 699 | 32,287 | - | 5,076 | 177,233 | 22,186 | |||||||||||||||||||||
(e) Foreign currency cost | - | - | - | - | 583 | 11 | 2,804 | |||||||||||||||||||||
(f) Proceeds from securities sold short/forward sales commitments | - | - | - | - | - | - | - | |||||||||||||||||||||
(g) Premiums from options written | - | - | - | - | - | - | - | |||||||||||||||||||||
See accompanying Notes to Financial Statements.
JNL Series Trust
Statements of Assets and Liabilities (in thousands, except net asset value per share)
December 31, 2010
| JNL/Franklin Templeton Mutual Shares Fund | JNL/Franklin Templeton Small Cap Value Fund | JNL/Goldman Sachs Core Plus Bond Fund | JNL/Goldman Sachs Emerging Markets Debt Fund | JNL/Goldman Sachs Mid Cap Value Fund | JNL/Goldman Sachs U.S. Equity Flex Fund | JNL/Invesco Global Real Estate Fund | ||||||||||||||||||||||
Assets | ||||||||||||||||||||||||||||
Investments - unaffiliated, at value (a) (d) | $ | 532,833 | $ | 274,072 | $ | 1,075,935 | $ | 518,877 | $ | 490,056 | $ | 145,714 | $ | 650,851 | ||||||||||||||
Investments - affiliated, at value (b) | 73,425 | 30,672 | 427,793 | 211,959 | 31,802 | 4,931 | 39,619 | |||||||||||||||||||||
Repurchase agreements (a) | - | - | - | - | - | - | - | |||||||||||||||||||||
Total investments, at value (c) | 606,258 | 304,744 | 1,503,728 | 730,836 | 521,858 | 150,645 | 690,470 | |||||||||||||||||||||
Cash | 49 | 21 | - | 808 | - | - | - | |||||||||||||||||||||
Foreign currency (e) | 1,231 | - | 256 | 163 | - | - | 3,305 | |||||||||||||||||||||
Receivable for investments sold | 4,141 | 98 | 342,531 | - | - | - | 4,829 | |||||||||||||||||||||
Receivable for fund shares sold | 1,031 | 724 | 1,217 | 1,526 | 1,054 | 344 | 1,180 | |||||||||||||||||||||
Receivable from adviser | - | - | - | - | - | - | - | |||||||||||||||||||||
Receivable for dividends and interest | 1,051 | 177 | 5,417 | 9,571 | 734 | 189 | 2,415 | |||||||||||||||||||||
Receivable for variation margin | - | - | 825 | - | - | - | - | |||||||||||||||||||||
Receivable for deposits with brokers | - | - | 1,014 | 650 | - | - | - | |||||||||||||||||||||
Receivable for deposits with counterparties | - | - | 7,580 | - | - | - | - | |||||||||||||||||||||
Unrealized appreciation on forward foreign currency contracts | 1,605 | - | 2,020 | 9,706 | - | - | - | |||||||||||||||||||||
Unrealized appreciation on swap agreements | - | - | 9,768 | 5,774 | - | - | - | |||||||||||||||||||||
Swap premiums paid | - | - | 5,711 | 17,509 | - | - | - | |||||||||||||||||||||
Other assets | 17 | - | - | - | - | - | - | |||||||||||||||||||||
Total assets | 615,383 | 305,764 | 1,880,067 | 776,543 | 523,646 | 151,178 | 702,199 | |||||||||||||||||||||
Liabilities | ||||||||||||||||||||||||||||
Cash overdraft | - | - | 6,378 | - | - | - | - | |||||||||||||||||||||
Payable for reverse repurchase agreements | - | - | - | - | - | - | - | |||||||||||||||||||||
Payable for advisory fees | 366 | 200 | 515 | 448 | 294 | 77 | 377 | |||||||||||||||||||||
Payable for administrative fees | 49 | 24 | 90 | 94 | 41 | 14 | 80 | |||||||||||||||||||||
Payable for 12b-1 fee (Class A) | 99 | 48 | 180 | 125 | 81 | 19 | 107 | |||||||||||||||||||||
Payable for investment securities purchased | 5,065 | - | 701,756 | - | 7,980 | 214 | 8,540 | |||||||||||||||||||||
Payable for fund shares redeemed | 593 | 217 | 747 | 700 | 366 | 174 | 387 | |||||||||||||||||||||
Payable for dividends on securities sold short | - | - | - | - | - | 35 | - | |||||||||||||||||||||
Payable for interest expense and brokerage charges | - | - | - | - | - | 23 | - | |||||||||||||||||||||
Payable for trustee fees | 11 | 5 | 24 | 5 | 8 | 2 | 9 | |||||||||||||||||||||
Payable for other expenses | 10 | 1 | 3 | 2 | 1 | - | 10 | |||||||||||||||||||||
Payable for variation margin | - | - | 3 | - | - | - | - | |||||||||||||||||||||
Payable for deposits from counterparties | - | - | 7,580 | - | - | - | - | |||||||||||||||||||||
Investment securities sold short/forward sales commitments, at value (f) | - | - | 23,595 | - | - | 35,216 | - | |||||||||||||||||||||
Options written, at value (g) | - | - | - | - | - | - | - | |||||||||||||||||||||
Unrealized depreciation on forward foreign currency contracts | 3,350 | - | 2,807 | 10,386 | - | - | - | |||||||||||||||||||||
Unrealized depreciation on swap agreements | - | - | 7,515 | 1,449 | - | - | - | |||||||||||||||||||||
Swap premiums received | - | - | 1,291 | - | - | - | - | |||||||||||||||||||||
Return of collateral for securities loaned | 10,775 | 10,669 | 70,924 | - | 8,784 | - | 30,901 | |||||||||||||||||||||
Total liabilities | 20,318 | 11,164 | 823,408 | 13,209 | 17,555 | 35,774 | 40,411 | |||||||||||||||||||||
Net assets | $ | 595,065 | $ | 294,600 | $ | 1,056,659 | $ | 763,334 | $ | 506,091 | $ | 115,404 | $ | 661,788 | ||||||||||||||
Net assets consist of: | ||||||||||||||||||||||||||||
Paid-in capital | $ | 632,120 | $ | 253,283 | $ | 1,013,728 | $ | 683,668 | $ | 453,493 | $ | 108,790 | $ | 668,455 | ||||||||||||||
Undistributed (excess of distributions over) net investment income | 18,020 | 1,111 | 21,079 | 35,962 | 1,353 | 159 | 7,115 | |||||||||||||||||||||
Accumulated net realized gain (loss) | (76,104 | ) | (8,125 | ) | 27,666 | 19,504 | (24,295 | ) | (3,883 | ) | (86,876 | ) | ||||||||||||||||
Net unrealized appreciation (depreciation) on investments and foreign currency | 21,029 | 48,331 | (5,814 | ) | 24,200 | 75,540 | 10,338 | 73,094 | ||||||||||||||||||||
| $ | 595,065 | $ | 294,600 | $ | 1,056,659 | $ | 763,334 | $ | 506,091 | $ | 115,404 | $ | 661,788 | |||||||||||||||
Class A | ||||||||||||||||||||||||||||
Net assets | $ | 594,707 | $ | 294,200 | $ | 1,056,413 | $ | 762,892 | $ | 496,550 | $ | 115,234 | $ | 661,172 | ||||||||||||||
Shares outstanding (no par value), unlimited shares authorized | 70,163 | 26,700 | 87,021 | 55,904 | 46,840 | 14,075 | 77,799 | |||||||||||||||||||||
Net asset value per share | $ | 8.48 | $ | 11.02 | $ | 12.14 | $ | 13.65 | $ | 10.60 | $ | 8.19 | $ | 8.50 | ||||||||||||||
Class B | ||||||||||||||||||||||||||||
Net assets | $ | 358 | $ | 400 | $ | 246 | $ | 442 | $ | 9,541 | $ | 170 | $ | 616 | ||||||||||||||
Shares outstanding (no par value), unlimited shares authorized | 42 | 36 | 20 | 32 | 899 | 21 | 72 | |||||||||||||||||||||
Net asset value per share | $ | 8.52 | $ | 10.98 | $ | 12.30 | $ | 13.70 | $ | 10.61 | $ | 8.24 | $ | 8.57 | ||||||||||||||
(a) Investments - unaffiliated, at cost | $ | 510,100 | $ | 225,725 | $ | 1,081,343 | $ | 498,466 | $ | 414,505 | $ | 133,023 | $ | 577,810 | ||||||||||||||
(b) Investments - affiliated, at cost | 73,425 | 30,688 | 427,803 | 211,959 | 31,813 | 4,931 | 39,644 | |||||||||||||||||||||
(c) Total investments, at cost | $ | 583,525 | $ | 256,413 | $ | 1,509,146 | $ | 710,425 | $ | 446,318 | $ | 137,954 | $ | 617,454 | ||||||||||||||
(d) Including value of securities on loan | 10,536 | 10,270 | 69,753 | - | 8,482 | - | 29,741 | |||||||||||||||||||||
(e) Foreign currency cost | 1,207 | - | 255 | 163 | - | - | 3,250 | |||||||||||||||||||||
(f) Proceeds from securities sold short/forward sales commitments | - | - | 23,214 | - | - | 32,863 | - | |||||||||||||||||||||
(g) Premiums from options written | - | - | - | - | - | - | - | |||||||||||||||||||||
See accompanying Notes to Financial Statements.
JNL Series Trust
Statements of Assets and Liabilities (in thousands, except net asset value per share)
December 31, 2010
| Assets | JNL/Invesco International Growth Fund | JNL/Invesco Large Cap Growth Fund | JNL/Invesco Small Cap Growth Fund | JNL/ Ivy Asset Strategy Fund | JNL/JPMorgan International Value Fund | JNL/JPMorgan MidCap Growth Fund | JNL/JPMorgan U.S. Government & Quality Bond Fund | |||||||||||||||||||||
Investments - unaffiliated, at value (a) (d) | $ | 549,879 | $ | 888,774 | $ | 145,867 | $ | 863,129 | $ | 590,665 | $ | 226,924 | $ | 878,305 | ||||||||||||||
Investments - affiliated, at value (b) | 64,044 | 25,059 | 18,035 | 100,979 | 33,214 | 20,141 | 67,601 | |||||||||||||||||||||
Repurchase agreements (a) | - | - | - | - | - | - | - | |||||||||||||||||||||
Total investments, at value (c) | 613,923 | 913,833 | 163,902 | 964,108 | 623,879 | 247,065 | 945,906 | |||||||||||||||||||||
Cash | 69 | - | - | 3,224 | - | - | - | |||||||||||||||||||||
Foreign currency (e) | 246 | 40 | - | 3 | 983 | - | - | |||||||||||||||||||||
Receivable for investments sold | 63 | 3,985 | 639 | 15,660 | - | 1,058 | 387 | |||||||||||||||||||||
Receivable for fund shares sold | 1,040 | 1,487 | 199 | 2,067 | 1,107 | 251 | 899 | |||||||||||||||||||||
Receivable from adviser | - | - | - | - | - | - | - | |||||||||||||||||||||
Receivable for dividends and interest | 661 | 559 | 37 | 538 | 1,093 | 77 | 4,424 | |||||||||||||||||||||
Receivable for variation margin | - | - | - | - | - | - | - | |||||||||||||||||||||
Receivable for deposits with brokers | - | - | - | - | - | - | - | |||||||||||||||||||||
Receivable for deposits with counterparties | - | - | - | - | - | - | - | |||||||||||||||||||||
Unrealized appreciation on forward foreign currency contracts | - | - | - | - | 5,552 | - | - | |||||||||||||||||||||
Unrealized appreciation on swap agreements | - | - | - | 15 | - | - | - | |||||||||||||||||||||
Swap premiums paid | - | - | - | - | - | - | - | |||||||||||||||||||||
Other assets | - | - | - | - | - | - | - | |||||||||||||||||||||
Total assets | 616,002 | 919,904 | 164,777 | 985,615 | 632,614 | 248,451 | 951,616 | |||||||||||||||||||||
Liabilities | ||||||||||||||||||||||||||||
Cash overdraft | - | - | - | - | - | - | - | |||||||||||||||||||||
Payable for reverse repurchase agreements | - | - | - | - | - | - | - | |||||||||||||||||||||
Payable for advisory fees | 318 | 498 | 105 | 694 | 329 | 136 | 315 | |||||||||||||||||||||
Payable for administrative fees | 72 | 75 | 12 | 119 | 75 | 19 | 78 | |||||||||||||||||||||
Payable for 12b-1 fee (Class A) | 96 | 151 | 25 | 158 | 101 | 39 | 157 | |||||||||||||||||||||
Payable for investment securities purchased | 187 | 311 | 632 | 1,811 | - | 401 | - | |||||||||||||||||||||
Payable for fund shares redeemed | 461 | 884 | 124 | 1,312 | 688 | 229 | 760 | |||||||||||||||||||||
Payable for dividends on securities sold short | - | - | - | - | - | - | - | |||||||||||||||||||||
Payable for interest expense and brokerage charges | - | - | - | - | - | - | - | |||||||||||||||||||||
Payable for trustee fees | 15 | 18 | 3 | 4 | 18 | 6 | 19 | |||||||||||||||||||||
Payable for other expenses | 25 | 2 | - | 26 | 30 | 9 | 3 | |||||||||||||||||||||
Payable for variation margin | - | - | - | - | - | - | - | |||||||||||||||||||||
Payable for deposits from counterparties | - | - | - | - | - | - | - | |||||||||||||||||||||
Investment securities sold short/forward sales commitments, at value (f) | - | - | - | - | - | - | - | |||||||||||||||||||||
Options written, at value (g) | - | - | - | 1,808 | - | - | - | |||||||||||||||||||||
Unrealized depreciation on forward foreign currency contracts | - | - | - | 3,797 | 1,290 | - | - | |||||||||||||||||||||
Unrealized depreciation on swap agreements | - | - | - | 41 | - | - | - | |||||||||||||||||||||
Swap premiums received | - | - | - | - | - | - | - | |||||||||||||||||||||
Return of collateral for securities loaned | 26,335 | 6,252 | 13,463 | - | 22,138 | 15,041 | 31,427 | |||||||||||||||||||||
Total liabilities | 27,509 | 8,191 | 14,364 | 9,770 | 24,669 | 15,880 | 32,759 | |||||||||||||||||||||
Net assets | $ | 588,493 | $ | 911,713 | $ | 150,413 | $ | 975,845 | $ | 607,945 | $ | 232,571 | $ | 918,857 | ||||||||||||||
Net assets consist of: | ||||||||||||||||||||||||||||
Paid-in capital | $ | 621,141 | $ | 789,869 | $ | 120,836 | $ | 893,535 | $ | 748,099 | $ | 235,466 | $ | 851,972 | ||||||||||||||
Undistributed (excess of distributions over) net investment income | 4,486 | 1,496 | 32 | 3,233 | 14,217 | (7 | ) | 30,277 | ||||||||||||||||||||
Accumulated net realized gain (loss) | (115,253 | ) | (25,681 | ) | 369 | (67,660 | ) | (215,786 | ) | (49,950 | ) | (999 | ) | |||||||||||||||
Net unrealized appreciation (depreciation) on investments and foreign currency | 78,119 | 146,029 | 29,176 | 146,737 | 61,415 | 47,062 | 37,607 | |||||||||||||||||||||
| $ | 588,493 | $ | 911,713 | $ | 150,413 | $ | 975,845 | $ | 607,945 | $ | 232,571 | $ | 918,857 | |||||||||||||||
Class A | ||||||||||||||||||||||||||||
Net assets | $ | 588,008 | $ | 910,935 | $ | 149,999 | $ | 975,565 | $ | 607,358 | $ | 232,386 | $ | 918,334 | ||||||||||||||
Shares outstanding (no par value), unlimited shares authorized | 56,880 | 72,333 | 11,751 | 85,349 | 80,719 | 11,605 | 70,951 | |||||||||||||||||||||
Net asset value per share | $ | 10.34 | $ | 12.59 | $ | 12.76 | $ | 11.43 | $ | 7.52 | $ | 20.02 | $ | 12.94 | ||||||||||||||
Class B | ||||||||||||||||||||||||||||
Net assets | $ | 485 | $ | 778 | $ | 414 | $ | 280 | $ | 587 | $ | 185 | $ | 523 | ||||||||||||||
Shares outstanding (no par value), unlimited shares authorized | 45 | 61 | 32 | 24 | 76 | 9 | 39 | |||||||||||||||||||||
Net asset value per share | $ | 10.81 | $ | 12.69 | $ | 12.98 | $ | 11.45 | $ | 7.68 | $ | 20.30 | $ | 13.47 | ||||||||||||||
(a) Investments - unaffiliated, at cost | $ | 471,805 | $ | 742,746 | $ | 116,684 | $ | 712,200 | $ | 533,581 | $ | 179,851 | $ | 840,616 | ||||||||||||||
(b) Investments - affiliated, at cost | 64,068 | 25,067 | 18,042 | 100,979 | 33,236 | 20,152 | 67,683 | |||||||||||||||||||||
(c) Total investments, at cost | $ | 535,873 | $ | 767,813 | $ | 134,726 | $ | 813,179 | $ | 566,817 | $ | 200,003 | $ | 908,299 | ||||||||||||||
(d) Including value of securities on loan | 25,394 | 5,986 | 13,039 | - | 21,207 | 14,631 | 30,935 | |||||||||||||||||||||
(e) Foreign currency cost | 207 | 39 | - | 2 | 901 | - | - | |||||||||||||||||||||
(f) Proceeds from securities sold short/forward sales commitments | - | - | - | - | - | - | - | |||||||||||||||||||||
(g) Premiums from options written | - | - | - | 1,434 | - | - | - | |||||||||||||||||||||
See accompanying Notes to Financial Statements.
JNL Series Trust
Statements of Assets and Liabilities (in thousands, except net asset value per share)
December 31, 2010
| Assets | JNL/Lazard Emerging Markets Fund | JNL/Lazard Mid Cap Equity Fund | JNL/M&G Global Basics Fund | JNL/M&G Global Leaders Fund | JNL/Mellon Capital Management 10 X 10 Fund | JNL/Mellon Capital Management Index 5 Fund | JNL/Mellon Capital Management European 30 Fund | |||||||||||||||||||||
Investments - unaffiliated, at value (a) (d) | $ | 1,334,987 | $ | 204,324 | $ | 189,690 | $ | 29,674 | $ | - | $ | - | $ | 18,311 | ||||||||||||||
Investments - affiliated, at value (b) | 129,721 | 13,184 | 23,050 | 1,053 | 257,560 | 332,499 | 191 | |||||||||||||||||||||
Repurchase agreements (a) | - | - | - | - | - | - | - | |||||||||||||||||||||
Total investments, at value (c) | 1,464,708 | 217,508 | 212,740 | 30,727 | 257,560 | 332,499 | 18,502 | |||||||||||||||||||||
Cash | - | - | - | - | - | - | - | |||||||||||||||||||||
Foreign currency (e) | 1,370 | - | 144 | 255 | - | - | 15 | |||||||||||||||||||||
Receivable for investments sold | 10,301 | 508 | 42 | 3,924 | - | - | - | |||||||||||||||||||||
Receivable for fund shares sold | 2,948 | 275 | 415 | 66 | 446 | 318 | 9 | |||||||||||||||||||||
Receivable from adviser | - | - | - | - | - | - | - | |||||||||||||||||||||
Receivable for dividends and interest | 1,261 | 108 | 88 | 30 | - | - | 37 | |||||||||||||||||||||
Receivable for variation margin | - | - | - | - | - | - | - | |||||||||||||||||||||
Receivable for deposits with brokers | - | - | - | - | - | - | - | |||||||||||||||||||||
Receivable for deposits with counterparties | - | - | - | - | - | - | - | |||||||||||||||||||||
Unrealized appreciation on forward foreign currency contracts | - | - | - | - | - | - | - | |||||||||||||||||||||
Unrealized appreciation on swap agreements | - | - | - | - | - | - | - | |||||||||||||||||||||
Swap premiums paid | - | - | - | - | - | - | - | |||||||||||||||||||||
Other assets | - | - | - | - | - | - | - | |||||||||||||||||||||
Total assets | 1,480,588 | 218,399 | 213,429 | 35,002 | 258,006 | 332,817 | 18,563 | |||||||||||||||||||||
Liabilities | ||||||||||||||||||||||||||||
Cash overdraft | - | - | - | 2,824 | - | - | - | |||||||||||||||||||||
Payable for reverse repurchase agreements | - | - | - | - | - | - | - | |||||||||||||||||||||
Payable for advisory fees | 977 | 126 | 134 | 23 | - | - | 6 | |||||||||||||||||||||
Payable for administrative fees | 169 | 18 | 24 | 4 | 10 | 14 | 3 | |||||||||||||||||||||
Payable for 12b-1 fee (Class A) | 225 | 35 | 32 | 5 | - | - | 3 | |||||||||||||||||||||
Payable for investment securities purchased | 20,586 | 1,865 | 107 | 1,133 | 11 | 84 | 75 | |||||||||||||||||||||
Payable for fund shares redeemed | 1,183 | 207 | 112 | 14 | 435 | 234 | 5 | |||||||||||||||||||||
Payable for dividends on securities sold short | - | - | - | - | - | - | - | |||||||||||||||||||||
Payable for interest expense and brokerage charges | - | - | - | - | - | - | - | |||||||||||||||||||||
Payable for trustee fees | 16 | 7 | 1 | - | 4 | 3 | - | |||||||||||||||||||||
Payable for other expenses | 24 | 1 | 26 | 8 | 1 | 1 | - | |||||||||||||||||||||
Payable for variation margin | - | - | - | - | - | - | - | |||||||||||||||||||||
Payable for deposits from counterparties | - | - | - | - | - | - | - | |||||||||||||||||||||
Investment securities sold short/forward sales commitments, at value (f) | - | - | - | - | - | - | - | |||||||||||||||||||||
Options written, at value (g) | - | - | - | - | - | - | - | |||||||||||||||||||||
Unrealized depreciation on forward foreign currency contracts | - | - | - | - | - | - | - | |||||||||||||||||||||
Unrealized depreciation on swap agreements | - | - | - | - | - | - | - | |||||||||||||||||||||
Swap premiums received | - | - | - | - | - | - | - | |||||||||||||||||||||
Return of collateral for securities loaned | 69,379 | 1,911 | 17,479 | 1,053 | - | - | 112 | |||||||||||||||||||||
Total liabilities | 92,559 | 4,170 | 17,915 | 5,064 | 461 | 336 | 204 | |||||||||||||||||||||
Net assets | $ | 1,388,029 | $ | 214,229 | $ | 195,514 | $ | 29,938 | $ | 257,545 | $ | 332,481 | $ | 18,359 | ||||||||||||||
Net assets consist of: | ||||||||||||||||||||||||||||
Paid-in capital | $ | 1,174,322 | $ | 248,316 | $ | 156,207 | $ | 24,729 | $ | 250,350 | $ | 284,418 | $ | 17,497 | ||||||||||||||
Undistributed (excess of distributions over) net investment income | 13,588 | 1,469 | (626 | ) | (1 | ) | 4,078 | 4,118 | 452 | |||||||||||||||||||
Accumulated net realized gain (loss) | (35,645 | ) | (69,789 | ) | 199 | 592 | (27,461 | ) | (12,852 | ) | 400 | |||||||||||||||||
Net unrealized appreciation (depreciation) on investments and foreign currency | 235,764 | 34,233 | 39,734 | 4,618 | 30,578 | 56,797 | 10 | |||||||||||||||||||||
| $ | 1,388,029 | $ | 214,229 | $ | 195,514 | $ | 29,938 | $ | 257,545 | $ | 332,481 | $ | 18,359 | |||||||||||||||
Class A | ||||||||||||||||||||||||||||
Net assets | $ | 1,386,967 | $ | 214,053 | $ | 195,399 | $ | 29,788 | $ | 257,545 | $ | 332,481 | $ | 18,217 | ||||||||||||||
Shares outstanding (no par value), unlimited shares authorized | 114,743 | 18,473 | 13,043 | 2,339 | 31,325 | 34,563 | 1,587 | |||||||||||||||||||||
Net asset value per share | $ | 12.09 | $ | 11.59 | $ | 14.98 | $ | 12.73 | $ | 8.22 | $ | 9.62 | $ | 11.48 | ||||||||||||||
Class B | ||||||||||||||||||||||||||||
Net assets | $ | 1,062 | $ | 176 | $ | 115 | $ | 150 | n/a | n/a | $ | 142 | ||||||||||||||||
Shares outstanding (no par value), unlimited shares authorized | 88 | 15 | 8 | 12 | n/a | n/a | 12 | |||||||||||||||||||||
Net asset value per share | $ | 12.14 | $ | 11.68 | $ | 15.02 | $ | 12.75 | n/a | n/a | $ | 11.51 | ||||||||||||||||
(a) Investments - unaffiliated, at cost | $ | 1,099,098 | $ | 170,080 | $ | 149,958 | $ | 25,063 | $ | - | $ | - | $ | 18,303 | ||||||||||||||
(b) Investments - affiliated, at cost | 129,742 | 13,195 | 23,050 | 1,053 | 226,982 | 275,702 | 191 | |||||||||||||||||||||
(c) Total investments, at cost | $ | 1,228,840 | $ | 183,275 | $ | 173,008 | $ | 26,116 | $ | 226,982 | $ | 275,702 | $ | 18,494 | ||||||||||||||
(d) Including value of securities on loan | 66,935 | 1,876 | 16,801 | 1,016 | - | - | 108 | |||||||||||||||||||||
(e) Foreign currency cost | 1,424 | - | 143 | 252 | - | - | 15 | |||||||||||||||||||||
(f) Proceeds from securities sold short/forward sales commitments | - | - | - | - | - | - | - | |||||||||||||||||||||
(g) Premiums from options written | - | - | - | - | - | - | - | |||||||||||||||||||||
See accompanying Notes to Financial Statements.
JNL Series Trust
Statements of Assets and Liabilities (in thousands, except net asset value per share)
December 31, 2010
| Assets | JNL/Mellon Capital Management Pacific Rim 30 Fund | JNL/Mellon Capital Management S&P 500 Index Fund | JNL/Mellon Capital Management S&P 400 MidCap Index Fund | JNL/Mellon Capital Management Small Cap Index Fund | JNL/Mellon Capital Management International Index Fund | JNL/Mellon Capital Management Bond Index Fund | JNL/Mellon Capital Management Global Alpha Fund | |||||||||||||||||||||
Investments - unaffiliated, at value (a) (d) | $ | 38,928 | $ | 1,319,060 | $ | 658,909 | $ | 700,767 | $ | 1,054,381 | $ | 1,317,439 | $ | 194,832 | ||||||||||||||
Investments - affiliated, at value (b) | 1,609 | 34,107 | 53,214 | 95,998 | 87,098 | 118,895 | 3,593 | |||||||||||||||||||||
Repurchase agreements (a) | - | - | - | - | - | - | - | |||||||||||||||||||||
Total investments, at value (c) | 40,537 | 1,353,167 | 712,123 | 796,765 | 1,141,479 | 1,436,334 | 198,425 | |||||||||||||||||||||
Cash | - | - | - | 14 | - | 72 | - | |||||||||||||||||||||
Foreign currency (e) | 87 | - | - | - | 1,844 | - | - | |||||||||||||||||||||
Receivable for investments sold | - | - | - | 70 | - | 54,087 | - | |||||||||||||||||||||
Receivable for fund shares sold | 43 | 1,540 | 589 | 1,647 | 1,349 | 1,839 | 335 | |||||||||||||||||||||
Receivable from adviser | - | - | - | - | - | - | - | |||||||||||||||||||||
Receivable for dividends and interest | 104 | 1,548 | 518 | 751 | 1,427 | 9,692 | 1 | |||||||||||||||||||||
Receivable for variation margin | - | - | - | - | - | - | 447 | |||||||||||||||||||||
Receivable for deposits with brokers | - | - | - | - | - | - | - | |||||||||||||||||||||
Receivable for deposits with counterparties | - | - | - | - | - | - | - | |||||||||||||||||||||
Unrealized appreciation on forward foreign currency contracts | - | - | - | - | 921 | - | 4,209 | |||||||||||||||||||||
Unrealized appreciation on swap agreements | - | - | - | - | - | - | - | |||||||||||||||||||||
Swap premiums paid | - | - | - | - | - | - | - | |||||||||||||||||||||
Other assets | - | - | - | - | - | - | - | |||||||||||||||||||||
Total assets | 40,771 | 1,356,255 | 713,230 | 799,247 | 1,147,020 | 1,502,024 | 203,417 | |||||||||||||||||||||
Liabilities | ||||||||||||||||||||||||||||
Cash overdraft | - | - | - | - | - | - | - | |||||||||||||||||||||
Payable for reverse repurchase agreements | - | - | - | - | - | - | - | |||||||||||||||||||||
Payable for advisory fees | 12 | 286 | 155 | 164 | 243 | 293 | 163 | |||||||||||||||||||||
Payable for administrative fees | 6 | 112 | 56 | 59 | 134 | 110 | 24 | |||||||||||||||||||||
Payable for 12b-1 fee (Class A) | 6 | 222 | 110 | 118 | 175 | 221 | 33 | |||||||||||||||||||||
Payable for investment securities purchased | 101 | - | - | - | - | 94,203 | - | |||||||||||||||||||||
Payable for fund shares redeemed | 36 | 1,114 | 805 | 778 | 1,015 | 794 | 89 | |||||||||||||||||||||
Payable for dividends on securities sold short | - | - | - | - | - | - | - | |||||||||||||||||||||
Payable for interest expense and brokerage charges | - | - | - | - | - | - | - | |||||||||||||||||||||
Payable for trustee fees | - | 30 | 15 | 17 | 21 | 19 | 1 | |||||||||||||||||||||
Payable for other expenses | - | 4 | 2 | 17 | 89 | 3 | - | |||||||||||||||||||||
Payable for variation margin | - | 18 | 91 | 93 | 100 | - | 553 | |||||||||||||||||||||
Payable for deposits from counterparties | - | - | - | - | - | - | - | |||||||||||||||||||||
Investment securities sold short/forward sales commitments, at value (f) | - | - | - | - | - | - | - | |||||||||||||||||||||
Options written, at value (g) | - | - | - | - | - | - | - | |||||||||||||||||||||
Unrealized depreciation on forward foreign currency contracts | - | - | - | - | 452 | - | 1,440 | |||||||||||||||||||||
Unrealized depreciation on swap agreements | - | - | - | - | - | - | - | |||||||||||||||||||||
Swap premiums received | - | - | - | - | - | - | - | |||||||||||||||||||||
Return of collateral for securities loaned | 1,475 | 13,169 | 41,186 | 83,182 | 56,504 | 74,817 | - | |||||||||||||||||||||
Total liabilities | 1,636 | 14,955 | 42,420 | 84,428 | 58,733 | 170,460 | 2,303 | |||||||||||||||||||||
Net assets | $ | 39,135 | $ | 1,341,300 | $ | 670,810 | $ | 714,819 | $ | 1,088,287 | $ | 1,331,564 | $ | 201,114 | ||||||||||||||
Net assets consist of: | ||||||||||||||||||||||||||||
Paid-in capital | $ | 34,246 | $ | 1,202,714 | $ | 580,167 | $ | 602,604 | $ | 1,052,427 | $ | 1,295,803 | $ | 193,377 | ||||||||||||||
Undistributed (excess of distributions over) net investment income | 892 | 869 | 3,583 | 4,923 | 2,574 | 9,505 | 1,170 | |||||||||||||||||||||
Accumulated net realized gain (loss) | 1,865 | (21,278 | ) | 4,684 | (13,016 | ) | (13,802 | ) | (2,364 | ) | 5,811 | |||||||||||||||||
Net unrealized appreciation (depreciation) on investments and foreign currency | 2,132 | 158,995 | 82,376 | 120,308 | 47,088 | 28,620 | 756 | |||||||||||||||||||||
| $ | 39,135 | $ | 1,341,300 | $ | 670,810 | $ | 714,819 | $ | 1,088,287 | $ | 1,331,564 | $ | 201,114 | |||||||||||||||
Class A | ||||||||||||||||||||||||||||
Net assets | $ | 38,944 | $ | 1,328,363 | $ | 664,777 | $ | 709,661 | $ | 1,066,567 | $ | 1,328,699 | $ | 200,918 | ||||||||||||||
Shares outstanding (no par value), unlimited shares authorized | 3,065 | 125,468 | 47,948 | 56,266 | 85,487 | 113,238 | 19,196 | |||||||||||||||||||||
Net asset value per share | $ | 12.71 | $ | 10.59 | $ | 13.86 | $ | 12.61 | $ | 12.48 | $ | 11.73 | $ | 10.47 | ||||||||||||||
Class B | ||||||||||||||||||||||||||||
Net assets | $ | 191 | $ | 12,937 | $ | 6,033 | $ | 5,158 | $ | 21,720 | $ | 2,865 | $ | 196 | ||||||||||||||
Shares outstanding (no par value), unlimited shares authorized | 15 | 1,200 | 429 | 404 | 1,688 | 237 | 19 | |||||||||||||||||||||
Net asset value per share | $ | 12.75 | $ | 10.78 | $ | 14.05 | $ | 12.75 | $ | 12.87 | $ | 12.08 | $ | 10.49 | ||||||||||||||
(a) Investments - unaffiliated, at cost | $ | 36,800 | $ | 1,160,029 | $ | 576,559 | $ | 580,515 | $ | 1,007,858 | $ | 1,288,744 | $ | 194,831 | ||||||||||||||
(b) Investments - affiliated, at cost | 1,609 | 34,247 | 53,259 | 96,060 | 86,865 | 118,970 | 3,593 | |||||||||||||||||||||
(c) Total investments, at cost | $ | 38,409 | $ | 1,194,276 | $ | 629,818 | $ | 676,575 | $ | 1,094,723 | $ | 1,407,714 | $ | 198,424 | ||||||||||||||
(d) Including value of securities on loan | 1,414 | 12,818 | 39,871 | 80,231 | 54,231 | 73,033 | - | |||||||||||||||||||||
(e) Foreign currency cost | 86 | - | - | - | 1,813 | - | - | |||||||||||||||||||||
(f) Proceeds from securities sold short/forward sales commitments | - | - | - | - | - | - | - | |||||||||||||||||||||
(g) Premiums from options written | - | - | - | - | - | - | - | |||||||||||||||||||||
See accompanying Notes to Financial Statements
JNL Series Trust
Statements of Assets and Liabilities (in thousands, except net asset value per share)
December 31, 2010
| Assets | JNL/ Oppenheimer Global Growth Fund | JNL/PAM Asia ex-Japan Fund | JNL/PAM China-India Fund | JNL/PIMCO Real Return Fund | JNL/PIMCO Total Return Bond Fund | JNL/PPM America High Yield Bond Fund | JNL/PPM America Mid Cap Value Fund | |||||||||||||||||||||
Investments - unaffiliated, at value (a) (d) | $ | 394,215 | $ | 149,703 | $ | 364,766 | $ | 2,981,817 | $ | 4,521,337 | $ | 856,007 | $ | 85,801 | ||||||||||||||
Investments - affiliated, at value (b) | 27,066 | 6,871 | 37,358 | 42,366 | 205,069 | 249,112 | 3,126 | |||||||||||||||||||||
Repurchase agreements (a) | - | - | - | - | - | - | - | |||||||||||||||||||||
Total investments, at value (c) | 421,281 | 156,574 | 402,124 | 3,024,183 | 4,726,406 | 1,105,119 | 88,927 | |||||||||||||||||||||
Cash | - | - | - | - | - | 73 | - | |||||||||||||||||||||
Foreign currency (e) | - | 177 | 209 | 895 | 3,758 | - | - | |||||||||||||||||||||
Receivable for investments sold | 600 | 376 | - | 74,257 | 227,326 | - | - | |||||||||||||||||||||
Receivable for fund shares sold | 586 | 267 | 750 | 2,810 | 4,660 | 1,643 | 472 | |||||||||||||||||||||
Receivable from adviser | - | - | - | - | - | - | - | |||||||||||||||||||||
Receivable for dividends and interest | 505 | 6 | 1 | 3,643 | 20,787 | 15,635 | 96 | |||||||||||||||||||||
Receivable for variation margin | - | - | - | 56 | 812 | - | - | |||||||||||||||||||||
Receivable for deposits with brokers | - | - | - | 29 | 10 | - | - | |||||||||||||||||||||
Receivable for deposits with counterparties | - | - | - | 6,261 | 9,230 | - | - | |||||||||||||||||||||
Unrealized appreciation on forward foreign currency contracts | - | - | - | 1,070 | 4,866 | - | - | |||||||||||||||||||||
Unrealized appreciation on swap agreements | - | - | - | 3,420 | 6,713 | - | - | |||||||||||||||||||||
Swap premiums paid | - | - | - | 5,250 | 6,722 | - | - | |||||||||||||||||||||
Other assets | - | - | - | - | - | - | - | |||||||||||||||||||||
Total assets | 422,972 | 157,400 | 403,084 | 3,121,874 | 5,011,290 | 1,122,470 | 89,495 | |||||||||||||||||||||
Liabilities | ||||||||||||||||||||||||||||
Cash overdraft | 3 | - | - | 3,919 | 7,987 | - | - | |||||||||||||||||||||
Payable for reverse repurchase agreements | - | - | - | 114,399 | 110,203 | - | - | |||||||||||||||||||||
Payable for advisory fees | 226 | 111 | 285 | 737 | 1,396 | 335 | 50 | |||||||||||||||||||||
Payable for administrative fees | 50 | 18 | 63 | 151 | 280 | 75 | 7 | |||||||||||||||||||||
Payable for 12b-1 fee (Class A) | 67 | 25 | 63 | 301 | 556 | 148 | 13 | |||||||||||||||||||||
Payable for investment securities purchased | 102 | 1,053 | - | 1,148,024 | 1,358,460 | - | 573 | |||||||||||||||||||||
Payable for fund shares redeemed | 341 | 207 | 424 | 1,557 | 4,595 | 630 | 170 | |||||||||||||||||||||
Payable for dividends on securities sold short | - | - | - | - | - | - | - | |||||||||||||||||||||
Payable for interest expense and brokerage charges | - | - | - | 123 | 7 | - | - | |||||||||||||||||||||
Payable for trustee fees | 10 | 2 | 4 | 28 | 60 | 15 | 1 | |||||||||||||||||||||
Payable for other expenses | 12 | 31 | 34 | 5 | 81 | 2 | - | |||||||||||||||||||||
Payable for variation margin | - | - | - | - | - | - | - | |||||||||||||||||||||
Payable for deposits from counterparties | - | - | - | 6,261 | 9,230 | - | - | |||||||||||||||||||||
Investment securities sold short/forward sales commitments, at value (f) | - | - | - | 1,540 | 49,840 | - | - | |||||||||||||||||||||
Options written, at value (g) | - | - | - | 4,803 | 9,638 | - | - | |||||||||||||||||||||
Unrealized depreciation on forward foreign currency contracts | - | - | - | 1,294 | 3,345 | - | - | |||||||||||||||||||||
Unrealized depreciation on swap agreements | - | - | - | 850 | 1,385 | - | - | |||||||||||||||||||||
Swap premiums received | - | - | - | 830 | 633 | - | - | |||||||||||||||||||||
Return of collateral for securities loaned | 19,909 | 5,120 | 16,877 | 41,966 | 189,445 | 213,565 | 2,262 | |||||||||||||||||||||
Total liabilities | 20,720 | 6,567 | 17,750 | 1,326,788 | 1,747,141 | 214,770 | 3,076 | |||||||||||||||||||||
Net assets | $ | 402,252 | $ | 150,833 | $ | 385,334 | $ | 1,795,086 | $ | 3,264,149 | $ | 907,700 | $ | 86,419 | ||||||||||||||
Net assets consist of: | ||||||||||||||||||||||||||||
Paid-in capital | $ | 364,139 | $ | 122,709 | $ | 318,187 | $ | 1,719,601 | $ | 3,220,043 | $ | 897,372 | $ | 77,041 | ||||||||||||||
Undistributed (excess of distributions over) net investment income | 2,774 | 357 | 1,156 | 21,452 | 14,311 | 3,530 | 144 | |||||||||||||||||||||
Accumulated net realized gain (loss) | (12,801 | ) | 6,695 | 16,288 | 70,069 | (18,076 | ) | (49,962 | ) | (454 | ) | |||||||||||||||||
Net unrealized appreciation (depreciation) on investments and foreign currency | 48,140 | 21,072 | 49,703 | (16,036 | ) | 47,871 | 56,760 | 9,688 | ||||||||||||||||||||
| $ | 402,252 | $ | 150,833 | $ | 385,334 | $ | 1,795,086 | $ | 3,264,149 | $ | 907,700 | $ | 86,419 | |||||||||||||||
Class A | ||||||||||||||||||||||||||||
Net assets | $ | 401,636 | $ | 150,646 | $ | 385,002 | $ | 1,794,823 | $ | 3,248,237 | $ | 900,088 | $ | 86,297 | ||||||||||||||
Shares outstanding (no par value), unlimited shares authorized | 38,355 | 15,513 | 43,123 | 148,806 | 262,996 | 135,030 | 8,071 | |||||||||||||||||||||
Net asset value per share | $ | 10.47 | $ | 9.71 | $ | 8.93 | $ | 12.06 | $ | 12.35 | $ | 6.67 | $ | 10.69 | ||||||||||||||
Class B | ||||||||||||||||||||||||||||
Net assets | $ | 616 | $ | 187 | $ | 332 | $ | 263 | $ | 15,912 | $ | 7,612 | $ | 122 | ||||||||||||||
Shares outstanding (no par value), unlimited shares authorized | 58 | 19 | 37 | 22 | 1,214 | 1,035 | 11 | |||||||||||||||||||||
Net asset value per share | $ | 10.59 | $ | 9.73 | $ | 8.98 | $ | 12.15 | $ | 13.11 | $ | 7.35 | $ | 10.70 | ||||||||||||||
(a) Investments - unaffiliated, at cost | $ | 346,072 | $ | 128,635 | $ | 315,064 | $ | 2,999,011 | $ | 4,475,274 | $ | 799,225 | $ | 76,113 | ||||||||||||||
(b) Investments - affiliated, at cost | 27,082 | 6,872 | 37,358 | 42,366 | 205,069 | 249,134 | 3,126 | |||||||||||||||||||||
(c) Total investments, at cost | $ | 373,154 | $ | 135,507 | $ | 352,422 | $ | 3,041,377 | $ | 4,680,343 | $ | 1,048,359 | $ | 79,239 | ||||||||||||||
(d) Including value of securities on loan | 19,158 | 4,897 | 15,514 | 41,208 | 186,454 | 209,072 | 2,178 | |||||||||||||||||||||
(e) Foreign currency cost | - | 172 | 208 | 887 | 3,681 | - | - | |||||||||||||||||||||
(f) Proceeds from securities sold short/forward sales commitments | - | - | - | 1,538 | 50,312 | - | - | |||||||||||||||||||||
(g) Premiums from options written | - | - | - | 3,230 | 6,624 | - | - | |||||||||||||||||||||
See accompanying Notes to Financial Statements
JNL Series Trust
Statements of Assets and Liabilities (in thousands, except net asset value per share)
December 31, 2010
| JNL/PPM America Small Cap Value Fund | JNL/PPM America Value Equity Fund | JNL/Red Rocks Listed Private Equity Fund | JNL/S&P Managed Conservative Fund | JNL/S&P Managed Moderate Fund | JNL/S&P Managed Moderate Growth Fund | JNL/S&P Managed Growth Fund | ||||||||||||||||||||||
Assets | ||||||||||||||||||||||||||||
Investments-unaffiliated, at value (a) (d) | $ | 67,226 | $ | 113,707 | $ | 623,842 | $ | - | $ | - | $ | - | $ | - | ||||||||||||||
Investments-affiliated, at value (b) | 5,966 | 1,684 | 20,811 | 979,714 | 1,665,329 | 2,861,578 | 2,141,119 | |||||||||||||||||||||
Repurchase agreements (a) | - | - | - | - | - | - | - | |||||||||||||||||||||
Total investments, at value (c) | 73,192 | 115,391 | 644,653 | 979,714 | 1,665,329 | 2,861,578 | 2,141,119 | |||||||||||||||||||||
Cash | - | - | - | - | - | - | - | |||||||||||||||||||||
Foreign currency (e) | - | - | 2,696 | - | - | - | - | |||||||||||||||||||||
Receivable for investments sold | - | - | 1,632 | - | - | - | - | |||||||||||||||||||||
Receivable for fund shares sold | 320 | 40 | 1,357 | 1,418 | 2,071 | 5,344 | 3,438 | |||||||||||||||||||||
Receivable from adviser | - | - | - | - | - | - | - | |||||||||||||||||||||
Receivable for dividends and interest | 70 | 154 | 753 | - | - | - | - | |||||||||||||||||||||
Receivable for variation margin | - | - | - | - | - | - | - | |||||||||||||||||||||
Receivable for deposits with brokers | - | - | - | - | - | - | - | |||||||||||||||||||||
Receivable for deposits with counterparties | - | - | - | - | - | - | - | |||||||||||||||||||||
Unrealized appreciation on forward foreign currency contracts | - | - | - | - | - | - | - | |||||||||||||||||||||
Unrealized appreciation on swap agreements | - | - | - | - | - | - | - | |||||||||||||||||||||
Swap premiums paid | - | - | - | - | - | - | - | |||||||||||||||||||||
Other assets | - | - | - | - | - | - | - | |||||||||||||||||||||
Total assets | 73,582 | 115,585 | 651,091 | 981,132 | 1,667,400 | 2,866,922 | 2,144,557 | |||||||||||||||||||||
Liabilities | ||||||||||||||||||||||||||||
Cash overdraft | - | - | - | - | - | - | - | |||||||||||||||||||||
Payable for reverse repurchase agreements | - | - | - | - | - | - | - | |||||||||||||||||||||
Payable for advisory fees | 40 | 52 | 419 | 87 | 132 | 210 | 162 | |||||||||||||||||||||
Payable for administrative fees | 5 | 9 | 77 | 41 | 69 | 118 | 88 | |||||||||||||||||||||
Payable for 12b-1 fee (Class A) | 10 | 19 | 103 | - | - | - | - | |||||||||||||||||||||
Payable for investment securities purchased | 562 | - | 6,854 | 556 | 1,107 | 3,627 | 2,028 | |||||||||||||||||||||
Payable for fund shares redeemed | 100 | 87 | 283 | 862 | 964 | 1,717 | 1,411 | |||||||||||||||||||||
Payable for dividends on securities sold short | - | - | - | - | - | - | - | |||||||||||||||||||||
Payable for interest expense and brokerage charges | - | - | - | - | - | - | - | |||||||||||||||||||||
Payable for trustee fees | 1 | 5 | 4 | 16 | 26 | 52 | 47 | |||||||||||||||||||||
Payable for other expenses | - | - | 1 | 2 | 4 | 7 | 5 | |||||||||||||||||||||
Payable for variation margin | - | - | - | - | - | - | - | |||||||||||||||||||||
Payable for deposits from counterparties | - | - | - | - | - | - | - | |||||||||||||||||||||
Investment securities sold short/forward sales commitments, at value (f) | - | - | - | - | - | - | - | |||||||||||||||||||||
Options written, at value (g) | - | - | - | - | - | - | - | |||||||||||||||||||||
Unrealized depreciation on forward foreign currency contracts | - | - | - | - | - | - | - | |||||||||||||||||||||
Unrealized depreciation on swap agreements | - | - | - | - | - | - | - | |||||||||||||||||||||
Swap premiums received | - | - | - | - | - | - | - | |||||||||||||||||||||
Return of collateral for securities loaned | 5,332 | 1,455 | 65 | - | - | - | - | |||||||||||||||||||||
Total liabilities | 6,050 | 1,627 | 7,806 | 1,564 | 2,302 | 5,731 | 3,741 | |||||||||||||||||||||
Net assets | $ | 67,532 | $ | 113,958 | $ | 643,285 | $ | 979,568 | $ | 1,665,098 | $ | 2,861,191 | $ | 2,140,816 | ||||||||||||||
Net assets consist of: | ||||||||||||||||||||||||||||
Paid-in capital | $ | 61,638 | $ | 214,389 | $ | 518,374 | $ | 955,483 | $ | 1,594,710 | $ | 2,698,878 | $ | 2,037,019 | ||||||||||||||
Undistributed (excess of distributions over) net investment income | 54 | 1,298 | 3,650 | 9,963 | 15,493 | 36,428 | 17,358 | |||||||||||||||||||||
Accumulated net realized gain (loss) | (2,123 | ) | (127,880 | ) | 10,429 | (23,241 | ) | (49,949 | ) | (52,433 | ) | (80,309 | ) | |||||||||||||||
Net unrealized appreciation (depreciation) on investments and foreign currency | 7,963 | 26,151 | 110,832 | 37,363 | 104,844 | 178,318 | 166,748 | |||||||||||||||||||||
| $ | 67,532 | $ | 113,958 | $ | 643,285 | $ | 979,568 | $ | 1,665,098 | $ | 2,861,191 | $ | 2,140,816 | |||||||||||||||
Class A | ||||||||||||||||||||||||||||
Net assets | $ | 61,362 | $ | 113,586 | $ | 643,051 | $ | 979,568 | $ | 1,665,098 | $ | 2,861,191 | $ | 2,140,816 | ||||||||||||||
Shares outstanding (no par value), unlimited shares authorized | 6,060 | 9,352 | 63,876 | 89,019 | 146,230 | 242,558 | 191,534 | |||||||||||||||||||||
Net asset value per share | $ | 10.13 | $ | 12.15 | $ | 10.07 | $ | 11.00 | $ | 11.39 | $ | 11.80 | $ | 11.18 | ||||||||||||||
Class B | ||||||||||||||||||||||||||||
Net assets | $ | 6,170 | $ | 372 | $ | 234 | n/a | n/a | n/a | n/a | ||||||||||||||||||
Shares outstanding (no par value), unlimited shares authorized | 608 | 31 | 23 | n/a | n/a | n/a | n/a | |||||||||||||||||||||
Net asset value per share | $ | 10.15 | $ | 12.19 | $ | 10.10 | n/a | n/a | n/a | n/a | ||||||||||||||||||
(a) Investments-unaffiliated, at cost | $ | 59,263 | $ | 87,552 | $ | 513,004 | $ | - | $ | - | $ | - | $ | - | ||||||||||||||
(b) Investments-affiliated, at cost | 5,966 | 1,688 | 20,811 | 942,351 | 1,560,485 | 2,683,260 | 1,974,371 | |||||||||||||||||||||
(c) Total investments, at cost | $ | 65,229 | $ | 89,240 | $ | 533,815 | $ | 942,351 | $ | 1,560,485 | $ | 2,683,260 | $ | 1,974,371 | ||||||||||||||
(d) Including value of securities on loan | 5,127 | 1,418 | 62 | - | - | - | - | |||||||||||||||||||||
(e) Foreign currency cost | - | - | 2,670 | - | - | - | - | |||||||||||||||||||||
(f) Proceeds from securities sold short/forward sales commitments | - | - | - | - | - | - | - | |||||||||||||||||||||
(g) Premiums from options written | - | - | - | - | - | - | - | |||||||||||||||||||||
See accompanying Notes to Financial Statements
JNL Series Trust
Statements of Assets and Liabilities (in thousands, except net asset value per share)
December 31, 2010
| JNL/S&P | JNL/S&P | JNL/S&P | ||||||||||||||||||||||||||
| Managed | Disciplined | Disciplined | JNL/S&P | JNL/S&P | JNL/S&P | JNL/S&P | ||||||||||||||||||||||
| Aggressive | Moderate | Moderate | Disciplined | Competitive | Dividend Income | Intrinsic | ||||||||||||||||||||||
| Growth Fund | Fund | Growth Fund | Growth Fund | Advantage Fund | & Growth Fund | Value Fund | ||||||||||||||||||||||
Assets | ||||||||||||||||||||||||||||
Investments-unaffiliated, at value (a) (d) | $ | - | $ | - | $ | - | $ | - | $ | 295,499 | $ | 439,805 | $ | 319,643 | ||||||||||||||
Investments-affiliated, at value (b) | 788,793 | 346,489 | 376,153 | 137,498 | 10,330 | 24,780 | 15,514 | |||||||||||||||||||||
Repurchase agreements (a) | - | - | - | - | - | - | - | |||||||||||||||||||||
Total investments, at value (c) | 788,793 | 346,489 | 376,153 | 137,498 | 305,829 | 464,585 | 335,157 | |||||||||||||||||||||
Cash | - | - | - | - | - | - | - | |||||||||||||||||||||
Foreign currency (e) | - | - | - | - | - | - | - | |||||||||||||||||||||
Receivable for investments sold | - | - | - | - | - | - | 17,205 | |||||||||||||||||||||
Receivable for fund shares sold | 2,657 | 161 | 581 | 473 | 219 | 1,092 | 264 | |||||||||||||||||||||
Receivable from adviser | - | - | - | - | - | - | - | |||||||||||||||||||||
Receivable for dividends and interest | - | - | - | - | 252 | 799 | 249 | |||||||||||||||||||||
Receivable for variation margin | - | - | - | - | - | - | - | |||||||||||||||||||||
Receivable for deposits with brokers | - | - | - | - | - | - | - | |||||||||||||||||||||
Receivable for deposits with counterparties | - | - | - | - | - | - | - | |||||||||||||||||||||
Unrealized appreciation on forward foreign currency contracts | - | - | - | - | - | - | - | |||||||||||||||||||||
Unrealized appreciation on swap agreements | - | - | - | - | - | - | - | |||||||||||||||||||||
Swap premiums paid | - | - | - | - | - | - | - | |||||||||||||||||||||
Other assets | - | - | - | - | - | - | ||||||||||||||||||||||
Total assets | 791,450 | 346,650 | 376,734 | 137,971 | 306,300 | 466,476 | 352,875 | |||||||||||||||||||||
Liabilities | ||||||||||||||||||||||||||||
Cash overdraft | - | - | - | - | - | - | - | |||||||||||||||||||||
Payable for reverse repurchase agreements | - | - | - | - | - | - | - | |||||||||||||||||||||
Payable for advisory fees | 73 | 37 | 40 | 14 | 100 | 143 | 107 | |||||||||||||||||||||
Payable for administrative fees | 32 | 14 | 16 | 6 | 25 | 36 | 27 | |||||||||||||||||||||
Payable for 12b-1 fee (Class A) | - | - | - | - | 50 | 72 | 53 | |||||||||||||||||||||
Payable for investment securities purchased | 2,287 | 43 | 452 | 363 | - | 4,996 | 18,392 | |||||||||||||||||||||
Payable for fund shares redeemed | 370 | 118 | 129 | 110 | 305 | 355 | 390 | |||||||||||||||||||||
Payable for dividends on securities sold short | - | - | - | - | - | - | - | |||||||||||||||||||||
Payable for interest expense and brokerage charges | - | - | - | - | - | - | - | |||||||||||||||||||||
Payable for trustee fees | 22 | 4 | 4 | 2 | 4 | 5 | 5 | |||||||||||||||||||||
Payable for other expenses | 2 | 1 | 1 | - | 1 | 1 | 1 | |||||||||||||||||||||
Payable for variation margin | - | - | - | - | - | - | - | |||||||||||||||||||||
Payable for deposits from counterparties | - | - | - | - | - | - | - | |||||||||||||||||||||
Investment securities sold short/forward sales commitments, at value (f) | - | - | - | - | - | - | - | |||||||||||||||||||||
Options written, at value (g) | - | - | - | - | - | - | - | |||||||||||||||||||||
Unrealized depreciation on forward foreign currency contracts | - | - | - | - | - | - | - | |||||||||||||||||||||
Unrealized depreciation on swap agreements | - | - | - | - | - | - | - | |||||||||||||||||||||
Swap premiums received | - | - | - | - | - | - | - | |||||||||||||||||||||
Return of collateral for securities loaned | - | - | - | - | 9,724 | 19,776 | 14,183 | |||||||||||||||||||||
Total liabilities | 2,786 | 217 | 642 | 495 | 10,209 | 25,384 | 33,158 | |||||||||||||||||||||
Net assets | $ | 788,664 | $ | 346,433 | $ | 376,092 | $ | 137,476 | $ | 296,091 | $ | 441,092 | $ | 319,717 | ||||||||||||||
Net assets consist of: | ||||||||||||||||||||||||||||
Paid-in capital | $ | 794,840 | $ | 320,011 | $ | 344,508 | $ | 125,459 | $ | 246,701 | $ | 384,804 | $ | 278,152 | ||||||||||||||
Undistributed (excess of distributions over) net investment income | 5,559 | 5,554 | 5,070 | 1,787 | 3,572 | 10,367 | 4,294 | |||||||||||||||||||||
Accumulated net realized gain (loss) | (65,332 | ) | (13,070 | ) | (24,699 | ) | (9,794 | ) | 29,355 | 8,188 | 32,435 | |||||||||||||||||
Net unrealized appreciation (depreciation) on investments and foreign currency | 53,597 | 33,938 | 51,213 | 20,024 | 16,463 | 37,733 | 4,836 | |||||||||||||||||||||
| $ | 788,664 | $ | 346,433 | $ | 376,092 | $ | 137,476 | $ | 296,091 | $ | 441,092 | $ | 319,717 | |||||||||||||||
Class A | ||||||||||||||||||||||||||||
Net assets | $ | 788,664 | $ | 346,433 | $ | 376,092 | $ | 137,476 | $ | 296,032 | $ | 440,926 | $ | 319,617 | ||||||||||||||
Shares outstanding (no par value), unlimited shares authorized | 64,825 | 35,172 | 41,362 | 16,135 | 27,659 | 45,165 | 32,074 | |||||||||||||||||||||
Net asset value per share | $ | 12.17 | $ | 9.85 | $ | 9.09 | $ | 8.52 | $ | 10.70 | $ | 9.76 | $ | 9.97 | ||||||||||||||
Class B | ||||||||||||||||||||||||||||
Net assets | n/a | n/a | n/a | n/a | $ | 59 | $ | 166 | $ | 100 | ||||||||||||||||||
Shares outstanding (no par value), unlimited shares authorized | n/a | n/a | n/a | n/a | 6 | 17 | 10 | |||||||||||||||||||||
Net asset value per share | n/a | n/a | n/a | n/a | $ | 10.70 | $ | 9.80 | $ | 10.05 | ||||||||||||||||||
(a) Investments-unaffiliated, at cost | $ | - | $ | - | $ | - | $ | - | $ | 279,029 | $ | 402,064 | $ | 314,799 | ||||||||||||||
(b) Investments-affiliated, at cost | 735,196 | 312,551 | 324,940 | 117,474 | 10,337 | 24,788 | 15,522 | |||||||||||||||||||||
(c) Total investments, at cost | $ | 735,196 | $ | 312,551 | $ | 324,940 | $ | 117,474 | $ | 289,366 | $ | 426,852 | $ | 330,321 | ||||||||||||||
(d) Including value of securities on loan | - | - | - | - | 9,513 | 19,216 | 13,924 | |||||||||||||||||||||
(e) Foreign currency cost | - | - | - | - | - | - | - | |||||||||||||||||||||
(f) Proceeds from securities sold short/forward sales commitments | - | - | - | - | - | - | - | |||||||||||||||||||||
(g) Premiums from options written | - | - | - | - | - | - | - | |||||||||||||||||||||
See accompanying Notes to Financial Statements
JNL Series Trust
Statements of Assets and Liabilities (in thousands, except net asset value per share)
December 31, 2010
| JNL/T. Rowe | JNL/T. Rowe | |||||||||||||||||||||||||||
| JNL/S&P | JNL/Select | JNL/Select | Price | Price | ||||||||||||||||||||||||
| Total | JNL/S&P 4 | Balanced | Money | JNL/Select | Established | Mid-Cap | ||||||||||||||||||||||
| Yield Fund | Fund | Fund | Market Fund | Value Fund | Growth Fund | Growth Fund | ||||||||||||||||||||||
Assets | ||||||||||||||||||||||||||||
Investments-unaffiliated, at value (a) (d) | $ | 281,043 | $ | - | $ | 1,240,472 | $ | 451,255 | $ | 1,129,045 | $ | 1,496,410 | $ | 1,341,016 | ||||||||||||||
Investments-affiliated, at value (b) | 10,049 | 843,994 | 153,986 | - | 31,658 | 42,812 | 160,657 | |||||||||||||||||||||
Repurchase agreements (a) | - | - | - | 262,000 | - | - | - | |||||||||||||||||||||
Total investments, at value (c) | 291,092 | 843,994 | 1,394,458 | 713,255 | 1,160,703 | 1,539,222 | 1,501,673 | |||||||||||||||||||||
Cash | - | - | - | - | - | 6 | - | |||||||||||||||||||||
Foreign currency (e) | - | - | - | - | - | 71 | - | |||||||||||||||||||||
Receivable for investments sold | 7,180 | 340 | 5,299 | - | - | 2,357 | 53 | |||||||||||||||||||||
Receivable for fund shares sold | 249 | 657 | 2,659 | 2,547 | 1,961 | 3,789 | 2,726 | |||||||||||||||||||||
Receivable from adviser | - | - | - | 184 | - | - | - | |||||||||||||||||||||
Receivable for dividends and interest | 294 | - | 3,587 | 476 | 1,479 | 815 | 286 | |||||||||||||||||||||
Receivable for variation margin | - | - | - | - | - | - | - | |||||||||||||||||||||
Receivable for deposits with brokers | - | - | - | - | - | - | - | |||||||||||||||||||||
Receivable for deposits with counterparties | - | - | - | - | - | - | - | |||||||||||||||||||||
Unrealized appreciation on forward foreign currency contracts | - | - | - | - | - | - | - | |||||||||||||||||||||
Unrealized appreciation on swap agreements | - | - | - | - | - | - | - | |||||||||||||||||||||
Swap premiums paid | - | - | - | - | - | - | - | |||||||||||||||||||||
Other assets | - | - | - | - | - | - | - | |||||||||||||||||||||
Total assets | 298,815 | 844,991 | 1,406,003 | 716,462 | 1,164,143 | 1,546,260 | 1,504,738 | |||||||||||||||||||||
Liabilities | ||||||||||||||||||||||||||||
Cash overdraft | - | - | - | - | - | - | - | |||||||||||||||||||||
Payable for reverse repurchase agreements | - | - | - | - | - | - | - | |||||||||||||||||||||
Payable for advisory fees | 93 | - | 475 | 167 | 460 | 722 | 821 | |||||||||||||||||||||
Payable for administrative fees | 23 | 35 | 106 | 62 | 95 | 126 | 116 | |||||||||||||||||||||
Payable for 12b-1 fee (Class A) | 46 | - | 213 | 123 | 186 | 247 | 226 | |||||||||||||||||||||
Payable for investment securities purchased | 7,527 | - | 89,323 | - | 2,300 | 10,942 | 2,905 | |||||||||||||||||||||
Payable for fund shares redeemed | 368 | 997 | 732 | 2,821 | 848 | 1,150 | 1,344 | |||||||||||||||||||||
Payable for dividends on securities sold short | - | - | - | - | - | - | - | |||||||||||||||||||||
Payable for interest expense and brokerage charges | - | - | - | - | - | - | - | |||||||||||||||||||||
Payable for trustee fees | 4 | 12 | 22 | 34 | 22 | 34 | 26 | |||||||||||||||||||||
Payable for other expenses | 1 | 2 | 3 | 3 | 3 | 12 | 4 | |||||||||||||||||||||
Payable for variation margin | - | - | - | - | - | - | - | |||||||||||||||||||||
Payable for deposits from counterparties | - | - | - | - | - | - | - | |||||||||||||||||||||
Investment securities sold short/forward sales commitments, at value (f) | - | - | - | - | - | - | - | |||||||||||||||||||||
Options written, at value (g) | - | - | - | - | - | - | - | |||||||||||||||||||||
Unrealized depreciation on forward foreign currency contracts | - | - | - | - | - | - | - | |||||||||||||||||||||
Unrealized depreciation on swap agreements | - | - | - | - | - | - | - | |||||||||||||||||||||
Swap premiums received | - | - | - | - | - | - | - | |||||||||||||||||||||
Return of collateral for securities loaned | 9,551 | - | 23,926 | - | 4,904 | 21,398 | 94,335 | |||||||||||||||||||||
Total liabilities | 17,613 | 1,046 | 114,800 | 3,210 | 8,818 | 34,631 | 99,777 | |||||||||||||||||||||
Net assets | $ | 281,202 | $ | 843,945 | $ | 1,291,203 | $ | 713,252 | $ | 1,155,325 | $ | 1,511,629 | $ | 1,404,961 | ||||||||||||||
Net assets consist of: | ||||||||||||||||||||||||||||
Paid-in capital | $ | 252,957 | $ | 668,838 | $ | 1,177,920 | $ | 713,268 | $ | 1,068,540 | $ | 1,362,023 | $ | 1,090,536 | ||||||||||||||
Undistributed (excess of distributions over) net investment income | 4,140 | 45,475 | 18,303 | (24 | ) | 12,301 | (35 | ) | (2,016 | ) | ||||||||||||||||||
Accumulated net realized gain (loss) | 14,637 | (17,202 | ) | (20,142 | ) | 8 | (74,460 | ) | (187,764 | ) | (3,720 | ) | ||||||||||||||||
Net unrealized appreciation (depreciation) on investments and foreign currency | 9,468 | 146,834 | 115,122 | - | 148,944 | 337,405 | 320,161 | |||||||||||||||||||||
| $ | 281,202 | $ | 843,945 | $ | 1,291,203 | $ | 713,252 | $ | 1,155,325 | $ | 1,511,629 | $ | 1,404,961 | |||||||||||||||
Class A | ||||||||||||||||||||||||||||
Net assets | $ | 281,137 | $ | 843,945 | $ | 1,290,162 | $ | 706,007 | $ | 1,138,293 | $ | 1,475,748 | $ | 1,366,836 | ||||||||||||||
Shares outstanding (no par value), unlimited shares authorized | 28,858 | 77,737 | 78,451 | 706,020 | 65,522 | 69,532 | 45,896 | |||||||||||||||||||||
Net asset value per share | $ | 9.74 | $ | 10.86 | $ | 16.45 | $ | 1.00 | $ | 17.37 | $ | 21.22 | $ | 29.78 | ||||||||||||||
Class B | ||||||||||||||||||||||||||||
Net assets | $ | 65 | n/a | $ | 1,041 | $ | 7,245 | $ | 17,032 | $ | 35,881 | $ | 38,125 | |||||||||||||||
Shares outstanding (no par value), unlimited shares authorized | 7 | n/a | 62 | 7,245 | 964 | 1,671 | 1,258 | |||||||||||||||||||||
Net asset value per share | $ | 9.76 | n/a | $ | 16.77 | $ | 1.00 | $ | 17.66 | $ | 21.47 | $ | 30.31 | |||||||||||||||
(a) Investments-unaffiliated, at cost | $ | 271,555 | $ | - | $ | 1,125,315 | $ | 713,255 | $ | 980,095 | $ | 1,158,967 | $ | 1,020,758 | ||||||||||||||
(b) Investments-affiliated, at cost | 10,069 | 697,160 | 154,021 | - | 31,664 | 42,858 | 160,754 | |||||||||||||||||||||
(c) Total investments, at cost | $ | 281,624 | $ | 697,160 | $ | 1,279,336 | $ | 713,255 | $ | 1,011,759 | $ | 1,201,825 | $ | 1,181,512 | ||||||||||||||
(d) Including value of securities on loan | 9,391 | - | 23,542 | - | 4,780 | 20,795 | 91,489 | |||||||||||||||||||||
(e) Foreign currency cost | - | - | - | - | - | 62 | - | |||||||||||||||||||||
(f) Proceeds from securities sold short/forward sales commitments | - | - | - | - | - | - | - | |||||||||||||||||||||
(g) Premiums from options written | - | - | - | - | - | - | - | |||||||||||||||||||||
See accompanying Notes to Financial Statements
JNL Series Trust
Statements of Assets and Liabilities (in thousands, except net asset value per share)
December 31, 2010
| JNL/T. Rowe Price Short- Term Bond Fund | JNL/T. Rowe Price Value Fund | |||||||
Assets | ||||||||
Investments-unaffiliated, at value (a) (d) | $ | 807,566 | $ | 1,114,039 | ||||
Investments-affiliated, at value (b) | 64,394 | 37,543 | ||||||
Repurchase agreements (a) | - | - | ||||||
Total investments, at value (c) | 871,960 | 1,151,582 | ||||||
Cash | - | - | ||||||
Foreign currency (e) | - | - | ||||||
Receivable for investments sold | 39 | 3,427 | ||||||
Receivable for fund shares sold | 1,565 | 1,883 | ||||||
Receivable from adviser | - | - | ||||||
Receivable for dividends and interest | 6,048 | 1,133 | ||||||
Receivable for variation margin | - | - | ||||||
Receivable for deposits with brokers | - | - | ||||||
Receivable for deposits with counterparties | - | - | ||||||
Unrealized appreciation on forward foreign currency contracts | - | - | ||||||
Unrealized appreciation on swap agreements | - | - | ||||||
Swap premiums paid | - | - | ||||||
Other assets | - | - | ||||||
Total assets | 879,612 | 1,158,025 | ||||||
Liabilities | ||||||||
Cash overdraft | 28 | - | ||||||
Payable for reverse repurchase agreements | - | - | ||||||
Payable for advisory fees | 302 | 584 | ||||||
Payable for administrative fees | 73 | 93 | ||||||
Payable for 12b-1 fee (Class A) | 145 | 185 | ||||||
Payable for investment securities purchased | - | 5,187 | ||||||
Payable for fund shares redeemed | 726 | 912 | ||||||
Payable for dividends on securities sold short | - | - | ||||||
Payable for interest expense and brokerage charges | - | - | ||||||
Payable for trustee fees | 14 | 24 | ||||||
Payable for other expenses | 3 | 2 | ||||||
Payable for variation margin | - | - | ||||||
Payable for deposits from counterparties | - | - | ||||||
Investment securities sold short/forward sales commitments, at value (f) | - | - | ||||||
Options written, at value (g) | - | - | ||||||
Unrealized depreciation on forward foreign currency contracts | 88 | - | ||||||
Unrealized depreciation on swap agreements | - | - | ||||||
Swap premiums received | - | - | ||||||
Return of collateral for securities loaned | 5,253 | 14,262 | ||||||
Total liabilities | 6,632 | 21,249 | ||||||
Net assets | $ | 872,980 | $ | 1,136,776 | ||||
Net assets consist of: | ||||||||
Paid-in capital | $ | 875,563 | $ | 1,071,777 | ||||
Undistributed (excess of distributions over) net investment income | 14,163 | 17,730 | ||||||
Accumulated net realized gain (loss) | (22,234 | ) | (86,430 | ) | ||||
Net unrealized appreciation (depreciation) on investments and foreign currency | 5,488 | 133,699 | ||||||
| $ | 872,980 | $ | 1,136,776 | |||||
Class A | ||||||||
Net assets | $ | 872,892 | $ | 1,136,182 | ||||
Shares outstanding (no par value), unlimited shares authorized | 88,346 | 104,856 | ||||||
Net asset value per share | $ | 9.88 | $ | 10.84 | ||||
Class B | ||||||||
Net assets | $ | 88 | $ | 594 | ||||
Shares outstanding (no par value), unlimited shares authorized | 9 | 53 | ||||||
Net asset value per share | $ | 9.95 | $ | 11.11 | ||||
(a) Investments-unaffiliated, at cost | $ | 801,678 | $ | 980,838 | ||||
(b) Investments-affiliated, at cost | 64,706 | 37,044 | ||||||
(c) Total investments, at cost | $ | 866,384 | $ | 1,017,882 | ||||
(d) Including value of securities on loan | 5,137 | 13,863 | ||||||
(e) Foreign currency cost | - | - | ||||||
(f) Proceeds from securities sold short/forward sales commitments | - | - | ||||||
See accompanying Notes to Financial Statements
JNL Series Trust
Statements of Operations (in thousands)
For the Year Ended December 31, 2010
| JNL/American Funds Blue Chip Income and Growth Fund (b)(c) | JNL/American Funds Global Bond Fund (b)(c) | JNL/American Funds Global Small Capitalization Fund (b)(c) | JNL/American Funds Growth- Income Fund (b)(c) | JNL/American Funds International Fund (b)(c) | JNL/American Funds New World Fund (b)(c) | JNL Institutional Alt 20 Fund | ||||||||||||||||||||||
Investment income | ||||||||||||||||||||||||||||
Dividends (a) | $ | - | $ | - | $ | - | $ | - | $ | - | $ | - | $ | 8,175 | ||||||||||||||
Dividends received from master fund | 2,165 | 2,560 | 539 | 2,055 | 1,462 | 1,485 | - | |||||||||||||||||||||
Foreign taxes withheld | - | - | - | - | - | - | - | |||||||||||||||||||||
Interest | - | - | - | - | - | - | - | |||||||||||||||||||||
Securities lending | - | - | - | - | - | - | - | |||||||||||||||||||||
Total investment income | 2,165 | 2,560 | 539 | 2,055 | 1,462 | 1,485 | 8,175 | |||||||||||||||||||||
Expenses | ||||||||||||||||||||||||||||
Advisory fees | 292 | 237 | 162 | 324 | 268 | 350 | 573 | |||||||||||||||||||||
Administrative fees | 63 | 51 | 33 | 69 | 47 | 50 | 193 | |||||||||||||||||||||
12b-1 fee (Class A) | 104 | 85 | 54 | 116 | 79 | 83 | - | |||||||||||||||||||||
Legal fees | - | - | - | - | - | - | 2 | |||||||||||||||||||||
Trustee fees | 1 | 1 | - | 1 | - | - | 7 | |||||||||||||||||||||
License fees | - | - | - | - | - | - | - | |||||||||||||||||||||
Dividends on securities sold short | - | - | - | - | - | - | - | |||||||||||||||||||||
Short holdings borrowing fees | - | - | - | - | - | - | - | |||||||||||||||||||||
Other expenses | - | - | 1 | - | - | 1 | 4 | |||||||||||||||||||||
Total expenses | 460 | 374 | 250 | 510 | 394 | 484 | 779 | |||||||||||||||||||||
Expense waiver | (188 | ) | (186 | ) | (130 | ) | (185 | ) | (173 | ) | (267 | ) | - | |||||||||||||||
Net expenses | 272 | 188 | 120 | 325 | 221 | 217 | 779 | |||||||||||||||||||||
Net investment income (loss) | 1,893 | 2,372 | 419 | 1,730 | 1,241 | 1,268 | 7,396 | |||||||||||||||||||||
Realized and unrealized gain (loss) | ||||||||||||||||||||||||||||
Net realized gain (loss) on: | ||||||||||||||||||||||||||||
Unaffiliated investments | (314 | ) | 150 | 11 | - | 126 | - | - | ||||||||||||||||||||
Affiliated investments | - | - | - | - | - | - | 532 | |||||||||||||||||||||
Distributions from affiliated investment companies | - | - | - | - | - | - | 625 | |||||||||||||||||||||
Swaps agreements | - | - | - | - | - | - | - | |||||||||||||||||||||
Foreign currency related items | - | - | - | - | - | - | - | |||||||||||||||||||||
Futures contracts | - | - | - | - | - | - | - | |||||||||||||||||||||
Option contracts | - | - | - | - | - | - | - | |||||||||||||||||||||
Investment securities sold short | - | - | - | - | - | - | - | |||||||||||||||||||||
Brokerage commissions recaptured | - | - | - | - | - | - | - | |||||||||||||||||||||
Net change in unrealized appreciation or depreciation on: | ||||||||||||||||||||||||||||
Investments | 10,711 | (1,175 | ) | 7,947 | 13,029 | 7,401 | 8,525 | 52,224 | ||||||||||||||||||||
Swap agreements | - | - | - | - | - | - | - | |||||||||||||||||||||
Foreign currency related items | - | - | - | - | - | - | - | |||||||||||||||||||||
Futures contracts | - | - | - | - | - | - | - | |||||||||||||||||||||
Written option contracts | - | - | - | - | - | - | - | |||||||||||||||||||||
Investment securities sold short | - | - | - | - | - | - | - | |||||||||||||||||||||
Net realized and unrealized gain (loss) | 10,397 | (1,025 | ) | 7,958 | 13,029 | 7,527 | 8,525 | 53,381 | ||||||||||||||||||||
Net increase in net assets from operations | $ | 12,290 | $ | 1,347 | $ | 8,377 | $ | 14,759 | $ | 8,768 | $ | 9,793 | $ | 60,777 | ||||||||||||||
(a) Income from affiliated investments | $ | - | $ | - | $ | - | $ | - | $ | - | $ | - | $ | 8,175 | ||||||||||||||
| (b) | Period from May 3, 2010 (commencement of operations) |
| (c) | The Master Funds for the JNL/American Funds Blue Chip Income and Growth Fund, JNL/American Funds Global Bond Fund, JNL/American Funds Global Small Capitalization Fund, JNL/American Funds Growth-Income Fund, JNL/American Funds International Fund and JNL/American Funds New World Fund are the Class 1 shares of the corresponding American Fund Insurance Series Fund. These financial statements should be read in conjunction with each Master Fund’s shareholder report. |
See accompanying Notes to Financial Statements
JNL Series Trust
Statements of Operations (in thousands)
For the Year Ended December 31, 2010
| JNL Institutional Alt 35 Fund | JNL Institutional Alt 50 Fund | JNL Institutional Alt 65 Fund | JNL/BlackRock Commodity Securities Fund | JNL/BlackRock Global Allocation Fund (b)(c) | JNL/Capital Guardian Global Balanced Fund | JNL/Capital Guardian Global Diversified Research Fund | ||||||||||||||||||||||
Investment income | ||||||||||||||||||||||||||||
Dividends (a) | $ | 11,234 | $ | 13,520 | $ | 7,494 | $ | 12,863 | $ | - | $ | 4,516 | $ | 7,933 | ||||||||||||||
Dividends received from master fund (a) | - | - | - | - | 2,176 | - | - | |||||||||||||||||||||
Foreign taxes withheld | - | - | - | (556 | ) | - | (361 | ) | (603 | ) | ||||||||||||||||||
Interest | - | - | - | 611 | - | 3,888 | 50 | |||||||||||||||||||||
Securities lending | - | - | - | 310 | - | 183 | 294 | |||||||||||||||||||||
Total investment income | 11,234 | 13,520 | 7,494 | 13,228 | 2,176 | 8,226 | 7,674 | |||||||||||||||||||||
Expenses | ||||||||||||||||||||||||||||
Advisory fees | 798 | 915 | 639 | 4,544 | 150 | 2,028 | 2,660 | |||||||||||||||||||||
Administrative fees | 283 | 337 | 218 | 1,061 | 25 | 468 | 554 | |||||||||||||||||||||
12b-1 fee (Class A) | - | - | - | 1,413 | 33 | 623 | 738 | |||||||||||||||||||||
Legal fees | 2 | 3 | 2 | 4 | - | 2 | 2 | |||||||||||||||||||||
Trustee fees | 11 | 13 | 8 | 17 | - | 8 | 9 | |||||||||||||||||||||
License fees | - | - | - | - | - | - | - | |||||||||||||||||||||
Dividends on securities sold short | - | - | - | - | - | - | - | |||||||||||||||||||||
Short holdings borrowing fees | - | - | - | - | - | - | - | |||||||||||||||||||||
Other expenses | 7 | 8 | 5 | 13 | - | 30 | 27 | |||||||||||||||||||||
Total expenses | 1,101 | 1,276 | 872 | 7,052 | 208 | 3,159 | 3,990 | |||||||||||||||||||||
Expense waiver | - | - | - | - | (110 | ) | - | - | ||||||||||||||||||||
Net expenses | 1,101 | 1,276 | 872 | 7,052 | 98 | 3,159 | 3,990 | |||||||||||||||||||||
Net investment income (loss) | 10,133 | 12,244 | 6,622 | 6,176 | 2,078 | 5,067 | 3,684 | |||||||||||||||||||||
Realized and unrealized gain (loss) | ||||||||||||||||||||||||||||
Net realized gain (loss) on: | ||||||||||||||||||||||||||||
Unaffiliated investments | - | - | - | 50,408 | - | (1,160 | ) | 3,868 | ||||||||||||||||||||
Affiliated investments | 1,133 | 1,672 | 2,217 | - | (3 | ) | - | - | ||||||||||||||||||||
Distributions from affiliated investment companies | 696 | 1,099 | 859 | - | - | - | - | |||||||||||||||||||||
Swaps agreements | - | - | - | - | - | - | - | |||||||||||||||||||||
Foreign currency related items | - | - | - | (89 | ) | - | 210 | 38 | ||||||||||||||||||||
Futures contracts | - | - | - | - | - | - | - | |||||||||||||||||||||
Option contracts | - | - | - | - | - | - | - | |||||||||||||||||||||
Investment securities sold short | - | - | - | - | - | - | - | |||||||||||||||||||||
Brokerage commissions recaptured | - | - | - | - | - | 6 | 13 | |||||||||||||||||||||
Net change in unrealized appreciation or depreciation on: | ||||||||||||||||||||||||||||
Investments | 84,551 | 102,316 | 69,635 | 80,017 | 1,380 | 24,868 | 36,557 | |||||||||||||||||||||
Swap agreements | - | - | - | - | - | - | - | |||||||||||||||||||||
Foreign currency related items | - | - | - | (8 | ) | - | 374 | 21 | ||||||||||||||||||||
Futures contracts | - | - | - | - | - | - | - | |||||||||||||||||||||
Written option contracts | - | - | - | - | - | - | - | |||||||||||||||||||||
Investment securities sold short | - | - | - | - | - | - | - | |||||||||||||||||||||
Net realized and unrealized gain (loss) | 86,380 | 105,087 | 72,711 | 130,328 | 1,377 | 24,298 | 40,497 | |||||||||||||||||||||
Net increase in net assets from operations | $ | 96,513 | $ | 117,331 | $ | 79,333 | $ | 136,504 | $ | 3,455 | $ | 29,365 | $ | 44,181 | ||||||||||||||
(a) Income from affiliated investments | $ | 11,234 | $ | 13,520 | $ | 7,494 | 331 | 2,176 | 189 | 302 | ||||||||||||||||||
| (b) | Period from October 11, 2010 (commencement of operations) |
| (c) | The Master Fund for the JNL/BlackRock Global Allocation Fund is the BlackRock Global Allocation Portfolio. These financial statements should be read in conjunction with the Master Fund’s shareholder report. |
See accompanying Notes to Financial Statements
JNL Series Trust
Statements of Operations (in thousands)
For the Year Ended December 31, 2010
| JNL/Capital Guardian U.S. Growth Equity Fund | JNL/Eagle Core Equity Fund | JNL/Eagle SmallCap Equity Fund | JNL/Franklin Templeton Founding Strategy Fund | JNL/Franklin Templeton Global Growth Fund | JNL/Franklin Templeton Income Fund | JNL/Franklin Small Cap | ||||||||||||||||||||||
Investment income | ||||||||||||||||||||||||||||
Dividends (a) | $ | 7,793 | $ | 2,729 | $ | 2,129 | $ | 16,261 | $ | 10,603 | $ | 13,758 | $ | 5,849 | ||||||||||||||
Dividends received from master fund | - | - | - | - | - | - | - | |||||||||||||||||||||
Foreign taxes withheld | (50 | ) | - | (6 | ) | - | (878 | ) | (175 | ) | (390 | ) | ||||||||||||||||
Interest | - | - | - | - | - | 39,009 | 3 | |||||||||||||||||||||
Securities lending | 358 | 4 | 888 | - | 316 | 450 | 156 | |||||||||||||||||||||
Total investment income | 8,101 | 2,733 | 3,011 | 16,261 | 10,041 | 53,042 | 5,618 | |||||||||||||||||||||
Expenses | ||||||||||||||||||||||||||||
Advisory fees | 4,510 | 999 | 2,551 | - | 2,950 | 5,687 | 1,637 | |||||||||||||||||||||
Administrative fees | 699 | 158 | 358 | 458 | 611 | 864 | 258 | |||||||||||||||||||||
12b-1 fee (Class A) | 1,397 | 316 | 715 | - | 815 | 1,728 | 344 | |||||||||||||||||||||
Legal fees | 4 | 1 | 2 | 5 | 2 | 5 | 1 | |||||||||||||||||||||
Trustee fees | 16 | 3 | 7 | 22 | 10 | 20 | 4 | |||||||||||||||||||||
License fees | - | - | - | - | - | - | - | |||||||||||||||||||||
Dividends on securities sold short | - | - | - | - | - | - | - | |||||||||||||||||||||
Short holdings borrowing fees | - | - | - | - | - | - | - | |||||||||||||||||||||
Other expenses | 11 | 3 | 8 | 16 | 18 | 15 | 4 | |||||||||||||||||||||
Total expenses | 6,637 | 1,480 | 3,641 | 501 | 4,406 | 8,319 | 2,248 | |||||||||||||||||||||
Expense waiver | - | - | - | - | - | - | - | |||||||||||||||||||||
Net expenses | 6,637 | 1,480 | 3,641 | 501 | 4,406 | 8,319 | 2,248 | |||||||||||||||||||||
Net investment income (loss) | 1,464 | 1,253 | (630 | ) | 15,760 | 5,635 | 44,723 | 3,370 | ||||||||||||||||||||
Realized and unrealized gain (loss) | ||||||||||||||||||||||||||||
Net realized gain (loss) on: | ||||||||||||||||||||||||||||
Unaffiliated investments | (1,506 | ) | 1,910 | 23,997 | - | (6,090 | ) | 2,983 | 14,873 | |||||||||||||||||||
Affiliated investments | - | - | - | (8,814 | ) | - | - | - | ||||||||||||||||||||
Distributions from affiliated investment companies | - | - | - | - | - | - | - | |||||||||||||||||||||
Swaps agreements | - | - | - | - | - | - | - | |||||||||||||||||||||
Foreign currency related items | - | - | - | - | (123 | ) | (93 | ) | (38 | ) | ||||||||||||||||||
Futures contracts | - | - | - | - | - | - | - | |||||||||||||||||||||
Option contracts | - | - | - | - | - | - | - | |||||||||||||||||||||
Investment securities sold short | - | - | - | - | - | - | - | |||||||||||||||||||||
Brokerage commissions recaptured | 21 | 20 | 68 | - | 9 | 13 | 6 | |||||||||||||||||||||
Net change in unrealized appreciation or depreciation on: | ||||||||||||||||||||||||||||
Investments | 98,995 | 18,111 | 99,113 | 87,147 | 31,741 | 59,031 | 14,446 | |||||||||||||||||||||
Swap agreements | - | - | - | - | - | - | - | |||||||||||||||||||||
Foreign currency related items | - | - | - | - | 25 | 12 | 27 | |||||||||||||||||||||
Futures contracts | - | - | - | - | - | - | - | |||||||||||||||||||||
Written option contracts | - | - | - | - | - | - | - | |||||||||||||||||||||
Investment securities sold short | - | - | - | - | - | - | - | |||||||||||||||||||||
Net realized and unrealized gain (loss) | 97,510 | 20,041 | 123,178 | 78,333 | 25,562 | 61,946 | 29,314 | |||||||||||||||||||||
Net increase in net assets from operations | $ | 98,974 | $ | 21,294 | $ | 122,548 | $ | 94,093 | $ | 31,197 | $ | 106,669 | $ | 32,684 | ||||||||||||||
(a) Income from affiliated investments | $ | 380 | $ | 11 | $ | 893 | $ | 16,261 | $ | 331 | $ | 490 | $ | 162 | ||||||||||||||
See accompanying Notes to Financial Statements
JNL Series Trust
Statements of Operations (in thousands)
For the Year Ended December 31, 2010
JNL/Franklin Shares | JNL/Franklin Small Cap | JNL/Goldman Sachs Core Plus Bond Fund | JNL/Goldman Emerging | JNL/Goldman Mid Cap | JNL/Goldman Sachs U.S. Equity Flex Fund | JNL/Invesco Global Real Estate Fund | ||||||||||||||||||||||
Investment income | ||||||||||||||||||||||||||||
Dividends (a) | $ | 18,623 | $ | 3,617 | $ | 115 | $ | 61 | $ | 5,801 | $ | 2,081 | $ | 16,460 | ||||||||||||||
Dividends received from master fund | - | - | - | - | - | - | - | |||||||||||||||||||||
Foreign taxes withheld | (720 | ) | - | - | (167 | ) | - | (2 | ) | (774 | ) | |||||||||||||||||
Interest | 2,085 | - | 30,251 | 29,823 | - | - | 6 | |||||||||||||||||||||
Securities lending | 235 | 30 | 94 | - | 88 | - | 157 | |||||||||||||||||||||
Total investment income | 20,223 | 3,647 | 30,460 | 29,717 | 5,889 | 2,079 | 15,849 | |||||||||||||||||||||
Expenses | ||||||||||||||||||||||||||||
Advisory fees | 3,706 | 1,860 | 5,473 | 3,728 | 2,636 | 811 | 3,293 | |||||||||||||||||||||
Administrative fees | 495 | 221 | 950 | 778 | 370 | 152 | 700 | |||||||||||||||||||||
12b-1 fee (Class A) | 990 | 442 | 1,899 | 1,036 | 724 | 203 | 933 | |||||||||||||||||||||
Legal fees | 45 | 1 | 5 | 2 | 2 | 1 | 2 | |||||||||||||||||||||
Trustee fees | 12 | 5 | 22 | 9 | 8 | 2 | 10 | |||||||||||||||||||||
License fees | - | - | - | - | - | - | - | |||||||||||||||||||||
Dividends on securities sold short | - | - | - | - | - | 451 | - | |||||||||||||||||||||
Short holdings borrowing fees | - | - | - | - | - | 281 | - | |||||||||||||||||||||
Other expenses | 20 | 4 | 17 | 62 | 6 | 3 | 16 | |||||||||||||||||||||
Total expenses | 5,268 | 2,533 | 8,366 | 5,615 | 3,746 | 1,904 | 4,954 | |||||||||||||||||||||
Expense waiver | - | - | - | - | - | - | - | |||||||||||||||||||||
Net expenses | 5,268 | 2,533 | 8,366 | 5,615 | 3,746 | 1,904 | 4,954 | |||||||||||||||||||||
Net investment income (loss) | 14,955 | 1,114 | 22,094 | 24,102 | 2,143 | 175 | 10,895 | |||||||||||||||||||||
Realized and unrealized gain (loss) | ||||||||||||||||||||||||||||
Net realized gain (loss) on: | ||||||||||||||||||||||||||||
Unaffiliated investments | (2,623 | ) | 3,493 | 21,491 | 29,456 | 35,599 | 7,080 | 44,560 | ||||||||||||||||||||
Affiliated investments | - | - | - | �� | - | - | - | - | ||||||||||||||||||||
Distributions from affiliated investment companies | - | - | - | - | - | - | - | |||||||||||||||||||||
Swaps agreements | - | - | 264 | (1,048 | ) | - | - | - | ||||||||||||||||||||
Foreign currency related items | 6,052 | - | (2,279 | ) | 3,580 | - | - | (652 | ) | |||||||||||||||||||
Futures contracts | - | - | 5,883 | - | - | - | - | |||||||||||||||||||||
Option contracts | - | - | - | - | - | - | - | |||||||||||||||||||||
Investment securities sold short | - | - | - | - | - | (4,334 | ) | - | ||||||||||||||||||||
Brokerage commissions recaptured | - | - | - | - | 72 | - | 89 | |||||||||||||||||||||
Net change in unrealized appreciation or depreciation on: | ||||||||||||||||||||||||||||
Investments | 42,463 | 49,341 | 15,652 | 15,292 | 48,330 | 7,436 | 26,810 | |||||||||||||||||||||
Swap agreements | - | - | 1,351 | 4,339 | - | - | - | |||||||||||||||||||||
Foreign currency related items | (4,202 | ) | - | (831 | ) | (1,585 | ) | - | - | 66 | ||||||||||||||||||
Futures contracts | - | - | 629 | - | - | - | - | |||||||||||||||||||||
Written option contracts | - | - | - | - | - | - | - | |||||||||||||||||||||
Investment securities sold short | - | - | - | - | - | (985 | ) | - | ||||||||||||||||||||
Net realized and unrealized gain (loss) | 41,690 | 52,834 | 42,160 | 50,034 | 84,001 | 9,197 | 70,873 | |||||||||||||||||||||
Net increase in net assets from operations | $ | 56,645 | $ | 53,948 | $ | 64,254 | $ | 74,136 | $ | 86,144 | $ | 9,372 | $ | 81,768 | ||||||||||||||
(a) Income from affiliated investments | $ | 263 | $ | 40 | $ | 209 | $ | 61 | $ | 96 | $ | 2 | $ | 163 | ||||||||||||||
See accompanying Notes to Financial Statements
JNL Series Trust
Statements of Operations (in thousands)
For the Year Ended December 31, 2010
| JNL/Invesco International Growth Fund | JNL/Invesco Large Cap Growth Fund | JNL/Invesco Small Cap Growth Fund | JNL/ Ivy Asset Strategy Fund | JNL/JPMorgan International Value Fund | JNL/JPMorgan MidCap Growth Fund | JNL/JPMorgan U.S. Government & Quality Bond Fund | ||||||||||||||||||||||
Investment income | ||||||||||||||||||||||||||||
Dividends (a) | $ | 11,540 | $ | 8,650 | $ | 698 | $ | 13,221 | $ | 15,382 | $ | 1,446 | $ | 34 | ||||||||||||||
Dividends received from master fund | - | - | - | - | - | - | - | |||||||||||||||||||||
Foreign taxes withheld | (1,341 | ) | (92 | ) | (7 | ) | (651 | ) | (1,795 | ) | (31 | ) | - | |||||||||||||||
Interest | - | - | - | - | - | - | 35,975 | |||||||||||||||||||||
Securities lending | 263 | 57 | 49 | - | 637 | 88 | 99 | |||||||||||||||||||||
Total investment income | 10,462 | 8,615 | 740 | 12,570 | 14,224 | 1,503 | 36,108 | |||||||||||||||||||||
Expenses | ||||||||||||||||||||||||||||
Advisory fees | 3,134 | 4,774 | 962 | 5,195 | 3,420 | 1,280 | 3,475 | |||||||||||||||||||||
Administrative fees | 707 | 723 | 113 | 877 | 775 | 183 | 857 | |||||||||||||||||||||
12b-1 fee (Class A) | 942 | 1,445 | 226 | 1,169 | 1,033 | 365 | 1,713 | |||||||||||||||||||||
Legal fees | 3 | 4 | 1 | 2 | 3 | 1 | 4 | |||||||||||||||||||||
Trustee fees | 11 | 17 | 2 | 10 | 13 | 4 | 20 | |||||||||||||||||||||
License fees | - | - | - | - | - | - | - | |||||||||||||||||||||
Dividends on securities sold short | - | - | - | - | - | - | - | |||||||||||||||||||||
Short holdings borrowing fees | - | - | - | - | - | - | - | |||||||||||||||||||||
Other expenses | 38 | 12 | 2 | 43 | 25 | 12 | 16 | |||||||||||||||||||||
Total expenses | 4,835 | 6,975 | 1,306 | 7,296 | 5,269 | 1,845 | 6,085 | |||||||||||||||||||||
Expense waiver | - | - | - | - | - | - | - | |||||||||||||||||||||
Net expenses | 4,835 | 6,975 | 1,306 | 7,296 | 5,269 | 1,845 | 6,085 | |||||||||||||||||||||
Net investment income (loss) | 5,627 | 1,640 | (566 | ) | 5,274 | 8,955 | (342 | ) | 30,023 | |||||||||||||||||||
Realized and unrealized gain (loss) | ||||||||||||||||||||||||||||
Net realized gain (loss) on: | ||||||||||||||||||||||||||||
Unaffiliated investments | (11,671 | ) | 48,763 | 4,728 | (3,392 | ) | (14,752 | ) | 19,436 | 1,120 | ||||||||||||||||||
Affiliated investments | - | - | - | - | - | - | - | |||||||||||||||||||||
Distributions from affiliated investment companies | - | - | - | - | - | - | - | |||||||||||||||||||||
Swaps agreements | - | - | - | 524 | - | - | - | |||||||||||||||||||||
Foreign currency related items | (42 | ) | (132 | ) | - | (2,346 | ) | 5,497 | - | - | ||||||||||||||||||
Futures contracts | - | - | - | (55,537 | ) | 171 | - | - | ||||||||||||||||||||
Option contracts | - | - | - | (6,798 | ) | - | - | - | ||||||||||||||||||||
Investment securities sold short | - | - | - | - | - | - | - | |||||||||||||||||||||
Brokerage commissions recaptured | 19 | 129 | 15 | 68 | - | 6 | - | |||||||||||||||||||||
Net change in unrealized appreciation or depreciation on: | ||||||||||||||||||||||||||||
Investments | 65,930 | 78,990 | 23,466 | 147,197 | 34,611 | 24,888 | 23,731 | |||||||||||||||||||||
Swap agreements | - | - | - | (24 | ) | - | - | - | ||||||||||||||||||||
Foreign currency related items | (78 | ) | 6 | - | (3,787 | ) | 4,278 | (1 | ) | - | ||||||||||||||||||
Futures contracts | - | - | - | - | 56 | - | - | |||||||||||||||||||||
Written option contracts | - | - | - | (374 | ) | - | - | - | ||||||||||||||||||||
Investment securities sold short | - | - | - | - | - | - | - | |||||||||||||||||||||
Net realized and unrealized gain (loss) | 54,158 | 127,756 | 28,209 | 75,531 | 29,861 | 44,329 | 24,851 | |||||||||||||||||||||
Net increase in net assets from operations | $ | 59,785 | $ | 129,396 | $ | 27,643 | $ | 80,805 | $ | 38,816 | $ | 43,987 | $ | 54,874 | ||||||||||||||
(a) Income from affiliated investments | $ | 282 | $ | 84 | $ | 51 | $ | 39 | $ | 644 | $ | 91 | $ | 133 | ||||||||||||||
See accompanying Notes to Financial Statements
JNL Series Trust
Statements of Operations (in thousands)
For the Year Ended December 31, 2010
| JNL/Lazard Emerging Markets Fund | JNL/Lazard Mid Cap Equity Fund | JNL/M&G Global Basics Fund | JNL/M&G Global Leaders Fund | JNL/Mellon Capital Management 10 X 10 Fund | JNL/Mellon Capital Management Index 5 Fund | JNL/Mellon Capital Management European 30 Fund | ||||||||||||||||||||||
Investment income | ||||||||||||||||||||||||||||
Dividends (a) | $ | 31,103 | $ | 3,275 | $ | 2,028 | $ | 438 | $ | 4,175 | $ | 4,203 | $ | 734 | ||||||||||||||
Dividends received from master fund | - | - | - | - | - | - | - | |||||||||||||||||||||
Foreign taxes withheld | (2,574 | ) | - | (111 | ) | (31 | ) | - | - | (99 | ) | |||||||||||||||||
Interest | 11 | - | - | - | - | - | - | |||||||||||||||||||||
Securities lending | 296 | 16 | 58 | 9 | - | - | 38 | |||||||||||||||||||||
Total investment income | 28,836 | 3,291 | 1,975 | 416 | 4,175 | 4,203 | 673 | |||||||||||||||||||||
Expenses | ||||||||||||||||||||||||||||
Advisory fees | 8,405 | 1,274 | 1,093 | 192 | - | - | 57 | |||||||||||||||||||||
Administrative fees | 1,444 | 178 | 193 | 34 | 107 | 129 | 30 | |||||||||||||||||||||
12b-1 fee (Class A) | 1,923 | 356 | 257 | 45 | - | - | 30 | |||||||||||||||||||||
Legal fees | 5 | 1 | - | - | 1 | 1 | - | |||||||||||||||||||||
Trustee fees | 21 | 4 | 2 | 1 | 6 | 6 | 1 | |||||||||||||||||||||
License fees | - | - | - | - | - | - | - | |||||||||||||||||||||
Dividends on securities sold short | - | - | - | - | - | - | - | |||||||||||||||||||||
Short holdings borrowing fees | - | - | - | - | - | - | - | |||||||||||||||||||||
Other expenses | 63 | 4 | 28 | 9 | 3 | 4 | 1 | |||||||||||||||||||||
Total expenses | 11,861 | 1,817 | 1,573 | 281 | 117 | 140 | 119 | |||||||||||||||||||||
Expense waiver | - | - | - | - | - | - | - | |||||||||||||||||||||
Net expenses | 11,861 | 1,817 | 1,573 | 281 | 117 | 140 | 119 | |||||||||||||||||||||
Net investment income (loss) | 16,975 | 1,474 | 402 | 135 | 4,058 | 4,063 | 554 | |||||||||||||||||||||
Realized and unrealized gain (loss) | ||||||||||||||||||||||||||||
Net realized gain (loss) on: | ||||||||||||||||||||||||||||
Unaffiliated investments | 59,618 | 16,234 | 982 | 1,097 | - | - | 576 | |||||||||||||||||||||
Affiliated investments | - | - | - | - | (8,160 | ) | (6,172 | ) | - | |||||||||||||||||||
Distributions from affiliated investment companies | - | - | - | - | 279 | 719 | - | |||||||||||||||||||||
Swaps agreements | - | - | - | - | - | - | - | |||||||||||||||||||||
Foreign currency related items | (996 | ) | - | (1 | ) | (22 | ) | - | - | (15 | ) | |||||||||||||||||
Futures contracts | - | - | - | - | - | - | - | |||||||||||||||||||||
Option contracts | - | - | - | - | - | - | - | |||||||||||||||||||||
Investment securities sold short | - | - | - | - | - | - | - | |||||||||||||||||||||
Brokerage commissions recaptured | 60 | 48 | - | - | - | - | - | |||||||||||||||||||||
Net change in unrealized appreciation or depreciation on: | ||||||||||||||||||||||||||||
Investments | 123,740 | 19,532 | 35,521 | 2,212 | 38,610 | 42,730 | (1,058 | ) | ||||||||||||||||||||
Swap agreements | - | - | - | - | - | - | - | |||||||||||||||||||||
Foreign currency related items | (133 | ) | - | 3 | 6 | - | - | 1 | ||||||||||||||||||||
Futures contracts | - | - | - | - | - | - | - | |||||||||||||||||||||
Written option contracts | - | - | - | - | - | - | - | |||||||||||||||||||||
Investment securities sold short | - | - | - | - | - | - | - | |||||||||||||||||||||
Net realized and unrealized gain (loss) | 182,289 | 35,814 | 36,505 | 3,293 | 30,729 | 37,277 | (496 | ) | ||||||||||||||||||||
Net increase in net assets from operations | $ | 199,264 | $ | 37,288 | $ | 36,907 | $ | 3,428 | $ | 34,787 | $ | 41,340 | $ | 58 | ||||||||||||||
(a) Income from affiliated investments | $ | 328 | $ | 20 | $ | 61 | $ | 9 | $ | 4,175 | $ | 4,203 | $ | 38 | ||||||||||||||
See accompanying Notes to Financial Statements
JNL Series Trust
Statements of Operations (in thousands)
For the Year Ended December 31, 2010
| JNL/Mellon Capital Management Pacific Rim 30 Fund | JNL/Mellon Capital Management S&P 500 Index Fund | JNL/Mellon Capital Management S&P 400 MidCap Index Fund | JNL/Mellon Capital Management Small Cap Index Fund | JNL/Mellon Capital Management International Index Fund | JNL/Mellon Capital Management Bond Index Fund | JNL/Mellon Capital Management Global Alpha Fund | ||||||||||||||||||||||
Investment income | ||||||||||||||||||||||||||||
Dividends (a) | $ | 1,109 | $ | 22,823 | $ | 6,453 | $ | 7,451 | $ | 26,833 | $ | 59 | $ | 6 | ||||||||||||||
Dividends received from master fund | - | - | - | - | - | - | - | |||||||||||||||||||||
Foreign taxes withheld | (46 | ) | - | - | - | (2,659 | ) | - | - | |||||||||||||||||||
Interest | - | 2 | 1 | 17 | 8 | 37,063 | 187 | |||||||||||||||||||||
Securities lending | 8 | 101 | 284 | 1,092 | 988 | 163 | - | |||||||||||||||||||||
Total investment income | 1,071 | 22,926 | 6,738 | 8,560 | 25,170 | 37,285 | 193 | |||||||||||||||||||||
Expenses | ||||||||||||||||||||||||||||
Advisory fees | 104 | 2,851 | 1,553 | 1,613 | 2,405 | 2,930 | 1,282 | |||||||||||||||||||||
Administrative fees | 56 | 1,098 | 544 | 569 | 1,300 | 1,086 | 192 | |||||||||||||||||||||
12b-1 fee (Class A) | 56 | 2,173 | 1,078 | 1,129 | 1,695 | 2,165 | 256 | |||||||||||||||||||||
Legal fees | - | 6 | 3 | 3 | 4 | 5 | 1 | |||||||||||||||||||||
Trustee fees | - | 26 | 13 | 13 | 20 | 24 | 2 | |||||||||||||||||||||
License fees | - | 112 | 59 | 65 | 319 | - | - | |||||||||||||||||||||
Dividends on securities sold short | - | - | - | - | - | - | - | |||||||||||||||||||||
Short holdings borrowing fees | - | - | - | - | - | - | - | |||||||||||||||||||||
Other expenses | 2 | 18 | 9 | 10 | 15 | 18 | 5 | |||||||||||||||||||||
Total expenses | 218 | 6,284 | 3,259 | 3,402 | 5,758 | 6,228 | 1,738 | |||||||||||||||||||||
Expense waiver | - | - | - | - | - | - | - | |||||||||||||||||||||
Net expenses | 218 | 6,284 | 3,259 | 3,402 | 5,758 | 6,228 | 1,738 | |||||||||||||||||||||
Net investment income (loss) | 853 | 16,642 | 3,479 | 5,158 | 19,412 | 31,057 | (1,545 | ) | ||||||||||||||||||||
Realized and unrealized gain (loss) | ||||||||||||||||||||||||||||
Net realized gain (loss) on: | ||||||||||||||||||||||||||||
Unaffiliated investments | 1,989 | 3,134 | 18,336 | 7,427 | (4,252 | ) | 2,851 | - | ||||||||||||||||||||
Affiliated investments | - | (2 | ) | - | - | - | - | - | ||||||||||||||||||||
Distributions from affiliated investment companies | - | - | - | - | - | - | - | |||||||||||||||||||||
Swaps agreements | - | - | - | - | - | - | - | |||||||||||||||||||||
Foreign currency related items | 56 | - | - | - | (801 | ) | - | 2,568 | ||||||||||||||||||||
Futures contracts | - | 4,220 | 1,796 | 866 | 609 | - | 5,768 | |||||||||||||||||||||
Option contracts | - | - | - | - | - | - | - | |||||||||||||||||||||
Investment securities sold short | - | - | - | - | - | - | - | |||||||||||||||||||||
Brokerage commissions recaptured | - | - | - | - | - | - | - | |||||||||||||||||||||
Net change in unrealized appreciation or depreciation on: | ||||||||||||||||||||||||||||
Investments | 566 | 139,047 | 106,277 | 126,298 | 57,121 | 21,145 | 1 | |||||||||||||||||||||
Swap agreements | - | - | - | - | - | - | - | |||||||||||||||||||||
Foreign currency related items | 4 | - | - | - | 1,125 | - | 2,927 | |||||||||||||||||||||
Futures contracts | - | (348 | ) | 16 | (510 | ) | (406 | ) | - | (1,593 | ) | |||||||||||||||||
Written option contracts | - | - | - | - | - | - | - | |||||||||||||||||||||
Investment securities sold short | - | - | - | - | - | - | - | |||||||||||||||||||||
Net realized and unrealized gain (loss) | 2,615 | 146,051 | 126,425 | 134,081 | 53,396 | 23,996 | 9,671 | |||||||||||||||||||||
Net increase in net assets from operations | $ | 3,468 | $ | 162,693 | $ | 129,904 | $ | 139,239 | $ | 72,808 | $ | 55,053 | $ | 8,126 | ||||||||||||||
(a) Income from affiliated investments | $ | 8 | $ | 163 | $ | 292 | $ | 1,099 | $ | 1,065 | $ | 183 | $ | 5 | ||||||||||||||
See accompanying Notes to Financial Statements
JNL Series Trust
Statements of Operations (in thousands)
For the Year Ended December 31, 2010
| JNL/ Oppenheimer Global Growth Fund | JNL/PAM Asia ex-Japan Fund | JNL/PAM China-India Fund | JNL/PIMCO Real Return Fund | JNL/PIMCO Total Return Bond Fund | JNL/PPM America High Yield Bond Fund | JNL/PPM America Mid Cap Value Fund | ||||||||||||||||||||||
Investment income | ||||||||||||||||||||||||||||
Dividends (a) | $ | 7,097 | $ | 2,110 | $ | 4,696 | $ | 114 | $ | 39 | $ | 979 | $ | 667 | ||||||||||||||
Dividends received from master fund | - | - | - | - | - | - | - | |||||||||||||||||||||
Foreign taxes withheld | (658 | ) | (220 | ) | (220 | ) | - | - | - | - | ||||||||||||||||||
Interest | 4 | - | - | 33,006 | 82,789 | 59,312 | - | |||||||||||||||||||||
Securities lending | 304 | 18 | 440 | 94 | 438 | 495 | 4 | |||||||||||||||||||||
Total investment income | 6,747 | 1,908 | 4,916 | 33,214 | 83,266 | 60,786 | 671 | |||||||||||||||||||||
Expenses | ||||||||||||||||||||||||||||
Advisory fees | 2,297 | 1,003 | 2,467 | 7,504 | 14,578 | 3,215 | 373 | |||||||||||||||||||||
Administrative fees | 500 | 167 | 548 | 1,527 | 2,916 | 709 | 50 | |||||||||||||||||||||
12b-1 fee (Class A) | 665 | 222 | 548 | 3,054 | 5,799 | 1,405 | 99 | |||||||||||||||||||||
Legal fees | 2 | 1 | 1 | 8 | 15 | 4 | - | |||||||||||||||||||||
Trustee fees | 8 | 3 | 6 | 35 | 67 | 16 | 1 | |||||||||||||||||||||
License fees | - | - | - | - | - | - | - | |||||||||||||||||||||
Dividends on securities sold short | - | - | - | - | - | - | - | |||||||||||||||||||||
Interest expense | - | - | - | 208 | 22 | - | - | |||||||||||||||||||||
Other expenses | 51 | 66 | 74 | 136 | 80 | 13 | 4 | |||||||||||||||||||||
Total expenses | 3,523 | 1,462 | 3,644 | 12,472 | 23,477 | 5,362 | 527 | |||||||||||||||||||||
Expense waiver | - | - | - | - | - | - | - | |||||||||||||||||||||
Net expenses | 3,523 | 1,462 | 3,644 | 12,472 | 23,477 | 5,362 | 527 | |||||||||||||||||||||
Net investment income (loss) | 3,224 | 446 | 1,272 | 20,742 | 59,789 | 55,424 | 144 | |||||||||||||||||||||
Realized and unrealized gain (loss) | ||||||||||||||||||||||||||||
Net realized gain (loss) on: | ||||||||||||||||||||||||||||
Unaffiliated investments | (1,614 | ) | 11,611 | 18,867 | 83,850 | 52,691 | 24,259 | 4,625 | ||||||||||||||||||||
Affiliated investments | - | - | - | - | - | - | - | |||||||||||||||||||||
Distributions from affiliated investment companies | - | - | - | - | - | - | - | |||||||||||||||||||||
Swaps agreements | - | - | - | (5,503 | ) | (6,007 | ) | - | - | |||||||||||||||||||
Foreign currency related items | 39 | (82 | ) | (22 | ) | (3,200 | ) | (4,076 | ) | - | - | |||||||||||||||||
Futures contracts | - | - | - | 3,162 | 36,193 | - | - | |||||||||||||||||||||
Written option contracts | - | - | - | 5,156 | 10,654 | - | - | |||||||||||||||||||||
Investment securities sold short | - | - | - | - | - | - | - | |||||||||||||||||||||
Brokerage commissions recaptured | - | - | - | - | - | - | 10 | |||||||||||||||||||||
Net change in unrealized appreciation or depreciation on: | ||||||||||||||||||||||||||||
Investments | 48,718 | 7,143 | 17,738 | (21 | ) | 39,684 | 24,915 | 6,593 | ||||||||||||||||||||
Swap agreements | - | - | - | 3,113 | 8,137 | - | - | |||||||||||||||||||||
Foreign currency related items | 14 | 5 | 1 | 94 | 175 | - | - | |||||||||||||||||||||
Futures contracts | - | - | - | (1,220 | ) | (2,822 | ) | - | - | |||||||||||||||||||
Written option contracts | - | - | - | (1,615 | ) | (2,789 | ) | - | - | |||||||||||||||||||
Investment securities sold short | - | - | - | - | - | - | - | |||||||||||||||||||||
Net realized and unrealized gain (loss) | 47,157 | 18,677 | 36,584 | 83,816 | 131,840 | 49,174 | 11,228 | |||||||||||||||||||||
Net increase in net assets from operations | $ | 50,381 | $ | 19,123 | $ | 37,856 | $ | 104,558 | $ | 191,629 | $ | 104,598 | $ | 11,372 | ||||||||||||||
(a) Income from affiliated investments | $ | 308 | $ | 19 | $ | 446 | $ | 97 | $ | 449 | $ | 518 | $ | 5 | ||||||||||||||
See accompanying Notes to Financial Statements
JNL Series Trust
Statements of Operations (in thousands)
For the Year Ended December 31, 2010
| JNL/PPM America Small Cap Value Fund | JNL/PPM America Value Equity Fund | JNL/Red Rocks Listed Private Equity Fund | JNL/S&P Managed Conservative Fund | JNL/S&P Managed Moderate Fund | JNL/S&P Managed Moderate Growth Fund | JNL/S&P Managed Growth Fund | ||||||||||||||||||||||
Investment income | ||||||||||||||||||||||||||||
Dividends (a) | $ | 577 | $ | 2,152 | $ | 8,116 | $ | 14,574 | $ | 20,302 | $ | 29,038 | $ | 15,361 | ||||||||||||||
Dividends received from master fund | - | - | - | - | - | - | - | |||||||||||||||||||||
Foreign taxes withheld | - | - | (743 | ) | - | - | - | - | ||||||||||||||||||||
Interest | - | - | - | - | - | - | - | |||||||||||||||||||||
Securities lending | 6 | 8 | 285 | - | - | - | - | |||||||||||||||||||||
Total investment income | 583 | 2,160 | 7,658 | 14,574 | 20,302 | 29,038 | 15,361 | |||||||||||||||||||||
Expenses | ||||||||||||||||||||||||||||
Advisory fees | 319 | 553 | 3,254 | 885 | 1,292 | 2,027 | 1,624 | |||||||||||||||||||||
Administrative fees | 43 | 100 | 592 | 397 | 651 | 1,111 | 859 | |||||||||||||||||||||
12b-1 fee (Class A) | 74 | 200 | 788 | - | - | - | - | |||||||||||||||||||||
Legal fees | - | 1 | 2 | 4 | 7 | 11 | 9 | |||||||||||||||||||||
Trustee fees | 1 | 2 | 8 | 18 | 29 | 51 | 41 | |||||||||||||||||||||
License fees | - | - | - | - | - | - | - | |||||||||||||||||||||
Dividends on securities sold short | - | - | - | - | - | - | - | |||||||||||||||||||||
Short holdings borrowing fees | - | - | - | - | - | - | - | |||||||||||||||||||||
Other expenses | 2 | 3 | 6 | 12 | 21 | 35 | 28 | |||||||||||||||||||||
Total expenses | 439 | 859 | 4,650 | 1,316 | 2,000 | 3,235 | 2,561 | |||||||||||||||||||||
Expense waiver | - | - | - | - | - | - | - | |||||||||||||||||||||
Net expenses | 439 | 859 | 4,650 | 1,316 | 2,000 | 3,235 | 2,561 | |||||||||||||||||||||
Net investment income (loss) | 144 | 1,301 | 3,008 | 13,258 | 18,302 | 25,803 | 12,800 | |||||||||||||||||||||
Realized and unrealized gain (loss) | ||||||||||||||||||||||||||||
Net realized gain (loss) on: | ||||||||||||||||||||||||||||
Unaffiliated investments | 3,962 | 6,707 | 18,457 | - | - | - | - | |||||||||||||||||||||
Affiliated investments | - | - | - | (950 | ) | (18,337 | ) | (17,515 | ) | (33,823 | ) | |||||||||||||||||
Distributions from affiliated investment companies | - | - | - | 9,350 | 13,158 | 14,583 | 7,543 | |||||||||||||||||||||
Swaps agreements | - | - | - | - | - | - | - | |||||||||||||||||||||
Foreign currency related items | - | - | (408 | ) | - | - | - | - | ||||||||||||||||||||
Futures contracts | - | - | - | - | - | - | - | |||||||||||||||||||||
Option contracts | - | - | - | - | - | - | - | |||||||||||||||||||||
Investment securities sold short | - | - | - | - | - | - | - | |||||||||||||||||||||
Brokerage commissions recaptured | 13 | 5 | - | - | - | - | - | |||||||||||||||||||||
Net change in unrealized appreciation or depreciation on: | ||||||||||||||||||||||||||||
Investments | 5,218 | 8,145 | 83,649 | 45,561 | 133,910 | 274,473 | 288,389 | |||||||||||||||||||||
Swap agreements | - | - | - | - | - | - | - | |||||||||||||||||||||
Foreign currency related items | - | - | (5 | ) | - | - | - | - | ||||||||||||||||||||
Futures contracts | - | - | - | - | - | - | - | |||||||||||||||||||||
Written option contracts | - | - | - | - | - | - | - | |||||||||||||||||||||
Investment securities sold short | - | - | - | - | - | - | - | |||||||||||||||||||||
Net realized and unrealized gain (loss) | 9,193 | 14,857 | 101,693 | 53,961 | 128,731 | 271,541 | 262,109 | |||||||||||||||||||||
Net increase in net assets from operations | $ | 9,337 | $ | 16,158 | $ | 104,701 | $ | 67,219 | $ | 147,033 | $ | 297,344 | $ | 274,909 | ||||||||||||||
(a) Income from affiliated investments | $ | 6 | $ | 8 | $ | 291 | $ | 14,574 | $ | 20,302 | $ | 29,038 | $ | 15,361 | ||||||||||||||
See accompanying Notes to Financial Statements
JNL Series Trust
Statements of Operations (in thousands)
For the Year Ended December 31, 2010
| JNL/S&P Managed Aggressive Growth Fund | JNL/S&P Disciplined Moderate Fund | JNL/S&P Disciplined Moderate Growth Fund | JNL/S&P Disciplined Growth Fund | JNL/S&P Competitive Advantage Fund | JNL/S&P Dividend Income & Growth Fund | JNL/S&P Intrinsic Value Fund | ||||||||||||||||||||||
Investment income | ||||||||||||||||||||||||||||
Dividends (a) | $ | 6,056 | $ | 5,249 | $ | 5,144 | $ | 1,897 | $ | 5,375 | $ | 12,634 | $ | 6,273 | ||||||||||||||
Dividends received from master fund | - | - | - | - | - | - | - | |||||||||||||||||||||
Foreign taxes withheld | - | - | - | - | - | - | - | |||||||||||||||||||||
Interest | - | - | - | - | - | - | - | |||||||||||||||||||||
Securities lending | - | - | - | - | 69 | 68 | 15 | |||||||||||||||||||||
Total investment income | 6,056 | 5,249 | 5,144 | 1,897 | 5,444 | 12,702 | 6,288 | |||||||||||||||||||||
Expenses | ||||||||||||||||||||||||||||
Advisory fees | 772 | 323 | 367 | 130 | 1,059 | 1,261 | 1,129 | |||||||||||||||||||||
Administrative fees | 326 | 124 | 141 | 50 | 265 | 315 | 282 | |||||||||||||||||||||
12b-1 fee (Class A) | - | - | - | - | 529 | 630 | 565 | |||||||||||||||||||||
Legal fees | 4 | 1 | 1 | 1 | 2 | 1 | 2 | |||||||||||||||||||||
Trustee fees | 15 | 5 | 7 | 2 | 6 | 7 | 7 | |||||||||||||||||||||
License fees | - | - | - | - | - | - | - | |||||||||||||||||||||
Dividends on securities sold short | - | - | - | - | - | - | - | |||||||||||||||||||||
Short holdings borrowing fees | - | - | - | - | - | - | - | |||||||||||||||||||||
Other expenses | 11 | 4 | 4 | 1 | 9 | 6 | 8 | |||||||||||||||||||||
Total expenses | 1,128 | 457 | 520 | 184 | 1,870 | 2,220 | 1,993 | |||||||||||||||||||||
Expense waiver | - | - | - | - | - | - | - | |||||||||||||||||||||
Net expenses | 1,128 | 457 | 520 | 184 | 1,870 | 2,220 | 1,993 | |||||||||||||||||||||
Net investment income (loss) | 4,928 | 4,792 | 4,624 | 1,713 | 3,574 | 10,482 | 4,295 | |||||||||||||||||||||
Realized and unrealized gain (loss) | ||||||||||||||||||||||||||||
Net realized gain (loss) on: | ||||||||||||||||||||||||||||
Unaffiliated investments | - | - | - | - | 31,721 | 17,941 | 38,315 | |||||||||||||||||||||
Affiliated investments | (18,258 | ) | (7,458 | ) | (8,225 | ) | 608 | - | - | - | ||||||||||||||||||
Distributions from affiliated investment companies | 1,527 | 1,127 | 921 | 234 | - | - | - | |||||||||||||||||||||
Swaps agreements | - | - | - | - | - | - | - | |||||||||||||||||||||
Foreign currency related items | - | - | - | - | - | - | - | |||||||||||||||||||||
Futures contracts | - | - | - | - | - | - | - | |||||||||||||||||||||
Option contracts | - | - | - | - | - | - | - | |||||||||||||||||||||
Investment securities sold short | - | - | - | - | - | - | - | |||||||||||||||||||||
Brokerage commissions recaptured | - | - | - | - | - | - | - | |||||||||||||||||||||
Net change in unrealized appreciation or depreciation on: | ||||||||||||||||||||||||||||
Investments | 120,981 | 30,788 | 41,943 | 11,263 | (3,418 | ) | 28,373 | (5,059 | ) | |||||||||||||||||||
Swap agreements | - | - | - | - | - | - | - | |||||||||||||||||||||
Foreign currency related items | - | - | - | - | - | - | - | |||||||||||||||||||||
Futures contracts | - | - | - | - | - | - | - | |||||||||||||||||||||
Written option contracts | - | - | - | - | - | - | - | |||||||||||||||||||||
Investment securities sold short | - | - | - | - | - | - | - | |||||||||||||||||||||
Net realized and unrealized gain (loss) | 104,250 | 24,457 | 34,639 | 12,105 | 28,303 | 46,314 | 33,256 | |||||||||||||||||||||
Net increase in net assets from operations | $ | 109,178 | $ | 29,249 | $ | 39,263 | $ | 13,818 | $ | 31,877 | $ | 56,796 | $ | 37,551 | ||||||||||||||
(a) Income from affiliated investments | $ | 6,056 | $ | 5,249 | $ | 5,144 | $ | 1,897 | $ | 70 | $ | 70 | $ | 16 | ||||||||||||||
See accompanying Notes to Financial Statements
JNL Series Trust
Statements of Operations (in thousands)
For the Year Ended December 31, 2010
| JNL/S&P Total Yield Fund | JNL/S&P 4 Fund | JNL/Select Balanced Fund | JNL/Select Money Market Fund | JNL/Select Value Fund | JNL/T. Rowe Price Established Growth Fund | JNL/T. Rowe Price Mid-Cap Growth Fund | ||||||||||||||||||||||
Investment income | ||||||||||||||||||||||||||||
Dividends (a) | $ | 5,421 | $ | 6,842 | $ | 15,898 | $ | - | $ | 19,671 | $ | 9,275 | $ | 10,210 | ||||||||||||||
Dividends received from master fund | - | - | - | - | - | - | - | |||||||||||||||||||||
Foreign taxes withheld | - | - | (187 | ) | - | (77 | ) | (119 | ) | (121 | ) | |||||||||||||||||
Interest | - | - | 9,290 | 2,175 | - | - | - | |||||||||||||||||||||
Securities lending | 428 | - | 128 | - | 28 | 119 | 467 | |||||||||||||||||||||
Total investment income | 5,849 | 6,842 | 25,129 | 2,175 | 19,622 | 9,275 | 10,556 | |||||||||||||||||||||
Expenses | ||||||||||||||||||||||||||||
Advisory fees | 968 | - | 4,373 | 2,163 | 4,521 | 6,848 | 7,344 | |||||||||||||||||||||
Administrative fees | 242 | 359 | 967 | 805 | 916 | 1,186 | 1,038 | |||||||||||||||||||||
12b-1 fee (Class A) | 484 | - | 1,932 | 1,596 | 1,800 | 2,307 | 2,012 | |||||||||||||||||||||
Legal fees | 1 | 4 | 5 | 6 | 5 | 6 | 5 | |||||||||||||||||||||
Trustee fees | 6 | 17 | 22 | 27 | 21 | 27 | 24 | |||||||||||||||||||||
License fees | - | - | - | - | - | - | - | |||||||||||||||||||||
Dividends on securities sold short | - | - | - | - | - | - | - | |||||||||||||||||||||
Short holdings borrowing fees | - | - | - | - | - | - | - | |||||||||||||||||||||
Other expenses | 6 | 9 | 14 | 20 | 15 | 40 | 17 | |||||||||||||||||||||
Total expenses | 1,707 | 389 | 7,313 | 4,617 | 7,278 | 10,414 | 10,440 | |||||||||||||||||||||
Expense waiver | - | - | - | (2,442 | ) | - | - | - | ||||||||||||||||||||
Net expenses | 1,707 | 389 | 7,313 | 2,175 | 7,278 | 10,414 | 10,440 | |||||||||||||||||||||
Net investment income (loss) | 4,142 | 6,453 | 17,816 | - | 12,344 | (1,139 | ) | 116 | ||||||||||||||||||||
Realized and unrealized gain (loss) | ||||||||||||||||||||||||||||
Net realized gain (loss) on: | ||||||||||||||||||||||||||||
Unaffiliated investments | 18,842 | - | 30,005 | 6 | 29,517 | 10,763 | 53,288 | |||||||||||||||||||||
Affiliated investments | - | 693 | - | - | - | - | - | |||||||||||||||||||||
Distributions from affiliated investment companies | - | 40,481 | - | - | - | - | - | |||||||||||||||||||||
Swaps agreements | - | - | - | - | - | - | - | |||||||||||||||||||||
Foreign currency related items | - | - | - | - | - | 17 | (6 | ) | ||||||||||||||||||||
Futures contracts | - | - | 121 | - | - | - | - | |||||||||||||||||||||
Option contracts | - | - | - | - | - | - | - | |||||||||||||||||||||
Investment securities sold short | - | - | - | - | - | - | - | |||||||||||||||||||||
Brokerage commissions recaptured | - | - | 11 | - | 30 | 21 | 28 | |||||||||||||||||||||
Net change in unrealized appreciation or depreciation on: | ||||||||||||||||||||||||||||
Investments | (2,417 | ) | 47,764 | 63,421 | - | 88,641 | 199,846 | 220,626 | ||||||||||||||||||||
Swap agreements | - | - | - | - | - | - | - | |||||||||||||||||||||
Foreign currency related items | - | - | - | - | - | 6 | (1 | ) | ||||||||||||||||||||
Futures contracts | - | - | - | - | - | - | - | |||||||||||||||||||||
Written option contracts | - | - | - | - | - | - | - | |||||||||||||||||||||
Investment securities sold short | - | - | - | - | - | - | - | |||||||||||||||||||||
Net realized and unrealized gain (loss) | 16,425 | 88,938 | 93,558 | 6 | 118,188 | 210,653 | 273,935 | |||||||||||||||||||||
Net increase in net assets from operations | $ | 20,567 | $ | 95,391 | $ | 111,374 | $ | 6 | $ | 130,532 | $ | 209,514 | $ | 274,051 | ||||||||||||||
(a) Income from affiliated investments | $ | 429 | $ | 6,842 | $ | 179 | $ | - | $ | 42 | $ | 120 | $ | 470 | ||||||||||||||
See accompanying Notes to Financial Statements
JNL Series Trust
Statements of Operations (in thousands)
For the Year Ended December 31, 2010
| JNL/T. Rowe Price Short- Term Bond Fund | JNL/T. Rowe Price Value Fund | |||||||
Investment income | ||||||||
Dividends (a) | $ | 983 | $ | 26,350 | ||||
Dividends received from master fund | - | - | ||||||
Foreign taxes withheld | - | (290 | ) | |||||
Interest | 17,043 | 39 | ||||||
Securities lending | 30 | 142 | ||||||
Total investment income | 18,056 | 26,241 | ||||||
Expenses | ||||||||
Advisory fees | 2,961 | 5,737 | ||||||
Administrative fees | 709 | 902 | ||||||
12b-1 fee (Class A) | 1,417 | 1,803 | ||||||
Legal fees | 3 | 5 | ||||||
Trustee fees | 15 | 21 | ||||||
License fees | - | - | ||||||
Dividends on securities sold short | - | - | ||||||
Short holdings borrowing fees | - | - | ||||||
Other expenses | 12 | 15 | ||||||
Total expenses | 5,117 | 8,483 | ||||||
Expense waiver | - | - | ||||||
Net expenses | 5,117 | 8,483 | ||||||
Net investment income (loss) | 12,939 | 17,758 | ||||||
Realized and unrealized gain (loss) | ||||||||
Net realized gain (loss) on: | ||||||||
Unaffiliated investments | (697 | ) | (511 | ) | ||||
Affiliated investments | 188 | 860 | ||||||
Distributions from affiliated investment companies | - | - | ||||||
Swaps agreements | - | - | ||||||
Foreign currency related items | (195 | ) | (14 | ) | ||||
Futures contracts | - | - | ||||||
Option contracts | - | - | ||||||
Investment securities sold short | - | - | ||||||
Brokerage commissions recaptured | - | 25 | ||||||
Net change in unrealized appreciation or depreciation on: | ||||||||
Investments | 6,386 | 127,179 | ||||||
Swap agreements | - | - | ||||||
Foreign currency related items | (7 | ) | - | |||||
Futures contracts | - | - | ||||||
Written option contracts | - | - | ||||||
Investment securities sold short | - | - | ||||||
Net realized and unrealized gain (loss) | 5,675 | 127,539 | ||||||
Net increase in net assets from operations | $ | 18,614 | $ | 145,297 | ||||
(a) Income from affiliated investments | $ | 957 | $ | 527 | ||||
See accompanying Notes to Financial Statements
JNL Series Trust
Statement of Cash Flows (in thousands)
For the Year Ended December 31, 2010
| JNL/Goldman Sachs U.S. Equity Flex Fund | ||||
Cash flows from operating activities | ||||
Net increase in net assets from operations | $ | 9,372 | ||
Adjustments to reconcile net increase in net assets from operations to net cash flow used in operating activities: | ||||
Purchase of investment securities | (548,682 | ) | ||
Proceeds from sales and maturities of investment securities | 531,764 | |||
Net purchases of short-term investments | (239 | ) | ||
Proceeds from securities sold short | 93,738 | |||
Purchases to cover securities sold short | (92,506 | ) | ||
Decrease in receivable for investments sold | 3,794 | |||
Decrease in payable for investments purchased | (2,991 | ) | ||
Increase in receivable for dividends and interest | (75 | ) | ||
Increase in payable for expenses | 24 | |||
Increase in payable for dividends on securities sold short | 13 | |||
Increase in payable for interest expense and brokerage charges | 18 | |||
Change in unrealized appreciation (depreciation) on investments | (6,451 | ) | ||
Net realized gain on investments | (2,746 | ) | ||
Net cash flow from operating activities | (14,967 | ) | ||
Cash flows from financing activities | ||||
Net proceeds from capital share transactions | 14,967 | |||
Net cash flow from financing activities | 14,967 | |||
Net increase in cash | ||||
Cash at beginning of year | - | |||
Cash at end of year | $ | - | ||
Supplemental disclosure of operating activities: | ||||
Short holding borrowing fees during the year were $281. | ||||
Supplemental disclosure of non-cash financing activities: | ||||
Reinvestment of distributions during the year were $671. | ||||
See accompanying Notes to Financial Statements
JNL Series Trust
Statements of Changes in Net Assets (in thousands)
For the Year Ended December 31, 2010
| Operations | JNL/American Funds Blue Chip Income and Growth Fund (a) | JNL/American Funds Global Bond Fund (a) | JNL/American Funds Global Small Capitalization Fund (a) | JNL/American Funds Growth- Income Fund (a) | JNL/American Funds International Fund (a) | JNL/American Funds New World Fund (a) | JNL Institutional Alt 20 Fund | |||||||||||||||||||||
Net investment income (loss) | $ | 1,893 | $ | 2,372 | $ | 419 | $ | 1,730 | $ | 1,241 | $ | 1,268 | $ | 7,396 | ||||||||||||||
Net realized gain (loss) | (314 | ) | 150 | 11 | - | 126 | - | 1,157 | ||||||||||||||||||||
Net change in unrealized appreciation (depreciation) | 10,711 | (1,175 | ) | 7,947 | 13,029 | 7,401 | 8,525 | 52,224 | ||||||||||||||||||||
Net increase (decrease) in net assets from operations | 12,290 | 1,347 | 8,377 | 14,759 | 8,768 | 9,793 | 60,777 | |||||||||||||||||||||
Distributions to shareholders | ||||||||||||||||||||||||||||
From net investment income | ||||||||||||||||||||||||||||
Class A | - | - | - | - | - | - | (2,748 | ) | ||||||||||||||||||||
Class B | - | - | - | - | - | - | ||||||||||||||||||||||
From net realized gains | ||||||||||||||||||||||||||||
Class A | - | - | - | - | - | - | (200 | ) | ||||||||||||||||||||
Class B | - | - | - | - | - | - | - | |||||||||||||||||||||
Total distributions to shareholders | - | - | - | - | - | - | (2,948 | ) | ||||||||||||||||||||
Share transactions¹ | ||||||||||||||||||||||||||||
Proceeds from the sale of shares | ||||||||||||||||||||||||||||
Class A | 150,108 | 121,279 | 79,845 | 171,314 | 102,299 | 130,341 | 405,032 | |||||||||||||||||||||
Class B | 9 | 81 | 22 | 22 | 19 | 17 | - | |||||||||||||||||||||
Reinvestment of distributions | ||||||||||||||||||||||||||||
Class A | - | - | - | - | - | - | 2,948 | |||||||||||||||||||||
Class B | - | - | - | - | - | - | - | |||||||||||||||||||||
Cost of shares redeemed | ||||||||||||||||||||||||||||
Class A | (13,401 | ) | (17,364 | ) | (7,297 | ) | (11,577 | ) | (8,300 | ) | (6,667 | ) | (50,291 | ) | ||||||||||||||
Class B | (1 | ) | (2 | ) | - | (1 | ) | - | (1 | ) | - | |||||||||||||||||
Net increase (decrease) in net assets from share transactions | 136,715 | 103,994 | 72,570 | 159,758 | 94,018 | 123,690 | 357,689 | |||||||||||||||||||||
Net increase (decrease) in net assets | 149,005 | 105,341 | 80,947 | 174,517 | 102,786 | 133,483 | 415,518 | |||||||||||||||||||||
Net assets beginning of year | - | - | - | - | - | - | 199,516 | |||||||||||||||||||||
Net assets end of year | $ | 149,005 | $ | 105,341 | $ | 80,947 | $ | 174,517 | $ | 102,786 | $ | 133,483 | $ | 615,034 | ||||||||||||||
Undistributed (excess of distributions over) net investment income | $ | 1,893 | $ | 2,372 | $ | 419 | $ | 1,730 | $ | 1,241 | $ | 1,268 | $ | 7,819 | ||||||||||||||
¹Share transactions | ||||||||||||||||||||||||||||
Shares sold | ||||||||||||||||||||||||||||
Class A | 15,779 | 11,730 | 7,976 | 17,903 | 10,269 | 12,377 | 30,872 | |||||||||||||||||||||
Class B | 1 | 8 | 2 | 2 | 2 | 2 | - | |||||||||||||||||||||
Reinvestment of distributions | ||||||||||||||||||||||||||||
Class A | - | - | - | - | - | - | 209 | |||||||||||||||||||||
Class B | - | - | - | - | - | - | - | |||||||||||||||||||||
Shares redeemed | ||||||||||||||||||||||||||||
Class A | (1,438 | ) | (1,656 | ) | (716 | ) | (1,200 | ) | (799 | ) | (627 | ) | (3,813 | ) | ||||||||||||||
Class B | - | - | - | - | - | - | - | |||||||||||||||||||||
Net increase (decrease) | ||||||||||||||||||||||||||||
Class A | 14,341 | 10,074 | 7,260 | 16,703 | 9,470 | 11,750 | 27,268 | |||||||||||||||||||||
Class B | 1 | 8 | 2 | 2 | 2 | 2 | - | |||||||||||||||||||||
Purchase and sales of investment securities | ||||||||||||||||||||||||||||
(excluding short-term securities): | ||||||||||||||||||||||||||||
Purchase of securities | $ | 141,889 | $ | 108,845 | $ | 74,385 | $ | 161,578 | $ | 96,547 | $ | 125,023 | $ | 372,986 | ||||||||||||||
Proceeds from sales of securities | 3,207 | 2,433 | 1,362 | - | 1,233 | - | 10,155 | |||||||||||||||||||||
| (a) | Period from May 3, 2010 (commencement of operations) |
See accompanying Notes to Financial Statements
JNL Series Trust
Statements of Changes in Net Assets (in thousands)
For the Year Ended December 31, 2010
| Operations | JNL Institutional Alt 35 Fund | JNL Institutional Alt 50 Fund | JNL Institutional Alt 65 Fund | JNL/ BlackRock Commodity Securities Fund | JNL/ BlackRock Global Allocation Fund (a) | JNL/ Capital Guardian Global Balanced Fund | JNL/ Capital Guardian Global Diversified Research Fund | |||||||||||||||||||||||||
Net investment income (loss) | $ | 10,133 | $ | 12,244 | $ | 6,622 | $ | 6,176 | $ | 2,078 | $ | 5,067 | $ | 3,684 | ||||||||||||||||||
Net realized gain (loss) | 1,829 | 2,771 | 3,076 | 50,319 | (3 | ) | (944 | ) | 3,919 | |||||||||||||||||||||||
Net change in unrealized appreciation (depreciation) | 84,551 | 102,316 | 69,635 | 80,009 | 1,380 | 25,242 | 36,578 | |||||||||||||||||||||||||
Net increase (decrease) in net assets from operations | 96,513 | 117,331 | 79,333 | 136,504 | 3,455 | 29,365 | 44,181 | |||||||||||||||||||||||||
Distributions to shareholders | ||||||||||||||||||||||||||||||||
From net investment income | ||||||||||||||||||||||||||||||||
Class A | (4,331 | ) | (5,229 | ) | (3,056 | ) | (2,641 | ) | - | (3,456 | ) | (2,798 | ) | |||||||||||||||||||
Class B | - | - | - | (2 | ) | - | (5 | ) | (2 | ) | ||||||||||||||||||||||
From net realized gains | ||||||||||||||||||||||||||||||||
Class A | (723 | ) | (1,476 | ) | (1,793 | ) | - | - | - | - | ||||||||||||||||||||||
Class B | - | - | - | - | - | - | - | |||||||||||||||||||||||||
Total distributions to shareholders | (5,054 | ) | (6,705 | ) | (4,849 | ) | (2,643 | ) | - | (3,461 | ) | (2,800 | ) | |||||||||||||||||||
Share transactions¹ | ||||||||||||||||||||||||||||||||
Proceeds from the sale of shares | ||||||||||||||||||||||||||||||||
Class A | 563,434 | 713,332 | 527,728 | 513,422 | 181,274 | 131,332 | 211,622 | |||||||||||||||||||||||||
Class B | - | - | - | 285 | 18 | 62 | 205 | |||||||||||||||||||||||||
Reinvestment of distributions | ||||||||||||||||||||||||||||||||
Class A | 5,054 | 6,705 | 4,849 | 2,641 | - | 3,456 | 2,798 | |||||||||||||||||||||||||
Class B | - | - | - | 2 | - | 5 | 2 | |||||||||||||||||||||||||
Cost of shares redeemed | ||||||||||||||||||||||||||||||||
Class A | (83,007 | ) | (114,556 | ) | (108,464 | ) | (290,691 | ) | (5,167 | ) | (81,872 | ) | (151,444 | ) | ||||||||||||||||||
Class B | - | - | - | (234 | ) | - | (90 | ) | (262 | ) | ||||||||||||||||||||||
Net increase (decrease) in net assets from share transactions | 485,481 | 605,481 | 424,113 | 225,425 | 176,125 | 52,893 | 62,921 | |||||||||||||||||||||||||
Net increase (decrease) in net assets | 576,940 | 716,107 | 498,597 | 359,286 | 179,580 | 78,797 | 104,302 | |||||||||||||||||||||||||
Net assets beginning of year | 308,516 | 361,516 | 229,813 | 641,646 | - | 280,217 | 332,906 | |||||||||||||||||||||||||
Net assets end of year | $ | 885,456 | $ | 1,077,623 | $ | 728,410 | $ | 1,000,932 | $ | 179,580 | $ | 359,014 | $ | 437,208 | ||||||||||||||||||
Undistributed (excess of distributions over) net investment income | $ | 10,500 | $ | 12,800 | $ | 7,039 | $ | 5,979 | $ | 2,078 | $ | 3,863 | $ | 2,921 | ||||||||||||||||||
¹Share transactions | ||||||||||||||||||||||||||||||||
Shares sold | ||||||||||||||||||||||||||||||||
Class A | 41,230 | 50,645 | 36,186 | 54,520 | 17,866 | 14,856 | 10,087 | |||||||||||||||||||||||||
Class B | - | - | - | 31 | 2 | 7 | 9 | |||||||||||||||||||||||||
Reinvestment of distributions | ||||||||||||||||||||||||||||||||
Class A | 342 | 442 | 309 | 250 | - | 370 | 123 | |||||||||||||||||||||||||
Class B | - | - | - | - | - | - | - | |||||||||||||||||||||||||
Shares redeemed | ||||||||||||||||||||||||||||||||
Class A | (6,049 | ) | (8,156 | ) | (7,614 | ) | (32,082 | ) | (514 | ) | (9,301 | ) | (7,297 | ) | ||||||||||||||||||
Class B | - | - | - | (25 | ) | - | (10 | ) | (12 | ) | ||||||||||||||||||||||
Net increase (decrease) | ||||||||||||||||||||||||||||||||
Class A | 35,523 | 42,931 | 28,881 | 22,688 | 17,352 | 5,925 | 2,913 | |||||||||||||||||||||||||
Class B | - | - | - | 6 | 2 | (3 | ) | (3 | ) | |||||||||||||||||||||||
Purchase and sales of investment securities (excluding short-term securities): | ||||||||||||||||||||||||||||||||
Purchase of securities | $ | 505,239 | $ | 626,063 | $ | 448,670 | $ | 655,820 | (b) | $ | 181,946 | $ | 212,461 | (c) | $ | 169,628 | ||||||||||||||||
Proceeds from sales of securities | 13,897 | 13,842 | 21,849 | 652,013 | (b) | 3,676 | 159,492 | (c) | 104,141 | |||||||||||||||||||||||
| (a) | Period from October 11, 2010 (commencement of operations) |
| (b) | Amount includes $62,008 and $123,976 of purchases and sales, respectively, of U.S. Government Securities. |
| (c) | Amount includes $24,828 and $20,653 of purchases and sales, respectively, of U.S. Government Securities. |
See accompanying Notes to Financial Statements
JNL Series Trust
Statements of Changes in Net Assets (in thousands)
For the Year Ended December 31, 2010
| Operations | JNL/ Capital Guardian U.S. Growth Equity Fund | JNL/ Eagle Core Equity Fund | JNL/ Eagle SmallCap Equity Fund | JNL/ Franklin Templeton Founding Strategy Fund | JNL/ Franklin Templeton Global Growth Fund | JNL/ Franklin Templeton Income Fund | JNL/ Franklin Templeton International Small Cap Growth Fund | |||||||||||||||||||||
Net investment income (loss) | $ | 1,464 | $ | 1,253 | $ | (630 | ) | $ | 15,760 | $ | 5,635 | $ | 44,723 | $ | 3,370 | |||||||||||||
Net realized gain (loss) | (1,485 | ) | 1,930 | 24,065 | (8,814 | ) | (6,204 | ) | 2,903 | 14,841 | ||||||||||||||||||
Net change in unrealized appreciation (depreciation) | 98,995 | 18,111 | 99,113 | 87,147 | 31,766 | 59,043 | 14,473 | |||||||||||||||||||||
Net increase (decrease) in net assets from operations | 98,974 | 21,294 | 122,548 | 94,093 | 31,197 | 106,669 | 32,684 | |||||||||||||||||||||
Distributions to shareholders | ||||||||||||||||||||||||||||
From net investment income | ||||||||||||||||||||||||||||
Class A | (1,990 | ) | (509 | ) | (679 | ) | (27,416 | ) | (5,696 | ) | (34,996 | ) | (2,197 | ) | ||||||||||||||
Class B | (1 | ) | - | (1 | ) | - | (4 | ) | (12 | ) | (2 | ) | ||||||||||||||||
From net realized gains | ||||||||||||||||||||||||||||
Class A | - | - | - | - | - | - | - | |||||||||||||||||||||
Class B | - | - | - | - | - | - | - | |||||||||||||||||||||
Total distributions to shareholders | (1,991 | ) | (509 | ) | (680 | ) | (27,416 | ) | (5,700 | ) | (35,008 | ) | (2,199 | ) | ||||||||||||||
Share transactions¹ | 203,409 | |||||||||||||||||||||||||||
Proceeds from the sale of shares | ||||||||||||||||||||||||||||
Class A | 564,155 | 189,640 | 361,575 | 290,256 | 297,645 | 579,705 | 110,117 | |||||||||||||||||||||
Class B | 52 | 31 | 258 | - | 92 | 242 | 91 | |||||||||||||||||||||
Reinvestment of distributions | ||||||||||||||||||||||||||||
Class A | 1,990 | 509 | 679 | 27,416 | 5,696 | 34,996 | 2,197 | |||||||||||||||||||||
Class B | 1 | - | 1 | - | 4 | 12 | 2 | |||||||||||||||||||||
Cost of shares redeemed | ||||||||||||||||||||||||||||
Class A | (323,335 | ) | (91,706 | ) | (174,060 | ) | (185,127 | ) | (228,869 | ) | (352,773 | ) | (72,950 | ) | ||||||||||||||
Class B | (165 | ) | (17 | ) | (87 | ) | - | (48 | ) | (327 | ) | (159 | ) | |||||||||||||||
Net increase (decrease) in net assets from share transactions | 242,698 | 98,457 | 188,366 | 132,545 | 74,520 | 261,855 | 39,298 | |||||||||||||||||||||
Net increase (decrease) in net assets | 339,681 | 119,242 | 310,234 | 199,222 | 100,017 | 333,516 | 69,783 | |||||||||||||||||||||
Net assets beginning of year | 555,288 | 84,286 | 279,696 | 838,759 | 375,724 | 728,624 | 144,222 | |||||||||||||||||||||
Net assets end of year | $ | 894,969 | $ | 203,528 | $ | 589,930 | $ | 1,037,981 | $ | 475,741 | $ | 1,062,140 | $ | 214,005 | ||||||||||||||
Undistributed (excess of distributions over) net investment income | $ | 1,458 | $ | 1,252 | $ | 92 | $ | 15,748 | $ | 4,626 | $ | 49,325 | $ | 3,211 | ||||||||||||||
¹Share transactions | ||||||||||||||||||||||||||||
Shares sold | ||||||||||||||||||||||||||||
Class A | 29,708 | 28,500 | 19,550 | 34,685 | 39,433 | 59,467 | 15,340 | |||||||||||||||||||||
Class B | 3 | 4 | 14 | - | 12 | 26 | 12 | |||||||||||||||||||||
Reinvestment of distributions | ||||||||||||||||||||||||||||
Class A | 96 | 71 | 31 | 3,151 | 714 | 3,513 | 273 | |||||||||||||||||||||
Class B | - | - | - | - | - | 2 | - | |||||||||||||||||||||
Shares redeemed | ||||||||||||||||||||||||||||
Class A | (17,037 | ) | (13,649 | ) | (9,950 | ) | (22,211 | ) | (30,477 | ) | (36,219 | ) | (10,447 | ) | ||||||||||||||
Class B | (8 | ) | (3 | ) | (5 | ) | - | (6 | ) | (35 | ) | (22 | ) | |||||||||||||||
Net increase (decrease) | ||||||||||||||||||||||||||||
Class A | 12,767 | 14,922 | 9,631 | 15,625 | 9,670 | 26,761 | 5,166 | |||||||||||||||||||||
Class B | (5 | ) | 1 | 9 | - | 6 | (7 | ) | (10 | ) | ||||||||||||||||||
Purchase and sales of investment securities (excluding short-term securities): | ||||||||||||||||||||||||||||
Purchase of securities | $ | 427,947 | $ | 173,575 | $ | 360,706 | $ | 148,727 | $ | 88,818 | $ | 537,457 | $ | 298,982 | ||||||||||||||
Proceeds from sales of securities | 224,843 | 74,804 | 179,309 | 27,822 | 18,899 | 265,825 | 258,454 | |||||||||||||||||||||
See accompanying Notes to Financial Statements
JNL Series Trust
Statements of Changes in Net Assets (in thousands)
For the Year Ended December 31, 2010
| Operations | JNL/ Franklin Templeton Mutual Shares Fund | JNL/Franklin Templeton Small Cap Value Fund | JNL/Goldman Sachs Core Plus Bond Fund | JNL/Goldman Sachs Emerging Markets Debt Fund | JNL/Goldman Sachs Mid Cap Value Fund | JNL/Goldman Sachs U.S. Equity Flex Fund | JNL/Invesco Global Real Estate Fund | |||||||||||||||||||||||
Net investment income (loss) | $ | 14,955 | $ | 1,114 | $ | 22,094 | $ | 24,102 | $ | 2,143 | $ | 175 | $ | 10,895 | ||||||||||||||||
Net realized gain (loss) | 3,429 | 3,493 | 25,359 | 31,988 | 35,671 | 2,746 | 43,997 | |||||||||||||||||||||||
Net change in unrealized appreciation (depreciation) | 38,261 | 49,341 | 16,801 | 18,046 | 48,330 | 6,451 | 26,876 | |||||||||||||||||||||||
Net increase (decrease) in net assets from operations | 56,645 | 53,948 | 64,254 | 74,136 | 86,144 | 9,372 | 81,768 | |||||||||||||||||||||||
Distributions to shareholders | ||||||||||||||||||||||||||||||
From net investment income | ||||||||||||||||||||||||||||||
Class A | (115 | ) | (1,042 | ) | (24,868 | ) | (6,416 | ) | (2,164 | ) | (670 | ) | (22,616 | ) | ||||||||||||||||
Class B | - | (2 | ) | (6 | ) | (4 | ) | (49 | ) | (1 | ) | (21 | ) | |||||||||||||||||
From net realized gains | ||||||||||||||||||||||||||||||
Class A | - | - | (11,209 | ) | (1,607 | ) | - | - | - | |||||||||||||||||||||
Class B | - | - | (3 | ) | (1 | ) | - | - | - | |||||||||||||||||||||
Total distributions to shareholders | (115 | ) | (1,044 | ) | (36,086 | ) | (8,028 | ) | (2,213 | ) | (671 | ) | (22,637 | ) | ||||||||||||||||
Share transactions¹ | 1,111 | |||||||||||||||||||||||||||||
Proceeds from the sale of shares | ||||||||||||||||||||||||||||||
Class A | 357,200 | 158,344 | 640,870 | 741,867 | 323,668 | 61,227 | 396,818 | |||||||||||||||||||||||
Class B | 121 | 204 | 88 | 258 | 3,381 | 46 | 340 | |||||||||||||||||||||||
Reinvestment of distributions | ||||||||||||||||||||||||||||||
Class A | 115 | 1,042 | 36,077 | 8,023 | 2,164 | 670 | 22,616 | |||||||||||||||||||||||
Class B | - | 2 | 9 | 5 | 49 | 1 | 21 | |||||||||||||||||||||||
Cost of shares redeemed | ||||||||||||||||||||||||||||||
Class A | (242,673 | ) | (85,606 | ) | (431,437 | ) | (246,113 | ) | (186,638 | ) | (45,657 | ) | (160,271 | ) | ||||||||||||||||
Class B | (82 | ) | (116 | ) | (105 | ) | (57 | ) | (1,189 | ) | (37 | ) | (222 | ) | ||||||||||||||||
Net increase (decrease) in net assets from share transactions | 114,681 | 73,870 | 245,502 | 503,983 | 141,435 | 16,250 | 259,302 | |||||||||||||||||||||||
Net increase (decrease) in net assets | 171,211 | 126,774 | 273,670 | 570,091 | 225,366 | 24,951 | 318,433 | |||||||||||||||||||||||
Net assets beginning of year | 423,854 | 167,826 | 782,989 | 193,243 | 280,725 | 90,453 | 343,355 | |||||||||||||||||||||||
Net assets end of year | $ | 595,065 | $ | 294,600 | $ | 1,056,659 | $ | 763,334 | $ | 506,091 | $ | 115,404 | $ | 661,788 | ||||||||||||||||
Undistributed (excess of distributions over) net investment income | $ | 18,020 | $ | 1,111 | $ | 21,079 | $ | 35,962 | $ | 1,353 | $ | 159 | $ | 7,115 | ||||||||||||||||
¹Share transactions | ||||||||||||||||||||||||||||||
Shares sold | ||||||||||||||||||||||||||||||
Class A | 45,295 | 16,583 | 51,975 | 57,956 | 34,724 | 8,151 | 49,969 | |||||||||||||||||||||||
Class B | 15 | 21 | 7 | 20 | 357 | 6 | 44 | |||||||||||||||||||||||
Reinvestment of distributions | ||||||||||||||||||||||||||||||
Class A | 14 | 96 | 3,012 | 599 | 209 | 84 | 2,768 | |||||||||||||||||||||||
Class B | - | - | 1 | - | 5 | - | 3 | |||||||||||||||||||||||
Shares redeemed | ||||||||||||||||||||||||||||||
Class A | (30,825 | ) | (9,202 | ) | (34,956 | ) | (18,889 | ) | (20,229 | ) | (6,078 | ) | (20,477 | ) | ||||||||||||||||
Class B | (10 | ) | (12 | ) | (9 | ) | (5 | ) | (129 | ) | (4 | ) | (28 | ) | ||||||||||||||||
Net increase (decrease) | ||||||||||||||||||||||||||||||
Class A | 14,484 | 7,477 | 20,031 | 39,666 | 14,704 | 2,157 | 32,260 | |||||||||||||||||||||||
Class B | 5 | 9 | (1 | ) | 15 | 233 | 2 | 19 | ||||||||||||||||||||||
Purchase and sales of investment securities (excluding short-term securities): | ||||||||||||||||||||||||||||||
Purchase of securities | $ | 256,385 | $ | 88,809 | $ | 9,427,621 | (a) | $ | 977,811 | $ | 439,186 | $ | 641,188 | $ | 567,241 | |||||||||||||||
Proceeds from sales of securities | 142,778 | 18,206 | 9,128,533 | (a) | 644,211 | 303,671 | 625,502 | 319,836 | ||||||||||||||||||||||
| (a) | Amounts include $3,213,974 and $3,286,679 of purchases and sales, respectively, of U.S. Government Securities. |
See accompanying Notes to Financial Statements
JNL Series Trust
Statements of Changes in Net Assets (in thousands)
For the Year Ended December 31, 2010
| Operations | JNL/Invesco International Growth Fund | JNL/Invesco Large Cap Growth Fund | JNL/Invesco Small Cap Growth Fund | JNL/ Ivy Asset Strategy Fund | JNL/JPMorgan International Value Fund | JNL/JPMorgan MidCap Growth Fund | JNL/JPMorgan U.S. Government & Quality Bond Fund | |||||||||||||||||||||||||
Net investment income (loss) | $ | 5,627 | $ | 1,640 | $ | (566 | ) | $ | 5,274 | $ | 8,955 | $ | (342 | ) | $ | 30,023 | ||||||||||||||||
Net realized gain (loss) | (11,694 | ) | 48,760 | 4,743 | (67,481 | ) | (9,084 | ) | 19,442 | 1,120 | ||||||||||||||||||||||
Net change in unrealized appreciation (depreciation) | 65,852 | 78,996 | 23,466 | 143,012 | 38,945 | 24,887 | 23,731 | |||||||||||||||||||||||||
Net increase (decrease) in net assets from operations | 59,785 | 129,396 | 27,643 | 80,805 | 38,816 | 43,987 | 54,874 | |||||||||||||||||||||||||
Distributions to shareholders | ||||||||||||||||||||||||||||||||
From net investment income | ||||||||||||||||||||||||||||||||
Class A | (3,869 | ) | (2,185 | ) | - | (36 | ) | (14,917 | ) | - | (24,715 | ) | ||||||||||||||||||||
Class B | (4 | ) | (3 | ) | - | - | (15 | ) | - | (15 | ) | |||||||||||||||||||||
From net realized gains | ||||||||||||||||||||||||||||||||
Class A | - | - | - | (62 | ) | - | - | - | ||||||||||||||||||||||||
Class B | - | - | - | - | - | - | - | |||||||||||||||||||||||||
Total distributions to shareholders | (3,873 | ) | (2,188 | ) | - | (98 | ) | (14,932 | ) | - | (24,730 | ) | ||||||||||||||||||||
Share transactions¹ | ||||||||||||||||||||||||||||||||
Proceeds from the sale of shares | ||||||||||||||||||||||||||||||||
Class A | 333,210 | 509,847 | 86,237 | 889,730 | 303,457 | 84,684 | 699,247 | |||||||||||||||||||||||||
Class B | 169 | 324 | 221 | 185 | 253 | 112 | 185 | |||||||||||||||||||||||||
Reinvestment of distributions | ||||||||||||||||||||||||||||||||
Class A | 3,869 | 2,185 | - | 98 | 14,917 | - | 24,715 | |||||||||||||||||||||||||
Class B | 4 | 3 | - | - | 15 | - | 15 | |||||||||||||||||||||||||
Cost of shares redeemed | ||||||||||||||||||||||||||||||||
Class A | (236,531 | ) | (352,339 | ) | (56,599 | ) | (191,728 | ) | (284,010 | ) | (59,945 | ) | (528,761 | ) | ||||||||||||||||||
Class B | (121 | ) | (258 | ) | (39 | ) | (124 | ) | (261 | ) | (71 | ) | (269 | ) | ||||||||||||||||||
Net increase (decrease) in net assets from share transactions | 100,600 | 159,762 | 29,820 | 698,161 | 34,371 | 24,780 | 195,132 | |||||||||||||||||||||||||
Net increase (decrease) in net assets | 156,512 | 286,970 | 57,463 | 778,868 | 58,255 | 68,767 | 225,276 | |||||||||||||||||||||||||
Net assets beginning of year | 431,981 | 624,743 | 92,950 | 196,977 | 549,690 | 163,804 | 693,581 | |||||||||||||||||||||||||
Net assets end of year | $ | 588,493 | $ | 911,713 | $ | 150,413 | $ | 975,845 | $ | 607,945 | $ | 232,571 | $ | 918,857 | ||||||||||||||||||
Undistributed (excess of distributions over) net investment income | $ | 4,486 | $ | 1,496 | $ | 32 | $ | 3,233 | $ | 14,217 | $ | (7 | ) | $ | 30,277 | |||||||||||||||||
¹Share transactions | ||||||||||||||||||||||||||||||||
Shares sold | ||||||||||||||||||||||||||||||||
Class A | 35,490 | 45,676 | 7,857 | 84,976 | 43,412 | 4,922 | 53,216 | |||||||||||||||||||||||||
Class B | 18 | 30 | 20 | 18 | 36 | 6 | 14 | |||||||||||||||||||||||||
Reinvestment of distributions | ||||||||||||||||||||||||||||||||
Class A | 382 | 177 | - | 9 | 2,010 | - | 1,932 | |||||||||||||||||||||||||
Class B | - | - | - | - | 2 | - | 1 | |||||||||||||||||||||||||
Shares redeemed | ||||||||||||||||||||||||||||||||
Class A | (25,526 | ) | (31,567 | ) | (5,285 | ) | (18,547 | ) | (41,273 | ) | (3,583 | ) | (40,110 | ) | ||||||||||||||||||
Class B | (13 | ) | (23 | ) | (3 | ) | (13 | ) | (37 | ) | (4 | ) | (20 | ) | ||||||||||||||||||
Net increase (decrease) | ||||||||||||||||||||||||||||||||
Class A | 10,346 | 14,286 | 2,572 | 66,438 | 4,149 | 1,339 | 15,038 | |||||||||||||||||||||||||
Class B | 5 | 7 | 17 | 5 | 1 | 2 | (5 | ) | ||||||||||||||||||||||||
Purchase and sales of investment securities (excluding short-term securities): | ||||||||||||||||||||||||||||||||
Purchase of securities | $ | 242,086 | $ | 1,305,364 | $ | 67,792 | $ | 1,045,700 | $ | 389,566 | $ | 174,226 | $ | 258,809 | (a | ) | ||||||||||||||||
Proceeds from sales of securities | 139,843 | 1,151,812 | 38,248 | 492,613 | 356,318 | 150,280 | 77,261 | (a | ) | |||||||||||||||||||||||
| (a) | Amount includes $236,087 and $70,834 of purchases and sales, respectively, of U.S. Government Securities. |
See accompanying Notes to Financial Statements
JNL Series Trust
Statements of Changes in Net Assets (in thousands)
For the Year Ended December 31, 2010
| Operations | JNL/Lazard Emerging Markets Fund | JNL/Lazard Mid Cap Equity Fund | JNL/M&G Global Basics Fund | JNL/M&G Global Leaders Fund | JNL/Mellon Capital Management 10 X 10 Fund | JNL/Mellon Capital Management Index 5 Fund | JNL/Mellon Capital Management European 30 Fund | |||||||||||||||||||||
Net investment income (loss) | $ | 16,975 | $ | 1,474 | $ | 402 | $ | 135 | $ | 4,058 | $ | 4,063 | $ | 554 | ||||||||||||||
Net realized gain (loss) | 58,682 | 16,282 | 981 | 1,075 | (7,881 | ) | (5,453 | ) | 561 | |||||||||||||||||||
Net change in unrealized appreciation (depreciation) | 123,607 | 19,532 | 35,524 | 2,218 | 38,610 | 42,730 | (1,057 | ) | ||||||||||||||||||||
Net increase (decrease) in net assets from operations | 199,264 | 37,288 | 36,907 | 3,428 | 34,787 | 41,340 | 58 | |||||||||||||||||||||
Distributions to shareholders | ||||||||||||||||||||||||||||
From net investment income | ||||||||||||||||||||||||||||
Class A | (5,660 | ) | (932 | ) | (1,034 | ) | (105 | ) | (4,451 | ) | (2,898 | ) | (11 | ) | ||||||||||||||
Class B | (5 | ) | (1 | ) | (1 | ) | (1 | ) | - | - | - | |||||||||||||||||
From net realized gains | ||||||||||||||||||||||||||||
Class A | - | - | (622 | ) | (339 | ) | (116 | ) | (219 | ) | (84 | ) | ||||||||||||||||
Class B | - | - | - | (1 | ) | - | - | (1 | ) | |||||||||||||||||||
Total distributions to shareholders | (5,665 | ) | (933 | ) | (1,657 | ) | (446 | ) | (4,567 | ) | (3,117 | ) | (96 | ) | ||||||||||||||
Share transactions¹ | ||||||||||||||||||||||||||||
Proceeds from the sale of shares | ||||||||||||||||||||||||||||
Class A | 890,442 | 93,010 | 217,316 | 19,707 | 76,226 | 147,178 | 17,977 | |||||||||||||||||||||
Class B | 514 | 61 | 43 | 8 | - | - | 17 | |||||||||||||||||||||
Reinvestment of distributions | ||||||||||||||||||||||||||||
Class A | 5,660 | 932 | 1,656 | 444 | 4,567 | 3,117 | 95 | |||||||||||||||||||||
Class B | 5 | 1 | 1 | 2 | - | - | 1 | |||||||||||||||||||||
Cost of shares redeemed | ||||||||||||||||||||||||||||
Class A | (438,419 | ) | (80,943 | ) | (88,510 | ) | (10,631 | ) | (47,962 | ) | (60,988 | ) | (13,051 | ) | ||||||||||||||
Class B | (409 | ) | (84 | ) | (110 | ) | (2 | ) | - | - | (8 | ) | ||||||||||||||||
Net increase (decrease) in net assets from share transactions | 457,793 | 12,977 | 130,396 | 9,528 | 32,831 | 89,307 | 5,031 | |||||||||||||||||||||
Net increase (decrease) in net assets | 651,392 | 49,332 | 165,646 | 12,510 | 63,051 | 127,530 | 4,993 | |||||||||||||||||||||
Net assets beginning of year | 736,637 | 164,897 | 29,868 | 17,428 | 194,494 | 204,951 | 13,366 | |||||||||||||||||||||
Net assets end of year | $ | 1,388,029 | $ | 214,229 | $ | 195,514 | $ | 29,938 | $ | 257,545 | $ | 332,481 | $ | 18,359 | ||||||||||||||
Undistributed (excess of distributions over) net investment income | $ | 13,588 | $ | 1,469 | $ | (626 | ) | $ | (1 | ) | $ | 4,078 | $ | 4,118 | $ | 452 | ||||||||||||
¹Share transactions | ||||||||||||||||||||||||||||
Shares sold | ||||||||||||||||||||||||||||
Class A | 82,378 | 9,078 | 17,502 | 1,692 | 10,177 | 16,864 | 1,628 | |||||||||||||||||||||
Class B | 49 | 5 | 3 | 1 | - | - | 2 | |||||||||||||||||||||
Reinvestment of distributions | ||||||||||||||||||||||||||||
Class A | 482 | 83 | 114 | 36 | 564 | 329 | 8 | |||||||||||||||||||||
Class B | - | - | - | - | - | - | - | |||||||||||||||||||||
Shares redeemed | ||||||||||||||||||||||||||||
Class A | (42,006 | ) | (8,106 | ) | (6,993 | ) | (905 | ) | (6,461 | ) | (7,064 | ) | (1,220 | ) | ||||||||||||||
Class B | (39 | ) | (8 | ) | (8 | ) | - | - | - | (1 | ) | |||||||||||||||||
Net increase (decrease) | ||||||||||||||||||||||||||||
Class A | 40,854 | 1,055 | 10,623 | 823 | 4,280 | 10,129 | 416 | |||||||||||||||||||||
Class B | 10 | (3 | ) | (5 | ) | 1 | - | - | 1 | |||||||||||||||||||
Purchase and sales of investment securities (excluding short-term securities): | ||||||||||||||||||||||||||||
Purchase of securities | $ | 665,780 | $ | 148,313 | $ | 146,091 | $ | 20,264 | $ | 49,698 | $ | 115,811 | $ | 21,140 | ||||||||||||||
Proceeds from sales of securities | 213,623 | 140,017 | 21,548 | 10,324 | 17,092 | 24,832 | 15,656 | |||||||||||||||||||||
See accompanying Notes to Financial Statements
JNL Series Trust
Statements of Changes in Net Assets (in thousands)
For the Year Ended December 31, 2010
| Operations | JNL/Mellon Capital Management Pacific Rim 30 Fund | JNL/Mellon Capital Management S&P 500 Index Fund | JNL/Mellon Capital Management S&P 400 MidCap Index Fund | JNL/Mellon Capital Management Small Cap Index Fund | JNL/Mellon Capital Management International Index Fund | JNL/Mellon Capital Management Bond Index Fund | JNL/Mellon Capital Management Global Alpha Fund | |||||||||||||||||||||||||
Net investment income (loss) | $ | 853 | $ | 16,642 | $ | 3,479 | $ | 5,158 | $ | 19,412 | $ | 31,057 | $ | (1,545 | ) | |||||||||||||||||
Net realized gain (loss) | 2,045 | 7,352 | 20,132 | 8,293 | (4,444 | ) | 2,851 | 8,336 | ||||||||||||||||||||||||
Net change in unrealized appreciation (depreciation) | 570 | 138,699 | 106,293 | 125,788 | 57,840 | 21,145 | 1,335 | |||||||||||||||||||||||||
Net increase (decrease) in net assets from operations | 3,468 | 162,693 | 129,904 | 139,239 | 72,808 | 55,053 | 8,126 | |||||||||||||||||||||||||
Distributions to shareholders | ||||||||||||||||||||||||||||||||
From net investment income | ||||||||||||||||||||||||||||||||
Class A | - | (16,148 | ) | (3,900 | ) | (3,973 | ) | (18,765 | ) | (32,959 | ) | - | ||||||||||||||||||||
Class B | - | (173 | ) | (41 | ) | (34 | ) | (410 | ) | (76 | ) | - | ||||||||||||||||||||
From net realized gains | ||||||||||||||||||||||||||||||||
Class A | (5 | ) | (1,499 | ) | (5,074 | ) | - | - | (2,136 | ) | (43 | ) | ||||||||||||||||||||
Class B | - | (14 | ) | (45 | ) | - | - | (5 | ) | - | ||||||||||||||||||||||
Total distributions to shareholders | (5 | ) | (17,834 | ) | (9,060 | ) | (4,007 | ) | (19,175 | ) | (35,176 | ) | (43 | ) | ||||||||||||||||||
Share transactions¹ | ||||||||||||||||||||||||||||||||
Proceeds from the sale of shares | ||||||||||||||||||||||||||||||||
Class A | 38,421 | 750,051 | 310,004 | 350,676 | 605,120 | 896,319 | 187,156 | |||||||||||||||||||||||||
Class B | 45 | 4,752 | 2,706 | 2,939 | 8,016 | 1,206 | 83 | |||||||||||||||||||||||||
Reinvestment of distributions | ||||||||||||||||||||||||||||||||
Class A | 5 | 17,647 | 8,974 | 3,973 | 18,765 | 35,095 | 43 | |||||||||||||||||||||||||
Class B | - | 187 | 86 | 34 | 410 | 81 | - | |||||||||||||||||||||||||
Cost of shares redeemed | ||||||||||||||||||||||||||||||||
Class A | (19,549 | ) | (482,998 | ) | (243,701 | ) | (249,623 | ) | (331,735 | ) | (415,623 | ) | (56,629 | ) | ||||||||||||||||||
Class B | (11 | ) | (4,476 | ) | (2,423 | ) | (2,777 | ) | (5,961 | ) | (1,161 | ) | (6 | ) | ||||||||||||||||||
Net increase (decrease) in net assets from share transactions | 18,911 | 285,163 | 75,646 | 105,222 | 294,615 | 515,917 | 130,647 | |||||||||||||||||||||||||
Net increase (decrease) in net assets | 22,374 | 430,022 | 196,490 | 240,454 | 348,248 | 535,794 | 138,730 | |||||||||||||||||||||||||
Net assets beginning of year | 16,761 | 911,278 | 474,320 | 474,365 | 740,039 | 795,770 | 62,384 | |||||||||||||||||||||||||
Net assets end of year | $ | 39,135 | $ | 1,341,300 | $ | 670,810 | $ | 714,819 | $ | 1,088,287 | $ | 1,331,564 | $ | 201,114 | ||||||||||||||||||
Undistributed (excess of distributions over) net investment income | $ | 892 | $ | 869 | $ | 3,583 | $ | 4,923 | $ | 2,574 | $ | 9,505 | $ | 1,170 | ||||||||||||||||||
¹Share transactions | ||||||||||||||||||||||||||||||||
Shares sold | ||||||||||||||||||||||||||||||||
Class A | 3,256 | 77,940 | 25,510 | 32,370 | 52,262 | 75,467 | 18,459 | |||||||||||||||||||||||||
Class B | 4 | 490 | 221 | 277 | 655 | 99 | 8 | |||||||||||||||||||||||||
Reinvestment of distributions | ||||||||||||||||||||||||||||||||
Class A | - | 1,697 | 659 | 321 | 1,525 | 3,028 | 4 | |||||||||||||||||||||||||
Class B | - | 18 | 6 | 2 | 32 | 7 | - | |||||||||||||||||||||||||
Shares redeemed | ||||||||||||||||||||||||||||||||
Class A | (1,667 | ) | (50,160 | ) | (20,294 | ) | (23,289 | ) | (28,959 | ) | (34,873 | ) | (5,569 | ) | ||||||||||||||||||
Class B | (1 | ) | (460 | ) | (200 | ) | (261 | ) | (491 | ) | (95 | ) | - | |||||||||||||||||||
Net increase (decrease) | ||||||||||||||||||||||||||||||||
Class A | 1,589 | 29,477 | 5,875 | 9,402 | 24,828 | 43,622 | 12,894 | |||||||||||||||||||||||||
Class B | 3 | 48 | 27 | 18 | 196 | 11 | 8 | |||||||||||||||||||||||||
Purchase and sales of investment securities (excluding short-term securities): | ||||||||||||||||||||||||||||||||
Purchase of securities | $ | 41,173 | $ | 324,025 | $ | 132,619 | $ | 185,809 | $ | 289,589 | $ | 1,520,827 | (a | ) | $ | - | ||||||||||||||||
Proceeds from sales of securities | 21,444 | 23,426 | 62,502 | 77,490 | 14,276 | 1,006,541 | (a | ) | - | |||||||||||||||||||||||
| (a) | Amounts include $979,714 and $578,615 of purchases and sales, respectively, of U.S. Government Securities. |
See accompanying Notes to Financial Statements
JNL Series Trust
Statements of Changes in Net Assets (in thousands)
For the Year Ended December 31, 2010
| Operations | JNL/ Oppenheimer Global Growth Fund | JNL/PAM Asia ex-Japan Fund | JNL/PAM China-India Fund | JNL/PIMCO Real Return Fund | JNL/PIMCO Total Return Bond Fund | JNL/PPM America High Yield Bond Fund | JNL/PPM America Mid Cap Value Fund | |||||||||||||||||||||||||||||
Net investment income (loss) | $ | 3,224 | $ | 446 | $ | 1,272 | $ | 20,742 | $ | 59,789 | $ | 55,424 | $ | 144 | ||||||||||||||||||||||
Net realized gain (loss) | (1,575 | ) | 11,529 | 18,845 | 83,465 | 89,455 | 24,259 | 4,635 | ||||||||||||||||||||||||||||
Net change in unrealized appreciation (depreciation) | 48,732 | 7,148 | 17,739 | 351 | 42,385 | 24,915 | 6,593 | |||||||||||||||||||||||||||||
Net increase (decrease) in net assets from operations | 50,381 | 19,123 | 37,856 | 104,558 | 191,629 | 104,598 | 11,372 | |||||||||||||||||||||||||||||
Distributions to shareholders | ||||||||||||||||||||||||||||||||||||
From net investment income | ||||||||||||||||||||||||||||||||||||
Class A | (2,816 | ) | (140 | ) | - | (23,351 | ) | (66,700 | ) | (54,449 | ) | (2 | ) | |||||||||||||||||||||||
Class B | (5 | ) | - | - | (4 | ) | (334 | ) | (438 | ) | - | |||||||||||||||||||||||||
From net realized gains | ||||||||||||||||||||||||||||||||||||
Class A | - | - | (3,486 | ) | (33,407 | ) | (121,072 | ) | - | - | ||||||||||||||||||||||||||
Class B | - | - | (3 | ) | (5 | ) | (561 | ) | - | - | ||||||||||||||||||||||||||
Total distributions to shareholders | (2,821 | ) | (140 | ) | (3,489 | ) | (56,767 | ) | (188,667 | ) | (54,887 | ) | (2 | ) | ||||||||||||||||||||||
Share transactions¹ | ||||||||||||||||||||||||||||||||||||
Proceeds from the sale of shares | ||||||||||||||||||||||||||||||||||||
Class A | 175,167 | 108,211 | 282,213 | 1,234,087 | 2,118,433 | 697,735 | 102,497 | |||||||||||||||||||||||||||||
Class B | 114 | 81 | 274 | 317 | 6,025 | 3,520 | 78 | |||||||||||||||||||||||||||||
Reinvestment of distributions | ||||||||||||||||||||||||||||||||||||
Class A | 2,816 | 140 | 3,486 | 56,758 | 187,772 | 54,449 | 2 | |||||||||||||||||||||||||||||
Class B | 5 | - | 3 | 9 | 895 | 438 | - | |||||||||||||||||||||||||||||
Cost of shares redeemed | ||||||||||||||||||||||||||||||||||||
Class A | (113,802 | ) | (84,935 | ) | (168,527 | ) | (733,626 | ) | (1,409,108 | ) | (467,766 | ) | (47,568 | ) | ||||||||||||||||||||||
Class B | (87 | ) | (57 | ) | (218 | ) | (315 | ) | (5,410 | ) | (2,889 | ) | (72 | ) | ||||||||||||||||||||||
Net increase (decrease) in net assets from share transactions | 64,213 | 23,440 | 117,231 | 557,230 | 898,607 | 285,487 | 54,937 | |||||||||||||||||||||||||||||
Net increase (decrease) in net assets | 111,773 | 42,423 | 151,598 | 605,021 | 901,569 | 335,198 | 66,307 | |||||||||||||||||||||||||||||
Net assets beginning of year | 290,479 | 108,410 | 233,736 | 1,190,065 | 2,362,580 | 572,502 | 20,112 | |||||||||||||||||||||||||||||
Net assets end of year | $ | 402,252 | $ | 150,833 | $ | 385,334 | $ | 1,795,086 | $ | 3,264,149 | $ | 907,700 | $ | 86,419 | ||||||||||||||||||||||
Undistributed (excess of distributions over) net investment income | $ | 2,774 | $ | 357 | $ | 1,156 | $ | 21,452 | $ | 14,311 | $ | 3,530 | $ | 144 | ||||||||||||||||||||||
¹Share transactions | ||||||||||||||||||||||||||||||||||||
Shares sold | ||||||||||||||||||||||||||||||||||||
Class A | 18,487 | 12,793 | 34,097 | 101,200 | 164,806 | 106,216 | 11,079 | |||||||||||||||||||||||||||||
Class B | 12 | 9 | 34 | 27 | 448 | 492 | 8 | |||||||||||||||||||||||||||||
Reinvestment of distributions | ||||||||||||||||||||||||||||||||||||
Class A | 273 | 15 | 398 | 4,778 | 15,442 | 8,262 | - | |||||||||||||||||||||||||||||
Class B | - | - | - | 1 | 69 | 60 | - | |||||||||||||||||||||||||||||
Shares redeemed | ||||||||||||||||||||||||||||||||||||
Class A | (12,134 | ) | (10,596 | ) | (21,640 | ) | (60,012 | ) | (109,862 | ) | (71,615 | ) | (5,434 | ) | ||||||||||||||||||||||
Class B | (9 | ) | (6 | ) | (28 | ) | (26 | ) | (398 | ) | (406 | ) | (8 | ) | ||||||||||||||||||||||
Net increase | - | |||||||||||||||||||||||||||||||||||
Class A | 6,626 | 2,212 | 12,855 | 45,966 | 70,386 | 42,863 | 5,645 | |||||||||||||||||||||||||||||
Class B | 3 | 3 | 6 | 2 | 119 | 146 | - | |||||||||||||||||||||||||||||
Purchase and sales of investment securities (excluding short-term securities): | ||||||||||||||||||||||||||||||||||||
Purchase of securities | $ | 144,405 | $ | 107,162 | $ | 205,917 | $ | 11,650,705 | (a | ) | $ | 15,336,618 | (b | ) | $ | 708,500 | $ | 90,569 | ||||||||||||||||||
Proceeds from sales of securities | 82,498 | 82,516 | 105,942 | 10,943,193 | (a | ) | 12,963,538 | (b | ) | 442,150 | 35,933 | |||||||||||||||||||||||||
| (a) | Amounts include $11,159,339 and $10,561,022 of purchases and sales, respectively, of U.S. Government Securities. |
| (b) | Amounts include $7,951,562 and $6,640,461 of purchases and sales, respectively, of U.S. Government Securities. |
See accompanying Notes to Financial Statements
JNL Series Trust
Statements of Changes in Net Assets (in thousands)
For the Year Ended December 31, 2010
| JNL/PPM | JNL/S&P | JNL/S&P | JNL/S&P | |||||||||||||||||||||||||
| America | JNL/PPM | JNL/Red Rocks | Managed | Managed | Managed | JNL/S&P | ||||||||||||||||||||||
| Small Cap | America Value | Listed Private | Conservative | Moderate | Moderate | Managed | ||||||||||||||||||||||
| Value Fund | Equity Fund | Equity Fund | Fund | Fund | Growth Fund | Growth Fund | ||||||||||||||||||||||
Operations | ||||||||||||||||||||||||||||
Net investment income (loss) | $ | 144 | $ | 1,301 | $ | 3,008 | $ | 13,258 | $ | 18,302 | $ | 25,803 | $ | 12,800 | ||||||||||||||
Net realized gain (loss) | 3,975 | 6,712 | 18,049 | 8,400 | (5,179 | ) | (2,932 | ) | (26,280 | ) | ||||||||||||||||||
Net change in unrealized appreciation (depreciation) | 5,218 | 8,145 | 83,644 | 45,561 | 133,910 | 274,473 | 288,389 | |||||||||||||||||||||
Net increase (decrease) in net assets from operations | 9,337 | 16,158 | 104,701 | 67,219 | 147,033 | 297,344 | 274,909 | |||||||||||||||||||||
Distributions to shareholders | ||||||||||||||||||||||||||||
From net investment income | ||||||||||||||||||||||||||||
Class A | (80 | ) | (1,221 | ) | (1,034 | ) | (20,853 | ) | (28,187 | ) | (30,938 | ) | (17,998 | ) | ||||||||||||||
Class B | (13 | ) | (3 | ) | - | - | - | - | - | |||||||||||||||||||
From net realized gains | ||||||||||||||||||||||||||||
Class A | (2,962 | ) | - | (3,317 | ) | - | - | - | - | |||||||||||||||||||
Class B | (296 | ) | - | (1 | ) | - | - | - | - | |||||||||||||||||||
Total distributions to shareholders | (3,351 | ) | (1,224 | ) | (4,352 | ) | (20,853 | ) | (28,187 | ) | (30,938 | ) | (17,998 | ) | ||||||||||||||
Share transactions¹ | ||||||||||||||||||||||||||||
Proceeds from the sale of shares | ||||||||||||||||||||||||||||
Class A | 70,253 | 48,836 | 462,973 | 537,778 | 770,760 | 1,248,698 | 786,950 | |||||||||||||||||||||
Class B | 3,747 | 334 | 193 | - | - | - | - | |||||||||||||||||||||
Reinvestment of distributions | ||||||||||||||||||||||||||||
Class A | 3,042 | 1,221 | 4,351 | 20,853 | 28,187 | 30,938 | 17,998 | |||||||||||||||||||||
Class B | 309 | 3 | 1 | - | - | - | - | |||||||||||||||||||||
Cost of shares redeemed | ||||||||||||||||||||||||||||
Class A | (32,810 | ) | (44,992 | ) | (148,454 | ) | (249,387 | ) | (274,030 | ) | (459,835 | ) | (400,802 | ) | ||||||||||||||
Class B | (2,706 | ) | (713 | ) | (157 | ) | - | - | - | - | ||||||||||||||||||
Net increase (decrease) in net assets from share transactions | 41,835 | 4,689 | 318,907 | 309,244 | 524,917 | 819,801 | 404,146 | |||||||||||||||||||||
Net increase (decrease) in net assets | 47,821 | 19,623 | 419,256 | 355,610 | 643,763 | 1,086,207 | 661,057 | |||||||||||||||||||||
Net assets beginning of year | 19,711 | 94,335 | 224,029 | 623,958 | 1,021,335 | 1,774,984 | 1,479,759 | |||||||||||||||||||||
Net assets end of year | $ | 67,532 | $ | 113,958 | $ | 643,285 | $ | 979,568 | $ | 1,665,098 | $ | 2,861,191 | $ | 2,140,816 | ||||||||||||||
Undistributed (excess of distributions over) net investment income | $ | 54 | $ | 1,298 | $ | 3,650 | $ | 9,963 | $ | 15,493 | $ | 36,428 | $ | 17,358 | ||||||||||||||
¹Share transactions | ||||||||||||||||||||||||||||
Shares sold | ||||||||||||||||||||||||||||
Class A | 7,561 | 4,474 | 52,978 | 49,885 | 70,836 | 113,682 | 77,548 | |||||||||||||||||||||
Class B | 408 | 29 | 23 | - | - | - | - | |||||||||||||||||||||
Reinvestment of distributions | ||||||||||||||||||||||||||||
Class A | 306 | 103 | 443 | 1,897 | 2,477 | 2,624 | 1,610 | |||||||||||||||||||||
Class B | 31 | - | - | - | - | - | - | |||||||||||||||||||||
Shares redeemed | ||||||||||||||||||||||||||||
Class A | (3,701 | ) | (4,178 | ) | (17,431 | ) | (23,102 | ) | (25,189 | ) | (42,151 | ) | (39,951 | ) | ||||||||||||||
Class B | (290 | ) | (62 | ) | (19 | ) | - | - | - | - | ||||||||||||||||||
Net increase | ||||||||||||||||||||||||||||
Class A | 4,166 | 399 | 35,990 | 28,680 | 48,124 | 74,155 | 39,207 | |||||||||||||||||||||
Class B | 149 | (33 | ) | 4 | - | - | - | - | ||||||||||||||||||||
Purchase and sales of investment securities (excluding short-term securities): | ||||||||||||||||||||||||||||
Purchase of securities | $ | 66,358 | $ | 41,014 | $ | 391,986 | $ | 423,532 | $ | 642,620 | $ | 1,015,444 | $ | 609,919 | ||||||||||||||
Proceeds from sales of securities | 27,932 | 35,725 | 92,954 | 71,566 | 68,078 | 123,378 | 119,858 | |||||||||||||||||||||
See accompanying Notes to Financial Statements.
JNL Series Trust
Statements of Changes in Net Assets (in thousands)
For the Year Ended December 31, 2010
| JNL/S&P | JNL/S&P | JNL/S&P | ||||||||||||||||||||||||||
| Managed | Disciplined | Disciplined | JNL/S&P | JNL/S&P | JNL/S&P | JNL/S&P | ||||||||||||||||||||||
| Aggressive | Moderate | Moderate | Disciplined | Competitive | Dividend Income | Intrinsic | ||||||||||||||||||||||
| Growth Fund | Fund | Growth Fund | Growth Fund | Advantage Fund | & Growth Fund | Value Fund | ||||||||||||||||||||||
Operations | ||||||||||||||||||||||||||||
Net investment income (loss) | $ | 4,928 | $ | 4,792 | $ | 4,624 | $ | 1,713 | $ | 3,574 | $ | 10,482 | $ | 4,295 | ||||||||||||||
Net realized gain (loss) | (16,731 | ) | (6,331 | ) | (7,304 | ) | 842 | 31,721 | 17,941 | 38,315 | ||||||||||||||||||
Net change in unrealized appreciation (depreciation) | 120,981 | 30,788 | 41,943 | 11,263 | (3,418 | ) | 28,373 | (5,059 | ) | |||||||||||||||||||
Net increase (decrease) in net assets from operations | 109,178 | 29,249 | 39,263 | 13,818 | 31,877 | 56,796 | 37,551 | |||||||||||||||||||||
Distributions to shareholders | ||||||||||||||||||||||||||||
From net investment income | ||||||||||||||||||||||||||||
Class A | (4,942 | ) | (2,774 | ) | (3,418 | ) | (1,410 | ) | (2,218 | ) | (4,709 | ) | (2,231 | ) | ||||||||||||||
Class B | - | - | - | - | (1 | ) | (2 | ) | (1 | ) | ||||||||||||||||||
From net realized gains | ||||||||||||||||||||||||||||
Class A | - | - | - | - | (10,989 | ) | (16,446 | ) | (30,955 | ) | ||||||||||||||||||
Class B | - | - | - | - | (2 | ) | (6 | ) | (10 | ) | ||||||||||||||||||
Total distributions to shareholders | (4,942 | ) | (2,774 | ) | (3,418 | ) | (1,410 | ) | (13,210 | ) | (21,163 | ) | (33,197 | ) | ||||||||||||||
Share transactions¹ | ||||||||||||||||||||||||||||
Proceeds from the sale of shares | ||||||||||||||||||||||||||||
Class A | 283,174 | 222,980 | 204,344 | 63,794 | 185,820 | 306,563 | 231,383 | |||||||||||||||||||||
Class B | - | - | - | - | 19 | 207 | 265 | |||||||||||||||||||||
Reinvestment of distributions | ||||||||||||||||||||||||||||
Class A | 4,942 | 2,774 | 3,418 | 1,410 | 13,207 | 21,155 | 33,186 | |||||||||||||||||||||
Class B | - | - | - | - | 3 | 8 | 11 | |||||||||||||||||||||
Cost of shares redeemed | ||||||||||||||||||||||||||||
Class A | (186,556 | ) | (74,251 | ) | (73,880 | ) | (20,999 | ) | (176,354 | ) | (161,792 | ) | (195,888 | ) | ||||||||||||||
Class B | - | - | - | - | (16 | ) | (232 | ) | (280 | ) | ||||||||||||||||||
Net increase (decrease) in net assets from share transactions | 101,560 | 151,503 | 133,882 | 44,205 | 22,679 | 165,909 | 68,677 | |||||||||||||||||||||
Net increase (decrease) in net assets | 205,796 | 177,978 | 169,727 | 56,613 | 41,346 | 201,542 | 73,031 | |||||||||||||||||||||
Net assets beginning of year | 582,868 | 168,455 | 206,365 | 80,863 | 254,745 | 239,550 | 246,686 | |||||||||||||||||||||
Net assets end of year | $ | 788,664 | $ | 346,433 | $ | 376,092 | $ | 137,476 | $ | 296,091 | $ | 441,092 | $ | 319,717 | ||||||||||||||
Undistributed (excess of distributions over) net investment income | $ | 5,559 | $ | 5,554 | $ | 5,070 | $ | 1,787 | $ | 3,572 | $ | 10,367 | $ | 4,294 | ||||||||||||||
¹Share transactions | ||||||||||||||||||||||||||||
Shares sold | ||||||||||||||||||||||||||||
Class A | 25,933 | 24,318 | 24,521 | 8,108 | 18,201 | 32,831 | 22,688 | |||||||||||||||||||||
Class B | - | - | - | - | 2 | 23 | 25 | |||||||||||||||||||||
Reinvestment of distributions | ||||||||||||||||||||||||||||
Class A | 406 | 286 | 382 | 168 | 1,246 | 2,206 | 3,359 | |||||||||||||||||||||
Class B | - | - | - | - | - | 1 | 1 | |||||||||||||||||||||
Shares redeemed | ||||||||||||||||||||||||||||
Class A | (17,261 | ) | (8,277 | ) | (9,009 | ) | (2,719 | ) | (17,375 | ) | (17,417 | ) | (19,275 | ) | ||||||||||||||
Class B | - | - | - | - | (1 | ) | (25 | ) | (27 | ) | ||||||||||||||||||
Net increase | ||||||||||||||||||||||||||||
Class A | 9,078 | 16,327 | 15,894 | 5,557 | 2,072 | 17,620 | 6,772 | |||||||||||||||||||||
Class B | - | - | - | - | 1 | (1 | ) | (1 | ) | |||||||||||||||||||
Purchase and sales of investment securities (excluding short-term securities): | ||||||||||||||||||||||||||||
Purchase of securities | $ | 206,231 | $ | 218,125 | $ | 221,908 | $ | 75,724 | $ | 215,618 | $ | 274,054 | $ | 329,688 | ||||||||||||||
Proceeds from sales of securities | 69,440 | 51,077 | 72,085 | 27,690 | 202,188 | 119,096 | 288,499 | |||||||||||||||||||||
See accompanying Notes to Financial Statements.
JNL Series Trust
Statements of Changes in Net Assets (in thousands)
For the Year Ended December 31, 2010
| JNL/T. Rowe | JNL/T. Rowe | |||||||||||||||||||||||||||
| JNL/S&P | JNL/Select | JNL/Select | Price | Price | ||||||||||||||||||||||||
| Total | JNL/S&P 4 | Balanced | Money | JNL/Select | Established | Mid-Cap | ||||||||||||||||||||||
| Yield Fund | Fund | Fund | Market Fund | Value Fund | Growth Fund | Growth Fund | ||||||||||||||||||||||
Operations | ||||||||||||||||||||||||||||
Net investment income (loss) | $ | 4,142 | $ | 6,453 | $ | 17,816 | $ | - | $ | 12,344 | $ | (1,139 | ) | $ | 116 | |||||||||||||
Net realized gain (loss) | 18,842 | 41,174 | 30,137 | 6 | 29,547 | 10,801 | 53,310 | |||||||||||||||||||||
Net change in unrealized appreciation (depreciation) | (2,417 | ) | 47,764 | 63,421 | - | 88,641 | 199,852 | 220,625 | ||||||||||||||||||||
Net increase (decrease) in net assets from operations | 20,567 | 95,391 | 111,374 | 6 | 130,532 | 209,514 | 274,051 | |||||||||||||||||||||
Distributions to shareholders | ||||||||||||||||||||||||||||
From net investment income | ||||||||||||||||||||||||||||
Class A | (1,966 | ) | - | (13,924 | ) | (22 | ) | (9,433 | ) | (518 | ) | (2,006 | ) | |||||||||||||||
Class B | (1 | ) | - | (12 | ) | - | (158 | ) | (45 | ) | (104 | ) | ||||||||||||||||
From net realized gains | ||||||||||||||||||||||||||||
Class A | (5,597 | ) | (559 | ) | - | - | - | - | (26,025 | ) | ||||||||||||||||||
Class B | (1 | ) | - | - | - | - | - | (723 | ) | |||||||||||||||||||
Total distributions to shareholders | (7,565 | ) | (559 | ) | (13,936 | ) | (22 | ) | (9,591 | ) | (563 | ) | (28,858 | ) | ||||||||||||||
Share transactions¹ | ||||||||||||||||||||||||||||
Proceeds from the sale of shares | ||||||||||||||||||||||||||||
Class A | 213,276 | 337,075 | 649,943 | 980,495 | 634,322 | 790,504 | 632,488 | |||||||||||||||||||||
Class B | 94 | - | 356 | 5,729 | 3,298 | 5,179 | 7,021 | |||||||||||||||||||||
Reinvestment of distributions | ||||||||||||||||||||||||||||
Class A | 7,563 | 559 | 13,924 | 22 | 9,433 | 518 | 28,031 | |||||||||||||||||||||
Class B | 2 | - | 12 | - | 158 | 45 | 827 | |||||||||||||||||||||
Cost of shares redeemed | ||||||||||||||||||||||||||||
Class A | (165,690 | ) | (215,926 | ) | (207,915 | ) | (1,415,005 | ) | (386,536 | ) | (435,469 | ) | (352,320 | ) | ||||||||||||||
Class B | (81 | ) | - | (274 | ) | (5,754 | ) | (2,524 | ) | (4,955 | ) | (5,545 | ) | |||||||||||||||
Net increase (decrease) in net assets from share transactions | 55,164 | 121,708 | 456,046 | (434,513 | ) | 258,151 | 355,822 | 310,502 | ||||||||||||||||||||
Net increase (decrease) in net assets | 68,166 | 216,540 | 553,484 | (434,529 | ) | 379,092 | 564,773 | 555,695 | ||||||||||||||||||||
Net assets beginning of year | 213,036 | 627,405 | 737,719 | 1,147,781 | 776,233 | 946,856 | 849,266 | |||||||||||||||||||||
Net assets end of year | $ | 281,202 | $ | 843,945 | $ | 1,291,203 | $ | 713,252 | $ | 1,155,325 | $ | 1,511,629 | $ | 1,404,961 | ||||||||||||||
Undistributed (excess of distributions over) net investment income | $ | 4,140 | $ | 45,475 | $ | 18,303 | $ | (24 | ) | $ | 12,301 | $ | (35 | ) | $ | (2,016 | ) | |||||||||||
¹Share transactions | ||||||||||||||||||||||||||||
Shares sold | ||||||||||||||||||||||||||||
Class A | 22,554 | 33,956 | 41,987 | 980,495 | 39,952 | 42,408 | 24,104 | |||||||||||||||||||||
Class B | 10 | - | 22 | 5,729 | 205 | 280 | 271 | |||||||||||||||||||||
Reinvestment of distributions | ||||||||||||||||||||||||||||
Class A | 792 | 52 | 862 | 22 | 557 | 25 | 952 | |||||||||||||||||||||
Class B | - | - | 1 | - | 9 | 2 | 28 | |||||||||||||||||||||
Shares redeemed | ||||||||||||||||||||||||||||
Class A | (17,898 | ) | (21,977 | ) | (13,478 | ) | (1,415,005 | ) | (24,426 | ) | (23,316 | ) | (13,670 | ) | ||||||||||||||
Class B | (9 | ) | - | (17 | ) | (5,754 | ) | (158 | ) | (266 | ) | (214 | ) | |||||||||||||||
Net increase (decrease) | ||||||||||||||||||||||||||||
Class A | 5,448 | 12,031 | 29,371 | (434,488 | ) | 16,083 | 19,117 | 11,386 | ||||||||||||||||||||
Class B | 1 | - | 6 | (25 | ) | 56 | 16 | 85 | ||||||||||||||||||||
Purchase and sales of investment securities (excluding short-term securities): | ||||||||||||||||||||||||||||
Purchase of securities | $ | 261,736 | $ | 238,909 | $ | 1,290,355 | (a) | $ | 87,200 | (b) | $ | 484,374 | $ | 752,527 | $ | 525,172 | ||||||||||||
Proceeds from sales of securities | 210,196 | 70,812 | 852,952 | (a) | 92,777 | (b) | 226,029 | 405,692 | 260,525 | |||||||||||||||||||
| (a) | Amounts include $195,225 and $149,833 of purchases and sales, respectively, of U.S. Government Securities. |
| (b) | Amounts include $56,971 and $68,971 of purchases and sales, respectively, of U.S. Government Securities. |
See accompanying Notes to Financial Statements.
JNL Series Trust
Statements of Changes in Net Assets (in thousands)
For the Year Ended December 31, 2010
| JNL/T. Rowe | ||||||||
| Price Short- | JNL/T. Rowe | |||||||
| Term Bond | Price | |||||||
| Fund | Value Fund | |||||||
Operations | ||||||||
Net investment income (loss) | $ | 12,939 | $ | 17,758 | ||||
Net realized gain (loss) | (704 | ) | 360 | |||||
Net change in unrealized appreciation (depreciation) | 6,379 | 127,179 | ||||||
Net increase (decrease) in net assets from operations | 18,614 | 145,297 | ||||||
Distributions to shareholders | ||||||||
From net investment income | ||||||||
Class A | (9,874 | ) | (9,950 | ) | ||||
Class B | (1 | ) | (6 | ) | ||||
From net realized gains | ||||||||
Class A | - | - | ||||||
Class B | - | - | ||||||
Total distributions to shareholders | (9,875 | ) | (9,956 | ) | ||||
Share transactions¹ | ||||||||
Proceeds from the sale of shares | ||||||||
Class A | 777,055 | 677,873 | ||||||
Class B | 181 | 220 | ||||||
Reinvestment of distributions | ||||||||
Class A | 9,874 | 9,950 | ||||||
Class B | 1 | 6 | ||||||
Cost of shares redeemed | ||||||||
Class A | (407,604 | ) | (414,580 | ) | ||||
Class B | (309 | ) | (255 | ) | ||||
Net increase (decrease) in net assets from share transactions | 379,198 | 273,214 | ||||||
Net increase (decrease) in net assets | 387,937 | 408,555 | ||||||
Net assets beginning of year | 485,043 | 728,221 | ||||||
Net assets end of year | $ | 872,980 | $ | 1,136,776 | ||||
Undistributed (excess of distributions over) net investment income | $ | 14,163 | $ | 17,730 | ||||
¹Share transactions | ||||||||
Shares sold | ||||||||
Class A | 78,433 | 69,177 | ||||||
Class B | 18 | 21 | ||||||
Reinvestment of distributions | ||||||||
Class A | 1,003 | 946 | ||||||
Class B | - | 1 | ||||||
Shares redeemed | ||||||||
Class A | (41,040 | ) | (42,343 | ) | ||||
Class B | (31 | ) | (26 | ) | ||||
Net increase (decrease) | ||||||||
Class A | 38,396 | 27,780 | ||||||
Class B | (13 | ) | (4 | ) | ||||
Purchase and sales of investment securities (excluding short-term securities): | ||||||||
Purchase of securities | $ | 741,122 | (a) | $ | 513,331 | |||
Proceeds from sales of securities | 384,802 | (a) | 235,227 | |||||
| (a) | Amounts include $210,132 and $87,334 of purchases and sales, respectively, of U.S. Government Securities. |
See accompanying Notes to Financial Statements.
JNL Series Trust
Statements of Changes in Net Assets (in thousands)
For the Year Ended December 31, 2009
| Operations | JNL Institutional Alt 20 Fund (a) | JNL Institutional Alt 35 Fund (a) | JNL Institutional Alt 50 Fund (a) | JNL Institutional Alt 65 Fund (a) | JNL/BlackRock Commodity Securities Fund | JNL/ Capital Guardian Global Balanced Fund | JNL/ Capital Guardian Global Diversified Research Fund | |||||||||||||||||||||
Net investment income (loss) | $ | 2,705 | $ | 4,260 | $ | 5,131 | $ | 2,990 | $ | 3,410 | $ | 3,990 | $ | 2,167 | ||||||||||||||
Net realized gain (loss) | 242 | 794 | 1,574 | 1,857 | (98,798 | ) | (27,982 | ) | (41,649 | ) | ||||||||||||||||||
Net change in unrealized appreciation (depreciation) | 8,997 | 17,516 | 17,922 | 10,341 | 249,014 | 68,222 | 109,226 | |||||||||||||||||||||
Net increase (decrease) in net assets from operations | 11,944 | 22,570 | 24,627 | 15,188 | 153,626 | 44,230 | 69,744 | |||||||||||||||||||||
Distributions to shareholders | ||||||||||||||||||||||||||||
From net investment income | ||||||||||||||||||||||||||||
Class A | - | - | - | - | (4,270 | ) | (5,555 | ) | (4,295 | ) | ||||||||||||||||||
Class B | - | - | - | - | (4 | ) | (9 | ) | (5 | ) | ||||||||||||||||||
From net realized gains | ||||||||||||||||||||||||||||
Class A | - | - | - | - | - | - | - | |||||||||||||||||||||
Class B | - | - | - | - | - | - | - | |||||||||||||||||||||
Total distributions to shareholders | - | - | - | - | (4,274 | ) | (5,564 | ) | (4,300 | ) | ||||||||||||||||||
Share transactions¹ | ||||||||||||||||||||||||||||
Proceeds from the sale of shares | ||||||||||||||||||||||||||||
Class A | 199,802 | 298,773 | 356,850 | 235,122 | 438,567 | 114,399 | 178,185 | (b) | ||||||||||||||||||||
Class B | - | - | - | - | 422 | 235 | 191 | (b) | ||||||||||||||||||||
Proceeds in connection with acquisition | ||||||||||||||||||||||||||||
Class A | - | - | - | - | - | - | - | |||||||||||||||||||||
Class B | - | - | - | - | - | - | - | |||||||||||||||||||||
Reinvestment of distributions | ||||||||||||||||||||||||||||
Class A | - | - | - | - | 4,270 | 5,555 | 4,295 | |||||||||||||||||||||
Class B | - | - | - | - | 4 | 9 | 5 | |||||||||||||||||||||
Cost of shares redeemed | ||||||||||||||||||||||||||||
Class A | (12,230 | ) | (12,827 | ) | (19,961 | ) | (20,497 | ) | (165,603 | ) | (62,337 | ) | (78,384 | ) | ||||||||||||||
Class B | - | - | - | - | (287 | ) | (71 | ) | (98 | ) | ||||||||||||||||||
Net increase (decrease) in net assets from share transactions | 187,572 | 285,946 | 336,889 | 214,625 | 277,373 | 57,790 | 104,194 | |||||||||||||||||||||
Net increase (decrease) in net assets | 199,516 | 308,516 | 361,516 | 229,813 | 426,725 | 96,456 | 169,638 | |||||||||||||||||||||
Net assets beginning of year | - | - | - | - | 214,921 | 183,761 | 163,268 | |||||||||||||||||||||
Net assets end of year | $ | 199,516 | $ | 308,516 | $ | 361,516 | $ | 229,813 | $ | 641,646 | $ | 280,217 | $ | 332,906 | ||||||||||||||
Undistributed (excess of distributions over) net investment income | $ | 2,749 | $ | 4,330 | $ | 5,229 | $ | 3,056 | $ | 2,536 | $ | 3,071 | $ | 2,000 | ||||||||||||||
¹Share transactions | ||||||||||||||||||||||||||||
Shares sold | ||||||||||||||||||||||||||||
Class A | 16,682 | 24,301 | 28,185 | 17,990 | 55,480 | 14,311 | 9,514 | |||||||||||||||||||||
Class B | - | - | - | - | 54 | 28 | 10 | |||||||||||||||||||||
Shares issued in connection with acquisition | ||||||||||||||||||||||||||||
Class A | - | - | - | - | - | - | - | |||||||||||||||||||||
Class B | - | - | - | - | - | - | - | |||||||||||||||||||||
Reinvestment of distributions | ||||||||||||||||||||||||||||
Class A | - | - | - | - | 465 | 632 | 208 | |||||||||||||||||||||
Class B | - | - | - | - | 1 | 1 | - | |||||||||||||||||||||
Shares redeemed | ||||||||||||||||||||||||||||
Class A | (1,010 | ) | (1,008 | ) | (1,535 | ) | (1,535 | ) | (21,863 | ) | (8,199 | ) | (4,466 | ) | ||||||||||||||
Class B | - | - | - | - | (41 | ) | (8 | ) | (4 | ) | ||||||||||||||||||
Net increase (decrease) | ||||||||||||||||||||||||||||
Class A | 15,672 | 23,293 | 26,650 | 16,455 | 34,082 | 6,744 | 5,256 | |||||||||||||||||||||
Class B | - | - | - | - | 14 | 21 | 6 | |||||||||||||||||||||
Purchase and sales of investment securities (excluding short-term securities): | ||||||||||||||||||||||||||||
Purchase of securities | $ | 192,833 | $ | 298,630 | $ | 360,201 | $ | 238,403 | $ | 553,211 | (c) | $ | 208,334 | (d) | $ | 269,821 | ||||||||||||
Proceeds from sales of securities | 2,476 | 8,298 | 18,020 | 20,683 | 379,145 | (c) | 158,946 | (d) | 178,580 | |||||||||||||||||||
| (a) | Period from April 6, 2009 (commencement of operations) |
| (b) | Amount includes $4,094 for Class A and $4 for Class B received in a class action settlement. |
| (c) | Amount includes $102,657 and $10,067 of purchases and sales, respectively, of U.S. Government Securities. |
| (d) | Amount includes $18,592 and $14,646 of purchases and sales, respectively, of U.S. Government Securities. |
See accompanying Notes to Financial Statements.
JNL Series Trust
Statements of Changes in Net Assets (in thousands)
For the Year Ended December 31, 2009
| Operations | JNL/Capital Guardian U.S. Growth Equity Fund | JNL/Eagle Core Equity Fund | JNL/Eagle SmallCap Equity Fund | JNL/Franklin Templeton Founding Strategy Fund | JNL/Franklin Templeton Global Growth Fund | JNL/Franklin Templeton Income Fund | JNL/Franklin Templeton International Small Cap Growth Fund | |||||||||||||||||||||
Net investment income (loss) | $ | 1,987 | $ | 508 | $ | 678 | $ | 27,409 | $ | 4,411 | $ | 35,167 | $ | 525 | ||||||||||||||
Net realized gain (loss) | (53,049 | ) | (4,024 | ) | (16,530 | ) | (19,615 | ) | (20,493 | ) | (35,898 | ) | (11,506 | ) | ||||||||||||||
Net change in unrealized appreciation (depreciation) | 164,017 | 20,688 | 82,194 | 172,514 | 95,128 | 157,994 | 42,382 | |||||||||||||||||||||
Net increase (decrease) in net assets from operations | 112,955 | 17,172 | 66,342 | 180,308 | 79,046 | 157,263 | 31,401 | |||||||||||||||||||||
Distributions to shareholders | ||||||||||||||||||||||||||||
From net investment income | ||||||||||||||||||||||||||||
Class A | (673 | ) | (841 | ) | - | (449 | ) | (5,599 | ) | (38,686 | ) | (1,563 | ) | |||||||||||||||
Class B | (1 | ) | (1 | ) | - | - | (3 | ) | (22 | ) | (3 | ) | ||||||||||||||||
From net realized gains | ||||||||||||||||||||||||||||
Class A | - | - | - | - | - | - | - | |||||||||||||||||||||
Class B | - | - | - | - | - | - | - | |||||||||||||||||||||
Total distributions to shareholders | (674 | ) | (842 | ) | - | (449 | ) | (5,602 | ) | (38,708 | ) | (1,566 | ) | |||||||||||||||
Share transactions¹ | ||||||||||||||||||||||||||||
Proceeds from the sale of shares | ||||||||||||||||||||||||||||
Class A | 380,864 | 49,060 | 141,233 | 253,297 | 136,522 | 290,493 | 98,520 | |||||||||||||||||||||
Class B | 252 | 30 | 209 | - | 105 | 179 | 225 | |||||||||||||||||||||
Proceeds in connection with acquisition | ||||||||||||||||||||||||||||
Class A | - | - | - | - | - | - | - | |||||||||||||||||||||
Class B | - | - | - | - | - | - | - | |||||||||||||||||||||
Reinvestment of distributions | ||||||||||||||||||||||||||||
Class A | 673 | 841 | - | 449 | 5,599 | 38,686 | 1,563 | |||||||||||||||||||||
Class B | 1 | 1 | - | - | 3 | 22 | 3 | |||||||||||||||||||||
Cost of shares redeemed | ||||||||||||||||||||||||||||
Class A | (134,589 | ) | (24,636 | ) | (92,166 | ) | (175,647 | ) | (76,035 | ) | (151,675 | ) | (30,618 | ) | ||||||||||||||
Class B | (175 | ) | (122 | ) | (213 | ) | - | (90 | ) | (97 | ) | (141 | ) | |||||||||||||||
Net increase (decrease) in net assets from share transactions | 247,026 | 25,174 | 49,063 | 78,099 | 66,104 | 177,608 | 69,552 | |||||||||||||||||||||
Net increase (decrease) in net assets | 359,307 | 41,504 | 115,405 | 257,958 | 139,548 | 296,163 | 99,387 | |||||||||||||||||||||
Net assets beginning of year | 195,981 | 42,782 | 164,291 | 580,801 | 236,176 | 432,461 | 44,835 | |||||||||||||||||||||
Net assets end of year | $ | 555,288 | $ | 84,286 | $ | 279,696 | $ | 838,759 | $ | 375,724 | $ | 728,624 | $ | 144,222 | ||||||||||||||
Undistributed (excess of distributions over) net investment income | $ | 1,985 | $ | 508 | $ | 676 | $ | 27,404 | $ | 4,814 | $ | 34,982 | $ | 459 | ||||||||||||||
¹Share transactions | ||||||||||||||||||||||||||||
Shares sold | ||||||||||||||||||||||||||||
Class A | 23,918 | 8,449 | 10,659 | 35,998 | 20,526 | 34,115 | 16,053 | |||||||||||||||||||||
Class B | 15 | 5 | 15 | - | 17 | 21 | 35 | |||||||||||||||||||||
Shares issued in connection with acquisition | ||||||||||||||||||||||||||||
Class A | - | - | - | - | - | - | - | |||||||||||||||||||||
Class B | - | - | - | - | - | - | - | |||||||||||||||||||||
Reinvestment of distributions | ||||||||||||||||||||||||||||
Class A | 36 | 129 | - | 55 | 742 | 4,196 | 227 | |||||||||||||||||||||
Class B | - | - | - | - | - | 2 | - | |||||||||||||||||||||
Shares redeemed | ||||||||||||||||||||||||||||
Class A | (8,500 | ) | (4,361 | ) | (7,124 | ) | (25,914 | ) | (11,965 | ) | (18,406 | ) | (5,134 | ) | ||||||||||||||
Class B | (10 | ) | (18 | ) | (15 | ) | - | (14 | ) | (12 | ) | (21 | ) | |||||||||||||||
Net increase (decrease) | ||||||||||||||||||||||||||||
Class A | 15,454 | 4,217 | 3,535 | 10,139 | 9,303 | 19,905 | 11,146 | |||||||||||||||||||||
Class B | 5 | (13 | ) | - | - | 3 | 11 | 14 | ||||||||||||||||||||
Purchase and sales of investment securities (excluding short-term securities): | ||||||||||||||||||||||||||||
Purchase of securities | $ | 432,361 | $ | 43,233 | $ | 182,856 | $ | 136,470 | $ | 82,118 | $ | 359,517 | $ | 95,204 | ||||||||||||||
Proceeds from sales of securities | 183,673 | 19,574 | 132,564 | 31,392 | 13,688 | 224,260 | 35,100 | |||||||||||||||||||||
See accompanying Notes to Financial Statements.
JNL Series Trust
Statements of Changes in Net Assets (in thousands)
For the Year Ended December 31, 2009
| Operations | JNL/Franklin Templeton Mutual Shares Fund | JNL/Franklin Templeton Small Cap Value Fund | JNL/ Goldman Sachs Core Plus Bond Fund | JNL/Goldman Sachs Emerging Markets Debt Fund | JNL/Goldman Sachs Mid Cap Value Fund | JNL/Goldman Sachs U.S. Equity Flex Fund | JNL/Invesco Global Real Estate Fund | |||||||||||||||||||||
Net investment income (loss) | $ | 4,574 | $ | 1,043 | $ | 24,995 | $ | 3,389 | $ | 2,446 | $ | 680 | $ | 5,732 | ||||||||||||||
Net realized gain (loss) | (40,846 | ) | (4,734 | ) | 16,409 | 5,451 | (19,531 | ) | 13,712 | (12,501 | ) | |||||||||||||||||
Net change in unrealized appreciation (depreciation) | 114,677 | 39,541 | 42,144 | 5,514 | 75,527 | 5,946 | 74,282 | |||||||||||||||||||||
Net increase (decrease) in net assets from operations | 78,405 | 35,850 | 83,548 | 14,354 | 58,442 | 20,338 | 67,513 | |||||||||||||||||||||
Distributions to shareholders | ||||||||||||||||||||||||||||
From net investment income | ||||||||||||||||||||||||||||
Class A | (13,019 | ) | (1,068 | ) | (31,680 | ) | (150 | ) | (2,397 | ) | (569 | ) | (6,177 | ) | ||||||||||||||
Class B | (9 | ) | (2 | ) | (10 | ) | - | (63 | ) | (1 | ) | (8 | ) | |||||||||||||||
From net realized gains | ||||||||||||||||||||||||||||
Class A | - | - | (2,939 | ) | - | - | - | - | ||||||||||||||||||||
Class B | - | - | (1 | ) | - | - | - | - | ||||||||||||||||||||
Total distributions to shareholders | (13,028 | ) | (1,070 | ) | (34,630 | ) | (150 | ) | (2,460 | ) | (570 | ) | (6,185 | ) | ||||||||||||||
Share transactions¹ | ||||||||||||||||||||||||||||
Proceeds from the sale of shares | ||||||||||||||||||||||||||||
Class A | 172,726 | 91,804 | 339,012 | 177,813 | 160,445 | 108,225 | 193,414 | |||||||||||||||||||||
Class B | 183 | 195 | 131 | 113 | 5,703 | 49 | 257 | |||||||||||||||||||||
Proceeds in connection with acquisition | ||||||||||||||||||||||||||||
Class A | - | - | - | - | - | - | - | |||||||||||||||||||||
Class B | - | - | - | - | - | - | - | |||||||||||||||||||||
Reinvestment of distributions | ||||||||||||||||||||||||||||
Class A | 13,019 | 1,068 | 34,619 | 150 | 2,397 | 569 | 6,177 | |||||||||||||||||||||
Class B | 9 | 2 | 11 | - | 63 | 1 | 8 | |||||||||||||||||||||
Cost of shares redeemed | ||||||||||||||||||||||||||||
Class A | (83,452 | ) | (46,420 | ) | (204,572 | ) | (28,066 | ) | (76,420 | ) | (80,109 | ) | (63,093 | ) | ||||||||||||||
Class B | (119 | ) | (141 | ) | (112 | ) | (41 | ) | (2,149 | ) | (22 | ) | (248 | ) | ||||||||||||||
Net increase (decrease) in net assets from share transactions | 102,366 | 46,508 | 169,089 | 149,969 | 90,039 | 28,713 | 136,515 | |||||||||||||||||||||
Net increase (decrease) in net assets | 167,743 | 81,288 | 218,007 | 164,173 | 146,021 | 48,481 | 197,843 | |||||||||||||||||||||
Net assets beginning of year | 256,111 | 86,538 | 564,982 | 29,070 | 134,704 | 41,972 | 145,512 | |||||||||||||||||||||
Net assets end of year | $ | 423,854 | $ | 167,826 | $ | 782,989 | $ | 193,243 | $ | 280,725 | $ | 90,453 | $ | 343,355 | ||||||||||||||
Undistributed (excess of distributions over) net investment income | $ | (2,614 | ) | $ | 1,041 | $ | 24,797 | $ | 5,800 | $ | 1,423 | $ | 670 | $ | 10,130 | |||||||||||||
¹Share transactions | ||||||||||||||||||||||||||||
Shares sold | ||||||||||||||||||||||||||||
Class A | 25,477 | 12,436 | 29,330 | 15,714 | 22,084 | 16,819 | 29,777 | |||||||||||||||||||||
Class B | 28 | 26 | 12 | 10 | 931 | 7 | 43 | |||||||||||||||||||||
Shares issued in connection with acquisition | ||||||||||||||||||||||||||||
Class A | - | - | - | - | - | - | - | |||||||||||||||||||||
Class B | - | - | - | - | - | - | - | |||||||||||||||||||||
Reinvestment of distributions | ||||||||||||||||||||||||||||
Class A | 1,731 | 124 | 2,951 | 13 | 279 | 76 | 833 | |||||||||||||||||||||
Class B | 1 | - | 1 | - | 7 | - | 1 | |||||||||||||||||||||
Shares redeemed | ||||||||||||||||||||||||||||
Class A | (12,807 | ) | (6,499 | ) | (18,035 | ) | (2,485 | ) | (10,893 | ) | (11,831 | ) | (10,142 | ) | ||||||||||||||
Class B | (19 | ) | (20 | ) | (10 | ) | (3 | ) | (310 | ) | (4 | ) | (41 | ) | ||||||||||||||
Net increase (decrease) | ||||||||||||||||||||||||||||
Class A | 14,401 | 6,061 | 14,246 | 13,242 | 11,470 | 5,064 | 20,468 | |||||||||||||||||||||
Class B | 10 | 6 | 3 | 7 | 628 | 3 | 3 | |||||||||||||||||||||
Purchase and sales of investment securities (excluding short-term securities): | ||||||||||||||||||||||||||||
Purchase of securities | $ | 235,025 | $ | 39,513 | $ | 4,207,935 | (a) | $ | 171,680 | $ | 287,985 | $ | 623,525 | $ | 261,679 | |||||||||||||
Proceeds from sales of securities | 156,534 | 2,534 | 4,153,182 | (a) | 50,095 | 204,623 | 599,200 | 131,270 | ||||||||||||||||||||
| (a) | Amounts include $1,534,531 and $1,568,551 of purchases and sales, respectively, of U.S. Government Securities. |
See accompanying Notes to Financial Statements.
JNL Series Trust
Statements of Changes in Net Assets (in thousands)
For the Year Ended December 31, 2009
| Operations | JNL/Invesco International Growth Fund | JNL/Invesco Large Cap Growth Fund | JNL/Invesco Small Cap Growth Fund | JNL/ Ivy Asset Strategy Fund (a) | JNL/JPMorgan International Value Fund | JNL/JPMorgan Midcap Growth Fund | JNL/JPMorgan U.S. Government & Quality Bond Fund | |||||||||||||||||||||
Net investment income (loss) | $ | 4,663 | $ | 2,065 | $ | (106 | ) | $ | 128 | $ | 9,085 | $ | (297 | ) | $ | 25,308 | ||||||||||||
Net realized gain (loss) | (44,638 | ) | (30,614 | ) | (598 | ) | (2,250 | ) | (59,511 | ) | (20,432 | ) | (1,365 | ) | ||||||||||||||
Net change in unrealized appreciation (depreciation) | 136,861 | 138,511 | 19,603 | 3,725 | 162,738 | 65,912 | (1,382 | ) | ||||||||||||||||||||
Net increase (decrease) in net assets from operations | 96,886 | 109,962 | 18,899 | 1,603 | 112,312 | 45,183 | 22,561 | |||||||||||||||||||||
Distributions to shareholders | ||||||||||||||||||||||||||||
From net investment income | ||||||||||||||||||||||||||||
Class A | (6,883 | ) | (1,465 | ) | - | - | (19,862 | ) | - | (17,134 | ) | |||||||||||||||||
Class B | (7 | ) | (2 | ) | - | - | (21 | ) | - | (14 | ) | |||||||||||||||||
From net realized gains | ||||||||||||||||||||||||||||
Class A | - | - | - | - | - | - | - | |||||||||||||||||||||
Class B | - | - | - | - | - | - | - | |||||||||||||||||||||
Total distributions to shareholders | (6,890 | ) | (1,467 | ) | - | - | (19,883 | ) | - | (17,148 | ) | |||||||||||||||||
Share transactions¹ | ||||||||||||||||||||||||||||
Proceeds from the sale of shares | ||||||||||||||||||||||||||||
Class A | 197,079 | (b) | 303,951 | 59,643 | 200,801 | 232,300 | 58,582 | 396,612 | ||||||||||||||||||||
Class B | 1,140 | (b) | 226 | 85 | 201 | 245 | 42 | 940 | ||||||||||||||||||||
Proceeds in connection with acquisition | ||||||||||||||||||||||||||||
Class A | - | - | - | - | - | - | - | |||||||||||||||||||||
Class B | - | - | - | - | - | - | - | |||||||||||||||||||||
Reinvestment of distributions | ||||||||||||||||||||||||||||
Class A | 6,883 | 1,465 | - | - | 19,862 | - | 17,134 | |||||||||||||||||||||
Class B | 7 | 2 | - | - | 21 | - | 14 | |||||||||||||||||||||
Cost of shares redeemed | ||||||||||||||||||||||||||||
Class A | (112,975 | ) | (140,475 | ) | (26,024 | ) | (5,626 | ) | (141,732 | ) | (31,970 | ) | (406,987 | ) | ||||||||||||||
Class B | (9,464 | ) | (151 | ) | (70 | ) | (2 | ) | (272 | ) | (149 | ) | (1,291 | ) | ||||||||||||||
Net increase (decrease) in net assets from share transactions | 82,670 | 165,018 | 33,634 | 195,374 | 110,424 | 26,505 | 6,422 | |||||||||||||||||||||
Net increase (decrease) in net assets | 172,666 | 273,513 | 52,533 | 196,977 | 202,853 | 71,688 | 11,835 | |||||||||||||||||||||
Net assets beginning of year | 259,315 | 351,230 | 40,417 | - | 346,837 | 92,116 | 681,746 | |||||||||||||||||||||
Net assets end of year | $ | 431,981 | $ | 624,743 | $ | 92,950 | $ | 196,977 | $ | 549,690 | $ | 163,804 | $ | 693,581 | ||||||||||||||
Undistributed (excess of distributions over) net investment income | $ | 2,774 | $ | 2,176 | $ | 22 | $ | 26 | $ | 14,697 | $ | (5 | ) | $ | 24,719 | |||||||||||||
¹Share transactions | ||||||||||||||||||||||||||||
Shares sold | ||||||||||||||||||||||||||||
Class A | 24,272 | 32,611 | 6,848 | 19,460 | 36,818 | 4,488 | 31,731 | |||||||||||||||||||||
Class B | 160 | 24 | 9 | 19 | 39 | 3 | 72 | |||||||||||||||||||||
Shares issued in connection with acquisition | ||||||||||||||||||||||||||||
Class A | - | - | - | - | - | - | - | |||||||||||||||||||||
Class B | - | - | - | - | - | - | - | |||||||||||||||||||||
Reinvestment of distributions | ||||||||||||||||||||||||||||
Class A | 752 | 139 | - | - | 2,801 | - | 1,365 | |||||||||||||||||||||
Class B | 1 | - | - | - | 3 | - | 1 | |||||||||||||||||||||
Shares redeemed | ||||||||||||||||||||||||||||
Class A | (14,817 | ) | (15,172 | ) | (3,041 | ) | (549 | ) | (23,609 | ) | (2,468 | ) | (32,744 | ) | ||||||||||||||
Class B | (1,458 | ) | (16 | ) | (8 | ) | - | (46 | ) | (10 | ) | (100 | ) | |||||||||||||||
Net increase (decrease) | ||||||||||||||||||||||||||||
Class A | 10,207 | 17,578 | 3,807 | 18,911 | 16,010 | 2,020 | 352 | |||||||||||||||||||||
Class B | (1,297 | ) | 8 | 1 | 19 | (4 | ) | (7 | ) | (27 | ) | |||||||||||||||||
Purchase and sales of investment securities (excluding short-term securities): | ||||||||||||||||||||||||||||
Purchase of securities | $ | 151,135 | $ | 418,014 | $ | 48,533 | $ | 182,298 | $ | 466,877 | $ | 118,248 | $ | 164,578 | (c) | |||||||||||||
Proceeds from sales of securities | 72,569 | 247,349 | 19,168 | 12,705 | 359,692 | 95,637 | 82,865 | (c) | ||||||||||||||||||||
| (a) | Period from September 28, 2009 (commencement of operations) |
| (b) | Amount includes $826 for Class A and $1 for Class B received in a class action settlement. |
| (c) | Amounts include $153,207 and $78,280 of purchases and sales, respectively, of U.S. Government Securities. |
See accompanying Notes to Financial Statements.
JNL Series Trust
Statements of Changes in Net Assets (in thousands)
For the Year Ended December 31, 2009
| Operations | JNL/Lazard Emerging Markets Fund | JNL/Lazard Mid Cap Equity Fund | JNL/M&G Global Basics Fund | JNL/M&G Global Leaders Fund | JNL/Mellon Capital Management 10 X 10 Fund | JNL/Mellon Capital Management Index 5 Fund | JNL/Mellon Capital Management European 30 Fund | |||||||||||||||||||||
Net investment income (loss) | $ | 8,084 | $ | 1,147 | $ | 61 | $ | 82 | $ | 4,439 | $ | 2,875 | $ | 153 | ||||||||||||||
Net realized gain (loss) | (65,568 | ) | (18,562 | ) | 114 | 259 | (15,556 | ) | (5,475 | ) | 514 | |||||||||||||||||
Net change in unrealized appreciation (depreciation) | 261,069 | 62,130 | 4,861 | 2,760 | 47,726 | 35,129 | 1,331 | |||||||||||||||||||||
Net increase (decrease) in net assets from operations | 203,585 | 44,715 | 5,036 | 3,101 | 36,609 | 32,529 | 1,998 | |||||||||||||||||||||
Distributions to shareholders | ||||||||||||||||||||||||||||
From net investment income | ||||||||||||||||||||||||||||
Class A | (9,731 | ) | (1,100 | ) | (76 | ) | (94 | ) | (6,552 | ) | (1,700 | ) | (254 | ) | ||||||||||||||
Class B | (11 | ) | (1 | ) | (1 | ) | (1 | ) | - | - | (3 | ) | ||||||||||||||||
From net realized gains | ||||||||||||||||||||||||||||
Class A | - | - | (144 | ) | - | (6,382 | ) | (1,937 | ) | (571 | ) | |||||||||||||||||
Class B | - | - | (1 | ) | - | - | - | (6 | ) | |||||||||||||||||||
Total distributions to shareholders | (9,742 | ) | (1,101 | ) | (222 | ) | (95 | ) | (12,934 | ) | (3,637 | ) | (834 | ) | ||||||||||||||
Share transactions¹ | ||||||||||||||||||||||||||||
Proceeds from the sale of shares | ||||||||||||||||||||||||||||
Class A | 481,395 | 53,958 | 29,137 | 11,004 | 109,190 | 147,279 | 14,684 | |||||||||||||||||||||
Class B | 639 | 386 | 152 | 11 | - | - | 7 | |||||||||||||||||||||
Proceeds in connection with acquisition | ||||||||||||||||||||||||||||
Class A | - | - | - | - | - | - | - | |||||||||||||||||||||
Class B | - | - | - | - | - | - | - | |||||||||||||||||||||
Reinvestment of distributions | ||||||||||||||||||||||||||||
Class A | 9,731 | 1,100 | 220 | 94 | 12,934 | 3,637 | 825 | |||||||||||||||||||||
Class B | 11 | 1 | 2 | 1 | - | - | 9 | |||||||||||||||||||||
Cost of shares redeemed | ||||||||||||||||||||||||||||
Class A | (160,488 | ) | (59,254 | ) | (9,114 | ) | (1,273 | ) | (51,675 | ) | (35,266 | ) | (5,462 | ) | ||||||||||||||
Class B | (338 | ) | (2,200 | ) | (130 | ) | - | - | - | (2 | ) | |||||||||||||||||
Net increase (decrease) in net assets from share transactions | 330,950 | (6,009 | ) | 20,267 | 9,837 | 70,449 | 115,650 | 10,061 | ||||||||||||||||||||
Net increase (decrease) in net assets | 524,793 | 37,605 | 25,081 | 12,843 | 94,124 | 144,542 | 11,225 | |||||||||||||||||||||
Net assets beginning of year | 211,844 | 127,292 | 4,787 | 4,585 | 100,370 | 60,409 | 2,141 | |||||||||||||||||||||
Net assets end of year | $ | 736,637 | $ | 164,897 | $ | 29,868 | $ | 17,428 | $ | 194,494 | $ | 204,951 | $ | 13,366 | ||||||||||||||
Undistributed (excess of distributions over) net investment income | $ | 4,989 | $ | 928 | $ | 8 | $ | (8 | ) | $ | 4,449 | $ | 2,895 | $ | (76 | ) | ||||||||||||
1Share transactions | ||||||||||||||||||||||||||||
Shares sold | ||||||||||||||||||||||||||||
Class A | 57,759 | 6,865 | 2,712 | 1,093 | 16,988 | 20,008 | 1,355 | |||||||||||||||||||||
Class B | 77 | 57 | 14 | 1 | - | - | - | |||||||||||||||||||||
Shares issued in connection with acquisition | ||||||||||||||||||||||||||||
Class A | - | - | - | - | - | - | - | |||||||||||||||||||||
Class B | - | - | - | - | - | - | - | |||||||||||||||||||||
Reinvestment of distributions | ||||||||||||||||||||||||||||
Class A | 987 | 118 | 18 | 8 | 1,814 | 439 | 74 | |||||||||||||||||||||
Class B | 1 | - | - | - | - | - | 1 | |||||||||||||||||||||
Shares redeemed | ||||||||||||||||||||||||||||
Class A | (20,848 | ) | (7,929 | ) | (868 | ) | (124 | ) | (7,975 | ) | (4,864 | ) | (497 | ) | ||||||||||||||
Class B | (40 | ) | (344 | ) | (11 | ) | - | - | - | - | ||||||||||||||||||
Net increase (decrease) | ||||||||||||||||||||||||||||
Class A | 37,898 | (946 | ) | 1,862 | 977 | 10,827 | 15,583 | 932 | ||||||||||||||||||||
Class B | 38 | (287 | ) | 3 | 1 | - | - | 1 | ||||||||||||||||||||
Purchase and sales of investment securities (excluding short-term securities): | ||||||||||||||||||||||||||||
Purchase of securities | $ | 484,878 | $ | 101,301 | $ | 23,880 | $ | 12,217 | $ | 77,320 | $ | 124,183 | $ | 13,012 | ||||||||||||||
Proceeds from sales of securities | 187,620 | 107,944 | 5,358 | 3,478 | 15,253 | 9,065 | 3,674 | |||||||||||||||||||||
See accompanying Notes to Financial Statements.
JNL Series Trust
Statements of Changes in Net Assets (in thousands)
For the Year Ended December 31, 2009
| Operations | JNL/Mellon Capital Management Pacific Rim 30 Fund | JNL/Mellon Capital Management S&P 500 Index Fund | JNL/Mellon Capital Management S&P 400 MidCap Index Fund | JNL/Mellon Capital Management Small Cap Index Fund | JNL/Mellon Capital Management International Index Fund | JNL/Mellon Capital Management Bond Index Fund | JNL/Mellon Capital Management Global Alpha Fund (a) | |||||||||||||||||||||
Net investment income (loss) | $ | 169 | $ | 11,342 | $ | 4,728 | $ | 3,774 | $ | 12,363 | $ | 19,527 | $ | (151 | ) | |||||||||||||
Net realized gain (loss) | 573 | 2,328 | (3,695 | ) | (19,156 | ) | (447 | ) | (75 | ) | 3 | |||||||||||||||||
Net change in unrealized appreciation (depreciation) | 1,634 | 158,392 | 117,279 | 120,377 | 131,672 | 9,023 | (579 | ) | ||||||||||||||||||||
Net increase (decrease) in net assets from operations | 2,376 | 172,062 | 118,312 | 104,995 | 143,588 | 28,475 | (727 | ) | ||||||||||||||||||||
Distributions to shareholders | ||||||||||||||||||||||||||||
From net investment income | ||||||||||||||||||||||||||||
Class A | (195 | ) | (11,083 | ) | (4,488 | ) | (3,292 | ) | (15,267 | ) | (19,791 | ) | - | |||||||||||||||
Class B | (2 | ) | (149 | ) | (51 | ) | (32 | ) | (411 | ) | (67 | ) | - | |||||||||||||||
From net realized gains | ||||||||||||||||||||||||||||
Class A | (676 | ) | - | - | (2,281 | ) | (48 | ) | (531 | ) | - | |||||||||||||||||
Class B | (6 | ) | - | - | (19 | ) | (1 | ) | (2 | ) | - | |||||||||||||||||
Total distributions to shareholders | (879 | ) | (11,232 | ) | (4,539 | ) | (5,624 | ) | (15,727 | ) | (20,391 | ) | - | |||||||||||||||
Share transactions¹ | ||||||||||||||||||||||||||||
Proceeds from the sale of shares | ||||||||||||||||||||||||||||
Class A | 17,843 | 419,298 | 194,952 | 185,703 | 372,062 | 570,482 | 67,200 | |||||||||||||||||||||
Class B | 16 | 4,296 | 2,561 | 2,009 | 12,456 | 1,618 | 110 | |||||||||||||||||||||
Proceeds in connection with acquisition | ||||||||||||||||||||||||||||
Class A | - | 94,890 | - | 63,228 | - | - | - | |||||||||||||||||||||
Class B | - | 259 | - | 171 | - | - | - | |||||||||||||||||||||
Reinvestment of distributions | ||||||||||||||||||||||||||||
Class A | 871 | 11,083 | 4,488 | 5,573 | 15,315 | 20,322 | - | |||||||||||||||||||||
Class B | 8 | 149 | 51 | 51 | 412 | 69 | - | |||||||||||||||||||||
Cost of shares redeemed | ||||||||||||||||||||||||||||
Class A | (6,869 | ) | (240,768 | ) | (126,638 | ) | (123,990 | ) | (158,550 | ) | (184,946 | ) | (4,199 | ) | ||||||||||||||
Class B | (2 | ) | (4,801 | ) | (1,906 | ) | (1,494 | ) | (5,141 | ) | (694 | ) | - | |||||||||||||||
Net increase (decrease) in net assets from share transactions | 11,867 | 284,406 | 73,508 | 131,251 | 236,554 | 406,851 | 63,111 | |||||||||||||||||||||
Net increase (decrease) in net assets | 13,364 | 445,236 | 187,281 | 230,622 | 364,415 | 414,935 | 62,384 | |||||||||||||||||||||
Net assets beginning of year | 3,397 | 466,042 | 287,039 | 243,743 | 375,624 | 380,835 | - | |||||||||||||||||||||
Net assets end of year | $ | 16,761 | $ | 911,278 | $ | 474,320 | $ | 474,365 | $ | 740,039 | $ | 795,770 | $ | 62,384 | ||||||||||||||
Undistributed (excess of distributions over) net investment income | $ | (18 | ) | $ | 619 | $ | 4,045 | $ | 3,772 | $ | 3,094 | $ | 9,215 | $ | 147 | |||||||||||||
¹Share transactions | ||||||||||||||||||||||||||||
Shares sold | ||||||||||||||||||||||||||||
Class A | 1,663 | 52,379 | 20,952 | 22,046 | 35,696 | 49,872 | 6,723 | |||||||||||||||||||||
Class B | 1 | 558 | 289 | 242 | 1,348 | 139 | 11 | |||||||||||||||||||||
Shares issued in connection with acquisition | ||||||||||||||||||||||||||||
Class A | - | 12,047 | - | 8,656 | - | - | - | |||||||||||||||||||||
Class B | - | 33 | - | 23 | - | - | - | |||||||||||||||||||||
Reinvestment of distributions | ||||||||||||||||||||||||||||
Class A | 77 | 1,188 | 400 | 573 | 1,301 | 1,772 | - | |||||||||||||||||||||
Class B | 1 | 16 | 4 | 5 | 34 | 6 | - | |||||||||||||||||||||
Shares redeemed | ||||||||||||||||||||||||||||
Class A | (608 | ) | (30,260 | ) | (14,100 | ) | (14,694 | ) | (15,598 | ) | (16,298 | ) | (421 | ) | ||||||||||||||
Class B | - | (618 | ) | (207 | ) | (170 | ) | (536 | ) | (60 | ) | - | ||||||||||||||||
Net increase (decrease) | ||||||||||||||||||||||||||||
Class A | 1,132 | 35,354 | 7,252 | 16,581 | 21,399 | 35,346 | 6,302 | |||||||||||||||||||||
Class B | 2 | (11 | ) | 86 | 100 | 846 | 85 | 11 | ||||||||||||||||||||
Purchase and sales of investment securities | ||||||||||||||||||||||||||||
(excluding short-term securities): | ||||||||||||||||||||||||||||
Purchase of securities | $ | 15,169 | $ | 302,812 | $ | 119,362 | $ | 173,230 | $ | 246,482 | $ | 922,816 | (b) | $ | - | |||||||||||||
Proceeds from sales of securities | 4,091 | 27,617 | 49,119 | 57,318 | 11,057 | 523,179 | (b) | - | ||||||||||||||||||||
| (a) | Period from September 28, 2009 (commencement of operations) |
| (b) | Amounts include $664,564 and $372,890 of purchases and sales, respectively, of U.S. Government Securities. |
See accompanying Notes to Financial Statements.
JNL Series Trust
Statements of Changes in Net Assets (in thousands)
For the Year Ended December 31, 2009
| Operations | JNL/ Oppenheimer Global Growth Fund | JNL/PAM Asia ex-Japan Fund | JNL/PAM China-India Fund | JNL/PIMCO Real Return Fund | JNL/PIMCO Total Return Bond Fund | JNL/PPM America High Yield Bond Fund | JNL/PPM America Mid Cap Value Fund | |||||||||||||||||||||
Net investment income (loss) | $ | 2,523 | $ | 236 | $ | 55 | $ | 23,049 | $ | 70,331 | $ | 32,474 | $ | 86 | ||||||||||||||
Net realized gain (loss) | (6,526 | ) | 836 | 10,363 | 102,884 | 62,666 | (20,028 | ) | (549 | ) | ||||||||||||||||||
Net change in unrealized appreciation (depreciation) | 76,304 | 18,791 | 40,790 | 8,628 | 107,967 | 123,546 | 4,567 | |||||||||||||||||||||
Net increase (decrease) in net assets from operations | 72,301 | 19,863 | 51,208 | 134,561 | 240,964 | 135,992 | 4,104 | |||||||||||||||||||||
Distributions to shareholders | ||||||||||||||||||||||||||||
From net investment income | ||||||||||||||||||||||||||||
Class A | (3,556 | ) | (5 | ) | - | (26,832 | ) | (52,191 | ) | (32,079 | ) | (76 | ) | |||||||||||||||
Class B | (7 | ) | - | - | (6 | ) | (321 | ) | (315 | ) | - | |||||||||||||||||
From net realized gains | ||||||||||||||||||||||||||||
Class A | (14,477 | ) | - | - | - | (55,522 | ) | - | - | |||||||||||||||||||
Class B | (25 | ) | - | - | - | (322 | ) | - | - | |||||||||||||||||||
Total distributions to shareholders | (18,065 | ) | (5 | ) | - | (26,838 | ) | (108,356 | ) | (32,394 | ) | (76 | ) | |||||||||||||||
Share transactions¹ | ||||||||||||||||||||||||||||
Proceeds from the sale of shares | ||||||||||||||||||||||||||||
Class A | 102,650 | 120,875 | 234,537 | 819,629 | 1,301,149 | 483,716 | 21,759 | |||||||||||||||||||||
Class B | 136 | 62 | 429 | 378 | 5,965 | 2,730 | 8 | |||||||||||||||||||||
Proceeds in connection with acquisition | ||||||||||||||||||||||||||||
Class A | - | - | - | - | - | - | - | |||||||||||||||||||||
Class B | - | - | - | - | - | - | - | |||||||||||||||||||||
Reinvestment of distributions | ||||||||||||||||||||||||||||
Class A | 18,033 | 5 | - | 26,832 | 107,713 | 32,079 | 76 | |||||||||||||||||||||
Class B | 32 | - | - | 6 | 643 | 315 | - | |||||||||||||||||||||
Cost of shares redeemed | ||||||||||||||||||||||||||||
Class A | (60,924 | ) | (40,143 | ) | (78,162 | ) | (428,252 | ) | (517,672 | ) | (239,406 | ) | (10,826 | ) | ||||||||||||||
Class B | (108 | ) | (31 | ) | (331 | ) | (539 | ) | (3,457 | ) | (1,820 | ) | (2 | ) | ||||||||||||||
Net increase (decrease) in net assets from share transactions | 59,819 | 80,768 | 156,473 | 418,054 | 894,341 | 277,614 | 11,015 | |||||||||||||||||||||
Net increase (decrease) in net assets | 114,055 | 100,626 | 207,681 | 525,777 | 1,026,949 | 381,212 | 15,043 | |||||||||||||||||||||
Net assets beginning of year | 176,424 | 7,784 | 26,055 | 664,288 | 1,335,631 | 191,290 | 5,069 | |||||||||||||||||||||
Net assets end of year | $ | 290,479 | $ | 108,410 | $ | 233,736 | $ | 1,190,065 | $ | 2,362,580 | $ | 572,502 | $ | 20,112 | ||||||||||||||
Undistributed (excess of distributions over) net investment income | $ | 2,177 | $ | 133 | $ | (94 | ) | $ | 23,571 | $ | 13,156 | $ | 2,997 | $ | 2 | |||||||||||||
¹Share transactions | ||||||||||||||||||||||||||||
Shares sold | ||||||||||||||||||||||||||||
Class A | 12,284 | 17,242 | 36,231 | 74,128 | 107,536 | 89,094 | 3,236 | |||||||||||||||||||||
Class B | 16 | 8 | 62 | 34 | 471 | 474 | 1 | |||||||||||||||||||||
Shares issued in connection with acquisition | ||||||||||||||||||||||||||||
Class A | - | - | - | - | - | - | - | |||||||||||||||||||||
Class B | - | - | - | - | - | - | - | |||||||||||||||||||||
Reinvestment of distributions | ||||||||||||||||||||||||||||
Class A | 1,990 | 1 | - | 2,311 | 8,793 | 5,275 | 9 | |||||||||||||||||||||
Class B | 4 | - | - | 1 | 50 | 47 | - | |||||||||||||||||||||
Shares redeemed | ||||||||||||||||||||||||||||
Class A | (7,695 | ) | (5,551 | ) | (12,099 | ) | (39,314 | ) | (43,458 | ) | (44,372 | ) | (1,711 | ) | ||||||||||||||
Class B | (13 | ) | (4 | ) | (47 | ) | (49 | ) | (274 | ) | (307 | ) | - | |||||||||||||||
Net increase | - | |||||||||||||||||||||||||||
Class A | 6,579 | 11,692 | 24,132 | 37,125 | 72,871 | 49,997 | 1,534 | |||||||||||||||||||||
Class B | 7 | 4 | 15 | (14 | ) | 247 | 214 | 1 | ||||||||||||||||||||
Purchase and sales of investment securities (excluding short-term securities): | ||||||||||||||||||||||||||||
Purchase of securities | $ | 83,055 | $ | 97,816 | $ | 224,610 | $ | 10,624,029 | (a) | $ | 10,623,069 | (b) | $ | 433,423 | $ | 20,878 | ||||||||||||
Proceeds from sales of securities | 42,623 | 19,604 | 75,555 | 10,682,988 | (a) | 11,030,293 | (b) | 168,654 | 9,967 | |||||||||||||||||||
| (a) | Amounts include $9,056,244 and $9,110,195 of purchases and sales, respectively, of U.S. Government Securities. |
| (b) | Amounts include $2,653,491 and $2,445,715 of purchases and sales, respectively, of U.S. Government Securities. |
See accompanying Notes to Financial Statements.
JNL Series Trust
Statements of Changes in Net Assets (in thousands)
For the Year Ended December 31, 2009
| Operations | JNL/PPM America Small Cap Value Fund | JNL/PPM America Value Equity Fund | JNL/Red Rocks Listed Private Equity Fund | JNL/S&P Managed Conservative Fund | JNL/S&P Managed Moderate Fund | JNL/S&P Managed Moderate Growth Fund | JNL/S&P Managed Growth Fund | |||||||||||||||||||||
Net investment income (loss) | $ | 77 | $ | 1,223 | $ | 844 | $ | 13,360 | $ | 18,568 | $ | 27,055 | $ | 16,028 | ||||||||||||||
Net realized gain (loss) | (644 | ) | (27,858 | ) | 2,887 | (15,712 | ) | (19,997 | ) | (26,548 | ) | (37,116 | ) | |||||||||||||||
Net change in unrealized appreciation (depreciation) | 5,025 | 51,515 | 30,145 | 67,729 | 126,668 | 273,961 | 287,667 | |||||||||||||||||||||
Net increase (decrease) in net assets from operations | 4,458 | 24,880 | 33,876 | 65,377 | 125,239 | 274,468 | 266,579 | |||||||||||||||||||||
Distributions to shareholders | ||||||||||||||||||||||||||||
From net investment income | ||||||||||||||||||||||||||||
Class A | (54 | ) | (4,058 | ) | (6,449 | ) | (10,219 | ) | (11,077 | ) | (10,776 | ) | (23,405 | ) | ||||||||||||||
Class B | (18 | ) | (32 | ) | (4 | ) | - | - | - | - | ||||||||||||||||||
From net realized gains | ||||||||||||||||||||||||||||
Class A | - | - | (322 | ) | (5,948 | ) | (11,102 | ) | (40,252 | ) | (44,252 | ) | ||||||||||||||||
Class B | - | - | - | - | - | - | - | |||||||||||||||||||||
Total distributions to shareholders | (72 | ) | (4,090 | ) | (6,775 | ) | (16,167 | ) | (22,179 | ) | (51,028 | ) | (67,657 | ) | ||||||||||||||
Share transactions¹ | ||||||||||||||||||||||||||||
Proceeds from the sale of shares | ||||||||||||||||||||||||||||
Class A | 16,964 | 34,983 | 206,438 | 344,525 | 466,824 | 738,915 | 634,896 | |||||||||||||||||||||
Class B | 3,701 | 972 | 92 | - | - | - | - | |||||||||||||||||||||
Proceeds in connection with acquisition | ||||||||||||||||||||||||||||
Class A | - | - | - | - | 66,649 | 51,820 | 45,206 | |||||||||||||||||||||
Class B | - | - | - | - | - | - | - | |||||||||||||||||||||
Reinvestment of distributions | ||||||||||||||||||||||||||||
Class A | 54 | 4,058 | 6,771 | 16,167 | 22,179 | 51,028 | 67,657 | |||||||||||||||||||||
Class B | 18 | 32 | 4 | - | - | - | - | |||||||||||||||||||||
Cost of shares redeemed | ||||||||||||||||||||||||||||
Class A | (12,638 | ) | (53,873 | ) | (31,671 | ) | (193,370 | ) | (194,992 | ) | (288,180 | ) | (275,722 | ) | ||||||||||||||
Class B | (1,217 | ) | (473 | ) | (37 | ) | - | - | - | - | ||||||||||||||||||
Net increase (decrease) in net assets from share transactions | 6,882 | (14,301 | ) | 181,597 | 167,322 | 360,660 | 553,583 | 472,037 | ||||||||||||||||||||
Net increase (decrease) in net assets | 11,268 | 6,489 | 208,698 | 216,532 | 463,720 | 777,023 | 670,959 | |||||||||||||||||||||
Net assets beginning of year | 8,443 | 87,846 | 15,331 | 407,426 | 557,615 | 997,961 | 808,800 | |||||||||||||||||||||
Net assets end of year | $ | 19,711 | $ | 94,335 | $ | 224,029 | $ | 623,958 | $ | 1,021,335 | $ | 1,774,984 | $ | 1,479,759 | ||||||||||||||
Undistributed (excess of distributions over) net investment income | $ | 3 | $ | 1,221 | $ | (4,068 | ) | $ | 9,756 | $ | 15,205 | $ | 30,911 | $ | 17,970 | |||||||||||||
¹Share transactions | ||||||||||||||||||||||||||||
Shares sold | ||||||||||||||||||||||||||||
Class A | 2,378 | 4,183 | 28,778 | 34,656 | 47,654 | 75,284 | 70,313 | |||||||||||||||||||||
Class B | 625 | 110 | 12 | - | - | - | - | |||||||||||||||||||||
Shares issued in connection with acquisition | ||||||||||||||||||||||||||||
Class A | - | - | - | - | 6,456 | 4,985 | 4,691 | |||||||||||||||||||||
Class B | - | - | - | - | - | - | - | |||||||||||||||||||||
Reinvestment of distributions | ||||||||||||||||||||||||||||
Class A | 7 | 392 | 844 | 1,560 | 2,124 | 4,823 | 6,932 | |||||||||||||||||||||
Class B | 2 | 3 | 1 | - | - | - | - | |||||||||||||||||||||
Shares redeemed | ||||||||||||||||||||||||||||
Class A | (1,824 | ) | (7,211 | ) | (4,320 | ) | (19,474 | ) | (20,288 | ) | (30,257 | ) | (31,437 | ) | ||||||||||||||
Class B | (182 | ) | (59 | ) | (5 | ) | - | - | - | - | ||||||||||||||||||
Net increase | ||||||||||||||||||||||||||||
Class A | 561 | (2,636 | ) | 25,302 | 16,742 | 35,946 | 54,835 | 50,499 | ||||||||||||||||||||
Class B | 445 | 54 | 8 | - | - | - | - | |||||||||||||||||||||
Purchase and sales of investment securities (excluding short-term securities): | ||||||||||||||||||||||||||||
Purchase of securities | $ | 21,035 | $ | 46,689 | $ | 203,304 | $ | 195,704 | $ | 379,679 | $ | 563,493 | $ | 450,556 | ||||||||||||||
Proceeds from sales of securities | 14,201 | 63,884 | 30,438 | 55,830 | 46,920 | 60,414 | 84,540 | |||||||||||||||||||||
See accompanying Notes to Financial Statements.
JNL Series Trust
Statements of Changes in Net Assets (in thousands)
For the Year Ended December 31, 2009
| JNL/S&P | JNL/S&P | JNL/S&P | ||||||||||||||||||||||||||
| Managed | Disciplined | Disciplined | JNL/S&P | JNL/S&P | JNL/S&P | JNL/S&P | ||||||||||||||||||||||
| Aggressive | Moderate | Moderate | Disciplined | Competitive | Dividend Income | Intrinsic | ||||||||||||||||||||||
| Growth Fund | Fund | Growth Fund | Growth Fund | Advantage Fund | & Growth Fund | Value Fund | ||||||||||||||||||||||
Operations | ||||||||||||||||||||||||||||
Net investment income (loss) | $ | 4,928 | $ | 2,753 | $ | 3,411 | $ | 1,408 | $ | 2,217 | $ | 4,710 | $ | 2,230 | ||||||||||||||
Net realized gain (loss) | (38,676 | ) | (4,476 | ) | (14,165 | ) | (8,221 | ) | 32,235 | 19,690 | 59,957 | |||||||||||||||||
Net change in unrealized appreciation (depreciation) | 162,066 | 21,725 | 39,827 | 20,449 | 28,899 | 16,445 | 14,071 | |||||||||||||||||||||
Net increase (decrease) in net assets from operations | 128,318 | 20,002 | 29,073 | 13,636 | 63,351 | 40,845 | 76,258 | |||||||||||||||||||||
Distributions to shareholders | ||||||||||||||||||||||||||||
From net investment income | ||||||||||||||||||||||||||||
Class A | (11,203 | ) | (2,845 | ) | (3,991 | ) | (1,712 | ) | (27 | ) | (57 | ) | (46 | ) | ||||||||||||||
Class B | - | - | - | - | - | - | - | |||||||||||||||||||||
From net realized gains | ||||||||||||||||||||||||||||
Class A | (17,264 | ) | (1,066 | ) | (2,254 | ) | (992 | ) | - | - | - | |||||||||||||||||
Class B | - | - | - | - | - | - | - | |||||||||||||||||||||
Total distributions to shareholders | (28,467 | ) | (3,911 | ) | (6,245 | ) | (2,704 | ) | (27 | ) | (57 | ) | (46 | ) | ||||||||||||||
Share transactions¹ | ||||||||||||||||||||||||||||
Proceeds from the sale of shares | ||||||||||||||||||||||||||||
Class A | 214,398 | 117,823 | 137,951 | 64,478 | 203,923 | 152,566 | 177,653 | |||||||||||||||||||||
Class B | - | - | - | - | 245 | 146 | 570 | |||||||||||||||||||||
Proceeds in connection with acquisition | ||||||||||||||||||||||||||||
Class A | - | 1,090 | 570 | 537 | - | - | - | |||||||||||||||||||||
Class B | - | - | - | - | - | - | - | |||||||||||||||||||||
Reinvestment of distributions | ||||||||||||||||||||||||||||
Class A | 28,467 | 3,911 | 6,245 | 2,704 | 27 | 57 | 46 | |||||||||||||||||||||
Class B | - | - | - | - | - | - | - | |||||||||||||||||||||
Cost of shares redeemed | ||||||||||||||||||||||||||||
Class A | (174,566 | ) | (28,522 | ) | (35,681 | ) | (23,921 | ) | (102,965 | ) | (55,322 | ) | (103,954 | ) | ||||||||||||||
Class B | - | - | - | - | (222 | ) | (134 | ) | (519 | ) | ||||||||||||||||||
Net increase (decrease) in net assets from share transactions | 68,299 | 94,302 | 109,085 | 43,798 | 101,008 | 97,313 | 73,796 | |||||||||||||||||||||
Net increase (decrease) in net assets | 168,150 | 110,393 | 131,913 | 54,730 | 164,332 | 138,101 | 150,008 | |||||||||||||||||||||
Net assets beginning of year | 414,718 | 58,062 | 74,452 | 26,133 | 90,413 | 101,449 | 96,678 | |||||||||||||||||||||
Net assets end of year | $ | 582,868 | $ | 168,455 | $ | 206,365 | $ | 80,863 | $ | 254,745 | $ | 239,550 | $ | 246,686 | ||||||||||||||
Undistributed (excess of distributions over) net investment income | $ | 4,931 | $ | 2,774 | $ | 3,418 | $ | 1,408 | $ | 2,217 | $ | 4,709 | $ | 2,231 | ||||||||||||||
¹Share transactions | ||||||||||||||||||||||||||||
Shares sold | ||||||||||||||||||||||||||||
Class A | 22,539 | 14,212 | 18,845 | 9,454 | 24,661 | 21,138 | 23,337 | |||||||||||||||||||||
Class B | - | - | - | - | 28 | 19 | 65 | |||||||||||||||||||||
Shares issued in connection with acquisition | ||||||||||||||||||||||||||||
Class A | - | 146 | 89 | 91 | - | - | - | |||||||||||||||||||||
Class B | - | - | - | - | - | - | - | |||||||||||||||||||||
Reinvestment of distributions | ||||||||||||||||||||||||||||
Class A | 2,709 | 439 | 775 | 357 | 2 | 6 | 5 | |||||||||||||||||||||
Class B | - | - | - | - | - | - | - | |||||||||||||||||||||
Shares redeemed | ||||||||||||||||||||||||||||
Class A | (18,923 | ) | (3,471 | ) | (5,171 | ) | (3,466 | ) | (12,186 | ) | (7,997 | ) | (13,612 | ) | ||||||||||||||
Class B | - | - | - | - | (25 | ) | (18 | ) | (59 | ) | ||||||||||||||||||
Net increase | ||||||||||||||||||||||||||||
Class A | 6,325 | 11,326 | 14,538 | 6,436 | 12,477 | 13,147 | 9,730 | |||||||||||||||||||||
Class B | - | - | - | - | 3 | 1 | 6 | |||||||||||||||||||||
Purchase and sales of investment securities (excluding short-term securities): | ||||||||||||||||||||||||||||
Purchase of securities | $ | 111,737 | $ | 92,161 | $ | 111,220 | $ | 51,010 | $ | 275,870 | $ | 222,148 | $ | 314,981 | ||||||||||||||
Proceeds from sales of securities | 86,826 | 11,330 | 18,692 | 11,766 | 173,641 | 120,973 | 240,647 | |||||||||||||||||||||
See accompanying Notes to Financial Statements.
JNL Series Trust
Statements of Changes in Net Assets (in thousands)
For the Year Ended December 31, 2009
| JNL/T. Rowe | JNL/T. Rowe | |||||||||||||||||||||||||||||||
| JNL/S&P | JNL/Select | JNL/Select | Price | Price | ||||||||||||||||||||||||||||
| Total | JNL/S&P 4 | Balanced | Money | JNL/Select | Established | Mid-Cap | ||||||||||||||||||||||||||
| Yield Fund | Fund | Fund | Market Fund | Value Fund | Growth Fund | Growth Fund | ||||||||||||||||||||||||||
Operations | ||||||||||||||||||||||||||||||||
Net investment income (loss) | $ | 1,965 | $ | (131 | ) | $ | 13,872 | $ | 2,068 | $ | 9,600 | $ | 849 | $ | (1,511 | ) | ||||||||||||||||
Net realized gain (loss) | 40,287 | (10,383 | ) | (24,563 | ) | - | (61,202 | ) | (92,850 | ) | (16,180 | ) | ||||||||||||||||||||
Net change in unrealized appreciation (depreciation) | 12,192 | 173,760 | 116,411 | - | 187,290 | 341,595 | 249,684 | |||||||||||||||||||||||||
Net increase (decrease) in net assets from operations | 54,444 | 163,246 | 105,720 | 2,068 | 135,688 | 249,594 | 231,993 | |||||||||||||||||||||||||
Distributions to shareholders | ||||||||||||||||||||||||||||||||
From net investment income | ||||||||||||||||||||||||||||||||
Class A | (33 | ) | (5,191 | ) | (15,778 | ) | (2,055 | ) | (10,148 | ) | (2,134 | ) | - | |||||||||||||||||||
Class B | - | - | (20 | ) | (13 | ) | (206 | ) | (126 | ) | - | |||||||||||||||||||||
From net realized gains | ||||||||||||||||||||||||||||||||
Class A | - | (5 | ) | - | - | - | - | (136 | ) | |||||||||||||||||||||||
Class B | - | - | - | - | - | - | (4 | ) | ||||||||||||||||||||||||
From return of capital | ||||||||||||||||||||||||||||||||
Class A | - | - | - | - | - | - | (281 | ) | ||||||||||||||||||||||||
Class B | - | - | - | - | - | - | (10 | ) | ||||||||||||||||||||||||
Total distributions to shareholders | (33 | ) | (5,196 | ) | (15,798 | ) | (2,068 | ) | (10,354 | ) | (2,260 | ) | (431 | ) | ||||||||||||||||||
Share transactions¹ | ||||||||||||||||||||||||||||||||
Proceeds from the sale of shares | ||||||||||||||||||||||||||||||||
Class A | 147,225 | 362,194 | 332,082 | 1,252,932 | 304,692 | 352,768 | 342,393 | |||||||||||||||||||||||||
Class B | 221 | - | 224 | 7,934 | 2,859 | 4,221 | 5,066 | |||||||||||||||||||||||||
Proceeds in connection with acquisition | ||||||||||||||||||||||||||||||||
Class A | - | - | - | - | - | - | - | |||||||||||||||||||||||||
Class B | - | - | - | - | - | - | - | |||||||||||||||||||||||||
Reinvestment of distributions | ||||||||||||||||||||||||||||||||
Class A | 33 | 5,196 | 15,778 | 2,055 | 10,148 | 2,134 | 417 | |||||||||||||||||||||||||
Class B | - | - | 20 | 13 | 206 | 126 | 14 | |||||||||||||||||||||||||
Cost of shares redeemed | ||||||||||||||||||||||||||||||||
Class A | (92,265 | ) | (163,218 | ) | (155,903 | ) | (1,454,529 | ) | (160,319 | ) | (258,030 | ) | (169,644 | ) | ||||||||||||||||||
Class B | (278 | ) | - | (171 | ) | (7,898 | ) | (2,388 | ) | (3,069 | ) | (3,537 | ) | |||||||||||||||||||
Net increase (decrease) in net assets from share transactions | 54,936 | 204,172 | 192,030 | (199,493 | ) | 155,198 | 98,150 | 174,709 | ||||||||||||||||||||||||
Net increase (decrease) in net assets | 109,347 | 362,222 | 281,952 | (199,493 | ) | 280,532 | 345,484 | 406,271 | ||||||||||||||||||||||||
Net assets beginning of year | 103,689 | 265,183 | 455,767 | 1,347,274 | 495,701 | 601,372 | 442,995 | |||||||||||||||||||||||||
Net assets end of year | $ | 213,036 | $ | 627,405 | $ | 737,719 | $ | 1,147,781 | $ | 776,233 | $ | 946,856 | $ | 849,266 | ||||||||||||||||||
Undistributed (excess of distributions over) net investment income | $ | 1,965 | $ | (4 | ) | $ | 13,925 | $ | (3 | ) | $ | 9,584 | $ | 539 | $ | (16 | ) | |||||||||||||||
¹Share transactions | ||||||||||||||||||||||||||||||||
Shares sold | ||||||||||||||||||||||||||||||||
Class A | 19,966 | 47,871 | 24,199 | 1,252,931 | 22,529 | 23,009 | 17,145 | |||||||||||||||||||||||||
Class B | 26 | - | 16 | 7,934 | 220 | 303 | 275 | |||||||||||||||||||||||||
Shares issued in connection with acquisition | ||||||||||||||||||||||||||||||||
Class A | - | - | - | - | - | - | - | |||||||||||||||||||||||||
Class B | - | - | - | - | - | - | - | |||||||||||||||||||||||||
Reinvestment of distributions | ||||||||||||||||||||||||||||||||
Class A | 3 | 547 | 1,049 | 2,055 | 663 | 120 | 18 | |||||||||||||||||||||||||
Class B | - | - | 1 | 13 | 13 | 7 | 1 | |||||||||||||||||||||||||
Shares redeemed | ||||||||||||||||||||||||||||||||
Class A | (12,835 | ) | �� | (21,739 | ) | (11,687 | ) | (1,454,531 | ) | (12,220 | ) | (18,504 | ) | (8,891 | ) | |||||||||||||||||
Class B | (34 | ) | - | (12 | ) | (7,898 | ) | (181 | ) | (208 | ) | (186 | ) | |||||||||||||||||||
Net increase (decrease) | ||||||||||||||||||||||||||||||||
Class A | 7,134 | 26,679 | 13,561 | (199,545 | ) | 10,972 | 4,625 | 8,272 | ||||||||||||||||||||||||
Class B | (8 | ) | - | 5 | 49 | 52 | 102 | 90 | ||||||||||||||||||||||||
Purchase and sales of investment securities (excluding short-term securities): | ||||||||||||||||||||||||||||||||
Purchase of securities | $ | 247,940 | $ | 249,429 | $ | 586,212 | (a) | $ | 93,844 | (b) | $ | 383,098 | $ | 529,617 | $ | 329,090 | ||||||||||||||||
Proceeds from sales of securities | 191,272 | 50,560 | 423,934 | (a) | 28,355 | (b) | 234,591 | 420,991 | 180,890 | |||||||||||||||||||||||
| (a) | Amounts include $129,427 and $76,181 of purchases and sales, respectively, of U.S. Government Securities. |
| (b) | Amounts include $68,035 and $20,000 of purchases and sales, respectively, of U.S. Government Securities. |
See accompanying Notes to Financial Statements
JNL Series Trust
Statements of Changes in Net Assets (in thousands)
For the Year Ended December 31, 2009
| JNL/T. Rowe | ||||||||||||
| Price Short- | JNL/T. Rowe | |||||||||||
| Term Bond | Price | |||||||||||
| Fund | Value Fund | |||||||||||
Operations | ||||||||||||
Net investment income (loss) | $ | 9,706 | $ | 9,942 | ||||||||
Net realized gain (loss) | (17,146 | ) | (40,718 | ) | ||||||||
Net change in unrealized appreciation (depreciation) | 33,959 | 204,680 | ||||||||||
Net increase (decrease) in net assets from operations | 26,519 | 173,904 | ||||||||||
Distributions to shareholders | ||||||||||||
From net investment income | ||||||||||||
Class A | (13,181 | ) | (9,641 | ) | ||||||||
Class B | (6 | ) | (8 | ) | ||||||||
From net realized gains | ||||||||||||
Class A | (4,268 | ) | - | |||||||||
Class B | (2 | ) | - | |||||||||
Total distributions to shareholders | (17,457 | ) | (9,649 | ) | ||||||||
Share transactions¹ | ||||||||||||
Proceeds from the sale of shares | ||||||||||||
Class A | 329,418 | 311,003 | ||||||||||
Class B | 197 | 155 | ||||||||||
Proceeds in connection with acquisition | ||||||||||||
Class A | - | - | ||||||||||
Class B | - | - | ||||||||||
Reinvestment of distributions | ||||||||||||
Class A | 17,449 | 9,641 | ||||||||||
Class B | 8 | 8 | ||||||||||
Cost of shares redeemed | ||||||||||||
Class A | (166,506 | ) | (169,622 | ) | ||||||||
Class B | (44 | ) | (140 | ) | ||||||||
Net increase (decrease) in net assets from share transactions | 180,522 | 151,045 | ||||||||||
Net increase (decrease) in net assets | 189,584 | 315,300 | ||||||||||
Net assets beginning of year | 295,459 | 412,921 | ||||||||||
Net assets end of year | $ | 485,043 | $ | 728,221 | ||||||||
Undistributed (excess of distributions over) net investment income | $ | 9,862 | $ | 9,943 | ||||||||
¹Share transactions | ||||||||||||
Shares sold | ||||||||||||
Class A | 33,669 | 38,732 | ||||||||||
Class B | 20 | 19 | ||||||||||
Shares issued in connection with acquisition | ||||||||||||
Class A | - | - | ||||||||||
Class B | - | - | ||||||||||
Reinvestment of distributions | ||||||||||||
Class A | 1,791 | 1,024 | ||||||||||
Class B | 1 | 1 | ||||||||||
Shares redeemed | ||||||||||||
Class A | (17,057 | ) | (21,802 | ) | ||||||||
Class B | (4 | ) | (17 | ) | ||||||||
Net increase (decrease) | ||||||||||||
Class A | 18,403 | 17,954 | ||||||||||
Class B | 17 | 3 | ||||||||||
Purchase and sales of investment securities (excluding short-term securities): | ||||||||||||
Purchase of securities | $ | 665,800 | (a) | $ | 239,152 | |||||||
Proceeds from sales of securities | 500,591 | (a) | 101,689 | |||||||||
| (a) | Amounts include $277,934 and $262,256 of purchases and sales, respectively, of U.S. Government Securities. |
See accompanying Notes to Financial Statements.
JNL Series Trust
Financial Highlights
| Increase (Decrease) from | Distributions Net Gains on | Ratio of Investment Income Assets (c) | ||||||||||||||||||||||||||||||||||||||||||||||||||||
Net Asset Value | Investment Operations (e) | Supplemental Data | Ratio of Expenses (c) | |||||||||||||||||||||||||||||||||||||||||||||||||||
| Period Ended | Net Investment Income (Loss) | Net Realized & Unrealized Gains (Losses) | Total from Investment Operations | Distributions from Net Investment Income | Net Asset Value, End of Period | Total (b) | Net Assets, End of Period (in thousands) | Portfolio (d) | ||||||||||||||||||||||||||||||||||||||||||||||
JNL/American Funds Blue Chip Income and Growth Fund (h) |
| |||||||||||||||||||||||||||||||||||||||||||||||||||||
Class A | ||||||||||||||||||||||||||||||||||||||||||||||||||||||
05/03(a) -12/31/2010 | $ | 10.00 | $ | 0.29 | $ | 0.10 | $ | 0.39 | $ | - | $ | - | $ | 10.39 | 3.90 | % | $ | 148,996 | 5 | % | 0.65 | % | (y) | 4.51 | % | (y) | ||||||||||||||||||||||||||||
Class B | ||||||||||||||||||||||||||||||||||||||||||||||||||||||
05/03(a) -12/31/2010 | 10.00 | 0.42 | (0.01 | ) | 0.41 | - | - | 10.41 | 4.10 | 9 | 5 | 0.40 | (y) | 6.57 | (y) | |||||||||||||||||||||||||||||||||||||||
JNL/American Funds Global Bond Fund (h) |
| |||||||||||||||||||||||||||||||||||||||||||||||||||||
Class A | ||||||||||||||||||||||||||||||||||||||||||||||||||||||
05/03(a) -12/31/2010 | 10.00 | 0.48 | (0.03 | ) | 0.45 | - | - | 10.45 | 4.50 | 105,262 | 5 | 0.55 | (y) | 6.97 | (y) | |||||||||||||||||||||||||||||||||||||||
Class B | ||||||||||||||||||||||||||||||||||||||||||||||||||||||
05/03(a) -12/31/2010 | 10.00 | 0.63 | (0.16 | ) | 0.47 | - | - | 10.47 | 4.70 | 79 | 5 | 0.30 | (y) | 8.98 | (y) | |||||||||||||||||||||||||||||||||||||||
JNL/American Funds Global Small Capitalization Fund (h) |
| |||||||||||||||||||||||||||||||||||||||||||||||||||||
Class A | ||||||||||||||||||||||||||||||||||||||||||||||||||||||
05/03(a) -12/31/2010 | 10.00 | 0.13 | 1.02 | 1.15 | - | - | 11.15 | 11.50 | 80,924 | 4 | 0.55 | (y) | 1.93 | (y) | ||||||||||||||||||||||||||||||||||||||||
Class B | ||||||||||||||||||||||||||||||||||||||||||||||||||||||
05/03(a) -12/31/2010 | 10.00 | 0.22 | 0.94 | 1.16 | - | - | 11.16 | 11.60 | 23 | 4 | 0.30 | (y) | 3.11 | (y) | ||||||||||||||||||||||||||||||||||||||||
JNL/American Funds Growth-Income Fund (h) |
| |||||||||||||||||||||||||||||||||||||||||||||||||||||
Class A | ||||||||||||||||||||||||||||||||||||||||||||||||||||||
05/03(a) -12/31/2010 | 10.00 | 0.24 | 0.21 | 0.45 | - | - | 10.45 | 4.50 | 174,494 | 0 | 0.70 | (y) | 3.72 | (y) | ||||||||||||||||||||||||||||||||||||||||
Class B | ||||||||||||||||||||||||||||||||||||||||||||||||||||||
05/03(a) -12/31/2010 | 10.00 | 0.27 | 0.19 | 0.46 | - | - | 10.46 | 4.60 | 23 | 0 | 0.45 | (y) | 4.22 | (y) | ||||||||||||||||||||||||||||||||||||||||
JNL/American Funds International Fund (h) |
| |||||||||||||||||||||||||||||||||||||||||||||||||||||
Class A | ||||||||||||||||||||||||||||||||||||||||||||||||||||||
05/03(a) -12/31/2010 | 10.00 | 0.27 | 0.58 | 0.85 | - | - | 10.85 | 8.50 | 102,766 | 3 | 0.70 | (y) | 3.92 | (y) | ||||||||||||||||||||||||||||||||||||||||
Class B | ||||||||||||||||||||||||||||||||||||||||||||||||||||||
05/03(a) -12/31/2010 | 10.00 | 0.46 | 0.41 | 0.87 | - | - | 10.87 | 8.70 | 20 | 3 | 0.45 | (y) | 6.65 | (y) | ||||||||||||||||||||||||||||||||||||||||
JNL/American Funds New World Fund (h) |
| |||||||||||||||||||||||||||||||||||||||||||||||||||||
Class A | ||||||||||||||||||||||||||||||||||||||||||||||||||||||
05/03(a) -12/31/2010 | 10.00 | 0.27 | 1.09 | 1.36 | - | - | 11.36 | 13.60 | 133,465 | 0 | 0.65 | (y) | 3.78 | (y) | ||||||||||||||||||||||||||||||||||||||||
Class B | ||||||||||||||||||||||||||||||||||||||||||||||||||||||
05/03(a) -12/31/2010 | 10.00 | 0.28 | 1.09 | 1.37 | - | - | 11.37 | 13.70 | 18 | 0 | 0.40 | (y) | 3.94 | (y) | ||||||||||||||||||||||||||||||||||||||||
JNL Alt Institutional Alt 20 Fund (h) |
| |||||||||||||||||||||||||||||||||||||||||||||||||||||
Class A | ||||||||||||||||||||||||||||||||||||||||||||||||||||||
12/31/2010 | 12.73 | 0.25 | 1.41 | 1.66 | (0.07 | ) | (0.00 | ) | (f) | 14.32 | 13.06 | 615,034 | 3 | 0.20 | 1.91 | |||||||||||||||||||||||||||||||||||||||
04/06(a)-12/31/2009 | 10.00 | 0.45 | 2.28 | 2.73 | - | - | 12.73 | 27.30 | 199,516 | 3 | 0.20 | 4.93 | ||||||||||||||||||||||||||||||||||||||||||
JNL Alt Institutional Alt 35 Fund (h) |
| |||||||||||||||||||||||||||||||||||||||||||||||||||||
Class A | ||||||||||||||||||||||||||||||||||||||||||||||||||||||
12/31/2010 | 13.24 | 0.25 | 1.65 | 1.90 | (0.08 | ) | (0.01 | ) | 15.05 | 14.36 | 885,456 | 2 | 0.20 | 1.79 | ||||||||||||||||||||||||||||||||||||||||
04/06(a)-12/31/2009 | 10.00 | 0.44 | 2.80 | 3.24 | - | - | 13.24 | 32.40 | 308,516 | 6 | 0.20 | 4.72 | ||||||||||||||||||||||||||||||||||||||||||
JNL Alt Institutional Alt 50 Fund (h) |
| |||||||||||||||||||||||||||||||||||||||||||||||||||||
Class A | ||||||||||||||||||||||||||||||||||||||||||||||||||||||
12/31/2010 | 13.57 | 0.26 | 1.76 | 2.02 | (0.08 | ) | (0.02 | ) | 15.49 | 14.90 | 1,077,623 | 2 | 0.20 | 1.82 | ||||||||||||||||||||||||||||||||||||||||
04/06(a)-12/31/2009 | 10.00 | 0.49 | 3.08 | 3.57 | - | - | 13.57 | 35.70 | 361,516 | 13 | 0.20 | 5.06 | ||||||||||||||||||||||||||||||||||||||||||
See accompanying Notes to Financial Statements.
JNL Series Trust
Financial Highlights
Net Asset Value | Increase (Decrease) from Investment Operations (e) | Distribu- tions from | Distribu- tions from Gains on |
Supplemental Data | Ratio of Expenses | Ratio of Income | ||||||||||||||||||||||||||||||||||||||||||||||||||||||||||
| Period Ended | Net Investment Income (Loss) | Net & | Total from Investment Operations | Net Asset Value, End of Period | Total Return | Net Assets, End of Period (in thousands) | Portfolio Turnover (d) | |||||||||||||||||||||||||||||||||||||||||||||||||||||||||
JNL Alt Institutional Alt 65 Fund (h) |
| |||||||||||||||||||||||||||||||||||||||||||||||||||||||||||||||
Class A | ||||||||||||||||||||||||||||||||||||||||||||||||||||||||||||||||
12/31/2010 | $ | 13.97 | $ | 0.22 | $ | 1.99 | $ | 2.21 | $ | (0.07 | ) | $ | (0.04 | ) | $ | 16.07 | 15.85 | % | $ | 728,410 | 5 | % | 0.20 | % | 1.52 | % | ||||||||||||||||||||||||||||||||||||||
04/06(a) - 12/31/2009 | 10.00 | 0.47 | 3.50 | 3.97 | - | - | 13.97 | 39.70 | 229,813 | 24 | 0.20 | 4.80 | ||||||||||||||||||||||||||||||||||||||||||||||||||||
JNL/BlackRock Commodity Securities Fund |
| |||||||||||||||||||||||||||||||||||||||||||||||||||||||||||||||
Class A | ||||||||||||||||||||||||||||||||||||||||||||||||||||||||||||||||
12/31/2010 | 9.41 | 0.08 | 1.56 | 1.64 | (0.03 | ) | - | 11.02 | 17.44 | 1,000,238 | 102 | 1.00 | 0.87 | |||||||||||||||||||||||||||||||||||||||||||||||||||
12/31/2009 | 6.31 | 0.07 | 3.09 | 3.16 | (0.06 | ) | - | 9.41 | 50.17 | 641,108 | 108 | 1.03 | 0.88 | |||||||||||||||||||||||||||||||||||||||||||||||||||
12/31/2008 | 13.90 | 0.20 | (7.35 | ) | (7.15 | ) | (0.01 | ) | (0.43 | ) | 6.31 | (51.30 | ) | 214,651 | 71 | 1.04 | 1.67 | |||||||||||||||||||||||||||||||||||||||||||||||
01/16(a) - 12/31/2007 | 10.00 | 0.07 | 3.83 | 3.90 | - | - | 13.90 | 39.00 | 388,379 | 51 | 1.05 | 0.57 | ||||||||||||||||||||||||||||||||||||||||||||||||||||
Class B | ||||||||||||||||||||||||||||||||||||||||||||||||||||||||||||||||
12/31/2010 | 9.44 | 0.11 | 1.55 | 1.66 | (0.04 | ) | - | 11.06 | 17.59 | 694 | 102 | 0.80 | 1.13 | |||||||||||||||||||||||||||||||||||||||||||||||||||
12/31/2009 | 6.33 | 0.09 | 3.09 | 3.18 | (0.07 | ) | - | 9.44 | 50.34 | 538 | 108 | 0.83 | 1.22 | |||||||||||||||||||||||||||||||||||||||||||||||||||
12/31/2008 | 13.93 | 0.21 | (7.36 | ) | (7.15 | ) | (0.02 | ) | (0.43 | ) | 6.33 | (51.18 | ) | 270 | 71 | 0.84 | 1.94 | |||||||||||||||||||||||||||||||||||||||||||||||
01/16(a) - 12/31/2007 | 10.00 | 0.12 | 3.81 | 3.93 | - | - | 13.93 | 39.30 | 302 | 51 | 0.85 | 0.96 | ||||||||||||||||||||||||||||||||||||||||||||||||||||
JNL/BlackRock Global Allocation Fund (h) |
| |||||||||||||||||||||||||||||||||||||||||||||||||||||||||||||||
Class A | ||||||||||||||||||||||||||||||||||||||||||||||||||||||||||||||||
10/11(a) - 12/31/2010 | 10.00 | 0.28 | 0.07 | 0.35 | - | - | 10.35 | 3.50 | 179,580 | 5 | 0.59 | (y) | 12.50 | (y) | ||||||||||||||||||||||||||||||||||||||||||||||||||
Class B | ||||||||||||||||||||||||||||||||||||||||||||||||||||||||||||||||
10/11(a) - 12/31/2010 | 10.00 | 0.33 | 0.02 | 0.35 | - | - | 10.35 | 3.50 | 20 | 5 | 0.39 | (y) | 14.63 | (y) | ||||||||||||||||||||||||||||||||||||||||||||||||||
JNL/Capital Guardian Global Balanced Fund |
| |||||||||||||||||||||||||||||||||||||||||||||||||||||||||||||||
Class A | ||||||||||||||||||||||||||||||||||||||||||||||||||||||||||||||||
12/31/2010 | 8.82 | 0.14 | 0.65 | 0.79 | (0.09 | ) | - | 9.52 | 9.01 | 358,593 | 47 | (z | ) | 1.01 | 1.62 | |||||||||||||||||||||||||||||||||||||||||||||||||
12/31/2009 | 7.35 | 0.15 | 1.50 | 1.65 | (0.18 | ) | - | 8.82 | 22.48 | 279,806 | 78 | 1.01 | 1.88 | |||||||||||||||||||||||||||||||||||||||||||||||||||
12/31/2008 | 11.95 | 0.25 | (3.67 | ) | (3.42 | ) | (0.12 | ) | (1.06 | ) | 7.35 | (28.29 | ) | 183,572 | 70 | 1.01 | 2.37 | |||||||||||||||||||||||||||||||||||||||||||||||
12/31/2007 | 11.92 | 0.20 | 0.72 | 0.92 | (0.14 | ) | (0.75 | ) | 11.95 | 7.96 | 197,825 | 155 | 0.98 | 1.60 | ||||||||||||||||||||||||||||||||||||||||||||||||||
12/31/2006 | 11.03 | 0.18 | 1.01 | 1.19 | (0.10 | ) | (0.20 | ) | 11.92 | 10.79 | 162,743 | 62 | 1.02 | 1.55 | ||||||||||||||||||||||||||||||||||||||||||||||||||
Class B | ||||||||||||||||||||||||||||||||||||||||||||||||||||||||||||||||
12/31/2010 | 9.01 | 0.16 | 0.68 | 0.84 | (0.10 | ) | - | 9.75 | 9.40 | 421 | 47 | (z | ) | 0.81 | 1.82 | |||||||||||||||||||||||||||||||||||||||||||||||||
12/31/2009 | 7.50 | 0.17 | 1.54 | 1.71 | (0.20 | ) | - | 9.01 | 22.75 | 411 | 78 | 0.81 | 2.04 | |||||||||||||||||||||||||||||||||||||||||||||||||||
12/31/2008 | 12.17 | 0.30 | (3.78 | ) | (3.48 | ) | (0.13 | ) | (1.06 | ) | 7.50 | (28.22 | ) | 189 | 70 | 0.81 | 2.74 | |||||||||||||||||||||||||||||||||||||||||||||||
12/31/2007 | 12.07 | 0.23 | 0.74 | 0.97 | (0.12 | ) | (0.75 | ) | 12.17 | 8.24 | 290 | 155 | 0.78 | 1.78 | ||||||||||||||||||||||||||||||||||||||||||||||||||
12/31/2006 | 11.14 | 0.20 | 1.03 | 1.23 | (0.10 | ) | (0.20 | ) | 12.07 | 10.98 | 166 | 62 | 0.82 | 1.75 | ||||||||||||||||||||||||||||||||||||||||||||||||||
JNL/Capital Guardian Global Diversified Research Fund |
| |||||||||||||||||||||||||||||||||||||||||||||||||||||||||||||||
Class A | ||||||||||||||||||||||||||||||||||||||||||||||||||||||||||||||||
12/31/2010 | 20.92 | 0.21 | 2.25 | 2.46 | (0.15 | ) | - | 23.23 | 11.77 | 436,897 | 30 | 1.08 | 1.00 | |||||||||||||||||||||||||||||||||||||||||||||||||||
12/31/2009 | 15.33 | 0.17 | 5.70 | 5.87 | (0.28 | ) | - | 20.92 | 38.32 | (u) | 332,577 | 85 | 1.09 | 0.97 | ||||||||||||||||||||||||||||||||||||||||||||||||||
12/31/2008 | 26.67 | 0.44 | (11.78 | ) | (11.34 | ) | - | - | 15.33 | (42.52 | ) | 163,107 | 96 | 1.09 | 2.04 | |||||||||||||||||||||||||||||||||||||||||||||||||
12/31/2007 | 22.23 | (0.03 | ) | 4.62 | 4.59 | (0.15 | ) | - | 26.67 | 20.65 | 232,460 | 195 | 1.10 | (0.11 | ) | |||||||||||||||||||||||||||||||||||||||||||||||||
12/31/2006 | 19.68 | 0.07 | 2.55 | 2.62 | (0.07 | ) | - | 22.23 | 13.31 | 160,207 | 116 | 1.10 | 0.35 | |||||||||||||||||||||||||||||||||||||||||||||||||||
Class B | ||||||||||||||||||||||||||||||||||||||||||||||||||||||||||||||||
12/31/2010 | 21.05 | 0.25 | 2.27 | 2.52 | (0.17 | ) | - | 23.40 | 12.01 | 311 | 30 | 0.88 | 1.21 | |||||||||||||||||||||||||||||||||||||||||||||||||||
12/31/2009 | 15.41 | 0.21 | 5.74 | 5.95 | (0.31 | ) | - | 21.05 | 38.63 | (u) | 329 | 85 | 0.89 | 1.19 | ||||||||||||||||||||||||||||||||||||||||||||||||||
12/31/2008 | 26.75 | 0.44 | (11.78 | ) | (11.34 | ) | - | - | 15.41 | (42.39 | ) | 161 | 96 | 0.89 | 2.05 | |||||||||||||||||||||||||||||||||||||||||||||||||
12/31/2007 | 22.39 | 0.01 | 4.65 | 4.66 | (0.30 | ) | - | 26.75 | 20.87 | 133 | 195 | 0.90 | 0.05 | |||||||||||||||||||||||||||||||||||||||||||||||||||
12/31/2006 | 19.76 | 0.10 | 2.58 | 2.68 | (0.05 | ) | - | 22.39 | 13.57 | 204 | 116 | 0.90 | 0.49 | |||||||||||||||||||||||||||||||||||||||||||||||||||
See accompanying Notes to Financial Statements.
JNL Series Trust
Financial Highlights
Net Asset Value | Increase (Decrease) from Investment Operations (e) | Distributions from Net Investment Income | Distributions Gains on | Supplemental Data | Ratio of Expenses to | Ratio of Income | ||||||||||||||||||||||||||||||||||||||||||||||||||||||||||
| Period Ended | Net (Loss) | Net & | Total from Investment Operations | Net Asset Value, End of Period | Total Return | Net thousands) | Portfolio (d) | |||||||||||||||||||||||||||||||||||||||||||||||||||||||||
JNL/Capital Guardian U.S. Growth Equity Fund |
| |||||||||||||||||||||||||||||||||||||||||||||||||||||||||||||||
Class A | ||||||||||||||||||||||||||||||||||||||||||||||||||||||||||||||||
12/31/2010 | $ | 18.85 | $ | 0.04 | $ | 2.35 | $ | 2.39 | $ | (0.05 | ) | $ | - | $ | 21.19 | 12.67 | % | $ | 894,742 | 34 | % | 0.95 | % | 0.21 | % | |||||||||||||||||||||||||||||||||||||||
12/31/2009 | 13.99 | 0.09 | 4.79 | 4.88 | (0.02 | ) | - | 18.85 | 34.91 | 554,978 | 55 | 0.98 | 0.57 | |||||||||||||||||||||||||||||||||||||||||||||||||||
12/31/2008 | 23.68 | 0.06 | (9.75 | ) | (9.69 | ) | 0.00 | (f) | - | 13.99 | (40.92 | ) | 195,824 | 47 | 0.99 | 0.29 | ||||||||||||||||||||||||||||||||||||||||||||||||
12/31/2007 | 21.58 | 0.00 | (f) | 2.10 | 2.10 | - | - | 23.68 | 9.73 | 226,712 | 190 | 1.00 | (0.01 | ) | ||||||||||||||||||||||||||||||||||||||||||||||||||
12/31/2006 | 20.63 | (0.01 | ) | 0.96 | 0.95 | - | - | 21.58 | 4.60 | 186,424 | 89 | 0.99 | (0.07 | ) | ||||||||||||||||||||||||||||||||||||||||||||||||||
Class B | ||||||||||||||||||||||||||||||||||||||||||||||||||||||||||||||||
12/31/2010 | 19.03 | 0.08 | 2.39 | 2.47 | (0.07 | ) | - | 21.43 | 12.96 | 227 | 34 | 0.75 | 0.40 | |||||||||||||||||||||||||||||||||||||||||||||||||||
12/31/2009 | 14.11 | 0.12 | 4.84 | 4.96 | (0.04 | ) | - | 19.03 | 35.16 | 310 | 55 | 0.78 | 0.73 | |||||||||||||||||||||||||||||||||||||||||||||||||||
12/31/2008 | 23.88 | 0.09 | (9.84 | ) | (9.75 | ) | (0.02 | ) | - | 14.11 | (40.81 | ) | 157 | 47 | 0.79 | 0.47 | ||||||||||||||||||||||||||||||||||||||||||||||||
12/31/2007 | 21.72 | 0.04 | 2.12 | 2.16 | - | - | 23.88 | 9.94 | 210 | 190 | 0.80 | 0.19 | ||||||||||||||||||||||||||||||||||||||||||||||||||||
12/31/2006 | 20.71 | 0.02 | 0.99 | 1.01 | - | - | 21.72 | 4.88 | 173 | 89 | 0.80 | 0.12 | ||||||||||||||||||||||||||||||||||||||||||||||||||||
JNL/Eagle Core Equity Fund |
| |||||||||||||||||||||||||||||||||||||||||||||||||||||||||||||||
Class A | ||||||||||||||||||||||||||||||||||||||||||||||||||||||||||||||||
12/31/2010 | 6.57 | 0.05 | 0.73 | 0.78 | (0.02 | ) | - | 7.33 | 11.86 | 203,409 | 52 | 0.93 | 0.79 | |||||||||||||||||||||||||||||||||||||||||||||||||||
12/31/2009 | 4.96 | 0.05 | 1.63 | 1.68 | (0.07 | ) | - | 6.57 | 33.83 | 84,192 | 36 | 0.96 | 0.84 | |||||||||||||||||||||||||||||||||||||||||||||||||||
12/31/2008 | 14.53 | 0.16 | (5.92 | ) | (5.76 | ) | (0.34 | ) | (3.47 | ) | 4.96 | (39.04 | ) | 42,644 | 57 | 0.96 | 1.35 | |||||||||||||||||||||||||||||||||||||||||||||||
12/31/2007 | 17.22 | 0.20 | (0.12 | ) | 0.08 | (0.35 | ) | (2.42 | ) | 14.53 | 0.59 | 81,088 | 43 | 0.94 | 1.13 | |||||||||||||||||||||||||||||||||||||||||||||||||
12/31/2006 | 15.33 | 0.15 | 1.74 | 1.89 | 0.00 | (f) | - | 17.22 | 12.35 | 177,972 | 109 | 0.96 | 0.92 | |||||||||||||||||||||||||||||||||||||||||||||||||||
Class B | ||||||||||||||||||||||||||||||||||||||||||||||||||||||||||||||||
12/31/2010 | 6.85 | 0.06 | 0.76 | 0.82 | (0.02 | ) | - | 7.65 | 12.02 | 119 | 52 | 0.73 | 0.95 | |||||||||||||||||||||||||||||||||||||||||||||||||||
12/31/2009 | 5.16 | 0.07 | 1.70 | 1.77 | (0.08 | ) | - | 6.85 | 34.26 | 94 | 36 | 0.76 | 1.11 | |||||||||||||||||||||||||||||||||||||||||||||||||||
12/31/2008 | 14.93 | 0.19 | (6.09 | ) | (5.90 | ) | (0.40 | ) | (3.47 | ) | 5.16 | (38.93 | ) | 138 | 57 | 0.76 | 1.55 | |||||||||||||||||||||||||||||||||||||||||||||||
12/31/2007 | 17.35 | 0.25 | (0.12 | ) | 0.13 | (0.13 | ) | (2.42 | ) | 14.93 | 0.84 | 220 | 43 | 0.74 | 1.41 | |||||||||||||||||||||||||||||||||||||||||||||||||
12/31/2006 | 15.42 | 0.19 | 1.74 | 1.93 | 0.00 | (f) | - | 17.35 | 12.53 | 175 | 109 | 0.76 | 1.16 | |||||||||||||||||||||||||||||||||||||||||||||||||||
JNL/Eagle SmallCap Equity Fund |
| |||||||||||||||||||||||||||||||||||||||||||||||||||||||||||||||
Class A | ||||||||||||||||||||||||||||||||||||||||||||||||||||||||||||||||
12/31/2010 | 16.14 | (0.03 | ) | 5.80 | 5.77 | (0.03 | ) | - | 21.88 | 35.73 | 589,399 | 50 | 1.02 | (0.18 | ) | |||||||||||||||||||||||||||||||||||||||||||||||||
12/31/2009 | 11.91 | 0.04 | 4.19 | 4.23 | - | - | 16.14 | 35.52 | 279,448 | 67 | 1.03 | 0.34 | ||||||||||||||||||||||||||||||||||||||||||||||||||||
12/31/2008 | 20.73 | (0.04 | ) | (7.93 | ) | (7.97 | ) | - | (0.85 | ) | 11.91 | (38.34 | ) | 164,108 | 69 | 1.03 | (0.25 | ) | ||||||||||||||||||||||||||||||||||||||||||||||
12/31/2007 | 22.19 | (0.11 | ) | 2.65 | 2.54 | - | (4.00 | ) | 20.73 | 12.14 | 231,713 | 81 | 1.03 | (0.45 | ) | |||||||||||||||||||||||||||||||||||||||||||||||||
12/31/2006 | 20.13 | (0.15 | ) | 4.17 | 4.02 | - | (1.96 | ) | 22.19 | 20.03 | 199,096 | 68 | 1.05 | (0.67 | ) | |||||||||||||||||||||||||||||||||||||||||||||||||
Class B | ||||||||||||||||||||||||||||||||||||||||||||||||||||||||||||||||
12/31/2010 | 16.40 | - | 5.89 | 5.89 | (0.04 | ) | - | 22.25 | 35.94 | 531 | 50 | 0.82 | 0.02 | |||||||||||||||||||||||||||||||||||||||||||||||||||
12/31/2009 | 12.08 | 0.06 | 4.26 | 4.32 | - | - | 16.40 | 35.76 | 248 | 67 | 0.83 | 0.44 | ||||||||||||||||||||||||||||||||||||||||||||||||||||
12/31/2008 | 20.96 | (0.01 | ) | (8.02 | ) | (8.03 | ) | - | (0.85 | ) | 12.08 | (38.20 | ) | 183 | 69 | 0.83 | (0.03 | ) | ||||||||||||||||||||||||||||||||||||||||||||||
12/31/2007 | 22.36 | (0.06 | ) | 2.66 | 2.60 | - | (4.00 | ) | 20.96 | 12.32 | 217 | 81 | 0.83 | (0.24 | ) | |||||||||||||||||||||||||||||||||||||||||||||||||
12/31/2006 | 20.22 | (0.10 | ) | 4.20 | 4.10 | - | (1.96 | ) | 22.36 | 20.34 | 245 | 68 | 0.85 | (0.46 | ) | |||||||||||||||||||||||||||||||||||||||||||||||||
JNL/Franklin Templeton Founding Strategy Fund (h) |
| |||||||||||||||||||||||||||||||||||||||||||||||||||||||||||||||
Class A | ||||||||||||||||||||||||||||||||||||||||||||||||||||||||||||||||
12/31/2010 | 8.22 | 0.14 | 0.71 | 0.85 | (0.24 | ) | - | 8.83 | 10.39 | 1,037,981 | 3 | 0.05 | 1.72 | |||||||||||||||||||||||||||||||||||||||||||||||||||
12/31/2009 | 6.32 | 0.29 | 1.61 | 1.90 | 0.00 | (f | ) | - | 8.22 | 30.13 | 838,759 | 5 | 0.06 | 4.15 | ||||||||||||||||||||||||||||||||||||||||||||||||||
12/31/2008 | 10.09 | 0.00 | (f | ) | (3.66 | ) | (3.66 | ) | (0.11 | ) | 0.00 | (f | ) | 6.32 | (36.13 | ) | 580,801 | 14 | 0.06 | (0.02 | ) | |||||||||||||||||||||||||||||||||||||||||||
01/16(a) - 12/31/2007 | 10.00 | 0.24 | (0.15 | ) | 0.09 | - | - | 10.09 | 0.90 | 800,395 | 9 | 0.05 | 2.42 | |||||||||||||||||||||||||||||||||||||||||||||||||||
See accompanying Notes to Financial Statements.
JNL Series Trust
Financial Highlights
Net Asset Value | Increase (Decrease) from Investment Operations (e) | Distributions from Net Investment Income | Distributions Gains on | Supplemental Data | Ratio of Expenses to | Ratio of Income | ||||||||||||||||||||||||||||||||||||||||||||||||||||||||||
| Period Ended | Net Investment Income (Loss) | Net Realized & Unrealized | Total from Investment Operations | Net Asset Value, End of Period | Total Return | Net Assets, End of Period (in thousands) | Portfolio Turnover (d) | |||||||||||||||||||||||||||||||||||||||||||||||||||||||||
JNL/Franklin Templeton Global Growth Fund |
| |||||||||||||||||||||||||||||||||||||||||||||||||||||||||||||||
Class A | ||||||||||||||||||||||||||||||||||||||||||||||||||||||||||||||||
12/31/2010 | $ | 7.64 | $ | 0.10 | $ | 0.44 | $ | 0.54 | $ | (0.10 | ) | $ | - | $ | 8.08 | 7.07 | % | $ | 475,458 | 5 | % | 1.08 | % | 1.38 | % | |||||||||||||||||||||||||||||||||||||||
12/31/2009 | 5.92 | 0.10 | 1.74 | 1.84 | (0.12 | ) | - | 7.64 | 31.06 | 375,505 | 5 | 1.10 | 1.58 | |||||||||||||||||||||||||||||||||||||||||||||||||||
12/31/2008 | 9.99 | 0.17 | (4.24 | ) | (4.07 | ) | 0.00 | (f | ) | 0.00 | (f | ) | 5.92 | (40.72 | ) | 236,023 | 11 | 1.11 | 2.18 | |||||||||||||||||||||||||||||||||||||||||||||
01/16(a) - 12/31/2007 | 10.00 | 0.11 | (0.05 | ) | 0.06 | (0.06 | ) | (0.01 | ) | 9.99 | 0.63 | 318,542 | 3 | 1.10 | 1.15 | |||||||||||||||||||||||||||||||||||||||||||||||||
Class B | ||||||||||||||||||||||||||||||||||||||||||||||||||||||||||||||||
12/31/2010 | 7.65 | 0.12 | 0.44 | 0.56 | (0.11 | ) | - | 8.10 | 7.32 | 283 | 5 | 0.88 | 1.58 | |||||||||||||||||||||||||||||||||||||||||||||||||||
12/31/2009 | 5.93 | 0.12 | 1.73 | 1.85 | (0.13 | ) | - | 7.65 | 31.21 | 219 | 5 | 0.90 | 1.85 | |||||||||||||||||||||||||||||||||||||||||||||||||||
12/31/2008 | 9.97 | 0.20 | (4.24 | ) | (4.04 | ) | 0.00 | (f | ) | 0.00 | (f | ) | 5.93 | (40.50 | ) | 153 | 11 | 0.91 | 2.48 | |||||||||||||||||||||||||||||||||||||||||||||
01/16(a) - 12/31/2007 | 10.00 | 0.16 | (0.08 | ) | 0.08 | (0.10 | ) | (0.01 | ) | 9.97 | 0.82 | 211 | 3 | 0.90 | 1.58 | |||||||||||||||||||||||||||||||||||||||||||||||||
JNL/Franklin Templeton Income Fund |
| |||||||||||||||||||||||||||||||||||||||||||||||||||||||||||||||
Class A | ||||||||||||||||||||||||||||||||||||||||||||||||||||||||||||||||
12/31/2010 | 9.29 | 0.50 | 0.66 | 1.16 | (0.35 | ) | - | 10.10 | 12.57 | 1,061,794 | 33 | 0.96 | 5.17 | |||||||||||||||||||||||||||||||||||||||||||||||||||
12/31/2009 | 7.39 | 0.55 | 1.88 | 2.43 | (0.53 | ) | - | 9.29 | 32.92 | 728,236 | 39 | 1.00 | 6.51 | |||||||||||||||||||||||||||||||||||||||||||||||||||
12/31/2008 | 10.53 | 0.66 | (3.79 | ) | (3.13 | ) | (0.01 | ) | - | 7.39 | (29.74 | ) | 432,233 | 56 | 1.00 | 7.05 | ||||||||||||||||||||||||||||||||||||||||||||||||
12/31/2007 | 10.70 | 0.60 | (0.40 | ) | 0.20 | (0.35 | ) | (0.02 | ) | 10.53 | 1.85 | 549,659 | 21 | (i | ) | 1.02 | 5.45 | |||||||||||||||||||||||||||||||||||||||||||||||
05/01(a)-12/31/2006 | 10.00 | 0.34 | 0.64 | 0.98 | (0.26 | ) | (0.02 | ) | 10.70 | 9.78 | 64,653 | 43 | 1.10 | 4.85 | ||||||||||||||||||||||||||||||||||||||||||||||||||
Class B | ||||||||||||||||||||||||||||||||||||||||||||||||||||||||||||||||
12/31/2010 | 8.98 | 0.50 | 0.64 | 1.14 | (0.36 | ) | - | 9.76 | 12.79 | 346 | 33 | 0.76 | 5.37 | |||||||||||||||||||||||||||||||||||||||||||||||||||
12/31/2009 | 7.16 | 0.55 | 1.81 | 2.36 | (0.54 | ) | - | 8.98 | 33.07 | 388 | 39 | 0.80 | 6.74 | |||||||||||||||||||||||||||||||||||||||||||||||||||
12/31/2008 | 10.17 | 0.66 | (3.66 | ) | (3.00 | ) | (0.01 | ) | - | 7.16 | (29.51 | ) | 228 | 56 | 0.80 | 7.39 | ||||||||||||||||||||||||||||||||||||||||||||||||
12/31/2007 | 10.63 | 0.59 | (0.38 | ) | 0.21 | (0.65 | ) | (0.02 | ) | 10.17 | 1.96 | 170 | 21 | (i | ) | 0.83 | 5.37 | |||||||||||||||||||||||||||||||||||||||||||||||
05/01(a)-12/31/2006 | 10.00 | 0.35 | 0.65 | 1.00 | (0.35 | ) | (0.02 | ) | 10.63 | 10.01 | 114 | 43 | 0.90 | 5.06 | ||||||||||||||||||||||||||||||||||||||||||||||||||
JNL/Franklin Templeton International Small Cap Growth Fund |
| |||||||||||||||||||||||||||||||||||||||||||||||||||||||||||||||
Class A | ||||||||||||||||||||||||||||||||||||||||||||||||||||||||||||||||
12/31/2010 | 6.85 | 0.14 | 1.27 | 1.41 | (0.09 | ) | - | 8.17 | 20.55 | 213,824 | 162 | 1.30 | 1.96 | |||||||||||||||||||||||||||||||||||||||||||||||||||
12/31/2009 | 4.53 | 0.04 | 2.36 | 2.40 | (0.08 | ) | - | 6.85 | 52.93 | 144,004 | 46 | 1.31 | 0.65 | |||||||||||||||||||||||||||||||||||||||||||||||||||
12/31/2008 | 9.87 | 0.14 | (5.47 | ) | (5.33 | ) | (0.01 | ) | - | 4.53 | (54.00 | ) | 44,755 | 53 | 1.31 | 1.88 | ||||||||||||||||||||||||||||||||||||||||||||||||
12/03(a) - 12/31/2007 | 10.00 | 0.00 | (0.13 | ) | (0.13 | ) | - | - | 9.87 | (1.30 | ) | 73,063 | 2 | 1.30 | 0.22 | |||||||||||||||||||||||||||||||||||||||||||||||||
Class B | ||||||||||||||||||||||||||||||||||||||||||||||||||||||||||||||||
12/31/2010 | 6.88 | 0.14 | 1.28 | 1.42 | (0.09 | ) | - | 8.21 | 20.70 | 181 | 162 | 1.10 | 2.01 | |||||||||||||||||||||||||||||||||||||||||||||||||||
12/31/2009 | 4.55 | 0.05 | 2.36 | 2.41 | (0.08 | ) | - | 6.88 | 53.05 | 218 | 46 | 1.11 | 0.88 | |||||||||||||||||||||||||||||||||||||||||||||||||||
12/31/2008 | 9.88 | 0.14 | (5.46 | ) | (5.32 | ) | (0.01 | ) | - | 4.55 | (53.84 | ) | 80 | 53 | 1.11 | 2.01 | ||||||||||||||||||||||||||||||||||||||||||||||||
12/03(a) - 12/31/2007 | 10.00 | 0.00 | (0.12 | ) | (0.12 | ) | - | - | 9.88 | (1.20 | ) | 108 | 2 | 1.11 | 0.43 | |||||||||||||||||||||||||||||||||||||||||||||||||
JNL/Franklin Templeton Mutual Shares Fund |
| |||||||||||||||||||||||||||||||||||||||||||||||||||||||||||||||
Class A | ||||||||||||||||||||||||||||||||||||||||||||||||||||||||||||||||
12/31/2010 | 7.61 | 0.24 | 0.63 | 0.87 | (0.00 | ) | (f | ) | - | 8.48 | 11.45 | 594,707 | 33 | 1.06 | 3.02 | |||||||||||||||||||||||||||||||||||||||||||||||||
12/31/2009 | 6.20 | 0.10 | 1.55 | 1.65 | (0.24 | ) | - | 7.61 | 26.74 | 423,572 | 61 | 1.11 | (j | ) | 1.48 | |||||||||||||||||||||||||||||||||||||||||||||||||
12/31/2008 | 10.02 | 0.14 | (3.94 | ) | (3.80 | ) | - | (0.02 | ) | 6.20 | (37.90 | ) | 255,941 | 49 | 1.08 | (j | ) | 1.67 | ||||||||||||||||||||||||||||||||||||||||||||||
01/16(a) - 12/31/2007 | 10.00 | 0.16 | (0.14 | ) | 0.02 | - | - | 10.02 | 0.20 | 344,535 | 33 | 1.07 | (j | ) | 1.60 | |||||||||||||||||||||||||||||||||||||||||||||||||
Class B | ||||||||||||||||||||||||||||||||||||||||||||||||||||||||||||||||
12/31/2010 | 7.64 | 0.26 | 0.63 | 0.89 | (0.01 | ) | - | 8.52 | 11.66 | 358 | 33 | 0.86 | 3.26 | |||||||||||||||||||||||||||||||||||||||||||||||||||
12/31/2009 | 6.22 | 0.12 | 1.56 | 1.68 | (0.26 | ) | - | 7.64 | 27.00 | 282 | 61 | 0.91 | (j | ) | 1.79 | |||||||||||||||||||||||||||||||||||||||||||||||||
12/31/2008 | 10.03 | 0.17 | (3.96 | ) | (3.79 | ) | - | (0.02 | ) | 6.22 | (37.76 | ) | 170 | 49 | 0.88 | (j | ) | 2.13 | ||||||||||||||||||||||||||||||||||||||||||||||
01/16(a) - 12/31/2007 | 10.00 | 0.13 | (0.10 | ) | 0.03 | - | - | 10.03 | 0.30 | 210 | 33 | 0.86 | (j | ) | 1.29 | |||||||||||||||||||||||||||||||||||||||||||||||||
See accompanying Notes to Financial Statements.
JNL Series Trust
Financial Highlights
Net Asset Value | Increase (Decrease) from Investment Operations (e) | Distributions from Net Investment Income | Distributions Gains on | Supplemental Data | Ratio of Expenses | Ratio of Income | ||||||||||||||||||||||||||||||||||||||||||||||||||||||||||
| Period Ended | Net Investment Income (Loss) | Net & | Total from Investment Operations | Net Asset Value, End of Period | Total Return | Net Assets, End of Period (in thousands) | Portfolio Turnover (d) | |||||||||||||||||||||||||||||||||||||||||||||||||||||||||
JNL/Franklin Templeton Small Cap Value Fund |
| |||||||||||||||||||||||||||||||||||||||||||||||||||||||||||||||
Class A | ||||||||||||||||||||||||||||||||||||||||||||||||||||||||||||||||
12/31/2010 | $ | 8.72 | $ | 0.05 | $ | 2.29 | $ | 2.34 | $ | (0.04 | ) | $ | - | $ | 11.02 | 26.84 | % | $ | 294,200 | 9 | % | 1.14 | % | 0.50 | % | |||||||||||||||||||||||||||||||||||||||
12/31/2009 | 6.56 | 0.07 | 2.15 | 2.22 | (0.06 | ) | - | 8.72 | 33.80 | 167,589 | 2 | 1.16 | 0.89 | |||||||||||||||||||||||||||||||||||||||||||||||||||
12/31/2008 | 11.38 | 0.11 | (3.97 | ) | (3.86 | ) | (0.10 | ) | (0.86 | ) | 6.56 | (33.23 | ) | 86,399 | 14 | 1.16 | 1.10 | |||||||||||||||||||||||||||||||||||||||||||||||
12/31/2007 | 12.86 | 0.11 | (0.90 | ) | (0.79 | ) | (0.09 | ) | (0.60 | ) | 11.38 | (6.14 | ) | 100,289 | 26 | 1.16 | 0.80 | |||||||||||||||||||||||||||||||||||||||||||||||
12/31/2006 | 11.03 | 0.08 | 1.88 | 1.96 | (0.02 | ) | (0.11 | ) | 12.86 | 17.71 | 130,608 | 6 | 1.16 | 0.67 | ||||||||||||||||||||||||||||||||||||||||||||||||||
Class B | ||||||||||||||||||||||||||||||||||||||||||||||||||||||||||||||||
12/31/2010 | 8.68 | 0.07 | 2.28 | 2.35 | (0.05 | ) | - | 10.98 | 27.07 | 400 | 9 | 0.94 | 0.70 | |||||||||||||||||||||||||||||||||||||||||||||||||||
12/31/2009 | 6.53 | 0.08 | 2.14 | 2.22 | (0.07 | ) | - | 8.68 | 33.96 | 237 | 2 | 0.96 | 1.09 | |||||||||||||||||||||||||||||||||||||||||||||||||||
12/31/2008 | 11.35 | 0.13 | (3.97 | ) | (3.84 | ) | (0.12 | ) | (0.86 | ) | 6.53 | (33.06 | ) | 139 | 14 | 0.96 | 1.33 | |||||||||||||||||||||||||||||||||||||||||||||||
12/31/2007 | 12.89 | 0.13 | (0.89 | ) | (0.76 | ) | (0.18 | ) | (0.60 | ) | 11.35 | (5.89 | ) | 123 | 26 | 0.96 | 0.96 | |||||||||||||||||||||||||||||||||||||||||||||||
12/31/2006 | 11.04 | 0.11 | 1.87 | 1.98 | (0.02 | ) | (0.11 | ) | 12.89 | 17.93 | 239 | 6 | 0.95 | 0.88 | ||||||||||||||||||||||||||||||||||||||||||||||||||
JNL/Goldman Sachs Core Plus Bond Fund |
| |||||||||||||||||||||||||||||||||||||||||||||||||||||||||||||||
Class A | ||||||||||||||||||||||||||||||||||||||||||||||||||||||||||||||||
12/31/2010 | 11.68 | 0.28 | 0.60 | 0.88 | (0.29 | ) | (0.13 | ) | 12.14 | 7.63 | 1,056,413 | 977 | (k | ) | 0.88 | 2.33 | ||||||||||||||||||||||||||||||||||||||||||||||||
12/31/2009 | 10.71 | 0.45 | 1.07 | 1.52 | (0.50 | ) | (0.05 | ) | 11.68 | 14.16 | 782,744 | 430 | (k | ) | 0.90 | 3.90 | ||||||||||||||||||||||||||||||||||||||||||||||||
12/31/2008 | 12.01 | 0.55 | (1.18 | ) | (0.63 | ) | (0.48 | ) | (0.19 | ) | 10.71 | (5.17 | ) | 564,785 | 462 | 0.90 | 4.76 | |||||||||||||||||||||||||||||||||||||||||||||||
12/31/2007 | 11.60 | 0.57 | 0.23 | 0.80 | (0.39 | ) | - | 12.01 | 6.91 | 614,033 | 186 | (k | ) | 0.91 | 4.79 | |||||||||||||||||||||||||||||||||||||||||||||||||
12/31/2006 | 11.08 | 0.54 | (0.01 | ) | 0.53 | (0.01 | ) | - | 11.60 | 4.77 | 460,890 | 113 | (k | ) | 0.92 | 4.81 | ||||||||||||||||||||||||||||||||||||||||||||||||
Class B | ||||||||||||||||||||||||||||||||||||||||||||||||||||||||||||||||
12/31/2010 | 11.83 | 0.32 | 0.59 | 0.91 | (0.31 | ) | (0.13 | ) | 12.30 | 7.75 | 246 | 977 | (k | ) | 0.68 | 2.54 | ||||||||||||||||||||||||||||||||||||||||||||||||
12/31/2009 | 10.83 | 0.48 | 1.09 | 1.57 | (0.52 | ) | (0.05 | ) | 11.83 | 14.47 | 245 | 430 | (k | ) | 0.70 | 4.14 | ||||||||||||||||||||||||||||||||||||||||||||||||
12/31/2008 | 12.13 | 0.58 | (1.19 | ) | (0.61 | ) | (0.50 | ) | (0.19 | ) | 10.83 | (4.94 | ) | 197 | 462 | 0.70 | 4.95 | |||||||||||||||||||||||||||||||||||||||||||||||
12/31/2007 | 12.05 | 0.61 | 0.25 | 0.86 | (0.78 | ) | - | 12.13 | 7.18 | 171 | 186 | (k | ) | 0.71 | 4.99 | |||||||||||||||||||||||||||||||||||||||||||||||||
12/31/2006 | 11.49 | 0.58 | (0.01 | ) | 0.57 | (0.01 | ) | - | 12.05 | 4.94 | 259 | 113 | (k | ) | 0.72 | 5.01 | ||||||||||||||||||||||||||||||||||||||||||||||||
JNL/Goldman Sachs Emerging Markets Debt Fund |
| |||||||||||||||||||||||||||||||||||||||||||||||||||||||||||||||
Class A | ||||||||||||||||||||||||||||||||||||||||||||||||||||||||||||||||
12/31/2010 | 11.89 | 0.61 | 1.30 | 1.91 | (0.12 | ) | (0.03 | ) | 13.65 | 16.07 | 762,892 | 160 | 1.08 | 4.65 | ||||||||||||||||||||||||||||||||||||||||||||||||||
12/31/2009 | 9.67 | 0.44 | 1.79 | 2.23 | (0.01 | ) | - | 11.89 | 23.06 | 193,046 | 94 | 1.11 | 3.89 | |||||||||||||||||||||||||||||||||||||||||||||||||||
10/06(a)-12/31/2008 | 10.00 | 0.09 | (0.42 | ) | (0.33 | ) | - | - | 9.67 | (3.30 | ) | 28,973 | 44 | 1.11 | 3.92 | |||||||||||||||||||||||||||||||||||||||||||||||||
Class B | ||||||||||||||||||||||||||||||||||||||||||||||||||||||||||||||||
12/31/2010 | 11.92 | 0.65 | 1.28 | 1.93 | (0.12 | ) | (0.03 | ) | 13.70 | 16.22 | 442 | 160 | 0.88 | 4.95 | ||||||||||||||||||||||||||||||||||||||||||||||||||
12/31/2009 | 9.67 | 0.47 | 1.79 | 2.26 | (0.01 | ) | - | 11.92 | 23.38 | 197 | 94 | 0.91 | 4.23 | |||||||||||||||||||||||||||||||||||||||||||||||||||
10/06(a)-12/31/2008 | 10.00 | 0.09 | (0.42 | ) | (0.33 | ) | - | - | 9.67 | (3.30 | ) | 97 | 44 | 0.91 | 4.06 | |||||||||||||||||||||||||||||||||||||||||||||||||
JNL/Goldman Sachs Mid Cap Value Fund |
| |||||||||||||||||||||||||||||||||||||||||||||||||||||||||||||||
Class A | ||||||||||||||||||||||||||||||||||||||||||||||||||||||||||||||||
12/31/2010 | 8.56 | 0.05 | 2.04 | 2.09 | (0.05 | ) | - | 10.60 | 24.40 | 496,550 | 85 | 1.02 | 0.58 | |||||||||||||||||||||||||||||||||||||||||||||||||||
12/31/2009 | 6.51 | 0.09 | 2.04 | 2.13 | (0.08 | ) | - | 8.56 | 32.65 | 275,024 | 113 | 1.03 | 1.29 | |||||||||||||||||||||||||||||||||||||||||||||||||||
12/31/2008 | 12.82 | 0.09 | (4.82 | ) | (4.73 | ) | (0.11 | ) | (1.47 | ) | 6.51 | (36.09 | ) | 134,460 | 98 | 1.04 | 0.83 | |||||||||||||||||||||||||||||||||||||||||||||||
12/31/2007 | 12.96 | 0.14 | 0.22 | 0.36 | (0.08 | ) | (0.42 | ) | 12.82 | 2.80 | 169,388 | 117 | 1.03 | 1.01 | ||||||||||||||||||||||||||||||||||||||||||||||||||
12/31/2006 | 11.39 | 0.11 | 1.68 | 1.79 | (0.04 | ) | (0.18 | ) | 12.96 | 15.73 | 144,432 | 47 | 1.05 | 0.90 | ||||||||||||||||||||||||||||||||||||||||||||||||||
Class B | ||||||||||||||||||||||||||||||||||||||||||||||||||||||||||||||||
12/31/2010 | 8.56 | 0.07 | 2.04 | 2.11 | (0.06 | ) | - | 10.61 | 24.62 | 9,541 | 85 | 0.82 | 0.76 | |||||||||||||||||||||||||||||||||||||||||||||||||||
12/31/2009 | 6.50 | 0.11 | 2.04 | 2.15 | (0.09 | ) | - | 8.56 | 33.09 | 5,701 | 113 | 0.83 | 1.55 | |||||||||||||||||||||||||||||||||||||||||||||||||||
12/31/2008 | 12.83 | 0.12 | (4.85 | ) | (4.73 | ) | (0.13 | ) | (1.47 | ) | 6.50 | (36.03 | ) | 244 | 98 | 0.84 | 1.11 | |||||||||||||||||||||||||||||||||||||||||||||||
12/31/2007 | 12.99 | 0.16 | 0.22 | 0.38 | (0.12 | ) | (0.42 | ) | 12.83 | 2.97 | 210 | 117 | 0.83 | 1.16 | ||||||||||||||||||||||||||||||||||||||||||||||||||
12/31/2006 | 11.40 | 0.13 | 1.70 | 1.83 | (0.06 | ) | (0.18 | ) | 12.99 | 16.06 | 206 | 47 | 0.85 | 1.09 | ||||||||||||||||||||||||||||||||||||||||||||||||||
See accompanying Notes to Financial Statements.
JNL Series Trust
Financial Highlights
Net Asset Value | Increase (Decrease) from Investment Operations (e) | Distributions Gains on |
Supplemental Data | Ratio of Expenses to | Ratio of Income | |||||||||||||||||||||||||||||||||||||||||||||||||||||||
| Period Ended | Net Investment Income (Loss) | Net & | Total from Investment Operations | Distributions from Net Investment Income | Net Asset Value, End of Period | Total Return | Net Assets, End of Period (in thousands) | Portfolio Turnover (d) | ||||||||||||||||||||||||||||||||||||||||||||||||||||
JNL/Goldman Sachs U.S. Equity Flex Fund |
| |||||||||||||||||||||||||||||||||||||||||||||||||||||||||||
Class A | ||||||||||||||||||||||||||||||||||||||||||||||||||||||||||||
12/31/2010 | $ | 7.58 | $ | 0.01 | $ | 0.65 | $ | 0.66 | $ | (0.05 | ) | $ | - | $ | 8.19 | 8.70 | % | $ | 115,234 | 639 | % | 1.88 | % | (g | ) | 0.17 | % | |||||||||||||||||||||||||||||||||
12/31/2009 | 6.11 | 0.06 | 1.46 | 1.52 | (0.05 | ) | - | 7.58 | 24.86 | 90,306 | 909 | 1.54 | (g | ) | 0.98 | |||||||||||||||||||||||||||||||||||||||||||||
12/31/2008 | 10.85 | 0.09 | (4.22 | ) | (4.13 | ) | - | (0.61 | ) | 6.11 | (37.68 | ) | 41,879 | 455 | 1.59 | (g | ) | 0.98 | ||||||||||||||||||||||||||||||||||||||||||
01/16(a) - 12/31/2007 | 10.00 | (0.02 | ) | 0.87 | 0.85 | - | - | 10.85 | 8.50 | 68,632 | 240 | 2.26 | (g | ) | (0.19 | ) | ||||||||||||||||||||||||||||||||||||||||||||
Class B | ||||||||||||||||||||||||||||||||||||||||||||||||||||||||||||
12/31/2010 | 7.62 | 0.03 | 0.65 | 0.68 | (0.06 | ) | - | 8.24 | 8.92 | 170 | 639 | 1.68 | (g | ) | 0.38 | |||||||||||||||||||||||||||||||||||||||||||||
12/31/2009 | 6.14 | 0.08 | 1.46 | 1.54 | (0.06 | ) | - | 7.62 | 25.07 | 147 | 909 | 1.34 | (g | ) | 1.19 | |||||||||||||||||||||||||||||||||||||||||||||
12/31/2008 | 10.87 | 0.11 | (4.23 | ) | (4.12 | ) | - | (0.61 | ) | 6.14 | (37.51 | ) | 93 | 455 | 1.39 | (g | ) | 1.22 | ||||||||||||||||||||||||||||||||||||||||||
01/16(a) - 12/31/2007 | 10.00 | 0.00 | 0.87 | 0.87 | - | - | 10.87 | 8.70 | 117 | 240 | 2.07 | (g | ) | (0.01 | ) | |||||||||||||||||||||||||||||||||||||||||||||
JNL/Invesco Global Real Estate Fund |
| |||||||||||||||||||||||||||||||||||||||||||||||||||||||||||
Class A | ||||||||||||||||||||||||||||||||||||||||||||||||||||||||||||
12/31/2010 | 7.53 | 0.19 | 1.09 | 1.28 | (0.31 | ) | - | 8.50 | 17.15 | 661,172 | 70 | 1.06 | 2.33 | |||||||||||||||||||||||||||||||||||||||||||||||
12/31/2009 | 5.79 | 0.18 | 1.70 | 1.88 | (0.14 | ) | - | 7.53 | 32.53 | 342,951 | 65 | 1.07 | 2.78 | |||||||||||||||||||||||||||||||||||||||||||||||
12/31/2008 | 12.44 | 0.31 | (4.96 | ) | (4.65 | ) | (0.23 | ) | (1.77 | ) | 5.79 | (35.71 | ) | 145,218 | 117 | 1.03 | 2.78 | |||||||||||||||||||||||||||||||||||||||||||
12/31/2007 | 15.80 | 0.20 | (2.58 | ) | (2.38 | ) | (0.17 | ) | (0.81 | ) | 12.44 | (15.01 | ) | 184,451 | 76 | 1.02 | 1.29 | |||||||||||||||||||||||||||||||||||||||||||
12/31/2006 | 11.70 | 0.42 | 3.84 | 4.26 | (0.05 | ) | (0.11 | ) | 15.80 | 36.38 | 254,557 | 37 | 1.02 | 2.98 | ||||||||||||||||||||||||||||||||||||||||||||||
Class B | ||||||||||||||||||||||||||||||||||||||||||||||||||||||||||||
12/31/2010 | 7.58 | 0.20 | 1.10 | 1.30 | (0.31 | ) | - | 8.57 | 17.37 | 616 | 70 | 0.86 | 2.51 | |||||||||||||||||||||||||||||||||||||||||||||||
12/31/2009 | 5.82 | 0.19 | 1.72 | 1.91 | (0.15 | ) | - | 7.58 | 32.86 | 404 | 65 | 0.87 | 3.09 | |||||||||||||||||||||||||||||||||||||||||||||||
12/31/2008 | 12.52 | 0.33 | (5.00 | ) | (4.67 | ) | (0.26 | ) | (1.77 | ) | 5.82 | (35.61 | ) | 294 | 117 | 0.83 | 2.93 | |||||||||||||||||||||||||||||||||||||||||||
12/31/2007 | 15.83 | 0.24 | (2.60 | ) | (2.36 | ) | (0.14 | ) | (0.81 | ) | 12.52 | (14.82 | ) | 368 | 76 | 0.82 | 1.55 | |||||||||||||||||||||||||||||||||||||||||||
12/31/2006 | 11.72 | 0.44 | 3.85 | 4.29 | (0.07 | ) | (0.11 | ) | 15.83 | 36.59 | 378 | 37 | 0.82 | 3.13 | ||||||||||||||||||||||||||||||||||||||||||||||
JNL/Invesco International Growth Fund |
| |||||||||||||||||||||||||||||||||||||||||||||||||||||||||||
Class A | ||||||||||||||||||||||||||||||||||||||||||||||||||||||||||||
12/31/2010 | 9.27 | 0.11 | 1.03 | 1.14 | (0.07 | ) | - | 10.34 | 12.31 | 588,008 | 32 | 1.02 | 1.19 | |||||||||||||||||||||||||||||||||||||||||||||||
12/31/2009 | 6.88 | 0.12 | 2.42 | 2.54 | (0.15 | ) | - | 9.27 | 36.99 | (t | ) | 431,595 | 27 | 1.04 | 1.55 | |||||||||||||||||||||||||||||||||||||||||||||
12/31/2008 | 15.74 | 0.27 | (6.68 | ) | (6.41 | ) | (0.06 | ) | (2.39 | ) | 6.88 | (40.94 | ) | 249,897 | 53 | 1.03 | 2.10 | |||||||||||||||||||||||||||||||||||||||||||
12/31/2007 | 14.55 | 0.30 | 1.10 | 1.40 | (0.21 | ) | - | 15.74 | 9.70 | 475,302 | 105 | 1.03 | 1.90 | |||||||||||||||||||||||||||||||||||||||||||||||
12/31/2006 | 12.03 | 0.18 | 2.55 | 2.73 | (0.21 | ) | - | 14.55 | 22.67 | 259,811 | 12 | 1.06 | 1.35 | |||||||||||||||||||||||||||||||||||||||||||||||
Class B | ||||||||||||||||||||||||||||||||||||||||||||||||||||||||||||
12/31/2010 | 9.68 | 0.14 | 1.07 | 1.21 | (0.08 | ) | - | 10.81 | 12.52 | 485 | 32 | 0.82 | 1.43 | |||||||||||||||||||||||||||||||||||||||||||||||
12/31/2009 | 7.04 | 0.01 | 2.80 | 2.81 | (0.17 | ) | - | 9.68 | 39.94 | (t | ) | 386 | 27 | 0.84 | 0.10 | |||||||||||||||||||||||||||||||||||||||||||||
12/31/2008 | 15.99 | 0.29 | (6.79 | ) | (6.50 | ) | (0.06 | ) | (2.39 | ) | 7.04 | (40.85 | ) | 9,418 | 53 | 0.83 | 2.27 | |||||||||||||||||||||||||||||||||||||||||||
12/31/2007 | 14.82 | 0.33 | 1.14 | 1.47 | (0.30 | ) | - | 15.99 | 9.96 | 15,987 | 105 | 0.83 | 2.08 | |||||||||||||||||||||||||||||||||||||||||||||||
12/31/2006 | 12.08 | 0.13 | 2.64 | 2.77 | (0.03 | ) | - | 14.82 | 22.97 | 14,618 | 12 | 0.85 | 0.88 | |||||||||||||||||||||||||||||||||||||||||||||||
JNL/Invesco Large Cap Growth Fund |
| |||||||||||||||||||||||||||||||||||||||||||||||||||||||||||
Class A | ||||||||||||||||||||||||||||||||||||||||||||||||||||||||||||
12/31/2010 | 10.75 | 0.03 | 1.84 | 1.87 | (0.03 | ) | - | 12.59 | 17.41 | 910,935 | 169 | 0.96 | 0.23 | |||||||||||||||||||||||||||||||||||||||||||||||
12/31/2009 | 8.67 | 0.04 | 2.07 | 2.11 | (0.03 | ) | - | 10.75 | 24.29 | 624,156 | 57 | 0.97 | 0.45 | |||||||||||||||||||||||||||||||||||||||||||||||
12/31/2008 | 14.93 | 0.04 | (5.69 | ) | (5.65 | ) | (0.02 | ) | (0.59 | ) | 8.67 | (37.66 | ) | 350,826 | 56 | 0.97 | 0.29 | |||||||||||||||||||||||||||||||||||||||||||
12/31/2007 | 13.49 | 0.02 | 2.09 | 2.11 | (0.01 | ) | (0.66 | ) | 14.93 | 15.75 | 525,103 | 71 | 0.99 | 0.17 | ||||||||||||||||||||||||||||||||||||||||||||||
12/31/2006 | 12.51 | 0.02 | 0.96 | 0.98 | 0.00 | (f | ) | - | 13.49 | 7.86 | 396,703 | 90 | 1.00 | 0.12 | ||||||||||||||||||||||||||||||||||||||||||||||
Class B | ||||||||||||||||||||||||||||||||||||||||||||||||||||||||||||
12/31/2010 | 10.82 | 0.05 | 1.86 | 1.91 | (0.04 | ) | - | 12.69 | 17.69 | 778 | 169 | 0.76 | 0.43 | |||||||||||||||||||||||||||||||||||||||||||||||
12/31/2009 | 8.72 | 0.06 | 2.08 | 2.14 | (0.04 | ) | - | 10.82 | 24.57 | 587 | 57 | 0.77 | 0.66 | |||||||||||||||||||||||||||||||||||||||||||||||
12/31/2008 | 15.02 | 0.06 | (5.73 | ) | (5.67 | ) | (0.04 | ) | (0.59 | ) | 8.72 | (37.55 | ) | 404 | 56 | 0.77 | 0.52 | |||||||||||||||||||||||||||||||||||||||||||
12/31/2007 | 13.55 | 0.05 | 2.11 | 2.16 | (0.03 | ) | (0.66 | ) | 15.02 | 16.05 | 436 | 71 | 0.80 | 0.36 | ||||||||||||||||||||||||||||||||||||||||||||||
12/31/2006 | 12.55 | 0.04 | 0.97 | 1.01 | (0.01 | ) | - | 13.55 | 8.07 | 344 | 90 | 0.80 | 0.32 | |||||||||||||||||||||||||||||||||||||||||||||||
See accompanying Notes to Financial Statements.
JNL Series Trust
Financial Highlights
Net Asset Value | Increase (Decrease) from Investment Operations (e) | Distributions Gains on | Supplemental Data | Ratio of Expenses | Ratio of Income | |||||||||||||||||||||||||||||||||||||||||||||||||||
| Period Ended | Net Investment Income (Loss) | Net & | Total from Investment Operations | Distributions from Net Investment Income | Net Asset Value, End of Period | Total Return | Net Assets, End of Period (in thousands) | Portfolio Turnover (d) | ||||||||||||||||||||||||||||||||||||||||||||||||
JNL/Invesco Small Cap Growth Fund |
| |||||||||||||||||||||||||||||||||||||||||||||||||||||||
Class A | ||||||||||||||||||||||||||||||||||||||||||||||||||||||||
12/31/2010 | $ | 10.11 | $ | (0.05 | ) | $ | 2.70 | $ | 2.65 | $ | - | $ | - | $ | 12.76 | 26.21 | % | $ | 149,999 | 35 | % | 1.15 | % | (0.50 | )% | |||||||||||||||||||||||||||||||
12/31/2009 | 7.50 | (0.02 | ) | 2.63 | 2.61 | - | - | 10.11 | 34.80 | 92,793 | 33 | 1.16 | (0.17 | ) | ||||||||||||||||||||||||||||||||||||||||||
12/31/2008 | 14.82 | (0.04 | ) | (5.95 | ) | (5.99 | ) | - | (1.33 | ) | 7.50 | (39.73 | ) | 40,314 | 42 | 1.16 | (0.32 | ) | ||||||||||||||||||||||||||||||||||||||
12/31/2007 | 14.27 | (0.10 | ) | 1.71 | 1.61 | - | (1.06 | ) | 14.82 | 11.37 | 73,951 | 37 | 1.15 | (0.64 | ) | |||||||||||||||||||||||||||||||||||||||||
12/31/2006 | 13.52 | (0.11 | ) | 2.07 | 1.96 | - | (1.21 | ) | 14.27 | 14.49 | 53,265 | 54 | 1.16 | (0.79 | ) | |||||||||||||||||||||||||||||||||||||||||
Class B | ||||||||||||||||||||||||||||||||||||||||||||||||||||||||
12/31/2010 | 10.26 | (0.03 | ) | 2.75 | 2.72 | - | - | 12.98 | 26.51 | 414 | 35 | 0.95 | (0.29 | ) | ||||||||||||||||||||||||||||||||||||||||||
12/31/2009 | 7.60 | 0.00 | (f | ) | 2.66 | 2.66 | - | - | 10.26 | 35.00 | 157 | 33 | 0.96 | 0.01 | ||||||||||||||||||||||||||||||||||||||||||
12/31/2008 | 14.95 | (0.01 | ) | (6.01 | ) | (6.02 | ) | - | (1.33 | ) | 7.60 | (39.58 | ) | 103 | 42 | 0.96 | (0.10 | ) | ||||||||||||||||||||||||||||||||||||||
12/31/2007 | 14.36 | (0.07 | ) | 1.72 | 1.65 | - | (1.06 | ) | 14.95 | 11.58 | 111 | 37 | 0.95 | (0.47 | ) | |||||||||||||||||||||||||||||||||||||||||
12/31/2006 | 13.57 | (0.08 | ) | 2.08 | 2.00 | - | (1.21 | ) | 14.36 | 14.74 | 215 | 54 | 0.96 | (0.58 | ) | |||||||||||||||||||||||||||||||||||||||||
JNL/Ivy Asset Strategy Fund |
| |||||||||||||||||||||||||||||||||||||||||||||||||||||||
Class A | ||||||||||||||||||||||||||||||||||||||||||||||||||||||||
12/31/2010 | 10.41 | 0.09 | 0.93 | 1.02 | (0.00 | ) | (f | ) | - | 11.43 | 9.81 | 975,565 | 96 | 1.25 | 0.90 | |||||||||||||||||||||||||||||||||||||||||
9/28 (a) - 12/31/2009 | 10.00 | 0.01 | 0.40 | 0.41 | - | - | 10.41 | 4.10 | 196,774 | 16 | 1.25 | 0.52 | ||||||||||||||||||||||||||||||||||||||||||||
Class B | ||||||||||||||||||||||||||||||||||||||||||||||||||||||||
12/31/2010 | 10.41 | 0.10 | 0.94 | 1.04 | (0.00 | ) | (f | ) | - | 11.45 | 10.01 | 280 | 96 | 1.05 | 0.95 | |||||||||||||||||||||||||||||||||||||||||
9/28 (a) - 12/31/2009 | 10.00 | 0.01 | 0.40 | 0.41 | - | - | 10.41 | 4.10 | 203 | 16 | 1.05 | 0.47 | ||||||||||||||||||||||||||||||||||||||||||||
JNL/JPMorgan International Value Fund |
| |||||||||||||||||||||||||||||||||||||||||||||||||||||||
Class A | ||||||||||||||||||||||||||||||||||||||||||||||||||||||||
12/31/2010 | 7.17 | 0.12 | 0.42 | 0.54 | (0.19 | ) | - | 7.52 | 7.58 | 607,358 | 71 | 1.02 | 1.73 | |||||||||||||||||||||||||||||||||||||||||||
12/31/2009 | 5.72 | 0.14 | 1.58 | 1.72 | (0.27 | ) | - | 7.17 | 30.17 | 549,144 | 92 | 1.03 | 2.24 | |||||||||||||||||||||||||||||||||||||||||||
12/31/2008 | 14.35 | 0.38 | (6.85 | ) | (6.47 | ) | (0.25 | ) | (1.91 | ) | 5.72 | (44.49 | ) | 346,379 | 90 | 1.01 | 3.40 | |||||||||||||||||||||||||||||||||||||||
12/31/2007 | 14.02 | 0.27 | 1.36 | 1.63 | (0.17 | ) | (1.13 | ) | 14.35 | 11.97 | 727,077 | 98 | 1.01 | 1.81 | ||||||||||||||||||||||||||||||||||||||||||
12/31/2006 | 10.94 | 0.26 | 3.23 | 3.49 | (0.08 | ) | (0.33 | ) | 14.02 | 31.98 | 485,663 | 83 | 1.04 | 2.09 | ||||||||||||||||||||||||||||||||||||||||||
Class B | ||||||||||||||||||||||||||||||||||||||||||||||||||||||||
12/31/2010 | 7.31 | 0.13 | 0.44 | 0.57 | (0.20 | ) | - | 7.68 | 7.86 | 587 | 71 | 0.82 | 1.91 | |||||||||||||||||||||||||||||||||||||||||||
12/31/2009 | 5.82 | 0.16 | 1.62 | 1.78 | (0.29 | ) | - | 7.31 | 30.60 | 546 | 92 | 0.83 | 2.51 | |||||||||||||||||||||||||||||||||||||||||||
12/31/2008 | 14.57 | 0.39 | (6.95 | ) | (6.56 | ) | (0.28 | ) | (1.91 | ) | 5.82 | (44.44 | ) | 458 | 90 | 0.81 | 3.55 | |||||||||||||||||||||||||||||||||||||||
12/31/2007 | 14.23 | 0.31 | 1.38 | 1.69 | (0.22 | ) | (1.13 | ) | 14.57 | 12.23 | 467 | 98 | 0.81 | 2.01 | ||||||||||||||||||||||||||||||||||||||||||
12/31/2006 | 11.07 | 0.28 | 3.29 | 3.57 | (0.08 | ) | (0.33 | ) | 14.23 | 32.27 | 390 | 83 | 0.84 | 2.14 | ||||||||||||||||||||||||||||||||||||||||||
JNL/JPMorgan MidCap Growth Fund |
| |||||||||||||||||||||||||||||||||||||||||||||||||||||||
Class A | ||||||||||||||||||||||||||||||||||||||||||||||||||||||||
12/31/2010 | 15.94 | (0.03 | ) | 4.11 | 4.08 | - | - | 20.02 | 25.60 | 232,386 | 84 | 1.01 | (0.19 | ) | ||||||||||||||||||||||||||||||||||||||||||
12/31/2009 | 11.15 | (0.03 | ) | 4.82 | 4.79 | - | - | 15.94 | 42.96 | 163,690 | 82 | 1.01 | (0.25 | ) | ||||||||||||||||||||||||||||||||||||||||||
12/31/2008 | 20.07 | (0.05 | ) | (8.87 | ) | (8.92 | ) | - | - | 11.15 | (44.44 | ) | 91,958 | 105 | 1.02 | (0.30 | ) | |||||||||||||||||||||||||||||||||||||||
12/31/2007 | 18.59 | (0.03 | ) | 1.51 | 1.48 | - | - | 20.07 | 7.96 | 184,228 | 184 | 1.01 | (0.16 | ) | ||||||||||||||||||||||||||||||||||||||||||
12/31/2006 | 16.59 | (0.01 | ) | 2.01 | 2.00 | - | - | 18.59 | 12.06 | 221,504 | 151 | 1.01 | (0.07 | ) | ||||||||||||||||||||||||||||||||||||||||||
Class B | ||||||||||||||||||||||||||||||||||||||||||||||||||||||||
12/31/2010 | 16.13 | 0.00 | (f | ) | 4.17 | 4.17 | - | - | 20.30 | 25.85 | 185 | 84 | 0.81 | 0.02 | ||||||||||||||||||||||||||||||||||||||||||
12/31/2009 | 11.26 | (0.01 | ) | 4.88 | 4.87 | - | - | 16.13 | 43.25 | 114 | 82 | 0.81 | (0.05 | ) | ||||||||||||||||||||||||||||||||||||||||||
12/31/2008 | 20.22 | (0.01 | ) | (8.95 | ) | (8.96 | ) | - | - | 11.26 | (44.31 | ) | 158 | 105 | 0.82 | (0.08 | ) | |||||||||||||||||||||||||||||||||||||||
12/31/2007 | 18.70 | 0.01 | 1.51 | 1.52 | - | - | 20.22 | 8.13 | 234 | 184 | 0.81 | 0.03 | ||||||||||||||||||||||||||||||||||||||||||||
12/31/2006 | 16.65 | 0.02 | 2.03 | 2.05 | - | - | 18.70 | 12.31 | 163 | 151 | 0.81 | 0.14 | ||||||||||||||||||||||||||||||||||||||||||||
See accompanying Notes to Financial Statements.
JNL Series Trust
Financial Highlights
Net Asset Value | Increase (Decrease) from Investment Operations (e) | Distributions Gains on |
Supplemental Data | Ratio of Expenses | Ratio of Income | |||||||||||||||||||||||||||||||||||||||||||||||||||
| Period Ended | Net Investment Income (Loss) | Net & | Total from Investment Operations | Distributions from Net Investment Income | Net Asset Value, End of Period | Total Return | Net Assets, End of Period (in thousands) | Portfolio Turnover (d) | ||||||||||||||||||||||||||||||||||||||||||||||||
JNL/JPMorgan U.S. Government & Quality Bond Fund |
| |||||||||||||||||||||||||||||||||||||||||||||||||||||||
Class A | ||||||||||||||||||||||||||||||||||||||||||||||||||||||||
12/31/2010 | $ | 12.39 | $ | 0.46 | $ | 0.45 | $ | 0.91 | $ | (0.36 | ) | $ | - | $ | 12.94 | 7.34 | % | $ | 918,334 | 9 | % | 0.71 | % | 3.50 | % | |||||||||||||||||||||||||||||||
12/31/2009 | 12.25 | 0.47 | (0.01 | ) | 0.46 | (0.32 | ) | - | 12.39 | 3.69 | 693,017 | 12 | 0.73 | 3.78 | ||||||||||||||||||||||||||||||||||||||||||
12/31/2008 | 11.74 | 0.49 | 0.27 | 0.76 | (0.25 | ) | - | 12.25 | 6.53 | 680,849 | 14 | 0.76 | 4.06 | |||||||||||||||||||||||||||||||||||||||||||
12/31/2007 | 11.43 | 0.53 | 0.20 | 0.73 | (0.42 | ) | - | 11.74 | 6.38 | 265,662 | 57 | (m | ) | 0.78 | 4.51 | |||||||||||||||||||||||||||||||||||||||||
12/31/2006 | 11.07 | 0.46 | (0.10 | ) | 0.36 | - | - | 11.43 | 3.25 | 235,088 | 114 | (m | ) | 0.79 | 4.16 | |||||||||||||||||||||||||||||||||||||||||
Class B | ||||||||||||||||||||||||||||||||||||||||||||||||||||||||
12/31/2010 | 12.88 | 0.51 | 0.46 | 0.97 | (0.38 | ) | - | 13.47 | 7.53 | 523 | 9 | 0.51 | 3.72 | |||||||||||||||||||||||||||||||||||||||||||
12/31/2009 | 12.71 | 0.48 | 0.02 | 0.50 | (0.33 | ) | - | 12.88 | 3.92 | 564 | 12 | 0.53 | 3.71 | |||||||||||||||||||||||||||||||||||||||||||
12/31/2008 | 12.16 | 0.51 | 0.30 | 0.81 | (0.26 | ) | - | 12.71 | 6.73 | 897 | 14 | 0.56 | 4.11 | |||||||||||||||||||||||||||||||||||||||||||
12/31/2007 | 11.89 | 0.57 | 0.22 | 0.79 | (0.52 | ) | - | 12.16 | 6.64 | 138 | 57 | (m | ) | 0.58 | 4.71 | |||||||||||||||||||||||||||||||||||||||||
12/31/2006 | 11.50 | 0.50 | (0.11 | ) | 0.39 | - | - | 11.89 | 3.39 | 140 | 114 | (m | ) | 0.59 | 4.36 | |||||||||||||||||||||||||||||||||||||||||
JNL/Lazard Emerging Markets Fund |
| |||||||||||||||||||||||||||||||||||||||||||||||||||||||
Class A | ||||||||||||||||||||||||||||||||||||||||||||||||||||||||
12/31/2010 | 9.96 | 0.19 | 1.99 | 2.18 | (0.05 | ) | - | 12.09 | 21.91 | 1,386,967 | 23 | 1.23 | 1.76 | |||||||||||||||||||||||||||||||||||||||||||
12/31/2009 | 5.88 | 0.16 | 4.06 | 4.22 | (0.14 | ) | - | 9.96 | 71.74 | 735,862 | 49 | 1.27 | 1.98 | |||||||||||||||||||||||||||||||||||||||||||
12/31/2008 | 14.47 | 0.38 | (7.64 | ) | (7.26 | ) | (0.08 | ) | (1.25 | ) | 5.88 | (50.05 | ) | 211,608 | 64 | 1.28 | 3.21 | |||||||||||||||||||||||||||||||||||||||
12/31/2007 | 10.99 | 0.18 | 3.32 | 3.50 | (0.02 | ) | - | 14.47 | 31.81 | 411,866 | 53 | 1.29 | 1.37 | |||||||||||||||||||||||||||||||||||||||||||
05/01(a)-12/31/2006 | 10.00 | 0.10 | 0.89 | 0.99 | - | - | 10.99 | 9.90 | 88,626 | 28 | 1.35 | 1.52 | ||||||||||||||||||||||||||||||||||||||||||||
Class B | ||||||||||||||||||||||||||||||||||||||||||||||||||||||||
12/31/2010 | 9.98 | 0.22 | 2.00 | 2.22 | (0.06 | ) | - | 12.14 | 22.24 | 1,062 | 23 | 1.03 | 2.04 | |||||||||||||||||||||||||||||||||||||||||||
12/31/2009 | 5.89 | 0.18 | 4.06 | 4.24 | (0.15 | ) | - | 9.98 | 71.96 | 775 | 49 | 1.07 | 2.13 | |||||||||||||||||||||||||||||||||||||||||||
12/31/2008 | 14.49 | 0.37 | (7.63 | ) | (7.26 | ) | (0.09 | ) | (1.25 | ) | 5.89 | (49.94 | ) | 236 | 64 | 1.08 | 3.28 | |||||||||||||||||||||||||||||||||||||||
12/31/2007 | 11.00 | 0.21 | 3.32 | 3.53 | (0.04 | ) | - | 14.49 | 32.12 | 347 | 53 | 1.09 | 1.63 | |||||||||||||||||||||||||||||||||||||||||||
05/01(a)-12/31/2006 | 10.00 | 0.11 | 0.89 | 1.00 | - | - | 11.00 | 10.00 | 150 | 28 | 1.16 | 1.69 | ||||||||||||||||||||||||||||||||||||||||||||
JNL/Lazard Mid Cap Equity Fund |
| |||||||||||||||||||||||||||||||||||||||||||||||||||||||
Class A | ||||||||||||||||||||||||||||||||||||||||||||||||||||||||
12/31/2010 | 9.46 | 0.08 | 2.10 | 2.18 | (0.05 | ) | - | 11.59 | 23.07 | 214,053 | 82 | 1.02 | 0.83 | |||||||||||||||||||||||||||||||||||||||||||
12/31/2009 | 6.82 | 0.07 | 2.63 | 2.70 | (0.06 | ) | - | 9.46 | 39.65 | 164,730 | 79 | 1.03 | 0.86 | |||||||||||||||||||||||||||||||||||||||||||
12/31/2008 | 11.47 | 0.15 | (4.62 | ) | (4.47 | ) | (0.13 | ) | (0.05 | ) | 6.82 | (38.96 | ) | 125,184 | 81 | 1.02 | 1.50 | |||||||||||||||||||||||||||||||||||||||
12/31/2007 | 14.08 | 0.11 | (0.50 | ) | (0.39 | ) | (0.08 | ) | (2.14 | ) | 11.47 | (2.61 | ) | 243,429 | 84 | 1.02 | 0.71 | |||||||||||||||||||||||||||||||||||||||
12/31/2006 | 13.54 | 0.07 | 1.89 | 1.96 | (0.07 | ) | (1.35 | ) | 14.08 | 14.56 | 217,646 | 70 | 1.03 | 0.50 | ||||||||||||||||||||||||||||||||||||||||||
Class B | ||||||||||||||||||||||||||||||||||||||||||||||||||||||||
12/31/2010 | 9.53 | 0.10 | 2.11 | 2.21 | (0.06 | ) | - | 11.68 | 23.24 | 176 | 82 | 0.82 | 1.00 | |||||||||||||||||||||||||||||||||||||||||||
12/31/2009 | 6.90 | 0.05 | 2.65 | 2.70 | (0.07 | ) | - | 9.53 | 39.19 | 167 | 79 | 0.83 | 0.61 | |||||||||||||||||||||||||||||||||||||||||||
12/31/2008 | 11.62 | 0.17 | (4.69 | ) | (4.52 | ) | (0.15 | ) | (0.05 | ) | 6.90 | (38.88 | ) | 2,108 | 81 | 0.82 | 1.70 | |||||||||||||||||||||||||||||||||||||||
12/31/2007 | 14.23 | 0.14 | (0.51 | ) | (0.37 | ) | (0.10 | ) | (2.14 | ) | 11.62 | (2.44 | ) | 3,683 | 84 | 0.82 | 0.92 | |||||||||||||||||||||||||||||||||||||||
12/31/2006 | 13.61 | 0.10 | 1.90 | 2.00 | (0.03 | ) | (1.35 | ) | 14.23 | 14.77 | 3,093 | 70 | 0.83 | 0.68 | ||||||||||||||||||||||||||||||||||||||||||
JNL/M&G Global Basics Fund |
| |||||||||||||||||||||||||||||||||||||||||||||||||||||||
Class A | ||||||||||||||||||||||||||||||||||||||||||||||||||||||||
12/31/2010 | 12.27 | 0.04 | 2.80 | 2.84 | (0.08 | ) | (0.05 | ) | 14.98 | 23.19 | 195,399 | 18 | 1.22 | 0.31 | ||||||||||||||||||||||||||||||||||||||||||
12/31/2009 | 8.42 | 0.05 | 3.89 | 3.94 | (0.03 | ) | (0.06 | ) | 12.27 | 46.88 | 29,708 | 43 | 1.21 | 0.47 | ||||||||||||||||||||||||||||||||||||||||||
10/06(a)-12/31/2008 | 10.00 | (0.00 | ) | (f | ) | (1.58 | ) | (1.58 | ) | - | - | 8.42 | (15.80 | ) | 4,703 | 10 | 1.24 | (0.03 | ) | |||||||||||||||||||||||||||||||||||||
Class B | ||||||||||||||||||||||||||||||||||||||||||||||||||||||||
12/31/2010 | 12.30 | 0.06 | 2.81 | 2.87 | (0.10 | ) | (0.05 | ) | 15.02 | 23.37 | 115 | 18 | 1.02 | 0.50 | ||||||||||||||||||||||||||||||||||||||||||
12/31/2009 | 8.43 | 0.08 | 3.89 | 3.97 | (0.04 | ) | (0.06 | ) | 12.30 | 47.19 | 160 | 43 | 1.01 | 0.75 | ||||||||||||||||||||||||||||||||||||||||||
10/06(a)-12/31/2008 | 10.00 | 0.00 | (f | ) | (1.57 | ) | (1.57 | ) | - | - | 8.43 | (15.70 | ) | 84 | 10 | 1.04 | 0.17 | |||||||||||||||||||||||||||||||||||||||
See accompanying Notes to Financial Statements.
JNL Series Trust
Financial Highlights
Net Asset Value | Increase (Decrease) from Investment Operations (e) | Distributions Gains on |
Supplemental Data | Ratio of Expenses to Net Assets | Ratio of Income (Loss) to | |||||||||||||||||||||||||||||||||||||||||||||||
| Period Ended | Net Investment Income (Loss) | Net Realized & Unrealized (Losses) | Total from Investment Operations | Distributions from Net | Net Asset Value, End of Period | Total Return (b) | Net Assets, End of Period (in thousands) | Portfolio Turnover (d) | ||||||||||||||||||||||||||||||||||||||||||||
JNL/M&G Global Leaders Fund |
| |||||||||||||||||||||||||||||||||||||||||||||||||||
Class A | ||||||||||||||||||||||||||||||||||||||||||||||||||||
12/31/2010 | $ | 11.41 | $ | 0.07 | $ | 1.42 | $ | 1.49 | $ | (0.04 | ) | $ | (0.13 | ) | $ | 12.73 | 13.13 | % | $ | 29,788 | 47 | % | 1.24 | % | 0.59 | % | ||||||||||||||||||||||||||
12/31/2009 | 8.35 | 0.09 | 3.03 | 3.12 | (0.06 | ) | - | 11.41 | 37.43 | 17,302 | 39 | 1.21 | 0.87 | |||||||||||||||||||||||||||||||||||||||
10/06(a)-12/31/2008 | 10.00 | 0.02 | (1.66 | ) | (1.64 | ) | (0.01 | ) | - | 8.35 | (16.43 | ) | 4,501 | 34 | 1.23 | 0.82 | ||||||||||||||||||||||||||||||||||||
Class B | ||||||||||||||||||||||||||||||||||||||||||||||||||||
12/31/2010 | 11.42 | 0.10 | 1.42 | 1.52 | (0.06 | ) | (0.13 | ) | 12.75 | 13.36 | 150 | 47 | 1.04 | 0.84 | ||||||||||||||||||||||||||||||||||||||
12/31/2009 | 8.35 | 0.12 | 3.03 | 3.15 | (0.08 | ) | - | 11.42 | 37.70 | 126 | 39 | 1.01 | 1.25 | |||||||||||||||||||||||||||||||||||||||
10/06(a)-12/31/2008 | 10.00 | 0.02 | (1.66 | ) | (1.64 | ) | (0.01 | ) | - | 8.35 | (16.40 | ) | 84 | 34 | 1.03 | 1.03 | ||||||||||||||||||||||||||||||||||||
JNL/Mellon Capital Management 10 X 10 Fund (h) |
| |||||||||||||||||||||||||||||||||||||||||||||||||||
Class A | ||||||||||||||||||||||||||||||||||||||||||||||||||||
12/31/2010 | 7.19 | 0.14 | 1.04 | 1.18 | (0.15 | ) | (0.00 | ) | (f | ) | 8.22 | 16.43 | 257,545 | 8 | 0.05 | 1.90 | ||||||||||||||||||||||||||||||||||||
12/31/2009 | 6.19 | 0.21 | 1.31 | 1.52 | (0.26 | ) | (0.26 | ) | 7.19 | 24.59 | 194,494 | 11 | 0.06 | 3.20 | ||||||||||||||||||||||||||||||||||||||
12/31/2008 | 9.92 | 0.25 | (3.85 | ) | (3.60 | ) | (0.07 | ) | (0.06 | ) | 6.19 | (36.25 | ) | 100,370 | 20 | 0.06 | 3.11 | |||||||||||||||||||||||||||||||||||
04/30(a) - 12/31/2007 | 10.00 | 0.21 | (0.29 | ) | (0.08 | ) | - | - | 9.92 | (0.80 | ) | 57,683 | 60 | 0.06 | 3.14 | |||||||||||||||||||||||||||||||||||||
JNL/Mellon Capital Management Index 5 Fund (h) |
| |||||||||||||||||||||||||||||||||||||||||||||||||||
Class A | ||||||||||||||||||||||||||||||||||||||||||||||||||||
12/31/2010 | 8.39 | 0.14 | 1.19 | 1.33 | (0.09 | ) | (0.01 | ) | 9.62 | 15.78 | 332,481 | 10 | 0.05 | 1.58 | ||||||||||||||||||||||||||||||||||||||
12/31/2009 | 6.83 | 0.18 | 1.53 | 1.71 | (0.07 | ) | (0.08 | ) | 8.39 | 25.16 | 204,951 | 8 | 0.06 | 2.43 | ||||||||||||||||||||||||||||||||||||||
12/31/2008 | 10.00 | 0.30 | (3.30 | ) | (3.00 | ) | (0.07 | ) | (0.10 | ) | 6.83 | (29.87 | ) | 60,409 | 23 | 0.06 | 3.49 | |||||||||||||||||||||||||||||||||||
04/30(a) - 12/31/2007 | 10.00 | 0.36 | (0.36 | ) | - | - | - | 10.00 | 0.00 | 29,922 | 32 | 0.06 | 5.34 | |||||||||||||||||||||||||||||||||||||||
JNL/Mellon Capital Management European 30 Fund |
| |||||||||||||||||||||||||||||||||||||||||||||||||||
Class A | ||||||||||||||||||||||||||||||||||||||||||||||||||||
12/31/2010 | 11.30 | 0.40 | (0.16 | ) | 0.24 | (0.01 | ) | (0.05 | ) | 11.48 | 2.13 | 18,217 | 104 | 0.78 | 3.63 | |||||||||||||||||||||||||||||||||||||
12/31/2009 | 8.59 | 0.29 | 3.23 | 3.52 | (0.25 | ) | (0.56 | ) | 11.30 | 41.03 | 13,238 | 65 | 0.78 | 2.76 | ||||||||||||||||||||||||||||||||||||||
10/06(a)-12/31/2008 | 10.00 | 0.04 | (1.41 | ) | (1.37 | ) | (0.04 | ) | - | 8.59 | (13.74 | ) | 2,055 | 0 | 0.84 | 2.26 | ||||||||||||||||||||||||||||||||||||
Class B | ||||||||||||||||||||||||||||||||||||||||||||||||||||
12/31/2010 | 11.31 | 0.41 | (0.15 | ) | 0.26 | (0.01 | ) | (0.05 | ) | 11.51 | 2.31 | 142 | 104 | 0.58 | 3.72 | |||||||||||||||||||||||||||||||||||||
12/31/2009 | 8.59 | 0.35 | 3.19 | 3.54 | (0.26 | ) | (0.56 | ) | 11.31 | 41.27 | 128 | 65 | 0.58 | 3.65 | ||||||||||||||||||||||||||||||||||||||
10/06(a)-12/31/2008 | 10.00 | 0.05 | (1.42 | ) | (1.37 | ) | (0.04 | ) | - | 8.59 | 13.71 | 86 | 0 | 0.64 | 2.45 | |||||||||||||||||||||||||||||||||||||
JNL/Mellon Capital Management Pacific Rim 30 Fund |
| |||||||||||||||||||||||||||||||||||||||||||||||||||
Class A | ||||||||||||||||||||||||||||||||||||||||||||||||||||
12/31/2010 | 11.26 | 0.36 | 1.09 | 1.45 | - | (0.00 | ) | (f | ) | 12.71 | 12.89 | 38,944 | 78 | 0.78 | 3.03 | |||||||||||||||||||||||||||||||||||||
12/31/2009 | 9.60 | 0.21 | 2.11 | 2.32 | (0.15 | ) | (0.51 | ) | 11.26 | 24.15 | 16,625 | 47 | 0.78 | 1.95 | ||||||||||||||||||||||||||||||||||||||
10/06(a)-12/31/2008 | 10.00 | 0.02 | (0.42 | ) | (0.40 | ) | - | - | 9.60 | (4.00 | ) | 3,299 | 0 | 0.82 | 0.78 | |||||||||||||||||||||||||||||||||||||
Class B | ||||||||||||||||||||||||||||||||||||||||||||||||||||
12/31/2010 | 11.28 | 0.37 | 1.10 | 1.47 | - | (0.00 | ) | (f | ) | 12.75 | 13.05 | 191 | 78 | 0.58 | 3.16 | |||||||||||||||||||||||||||||||||||||
12/31/2009 | 9.60 | 0.26 | 2.09 | 2.35 | (0.16 | ) | (0.51 | ) | 11.28 | 24.49 | 136 | 47 | 0.58 | 2.54 | ||||||||||||||||||||||||||||||||||||||
10/06(a)-12/31/2008 | 10.00 | 0.02 | (0.42 | ) | (0.40 | ) | - | - | 9.60 | (4.00 | ) | 98 | 0 | 0.62 | 0.99 | |||||||||||||||||||||||||||||||||||||
JNL/Mellon Capital Management S&P 500 Index Fund |
| |||||||||||||||||||||||||||||||||||||||||||||||||||
Class A | ||||||||||||||||||||||||||||||||||||||||||||||||||||
12/31/2010 | 9.38 | 0.15 | 1.20 | 1.35 | (0.13 | ) | (0.01 | ) | 10.59 | 14.44 | 1,328,363 | 2 | 0.57 | 1.51 | ||||||||||||||||||||||||||||||||||||||
12/31/2009 | 7.54 | 0.14 | 1.82 | 1.96 | (0.12 | ) | - | 9.38 | 25.97 | 900,282 | 4 | 0.60 | 1.76 | |||||||||||||||||||||||||||||||||||||||
12/31/2008 | 12.36 | 0.19 | (4.84 | ) | (4.65 | ) | (0.17 | ) | - | 7.54 | (37.64 | ) | 457,126 | 7 | 0.60 | 1.80 | ||||||||||||||||||||||||||||||||||||
12/31/2007 | 12.06 | 0.18 | 0.40 | 0.58 | (0.16 | ) | (0.12 | ) | 12.36 | 4.90 | 656,286 | 3 | 0.59 | 1.45 | ||||||||||||||||||||||||||||||||||||||
12/31/2006 | 10.68 | 0.16 | 1.45 | 1.61 | (0.15 | ) | (0.08 | ) | 12.06 | 15.08 | 559,179 | 1 | 0.60 | 1.42 | ||||||||||||||||||||||||||||||||||||||
Class B | ||||||||||||||||||||||||||||||||||||||||||||||||||||
12/31/2010 | 9.54 | 0.17 | 1.23 | 1.40 | (0.15 | ) | (0.01 | ) | 10.78 | 14.70 | 12,937 | 2 | 0.37 | 1.71 | ||||||||||||||||||||||||||||||||||||||
12/31/2009 | 7.66 | 0.16 | 1.85 | 2.01 | (0.13 | ) | - | 9.54 | 26.26 | 10,996 | 4 | 0.40 | 2.02 | |||||||||||||||||||||||||||||||||||||||
12/31/2008 | 12.57 | 0.21 | (4.93 | ) | (4.72 | ) | (0.19 | ) | - | 7.66 | (37.57 | ) | 8,916 | 7 | 0.40 | 2.01 | ||||||||||||||||||||||||||||||||||||
12/31/2007 | 12.27 | 0.21 | 0.41 | 0.62 | (0.20 | ) | (0.12 | ) | 12.57 | 5.14 | 10,797 | 3 | 0.39 | 1.65 | ||||||||||||||||||||||||||||||||||||||
12/31/2006 | 10.76 | 0.21 | 1.44 | 1.65 | (0.06 | ) | (0.08 | ) | 12.27 | 15.29 | 9,547 | 1 | 0.40 | 1.74 | ||||||||||||||||||||||||||||||||||||||
See accompanying Notes to Financial Statements.
JNL Series Trust
Financial Highlights
| Ratio of | Ratio of Net | |||||||||||||||||||||||||||||||||||||||||||||||||||
| Increase (Decrease) from | Expenses | Investment | ||||||||||||||||||||||||||||||||||||||||||||||||||
| Investment Operations (e) | Distributions from | Net | Supplemental Data | to | Income | |||||||||||||||||||||||||||||||||||||||||||||||
Period Ended | Net Asset Value Beginning of Period | Net Investment Income (Loss) | Net Realized & Unrealized Gains (Losses) | Total from Investment Operations | Distributions from Net Investment Income | Net Realized Gains on Investment Transactions | Asset Value, End of Period | Total Return (b) | Net Assets, End of Period (in thousands) | Portfolio Turnover (d) | Average Net Assets (c) | (Loss) to Average Net Assets (c) | ||||||||||||||||||||||||||||||||||||||||
JNL/Mellon Capital Management S&P 400 MidCap Index Fund |
| |||||||||||||||||||||||||||||||||||||||||||||||||||
Class A | ||||||||||||||||||||||||||||||||||||||||||||||||||||
12/31/2010 | $ | 11.17 | $ | 0.08 | $ | 2.80 | $ | 2.88 | $ | (0.08 | ) | $ | (0.11 | ) | $ | 13.86 | 25.83 | % | $ | 664,777 | 12 | % | 0.60 | % | 0.64 | % | ||||||||||||||||||||||||||
12/31/2009 | 8.17 | 0.13 | 2.98 | 3.11 | (0.11 | ) | - | 11.17 | 38.03 | 469,779 | 14 | 0.61 | 1.35 | |||||||||||||||||||||||||||||||||||||||
12/31/2008 | 14.78 | 0.17 | (5.75 | ) | (5.58 | ) | (0.13 | ) | (0.90 | ) | 8.17 | (37.58 | ) | 284,426 | 30 | 0.61 | 1.35 | |||||||||||||||||||||||||||||||||||
12/31/2007 | 14.96 | 0.17 | 0.93 | 1.10 | (0.05 | ) | (1.23 | ) | 14.78 | 7.45 | 464,641 | 25 | 0.60 | 1.06 | ||||||||||||||||||||||||||||||||||||||
12/31/2006 | 14.21 | 0.14 | 1.24 | 1.38 | (0.13 | ) | (0.50 | ) | 14.96 | 9.69 | 381,163 | 10 | 0.61 | 0.97 | ||||||||||||||||||||||||||||||||||||||
Class B | ||||||||||||||||||||||||||||||||||||||||||||||||||||
12/31/2010 | 11.30 | 0.10 | 2.86 | 2.96 | (0.10 | ) | (0.11 | ) | 14.05 | 26.19 | 6,033 | 12 | 0.40 | 0.84 | ||||||||||||||||||||||||||||||||||||||
12/31/2009 | 8.26 | 0.14 | 3.03 | 3.17 | (0.13 | ) | - | 11.30 | 38.34 | 4,541 | 14 | 0.41 | 1.55 | |||||||||||||||||||||||||||||||||||||||
12/31/2008 | 14.95 | 0.20 | (5.83 | ) | (5.63 | ) | (0.16 | ) | (0.90 | ) | 8.26 | (37.51 | ) | 2,613 | 30 | 0.41 | 1.55 | |||||||||||||||||||||||||||||||||||
12/31/2007 | 15.07 | 0.21 | 0.94 | 1.15 | (0.04 | ) | (1.23 | ) | 14.95 | 7.69 | 3,470 | 25 | 0.40 | 1.27 | ||||||||||||||||||||||||||||||||||||||
12/31/2006 | 14.22 | 0.19 | 1.22 | 1.41 | (0.06 | ) | (0.50 | ) | 15.07 | 9.91 | 2,804 | 10 | 0.41 | 1.26 | ||||||||||||||||||||||||||||||||||||||
JNL/Mellon Capital Management Small Cap Index Fund | ||||||||||||||||||||||||||||||||||||||||||||||||||||
Class A | ||||||||||||||||||||||||||||||||||||||||||||||||||||
12/31/2010 | 10.04 | 0.10 | 2.54 | 2.64 | (0.07 | ) | - | 12.61 | 26.32 | 709,661 | 14 | 0.60 | 0.91 | |||||||||||||||||||||||||||||||||||||||
12/31/2009 | 7.97 | 0.09 | 2.10 | 2.19 | (0.07 | ) | (0.05 | ) | 10.04 | 27.54 | 470,449 | 17 | 0.61 | 1.08 | ||||||||||||||||||||||||||||||||||||||
12/31/2008 | 13.53 | 0.11 | (4.87 | ) | (4.76 | ) | (0.15 | ) | (0.65 | ) | 7.97 | (35.01 | ) | 241,444 | 29 | 0.61 | 0.96 | |||||||||||||||||||||||||||||||||||
12/31/2007 | 14.79 | 0.18 | (0.51 | ) | (0.33 | ) | (0.04 | ) | (0.89 | ) | 13.53 | (2.11 | ) | 361,126 | 21 | 0.60 | 1.21 | |||||||||||||||||||||||||||||||||||
12/31/2006 | 13.44 | 0.15 | 2.19 | 2.34 | (0.12 | ) | (0.87 | ) | 14.79 | 17.49 | 339,124 | 17 | 0.60 | 1.02 | ||||||||||||||||||||||||||||||||||||||
Class B | ||||||||||||||||||||||||||||||||||||||||||||||||||||
12/31/2010 | 10.14 | 0.12 | 2.57 | 2.69 | (0.08 | ) | - | 12.75 | 26.58 | 5,158 | 14 | 0.40 | 1.08 | |||||||||||||||||||||||||||||||||||||||
12/31/2009 | 8.05 | 0.11 | 2.11 | 2.22 | (0.08 | ) | (0.05 | ) | 10.14 | 27.68 | 3,916 | 17 | 0.41 | 1.30 | ||||||||||||||||||||||||||||||||||||||
12/31/2008 | 13.66 | 0.14 | (4.92 | ) | (4.78 | ) | (0.18 | ) | (0.65 | ) | 8.05 | (34.83 | ) | 2,299 | 29 | 0.41 | 1.17 | |||||||||||||||||||||||||||||||||||
12/31/2007 | 14.86 | 0.21 | (0.50 | ) | (0.29 | ) | (0.02 | ) | (0.89 | ) | 13.66 | (1.84 | ) | 2,771 | 21 | 0.40 | 1.41 | |||||||||||||||||||||||||||||||||||
12/31/2006 | 13.42 | 0.20 | 2.16 | 2.36 | (0.05 | ) | (0.87 | ) | 14.86 | 17.66 | 2,714 | 17 | 0.40 | 1.33 | ||||||||||||||||||||||||||||||||||||||
JNL/Mellon Capital Management International Index Fund | ||||||||||||||||||||||||||||||||||||||||||||||||||||
Class A | ||||||||||||||||||||||||||||||||||||||||||||||||||||
12/31/2010 | 11.90 | 0.26 | 0.55 | 0.81 | (0.23 | ) | - | 12.48 | 6.81 | 1,066,567 | 2 | 0.67 | 2.23 | |||||||||||||||||||||||||||||||||||||||
12/31/2009 | 9.41 | 0.25 | 2.50 | 2.75 | (0.26 | ) | 0.00 | (f) | 11.90 | 29.28 | 721,755 | 2 | 0.69 | 2.43 | ||||||||||||||||||||||||||||||||||||||
12/31/2008 | 17.55 | 0.47 | (8.00 | ) | (7.53 | ) | (0.30 | ) | (0.31 | ) | 9.41 | (42.92 | ) | 369,368 | 15 | 0.65 | 3.31 | |||||||||||||||||||||||||||||||||||
12/31/2007 | 16.54 | 0.40 | 1.29 | 1.69 | (0.45 | ) | (0.23 | ) | 17.55 | 10.39 | 645,505 | 5 | 0.65 | 2.23 | ||||||||||||||||||||||||||||||||||||||
12/31/2006 | 13.59 | 0.32 | 3.15 | 3.47 | (0.37 | ) | (0.15 | ) | 16.54 | 25.58 | 497,487 | 2 | 0.66 | 2.11 | ||||||||||||||||||||||||||||||||||||||
Class B | ||||||||||||||||||||||||||||||||||||||||||||||||||||
12/31/2010 | 12.26 | 0.30 | 0.56 | 0.86 | (0.25 | ) | - | 12.87 | 7.01 | 21,720 | 2 | 0.47 | 2.48 | |||||||||||||||||||||||||||||||||||||||
12/31/2009 | 9.68 | 0.30 | 2.56 | 2.86 | (0.28 | ) | 0.00 | (f) | 12.26 | 29.57 | 18,284 | 2 | 0.49 | 2.83 | ||||||||||||||||||||||||||||||||||||||
12/31/2008 | 18.04 | 0.52 | (8.24 | ) | (7.72 | ) | (0.33 | ) | (0.31 | ) | 9.68 | (42.82 | ) | 6,256 | 15 | 0.45 | 3.55 | |||||||||||||||||||||||||||||||||||
12/31/2007 | 16.88 | 0.44 | 1.32 | 1.76 | (0.37 | ) | (0.23 | ) | 18.04 | 10.56 | 10,527 | 5 | 0.45 | 2.43 | ||||||||||||||||||||||||||||||||||||||
12/31/2006 | 13.60 | 0.22 | 3.30 | 3.52 | (0.09 | ) | (0.15 | ) | 16.88 | 25.93 | 5,982 | 2 | 0.47 | 1.40 | ||||||||||||||||||||||||||||||||||||||
JNL/Mellon Capital Management Bond Index Fund | ||||||||||||||||||||||||||||||||||||||||||||||||||||
Class A | ||||||||||||||||||||||||||||||||||||||||||||||||||||
12/31/2010 | 11.39 | 0.34 | 0.32 | 0.66 | (0.30 | ) | (0.02 | ) | 11.73 | 5.87 | 1,328,699 | 83 | (n) | 0.57 | 2.86 | |||||||||||||||||||||||||||||||||||||
12/31/2009 | 11.07 | 0.42 | 0.21 | 0.63 | (0.30 | ) | (0.01 | ) | 11.39 | 5.65 | 793,123 | 87 | (n) | 0.60 | 3.67 | |||||||||||||||||||||||||||||||||||||
12/31/2008 | 11.16 | 0.52 | (0.10 | ) | 0.42 | (0.51 | ) | - | 11.07 | 3.79 | 379,239 | 51 | (n) | 0.61 | 4.60 | |||||||||||||||||||||||||||||||||||||
12/31/2007 | 10.92 | 0.52 | 0.18 | 0.70 | (0.46 | ) | - | 11.16 | 6.43 | 349,683 | 45 | (n) | 0.60 | 4.68 | ||||||||||||||||||||||||||||||||||||||
12/31/2006 | 10.75 | 0.48 | (0.09 | ) | 0.39 | (0.22 | ) | - | 10.92 | 3.64 | 247,489 | 65 | (n) | 0.61 | 4.42 | |||||||||||||||||||||||||||||||||||||
Class B | ||||||||||||||||||||||||||||||||||||||||||||||||||||
12/31/2010 | 11.71 | 0.38 | 0.34 | 0.72 | (0.33 | ) | (0.02 | ) | 12.08 | 6.14 | 2,865 | 83 | (n) | 0.37 | 3.08 | |||||||||||||||||||||||||||||||||||||
12/31/2009 | 11.36 | 0.46 | 0.21 | 0.67 | (0.31 | ) | (0.01 | ) | 11.71 | 5.90 | 2,647 | 87 | (n) | 0.40 | 3.92 | |||||||||||||||||||||||||||||||||||||
12/31/2008 | 11.44 | 0.56 | (0.11 | ) | 0.45 | (0.53 | ) | - | 11.36 | 3.98 | 1,596 | 51 | (n) | 0.41 | 4.81 | |||||||||||||||||||||||||||||||||||||
12/31/2007 | 11.05 | 0.55 | 0.19 | 0.74 | (0.35 | ) | - | 11.44 | 6.68 | 906 | 45 | (n) | 0.41 | 4.88 | ||||||||||||||||||||||||||||||||||||||
12/31/2006 | 10.70 | 0.50 | (0.09 | ) | 0.41 | (0.06 | ) | - | 11.05 | 3.85 | 692 | 65 | (n) | 0.41 | 4.65 | |||||||||||||||||||||||||||||||||||||
See accompanying Notes to Financial Statements.
JNL Series Trust
Financial Highlights
Net Asset Value | Increase (Decrease) from Investment Operations (e) | Distributions Gains on |
Supplemental Data | Ratio of Expenses to | Ratio of Income | |||||||||||||||||||||||||||||||||||||||||||||||||||||||||||
| Period Ended | Net Investment Income (Loss) | Net & | Total from Investment Operations | Distributions from Net Investment Income | Net Asset Value, End of Period | Total Return | Net Assets, End of Period (in thousands) | Portfolio Turnover (d) | ||||||||||||||||||||||||||||||||||||||||||||||||||||||||
JNL/Mellon Capital Management Global Alpha Fund |
| |||||||||||||||||||||||||||||||||||||||||||||||||||||||||||||||
Class A | ||||||||||||||||||||||||||||||||||||||||||||||||||||||||||||||||
12/31/2010 | $ | 9.88 | $ | (0.12 | ) | $ | 0.71 | $ | 0.59 | $ | - | $ | (0.00 | ) | (f | ) | $ | 10.47 | 6.00 | % | $ | 200,918 | 0 | % | 1.36 | % | (1.20 | )% | ||||||||||||||||||||||||||||||||||||
9/28(a) - 12/31/2009 | 10.00 | (0.03 | ) | (0.09 | ) | (0.12 | ) | - | - | 9.88 | (1.20 | ) | 62,275 | 0 | 1.35 | (1.28 | ) | |||||||||||||||||||||||||||||||||||||||||||||||
Class B | ||||||||||||||||||||||||||||||||||||||||||||||||||||||||||||||||
12/31/2010 | 9.89 | (0.10 | ) | 0.70 | 0.60 | - | (0.00 | ) | (f | ) | 10.49 | 6.09 | 196 | 0 | 1.16 | (1.01 | ) | |||||||||||||||||||||||||||||||||||||||||||||||
9/28(a) - 12/31/2009 | 10.00 | (0.03 | ) | (0.08 | ) | (0.11 | ) | - | - | 9.89 | (1.10 | ) | 109 | 0 | 1.15 | (1.09 | ) | |||||||||||||||||||||||||||||||||||||||||||||||
JNL/Oppenheimer Global Growth Fund |
| |||||||||||||||||||||||||||||||||||||||||||||||||||||||||||||||
Class A | ||||||||||||||||||||||||||||||||||||||||||||||||||||||||||||||||
12/31/2010 | 9.14 | 0.09 | 1.31 | 1.40 | (0.07 | ) | - | 10.47 | 15.38 | 401,636 | 25 | 1.06 | 0.97 | |||||||||||||||||||||||||||||||||||||||||||||||||||
12/31/2009 | 7.00 | 0.10 | 2.65 | 2.75 | (0.12 | ) | (0.49 | ) | 9.14 | 39.42 | 289,972 | 21 | 1.06 | 1.19 | ||||||||||||||||||||||||||||||||||||||||||||||||||
12/31/2008 | 14.97 | 0.21 | (6.42 | ) | (6.21 | ) | (0.17 | ) | (1.59 | ) | 7.00 | (40.86 | ) | 176,084 | 22 | 1.06 | 1.71 | |||||||||||||||||||||||||||||||||||||||||||||||
12/31/2007 | 15.25 | 0.13 | 0.81 | 0.94 | (0.12 | ) | (1.10 | ) | 14.97 | 6.33 | 372,934 | 31 | 1.05 | 0.79 | ||||||||||||||||||||||||||||||||||||||||||||||||||
12/31/2006 | 13.53 | 0.08 | 2.21 | 2.29 | (0.07 | ) | (0.50 | ) | 15.25 | 16.96 | 349,246 | 30 | 1.06 | 0.58 | ||||||||||||||||||||||||||||||||||||||||||||||||||
Class B | ||||||||||||||||||||||||||||||||||||||||||||||||||||||||||||||||
12/31/2010 | 9.23 | 0.11 | 1.34 | 1.45 | (0.09 | ) | - | 10.59 | 15.68 | 616 | 25 | 0.86 | 1.16 | |||||||||||||||||||||||||||||||||||||||||||||||||||
12/31/2009 | 7.07 | 0.11 | 2.68 | 2.79 | (0.14 | ) | (0.49 | ) | 9.23 | 39.58 | 507 | 21 | 0.86 | 1.40 | ||||||||||||||||||||||||||||||||||||||||||||||||||
12/31/2008 | 15.11 | 0.22 | (6.46 | ) | (6.24 | ) | (0.21 | ) | (1.59 | ) | 7.07 | (40.69 | ) | 340 | 22 | 0.86 | 1.82 | |||||||||||||||||||||||||||||||||||||||||||||||
12/31/2007 | 15.35 | 0.17 | 0.81 | 0.98 | (0.12 | ) | (1.10 | ) | 15.11 | 6.56 | 397 | 31 | 0.85 | 1.02 | ||||||||||||||||||||||||||||||||||||||||||||||||||
12/31/2006 | 13.57 | 0.11 | 2.22 | 2.33 | (0.05 | ) | (0.50 | ) | 15.35 | 17.21 | 386 | 30 | 0.86 | 0.72 | ||||||||||||||||||||||||||||||||||||||||||||||||||
JNL/PAM Asia ex-Japan Fund |
| |||||||||||||||||||||||||||||||||||||||||||||||||||||||||||||||
Class A | ||||||||||||||||||||||||||||||||||||||||||||||||||||||||||||||||
12/31/2010 | 8.14 | 0.03 | 1.55 | 1.58 | (0.01 | ) | - | 9.71 | 19.40 | 150,646 | 75 | 1.31 | 0.40 | |||||||||||||||||||||||||||||||||||||||||||||||||||
12/31/2009 | 4.80 | 0.03 | 3.31 | 3.34 | 0.00 | (f | ) | - | 8.14 | 69.59 | 108,276 | 39 | 1.27 | 0.46 | ||||||||||||||||||||||||||||||||||||||||||||||||||
12/31/2008 | 9.80 | 0.12 | (5.03 | ) | (4.91 | ) | (0.09 | ) | - | 4.80 | (50.09 | ) | 7,727 | 132 | 1.29 | 1.66 | ||||||||||||||||||||||||||||||||||||||||||||||||
12/03(a) - 12/31/2007 | 10.00 | (0.01 | ) | (0.19 | ) | (0.20 | ) | - | - | 9.80 | (2.00 | ) | 11,747 | 0 | 1.30 | (0.67 | ) | |||||||||||||||||||||||||||||||||||||||||||||||
Class B | ||||||||||||||||||||||||||||||||||||||||||||||||||||||||||||||||
12/31/2010 | 8.15 | 0.06 | 1.54 | 1.60 | (0.02 | ) | - | 9.73 | 19.59 | 187 | 75 | 1.11 | 0.65 | |||||||||||||||||||||||||||||||||||||||||||||||||||
12/31/2009 | 4.80 | 0.06 | 3.29 | 3.35 | 0.00 | (f | ) | - | 8.15 | 69.80 | 134 | 39 | 1.07 | 0.94 | ||||||||||||||||||||||||||||||||||||||||||||||||||
12/31/2008 | 9.80 | 0.13 | (5.02 | ) | (4.89 | ) | (0.11 | ) | - | 4.80 | (49.92 | ) | 57 | 132 | 1.09 | 1.73 | ||||||||||||||||||||||||||||||||||||||||||||||||
12/03(a) - 12/31/2007 | 10.00 | 0.00 | (0.20 | ) | (0.20 | ) | - | - | 9.80 | (2.00 | ) | 98 | 0 | 1.10 | (0.47 | ) | ||||||||||||||||||||||||||||||||||||||||||||||||
JNL/PAM China-India Fund |
| |||||||||||||||||||||||||||||||||||||||||||||||||||||||||||||||
Class A | ||||||||||||||||||||||||||||||||||||||||||||||||||||||||||||||||
12/31/2010 | 7.71 | 0.04 | 1.26 | 1.30 | - | (0.08 | ) | 8.93 | 16.93 | 385,002 | 40 | 1.33 | 0.46 | |||||||||||||||||||||||||||||||||||||||||||||||||||
12/31/2009 | 4.23 | 0.00 | (f | ) | 3.48 | 3.48 | - | - | 7.71 | 82.27 | 233,497 | 73 | 1.33 | 0.05 | ||||||||||||||||||||||||||||||||||||||||||||||||||
12/31/2008 | 9.98 | 0.03 | (5.78 | ) | (5.75 | ) | - | - | 4.23 | (57.62 | ) | 25,987 | 188 | 1.41 | 0.51 | |||||||||||||||||||||||||||||||||||||||||||||||||
12/03(a) - 12/31/2007 | 10.00 | (0.01 | ) | (0.01 | ) | (0.02 | ) | - | - | 9.98 | (0.20 | ) | 4,888 | 0 | 1.40 | (0.93 | ) | |||||||||||||||||||||||||||||||||||||||||||||||
Class B | ||||||||||||||||||||||||||||||||||||||||||||||||||||||||||||||||
12/31/2010 | 7.74 | 0.04 | 1.28 | 1.32 | - | (0.08 | ) | 8.98 | 17.12 | 332 | 40 | 1.13 | 0.55 | |||||||||||||||||||||||||||||||||||||||||||||||||||
12/31/2009 | 4.24 | 0.03 | 3.47 | 3.50 | - | - | 7.74 | 82.55 | 239 | 73 | 1.13 | 0.40 | ||||||||||||||||||||||||||||||||||||||||||||||||||||
12/31/2008 | 9.98 | 0.03 | (5.77 | ) | (5.74 | ) | - | - | 4.24 | (57.52 | ) | 68 | 188 | 1.21 | 0.52 | |||||||||||||||||||||||||||||||||||||||||||||||||
12/03(a) - 12/31/2007 | 10.00 | (0.01 | ) | (0.01 | ) | (0.02 | ) | - | - | 9.98 | (0.20 | ) | 100 | 0 | 1.20 | (0.74 | ) | |||||||||||||||||||||||||||||||||||||||||||||||
JNL/PIMCO Real Return Fund |
| |||||||||||||||||||||||||||||||||||||||||||||||||||||||||||||||
Class A | ||||||||||||||||||||||||||||||||||||||||||||||||||||||||||||||||
12/31/2010 | 11.57 | 0.17 | 0.72 | 0.89 | (0.17 | ) | (0.23 | ) | 12.06 | 7.72 | 1,794,823 | 536 | 0.82 | 1.36 | ||||||||||||||||||||||||||||||||||||||||||||||||||
12/31/2009 | 10.10 | 0.30 | 1.44 | 1.74 | (0.27 | ) | - | 11.57 | 17.25 | 1,189,828 | 722 | 0.81 | 2.69 | |||||||||||||||||||||||||||||||||||||||||||||||||||
12/31/2008 | 11.09 | 0.39 | (0.82 | ) | (0.43 | ) | (0.16 | ) | (0.40 | ) | 10.10 | (3.73 | ) | 663,938 | 2289 | 0.81 | 3.44 | |||||||||||||||||||||||||||||||||||||||||||||||
01/16(a) - 12/31/2007 | 10.00 | 0.43 | 0.66 | 1.09 | - | - | 11.09 | 10.90 | 397,393 | 1215 | (o | ) | 0.80 | 4.27 | ||||||||||||||||||||||||||||||||||||||||||||||||||
Class B | ||||||||||||||||||||||||||||||||||||||||||||||||||||||||||||||||
12/31/2010 | 11.64 | 0.19 | 0.73 | 0.92 | (0.18 | ) | (0.23 | ) | 12.15 | 7.96 | 263 | 536 | 0.62 | 1.57 | ||||||||||||||||||||||||||||||||||||||||||||||||||
12/31/2009 | 10.13 | 0.32 | 1.48 | 1.80 | (0.29 | ) | - | 11.64 | 17.76 | 237 | 722 | 0.61 | 2.97 | |||||||||||||||||||||||||||||||||||||||||||||||||||
12/31/2008 | 11.11 | 0.41 | (0.82 | ) | (0.41 | ) | (0.17 | ) | (0.40 | ) | 10.13 | (3.57 | ) | 350 | 2289 | 0.61 | 3.63 | |||||||||||||||||||||||||||||||||||||||||||||||
01/16(a) - 12/31/2007 | 10.00 | 0.32 | 0.79 | 1.11 | - | - | 11.11 | 11.10 | 126 | 1215 | (o | ) | 0.60 | 3.20 | ||||||||||||||||||||||||||||||||||||||||||||||||||
See accompanying Notes to Financial Statements.
JNL Series Trust
Financial Highlights
Net Asset Value | Increase (Decrease) from Investment Operations (e) | Distributions Gains on |
Supplemental Data | Ratio of Expenses | Ratio of Income | |||||||||||||||||||||||||||||||||||||||||||||||||||||||
| Period Ended | Net Investment Income (Loss) | Net & | Total from Investment Operations | Distributions from Net Investment Income | Net Asset Value, End of Period | Total Return (b) | Net Assets, End of Period (in thousands) | Portfolio Turnover (d) | ||||||||||||||||||||||||||||||||||||||||||||||||||||
JNL/PIMCO Total Return Bond Fund |
| |||||||||||||||||||||||||||||||||||||||||||||||||||||||||||
Class A | ||||||||||||||||||||||||||||||||||||||||||||||||||||||||||||
12/31/2010 | $ | 12.19 | $ | 0.26 | $ | 0.65 | $ | 0.91 | $ | (0.27 | ) | $ | (0.48 | ) | $ | 12.35 | 7.57 | % | $ | 3,248,237 | 489 | % | 0.81 | % | 2.05 | % | ||||||||||||||||||||||||||||||||||
12/31/2009 | 11.07 | 0.48 | 1.24 | 1.72 | (0.29 | ) | (0.31 | ) | 12.19 | 15.45 | 2,348,470 | 177 | 0.81 | 4.04 | ||||||||||||||||||||||||||||||||||||||||||||||
12/31/2008 | 12.04 | 0.51 | (0.48 | ) | 0.03 | (0.53 | ) | (0.47 | ) | 11.07 | 0.40 | 1,325,740 | 660 | 0.81 | 4.22 | |||||||||||||||||||||||||||||||||||||||||||||
12/31/2007 | 11.66 | 0.54 | 0.42 | 0.96 | (0.56 | ) | (0.02 | ) | 12.04 | 8.25 | 1,037,811 | 119 | (p | ) | 0.80 | 4.54 | ||||||||||||||||||||||||||||||||||||||||||||
12/31/2006 | 11.70 | 0.50 | (0.10 | ) | 0.40 | (0.44 | ) | 0.00 | (f | ) | 11.66 | 3.38 | 760,176 | 63 | (p | ) | 0.81 | 4.20 | ||||||||||||||||||||||||||||||||||||||||||
Class B | ||||||||||||||||||||||||||||||||||||||||||||||||||||||||||||
12/31/2010 | 12.89 | 0.30 | 0.69 | 0.99 | (0.29 | ) | (0.48 | ) | 13.11 | 7.79 | 15,912 | 489 | 0.61 | 2.24 | ||||||||||||||||||||||||||||||||||||||||||||||
12/31/2009 | 11.67 | 0.53 | 1.30 | 1.83 | (0.30 | ) | (0.31 | ) | 12.89 | 15.66 | 14,110 | 177 | 0.61 | 4.21 | ||||||||||||||||||||||||||||||||||||||||||||||
12/31/2008 | 12.64 | 0.56 | (0.51 | ) | 0.05 | (0.55 | ) | (0.47 | ) | 11.67 | 0.57 | 9,891 | 660 | 0.61 | 4.40 | |||||||||||||||||||||||||||||||||||||||||||||
12/31/2007 | 12.22 | 0.59 | 0.45 | 1.04 | (0.60 | ) | (0.02 | ) | 12.64 | 8.53 | 8,145 | 119 | (p | ) | 0.61 | 4.74 | ||||||||||||||||||||||||||||||||||||||||||||
12/31/2006 | 11.91 | 0.55 | (0.13 | ) | 0.42 | (0.11 | ) | 0.00 | (f | ) | 12.22 | 3.57 | 6,953 | 63 | (p | ) | 0.60 | 4.51 | ||||||||||||||||||||||||||||||||||||||||||
JNL/PPM America High Yield Bond Fund |
| |||||||||||||||||||||||||||||||||||||||||||||||||||||||||||
Class A | ||||||||||||||||||||||||||||||||||||||||||||||||||||||||||||
12/31/2010 | 6.15 | 0.52 | 0.44 | 0.96 | (0.44 | ) | - | 6.67 | 15.63 | 900,088 | 66 | 0.76 | 7.81 | |||||||||||||||||||||||||||||||||||||||||||||||
12/31/2009 | 4.46 | 0.50 | 1.56 | 2.06 | (0.37 | ) | - | 6.15 | 46.30 | 566,513 | 50 | 0.78 | 8.87 | |||||||||||||||||||||||||||||||||||||||||||||||
12/31/2008 | 7.43 | 0.59 | (2.93 | ) | (2.34 | ) | (0.63 | ) | - | 4.46 | (30.75 | ) | 188,010 | 78 | 0.79 | 8.82 | ||||||||||||||||||||||||||||||||||||||||||||
12/31/2007 | 8.22 | 0.66 | (0.75 | ) | (0.09 | ) | (0.70 | ) | - | 7.43 | (1.10 | ) | 303,282 | 95 | 0.78 | 7.92 | ||||||||||||||||||||||||||||||||||||||||||||
12/31/2006 | 7.95 | 0.62 | 0.21 | 0.83 | (0.56 | ) | - | 8.22 | 10.51 | 365,753 | 62 | 0.80 | 7.49 | |||||||||||||||||||||||||||||||||||||||||||||||
Class B | ||||||||||||||||||||||||||||||||||||||||||||||||||||||||||||
12/31/2010 | 6.74 | 0.58 | 0.48 | 1.06 | (0.45 | ) | - | 7.35 | 15.76 | 7,612 | 66 | 0.56 | 8.03 | |||||||||||||||||||||||||||||||||||||||||||||||
12/31/2009 | 4.86 | 0.55 | 1.71 | 2.26 | (0.38 | ) | - | 6.74 | 46.58 | 5,989 | 50 | 0.58 | 9.22 | |||||||||||||||||||||||||||||||||||||||||||||||
12/31/2008 | 8.02 | 0.65 | (3.17 | ) | (2.52 | ) | (0.64 | ) | - | 4.86 | (30.65 | ) | 3,280 | 78 | 0.59 | 9.09 | ||||||||||||||||||||||||||||||||||||||||||||
12/31/2007 | 8.81 | 0.72 | (0.79 | ) | (0.07 | ) | (0.72 | ) | - | 8.02 | (0.79 | ) | 3,999 | 95 | 0.58 | 8.12 | ||||||||||||||||||||||||||||||||||||||||||||
12/31/2006 | 8.12 | 0.66 | 0.21 | 0.87 | (0.18 | ) | - | 8.81 | 10.72 | 4,443 | 62 | 0.59 | 7.60 | |||||||||||||||||||||||||||||||||||||||||||||||
JNL/PPM America Mid Cap Value Fund |
| |||||||||||||||||||||||||||||||||||||||||||||||||||||||||||
Class A | ||||||||||||||||||||||||||||||||||||||||||||||||||||||||||||
12/31/2010 | 8.25 | 0.03 | 2.41 | 2.44 | (0.00 | ) | (f | ) | - | 10.69 | 29.58 | 86,297 | 73 | 1.06 | 0.29 | |||||||||||||||||||||||||||||||||||||||||||||
12/31/2009 | 5.62 | 0.05 | 2.61 | 2.66 | (0.03 | ) | - | 8.25 | 47.38 | 20,020 | 89 | 1.06 | 0.77 | |||||||||||||||||||||||||||||||||||||||||||||||
03/31(a)-12/31/2008 | 10.00 | 0.07 | (4.37 | ) | (4.30 | ) | (0.08 | ) | - | 5.62 | (43.00 | ) | 5,011 | 154 | 1.06 | 1.05 | ||||||||||||||||||||||||||||||||||||||||||||
Class B | ||||||||||||||||||||||||||||||||||||||||||||||||||||||||||||
12/31/2010 | 8.25 | 0.04 | 2.41 | 2.45 | (0.00 | ) | (f | ) | - | 10.70 | 29.70 | 122 | 73 | 0.86 | 0.43 | |||||||||||||||||||||||||||||||||||||||||||||
12/31/2009 | 5.61 | 0.06 | 2.62 | 2.68 | (0.04 | ) | - | 8.25 | 47.82 | 92 | 89 | 0.86 | 0.99 | |||||||||||||||||||||||||||||||||||||||||||||||
03/31(a)-12/31/2008 | 10.00 | 0.08 | (4.38 | ) | (4.30 | ) | (0.09 | ) | - | 5.61 | (42.94 | ) | 58 | 154 | 0.86 | 1.28 | ||||||||||||||||||||||||||||||||||||||||||||
JNL/PPM America Small Cap Value Fund |
| |||||||||||||||||||||||||||||||||||||||||||||||||||||||||||
Class A | ||||||||||||||||||||||||||||||||||||||||||||||||||||||||||||
12/31/2010 | 8.37 | 0.03 | 2.28 | 2.31 | (0.01 | ) | (0.54 | ) | 10.13 | 27.71 | 61,362 | 67 | 1.06 | 0.32 | ||||||||||||||||||||||||||||||||||||||||||||||
12/31/2009 | 6.27 | 0.04 | 2.09 | 2.13 | (0.03 | ) | - | 8.37 | 33.97 | 15,861 | 114 | 1.06 | 0.60 | |||||||||||||||||||||||||||||||||||||||||||||||
03/31(a)-12/31/2008 | 10.00 | 0.06 | (3.75 | ) | (3.69 | ) | (0.04 | ) | - | 6.27 | (36.85 | ) | 8,356 | 66 | 1.06 | 1.02 | ||||||||||||||||||||||||||||||||||||||||||||
Class B | ||||||||||||||||||||||||||||||||||||||||||||||||||||||||||||
12/31/2010 | 8.38 | 0.04 | 2.29 | 2.33 | (0.02 | ) | (0.54 | ) | 10.15 | 27.91 | 6,170 | 67 | 0.86 | 0.46 | ||||||||||||||||||||||||||||||||||||||||||||||
12/31/2009 | 6.27 | 0.05 | 2.10 | 2.15 | (0.04 | ) | - | 8.38 | 34.30 | 3,850 | 114 | 0.86 | 0.68 | |||||||||||||||||||||||||||||||||||||||||||||||
03/31(a)-12/31/2008 | 10.00 | 0.07 | (3.75 | ) | (3.68 | ) | (0.05 | ) | - | 6.27 | (36.75 | ) | 87 | 66 | 0.86 | 1.15 | ||||||||||||||||||||||||||||||||||||||||||||
See accompanying Notes to Financial Statements.
JNL Series Trust
Financial Highlights
Net Asset Value | Increase (Decrease) from Investment Operations (e) | Distributions Gains on |
Supplemental Data | Ratio of Expenses to | Ratio of Income (Loss) to | |||||||||||||||||||||||||||||||||||||||||||||||
| Period Ended | Net (Loss) | Net & (Losses) | Total from Investment Operations | Distributions from Net | Net Asset Value, End of Period | Total Return | Net Assets, End of Period (in thousands) | Portfolio Turnover (d) | ||||||||||||||||||||||||||||||||||||||||||||
JNL/PPM America Value Equity Fund |
| |||||||||||||||||||||||||||||||||||||||||||||||||||
Class A | ||||||||||||||||||||||||||||||||||||||||||||||||||||
12/31/2010 | $ | 10.46 | $ | 0.14 | $ | 1.68 | $ | 1.82 | $ | (0.13 | ) | $ | - | $ | 12.15 | 17.46 | % | $ | 113,586 | 36 | % | 0.86 | % | 1.29 | % | |||||||||||||||||||||||||||
12/31/2009 | 7.57 | 0.14 | 3.23 | 3.37 | (0.48 | ) | - | 10.46 | 44.58 | 93,660 | 63 | 0.86 | 1.65 | |||||||||||||||||||||||||||||||||||||||
12/31/2008 | 19.15 | 0.35 | (9.54 | ) | (9.19 | ) | (0.39 | ) | (2.00 | ) | 7.57 | (47.21 | ) | 87,770 | 96 | 0.86 | 2.28 | |||||||||||||||||||||||||||||||||||
12/31/2007 | 20.44 | 0.33 | (1.48 | ) | (1.15 | ) | (0.14 | ) | - | 19.15 | (5.63 | ) | 219,654 | 86 | 0.86 | 1.55 | ||||||||||||||||||||||||||||||||||||
12/31/2006 | 18.09 | 0.17 | 2.19 | 2.36 | (0.01 | ) | - | 20.44 | 13.03 | 165,734 | 145 | 0.97 | 0.92 | |||||||||||||||||||||||||||||||||||||||
Class B | ||||||||||||||||||||||||||||||||||||||||||||||||||||
12/31/2010 | 10.50 | 0.15 | 1.69 | 1.84 | (0.15 | ) | - | 12.19 | 17.55 | 372 | 36 | 0.66 | 1.37 | |||||||||||||||||||||||||||||||||||||||
12/31/2009 | 7.62 | 0.16 | 3.24 | 3.40 | (0.52 | ) | - | 10.50 | 44.72 | 675 | 63 | 0.66 | 1.61 | |||||||||||||||||||||||||||||||||||||||
12/31/2008 | 19.30 | 0.37 | (9.61 | ) | (9.24 | ) | (0.44 | ) | (2.00 | ) | 7.62 | (47.07 | ) | 76 | 96 | 0.66 | 2.53 | |||||||||||||||||||||||||||||||||||
12/31/2007 | 20.60 | 0.37 | (1.48 | ) | (1.11 | ) | (0.19 | ) | - | 19.30 | (5.36 | ) | 132 | 86 | 0.66 | 1.75 | ||||||||||||||||||||||||||||||||||||
12/31/2006 | 18.20 | 0.22 | 2.18 | 2.40 | 0.00 | (f | ) | - | 20.60 | 13.21 | 129 | 145 | 0.77 | 1.14 | ||||||||||||||||||||||||||||||||||||||
JNL/Red Rocks Listed Private Equity Fund |
| |||||||||||||||||||||||||||||||||||||||||||||||||||
Class A | ||||||||||||||||||||||||||||||||||||||||||||||||||||
12/31/2010 | 8.03 | 0.07 | 2.04 | 2.11 | (0.02 | ) | (0.05 | ) | 10.07 | 26.32 | 643,051 | 24 | 1.18 | 0.76 | ||||||||||||||||||||||||||||||||||||||
12/31/2009 | 5.91 | 0.07 | 2.31 | 2.38 | (0.25 | ) | (0.01 | ) | 8.03 | 40.33 | 223,873 | 34 | 1.20 | 0.92 | ||||||||||||||||||||||||||||||||||||||
10/06(a)-12/31/2008 | 10.00 | 0.04 | (4.10 | ) | (4.06 | ) | (0.03 | ) | (s | ) | - | 5.91 | (40.56 | ) | 15,265 | 6 | 1.22 | 2.55 | ||||||||||||||||||||||||||||||||||
Class B | ||||||||||||||||||||||||||||||||||||||||||||||||||||
12/31/2010 | 8.04 | 0.07 | 2.06 | 2.13 | (0.02 | ) | (0.05 | ) | 10.10 | 26.53 | 234 | 24 | 0.98 | 0.85 | ||||||||||||||||||||||||||||||||||||||
12/31/2009 | 5.91 | 0.09 | 2.31 | 2.40 | (0.26 | ) | (0.01 | ) | 8.04 | 40.62 | 156 | 34 | 1.00 | 1.36 | ||||||||||||||||||||||||||||||||||||||
10/06(a)-12/31/2008 | 10.00 | 0.03 | (4.08 | ) | (4.05 | ) | (0.04 | ) | (s | ) | - | 5.91 | (40.54 | ) | 66 | 6 | 1.02 | 1.82 | ||||||||||||||||||||||||||||||||||
JNL/S&P Managed Conservative Fund (h) |
| |||||||||||||||||||||||||||||||||||||||||||||||||||
Class A | ||||||||||||||||||||||||||||||||||||||||||||||||||||
12/31/2010 | 10.34 | 0.18 | 0.72 | 0.90 | (0.24 | ) | - | 11.00 | 8.70 | 979,568 | 9 | 0.17 | 1.67 | |||||||||||||||||||||||||||||||||||||||
12/31/2009 | 9.35 | 0.26 | 1.00 | 1.26 | (0.17 | ) | (0.10 | ) | 10.34 | 13.53 | 623,958 | 11 | 0.18 | 2.66 | ||||||||||||||||||||||||||||||||||||||
12/31/2008 | 11.47 | 0.32 | (1.90 | ) | (1.58 | ) | (0.39 | ) | (0.15 | ) | 9.35 | (13.75 | ) | 407,426 | 30 | 0.19 | 2.95 | |||||||||||||||||||||||||||||||||||
12/31/2007 | 11.29 | 0.34 | 0.37 | 0.71 | (0.27 | ) | (0.26 | ) | 11.47 | 6.30 | 264,755 | 54 | 0.18 | 2.92 | ||||||||||||||||||||||||||||||||||||||
12/31/2006 | 10.70 | 0.20 | 0.64 | 0.84 | (0.18 | ) | (0.07 | ) | 11.29 | 7.85 | 137,126 | 39 | 0.19 | 1.82 | ||||||||||||||||||||||||||||||||||||||
JNL/S&P Managed Moderate Fund (h) |
| |||||||||||||||||||||||||||||||||||||||||||||||||||
Class A | ||||||||||||||||||||||||||||||||||||||||||||||||||||
12/31/2010 | 10.41 | 0.15 | 1.02 | 1.17 | (0.19 | ) | - | 11.39 | 11.30 | 1,665,098 | 5 | 0.15 | 1.41 | |||||||||||||||||||||||||||||||||||||||
12/31/2009 | 8.97 | 0.25 | 1.43 | 1.68 | (0.12 | ) | (0.12 | ) | 10.41 | 18.63 | 1,021,335 | 6 | 0.17 | 2.57 | ||||||||||||||||||||||||||||||||||||||
12/31/2008 | 12.21 | 0.26 | (2.85 | ) | (2.59 | ) | (0.41 | ) | (0.24 | ) | 8.97 | (21.24 | ) | 557,615 | 28 | 0.18 | 2.36 | |||||||||||||||||||||||||||||||||||
12/31/2007 | 11.90 | 0.28 | 0.64 | 0.92 | (0.29 | ) | (0.32 | ) | 12.21 | 7.74 | 521,470 | 30 | 0.19 | 2.26 | ||||||||||||||||||||||||||||||||||||||
12/31/2006 | 11.04 | 0.17 | 0.97 | 1.14 | (0.13 | ) | (0.15 | ) | 11.90 | 10.39 | 314,249 | 35 | 0.19 | 1.44 | ||||||||||||||||||||||||||||||||||||||
JNL/S&P Managed Moderate Growth Fund (h) |
| |||||||||||||||||||||||||||||||||||||||||||||||||||
Class A | ||||||||||||||||||||||||||||||||||||||||||||||||||||
12/31/2010 | 10.54 | 0.13 | 1.26 | 1.39 | (0.13 | ) | - | 11.80 | 13.18 | 2,861,191 | 6 | 0.15 | 1.16 | |||||||||||||||||||||||||||||||||||||||
12/31/2009 | 8.79 | 0.21 | 1.86 | 2.07 | (0.07 | ) | (0.25 | ) | 10.54 | 23.46 | 1,774,984 | 13 | 0.16 | 2.14 | ||||||||||||||||||||||||||||||||||||||
12/31/2008 | 13.20 | 0.17 | (3.80 | ) | (3.63 | ) | (0.27 | ) | (0.51 | ) | 8.79 | (27.50 | ) | 997,961 | 28 | 0.16 | 1.45 | |||||||||||||||||||||||||||||||||||
12/31/2007 | 13.08 | 0.19 | 0.92 | 1.11 | (0.28 | ) | (0.71 | ) | 13.20 | 8.65 | 1,403,279 | 34 | 0.16 | 1.34 | ||||||||||||||||||||||||||||||||||||||
12/31/2006 | 12.13 | 0.12 | 1.36 | 1.48 | (0.12 | ) | (0.41 | ) | 13.08 | 12.17 | 1,123,984 | 29 | 0.16 | 0.97 | ||||||||||||||||||||||||||||||||||||||
JNL/S&P Managed Growth Fund (h) |
| |||||||||||||||||||||||||||||||||||||||||||||||||||
Class A | ||||||||||||||||||||||||||||||||||||||||||||||||||||
12/31/2010 | 9.71 | 0.08 | 1.49 | 1.57 | (0.10 | ) | - | 11.18 | 16.12 | 2,140,816 | 7 | 0.15 | 0.75 | |||||||||||||||||||||||||||||||||||||||
12/31/2009 | 7.94 | 0.14 | 2.09 | 2.23 | (0.16 | ) | (0.30 | ) | 9.71 | 28.06 | 1,479,759 | 8 | 0.16 | 1.55 | ||||||||||||||||||||||||||||||||||||||
12/31/2008 | 13.84 | 0.10 | (5.00 | ) | (4.90 | ) | (0.07 | ) | (0.93 | ) | 7.94 | (35.36 | ) | 808,800 | 32 | 0.16 | 0.80 | |||||||||||||||||||||||||||||||||||
12/31/2007 | 13.62 | 0.12 | 1.05 | 1.17 | (0.24 | ) | (0.71 | ) | 13.84 | 8.70 | 1,388,072 | 34 | 0.15 | 0.86 | ||||||||||||||||||||||||||||||||||||||
12/31/2006 | 12.56 | 0.07 | 1.71 | 1.78 | (0.07 | ) | (0.65 | ) | 13.62 | 14.15 | 1,246,802 | 34 | 0.16 | 0.53 | ||||||||||||||||||||||||||||||||||||||
See accompanying Notes to Financial Statements.
JNL Series Trust
Financial Highlights
Net Asset Value | Increase (Decrease) from Investment Operations (e) | Distributions Gains on |
Supplemental Data | Ratio of Expenses to Average Net Assets | Ratio of Income (Loss) to | |||||||||||||||||||||||||||||||||||||||||||||||||||
| Period Ended | Net (Loss) | Net Realized & Unrealized (Losses) | Total from Investment Operations | Distributions from Net | Net Asset End of | Total Return (b) | Net Assets, End of Period (in thousands) | Portfolio Turnover (d) | ||||||||||||||||||||||||||||||||||||||||||||||||
JNL/S&P Managed Aggressive Growth Fund (h) |
| |||||||||||||||||||||||||||||||||||||||||||||||||||||||
Class A | ||||||||||||||||||||||||||||||||||||||||||||||||||||||||
12/31/2010 | $ | 10.46 | $ | 0.08 | $ | 1.71 | $ | 1.79 | $ | (0.08 | ) | $ | - | $ | 12.17 | 17.09 | % | $ | 788,664 | 11 | % | 0.17 | % | 0.76 | % | |||||||||||||||||||||||||||||||
12/31/2009 | 8.39 | 0.10 | 2.51 | 2.61 | (0.21 | ) | (0.33 | ) | 10.46 | 31.05 | 582,868 | 19 | 0.19 | 1.07 | ||||||||||||||||||||||||||||||||||||||||||
12/31/2008 | 14.89 | 0.06 | (5.90 | ) | (5.84 | ) | (0.05 | ) | (0.61 | ) | 8.39 | (39.16 | ) | 414,718 | 42 | 0.18 | 0.50 | |||||||||||||||||||||||||||||||||||||||
12/31/2007 | 13.91 | 0.08 | 1.19 | 1.27 | (0.24 | ) | (0.05 | ) | 14.89 | 9.17 | 702,285 | 46 | 0.17 | 0.56 | ||||||||||||||||||||||||||||||||||||||||||
12/31/2006 | 12.80 | 0.04 | 1.95 | 1.99 | (0.04 | ) | (0.84 | ) | 13.91 | 15.57 | 672,325 | 33 | 0.17 | 0.28 | ||||||||||||||||||||||||||||||||||||||||||
JNL/S&P Disciplined Moderate Fund (h) |
| |||||||||||||||||||||||||||||||||||||||||||||||||||||||
Class A | ||||||||||||||||||||||||||||||||||||||||||||||||||||||||
12/31/2010 | 8.94 | 0.18 | 0.81 | 0.99 | (0.08 | ) | - | 9.85 | 11.10 | 346,433 | 21 | 0.18 | 1.93 | |||||||||||||||||||||||||||||||||||||||||||
12/31/2009 | 7.72 | 0.23 | 1.21 | 1.44 | (0.16 | ) | (0.06 | ) | 8.94 | 18.67 | 168,455 | 12 | 0.19 | 2.75 | ||||||||||||||||||||||||||||||||||||||||||
12/31/2008 | 10.70 | 0.27 | (3.12 | ) | (2.85 | ) | (0.09 | ) | (0.04 | ) | 7.72 | (26.60 | ) | 58,062 | 27 | 0.19 | 2.91 | |||||||||||||||||||||||||||||||||||||||
01/16(a) - 12/31/2007 | 10.00 | 0.48 | 0.22 | 0.70 | - | - | 10.70 | 7.00 | 34,588 | 31 | 0.18 | 4.75 | ||||||||||||||||||||||||||||||||||||||||||||
JNL/S&P Disciplined Moderate Growth Fund (h) |
| |||||||||||||||||||||||||||||||||||||||||||||||||||||||
Class A | ||||||||||||||||||||||||||||||||||||||||||||||||||||||||
12/31/2010 | 8.10 | 0.14 | 0.94 | 1.08 | (0.09 | ) | - | 9.09 | 13.29 | 376,092 | 26 | 0.18 | 1.64 | |||||||||||||||||||||||||||||||||||||||||||
12/31/2009 | 6.81 | 0.21 | 1.34 | 1.55 | (0.17 | ) | (0.09 | ) | 8.10 | 22.77 | 206,365 | 16 | 0.19 | 2.78 | ||||||||||||||||||||||||||||||||||||||||||
12/31/2008 | 10.67 | 0.23 | (3.94 | ) | (3.71 | ) | (0.09 | ) | (0.06 | ) | 6.81 | (34.76 | ) | 74,452 | 29 | 0.19 | 2.60 | |||||||||||||||||||||||||||||||||||||||
01/16(a) - 12/31/2007 | 10.00 | 0.35 | 0.32 | 0.67 | - | - | 10.67 | 6.70 | 40,459 | 31 | 0.18 | 3.49 | ||||||||||||||||||||||||||||||||||||||||||||
JNL/S&P Disciplined Growth Fund (h) |
| |||||||||||||||||||||||||||||||||||||||||||||||||||||||
Class A | ||||||||||||||||||||||||||||||||||||||||||||||||||||||||
12/31/2010 | 7.64 | 0.13 | 0.84 | 0.97 | (0.09 | ) | - | 8.52 | 12.74 | 137,476 | 28 | 0.18 | 1.71 | |||||||||||||||||||||||||||||||||||||||||||
12/31/2009 | 6.31 | 0.20 | 1.40 | 1.60 | (0.17 | ) | (0.10 | ) | 7.64 | 25.39 | 80,863 | 24 | 0.19 | 2.87 | ||||||||||||||||||||||||||||||||||||||||||
12/31/2008 | 10.65 | 0.22 | (4.40 | ) | (4.18 | ) | (0.10 | ) | (0.06 | ) | 6.31 | (39.21 | ) | 26,133 | 48 | 0.19 | 2.55 | |||||||||||||||||||||||||||||||||||||||
01/16(a) - 12/31/2007 | 10.00 | 0.36 | 0.29 | 0.65 | - | - | 10.65 | 6.50 | 16,525 | 28 | 0.19 | 3.58 | ||||||||||||||||||||||||||||||||||||||||||||
JNL/S&P Competitive Advantage Fund |
| |||||||||||||||||||||||||||||||||||||||||||||||||||||||
Class A | ||||||||||||||||||||||||||||||||||||||||||||||||||||||||
12/31/2010 | 9.95 | 0.14 | 1.11 | 1.25 | (0.08 | ) | (0.42 | ) | 10.70 | 12.63 | 296,032 | 77 | 0.71 | 1.35 | ||||||||||||||||||||||||||||||||||||||||||
12/31/2009 | 6.90 | 0.11 | 2.94 | 3.05 | 0.00 | (f | ) | - | 9.95 | 44.22 | 254,695 | 101 | 0.72 | 1.28 | ||||||||||||||||||||||||||||||||||||||||||
12/31/2008 | 9.92 | 0.16 | (3.08 | ) | (2.92 | ) | (0.10 | ) | - | 6.90 | (29.40 | ) | 90,399 | 97 | 0.71 | 1.81 | ||||||||||||||||||||||||||||||||||||||||
12/03(a) - 12/31/2007 | 10.00 | 0.01 | (0.08 | ) | (0.07 | ) | (0.01 | ) | - | 9.92 | (0.74 | ) | 15,294 | 0 | 0.70 | 1.46 | ||||||||||||||||||||||||||||||||||||||||
Class B | ||||||||||||||||||||||||||||||||||||||||||||||||||||||||
12/31/2010 | 9.94 | 0.16 | 1.12 | 1.28 | (0.10 | ) | (0.42 | ) | 10.70 | 12.87 | 59 | 77 | 0.51 | 1.55 | ||||||||||||||||||||||||||||||||||||||||||
12/31/2009 | 6.87 | 0.14 | 2.93 | 3.07 | 0.00 | (f | ) | - | 9.94 | 44.70 | 50 | 101 | 0.52 | 1.57 | ||||||||||||||||||||||||||||||||||||||||||
12/31/2008 | 9.92 | 0.15 | (3.08 | ) | (2.93 | ) | (0.12 | ) | - | 6.87 | (29.59 | ) | 14 | 97 | 0.51 | 1.61 | ||||||||||||||||||||||||||||||||||||||||
12/03(a) - 12/31/2007 | 10.00 | 0.01 | (0.08 | ) | (0.07 | ) | (0.01 | ) | - | 9.92 | (0.67 | ) | 99 | 0 | 0.47 | 1.93 | ||||||||||||||||||||||||||||||||||||||||
JNL/S&P Dividend Income & Growth Fund |
| |||||||||||||||||||||||||||||||||||||||||||||||||||||||
Class A | ||||||||||||||||||||||||||||||||||||||||||||||||||||||||
12/31/2010 | 8.69 | 0.31 | 1.26 | 1.57 | (0.11 | ) | (0.39 | ) | 9.76 | 18.24 | 440,926 | 38 | 0.70 | 3.33 | ||||||||||||||||||||||||||||||||||||||||||
12/31/2009 | 7.04 | 0.23 | 1.42 | 1.65 | 0.00 | (f | ) | - | 8.69 | 23.47 | 239,392 | 84 | 0.72 | 3.24 | ||||||||||||||||||||||||||||||||||||||||||
12/31/2008 | 9.77 | 0.35 | (2.89 | ) | (2.54 | ) | (0.19 | ) | 0.00 | (f | ) | 7.04 | (25.93 | ) | 101,329 | 64 | 0.71 | 4.47 | ||||||||||||||||||||||||||||||||||||||
12/03(a) - 12/31/2007 | 10.00 | 0.02 | (0.24 | ) | (0.22 | ) | (0.01 | ) | - | 9.77 | (2.24 | ) | 7,203 | 0 | 0.70 | 2.03 | ||||||||||||||||||||||||||||||||||||||||
Class B | ||||||||||||||||||||||||||||||||||||||||||||||||||||||||
12/31/2010 | 8.70 | 0.33 | 1.28 | 1.61 | (0.12 | ) | (0.39 | ) | 9.80 | 18.65 | 166 | 38 | 0.50 | 3.57 | ||||||||||||||||||||||||||||||||||||||||||
12/31/2009 | 7.03 | 0.25 | 1.42 | 1.67 | 0.00 | (f | ) | - | 8.70 | 23.79 | 158 | 84 | 0.52 | 3.40 | ||||||||||||||||||||||||||||||||||||||||||
12/31/2008 | 9.75 | 0.36 | (2.88 | ) | (2.52 | ) | (0.20 | ) | 0.00 | (f | ) | 7.03 | (25.79 | ) | 120 | 64 | 0.51 | 4.41 | ||||||||||||||||||||||||||||||||||||||
12/03(a) - 12/31/2007 | 10.00 | 0.03 | (0.26 | ) | (0.23 | ) | (0.02 | ) | - | 9.75 | (2.28 | ) | 98 | 0 | 0.47 | 3.29 | ||||||||||||||||||||||||||||||||||||||||
See accompanying Notes to Financial Statements.
JNL Series Trust
Financial Highlights
Net Asset Value | Increase (Decrease) from Investment Operations (e) | Distributions Gains on |
Supplemental Data | Ratio of Expenses | Ratio Income (Loss) to Assets | |||||||||||||||||||||||||||||||||||||||||||||||||||||||||||||||||||||||||||
| Period Ended | Net (Loss) | Net Realized & (Losses) | Total from Investment Operations | Distributions from Net | Net Asset Value, End of Period | Total Return | Net Assets, End of Period (in thousands) | Portfolio Turnover (d) | ||||||||||||||||||||||||||||||||||||||||||||||||||||||||||||||||||||||||
JNL/S&P Intrinsic Value Fund |
| |||||||||||||||||||||||||||||||||||||||||||||||||||||||||||||||||||||||||||||||
Class A | ||||||||||||||||||||||||||||||||||||||||||||||||||||||||||||||||||||||||||||||||
12/31/2010 | $ | 9.75 | $ | 0.15 | $ | 1.24 | $ | 1.39 | $ | (0.08 | ) | $ | (1.09 | ) | $ | 9.97 | 14.39 | % | $ | 319,617 | 103 | % | 0.71 | % | 1.52 | % | ||||||||||||||||||||||||||||||||||||||||||||||||||||||
12/31/2009 | 6.21 | 0.11 | 3.43 | 3.54 | 0.00 | (f | ) | - | 9.75 | 57.04 | 246,578 | 151 | 0.72 | 1.40 | ||||||||||||||||||||||||||||||||||||||||||||||||||||||||||||||||||
12/31/2008 | 9.91 | 0.15 | (3.70 | ) | (3.55 | ) | (0.09 | ) | (0.06 | ) | 6.21 | (35.84 | ) | 96,643 | 98 | 0.71 | 1.88 | |||||||||||||||||||||||||||||||||||||||||||||||||||||||||||||||
12/03(a) - 12/31/2007 | 10.00 | 0.02 | (0.10 | ) | (0.08 | ) | (0.01 | ) | - | 9.91 | (0.81 | ) | 18,261 | 0 | 0.70 | 2.06 | ||||||||||||||||||||||||||||||||||||||||||||||||||||||||||||||||
Class B | ||||||||||||||||||||||||||||||||||||||||||||||||||||||||||||||||||||||||||||||||
12/31/2010 | 9.80 | 0.17 | 1.26 | 1.43 | (0.09 | ) | (1.09 | ) | 10.05 | 14.74 | 100 | 103 | 0.51 | 1.68 | ||||||||||||||||||||||||||||||||||||||||||||||||||||||||||||||||||
12/31/2009 | 6.21 | 0.12 | 3.47 | 3.59 | 0.00 | (f | ) | - | 9.80 | 57.84 | 108 | 151 | 0.52 | 1.45 | ||||||||||||||||||||||||||||||||||||||||||||||||||||||||||||||||||
12/31/2008 | 9.91 | 0.14 | (3.68 | ) | (3.54 | ) | (0.10 | ) | (0.06 | ) | 6.21 | (35.73 | ) | 35 | 98 | 0.51 | 1.55 | |||||||||||||||||||||||||||||||||||||||||||||||||||||||||||||||
12/03(a) - 12/31/2007 | 10.00 | 0.02 | (0.09 | ) | (0.07 | ) | (0.02 | ) | - | 9.91 | (0.71 | ) | 99 | 0 | 0.48 | 2.37 | �� | |||||||||||||||||||||||||||||||||||||||||||||||||||||||||||||||
JNL/S&P Total Yield Fund |
| |||||||||||||||||||||||||||||||||||||||||||||||||||||||||||||||||||||||||||||||
Class A | ||||||||||||||||||||||||||||||||||||||||||||||||||||||||||||||||||||||||||||||||
12/31/2010 | 9.10 | 0.16 | 0.75 | 0.91 | (0.07 | ) | (0.20 | ) | 9.74 | 10.08 | 281,137 | 88 | 0.71 | 1.71 | ||||||||||||||||||||||||||||||||||||||||||||||||||||||||||||||||||
12/31/2009 | 6.37 | 0.10 | 2.63 | 2.73 | 0.00 | (f | ) | - | 9.10 | 42.88 | 212,981 | 126 | 0.72 | 1.28 | ||||||||||||||||||||||||||||||||||||||||||||||||||||||||||||||||||
12/31/2008 | 10.07 | 0.20 | (3.79 | ) | (3.59 | ) | (0.11 | ) | 0.00 | (f | ) | 6.37 | (35.67 | ) | 103,601 | 115 | 0.71 | 2.38 | ||||||||||||||||||||||||||||||||||||||||||||||||||||||||||||||
12/03(a) - 12/31/2007 | 10.00 | 0.01 | 0.06 | 0.07 | 0.00 | (f | ) | - | 10.07 | 0.74 | 9,806 | 0 | 0.70 | 1.26 | ||||||||||||||||||||||||||||||||||||||||||||||||||||||||||||||||||
Class B | ||||||||||||||||||||||||||||||||||||||||||||||||||||||||||||||||||||||||||||||||
12/31/2010 | 9.11 | 0.18 | 0.75 | 0.93 | (0.08 | ) | (0.20 | ) | 9.76 | 10.30 | 65 | 88 | 0.51 | 1.90 | ||||||||||||||||||||||||||||||||||||||||||||||||||||||||||||||||||
12/31/2009 | 6.37 | 0.11 | 2.63 | 2.74 | 0.00 | (f | ) | - | 9.11 | 43.04 | 55 | 126 | 0.52 | 1.50 | ||||||||||||||||||||||||||||||||||||||||||||||||||||||||||||||||||
12/31/2008 | 10.07 | 0.20 | (3.78 | ) | (3.58 | ) | (0.12 | ) | 0.00 | (f | ) | 6.37 | (35.58 | ) | 88 | 115 | 0.51 | 2.35 | ||||||||||||||||||||||||||||||||||||||||||||||||||||||||||||||
12/03(a) - 12/31/2007 | 10.00 | 0.01 | 0.07 | 0.08 | (0.01 | ) | - | 10.07 | 0.81 | 101 | 0 | 0.48 | 1.64 | |||||||||||||||||||||||||||||||||||||||||||||||||||||||||||||||||||
JNL/S&P 4 Fund (h) |
| |||||||||||||||||||||||||||||||||||||||||||||||||||||||||||||||||||||||||||||||
Class A | ||||||||||||||||||||||||||||||||||||||||||||||||||||||||||||||||||||||||||||||||
12/31/2010 | 9.55 | 0.09 | 1.23 | 1.32 | - | (0.01 | ) | 10.86 | 13.79 | 843,945 | 10 | 0.05 | 0.90 | |||||||||||||||||||||||||||||||||||||||||||||||||||||||||||||||||||
12/31/2009 | 6.79 | (0.00 | ) | (f | ) | 2.84 | 2.84 | (0.08 | ) | 0.00 | (f | ) | 9.55 | 41.85 | 627,405 | 12 | 0.06 | (0.03 | ) | |||||||||||||||||||||||||||||||||||||||||||||||||||||||||||||
12/31/2008 | 9.93 | 0.21 | (3.35 | ) | (3.14 | ) | 0.00 | (f | ) | - | 6.79 | (31.62 | ) | 265,183 | 15 | 0.06 | 2.54 | |||||||||||||||||||||||||||||||||||||||||||||||||||||||||||||||
12/03(a) - 12/31/2007 | 10.00 | 0.02 | (0.09 | ) | (0.07 | ) | - | - | 9.93 | (0.70 | ) | 22,194 | 0 | 0.05 | 2.85 | |||||||||||||||||||||||||||||||||||||||||||||||||||||||||||||||||
JNL/Select Balanced Fund |
| |||||||||||||||||||||||||||||||||||||||||||||||||||||||||||||||||||||||||||||||
Class A | ||||||||||||||||||||||||||||||||||||||||||||||||||||||||||||||||||||||||||||||||
12/31/2010 | 15.01 | 0.28 | 1.34 | 1.62 | (0.18 | ) | - | 16.45 | 10.83 | 1,290,162 | 46 | (q | ) | 0.76 | 1.84 | |||||||||||||||||||||||||||||||||||||||||||||||||||||||||||||||||
12/31/2009 | 12.81 | 0.34 | 2.19 | 2.53 | (0.33 | ) | - | 15.01 | 19.78 | 736,864 | 54 | (q | ) | 0.78 | 2.53 | |||||||||||||||||||||||||||||||||||||||||||||||||||||||||||||||||
12/31/2008 | 17.56 | 0.48 | (4.18 | ) | (3.70 | ) | (0.39 | ) | (0.66 | ) | 12.81 | (20.79 | ) | 455,105 | 60 | (q | ) | 0.78 | 2.98 | |||||||||||||||||||||||||||||||||||||||||||||||||||||||||||||
12/31/2007 | 17.35 | 0.48 | 0.81 | 1.29 | (0.37 | ) | (0.71 | ) | 17.56 | 7.49 | 526,511 | 41 | (q | ) | 0.78 | 2.62 | ||||||||||||||||||||||||||||||||||||||||||||||||||||||||||||||||
12/31/2006 | 15.75 | 0.42 | 1.73 | 2.15 | (0.31 | ) | (0.24 | ) | 17.35 | 13.65 | 439,868 | 46 | (q | ) | 0.79 | 2.55 | ||||||||||||||||||||||||||||||||||||||||||||||||||||||||||||||||
Class B | ||||||||||||||||||||||||||||||||||||||||||||||||||||||||||||||||||||||||||||||||
12/31/2010 | 15.29 | 0.32 | 1.35 | 1.67 | (0.19 | ) | - | 16.77 | 10.99 | 1,041 | �� | 46 | (q | ) | 0.56 | 2.04 | ||||||||||||||||||||||||||||||||||||||||||||||||||||||||||||||||
12/31/2009 | 13.03 | 0.38 | 2.24 | 2.62 | (0.36 | ) | - | 15.29 | 20.08 | 855 | 54 | (q | ) | 0.58 | 2.74 | |||||||||||||||||||||||||||||||||||||||||||||||||||||||||||||||||
12/31/2008 | 17.84 | 0.52 | (4.25 | ) | (3.73 | ) | (0.42 | ) | (0.66 | ) | 13.03 | (20.62 | ) | 662 | 60 | (q | ) | 0.58 | 3.21 | |||||||||||||||||||||||||||||||||||||||||||||||||||||||||||||
12/31/2007 | 17.39 | 0.52 | 0.81 | 1.33 | (0.17 | ) | (0.71 | ) | 17.84 | 7.73 | 665 | 41 | (q | ) | 0.58 | 2.83 | ||||||||||||||||||||||||||||||||||||||||||||||||||||||||||||||||
12/31/2006 | 15.64 | 0.45 | 1.72 | 2.17 | (0.18 | ) | (0.24 | ) | 17.39 | 13.89 | 276 | 46 | (q | ) | 0.59 | 2.75 | ||||||||||||||||||||||||||||||||||||||||||||||||||||||||||||||||
JNL/Select Money Market Fund |
| |||||||||||||||||||||||||||||||||||||||||||||||||||||||||||||||||||||||||||||||
Class A | ||||||||||||||||||||||||||||||||||||||||||||||||||||||||||||||||||||||||||||||||
12/31/2010 | 1.00 | 0.00 | (f | ) | - | 0.00 | (f | ) | 0.00 | (f | ) | - | 1.00 | 0.00 | 706,007 | n/a | 0.27 | (w | ) | 0.00 | (w | ) | ||||||||||||||||||||||||||||||||||||||||||||||||||||||||||
12/31/2009 | 1.00 | 0.00 | (f | ) | - | 0.00 | (f | ) | 0.00 | (f | ) | - | 1.00 | 0.15 | (v | ) | 1,140,511 | n/a | 0.47 | (w | ) | 0.16 | (w | ) | ||||||||||||||||||||||||||||||||||||||||||||||||||||||||
12/31/2008 | 1.00 | 0.02 | - | 0.02 | (0.02 | ) | - | 1.00 | 2.20 | (r | ) | 1,340,054 | n/a | 0.57 | 2.08 | |||||||||||||||||||||||||||||||||||||||||||||||||||||||||||||||||
12/31/2007 | 1.00 | 0.05 | - | 0.05 | (0.05 | ) | - | 1.00 | 4.76 | 651,204 | n/a | 0.58 | 4.63 | |||||||||||||||||||||||||||||||||||||||||||||||||||||||||||||||||||
12/31/2006 | 1.00 | 0.04 | - | 0.04 | (0.04 | ) | - | 1.00 | 4.49 | 269,095 | n/a | 0.59 | 4.42 | |||||||||||||||||||||||||||||||||||||||||||||||||||||||||||||||||||
Class B | ||||||||||||||||||||||||||||||||||||||||||||||||||||||||||||||||||||||||||||||||
12/31/2010 | 1.00 | 0.00 | (f | ) | - | 0.00 | (f | ) | 0.00 | (f | ) | - | 1.00 | 0.00 | 7,245 | n/a | 0.27 | (w | ) | 0.00 | (w | ) | ||||||||||||||||||||||||||||||||||||||||||||||||||||||||||
12/31/2009 | 1.00 | 0.00 | (f | ) | - | 0.00 | (f | ) | 0.00 | (f | ) | - | 1.00 | 0.21 | (v | ) | 7,270 | n/a | 0.37 | (w | ) | 0.24 | (w | ) | ||||||||||||||||||||||||||||||||||||||||||||||||||||||||
12/31/2008 | 1.00 | 0.02 | - | 0.02 | (0.02 | ) | - | 1.00 | 2.40 | (r | ) | 7,220 | n/a | 0.37 | 2.32 | |||||||||||||||||||||||||||||||||||||||||||||||||||||||||||||||||
12/31/2007 | 1.00 | 0.05 | - | 0.05 | (0.05 | ) | - | 1.00 | 4.97 | 4,617 | n/a | 0.38 | 4.84 | |||||||||||||||||||||||||||||||||||||||||||||||||||||||||||||||||||
12/31/2006 | 1.00 | 0.05 | - | 0.05 | (0.05 | ) | - | 1.00 | 4.70 | 2,955 | n/a | 0.39 | 4.80 | |||||||||||||||||||||||||||||||||||||||||||||||||||||||||||||||||||
See accompanying Notes to Financial Statements.
JNL Series Trust
Financial Highlights
Net Asset Value | Increase (Decrease) from Investment Operations (e) | Distributions Gains on | Supplemental Data | Ratio of Expenses to Net Assets (c) | Ratio of Income (Loss) to Assets (c) | |||||||||||||||||||||||||||||||||||||||||||||||||||||||||||
| Period Ended | Net (Loss) | Net Realized & Unrealized (Losses) | Total from Investment Operations | Distributions from Net | Net Asset End of | Total Return | Net Assets, of Period (in thousands) | Portfolio Turnover (d) | ||||||||||||||||||||||||||||||||||||||||||||||||||||||||
JNL/Select Value Fund |
| |||||||||||||||||||||||||||||||||||||||||||||||||||||||||||||||
Class A | ||||||||||||||||||||||||||||||||||||||||||||||||||||||||||||||||
12/31/2010 | $ | 15.41 | $ | 0.21 | $ | 1.90 | $ | 2.11 | $ | (0.15 | ) | $ | - | $ | 17.37 | 13.70 | % | $ | 1,138,293 | 25 | % | 0.80 | % | 1.34 | % | |||||||||||||||||||||||||||||||||||||||
12/31/2009 | 12.60 | 0.22 | 2.80 | 3.02 | (0.21 | ) | - | 15.41 | 23.98 | 762,013 | 42 | 0.82 | 1.64 | |||||||||||||||||||||||||||||||||||||||||||||||||||
12/31/2008 | 19.33 | 0.32 | (6.76 | ) | (6.44 | ) | (0.01 | ) | (0.28 | ) | 12.60 | (33.35 | ) | 484,751 | 54 | 0.83 | 1.97 | |||||||||||||||||||||||||||||||||||||||||||||||
12/31/2007 | 19.42 | 0.29 | 1.22 | 1.51 | (0.26 | ) | (1.34 | ) | 19.33 | 7.90 | 538,410 | 41 | 0.83 | 1.39 | ||||||||||||||||||||||||||||||||||||||||||||||||||
12/31/2006 | 16.90 | 0.25 | 3.28 | 3.53 | (0.31 | ) | (0.70 | ) | 19.42 | 20.86 | 481,805 | 34 | 0.84 | 1.37 | ||||||||||||||||||||||||||||||||||||||||||||||||||
Class B | ||||||||||||||||||||||||||||||||||||||||||||||||||||||||||||||||
12/31/2010 | 15.65 | 0.25 | 1.93 | 2.18 | (0.17 | ) | - | 17.66 | 13.92 | 17,032 | 25 | 0.60 | 1.53 | |||||||||||||||||||||||||||||||||||||||||||||||||||
12/31/2009 | 12.79 | 0.25 | 2.84 | 3.09 | (0.23 | ) | - | 15.65 | 24.18 | 14,220 | 42 | 0.62 | 1.87 | |||||||||||||||||||||||||||||||||||||||||||||||||||
12/31/2008 | 19.57 | 0.36 | (6.85 | ) | (6.49 | ) | (0.01 | ) | (0.28 | ) | 12.79 | (33.19 | ) | 10,950 | 54 | 0.63 | 2.13 | |||||||||||||||||||||||||||||||||||||||||||||||
12/31/2007 | 19.66 | 0.33 | 1.25 | 1.58 | (0.33 | ) | (1.34 | ) | 19.57 | 8.13 | 15,294 | 41 | 0.63 | 1.59 | ||||||||||||||||||||||||||||||||||||||||||||||||||
12/31/2006 | 16.91 | 0.34 | 3.22 | 3.56 | (0.11 | ) | (0.70 | ) | 19.66 | 21.05 | 12,976 | 34 | 0.64 | 1.76 | ||||||||||||||||||||||||||||||||||||||||||||||||||
JNL/T. Rowe Price Established Growth Fund |
| |||||||||||||||||||||||||||||||||||||||||||||||||||||||||||||||
Class A | ||||||||||||||||||||||||||||||||||||||||||||||||||||||||||||||||
12/31/2010 | 18.18 | (0.02 | ) | 3.07 | 3.05 | (0.01 | ) | - | 21.22 | 16.76 | 1,475,748 | 35 | 0.88 | (0.10 | ) | |||||||||||||||||||||||||||||||||||||||||||||||||
12/31/2009 | 12.70 | 0.02 | 5.50 | 5.52 | (0.04 | ) | - | 18.18 | 43.49 | 916,445 | 62 | 0.91 | 0.12 | |||||||||||||||||||||||||||||||||||||||||||||||||||
12/31/2008 | 22.49 | 0.06 | (9.69 | ) | (9.63 | ) | (0.02 | ) | (0.14 | ) | 12.70 | (42.85 | ) | 581,447 | 54 | 0.90 | 0.30 | |||||||||||||||||||||||||||||||||||||||||||||||
12/31/2007 | 21.84 | 0.09 | 2.16 | 2.25 | (0.08 | ) | (1.52 | ) | 22.49 | 10.12 | 1,043,708 | 56 | 0.88 | 0.40 | ||||||||||||||||||||||||||||||||||||||||||||||||||
12/31/2006 | 19.44 | 0.09 | 2.57 | 2.66 | (0.09 | ) | (0.17 | ) | 21.84 | 13.70 | 750,771 | 46 | 0.90 | 0.46 | ||||||||||||||||||||||||||||||||||||||||||||||||||
Class B | ||||||||||||||||||||||||||||||||||||||||||||||||||||||||||||||||
12/31/2010 | 18.37 | 0.02 | 3.11 | 3.13 | (0.03 | ) | - | 21.47 | 17.02 | 35,881 | 35 | 0.68 | 0.09 | |||||||||||||||||||||||||||||||||||||||||||||||||||
12/31/2009 | 12.83 | 0.05 | 5.57 | 5.62 | (0.08 | ) | - | 18.37 | 43.79 | 30,411 | 62 | 0.71 | 0.33 | |||||||||||||||||||||||||||||||||||||||||||||||||||
12/31/2008 | 22.69 | 0.09 | (9.79 | ) | (9.70 | ) | (0.02 | ) | (0.14 | ) | 12.83 | (42.75 | ) | 19,925 | 54 | 0.70 | 0.50 | |||||||||||||||||||||||||||||||||||||||||||||||
12/31/2007 | 22.02 | 0.15 | 2.09 | 2.24 | (0.12 | ) | (1.45 | ) | 22.69 | 10.31 | 34,482 | 56 | 0.68 | 0.62 | ||||||||||||||||||||||||||||||||||||||||||||||||||
12/31/2006 | 19.50 | 0.14 | 2.58 | 2.72 | (0.03 | ) | (0.17 | ) | 22.02 | 13.95 | 32,185 | 46 | 0.70 | 0.64 | ||||||||||||||||||||||||||||||||||||||||||||||||||
JNL/T. Rowe Price Mid-Cap Growth Fund |
| |||||||||||||||||||||||||||||||||||||||||||||||||||||||||||||||
Class A | ||||||||||||||||||||||||||||||||||||||||||||||||||||||||||||||||
12/31/2010 | 23.79 | 0.00 | (f | ) | 6.62 | 6.62 | (0.04 | ) | (0.59 | ) | 29.78 | 27.86 | 1,366,836 | 27 | 1.01 | 0.01 | ||||||||||||||||||||||||||||||||||||||||||||||||
12/31/2009 | 16.20 | (0.05 | ) | 7.65 | 7.60 | - | (0.01 | ) | (x | ) | 23.79 | 46.93 | 820,894 | 32 | 1.02 | (0.26 | ) | |||||||||||||||||||||||||||||||||||||||||||||||
12/31/2008 | 30.37 | (0.04 | ) | (12.33 | ) | (12.37 | ) | - | (1.80 | ) | 16.20 | (40.68 | ) | 425,184 | 37 | 1.02 | (0.14 | ) | ||||||||||||||||||||||||||||||||||||||||||||||
12/31/2007 | 29.05 | (0.01 | ) | 4.97 | 4.96 | 0.00 | (f | ) | (3.64 | ) | 30.37 | 17.26 | 697,484 | 45 | 1.02 | (0.04 | ) | |||||||||||||||||||||||||||||||||||||||||||||||
12/31/2006 | 29.64 | 0.05 | 1.96 | 2.01 | (0.05 | ) | (2.55 | ) | 29.05 | 6.76 | 625,869 | 37 | 1.02 | 0.16 | ||||||||||||||||||||||||||||||||||||||||||||||||||
Class B | ||||||||||||||||||||||||||||||||||||||||||||||||||||||||||||||||
12/31/2010 | 24.19 | 0.05 | 6.74 | 6.79 | (0.08 | ) | (0.59 | ) | 30.31 | 28.10 | 38,125 | 27 | 0.81 | 0.17 | ||||||||||||||||||||||||||||||||||||||||||||||||||
12/31/2009 | 16.44 | (0.01 | ) | 7.77 | 7.76 | - | (0.01 | ) | (x | ) | 24.19 | 47.22 | 28,372 | 32 | 0.82 | (0.05 | ) | |||||||||||||||||||||||||||||||||||||||||||||||
12/31/2008 | 30.71 | 0.01 | (12.48 | ) | (12.47 | ) | - | (1.80 | ) | 16.44 | (40.56 | ) | 17,811 | 37 | 0.82 | 0.05 | ||||||||||||||||||||||||||||||||||||||||||||||||
12/31/2007 | 29.28 | 0.06 | 5.01 | 5.07 | 0.00 | (f | ) | (3.64 | ) | 30.71 | 17.50 | 29,638 | 45 | 0.82 | 0.18 | |||||||||||||||||||||||||||||||||||||||||||||||||
12/31/2006 | 29.76 | 0.03 | 2.05 | 2.08 | (0.01 | ) | (2.55 | ) | 29.28 | 6.97 | 24,998 | 37 | 0.81 | 0.08 | ||||||||||||||||||||||||||||||||||||||||||||||||||
JNL/T. Rowe Price Short-Term Bond Fund |
| |||||||||||||||||||||||||||||||||||||||||||||||||||||||||||||||
Class A | ||||||||||||||||||||||||||||||||||||||||||||||||||||||||||||||||
12/31/2010 | 9.71 | 0.18 | 0.10 | 0.28 | (0.11 | ) | - | 9.88 | 2.94 | 872,892 | 54 | 0.72 | 1.83 | |||||||||||||||||||||||||||||||||||||||||||||||||||
12/31/2009 | 9.36 | 0.25 | 0.47 | 0.72 | (0.28 | ) | (0.09 | ) | 9.71 | 7.64 | 484,832 | 102 | 0.74 | 2.56 | ||||||||||||||||||||||||||||||||||||||||||||||||||
12/31/2008 | 10.49 | 0.40 | (1.04 | ) | (0.64 | ) | (0.45 | ) | (0.04 | ) | 9.36 | (5.97 | ) | 295,409 | 134 | 0.74 | 3.86 | |||||||||||||||||||||||||||||||||||||||||||||||
12/31/2007 | 10.31 | 0.49 | 0.01 | 0.50 | (0.32 | ) | - | 10.49 | 4.82 | 311,237 | 73 | (l | ) | 0.75 | 4.62 | |||||||||||||||||||||||||||||||||||||||||||||||||
05/01(a)-12/31/2006 | 10.00 | 0.31 | 0.00 | 0.31 | - | - | 10.31 | 3.10 | 327,071 | 109 | (l | ) | 0.74 | 4.52 | ||||||||||||||||||||||||||||||||||||||||||||||||||
Class B | ||||||||||||||||||||||||||||||||||||||||||||||||||||||||||||||||
12/31/2010 | 9.76 | 0.20 | 0.11 | 0.31 | (0.12 | ) | - | 9.95 | 3.22 | 88 | 54 | 0.52 | 2.03 | |||||||||||||||||||||||||||||||||||||||||||||||||||
12/31/2009 | 9.41 | 0.26 | 0.47 | 0.73 | (0.29 | ) | (0.09 | ) | 9.76 | 7.74 | 211 | 102 | 0.54 | 2.57 | ||||||||||||||||||||||||||||||||||||||||||||||||||
12/31/2008 | 10.53 | 0.42 | (1.03 | ) | (0.61 | ) | (0.47 | ) | (0.04 | ) | 9.41 | (5.66 | ) | 50 | 134 | 0.54 | 4.05 | |||||||||||||||||||||||||||||||||||||||||||||||
12/31/2007 | 10.33 | 0.50 | 0.01 | 0.51 | (0.31 | ) | - | 10.53 | 4.95 | 118 | 73 | (l | ) | 0.55 | 4.74 | |||||||||||||||||||||||||||||||||||||||||||||||||
05/01(a)-12/31/2006 | 10.00 | 0.32 | 0.01 | 0.33 | - | - | 10.33 | 3.30 | 103 | 109 | (l | ) | 0.54 | 4.72 | ||||||||||||||||||||||||||||||||||||||||||||||||||
See accompanying Notes to Financial Statements.
JNL Series Trust
Financial Highlights
Net Asset Value | Increase (Decrease) from Investment Operations (e) | Distributions Gains on | Supplemental Data | Ratio of Expenses to Net Assets (c) | Ratio of Net Income (Loss) to Assets (c) | |||||||||||||||||||||||||||||||||||||||||||
| Period Ended | Net (Loss) | Net Realized & Unrealized (Losses) | Total from Investment Operations | Distributions from Net | Net Asset End of | Total Return (b) | Net Assets, Period (in thousands) | Portfolio Turnover (d) | ||||||||||||||||||||||||||||||||||||||||
JNL/T. Rowe Price Value Fund |
| |||||||||||||||||||||||||||||||||||||||||||||||
Class A | ||||||||||||||||||||||||||||||||||||||||||||||||
12/31/2010 | $ | 9.44 | $ | 0.19 | $ | 1.31 | $ | 1.50 | $ | (0.10 | ) | $ | - | $ | 10.84 | 15.89 | % | $ | 1,136,182 | 27 | % | 0.94 | % | 1.97 | % | |||||||||||||||||||||||
12/31/2009 | 6.98 | 0.15 | 2.44 | 2.59 | (0.13 | ) | - | 9.44 | 37.09 | 727,672 | 21 | 0.96 | 1.89 | |||||||||||||||||||||||||||||||||||
12/31/2008 | 14.65 | 0.20 | (6.20 | ) | (6.00 | ) | (0.24 | ) | (1.43 | ) | 6.98 | (40.47 | ) | 412,536 | 29 | 0.96 | 1.65 | |||||||||||||||||||||||||||||||
12/31/2007 | 15.62 | 0.26 | (0.14 | ) | 0.12 | (0.20 | ) | (0.89 | ) | 14.65 | 0.85 | 707,468 | 33 | 0.95 | 1.59 | |||||||||||||||||||||||||||||||||
12/31/2006 | 13.93 | 0.22 | 2.57 | 2.79 | (0.13 | ) | (0.97 | ) | 15.62 | 20.11 | 681,711 | 26 | 0.96 | 1.48 | ||||||||||||||||||||||||||||||||||
Class B | ||||||||||||||||||||||||||||||||||||||||||||||||
12/31/2010 | 9.67 | 0.22 | 1.33 | 1.55 | (0.11 | ) | - | 11.11 | 16.04 | 594 | 27 | 0.74 | 2.19 | |||||||||||||||||||||||||||||||||||
12/31/2009 | 7.14 | 0.17 | 2.50 | 2.67 | (0.14 | ) | - | 9.67 | 37.46 | 549 | 21 | 0.76 | 2.16 | |||||||||||||||||||||||||||||||||||
12/31/2008 | 14.95 | 0.23 | (6.34 | ) | (6.11 | ) | (0.27 | ) | (1.43 | ) | 7.14 | (40.39 | ) | 385 | 29 | 0.76 | 1.85 | |||||||||||||||||||||||||||||||
12/31/2007 | 15.83 | 0.29 | (0.14 | ) | 0.15 | (0.14 | ) | (0.89 | ) | 14.95 | 1.03 | 641 | 33 | 0.75 | 1.73 | |||||||||||||||||||||||||||||||||
12/31/2006 | 14.03 | 0.26 | 2.58 | 2.84 | (0.07 | ) | (0.97 | ) | 15.83 | 20.30 | 391 | 26 | 0.76 | 1.71 | ||||||||||||||||||||||||||||||||||
| (a) | Commencement of operations. |
| (b) | Total return assumes reinvestment of all distributions for the period. Total return is not annualized for periods less than one year and does not reflect payment of the expenses that apply to the variable accounts or any annuity charges. |
| (c) | Annualized for periods less than one year. |
| (d) | Not annualized for periods of less than one year. Portfolio turnover rate is based on the Feeder Funds or fund of fund’s purchases or sales of the Master Fund or underlying funds, respectively. Portfolio turnover excludes dollar roll transactions. |
| (e) | Calculated using the average shares method. |
| (f) | Amount represents less than $0.005. |
| (g) | Includes dividend expense and borrowing fees on securities sold short for JNL/Goldman Sachs U.S. Equity Flex Fund of 0.72%, 0.37%, 0.40% and 1.06% for Class A and B shares for the years ended December 31, 2010, 2009, 2008 and 2007, respectively. |
| (h) | Ratios of net investment income and expenses to average net assets do not include the impact of each Master Fund’s and underlying fund’s expenses. |
| (i) | Portfolio turnover including dollar roll transactions for JNL/Franklin Templeton Income Fund was 34% for 2007. The Fund had no dollar roll transactions for periods ending after December 31, 2007. |
| (j) | Includes dividend expense and borrowing fees on securities sold short for JNL/Franklin Templeton Mutual Shares Fund of 0.05%, 0.01% and 0.01% for Class A and B shares for the periods ended December 31, 2009, December 31, 2008 and December 31, 2007, respectively. |
| (k) | Portfolio turnover including dollar roll transactions for JNL/Goldman Sachs Core Plus Bond Fund was 570%, 332%, 484% and 1,137% in 2006, 2007, 2009 and 2010, respectively. The Fund had no dollar roll transactions for year ended December 31, 2008. |
| (l) | Portfolio turnover including dollar roll transactions for JNL/T. Rowe Price Short-Term Bond Fund was 118% and 78% for 2006 and 2007, respectively. The Fund had no dollar roll transactions for periods ending after December 31, 2007. |
| (m) | Portfolio turnover including dollar roll transactions for JNL/JPMorgan U.S. Government & Quality Bond Fund was 524% and 217% in 2006 and 2007, respectively. The Fund had no dollar roll transactions for the periods ending after December 31, 2007. |
| (n) | Portfolio turnover including dollar roll transactions for JNL/Mellon Capital Management Bond Index Fund was 79%, 52%, 52%, 90% and 83% in 2006, 2007, 2008, 2009 and 2010, respectively. |
| (o) | Portfolio turnover including dollar roll transactions for JNL/PIMCO Real Return Fund was 1,340% in 2007. The Fund had no dollar roll transactions for periods ending after December 31, 2007. |
| (p) | Portfolio turnover including dollar roll transactions for JNL/PIMCO Total Return Bond Fund was 271% and 402% in 2006 and 2007, respectively. The Fund had no dollar roll transactions for periods ending after December 31, 2007. |
| (q) | Portfolio turnover including dollar roll transactions for JNL/Select Balanced Fund was 64%, 76%, 76%, 81% and 90% in 2006, 2007, 2008, 2009 and 2010, respectively. |
| (r) | For the year ended December 31, 2008, the Adviser voluntarily contributed capital to the JNL/Select Money Market Fund. The return for Class A and Class B shares without the contribution was 2.00% and 2.18%, respectively. |
| (s) | Distribution amount includes a return of capital distribution which was less than $0.005 per share. |
| (t) | Total return for the JNL/Invesco International Growth Fund includes class action settlement proceeds. The return for Class A and Class B shares without the class action settlement proceeds was 36.63% and 39.63%, respectively. |
| (u) | Total return for the JNL/Capital Guardian Global Diversified Research Fund includes class action settlement proceeds. The return for Class A and Class B shares without the class action settlement proceeds was 36.07% and 36.40%, respectively. |
| (v) | Total return for the JNL/Select Money Market Fund includes class action settlement proceeds. The return for Class A and Class B shares without the class action settlement proceeds was 0.14% and 0.20%, respectively. |
| (w) | For the JNL/Select Money Market Fund, the ratios of expense to average net assets for Class A and Class B shares without the expense waivers were 0.57% and 0.37% and 0.57% and 0.37%, respectively, for the years ended December 31, 2010 and 2009, and the . ratios of net investment income to average net assets for Class A and Class B shares without the waivers were (0.30%) and (0.10%) and 0.06% and 0.24% for the years ended December 31, 2010 and 2009, respectively. |
| (x) | Distribution amount for the JNL/T. Rowe Price Mid-Cap Growth Fund includes a return of capital distribution for Class A and Class B shares of $0.01 and $0.01 per share, respectively, for the year ended December 31, 2009. |
| (y) | For the JNL/American Funds Blue Chip Income and Growth Fund, JNL/American Funds Global Bond Fund, JNL/American Funds Global Small Capitalization Fund, JNL/American Funds Growth-Income Fund, JNL/American Funds International Fund, JNL/American Funds New World Fund, and JNL/BlackRock Global Allocation Fund the ratios of expense to average net assets for Class A and Class B shares without the expense waivers were 1.10% and 0.85%, 1.10% and 0.85%, 1.15%, and 0.90%, 1.10% and 0.85%, 1.25% and 1.00%, 1.45% and 1.20%, and 1.26% and 1.06%, respectively; and the ratios of net income to average net assets for Class A and Class B shares without expense waivers were 4.07% and 6.13%, 6.43% and 8.44%, 1.33% and 2.51%, 3.32% and 3.82%, 3.38% and 6.44%, 2.98% and 3.14%, and 11.84% and 13.96%, respectively. |
| (z) | Portfolio turnover including dollar roll transactions for JNL/Capital Guardian Global Balanced Fund was 52% in 2010. |
See accompanying Notes to Financial Statements.
JNL Series Trust
Notes to Financial Statements
December 31, 2010
NOTE 1. ORGANIZATION
The JNL Series Trust (“Trust”) is an open-end management investment company organized under the laws of the state of Massachusetts, by a Declaration of Trust, dated June 1, 1994. The Trust is registered with the U.S. Securities and Exchange Commission (“SEC”) under the Investment Company Act of 1940, as amended, (“1940 Act”), and its shares are registered under the Securities Act of 1933 (“1933 Act”), as amended. The Trust currently offers shares in seventy-nine (79) separate funds (each a “Fund”, and collectively, “Funds”), each with its own investment objective.
Jackson National Asset Management, LLC (“JNAM” or “Adviser”) is a wholly-owned subsidiary of Jackson National Life Insurance Company® (“Jackson”) and an indirect wholly owned subsidiary of Prudential plc, a publicly traded company incorporated in the United Kingdom. Prudential plc is not affiliated in any manner with Prudential Financial Inc., a company whose principal place of business is in the United States of America. JNAM serves as investment adviser to each of the Funds. Shares are presently offered to Jackson, Jackson National Life Insurance Company of New York, and affiliated separate accounts to fund the benefits of variable annuity and variable life policies. Shares are also sold to qualified and non-qualified retirement plans as well as certain affiliated “funds of funds”. The Funds offered by the Trust and each Fund’s Adviser/Sub-adviser are:
| Adviser/Sub-Adviser: | Fund: (Sub-Sub-advisers are in parenthesis) |
| BlackRock Investment Management, LLC | JNL/BlackRock Commodity Securities Fund and JNL/BlackRock Global Allocation Fund. The JNL/BlackRock Global Allocation Fund utilizes a Master Feeder structure. | |
| Capital Guardian Trust Company | JNL/Capital Guardian Global Balanced Fund, JNL/Capital Guardian Global Diversified Research Fund, JNL/Capital Guardian U.S. Growth Equity Fund | |
| Capital Research and Management Company (Investment Adviser to each Master Fund) | JNL/American Funds Blue Chip Income and Growth Fund, JNL/American Funds Global Bond Fund, JNL/American Funds Global Small Capitalization Fund, JNL/American Funds Growth-Income Fund, JNL/American Funds International Fund, JNL/American Funds New World Fund. These funds are collectively known as “JNL American Funds”. The JNL American Funds each utilize a Master Feeder structure. | |
| Eagle Asset Management, Inc. | JNL/Eagle Core Equity Fund and JNL/Eagle SmallCap Equity Fund | |
| Templeton Global Advisors Limited | JNL/Franklin Templeton Global Growth Fund | |
| Franklin Advisers, Inc. | JNL/Franklin Templeton Income Fund | |
| Franklin Mutual Advisers, LLC | JNL/Franklin Templeton Mutual Shares Fund | |
| Franklin Advisory Services, LLC | JNL/Franklin Templeton Small Cap Value Fund | |
| Franklin Templeton Institutional, LLC | JNL/Franklin Templeton International Small Cap Growth Fund | |
Goldman Sachs Asset Management, L.P. Goldman Sachs Asset Management International (sub-sub-adviser) | JNL/Goldman Sachs Core Plus Bond Fund (Goldman Sachs Asset Management International), JNL/Goldman Sachs Emerging Markets Debt Fund, JNL/Goldman Sachs Mid Cap Value Fund, JNL/Goldman Sachs U.S. Equity Flex Fund | |
Invesco Advisers, Inc. Invesco Asset Management Ltd. (sub-sub-adviser) | JNL/Invesco Global Real Estate Fund (Invesco Asset Management Ltd.), JNL/Invesco International Growth Fund, JNL/Invesco Large Cap Growth Fund, JNL/Invesco Small Cap Growth Fund | |
| Ivy Investment Management Company | JNL/Ivy Asset Strategy Fund | |
| JNAM | JNL Institutional Alt 20 Fund, JNL Institutional Alt 35 Fund, JNL Institutional Alt 50 Fund, JNL Institutional Alt 65 Fund; the funds are collectively known as “JNL Institutional Alt Funds”. JNL/Franklin Templeton Founding Strategy Fund, JNL/Mellon Capital Management 10 x 10 Fund, JNL/Mellon Capital Management Index 5 Fund, JNL/S&P 4 Fund. All have a fund of funds structure. | |
| J.P. Morgan Investment Management Inc. | JNL/JPMorgan International Value Fund, JNL/JPMorgan MidCap Growth Fund, JNL/JPMorgan U.S. Government & Quality Bond Fund | |
| Lazard Asset Management, LLC | JNL/Lazard Emerging Markets Fund and JNL/Lazard Mid Cap Equity Fund | |
| M&G Investment Management Limited* | JNL/M&G Global Basics Fund and JNL/M&G Global Leaders Fund | |
| Mellon Capital Management Corporation | JNL/Mellon Capital Management European 30 Fund, JNL/Mellon Capital Management Pacific Rim 30 Fund, JNL/Mellon Capital Management S&P 500 Index Fund, JNL/Mellon Capital Management S&P 400 MidCap Index Fund, JNL/Mellon Capital Management Small Cap Index Fund, JNL/Mellon Capital Management International Index Fund, JNL/Mellon Capital Management Bond Index Fund, JNL/Mellon Capital Management Global Alpha Fund |
JNL Series Trust
Notes to Financial Statements
December 31, 2010
| Adviser/Sub-Adviser: | Fund: (Sub-Sub-advisers are in parenthesis) |
| OppenheimerFunds, Inc. | JNL/Oppenheimer Global Growth Fund | |
| Pacific Investment Management Company LLC | JNL/PIMCO Real Return Fund and JNL/PIMCO Total Return Bond Fund | |
| PPM America, Inc.* | JNL/PPM America High Yield Bond Fund, JNL/PPM America Mid Cap Value Fund, JNL/PPM America Small Cap Value Fund, JNL/PPM America Value Equity Fund | |
| Prudential Asset Management (Singapore) Limited* | JNL/PAM Asia ex-Japan Fund and JNL/PAM China-India Fund | |
| Red Rocks Capital LLC | JNL/Red Rocks Listed Private Equity Fund | |
| Standard & Poor’s Investment Advisory Services LLC | JNL/S&P Competitive Advantage Fund, JNL/S&P Dividend Income & Growth Fund, JNL/S&P Intrinsic Value Fund, JNL/S&P Total Yield Fund (all co-Sub-Advised by Mellon Capital Management Corporation) | |
| Standard & Poor’s Investment Advisory Services LLC | JNL/S&P Managed Conservative Fund, JNL/S&P Managed Moderate Fund, JNL/S&P Managed Moderate Growth Fund, JNL/S&P Managed Growth Fund, JNL/S&P Managed Aggressive Growth Fund, JNL/S&P Disciplined Moderate Fund, JNL/S&P Disciplined Moderate Growth Fund, JNL/S&P Disciplined Growth Fund. The funds are collectively known as “JNL/S&P Funds” and each utilizes a fund of funds structure which invests in other affiliated underlying funds. | |
| Wellington Management Company, LLP | JNL/Select Balanced Fund, JNL/Select Money Market Fund, JNL/Select Value Fund | |
| T. Rowe Price Associates, Inc. | JNL/T. Rowe Price Established Growth Fund, JNL/T. Rowe Price Mid-Cap Growth Fund, JNL/T. Rowe Price Short-Term Bond Fund, JNL/T. Rowe Price Value Fund |
| * | M&G Investment Management Limited, PPM America, Inc., and Prudential Asset Management (Singapore) Limited are affiliates of JNAM. |
The Trust consists of all diversified Funds for purposes of the 1940 Act, with the exception of the following non-diversified Funds: JNL/American Funds Global Bond Fund, JNL/BlackRock Commodity Securities Fund, JNL/BlackRock Global Allocation Fund, JNL Institutional Alt Funds, JNL/Goldman Sachs Emerging Markets Debt Fund, JNL/Lazard Mid Cap Equity Fund, JNL/Mellon Capital Management European 30 Fund, JNL/Mellon Capital Management Pacific Rim 30 Fund, JNL/Mellon Capital Management Global Alpha Fund, JNL/M&G Global Basics Fund, JNL/M&G Global Leaders Fund, JNL/PAM Asia ex-Japan Fund, JNL/PAM China-India Fund, JNL/PIMCO Real Return Fund, JNL/Red Rocks Listed Private Equity Fund, JNL/S&P Funds, JNL/S&P 4 Fund, JNL/S&P Competitive Advantage Fund, JNL/S&P Dividend Income & Growth Fund, JNL/S&P Intrinsic Value Fund and JNL/S&P Total Yield Fund.
Each Fund, except the JNL Institutional Alt Funds, JNL/S&P Funds, JNL/S&P 4 Fund, JNL/Franklin Templeton Founding Strategy Fund, JNL/Mellon Capital Management 10 x 10 Fund and JNL/Mellon Capital Management Index 5 Fund, offers Class A and Class B shares. The two classes differ principally in applicable 12b-1 fees. Shareholders bear the common expenses of each Fund and earn income and realized gains/losses from each Fund pro rata based on the average daily net assets of each class, without discrimination between share classes. Each share class also has different voting rights on matters affecting a single class. No class has preferential dividend rights. Trust level expenses are allocated to the Funds based on the average daily net assets of each Fund.
Each of the JNL American Funds and the JNL/BlackRock Global Allocation Fund operate as a “Feeder Fund” and seeks to achieve its investment objective by investing primarily all its investable assets in a separate mutual fund (“Master Fund”). Each of the JNL American Fund’s Master Fund is a series of American Funds Insurance Series® (“American Funds”), a registered open-end management investment company, that has the same investment objective as each corresponding Feeder Fund. The JNL/BlackRock Global Allocation Fund’s Master Fund is a series of BlackRock Series Fund, Inc., a registered open-end management investment company, that has the same investment objective as the Feeder Fund. Each Master Fund directly acquires securities and the Feeder Fund investing in the Master Fund acquires an indirect interest in those securities. The Master Funds’ accounting policies are outlined in each Master Fund’s shareholder report. As of December 31, 2010, each American Fund Feeder Fund owned less than 5% in its corresponding Master Fund. The JNL/BlackRock Global Allocation Fund owned 36.2% in its corresponding Master Fund. This report should be read in conjunction with the Master Funds’ shareholder reports, which accompany this report.
Effective May 3, 2010, the Sub-Adviser for JNL/Capital Guardian International Small Cap Fund was changed from Capital Guardian Trust Company to Franklin Templeton Institutional, LLC. The name of the Fund was changed to JNL/Franklin Templeton International Small Cap Growth Fund.
Effective October 11, 2010, the Sub-Adviser for JNL/Credit Suisse Commodity Securities Fund was changed from Credit Suisse Asset Management, LLC to BlackRock Investment Management, LLC and the Sub-Adviser for JNL/Credit Suisse Long/Short Fund was changed from Credit Suisse Asset Management, LLC to Goldman Sachs Asset Management, L.P. The names of the Funds were changed to JNL/BlackRock Commodity Securities Fund and JNL/Goldman Sachs U.S. Equity Flex Fund, respectively. Additionally, effective October 11, 2010; JNL/AIM Global Real Estate Fund, JNL/AIM International Growth Fund, JNL/AIM Large Cap Growth Fund and JNL/AIM Small Cap Growth Fund names were changed to JNL/Invesco Global Real Estate Fund, JNL/Invesco International Growth Fund, JNL/Invesco Large Cap Growth Fund and JNL/Invesco Small Cap Growth Fund, respectively.
JNL Series Trust
Notes to Financial Statements
December 31, 2010
NOTE 2. SIGNIFICANT ACCOUNTING POLICIES
The following is a summary of significant accounting policies consistently followed by the Trust in the preparation of its financial statements in conformity with accounting principles generally accepted in the United States of America (“GAAP”).
Security Valuation – The net asset value (“NAV”) of each Fund shall be determined as of the close of trading (generally, 4:00 PM Eastern Time) on each day the New York Stock Exchange (“NYSE”) is open for trading. Stocks traded on an exchange are generally valued at the official closing price of the exchange where the security is principally traded. If there is no official closing price for the security, the security may be valued at the last quoted sale price on the exchange where the security is principally traded or final bid price in the absence of a sale. Stocks not listed on a national or foreign stock exchange may be valued at the closing bid price on the over-the-counter market. Investments in mutual funds are valued at the NAV per share determined as of the close of the NYSE on each valuation date. Each Feeder Fund’s investment in its corresponding Master Fund is valued at the NAV per share of the applicable Master Fund determined as of the close of the NYSE on each valuation date. Valuation of the investments by the Master Funds is discussed in the Master Funds’ shareholder reports, which accompany this report. The securities lending collateral funds, which provide daily liquidity, are valued at the daily reported NAV of the funds, as a practical expedient, as of the close of the NYSE on each valuation date. All securities in the JNL/Select Money Market Fund, as permitted by compliance with applicable provisions under Rule 2a-7 under the 1940 Act, and other short-term securities maturing within sixty (60) days are valued at amortized cost, unless it is determined that such practice does not approximate market value. Debt securities are generally valued by independent pricing services approved by the Trust’s Board of Trustees (“Board” or Trustees”). If pricing services are unable to provide valuations, debt securities are valued at the most recent bid quotation or evaluated price, as applicable, obtained from a broker/dealer or widely used quotation system. Commodity-linked structured notes are valued by pricing models using observable inputs. Credit-linked notes are valued at the most recent bid quotation obtained from a broker/dealer. Options and futures contracts traded on a liquid exchange are valued at the last sales price as of the close of business on the local exchange. Options traded on an illiquid exchange or over the counter are valued at the most recent bid quotation obtained from a broker/dealer. Forward foreign currency contracts are valued at the foreign currency exchange rate as of the close of the NYSE, unless the Adviser determines that such markets lack an appropriate level of liquidity at that time. In such instances, the Funds will generally utilize foreign currency exchange rates as of the close of the London Stock Exchange. Non-exchange traded derivatives, such as options and swap agreements, are generally valued by approved pricing services. If the pricing services are unable to provide valuations, non-exchange traded derivatives are valued at the most recent bid quotation or evaluated price, as applicable, obtained from a broker/dealer or by pricing models using observable inputs. Pricing services utilized to value debt and derivatives securities may use various pricing techniques which take into account appropriate factors such as: yield; credit quality; coupon rate; maturity; type of issue; trading characteristics; call features; credit ratings; and other data, as well as broker quotes.
Market quotations may not be readily available for certain investments or it may be determined that a quotation for an investment does not represent market value. In such instances, the investment is valued as determined in good faith using procedures adopted by the Board. Situations that may require an investment to be fair valued may include instances where a security is thinly traded, halted or restricted as to resale. In addition, investments may be fair valued based on the occurrence of a significant event. Significant events may be specific to a particular issuer, such as mergers, restructurings or defaults. Alternatively, significant events may affect an entire market, such as natural disasters, government actions, and significant changes in value of U.S. securities markets. Securities are fair valued based on observable and unobservable inputs, including the Adviser’s own assumptions in determining fair value. Under the procedures adopted by the Board, the Adviser may rely on pricing services or other sources to assist in determining the fair value of an investment. Factors considered to determine fair value may include the correlation with price movement of similar securities in the same or other markets; the type, cost and investment characteristics of the security; the business and financial condition of the issuer; and trading or other market data. The Board has retained an independent statistical fair value pricing service to assist in the fair valuation process for securities traded in foreign markets in order to adjust for possible changes in value that may occur between the close of the foreign exchange and the time at which the NAVs are determined.
If an investment is valued at a fair value for purposes of calculating a Fund’s NAV, the value may be different from the last quoted price for the investment depending on the source and method used to determine the value. Although there can be no assurance, in general, the fair value of the investment is the amount the owner of such investment might reasonably expect to receive upon its current sale.
In January 2010, the Financial Accounting Standards Board (“FASB”) issued Accounting Standards Update (“ASU”) No. 2010-06 “Improving Disclosures about Fair Value Measurements”. ASU No. 2010-06 clarifies existing disclosure requirements and mandates additional disclosures regarding fair value measurements. Entities are required to disclose significant transfers into and out of Level 1 and 2 measurements in the fair value hierarchy and the reasons for those transfers. Effective for fiscal years beginning after December 15, 2010, and for interim periods within those fiscal years, entities will need to disclose information about purchases, sales, issuances and settlements of Level 3 securities on a gross basis, rather than as a net number. Please see the Notes to the Schedules of Investments, FASB Accounting Standards Codification (“ASC”) Topic 820, “Fair Value Measurements and Disclosure”, for expanded disclosure of fair value measurements.
Distributions to Shareholders – The amount and timing of distributions are determined in accordance with federal income tax regulations, which may differ from GAAP. The JNL/Select Money Market Fund declares dividends daily and pays dividends monthly. For all other Funds, dividends from net investment income are generally declared and paid annually, but may be paid more frequently to avoid excise tax. Distributions of net realized capital gains, if any, will be distributed at least annually, to the extent they exceed available capital loss carry forwards.
Federal Income Taxes – Each Fund is a separate taxpayer for federal income tax purposes. Each Fund intends to qualify as a regulated investment company (“RIC”) and to distribute substantially all net investment income and net capital gains, if any, to its shareholders and otherwise comply with
JNL Series Trust
Notes to Financial Statements
December 31, 2010
Subchapter M of the Internal Revenue Code of 1986, as amended, applicable to regulated investment companies. Therefore, no federal income tax provision is required. Under current tax law, interest and dividend income and capital gains paid by the Funds are not currently taxable to shareholders when left to accumulate within a variable annuity contract.
Foreign Taxes - The Funds may be subject to foreign taxes on income, gains on investments or currency purchases/repatriation, a portion of which may be recoverable. The Funds will accrue such taxes and recoveries as applicable, based upon their current interpretation of tax rules and regulations that exist in the markets in which they invest.
Foreign Currency Translations - The accounting records of each Fund are maintained in U.S. dollars. Investment securities and other assets and liabilities denominated in a foreign currency are translated into U.S. dollars. Purchases and sales of investment securities, income receipts and expense payments are translated into U.S. dollars at the respective exchange rates prevailing on the dates of such transactions. The Funds do not isolate that portion of the results of operations resulting from changes in foreign exchange rates on investments from the fluctuations arising from changes in market prices of foreign securities. Such fluctuations are included in net realized gain or loss on investments and net change in unrealized appreciation or depreciation on investments. Net realized gains and losses on foreign currency related items are considered ordinary income for tax purposes and arise from sales of foreign currencies; currency gains or losses realized between the trade and settlement dates on securities transactions; the difference between the amounts of dividends, interest and foreign withholding taxes recorded and the U.S. dollar equivalent of the amounts actually received or paid; and the realized gains or losses resulting from portfolio and transaction hedges. Net change in unrealized appreciation or depreciation on foreign currency related items arises from changes in the fair value of assets and liabilities, other than investments in securities, at period end resulting from changes in exchange rates.
Guarantees and Indemnifications – Under the Trust’s organizational documents, its officers and Trustees are indemnified against certain liabilities arising out of the performance of their duties to the Funds. In addition, certain of the Funds’ contracts with service providers contain general indemnification clauses. The Funds’ maximum exposure under these arrangements is unknown since the amount of any future claims that may be made against the Funds cannot be determined and the Funds have no historical basis for predicting the likelihood of any such claims.
Security Transactions and Investment Income - Security transactions are recorded on the trade date for financial reporting purposes. Dividend income, net of applicable withholding taxes, is recorded on the ex-dividend date. Interest income, including level-yield amortization of discounts and premiums, is accrued daily. A Fund may place a debt obligation on non-accrual status and reduce related interest income by ceasing current accruals and writing off interest receivables when the collection of all or a portion of interest has become doubtful. A debt obligation is removed from non-accrual status when the issuer resumes interest payments or when collectability of interest is reasonably assured. Realized gains and losses are determined on the specific identification basis.
Use of Estimates - The preparation of financial statements in conformity with GAAP requires management to make estimates and assumptions that affect the reported amounts of assets and liabilities and disclosure of contingent assets and liabilities at the date of the financial statements and the reported amounts of increases and decreases in net assets from operations during the reporting period. Actual results could differ from those estimates.
Expenses in Master Funds and Fund of Funds - Because each Feeder Fund invests substantially all of its assets in a Master Fund, the Feeder Fund shareholders bear the fees and expenses of each respective Master Fund in which the Feeder Fund invests. Such expenses are not included in the Statements of Operations, but are incurred indirectly because they are considered in the calculation of the net asset value of the respective master fund. As a result, the Feeder Fund’s actual expenses may be higher than those of other mutual funds that invest directly in securities. A similar situation exists for a fund of funds as it relates to the expenses associated with the investments in underlying funds.
NOTE 3. SECURITIES AND OTHER INVESTMENTS
Securities Lending and Securities Lending Collateral – A Fund may lend securities to certain brokers, dealers or other financial institutions in order to earn additional income. The borrowers and the Funds’ securities lending agent exchange negotiated lender fees and the Funds receive a fee equal to a percentage of the net negotiated lender fees and the net income generated by the securities lending collateral held during each lending transaction. The securities lending agent is authorized to loan securities on behalf of the Funds to approved borrowers and is required to maintain collateral at least equal to the value of the securities loaned based on the previous day’s value of the securities loaned, marked to market daily. Any shortfalls are adjusted the next business day. In the event of bankruptcy or other default of the borrower, a Fund could experience delays in liquidating the loan collateral or recovering the loaned securities and incur expenses related to enforcing its rights. In addition, there could be a decline in the value of the collateral or in the value of the securities loaned while a Fund seeks to enforce its rights thereto and the Fund could experience subnormal levels of income or lack of access to income during that period. The Funds also bear the risk of any deficiency in the amount of collateral available for return to a borrower due to a loss in an approved investment. Each Fund is responsible for returning the full amount of collateral received for a particular loan when the borrower returns the applicable security.
JPMorgan Chase Bank, N.A. (“JPM Chase” or “Custodian”) serves as custodian and securities lending agent to the Trust. The Funds have cash collateral invested in the Securities Lending Cash Collateral Fund LLC and the Securities Lending Liquidating Fund LLC, each a limited liability company sponsored by the Adviser. As the assets in the Securities Lending Liquidating Fund LLC mature or are liquidated, the proceeds are invested in the Securities Lending Cash Collateral Fund LLC. Although the Securities Lending Cash Collateral Fund LLC is not a registered fund under the 1940 Act, and is not a
JNL Series Trust
Notes to Financial Statements
December 31, 2010
“money market fund”, it typically invests in high quality U.S. dollar-denominated instruments that qualify at time of purchase as “eligible securities” within the meaning of Rule 2a-7 under the 1940 Act, which governs money market funds. The Securities Lending Cash Collateral Fund LLC and the Securities Lending Liquidating Fund LLC are only offered to the Funds and JNAM affiliated Funds.
The Securities Lending Cash Collateral Fund LLC’s and the Securities Lending Liquidating Fund LLC’s NAVs are determined as of the close of trading (generally, 4:00 PM Eastern Time) on each day the NYSE is open for trading. Short-term securities in the Securities Lending Cash Collateral Fund LLC and securities maturing within 60 days in Securities Lending Liquidating LLC are valued at amortized cost, unless it is determined that such practice does not approximate market value. Securities that are not valued at amortized cost in the Securities Lending Liquidating Fund LLC are generally valued based on prices furnished by pricing services. If pricing services are unable to provide valuations, debt securities are valued at the most recent bid quotation or evaluated price, as applicable, obtained from a broker/dealer or widely used quotation system.
U.S. Government Agencies or Government Sponsored Enterprises - Certain Funds may invest in U.S. government agencies or government sponsored enterprises. U.S. Government securities are obligations of and, in certain cases, guaranteed by, the U.S. government, its agencies or instrumentalities. Some U.S. Government securities, such as Treasury bills, notes and bonds, and securities guaranteed by the Government National Mortgage Association, are supported by the full faith and credit of the U.S. government; others, such as those of the Federal Home Loan Bank, are supported by the right of the issuer to borrow from the U.S. Department of the Treasury (the “U.S. Treasury”); others, such as those of the Federal National Mortgage Association (“FNMA” or “Fannie Mae”), are supported by the discretionary authority of the U.S. government to purchase the agency’s obligations; and still others, such as those of the Student Loan Marketing Association, are supported only by the credit of the instrumentality. U.S. Government securities may include zero coupon securities, which do not distribute interest on a current basis and tend to be subject to greater risk than interest paying securities of similar maturities.
Government-related guarantors (i.e., guarantors who are not backed by the full faith and credit of the U.S. government) include FNMA and the Federal Home Loan Mortgage Corporation (“FHLMC” or “Freddie Mac”). FNMA purchases conventional (i.e., not insured or guaranteed by any government agency) residential mortgages from a list of approved seller/servicers which include state and federally chartered savings and loan associations, mutual savings banks, commercial banks and credit unions and mortgage bankers. Pass-through securities issued by FNMA are guaranteed as to timely payment of principal and interest by FNMA, but are not backed by the full faith and credit of the U.S. government. FHLMC issues Participation Certificates (“PCs”), which are pass-through securities, each representing an undivided interest in a pool of residential mortgages. FHLMC guarantees the timely payment of interest and ultimate collection of principal, but PCs are not backed by the full faith and credit of the U.S. government.
FNMA and FHMLC were placed into conservatorship by the Federal Housing Finance Agency (“FHFA”). As the conservator, FHFA succeeded to all rights, titles, powers and privileges of FNMA and FHLMC and of any stockholder, officer or director of FNMA and FHLMC with respect to FNMA and FHLMC and each enterprise’s assets. In connection with the conservatorship, the U.S. Treasury entered into a Senior Preferred Stock Purchase Agreement with FNMA and FHLMC. This agreement contains various covenants that severely limit each enterprise’s operations. In exchange for entering into these agreements, the U.S. Treasury received senior preferred stock in each enterprise and warrants to purchase each enterprise’s common stock. The U.S. Treasury announced the creation of a new secured lending facility, which is available to FNMA and FHLMC as a liquidity backstop and the creation of a temporary program to purchase mortgage-backed securities issued by FNMA and FHLMC. FNMA and FHLMC are continuing to operate as going concerns while in conservatorship and each remains liable for all of its obligations, including its guaranty obligations, associated with its mortgage-backed securities.
Unregistered Securities - A Fund may own certain investment securities, which are unregistered and thus restricted to resale. These securities may also be referred to as “private placements”. Unregistered securities may be “illiquid” because there is no readily available market for sale of the securities. Where future dispositions of the securities require registration under the 1933 Act, as amended, the Funds have the right to include those securities in such registration generally without cost to the Funds. The Funds have no right to require registration of unregistered securities.
Repurchase Agreements - A Fund may invest in repurchase agreements. A repurchase agreement involves the purchase of a security by a Fund and a simultaneous agreement by the seller, generally a bank or broker dealer, to repurchase that security back from the Fund at a specified price and date or upon demand. The underlying securities used as collateral for all repurchase agreements are held in safekeeping at the Fund’s Custodian or designated subcustodians under triparty repurchase agreements. The market value of the collateral must be equal to or exceed at all times the total amount of the repurchase obligations, including interest. JNAM monitors that the daily market value of the collateral for the repurchase agreement is in excess of the repurchase agreement. In the event of a default by the counterparty, realization of the collateral proceeds could be delayed, during which time the value of such collateral may decline.
Reverse Repurchase Agreements - A Fund may enter into reverse repurchase agreements. A reverse repurchase agreement involves the sale of a security by a Fund and a simultaneous agreement by the purchaser, generally a bank or broker dealer, to resell that security to the Fund at an agreed-upon price and date. Securities sold under reverse repurchase agreements are reflected as a liability on the Statements of Assets and Liabilities. Interest payments made are recorded as a component of interest expense on the Statements of Operations. A reverse repurchase agreement involves the risk that the value of the security sold by the Fund may decline below the repurchase price of the security. The Fund will segregate assets at the Custodian determined to be liquid or otherwise cover its obligations under reverse repurchase agreements.
JNL Series Trust
Notes to Financial Statements
December 31, 2010
Forward Sales Commitments – A Fund may purchase or sell forward sales commitments. A forward sales commitment involves a Fund entering into a contract to purchase or sell securities for a fixed price at a future date beyond the customary settlement period. The purchase of a forward sales commitment involves the risk of loss if the value of the security to be purchased declines before the settlement date while the sale of a forward sales commitment involves the risk that the value of the securities to be sold may increase before the settlement date. A Fund may dispose of or renegotiate forward sales commitments after they are entered into, and may sell these securities before they are delivered, which may result in capital gain or loss.
Delayed-Delivery Securities - A Fund may purchase or sell securities on a delayed delivery basis, including “To Be Announced” (“TBA”) or “To Be Acquired” securities. These transactions involve a commitment by a Fund to purchase or sell securities for a predetermined price or yield, with payment and delivery taking place beyond the customary settlement period. In TBA transactions, a Fund commits to purchasing or selling securities for which all specific information is not yet known at the time of the trade, particularly the face amount and maturity date of the underlying securities. When delayed-delivery purchases are outstanding, the Fund is required to have sufficient cash and/or liquid securities to cover its commitments on these transactions. When purchasing a security on a delayed-delivery basis, the Fund assumes the rights of ownership of the security, including the risk of price and yield fluctuations, and considers such fluctuations when determining its NAV. A Fund may dispose of or renegotiate a delayed-delivery transaction after it is entered into, and may sell delayed-delivery securities before they are delivered, which may result in a realized gain or loss. When a Fund has sold a security on a delayed delivery basis, the Fund does not participate in future gains or losses with respect to the security. Securities purchased on a TBA basis are not settled until they are delivered to the Fund. In connection with TBA transactions, Funds may maintain a short position related to certain securities. In connection with these transactions, the Fund owns an equal amount of the securities or holds securities convertible (or exchangeable) into an equal amount of the securities, of the same issuer, as the position held short. Master Securities Forward Transaction Agreements (“Master Forward Agreements”) govern the consideration of factors surrounding the settlement of certain purchases and sales made on a delayed-delivery basis by and between the Fund and select counterparties. The Master Forward Agreements maintain provisions for, among other things, initiation and confirmation, payment and transfer, events of default, termination and maintenance of collateral.
Dollar Roll Transactions - A Fund may enter into mortgage dollar rolls in which a Fund sells mortgage-backed securities for delivery in the current month and simultaneously contracts to repurchase substantially similar (same type, coupon and maturity) securities on a specified future date. During the roll period, a Fund foregoes principal and interest paid on the mortgage-backed securities. A Fund is compensated by the interest earned on the cash proceeds of the initial sale and from negotiated fees paid by brokers offered as an inducement to the Fund to “roll over” its purchase commitments. A Fund may only enter into covered rolls. A “covered roll” is a type of dollar roll for which a Fund maintains offsetting positions in cash, U.S. Government securities, or other liquid assets which mature on or before the forward repurchase settlement date of the dollar roll transaction. Dollar roll transactions involve the risk that the market value of the securities sold by a Fund may decline below the repurchase price of those similar securities which the Fund is obligated to purchase or that the return earned by the Fund with the proceeds of a dollar roll may not exceed transaction costs.
Inflation-Indexed Bonds - A Fund may invest in inflation-indexed bonds which are fixed income securities whose principal value is periodically adjusted to the rate of inflation. The interest rate on these bonds is generally fixed at issuance at a rate lower than typical bonds. Over the life of an inflation-indexed bond, however, interest will be paid based on a principal value which is adjusted for inflation. Any increase in the principal amount of an inflation-indexed bond will be considered interest income, even though investors do not receive principal payments until maturity.
Unfunded Loan Commitments - A Fund may enter into certain credit agreements, all or a portion of which may be unfunded. The Fund is obligated to fund these loan commitments at the borrowers’ discretion. Unfunded loan commitments and funded portions of credit agreements are marked to market daily. Net unrealized appreciation or depreciation on unfunded loan commitments is reflected in other assets and other liabilities in the Statements of Assets and Liabilities and unrealized appreciation or depreciation on investments in the Statements of Operations. Funded portions of credit agreements are presented in the Schedules of Investments.
Securities Sold Short - A Fund may enter into short sales transactions. A short sale is a transaction in which a Fund sells a security it does not own in anticipation of a decline in the market price of the security. Until the security is replaced, the Fund is required to pay amounts equal to any dividend or interest which accrue during the period of the short sale. To borrow the security, the Fund also may be required to pay a premium, which would increase the cost of the security sold. Until a Fund closes its short position or replaces the borrowed security, the Fund will: (a) maintain cash or liquid securities at such a level that the amount so maintained plus any amounts deposited with the broker or segregated at the Custodian as collateral will equal the current value of the security sold short; or (b) otherwise cover the Fund’s short position. The Fund is obligated to deliver securities at the market price at the time the short position is closed. Potential losses from short sales may be unlimited.
Commodity-Linked Structured Notes - A commodity-linked structured note is a debt security that contains a return component based on the movement of a commodity index. These notes typically pay interest on the face value of the instrument and a formula based return tied to a commodity index return. These notes may be issued by U.S. and foreign banks, brokerage firms, insurance companies and other corporations. Performance of the particular commodity index will affect performance of the commodity-linked structured note. Commodity-linked structured notes are often leveraged, increasing the volatility of each note’s value relative to the change in the underlying index. They may be more volatile and less liquid than the underlying linked index and their value may be affected by the performance of commodities as well as other factors including liquidity, quality, maturity and other economic variables. Commodity-linked structured notes may have early redemption features based on advanced notice from the purchaser or automatic redemption triggered by a preset decline in the underlying commodity index. In addition to fluctuating in response to changes in the underlying commodity index, these notes are debt securities of the issuer and will be subject to credit and interest rate risks that typically affect debt securities.
JNL Series Trust
Notes to Financial Statements
December 31, 2010
NOTE 4. FINANCIAL DERIVATIVE INSTRUMENTS
FASB ASC Topic 815, “Derivatives and Hedging” – This standard includes the requirement for enhanced qualitative disclosures about objectives and strategies for using derivative instruments and disclosures regarding credit related contingent features in derivative instruments; as well as requiring quantitative disclosures in the semi-annual and annual financial statements about fair value, realized and unrealized gains and losses and volume of activity for derivative instruments. Information about these instruments is disclosed in the context of each instrument’s primary underlying risk exposure which is categorized as credit, equity price, interest rate and foreign currency exchange rate risk. A tabular disclosure for each derivative instrument by risk category is presented in the Notes to the Schedules of Investments which references the location on the Statements of Assets and Liabilities and the realized and unrealized gain or loss in the Statements of Operations for each derivative instrument. The objectives, strategies and underlying risks for each instrument held by the Funds are discussed in the following paragraphs.
Credit Linked Notes - A Fund may invest in credit linked notes in the normal course of pursuing its investment objective. During the year, JNL/Goldman Sachs Core Plus Bond Fund and JNL/Goldman Sachs Emerging Markets Debt Fund invested in credit linked notes to manage portfolio risk and to gain exposure to certain foreign markets. The value of a credit linked note is based on the price movements of a particular credit, known as a reference credit. Credit linked notes that the Funds invest in are listed instruments that typically provide the same return as the underlying reference credit. Credit linked notes are intended to replicate the economic effects that would apply had a Fund directly purchased the underlying reference credit. The Fund generally will receive a fixed or floating coupon and the note’s par value upon maturity. If a specified credit event occurs, such as default or bankruptcy, the Fund may experience a delay in payment or forego interest. The maximum potential risk of loss is limited to the par amount of the credit linked note plus any accrued interest. The reference credit and its credit rating, for each credit linked note, is presented parenthetically in the Schedules of Investments.
Forward Foreign Currency Contracts - A Fund may be subject to foreign currency exchange rate risk in the normal course of pursuing its investment objective. During the year, these Funds entered into forward foreign currency contracts for the following reasons: JNL/Capital Guardian Global Balanced Fund, JNL/Goldman Sachs Core Plus Bond Fund, JNL Goldman Sachs Emerging Markets Debt Fund, JNL/Ivy Asset Strategy Fund, JNL/PIMCO Real Return Fund and JNL/PIMCO Total Return Bond Fund to minimize foreign currency exposure on portfolio securities denominated in foreign currencies and as part of their overall investment strategy; JNL/Capital Guardian Global Diversified Research Fund to minimize foreign currency exposure on portfolio securities denominated in foreign currencies; JNL/Franklin Templeton Mutual Shares Fund to hedge foreign currency exposure between trade date and settlement date on portfolio security purchases and sales; JNL/JPMorgan International Value Fund to minimize foreign currency exposure on portfolio securities denominated in foreign currencies and to strive to reduce currency deviations from its benchmark as a means of risk management; JNL/Mellon Capital Management International Index Fund to create foreign currency exposure on U.S. dollar cash balances; and JNL/ Mellon Capital Management Global Alpha Fund and JNL/T. Rowe Price Short-Term Bond Fund as part of their overall investment strategy. A forward foreign currency contract is an agreement between two parties to buy and sell a currency at a set price on a future date. The use of forward foreign currency contracts does not eliminate fluctuations in the underlying prices of a Fund’s portfolio securities, but it does establish a rate of currency exchange that can be achieved in the future. The value of a forward foreign currency contract fluctuates with changes in foreign currency exchange rates. Forward foreign currency contracts are marked-to-market daily and the change in value is recorded by a Fund as an unrealized gain or loss and as a receivable or payable from forward foreign currency contracts. Upon settlement, or delivery or receipt of the currency, a realized gain or loss is recorded which is equal to the difference between the value of the contract at the time it was opened and the value at the time it was closed. Forward foreign currency contracts involve market risk in excess of the receivable or payable related to forward foreign currency contracts recorded by the Funds. Although contracts limit the risk of loss due to a decline in the value of the hedged currency, they also limit any potential gain that might result should the value of the currency increase. Additionally, a Fund could be exposed to the risk of a previously hedged position becoming unhedged if the counterparty to a contract is unable to meet the terms of the contract or if the value of the currency changes unfavorably to the value of the offsetting currency.
Futures Contracts - A Fund may be subject to equity price, interest rate and foreign currency exchange rate risk in the normal course of pursuing its investment objective. During the year, these Funds entered into futures contracts for the following reasons: JNL/Ivy Asset Strategy Fund and JNL/ Mellon Capital Management Global Alpha Fund as an efficient means of adjusting overall exposure to certain markets as part of their investment strategy; JNL/JPMorgan International Value Fund to gain exposure to markets for efficient management of cash flows; JNL/Mellon Capital Management S&P 500 Index Fund, JNL/Mellon Capital Management S&P 400 Mid Cap Index Fund, JNL/Mellon Capital Management Small Cap Index Fund and JNL/ Mellon Capital Management International Index Fund to hedge accrued dividends and for efficient management of cash flows; JNL/Goldman Sachs Core Plus Bond Fund, JNL/PIMCO Real Return Fund and JNL/PIMCO Total Return Bond Fund to manage their exposure to or hedge interest rates and as an efficient means of adjusting overall exposure to certain markets as part of its investment strategy; and JNL/Select Balanced Fund to manage its exposure to or hedge interest rates. Upon entering into a futures contract, the Fund is required to deposit with the broker or counterparty an amount of cash or cash equivalents equal to a certain percentage of the contract amount known as the “initial margin”. The Fund receives from or pays to the counterparty an amount of cash equal to the daily fluctuation in the value of the contracts. Such receipts or payments, known as the “variation margin”, are recorded by the Fund until the contracts are terminated at which time realized gains and losses are recognized. Futures contracts involve to varying degrees, risk of loss in excess of the variation margin recorded by the Fund. The primary risks associated with the use of futures contracts are the imperfect correlation between the change in market value of the securities held by a Fund or the change in the market value of an underlying entity and the prices of the futures contracts and the possibility a Fund may not be able to enter into a closing transaction because of an illiquid market. The Funds may also suffer a loss on futures contacts. With futures, there is minimal counterparty risk to a Fund since future contracts are exchange traded and the exchange’s clearinghouse, as counterparty to all exchange traded futures, guarantees the future contracts against default.
Options Transactions – A Fund may be subject to equity price, interest rate and foreign currency exchange rate risk in the normal course of pursuing its investment objective. A Fund may buy and sell (“write”) call and put options on securities, futures, currencies and swaps (“swaptions”) and on inflation
JNL Series Trust
Notes to Financial Statements
December 31, 2010
caps and floors. During the year, JNL/Ivy Asset Strategy Fund used options to manage exposure to or hedge changes in securities prices and foreign currencies and as efficient means of adjusting overall exposure to certain markets as part of its investment strategy. JNL/PIMCO Real Return Fund and JNL/PIMCO Total Return Bond Fund used written options to generate income and used straddle options to take a position on expectations of volatility of the reference entity. Straddle options are written or purchased with premiums to be determined on a future date which are based upon implied volatility parameters at specified terms. The purpose of an inflation cap is to protect the buyer from inflation erosion above a certain rate. An inflation floor can be used to provide downside protection to investments in inflation-linked products.
When a Fund purchases an option, the premium paid by the Fund is recorded as an asset and is subsequently marked-to-market to reflect the current value of the option. Premiums paid for purchasing options which expire are treated as realized losses. Premiums paid for purchasing options which are exercised or closed are added to the cost basis of the underlying investment or offset against the proceeds of the underlying investment transaction to determine realized gain or loss. Purchasing call options tends to increase a Fund’s exposure to the underlying instrument. Purchasing put options tends to decrease a Fund’s exposure to the underlying instrument. The risks associated with purchasing options are limited to premiums paid and the failure of the counterparty to honor its obligation under the contract.
When a Fund writes a call or put option or inflation cap or floor, the premium received by the Fund is recorded as a liability and is subsequently marked to market to reflect the current value of the option. Premiums received from writing options which expire are treated as realized gains. Premiums received from writing options which are exercised or closed are added to the proceeds of the underlying investment transaction or reduce the cost basis of the underlying investment to determine the realized gain or loss. Writing call options tends to decrease a Fund’s exposure to the underlying instrument. Writing put options tends to increase a Fund’s exposure to the underlying instrument. The risk associated with writing an option that is exercised is that an unfavorable change in the price of the security underlying the option could result in a Fund buying the underlying security at a price higher than the current value. There is also the risk a Fund may not be able to enter into a closing transaction because of an illiquid market. Options written by a Fund do not give rise to counterparty credit risk, as they obligate the Fund, not the counterparty, to perform. The maximum potential amount of future payments (undiscounted) that a Fund could be required to make under an inflation cap or floor would be the notional amount times the percentage increase (for an inflation cap) or decrease (for an inflation floor) in inflation determined by the difference between the index’s current value and the value at the time the inflation cap or floor was entered into.
Swap Agreements - Swap agreements are privately negotiated agreements between a Fund and a counterparty to exchange the return generated by one instrument for the return generated by another instrument. Swap agreements are illiquid investments. If a Fund transacts in swap agreements, they are a party to International Swaps and Derivatives Association, Inc. (“ISDA”) Master Agreements (“ISDA Master Agreements”) with select counterparties. The ISDA Master Agreements govern transactions in over-the-counter derivative and forward foreign currency contracts and maintain provisions for general obligations, representations, agreements, collateral and events of default or termination. Events of termination include conditions that may entitle counterparties to elect to terminate early and cause settlement of all outstanding transactions under the applicable ISDA Master Agreement. Any election to early termination could be material to the financial statements. The amount of collateral exchanged is based on provisions within the ISDA Master Agreements and is determined by the net exposure with the counterparty and is not identified for a specific swap agreement. The Fund’s pledged collateral, which is delivered to counterparties, or segregated collateral, which is at the Custodian, as of December 31, 2010 is included in a table in the Notes to the Schedules of Investments. Collateral received from counterparties is included in deposits with/from counterparties in the Statements of Assets and Liabilities.
Swap agreements are marked-to-market daily and change in value is recorded by a Fund as an unrealized gain or loss. Swap premiums paid or received at the beginning of the measurement period which are recorded by the Fund represent payments made or received upon entering into the swap agreement to compensate for differences between the stated terms of the swap agreement and prevailing market conditions relating to credit spreads, interest rates, currency exchange rates, and other relevant factors as appropriate. These upfront payments are amortized over the life of the swap agreement and recorded as a realized gain or loss upon termination or maturity of the swap agreement. A liquidation payment received or made at the termination of the swap agreement is recorded as a realized gain or loss. Net periodic payments received or paid by a Fund are included as part of realized gain or loss.
Entering into swap agreements involves, to varying degrees, elements of credit and market risk in excess of the unrealized gain or loss recorded by the Fund. Such risks involve the possibility that there will be no liquid market for these agreements, that there may be unfavorable changes in interest rates or value of underlying securities and that the counterparty to the agreements may default on its obligation to perform. In addition, entering into swap agreements involves documentation risk resulting from the possibility that the parties to a swap agreement may disagree as to the meaning of contractual terms in the agreement. The credit risk associated with contracts is reduced by master netting arrangements to the extent that if an event of default occurs, all amounts with the counterparty are terminated and settled on a net basis. A Fund’s overall exposure to credit risk subject to master netting arrangements can change substantially within a short period, as it is affected by each transaction subject to the arrangement.
Interest Rate Swap Agreements - A Fund may be subject to interest rate risk and foreign currency exchange risk in the normal course of pursuing its investment objective. During then year, JNL/Goldman Sachs Core Plus Bond Fund and JNL/Goldman Sachs Emerging Markets Debt Fund entered into interest rate swap agreements to hedge against the risk that the value of their fixed rate bond investments would decrease/increase as interest rates rise/fall; to execute yield curve, swap spread and sovereign relative value trades; and to express views on a country’s interest rates. JNL/PIMCO Real Return Fund and JNL/PIMCO Total Return Bond Fund entered into interest rate swap agreements to manage interest rate and yield curve exposure and as a substitute for investment in physical securities. Interest rate swap agreements involve the exchange by a Fund with another party of their respective
JNL Series Trust
Notes to Financial Statements
December 31, 2010
commitments to pay or receive interest with respect to the notional amount of principal. Forms of interest rate swap agreements may include: interest rate caps, under which, in return for a premium, one party agrees to make payments to the other party to the extent that interest rates exceed a specified rate, or “cap”; interest rate floors, under which, in return for a premium, one party agrees to make payments to the other party to the extent that interest rates fall below a specified rate, or “floor”; interest rate collars, under which a party sells a cap and purchases a floor or vice versa in an attempt to protect itself against interest rate movements exceeding certain levels; callable interest rate swaps, under which the counterparty may terminate the swap transaction in whole at zero cost by a predetermined date and time prior to the maturity date; or forward spread locks, which allow the interest rate swap users to lock in the forward differential (or spread) between the interest rate swap rate and a specified benchmark.
A Fund’s maximum risk of loss from counterparty credit risk for an interest rate swap agreement is the discounted net value of the cash flows to be received from or paid to the counterparty over the contract’s remaining life, to the extent this amount is positive. This risk is mitigated by having a master netting arrangement between a Fund and the counterparty and by posting of collateral by the counterparty to the Fund to cover the Fund’s exposure to the counterparty.
Credit Default Swap Agreements – A Fund may be subject to credit rate risk in the normal course of pursuing its investment objective. Credit default swap agreements involve one party making a stream of payments (referred to as the buyer of protection) to another party (the seller of protection) in exchange for the right to receive a specified return if a credit event occurs for the referenced entity, obligation or index. A credit event is defined under the terms of each swap agreement and may include, but is not limited to, underlying entity default, bankruptcy, write-down, principal shortfall, or interest shortfall.
A Fund may use credit default swap agreements on corporate or sovereign issues to provide a measure of protection against defaults of the issuers (i.e., to reduce risk where a Fund owns or has exposure to the referenced obligation) or to take an active long or short position with respect to the likelihood of a particular issuer’s default. If a credit event occurs and cash settlement is not elected, a variety of other deliverable obligations may be delivered in lieu of the specific referenced obligation. The ability to deliver other obligations may result in a cheapest-to-deliver option (the buyer of protection’s right to choose the deliverable obligation with the lowest value following a credit event).
A Fund may use credit default swap agreements on asset-backed securities to provide a measure of protection against defaults of the referenced obligation or to take an active long or short position with respect to the likelihood of a particular referenced obligation’s default. Unlike credit default swaps on corporate or sovereign issues, deliverable obligations in most instances would be limited to the specific referenced obligation because performance for asset-backed securities can vary across deals. Write-downs, such as prepayments and principal pay downs, or loss events on the underlying mortgage loans will reduce the outstanding principal balance of the referenced obligation. These reductions may be temporary or permanent as defined under the terms of the swap agreement and the notional amount for the swap agreement will be adjusted by corresponding amounts.
A Fund may also use credit default swap agreements to generate income. In such an arrangement, a Fund would write protection on a security or instrument, and receive a premium in return for such protection. Written credit default swaps offer the Fund an opportunity to generate income, but may expose the Fund to risk of loss where there is a credit event.
A Fund may use credit default swap agreements on credit indices to hedge a portfolio of credit default swap agreements or bonds, to protect investors owning bonds against default and to speculate on changes in credit quality. A credit index is a basket of credit instruments or exposures designed to represent a portion of the credit market. These indices consist of reference credits that are considered to be the liquid entities in the credit default swap market based on the index sector. Components of the indices may include, but are not limited to, investment grade securities, high yield securities, asset-backed securities and emerging market securities. These components can be determined based upon various credit ratings within each sector. Credit indices are traded using credit default swaps with standardized terms including a fixed spread and standard maturity dates. An index credit default swap references all the issuers in the index, and if there is a credit event, the credit event is settled based on that issuer’s weight in the index. The composition of the indices changes periodically, usually every six months, and for most indices, each issuer has an equal weight in the index.
During the year, these Funds entered into credit default swap agreements for the following reasons: JNL/Goldman Sachs Core Plus Bond Fund to provide a measure of protection against defaults of the issuers, to manage duration at the cross sector level and to manage credit exposure; JNL/PIMCO Total Return Bond Fund to manage credit exposure; and JNL/PIMCO Real Return Fund to manage credit exposure and in combination with cash bonds to (1) take advantage of spread variances between cash bonds and the credit default swap agreement or (2) to hedge the underlying exposure to the cash bonds.
A Fund can be either a seller or buyer of protection when entering into a credit default swap agreement. As a seller of protection, the Fund will generally receive from the buyer of protection a fixed rate of income throughout the term of the swap if there is no credit event. As a seller, the Fund adds leverage to its portfolio because, in addition to its total net assets, the Fund is subject to investment exposure on the notional amount of the swap. If a Fund is a seller of protection and a credit event occurs, as defined under the terms of that particular swap agreement, the Fund will either pay to the buyer of protection an amount equal to the notional amount of the swap and take delivery of the referenced obligation, other deliverable obligations or underlying securities comprising the referenced index or pay a net settlement amount in the form of cash or securities equal to the notional amount of the swap less the recovery value of the referenced obligation or underlying securities comprising the referenced index. If a Fund is a buyer of protection and a credit event occurs, as defined under the terms of that particular swap agreement, the Fund will either receive from the seller of protection an amount equal to the notional amount of the swap and deliver the referenced obligation, other deliverable obligations or underlying securities comprising the referenced index or receive a net settlement amount in the form of cash or securities equal to the notional amount of the swap less the recovery value of the
JNL Series Trust
Notes to Financial Statements
December 31, 2010
referenced obligation or underlying securities comprising the referenced index. Until a credit event occurs, recovery values are determined by market makers considering either industry standard recovery rates or entity specific factors and considerations. When a credit event occurs, the recovery value is determined by a facilitated auction, administered by ISDA, whereby a minimum number of allowable broker bids, together with a specified valuation method, are used to calculate the settlement value.
Either as a seller of protection or a buyer of protection of a credit default swap agreement, a Fund’s maximum risk of loss from counterparty risk is the fair value of the agreement. This risk is mitigated by having a master netting arrangement between the Fund and the counterparty and by posting collateral by the counterparty to the Fund to cover the Fund’s exposure to the counterparty. The maximum potential amount of future payments (undiscounted) that a Fund as a seller of protection could be required to make under a credit default swap agreement would be an amount equal to the notional amount of the agreement. Notional amounts of all credit default swap agreements outstanding as of December 31, 2010, for which the Fund is the seller of protection are disclosed in these Notes to the Schedules of Investments. These potential amounts would be partially offset by any recovery values of the respective referenced obligations, upfront payments received upon entering into the agreement or net amounts received from the settlement of buy protection credit default swap agreements entered into by the Fund for the same referenced entity or entities.
Total Return Swap Agreements - A Fund may be subject to equity price and interest rate risk in the normal course of pursuing its investment objective. During the year, JNL/Goldman Sachs Emerging Markets Debt Fund entered into total return swap agreements to manage its exposure to or hedge changes in securities prices and as an efficient means of adjusting overall exposure to certain markets as part of its investment strategy. JNL/Ivy Asset Strategy Fund entered into total return swap agreements as an efficient means of adjusting overall exposure to certain markets as part of its investment strategy. Some total return swap agreements involve a commitment to pay periodic interest payments in exchange for a market-linked return based on a security or a basket of securities. To the extent the total return of the security, index or other financial measure underlying the transaction exceeds or falls short of the offsetting interest rate obligation, a Fund will receive a payment from or make a payment to the counterparty. A Fund’s maximum risk of loss from counterparty credit risk for this type of total return swap agreement is the discounted net value of the cash flows to be received from or paid to the counterparty over the contract’s remaining life, to the extent this amount is positive. Other total return swap agreements involve a right to receive the appreciation in value of a specified security, index or other instrument in return for a fee paid to the counterparty, which will typically be an agreed upon rate. To the extent the underlying asset declines in value over the term of the swap, a Fund may also be required to pay the value of that decline to the counterparty. A Fund’s maximum risk of loss from counterparty credit risk for this type of total return swap agreement is the value of the underlying security, index or other financial instrument.
The counterparty credit risk for the total return swap agreement is mitigated by having a master netting arrangement between a Fund and the counterparty and by posting of collateral by the counterparty to the Fund to cover the Fund’s exposure to the counterparty.
NOTE 5. OTHER INVESTMENT RISKS
Emerging Market Securities Risk – Investing in securities of emerging market countries generally involves greater risk than investing in foreign securities in developed markets. Emerging market countries typically have economic and political systems that are less fully developed and are likely to be less stable than those in more advanced countries. These risks include the potential for government intervention, adverse changes in earnings and business prospects, liquidity, credit and currency risks, and price volatility.
Foreign Securities Risk - Investing in securities of foreign companies and foreign governments generally involves special risks and considerations not typically associated with investing in U.S. companies and the U.S. government. These risks include the potential for revaluation of currencies, different accounting policies, and future adverse political and economic developments. Moreover, securities of many foreign companies and foreign governments and their markets may be less liquid and their prices may be more volatile than those of securities of comparable U.S. companies and the U.S. government.
Market, Credit and Counterparty Risk - In the normal course of business the Funds trade financial instruments and enter into financial transactions where the risk of potential loss exists due to changes in the market (“market risk”) or failure of the other party to a transaction to perform (“credit risk”). Similar to credit risk, the Funds may be exposed to counterparty risk, or the risk that an institution or other entity with which the Funds have unsettled or open transactions will default. For certain derivative contracts, the potential loss could exceed the value of the financial assets recorded in the financial statements. Financial assets, which potentially expose the Funds to credit risk, consist principally of investments and cash due from counterparties (“counterparty risk”). The extent of the Funds’ exposure to credit and counterparty risks in respect to these financial assets is incorporated within their carrying value as recorded in the Funds’ Statements of Assets and Liabilities.
Private Equity Companies Risk - There are inherent risks in investing in private equity companies, which encompass financial institutions or vehicles whose principal business is to invest in and lend capital to privately held companies. Generally, little public information exists for private and thinly traded companies, and there is a risk that investors may not be able to make a fully informed investment decision. In addition, private equity companies are subject to minimal regulation. In addition to the risks associated with the JNL/Red Rocks Listed Private Equity Fund’s direct investments, the Fund is also subject to the underlying risks which affect the listed private equity companies in which the Fund invests. Listed private equity companies are subject to various risks depending on their underlying investments, which could include, but are not limited to, additional liquidity, sector, non-U.S. security, currency, credit, managed portfolio and derivatives risks.
JNL Series Trust
Notes to Financial Statements
December 31, 2010
Real Estate Investment Risk – The JNL/Invesco Global Real Estate Fund concentrates its assets in the real estate industry and an investment in the Fund will be closely linked to the performance of the real estate markets. Property values may fall due to increasing vacancies or declining rents resulting from economic, legal, cultural or technological developments. Many real estate companies, including real estate investment trusts (“REITs”), utilize leverage (and some may be highly leveraged), which increases investment risk and could adversely affect a real estate company’s operations and market value in periods of rising interest rates. The value of a Fund’s investment in REITs may be affected by the management skill of the persons managing the REIT. Because REITs have expenses of their own, the Fund will bear a proportional share of those expenses. Due to the fact that the Fund focuses its investments in REITs and other companies related to the real estate industry, the value of shares may rise and fall more than the value of shares of a fund that invests in a broader range of companies.
Feeder Funds and Fund of Funds Risks - The value of an investment in a Feeder Fund changes with the value of the corresponding Master Fund and its investments. The value of an investment in a fund of funds changes with the values of the corresponding underlying funds and their investments. Each of the Master Fund’s and underlying funds’ shares may be purchased by other investment companies and shareholders. In some cases, a Master Fund or underlying fund may experience large subscriptions or redemptions due to allocation changes or rebalancing. While it is impossible to predict the overall impact of these transactions over time, there could be adverse effects on Fund performance.
NOTE 6. INVESTMENT ADVISORY FEES AND TRANSACTIONS WITH AFFILIATES
Advisory Fee - The Trust has an investment advisory agreement with JNAM, whereby JNAM provides investment management services. Each Fund pays JNAM an annual fee, accrued daily and paid monthly, based on a specified percentage of the average daily net assets of each Fund. A portion of this fee is paid by JNAM to the sub-advisers as compensation for their services. The following is a schedule of the fees each Fund is currently obligated to pay JNAM:
| $0 to | $50M to | $100M to | $150M to | $200M to | $250M to | $300M to | $350M to | $500M to | $750M to | $1.0B to | Over | |||||||||||||||||||||||||||||||||||||
(M - Millions; B - Billions) | $50M | $100M | $150M | $200M | $250M | $300M | $350M | $500M | $750M | $1.0B | $1.5B | $1.5B | ||||||||||||||||||||||||||||||||||||
JNL/American Funds Blue Chip Income and Growth Fund | 0.70 | % | 0.70 | % | 0.70 | % | 0.70 | % | 0.70 | % | 0.70 | % | 0.70 | % | 0.70 | % | 0.70 | % | 0.70 | % | 0.65 | % | 0.65 | % | ||||||||||||||||||||||||
JNL/American Funds Global Bond Fund | 0.70 | 0.70 | 0.70 | 0.70 | 0.70 | 0.70 | 0.70 | 0.70 | 0.70 | 0.70 | 0.65 | 0.65 | ||||||||||||||||||||||||||||||||||||
JNL/American Funds Global Small Capitalization Fund | 0.75 | 0.75 | 0.75 | 0.75 | 0.75 | 0.75 | 0.75 | 0.75 | 0.75 | 0.75 | 0.70 | 0.70 | ||||||||||||||||||||||||||||||||||||
JNL/American Funds Growth-Income Fund | 0.70 | 0.70 | 0.70 | 0.70 | 0.70 | 0.70 | 0.70 | 0.70 | 0.70 | 0.70 | 0.65 | 0.65 | ||||||||||||||||||||||||||||||||||||
JNL/American Funds International Fund | 0.85 | 0.85 | 0.85 | 0.85 | 0.85 | 0.85 | 0.85 | 0.85 | 0.85 | 0.85 | 0.80 | 0.80 | ||||||||||||||||||||||||||||||||||||
JNL/American Funds New World Fund | 1.05 | 1.05 | 1.05 | 1.05 | 1.05 | 1.05 | 1.05 | 1.05 | 1.05 | 1.05 | 1.00 | 1.00 | ||||||||||||||||||||||||||||||||||||
JNL Institutional Alt Funds | 0.15 | 0.15 | 0.15 | 0.15 | 0.15 | 0.15 | 0.15 | 0.15 | 0.10 | 0.10 | 0.10 | 0.10 | ||||||||||||||||||||||||||||||||||||
JNL/BlackRock Commodity Securities Fund | 0.70 | 0.70 | 0.70 | 0.70 | 0.70 | 0.70 | 0.60 | 0.60 | 0.60 | 0.60 | 0.60 | 0.60 | ||||||||||||||||||||||||||||||||||||
JNL/BlackRock Global Allocation Fund | 0.90 | 0.90 | 0.90 | 0.90 | 0.90 | 0.90 | 0.90 | 0.90 | 0.90 | 0.90 | 0.85 | 0.85 | ||||||||||||||||||||||||||||||||||||
JNL/Capital Guardian Global Balanced Fund | 0.65 | 0.65 | 0.65 | 0.65 | 0.65 | 0.65 | 0.65 | 0.65 | 0.60 | 0.60 | 0.60 | 0.60 | ||||||||||||||||||||||||||||||||||||
JNL/Capital Guardian Global Diversified Research Fund | 0.75 | 0.75 | 0.75 | 0.70 | 0.70 | 0.70 | 0.70 | 0.70 | 0.65 | 0.60 | 0.60 | 0.60 | ||||||||||||||||||||||||||||||||||||
JNL/Capital Guardian U.S. Growth Equity Fund | 0.70 | 0.70 | 0.70 | 0.65 | 0.65 | 0.65 | 0.65 | 0.65 | 0.60 | 0.55 | 0.55 | 0.55 | ||||||||||||||||||||||||||||||||||||
JNL/Eagle Core Equity Fund | 0.65 | 0.65 | 0.60 | 0.60 | 0.60 | 0.60 | 0.55 | 0.55 | 0.55 | 0.55 | 0.55 | 0.55 | ||||||||||||||||||||||||||||||||||||
JNL/Eagle SmallCap Equity Fund | 0.75 | 0.75 | 0.70 | 0.70 | 0.70 | 0.70 | 0.70 | 0.70 | 0.65 | 0.65 | 0.65 | 0.65 | ||||||||||||||||||||||||||||||||||||
JNL/Franklin Templeton Founding Strategy Fund | 0.00 | 0.00 | 0.00 | 0.00 | 0.00 | 0.00 | 0.00 | 0.00 | 0.00 | 0.00 | 0.00 | 0.00 | ||||||||||||||||||||||||||||||||||||
JNL/Franklin Templeton Global Growth Fund | 0.75 | 0.75 | 0.75 | 0.75 | 0.75 | 0.75 | 0.65 | 0.65 | 0.60 | 0.60 | 0.60 | 0.60 | ||||||||||||||||||||||||||||||||||||
JNL/Franklin Templeton Income Fund | 0.80 | 0.80 | 0.75 | 0.75 | 0.65 | 0.65 | 0.65 | 0.65 | 0.60 | 0.60 | 0.60 | 0.60 | ||||||||||||||||||||||||||||||||||||
JNL/Franklin Templeton International Small Cap Growth Fund | 0.95 | 0.95 | 0.95 | 0.95 | 0.95 | 0.95 | 0.95 | 0.95 | 0.90 | 0.90 | 0.90 | 0.90 | ||||||||||||||||||||||||||||||||||||
JNL/Franklin Templeton Mutual Shares Fund | 0.75 | 0.75 | 0.75 | 0.75 | 0.75 | 0.75 | 0.75 | 0.75 | 0.70 | 0.70 | 0.70 | 0.70 | ||||||||||||||||||||||||||||||||||||
JNL/Franklin Templeton Small Cap Value Fund | 0.85 | 0.85 | 0.85 | 0.85 | 0.77 | 0.77 | 0.77 | 0.77 | 0.75 | 0.75 | 0.75 | 0.75 | ||||||||||||||||||||||||||||||||||||
JNL/Goldman Sachs Core Plus Bond Fund | 0.60 | 0.60 | 0.60 | 0.60 | 0.60 | 0.60 | 0.60 | 0.60 | 0.55 | 0.55 | 0.55 | 0.55 | ||||||||||||||||||||||||||||||||||||
JNL/Goldman Sachs Emerging Markets Debt Fund | 0.75 | 0.75 | 0.75 | 0.75 | 0.70 | 0.70 | 0.70 | 0.70 | 0.70 | 0.70 | 0.70 | 0.70 | ||||||||||||||||||||||||||||||||||||
JNL/Goldman Sachs Mid Cap Value Fund | 0.75 | 0.75 | 0.70 | 0.70 | 0.70 | 0.70 | 0.70 | 0.70 | 0.70 | 0.70 | 0.70 | 0.70 | ||||||||||||||||||||||||||||||||||||
JNL/Goldman Sacks U.S. Equity Flex Fund | 0.80 | 0.80 | 0.80 | 0.80 | 0.80 | 0.80 | 0.75 | 0.75 | 0.75 | 0.75 | 0.75 | 0.75 | ||||||||||||||||||||||||||||||||||||
JNL/Invesco International Growth Fund | 0.70 | 0.70 | 0.70 | 0.65 | 0.65 | 0.65 | 0.65 | 0.65 | 0.60 | 0.60 | 0.60 | 0.60 | ||||||||||||||||||||||||||||||||||||
JNL/Invesco Large Cap Growth Fund | 0.70 | 0.70 | 0.70 | 0.65 | 0.65 | 0.65 | 0.65 | 0.65 | 0.65 | 0.65 | 0.65 | 0.65 | ||||||||||||||||||||||||||||||||||||
JNL/Invesco Global Real Estate Fund | 0.75 | 0.70 | 0.70 | 0.70 | 0.70 | 0.70 | 0.70 | 0.70 | 0.70 | 0.70 | 0.70 | 0.70 | ||||||||||||||||||||||||||||||||||||
JNL/Invesco Small Cap Growth Fund | 0.85 | 0.85 | 0.85 | 0.85 | 0.85 | 0.85 | 0.80 | 0.80 | 0.80 | 0.80 | 0.80 | 0.80 | ||||||||||||||||||||||||||||||||||||
JNL/Ivy Asset Strategy Fund | 0.90 | 0.90 | 0.90 | 0.90 | 0.90 | 0.90 | 0.90 | 0.90 | 0.85 | 0.85 | 0.85 | 0.85 | ||||||||||||||||||||||||||||||||||||
JNL/JPMorgan International Value Fund | 0.70 | 0.70 | 0.70 | 0.65 | 0.65 | 0.65 | 0.65 | 0.65 | 0.60 | 0.60 | 0.60 | 0.60 | ||||||||||||||||||||||||||||||||||||
JNL/JPMorgan MidCap Growth Fund | 0.70 | 0.70 | 0.70 | 0.70 | 0.70 | 0.65 | 0.65 | 0.65 | 0.65 | 0.60 | 0.60 | 0.55 | ||||||||||||||||||||||||||||||||||||
JNL/JPMorgan U.S. Government & Quality Bond Fund | 0.50 | 0.50 | 0.50 | 0.45 | 0.45 | 0.45 | 0.40 | 0.40 | 0.35 | 0.35 | 0.35 | 0.35 | ||||||||||||||||||||||||||||||||||||
JNL/Lazard Emerging Markets Fund | 1.00 | 1.00 | 0.90 | 0.90 | 0.90 | 0.85 | 0.85 | 0.85 | 0.85 | 0.85 | 0.85 | 0.85 | ||||||||||||||||||||||||||||||||||||
JNL/Lazard Mid Cap Equity Fund | 0.75 | 0.70 | 0.70 | 0.70 | 0.70 | 0.65 | 0.65 | 0.65 | 0.65 | 0.65 | 0.65 | 0.65 | ||||||||||||||||||||||||||||||||||||
JNL/M&G Global Basics Fund | 0.85 | 0.85 | 0.85 | 0.85 | 0.85 | 0.85 | 0.85 | 0.85 | 0.80 | 0.80 | 0.80 | 0.80 | ||||||||||||||||||||||||||||||||||||
JNL/M&G Global Leaders Fund | 0.85 | 0.85 | 0.85 | 0.85 | 0.85 | 0.85 | 0.85 | 0.85 | 0.80 | 0.80 | 0.80 | 0.80 | ||||||||||||||||||||||||||||||||||||
JNL Series Trust
Notes to Financial Statements
December 31, 2010
| $0 to | $50M to | $100M to | $150M to | $200M to | $250M to | $300M to | $350M to | $500M to | $750M to | $1.0B to | Over | |||||||||||||||||||||||||||||||||||||
(M - Millions; B - Billions) | $50M | $100M | $150M | $200M | $250M | $300M | $350M | $500M | $750M | $1.0B | $1.5B | $1.5B | ||||||||||||||||||||||||||||||||||||
JNL/Mellon Capital Management 10 x 10 Fund | 0.00 | % | 0.00 | % | 0.00 | % | 0.00 | % | 0.00 | % | 0.00 | % | 0.00 | % | 0.00 | % | 0.00 | % | 0.00 | % | 0.00 | % | 0.00 | % | ||||||||||||||||||||||||
JNL/Mellon Capital Management Index 5 Fund | 0.00 | 0.00 | 0.00 | 0.00 | 0.00 | 0.00 | 0.00 | 0.00 | 0.00 | 0.00 | 0.00 | 0.00 | ||||||||||||||||||||||||||||||||||||
JNL/Mellon Capital Management European 30 Fund | 0.37 | 0.31 | 0.28 | 0.28 | 0.28 | 0.28 | 0.28 | 0.28 | 0.28 | 0.28 | 0.28 | 0.28 | ||||||||||||||||||||||||||||||||||||
JNL/Mellon Capital Management Pacific Rim 30 Fund | 0.37 | 0.31 | 0.28 | 0.28 | 0.28 | 0.28 | 0.28 | 0.28 | 0.28 | 0.28 | 0.28 | 0.28 | ||||||||||||||||||||||||||||||||||||
JNL/Mellon Capital Management S&P 500 Index Fund | 0.29 | 0.29 | 0.29 | 0.29 | 0.29 | 0.29 | 0.29 | 0.29 | 0.24 | 0.23 | 0.23 | 0.23 | ||||||||||||||||||||||||||||||||||||
JNL/Mellon Capital Management S&P 400 MidCap Index Fund | 0.29 | 0.29 | 0.29 | 0.29 | 0.29 | 0.29 | 0.29 | 0.29 | 0.24 | 0.23 | 0.23 | 0.23 | ||||||||||||||||||||||||||||||||||||
JNL/Mellon Capital Management Small Cap Index Fund | 0.29 | 0.29 | 0.29 | 0.29 | 0.29 | 0.29 | 0.29 | 0.29 | 0.24 | 0.23 | 0.23 | 0.23 | ||||||||||||||||||||||||||||||||||||
JNL/Mellon Capital Management International Index Fund | 0.30 | % | 0.30 | % | 0.30 | % | 0.30 | % | 0.30 | % | 0.30 | % | 0.30 | % | 0.30 | % | 0.25 | % | 0.24 | % | 0.24 | % | 0.24 | % | ||||||||||||||||||||||||
JNL/Mellon Capital Management Bond Index Fund | 0.30 | 0.30 | 0.30 | 0.30 | 0.30 | 0.30 | 0.30 | 0.30 | 0.25 | 0.24 | 0.24 | 0.24 | ||||||||||||||||||||||||||||||||||||
JNL/Mellon Capital Management Global Alpha Fund | 1.00 | 1.00 | 1.00 | 1.00 | 1.00 | 1.00 | 1.00 | 1.00 | 0.90 | 0.90 | 0.90 | 0.90 | ||||||||||||||||||||||||||||||||||||
JNL/Oppenheimer Global Growth Fund | 0.70 | 0.70 | 0.70 | 0.70 | 0.70 | 0.70 | 0.60 | 0.60 | 0.60 | 0.60 | 0.60 | 0.60 | ||||||||||||||||||||||||||||||||||||
JNL/PAM Asia ex-Japan Fund | 0.90 | 0.90 | 0.90 | 0.90 | 0.90 | 0.90 | 0.90 | 0.90 | 0.85 | 0.85 | 0.85 | 0.85 | ||||||||||||||||||||||||||||||||||||
JNL/PAM China-India Fund | 0.90 | 0.90 | 0.90 | 0.90 | 0.90 | 0.90 | 0.90 | 0.90 | 0.85 | 0.85 | 0.85 | 0.85 | ||||||||||||||||||||||||||||||||||||
JNL/PIMCO Real Return Fund | 0.50 | 0.50 | 0.50 | 0.50 | 0.50 | 0.50 | 0.50 | 0.50 | 0.50 | 0.50 | 0.475 | 0.475 | ||||||||||||||||||||||||||||||||||||
JNL/PIMCO Total Return Bond Fund | 0.50 | 0.50 | 0.50 | 0.50 | 0.50 | 0.50 | 0.50 | 0.50 | 0.50 | 0.50 | 0.50 | 0.50 | ||||||||||||||||||||||||||||||||||||
JNL/PPM America High Yield Bond Fund | 0.50 | 0.50 | 0.50 | 0.45 | 0.45 | 0.45 | 0.45 | 0.45 | 0.425 | 0.425 | 0.425 | 0.425 | ||||||||||||||||||||||||||||||||||||
JNL/PPM America Mid Cap Value Fund | 0.75 | 0.75 | 0.75 | 0.75 | 0.75 | 0.75 | 0.75 | 0.75 | 0.70 | 0.70 | 0.70 | 0.70 | ||||||||||||||||||||||||||||||||||||
JNL/PPM America Small Cap Value Fund | 0.75 | 0.75 | 0.75 | 0.75 | 0.75 | 0.75 | 0.75 | 0.75 | 0.70 | 0.70 | 0.70 | 0.70 | ||||||||||||||||||||||||||||||||||||
JNL/PPM America Value Equity Fund | 0.55 | 0.55 | 0.55 | 0.55 | 0.55 | 0.55 | 0.50 | 0.50 | 0.50 | 0.50 | 0.50 | 0.50 | ||||||||||||||||||||||||||||||||||||
JNL/Red Rocks Listed Private Equity Fund | 0.85 | 0.85 | 0.85 | 0.85 | 0.80 | 0.80 | 0.80 | 0.80 | 0.80 | 0.80 | 0.80 | 0.80 | ||||||||||||||||||||||||||||||||||||
JNL/S&P Funds | 0.13 | 0.13 | 0.13 | 0.13 | 0.13 | 0.13 | 0.13 | 0.13 | 0.08 | 0.08 | 0.08 | 0.08 | ||||||||||||||||||||||||||||||||||||
JNL/S&P Competitive Advantage Fund | 0.40 | 0.40 | 0.40 | 0.40 | 0.40 | 0.40 | 0.40 | 0.40 | 0.35 | 0.35 | 0.35 | 0.35 | ||||||||||||||||||||||||||||||||||||
JNL/S&P Dividend Income & Growth Fund | 0.40 | 0.40 | 0.40 | 0.40 | 0.40 | 0.40 | 0.40 | 0.40 | 0.35 | 0.35 | 0.35 | 0.35 | ||||||||||||||||||||||||||||||||||||
JNL/S&P Intrinsic Value Fund | 0.40 | 0.40 | 0.40 | 0.40 | 0.40 | 0.40 | 0.40 | 0.40 | 0.35 | 0.35 | 0.35 | 0.35 | ||||||||||||||||||||||||||||||||||||
JNL/S&P Total Yield Fund | 0.40 | 0.40 | 0.40 | 0.40 | 0.40 | 0.40 | 0.40 | 0.40 | 0.35 | 0.35 | 0.35 | 0.35 | ||||||||||||||||||||||||||||||||||||
JNL/S&P 4 Fund | 0.00 | 0.00 | 0.00 | 0.00 | 0.00 | 0.00 | 0.00 | 0.00 | 0.00 | 0.00 | 0.00 | 0.00 | ||||||||||||||||||||||||||||||||||||
JNL/Select Balanced Fund | 0.55 | 0.50 | 0.50 | 0.475 | 0.475 | 0.475 | 0.45 | 0.45 | 0.425 | 0.425 | 0.425 | 0.425 | ||||||||||||||||||||||||||||||||||||
JNL/Select Money Market Fund | 0.28 | 0.28 | 0.28 | 0.28 | 0.28 | 0.28 | 0.28 | 0.28 | 0.25 | 0.25 | 0.25 | 0.25 | ||||||||||||||||||||||||||||||||||||
JNL/Select Value Fund | 0.55 | 0.55 | 0.55 | 0.55 | 0.55 | 0.55 | 0.50 | 0.50 | 0.45 | 0.45 | 0.45 | 0.45 | ||||||||||||||||||||||||||||||||||||
JNL/T. Rowe Price Established Growth Fund | 0.65 | 0.65 | 0.65 | 0.60 | 0.60 | 0.60 | 0.60 | 0.60 | 0.55 | 0.55 | 0.55 | 0.55 | ||||||||||||||||||||||||||||||||||||
JNL/T. Rowe Price Mid-Cap Growth Fund | 0.75 | 0.75 | 0.75 | 0.70 | 0.70 | 0.70 | 0.70 | 0.70 | 0.70 | 0.70 | 0.70 | 0.70 | ||||||||||||||||||||||||||||||||||||
JNL/T. Rowe Price Short-Term Bond Fund | 0.45 | 0.45 | 0.45 | 0.45 | 0.45 | 0.40 | 0.40 | 0.40 | 0.40 | 0.40 | 0.40 | 0.40 | ||||||||||||||||||||||||||||||||||||
JNL/T. Rowe Price Value Fund | 0.70 | 0.70 | 0.70 | 0.65 | 0.65 | 0.65 | 0.65 | 0.65 | 0.60 | 0.60 | 0.60 | 0.60 | ||||||||||||||||||||||||||||||||||||
Administrative Fee – JNAM also serves as the “Administrator” to the Funds. The Funds pay an administrative fee based on the average daily net assets of each Fund, accrued daily and paid monthly. The JNL Institutional Alt Funds, JNL/Franklin Templeton Founding Strategy Fund, JNL/Mellon Capital Management 10 x 10 Fund, JNL/Mellon Capital Management Index 5 Fund, JNL/S&P 4 Fund and JNL/S&P Funds pay JNAM an annual administrative fee of 0.05%. The JNL American Funds, JNL/BlackRock Commodity Securities Fund, JNL/BlackRock Global Allocation Fund, JNL/Capital Guardian Global Balanced Fund, JNL/Capital Guardian Global Diversified Research Fund, JNL/Franklin Templeton Global Growth Fund, JNL/Franklin Templeton International Small Cap Fund, JNL/Goldman Sachs Emerging Markets Debt Fund, JNL/Goldman Sachs U.S. Equity Flex Fund, JNL/Invesco Global Real Estate Fund, JNL/Invesco International Growth Fund, JNL/Ivy Asset Strategy Fund, JNL/JPMorgan International Value Fund, JNL/Lazard Emerging Markets Fund, JNL/M&G Global Basics Fund, JNL/M&G Global Leaders Fund, JNL/Mellon Capital Management Global Alpha Fund, JNL/Mellon Capital Management International Index Fund, JNL/Oppenheimer Global Growth Fund, JNL/PAM Asia ex-Japan Fund and JNL/Red Rocks Listed Private Equity Fund pay JNAM an annual administration fee of 0.15%. The JNL/Mellon Capital Management European 30 Fund, JNL/Mellon Capital Management Pacific Rim 30 Fund and JNL/PAM China-India Fund pay JNAM an annual administration fee of 0.20%. All other Funds pay JNAM an annual administration fee of 0.10%.
In return for the administrative fee, JNAM provides or procures all necessary administrative functions and services for the operation of the Funds. In addition, JNAM, at its own expense, arranges for legal (except for litigation expenses incurred by the JNL/Franklin Templeton Mutual Shares Fund), audit, fund accounting, transfer agency, custody, printing and mailing, a portion of the Chief Compliance Officer costs, and all other services necessary for the operation of each Fund. Each Fund is responsible for trading expenses including brokerage commissions, interest and taxes, other non-operating expenses, registration fees, licensing costs, directors and officers insurance, the fees and expenses of the disinterested Trustees and independent legal counsel to the disinterested Trustees, and a portion of the costs associated with the Chief Compliance Officer.
JNL Series Trust
Notes to Financial Statements
December 31, 2010
12b-1 Fees - The Funds, except for the JNL Institutional Alt Funds, JNL/Franklin Templeton Founding Strategy Fund, JNL/Mellon Capital Management 10 x 10 Fund, JNL/Mellon Capital Management Index 5 Fund, JNL/S&P 4 Fund and JNL/S&P Funds, adopted a Distribution Plan under the provisions of Rule 12b-1 under the 1940 Act for the purpose of reimbursement of certain distribution and related service expenses from the sale and distribution of each Fund’s Class A shares (through the sale of variable insurance products funded by the Trust). Jackson National Life Distributors LLC (“JNLD”), a wholly-owned subsidiary of Jackson and an affiliate of JNAM, is the principal underwriter of the Funds, with responsibility for promoting sales of their shares. JNLD also is the principal underwriter of the variable insurance products issued by Jackson and its subsidiaries. For all Funds which adopted the Distribution Plan, except for the JNL American Funds, the maximum annual 12b-1 fee allowed shall be 0.20% of the average daily net assets attributable to the Class A shares. For the JNL American Funds, the maximum annual 12b-1 fee allowed shall be 0.25% of the average daily net assets attributable to the Class A shares. Amounts charged pursuant to the Distribution Plan are reflected as 12b-1 fees (Class A) in the Statements of Operations.
Fee Waiver and Expense Reimbursements – Effective October 1, 2009, the Board approved a contractual expense limitation agreement whereby JNAM agreed to waive fees and reimburse expenses of the JNL/Select Money Market Fund to the extent necessary to limit operating expenses of each class of shares of the Fund (excluding brokerage expense, interest, taxes, and extraordinary expenses) to an annual rate as a percentage of average daily net assets equal to or less than the Fund’s net investment income for the period. JNAM may recover previously reimbursed expenses from the Fund for fees waived and reimbursed after October 1, 2009. During the year ended December 31, 2010, the Adviser waived expenses of the Fund in the amount of $2,442 (in thousands). This amount is recorded as expense waiver in the Fund’s Statement of Operations. During the year ended December 31, 2010, JNAM did not recover any previously reimbursed expenses. At December 31, 2010, the amount of potentially recoverable expenses was $1,106 (in thousands) that expires on December 31, 2012 and $2,442 (in thousands) that expires on December 31, 2013.
Effective May 1, 2010, the Board approved a contractual fee waiver agreement whereby JNAM agrees to waive a portion of its advisory fees for the JNL American Funds. The amount of the fee waiver is 0.45% for the JNL/American Funds Blue Chip Income and Growth Fund, 0.55% for the JNL/American Funds Global Bond Fund and the JNL/American Funds International Fund, 0.60% for the JNL/American Funds Global Small Capitalization Fund, 0.40% for the JNL/American Funds Growth-Income Fund and 0.80% for the JNL/American Funds New World Fund. This amount is recorded as expense waiver in the Fund’s Statement of Operations. The agreement remains in effect for as long as the Master Feeder structure is in place.
Effective October 11, 2010, the Board approved a contractual fee waiver agreement whereby JNAM agrees to waive 0.66% of its advisory fees for the JNL/BlackRock Global Allocation Fund. This amount is recorded as expense waiver in the Fund’s Statement of Operations. The agreement remains in effect for as long as the Master Feeder structure is in place.
Affiliated Brokerage Commissions - During the year ended December 31, 2010, the following Funds paid brokerage fees to affiliates of their Fund on the execution of purchases and sales of portfolio investments (in thousands): JNL/BlackRock Commodity Securities Fund $6; JNL/Eagle SmallCap Equity Fund $8; JNL/Goldman Sachs Core Plus Bond Fund $4; JNL/Goldman Sachs Mid Cap Value Fund $42; JNL/Goldman Sachs U.S. Equity Flex Fund $6; JNL/JPMorgan International Value Fund $3; JNL/S&P Dividend Income & Growth Fund $1; and JNL/S&P Intrinsic Value Fund $1.
Deferred Compensation Plan – Effective January 1, 2007, the Funds adopted a Deferred Compensation Plan whereby disinterested Trustees may defer the receipt of all or a portion of their compensation. These deferred amounts, which remain as liabilities of the Funds, shall be treated as if invested and reinvested in shares of one or more affiliated funds at the discretion of the applicable Trustee. These amounts represent general, unsecured liabilities of the Funds and vary according to the total returns of the selected Funds. Prior to January 1, 2007, Trustees were able to defer the receipt of their compensation under a separate plan. Deferred amounts under this plan are credited at a fixed annual rate of return of five percent (5%). Liabilities related to deferred balances are included in payable for trustee fees in the Statements of Assets and Liabilities. Increases or decreases related to the changes in value of deferred balances are included in trustee fees set forth in the Statements of Operations.
Directed Brokerage Commissions - A sub-adviser may allocate a portion of a Fund’s equity security transactions (subject to obtaining best execution of each transaction) through certain designated broker-dealers which will rebate a portion of the brokerage commissions to that Fund. Any amount credited to the Fund is reflected as brokerage commissions recaptured in the Statements of Operations.
Investments in Affiliates - During the year ended December 31, 2010, certain Funds invested in a money market fund which is managed by the Adviser. The JNL Money Market Fund is offered as a cash management tool to the Funds and their affiliates and is not available for direct purchase by members of the public. In addition, the Custodian is an affiliate of the Funds for which J.P. Morgan Investment Management Inc. is the Sub-Adviser. Certain Funds participating in securities lending receive cash collateral, which is invested by the Custodian in the Securities Lending Cash Collateral Fund LLC and the Securities Lending Liquidating Fund LLC, which are affiliates of the Funds’ Adviser. JNAM serves as the Administrator for the Securities Lending Cash Collateral Fund LLC and Securities Lending Liquidating Fund LLC. Furthermore, the JNL Institutional Alt Funds, JNL/Franklin Templeton Founding Strategy Fund, JNL/Mellon Capital Management 10 x 10 Fund, JNL/Mellon Capital Management Index 5 Fund, JNL/S&P 4 Fund and JNL/S&P Funds invested solely in the Class A shares of other affiliated Funds of the Trust and the JNL Variable Fund LLC. The JNL/BlackRock Global Allocation Fund (“BlackRock Feeder Fund”) invests primarily all of its investable assets in the BlackRock Global Allocation Portfolio (“BlackRock Master Fund”). Due to its ownership of more than 5% of the shares of the BlackRock Master Fund, the BlackRock Feeder Fund may be deemed an affiliated person thereof under the 1940 Act. The JNL/Mellon Capital Management International Index Fund invested in Prudential plc, the parent Company of Jackson. Prudential plc is not affiliated in any manner with Prudential Financial Inc., a company whose principal place of business is in the United States of America. The JNL/Mellon Capital Management S&P 500 Index Fund invested in the Bank of New York Mellon Corporation, the parent company of the Fund’s sub-adviser. The JNL/T. Rowe Price Established Growth Fund, JNL/T. Rowe Price Mid-Cap Growth Fund, JNL/T. Rowe Price Short-Term Bond Fund and
JNL Series Trust
Notes to Financial Statements
December 31, 2010
JNL/T. Rowe Price Value Fund invested in T. Rowe Price Reserves Investment Fund, a money market fund managed by the Funds’ Sub-Adviser; JNL/T. Rowe Price Value Fund invested in T. Rowe Price Institutional Floating Rate Fund; and JNL/T. Rowe Price Short-Term Bond Fund invested in T. Rowe Price Term Asset-Backed Opportunity Fund, LLC which are affiliates of each Fund’s sub-adviser. The total value and cost of such affiliated investments is disclosed separately in the Statements of Assets and Liabilities, and the associated income and realized gain (loss) are disclosed separately in the Statements of Operations.
NOTE 7. INCOME TAX MATTERS
The following information is presented on an income tax basis. Differences between amounts for financial statements and federal income tax purposes are primarily due to timing and character differences in recognizing certain gains and losses on investment transactions. Permanent differences between financial statement and federal income tax reporting are reclassified within the capital accounts based on their federal income tax treatment. These reclassifications have no impact on total net assets. Temporary differences do not require reclassification.
To the extent there are differences between the amounts recognized for financial statements and federal income tax purposes that are permanent in nature, such amounts (in thousands) are reclassified within the capital accounts based on their federal income tax treatment as indicated below; temporary differences do not require reclassification. Permanent differences may include but are not limited to the following: expired capital loss carryforwards, foreign currency reclassifications, market discount or paydown reclassifications, reclassifications on the sale of PFIC or REIT securities, net operating losses, accounting treatment of notional principal contracts and distribution adjustments. These reclassifications have no impact on net assets.
| Net Increase (Decrease) | ||||||||||||
| Undistributed Net Investment Income | Accumulated Net Realized Gain (Loss) | Paid-in Capital | ||||||||||
JNL/American Funds Blue Chip Income and Growth Fund | $ | – | $ | – | $ | – | ||||||
JNL/American Funds Global Bond Fund | – | – | – | |||||||||
JNL/American Funds Global Small Capitalization Fund | – | – | – | |||||||||
JNL/American Funds Growth-Income Fund | – | – | – | |||||||||
JNL/American Funds International Fund | – | – | – | |||||||||
JNL/American Funds New World Fund | – | – | – | |||||||||
JNL Institutional Alt 20 Fund | 422 | (422 | ) | – | ||||||||
JNL Institutional Alt 35 Fund | 368 | (368 | ) | – | ||||||||
JNL Institutional Alt 50 Fund | 556 | (556 | ) | – | ||||||||
JNL Institutional Alt 65 Fund | 417 | (417 | ) | – | ||||||||
JNL/BlackRock Commodity Securities Fund | (90 | ) | 90 | – | ||||||||
JNL/BlackRock Global Allocation Fund | – | – | – | |||||||||
JNL/Capital Guardian Global Balanced Fund | (814 | ) | 814 | – | ||||||||
JNL/Capital Guardian Global Diversified Research Fund | 37 | 67,932 | (67,969 | ) | ||||||||
JNL/Capital Guardian U.S. Growth Equity Fund | – | 148,657 | (148,657 | ) | ||||||||
JNL/Eagle Core Equity Fund | – | – | – | |||||||||
JNL/Eagle SmallCap Equity Fund | 726 | – | (726 | ) | ||||||||
JNL/Franklin Templeton Founding Strategy Fund | – | – | – | |||||||||
JNL/Franklin Templeton Global Growth Fund | (123 | ) | 123 | – | ||||||||
JNL/Franklin Templeton Income Fund | 4,628 | (4,628 | ) | – | ||||||||
JNL/Franklin Templeton International Small Cap Growth Fund | 1,581 | (1,581 | ) | – | ||||||||
JNL/Franklin Templeton Mutual Shares Fund | 5,794 | (5,794 | ) | – | ||||||||
JNL/Franklin Templeton Small Cap Value Fund | – | – | �� | |||||||||
JNL/Goldman Sachs Core Plus Bond Fund | (938 | ) | 938 | – | ||||||||
JNL/Goldman Sachs Emerging Markets Debt Fund | 12,480 | (12,480 | ) | – | ||||||||
JNL/Goldman Sachs Mid Cap Value Fund | – | – | – | |||||||||
JNL/Goldman Sachs U.S. Equity Flex Fund | (15 | ) | 15 | – | ||||||||
JNL/Invesco Global Real Estate Fund | 8,727 | (8,727 | ) | – | ||||||||
JNL/Invesco International Growth Fund | (42 | ) | 42 | – | ||||||||
JNL/Invesco Large Cap Growth Fund | (132 | ) | 132 | – | ||||||||
JNL/Invesco Small Cap Growth Fund | 576 | – | (576 | ) | ||||||||
JNL/Ivy Asset Strategy Fund | (2,031 | ) | 2,031 | – | ||||||||
JNL/JPMorgan International Value Fund | 5,497 | (5,497 | ) | – | ||||||||
JNL/JPMorgan Mid Cap Growth Fund | 340 | 102,333 | (102,673 | ) | ||||||||
JNL/JPMorgan U.S. Government & Quality Bond Fund | 265 | (265 | ) | – | ||||||||
JNL/Lazard Emerging Markets Fund | (2,711 | ) | 2,711 | – | ||||||||
JNL/Lazard Mid Cap Equity Fund | – | – | – | |||||||||
JNL/M&G Global Basics Fund | (1 | ) | 1 | – | ||||||||
JNL/M&G Global Leaders Fund | (22 | ) | 22 | – | ||||||||
JNL Series Trust
Notes to Financial Statements
December 31, 2010
| Net Increase (Decrease) | ||||||||||||
| Undistributed Net Investment Income | Accumulated Net Realized Gain (Loss) | Paid-in Capital | ||||||||||
JNL/Mellon Capital Management 10 x 10 Fund | $ | 22 | $ | (22 | ) | $ | – | |||||
JNL/Mellon Capital Management Index 5 Fund | 58 | (58 | ) | – | ||||||||
JNL/Mellon Capital Management European 30 Fund | (15 | ) | 15 | – | ||||||||
JNL/Mellon Capital Management Pacific Rim 30 Fund | 57 | (57 | ) | – | ||||||||
JNL/Mellon Capital Management S&P 500 Index Fund | (71 | ) | 71 | – | ||||||||
JNL/Mellon Capital Management S&P 400 MidCap Index Fund | – | – | – | |||||||||
JNL/Mellon Capital Management Small Cap Index Fund | – | – | – | |||||||||
JNL/Mellon Capital Management International Index Fund | (757 | ) | 757 | – | ||||||||
JNL/Mellon Capital Management Bond Index Fund | 2,268 | (2,268 | ) | – | ||||||||
JNL/Mellon Capital Management Global Alpha Fund | 2,568 | (2,568 | ) | – | ||||||||
JNL/Oppenheimer Global Growth Fund | 194 | (194 | ) | – | ||||||||
JNL/PAM Asia ex-Japan Fund | (82 | ) | 82 | – | ||||||||
JNL/PAM China-India Fund | (22 | ) | 22 | – | ||||||||
JNL/PIMCO Real Return Fund | 494 | (494 | ) | – | ||||||||
JNL/PIMCO Total Return Bond Fund | 5,572 | (5,572 | ) | – | ||||||||
JNL/PPM America High Yield Bond Fund | (4 | ) | 4 | – | ||||||||
JNL/PPM America Mid Cap Value Fund | – | – | – | |||||||||
JNL/PPM America Small Cap Value Fund | – | – | – | |||||||||
JNL/PPM America Value Equity Fund | – | – | – | |||||||||
JNL/Red Rocks Listed Private Equity Fund | 5,744 | (4,579 | ) | (1,165 | ) | |||||||
JNL/S&P Managed Conservative Fund | 7,802 | (7,802 | ) | – | ||||||||
JNL/S&P Managed Moderate Fund | 10,173 | (10,173 | ) | – | ||||||||
JNL/S&P Managed Moderate Growth Fund | 10,652 | (10,652 | ) | – | ||||||||
JNL/S&P Managed Growth Fund | 4,586 | (4,586 | ) | – | ||||||||
JNL/S&P Managed Aggressive Growth Fund | 642 | (642 | ) | – | ||||||||
JNL/S&P Disciplined Moderate Fund | 762 | (762 | ) | – | ||||||||
JNL/S&P Disciplined Moderate Growth Fund | 446 | (446 | ) | – | ||||||||
JNL/S&P Disciplined Growth Fund | 76 | (76 | ) | – | ||||||||
JNL/S&P Competitive Advantage Fund | – | – | – | |||||||||
JNL/S&P Dividend Income & Growth Fund | (113 | ) | 113 | – | ||||||||
JNL/S&P Intrinsic Value Fund | – | – | – | |||||||||
JNL/S&P Total Yield Fund | – | – | – | |||||||||
JNL/S&P 4 Fund | 39,026 | (39,026 | ) | – | ||||||||
JNL/Select Balanced Fund | 498 | (498 | ) | – | ||||||||
JNL/Select Money Market Fund | 1 | (1 | ) | – | ||||||||
JNL/Select Value Fund | (36 | ) | 36 | – | ||||||||
JNL/T.Rowe Price Established Growth Fund | 1,128 | (17 | ) | (1,111 | ) | |||||||
JNL/T.Rowe Price Mid-Cap Growth Fund | (6 | ) | 6 | – | ||||||||
JNL/T.Rowe Price Short-Term Bond Fund | 1,237 | (1,091 | ) | (146 | ) | |||||||
JNL/T.Rowe Price Value Fund | (15 | ) | 15 | – | ||||||||
At December 31, 2010, the following Funds had unused capital loss carryovers (in thousands) for U.S. federal income tax purposes, which may be used to offset future net realized capital gains. If not used, the capital loss carryovers will expire as follows:
| Amount | Year(s) of Expiration | |||||
JNL/BlackRock Commodity Securities Fund | $ | 72,793 | 2017 | |||
JNL/Capital Guardian Global Balanced Fund | 53,275 | 2016-2018 | ||||
JNL/Capital Guardian Global Diversified Research Fund | 101,874 | 2011-2017 | ||||
JNL/Capital Guardian U.S. Growth Equity Fund | 98,571 | 2011-2018 | ||||
JNL/Eagle Core Equity Fund | 15,160 | 2016-2017 | ||||
JNL/Eagle SmallCap Equity Fund | 22,664 | 2017 | ||||
JNL/Franklin Templeton Founding Strategy Fund | 9,243 | 2016 | ||||
JNL/Franklin Templeton Global Growth Fund | 49,005 | 2016-2018 | ||||
JNL/Franklin Templeton Income Fund | 91,385 | 2016-2018 | ||||
JNL/Franklin Templeton International Small Cap Growth Fund | 11,818 | 2017 | ||||
JNL Series Trust
Notes to Financial Statements
December 31, 2010
| Amount | Year(s) of Expiration | |||||
JNL/Franklin Templeton Mutual Shares Fund | $ | 69,129 | 2016-2018 | |||
JNL/Franklin Templeton Small Cap Value Fund | 7,217 | 2016-2017 | ||||
JNL/Goldman Sachs Mid Cap Value Fund | 20,552 | 2017 | ||||
JNL/Goldman Sachs U.S. Equity Flex Fund | 3,065 | 2016 | ||||
JNL/Invesco Global Real Estate Fund | 72,509 | 2016-2017 | ||||
JNL/Invesco International Growth Fund | 106,224 | 2016-2018 | ||||
JNL/Invesco Large Cap Growth Fund | 21,686 | 2017 | ||||
JNL/Ivy Asset Strategy Fund | 61,100 | 2018 | ||||
JNL/JPMorgan International Value Fund | 209,058 | 2016-2018 | ||||
JNL/JPMorgan Mid Cap Growth Fund | 46,370 | 2011-2017 | ||||
JNL/JPMorgan U.S. Government & Quality Bond Fund | 999 | 2014-2017 | ||||
JNL/Lazard Emerging Markets Fund | 23,916 | 2017 | ||||
JNL/Lazard Mid Cap Equity Fund | 67,730 | 2016-2017 | ||||
JNL/Mellon Capital Management 10 x 10 Fund | 48 | 2018 | ||||
JNL/Mellon Capital Management S&P 500 Index Fund | 13,020 | 2011-2016 | ||||
JNL/Mellon Capital Management Small Cap Index Fund | 9,703 | 2017 | ||||
JNL/Mellon Capital Management International Index Fund | 8,175 | 2017-2018 | ||||
JNL/Oppenheimer Global Growth Fund | 7,224 | 2017 | ||||
JNL/PPM America High Yield Bond Fund | 49,935 | 2016-2017 | ||||
JNL/PPM America Value Equity Fund | 117,407 | 2016-2017 | ||||
JNL/S&P Managed Conservative Fund | 9,794 | 2017 | ||||
JNL/S&P Managed Moderate Fund | 31,387 | 2016-2018 | ||||
JNL/S&P Managed Moderate Growth Fund | 33,642 | 2015-2018 | ||||
JNL/S&P Managed Growth Fund | 43,750 | 2016-2018 | ||||
JNL/S&P Managed Aggressive Growth Fund | 32,290 | 2012-2018 | ||||
JNL/S&P Disciplined Moderate Fund | 3,044 | 2017-2018 | ||||
JNL/S&P Disciplined Moderate Growth Fund | 8,391 | 2017-2018 | ||||
JNL/S&P Disciplined Growth Fund | 3,545 | 2017-2018 | ||||
JNL/Select Balanced Fund | 16,948 | 2017 | ||||
JNL/Select Value Fund | 71,102 | 2017 | ||||
JNL/T.Rowe Price Established Growth Fund | 183,910 | 2016-2017 | ||||
JNL/T.Rowe Price Short-Term Bond Fund | 21,368 | 2017-2018 | ||||
JNL/T.Rowe Price Value Fund | 78,880 | 2016-2018 | ||||
The Regulated Investment Company Modernization Act of 2010 (“Act”) was enacted on December 22, 2010. In general, the provisions of the Act will be effective for the Funds’ fiscal year ending December 31, 2011. Under the Act, a Fund will be permitted to carry forward capital losses for an unlimited period. However, any losses incurred during those future taxable years will be required to be utilized prior to the losses incurred in pre-enactment taxable years. As a result of this ordering rule, pre-enactment capital loss carry forwards may be more likely to expire unused. Additionally, post-enactment capital losses that are carried forward will retain their character as either short-term or long-term capital losses, and will not be considered exclusively short-term as under previous law. Relevant information regarding the impact of the Act on the Funds will be contained within the Income Tax Matters section of the financial statement notes in the Funds’ Annual Report for the fiscal year ending December 31, 2011.
At December 31, 2010, the following Funds had capital, currency and/or passive foreign investment company (“PFIC”) mark to market losses (in thousands) realized after October 31, 2010 (“Post-October losses”), which were deferred for tax purposes to January 1, 2011.
| Amount | ||||
JNL/BlackRock Commodity Securities Fund | $ | 14 | ||
JNL/Capital Guardian Global Balanced Fund | 452 | |||
JNL/Capital Guardian Global Diversified Research Fund | 645 | |||
JNL/Eagle SmallCap Equity Fund | 280 | |||
JNL/Franklin Templeton Global Growth Fund | 249 | |||
JNL/Franklin Templeton Income Fund | 11 | |||
JNL/Franklin Templeton International Small Cap Growth Fund | 278 | |||
JNL/Franklin Templeton Mutual Shares Fund | 1,350 | |||
JNL/Goldman Sachs Core Plus Bond Fund | 12,345 | |||
JNL/Goldman Sachs U.S. Equity Flex Fund | 19 | |||
JNL/Invesco Global Real Estate Fund | 170 | |||
JNL/Invesco International Growth Fund | 1,391 | |||
JNL/Ivy Asset Strategy Fund | 7,563 | |||
JNL Series Trust
Notes to Financial Statements
December 31, 2010
| Amount | ||||
JNL/Lazard Emerging Markets Fund | $ | 537 | ||
JNL/M&G Global Basics Fund | 20 | |||
JNL/M&G Global Leaders Fund | 9 | |||
JNL/Mellon Capital Management European 30 Fund | 12 | |||
JNL/Mellon Capital Management Pacific Rim 30 Fund | 1 | |||
JNL/Mellon Capital Management International Index Fund | 2,712 | |||
JNL/Mellon Capital Management Bond Index Fund | 1,665 | |||
JNL/Mellon Capital Management Global Alpha Fund | 1,256 | |||
JNL/PAM Asia ex-Japan Fund | 75 | |||
JNL/PAM China-India Fund | 8 | |||
JNL/PIMCO Real Return Fund | 142 | |||
JNL/PIMCO Total Return Bond Fund | 12,462 | |||
JNL/PPM America Mid Cap Value Fund | 80 | |||
JNL/Red Rocks Listed Private Equity Fund | 35 | |||
JNL/T.Rowe Price Established Growth Fund | 456 | |||
JNL/T.Rowe Price Mid-Cap Growth Fund | 199 | |||
JNL/T.Rowe Price Short-Term Bond Fund | 943 | |||
As of December 31, 2010, the cost of investments, the components of net unrealized appreciation/(depreciation), undistributed net ordinary income and undistributed net long-term capital gains for U.S. federal income tax purposes (in thousands) were as follows:
| Tax Cost of Investments | Gross Unrealized Appreciation | Gross Unrealized Depreciation | Net Unrealized Appreciation/ (Depreciation) | Undistributed Net Ordinary Income* | Undistributed Net Long-Term Capital Gain | |||||||||||||||||||||||||||||||||||||||||||
JNL/American Funds Blue Chip Income and Growth Fund | $ | 138,683 | $ | 10,404 | $ | (8 | ) | $ | 10,396 | $ | 1,893 | $ | – | |||||||||||||||||||||||||||||||||||
JNL/American Funds Global Bond Fund | 106,562 | 906 | (2,081 | ) | (1,175 | ) | 2,522 | – | ||||||||||||||||||||||||||||||||||||||||
JNL/American Funds Global Small Capitalization Fund | 73,092 | 7,889 | – | 7,889 | 487 | – | ||||||||||||||||||||||||||||||||||||||||||
JNL/American Funds Growth-Income Fund | 161,578 | 13,034 | (5 | ) | 13,029 | 1,731 | – | |||||||||||||||||||||||||||||||||||||||||
JNL/American Funds International Fund | 95,439 | 7,557 | (156 | ) | 7,401 | 1,367 | – | |||||||||||||||||||||||||||||||||||||||||
JNL/American Funds New World Fund | 125,023 | 8,650 | (125 | ) | 8,525 | 1,268 | – | |||||||||||||||||||||||||||||||||||||||||
JNL Institutional Alt 20 Fund | 553,914 | 63,609 | (2,388 | ) | 61,221 | 8,314 | 241 | |||||||||||||||||||||||||||||||||||||||||
JNL Institutional Alt 35 Fund | 783,527 | 104,387 | (2,322 | ) | 102,065 | 11,093 | 875 | |||||||||||||||||||||||||||||||||||||||||
JNL Institutional Alt 50 Fund | 957,546 | 122,934 | (2,697 | ) | 120,237 | 13,247 | 1,774 | |||||||||||||||||||||||||||||||||||||||||
JNL Institutional Alt 65 Fund | 648,593 | 81,330 | (1,399 | ) | 79,931 | 7,466 | 2,279 | |||||||||||||||||||||||||||||||||||||||||
JNL/BlackRock Commodity Securities Fund | 1,034,379 | 150,363 | (3,377 | ) | 146,986 | 6,182 | – | |||||||||||||||||||||||||||||||||||||||||
JNL/BlackRock Global Allocation Fund | 178,274 | 1,588 | (216 | ) | 1,372 | 2,083 | – | |||||||||||||||||||||||||||||||||||||||||
JNL/Capital Guardian Global Balanced Fund | 333,291 | 49,312 | (7,774 | ) | 41,538 | 4,051 | – | |||||||||||||||||||||||||||||||||||||||||
JNL/Capital Guardian Global Diversified Research Fund | 376,187 | 81,495 | (10,626 | ) | 70,869 | 2,941 | – | |||||||||||||||||||||||||||||||||||||||||
JNL/Capital Guardian U.S. Growth Equity Fund | 765,164 | 171,689 | (17,100 | ) | 154,589 | 1,470 | – | |||||||||||||||||||||||||||||||||||||||||
JNL/Eagle Core Equity Fund | 187,588 | 23,479 | (2,848 | ) | 20,631 | 1,254 | – | |||||||||||||||||||||||||||||||||||||||||
JNL/Eagle SmallCap Equity Fund | 503,252 | 144,392 | (8,401 | ) | 135,991 | – | – | |||||||||||||||||||||||||||||||||||||||||
JNL/Franklin Templeton Founding Strategy Fund | 1,152,211 | 22,095 | (136,257 | ) | (114,162 | ) | 15,769 | – | ||||||||||||||||||||||||||||||||||||||||
JNL/Franklin Templeton Global Growth Fund | 491,321 | 57,018 | (68,508 | ) | (11,490 | ) | 4,674 | – | ||||||||||||||||||||||||||||||||||||||||
JNL/Franklin Templeton Income Fund | 1,219,762 | 79,468 | (63,781 | ) | 15,687 | 49,319 | – | |||||||||||||||||||||||||||||||||||||||||
JNL/Franklin Templeton International Small Cap Growth Fund | 210,403 | 26,208 | (3,925 | ) | 22,283 | 3,322 | – | |||||||||||||||||||||||||||||||||||||||||
JNL/Franklin Templeton Mutual Shares Fund | 589,312 | 54,802 | (37,856 | ) | 16,946 | 16,469 | – | |||||||||||||||||||||||||||||||||||||||||
JNL/Franklin Templeton Small Cap Value Fund | 257,321 | 62,605 | (15,182 | ) | 47,423 | 1,116 | – | |||||||||||||||||||||||||||||||||||||||||
JNL/Goldman Sachs Core Plus Bond Fund | 1,509,759 | 30,333 | (36,364 | ) | (6,031 | ) | 45,634 | 13,815 | ||||||||||||||||||||||||||||||||||||||||
JNL/Goldman Sachs Emerging Markets Debt Fund | 710,747 | 30,028 | (9,939 | ) | 20,089 | 59,020 | 1,334 | |||||||||||||||||||||||||||||||||||||||||
JNL/Goldman Sachs Mid Cap Value Fund | 450,061 | 75,968 | (4,171 | ) | 71,797 | 1,360 | – | |||||||||||||||||||||||||||||||||||||||||
JNL/Goldman Sachs U.S. Equity Flex Fund | 138,753 | 13,469 | (1,577 | ) | 11,892 | 161 | – | |||||||||||||||||||||||||||||||||||||||||
JNL/Invesco Global Real Estate Fund | 644,822 | 53,719 | (8,071 | ) | 45,648 | 20,348 | – | |||||||||||||||||||||||||||||||||||||||||
JNL/Invesco International Growth Fund | 543,554 | 89,190 | (18,821 | ) | 70,369 | 4,545 | – | |||||||||||||||||||||||||||||||||||||||||
JNL/Invesco Large Cap Growth Fund | 771,809 | 149,717 | (7,693 | ) | 142,024 | 1,515 | – | |||||||||||||||||||||||||||||||||||||||||
JNL/Invesco Small Cap Growth Fund | 134,836 | 31,858 | (2,792 | ) | 29,066 | – | 515 | |||||||||||||||||||||||||||||||||||||||||
JNL/Ivy Asset Strategy Fund | 814,833 | 157,205 | (7,930 | ) | 149,275 | 2,094 | – | |||||||||||||||||||||||||||||||||||||||||
JNL/JPMorgan International Value Fund | 573,542 | 80,460 | (30,123 | ) | 50,337 | 18,370 | – | |||||||||||||||||||||||||||||||||||||||||
JNL/JPMorgan Mid Cap Growth Fund | 203,583 | 47,652 | (4,170 | ) | 43,482 | – | – | |||||||||||||||||||||||||||||||||||||||||
JNL/JPMorgan U.S. Government & Quality Bond Fund | 908,299 | 45,279 | (7,672 | ) | 37,607 | 30,296 | – | |||||||||||||||||||||||||||||||||||||||||
JNL Series Trust
Notes to Financial Statements
December 31, 2010
| Tax Cost of Investments | Gross Unrealized Appreciation | Gross Unrealized Depreciation | Net Unrealized Appreciation/ (Depreciation) | Undistributed Net Ordinary Income* | Undistributed Net Long-Term Capital Gain | |||||||||||||||||||
JNL/Lazard Emerging Markets Fund | $ | 1,240,568 | $ | 255,108 | $ | (30,968 | ) | $ | 224,140 | $ | 14,096 | $ | – | |||||||||||
JNL/Lazard Mid Cap Equity Fund | 185,335 | 34,041 | (1,868 | ) | 32,173 | 1,476 | – | |||||||||||||||||
JNL/M&G Global Basics Fund | 174,462 | 39,284 | (1,006 | ) | 38,278 | 1,049 | – | |||||||||||||||||
JNL/M&G Global Leaders Fund | 26,265 | 4,783 | (321 | ) | 4,462 | 8 | 741 | |||||||||||||||||
JNL/Mellon Capital Management 10 x 10 Fund | 254,394 | 16,073 | (12,907 | ) | 3,166 | 4,082 | – | |||||||||||||||||
JNL/Mellon Capital Management Index 5 Fund | 289,387 | 44,008 | (896 | ) | 43,112 | 4,123 | 833 | |||||||||||||||||
JNL/Mellon Capital Management European 30 Fund | 19,218 | 563 | (1,279 | ) | (716 | ) | 1,567 | 20 | ||||||||||||||||
JNL/Mellon Capital Management Pacific Rim 30 Fund | 38,748 | 2,606 | (817 | ) | 1,789 | 2,891 | 206 | |||||||||||||||||
JNL/Mellon Capital Management S&P 500 Index Fund | 1,204,279 | 260,851 | (111,963 | ) | 148,888 | 824 | 1,921 | |||||||||||||||||
JNL/Mellon Capital Management S&P 400 MidCap Index Fund | 633,212 | 134,540 | (55,629 | ) | 78,911 | 3,598 | 8,148 | |||||||||||||||||
JNL/Mellon Capital Management Small Cap Index Fund | 679,861 | 186,679 | (69,775 | ) | 116,904 | 5,029 | – | |||||||||||||||||
JNL/Mellon Capital Management International Index Fund | 1,100,049 | 172,158 | (130,728 | ) | 41,430 | 5,504 | – | |||||||||||||||||
JNL/Mellon Capital Management Bond Index Fund | 1,408,414 | 35,807 | (7,887 | ) | 27,920 | 9,526 | – | |||||||||||||||||
JNL/Mellon Capital Management Global Alpha Fund | 198,424 | 1 | – | 1 | 7,411 | 2,161 | ||||||||||||||||||
JNL/Oppenheimer Global Growth Fund | 379,355 | 64,353 | (22,427 | ) | 41,926 | 3,406 | – | |||||||||||||||||
JNL/PAM Asia ex-Japan Fund | 137,420 | 22,816 | (3,662 | ) | 19,154 | 6,932 | 2,110 | |||||||||||||||||
JNL/PAM China-India Fund | 355,079 | 59,559 | (12,514 | ) | 47,045 | 10,339 | 9,772 | |||||||||||||||||
JNL/PIMCO Real Return Fund | 3,076,924 | 3,940 | (56,681 | ) | (52,741 | ) | 118,063 | 8,649 | ||||||||||||||||
JNL/PIMCO Total Return Bond Fund | 4,693,119 | 80,842 | (47,555 | ) | 33,287 | 15,310 | 4,665 | |||||||||||||||||
JNL/PPM America High Yield Bond Fund | 1,048,385 | 71,683 | (14,949 | ) | 56,734 | 3,543 | – | |||||||||||||||||
JNL/PPM America Mid Cap Value Fund | 80,865 | 9,639 | (1,577 | ) | 8,062 | 152 | 1,245 | |||||||||||||||||
JNL/PPM America Small Cap Value Fund | 67,791 | 7,657 | (2,256 | ) | 5,401 | 375 | 122 | |||||||||||||||||
JNL/PPM America Value Equity Fund | 99,713 | 17,877 | (2,199 | ) | 15,678 | 1,302 | – | |||||||||||||||||
JNL/Red Rocks Listed Private Equity Fund | 599,151 | 51,387 | (5,885 | ) | 45,502 | 70,288 | 9,191 | |||||||||||||||||
JNL/S&P Managed Conservative Fund | 955,797 | 45,488 | (21,571 | ) | 23,917 | 9,978 | – | |||||||||||||||||
JNL/S&P Managed Moderate Fund | 1,579,047 | 127,235 | (40,953 | ) | 86,282 | 15,518 | – | |||||||||||||||||
JNL/S&P Managed Moderate Growth Fund | 2,702,051 | 268,450 | (108,923 | ) | 159,527 | 36,475 | – | |||||||||||||||||
JNL/S&P Managed Growth Fund | 2,010,931 | 226,308 | (96,120 | ) | 130,188 | 17,402 | – | |||||||||||||||||
JNL/S&P Managed Aggressive Growth Fund | 768,236 | 66,798 | (46,241 | ) | 20,557 | 5,576 | – | |||||||||||||||||
JNL/S&P Disciplined Moderate Fund | 322,577 | 24,991 | (1,079 | ) | 23,912 | 5,555 | – | |||||||||||||||||
JNL/S&P Disciplined Moderate Growth Fund | 341,249 | 35,344 | (440 | ) | 34,904 | 5,073 | – | |||||||||||||||||
JNL/S&P Disciplined Growth Fund | 123,724 | 13,875 | (101 | ) | 13,774 | 1,790 | – | |||||||||||||||||
JNL/S&P Competitive Advantage Fund | 291,617 | 22,283 | (8,071 | ) | 14,212 | 7,792 | 27,390 | |||||||||||||||||
JNL/S&P Dividend Income & Growth Fund | 429,161 | 39,762 | (4,338 | ) | 35,424 | 16,173 | 4,695 | |||||||||||||||||
JNL/S&P Intrinsic Value Fund | 331,794 | 11,805 | (8,442 | ) | 3,363 | 17,947 | 20,259 | |||||||||||||||||
JNL/S&P Total Yield Fund | 286,134 | 13,085 | (8,127 | ) | 4,958 | 9,474 | 13,817 | |||||||||||||||||
JNL/S&P 4 Fund | 718,571 | 128,282 | (2,859 | ) | 125,423 | 45,486 | 4,208 | |||||||||||||||||
JNL/Select Balanced Fund | 1,282,531 | 130,129 | (18,202 | ) | 111,927 | 18,322 | – | |||||||||||||||||
JNL/Select Money Market Fund | 713,255 | – | – | – | 15 | – | ||||||||||||||||||
JNL/Select Value Fund | 1,015,117 | 175,226 | (29,640 | ) | 145,586 | 12,322 | – | |||||||||||||||||
JNL/T.Rowe Price Established Growth Fund | 1,205,224 | 345,020 | (11,022 | ) | 333,998 | – | – | |||||||||||||||||
JNL/T.Rowe Price Mid-Cap Growth Fund | 1,188,092 | 337,020 | (23,439 | ) | 313,581 | 237 | 829 | |||||||||||||||||
JNL/T.Rowe Price Short-Term Bond Fund | 866,384 | 10,227 | (4,651 | ) | 5,576 | 14,168 | – | |||||||||||||||||
JNL/T.Rowe Price Value Fund | 1,025,433 | 176,778 | (50,629 | ) | 126,149 | 17,752 | – | |||||||||||||||||
| * | Undistributed net ordinary income consists of net taxable income derived from dividends, interest and net short-term capital gains, if any. |
The tax character of distributions paid (in thousands) during the Funds’ fiscal year ended December 31, 2010 was as follows:
| Net Ordinary Income* | Long-term Capital Gain** | |||||||
JNL Institutional Alt 20 Fund | $ | 2,943 | $ | 5 | ||||
JNL Institutional Alt 35 Fund | 5,049 | 6 | ||||||
JNL Institutional Alt 50 Fund | 6,700 | 5 | ||||||
JNL Institutional Alt 65 Fund | 4,847 | 2 | ||||||
JNL/BlackRock Commodity Securities Fund | 2,643 | – | ||||||
JNL/Capital Guardian Global Balanced Fund | 3,461 | – | ||||||
JNL/Capital Guardian Global Diversified Research Fund | 2,800 | – | ||||||
JNL/Capital Guardian U.S. Growth Equity Fund | 1,991 | – | ||||||
JNL Series Trust
Notes to Financial Statements
December 31, 2010
| Net Ordinary Income* | Long-term Capital Gain** | |||||||
JNL/Eagle Core Equity Fund | $ | 509 | $ | – | ||||
JNL/Eagle SmallCap Equity Fund | 680 | – | ||||||
JNL/Franklin Templeton Founding Strategy Fund | 27,416 | – | ||||||
JNL/Franklin Templeton Global Growth Fund | 5,699 | – | ||||||
JNL/Franklin Templeton Income Fund | 35,008 | – | ||||||
JNL/Franklin Templeton International Small Cap Growth Fund | 2,199 | – | ||||||
JNL/Franklin Templeton Mutual Shares Fund | 115 | – | ||||||
JNL/Franklin Templeton Small Cap Value Fund | 1,044 | – | ||||||
JNL/Goldman Sachs Core Plus Bond Fund | 36,086 | – | ||||||
JNL/Goldman Sachs Emerging Markets Debt Fund | 7,785 | 243 | ||||||
JNL/Goldman Sachs Mid Cap Value Fund | 2,213 | – | ||||||
JNL/Goldman Sachs U.S. Equity Flex Fund | 671 | – | ||||||
JNL/Invesco Global Real Estate Fund | 22,637 | – | ||||||
JNL/Invesco International Growth Fund | 3,873 | – | ||||||
JNL/Invesco Large Cap Growth Fund | 2,188 | – | ||||||
JNL/Ivy Asset Strategy Fund | 98 | – | ||||||
JNL/JPMorgan International Value Fund | 14,932 | – | ||||||
JNL/JPMorgan U.S. Government & Quality Bond Fund | 24,730 | – | ||||||
JNL/Lazard Emerging Markets Fund | 5,665 | – | ||||||
JNL/Lazard Mid Cap Equity Fund | 933 | – | ||||||
JNL/M&G Global Basics Fund | 1,320 | 337 | ||||||
JNL/M&G Global Leaders Fund | 105 | 341 | ||||||
JNL/Mellon Capital Management 10 x 10 Fund | 4,451 | 116 | ||||||
JNL/Mellon Capital Management Index 5 Fund | 2,898 | 219 | ||||||
JNL/Mellon Capital Management European 30 Fund | 96 | – | ||||||
JNL/Mellon Capital Management Pacific Rim 30 Fund | 5 | – | ||||||
JNL/Mellon Capital Management S&P 500 Index Fund | 16,321 | 1,513 | ||||||
JNL/Mellon Capital Management S&P 400 MidCap Index Fund | 3,941 | 5,119 | ||||||
JNL/Mellon Capital Management Small Cap Index Fund | 4,007 | – | ||||||
JNL/Mellon Capital Management International Index Fund | 19,175 | – | ||||||
JNL/Mellon Capital Management Bond Index Fund | 34,279 | 897 | ||||||
JNL/Mellon Capital Management Global Alpha Fund | – | 43 | ||||||
JNL/Oppenheimer Global Growth Fund | 2,821 | – | ||||||
JNL/PAM Asia ex-Japan Fund | 140 | – | ||||||
JNL/PAM China-India Fund | 2,466 | 1,023 | ||||||
JNL/PIMCO Real Return Fund | 53,623 | 3,144 | ||||||
JNL/PIMCO Total Return Bond Fund | 158,516 | 30,151 | ||||||
JNL/PPM America High Yield Bond Fund | 54,887 | – | ||||||
JNL/PPM America Mid Cap Value Fund | 2 | – | ||||||
JNL/PPM America Small Cap Value Fund | 2,009 | 1,342 | ||||||
JNL/PPM America Value Equity Fund | 1,224 | – | ||||||
JNL/Red Rocks Listed Private Equity Fund | 2,504 | 1,848 | ||||||
JNL/S&P Managed Conservative Fund | 20,853 | – | ||||||
JNL/S&P Managed Moderate Fund | 28,187 | – | ||||||
JNL/S&P Managed Moderate Growth Fund | 30,938 | – | ||||||
JNL/S&P Managed Growth Fund | 17,998 | – | ||||||
JNL/S&P Managed Aggressive Growth Fund | 4,942 | – | ||||||
JNL/S&P Disciplined Moderate Fund | 2,774 | – | ||||||
JNL/S&P Disciplined Moderate Growth Fund | 3,418 | – | ||||||
JNL/S&P Disciplined Growth Fund | 1,410 | – | ||||||
JNL/S&P Competitive Advantage Fund | 12,840 | 370 | ||||||
JNL/S&P Dividend Income & Growth Fund | 21,150 | 13 | ||||||
JNL/S&P Intrinsic Value Fund | 33,180 | 17 | ||||||
JNL/S&P Total Yield Fund | 6,019 | 1,546 | ||||||
JNL/S&P 4 Fund | – | 559 | ||||||
JNL Series Trust
Notes to Financial Statements
December 31, 2010
| Net Ordinary Income* | Long-term Capital Gain** | |||||||
JNL/Select Balanced Fund | $ | 13,936 | $ | – | ||||
JNL/Select Money Market Fund | 22 | – | ||||||
JNL/Select Value Fund | 9,591 | – | ||||||
JNL/T.Rowe Price Established Growth Fund | 563 | – | ||||||
JNL/T.Rowe Price Mid-Cap Growth Fund | 2,110 | 26,748 | ||||||
JNL/T.Rowe Price Short-Term Bond Fund | 9,875 | – | ||||||
JNL/T.Rowe Price Value Fund | 9,956 | – | ||||||
| * | Net ordinary income consists of net taxable income derived from dividends, interest and net short-term capital gains, if any. |
| ** | The Funds designated as a long-term capital gain dividend, pursuant to the Internal Revenue Code Section 852(b)(3), the amount necessary to reduce earnings and profits of the Funds related to net capital gains to zero for the year ended December 31, 2010. |
The tax character of distributions paid (in thousands) during the fiscal year ended December 31, 2009 was as follows:
| Net Ordinary Income* | Long-term Capital Gain | |||||||
JNL/Capital Guardian Global Balanced Fund | $ | 5,564 | $ | – | ||||
JNL/Capital Guardian Global Diversified Research Fund | 4,300 | – | ||||||
JNL/Capital Guardian U.S. Growth Equity Fund | 674 | – | ||||||
JNL/BlackRock Commodity Securities Fund | 4,274 | – | ||||||
JNL/Eagle Core Equity Fund | 842 | – | ||||||
JNL/Franklin Templeton Founding Strategy Fund | 449 | – | ||||||
JNL/Franklin Templeton Global Growth Fund | 5,602 | – | ||||||
JNL/Franklin Templeton Income Fund | 38,708 | – | ||||||
JNL/Franklin Templeton International Small Cap Growth Fund | 1,566 | – | ||||||
JNL/Franklin Templeton Mutual Shares Fund | 13,028 | – | ||||||
JNL/Franklin Templeton Small Cap Value Fund | 1,070 | – | ||||||
JNL/Goldman Sachs Core Plus Bond Fund | 31,690 | 2,940 | ||||||
JNL/Goldman Sachs Emerging Markets Debt Fund | 150 | – | ||||||
JNL/Goldman Sachs Mid Cap Value Fund | 2,460 | – | ||||||
JNL/Goldman Sachs U.S. Equity Flex Fund | 570 | – | ||||||
JNL/Invesco International Growth Fund | 8,057 | – | ||||||
JNL/Invesco Large Cap Growth Fund | 1,467 | – | ||||||
JNL/Invesco Global Real Estate Fund | 6,185 | – | ||||||
JNL/JPMorgan International Value Fund | 19,883 | – | ||||||
JNL/JPMorgan U.S. Government & Quality Bond Fund | 17,148 | – | ||||||
JNL/Lazard Emerging Markets Fund | 9,742 | – | ||||||
JNL/Lazard Mid Cap Equity Fund | 1,101 | – | ||||||
JNL/M&G Global Basics Fund | 186 | 36 | ||||||
JNL/M&G Global Leaders Fund | 95 | – | ||||||
JNL/Mellon Capital Management 10 x 10 Fund | 6,552 | 6,382 | ||||||
JNL/Mellon Capital Management Index 5 Fund | 1,700 | 1,937 | ||||||
JNL/Mellon Capital Management European 30 Fund | 825 | 9 | ||||||
JNL/Mellon Capital Management Pacific Rim 30 Fund | 868 | 11 | ||||||
JNL/Mellon Capital Management S&P 500 Index Fund | 11,232 | – | ||||||
JNL/Mellon Capital Management S&P 400 MidCap Index Fund | 4,539 | – | ||||||
JNL/Mellon Capital Management Small Cap Index Fund | 3,324 | 2,300 | ||||||
JNL/Mellon Capital Management International Index Fund | 15,689 | 49 | ||||||
JNL/Mellon Capital Management Bond Index Fund | 20,350 | 41 | ||||||
JNL/Oppenheimer Global Growth Fund | 3,563 | 14,502 | ||||||
JNL/PAM Asia ex-Japan Fund | 5 | – | ||||||
JNL/PIMCO Real Return Fund | 26,838 | – | ||||||
JNL/PIMCO Total Return Bond Fund | 108,793 | 4,500 | ||||||
JNL/PPM America High Yield Bond Fund | 32,394 | – | ||||||
JNL/PPM America Mid Cap Value Fund | 86 | – | ||||||
JNL/PPM America Small Cap Value Fund | 77 | – | ||||||
JNL/PPM America Value Equity Fund | 4090 | – | ||||||
JNL/Red Rocks Listed Private Equity Fund | 6,775 | – | ||||||
JNL/S&P Managed Conservative Fund | 10,219 | 5,948 | ||||||
JNL/S&P Managed Moderate Fund | 11,077 | 11,102 | ||||||
JNL/S&P Managed Moderate Growth Fund | 10,776 | 40,252 | ||||||
JNL Series Trust
Notes to Financial Statements
December 31, 2010
| Net Ordinary Income* | Long-term Capital Gain | |||||||
JNL/S&P Managed Growth Fund | $ | 23,405 | $ | 44,252 | ||||
JNL/S&P Managed Aggressive Growth Fund | 11,203 | 17,264 | ||||||
JNL/S&P Disciplined Moderate Fund | 2,845 | 1,066 | ||||||
JNL/S&P Disciplined Moderate Growth Fund | 3,991 | 2,254 | ||||||
JNL/S&P Disciplined Growth Fund | 1,712 | 992 | ||||||
JNL/S&P Competitive Advantage Fund | 27 | – | ||||||
JNL/S&P Dividend Income & Growth Fund | 57 | – | ||||||
JNL/S&P Intrinsic Value Fund | 46 | – | ||||||
JNL/S&P Total Yield Fund | 33 | – | ||||||
JNL/S&P 4 Fund | 5,196 | – | ||||||
JNL/Select Balanced Fund | 15,798 | – | ||||||
JNL/Select Money Market Fund | 2,068 | – | ||||||
JNL/Select Value Fund | 10,354 | – | ||||||
JNL/T. Rowe Price Established Growth Fund | 2,260 | – | ||||||
JNL/T. Rowe Price Mid-Cap Growth Fund | 291 | 140 | ||||||
JNL/T. Rowe Price Short-Term Bond Fund | 13,187 | 4,270 | ||||||
JNL/T. Rowe Price Value Fund | 9,649 | – | ||||||
* Net ordinary income consists of net taxable income derived from dividends, interest and net short-term capital gains, if any.
FASB ASC Topic 740 “Income Taxes” provides guidance for how uncertain tax positions should be recognized, measured, presented and disclosed in the financial statements. FASB ASC Topic 740 requires the evaluation of tax positions taken or expected to be taken in the course of preparing each Fund’s tax return to determine whether the tax positions are “more-likely-than-not” of being sustained by the applicable tax authority. Tax positions not deemed to meet the “more-likely-than-not” threshold would be recorded as a tax expense in the current year. FASB ASC Topic 740 requires that management evaluate the tax positions taken in returns for 2007, 2008, 2009 and 2010 which remain subject to examination, by the Internal Revenue Service. These returns are not subject to examination by any other tax jurisdictions. Management completed an evaluation of the Funds’ tax positions and based on that evaluation, determined that no provision for federal income tax was required in the Funds’ financial statements for the year ended December 31, 2010.
NOTE 8. SUBSEQUENT EVENTS
Management has evaluated subsequent events for the Funds through the date the financial statements are issued, and has concluded there are no events that require adjustments to the financial statements.
Effective February 22, 2011, the JNL/BlackRock Global Allocation Fund was closed to new investment. Please refer to the Supplement to the Fund’s prospectus on page 3 of this Annual Report.
Report of Independent Registered Public Accounting Firm
To the Shareholders and Board of Trustees
JNL Series Trust:
We have audited the accompanying statements of assets and liabilities, including the schedules of investments where applicable, of each series within JNL Series Trust (the “Funds”) as listed in Note 1 of the financial statements as of December 31, 2010, and the related statements of operations for the year or period then ended, the statement of cash flows for the year then ended with respect to JNL/Goldman Sachs U.S. Equity Flex Fund, the statements of changes in net assets for each of the years or periods in the two-year period indicated herein, and the financial highlights for each of the years or periods in the five-year period indicated herein. These financial statements and financial highlights are the responsibility of the Funds’ management. Our responsibility is to express an opinion on these financial statements and financial highlights based on our audits.
We conducted our audits in accordance with the standards of the Public Company Accounting Oversight Board (United States). Those standards require that we plan and perform the audit to obtain reasonable assurance about whether the financial statements and financial highlights are free of material misstatement. An audit includes examining, on a test basis, evidence supporting the amounts and disclosures in the financial statements. Our procedures included confirmation of securities owned as of December 31, 2010, by correspondence with the custodian and brokers or other appropriate auditing procedures. An audit also includes assessing the accounting principles used and significant estimates made by management, as well as evaluating the overall financial statement presentation. We believe that our audits provide a reasonable basis for our opinion.
In our opinion, the financial statements and financial highlights referred to above present fairly, in all material respects, the financial position of the Funds as of December 31, 2010, the results of their operations, JNL/Goldman Sachs U.S. Equity Flex Fund’s cash flows, changes in their net assets and the financial highlights for each of the years or periods indicated herein, in conformity with U.S. generally accepted accounting principles.
/s/ KPMG LLP
February 28, 2011
JNL Series Trust
Additional Disclosures (Unaudited)
December 31, 2010
Disclosure of Fund Expenses
Shareholders incur ongoing costs, which include costs for portfolio management, administrative services, 12b-1 fees (Class A shares of certain Funds) and other operating expenses. Operating expenses such as these are deducted from each Fund's gross income and directly reduce the final investment return. These expenses are expressed as a percentage of the Fund's average net assets; this percentage is known as the Fund's expense ratio. The examples below use the expense ratio and are intended to help the investor understand the ongoing costs (in dollars) of investing in a Fund and to compare these costs with the ongoing costs of investing in other mutual funds. The examples are based on an investment of $1,000 made at the beginning of the period shown and held for the entire period. The examples do not reflect the expenses of the variable insurance contracts or the separate account. Total expenses would be higher if these expenses were included.
Expenses Using Actual Fund Return. This section provides information about the actual account values and actual expenses incurred by the Fund. Use the information in this section, together with the amount invested, to estimate the expenses paid over the period. Simply divide the account value by $1,000 (for example, an $8,600 account value divided by $1,000 = 8.6), then multiply the result by the number in the first section under the heading entitled “Expenses Paid During Period” to estimate the expenses paid during this period.
Expenses Using Hypothetical 5% Return. The information in this section can be used to compare each Fund's costs with those of other mutual funds. It assumes that the Fund had an annual 5% return before expenses during the year, but that the expense ratio for the period is unchanged. This example is useful in making comparisons because the SEC requires all mutual funds to make the 5% calculation.
| Expenses Using Actual Fund Return | Expenses Using Hypothetical 5% Return | |||||||||||||||||||||||||||||||
| Beginning Account Value 7/1/2010 | Ending Account Value 12/31/2010 | Annualized Expense Ratios | Expenses Paid During Period | Beginning Account Value 7/1/2010 | Ending Account Value 12/31/2010 | Annualized Expense Ratios | Expenses Paid During Period | |||||||||||||||||||||||||
JNL/American Funds Blue Chip Income and Growth Fund* |
| |||||||||||||||||||||||||||||||
Class A | $ | 1,000.00 | $ | 1,208.10 | 0.64 | % | $ | 3.56 | $ | 1,000.00 | $ | 1,021.98 | 0.64 | % | $ | 3.26 | ||||||||||||||||
Class B | 1,000.00 | 1,210.50 | 0.39 | 2.17 | 1,000.00 | 1,023.24 | 0.39 | 1.99 | ||||||||||||||||||||||||
JNL/American Funds Global Bond Fund* |
| |||||||||||||||||||||||||||||||
Class A | 1,000.00 | 1,057.70 | 0.55 | 2.85 | 1,000.00 | 1,022.43 | 0.55 | 2.80 | ||||||||||||||||||||||||
Class B | 1,000.00 | 1,059.70 | 0.30 | 1.56 | 1,000.00 | 1,023.69 | 0.30 | 1.53 | ||||||||||||||||||||||||
JNL/American Funds Global Small Capitalization Fund* |
| |||||||||||||||||||||||||||||||
Class A | 1,000.00 | 1,280.10 | 0.55 | 3.16 | 1,000.00 | 1,022.43 | 0.55 | 2.80 | ||||||||||||||||||||||||
Class B | 1,000.00 | 1,279.80 | 0.30 | 1.72 | 1,000.00 | 1,023.69 | 0.30 | 1.53 | ||||||||||||||||||||||||
JNL/American Funds Growth-Income Fund* |
| |||||||||||||||||||||||||||||||
Class A | 1,000.00 | 1,222.20 | 0.69 | 3.86 | 1,000.00 | 1,021.73 | 0.69 | 3.52 | ||||||||||||||||||||||||
Class B | 1,000.00 | 1,223.40 | 0.44 | 2.47 | 1,000.00 | 1,022.99 | 0.44 | 2.24 | ||||||||||||||||||||||||
JNL/American Funds International Fund* |
| |||||||||||||||||||||||||||||||
Class A | 1,000.00 | 1,234.40 | 0.70 | 3.94 | 1,000.00 | 1,021.68 | 0.70 | 3.57 | ||||||||||||||||||||||||
Class B | 1,000.00 | 1,235.20 | 0.45 | 2.54 | 1,000.00 | 1,022.94 | 0.45 | 2.29 | ||||||||||||||||||||||||
JNL/American Funds New World Fund* |
| - | ||||||||||||||||||||||||||||||
Class A | 1,000.00 | 1,242.90 | 0.64 | 3.62 | 1,000.00 | 1,021.98 | 0.64 | 3.26 | ||||||||||||||||||||||||
Class B | 1,000.00 | 1,244.00 | 0.39 | 2.21 | 1,000.00 | 1,023.24 | 0.39 | 1.99 | ||||||||||||||||||||||||
JNL Institutional Alt 20 Fund | ||||||||||||||||||||||||||||||||
Class A | 1,000.00 | 1,179.70 | 0.20 | 1.10 | 1,000.00 | 1,024.20 | 0.20 | 1.02 | ||||||||||||||||||||||||
JNL Institutional Alt 35 Fund | ||||||||||||||||||||||||||||||||
Class A | 1,000.00 | 1,203.60 | 0.19 | 1.06 | 1,000.00 | 1,024.25 | 0.19 | 0.97 | ||||||||||||||||||||||||
JNL Institutional Alt 50 Fund | ||||||||||||||||||||||||||||||||
Class A | 1,000.00 | 1,206.80 | 0.19 | 1.06 | 1,000.00 | 1,024.25 | 0.19 | 0.97 | ||||||||||||||||||||||||
JNL Institutional Alt 65 Fund | ||||||||||||||||||||||||||||||||
Class A | 1,000.00 | 1,222.40 | 0.20 | 1.12 | 1,000.00 | 1,024.20 | 0.20 | 1.02 | ||||||||||||||||||||||||
JNL/BlackRock Commodity Securities Fund |
| |||||||||||||||||||||||||||||||
Class A | 1,000.00 | 1,334.70 | 0.99 | 5.83 | 1,000.00 | 1,020.21 | 0.99 | 5.04 | ||||||||||||||||||||||||
Class B | 1,000.00 | 1,335.80 | 0.79 | 4.65 | 1,000.00 | 1,021.22 | 0.79 | 4.02 | ||||||||||||||||||||||||
JNL/BlackRock Global Allocation Fund* |
| |||||||||||||||||||||||||||||||
Class A | 1,000.00 | 1,035.00 | 0.58 | 2.98 | 1,000.00 | 1,022.28 | 0.58 | 2.96 | ||||||||||||||||||||||||
Class B | 1,000.00 | 1,035.00 | 0.38 | 1.95 | 1,000.00 | 1,023.29 | 0.38 | 1.94 | ||||||||||||||||||||||||
JNL Series Trust
Additional Disclosures (Unaudited)
December 31, 2010
Disclosure of Fund Expenses
| Expenses Using Actual Fund Return | Expenses Using Hypothetical 5% Return | |||||||||||||||||||||||||||||||
| Beginning Account Value 7/1/2010 | Ending Account Value 12/31/2010 | Annualized Expense Ratios | Expenses Paid During Period | Beginning Account Value 7/1/2010 | Ending Account Value 12/31/2010 | Annualized Expense Ratios | Expenses Paid During Period | |||||||||||||||||||||||||
JNL/Capital Guardian Global Balanced Fund |
| |||||||||||||||||||||||||||||||
Class A | $ | 1,000.00 | $ | 1,176.90 | 1.02 | % | $ | 5.60 | $ | 1,000.00 | $ | 1,020.06 | 1.02 | % | $ | 5.19 | ||||||||||||||||
Class B | 1,000.00 | 1,179.00 | 0.81 | 4.45 | 1,000.00 | 1,021.12 | 0.81 | 4.13 | ||||||||||||||||||||||||
JNL/Capital Guardian Global Diversified Research Fund |
| |||||||||||||||||||||||||||||||
Class A | 1,000.00 | 1,246.40 | 1.08 | 6.12 | 1,000.00 | 1,019.76 | 1.08 | 5.50 | ||||||||||||||||||||||||
Class B | 1,000.00 | 1,248.10 | 0.88 | 4.99 | 1,000.00 | 1,020.77 | 0.88 | 4.48 | ||||||||||||||||||||||||
JNL/Capital Guardian U.S. Growth Equity Fund |
| |||||||||||||||||||||||||||||||
Class A | 1,000.00 | 1,253.00 | 0.94 | 5.34 | 1,000.00 | 1,020.47 | 0.94 | 4.79 | ||||||||||||||||||||||||
Class B | 1,000.00 | 1,254.90 | 0.74 | 4.21 | 1,000.00 | 1,021.48 | 0.74 | 3.77 | ||||||||||||||||||||||||
JNL/Eagle Core Equity Fund |
| |||||||||||||||||||||||||||||||
Class A | 1,000.00 | 1,202.80 | 0.93 | 5.16 | 1,000.00 | 1,020.52 | 0.93 | 4.74 | ||||||||||||||||||||||||
Class B | 1,000.00 | 1,202.70 | 0.73 | 4.05 | 1,000.00 | 1,021.53 | 0.73 | 3.72 | ||||||||||||||||||||||||
JNL/Eagle SmallCap Equity Fund |
| |||||||||||||||||||||||||||||||
Class A | 1,000.00 | 1,356.50 | 1.02 | 6.06 | 1,000.00 | 1,020.06 | 1.02 | 5.19 | ||||||||||||||||||||||||
Class B | 1,000.00 | 1,356.90 | 0.82 | 4.87 | 1,000.00 | 1,021.07 | 0.82 | 4.18 | ||||||||||||||||||||||||
JNL/Franklin Templeton Founding Strategy Fund |
| |||||||||||||||||||||||||||||||
Class A | 1,000.00 | 1,169.30 | 0.05 | 0.27 | 1,000.00 | 1,024.95 | 0.05 | 0.26 | ||||||||||||||||||||||||
JNL/Franklin Templeton Global Growth Fund |
| |||||||||||||||||||||||||||||||
Class A | 1,000.00 | 1,215.40 | 1.08 | 6.03 | 1,000.00 | 1,019.76 | 1.08 | 5.50 | ||||||||||||||||||||||||
Class B | 1,000.00 | 1,216.30 | 0.88 | 4.92 | 1,000.00 | 1,020.77 | 0.88 | 4.48 | ||||||||||||||||||||||||
JNL/Franklin Templeton Income Fund |
| |||||||||||||||||||||||||||||||
Class A | 1,000.00 | 1,126.90 | 0.95 | 5.09 | 1,000.00 | 1,020.42 | 0.95 | 4.84 | ||||||||||||||||||||||||
Class B | 1,000.00 | 1,127.90 | 0.75 | 4.02 | 1,000.00 | 1,021.42 | 0.75 | 3.82 | ||||||||||||||||||||||||
JNL/Franklin Templeton International Small Cap Growth Fund |
| |||||||||||||||||||||||||||||||
Class A | 1,000.00 | 1,272.30 | 1.30 | 7.45 | 1,000.00 | 1,018.65 | 1.30 | 6.61 | ||||||||||||||||||||||||
Class B | 1,000.00 | 1,276.30 | 1.10 | 6.31 | 1,000.00 | 1,019.66 | 1.10 | 5.60 | ||||||||||||||||||||||||
JNL/Franklin Templeton Mutual Shares Fund |
| |||||||||||||||||||||||||||||||
Class A | 1,000.00 | 1,171.50 | 1.06 | 5.80 | 1,000.00 | 1,019.86 | 1.06 | 5.40 | ||||||||||||||||||||||||
Class B | 1,000.00 | 1,171.80 | 0.86 | 4.71 | 1,000.00 | 1,020.87 | 0.86 | 4.38 | ||||||||||||||||||||||||
JNL/Franklin Templeton Small Cap Value Fund |
| |||||||||||||||||||||||||||||||
Class A | 1,000.00 | 1,312.00 | 1.13 | 6.59 | 1,000.00 | 1,019.51 | 1.13 | 5.75 | ||||||||||||||||||||||||
Class B | 1,000.00 | 1,313.00 | 0.93 | 5.42 | 1,000.00 | 1,020.52 | 0.93 | 4.74 | ||||||||||||||||||||||||
JNL/Goldman Sachs Core Plus Bond Fund |
| |||||||||||||||||||||||||||||||
Class A | 1,000.00 | 1,017.90 | 0.88 | 4.48 | 1,000.00 | 1,020.77 | 0.88 | 4.48 | ||||||||||||||||||||||||
Class B | 1,000.00 | 1,018.90 | 0.68 | 3.46 | 1,000.00 | 1,021.78 | 0.68 | 3.47 | ||||||||||||||||||||||||
JNL/Goldman Sachs Emerging Markets Debt Fund |
| |||||||||||||||||||||||||||||||
Class A | 1,000.00 | 1,118.40 | 1.09 | 5.82 | 1,000.00 | 1,019.71 | 1.09 | 5.55 | ||||||||||||||||||||||||
Class B | 1,000.00 | 1,119.00 | 0.89 | 4.75 | 1,000.00 | 1,020.72 | 0.89 | 4.53 | ||||||||||||||||||||||||
JNL/Goldman Sachs Mid Cap Value Fund |
| |||||||||||||||||||||||||||||||
Class A | 1,000.00 | 1,284.50 | 1.02 | 5.87 | 1,000.00 | 1,020.06 | 1.02 | 5.19 | ||||||||||||||||||||||||
Class B | 1,000.00 | 1,285.30 | 0.82 | 4.72 | 1,000.00 | 1,021.07 | 0.82 | 4.18 | ||||||||||||||||||||||||
JNL/Goldman Sachs U.S. Equity Flex Fund |
| |||||||||||||||||||||||||||||||
Class A | 1,000.00 | 1,202.80 | 2.13 | 11.83 | 1,000.00 | 1,014.47 | 2.13 | 10.82 | ||||||||||||||||||||||||
Class B | 1,000.00 | 1,202.80 | 1.95 | 10.83 | 1,000.00 | 1,015.38 | 1.95 | 9.91 | ||||||||||||||||||||||||
JNL/Invesco Global Real Estate Fund |
| - | ||||||||||||||||||||||||||||||
Class A | 1,000.00 | 1,245.90 | 1.06 | 6.00 | 1,000.00 | 1,019.86 | 1.06 | 5.40 | ||||||||||||||||||||||||
Class B | 1,000.00 | 1,247.80 | 0.86 | 4.87 | 1,000.00 | 1,020.87 | 0.86 | 4.38 | ||||||||||||||||||||||||
JNL Series Trust
Additional Disclosures (Unaudited)
December 31, 2010
Disclosure of Fund Expenses
| Expenses Using Actual Fund Return | Expenses Using Hypothetical 5% Return | |||||||||||||||||||||||||||||||
| Beginning Account Value 7/1/2010 | Ending Account Value 12/31/2010 | Annualized Expense Ratios | Expenses Paid During Period | Beginning Account Value 7/1/2010 | Ending Account Value 12/31/2010 | Annualized Expense Ratios | Expenses Paid During Period | |||||||||||||||||||||||||
JNL/Invesco International Growth Fund | ||||||||||||||||||||||||||||||||
Class A | $ | 1,000.00 | $ | 1,227.70 | 1.02 | % | $ | 5.73 | $ | 1,000.00 | $ | 1,020.06 | 1.02 | % | $ | 5.19 | ||||||||||||||||
Class B | 1,000.00 | 1,229.30 | 0.82 | 4.61 | 1,000.00 | 1,021.07 | 0.82 | 4.18 | ||||||||||||||||||||||||
JNL/Invesco Large Cap Growth Fund | ||||||||||||||||||||||||||||||||
Class A | 1,000.00 | 1,244.70 | 0.96 | 5.43 | 1,000.00 | 1,020.37 | 0.96 | 4.89 | ||||||||||||||||||||||||
Class B | 1,000.00 | 1,246.00 | 0.76 | 4.30 | 1,000.00 | 1,021.37 | 0.76 | 3.87 | ||||||||||||||||||||||||
JNL/Invesco Small Cap Growth Fund | ||||||||||||||||||||||||||||||||
Class A | 1,000.00 | 1,286.30 | 1.15 | 6.63 | 1,000.00 | 1,019.41 | 1.15 | 5.85 | ||||||||||||||||||||||||
Class B | 1,000.00 | 1,287.70 | 0.95 | 5.48 | 1,000.00 | 1,020.42 | 0.95 | 4.84 | ||||||||||||||||||||||||
JNL/Ivy Asset Strategy Fund | ||||||||||||||||||||||||||||||||
Class A | 1,000.00 | 1,180.90 | 1.23 | 6.76 | 1,000.00 | 1,019.00 | 1.23 | 6.26 | ||||||||||||||||||||||||
Class B | 1,000.00 | 1,181.80 | 1.03 | 5.66 | 1,000.00 | 1,020.01 | 1.03 | 5.24 | ||||||||||||||||||||||||
JNL/JPMorgan International Value Fund | ||||||||||||||||||||||||||||||||
Class A | 1,000.00 | 1,283.50 | 1.02 | 5.87 | 1,000.00 | 1,020.06 | 1.02 | 5.19 | ||||||||||||||||||||||||
Class B | 1,000.00 | 1,286.20 | 0.82 | 4.73 | 1,000.00 | 1,021.07 | 0.82 | 4.18 | ||||||||||||||||||||||||
JNL/JPMorgan MidCap Growth Fund | ||||||||||||||||||||||||||||||||
Class A | 1,000.00 | 1,313.60 | 1.01 | 5.89 | 1,000.00 | 1,020.11 | 1.01 | 5.14 | ||||||||||||||||||||||||
Class B | 1,000.00 | 1,314.80 | 0.81 | 4.73 | 1,000.00 | 1,021.12 | 0.81 | 4.13 | ||||||||||||||||||||||||
JNL/JPMorgan U.S. Government and Quality Bond Fund |
| |||||||||||||||||||||||||||||||
Class A | 1,000.00 | 1,003.00 | 0.70 | 3.53 | 1,000.00 | 1,021.68 | 0.70 | 3.57 | ||||||||||||||||||||||||
Class B | 1,000.00 | 1,003.60 | 0.50 | 2.53 | 1,000.00 | 1,022.68 | 0.50 | 2.55 | ||||||||||||||||||||||||
JNL/Lazard Emerging Markets Fund | ||||||||||||||||||||||||||||||||
Class A | 1,000.00 | 1,262.20 | 1.22 | 6.96 | 1,000.00 | 1,019.06 | 1.22 | 6.21 | ||||||||||||||||||||||||
Class B | 1,000.00 | 1,264.20 | 1.02 | 5.82 | 1,000.00 | 1,020.06 | 1.02 | 5.19 | ||||||||||||||||||||||||
JNL/Lazard Mid Cap Equity Fund | ||||||||||||||||||||||||||||||||
Class A | 1,000.00 | 1,260.00 | 1.02 | 5.81 | 1,000.00 | 1,020.06 | 1.02 | 5.19 | ||||||||||||||||||||||||
Class B | 1,000.00 | 1,260.20 | 0.82 | 4.67 | 1,000.00 | 1,021.07 | 0.82 | 4.18 | ||||||||||||||||||||||||
JNL/M&G Global Basics Fund | ||||||||||||||||||||||||||||||||
Class A | 1,000.00 | 1,355.60 | 1.23 | 7.30 | 1,000.00 | 1,019.00 | 1.23 | 6.26 | ||||||||||||||||||||||||
Class B | 1,000.00 | 1,356.10 | 1.03 | 6.12 | 1,000.00 | 1,020.01 | 1.03 | 5.24 | ||||||||||||||||||||||||
JNL/M&G Global Leaders Fund | ||||||||||||||||||||||||||||||||
Class A | 1,000.00 | 1,284.40 | 1.26 | 7.26 | 1,000.00 | 1,018.85 | 1.26 | 6.41 | ||||||||||||||||||||||||
Class B | �� | 1,000.00 | 1,285.50 | 1.06 | 6.11 | 1,000.00 | 1,019.86 | 1.06 | 5.40 | |||||||||||||||||||||||
JNL/Mellon Capital Management 10 x 10 Fund |
| |||||||||||||||||||||||||||||||
Class A | 1,000.00 | 1,220.30 | 0.05 | 0.28 | 1,000.00 | 1,024.95 | 0.05 | 0.26 | ||||||||||||||||||||||||
JNL/Mellon Capital Management Index 5 Fund |
| |||||||||||||||||||||||||||||||
Class A | 1,000.00 | 1,206.70 | 0.05 | 0.28 | 1,000.00 | 1,024.95 | 0.05 | 0.26 | ||||||||||||||||||||||||
JNL/Mellon Capital Management European 30 Fund |
| |||||||||||||||||||||||||||||||
Class A | 1,000.00 | 1,203.50 | 0.77 | 4.28 | 1,000.00 | 1,021.32 | 0.77 | 3.92 | ||||||||||||||||||||||||
Class B | 1,000.00 | 1,204.10 | 0.57 | 3.17 | 1,000.00 | 1,022.33 | 0.57 | 2.91 | ||||||||||||||||||||||||
JNL/Mellon Capital Management Pacific Rim 30 Fund |
| |||||||||||||||||||||||||||||||
Class A | 1,000.00 | 1,146.20 | 0.77 | 4.17 | 1,000.00 | 1,021.32 | 0.77 | 3.92 | ||||||||||||||||||||||||
Class B | 1,000.00 | 1,146.70 | 0.57 | 3.08 | 1,000.00 | 1,022.33 | 0.57 | 2.91 | ||||||||||||||||||||||||
JNL/Mellon Capital Management S&P 500 Index Fund |
| |||||||||||||||||||||||||||||||
Class A | 1,000.00 | 1,229.60 | 0.57 | 3.20 | 1,000.00 | 1,022.33 | 0.57 | 2.91 | ||||||||||||||||||||||||
Class B | 1,000.00 | 1,229.40 | 0.37 | 2.08 | 1,000.00 | 1,023.34 | 0.37 | 1.89 | ||||||||||||||||||||||||
JNL Series Trust
Additional Disclosures (Unaudited)
December 31, 2010
Disclosure of Fund Expenses
| Expenses Using Actual Fund Return | Expenses Using Hypothetical 5% Return | |||||||||||||||||||||||||||||||
| Beginning Account Value 7/1/2010 | Ending Account Value 12/31/2010 | Annualized Expense Ratios | Expenses Paid During Period | Beginning Account Value 7/1/2010 | Ending Account Value 12/31/2010 | Annualized Expense Ratios | Expenses Paid During Period | |||||||||||||||||||||||||
JNL/Mellon Capital Management S&P 400 MidCap Index Fund |
| |||||||||||||||||||||||||||||||
Class A | $ | 1,000.00 | $ | 1,280.10 | 0.60 | % | $ | 3.45 | $ | 1,000.00 | $ | 1,022.18 | 0.60 | % | $ | 3.06 | ||||||||||||||||
Class B | 1,000.00 | 1,282.40 | 0.40 | 2.30 | 1,000.00 | 1,023.19 | 0.40 | 2.04 | ||||||||||||||||||||||||
JNL/Mellon Capital Management Small Cap Index Fund |
| |||||||||||||||||||||||||||||||
Class A | 1,000.00 | 1,291.50 | 0.60 | 3.47 | 1,000.00 | 1,022.18 | 0.60 | 3.06 | ||||||||||||||||||||||||
Class B | 1,000.00 | 1,292.60 | 0.40 | 2.31 | 1,000.00 | 1,023.19 | 0.40 | 2.04 | ||||||||||||||||||||||||
JNL/Mellon Capital Management International Index Fund |
| |||||||||||||||||||||||||||||||
Class A | 1,000.00 | 1,246.10 | 0.66 | 3.74 | 1,000.00 | 1,021.88 | 0.66 | 3.36 | ||||||||||||||||||||||||
Class B | 1,000.00 | 1,248.30 | 0.46 | 2.61 | 1,000.00 | 1,022.89 | 0.46 | 2.35 | ||||||||||||||||||||||||
JNL/Mellon Capital Management Bond Index Fund | ||||||||||||||||||||||||||||||||
Class A | 1,000.00 | 1,007.40 | 0.57 | 2.88 | 1,000.00 | 1,022.33 | 0.57 | 2.91 | ||||||||||||||||||||||||
Class B | 1,000.00 | 1,009.60 | 0.37 | 1.87 | 1,000.00 | 1,023.34 | 0.37 | 1.89 | ||||||||||||||||||||||||
JNL/Mellon Capital Management Global Alpha Fund |
| |||||||||||||||||||||||||||||||
Class A | 1,000.00 | 1,047.20 | 1.35 | 6.97 | 1,000.00 | 1,018.40 | 1.35 | 6.87 | ||||||||||||||||||||||||
Class B | 1,000.00 | 1,048.20 | 1.15 | 5.94 | 1,000.00 | 1,019.41 | 1.15 | 5.85 | ||||||||||||||||||||||||
JNL/Oppenheimer Global Growth Fund | ||||||||||||||||||||||||||||||||
Class A | 1,000.00 | 1,249.50 | 1.05 | 5.95 | 1,000.00 | 1,019.91 | 1.05 | 5.35 | ||||||||||||||||||||||||
Class B | 1,000.00 | 1,251.70 | 0.85 | 4.82 | 1,000.00 | 1,020.92 | 0.85 | 4.33 | ||||||||||||||||||||||||
JNL/PAM Asia ex-Japan Fund | ||||||||||||||||||||||||||||||||
Class A | 1,000.00 | 1,287.30 | 1.30 | 7.49 | 1,000.00 | 1,018.65 | 1.30 | 6.61 | ||||||||||||||||||||||||
Class B | 1,000.00 | 1,287.50 | 1.10 | 6.34 | 1,000.00 | 1,019.66 | 1.10 | 5.60 | ||||||||||||||||||||||||
JNL/PAM China-India Fund | ||||||||||||||||||||||||||||||||
Class A | 1,000.00 | 1,186.20 | 1.33 | 7.33 | 1,000.00 | 1,018.50 | 1.33 | 6.77 | ||||||||||||||||||||||||
Class B | 1,000.00 | 1,186.50 | 1.13 | 6.23 | 1,000.00 | 1,019.51 | 1.13 | 5.75 | ||||||||||||||||||||||||
JNL/PIMCO Real Return Fund | ||||||||||||||||||||||||||||||||
Class A | 1,000.00 | 1,023.30 | 0.78 | 3.98 | 1,000.00 | 1,021.27 | 0.78 | 3.97 | ||||||||||||||||||||||||
Class B | 1,000.00 | 1,025.00 | 0.60 | 3.06 | 1,000.00 | 1,022.18 | 0.60 | 3.06 | ||||||||||||||||||||||||
JNL/PIMCO Total Return Bond Fund | ||||||||||||||||||||||||||||||||
Class A | 1,000.00 | 1,018.10 | 0.81 | 4.12 | 1,000.00 | 1,021.12 | 0.81 | 4.13 | ||||||||||||||||||||||||
Class B | 1,000.00 | 1,019.40 | 0.61 | 3.10 | 1,000.00 | 1,022.13 | 0.61 | 3.11 | ||||||||||||||||||||||||
JNL/PPM America High Yield Bond Fund |
| |||||||||||||||||||||||||||||||
Class A | 1,000.00 | 1,111.10 | 0.75 | 3.99 | 1,000.00 | 1,021.42 | 0.75 | 3.82 | ||||||||||||||||||||||||
Class B | 1,000.00 | 1,111.40 | 0.55 | 2.93 | 1,000.00 | 1,022.43 | 0.55 | 2.80 | ||||||||||||||||||||||||
JNL/PPM America Mid Cap Value Fund | ||||||||||||||||||||||||||||||||
Class A | 1,000.00 | 1,344.70 | 1.06 | 6.26 | 1,000.00 | 1,019.86 | 1.06 | 5.40 | ||||||||||||||||||||||||
Class B | 1,000.00 | 1,345.90 | 0.86 | 5.09 | 1,000.00 | 1,020.87 | 0.86 | 4.38 | ||||||||||||||||||||||||
JNL/PPM America Small Cap Value Fund | ||||||||||||||||||||||||||||||||
Class A | 1,000.00 | 1,303.60 | 1.05 | 6.10 | 1,000.00 | 1,019.91 | 1.05 | 5.35 | ||||||||||||||||||||||||
Class B | 1,000.00 | 1,305.60 | 0.85 | 4.94 | 1,000.00 | 1,020.92 | 0.85 | 4.33 | ||||||||||||||||||||||||
JNL/PPM America Value Equity Fund | ||||||||||||||||||||||||||||||||
Class A | 1,000.00 | 1,253.70 | 0.85 | 4.83 | 1,000.00 | 1,020.92 | 0.85 | 4.33 | ||||||||||||||||||||||||
Class B | 1,000.00 | 1,254.30 | 0.65 | 3.69 | 1,000.00 | 1,021.93 | 0.65 | 3.31 | ||||||||||||||||||||||||
JNL/Red Rocks Listed Private Equity Fund | ||||||||||||||||||||||||||||||||
Class A | 1,000.00 | 1,343.50 | 1.17 | 6.91 | 1,000.00 | 1,019.31 | 1.17 | 5.96 | ||||||||||||||||||||||||
Class B | 1,000.00 | 1,343.90 | 0.97 | 5.73 | 1,000.00 | 1,020.32 | 0.97 | 4.94 | ||||||||||||||||||||||||
JNL/S&P Managed Conservative Fund | ||||||||||||||||||||||||||||||||
Class A | 1,000.00 | 1,068.40 | 0.16 | 0.83 | 1,000.00 | 1,024.40 | 0.16 | 0.82 | ||||||||||||||||||||||||
JNL Series Trust
Additional Disclosures (Unaudited)
December 31, 2010
Disclosure of Fund Expenses
| Expenses Using Actual Fund Return | Expenses Using Hypothetical 5% Return | |||||||||||||||||||||||||||||||
| Beginning Account Value 7/1/2010 | Ending Account Value 12/31/2010 | Annualized Expense Ratios | Expenses Paid During Period | Beginning Account Value 7/1/2010 | Ending Account Value 12/31/2010 | Annualized Expense Ratios | Expenses Paid During Period | |||||||||||||||||||||||||
JNL/S&P Managed Moderate Fund | ||||||||||||||||||||||||||||||||
Class A | $ | 1,000.00 | $ | 1,116.20 | 0.15 | % | $ | 0.80 | $ | 1,000.00 | $ | 1,024.45 | 0.15 | % | $ | 0.77 | ||||||||||||||||
JNL/S&P Managed Moderate Growth Fund |
| |||||||||||||||||||||||||||||||
Class A | 1,000.00 | 1,162.70 | 0.14 | 0.76 | 1,000.00 | 1,024.50 | 0.14 | 0.71 | ||||||||||||||||||||||||
JNL/S&P Managed Growth Fund | ||||||||||||||||||||||||||||||||
Class A | 1,000.00 | 1,220.30 | 0.15 | 0.84 | 1,000.00 | 1,024.45 | 0.15 | 0.77 | ||||||||||||||||||||||||
JNL/S&P Managed Aggressive Growth Fund |
| |||||||||||||||||||||||||||||||
Class A | 1,000.00 | 1,243.40 | 0.17 | 0.96 | 1,000.00 | 1,024.35 | 0.17 | 0.87 | ||||||||||||||||||||||||
JNL/S&P Disciplined Moderate Fund | ||||||||||||||||||||||||||||||||
Class A | 1,000.00 | 1,156.30 | 0.18 | 0.98 | 1,000.00 | 1,024.30 | 0.18 | 0.92 | ||||||||||||||||||||||||
JNL/S&P Disciplined Moderate Growth Fund |
| |||||||||||||||||||||||||||||||
Class A | 1,000.00 | 1,204.20 | 0.18 | 1.00 | 1,000.00 | 1,024.30 | 0.18 | 0.92 | ||||||||||||||||||||||||
JNL/S&P Disciplined Growth Fund | ||||||||||||||||||||||||||||||||
Class A | 1,000.00 | 1,218.30 | 0.18 | 1.01 | 1,000.00 | 1,024.30 | 0.18 | 0.92 | ||||||||||||||||||||||||
JNL/S&P Competitive Advantage Fund | ||||||||||||||||||||||||||||||||
Class A | 1,000.00 | 1,214.10 | 0.71 | 3.96 | 1,000.00 | 1,021.63 | 0.71 | 3.62 | ||||||||||||||||||||||||
Class B | 1,000.00 | 1,215.60 | 0.51 | 2.85 | 1,000.00 | 1,022.63 | 0.51 | 2.60 | ||||||||||||||||||||||||
JNL/S&P Dividend Income & Growth Fund |
| |||||||||||||||||||||||||||||||
Class A | 1,000.00 | 1,193.40 | 0.70 | 3.87 | 1,000.00 | 1,021.68 | 0.70 | 3.57 | ||||||||||||||||||||||||
Class B | 1,000.00 | 1,196.10 | 0.50 | 2.77 | 1,000.00 | 1,022.68 | 0.50 | 2.55 | ||||||||||||||||||||||||
JNL/S&P Intrinsic Value Fund | ||||||||||||||||||||||||||||||||
Class A | 1,000.00 | 1,185.20 | 0.71 | 3.91 | 1,000.00 | 1,021.63 | 0.71 | 3.62 | ||||||||||||||||||||||||
Class B | 1,000.00 | 1,186.10 | 0.50 | 2.76 | 1,000.00 | 1,022.68 | 0.50 | 2.55 | ||||||||||||||||||||||||
JNL/S&P Total Yield Fund | ||||||||||||||||||||||||||||||||
Class A | 1,000.00 | 1,177.10 | 0.71 | 3.90 | 1,000.00 | 1,021.63 | 0.71 | 3.62 | ||||||||||||||||||||||||
Class B | 1,000.00 | 1,178.00 | 0.51 | 2.80 | 1,000.00 | 1,022.63 | 0.51 | 2.60 | ||||||||||||||||||||||||
JNL/S&P 4 Fund | ||||||||||||||||||||||||||||||||
Class A | 1,000.00 | 1,192.90 | 0.05 | 0.28 | 1,000.00 | 1,024.95 | 0.05 | 0.26 | ||||||||||||||||||||||||
JNL/Select Balanced Fund | ||||||||||||||||||||||||||||||||
Class A | 1,000.00 | 1,142.50 | 0.75 | 4.05 | 1,000.00 | 1,021.42 | 0.75 | 3.82 | ||||||||||||||||||||||||
Class B | 1,000.00 | 1,144.30 | 0.55 | 2.97 | 1,000.00 | 1,022.43 | 0.55 | 2.80 | ||||||||||||||||||||||||
JNL/Select Money Market Fund | ||||||||||||||||||||||||||||||||
Class A | 1,000.00 | 1,000.00 | 0.28 | 1.41 | 1,000.00 | 1,023.79 | 0.28 | 1.43 | ||||||||||||||||||||||||
Class B | 1,000.00 | 1,000.00 | 0.28 | 1.41 | 1,000.00 | 1,023.79 | 0.28 | 1.43 | ||||||||||||||||||||||||
JNL/Select Value Fund | ||||||||||||||||||||||||||||||||
Class A | 1,000.00 | 1,228.70 | 0.79 | 4.44 | 1,000.00 | 1,021.22 | 0.79 | 4.02 | ||||||||||||||||||||||||
Class B | 1,000.00 | 1,229.60 | 0.59 | 3.32 | 1,000.00 | 1,022.23 | 0.59 | 3.01 | ||||||||||||||||||||||||
JNL/T. Rowe Price Established Growth Fund |
| |||||||||||||||||||||||||||||||
Class A | 1,000.00 | 1,268.80 | 0.87 | 4.98 | 1,000.00 | 1,020.82 | 0.87 | 4.43 | ||||||||||||||||||||||||
Class B | 1,000.00 | 1,270.50 | 0.67 | 3.83 | 1,000.00 | 1,021.83 | 0.67 | 3.41 | ||||||||||||||||||||||||
JNL/T. Rowe Price Mid-Cap Growth Fund |
| |||||||||||||||||||||||||||||||
Class A | 1,000.00 | 1,285.10 | 1.01 | 5.82 | 1,000.00 | 1,020.11 | 1.01 | 5.14 | ||||||||||||||||||||||||
Class B | 1,000.00 | 1,286.40 | 0.81 | 4.67 | 1,000.00 | 1,021.12 | 0.81 | 4.13 | ||||||||||||||||||||||||
JNL/T. Rowe Price Short-Term Bond Fund |
| |||||||||||||||||||||||||||||||
Class A | 1,000.00 | 1,009.60 | 0.72 | 3.65 | 1,000.00 | 1,021.58 | 0.72 | 3.67 | ||||||||||||||||||||||||
Class B | 1,000.00 | 1,010.50 | 0.52 | 2.64 | 1,000.00 | 1,022.58 | 0.52 | 2.65 | ||||||||||||||||||||||||
JNL Series Trust
Additional Disclosures (Unaudited)
December 31, 2010
Disclosure of Fund Expenses
| Expenses Using Actual Fund Return | Expenses Using Hypothetical 5% Return | |||||||||||||||||||||||||||||||
| Beginning Account Value 7/1/2010 | Ending Account Value 12/31/2010 | Annualized Expense Ratios | Expenses Paid During Period | Beginning Account Value 7/1/2010 | Ending Account Value 12/31/2010 | Annualized Expense Ratios | Expenses Paid During Period | |||||||||||||||||||||||||
JNL/T. Rowe Price Value Fund | ||||||||||||||||||||||||||||||||
Class A | $ | 1,000.00 | $ | 1,234.80 | 0.94 | % | $ | 5.29 | $ | 1,000.00 | $ | 1,020.47 | 0.94 | % | $ | 4.79 | ||||||||||||||||
Class B | 1,000.00 | 1,234.40 | 0.74 | 4.17 | 1,000.00 | 1,021.48 | 0.74 | 3.77 | ||||||||||||||||||||||||
Expenses paid during the period are equal to the annualized expense ratio, multiplied by the average account value over the period, multiplied by the number of days in the period, then divided by the number of days in the most recent 12-month period (to reflect the most recent 6-month period).
For Funds with less than 6- month’s operating history, the amounts reported under Expenses Using Hypothetical 5% Return are not comparable to the amounts reported in Expenses Using Actual Fund Return.
| * | Fund has less than 6-month’s operating history. |
Quarterly Portfolio Holdings
The Funds file a complete schedule of portfolio holdings with the U.S. Securities and Exchange Commission (“SEC”) for the first and third quarters of each fiscal year on Form N-Q. The Funds’ Forms N-Q are available on the SEC’s website at www.sec.gov. The Forms N-Q may be reviewed and copied at the SEC’s Public Reference Room in Washington, DC, and information on the operation of the Public Reference Room may be obtained by calling 800-SEC-0330. It is also available upon request from the registrant by calling the Fund toll-free at 1-866-255-1935.
Proxy Voting Guidelines
The Board has adopted the proxy voting policy and procedures (“Policy”) of the Funds' Adviser, pursuant to which the Board has delegated proxy voting responsibility to the Adviser, and pursuant to which the Adviser has delegated proxy voting responsibility to each of the Sub-Advisers, except Standard & Poor’s Investment Advisory Services LLC (“SPIAS”), which does not have a proxy voting policy, nor does SPIAS vote proxies. The Trust has adopted each of the Sub-Adviser’s proxy voting policies and procedures (“Procedures”).
The Policy is designed to promote accountability of the company’s management to its shareholders and to align the interests of management with those shareholders. The Sub-Advisers generally review each matter on a case-by-case basis in order to make a determination of how to vote in a manner that best serves the interests of Fund shareholders. The Sub-Advisers may abstain from voting from time to time where it determines that the costs associated with voting a proxy outweigh the benefits derived from exercising the right to vote. In addition, the Sub-Advisers will monitor situations that may result in a conflict of interest in accordance with their Procedures. A description of the policies and procedures used by the Funds to vote proxies relating to the portfolio securities and information on how the Funds voted proxies relating to portfolio securities during the 12 month period ended June 30, 2010 are available (1) without charge, upon request by calling 1-800-873-5654 (Annuity Service Center), 1-800-599-5651 (NY Annuity Service Center) or 1-800-777-7799 (for contracts purchased through a bank or financial institution) or 1-888-464-7779 (for NY contracts purchased through a bank or financial institution), (2) by writing JNL Series Trust, P.O. Box 30314, Lansing, Michigan 48909-7814 (3) on Jackson National Life Insurance Company’s or Jackson National Life Insurance Company of New York’s website at www.jackson.com, and (4) on the Securities and Exchange Commission’s website at www.sec.gov.
TRUSTEESAND OFFICERSOF JNL SERIES TRUST (“TRUST”)
| NAME, ADDRESSAND (AGE) | POSITION(S) HELD WITHTHE TRUST (LENGTH OF TIME SERVED) | NUMBER OF PORTFOLIOS IN FUND COMPLEX TOBE OVERSEENBY TRUSTEEOR OFFICER | ||
Interested Trustee | ||||
Mark D. Nerud (44) 1 1 Corporate Way Lansing, MI 48951 | Trustee 2 (1/2007 to present)
President and Chief Executive Officer (12/2006 to present) | 102 | ||
PRINCIPAL OCCUPATION(S) DURING PAST 5 YEARS: Chief Executive Officer of the Adviser (1/2010 to present); President of the Adviser (1/2007 to present); Chief Financial Officer of the Adviser (11/2000 to 1/2007) and Managing Board Member of the Adviser (11/2000 to 11/2003) (1/2007 to 12/2010); President and CEO of other Investment Companies advised by the Adviser (12/2006 to present); Vice President (8/1997 to 12/2006), Treasurer, Chief Financial Officer of other Investment Companies advised by the Adviser (12/2002 to 12/2006); Vice President – Fund Accounting & Administration of Jackson National Life Insurance Company (1/2000 to 12/2009) | ||||
| OTHER DIRECTORSHIPS HELDBY TRUSTEE DURING PAST 5 YEARS: None | ||||
Disinterested Trustees | ||||
Michael Bouchard (54) 1 Corporate Way Lansing, MI 48951 | Trustee 2 (12/2003 to present) | 102 | ||
PRINCIPAL OCCUPATION(S) DURING PAST 5 YEARS: Sheriff, Oakland County, Michigan (1/1999 to present) | ||||
| OTHER DIRECTORSHIPS HELDBY TRUSTEE DURING PAST 5 YEARS: None | ||||
William J. Crowley, Jr. (65) 1 Corporate Way Lansing, MI 48951 | Trustee 2 (1/2007 to present) | 102 | ||
PRINCIPAL OCCUPATION(S) DURING PAST 5 YEARS: Managing Partner (Baltimore Office) – Arthur Andersen LLP (1995 to 2002); Board Member of various corporate boards (2002 to present)
OTHER DIRECTORSHIPS HELDBY TRUSTEE DURING PAST 5 YEARS: Director of Alpha Natural Resources; Director of Foundation Coal Holdings, Inc. (from 12/2004 until 7/2009 when the company was acquired); Director of Bio Veris Corporation (from 5/2003 until 6/2007 when the company was acquired); Director of Provident Bankshares Corporation (from 5/2003 until 5/2009 when the company was acquired) | ||||
Dominic D’Annunzio (72) 1 Corporate Way Lansing, MI 48951 | Chairman of the Board (2/2004 to present)
Trustee 2 (2/2002 to present) | 102 | ||
PRINCIPAL OCCUPATION(S) DURING PAST 5 YEARS: Acting Commissioner of Insurance for the State of Michigan (1/1990 to 5/1990) and (8/1997 to 5/1998) | ||||
| OTHER DIRECTORSHIPS HELDBY TRUSTEE DURING PAST 5 YEARS: None | ||||
Michelle Engler (52) 1 Corporate Way Lansing, MI 48951 | Chairman of the Board 3 (1/2011 to present)
Trustee 2 (12/2003 to present) | 102 | ||
PRINCIPAL OCCUPATION(S) DURING PAST 5 YEARS: Attorney (1983 to present); First Lady of the State of Michigan (1990 to 2002) | ||||
OTHER DIRECTORSHIPS HELDBY TRUSTEE DURING PAST 5 YEARS: Director of Federal Home Loan Mortgage Corporation (2001 to 9/2008) | ||||
| 1 | Mr. Nerud is an “interested person” of the Trust due to his position with Jackson National Asset Management, LLC, the Adviser. |
| 2 | The interested and disinterested Trustees are elected to serve for an indefinite term. |
| 3 | Beginning January 1, 2011, the Chairman shall serve as Chairman for no more than three consecutive years and may not be re-elected as Chairman until at least one year has elapsed since the end of the Chairman’s term. Chairman Engler’s term will lapse at the end of 2013. |
| NAME, ADDRESSAND (AGE) | POSITION(S) HELD WITHTHE TRUST (LENGTH OF TIME SERVED) | NUMBER OF PORTFOLIOS IN FUND COMPLEX TO BE OVERSEENBY TRUSTEEOR OFFICER | ||
Disinterested Trustees | ||||
James Henry, Ph.D. (72) 1 Corporate Way Lansing, MI 48951 | Trustee 2 (1/2007 to present) | 102 | ||
PRINCIPAL OCCUPATION(S) DURING PAST 5 YEARS: Dean Emeritus and Professor of Finance, Eli Broad College of Business and Graduate School of Management at Michigan State University (2001 to July 2009) | ||||
OTHER DIRECTORSHIPS HELDBY TRUSTEE DURING PAST 5 YEARS: None | ||||
Richard McLellan (68) 1 Corporate Way Lansing, MI 48951 | Trustee 2 (12/1994 to present) | 102 | ||
PRINCIPAL OCCUPATION(S) DURING PAST 5 YEARS: Attorney (2010 to present); Senior Counsel, Dykema Gossett PLLC (2007 to 2009); Member, Dykema Gossett PLLC (Law Firm) (1973 to 2007); Senior Counsel, Dykema Gossett PLLC (2007 to present); Adjunct Associate Professor, Michigan State University (2008 to present) | ||||
OTHER DIRECTORSHIPS HELDBY TRUSTEE DURING PAST 5 YEARS: Member of the Board of Directors of ITC Holdings Corp. (11/2007 to present) | ||||
William R. Rybak (59) 1 Corporate Way Lansing, MI 48951 | Trustee 2 (1/2007 to present) | 102 | ||
PRINCIPAL OCCUPATION(S) DURING PAST 5 YEARS: Board Member of various corporate boards (see below) (2002 to present) | ||||
OTHER DIRECTORSHIPS HELDBY TRUSTEE DURING PAST 5 YEARS: Member of the Board of Directors of Christian Brothers Investments, Inc. (2010 to present); Chairman of the Board of Trustees of Lewis University (1982 – 2009) and Chair Emeritus (2009 to present); Member of the Board of Directors of Howe Barnes Hoefer Arnett (2001 to present); Member of the Boards of each of the Calamos Mutual Funds (2002 to present) since 2002; Member of the Board of Directors of The PrivateBancorp (2003 to present); Chairman of the Board of Trustees of St. Coletta’s of Illinois (2004 to 2007) and Member of the Board (2000 to 2007) | ||||
Patricia A. Woodworth (55) 1 Corporate Way Lansing, MI 48951 | Trustee 2 (1/2007 to present) | 102 | ||
PRINCIPAL OCCUPATION(S) DURING PAST 5 YEARS: Vice President, Chief Financial Officer and Chief Operating Officer, The J. Paul Getty Trust (12/2007 to present); Executive Vice President for Finance and Administration, Chief Financial Officer, Art Institute of Chicago (2002 to 11/2007) | ||||
OTHER DIRECTORSHIPS HELDBY TRUSTEE DURING PAST 5 YEARS: None | ||||
Officers | ||||
Danielle A. Bergandine (30) 1 Corporate Way Lansing, MI 48951 | Anti-Money Laundering Officer (12/2007 to present) | Not Applicable | ||
PRINCIPAL OCCUPATION(S) DURING PAST 5 YEARS: Senior Compliance Analyst of the Adviser (6/2009 to present); Compliance Analyst of the Adviser (08/2006 to 6/2009); Administrative Assistant of the Adviser (12/2005 To 08/2006) | ||||
| OTHER DIRECTORSHIPS HELDBY TRUSTEE DURING PAST 5 YEARS: NOT APPLICABLE | ||||
Karen J. Buiter (45) 1 Corporate Way Lansing, MI 48951 | Assistant Treasurer (12/2008 to present) | Not Applicable | ||
PRINCIPAL OCCUPATION(S) DURING PAST 5 YEARS: Assistant Vice President – Financial Reporting of the Adviser (4/2008 to present); Assistant Treasurer of other Investment Companies advised by the Adviser (12/2008 to present); Treasurer of Henderson Global Funds (2/2004 to 3/2008) | ||||
| OTHER DIRECTORSHIPS HELDBY TRUSTEE DURING PAST 5 YEARS: Not Applicable | ||||
| NAME, ADDRESSAND (AGE) | POSITION(S) HELD WITHTHE TRUST (LENGTH OF TIME SERVED) | NUMBER OF PORTFOLIOS IN FUND COMPLEX TO BE OVERSEENBY TRUSTEEOR OFFICER | ||
Officers | ||||
Kelly L. Crosser (38) 1 Corporate Way Lansing, MI 48951 | Assistant Secretary (9/2007 to present) | Not Applicable | ||
PRINCIPAL OCCUPATION(S) DURING PAST 5 YEARS: Assistant Secretary of other Investment Companies advised by the Adviser (9/2007 to present); Senior Compliance Analyst of Jackson National Life Insurance Company (4/2007 to present); Mutual Fund Compliance Analyst of Jackson National Life Insurance Company (2/2006 to 4/2007): Senior Paralegal of Jackson National Life Insurance Company (6/2004 to 2/2006) | ||||
| OTHER DIRECTORSHIPS HELDBY TRUSTEE DURING PAST 5 YEARS: Not Applicable | ||||
Steven J. Fredricks (40) 1 Corporate Way Lansing, MI 48951 | Chief Compliance Officer (1/2005 to present) | Not Applicable | ||
PRINCIPAL OCCUPATION(S) DURING PAST 5 YEARS: Chief Compliance Officer of the Adviser and other Investment Companies advised by the Adviser (1/2005 to present) | ||||
| OTHER DIRECTORSHIPS HELDBY TRUSTEE DURING PAST 5 YEARS: Not Applicable | ||||
Daniel W. Koors (40) 1 Corporate Way Lansing, MI 48951 | Vice President, Treasurer and Chief Financial Officer (12/2006 to present) | Not Applicable | ||
PRINCIPAL OCCUPATION(S) DURING PAST 5 YEARS: Senior Vice President of the Adviser (1/2009 to present) and Chief Financial Officer of the Adviser (1/2007 to present); Vice President of the Adviser (1/2007 to 12/2008); Vice President, Treasurer and Chief Financial Officer of other Investment Companies advised by the Adviser (12/2006 to present); Assistant Treasurer of other Investment Companies advised by the Adviser (9/2006 to 12/2006); Assistant Vice President – Fund Administration of Jackson National Life Insurance Company (8/2006 to present) | ||||
| OTHER DIRECTORSHIPS HELDBY TRUSTEE DURING PAST 5 YEARS: Not Applicable | ||||
Michael Piszczek (53) 1 Corporate Way Lansing, MI 48951 | Vice President (11/2007 to present) | Not Applicable | ||
PRINCIPAL OCCUPATION(S) DURING PAST 5 YEARS: Vice President of other Investment Companies advised by the Adviser (11/2007 to present); Assistant Vice President – Tax of the Adviser (11/2007 to present); Assistant Vice President – Nuveen Investments (4/1999 to 8/2007); Assistant Vice President and Assistant Secretary – Nuveen Funds (4/1999 to 8/2007) | ||||
| OTHER DIRECTORSHIPS HELDBY TRUSTEE DURING PAST 5 YEARS: Not Applicable | ||||
Susan S. Rhee (39) 1 Corporate Way Lansing, MI 48951 | Vice President, Counsel and Secretary (2/2004 to present) | Not Applicable | ||
PRINCIPAL OCCUPATION(S) DURING PAST 5 YEARS: Senior Vice President and General Counsel of the Adviser (1/2010 to present); Chief Legal Officer (7/2004 to 12/2009) and Secretary (11/2000 to present) of the Adviser; Vice President, Counsel, and Secretary of other Investment Companies advised by the Adviser (2/2004 to present); Assistant Vice President of Jackson National Life Insurance Company (8/2003 to 12/2009); Associate General Counsel of Jackson National Life Insurance Company (7/2001 to 12/2009) | ||||
| OTHER DIRECTORSHIPS HELDBY TRUSTEE DURING PAST 5 YEARS: Not Applicable | ||||
The Statement of Additional Information includes additional information about Fund Trustees and may be obtained at no charge by calling 1-800-873-5654 (Annuity and Life Service Center), 1-800-599-5651 (NY Annuity and Life Service Center), 1-800-777-7779 (for contracts purchased through a bank or financial institution) or 1-888-464-7779 (for NY contracts purchased through a bank or financial institution), by writing JNL Series Trust, P.O. Box 30314, Lansing, Michigan 48951 or by visiting www.jackson.com.
TRUSTEESAND OFFICERSOF JNL SERIES TRUST (THE “TRUST”)
The interested Trustee and the Officers of the Trust (other than the Chief Compliance Officer, as described below) or the Adviser do not receive any compensation from the Trust for their services as Trustees or Officers. The following persons, who are disinterested Trustees of the Trust, and the Trust’s Chief Compliance Officer, received from the Trust the compensation amounts indicated for the services as such for the twelve-month period ended December 31, 2010:
| TRUSTEE | AGGREGATE COMPENSATION FROMTHE TRUST1 | PENSION OR RETIREMENT BENEFITS ACCRUED AS PARTOF TRUST EXPENSES | ESTIMATED ANNUAL BENEFITS UPON RETIREMENT | TOTAL COMPENSATION FROMTHE TRUSTAND FUND COMPLEX | ||||
Michael Bouchard | $102,346 | $0 | $0 | $129,0004 | ||||
William J. Crowley, Jr. | $102,346 | $0 | $0 | $129,0005 | ||||
Dominic D’Annunzio 3 | $126,148 | $0 | $0 | $159,0006 | ||||
Michelle Engler 9 | $102,346 | $0 | $0 | $129,000 | ||||
James Henry | $102,346 | $0 | $0 | $129,0007 | ||||
Richard McLellan | $114,247 | $0 | $0 | $144,000 | ||||
William R. Rybak | $102,346 | $0 | $0 | $129,000 | ||||
Patricia Woodworth | $114,247 | $0 | $0 | $144,0008 | ||||
Steven J. Fredricks 2 | $155,494 | $0 | $0 | $267,358 |
| 1 | The fees paid to the independent Trustees are paid for combined service on the Boards of the Trust, JNL Investors Series Trust and JNL Variable Fund LLC (the “Fund Complex”). The fees are allocated to the Funds and affiliated investment companies on a pro-rata basis based on net assets. The total fees to all the independent Trustees is $1,092,000. |
| 2 | Mr. Fredricks’ compensation is paid by the Funds for his duties as the Chief Compliance Officer of the Fund Complex. The expense is allocated to the Funds and affiliated investment companies on a pro-rata basis based on net assets. |
| 3 | Mr. D’Annunzio was an ex officio (non-voting) member of the Governance Committee during 2010. Therefore, he did not receive any compensation as a member of the Governance Committee. |
| 4 | Amount includes $6,450 deferred by Mr. Bouchard. |
| 5 | Amount includes $77,400 deferred by Mr. Crowley. |
| 6 | Amount includes $79,500 deferred by Mr. D’Annunzio. |
| 7 | Amount includes $90,300 deferred by Mr. Henry. |
| 8 | Amount includes $144,000 deferred by Ms. Woodworth. |
| 9 | Ms. Engler is an ex officio (non-voting) member of the Governance Committee beginning in 2011. Therefore, she will not receive any compensation as a member of the Governance Committee. |
JNL SERIES TRUST
(the “Trust”)
APPROVAL OF THE TRUST’S
INVESTMENT ADVISORY AND SUB-ADVISORY AGREEMENTS
The Board of Trustees of the Trust (“Board”) oversees the management of each Fund and, as required by law, determines annually whether to approve the Trust’s advisory agreement with Jackson National Asset Management, LLC (“JNAM”) and each Fund’s sub-advisory agreement(s).
At a meeting on September 9-10, 2010, the Board, including all of the Independent Trustees, considered information relating to the amendment to the Trust’s investment advisory and management agreement with JNAM (“Agreement”) and information relating to the approval of an amendment to the investment sub-advisory agreement between JNAM and PPM America, Inc. (“PPM”) to the Trust (together, “Agreements” refers to the Agreement and applicable Sub-Advisory Agreement). In advance of the meeting, independent legal counsel for the Independent Trustees requested that certain information be provided to the Board relating to the Agreements. The Board received, and had the opportunity to review, this and other materials, ask questions and request further information in connection with its consideration. At the conclusion of the Board’s discussion, the Board approved the Agreements through June 30, 2011.
At a meeting on November 22-23, 2010, the Board, including all of the Independent Trustees, considered information relating to the amendment to the Trust’s investment advisory and management agreement with JNAM (“Agreement”) and information relating to the approval of an amendment to the investment advisory agreement between JNAM and the Trust (together, “Agreements” refers to the Agreement and applicable Sub-Advisory Agreement). In advance of the meeting, independent legal counsel for the Independent Trustees requested that certain information be provided to the Board relating to the Agreements. The Board received, and had the opportunity to review, this and other materials, ask questions and request further information in connection with its consideration. At the conclusion of the Board’s discussion, the Board approved the Agreements through June 30, 2011.
In reviewing the Advisory Agreement and considering the information, the Board was advised by outside legal counsel to the Trust, and the Independent Trustees were advised by independent legal counsel. The Board considered the factors it deemed relevant: (1) the nature, quality and extent of the services to be provided, (2) the investment performance of each Fund, (3) its profitability, including an analysis of the cost of providing services and comparative expense information, (4) whether economies of scale may be realized as each Fund grows and whether the fee structure reflects the economies of scale for each Fund’s investors, and (5) other benefits that may accrue to JNAM through its relationship with the Trust. In its deliberations, the Board, in exercising its business judgment did not identify any single factor that alone was responsible for the Board’s decision to approve the Advisory Agreement.
Before approving the Agreements, the Independent Trustees met in executive session with their independent legal counsel to consider the materials provided by JNAM and the terms of the Agreements. Based on its evaluation of those materials, the Board, including the interested and Independent Trustees, concluded that the Agreements are in the best interests of the shareholders of the applicable Fund. In reaching its conclusions, the Board considered the following:
Nature, Quality and Extent of Services
The Board examined the nature, quality and extent of the services to be provided by JNAM and the Sub-Advisers.
For each Fund, the Board considered the services to be provided by JNAM, including but not limited to the oversight of the Sub-Advisers pursuant to the “Manager of Managers” exemption, as well as the provision of recordkeeping and compliance services to the Funds. The Board also took into account that JNAM would monitor the performance of the various organizations that would provide services to the Funds, including the Funds’ distributor, transfer agent, and custodian. With respect to JNAM’s oversight of the Sub-Advisers, the Board noted that JNAM would be responsible for screening and recommending new sub-advisers when appropriate, as well as monitoring and reporting to the Board on the performance and operations of the existing Sub-Advisers. The Board also considered the investment sub-advisory services to be provided by each Sub-Adviser. The Board noted JNAM’s evaluation of the Sub-Advisers, as well as JNAM’s recommendations, based on its review of the Sub-Advisers, to approve the Agreements.
The Board reviewed the qualifications, backgrounds and responsibilities of JNAM’s senior management that would be responsible for oversight of the Funds and the Sub-Adviser, and also reviewed the qualifications, backgrounds and responsibilities of the Sub-Advisers’ portfolio managers who would be responsible for the day-to-day management of each Fund. The Board reviewed information pertaining to JNAM’s and the Sub-Adviser’s organizational structure, senior management, financial stability, investment operations, and other relevant information pertaining to both JNAM and the Sub-Adviser. The Board considered compliance reports about JNAM and the Sub-Adviser from the Funds’ Chief Compliance Officer (“CCO”).
Based on the foregoing, the Board concluded that (i) the Fund is likely to benefit from the nature, extent and quality of the services to be provided by JNAM under the Agreement and (ii) the Fund is likely to benefit from the nature, extent and quality of the services to be provided by the Sub-Adviser under the Agreements.
Investment Performance of the Funds
The Board considered the performance of the Fund, including how the Fund performed versus the average performance of a group of comparable funds (“peer group”) selected by an independent data service and how the Fund performed versus its primary benchmark (“benchmark”) index. For certain Funds, the Board considered the relevant custom benchmark or relevant blended benchmark. This consideration was based on JNAM’s assertion that the custom or blended benchmark may, in many circumstances, be a more meaningful source of comparative information than a broad-based benchmark index for certain Funds that utilize a specific investment focus. A custom benchmark may not be available for certain periods presented, in which case the Fund was compared to its primary benchmark. The performance reviewed by the Board was for periods ended on December 31, 2009 (unless otherwise noted). When available, the Board considered one-, five-, ten-year, or since inception performance.
New Funds – JNL Series Trust:
JNL/PPM America Floating Rate Income Fund. The Board could not consider the Sub-Adviser’s performance as the Fund has not yet commenced operations. The Board, however, considered the performance of a similarly managed strategy, including how the similarly managed strategy performed versus its primary benchmark (“benchmark”) index. The performance reviewed by the Board was for the one-, three-, five-, and ten-year periods ended on June 30, 2010.
JNL Institutional Alt 100 Fund. The Board could not consider the Fund’s performance as the Fund has not yet commenced operations. The Board did consider the performance of the portfolio manager in managing other Funds.
Costs of Services
The Board reviewed the fees to be paid to JNAM and the Fund’s Sub-Adviser. The Board reviewed fee and expense information as compared to that of comparable funds managed by other advisers. Using information provided by an independent data service, the Board evaluated the Fund’s advisory fees compared to the average advisory fees for other funds similar in size, character and investment strategy (the “peer group”). While the Board also considered the Fund’s sub-advisory fee and compared that to the average sub-advisory fee of the peer group, the Board noted that the Fund’s sub-advisory fee would be paid by JNAM (not the Fund) and, therefore, would be neither a direct shareholder expense nor a direct influence on the Fund’s total expense ratio.
Further detail considered by the Board regarding the advisory and sub-advisory fees of the Fund is set forth below:
New Fund – JNL Series Trust:
JNL/PPM America Floating Rate Income Fund. The Board took into account that the Fund’s advisory fees and total expense ratio are higher than the respective peer group averages. The Board noted that the Fund’s sub-advisory fees are lower than the peer group average. Presently, Lipper does not have a specific classification for floating rate income funds in the variable annuity universe. Many of the Fund’s peers do not invest a significant portion of assets in senior loans. Therefore, it is reasonable that fees and expenses for the Fund are higher than the provided peer group averages and that expense ratios are often higher for floating rate income funds than those of other fixed income funds. The Board concluded that the advisory and sub-advisory fees are in the best interests of the Fund and its potential shareholders in light of the services provided.
JNL Institutional Alt 100 Fund. The Fund’s advisory fee is consistent with the peer group average, and the total expense ratio (excluding underlying Fund expenses) is lower than the Lipper peer group average. The total expense ratio (including underlying Fund expenses) is higher than the peer group average. The Board considered that the expense ratios of each underlying Fund are subject to review and approval by the Board. The Board concluded that approving the advisory fee, as a part of the management agreement, was in the best interests of the Fund and its potential shareholders in light of the services provided.
Economies of Scale
The Board considered whether the Fund’s proposed advisory fee reflects the potential for economies of scale for the benefit of Fund shareholders. Based on information provided by JNAM, the Board noted that the fee arrangement for the Fund contains breakpoints that decrease the fee rate as assets increase. The Board concluded that the advisory fees in some measure share economies of scale with shareholders.
Other Benefits to JNAM and the Sub-Advisers
In evaluating the benefits that may accrue to JNAM through its relationship with the Fund, the Board noted that JNAM and certain of its affiliates would serve the Fund in various capacities, including as adviser, administrator, transfer agent and distributor, and receive compensation from the Fund in connection with providing services to the Fund. The Board noted that each service to be provided to the Funds by JNAM or one of its affiliates would be pursuant to a written agreement, which the Board would evaluate periodically as required by law. Lastly, certain affiliates of JNAM may receive benefits under the federal income tax laws with respect to certain tax deductions and credits.
In evaluating the benefits that may accrue to the Sub-Adviser through its relationship with the Fund, the Board noted that the Sub-Adviser may receive indirect benefits in the form of soft dollar arrangements for portfolio securities trades placed with the Funds’ assets and may also develop additional investment advisory business with JNAM, the Fund or other clients of the sub-adviser as a result of its relationship with the Fund. PPM America, Inc. also serves as Sub-Adviser to the following funds of JNL Series Trust: JNL/PPM America High Yield Bond Fund, JNL/PPM America Mid Cap Value Fund, JNL/PPM America Small Cap Value Fund, JNL/PPM America Value Equity Fund, and of JNL Investors Series Trust, the JNL/PPM America Total Return Fund.
SUPPLEMENT DATED OCTOBER 27, 2010
TO THE SUMMARY PROSPECTUS DATED MAY 1, 2010
SUPPLEMENT DATED OCTOBER 27, 2010
TO THE PROSPECTUS DATED MAY 1, 2010
JNL® SERIES TRUST
Please note that the changes apply to your variable annuity and/or variable life product(s).
Effective September 27, 2010, in the summary prospectus for the JNL/Lazard Mid Cap Equity Fund, please delete the table entitled “Portfolio Managers” in its entirety and replace it with the following:
| Portfolio Managers: | ||||
| Name: | Joined Management Team In: | Title: | ||
Christopher Blake | 1998 | Managing Director | ||
Daniel Breslin | 2010 | Director | ||
Andrew Lacey | 1998 | Deputy Chairman | ||
Robert A. Failla | 2005 | Director |
Effective October 18, 2010, in the summary prospectus for the JNL/Franklin Templeton Founding Strategy Fund, please delete the table entitled “Portfolio Managers” in its entirety and replace it with the following:
| Portfolio Manager: | ||||
| Name: | Joined Management Team In: | Title: | ||
Saumen Chattapadhyay | 2010 | Vice President – Investment Management |
Effective October 18, 2010, in the summary prospectus for the JNL/Mellon Capital Management Index 5 Fund, please delete the table entitled “Portfolio Managers” in its entirety and replace it with the following:
| Portfolio Manager: | ||||
| Name: | Joined Management Team In: | Title: | ||
Saumen Chattapadhyay | 2010 | Vice President – Investment Management |
Effective October 18, 2010, in the summary prospectus for the JNL/Mellon Capital Management 10 x 10 Fund, please delete the table entitled “Portfolio Managers” in its entirety and replace it with the following:
| Portfolio Manager: | ||||
| Name: | Joined Management Team In: | Title: | ||
Saumen Chattapadhyay | 2010 | Vice President – Investment Management |
Effective October 18, 2010, in the summary prospectus for the JNL/S&P 4 Fund, please delete the table entitled “Portfolio Managers” in its entirety and replace it with the following:
| Portfolio Manager: | ||||
| Name: | Joined Management Team In: | Title: | ||
Saumen Chattapadhyay | 2010 | Vice President – Investment Management |
Effective September 27, 2010, in the prospectus for the JNL/Lazard Mid Cap Equity Fund, please delete the second paragraph of the section entitled “The Sub-Adviser and Portfolio Management” in its entirety and replace it with the following:
The Fund is managed on a team basis by Christopher Blake, Daniel Breslin, Andrew Lacey, and Robert A. Failla. Mr. Blake has been with Lazard since 1995. Mr. Blake is a Managing Director of Lazard. Mr. Breslin is a Director of Lazard and has been with Lazard since 2002. Mr. Lacey has been with Lazard since 1996. He is a portfolio manager and Deputy Chairman of Lazard. Mr. Lacey and Mr. Blake have shared responsibility for the day-to-day management of the Fund since January 2001 and November 2001, respectively. Mr. Failla is Director and portfolio manager and has been with Lazard since 2003.
Effective October 18, 2010, in the prospectus for the JNL/Franklin Templeton Founding Strategy Fund, please delete the second through fifth paragraphs of the section entitled “The Sub-Adviser and Portfolio Management” in its entirety and replace it with the following:
Saumen Chattopadhyay is Vice President, Investment Management of JNAM as of October 2010. Mr. Chattopadhyay is responsible for reviewing the allocations made to the Fund and the application of the Fund’s investment strategy.
Prior to joining JNAM, Mr. Chattopadhyay was Director of Quantitative Management at Harbor Capital Advisors Inc. (“Harbor Capital”) and Portfolio Manager for Harbor Capital’s Target Retirement Funds from January 2009 to September 2010, and was a Senior Financial Analyst from August 2003 to December 2008. At Harbor Capital, Mr. Chattopadhyay directed asset allocation, manager research and due diligence, performance analytics and portfolio attribution and was a senior member of Harbor Capital’s Investment Committee. Prior to his time at Harbor Capital, Mr. Chattopadhyay was Assistant General Manager at IDBI in Mumbai, India where he launched the IDBI mutual fund, managed project appraisals and investment banking relationships.
Mr. Chattopadhyay holds his Bachelors and Masters in Accounting and Finance from the University of Calcutta and his MBA (Finance) from the University of Toledo. Mr. Chattopadhyay is also a Certified Public Accountant and also has a Fellow Chartered Accountant designation from India.
Effective October 18, 2010, in the prospectus for the JNL/Mellon Capital Management Index 5 Fund, please delete the second through fifth paragraphs of the section entitled “The Sub-Adviser and Portfolio Management” in its entirety and replace it with the following:
Saumen Chattopadhyay is Vice President, Investment Management of JNAM as of October 2010. Mr. Chattopadhyay is responsible for reviewing the allocations made to the Fund and the application of the Fund’s investment strategy.
Prior to joining JNAM, Mr. Chattopadhyay was Director of Quantitative Management at Harbor Capital Advisors Inc. (“Harbor Capital”) and Portfolio Manager for Harbor Capital’s Target Retirement Funds from January 2009 to September 2010, and was a Senior Financial Analyst from August 2003 to December 2008. At Harbor Capital, Mr. Chattopadhyay directed asset allocation, manager research and due diligence, performance analytics and portfolio attribution and was a senior member of Harbor Capital’s Investment Committee. Prior to his time at Harbor Capital, Mr. Chattopadhyay was Assistant General Manager at IDBI in Mumbai, India where he launched the IDBI mutual fund, managed project appraisals and investment banking relationships.
Mr. Chattopadhyay holds his Bachelors and Masters in Accounting and Finance from the University of Calcutta and his MBA (Finance) from the University of Toledo. Mr. Chattopadhyay is also a Certified Public Accountant and also has a Fellow Chartered Accountant designation from India.
Effective October 18, 2010, in the prospectus for the JNL/Mellon Capital Management 10 x 10 Fund, please delete the second through fifth paragraphs of the section entitled “The Sub-Adviser and Portfolio Management” in its entirety and replace it with the following:
Saumen Chattopadhyay is Vice President, Investment Management of JNAM as of October 2010. Mr. Chattopadhyay is responsible for reviewing the allocations made to the Fund and the application of the Fund’s investment strategy.
Prior to joining JNAM, Mr. Chattopadhyay was Director of Quantitative Management at Harbor Capital Advisors Inc. (“Harbor Capital”) and Portfolio Manager for Harbor Capital’s Target Retirement Funds from January 2009 to September 2010, and was a Senior Financial Analyst from August 2003 to December 2008. At Harbor Capital, Mr. Chattopadhyay directed asset allocation, manager research and due diligence, performance analytics and portfolio attribution and was a senior member of Harbor Capital’s Investment Committee. Prior to his time at Harbor Capital, Mr. Chattopadhyay was Assistant General Manager at IDBI in Mumbai, India where he launched the IDBI mutual fund, managed project appraisals and investment banking relationships.
Mr. Chattopadhyay holds his Bachelors and Masters in Accounting and Finance from the University of Calcutta and his MBA (Finance) from the University of Toledo. Mr. Chattopadhyay is also a Certified Public Accountant and also has a Fellow Chartered Accountant designation from India.
Effective October 18, 2010, in the prospectus for the JNL/S&P 4 Fund, please delete the second through fifth paragraphs of the section entitled “The Sub-Adviser and Portfolio Management” in its entirety and replace it with the following:
Saumen Chattopadhyay is Vice President, Investment Management of JNAM as of October 2010. Mr. Chattopadhyay is responsible for reviewing the allocations made to the Fund and the application of the Fund’s investment strategy.
Prior to joining JNAM, Mr. Chattopadhyay was Director of Quantitative Management at Harbor Capital Advisors Inc. (“Harbor Capital”) and Portfolio Manager for Harbor Capital’s Target Retirement Funds from January 2009 to September 2010, and was a Senior Financial Analyst from August 2003 to December 2008. At Harbor Capital, Mr. Chattopadhyay directed asset allocation, manager research and due diligence, performance analytics and portfolio attribution and was a senior member of Harbor Capital’s Investment Committee. Prior to his time at Harbor Capital, Mr. Chattopadhyay was Assistant General Manager at IDBI in Mumbai, India where he launched the IDBI mutual fund, managed project appraisals and investment banking relationships.
Mr. Chattopadhyay holds his Bachelors and Masters in Accounting and Finance from the University of Calcutta and his MBA (Finance) from the University of Toledo. Mr. Chattopadhyay is also a Certified Public Accountant and also has a Fellow Chartered Accountant designation from India.
This Supplement is dated October 27, 2010.
(To be used with JMV2731 10/10, VC4224 10/10, JMV5763 10/10, JMV5763P 10/10, VC5890 10/10, VC5869 10/10, VC5995 10/10, JMV5765 10/10, VC3656 05/10, VC5526 05/10, FVC4224FT 05/10, VC3723 05/10, VC3657 05/10, NMV2731 10/10, NV4224 10/10, NV5869 10/10, NV5890 10/10, NV3174CE 05/10, NV5526 05/10, and NV3784 05/10.)
SUPPLEMENT DATED NOVEMBER 8, 2010
TO THE SUMMARY PROSPECTUS DATED OCTOBER 11, 2010
SUPPLEMENT DATED NOVEMBER 8, 2010
TO THE PROSPECTUS DATED OCTOBER 11, 2010
JNL® SERIES TRUST
Please note that the changes apply to your variable annuity product(s).
Effective October 1, 2010, in the summary prospectus for the JNL/S&P Managed Conservative Fund, JNL/S&P Managed Moderate Fund, JNL/S&P Managed Moderate Growth Fund, JNL/S&P Managed Growth Fund, JNL/S&P Managed Aggressive Growth Fund, JNL/S&P Disciplined Moderate Fund, JNL/S&P Disciplined Moderate Growth Fund, and JNL/S&P Disciplined Growth Fund, please delete the table entitled “Portfolio Managers” in its entirety and replace it with the following:
| Portfolio Managers: | ||||
| Name: | Joined Management Team In: | Title: | ||
Massimo Santicchia | 2008 | Vice President | ||
John W. Krey | 2003 | Senior Portfolio Officer | ||
Michael Carapucci | 2010 | Portfolio Officer |
Effective October 1, 2010, in the prospectus for the JNL/S&P Managed Conservative Fund, JNL/S&P Managed Moderate Fund, JNL/S&P Managed Moderate Growth Fund, JNL/S&P Managed Growth Fund, JNL/S&P Managed Aggressive Growth Fund, JNL/S&P Disciplined Moderate Fund, JNL/S&P Disciplined Moderate Growth Fund, and JNL/S&P Disciplined Growth Fund, please delete the second paragraph of the section entitled “The Sub-Adviser and Portfolio Management” in its entirety and replace it with the following:
Massimo Santicchia, John W. Krey, and Michael Carapucci share the primary responsibility for the development of the investment allocations of each Fund.
Michael Carapucci has been a Portfolio Officer with SPIAS since October 2010. Mr. Carapucci participates in establishing asset allocation strategies and fund recommendations to support multi-manager products. Prior to his appointment, Mr. Carapucci was an Analyst since April 2008 and Statistician since January 2005. Mr. Carapucci was primarily responsible for fund research to support multi-manager products.
Effective September 30, 2010, in the prospectus for the JNL/Select Balanced Fund, please delete the first paragraph of the section entitled “The Sub-Adviser and Portfolio Management” in its entirety and replace it with the following:
The Sub-Adviser and Portfolio Management. The Sub-Adviser to the JNL/Select Balanced Fund is Wellington Management Company, LLP (“Wellington Management”). Wellington Management is a Massachusetts limited liability partnership with principal offices at 280 Congress Street, Boston, Massachusetts 02210. Wellington Management is a professional investment counseling firm which provides investment services to investment companies, employee benefit plans, endowments, foundations, and other institutions. Wellington Management and its predecessor organizations have provided investment advisory services for over 70 years. As of September 30, 2010, Wellington Management had investment management authority with respect to approximately $599 billion in assets.
Effective September 30, 2010, in the prospectus for the JNL/Select Money Market Fund, please delete the first paragraph of the section entitled “The Sub-Adviser” in its entirety and replace it with the following:
The Sub-Adviser. The Sub-Adviser to the JNL/Select Money Market Fund is Wellington Management Company, LLP (“Wellington Management”). Wellington Management is a Massachusetts limited liability partnership with principal offices at 280 Congress Street, Boston, Massachusetts 02210. Wellington Management is a professional investment counseling firm which provides investment services to investment companies, employee benefit plans, endowments, foundations, and other institutions. Wellington Management and its predecessor organizations have provided investment advisory services for over 70 years. As of September 30, 2010, Wellington Management had investment management authority with respect to approximately $599 billion in assets.
Effective September 30, 2010, in the prospectus for the JNL/Select Value Fund, please delete the first paragraph of the section entitled “The Sub-Adviser and Portfolio Management” in its entirety and replace it with the following:
The Sub-Adviser and Portfolio Management. The Sub-Adviser to the JNL/Select Value Fund is Wellington Management Company, LLP (“Wellington Management”). Wellington Management is a Massachusetts limited liability partnership with principal offices at 280 Congress Street, Boston, Massachusetts 02210. Wellington Management is a professional investment counseling firm which provides investment services to investment companies, employee benefit plans, endowments, foundations, and other institutions. Wellington Management and its predecessor organizations have provided investment advisory services for over 70 years. As of September 30, 2010, Wellington Management had investment management authority with respect to approximately $599 billion in assets.
This Supplement is dated November 8, 2010.
(To be used with JMV2731 10/10, VC4224 10/10, JMV5763 10/10, JMV5763P 10/10, VC5890 10/10, VC5869 10/10, NMV2731 10/10, NV4224 10/10, NV5869 10/10, and NV5890 10/10.)
SUPPLEMENT DATED NOVEMBER 8, 2010
TO THE SUMMARY PROSPECTUS DATED MAY 1, 2010
SUPPLEMENT DATED NOVEMBER 8, 2010
TO THE PROSPECTUS DATED MAY 1, 2010
JNL® SERIES TRUST
Please note that the changes apply to your variable annuity product(s).
Effective October 1, 2010, in the summary prospectus for the JNL/S&P Managed Conservative Fund, JNL/S&P Managed Moderate Fund, JNL/S&P Managed Moderate Growth Fund, JNL/S&P Managed Growth Fund, JNL/S&P Managed Aggressive Growth Fund, JNL/S&P Disciplined Moderate Fund, JNL/S&P Disciplined Moderate Growth Fund, and JNL/S&P Disciplined Growth Fund, please delete the table entitled “Portfolio Managers” in its entirety and replace it with the following:
| Portfolio Managers: | ||||
| Name: | Joined Management Team In: | Title: | ||
Massimo Santicchia | 2008 | Vice President | ||
John W. Krey | 2003 | Senior Portfolio Officer | ||
Michael Carapucci | 2010 | Portfolio Officer |
Effective October 1, 2010, in the prospectus for the JNL/S&P Managed Conservative Fund, JNL/S&P Managed Moderate Fund, JNL/S&P Managed Moderate Growth Fund, JNL/S&P Managed Growth Fund, JNL/S&P Managed Aggressive Growth Fund, JNL/S&P Disciplined Moderate Fund, JNL/S&P Disciplined Moderate Growth Fund, and JNL/S&P Disciplined Growth Fund, please delete the second paragraph of the section entitled “The Sub-Adviser and Portfolio Management” in its entirety and replace it with the following:
Massimo Santicchia, John W. Krey, and Michael Carapucci share the primary responsibility for the development of the investment allocations of each Fund.
Michael Carapucci has been a Portfolio Officer with SPIAS since October 2010. Mr. Carapucci participates in establishing asset allocation strategies and fund recommendations to support multi-manager products. Prior to his appointment, Mr. Carapucci was an Analyst since April 2008 and Statistician since January 2005. Mr. Carapucci was primarily responsible for fund research to support multi-manager products.
Effective September 30, 2010, in the prospectus for the JNL/Select Balanced Fund, please delete the first paragraph of the section entitled “The Sub-Adviser and Portfolio Management” in its entirety and replace it with the following:
The Sub-Adviser and Portfolio Management. The Sub-Adviser to the JNL/Select Balanced Fund is Wellington Management Company, LLP (“Wellington Management”). Wellington Management is a Massachusetts limited liability partnership with principal offices at 280 Congress Street, Boston, Massachusetts 02210. Wellington Management is a professional investment counseling firm which provides investment services to investment companies, employee benefit plans, endowments, foundations, and other institutions. Wellington Management and its predecessor organizations have provided investment advisory services for over 70 years. As of September 30, 2010, Wellington Management had investment management authority with respect to approximately $599 billion in assets.
Effective September 30, 2010, in the prospectus for the JNL/Select Money Market Fund, please delete the first paragraph of the section entitled “The Sub-Adviser” in its entirety and replace it with the following:
The Sub-Adviser. The Sub-Adviser to the JNL/Select Money Market Fund is Wellington Management Company, LLP (“Wellington Management”). Wellington Management is a Massachusetts limited liability partnership with principal offices at 280 Congress Street, Boston, Massachusetts 02210. Wellington Management is a professional investment counseling firm which provides investment services to investment companies, employee benefit plans, endowments, foundations, and other institutions. Wellington Management and its predecessor organizations have provided investment advisory services for over 70 years. As of September 30, 2010, Wellington Management had investment management authority with respect to approximately $599 billion in assets.
Effective September 30, 2010, in the prospectus for the JNL/Select Value Fund, please delete the first paragraph of the section entitled “The Sub-Adviser and Portfolio Management” in its entirety and replace it with the following:
The Sub-Adviser and Portfolio Management. The Sub-Adviser to the JNL/Select Value Fund is Wellington Management Company, LLP (“Wellington Management”). Wellington Management is a Massachusetts limited liability partnership with principal offices at 280 Congress Street, Boston, Massachusetts 02210. Wellington Management is a professional investment counseling firm which provides investment services to investment companies, employee benefit plans, endowments, foundations, and other institutions. Wellington Management and its predecessor organizations have provided investment advisory services for over 70 years. As of September 30, 2010, Wellington Management had investment management authority with respect to approximately $599 billion in assets.
This Supplement is dated November 8, 2010.
(To be used with VC3656 05/10, VC5526 05/10, VC3723 05/10, VC3657 05/10, NV3174CE 05/10, NV5526 05/10, and NV3784 05/10.)
SUPPLEMENT DATED NOVEMBER 8, 2010
TO THE SUMMARY PROSPECTUS DATED OCTOBER 11, 2010
SUPPLEMENT DATED NOVEMBER 8, 2010
TO THE PROSPECTUS DATED OCTOBER 11, 2010
JNL® SERIES TRUST
Please note that the changes apply to your variable annuity product.
On page 2 of the prospectus, please delete the second, third, and fourth paragraphs in their entirety and replace with the following:
The JNL/Franklin Templeton Global Growth Fund, JNL/Franklin Templeton Mutual Shares Fund, JNL/Franklin Templeton Small Cap Value Fund, JNL/Goldman Sachs Mid Cap Value Fund, JNL/Goldman Sachs U.S. Equity Flex Fund, JNL/Invesco Small Cap Growth Fund, JNL/JPMorgan MidCap Growth Fund, JNL/Lazard Mid Cap Equity Fund, and JNL/Oppenheimer Global Growth Fund (each a “Fund”) are available only as an underlying Fund of the JNL/S&P Managed Conservative Fund, JNL/S&P Managed Moderate Fund, JNL/S&P Managed Moderate Growth Fund, JNL/S&P Managed Growth Fund, and JNL/S&P Managed Aggressive Growth Fund.
The JNL/Mellon Capital Management European 30 Fund and the JNL/Mellon Capital Management Pacific Rim 30 Fund (each a “Fund”) are available only as an underlying Fund of the JNL/S&P Managed Conservative Fund, JNL/S&P Managed Moderate Fund, JNL/S&P Managed Moderate Growth Fund, JNL/S&P Managed Growth Fund, JNL/S&P Managed Aggressive Growth Fund, JNL/S&P Disciplined Moderate Fund, JNL/S&P Disciplined Moderate Growth Fund, and JNL/S&P Disciplined Growth Fund.
Effective October 1, 2010, in the summary prospectus for the JNL/S&P Managed Conservative Fund, JNL/S&P Managed Moderate Fund, JNL/S&P Managed Moderate Growth Fund, JNL/S&P Managed Growth Fund, JNL/S&P Managed Aggressive Growth Fund, JNL/S&P Disciplined Moderate Fund, JNL/S&P Disciplined Moderate Growth Fund, and JNL/S&P Disciplined Growth Fund, please delete the table entitled “Portfolio Managers” in its entirety and replace it with the following:
| Portfolio Managers: | ||||
| Name: | Joined Management Team In: | Title: | ||
Massimo Santicchia | 2008 | Vice President | ||
John W. Krey | 2003 | Senior Portfolio Officer | ||
Michael Carapucci | 2010 | Portfolio Officer |
Effective October 1, 2010, in the prospectus for the JNL/S&P Managed Conservative Fund, JNL/S&P Managed Moderate Fund, JNL/S&P Managed Moderate Growth Fund, JNL/S&P Managed Growth Fund, JNL/S&P Managed Aggressive Growth Fund, JNL/S&P Disciplined Moderate Fund, JNL/S&P Disciplined Moderate Growth Fund, and JNL/S&P Disciplined Growth Fund, please delete the second paragraph of the section entitled “The Sub-Adviser and Portfolio Management” in its entirety and replace it with the following:
Massimo Santicchia, John W. Krey, and Michael Carapucci share the primary responsibility for the development of the investment allocations of each Fund.
Michael Carapucci has been a Portfolio Officer with SPIAS since October 2010. Mr. Carapucci participates in establishing asset allocation strategies and fund recommendations to support multi-manager products. Prior to his appointment, Mr. Carapucci was an Analyst since April 2008 and Statistician since January 2005. Mr. Carapucci was primarily responsible for fund research to support multi-manager products.
Effective September 30, 2010, in the prospectus for the JNL/Select Balanced Fund, please delete the first paragraph of the section entitled “The Sub-Adviser and Portfolio Management” in its entirety and replace it with the following:
The Sub-Adviser and Portfolio Management. The Sub-Adviser to the JNL/Select Balanced Fund is Wellington Management Company, LLP (“Wellington Management”). Wellington Management is a Massachusetts limited liability partnership with principal offices at 280 Congress Street, Boston, Massachusetts 02210. Wellington Management is a professional investment counseling firm which provides investment services to investment companies, employee benefit plans, endowments, foundations, and other institutions. Wellington Management and its predecessor organizations have provided investment advisory services for over 70 years. As of September 30, 2010, Wellington Management had investment management authority with respect to approximately $599 billion in assets.
Effective September 30, 2010, in the prospectus for the JNL/Select Money Market Fund, please delete the first paragraph of the section entitled “The Sub-Adviser” in its entirety and replace it with the following:
The Sub-Adviser. The Sub-Adviser to the JNL/Select Money Market Fund is Wellington Management Company, LLP (“Wellington Management”). Wellington Management is a Massachusetts limited liability partnership with principal offices at 280 Congress Street, Boston, Massachusetts 02210. Wellington Management is a professional investment counseling firm which provides investment services to investment companies, employee benefit plans, endowments, foundations, and other institutions. Wellington Management and its predecessor organizations have provided investment advisory services for over 70 years. As of September 30, 2010, Wellington Management had investment management authority with respect to approximately $599 billion in assets.
Effective September 30, 2010, in the prospectus for the JNL/Select Value Fund, please delete the first paragraph of the section entitled “The Sub-Adviser and Portfolio Management” in its entirety and replace it with the following:
The Sub-Adviser and Portfolio Management. The Sub-Adviser to the JNL/Select Value Fund is Wellington Management Company, LLP (“Wellington Management”). Wellington Management is a Massachusetts limited liability partnership with principal offices at 280 Congress Street, Boston, Massachusetts 02210. Wellington Management is a professional investment counseling firm which provides investment services to investment companies, employee benefit plans, endowments, foundations, and other institutions. Wellington Management and its predecessor organizations have provided investment advisory services for over 70 years. As of September 30, 2010, Wellington Management had investment management authority with respect to approximately $599 billion in assets.
This Supplement is dated November 8, 2010.
(To be used with JMV5765 10/10.)
SUPPLEMENT DATED NOVEMBER 8, 2010
TO THE SUMMARY PROSPECTUS DATED OCTOBER 11, 2010
SUPPLEMENT DATED NOVEMBER 8, 2010
TO THE PROSPECTUS DATED OCTOBER 11, 2010
JNL® SERIES TRUST
Please note that the changes apply to your variable annuity product.
On page 2 of the prospectus, please delete the second, third, and fourth paragraphs in their entirety.
Effective October 1, 2010, in the summary prospectus for the JNL/S&P Managed Conservative Fund, JNL/S&P Managed Moderate Fund, JNL/S&P Managed Moderate Growth Fund, JNL/S&P Managed Growth Fund, JNL/S&P Managed Aggressive Growth Fund, JNL/S&P Disciplined Moderate Fund, JNL/S&P Disciplined Moderate Growth Fund, and JNL/S&P Disciplined Growth Fund, please delete the table entitled “Portfolio Managers” in its entirety and replace it with the following:
| Portfolio Managers: | ||||
| Name: | Joined Management Team In: | Title: | ||
Massimo Santicchia | 2008 | Vice President | ||
John W. Krey | 2003 | Senior Portfolio Officer | ||
Michael Carapucci | 2010 | Portfolio Officer |
Effective October 1, 2010, in the prospectus for the JNL/S&P Managed Conservative Fund, JNL/S&P Managed Moderate Fund, JNL/S&P Managed Moderate Growth Fund, JNL/S&P Managed Growth Fund, JNL/S&P Managed Aggressive Growth Fund, JNL/S&P Disciplined Moderate Fund, JNL/S&P Disciplined Moderate Growth Fund, and JNL/S&P Disciplined Growth Fund, please delete the second paragraph of the section entitled “The Sub-Adviser and Portfolio Management” in its entirety and replace it with the following:
Massimo Santicchia, John W. Krey, and Michael Carapucci share the primary responsibility for the development of the investment allocations of each Fund.
Michael Carapucci has been a Portfolio Officer with SPIAS since October 2010. Mr. Carapucci participates in establishing asset allocation strategies and fund recommendations to support multi-manager products. Prior to his appointment, Mr. Carapucci was an Analyst since April 2008 and Statistician since January 2005. Mr. Carapucci was primarily responsible for fund research to support multi-manager products.
Effective September 30, 2010, in the prospectus for the JNL/Select Balanced Fund, please delete the first paragraph of the section entitled “The Sub-Adviser and Portfolio Management” in its entirety and replace it with the following:
The Sub-Adviser and Portfolio Management. The Sub-Adviser to the JNL/Select Balanced Fund is Wellington Management Company, LLP (“Wellington Management”). Wellington Management is a Massachusetts limited liability partnership with principal offices at 280 Congress Street, Boston, Massachusetts 02210. Wellington Management is a professional investment counseling firm which provides investment services to investment companies, employee benefit plans, endowments, foundations, and other institutions. Wellington Management and its predecessor organizations have provided investment advisory services for over 70 years. As of September 30, 2010, Wellington Management had investment management authority with respect to approximately $599 billion in assets.
Effective September 30, 2010, in the prospectus for the JNL/Select Money Market Fund, please delete the first paragraph of the section entitled “The Sub-Adviser” in its entirety and replace it with the following:
The Sub-Adviser. The Sub-Adviser to the JNL/Select Money Market Fund is Wellington Management Company, LLP (“Wellington Management”). Wellington Management is a Massachusetts limited liability partnership with principal offices at 280 Congress Street, Boston, Massachusetts 02210. Wellington Management is a professional investment counseling firm which provides investment services to investment companies, employee benefit plans, endowments, foundations, and other institutions. Wellington Management and its predecessor organizations have provided investment advisory services for over 70 years. As of September 30, 2010, Wellington Management had investment management authority with respect to approximately $599 billion in assets.
Effective September 30, 2010, in the prospectus for the JNL/Select Value Fund, please delete the first paragraph of the section entitled “The Sub-Adviser and Portfolio Management” in its entirety and replace it with the following:
The Sub-Adviser and Portfolio Management. The Sub-Adviser to the JNL/Select Value Fund is Wellington Management Company, LLP (“Wellington Management”). Wellington Management is a Massachusetts limited liability partnership with principal offices at 280 Congress Street, Boston, Massachusetts 02210. Wellington Management is a professional investment counseling firm which provides investment services to investment companies, employee benefit plans, endowments, foundations, and other institutions. Wellington Management and its predecessor organizations have provided investment advisory services for over 70 years. As of September 30, 2010, Wellington Management had investment management authority with respect to approximately $599 billion in assets.
This Supplement is dated November 8, 2010.
(To be used with VC5995 10/10.)
SUPPLEMENT DATED NOVEMBER 8, 2010
TO THE PROSPECTUS DATED MAY 1, 2010
JNL® SERIES TRUST
Please note that the changes apply to your variable life product(s).
Effective September 30, 2010, in the prospectus for the JNL/Select Balanced Fund, please delete the first paragraph of the section entitled “The Sub-Adviser and Portfolio Management” in its entirety and replace it with the following:
The Sub-Adviser and Portfolio Management. The Sub-Adviser to the JNL/Select Balanced Fund is Wellington Management Company, LLP (“Wellington Management”). Wellington Management is a Massachusetts limited liability partnership with principal offices at 280 Congress Street, Boston, Massachusetts 02210. Wellington Management is a professional investment counseling firm which provides investment services to investment companies, employee benefit plans, endowments, foundations, and other institutions. Wellington Management and its predecessor organizations have provided investment advisory services for over 70 years. As of September 30, 2010, Wellington Management had investment management authority with respect to approximately $599 billion in assets.
Effective September 30, 2010, in the prospectus for the JNL/Select Money Market Fund, please delete the first paragraph of the section entitled “The Sub-Adviser” in its entirety and replace it with the following:
The Sub-Adviser. The Sub-Adviser to the JNL/Select Money Market Fund is Wellington Management Company, LLP (“Wellington Management”). Wellington Management is a Massachusetts limited liability partnership with principal offices at 280 Congress Street, Boston, Massachusetts 02210. Wellington Management is a professional investment counseling firm which provides investment services to investment companies, employee benefit plans, endowments, foundations, and other institutions. Wellington Management and its predecessor organizations have provided investment advisory services for over 70 years. As of September 30, 2010, Wellington Management had investment management authority with respect to approximately $599 billion in assets.
Effective September 30, 2010, in the prospectus for the JNL/Select Value Fund, please delete the first paragraph of the section entitled “The Sub-Adviser and Portfolio Management” in its entirety and replace it with the following:
The Sub-Adviser and Portfolio Management. The Sub-Adviser to the JNL/Select Value Fund is Wellington Management Company, LLP (“Wellington Management”). Wellington Management is a Massachusetts limited liability partnership with principal offices at 280 Congress Street, Boston, Massachusetts 02210. Wellington Management is a professional investment counseling firm which provides investment services to investment companies, employee benefit plans, endowments, foundations, and other institutions. Wellington Management and its predecessor organizations have provided investment advisory services for over 70 years. As of September 30, 2010, Wellington Management had investment management authority with respect to approximately $599 billion in assets.
This Supplement is dated November 8, 2010.
(To be used with VC5825 05/10, VC5884 05/10, VC5885 05/10, and NV5825 05/10.)
CMU6436 11/10
SUPPLEMENT DATED NOVEMBER 8, 2010
TO THE SUMMARY PROSPECTUS DATED MAY 1, 2010
SUPPLEMENT DATED NOVEMBER 8, 2010
TO THE PROSPECTUS DATED MAY 1, 2010
JNL® SERIES TRUST
Please note that the changes apply to your variable annuity product.
Effective September 30, 2010, in the prospectus for the JNL/Select Money Market Fund, please delete the first paragraph of the section entitled “The Sub-Adviser” in its entirety and replace it with the following:
The Sub-Adviser. The Sub-Adviser to the JNL/Select Money Market Fund is Wellington Management Company, LLP (“Wellington Management”). Wellington Management is a Massachusetts limited liability partnership with principal offices at 280 Congress Street, Boston, Massachusetts 02210. Wellington Management is a professional investment counseling firm which provides investment services to investment companies, employee benefit plans, endowments, foundations, and other institutions. Wellington Management and its predecessor organizations have provided investment advisory services for over 70 years. As of September 30, 2010, Wellington Management had investment management authority with respect to approximately $599 billion in assets.
This Supplement is dated November 8, 2010.
(To be used with VC3652 05/10.)
SUPPLEMENT DATED NOVEMBER 8, 2010
TO THE SUMMARY PROSPECTUS DATED MAY 1, 2010
SUPPLEMENT DATED NOVEMBER 8, 2010
TO THE PROSPECTUS DATED MAY 1, 2010
JNL® SERIES TRUST
Please note that the changes apply to your variable annuity product(s).
Effective October 1, 2010, in the summary prospectus for the JNL/S&P Disciplined Moderate Fund, JNL/S&P Disciplined Moderate Growth Fund, and JNL/S&P Disciplined Growth Fund, please delete the table entitled “Portfolio Managers” in its entirety and replace it with the following:
| Portfolio Managers: | ||||
| Name: | Joined Management Team In: | Title: | ||
Massimo Santicchia | 2008 | Vice President | ||
John W. Krey | 2003 | Senior Portfolio Officer | ||
Michael Carapucci | 2010 | Portfolio Officer |
Effective October 1, 2010, in the prospectus for the JNL/S&P Disciplined Moderate Fund, JNL/S&P Disciplined Moderate Growth Fund, and JNL/S&P Disciplined Growth Fund, please delete the second paragraph of the section entitled “The Sub-Adviser and Portfolio Management” in its entirety and replace it with the following:
Massimo Santicchia, John W. Krey, and Michael Carapucci share the primary responsibility for the development of the investment allocations of each Fund.
Michael Carapucci has been a Portfolio Officer with SPIAS since October 2010. Mr. Carapucci participates in establishing asset allocation strategies and fund recommendations to support multi-manager products. Prior to his appointment, Mr. Carapucci was an Analyst since April 2008 and Statistician since January 2005. Mr. Carapucci was primarily responsible for fund research to support multi-manager products.
This Supplement is dated November 8, 2010.
(To be used with VC6016 05/10 and NV6016 05/10.)
SUPPLEMENT DATED NOVEMBER 8, 2010
TO THE SUMMARY PROSPECTUS DATED MAY 1, 2010
SUPPLEMENT DATED NOVEMBER 8, 2010
TO THE PROSPECTUS DATED MAY 1, 2010
JNL® SERIES TRUST
Please note that the changes apply to your variable annuity product(s).
Effective October 1, 2010, in the summary prospectus for the JNL/S&P Managed Conservative Fund, JNL/S&P Managed Moderate Fund, JNL/S&P Managed Moderate Growth Fund, JNL/S&P Managed Growth Fund, and JNL/S&P Managed Aggressive Growth Fund, please delete the table entitled “Portfolio Managers” in its entirety and replace it with the following:
| Portfolio Managers: | ||||
| Name: | Joined Management Team In: | Title: | ||
Massimo Santicchia | 2008 | Vice President | ||
John W. Krey | 2003 | Senior Portfolio Officer | ||
Michael Carapucci | 2010 | Portfolio Officer |
Effective October 1, 2010, in the prospectus for the JNL/S&P Managed Conservative Fund, JNL/S&P Managed Moderate Fund, JNL/S&P Managed Moderate Growth Fund, JNL/S&P Managed Growth Fund, and JNL/S&P Managed Aggressive Growth Fund, please delete the second paragraph of the section entitled “The Sub-Adviser and Portfolio Management” in its entirety and replace it with the following:
Massimo Santicchia, John W. Krey, and Michael Carapucci share the primary responsibility for the development of the investment allocations of each Fund.
Michael Carapucci has been a Portfolio Officer with SPIAS since October 2010. Mr. Carapucci participates in establishing asset allocation strategies and fund recommendations to support multi-manager products. Prior to his appointment, Mr. Carapucci was an Analyst since April 2008 and Statistician since January 2005. Mr. Carapucci was primarily responsible for fund research to support multi-manager products.
Effective September 30, 2010, in the prospectus for the JNL/Select Balanced Fund, please delete the first paragraph of the section entitled “The Sub-Adviser and Portfolio Management” in its entirety and replace it with the following:
The Sub-Adviser and Portfolio Management. The Sub-Adviser to the JNL/Select Balanced Fund is Wellington Management Company, LLP (“Wellington Management”). Wellington Management is a Massachusetts limited liability partnership with principal offices at 280 Congress Street, Boston, Massachusetts 02210. Wellington Management is a professional investment counseling firm which provides investment services to investment companies, employee benefit plans, endowments, foundations, and other institutions. Wellington Management and its predecessor organizations have provided investment advisory services for over 70 years. As of September 30, 2010, Wellington Management had investment management authority with respect to approximately $599 billion in assets.
Effective September 30, 2010, in the prospectus for the JNL/Select Money Market Fund, please delete the first paragraph of the section entitled “The Sub-Adviser” in its entirety and replace it with the following:
The Sub-Adviser. The Sub-Adviser to the JNL/Select Money Market Fund is Wellington Management Company, LLP (“Wellington Management”). Wellington Management is a Massachusetts limited liability partnership with principal offices at 280 Congress Street, Boston, Massachusetts 02210. Wellington Management is a professional investment counseling firm which provides investment services to investment companies, employee benefit plans, endowments, foundations, and other institutions. Wellington Management and its predecessor organizations have provided investment advisory services for over 70 years. As of September 30, 2010, Wellington Management had investment management authority with respect to approximately $599 billion in assets.
Effective September 30, 2010, in the prospectus for the JNL/Select Value Fund, please delete the first paragraph of the section entitled “The Sub-Adviser and Portfolio Management” in its entirety and replace it with the following:
The Sub-Adviser and Portfolio Management. The Sub-Adviser to the JNL/Select Value Fund is Wellington Management Company, LLP (“Wellington Management”). Wellington Management is a Massachusetts limited liability partnership with principal offices at 280 Congress Street, Boston, Massachusetts 02210. Wellington Management is a professional investment counseling firm which provides investment services to investment companies, employee benefit plans, endowments, foundations, and other institutions. Wellington Management and its predecessor organizations have provided investment advisory services for over 70 years. As of September 30, 2010, Wellington Management had investment management authority with respect to approximately $599 billion in assets.
This Supplement is dated November 8, 2010.
(To be used with FVC4224FT 05/10, HR105 05/10 and VC2440 05/10.)
SUPPLEMENT DATED FEBRUARY 1, 2011
TO THE SUMMARY PROSPECTUS DATED OCTOBER 11, 2010
SUPPLEMENT DATED FEBRUARY 1, 2011
TO THE PROSPECTUS DATED OCTOBER 11, 2010
JNL® SERIES TRUST
Please note that the changes apply to your variable annuity and/or variable life product(s).
In the summary prospectus for the JNL/Eagle SmallCap Equity Fund, please delete the first paragraph of the section entitled “Principal Investment Strategies” in its entirety, and replace it with the following:
Principal Investment Strategies. The Fund seeks to achieve its objective by investing under normal circumstances at least 80% of its assets in equity securities of U.S. companies with market capitalizations in the range of the companies represented by the Russell 2000®.
In the prospectus for the JNL/Eagle SmallCap Equity Fund, please delete the first paragraph of the section entitled “Principal Investment Strategies” in its entirety, and replace it with the following:
Principal Investment Strategies. The Fund seeks to achieve its objective by investing under normal circumstances at least 80% of its assets (net assets plus the amount of any borrowings for investment purposes) in a diversified portfolio of equity securities of U.S. companies with market capitalizations in the range of the companies represented by the Russell 2000®. The Sub-Adviser employs a bottom-up approach to identify rapidly growing, under-researched small capitalization companies that appear to be undervalued in relation to their long-term earnings growth rate or asset value. The Sub-Adviser generally invests in companies which have accelerating earnings, reasonable valuations, strong management that participates in the ownership of the company, reasonable debt, and a high or expanding return on equity. The Fund’s equity holdings consist primarily of common stocks, but may also include preferred stocks and investment grade securities convertible into common stocks, and warrants.
This Supplement is dated February 1, 2011.
(To be used with JMV5765 10/10, JMV5765 01/11, VC5995 10/10, VC4224 10/10, JMV5763 10/10, JMV5763P 10/10, VC3656 05/10, VC5526 05/10, VC5869 10/10, VC5890 10/10, JMV2731 10/10, VC3723 05/10, VC3657 05/10, FVC4224FT 05/10, NV3174CE 05/10, NV4224 10/10, NV5526 05/10, NV5869 10/10, NV5890 10/10, NMV2731 10/10, NV3784 05/10, VC5825 05/10, VC5884 05/10, VC5885 05/10, NV5825 05/10, HR105 05/10 and VC2440 05/10.)
JNL Series Trust JNL Variable Fund LLC | ||||
|
PRSRT STD |
| ||
| U.S. POSTAGE | ||||
| PAID | ||||
One Corporate Way | JACKSON NATIONAL | |||
Lansing, MI 48951 | ASSET MANAGEMENT | |||
| L.L.C. |
Item 2. Code of Ethics.
As of the end of the period covered by this report, the registrant had adopted a code of ethics, as defined in Item 2 of Form N-CSR, applicable to its principal executive officer, principal financial officer, principal accounting officer or controller, or persons performing similar functions. There were no substantive amendments or any waivers to this code of ethics during the period covered by this report. A copy of this code of ethics is filed as Exhibit 12(a)(1) to this Form N-CSR.
Item 3. Audit Committee Financial Expert.
The registrant has named William J. Crowley, Jr. as an Audit Committee financial expert serving on its Audit Committee. William J. Crowley, Jr. is not an “interested person” of the Trust, as that term is defined by Section 2(a)(19) of the Investment Company Act of 1940, as amended, and is considered “independent” for purposes of this Item.
An “audit committee financial expert” is not an “expert” for any purpose, including for purposes of Section 11 of the Securities Act of 1933, as amended, as a result of being designated as an “audit committee financial expert.” Further, the designation of a person as an “audit committee financial expert” does not mean that the person has any greater duties, obligations, or liability than those imposed on the person without the “audit committee financial expert” designation. Similarly, the designation of a person as an “audit committee financial expert” does not affect the duties, obligations, or liability of any other member of the Audit Committee or Board of Trustees.
Item 4. Principal Accountant Fees and Services.
(a)-(d)
The administrator of the registrant is responsible for payment of all expenses associated with the annual audit and other required services of the independent registered accounting firm, and all expenses associated with the preparation and filing of the tax returns.
KPMG LLP (“KPMG”) was appointed by the Board of Trustees as the independent registered public accounting firm of the registrant for the fiscal years ended December 31, 2009 and December 31, 2010. The following table sets forth aggregate fees billed by KPMG for the respective period for professional services rendered to the registrant.
Fees for Services Rendered to the Registrant by KPMG
| Fiscal Year | Audit Fees | Audit- Related Fees | Tax Fees | All Other Fees | ||||
2009 | $607,173 | $22,545 | $160,000 | $0 | ||||
2010 | $657,625 | $18,000 | $158,000 | $0 |
The above Audit-Related Fees for 2009 and 2010 are the aggregate fees billed for professional services rendered by KPMG to the registrant for the services provided in connection with the registrant’s Rule 17f-2 security counts.
The above Tax Fees for 2009 and 2010 are the aggregate fees billed for professional services by KPMG to the registrant for tax compliance, tax advice, and tax return review.
Fees for Services Rendered to Adviser Entities by KPMG
The following table sets forth the amount of fees that were billed by KPMG for the respective period to any entity controlling, controlled by, or under common control with the investment adviser that provided ongoing services to the registrant (“Adviser Entities”) that were directly related to the registrant’s operations and financial reporting.
| Fiscal Year | Audit-Related Fees | Tax Fees | All Other Fees | |||
2009 | $48,110 | $0 | $0 | |||
2010 | $51,129 | $18,500 | $0 |
The above Audit-Related Fees are the aggregate fees billed to Adviser Entities for the performance of an internal control review pursuant to Statement of Auditing Standards No. 70 of the adviser and administrator of the registrant.
The above Tax Fees for 2010 are the aggregate fees billed for professional services by KPMG to Adviser Entities for tax compliance, tax advice, and tax return review.
(e)(1) The Audit Committee is authorized to pre-approve non-audit services provided by the registrant’s auditors, if they find it appropriate in light of their fiduciary duties and in the exercise of their good faith business judgment and compatible with the auditor’s independence. The Chairman of the Audit Committee is authorized to approve audit and non-audit services for newly established funds of the registrant on the same terms as the full Audit Committee previously had approved for the then existing Funds.
(e)(2) 0%
(f) Not applicable.
(g) As detailed in the tables above, the aggregate fees billed for all non-audit fees to the registrant and Adviser Entities for the fiscal year ended December 31, 2009 was $230,655. As detailed in the tables above, the aggregate fees billed for all non-audit fees to the registrant and Adviser Entities for the fiscal year ended December 31, 2010 was $245,629.
(h) For the fiscal years ended December 31, 2009 and December 31, 2010, the Audit Committee of the registrant’s Board of Trustees considered the provision of non-audit services that were rendered to the Adviser Entities that were not pre-approved pursuant to paragraph (c)(7)(ii) of Rule 2-01 of Regulation S-X and concluded that such services were compatible with maintaining KPMG’s independence.
Item 5. Audit Committee of Listed Registrants.
Not applicable.
Item 6. Schedule of Investments
(a) Below is a Schedule I – Investments in securities of unaffiliated issuers for the JNL/BlackRock Commodity Securities Fund, the JNL/Capital Guardian Global Balanced Fund, the JNL/Capital Guardian Global Diversified Research Fund, the JNL/Eagle SmallCap Equity Fund, the JNL/Franklin Templeton Global Growth Fund, the JNL/Franklin Templeton Income Fund, the JNL/Franklin Templeton Mutual Shares Fund, the JNL/Franklin Templeton Small Cap Value Fund, the JNL/Goldman Sachs Mid Cap Value
Fund, the JNL/Goldman Sachs U.S. Equity Flex Fund, the JNL/Invesco Global Real Estate Fund, the JNL/Invesco International Growth Fund, the JNL/Invesco Large Cap Growth Fund, the JNL/Invesco Small Cap Growth Fund, the JNL/Ivy Asset Strategy Fund, the JNL/JPMorgan International Value Fund, the JNL/JPMorgan MidCap Growth Fund, the JNL/Lazard Emerging Markets Fund, the JNL/Lazard Mid Cap Equity Fund, the JNL/Mellon Capital Management International Index Fund, the JNL/Mellon Capital Management S&P 400 MidCap Index Fund, the JNL/Mellon Capital Management S&P 500 Index Fund, the JNL/Mellon Capital Management Small Cap Index Fund, the JNL/Oppenheimer Global Growth Fund, the JNL/PAM Asia ex-Japan Fund, the JNL/Select Balanced Fund, the JNL/Select Value Fund, the JNL/T.Rowe Price Established Growth Fund, the JNL/T. Rowe Price Mid-Cap Growth Fund, and the JNL/T. Rowe Price Value Fund for which a summary schedule of investments was provided in the Annual Report dated December 31, 2010, pursuant to §210.1212 of Regulation S-X.
JNL Series Trust
Schedules of Investments (in thousands)
December 31, 2010
| Shares/Par (p) | Value | |||||
JNL/BlackRock Commodity Securities Fund | ||||||
COMMON STOCKS - 45.9% | ||||||
ENERGY - 40.1% | ||||||
Acergy SA - ADR (e) | 65 | $ 1,585 | ||||
Anadarko Petroleum Corp. | 125 | 9,493 | ||||
Apache Corp. | 162 | 19,350 | ||||
Arch Coal Inc. | 30 | 1,041 | ||||
Baker Hughes Inc. | 97 | 5,545 | ||||
Berry Petroleum Co. - Class A | 56 | 2,437 | ||||
Brigham Exploration Co. (c) | 197 | 5,359 | ||||
Cabot Oil & Gas Corp. - Class A | 92 | 3,494 | ||||
Cameron International Corp. (c) | 174 | 8,808 | ||||
Canadian Natural Resources Ltd. | 183 | 8,181 | ||||
Carrizo Oil & Gas Inc. (c) | 58 | 2,002 | ||||
Cenovus Energy Inc. | 120 | 4,027 | ||||
Chevron Corp. | 139 | 12,648 | ||||
Cimarex Energy Co. | 45 | 3,944 | ||||
CNOOC Ltd. - ADR (e) | 27 | 6,343 | ||||
Coastal Energy Co. (c) | 64 | 387 | ||||
ConocoPhillips | 111 | 7,560 | ||||
Consol Energy Inc. | 52 | 2,520 | ||||
Crew Energy Inc. (c) | 242 | 4,648 | ||||
Denbury Resources Inc. (c) | 46 | 886 | ||||
Devon Energy Corp. | 165 | 12,971 | ||||
Dresser-Rand Group Inc. (c) | 182 | 7,744 | ||||
Dril-Quip Inc. (c) | 76 | 5,921 | ||||
EnCana Corp. (e) | 119 | 3,494 | ||||
EOG Resources Inc. | 193 | 17,682 | ||||
EQT Corp. | 93 | 4,177 | ||||
EXCO Resources Inc. | 92 | 1,779 | ||||
Exxon Mobil Corp. | 178 | 13,029 | ||||
FMC Technologies Inc. (c) | 138 | 12,291 | ||||
Forest Oil Corp. (c) | 43 | 1,616 | ||||
Halliburton Co. | 176 | 7,206 | ||||
Helmerich & Payne Inc. | 95 | 4,610 | ||||
Hess Corp. | 84 | 6,423 | ||||
Husky Energy Inc. | 90 | 2,411 | ||||
Marathon Oil Corp. | 138 | 5,111 | ||||
MEG Energy Corp. (c) | 43 | 1,951 | ||||
Murphy Oil Corp. | 231 | 17,222 | ||||
Nabors Industries Ltd. (c) | 104 | 2,433 | ||||
National Oilwell Varco Inc. | 225 | 15,102 | ||||
Newfield Exploration Co. (c) | 67 | 4,818 | ||||
Nexen Inc. | 93 | 2,121 | ||||
Niko Resources Ltd. | 19 | 1,961 | ||||
Noble Corp. | 138 | 4,934 | ||||
Noble Energy Inc. | 80 | 6,858 | ||||
Occidental Petroleum Corp. | 132 | 12,950 | ||||
Pan Orient Energy Corp. (c) | 119 | 798 | ||||
Paramount Resources Ltd. - Class A (c) | 38 | 1,224 | ||||
Peabody Energy Corp. | 121 | 7,747 | ||||
PetroBakken Energy Ltd. (e) | 51 | 1,118 | ||||
PetroHawk Energy Corp. (c) | 42 | 760 | ||||
Petroleo Brasileiro SA - Petrobras - ADR | 100 | 3,794 | ||||
Pioneer Natural Resources Co. | 46 | 3,992 | ||||
Pride International Inc. (c) | 133 | 4,377 | ||||
Progress Energy Resources Corp. | 135 | 1,724 | ||||
Range Resources Corp. | 142 | 6,395 | ||||
Rowan Cos. Inc. (c) | 48 | 1,684 | ||||
Saipem SpA | 117 | 5,758 | ||||
Schlumberger Ltd. | 133 | 11,122 | ||||
Southwestern Energy Co. (c) | 91 | 3,400 | ||||
Suncor Energy Inc. | 325 | 12,498 | ||||
Talisman Energy Inc. | 579 | 12,892 | ||||
Technip SA - ADR | 49 | 4,520 | ||||
Tesco Corp. (c) | 81 | 1,284 | ||||
| Shares/Par (p) | Value | |||||
Total SA - ADR | 100 | 5,366 | ||||
Transocean Ltd. (c) | 128 | 8,899 | ||||
Trican Well Service Ltd. | 68 | 1,371 | ||||
Uranium Energy Corp. (c) (q) | 366 | 2,209 | ||||
Valero Energy Corp. | 68 | 1,580 | ||||
Weatherford International Ltd. (c) | 116 | 2,656 | ||||
Whiting Petroleum Corp. (c) | 46 | 5,443 | ||||
Williams Cos. Inc. | 54 | 1,333 | ||||
| 401,017 | ||||||
INDUSTRIALS - 0.1% | ||||||
Aegean Marine Petroleum Network Inc. (e) | 57 | 592 | ||||
MATERIALS - 5.7% | ||||||
Aluminum Corp. of China Ltd. - ADR (c) (e) | 147 | 3,357 | ||||
Barrick Gold Corp. | 52 | 2,759 | ||||
BHP Billiton Ltd. | 56 | 2,608 | ||||
EI Du Pont de Nemours & Co. | 49 | 2,442 | ||||
Eldorado Gold Corp. | 406 | 7,560 | ||||
Fibria Celulose SA - ADR (c) (e) | 67 | 1,078 | ||||
First Quantum Minerals Ltd. (e) | 39 | 4,283 | ||||
Franco-Nevada Corp. | 64 | 2,138 | ||||
Gammon Gold Inc. (c) | 123 | 1,005 | ||||
Goldcorp Inc. | 126 | 5,821 | ||||
HudBay Minerals Inc. | 175 | 3,155 | ||||
Inmet Mining Corp. | 10 | 818 | ||||
Newcrest Mining Ltd. | 140 | 5,770 | ||||
Newmont Mining Corp. | 8 | 484 | ||||
Praxair Inc. | 18 | 1,739 | ||||
Southern Copper Corp. | 136 | 6,635 | ||||
Vale SA - ADR (c) | 169 | 5,856 | ||||
57,508 | ||||||
Total Common Stocks (cost $386,991) | 459,117 | |||||
WARRANTS - 0.0% | ||||||
Uranium Energy Corp. (c) (q) (f) | 183 | — | ||||
Total Warrants (cost $0) | — | |||||
COMMODITY INDEXED STRUCTURED NOTES - 21.0% | ||||||
Bank of America Corp. - Series DJUB, Dow Jones-UBS Commodity Index 2 Month Forward Total Return linked note, 0.17%, 06/07/11 (i) (f) | $ | 7,000 | 11,348 | |||
Bank of America Corp., Dow Jones-UBS Commodity Index linked note, 0.01%, 08/18/11 (i) (f) | 10,000 | 18,778 | ||||
Bank of America Corp., Dow Jones-UBS Commodity Index linked note, 0.01%, 10/24/11 (i) (f) | 10,000 | 15,269 | ||||
BNP Paribas, BNP Paribas Millenium Commodities Long/Short Excess Return Index linked note, 0.02%, 04/15/11 (r) (f) (i) | 14,000 | 27,651 | ||||
Citigroup, Dow Jones-UBS Commodity Index Total Return linked note, 0.29%, 12/15/11 (f) (i) | 28,000 | 35,600 | ||||
JP Morgan, Dow Jones-UBS Commodity Index Total Return linked note, 0.26%, 11/17/11 (f) (i) | 6,000 | 7,869 | ||||
JP Morgan, Dow Jones-UBS Commodity Index Total Return linked note, 0.26%, 12/07/11 (f) (i) | 16,000 | 20,450 | ||||
Societe Generale, Dow Jones-UBS Commodity Index Total Return linked note, 0.26%, 04/15/11 (i) (r) (f) | 10,000 | 19,192 | ||||
See accompanying Notes to the Financial Statements.
JNL Series Trust
Schedules of Investments (in thousands)
December 31, 2010
Shares/Par (p) | Value | |||||
Societe Generale, Dow Jones-UBS Commodity Index Total Return linked note, 0.26%, 08/19/11 (i) (r) (f) | 10,000 | 18,721 | ||||
Svensk Exportkredit AB, Dow Jones-UBS Commodity Index 2 Month Forward Total Return linked note, 0.03%, 04/15/11 (i) (f) | 12,000 | 20,033 | ||||
UBS, Dow Jones-UBS Commodity Index Total Return linked note, 0.26%, 12/30/11 (f) (i) | 7,500 | 10,193 | ||||
UBS, Dow Jones-UBS Commodity Index Total Return linked note, 0.26%, 01/23/12 (f) (i) | 5,000 | 5,667 | ||||
Total Commodity Indexed Structured Notes (cost $135,500) | 210,771 | |||||
SHORT TERM INVESTMENTS - 51.1% | ||||||
Investment Company - 6.3% | ||||||
JNL Money Market Fund, 0.08% (a) (h) | 62,860 | 62,860 | ||||
Securities Lending Collateral 17.7% | ||||||
Securities Lending Cash Collateral Fund LLC, 0.31% (a) (h) | 176,969 | 176,969 | ||||
Securities Lending Liquidating Fund LLC, 0.66% (a) (h) | 698 | 687 | ||||
| 177,656 | ||||||
Treasury Securities 27.1% | ||||||
U.S. Treasury Bill | ||||||
0.13%, 03/24/11 (e) | $ | 10,000 | 9,997 | |||
0.14%, 03/31/11 (e) | 261,050 | 260,964 | ||||
| 270,961 | ||||||
Total Short Term Investments (cost $511,488) | 511,477 | |||||
Total Investments - 118.0% (cost $1,033,979) | 1,181,365 | |||||
Other Assets and Liabilities, Net - (18.0%) | (180,433) | |||||
Total Net Assets - 100.0% | $1,000,932 | |||||
JNL/Capital Guardian Global Balanced Fund | ||||||
COMMON STOCKS - 65.3% | ||||||
CONSUMER DISCRETIONARY - 7.6% | ||||||
Adidas AG | 10 | $656 | ||||
Anhanguera Educacional Participacoes SA | 39 | 942 | ||||
Astra International Tbk PT | 40 | 239 | ||||
Berkeley Group Holdings Plc (c) | 12 | 165 | ||||
CBS Corp. - Class B | 61 | 1,158 | ||||
Coach Inc. | 11 | 586 | ||||
Comcast Corp. - Class A | 68 | 1,485 | ||||
Daimler AG (c) | 49 | 3,328 | ||||
Denso Corp. | 64 | 2,197 | ||||
Discovery Communications Inc. - Class A (c) | 24 | 992 | ||||
DreamWorks Animation SKG Inc. - Class A (c) | 10 | 280 | ||||
GKN Plc | 557 | 1,929 | ||||
Hyundai Mobis (c) | 6 | 1,528 | ||||
Isuzu Motors Ltd. | 55 | 249 | ||||
Li & Fung Ltd. | 120 | 696 | ||||
Li Ning Co. Ltd. (e) | 69 | 145 | ||||
Lowe’s Cos. Inc. | 22 | 554 | ||||
Mazda Motor Corp. | 49 | 140 | ||||
McDonald’s Corp. | 3 | 230 | ||||
Nike Inc. - Class B | 8 | 709 | ||||
SES SA - FDR - Class A | 69 | 1,652 | ||||
Shimamura Co. Ltd. | 8 | 722 | ||||
Target Corp. | 74 | 4,426 | ||||
Time Warner Cable Inc. | 4 | 271 | ||||
Urban Outfitters Inc. (c) | 39 | 1,393 | ||||
| Shares/Par (p) | Value | |||||
Urbi Desarrollos Urbanos SAB DE CV (c) (e) | 47 | 111 | ||||
Walt Disney Co. | 16 | 600 | ||||
| 27,383 | ||||||
CONSUMER STAPLES - 4.6% | ||||||
Avon Products Inc. | 8 | 230 | ||||
Coca-Cola Amatil Ltd. | 28 | 307 | ||||
Colgate-Palmolive Co. | 12 | 989 | ||||
Danone SA | 33 | 2,103 | ||||
General Mills Inc. | 6 | 214 | ||||
Hypermarcas SA (c) | 51 | 688 | ||||
Imperial Tobacco Group Plc | 16 | 500 | ||||
Kraft Foods Inc. - Class A | 6 | 202 | ||||
KT&G Corp. (c) | 1 | 31 | ||||
KT&G Corp. - GDR (c) (q) | 4 | 122 | ||||
L’Oreal SA | 3 | 366 | ||||
Magnit OJSC - GDR | 20 | 586 | ||||
Marfrig Frigorificos e Comercio de Alimentos SA | 21 | 193 | ||||
Nestle SA | 22 | 1,287 | ||||
Organizacion Soriana SAB de CV | 5 | 15 | ||||
PepsiCo Inc. | 5 | 294 | ||||
Pernod-Ricard SA (e) | 16 | 1,480 | ||||
Philip Morris International Inc. | 29 | 1,703 | ||||
Procter & Gamble Co. | 31 | 1,988 | ||||
Tesco Plc | 237 | 1,573 | ||||
United Spirits Ltd. | 52 | 1,691 | ||||
| 16,562 | ||||||
ENERGY - 7.4% | ||||||
Anadarko Petroleum Corp. | 21 | 1,630 | ||||
Baker Hughes Inc. | 13 | 732 | ||||
BG Group Plc | 102 | 2,059 | ||||
Cairn Energy Plc (c) | 86 | 564 | ||||
Cameco Corp. | 83 | 3,356 | ||||
Canadian Natural Resources Ltd. | 7 | 312 | ||||
Cenovus Energy Inc. | 31 | 1,021 | ||||
Chevron Corp. | 8 | 684 | ||||
China Shenhua Energy Co. Ltd. - Class H | 291 | 1,219 | ||||
Gazprom OAO - ADR | 36 | 912 | ||||
Halliburton Co. | 48 | 1,952 | ||||
Lukoil OAO - ADR | 3 | 154 | ||||
Noble Energy Inc. | 26 | 2,204 | ||||
Oil Search Ltd. | 30 | 212 | ||||
Paladin Energy Ltd. (c) | 49 | 247 | ||||
Reliance Industries Ltd. | 23 | 553 | ||||
Repsol YPF SA | 27 | 756 | ||||
Royal Dutch Shell Plc - Class A | 34 | 1,126 | ||||
Sasol Ltd. | 28 | 1,477 | ||||
Schlumberger Ltd. | 27 | 2,246 | ||||
SeaDrill Ltd. | 11 | 362 | ||||
TMK OAO - GDR (c) | 1 | 26 | ||||
Transocean Ltd. (c) | 4 | 263 | ||||
Ultra Petroleum Corp. (c) | 6 | 287 | ||||
Uranium One Inc. | 30 | 144 | ||||
Weatherford International Ltd. (c) | 93 | 2,125 | ||||
| 26,623 | ||||||
FINANCIALS - 11.0% | ||||||
ACE Ltd. | 3 | 193 | ||||
Agricultural Bank of China - Class H (c) (e) (q) | 863 | 433 | ||||
AIA Group Ltd. (c) (q) | 723 | 2,031 | ||||
Allianz SE | 4 | 416 | ||||
Allstate Corp. | 49 | 1,565 | ||||
AON Corp. | 8 | 373 | ||||
Arthur J Gallagher & Co. | 27 | 776 | ||||
Azrieli Group (c) | 19 | 532 | ||||
Banco Bradesco SA - ADR (e) | 50 | 1,007 | ||||
See accompanying Notes to the Financial Statements.
JNL Series Trust
Schedules of Investments (in thousands)
December 31, 2010
| Shares/Par | (p) | Value | ||||||
Bangkok Bank PCL | 45 | 220 | ||||||
Bank of China Ltd. - Class H | 581 | 306 | ||||||
Bank of New York Mellon Corp. | 3 | 91 | ||||||
Barclays Plc | 305 | 1,243 | ||||||
BNP Paribas (q) | 10 | 609 | ||||||
BOC Hong Kong Holdings Ltd. | 85 | 288 | ||||||
Charles Schwab Corp. | 69 | 1,187 | ||||||
China Life Insurance Co. Ltd. | 82 | 335 | ||||||
China Overseas Land & Investment Ltd. (e) | 46 | 85 | ||||||
CIMB Group Holdings Bhd | 356 | 982 | ||||||
CME Group Inc. | 1 | 225 | ||||||
DBS Group Holdings Ltd. | 20 | 226 | ||||||
DLF Ltd. | 345 | 2,252 | ||||||
First Pacific Co. Ltd. | 188 | 169 | ||||||
Goldman Sachs Group Inc. | 8 | 1,328 | ||||||
Grupo Financiero Inbursa SA | 440 | 1,932 | ||||||
HDFC Bank Ltd. | 20 | 1,028 | ||||||
Housing Development & Infrastructure Ltd. (c) | 46 | 198 | ||||||
HSBC Holdings Plc | 276 | 2,808 | ||||||
ICICI Bank Ltd. | 15 | 387 | ||||||
Industrial & Commercial Bank of China – Class H | 1,542 | 1,148 | ||||||
Intact Financial Corp. | 3 | 148 | ||||||
Itau Unibanco Holding SA - ADR | 10 | 252 | ||||||
JPMorgan Chase & Co. | 15 | 645 | ||||||
Kotak Mahindra Bank Ltd. | 11 | 114 | ||||||
Link REIT | 166 | 516 | ||||||
Lloyds Banking Group Plc (c) | 307 | 315 | ||||||
Mitsui Fudosan Co. Ltd. | 89 | 1,769 | ||||||
MSCI Inc. - Class A (c) | 38 | 1,469 | ||||||
Plum Creek Timber Co. Inc. | 12 | 446 | ||||||
Powszechny Zaklad Ubezpieczen SA | 6 | 757 | ||||||
Progressive Corp. | 72 | 1,425 | ||||||
Sampo Oyj - Class A | 28 | 754 | ||||||
Sberbank - GDR (e) | 6 | 2,513 | ||||||
SinoPac Financial Holdings Co. Ltd. | 1,316 | 607 | ||||||
Swire Pacific Ltd. - Class A | 27 | 444 | ||||||
UBS AG (c) | 65 | 1,065 | ||||||
UniCredit SpA (q) | 369 | 764 | ||||||
Vienna Insurance Group | 4 | 214 | ||||||
Wharf Holdings Ltd. | 127 | 977 | ||||||
| 39,567 | ||||||||
HEALTH CARE - 5.2% | ||||||||
Allergan Inc. | 7 | 474 | ||||||
Baxter International Inc. | 14 | 709 | ||||||
Bayer AG | 20 | 1,498 | ||||||
Bristol-Myers Squibb Co. | 14 | 371 | ||||||
Celgene Corp. (c) | 29 | 1,733 | ||||||
Cerner Corp. (c) (e) | 21 | 2,027 | ||||||
CSL Ltd. | 39 | 1,444 | ||||||
Medtronic Inc. | 22 | 823 | ||||||
Merck & Co. Inc. | 30 | 1,092 | ||||||
Novo-Nordisk A/S - Class B | 16 | 1,836 | ||||||
Roche Holding AG | 22 | 3,219 | ||||||
Shire Plc | 96 | 2,305 | ||||||
Shire Plc - ADR (e) | 4 | 268 | ||||||
Sysmex Corp. | 15 | 1,031 | ||||||
| 18,830 | ||||||||
INDUSTRIALS - 6.6% | ||||||||
Adani Enterprises Ltd. | 43 | 630 | ||||||
Andritz AG | 9 | 820 | ||||||
Assa Abloy AB - Class B | 46 | 1,283 | ||||||
China Railway Construction Corp. Ltd. – Class H (c) | 472 | 568 | ||||||
China Railway Group Ltd. - Class H | 1,040 | 751 | ||||||
Cia de Concessoes Rodoviarias | 33 | 932 | ||||||
| Shares/Par | (p) | Value | ||||||
Danaher Corp. | 7 | 349 | ||||||
DP World Ltd. | 190 | 120 | ||||||
Emerson Electric Co. | 24 | 1,372 | ||||||
Empresas ICA SAB de CV (c) (e) | 44 | 111 | ||||||
Fanuc Ltd. | 6 | 841 | ||||||
FedEx Corp. | 27 | 2,521 | ||||||
Harbin Power Equipment Co. Ltd. (e) | 554 | 874 | ||||||
Hyundai Engineering & Construction Co. Ltd. (c) | 12 | 765 | ||||||
Impulsora del Desarrollo y El Empleo en America Latina SAB de CV (c) | 112 | 159 | ||||||
Jardine Matheson Holdings Ltd. | 6 | 282 | ||||||
Kurita Water Industries Ltd. | 41 | 1,293 | ||||||
Mills Estruturas e Servicos de Engenharia SA (c) | 6 | 76 | ||||||
Mitsui OSK Lines Ltd. | 119 | 806 | ||||||
Norfolk Southern Corp. | 29 | 1,828 | ||||||
Sany Heavy Equipment International Holdings Co. Ltd. | 425 | 627 | ||||||
Siemens AG | 32 | 3,984 | ||||||
SMC Corp. | 5 | 819 | ||||||
Sumitomo Corp. | 123 | 1,729 | ||||||
| 23,540 | ||||||||
INFORMATION TECHNOLOGY - 11.7% |
| |||||||
Akamai Technologies Inc. (c) | 19 | 870 | ||||||
Apple Inc. (c) | 7 | 2,129 | ||||||
ASML Holding NV | 52 | 1,998 | ||||||
Autonomy Corp. Plc (c) | 17 | 392 | ||||||
Broadcom Corp. - Class A | 20 | 871 | ||||||
Canon Inc. (e) | 17 | 883 | ||||||
Cisco Systems Inc. (c) | 43 | 860 | ||||||
Daum Communications Corp. (c) | 4 | 255 | ||||||
Delta Electronics Inc. | 200 | 977 | ||||||
First Solar Inc. (c) (e) | 8 | 1,002 | ||||||
Genpact Ltd. (c) | 73 | 1,102 | ||||||
Google Inc. - Class A (c) | 5 | 2,732 | ||||||
HON HAI Precision Industry Co. Ltd. | 17 | 68 | ||||||
HON HAI Precision Industry Co. Ltd. - GDR | 35 | 282 | ||||||
Hynix Semiconductor Inc. (c) | 5 | 102 | ||||||
Ibiden Co. Ltd. | 16 | 486 | ||||||
International Business Machines Corp. | 16 | 2,348 | ||||||
Juniper Networks Inc. (c) | 127 | 4,685 | ||||||
Keyence Corp. | 1 | 300 | ||||||
KLA-Tencor Corp. | 44 | 1,689 | ||||||
Maxim Integrated Products Inc. | 35 | 831 | ||||||
Microchip Technology Inc. (e) | 8 | 274 | ||||||
Murata Manufacturing Co. Ltd. | 27 | 1,857 | ||||||
Nintendo Co. Ltd. | 13 | 3,649 | ||||||
Oracle Corp. | 35 | 1,105 | ||||||
Oracle Corp. Japan | 16 | 804 | ||||||
QUALCOMM Inc. | 36 | 1,787 | ||||||
Redecard SA | 6 | 74 | ||||||
Samsung Electronics Co. Ltd. | 2 | 1,795 | ||||||
Samsung Electronics Co. Ltd. - GDR | 1 | 308 | ||||||
SAP AG | 28 | 1,442 | ||||||
Suntech Power Holdings Co. Ltd. - ADR (c) (e) | 23 | 186 | ||||||
TDK Corp. | 4 | 277 | ||||||
Trend Micro Inc. (c) (e) | 50 | 1,656 | ||||||
Visa Inc. - Class A | 14 | 950 | ||||||
Yahoo! Japan Corp. | 3 | 1,081 | ||||||
| 42,107 | ||||||||
MATERIALS - 6.6% | ||||||||
Air Liquide | 4 | 524 | ||||||
Allegheny Technologies Inc. | 30 | 1,677 | ||||||
Alumina Ltd. | 442 | 1,120 | ||||||
Anglo American Plc | 10 | 494 | ||||||
See accompanying Notes to the Financial Statements.
JNL Series Trust
Schedules of Investments (in thousands)
December 31, 2010
| Shares/Par (p) | Value | |||||
AngloGold Ashanti Ltd. (e) | 9 | 437 | ||||
Barrick Gold Corp. | 23 | 1,219 | ||||
China Shanshui Cement Group Ltd. | 549 | 392 | ||||
Cliffs Natural Resources Inc. | 10 | 780 | ||||
CRH Plc | 90 | 1,874 | ||||
Evraz Group SA - GDR (c) | 5 | 185 | ||||
Grupo Mexico SAB de CV (c) | 46 | 186 | ||||
Harmony Gold Mining Co. Ltd | 9 | 107 | ||||
Harmony Gold Mining Co. Ltd. - ADR (e) | 21 | �� | 257 | |||
HeidelbergCement AG | 3 | 163 | ||||
Holcim Ltd. | 10 | 749 | ||||
Indocement Tunggal Prakarsa Tbk PT | 9 | 16 | ||||
Inmet Mining Corp. | 6 | 493 | ||||
Ivanhoe Mines Ltd. (c) | 12 | 271 | ||||
Labrador Iron Ore Royalty Corp. | 8 | 555 | ||||
Lee & Man Paper Manufacturing Ltd. | 738 | 559 | ||||
LG Chem Ltd. (c) | 4 | 1,388 | ||||
LG Chem Ltd. - GDR (c) (q) | 2 | 276 | ||||
Monsanto Co. | 41 | 2,876 | ||||
Rio Tinto Plc | 6 | 406 | ||||
Sappi Ltd. (c) | 124 | 641 | ||||
Semen Gresik Persero Tbk PT | 473 | 495 | ||||
Shin-Etsu Chemical Co. Ltd. | 3 | 167 | ||||
Stora Enso Oyj - Class R | 60 | 621 | ||||
Sumitomo Chemical Co. Ltd. | 287 | 1,409 | ||||
Syngenta AG | 7 | 1,923 | ||||
United Co. RUSAL Plc (c) | 144 | 221 | ||||
Vale SA - ADR | 3 | 75 | ||||
Vulcan Materials Co. (e) | 11 | 497 | ||||
Xstrata Plc | 19 | 453 | ||||
| 23,506 | ||||||
TELECOMMUNICATION SERVICES - 3.7% | ||||||
America Movil SAB de CV - ADR | 3 | 189 | ||||
American Tower Corp. - Class A (c) | 41 | 2,102 | ||||
Bharti Airtel Ltd. | 53 | 428 | ||||
China Mobile Ltd. | 49 | 487 | ||||
France Telecom SA | 7 | 156 | ||||
Koninklijke KPN NV | 70 | 1,016 | ||||
Magyar Telekom Telecommunications Plc | 63 | 156 | ||||
Maxis Bhd | 252 | 434 | ||||
MTN Group Ltd. (c) | 13 | 265 | ||||
Rostelecom OJSC - ADR | 1 | 35 | ||||
SK Telecom Co. Ltd. | 1 | 210 | ||||
SK Telecom Co. Ltd. - ADR | 16 | 304 | ||||
SoftBank Corp. | 95 | 3,276 | ||||
Tele Norte Leste Participacoes SA | 1 | 16 | ||||
Telefonos de Mexico SAB de CV | 50 | 40 | ||||
Telefonos de Mexico SAB de CV - ADR (e) | 48 | 780 | ||||
Telekomunikacja Polska SA | 150 | 826 | ||||
Telstra Corp. Ltd. | 98 | 280 | ||||
TELUS Corp. (e) | 5 | 235 | ||||
Verizon Communications Inc. | 38 | 1,345 | ||||
Vodafone Group Plc | 207 | 534 | ||||
| 13,114 | ||||||
UTILITIES - 0.9% | ||||||
China Longyuan Power Group Corp. – Class H (c) (e) | 236 | 216 | ||||
Companhia Energetica de Minas Gerais – ADR (e) | 12 | 202 | ||||
Edison International | 4 | 162 | ||||
Electricite de France SA | 6 | 230 | ||||
GDF Suez | 21 | 739 | ||||
Hong Kong & China Gas Co. Ltd. (e) | 215 | 507 | ||||
National Grid Plc | 25 | 215 | ||||
| Shares/Par (p) | Value | |||||
Veolia Environnement | 34 | 980 | ||||
| 3,251 | ||||||
Total Common Stocks (cost $194,712) | 234,483 | |||||
PREFERRED STOCKS - 0.4% | ||||||
INFORMATION TECHNOLOGY - 0.0% | ||||||
ASAT Holdings Ltd. (f) (q) | 7 | — | ||||
MATERIALS - 0.1% | ||||||
Vale SA, Class A | 6 | 176 | ||||
TELECOMMUNICATION SERVICES - 0.1% | ||||||
Tele Norte Leste Participacoes SA | 21 | 305 | ||||
UTILITIES - 0.2% | ||||||
Cia Energetica de Sao Paulo, Class B | 52 | 839 | ||||
Total Preferred Stocks (cost $1,059) | 1,320 | |||||
RIGHTS - 0.0% | ||||||
Ivanhoe Mines Ltd. (c) | 12 | 16 | ||||
Total Rights (cost $0) | 16 | |||||
CORPORATE BONDS AND NOTES - 5.7% | ||||||
CONSUMER DISCRETIONARY - 0.7% | ||||||
Altegrity Inc., 10.50%, 11/01/15 (q) | $ | 200 | 205 | |||
AMC Entertainment Inc., 8.75%, 06/01/19 (e) | 300 | 320 | ||||
CCO Holdings LLC, 7.25%, 10/30/17 | 400 | 406 | ||||
Comcast Corp., 5.88%, 02/15/18 | 250 | 278 | ||||
Michaels Stores Inc., 7.75%, 11/01/18 (e) (q) | 250 | 249 | ||||
Nextel Communications Inc., 7.38%, 08/01/15 | 300 | 301 | ||||
Time Warner Inc., 5.88%, 11/15/16 | 450 | 508 | ||||
Toys R Us Property Co. II LLC, 8.50%, 12/01/17 | 200 | 215 | ||||
| 2,482 | ||||||
CONSUMER STAPLES - 0.3% | ||||||
Anheuser-Busch InBev NV, 8.63%, 01/30/17, EUR | 425 | 722 | ||||
Imperial Tobacco Finance Plc, 8.38%, 02/17/16, EUR | 250 | 407 | ||||
Tesco Plc, 5.50%, 01/13/33, GBP | 100 | 158 | ||||
| 1,287 | ||||||
ENERGY - 0.0% | ||||||
Petrobras International Finance Co., 6.88%, 01/20/40 (e) | 85 | 89 | ||||
FINANCIALS - 2.4% | ||||||
Bank of America Corp., 5.75%, 12/01/17 | 480 | 500 | ||||
Barclays Bank Plc, 5.13%, 01/08/20 (e) | 285 | 291 | ||||
CIT Group Inc., 7.00%, 05/01/15 (e) | 400 | 401 | ||||
Depfa ACS Bank, 3.25%, 02/15/12, EUR | 550 | 726 | ||||
Eurohypo AG, 4.50%, 01/21/13, EUR | 100 | 141 | ||||
Ford Motor Credit Co. LLC, 8.00%, 12/15/16 | 375 | 419 | ||||
Goldman Sachs Group Inc., 5.38%, 03/15/20 | 300 | 310 | ||||
JPMorgan Chase & Co., 4.40%, 07/22/20 | 325 | 320 | ||||
Liberty Mutual Group Inc., 7.50%, 08/15/36 (q) | 350 | 348 | ||||
Lloyds TSB Bank Plc, 6.38%, 06/17/16, EUR | 500 | 718 | ||||
Merrill Lynch & Co. Inc., 4.63%, 09/14/18, EUR | 250 | 297 | ||||
Muenchener Rueckversicherungs AG, 6.75%, 06/21/23, EUR | 150 | 209 | ||||
Nordea Hypotek AB, 4.00%, 06/18/14, SEK | 2,600 | 394 | ||||
ProLogis, 7.38%, 10/30/19 | 600 | 655 | ||||
Rodamco Europe Finance BV, 3.75%, 12/12/12, EUR | 200 | 275 | ||||
See accompanying Notes to the Financial Statements.
JNL Series Trust
Schedules of Investments (in thousands)
December 31, 2010
| Shares/Par (p) | Value | |||||||
Royal Bank of Scotland Plc | ||||||||
4.38%, 07/13/16, EUR | 250 | 343 | ||||||
6.93%, 04/09/18, EUR | 550 | 695 | ||||||
Societe Generale, 5.75%, 04/20/16 (q) | 150 | 159 | ||||||
Standard Chartered Bank, 6.40%, 09/26/17 (q) | 300 | 321 | ||||||
UBS AG Stamford, 5.88%, 12/20/17 | 175 | 192 | ||||||
Westfield Europe Finance Plc. | ||||||||
3.63%, 06/27/12, EUR | 400 | 542 | ||||||
5.50%, 06/27/17, GBP | 150 | 244 | ||||||
| 8,500 | ||||||||
HEALTH CARE - 0.5% | ||||||||
HCA Inc. | ||||||||
6.38%, 01/15/15 | 300 | 295 | ||||||
9.25%, 11/15/16 | 75 | 80 | ||||||
Merck & Co Inc., 5.38%, 10/01/14, EUR | 350 | 514 | ||||||
Pfizer Inc., 6.20%, 03/15/19 | 400 | 469 | ||||||
Roche Holdings Inc., 6.00%, 03/01/19 (l) (q) | 400 | 465 | ||||||
| 1,823 | ||||||||
INDUSTRIALS - 0.2% | ||||||||
TransDigm Inc., 7.75%, 12/15/18 (e) (q) | 400 | 414 | ||||||
Volvo AB, 5.00%, 05/31/17, EUR | 150 | 210 | ||||||
| 624 | ||||||||
INFORMATION TECHNOLOGY - 0.2% |
| |||||||
First Data Corp. | ||||||||
9.88%, 09/24/15 | 23 | 22 | ||||||
8.25%, 01/15/21 (q) | 100 | 96 | ||||||
12.63%, 01/15/21 (e) (q) | 201 | 192 | ||||||
8.75%, 01/15/22 (e) (q) | 100 | 96 | ||||||
NXP BV, 7.88%, 10/15/14 | 200 | 208 | ||||||
| 614 | ||||||||
MATERIALS - 0.1% | ||||||||
Georgia Gulf Corp., 9.00%, 01/15/17 (q) | 300 | 326 | ||||||
TELECOMMUNICATION SERVICES - 0.6% |
| |||||||
AT&T Inc., 2.50%, 08/15/15 | 600 | 598 | ||||||
AT&T Wireless Services Inc, 8.13%, 05/01/12 | 250 | 273 | ||||||
France Telecom SA, 7.50%, 03/14/11, GBP | 150 | 237 | ||||||
Koninklijke KPN NV, 4.75%, 01/17/17, EUR | 200 | 283 | ||||||
Telecom Italia Finance SA, 7.75%, 01/24/33, EUR | 150 | 212 | ||||||
Telecom Italia SpA, 8.25%, 03/21/16, EUR | 150 | 234 | ||||||
Vodafone Group Plc, 4.75%, 06/14/16, EUR | 350 | 501 | ||||||
| 2,338 | ||||||||
UTILITIES - 0.7% | ||||||||
Abu Dhabi National Energy Co., 6.17%, 10/25/17 | 300 | 316 | ||||||
AES Corp., 7.75%, 10/15/15 | 125 | 133 | ||||||
AES Panama SA, 6.35%, 12/21/16 (q) | 300 | 322 | ||||||
Dubai Electricity & Water Authority | ||||||||
6.38%, 10/21/16 (q) | 100 | 97 | ||||||
7.38%, 10/21/20 (q) | 125 | 117 | ||||||
E.ON International Finance BV, 5.80%, 04/30/18 (e) (q) | 500 | 565 | ||||||
Edison Mission Energy, 7.75%, 06/15/16 | 150 | 129 | ||||||
National Grid Plc, 6.30%, 08/01/16 (e) | 300 | 342 | ||||||
Veolia Environnement, 5.25%, 06/03/13 | 525 | 567 | ||||||
| 2,588 | ||||||||
Total Corporate Bonds and Notes (cost $20,419) | 20,671 | |||||||
| Shares/Par (p) | Value | |||||||
GOVERNMENT AND AGENCY OBLIGATIONS - 24.6% |
| |||||||
GOVERNMENT SECURITIES - 21.8% |
| |||||||
Sovereign - 16.0% | ||||||||
Brazil Notas do Tesouro Nacional - Series B, 6.00%, 05/15/17, BRL | 580 | 699 | ||||||
Bundesrepublic Deutschland, 3.00%, 07/04/20, EUR | 3,600 | 4,835 | ||||||
Canadian Government Bond | ||||||||
4.50%, 06/01/15, CAD | 1,750 | 1,922 | ||||||
4.25%, 06/01/18, CAD | 300 | 329 | ||||||
Colombia Government International Bond | ||||||||
12.00%, 10/22/15, COP | 231,000 | 160 | ||||||
9.85%, 06/28/27, COP | 285,000 | 210 | ||||||
Croatia Government International Bond, 6.75%, 11/05/19 (q) | 625 | 654 | ||||||
Denmark Government Bond, 5.00%, 11/15/13, DKK | 11,975 | 2,365 | ||||||
Dominican Republic International Bond, 8.63%, 04/20/27 (q) | 150 | 168 | ||||||
Egypt Government International Bond, 5.75%, 04/29/20 (q) | 125 | 129 | ||||||
France Government Bond, 4.25%, 10/25/23, EUR | 300 | 429 | ||||||
Hungary Government International Bond, 5.50%, 02/12/14, HUF | 100,000 | 452 | ||||||
Indonesia Government Bond | ||||||||
12.50%, 03/15/13, IDR | 250,000 | 31 | ||||||
11.00%, 10/15/14, IDR | 65,000 | 8 | ||||||
9.50%, 06/15/15, IDR | 3,000,000 | 366 | ||||||
10.75%, 05/15/16, IDR | 145,000 | 19 | ||||||
12.80%, 06/15/21, IDR | 495,000 | 74 | ||||||
Italy Buoni Poliennali Del Tesoro | ||||||||
5.00%, 02/01/12, EUR | 825 | 1,132 | ||||||
4.50%, 03/01/19, EUR | 350 | 467 | ||||||
Japan Government Bond | ||||||||
1.10%, 03/21/11, JPY | 105,000 | 1,296 | ||||||
1.70%, 09/20/17, JPY | 325,000 | 4,277 | ||||||
2.30%, 12/20/35, JPY | 50,000 | 655 | ||||||
Korea Treasury Bond, 4.25%, 09/10/14, KRW | 2,550,000 | 2,268 | ||||||
Malaysia Government Bond, 5.09%, 04/30/14, MYR | 9,325 | 3,199 | ||||||
Mexican Bonos | ||||||||
9.50%, 12/18/14, MXN | 29,000 | 2,628 | ||||||
7.75%, 12/14/17, MXN | 3,800 | 327 | ||||||
Netherlands Government Bond, 3.25%, 07/15/15, EUR | 1,250 | 1,765 | ||||||
Norway Government Bond, 6.50%, 05/15/13, NOK | 4,750 | 888 | ||||||
Poland Government Treasury International Bond | ||||||||
5.75%, 04/25/14, PLN | 5,250 | 1,808 | ||||||
5.25%, 10/25/17, PLN | 3,000 | 990 | ||||||
6.38%, 07/15/19 | 650 | 728 | ||||||
Queensland Treasury Corp., 6.00%, 10/14/15, AUD | 3,500 | 3,622 | ||||||
Republic of Argentina | ||||||||
8.28%, 12/31/33 (e) | 385 | 358 | ||||||
2.28%, 12/15/35 (e) (i) | 515 | 78 | ||||||
Republic of Deutschland | ||||||||
3.75%, 07/04/13, EUR | 250 | 357 | ||||||
4.25%, 07/04/14 - 07/04/18 , EUR | 4,195 | 6,180 | ||||||
3.25%, 07/04/15, EUR | 825 | 1,172 | ||||||
4.75%, 07/04/34, EUR | 950 | 1,514 | ||||||
4.00%, 01/04/37, EUR | 100 | 145 | ||||||
Republic of Hungary, 6.25%, 01/29/20 (e) | 400 | 387 | ||||||
Republic of Iraq, 5.80%, 01/15/28 | 500 | 455 | ||||||
Republic of Turkey, 7.50%, 11/07/19 | 150 | 178 | ||||||
Republic of Venezuela, 9.38%, 01/13/34 | 300 | 203 | ||||||
See accompanying Notes to the Financial Statements.
JNL Series Trust
Schedules of Investments (in thousands)
December 31, 2010
| Shares/Par (p) | Value | |||||||
Singapore Government Bond, 3.75%, 09/01/16, SGD | 1,950 | 1,677 | ||||||
Sweden Government Bond, 6.75%, 05/05/14, SEK | 13,250 | 2,238 | ||||||
Thailand Government Bond | ||||||||
5.25%, 05/12/14, THB | 1,650 | 58 | ||||||
3.63%, 05/22/15, THB | 4,150 | 140 | ||||||
Turkey Government International Bond | ||||||||
16.00%, 03/07/12 - 08/28/13 , TRY | 350 | 271 | ||||||
6.75%, 05/30/40 | 150 | 164 | ||||||
United Kingdom Treasury Bond | ||||||||
2.75%, 01/22/15, GBP | 200 | 320 | ||||||
4.00%, 09/07/16, GBP | 400 | 672 | ||||||
4.50%, 03/07/19, GBP | 375 | 639 | ||||||
5.00%, 03/07/25, GBP | 400 | 700 | ||||||
4.75%, 12/07/38, GBP | 350 | 596 | ||||||
| 57,402 | ||||||||
Treasury Inflation Index Securities - 0.5% |
| |||||||
Republic of Turkey Treasury Inflation Indexed Note, 10.00%, 02/15/12 (n), TRY | 305 | 217 | ||||||
U.S. Treasury Inflation Indexed Note, 2.00%, 07/15/14 (n) | 1,479 | 1,599 | ||||||
| 1,816 | ||||||||
U.S. Treasury Securities - 5.3% |
| |||||||
U.S. Treasury Bond | ||||||||
5.25%, 02/15/29 | 1,000 | 1,147 | ||||||
4.38%, 02/15/38 | 1,650 | 1,667 | ||||||
U.S. Treasury Note | ||||||||
0.75%, 05/31/12 | 4,500 | 4,521 | ||||||
2.75%, 02/28/13 | 2,650 | 2,770 | ||||||
4.25%, 08/15/13 - 11/15/13 | 7,700 | 8,393 | ||||||
3.50%, 02/15/18 | 400 | 421 | ||||||
| 18,919 | ||||||||
U.S. GOVERNMENT AGENCY MORTGAGE-BACKED SECURITIES - 2.8% |
| |||||||
Federal National Mortgage Association - 2.2% |
| |||||||
Federal National Mortgage Association |
| |||||||
4.00%, 06/01/25 | 1,894 | 1,958 | ||||||
3.50%, 12/01/25 | 1,475 | 1,489 | ||||||
5.50%, 06/01/38, TBA (g) | 1,943 | 2,080 | ||||||
6.00%, 07/01/38 | 1,254 | 1,365 | ||||||
5.00%, 04/01/39 | 822 | 865 | ||||||
| 7,757 | ||||||||
Government National Mortgage Association - 0.6% |
| |||||||
Government National Mortgage Association |
| |||||||
4.50%, 11/20/39 | 791 | 823 | ||||||
4.00%, 01/15/41, TBA (g) | 1,500 | 1,510 | ||||||
| 2,333 | ||||||||
Total Government and Agency Obligations (cost $85,462) | 88,227 | |||||||
SHORT TERM INVESTMENTS - 8.4% |
| |||||||
Investment Company - 4.5% | ||||||||
JNL Money Market Fund, 0.08% (a) (h) | 16,241 | 16,241 | ||||||
Securities Lending Collateral 3.9% | ||||||||
Securities Lending Cash Collateral Fund LLC, 0.31% (a) (h) | 12,684 | 12,684 | ||||||
Securities Lending Liquidating Fund LLC, 0.66% (a) (h) | 1,207 | 1,187 | ||||||
| 13,871 | ||||||||
Total Short Term Investments (cost $30,132) | 30,112 | |||||||
| Shares/Par (p) | Value | |||||||
Total Investments - 104.4% (cost $331,784) | 374,829 | |||||||
Other Assets and Liabilities, Net - (4.4%) | (15,815) | |||||||
Total Net Assets - 100.0% | $ | 359,014 | ||||||
JNL/Capital Guardian Global Diversified Research Fund |
| |||||||
COMMON STOCKS - 96.6% |
| |||||||
CONSUMER DISCRETIONARY - 8.3% | ||||||||
Astra International Tbk PT | 187 | $ | 1,127 | |||||
Comcast Corp. - Class A | 145 | 3,190 | ||||||
Daimler AG (c) | �� | 51 | 3,443 | |||||
Denso Corp. | 64 | 2,211 | ||||||
Discovery Communications Inc. - Class A (c) | 33 | 1,384 | ||||||
DreamWorks Animation SKG Inc. - Class A (c) | 72 | 2,107 | ||||||
Gannett Co. Inc. | 83 | 1,248 | ||||||
Isuzu Motors Ltd. | 338 | 1,527 | ||||||
Lowe’s Cos. Inc. | 102 | 2,558 | ||||||
Mazda Motor Corp. | 633 | 1,806 | ||||||
McDonald’s Corp. | 34 | 2,641 | ||||||
Nike Inc. - Class B | 23 | 1,990 | ||||||
Shimamura Co. Ltd. | 19 | 1,749 | ||||||
Target Corp. | 82 | 4,913 | ||||||
Time Warner Cable Inc. | 37 | 2,430 | ||||||
Urban Outfitters Inc. (c) | 51 | 1,830 | ||||||
| 36,154 | ||||||||
CONSUMER STAPLES - 8.0% |
| |||||||
Avon Products Inc. | 71 | 2,066 | ||||||
Coca-Cola Amatil Ltd. (e) | 348 | 3,865 | ||||||
Danone SA | 73 | 4,570 | ||||||
General Mills Inc. | 77 | 2,726 | ||||||
Imperial Tobacco Group Plc | 121 | 3,704 | ||||||
Kraft Foods Inc. - Class A | 86 | 2,723 | ||||||
PepsiCo Inc. | 43 | 2,822 | ||||||
Pernod-Ricard SA | 66 | 6,247 | ||||||
Philip Morris International Inc. | 45 | 2,651 | ||||||
Procter & Gamble Co. | 53 | 3,429 | ||||||
| 34,803 | ||||||||
ENERGY - 14.5% | ||||||||
BG Group Plc | 538 | 10,861 | ||||||
Cairn Energy Plc (c) | 475 | 3,110 | ||||||
Cameco Corp. | 63 | 2,562 | ||||||
Canadian Natural Resources Ltd. | 70 | 3,132 | ||||||
Cenovus Energy Inc. | 126 | 4,214 | ||||||
Chevron Corp. | 70 | 6,415 | ||||||
China Shenhua Energy Co. Ltd. - Class H | 922 | 3,867 | ||||||
Gazprom OAO - ADR | 174 | 4,383 | ||||||
Halliburton Co. | 88 | 3,577 | ||||||
Oil Search Ltd. (e) | 288 | 2,075 | ||||||
Reliance Industries Ltd. | 48 | 1,136 | ||||||
Royal Dutch Shell Plc - Class A | 156 | 5,166 | ||||||
Schlumberger Ltd. | 36 | 2,998 | ||||||
SeaDrill Ltd. | 48 | 1,651 | ||||||
Total SA | 42 | 2,215 | ||||||
Transocean Ltd. (c) | 21 | 1,487 | ||||||
Ultra Petroleum Corp. (c) | 45 | 2,131 | ||||||
Weatherford International Ltd. (c) | 110 | 2,510 | ||||||
| 63,490 | ||||||||
FINANCIALS - 16.0% | ||||||||
AIA Group Ltd. (c) (q) | 1,241 | 3,489 | ||||||
Allstate Corp. | 89 | 2,831 | ||||||
See accompanying Notes to the Financial Statements.
JNL Series Trust
Schedules of Investments (in thousands)
December 31, 2010
| Shares/Par (p) | Value | |||||||
AON Corp. | 65 | 2,977 | ||||||
Bank of China Ltd. - Class H | 7,530 | 3,972 | ||||||
Bank of New York Mellon Corp. | 37 | 1,114 | ||||||
Barclays Plc | 548 | 2,234 | ||||||
BNP Paribas (q) | 25 | 1,609 | ||||||
Charles Schwab Corp. | 132 | 2,255 | ||||||
CIMB Group Holdings Bhd | 540 | 1,489 | ||||||
CME Group Inc. - Class A | 8 | 2,413 | ||||||
DBS Group Holdings Ltd. | 177 | 1,973 | ||||||
DLF Ltd. | 125 | 816 | ||||||
Goldman Sachs Group Inc. | 23 | 3,901 | ||||||
Grupo Financiero Inbursa SA | 273 | 1,199 | ||||||
HSBC Holdings Plc | 385 | 3,906 | ||||||
Industrial & Commercial Bank of China – Class H | 5,235 | 3,900 | ||||||
Intact Financial Corp. | 35 | 1,785 | ||||||
Itau Unibanco Holding SA - ADR | 72 | 1,729 | ||||||
JPMorgan Chase & Co. | 54 | 2,269 | ||||||
Link REIT | 1,582 | 4,914 | ||||||
Lloyds Banking Group Plc (c) | 2,662 | 2,727 | ||||||
Mitsui Fudosan Co. Ltd. | 62 | 1,232 | ||||||
Plum Creek Timber Co. Inc. | 25 | 918 | ||||||
Progressive Corp. | 127 | 2,525 | ||||||
Sampo Oyj | 107 | 2,864 | ||||||
UBS AG (c) | 204 | 3,347 | ||||||
Wells Fargo & Co. | 42 | 1,314 | ||||||
Wharf Holdings Ltd. | 551 | 4,239 | ||||||
| 69,941 | ||||||||
HEALTH CARE - 7.5% | ||||||||
Allergan Inc. | 71 | 4,896 | ||||||
Bayer AG | 57 | 4,214 | ||||||
Celgene Corp. (c) | 43 | 2,561 | ||||||
Cerner Corp. (c) (e) | 31 | 2,908 | ||||||
CSL Ltd. | 67 | 2,487 | ||||||
Merck & Co. Inc. | 74 | 2,681 | ||||||
Novo-Nordisk A/S - Class B | 36 | 4,045 | ||||||
Roche Holding AG | 20 | 2,881 | ||||||
Shire Plc | 201 | 4,828 | ||||||
Sysmex Corp. | 19 | 1,286 | ||||||
| 32,787 | ||||||||
INDUSTRIALS - 6.9% | ||||||||
Assa Abloy AB - Class B | 101 | 2,846 | ||||||
China Railway Construction Corp. Ltd. – Class H (c) | 938 | 1,129 | ||||||
China Railway Group Ltd. - Class H | 1,715 | 1,238 | ||||||
Cia de Concessoes Rodoviarias | 62 | 1,752 | ||||||
Danaher Corp. | 64 | 3,019 | ||||||
Emerson Electric Co. | 27 | 1,526 | ||||||
FedEx Corp. | 33 | 3,088 | ||||||
Jardine Matheson Holdings Ltd. | 56 | 2,482 | ||||||
Kurita Water Industries Ltd. | 42 | 1,306 | ||||||
Mitsui OSK Lines Ltd. | 444 | 3,009 | ||||||
Norfolk Southern Corp. | 34 | 2,123 | ||||||
Siemens AG | 41 | 5,055 | ||||||
Sumitomo Corp. | 101 | 1,420 | ||||||
| 29,993 | ||||||||
INFORMATION TECHNOLOGY - 15.4% |
| |||||||
Apple Inc. (c) | 13 | 4,064 | ||||||
ASML Holding NV | 95 | 3,684 | ||||||
ASML Holding NV - NYS | 14 | 548 | ||||||
Autonomy Corp. Plc (c) | 72 | 1,689 | ||||||
Canon Inc. (e) | 42 | 2,157 | ||||||
Cisco Systems Inc. (c) | 86 | 1,744 | ||||||
Delta Electronics Inc. | 393 | 1,921 | ||||||
First Solar Inc. (c) (e) | 6 | 807 | ||||||
| Shares/Par (p) | Value | |||||||
Google Inc. - Class A (c) | 6 | 3,445 | ||||||
Ibiden Co. Ltd. | 45 | 1,408 | ||||||
International Business Machines Corp. | 27 | 3,933 | ||||||
Juniper Networks Inc. (c) | 78 | 2,869 | ||||||
Keyence Corp. | 12 | 3,353 | ||||||
KLA-Tencor Corp. | 34 | 1,322 | ||||||
Maxim Integrated Products Inc. | 182 | 4,299 | ||||||
Murata Manufacturing Co. Ltd. | 30 | 2,094 | ||||||
Nintendo Co. Ltd. | 7 | 2,131 | ||||||
Oracle Corp. | 105 | 3,299 | ||||||
Oracle Corp. Japan | 22 | 1,079 | ||||||
QUALCOMM Inc. | 102 | 5,028 | ||||||
Samsung Electronics Co. Ltd. | 2 | 1,804 | ||||||
Samsung Electronics Co. Ltd. - GDR | 9 | 3,700 | ||||||
SAP AG | 49 | 2,493 | ||||||
TDK Corp. | 41 | 2,839 | ||||||
Trend Micro Inc. (c) (e) | 57 | 1,866 | ||||||
Visa Inc. - Class A | 55 | 3,836 | ||||||
| 67,412 | ||||||||
MATERIALS - 11.9% | ||||||||
Air Products & Chemicals Inc. | 27 | 2,410 | ||||||
Allegheny Technologies Inc. | 47 | 2,571 | ||||||
Anglo American Plc | 81 | 4,212 | ||||||
Barrick Gold Corp. | 40 | 2,122 | ||||||
Cliffs Natural Resources Inc. | 47 | 3,690 | ||||||
CRH Plc | 78 | 1,606 | ||||||
HeidelbergCement AG | 22 | 1,352 | ||||||
Holcim Ltd. | 18 | 1,373 | ||||||
Inmet Mining Corp. | 54 | 4,218 | ||||||
LG Chem Ltd. - GDR (c) (q) | 21 | 3,600 | ||||||
Monsanto Co. | 16 | 1,128 | ||||||
Newcrest Mining Ltd. | 81 | 3,354 | ||||||
Rio Tinto Plc | 54 | 3,776 | ||||||
Sappi Ltd. (c) | 235 | 1,214 | ||||||
Shin-Etsu Chemical Co. Ltd. | 31 | 1,671 | ||||||
Stora Enso Oyj - Class R | 243 | 2,501 | ||||||
Sumitomo Chemical Co. Ltd. | 406 | 1,993 | ||||||
Syngenta AG | 14 | 4,163 | ||||||
Vale SA - ADR | 50 | 1,517 | ||||||
Xstrata Plc | 160 | 3,760 | ||||||
| 52,231 | ||||||||
TELECOMMUNICATION SERVICES - 5.8% |
| |||||||
American Tower Corp. - Class A (c) | 173 | 8,949 | ||||||
Bharti Airtel Ltd. | 250 | 2,006 | ||||||
France Telecom SA | 97 | 2,028 | ||||||
Koninklijke KPN NV | 295 | 4,309 | ||||||
MTN Group Ltd. (c) | 117 | 2,387 | ||||||
SoftBank Corp. | 78 | 2,683 | ||||||
Telstra Corp. Ltd. | 546 | 1,557 | ||||||
TELUS Corp. (e) | 38 | 1,653 | ||||||
| 25,572 | ||||||||
UTILITIES - 2.3% | ||||||||
Edison International | 48 | 1,849 | ||||||
GDF Suez | 53 | 1,912 | ||||||
Hong Kong & China Gas Co. Ltd. | 1,073 | 2,529 | ||||||
National Grid Plc | 218 | 1,880 | ||||||
Veolia Environnement | 60 | 1,764 | ||||||
| 9,934 | ||||||||
Total Common Stocks (cost $351,384) | 422,317 | |||||||
See accompanying Notes to the Financial Statements.
JNL Series Trust
Schedules of Investments (in thousands)
December 31, 2010
| Shares/Par (p) | Value | |||||||
CORPORATE BONDS AND NOTES - 0.1% |
| |||||||
ENERGY - 0.1% | ||||||||
Seadrill Ltd., 3.63%, 11/08/12 | $ | 300 | 372 | |||||
Total Corporate Bonds and Notes (cost $191) | 372 | |||||||
SHORT TERM INVESTMENTS - 5.6% |
| |||||||
Investment Company - 3.3% |
| |||||||
JNL Money Market Fund, 0.08% (a) (h) | 14,275 | 14,275 | ||||||
Securities Lending Collateral 2.3% |
| |||||||
Securities Lending Cash Collateral Fund LLC, 0.31% (a) (h) | 9,218 | 9,218 | ||||||
Securities Lending Liquidating Fund LLC, 0.66% (a) (h) | 889 | 874 | ||||||
| 10,092 | ||||||||
Total Short Term Investments (cost $24,382) |
| 24,367 | ||||||
Total Investments - 102.3% (cost $375,957) |
| 447,056 | ||||||
Other Assets and Liabilities, Net - (2.3%) |
| (9,848) | ||||||
Total Net Assets - 100.0% | $ | 437,208 | ||||||
JNL/Eagle SmallCap Equity Fund |
| |||||||
COMMON STOCKS - 99.0% |
| |||||||
CONSUMER DISCRETIONARY - 21.6% |
| |||||||
American Axle & Manufacturing Holdings Inc. (c) | 710 | $ | 9,135 | |||||
ArvinMeritor Inc. (c) | 455 | 9,339 | ||||||
Bally Technologies Inc. (c) | 231 | 9,748 | ||||||
BJ’s Restaurants Inc. (c) | 277 | 9,812 | ||||||
Buffalo Wild Wings Inc. (c) (e) | 86 | 3,759 | ||||||
Chico’s FAS Inc. | 568 | 6,834 | ||||||
Genesco Inc. (c) | 455 | 17,059 | ||||||
Gentex Corp. | 214 | 6,326 | ||||||
Orient-Express Hotels Ltd. - Class A (c) | 318 | 4,125 | ||||||
Pinnacle Entertainment Inc. (c) | 419 | 5,877 | ||||||
Shuffle Master Inc. (c) | 928 | 10,624 | ||||||
Sotheby’s - Class A | 165 | 7,431 | ||||||
Steven Madden Ltd. (c) | 125 | 5,214 | ||||||
Universal Electronics Inc. (c) | 296 | 8,387 | ||||||
Vitamin Shoppe Inc. (c) | 401 | 13,491 | ||||||
| 127,161 | ||||||||
CONSUMER STAPLES - 1.9% |
| |||||||
Herbalife Ltd. | 82 | 5,624 | ||||||
The Fresh Market Inc. (c) | 131 | 5,410 | ||||||
| 11,034 | ||||||||
ENERGY - 7.4% | ||||||||
Cloud Peak Energy Inc. (c) | 286 | 6,641 | ||||||
Lufkin Industries Inc. | 291 | 18,154 | ||||||
Oasis Petroleum Inc. (c) | 289 | 7,827 | ||||||
OYO Geospace Corp. (c) | 113 | 11,150 | ||||||
| 43,772 | ||||||||
FINANCIALS - 4.9% | ||||||||
Cash America International Inc. | 265 | 9,803 | ||||||
Duff & Phelps Corp. - Class A | 240 | 4,038 | ||||||
DuPont Fabros Technology Inc. (e) | 105 | 2,224 | ||||||
MGIC Investment Corp. (c) | 338 | 3,449 | ||||||
optionsXpress Holdings Inc. (c) | 192 | 3,008 | ||||||
Redwood Trust Inc. | 297 | 4,428 | ||||||
| Shares/Par (p) | Value | |||||||
UMB Financial Corp. | 53 | 2,183 | ||||||
| 29,133 | ||||||||
HEALTH CARE - 16.5% | ||||||||
Allscripts Healthcare Solutions Inc. (c) | 382 | 7,352 | ||||||
American Medical Systems Holdings Inc. (c) | 404 | 7,624 | ||||||
ArthroCare Corp. (c) | 141 | 4,379 | ||||||
BioMarin Pharmaceutical Inc. (c) (e) | 218 | 5,871 | ||||||
Bruker Corp. (c) | 384 | 6,370 | ||||||
Catalyst Health Solutions Inc. (c) | 99 | 4,599 | ||||||
Centene Corp. (c) | 221 | 5,593 | ||||||
Genoptix Inc. (c) | 216 | 4,116 | ||||||
ICON Plc - ADR (c) | 247 | 5,406 | ||||||
MedAssets Inc. (c) | 287 | 5,800 | ||||||
Quality Systems Inc. (e) | 123 | 8,620 | ||||||
Regeneron Pharmaceuticals Inc. (c) | 149 | 4,881 | ||||||
Salix Pharmaceuticals Ltd. (c) | 95 | 4,468 | ||||||
Seattle Genetics Inc. (c) (e) | 241 | 3,597 | ||||||
Sirona Dental Systems Inc. (c) | 188 | 7,868 | ||||||
Thoratec Corp. (c) | 289 | 8,182 | ||||||
Vital Images Inc. (c) | 198 | 2,762 | ||||||
| 97,488 | ||||||||
INDUSTRIALS - 14.5% | ||||||||
Atlas Air Worldwide Holdings Inc. (c) | 104 | 5,800 | ||||||
FTI Consulting Inc. (c) | 158 | 5,889 | ||||||
Geo Group Inc. (c) | 451 | 11,128 | ||||||
GrafTech International Ltd. (c) | 591 | 11,722 | ||||||
JetBlue Airways Corp. (c) | 885 | 5,849 | ||||||
Landstar System Inc. | 132 | 5,412 | ||||||
Northwest Pipe Co. (c) | 168 | 4,044 | ||||||
Regal-Beloit Corp. | 124 | 8,279 | ||||||
Triumph Group Inc. | 72 | 6,393 | ||||||
WABCO Holdings Inc. (c) | 203 | 12,381 | ||||||
Waste Connections Inc. | 321 | 8,850 | ||||||
| 85,747 | ||||||||
INFORMATION TECHNOLOGY - 26.3% |
| |||||||
Ansys Inc. (c) | 175 | 9,090 | ||||||
Coherent Inc. (c) | 186 | 8,399 | ||||||
Compuware Corp. (c) | 752 | 8,778 | ||||||
DTS Inc. (c) | 240 | 11,767 | ||||||
EMS Technologies Inc. (c) | 336 | 6,647 | ||||||
Fortinet Inc. (c) (e) | 193 | 6,244 | ||||||
Informatica Corp. (c) (e) | 237 | 10,426 | ||||||
Monster Worldwide Inc. (c) | 168 | 3,978 | ||||||
NetLogic Microsystems Inc. (c) | 206 | 6,483 | ||||||
Nice Systems Ltd. - ADR (c) | 185 | 6,458 | ||||||
Progress Software Corp. (c) | 160 | 6,772 | ||||||
Radiant Systems Inc. (c) | 342 | 6,683 | ||||||
Riverbed Technology Inc. (c) | 351 | 12,342 | ||||||
Rovi Corp. (c) | 248 | 15,409 | ||||||
SuccessFactors Inc. (c) | 218 | 6,306 | ||||||
Teradyne Inc. (c) | 421 | 5,912 | ||||||
TIBCO Software Inc. (c) | 548 | 10,793 | ||||||
Varian Semiconductor Equipment Associates Inc. (c) | 163 | 6,015 | ||||||
Veeco Instruments Inc. (c) (e) | 153 | 6,574 | ||||||
| 155,076 | ||||||||
MATERIALS - 5.9% | ||||||||
Huntsman Corp. | 700 | 10,929 | ||||||
Intrepid Potash Inc. (c) (e) | 177 | 6,611 | ||||||
RTI International Metals Inc. (c) | 171 | 4,601 | ||||||
Texas Industries Inc. (e) | 170 | 7,765 | ||||||
See accompanying Notes to the Financial Statements.
JNL Series Trust
Schedules of Investments (in thousands)
December 31, 2010
| Shares/Par (p) | Value | |||||
Titanium Metals Corp. (c) | 275 | 4,722 | ||||
| 34,628 | ||||||
Total Common Stocks (cost $445,505) | 584,039 | |||||
SHORT TERM INVESTMENTS - 9.4% |
| |||||
Investment Company - 3.7% | ||||||
JNL Money Market Fund, 0.08% (a) (h) | 21,944 | 21,944 | ||||
Securities Lending Collateral 5.7% | ||||||
Securities Lending Cash Collateral Fund LLC, 0.31% (a) (h) | 31,617 | 31,617 | ||||
Securities Lending Liquidating Fund LLC, 0.66% (a) (h) | 1,670 | 1,643 | ||||
| 33,260 | ||||||
Total Short Term Investments (cost $55,231) | 55,204 | |||||
Total Investments - 108.4% (cost $500,736) | 639,243 | |||||
Other Assets and Liabilities, Net - (8.4%) | (49,313) | |||||
Total Net Assets - 100.0% | $ 589,930 | |||||
JNL/Franklin Templeton Global Growth Fund | ||||||
COMMON STOCKS - 93.8% |
| |||||
CONSUMER DISCRETIONARY - 16.3% |
| |||||
Bayerische Motoren Werke AG | 54 | $ 4,240 | ||||
Comcast Corp. - Class A | 30 | 670 | ||||
Comcast Corp. - Special Class A | 395 | 8,213 | ||||
Compagnie Generale des Etablissements Michelin | 40 | 2,861 | ||||
Compass Group Plc | 194 | 1,759 | ||||
Expedia Inc. | 75 | 1,884 | ||||
Home Depot Inc. | 62 | 2,191 | ||||
Hyundai Motor Co. (c) | 38 | 5,793 | ||||
Inditex SA | 31 | 2,340 | ||||
Kingfisher Plc | 1,055 | 4,334 | ||||
News Corp. - Class A | 497 | 7,229 | ||||
Pearson Plc | 257 | 4,038 | ||||
Reed Elsevier NV | 173 | 2,143 | ||||
Target Corp. | 42 | 2,497 | ||||
Time Warner Cable Inc. | 69 | 4,553 | ||||
Time Warner Inc. | 116 | 3,719 | ||||
Toyota Motor Corp. | 87 | 3,429 | ||||
USS Co. Ltd. | 19 | 1,570 | ||||
Viacom Inc. - Class B | 113 | 4,475 | ||||
Vivendi SA | 207 | 5,596 | ||||
Walt Disney Co. | 112 | 4,194 | ||||
| 77,728 | ||||||
CONSUMER STAPLES - 2.7% | ||||||
CVS Caremark Corp. | 129 | 4,473 | ||||
Nestle SA | 78 | 4,594 | ||||
Tesco Plc | 594 | 3,937 | ||||
| 13,004 | ||||||
ENERGY - 10.0% | ||||||
Baker Hughes Inc. | 62 | 3,567 | ||||
BG Group Plc | 131 | 2,645 | ||||
BP Plc (c) | 782 | 5,673 | ||||
Chesapeake Energy Corp. | 40 | 1,040 | ||||
Chevron Corp. | 40 | 3,614 | ||||
ENI SpA | 152 | 3,338 | ||||
Gazprom OAO - ADR | 87 | 2,187 | ||||
| Shares/Par (p) | Value | |||||
Halliburton Co. | 140 | 5,720 | ||||
Noble Corp. | 40 | 1,427 | ||||
Royal Dutch Shell Plc - Class B | 233 | 7,691 | ||||
SBM Offshore NV | 76 | 1,692 | ||||
StatoilHydro ASA | 110 | 2,608 | ||||
Total SA | 116 | 6,168 | ||||
| 47,370 | ||||||
FINANCIALS - 13.7% | ||||||
ACE Ltd. | 50 | 3,120 | ||||
AIA Group Ltd. (c) | 499 | 1,402 | ||||
American Express Co. | 80 | 3,424 | ||||
Aviva Plc | 752 | 4,610 | ||||
AXA SA | 136 | 2,267 | ||||
Bank of America Corp. | 163 | 2,168 | ||||
Bank of New York Mellon Corp. | 68 | 2,058 | ||||
Cheung Kong Holdings Ltd. | 223 | 3,440 | ||||
DBS Group Holdings Ltd. | 211 | 2,354 | ||||
HSBC Holdings Plc (e) | 413 | 4,231 | ||||
ICICI Bank Ltd. - ADR | 61 | 3,099 | ||||
ING Groep NV (c) | 427 | 4,157 | ||||
Intesa Sanpaolo SpA | 791 | 2,151 | ||||
JPMorgan Chase & Co. | 59 | 2,491 | ||||
KB Financial Group Inc. - ADR (c) | 89 | 4,720 | ||||
Muenchener Rueckversicherungs AG | 20 | 2,988 | ||||
Progressive Corp. | 194 | 3,859 | ||||
RenaissanceRe Holdings Ltd. | 37 | 2,384 | ||||
Swire Pacific Ltd. | 156 | 2,557 | ||||
Swiss Reinsurance | 47 | 2,535 | ||||
Torchmark Corp. | 20 | 1,192 | ||||
UBS AG (c) | 66 | 1,088 | ||||
UniCredit SpA | 1,349 | 2,797 | ||||
| 65,092 | ||||||
HEALTH CARE - 14.8% | ||||||
Abbott Laboratories | 35 | 1,699 | ||||
Amgen Inc. (c) | 167 | 9,143 | ||||
Biogen Idec Inc. (c) | 33 | 2,206 | ||||
Bristol-Myers Squibb Co. | 62 | 1,637 | ||||
Covidien Plc | 125 | 5,708 | ||||
GlaxoSmithKline Plc | 367 | 7,095 | ||||
Lonza Group AG | 25 | 2,039 | ||||
Medtronic Inc. | 99 | 3,678 | ||||
Merck & Co. Inc. | 149 | 5,353 | ||||
Merck KGaA | 23 | 1,886 | ||||
Novartis AG | 97 | 5,681 | ||||
Pfizer Inc. | 434 | 7,599 | ||||
Quest Diagnostics Inc. | 65 | 3,511 | ||||
Roche Holding AG | 31 | 4,610 | ||||
Sanofi-Aventis SA | 135 | 8,630 | ||||
| 70,475 | ||||||
INDUSTRIALS - 10.8% | ||||||
Adecco SA | 38 | 2,521 | ||||
Alstom SA | 39 | 1,875 | ||||
BAE Systems Plc | 367 | 1,889 | ||||
Brambles Ltd. (e) | 160 | 1,167 | ||||
Deutsche Post AG | 119 | 2,009 | ||||
Embraer SA - ADR | 42 | 1,221 | ||||
FedEx Corp. | 49 | 4,538 | ||||
General Electric Co. | 279 | 5,102 | ||||
Hays Plc | 629 | 1,263 | ||||
Koninklijke Philips Electronics NV | 104 | 3,185 | ||||
Randstad Holding NV (c) | 50 | 2,654 | ||||
Siemens AG | 59 | 7,319 | ||||
Tyco International Ltd. | 146 | 6,060 | ||||
United Parcel Service Inc. - Class B | 81 | 5,883 | ||||
See accompanying Notes to the Financial Statements.
JNL Series Trust
Schedules of Investments (in thousands)
December 31, 2010
| Shares/Par (p) | Value | |||||
Wolseley Plc (c) | 142 | 4,538 | ||||
| 51,224 | ||||||
INFORMATION TECHNOLOGY - 16.5% |
| |||||
Accenture Plc - Class A | 241 | 11,676 | ||||
Brocade Communications Systems Inc. (c) | 402 | 2,128 | ||||
Cisco Systems Inc. (c) | 250 | 5,063 | ||||
Dell Inc. (c) | 176 | 2,382 | ||||
Flextronics International Ltd. (c) | 258 | 2,026 | ||||
FUJIFILM Holdings Corp. | 50 | 1,801 | ||||
Konica Minolta Holdings Inc. | 154 | 1,592 | ||||
Microsoft Corp. | 359 | 10,022 | ||||
Nintendo Co. Ltd. | 10 | 2,949 | ||||
Oracle Corp. | 386 | 12,076 | ||||
Samsung Electronics Co. Ltd. - GDR (q) | 19 | 8,206 | ||||
SAP AG | 92 | 4,658 | ||||
Seagate Technology (c) | 148 | 2,224 | ||||
Taiwan Semiconductor Manufacturing Co. Ltd. - ADR | 408 | 5,118 | ||||
Telefonaktiebolaget LM Ericsson - Class B | 233 | 2,703 | ||||
Tyco Electronics Ltd. | 117 | 4,130 | ||||
| 78,754 | ||||||
MATERIALS - 2.0% | ||||||
Alcoa Inc. | 142 | 2,185 | ||||
CRH Plc | 178 | 3,683 | ||||
Svenska Cellulosa AB | 113 | 1,791 | ||||
Vale SA - ADR (e) | 59 | 1,774 | ||||
| 9,433 | ||||||
TELECOMMUNICATION SERVICES - 7.0% | ||||||
AT&T Inc. | 37 | 1,101 | ||||
China Telecom Corp. Ltd. - ADR (e) | 34 | 1,779 | ||||
France Telecom SA | 250 | 5,208 | ||||
Singapore Telecommunications Ltd. | 2,869 | 6,818 | ||||
Sprint Nextel Corp. (c) | 539 | 2,281 | ||||
Telefonica SA | 143 | 3,266 | ||||
Telekom Austria AG | 160 | 2,256 | ||||
Turkcell Iletisim Hizmet AS - ADR | 127 | 2,168 | ||||
Vodafone Group Plc | 3,194 | 8,255 | ||||
| 33,132 | ||||||
Total Common Stocks (cost $457,426) |
|
446,212 | ||||
SHORT TERM INVESTMENTS - 7.1% |
| |||||
Investment Company - 6.0% | ||||||
JNL Money Market Fund, 0.08% (a) (h) | 28,349 | 28,349 | ||||
Securities Lending Collateral 1.1% | ||||||
Securities Lending Cash Collateral Fund LLC, 0.31% (a) (h) | 4,895 | 4,895 | ||||
Securities Lending Liquidating Fund LLC, 0.66% (a) (h) | 381 | 375 | ||||
| 5,270 | ||||||
Total Short Term Investments (cost $33,625) |
| 33,619 | ||||
Total Investments - 100.9% (cost $491,051) |
| 479,831 | ||||
Other Assets and Liabilities, Net - (0.9%) |
| (4,090) | ||||
Total Net Assets - 100.0% | $ 475,741 | |||||
| Shares/Par (p) | Value | |||||
JNL/Franklin Templeton Income Fund | ||||||
COMMON STOCKS - 34.5% | ||||||
CONSUMER DISCRETIONARY - 0.7% | ||||||
Charter Communications Inc. - Class A (c) (e) | 32 | $1,239 | ||||
Comcast Corp. - Class A | 150 | 3,296 | ||||
Dex One Corp. (c) | 106 | 793 | ||||
Home Depot Inc. | 69 | 2,433 | ||||
| 7,761 | ||||||
CONSUMER STAPLES - 0.8% | ||||||
Diageo Plc | 150 | 2,771 | ||||
PepsiCo Inc. | 90 | 5,860 | ||||
| 8,631 | ||||||
ENERGY - 6.8% | ||||||
Baker Hughes Inc. | 50 | 2,858 | ||||
BP Plc - ADR (c) | 150 | 6,625 | ||||
Callon Petroleum Co. (c) (e) | 75 | 444 | ||||
Canadian Oil Sands Trust | 425 | 11,306 | ||||
Chesapeake Energy Corp. | 90 | 2,332 | ||||
Chevron Corp. | 30 | 2,738 | ||||
ConocoPhillips | 200 | 13,620 | ||||
Exxon Mobil Corp. | 300 | 21,936 | ||||
Schlumberger Ltd. | 40 | 3,340 | ||||
Spectra Energy Corp. | 165 | 4,113 | ||||
Weatherford International Ltd. (c) | 125 | 2,850 | ||||
| 72,162 | ||||||
FINANCIALS - 4.5% | ||||||
Banco Santander SA | 250 | 2,664 | ||||
Bank of America Corp. | 650 | 8,671 | ||||
Barclays Plc | 150 | 612 | ||||
CIT Group Inc. (c) | 50 | 2,355 | ||||
Citigroup Inc. (c) | 894 | 4,231 | ||||
HSBC Holdings Plc | 300 | 3,045 | ||||
JPMorgan Chase & Co. | 200 | 8,484 | ||||
M&T Bank Corp. | 60 | 5,223 | ||||
Wells Fargo & Co. | 325 | 10,072 | ||||
Westfield Retail Trust (c) | 813 | 2,136 | ||||
| 47,493 | ||||||
HEALTH CARE - 4.8% | ||||||
Johnson & Johnson | 150 | 9,278 | ||||
Merck & Co. Inc. | 500 | 18,020 | ||||
Pfizer Inc. | 500 | 8,755 | ||||
Roche Holding AG | 100 | 14,659 | ||||
| 50,712 | ||||||
INDUSTRIALS - 0.5% | ||||||
General Electric Co. | 300 | 5,487 | ||||
INFORMATION TECHNOLOGY - 1.7% | ||||||
Intel Corp. | 350 | 7,361 | ||||
Maxim Integrated Products Inc. (e) | 200 | 4,724 | ||||
Xerox Corp. | 300 | 3,456 | ||||
Xilinx Inc. | 90 | 2,608 | ||||
| 18,149 | ||||||
MATERIALS - 1.4% | ||||||
Barrick Gold Corp. | 130 | 6,914 | ||||
Newmont Mining Corp. | 110 | 6,757 | ||||
Nucor Corp. | 20 | 876 | ||||
| 14,547 | ||||||
TELECOMMUNICATION SERVICES - 2.7% |
| |||||
AT&T Inc. | 300 | 8,814 | ||||
See accompanying Notes to the Financial Statements.
JNL Series Trust
Schedules of Investments (in thousands)
December 31, 2010
| Shares/Par (p) | Value | |||||
CenturyLink Inc. (e) | 70 | 3,232 | ||||
Frontier Communications Corp. | 116 | 1,129 | ||||
Telstra Corp. Ltd. | 900 | 2,568 | ||||
Verizon Communications Inc. | 150 | 5,367 | ||||
Vodafone Group Plc | 3,000 | 7,755 | ||||
| 28,865 | ||||||
UTILITIES - 10.6% | ||||||
AGL Resources Inc. (e) | 100 | 3,585 | ||||
American Electric Power Co. Inc. | 170 | 6,117 | ||||
CenterPoint Energy Inc. | 95 | 1,493 | ||||
Consolidated Edison Inc. | 80 | 3,966 | ||||
Dominion Resources Inc. | 165 | 7,049 | ||||
Duke Energy Corp. | 550 | 9,795 | ||||
Entergy Corp. | 100 | 7,083 | ||||
FirstEnergy Corp. (e) | 75 | 2,777 | ||||
NextEra Energy Inc. | 170 | 8,838 | ||||
NiSource Inc. | 40 | 705 | ||||
PG&E Corp. | 220 | 10,525 | ||||
Pinnacle West Capital Corp. | 100 | 4,145 | ||||
PPL Corp. | 76 | 1,987 | ||||
Progress Energy Inc. | 125 | 5,435 | ||||
Public Service Enterprise Group Inc. | 220 | 6,998 | ||||
Sempra Energy | 120 | 6,298 | ||||
Southern Co. | 380 | 14,527 | ||||
TECO Energy Inc. | 200 | 3,560 | ||||
Xcel Energy Inc. | 350 | 8,242 | ||||
| 113,125 | ||||||
Total Common Stocks (cost $355,889) | 366,932 | |||||
PREFERRED STOCKS - 4.6% | ||||||
CONSUMER DISCRETIONARY - 0.3% | ||||||
General Motors Co., Convertible Preferred, 4.75% (c) (d) | 44 | 2,392 | ||||
General Motors Corp., 6.25%, Series C (c) (d) | 100 | 835 | ||||
| 3,227 | ||||||
ENERGY - 1.0% | ||||||
Chesapeake Energy Corp., Convertible Preferred, 5.75% (m) (r) | 5 | 5,030 | ||||
SandRidge Energy Inc., Convertible Preferred, 7.00% (m) (r) | 50 | 5,947 | ||||
| 10,977 | ||||||
FINANCIALS - 2.8% | ||||||
Ally Financial Inc., 7.00%, (callable at 1000 beginning 12/31/11) (m) (r) | 2 | 1,745 | ||||
Bank of America Corp., Convertible Preferred, 7.25%, Series L (m) | 10 | 9,438 | ||||
Citigroup Inc., Convertible Preferred, 7.50% | 60 | 8,201 | ||||
Federal Home Loan Mortgage Corp., 8.38%, (callable at 25 beginning 12/31/12), Series Z (c) (d) (m) | 186 | 117 | ||||
Federal National Mortgage Association, 8.25%, (callable at 25 beginning 12/31/10), Series S (c) (d) (m) | 65 | 36 | ||||
Federal National Mortgage Association, 5.38%, (callable at 105,000 on 12/03/10) (c) (d) (m) | — | 88 | ||||
Federal National Mortgage Association, 6.75%, (callable at 25 beginning 09/30/10), Series Q (c) (d) (m) | 100 | 55 | ||||
Federal National Mortgage Association, 7.63%, (callable at 25 beginning 11/21/12), Series R (c) (d) (m) | 143 | 73 | ||||
Federal National Mortgage Association, Convertible Preferred, | 91 | 45 | ||||
| Shares/Par (p) | Value | |||||
FelCor Lodging Trust Inc., Convertible Preferred, 1.95%, Series A (m) | 60 | 1,479 | ||||
Wells Fargo & Co., Convertible Preferred, 7.50%, Series L (m) | 9 | 8,505 | ||||
| 29,782 | ||||||
HEALTH CARE - 0.2% | ||||||
Tenet Healthcare Corp., 7.00% | 2 | 2,197 | ||||
MATERIALS - 0.2% | ||||||
AngloGold Ashanti Ltd., 6.00% (e) | 30 | 1,664 | ||||
UTILITIES - 0.1% | ||||||
NextEra Energy Inc., Convertible Preferred, 8.38% | 20 | 993 | ||||
Total Preferred Stocks (cost $62,625) | 48,840 | |||||
WARRANTS - 0.0% | ||||||
Charter Communications Inc. (c) | 30 | 251 | ||||
Total Warrants (cost $106) | 251 | |||||
NON-U.S. GOVERNMENT AGENCY ASSET-BACKED SECURITIES - 0.7% | ||||||
Banc of America Large Loan Inc. REMIC, 2.01%, 11/15/13 (i) (r) | $ | 7,478 | 6,667 | |||
Dynegy Roseton Pass Through Trust, 7.67%, 11/08/16 (e) | 1,000 | 940 | ||||
Total Non-U.S. Government Agency Asset- Backed Securities (cost $7,521) | 7,607 | |||||
CORPORATE BONDS AND NOTES - 52.4% | ||||||
CONSUMER DISCRETIONARY - 5.7% |
| |||||
Cablevision Systems Corp. | ||||||
8.63%, 09/15/17 | 1,000 | 1,089 | ||||
7.75%, 04/15/18 | 3,000 | 3,142 | ||||
8.00%, 04/15/20 (e) | 3,000 | 3,210 | ||||
CCH II LLC, 13.50%, 11/30/16 | 5,134 | 6,122 | ||||
CCO Holdings LLC, 8.13%, 04/30/20 (e) | 3,700 | 3,894 | ||||
Cequel Communications Holdings I LLC, 8.63%, 11/15/17 (r) | 2,500 | 2,612 | ||||
CKE Restaurants Inc., 11.38%, | 1,500 | 1,661 | ||||
Clear Channel Worldwide Holdings Inc., 9.25%, 12/15/17 (e) | 1,600 | 1,752 | ||||
ClubCorp Club Operations Inc., 10.00%, 12/01/18 (r) | 5,000 | 4,750 | ||||
Clubcorp Club Operations Inc. Term Loan B, 6.00%, 11/23/16 (i) | 5,000 | 5,050 | ||||
Diversey Holdings Inc., 10.50%, 05/15/20 | 1,600 | 1,840 | ||||
Diversey Inc., 8.25%, 11/15/19 | 2,500 | 2,712 | ||||
Goodyear Tire & Rubber Co., 8.25%, 08/15/20 (e) | 2,300 | 2,381 | ||||
Harrah’s Operating Co. Inc., 11.25%, 06/01/17 | 750 | 844 | ||||
Interactive Data Corp., 10.25%, 08/01/18 (r) | 500 | 548 | ||||
KB Home | ||||||
5.75%, 02/01/14 | 2,000 | 2,000 | ||||
6.25%, 06/15/15 | 1,300 | 1,287 | ||||
MGM Resorts International | ||||||
6.75%, 04/01/13 (e) | 2,900 | 2,883 | ||||
10.00%, 11/01/16 (e) (r) | 3,000 | 3,082 | ||||
Univision Communications Inc., 9.75%, 03/15/15 (e) (r) | 2,648 | 2,860 | ||||
UPC Germany GmbH, 8.13%, | 2,100 | 2,195 | ||||
Visant Corp., 10.00%, 10/01/17 (r) | 4,700 | 4,994 | ||||
| 60,908 | ||||||
See accompanying Notes to the Financial Statements.
JNL Series Trust
Schedules of Investments (in thousands)
December 31, 2010
| Shares/Par (p) | Value | |||||
CONSUMER STAPLES - 0.7% | ||||||
Dean Foods Co., 9.75%, 12/15/18 (e) (r) | 3,900 | 3,929 | ||||
JBS USA LLC, 11.63%, 05/01/14 (e) | 1,000 | 1,170 | ||||
SUPERVALU Inc., 8.00%, 05/01/16 (e) | 2,000 | 1,915 | ||||
| 7,014 | ||||||
ENERGY - 10.5% | ||||||
Antero Resources Finance Corp., 9.38%, 12/01/17 | 2,000 | 2,092 | ||||
ATP Oil & Gas Corp., 11.88%, 05/01/15 (e) (r) | 2,500 | 2,362 | ||||
Calpine Corp., 7.25%, 10/15/17 (r) | 1,000 | 1,000 | ||||
Calpine Generating Co. LLC, 8.00%, 06/01/16 (r) | 1,750 | 1,859 | ||||
Chesapeake Energy Corp. | ||||||
9.50%, 02/15/15 (e) | 2,500 | 2,819 | ||||
6.50%, 08/15/17 (e) | 4,000 | 4,020 | ||||
6.88%, 08/15/18 | 1,600 | 1,624 | ||||
7.25%, 12/15/18 | 5,000 | 5,175 | ||||
Consol Energy Inc., 8.25%, | 1,600 | 1,728 | ||||
Denbury Resources Inc., 8.25%, 02/15/20 | 397 | 431 | ||||
El Paso Corp. | ||||||
6.50%, 09/15/20 (e) (r) | 1,600 | 1,611 | ||||
7.75%, 01/15/32 (e) | 1,000 | 995 | ||||
Energy Transfer Partners LP, 7.50%, 10/15/20 (e) | 2,500 | 2,575 | ||||
Energy XXI Gulf Coast Inc., 9.25%, 12/15/17 (r) | 3,500 | 3,640 | ||||
EXCO Resources Inc., 7.50%, 09/15/18 | 3,500 | 3,430 | ||||
Linn Energy LLC, 8.63%, 04/15/20 (r) | 3,300 | 3,556 | ||||
NXP BV, 9.75%, 08/01/18 (r) | 1,200 | 1,350 | ||||
Petrohawk Energy Corp. | ||||||
10.50%, 08/01/14 | 2,000 | 2,280 | ||||
7.88%, 06/01/15 (e) | 3,200 | 3,332 | ||||
Pioneer Natural Resources Co., 6.88%, 05/01/18 | 1,400 | 1,488 | ||||
Plains Exploration & Production Co., 7.75%, 06/15/15 | 1,500 | 1,564 | ||||
Sabine Pass LNG LP | ||||||
7.25%, 11/30/13 | 1,350 | 1,313 | ||||
7.50%, 11/30/16 | 2,500 | 2,344 | ||||
SandRidge Energy Inc. | ||||||
3.93%, 04/01/14 (e) (i) | 2,000 | 1,862 | ||||
9.88%, 05/15/16 (r) | 2,600 | 2,749 | ||||
8.00%, 06/01/18 (e) (r) | 2,500 | 2,537 | ||||
8.75%, 01/15/20 (e) | 650 | 668 | ||||
SESI LLC, 6.88%, 06/01/14 | 1,370 | 1,391 | ||||
Texas Competitive Electric Holdings Co. LLC | ||||||
10.25%, 11/01/15 (e) | 18,000 | 10,170 | ||||
10.50%, 11/01/16 | 297 | 149 | ||||
15.00%, 04/01/21 (e) (r) | 15,255 | 13,348 | ||||
Texas Competitive Electric Holdings Co. LLC Term Loan | ||||||
3.76%, 10/10/14 (i) | 2,977 | 2,302 | ||||
3.76%, 10/10/14 (i) | 1,975 | 1,532 | ||||
3.76%, 10/10/14 (i) | 4,560 | 3,537 | ||||
3.79%, 10/10/14 (i) | 282 | 218 | ||||
Texas Competitive Electric Holdings Co. LLC Term Loan B-1 | ||||||
3.75%, 10/10/14 (i) | 4,987 | 3,868 | ||||
3.76%, 10/10/14 (i) | 3,000 | 2,327 | ||||
3.76%, 10/10/14 (i) | 2,486 | 1,928 | ||||
Texas Competitive Electric Holdings Co. LLC Term Loan B-2, 3.76%, 10/10/14 (i) | 3,979 | 3,086 | ||||
Texas Competitive Electric Holdings Co. LLC Term Loan B-3 | ||||||
3.76%, 10/10/14 (i) | 1,990 | 1,540 | ||||
3.76%, 10/10/14 (i) | 2,985 | 2,310 | ||||
| Shares/Par (p) | Value | |||||
W&T Offshore Inc., 8.25%, 06/15/14 (r) | 3,000 | 2,917 | ||||
| 111,027 | ||||||
FINANCIALS - 12.6% | ||||||
Abengoa Finance SAU, 8.88%, | 3,200 | 2,960 | ||||
Ally Financial Inc., 8.00%, 03/15/20 | 3,500 | 3,824 | ||||
Bank of America Corp., 8.13%, (callable at 100 beginning 05/15/18) (m) | 1,000 | 1,008 | ||||
CapitalSource Inc., 4.00%, 07/15/34 (k) | 2,500 | 2,484 | ||||
CEVA Group Plc | ||||||
8.38%, 12/01/17 (r) | 3,400 | 3,434 | ||||
11.50%, 04/01/18 (e) (r) | 3,600 | 3,888 | ||||
CIT Group Inc. | ||||||
7.00%, 05/01/14 (e) | 800 | 808 | ||||
7.00%, 05/01/15 (e) | 12,000 | 12,030 | ||||
7.00%, 05/01/16 (e) | 17,000 | 17,064 | ||||
7.00%, 05/01/17 (e) | 12,000 | 12,030 | ||||
Felcor Lodging LP, 10.00%, 10/01/14 (e) | 1,700 | 1,904 | ||||
Ford Motor Credit Co. LLC | ||||||
8.00%, 06/01/14 (e) | 2,500 | 2,754 | ||||
7.00%, 04/15/15 | 2,000 | 2,149 | ||||
12.00%, 05/15/15 | 3,000 | 3,774 | ||||
Host Hotels & Resorts LP, 9.00%, 05/15/17 (e) | 600 | 666 | ||||
Interactive Data Corp. Term Loan, 6.75%, 12/31/17 (i) | 1,990 | 2,019 | ||||
International Lease Finance Corp. | ||||||
8.63%, 09/15/15 (e) (r) | 700 | 753 �� | ||||
8.75%, 03/15/17 (r) | 2,000 | 2,145 | ||||
8.88%, 09/01/17 (e) | 4,700 | 5,070 | ||||
7.13%, 09/01/18 (r) | 7,000 | 7,437 | ||||
iStar Financial Inc. | ||||||
0.80%, 10/01/12 (i) | 4,500 | 4,005 | ||||
8.63%, 06/01/13 | 5,000 | 4,650 | ||||
JPMorgan Chase & Co., 7.90%, (callable at 100 beginning 04/30/18) (m) | 11,500 | 12,224 | ||||
Liberty Mutual Group Inc., 10.75%, 06/15/58 (r) | 2,500 | 3,025 | ||||
Petroplus Finance Ltd. | ||||||
6.75%, 05/01/14 (r) | 3,500 | 3,220 | ||||
7.00%, 05/01/17 (e) (r) | 3,000 | 2,655 | ||||
9.38%, 09/15/19 (e) (r) | 2,000 | 1,850 | ||||
Pinafore LLC, 9.00%, 10/01/18 (e) (r) | 700 | 756 | ||||
SuperMedia Inc. Escrow Litigation Trust, 0.00%, 12/31/49 (f) | 868 | 7 | ||||
SuperMedia Inc. Term Loan, 11.00%, 12/31/15 (i) | 695 | 479 | ||||
UPC Germany GmbH | ||||||
8.13%, 12/01/17 (r), EUR | 2,750 | 3,877 | ||||
9.63%, 12/01/19 (r), EUR | 1,500 | 2,190 | ||||
Wells Fargo Capital XIII, 7.70%, (callable at 100 beginning 03/26/13) (m) | 900 | 930 | ||||
Wells Fargo Capital XV, 9.75%, (callable at 100 beginning 09/26/13) (m) | 5,000 | 5,562 | ||||
| 133,631 | ||||||
HEALTH CARE - 5.8% | ||||||
Community Health Systems Inc., 8.88%, 07/15/15 (e) | 5,000 | 5,250 | ||||
HCA Holdings Inc., 7.75%, 05/15/21 (e) (r) | 5,000 | 5,000 | ||||
HCA Inc. | ||||||
6.38%, 01/15/15 | 1,500 | 1,474 | ||||
6.50%, 02/15/16 | 1,500 | 1,466 | ||||
9.25%, 11/15/16 | 3,500 | 3,734 | ||||
8.50%, 04/15/19 (e) | 6,000 | 6,570 | ||||
7.88%, 02/15/20 | 6,000 | 6,420 | ||||
Mylan Inc., 6.00%, 11/15/18 (e) (r) | 5,000 | 4,912 | ||||
Quintiles Transnational Corp., 9.50%, 12/30/14 (e) (r) | 4,000 | 4,100 | ||||
See accompanying Notes to the Financial Statements.
JNL Series Trust
Schedules of Investments (in thousands)
December 31, 2010
| Shares/Par (p) | Value | |||||
Tenet Healthcare Corp. | ||||||
9.25%, 02/01/15 (e) | 5,000 | 5,325 | ||||
9.00%, 05/01/15 (e) | 3,500 | 3,885 | ||||
10.00%, 05/01/18 (e) | 3,500 | 4,078 | ||||
8.00%, 08/01/20 (e) (r) | 2,600 | 2,639 | ||||
US Oncology Holdings Inc., 6.74%, 03/15/12 (i) | 3,097 | 3,120 | ||||
Vanguard Health Holding Co. II LLC, 8.00%, 02/01/18 (e) | 3,700 | 3,793 | ||||
| 61,766 | ||||||
INDUSTRIALS - 3.7% | ||||||
Case New Holland Inc., 7.88%, 12/01/17 (e) (r) | 5,000 | 5,462 | ||||
Ceridian Corp., 11.25%, 11/15/15 (e) | 4,000 | 3,960 | ||||
CHC Helicopter SA, 9.25%, 10/15/20 (e) (r) | 4,500 | 4,658 | ||||
Hertz Corp. | ||||||
8.88%, 01/01/14 | 10,000 | 10,225 | ||||
10.50%, 01/01/16 | 1,250 | 1,319 | ||||
Manitowoc Co. Inc., 9.50%, 02/15/18 (e) | 1,000 | 1,095 | ||||
Niska Gas Storage US LLC, 8.88%, 03/15/18 (r) | 2,500 | 2,675 | ||||
RBS Global & Rexnord LLC | ||||||
11.75%, 08/01/16 (e) | 1,500 | 1,609 | ||||
8.50%, 05/01/18 (e) | 4,500 | 4,781 | ||||
Terex Corp., 8.00%, 11/15/17 (e) | 2,000 | 2,020 | ||||
United Rentals North America Inc., 8.38%, 09/15/20 (e) | 1,600 | 1,628 | ||||
| 39,432 | ||||||
INFORMATION TECHNOLOGY - 6.8% |
| |||||
Advanced Micro Devices Inc. | ||||||
6.00%, 05/01/15 | 477 | 481 | ||||
8.13%, 12/15/17 | 1,000 | 1,060 | ||||
CDW LLC | ||||||
11.00%, 10/12/15 | 3,000 | 3,113 | ||||
12.54%, 10/12/17 | 2,000 | 1,980 | ||||
First Data Corp. | ||||||
9.88%, 09/24/15 | 318 | 301 | ||||
9.88%, 09/24/15 (e) | 1,896 | 1,806 | ||||
11.25%, 03/31/16 (e) | 3,000 | 2,625 | ||||
8.25%, 01/15/21 (r) | 2,816 | 2,703 | ||||
12.63%, 01/15/21 (r) | 5,643 | 5,389 | ||||
8.75%, 01/15/22 (r) (e) | 2,824 | 2,732 | ||||
First Data Corp. Term Loan | ||||||
3.01%, 09/24/14 (i) | 158 | 147 | ||||
3.01%, 09/24/14 (i) | 1,699 | 1,574 | ||||
3.01%, 09/24/14 (i) | 1,870 | 1,732 | ||||
First Data Corp. Term Loan B-1, 3.01%, 09/24/14 (i) | 4,987 | 4,620 | ||||
First Data Corp. Term Loan B-2, 3.01%, 09/24/14 (i) | 4,987 | 4,620 | ||||
First Data Corp. Term Loan B-3 | ||||||
3.01%, 09/24/14 (i) | 142 | 131 | ||||
3.01%, 09/24/14 (i) | 1,647 | 1,526 | ||||
3.01%, 09/24/14 (i) | 79 | 74 | ||||
3.01%, 09/24/14 (i) | 2,992 | 2,772 | ||||
Freescale Semiconductor Inc. | ||||||
10.13%, 12/15/16 (e) | 3,000 | 3,157 | ||||
10.13%, 03/15/18 (r) | 5,000 | 5,625 | ||||
9.25%, 04/15/18 (r) | 4,000 | 4,400 | ||||
10.75%, 08/01/20 (e) (r) | 9,500 | 10,355 | ||||
Sanmina-SCI Corp. | ||||||
6.75%, 03/01/13 (e) | 1,200 | 1,197 | ||||
8.13%, 03/01/16 (e) | 1,500 | 1,515 | ||||
Seagate HDD Cayman, 7.75%, 12/15/18 (r) | 1,500 | 1,519 | ||||
SunGard Data Systems Inc. | ||||||
10.63%, 05/15/15 (e) | 2,500 | 2,756 | ||||
| Shares/Par (p) | Value | |||||
7.63%, 11/15/20 (e) (r) | 2,000 | 2,025 | ||||
| 71,935 | ||||||
MATERIALS - 2.4% | ||||||
Berry Plastics Corp., 9.75%, 01/15/21 (r) (e) | 1,000 | 990 | ||||
FMG Resources August 2006 Pty Ltd. | ||||||
7.00%, 11/01/15 (r) | 2,100 | 2,152 | ||||
6.88%, 02/01/18 (e) (r) | 7,500 | 7,462 | ||||
Hexion US Finance Corp., 8.88%, 02/01/18 (e) | 3,000 | 3,206 | ||||
Huntsman International LLC | ||||||
5.50%, 06/30/16 (e) | 1,000 | 968 | ||||
8.63%, 03/15/21 (e) (r) | 400 | 432 | ||||
Ineos Group Holdings Plc, 7.88%, 02/15/16(r), EUR | 3,250 | 3,887 | ||||
Kerling Plc, 10.63%, 01/28/17 (r), EUR | 3,600 | 5,196 | ||||
NewPage Corp., 11.38%, 12/31/14 (e) | 1,000 | 940 | ||||
| 25,233 | ||||||
TELECOMMUNICATION SERVICES - 1.5% |
| |||||
Clearwire Communications LLC | ||||||
12.00%, 12/01/15 (e) (r) | 1,500 | 1,620 | ||||
12.00%, 12/01/15 (r) | 2,500 | 2,694 | ||||
12.00%, 12/01/17 (e) (r) | 1,500 | 1,553 | ||||
Cricket Communications Inc., 7.75%, 10/15/20 (e) (r) | 5,500 | 5,239 | ||||
Frontier Communications Corp. | ||||||
8.25%, 04/15/17 (e) | 800 | 878 | ||||
8.50%, 04/15/20 | 900 | 983 | ||||
Virgin Media Secured Finance Plc, 7.00%, 01/15/18, GBP | 2,000 | 3,305 | ||||
| 16,272 | ||||||
UTILITIES - 2.7% | ||||||
AES Corp., 8.00%, 10/15/17 | 450 | 476 | ||||
Calpine Corp. | ||||||
7.88%, 07/31/20 (r) | 800 | 810 | ||||
7.50%, 02/15/21 (r) | 5,475 | 5,393 | ||||
Dynegy Holdings Inc. | ||||||
7.50%, 06/01/15 | 11,000 | 8,305 | ||||
8.38%, 05/01/16 | 2,750 | 2,056 | ||||
7.75%, 06/01/19 | 2,000 | 1,335 | ||||
Energy Future Holdings Corp., 6.55%, 11/15/34 | 9,000 | 3,195 | ||||
Public Service Co. of New Mexico., 7.95%, 05/15/18 | 2,200 | 2,472 | ||||
RRI Energy Inc., 7.88%, 06/15/17 | 5,000 | 4,850 | ||||
| 28,892 | ||||||
Total Corporate Bonds and Notes (cost $537,586) | 556,110 | |||||
GOVERNMENT AND AGENCY OBLIGATIONS - 0.6% | ||||||
GOVERNMENT SECURITIES - 0.6% | ||||||
Municipals - 0.6% | ||||||
State of California | ||||||
7.95%, 03/01/36 | 2,500 | 2,564 | ||||
7.60%, 11/01/40 | 3,480 | 3,624 | ||||
Total Government and Agency Obligations (cost $6,016) | 6,188 | |||||
SHORT TERM INVESTMENTS - 23.5% |
| |||||
Investment Company - 6.4% | ||||||
JNL Money Market Fund, 0.08% (a) (h) | 67,966 | 67,966 | ||||
Securities Lending Collateral 17.1% | ||||||
Securities Lending Cash Collateral Fund LLC, 0.31% (a) (h) | 179,145 | 179,145 | ||||
See accompanying Notes to the Financial Statements.
JNL Series Trust
Schedules of Investments (in thousands)
December 31, 2010
| Shares/Par (p) | Value | |||||
Securities Lending Liquidating Fund LLC, 0.66% (a) (h) | 2,450 | 2,410 | ||||
| 181,555 | ||||||
Total Short Term Investments | 249,521 | |||||
Total Investments - 116.3% | 1,235,449 | |||||
Other Assets and Liabilities, | (173,309) | |||||
Total Net Assets - 100.0% | $ 1,062,140 | |||||
JNL/Franklin Templeton Mutual Shares Fund (t) | ||||||
COMMON STOCKS - 86.5% | ||||||
CONSUMER DISCRETIONARY - 7.6% |
| |||||
British Sky Broadcasting Group Plc | 393 | $ 4,513 | ||||
Cerberus Capital Management | 999 | 809 | ||||
Cerberus Capital Management | 999 | 809 | ||||
Cerberus Capital Management | 500 | 405 | ||||
Comcast Corp. - Special Class A | 110 | 2,298 | ||||
Daimler AG (c) | 53 | 3,611 | ||||
Harrah’s Investment LP (c) (f) (q) | 39 | 16 | ||||
Mattel Inc. | 175 | 4,450 | ||||
News Corp. - Class A | 411 | 5,981 | ||||
Stanley Black & Decker Inc. | 48 | 3,234 | ||||
Thomas Cook Group Plc | 121 | 357 | ||||
Time Warner Cable Inc. | 99 | 6,519 | ||||
Time Warner Inc. | 204 | 6,560 | ||||
Virgin Media Inc. (e) | 207 | 5,642 | ||||
| 45,204 | ||||||
CONSUMER STAPLES - 22.6% | ||||||
Altria Group Inc. | 414 | 10,182 | ||||
British American Tobacco Plc | 363 | 13,925 | ||||
Brown-Forman Corp. - Class B | 32 | 2,220 | ||||
Carlsberg A/S | 23 | 2,271 | ||||
Carrefour SA | 61 | 2,508 | ||||
Coca-Cola Enterprises Inc. | 119 | 2,979 | ||||
CVS Caremark Corp. | 526 | 18,301 | ||||
Dr. Pepper Snapple Group Inc. | 153 | 5,380 | ||||
General Mills Inc. | 128 | 4,569 | ||||
Imperial Tobacco Group Plc | 327 | 10,045 | ||||
Japan Tobacco Inc. | 1 | 3,837 | ||||
Kraft Foods Inc. - Class A | 423 | 13,315 | ||||
Kroger Co. | 320 | 7,158 | ||||
Lorillard Inc. | 34 | 2,785 | ||||
Nestle SA | 175 | 10,272 | ||||
PepsiCo Inc. | 63 | 4,112 | ||||
Pernod-Ricard SA (e) | 86 | 8,122 | ||||
Philip Morris International Inc. | 67 | 3,936 | ||||
Reynolds American Inc. | 159 | 5,170 | ||||
Wal-Mart Stores Inc. | 64 | 3,434 | ||||
| 134,521 | ||||||
ENERGY - 6.7% | ||||||
Baker Hughes Inc. | 53 | 3,012 | ||||
BP Plc (c) | 320 | 2,323 | ||||
Exterran Holdings Inc. (c) (e) | 46 | 1,100 | ||||
Marathon Oil Corp. | 259 | 9,574 | ||||
Noble Energy Inc. | 25 | 2,141 | ||||
Pride International Inc. (c) | 82 | 2,705 | ||||
Prime AET&D Holdings No. 1 Pty Ltd. (c) (f) | 402 | — | ||||
Royal Dutch Shell Plc | 247 | 8,151 | ||||
Total SA | 58 | 3,085 | ||||
| Shares/Par (p) | Value | |||||
Transocean Ltd. (c) | 113 | 7,858 | ||||
| 39,949 | ||||||
FINANCIALS - 12.6% | ||||||
ACE Ltd. | 101 | 6,281 | ||||
Alexander’s Inc. (e) | 8 | 3,297 | ||||
Alleghany Corp. (c) | 7 | 2,228 | ||||
Bank of America Corp. | 468 | 6,242 | ||||
Barclays Plc | 1,180 | 4,815 | ||||
Berkshire Hathaway Inc. - Class B (c) | 12 | 931 | ||||
Bond Street Holding LLC (c) (f) | 39 | 798 | ||||
Canary Wharf Group Plc (c) (f) | 405 | 1,756 | ||||
CNO Financial Group Inc. (c) | 97 | 658 | ||||
Deutsche Boerse AG | 47 | 3,230 | ||||
Forestar Group Inc. (c) | 62 | 1,188 | ||||
Guaranty Bancorp (c) | 49 | 68 | ||||
Intesa Sanpaolo SpA | 581 | 1,579 | ||||
Link REIT | 679 | 2,109 | ||||
Morgan Stanley | 245 | 6,660 | ||||
Old Republic International Corp. | 240 | 3,270 | ||||
PNC Financial Services Group Inc. | 115 | 6,966 | ||||
St. Joe Co. (c) (e) | 40 | 867 | ||||
UBS AG (c) | 225 | 3,694 | ||||
Wells Fargo & Co. | 281 | 8,709 | ||||
White Mountains Insurance Group Ltd. | 17 | 5,751 | ||||
Zurich Financial Services AG | 14 | 3,660 | ||||
| 74,757 | ||||||
HEALTH CARE - 10.8% | ||||||
Alcon Inc. - ADR | 27 | 4,416 | ||||
Amgen Inc. (c) | 64 | 3,487 | ||||
Boston Scientific Corp. (c) | 484 | 3,662 | ||||
Community Health Systems Inc. (c) | 60 | 2,235 | ||||
Coventry Health Care Inc. (c) | 7 | 182 | ||||
Eli Lilly & Co. | 263 | 9,232 | ||||
Genzyme Corp. (c) | 94 | 6,669 | ||||
Medtronic Inc. | 145 | 5,369 | ||||
Pfizer Inc. | 570 | 9,978 | ||||
Tenet Healthcare Corp. (c) | 787 | 5,262 | ||||
UnitedHealth Group Inc. | 323 | 11,663 | ||||
Zimmer Holdings Inc. (c) | 40 | 2,142 | ||||
| 64,297 | ||||||
INDUSTRIALS - 4.1% | ||||||
A P Moller - Maersk A/S - Class B | 1 | 7,107 | ||||
Alstom SA | 61 | 2,913 | ||||
Federal Signal Corp. | 96 | 655 | ||||
GenCorp Inc. (c) | 59 | 304 | ||||
Orkla ASA | 699 | 6,820 | ||||
Owens Corning Inc. (c) | 140 | 4,354 | ||||
TNT NV | 84 | 2,210 | ||||
| 24,363 | ||||||
INFORMATION TECHNOLOGY - 9.7% | ||||||
Hewlett-Packard Co. | 173 | 7,276 | ||||
LSI Corp. (c) | 914 | 5,478 | ||||
Maxim Integrated Products Inc. | �� | 201 | 4,744 | |||
McAfee Inc. (c) | 61 | 2,831 | ||||
Microsoft Corp. | 462 | 12,887 | ||||
Motorola Inc. (c) | 570 | 5,169 | ||||
Motorola Mobility Holdings Inc. (When-issued shares) | (63 | ) | (1,838) | |||
Nintendo Co. Ltd. | 13 | 3,709 | ||||
Symantec Corp. (c) | 184 | 3,080 | ||||
Tyco Electronics Ltd. | 119 | 4,198 | ||||
Xerox Corp. | 882 | 10,156 | ||||
| 57,690 | ||||||
See accompanying Notes to the Financial Statements.
JNL Series Trust
Schedules of Investments (in thousands)
December 31, 2010
| Shares/Par (p) | Value | |||||
MATERIALS - 5.2% | ||||||
Domtar Corp. (e) | 37 | 2,779 | ||||
International Paper Co. | 286 | 7,803 | ||||
Linde AG | 48 | 7,355 | ||||
MeadWestvaco Corp. | 117 | 3,051 | ||||
ThyssenKrupp AG | 3 | 120 | ||||
Weyerhaeuser Co. | 499 | 9,442 | ||||
| 30,550 | ||||||
TELECOMMUNICATION SERVICES - 3.3% | ||||||
Cable & Wireless Communications Plc | 1,730 | 1,309 | ||||
Cable & Wireless Worldwide Plc | 1,730 | 1,771 | ||||
Telefonica SA | 317 | 7,234 | ||||
Vodafone Group Plc | 3,587 | 9,271 | ||||
| 19,585 | ||||||
UTILITIES - 3.9% | ||||||
Brookfield Infrastructure Partners LP | 97 | 2,032 | ||||
E.ON AG | 205 | 6,234 | ||||
Entergy Corp. | 35 | 2,466 | ||||
Exelon Corp. | 121 | 5,047 | ||||
GDF Suez | 103 | 3,678 | ||||
NRG Energy Inc. (c) | 202 | 3,944 | ||||
| 23,401 | ||||||
Total Common Stocks (cost $491,475) | 514,317 | |||||
CORPORATE BONDS AND NOTES - 3.1% | ||||||
CONSUMER DISCRETIONARY - 0.3% | ||||||
Cerberus Capital Management LP | ||||||
12.00%, 07/31/14 (f) (q) | $ | 780 | 632 | |||
12.00%, 07/31/14 (f) (q) | 780 | 631 | ||||
12.00%, 07/31/14 (f) (q) | 390 | 316 | ||||
| 1,579 | ||||||
ENERGY - 0.6% | ||||||
Boston Generating LLC Term Loan, 0.18%, 12/21/13 (i) | 41 | 39 | ||||
Boston Generating LLC Term Loan B, 6.50%, 12/21/13 (i) | 244 | 233 | ||||
Boston Generating LLC Term Loan Revolver, 6.50%, 12/21/13 (i) | 4 | 4 | ||||
Texas Competitive Electric Holdings Co. LLC Delay Draw Term Loan, 3.74%, 10/10/14 (i) | 2,073 | 1,603 | ||||
Texas Competitive Electric Holdings Co. LLC Term Loan | ||||||
3.76%, 10/10/14 (i) | 1,419 | 1,101 | ||||
3.76%, 10/10/14 (i) | 223 | 173 | ||||
3.76%, 10/10/14 (i) | 689 | 533 | ||||
| 3,686 | ||||||
FINANCIALS - 1.8% | ||||||
Avaya Inc. Term Loan B-1, 3.03%, 10/26/14 (i) | 143 | 136 | ||||
CIT Group Inc. | ||||||
7.00%, 05/01/16 (e) | 1,799 | 1,806 | ||||
7.00%, 05/01/17 (e) | 1,626 | 1,630 | ||||
CIT Group Inc. Term Loan | ||||||
6.25%, 01/20/12 (i) | 250 | 255 | ||||
6.25%, 01/20/12 (i) | 639 | 653 | ||||
Realogy Corp. Delay Draw Term Loan, 3.26%, 10/10/13 (i) | 1,617 | 1,524 | ||||
Realogy Corp. Term Loan | ||||||
1.47%, 10/10/13 (i) | 507 | 478 | ||||
3.29%, 10/10/13 (i) | 3,770 | 3,554 | ||||
Realogy Corp. Term Loan A, 13.50%, 10/15/17 (i) | 93 | 102 | ||||
| Shares/Par (p) | Value | |||||||
Smurfit-Stone Container Enterprises Inc. Term Loan, 6.75%, 02/22/16 (i) | 805 | 820 | ||||||
Tropicana Entertainment LLC, 9.63%, 12/15/14 (c) (d) | 1,130 | 1 | ||||||
| 10,959 | ||||||||
INFORMATION TECHNOLOGY - 0.4% |
| |||||||
First Data Corp. Term Loan, 3.00%, 09/24/14 (i) | 878 | 813 | ||||||
First Data Corp. Term Loan B-1, 3.00%, 09/24/14 (i) | 1,338 | 1,239 | ||||||
First Data Corp. Term Loan B-3, 3.00%, 09/24/14 (i) | 258 | 240 | ||||||
| 2,292 | ||||||||
Total Corporate Bonds and Notes (cost $18,606) | 18,516 | |||||||
OTHER EQUITY INTERESTS - 0.0% |
| |||||||
Dana Corp. NT Escrow (f) (u) | 72 | — | ||||||
Dana Corp. NT Escrow (f) (u) | 65 | — | ||||||
Dana Corp. NT Escrow (f) (u) | 115 | — | ||||||
Northwest Airlines Corp. Contingent Distribution (f) (u) | 725 | — | ||||||
Total Other Equity Interests (cost $19) | — | |||||||
SHORT TERM INVESTMENTS - 12.3% |
| |||||||
Investment Company - 10.5% |
| |||||||
JNL Money Market Fund, 0.08% (a) (h) | 62,650 | 62,650 | ||||||
Securities Lending Collateral 1.8% |
| |||||||
Securities Lending Cash Collateral Fund LLC, 0.31% (a) (h) | 10,775 | 10,775 | ||||||
Total Short Term Investments (cost $73,425) | 73,425 | |||||||
Total Investments - 101.9% | 606,258 | |||||||
Other Assets and Liabilities, Net - (1.9%) | (11,193 | ) | ||||||
Total Net Assets - 100.0% | $ | 595,065 | ||||||
JNL/Franklin Templeton Small Cap |
| |||||||
COMMON STOCKS - 93.0% |
| |||||||
CONSUMER DISCRETIONARY - 18.2% |
| |||||||
Autoliv Inc. | 55 | $ | 4,342 | |||||
Brown Shoe Co. Inc. | 178 | 2,480 | ||||||
Brunswick Corp. | 111 | 2,074 | ||||||
Cato Corp. - Class A | 12 | 334 | ||||||
Christopher & Banks Corp. | 125 | 769 | ||||||
DR Horton Inc. | 78 | 931 | ||||||
Drew Industries Inc. (c) | 39 | 877 | ||||||
Ethan Allen Interiors Inc. (e) | 36 | 710 | ||||||
Fred’s Inc. - Class A (e) | 182 | 2,499 | ||||||
Gentex Corp. | 150 | 4,434 | ||||||
Group 1 Automotive Inc. (e) | 110 | 4,594 | ||||||
Hillenbrand Inc. | 74 | 1,534 | ||||||
Hooker Furniture Corp. | 40 | 561 | ||||||
J.C. Penney Co. Inc. | 56 | 1,809 | ||||||
La-Z-Boy Inc. (c) | 254 | 2,290 | ||||||
M/I Homes Inc. (c) | 95 | 1,461 | ||||||
MDC Holdings Inc. | 49 | 1,398 | ||||||
Men’s Wearhouse Inc. | 128 | 3,205 | ||||||
Pier 1 Imports Inc. (c) | 152 | 1,598 | ||||||
See accompanying Notes to the Financial Statements.
JNL Series Trust
Schedules of Investments (in thousands)
December 31, 2010
| Shares/Par (p) | Value | |||||
Regis Corp. | 170 | 2,829 | ||||
Saks Inc. (c) (e) | 146 | 1,562 | ||||
Thor Industries Inc. | 159 | 5,403 | ||||
Tuesday Morning Corp. (c) | 166 | 874 | ||||
Warnaco Group Inc. (c) | 35 | 1,949 | ||||
West Marine Inc. (c) (e) | 155 | 1,640 | ||||
Winnebago Industries Inc. (c) | 95 | 1,444 | ||||
| 53,601 | ||||||
CONSUMER STAPLES - 1.7% | ||||||
Casey’s General Stores Inc. | 45 | 1,913 | ||||
Lancaster Colony Corp. (e) | 55 | 3,129 | ||||
| 5,042 | ||||||
ENERGY - 11.9% | ||||||
Arch Coal Inc. | 23 | 806 | ||||
Atwood Oceanics Inc. (c) | 95 | 3,561 | ||||
Bristow Group Inc. (c) | 108 | 5,095 | ||||
Global Industries Ltd. (c) | 337 | 2,338 | ||||
Helix Energy Solutions Group Inc. (c) | 178 | 2,155 | ||||
Oil States International Inc. (c) | 57 | 3,634 | ||||
Overseas Shipholding Group Inc. | 66 | 2,331 | ||||
Rowan Cos. Inc. (c) | 140 | 4,891 | ||||
Teekay Corp. | 64 | 2,101 | ||||
Tidewater Inc. | 92 | 4,953 | ||||
Unit Corp. (c) | 69 | 3,221 | ||||
| 35,086 | ||||||
FINANCIALS - 13.4% | ||||||
American National Insurance Co. | 14 | 1,199 | ||||
Arthur J Gallagher & Co. | 59 | 1,713 | ||||
Aspen Insurance Holdings Ltd. | 109 | 3,108 | ||||
Chemical Financial Corp. | 80 | 1,781 | ||||
Erie Indemnity Co. - Class A | 24 | 1,545 | ||||
Hanover Insurance Group Inc. | 32 | 1,504 | ||||
HCC Insurance Holdings Inc. | 49 | 1,421 | ||||
Montpelier Re Holdings Ltd. | 138 | 2,748 | ||||
Old Republic International Corp. | 265 | 3,612 | ||||
Peoples Bancorp Inc. (e) | 33 | 513 | ||||
Protective Life Corp. | 223 | 5,951 | ||||
RLI Corp. | 29 | 1,514 | ||||
StanCorp Financial Group Inc. | 64 | 2,880 | ||||
Tower Group Inc. | 121 | 3,098 | ||||
Transatlantic Holdings Inc. | 38 | 1,941 | ||||
TrustCo Bank Corp. | 325 | 2,061 | ||||
Validus Holdings Ltd. | 97 | 2,967 | ||||
| 39,556 | ||||||
HEALTH CARE - 4.6% | ||||||
Mettler Toledo International Inc. (c) | 21 | 3,100 | ||||
Pharmaceutical Product Development Inc. | 109 | 2,953 | ||||
STERIS Corp. | 90 | 3,289 | ||||
Teleflex Inc. | 53 | 2,830 | ||||
West Pharmaceutical Services Inc. | 36 | 1,475 | ||||
| 13,647 | ||||||
INDUSTRIALS - 29.3% | ||||||
ABM Industries Inc. | 135 | 3,556 | ||||
Administaff Inc. | 66 | 1,922 | ||||
American Woodmark Corp. | 88 | 2,150 | ||||
AO Smith Corp. | 26 | 1,005 | ||||
Apogee Enterprises Inc. | 102 | 1,368 | ||||
Applied Industrial Technologies Inc. | 54 | 1,754 | ||||
Astec Industries Inc. (c) | 79 | 2,551 | ||||
Brady Corp. - Class A | 88 | 2,866 | ||||
Briggs & Stratton Corp. (e) | 103 | 2,022 | ||||
Carlisle Cos. Inc. | 81 | 3,207 | ||||
| Shares/Par (p) | Value | |||||
Ceradyne Inc. (c) | 75 | 2,368 | ||||
CIRCOR International Inc. | 30 | 1,258 | ||||
CNH Global NV (c) | 12 | 568 | ||||
EMCOR Group Inc. (c) | 68 | 1,956 | ||||
Franklin Electric Co. Inc. | 49 | 1,899 | ||||
Gardner Denver Inc. | 52 | 3,572 | ||||
Genesee & Wyoming Inc. - Class A (c) | 65 | 3,452 | ||||
Gibraltar Industries Inc. (c) (e) | 179 | 2,428 | ||||
Graco Inc. | 88 | 3,456 | ||||
Granite Construction Inc. | 112 | 3,067 | ||||
Kennametal Inc. | 93 | 3,654 | ||||
Lincoln Electric Holdings Inc. | 42 | 2,739 | ||||
Mine Safety Appliances Co. | 82 | 2,562 | ||||
Mueller Industries Inc. | 123 | 4,012 | ||||
Nordson Corp. | 41 | 3,767 | ||||
Powell Industries Inc. (c) | 32 | 1,039 | ||||
Roper Industries Inc. | 20 | 1,529 | ||||
Simpson Manufacturing Co. Inc. | 100 | 3,100 | ||||
SkyWest Inc. | 200 | 3,118 | ||||
Timken Co. | 21 | 1,002 | ||||
Trinity Industries Inc. (e) | 170 | 4,518 | ||||
Universal Forest Products Inc. | 101 | 3,944 | ||||
Wabash National Corp. (c) | 215 | 2,548 | ||||
Watts Water Technologies Inc. - Class A | 61 | 2,214 | ||||
| 86,171 | ||||||
INFORMATION TECHNOLOGY - 3.4% | ||||||
Benchmark Electronics Inc. (c) | 251 | 4,563 | ||||
Cohu Inc. | 156 | 2,583 | ||||
Rofin-Sinar Technologies Inc. (c) | 82 | 2,917 | ||||
| 10,063 | ||||||
MATERIALS - 7.7% | ||||||
A. Schulman Inc. | 6 | 146 | ||||
AptarGroup Inc. | 47 | 2,222 | ||||
Cabot Corp. | 74 | 2,801 | ||||
Glatfelter | 69 | 852 | ||||
Reliance Steel & Aluminum Co. | 81 | 4,160 | ||||
RPM International Inc. | 164 | 3,627 | ||||
Sensient Technologies Corp. | 42 | 1,539 | ||||
Steel Dynamics Inc. | 222 | 4,055 | ||||
United States Steel Corp. | 5 | 292 | ||||
Westlake Chemical Corp. (e) | 67 | 2,912 | ||||
| 22,606 | ||||||
UTILITIES - 2.8% | ||||||
Energen Corp. | 49 | 2,365 | ||||
NV Energy Inc. | 265 | 3,721 | ||||
PNM Resources Inc. | 170 | 2,214 | ||||
| 8,300 | ||||||
Total Common Stocks | 274,072 | |||||
SHORT TERM INVESTMENTS - 10.4% | ||||||
Investment Company - 6.8% | ||||||
JNL Money Market Fund, 0.08% (a) (h) | 20,020 | 20,020 | ||||
Securities Lending Collateral 3.6% | ||||||
Securities Lending Cash Collateral Fund LLC, 0.31% (a) (h) | 9,698 | 9,698 | ||||
Securities Lending Liquidating Fund LLC, 0.66% (a) (h) | 971 | 954 | ||||
| 10,652 | ||||||
Total Short Term Investments (cost $30,688) | 30,672 | |||||
See accompanying Notes to the Financial Statements.
JNL Series Trust
Schedules of Investments (in thousands)
December 31, 2010
| Shares/Par (p) | Value | |||||
Total Investments - 103.4% (cost $256,413) | 304,744 | |||||
Other Assets and Liabilities, Net - (3.4%) | (10,144) | |||||
Total Net Assets - 100.0% | $ 294,600 | |||||
JNL/Goldman Sachs Mid Cap Value Fund | ||||||
COMMON STOCKS - 96.8% | ||||||
CONSUMER DISCRETIONARY - 11.8% | ||||||
CBS Corp. - Class B | 457 | $8,698 | ||||
DISH Network Corp. - Class A (c) | 368 | 7,230 | ||||
Guess? Inc. | 79 | 3,735 | ||||
Hasbro Inc. | 52 | 2,464 | ||||
Lear Corp. (c) | 86 | 8,474 | ||||
Liberty Media Corp. - Interactive (c) | 396 | 6,250 | ||||
Mohawk Industries Inc. (c) | 43 | 2,460 | ||||
Newell Rubbermaid Inc. | 326 | 5,919 | ||||
NVR Inc. (c) | 5 | 3,322 | ||||
TRW Automotive Holdings Corp. (c) | 98 | 5,180 | ||||
Urban Outfitters Inc. (c) | 62 | 2,211 | ||||
Wyndham Worldwide Corp. | 121 | 3,627 | ||||
| 59,570 | ||||||
CONSUMER STAPLES - 4.9% | ||||||
ConAgra Foods Inc. | 211 | 4,769 | ||||
Energizer Holdings Inc. (c) | 33 | 2,435 | ||||
Hansen Natural Corp. (c) | 42 | 2,184 | ||||
HJ Heinz Co. | 89 | 4,407 | ||||
JM Smucker Co. | 120 | 7,867 | ||||
Sara Lee Corp. | 187 | 3,271 | ||||
| 24,933 | ||||||
ENERGY - 11.0% | ||||||
Alpha Natural Resources Inc. (c) | 99 | 5,915 | ||||
Cameron International Corp. (c) | 121 | 6,126 | ||||
Forest Oil Corp. (c) | 219 | 8,317 | ||||
Key Energy Services Inc. (c) | 181 | 2,353 | ||||
Newfield Exploration Co. (c) | 194 | 14,003 | ||||
QEP Resources Inc. | 180 | 6,552 | ||||
Range Resources Corp. | 100 | 4,511 | ||||
Weatherford International Ltd. (c) | 357 | 8,144 | ||||
| 55,921 | ||||||
FINANCIALS - 28.2% | ||||||
Alexandria Real Estate Equities Inc. | 54 | 3,943 | ||||
Boston Properties Inc. | 61 | 5,269 | ||||
CIT Group Inc. (c) | 31 | 1,482 | ||||
Comerica Inc. | 73 | 3,086 | ||||
Douglas Emmett Inc. | 167 | 2,768 | ||||
Equity Residential | 163 | 8,460 | ||||
Everest Re Group Ltd. | 96 | 8,126 | ||||
Fifth Third Bancorp | 532 | 7,806 | ||||
First Horizon National Corp. (c) | 5 | 55 | ||||
First Republic Bank (c) | 40 | 1,152 | ||||
Genworth Financial Inc. - Class A (c) | 409 | 5,377 | ||||
Hartford Financial Services Group Inc. | 273 | 7,229 | ||||
Host Hotels & Resorts Inc. | 292 | 5,223 | ||||
Invesco Ltd. | 313 | 7,527 | ||||
Janus Capital Group Inc. | 286 | 3,709 | ||||
Lazard Ltd. - Class A | 83 | 3,270 | ||||
Legg Mason Inc. | 104 | 3,784 | ||||
M&T Bank Corp. | 40 | 3,492 | ||||
Marsh & McLennan Cos. Inc. | 196 | 5,366 | ||||
MFA Financial Inc. | 554 | 4,523 | ||||
Principal Financial Group Inc. | 331 | 10,778 | ||||
| Shares/Par (p) | Value | |||||
Progressive Corp. | 129 | 2,560 | ||||
SLM Corp. (c) | 513 | 6,463 | ||||
SunTrust Banks Inc. | 258 | 7,625 | ||||
Tanger Factory Outlet Centers Inc. | 71 | 3,625 | ||||
Unum Group | 154 | 3,732 | ||||
Ventas Inc. | 102 | 5,364 | ||||
WR Berkley Corp. | 208 | 5,705 | ||||
XL Group Plc | 228 | 4,974 | ||||
| 142,473 | ||||||
HEALTH CARE - 6.0% | ||||||
Aetna Inc. | 220 | 6,708 | ||||
Biogen Idec Inc. (c) | 108 | 7,272 | ||||
Boston Scientific Corp. (c) | 350 | 2,652 | ||||
CR Bard Inc. | 48 | 4,441 | ||||
Hologic Inc. (c) | 234 | 4,401 | ||||
Kinetic Concepts Inc. (c) | 114 | 4,793 | ||||
| 30,267 | ||||||
INDUSTRIALS - 9.3% | ||||||
BE Aerospace Inc. (c) | 107 | 3,949 | ||||
Cooper Industries Plc | 64 | 3,746 | ||||
Eaton Corp. | 52 | 5,243 | ||||
JetBlue Airways Corp. (c) (e) | 437 | 2,890 | ||||
Kansas City Southern (c) | 98 | 4,674 | ||||
Masco Corp. | 291 | 3,681 | ||||
Parker Hannifin Corp. | 65 | 5,575 | ||||
Pentair Inc. | 173 | 6,309 | ||||
Republic Services Inc. - Class A | 130 | 3,893 | ||||
Ryder System Inc. | 53 | 2,804 | ||||
Textron Inc. | 189 | 4,471 | ||||
| 47,235 | ||||||
INFORMATION TECHNOLOGY - 6.6% | ||||||
Adobe Systems Inc. (c) | 164 | 5,040 | ||||
Amphenol Corp. - Class A | 70 | 3,711 | ||||
BMC Software Inc. (c) | 105 | 4,939 | ||||
Check Point Software Technologies Ltd. (c) | 57 | 2,637 | ||||
ON Semiconductor Corp. (c) | 472 | 4,667 | ||||
Parametric Technology Corp. (c) | 179 | 4,042 | ||||
Polycom Inc. (c) | 65 | 2,531 | ||||
Quest Software Inc. (c) | 55 | 1,517 | ||||
VeriFone Holdings Inc. (c) | 41 | 1,584 | ||||
Xilinx Inc. | �� | 87 | 2,530 | |||
| 33,198 | ||||||
MATERIALS - 5.2% | ||||||
Celanese Corp. - Class A | 71 | 2,908 | ||||
Cliffs Natural Resources Inc. | 36 | 2,786 | ||||
Huntsman Corp. | 456 | 7,125 | ||||
Owens-Illinois Inc. (c) | 114 | 3,485 | ||||
Steel Dynamics Inc. | 87 | 1,587 | ||||
Stillwater Mining Co. (c) | 129 | 2,745 | ||||
Temple-Inland Inc. | 176 | 3,743 | ||||
Thompson Creek Metals Co. Inc. (c) (e) | 141 | 2,076 | ||||
| 26,455 | ||||||
TELECOMMUNICATION SERVICES - 3.3% | ||||||
CenturyLink Inc. | 165 | 7,623 | ||||
Clearwire Corp. - Class A (c) (e) | 354 | 1,825 | ||||
Sprint Nextel Corp. (c) | 1,696 | 7,175 | ||||
| 16,623 | ||||||
UTILITIES - 10.5% | ||||||
Alliant Energy Corp. | 27 | 993 | ||||
CMS Energy Corp. | 314 | 5,835 | ||||
DPL Inc. | 55 | 1,409 | ||||
Edison International | 105 | 4,056 | ||||
See accompanying Notes to the Financial Statements.
JNL Series Trust
Schedules of Investments (in thousands)
December 31, 2010
| Shares/Par (p) | Value | |||||
FirstEnergy Corp. (e) | 48 | 1,768 | ||||
Northeast Utilities | 149 | 4,762 | ||||
NV Energy Inc. | 275 | 3,858 | ||||
Pinnacle West Capital Corp. | 69 | 2,860 | ||||
PPL Corp. | 207 | 5,440 | ||||
Progress Energy Inc. | 45 | 1,952 | ||||
SCANA Corp. (e) | 146 | 5,925 | ||||
Sempra Energy | 96 | 5,030 | ||||
Westar Energy Inc. | 52 | 1,305 | ||||
Xcel Energy Inc. | 348 | 8,188 | ||||
| 53,381 | ||||||
Total Common Stocks (cost $414,505) | 490,056 | |||||
SHORT TERM INVESTMENTS - 6.3% | ||||||
Investment Company - 4.6% | ||||||
JNL Money Market Fund, 0.08% (a) (h) | 23,029 | 23,029 | ||||
Securities Lending Collateral 1.7% | ||||||
Securities Lending Cash Collateral Fund LLC, 0.31% (a) (h) | 8,112 | 8,112 | ||||
Securities Lending Liquidating Fund LLC, 0.66% (a) (h) | 672 | 661 | ||||
| 8,773 | ||||||
Total Short Term Investments (cost $31,813) |
| 31,802 | ||||
Total Investments - 103.1% (cost $446,318) |
| 521,858 | ||||
Other Assets and Liabilities, Net - (3.1%) |
| (15,767) | ||||
Total Net Assets - 100.0% | $ 506,091 | |||||
JNL/Goldman Sachs U.S. Equity Flex Fund | ||||||
COMMON STOCKS - 126.2% | ||||||
CONSUMER DISCRETIONARY - 18.9% |
| |||||
CBS Corp. - Class B (o) | 105 | $2,008 | ||||
Comcast Corp. - Class A (o) | 117 | 2,561 | ||||
DISH Network Corp. - Class A (c) (o) | 123 | 2,413 | ||||
Ford Motor Co. (c) (o) | 106 | 1,778 | ||||
G-III Apparel Group Ltd. (c) | 13 | 463 | ||||
General Motors Co. (c) (o) | 41 | 1,525 | ||||
Guess? Inc. | 25 | 1,174 | ||||
Johnson Controls Inc. | 29 | 1,105 | ||||
Jos. A. Bank Clothiers Inc. (c) | 18 | 742 | ||||
Lear Corp. (c) | 25 | 2,501 | ||||
Liberty Media Corp. - Interactive (c) (o) | 70 | 1,108 | ||||
Newell Rubbermaid Inc. (o) | 77 | 1,396 | ||||
Phillips-Van Heusen Corp. | 10 | 651 | ||||
Polo Ralph Lauren Corp. - Class A | 8 | 937 | ||||
Target Corp. | 24 | 1,455 | ||||
| 21,817 | ||||||
CONSUMER STAPLES - 9.5% | ||||||
Archer-Daniels-Midland Co. | 28 | 840 | ||||
CVS Caremark Corp. | 30 | 1,052 | ||||
General Mills Inc. (o) | 72 | 2,558 | ||||
Hansen Natural Corp. (c) | 11 | 550 | ||||
PepsiCo Inc. (o) | 23 | 1,534 | ||||
Procter & Gamble Co. (o) | 20 | 1,305 | ||||
Unilever NV - NYS (o) | 44 | 1,375 | ||||
Wal-Mart Stores Inc. (o) | 33 | 1,800 | ||||
| 11,014 | ||||||
| Shares/Par (p) | Value | |||||
ENERGY - 15.0% | ||||||
EOG Resources Inc. | 6 | 538 | ||||
Forest Oil Corp. (c) (o) | 51 | 1,933 | ||||
Halliburton Co. (o) | 33 | 1,366 | ||||
Newfield Exploration Co. (c) (o) | 56 | 4,022 | ||||
Occidental Petroleum Corp. (o) | 39 | 3,803 | ||||
Range Resources Corp. (o) | 43 | 1,916 | ||||
Schlumberger Ltd. | 22 | 1,867 | ||||
Weatherford International Ltd. (c) | 81 | 1,838 | ||||
| 17,283 | ||||||
FINANCIALS - 23.2% | ||||||
AFLAC Inc. (o) | 36 | 2,003 | ||||
Allstate Corp. | 33 | 1,057 | ||||
American Express Co. | 24 | 1,043 | ||||
Bank of America Corp. (o) | 194 | 2,595 | ||||
Bank of New York Mellon Corp. (o) | 53 | 1,614 | ||||
Franklin Resources Inc. | 13 | 1,401 | ||||
Hartford Financial Services Group Inc. | 39 | 1,041 | ||||
Invesco Ltd. (o) | 62 | 1,492 | ||||
JPMorgan Chase & Co. (o) | 102 | 4,322 | ||||
MFA Financial Inc. (o) | 80 | 652 | ||||
Prudential Financial Inc. (o) | 37 | 2,195 | ||||
State Street Corp. | 27 | 1,266 | ||||
SunTrust Banks Inc. | 44 | 1,291 | ||||
Travelers Cos. Inc. (o) | 39 | 2,156 | ||||
U.S. Bancorp (o) | 97 | 2,624 | ||||
| 26,752 | ||||||
HEALTH CARE - 13.6% | ||||||
Baxter International Inc. (o) | 59 | 2,981 | ||||
Biogen Idec Inc. (c) (o) | 38 | 2,521 | ||||
ICON Plc - ADR (c) | 40 | 871 | ||||
Johnson & Johnson (o) | 42 | 2,602 | ||||
Merck & Co. Inc. (o) | 88 | 3,170 | ||||
Teva Pharmaceutical Industries | 43 | 2,233 | ||||
WellPoint Inc. (c) | 23 | 1,312 | ||||
| 15,690 | ||||||
INDUSTRIALS - 11.7% | ||||||
Boeing Co. (o) | 40 | 2,588 | ||||
Emerson Electric Co. (o) | 40 | 2,264 | ||||
General Electric Co. (o) | 198 | 3,627 | ||||
Honeywell International Inc. (o) | 77 | 4,072 | ||||
Union Pacific Corp. | 11 | 975 | ||||
| 13,526 | ||||||
INFORMATION TECHNOLOGY - 24.1% |
| |||||
Adobe Systems Inc. (c) (o) | 69 | 2,123 | ||||
Apple Inc. (c) (o) | 14 | 4,655 | ||||
BMC Software Inc. (c) (o) | 26 | 1,242 | ||||
Cisco Systems Inc. (c) (o) | 68 | 1,383 | ||||
EMC Corp. (c) (o) | 139 | 3,192 | ||||
Google Inc. - Class A (c) | 6 | 3,475 | ||||
Microsoft Corp. (o) | 123 | 3,445 | ||||
Oracle Corp. (o) | 100 | 3,116 | ||||
Parametric Technology Corp. (c) (o) | 53 | 1,183 | ||||
QUALCOMM Inc. (o) | 34 | 1,705 | ||||
Texas Instruments Inc. (o) | 43 | 1,401 | ||||
Xilinx Inc. | 32 | 917 | ||||
| 27,837 | ||||||
MATERIALS - 4.4% | ||||||
Dow Chemical Co. (o) | 40 | 1,353 | ||||
Freeport-McMoRan Copper & Gold Inc. | 12 | 1,418 | ||||
Huntsman Corp. (o) | 144 | 2,254 | ||||
| 5,025 | ||||||
See accompanying Notes to the Financial Statements.
JNL Series Trust
Schedules of Investments (in thousands)
December 31, 2010
| Shares/Par (p) | Value | |||||
TELECOMMUNICATION SERVICES - 2.6% | ||||||
Clearwire Corp. - Class A (c) (o) | 108 | 555 | ||||
Sprint Nextel Corp. (c) (o) | 588 | 2,489 | ||||
| 3,044 | ||||||
UTILITIES - 3.2% | ||||||
American Electric Power Co. Inc. | 30 | 1,092 | ||||
Entergy Corp. | 18 | 1,264 | ||||
PG&E Corp. | 29 | 1,370 | ||||
| 3,726 | ||||||
Total Common Stocks (cost $133,023) | 145,714 | |||||
SHORT TERM INVESTMENTS - 4.3% | ||||||
Investment Company - 4.3% | ||||||
JNL Money Market Fund, 0.08% (a) (h) | 4,931 | 4,931 | ||||
Total Short Term Investments (cost $4,931) | 4,931 | |||||
Total Investments - 130.5% (cost $137,954) | 150,645 | |||||
Total Securities Sold Short - (30.5)% (proceeds $32,863) | (35,216) | |||||
Other Assets and Liabilities, Net - (0.0% ) | (25) | |||||
Total Net Assets - 100.0% | $ 115,404 | |||||
Securities Sold Short - 30.5% | ||||||
COMMON STOCKS - 30.5% | ||||||
CONSUMER DISCRETIONARY - 6.2% | ||||||
AutoNation Inc. | 21 | $ 601 | ||||
Buckle Inc. | 12 | 467 | ||||
Gentex Corp. | 19 | 558 | ||||
Genuine Parts Co. | 6 | 295 | ||||
Gildan Activewear Inc. | 11 | 319 | ||||
Harman International Industries Inc. | 8 | 373 | ||||
Hibbett Sports Inc. | 10 | 383 | ||||
KB Home | 23 | 314 | ||||
NetFlix Inc. | 4 | 643 | ||||
New York Times Co. - Class A | 150 | 1,467 | ||||
Penske Auto Group Inc. | 28 | 495 | ||||
Pool Corp. | 13 | 283 | ||||
Starwood Hotels & Resorts Worldwide Inc. | 10 | 609 | ||||
Toll Brothers Inc. | 20 | 382 | ||||
| 7,189 | ||||||
CONSUMER STAPLES - 0.9% | ||||||
Campbell Soup Co. | 16 | 544 | ||||
Kimberly-Clark Corp. | 9 | 553 | ||||
| 1,097 | ||||||
ENERGY - 3.6% | ||||||
Marathon Oil Corp. | 52 | 1,938 | ||||
Noble Corp. | 32 | 1,142 | ||||
Transocean Ltd. | 16 | 1,132 | ||||
| 4,212 | ||||||
FINANCIALS - 3.2% | ||||||
ACE Ltd. | 6 | 391 | ||||
eHealth Inc. | 37 | 528 | ||||
Jefferies Group Inc. | 23 | 619 | ||||
MetLife Inc. | 8 | 349 | ||||
Reinsurance Group of America Inc. | 1 | 44 | ||||
T. Rowe Price Group Inc. | 10 | 670 | ||||
TCF Financial Corp. | 73 | 1,088 | ||||
| 3,689 | ||||||
| Shares/Par (p) | Value | |||||
HEALTH CARE - 5.4% | ||||||
Align Technology Inc. | 37 | 714 | ||||
AMERIGROUP Corp. | 13 | 577 | ||||
Bristol-Myers Squibb Co. | 31 | 829 | ||||
Centene Corp. | 23 | 586 | ||||
Intuitive Surgical Inc. | 2 | 611 | ||||
NuVasive Inc. | 18 | 455 | ||||
Perrigo Co. | 14 | 880 | ||||
Pfizer Inc. | 49 | 854 | ||||
Stryker Corp. | 13 | 692 | ||||
| 6,198 | ||||||
INDUSTRIALS - 2.1% | ||||||
General Dynamics Corp. | 5 | 346 | ||||
Joy Global Inc. | 9 | 753 | ||||
Northrop Grumman Corp. | 9 | 568 | ||||
Precision Castparts Corp. | 5 | 710 | ||||
| 2,377 | ||||||
INFORMATION TECHNOLOGY - 4.2% | ||||||
Novellus Systems Inc. | 40 | 1,299 | ||||
Red Hat Inc. | 28 | 1,300 | ||||
SAIC Inc. | 43 | 685 | ||||
SAP AG - ADR | 17 | 858 | ||||
Tech Data Corp. | 16 | 709 | ||||
| 4,851 | ||||||
MATERIALS - 1.0% | ||||||
EI Du Pont de Nemours & Co. | 23 | 1,158 | ||||
TELECOMMUNICATION SERVICES - 2.8% | ||||||
Telefonos de Mexico SAB de CV - ADR | 58 | 933 | ||||
US Cellular Corp. | 20 | 1,006 | ||||
Verizon Communications Inc. | 16 | 589 | ||||
Windstream Corp. | 49 | 680 | ||||
| 3,208 | ||||||
UTILITIES - 1.1% | ||||||
Exelon Corp. | 18 | 737 | ||||
Piedmont Natural Gas Co. Inc. | 18 | 500 | ||||
| 1,237 | ||||||
Total Securities Sold Short - 30.5% (proceeds $32,863) | $ 35,216 | |||||
JNL/Invesco Global Real Estate Fund | ||||||
COMMON STOCKS - 98.3% | ||||||
CONSUMER DISCRETIONARY - 0.7% | ||||||
Marriott International Inc. - Class A | 68 | $2,829 | ||||
Starwood Hotels & Resorts Worldwide Inc. | 36 | 2,192 | ||||
| 5,021 | ||||||
FINANCIALS - 97.6% | ||||||
Real Estate Investment Trusts - 66.9% |
| |||||
Diversified - REITS - 21.1% | ||||||
BGP Holdings Plc (c) (f) | 5,552 | — | ||||
British Land Co. Plc | 787 | 6,437 | ||||
CapitaCommercial Trust (e) | 2,342 | 2,737 | ||||
Cominar Real Estate Investment Trust | 137 | 2,872 | ||||
Corio NV | 111 | 7,151 | ||||
Derwent London Plc | 177 | 4,308 | ||||
Dexus Property Group | 5,290 | 4,301 | ||||
Digital Realty Trust Inc. (e) | 179 | 9,216 | ||||
Eurocommercial Properties NV | 54 | 2,487 | ||||
See accompanying Notes to the Financial Statements.
JNL Series Trust
Schedules of Investments (in thousands)
December 31, 2010
| Shares/Par (p) | Value | |||||
Fonciere Des Regions | 34 | 3,295 | ||||
Goodman Group | 14,771 | 9,820 | ||||
Hammerson Plc | 734 | 4,774 | ||||
Kenedix Realty Investment Corp. | 1 | 3,238 | ||||
Klepierre | 109 | 3,928 | ||||
Land Securities Group Plc | 795 | 8,358 | ||||
Liberty Property Trust | 212 | 6,766 | ||||
Mercialys SA | 59 | 2,212 | ||||
Morguard Real Estate Investment Trust | 131 | 1,934 | ||||
Segro Plc | 588 | 2,624 | ||||
Shaftesbury Plc | 351 | 2,449 | ||||
Stockland | 3,437 | 12,654 | ||||
Suntec Real Estate Investment Trust | 3,522 | 4,117 | ||||
Unibail-Rodamco SE (c) | 66 | 13,048 | ||||
Vornado Realty Trust | 153 | 12,745 | ||||
Washington REIT | 120 | 3,728 | ||||
Wereldhave NV | 46 | 4,528 | ||||
| 139,727 | ||||||
Industrial - REITS - 2.3% | ||||||
DCT Industrial Trust Inc. | 269 | 1,431 | ||||
Hansteen Holdings Plc (c) | 1,078 | 1,370 | ||||
ProLogis | 870 | 12,562 | ||||
| 15,363 | ||||||
Office - REITS - 9.5% | ||||||
Alexandria Real Estate Equities Inc. | 80 | 5,895 | ||||
BioMed Realty Trust Inc. | 228 | 4,253 | ||||
Boston Properties Inc. | 86 | 7,366 | ||||
Corporate Office Properties Trust | 57 | 2,009 | ||||
Duke Realty Corp. | 33 | 411 | ||||
Great Portland Estates Plc | 265 | 1,489 | ||||
Highwoods Properties Inc. | 169 | 5,376 | ||||
ING Office Fund (e) | 5,736 | 3,256 | ||||
Japan Prime Realty Investment Corp. | 1 | 3,456 | ||||
Japan Real Estate Investment Corp. | 1 | 7,003 | ||||
Kilroy Realty Corp. | 86 | 3,136 | ||||
Nippon Building Fund Inc. (e) | — | 5,011 | ||||
Orix JREIT Inc. | — | 1,391 | ||||
Piedmont Office Realty Trust Inc. (e) | 147 | 2,963 | ||||
SL Green Realty Corp. | 96 | 6,507 | ||||
Societe Immobiliere de Location pour l’Industrie et le Commerce | 25 | 3,082 | ||||
| 62,604 | ||||||
Residential - REITS - 7.0% | ||||||
Advance Residence Investment Corp. (c) | 1 | 2,956 | ||||
AvalonBay Communities Inc. | 46 | 5,205 | ||||
Camden Property Trust | 188 | 10,169 | ||||
Equity Residential | 146 | 7,597 | ||||
Essex Property Trust Inc. (e) | 80 | 9,178 | ||||
Home Properties Inc. | 70 | 3,873 | ||||
Mid-America Apartment Communities Inc. | 42 | 2,648 | ||||
UDR Inc. | 207 | 4,857 | ||||
| 46,483 | ||||||
Retail - REITS - 18.4% | ||||||
Acadia Realty Trust | 161 | 2,932 | ||||
CapitaMall Trust | 2,522 | 3,833 | ||||
CBL & Associates Properties Inc. | 186 | 3,250 | ||||
CFS Retail Property Trust | 4,470 | 8,047 | ||||
Charter Hall Retail REIT (e) | 509 | 1,530 | ||||
Developers Diversified Realty Corp. | 66 | 925 | ||||
Japan Retail Fund Investment Corp. | 1 | 2,411 | ||||
Kimco Realty Corp. | 714 | 12,877 | ||||
Link REIT | 2,127 | 6,607 | ||||
Macerich Co. | 199 | 9,407 | ||||
National Retail Properties Inc. (e) | 153 | 4,052 | ||||
Primaris Retail Real Estate Investment Trust | 241 | 4,744 | ||||
Regency Centers Corp. | 221 | 9,339 | ||||
| Shares/Par (p) | Value | |||||
RioCan Real Estate Investment Trust | 232 | 5,138 | ||||
Simon Property Group Inc. | 285 | 28,306 | ||||
Westfield Group | 1,469 | 14,392 | ||||
Westfield Retail Trust (c) | 1,464 | 3,849 | ||||
| 121,639 | ||||||
Specialized - REITS - 8.6% | ||||||
Big Yellow Group Plc | 445 | 2,434 | ||||
Chartwell Seniors Housing REIT | 375 | 3,081 | ||||
DiamondRock Hospitality Co. (c) | 280 | 3,365 | ||||
Health Care REIT Inc. | 244 | 11,645 | ||||
Hersha Hospitality Trust | 231 | 1,525 | ||||
Host Hotels & Resorts Inc. | 834 | 14,907 | ||||
LaSalle Hotel Properties | 97 | 2,548 | ||||
Nationwide Health Properties Inc. | 169 | 6,147 | ||||
Omega Healthcare Investors Inc. | 55 | 1,230 | ||||
Senior Housing Properties Trust | 290 | 6,364 | ||||
Sovran Self Storage Inc. | 69 | 2,540 | ||||
Ventas Inc. | 23 | 1,193 | ||||
| 56,979 | ||||||
Real Estate Management & Development - 30.7% | ||||||
Real Estate Operating Companies - 25.2% | ||||||
Agile Property Holdings Ltd. | 3,654 | 5,378 | ||||
Beni Stabili SpA | 1,725 | 1,464 | ||||
BR Properties SA | 35 | 377 | ||||
Brookfield Properties Corp. | 309 | 5,457 | ||||
CapitaLand Ltd. | 3,190 | 9,222 | ||||
China Overseas Land & Investment Ltd. (e) | 4,381 | 8,105 | ||||
Global Logistic Properties Ltd. (c) | 1,693 | 2,850 | ||||
Hang Lung Properties Ltd. | 1,839 | 8,600 | ||||
Henderson Land Development Co. Ltd. (c) (e) | 347 | 2,366 | ||||
Hongkong Land Holdings Ltd. (e) | 1,844 | 13,314 | ||||
Hysan Development Co. Ltd. | 1,092 | 5,142 | ||||
Keppel Land Ltd. (e) | 1,579 | 5,906 | ||||
Kerry Properties Ltd. | 990 | 5,158 | ||||
KWG Property Holding Ltd. | 2,534 | 1,930 | ||||
Mitsui Fudosan Co. Ltd. | 956 | 18,999 | ||||
Multiplan Empreendimentos Imobiliarios SA | 56 | 1,254 | ||||
New World Development Ltd. (c) | 1,562 | 2,934 | ||||
NTT Urban Development Corp. | 3 | 2,561 | ||||
Retail Opportunity Investments Corp. | 121 | 1,195 | ||||
Shimao Property Holdings Ltd. (e) | 2,430 | 3,670 | ||||
Sino Land Co. | 3,840 | 7,183 | ||||
Sumitomo Realty & Development Co. Ltd. | 396 | 9,421 | ||||
Sun Hung Kai Properties Ltd. | 1,888 | 31,358 | ||||
Unite Group Plc (c) | 595 | 1,801 | ||||
Wharf Holdings Ltd. | 1,428 | 10,986 | ||||
| 166,631 | ||||||
Real Estate Services - 5.5% | ||||||
AEON Mall Co. Ltd. | 103 | 2,747 | ||||
Castellum AB | 311 | 4,236 | ||||
Conwert Immobilien Invest SE | 157 | 2,256 | ||||
Mitsubishi Estate Co. Ltd. | 1,062 | 19,627 | ||||
Sponda OYJ | 573 | 2,977 | ||||
Swiss Prime Site AG (c) | 61 | 4,561 | ||||
| 36,404 | ||||||
Total Common Stocks (cost $577,810) | 650,851 | |||||
SHORT TERM INVESTMENTS - 6.0% | ||||||
Investment Company - 1.3% | ||||||
JNL Money Market Fund, 0.08% (a) (h) | 8,743 | 8,743 | ||||
Securities Lending Collateral - 4.7% |
| |||||
Securities Lending Cash Collateral Fund LLC, 0.31% (a) (h) | 29,376 | 29,376 | ||||
See accompanying Notes to the Financial Statements.
JNL Series Trust
Schedules of Investments (in thousands)
December 31, 2010
| Shares/Par (p) | Value | |||||
Securities Lending Liquidating Fund LLC, 0.66% (a) (h) | 1,525 | 1,500 | ||||
| 30,876 | ||||||
Total Short Term Investments (cost $39,644) | 39,619 | |||||
Total Investments - 104.3% (cost $617,454) | 690,470 | |||||
Other Assets and Liabilities, Net - (4.3%) | (28,682) | |||||
Total Net Assets - 100.0% | $661,788 | |||||
JNL/Invesco International Growth Fund | ||||||
COMMON STOCKS - 93.4% | ||||||
CONSUMER DISCRETIONARY - 17.6% | ||||||
Adidas AG | 112 | $ 7,378 | ||||
Bayerische Motoren Werke AG | 110 | 8,635 | ||||
Compagnie Generale des Etablissements Michelin | 38 | 2,698 | ||||
Compass Group Plc | 1,163 | 10,538 | ||||
Denso Corp. | 142 | 4,892 | ||||
Eutelsat Communications Group SA | 95 | 3,475 | ||||
Grupo Televisa SA - ADR (c) | 234 | 6,066 | ||||
Hyundai Mobis (c) | 38 | 9,398 | ||||
Informa Plc | 797 | 5,064 | ||||
Kingfisher Plc | 1,325 | 5,443 | ||||
Li & Fung Ltd. | 636 | 3,690 | ||||
Next Plc | 167 | 5,138 | ||||
Publicis Groupe | 62 | 3,217 | ||||
Puma AG Rudolf Dassler Sport | 17 | 5,554 | ||||
Reed Elsevier Plc | 676 | 5,710 | ||||
Toyota Motor Corp. | 130 | 5,114 | ||||
WPP Plc | 439 | 5,404 | ||||
Yamada Denki Co. Ltd. | 93 | 6,298 | ||||
| 103,712 | ||||||
CONSUMER STAPLES - 13.0% | ||||||
Anheuser-Busch InBev NV | 164 | 9,395 | ||||
British American Tobacco Plc | 190 | 7,312 | ||||
Danone SA | 85 | 5,369 | ||||
Fomento Economico Mexicano SAB de CV - ADR | 66 | 3,717 | ||||
Imperial Tobacco Group Plc | 344 | 10,562 | ||||
Koninklijke Ahold NV | 432 | 5,708 | ||||
Nestle SA | 206 | 12,046 | ||||
Reckitt Benckiser Group Plc | 99 | 5,445 | ||||
Tesco Plc | 1,176 | 7,795 | ||||
Unilever NV | 174 | 5,425 | ||||
Woolworths Ltd. | 143 | 3,931 | ||||
| 76,705 | ||||||
ENERGY - 10.3% | ||||||
BG Group Plc | 368 | 7,438 | ||||
Canadian Natural Resources Ltd. | 122 | 5,446 | ||||
Cenovus Energy Inc. | 154 | 5,171 | ||||
EnCana Corp. (e) | 115 | 3,377 | ||||
Gazprom OAO - ADR | 246 | 6,222 | ||||
Petroleo Brasileiro SA - ADR | 153 | 5,227 | ||||
Royal Dutch Shell Plc - B Shares | 180 | 5,923 | ||||
Suncor Energy Inc. | 142 | 5,484 | ||||
Talisman Energy Inc. | 156 | 3,465 | ||||
Total SA | 96 | 5,077 | ||||
WorleyParsons Ltd. (e) | 292 | 7,983 | ||||
| 60,813 | ||||||
| Shares/Par (p) | Value | |||||
FINANCIALS - 9.4% | ||||||
Akbank T.A.S. | 875 | 4,860 | ||||
AXA SA | 184 | 3,056 | ||||
Banco Bradesco SA - ADR (e) | 431 | 8,744 | ||||
BNP Paribas | 98 | 6,222 | ||||
Fairfax Financial Holdings Ltd. | 11 | 4,528 | ||||
Industrial & Commercial Bank of China | 11,144 | 8,301 | ||||
Julius Baer Group Ltd. | 117 | 5,462 | ||||
Kinnevik Investment AB | 138 | 2,810 | ||||
QBE Insurance Group Ltd. | 237 | 4,397 | ||||
United Overseas Bank Ltd. | 474 | 6,722 | ||||
| 55,102 | ||||||
HEALTH CARE - 13.5% | ||||||
Bayer AG | 78 | 5,768 | ||||
Cochlear Ltd. (e) | 92 | 7,532 | ||||
CSL Ltd. | 156 | 5,782 | ||||
Fresenius Medical Care AG & Co. KGaA | 88 | 5,083 | ||||
Novartis AG | 144 | 8,474 | ||||
Novo-Nordisk A/S | 92 | 10,311 | ||||
Roche Holding AG | 80 | 11,779 | ||||
Shire Plc | 442 | 10,642 | ||||
Smith & Nephew Plc | 240 | 2,534 | ||||
Teva Pharmaceutical Industries Ltd. - ADR | 226 | 11,785 | ||||
| 79,690 | ||||||
INDUSTRIALS - 10.0% | ||||||
Bharat Heavy Electricals Ltd. | 56 | 2,925 | ||||
Canadian National Railway Co. | 41 | 2,715 | ||||
Fanuc Ltd. | 69 | 10,501 | ||||
Hutchison Whampoa Ltd. | 620 | 6,381 | ||||
Keppel Corp. Ltd. | 1,100 | 9,703 | ||||
Komatsu Ltd. | 173 | 5,198 | ||||
Nidec Corp. | 127 | 12,755 | ||||
TNT NV | 209 | 5,522 | ||||
Volvo AB (c) | 183 | 3,224 | ||||
| 58,924 | ||||||
INFORMATION TECHNOLOGY - 7.9% | ||||||
Canon Inc. (e) | 108 | 5,522 | ||||
HON HAI Precision Industry Co. Ltd. | 1,268 | 5,109 | ||||
Infosys Technologies Ltd. - ADR | 115 | 8,717 | ||||
Keyence Corp. | 21 | 5,938 | ||||
NHN Corp. (c) | 24 | 4,746 | ||||
SAP AG | 106 | 5,372 | ||||
Taiwan Semiconductor Manufacturing Co. Ltd. | 3,319 | 8,083 | ||||
Telefonaktiebolaget LM Ericsson | 257 | 2,980 | ||||
| �� | ||||||
| 46,467 | ||||||
MATERIALS - 3.0% | ||||||
BHP Billiton Ltd. (e) | 251 | 11,624 | ||||
Syngenta AG | 21 | 6,086 | ||||
| 17,710 | ||||||
TELECOMMUNICATION SERVICES - 5.7% | ||||||
America Movil SAB de CV - ADR | 193 | 11,038 | ||||
Koninklijke KPN NV | 365 | 5,329 | ||||
Philippine Long Distance Telephone Co. | 108 | 6,277 | ||||
VimpelCom Ltd. - ADR | 180 | 2,707 | ||||
Vodafone Group Plc | 3,062 | 7,916 | ||||
| 33,267 | ||||||
UTILITIES - 3.0% | ||||||
Centrica Plc | 1,512 | 7,817 | ||||
See accompanying Notes to the Financial Statements.
JNL Series Trust
Schedules of Investments (in thousands)
December 31, 2010
| Shares/Par (p) | Value | |||||
International Power Plc | 1,418 | 9,672 | ||||
| 17,489 | ||||||
Total Common Stocks (cost $471,805) | 549,879 | |||||
SHORT TERM INVESTMENTS - 10.9% | ||||||
Investment Company - 6.4% | ||||||
JNL Money Market Fund, 0.08% (a) (h) | 37,733 | 37,733 | ||||
Securities Lending Collateral 4.5% | ||||||
Securities Lending Cash Collateral Fund LLC, 0.31% (a) (h) | 24,856 | 24,856 | ||||
Securities Lending Liquidating Fund LLC, 0.66% (a) (h) | 1,479 | 1,455 | ||||
| 26,311 | ||||||
Total Short Term Investments (cost $64,068) | 64,044 | |||||
Total Investments - 104.3% (cost $535,873) | 613,923 | |||||
Other Assets and Liabilities, Net - (4.3%) | (25,430) | |||||
Total Net Assets - 100.0% | $ 588,493 | |||||
JNL/Invesco Large Cap Growth Fund | ||||||
COMMON STOCKS - 97.5% | ||||||
CONSUMER DISCRETIONARY - 13.5% | ||||||
Amazon.com Inc. (c) | 64 | $11,511 | ||||
Comcast Corp. - Class A | 779 | 17,107 | ||||
DirecTV - Class A (c) | 231 | 9,227 | ||||
Dollar Tree Inc. (c) | 111 | 6,219 | ||||
Ford Motor Co. (c) | 487 | 8,174 | ||||
Las Vegas Sands Corp. (c) | 183 | 8,423 | ||||
Limited Brands Inc. | 447 | 13,747 | ||||
McDonald’s Corp. | 82 | 6,308 | ||||
NetFlix Inc. (c) (e) | 38 | 6,651 | ||||
Ross Stores Inc. | 124 | 7,821 | ||||
Starwood Hotels & Resorts Worldwide Inc. | 147 | 8,948 | ||||
Target Corp. | 116 | 6,960 | ||||
Tiffany & Co. | 86 | 5,335 | ||||
Walt Disney Co. | 186 | 6,962 | ||||
| 123,393 | ||||||
CONSUMER STAPLES - 2.7% | ||||||
Hansen Natural Corp. (c) | 52 | 2,728 | ||||
Mead Johnson Nutrition Co. | 261 | 16,226 | ||||
PepsiCo Inc. | 79 | 5,180 | ||||
| 24,134 | ||||||
ENERGY - 12.5% | ||||||
Cameron International Corp. (c) | 203 | 10,275 | ||||
EOG Resources Inc. | 146 | 13,301 | ||||
Halliburton Co. | 446 | 18,213 | ||||
National Oilwell Varco Inc. | 158 | 10,650 | ||||
Peabody Energy Corp. | 256 | 16,405 | ||||
Schlumberger Ltd. | 223 | 18,611 | ||||
Transocean Ltd. (c) | 191 | 13,242 | ||||
Weatherford International Ltd. (c) | 586 | 13,366 | ||||
| 114,063 | ||||||
FINANCIALS - 4.8% | ||||||
American Express Co. | 129 | 5,533 | ||||
Ameriprise Financial Inc. | 227 | 13,089 | ||||
Comerica Inc. | 117 | 4,954 | ||||
Franklin Resources Inc. | 95 | 10,515 | ||||
| Shares/Par (p) | Value | |||||
JPMorgan Chase & Co. | 223 | 9,477 | ||||
| 43,568 | ||||||
HEALTH CARE - 9.4% | ||||||
Baxter International Inc. | 175 | 8,881 | ||||
Covidien Plc | 198 | 9,059 | ||||
Dendreon Corp. (c) | 197 | 6,895 | ||||
Gilead Sciences Inc. (c) | 449 | 16,279 | ||||
Hospira Inc. (c) | 241 | 13,408 | ||||
McKesson Corp. | 98 | 6,925 | ||||
Medco Health Solutions Inc. (c) | 73 | 4,482 | ||||
Teva Pharmaceutical Industries Ltd. - ADR | 109 | 5,662 | ||||
United Therapeutics Corp. (c) | 106 | 6,722 | ||||
UnitedHealth Group Inc. | 193 | 6,976 | ||||
| 85,289 | ||||||
INDUSTRIALS - 11.4% | ||||||
CH Robinson Worldwide Inc. | 135 | 10,842 | ||||
Cummins Inc. | 63 | 6,878 | ||||
Deere & Co. | 135 | 11,238 | ||||
Foster Wheeler AG (c) | 51 | 1,765 | ||||
Goodrich Corp. | 213 | 18,745 | ||||
Honeywell International Inc. | 174 | 9,265 | ||||
Ingersoll-Rand Plc | 318 | 14,952 | ||||
JB Hunt Transport Services Inc. | 127 | 5,163 | ||||
Union Pacific Corp. | 172 | 15,924 | ||||
WW Grainger Inc. | 64 | 8,857 | ||||
| 103,629 | ||||||
INFORMATION TECHNOLOGY - 32.3% |
| |||||
Apple Inc. (c) | 213 | 68,569 | ||||
Baidu.com - ADR (c) | 202 | 19,534 | ||||
Broadcom Corp. - Class A | 201 | 8,772 | ||||
Cisco Systems Inc. (c) | 539 | 10,896 | ||||
Citrix Systems Inc. (c) | 148 | 10,138 | ||||
Cognizant Technology Solutions Corp. – Class A (c) | 152 | 11,121 | ||||
EMC Corp. (c) | 917 | 21,002 | ||||
Google Inc. - Class A (c) | 39 | 23,166 | ||||
Oracle Corp. | 701 | 21,931 | ||||
QUALCOMM Inc. | 233 | 11,535 | ||||
Red Hat Inc. (c) | 153 | 6,979 | ||||
Rovi Corp. (c) | 292 | 18,109 | ||||
Salesforce.com Inc. (c) | 69 | 9,062 | ||||
SanDisk Corp. (c) | 143 | 7,107 | ||||
Tyco Electronics Ltd. | 70 | 2,477 | ||||
Visa Inc. - Class A | 401 | 28,188 | ||||
Western Digital Corp. (c) | 210 | 7,122 | ||||
Xilinx Inc. | 310 | 8,977 | ||||
| 294,685 | ||||||
MATERIALS - 8.7% | ||||||
Barrick Gold Corp. | 291 | 15,476 | ||||
Monsanto Co. | 472 | 32,850 | ||||
Mosaic Co. | 92 | 7,036 | ||||
Potash Corp. of Saskatchewan Inc. (c) | 156 | 24,223 | ||||
| 79,585 | ||||||
TELECOMMUNICATION SERVICES - 2.2% | ||||||
America Movil SAB de CV - ADR | 151 | 8,655 | ||||
American Tower Corp. - Class A (c) | 228 | 11,773 | ||||
| 20,428 | ||||||
Total Common Stocks (cost $742,746) | 888,774 | |||||
See accompanying Notes to the Financial Statements.
JNL Series Trust
Schedules of Investments (in thousands)
December 31, 2010
| Shares/Par (p) | Value | |||||
SHORT TERM INVESTMENTS - 2.7% | ||||||
Investment Company - 2.0% | ||||||
JNL Money Market Fund, 0.08% (a) (h) | 18,815 | 18,815 | ||||
Securities Lending Collateral 0.7% |
| |||||
Securities Lending Cash Collateral Fund LLC, 0.31% (a) (h) | 5,726 | 5,726 | ||||
Securities Lending Liquidating Fund LLC, 0.66% (a) (h) | 526 | 518 | ||||
| 6,244 | ||||||
Total Short Term Investments (cost $25,067) | 25,059 | |||||
Total Investments - 100.2% (cost $767,813) | 913,833 | |||||
Other Assets and Liabilities, Net - (0.2%) | (2,120) | |||||
Total Net Assets - 100.0% | $ 911,713 | |||||
JNL/Invesco Small Cap Growth Fund | ||||||
COMMON STOCKS - 97.0% |
| |||||
CONSUMER DISCRETIONARY - 17.4% |
| |||||
Brinker International Inc. | 52 | $ 1,092 | ||||
Buffalo Wild Wings Inc. (c) (e) | 20 | 891 | ||||
Choice Hotels International Inc. | 27 | 1,025 | ||||
Darden Restaurants Inc. | 22 | 1,038 | ||||
Dick’s Sporting Goods Inc. (c) | 33 | 1,247 | ||||
DreamWorks Animation SKG Inc. - Class A (c) | 25 | 746 | ||||
DSW Inc. - Class A (c) | 30 | 1,162 | ||||
Foot Locker Inc. | 62 | 1,215 | ||||
Group 1 Automotive Inc. (e) | 32 | 1,350 | ||||
Jack in the Box Inc. (c) | 48 | 1,022 | ||||
Maidenform Brands Inc. (c) | 35 | 831 | ||||
National CineMedia Inc. | 53 | 1,050 | ||||
Penn National Gaming Inc. (c) | 40 | 1,402 | ||||
PF Chang’s China Bistro Inc. (e) | 31 | 1,526 | ||||
Pool Corp. | 39 | 871 | ||||
Steven Madden Ltd. (c) | 27 | 1,126 | ||||
Tenneco Inc. (c) | 30 | 1,240 | ||||
Tractor Supply Co. | 30 | 1,456 | ||||
TRW Automotive Holdings Corp. (c) | 42 | 2,212 | ||||
Warnaco Group Inc. (c) | 20 | 1,082 | ||||
Williams-Sonoma Inc. | 43 | 1,534 | ||||
WMS Industries Inc. (c) | 23 | 1,055 | ||||
| 26,173 | ||||||
CONSUMER STAPLES - 1.9% | ||||||
Diamond Foods Inc. (e) | 20 | 1,049 | ||||
Nu Skin Enterprises Inc. - Class A | 36 | 1,088 | ||||
Ralcorp Holdings Inc. (c) | 11 | 732 | ||||
| 2,869 | ||||||
ENERGY - 8.2% | ||||||
Bill Barrett Corp. (c) | 25 | 1,037 | ||||
Carrizo Oil & Gas Inc. (c) | 37 | 1,289 | ||||
Dresser-Rand Group Inc. (c) | 28 | 1,176 | ||||
Dril-Quip Inc. (c) | 17 | 1,297 | ||||
FMC Technologies Inc. (c) | 16 | 1,434 | ||||
Frontier Oil Corp. (c) | 66 | 1,190 | ||||
Goodrich Petroleum Corp. (c) (e) | 31 | 551 | ||||
James River Coal Co. (c) | 46 | 1,155 | ||||
Lufkin Industries Inc. | 12 | 752 | ||||
Patterson-UTI Energy Inc. | 56 | 1,205 | ||||
SandRidge Energy Inc. (c) (e) | 175 | 1,283 | ||||
| 12,369 | ||||||
| Shares/Par (p) | Value | |||||
FINANCIALS - 5.9% | ||||||
Affiliated Managers Group Inc. (c) | 15 | 1,473 | ||||
Brown & Brown Inc. | 31 | 747 | ||||
City National Corp. | 18 | 1,109 | ||||
Greenhill & Co. Inc. | 13 | 1,096 | ||||
Huntington Bancshares Inc. | 157 | 1,076 | ||||
ProAssurance Corp. (c) | 19 | 1,173 | ||||
Stifel Financial Corp. (c) | 14 | 893 | ||||
SVB Financial Group (c) | 26 | 1,379 | ||||
8,946 | ||||||
HEALTH CARE - 14.3% | ||||||
Acorda Therapeutics Inc. (c) | 30 | 831 | ||||
Allscripts Healthcare Solutions Inc. (c) | 64 | 1,238 | ||||
BioMarin Pharmaceutical Inc. (c) | 48 | 1,281 | ||||
Chemed Corp. | 22 | 1,414 | ||||
Health Management Associates Inc. – Class A (c) | 108 | 1,026 | ||||
Insulet Corp. (c) | 43 | 666 | ||||
Martek Biosciences Corp. (c) (e) | 24 | 751 | ||||
Medicis Pharmaceutical Corp. - Class A | 39 | 1,041 | ||||
Mednax Inc. (c) | 16 | 1,100 | ||||
Meridian Bioscience Inc. | 37 | 859 | ||||
Parexel International Corp. (c) | 41 | 869 | ||||
PerkinElmer Inc. | 43 | 1,099 | ||||
Perrigo Co. | 17 | 1,091 | ||||
PSS World Medical Inc. (c) | 43 | 968 | ||||
Quality Systems Inc. (e) | 15 | 1,071 | ||||
Sirona Dental Systems Inc. (c) | 26 | 1,102 | ||||
Techne Corp. | 14 | 933 | ||||
United Therapeutics Corp. (c) | 17 | 1,058 | ||||
Valeant Pharmaceuticals International Inc. | 36 | 1,026 | ||||
VCA Antech Inc. (c) | 38 | 895 | ||||
Zoll Medical Corp. (c) | 30 | 1,123 | ||||
21,442 | ||||||
INDUSTRIALS - 14.3% | ||||||
Corrections Corp. of America (c) | 48 | 1,215 | ||||
CoStar Group Inc. (c) (e) | 26 | 1,524 | ||||
Forward Air Corp. | 34 | 978 | ||||
Fuel Tech Inc. (c) | 50 | 490 | ||||
Hexcel Corp. (c) | 57 | 1,029 | ||||
HUB Group Inc. - Class A (c) | 39 | 1,386 | ||||
Kaydon Corp. | 24 | 976 | ||||
Kennametal Inc. | 25 | 995 | ||||
Knight Transportation Inc. (e) | 69 | 1,317 | ||||
Lincoln Electric Holdings Inc. | 17 | 1,087 | ||||
Lindsay Corp. (e) | 15 | 899 | ||||
Regal-Beloit Corp. | 24 | 1,604 | ||||
Tetra Tech Inc. (c) | 44 | 1,093 | ||||
Thomas & Betts Corp. (c) | 22 | 1,048 | ||||
TransDigm Group Inc. (c) | 33 | 2,349 | ||||
Wabtec Corp. | 26 | 1,393 | ||||
Watsco Inc. | 14 | 874 | ||||
WESCO International Inc. (c) | 23 | 1,188 | ||||
21,445 | ||||||
INFORMATION TECHNOLOGY - 28.8% | ||||||
Advanced Energy Industries Inc. (c) | 71 | 968 | ||||
Alliance Data Systems Corp. (c) (e) | 14 | 999 | ||||
Ansys Inc. (c) | 22 | 1,149 | ||||
Aspen Technology Inc. (c) | 78 | 984 | ||||
Ciena Corp. (c) (e) | 80 | 1,694 | ||||
Coherent Inc. (c) | 24 | 1,092 | ||||
CommVault Systems Inc. (c) | 39 | 1,129 | ||||
Cymer Inc. (c) | 16 | 706 | ||||
F5 Networks Inc. (c) | 10 | 1,244 | ||||
See accompanying Notes to the Financial Statements.
JNL Series Trust
Schedules of Investments (in thousands)
December 31, 2010
| Shares/Par (p) | Value | |||||
Fair Isaac Corp. | 37 | 861 | ||||
Finisar Corp. (c) | 53 | 1,584 | ||||
Global Payments Inc. | 21 | 982 | ||||
Harmonic Inc. (c) | 119 | 1,021 | ||||
Hittite Microwave Corp. (c) (e) | 23 | 1,376 | ||||
Informatica Corp. (c) (e) | 50 | 2,182 | ||||
Lawson Software Inc. (c) | 149 | 1,380 | ||||
Littelfuse Inc. | 23 | 1,097 | ||||
Micros Systems Inc. (c) | 30 | 1,298 | ||||
Microsemi Corp. (c) | 65 | 1,488 | ||||
NetGear Inc. (c) | 35 | 1,175 | ||||
Nice Systems Ltd. - ADR (c) | 36 | 1,246 | ||||
ON Semiconductor Corp. (c) | 111 | 1,095 | ||||
Open Text Corp. (c) | 22 | 1,024 | ||||
Parametric Technology Corp. (c) | 46 | 1,044 | ||||
Polycom Inc. (c) | 51 | 1,971 | ||||
Power Integrations Inc. | 24 | 949 | ||||
Quest Software Inc. (c) | 55 | 1,516 | ||||
RF Micro Devices Inc. (c) | 153 | 1,124 | ||||
Semtech Corp. (c) | 49 | 1,104 | ||||
SuccessFactors Inc. (c) | 51 | 1,479 | ||||
Tech Data Corp. (c) | 21 | 917 | ||||
Teradyne Inc. (c) | 86 | 1,202 | ||||
ValueClick Inc. (c) | 25 | 404 | ||||
VistaPrint NV (c) | 20 | 906 | ||||
Volterra Semiconductor Corp. (c) | 43 | 995 | ||||
WebMD Health Corp. - Class A (c) | 20 | 1,002 | ||||
Websense Inc. (c) | 49 | 995 | ||||
| 43,382 | ||||||
MATERIALS - 4.4% | ||||||
Calgon Carbon Corp. (c) | 45 | 683 | ||||
Carpenter Technology Corp. | 22 | 897 | ||||
Grief Inc. - Class A | 23 | 1,439 | ||||
Intrepid Potash Inc. (c) (e) | 33 | 1,229 | ||||
Olin Corp. | 54 | 1,118 | ||||
Rockwood Holdings Inc. (c) | 30 | 1,183 | ||||
| 6,549 | ||||||
TELECOMMUNICATION SERVICES - 1.1% | ||||||
SBA Communications Corp. (c) | 39 | 1,591 | ||||
UTILITIES - 0.7% | ||||||
ITC Holdings Corp. | 18 | 1,101 | ||||
Total Common Stocks (cost $116,684) | 145,867 | |||||
SHORT TERM INVESTMENTS - 12.0% | ||||||
Investment Company - 3.0% | ||||||
JNL Money Market Fund, 0.08% (a) (h) | 4,579 | 4,579 | ||||
Securities Lending Collateral 9.0% | ||||||
Securities Lending Cash Collateral Fund LLC, 0.31% (a) (h) | 13,000 | 13,000 | ||||
Securities Lending Liquidating Fund LLC, 0.66% (a) (h) | 463 | 456 | ||||
| 13,456 | ||||||
Total Short Term Investments (cost $18,042) | 18,035 | |||||
Total Investments - 109.0% (cost $134,726) |
| 163,902 | ||||
Other Assets and Liabilities, Net - (9.0%) |
| (13,489) | ||||
Total Net Assets - 100.0% $ | 150,413 | |||||
| Shares/Par (p) | Value | |||||
JNL/Ivy Asset Strategy Fund |
| |||||
COMMON STOCKS - 71.1% |
| |||||
CONSUMER DISCRETIONARY - 22.2% |
| |||||
Bayerische Motoren Werke AG | 113 | $ 8,850 | ||||
CBS Corp. - Class B | 411 | 7,828 | ||||
Compagnie Financiere Richemont SA | 247 | 14,531 | ||||
Hyundai Motor Co. (c) | 165 | 25,146 | ||||
Las Vegas Sands Corp. (c) | 151 | 6,952 | ||||
Li & Fung Ltd. | 1,758 | 10,200 | ||||
Luxottica Group SpA | 16 | 495 | ||||
LVMH Moet Hennessy Louis Vuitton SA | 82 | 13,423 | ||||
Nike Inc. - Class B | 104 | 8,918 | ||||
Sands China Ltd. (c) (r) | 14,327 | 31,482 | ||||
Shangri-La Asia Ltd. | 334 | 907 | ||||
Starwood Hotels & Resorts Worldwide Inc. | 355 | 21,577 | ||||
Wynn Macau Ltd. (c) | 8,389 | 18,780 | ||||
Wynn Resorts Ltd. | 463 | 48,084 | ||||
| 217,173 | ||||||
CONSUMER STAPLES - 2.7% |
| |||||
Hengan International Group Co. Ltd. | 666 | 5,745 | ||||
Mead Johnson Nutrition Co. | 145 | 9,001 | ||||
Philip Morris International Inc. | 198 | 11,560 | ||||
| 26,306 | ||||||
ENERGY - 8.0% | ||||||
China Coal Energy Co | 1,468 | 2,293 | ||||
ConocoPhillips | 311 | 21,159 | ||||
Exxon Mobil Corp. | 13 | 943 | ||||
Halliburton Co. | 504 | 20,576 | ||||
National Oilwell Varco Inc. | 15 | 975 | ||||
Schlumberger Ltd. | 235 | 19,635 | ||||
SeaDrill Ltd. | 356 | 12,139 | ||||
77,720 | ||||||
FINANCIALS - 13.1% | ||||||
AIA Group Ltd. (c) (r) | 4,234 | 11,903 | ||||
Banco Santander Brasil SA - ADR | 770 | 10,473 | ||||
Banco Santander SA | 885 | 9,426 | ||||
BOC Hong Kong Holdings Ltd. | 2,093 | 7,121 | ||||
China Life Insurance Co. Ltd. | 1,486 | 6,070 | ||||
China Pacific Insurance Group Co. Ltd. | 4,230 | 17,577 | ||||
Chonqing Rural Commercial Bank Co. Ltd. (c) | 2,732 | 1,838 | ||||
Credit Suisse Group AG | 115 | 4,632 | ||||
Goldman Sachs Group Inc. | 29 | 4,910 | ||||
HDFC Bank Ltd. | 65 | 3,432 | ||||
ICICI Bank Ltd. | 526 | 13,465 | ||||
Industrial & Commercial Bank of China | 748 | 557 | ||||
Itau Unibanco Holding SA - ADR (c) | 390 | 9,373 | ||||
Ping an Insurance Group Co. of China Ltd. (r) | 134 | 1,498 | ||||
Renhe Commercial Holdings Co. Ltd. | 1,520 | 266 | ||||
Standard Chartered Plc | 843 | 22,675 | ||||
State Bank of India Ltd. | 43 | 2,679 | ||||
| 127,895 | ||||||
HEALTH CARE - 0.2% | ||||||
Allergan Inc. | 25 | 1,703 | ||||
INDUSTRIALS - 4.9% | ||||||
A P Moller - Maersk A/S - Class B | — | 3,015 | ||||
Cathay Pacific Airways Ltd. (c) | 1,206 | 3,328 | ||||
China Railway Construction Corp. Ltd. (c) | 1,701 | 2,048 | ||||
China Railway Group Ltd. | 2,364 | 1,706 | ||||
Cummins Inc. | 99 | 10,902 | ||||
Eaton Corp. | 9 | 954 | ||||
Honeywell International Inc. | 53 | 2,818 | ||||
Hutchison Whampoa Ltd. | 307 | 3,160 | ||||
See accompanying Notes to the Financial Statements.
JNL Series Trust
Schedules of Investments (in thousands)
December 31, 2010
| Shares/Par (p) | Value | |||||
Tata Motors Ltd. | 333 | 9,746 | ||||
Volvo AB - Class B (c) | 566 | 9,969 | ||||
| 47,646 | ||||||
INFORMATION TECHNOLOGY - 13.5% | ||||||
Apple Inc. (c) (o) | 97 | 31,272 | ||||
ASML Holding NV | 172 | 6,654 | ||||
Baidu.com - ADR (c) | 180 | 17,385 | ||||
Cognizant Technology Solutions Corp. – Class A (c) | 303 | 22,236 | ||||
First Solar Inc. (c) | 70 | 9,058 | ||||
Google Inc. - Class A (c) | 3 | 1,901 | ||||
Juniper Networks Inc. (c) | 211 | 7,779 | ||||
NetApp Inc. (c) | 324 | 17,813 | ||||
Oracle Corp. | 278 | 8,704 | ||||
Tencent Holdings Ltd. | 435 | 9,455 | ||||
| 132,257 | ||||||
MATERIALS - 5.7% | ||||||
Freeport-McMoRan Copper & Gold Inc. | 164 | 19,683 | ||||
PTT Chemical PCL - NVDR (c) (r) | 1,328 | 6,474 | ||||
Rio Tinto Ltd. | 71 | 6,189 | ||||
Vale SA - ADR (c) | 303 | 10,457 | ||||
Xstrata Plc | 533 | 12,506 | ||||
| 55,309 | ||||||
TELECOMMUNICATION SERVICES - 0.8% | ||||||
China Mobile Ltd. | 803 | 7,975 | ||||
Total Common Stocks (cost $574,321) | 693,984 | |||||
PREFERRED STOCKS - 5.3% | ||||||
CONSUMER DISCRETIONARY - 4.7% |
| |||||
Volkswagen AG | 238 | 38,776 | ||||
Volkswagen AG Rights, Convertible Preferred (r) | 42 | 6,853 | ||||
| 45,629 | ||||||
INDUSTRIALS - 0.6% | ||||||
Volvo (r) | 350 | 6,168 | ||||
Total Preferred Stocks (cost $34,494) | 51,797 | |||||
PURCHASED OPTIONS - 0.7% | ||||||
Euro Stoxx 50 Index Put Option, Strike Price EUR 2700, Expiration 02/18/2011 (f) (v) | 799 | 619 | ||||
Euro Stoxx 50 Index Put Option, Strike Price EUR 2700, Expiration 03/18/2011, 03/18/11 | 284 | 317 | ||||
Euro Stoxx 50 Index Put Option, Strike Price EUR 2700, Expiration 03/18/2011 (f) (v) | 824 | 905 | ||||
Euro Stoxx 50 Index Put Option, Strike Price EUR 2750, Expiration 02/18/2011 (f) (v) | 612 | 606 | ||||
Euro Stoxx 50 Index Put Option, Strike Price EUR 2750, Expiration 03/18/2011 | 211 | 284 | ||||
Euro Stoxx 50 Index Put Option, Strike Price EUR 2750, Expiration 03/18/2011 (f) (v) | 1,218 | 1,630 | ||||
Euro Stoxx 50 Index Put Option, Strike Price EUR 2800, Expiration 02/18/2011 (f) (v) | 821 | 1,036 | ||||
Hang Seng China Enterprises Index Put Option, Strike Price HKD 12200, Expiration 01/28/2011 (f) (v) | 172 | 142 | ||||
Hang Seng China Enterprises Index Put Option, Strike Price HKD 12400, Expiration 03/30/2011 (f) (v) | 172 | 499 | ||||
Hang Seng Index Put Option, Strike Price HKD 22000, Expiration 03/30/2011 (f) (v) | 119 | 382 | ||||
| Shares/Par (p) | Value | |||||||
Hang Seng Index Put Option, Strike Price HKD 22400, Expiration 01/28/2011 (f) (v) | 167 | 218 | ||||||
Total Options (cost $6,529) | 6,638 | |||||||
PRECIOUS METALS - 11.3% |
| |||||||
Gold Bullion | 77,973 | 110,710 | ||||||
Total Precious Metals (cost $96,856) | 110,710 | |||||||
SHORT TERM INVESTMENTS - 10.4% |
| |||||||
Investment Company - 10.4% | ||||||||
JNL Money Market Fund, 0.08% (a) (h) | 100,979 | 100,979 | ||||||
Total Short Term Investments (cost $100,979) | 100,979 | |||||||
Total Investments - 98.8% (cost $813,179) | 964,108 | |||||||
Other Assets and Liabilities, | 11,737 | |||||||
Total Net Assets - 100.0% | $ | 975,845 | ||||||
JNL/JPMorgan International Value Fund |
| |||||||
COMMON STOCKS - 95.7% |
| |||||||
CONSUMER DISCRETIONARY - 6.8% |
| |||||||
Daimler AG (c) | 101 | $ | 6,838 | |||||
GKN Plc | 1,470 | 5,093 | ||||||
InterContinental Hotels Group Plc | 327 | 6,342 | ||||||
Nissan Motor Co. Ltd. | 1,231 | 11,643 | ||||||
PPR SA | 31 | 4,920 | ||||||
Sodexo SA | 89 | 6,145 | ||||||
| 40,981 | ||||||||
CONSUMER STAPLES - 2.5% |
| |||||||
Japan Tobacco Inc. | 1 | 3,072 | ||||||
Shiseido Co. Ltd. | 192 | 4,186 | ||||||
Unilever NV | 257 | 8,007 | ||||||
| 15,265 | ||||||||
ENERGY - 8.8% | ||||||||
BP Plc (c) | 1,948 | 14,136 | ||||||
Cairn Energy Plc (c) | 452 | 2,961 | ||||||
JX Holdings Inc. | 1,034 | 6,996 | ||||||
Royal Dutch Shell Plc - A Shares | 791 | 26,359 | ||||||
Tullow Oil Plc | 158 | 3,108 | ||||||
| 53,560 | ||||||||
FINANCIALS - 24.9% | ||||||||
African Bank Investments Ltd. | 923 | 5,431 | ||||||
Allianz SE | 97 | 11,567 | ||||||
Aviva Plc | 820 | 5,025 | ||||||
Banco Bilbao Vizcaya Argentaria SA (e) | 599 | 6,107 | ||||||
Barclays Plc | 1,868 | 7,619 | ||||||
BNP Paribas | 152 | 9,656 | ||||||
China Merchants Bank Co. | 2,005 | 5,061 | ||||||
DnB NOR ASA | 602 | 8,469 | ||||||
Erste Group Bank AG | 132 | 6,216 | ||||||
HSBC Holdings Plc | 1,069 | 10,848 | ||||||
ING Groep NV (c) | 1,091 | 10,614 | ||||||
KBC Groep NV (c) | 160 | 5,460 | ||||||
Lloyds Banking Group Plc (c) | 3,540 | 3,626 | ||||||
Man Group Plc | 976 | 4,504 | ||||||
QBE Insurance Group Ltd. | 477 | 8,853 | ||||||
Societe Generale | 110 | 5,912 | ||||||
Sumitomo Mitsui Financial Group Inc. | 438 | 15,515 | ||||||
See accompanying Notes to the Financial Statements.
JNL Series Trust
Schedules of Investments (in thousands)
December 31, 2010
| Shares/Par (p) | Value | |||||||
Sun Hung Kai Properties Ltd. | 356 | 5,913 | ||||||
UBS AG (c) | 304 | 4,999 | ||||||
Zurich Financial Services AG | 38 | 9,945 | ||||||
| 151,340 | ||||||||
HEALTH CARE - 5.7% | ||||||||
Bayer AG | 144 | 10,654 | ||||||
GlaxoSmithKline Plc | 527 | 10,189 | ||||||
Sanofi-Aventis SA | 213 | 13,596 | ||||||
| 34,439 | ||||||||
INDUSTRIALS - 15.6% | ||||||||
Cookson Group Plc (c) | 509 | 5,226 | ||||||
East Japan Railway Co. | 90 | 5,808 | ||||||
Experian Plc | 416 | 5,172 | ||||||
Hamburger Hafen und Logistik AG (e) | 69 | 3,220 | ||||||
Hutchison Whampoa Ltd. | 830 | 8,543 | ||||||
Koninklijke Philips Electronics NV | 213 | 6,527 | ||||||
Marubeni Corp. | 629 | 4,403 | ||||||
Mitsubishi Electric Corp. | 691 | 7,220 | ||||||
Mitsui & Co. Ltd. | 500 | 8,229 | ||||||
Nippon Express Co. Ltd. | 1,001 | 4,495 | ||||||
Nippon Sheet Glass Co. Ltd. | 955 | 2,561 | ||||||
Orkla ASA | 626 | 6,111 | ||||||
Ruukki Group Oyj (c) (e) | 583 | 1,325 | ||||||
Schneider Electric SA | 55 | 8,291 | ||||||
Siemens AG | 97 | 12,049 | ||||||
Sumitomo Corp. | 410 | 5,766 | ||||||
| 94,946 | ||||||||
INFORMATION TECHNOLOGY - 7.7% |
| |||||||
FUJIFILM Holdings Corp. | 253 | 9,116 | ||||||
Fujitsu Ltd. | 927 | 6,423 | ||||||
HON HAI Precision Industry Co. Ltd. | 1,279 | 5,155 | ||||||
Nintendo Co. Ltd. | 18 | 5,226 | ||||||
Nokia Oyj | 608 | 6,302 | ||||||
Ricoh Co. Ltd. | 463 | 6,751 | ||||||
Samsung Electronics Co. Ltd. | 9 | 7,612 | ||||||
| 46,585 | ||||||||
MATERIALS - 6.0% | ||||||||
ArcelorMittal | 147 | 5,571 | ||||||
First Quantum Minerals Ltd. (e) | 80 | 8,687 | ||||||
Lanxess AG | 72 | 5,625 | ||||||
Petropavlovsk Plc | 152 | 2,708 | ||||||
Rhodia SA | 278 | 9,178 | ||||||
UPM-Kymmene Oyj | 269 | 4,776 | ||||||
| 36,545 | ||||||||
TELECOMMUNICATION SERVICES - 10.7% |
| |||||||
BT Group Plc | 2,478 | 6,986 | ||||||
KDDI Corp. | 1 | 8,454 | ||||||
Koninklijke KPN NV | 456 | 6,660 | ||||||
Nippon Telegraph & Telephone Corp. | 145 | 6,590 | ||||||
Singapore Telecommunications Ltd. | 2,234 | 5,309 | ||||||
Telefonica SA | 623 | 14,223 | ||||||
Vodafone Group Plc | 6,583 | 17,017 | ||||||
| 65,239 | ||||||||
UTILITIES - 7.0% | ||||||||
Centrica Plc | 1,642 | 8,487 | ||||||
GDF Suez | 402 | 14,428 | ||||||
International Power Plc | 853 | 5,823 | ||||||
National Grid Plc | 1,014 | 8,740 | ||||||
| Shares/Par (p) | Value | |||||
Snam Rete Gas SpA | 1,058 | 5,268 | ||||
| 42,746 | ||||||
Total Common Stocks (cost $528,248) | 581,646 | |||||
PREFERRED STOCKS - 1.5% | ||||||
CONSUMER DISCRETIONARY - 1.5% | ||||||
Volkswagen AG | 55 | 9,019 | ||||
Total Preferred Stocks (cost $5,333) | 9,019 | |||||
SHORT TERM INVESTMENTS - 5.4% | ||||||
Investment Company - 1.8% | ||||||
JNL Money Market Fund, 0.08% (a) (h) | 11,098 | 11,098 | ||||
Securities Lending Collateral 3.6% | ||||||
Securities Lending Cash Collateral Fund LLC, 0.31% (a) (h) | 20,804 | 20,804 | ||||
Securities Lending Liquidating Fund LLC, 0.66% (a) (h) | 1,334 | 1,312 | ||||
| 22,116 | ||||||
Total Short Term Investments (cost $33,236) | 33,214 | |||||
Total Investments - 102.6% (cost $566,817) |
| 623,879 | ||||
Other Assets and Liabilities, Net - (2.6%) |
| (15,934) | ||||
Total Net Assets - 100.0% | $ 607,945 | |||||
JNL/JPMorgan Mid Cap Growth Fund | ||||||
COMMON STOCKS - 97.6% | ||||||
CONSUMER DISCRETIONARY - 17.8% | ||||||
Cheesecake Factory Inc. (c) | 50 | $ 1,530 | ||||
Coach Inc. | 59 | 3,280 | ||||
Dick’s Sporting Goods Inc. (c) | 70 | 2,617 | ||||
Education Management Corp. (c) (e) | 88 | 1,593 | ||||
Gentex Corp. | 98 | 2,887 | ||||
Harley-Davidson Inc. | 103 | 3,564 | ||||
Harman International Industries Inc. (c) | 56 | 2,574 | ||||
International Game Technology | 66 | 1,168 | ||||
Lamar Advertising Co. - Class A (c) | 100 | 3,980 | ||||
MGM Resorts International (c) (e) | 126 | 1,874 | ||||
NetFlix Inc. (c) (e) | 8 | 1,318 | ||||
OfficeMax Inc. (c) (e) | 118 | 2,082 | ||||
Panera Bread Co. - Class A (c) | 13 | 1,306 | ||||
Polo Ralph Lauren Corp. - Class A | 17 | 1,830 | ||||
Priceline.com Inc. (c) | 5 | 2,118 | ||||
Scripps Networks Interactive Inc. - Class A | 52 | 2,675 | ||||
Sotheby’s - Class A (e) | 53 | 2,385 | ||||
Starwood Hotels & Resorts Worldwide Inc. | 43 | 2,638 | ||||
| 41,419 | ||||||
CONSUMER STAPLES - 0.5% |
| |||||
Green Mountain Coffee Roasters Inc. (c) (e) | 37 | 1,229 | ||||
ENERGY - 6.1% | ||||||
Cameron International Corp. (c) | 60 | 3,055 | ||||
CARBO Ceramics Inc. | 19 | 2,009 | ||||
Concho Resources Inc. (c) | 50 | 4,366 | ||||
Forest Oil Corp. (c) | 67 | 2,540 | ||||
Newfield Exploration Co. (c) | 32 | 2,293 | ||||
| 14,263 | ||||||
See accompanying Notes to the Financial Statements.
JNL Series Trust
Schedules of Investments (in thousands)
December 31, 2010
| Shares/Par (p) | Value | |||||
FINANCIALS - 9.9% | ||||||
AON Corp. | 44 | 2,005 | ||||
Apollo Global Management LLC (c) (q) (f) | 73 | 587 | ||||
BOK Financial Corp. | 39 | 2,099 | ||||
Comerica Inc. | 49 | 2,078 | ||||
HCC Insurance Holdings Inc. | 49 | 1,409 | ||||
Invesco Ltd. | 120 | 2,880 | ||||
Lazard Ltd. - Class A | 60 | 2,382 | ||||
LPL Investment Holdings Inc. (c) | 19 | 698 | ||||
MSCI Inc. - Class A (c) | 51 | 1,979 | ||||
Och-Ziff Capital Management Group LLC - Class A | 93 | 1,443 | ||||
T. Rowe Price Group Inc. | 53 | 3,443 | ||||
TD Ameritrade Holding Corp. | 106 | 2,012 | ||||
| 23,015 | ||||||
HEALTH CARE - 11.5% | ||||||
Alexion Pharmaceuticals Inc. (c) | 27 | 2,183 | ||||
Brookdale Senior Living Inc. (c) | 106 | 2,272 | ||||
Cerner Corp. (c) (e) | 17 | 1,654 | ||||
Coventry Health Care Inc. (c) | 103 | 2,714 | ||||
DaVita Inc. (c) | 41 | 2,842 | ||||
Humana Inc. (c) | 31 | 1,680 | ||||
Illumina Inc. (c) | 27 | 1,704 | ||||
Lincare Holdings Inc. | 107 | 2,863 | ||||
Sirona Dental Systems Inc. (c) | 50 | 2,089 | ||||
Thoratec Corp. (c) | 81 | 2,297 | ||||
Valeant Pharmaceuticals International Inc. | 159 | 4,484 | ||||
| 26,782 | ||||||
INDUSTRIALS - 19.1% | ||||||
AGCO Corp. (c) | 31 | 1,555 | ||||
Avis Budget Group Inc. (c) (e) | 147 | 2,287 | ||||
Carlisle Cos. Inc. | 66 | 2,639 | ||||
Cummins Inc. | 54 | 5,900 | ||||
Delta Air Lines Inc. (c) | 219 | 2,763 | ||||
Goodrich Corp. | 35 | 3,082 | ||||
Hubbell Inc. - Class B | 42 | 2,538 | ||||
IHS Inc. - Class A (c) | 22 | 1,745 | ||||
JB Hunt Transport Services Inc. | 36 | 1,475 | ||||
Lennox International Inc. | 39 | 1,863 | ||||
Precision Castparts Corp. | 16 | 2,184 | ||||
Robert Half International Inc. | 69 | 2,108 | ||||
Rockwell Automation Inc. | 42 | 3,012 | ||||
Roper Industries Inc. | 26 | 2,024 | ||||
Stericycle Inc. (c) | 32 | 2,586 | ||||
Wabtec Corp. (e) | 52 | 2,724 | ||||
WW Grainger Inc. | 29 | 3,950 | ||||
| 44,435 | ||||||
INFORMATION TECHNOLOGY - 28.3% | ||||||
Agilent Technologies Inc. (c) | 102 | 4,205 | ||||
Alliance Data Systems Corp. (c) (e) | 27 | 1,918 | ||||
Amdocs Ltd. (c) | 52 | 1,418 | ||||
Amphenol Corp. - Class A | 66 | 3,487 | ||||
Autodesk Inc. (c) | 46 | 1,765 | ||||
Broadcom Corp. - Class A | 57 | 2,499 | ||||
CGI Group Inc. - Class A (c) | 100 | 1,717 | ||||
Citrix Systems Inc. (c) | 25 | 1,676 | ||||
Cognizant Technology Solutions Corp. – Class A (c) | 39 | 2,829 | ||||
Concur Technologies Inc. (c) | 29 | 1,521 | ||||
Cree Inc. (c) (e) | 30 | 1,983 | ||||
Equinix Inc. (c) | 17 | 1,341 | ||||
F5 Networks Inc. (c) | 25 | 3,202 | ||||
FleetCor Technologies Inc. (c) | 42 | 1,302 | ||||
Juniper Networks Inc. (c) | 73 | 2,691 | ||||
| Shares/Par (p) | Value | |||||
Marvell Technology Group Ltd. (c) | 173 | 3,207 | ||||
MasterCard Inc. - Class A | 9 | 1,997 | ||||
Microchip Technology Inc. (e) | 68 | 2,333 | ||||
Micros Systems Inc. (c) | 77 | 3,395 | ||||
NetApp Inc. (c) | 84 | 4,622 | ||||
Red Hat Inc. (c) | 50 | 2,292 | ||||
Riverbed Technology Inc. (c) | 48 | 1,674 | ||||
Salesforce.com Inc. (c) | 21 | 2,719 | ||||
Tyco Electronics Ltd. | 102 | 3,604 | ||||
Varian Semiconductor Equipment Associates Inc. (c) | 66 | 2,455 | ||||
Western Union Co. | 105 | 1,952 | ||||
Zebra Technologies Corp. - Class A (c) | 51 | 1,945 | ||||
65,749 | ||||||
MATERIALS - 3.5% | ||||||
Bemis Co. Inc. | 64 | 2,097 | ||||
Grief Inc. - Class A | 38 | 2,340 | ||||
Sherwin-Williams Co. | 43 | 3,559 | ||||
| 7,996 | ||||||
TELECOMMUNICATION SERVICES - 0.9% | ||||||
tw telecom inc. (c) | 119 | 2,036 | ||||
Total Common Stocks | 226,924 | |||||
SHORT TERM INVESTMENTS - 8.6% | ||||||
Investment Company - 2.2% | ||||||
JNL Money Market Fund, 0.08% (a) (h) | 5,111 | 5,111 | ||||
Securities Lending Collateral 6.4% |
| |||||
Securities Lending Cash Collateral Fund LLC, 0.31% (a) (h) | 14,378 | 14,378 | ||||
Securities Lending Liquidating Fund LLC, 0.66% (a) (h) | 663 | 652 | ||||
| 15,030 | ||||||
Total Short Term Investments | 20,141 | |||||
Total Investments - 106.2% (cost $200,003) |
| 247,065 | ||||
Other Assets and Liabilities, Net - (6.2%) |
| (14,494) | ||||
Total Net Assets - 100.0% |
| $ 232,571 | ||||
JNL/Lazard Emerging Markets Fund | ||||||
COMMON STOCKS - 93.5% | ||||||
CONSUMER DISCRETIONARY - 5.2% |
| |||||
Desarrolladora Homex SAB de CV – ADR (c) (e) | 225 | $ 7,607 | ||||
Grupo Televisa SA - ADR (c) | 710 | 18,400 | ||||
Hyundai Mobis (c) | 64 | 16,118 | ||||
Truworths International Ltd. | 1,412 | 15,354 | ||||
Woongjin Coway Co. Ltd. (c) | 421 | 14,950 | ||||
| 72,429 | ||||||
CONSUMER STAPLES - 11.4% | ||||||
British American Tobacco Malaysia Bhd | 510 | 7,441 | ||||
Cia de Bebidas das Americas - ADR | 15 | 459 | ||||
Eastern Tobacco | 244 | 5,040 | ||||
Fomento Economico Mexicano SAB de CV - ADR | 248 | 13,841 | ||||
Hite Brewery Co. Ltd. (c) | 61 | 6,486 | ||||
Kimberly-Clark de Mexico SAB de CV | 1,396 | 8,519 | ||||
KT&G Corp. (c) | 388 | 22,136 | ||||
Magnit OJSC - GDR | 382 | 11,187 | ||||
See accompanying Notes to the Financial Statements.
JNL Series Trust
Schedules of Investments (in thousands)
December 31, 2010
| Shares/Par (p) | Value | |||||
Massmart Holdings Ltd. | 589 | 13,113 | ||||
Natura Cosmeticos SA (c) | 662 | 19,010 | ||||
Oriflame Cosmetics SA - SDR (e) | 201 | 10,561 | ||||
Shoprite Holdings Ltd. | 843 | 12,745 | ||||
Souza Cruz SA (c) | 257 | 13,978 | ||||
Tiger Brands Ltd. | 474 | 13,942 | ||||
| 158,458 | ||||||
ENERGY - 4.4% | ||||||
Banpu PCL | 550 | 14,359 | ||||
LUKOIL OAO - ADR | 333 | 18,828 | ||||
Oil & Gas Development Co. Ltd. | 3,538 | 7,052 | ||||
Pakistan Petroleum Ltd. | 3,917 | 9,925 | ||||
Tambang Batubara Bukit Asam Tbk PT | 4,390 | 11,162 | ||||
| 61,326 | ||||||
FINANCIALS - 23.4% | ||||||
Akbank T.A.S. | 2,820 | 15,673 | ||||
Banco do Brasil SA (c) | 2,770 | 52,436 | ||||
Bank Mandiri Persero Tbk PT | 12,432 | 8,940 | ||||
Bank of India | 1,414 | 14,279 | ||||
China Construction Bank Corp. | 15,768 | 14,140 | ||||
Commercial International Bank | 1,830 | 14,941 | ||||
Kasikornbank PCL | 2,347 | 10,151 | ||||
KB Financial Group Inc. (c) | 225 | 11,859 | ||||
Korea Life Insurance Co. Ltd. | 2,668 | 18,647 | ||||
Nedbank Group Ltd. | 628 | 12,417 | ||||
OTP Bank Rt (c) (e) | 706 | 17,038 | ||||
Punjab National Bank Ltd. | 993 | 27,124 | ||||
Sanlam Ltd. | 4,604 | 19,515 | ||||
Shinhan Financial Group Co. | 894 | 41,590 | ||||
Standard Bank Group Ltd. | 793 | 12,954 | ||||
Turkiye Is Bankasi SA | 9,528 | 33,941 | ||||
| 325,645 | ||||||
INDUSTRIALS - 5.4% | ||||||
Bidvest Group Ltd. | 135 | 3,208 | ||||
China High Speed Transmission Equipment Group Co. Ltd. (e) | 151 | 234 | ||||
Cia de Concessoes Rodoviarias | 407 | 11,499 | ||||
KOC Holding AS | 2,092 | 10,188 | ||||
Murray & Roberts Holdings Ltd. | 2,114 | 12,894 | ||||
Orascom Construction Industries | 379 | 18,721 | ||||
United Tractors Tbk PT | 3,740 | 9,864 | ||||
Weichai Power Co. Ltd. (c) (e) | 1,299 | 7,997 | ||||
| 74,605 | ||||||
INFORMATION TECHNOLOGY - 18.6% | ||||||
Advanced Semiconductor Engineering Inc. | 10,261 | 11,878 | ||||
Cielo SA | 4,401 | 35,660 | ||||
Delta Electronics Inc. | 2,441 | 11,930 | ||||
HON HAI Precision Industry Co. Ltd. - GDR | 2,565 | 20,699 | ||||
HTC Corp. | 345 | 10,653 | ||||
Infosys Technologies | 143 | 10,864 | ||||
MediaTek Inc. | 1,590 | 22,767 | ||||
Netease.com - ADR (c) (e) | 381 | 13,762 | ||||
NHN Corp. (c) | 134 | 26,841 | ||||
Redecard SA | 2,523 | 31,994 | ||||
Samsung Electronics Co. Ltd. | 40 | 33,212 | ||||
Taiwan Semiconductor Manufacturing Co. Ltd. - ADR | 2,190 | 27,464 | ||||
| 257,724 | ||||||
MATERIALS - 14.6% | ||||||
Cia Siderurgica Nacional SA - ADR (e) | 1,250 | 20,844 | ||||
First Quantum Minerals Ltd. (e) | 223 | 24,200 | ||||
Grupo Mexico SAB de CV (c) (e) | 5,940 | 24,333 | ||||
Jindal Steel & Power Ltd. | 920 | 14,646 | ||||
| Shares/Par (p) | Value | |||||
Kumba Iron Ore Ltd. (e) | 406 | 26,195 | ||||
Pretoria Portland Cement Co. Ltd. | 2,668 | 14,156 | ||||
Semen Gresik Persero Tbk PT | 10,280 | 10,765 | ||||
Shougang Concord International Enterprises Co. Ltd. (c) | 2,238 | 325 | ||||
Uralkali - GDR (e) | 541 | 19,884 | ||||
Vale SA - ADR (c) | 1,359 | 46,967 | ||||
| 202,315 | ||||||
TELECOMMUNICATION SERVICES - 9.3% | ||||||
America Movil SAB de CV - ADR | 366 | 20,958 | ||||
Egyptian Co. for Mobile Services | 186 | 5,277 | ||||
Mobile Telesystems - ADR | 948 | 19,792 | ||||
Philippine Long Distance Telephone Co. – ADR (e) | 442 | 25,761 | ||||
PT Telekomunikasi Indonesia - ADR (e) | 760 | 27,082 | ||||
Turkcell Iletisim Hizmet AS | 4,392 | 30,009 | ||||
| 128,879 | ||||||
UTILITIES - 1.2% | ||||||
Companhia Energetica de Minas Gerais – ADR (e) | 981 | 16,279 | ||||
Total Common Stocks (cost $1,061,461) | 1,297,660 | |||||
PREFERRED STOCKS - 2.7% |
| |||||
ENERGY - 0.7% | ||||||
Ultrapar Participacoes SA | 151 | 9,548 | ||||
MATERIALS - 1.8% | ||||||
Usinas Siderurgicas de Minas Gerais SA, Class A | 2,024 | 23,365 | ||||
Vale Fertilizantes SA | 119 | 1,362 | ||||
| 24,727 | ||||||
UTILITIES - 0.2% | ||||||
Eletropaulo Metropolitana Eletricidade de Sao | 158 | 3,052 | ||||
Total Preferred Stocks | 37,327 | |||||
SHORT TERM INVESTMENTS - 9.3% | ||||||
Investment Company - 4.3% | ||||||
JNL Money Market Fund, 0.08% (a) (h) | 60,363 | 60,363 | ||||
Securities Lending Collateral 5.0% |
| |||||
Securities Lending Cash Collateral Fund LLC, 0.31% (a) (h) | 68,109 | 68,109 | ||||
Securities Lending Liquidating Fund LLC, 0.66% (a) (h) | 1,270 | 1,249 | ||||
| 69,358 | ||||||
Total Short Term Investments (cost $129,742) | 129,721 | |||||
Total Investments - 105.5% (cost $1,228,840) |
|
1,464,708 | ||||
Other Assets and Liabilities, Net - (5.5%) |
| (76,679) | ||||
Total Net Assets - 100.0% | $ 1,388,029 | |||||
JNL/Lazard Mid Cap Equity Fund | ||||||
COMMON STOCKS - 94.9% | ||||||
CONSUMER DISCRETIONARY - 15.4% | ||||||
AutoZone Inc. (c) | 14 | $ 3,816 | ||||
Big Lots Inc. (c) | 52 | 1,581 | ||||
Cablevision Systems Corp. - Class A | 58 | 1,953 | ||||
See accompanying Notes to the Financial Statements.
JNL Series Trust
Schedules of Investments (in thousands)
December 31, 2010
| Shares/Par (p) | Value | |||||
Darden Restaurants Inc. | 57 | 2,656 | ||||
DeVry Inc. | 56 | 2,677 | ||||
International Game Technology | 184 | 3,250 | ||||
Lear Corp. (c) | 33 | 3,267 | ||||
Mattel Inc. | 162 | 4,125 | ||||
Newell Rubbermaid Inc. | 295 | 5,370 | ||||
Stanley Black & Decker Inc. | 32 | 2,167 | ||||
TJX Cos. Inc. | 49 | 2,166 | ||||
| 33,028 | ||||||
CONSUMER STAPLES - 8.1% | ||||||
Avon Products Inc. | 95 | 2,758 | ||||
Campbell Soup Co. | 77 | 2,676 | ||||
McCormick & Co. Inc. | 31 | 1,438 | ||||
Molson Coors Brewing Co. - Class B | 119 | 5,967 | ||||
Ralcorp Holdings Inc. (c) | 70 | 4,525 | ||||
| 17,364 | ||||||
ENERGY - 10.2% | ||||||
Arch Coal Inc. | 61 | 2,146 | ||||
EQT Corp. | 63 | 2,829 | ||||
Holly Corp. | 43 | 1,769 | ||||
Massey Energy Co. | 24 | 1,261 | ||||
Murphy Oil Corp. | 32 | 2,371 | ||||
Noble Energy Inc. | 21 | 1,799 | ||||
Rowan Cos. Inc. (c) | 74 | 2,587 | ||||
Tidewater Inc. | 48 | 2,584 | ||||
Valero Energy Corp. | 76 | 1,748 | ||||
Williams Cos. Inc. | 113 | 2,803 | ||||
| 21,897 | ||||||
FINANCIALS - 14.6% | ||||||
Ameriprise Financial Inc. | 101 | 5,784 | ||||
City National Corp. | 71 | 4,326 | ||||
Digital Realty Trust Inc. (e) | 35 | 1,799 | ||||
Fifth Third Bancorp | 145 | 2,129 | ||||
Invesco Ltd. | 145 | 3,486 | ||||
KeyCorp | 170 | 1,504 | ||||
LaSalle Hotel Properties | 42 | 1,114 | ||||
Macerich Co. | 50 | 2,354 | ||||
NYSE Euronext | 80 | 2,386 | ||||
PartnerRe Ltd. | 32 | 2,539 | ||||
Public Storage | 17 | 1,673 | ||||
UDR Inc. | 91 | 2,133 | ||||
| 31,227 | ||||||
HEALTH CARE - 7.2% | ||||||
CareFusion Corp. (c) | 113 | 2,909 | ||||
Hospira Inc. (c) | 55 | 3,035 | ||||
Laboratory Corp. of America Holdings (c) | 17 | 1,451 | ||||
Life Technologies Corp. (c) | 45 | 2,485 | ||||
Warner Chilcott Plc - Class A (c) | 119 | 2,687 | ||||
Zimmer Holdings Inc. (c) | 55 | 2,942 | ||||
| 15,509 | ||||||
INDUSTRIALS - 13.2% | ||||||
Corrections Corp. of America (c) | 123 | 3,072 | ||||
Dover Corp. | 124 | 7,225 | ||||
Equifax Inc. | 115 | 4,098 | ||||
Foster Wheeler AG (c) | 87 | 2,996 | ||||
Harsco Corp. | 31 | 878 | ||||
Joy Global Inc. | 21 | 1,796 | ||||
Parker Hannifin Corp. | 40 | 3,443 | ||||
Rockwell Collins Inc. | 80 | 4,684 | ||||
| 28,192 | ||||||
INFORMATION TECHNOLOGY - 13.4% | ||||||
Analog Devices Inc. | 111 | 4,163 | ||||
| Shares/Par (p) | Value | |||||
BMC Software Inc. (c) | 80 | 3,771 | ||||
Ingram Micro Inc. - Class A (c) | 218 | 4,164 | ||||
Intuit Inc. (c) | 44 | 2,164 | ||||
NetApp Inc. (c) | 15 | 846 | ||||
Quest Software Inc. (c) | 53 | 1,465 | ||||
Seagate Technology (c) | 97 | 1,455 | ||||
Symantec Corp. (c) | 171 | 2,868 | ||||
Teradata Corp. (c) | 46 | 1,893 | ||||
Teradyne Inc. (c) | 168 | 2,354 | ||||
Xilinx Inc. | 120 | 3,472 | ||||
| 28,615 | ||||||
MATERIALS - 8.4% | ||||||
Air Products & Chemicals Inc. | 20 | 1,846 | ||||
Ball Corp. | 90 | 6,118 | ||||
Cliffs Natural Resources Inc. | 34 | 2,629 | ||||
Compass Minerals International Inc. | 39 | 3,473 | ||||
Eastman Chemical Co. | 28 | 2,354 | ||||
United States Steel Corp. | 27 | 1,595 | ||||
| 18,015 | ||||||
UTILITIES - 4.4% | ||||||
Allegheny Energy Inc. | 87 | 2,109 | ||||
American Electric Power Co. Inc. | 124 | 4,443 | ||||
Energen Corp. | 60 | 2,910 | ||||
| 9,462 | ||||||
Total Common Stocks (cost $169,065) | 203,309 | |||||
PREFERRED STOCKS - 0.5% | ||||||
INDUSTRIALS - 0.5% | ||||||
Better Place (f) (q) | 338 | 1,015 | ||||
Total Preferred Stocks (cost $1,015) | 1,015 | |||||
SHORT TERM INVESTMENTS - 6.1% | ||||||
Investment Company - 5.2% | ||||||
JNL Money Market Fund, 0.08% (a) (h) | 11,284 | 11,284 | ||||
Securities Lending Collateral 0.9% | ||||||
Securities Lending Cash Collateral Fund LLC, 0.31% (a) (h) | 1,230 | 1,230 | ||||
Securities Lending Liquidating Fund LLC, 0.66% (a) (h) | 681 | 670 | ||||
| 1,900 | ||||||
Total Short Term Investments (cost $13,195) | 13,184 | |||||
Total Investments - 101.5% (cost $183,275) | 217,508 | |||||
Other Assets and Liabilities, Net - (1.5%) | (3,279) | |||||
Total Net Assets - 100.0% | $ 214,229 | |||||
JNL/Mellon Capital Management S&P 500 Index Fund | ||||||
COMMON STOCKS - 98.6% | ||||||
CONSUMER DISCRETIONARY - 10.5% | ||||||
Abercrombie & Fitch Co. - Class A | 10 | $ 564 | ||||
Amazon.com Inc. (c) | 41 | 7,342 | ||||
Apollo Group Inc. - Class A (c) | 15 | 573 | ||||
AutoNation Inc. (c) (e) | 8 | 222 | ||||
AutoZone Inc. (c) | 3 | 922 | ||||
Bed Bath & Beyond Inc. (c) | 30 | 1,499 | ||||
See accompanying Notes to the Financial Statements.
JNL Series Trust
Schedules of Investments (in thousands)
December 31, 2010
| Shares/Par (p) | Value | |||||
Best Buy Co. Inc. | 40 | 1,374 | ||||
Big Lots Inc. (c) | 9 | 263 | ||||
Cablevision Systems Corp. - Class A | 26 | 876 | ||||
Carmax Inc. (c) | 26 | 831 | ||||
Carnival Corp. | 50 | 2,312 | ||||
CBS Corp. - Class B | 79 | 1,501 | ||||
Coach Inc. | 35 | 1,946 | ||||
Comcast Corp. - Class A | 323 | 7,097 | ||||
Darden Restaurants Inc. | 16 | 756 | ||||
DeVry Inc. | 7 | 323 | ||||
DirecTV - Class A (c) | 97 | 3,864 | ||||
Discovery Communications Inc. - Class A (c) | 33 | 1,377 | ||||
DR Horton Inc. | 32 | 385 | ||||
Expedia Inc. | 23 | 586 | ||||
Family Dollar Stores Inc. | 15 | 744 | ||||
Ford Motor Co. (c) | 433 | 7,269 | ||||
Fortune Brands Inc. | 17 | 1,034 | ||||
GameStop Corp. - Class A (c) | 19 | 434 | ||||
Gannett Co. Inc. | 27 | 414 | ||||
Gap Inc. | 53 | 1,179 | ||||
Genuine Parts Co. | 18 | 945 | ||||
Goodyear Tire & Rubber Co. (c) | 28 | 334 | ||||
H&R Block Inc. (e) | 38 | 455 | ||||
Harley-Davidson Inc. | 27 | 947 | ||||
Harman International Industries Inc. (c) | 8 | 352 | ||||
Hasbro Inc. | 16 | 755 | ||||
Home Depot Inc. | 190 | 6,659 | ||||
International Game Technology | 33 | 581 | ||||
Interpublic Group of Cos. Inc. (c) | 56 | 596 | ||||
J.C. Penney Co. Inc. | 27 | 862 | ||||
Johnson Controls Inc. | 78 | 2,974 | ||||
Kohl’s Corp. (c) | 36 | 1,937 | ||||
Leggett & Platt Inc. | 16 | 364 | ||||
Lennar Corp. - Class A | 18 | 333 | ||||
Limited Brands Inc. | 30 | 928 | ||||
Lowe’s Cos. Inc. | 160 | 4,010 | ||||
Macy’s Inc. | 49 | 1,233 | ||||
Marriott International Inc. - Class A | 33 | 1,363 | ||||
Mattel Inc. | 41 | 1,043 | ||||
McDonald’s Corp. | 122 | 9,388 | ||||
McGraw-Hill Cos. Inc. | 36 | 1,329 | ||||
Meredith Corp. (e) | 4 | 131 | ||||
NetFlix Inc. (c) (e) | 5 | 820 | ||||
Newell Rubbermaid Inc. | 33 | 592 | ||||
News Corp. - Class A | 263 | 3,835 | ||||
Nike Inc. - Class B | 45 | 3,839 | ||||
Nordstrom Inc. | 19 | 823 | ||||
O’Reilly Automotive Inc. (c) | 16 | 968 | ||||
Omnicom Group Inc. | 35 | 1,596 | ||||
Polo Ralph Lauren Corp. - Class A | 8 | 851 | ||||
Priceline.com Inc. (c) | 6 | 2,231 | ||||
Pulte Homes Inc. (c) | 37 | 279 | ||||
RadioShack Corp. | 15 | 272 | ||||
Ross Stores Inc. | 14 | 860 | ||||
Scripps Networks Interactive Inc. - Class A | 10 | 537 | ||||
Sears Holdings Corp. (c) (e) | 5 | 392 | ||||
Stanley Black & Decker Inc. | 19 | 1,277 | ||||
Staples Inc. | 85 | 1,924 | ||||
Starbucks Corp. | 86 | 2,769 | ||||
Starwood Hotels & Resorts Worldwide Inc. (e) | 22 | 1,335 | ||||
Target Corp. | 82 | 4,933 | ||||
Tiffany & Co. | 15 | 923 | ||||
Time Warner Cable Inc. | 41 | 2,706 | ||||
Time Warner Inc. | 129 | 4,136 | ||||
TJX Cos. Inc. | 47 | 2,084 | ||||
Urban Outfitters Inc. (c) | 15 | 541 | ||||
VF Corp. | 10 | 879 | ||||
Viacom Inc. - Class B | 70 | 2,784 | ||||
| Shares/Par (p) | Value | |||||
Walt Disney Co. | 219 | 8,225 | ||||
Washington Post Co. - Class B (e) | 1 | 280 | ||||
Whirlpool Corp. (e) | 8 | 752 | ||||
Wyndham Worldwide Corp. | 21 | 630 | ||||
Wynn Resorts Ltd. | 9 | 894 | ||||
Yum! Brands Inc. | 54 | 2,653 | ||||
| 140,826 | ||||||
CONSUMER STAPLES - 10.5% | ||||||
Altria Group Inc. | 241 | 5,931 | ||||
Archer-Daniels-Midland Co. | 74 | 2,238 | ||||
Avon Products Inc. | 50 | 1,442 | ||||
Brown-Forman Corp. - Class B | 13 | 874 | ||||
Campbell Soup Co. | 22 | 756 | ||||
Clorox Co. | 16 | 1,000 | ||||
Coca-Cola Co. | 269 | 17,660 | ||||
Coca-Cola Enterprises Inc. | 38 | 945 | ||||
Colgate-Palmolive Co. | 57 | 4,556 | ||||
ConAgra Foods Inc. | 52 | 1,164 | ||||
Constellation Brands Inc. - Class A (c) | 22 | 480 | ||||
Costco Wholesale Corp. | 50 | 3,617 | ||||
CVS Caremark Corp. | 157 | 5,473 | ||||
Dean Foods Co. (c) | 20 | 180 | ||||
Dr. Pepper Snapple Group Inc. | 26 | 929 | ||||
Estee Lauder Cos. Inc. - Class A | 13 | 1,075 | ||||
General Mills Inc. | 75 | 2,659 | ||||
Hershey Co. | 19 | 882 | ||||
HJ Heinz Co. | 37 | 1,812 | ||||
Hormel Foods Corp. | 8 | 400 | ||||
JM Smucker Co. | 13 | 883 | ||||
Kellogg Co. | 30 | 1,511 | ||||
Kimberly-Clark Corp. | 48 | 3,017 | ||||
Kraft Foods Inc. - Class A | 202 | 6,354 | ||||
Kroger Co. | 75 | 1,672 | ||||
Lorillard Inc. | 18 | 1,452 | ||||
McCormick & Co. Inc. | 15 | 719 | ||||
Mead Johnson Nutrition Co. | 24 | 1,468 | ||||
Molson Coors Brewing Co. - Class B | 18 | 899 | ||||
PepsiCo Inc. | 184 | 12,047 | ||||
Philip Morris International Inc. | 210 | 12,296 | ||||
Procter & Gamble Co. | 324 | 20,856 | ||||
Reynolds American Inc. | 38 | 1,244 | ||||
Safeway Inc. | 45 | 1,011 | ||||
Sara Lee Corp. | 74 | 1,300 | ||||
SUPERVALU Inc. (e) | 24 | 228 | ||||
Sysco Corp. | 68 | 2,012 | ||||
Tyson Foods Inc. - Class A | 36 | 612 | ||||
Wal-Mart Stores Inc. | 227 | 12,247 | ||||
Walgreen Co. | 108 | 4,189 | ||||
Whole Foods Market Inc. (c) | 17 | 883 | ||||
| 140,973 | ||||||
ENERGY - 11.8% | ||||||
Anadarko Petroleum Corp. | 57 | 4,360 | ||||
Apache Corp. | 44 | 5,262 | ||||
Baker Hughes Inc. | 50 | 2,839 | ||||
Cabot Oil & Gas Corp. - Class A | 12 | 436 | ||||
Cameron International Corp. (c) | 28 | 1,395 | ||||
Chesapeake Energy Corp. | 75 | 1,953 | ||||
Chevron Corp. | 232 | 21,196 | ||||
ConocoPhillips | 170 | 11,585 | ||||
Consol Energy Inc. | 26 | 1,275 | ||||
Denbury Resources Inc. (c) | 45 | 855 | ||||
Devon Energy Corp. | 51 | 3,969 | ||||
Diamond Offshore Drilling Inc. (e) | 8 | 511 | ||||
El Paso Corp. | 79 | 1,090 | ||||
EOG Resources Inc. | 29 | 2,678 | ||||
EQT Corp. | 17 | 769 | ||||
See accompanying Notes to the Financial Statements.
JNL Series Trust
Schedules of Investments (in thousands)
December 31, 2010
| Shares/Par (p) | Value | |||||
Exxon Mobil Corp. | 584 | 42,686 | ||||
FMC Technologies Inc. (c) | 14 | 1,223 | ||||
Halliburton Co. | 105 | 4,278 | ||||
Helmerich & Payne Inc. | 12 | 599 | ||||
Hess Corp. | 34 | 2,589 | ||||
Marathon Oil Corp. | 82 | 3,040 | ||||
Massey Energy Co. | 11 | 593 | ||||
Murphy Oil Corp. | 22 | 1,654 | ||||
Nabors Industries Ltd. (c) | 33 | 766 | ||||
National Oilwell Varco Inc. | 49 | 3,262 | ||||
Newfield Exploration Co. (c) | 15 | 1,051 | ||||
Noble Energy Inc. | 20 | 1,741 | ||||
Occidental Petroleum Corp. | 94 | 9,215 | ||||
Peabody Energy Corp. | 31 | 1,992 | ||||
Pioneer Natural Resources Co. | 13 | 1,135 | ||||
QEP Resources Inc. | 20 | 716 | ||||
Range Resources Corp. | 18 | 809 | ||||
Rowan Cos. Inc. (c) | 13 | 440 | ||||
Schlumberger Ltd. | 158 | 13,193 | ||||
Southwestern Energy Co. (c) | 40 | 1,500 | ||||
Spectra Energy Corp. | 75 | 1,875 | ||||
Sunoco Inc. | 14 | 558 | ||||
Tesoro Corp. (c) | 17 | 311 | ||||
Valero Energy Corp. | 66 | 1,515 | ||||
Williams Cos. Inc. | 68 | 1,673 | ||||
| 158,587 | ||||||
FINANCIALS - 15.7% | ||||||
ACE Ltd. | 39 | 2,428 | ||||
AFLAC Inc. | 54 | 3,067 | ||||
Allstate Corp. | 62 | 1,985 | ||||
American Express Co. | 121 | 5,208 | ||||
American International Group Inc. (c) (e) | 15 | 858 | ||||
Ameriprise Financial Inc. | 30 | 1,703 | ||||
AON Corp. | 38 | 1,746 | ||||
Apartment Investment & Management Co. - Class A | 13 | 344 | ||||
Assurant Inc. | 13 | 516 | ||||
AvalonBay Communities Inc. | 10 | 1,084 | ||||
Bank of America Corp. | 1,166 | 15,558 | ||||
Bank of New York Mellon Corp. (a) | 143 | 4,327 | ||||
BB&T Corp. | 80 | 2,106 | ||||
Berkshire Hathaway Inc. - Class B (c) | 200 | 16,032 | ||||
Boston Properties Inc. | 16 | 1,386 | ||||
Capital One Financial Corp. | 53 | 2,249 | ||||
CB Richard Ellis Group Inc. - Class A (c) | 33 | 681 | ||||
Charles Schwab Corp. | 113 | 1,940 | ||||
Chubb Corp. | 35 | 2,110 | ||||
Cincinnati Financial Corp. | 19 | 603 | ||||
Citigroup Inc. (c) | 3,360 | 15,891 | ||||
CME Group Inc. | 8 | 2,495 | ||||
Comerica Inc. | 20 | 863 | ||||
Discover Financial Services | 61 | 1,137 | ||||
E*Trade Financial Corp. (c) | 22 | 347 | ||||
Equity Residential | 33 | 1,702 | ||||
Federated Investors Inc. - Class B (e) | 10 | 274 | ||||
Fifth Third Bancorp | 92 | 1,348 | ||||
First Horizon National Corp. (c) | 26 | 311 | ||||
Franklin Resources Inc. | 17 | 1,901 | ||||
Genworth Financial Inc. - Class A (c) | 57 | 745 | ||||
Goldman Sachs Group Inc. | 60 | 10,012 | ||||
Hartford Financial Services Group Inc. | 51 | 1,357 | ||||
HCP Inc. | 42 | 1,550 | ||||
Health Care REIT Inc. | 17 | 792 | ||||
Host Hotels & Resorts Inc. | 76 | 1,363 | ||||
Hudson City Bancorp Inc. | 60 | 767 | ||||
Huntington Bancshares Inc. | 83 | 569 | ||||
IntercontinentalExchange Inc. (c) | 8 | 991 | ||||
| Shares/Par (p) | Value | |||||
Invesco Ltd. | 54 | 1,302 | ||||
Janus Capital Group Inc. | 19 | 246 | ||||
JPMorgan Chase & Co. | 453 | 19,204 | ||||
KeyCorp | 99 | 879 | ||||
Kimco Realty Corp. | 47 | 849 | ||||
Legg Mason Inc. | 19 | 694 | ||||
Leucadia National Corp. | 23 | 660 | ||||
Lincoln National Corp. | 36 | 1,012 | ||||
Loews Corp. | 37 | 1,452 | ||||
M&T Bank Corp. | 14 | 1,199 | ||||
Marsh & McLennan Cos. Inc. | 63 | 1,714 | ||||
Marshall & Ilsley Corp. | 59 | 405 | ||||
MetLife Inc. | 105 | 4,646 | ||||
Moody’s Corp. | 23 | 621 | ||||
Morgan Stanley | 175 | 4,758 | ||||
NASDAQ OMX Group Inc. (c) | 16 | 385 | ||||
Northern Trust Corp. | 28 | 1,552 | ||||
NYSE Euronext | 29 | 883 | ||||
People’s United Financial Inc. | 44 | 612 | ||||
Plum Creek Timber Co. Inc. (e) | 19 | 707 | ||||
PNC Financial Services Group Inc. | 61 | 3,695 | ||||
Principal Financial Group Inc. | 36 | 1,173 | ||||
Progressive Corp. | 78 | 1,542 | ||||
ProLogis | 65 | 941 | ||||
Prudential Financial Inc. | 56 | 3,287 | ||||
Public Storage | 16 | 1,632 | ||||
Regions Financial Corp. | 144 | 1,009 | ||||
Simon Property Group Inc. | 34 | 3,369 | ||||
SLM Corp. (c) | 54 | 674 | ||||
State Street Corp. | 58 | 2,691 | ||||
SunTrust Banks Inc. | 58 | 1,708 | ||||
T. Rowe Price Group Inc. | 30 | 1,938 | ||||
Torchmark Corp. | 9 | 537 | ||||
Travelers Cos. Inc. | 53 | 2,966 | ||||
U.S. Bancorp | 222 | 5,980 | ||||
Unum Group | 37 | 907 | ||||
Ventas Inc. | 18 | 930 | ||||
Vornado Realty Trust | 19 | 1,560 | ||||
Wells Fargo & Co. | 607 | 18,813 | ||||
XL Group Plc | 40 | 864 | ||||
Zions Bancorporation | 20 | 490 | ||||
| 210,832 | ||||||
HEALTH CARE - 10.7% | ||||||
Abbott Laboratories | 179 | 8,553 | ||||
Aetna Inc. | 48 | 1,475 | ||||
Allergan Inc. | 36 | 2,444 | ||||
AmerisourceBergen Corp. (e) | 33 | 1,116 | ||||
Amgen Inc. (c) | 109 | 6,007 | ||||
Baxter International Inc. | 68 | 3,434 | ||||
Becton Dickinson & Co. | 27 | 2,282 | ||||
Biogen Idec Inc. (c) | 28 | 1,903 | ||||
Boston Scientific Corp. (c) | 170 | 1,289 | ||||
Bristol-Myers Squibb Co. | 199 | 5,266 | ||||
Cardinal Health Inc. | 42 | 1,603 | ||||
CareFusion Corp. (c) | 25 | 654 | ||||
Celgene Corp. (c) | 53 | 3,155 | ||||
Cephalon Inc. (c) | 9 | 542 | ||||
Cerner Corp. (c) | 8 | 771 | ||||
CIGNA Corp. | 32 | 1,174 | ||||
Coventry Health Care Inc. (c) | 16 | 435 | ||||
CR Bard Inc. | 11 | 990 | ||||
DaVita Inc. (c) | 12 | 835 | ||||
Dentsply International Inc. | 17 | 577 | ||||
Eli Lilly & Co. | 117 | 4,113 | ||||
Express Scripts Inc. (c) | 61 | 3,305 | ||||
Forest Laboratories Inc. (c) | 34 | 1,087 | ||||
Genzyme Corp. (c) | 30 | 2,117 | ||||
See accompanying Notes to the Financial Statements.
JNL Series Trust
Schedules of Investments (in thousands)
December 31, 2010
| Shares/Par (p) | Value | |||||
Gilead Sciences Inc. (c) | 94 | 3,414 | ||||
Hospira Inc. (c) | 19 | 1,071 | ||||
Humana Inc. (c) | 19 | 1,053 | ||||
Intuitive Surgical Inc. (c) | 5 | 1,169 | ||||
Johnson & Johnson | 318 | 19,656 | ||||
Laboratory Corp. of America Holdings (c) | 12 | 1,059 | ||||
Life Technologies Corp. (c) | 21 | 1,175 | ||||
McKesson Corp. | 29 | 2,066 | ||||
Medco Health Solutions Inc. (c) | 49 | 3,015 | ||||
Medtronic Inc. | 125 | 4,648 | ||||
Merck & Co. Inc. | 357 | 12,855 | ||||
Mylan Inc. (c) (e) | 50 | 1,062 | ||||
Patterson Cos. Inc. | 10 | 321 | ||||
PerkinElmer Inc. | 13 | 341 | ||||
Pfizer Inc. | 930 | 16,283 | ||||
Quest Diagnostics Inc. | 17 | 944 | ||||
St. Jude Medical Inc. (c) | 40 | 1,690 | ||||
Stryker Corp. | 39 | 2,085 | ||||
Tenet Healthcare Corp. (c) | 55 | 370 | ||||
Thermo Fisher Scientific Inc. (c) | 46 | 2,551 | ||||
UnitedHealth Group Inc. | 128 | 4,606 | ||||
Varian Medical Systems Inc. (c) | 14 | 991 | ||||
Waters Corp. (c) | 10 | 800 | ||||
Watson Pharmaceuticals Inc. (c) | 14 | 742 | ||||
WellPoint Inc. (c) | 46 | 2,594 | ||||
Zimmer Holdings Inc. (c) | 23 | 1,244 | ||||
| 142,932 | ||||||
INDUSTRIALS - 10.8% | ||||||
3M Co. | 82 | 7,117 | ||||
Avery Dennison Corp. | 13 | 548 | ||||
Boeing Co. | 85 | 5,559 | ||||
Caterpillar Inc. | 73 | 6,872 | ||||
CH Robinson Worldwide Inc. | 19 | 1,505 | ||||
Cintas Corp. | 15 | 427 | ||||
CSX Corp. | 44 | 2,850 | ||||
Cummins Inc. | 23 | 2,553 | ||||
Danaher Corp. | 62 | 2,914 | ||||
Deere & Co. | 49 | 4,082 | ||||
Dover Corp. | 21 | 1,228 | ||||
Dun & Bradstreet Corp. | 6 | 463 | ||||
Eaton Corp. | 19 | 1,970 | ||||
Emerson Electric Co. | 87 | 4,981 | ||||
Equifax Inc. | 14 | 498 | ||||
Expeditors International Washington Inc. | 24 | 1,307 | ||||
Fastenal Co. (e) | 17 | 1,011 | ||||
FedEx Corp. | 36 | 3,372 | ||||
Flowserve Corp. | 7 | 779 | ||||
Fluor Corp. | 20 | 1,336 | ||||
General Dynamics Corp. | 45 | 3,164 | ||||
General Electric Co. | 1,235 | 22,582 | ||||
Goodrich Corp. | 15 | 1,277 | ||||
Honeywell International Inc. | 90 | 4,792 | ||||
Illinois Tool Works Inc. | 57 | 3,042 | ||||
Ingersoll-Rand Plc | 37 | 1,752 | ||||
Iron Mountain Inc. | 23 | 578 | ||||
ITT Corp. | 21 | 1,074 | ||||
Jacobs Engineering Group Inc. (c) | 14 | 632 | ||||
L-3 Communications Holdings Inc. | 13 | 917 | ||||
Lockheed Martin Corp. | 35 | 2,424 | ||||
Masco Corp. | 40 | 502 | ||||
Norfolk Southern Corp. | 43 | 2,689 | ||||
Northrop Grumman Corp. | 35 | 2,255 | ||||
PACCAR Inc. | 42 | 2,425 | ||||
Pall Corp. | 14 | 677 | ||||
Parker Hannifin Corp. | 19 | 1,610 | ||||
Pitney Bowes Inc. | 24 | 585 | ||||
Precision Castparts Corp. | 16 | 2,291 | ||||
| Shares/Par (p) | Value | |||||
Quanta Services Inc. (c) | 23 | 465 | ||||
Raytheon Co. | 42 | 1,960 | ||||
Republic Services Inc. - Class A | 36 | 1,085 | ||||
Robert Half International Inc. | 16 | 501 | ||||
Rockwell Automation Inc. | 16 | 1,155 | ||||
Rockwell Collins Inc. | 18 | 1,032 | ||||
Roper Industries Inc. | 11 | 821 | ||||
RR Donnelley & Sons Co. | 22 | 390 | ||||
Ryder System Inc. | 6 | 291 | ||||
Snap-On Inc. | 6 | 343 | ||||
Southwest Airlines Co. | 84 | 1,088 | ||||
Stericycle Inc. (c) | 10 | 799 | ||||
Textron Inc. | 32 | 745 | ||||
Tyco International Ltd. | 57 | 2,379 | ||||
Union Pacific Corp. | 58 | 5,348 | ||||
United Parcel Service Inc. - Class B | 115 | 8,314 | ||||
United Technologies Corp. | 107 | 8,415 | ||||
Waste Management Inc. | 56 | 2,060 | ||||
WW Grainger Inc. | 7 | 990 | ||||
| 144,821 | ||||||
INFORMATION TECHNOLOGY - 18.5% |
| |||||
Adobe Systems Inc. (c) | 61 | 1,875 | ||||
Advanced Micro Devices Inc. (c) | 66 | 537 | ||||
Agilent Technologies Inc. (c) | 40 | 1,670 | ||||
Akamai Technologies Inc. (c) | 21 | 983 | ||||
Altera Corp. | 35 | 1,245 | ||||
Amphenol Corp. - Class A | 20 | 1,033 | ||||
Analog Devices Inc. | 35 | 1,301 | ||||
Apple Inc. (c) | 106 | 34,219 | ||||
Applied Materials Inc. | 155 | 2,184 | ||||
Autodesk Inc. (c) | 26 | 991 | ||||
Automatic Data Processing Inc. | 58 | 2,690 | ||||
BMC Software Inc. (c) | 21 | 991 | ||||
Broadcom Corp. - Class A | 52 | 2,249 | ||||
CA Inc. | 45 | 1,088 | ||||
Cisco Systems Inc. (c) | 643 | 13,000 | ||||
Citrix Systems Inc. (c) | 22 | 1,473 | ||||
Cognizant Technology Solutions Corp. – Class A (c) | 35 | 2,541 | ||||
Computer Sciences Corp. | 18 | 887 | ||||
Compuware Corp. (c) | 26 | 303 | ||||
Corning Inc. | 181 | 3,489 | ||||
Dell Inc. (c) | 199 | 2,698 | ||||
eBay Inc. (c) | 133 | 3,710 | ||||
Electronic Arts Inc. (c) | 38 | 627 | ||||
EMC Corp. (c) | 238 | 5,445 | ||||
F5 Networks Inc. (c) | 9 | 1,154 | ||||
Fidelity National Information Services Inc. | 31 | 851 | ||||
First Solar Inc. (c) (e) | 6 | 804 | ||||
Fiserv Inc. (c) | 18 | 1,035 | ||||
FLIR Systems Inc. (c) | 18 | 534 | ||||
Google Inc. - Class A (c) | 29 | 17,132 | ||||
Harris Corp. | 14 | 652 | ||||
Hewlett-Packard Co. | 264 | 11,098 | ||||
Intel Corp. | 643 | 13,532 | ||||
International Business Machines Corp. | 144 | 21,120 | ||||
Intuit Inc. (c) | 33 | 1,645 | ||||
Jabil Circuit Inc. | 21 | 422 | ||||
JDS Uniphase Corp. (c) | 23 | 338 | ||||
Juniper Networks Inc. (c) (e) | 61 | 2,247 | ||||
KLA-Tencor Corp. | 20 | 765 | ||||
Lexmark International Inc. - Class A (c) | 9 | 321 | ||||
Linear Technology Corp. (e) | 25 | 875 | ||||
LSI Corp. (c) | 71 | 426 | ||||
MasterCard Inc. - Class A | 11 | 2,510 | ||||
McAfee Inc. (c) | 18 | 830 | ||||
MEMC Electronic Materials Inc. (c) | 26 | 297 | ||||
See accompanying Notes to the Financial Statements.
JNL Series Trust
Schedules of Investments (in thousands)
December 31, 2010
| Shares/Par (p) | Value | |||||||
Microchip Technology Inc. (e) | 22 | 736 | ||||||
Micron Technology Inc. (c) | 96 | 769 | ||||||
Microsoft Corp. | 872 | 24,339 | ||||||
Molex Inc. (e) | 15 | 339 | ||||||
Monster Worldwide Inc. (c) | 13 | 311 | ||||||
Motorola Inc. (c) | 269 | 2,440 | ||||||
National Semiconductor Corp. | 26 | 356 | ||||||
NetApp Inc. (c) | 41 | 2,262 | ||||||
Novell Inc. (c) | 40 | 235 | ||||||
Novellus Systems Inc. (c) | 11 | 364 | ||||||
Nvidia Corp. (c) | 66 | 1,022 | ||||||
Oracle Corp. | 448 | 14,036 | ||||||
Paychex Inc. | 36 | 1,120 | ||||||
QLogic Corp. (c) | 13 | 229 | ||||||
QUALCOMM Inc. | 186 | 9,222 | ||||||
Red Hat Inc. (c) | 22 | 993 | ||||||
SAIC Inc. (c) | 33 | 531 | ||||||
Salesforce.com Inc. (c) | 13 | 1,779 | ||||||
SanDisk Corp. (c) | 27 | 1,330 | ||||||
Symantec Corp. (c) | 92 | 1,547 | ||||||
Tellabs Inc. | 43 | 289 | ||||||
Teradata Corp. (c) | 18 | 760 | ||||||
Teradyne Inc. (c) | 18 | 259 | ||||||
Texas Instruments Inc. | 136 | 4,421 | ||||||
Total System Services Inc. | 22 | 336 | ||||||
VeriSign Inc. (c) | 21 | 676 | ||||||
Visa Inc. - Class A | 57 | 4,010 | ||||||
Western Digital Corp. (c) | 27 | 901 | ||||||
Western Union Co. | 77 | 1,423 | ||||||
Xerox Corp. | 160 | 1,840 | ||||||
Xilinx Inc. | 31 | 902 | ||||||
Yahoo! Inc. (c) | 154 | 2,562 | ||||||
| 248,156 | ||||||||
MATERIALS - 3.8% | ||||||||
Air Products & Chemicals Inc. | 25 | 2,236 | ||||||
Airgas Inc. | 9 | 551 | ||||||
AK Steel Holding Corp. (e) | 11 | 186 | ||||||
Alcoa Inc. | 118 | 1,820 | ||||||
Allegheny Technologies Inc. | 11 | 634 | ||||||
Ball Corp. | 10 | 691 | ||||||
Bemis Co. Inc. | 13 | 415 | ||||||
CF Industries Holdings Inc. | 8 | 1,120 | ||||||
Cliffs Natural Resources Inc. | 16 | 1,225 | ||||||
Dow Chemical Co. | 134 | 4,563 | ||||||
Eastman Chemical Co. | 8 | 678 | ||||||
Ecolab Inc. | 27 | 1,341 | ||||||
EI Du Pont de Nemours & Co. | 105 | 5,228 | ||||||
FMC Corp. | 8 | 678 | ||||||
Freeport-McMoRan Copper & Gold Inc. | 55 | 6,552 | ||||||
International Flavors & Fragrances Inc. | 9 | 480 | ||||||
International Paper Co. | 51 | 1,378 | ||||||
MeadWestvaco Corp. | 19 | 497 | ||||||
Monsanto Co. | 63 | 4,392 | ||||||
Newmont Mining Corp. | 57 | 3,492 | ||||||
Nucor Corp. | 36 | 1,599 | ||||||
Owens-Illinois Inc. (c) | 18 | 559 | ||||||
PPG Industries Inc. | 19 | 1,618 | ||||||
Praxair Inc. | 35 | 3,380 | ||||||
Sealed Air Corp. | 18 | 471 | ||||||
Sherwin-Williams Co. | 11 | 894 | ||||||
Sigma-Aldrich Corp. | 14 | 937 | ||||||
Titanium Metals Corp. (c) | 10 | 173 | ||||||
United States Steel Corp. | 17 | 971 | ||||||
Vulcan Materials Co. (e) | 15 | 657 | ||||||
Weyerhaeuser Co. | 62 | 1,165 | ||||||
| 50,581 | ||||||||
| Shares/Par (p) | Value | |||||||
TELECOMMUNICATION SERVICES - 3.1% |
| |||||||
American Tower Corp. - Class A (c) | 47 | 2,410 | ||||||
AT&T Inc. | 683 | 20,075 | ||||||
CenturyLink Inc. (e) | 35 | 1,607 | ||||||
Frontier Communications Corp. | 115 | 1,117 | ||||||
MetroPCS Communications Inc. (c) | 31 | 395 | ||||||
Qwest Communications International Inc. | 198 | 1,507 | ||||||
Sprint Nextel Corp. (c) | 345 | 1,460 | ||||||
Verizon Communications Inc. | 327 | 11,697 | ||||||
Windstream Corp. | 56 | 785 | ||||||
| 41,053 | ||||||||
UTILITIES - 3.2% | ||||||||
AES Corp. (c) | 75 | 920 | ||||||
Allegheny Energy Inc. | 19 | 457 | ||||||
Ameren Corp. | 28 | 779 | ||||||
American Electric Power Co. Inc. | 55 | 1,994 | ||||||
CenterPoint Energy Inc. | 49 | 763 | ||||||
CMS Energy Corp. | 27 | 498 | ||||||
Consolidated Edison Inc. | 33 | 1,619 | ||||||
Constellation Energy Group Inc. | 23 | 696 | ||||||
Dominion Resources Inc. | 67 | 2,874 | ||||||
DTE Energy Co. | 20 | 885 | ||||||
Duke Energy Corp. | 152 | 2,707 | ||||||
Edison International | 38 | 1,450 | ||||||
Entergy Corp. | 22 | 1,551 | ||||||
Exelon Corp. | 76 | 3,183 | ||||||
FirstEnergy Corp. (e) | 35 | 1,307 | ||||||
Integrys Energy Group Inc. (e) | 9 | 414 | ||||||
NextEra Energy Inc. | 48 | 2,495 | ||||||
Nicor Inc. | 5 | 257 | ||||||
NiSource Inc. | 31 | 541 | ||||||
Northeast Utilities | 19 | 620 | ||||||
NRG Energy Inc. (c) | 30 | 584 | ||||||
Oneok Inc. | 12 | 673 | ||||||
Pepco Holdings Inc. (e) | 26 | 471 | ||||||
PG&E Corp. | 45 | 2,152 | ||||||
Pinnacle West Capital Corp. | 12 | 516 | ||||||
PPL Corp. | 56 | 1,465 | ||||||
Progress Energy Inc. | 33 | 1,448 | ||||||
Public Service Enterprise Group Inc. | 59 | 1,863 | ||||||
SCANA Corp. | 13 | 538 | ||||||
Sempra Energy | 29 | 1,504 | ||||||
Southern Co. | 95 | 3,649 | ||||||
TECO Energy Inc. | 23 | 416 | ||||||
Wisconsin Energy Corp. | 13 | 788 | ||||||
Xcel Energy Inc. | 53 | 1,254 | ||||||
| 43,331 | ||||||||
Total Common Stocks (cost $1,163,172) | 1,322,092 | |||||||
SHORT TERM INVESTMENTS - 2.3% |
| |||||||
Investment Company - 1.2% | ||||||||
JNL Money Market Fund, 0.08% (a) (h) | 16,641 | 16,641 | ||||||
Securities Lending Collateral 1.0% | ||||||||
Securities Lending Cash Collateral Fund LLC, 0.31% (a) (h) | 11,362 | 11,362 | ||||||
Securities Lending Liquidating Fund LLC, 0.66% (a) (h) | 1,807 | 1,777 | ||||||
| 13,139 | ||||||||
Treasury Securities 0.1% | ||||||||
U.S. Treasury Bill, 0.13%, 03/24/11 (o) | $ | 1,295 | 1,295 | |||||
Total Short Term Investments (cost $31,104) | 31,075 | |||||||
See accompanying Notes to the Financial Statements.
JNL Series Trust
Schedules of Investments (in thousands)
December 31, 2010
| Shares/Par (p) | Value | |||||||
Total Investments - 100.9% | 1,353,167 | |||||||
Other Assets and Liabilities, Net - (0.9%) |
| (11,867) | ||||||
Total Net Assets - 100.0% | $ | 1,341,300 | ||||||
JNL/Mellon Capital Management S&P 400 MidCap Index Fund |
| |||||||
COMMON STOCKS - 98.1% |
| |||||||
CONSUMER DISCRETIONARY - 14.0% |
| |||||||
99 Cents Only Stores (c) | 27 | $ | 427 | |||||
Aaron’s Inc. | 42 | 852 | ||||||
Advance Auto Parts Inc. | 50 | 3,300 | ||||||
Aeropostale Inc. (c) | 55 | 1,355 | ||||||
American Eagle Outfitters Inc. | 116 | 1,702 | ||||||
American Greetings Corp. - Class A | 23 | 508 | ||||||
AnnTaylor Stores Corp. (c) | 35 | 955 | ||||||
Bally Technologies Inc. (c) | 32 | 1,346 | ||||||
Barnes & Noble Inc. (e) | 22 | 312 | ||||||
Bob Evans Farms Inc. | 17 | 574 | ||||||
BorgWarner Inc. (c) | 67 | 4,882 | ||||||
Boyd Gaming Corp. (c) (e) | 31 | 332 | ||||||
Brinker International Inc. | 54 | 1,121 | ||||||
Career Education Corp. (c) | 38 | 781 | ||||||
Cheesecake Factory Inc. (c) | 35 | 1,085 | ||||||
Chico’s FAS Inc. | 106 | 1,272 | ||||||
Chipotle Mexican Grill Inc. - Class A (c) | 18 | 3,904 | ||||||
Collective Brands Inc. (c) | 39 | 827 | ||||||
Deckers Outdoor Corp. (c) | 23 | 1,826 | ||||||
Dick’s Sporting Goods Inc. (c) | 53 | 1,975 | ||||||
Dollar Tree Inc. (c) | 74 | 4,166 | ||||||
DreamWorks Animation SKG Inc. - Class A (c) | 43 | 1,256 | ||||||
Dress Barn Inc. (c) | 41 | 1,091 | ||||||
Eastman Kodak Co. (c) (e) | 154 | 825 | ||||||
Foot Locker Inc. | 93 | 1,815 | ||||||
Fossil Inc. (c) | 30 | 2,120 | ||||||
Gentex Corp. | 83 | 2,464 | ||||||
Guess? Inc. | 38 | 1,785 | ||||||
HanesBrands Inc. (c) | 57 | 1,447 | ||||||
Harte-Hanks Inc. | 22 | 284 | ||||||
International Speedway Corp. - Class A | 17 | 439 | ||||||
ITT Educational Services Inc. (c) (e) | 15 | 963 | ||||||
J Crew Group Inc. (c) | 38 | 1,640 | ||||||
John Wiley & Sons Inc. - Class A | 28 | 1,249 | ||||||
KB Home (e) | 41 | 558 | ||||||
Lamar Advertising Co. - Class A (c) | 34 | 1,359 | ||||||
Life Time Fitness Inc. (c) (e) | 25 | 1,032 | ||||||
LKQ Corp. (c) | 86 | 1,950 | ||||||
Matthews International Corp. - Class A (e) | 17 | 590 | ||||||
MDC Holdings Inc. | 22 | 621 | ||||||
Mohawk Industries Inc. (c) | 33 | 1,897 | ||||||
New York Times Co. - Class A (c) (e) | 68 | 663 | ||||||
NVR Inc. (c) | 3 | 2,289 | ||||||
Office Depot Inc. (c) | 169 | 911 | ||||||
Panera Bread Co. - Class A (c) | 18 | 1,786 | ||||||
PetSmart Inc. | 70 | 2,780 | ||||||
Phillips-Van Heusen Corp. | 39 | 2,483 | ||||||
Polaris Industries Inc. | 20 | 1,572 | ||||||
Regis Corp. | 33 | 547 | ||||||
Rent-A-Center Inc. | 38 | 1,233 | ||||||
Ryland Group Inc. | 27 | 468 | ||||||
Saks Inc. (c) (e) | 92 | 986 | ||||||
Scholastic Corp. (e) | 15 | 445 | ||||||
Scientific Games Corp. - Class A (c) | 35 | 348 | ||||||
| Shares/Par (p) | Value | |||||||
Service Corp. International | 140 | 1,157 | ||||||
Sotheby’s - Class A (e) | 40 | 1,794 | ||||||
Strayer Education Inc. (e) | 8 | 1,228 | ||||||
Thor Industries Inc. | 25 | 863 | ||||||
Timberland Co. - Class A (c) | 23 | 565 | ||||||
Toll Brothers Inc. (c) | 86 | 1,630 | ||||||
Tractor Supply Co. | 43 | 2,100 | ||||||
Tupperware Brands Corp. | 38 | 1,789 | ||||||
Under Armour Inc. - Class A (c) (e) | 20 | 1,105 | ||||||
Warnaco Group Inc. (c) | 26 | 1,457 | ||||||
Wendy’s/Arby’s Group Inc. | 184 | 851 | ||||||
Williams-Sonoma Inc. | 63 | 2,250 | ||||||
WMS Industries Inc. (c) | 34 | 1,554 | ||||||
| 93,741 | ||||||||
CONSUMER STAPLES - 3.5% | ||||||||
Alberto-Culver Co. | 51 | 1,889 | ||||||
BJ’s Wholesale Club Inc. (c) | 32 | 1,556 | ||||||
Church & Dwight Co. Inc. | 42 | 2,914 | ||||||
Corn Products International Inc. | 45 | 2,066 | ||||||
Energizer Holdings Inc. (c) | 42 | 3,054 | ||||||
Flowers Foods Inc. | 43 | 1,167 | ||||||
Green Mountain Coffee Roasters Inc. (c) (e) | 69 | 2,263 | ||||||
Hansen Natural Corp. (c) | 41 | 2,146 | ||||||
Lancaster Colony Corp. | 11 | 630 | ||||||
Ralcorp Holdings Inc. (c) | 33 | 2,121 | ||||||
Ruddick Corp. | 26 | 942 | ||||||
Smithfield Foods Inc. (c) | 99 | 2,035 | ||||||
Tootsie Roll Industries Inc. (e) | 14 | 416 | ||||||
Universal Corp. | 14 | 554 | ||||||
| 23,753 | ||||||||
ENERGY - 5.8% | ||||||||
Arch Coal Inc. | 96 | 3,381 | ||||||
Atwood Oceanics Inc. (c) | 33 | 1,248 | ||||||
Bill Barrett Corp. (c) | 27 | 1,093 | ||||||
Cimarex Energy Co. | 50 | 4,448 | ||||||
Comstock Resources Inc. (c) | 27 | 665 | ||||||
Dril-Quip Inc. (c) | 20 | 1,584 | ||||||
Exterran Holdings Inc. (c) (e) | 36 | 867 | ||||||
Forest Oil Corp. (c) | 67 | 2,557 | ||||||
Frontier Oil Corp. (c) | 64 | 1,144 | ||||||
Helix Energy Solutions Group Inc. (c) | 64 | 780 | ||||||
Oceaneering International Inc. (c) | 32 | 2,366 | ||||||
Overseas Shipholding Group Inc. | 15 | 543 | ||||||
Patriot Coal Corp. (c) | 46 | 888 | ||||||
Patterson-UTI Energy Inc. | 92 | 1,973 | ||||||
Plains Exploration & Production Co. (c) | 83 | 2,674 | ||||||
Pride International Inc. (c) | 104 | 3,442 | ||||||
Quicksilver Resources Inc. (c) | 67 | 992 | ||||||
SM Energy Co. | 37 | 2,207 | ||||||
Southern Union Co. | 74 | 1,781 | ||||||
Superior Energy Services Inc. (c) | 47 | 1,640 | ||||||
Tidewater Inc. | 31 | 1,646 | ||||||
Unit Corp. (c) | 23 | 1,058 | ||||||
| 38,977 | ||||||||
FINANCIALS - 19.4% | ||||||||
Affiliated Managers Group Inc. (c) | 31 | 3,037 | ||||||
Alexandria Real Estate Equities Inc. | 33 | 2,408 | ||||||
AMB Property Corp. | 100 | 3,169 | ||||||
American Financial Group Inc. | 47 | 1,511 | ||||||
Apollo Investment Corp. | 116 | 1,285 | ||||||
Arthur J Gallagher & Co. | 63 | 1,832 | ||||||
Associated Banc-Corp | 103 | 1,559 | ||||||
Astoria Financial Corp. | 47 | 655 | ||||||
BancorpSouth Inc. | 42 | 671 | ||||||
Bank of Hawaii Corp. | 29 | 1,355 | ||||||
See accompanying Notes to the Financial Statements.
JNL Series Trust
Schedules of Investments (in thousands)
December 31, 2010
| Shares/Par (p) | Value | |||||
BRE Properties Inc. - Class A (e) | 38 | 1,658 | ||||
Brown & Brown Inc. | 70 | 1,665 | ||||
Camden Property Trust | 41 | 2,202 | ||||
Cathay General Bancorp | 48 | 801 | ||||
City National Corp. | 28 | 1,692 | ||||
Commerce Bancshares Inc. | 46 | 1,831 | ||||
Corporate Office Properties Trust | 40 | 1,391 | ||||
Cousins Properties Inc. | 64 | 535 | ||||
Cullen/Frost Bankers Inc. | 36 | 2,212 | ||||
Duke Realty Corp. | 150 | 1,868 | ||||
East West Bancorp Inc. | 88 | 1,720 | ||||
Eaton Vance Corp. (e) | 70 | 2,125 | ||||
Equity One Inc. (e) | 26 | 480 | ||||
Essex Property Trust Inc. (e) | 19 | 2,126 | ||||
Everest Re Group Ltd. | 32 | 2,756 | ||||
Federal Realty Investment Trust | 37 | 2,846 | ||||
Fidelity National Financial Inc. - Class A | 135 | 1,845 | ||||
First American Financial Corp. | 60 | 892 | ||||
First Niagara Financial Group Inc. | 124 | 1,738 | ||||
FirstMerit Corp. | 65 | 1,282 | ||||
Fulton Financial Corp. (e) | 119 | 1,228 | ||||
Greenhill & Co. Inc. | 15 | 1,227 | ||||
Hanover Insurance Group Inc. | 27 | 1,254 | ||||
HCC Insurance Holdings Inc. | 69 | 1,983 | ||||
Highwoods Properties Inc. | 43 | 1,358 | ||||
Hospitality Properties Trust | 73 | 1,691 | ||||
International Bancshares Corp. | 30 | 608 | ||||
Jefferies Group Inc. (e) | 74 | 1,958 | ||||
Jones Lang LaSalle Inc. | 25 | 2,126 | ||||
Liberty Property Trust | 68 | 2,166 | ||||
Macerich Co. | 77 | 3,657 | ||||
Mack-Cali Realty Corp. | 47 | 1,564 | ||||
Mercury General Corp. | 20 | 877 | ||||
MSCI Inc. - Class A (c) | 71 | 2,747 | ||||
Nationwide Health Properties Inc. | 75 | 2,727 | ||||
New York Community Bancorp Inc. | 258 | 4,870 | ||||
NewAlliance Bancshares Inc. | 60 | 901 | ||||
Old Republic International Corp. | 151 | 2,061 | ||||
Omega Healthcare Investors Inc. | 59 | 1,316 | ||||
PacWest Bancorp | 18 | 389 | ||||
Potlatch Corp. | 23 | 745 | ||||
Prosperity Bancshares Inc. | 28 | 1,101 | ||||
Protective Life Corp. | 51 | 1,358 | ||||
Raymond James Financial Inc. | 59 | 1,942 | ||||
Rayonier Inc. | 48 | 2,513 | ||||
Realty Income Corp. (e) | 70 | 2,378 | ||||
Regency Centers Corp. | 49 | 2,055 | ||||
Reinsurance Group of America Inc. | 43 | 2,336 | ||||
SEI Investments Co. | 87 | 2,062 | ||||
Senior Housing Properties Trust | 83 | 1,825 | ||||
SL Green Realty Corp. | 46 | 3,136 | ||||
StanCorp Financial Group Inc. | 27 | 1,236 | ||||
SVB Financial Group (c) | 25 | 1,326 | ||||
Synovus Financial Corp. (e) | 469 | 1,237 | ||||
TCF Financial Corp. (e) | 76 | 1,124 | ||||
Transatlantic Holdings Inc. | 38 | 1,940 | ||||
Trustmark Corp. (e) | 32 | 806 | ||||
UDR Inc. | 108 | 2,544 | ||||
Unitrin Inc. | 28 | 699 | ||||
Valley National Bancorp | 96 | 1,372 | ||||
Waddell & Reed Financial Inc. - Class A | 51 | 1,791 | ||||
Washington Federal Inc. | 68 | 1,144 | ||||
Webster Financial Corp. | 43 | 855 | ||||
Weingarten Realty Investors | 72 | 1,701 | ||||
Westamerica Bancorporation | 18 | 972 | ||||
WR Berkley Corp. | 69 | 1,889 | ||||
| 129,942 | ||||||
| Shares/Par (p) | Value | |||||
HEALTH CARE - 10.9% | ||||||
Allscripts Healthcare Solutions Inc. (c) | 111 | 2,142 | ||||
Beckman Coulter Inc. | 41 | 3,092 | ||||
Bio-Rad Laboratories Inc. - Class A (c) | 11 | 1,157 | ||||
Charles River Laboratories International Inc. (c) | 33 | 1,190 | ||||
Community Health Systems Inc. (c) | 55 | 2,055 | ||||
Covance Inc. (c) (e) | 39 | 1,981 | ||||
Edwards Lifesciences Corp. (c) | 68 | 5,474 | ||||
Endo Pharmaceuticals Holdings Inc. (c) | 69 | 2,451 | ||||
Gen-Probe Inc. (c) | 29 | 1,672 | ||||
Health Management Associates Inc. – Class A (c) | 149 | 1,422 | ||||
Health Net Inc. (c) | 55 | 1,508 | ||||
Henry Schein Inc. (c) | 55 | 3,362 | ||||
Hill-Rom Holdings Inc. | 37 | 1,476 | ||||
Hologic Inc. (c) | 154 | 2,904 | ||||
Idexx Laboratories Inc. (c) (e) | 34 | 2,364 | ||||
Immucor Inc. (c) | 40 | 795 | ||||
Kindred Healthcare Inc. (c) | 23 | 415 | ||||
Kinetic Concepts Inc. (c) | 37 | 1,559 | ||||
LifePoint Hospitals Inc. (c) | 31 | 1,133 | ||||
Lincare Holdings Inc. | 58 | 1,557 | ||||
Masimo Corp. (c) | 35 | 1,023 | ||||
Medicis Pharmaceutical Corp. - Class A | 36 | 976 | ||||
Mednax Inc. (c) | 28 | 1,907 | ||||
Mettler Toledo International Inc. (c) | 19 | 2,946 | ||||
Omnicare Inc. | 67 | 1,702 | ||||
Owens & Minor Inc. | 38 | 1,113 | ||||
Perrigo Co. | 49 | 3,120 | ||||
Pharmaceutical Product Development Inc. | 71 | 1,917 | ||||
ResMed Inc. (c) (e) | 90 | 3,108 | ||||
STERIS Corp. | 35 | 1,283 | ||||
Techne Corp. | 22 | 1,449 | ||||
Teleflex Inc. | 24 | 1,280 | ||||
Thoratec Corp. (c) | 35 | 996 | ||||
United Therapeutics Corp. (c) | 30 | 1,882 | ||||
Universal Health Services Inc. - Class B | 58 | 2,508 | ||||
VCA Antech Inc. (c) | 49 | 1,149 | ||||
Vertex Pharmaceuticals Inc. (c) | 121 | 4,222 | ||||
WellCare Health Plans Inc. (c) | 26 | 786 | ||||
| 73,076 | ||||||
INDUSTRIALS - 15.9% | ||||||
Acuity Brands Inc. | 26 | 1,477 | ||||
AECOM Technology Corp. (c) | 70 | 1,970 | ||||
AGCO Corp. (c) (e) | 55 | 2,799 | ||||
AirTran Holdings Inc. (c) | 83 | 615 | ||||
Alaska Air Group Inc. (c) | 22 | 1,242 | ||||
Alexander & Baldwin Inc. | 25 | 994 | ||||
Alliant Techsystems Inc. (c) | 20 | 1,474 | ||||
AMETEK Inc. | 95 | 3,727 | ||||
Baldor Electric Co. | 28 | 1,767 | ||||
BE Aerospace Inc. (c) | 61 | 2,249 | ||||
Brink’s Co. | 28 | 761 | ||||
Bucyrus International Inc. - Class A | 48 | 4,296 | ||||
Carlisle Cos. Inc. | 36 | 1,442 | ||||
Clean Harbors Inc. (c) | 13 | 1,104 | ||||
Con-Way Inc. | 33 | 1,196 | ||||
Copart Inc. (c) | 41 | 1,520 | ||||
Corporate Executive Board Co. | 21 | 785 | ||||
Corrections Corp. of America (c) | 66 | 1,643 | ||||
Crane Co. | 26 | 1,086 | ||||
Deluxe Corp. | 29 | 676 | ||||
Donaldson Co. Inc. | 45 | 2,647 | ||||
FTI Consulting Inc. (c) | 27 | 993 | ||||
Gardner Denver Inc. | 31 | 2,145 | ||||
GATX Corp. (e) | 28 | 983 | ||||
See accompanying Notes to the Financial Statements.
JNL Series Trust
Schedules of Investments (in thousands)
December 31, 2010
| Shares/Par (p) | Value | |||||
Graco Inc. | 36 | 1,405 | ||||
Granite Construction Inc. | 20 | 536 | ||||
Harsco Corp. | 48 | 1,357 | ||||
Herman Miller Inc. (e) | 33 | 827 | ||||
HNI Corp. | 26 | 800 | ||||
Hubbell Inc. - Class B | 36 | 2,144 | ||||
IDEX Corp. | 49 | 1,903 | ||||
JB Hunt Transport Services Inc. | 53 | 2,152 | ||||
JetBlue Airways Corp. (c) | 115 | 763 | ||||
Joy Global Inc. | 61 | 5,313 | ||||
Kansas City Southern (c) | 61 | 2,915 | ||||
KBR Inc. | 89 | 2,697 | ||||
Kennametal Inc. | 49 | 1,925 | ||||
Kirby Corp. (c) | 32 | 1,403 | ||||
Korn/Ferry International (c) | 27 | 612 | ||||
Landstar System Inc. | 28 | 1,160 | ||||
Lennox International Inc. | 27 | 1,263 | ||||
Lincoln Electric Holdings Inc. | 25 | 1,640 | ||||
Manpower Inc. | 48 | 3,038 | ||||
Mine Safety Appliances Co. | 18 | 551 | ||||
MSC Industrial Direct Co. - Class A | 26 | 1,714 | ||||
Navigant Consulting Inc. (c) | 29 | 263 | ||||
Nordson Corp. | 20 | 1,854 | ||||
Oshkosh Corp. (c) | 54 | 1,900 | ||||
Pentair Inc. | 59 | 2,141 | ||||
Regal-Beloit Corp. | 23 | 1,532 | ||||
Rollins Inc. | 37 | 721 | ||||
Shaw Group Inc. (c) | 51 | 1,729 | ||||
SPX Corp. | 30 | 2,132 | ||||
Terex Corp. (c) | 65 | 2,009 | ||||
Thomas & Betts Corp. (c) | 31 | 1,489 | ||||
Timken Co. | 48 | 2,285 | ||||
Towers Watson & Co. - Class A | 27 | 1,403 | ||||
Trinity Industries Inc. (e) | 48 | 1,267 | ||||
United Rentals Inc. (c) | 37 | 839 | ||||
URS Corp. (c) | 49 | 2,045 | ||||
Valmont Industries Inc. (e) | 13 | 1,128 | ||||
Wabtec Corp. (e) | 29 | 1,508 | ||||
Waste Connections Inc. | 68 | 1,884 | ||||
Watsco Inc. | 17 | 1,056 | ||||
Werner Enterprises Inc. (e) | 25 | 573 | ||||
Woodward Governor Co. | 35 | 1,325 | ||||
| 106,792 | ||||||
INFORMATION TECHNOLOGY - 15.3% | ||||||
ACI Worldwide Inc. (c) | 19 | 511 | ||||
Acxiom Corp. (c) | 48 | 829 | ||||
ADTRAN Inc. | 38 | 1,359 | ||||
Advent Software Inc. (c) (e) | 9 | 530 | ||||
Alliance Data Systems Corp. (c) (e) | 31 | 2,194 | ||||
Ansys Inc. (c) | 54 | 2,813 | ||||
AOL Inc. (c) | 63 | 1,505 | ||||
Arrow Electronics Inc. (c) | 69 | 2,356 | ||||
Atmel Corp. (c) | 272 | 3,351 | ||||
Avnet Inc. (c) | 90 | 2,979 | ||||
Broadridge Financial Solutions Inc. | 74 | 1,630 | ||||
Cadence Design Systems Inc. (c) | 159 | 1,313 | ||||
Ciena Corp. (c) (e) | 56 | 1,176 | ||||
CommScope Inc. (c) | 56 | 1,764 | ||||
Concur Technologies Inc. (c) | 27 | 1,408 | ||||
Convergys Corp. (c) | 71 | 932 | ||||
CoreLogic Inc. (c) | 62 | 1,149 | ||||
Cree Inc. (c) (e) | 64 | 4,239 | ||||
Diebold Inc. | 39 | 1,253 | ||||
Digital River Inc. (c) | 24 | 832 | ||||
DST Systems Inc. | 20 | 904 | ||||
Equinix Inc. (c) | 27 | 2,220 | ||||
Factset Research Systems Inc. | 28 | 2,581 | ||||
| Shares/Par (p) | Value | |||||
Fair Isaac Corp. | 23 | 539 | ||||
Fairchild Semiconductor International Inc. (c) | 74 | 1,155 | ||||
Gartner Inc. - Class A (c) | 43 | 1,443 | ||||
Global Payments Inc. | 47 | 2,187 | ||||
Informatica Corp. (c) (e) | 56 | 2,454 | ||||
Ingram Micro Inc. - Class A (c) | 93 | 1,779 | ||||
Integrated Device Technology Inc. (c) | 93 | 618 | ||||
International Rectifier Corp. (c) | 40 | 1,189 | ||||
Intersil Corp. - Class A | 74 | 1,134 | ||||
Itron Inc. (c) | 24 | 1,333 | ||||
Jack Henry & Associates Inc. | 51 | 1,484 | ||||
Lam Research Corp. (c) | 73 | 3,778 | ||||
Lender Processing Services Inc. | 53 | 1,558 | ||||
Mantech International Corp. - Class A (c) | 13 | 534 | ||||
Mentor Graphics Corp. (c) | 67 | 802 | ||||
Micros Systems Inc. (c) | 48 | 2,099 | ||||
National Instruments Corp. | 35 | 1,314 | ||||
NCR Corp. (c) | 95 | 1,456 | ||||
NeuStar Inc. - Class A (c) | 43 | 1,111 | ||||
Parametric Technology Corp. (c) | 70 | 1,579 | ||||
Plantronics Inc. | 29 | 1,065 | ||||
Polycom Inc. (c) | 51 | 1,978 | ||||
Quest Software Inc. (c) | 34 | 955 | ||||
Rackspace Hosting Inc. (c) (e) | 58 | 1,813 | ||||
RF Micro Devices Inc. (c) | 164 | 1,202 | ||||
Riverbed Technology Inc. (c) | 87 | 3,069 | ||||
Rovi Corp. (c) | 62 | 3,870 | ||||
Semtech Corp. (c) | 38 | 851 | ||||
Silicon Laboratories Inc. (c) | 26 | 1,201 | ||||
Skyworks Solutions Inc. (c) | 109 | 3,115 | ||||
Solera Holdings Inc. | 42 | 2,142 | ||||
SRA International Inc. - Class A (c) | 25 | 501 | ||||
Synopsys Inc. (c) | 88 | 2,374 | ||||
Tech Data Corp. (c) | 28 | 1,225 | ||||
TIBCO Software Inc. (c) | 99 | 1,955 | ||||
Trimble Navigation Ltd. (c) | 71 | 2,847 | ||||
ValueClick Inc. (c) | 49 | 789 | ||||
Vishay Intertechnology Inc. (c) | 95 | 1,399 | ||||
Zebra Technologies Corp. - Class A (c) | 34 | 1,278 | ||||
| 103,003 | ||||||
MATERIALS - 6.7% | ||||||
Albemarle Corp. | 54 | 3,032 | ||||
AptarGroup Inc. | 40 | 1,896 | ||||
Ashland Inc. | 47 | 2,382 | ||||
Cabot Corp. | 39 | 1,464 | ||||
Carpenter Technology Corp. | 26 | 1,063 | ||||
Commercial Metals Co. | 68 | 1,133 | ||||
Compass Minerals International Inc. | 19 | 1,736 | ||||
Cytec Industries Inc. | 29 | 1,558 | ||||
Grief Inc. - Class A | 19 | 1,156 | ||||
Intrepid Potash Inc. (c) (e) | 25 | 946 | ||||
Louisiana-Pacific Corp. (c) | 81 | 762 | ||||
Lubrizol Corp. | 39 | 4,161 | ||||
Martin Marietta Materials Inc. (e) | 27 | 2,494 | ||||
Minerals Technologies Inc. | 11 | 694 | ||||
NewMarket Corp. | 6 | 696 | ||||
Olin Corp. | 48 | 982 | ||||
Packaging Corp. of America | 61 | 1,576 | ||||
Reliance Steel & Aluminum Co. | 44 | 2,264 | ||||
Rock-Tenn Co. - Class A | 23 | 1,250 | ||||
RPM International Inc. | 77 | 1,694 | ||||
Scotts Miracle-Gro Co. - Class A | 27 | 1,388 | ||||
Sensient Technologies Corp. | 30 | 1,090 | ||||
Silgan Holdings Inc. | 29 | 1,030 | ||||
Sonoco Products Co. | 61 | 2,058 | ||||
Steel Dynamics Inc. | 129 | 2,359 | ||||
Temple-Inland Inc. | 64 | 1,363 | ||||
See accompanying Notes to the Financial Statements.
JNL Series Trust
Schedules of Investments (in thousands)
December 31, 2010
| Shares/Par (p) | Value | |||||
Valspar Corp. | 59 | 2,017 | ||||
Worthington Industries Inc. | 33 | 603 | ||||
| 44,847 | ||||||
TELECOMMUNICATION SERVICES - 0.8% | ||||||
Cincinnati Bell Inc. (c) | 116 | 323 | ||||
Syniverse Holdings Inc. (c) | 42 | 1,289 | ||||
Telephone & Data Systems Inc. | 55 | 1,999 | ||||
tw telecom inc. (c) | 90 | 1,534 | ||||
| 5,145 | ||||||
UTILITIES - 5.8% | ||||||
AGL Resources Inc. | 46 | 1,663 | ||||
Alliant Energy Corp. | 66 | 2,421 | ||||
Aqua America Inc. | 82 | 1,838 | ||||
Atmos Energy Corp. | 54 | 1,677 | ||||
Black Hills Corp. | 24 | 719 | ||||
Cleco Corp. | 36 | 1,116 | ||||
DPL Inc. | 71 | 1,817 | ||||
Dynegy Inc. (c) | 57 | 321 | ||||
Energen Corp. | 43 | 2,061 | ||||
Great Plains Energy Inc. | 81 | 1,564 | ||||
Hawaiian Electric Industries Inc. (e) | 56 | 1,277 | ||||
IDACORP Inc. | 28 | 1,040 | ||||
MDU Resources Group Inc. | 112 | 2,267 | ||||
National Fuel Gas Co. | 49 | 3,201 | ||||
NSTAR | 62 | 2,595 | ||||
NV Energy Inc. | 140 | 1,963 | ||||
OGE Energy Corp. | 58 | 2,636 | ||||
PNM Resources Inc. | 50 | 646 | ||||
Questar Corp. | 104 | 1,807 | ||||
UGI Corp. | 66 | 2,073 | ||||
Vectren Corp. | 49 | 1,234 | ||||
Westar Energy Inc. (e) | 66 | 1,666 | ||||
WGL Holdings Inc. | 31 | 1,091 | ||||
| 38,693 | ||||||
Total Common Stocks (cost $575,619) | 657,969 | |||||
SHORT TERM INVESTMENTS - 8.1% | ||||||
Investment Company - 1.8% | ||||||
JNL Money Market Fund, 0.08% (a) (h) | 12,073 | 12,073 | ||||
Securities Lending Collateral 6.1% |
| |||||
Securities Lending Cash Collateral Fund LLC, 0.31% (a) (h) | 38,464 | 38,464 | ||||
Securities Lending Liquidating Fund LLC, 0.66% (a) (h) | 2,723 | 2,677 | ||||
| 41,141 | ||||||
Treasury Securities 0.2% | ||||||
U.S. Treasury Bill, 0.13%, 03/24/11 (o) | $ | 940 | 940 | |||
Total Short Term Investments (cost $54,199) | 54,154 | |||||
Total Investments - 106.2% (cost $629,818) | 712,123 | |||||
Other Assets and Liabilities, Net - (6.2%) | (41,313) | |||||
Total Net Assets - 100.0% | $670,810 | |||||
JNL/Mellon Capital Management Small Cap Index Fund | ||||||
COMMON STOCKS - 97.9% |
| |||||
CONSUMER DISCRETIONARY - 13.6% |
| |||||
1-800-Flowers.com Inc. - Class A (c) | 14 | $38 | ||||
| Shares/Par (p) | Value | |||||
99 Cents Only Stores (c) | 26 | 421 | ||||
AFC Enterprises Inc. (c) | 15 | 204 | ||||
AH Belo Corp. - Class A (c) | 14 | 124 | ||||
Ambassadors Group Inc. | 11 | 126 | ||||
America’s Car-Mart Inc. (c) | 5 | 140 | ||||
American Apparel Inc. (c) | 16 | 26 | ||||
American Axle & Manufacturing Holdings Inc. (c) | 35 | 453 | ||||
American Greetings Corp. - Class A | 24 | 535 | ||||
American Public Education Inc. (c) (e) | 10 | 386 | ||||
Amerigon Inc. (c) | 11 | 125 | ||||
Ameristar Casinos Inc. | 16 | 244 | ||||
AnnTaylor Stores Corp. (c) | 35 | 952 | ||||
Arbitron Inc. | 16 | 676 | ||||
Arctic Cat Inc. (c) | 9 | 135 | ||||
ArvinMeritor Inc. (c) | 55 | 1,138 | ||||
Asbury Automotive Group Inc. (c) | 17 | 323 | ||||
Ascent Media Corp. (c) | 8 | 318 | ||||
Audiovox Corp. - Class A (c) | 14 | 124 | ||||
Ballantyne Strong Inc. (c) | 8 | 59 | ||||
Barnes & Noble Inc. (e) | 23 | 320 | ||||
Beazer Homes USA Inc. (c) (e) | 45 | 245 | ||||
Bebe Stores Inc. | 18 | 106 | ||||
Belo Corp. (c) | 51 | 363 | ||||
Big 5 Sporting Goods Corp. | 13 | 194 | ||||
Biglari Holdings Inc. (c) | 1 | 351 | ||||
BJ’s Restaurants Inc. (c) | 13 | 478 | ||||
Blue Nile Inc. (c) (e) | 7 | 409 | ||||
Bluegreen Corp. (c) | 6 | 21 | ||||
Blyth Inc. | 4 | 121 | ||||
Bob Evans Farms Inc. | 18 | 600 | ||||
Bon-Ton Stores Inc. (c) (e) | 9 | 117 | ||||
Books-A-Million Inc. (e) | 3 | 19 | ||||
Borders Group Inc. (c) (e) | 36 | 32 | ||||
Boyd Gaming Corp. (c) (e) | 33 | 351 | ||||
Bravo Brio Restaurant Group Inc. (c) | 3 | 61 | ||||
Bridgepoint Education Inc. (c) (e) | 11 | 202 | ||||
Brookfield Homes Corp. (c) (e) | 6 | 56 | ||||
Brown Shoe Co. Inc. | 25 | 355 | ||||
Brunswick Corp. | 53 | 1,001 | ||||
Buckle Inc. (e) | 16 | 592 | ||||
Buffalo Wild Wings Inc. (c) (e) | 11 | 463 | ||||
Build-A-Bear Workshop Inc. (c) | 13 | 99 | ||||
Cabela’s Inc. - Class A (c) (e) | 25 | 534 | ||||
California Pizza Kitchen Inc. (c) | 11 | 189 | ||||
Callaway Golf Co. (e) | 40 | 319 | ||||
Cambium Learning Group Inc. (c) | 9 | 31 | ||||
Capella Education Co. (c) (e) | 10 | 643 | ||||
Caribou Coffee Co. Inc. (c) | 3 | 32 | ||||
Carmike Cinemas Inc. (c) | 8 | 64 | ||||
Carrol’s Restaurant Group Inc. (c) | 5 | 37 | ||||
Carter’s Inc. (c) | 36 | 1,055 | ||||
Casual Male Retail Group Inc. (c) | 22 | 106 | ||||
Cato Corp. - Class A | 17 | 467 | ||||
Cavco Industries Inc. (c) (e) | 4 | 177 | ||||
CEC Entertainment Inc. (c) | 12 | 476 | ||||
Charming Shoppes Inc. (c) | 74 | 263 | ||||
Cheesecake Factory Inc. (c) | 36 | 1,114 | ||||
Cherokee Inc. | 5 | 99 | ||||
Childrens Place Retail Stores Inc. (c) | 15 | 768 | ||||
Christopher & Banks Corp. | 24 | 147 | ||||
Churchill Downs Inc. | 7 | 291 | ||||
Cinemark Holdings Inc. | 33 | 568 | ||||
Citi Trends Inc. (c) | 9 | 209 | ||||
CKX Inc. (c) | 35 | 139 | ||||
Coinstar Inc. (c) (e) | 19 | 1,076 | ||||
Coldwater Creek Inc. (c) | 32 | 101 | ||||
Collective Brands Inc. (c) | 38 | 791 | ||||
See accompanying Notes to the Financial Statements.
JNL Series Trust
Schedules of Investments (in thousands)
December 31, 2010
| Shares/Par (p) | Value | |||||
Columbia Sportswear Co. (e) | 7 | 425 | ||||
Conn’s Inc. (c) (e) | 10 | 45 | ||||
Cooper Tire & Rubber Co. | 37 | 873 | ||||
Core-Mark Holding Co. Inc. (c) | 6 | 230 | ||||
Corinthian Colleges Inc. (c) (e) | 56 | 294 | ||||
CPI Corp. | 4 | 79 | ||||
Cracker Barrel Old Country Store Inc. | 14 | 790 | ||||
Crocs Inc. (c) | 52 | 887 | ||||
Crown Media Holdings Inc. - Class A (c) (e) | 5 | 14 | ||||
CSS Industries Inc. | 6 | 117 | ||||
Culp Inc. (c) | 5 | 49 | ||||
Cumulus Media Inc. - Class A (c) (e) | 12 | 50 | ||||
Dana Holding Corp. (c) | 84 | 1,447 | ||||
Deckers Outdoor Corp. (c) | 23 | 1,847 | ||||
Delta Apparel Inc. (c) | 3 | 43 | ||||
Denny’s Corp. (c) | 57 | 203 | ||||
Destination Maternity Corp. (c) | 3 | 110 | ||||
Dex One Corp. (c) | 29 | 218 | ||||
Dillard’s Inc. - Class A (e) | 24 | 910 | ||||
DineEquity Inc. (c) (e) | 11 | 530 | ||||
Domino’s Pizza Inc. (c) | 23 | 366 | ||||
Dorman Products Inc. (c) | 7 | 239 | ||||
Dress Barn Inc. (c) | 36 | 947 | ||||
Drew Industries Inc. (c) | 11 | 258 | ||||
Drugstore.com Inc. (c) (e) | 53 | 117 | ||||
DSW Inc. - Class A (c) | 9 | 343 | ||||
Eastman Kodak Co. (c) (e) | 159 | 853 | ||||
Einstein Noah Restaurant Group Inc. (c) | 2 | 33 | ||||
Empire Resorts Inc. (c) (e) | 14 | 14 | ||||
Entercom Communications Corp. - Class A (c) | 13 | 146 | ||||
Entravision Communications Corp. – Class A (c) | 26 | 67 | ||||
Ethan Allen Interiors Inc. (e) | 14 | 272 | ||||
EW Scripps Co. - Class A (c) | 20 | 206 | ||||
Exide Technologies (c) | 47 | 438 | ||||
Express Inc. (c) | 9 | 161 | ||||
Finish Line - Class A | 30 | 524 | ||||
Fisher Communications Inc. (c) | 4 | 86 | ||||
Fred’s Inc. - Class A | 23 | 320 | ||||
Fuel Systems Solutions Inc. (c) | 8 | 248 | ||||
Furniture Brands International Inc. (c) | 31 | 159 | ||||
G-III Apparel Group Ltd. (c) | 10 | 335 | ||||
Gaiam Inc. - Class A | 8 | 61 | ||||
Gaylord Entertainment Co. (c) | 20 | 721 | ||||
Genesco Inc. (c) | 14 | 528 | ||||
Global Sources Ltd. (c) | 11 | 101 | ||||
Gordman’s Stores Inc. (c) | 2 | 35 | ||||
Grand Canyon Education Inc. (c) (e) | 19 | 368 | ||||
Gray Television Inc. (c) | 26 | 49 | ||||
Group 1 Automotive Inc. (e) | 15 | 612 | ||||
Harte-Hanks Inc. | 23 | 294 | ||||
Haverty Furniture Cos. Inc. (c) | 10 | 133 | ||||
Helen of Troy Ltd. (c) | 18 | 547 | ||||
hhgregg Inc. (c) (e) | 7 | 148 | ||||
Hibbett Sports Inc. (c) | 17 | 618 | ||||
Hooker Furniture Corp. | 5 | 73 | ||||
HOT Topic Inc. | 27 | 168 | ||||
Hovnanian Enterprises Inc. - Class A (c) (e) | 32 | 131 | ||||
HSN Inc. (c) | 23 | 706 | ||||
Iconix Brand Group Inc. (c) | 44 | 843 | ||||
Interval Leisure Group Inc. (c) | 24 | 390 | ||||
iRobot Corp. (c) | 13 | 312 | ||||
Isle of Capri Casinos Inc. (c) | 8 | 81 | ||||
Jack in the Box Inc. (c) | 32 | 681 | ||||
Jakks Pacific Inc. (c) | 17 | 303 | ||||
Jamba Inc. (c) | 45 | 103 | ||||
Jo-Ann Stores Inc. (c) | 16 | 952 | ||||
Joe’s Jeans Inc. (c) (e) | 23 | 36 | ||||
| Shares/Par (p) | Value | |||||
Johnson Outdoors Inc. - Class A (c) | 2 | 29 | ||||
Jos. A. Bank Clothiers Inc. (c) | 16 | 641 | ||||
Journal Communications Inc. - Class A (c) | 27 | 137 | ||||
K-Swiss Inc. - Class A (c) | 15 | 187 | ||||
K12 Inc. (c) | 15 | 421 | ||||
Kenneth Cole Productions Inc. - Class A (c) | 5 | 64 | ||||
Kid Brands Inc. (c) | 7 | 58 | ||||
Kirkland’s Inc. (c) | 9 | 128 | ||||
Knology Inc. (c) | 17 | 268 | ||||
Krispy Kreme Doughnuts Inc. (c) | 35 | 245 | ||||
La-Z-Boy Inc. (c) (e) | 28 | 253 | ||||
LaCrosse Footwear Inc. (e) | 3 | 41 | ||||
Leapfrog Enterprises Inc. - Class A (c) | 24 | 131 | ||||
Learning Tree International Inc. (c) | 5 | 47 | ||||
Lee Enterprises Inc. (c) (e) | 24 | 59 | ||||
Libbey Inc. (c) | 12 | 184 | ||||
Life Time Fitness Inc. (c) | 25 | 1,032 | ||||
Lifetime Brands Inc. (c) | 5 | 70 | ||||
LIN TV Corp. - Class A (c) | 17 | 89 | ||||
Lincoln Educational Services Corp. | 9 | 139 | ||||
Lions Gate Entertainment Corp. (c) | 36 | 238 | ||||
Lithia Motors Inc. - Class A | 14 | 197 | ||||
Live Nation Inc. (c) | 83 | 950 | ||||
Liz Claiborne Inc. (c) (e) | 54 | 386 | ||||
LodgeNet Interactive Corp. (c) | 22 | 93 | ||||
Lumber Liquidators Holdings Inc. (c) (e) | 14 | 337 | ||||
M/I Homes Inc. (c) | 11 | 165 | ||||
Mac-Gray Corp. | 6 | 91 | ||||
Maidenform Brands Inc. (c) | 14 | 330 | ||||
Marcus Corp. | 12 | 156 | ||||
Marine Products Corp. (c) (e) | 5 | 36 | ||||
MarineMax Inc. (c) | 17 | 154 | ||||
Martha Stewart Living Omnimedia Inc. – Class A (c) (e) | 19 | 84 | ||||
Matthews International Corp. - Class A (e) | 17 | 611 | ||||
McClatchy Co. - Class A (c) (e) | 38 | 175 | ||||
McCormick & Schmick’s Seafood Restaurants Inc. (c) | 10 | 87 | ||||
Media General Inc. - Class A (c) (e) | 15 | 88 | ||||
Mediacom Communications Corp. - Class A (c) | 24 | 207 | ||||
Men’s Wearhouse Inc. | 31 | 778 | ||||
Meritage Homes Corp. (c) | 19 | 419 | ||||
Midas Inc. (c) | 10 | 82 | ||||
Modine Manufacturing Co. (c) | 26 | 408 | ||||
Monarch Casino & Resort Inc. (c) | 5 | 64 | ||||
Monro Muffler Brake Inc. | 18 | 614 | ||||
Morgans Hotel Group Co. (c) | 13 | 117 | ||||
Movado Group Inc. (c) | 10 | 159 | ||||
Multimedia Games Inc. (c) | 14 | 79 | ||||
National American University Holdings Inc. | 4 | 31 | ||||
National CineMedia Inc. | 32 | 628 | ||||
National Presto Industries Inc. | 3 | 379 | ||||
New York & Co. Inc. (c) | 21 | 92 | ||||
Nexstar Broadcasting Group Inc. – Class A (c) (e) | 6 | 34 | ||||
NutriSystem Inc. (e) | 16 | 335 | ||||
O’Charley’s Inc. (c) | 12 | 89 | ||||
OfficeMax Inc. (c) | 51 | 906 | ||||
Orbitz Worldwide Inc. (c) | 13 | 75 | ||||
Orient-Express Hotels Ltd. - Class A (c) | 60 | 784 | ||||
Outdoor Channel Holdings Inc. (c) | 6 | 46 | ||||
Overstock.com Inc. (c) (e) | 9 | 153 | ||||
Oxford Industries Inc. | 8 | 193 | ||||
Pacific Sunwear of California Inc. (c) | 39 | 213 | ||||
Papa John’s International Inc. (c) | 12 | 330 | ||||
Peets Coffee & Tea Inc. (c) (e) | 7 | 278 | ||||
Penske Auto Group Inc. (c) | 26 | 452 | ||||
PEP Boys-Manny Moe & Jack | 32 | 426 | ||||
See accompanying Notes to the Financial Statements.
JNL Series Trust
Schedules of Investments (in thousands)
December 31, 2010
| Shares/Par (p) | Value | |||||
Perry Ellis International Inc. (c) | 6 | 160 | ||||
PetMed Express Inc. | 13 | 228 | ||||
PF Chang’s China Bistro Inc. (e) | 14 | 667 | ||||
Pier 1 Imports Inc. (c) | 62 | 655 | ||||
Pinnacle Entertainment Inc. (c) | 34 | 483 | ||||
Playboy Enterprises Inc. - Class B (c) | 12 | 63 | ||||
Polaris Industries Inc. | 19 | 1,458 | ||||
Pool Corp. | 29 | 645 | ||||
Pre-Paid Legal Services Inc. (c) (e) | 5 | 283 | ||||
PRIMEDIA Inc. | 12 | 51 | ||||
Princeton Review Inc. (c) | 7 | 8 | ||||
Quicksilver Inc. (c) | 74 | 374 | ||||
Radio One Inc. - Class D (c) | 17 | 19 | ||||
RC2 Corp. (c) | 13 | 287 | ||||
ReachLocal Inc. (c) (e) | 3 | 51 | ||||
Red Lion Hotels Corp. (c) | 10 | 83 | ||||
Red Robin Gourmet Burgers Inc. (c) | 9 | 187 | ||||
Regis Corp. | 33 | 551 | ||||
Rent-A-Center Inc. | 39 | 1,251 | ||||
Rentrak Corp. (c) | 5 | 148 | ||||
Retail Ventures Inc. (c) | 14 | 227 | ||||
RG Barry Corp. | 5 | 50 | ||||
Ruby Tuesday Inc. (c) | 37 | 486 | ||||
Rue21 Inc. (c) | 9 | 270 | ||||
Ruth’s Hospitality Group Inc. (c) | 20 | 94 | ||||
Ryland Group Inc. | 26 | 437 | ||||
Saks Inc. (c) (e) | 82 | 874 | ||||
Sally Beauty Holdings Inc. (c) | 56 | 813 | ||||
Scholastic Corp. (e) | 18 | 524 | ||||
Scientific Games Corp. - Class A (c) | 38 | 377 | ||||
Sealy Corp. (c) (e) | 35 | 103 | ||||
Select Comfort Corp. (c) | 34 | 306 | ||||
Shiloh Industries Inc. (c) | 3 | 33 | ||||
Shoe Carnival Inc. (c) | 6 | 161 | ||||
Shuffle Master Inc. (c) | 31 | 357 | ||||
Shutterfly Inc. (c) | 16 | 563 | ||||
Sinclair Broadcast Group Inc. - Class A (c) | 28 | 229 | ||||
Skechers U.S.A. Inc. - Class A (c) | 20 | 400 | ||||
Skyline Corp. | 5 | 133 | ||||
Smith & Wesson Holding Corp. (c) (e) | 32 | 119 | ||||
Sonic Automotive Inc. - Class A (c) | 25 | 328 | ||||
Sonic Corp. (c) | 35 | 350 | ||||
Sotheby’s - Class A | 40 | 1,807 | ||||
Spartan Motors Inc. | 21 | 127 | ||||
Speedway Motorsports Inc. | 6 | 97 | ||||
Stage Stores Inc. | 22 | 380 | ||||
Standard Motor Products Inc. | 11 | 149 | ||||
Standard-Pacific Corp. (c) (e) | 68 | 314 | ||||
Stein Mart Inc. (c) | 15 | 143 | ||||
Steiner Leisure Ltd. (c) | 8 | 391 | ||||
Steinway Musical Instruments Inc. (c) | 4 | 76 | ||||
Steven Madden Ltd. (c) | 14 | 593 | ||||
Stewart Enterprises Inc. - Class A (e) | 47 | 312 | ||||
Stoneridge Inc. (c) | 11 | 167 | ||||
Sturm Ruger & Co. Inc. (e) | 12 | 178 | ||||
Summer Infant Inc. (c) | 6 | 44 | ||||
Superior Industries International Inc. | 13 | 275 | ||||
SuperMedia Inc. (c) (e) | 9 | 79 | ||||
Systemax Inc. (c) | 5 | 74 | ||||
Talbots Inc. (c) | 41 | 349 | ||||
Tenneco Inc. (c) | 35 | 1,445 | ||||
Texas Roadhouse Inc. - Class A (c) (e) | 34 | 589 | ||||
The Jones Group Inc. | 53 | 820 | ||||
Timberland Co. - Class A (c) | 23 | 575 | ||||
True Religion Apparel Inc. (c) | 16 | 351 | ||||
Tuesday Morning Corp. (c) | 19 | 99 | ||||
U.S. Auto Parts Network Inc. (c) | 9 | 72 | ||||
Ulta Salon Cosmetics & Fragrance Inc. (c) | 19 | 636 | ||||
| Shares/Par (p) | Value | |||||
Under Armour Inc. - Class A (c) (e) | 21 | 1,160 | ||||
Unifi Inc. (c) | 7 | 123 | ||||
Universal Electronics Inc. (c) | 9 | 241 | ||||
Universal Technical Institute Inc. (c) | 13 | 286 | ||||
Vail Resorts Inc. (c) | 22 | 1,136 | ||||
Valassis Communications Inc. (c) | 30 | 972 | ||||
Value Line Inc. | 1 | 9 | ||||
Vera Bradley Inc. (c) | 6 | 184 | ||||
Vitacost.com Inc. (c) (e) (f) | 8 | 45 | ||||
Vitamin Shoppe Inc. (c) | 10 | 334 | ||||
Volcom Inc. (c) | 11 | 200 | ||||
Warnaco Group Inc. (c) | 26 | 1,434 | ||||
Warner Music Group Corp. (c) | 24 | 135 | ||||
West Marine Inc. (c) | 9 | 95 | ||||
Westwood One Inc. (c) (e) | 3 | 26 | ||||
Wet Seal Inc. - Class A (c) | 65 | 242 | ||||
Weyco Group Inc. | 3 | 77 | ||||
Winmark Corp. | 1 | 43 | ||||
Winnebago Industries Inc. (c) | 17 | 258 | ||||
Wolverine World Wide Inc. | 29 | 934 | ||||
World Wrestling Entertainment Inc. – Class A (e) | 14 | 206 | ||||
Zumiez Inc. (c) | 13 | 341 | ||||
| 97,367 | ||||||
CONSUMER STAPLES - 2.9% | ||||||
Alico Inc. | 2 | 38 | ||||
Alliance One International Inc. (c) | 57 | 243 | ||||
Andersons Inc. | 11 | 390 | ||||
Arden Group Inc. - Class A | 1 | 46 | ||||
B&G Foods Inc. | 28 | 380 | ||||
Boston Beer Co. Inc. - Class A (c) | 5 | 497 | ||||
Cal-Maine Foods Inc. (e) | 8 | 247 | ||||
Calavo Growers Inc. (e) | 6 | 138 | ||||
Casey’s General Stores Inc. | 23 | 971 | ||||
Central Garden & Pet Co. - Class A (c) | 34 | 336 | ||||
Chiquita Brands International Inc. (c) | 27 | 381 | ||||
Coca-Cola Bottling Co. Consolidated | 3 | 143 | ||||
Darling International Inc. (c) | 50 | 666 | ||||
Diamond Foods Inc. (e) | 13 | 671 | ||||
Dole Food Co. Inc. (c) (e) | 20 | 269 | ||||
Elizabeth Arden Inc. (c) | 15 | 341 | ||||
Farmer Bros. Co. | 3 | 55 | ||||
Female Health Co. (e) | 7 | 40 | ||||
Fresh Del Monte Produce Inc. | 24 | 603 | ||||
Griffin Land & Nurseries Inc. - Class A | 2 | 49 | ||||
Hain Celestial Group Inc. (c) | 24 | 643 | ||||
Harbinger Group Inc. (c) | 4 | 24 | ||||
Heckmann Corp. (c) | 49 | 246 | ||||
Imperial Sugar Co. (e) | 9 | 116 | ||||
Ingles Markets Inc. - Class A | 7 | 142 | ||||
Inter Parfums Inc. | 8 | 149 | ||||
J&J Snack Foods Corp. | 8 | 389 | ||||
John B. Sanfilippo & Son (c) | 4 | 53 | ||||
Lancaster Colony Corp. | 11 | 640 | ||||
Lifeway Foods Inc. (c) (e) | 2 | 21 | ||||
Limoneira Co. (e) | 4 | 125 | ||||
Medifast Inc. (c) (e) | 8 | 232 | ||||
MGP Ingredients Inc. | 6 | 65 | ||||
Nash Finch Co. | 7 | 315 | ||||
National Beverage Corp. (c) | 8 | 100 | ||||
Natures Sunshine Products Inc. (c) | 4 | 37 | ||||
Nu Skin Enterprises Inc. - Class A | 29 | 879 | ||||
Nutraceutical International Corp. (c) | 5 | 69 | ||||
Oil-Dri Corp. of America | 2 | 49 | ||||
Pantry Inc. (c) | 13 | 253 | ||||
Pilgrim’s Pride Corp. (c) | 26 | 185 | ||||
Prestige Brands Holdings Inc. (c) | 26 | 312 | ||||
See accompanying Notes to the Financial Statements.
JNL Series Trust
Schedules of Investments (in thousands)
December 31, 2010
| Shares/Par (p) | Value | |||||
PriceSmart Inc. | 10 | 371 | ||||
Revlon Inc. - Class A (c) | 6 | 58 | ||||
Rite Aid Corp. (c) | 299 | 264 | ||||
Ruddick Corp. | 26 | 974 | ||||
Sanderson Farms Inc. | 14 | 542 | ||||
Schiff Nutrition International Inc. (c) | 9 | 82 | ||||
Seneca Foods Corp. - Class A (c) (e) | 5 | 137 | ||||
Smart Balance Inc. (c) | 35 | 153 | ||||
Snyders-Lance Inc. | 16 | 371 | ||||
Spartan Stores Inc. | 13 | 213 | ||||
Spectrum Brands Holdings Inc. (c) (e) | 11 | 346 | ||||
Star Scientific Inc. (c) (e) | 63 | 123 | ||||
Susser Holdings Corp. (c) | 3 | 48 | ||||
Synutra International Inc. (c) (e) | 10 | 133 | ||||
The Fresh Market Inc. (c) | 7 | 289 | ||||
Tootsie Roll Industries Inc. (e) | 14 | 409 | ||||
TreeHouse Foods Inc. (c) | 20 | 1,047 | ||||
United Natural Foods Inc. (c) | 28 | 1,036 | ||||
Universal Corp. | 14 | 565 | ||||
USANA Health Sciences Inc. (c) | 4 | 160 | ||||
Vector Group Ltd. (e) | 27 | 470 | ||||
Village Super Market Inc. - Class A | 4 | 126 | ||||
WD-40 Co. | 10 | 384 | ||||
Weis Markets Inc. | 7 | 279 | ||||
Winn-Dixie Stores Inc. (c) | 31 | 222 | ||||
| 20,350 | ||||||
ENERGY - 6.3% | ||||||
Abraxas Petroleum Corp. (c) (e) | 36 | 165 | ||||
Allis-Chalmers Energy Inc. (c) | 24 | 169 | ||||
Alon USA Energy Inc. (e) | 5 | 27 | ||||
Amyris Inc. (c) | — | 11 | ||||
Apco Oil And Gas International Inc. (e) | 6 | 322 | ||||
Approach Resources Inc. (c) | 9 | 202 | ||||
ATP Oil & Gas Corp. (c) (e) | 27 | 450 | ||||
Basic Energy Services Inc. (c) | 15 | 243 | ||||
Berry Petroleum Co. - Class A (e) | 30 | 1,315 | ||||
Bill Barrett Corp. (c) (e) | 28 | 1,138 | ||||
BPZ Resources Inc. (c) (e) | 61 | 292 | ||||
Brigham Exploration Co. (c) | 70 | 1,899 | ||||
Bristow Group Inc. (c) | 21 | 1,006 | ||||
Cal Dive International Inc. (c) | 58 | 327 | ||||
Callon Petroleum Co. (c) (e) | 22 | 132 | ||||
CAMAC Energy Inc. (c) (e) | 26 | 51 | ||||
CARBO Ceramics Inc. | 11 | 1,188 | ||||
Carrizo Oil & Gas Inc. (c) | 19 | 645 | ||||
Cheniere Energy Inc. (c) (e) | 33 | 180 | ||||
Clayton Williams Energy Inc. (c) | 4 | 301 | ||||
Clean Energy Fuels Corp. (c) (e) | 27 | 372 | ||||
Cloud Peak Energy Inc. (c) | 19 | 445 | ||||
Complete Production Services Inc. (c) | 47 | 1,379 | ||||
Contango Oil & Gas Co. (c) | 7 | 421 | ||||
Crosstex Energy Inc. | 23 | 200 | ||||
CVR Energy Inc. (c) | 16 | 250 | ||||
Dawson Geophysical Co. (c) | 4 | 126 | ||||
Delek US Holdings Inc. | 6 | 41 | ||||
Delta Petroleum Corp. (c) (e) | 90 | 68 | ||||
DHT Holdings Inc. (e) | 31 | 146 | ||||
Dril-Quip Inc. (c) | 20 | 1,582 | ||||
Endeavour International Corp. (c) (e) | 12 | 170 | ||||
Energy Partners Ltd. (c) | 18 | 272 | ||||
Energy XXI Bermuda Ltd. (c) | 41 | 1,128 | ||||
Evolution Petroleum Corp. (c) (e) | 8 | 52 | ||||
FX Energy Inc. (c) | 25 | 151 | ||||
Gastar Exploration Ltd. (c) | 34 | 144 | ||||
General Maritime Corp. (e) | 43 | 140 | ||||
GeoResources Inc. (c) | 7 | 157 | ||||
Global Geophysical Services Inc. (c) | 4 | 42 | ||||
| Shares/Par (p) | Value | |||||
Global Industries Ltd. (c) | 60 | 414 | ||||
GMX Resources Inc. (c) (e) | 19 | 104 | ||||
Golar LNG Ltd. | 22 | 326 | ||||
Goodrich Petroleum Corp. (c) (e) | 14 | 252 | ||||
Green Plains Renewable Energy Inc. (c) (e) | 11 | 120 | ||||
Gulf Island Fabrication Inc. | 9 | 257 | ||||
Gulfmark Offshore Inc. - Class A (c) | 14 | 436 | ||||
Gulfport Energy Corp. (c) | 16 | 351 | ||||
Hallador Energy Co. (c) | 2 | 21 | ||||
Harvest Natural Resources Inc. (c) | 21 | 250 | ||||
Helix Energy Solutions Group Inc. (c) | 63 | 768 | ||||
Hercules Offshore Inc. (c) | 63 | 219 | ||||
Hornbeck Offshore Services Inc. (c) | 13 | 278 | ||||
Houston American Energy Corp. (e) | 10 | 175 | ||||
International Coal Group Inc. (c) | 77 | 594 | ||||
ION Geophysical Corp. (c) | 77 | 655 | ||||
Isramco Inc. (c) (e) | — | 39 | ||||
James River Coal Co. (c) | 16 | 407 | ||||
Key Energy Services Inc. (c) | 74 | 964 | ||||
Knightsbridge Tankers Ltd. (e) | 15 | 331 | ||||
Kodiak Oil & Gas Corp. (c) (e) | 105 | 690 | ||||
L&L Energy Inc. (c) (e) | 12 | 129 | ||||
Lufkin Industries Inc. | 18 | 1,102 | ||||
Magnum Hunter Resources Corp. (c) | 34 | 243 | ||||
Matrix Service Co. (c) | 15 | 180 | ||||
McMoRan Exploration Co. (c) | 56 | 967 | ||||
Miller Petroleum Inc. (c) | 10 | 50 | ||||
Natural Gas Services Group Inc. (c) | 8 | 160 | ||||
Newpark Resources Inc. (c) | 52 | 319 | ||||
Nordic American Tanker Shipping Ltd. (e) | 28 | 723 | ||||
Northern Oil and Gas Inc. (c) | 32 | 865 | ||||
Oasis Petroleum Inc. (c) | 29 | 779 | ||||
Overseas Shipholding Group Inc. | 15 | 525 | ||||
OYO Geospace Corp. (c) | 3 | 260 | ||||
Panhandle Oil and Gas Inc. - Class A | 5 | 124 | ||||
Parker Drilling Co. (c) | 66 | 302 | ||||
Patriot Coal Corp. (c) | 45 | 877 | ||||
Penn Virginia Corp. | 28 | 468 | ||||
Petroleum Development Corp. (c) | 14 | 582 | ||||
PetroQuest Energy Inc. (c) | 30 | 227 | ||||
PHI Inc. (c) | 8 | 151 | ||||
Pioneer Drilling Co. (c) | 32 | 286 | ||||
RAM Energy Resources Inc. (c) | 30 | 55 | ||||
Rentech Inc. (c) | 116 | 141 | ||||
Resolute Energy Corp. (c) (e) | 23 | 344 | ||||
Rex Energy Corp. (c) | 20 | 272 | ||||
Rex Stores Corp. (c) | 4 | 66 | ||||
Rosetta Resources Inc. (c) | 31 | 1,175 | ||||
RPC Inc. (e) | 26 | 462 | ||||
Scorpio Tankers Inc. (c) | 11 | 107 | ||||
Seahawk Drilling Inc. (c) (e) | 8 | 70 | ||||
Ship Finance International Ltd. (e) | 26 | 558 | ||||
Stone Energy Corp. (c) | 26 | 579 | ||||
Swift Energy Co. (c) | 25 | 969 | ||||
Syntroleum Corp. (c) | 33 | 61 | ||||
T-3 Energy Services Inc. (c) | 8 | 325 | ||||
Teekay Tankers Ltd. - Class A (e) | 20 | 246 | ||||
Tesco Corp. (c) | 19 | 302 | ||||
Tetra Technologies Inc. (c) | 46 | 549 | ||||
TransAtlantic Petroleum Ltd. (c) | 90 | 301 | ||||
Union Drilling Inc. (c) | 7 | 48 | ||||
Uranium Energy Corp. (c) (e) | 37 | 221 | ||||
USEC Inc. (c) | 67 | 402 | ||||
VAALCO Energy Inc. (c) | 31 | 223 | ||||
Vantage Drilling Co. (c) | 97 | 196 | ||||
Venoco Inc. (c) | 12 | 219 | ||||
W&T Offshore Inc. (e) | 20 | 357 | ||||
Warren Resources Inc. (c) | 39 | 178 | ||||
See accompanying Notes to the Financial Statements.
JNL Series Trust
Schedules of Investments (in thousands)
December 31, 2010
| Shares/Par (p) | Value | |||||
Western Refining Inc. (c) (e) | 32 | 338 | ||||
Willbros Group Inc. (c) | 29 | 290 | ||||
World Fuel Services Corp. | 40 | 1,460 | ||||
| 44,833 | ||||||
FINANCIALS - 20.1% | ||||||
1st Source Corp. | 8 | 169 | ||||
1st United Bancorp Inc. (c) | 12 | 81 | ||||
Abington Bancorp Inc. | 11 | 129 | ||||
Acadia Realty Trust | 25 | 450 | ||||
Advance America Cash Advance Centers Inc. | 30 | 169 | ||||
Agree Realty Corp. | 5 | 125 | ||||
Alexander’s Inc. | 1 | 482 | ||||
Alliance Financial Corp. (e) | 3 | 91 | ||||
Alterra Capital Holdings Ltd. | 58 | 1,253 | ||||
American Campus Communities Inc. | 38 | 1,217 | ||||
American Capital Agency Corp. | 30 | 856 | ||||
American Capital Ltd. (c) | 204 | 1,540 | ||||
American Equity Investment Life Holding Co. | 33 | 420 | ||||
American National Bankshares Inc. (e) | 3 | 63 | ||||
American Safety Insurance Holdings Ltd. (c) | 7 | 155 | ||||
Ameris Bancorp (c) | 13 | 138 | ||||
Amerisafe Inc. (c) | 11 | 185 | ||||
Ames National Corp. (e) | 4 | 96 | ||||
AmTrust Financial Services Inc. | 12 | 217 | ||||
Anworth Mortgage Asset Corp. | 69 | 482 | ||||
Apollo Commercial Real Estate Finance Inc. | 11 | 185 | ||||
Apollo Investment Corp. | 116 | 1,289 | ||||
Argo Group International Holdings Ltd. | 19 | 705 | ||||
Arlington Asset Investment Corp. - Class A (e) | 5 | 122 | ||||
Arrow Financial Corp. (e) | 5 | 148 | ||||
Artio Global Investors Inc. | 16 | 243 | ||||
Ashford Hospitality Trust Inc. (c) | 25 | 243 | ||||
Asset Acceptance Capital Corp. (c) (e) | 7 | 39 | ||||
Associated Estates Realty Corp. | 25 | 384 | ||||
Asta Funding Inc. | 6 | 46 | ||||
Astoria Financial Corp. (e) | 52 | 717 | ||||
Avatar Holdings Inc. (c) | 5 | 96 | ||||
Baldwin & Lyons Inc. - Class B | 4 | 89 | ||||
BancFirst Corp. | 4 | 170 | ||||
Banco Latinoamericano de Comercio Exterior SA - Class E | 18 | 324 | ||||
Bancorp Inc. (c) | 12 | 123 | ||||
Bancorp Rhode Island Inc. | 2 | 47 | ||||
Bank Mutual Corp. | 26 | 126 | ||||
Bank of Marin Bancorp. | 3 | 94 | ||||
Bank of the Ozarks Inc. | 8 | 339 | ||||
BankFinancial Corp. | 10 | 98 | ||||
Beneficial Mutual Bancorp Inc. (c) | 19 | 166 | ||||
Berkshire Hills Bancorp Inc. | 8 | 173 | ||||
BGC Partners Inc. - Class A | 31 | 259 | ||||
BioMed Realty Trust Inc. | 77 | 1,430 | ||||
BlackRock Kelso Capital Corp. | 43 | 473 | ||||
BofI Holding Inc. (c) (e) | 4 | 59 | ||||
Boston Private Financial Holdings Inc. | 47 | 305 | ||||
Bridge Bancorp Inc. (e) | 3 | 80 | ||||
Brookline Bancorp Inc. | 34 | 373 | ||||
Bryn Mawr Bank Corp. | 5 | 81 | ||||
Calamos Asset Management Inc. - Class A | 12 | 167 | ||||
California First National Bancorp. | 1 | 13 | ||||
Camden National Corp. | 4 | 153 | ||||
Campus Crest Communities Inc. | 13 | 176 | ||||
Capital City Bank Group Inc. (e) | 5 | 67 | ||||
Capital Southwest Corp. | 1 | 145 | ||||
CapLease Inc. | 32 | 185 | ||||
Capstead Mortgage Corp. | 43 | 540 | ||||
Cardinal Financial Corp. | 16 | 189 | ||||
Cardtronics Inc. (c) | 17 | 299 | ||||
| Shares/Par (p) | Value | |||||
Cash America International Inc. | 18 | 663 | ||||
Cathay General Bancorp | 47 | 783 | ||||
CBL & Associates Properties Inc. | 83 | 1,450 | ||||
Cedar Shopping Centers Inc. | 30 | 188 | ||||
Center Financial Corp. (c) | 24 | 183 | ||||
CenterState Banks of Florida Inc. | 14 | 111 | ||||
Century Bancorp. Inc. - Class A | 2 | 42 | ||||
Chatham Lodging Trust | 5 | 80 | ||||
Chemical Financial Corp. | 15 | 334 | ||||
Chesapeake Lodging Trust | 10 | 179 | ||||
Citizens & Northern Corp. (e) | 6 | 85 | ||||
Citizens Inc. - Class A (c) (e) | 22 | 166 | ||||
Citizens Republic Bancorp Inc. (c) | 218 | 134 | ||||
City Holdings Co. (e) | 9 | 340 | ||||
Clifton Savings Bancorp Inc. (e) | 5 | 51 | ||||
CNA Surety Corp. (c) | 10 | 239 | ||||
CNB Financial Corp. | 6 | 83 | ||||
CNO Financial Group Inc. (c) | 134 | 910 | ||||
CoBiz Financial Inc. | 18 | 111 | ||||
Cogdell Spencer Inc. | 23 | 136 | ||||
Cohen & Steers Inc. (e) | 11 | 280 | ||||
Colonial Properties Trust | 46 | 828 | ||||
Colony Financial Inc. | 9 | 175 | ||||
Columbia Banking System Inc. | 24 | 501 | ||||
Community Bank System Inc. (e) | 21 | 570 | ||||
Community Trust Bancorp Inc. | 8 | 237 | ||||
Compass Diversified Holdings | 21 | 379 | ||||
CompuCredit Holdings Corp. (c) (e) | 6 | 40 | ||||
Consolidated-Tomoka Land Co. (e) | 2 | 72 | ||||
Coresite Realty Corp. (c) | 6 | 86 | ||||
Cousins Properties Inc. | 55 | 457 | ||||
Cowen Group Inc. - Class A (c) | 20 | 92 | ||||
Crawford & Co. - Class B (c) | 11 | 38 | ||||
Credit Acceptance Corp. (c) | 4 | 228 | ||||
CreXus Investment Corp. | 9 | 120 | ||||
CVB Financial Corp. (e) | 55 | 473 | ||||
Cypress Sharpridge Investments Inc. | 29 | 379 | ||||
Danvers BanCorp Inc. | 12 | 215 | ||||
DCT Industrial Trust Inc. | 122 | 648 | ||||
Delphi Financial Group Inc. - Class A | 29 | 830 | ||||
Diamond Hill Investment Group Inc. (c) | 2 | 115 | ||||
DiamondRock Hospitality Co. (c) | 93 | 1,116 | ||||
Dime Community Bancshares Inc. | 15 | 225 | ||||
Dollar Financial Corp. (c) | 15 | 422 | ||||
Donegal Group Inc. - Class A | 5 | 76 | ||||
Doral Financial Corp. (c) | 10 | 14 | ||||
Duff & Phelps Corp. - Class A | 17 | 293 | ||||
DuPont Fabros Technology Inc. (e) | 24 | 503 | ||||
Dynex Capital Inc. | 14 | 149 | ||||
Eagle Bancorp Inc. (c) | 9 | 129 | ||||
EastGroup Properties Inc. | 16 | 693 | ||||
Education Realty Trust Inc. | 35 | 272 | ||||
eHealth Inc. (c) (e) | 14 | 193 | ||||
EMC Insurance Group Inc. | 3 | 59 | ||||
Employer Holdings Inc. | 24 | 416 | ||||
Encore Bancshares Inc. (c) (e) | 4 | 44 | ||||
Encore Capital Group Inc. (c) | 8 | 199 | ||||
Enstar Group Ltd. (c) | 4 | 333 | ||||
Enterprise Financial Services Corp. | 8 | 85 | ||||
Entertainment Properties Trust | 28 | 1,292 | ||||
Epoch Holding Corp. | 8 | 124 | ||||
Equity Lifestyle Properties Inc. | 16 | 884 | ||||
Equity One Inc. (e) | 22 | 400 | ||||
ESB Financial Corp. (e) | 5 | 79 | ||||
ESSA BanCorp Inc. | 8 | 109 | ||||
Evercore Partners Inc. - Class A | 9 | 317 | ||||
Excel Trust Inc. | 11 | 135 | ||||
Extra Space Storage Inc. | 53 | 916 | ||||
See accompanying Notes to the Financial Statements.
JNL Series Trust
Schedules of Investments (in thousands)
December 31, 2010
| Shares/Par (p) | Value | |||||||
EZCORP Inc. - Class A (c) | 27 | 746 | ||||||
FBL Financial Group Inc. - Class A | 8 | 244 | ||||||
FBR Capital Markets Corp. (c) | 28 | 109 | ||||||
Federal Agricultural Mortgage Corp. – Class C (e) | 6 | 106 | ||||||
FelCor Lodging Trust Inc. (c) | 59 | 414 | ||||||
Fifth Street Finance Corp. (e) | 33 | 399 | ||||||
Financial Engines Inc. (c) | 7 | 137 | ||||||
Financial Institutions Inc. | 7 | 124 | ||||||
First American Financial Corp. | 63 | 937 | ||||||
First Bancorp Inc. (e) | 13 | 195 | ||||||
First Bancorp Inc. Puerto Rico (c) (e) | 55 | 25 | ||||||
First Busey Corp. | 25 | 120 | ||||||
First Cash Financial Services Inc. (c) | 18 | 558 | ||||||
First Commonwealth Financial Corp. | 64 | 453 | ||||||
First Community Bancshares Inc. | 9 | 129 | ||||||
First Financial Bancorp | 36 | 657 | ||||||
First Financial Bankshares Inc. (e) | 13 | 656 | ||||||
First Financial Corp. | 7 | 231 | ||||||
First Financial Holdings Inc. | 10 | 118 | ||||||
First Industrial Realty Trust Inc. (c) (e) | 39 | 345 | ||||||
First Interstate BancSystem Inc. | 7 | 102 | ||||||
First Marblehead Corp. (c) | 33 | 71 | ||||||
First Merchants Corp. | 16 | 139 | ||||||
First Mercury Financial Corp. | 9 | 149 | ||||||
First Midwest Bancorp Inc. | 46 | 530 | ||||||
First of Long Island Corp. | 4 | 122 | ||||||
First Potomac Realty Trust | 29 | 494 | ||||||
First South Bancorp Inc. (c) | 4 | 25 | ||||||
FirstMerit Corp. | 64 | 1,267 | ||||||
Flagstar Bancorp Inc. (c) | 25 | 41 | ||||||
Flagstone Reinsurance Holdings SA | 32 | 398 | ||||||
Flushing Financial Corp. | 19 | 261 | ||||||
FNB Corp. | 70 | 690 | ||||||
Forestar Group Inc. (c) | 22 | 434 | ||||||
Fox Chase Bancorp Inc. (c) | 3 | 31 | ||||||
FPIC Insurance Group Inc. (c) | 5 | 197 | ||||||
Franklin Street Properties Corp. | 40 | 573 | ||||||
GAMCO Investors Inc. | 4 | 214 | ||||||
German American Bancorp Inc. | 6 | 101 | ||||||
Gerova Financial Group Ltd. (c) (e) | 1 | 21 | ||||||
Getty Realty Corp. | 13 | 396 | ||||||
GFI Group Inc. | 38 | 178 | ||||||
Glacier Bancorp Inc. (e) | 44 | 669 | ||||||
Gladstone Capital Corp. | 13 | 151 | ||||||
Gladstone Commercial Corp. | 4 | 71 | ||||||
Gladstone Investment Corp. | 11 | 82 | ||||||
Gleacher & Co. Inc. (c) | 42 | 100 | ||||||
Glimcher Realty Trust | 51 | 431 | ||||||
Global Indemnity Plc (c) | 9 | 178 | ||||||
Golub Capital BDC Inc. | 4 | 68 | ||||||
Government Properties Income Trust | 17 | 443 | ||||||
Great Southern Bancorp Inc. (e) | 5 | 122 | ||||||
Green Bankshares Inc. (c) (e) | 6 | 20 | ||||||
Greenlight Capital Re Ltd. - Class A (c) | 17 | 465 | ||||||
Hallmark Financial Services Inc. (c) | 6 | 58 | ||||||
Hancock Holding Co. | 17 | 590 | ||||||
Hanmi Financial Corp. (c) | 63 | 72 | ||||||
Harleysville Group Inc. | 7 | 260 | ||||||
Harris & Harris Group Inc. (c) (e) | 15 | 66 | ||||||
Hatteras Financial Corp. | 27 | 825 | ||||||
Healthcare Realty Trust Inc. | 38 | 799 | ||||||
Heartland Financial USA Inc. | 6 | 109 | ||||||
Hercules Technology Growth Capital Inc. | 20 | 205 | ||||||
Heritage Financial Corp. (c) | 5 | 71 | ||||||
Heritage Financial Group Inc. | 1 | 10 | ||||||
Hersha Hospitality Trust | 81 | 532 | ||||||
HFF Inc. - Class A (c) | 10 | 99 | ||||||
| Shares/Par (p) | Value | |||||||
Highwoods Properties Inc. | 42 | 1,337 | ||||||
Hilltop Holdings Inc. (c) | 23 | 227 | ||||||
Home Bancorp Inc. (c) | 4 | 54 | ||||||
Home Bancshares Inc. | 13 | 285 | ||||||
Home Federal Bancorp Inc. | 9 | 107 | ||||||
Home Properties Inc. | 23 | 1,251 | ||||||
Horace Mann Educators Corp. | 24 | 425 | ||||||
Hudson Pacific Properties Inc. | 10 | 150 | ||||||
Hudson Valley Holding Corp. | 8 | 196 | ||||||
IberiaBank Corp. | 16 | 938 | ||||||
Independent Bank Corp. (e) | 13 | 362 | ||||||
Infinity Property & Casualty Corp. | 8 | 466 | ||||||
Inland Real Estate Corp. | 44 | 384 | ||||||
International Assets Holding Corp. (c) (e) | 8 | 185 | ||||||
International Bancshares Corp. | 31 | 616 | ||||||
Invesco Mortgage Capital Inc. | 24 | 520 | ||||||
Investment Technology Group Inc. (c) | 25 | 417 | ||||||
Investors Bancorp Inc. (c) | 27 | 359 | ||||||
Investors Real Estate Trust | 44 | 393 | ||||||
iStar Financial Inc. (c) (e) | 58 | 451 | ||||||
JMP Group Inc. | 9 | 66 | ||||||
Kaiser Federal Financial Group Inc. | 1 | 15 | ||||||
Kansas City Life Insurance Co. (e) | 2 | 71 | ||||||
Kayne Anderson Energy Development Co. | 7 | 121 | ||||||
KBW Inc. | 21 | 591 | ||||||
Kearny Financial Corp. | 9 | 73 | ||||||
Kennedy-Wilson Holdings Inc. (c) | 11 | 111 | ||||||
Kilroy Realty Corp. | 33 | 1,193 | ||||||
Kite Realty Group Trust | 36 | 196 | ||||||
Knight Capital Group Inc. - Class A (c) | 57 | 789 | ||||||
LaBranche & Co. Inc. (c) | 26 | 94 | ||||||
Ladenburg Thalmann Financial Services Inc. (c) | 49 | 57 | ||||||
Lakeland Bancorp Inc. (e) | 12 | 137 | ||||||
Lakeland Financial Corp. | 8 | 180 | ||||||
LaSalle Hotel Properties | 42 | 1,110 | ||||||
Lexington Realty Trust (e) | 59 | 466 | ||||||
Life Partners Holdings Inc. (e) | 5 | 95 | ||||||
LTC Properties Inc. | 16 | 436 | ||||||
Maiden Holdings Ltd. | 27 | 213 | ||||||
Main Street Capital Corp. (e) | 10 | 174 | ||||||
MainSource Financial Group Inc. | 12 | 129 | ||||||
MarketAxess Holdings Inc. | 17 | 354 | ||||||
Marlin Business Services Inc. (c) | 5 | 58 | ||||||
MB Financial Inc. | 32 | 553 | ||||||
MCG Capital Corp. | 48 | 332 | ||||||
Meadowbrook Insurance Group Inc. | 33 | 342 | ||||||
Medallion Financial Corp. | 7 | 59 | ||||||
Medical Properties Trust Inc. | 66 | 713 | ||||||
Merchants Bancshares Inc. | 2 | 58 | ||||||
Meridian Interstate BanCorp Inc. (c) | 4 | 51 | ||||||
Metro Bancorp Inc. (c) | 7 | 81 | ||||||
MF Global Holdings Ltd. (c) | 68 | 570 | ||||||
MFA Financial Inc. | 164 | 1,341 | ||||||
MGIC Investment Corp. (c) | 121 | 1,236 | ||||||
Mid-America Apartment Communities Inc. | 19 | 1,223 | ||||||
Midsouth Bancorp Inc. | 5 | 73 | ||||||
MidWestOne Financial Group Inc. (e) | 4 | 56 | ||||||
Mission West Properties Inc. | 12 | 78 | ||||||
Monmouth Real Estate Investment Corp. - Class A | 16 | 138 | ||||||
Montpelier Re Holdings Ltd. | 40 | 791 | ||||||
MPG Office Trust Inc. (c) | 38 | 105 | ||||||
MVC Capital Inc. (e) | 13 | 194 | ||||||
Nara Bancorp Inc. (c) | 24 | 232 | ||||||
NASB Financial Inc. (c) (e) | 2 | 32 | ||||||
National Bankshares Inc. | 4 | 113 | ||||||
National Financial Partners Corp. (c) | 26 | 347 | ||||||
See accompanying Notes to the Financial Statements.
JNL Series Trust
Schedules of Investments (in thousands)
December 31, 2010
| Shares/Par (p) | Value | |||||||
National Health Investors Inc. | 14 | 637 | ||||||
National Interstate Corp. | 3 | 60 | ||||||
National Penn Bancshares Inc. | 76 | 610 | ||||||
National Retail Properties Inc. (e) | 50 | 1,326 | ||||||
National Western Life Insurance Co. - Class A | 1 | 184 | ||||||
Navigators Group Inc. (c) | 8 | 379 | ||||||
NBT Bancorp Inc. | 21 | 503 | ||||||
Nelnet Inc. - Class A | 16 | 379 | ||||||
Netspend Holdings Inc. (c) (e) | 13 | 168 | ||||||
NewAlliance Bancshares Inc. | 63 | 942 | ||||||
Newcastle Investment Corp. (c) | 40 | 268 | ||||||
NewStar Financial Inc. (c) | 17 | 174 | ||||||
NGP Capital Resources Co. | 11 | 105 | ||||||
Northfield Bancorp Inc. (e) | 11 | 145 | ||||||
NorthStar Realty Finance Corp. (e) | 41 | 193 | ||||||
Northwest Bancshares Inc. | 68 | 796 | ||||||
OceanFirst Financial Corp. | 8 | 102 | ||||||
Ocwen Financial Corp. (c) | 45 | 431 | ||||||
Old National Bancorp | 50 | 600 | ||||||
Omega Healthcare Investors Inc. | 58 | 1,306 | ||||||
OmniAmerican Bancorp Inc. (c) | 6 | 83 | ||||||
One Liberty Properties Inc. | 5 | 76 | ||||||
Oppenheimer Holdings Inc. - Class A | 6 | 152 | ||||||
optionsXpress Holdings Inc. (c) | 26 | 405 | ||||||
Oriental Financial Group Inc. | 28 | 345 | ||||||
Oritani Financial Corp. | 34 | 416 | ||||||
Orrstown Financial Services Inc. | 5 | 129 | ||||||
Pacific Continental Corp. | 11 | 109 | ||||||
PacWest Bancorp | 19 | 403 | ||||||
Park National Corp. (e) | 8 | 547 | ||||||
Parkway Properties Inc. | 12 | 212 | ||||||
Peapack Gladstone Financial Corp. | 4 | 54 | ||||||
Pebblebrook Hotel Trust | 22 | 452 | ||||||
PennantPark Investment Corp. | 22 | 269 | ||||||
Penns Woods Bancorp Inc. (e) | 2 | 67 | ||||||
Pennsylvania Real Estate Investment Trust (e) | 33 | 482 | ||||||
Pennymac Mortgage Investment Trust | 10 | 184 | ||||||
Penson Worldwide Inc. (c) (e) | 12 | 59 | ||||||
Peoples Bancorp Inc. | 5 | 76 | ||||||
PHH Corp. (c) | 33 | 763 | ||||||
Phoenix Cos. Inc. (c) | 77 | 197 | ||||||
Pico Holdings Inc. (c) | 14 | 433 | ||||||
Pinnacle Financial Partners Inc. (c) | 19 | 264 | ||||||
Piper Jaffray Cos. (c) | 10 | 342 | ||||||
Platinum Underwriters Holdings Ltd. | 25 | 1,113 | ||||||
PMI Group Inc. (c) (e) | 88 | 292 | ||||||
Porter Bancorp Inc. | 1 | 14 | ||||||
Portfolio Recovery Associates Inc. (c) | 10 | 774 | ||||||
Post Properties Inc. | 29 | 1,041 | ||||||
Potlatch Corp. | 24 | 769 | ||||||
Presidential Life Corp. | 12 | 121 | ||||||
Primerica Inc. (e) | 15 | 356 | ||||||
Primus Guaranty Ltd. (c) (e) | 12 | 59 | ||||||
PrivateBancorp Inc. | 33 | 468 | ||||||
ProAssurance Corp. (c) | 18 | 1,106 | ||||||
Prospect Capital Corp. (e) | 49 | 530 | ||||||
Prosperity Bancshares Inc. | 28 | 1,085 | ||||||
Provident Financial Services Inc. | 36 | 548 | ||||||
Provident New York Bancorp | 21 | 223 | ||||||
PS Business Parks Inc. | 11 | 595 | ||||||
Pzena Investment Management Inc. - Class A | 4 | 29 | ||||||
Radian Group Inc. | 82 | 660 | ||||||
RAIT Financial Trust (c) (e) | 60 | 131 | ||||||
Ramco-Gershenson Properties Trust | 24 | 296 | ||||||
Redwood Trust Inc. | 46 | 691 | ||||||
Renasant Corp. (e) | 15 | 251 | ||||||
Republic Bancorp Inc. - Class A | 6 | 144 | ||||||
Resource Capital Corp. | 29 | 212 | ||||||
| Shares/Par (p) | Value | |||||||
Retail Opportunity Investments Corp. | 26 | 260 | ||||||
RLI Corp. | 11 | 557 | ||||||
Rockville Financial Inc. (e) | 4 | 47 | ||||||
Rodman & Renshaw Capital Group Inc. (c) (e) | 9 | 23 | ||||||
Roma Financial Corp. | 4 | 45 | ||||||
S&T Bancorp Inc. (e) | 14 | 318 | ||||||
Sabra Healthcare REIT Inc. (c) | 15 | 276 | ||||||
Safeguard Scientifics Inc. (c) | 12 | 201 | ||||||
Safety Insurance Group Inc. | 8 | 363 | ||||||
Sanders Morris Harris Group Inc. | 9 | 64 | ||||||
Sandy Spring Bancorp Inc. | 14 | 263 | ||||||
Saul Centers Inc. | 3 | 156 | ||||||
SCBT Financial Corp. | 7 | 234 | ||||||
SeaBright Insurance Holdings Inc. | 13 | 124 | ||||||
Selective Insurance Group | 32 | 589 | ||||||
Sierra Bancorp (e) | 7 | 78 | ||||||
Signature Bank (c) | 24 | 1,215 | ||||||
Simmons First National Corp. - Class A | 11 | 303 | ||||||
Solar Capital Ltd. (e) | 3 | 75 | ||||||
Southside Bancshares Inc. (e) | 9 | 193 | ||||||
Southwest Bancorp Inc. (c) | 12 | 145 | ||||||
Sovran Self Storage Inc. | 17 | 618 | ||||||
Starwood Property Trust Inc. | 28 | 592 | ||||||
State Auto Financial Corp. | 7 | 117 | ||||||
State Bancorp. Inc. | 7 | 69 | ||||||
StellarOne Corp. | 12 | 178 | ||||||
Sterling Bancorp | 17 | 174 | ||||||
Sterling Bancshares Inc. | 56 | 396 | ||||||
Stewart Information Services Corp. | 10 | 116 | ||||||
Stifel Financial Corp. (c) | 21 | 1,273 | ||||||
Strategic Hotels & Resorts Inc. (c) | 82 | 436 | ||||||
Suffolk Bancorp (e) | 5 | 130 | ||||||
Sun Communities Inc. | 11 | 382 | ||||||
Sunstone Hotel Investors Inc. (c) | 70 | 719 | ||||||
Susquehanna Bancshares Inc. | 77 | 747 | ||||||
SVB Financial Group (c) | 25 | 1,316 | ||||||
SWS Group Inc. | 20 | 100 | ||||||
SY Bancorp Inc. (e) | 6 | 159 | ||||||
Tanger Factory Outlet Centers Inc. | 24 | 1,246 | ||||||
Taylor Capital Group Inc. (c) (e) | 5 | 68 | ||||||
Tejon Ranch Co. (c) (e) | 7 | 197 | ||||||
Terreno Realty Corp (c) | 7 | 119 | ||||||
Territorial Bancorp Inc. | 6 | 127 | ||||||
Teton Advisors Inc. - Class A (c) | — | — | ||||||
Texas Capital Bancshares Inc. (c) | 21 | 455 | ||||||
THL Credit Inc. | 5 | 63 | ||||||
Thomas Properties Group Inc. (c) | 19 | 80 | ||||||
TICC Capital Corp. | 18 | 207 | ||||||
Tompkins Financial Corp. | 5 | 189 | ||||||
Tower Bancorp Inc. | 5 | 103 | ||||||
Tower Group Inc. | 22 | 570 | ||||||
TowneBank (e) | 14 | 217 | ||||||
TradeStation Group Inc. (c) | 25 | 172 | ||||||
Triangle Capital Corp. (e) | 10 | 185 | ||||||
Trico Bancshares (e) | 7 | 106 | ||||||
TrustCo Bank Corp. (e) | 49 | 313 | ||||||
Trustmark Corp. (e) | 38 | 941 | ||||||
Two Harbors Investment Corp. | 14 | 137 | ||||||
U-Store-It Trust | 56 | 533 | ||||||
UMB Financial Corp. | 19 | 782 | ||||||
UMH Properties Inc. | 4 | 40 | ||||||
Umpqua Holdings Corp. | 68 | 829 | ||||||
Union First Market Bankshares Corp. | 11 | 166 | ||||||
United Bankshares Inc. (e) | 23 | 677 | ||||||
United Community Banks Inc. (c) | 67 | 131 | ||||||
United Financial Bancorp Inc. | 9 | 136 | ||||||
United Fire & Casualty Co. | 13 | 301 | ||||||
Universal Health Realty Income Trust | 6 | 237 | ||||||
See accompanying Notes to the Financial Statements.
JNL Series Trust
Schedules of Investments (in thousands)
December 31, 2010
| Shares/Par (p) | Value | |||||
Universal Insurance Holdings Inc. | 6 | 28 | ||||
Univest Corp. of Pennsylvania (e) | 9 | 179 | ||||
Urstadt Biddle Properties Inc. - Class A | 14 | 268 | ||||
ViewPoint Financial Group | 9 | 102 | ||||
Virginia Commerce Bancorp (c) (e) | 11 | 67 | ||||
Virtus Investment Partners Inc. (c) | 3 | 139 | ||||
Walter Investment Management Corp. | 15 | 274 | ||||
Washington Banking Co. | 8 | 109 | ||||
Washington REIT | 38 | 1,173 | ||||
Washington Trust Bancorp Inc. (e) | 8 | 167 | ||||
Waterstone Financial Inc. (c) (e) | 3 | 11 | ||||
Webster Financial Corp. | 40 | 788 | ||||
WesBanco Inc. | 14 | 259 | ||||
West Bancorp Inc. (c) | 8 | 59 | ||||
West Coast Bancorp (c) (e) | 50 | 142 | ||||
Westamerica Bancorporation | 17 | 967 | ||||
Western Alliance Bancorp (c) | 41 | 302 | ||||
Westfield Financial Inc. | 15 | 140 | ||||
Westwood Holdings Group Inc. | 4 | 149 | ||||
Whitney Holding Corp. | 56 | 794 | ||||
Wilshire Bancorp Inc. (c) (e) | 10 | 72 | ||||
Winthrop Realty Trust | 14 | 184 | ||||
Wintrust Financial Corp. (e) | 20 | 669 | ||||
World Acceptance Corp. (c) (e) | 10 | 506 | ||||
WSFS Financial Corp. | 3 | 161 | ||||
| 143,411 | ||||||
HEALTH CARE - 12.0% | ||||||
Abaxis Inc. (c) | 13 | 339 | ||||
Abiomed Inc. (c) | 19 | 181 | ||||
Accelrys Inc. (c) | 31 | 254 | ||||
Accretive Health Inc. (c) (e) | 6 | 101 | ||||
Accuray Inc. (c) (e) | 28 | 188 | ||||
Acorda Therapeutics Inc. (c) | 23 | 628 | ||||
Acura Pharmaceuticals Inc. (c) (e) | 4 | 12 | ||||
Aegerion Pharmaceuticals Inc. (c) | 4 | 54 | ||||
Affymax Inc. (c) | 15 | 99 | ||||
Affymetrix Inc. (c) | 39 | 197 | ||||
Air Methods Corp. (c) | 7 | 389 | ||||
Akorn Inc. (c) | 30 | �� | 182 | |||
Albany Molecular Research Inc. (c) | 11 | 62 | ||||
Alexza Pharmaceuticals Inc. (c) (e) | 21 | 26 | ||||
Align Technology Inc. (c) | 34 | 669 | ||||
Alimera Sciences Inc. (c) (e) | 4 | 37 | ||||
Alkermes Inc. (c) | 58 | 708 | ||||
Alliance HealthCare Services Inc. (c) | 19 | 79 | ||||
Allied Healthcare International Inc. (c) | 20 | 50 | ||||
Allos Therapeutics Inc. (c) (e) | 47 | 217 | ||||
Almost Family Inc. (c) | 5 | 183 | ||||
Alnylam Pharmaceuticals Inc. (c) (e) | 20 | 202 | ||||
Alphatec Holdings Inc. (c) | 28 | 75 | ||||
AMAG Pharmaceuticals Inc. (c) | 12 | 218 | ||||
Amedisys Inc. (c) (e) | 17 | 575 | ||||
America Service Group Inc. | 5 | 82 | ||||
American Dental Partners Inc. (c) | 8 | 106 | ||||
American Medical Systems Holdings Inc. (c) | 46 | 859 | ||||
AMERIGROUP Corp. (c) | 31 | 1,363 | ||||
AMN Healthcare Services Inc. (c) | 28 | 171 | ||||
Amsurg Corp. (c) | 19 | 394 | ||||
Analogic Corp. | 8 | 375 | ||||
AngioDynamics Inc. (c) | 14 | 217 | ||||
Antares Pharma Inc. (c) (e) | 38 | 64 | ||||
Aoxing Pharmaceutical Co. Inc. (c) (e) | 13 | 36 | ||||
Ardea Biosciences Inc. (c) | 7 | 190 | ||||
Arena Pharmaceuticals Inc. (c) (e) | 65 | 112 | ||||
Ariad Pharmaceuticals Inc. (c) | 69 | 352 | ||||
ArQule Inc. (c) | 25 | 149 | ||||
Array BioPharma Inc. (c) | 26 | 77 | ||||
| Shares/Par (p) | Value | |||||
ArthroCare Corp. (c) | 16 | 487 | ||||
Assisted Living Concepts Inc. - Class A (c) | 6 | 195 | ||||
athenahealth Inc. (c) (e) | 20 | 820 | ||||
Atrion Corp. | 1 | 164 | ||||
Auxilium Pharmaceuticals Inc. (c) (e) | 24 | 508 | ||||
AVANIR Pharmaceuticals - Class A (c) (e) | 54 | 221 | ||||
AVEO Pharmaceuticals Inc. (c) | 5 | 73 | ||||
AVI BioPharma Inc. (c) (e) | 70 | 148 | ||||
Bio-Reference Labs Inc. (c) (e) | 13 | 293 | ||||
BioCryst Pharmaceuticals Inc. (c) (e) | 16 | 81 | ||||
Biodel Inc. (c) (e) | 10 | 19 | ||||
BioMimetic Therapeutics Inc. (c) (e) | 11 | 136 | ||||
Biosante Pharmaceuticals Inc. (c) | 34 | 56 | ||||
BioScrip Inc. (c) | 21 | 111 | ||||
BioSpecifics Technologies Corp. (c) (e) | 2 | 41 | ||||
Biotime Inc. (c) (e) | 11 | 95 | ||||
BMP Sunstone Corp. (c) | 15 | 149 | ||||
Bruker Corp. (c) | 42 | 697 | ||||
Cadence Pharmaceuticals Inc. (c) (e) | 18 | 135 | ||||
Caliper Life Sciences Inc. (c) | 24 | 153 | ||||
Cambrex Corp. (c) | 16 | 84 | ||||
Cantel Medical Corp. | 8 | 180 | ||||
Capital Senior Living Corp. (c) | 15 | 102 | ||||
Caraco Pharmaceutical Laboratories Ltd. (c) | 5 | 23 | ||||
CardioNet Inc. (c) | 16 | 76 | ||||
Catalyst Health Solutions Inc. (c) | 23 | 1,063 | ||||
Celera Corp. (c) | 48 | 303 | ||||
Celldex Therapeutics Inc. (c) (e) | 23 | 93 | ||||
Centene Corp. (c) | 29 | 738 | ||||
Cepheid Inc. (c) (e) | 34 | 782 | ||||
Cerus Corp. (c) (e) | 21 | 51 | ||||
Chelsea Therapeutics International Inc. (c) | 21 | 158 | ||||
Chemed Corp. | 14 | 858 | ||||
Chindex International Inc. (c) (e) | 9 | 142 | ||||
Clinical Data Inc. (c) (e) | 7 | 118 | ||||
Codexis Inc. (c) (e) | 6 | 68 | ||||
Computer Programs & Systems Inc. | 5 | 252 | ||||
Conceptus Inc. (c) (e) | 17 | 240 | ||||
Conmed Corp. (c) | 16 | 435 | ||||
Continucare Corp. (c) | 22 | 101 | ||||
Corcept Therapeutics Inc. (c) (e) | 14 | 52 | ||||
Cornerstone Therapeutics Inc. (c) | 3 | 17 | ||||
Corvel Corp. (c) | 4 | 195 | ||||
Cross Country Healthcare Inc. (c) | 17 | 148 | ||||
CryoLife Inc. (c) | 17 | 91 | ||||
Cubist Pharmaceuticals Inc. (c) | 35 | 739 | ||||
Cumberland Pharmaceuticals Inc. (c) | 5 | 29 | ||||
Curis Inc. (c) (e) | 37 | 72 | ||||
Cutera Inc. (c) | 7 | 61 | ||||
Cyberonics Inc. (c) | 17 | 517 | ||||
Cynosure Inc. - Class A (c) | 6 | 59 | ||||
Cypress Bioscience Inc. (c) | 24 | 154 | ||||
Cytokinetics Inc. (c) | 25 | 53 | ||||
Cytori Therapeutics Inc. (c) (e) | 26 | 137 | ||||
CytRx Corp. (c) | 70 | 70 | ||||
Delcath Systems Inc. (c) (e) | 27 | 266 | ||||
DepoMed Inc. (c) | 34 | 219 | ||||
DexCom Inc. (c) | 34 | 470 | ||||
Dionex Corp. (c) | 10 | 1,226 | ||||
Durect Corp. (c) | 47 | 163 | ||||
Dyax Corp. (c) | 50 | 107 | ||||
Dynavax Technologies Inc. (c) (e) | 58 | 186 | ||||
Dynavox Inc. - Class A (c) | 5 | 26 | ||||
Emergent BioSolutions Inc. (c) | 13 | 305 | ||||
Emeritus Corp. (c) | 13 | 258 | ||||
Endologix Inc. (c) (e) | 28 | 203 | ||||
Ensign Group Inc. | 8 | 194 | ||||
Enzo Biochem Inc. (c) | 21 | 110 | ||||
See accompanying Notes to the Financial Statements.
JNL Series Trust
Schedules of Investments (in thousands)
December 31, 2010
| Shares/Par (p) | Value | |||||
Enzon Pharmaceuticals Inc. (c) (e) | 31 | 374 | ||||
eResearch Technology Inc. (c) | 27 | 196 | ||||
Eurand NV (c) | 10 | 116 | ||||
Exact Sciences Corp. (c) (e) | 28 | 167 | ||||
ExacTech Inc. (c) | 4 | 72 | ||||
ExamWorks Group Inc. (c) | 3 | 63 | ||||
Exelixis Inc. (c) | 67 | 551 | ||||
Five Star Quality Care Inc. (c) | 23 | 162 | ||||
Furiex Pharmaceuticals Inc. (c) | 5 | 68 | ||||
Genomic Health Inc. (c) (e) | 8 | 181 | ||||
Genoptix Inc. (c) | 11 | 214 | ||||
Gentiva Health Services Inc. (c) | 18 | 477 | ||||
Geron Corp. (c) (e) | 72 | 372 | ||||
Greatbatch Inc. (c) | 14 | 349 | ||||
Haemonetics Corp. (c) | 15 | 938 | ||||
Halozyme Therapeutics Inc. (c) | 44 | 346 | ||||
Hanger Orthopedic Group Inc. (c) | 15 | 310 | ||||
Hansen Medical Inc. (c) | 23 | 34 | ||||
HealthSouth Corp. (c) (e) | 56 | 1,168 | ||||
HealthSpring Inc. (c) | 35 | 927 | ||||
Healthways Inc. (c) | 19 | 207 | ||||
HeartWare International Inc. (c) (e) | 6 | 495 | ||||
Hi-Tech Pharmacal Co. Inc. (c) (e) | 6 | 145 | ||||
HMS Holdings Corp. (c) | 16 | 1,059 | ||||
ICU Medical Inc. (c) | 7 | 254 | ||||
Idenix Pharmaceuticals Inc. (c) (e) | 19 | 98 | ||||
Immucor Inc. (c) | 42 | 839 | ||||
Immunogen Inc. (c) (e) | 41 | 381 | ||||
Immunomedics Inc. (c) (e) | 43 | 153 | ||||
Impax Laboratories Inc. (c) | 36 | 728 | ||||
Incyte Corp. (c) (e) | 52 | 860 | ||||
Infinity Pharmaceuticals Inc. (c) (e) | 8 | 47 | ||||
Inhibitex Inc. (c) (e) | 26 | 69 | ||||
Inovio Pharmaceuticals Inc. (c) | 43 | 50 | ||||
Inspire Pharmaceuticals Inc. (c) | 33 | 274 | ||||
Insulet Corp. (c) | 25 | 386 | ||||
Integra LifeSciences Holdings Corp. (c) | 13 | 594 | ||||
InterMune Inc. (c) (e) | 28 | 1,026 | ||||
Invacare Corp. | 17 | 499 | ||||
IPC The Hospitalist Co. Inc. (c) | 9 | 361 | ||||
IRIS International Inc. (c) | 8 | 86 | ||||
Ironwood Pharmaceuticals Inc. (c) | 10 | 103 | ||||
Isis Pharmaceuticals Inc. (c) | 55 | 553 | ||||
Jazz Pharmaceuticals Inc. (c) (e) | 8 | 158 | ||||
Kendle International Inc. (c) | 9 | 94 | ||||
Kensey Nash Corp. (c) | 5 | 129 | ||||
Keryx Biopharmaceuticals Inc. (c) (e) | 27 | 126 | ||||
Kindred Healthcare Inc. (c) | 24 | 441 | ||||
Landauer Inc. | 5 | 323 | ||||
Lannett Co. Inc. (c) | 4 | 25 | ||||
LCA-Vision Inc. (c) (e) | 12 | 67 | ||||
Lexicon Pharmaceuticals Inc. (c) | 108 | 155 | ||||
LHC Group Inc. (c) | 9 | 262 | ||||
Ligand Pharmaceuticals Inc. (c) | 9 | 79 | ||||
Luminex Corp. (c) | 22 | 404 | ||||
Magellan Health Services Inc. (c) | 20 | 951 | ||||
MAKO Surgical Corp. (c) (e) | 18 | 272 | ||||
MannKind Corp. (c) (e) | 37 | 295 | ||||
MAP Pharmaceuticals Inc. (c) | 10 | 170 | ||||
Martek Biosciences Corp. (c) | 20 | 639 | ||||
Masimo Corp. (c) | 31 | 910 | ||||
Maxygen Inc. (c) | 17 | 66 | ||||
MedAssets Inc. (c) | 25 | 503 | ||||
MedCath Corp. (c) | 14 | 190 | ||||
Medical Action Industries Inc. (c) | 10 | 99 | ||||
Medicines Co. (c) | 30 | 430 | ||||
Medicis Pharmaceutical Corp. - Class A | 36 | 974 | ||||
Medidata Solutions Inc. (c) | 10 | 244 | ||||
| Shares/Par (p) | Value | |||||
Medivation Inc. (c) (e) | 22 | 330 | ||||
MedQuist Inc. (c) | 4 | 34 | ||||
MELA Sciences Inc. (c) (e) | 16 | 54 | ||||
Merge Healthcare Inc. (c) | 32 | 118 | ||||
Meridian Bioscience Inc. | 24 | 547 | ||||
Merit Medical Systems Inc. (c) | 17 | 264 | ||||
Metabolix Inc. (c) (e) | 17 | 202 | ||||
Metropolitan Health Networks Inc. (c) (e) | 30 | 132 | ||||
Micromet Inc. (c) (e) | 53 | 434 | ||||
Molina Healthcare Inc. (c) | 10 | 267 | ||||
Momenta Pharmaceuticals Inc. (c) (e) | 26 | 389 | ||||
MWI Veterinary Supply Inc. (c) | 7 | 467 | ||||
Nabi Biopharmaceuticals (c) | 28 | 162 | ||||
Nanosphere Inc. (c) | 7 | 28 | ||||
National Healthcare Corp. | 5 | 250 | ||||
National Research Corp. | 1 | 26 | ||||
Natus Medical Inc. (c) | 16 | 230 | ||||
Nektar Therapeutics (c) | 56 | 714 | ||||
Neogen Corp. (c) | 14 | 556 | ||||
NeoStem Inc. (c) (e) | 14 | 19 | ||||
Neuralstem Inc. (c) (e) | 23 | 48 | ||||
Neurocrine Biosciences Inc. (c) | 30 | 226 | ||||
NeurogesX Inc. (c) (e) | 5 | 29 | ||||
Novavax Inc. (c) (e) | 51 | 123 | ||||
NPS Pharmaceuticals Inc. (c) | 41 | 326 | ||||
NuVasive Inc. (c) (e) | 23 | 597 | ||||
NxStage Medical Inc. (c) | 15 | 367 | ||||
Nymox Pharmaceutical Corp. (c) (e) | 10 | 70 | ||||
Obagi Medical Products Inc. (c) | 9 | 110 | ||||
Omeros Corp. (c) (e) | 10 | 83 | ||||
Omnicell Inc. (c) | 18 | 262 | ||||
Onyx Pharmaceuticals Inc. (c) | 38 | 1,388 | ||||
Opko Health Inc. (c) (e) | 48 | 176 | ||||
Optimer Pharmaceuticals Inc. (c) | 22 | 245 | ||||
OraSure Technologies Inc. (c) | 28 | 163 | ||||
Orexigen Therapeutics Inc. (c) (e) | 18 | 148 | ||||
Orthofix International NV (c) | 10 | 300 | ||||
Orthovita Inc. (c) (e) | 41 | 82 | ||||
Osiris Therapeutics Inc. (c) (e) | 8 | 61 | ||||
Owens & Minor Inc. (e) | 37 | 1,093 | ||||
Pacific Biosciences of California Inc. (c) (e) | 4 | 63 | ||||
Pain Therapeutics Inc. (c) | 21 | 139 | ||||
Palomar Medical Technologies Inc. (c) | 13 | 181 | ||||
Par Pharmaceutical Cos. Inc. (c) | 20 | 781 | ||||
Parexel International Corp. (c) | 35 | 734 | ||||
PDI Inc. (c) | 5 | 50 | ||||
PDL BioPharma Inc. (c) | 84 | 523 | ||||
Peregrine Pharmaceuticals Inc. (c) (e) | 28 | 64 | ||||
Pharmacyclics Inc. (c) | 28 | 168 | ||||
Pharmasset Inc. (c) (e) | 17 | 756 | ||||
PharMerica Corp. (c) | 18 | 201 | ||||
Pozen Inc. (c) | 13 | 90 | ||||
Progenics Pharmaceuticals Inc. (c) | 17 | 93 | ||||
Providence Services Corp. (c) | 9 | 142 | ||||
PSS World Medical Inc. (c) | 34 | 758 | ||||
PURE Bioscience (c) (e) | 19 | 42 | ||||
Quality Systems Inc. (e) | 11 | 761 | ||||
Questcor Pharmaceuticals Inc. (c) | 32 | 473 | ||||
Quidel Corp. (c) (e) | 14 | 209 | ||||
RehabCare Group Inc. (c) | 15 | 358 | ||||
Rigel Pharmaceuticals Inc. (c) | 31 | 232 | ||||
Rochester Medical Corp. (c) | 4 | 47 | ||||
RTI Biologics Inc. (c) | 33 | 88 | ||||
Rural/Metro Corp. (c) | 10 | 150 | ||||
Salix Pharmaceuticals Ltd. (c) | 34 | 1,606 | ||||
Sangamo Biosciences Inc. (c) (e) | 25 | 167 | ||||
Santarus Inc. (c) | 37 | 120 | ||||
Savient Pharmaceuticals Inc. (c) | 41 | 461 | ||||
See accompanying Notes to the Financial Statements.
JNL Series Trust
Schedules of Investments (in thousands)
December 31, 2010
| Shares/Par (p) | Value | |||||
Sciclone Pharmaceuticals Inc. (c) | 27 | 112 | ||||
Seattle Genetics Inc. (c) (e) | 48 | 722 | ||||
Select Medical Holdings Corp. (c) | 27 | 200 | ||||
Sequenom Inc. (c) (e) | 54 | 435 | ||||
SIGA Technologies Inc. (c) (e) | 20 | 276 | ||||
Sirona Dental Systems Inc. (c) | 20 | 847 | ||||
Skilled Healthcare Group Inc. - Class A (c) | 15 | 136 | ||||
Solta Medical Inc. (c) | 32 | 97 | ||||
Somaxon Pharmaceuticals Inc. (c) (e) | 15 | 48 | ||||
SonoSite Inc. (c) | 8 | 268 | ||||
Spectranetics Corp. (c) | 15 | 78 | ||||
Spectrum Pharmaceuticals Inc. (c) (e) | 31 | 216 | ||||
Staar Surgical Co. (c) | 19 | 114 | ||||
StemCells Inc. (c) (e) | 72 | 78 | ||||
Stereotaxis Inc. (c) | 15 | 56 | ||||
STERIS Corp. | 36 | 1,298 | ||||
Sucampo Pharmaceuticals Inc. - Class A (c) (e) | 4 | 17 | ||||
Sun Healthcare Group Inc. (c) | 15 | 190 | ||||
Sunrise Senior Living Inc. (c) | 35 | 191 | ||||
SuperGen Inc. (c) | 31 | 82 | ||||
SurModics Inc. (c) | 12 | 141 | ||||
Symmetry Medical Inc. (c) | 20 | 186 | ||||
Syneron Medical Ltd. (c) | 23 | 230 | ||||
Synovis Life Technologies Inc. (c) | 7 | 114 | ||||
Synta Pharmaceuticals Corp. (c) (e) | 14 | 84 | ||||
Targacept Inc. (c) | 14 | 383 | ||||
Team Health Holdings Inc. (c) | 8 | 128 | ||||
Theravance Inc. (c) | 38 | 945 | ||||
TomoTherapy Inc. (c) | 31 | 111 | ||||
Transcend Services Inc. (c) | 6 | 113 | ||||
Transcept Pharmaceuticals Inc. (c) | 3 | 21 | ||||
Triple-S Management Corp. - Class B (c) | 12 | 230 | ||||
Unilife Corp. (c) (e) | 26 | 138 | ||||
Universal American Corp. (c) | 20 | 408 | ||||
US Physical Therapy Inc. (c) | 6 | 122 | ||||
Vanda Pharmaceuticals Inc. (c) | 16 | 153 | ||||
Vascular Solutions Inc. (c) | 9 | 107 | ||||
Vical Inc. (c) (e) | 33 | 67 | ||||
ViroPharma Inc. (c) | 46 | 798 | ||||
Vital Images Inc. (c) | 9 | 124 | ||||
Vivus Inc. (c) (e) | 50 | 466 | ||||
Volcano Corp. (c) | 30 | 830 | ||||
WellCare Health Plans Inc. (c) | 25 | 760 | ||||
West Pharmaceutical Services Inc. (e) | 20 | 812 | ||||
Wright Medical Group Inc. (c) | 22 | 337 | ||||
XenoPort Inc. (c) | 15 | 131 | ||||
Young Innovations Inc. | 3 | 93 | ||||
Zalicus Inc. (c) | 35 | 56 | ||||
ZIOPHARM Oncology Inc. (c) (e) | 34 | 159 | ||||
Zoll Medical Corp. (c) | 13 | 480 | ||||
| 85,971 | ||||||
INDUSTRIALS - 15.4% | ||||||
3D Systems Corp. (c) | 10 | 327 | ||||
A123 Systems Inc. (c) (e) | 43 | 406 | ||||
AAON Inc. | 7 | 201 | ||||
AAR Corp. (c) | 23 | 627 | ||||
ABM Industries Inc. (e) | 30 | 788 | ||||
Acacia Research Corp. (c) | 20 | 523 | ||||
ACCO Brands Corp. (c) | 32 | 272 | ||||
Aceto Corp. | 16 | 147 | ||||
Actuant Corp. - Class A | 41 | 1,089 | ||||
Acuity Brands Inc. (e) | 26 | 1,505 | ||||
Administaff Inc. | 12 | 360 | ||||
Advanced Battery Technologies Inc. (c) (e) | 35 | 136 | ||||
Advisory Board Co. (c) | 9 | 425 | ||||
AeroVironment Inc. (c) | 9 | 242 | ||||
Air Transport Services Group Inc (c) | 34 | 270 | ||||
| Shares/Par (p) | Value | |||||
Aircastle Ltd. | 32 | 330 | ||||
AirTran Holdings Inc. (c) | 81 | 595 | ||||
Alamo Group Inc. | 3 | 95 | ||||
Alaska Air Group Inc. (c) | 22 | 1,219 | ||||
Albany International Corp. - Class A | 16 | 381 | ||||
Allegiant Travel Co. (c) (e) | 9 | 450 | ||||
Altra Holdings Inc. (c) | 16 | 318 | ||||
AMERCO (c) | 5 | 496 | ||||
Ameresco Inc. - Class A (c) | 7 | 97 | ||||
American Railcar Industries Inc. (c) | 6 | 143 | ||||
American Reprographics Co. (c) | 22 | 167 | ||||
American Science & Engineering Inc. | 5 | 440 | ||||
American Superconductor Corp. (c) (e) | 30 | 855 | ||||
American Woodmark Corp. | 5 | 116 | ||||
Ameron International Corp. | 6 | 425 | ||||
Ampco-Pittsburgh Corp. | 5 | 140 | ||||
AO Smith Corp. | 22 | 836 | ||||
APAC Customer Services Inc. (c) | 20 | 119 | ||||
Apogee Enterprises Inc. | 16 | 219 | ||||
Applied Energetics Inc. (c) | 42 | 35 | ||||
Applied Industrial Technologies Inc. | 26 | 832 | ||||
Applied Signal Technology Inc. | 8 | 288 | ||||
Argan Inc. (c) (e) | 3 | 29 | ||||
Arkansas Best Corp. | 14 | 397 | ||||
Astec Industries Inc. (c) | 12 | 390 | ||||
Astronics Corp. (c) | 6 | 119 | ||||
Atlas Air Worldwide Holdings Inc. (c) | 16 | 871 | ||||
Avis Budget Group Inc. (c) | 61 | 947 | ||||
AZZ Inc. | 8 | 311 | ||||
Badger Meter Inc. | 9 | 378 | ||||
Baldor Electric Co. | 28 | 1,734 | ||||
Baltic Trading Ltd. | 12 | 122 | ||||
Barnes Group Inc. (e) | 29 | 605 | ||||
Barrett Business Services Inc. | 3 | 53 | ||||
Beacon Roofing Supply Inc. (c) | 27 | 475 | ||||
Belden Inc. | 28 | 1,019 | ||||
Blount International Inc. (c) | 29 | 453 | ||||
BlueLinx Holdings Inc. (c) | 5 | 20 | ||||
Brady Corp. - Class A | 29 | 961 | ||||
Briggs & Stratton Corp. | 29 | 571 | ||||
Brink’s Co. | 28 | 744 | ||||
Broadwind Energy Inc. (c) (e) | 71 | 163 | ||||
Builders FirstSource Inc. (c) (e) | 25 | 49 | ||||
CAI International Inc. (c) | 7 | 135 | ||||
Capstone Turbine Corp. (c) | 129 | 124 | ||||
Cascade Corp. | 6 | 270 | ||||
Casella Waste Systems Inc. - Class A (c) | 13 | 95 | ||||
CBIZ Inc. (c) | 22 | 139 | ||||
CDI Corp. | 8 | 153 | ||||
Celadon Group Inc. (c) | 12 | 182 | ||||
Cenveo Inc. (c) | 33 | 177 | ||||
Ceradyne Inc. (c) | 16 | 492 | ||||
Chart Industries Inc. (c) | 17 | 590 | ||||
CIRCOR International Inc. | 10 | 437 | ||||
CLARCOR Inc. | 30 | 1,271 | ||||
Clean Harbors Inc. (c) | 14 | 1,168 | ||||
Coleman Cable Inc. (c) (e) | 4 | 27 | ||||
Colfax Corp. (c) | 14 | 264 | ||||
Columbus Mckinnon Corp. (c) | 12 | 243 | ||||
Comfort Systems USA Inc. | 24 | 313 | ||||
Commercial Vehicle Group Inc. (c) | 15 | 251 | ||||
Consolidated Graphics Inc. (c) | 5 | 255 | ||||
Corporate Executive Board Co. | 21 | 779 | ||||
CoStar Group Inc. (c) (e) | 12 | 690 | ||||
Courier Corp. | 6 | 99 | ||||
CRA International Inc. (c) | 7 | 155 | ||||
Cubic Corp. | 9 | 425 | ||||
Curtiss-Wright Corp. (e) | 28 | 920 | ||||
See accompanying Notes to the Financial Statements.
JNL Series Trust
Schedules of Investments (in thousands)
December 31, 2010
| ` | Shares/Par (p) | Value | ||||
Deluxe Corp. | 30 | 684 | ||||
DigitalGlobe Inc. (c) | 16 | 507 | ||||
Dolan Media Co. (c) | 18 | 255 | ||||
Dollar Thrifty Automotive Group Inc. (c) | 16 | 778 | ||||
Douglas Dynamics Inc. | 6 | 94 | ||||
Ducommun Inc. | 6 | 134 | ||||
DXP Enterprises Inc. (c) | 5 | 127 | ||||
Dycom Industries Inc. (c) | 21 | 311 | ||||
Dynamex Inc. (c) | 7 | 163 | ||||
Dynamic Materials Corp. | 9 | 198 | ||||
Eagle Bulk Shipping Inc. (c) (e) | 41 | 204 | ||||
EMCOR Group Inc. (c) | 40 | 1,157 | ||||
Encore Wire Corp. | 12 | 291 | ||||
Ener1 Inc. (c) (e) | 37 | 141 | ||||
Energy Recovery Inc. (c) | 24 | 87 | ||||
EnergySolutions Inc. | 55 | 308 | ||||
EnerNOC Inc. (c) (e) | 12 | 285 | ||||
EnerSys (c) | 29 | 936 | ||||
Ennis Inc. | 15 | 256 | ||||
EnPro Industries Inc. (c) | 12 | 500 | ||||
ESCO Technologies Inc. | 15 | 581 | ||||
Esterline Technologies Corp. (c) | 18 | 1,231 | ||||
Excel Maritime Carriers Ltd. (c) (e) | 21 | 120 | ||||
Exponent Inc. (c) | 8 | 294 | ||||
Federal Signal Corp. | 40 | 273 | ||||
Flow International Corp. (c) | 35 | 145 | ||||
Force Protection Inc. (c) | 45 | 249 | ||||
Forward Air Corp. | 18 | 503 | ||||
Franklin Covey Co. (c) | 6 | 49 | ||||
Franklin Electric Co. Inc. | 14 | 552 | ||||
FreightCar America Inc. (c) | 7 | 207 | ||||
Fuel Tech Inc. (c) | 12 | 117 | ||||
FuelCell Energy Inc. (c) (e) | 60 | 138 | ||||
Furmanite Corp. (c) | 25 | 175 | ||||
G&K Services Inc. - Class A | 11 | 349 | ||||
Genco Shipping & Trading Ltd. (c) (e) | 17 | 242 | ||||
GenCorp Inc. (c) | 32 | 165 | ||||
Generac Holdings Inc. (c) | 10 | 163 | ||||
Genesee & Wyoming Inc. - Class A (c) | 23 | 1,235 | ||||
Geo Group Inc. (c) | 37 | 909 | ||||
GeoEye Inc. (c) | 13 | 557 | ||||
Gibraltar Industries Inc. (c) | 20 | 266 | ||||
Global Defense Technology & Systems Inc. (c) | 2 | 38 | ||||
Gorman-Rupp Co. | 7 | 240 | ||||
GP Strategies Corp. (c) | 11 | 114 | ||||
GrafTech International Ltd. (c) | 72 | 1,434 | ||||
Graham Corp. | 7 | 135 | ||||
Granite Construction Inc. | 20 | 556 | ||||
Great Lakes Dredge & Dock Corp. | 32 | 236 | ||||
Greenbrier Cos. Inc. (c) | 11 | 233 | ||||
Griffon Corp. (c) | 26 | 335 | ||||
GT Solar International Inc. (c) (e) | 38 | 347 | ||||
H&E Equipment Services Inc. (c) | 17 | 198 | ||||
Hawaiian Holdings Inc. (c) | 32 | 252 | ||||
Healthcare Services Group Inc. (e) | 38 | 618 | ||||
Heartland Express Inc. | 29 | 470 | ||||
HEICO Corp. (e) | 17 | 884 | ||||
Heidrick & Struggles International Inc. | 11 | 311 | ||||
Herley Industries Inc. (c) | 8 | 132 | ||||
Herman Miller Inc. (e) | 33 | 833 | ||||
Hexcel Corp. (c) | 57 | 1,033 | ||||
Higher One Holdings Inc. (c) (e) | 7 | 139 | ||||
Hill International Inc. (c) | 12 | 80 | ||||
HNI Corp. | 27 | 853 | ||||
Hoku Corp. (c) (e) | 9 | 24 | ||||
Horizon Lines Inc. - Class A | 21 | 91 | ||||
Houston Wire & Cable Co. (e) | 12 | 161 | ||||
HUB Group Inc. - Class A (c) | 23 | 794 | ||||
| Shares/Par (p) | Value | |||||
Hudson Highland Group Inc. (c) | 17 | 101 | ||||
Huron Consulting Group Inc. (c) | 14 | 361 | ||||
ICF International Inc. (c) (e) | 11 | 276 | ||||
II-VI Inc. (c) | 15 | 692 | ||||
InnerWorkings Inc. (c) | 14 | 89 | ||||
Insituform Technologies Inc. - Class A (c) | 23 | 604 | ||||
Insteel Industries Inc. | 12 | 154 | ||||
Interface Inc. - Class A | 30 | 475 | ||||
Interline Brands Inc. (c) | 19 | 425 | ||||
International Shipholding Corp. | 4 | 104 | ||||
JetBlue Airways Corp. (c) | 147 | 973 | ||||
John Bean Technologies Corp. | 16 | 319 | ||||
Kadant Inc. (c) | 8 | 184 | ||||
Kaman Corp. - Class A | 16 | 463 | ||||
Kaydon Corp. | 20 | 808 | ||||
Kelly Services Inc. - Class A (c) | 16 | 308 | ||||
Keyw Holding Corp. (c) (e) | 1 | 19 | ||||
Kforce Inc. (c) | 19 | 310 | ||||
Kimball International Inc. - Class B | 17 | 118 | ||||
Knight Transportation Inc. | 34 | 651 | ||||
Knoll Inc. | 27 | 460 | ||||
Korn/Ferry International (c) | 27 | 621 | ||||
Kratos Defense & Security Solutions Inc. (c) | 11 | 149 | ||||
LaBarge Inc. (c) | 6 | 91 | ||||
Ladish Co. Inc. (c) | 9 | 452 | ||||
Lawson Products Inc. | 2 | 53 | ||||
Layne Christensen Co. (c) | 11 | 388 | ||||
LB Foster Co. (c) | 6 | 252 | ||||
LECG Corp. (c) | 14 | 19 | ||||
Lindsay Corp. (e) | 7 | 440 | ||||
LMI Aerospace Inc. (c) | 6 | 91 | ||||
LSI Industries Inc. | 9 | 80 | ||||
Lydall Inc. (c) | 14 | 110 | ||||
M&F Worldwide Corp. (c) | 6 | 139 | ||||
Marten Transport Ltd. | 9 | 195 | ||||
MasTec Inc. (c) | 33 | 474 | ||||
McGrath RentCorp | 14 | 380 | ||||
Met-Pro Corp. | 8 | 91 | ||||
Metalico Inc. (c) (e) | 23 | 133 | ||||
Michael Baker Corp. (c) | 5 | 148 | ||||
Middleby Corp. (c) | 10 | 831 | ||||
Miller Industries Inc. | 6 | 88 | ||||
Mine Safety Appliances Co. | 15 | 475 | ||||
Mistras Group Inc. (c) | 8 | 106 | ||||
Mobile Mini Inc. (c) | 22 | 441 | ||||
Moog Inc. - Class A (c) | 27 | 1,087 | ||||
Mueller Industries Inc. | 22 | 714 | ||||
Mueller Water Products Inc. | 87 | 363 | ||||
Multi-Color Corp. | 7 | 133 | ||||
MYR Group Inc. (c) | 11 | 228 | ||||
NACCO Industries Inc. - Class A | 4 | 380 | ||||
Navigant Consulting Inc. (c) | 28 | 262 | ||||
NCI Building Systems Inc. (c) | 13 | 180 | ||||
Nordson Corp. | 20 | 1,878 | ||||
Northwest Pipe Co. (c) | 6 | 152 | ||||
Old Dominion Freight Line Inc. (c) | 25 | 809 | ||||
Omega Flex Inc. (c) (e) | 1 | 15 | ||||
On Assignment Inc. (c) | 24 | 198 | ||||
Orbital Sciences Corp. (c) | 34 | 589 | ||||
Orion Marine Group Inc. (c) | 17 | 199 | ||||
Otter Tail Corp. | 21 | 472 | ||||
P.A.M. Transportation Services (c) | 2 | 28 | ||||
Pacer International Inc. (c) | 25 | 173 | ||||
Park-Ohio Holdings Corp. (c) | 4 | 88 | ||||
Patriot Transportation Holding Inc. (c) | 1 | 103 | ||||
PGT Inc. (c) (e) | 10 | 25 | ||||
Pike Electric Corp. (c) | 8 | 65 | ||||
Pinnacle Airlines Corp. (c) | 10 | 79 | ||||
See accompanying Notes to the Financial Statements.
JNL Series Trust
Schedules of Investments (in thousands)
December 31, 2010
| Shares/Par (p) | Value | |||||
PMFG Inc. (c) (e) | 9 | 139 | ||||
Polypore International Inc. (c) | 13 | 541 | ||||
Powell Industries Inc. (c) | 5 | 155 | ||||
PowerSecure International Inc. (c) | 12 | 96 | ||||
Preformed Line Products Co. | 1 | 58 | ||||
Primoris Services Corp. (e) | 11 | 104 | ||||
Quality Distribution Inc. (c) | 5 | 44 | ||||
Quanex Building Products Corp. | 21 | 407 | ||||
RailAmerica Inc. (c) | 13 | 171 | ||||
Raven Industries Inc. | 10 | 455 | ||||
RBC Bearings Inc. (c) | 13 | 510 | ||||
Republic Airways Holdings Inc. (c) | 28 | 205 | ||||
Resources Connection Inc. | 27 | 505 | ||||
Roadrunner Transportation Systems Inc. (c) | 6 | 82 | ||||
Robbins & Myers Inc. | 16 | 562 | ||||
Rollins Inc. | 37 | 739 | ||||
RSC Holdings Inc. (c) | 31 | 301 | ||||
Rush Enterprises Inc. - Class A (c) | 19 | 383 | ||||
Saia Inc. (c) | 8 | 139 | ||||
SatCon Technology Corp. (c) (e) | 71 | 319 | ||||
Sauer-Danfoss Inc. (c) | 7 | 196 | ||||
Schawk Inc. - Class A | 7 | 152 | ||||
School Specialty Inc. (c) | 10 | 146 | ||||
Seaboard Corp. | — | 366 | ||||
SeaCube Container Leasing Ltd. | 1 | 20 | ||||
SFN Group Inc. (c) | 30 | 292 | ||||
Simpson Manufacturing Co. Inc. | 23 | 705 | ||||
SkyWest Inc. | 34 | 533 | ||||
Standard Parking Corp. (c) | 8 | 159 | ||||
Standard Register Co. | 14 | 46 | ||||
Standex International Corp. | 8 | 240 | ||||
Steelcase Inc. - Class A | 45 | 476 | ||||
Sterling Construction Co. Inc. (c) | 10 | 126 | ||||
Sun Hydraulics Corp. | 7 | 264 | ||||
Sykes Enterprises Inc. (c) | 25 | 504 | ||||
TAL International Group Inc. | 10 | 322 | ||||
Taser International Inc. (c) | 41 | 194 | ||||
Team Inc. (c) | 12 | 294 | ||||
Tecumseh Products Co. - Class A (c) | 10 | 132 | ||||
Teledyne Technologies Inc. (c) | 21 | 940 | ||||
Tennant Co. | 11 | 414 | ||||
Tetra Tech Inc. (c) | 37 | 934 | ||||
Textainer Group Holdings Ltd. | 6 | 165 | ||||
Titan International Inc. (e) | 20 | 389 | ||||
Titan Machinery Inc. (c) (e) | 8 | 159 | ||||
Tredegar Corp. | 15 | 297 | ||||
Trex Co. Inc. (c) (e) | 10 | 228 | ||||
TriMas Corp. (c) | 10 | 198 | ||||
Triumph Group Inc. | 10 | 901 | ||||
TrueBlue Inc. (c) | 27 | 480 | ||||
Tutor Perini Corp. (c) (e) | 16 | 336 | ||||
Twin Disc Inc. | 6 | 171 | ||||
Ultrapetrol Ltd. (c) (e) | 13 | 85 | ||||
UniFirst Corp. | 8 | 439 | ||||
United Capital Corp. (c) | 1 | 28 | ||||
United Rentals Inc. (c) | 37 | 832 | ||||
United Stationers Inc. (c) | 15 | 932 | ||||
Universal Forest Products Inc. | 11 | 426 | ||||
Universal Truckload Services Inc. (c) | 3 | 44 | ||||
UQM Technologies Inc. (c) (e) | 19 | 44 | ||||
US Airways Group Inc. (c) | 95 | 949 | ||||
US Ecology Inc. | 11 | 183 | ||||
USA Truck Inc. (c) | 3 | 45 | ||||
Viad Corp. | 11 | 292 | ||||
Vicor Corp. | 12 | 189 | ||||
Volt Information Sciences Inc. (c) | 11 | 91 | ||||
VSE Corp. | 2 | 70 | ||||
Wabash National Corp. (c) | 42 | 492 | ||||
| Shares/Par (p) | Value | |||||
Watsco Inc. | 17 | 1,058 | ||||
Watts Water Technologies Inc. - Class A | 18 | 653 | ||||
Werner Enterprises Inc. (e) | 25 | 563 | ||||
Woodward Governor Co. | 37 | 1,374 | ||||
Xerium Technologies Inc. (c) | 7 | 104 | ||||
| 110,404 | ||||||
INFORMATION TECHNOLOGY - 18.2% | ||||||
ACI Worldwide Inc. (c) | 20 | 532 | ||||
Acme Packet Inc. (c) | 26 | 1,397 | ||||
Actuate Corp. (c) | 28 | 157 | ||||
Acxiom Corp. (c) | 41 | 695 | ||||
ADTRAN Inc. | 37 | 1,353 | ||||
Advanced Analogic Technologies Inc. (c) | 21 | 85 | ||||
Advanced Energy Industries Inc. (c) | 20 | 272 | ||||
Advent Software Inc. (c) (e) | 9 | 546 | ||||
Agilysys Inc. (c) | 11 | 61 | ||||
Alpha & Omega Semiconductor Ltd. (c) | 3 | 35 | ||||
American Software Inc. - Class A | 11 | 73 | ||||
Amkor Technology Inc. (c) (e) | 62 | 457 | ||||
Anadigics Inc. (c) (e) | 37 | 253 | ||||
Anaren Inc. (c) | 9 | 179 | ||||
Ancestry.com Inc. (c) (e) | 12 | 327 | ||||
Anixter International Inc. (c) | 17 | 1,012 | ||||
Applied Micro Circuits Corp. (c) | 39 | 422 | ||||
Archipelago Learning Inc. (c) | 6 | 62 | ||||
Ariba Inc. (c) | 54 | 1,269 | ||||
Arris Group Inc. (c) | 77 | 861 | ||||
Art Technology Group Inc. (c) | 95 | 566 | ||||
Aruba Networks Inc. (c) (e) | 45 | 949 | ||||
Aspen Technology Inc. (c) | 36 | 462 | ||||
ATMI Inc. (c) | 19 | 388 | ||||
Aviat Networks Inc. (c) | 35 | 175 | ||||
Avid Technology Inc. (c) | 16 | 286 | ||||
Axcelis Technologies Inc. (c) | 69 | 239 | ||||
AXT Inc. (c) | 17 | 174 | ||||
Bel Fuse Inc. - Class B | 5 | 130 | ||||
Benchmark Electronics Inc. (c) | 36 | 658 | ||||
BigBand Networks Inc. (c) | 27 | 76 | ||||
Black Box Corp. | 10 | 395 | ||||
Blackbaud Inc. | 26 | 671 | ||||
Blackboard Inc. (c) (e) | 21 | 852 | ||||
Blue Coat Systems Inc. (c) | 25 | 754 | ||||
Bottomline Technologies Inc. (c) | 19 | 415 | ||||
Brightpoint Inc. (c) | 43 | 375 | ||||
BroadSoft Inc. (c) | 5 | 120 | ||||
Brooks Automation Inc. (c) | 40 | 366 | ||||
Cabot Microelectronics Corp. (c) | 14 | 597 | ||||
CACI International Inc. - Class A (c) | 18 | 974 | ||||
Calix Inc. (c) (e) | 4 | 67 | ||||
Cass Information Systems Inc. | 5 | 174 | ||||
Cavium Networks Inc. (c) | 27 | 1,007 | ||||
CDC Corp. - Class A (c) | 18 | 62 | ||||
Ceva Inc. (c) | 13 | 268 | ||||
Checkpoint Systems Inc. (c) | 24 | 497 | ||||
Ciber Inc. (c) | 40 | 186 | ||||
Cirrus Logic Inc. (c) (e) | 41 | 660 | ||||
Cognex Corp. | 24 | 708 | ||||
Coherent Inc. (c) | 15 | 661 | ||||
Cohu Inc. | 13 | 218 | ||||
CommVault Systems Inc. (c) | 25 | 717 | ||||
Compellent Technologies Inc. (c) | 14 | 390 | ||||
Computer Task Group Inc. (c) | 7 | 72 | ||||
comScore Inc. (c) | 13 | 300 | ||||
Comtech Telecommunications Corp. | 17 | 483 | ||||
Comverge Inc. (c) (e) | 17 | 120 | ||||
Concur Technologies Inc. (c) | 24 | 1,256 | ||||
Conexant Systems Inc. (c) | 44 | 71 | ||||
See accompanying Notes to the Financial Statements.
JNL Series Trust
Schedules of Investments (in thousands)
December 31, 2010
| Shares/Par (p) | Value | |||||
Constant Contact Inc. (c) (e) | 17 | 533 | ||||
Convio Inc. (c) | 3 | 26 | ||||
CPI International Inc. (c) | 4 | 80 | ||||
Cray Inc. (c) | 24 | 170 | ||||
CSG Systems International Inc. (c) | 20 | 376 | ||||
CTS Corp. | 20 | 217 | ||||
Cymer Inc. (c) | 17 | 785 | ||||
Daktronics Inc. | 20 | 323 | ||||
DDi Corp. | 10 | 119 | ||||
DealerTrack Holdings Inc. (c) | 24 | 485 | ||||
Deltek Inc. (c) | 8 | 61 | ||||
DemandTec Inc. (c) | 12 | 134 | ||||
DG FastChannel Inc. (c) (e) | 15 | 420 | ||||
Dice Holdings Inc. (c) | 11 | 154 | ||||
Digi International Inc. (c) | 14 | 151 | ||||
Digimarc Corp. (c) | 5 | 148 | ||||
Digital River Inc. (c) (e) | 24 | 824 | ||||
Diodes Inc. (c) | 21 | 558 | ||||
DSP Group Inc. (c) | 15 | 125 | ||||
DTS Inc. (c) | 10 | 492 | ||||
Earthlink Inc. | 64 | 553 | ||||
Ebix Inc. (c) (e) | 16 | 384 | ||||
Echelon Corp. (c) | 21 | 215 | ||||
Echo Global Logistics Inc. (c) (e) | 6 | 69 | ||||
Electro Rent Corp. | 9 | 146 | ||||
Electro Scientific Industries Inc. (c) | 15 | 245 | ||||
Electronics for Imaging Inc. (c) | 28 | 400 | ||||
EMS Technologies Inc. (c) | 10 | 189 | ||||
Emulex Corp. (c) | 51 | 597 | ||||
Energy Conversion Devices Inc. (c) (e) | 31 | 142 | ||||
Entegris Inc. (c) | 80 | 599 | ||||
Entropic Communications Inc. (c) (e) | 40 | 478 | ||||
Envestnet Inc. (c) | 6 | 96 | ||||
Epicor Software Corp. (c) | 27 | 278 | ||||
EPIQ Systems Inc. | 19 | 260 | ||||
ePlus Inc. (c) | 2 | 39 | ||||
Euronet Worldwide Inc. (c) | 29 | 498 | ||||
Evergreen Solar Inc. (c) (e) | 94 | 55 | ||||
Exar Corp. (c) (e) | 24 | 164 | ||||
ExlService Holdings Inc. (c) | 9 | 195 | ||||
Extreme Networks (c) | 61 | 187 | ||||
Fabrinet (c) | 7 | 143 | ||||
Fair Isaac Corp. | 24 | 565 | ||||
FalconStor Software Inc. (c) (e) | 18 | 61 | ||||
FARO Technologies Inc. (c) | 9 | 306 | ||||
FEI Co. (c) | 22 | 584 | ||||
Finisar Corp. (c) (e) | 45 | 1,347 | ||||
FormFactor Inc. (c) | 28 | 249 | ||||
Forrester Research Inc. (c) | 8 | 296 | ||||
Fortinet Inc. (c) | 25 | 802 | ||||
FSI International Inc. (c) | 28 | 125 | ||||
Gerber Scientific Inc. (c) | 19 | 148 | ||||
Global Cash Access Holdings Inc. (c) | 41 | 131 | ||||
Globecomm Systems Inc. (c) | 13 | 133 | ||||
GSI Commerce Inc. (c) | 39 | 907 | ||||
GSI Technology Inc. (c) | 12 | 99 | ||||
Guidance Software Inc. (c) | 7 | 51 | ||||
Hackett Group Inc. (c) (e) | 19 | 66 | ||||
Harmonic Inc. (c) | 66 | 564 | ||||
Heartland Payment Systems Inc. | 23 | 355 | ||||
Hittite Microwave Corp. (c) (e) | 16 | 1,005 | ||||
Hughes Communications Inc. (c) | 5 | 222 | ||||
Hutchinson Technology Inc. (c) (e) | 13 | 47 | ||||
Hypercom Corp. (c) | 29 | 244 | ||||
iGate Corp. | 13 | 255 | ||||
Ikanos Communications Inc. (c) (e) | 16 | 22 | ||||
Imation Corp. (c) | 17 | 173 | ||||
Immersion Corp. (c) | 20 | 135 | ||||
| Shares/Par (p) | Value | |||||
Infinera Corp. (c) | 51 | 529 | ||||
Infospace Inc. (c) | 23 | 191 | ||||
Insight Enterprises Inc. (c) | 28 | 366 | ||||
Integral Systems Inc. (c) | 10 | 100 | ||||
Integrated Device Technology Inc. (c) | 94 | 627 | ||||
Integrated Silicon Solutions Inc. (c) | 19 | 150 | ||||
Interactive Intelligence Inc. (c) | 8 | 214 | ||||
InterDigital Inc. (c) (e) | 26 | 1,081 | ||||
Intermec Inc. (c) | 30 | 375 | ||||
Internap Network Services Corp. (c) | 32 | 198 | ||||
Internet Capital Group Inc. (c) | 22 | 307 | ||||
Intevac Inc. (c) | 14 | 196 | ||||
IntraLinks Holdings Inc. (c) | 7 | 133 | ||||
IPG Photonics Corp. (c) (e) | 16 | 498 | ||||
Ixia (c) | 20 | 329 | ||||
IXYS Corp. (c) | 15 | 172 | ||||
j2 Global Communications Inc. (c) | 27 | 775 | ||||
Jack Henry & Associates Inc. | 50 | 1,459 | ||||
JDA Software Group Inc. (c) | 26 | 723 | ||||
Kenexa Corp. (c) | 14 | 304 | ||||
Keynote Systems Inc. | 7 | 105 | ||||
KIT Digital Inc. (c) (e) | 17 | 266 | ||||
Knot Inc. (c) | 19 | 183 | ||||
Kopin Corp. (c) | 41 | 173 | ||||
Kulicke & Soffa Industries Inc. (c) | 42 | 300 | ||||
KVH Industries Inc. (c) | 9 | 102 | ||||
L-1 Identity Solutions Inc. (c) | 45 | 534 | ||||
Lattice Semiconductor Corp. (c) | 69 | 419 | ||||
Lawson Software Inc. (c) | 82 | 760 | ||||
Limelight Networks Inc. (c) | 29 | 168 | ||||
Lionbridge Technologies Inc. (c) | 36 | 133 | ||||
Liquidity Services Inc. (c) | 8 | 110 | ||||
Littelfuse Inc. | 13 | 615 | ||||
LivePerson Inc. (c) | 27 | 303 | ||||
Local.com Corp. (c) (e) | 9 | 56 | ||||
LogMeIn Inc. (c) | 9 | 404 | ||||
LoopNet Inc. (c) | 10 | 106 | ||||
Loral Space & Communications Inc. (c) | 7 | 500 | ||||
LTX-Credence Corp. (c) | 32 | 235 | ||||
Magma Design Automation Inc. (c) | 39 | 195 | ||||
Manhattan Associates Inc. (c) | 14 | 426 | ||||
Mantech International Corp. - Class A (c) | 13 | 533 | ||||
Marchex Inc. - Class B | 13 | 126 | ||||
Mattson Technology Inc. (c) | 34 | 101 | ||||
MAXIMUS Inc. | 11 | 695 | ||||
MaxLinear Inc. - Class A (c) (e) | 4 | 43 | ||||
Maxwell Technologies Inc. (c) (e) | 17 | 312 | ||||
Measurement Specialties Inc. (c) | 8 | 247 | ||||
Mediamind Technologies Inc. (c) | 3 | 47 | ||||
Mentor Graphics Corp. (c) | 62 | 741 | ||||
Mercury Computer Systems Inc. (c) | 15 | 270 | ||||
Meru Networks Inc. (c) (e) | 3 | 45 | ||||
Methode Electronics Inc. | 21 | 274 | ||||
Micrel Inc. | 31 | 400 | ||||
Microsemi Corp. (c) | 50 | 1,143 | ||||
MicroStrategy Inc. - Class A (c) | 5 | 426 | ||||
Microvision Inc. (c) (e) | 52 | 97 | ||||
Mindspeed Technologies Inc. (c) (e) | 24 | 146 | ||||
MIPS Technologies Inc. - Class A (c) | 27 | 417 | ||||
MKS Instruments Inc. (c) | 29 | 710 | ||||
ModusLink Global Solutions Inc. (c) | 25 | 165 | ||||
MoneyGram International Inc. (c) | 60 | 162 | ||||
Monolithic Power Systems Inc. (c) | 19 | 320 | ||||
Monotype Imaging Holdings Inc. (c) | 13 | 143 | ||||
MoSys Inc. (c) (e) | 15 | 83 | ||||
Motricity Inc. (c) | 4 | 70 | ||||
Move Inc. (c) | 90 | 230 | ||||
MTS Systems Corp. (e) | 9 | 347 | ||||
See accompanying Notes to the Financial Statements.
JNL Series Trust
Schedules of Investments (in thousands)
December 31, 2010
| Shares/Par (p) | Value | |||||||
Multi-Fineline Electronix Inc. (c) | 6 | 159 | ||||||
Nanometrics Inc. (c) | 10 | 123 | ||||||
NCI Inc. - Class A (c) | 4 | 100 | ||||||
NetGear Inc. (c) | 20 | 689 | ||||||
NetLogic Microsystems Inc. (c) | 38 | 1,182 | ||||||
NetScout Systems Inc. (c) | 18 | 423 | ||||||
NetSuite Inc. (c) (e) | 11 | 276 | ||||||
Network Engines Inc. (c) | 19 | 29 | ||||||
Network Equipment Technologies Inc. (c) (e) | 13 | 59 | ||||||
Newport Corp. (c) | 21 | 366 | ||||||
NIC Inc. (c) | 34 | 332 | ||||||
Novatel Wireless Inc. (c) (e) | 21 | 199 | ||||||
NVE Corp. (c) | 3 | 186 | ||||||
Occam Networks Inc. (c) | 7 | 58 | ||||||
Oclaro Inc. (c) | 30 | 401 | ||||||
Omnivision Technologies Inc. (c) | 33 | 973 | ||||||
Online Resources Corp. (c) | 12 | 58 | ||||||
OpenTable Inc. (c) (e) | 9 | 646 | ||||||
Openwave Systems Inc. (c) | 62 | 133 | ||||||
Oplink Communications Inc. (c) | 12 | 228 | ||||||
OPNET Technologies Inc. | 8 | 222 | ||||||
Opnext Inc. (c) | 13 | 22 | ||||||
OSI Systems Inc. (c) | 10 | 348 | ||||||
Parametric Technology Corp. (c) | 68 | 1,533 | ||||||
Park Electrochemical Corp. | 13 | 381 | ||||||
PC Connection Inc. (c) | 5 | 41 | ||||||
PC-Tel Inc. (c) | 10 | 63 | ||||||
PDF Solutions Inc. (c) | 12 | 58 | ||||||
Pegasystems Inc. (e) | 10 | 355 | ||||||
Perficient Inc. (c) | 13 | 161 | ||||||
Pericom Semiconductor Corp. (c) | 16 | 174 | ||||||
Photronics Inc. (c) | 34 | 203 | ||||||
Plantronics Inc. | 29 | 1,082 | ||||||
Plexus Corp. (c) | 24 | 740 | ||||||
PLX Technology Inc. (c) | 24 | 85 | ||||||
Power Integrations Inc. | 15 | 592 | ||||||
Power-One Inc. (c) (e) | 42 | 428 | ||||||
Powerwave Technologies Inc. (c) (e) | 80 | 203 | ||||||
Presstek Inc. (c) | 15 | 33 | ||||||
Progress Software Corp. (c) | 25 | 1,075 | ||||||
PROS Holdings Inc. (c) | 12 | 139 | ||||||
Pulse Electronics Corp. | 29 | 153 | ||||||
QAD Inc. - Class A (c) | 2 | 22 | ||||||
QAD Inc. - Class B (c) (e) | 1 | 6 | ||||||
QLIK Technologies Inc. (c) | 8 | 216 | ||||||
Quantum Corp. (c) | 131 | 488 | ||||||
Quest Software Inc. (c) | 36 | 1,003 | ||||||
QuinStreet Inc. (c) (e) | 5 | 100 | ||||||
Rackspace Hosting Inc. (c) (e) | 58 | 1,824 | ||||||
Radiant Systems Inc. (c) | 20 | 390 | ||||||
Radisys Corp. (c) | 13 | 119 | ||||||
RealD Inc. (c) (e) | 9 | 237 | ||||||
RealNetworks Inc. (c) | 47 | 198 | ||||||
RealPage Inc. (c) (e) | 9 | 274 | ||||||
Renaissance Learning Inc. | 7 | 85 | ||||||
RF Micro Devices Inc. (c) | 158 | 1,159 | ||||||
Richardson Electronics Ltd. | 11 | 126 | ||||||
RightNow Technologies Inc. (c) (e) | 13 | 302 | ||||||
Rimage Corp. (c) | 4 | 67 | ||||||
Riverbed Technology Inc. (c) | 75 | 2,649 | ||||||
Rofin-Sinar Technologies Inc. (c) | 17 | 587 | ||||||
Rogers Corp. (c) | 10 | 375 | ||||||
Rosetta Stone Inc. (c) | 6 | 121 | ||||||
Rubicon Technology Inc. (c) (e) | 9 | 183 | ||||||
Rudolph Technologies Inc. (c) | 19 | 155 | ||||||
S1 Corp. (c) | 32 | 217 | ||||||
Saba Software Inc. (c) | 15 | 93 | ||||||
Sanmina-SCI Corp. (c) | 46 | 530 | ||||||
| Shares/Par (p) | Value | |||||||
Sapient Corp. (c) | 62 | 755 | ||||||
SAVVIS Inc. (c) | 22 | 559 | ||||||
ScanSource Inc. (c) | 16 | 499 | ||||||
SeaChange International Inc. (c) | 19 | 165 | ||||||
Semtech Corp. (c) | 37 | 831 | ||||||
ShoreTel Inc. (c) | 29 | 227 | ||||||
Sigma Designs Inc. (c) | 17 | 244 | ||||||
Silicon Graphics International Corp. (c) | 18 | 161 | ||||||
Silicon Image Inc. (c) | 44 | 325 | ||||||
Smart Modular Technologies WWH Inc. (c) | 29 | 165 | ||||||
Smith Micro Software Inc. (c) | 19 | 300 | ||||||
SolarWinds Inc. (c) | 21 | 406 | ||||||
Sonic Solutions Inc. (c) | 24 | 361 | ||||||
Sonus Networks Inc. (c) | 119 | 318 | ||||||
Sourcefire Inc. (c) | �� | 17 | 430 | |||||
Spansion Inc. (c) | 7 | 144 | ||||||
Spectrum Control Inc. (c) | 8 | 120 | ||||||
SPS Commerce Inc. (c) (e) | 3 | 40 | ||||||
SRA International Inc. - Class A (c) | 25 | 509 | ||||||
SRS Labs Inc. (c) | 5 | 45 | ||||||
SS&C Technologies Holdings Inc. (c) (e) | 7 | 138 | ||||||
Stamps.com Inc. (c) | 6 | 86 | ||||||
Standard Microsystems Corp. (c) | 13 | 383 | ||||||
STEC Inc. (c) (e) | 25 | 434 | ||||||
Stratasys Inc. (c) | 12 | 404 | ||||||
SuccessFactors Inc. (c) | 38 | 1,096 | ||||||
Super Micro Computer Inc. (c) | 16 | 179 | ||||||
Supertex Inc. (c) | 7 | 160 | ||||||
support.com Inc. (c) | 26 | 166 | ||||||
Sycamore Networks Inc. (c) | 11 | 235 | ||||||
Symmetricom Inc. (c) | 27 | 190 | ||||||
Synaptics Inc. (c) | 20 | 573 | ||||||
Synchronoss Technologies Inc. (c) | 13 | 337 | ||||||
SYNNEX Corp. (c) | 14 | 423 | ||||||
Syntel Inc. | 8 | 370 | ||||||
Take-Two Interactive Software Inc. (c) | 42 | 518 | ||||||
Taleo Corp. - Class A (c) | 24 | 652 | ||||||
TechTarget Inc. (c) (e) | 8 | 65 | ||||||
Tekelec (c) | 41 | 486 | ||||||
TeleCommunication Systems Inc. - Class A (c) | 29 | 138 | ||||||
TeleNav Inc. (c) | 4 | 31 | ||||||
TeleTech Holdings Inc. (c) | 18 | 367 | ||||||
Terremark Worldwide Inc. (c) (e) | 34 | 446 | ||||||
Tessco Technologies Inc. | 3 | 43 | ||||||
Tessera Technologies Inc. (c) | 30 | 662 | ||||||
THQ Inc. (c) | 39 | 236 | ||||||
TIBCO Software Inc. (c) | 99 | 1,959 | ||||||
Tier Technologies Inc. - Class B (c) | 8 | 45 | ||||||
TiVo Inc. (c) | 67 | 576 | ||||||
TNS Inc. (c) | 14 | 299 | ||||||
Travelzoo Inc. (c) (e) | 4 | 151 | ||||||
Trident Microsystems Inc. (c) | 49 | 88 | ||||||
TriQuint Semiconductor Inc. (c) | 93 | 1,092 | ||||||
TTM Technologies Inc. (c) | 48 | 714 | ||||||
Tyler Technologies Inc. (c) | 17 | 354 | ||||||
Ultimate Software Group Inc. (c) (e) | 15 | 721 | ||||||
Ultra Clean Holdings Inc. (c) | 16 | 151 | ||||||
Ultratech Inc. (c) | 13 | 264 | ||||||
Unisys Corp. (c) | 25 | 637 | ||||||
United Online Inc. | 52 | 341 | ||||||
Universal Display Corp. (c) (e) | 18 | 554 | ||||||
UTStarcom Inc. (c) (e) | 63 | 130 | ||||||
ValueClick Inc. (c) | 47 | 758 | ||||||
VASCO Data Security International Inc. (c) | 16 | 134 | ||||||
Veeco Instruments Inc. (c) (e) | 24 | 1,048 | ||||||
VeriFone Holdings Inc. (c) | 51 | 1,971 | ||||||
ViaSat Inc. (c) | 20 | 890 | ||||||
Viasystems Group Inc. (c) (e) | 2 | 46 | ||||||
See accompanying Notes to the Financial Statements.
JNL Series Trust
Schedules of Investments (in thousands)
December 31, 2010
| Shares/Par (p) | Value | |||||
VirnetX Holding Corp. (c) | 21 | 316 | ||||
Virtusa Corp. (c) | 9 | 142 | ||||
Vocus Inc. (c) (e) | 10 | 277 | ||||
Volterra Semiconductor Corp. (c) | 15 | 355 | ||||
Wave Systems Corp. (c) (e) | 43 | 169 | ||||
Websense Inc. (c) | 26 | 523 | ||||
Wright Express Corp. (c) | 23 | 1,075 | ||||
X-Rite Inc. (c) | 19 | 87 | ||||
Xyratex Ltd. (c) | 18 | 301 | ||||
Zixit Corp. (c) (e) | 39 | 166 | ||||
Zoran Corp. (c) | 28 | 249 | ||||
Zygo Corp. (c) | 9 | 111 | ||||
| 130,058 | ||||||
MATERIALS - 5.6% | ||||||
A. Schulman Inc. | 19 | 434 | ||||
AEP Industries Inc. (c) | 3 | 76 | ||||
Allied Nevada Gold Corp. (c) (e) | 45 | 1,185 | ||||
AM Castle & Co. (c) | 10 | 186 | ||||
AMCOL International Corp. | 14 | 446 | ||||
American Vanguard Corp. | 13 | 111 | ||||
Arch Chemicals Inc. | 14 | 517 | ||||
Balchem Corp. | 17 | 570 | ||||
Boise Inc. (c) | 43 | 339 | ||||
Brush Engineered Materials Inc. (c) | 12 | 472 | ||||
Buckeye Technologies Inc. | 24 | 504 | ||||
Calgon Carbon Corp. (c) | 33 | 495 | ||||
Capital Gold Corp. (c) | 35 | 179 | ||||
Century Aluminum Co. (c) | 38 | 592 | ||||
Clearwater Paper Corp. (c) | 7 | 513 | ||||
Coeur d’Alene Mines Corp. (c) | 53 | 1,445 | ||||
Contango ORE Inc. (c) | 1 | 7 | ||||
Deltic Timber Corp. | 6 | 357 | ||||
Ferro Corp. (c) | 52 | 763 | ||||
General Moly Inc. (c) (e) | 42 | 275 | ||||
Georgia Gulf Corp. (c) | 20 | 489 | ||||
Glatfelter | 28 | 341 | ||||
Globe Specialty Metals Inc. | 36 | 611 | ||||
Golden Star Resources Ltd. (c) | 149 | 682 | ||||
Graham Packaging Co. Inc. (c) | 9 | 117 | ||||
Graphic Packaging Holding Co. (c) | 70 | 274 | ||||
Hawkins Inc. | 5 | 244 | ||||
Haynes International Inc. | 7 | 312 | ||||
HB Fuller Co. | 28 | 580 | ||||
Headwaters Inc. (c) | 37 | 168 | ||||
Hecla Mining Co. (c) (e) | 151 | 1,697 | ||||
Horsehead Holding Corp. (c) | 25 | 327 | ||||
Innophos Holdings Inc. | 13 | 463 | ||||
Jaguar Mining Inc. (c) (e) | 51 | 365 | ||||
Kaiser Aluminum Corp. | 9 | 467 | ||||
KapStone Paper and Packaging Corp. (c) | 23 | 346 | ||||
KMG Chemicals Inc. | 3 | 54 | ||||
Koppers Holdings Inc. | 12 | 434 | ||||
Kraton Performance Polymers Inc. (c) | 6 | 186 | ||||
Landec Corp. (c) | 16 | 95 | ||||
Louisiana-Pacific Corp. (c) | 76 | 714 | ||||
LSB Industries Inc. (c) | 11 | 257 | ||||
Metals USA Holdings Corp. (c) | 6 | 94 | ||||
Minerals Technologies Inc. | 11 | 711 | ||||
Molycorp Inc. (c) (e) | 15 | 763 | ||||
Myers Industries Inc. | 23 | 221 | ||||
Neenah Paper Inc. | 10 | 192 | ||||
NewMarket Corp. | 6 | 755 | ||||
NL Industries Inc. | 4 | 40 | ||||
Noranda Aluminium Holding Corp. (c) | 6 | 90 | ||||
Olin Corp. | 47 | 954 | ||||
Olympic Steel Inc. | 5 | 158 | ||||
OM Group Inc. (c) | 18 | 690 | ||||
| Shares/Par (p) | Value | |||||
Omnova Solutions Inc. (c) | 27 | 225 | ||||
PolyOne Corp. (c) | 55 | 687 | ||||
Quaker Chemical Corp. | 7 | 278 | ||||
Rock-Tenn Co. - Class A | 23 | 1,262 | ||||
Rockwood Holdings Inc. (c) | 31 | 1,225 | ||||
RTI International Metals Inc. (c) | 18 | 497 | ||||
Schweitzer-Mauduit International Inc. | 11 | 669 | ||||
Senomyx Inc. (c) | 21 | 148 | ||||
Sensient Technologies Corp. | 29 | 1,072 | ||||
Silgan Holdings Inc. | 32 | 1,163 | ||||
Solutia Inc. (c) | 73 | 1,679 | ||||
Spartech Corp. (c) | 18 | 167 | ||||
Stepan Co. | 5 | 369 | ||||
Stillwater Mining Co. (c) | 26 | 556 | ||||
STR Holdings Inc. (c) (e) | 17 | 341 | ||||
Texas Industries Inc. (e) | 13 | 573 | ||||
Thompson Creek Metals Co. Inc. (c) | 97 | 1,429 | ||||
TPC Group Inc. (c) | 4 | 129 | ||||
United States Lime & Minerals Inc. (c) | 1 | 59 | ||||
Universal Stainless & Alloy Products Inc. (c) | 4 | 112 | ||||
US Energy Corp. Wyoming (c) | 14 | 87 | ||||
US Gold Corp. (c) (e) | 55 | 444 | ||||
Verso Paper Corp. (c) (e) | 8 | 27 | ||||
Wausau Paper Corp. | 29 | 254 | ||||
Westlake Chemical Corp. | 11 | 490 | ||||
Worthington Industries Inc. | 34 | 631 | ||||
WR Grace & Co. (c) | 44 | 1,532 | ||||
Zep Inc. | 12 | 239 | ||||
Zoltek Cos. Inc. (c) (e) | 17 | 194 | ||||
| 39,895 | ||||||
TELECOMMUNICATION SERVICES - 0.9% | ||||||
AboveNet Inc. (c) | 14 | 797 | ||||
Alaska Communications Systems Group Inc. | 25 | 276 | ||||
Atlantic Tele-Network Inc. | 5 | 201 | ||||
Cbeyond Inc. (c) | 16 | 245 | ||||
Cincinnati Bell Inc. (c) | 116 | 326 | ||||
Cogent Communications Group Inc. (c) | 27 | 378 | ||||
Consolidated Communications Holdings Inc. | 15 | 285 | ||||
FiberTower Corp. (c) | 25 | 110 | ||||
General Communication Inc. - Class A (c) | 25 | 311 | ||||
Global Crossing Ltd. (c) | 18 | 237 | ||||
Globalstar Inc. (c) | 37 | 54 | ||||
ICO Global Communications Holdings Ltd. - Class A (c) (e) | 51 | 76 | ||||
IDT Corp. - Class B (e) | 8 | 195 | ||||
Iridium Communications Inc. (c) (e) | 18 | 151 | ||||
Neutral Tandem Inc. (c) | 21 | 297 | ||||
NTELOS Holdings Corp. | 17 | 319 | ||||
PAETEC Holding Corp. (c) | 75 | 279 | ||||
Premiere Global Services Inc. (c) | 38 | 261 | ||||
Shenandoah Telecommunications Co. | 14 | 257 | ||||
Syniverse Holdings Inc. (c) | 42 | 1,292 | ||||
USA Mobility Inc. | 13 | 232 | ||||
Vonage Holdings Corp. (c) | 57 | 127 | ||||
| 6,706 | ||||||
UTILITIES - 2.9% | ||||||
Allete Inc. | 18 | 668 | ||||
American DG Energy Inc. (c) (e) | 10 | 28 | ||||
American States Water Co. | 11 | 374 | ||||
Artesian Resources Corp. - Class A (e) | 3 | 52 | ||||
Avista Corp. | 32 | 713 | ||||
Black Hills Corp. | 23 | 696 | ||||
Cadiz Inc. (c) (e) | 6 | 75 | ||||
California Water Service Group | 11 | 428 | ||||
Central Vermont Public Service Corp. | 7 | 158 | ||||
CH Energy Group Inc. | 9 | 451 | ||||
See accompanying Notes to the Financial Statements.
JNL Series Trust
Schedules of Investments (in thousands)
December 31, 2010
| Shares/Par (p) | Value | |||||
Chesapeake Utilities Corp. | 6 | 238 | ||||
Cleco Corp. | 37 | 1,124 | ||||
Connecticut Water Services Inc. | 5 | 146 | ||||
Consolidated Water Co. Ltd. (e) | 10 | 88 | ||||
Dynegy Inc. (c) | 63 | 353 | ||||
El Paso Electric Co. (c) | 26 | 704 | ||||
Empire District Electric Co. (e) | 24 | 533 | ||||
IDACORP Inc. | 29 | 1,071 | ||||
Laclede Group Inc. | 14 | 499 | ||||
MGE Energy Inc. | 13 | 573 | ||||
Middlesex Water Co. | 8 | 154 | ||||
New Jersey Resources Corp. (e) | 24 | 1,049 | ||||
Nicor Inc. | 27 | 1,326 | ||||
Northwest Natural Gas Co. | 16 | 730 | ||||
NorthWestern Corp. | 22 | 634 | ||||
Piedmont Natural Gas Co. Inc. (e) | 43 | 1,206 | ||||
PNM Resources Inc. | 50 | 652 | ||||
Portland General Electric Co. | 45 | 985 | ||||
SJW Corp. | 8 | 202 | ||||
South Jersey Industries Inc. | 18 | 931 | ||||
Southwest Gas Corp. | 27 | 981 | ||||
UIL Holdings Corp. | 30 | 892 | ||||
UniSource Energy Corp. | 22 | 783 | ||||
Unitil Corp. | 7 | 155 | ||||
WGL Holdings Inc. (e) | 31 | 1,091 | ||||
York Water Co. (e) | 8 | 134 | ||||
| 20,877 | ||||||
Total Common Stocks (cost $579,620) | 699,872 | |||||
WARRANTS - 0.0% | ||||||
Lantronix Inc. (c) (f) | — | |||||
Total Warrants (cost $0) | — | |||||
SHORT TERM INVESTMENTS - 13.6% | ||||||
Investment Company - 1.8% | ||||||
JNL Money Market Fund, 0.08% (a) (h) | 12,878 | 12,878 | ||||
Securities Lending Collateral 11.7% |
| |||||
Securities Lending Cash Collateral Fund LLC, 0.31% (a) (h) | 79,415 | 79,415 | ||||
Securities Lending Liquidating Fund LLC, 0.66% (a) (h) | 3,767 | 3,705 | ||||
| 83,120 | ||||||
Treasury Securities 0.1% | ||||||
U.S. Treasury Bill, 0.13%, 03/24/11 (o) | $ | 895 | 895 | |||
Total Short Term Investments (cost $96,955) | 96,893 | |||||
Total Investments - 111.5% (cost $676,575) | 796,765 | |||||
Other Assets and Liabilities, Net - (11.5%) | (81,946) | |||||
Total Net Assets - 100.0% | $ 714,819 | |||||
JNL/Mellon Capital Management International Index Fund | ||||||
COMMON STOCKS - 96.3% |
| |||||
CONSUMER DISCRETIONARY - 9.9% | ||||||
ABC-Mart Inc. | 2 | $ 71 | ||||
Accor SA | 14 | 612 | ||||
Adidas AG | 20 | 1,302 | ||||
Aisin Seiki Co. Ltd. | 18 | 641 | ||||
Asics Corp. | 14 | 179 | ||||
| Shares/Par (p) | Value | |||||
Autogrill SpA (c) | 11 | 159 | ||||
Axel Springer AG | 1 | 204 | ||||
Bayerische Motoren Werke AG | 32 | 2,509 | ||||
Benesse Holdings Inc. | 6 | 295 | ||||
Billabong International Ltd. (e) | 22 | 186 | ||||
Bridgestone Corp. (e) | 62 | 1,192 | ||||
British Sky Broadcasting Group Plc | 108 | 1,242 | ||||
Burberry Group Plc | 42 | 733 | ||||
Canon Marketing Japan Inc. | 5 | 72 | ||||
Carnival Plc | 18 | 822 | ||||
Casio Computer Co. Ltd. | 20 | 161 | ||||
CDON Group AB (c) | 5 | 21 | ||||
Christian Dior SA | 6 | 889 | ||||
Compagnie Financiere Richemont SA | 50 | 2,958 | ||||
Compagnie Generale des Etablissements Michelin | 17 | 1,188 | ||||
Compass Group Plc | 178 | 1,614 | ||||
Continental AG (c) | 5 | 356 | ||||
Crown Ltd. (e) | 41 | 347 | ||||
Daihatsu Motor Co. Ltd. | 18 | 275 | ||||
Daimler AG (c) | 87 | 5,882 | ||||
Dena Co. Ltd. | 8 | 269 | ||||
Denso Corp. | 47 | 1,619 | ||||
Dentsu Inc. | 17 | 516 | ||||
Electrolux AB (e) | 23 | 645 | ||||
Esprit Holdings Ltd. | 107 | 509 | ||||
Eutelsat Communications Group SA | 9 | 332 | ||||
Fairfax Media Ltd. (e) | 209 | 300 | ||||
Fast Retailing Co. Ltd. | 5 | 809 | ||||
Fiat SpA (e) | 73 | 1,501 | ||||
Fuji Heavy Industries Ltd. | 54 | 416 | ||||
Fuji Media Holdings Inc. | — | 25 | ||||
Genting International Plc (c) (e) | 571 | 974 | ||||
Gestevision Telecinco SA (e) | 18 | 202 | ||||
Hakuhodo DY Holdings Inc. | 2 | 119 | ||||
Harvey Norman Holdings Ltd. | 55 | 166 | ||||
Hennes & Mauritz AB | 98 | 3,277 | ||||
Hermes International SCA | 2 | 316 | ||||
Home Retail Group Plc | 76 | 223 | ||||
Honda Motor Co. Ltd. (e) | 157 | 6,177 | ||||
Husqvarna AB | 36 | 303 | ||||
Inditex SA | 21 | 1,581 | ||||
InterContinental Hotels Group Plc | 27 | 521 | ||||
Isetan Mitsukoshi Holdings Ltd. | 35 | 407 | ||||
Isuzu Motors Ltd. | 116 | 524 | ||||
ITV Plc (c) | 339 | 370 | ||||
J. Front Retailing Co. Ltd. | 43 | 235 | ||||
Jardine Cycle & Carriage Ltd. | 10 | 281 | ||||
JC Decaux SA (c) | 6 | 177 | ||||
Jupiter Telecommunications Co. Ltd. | — | 216 | ||||
Kabel Deutschland Holding AG (c) | 5 | 213 | ||||
Kingfisher Plc | 231 | 949 | ||||
Koito Manufacturing Co. Ltd. | 8 | 124 | ||||
Lagardere SCA | 11 | 473 | ||||
Li & Fung Ltd. | 218 | 1,264 | ||||
Lifestyle International Holdings Ltd. | 48 | 117 | ||||
Luxottica Group SpA | 11 | 339 | ||||
LVMH Moet Hennessy Louis Vuitton SA | 24 | 3,875 | ||||
M6-Metropole Television SA | 5 | 128 | ||||
Marks & Spencer Group Plc | 155 | 891 | ||||
Marui Group Co. Ltd. | 25 | 199 | ||||
Mazda Motor Corp. | 146 | 417 | ||||
McDonald’s Holdings Co. Japan Ltd. (e) | 6 | 155 | ||||
Mediaset SpA | 68 | 410 | ||||
Mitsubishi Motors Corp. (c) (e) | 377 | 546 | ||||
Modern Times Group AB - Class B | 5 | 307 | ||||
Namco Bandai Holdings Inc. | 18 | 191 | ||||
Next Plc | 18 | 550 | ||||
See accompanying Notes to the Financial Statements.
JNL Series Trust
Schedules of Investments (in thousands)
December 31, 2010
| Shares/Par (p) | Value | |||||
NGK Spark Plug Co. Ltd. | 15 | 229 | ||||
NHK Spring Co. Ltd. | 15 | 163 | ||||
Nikon Corp. | 32 | 640 | ||||
Nissan Motor Co. Ltd. | 240 | 2,270 | ||||
Nisshinbo Holdings Inc. | 10 | 109 | ||||
Nitori Co. Ltd. | 4 | 323 | ||||
NOK Corp. | 9 | 195 | ||||
Nokian Renkaat Oyj | 10 | 365 | ||||
OPAP SA | 22 | 373 | ||||
Oriental Land Co. Ltd. | 5 | 453 | ||||
PagesJaunes Groupe SA (e) | 10 | 94 | ||||
Panasonic Corp. | 189 | 2,672 | ||||
Pearson Plc | 77 | 1,213 | ||||
Peugeot SA (c) | 14 | 550 | ||||
Pirelli & C. SpA (e) | 24 | 193 | ||||
PPR SA | 7 | 1,149 | ||||
ProSiebenSat.1 Media AG | 8 | 245 | ||||
Publicis Groupe | 11 | 592 | ||||
Puma AG Rudolf Dassler Sport | — | 160 | ||||
Rakuten Inc. (c) (e) | 1 | 560 | ||||
Reed Elsevier NV | 65 | 799 | ||||
Reed Elsevier Plc | 114 | 960 | ||||
Renault SA (c) | 18 | 1,047 | ||||
Rinnai Corp. | 3 | 195 | ||||
Sands China Ltd. (c) | 227 | 499 | ||||
Sankyo Co. Ltd. | 5 | 270 | ||||
Sanoma Oyj (e) | 7 | 149 | ||||
Sega Sammy Holdings Inc. | 18 | 336 | ||||
Sekisui Chemical Co. Ltd. | 38 | 272 | ||||
Sekisui House Ltd. | 56 | 564 | ||||
SES SA - FDR | 28 | 673 | ||||
Shangri-La Asia Ltd. | 128 | 348 | ||||
Sharp Corp. | 95 | 975 | ||||
Shimamura Co. Ltd. | 2 | 185 | ||||
Shimano Inc. (e) | 6 | 319 | ||||
Singapore Press Holdings Ltd. (e) | 147 | 457 | ||||
SJM Holdings Ltd. (c) | 132 | 210 | ||||
SKYCITY Entertainment Group Ltd. | 50 | 127 | ||||
Societe Television Francaise 1 | 11 | 198 | ||||
Sodexo SA | 9 | 643 | ||||
Sony Corp. | 97 | 3,458 | ||||
Stanley Electric Co. Ltd. | 14 | 251 | ||||
Sumitomo Rubber Industries Inc. | 16 | 165 | ||||
Suzuki Motor Corp. | 33 | 813 | ||||
Swatch Group AG | 7 | 1,628 | ||||
Tabcorp Holdings Ltd. | 66 | 482 | ||||
Takashimaya Co. Ltd. | 25 | 214 | ||||
Tatts Group Ltd. | 127 | 336 | ||||
Thomas Cook Group Plc | 86 | 256 | ||||
Toho Co. Ltd. | 9 | 144 | ||||
Toyoda Gosei Co. Ltd. | 6 | 140 | ||||
Toyota Boshoku Corp. | 7 | 129 | ||||
Toyota Industries Corp. | 17 | 538 | ||||
Toyota Motor Corp. | 264 | 10,408 | ||||
TUI AG (c) (e) | 11 | 159 | ||||
TUI Travel Plc | 46 | 178 | ||||
USS Co. Ltd. | 2 | 164 | ||||
Vivendi SA | 119 | 3,214 | ||||
Volkswagen AG | 3 | 409 | ||||
Whitbread Plc | 16 | 460 | ||||
Wolters Kluwer NV | 29 | 631 | ||||
WPP Plc | 119 | 1,466 | ||||
Wynn Macau Ltd. (c) | 144 | 323 | ||||
Yamada Denki Co. Ltd. | 8 | 556 | ||||
Yamaha Corp. | 13 | 164 | ||||
Yamaha Motor Co. Ltd. (c) | 26 | 419 | ||||
| Shares/Par (p) | Value | |||||
Yue Yuen Industrial Holdings Ltd. | 68 | 245 | ||||
| 107,192 | ||||||
CONSUMER STAPLES - 9.6% | ||||||
AEON Co. Ltd. | 55 | 691 | ||||
Ajinomoto Co. Inc. | 66 | 686 | ||||
Anheuser-Busch InBev NV | 69 | 3,972 | ||||
Anheuser-Busch InBev NV - Strip VVPR (c) | 13 | — | ||||
Aryzta AG (c) | 8 | 367 | ||||
Asahi Breweries Ltd. | 37 | 704 | ||||
Associated British Foods Plc | 34 | 623 | ||||
Beiersdorf AG | 10 | 542 | ||||
British American Tobacco Plc | 192 | 7,358 | ||||
Carlsberg A/S | 10 | 1,023 | ||||
Carrefour SA | 58 | 2,383 | ||||
Casino Guichard Perrachon SA | 5 | 536 | ||||
Coca-Cola Amatil Ltd. (e) | 54 | 594 | ||||
Coca-Cola Hellenic Bottling Co. SA | 18 | 472 | ||||
Coca-Cola West Co. Ltd. | 4 | 80 | ||||
Colruyt SA | 8 | 387 | ||||
Danone SA | 56 | 3,526 | ||||
Delhaize Group | 10 | 718 | ||||
Diageo Plc | 241 | 4,450 | ||||
FamilyMart Co. Ltd. | 6 | 226 | ||||
Foster’s Group Ltd. | 184 | 1,068 | ||||
Golden Agri-Resources Ltd. | 648 | 404 | ||||
Goodman Fielder Ltd. | 140 | 192 | ||||
Heineken Holding NV | 11 | 467 | ||||
Heineken NV | 25 | 1,208 | ||||
Henkel AG & Co. KGaA | 12 | 643 | ||||
Imperial Tobacco Group Plc | 98 | 3,010 | ||||
Ito En Ltd. | 4 | 73 | ||||
J Sainsbury Plc | 112 | 654 | ||||
Japan Tobacco Inc. | — | 1,610 | ||||
Jeronimo Martins SGPS SA (c) | 21 | 322 | ||||
Kao Corp. | 53 | 1,411 | ||||
Kerry Group Plc | 13 | 447 | ||||
Kesko Oyj | 7 | 309 | ||||
Kikkoman Corp. | 13 | 145 | ||||
Kirin Holdings Co. Ltd. | 80 | 1,119 | ||||
Koninklijke Ahold NV | 116 | 1,526 | ||||
L’Oreal SA | 23 | 2,566 | ||||
Lawson Inc. | 6 | 272 | ||||
Lindt & Spruengli AG | — | 354 | ||||
MEIJI Holdings Co. Ltd. | 7 | 293 | ||||
Metcash Ltd. (e) | 70 | 296 | ||||
Metro AG | 12 | 881 | ||||
Nestle SA | 332 | 19,441 | ||||
Nippon Meat Packers Inc. | 19 | 248 | ||||
Nisshin Seifun Group Inc. | 18 | 227 | ||||
Nissin Foods Holdings Co. Ltd. | 6 | 204 | ||||
Olam International Ltd. | 106 | 258 | ||||
Parmalat SpA | 174 | 477 | ||||
Pernod-Ricard SA (e) | 19 | 1,804 | ||||
Reckitt Benckiser Group Plc | 59 | 3,262 | ||||
SABMiller Plc | 92 | 3,220 | ||||
Sapporo Holdings Ltd. (e) | 26 | 117 | ||||
Seven & I Holdings Co. Ltd. | 73 | 1,941 | ||||
Shiseido Co. Ltd. | 33 | 712 | ||||
Suedzucker AG | 7 | 187 | ||||
Swedish Match AB | 22 | 633 | ||||
Tesco Plc | 771 | 5,108 | ||||
Toyo Suisan Kaisha Ltd. | 9 | 200 | ||||
Unicharm Corp. | 12 | 480 | ||||
Unilever NV | 157 | 4,873 | ||||
Unilever Plc | 123 | 3,779 | ||||
UNY Co. Ltd. | 17 | 166 | ||||
Wesfarmers Ltd. | 112 | 3,648 | ||||
See accompanying Notes to the Financial Statements.
JNL Series Trust
Schedules of Investments (in thousands)
December 31, 2010
| Shares/Par (p) | Value | |||||||
Wilmar International Ltd. (e) | 188 | 825 | ||||||
WM Morrison Supermarkets Plc | 199 | 830 | ||||||
Woolworths Ltd. | 117 | 3,222 | ||||||
Yakult Honsha Co. Ltd. | 9 | 244 | ||||||
Yamazaki Baking Co. Ltd. (e) | 10 | 120 | ||||||
| 104,834 | ||||||||
ENERGY - 7.6% | ||||||||
Aker Solutions ASA | 15 | 259 | ||||||
AMEC Plc | 32 | 565 | ||||||
BG Group Plc | 325 | 6,558 | ||||||
BP Plc (c) | 1,801 | 13,069 | ||||||
Cairn Energy Plc (c) | 137 | 897 | ||||||
Caltex Australia Ltd. | 12 | 173 | ||||||
Cie Generale de Geophysique-Veritas (c) | 14 | 429 | ||||||
Cosmo Oil Co. Ltd. | 52 | 170 | ||||||
ENI SpA | 250 | 5,480 | ||||||
Essar Energy Plc (c) | 33 | 303 | ||||||
Fugro NV | 6 | 515 | ||||||
Galp Energia SGPS SA | 21 | 406 | ||||||
Idemitsu Kosan Co. Ltd. | 2 | 203 | ||||||
INPEX Corp. | — | 1,191 | ||||||
Japan Petroleum Exploration Co. | 3 | 95 | ||||||
JX Holdings Inc. | 213 | 1,442 | ||||||
Mongolia Energy Co. Ltd. (c) | 231 | 69 | ||||||
Neste Oil Oyj | 11 | 176 | ||||||
OMV AG | 14 | 567 | ||||||
Origin Energy Ltd. (e) | 86 | 1,459 | ||||||
Paladin Energy Ltd. (c) (e) | 64 | 321 | ||||||
Petrofac Ltd. | 26 | 635 | ||||||
Repsol YPF SA (e) | 71 | 1,984 | ||||||
Royal Dutch Shell Plc - A Shares | 340 | 11,331 | ||||||
Royal Dutch Shell Plc - B Shares | 259 | 8,526 | ||||||
Saipem SpA | 25 | 1,223 | ||||||
Santos Ltd. | 78 | 1,050 | ||||||
SBM Offshore NV | 17 | 370 | ||||||
SeaDrill Ltd. (e) | 27 | 912 | ||||||
Showa Shell Sekiyu KK (e) | 16 | 142 | ||||||
StatoilHydro ASA | 108 | 2,565 | ||||||
Technip SA | 10 | 891 | ||||||
Tenaris SA | 44 | 1,087 | ||||||
TonenGeneral Sekiyu KK (e) | 26 | 284 | ||||||
Total SA | 203 | 10,734 | ||||||
Transocean Ltd. (c) | 31 | 2,129 | ||||||
Tullow Oil Plc | 84 | 1,650 | ||||||
Woodside Petroleum Ltd. | 60 | 2,620 | ||||||
WorleyParsons Ltd. (e) | 18 | 492 | ||||||
| 82,972 | ||||||||
FINANCIALS - 23.1% | ||||||||
3i Group Plc | 94 | 483 | ||||||
77 Bank Ltd. | 31 | 164 | ||||||
Admiral Group Plc | 20 | 462 | ||||||
Aegon NV (c) | 153 | 935 | ||||||
AEON Credit Service Co. Ltd. | 7 | 96 | ||||||
AEON Mall Co. Ltd. | 7 | 188 | ||||||
Ageas | 215 | 492 | ||||||
AIA Group Ltd. (c) | 739 | 2,077 | ||||||
Allianz SE | 44 | 5,182 | ||||||
Alpha Bank AE (c) | 47 | 238 | ||||||
AMP Ltd. (e) | 197 | 1,068 | ||||||
Anglo Irish Bank Corp. Plc (c) (f) | 34 | — | ||||||
Aozora Bank Ltd. | 67 | 137 | ||||||
Ascendas Real Estate Investment Trust | 159 | 256 | ||||||
Assicurazioni Generali SpA | 113 | 2,147 | ||||||
ASX Ltd. | 16 | 636 | ||||||
Australia & New Zealand Banking Group Ltd. | 246 | 5,869 | ||||||
Aviva Plc | 265 | 1,626 | ||||||
| Shares/Par (p) | Value | |||||||
AXA Asia Pacific Holdings Ltd. (e) | 99 | 636 | ||||||
AXA SA | 166 | 2,755 | ||||||
Baloise Holding AG | 5 | 455 | ||||||
Banca Carige SpA (e) | 60 | 126 | ||||||
Banca Monte dei Paschi di Siena SpA (c) (e) | 205 | 235 | ||||||
Banco Bilbao Vizcaya Argentaria SA (e) | 411 | 4,186 | ||||||
Banco Comercial Portugues SA (e) | 259 | 201 | ||||||
Banco de Sabadell SA (e) | 101 | 398 | ||||||
Banco de Valencia SA (c) (e) | 19 | 83 | ||||||
Banco Espirito Santo SA (e) | 49 | 189 | ||||||
Banco Popolare SC (e) | 58 | 265 | ||||||
Banco Popular Espanol SA (e) | 82 | 425 | ||||||
Banco Santander SA | 789 | 8,409 | ||||||
Bank Hapoalim BM (c) | 99 | 515 | ||||||
Bank Leumi Le-Israel BM | 114 | 585 | ||||||
Bank of Cyprus Public Co. Ltd. | 81 | 280 | ||||||
Bank of East Asia Ltd. | 144 | 605 | ||||||
Bank of Kyoto Ltd. | 32 | 302 | ||||||
Bank of Yokohama Ltd. | 114 | 588 | ||||||
Bankinter SA (e) | 24 | 135 | ||||||
Barclays Plc | 1,100 | 4,487 | ||||||
Bendigo and Adelaide Bank Ltd. (e) | 36 | 364 | ||||||
BGP Holdings Plc (c) (f) | 479 | — | ||||||
BNP Paribas | 92 | 5,854 | ||||||
BOC Hong Kong Holdings Ltd. | 346 | 1,177 | ||||||
British Land Co. Plc | 81 | 659 | ||||||
Capital Shopping Centres Group | 53 | 344 | ||||||
CapitaLand Ltd. | 241 | 697 | ||||||
CapitaMall Trust | 216 | 328 | ||||||
CapitaMalls Asia Ltd. (e) | 139 | 210 | ||||||
CFS Retail Property Trust | 204 | 367 | ||||||
Cheung Kong Holdings Ltd. | 134 | 2,067 | ||||||
China Bank Ltd. | 71 | 460 | ||||||
Chugoku Bank Ltd. | 17 | 205 | ||||||
Chuo Mitsui Trust Holdings Inc. | 89 | 368 | ||||||
City Developments Ltd. | 54 | 528 | ||||||
CNP Assurances SA | 14 | 256 | ||||||
Commerzbank AG (c) (e) | 67 | 502 | ||||||
Commonwealth Bank of Australia (e) | 149 | 7,716 | ||||||
Corio NV | 6 | 365 | ||||||
Credit Agricole SA | 93 | 1,187 | ||||||
Credit Saison Co. Ltd. | 14 | 220 | ||||||
Credit Suisse Group AG | 108 | 4,362 | ||||||
Criteria CaixaCorp SA (e) | 79 | 420 | ||||||
Dai-Ichi Life Insurance Co. Ltd. | 1 | 1,233 | ||||||
Daito Trust Construction Co. Ltd. | 7 | 472 | ||||||
Daiwa House Industry Co. Ltd. | 48 | 588 | ||||||
Daiwa Securities Group Inc. | 160 | 821 | ||||||
Danske Bank A/S (c) | 43 | 1,108 | ||||||
DBS Group Holdings Ltd. | 167 | 1,858 | ||||||
Delta Lloyd NV (c) | 8 | 161 | ||||||
Deutsche Bank AG | 90 | 4,676 | ||||||
Deutsche Boerse AG | 18 | 1,262 | ||||||
Dexia SA (c) | 49 | 172 | ||||||
Dexus Property Group | 471 | 383 | ||||||
DnB NOR ASA | 93 | 1,306 | ||||||
EFG Eurobank Ergasias SA (c) | 33 | 164 | ||||||
Erste Group Bank AG | 19 | 876 | ||||||
Eurazeo | 3 | 186 | ||||||
Exor SpA | 7 | 221 | ||||||
Fonciere Des Regions (e) | 3 | 268 | ||||||
Fukuoka Financial Group Inc. | 68 | 294 | ||||||
GAM Holding Ltd. (c) | 20 | 326 | ||||||
Gecina SA | 2 | 173 | ||||||
Global Logistic Properties Ltd. (c) | 163 | 275 | ||||||
Goodman Group | 613 | 408 | ||||||
GPT Group | 162 | 487 | ||||||
Groupe Bruxelles Lambert SA | 8 | 652 | ||||||
See accompanying Notes to the Financial Statements.
JNL Series Trust
Schedules of Investments (in thousands)
December 31, 2010
| Shares/Par (p) | Value | |||||
Groupe Bruxelles Lambert SA - Strip VVPR (c) | — | — | ||||
Gunma Bank Ltd. | 41 | 224 | ||||
Hachijuni Bank Ltd. | 38 | 214 | ||||
Hammerson Plc | 68 | 440 | ||||
Hang Lung Group Ltd. | 75 | 493 | ||||
Hang Lung Properties Ltd. | 239 | 1,118 | ||||
Hang Seng Bank Ltd. | 73 | 1,197 | ||||
Hannover Rueckversicherung AG | 6 | 307 | ||||
Henderson Land Development Co. Ltd. (c) | 102 | 696 | ||||
Hiroshima Bank Ltd. | 44 | 187 | ||||
Hokuhoku Financial Group Inc. | 107 | 217 | ||||
Hong Kong Exchanges & Clearing Ltd. | 99 | 2,241 | ||||
Hopewell Holdings Ltd. | 47 | 148 | ||||
HSBC Holdings Plc | 1,686 | 17,120 | ||||
Hysan Development Co. Ltd. | 54 | 254 | ||||
Icade SA (c) | 2 | 234 | ||||
ICAP Plc | 55 | 460 | ||||
IMMOFINANZ Immobilien Anlagen AG (c) (e) | 95 | 406 | ||||
Industrivarden AB | 10 | 174 | ||||
ING Groep NV (c) | 369 | 3,585 | ||||
Insurance Australia Group Ltd. (e) | 196 | 778 | ||||
Intesa Sanpaolo SpA | 828 | 2,223 | ||||
Investec Plc | 47 | 390 | ||||
Investor AB | 45 | 954 | ||||
Israel Discount Bank Ltd. (c) | 85 | 194 | ||||
Iyo Bank Ltd. | 20 | 160 | ||||
Japan Prime Realty Investment Corp. | — | 221 | ||||
Japan Real Estate Investment Corp. | — | 456 | ||||
Japan Retail Fund Investment Corp. | — | 308 | ||||
Joyo Bank Ltd. | 64 | 281 | ||||
Julius Baer Group Ltd. | 20 | 926 | ||||
KBC Groep NV (c) | 15 | 518 | ||||
Keppel Land Ltd. | 66 | 247 | ||||
Kerry Properties Ltd. | 64 | 331 | ||||
Kinnevik Investment AB | 21 | 432 | ||||
Klepierre | 8 | 304 | ||||
Land Securities Group Plc | 73 | 767 | ||||
Legal & General Group Plc | 550 | 830 | ||||
Lend Lease Corp. Ltd. | 49 | 435 | ||||
Link REIT | 208 | 646 | ||||
Lloyds Banking Group Plc (c) | 3,927 | 4,023 | ||||
London Stock Exchange Group Plc | 15 | 192 | ||||
Macquarie Group Ltd. | 33 | 1,240 | ||||
Man Group Plc | 171 | 787 | ||||
Mapfre SA | 75 | 208 | ||||
Matsui Securities Co. Ltd. | 8 | 58 | ||||
Mediobanca SpA (e) | 43 | 385 | ||||
Mirvac Group | 321 | 402 | ||||
Mitsubishi Estate Co. Ltd. | 114 | 2,107 | ||||
Mitsubishi UFJ Financial Group Inc. | 1,223 | 6,593 | ||||
Mitsubishi UFJ Lease & Finance Co. Ltd. | 6 | 228 | ||||
Mitsui Fudosan Co. Ltd. | 79 | 1,570 | ||||
Mizrahi Tefahot Bank Ltd. | 14 | 156 | ||||
Mizuho Financial Group Inc. | 1,968 | 3,692 | ||||
Mizuho Securities Co. Ltd. | 48 | 137 | ||||
Mizuho Trust & Banking Co. Ltd. (c) | 121 | 125 | ||||
MS&AD Insurance Group Holdings | 51 | 1,276 | ||||
Muenchener Rueckversicherungs AG | 18 | 2,750 | ||||
National Australia Bank Ltd. | 205 | 4,968 | ||||
National Bank of Greece SA (c) | 91 | 738 | ||||
Nationale A Portefeuille | 2 | 120 | ||||
Natixis (c) | 81 | 379 | ||||
New World Development Ltd. (c) | 243 | 456 | ||||
Nippon Building Fund Inc. | — | 512 | ||||
Nishi-Nippon City Bank Ltd. | 74 | 224 | ||||
NKSJ Holdings Inc. (c) | 138 | 1,012 | ||||
Nomura Holdings Inc. | 342 | 2,167 | ||||
Nomura Real Estate Holdings Inc. | 8 | 150 | ||||
| Shares/Par (p) | Value | |||||
Nomura Real Estate Office Fund Inc. | — | 166 | ||||
Nordea Bank AB | 311 | 3,385 | ||||
NTT Urban Development Corp. | — | 109 | ||||
Old Mutual Plc | 507 | 974 | ||||
ORIX Corp. | 10 | 1,004 | ||||
Oversea-Chinese Banking Corp. Ltd. | 239 | 1,837 | ||||
Pargesa Holding SA | 2 | 208 | ||||
Pohjola Bank Plc | 13 | 162 | ||||
Prudential plc (a) | 245 | 2,552 | ||||
QBE Insurance Group Ltd. | 98 | 1,819 | ||||
Raiffeisen International Bank Holding AG (e) | 5 | 268 | ||||
Ratos AB Series B | 10 | 381 | ||||
Resolution Ltd. | 132 | 482 | ||||
Resona Holdings Inc. (e) | 53 | 318 | ||||
Royal Bank of Scotland Plc (c) | 1,624 | 989 | ||||
RSA Insurance Group Plc | 318 | 620 | ||||
Sampo Oyj | 40 | 1,069 | ||||
Sapporo Hokuyo Holdings Inc. | 28 | 128 | ||||
SBI Holdings Inc. | 2 | 277 | ||||
Schroders Plc | 10 | 287 | ||||
SCOR SE | 16 | 414 | ||||
Segro Plc | 67 | 301 | ||||
Senshu Ikeda Holdings Inc. | 56 | 80 | ||||
Seven Bank Ltd. | — | 131 | ||||
Shinsei Bank Ltd. (c) (e) | 79 | 103 | ||||
Shizuoka Bank Ltd. | 58 | 533 | ||||
Singapore Exchange Ltd. (e) | 81 | 531 | ||||
Sino Land Co. | 235 | 439 | ||||
Skandinaviska Enskilda Banken AB | 132 | 1,103 | ||||
Societe Generale | 61 | 3,284 | ||||
Sony Financial Holdings Inc. | — | 334 | ||||
Standard Chartered Plc | 224 | 6,022 | ||||
Standard Life Plc | 208 | 700 | ||||
Stockland | 228 | 840 | ||||
Sumitomo Mitsui Financial Group Inc. | 129 | 4,575 | ||||
Sumitomo Realty & Development Co. Ltd. | 34 | 797 | ||||
Sumitomo Trust & Banking Co. Ltd. | 131 | 821 | ||||
Sun Hung Kai Properties Ltd. | 136 | 2,259 | ||||
Suncorp Group Ltd. (c) | 122 | 1,074 | ||||
Suruga Bank Ltd. | 18 | 167 | ||||
Svenska Handelsbanken | 47 | 1,518 | ||||
Swedbank AB (c) | 70 | 976 | ||||
Swire Pacific Ltd. | 73 | 1,200 | ||||
Swiss Life Holding AG (c) | 3 | 421 | ||||
Swiss Reinsurance | 33 | 1,787 | ||||
T&D Holdings Inc. | 26 | 665 | ||||
The Governor & Co. of the Bank of Ireland (c) | 307 | 154 | ||||
Tokio Marine Holdings Inc. | 70 | 2,080 | ||||
Tokyo Tatemono Co. Ltd. (e) | 43 | 198 | ||||
Tokyu Land Corp. | 49 | 245 | ||||
TrygVesta AS | 2 | 99 | ||||
UBS AG (c) | 349 | 5,738 | ||||
Unibail-Rodamco SE (c) | 9 | 1,751 | ||||
UniCredit SpA | 1,300 | 2,695 | ||||
Unione di Banche Italiane SCPA | �� | 59 | 515 | |||
United Overseas Bank Ltd. | 119 | 1,688 | ||||
UOL Group Ltd. | 45 | 165 | ||||
Vienna Insurance Group | 4 | 200 | ||||
Westfield Group | 211 | 2,072 | ||||
Westfield Retail Trust (c) | 211 | 556 | ||||
Westpac Banking Corp. | 287 | 6,518 | ||||
Wharf Holdings Ltd. (e) | 132 | 1,015 | ||||
Wheelock & Co. Ltd. | 89 | 360 | ||||
Wing Hang Bank Ltd. | 9 | 126 | ||||
Yamaguchi Financial Group Inc. | 19 | 191 | ||||
Zurich Financial Services AG | 14 | 3,631 | ||||
| 250,820 | ||||||
See accompanying Notes to the Financial Statements.
JNL Series Trust
Schedules of Investments (in thousands)
December 31, 2010
| Shares/Par (p) | Value | |||||
HEALTH CARE - 7.8% | ||||||
Actelion Ltd. (c) | 10 | 521 | ||||
Alfresa Holdings Corp. | 3 | 146 | ||||
Astellas Pharma Inc. | 43 | 1,636 | ||||
AstraZeneca Plc | 138 | 6,266 | ||||
Bayer AG | 79 | 5,857 | ||||
BioMerieux SA | 1 | 116 | ||||
Celesio AG | 8 | 188 | ||||
Chugai Pharmaceutical Co. Ltd. (e) | 21 | 384 | ||||
Cie Generale d’Optique Essilor International SA | 20 | 1,266 | ||||
Cochlear Ltd. (e) | 6 | 456 | ||||
Coloplast A/S | 2 | 297 | ||||
CSL Ltd. | 52 | 1,938 | ||||
Daiichi Sankyo Co. Ltd. | 64 | 1,395 | ||||
Dainippon Sumitomo Pharma Co. Ltd. | 15 | 135 | ||||
Eisai Co. Ltd. (e) | 25 | 892 | ||||
Elan Corp. Plc (c) | 47 | 262 | ||||
Fresenius Medical Care AG & Co. KGaA | 18 | 1,042 | ||||
Fresenius SE | 3 | 241 | ||||
Getinge AB | 18 | 374 | ||||
GlaxoSmithKline Plc | 498 | 9,624 | ||||
Grifols SA (e) | 14 | 194 | ||||
Hisamitsu Pharmaceutical Co. Inc. | 7 | 282 | ||||
kyowa Hakko Kirin Co. Ltd. | 25 | 254 | ||||
Lonza Group AG | 5 | 385 | ||||
Medipal Holdings Corp. | 12 | 132 | ||||
Merck KGaA | 6 | 471 | ||||
Miraca Holdings Inc. | 5 | 189 | ||||
Mitsubishi Tanabe Pharma Corp. | 20 | 337 | ||||
Novartis AG | 202 | 11,905 | ||||
Novo-Nordisk A/S | 40 | 4,535 | ||||
Olympus Corp. | 20 | 605 | ||||
Ono Pharmaceutical Co. Ltd. | 8 | 382 | ||||
Orion Oyj | 9 | 206 | ||||
Qiagen NV (c) (e) | 22 | 442 | ||||
Ramsay Health Care Ltd. | 11 | 201 | ||||
Roche Holding AG | 67 | 9,874 | ||||
Sanofi-Aventis SA | 101 | 6,435 | ||||
Santen Pharmaceutical Co. Ltd. | 7 | 243 | ||||
Shionogi & Co. Ltd. | 28 | 560 | ||||
Shire Plc | 53 | 1,284 | ||||
Smith & Nephew Plc | 85 | 897 | ||||
Sonic Health Care Ltd. | 34 | 402 | ||||
Sonova Holding AG | 4 | 562 | ||||
Straumann Holding AG | 1 | 147 | ||||
Suzuken Co. Ltd. | 6 | 191 | ||||
Synthes Inc. | 6 | 757 | ||||
Sysmex Corp. | 3 | 228 | ||||
Taisho Pharmaceutical Co. Ltd. | 14 | 306 | ||||
Takeda Pharmaceutical Co. Ltd. | 72 | 3,547 | ||||
Terumo Corp. | 17 | 925 | ||||
Teva Pharmaceutical Industries Ltd. | 90 | 4,715 | ||||
Tsumura & Co. | 6 | 184 | ||||
UCB SA | 9 | 305 | ||||
William Demant Holding AS (c) | 2 | 181 | ||||
| 85,299 | ||||||
INDUSTRIALS - 12.3% | ||||||
A P Moller - Maersk A/S - Class A | — | 485 | ||||
A P Moller - Maersk A/S - Class B | — | 1,123 | ||||
ABB Ltd. (c) | 211 | 4,703 | ||||
Abertis Infraestructuras SA | 27 | 483 | ||||
ACS Actividades de Construccion y Servicios SA (e) | 13 | 613 | ||||
Adecco SA | 12 | 775 | ||||
Aeroports de Paris | 3 | 200 | ||||
| Shares/Par (p) | Value | |||||
Aggreko Plc | 25 | 580 | ||||
Air France-KLM (c) | 14 | 249 | ||||
Alfa Laval AB | 32 | 676 | ||||
All Nippon Airways Co. Ltd. (c) | 75 | 279 | ||||
Alstom SA | 19 | 923 | ||||
Amada Co. Ltd. | 33 | 267 | ||||
Asahi Glass Co. Ltd. | 95 | 1,105 | ||||
Asciano Group (c) | 292 | 477 | ||||
Assa Abloy AB | 29 | 829 | ||||
Atlantia SpA | 22 | 457 | ||||
Atlas Copco AB - Class A | 64 | 1,608 | ||||
Atlas Copco AB - Class B | 37 | 848 | ||||
Auckland International Airport Ltd. | 86 | 146 | ||||
Babcock International Group Plc | 34 | 300 | ||||
BAE Systems Plc | 326 | 1,676 | ||||
Balfour Beatty Plc | 65 | 316 | ||||
Bekaert SA (c) | 4 | 448 | ||||
Bouygues SA | 23 | 974 | ||||
Brambles Ltd. | 139 | 1,013 | ||||
Brenntag AG (c) | 3 | 297 | ||||
Brisa-Auto Estradas de Portugal SA | 19 | 136 | ||||
British Airways Plc (c) (e) | 53 | 224 | ||||
Bunzl Plc | 32 | 355 | ||||
Bureau Veritas SA | 5 | 343 | ||||
Capita Group Plc | 58 | 633 | ||||
Cathay Pacific Airways Ltd. (c) | 112 | 309 | ||||
Central Japan Railway Co. | — | 1,195 | ||||
Chiyoda Corp. | 13 | 129 | ||||
Cie de Saint-Gobain | 38 | 1,980 | ||||
Cobham Plc | 113 | 360 | ||||
ComfortDelgro Corp. Ltd. | 181 | 219 | ||||
Cosco Corp. Singapore Ltd. | 108 | 180 | ||||
CSR Ltd. (e) | 142 | 243 | ||||
Dai Nippon Printing Co. Ltd. | 52 | 705 | ||||
Daikin Industries Ltd. | 23 | 795 | ||||
Delek Group Ltd. | — | 77 | ||||
Deutsche Lufthansa AG (c) | 21 | 459 | ||||
Deutsche Post AG | 82 | 1,388 | ||||
DSV A/S | 20 | 444 | ||||
East Japan Railway Co. | 33 | 2,134 | ||||
Edenred (c) | 15 | 344 | ||||
Eiffage SA | 4 | 183 | ||||
Elbit Systems Ltd. | 2 | 93 | ||||
European Aeronautic Defence & Space Co. NV (c) | 38 | 891 | ||||
Experian Plc | 97 | 1,213 | ||||
Fanuc Ltd. | 19 | 2,828 | ||||
Ferrovial SA | 40 | 402 | ||||
Finmeccanica SpA | 39 | 447 | ||||
Firstgroup Plc | 43 | 267 | ||||
Fomento de Construcciones y Contratas SA (e) | 4 | 113 | ||||
Fraport AG Frankfurt Airport Services Worldwide | 4 | 235 | ||||
Fraser and Neave Ltd. | 88 | 437 | ||||
Fuji Electric Holdings Co. Ltd. | 51 | 158 | ||||
Furukawa Electric Co. Ltd. | 56 | 251 | ||||
G4S Plc | 137 | 542 | ||||
GEA Group AG | 15 | 429 | ||||
Geberit AG | 4 | 850 | ||||
Groupe Eurotunnel SA | 45 | 394 | ||||
GS Yuasa Corp. (e) | 37 | 255 | ||||
Hankyu Hanshin Holdings Inc. | 103 | 478 | ||||
Hexagon AB - B Shares (e) | 25 | 544 | ||||
Hino Motors Ltd. | 28 | 151 | ||||
Hitachi Construction Machinery Co. Ltd. | 9 | 212 | ||||
Hochtief AG | 4 | 347 | ||||
Hutchison Whampoa Ltd. | 206 | 2,120 | ||||
Iberia Lineas Aereas de Espana (c) | 47 | 200 | ||||
See accompanying Notes to the Financial Statements.
JNL Series Trust
Schedules of Investments (in thousands)
December 31, 2010
| Shares/Par (p) | Value | |||||
IHI Corp. | 130 | 289 | ||||
Intertek Group Plc | 15 | 412 | ||||
Invensys Plc | 79 | 435 | ||||
ITOCHU Corp. | 146 | 1,473 | ||||
Japan Steel Works Ltd. | 31 | 323 | ||||
JGC Corp. | 20 | 433 | ||||
JS Group Corp. | 24 | 535 | ||||
JTEKT Corp. | 24 | 276 | ||||
Kajima Corp. | 72 | 191 | ||||
Kamigumi Co. Ltd. | 23 | 193 | ||||
Kawasaki Heavy Industries Ltd. | 137 | 459 | ||||
Kawasaki Kisen Kaisha Ltd. | 67 | 292 | ||||
Keihin Electric Express Railway Co. Ltd. | 42 | 370 | ||||
Keio Corp. | 57 | 388 | ||||
Keisei Electric Railway Co. Ltd. | 24 | 160 | ||||
Keppel Corp. Ltd. | 120 | 1,058 | ||||
Kinden Corp. | 10 | 92 | ||||
Kintetsu Corp. (e) | 147 | 459 | ||||
Komatsu Ltd. | 92 | 2,754 | ||||
Kone Oyj | 15 | 814 | ||||
Koninklijke Boskalis Westminster NV | 7 | 322 | ||||
Koninklijke Philips Electronics NV | 95 | 2,911 | ||||
Koninklijke Vopak NV | 6 | 302 | ||||
Kubota Corp. | 113 | 1,065 | ||||
Kuehne & Nagel International AG | 5 | 711 | ||||
Kurita Water Industries Ltd. | 11 | 342 | ||||
Legrand SA | 14 | 590 | ||||
Leighton Holdings Ltd. | 13 | 407 | ||||
Mabuchi Motor Co. Ltd. | 2 | 118 | ||||
Makita Corp. | 10 | 411 | ||||
Man AG | 10 | 1,187 | ||||
MAp Group | 55 | 169 | ||||
Marubeni Corp. | 157 | 1,099 | ||||
Metso Oyj | 12 | 689 | ||||
Minebea Co. Ltd. | 29 | 182 | ||||
Mitsubishi Corp. | 131 | 3,521 | ||||
Mitsubishi Electric Corp. | 187 | 1,954 | ||||
Mitsubishi Heavy Industries Ltd. | 289 | 1,082 | ||||
Mitsubishi Logistics Corp. | 13 | 172 | ||||
Mitsui & Co. Ltd. | 168 | 2,756 | ||||
Mitsui Engineering & Shipbuilding Co. Ltd. (e) | 65 | 171 | ||||
Mitsui OSK Lines Ltd. | 113 | 766 | ||||
MTR Corp. | 139 | 505 | ||||
Nabtesco Corp. | 8 | 170 | ||||
Neptune Orient Lines Ltd. (c) (e) | 94 | 160 | ||||
NGK Insulators Ltd. | 24 | 390 | ||||
Nidec Corp. | 10 | 1,049 | ||||
Nippon Express Co. Ltd. | 75 | 337 | ||||
Nippon Sheet Glass Co. Ltd. | 93 | 249 | ||||
Nippon Yusen KK | 141 | 621 | ||||
Noble Group Ltd. | 285 | 482 | ||||
NSK Ltd. | 44 | 396 | ||||
NTN Corp. | 49 | 259 | ||||
NWS Holdings Ltd. (c) | 114 | 173 | ||||
Obayashi Corp. | 65 | 298 | ||||
Odakyu Electric Railway Co. Ltd. | 61 | 567 | ||||
Orient Overseas International Ltd. (c) | 18 | 178 | ||||
Orkla ASA | 71 | 694 | ||||
Prysmian SPA | 17 | 285 | ||||
Qantas Airways Ltd. (c) | 104 | 269 | ||||
QR National Ltd. (c) | 171 | 481 | ||||
Randstad Holding NV (c) | 11 | 564 | ||||
Rolls-Royce Group Plc (c) | 175 | 1,704 | ||||
Ryanair Holdings Plc (c) | 2 | 9 | ||||
Safran SA | 16 | 565 | ||||
Sandvik AB | 96 | 1,864 | ||||
Scania AB | 32 | 726 | ||||
Schindler Holding AG | 2 | 217 | ||||
| Shares/Par (p) | Value | |||||
Schneider Electric SA (virt-x) | 23 | 3,500 | ||||
Secom Co. Ltd. | 21 | 969 | ||||
Securitas AB | 32 | 378 | ||||
SembCorp Industries Ltd. | 88 | 352 | ||||
SembCorp Marine Ltd. | 79 | 332 | ||||
Serco Group Plc | 47 | 408 | ||||
SGS SA | 1 | 900 | ||||
Shimizu Corp. | 60 | 256 | ||||
Siemens AG | 79 | 9,821 | ||||
Singapore Airlines Ltd. (e) | 53 | 636 | ||||
Singapore Technologies Engineering Ltd. | 152 | 405 | ||||
Skanska AB | 38 | 746 | ||||
SKF AB | 37 | 1,061 | ||||
SMC Corp. | 5 | 870 | ||||
Smiths Group Plc | 36 | 698 | ||||
Societe BIC SA | 2 | 206 | ||||
Sojitz Corp. | 125 | 273 | ||||
Sumitomo Corp. | 107 | 1,502 | ||||
Sumitomo Electric Industries Ltd. | 74 | 1,018 | ||||
Sumitomo Heavy Industries Ltd. | 50 | 320 | ||||
Taisei Corp. | 96 | 224 | ||||
Thales SA | 8 | 289 | ||||
THK Co. Ltd. | 13 | 290 | ||||
TNT NV | 37 | 971 | ||||
Tobu Railway Co. Ltd. (e) | 78 | 437 | ||||
Tokyu Corp. | 105 | 480 | ||||
Toll Holdings Ltd. (e) | 61 | 357 | ||||
Toppan Printing Co. Ltd. | 52 | 473 | ||||
TOTO Ltd. | 26 | 188 | ||||
Toyota Tsusho Corp. | 20 | 354 | ||||
Transurban Group | 123 | 642 | ||||
Ushio Inc. | 10 | 194 | ||||
Vallourec SA | 11 | 1,134 | ||||
Vestas Wind Systems A/S (c) | 19 | 608 | ||||
Vinci SA | 42 | 2,309 | ||||
Volvo AB (c) | 133 | 2,345 | ||||
Wartsila Oyj | 7 | 561 | ||||
Weir Group Plc | 21 | 579 | ||||
West Japan Railway Co. | — | 631 | ||||
Wolseley Plc (c) | 27 | 857 | ||||
Yamato Holdings Co. Ltd. | 39 | 548 | ||||
Yangzijiang Shipbuilding Holdings Ltd. | 139 | 207 | ||||
Zardoya Otis SA | 14 | 201 | ||||
| 133,617 | ||||||
INFORMATION TECHNOLOGY - 4.8% | ||||||
Advantest Corp. | 16 | 358 | ||||
Alcatel-Lucent (c) | 214 | 623 | ||||
Amadeus IT Holding SA (c) | 20 | 427 | ||||
ARM Holdings Plc | 124 | 818 | ||||
ASM Pacific Technology Ltd. | 18 | 226 | ||||
ASML Holding NV | 42 | 1,616 | ||||
Atos Origin SA (c) | 4 | 202 | ||||
Autonomy Corp. Plc (c) | 21 | 497 | ||||
Brother Industries Ltd. | 22 | 322 | ||||
Canon Inc. (e) | 109 | 5,594 | ||||
Cap Gemini SA (e) | 14 | 647 | ||||
Citizen Holdings Co. Ltd. | 21 | 146 | ||||
Computershare Ltd. | 43 | 479 | ||||
Dassault Systemes SA | 6 | 428 | ||||
Elpida Memory Inc. (c) (e) | 16 | 180 | ||||
Foxconn International Holdings Ltd. (c) (e) | 161 | 113 | ||||
FUJIFILM Holdings Corp. | 45 | 1,617 | ||||
Fujitsu Ltd. | 177 | 1,226 | ||||
Gree Inc. | 8 | 98 | ||||
Hamamatsu Photonics KK | 7 | 244 | ||||
Hirose Electric Co. Ltd. | 3 | 326 | ||||
Hitachi High-Technologies Corp. | 7 | 170 | ||||
See accompanying Notes to the Financial Statements.
JNL Series Trust
Schedules of Investments (in thousands)
December 31, 2010
| Shares/Par (p) | Value | |||||
Hitachi Ltd. | 427 | 2,267 | ||||
Hoya Corp. | 41 | 987 | ||||
Ibiden Co. Ltd. | 13 | 405 | ||||
Indra Sistemas SA | 8 | 142 | ||||
Infineon Technologies AG (c) | 104 | 975 | ||||
Itochu Techno-Solutions Corp. | 2 | 79 | ||||
Keyence Corp. | 4 | 1,126 | ||||
Konami Corp. | 8 | 178 | ||||
Konica Minolta Holdings Inc. | 43 | 449 | ||||
Kyocera Corp. | 16 | 1,605 | ||||
Logitech International SA (c) (e) | 18 | 335 | ||||
Mitsumi Electric Co. Ltd. | 7 | 122 | ||||
Murata Manufacturing Co. Ltd. | 19 | 1,326 | ||||
NEC Corp. | 221 | 661 | ||||
Neopost SA (e) | 3 | 273 | ||||
NICE Systems Ltd. (c) | 6 | 209 | ||||
Nintendo Co. Ltd. | 10 | 2,803 | ||||
Nippon Electric Glass Co. Ltd. | 33 | 474 | ||||
Nokia Oyj | 360 | 3,732 | ||||
Nomura Research Institute Ltd. | 8 | 187 | ||||
NTT Data Corp. | — | 428 | ||||
Obic Co. Ltd. | 1 | 121 | ||||
Omron Corp. | 20 | 522 | ||||
Oracle Corp. Japan | 3 | 162 | ||||
Otsuka Corp. (e) | 1 | 95 | ||||
Renewable Energy Corp. AS (c) (e) | 49 | 151 | ||||
Ricoh Co. Ltd. | 63 | 919 | ||||
Rohm Co. Ltd. | 10 | 631 | ||||
Sage Group Plc | 122 | 521 | ||||
SAP AG | 83 | 4,190 | ||||
Seiko Epson Corp. | 11 | 203 | ||||
Shimadzu Corp. | 26 | 201 | ||||
Shinko Electric Industries Co. Ltd. | 6 | 68 | ||||
Square Enix Holdings Co. Ltd. | 6 | 106 | ||||
STMicroelectronics NV | 63 | 652 | ||||
Sumco Corp. (c) (e) | 10 | 135 | ||||
TDK Corp. | 12 | 803 | ||||
Telefonaktiebolaget LM Ericsson | 290 | 3,361 | ||||
Tokyo Electron Ltd. | 16 | 1,014 | ||||
Toshiba Corp. | 389 | 2,111 | ||||
Trend Micro Inc. (c) | 9 | 299 | ||||
United Internet AG | 11 | 175 | ||||
Yahoo! Japan Corp. | 1 | 507 | ||||
Yaskawa Electric Corp. | 19 | 179 | ||||
Yokogawa Electric Corp. (c) | 18 | 139 | ||||
| 52,385 | ||||||
MATERIALS - 11.1% | ||||||
Acerinox SA (c) (e) | 9 | 152 | ||||
Air Liquide | 27 | 3,444 | ||||
Air Water Inc. | 14 | 178 | ||||
Akzo Nobel NV | 22 | 1,366 | ||||
Alumina Ltd. | 219 | 556 | ||||
Amcor Ltd. (e) | 115 | 795 | ||||
Anglo American Plc | 127 | 6,585 | ||||
Antofagasta Plc | 39 | 970 | ||||
ArcelorMittal | 83 | 3,137 | ||||
Asahi Kasei Corp. | 119 | 774 | ||||
BASF SE | 88 | 7,069 | ||||
BHP Billiton Ltd. (e) | 322 | 14,891 | ||||
BHP Billiton Plc | 212 | 8,418 | ||||
BlueScope Steel Ltd. (e) | 167 | 383 | ||||
Boliden AB | 27 | 555 | ||||
Boral Ltd. | 69 | 343 | ||||
Cimpor Cimentos de Portugal SGPS SA | 17 | 118 | ||||
CRH Plc | 67 | 1,393 | ||||
Daicel Chemical Industries Ltd. | 28 | 204 | ||||
Daido Steel Co. Ltd. | 32 | 187 | ||||
| Shares/Par (p) | Value | |||||
Denki Kagaku Kogyo K K | 49 | 232 | ||||
Dowa Holdings Co. Ltd. | 24 | 157 | ||||
Eramet | 1 | 184 | ||||
Eurasian Natural Resources Corp. | 25 | 406 | ||||
Fletcher Building Ltd. (e) | 58 | 347 | ||||
Fortescue Metals Group Ltd. (c) | 115 | 770 | ||||
Fresnillo Plc | 18 | 457 | ||||
Givaudan SA | 1 | 879 | ||||
HeidelbergCement AG | 13 | 844 | ||||
Hitachi Chemical Co. Ltd. | 9 | 191 | ||||
Hitachi Metals Ltd. | 17 | 203 | ||||
Holcim Ltd. | 24 | 1,798 | ||||
Holmen AB | 5 | 165 | ||||
Imerys SA | 4 | 255 | ||||
Incitec Pivot Ltd. | 161 | 653 | ||||
Israel Chemicals Ltd. | 43 | 732 | ||||
Israel Corp. Ltd. (c) | — | 273 | ||||
James Hardie Industries SE (c) (e) | 38 | 266 | ||||
JFE Holdings Inc. | 44 | 1,514 | ||||
Johnson Matthey Plc | 20 | 632 | ||||
JSR Corp. | 16 | 293 | ||||
K+S AG | 14 | 1,061 | ||||
Kaneka Corp. | 25 | 173 | ||||
Kansai Paint Co. Ltd. | 22 | 212 | ||||
Kazakhmys Plc | 21 | 523 | ||||
Kobe Steel Ltd. | 247 | 624 | ||||
Koninklijke DSM NV | 15 | 841 | ||||
Kuraray Co. Ltd. | 33 | 464 | ||||
Lafarge SA | 19 | 1,176 | ||||
Lanxess AG | 8 | 643 | ||||
Linde AG | 16 | 2,480 | ||||
Lonmin Plc (c) | 15 | 464 | ||||
MacArthur Coal Ltd. | 18 | 231 | ||||
Makhteshim-Agan Industries Ltd. (c) | 18 | 93 | ||||
Maruichi Steel Tube Ltd. | 3 | 72 | ||||
Mitsubishi Chemical Holdings Corp. | 121 | 819 | ||||
Mitsubishi Gas Chemical Co. Inc. | 35 | 248 | ||||
Mitsubishi Materials Corp. (c) | 110 | 350 | ||||
Mitsui Chemicals Inc. | 88 | 314 | ||||
Mitsui Mining & Smelting Co. Ltd. | 63 | 207 | ||||
Newcrest Mining Ltd. | 74 | 3,046 | ||||
Nippon Paper Group Inc. | 11 | 275 | ||||
Nippon Steel Corp. | 494 | 1,770 | ||||
Nissan Chemical Industries Ltd. | 15 | 187 | ||||
Nisshin Steel Co. Ltd. | 62 | 138 | ||||
Nitto Denko Corp. | 15 | 718 | ||||
Norsk Hydro ASA | 88 | 651 | ||||
Novozymes A/S | 4 | 611 | ||||
OJI Paper Co. Ltd. | 75 | 362 | ||||
OneSteel Ltd. | 125 | 332 | ||||
Orica Ltd. (e) | 35 | 879 | ||||
Outokumpu Oyj (e) | 12 | 223 | ||||
OZ Minerals Ltd. | 298 | 524 | ||||
Randgold Resources Ltd. | 8 | 698 | ||||
Rautaruukki Oyj (e) | 8 | 195 | ||||
Rexam Plc | 80 | 413 | ||||
Rio Tinto Ltd. (e) | 42 | 3,665 | ||||
Rio Tinto Plc | 139 | 9,721 | ||||
Salzgitter AG | 4 | 292 | ||||
Shin-Etsu Chemical Co. Ltd. | 40 | 2,140 | ||||
Showa Denko KK (e) | 131 | 294 | ||||
Sika AG | — | 402 | ||||
Sims Metal Management Ltd. | 16 | 360 | ||||
Solvay SA | 6 | 626 | ||||
SSAB Svenskt Stal AB - Class A | 16 | 264 | ||||
Stora Enso Oyj | 54 | 557 | ||||
Sumitomo Chemical Co. Ltd. | 151 | 741 | ||||
Sumitomo Metal Industries Ltd. | 322 | 789 | ||||
See accompanying Notes to the Financial Statements.
JNL Series Trust
Schedules of Investments (in thousands)
December 31, 2010
| Shares/Par (p) | Value | |||||
Sumitomo Metal Mining Co. Ltd. | 51 | 888 | ||||
Svenska Cellulosa AB | 55 | 866 | ||||
Syngenta AG | 9 | 2,674 | ||||
Taiyo Nippon Sanso Corp. | 22 | 194 | ||||
Teijin Ltd. | 91 | 387 | ||||
ThyssenKrupp AG | 32 | 1,354 | ||||
Tokuyama Corp. | 26 | 134 | ||||
Tokyo Steel Manufacturing Co. Ltd. | 11 | 118 | ||||
Toray Industries Inc. | 136 | 811 | ||||
Tosoh Corp. | 50 | 162 | ||||
Toyo Seikan Kaisha Ltd. | 15 | 288 | ||||
Ube Industries Ltd. | 84 | 252 | ||||
Umicore | 11 | 574 | ||||
UPM-Kymmene Oyj | 49 | 865 | ||||
Vedanta Resources Plc (e) | 12 | 458 | ||||
Voestalpine AG | 11 | 524 | ||||
Wacker Chemie AG | 2 | 267 | ||||
Xstrata Plc | 198 | 4,641 | ||||
Yamato Kogyo Co. Ltd. | 4 | 120 | ||||
Yara International ASA | 19 | 1,078 | ||||
| 121,292 | ||||||
TELECOMMUNICATION SERVICES - 5.2% | ||||||
Belgacom SA | 14 | 473 | ||||
Bezeq Israeli Telecommunication Corp. Ltd. | 174 | 530 | ||||
BT Group Plc | 750 | 2,113 | ||||
Cable & Wireless Worldwide Plc | 278 | 284 | ||||
Cellcom Israel Ltd. | 5 | 167 | ||||
Deutsche Telekom AG | 273 | 3,505 | ||||
Elisa Oyj | 13 | 282 | ||||
France Telecom SA | 178 | 3,717 | ||||
Hellenic Telecommunications Organization SA | 25 | 203 | ||||
Iliad SA (e) | 1 | 155 | ||||
Inmarsat Plc | 43 | 447 | ||||
KDDI Corp. | — | 1,632 | ||||
Koninklijke KPN NV | 150 | 2,191 | ||||
Millicom International Cellular SA - SDR | 7 | 689 | ||||
Mobistar SA | 3 | 178 | ||||
Nippon Telegraph & Telephone Corp. | 50 | 2,285 | ||||
NTT DoCoMo Inc. | 1 | 2,576 | ||||
Partner Communications Co. Ltd. | 9 | 179 | ||||
PCCW Ltd. | 321 | 142 | ||||
Portugal Telecom SGPS SA | 54 | 601 | ||||
Singapore Telecommunications Ltd. | 771 | 1,831 | ||||
SoftBank Corp. | 78 | 2,696 | ||||
StarHub Ltd. | 65 | 133 | ||||
Swisscom AG | 2 | 1,002 | ||||
Tele2 AB | 30 | 630 | ||||
Telecom Corp. of New Zealand Ltd. | 200 | 337 | ||||
Telecom Italia SpA | 914 | 1,186 | ||||
Telefonica SA | 394 | 8,992 | ||||
Telekom Austria AG | 30 | 419 | ||||
Telenor ASA | 79 | 1,283 | ||||
TeliaSonera AB | 217 | 1,726 | ||||
Telstra Corp. Ltd. | 415 | 1,183 | ||||
Vodafone Group Plc | 5,054 | 13,065 | ||||
| 56,832 | ||||||
UTILITIES - 4.9% | ||||||
A2A SpA | 92 | 126 | ||||
Acciona SA (e) | 3 | 185 | ||||
AGL Energy Ltd. | 43 | 662 | ||||
Centrica Plc | 497 | 2,570 | ||||
Cheung Kong Infrastructure Holdings Ltd. | 46 | 211 | ||||
Chubu Electric Power Co. Inc. | 62 | 1,510 | ||||
Chugoku Electric Power Co. Inc. | 29 | 582 | ||||
CLP Holdings Ltd. | 182 | 1,481 | ||||
Contact Energy Ltd. (c) | 25 | 123 | ||||
| Shares/Par (p) | Value | |||||
E.ON AG | 173 | 5,267 | ||||
EDP Renovaveis SA (c) (e) | 17 | 97 | ||||
Electric Power Development Co. Ltd. | 12 | 361 | ||||
Electricite de France SA | 25 | 1,011 | ||||
Enagas SA (e) | 18 | 353 | ||||
Enel Green Power SpA (c) | 140 | 296 | ||||
Enel SpA | 634 | 3,176 | ||||
Energias de Portugal SA | 189 | 628 | ||||
Fortum Oyj | 42 | 1,274 | ||||
Gas Natural SDG SA (e) | 29 | 451 | ||||
GDF Suez | 119 | 4,267 | ||||
Hokkaido Electric Power Co. Inc. | 16 | 333 | ||||
Hokuriku Electric Power Co. | 16 | 386 | ||||
Hong Kong & China Gas Co. Ltd. | 411 | 968 | ||||
Hongkong Electric Holdings Ltd. | 133 | 835 | ||||
Iberdrola Renovables SA | 85 | 301 | ||||
Iberdrola SA (e) | 400 | 3,098 | ||||
International Power Plc | 143 | 975 | ||||
Kansai Electric Power Co. Inc. | 72 | 1,766 | ||||
Kyushu Electric Power Co. Inc. | 37 | 833 | ||||
National Grid Plc | 337 | 2,904 | ||||
Osaka Gas Co. Ltd. | 187 | 725 | ||||
Public Power Corp. SA | 10 | 148 | ||||
Red Electrica Corp. SA | 10 | 463 | ||||
RWE AG | 40 | 2,703 | ||||
Scottish & Southern Energy Plc | 89 | 1,709 | ||||
Severn Trent Plc | 23 | 521 | ||||
Shikoku Electric Power Co. Inc. | 17 | 511 | ||||
Snam Rete Gas SpA | 135 | 671 | ||||
SP AusNet | 110 | 98 | ||||
Suez Environnement SA | 24 | 504 | ||||
Terna Rete Elettrica Nazionale SpA | 121 | 510 | ||||
Toho Gas Co. Ltd. | 40 | 200 | ||||
Tohoku Electric Power Co. Inc. | 42 | 931 | ||||
Tokyo Electric Power Co. Inc. | 137 | 3,338 | ||||
Tokyo Gas Co. Ltd. | 244 | 1,080 | ||||
United Utilities Group Plc | 63 | 581 | ||||
Veolia Environnement | 33 | 963 | ||||
Verbund - Oesterreichische Elektrizitaetswirtschafts AG | 7 | 276 | ||||
| 52,962 | ||||||
Total Common Stocks (cost $1,002,987) | 1,048,205 | |||||
PREFERRED STOCKS - 0.6% | ||||||
CONSUMER DISCRETIONARY - 0.2% | ||||||
Bayerische Motoren Werke AG | 5 | 281 | ||||
Porsche Automobil Holding SE | 9 | 686 | ||||
Volkswagen AG | 16 | 2,674 | ||||
| 3,641 | ||||||
CONSUMER STAPLES - 0.1% | ||||||
Henkel AG & Co. KGaA | 17 | 1,041 | ||||
Lindt & Spruengli AG | — | 284 | ||||
| 1,325 | ||||||
HEALTH CARE - 0.1% | ||||||
Fresenius SE | 8 | 651 | ||||
INDUSTRIALS - 0.1% | ||||||
Schindler Holding AG | 5 | 548 | ||||
TELECOMMUNICATION SERVICES - 0.1% | ||||||
Telecom Italia SpA - RSP | 555 | 604 | ||||
See accompanying Notes to the Financial Statements.
JNL Series Trust
Schedules of Investments (in thousands)
December 31, 2010
| Shares/Par (p) | Value | |||||||
UTILITIES - 0.0% | ||||||||
RWE AG | 4 | 250 | ||||||
Total Preferred Stocks (cost $5,448) | 7,019 | |||||||
OTHER EQUITY INTERESTS - 0.0% |
| |||||||
IMMOEAST AG - Escrow Shares (c) (e) (f) (u) | 37 | — | ||||||
IMMOFINANZ AG - Escrow Shares (c) (f) (u) | 27 | — | ||||||
Total Other Equity Interests (cost $0) | — | |||||||
SHORT TERM INVESTMENTS - 8.0%
|
| |||||||
Investment Company - 2.6% | ||||||||
JNL Money Market Fund, 0.08% (a) (h) | 28,075 | 28,075 | ||||||
Securities Lending Collateral 5.2% | ||||||||
Securities Lending Cash Collateral Fund LLC, 0.31% (a) (h) | 54,516 | 54,516 | ||||||
Securities Lending Liquidating Fund LLC, 0.66% (a) (h) | 1,988 | 1,955 | ||||||
| 56,471 | ||||||||
Treasury Securities 0.2% | ||||||||
U.S. Treasury Bill, | $ | 1,710 | 1,709 | |||||
Total Short Term Investments (cost $86,288) | 86,255 | |||||||
Total Investments - 104.9% | 1,141,479 | |||||||
Other Assets and Liabilities, | (53,192 | ) | ||||||
Total Net Assets - 100.0% | $ | 1,088,287 | ||||||
JNL/Oppenheimer Global Growth Fund |
| |||||||
COMMON STOCKS - 96.7% |
| |||||||
CONSUMER DISCRETIONARY - 16.1% |
| |||||||
Bayerische Motoren Werke AG | 11 | $ | 840 | |||||
Bulgari SpA (e) | 248 | 2,690 | ||||||
Carnival Corp. | 158 | 7,267 | ||||||
Grupo Televisa SA - ADR (c) | 198 | 5,125 | ||||||
Inditex SA | 70 | 5,221 | ||||||
Lottomatica SpA (e) | 57 | 714 | ||||||
LVMH Moet Hennessy Louis Vuitton SA | 46 | 7,590 | ||||||
McDonald’s Corp. | 83 | 6,343 | ||||||
McGraw-Hill Cos. Inc. | 40 | 1,457 | ||||||
Shuffle Master Inc. (c) | 91 | 1,041 | ||||||
Sony Corp. | 184 | 6,581 | ||||||
Tiffany & Co. | 121 | 7,533 | ||||||
Tod’s SpA (e) | 39 | 3,865 | ||||||
Walt Disney Co. | 171 | 6,414 | ||||||
Wire & Wireless India Ltd. (c) | 217 | 59 | ||||||
Zee Entertainment Enterprises Ltd. | 573 | 1,885 | ||||||
Zee Learn Ltd. (c) | 68 | 42 | ||||||
| 64,667 | ||||||||
CONSUMER STAPLES - 8.3% |
| |||||||
Cia de Bebidas das Americas - ADR | 133 | 4,122 | ||||||
Colgate-Palmolive Co. | 69 | 5,570 | ||||||
Fomento Economico Mexicano SAB de CV (e) | 975 | 5,453 | ||||||
Grupo Modelo SAB de CV (e) | 489 | 3,040 | ||||||
Nestle SA | 76 | 4,464 | ||||||
Shinsegae Co. Ltd. (c) | 1 | 786 | ||||||
Unilever Plc | 164 | 5,014 | ||||||
Wal-Mart Stores Inc. | 90 | 4,861 | ||||||
| 33,310 | ||||||||
| Shares/Par (p) | Value | |||||||
ENERGY - 3.7% | ||||||||
Technip SA (e) | 59 | 5,458 | ||||||
Total SA | 85 | 4,503 | ||||||
Transocean Ltd. (c) | 69 | 4,812 | ||||||
| 14,773 | ||||||||
FINANCIALS - 15.4% | ||||||||
3i Group Plc | 382 | 1,955 | ||||||
AFLAC Inc. | 69 | 3,882 | ||||||
Allianz SE | 46 | 5,446 | ||||||
Banco Bilbao Vizcaya Argentaria SA (e) | 389 | 3,967 | ||||||
Credit Suisse Group AG | 214 | 8,635 | ||||||
Dai-Ichi Life Insurance Co. Ltd. | 3 | 4,805 | ||||||
Fidelity National Financial Inc. - Class A | 140 | 1,910 | ||||||
Goldman Sachs Group Inc. | 26 | 4,308 | ||||||
HSBC Holdings Plc (e) | 532 | 5,452 | ||||||
Investor AB - Class B | 201 | 4,309 | ||||||
SLM Corp. (c) | 210 | 2,642 | ||||||
Societe Generale - Class A | 47 | 2,552 | ||||||
Sumitomo Mitsui Financial Group Inc. | 92 | 3,247 | ||||||
UBS AG (c) | 315 | 5,173 | ||||||
XL Group Plc - Class A | 171 | 3,740 | ||||||
| 62,023 | ||||||||
HEALTH CARE - 7.2% |
| |||||||
Aetna Inc. | 149 | 4,556 | ||||||
Amylin Pharmaceuticals Inc. (c) | 157 | 2,312 | ||||||
Basilea Pharmaceutical AG (c) | 3 | 181 | ||||||
Bayer AG | 51 | 3,761 | ||||||
Dendreon Corp. (c) | 29 | 1,014 | ||||||
Gilead Sciences Inc. (c) | 34 | 1,241 | ||||||
Mitsubishi Tanabe Pharma Corp. | 113 | 1,905 | ||||||
Regeneron Pharmaceuticals Inc. (c) | 13 | 436 | ||||||
Roche Holding AG | 15 | 2,143 | ||||||
Theravance Inc. (c) (e) | 84 | 2,108 | ||||||
WellPoint Inc. (c) | 88 | 4,999 | ||||||
Zimmer Holdings Inc. (c) | 78 | 4,186 | ||||||
| 28,842 | ||||||||
INDUSTRIALS - 14.1% |
| |||||||
3M Co. | 62 | 5,357 | ||||||
Assa Abloy AB | 229 | 6,458 | ||||||
Embraer SA - ADR | 126 | 3,719 | ||||||
Emerson Electric Co. | 64 | 3,666 | ||||||
European Aeronautic Defence & Space Co. NV (c) | 205 | 4,781 | ||||||
Fanuc Ltd. | 19 | 2,874 | ||||||
Koninklijke Philips Electronics NV | 171 | 5,239 | ||||||
Lockheed Martin Corp. | 23 | 1,626 | ||||||
Nidec Corp. | 25 | 2,531 | ||||||
Prysmian SPA | 98 | 1,666 | ||||||
Raytheon Co. | 35 | 1,605 | ||||||
Secom Co. Ltd. | 58 | 2,750 | ||||||
Siemens AG | 95 | 11,826 | ||||||
TNT NV | 106 | 2,799 | ||||||
| 56,897 | ||||||||
INFORMATION TECHNOLOGY - 28.3% |
| |||||||
Adobe Systems Inc. (c) | 156 | 4,812 | ||||||
Altera Corp. | 220 | 7,845 | ||||||
Automatic Data Processing Inc. | 82 | 3,795 | ||||||
Corning Inc. | 199 | 3,837 | ||||||
eBay Inc. (c) | 364 | 10,123 | ||||||
Hoya Corp. | 150 | 3,629 | ||||||
Infosys Technologies Ltd. | 91 | 7,032 | ||||||
Intuit Inc. (c) | 150 | 7,407 | ||||||
Juniper Networks Inc. (c) (e) | 228 | 8,432 | ||||||
See accompanying Notes to the Financial Statements.
JNL Series Trust
Schedules of Investments (in thousands)
December 31, 2010
| Shares/Par (p) | Value | |||||||
Keyence Corp. | 14 | 3,983 | ||||||
Kyocera Corp. | 23 | 2,357 | ||||||
Maxim Integrated Products Inc. | 208 | 4,922 | ||||||
MediaTek Inc. | 217 | 3,113 | ||||||
Microsoft Corp. | 243 | 6,797 | ||||||
Murata Manufacturing Co. Ltd. | 77 | 5,361 | ||||||
Nintendo Co. Ltd. | 9 | 2,540 | ||||||
SAP AG | 134 | 6,809 | ||||||
Taiwan Semiconductor Manufacturing Co. Ltd. | 1,925 | 4,687 | ||||||
Telefonaktiebolaget LM Ericsson | 1,399 | 16,218 | ||||||
| 113,699 | ||||||||
MATERIALS - 0.6% | ||||||||
Linde AG | 18 | 2,666 | ||||||
TELECOMMUNICATION SERVICES - 2.2% |
| |||||||
America Movil SAB de CV - ADR | 17 | 969 | ||||||
KDDI Corp. | 1 | 3,887 | ||||||
Vodafone Group Plc | 1,531 | 3,957 | ||||||
| 8,813 | ||||||||
UTILITIES - 0.8% | ||||||||
Fortum Oyj | 113 | 3,396 | ||||||
Total Common Stocks (cost $342,455) | 389,086 | |||||||
PREFERRED STOCKS - 1.3% |
| |||||||
CONSUMER DISCRETIONARY - 1.3% |
| |||||||
Bayerische Motoren Werke AG | 100 | 5,129 | ||||||
Total Preferred Stocks (cost $3,617) | 5,129 | |||||||
SHORT TERM INVESTMENTS - 6.7% |
| |||||||
Investment Company - 1.8% | ||||||||
JNL Money Market Fund, 0.08% (a) (h) | 7,173 | 7,173 | ||||||
Securities Lending Collateral 4.9% | ||||||||
Securities Lending Cash Collateral Fund LLC, 0.31% (a) (h) | 18,929 | 18,929 | ||||||
Securities Lending Liquidating Fund LLC, 0.66% (a) (h) | 980 | 964 | ||||||
| 19,893 | ||||||||
Total Short Term Investments (cost $27,082) | 27,066 | |||||||
Total Investments - 104.7% (cost $373,154) | 421,281 | |||||||
Other Assets and Liabilities, Net - (4.7%) | (19,029) | |||||||
Total Net Assets - 100.0% | $ | 402,252 | ||||||
JNL/PAM Asia ex-Japan Fund |
| |||||||
COMMON STOCKS - 99.2% |
| |||||||
CONSUMER DISCRETIONARY - 2.6% |
| |||||||
Astra International Tbk PT | 134 | $ | 810 | |||||
Esprit Holdings Ltd. (e) | 172 | 820 | ||||||
Hankook Tire Co. Ltd. (c) | 36 | 1,015 | ||||||
Kangwon Land Inc. (c) | 50 | 1,242 | ||||||
| 3,887 | ||||||||
CONSUMER STAPLES - 3.3% |
| |||||||
Hengan International Group Co. Ltd. | 139 | 1,195 | ||||||
Shinsegae Co. Ltd. (c) | 7 | 3,833 | ||||||
| 5,028 | ||||||||
| Shares/Par (p) | Value | |||||||
ENERGY - 8.7% | ||||||||
Banpu Public Co. Ltd. | 95 | 2,505 | ||||||
Cairn India Ltd. (c) | 249 | 1,854 | ||||||
China Petroleum & Chemical Corp. | 2,546 | 2,437 | ||||||
China Shenhua Energy Co. Ltd. | 411 | 1,722 | ||||||
CNOOC Ltd. | 1,440 | 3,416 | ||||||
GS Holdings Corp. (c) | 22 | 1,239 | ||||||
| 13,173 | ||||||||
FINANCIALS - 31.1% | ||||||||
AIA Group Ltd. (c) | 502 | 1,410 | ||||||
Alam Sutera Realty Tbk PT | 32,054 | 1,047 | ||||||
AMMB Holdings Bhd (c) | 1,127 | 2,568 | ||||||
Bangkok Bank PCL | 400 | 2,025 | ||||||
Bank of China Ltd. | 9,372 | 4,944 | ||||||
Bumi Serpong Damai PT | 12,512 | 1,247 | ||||||
China Construction Bank Corp. | 3,404 | 3,053 | ||||||
China Pacific Insurance Group Co. Ltd. (e) | 779 | 3,237 | ||||||
DBS Group Holdings Ltd. | 285 | 3,184 | ||||||
Global Logistic Properties Ltd. (c) | 795 | 1,338 | ||||||
Hana Financial Group Inc. | 47 | 1,800 | ||||||
Hang Seng Bank Ltd. | 169 | 2,780 | ||||||
Henderson Land Development Co. Ltd. (c) (e) | 452 | 3,082 | ||||||
Infrastructure Development Finance Co. Ltd. | 505 | 2,063 | ||||||
Korea Exchange Bank | 197 | 2,040 | ||||||
Metropolitan Bank & Trust Co. | 791 | 1,293 | ||||||
Rural Electrification Corp. Ltd. | 108 | 725 | ||||||
Samsung Fire & Marine Insurance Co. Ltd. | 22 | 4,297 | ||||||
Sino-Ocean Land Holdings Ltd. (e) | 2,272 | 1,488 | ||||||
Wharf Holdings Ltd. | 180 | 1,384 | ||||||
Yuanta Financial Holding Co. Ltd. | 2,567 | 1,919 | ||||||
| 46,924 | ||||||||
HEALTH CARE - 1.8% | ||||||||
Ranbaxy Laboratories Ltd. (c) | 203 | 2,721 | ||||||
INDUSTRIALS - 13.5% | ||||||||
Aditya Birla Nuvo Ltd. | 18 | 345 | ||||||
Far Eastern New Century Corp | 1,747 | 2,959 | ||||||
Hutchison Whampoa Ltd. | 501 | 5,157 | ||||||
Hyundai Engineering & Construction Co. Ltd. (c) | 55 | 3,527 | ||||||
IVRCL Infrastructures & Projects Ltd. | 451 | 1,296 | ||||||
S1 Corp. (c) | 21 | 1,060 | ||||||
SembCorp Industries Ltd. | 802 | 3,212 | ||||||
Suzlon Energy Ltd. (c) | 476 | 583 | ||||||
Tata Motors Ltd. | 129 | 2,262 | ||||||
| 20,401 | ||||||||
INFORMATION TECHNOLOGY - 20.2% |
| |||||||
AAC Acoustic Technologies Holdings Inc. | 1,236 | 3,300 | ||||||
Acer Inc. | 478 | 1,478 | ||||||
Foxconn Technology Co. Ltd. | 676 | 2,711 | ||||||
HON HAI Precision Industry Co. Ltd. | 1,078 | 4,345 | ||||||
Largan Precision Co. Ltd. | 63 | 1,567 | ||||||
Mphasis Ltd. | 167 | 2,516 | ||||||
Samsung Electronics Co. Ltd. | 8 | 6,508 | ||||||
Shanda Games Ltd. - ADR (c) (e) | 256 | 1,648 | ||||||
Sohu.com Inc. (c) | 18 | 1,133 | ||||||
Taiwan Semiconductor Manufacturing Co. Ltd. | 1,285 | 3,128 | ||||||
Wistron Corp. | 1,060 | 2,160 | ||||||
| 30,494 | ||||||||
MATERIALS - 8.3% | ||||||||
China Resources Cement Holdings Ltd. (c) | 1,306 | 991 | ||||||
China Shanshui Cement Group Ltd. | 3,436 | 2,454 | ||||||
Hindalco Industries Ltd. | 355 | 1,959 | ||||||
Huabao International Holdings Ltd. | 715 | 1,157 | ||||||
See accompanying Notes to the Financial Statements.
JNL Series Trust
Schedules of Investments (in thousands)
December 31, 2010
| Shares/Par (p) | Value | |||||||
Mongolian Mining Corp. (c) (e) | 706 | 823 | ||||||
POSCO Inc. | 3 | 1,286 | ||||||
Sterlite Industries India Ltd. | 193 | 807 | ||||||
Taiwan Fertilizer Co. Ltd. | 392 | 1,466 | ||||||
Xingda International Holdings Ltd. | 1,438 | 1,554 | ||||||
| 12,497 | ||||||||
TELECOMMUNICATION SERVICES - 6.6% |
| |||||||
Axiata Group Bhd (c) | 1,584 | 2,438 | ||||||
China Mobile Ltd. | 170 | 1,683 | ||||||
China Unicom Hong Kong Ltd. | 2,682 | 3,836 | ||||||
KT Corp. (c) | 11 | 454 | ||||||
Telekomunikasi Indonesia Tbk PT | 1,725 | 1,522 | ||||||
| 9,933 | ||||||||
UTILITIES - 3.1% |
| |||||||
GVK Power & Infrastructure Ltd. (c) | 1,454 | 1,319 | ||||||
Korea Electric Power Corp. (c) | 123 | 3,266 | ||||||
| 4,585 | ||||||||
Total Common Stocks | 149,643 | |||||||
RIGHTS - 0.0% |
| |||||||
Metropolitan Bank & Trust Co. (c) (f) | 82 | 42 | ||||||
Total Rights (cost $0) | 42 | |||||||
WARRANTS - 0.0% |
| |||||||
Henderson Land Development Co. Ltd. (c) | 77 | 18 | ||||||
Total Warrants (cost $0) | 18 | |||||||
SHORT TERM INVESTMENTS - 4.6% |
| |||||||
Investment Company - 1.2% | ||||||||
JNL Money Market Fund, 0.08% (a) (h) | 1,752 | 1,752 | ||||||
Securities Lending Collateral 3.4% | ||||||||
Securities Lending Cash Collateral Fund LLC, 0.31% (a) (h) | 5,075 | 5,075 | ||||||
Securities Lending Liquidating Fund LLC, 0.66% (a) (h) | 45 | 44 | ||||||
| 5,119 | ||||||||
Total Short Term Investments (cost $6,872) | 6,871 | |||||||
Total Investments - 103.8% (cost $135,507) |
| 156,574 | ||||||
Other Assets and Liabilities, Net - (3.8%) |
| (5,741 | ) | |||||
Total Net Assets - 100.0% | $ | 150,833 | ||||||
JNL/Select Balanced Fund |
| |||||||
COMMON STOCKS - 66.1% |
| |||||||
CONSUMER DISCRETIONARY - 5.1% |
| |||||||
Comcast Corp. - Class A | 613 | $ | 13,462 | |||||
Honda Motor Co. Ltd. - ADR (e) | 190 | 7,493 | ||||||
Johnson Controls Inc. | 192 | 7,335 | ||||||
Lowe’s Cos. Inc. | 417 | 10,466 | ||||||
News Corp. - Class A | 673 | 9,796 | ||||||
Staples Inc. | 454 | 10,342 | ||||||
Time Warner Inc. | 203 | 6,526 | ||||||
| 65,420 | ||||||||
CONSUMER STAPLES - 5.0% |
| |||||||
Colgate-Palmolive Co. | 42 | 3,408 | ||||||
| Shares/Par (p) | Value | |||||||
CVS Caremark Corp. | 235 | 8,181 | ||||||
PepsiCo Inc. | 236 | 15,385 | ||||||
Philip Morris International Inc. | 206 | 12,034 | ||||||
Procter & Gamble Co. | 138 | 8,877 | ||||||
Unilever NV - NYS | 290 | 9,109 | ||||||
Wal-Mart Stores Inc. | 143 | 7,734 | ||||||
| 64,728 | ||||||||
ENERGY - 9.6% |
| |||||||
Anadarko Petroleum Corp. | 193 | 14,706 | ||||||
Baker Hughes Inc. | 193 | 11,051 | ||||||
Chevron Corp. | 353 | 32,220 | ||||||
Exxon Mobil Corp. | 462 | 33,745 | ||||||
Marathon Oil Corp. | 117 | 4,344 | ||||||
Occidental Petroleum Corp. | 119 | 11,684 | ||||||
Total SA - ADR | 152 | 8,129 | ||||||
Ultra Petroleum Corp. (c) | 172 | 8,207 | ||||||
| 124,086 | ||||||||
FINANCIALS - 11.5% |
| |||||||
ACE Ltd. | 227 | 14,118 | ||||||
Bank of America Corp. | 841 | 11,216 | ||||||
BB&T Corp. | 258 | 6,772 | ||||||
Chubb Corp. | 108 | 6,447 | ||||||
Goldman Sachs Group Inc. | 34 | 5,768 | ||||||
Hartford Financial Services Group Inc. | 270 | 7,163 | ||||||
JPMorgan Chase & Co. | 614 | 26,050 | ||||||
Marsh & McLennan Cos. Inc. | 163 | 4,459 | ||||||
MetLife Inc. | 330 | 14,683 | ||||||
PNC Financial Services Group Inc. | 195 | 11,853 | ||||||
UBS AG (c) (e) | 506 | 8,341 | ||||||
Wells Fargo & Co. | 1,034 | 32,056 | ||||||
| 148,926 | ||||||||
HEALTH CARE - 8.2% |
| |||||||
Bristol-Myers Squibb Co. | 259 | 6,858 | ||||||
Cardinal Health Inc. | 249 | 9,528 | ||||||
Eli Lilly & Co. | 443 | 15,537 | ||||||
Johnson & Johnson | 258 | 15,945 | ||||||
Medtronic Inc. | 335 | 12,421 | ||||||
Merck & Co. Inc. | 548 | 19,764 | ||||||
Pfizer Inc. | 1,500 | 26,258 | ||||||
| 106,311 | ||||||||
INDUSTRIALS - 8.9% |
| |||||||
Avery Dennison Corp. | 92 | 3,908 | ||||||
Cooper Industries Plc | 194 | 11,326 | ||||||
Deere & Co. | 133 | 11,021 | ||||||
FedEx Corp. | 91 | 8,427 | ||||||
General Dynamics Corp. | 146 | 10,360 | ||||||
General Electric Co. | 662 | 12,104 | ||||||
Honeywell International Inc. | 85 | 4,518 | ||||||
Masco Corp. | 333 | 4,216 | ||||||
Northrop Grumman Corp. | 97 | 6,277 | ||||||
Pentair Inc. | 281 | 10,270 | ||||||
Siemens AG - ADR | 82 | 10,139 | ||||||
United Continental Holdings Inc. (c) | 256 | 6,101 | ||||||
United Parcel Service Inc. - Class B | 126 | 9,152 | ||||||
Waste Management Inc. | 197 | 7,249 | ||||||
| 115,068 | ||||||||
INFORMATION TECHNOLOGY - 9.0% |
| |||||||
Accenture Plc - Class A | 208 | 10,066 | ||||||
Analog Devices Inc. | 230 | 8,656 | ||||||
Automatic Data Processing Inc. | 194 | 8,997 | ||||||
Avnet Inc. (c) | 186 | 6,134 | ||||||
Cisco Systems Inc. (c) | 443 | 8,956 | ||||||
Corning Inc. | 312 | 6,035 | ||||||
See accompanying Notes to the Financial Statements.
JNL Series Trust
Schedules of Investments (in thousands)
December 31, 2010
| Shares/Par (p) | Value | |||||
eBay Inc. (c) | 188 | 5,238 | ||||
Hewlett-Packard Co. | 150 | 6,328 | ||||
International Business Machines Corp. | 161 | 23,614 | ||||
Microsoft Corp. | 466 | 13,013 | ||||
QUALCOMM Inc. | 200 | 9,883 | ||||
Taiwan Semiconductor Manufacturing Co. Ltd. - ADR | 343 | 4,304 | ||||
Xilinx Inc. | 173 | 5,025 | ||||
| 116,249 | ||||||
MATERIALS - 3.1% | ||||||
Agrium Inc. | 26 | 2,422 | ||||
Barrick Gold Corp. | 132 | 7,025 | ||||
Dow Chemical Co. | 268 | 9,143 | ||||
Owens-Illinois Inc. (c) | 225 | 6,905 | ||||
Rio Tinto Plc - ADR | 113 | 8,090 | ||||
Temple-Inland Inc. | 268 | 5,688 | ||||
| 39,273 | ||||||
TELECOMMUNICATION SERVICES - 2.5% |
| |||||
AT&T Inc. | 1,105 | 32,468 | ||||
UTILITIES - 3.2% | ||||||
Dominion Resources Inc. (e) | 231 | �� | 9,868 | |||
Exelon Corp. | 239 | 9,952 | ||||
PG&E Corp. | 189 | 9,023 | ||||
PPL Corp. | 185 | 4,875 | ||||
Xcel Energy Inc. | 325 | 7,663 | ||||
| 41,381 | ||||||
Total Common Stocks (cost $743,676) | 853,910 | |||||
NON-U.S. GOVERNMENT AGENCY ASSET-BACKED SECURITIES - 1.1% | ||||||
Ally Auto Receivables Trust, 1.35%, 12/15/15 | $ | 275 | 269 | |||
AmeriCredit Automobile Receivables Trust, 3.34%, 04/08/16 | 455 | 459 | ||||
Avis Budget Rental Car Funding AESOP LLC, 2.09%, 04/20/14 (r) | 1,375 | 1,354 | ||||
Banc of America Commercial Mortgage Inc. REMIC | ||||||
5.12%, 07/11/43 | 750 | 773 | ||||
5.74%, 05/10/45 (i) | 350 | 383 | ||||
5.20%, 09/10/47 (i) | 1,200 | 1,289 | ||||
Bank of America-First Union NB Commercial Mortgage REMIC, 5.46%, 04/11/37 | 440 | 445 | ||||
Bear Stearns Commercial Mortgage Securities Inc. REMIC | ||||||
5.51%, 04/12/38 (i) | 168 | 183 | ||||
5.72%, 09/11/38 (i) | 540 | 589 | ||||
5.20%, 12/11/38 | 780 | 824 | ||||
5.46%, 03/11/39 (i) | 915 | 989 | ||||
5.54%, 09/11/41 | 600 | 644 | ||||
5.54%, 10/12/41 | 545 | 587 | ||||
CarMax Auto Owner Trust, 4.79%, 02/15/13 | 500 | 512 | ||||
Citibank Credit Card Issuance Trust, 5.65%, 09/20/19 | 750 | 853 | ||||
Continental Airlines Inc. Pass-Through Trust - Class A, 5.98%, 10/19/23 (e) | 270 | 285 | ||||
Ford Credit Floorplan Master Owner Trust, 1.91%, 12/15/14 (i) (r) | 1,000 | 1,018 | ||||
GS Mortgage Securities Corp. II REMIC, 4.75%, 07/10/39 | 900 | 949 | ||||
Marriott Vacation Club Trust, 5.36%, 10/20/28 (r) | 31 | 33 | ||||
Merrill Lynch Mortgage Trust REMIC, 5.05%, 07/12/38 (i) | 500 | 533 | ||||
| Shares/Par (p) | Value | |||||
Morgan Stanley Dean Witter Capital I REMIC, 5.98%, 01/15/39 | 538 | 562 | ||||
OBP Depositor LLC Trust, 4.65%, 07/15/45 (r) | 495 | 505 | ||||
SBA Tower Trust, 4.25%, 04/15/40 (r) | 420 | 435 | ||||
Southwest Airlines Co. Pass-Through Trust, 6.15%, 02/01/24 (e) | 226 | 248 | ||||
Total Non-U.S. Government Agency Asset- Backed Securities (cost $14,116) | 14,721 | |||||
CORPORATE BONDS AND NOTES - 9.8% |
| |||||
CONSUMER DISCRETIONARY - 0.8% |
| |||||
CBS Corp. | ||||||
5.75%, 04/15/20 (e) | 805 | 855 | ||||
4.30%, 02/15/21 (e) | 25 | 24 | ||||
Comcast Corp. | ||||||
6.50%, 01/15/17 (e) | 750 | 865 | ||||
6.55%, 07/01/39 | 375 | 408 | ||||
COX Communications Inc., 5.45%, 12/15/14 | 500 | 550 | ||||
Daimler Finance North America LLC | ||||||
6.50%, 11/15/13 | 425 | 481 | ||||
8.50%, 01/18/31 (e) | 300 | 401 | ||||
DirecTV Holdings LLC, 3.13%, 02/15/16 | 900 | 888 | ||||
Grupo Televisa SA, 6.63%, 01/15/40 | 375 | 406 | ||||
Lowe’s Cos. Inc., 6.65%, 09/15/37 | 420 | 492 | ||||
NBC Universal Inc., 2.88%, 04/01/16 (r) | 1,700 | 1,661 | ||||
News America Inc., 5.65%, 08/15/20 (e) | 845 | 948 | ||||
Staples Inc., 9.75%, 01/15/14 (l) | 335 | 406 | ||||
Target Corp., 5.38%, 05/01/17 | 800 | 896 | ||||
Time Warner Cable Inc. | ||||||
5.85%, 05/01/17 (e) | 270 | 301 | ||||
5.00%, 02/01/20 | 500 | 515 | ||||
Viacom Inc., 6.88%, 04/30/36 | 670 | 769 | ||||
| 10,866 | ||||||
CONSUMER STAPLES - 0.7% | ||||||
Anheuser-Busch InBev Worldwide Inc. | ||||||
6.88%, 11/15/19 (r) | 680 | 811 | ||||
5.38%, 01/15/20 (e) | 170 | 184 | ||||
CVS Caremark Corp. | ||||||
6.13%, 08/15/16 | 400 | 454 | ||||
5.75%, 06/01/17 | 245 | 273 | ||||
Kellogg Co., 4.00%, 12/15/20 (e) | 1,300 | 1,282 | ||||
Kraft Foods Inc., 6.25%, 06/01/12 | 302 | 323 | ||||
PepsiCo Inc., 3.13%, 11/01/20 | 1,800 | 1,692 | ||||
SABMiller Plc, 6.50%, 07/15/18 (r) | 600 | 701 | ||||
Wal-Mart Stores Inc., 3.63%, 07/08/20 | 2,300 | 2,238 | ||||
WM Wrigley Jr. Co., 3.70%, 06/30/14 (r) | 925 | 953 | ||||
| 8,911 | ||||||
ENERGY - 0.4% | ||||||
BP Capital Markets Plc, 4.75%, 03/10/19 | 675 | 696 | ||||
ConocoPhillips, 4.60%, 01/15/15 | 500 | 545 | ||||
EOG Resources Inc., 5.63%, 06/01/19 | 190 | 210 | ||||
Motiva Enterprises LLC, 5.75%, 01/15/20 (r) (e) | 75 | 84 | ||||
Occidental Petroleum Corp., 4.10%, 02/01/21 | 941 | 956 | ||||
Shell International Finance BV | ||||||
3.10%, 06/28/15 | 400 | 411 | ||||
3.25%, 09/22/15 | 550 | 565 | ||||
4.38%, 03/25/20 | 675 | 708 | ||||
StatoilHydro ASA, 5.25%, 04/15/19 | 215 | 240 | ||||
TransCanada Pipelines Ltd., 3.80%, 10/01/20 (e) | 975 | 951 | ||||
| 5,366 | ||||||
FINANCIALS - 5.5% | ||||||
Ace Capital Trust II, 9.70%, 04/01/30 | 525 | 645 | ||||
See accompanying Notes to the Financial Statements.
JNL Series Trust
Schedules of Investments (in thousands)
December 31, 2010
| Shares/Par (p) | Value | |||||||
American Express Centurion Bank, 6.00%, 09/13/17 | 850 | 947 | ||||||
American Express Credit Corp., 2.75%, 09/15/15 | 500 | 492 | ||||||
American Honda Finance Corp., 2.50%, 09/21/15 (r) | 1,000 | 988 | ||||||
Ameriprise Financial Inc., 5.30%, 03/15/20 | 170 | 179 | ||||||
ANZ National International Ltd., 2.38%, 12/21/12 (r) | 260 | 264 | ||||||
ASIF Global Financing XIX, 4.90%, 01/17/13 (r) | 500 | 515 | ||||||
AXA SA, 8.60%, 12/15/30 | 425 | 476 | ||||||
Bank of America Corp. | ||||||||
6.50%, 08/01/16 | 2,000 | 2,170 | ||||||
5.42%, 03/15/17 | 700 | 694 | ||||||
7.63%, 06/01/19 | 800 | 921 | ||||||
Bank of New York Mellon Corp. | ||||||||
4.30%, 05/15/14 | 240 | 256 | ||||||
5.45%, 05/15/19 | 500 | 549 | ||||||
Bank of Nova Scotia, 3.40%, 01/22/15 | 625 | 649 | ||||||
Barclays Bank Plc, 6.75%, 05/22/19 | 320 | 361 | ||||||
Canadian Imperial Bank of Commerce, 2.35%, 12/11/15 | 1,300 | 1,271 | ||||||
Capital One Capital IV, 6.75%, 02/17/37 (e) | 250 | 247 | ||||||
Caterpillar Financial Services Corp. - Series MTN, 2.75%, 06/24/15 (e) | 600 | 609 | ||||||
CDP Financial, 4.40%, 11/25/19 (r) | 600 | 610 | ||||||
Charles Schwab Corp., 4.95%, 06/01/14 | 190 | 207 | ||||||
Citigroup Inc. | ||||||||
5.50%, 10/15/14 | 515 | 555 | ||||||
4.59%, 12/15/15 | 535 | 558 | ||||||
5.85%, 08/02/16 | 1,300 | 1,395 | ||||||
8.50%, 05/22/19 | 400 | 497 | ||||||
8.13%, 07/15/39 | 115 | 146 | ||||||
Comerica Inc., 3.00%, 09/16/15 | 95 | 94 | ||||||
Credit Agricole SA, 3.50%, 04/13/15 (r) | 740 | 745 | ||||||
Credit Suisse New York, 3.50%, 03/23/15 | 345 | 353 | ||||||
Deutsche Bank AG London, 3.45%, 03/30/15 (e) | 500 | 512 | ||||||
Discover Financial Services, 6.45%, 06/12/17 | 90 | 94 | ||||||
Eaton Vance Corp., 6.50%, 10/02/17 | 160 | 181 | ||||||
EDP Finance BV, 4.90%, 10/01/19 (r) (e) | 390 | 332 | ||||||
ENEL Finance International SA | ||||||||
5.13%, 10/07/19 (r) (e) | 350 | 347 | ||||||
6.80%, 09/15/37 (r) | 235 | 238 | ||||||
ERP Operating LP, 4.75%, 07/15/20 | 765 | 771 | ||||||
Everest Reinsurance Holdings Inc., 5.40%, 10/15/14 | 215 | 227 | ||||||
General Electric Capital Corp. | ||||||||
3.00%, 12/09/11 | 5,000 | 5,120 | ||||||
5.88%, 02/15/12 | 1,000 | 1,052 | ||||||
5.90%, 05/13/14 | 250 | 277 | ||||||
2.25%, 11/09/15 | 1,000 | 961 | ||||||
5.63%, 09/15/17 (e) | 1,700 | 1,864 | ||||||
Goldman Sachs Group Inc. | ||||||||
1.63%, 07/15/11 | 4,000 | 4,029 | ||||||
5.35%, 01/15/16 | 1,700 | 1,826 | ||||||
5.63%, 01/15/17 | 1,350 | 1,428 | ||||||
Hartford Financial Services Group Inc., 6.10%, 10/01/41 | 700 | 661 | ||||||
HCP Inc., 6.00%, 01/30/17 | 365 | 382 | ||||||
HSBC Bank Plc, 4.13%, 08/12/20 (r) (e) | 900 | 865 | ||||||
HSBC Bank USA, 5.88%, 11/01/34 | 250 | 248 | ||||||
HSBC Finance Corp., 6.38%, 11/27/12 | 500 | 542 | ||||||
ING Bank NV, 2.00%, 10/18/13 (r) | 1,850 | 1,828 | ||||||
John Deere Capital Corp., 2.95%, 03/09/15 | 180 | 185 | ||||||
JPMorgan Chase & Co. | ||||||||
3.70%, 01/20/15 | 600 | 621 | ||||||
3.40%, 06/24/15 | 1,800 | 1,836 | ||||||
| Shares/Par (p) | Value | |||||||
6.30%, 04/23/19 | 475 | 541 | ||||||
6.40%, 05/15/38 (e) | 425 | 482 | ||||||
Kimco Realty Corp., 5.78%, 03/15/16 | 345 | 375 | ||||||
Kreditanstalt fuer Wiederaufbau, 1.25%, 10/26/15 (e) | 2,000 | 1,912 | ||||||
Liberty Mutual Insurance Co., 7.88%, 10/15/26 (e) (r) | 475 | 497 | ||||||
Liberty Property LP, 6.63%, 10/01/17 | 225 | 255 | ||||||
Lloyds TSB Bank Plc., 4.38%, 01/12/15 (r) (e) | 625 | 625 | ||||||
MassMutual Global Funding II, 2.88%, 04/21/14 (r) | 172 | 175 | ||||||
MetLife Global Funding I Inc., 2.50%, 09/29/15 (r) | 1,200 | 1,183 | ||||||
Metropolitan Life Global Funding I, 2.88%, 09/17/12 (r) (e) | 600 | 615 | ||||||
Morgan Stanley | ||||||||
2.00%, 09/22/11 | 5,000 | 5,061 | ||||||
6.00%, 05/13/14 (e) | 400 | 432 | ||||||
5.38%, 10/15/15 (e) | 170 | 179 | ||||||
5.45%, 01/09/17 | 700 | 726 | ||||||
National Rural Utilities Cooperative Finance Corp., 5.45%, 02/01/18 | 1,000 | 1,104 | ||||||
Nomura Holdings Inc., 5.00%, 03/04/15 | 280 | 292 | ||||||
Nordea Bank AB, 3.70%, 11/13/14 (r) | 345 | 356 | ||||||
Northern Trust Corp., 3.45%, 11/04/20 | 490 | 469 | ||||||
PNC Funding Corp., 5.40%, 06/10/14 | 525 | 575 | ||||||
Private Export Funding Corp., 2.25%, 12/15/17 | 1,985 | 1,881 | ||||||
Prudential Financial Inc. | ||||||||
5.50%, 03/15/16 | 425 | 455 | ||||||
6.00%, 12/01/17 (e) | 450 | 500 | ||||||
Rabobank Nederland NV, 3.20%, 03/11/15 (r) | 750 | 763 | ||||||
Realty Income Corp. | ||||||||
6.75%, 08/15/19 | 355 | 401 | ||||||
5.75%, 01/15/21 | 335 | 346 | ||||||
Royal Bank of Scotland Plc, 4.88%, 03/16/15 | 500 | 511 | ||||||
Simon Property Group LP | ||||||||
4.20%, 02/01/15 (e) | 600 | 627 | ||||||
6.10%, 05/01/16 | 325 | 364 | ||||||
Sovereign Bank, 8.75%, 05/30/18 | 450 | 491 | ||||||
Standard Chartered Plc, 3.85%, 04/27/15 (r) | 265 | 273 | ||||||
Svenska Handelsbanken AB, 4.88%, 06/10/14 (r) | 700 | 744 | ||||||
U.S. Bank NA, 4.95%, 10/30/14 | 450 | 490 | ||||||
US Bancorp, 2.88%, 11/20/14 | 500 | 512 | ||||||
Wachovia Corp. | ||||||||
5.25%, 08/01/14 | 500 | 533 | ||||||
5.75%, 06/15/17 | 1,500 | 1,661 | ||||||
WEA Finance LLC | ||||||||
5.70%, 10/01/16 (r) | 100 | 108 | ||||||
7.13%, 04/15/18 (r) (e) | 350 | 403 | ||||||
Wells Fargo & Co., 3.75%, 10/01/14 (e) | 575 | 600 | ||||||
| 71,337 | ||||||||
HEALTH CARE - 0.5% | ||||||||
Amgen Inc. | ||||||||
6.15%, 06/01/18 | 425 | 496 | ||||||
5.70%, 02/01/19 | 350 | 398 | ||||||
Express Scripts Inc., 6.25%, 06/15/14 | 160 | 179 | ||||||
Schering-Plough, 5.30%, 12/01/13 (l) | 450 | 500 | ||||||
Merck & Co. Inc., 4.00%, 06/30/15 | 370 | 397 | ||||||
Pfizer Inc., 6.20%, 03/15/19 | 700 | 820 | ||||||
Roche Holdings Inc., 6.00%, 03/01/19 (l) (r) | 750 | 872 | ||||||
Thermo Fisher Scientific Inc. | ||||||||
3.25%, 11/20/14 | 140 | 144 | ||||||
3.20%, 05/01/15 | 180 | 184 | ||||||
UnitedHealth Group Inc. | ||||||||
5.50%, 11/15/12 | 379 | 406 | ||||||
3.88%, 10/15/20 (e) | 600 | 572 | ||||||
See accompanying Notes to the Financial Statements.
JNL Series Trust
Schedules of Investments (in thousands)
December 31, 2010
| Shares/Par (p) | Value | |||||
WellPoint Inc., 4.35%, 08/15/20 | 1,000 | 992 | ||||
| 5,960 | ||||||
INDUSTRIALS -0.3% | ||||||
Boeing Co., 3.75%, 11/20/16 (e) | 860 | 900 | ||||
Cargill Inc., 5.60%, 09/15/12 (r) (e) | 485 | 521 | ||||
Deere & Co., 4.38%, 10/16/19 | 185 | 193 | ||||
Pitney Bowes Inc., 5.75%, 09/15/17 | 385 | 405 | ||||
Raytheon Co., 1.63%, 10/15/15 | 835 | 801 | ||||
Siemens Financieringsmaatschappij NV, 5.75%, 10/17/16 (r) | 675 | 776 | ||||
Southwest Airlines Co., 5.75%, 12/15/16 (e) | 500 | 529 | ||||
United Parcel Service Inc., 4.88%, 11/15/40 (e) | 370 | 358 | ||||
| 4,483 | ||||||
INFORMATION TECHNOLOGY -0.5% | ||||||
Cisco Systems Inc., 4.45%, 01/15/20 | 500 | 524 | ||||
Dell Inc., 5.88%, 06/15/19 | 460 | 503 | ||||
Fiserv Inc., 6.13%, 11/20/12 | 247 | 267 | ||||
Hewlett-Packard Co., 3.75%, 12/01/20 (e) | 1,000 | 978 | ||||
International Business Machines Corp., 2.00%, 01/05/16 | 1,300 | 1,271 | ||||
Intuit Inc., 5.40%, 03/15/12 | 550 | 576 | ||||
Microsoft Corp., 4.50%, 10/01/40 (e) | 650 | 609 | ||||
Oracle Corp., 6.13%, 07/08/39 (e) | 500 | 561 | ||||
Xerox Corp. | ||||||
8.25%, 05/15/14 | 345 | 403 | ||||
6.75%, 02/01/17 (e) | 75 | 87 | ||||
6.35%, 05/15/18 (e) | 50 | 56 | ||||
5.63%, 12/15/19 | 30 | 32 | ||||
| 5,867 | ||||||
MATERIALS -0.0% | ||||||
Agrium Inc., 6.13%, 01/15/41 | 210 | 222 | ||||
TELECOMMUNICATION SERVICES -0.4% | ||||||
AT&T Inc. | ||||||
2.50%, 08/15/15 | 500 | 498 | ||||
6.45%, 06/15/34 | 480 | 509 | ||||
6.80%, 05/15/36 | 150 | 166 | ||||
BellSouth Corp., 6.55%, 06/15/34 | 300 | 316 | ||||
BellSouth Telecommunications Inc., 7.00%, 12/01/95 | 70 | 72 | ||||
Deutsche Telekom International Finance BV, 8.75%, 06/15/30 (l) | 275 | 370 | ||||
France Telecom SA, 4.38%, 07/08/14 | 230 | 246 | ||||
Telecom Italia Capital SA, 5.25%, 10/01/15 | 675 | 691 | ||||
Verizon Global Funding Corp., 7.75%, 12/01/30 (e) | 500 | 620 | ||||
Verizon Wireless Capital LLC, 5.55%, 02/01/14 | 500 | 551 | ||||
Vodafone Group Plc, 5.45%, 06/10/19 (e) | 600 | 659 | ||||
| 4,698 | ||||||
UTILITIES -0.7% | ||||||
Abu Dhabi National Energy Co. | ||||||
5.62%, 10/25/12 (r) | 250 | 262 | ||||
5.88%, 10/27/16 (r) | 195 | 205 | ||||
Atmos Energy Corp., 6.35%, 06/15/17 | 385 | 424 | ||||
Consolidated Edison Co. of New York Inc., 5.30%, 12/01/16 | 250 | 281 | ||||
Duke Energy Carolinas LLC, 4.30%, 06/15/20 | 875 | 902 | ||||
Florida Power & Light Co., 5.25%, 02/01/41 (e) | 1,465 | 1,483 | ||||
Indianapolis Power & Light Co. (insured by AMBAC Assurance Corp.), 6.60%, 06/01/37 (r) | 500 | 546 | ||||
MidAmerican Energy Co., 5.65%, 07/15/12 | 500 | 534 | ||||
MidAmerican Energy Holdings Co., 6.13%, 04/01/36 | 350 | 378 | ||||
| Shares/Par (p) | Value | |||||
Niagara Mohawk Power Corp., 3.55%, 10/01/14 (r) | 415 | 431 | ||||
Oncor Electric Delivery Co. LLC, 5.25%, 09/30/40 (r) (e) | 325 | 312 | ||||
Pennsylvania Electric Co., 5.20%, 04/01/20 | 600 | 620 | ||||
PPL Electric Utilities Corp., 6.25%, 05/15/39 | 60 | 68 | ||||
Public Service Co. of Colorado, 5.13%, 06/01/19 | 500 | 545 | ||||
Public Service Electric & Gas Co., 2.70%, 05/01/15 | 230 | 232 | ||||
San Diego Gas & Electric Co. | ||||||
6.00%, 06/01/39 | 100 | 111 | ||||
5.35%, 05/15/40 | 800 | 818 | ||||
Southern California Edison Co., 5.55%, 01/15/37 | 500 | 521 | ||||
| 8,673 | ||||||
Total Corporate Bonds and Notes (cost $123,005) | 126,383 | |||||
GOVERNMENT AND AGENCY OBLIGATIONS -19.0% | ||||||
GOVERNMENT SECURITIES -7.7% | ||||||
Federal Home Loan Mortgage Corp. -0.4% (w) | ||||||
Federal Home Loan Mortgage Corp., 3.50%, 05/29/13 | 5,000 | 5,311 | ||||
Municipals -0.7% | ||||||
Bay Area Toll Authority, 6.26%, 04/01/49 | 600 | 593 | ||||
Dallas Area Rapid Transit (insured by AMBAC Assurance Corp.), 6.00%, 12/01/44 | 890 | 923 | ||||
Illinois State Toll Highway Municipal Bond, 6.18%, 01/01/34 | 565 | 553 | ||||
Irvine Ranch Water District, 2.61%, 03/15/14 | 545 | 553 | ||||
Los Angeles Unified School District, 5.75%, 07/01/34 | 800 | 747 | ||||
Maryland Transportation Authority, 5.89%, 07/01/43 | 270 | 280 | ||||
Massachusetts School Building Authority, 5.72%, 08/15/39 | 500 | 519 | ||||
New Jersey State Turnpike Authority, 7.41%, 01/01/40 | 205 | 225 | ||||
New York State Thruway Authority, Miscellaneous Revenue, RB, 5.88%, 04/01/30 | 840 | 845 | ||||
New York, NJ, Port Authority Revenue | ||||||
5.86%, 12/01/24 | 180 | 183 | ||||
6.04%, 12/01/29 | 105 | 104 | ||||
North Texas Tollway Authority, 6.72%, 01/01/49 | 850 | 832 | ||||
Oregon School Boards Association (insured by AMBAC Assurance Corp.), 4.76%, 06/30/28 | 420 | 374 | ||||
Oregon State Department of Transportation, 5.83%, 11/15/34 | 255 | 260 | ||||
San Antonio Texas Electric & Gas, 5.99%, 02/01/39 | 135 | 138 | ||||
State of Utah, Series B, 3.29%, 07/01/20 | 1,000 | 936 | ||||
University of California Build America Bond, 5.77%, 05/15/43 | 615 | 579 | ||||
University of California, Series F, 6.58%, 05/15/49 | 370 | 362 | ||||
University of Missouri, 5.96%, 11/01/39 | 360 | 371 | ||||
| 9,377 | ||||||
Sovereign -0.5% | ||||||
Financing Corp. Fico, 0.00%, 12/06/13 -12/27/13 (j) | 495 | 473 | ||||
Province of Ontario, Canada, 4.00%, 10/07/19 (e) | 550 | 565 | ||||
Qatar Government International Bond, 4.00%, 01/20/15 (r) | 425 | 440 | ||||
See accompanying Notes to the Financial Statements.
JNL Series Trust
Schedules of Investments (in thousands)
December 31, 2010
| Shares/Par (p) | Value | |||||
Resolution Funding Corp., 0.00%, 04/15/14 (j) | 2,550 | 2,417 | ||||
Tennessee Valley Authority, 4.38%, 06/15/15 | 1,900 | 2,086 | ||||
| 5,981 | ||||||
U.S. Treasury Securities - 6.1% | ||||||
U.S. Treasury Bond | ||||||
4.25%, 05/15/39 | 1,000 | 985 | ||||
4.38%, 11/15/39 | 2,438 | 2,451 | ||||
4.63%, 02/15/40 | 5,100 | 5,342 | ||||
U.S. Treasury Note | ||||||
0.88%, 04/30/11 | 6,100 | 6,114 | ||||
1.00%, 09/30/11 | 15,500 | 15,584 | ||||
4.50%, 03/31/12 (e) | 2,225 | 2,339 | ||||
1.38%, 05/15/12 | 13,000 | 13,173 | ||||
4.75%, 05/31/12 | 2,000 | 2,122 | ||||
3.13%, 09/30/13 | 2,500 | 2,652 | ||||
1.88%, 02/28/14 | 2,000 | 2,048 | ||||
1.75%, 07/31/15 | 7,000 | 6,978 | ||||
1.25%, 10/31/15, TBA (g) | 5,000 | 4,839 | ||||
3.88%, 05/15/18 | 1,000 | 1,076 | ||||
3.63%, 02/15/20 | 12,915 | 13,403 | ||||
| 79,106 | ||||||
U.S. GOVERNMENT AGENCY MORTGAGE-BACKED SECURITIES - 11.3% | ||||||
Federal Home Loan Mortgage Corp. - 2.9% | ||||||
Federal Home Loan Mortgage Corp. | ||||||
6.00%, 04/01/17 - 12/01/39 | 4,370 | 4,769 | ||||
6.50%, 11/01/17 | 34 | 37 | ||||
4.50%, 05/01/18 - 03/01/39 | 9,441 | 9,716 | ||||
7.00%, 11/01/30 - 10/01/32 | 174 | 199 | ||||
4.00%, 01/15/41, TBA (g) | 23,500 | 23,327 | ||||
| 38,048 | ||||||
Federal National Mortgage Association - 8.0% | ||||||
Federal National Mortgage Association | ||||||
6.00%, 01/01/18 - 09/01/38 | 778 | 849 | ||||
4.88%, 09/01/19 | 99 | 105 | ||||
4.21%, 11/01/19 - 07/01/20 | 528 | 536 | ||||
3.74%, 07/01/20 - 10/01/20 | 324 | 320 | ||||
4.04%, 07/01/20 | 100 | 100 | ||||
3.75%, 08/01/20 | 149 | 147 | ||||
3.99%, 08/01/20 | 249 | 249 | ||||
4.03%, 08/01/20 | 100 | 100 | ||||
3.43%, 09/01/20 | 150 | 144 | ||||
3.54%, 09/01/20 | 25 | 24 | ||||
3.55%, 09/01/20 | 249 | 242 | ||||
3.56%, 09/01/20 | 58 | 56 | ||||
3.59%, 09/01/20 | 130 | 126 | ||||
3.61%, 09/01/20 | 15 | 15 | ||||
3.65%, 09/01/20 | 25 | 24 | ||||
3.68%, 09/01/20 - 09/01/20 | 201 | 197 | ||||
3.69%, 09/01/20 | 50 | 49 | ||||
3.70%, 09/01/20 | 40 | 39 | ||||
3.73%, 09/01/20 | 50 | 49 | ||||
3.81%, 09/01/20 | 50 | 49 | ||||
3.83%, 09/01/20 | 25 | 25 | ||||
3.93%, 09/01/20 | 199 | 199 | ||||
3.50%, 10/01/20 | 50 | 48 | ||||
3.66%, 10/01/20 | 125 | 122 | ||||
3.50%, 01/15/26 - 01/15/41 , TBA (g) | 16,000 | 15,617 | ||||
5.00%, 06/01/28 - 08/01/40 | 11,651 | 12,257 | ||||
7.50%, 09/01/29 | 29 | 34 | ||||
7.00%, 10/01/33 | 178 | 203 | ||||
4.50%, 11/01/33 - 03/01/39 | 16,316 | 16,771 | ||||
5.50%, 03/01/38 - 06/01/39 | 8,751 | 9,373 | ||||
5.00%, 01/15/41, TBA (g) | 12,000 | 12,615 | ||||
5.50%, 01/15/41, TBA (g) | 14,000 | 14,978 | ||||
6.00%, 01/15/41, TBA (g) | 9,000 | 9,782 | ||||
| Shares/Par (p) | Value | |||||
6.50%, 01/15/41, TBA (g) | 6,500 | 7,223 | ||||
| 102,667 | ||||||
Government National Mortgage Association - 0.4% | ||||||
Government National Mortgage Association | ||||||
6.50%, 04/15/26 | 36 | 41 | ||||
5.50%, 11/15/32 - 02/15/36 | 325 | 352 | ||||
7.00%, 01/15/33 - 05/15/33 | 51 | 58 | ||||
6.00%, 02/15/33 - 01/15/35 | 277 | 306 | ||||
5.00%, 06/20/33 - 09/15/38 | 3,915 | 4,189 | ||||
REMIC, 7.50%, 09/16/35 | 19 | 22 | ||||
| 4,968 | ||||||
Total Government and Agency Obligations | 245,458 | |||||
SHORT TERM INVESTMENTS - 12.0% | ||||||
Investment Company - 10.1% | ||||||
JNL Money Market Fund, 0.08% (a) (h) | 130,095 | 130,095 | ||||
Securities Lending Collateral 1.9% | ||||||
Securities Lending Cash Collateral Fund LLC, 0.31% (a) (h) | 21,829 | 21,829 | ||||
Securities Lending Liquidating Fund LLC, 0.66% (a) (h) | 2,097 | 2,062 | ||||
| 23,891 | ||||||
Total Short Term Investments (cost $154,021) | 153,986 | |||||
Total Investments - 108.0% (cost $1,279,336) |
| 1,394,458 | ||||
Other Assets and Liabilities, Net - (8.0%) |
| (103,255) | ||||
Total Net Assets - 100.0% | $1,291,203 | |||||
JNL/Select Value Fund |
| |||||
COMMON STOCKS - 97.8% |
| |||||
CONSUMER DISCRETIONARY - 11.0% | ||||||
CBS Corp. - Class B | 567 | $ 10,807 | ||||
Comcast Corp. - Class A | 814 | 17,891 | ||||
General Motors Co. (c) | 147 | 5,422 | ||||
Home Depot Inc. | 357 | 12,513 | ||||
Kohl’s Corp. (c) | 298 | 16,166 | ||||
Mattel Inc. | 497 | 12,636 | ||||
Nordstrom Inc. | 140 | 5,942 | ||||
Stanley Black & Decker Inc. | 319 | 21,298 | ||||
Staples Inc. | 474 | 10,798 | ||||
Target Corp. | 234 | 14,064 | ||||
| 127,537 | ||||||
CONSUMER STAPLES - 7.3% | ||||||
CVS Caremark Corp. | 438 | 15,215 | ||||
General Mills Inc. | 141 | 5,025 | ||||
Kraft Foods Inc. - Class A | 447 | 14,079 | ||||
Molson Coors Brewing Co. - Class B | 221 | 11,082 | ||||
PepsiCo Inc. | 195 | 12,726 | ||||
Philip Morris International Inc. | 225 | 13,140 | ||||
Sysco Corp. | 453 | 13,330 | ||||
| 84,597 | ||||||
ENERGY - 12.7% | ||||||
Apache Corp. | 119 | 14,141 | ||||
Baker Hughes Inc. | 258 | 14,750 | ||||
Chevron Corp. | 371 | 33,845 | ||||
ConocoPhillips | 235 | 15,990 | ||||
EOG Resources Inc. | 74 | 6,728 | ||||
See accompanying Notes to the Financial Statements.
JNL Series Trust
Schedules of Investments (in thousands)
December 31, 2010
| Shares/Par (p) | Value | |||||
Exxon Mobil Corp. | 220 | 16,057 | ||||
Marathon Oil Corp. | 312 | 11,561 | ||||
Occidental Petroleum Corp. | 255 | 24,966 | ||||
Southwestern Energy Co. (c) | 217 | 8,133 | ||||
| 146,171 | ||||||
FINANCIALS - 23.1% | ||||||
ACE Ltd. | 360 | 22,410 | ||||
Ameriprise Financial Inc. | 156 | 9,001 | ||||
Bank of America Corp. | 1,182 | 15,761 | ||||
Bank of New York Mellon Corp. | 404 | 12,196 | ||||
BlackRock Inc. | 68 | 12,864 | ||||
Chubb Corp. | 233 | 13,908 | ||||
Credit Suisse Group AG - ADR | 258 | 10,426 | ||||
Goldman Sachs Group Inc. | 117 | 19,691 | ||||
JPMorgan Chase & Co. | 818 | 34,683 | ||||
Marsh & McLennan Cos. Inc. | 608 | 16,623 | ||||
PNC Financial Services Group Inc. | 392 | 23,820 | ||||
Principal Financial Group Inc. | 328 | 10,667 | ||||
U.S. Bancorp | 423 | 11,416 | ||||
Unum Group | 512 | 12,401 | ||||
Wells Fargo & Co. | 1,310 | 40,600 | ||||
| 266,467 | ||||||
HEALTH CARE - 11.1% | ||||||
Abbott Laboratories | 210 | 10,037 | ||||
Amgen Inc. (c) | 216 | 11,842 | ||||
Baxter International Inc. | 224 | 11,314 | ||||
Covidien Plc | 234 | 10,675 | ||||
Johnson & Johnson | 182 | 11,226 | ||||
Merck & Co. Inc. | 357 | 12,866 | ||||
Pfizer Inc. | 1,546 | 27,067 | ||||
Teva Pharmaceutical Industries Ltd. - ADR (e) | 272 | 14,179 | ||||
UnitedHealth Group Inc. | 350 | 12,639 | ||||
Zimmer Holdings Inc. (c) | 119 | 6,377 | ||||
| 128,222 | ||||||
INDUSTRIALS - 11.1% | ||||||
3M Co. | 119 | 10,227 | ||||
Boeing Co. | 153 | 9,985 | ||||
General Electric Co. | 1,416 | 25,902 | ||||
Illinois Tool Works Inc. | 232 | 12,410 | ||||
Ingersoll-Rand Plc | 435 | 20,498 | ||||
PACCAR Inc. | 180 | 10,353 | ||||
Textron Inc. (e) | 496 | 11,721 | ||||
Tyco International Ltd. | 400 | 16,576 | ||||
Waste Management Inc. | 291 | 10,740 | ||||
| 128,412 | ||||||
INFORMATION TECHNOLOGY - 9.4% |
| |||||
Analog Devices Inc. | 331 | 12,473 | ||||
Cisco Systems Inc. (c) | 652 | 13,194 | ||||
Hewlett-Packard Co. | 248 | 10,454 | ||||
Intel Corp. | 729 | 15,335 | ||||
Maxim Integrated Products Inc. | 360 | 8,508 | ||||
Microsoft Corp. | 615 | 17,157 | ||||
QUALCOMM Inc. | 188 | 9,299 | ||||
Taiwan Semiconductor Manufacturing Co. Ltd. - ADR | 693 | 8,685 | ||||
Xilinx Inc. (e) | 465 | 13,484 | ||||
| 108,589 | ||||||
MATERIALS - 6.2% | ||||||
CF Industries Holdings Inc. | 76 | 10,204 | ||||
Dow Chemical Co. | 389 | 13,263 | ||||
EI Du Pont de Nemours & Co. | 229 | 11,423 | ||||
Mosaic Co. | 157 | 11,988 | ||||
Nucor Corp. | 108 | 4,746 | ||||
| Shares/Par (p) | Value | |||||
Rexam Plc - ADR (e) | 194 | 5,005 | ||||
Steel Dynamics Inc. | 803 | 14,693 | ||||
| 71,322 | ||||||
TELECOMMUNICATION SERVICES - 2.8% | ||||||
AT&T Inc. | 1,104 | 32,445 | ||||
UTILITIES - 3.1% | ||||||
Edison International | 249 | 9,600 | ||||
Entergy Corp. | 157 | 11,092 | ||||
NextEra Energy Inc. | 96 | 4,991 | ||||
Northeast Utilities | 301 | 9,600 | ||||
| 35,283 | ||||||
Total Common Stocks (cost $980,095) | 1,129,045 | |||||
SHORT TERM INVESTMENTS - 2.7% | ||||||
Investment Company - 2.3% | ||||||
JNL Money Market Fund, 0.08% (a) (h) | 26,760 | 26,760 | ||||
Securities Lending Collateral 0.4% | ||||||
Securities Lending Cash Collateral Fund LLC, 0.31% (a) (h) | 4,560 | 4,560 | ||||
Securities Lending Liquidating Fund LLC, 0.66% (a) (h) | 344 | 338 | ||||
| 4,898 | ||||||
Total Short Term Investments (cost $31,664) | 31,658 | |||||
Total Investments - 100.5% (cost $1,011,759) |
| 1,160,703 | ||||
Other Assets and Liabilities, Net - (0.5%) |
| (5,378) | ||||
Total Net Assets - 100.0% | $1,155,325 | |||||
JNL/T.Rowe Price Established Growth Fund | ||||||
COMMON STOCKS - 98.8% | ||||||
CONSUMER DISCRETIONARY - 18.7% | ||||||
Amazon.com Inc. (c) | 350 | $62,964 | ||||
AutoZone Inc. (c) | 31 | 8,450 | ||||
Carmax Inc. (c) | 314 | 10,023 | ||||
Carnival Plc | 191 | 8,875 | ||||
Chipotle Mexican Grill Inc. - Class A (c) | 27 | 5,678 | ||||
Coach Inc. | 359 | 19,856 | ||||
Ctrip.com International Ltd. - ADR (c) | 204 | 8,240 | ||||
Discovery Communications Inc. - Class A (c) | 146 | 6,105 | ||||
Dollar General Corp. (c) | 204 | 6,266 | ||||
General Motors Co. (c) | 137 | 5,035 | ||||
Las Vegas Sands Corp. (c) | 180 | 8,257 | ||||
Liberty Media Corp. - Interactive (c) | 646 | 10,189 | ||||
Lowe’s Cos. Inc. | 374 | 9,370 | ||||
Marriott International Inc. - Class A | 415 | 17,247 | ||||
MGM Resorts International (c) (e) | 203 | 3,012 | ||||
NetFlix Inc. (c) (e) | 8 | 1,388 | ||||
Nike Inc. - Class B | 172 | 14,692 | ||||
O’Reilly Automotive Inc. (c) | 153 | 9,250 | ||||
Priceline.com Inc. (c) | 34 | 13,551 | ||||
Ross Stores Inc. | 81 | 5,136 | ||||
Starbucks Corp. | 678 | 21,775 | ||||
Starwood Hotels & Resorts Worldwide Inc. | 205 | 12,466 | ||||
Walt Disney Co. | 381 | 14,280 | ||||
| 282,105 | ||||||
CONSUMER STAPLES - 2.4% | ||||||
Colgate-Palmolive Co. | 45 | 3,617 | ||||
Costco Wholesale Corp. | 161 | 11,604 | ||||
See accompanying Notes to the Financial Statements.
JNL Series Trust
Schedules of Investments (in thousands)
December 31, 2010
| Shares/Par (p) | Value | |||||||
PepsiCo Inc. | 152 | 9,950 | ||||||
Procter & Gamble Co. | 163 | 10,490 | ||||||
| 35,661 | ||||||||
ENERGY - 8.7% | ||||||||
Cameron International Corp. (c) | 240 | 12,155 | ||||||
EOG Resources Inc. | 163 | 14,909 | ||||||
FMC Technologies Inc. (c) | 130 | 11,532 | ||||||
McDermott International Inc. (c) | 286 | 5,917 | ||||||
Murphy Oil Corp. | 133 | 9,878 | ||||||
Occidental Petroleum Corp. | 170 | 16,716 | ||||||
Peabody Energy Corp. | 168 | 10,762 | ||||||
Petroleo Brasileiro SA - ADR | 206 | 7,025 | ||||||
Schlumberger Ltd. | 327 | 27,288 | ||||||
Suncor Energy Inc. | 407 | 15,580 | ||||||
| 131,762 | ||||||||
FINANCIALS - 7.3% | ||||||||
American Express Co. | 450 | 19,327 | ||||||
Discover Financial Services | 335 | 6,204 | ||||||
Franklin Resources Inc. | 194 | 21,564 | ||||||
IntercontinentalExchange Inc. (c) | 104 | 12,392 | ||||||
Invesco Ltd. | 580 | 13,947 | ||||||
JPMorgan Chase & Co. | 449 | 19,051 | ||||||
Northern Trust Corp. | 171 | 9,447 | ||||||
U.S. Bancorp | 329 | 8,878 | ||||||
| 110,810 | ||||||||
HEALTH CARE - 6.1% | ||||||||
Allergan Inc. | 141 | 9,682 | ||||||
Celgene Corp. (c) | 136 | 8,019 | ||||||
Edwards Lifesciences Corp. (c) | 94 | 7,623 | ||||||
Express Scripts Inc. (c) | 498 | 26,895 | ||||||
Human Genome Sciences Inc. (c) | 207 | 4,946 | ||||||
Illumina Inc. (c) (e) | 159 | 10,065 | ||||||
McKesson Corp. | 215 | 15,097 | ||||||
Stryker Corp. | 178 | 9,543 | ||||||
| 91,870 | ||||||||
INDUSTRIALS - 15.2% | ||||||||
3M Co. | 157 | 13,515 | ||||||
Babcock & Wilcox Co. (c) | 116 | 2,958 | ||||||
Caterpillar Inc. | 61 | 5,713 | ||||||
Cummins Inc. | 60 | 6,546 | ||||||
Danaher Corp. | 951 | 44,845 | ||||||
Deere & Co. | 89 | 7,425 | ||||||
Emerson Electric Co. | 249 | 14,247 | ||||||
Expeditors International Washington Inc. | 233 | 12,727 | ||||||
Fastenal Co. (e) | 251 | 15,031 | ||||||
FedEx Corp. | 291 | 27,047 | ||||||
Joy Global Inc. | 70 | 6,099 | ||||||
PACCAR Inc. | 181 | 10,387 | ||||||
Precision Castparts Corp. | 130 | 18,125 | ||||||
Rockwell Automation Inc. | 116 | 8,353 | ||||||
Union Pacific Corp. | 154 | 14,270 | ||||||
United Parcel Service Inc. - Class B | 199 | 14,451 | ||||||
WW Grainger Inc. | 64 | 8,880 | ||||||
| 230,619 | ||||||||
INFORMATION TECHNOLOGY - 31.2% |
| |||||||
Accenture Plc - Class A | 307 | 14,896 | ||||||
Akamai Technologies Inc. (c) | 209 | 9,815 | ||||||
Apple Inc. (c) | 348 | 112,089 | ||||||
ASML Holding NV | 191 | 7,327 | ||||||
Autodesk Inc. (c) | 79 | 3,005 | ||||||
Autonomy Corp. Plc (c) | 112 | 2,637 | ||||||
Baidu.com - ADR (c) | 292 | 28,158 | ||||||
Broadcom Corp. - Class A | 372 | 16,201 | ||||||
| Shares/Par (p) | Value | |||||||
Corning Inc. | 1,043 | 20,141 | ||||||
Dolby Laboratories Inc. - Class A (c) (e) | 222 | 14,804 | ||||||
eBay Inc. (c) | 473 | 13,155 | ||||||
EMC Corp. (c) | 220 | 5,047 | ||||||
Google Inc. - Class A (c) | 132 | 78,107 | ||||||
Juniper Networks Inc. (c) | 553 | 20,413 | ||||||
Mail.ru Group Ltd. - GDR (c) (f) | 10 | 342 | ||||||
Marvell Technology Group Ltd. (c) | 179 | 3,317 | ||||||
MasterCard Inc. - Class A | 78 | 17,548 | ||||||
NetApp Inc. (c) | 165 | 9,086 | ||||||
QUALCOMM Inc. | 614 | 30,402 | ||||||
Rovi Corp. (c) | 136 | 8,408 | ||||||
Salesforce.com Inc. (c) | 8 | 1,109 | ||||||
Samsung Electronics Co. Ltd. | 7 | 5,750 | ||||||
Tencent Holdings Ltd. | 539 | 11,712 | ||||||
Visa Inc. - Class A | 412 | 29,018 | ||||||
Western Union Co. | 486 | 9,017 | ||||||
| 471,504 | ||||||||
MATERIALS - 5.4% | ||||||||
Agnico-Eagle Mines Ltd. | 67 | 5,139 | ||||||
Air Products & Chemicals Inc. | 86 | 7,849 | ||||||
BHP Billiton Ltd. (e) | 312 | 14,424 | ||||||
Freeport-McMoRan Copper & Gold Inc. | 99 | 11,913 | ||||||
Mosaic Co. | 114 | 8,736 | ||||||
Praxair Inc. | 348 | 33,204 | ||||||
| 81,265 | ||||||||
TELECOMMUNICATION SERVICES - 3.8% |
| |||||||
American Tower Corp. - Class A (c) | 473 | 24,411 | ||||||
Crown Castle International Corp. (c) | 753 | 32,996 | ||||||
| 57,407 | ||||||||
Total Common Stocks (cost $1,155,560) | 1,493,003 | |||||||
PREFERRED STOCKS - 0.2% |
| |||||||
CONSUMER DISCRETIONARY - 0.2% |
| |||||||
Groupon Inc. (f) (q) | 108 | 3,407 | ||||||
Total Preferred Stocks (cost $3,407) | 3,407 | |||||||
SHORT TERM INVESTMENTS - 2.8% |
| |||||||
Investment Companies - 1.4% | ||||||||
JNL Money Market Fund, 0.08% (a) (h) | 250 | 250 | ||||||
T. Rowe Price Reserves Investment Fund, 0.27% (a) (h) | 21,210 | 21,210 | ||||||
Securities Lending Collateral 1.4% | ||||||||
Securities Lending Cash Collateral Fund LLC, 0.31% (a) (h) | 18,620 | 18,620 | ||||||
Securities Lending Liquidating Fund LLC, 0.66% (a) (h) | 2,778 | 2,732 | ||||||
| 21,351 | ||||||||
Total Short Term Investments (cost $42,858) | 42,812 | |||||||
Total Investments - 101.8% (cost $1,201,825) | 1,539,222 | |||||||
Other Assets and Liabilities, Net - (1.8%) | (27,593) | |||||||
Total Net Assets - 100.0% | $ | 1,511,629 | ||||||
See accompanying Notes to the Financial Statements.
JNL Series Trust
Schedules of Investments (in thousands)
December 31, 2010
| Shares/Par (p) | Value | |||||||
JNL/T.Rowe Price Mid-Cap Growth Fund |
| |||||||
COMMON STOCKS - 95.5% |
| |||||||
CONSUMER DISCRETIONARY - 14.8% |
| |||||||
Bed Bath & Beyond Inc. (c) | 141 | $ | 6,930 | |||||
Cablevision Systems Corp. - Class A | 405 | 13,705 | ||||||
Carmax Inc. (c) | 499 | 15,908 | ||||||
Chipotle Mexican Grill Inc. - Class A (c) | 83 | 17,651 | ||||||
Choice Hotels International Inc. | 159 | 6,085 | ||||||
Coach Inc. | 142 | 7,854 | ||||||
Discovery Communications Inc. - Class A (c) | 205 | 8,548 | ||||||
Discovery Communications Inc. - Class C (c) | 237 | 8,696 | ||||||
Dollar General Corp. (c) (e) | 538 | 16,500 | ||||||
Expedia Inc. | 549 | 13,774 | ||||||
Gaylord Entertainment Co. (c) | 74 | 2,660 | ||||||
Lamar Advertising Co. - Class A (c) | 405 | 16,135 | ||||||
Liberty Media Corp. - Starz (c) | 104 | 6,914 | ||||||
Liberty Media Corp. - Interactive (c) | 617 | 9,730 | ||||||
Madison Square Garden Inc. - Class A (c) | 91 | 2,346 | ||||||
Marriott International Inc. - Class A | 413 | 17,156 | ||||||
O’Reilly Automotive Inc. (c) | 218 | 13,172 | ||||||
Panera Bread Co. - Class A (c) | 55 | 5,567 | ||||||
Starbucks Corp. | 208 | 6,683 | ||||||
Tim Hortons Inc. | 150 | 6,184 | ||||||
Wynn Resorts Ltd. | 52 | 5,400 | ||||||
| 207,598 | ||||||||
CONSUMER STAPLES - 1.7% |
| |||||||
Shoppers Drug Mart Corp. (e) | 308 | 12,245 | ||||||
Whole Foods Market Inc. (c) | 241 | 12,192 | ||||||
| 24,437 | ||||||||
ENERGY - 9.2% | ||||||||
Alpha Natural Resources Inc. (c) | 105 | 6,303 | ||||||
Atlas Energy Inc. (c) | 224 | 9,849 | ||||||
Consol Energy Inc. | 326 | 15,889 | ||||||
Continental Resources Inc. (c) | 122 | 7,180 | ||||||
EQT Corp. | 177 | 7,950 | ||||||
FMC Technologies Inc. (c) | 157 | 13,959 | ||||||
McDermott International Inc. (c) | 835 | 17,276 | ||||||
Peabody Energy Corp. | 136 | 8,701 | ||||||
Range Resources Corp. | 309 | 13,899 | ||||||
SM Energy Co. | 139 | 8,191 | ||||||
Trican Well Service Ltd. | 409 | 8,285 | ||||||
Ultra Petroleum Corp. (c) | 240 | 11,465 | ||||||
| 128,947 | ||||||||
FINANCIALS - 7.8% | ||||||||
AON Corp. | 241 | 11,088 | ||||||
CBOE Holdings Inc. (e) | 171 | 3,898 | ||||||
Eaton Vance Corp. (e) | 241 | 7,285 | ||||||
Fifth Third Bancorp | 320 | 4,698 | ||||||
First Republic Bank (c) | 18 | 524 | ||||||
HCC Insurance Holdings Inc. | 17 | 487 | ||||||
Interactive Brokers Group Inc. (c) | 168 | 2,994 | ||||||
IntercontinentalExchange Inc. (c) | 79 | 9,413 | ||||||
LPL Investment Holdings Inc. (c) | 25 | 909 | ||||||
MSCI Inc. - Class A (c) | 329 | 12,818 | ||||||
NYSE Euronext | 277 | 8,304 | ||||||
Popular Inc. (c) | 1,440 | 4,522 | ||||||
Principal Financial Group Inc. | 342 | 11,135 | ||||||
SunTrust Banks Inc. | 172 | 5,076 | ||||||
TCF Financial Corp. (e) | 479 | 7,094 | ||||||
TD Ameritrade Holding Corp. | 618 | 11,736 | ||||||
WR Berkley Corp. | 258 | 7,064 | ||||||
| 109,045 | ||||||||
| Shares/Par (p) | Value | |||||||
HEALTH CARE - 15.6% | ||||||||
Alexion Pharmaceuticals Inc. (c) | 91 | 7,330 | ||||||
BioMarin Pharmaceutical Inc. (c) | 173 | 4,659 | ||||||
Bruker Corp. (c) | 338 | 5,611 | ||||||
CareFusion Corp. (c) | 449 | 11,539 | ||||||
Cephalon Inc. (c) | 208 | 12,838 | ||||||
Cerner Corp. (c) (e) | 42 | 3,979 | ||||||
Community Health Systems Inc. (c) | 378 | 14,126 | ||||||
Covance Inc. (c) | 277 | 14,241 | ||||||
CR Bard Inc. | 138 | 12,664 | ||||||
Dentsply International Inc. | 346 | 11,823 | ||||||
Edwards Lifesciences Corp. (c) | 173 | 13,985 | ||||||
Elan Corp. Plc - ADR (c) | 492 | 2,819 | ||||||
Henry Schein Inc. (c) | 224 | 13,751 | ||||||
Human Genome Sciences Inc. (c) | 343 | 8,194 | ||||||
Idexx Laboratories Inc. (c) (e) | 138 | 9,552 | ||||||
Illumina Inc. (c) (e) | 193 | 12,225 | ||||||
Laboratory Corp. of America Holdings (c) | 88 | 7,737 | ||||||
Qiagen NV (c) (e) | 405 | 7,918 | ||||||
Regeneron Pharmaceuticals Inc. (c) | 174 | 5,713 | ||||||
SXC Health Solutions Corp. (c) | 65 | 2,786 | ||||||
Theravance Inc. (c) (e) | 204 | 5,114 | ||||||
Valeant Pharmaceuticals International Inc. | 399 | 11,288 | ||||||
Vertex Pharmaceuticals Inc. (c) (e) | 173 | 6,060 | ||||||
Waters Corp. (c) | 173 | 13,444 | ||||||
| 219,396 | ||||||||
INDUSTRIALS - 17.7% | ||||||||
A123 Systems Inc. (c) (e) | 165 | 1,574 | ||||||
Alliant Techsystems Inc. (c) | 41 | 3,052 | ||||||
AMETEK Inc. | 594 | 23,315 | ||||||
Babcock & Wilcox Co. (c) | 446 | 11,413 | ||||||
Danaher Corp. | 70 | 3,302 | ||||||
Fastenal Co. (e) | 266 | 15,936 | ||||||
Foster Wheeler AG (c) | 138 | 4,764 | ||||||
Gardner Denver Inc. | 239 | 16,448 | ||||||
Goodrich Corp. | 96 | 8,455 | ||||||
Hertz Global Holdings Inc. (c) (e) | 1,104 | 15,997 | ||||||
IDEX Corp. | 309 | 12,088 | ||||||
IHS Inc. - Class A (c) (e) | 242 | 19,454 | ||||||
Manpower Inc. | 144 | 9,037 | ||||||
MSC Industrial Direct Co. - Class A | 121 | 7,828 | ||||||
Quanta Services Inc. (c) | 690 | 13,745 | ||||||
Robert Half International Inc. | 397 | 12,148 | ||||||
Rockwell Collins Inc. | 173 | 10,079 | ||||||
Roper Industries Inc. | 241 | 18,420 | ||||||
Textron Inc. | 449 | 10,614 | ||||||
UTi Worldwide Inc. | 361 | 7,653 | ||||||
Verisk Analytics Inc. - Class A (c) | 217 | 7,395 | ||||||
WABCO Holdings Inc. (c) | 225 | 13,709 | ||||||
Wabtec Corp. | 46 | 2,433 | ||||||
| 248,859 | ||||||||
INFORMATION TECHNOLOGY - 25.6% | ||||||||
Akamai Technologies Inc. (c) | 102 | 4,799 | ||||||
Altera Corp. | 352 | 12,524 | ||||||
Atheros Communications Inc. (c) | 171 | 6,142 | ||||||
Autodesk Inc. (c) | 139 | 5,310 | ||||||
Booz Allen Hamilton Holding Corp. – Class A (c) | 22 | 427 | ||||||
Cree Inc. (c) (e) | 116 | 7,643 | ||||||
Dolby Laboratories Inc. - Class A (c) (e) | 208 | 13,874 | ||||||
Electronic Arts Inc. (c) | 347 | 5,684 | ||||||
Equinix Inc. (c) | 87 | 7,070 | ||||||
Factset Research Systems Inc. | 139 | 13,033 | ||||||
First Solar Inc. (c) (e) | 42 | 5,466 | ||||||
Fiserv Inc. (c) | 294 | 17,217 | ||||||
See accompanying Notes to the Financial Statements.
JNL Series Trust
Schedules of Investments (in thousands)
December 31, 2010
| Shares/Par (p) | Value | |||||||
FLIR Systems Inc. (c) | 356 | 10,591 | ||||||
Gartner Inc. - Class A (c) | 344 | 11,421 | ||||||
Global Payments Inc. | 370 | 17,098 | ||||||
Intersil Corp. - Class A | 381 | 5,818 | ||||||
JDS Uniphase Corp. (c) | 1,258 | 18,216 | ||||||
Juniper Networks Inc. (c) | 386 | 14,251 | ||||||
Marvell Technology Group Ltd. (c) | 379 | 7,030 | ||||||
McAfee Inc. (c) | 218 | 10,096 | ||||||
MEMC Electronic Materials Inc. (c) | 585 | 6,587 | ||||||
Microchip Technology Inc. (e) | 324 | 11,084 | ||||||
Micros Systems Inc. (c) | 207 | 9,079 | ||||||
National Semiconductor Corp. | 690 | 9,494 | ||||||
Nuance Communications Inc. (c) | 689 | 12,526 | ||||||
Nvidia Corp. (c) | 448 | 6,899 | ||||||
PMC - Sierra Inc. (c) | 311 | 2,672 | ||||||
Rackspace Hosting Inc. (c) (e) | 174 | 5,465 | ||||||
Red Hat Inc. (c) | 320 | 14,608 | ||||||
Rovi Corp. (c) | 242 | 15,006 | ||||||
Silicon Laboratories Inc. (c) | 173 | 7,961 | ||||||
Solera Holdings Inc. | 276 | 14,164 | ||||||
Trimble Navigation Ltd. (c) | 311 | 12,418 | ||||||
Varian Semiconductor Equipment Associates Inc. (c) | 242 | 8,947 | ||||||
WebMD Health Corp. - Class A (c) | 25 | 1,290 | ||||||
Western Union Co. | 759 | 14,095 | ||||||
Xilinx Inc. | 448 | 12,983 | ||||||
| 358,988 | ||||||||
MATERIALS - 2.1% | ||||||||
Agnico-Eagle Mines Ltd. | 237 | 18,178 | ||||||
Franco-Nevada Corp. | 229 | 7,660 | ||||||
HudBay Minerals Inc. | 175 | 3,194 | ||||||
| 29,032 | ||||||||
UTILITIES - 1.0% | ||||||||
Calpine Corp. (c) | 1,103 | 14,714 | ||||||
Total Common Stocks (cost $1,020,758) | 1,341,016 | |||||||
SHORT TERM INVESTMENTS - 11.4% |
| |||||||
Investment Companies - 4.7% | ||||||||
JNL Money Market Fund, 0.08% (a) (h) | 4,056 | 4,056 | ||||||
T. Rowe Price Reserves Investment Fund, 0.27% (a) (h) | 62,363 | 62,363 | ||||||
Securities Lending Collateral 6.7% |
| |||||||
Securities Lending Cash Collateral Fund LLC, 0.31% (a) (h) | 88,427 | 88,427 | ||||||
Securities Lending Liquidating Fund LLC, 0.66% (a) (h) | 5,908 | 5,811 | ||||||
| 94,238 | ||||||||
Total Short Term Investments (cost $160,754) | 160,657 | |||||||
Total Investments - 106.9% (cost $1,181,512) | 1,501,673 | |||||||
Other Assets and Liabilities, Net - (6.9%) | (96,713) | |||||||
Total Net Assets - 100.0% | $ | 1,404,961 | ||||||
JNL/T.Rowe Price Value Fund |
| |||||||
COMMON STOCKS - 96.5% | ||||||||
CONSUMER DISCRETIONARY - 11.1% |
| |||||||
Bed Bath & Beyond Inc. (c) | 131 | $ | 6,429 | |||||
Cablevision Systems Corp. - Class A | 351 | 11,885 | ||||||
Comcast Corp. - Special Class A | 398 | 8,289 | ||||||
| Shares/Par (p) | Value | |||||||
Discovery Communications Inc. - Class C (c) | 335 | 12,280 | ||||||
General Motors Co. (c) | 254 | 9,348 | ||||||
H&R Block Inc. | 647 | 7,706 | ||||||
Harley-Davidson Inc. | 189 | 6,559 | ||||||
Home Depot Inc. | 184 | 6,461 | ||||||
International Game Technology | 407 | 7,196 | ||||||
Kohl’s Corp. (c) | 204 | 11,107 | ||||||
Liberty Media Corp. (c) | 27 | 1,810 | ||||||
Liberty Media Corp. - Capital (c) | 22 | 1,364 | ||||||
Lowe’s Cos. Inc. | 240 | 6,024 | ||||||
Madison Square Garden Inc. - Class A (c) | 128 | 3,304 | ||||||
Time Warner Cable Inc. | 193 | 12,711 | ||||||
Time Warner Inc. | 441 | 14,197 | ||||||
| 126,670 | ||||||||
CONSUMER STAPLES - 3.8% |
| |||||||
Avon Products Inc. | 187 | 5,440 | ||||||
Kellogg Co. | 128 | 6,538 | ||||||
Kimberly-Clark Corp. | 135 | 8,511 | ||||||
Kroger Co. | 258 | 5,762 | ||||||
PepsiCo Inc. | 84 | 5,468 | ||||||
Philip Morris International Inc. | 114 | 6,655 | ||||||
Procter & Gamble Co. | 73 | 4,683 | ||||||
| 43,057 | ||||||||
ENERGY - 16.6% | ||||||||
Alpha Natural Resources Inc. (c) | 73 | 4,352 | ||||||
Baker Hughes Inc. | 230 | 13,171 | ||||||
Chevron Corp. | 278 | 25,386 | ||||||
ConocoPhillips | 74 | 5,033 | ||||||
Consol Energy Inc. | 227 | 11,054 | ||||||
El Paso Corp. | 853 | 11,736 | ||||||
EQT Corp. | 200 | 8,977 | ||||||
Exxon Mobil Corp. | 132 | 9,659 | ||||||
Hess Corp. | 90 | 6,871 | ||||||
Murphy Oil Corp. | 199 | 14,806 | ||||||
Nexen Inc. | 566 | 12,952 | ||||||
Peabody Energy Corp. | 189 | 12,073 | ||||||
Royal Dutch Shell Plc - ADR | 223 | 14,919 | ||||||
Schlumberger Ltd. | 178 | 14,871 | ||||||
Spectra Energy Corp. | 664 | 16,598 | ||||||
Total SA - ADR | 115 | 6,145 | ||||||
| 188,603 | ||||||||
FINANCIALS - 21.7% | ||||||||
American Express Co. | 233 | 10,005 | ||||||
Ameriprise Financial Inc. | 53 | 3,056 | ||||||
AON Corp. | 289 | 13,274 | ||||||
Bank of America Corp. | 1,061 | 14,150 | ||||||
CIT Group Inc. (c) | 218 | 10,244 | ||||||
Citigroup Inc. (c) | 2,173 | 10,277 | ||||||
Fifth Third Bancorp | 132 | 1,938 | ||||||
First Horizon National Corp. (c) | 759 | 8,938 | ||||||
Goldman Sachs Group Inc. | 44 | 7,449 | ||||||
JPMorgan Chase & Co. | 585 | 24,799 | ||||||
Lazard Ltd. - Class A | 293 | 11,578 | ||||||
Marsh & McLennan Cos. Inc. | 254 | 6,953 | ||||||
Moody’s Corp. | 497 | 13,182 | ||||||
Morgan Stanley | 416 | 11,322 | ||||||
NYSE Euronext | 242 | 7,261 | ||||||
PNC Financial Services Group Inc. | 93 | 5,629 | ||||||
Principal Financial Group Inc. | 192 | 6,248 | ||||||
Regions Financial Corp. | 1,443 | 10,099 | ||||||
SLM Corp. (c) | 744 | 9,368 | ||||||
St. Joe Co. (c) (e) | 358 | 7,831 | ||||||
State Street Corp. | 112 | 5,176 | ||||||
SunTrust Banks Inc. | 271 | 8,011 | ||||||
U.S. Bancorp | 403 | 10,880 | ||||||
See accompanying Notes to the Financial Statements.
JNL Series Trust
Schedules of Investments (in thousands)
December 31, 2010
| Shares/Par (p) | Value | |||||||
Wells Fargo & Co. | 847 | 26,255 | ||||||
Willis Group Holdings Plc | 90 | 3,120 | ||||||
| 247,043 | ||||||||
HEALTH CARE - 9.3% | ||||||||
Amgen Inc. (c) | 171 | 9,393 | ||||||
CIGNA Corp. | 252 | 9,253 | ||||||
Covidien Plc | 352 | 16,086 | ||||||
Johnson & Johnson | 171 | 10,576 | ||||||
Medtronic Inc. | 188 | 6,988 | ||||||
Merck & Co. Inc. | 362 | 13,039 | ||||||
Pfizer Inc. | 1,851 | 32,406 | ||||||
WellPoint Inc. (c) | 149 | 8,461 | ||||||
| 106,202 | ||||||||
INDUSTRIALS - 9.9% | ||||||||
3M Co. | 131 | 11,271 | ||||||
Boeing Co. | 42 | 2,734 | ||||||
Fluor Corp. | 144 | 9,535 | ||||||
General Electric Co. | 1,101 | 20,143 | ||||||
Honeywell International Inc. | 215 | 11,424 | ||||||
Illinois Tool Works Inc. | 229 | 12,239 | ||||||
Lockheed Martin Corp. | 50 | 3,461 | ||||||
Raytheon Co. | 130 | 6,043 | ||||||
Republic Services Inc. - Class A | 268 | 8,014 | ||||||
Southwest Airlines Co. | 1,000 | 12,981 | ||||||
Tyco International Ltd. | 101 | 4,202 | ||||||
Union Pacific Corp. | 65 | 6,014 | ||||||
Waste Management Inc. | 110 | 4,070 | ||||||
| 112,131 | ||||||||
INFORMATION TECHNOLOGY - 10.2% |
| |||||||
Analog Devices Inc. | 234 | 8,807 | ||||||
Applied Materials Inc. | 924 | 12,984 | ||||||
CA Inc. | 251 | 6,144 | ||||||
Dell Inc. (c) | 548 | 7,419 | ||||||
Electronic Arts Inc. (c) | 261 | 4,270 | ||||||
Hewlett-Packard Co. | 145 | 6,083 | ||||||
International Business Machines Corp. | 104 | 15,190 | ||||||
Microsoft Corp. | 603 | 16,825 | ||||||
Motorola Inc. (c) | 386 | 3,501 | ||||||
Texas Instruments Inc. | 442 | 14,375 | ||||||
Tyco Electronics Ltd. | 305 | 10,786 | ||||||
Western Union Co. | 511 | 9,495 | ||||||
| 115,879 | ||||||||
MATERIALS - 5.8% | ||||||||
Anglo American Plc | 156 | 8,133 | ||||||
Eastman Chemical Co. | 33 | 2,800 | ||||||
International Paper Co. | 592 | 16,118 | ||||||
MeadWestvaco Corp. | 182 | 4,761 | ||||||
Monsanto Co. | 115 | 8,030 | ||||||
United States Steel Corp. (e) | 181 | 10,568 | ||||||
Vulcan Materials Co. (e) | 70 | 3,101 | ||||||
Weyerhaeuser Co. | 677 | 12,808 | ||||||
| 66,319 | ||||||||
TELECOMMUNICATION SERVICES - 2.4% |
| |||||||
AT&T Inc. | 457 | 13,429 | ||||||
CenturyLink Inc. (e) | 134 | 6,168 | ||||||
Qwest Communications International Inc. | 184 | 1,399 | ||||||
Sprint Nextel Corp. (c) (e) | 624 | 2,638 | ||||||
Vodafone Group Plc | 1,217 | 3,146 | ||||||
| 26,780 | ||||||||
UTILITIES - 5.7% | ||||||||
AES Corp. (c) | 1,061 | 12,925 | ||||||
Allegheny Energy Inc. | 147 | 3,568 | ||||||
| Shares/Par (p) | Value | |||||||
CenterPoint Energy Inc. | 507 | 7,972 | ||||||
Entergy Corp. | 145 | 10,292 | ||||||
Exelon Corp. | 121 | 5,022 | ||||||
NiSource Inc. | 299 | 5,274 | ||||||
NRG Energy Inc. (c) | 501 | 9,789 | ||||||
PPL Corp. | 364 | 9,588 | ||||||
| 64,430 | ||||||||
Total Common Stocks (cost $968,869) | 1,097,114 | |||||||
PREFERRED STOCKS - 1.3% |
| |||||||
FINANCIALS - 1.2% | ||||||||
Citigroup Inc., Convertible Preferred, 7.50% | 57 | 7,805 | ||||||
Fifth Third Bancorp, Convertible Preferred, 8.50%, Series G (m) | 40 | 5,869 | ||||||
| 13,674 | ||||||||
UTILITIES - 0.1% | ||||||||
PPL Corp., Convertible Preferred, 9.50% | 27 | 1,455 | ||||||
Total Preferred Stocks (cost $10,620) | 15,129 | |||||||
INVESTMENT COMPANIES - 0.4% |
| |||||||
T. Rowe Price Institutional Floating Rate Fund (a) | 410 | 4,227 | ||||||
Total Investment Companies (cost $3,698) | 4,227 | |||||||
CORPORATE BONDS AND NOTES - 0.2% |
| |||||||
CONSUMER DISCRETIONARY - 0.1% |
| |||||||
International Game Technology, 3.25%, 05/01/14 (e) | $ | 1,007 | 1,162 | |||||
MATERIALS - 0.1% | ||||||||
United States Steel Corp., 4.00%, 05/15/14 (e) | 327 | 634 | ||||||
Total Corporate Bonds and Notes (cost $1,348) | 1,796 | |||||||
SHORT TERM INVESTMENTS - 2.9% |
| |||||||
Investment Companies - 1.7% |
| |||||||
JNL Money Market Fund, 0.08% (a) (h) | 4,638 | 4,638 | ||||||
T. Rowe Price Reserves Investment Fund, 0.27% (a) (h) | 14,447 | 14,447 | ||||||
Securities Lending Collateral 1.2% |
| |||||||
Securities Lending Cash Collateral Fund LLC, 0.31% (a) (h) | 12,419 | 12,419 | ||||||
Securities Lending Liquidating Fund LLC, 0.66% (a) (h) | 1,843 | 1,812 | ||||||
| 14,231 | ||||||||
Total Short Term Investments (cost $33,347) | 33,316 | |||||||
Total Investments - 101.3% (cost $1,017,882) | 1,151,582 | |||||||
Other Assets and Liabilities, Net - (1.3%) | (14,806) | |||||||
Total Net Assets - 100.0% | $ | 1,136,776 | ||||||
See accompanying Notes to the Financial Statements.
JNL Series Trust
Schedules of Investments (in thousands)
December 31, 2010
| (a) | Investment in affiliate. |
| (b) | The Fund does not invest in the Underlying Affiliated Funds for the purpose of exercising management or control. At December 31, 2010, the percentage of shares outstanding held by each Fund in the Underlying Affiliated Fund is presented parenthetically in the Schedules of Investments. Percentages reflecting 0.0% represent amounts less than 0.05%. |
| (c) | Non-income producing security. |
| (d) | Issuer was in bankruptcy and/or was in default relating to principal and/or interest. |
| (e) | All or portion of the security was on loan. |
| (f) | Security fair valued in good faith in accordance with the procedures established by the Trust’s Board of Trustees (“Board”). Good faith fair valued securities may be classified as Level 2 or Level 3 for Financial Accounting Standards Board (“FASB”) Accounting Standards Codification (“ASC”) Topic 820 “Fair Value Measurements and Disclosures” based on the applicable valuation inputs. See FASB ASC Topic 820 “Fair Value Measurements and Disclosures” in these Notes to the Schedules of Investments. |
| (g) | Investment purchased on a delayed delivery basis. As of December 31, 2010, the total payable for investments purchased on a delayed delivery basis was as follows: JNL/Capital Guardian Global Balanced Fund $2,464; JNL/Goldman Sachs Core Plus Bond Fund $670,588; JNL/Mellon Capital Management Bond Index Fund $61,410; JNL/PIMCO Real Return Fund $1,134,441; JNL/PIMCO Total Return Bond Fund $1,337,924; and JNL/Select Balanced Fund $88,570. |
| (h) | Yield changes daily to reflect current market conditions. Rate was the quoted yield as of December 31, 2010. |
| (i) | Variable rate security. Rate stated was in effect as of December 31, 2010. |
| (j) | Security issued with a zero coupon. Income is recognized through the accretion of discount. |
| (k) | Security is a “step-up” bond where the coupon may increase or step up at a future date. Rate stated was the coupon as of December 31, 2010. |
| (l) | The interest rate for this security is inversely affected by upgrades or downgrades to the credit rating of the issuer. |
| (m) | Perpetual maturity security. Interest rate is fixed until the first call date and variable thereafter. |
| (n) | Foreign or U.S. Treasury inflation indexed note, par amount is adjusted for inflation. |
| (o) | All or a portion of the security or cash is pledged or segregated collateral. See Pledged or Segregated Collateral in these Notes to the Schedules of Investments. |
| (p) | Par amounts are listed in United States Dollars unless otherwise noted. Options are quoted in unrounded number of contracts. Gold bullion is quoted in unrounded ounces. |
| (q) | Restricted Security. Restricted as to public resale. Restricted security or Rule 144A or Section 4(2) of the Securities Act of 1933, as amended, provides an exemption from the registration requirements for resale of the security to an institutional investor. See Restricted Securities in these Notes to the Schedules of Investments. |
| (r) | Rule 144A or Section 4(2) liquid security. Rule 144A or Section 4(2) of the Securities Act of 1933, as amended, provides an exemption from the registration requirements for resale of this security to an institutional investor. The sub-adviser deemed this security to be liquid based on procedures approved by the Board. As of December 31, 2010, the value of Rule 144A and Section 4(2) liquid securities was as follows: JNL/BlackRock Commodity Securities Fund, $65,564; JNL/Franklin Templeton Income Fund, $222,828; JNL/Goldman Sachs Core Plus Bond Fund, $139,332; JNL/Goldman Sachs Emerging Markets Debt Fund, $1,544; JNL/Ivy Asset Strategy Fund, $64,378; JNL/JPMorgan U.S. Government & Quality Bond Fund, $7,002; JNL/Mellon Capital Management Bond Index Fund, $3,976; JNL/PIMCO Real Return Fund, $264,167; JNL/PIMCO Total Return Bond Fund, $380,356; JNL/PPM America High Yield Bond Fund, $332,830; JNL/Select Balanced Fund, $23,897; JNL/Select Money Market Fund, $105,072; and JNL/T. Rowe Price Short-Term Bond Fund, $97,504. |
| (s) | Foreign or U.S. Treasury inflation indexed note, par amount is not adjusted for inflation. |
| (t) | The Fund had an unfunded loan commitment at December 31, 2010. See Unfunded Loan Commitments in these Notes to Schedules of Investments. |
| (u) | Contingent distributions represent the right to receive additional distributions, if any, during the reorganization of the underlying company. |
| (v) | The counterparty for the over-the-counter options transactions were CSI, GSC and MSC. |
| (w) | The securities in this category are a direct debt of the agency and not collateralized by mortgages. |
| (x) | For all items listed as “Other Securities” in this Summary Schedule of Investments, this represents issues not identified as top-fifty unaffiliated holdings in terms of value and issues or issuers not exceeding one percent individually or in aggregate, respectively, as of December 31, 2010. In certain instances, securities for which footnotes listed above may otherwise apply are included in the Other Securities caption. |
| * | A Summary Schedule of Investments is presented for this portfolio. For information on availability of a complete Schedule of Investments, refer to www.jackson.com, www.sec.gov, or call the Shareholder Service Center at 1-800-873-5654. |
Currencies:
ARS - Argentine Peso | EUR - European Currency Unit (Euro) | MYR - Malaysian Ringgit | TRY - New Turkish Lira | |||
AUD - Australian Dollar | GBP - British Pound | NOK - Norwegian Krone | TWD - Taiwan Dollar | |||
BRL - Brazilian Real | HKD - Hong Kong Dollar | NZD - New Zealand Dollar | USD - United States Dollar | |||
CAD - Canadian Dollar | HUF - Hungarian Forint | PEN - Peruvian Nuevo Sol | ZAR - South African Rand | |||
CHF - Swiss Franc | IDR - Indonesian Rupiah | PHP - Philippine Peso | ||||
CLP - Chilean Peso | ILS - Israeli New Shekels | PLN - Polish Zloty | ||||
CNY - Chinese Yuan | INR - Indian Rupee | RUB - Russian Ruble | ||||
COP - Colombian Peso | JPY - Japanese Yen | SEK - Swedish Krona | ||||
DKK - Danish Krone | KRW - Korean Won | SGD - Singapore Dollar | ||||
EGP - Egyptian Pound | MXN - Mexican Peso | THB - Thai Baht |
Abbreviations:
“-” Amount rounds to less than one thousand | CDX - Credit Default Swap Index | |
ABS - Asset Backed Security | CLO - Collateralized Loan Obligation | |
ADR - American Depositary Receipt | CPI - Consumer Price Index | |
AMBAC - AMBAC Indemnity Corp. | CPURNSA - CPI Urban Consumers Index Non-Seasonably | |
ASX - Australian Stock Exchange | Adjusted | |
BDR - Brazilian Depository Receipt | DAX - Deutscher Aktienindex | |
CAC - Cotation Assistee en Continu | ETF - Exchange-Traded Fund | |
CDO - Collateralized Debt Obligation |
See accompanying Notes to the Financial Statements.
JNL Series Trust
Notes to Schedules of Investments (in thousands)
December 31, 2010
| Abbreviations (continued): | ||
Euro-Bobl - debt instrument issued by the Federal Republic of | RB - Revenue Bond | |
Germany with a term of 4.5 to 5.5 years | REIT - Real Estate Investment Trust | |
Euro-Bund - debt instrument issued by the Federal Republic of | REMIC - Real Estate Mortgage Investment Conduit | |
Germany with a term of 8.5 to 10.5 years | RSP - Risparmio Shares | |
FDR - Fiduciary Depository Receipt | SDR - Swedish Depository Receipt | |
FTSE - Financial Times and the London Stock Exchange | SPDR - Standard & Poor’s Depository Receipt | |
GDR - Global Depository Receipt | SPI - Schedule Performance Index | |
GO - General Obligation | TBA - To Be Announced (Securities purchased on a delayed | |
HSCEI - Hang Seng China Enterprises Index | delivery basis) | |
IBEX - Iberia Index | TSX - Toronto Stock Exchange | |
KOSPI - Korea Composite Stock Price Index | TAIEX - Taiwan Stock Exchange Capitalization Weighted Stock | |
LIBOR - London Interbank Offered Rate | Index | |
MBS - Mortgage Backed Security | virt-x - a cross border recognized investment exchange | |
MIB - Milano Indice Borsa | VVPR - Voter-Verified Paper Record | |
NYS - New York Registered Shares |
Restricted Securities - Restricted securities are often purchased in private placement transactions and cannot be sold without prior registration unless the sale is pursuant to an exemption under the Securities Exchange Act of 1933, as amended. The following table details restricted securities, including Rule 144A securities that have not been deemed liquid, held by the Funds at December 31, 2010.
| Initial Acquisition Date | Cost | Ending Value | Percent of Net Assets | |||||||||||||||||
JNL/BlackRock Commodity Securities Fund | ||||||||||||||||||||
Uranium Energy Corp. | 11/02/2010 | $ | 1,243 | $ | 2,209 | 0.2 | % | |||||||||||||
Uranium Energy Corp. Warrant | 10/22/2010 | — | — | — | ||||||||||||||||
| $ | 1,243 | $ | 2,209 | 0.2 | % | |||||||||||||||
JNL/Capital Guardian Global Balanced Fund | ||||||||||||||||||||
AES Panama SA, 6.35%, 12/21/16 | 01/04/2008 | $ | 298 | $ | 322 | 0.1 | % | |||||||||||||
AIA Group Ltd. | 10/25/2010 | 1,962 | 2,031 | 0.6 | ||||||||||||||||
ASAT Holdings Ltd., 13.00% | 07/28/2006 | 1 | — | — | ||||||||||||||||
Agricultural Bank of China- Class H | 07/09/2010 | 361 | 433 | 0.1 | ||||||||||||||||
Altegrity Inc., 10.50%, 11/01/15 | 07/27/2009 | 158 | 205 | 0.1 | ||||||||||||||||
BNP Paribas | 11/28/2007 | 705 | 609 | 0.2 | ||||||||||||||||
Croatia Government International Bond, 6.75%, 11/05/19 | 10/30/2009 | 630 | 654 | 0.2 | ||||||||||||||||
Dominican Republic International Bond, 8.63%, 04/20/27 | 12/17/2009 | 158 | 168 | 0.1 | ||||||||||||||||
Dubai Electricity & Water Authority, 6.38%, 10/21/16 | 10/15/2010 | 100 | 97 | — | ||||||||||||||||
Dubai Electricity & Water Authority, 7.38%, 10/21/20 | 10/15/2010 | 125 | 117 | — | ||||||||||||||||
E.ON International Finance BV, 5.80%, 04/30/18 | 01/14/2010 | 542 | 565 | 0.2 | ||||||||||||||||
Egypt Government International Bond, 5.75%, 04/29/20 | 11/04/2010 | 136 | 129 | — | ||||||||||||||||
First Data Corp., 8.25%, 01/15/21 | 12/22/2009 | 86 | 96 | — | ||||||||||||||||
First Data Corp., 8.75%, 01/15/22 | 12/22/2009 | 87 | 96 | — | ||||||||||||||||
First Data Corp., 12.63%, 01/15/21 | 12/22/2009 | 167 | 192 | 0.1 | ||||||||||||||||
Georgia Gulf Corp., 9.00%, 01/15/17 | 10/11/2010 | 321 | 326 | 0.1 | ||||||||||||||||
KT&G Corp. - GDR | 09/14/2006 | 118 | 122 | — | ||||||||||||||||
LG Chem Ltd. - GDR | 09/08/2009 | 134 | 276 | 0.1 | ||||||||||||||||
Liberty Mutual Group Inc., 7.50%, 08/15/36 | 08/06/2009 | 263 | 348 | 0.1 | ||||||||||||||||
Michaels Stores Inc., 7.75%, 11/01/18 | 12/15/2010 | 247 | 249 | 0.1 | ||||||||||||||||
Roche Holdings Inc., 6.00%, 03/01/19 | 05/19/2009 | 417 | 465 | 0.1 | ||||||||||||||||
Societe Generale, 5.75%, 04/20/16 | 08/07/2008 | 144 | 159 | — | ||||||||||||||||
Standard Chartered Bank, 6.40%, 09/26/17 | 12/18/2007 | 299 | 321 | 0.1 | ||||||||||||||||
TransDigm Inc., 7.75%, 12/15/18 | 12/02/2010 | 400 | 414 | 0.1 | ||||||||||||||||
UniCredit SpA | 09/09/2009 | 1,205 | 764 | 0.2 | ||||||||||||||||
| $ | 9,064 | $ | 9,158 | 2.6 | % | |||||||||||||||
JNL/Capital Guardian Global Diversified Research Fund | ||||||||||||||||||||
AIA Group Ltd. | 10/25/2010 | $ | 3,449 | $ | 3,489 | 0.8 | % | |||||||||||||
BNP Paribas | 10/08/2008 | 1,326 | 1,609 | 0.4 | ||||||||||||||||
LG Chem Ltd. - GDR | 12/17/2009 | 2,024 | 3,600 | 0.8 | ||||||||||||||||
| $ | 6,799 | $ | 8,698 | 2.0 | % | |||||||||||||||
JNL/Franklin Templeton Global Growth Fund | ||||||||||||||||||||
Samsung Electronics Co. Ltd. - GDR | 02/06/2007 | $ | 5,972 | $ | 8,206 | 1.7 | % | |||||||||||||
See accompanying Notes to the Financial Statements.
JNL Series Trust
Notes to Schedules of Investments (in thousands)
December 31, 2010
Restricted Securities
| Initial Acquisition Date | Cost | Ending Value | Percent of Net Assets | |||||||||||||
JNL/Franklin Templeton Mutual Shares Fund | ||||||||||||||||
Cerberus Capital Management LP | 08/06/2007 | $ | 999 | $ | 809 | 0.1 % | ||||||||||
Cerberus Capital Management LP | 08/06/2007 | 999 | 809 | 0.1 | ||||||||||||
Cerberus Capital Management LP | 08/06/2007 | 500 | 405 | 0.1 | ||||||||||||
Cerberus Capital Management LP, 12.00%, 07/31/14 | 08/06/2007 | 780 | 632 | 0.1 | ||||||||||||
Cerberus Capital Management LP, 12.00%, 07/31/14 | 08/06/2007 | 780 | 631 | 0.1 | ||||||||||||
Cerberus Capital Management LP, 12.00%, 07/31/14 | 08/06/2007 | 390 | 316 | 0.1 | ||||||||||||
Harrah’s Investment LP | 11/16/2008 | 39 | 16 | — | ||||||||||||
| $ | 4,487 | $ | 3,618 | 0.6 % | ||||||||||||
JNL/JPMorgan Mid Cap Growth Fund | ||||||||||||||||
Apollo Global Management LLC | 11/02/2007 | $ | 2,028 | $ | 587 | 0.3 % | ||||||||||
JNL/Lazard Mid Cap Equity Fund | ||||||||||||||||
Better Place | 04/23/2010 | $ | 1,015 | $ | 1,015 | 0.5 % | ||||||||||
JNL/T.Rowe Price Established Growth Fund | ||||||||||||||||
Groupon Inc. | 12/17/2010 | $ | 3,407 | $ | 3,407 | 0.2 % | ||||||||||
Investments in Affiliates - See Note 6 in the Notes to the Financial Statements for further discussion of investments in affiliates. During the year ended December 31, 2010, certain Funds invested in money market funds, which are managed by Jackson National Asset Management, LLC (“Adviser”) or an affiliate of the Funds. The JNL Money Market Fund is offered as a cash management tool to the Funds and their affiliates and is not available for direct purchase by members of the public. Certain Funds participating in securities lending receive cash collateral, which is invested by the Custodian in the Securities Lending Cash Collateral Fund LLC and the Securities Lending Liquidating Fund LLC, which are affiliates of the Funds’ Adviser. The fair value and par value of the investment in the Securities Lending Cash Collateral Fund LLC and the Securities Lending Liquidating Fund LLC are reported under Securities Lending Collateral in the Schedules of Investments. Income received from the Securities Lending Cash Collateral Fund LLC and the Securities Lending Liquidating Fund LLC is aggregated with income from securities lending when received from the custodian and each Fund’s affiliated income is included in the income from affiliates on the Statements of Operations. The JNL/BlackRock Global Allocation Fund (“BlackRock Feeder Fund”) invests primarily all of its investable assets in the BlackRock Global Allocation Portfolio (“BlackRock Master Fund”). Due to its ownership of more than 5% of the shares of the BlackRock Master Fund, the BlackRock Feeder Fund may be deemed an affiliated person thereof under the Investment Company Act of 1940. The JNL/Mellon Capital Management S&P 500 Index Fund invested in Bank of New York Mellon Corp., the parent company of its sub-adviser. The JNL/Mellon Capital Management International Index Fund invested in Prudential plc, the parent company of Jackson National Life Insurance Company® and the Funds’ Adviser. Prudential plc is not affiliated in any manner with Prudential Financial Inc., a company whose principal place of business is in the United States of America. The JNL/T. Rowe Price Value Fund invested in the T. Rowe Price Institutional Floating Rate Fund which is an affiliate of the Fund. The JNL/T. Rowe Price Short-Term Bond Fund invested in the T. Rowe Price Term Asset-Backed Securities Loan Facility which is an affiliate of the Fund.
The following table details each Fund’s long-term investments in affiliates held at December 31, 2010.
| Fund | Affiliate | Value Beginning of Period | Purchases | Sales Proceeds | Dividend Income | Realized Gain (Loss) | Value End of Period | |||||||||||||||||||
JNL/Mellon Capital Management S&P 500 Index Fund | Bank of New York Mellon Corp. | 3,008 | 1,042 | 35 | 45 | (2 | ) | 4,327 | ||||||||||||||||||
JNL/Mellon Capital Management International Index Fund | Prudential plc | 1,858 | 595 | — | 66 | — | 2,552 | |||||||||||||||||||
JNL/T. Rowe Price Value Fund | T. Rowe Price Institutional Floating Rate Fund | 8,104 | 307 | 4,432 | 346 | 860 | 4,227 | |||||||||||||||||||
The following table details cash management investments in affiliates held at December 31, 2010. There was no realized gain or loss relating to transactions in these investments during the year ended December 31, 2010.
| JNL Money Market Fund | ||||||||||||
| Fund | Beginning Amortized Cost | Ending Amortized Cost | Dividend Income | |||||||||
JNL/BlackRock Commodity Securities Fund | $ | 9,840 | $ | 62,860 | $ | 21 | ||||||
JNL/Capital Guardian Global Balanced Fund | 13,868 | 16,241 | 6 | |||||||||
JNL/Capital Guardian Global Diversified Research Fund | 18,355 | 14,275 | 8 | |||||||||
JNL/Eagle SmallCap Equity Fund | 3,885 | 21,944 | 5 | |||||||||
JNL/Franklin Templeton Global Growth Fund | 25,086 | 28,349 | 15 | |||||||||
JNL/Franklin Templeton Income Fund | 90,379 | 67,966 | 40 | |||||||||
JNL/Franklin Templeton Mutual Shares Fund | 50,580 | 62,650 | 28 | |||||||||
JNL/Franklin Templeton Small Cap Value Fund | 17,414 | 20,020 | 10 | |||||||||
JNL/Goldman Sachs Mid Cap Value Fund | 12,147 | 23,029 | 8 | |||||||||
JNL/Goldman Sachs U.S. Equity Flex Fund | 4,692 | 4,931 | 2 | |||||||||
See accompanying Notes to the Financial Statements.
JNL Series Trust
Notes to Schedules of Investments (in thousands)
December 31, 2010
Investments in Affiliates
| JNL Money Market Fund | ||||||||||||
| Fund | Beginning Amortized Cost | Ending Amortized Cost | Dividend Income | |||||||||
JNL/Invesco Global Real Estate Fund | $ | 8,814 | $ | 8,743 | $ | 6 | ||||||
JNL/Invesco International Growth Fund | 36,147 | 37,733 | 19 | |||||||||
JNL/Invesco Large Cap Growth Fund | 17,262 | 18,815 | 27 | |||||||||
JNL/Invesco Small Cap Growth Fund | 4,526 | 4,579 | 2 | |||||||||
JNL/Ivy Asset Strategy Fund | 29,184 | 100,979 | 39 | |||||||||
JNL/JPMorgan International Value Fund | 14,166 | 11,098 | 7 | |||||||||
JNL/JPMorgan MidCap Growth Fund | 5,286 | 5,111 | 3 | |||||||||
JNL/Lazard Emerging Markets Fund | 46,043 | 60,363 | 32 | |||||||||
JNL/Lazard Mid Cap Equity Fund | 4,587 | 11,284 | 4 | |||||||||
JNL/Mellon Capital Management S&P 500 Index Fund | 29,658 | 16,641 | 17 | |||||||||
JNL/Mellon Capital Management S&P 400 MidCap Index Fund | 7,170 | 12,073 | 8 | |||||||||
JNL/Mellon Capital Management Small Cap Index Fund | 14,720 | 12,878 | 7 | |||||||||
JNL/Mellon Capital Management International Index Fund | 15,534 | 28,075 | 11 | |||||||||
JNL/Mellon Capital Management Bond Index Fund | 26,989 | 44,153 | 20 | |||||||||
JNL/Oppenheimer Global Growth Fund | 6,887 | 7,173 | 4 | |||||||||
JNL/PAM Asia ex-Japan Fund | 2,890 | 1,752 | 1 | |||||||||
JNL/Select Balanced Fund | 39,129 | 130,095 | 51 | |||||||||
JNL/Select Value Fund | 22,516 | 26,760 | 14 | |||||||||
JNL/T. Rowe Price Established Growth Fund | 2,905 | 250 | 1 | |||||||||
JNL/T. Rowe Price Mid-Cap Growth Fund | 4,417 | 4,056 | 3 | |||||||||
JNL/T. Rowe Price Value Fund | 9,543 | 4,638 | 2 | |||||||||
| T. Rowe Price Reserves Investment Fund | ||||||||||||
| Fund | Beginning Amortized Cost | Ending Amortized Cost | Dividend Income | |||||||||
JNL/T. Rowe Price Established Growth Fund | $ | 5,950 | $ | 21,210 | $ | 30 | ||||||
JNL/T. Rowe Price Mid-Cap Growth Fund | 42,725 | 62,363 | 143 | |||||||||
JNL/T. Rowe Price Value Fund | 16,472 | 14,447 | 37 | |||||||||
Unfunded Loan Commitments – See Note 3 in the Notes to the Financial Statements for further discussion of unfunded commitments. The following table details unfunded loan commitments at December 31, 2010.
| JNL/Franklin Templeton Mutual Shares Fund | Unfunded Commitment | |||
Realogy Corp. Term Loan Revolver, 0.00%, 10/10/13 | $ | 582 | ||
FASB ASC Topic 820, “Fair Value Measurements and Disclosure” - This standard establishes a single authoritative definition of fair value, sets out a framework for measuring fair value and requires additional disclosures about fair value measurements. Various inputs are used in determining the value of a Fund’s investments under FASB ASC Topic 820 guidance. The inputs are summarized into three broad categories. Level 1 includes valuations based on quoted prices of identical securities in active markets, including valuations for securities listed on a national or foreign stock exchange, investments in mutual funds or securities lending collateral, which are valued as a practical expedient at its daily reported net asset value (“NAV”). Level 2 includes valuations for which all significant inputs are observable, either directly or indirectly. Direct observable inputs include broker quotes, closing prices of similar securities in active markets, closing prices for identical or similar securities in non-active markets or corporate action or reorganization entitlement values. Indirect significant observable inputs include factors such as interest rates, yield curves, prepayment speeds or credit ratings. Level 2 includes valuations for fixed income securities priced by pricing services, broker quotes in active markets, securities subject to corporate actions, securities valued at amortized cost, international equity securities priced by an independent statistical fair value pricing service, swap agreements valued by pricing services, or ADRs and GDRs for which quoted prices in active markets are not available. Level 3 includes valuations based on inputs that are unobservable and significant to the fair value measurement including the Adviser’s own assumptions in determining the fair value of the investment. Inputs used to determine the fair value of Level 3 securities include security specific inputs such as: credit quality, credit rating spreads, issuer news, trading characteristics, call features or maturity; or industry specific inputs such as: trading activity of similar markets or securities, or changes in the security’s underlying index or comparable securities’ models. Level 3 valuations include securities that are priced based on single source broker quotes, where prices may be unavailable due to halted trading, restricted to resale due to market events, newly issued or for which reliable quotes are not available. The inputs or methodology used for valuing securities are not necessarily an indication of the risk associated with investing in those securities. Please see Note 2 in the Notes to the Financial Statements for security valuation accounting policies.
See accompanying Notes to the Financial Statements.
JNL Series Trust
Notes to Schedules of Investments (in thousands)
December 31, 2010
FASB ASC Topic 820, “Fair Value Measurements and Disclosure”
The following table summarizes each Fund’s investments in securities and other financial instruments as of December 31, 2010 by valuation level.
| Assets - Securities | Liabilities - Securities | |||||||||||||||||||||||||||||||
| Level 1 | Level 2 | Level 3 | Total | Level 1 | Level 2 | Level 3 | Total | |||||||||||||||||||||||||
JNL/BlackRock Commodity Securities Fund | ||||||||||||||||||||||||||||||||
Common Stocks | $ | 453,359 | $ | 5,758 | $ | – | $ | 459,117 | $ | – | $ | – | $ | – | $ | – | ||||||||||||||||
Commodity Indexed Structured Notes | – | 210,771 | – | 210,771 | – | – | – | – | ||||||||||||||||||||||||
Short Term Securities | 240,516 | 270,961 | – | 511,477 | – | – | – | – | ||||||||||||||||||||||||
Fund Total | $ | 693,875 | $ | 487,490 | $ | – | $ | 1,181,365 | $ | – | $ | – | $ | – | $ | – | ||||||||||||||||
JNL/Capital Guardian Global Balanced Fund | ||||||||||||||||||||||||||||||||
Common Stocks | $ | 171,044 | $ | 63,439 | $ | – | $ | 234,483 | $ | – | $ | – | $ | – | $ | – | ||||||||||||||||
Preferred Stocks | 1,320 | – | – | 1,320 | – | – | – | – | ||||||||||||||||||||||||
Rights | 16 | – | – | 16 | – | – | – | – | ||||||||||||||||||||||||
Corporate Bonds and Notes | – | 20,671 | – | 20,671 | – | – | – | – | ||||||||||||||||||||||||
Government and Agency Obligations | – | 88,227 | – | 88,227 | – | – | – | – | ||||||||||||||||||||||||
Short Term Securities | 30,112 | – | – | 30,112 | – | – | – | – | ||||||||||||||||||||||||
Fund Total | $ | 202,492 | $ | 172,337 | $ | – | $ | 374,829 | $ | – | $ | – | $ | – | $ | – | ||||||||||||||||
JNL/Capital Guardian Global Diversified Research Fund | ||||||||||||||||||||||||||||||||
Common Stocks | $ | 333,250 | $ | 89,067 | $ | – | $ | 422,317 | $ | – | $ | – | $ | – | $ | – | ||||||||||||||||
Corporate Bonds and Notes | – | 372 | – | 372 | – | – | – | – | ||||||||||||||||||||||||
Short Term Securities | 24,367 | – | – | 24,367 | – | – | – | – | ||||||||||||||||||||||||
Fund Total | $ | 357,617 | $ | 89,439 | $ | – | $ | 447,056 | $ | – | $ | – | $ | – | $ | – | ||||||||||||||||
JNL/Eagle SmallCap Equity Fund | ||||||||||||||||||||||||||||||||
Common Stocks | $ | 584,039 | $ | – | $ | – | $ | 584,039 | $ | – | $ | – | $ | – | $ | – | ||||||||||||||||
Short Term Securities | 55,204 | – | – | 55,204 | – | – | – | – | ||||||||||||||||||||||||
Fund Total | $ | 639,243 | $ | – | $ | – | $ | 639,243 | $ | – | $ | – | $ | – | $ | – | ||||||||||||||||
JNL/Franklin Templeton Global Growth Fund | ||||||||||||||||||||||||||||||||
Common Stocks | $ | 361,547 | $ | 84,665 | $ | – | $ | 446,212 | $ | – | $ | – | $ | – | $ | – | ||||||||||||||||
Short Term Securities | 33,620 | – | – | 33,619 | – | – | – | – | ||||||||||||||||||||||||
Fund Total | $ | 395,167 | $ | 84,665 | $ | – | $ | 479,831 | $ | – | $ | – | $ | – | $ | – | ||||||||||||||||
JNL/Franklin Templeton Income Fund | ||||||||||||||||||||||||||||||||
Common Stocks | $ | 349,609 | $ | 17,323 | $ | – | $ | 366,932 | $ | – | $ | – | $ | – | $ | – | ||||||||||||||||
Preferred Stocks | 13,880 | 34,960 | – | 48,840 | – | – | – | – | ||||||||||||||||||||||||
Warrants | 251 | – | – | 251 | – | – | – | – | ||||||||||||||||||||||||
Non-U.S. Government Agency ABS | – | 7,607 | – | 7,607 | – | – | – | – | ||||||||||||||||||||||||
Corporate Bonds and Notes | – | 556,103 | 7 | 556,110 | – | – | – | – | ||||||||||||||||||||||||
Government and Agency Obligations | – | 6,188 | – | 6,188 | – | – | – | – | ||||||||||||||||||||||||
Short Term Securities | 249,521 | – | – | 249,521 | – | – | – | – | ||||||||||||||||||||||||
Fund Total | $ | 613,261 | $ | 622,181 | $ | 7 | $ | 1,235,449 | $ | – | $ | – | $ | – | $ | – | ||||||||||||||||
JNL/Franklin Templeton Mutual Shares Fund | ||||||||||||||||||||||||||||||||
Common Stocks | $ | 438,991 | $ | 70,748 | $ | 4,578 | $ | 514,317 | $ | – | $ | – | $ | – | $ | – | ||||||||||||||||
Corporate Bonds and Notes1 | – | 16,937 | 1,579 | 18,516 | – | (565) | – | (565) | ||||||||||||||||||||||||
Short Term Securities | 73,425 | – | – | 73,425 | – | – | – | – | ||||||||||||||||||||||||
Fund Total | $ | 512,416 | $ | 87,685 | $ | 6,157 | $ | 606,258 | $ | – | $ | (565) | $ | – | $ | (565) | ||||||||||||||||
JNL/Franklin Templeton Small Cap Value Fund | ||||||||||||||||||||||||||||||||
Common Stocks | $ | 274,072 | $ | – | $ | – | $ | 274,072 | $ | – | $ | – | $ | – | $ | – | ||||||||||||||||
Short Term Securities | 30,672 | – | – | 30,672 | – | – | – | – | ||||||||||||||||||||||||
Fund Total | $ | 304,744 | $ | – | $ | – | $ | 304,744 | $ | – | $ | – | $ | – | $ | – | ||||||||||||||||
JNL/Goldman Sachs MidCap Value Fund | ||||||||||||||||||||||||||||||||
Common Stocks | $ | 490,056 | $ | – | $ | – | $ | 490,056 | $ | – | $ | – | $ | – | $ | – | ||||||||||||||||
Short Term Securities | 31,802 | – | – | 31,802 | – | – | – | – | ||||||||||||||||||||||||
Fund Total | $ | 521,858 | $ | – | $ | – | $ | 521,858 | $ | – | $ | – | $ | – | $ | – | ||||||||||||||||
JNL/Goldman Sachs U.S. Equity Flex Fund | ||||||||||||||||||||||||||||||||
Common Stocks | $ | 145,714 | $ | – | $ | – | $ | 145,714 | $ | (35,216) | $ | – | $ | – | $ | (35,216) | ||||||||||||||||
Short Term Securities | 4,931 | – | – | 4,931 | – | – | – | – | ||||||||||||||||||||||||
Fund Total | $ | 150,645 | $ | – | $ | – | $ | 150,645 | $ | (35,216) | $ | – | $ | – | $ | (35,216) | ||||||||||||||||
JNL/Invesco Global Real Estate Fund | ||||||||||||||||||||||||||||||||
Common Stocks | $ | 556,534 | $ | 94,317 | $ | – | $ | 650,851 | $ | – | $ | – | $ | – | $ | – | ||||||||||||||||
Short Term Securities | 39,619 | – | – | 39,619 | – | – | – | – | ||||||||||||||||||||||||
Fund Total | $ | 596,153 | $ | 94,317 | $ | – | $ | 690,470 | $ | – | $ | – | $ | – | $ | – | ||||||||||||||||
JNL/Invesco International Growth Fund | ||||||||||||||||||||||||||||||||
Common Stocks | $ | 377,831 | $ | 172,048 | $ | – | $ | 549,879 | $ | – | $ | – | $ | – | $ | – | ||||||||||||||||
Short Term Securities | 64,044 | – | – | 64,044 | – | – | – | – | ||||||||||||||||||||||||
Fund Total | $ | 441,875 | $ | 172,048 | $ | – | $ | 613,923 | $ | – | $ | – | $ | – | $ | – | ||||||||||||||||
JNL/Invesco Large Cap Growth Fund | ||||||||||||||||||||||||||||||||
Common Stocks | $ | 888,774 | $ | – | $ | – | $ | 888,774 | $ | – | $ | – | $ | – | $ | – | ||||||||||||||||
Short Term Securities | 25,059 | – | – | 25,059 | – | – | – | – | ||||||||||||||||||||||||
Fund Total | $ | 913,833 | $ | – | $ | – | $ | 913,833 | $ | – | $ | – | $ | – | $ | – | ||||||||||||||||
See accompanying Notes to the Financial Statements.
JNL Series Trust
Notes to Schedules of Investments (in thousands)
December 31, 2010
FASB ASC Topic 820, “Fair Value Measurements and Disclosure” |
| |||||||||||||||||||||||||||||||
| Assets - Securities | Liabilities - Securities | |||||||||||||||||||||||||||||||
| Level 1 | Level 2 | Level 3 | Total | Level 1 | Level 2 | Level 3 | Total | |||||||||||||||||||||||||
JNL/Invesco Small Cap Growth Fund |
| |||||||||||||||||||||||||||||||
Common Stocks | $ | 145,867 | $ | – | $ | – | $ | 145,867 | $ | – | $ | – | $ | – | $ | – | ||||||||||||||||
Short Term Securities | 18,035 | – | – | 18,035 | – | – | – | – | ||||||||||||||||||||||||
Fund Total | $ | 163,902 | $ | – | $ | – | $ | 163,902 | $ | – | $ | – | $ | – | $ | – | ||||||||||||||||
JNL/Ivy Asset Strategy Fund |
| |||||||||||||||||||||||||||||||
Common Stocks | $ | 605,782 | $ | 88,202 | $ | – | $ | 693,984 | $ | – | $ | – | $ | – | $ | – | ||||||||||||||||
Preferred Stocks | 13,021 | 38,776 | – | 51,797 | – | – | – | – | ||||||||||||||||||||||||
Options Purchased | 601 | – | 6,037 | 6,638 | – | – | – | – | ||||||||||||||||||||||||
Precious Metals | 110,710 | – | – | 110,710 | – | – | – | – | ||||||||||||||||||||||||
Short Term Securities | 100,979 | – | – | 100,979 | – | – | – | – | ||||||||||||||||||||||||
Fund Total | $ | 831,093 | $ | 126,978 | $ | 6,037 | $ | 964,108 | $ | – | $ | – | $ | – | $ | – | ||||||||||||||||
JNL/JPMorgan International Value Fund |
| |||||||||||||||||||||||||||||||
Common Stocks | $ | 329,211 | $ | 252,435 | $ | – | $ | 581,646 | $ | – | $ | – | $ | – | $ | – | ||||||||||||||||
Preferred Stocks | – | 9,019 | – | 9,019 | – | – | – | – | ||||||||||||||||||||||||
Short Term Securities | 33,214 | – | – | 33,214 | – | – | – | – | ||||||||||||||||||||||||
Fund Total | $ | 362,425 | $ | 261,454 | $ | – | $ | 623,879 | $ | – | $ | – | $ | – | $ | – | ||||||||||||||||
JNL/JPMorgan Mid Cap Growth Fund |
| |||||||||||||||||||||||||||||||
Common Stocks | $ | 226,337 | $ | – | $ | 587 | $ | 226,924 | $ | – | $ | – | $ | – | $ | – | ||||||||||||||||
Short Term Securities | 20,141 | – | – | 20,141 | – | – | – | – | ||||||||||||||||||||||||
Fund Total | $ | 246,478 | $ | – | $ | 587 | $ | 247,065 | $ | – | $ | – | $ | – | $ | – | ||||||||||||||||
JNL/Lazard Emerging Markets Fund |
| |||||||||||||||||||||||||||||||
Common Stocks | $ | 1,022,578 | $ | 275,082 | $ | – | $ | 1,297,660 | $ | – | $ | – | $ | – | $ | – | ||||||||||||||||
Preferred Stocks | 37,327 | – | – | 37,327 | – | – | – | – | ||||||||||||||||||||||||
Short Term Securities | 129,721 | – | – | 129,721 | – | – | – | – | ||||||||||||||||||||||||
Fund Total | $ | 1,189,626 | $ | 275,082 | $ | – | $ | 1,464,708 | $ | – | $ | – | $ | – | $ | – | ||||||||||||||||
JNL/Lazard Mid Cap Equity Fund |
| |||||||||||||||||||||||||||||||
Common Stocks | $ | 203,309 | $ | – | $ | – | $ | 203,309 | $ | – | $ | – | $ | – | $ | – | ||||||||||||||||
Preferred Stocks | – | – | 1,015 | 1,015 | – | – | – | – | ||||||||||||||||||||||||
Short Term Securities | 13,184 | – | – | 13,184 | – | – | – | – | ||||||||||||||||||||||||
Fund Total | $ | 216,493 | $ | – | $ | 1,015 | $ | 217,508 | $ | – | $ | – | $ | – | $ | – | ||||||||||||||||
JNL/Mellon Capital Management S&P 500 Index Fund |
| |||||||||||||||||||||||||||||||
Common Stocks | $ | 1,322,092 | $ | – | $ | – | $ | 1,322,092 | $ | – | $ | – | $ | – | $ | – | ||||||||||||||||
Short Term Securities | 29,780 | 1,295 | – | 31,075 | – | – | – | – | ||||||||||||||||||||||||
Fund Total | $ | 1,351,872 | $ | 1,295 | $ | – | $ | 1,353,167 | $ | – | $ | – | $ | – | $ | – | ||||||||||||||||
JNL/Mellon Capital Management S&P 400 MidCap Index Fund |
| |||||||||||||||||||||||||||||||
Common Stocks | $ | 657,969 | $ | – | $ | – | $ | 657,969 | $ | – | $ | – | $ | – | $ | – | ||||||||||||||||
Short Term Securities | 53,214 | 940 | – | 54,154 | – | – | – | – | ||||||||||||||||||||||||
Fund Total | $ | 711,184 | $ | 940 | $ | – | $ | 712,123 | $ | – | $ | – | $ | – | $ | – | ||||||||||||||||
JNL/Mellon Capital Management Small Cap Index Fund |
| |||||||||||||||||||||||||||||||
Common Stocks | $ | 699,827 | $ | – | $ | 45 | $ | 699,872 | $ | – | $ | – | $ | – | $ | – | ||||||||||||||||
Short Term Securities | 95,998 | 895 | – | 96,893 | – | – | – | – | ||||||||||||||||||||||||
Fund Total | $ | 795,825 | $ | 895 | $ | 45 | $ | 796,765 | $ | – | $ | – | $ | – | $ | – | ||||||||||||||||
JNL/Mellon Capital Management International Index Fund |
| |||||||||||||||||||||||||||||||
Common Stocks | $ | 523,101 | $ | 525,104 | $ | – | $ | 1,048,205 | $ | – | $ | – | $ | – | $ | – | ||||||||||||||||
Preferred Stocks | – | 7,019 | – | 7,019 | – | – | – | – | ||||||||||||||||||||||||
Short Term Securities | 84,545 | 1,710 | – | 86,255 | – | – | – | – | ||||||||||||||||||||||||
Fund Total | $ | 607,646 | $ | 533,833 | $ | – | $ | 1,141,479 | $ | – | $ | – | $ | – | $ | – | ||||||||||||||||
JNL/Oppenheimer Global Growth Fund |
| |||||||||||||||||||||||||||||||
Common Stocks | $ | 242,189 | $ | 146,897 | – | $ | 389,086 | $ | – | $ | – | $ | – | $ | – | |||||||||||||||||
Preferred Stocks | – | 5,129 | – | 5,129 | – | – | – | – | ||||||||||||||||||||||||
Short Term Securities | 27,066 | – | – | 27,066 | – | – | – | – | ||||||||||||||||||||||||
Fund Total | $ | 269,255 | $ | 152,026 | $ | – | $ | 421,281 | $ | – | $ | – | $ | – | $ | – | ||||||||||||||||
JNL/PAM Asia ex-Japan Fund |
| |||||||||||||||||||||||||||||||
Common Stocks | $ | 107,976 | $ | 41,667 | $ | – | $ | 149,643 | $ | – | $ | – | $ | – | $ | – | ||||||||||||||||
Rights | – | 42 | – | 42 | – | – | – | – | ||||||||||||||||||||||||
Warrants | 18 | – | – | 18 | – | – | – | – | ||||||||||||||||||||||||
Short Term Securities | 6,871 | – | – | 6,871 | – | – | – | – | ||||||||||||||||||||||||
Fund Total | $ | 114,865 | $ | 41,709 | $ | – | $ | 156,574 | $ | – | $ | – | $ | – | $ | – | ||||||||||||||||
JNL/Select Balanced Fund |
| |||||||||||||||||||||||||||||||
Common Stocks | $ | 853,910 | $ | – | $ | – | $ | 853,910 | $ | – | $ | – | $ | – | $ | – | ||||||||||||||||
Non-U.S. Government Agency ABS | – | 14,721 | – | 14,721 | – | – | – | – | ||||||||||||||||||||||||
Corporate Bonds and Notes | – | 126,383 | – | 126,383 | – | – | – | – | ||||||||||||||||||||||||
Government and Agency Obligations | – | 245,458 | – | 245,458 | – | – | – | – | ||||||||||||||||||||||||
Short Term Securities | 153,986 | – | – | 153,986 | – | – | – | – | ||||||||||||||||||||||||
Fund Total | $ | 1,007,896 | $ | 386,562 | $ | – | $ | 1,394,458 | $ | – | $ | – | $ | – | $ | – | ||||||||||||||||
See accompanying Notes to the Financial Statements.
JNL Series Trust
Notes to Schedules of Investments (in thousands)
December 31, 2010
FASB ASC Topic 820, “Fair Value Measurements and Disclosure” |
| |||||||||||||||||||||||||||||||||
| Assets - Securities | Liabilities - Securities | |||||||||||||||||||||||||||||||||
| Level 1 | Level 2 | Level 3 | Total | Level 1 | Level 2 | Level 3 | Total | |||||||||||||||||||||||||||
JNL/Select Value Fund | ||||||||||||||||||||||||||||||||||
Common Stocks | $ | 1,129,045 | $ | – | $ | – | $ | 1,129,045 | $ | – | $ | – | $ | – | $ | – | ||||||||||||||||||
Short Term Securities | 31,658 | – | – | 31,658 | – | – | – | – | ||||||||||||||||||||||||||
Fund Total | $ | 1,160,703 | $ | – | $ | – | $ | 1,160,703 | $ | – | $ | – | $ | – | $ | – | ||||||||||||||||||
JNL/T.Rowe Price Established Growth Fund | ||||||||||||||||||||||||||||||||||
Common Stocks | $ | 1,486,911 | $ | 6,092 | $ | – | $ | 1,493,003 | $ | – | $ | – | $ | – | $ | – | ||||||||||||||||||
Preferred Stocks | – | – | 3,407 | 3,407 | – | – | – | – | ||||||||||||||||||||||||||
Short Term Securities | 42,812 | – | – | 42,812 | – | – | – | – | ||||||||||||||||||||||||||
Fund Total | $ | 1,529,723 | $ | 6,092 | $ | 3,407 | $ | 1,539,222 | $ | – | $ | – | $ | – | $ | – | ||||||||||||||||||
JNL/T.Rowe Price Mid-Cap Growth Fund | ||||||||||||||||||||||||||||||||||
Common Stocks | $ | 1,341,016 | $ | – | $ | – | $ | 1,341,016 | $ | – | $ | – | $ | – | $ | – | ||||||||||||||||||
Short Term Securities | 160,657 | – | – | 160,657 | – | – | – | – | ||||||||||||||||||||||||||
Fund Total | $ | 1,501,674 | $ | – | $ | – | $ | 1,501,673 | $ | – | $ | – | $ | – | $ | – | ||||||||||||||||||
JNL/T.Rowe Price Value Fund | ||||||||||||||||||||||||||||||||||
Common Stocks | $ | 1,097,114 | $ | – | $ | – | $ | 1,097,114 | $ | – | $ | – | $ | – | $ | – | ||||||||||||||||||
Preferred Stocks | 5,870 | 9,259 | – | 15,129 | – | – | – | – | ||||||||||||||||||||||||||
Investment Companies | 4,227 | – | – | 4,227 | – | – | – | – | ||||||||||||||||||||||||||
Corporate Bonds and Notes | – | 1,796 | – | 1,796 | – | – | – | – | ||||||||||||||||||||||||||
Short Term Securities | 33,316 | – | – | 33,316 | – | – | – | – | ||||||||||||||||||||||||||
Fund Total | $ | 1,140,527 | $ | 11,055 | $ | – | $ | 1,151,582 | $ | – | $ | – | $ | – | $ | – | ||||||||||||||||||
1Unfunded loan commitments in the JNL/Franklin Templeton Mutual Shares Fund are not reflected in the Schedules of Investments. The unfunded loan commitments and unrealized appreciation on these commitments are included in payable for investment securities purchased and other assets, respectively, in the Statements of Assets and Liabilities.
Assets - Other Financial Instruments1 | Liabilities - Other Financial Instruments1 | |||||||||||||||||||||||||||||||
| Level 1 | Level 2 | Level 3 | Total | Level 1 | Level 2 | Level 3 | Total | |||||||||||||||||||||||||
JNL/Capital Guardian Global Balanced Fund | ||||||||||||||||||||||||||||||||
Open Forward Foreign Currency Contracts | $ | - | $ | 284 | $ | - | $ | 284 | $ | - | $ | (147 | ) | $ | - | $ | (147 | ) | ||||||||||||||
JNL/Franklin Templeton Mutual Shares Fund | ||||||||||||||||||||||||||||||||
Open Forward Foreign Currency Contracts | $ | - | $ | 1,605 | $ | - | $ | 1,605 | $ | - | $ | (3,350 | ) | $ | - | $ | (3,350 | ) | ||||||||||||||
JNL/Ivy Asset Strategy Fund | ||||||||||||||||||||||||||||||||
Written Options | $ | - | $ | - | $ | - | $ | - | $ | (225 | ) | $ | - | $ | (1,583 | ) | $ | (1,808 | ) | |||||||||||||
Open Forward Foreign Currency Contracts | - | - | - | - | - | (3,797 | ) | - | (3,797 | ) | ||||||||||||||||||||||
Total Return Swap Agreements | - | 15 | - | 15 | - | (41 | ) | - | (41 | ) | ||||||||||||||||||||||
Fund Total | $ | - | $ | 15 | $ | - | $ | 15 | $ | (225 | ) | $ | (3,838 | ) | $ | (1,583 | ) | $ | (5,646 | ) | ||||||||||||
JNL/JPMorgan International Value Fund | ||||||||||||||||||||||||||||||||
Open Forward Foreign Currency Contracts | $ | - | $ | 5,552 | $ | - | $ | 5,552 | $ | - | $ | (1,290 | ) | $ | - | $ | (1,290 | ) | ||||||||||||||
JNL/Mellon Capital Management S&P 500 Index Fund | ||||||||||||||||||||||||||||||||
Open Futures Contracts | $ | 104 | $ | - | $ | - | $ | 104 | $ | - | $ | - | $ | - | $ | - | ||||||||||||||||
JNL/Mellon Capital Management S&P 400 MidCap Index Fund | ||||||||||||||||||||||||||||||||
Open Futures Contracts | $ | 71 | $ | - | $ | - | $ | 71 | $ | - | $ | - | $ | - | $ | - | ||||||||||||||||
JNL/Mellon Capital Management Small Cap Index Fund | ||||||||||||||||||||||||||||||||
Open Futures Contracts | $ | 118 | $ | - | $ | - | $ | 118 | $ | - | $ | - | $ | - | $ | - | ||||||||||||||||
JNL/Mellon Capital Management International Index Fund | ||||||||||||||||||||||||||||||||
Open Futures Contracts | $ | 32 | $ | - | $ | - | $ | 32 | $ | (237 | ) | $ | - | $ | - | $ | (237 | ) | ||||||||||||||
Open Forward Foreign Currency Contracts | - | 921 | - | 921 | - | (452 | ) | - | (452 | ) | ||||||||||||||||||||||
Fund Total | $ | 32 | $ | 921 | $ | - | $ | 953 | $ | (237 | ) | $ | (452 | ) | $ | - | $ | (689 | ) | |||||||||||||
1Investments in other financial instruments are derivative instruments not reflected in the Schedules of Investments and include, but are not limited to forward foreign currency contracts, futures contracts, options written and swap agreements. Options purchased are included in Investments in Securities. All derivatives, except for written options, are reflected at the unrealized appreciation/(depreciation) on the instrument. Written options are reflected at value. | ||||||||||||||||||||||||||||||||
Significant transfers between Level 1 and Level 2 valuations during the year ended December 31, 2010, related to certain Fund’s using an independent statistical fair value model pricing service to value certain foreign securities as described in Note 2 in the Notes to the Financial Statements. In instances when criteria constituting a significant event exists and foreign investments are valued using an independent statistical fair value pricing service, they are considered Level 2 valuations. In the absence of the existence of such criteria, the same foreign investments are generally valued using market prices from the applicable exchange and are considered Level 1 valuations. Significant event criteria existed as of December 31, 2009 and December 31, 2010, and therefore, certain foreign investments were valued as Level 2 valuations. In addition, securities lending collateral funds which were valued as a Level 2 at December 31, 2009, were valued as a Level 1 at December 31, 2010. There were no significant transfers into or out of Level 3.
The following table is a rollforward of Level 3 investments by category for which significant unobservable inputs were used to determine fair value during the year ended December 31, 2010:
See accompanying Notes to the Financial Statements.
JNL Series Trust
Notes to Schedules of Investments (in thousands)
December 31, 2010
Balance at Beginning of Period | Transfers Into Level 3 During the Period | Transfers Out of Level 3 During the Period | Total Realized and Change in Unrealized Gain/(Loss) | Purchases | (Sales) | Balance at End of | Change In Unrealized Appreciation/ (Depreciation) During the Period For Level 3 Investments held at End of Period2 | |||||||||||||||||||||||||
JNL/Capital Guardian Global Balanced Fund | ||||||||||||||||||||||||||||||||
Government and Agency Obligations | $ | 147 | $ | - | $ | - | $ | 28 | $ | 428 | $ | (603) | $ | - | $ | - | ||||||||||||||||
Fund Total Investments in Securities | $ | 147 | $ | - | $ | - | $ | 28 | $ | 428 | $ | (603) | $ | - | $ | - | ||||||||||||||||
JNL/Franklin Templeton Income Fund | ||||||||||||||||||||||||||||||||
Corporate Bond and Notes | $ | - | $ | 14 | $ | - | $ | (7) | $ | - | $ | - | $ | 7 | $ | (7) | ||||||||||||||||
Fund Total Investments in Securities | $ | - | $ | 14 | $ | - | $ | (7) | $ | - | $ | - | $ | 7 | $ | (7) | ||||||||||||||||
JNL/Franklin Templeton Mutual Shares Fund | ||||||||||||||||||||||||||||||||
Common Stocks | $ | 965 | $ | - | $ | - | $ | 1,105 | $ | 2,508 | $ | - | $ | 4,578 | $ | 1,118 | ||||||||||||||||
Corporate Bond and Notes | 391 | - | - | 1,188 | - | - | 1,579 | 1,188 | ||||||||||||||||||||||||
Fund Total Investments in Securities | $ | 1,356 | $ | - | $ | - | $ | 2,293 | $ | 2,508 | $ | - | $ | 6,157 | $ | 2,306 | ||||||||||||||||
JNL/Ivy Asset Strategy Fund | ||||||||||||||||||||||||||||||||
Options Purchased | $ | - | $ | - | $ | - | $ | 12 | $ | 6,025 | $ | - | $ | 6,037 | $ | 12 | ||||||||||||||||
Fund Total Investments in Securities | $ | - | $ | - | $ | - | $ | 12 | $ | 6,025 | $ | - | $ | 6,037 | $ | 12 | ||||||||||||||||
Investments in Other Financial Instruments1 | ||||||||||||||||||||||||||||||||
Written Options | $ | - | $ | - | $ | - | $ | (333) | $ | - | $ | (1,250) | $ | (1,583) | $ | (333) | ||||||||||||||||
Fund Total Investments in Other | ||||||||||||||||||||||||||||||||
Financial Instruments | $ | - | $ | - | $ | - | $ | (333) | $ | - | $ | (1.250) | $ | (1,583) | $ | (333) | ||||||||||||||||
JNL/JPMorgan MidCap Growth Fund | ||||||||||||||||||||||||||||||||
Common Stocks | $ | 440 | $ | - | $ | 147 | $ | - | $ | - | $ | - | $ | 587 | $ | 147 | ||||||||||||||||
Fund Total Investments in Securities | $ | 440 | $ | - | $ | 147 | $ | - | $ | - | $ | - | $ | 587 | $ | 147 | ||||||||||||||||
JNL/Lazard Emerging Markets Fund | ||||||||||||||||||||||||||||||||
Common Stocks | $ | 5,840 | $ | - | $ | (5,840) | $ | - | $ | - | $ | - | $ | - | $ | - | ||||||||||||||||
Fund Total Investments in Securities | $ | 5,840 | $ | - | $ | (5,840) | $ | - | $ | - | $ | - | $ | - | $ | - | ||||||||||||||||
JNL/Lazard Mid Cap Equity Fund | ||||||||||||||||||||||||||||||||
Preferred Stocks | $ | - | $ | - | $ | - | $ | - | $ | 1,015 | $ | - | $ | 1,015 | $ | - | ||||||||||||||||
Fund Total Investments in Securities | $ | - | $ | - | $ | - | $ | - | $ | 1,015 | $ | - | $ | 1,015 | $ | - | ||||||||||||||||
JNL/Mellon Capital Management Small Cap Index Fund | ||||||||||||||||||||||||||||||||
Common Stocks | $ | - | $ | - | $ | - | $ | 20 | $ | 25 | $ | - | $ | 45 | $ | 20 | ||||||||||||||||
Fund Total Investments in Securities | $ | - | $ | - | $ | - | $ | 20 | $ | 25 | $ | - | $ | 45 | $ | 20 | ||||||||||||||||
JNL/Mellon Capital Management International Index Fund | ||||||||||||||||||||||||||||||||
Common Stocks | $ | - | $ | 7 | $ | - | $ | (7) | $ | - | $ | - | $ | - | $ | (7) | ||||||||||||||||
Fund Total Investments in Securities | $ | - | $ | 7 | $ | - | $ | (7) | $ | - | $ | - | $ | - | $ | (7) | ||||||||||||||||
JNL/T. Rowe Price Established Growth Fund | ||||||||||||||||||||||||||||||||
Preferred Stocks | $ | - | $ | - | $ | - | $ | - | $ | 3,407 | $ | - | $ | 3,407 | $ | - | ||||||||||||||||
Fund Total Investments in Securities | $ | - | $ | - | $ | - | $ | - | $ | 3,407 | $ | - | $ | 3,407 | $ | - | ||||||||||||||||
1Investments in other financial instruments are derivative instruments not reflected in the Schedules of Investments and include forward foreign currency contracts, futures contracts, options written and swap agreements. Options purchased are included in Investments in Securities. All derivatives, except for options written are reflected at the unrealized appreciation/(depreciation) on the instrument. Written options are reflected at value.
2The change in unrealized appreciation/(depreciation) for Level 3 investments held at December 31, 2010 is included in net change in unrealized appreciation or depreciation in the Statements of Operations.
See accompanying Notes to the Financial Statements.
JNL Series Trust
Notes to Schedules of Investments (in thousands, except contracts)
December 31, 2010
Schedule of Written Options
| Expiration Date | Exercise Price | Contracts | Value | |||||||||||||||||||
Index Options | ||||||||||||||||||||||
JNL/Ivy Asset Strategy Fund | ||||||||||||||||||||||
** Euro Stoxx 50 Index Put Option | 02/18/2011 | 2,450.00 | 799 | $ | (174) | |||||||||||||||||
** Euro Stoxx 50 Index Put Option | 02/18/2011 | 2,500.00 | 612 | (168) | ||||||||||||||||||
** Euro Stoxx 50 Index Put Option | 02/18/2011 | 2,550.00 | 821 | (294) | ||||||||||||||||||
** Euro Stoxx 50 Index Put Option | 03/18/2011 | 2,450.00 | 824 | (336) | ||||||||||||||||||
** Euro Stoxx 50 Index Put Option | 03/18/2011 | 2,500.00 | 1,218 | (611) | ||||||||||||||||||
Euro Stoxx 50 Index Put Option | 03/18/2011 | 2,500.00 | 211 | (107) | ||||||||||||||||||
Euro Stoxx 50 Index Put Option | 03/18/2011 | 2,450.00 | 284 | (118) | ||||||||||||||||||
| 4,769 | $ | (1,808) | ||||||||||||||||||||
* Swaptions are illiquid investments.
** Written options fair valued in good faith in accordance with procedures established by the Board. Fair valued securities may be classified as Level 2 or Level 3 for FASB ASC Topic 820 disclosures based on the applicable valuation inputs. See FASB ASC Topic 820 note in these Notes to the Schedule of Investments.
Summary of Written Options | Contracts | Premiums | ||||||
JNL/Ivy Asset Strategy Fund | ||||||||
Options outstanding at December 31, 2009 | – | $ | – | |||||
Options written during the period | (37,109,778) | (3,936) | ||||||
Options closed during the period | 37,103,293 | 1,177 | ||||||
Options expired during the period | 1,716 | 1,325 | ||||||
Options outstanding at December 31, 2010 | (4,769) | $ | (1,434) | |||||
See accompanying Notes to the Financial Statements.
JNL Series Trust
Notes to Schedules of Investments (in thousands, except contracts)
December 31, 2010
Schedule of Open Futures Contracts
| Expiration | Contracts Long / | Unrealized Appreciation / (Depreciation) | ||||||||||||||
JNL/Mellon Capital Management International Index Fund |
| |||||||||||||||
ASX SPI 200 Index Future | March 2011 | 26 | $ | (27) | ||||||||||||
Euro Stoxx 50 Index Future | March 2011 | 296 | (210) | |||||||||||||
FTSE 100 Index Future | March 2011 | 97 | 21 | |||||||||||||
Topix Index Future | March 2011 | 74 | 11 | |||||||||||||
| $ | (205) | |||||||||||||||
JNL/Mellon Capital Management S&P 400 Mid Cap Index Fund |
| |||||||||||||||
S&P MidCap 400 E-Mini Index Future | March 2011 | 145 | $ | 71 | ||||||||||||
JNL/Mellon Capital Management S&P 500 Index Fund |
| |||||||||||||||
S&P 500 E-Mini Index Future | March 2011 | 301 | $ | 104 | ||||||||||||
JNL/Mellon Capital Management Small Cap Index Fund |
| |||||||||||||||
Russell 2000 Mini Index Future | March 2011 | 183 | $ | 118 | ||||||||||||
See accompanying Notes to the Financial Statements.
JNL Series Trust
Notes to Schedules of Investments (in thousands)
December 31, 2010
Schedule of Open Forward Foreign Currency Contracts
Purchased/ Sold | Settlement Date | Counter- Party | Notional Amount | Value | Unrealized Gain/ (Loss) | |||||||||||||
JNL/Capital Guardian Global Balanced Fund | ||||||||||||||||||
EUR/USD | 01/11/2011 | BNY | EUR | 2,225 | $ 2,973 | $ 24 | ||||||||||||
JPY/EUR | 01/18/2011 | BNY | EUR | (2,300) | (3,074) | 80 | ||||||||||||
JPY/USD | 01/11/2011 | BOA | JPY | 763,837 | 9,409 | 159 | ||||||||||||
USD/CAD | 01/28/2011 | BOA | CAD | (137) | (138) | (2) | ||||||||||||
USD/EUR | 01/11/2011 | BNY | EUR | (2,225) | (2,973) | (11) | ||||||||||||
USD/EUR | 01/24/2011 | BNY | EUR | (3,205) | (4,283) | (65) | ||||||||||||
USD/HUF | 01/28/2011 | BNY | HUF | (29,355) | (141) | (3) | ||||||||||||
USD/JPY | 01/11/2011 | BOA | JPY | (83,973) | (1,034) | (35) | ||||||||||||
USD/PLN | 01/28/2011 | BOA | PLN | (1,347) | (454) | (10) | ||||||||||||
| $ 285 | $ 137 | |||||||||||||||||
JNL/Franklin Templeton Mutual Shares Fund | ||||||||||||||||||
CHF/USD | 05/10/2011 | DUB | CHF | 192 | $ 206 | $ 13 | ||||||||||||
CHF/USD | 05/10/2011 | DUB | CHF | 401 | 430 | 28 | ||||||||||||
CHF/USD | 05/10/2011 | DUB | CHF | 280 | 300 | 14 | ||||||||||||
CHF/USD | 05/10/2011 | BOA | CHF | 318 | 340 | 10 | ||||||||||||
CHF/USD | 05/10/2011 | BOA | CHF | 199 | 213 | 7 | ||||||||||||
CHF/USD | 05/10/2011 | SSB | CHF | 185 | 198 | – | ||||||||||||
DKK/USD | 01/24/2011 | SSB | DKK | 466 | 84 | (1) | ||||||||||||
DKK/USD | 01/24/2011 | SSB | DKK | 456 | 82 | (3) | ||||||||||||
DKK/USD | 01/24/2011 | SSB | DKK | 900 | 161 | (8) | ||||||||||||
DKK/USD | 01/24/2011 | SSB | DKK | 305 | 55 | (2) | ||||||||||||
DKK/USD | 01/24/2011 | BOA | DKK | 1,050 | 188 | (4) | ||||||||||||
DKK/USD | 01/24/2011 | SSB | DKK | 583 | 105 | 3 | ||||||||||||
DKK/USD | 01/24/2011 | DUB | DKK | 700 | 125 | 4 | ||||||||||||
DKK/USD | 01/24/2011 | DUB | DKK | 645 | 116 | (1) | ||||||||||||
EUR/USD | 01/18/2011 | SSB | EUR | 186 | 249 | (10) | ||||||||||||
EUR/USD | 01/18/2011 | BOA | EUR | 355 | 474 | (22) | ||||||||||||
EUR/USD | 01/18/2011 | DUB | EUR | 433 | 579 | (22) | ||||||||||||
EUR/USD | 01/18/2011 | DUB | EUR | 490 | 655 | (25) | ||||||||||||
EUR/USD | 01/18/2011 | DUB | EUR | 1,431 | 1,912 | (96) | ||||||||||||
EUR/USD | 01/18/2011 | DUB | EUR | 495 | 662 | (28) | ||||||||||||
EUR/USD | 01/18/2011 | BOA | EUR | 312 | 417 | (10) | ||||||||||||
EUR/USD | 01/18/2011 | BOA | EUR | 234 | 313 | (8) | ||||||||||||
EUR/USD | 01/18/2011 | DUB | EUR | 640 | 855 | (14) | ||||||||||||
EUR/USD | 01/18/2011 | BOA | EUR | 320 | 428 | (7) | ||||||||||||
EUR/USD | 01/18/2011 | DUB | EUR | 312 | 417 | (8) | ||||||||||||
EUR/USD | 01/18/2011 | SSB | EUR | 229 | 305 | (5) | ||||||||||||
EUR/USD | 01/18/2011 | BOA | EUR | 279 | 373 | (7) | ||||||||||||
EUR/USD | 01/18/2011 | BOA | EUR | 320 | 428 | (6) | ||||||||||||
EUR/USD | 01/18/2011 | SSB | EUR | 319 | 426 | (8) | ||||||||||||
EUR/USD | 01/18/2011 | DUB | EUR | 214 | 286 | (2) | ||||||||||||
EUR/USD | 01/18/2011 | SSB | EUR | 217 | 290 | (3) | ||||||||||||
EUR/USD | 01/18/2011 | BOA | EUR | 232 | 311 | (3) | ||||||||||||
EUR/USD | 01/18/2011 | BOA | EUR | 373 | 499 | (5) | ||||||||||||
EUR/USD | 01/18/2011 | DUB | EUR | 640 | 855 | (13) | ||||||||||||
EUR/USD | 01/18/2011 | BCL | EUR | 480 | 641 | (5) | ||||||||||||
EUR/USD | 01/18/2011 | BOA | EUR | 320 | 428 | (6) | ||||||||||||
EUR/USD | 01/18/2011 | DUB | EUR | 819 | 1,094 | (12) | ||||||||||||
EUR/USD | 01/18/2011 | BOA | EUR | 160 | 214 | (3) | ||||||||||||
EUR/USD | 01/18/2011 | DUB | EUR | 980 | 1,310 | (27) | ||||||||||||
EUR/USD | 01/18/2011 | DUB | EUR | 137 | 183 | (3) | ||||||||||||
EUR/USD | 01/18/2011 | DUB | EUR | 1,024 | 1,369 | (27) | ||||||||||||
EUR/USD | 01/18/2011 | BOA | EUR | 175 | 234 | (5) | ||||||||||||
EUR/USD | 01/18/2011 | SSB | EUR | 57 | 76 | – | ||||||||||||
EUR/USD | 01/18/2011 | DUB | EUR | 75 | 100 | 2 | ||||||||||||
EUR/USD | 01/18/2011 | BOA | EUR | 198 | 265 | 7 | ||||||||||||
EUR/USD | 01/18/2011 | DUB | EUR | 120 | 160 | 4 | ||||||||||||
GBP/USD | 02/14/2011 | DUB | GBP | 190 | 296 | (5) | ||||||||||||
GBP/USD | 02/14/2011 | BCL | GBP | 95 | 148 | (3) | ||||||||||||
GBP/USD | 02/14/2011 | BOA | GBP | 190 | 296 | (7) | ||||||||||||
Purchased/ Sold | Settlement Date | Counter- Party | Notional Amount | Value | Unrealized Gain/ (Loss) | |||||||||||||||||
JNL/Franklin Templeton Mutual Shares Fund (continued) |
| |||||||||||||||||||||
NOK/USD | 02/16/2011 | SSB | NOK | 675 | $ | 115 | $ | – | ||||||||||||||
NOK/USD | 02/16/2011 | DUB | NOK | 609 | 104 | 1 | ||||||||||||||||
NOK/USD | 02/16/2011 | DUB | NOK | 847 | 145 | 2 | ||||||||||||||||
NOK/USD | 02/16/2011 | DUB | NOK | 717 | 123 | 1 | ||||||||||||||||
NOK/USD | 02/16/2011 | DUB | NOK | 699 | 120 | 1 | ||||||||||||||||
NOK/USD | 02/16/2011 | SSB | NOK | 1,184 | 202 | 1 | ||||||||||||||||
NOK/USD | 02/16/2011 | SSB | NOK | 1,177 | 201 | 1 | ||||||||||||||||
NOK/USD | 02/16/2011 | SSB | NOK | 661 | 113 | – | ||||||||||||||||
NOK/USD | 02/16/2011 | DUB | NOK | 1,077 | 184 | 2 | ||||||||||||||||
NOK/USD | 02/16/2011 | DUB | NOK | 879 | 150 | 6 | ||||||||||||||||
NOK/USD | 02/16/2011 | DUB | NOK | 2,300 | 393 | 24 | ||||||||||||||||
NOK/USD | 02/16/2011 | SSB | NOK | 800 | 137 | 11 | ||||||||||||||||
USD/CHF | 05/10/2011 | DUB | CHF | (6,489) | (6,952 | ) | (221 | ) | ||||||||||||||
USD/CHF | 05/10/2011 | SSB | CHF | (4,060) | (4,350 | ) | (140 | ) | ||||||||||||||
USD/CHF | 05/10/2011 | DUB | CHF | (216) | (232 | ) | (14 | ) | ||||||||||||||
USD/CHF | 05/10/2011 | SSB | CHF | (150) | (161 | ) | (7 | ) | ||||||||||||||
USD/DKK | 01/24/2011 | BOA | DKK | (14,926) | (2,676 | ) | (107 | ) | ||||||||||||||
USD/DKK | 01/24/2011 | DUB | DKK | (882) | (158 | ) | (2 | ) | ||||||||||||||
USD/DKK | 01/24/2011 | SSB | DKK | (500) | (90 | ) | (5 | ) | ||||||||||||||
USD/EUR | 01/18/2011 | DUB | EUR | (217) | (289 | ) | 6 | |||||||||||||||
USD/EUR | 01/18/2011 | DUB | EUR | (181) | (241 | ) | 4 | |||||||||||||||
USD/EUR | 01/18/2011 | BOA | EUR | (618) | (826 | ) | 30 | |||||||||||||||
USD/EUR | 01/18/2011 | DUB | EUR | (219) | (293 | ) | 1 | |||||||||||||||
USD/EUR | 01/18/2011 | DUB | EUR | (219) | (293 | ) | (1 | ) | ||||||||||||||
USD/EUR | 01/18/2011 | SSB | EUR | (228) | (305 | ) | 1 | |||||||||||||||
USD/EUR | 01/18/2011 | SSB | EUR | (20,029) | (26,764 | ) | (1,303 | ) | ||||||||||||||
USD/EUR | 01/18/2011 | SSB | EUR | (378) | (505 | ) | (9 | ) | ||||||||||||||
USD/EUR | 01/18/2011 | DUB | EUR | (21,940) | (29,318 | ) | (625 | ) | ||||||||||||||
USD/EUR | 01/18/2011 | BOA | EUR | (621) | (829 | ) | (33 | ) | ||||||||||||||
USD/EUR | 01/18/2011 | SSB | EUR | (119) | (159 | ) | (4 | ) | ||||||||||||||
USD/GBP | 02/14/2011 | DUB | GBP | (210) | (327 | ) | 12 | |||||||||||||||
USD/GBP | 02/14/2011 | BOA | GBP | (270) | (421 | ) | 18 | |||||||||||||||
USD/GBP | 02/14/2011 | SSB | GBP | (24,835) | (38,707 | ) | 1,383 | |||||||||||||||
USD/GBP | 02/14/2011 | DUB | GBP | (181) | (282 | ) | 5 | |||||||||||||||
USD/GBP | 02/14/2011 | DUB | GBP | (188) | (293 | ) | (1 | ) | ||||||||||||||
USD/GBP | 02/14/2011 | SSB | GBP | (193) | (300 | ) | (4 | ) | ||||||||||||||
USD/GBP | 02/14/2011 | SSB | GBP | (193) | (300 | ) | 1 | |||||||||||||||
USD/JPY | 04/20/2011 | BCL | JPY | (201,784) | (2,488 | ) | 1 | |||||||||||||||
USD/JPY | 04/20/2011 | DUB | JPY | (10,400) | (128 | ) | 1 | |||||||||||||||
USD/JPY | 04/20/2011 | DUB | JPY | (6,139) | (76 | ) | (1 | ) | ||||||||||||||
USD/JPY | 04/20/2011 | DUB | JPY | (4,163) | (51 | ) | (1 | ) | ||||||||||||||
USD/JPY | 04/20/2011 | DUB | JPY | (6,508) | (80 | ) | (2 | ) | ||||||||||||||
USD/JPY | 04/20/2011 | BOA | JPY | (3,216) | (40 | ) | (1 | ) | ||||||||||||||
USD/JPY | 04/20/2011 | DUB | JPY | (7,043) | (87 | ) | (2 | ) | ||||||||||||||
USD/NOK | 02/16/2011 | SSB | NOK | (1,848) | (316 | ) | (5 | ) | ||||||||||||||
USD/NOK | 02/16/2011 | BOA | NOK | (1,700) | (291 | ) | (1 | ) | ||||||||||||||
USD/NOK | 02/16/2011 | DUB | NOK | (1,600) | (274 | ) | (3 | ) | ||||||||||||||
USD/NOK | 02/16/2011 | DUB | NOK | (35,832) | (6,128 | ) | (387 | ) | ||||||||||||||
USD/NOK | 02/16/2011 | DUB | NOK | (1,920) | (328 | ) | (21 | ) | ||||||||||||||
USD/NOK | 02/16/2011 | SSB | NOK | (1,574) | (269 | ) | (13 | ) | ||||||||||||||
USD/NOK | 02/16/2011 | SSB | NOK | (1,900) | (325 | ) | (13 | ) | ||||||||||||||
| $ | (103,814 | ) | $ | (1,745 | ) | |||||||||||||||||
JNL/Ivy Asset Strategy Fund | ||||||||||||||||||||||
CNY/USD | 06/28/2012 | CIT | CNY | 1,610 | $ | 245 | $ | (3 | ) | |||||||||||||
CNY/USD | 06/28/2012 | CIT | CNY | 4,600 | 699 | (10 | ) | |||||||||||||||
CNY/USD | 06/28/2012 | CIT | CNY | 1,900 | 289 | (3 | ) | |||||||||||||||
CNY/USD | 06/28/2012 | CIT | CNY | 4,490 | 682 | (8 | ) | |||||||||||||||
EUR/USD | 03/24/2011 | MSC | EUR | 6,070 | 8,109 | (223 | ) | |||||||||||||||
EUR/USD | 03/24/2011 | MSC | EUR | 5,430 | 7,254 | (204 | ) | |||||||||||||||
See accompanying Notes to the Financial Statements.
JNL Series Trust
Notes to Schedules of Investments (in thousands)
December 31, 2010
Schedule of Open Forward Foreign Currency Contracts
Purchased/ Sold | Settlement Date | Counter- Party | Notional Amount | Value | Unrealized Gain/ (Loss) | |||||||||||||
JNL/Ivy Asset Strategy Fund (continued) |
| |||||||||||||||||
USD/EUR | 03/22/2011 | MSC | EUR | (8,800 | ) | $ | (11,757 | ) | $ | (212 | ) | |||||||
USD/EUR | 03/22/2011 | MSC | EUR | (12,300 | ) | (16,432 | ) | (261 | ) | |||||||||
USD/EUR | 03/24/2011 | NSI | EUR | (29,500 | ) | (39,410 | ) | (819 | ) | |||||||||
USD/EUR | 03/24/2011 | MSC | EUR | (11,500 | ) | (15,363 | ) | (1,194 | ) | |||||||||
USD/EUR | 03/28/2011 | GSC | EUR | (31,470 | ) | (42,041 | ) | (860 | ) | |||||||||
| $ | (107,725 | ) | $ | (3,797 | ) | |||||||||||||
JNL/JPMorgan International Value Fund |
| |||||||||||||||||
AUD/USD | 02/28/2011 | CSI | AUD | 42,388 | $ | 43,051 | $ | 1,910 | ||||||||||
AUD/USD | 02/28/2011 | UBS | AUD | 2,270 | 2,306 | 21 | ||||||||||||
CHF/EUR | 02/28/2011 | RBS | EUR | (2,871 | ) | (3,836 | ) | 248 | ||||||||||
CHF/EUR | 02/28/2011 | BNP | EUR | (6,558 | ) | (8,762 | ) | 397 | ||||||||||
CHF/JPY | 02/28/2011 | CSI | JPY | (676,532 | ) | (8,338 | ) | 209 | ||||||||||
EUR/GBP | 02/28/2011 | SSB | GBP | (1,490 | ) | (2,322 | ) | 30 | ||||||||||
EUR/USD | 02/28/2011 | RBS | EUR | 2,484 | 3,318 | (51 | ) | |||||||||||
EUR/USD | 02/28/2011 | BCL | EUR | 1,765 | 2,358 | 4 | ||||||||||||
EUR/USD | 02/28/2011 | BCL | EUR | 1,968 | 2,629 | 30 | ||||||||||||
GBP/EUR | 02/28/2011 | HSB | EUR | (1,574 | ) | (2,103 | ) | (25 | ) | |||||||||
GBP/USD | 02/28/2011 | GSC | GBP | 2,091 | 3,258 | (68 | ) | |||||||||||
HKD/USD | 02/28/2011 | SSB | HKD | 19,079 | 2,456 | 2 | ||||||||||||
JPY/GBP | 02/28/2011 | DUB | GBP | (862 | ) | (1,343 | ) | 14 | ||||||||||
JPY/USD | 02/28/2011 | DUB | JPY | 2,456,882 | 30,279 | 814 | ||||||||||||
SEK/USD | 02/28/2011 | UBS | SEK | 105,180 | 15,609 | 420 | ||||||||||||
SGD/CAD | 02/28/2011 | SSB | CAD | (2,102 | ) | (2,112 | ) | 28 | ||||||||||
SGD/USD | 02/28/2011 | RBS | SGD | 4,238 | 3,302 | 63 | ||||||||||||
USD/CAD | 02/28/2011 | RBS | CAD | (5,400 | ) | (5,425 | ) | (137 | ) | |||||||||
USD/CHF | 02/28/2011 | RBS | CHF | (4,091 | ) | (4,378 | ) | (234 | ) | |||||||||
USD/EUR | 02/28/2011 | UBS | EUR | (960 | ) | (1,282 | ) | 1 | ||||||||||
USD/GBP | 02/28/2011 | MLP | GBP | (34,712 | ) | (54,095 | ) | 1,153 | ||||||||||
USD/GBP | 02/28/2011 | BCL | GBP | (3,517 | ) | (5,482 | ) | (14 | ) | |||||||||
USD/HKD | 02/28/2011 | DUB | HKD | (40,481 | ) | (5,210 | ) | 11 | ||||||||||
USD/JPY | 02/28/2011 | DUB | JPY | (429,395 | ) | (5,292 | ) | (126 | ) | |||||||||
USD/JPY | 02/28/2011 | SSB | JPY | (408,780 | ) | (5,038 | ) | (122 | ) | |||||||||
USD/JPY | 02/28/2011 | UBS | JPY | (178,639 | ) | (2,202 | ) | (67 | ) | |||||||||
USD/JPY | 02/28/2011 | DUB | JPY | (109,806 | ) | (1,353 | ) | (29 | ) | |||||||||
USD/NOK | 02/28/2011 | UBS | NOK | (38,428 | ) | (6,568 | ) | (220 | ) | |||||||||
| $ | (16,575 | ) | $ | 4,262 | ||||||||||||||
JNL/Mellon Capital Management International Index Fund |
| |||||||||||||||||
AUD/USD | 03/16/2011 | CCI | AUD | 118 | $ | 120 | $ | 5 | ||||||||||
AUD/USD | 03/16/2011 | DUB | AUD | 1,264 | 1,281 | 57 | ||||||||||||
AUD/USD | 03/16/2011 | CCI | AUD | 1,264 | 1,281 | 59 | ||||||||||||
AUD/USD | 03/16/2011 | DUB | AUD | 119 | 121 | 4 | ||||||||||||
AUD/USD | 03/16/2011 | CSI | AUD | 358 | 363 | 12 | ||||||||||||
AUD/USD | 03/16/2011 | CCI | AUD | 119 | 121 | 4 | ||||||||||||
AUD/USD | 03/16/2011 | CSI | AUD | 120 | 121 | 5 | ||||||||||||
AUD/USD | 03/16/2011 | CCI | AUD | 238 | 241 | 7 | ||||||||||||
AUD/USD | 03/16/2011 | CCI | AUD | 118 | 120 | 3 | ||||||||||||
AUD/USD | 03/16/2011 | CCI | AUD | 238 | 242 | 6 | ||||||||||||
AUD/USD | 03/16/2011 | CCI | AUD | 478 | 485 | 4 | ||||||||||||
AUD/USD | 03/16/2011 | BOA | AUD | 119 | 121 | 1 | ||||||||||||
EUR/USD | 03/16/2011 | CCI | EUR | 7,947 | 10,617 | 85 | ||||||||||||
EUR/USD | 03/16/2011 | CCI | EUR | 224 | 300 | 3 | ||||||||||||
EUR/USD | 03/16/2011 | CCI | EUR | 284 | 379 | 4 | ||||||||||||
EUR/USD | 03/16/2011 | DUB | EUR | 57 | 76 | — | ||||||||||||
EUR/USD | 03/16/2011 | CSI | EUR | 200 | 267 | — | ||||||||||||
EUR/USD | 03/16/2011 | CSI | EUR | 743 | 993 | 1 | ||||||||||||
EUR/USD | 03/16/2011 | CCI | EUR | 398 | 532 | 5 | ||||||||||||
EUR/USD | 03/16/2011 | CSI | EUR | 427 | 570 | 6 | ||||||||||||
EUR/USD | 03/16/2011 | CCI | EUR | 564 | 753 | 11 | ||||||||||||
EUR/USD | 03/16/2011 | CCI | EUR | 511 | 682 | 12 | ||||||||||||
EUR/USD | 03/16/2011 | CCI | EUR | 402 | 537 | 11 | ||||||||||||
Purchased/ Sold | Settlement Date | Counter- Party | Notional Amount | Value | Unrealized Gain/ (Loss) | |||||||||||||
JNL/Mellon Capital Management International Index Fund (continued) |
| |||||||||||||||||
EUR/USD | 03/16/2011 | CGM | EUR | 201 | $ | 269 | $ | 6 | ||||||||||
EUR/USD | 03/16/2011 | CCI | EUR | 658 | 879 | 14 | ||||||||||||
EUR/USD | 03/16/2011 | CCI | EUR | 650 | 868 | 12 | ||||||||||||
EUR/USD | 03/16/2011 | CCI | EUR | 282 | 377 | 6 | ||||||||||||
EUR/USD | 03/16/2011 | BOA | EUR | 341 | 455 | 2 | ||||||||||||
EUR/USD | 03/16/2011 | BOA | EUR | 391 | 523 | — | ||||||||||||
GBP/USD | 03/16/2011 | CCI | GBP | 116 | 181 | (2 | ) | |||||||||||
GBP/USD | 03/16/2011 | BCL | GBP | 4,503 | 7,017 | (98 | ) | |||||||||||
GBP/USD | 03/16/2011 | CCI | GBP | 232 | 361 | (4 | ) | |||||||||||
GBP/USD | 03/16/2011 | CSI | GBP | 176 | 274 | (3 | ) | |||||||||||
GBP/USD | 03/16/2011 | CSI | GBP | 468 | 729 | (2 | ) | |||||||||||
GBP/USD | 03/16/2011 | CCI | GBP | 352 | 548 | (1 | ) | |||||||||||
GBP/USD | 03/16/2011 | CSI | GBP | 234 | 364 | 2 | ||||||||||||
GBP/USD | 03/16/2011 | CCI | GBP | 408 | 636 | 2 | ||||||||||||
GBP/USD | 03/16/2011 | CCI | GBP | 293 | 456 | 3 | ||||||||||||
GBP/USD | 03/16/2011 | CCI | GBP | 354 | 552 | 7 | ||||||||||||
GBP/USD | 03/16/2011 | CGM | GBP | 60 | 93 | 1 | ||||||||||||
GBP/USD | 03/16/2011 | CCI | GBP | 893 | 1,392 | 17 | ||||||||||||
GBP/USD | 03/16/2011 | CCI | GBP | 179 | 278 | 3 | ||||||||||||
GBP/USD | 03/16/2011 | BOA | GBP | 179 | 279 | 3 | ||||||||||||
GBP/USD | 03/16/2011 | BOA | GBP | 475 | 739 | 3 | ||||||||||||
JPY/USD | 03/16/2011 | CCI | JPY | 35,140 | 433 | 15 | ||||||||||||
JPY/USD | 03/16/2011 | DUB | JPY | 223,993 | 2,761 | 93 | ||||||||||||
JPY/USD | 03/16/2011 | BCL | JPY | 522,650 | 6,442 | 217 | ||||||||||||
JPY/USD | 03/16/2011 | CCI | JPY | 26,685 | 329 | 10 | ||||||||||||
JPY/USD | 03/16/2011 | DUB | JPY | 8,880 | 109 | 3 | ||||||||||||
JPY/USD | 03/16/2011 | CSI | JPY | 17,920 | 221 | 6 | ||||||||||||
JPY/USD | 03/16/2011 | CSI | JPY | 63,105 | 778 | 25 | ||||||||||||
JPY/USD | 03/16/2011 | CCI | JPY | 36,080 | 445 | 16 | ||||||||||||
JPY/USD | 03/16/2011 | CSI | JPY | 36,120 | 445 | 15 | ||||||||||||
JPY/USD | 03/16/2011 | CCI | JPY | 36,080 | 445 | 13 | ||||||||||||
JPY/USD | 03/16/2011 | CCI | JPY | 45,000 | 555 | 16 | ||||||||||||
JPY/USD | 03/16/2011 | CGM | JPY | 54,330 | 670 | 16 | ||||||||||||
JPY/USD | 03/16/2011 | CCI | JPY | 54,120 | 667 | 13 | ||||||||||||
JPY/USD | 03/16/2011 | CCI | JPY | 45,250 | 558 | 5 | ||||||||||||
JPY/USD | 03/16/2011 | CCI | JPY | 18,090 | 223 | 2 | ||||||||||||
JPY/USD | 03/16/2011 | BOA | JPY | 27,270 | 336 | 1 | ||||||||||||
USD/AUD | 03/16/2011 | CCI | AUD | (2,153 | ) | (2,182 | ) | (88 | ) | |||||||||
USD/EUR | 03/16/2011 | CCI | EUR | (5,859 | ) | (7,827 | ) | (73 | ) | |||||||||
USD/GBP | 03/16/2011 | CCI | GBP | (3,942 | ) | (6,143 | ) | 69 | ||||||||||
USD/JPY | 03/16/2011 | CCI | JPY | (500,519 | ) | (6,169 | ) | (181 | ) | |||||||||
| $ | 30,689 | $ | 469 | |||||||||||||||
See accompanying Notes to the Financial Statements.
JNL Series Trust
Notes to Schedules of Investments (in thousands)
December 31, 2010
Schedule of Total Return Swap Agreements
| Counterparty | Reference Entity | Paying/ Receiving Reference Entity Total Return | Expiration Date | Notional Amount1 | Unrealized Appreciation / (Depreciation) | |||||||||||||||||||||
JNL/Ivy Asset Strategy Fund |
| |||||||||||||||||||||||||
GSC | * Brazil Bovespa Index February 2011 Future | N/A | 02/17/2011 | BRL | — | $ | (4 | ) | ||||||||||||||||||
GSC | * Brazil Bovespa Index February 2011 Future | N/A | 02/17/2011 | BRL | — | (37 | ) | |||||||||||||||||||
GSC | * Brazil Bovespa Index February 2011 Future | N/A | 02/17/2011 | BRL | — | 4 | ||||||||||||||||||||
MSC | * Brazil Bovespa Index February 2011 Future | N/A | 02/17/2011 | BRL | — | 11 | ||||||||||||||||||||
| $ | (26 | ) | ||||||||||||||||||||||||
1Notional amount is stated in USD unless otherwise noted.
* Swap agreement fair valued in good faith in accordance with procedures established by the Board. Fair valued securities may be classified as Level 2 or Level 3 for FASB ASC Topic 820 disclosures based on the applicable valuation inputs. See FASB ASC Topic 820 note in these Notes to the Schedule of Investments.
| Counterparty | Abbreviations | |||
BANCAMERICA SECURITIES/BANK OF AMERICA NA | BOA | |||
BARCLAYS CAPITAL INC. | BCL | |||
BARCLAYS BANK PLC | BBP | |||
BNP PARIBAS SECURITIES | BNP | |||
BNY CAPITAL MARKETS | BNY | |||
CITIBANK, INC. | CIT | |||
CITICORP SECURITIES, INC. | CCI | |||
CITIGROUP GLOBAL MARKETS(FRMRLY SALOMON) | CGM | |||
CREDIT SUISSE INTERNATIONAL | CST | |||
CREDIT SUISSE SECURITIES, LLC | CSI | |||
DEUTSCHE BANK ALEX BROWN INC. | DUB | |||
GOLDMAN SACHS & CO. | GSC | |||
GOLDMAN SACHS BANK USA | GSB | |||
GOLDMAN SACHS INTERNATIONAL | GSI | |||
HSBC SECURITIES, INC. | HSB | |||
J.P. MORGAN | JPM | |||
J.P. MORGAN SECURITIES, INC. | JPM | |||
MERRILL LYNCH CAPITAL SERVICES | MLC | |||
MERRILL LYNCH INTERNATIONAL | MLI | |||
MERRILL LYNCH PROFESSIONAL CLEARING CORP | MLP | |||
MERRILL LYNCH, PIERCE, FENNER, & SMITH | MLP | |||
MORGAN STANLEY & CO., INCORPORATED | MSC | |||
MORGAN STANLEY CAPITAL SERVICES INC. | MSS | |||
NOMURA SECURITIES INTERNATIONAL, INC. | NSI | |||
ROYAL BANK OF CANADA | RBC | |||
ROYAL BANK OF SCOTLAND | RBS | |||
STATE STREET BROKERAGE SERVICES, INC. | SSB | |||
UBS SECURITIES LLC | UBS | |||
UBS AG STAMFORD | STA | |||
WESTPAC BANKING CORPORATION | WBC |
See accompanying Notes to the Financial Statements.
JNL Series Trust
Notes to Schedules of Investments (in thousands)
December 31, 2010
Pledged or Segregated Collateral – The following table summarizes cash and securities collateral pledged for futures contracts and reverse repurchase agreements or segregated for securities sold short, swap agreements and delayed delivery securities:
| Futures Contracts | Reverse Repurchase | Securities Sold Short | Swap Agreements | Delayed Delivery | Total Pledged or Segregated | |||||||||||
Pledged | Pledged | Segregated | Segregated | Segregated or Pledged Cash | Segregated | Segregated | Cash and | |||||||||
JNL/Goldman Sachs U.S. Equity Flex Fund | - | - | - | 107,241 | - | - | - | 107,241 | ||||||||
JNL/Ivy Asset Strategy Fund | - | - | - | - | - | 832 | - | 832 | ||||||||
JNL/Mellon Capital Management S&P 500 Index Fund | - | 1,295 | - | - | - | - | - | 1,295 | ||||||||
JNL/Mellon Capital Management S&P 400 Mid Cap Index Fund | - | 940 | - | - | - | - | - | 940 | ||||||||
JNL/Mellon Capital Management Small Cap Index Fund | - | 895 | - | - | - | - | - | 895 | ||||||||
JNL/Mellon Capital Management International Index Fund | - | 1,709 | - | - | - | - | - | 1,709 | ||||||||
See accompanying Notes to the Financial Statements.
JNL Series Trust
Schedules of Investments (in thousands)
December 31, 2010
FASB ASC Topic 815, “Derivatives and Hedging” – The following is a summary of the fair valuations of each Fund’s derivative instruments categorized by risk exposure. The derivative instruments outstanding as of December 31, 2010, as disclosed in these Notes to the Schedules of Investments and the amounts of realized and changes in unrealized gains and losses on derivative instruments during the year ended December 31, 2010, as disclosed in the Statements of Operations, serve as indicators of the volume of derivative activity for the Funds. See Note 4 in the Notes to Financial Statements for additional FASB ASC Topic 815 disclosures.
JNL/Ivy Asset Strategy Fund
Fair values of derivative instruments on the Statements of Assets and Liabilities as of December 31, 2010: | ||||||||||||||||||||||||||||||||||||||||||||
| Credit Contracts | Equity Contracts | Foreign Exchange Contracts | Interest Rate Contracts | Total |
| Credit Contracts | Equity Contracts | Foreign Exchange Contracts | Interest Rate Contracts | Total | ||||||||||||||||||||||||||||||||||
Assets: | Liabilities: | |||||||||||||||||||||||||||||||||||||||||||
Investments - unaffiliated, at value | $ - | $ | 6,638 | $ | - | $ | - | $ | 6,638 | Options written, at value | $ | - | $ | 1,808 | $ | - | $ | - | $ | 1,808 | ||||||||||||||||||||||||
Forward foreign currency contracts | - | - | - | - | - | Forward foreign currency contracts | - | - | 3,797 | - | 3,797 | |||||||||||||||||||||||||||||||||
Unrealized appreciation on swap agreements | - | 15 | - | - | 15 | Unrealized depreciation on swap agreements | - | 41 | - | - | 41 | |||||||||||||||||||||||||||||||||
Variation margin | - | - | - | - | - | Variation margin | - | - | - | - | - | |||||||||||||||||||||||||||||||||
| $ | - | $ | 6,653 | $ | - | $ | - | $ | 6,653 | $ | - | $ | 1,849 | $ | 3,797 | $ | - | $ | 5,646 | |||||||||||||||||||||||||
The effect of derivative instruments on the Statements of Operations for the year ended December 31, 2010: |
| |||||||||||||||||||||||||||||||||||||||||||
Net realized gain (loss) on: |
| Net change in unrealized appreciation or depreciation on: |
| |||||||||||||||||||||||||||||||||||||||||
Foreign currency related items | $ | - | $ | - | $ | (2,051 | ) | $ | - | $ | (2,051 | ) | Foreign currency related items | $ | - | $ | - | $ | (3,797 | ) | $ | - | $ | (3,797 | ) | |||||||||||||||||||
Futures contracts | - | (55,537 | ) | - | - | (55,537 | ) | Futures contracts † | - | - | - | - | ||||||||||||||||||||||||||||||||
Option contracts | - | (6,668 | ) | (130 | ) | - | (6,798 | ) | Option contracts* † | - | (265 | ) | - | - | $ | (265 | ) | |||||||||||||||||||||||||||
Swap agreements | - | 524 | - | - | 524 | Swap agreements | - | (24 | ) | - | - | (24 | ) | |||||||||||||||||||||||||||||||
| $ | - | $ | (61,681 | ) | $ | (2,181 | ) | $ | - | $ | (63,862 | ) | $ | - | $ | (289 | ) | $ | (3,797 | ) | $ | - | $ | (4,086 | ) | |||||||||||||||||||
JNL/JPMorgan International Value Fund
Fair values of derivative instruments on the Statements of Assets and Liabilities as of December 31, 2010:
|
| |||||||||||||||||||||||||||||||||||||||||||
| Credit Contracts | Equity Contracts | Foreign Exchange Contracts | Interest Rate Contracts | Total | Credit Contracts | Equity Contracts | Foreign Exchange Contracts | Interest Rate Contracts | Total | |||||||||||||||||||||||||||||||||||
Assets: | Liabilities: | |||||||||||||||||||||||||||||||||||||||||||
Forward foreign currency contracts | $ | - | $ | - | $ | 5,552 | $ | - | $ | 5,552 | Forward foreign currency contracts | $ | - | $ | - | $ | 1,290 | $ | - | $ | 1,290 | |||||||||||||||||||||||
Variation margin | - | - | - | - | - | Variation margin | - | - | - | - | - | |||||||||||||||||||||||||||||||||
| $ | - | $ | - | $ | 5,552 | $ | - | $ | 5,552 | $ | - | $ | - | $ | 1,290 | $ | - | $ | 1,290 | |||||||||||||||||||||||||
The effect of derivative instruments on the Statements of Operations for the year ended December 31, 2010:
|
| |||||||||||||||||||||||||||||||||||||||||||
Net realized gain (loss) on: |
| Net change in unrealized appreciation or depreciation on: | ||||||||||||||||||||||||||||||||||||||||||
Foreign currency related items | $ | - | $ | - | $ | 5,819 | $ | - | $ | 5,819 | Foreign currency related items | $ | - | $ | - | $ | 4,185 | $ | - | $ | 4,185 | |||||||||||||||||||||||
Futures contracts | - | 171 | - | - | 171 | Futures contracts | - | 56 | - | - | 56 | |||||||||||||||||||||||||||||||||
| $ | - | $ | 171 | $ | 5,819 | $ | - | $ | 5,990 | $ | - | $ | 56 | $ | 4,185 | $ | - | $ | 4,241 | |||||||||||||||||||||||||
JNL/Mellon Capital Management International Index Fund
Fair values of derivative instruments on the Statements of Assets and Liabilities as of December 31, 2010: |
| |||||||||||||||||||||||||||||||||||||||||||
| Credit Contracts | Equity Contracts | Foreign Exchange Contracts | Interest Rate Contracts | Total | Credit Contracts | Equity Contracts | Foreign Exchange Contracts | Interest Rate Contracts | Total | |||||||||||||||||||||||||||||||||||
Assets: | Liabilities: | |||||||||||||||||||||||||||||||||||||||||||
Forward foreign currency contracts | $ | - | $ | - | $ | 921 | $ | - | $ | 921 | Forward foreign currency contracts | $ | - | $ | - | $ | 452 | $ | - | $ | 452 | |||||||||||||||||||||||
Variation margin | - | - | - | - | - | Variation margin | - | 100 | - | - | 100 | |||||||||||||||||||||||||||||||||
| $ | - | $ | - | $ | 921 | $ | - | $ | 921 | $ | - | $ | 100 | $ | 452 | $ | - | $ | 552 | |||||||||||||||||||||||||
The effect of derivative instruments on the Statements of Operations for the year ended December 31, 2010: |
| |||||||||||||||||||||||||||||||||||||||||||
Net realized gain (loss) on: |
| Net change in unrealized appreciation or depreciation on: |
| |||||||||||||||||||||||||||||||||||||||||
Foreign currency related items | $ | - | $ | - | $ | (219) | $ | - | $ | (219) | Foreign currency related items | $ | - | $ | - | $ | 1,060 | $ | - | $ | 1,060 | |||||||||||||||||||||||
Futures contracts | - | 609 | - | - | 609 | Futures contracts | - | (406 | ) | - | - | (406 | ) | |||||||||||||||||||||||||||||||
| $ | - | $ | 609 | $ | (219) | $ | - | $ | 390 | $ | - | $ | (406 | ) | $ | 1,060 |
| $ | - |
| $ | 654 |
| |||||||||||||||||||||
† The Fund did not hold any open derivative instruments in this category at December 31, 2009.
*Includes change in unrealized appreciation (depreciation) on purchased and written options. Unrealized appreciation (depreciation) on purchased options is located in net change in unrealized appreciation (depreciation) on investments in the Statements of Operations. Unrealized appreciation (depreciation) on written options is located in net change in unrealized appreciation (depreciation) on written options contracts on the Statement of Operations.
See accompanying Notes to the Financial Statements.
JNL Series Trust
Notes to the Schedules of Investments
December 31, 2010
Summary of Investments by Country (as a percentage of total long-term investments)* :
JNL/BlackRock Commodity Securities Fund | JNL/Capital Guardian Global Balanced Fund | JNL/Capital Guardian Global Diversified Research Fund | JNL/Franklin Templeton Global Growth Fund | JNL/Franklin Templeton Income Fund | JNL/Franklin Templeton Mutual Shares | |||||||||||||||||||||||||||||||
Argentina | – | % | 0.1 | % | – | % | – | % | – | % | – | % | ||||||||||||||||||||||||
Australia | 1.2 | 2.3 | 3.2 | 0.3 | 1.4 | – | ||||||||||||||||||||||||||||||
Austria | – | 0.3 | – | 0.5 | – | – | ||||||||||||||||||||||||||||||
Barbados | 0.4 | – | – | – | – | – | ||||||||||||||||||||||||||||||
Belgium | – | 0.2 | – | – | – | – | ||||||||||||||||||||||||||||||
Bermuda | – | 0.3 | 0.1 | – | – | 0.4 | ||||||||||||||||||||||||||||||
Brazil | 1.6 | 1.9 | 1.2 | 0.7 | – | – | ||||||||||||||||||||||||||||||
Canada | 13.3 | 2.9 | 4.7 | – | 2.3 | 0.5 | ||||||||||||||||||||||||||||||
Cayman Islands | – | 0.2 | – | – | 0.2 | – | ||||||||||||||||||||||||||||||
China | 0.5 | 1.6 | 3.3 | 0.4 | – | – | ||||||||||||||||||||||||||||||
Colombia | – | 0.1 | – | – | – | – | ||||||||||||||||||||||||||||||
Croatia | – | 0.2 | – | – | – | – | ||||||||||||||||||||||||||||||
Denmark | – | 1.2 | 1.0 | – | – | 1.8 | ||||||||||||||||||||||||||||||
Dominican Republic | – | 0.1 | – | – | – | – | ||||||||||||||||||||||||||||||
Egypt | – | – | – | – | – | – | ||||||||||||||||||||||||||||||
Finland | – | 0.4 | 1.3 | – | – | – | ||||||||||||||||||||||||||||||
France | 11.3 | 2.5 | 4.8 | 7.3 | – | 3.8 | ||||||||||||||||||||||||||||||
Germany | – | 7.7 | 3.9 | 5.2 | 0.8 | 3.8 | ||||||||||||||||||||||||||||||
Greece | 0.1 | – | – | – | – | – | ||||||||||||||||||||||||||||||
Hong Kong | 0.9 | 2.3 | 4.2 | 1.7 | – | 0.4 | ||||||||||||||||||||||||||||||
Hungary | – | 0.3 | – | – | – | – | ||||||||||||||||||||||||||||||
India | – | 2.1 | 0.9 | 0.7 | – | – | ||||||||||||||||||||||||||||||
Indonesia | – | 0.4 | 0.3 | – | – | – | ||||||||||||||||||||||||||||||
Iraq | – | 0.1 | – | – | – | – | ||||||||||||||||||||||||||||||
Ireland | – | 0.8 | 0.4 | 5.2 | – | – | ||||||||||||||||||||||||||||||
Israel | – | 0.2 | – | – | – | – | ||||||||||||||||||||||||||||||
Italy | 0.9 | 0.8 | – | 1.9 | – | 0.3 | ||||||||||||||||||||||||||||||
Japan | – | 9.8 | 9.2 | 2.5 | – | 1.4 | ||||||||||||||||||||||||||||||
Luxembourg | – | 0.5 | – | – | – | – | ||||||||||||||||||||||||||||||
Malaysia | – | 1.3 | 0.3 | – | – | – | ||||||||||||||||||||||||||||||
Mexico | – | 1.9 | 0.3 | – | – | – | ||||||||||||||||||||||||||||||
Netherlands | – | 1.9 | 3.2 | 4.8 | 0.1 | 1.9 | ||||||||||||||||||||||||||||||
New Zealand | – | – | – | – | – | – | ||||||||||||||||||||||||||||||
Norway | – | 0.4 | 0.4 | 0.6 | – | 1.3 | ||||||||||||||||||||||||||||||
Panama | – | 0.1 | – | – | – | – | ||||||||||||||||||||||||||||||
Peru | – | – | – | – | – | – | ||||||||||||||||||||||||||||||
Poland | – | 1.5 | – | – | – | – | ||||||||||||||||||||||||||||||
Qatar | – | – | – | – | – | – | ||||||||||||||||||||||||||||||
Russian Federation | – | 1.3 | 1.0 | 0.5 | – | – | ||||||||||||||||||||||||||||||
Singapore | – | 0.6 | 0.5 | 2.0 | – | – | ||||||||||||||||||||||||||||||
South Africa | – | 0.9 | 0.8 | – | 0.2 | – | ||||||||||||||||||||||||||||||
South Korea | – | 2.7 | 2.1 | 4.2 | – | – | ||||||||||||||||||||||||||||||
Spain | – | 0.2 | – | 1.2 | 0.6 | 1.4 | ||||||||||||||||||||||||||||||
Sweden | 3.0 | 1.2 | 0.7 | 1.0 | – | – | ||||||||||||||||||||||||||||||
Switzerland | 0.7 | 2.6 | 2.8 | 8.5 | 2.3 | 6.1 | ||||||||||||||||||||||||||||||
Taiwan | – | 0.6 | 0.5 | 1.1 | – | – | ||||||||||||||||||||||||||||||
Thailand | – | 0.1 | – | – | – | – | ||||||||||||||||||||||||||||||
Turkey | – | 0.2 | – | 0.5 | – | – | ||||||||||||||||||||||||||||||
United Arab Emirates | – | 0.2 | – | – | – | – | ||||||||||||||||||||||||||||||
United Kingdom | 0.3 | 6.7 | 11.0 | 12.2 | 4.1 | 9.4 | ||||||||||||||||||||||||||||||
United States | 65.8 | 36.2 | 37.9 | 37.0 | 88.0 | 67.5 | ||||||||||||||||||||||||||||||
Venezuela | – | 0.1 | – | – | – | – | ||||||||||||||||||||||||||||||
Total Long-Term Investments* | 100.0 | % | 100.0 | % | 100.0 | % | 100.0 | % | 100.0 | % | 100.0 | % | ||||||||||||||||||||||||
JNL Series Trust
Notes to the Schedules of Investments
December 31, 2010
Summary of Investments by Country (as a percentage of total long-term investments)* :
JNL/Invesco Global Real Estate Fund | JNL/Invesco International Growth Fund | JNL/Invesco Large Cap Growth Fund | JNL/Ivy Asset Strategy Fund | JNL/JPMorgan International Value Fund | JNL/Lazard Emerging Markets Fund | |||||||||||||||||||||||||||||||
Argentina | – | % | – | % | – | % | – | % | – | % | – | % | ||||||||||||||||||||||||
Australia | 8.9 | 7.5 | – | 0.7 | 1.5 | – | ||||||||||||||||||||||||||||||
Austria | 0.3 | – | – | – | 1.1 | – | ||||||||||||||||||||||||||||||
Bahamas | – | – | – | – | – | – | ||||||||||||||||||||||||||||||
Belgium | – | 1.7 | – | – | 0.9 | – | ||||||||||||||||||||||||||||||
Bermuda | 2.0 | – | 1.7 | – | – | – | ||||||||||||||||||||||||||||||
Brazil | 0.3 | 2.5 | – | 3.5 | – | 21.5 | ||||||||||||||||||||||||||||||
Canada | 3.6 | 5.5 | 4.5 | – | 1.5 | 1.8 | ||||||||||||||||||||||||||||||
Cayman Islands | 0.8 | – | 2.2 | 2.0 | – | – | ||||||||||||||||||||||||||||||
Chile | – | – | – | – | – | – | ||||||||||||||||||||||||||||||
China | – | 1.5 | – | 4.8 | – | 2.1 | ||||||||||||||||||||||||||||||
Colombia | – | – | – | – | – | – | ||||||||||||||||||||||||||||||
Denmark | – | 1.9 | – | 0.3 | – | – | ||||||||||||||||||||||||||||||
Egypt | – | – | – | – | – | 3.3 | ||||||||||||||||||||||||||||||
European Union | – | – | – | 0.6 | – | – | ||||||||||||||||||||||||||||||
Finland | 0.5 | – | – | – | 2.1 | – | ||||||||||||||||||||||||||||||
France | 3.9 | 5.3 | – | 1.6 | 12.2 | – | ||||||||||||||||||||||||||||||
Germany | – | 6.9 | – | 6.3 | 10.0 | – | ||||||||||||||||||||||||||||||
Hong Kong | 14.5 | 1.8 | – | 6.2 | 3.3 | 0.6 | ||||||||||||||||||||||||||||||
Hungary | – | – | – | – | – | 1.3 | ||||||||||||||||||||||||||||||
India | – | 2.1 | – | 3.4 | – | 5.0 | ||||||||||||||||||||||||||||||
Indonesia | – | – | – | – | – | 5.1 | ||||||||||||||||||||||||||||||
Ireland | – | – | 1.0 | – | – | – | ||||||||||||||||||||||||||||||
Israel | – | 2.2 | 0.6 | – | – | – | ||||||||||||||||||||||||||||||
Italy | 0.2 | – | – | 0.1 | 0.9 | – | ||||||||||||||||||||||||||||||
Japan | 12.1 | 10.2 | – | – | 20.7 | – | ||||||||||||||||||||||||||||||
Luxembourg | – | – | – | – | 0.9 | 0.8 | ||||||||||||||||||||||||||||||
Macau | – | – | – | 5.8 | – | – | ||||||||||||||||||||||||||||||
Malaysia | – | – | – | – | – | 0.6 | ||||||||||||||||||||||||||||||
Malta | – | – | – | – | – | – | ||||||||||||||||||||||||||||||
Mexico | – | 3.8 | 1.0 | – | – | 7.0 | ||||||||||||||||||||||||||||||
Netherlands | 2.2 | 5.1 | – | 0.8 | 9.9 | – | ||||||||||||||||||||||||||||||
Norway | – | – | – | 1.4 | 2.5 | – | ||||||||||||||||||||||||||||||
Pakistan | – | – | – | – | – | 1.3 | ||||||||||||||||||||||||||||||
Peru | – | – | – | – | – | – | ||||||||||||||||||||||||||||||
Philippines | – | 1.1 | – | – | – | 1.9 | ||||||||||||||||||||||||||||||
Poland | – | – | – | – | – | – | ||||||||||||||||||||||||||||||
Russian Federation | – | 1.1 | – | – | – | 5.2 | ||||||||||||||||||||||||||||||
Singapore | 4.4 | 3.0 | – | – | 0.9 | – | ||||||||||||||||||||||||||||||
South Africa | – | – | – | – | 0.9 | 11.7 | ||||||||||||||||||||||||||||||
South Korea | – | 2.6 | – | 2.9 | 1.3 | 14.4 | ||||||||||||||||||||||||||||||
Spain | – | – | – | 1.1 | 3.4 | – | ||||||||||||||||||||||||||||||
Sweden | 0.7 | 1.6 | – | 1.9 | – | – | ||||||||||||||||||||||||||||||
Switzerland | 0.7 | 8.0 | 0.3 | 2.2 | 2.5 | – | ||||||||||||||||||||||||||||||
Taiwan | – | 2.4 | – | – | 0.9 | 7.9 | ||||||||||||||||||||||||||||||
Thailand | – | – | – | 0.8 | – | 1.8 | ||||||||||||||||||||||||||||||
Turkey | – | 0.9 | – | – | – | 6.7 | ||||||||||||||||||||||||||||||
United Arab Emirates | – | – | – | – | – | – | ||||||||||||||||||||||||||||||
United Kingdom | 5.5 | 20.8 | – | 4.1 | 22.6 | – | ||||||||||||||||||||||||||||||
United States | 39.4 | 0.5 | 88.7 | 49.5 | – | – | ||||||||||||||||||||||||||||||
Venezuela | – | – | – | – | – | – | ||||||||||||||||||||||||||||||
Total Long-Term Investments* | 100.0 | % | 100.0 | % | 100.0 | % | 100.0 | % | 100.0 | % | 100.0 | % | ||||||||||||||||||||||||
JNL Series Trust
Notes to the Schedules of Investments
December 31, 2010
Summary of Investments by Country (as a percentage of total long-term investments)* :
JNL/Mellon Capital Management International Index Fund | JNL/Oppenheimer Global Growth Fund | JNL/PAM Asia ex-Japan Fund | ||||||||||||||||
Australia | 8.8 | % | – | % | – | % | ||||||||||||
Austria | 0.3 | – | – | |||||||||||||||
Belgium | 0.9 | – | – | |||||||||||||||
Bermuda | – | 0.9 | – | |||||||||||||||
Brazil | – | 2.0 | – | |||||||||||||||
Canada | – | – | – | |||||||||||||||
Cayman Islands | – | – | – | |||||||||||||||
Chile | – | – | – | |||||||||||||||
China | – | – | 12.1 | |||||||||||||||
Cyprus | – | – | – | |||||||||||||||
Denmark | 1.0 | – | – | |||||||||||||||
Egypt | – | – | – | |||||||||||||||
European Monetary Unit | – | – | – | |||||||||||||||
European Union | – | – | – | |||||||||||||||
Finland | 1.1 | 0.9 | – | |||||||||||||||
France | 9.0 | 5.1 | – | |||||||||||||||
Germany | 8.2 | 9.3 | – | |||||||||||||||
Greece | 0.2 | – | – | |||||||||||||||
Guernsey | 0.1 | – | – | |||||||||||||||
Hong Kong | 2.7 | – | 23.9 | |||||||||||||||
India | – | 2.3 | 12.3 | |||||||||||||||
Indonesia | – | – | 3.1 | |||||||||||||||
Ireland | 0.2 | – | – | |||||||||||||||
Israel | 0.8 | – | – | |||||||||||||||
Italy | 2.5 | 2.3 | – | |||||||||||||||
Japan | 22.0 | 11.8 | – | |||||||||||||||
Jeresy | 0.1 | – | – | |||||||||||||||
Luxembourg | 0.5 | – | – | |||||||||||||||
Macau | 0.1 | – | – | |||||||||||||||
Malaysia | – | – | 3.3 | |||||||||||||||
Malta | – | – | – | |||||||||||||||
Mauritius | – | – | – | |||||||||||||||
Mexico | – | 3.7 | – | |||||||||||||||
Mongolia | – | – | 0.6 | |||||||||||||||
Netherlands | 4.6 | 3.2 | – | |||||||||||||||
New Zealand | 0.1 | – | – | |||||||||||||||
Norway | 0.9 | – | – | |||||||||||||||
Panama | – | – | – | |||||||||||||||
Philippines | – | – | 0.9 | |||||||||||||||
Portugal | 0.3 | – | – | |||||||||||||||
Qatar | – | – | – | |||||||||||||||
Russian Federation | – | – | – | |||||||||||||||
Singapore | 1.7 | – | 5.2 | |||||||||||||||
South Africa | – | – | – | |||||||||||||||
South Korea | – | 0.2 | 21.1 | |||||||||||||||
Spain | 3.3 | 2.3 | – | |||||||||||||||
Sweden | 3.2 | 6.8 | – | |||||||||||||||
Switzerland | 8.1 | 5.2 | – | |||||||||||||||
Taiwan | – | 2.0 | 14.5 | |||||||||||||||
Thailand | – | – | 3.0 | |||||||||||||||
United Kingdom | 19.3 | 4.2 | – | |||||||||||||||
United States | – | 37.8 | – | |||||||||||||||
Total Long-Term Investments* | 100.0 | % | 100.0 | % | 100.0 | % | ||||||||||||
Report of Independent Registered Public Accounting Firm
To the Shareholders and Board of Trustees
JNL Series Trust:
We have audited, in accordance with the standards of the Public Company Accounting Oversight Board (United States), the financial statements of JNL/BlackRock Commodity Securities Fund, JNL/Capital Guardian Global Balanced Fund, JNL/Capital Guardian Global Diversified Research Fund, JNL/Eagle SmallCap Equity Fund, JNL/Franklin Templeton Global Growth Fund, JNL/Franklin Templeton Income Fund, JNL/Franklin Templeton Mutual Shares Fund, JNL/Franklin Templeton Small Cap Value Fund, JNL/Goldman Sachs Mid Cap Value Fund, JNL/Goldman Sachs U.S. Equity Flex Fund, JNL/Invesco Global Real Estate Fund, JNL/Invesco International Growth Fund, JNL/Invesco Large Cap Growth Fund, JNL/Invesco Small Cap Growth Fund, JNL/Ivy Asset Strategy Fund, JNL/JPMorgan International Value Fund, JNL/JPMorgan MidCap Growth Fund, JNL/Lazard Emerging Markets Fund, JNL/Lazard Mid Cap Equity Fund, JNL/Mellon Capital Management International Index Fund, JNL/Mellon Capital Management S&P 400 MidCap Index Fund, JNL/Mellon Capital Management S&P 500 Index Fund, JNL/Mellon Capital Management Small Cap Index Fund, JNL/Oppenheimer Global Growth Fund, JNL/PAM Asia ex-Japan Fund, JNL/Select Balanced Fund, JNL/Select Value Fund, JNL/T. Rowe Price Established Growth Fund, JNL/T. Rowe Price Mid-Cap Growth Fund, and JNL/T. Rowe Price Value Fund (the “Funds”) as of and for the year ended December 31, 2010, and have issued our unqualified report thereon dated February 28, 2010 (which report and financial statements are included in Item 1 of this Certified Shareholder Report on Form N-CSR). Our audits included an audit of the Funds’ schedules of investments in securities (the “Schedules”) as of December 31, 2010 appearing in Item 6 of this Form N-CSR. These Schedules are the responsibility of the Funds’ management. Our responsibility is to express an opinion on these Schedules based on our audits.
In our opinion, the Schedules referred to above, when read in conjunction with the financial statements of the Funds referred to above, present fairly, in all material respects, the information set forth therein.
/s/ KPMG LLP
February 28, 2011
| (b) | Not applicable. |
Item 7. Disclosure of Proxy Voting Policies and Procedures for Closed-End Management Investment Companies.
Not applicable.
Item 8. Portfolio Managers of Closed-End Management Investment Companies.
Not applicable.
Item 9. Purchases of Equity Securities by Closed-End Management Investment Company and Affiliated Purchasers.
Not applicable.
Item 10. Submission of Matters to a Vote of Security Holders.
No material changes have been made.
Item 11. Controls and Procedures.
| (a) | The registrant maintains disclosure controls and procedures that are designed to ensure that information required to be disclosed in the registrant’s filings under the Securities Exchange Act of 1934, as amended, and the Investment Company Act of 1940, as amended, is recorded, processed, summarized, and reported within the periods specified in the rules and forms of the U.S. Securities and Exchange Commission. Such information is accumulated and communicated to the registrant’s management, including its principal executive officer and principal financial officer, as appropriate, to allow timely decisions regarding required disclosure. The registrant’s management, including the principal executive officer and the principal financial officer, recognizes that any set of controls and procedures, no matter how well designed and operated, can provide only reasonable assurance of achieving the desired control objectives. |
Within ninety (90) days prior to the filing date of this report on Form N-CSR, the registrant had carried out an evaluation, under the supervision and with the participation of the registrant’s management, including the registrant’s principal executive officer and the registrant’s principal financial officer, of the effectiveness of the design and operation of the registrant’s disclosure controls and procedures. Based on such evaluation, the registrant’s principal executive officer and principal financial officer concluded that the registrant’s disclosure controls and procedures are effective.
| (b) | There have been no significant changes in the registrant’s internal controls over financial reporting during the registrant’s second fiscal quarter of the period covered by this report that have materially affected, or are reasonably likely to materially affect, the registrant’s internal controls over financial reporting. There have been no significant changes in the registrant’s internal controls or in other factors that could significantly affect the internal controls subsequent to the date of their evaluation in connection with the preparation of this report on Form N-CSR. |
Item 12. Exhibits | ||||
(a) | (1) Code of Ethics pursuant to Section 406 of the Sarbanes-Oxley Act of 2002 (as defined in Item 2(b) of Form N-CSR) is attached hereto. (2) The certifications required by Rule 30a-2(a) under the Investment Company Act of 1940, as amended, are attached hereto. (3) Not applicable. | |||
(b) | The certification required by Rule 30a-2(b) under the Investment Company Act of 1940, as amended, is attached hereto. | |||
SIGNATURES
Pursuant to the requirements of the Securities Exchange Act of 1934, as amended, and the Investment Company Act of 1940, as amended, the registrant has duly caused this report to be signed on its behalf by the undersigned, thereunto duly authorized.
| JNL Series Trust | ||
By: | /s/ Mark D. Nerud | |
| Mark D. Nerud | ||
| Principal Executive Officer | ||
Date: | March 7, 2011 | |
Pursuant to the requirements of the Securities Exchange Act of 1934, as amended, and the Investment Company Act of 1940, as amended, this report has been signed below by the following persons on behalf of the registrant and in the capacities and on the dates indicated.
| By: | /s/ Mark D. Nerud | |
| Mark D. Nerud | ||
| Principal Executive Officer | ||
Date: | March 7, 2011 | |
By: | /s/ Daniel W. Koors | |
| Daniel W. Koors | ||
| Principal Financial Officer | ||
Date: | March 7, 2011 | |
EXHIBIT LIST
Exhibit 12(a)(1) | Registrant’s Code of Ethics pursuant to Section 406 of the Sarbanes-Oxley Act of 2002. | |||
Exhibit 12(a)(2) | Certification of the Principal Executive Officer required by Rule 30a-2(a) under the Investment Company Act of 1940, as amended. | |||
| Certification of the Principal Financial Officer required by Rule 30a-2(a) under the Investment Company Act of 1940, as amended. | ||||
Exhibit 12(b) | Certification required by Rule 30a-2(b) under the Investment Company Act of 1940, as amended. | |||