Exhibit 99.1
Conference slides for the presentation by Mr. Logue at the Merrill Lynch Banking and Financial Services Conference on November 13, 2007.
| BUILDING A STRONG GROWTH COMPANY EXTENDING MARKET LEADERSHIP Ronald E. Logue Chairman and Chief Executive Officer State Street. Merrill Lynch Banking and Financial Services Investor Conference 13 November 2007 |

| Building a Strong Growth Company Agenda Continuing Momentum Achieving Goals Extending Market Leadership |

| This presentation contains forward-looking statements as defined by United States securities laws, including statements about the recently completed acquisition of Investors Financial Services Corp., as well as about our financial goals, the financial outlook and business environment. These statements are not guarantees of future performance, are inherently uncertain, are based on current assumptions that are difficult to predict and involve a number of risks and uncertainties. Therefore, actual outcomes and results may differ materially from what is expressed in those statements, and those statements should not be relied upon as representing State Street’s expectations or beliefs as of any date subsequent to the date of this release. Important factors that may affect future results and outcomes include: State Street’s ability to integrate and convert acquisitions into its business, including the acquisition of Investors Financial Services Corp.; the level and volatility of interest rates, particularly in the U.S. and Europe; the performance and volatility of securities, currency and other markets in the U.S. and internationally; and economic conditions and monetary and other governmental actions designed to address those conditions; the illiquidity of the US and European securities markets, particularly the markets for fixed-income securities, including asset-backed commercial paper, as well as liquidity requirements of State Street’s customers; State Street’s ability to attract non-interest bearing deposits and other low-cost funds; the performance of, and demand for, the investment products State Street offers; the competitive environment in which State Street operates, including its ability to cross-sell services to customers and to maintain service levels, technology, and product offerings that are sufficient to attract new customers and retain current customers, as well as the effects of legal and regulatory proceedings, including litigation; the enactment of legislation, including tax legislation, and changes in regulation and enforcement that impact State Street and its customers; State Street’s ability to continue to grow revenue, control expenses and attract the capital necessary to achieve its business goals and comply with regulatory requirements; State Street’s ability to control systemic and operating risk; trends in the globalization of investment activity and the growth on a worldwide basis in financial assets; trends in governmental and corporate pension plans and savings rates; changes in accounting standards and practices, including changes in the interpretation of existing standards, that impact State Street’s consolidated financial statements; and changes in tax legislation and in the interpretation of existing tax laws by U.S. and non-U.S. tax authorities that impact the amount of taxes due. Other important factors that could cause actual results to differ materially from those indicated by any forward-looking statements are set forth in State Street’s 2006 Annual Report on Form 10-K and its subsequent SEC filings. State Street encourages investors to read these filings, particularly the sections on Risk Factors, for additional information with respect to any forward-looking statements and prior to making any investment decision. The forward-looking statements contained in this presentation speak only as of the date hereof, November 13, 2007, and State Street will not undertake efforts to revise those forward-looking statements to reflect events after this date. Reminder |

| CONTINUING MOMENTUM |
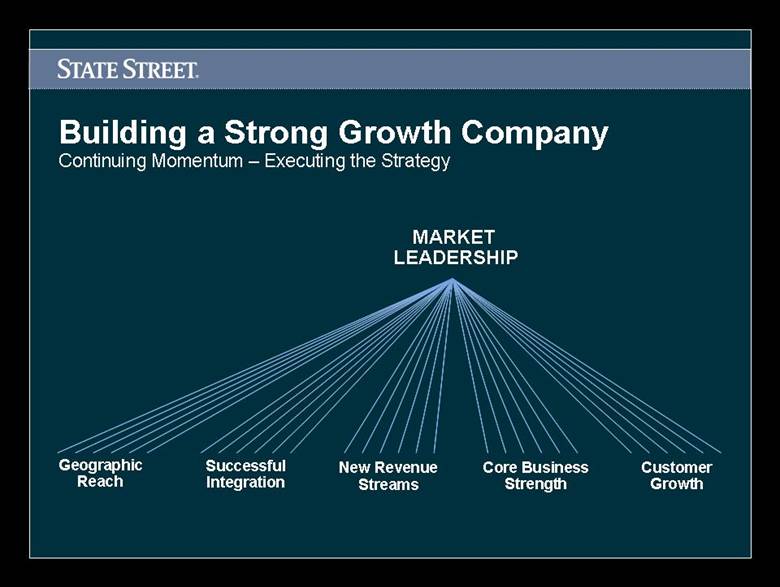
| Building a Strong Growth Company Continuing Momentum – Executing the Strategy Customer Growth New Revenue Streams Successful Integration Geographic Reach Core Business Strength LEADERSHIP MARKET |
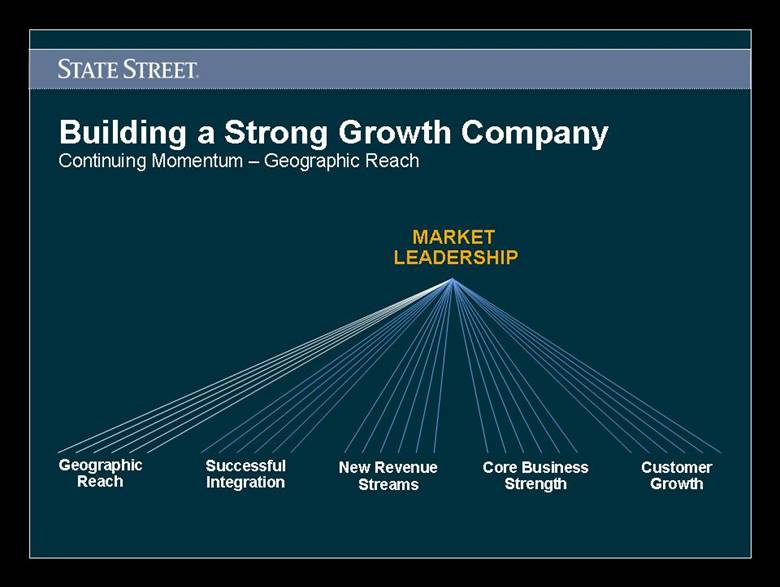
| Building a Strong Growth Company Continuing Momentum – Geographic Reach Geographic Reach LEADERSHIP MARKET Customer Growth New Revenue Streams Successful Integration Core Business Strength |
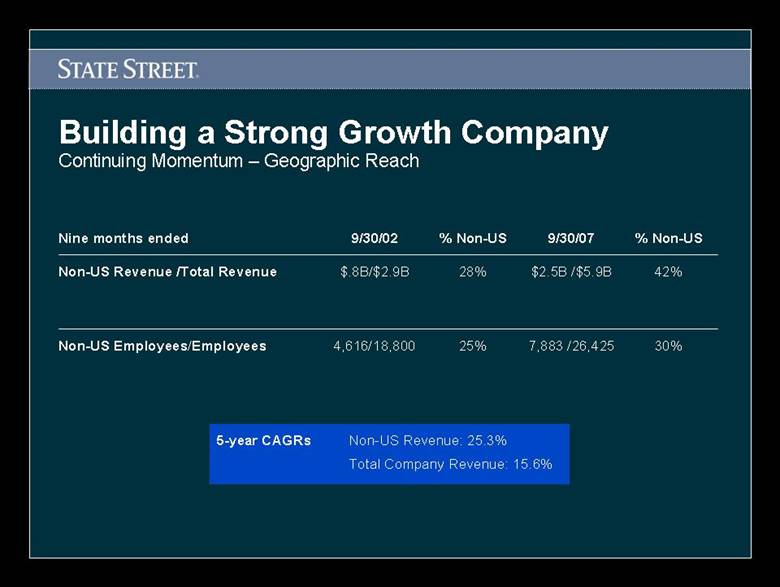
| 25% 28% % Non-US 30% 42% % Non-US 9/30/07 9/30/02 Nine months ended 4,616/18,800 $.8B/$2.9B 7,883 /26,425 Non-US Employees/Employees $2.5B /$5.9B Non-US Revenue /Total Revenue Building a Strong Growth Company Continuing Momentum – Geographic Reach Non-US Revenue: 25.3% Total Company Revenue: 15.6% 5-year CAGRs |
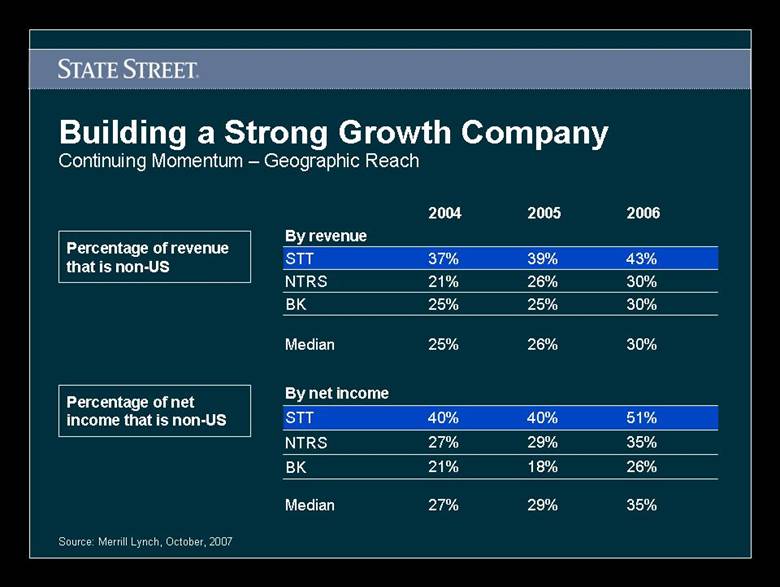
| Building a Strong Growth Company Continuing Momentum – Geographic Reach Source: Merrill Lynch, October, 2007 Percentage of revenue that is non-US 51% 40% 40% STT 43% 39% 37% STT By net income 18% 29% 26% 29% 35% 27% Median 26% 21% BK 35% 27% NTRS 30% 30% 30% 2006 2005 2004 25% 25% 21% Median 25% BK 26% NTRS By revenue Percentage of net income that is non-US |
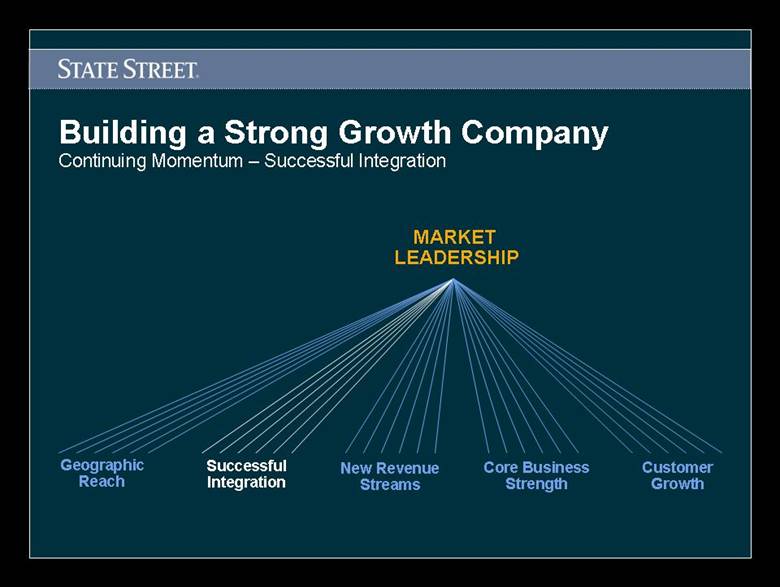
| Building a Strong Growth Company Continuing Momentum – Successful Integration Geographic Reach Customer Growth New Revenue Streams Successful Integration Core Business Strength LEADERSHIP MARKET |
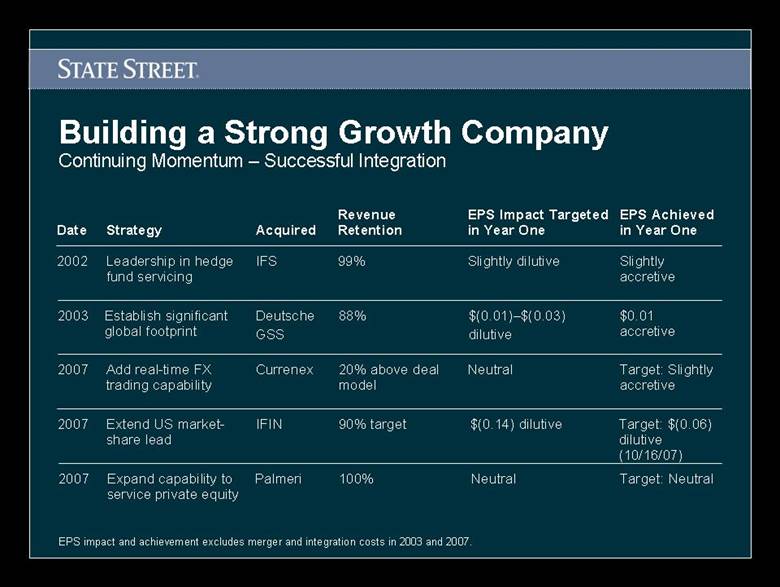
| Building a Strong Growth Company Continuing Momentum – Successful Integration EPS impact and achievement excludes merger and integration costs in 2003 and 2007. Leadership in hedge fund servicing Strategy Slightly accretive Slightly dilutive 99% IFS 2002 EPS Achieved in Year One EPS Impact Targeted in Year One Revenue Retention Acquired Date Establish significant global footprint $0.01 accretive $(0.01)–$(0.03) dilutive 88% Deutsche GSS 2003 Add real-time FX trading capability Target: Slightly accretive Neutral 20% above deal model Currenex 2007 Extend US market-share lead Target: $(0.06) dilutive (10/16/07) $(0.14) dilutive 90% target IFIN 2007 Expand capability to service private equity Neutral Target: Neutral 100% Palmeri 2007 |
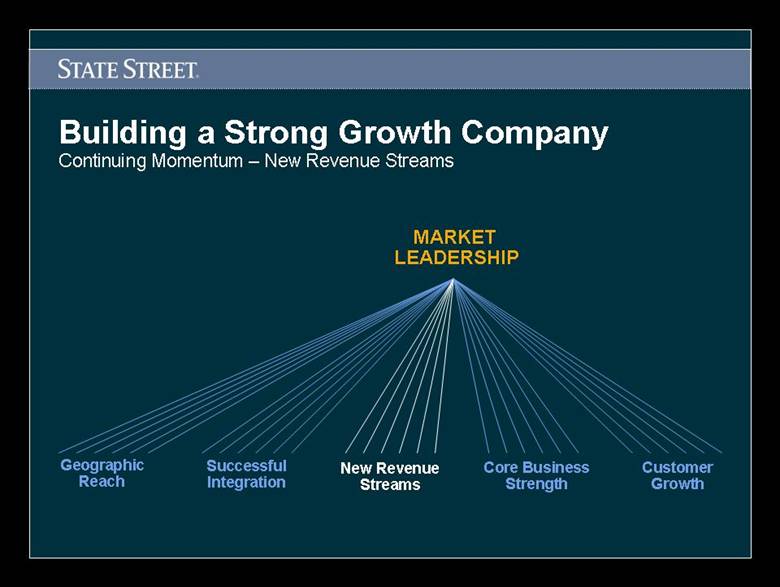
| Building a Strong Growth Company Continuing Momentum – New Revenue Streams Geographic Reach Customer Growth New Revenue Streams Successful Integration Core Business Strength LEADERSHIP MARKET |
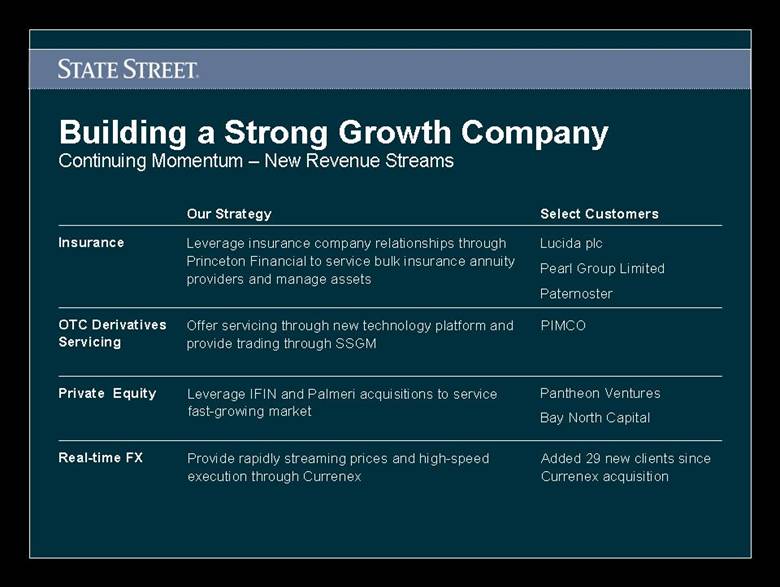
| OTC Derivatives Servicing PIMCO Offer servicing through new technology platform and provide trading through SSGM Building a Strong Growth Company Continuing Momentum – New Revenue Streams Insurance Lucida plc Pearl Group Limited Paternoster Leverage insurance company relationships through Princeton Financial to service bulk insurance annuity providers and manage assets Select Customers Our Strategy Real-time FX Added 29 new clients since Currenex acquisition Provide rapidly streaming prices and high-speed execution through Currenex Private Equity Pantheon Ventures Bay North Capital Leverage IFIN and Palmeri acquisitions to service fast-growing market |
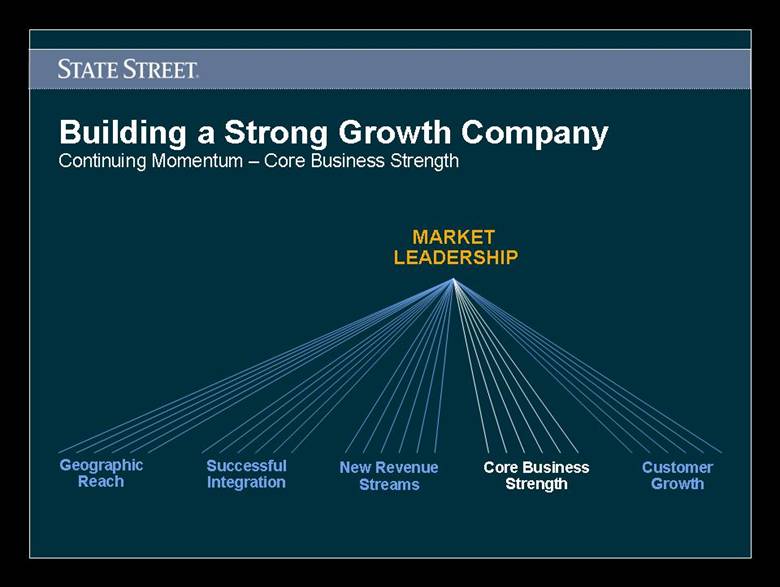
| Building a Strong Growth Company Continuing Momentum – Core Business Strength Geographic Reach Customer Growth New Revenue Streams Successful Integration Core Business Strength LEADERSHIP MARKET |
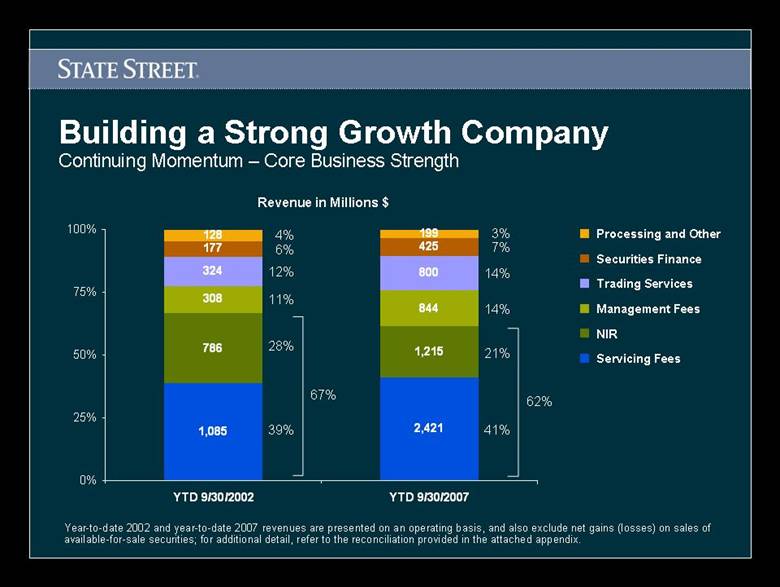
| Building a Strong Growth Company Continuing Momentum – Core Business Strength 28% 4% 6% 12% 11% 39% Year-to-date 2002 and year-to-date 2007 revenues are presented on an operating basis, and also exclude net gains (losses) on sales of available-for-sale securities; for additional detail, refer to the reconciliation provided in the attached appendix. Processing and Other Securities Finance Trading Services Management Fees Servicing Fees NIR Revenue in Millions $ 67% 21% 3% 7% 14% 14% 41% 62% 100% 75% 50% 25% 0% 128 177 3244 308 786 1,085 199 425 800 844 1,215 2,421 YTD 9/30/2002 YTD 9/30/2007 |
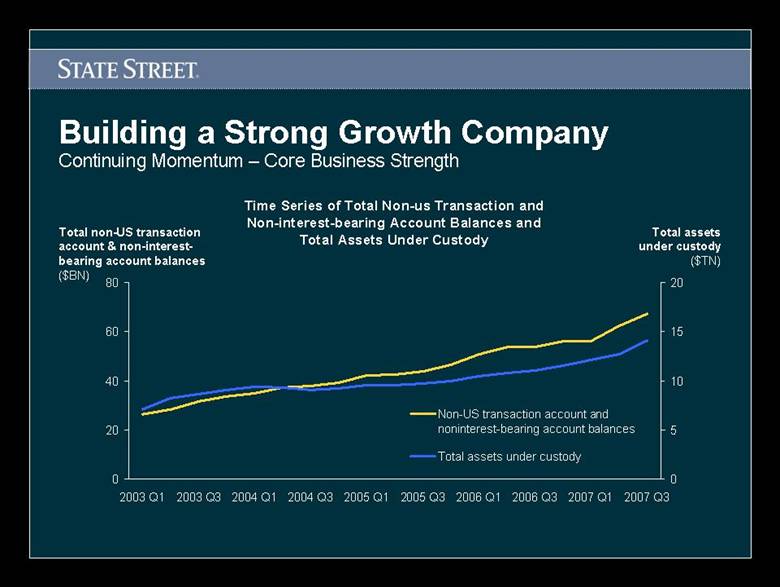
| Building a Strong Growth Company Continuing Momentum – Core Business Strength Total non-US transaction account & non-interest-bearing account balances ($BN) Time Series of Total Non-us Transaction and Non-interest-bearing Account Balances and Total Assets Under Custody Total assets under custody ($TN) 0 20 40 60 80 2003 Q1 2003 Q3 2004 Q1 2004 Q3 2005 Q1 2005 Q3 2006 Q1 2006 Q3 2007 Q1 2007 Q3 0 5 10 15 20 Non-US transaction account and noninterest-bearing account balances Total assets under custody |
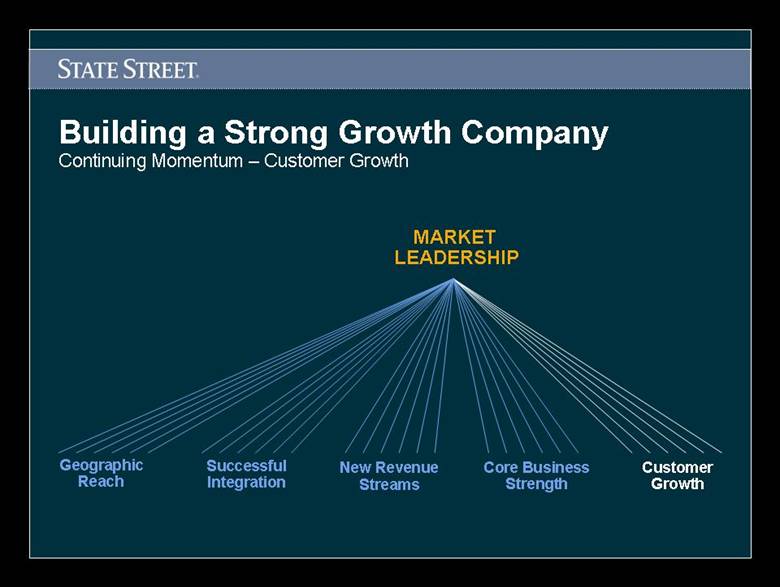
| Building a Strong Growth Company Continuing Momentum – Customer Growth Geographic Reach Customer Growth New Revenue Streams Successful Integration Core Business Strength LEADERSHIP MARKET |
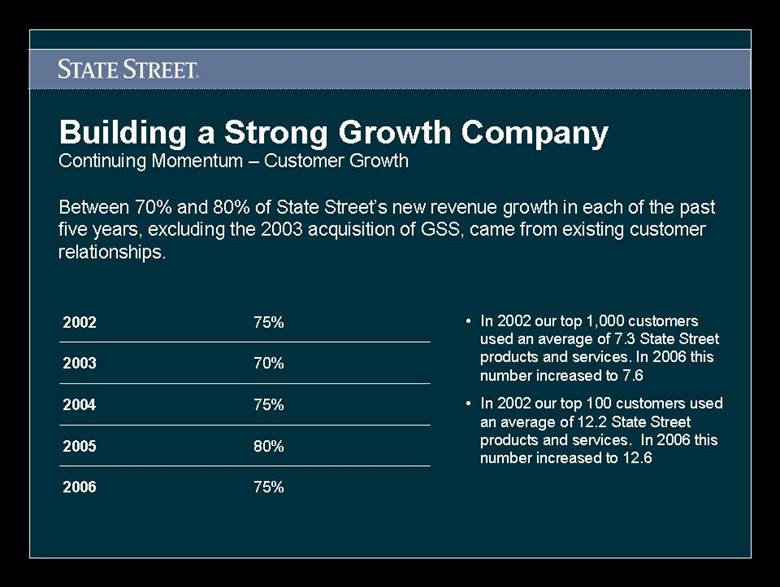
| Building a Strong Growth Company Continuing Momentum – Customer Growth Between 70% and 80% of State Street’s new revenue growth in each of the past five years, excluding the 2003 acquisition of GSS, came from existing customer relationships. 75% 80% 75% 70% 75% 2002 2006 2005 2004 2003 In 2002 our top 1,000 customers used an average of 7.3 State Street products and services. In 2006 this number increased to 7.6 In 2002 our top 100 customers used an average of 12.2 State Street products and services. In 2006 this number increased to 12.6 |
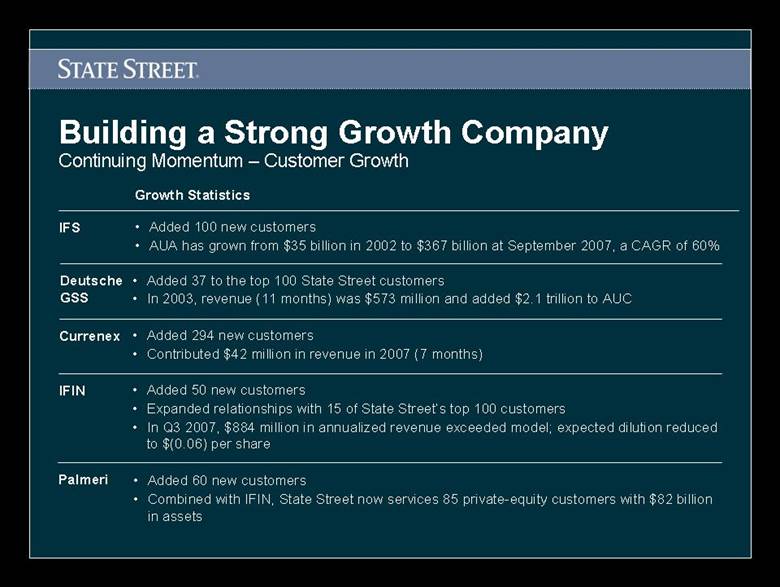
| Added 100 new customers AUA has grown from $35 billion in 2002 to $367 billion at September 2007, a CAGR of 60% IFS Growth Statistics Building a Strong Growth Company Continuing Momentum – Customer Growth Added 37 to the top 100 State Street customers In 2003, revenue (11 months) was $573 million and added $2.1 trillion to AUC Deutsche GSS Added 294 new customers Contributed $42 million in revenue in 2007 (7 months) Currenex Added 50 new customers Expanded relationships with 15 of State Street’s top 100 customers In Q3 2007, $884 million in annualized revenue exceeded model; expected dilution reduced to $(0.06) per share IFIN Added 60 new customers Combined with IFIN, State Street now services 85 private-equity customers with $82 billion in assets Palmeri |

| ACHIEVING GOALS |
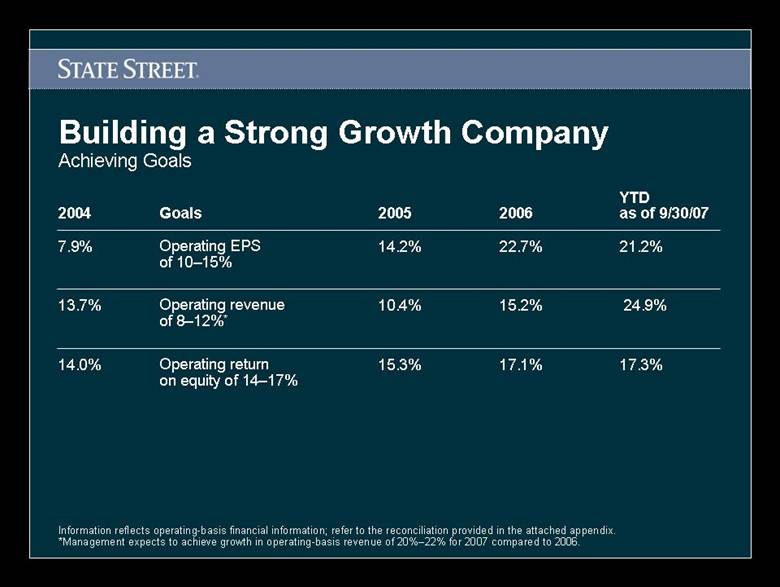
| Information reflects operating-basis financial information; refer to the reconciliation provided in the attached appendix. *Management expects to achieve growth in operating-basis revenue of 20%–22% for 2007 compared to 2006. Building a Strong Growth Company Achieving Goals 17.1% 15.2% 22.7% 2006 15.3% 10.4% 14.2% 2005 Operating return on equity of 14–17% Operating revenue of 8–12%* Operating EPS of 10–15% Goals 17.3% 14.0% 24.9% 13.7% 21.2% 7.9% YTD as of 9/30/07 2004 |
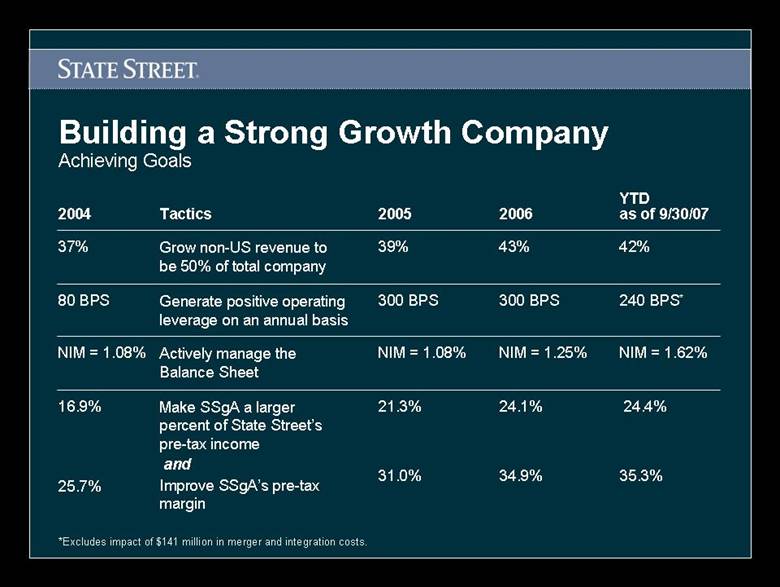
| Building a Strong Growth Company Achieving Goals 24.4% 35.3% 24.1% 34.9% 21.3% 31.0% Make SSgA a larger percent of State Street’s pre-tax income and Improve SSgA’s pre-tax margin 16.9% 25.7% NIM = 1.25% 300 BPS 43% 2006 NIM = 1.08% 300 BPS 39% 2005 Actively manage the Balance Sheet Generate positive operating leverage on an annual basis Grow non-US revenue to be 50% of total company Tactics NIM = 1.62% NIM = 1.08% 240 BPS* 80 BPS 42% 37% YTD as of 9/30/07 2004 *Excludes impact of $141 million in merger and integration costs. |
| EXTENDING MARKET LEADERSHIP |
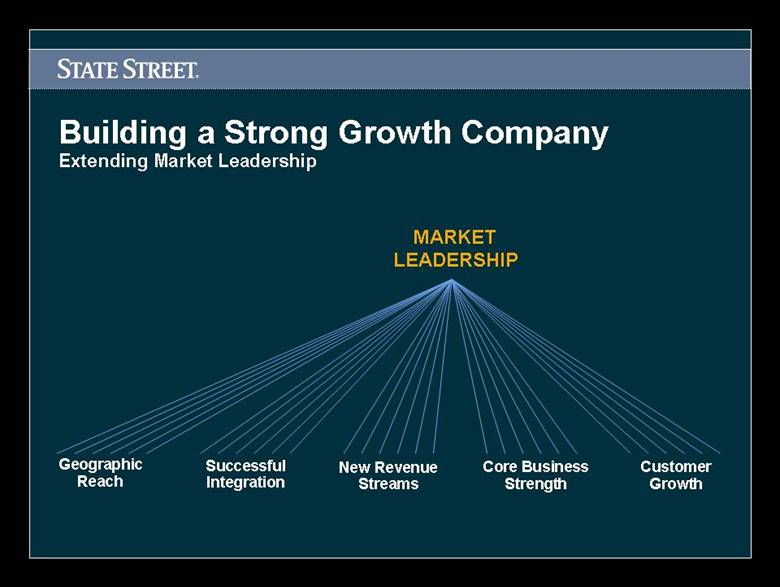
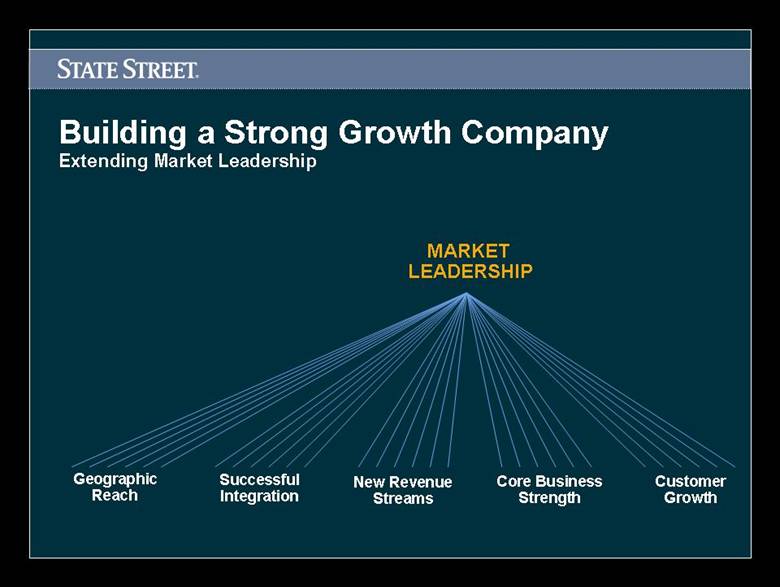
| Building a Strong Growth Company Extending Market Leadership MARKET LEADERSHIP Customer Growth New Revenue Streams Successful Integration Geographic Reach Core Business Strength |
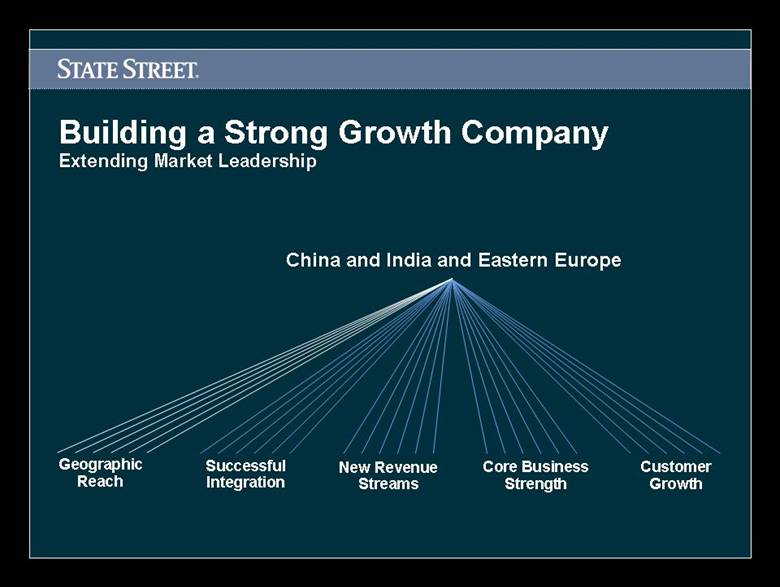
| Building a Strong Growth Company Extending Market Leadership China and India and Eastern Europe Geographic Reach Customer Growth New Revenue Streams Successful Integration Core Business Strength |
| Selective Acquisitions Building a Strong Growth Company Extending Market Leadership Customer Growth New Revenue Streams Successful Integration Geographic Reach Core Business Strength |
| Building a Strong Growth Company Extending Market Leadership New Revenue Streams Successful Integration Geographic Reach Derivatives, Insurance, Private Equity and Real-time FX Core Business Strength Customer Growth |
| Focus and Consistency Building a Strong Growth Company Extending Market Leadership Customer Growth Core Business Strength New Revenue Streams Successful Integration Geographic Reach |
| Building a Strong Growth Company Extending Market Leadership Customer Growth Core Business Strength New Revenue Streams Successful Integration Geographic Reach Continued Cross Sell |
| Building a Strong Growth Company Extending Market Leadership Customer Growth New Revenue Streams Successful Integration Geographic Reach Core Business Strength LEADERSHIP MARKET |

| APPENDIX |
STATE STREET CORPORATION
State Street presents supplemental financial information on an “operating” basis in order to provide financial information that is comparable from period to period, and to present comparable financial trends with respect to its ongoing business operations. Management believes that operating-basis financial information facilitates an investor’s understanding and analysis of State Street’s underlying performance and trends in addition to reported financial information, which is prepared in accordance with GAAP.
RECONCILIATION OF REPORTED RESULTS TO OPERATING-BASIS RESULTS
Nine Months Ended September 30, 2002 and Nine Months Ended September 30, 2007
| | Nine Months Ended September 30, 2002 | | Nine Months Ended September 30, 2007 | |
(Dollars in millions) | | Reported | | Adjustments | | Operating-
Basis | | % | | Reported | | Adjustments | | Operating-
Basis | | % | |
Fee Revenue: | | | | | | | | | | | | | | | | | |
Servicing fees | | $ | 1,143 | | $ | (58 | ) | $ | 1,085 | | 39% | | $ | 2,421 | | | | $ | 2,421 | | 41% | |
Management fees | | 369 | | (61 | ) | 308 | | 11% | | 844 | | | | 844 | | 14% | |
Trading services | | 324 | | — | | 324 | | 12% | | 800 | | | | 800 | | 14% | |
Securities finance | | 177 | | — | | 177 | | 6% | | 425 | | | | 425 | | 7% | |
Processing fees and other | | 131 | | (3 | ) | 128 | | 4% | | 199 | | | | 199 | | 3% | |
Total fee revenue | | 2,144 | | (122 | )(1) | 2,022 | | | | 4,689 | | | | 4,689 | | | |
| | | | | | | | | | | | | | | | | |
Net interest revenue | | 754 | | 32 | (2) | 786 | | 28% | | 1,174 | | $ | 41 | (4) | 1,215 | | 21% | |
| | | | | | | | | | | | | | | | | |
Other revenue | | 42 | | (42 | )(3) | — | | — | | (6 | ) | 6 | (5) | — | | — | |
| | | | | | | | | | | | | | | | | |
Total revenue | | $ | 2,940 | | $ | (132 | ) | $ | 2,808 | | 100% | | $ | 5,857 | | $ | 47 | | $ | 5,904 | | 100% | |
(1) Certain fee revenue has been adjusted to exclude results prior to the divestiture of the Private Asset Management and Corporate Trust businesses.
(2) Adjustment composed of taxable-equivalent adjustment of $46 million, not included in reported results, net of miscellaneous adjustments totaling $14 million.
(3) For purposes of this presentation, net gains from sales of available-for-sale securities and provision for loan loss have been excluded from total revenue.
(4) Taxable-equivalent adjustment not included in reported results.
(5) For purposes of this presentation, net losses from sales of available-for-sale securities have been excluded from total revenue.
STATE STREET CORPORATION
RECONCILIATION OF REPORTED RESULTS TO OPERATING-BASIS RESULTS
| | | | | | % Change | |
| | Year Ended December 31, 2003 | | Year Ended December 31, 2004 | | 2003 | |
| | Reported | | | | Operating | | Reported | | | | Operating | | vs | |
(Dollars in millions, except per share amounts) | | Results | | Adjustments | | Results | | Results | | Adjustments | | Results | | 2004 | |
Total fee revenue | | $ | 3,556 | | (47 | )(2) | $ | 3,509 | | $ | 4,048 | | — | | $ | 4,048 | | 15.4 | % |
Net interest revenue | | 810 | | 51 | (1) | 861 | | 859 | | 45 | (1) | 904 | | 5.0 | |
Provision for loan losses | | — | | — | | — | | (18 | ) | — | | (18 | ) | | |
Gains (Losses) on sales of available-for-sale investment securities, net | | 23 | | — | | 23 | | 26 | | — | | 26 | | | |
Gain on sale of Private Asset Management Business | | 285 | | (285 | ) | — | | — | | — | | — | | | |
Gain on sale of Corporate Trust Business | | 60 | | (60 | ) | — | | — | | — | | — | | | |
Total revenue | | 4,734 | | (341 | ) | 4,393 | | 4,951 | | 45 | | 4,996 | | 13.7 | |
| | | | | | | | | | | | | | | |
Total operating expenses | | 3,622 | | (443 | )(3) | 3,179 | | 3,759 | | (62 | )(4) | 3,697 | | 16.3 | |
Income from continuing operations before income taxes | | 1,112 | | 102 | | 1,214 | | 1,192 | | 107 | | 1,299 | | | |
Income tax expense from continuing operations | | 390 | | 5 | | 395 | | 394 | | 21 | | 415 | | | |
Taxable-equivalent adjustment | | — | | 51 | (1) | 51 | | — | | 45 | (1) | 45 | | | |
Income from continuing operations | | $ | 722 | | $ | 46 | | $ | 768 | | $ | 798 | | $ | 41 | | $ | 839 | | 9.2 | |
| | | | | | | | | | | | | | | |
Diluted earnings per share from continuing operations | | $ | 2.15 | | $ | .14 | | $ | 2.29 | | $ | 2.35 | | $ | .12 | | $ | 2.47 | | 7.9 | |
| | | | | | | | | | | | | | | |
Return on equity from continuing operations | | 13.9 | % | 0.9 | % | 14.8 | % | 13.3 | % | 0.7 | % | 14.0 | % | | |
Reported results reflect State Street’s Consolidated Statement of Income prepared in accordance with accounting principles generally accepted in the United States.
(1) Taxable-equivalent adjustment not included in reported results.
(2) Represents $60 million of fee revenue from Private Asset Management business prior to divestiture net of loss of $13 million on the sale of certain real estate.
(3) Represents merger and integration costs of $103 million related to the GSS acquisition, $37 million of expenses from Private Asset Management business prior to divestiture, $7 million of divestiture costs related to the sale of Private Asset Management business and $296 million of restructuring costs related to the voluntary separation program.
(4) Represents merger and integration costs of $62 million, or $41 million after-tax, recorded in connection with the Global Securities Services acquisition.
| | | | | | | | | | | | | | % Change | |
| | Year Ended December 31, 2004 | | Year Ended December 31, 2005 | | 2004 | |
| | Reported | | | | Operating | | Reported | | | | Operating | | vs | |
(Dollars in millions, except per share amounts) | | Results | | Adjustments | | Results | | Results | | Adjustments | | Results | | 2005 | |
Total fee revenue | | $ | 4,048 | | — | | $ | 4,048 | | $ | 4,551 | | — | | $ | 4,551 | | 12.4 | % |
Net interest revenue | | 859 | | 45 | (1) | 904 | | 907 | | 42 (1 | ) | 949 | | 5.0 | |
Provision for loan losses | | (18 | ) | — | | (18 | ) | — | | — | | — | | | |
Gains (Losses) on sales of available-for-sale investment securities, net | | 26 | | — | | 26 | | (1 | ) | — | | (1 | ) | | |
Gain on sale of Private Asset Management Business | | — | | — | | — | | 16 | | — | | 16 | | | |
Total revenue | | 4,951 | | 45 | | 4,996 | | 5,473 | | 42 | | 5,515 | | 10.4 | |
| | | | | | | | | | | | | | | |
Total operating expenses | | 3,759 | | (62 | )(2) | 3,697 | | 4,041 | | — | | 4,041 | | 9.3 | |
Income from continuing operations before income taxes | | 1,192 | | 107 | | 1,299 | | 1,432 | | 42 | | 1,474 | | | |
Income tax expense from continuing operations | | 394 | | 21 | | 415 | | 487 | | — | | 487 | | | |
Taxable-equivalent adjustment | | — | | 45 | (1) | 45 | | — | | 42 | (1) | 42 | | | |
Income from continuing operations | | $ | 798 | | $ | 41 | | $ | 839 | | $ | 945 | | $ | — | | $ | 945 | | 12.6 | |
| | | | | | | | | | | | | | | |
Diluted earnings per share from continuing operations | | $ | 2.35 | | $ | .12 | | $ | 2.47 | | $ | 2.82 | | $ | — | | $ | 2.82 | | 14.2 | |
| | | | | | | | | | | | | | | |
Return on equity from continuing operations | | 13.3 | % | 0.7 | % | 14.0 | % | 15.3 | % | — | | 15.3 | % | | |
Reported results reflect State Street’s Consolidated Statement of Income prepared in accordance with accounting principles generally accepted in the United States.
(1) Taxable-equivalent adjustment not included in reported results.
(2) Represents merger and integration costs of $62 million, or $41 million after-tax, recorded in connection with the Global Securities Services acquisition.
| | | | | | % Change | |
| | Year Ended December 31, 2005 | | Year Ended December 31, 2006 | | 2005 | |
| | Reported | | | | Operating | | Reported | | | | Operating | | vs | |
(Dollars in millions, except per share amounts) | | Results | | Adjustments | | Results | | Results | | Adjustments | | Results | | 2006 | |
Total fee revenue | | $ | 4,551 | | — | | $ | 4,551 | | $ | 5,186 | | — | | $ | 5,186 | | 14.0 | % |
Net interest revenue | | 907 | | 42 | (1) | 949 | | 1,110 | | 45 | (1) | 1,155 | | 21.7 | |
Gains (Losses) on sales of available-for-sale investment securities, net | | (1 | ) | — | | (1 | ) | 15 | | — | | 15 | | | |
Gain on sale of Private Asset Management Business | | 16 | | — | | 16 | | — | | — | | — | | | |
Total revenue | | 5,473 | | 42 | | 5,515 | | 6,311 | | 45 | | 6,356 | | 15.2 | |
| | | | | | | | | | | | | | | |
Total operating expenses | | 4,041 | | — | | 4,041 | | 4,540 | | — | | 4,540 | | 12.3 | |
Income from continuing operations before income taxes | | 1,432 | | 42 | | 1,474 | | 1,771 | | 45 | | 1,816 | | | |
Income tax expense from continuing operations | | 487 | | — | | 487 | | 675 | | (65 | )(2) | 610 | | | |
Taxable-equivalent adjustment | | — | | 42 | (1) | 42 | | — | | 45 | (1) | 45 | | | |
Income from continuing operations | | $ | 945 | | $ | — | | $ | 945 | | $ | 1,096 | | $ | 65 | | $ | 1,161 | | 22.9 | |
| | | | | | | | | | | | | | | |
Diluted earnings per share from continuing operations | | $ | 2.82 | | $ | — | | $ | 2.82 | | $ | 3.26 | | $ | .20 | | $ | 3.46 | | 22.7 | |
| | | | | | | | | | | | | | | |
Return on equity from continuing operations | | 15.3 | % | — | | 15.3 | % | 16.2 | % | 0.9 | % | 17.1 | % | | |
Reported results reflect State Street’s Consolidated Statement of Income prepared in accordance with accounting principles generally accepted in the United States.
(1) Taxable-equivalent adjustment not included in reported results.
(2) Represents $65 million of additional income tax expense primarily associated with tax legislation and leveraged leases.
| | | | | | % Change | |
| | Nine Months Ended September 30, 2006 | | Nine Months Ended September 30, 2007 | | 2006 | |
| | Reported | | | | Operating | | Reported | | | | Operating | | vs | |
(Dollars in millions, except per share amounts) | | Results | | Adjustments | | Results | | Results | | Adjustments | | Results | | 2007 | |
Total fee revenue | | $ | 3,881 | | — | | $ | 3,881 | | $ | 4,689 | | — | | $ | 4,689 | | 20.8 | % |
Net interest revenue | | 794 | | 33 | (1) | 827 | | 1,174 | | 41 | (1) | 1,215 | | 46.9 | |
Gains (Losses) on sales of available-for-sale investment securities, net | | 14 | | — | | 14 | | (6 | ) | — | | (6 | ) | | |
Total revenue | | 4,689 | | 33 | | 4,722 | | 5,857 | | 41 | | 5,898 | | 24.9 | |
| | | | | | | | | | | | | | | |
Total operating expenses | | 3,362 | | — | | 3,362 | | 4,260 | | (141 | )(3) | 4,119 | | 22.5 | |
Income from continuing operations before income taxes | | 1,327 | | 33 | | 1,360 | | 1,597 | | 182 | | 1,779 | | | |
Income tax expense from continuing operations | | 540 | | (83 | )(2) | 457 | | 559 | | 50 | | 609 | | | |
Taxable-equivalent adjustment | | — | | 33 | (1) | 33 | | — | | 41 | (1) | 41 | | | |
Income from continuing operations | | $ | 787 | | $ | 83 | | $ | 870 | | $ | 1,038 | | $ | 91 | | $ | 1,129 | | 29.8 | |
| | | | | | | | | | | | | | | |
Diluted earnings per share from continuing operations | | $ | 2.35 | | $ | .25 | | $ | 2.60 | | $ | 2.91 | | $ | .24 | | $ | 3.15 | | 21.2 | |
| | | | | | | | | | | | | | | |
Return on equity from continuing operations | | 16.0 | % | 1.7 | % | 17.7 | % | 15.9 | % | 1.4 | % | 17.3 | % | | |
Reported results reflect State Street’s Consolidated Statement of Income prepared in accordance with accounting principles generally accepted in the United States.
(1) Taxable-equivalent adjustment not included in reported results.
(2) Represents $83 million of additional income tax expense primarily associated with tax legislation and leveraged leases.
(3) Represents merger and integration costs of $141 million, or $91 million after-tax, recorded in connection with the Investors Financial acquisition, completed in July 2007.