During the third quarter of 2005, the FASB issued a proposed FSP for comment addressing accounting for changes in tax-related cash flows of leveraged leases. The FSP would require the recalculation of the allocation of income over the lease term when there is a change in the expected timing of tax-related cash flows of a leveraged lease. The proposed FSP, if finalized, will amend SFAS No. 13, “Accounting for Leases,” and will require companies to record any charge resulting from adoption of the FSP as the cumulative effect of a change in accounting principle. A final FSP is expected to be issued during the first quarter of 2006.
Depending on the requirements of the final FSP and the timing of its issuance and effective date, the FSP may require a material cumulative charge. Future income would be expected to increase over the remaining terms of the leases by an amount approximately equal to the charge.
During the third quarter of 2005, the FASB also issued for comment a proposed interpretation, “Accounting for Uncertain Tax Positions — an Interpretation of FASB SFAS No. 109,” which attempts to clarify the criteria for recognition of uncertain tax positions. Adoption of the proposed interpretation in its present form would be recorded as the cumulative effect of a change in accounting principle. A final interpretation is expected to be issued during the first quarter of 2006.
In the normal course of business, we structure and sell participating interests in pools of tax-exempt investment-grade assets to mutual fund customers. This is achieved by utilizing trusts that are set up as qualifying special purpose entities, or “QSPEs,” which are not subject to the requirements of FASB Interpretation No. 46-R, or “FIN 46-R,” and are not recorded in our consolidated statement of condition. Typically, we transfer assets to these unaffiliated QSPEs from our investment securities portfolio at fair market value, and treat such transfers as sales, recognizing a profit or loss on the transaction. The QSPEs finance the acquisition of these assets by selling participating interests to third-party investors. Typically, we purchase a minority residual interest in these QSPEs, and we provide investment management services, liquidity and remarketing services to them.
During the year ended December 31, 2005, State Street sold $1.82 billion of investment securities to these QSPEs, compared to $851 million during the year ended December 31, 2004. At December 31, 2005, we owned a minority residual interest in these QSPEs of less than 11%, or $270 million, compared to less than 9%, or $156 million, at December 31, 2004. These minority residual interests are accounted for and reported as securities available for sale. At December 31, 2005, the QSPEs had total assets of $2.50 billion, compared to $1.79 billion at December 31, 2004. The QSPEs had a weighted-average life of approximately 6.2 years at December 31, 2005, compared to approximately 5.4 years at December 31, 2004.
We administer four third-party owned, special purpose, multi-seller asset-backed commercial paper programs, or “conduits,” that purchase financial assets with various asset classifications from our third-party customers. These conduits, which are structured as bankruptcy-remote limited liability companies, provide access to the efficiencies of the U.S. commercial paper markets, which have historically offered an attractive cost of financing relative to bank-based borrowing. The conduits’ asset purchases are funded by issuing commercial paper, which is supported by liquidity asset purchase agreements and backup liquidity lines of credit, the majority of which are provided by us. In addition, we provide direct credit support to the conduits in the form of standby letters of credit. All fees are charged on a market basis. The sellers continue to service the transferred assets and absorb the first losses of the conduits by providing collateral in the form of excess assets also known as over-collaterization. Our off-balance sheet commitments to these conduits are disclosed in Note 9.
As a result of the issuance of FIN 46-R in December 2003, we applied an expected loss model to the conduits to determine the primary beneficiaries of conduits meeting the definition of variable interest entities. Variable interests factored into the model included basis risk, credit risk, interest-rate risk and fees paid to the administrator. We hold no equity ownership interest in these conduits. As a result of the model, we modified the conduits by selling certain fixed-rate assets and related interest-rate swaps, and issuing subordinated notes to outside investors. We concluded that we are not the primary beneficiary of these conduits, as defined in FIN 46-R, and as a result we do not record these conduits in our consolidated financial statements. At December 31, 2005 and 2004, total assets in unconsolidated conduits were $17.90 billion and $14.39 billion, respectively.
Collateralized Debt Obligations:
We manage a series of collateralized debt obligations, or “CDOs.” A CDO is a managed investment vehicle which purchases a portfolio of diversified highly rated assets. A CDO funds purchases through the issuance of several tranches of debt and equity, the repayment and return of which are linked to the performance of the assets in the CDO. Typically, our involvement is as collateral manager as well as an investor in a small percentage of the debt issued. These entities typically meet the definition of a variable interest entity as defined by FIN 46-R. We concluded that we are not the primary beneficiary of these CDOs, as defined in FIN 46-R, and as a result we do not record these CDOs in our consolidated financial statements. At December 31, 2005 and 2004, total assets in these CDOs were $2.73 billion and $2.40 billion, respectively.
During 2005 and 2004, we acquired and transferred $60 million and $604 million, respectively, of investment securities from our available-for-sale portfolio into a CDO. These transfers, which were executed at fair market value in exchange for cash, were treated as sales.
Note 11. Shareholders’ Equity
Treasury Stock:
Our Board of Directors, or “Board,” authorized a publicly announced stock purchase program for our common stock in 1995 for general corporate purposes, including employee benefit programs, and subsequently increased the authorization, most recently in 2001. Under the 1995 program, 2.9 million shares of our common stock were purchased during the first quarter of 2005. The 1995 stock purchase program was terminated by the Board effective February 17, 2005. In its place, the Board authorized a new publicly announced stock purchase program for 15 million shares of our common stock for general corporate purposes, including employee benefit programs. Under the 2005 program, 10.2 million shares of our common stock were purchased during 2005, and the remaining purchase authorization as of December 31, 2005, was 4.8 million shares. We utilize third-party broker-dealers to acquire common shares on the open market in our execution of the stock purchase program.
Additionally, shares may be acquired for other deferred compensation plans, held by an external trustee, that are not part of the stock purchase program. As of December 31, 2005, cumulative shares purchased and held in trust were 407,000. These shares are reflected as treasury stock in our consolidated statement of condition.
During 2005, 2004 and 2003, our total common stock purchased and recorded as treasury stock was 13,130,000 shares, 4,098,000 shares and 80,000 shares, respectively, at an average historical cost per share of $51, $43 and $34, respectively.
SPACESSM:
In January 2003, in connection with our acquisition of the GSS business of Deutsche Bank, we issued $345 million, or 1,725,000 units, of SPACES. SPACES were collateralized, forward-purchase contract units for additional shares of our common stock. Each of the SPACES had a stated amount of $200 and consisted of PACES, a fixed-share purchase contract and U.S. Treasury securities, and COVERS, a variable-share repurchase contract. The present value of the contract payments totaled $45 million and was treated as a cost of capital and charged to surplus upon issuance.
While the SPACES were outstanding, investors received total annual payments of 6.75% on the units, payable quarterly, consisting of an annual 4.00% contract payment on the COVERS, an annual .75% contract payment on the PACES and a 2.00% annual return on the underlying U.S. Treasury securities.
For the years ended December 31, 2004 and 2003, unrealized gains of approximately $3 million and $23 million, respectively were recorded in processing fees and other revenue related to changes in fair value of the variable-share contracts. Effective March 22, 2004, we exercised our right to fix the settlement rate of the variable-share repurchase contracts constituting parts of the SPACES or existing separately as COVERS, in accordance with the terms of the contracts. The variable-share settlement rate was fixed at .6949 shares per contract in accordance with a formula specified in the contracts. The impact of fixing the settlement rate for the SPACES and separate COVERS was a reclassification of the recognized gains on the mark-to-market of the variable-share contracts of $26 million from other assets to a reduction of surplus in shareholders’ equity.
On November 15, 2005, we issued approximately 8.7 million shares of common stock upon settlement of the fixed share purchase contracts underlying the SPACES units. On February 15, 2006, we received 1.2 million shares as settlement of the COVERS.
80 State Street Corporation
Accumulated Other Comprehensive (Loss) Income:
| | | |
2005
| | 2004
| | 2003
|
|---|
(Dollars in millions)
| | | |
|---|
| Foreign currency translation | | | | $ | 73 | | | $ | 213 | | | $ | 128 | |
| Unrealized gain (loss) on hedge of net foreign investment in subsidiaries | | | | | 11 | | | | (26 | ) | | | – | |
| Unrealized (loss) gain on available-for-sale securities | | | | | (285 | ) | | | (56 | ) | | | 74 | |
| Minimum pension liability | | | | | (26 | ) | | | (26 | ) | | | – | |
| Unrealized loss on cash flow hedges | | | | | (4 | ) | | | (13 | ) | | | (10 | ) |
| Total | | | | $ | (231 | ) | | $ | 92 | | | $ | 192 | |
| | | | | | | | | | | | | | | |
For the year ended December 31, 2005, we realized net losses of $1 million on sales of available-for-sale securities. Unrealized gains of $1 million were included in other comprehensive income at December 31, 2004, net of deferred taxes of less than $1 million, related to these sales.
For the year ended December 31, 2004, we realized net gains of $26 million. Unrealized gains of $11 million were included in other comprehensive income at December 31, 2003, net of deferred taxes of $7 million, related to these sales.
For the year ended December 31, 2003, we realized net gains of $23 million. Unrealized gains of $22 million were included in other comprehensive income at December 31, 2002, net of deferred taxes of $15 million, related to these sales.
Shareholders’ Rights Plan:
In 1988, we declared a dividend of one preferred share purchase right for each outstanding share of common stock. In 1998, the Rights Agreement was amended and restated. Accordingly, a right may be exercised, under certain conditions, to purchase one eight-hundredths share of a series of participating preferred stock at an exercise price of $132.50, subject to adjustment. The rights become exercisable if a party acquires or obtains the right to acquire 10% or more of our common stock or after commencement or public announcement of an offer for 10% or more of our common stock. When exercisable, under certain conditions, each right entitles the holder thereof to purchase shares of common stock, of either State Street or of the acquirer, having a market value of two times the then-current exercise price of that right.
The rights expire in September 2008, and may be redeemed at a price of $.00125 per right, subject to adjustment, at any time prior to expiration or the acquisition of 10% of our common stock. Under certain circumstances, the rights may be redeemed after they become exercisable and may be subject to automatic redemption.
Note 12. Equity-Based Compensation
We have a 1997 Equity Incentive Plan, or the “1997 Plan,” with 46,800,000 shares of common stock approved for issuance for stock and stock-based awards, including stock options, restricted stock, deferred stock and performance awards. Other award types are available under the plan, but are not currently utilized. All stock awards and stock options are awarded at the fair market value of our common stock at the date of grant. At December 31, 2005, 5,175,000 shares were available for future awards under the 1997 Plan. We have stock options outstanding from previous plans under which no further grants can be made.
Stock options expire no later than ten years from the date of grant, and the exercise price of non-qualified and incentive stock options may not be less than the fair value of such shares at the date of grant. Information on stock option activity is provided in the stock options table that follows.
We have a restricted stock program under the 1997 Plan whereby stock certificates are issued at the time of grant, and recipients have dividend and voting rights. In general, these grants vest over three years. Awards were 225,000, 196,000 and 138,000 shares for the years ended December 31, 2005, 2004 and 2003, respectively, with a weighted average fair value on grant date of $45.26, $51.39 and $43.82, respectively. At December 31, 2005, a total of 378,000 restricted shares have been awarded but have not vested under this program.
State Street Corporation 81
We currently have deferred stock award programs under the 1997 Plan whereby no stock is issued at the time of grant. These grants vest over various time periods. Awards were 3,202,000, 172,000 and 295,000 shares for the years ended December 31, 2005, 2004 and 2003, respectively, with a weighted-average fair value on grant date of $43.40, $50.28 and $42.66, respectively. At December 31, 2005, 3,203,000 awards were outstanding under these programs.
Performance awards granted under the 1997 Plan are earned over a performance period based on achievement of goals. Payment for performance awards is made in shares or cash equal to the fair market value of our common stock, based on certain financial ratios after the conclusion of each performance period. There are currently 531,000 award units outstanding for the two-year performance period ending December 31, 2006. There are 205,000 award units outstanding for the three-year performance period ending December 31, 2006. There are 257,000 award units outstanding for the three-year performance period ending December 31, 2007. A total of 290,000 awards were outstanding and paid out for the performance period ended December 31, 2005.
In June 2001, the Board approved a savings-related stock purchase plan for employees resident in the United Kingdom that is not part of the 1997 Plan. A total of 170,000 shares of common stock were approved for issuance under this plan. These awards vest in three to five years. There have not been any awards granted under this program since 2002. For the year ended December 31, 2002, 25,000 awards were granted. At December 31, 2005, 49,000 awards were outstanding under this program. During 2005, no shares were issued from treasury stock in accordance with plan provisions. Remaining shares, if any, would be issued from treasury stock in 2006 and 2007.
Compensation expense related to restricted stock awards, deferred stock awards, performance awards and stock options was $110 million, $74 million and $66 million for the years ended December 31, 2005, 2004 and 2003, respectively.
Options outstanding and related activity consisted of the following for the years indicated:
STOCK OPTIONS
| | | |
|---|
| | | | Option Price
Per Share
| | Weighted
Average
Option Price
| | Shares
|
|---|
(Shares in thousands)
| | | |
|---|
| December 31, 2002 | | | | $ | 1.75–60.74 | | | | $40.35 | | | | 26,314 | |
| Granted | | | | | 37.57–49.84 | | | | 46.20 | | | | 5,672 | |
| Exercised | | | | | 1.75–44.02 | | | | 26.76 | | | | (1,765 | ) |
| Canceled | | | | | 8.13–60.74 | | | | 48.39 | | | | (655 | ) |
| |
| December 31, 2003 | | | | | 1.75–60.74 | | | | 42.13 | | | | 29,566 | |
| Granted | | | | | 45.18–52.96 | | | | 52.44 | | | | 2,369 | |
| Exercised | | | | | 1.75–57.29 | | | | 24.29 | | | | (1,897 | ) |
| Canceled | | | | | 8.13–60.74 | | | | 48.64 | | | | (1,555 | ) |
| |
| December 31, 2004 | | | | | 5.61–60.74 | | | | 43.82 | | | | 28,483 | |
| Granted | | | | | 44.53–49.12 | | | | 44.73 | | | | 1,292 | |
| Exercised | | | | | 5.61–53.05 | | | | 35.49 | | | | (3,690 | ) |
| Canceled | | | | | 8.13–60.74 | | | | 49.97 | | | | (2,129 | ) |
| |
| December 31, 2005 | | | | | 5.61–60.74 | | | | 44.60 | | | | 23,956 | |
| | | | | | | | | | | | | | | |
82 State Street Corporation
The following table summarizes the weighted average remaining contractual life of stock options outstanding as of December 31, 2005:
RANGE OF EXERCISE PRICES
| | | |
|---|
| | | | Shares Outstanding
| | Shares Exercisable
|
|---|
| | | | Number of
Shares
Outstanding
| | Weighted
Average
Remaining
Contractual
Life
(years)
| | Weighted
Average
Exercise Price
| | Number of
Shares
Exercisable
| | Weighted
Average
Exercise Price
|
|---|
(Shares in thousands)
| | | |
|---|
| $5.61–28.16 | | | | | 821 | | | | 1.3 | | | $ | 23.24 | | | | 821 | | | $ | 23.24 | |
| 32.23–39.95 | | | | | 7,233 | | | | 5.5 | | | | 38.01 | | | | 6,948 | | | | 37.95 | |
| 40.22–49.81 | | | | | 9,448 | | | | 7.1 | | | | 45.02 | | | | 4,521 | | | | 44.33 | |
| 51.10–60.74 | | | | | 6,454 | | | | 6.0 | | | | 54.07 | | | | 4,612 | | | | 54.59 | |
| 5.61–60.74 | | | | | 23,956 | | | | 6.1 | | | | 44.60 | | | | 16,902 | | | | 43.48 | |
| | | | | | | | | | | | | | | | | | | | | | | |
At December 31, 2005, 2004 and 2003, a total of 16,902,000, 18,425,000 and 16,281,000 shares under options, respectively, were exercisable.
Note 13. Regulatory Matters
Regulatory Capital:
We are subject to various regulatory capital requirements administered by federal banking agencies. Failure to meet minimum capital requirements can initiate certain mandatory and discretionary actions by regulators that, if undertaken, could have a direct material effect on our financial condition. Under capital adequacy guidelines, we must meet specific capital guidelines that involve quantitative measures of our consolidated assets, liabilities and off-balance sheet items as calculated under regulatory accounting practices. Our capital amounts and classification are subject to qualitative judgments by the regulators about components, risk weightings and other factors.
Quantitative measures established by regulation to ensure capital adequacy require State Street and State Street Bank to maintain minimum risk-based capital and leverage ratios as set forth in the table that follows. The risk-based capital ratios are Tier 1 capital and total capital divided by total adjusted risk-weighted assets and market-risk equivalents, and the Tier 1 leverage ratio is Tier 1 capital divided by quarterly adjusted average assets. As of December 31, 2005 and 2004, State Street and State Street Bank met all capital adequacy requirements to which they were subject.
As of December 31, 2005, State Street Bank was categorized as “well capitalized” under the regulatory framework. To be categorized as “well capitalized,” State Street Bank must exceed the “well capitalized” guideline ratios, as set forth in the table, and meet certain other requirements. State Street Bank exceeded all “well capitalized” requirements as of December 31, 2005 and 2004.
State Street Corporation 83
The regulatory capital ratios and amounts were the following as of December 31:
| |
Regulatory Guidelines(1)
| | State Street
| | State Street Bank
|
|---|
| | Minimum
| | Well
Capitalized
| | 2005
| | 2004
| | 2005
| | 2004
|
|---|
(Dollars in millions)
| |
|---|
| Risk-Based Ratios: | | | | | | | | | | | | | | | | | | | | | | | | |
| Tier 1 capital | | | 4 | % | | | 6 | % | | | 11.7 | % | | | 13.3 | % | | | 10.3 | % | | | 11.6 | % |
| Total capital | | | 8 | | | | 10 | | | | 14.0 | | | | 14.7 | | | | 12.5 | | | | 12.5 | |
| Tier 1 leverage ratio | | | 4 | | | | 5 | | | | 5.6 | | | | 5.5 | | | | 5.4 | | | | 5.3 | |
| |
| Shareholders’ equity | | | | | | | | | | $ | 6,367 | | | $ | 6,159 | | | $ | 6,139 | | | $ | 6,262 | |
| Capital securities | | | | | | | | | | | 650 | | | | 995 | | | | – | | | | – | |
| Unrealized losses on available-for-sale securities | | | | | | | | | | | 285 | | | | 56 | | | | 292 | | | | 63 | |
| Unrealized losses (gains) on cash flow hedges | | | | | | | | | | | 4 | | | | 13 | | | | (10 | ) | | | (1 | ) |
| Qualifying minority interest in consolidated subsidiaries | | | | | | | | | | | 2 | | | | 3 | | | | 2 | | | | 3 | |
| Less: | | | | | | | | | | | | | | | | | | | | | | | | |
| Goodwill | | | | | | | | | | | 1,337 | | | | 1,497 | | | | 1,247 | | | | 1,408 | |
| Other intangible assets | | | | | | | | | | | 459 | | | | 494 | | | | 438 | | | | 492 | |
| Other deductions | | | | | | | | | | | 1 | | | | 2 | | | | – | | | | – | |
| Tier 1 capital | | | | | | | | | | | 5,511 | | | | 5,233 | | | | 4,738 | | | | 4,426 | |
| |
| Qualifying subordinated debt | | | | | | | | | | | 1,238 | | | | 698 | | | | 998 | | | | 399 | |
| Allowance for on- and off-balance sheet loan losses | | | | | | | | | | | 30 | | | | 30 | | | | 30 | | | | 30 | |
| Unrealized gains on available-for-sale equity securities | | | | | | | | | | | 12 | | | | 7 | | | | 6 | | | | 2 | |
| Tier 2 capital | | | | | | | | | | | 1,280 | | | | 735 | | | | 1,034 | | | | 431 | |
| Deduction for investments in finance subsidiaries | | | | | | | | | | | (174 | ) | | | (165 | ) | | | (52 | ) | | | (62 | ) |
| Total capital | | | | | | | | | | $ | 6,617 | | | $ | 5,803 | | | $ | 5,720 | | | $ | 4,795 | |
| Adjusted risk-weighted assets and market-risk equivalents: | | | | | | | | | | | | | | | | | | | | | | | | |
| On-balance sheet | | | | | | | | | | $ | 27,288 | | | $ | 22,714 | | | $ | 25,965 | | | $ | 21,560 | |
| Off-balance sheet | | | | | | | | | | | 19,586 | | | | 16,398 | | | | 19,602 | | | | 16,403 | |
| Market-risk equivalents | | | | | | | | | | | 361 | | | | 288 | | | | 351 | | | | 253 | |
| Total | | | | | | | | | | $ | 47,235 | | | $ | 39,400 | | | $ | 45,918 | | | $ | 38,216 | |
| Quarterly adjusted average assets | | | | | | | | | | $ | 98,970 | | | $ | 94,834 | | | $ | 87,667 | | | $ | 83,843 | |
| | | | | | | | | | | | | | | | | | | | | | | | | | |
| (1) | | State Street Bank must meet the regulatory designation of “well capitalized” in order to maintain our status as a financial holding company, including maintaining a minimum Tier 1 risk-based capital ratio (Tier 1 capital divided by total adjusted risk-weighted assets and market-risk equivalents) of 6%, a minimum total risk-based capital ratio (total capital divided by total adjusted risk-weighted assets and market-risk equivalents) of 10%, and a Tier 1 leverage ratio (Tier 1 capital divided by quarterly adjusted average assets) of 5%. In addition, Federal Reserve Regulation Y defines “well capitalized” for a bank holding company such as us for the purpose of determining eligibility for a streamlined review process for acquisition proposals. For such Regulation Y purposes, “well capitalized” requires us to maintain a minimum Tier 1 risk-based capital ratio of 6% and a minimum total risk-based capital ratio of 10%. |
84 State Street Corporation
Cash, Dividend, Loan and Other Restrictions:
During 2005, our subsidiary banks were required by the Federal Reserve Bank to maintain average cash reserve balances of $267 million. In addition, federal and state banking regulations place certain restrictions on dividends paid by subsidiary banks to a parent holding company. For 2006, aggregate dividends by State Street Bank without prior regulatory approval are limited to approximately $503 million of its undistributed earnings at December 31, 2005, plus an additional amount equal to its net profits, as defined, for 2006 up to the date of any dividend.
The Federal Reserve Act requires that extensions of credit by State Street Bank to certain affiliates, including the parent company, be secured by specific collateral, that the extension of credit to any one affiliate be limited to 10% of its capital and surplus (as defined), and that extensions of credit to all such affiliates be limited to 20% of its capital and surplus.
At December 31, 2005, consolidated retained earnings included $179 million representing undistributed earnings of affiliates that are accounted for using the equity method.
Note 14. Derivative Financial Instruments
We use derivatives to support customers’ needs, conduct trading activities, and manage our interest-rate and currency risk.
As part of our trading activities, we assume positions in both the foreign exchange and interest-rate markets by buying and selling cash instruments and using derivative financial instruments, including foreign exchange forward contracts, foreign exchange and interest-rate options, and interest-rate swaps. In the aggregate, long and short foreign exchange forward positions are matched closely to minimize currency and interest-rate risk. All foreign exchange contracts are valued daily at current market rates.
Interest-rate contracts involve an agreement with a counterparty to exchange cash flows based on the movement of an underlying interest-rate index. An interest-rate swap agreement involves the exchange of a series of interest payments, either at a fixed or variable rate, based upon the notional amount without the exchange of the underlying principal amount. An interest-rate option contract provides the purchaser, for a premium, the right, but not the obligation, to receive an interest rate based upon a predetermined notional value during a specified period. An interest-rate futures contract is a commitment to buy or sell, at a future date, a financial instrument at a contracted price; it may be settled in cash or through the delivery of the contracted instrument.
Foreign exchange contracts involve an agreement to exchange one currency for another currency at an agreed-upon rate and settlement date. Foreign exchange contracts consist of cross-currency swap agreements and foreign exchange forward and spot contracts.
The following table summarizes the contractual or notional amounts of derivative financial instruments held or issued for trading and asset and liability management as of December 31:
| | | |
2005
| | 2004
|
|---|
(Dollars in millions)
| | | |
|---|
| Trading: | | | | | | | | | | |
| Interest-rate contracts: | | | | | | | | | | |
| Swap agreements | | | | $ | 4,508 | | | $ | 1,450 | |
| Options and caps purchased | | | | | 912 | | | | 310 | |
| Options and caps written | | | | | 2,564 | | | | 1,464 | |
| Futures | | | | | 534 | | | | 1,767 | |
| Foreign exchange contracts: | | | | | | | | | | |
| Forward, swap and spot | | | | | 414,376 | | | | 364,357 | |
| Options purchased | | | | | 6,624 | | | | 3,298 | |
| Options written | | | | | 6,763 | | | | 3,214 | |
| Asset and Liability Management: | | | | | | | | | | |
| Interest-rate contracts: | | | | | | | | | | |
| Swap agreements | | | | | 5,369 | | | | 4,300 | |
| Foreign exchange contracts: | | | | | | | | | | |
| Swap agreements | | | | | 355 | | | | 407 | |
| | | | | | | | | | | |
State Street Corporation 85
In connection with our asset and liability management activities, we have executed interest-rate swap agreements designated as fair value and cash flow hedges to manage interest-rate risk. The notional values of these interest-rate swap agreements and the related assets or liabilities being hedged at December 31, were as follows:
| |
2005
| | 2004
|
|---|
| | Fair
Value
Hedges
| | Cash
Flow
Hedges
| | Total
| | Fair
Value
Hedges
| | Cash
Flow
Hedges
| | Total
|
|---|
(Dollars in millions)
| |
|---|
| Available-for-sale investment securities | | $ | 2,211 | | | | | | | $ | 2,211 | | | $ | 1,515 | | | | | | | $ | 1,515 | |
Interest-bearing time deposits(1) | | | 118 | | | $ | 1,490 | | | | 1,608 | | | | 245 | | | $ | 1,190 | | | | 1,435 | |
Long-term debt(2)(3) | | | 1,200 | | | | 350 | | | | 1,550 | | | | 1,200 | | | | 150 | | | | 1,350 | |
| Total | | $ | 3,529 | | | $ | 1,840 | | | $ | 5,369 | | | $ | 2,960 | | | $ | 1,340 | | | $ | 4,300 | |
| | | | | | | | | | | | | | | | | | | | | | | | | |
| (1) | | For the years ended December 31, 2005 and 2004, the overall weighted-average interest rate for interest-bearing time deposits was 3.23% and 1.38%, respectively, on a contractual basis, and 3.19% and 1.35%, respectively, including the effects of hedges. |
| (2) | | For the years ended December 31, 2005 and 2004, the fair value hedges of long-term debt increased the carrying value of long-term debt presented in our consolidated statement of condition by $18 million and $55 million, respectively. |
| (3) | | For the years ended December 31, 2005 and 2004, the overall weighted-average interest rate for long-term debt was 6.58% and 6.30%, respectively, on a contractual basis, and 5.63% and 4.36%, respectively, including the effects of hedges. |
For cash flow hedges, any changes in the fair value of the derivative financial instruments remain in accumulated other comprehensive income and are generally recorded in our statement of income in future periods when earnings are affected by the variability of the hedged cash flow. At December 31, 2005, the after-tax unrealized gain on cash flow hedges of time deposits was $10 million, almost all of which is expected to be reclassified from accumulated other comprehensive (loss) income to earnings during the next 12 months due to the short maturities of the derivative financial instruments and the time deposits being hedged. The after-tax unrealized loss on cash flow hedges of long-term debt was $14 million, and we expect to reclassify a gain of $1 million from accumulated other comprehensive (loss) income to earnings during the next 12 months. These derivative financial instruments and the hedged long-term debt extend to the year 2018. Ineffectiveness recorded in processing fees and other revenue was not material in 2005, 2004 or 2003.
We have entered into foreign exchange forward contracts with an aggregate notional amount of €300 million, or approximately $355 million, to hedge a portion of our net foreign investment in non-U.S. subsidiaries. As a result, approximately $37 million of after-tax translation gains and $26 million of after-tax translation losses for the years ended December 31, 2005 and 2004, respectively, on the hedge contracts were included within accumulated other comprehensive (loss) income.
Foreign exchange trading revenue related to foreign exchange contracts was $468 million, $420 million and $330 million for the years ended December 31, 2005, 2004 and 2003, respectively. In 2003, we also recorded $61 million from Deutsche Bank as foreign exchange trading revenue. For other financial instrument contracts, there were gains of $4 million in 2005, and losses of $25 million in 2004 and $31 million in 2003 recorded in trading services revenue. Future cash requirements, if any, related to foreign exchange contracts are represented by the gross amount of currencies to be exchanged under each contract unless we and the counterparty have agreed to pay or receive the net contractual settlement amount on the settlement date. Future cash requirements on other financial instruments are limited to the net amounts payable under the agreements.
86 State Street Corporation
Note 15. Net Interest Revenue
| | | |
2005
| | 2004
| | 2003
|
|---|
(Dollars in millions)
| | | |
|---|
| Interest Revenue: | | | | | | | | | | | | | | |
| Deposits with banks | | | | $ | 529 | | | $ | 591 | | | $ | 474 | |
| Investment securities: | | | | | | | | | | | | | | |
| U.S. Treasury and federal agencies | | | | | 866 | | | | 536 | | | | 409 | |
| State and political subdivisions (exempt from federal tax) | | | | | 58 | | | | 57 | | | | 62 | |
| Other investments | | | | | 873 | | | | 277 | | | | 259 | |
| Securities purchased under resale agreements and federal funds sold | | | | | 412 | | | | 196 | | | | 168 | |
| Commercial and financial loans | | | | | 106 | | | | 59 | | | | 61 | |
| Lease financing | | | | | 65 | | | | 57 | | | | 87 | |
| Trading account assets | | | | | 21 | | | | 14 | | | | 19 | |
| Total interest revenue | | | | | 2,930 | | | | 1,787 | | | | 1,539 | |
| Interest Expense: | | | | | | | | | | | | | | |
| Deposits | | | | | 1,132 | | | | 512 | | | | 372 | |
| Other short-term borrowings | | | | | 753 | | | | 315 | | | | 279 | |
| Long-term debt | | | | | 138 | | | | 101 | | | | 78 | |
| Total interest expense | | | | | 2,023 | | | | 928 | | | | 729 | |
| Net interest revenue | | | | $ | 907 | | | $ | 859 | | | $ | 810 | |
| | | | | | | | | | | | | | | |
Note 16. Processing Fees and Other Revenue
Sources of processing fees and other revenue include structured products fees, fees from software licensing and maintenance, loan fees, profits and losses from unconsolidated affiliates, gains and losses on sales of leased equipment and other assets, amortization of investments in tax-advantaged financings, and interests from variable interest entities not recorded in our consolidated financial statements and, for 2003, unrealized gains on SPACES and other-than-temporary impairment losses on investment securities.
In addition, processing fees and other revenue included payments received from Deutsche Bank representing amounts earned on customer deposits of the GSS business that were not yet converted to our systems. For the years ended December 31, 2005, 2004 and 2003, these payments were $17 million, $47 million and $95 million, respectively. Once converted, GSS deposits are recorded as deposits in our consolidated statement of condition, and the related earnings on those deposits are recorded in net interest revenue.
State Street Corporation 87
Note 17. Employee Benefits
State Street Bank and certain of its U.S. subsidiaries participate in a non-contributory, tax-qualified defined benefit pension plan. In addition to this primary plan, we have non-qualified unfunded supplemental retirement plans, or “SERPs,” that provide certain officers with defined pension benefits in excess of allowable qualified plan limits. Non-U.S. employees participate in local defined benefit plans.
State Street Bank and certain of its U.S. subsidiaries participate in a post-retirement plan that provides health care and insurance benefits for retired employees.
Information combined for the U.S. and non-U.S. defined benefit plans, and information for the post-retirement plan as of the December 31 measurement date is as follows:
| |
Primary U.S. and Non-U.S.
Defined Benefit Plans
| | Post-Retirement Plan
|
|---|
| | 2005
| | 2004
| | 2005
| | 2004
|
|---|
(Dollars in millions)
| |
|---|
| Benefit Obligations: | | | | | | | | | | | | | | | | |
| Beginning of year | | $ | 650 | | | $ | 587 | | | $ | 72 | | | $ | 65 | |
| Service cost | | | 50 | | | | 41 | | | | 4 | | | | 3 | |
| Interest cost | | | 35 | | | | 32 | | | | 4 | | | | 4 | |
| Transfers in | | | 27 | | | | – | | | | – | | | | – | |
| Actuarial losses | | | 62 | | | | 21 | | | | 4 | | | | 4 | |
| Benefits paid | | | (45 | ) | | | (44 | ) | | | (5 | ) | | | (4 | ) |
| Expenses paid | | | (2 | ) | | | – | | | | – | | | | – | |
| Special termination benefits | | | 1 | | | | – | | | | – | | | | – | |
| Foreign currency translation | | | (19 | ) | | | 13 | | | | – | | | | – | |
| End of year | | $ | 759 | | | $ | 650 | | | $ | 79 | | | $ | 72 | |
| Plan Assets at Fair Value: | | | | | | | | | | | | | | | | |
| Beginning of year | | $ | 592 | | | $ | 512 | | | | | | | | | |
| Actual return on plan assets | | | 63 | | | | 59 | | | | | | | | | |
| Employer contributions | | | 98 | | | | 57 | | | | | | | | | |
| Transfers in | | | 13 | | | | – | | | | | | | | | |
| Benefits paid | | | (45 | ) | | | (44 | ) | | | | | | | | |
| Expenses paid | | | (2 | ) | | | – | | | | | | | | | |
| Foreign currency translation | | | (13 | ) | | | 8 | | | | | | | | | |
| End of year | | $ | 706 | | | $ | 592 | | | | | | | | | |
| Accrued Benefit Expense: | | | | | | | | | | | | | | | | |
| Underfunded status of the plans — liability | | $ | 53 | | | $ | 58 | | | $ | 79 | | | $ | 72 | |
| Unrecognized net asset (obligation) at transition | | | – | | | | 1 | | | | (6 | ) | | | (7 | ) |
| Unrecognized net losses | | | (263 | ) | | | (241 | ) | | | (22 | ) | | | (18 | ) |
| Unrecognized prior service benefits (costs) | | | 23 | | | | 25 | | | | – | | | | – | |
| Net (prepaid) accrued benefit expense | | $ | (187 | ) | | $ | (157 | ) | | $ | 51 | | | $ | 47 | |
| | | | | | | | | | | | | | | | | |
88 State Street Corporation
| |
Primary U.S. and Non-U.S.
Defined Benefit Plans
| | Post-Retirement Plan
|
|---|
| | 2005
| | 2004
| | 2005
| | 2004
|
|---|
(Dollars in millions)
| |
|---|
| Amounts Recognized in the Consolidated Statement of Condition: | | | | | | | | | | | | | | | | |
| As of December 31: | | | | | | | | | | | | | | | | |
| Prepaid benefit cost | | $ | (183 | ) | | $ | (170 | ) | | | | | | | | |
| Accrued benefit cost | | | 26 | | | | 45 | | | $ | 51 | | | $ | 47 | |
| Intangible assets | | | – | | | | (1 | ) | | | – | | | | – | |
| Other | | | (30 | ) | | | (31 | ) | | | – | | | | – | |
| Net (prepaid) accrued benefit expense | | $ | (187 | ) | | $ | (157 | ) | | $ | 51 | | | $ | 47 | |
| Decrease in minimum liability | | $ | – | | | $ | (2 | ) | | $ | – | | | $ | – | |
| |
| Actuarial Assumptions (U.S. Plans): | | | | | | | | | | | | | | | | |
| Used to determine benefit obligations as of December 31: | | | | | | | | | | | | | | | | |
| Discount rate | | | 5.50 | % | | | 5.75 | % | | | 5.50 | % | | | 5.75 | % |
| Rate of increase for future compensation | | | 4.50 | | | | 4.50 | | | | – | | | | – | |
| Used to determine periodic benefit cost for the years ended December 31: | | | | | | | | | | | | | | | | |
| Discount rate | | | 5.75 | % | | | 6.00 | % | | | 5.75 | % | | | 6.00 | % |
| Rate of increase for future compensation | | | 4.50 | | | | 4.50 | | | | – | | | | – | |
| Expected long-term rate of return on plan assets | | | 8.00 | | | | 8.00 | | | | – | | | | – | |
| Assumed health care cost trend rates as of December 31: | | | | | | | | | | | | | | | | |
| Cost trend rate assumed for next year | | | – | | | | – | | | | 11.00 | % | | | 12.00 | % |
| Rate to which the cost trend rate is assumed to decline | | | – | | | | – | | | | 5.00 | | | | 5.00 | |
| Year that the rate reaches the ultimate trend rate | | | – | | | | – | | | | 2013 | | | | 2013 | |
| | | | | | | | | | | | | | | | | |
The expected benefit payments for the next ten years are as follows:
| | | |
Primary U.S. and
Non-U.S. Defined
Benefit Plans
| | Non-Qualified
SERPs
| | Post-Retirement
Plan
|
|---|
(Dollars in millions)
| | | |
|---|
| 2006 | | | | $ | 46 | | | $ | 7 | | | $ | 6 | |
| 2007 | | | | | 38 | | | | 7 | | | | 5 | |
| 2008 | | | | | 27 | | | | 5 | | | | 5 | |
| 2009 | | | | | 24 | | | | 4 | | | | 4 | |
| 2010 | | | | | 22 | | | | 5 | | | | 4 | |
| 2011–2015 | | | | | 131 | | | | 31 | | | | 15 | |
| | | | | | | | | | | | | | | |
The accumulated benefit obligation for all of our U.S. defined benefit pension plans was $581 million and $522 million at December 31, 2005, and 2004, respectively.
To develop the expected long-term, rate-of-return-on-assets assumption, we considered the historical returns and the future expectations for returns for each asset class, as well as the target asset allocation of the pension portfolio. This analysis resulted in the selection of 8.00% as the long-term rate of return on assets assumption.
State Street Corporation 89
For the tax-qualified U.S. defined benefit pension plan, the asset allocation as of December 31, 2005 and 2004, and the strategic target allocation for 2006, by asset category, were as follows:
ASSET CATEGORY
| | | |
|---|
| | | | Strategic Target
Allocation
| | Percentage of Plan
Assets at December 31,
|
|---|
| | | | 2006
| | 2005
| | 2004
|
|---|
| Equity securities | | | | | 55 | % | | | 59 | % | | | 59 | % |
| Fixed income securities | | | | | 30 | | | | 29 | | | | 30 | |
| Other | | | | | 15 | | | | 12 | | | | 11 | |
| Total | | | | | 100 | % | | | 100 | % | | | 100 | % |
| | | | | | | | | | | | | | | |
The preceding strategic target asset allocation was last amended in May 1999. Consistent with that target allocation, the plan should generate a real return above inflation and superior to that of a benchmark index consisting of a combination of appropriate capital markets indices weighted in the same proportions as the plan’s strategic target asset allocation. Equities included domestic and international publicly-traded common, preferred and convertible securities. Fixed income securities included domestic and international corporate and government debt securities, as well as asset-backed securities and private debt. The “other” category included real estate, alternative investments and cash and cash equivalents. Derivative financial instruments are an acceptable alternative to investing in these types of securities, but may not be used to leverage the plan’s portfolio.
Expected employer contributions to the tax-qualified U.S. defined benefit pension plan, SERPs and post-retirement plan for the year ending December 31, 2006 are $59 million, $7 million and $6 million, respectively.
90 State Street Corporation
We have unfunded SERPs that provide certain officers with defined pension benefits in excess of qualified plan limits imposed by U.S. federal tax law. Information for the SERPs as of and for the years ended December 31, was as follows:
| | | |
Non-Qualified SERPs
|
|---|
| | | | 2005
| | 2004
|
|---|
(Dollars in millions)
| | | |
|---|
| Benefit Obligations: | | | | | | | | | | |
| Beginning of year | | | | $ | 99 | | | $ | 91 | |
| Service cost | | | | | 4 | | | | 5 | |
| Interest cost | | | | | 5 | | | | 6 | |
| Actuarial loss | | | | | 11 | | | | 7 | |
| Benefits paid | | | | | (8 | ) | | | (10 | ) |
| Settlements | | | | | (8 | ) | | | (9 | ) |
| Amendments | | | | | 4 | | | | 9 | |
| End of year | | | | $ | 107 | | | $ | 99 | |
| Accrued Benefit Expense: | | | | | | | | | | |
| Underfunded status of the plans | | | | $ | 107 | | | $ | 99 | |
| Unrecognized net loss | | | | | (39 | ) | | | (33 | ) |
| Unrecognized prior service cost | | | | | (17 | ) | | | (14 | ) |
| Net accrued benefit expense | | | | $ | 51 | | | $ | 52 | |
| Amounts Recognized in the Consolidated Statement of Condition: | | | | | | | | | | |
| Accrued benefit cost | | | | $ | 78 | | | $ | 71 | |
| Intangible assets | | | | | (20 | ) | | | (16 | ) |
| Other | | | | | (7 | ) | | | (3 | ) |
| Net accrued benefit expense | | | | $ | 51 | | | $ | 52 | |
| |
| Decrease in minimum liability | | | | $ | (5 | ) | | $ | (2 | ) |
| Accumulated benefit obligation | | | | $ | 78 | | | $ | 71 | |
| |
| Actuarial assumptions used to determine benefit obligations and periodic benefit costs are consistent with those noted for the post-retirement plan, with the following exception: | | | | | | | | | | |
| Rate of increase for future compensation | | | | | 4.75 | % | | | 4.75 | % |
| | | | | | | | | | | |
For those defined benefit plans that had accumulated benefit obligations in excess of plan assets as of December 31, 2005 and 2004, the accumulated benefit obligations were $262 million and $208 million, respectively, and the plan assets were $163 million and $95 million, respectively.
For those defined benefit plans that have projected benefit obligations in excess of plan assets as of December 31, 2005 and 2004, the projected benefit obligations were $866 million and $749 million, respectively, and the plan assets were $706 million and $592 million, respectively.
If the health care cost trend rates were increased by 1%, the post-retirement benefit obligation as of December 31, 2005, would have increased 8%, and the aggregate expense for service and interest costs for 2005 would have increased 15%. Conversely, if the health care cost trend rates were decreased by 1%, the post-retirement benefit obligation as of December 31, 2005, would have decreased 7%, and the aggregate expense for service and interest costs for 2005 would have decreased 13%.
State Street Corporation 91
The following table presents the actuarially determined expense (income) for our U.S. and non-U.S. defined benefit plans, SERPs and post-retirement plan for the years ended December 31:
| |
Primary U.S. and Non-U.S.
Defined Benefit Plans
| | Post-Retirement Plan
|
|---|
| | 2005
| | 2004
| | 2003
| | 2005
| | 2004
| | 2003
|
|---|
(Dollars in millions)
| |
|---|
| Components of Net Periodic Benefit Cost: | | | | | | | | | | | | | | | | | | | | | | | | |
| Service cost | | $ | 50 | | | $ | 41 | | | $ | 39 | | | $ | 3 | | | $ | 3 | | | $ | 3 | |
| Interest cost | | | 35 | | | | 32 | | | | 30 | | | | 4 | | | | 4 | | | | 3 | |
| Assumed return on plan assets | | | (45 | ) | | | (40 | ) | | | (35 | ) | | | – | | | | – | | | | – | |
| Amortization of transition obligation (asset) | | | – | | | | (1 | ) | | | (2 | ) | | | 1 | | | | 1 | | | | 1 | |
| Amortization of prior service cost | | | (2 | ) | | | (2 | ) | | | – | | | | – | | | | – | | | | – | |
| Amortization of net loss (gain) | | | 15 | | | | 16 | | | | 12 | | | | 1 | | | | 1 | | | | 1 | |
| Net periodic benefit cost | | | 53 | | | | 46 | | | | 44 | | | | 9 | | | | 9 | | | | 8 | |
| Special Events Accounting Expense: | | | | | | | | | | | | | | | | | | | | | | | | |
| Curtailments | | | – | | | | – | | | | 3 | | | | – | | | | – | | | | 7 | |
| Special termination benefits | | | 1 | | | | – | | | | 51 | | | | – | | | | – | | | | 6 | |
| Special events accounting expense | | | 1 | | | | – | | | | 54 | | | | – | | | | – | | | | 13 | |
| Total expense | | $ | 54 | | | $ | 46 | | | $ | 98 | | | $ | 9 | | | $ | 9 | | | $ | 21 | |
| | | | | | | | | | | | | | | | | | | | | | | | | |
| | | |
Non-Qualified SERPs
|
|---|
| | | | 2005
| | 2004
| | 2003
|
|---|
(Dollars in millions)
| | | |
|---|
| Components of Net Periodic Benefit Cost: | | | | | | | | | | | | | | |
| Service cost | | | | $ | 4 | | | $ | 5 | | | $ | 4 | |
| Interest cost | | | | | 5 | | | | 6 | | | | 5 | |
| Amortization of prior service cost | | | | | 2 | | | | 1 | | | | 2 | |
| Amortization of net loss | | | | | 2 | | | | 2 | | | | 2 | |
| Net periodic benefit cost | | | | | 13 | | | | 14 | | | | 13 | |
| |
| Special Events Accounting Expense: | | | | | | | | | | | | | | |
| Settlements | | | | | 2 | | | | 1 | | | | 1 | |
| Curtailments | | | | | – | | | | – | | | | 2 | |
| Special termination benefits | | | | | – | | | | – | | | | 23 | |
| Special events accounting expense | | | | | 2 | | | | 1 | | | | 26 | |
| Total expense | | | | $ | 15 | | | $ | 15 | | | $ | 39 | |
| | | | | | | | | | | | | | | |
In connection with our voluntary separation program (see Note 19), we recorded severance expense of approximately $80 million during the year ended December 31, 2003, for enhanced pension benefits.
Certain of our U.S. employees are eligible to contribute a portion of their pre-tax salary to a 401(k) savings plan and an Employee Stock Ownership Plan, or “ESOP.” Our matching portion of these contributions is made in cash, and the related expense was $21 million for 2005, $16 million for 2004 and $22 million for 2003. In addition, employees in certain non-U.S. offices participate in other local plans. Expenses related to these plans were $39 million, $31 million and $25 million for 2005, 2004 and 2003, respectively.
The ESOP is a non-leveraged plan. Compensation cost is equal to the contribution called for by the plan formula and is equal to the cash contributed for the purchase of shares on the open market or the fair value of the shares contributed from treasury stock. Dividends on shares held by the ESOP are charged to retained earnings and shares are treated as outstanding for purposes of calculating earnings per share.
92 State Street Corporation
Note 18. Occupancy Expense and Information Systems and Communications Expense
Occupancy expense and information systems and communications expense included expense for depreciation of buildings, leasehold improvements, computers, equipment and furniture and fixtures. Total depreciation expense for the years ended December 31, 2005, 2004 and 2003 were $315 million, $301 million and $274 million, respectively.
As of December 31, 2005, accumulated amortization of assets under capital leases was $57 million. Amortization of assets recorded under capital leases and the costs of operating leases for office space are recorded in occupancy expense. The costs of operating leases related to computers and equipment are recorded in information systems and communications expense. The following is a summary of future minimum lease payments under non-cancelable capital and operating leases as of December 31, 2005:
| | | |
Capital
Leases
| | Operating
Leases
| | Total
|
|---|
(Dollars in millions)
| | | |
|---|
| 2006 | | | | $ | 51 | | | $ | 180 | | | $ | 231 | |
| 2007 | | | | | 51 | | | | 157 | | | | 208 | |
| 2008 | | | | | 52 | | | | 135 | | | | 187 | |
| 2009 | | | | | 52 | | | | 121 | | | | 173 | |
| 2010 | | | | | 52 | | | | 106 | | | | 158 | |
| Thereafter | | | | | 667 | | | | 468 | | | | 1,135 | |
| Total minimum lease payments | | | | | 925 | | | $ | 1,167 | | | $ | 2,092 | |
| Less amount representing interest payments | | | | | (410 | ) | | | | | | | | |
| Present value of minimum lease payments | | | | $ | 515 | | | | | | | | | |
| | | | | | | | | | | | | | | |
We lease approximately 865,000 square feet at One Lincoln Street, an office building located in Boston, Massachusetts, and a related 366,000 square-foot underground parking garage, under 20-year, non-cancelable capital leases expiring in September 2023. As of December 31, 2005 and 2004, an aggregate net book value of $474 million and $492 million, respectively, for the capital leases was recorded in premises and equipment in our consolidated statement of condition, and the related liability was recorded in long-term debt. Capital lease asset amortization will be recorded in occupancy expense over the lease terms. Lease payments are recorded as both a reduction of the liability and as imputed interest expense. For the years ended December 31, 2005 and 2004, interest expense related to these capital lease obligations, recorded in net interest revenue, was $38 million and $31 million, respectively.
We have entered into non-cancelable operating leases for premises and equipment. Future minimum rental commitments in the preceding table have been reduced by aggregate sublease rental commitments of $167 million for operating leases and $67 for capital leases. Nearly all leases include renewal options.
Total rental expense amounted to $181 million, $190 million and $200 million in 2005, 2004 and 2003, respectively. Rental expense has been reduced by sublease revenue of $10 million, $20 million and $14 million for the years ended December 31, 2005, 2004 and 2003, respectively. During 2005 and 2004, we entered into sub-lease agreements for our headquarters building and other office space in Boston. These sub-lease agreements resulted in the recognition of charges to occupancy expense of $26 million and $16 million for the years ended December 31, 2005 and 2004, respectively.
State Street Corporation 93
Note 19. Restructuring Expenses
In 2004, we incurred $21 million of restructuring costs related to cost control efforts through the elimination of positions. At December 31, 2005, essentially all of these costs have been paid or reclassified to deferred compensation or deferred benefit liabilities. During the year ended December 31, 2003, we implemented an expense reduction program to reduce operating expenses. The expense reductions were achieved through a decrease in direct controllable expenses and by a Voluntary Separation and Enhanced Severance Program, or “VSP,” primarily in the United States. At June 30, 2003, approximately 3,000 individuals accepted the VSP. Subsequent to the VSP, approximately 1,000 positions were refilled. Restructuring costs were recorded at the time the accounting events and measurement date occurred.
We incurred $296 million of restructuring costs for the year ended December 31, 2003, as a result of the program, as follows:
| | | |
Restructuring
Costs
|
|---|
(Dollars in millions)
| | | |
|---|
| Costs by Category: | | | | | | |
| Severance | | | | $ | 158 | |
| Pension | | | | | 80 | |
| Stock-based compensation | | | | | 36 | |
| Other | | | | | 22 | |
| Total | | | | $ | 296 | |
| Costs by Line of Business: | | | | | | |
| Investment Servicing | | | | $ | 262 | |
| Investment Management | | | | | 34 | |
| Total | | | | $ | 296 | |
| | | | | | | |
Severance costs related to the VSP included salaries and related benefits to be paid over a defined period of up to two years. Pension costs were to be paid primarily in equal annual installments over a five-year period. Stock-based compensation expense was attributable to the modification of various stock options and restricted and deferred stock awards for individuals who accepted the VSP (see the equity-based compensation disclosures in Note 1). Other restructuring costs included outplacement services associated with the termination of employees and professional and actuarial fees incurred.
No expenses related to the VSP were incurred in 2005 or 2004, and primarily all expenses were paid or reclassified to deferred compensation or deferred benefit liabilities by December 31, 2004.
Note 20. Other Operating Expenses
| | | |
2005
| | 2004
| | 2003
|
|---|
(Dollars in millions)
| | | |
|---|
| Professional services | | | | $ | 184 | | | $ | 165 | | | $ | 94 | |
| Advertising and sales promotion | | | | | 42 | | | | 44 | | | | 40 | |
| Other | | | | | 258 | | | | 222 | | | | 186 | |
| Total operating expenses — other | | | | $ | 484 | | | $ | 431 | | | $ | 320 | |
| | | | | | | | | | | | | | | |
94 State Street Corporation
The components of income tax expense from continuing operations consisted of the following for the years ended December 31:
| | | |
2005
| | 2004
| | 2003
|
|---|
(Dollars in millions)
| | | |
|---|
| Current: | | | | | | | | | | | | | | |
| Federal | | | | $ | 197 | | | $ | 31 | | | $ | 54 | |
| State | | | | | 49 | | | | 27 | | | | 48 | |
| Non-U.S. | | | | | 138 | | | | 157 | | | | 59 | |
| Total current | | | | | 384 | | | | 215 | | | | 161 | |
| Deferred: | | | | | | | | | | | | | | |
| Federal | | | | | 72 | | | | 160 | | | | 168 | |
| State | | | | | 10 | | | | 23 | | | | 35 | |
| Non-U.S. | | | | | 21 | | | | (4 | ) | | | 26 | |
| Total deferred | | | | | 103 | | | | 179 | | | | 229 | |
| Total income tax expense from continuing operations | | | | $ | 487 | | | $ | 394 | | | $ | 390 | |
| | | | | | | | | | | | | | | |
Current and deferred income taxes from continuing operations for 2004 and 2003 have been reclassified to reflect tax returns as actually filed. The income tax expense (benefit) related to net realized securities gains or losses was $(1) million, $10 million and $9 million for 2005, 2004 and 2003, respectively. Pre-tax income from continuing operations attributable to operations located outside the United States was $494 million, $424 million and $217 million for 2005, 2004 and 2003, respectively.
For those foreign subsidiaries for which accumulated earnings of the subsidiary are considered to be permanently invested, no provision for deferred U.S. income taxes is recorded. The total undistributed retained earnings of these subsidiaries was $145 million at December 31, 2005. If the accumulated earnings in these subsidiaries had been temporarily invested, a deferred U.S. tax liability of $37 million would have been recorded.
Income tax expense from continuing operations for 2004 included a cumulative benefit of $18 million recorded in the first quarter resulting from a change in the effective state tax rate applied to leveraged leasing transactions.
In 2003, we recorded a one-time, after-tax charge of $12 million representing settlement of a REIT-related tax matter with the Massachusetts Department of Revenue. The tax rate for the year ended December 31, 2003 was 34.0% excluding the impact of the REIT settlement, and 35.1% including the REIT settlement.
State Street Corporation 95
Significant components of deferred tax liabilities and assets at December 31 were as follows:
| | | |
2005
| | 2004
|
|---|
(Dollars in millions)
| | | |
|---|
| Deferred Tax Liabilities: | | | | | | | | | | |
| Lease financing transactions | | | | $ | 1,735 | | | $ | 1,653 | |
| Foreign currency translation | | | | | 34 | | | | 89 | |
| Pension | | | | | 53 | | | | 51 | |
| Other | | | | | 40 | | | | 53 | |
| Operating expenses | | | | | 20 | | | | 1 | |
| Total deferred tax liabilities | | | | | 1,882 | | | | 1,847 | |
| Deferred Tax Assets: | | | | | | | | | | |
| Unrealized losses on available-for-sale securities, net | | | | | 190 | | | | 40 | |
| Deferred compensation | | | | | 70 | | | | 61 | |
| Unrealized loss related to discontinued operations | | | | | 58 | | | | – | |
| Allowance for loan losses | | | | | 11 | | | | 11 | |
| Tax carryforwards | | | | | 1 | | | | 69 | |
| Other | | | | | 44 | | | | 76 | |
| Total deferred tax assets | | | | | 374 | | | | 257 | |
| Valuation allowance for deferred tax assets | | | | | 1 | | | | 1 | |
| Net deferred tax assets | | | | | 373 | | | | 256 | |
| Net deferred tax liabilities | | | | $ | 1,509 | | | $ | 1,591 | |
| | | | | | | | | | | |
Management considers the valuation allowance adequate to reduce the total deferred tax asset to an amount that will more likely than not be realized. At December 31, 2005, we had non-U.S. and state tax loss carryforwards of $1 million that expire beginning in 2006.
A reconciliation of the U.S. statutory income tax rate to the effective tax rate based on income from continuing operations before income taxes was as follows for the years ended December 31:
| | | |
2005
| | 2004
| | 2003
|
|---|
| | | |
|---|
| U.S. federal income tax rate | | | | | 35.0 | % | | | 35.0 | % | | | 35.0 | % |
| Changes from Statutory Rate: | | | | | | | | | | | | | | |
| State taxes, net of federal benefit | | | | | 3.3 | | | | 3.7 | | | | 3.8 | |
| Tax-exempt interest revenue, net of disallowed interest | | | | | (1.5 | ) | | | (2.2 | ) | | | (2.6 | ) |
| Tax credits | | | | | (1.3 | ) | | | (.6 | ) | | | (.9 | ) |
| Foreign tax differential | | | | | (1.0 | ) | | | (1.1 | ) | | | (.8 | ) |
| Leveraged lease transactions — cumulative benefit | | | | | – | | | | (.9 | ) | | | – | |
| Other, net | | | | | (.5 | ) | | | (.8 | ) | | | (.5 | ) |
Non-operating item(1) | | | | | – | | | | – | | | | 1.1 | |
| Effective tax rate | | | | | 34.0 | % | | | 33.1 | % | | | 35.1 | % |
| | | | | | | | | | | | | | | |
| (1) | | The non-operating item reported in 2003 related to an increase in the effective tax rate for a state tax matter that was settled. |
See Note 9 for information about the IRS’s review of our federal income tax returns and contingencies related to leveraged leasing transactions.
96 State Street Corporation
Note 22. Earnings Per Share
The following table presents the computation of basic and diluted earnings per share for the years ended December 31:
| |
2005
| | 2004
| | 2003
|
|---|
(Dollars in millions, except per share amounts)
| |
|---|
| Net Income | | $ | 838 | | $ | 798 | | $ | 722 |
| Average Shares Outstanding (in thousands): | | | | | | | | | |
| Basic average shares | | | 330,361 | | | 334,606 | | | 331,692 |
| Effect of dilutive securities: | | | | | | | | | |
| Stock options and stock awards | | | 2,762 | | | 3,358 | | | 2,938 |
| Equity-related financial instruments | | | 1,513 | | | 1,641 | | | 696 |
| Dilutive average shares | | | 334,636 | | | 339,605 | | | 335,326 |
Anti-dilutive securities (in thousands)(1) | | | 8,791 | | | 10,289 | | | 13,216 |
| Earnings per Share: | | | | | | | | | |
| Basic | | $ | 2.53 | | $ | 2.38 | | $ | 2.18 |
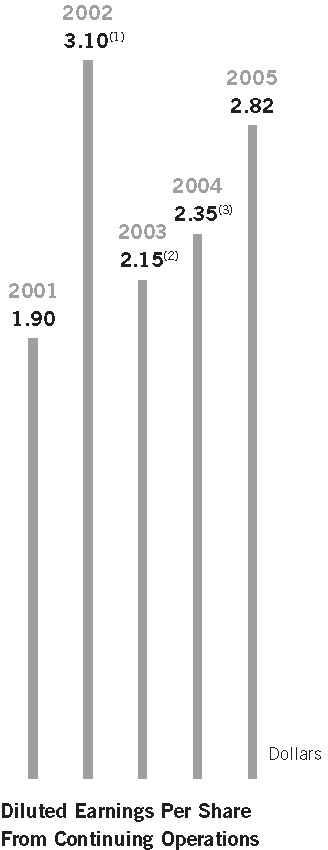
| Diluted | | | 2.50 | | | 2.35 | | | 2.15 |
| | | | | | | | | | |
| (1) | | Represents stock options outstanding but not included in the computation of diluted average shares because the exercise prices of the instruments were greater than the average fair value of our common stock during those periods. |
Note 23. Line of Business Information
We report two lines of business: Investment Servicing and Investment Management. Given our services and management organization, the results of operations for these lines of business are not necessarily comparable with those of other companies, including companies in the financial services industry.
Investment Servicing provides services for U.S. mutual funds, collective investment funds worldwide, corporate and public retirement plans, insurance companies, foundations, endowments, and other investment pools. Products include custody, accounting, daily pricing and administration; master trust and master custody; recordkeeping; foreign exchange; securities finance; deposit and short-term investment facilities; loans and lease financing; investment manager and hedge fund manager operations outsourcing; and performance, risk and compliance analytics to support institutional investors. We provide shareholder services, which include mutual fund and collective investment fund shareholder accounting, through 50%-owned affiliates, Boston Financial Data Services, Inc. and the International Financial Data Services group of companies.
Investment Management offers a broad array of services for managing financial assets, including investment management and investment research, primarily for institutional investors worldwide. These services include passive and active U.S. and non-U.S. equity and fixed income strategies, and other related services, such as securities finance.
Revenue and expenses are directly charged or allocated to the lines of business through management information systems. We price our products and services on the basis of total customer relationships and other factors; therefore, revenue may not necessarily reflect market pricing on products within the business lines in the same way it would for independent business entities. Assets and liabilities are allocated according to rules that support management’s strategic and tactical goals. Capital is allocated based on risk-weighted assets employed and management’s judgment. Capital allocations may not be representative of the capital that might be required if these lines of business were independent business entities.
State Street Corporation 97
The following is a summary of line of business results. These results exclude the loss from discontinued operations related to the planned divestiture of our investment interest in Bel Air, as discussed in Note 2. The “Business Divestiture” column includes the revenue and expenses of the divested PAM business for 2003 prior to its divestiture. The “Other/One-Time” column for 2005 includes the additional gain from the sale of the PAM business, as discussed in Note 2. For 2004, this column includes merger and integration costs related to the acquisition of the GSS business. For 2003, this column includes the gains from the sales of the PAM and Corporate Trust businesses, the loss on certain real estate sold, and restructuring and merger, integration and divestiture charges. These items were not allocated to our business lines for any period presented.
| | Investment Servicing
| |
Investment Management
| | Business Divestiture
| | Other/One-Time
| | Total
|
|---|
| | 2005
| | 2004
| | 2003
| | 2005
| | 2004
| | 2003
| | 2005
| | 2004
| | 2003
| | 2005
| | 2004
| | 2003
| | 2005
| | 2004
| | 2003
|
|---|
(Dollars in millions,
unless otherwise noted)
| |
|---|
Years ended December 31,
| |
|---|
| Fee revenue: | | | | | | | | | | | | | | | | | | | | | | | | | | | | | | | | | | | | | | | | | | | | | | | | | | | | | | | | | |
| Servicing fees | | $ | 2,474 | | | $ | 2,263 | | | $ | 1,950 | | | | | | | | | | | | | | | | | | | | | | | | | | | | | | | | | | | | | $ | 2,474 | | | $ | 2,263 | | | $ | 1,950 |
| Management fees | | | – | | | | – | | | | – | | | $ | 751 | | | $ | 623 | | | $ | 474 | | | | | | | | | | | $ | 59 | | | | | | | | | | | | | | 751 | | | | 623 | | | | 533 |
| Trading services | | | 694 | | | | 595 | | | | 529 | | | | – | | | | – | | | | – | | | | | | | | | | | | – | | | | | | | | | | | | | | 694 | | | | 595 | | | | 529 |
| Securities finance | | | 260 | | | | 211 | | | | 206 | | | | 70 | | | | 48 | | | | 39 | | | | | | | | | | | | – | | | | | | | | | | | | | | 330 | | | | 259 | | | | 245 |
| Processing fees and other | | | 221 | | | | 239 | | | | 277 | | | | 81 | | | | 69 | | | | 34 | | | | | | | | | | | | 1 | | | | | | | | | $ | (13 | ) | | | 302 | | | | 308 | | | | 299 |
| Total fee revenue | | | 3,649 | | | | 3,308 | | | | 2,962 | | | | 902 | | | | 740 | | | | 547 | | | | | | | | | | | | 60 | | | | | | | | | | (13 | ) | | | 4,551 | | | | 4,048 | | | | 3,556 |
| Net interest revenue | | | 826 | | | | 816 | | | | 773 | | | | 81 | | | | 43 | | | | 37 | | | | | | | | | | | | – | | | | | | | | | | – | | | | 907 | | | | 859 | | | | 810 |
| Provision for loan losses | | | – | | | | (18 | ) | | | – | | | | – | | | | – | | | | – | | | | | | | | | | | | – | | | | | | | | | | – | | | | – | | | | (18 | ) | | | – |
| Net interest revenue after provision for loan losses | | | 826 | | | | 834 | | | | 773 | | | | 81 | | | | 43 | | | | 37 | | | | | | | | | | | | – | | | | | | | | | | – | | | | 907 | | | | 877 | | | | 810 |
| (Losses) gains on sales of available-for-sale investment securities, net | | | (1 | ) | | | 26 | | | | 23 | | | | – | | | | – | | | | – | | | | | | | | | | | | – | | | | | | | | | | – | | | | (1 | ) | | | 26 | | | | 23 |
| Gains on the sales of divested businesses, net | | | – | | | | – | | | | – | | | | – | | | | – | | | | – | | | | | | | | | | | | – | | $ | 16 | | | | | | | 345 | | | | 16 | | | | – | | | | 345 |
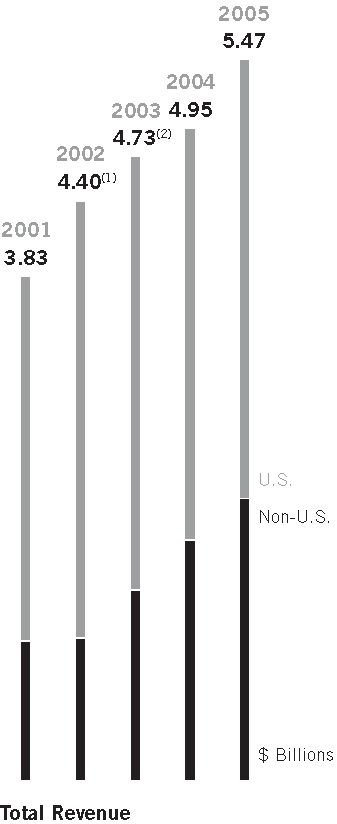
| Total revenue | | | 4,474 | | | | 4,168 | | | | 3,758 | | | | 983 | | | | 783 | | | | 584 | | | | | | | | | | | | 60 | | | 16 | | | | | | | 332 | | | | 5,473 | | | | 4,951 | | | | 4,734 |
| Operating expenses | | | 3,363 | | | | 3,115 | | | | 2,706 | | | | 678 | | | | 582 | | | | 473 | | | | | | | | | | | | 37 | | | – | | $ | 62 | | | | 406 | | | | 4,041 | | | | 3,759 | | | | 3,622 |
| Income from continuing operations before income taxes | | $ | 1,111 | | | $ | 1,053 | | | $ | 1,052 | | | $ | 305 | | | $ | 201 | | | $ | 111 | | | | | | | | | | | $ | 23 | | $ | 16 | | $ | (62 | ) | | $ | (74 | ) | | $ | 1,432 | | | $ | 1,192 | | | $ | 1,112 |
| Pre-tax margin | | | 25 | % | | | 25 | % | | | 28 | % | | | 31 | % | | | 26 | % | | | 19 | % | | | | | | | | | | | | | | | | | | | | | | | | | | | | | | | | | |
| Average assets (in billions) | | $ | 96.9 | | | $ | 92.5 | | | $ | 80.6 | | | $ | 2.9 | | | $ | 2.6 | | | $ | 2.0 | | | | | | | | | | | $ | .1 | | | | | | | | | | | | | $ | 99.8 | | | $ | 95.1 | | | $ | 82.7 |
| | | | | | | | | | | | | | | | | | | | | | | | | | | | | | | | | | | | | | | | | | | | | | | | | | | | | | | | | | |
98 State Street Corporation
Note 24. Non-U.S. Activities
We define non-U.S. activities as those revenue-producing assets and transactions that arise from customers domiciled outside the United States. Due to the nature of our business, precise segregation of U.S. and non-U.S. activities is not possible. Subjective judgments have been used to arrive at the operating results related to non-U.S. activities, including the application of transfer pricing and asset and liability management policies. Interest expense allocations are based on the average cost of short-term borrowed funds.
The following table summarizes non-U.S. operating results for the years ended December 31, and assets as of December 31, based on the domicile location of customers:
| |
2005
| | 2004
| | 2003
|
|---|
(Dollars in millions)
| |
|---|
| Results of Operations: | | | | | | | | | |
| Total fee revenue | | $ | 1,881 | | $ | 1,549 | | $ | 1,111 |
| |
| Interest revenue | | | 653 | | | 660 | | | 612 |
| Interest expense | | | 404 | | | 393 | | | 288 |
| Net interest revenue | | | 249 | | | 267 | | | 324 |
| Total revenue | | | 2,130 | | | 1,816 | | | 1,435 |
| Operating expenses | | | 1,589 | | | 1,309 | | | 1,045 |
| Income before income taxes | | | 541 | | | 507 | | | 390 |
| Income tax expense | | | 205 | | | 191 | | | 146 |
| Net income | | $ | 336 | | $ | 316 | | $ | 244 |
| Assets: | | | | | | | | | |
| Interest-bearing deposits with banks | | $ | 11,235 | | $ | 20,451 | | $ | 21,608 |
| Other assets | | | 8,800 | | | 6,719 | | | 7,183 |
| Total assets | | $ | 20,035 | | $ | 27,170 | | $ | 28,791 |
| | | | | | | | | | |
Note 25. Fair Value of Financial Instruments
Fair value estimates are generally subjective in nature, and are made as of a specific point in time based on the characteristics of the financial instruments and relevant market information. Disclosure of fair values is not required for certain items, such as lease financing, equity method investments, obligations for pension and other postretirement plans, premises and equipment, other intangible assets and income tax assets and liabilities. Accordingly, aggregate fair value amounts presented do not purport to represent, and should not be considered representative of, our underlying “market” or franchise value. In addition, because of differences in methodologies and assumptions used to estimate fair values, our fair values should not be compared to those of other financial institutions.
We use the following methods to estimate the fair value of financial instruments:
| • | | For financial instruments that have quoted market prices, those quotes are used to determine fair value. |
| • | | Financial instruments that have no defined maturity, have a remaining maturity of 180 days or less, or reprice frequently to a market rate are assumed to have a fair value that approximates reported value, after taking into consideration any applicable credit risk. |
| • | | If no market quotes are available, financial instruments are valued by discounting the expected cash flow(s) using an estimated current market interest rate for the financial instrument. |
| • | | For derivative financial instruments, fair value is estimated as the amount at which an asset or liability could be bought or sold in a current transaction between willing parties, other than in a forced liquidation or sale. |
State Street Corporation 99
The short maturity of our assets and liabilities results in a significant number of financial instruments for which fair value equals or closely approximates the value reported in our consolidated statement of condition. These financial instruments are reported in the following captions in the consolidated statement of condition: cash and due from banks; interest-bearing deposits with banks; securities purchased under resale agreements; federal funds sold; deposits; securities sold under repurchase agreements; federal funds purchased; and other short-term borrowings. The fair value of trading account assets equals their reported value. In addition, due to the relatively short-term nature of our net loans (excluding leases), substantially all of which are due within one year, we have determined that fair value approximates the reported value. Loan commitments have no reported value because terms are at prevailing market rates.
The reported value and fair value for other captions in the consolidated statement of condition as of December 31 were as follows:
| |
Reported Value
| | Fair Value
|
|---|
(Dollars in millions)
| |
|---|
| 2005: | | | | | | |
Financial Assets: | | | | | | |
| Investment securities: | | | | | | |
| Available for sale | | $ | 54,979 | | $ | 54,979 |
| Held to maturity | | | 4,891 | | | 4,815 |
| Net loans (excluding leases) | | | 4,134 | | | 4,134 |
| Unrealized gains on derivative financial instruments — trading | | | 2,038 | | | 2,038 |
| Unrealized gains on derivative financial instruments — asset and liability management | | | 76 | | | 76 |
Financial Liabilities: | | | | | | |
| Long-term debt | | | 2,659 | | | 2,775 |
| Unrealized losses on derivative financial instruments — trading | | | 2,042 | | | 2,042 |
| Unrealized losses on derivative financial instruments — asset and liability management | | | 76 | | | 76 |
| |
| 2004: | | | | | | |
Financial Assets: | | | | | | |
| Investment securities: | | | | | | |
| Available for sale | | $ | 36,171 | | $ | 36,171 |
| Held to maturity | | | 1,400 | | | 1,389 |
| Net loans (excluding leases) | | | 2,334 | | | 2,334 |
| Unrealized gains on derivative financial instruments — trading | | | 3,243 | | | 3,243 |
| Unrealized gains on derivative financial instruments — asset and liability management | | | 70 | | | 70 |
Financial Liabilities: | | | | | | |
| Long-term debt | | | 2,458 | | | 2,588 |
| Unrealized losses on derivative financial instruments — trading | | | 3,131 | | | 3,131 |
| Unrealized losses on derivative financial instruments — asset and liability management | | | 146 | | | 146 |
| | | | | | | |
100 State Street Corporation
Note 26. Parent Company Financial Statements
STATEMENT OF INCOME
| | | |
|---|
| | | | 2005
| | 2004
| | 2003
|
|---|
(Dollars in millions)
| | | |
|---|
Years ended December 31,
| | | |
|---|
| Interest on securities purchased under resale agreements | | | | $ | 332 | | | $ | 140 | | | $ | 93 | |
| Cash dividends from consolidated bank subsidiary | | | | | 570 | | | | 400 | | | | 145 | |
Cash dividends from consolidated non-bank subsidiaries
and unconsolidated affiliates | | | | | 74 | | | | 50 | | | | 52 | |
| Other, net | | | | | 42 | | | | 28 | | | | 33 | |
| Total revenue | | | | | 1,018 | | | | 618 | | | | 323 | |
| Interest on securities sold under repurchase agreements | | | | | 265 | | | | 112 | | | | 75 | |
| Other interest expense | | | | | 131 | | | | 78 | | | | 77 | |
| Other expenses | | | | | 6 | | | | 11 | | | | 12 | |
| Total expenses | | | | | 402 | | | | 201 | | | | 164 | |
| Income tax expense (benefit) | | | | | 33 | | | | 11 | | | | (1 | ) |
| Income before equity in undistributed income of subsidiaries and affiliates | | | | | 583 | | | | 406 | | | | 160 | |
| Equity in undistributed income of subsidiaries and affiliates: | | | | | | | | | | | | | | |
| Consolidated bank subsidiary | | | | | 165 | | | | 338 | | | | 541 | |
| Consolidated non-bank subsidiaries and unconsolidated affiliates | | | | | 90 | | | | 54 | | | | 21 | |
| Net income | | | | $ | 838 | | | $ | 798 | | | $ | 722 | |
| | | | | | | | | | | | | | | |
State Street Corporation 101
STATEMENT OF CONDITION
| | | |
|---|
| | | | 2005
| | 2004
|
|---|
(Dollars in millions)
| | | |
|---|
As of December 31,
| | | |
|---|
| Assets: | | | �� | | | | | |
| Interest-bearing deposits with bank subsidiary | | | | $ | 550 | | $ | 1,130 |
| Securities purchased under resale agreements from: | | | | | | | | |
| External parties | | | | | 8,464 | | | 1,901 |
| Consolidated non-bank subsidiary and unconsolidated affiliates | | | | | 615 | | | 333 |
| Investment securities available for sale | | | | | 91 | | | 101 |
| Investments in subsidiaries: | | | | | | | | |
| Consolidated bank subsidiary | | | | | 6,139 | | | 6,262 |
| Consolidated non-bank subsidiaries | | | | | 983 | | | 898 |
| Unconsolidated affiliates | | | | | 164 | | | 158 |
| Notes and other receivables from: | | | | | | | | |
| Consolidated bank subsidiary | | | | | 19 | | | 50 |
| Consolidated non-bank subsidiaries and affiliates | | | | | 71 | | | 88 |
| Other assets | | | | | 70 | | | 83 |
| Total assets | | | | $ | 17,166 | | $ | 11,004 |
| Liabilities: | | | | | | | | |
| Securities sold under repurchase agreements | | | | $ | 8,624 | | $ | 2,118 |
| Commercial paper | | | | | 864 | | | 966 |
| Accrued taxes, expenses and other liabilities due to: | | | | | | | | |
| Consolidated bank subsidiary | | | | | 33 | | | 109 |
| Consolidated non-bank subsidiaries | | | | | 7 | | | 10 |
| External parties | | | | | 148 | | | 167 |
| Long-term debt | | | | | 1,123 | | | 1,475 |
| Total liabilities | | | | | 10,799 | | | 4,845 |
| Shareholders’ equity | | | | | 6,367 | | | 6,159 |
| Total liabilities and shareholders’ equity | | | | $ | 17,166 | | $ | 11,004 |
| | | | | | | | | |
102 State Street Corporation
STATEMENT OF CASH FLOWS
| |
|---|
| | 2005
| | 2004
| | 2003
|
|---|
(Dollars in millions)
| |
|---|
Years ended December 31,
| |
|---|
| Net Cash Provided by Operating Activities | | $ | 512 | | | $ | 412 | | | $ | 167 | |
| Investing Activities: | | | | | | | | | | | | |
| Net decrease (increase) in interest-bearing deposits with bank subsidiary | | | 580 | | | | (327 | ) | | | (286 | ) |
| Net (increase) decrease in securities purchased under resale agreements | | | (6,845 | ) | | | 5,154 | | | | (1,509 | ) |
| Purchases of available-for-sale securities | | | (378 | ) | | | (43 | ) | | | (23 | ) |
| Sales of available-for-sale securities | | | 385 | | | | 43 | | | | – | |
| Investments in consolidated bank subsidiary | | | – | | | | – | | | | (320 | ) |
| Investments in non-bank subsidiaries and affiliates | | | (20 | ) | | | (75 | ) | | | (272 | ) |
| Net decrease in notes receivable from subsidiaries | | | 15 | | | | 26 | | | | 56 | |
| Other | | | 12 | | | | 13 | | | | 12 | |
| Net cash (used) provided by investing activities | | | (6,251 | ) | | | 4,791 | | | | (2,342 | ) |
| Financing Activities: | | | | | | | | | | | | |
| Net increase (decrease) in short-term borrowings | | | 6,506 | | | | (4,914 | ) | | | 1,755 | |
| Net decrease in commercial paper | | | (102 | ) | | | (15 | ) | | | (17 | ) |
| Proceeds from issuance of long-term debt, net of issuance costs | | | – | | | | – | | | | 343 | |
| Repayments of long-term debt | | | (345 | ) | | | – | | | | (100 | ) |
| Proceeds from SPACES, net of issuance costs | | | 345 | | | | – | | | | 257 | |
| Purchases of common stock | | | (664 | ) | | | (178 | ) | | | (3 | ) |
| Proceeds from issuance of treasury stock for stock awards and options exercised | | | 231 | | | | 113 | | | | 119 | |
| Payments for cash dividends | | | (232 | ) | | | (209 | ) | | | (179 | ) |
| Net cash provided (used) by financing activities | | | 5,739 | | | | (5,203 | ) | | | 2,175 | |
| Net change | | | – | | | | – | | | | – | |
| Cash and due from banks at beginning of year | | | – | | | | – | | | | – | |
| Cash and due from banks at end of year | | $ | – | | | $ | – | | | $ | – | |
| | | | | | | | | | | | | |
State Street Corporation 103
STATISTICAL DISCLOSURE BY BANK HOLDING COMPANIES
Distribution of Average Assets, Liabilities and Shareholders’ Equity; Interest Rates and Interest Differential
The average statements of condition and net interest revenue analysis for the years indicated are presented below.
| |
2005
| | 2004
| | 2003
|
|---|
| | Average
Balance
| | Interest
| | Average
Rate
| | Average
Balance
| | Interest
| | Average
Rate
| | Average
Balance
| | Interest
| | Average
Rate
|
|---|
(Dollars in millions; taxable equivalent)
| |
|---|
Years ended December 31,
| |
|---|
| Assets: | | | | | | | | | | | | | | | | | | | | | | | | | | | | | | | | | | | | |
| Interest-bearing deposits with non-U.S. banks | | $ | 17,186 | | | $ | 527 | | | | 3.07 | % | | $ | 27,221 | | | $ | 589 | | | | 2.17 | % | | $ | 22,452 | | | $ | 473 | | | | 2.11 | % |
| Interest-bearing deposits with U.S. banks | | | 74 | | | | 2 | | | | 2.60 | | | | 167 | | | | 2 | | | | .94 | | | | 86 | | | | 1 | | | | .56 | |
| Securities purchased under resale agreements | | | 12,579 | | | | 403 | | | | 3.21 | | | | 13,733 | | | | 191 | | | | 1.39 | | | | 13,152 | | | | 164 | | | | 1.25 | |
| Federal funds sold | | | 311 | | | | 9 | | | | 2.82 | | | | 359 | | | | 5 | | | | 1.29 | | | | 393 | | | | 4 | | | | 1.12 | |
Trading account assets(2) | | | 470 | | | | 21 | | | | 4.39 | | | | 614 | | | | 14 | | | | 2.36 | | | | 819 | | | | 19 | | | | 2.37 | |
| Investment securities: | | | | | | | | | | | | | | | | | | | | | | | | | | | | | | | | | | | | |
| U.S. Treasury and federal agencies | | | 24,833 | | | | 866 | | | | 3.49 | | | | 22,314 | | | | 536 | | | | 2.40 | | | | 19,815 | | | | 409 | | | | 2.06 | |
State and political subdivisions(2) | | | 1,839 | | | | 78 | | | | 4.23 | | | | 1,945 | | | | 77 | | | | 3.93 | | | | 1,912 | | | | 86 | | | | 4.47 | |
| Other investments | | | 24,481 | | | | 873 | | | | 3.56 | | | | 11,834 | | | | 277 | | | | 2.31 | | | | 9,377 | | | | 259 | | | | 2.70 | |
| Commercial and financial loans | | | 3,718 | | | | 106 | | | | 2.85 | | | | 3,433 | | | | 59 | | | | 1.72 | | | | 3,402 | | | | 61 | | | | 1.79 | |
Lease financing(2) | | | 2,295 | | | | 87 | | | | 3.81 | | | | 2,256 | | | | 82 | | | | 3.61 | | | | 2,166 | | | | 114 | | | | 5.26 | |
Total interest-earning assets(2) | | | 87,786 | | | | 2,972 | | | | 3.39 | | | | 83,876 | | | | 1,832 | | | | 2.18 | | | | 73,574 | | | | 1,590 | | | | 2.16 | |
| Cash and due from banks | | | 2,598 | | | | | | | | | | | | 2,853 | | | | | | | | | | | | 1,596 | | | | | | | | | |
| Other assets | | | 9,385 | | | | | | | | | | | | 8,413 | | | | | | | | | | | | 7,503 | | | | | | | | | |
| Total assets | | $ | 99,769 | | | | | | | | | | | $ | 95,142 | | | | | | | | | | | $ | 82,673 | | | | | | | | | |
| Liabilities and Shareholders’ Equity: | | | | | | | | | | | | | | | | | | | | | | | | | | | | | | | | | | | | |
| Interest-bearing deposits: | | | | | | | | | | | | | | | | | | | | | | | | | | | | | | | | | | | | |
| Time | | $ | 2,058 | | | | 66 | | | | 3.19 | | | $ | 5,352 | | | | 72 | | | | 1.35 | | | $ | 4,731 | | | | 59 | | | | 1.22 | |
| Savings | | | 934 | | | | 21 | | | | 2.28 | | | | 855 | | | | 6 | | | | .72 | | | | 1,079 | | | | 6 | | | | .57 | |
| Non-U.S. | | | 46,711 | | | | 1,045 | | | | 2.24 | | | | 39,046 | | | | 434 | | | | 1.11 | | | | 29,746 | | | | 307 | | | | 1.04 | |
| Total interest-bearing deposits | | | 49,703 | | | | 1,132 | | | | 2.28 | | | | 45,253 | | | | 512 | | | | 1.13 | | | | 35,556 | | | | 372 | | | | 1.05 | |
| Securities sold under repurchase agreements | | | 22,432 | | | | 613 | | | | 2.73 | | | | 22,989 | | | | 234 | | | | 1.02 | | | | 22,724 | | | | 205 | | | | .90 | |
| Federal funds purchased | | | 2,306 | | | | 75 | | | | 3.23 | | | | 2,891 | | | | 41 | | | | 1.40 | | | | 2,901 | | | | 33 | | | | 1.13 | |
| Other short-term borrowings | | | 1,970 | | | | 65 | | | | 3.30 | | | | 1,736 | | | | 40 | | | | 2.28 | | | | 2,031 | | | | 41 | | | | 2.03 | |
| Long-term debt | | | 2,461 | | | | 138 | | | | 5.63 | | | | 2,319 | | | | 101 | | | | 4.36 | | | | 1,810 | | | | 78 | | | | 4.31 | |
| Total interest-bearing liabilities | | | 78,872 | | | | 2,023 | | | | 2.57 | | | | 75,188 | | | | 928 | | | | 1.23 | | | | 65,022 | | | | 729 | | | | 1.12 | |
| Noninterest-bearing deposits: | | | | | | | | | | | | | | | | | | | | | | | | | | | | | | | | | | | | |
| Special time | | | 6,880 | | | | | | | | | | | | 6,697 | | | | | | | | | | | | 6,607 | | | | | | | | | |
| Demand | | | 1,243 | | | | | | | | | | | | 1,296 | | | | | | | | | | | | 717 | | | | | | | | | |
Non-U.S.(3) | | | 170 | | | | | | | | | | | | 53 | | | | | | | | | | | | 35 | | | | | | | | | |
| Other liabilities | | | 6,426 | | | | | | | | | | | | 5,900 | | | | | | | | | | | | 5,090 | | | | | | | | | |
| Shareholders’ equity | | | 6,178 | | | | | | | | | | | | 6,008 | | | | | | | | | | | | 5,202 | | | | | | | | | |
| Total liabilities and shareholders’ equity | | $ | 99,769 | | | | | | | | | | | $ | 95,142 | | | | | | | | | | | $ | 82,673 | | | | | | | | | |
| Net interest revenue | | | | | | $ | 949 | | | | | | | | | | | $ | 904 | | | | | | | | | | | $ | 861 | | | | | |
| Excess of rate earned over rate paid | | | | | | | | | | | .82 | % | | | | | | | | | | | .95 | % | | | | | | | | | | | 1.04 | % |
Net interest margin(1) | | | | | | | | | | | 1.08 | | | | | | | | | | | | 1.08 | | | | | | | | | | | | 1.17 | |
| | | | | | | | | | | | | | | | | | | | | | | | | | | | | | | | | | | | | |
| (1) | | Net interest margin is taxable-equivalent net interest revenue divided by average interest-earning assets. |
| (2) | | Taxable-equivalent adjusted revenue is a method of presentation in which the tax savings achieved by investing in tax-exempt securities are included in interest income with a corresponding charge to income tax expense. This method provides better comparability between the performance of tax-exempt and taxable securities. The adjustment is computed using a federal income tax rate of 35%, adjusted for applicable state income taxes, net of the related federal-tax benefit. The taxable-equivalent adjustments included in interest revenue above were $42 million, $45 million and $51 million for the years ended December 31, 2005, 2004 and 2003, respectively. |
| (3) | | Non-U.S. noninterest-bearing deposits were $122 million, $71 million and $53 million at December 31, 2005, 2004 and 2003, respectively. |
104 State Street Corporation
The table below summarizes changes in taxable-equivalent interest revenue and interest expense due to changes in volume of interest-earning assets and interest-bearing liabilities, and changes in interest rates. Changes attributed to both volumes and rates have been allocated based on the proportion of change in each category.
| |
2005 Compared to 2004
| | 2004 Compared to 2003
|
|---|
| | Change in
Volume
| | Change in
Rate
| | Net (Decrease)
Increase
| | Change in
Volume
| | Change in
Rate
| | Net Increase
(Decrease)
|
|---|
(Dollars in millions; taxable equivalent)
| |
|---|
Years ended December 31,
| |
|---|
| Interest Revenue Related to: | | | | | | | | | | | | | | | | | | | | | | | | |
| Interest-bearing deposits with non-U.S. banks | | $ | (219 | ) | | $ | 157 | | | $ | (62 | ) | | $ | 100 | | | $ | 16 | | | $ | 116 | |
| Interest-bearing deposits with U.S. banks | | | – | | | | – | | | | – | | | | 1 | | | | – | | | | 1 | |
| Securities purchased under resale agreements | | | (16 | ) | | | 228 | | | | 212 | | | | 7 | | | | 20 | | | | 27 | |
| Federal funds sold | | | (1 | ) | | | 5 | | | | 4 | | | | – | | | | 1 | | | | 1 | |
| Trading account assets | | | (3 | ) | | | 10 | | | | 7 | | | | (5 | ) | | | – | | | | (5 | ) |
| Investment securities: | | | | | | | | | | | | | | | | | | | | | | | | |
| U.S. Treasury and federal agencies | | | 60 | | | | 270 | | | | 330 | | | | 51 | | | | 76 | | | | 127 | |
| State and political subdivisions | | | (4 | ) | | | 5 | | | | 1 | | | | 1 | | | | (10 | ) | | | (9 | ) |
| Other investments | | | 296 | | | | 300 | | | | 596 | | | | 68 | | | | (50 | ) | | | 18 | |
| Commercial and financial loans | | | 5 | | | | 42 | | | | 47 | | | | 1 | | | | (3 | ) | | | (2 | ) |
| Lease financing | | | 1 | | | | 4 | | | | 5 | | | | 5 | | | | (37 | ) | | | (32 | ) |
| Total interest-earning assets | | | 119 | | | | 1,021 | | | | 1,140 | | | | 229 | | | | 13 | | | | 242 | |
| Interest Expense Related to: | | | | | | | | | | | | | | | | | | | | | | | | |
| Deposits: | | | | | | | | | | | | | | | | | | | | | | | | |
| Time | | | (44 | ) | | | 38 | | | | (6 | ) | | | 6 | | | | 7 | | | | 13 | |
| Savings | | | 1 | | | | 14 | | | | 15 | | | | (1 | ) | | | 1 | | | | – | |
| Non-U.S. | | | 85 | | | | 526 | | | | 611 | | | | 99 | | | | 28 | | | | 127 | |
| Securities sold under repurchase agreements | | | (5 | ) | | | 384 | | | | 379 | | | | 2 | | | | 27 | | | | 29 | |
| Federal funds purchased | | | (8 | ) | | | 42 | | | | 34 | | | | – | | | | 8 | | | | 8 | |
| Other short-term borrowings | | | 5 | | | | 20 | | | | 25 | | | | (5 | ) | | | 4 | | | | (1 | ) |
| Long-term debt | | | 6 | | | | 31 | | | | 37 | | | | 22 | | | | 1 | | | | 23 | |
| Total interest-bearing liabilities | | | 40 | | | | 1,055 | | | | 1,095 | | | | 123 | | | | 76 | | | | 199 | |
| Net interest revenue | | $ | 79 | | | $ | (34 | ) | | $ | 45 | | | $ | 106 | | | $ | (63 | ) | | $ | 43 | |
| | | | | | | | | | | | | | | | | | | | | | | | | |
State Street Corporation 105
Quarterly Summarized Financial Information
| |
2005 Quarters
| | 2004 Quarters
|
|---|
| | Fourth
| | Third
| | Second
| | First
| | Fourth
| | Third
| | Second
| | First
|
|---|
(Dollars and shares in millions, except per share data)
| |
|---|
| Consolidated Statement of Income: | | | | | | | | | | | | | | | | | | | | | | | | | | | | | | | | |
| Total fee revenue | | $ | 1,176 | | | $ | 1,135 | | | $ | 1,143 | | | $ | 1,097 | | | $ | 1,029 | | | $ | 961 | | | $ | 1,045 | | | $ | 1,013 | |
| |
| Interest revenue | | | 861 | | | | 773 | | | | 693 | | | | 603 | | | | 532 | | | | 463 | | | | 408 | | | | 384 | |
| Interest expense | | | 619 | | | | 537 | | | | 476 | | | | 391 | | | | 315 | | | | 250 | | | | 182 | | | | 181 | |
| Net interest revenue | | | 242 | | | | 236 | | | | 217 | | | | 212 | | | | 217 | | | | 213 | | | | 226 | | | | 203 | |
| Provision for loan losses | | | – | | | | – | | | | – | | | | – | | | | (18 | ) | | | – | | | | – | | | | – | |
| Net interest revenue after provision for loan losses | | | 242 | | | | 236 | | | | 217 | | | | 212 | | | | 235 | | | | 213 | | | | 226 | | | | 203 | |
| (Losses) gains on sales of available- for-sale securities, net | | | (2 | ) | | | 1 | | | | 1 | | | | (1 | ) | | | 7 | | | | – | | | | 16 | | | | 3 | |
| Gain on sales of divested businesses, net | | | – | | | | 16 | | | | – | | | | – | | | | – | | | | – | | | | – | | | | – | |
| Total revenue | | | 1,416 | | | | 1,388 | | | | 1,361 | | | | 1,308 | | | | 1,271 | | | | 1,174 | | | | 1,287 | | | | 1,219 | |
| Total operating expenses | | | 1,039 | | | | 1,008 | | | | 1,028 | | | | 966 | | | | 992 | | | | 906 | | | | 953 | | | | 908 | |
| Income from continuing operations before income taxes | | | 377 | | | | 380 | | | | 333 | | | | 342 | | | | 279 | | | | 268 | | | | 334 | | | | 311 | |
| Income tax expense from continuing operations | | | 128 | | | | 130 | | | | 113 | | | | 116 | | | | 95 | | | | 91 | | | | 114 | | | | 94 | |
| Income from continuing operations | | | 249 | | | | 250 | | | | 220 | | | | 226 | | | | 184 | | | | 177 | | | | 220 | | | | 217 | |
| Net loss from discontinued operations | | | – | | | | (107 | ) | | | – | | | | – | | | | – | | | | – | | | | – | | | | – | |
| Net income | | $ | 249 | | | $ | 143 | | | $ | 220 | | | $ | 226 | | | $ | 184 | | | $ | 177 | | | $ | 220 | | | $ | 217 | |
| Earnings Per Share From Continuing Operations: | | | | | | | | | | | | | | | | | | | | | | | | | | | | | | | | |
| Basic | | $ | .75 | | | $ | .76 | | | $ | .67 | | | $ | .68 | | | $ | .55 | | | $ | .52 | | | $ | .66 | | | $ | .65 | |
| Diluted | | | .74 | | | | .75 | | | | .66 | | | | .67 | | | | .55 | | | | .52 | | | | .65 | | | | .63 | |
| Loss Per Share From Discontinued Operations: | | | | | | | | | | | | | | | | | | | | | | | | | | | | | | | | |
| Basic | | $ | – | | | $ | (.33 | ) | | $ | – | | | $ | – | | | $ | – | | | $ | – | | | $ | – | | | $ | – | |
| Diluted | | | – | | | | (.32 | ) | | | – | | | | – | | | | – | | | | – | | | | – | | | | – | |
| Earnings Per Share: | | | | | | | | | | | | | | | | | | | | | | | | | | | | | | | | |
| Basic | | $ | .75 | | | $ | .43 | | | $ | .67 | | | $ | .68 | | | $ | .55 | | | $ | .52 | | | $ | .66 | | | $ | .65 | |
| Diluted | | | .74 | | | | .43 | | | | .66 | | | | .67 | | | | .55 | | | | .52 | | | | .65 | | | | .63 | |
| Average Shares Outstanding: | | | | | | | | | | | | | | | | | | | | | | | | | | | | | | | | |
| Basic | | | 331 | | | | 329 | | | | 330 | | | | 332 | | | | 333 | | | | 336 | | | | 335 | | | | 335 | |
| Diluted | | | 337 | | | | 334 | | | | 334 | | | | 335 | | | | 337 | | | | 339 | | | | 341 | | | | 342 | |
| Dividends per share | | $ | .19 | | | $ | .18 | | | $ | .18 | | | $ | .17 | | | $ | .17 | | | $ | .16 | | | $ | .16 | | | $ | .15 | |
| Stock price: | | | | | | | | | | | | | | | | | | | | | | | | | | | | | | | | |
| High | | | 59.80 | | | | 51.50 | | | | 51.93 | | | | 49.25 | | | | 49.25 | | | | 50.12 | | | | 54.39 | | | | 56.90 | |
| Low | | | 48.47 | | | | 47.20 | | | | 40.62 | | | | 42.60 | | | | 39.91 | | | | 41.59 | | | | 45.39 | | | | 49.00 | |
| Close | | | 55.44 | | | | 48.92 | | | | 48.25 | | | | 43.72 | | | | 49.12 | | | | 42.71 | | | | 49.04 | | | | 52.13 | |
| | | | | | | | | | | | | | | | | | | | | | | | | | | | | | | | | |
106 State Street Corporation
ITEM 9. | | CHANGES IN AND DISAGREEMENTS WITH ACCOUNTANTS ON ACCOUNTING AND FINANCIAL DISCLOSURE |
None.
ITEM 9A. CONTROLS AND PROCEDURES
DISCLOSURE CONTROLS AND PROCEDURES: CHANGES IN INTERNAL CONTROL OVER FINANCIAL REPORTING
State Street has established and maintains disclosure controls and other procedures that are designed to ensure that material information relating to State Street and its subsidiaries on a consolidated basis required to be disclosed in its reports filed or submitted under the Securities Exchange Act of 1934 is recorded, processed, summarized, and reported within the time periods specified in the SEC’s rules and forms, and that such information is accumulated and communicated to State Street management, including its Chief Executive Officer and Chief Financial Officer, as appropriate, to allow timely decisions regarding required disclosure. For the fiscal quarter ended December 31, 2005, State Street carried out an evaluation, under the supervision and with the participation of State Street management, including its Chief Executive Officer and Chief Financial Officer, of the effectiveness of the design and operation of State Street’s disclosure controls and procedures. Based on the evaluation of these disclosure controls and procedures, the Chief Executive Officer and Chief Financial Officer concluded that State Street’s disclosure controls and procedures were effective as of December 31, 2005.
State Street has also established and maintains internal control over financial reporting as a process designed to provide reasonable assurance regarding the reliability of financial reporting and the preparation of consolidated financial statements for external purposes in accordance with accounting principles generally accepted in the United States. In the ordinary course of business, State Street routinely enhances its internal controls and procedures for financial reporting by either upgrading its current systems or implementing new systems. Changes have been made and will be made to State Street’s internal controls and procedures for financial reporting as a result of these efforts. For the fourth fiscal quarter ended December 31, 2005, State Street carried out an evaluation, under the supervision and with the participation of State Street management, including its Chief Executive Officer and Chief Financial Officer, of any change in State Street’s internal control over financial reporting that occurred during the fourth quarter that has materially affected, or is reasonably likely to materially affect, State Street’s internal control over financial reporting. The Chief Executive Officer and Chief Financial Officer have concluded that there was no change in State Street’s internal control over financial reporting identified in connection with the evaluation described in this paragraph that has materially affected, or is reasonably likely to materially affect, State Street’s internal control over financial reporting.
INTERNAL CONTROL OVER FINANCIAL REPORTING
Management’s Report on Internal Control Over Financial Reporting
The management of State Street is responsible for the preparation and fair presentation of the financial statements and other financial information contained in this Form 10-K. Management is also responsible for establishing and maintaining adequate internal control over financial reporting. Management has designed business processes and internal controls and has also established and is responsible for maintaining a business culture that fosters financial integrity and accurate reporting. To these ends, management maintains a comprehensive system of internal controls intended to provide reasonable assurances regarding the reliability of financial reporting and the preparation of the consolidated financial statements of State Street in accordance with generally accepted accounting principles. State Street’s accounting policies and internal controls over financial reporting, established and maintained by management, are under the general oversight of State Street’s Board of Directors, including State Street’s Examining and Audit Committee.
Management has made a comprehensive review, evaluation, and assessment of State Street’s internal control over financial reporting as of December 31, 2005. The standard measures adopted by management in making its evaluation are the measures in the Integrated Framework published by the Committee of Sponsoring Organizations of the Treadway Commission (the COSO Framework).
State Street Corporation 107
Based upon its review and evaluation, management has concluded that State Street’s internal control over financial reporting is effective at December 31, 2005, and that there were no material weaknesses in State Street’s internal control over financial reporting as of that date.
Ernst & Young LLP, an independent registered public accounting firm, which has audited and reported on the consolidated financial statements contained in this Form 10-K, has issued its written attestation report on management’s assessment of State Street’s internal control over financial reporting which follows this report.
108 State Street Corporation
REPORT OF INDEPENDENT REGISTERED PUBLIC ACCOUNTING FIRM ON INTERNAL CONTROL OVER FINANCIAL REPORTING
THE SHAREHOLDERS AND BOARD OF DIRECTORS
STATE STREET CORPORATION
We have audited management’s assessment, included in the accompanying Management’s Report on Internal Control Over Financial Reporting, that State Street Corporation maintained effective internal control over financial reporting as of December 31, 2005, based on criteria established in Internal Control — Integrated Framework issued by the Committee of Sponsoring Organizations of the Treadway Commission (the COSO criteria). State Street Corporation’s management is responsible for maintaining effective internal control over financial reporting and for its assessment of the effectiveness of internal control over financial reporting. Our responsibility is to express an opinion on management’s assessment and an opinion on the effectiveness of the company’s internal control over financial reporting based on our audit.
We conducted our audit in accordance with the standards of the Public Company Accounting Oversight Board (United States). Those standards require that we plan and perform the audit to obtain reasonable assurance about whether effective internal control over financial reporting was maintained in all material respects. Our audit included obtaining an understanding of internal control over financial reporting, evaluating management’s assessment, testing and evaluating the design and operating effectiveness of internal control, and performing such other procedures as we considered necessary in the circumstances. We believe that our audit provides a reasonable basis for our opinion.
A company’s internal control over financial reporting is a process designed to provide reasonable assurance regarding the reliability of financial reporting and the preparation of financial statements for external purposes in accordance with generally accepted accounting principles. A company’s internal control over financial reporting includes those policies and procedures that (1) pertain to the maintenance of records that, in reasonable detail, accurately and fairly reflect the transactions and dispositions of the assets of the company; (2) provide reasonable assurance that transactions are recorded as necessary to permit preparation of financial statements in accordance with generally accepted accounting principles, and that receipts and expenditures of the company are being made only in accordance with authorizations of management and directors of the company; and (3) provide reasonable assurance regarding prevention or timely detection of unauthorized acquisition, use, or disposition of the company’s assets that could have a material effect on the financial statements.
Because of its inherent limitations, internal control over financial reporting may not prevent or detect misstatements. Also, projections of any evaluation of effectiveness to future periods are subject to the risk that controls may become inadequate because of changes in conditions, or that the degree of compliance with the policies or procedures may deteriorate.
In our opinion, management’s assessment that State Street Corporation maintained effective internal control over financial reporting as of December 31, 2005, is fairly stated, in all material respects, based on the COSO criteria. Also, in our opinion, State Street Corporation maintained, in all material respects, effective internal control over financial reporting as of December 31, 2005, based on the COSO criteria.
We also have audited, in accordance with the standards of the Public Company Accounting Oversight Board (United States), the consolidated statement of condition of State Street Corporation as of December 31, 2005 and 2004, and the related consolidated statements of income, changes in shareholders’ equity, and cash flows for each of the three years in the period ended December 31, 2005 of State Street Corporation and our report dated February 17, 2006 expressed an unqualified opinion thereon.
Boston, Massachusetts
February 17, 2006
State Street Corporation 109
ITEM 9B. OTHER INFORMATION
None.
ITEM 10. DIRECTORS AND EXECUTIVE OFFICERS OF THE REGISTRANT
Information concerning our directors will appear in our Proxy Statement for the 2006 Annual Meeting of Shareholders, to be filed pursuant to Regulation 14A on or before April 30, 2006, under the caption “Election of Directors.” Such information is incorporated herein by reference.
Information concerning our executive officers appears under the caption “Executive Officers of the Registrant” in Item 4A of this Form 10-K.
Information concerning our Examining and Audit Committee will appear in our Proxy Statement for the 2006 Annual Meeting of Shareholders, to be filed pursuant to Regulation 14A on or before April 30, 2006, under the caption “Corporate Governance at State Street — Committees of the Board of Directors.” Such information is incorporated herein by reference.
Information concerning compliance with Section 16(a) of the Securities Exchange Act will appear in our Proxy Statement for the 2006 Annual Meeting of Shareholders, to be filed pursuant to Regulation 14A on or before April 30, 2006, under the caption “Section 16(a) Beneficial Ownership Reporting Compliance.” Such information is incorporated herein by reference.
Our Board has adopted a code of ethics that applies to our Chief Executive Officer, Chief Financial Officer, Corporate Controller and other financial officers. That Code of Ethics for Financial Officers has been posted on our Internet website atwww.statestreet.com. We intend to satisfy the disclosure requirements under Item 5.05 of Form 8-K regarding an amendment to, or waiver from, a provision of its Code of Ethics for Financial Officers and that relates to a substantive amendment or material departure from a provision of the Code by posting such information on our Internet website atwww.statestreet.com. We also intend to satisfy the disclosure requirements of the NYSE listing standards regarding waivers of the Standard of Conduct for Directors, and waivers for executive officers of the Standard of Conduct at State Street, by posting such information on our Internet website atwww.statestreet.com.
ITEM 11. EXECUTIVE COMPENSATION
Information in response to this item will appear in our Proxy Statement for the 2006 Annual Meeting of Shareholders, to be filed pursuant to Regulation 14A on or before April 30, 2006, under the captions “Executive Compensation,” “Compensation of Directors,” “Retirement Benefits,” “Committees of the Board of Directors — Executive Compensation Committee,” “Report of the Executive Compensation Committee,” and “Shareholder Return Performance Presentation.” Such information is incorporated herein by reference.
ITEM 12. | | SECURITY OWNERSHIP OF CERTAIN BENEFICIAL OWNERS AND MANAGEMENT AND RELATED STOCKHOLDER MATTERS |
Information concerning security ownership of certain beneficial owners and management will appear in our Proxy Statement for the 2006 Annual Meeting of Shareholders, to be filed pursuant to Regulation 14A on or before April 30, 2006, under the caption “Beneficial Ownership of Shares.” Such information is incorporated herein by reference.
Information concerning related shareholder matters will appear in our Proxy Statement for the 2006 Annual Meeting of Shareholders, to be filed pursuant to Regulation 14A on or before April 30, 2006, under the caption “Equity Plan Compensation Information.” Such information is incorporated herein by reference.
110 State Street Corporation
ITEM 13. CERTAIN RELATIONSHIPS AND RELATED TRANSACTIONS
Information concerning certain relationships and related transactions will appear in our Proxy Statement for the 2006 Annual Meeting of Shareholders, to be filed pursuant to Regulation 14A on or before April 30, 2006, under the caption “Related Transactions.” Such information is incorporated herein by reference.
ITEM 14. PRINCIPAL ACCOUNTANT FEES AND SERVICES
Information concerning principal accountant fees and services will appear in our Proxy Statement for the 2006 Annual Meeting of Shareholders, to be filed pursuant to Regulation 14A on or before April 30, 2006, under the caption “Relationship with Independent Registered Public Accounting Firm.” Such information is incorporated herein by reference.
State Street Corporation 111
PART IV
ITEM 15. EXHIBITS AND FINANCIAL STATEMENT SCHEDULES
(A)(1) FINANCIAL STATEMENTS
The following consolidated financial statements of State Street are included in Item 8 hereof:
Report of Independent Registered Public Accounting Firm
Consolidated Statement of Income — Years ended December 31, 2005, 2004 and 2003
Consolidated Statement of Condition — As of December 31, 2005 and 2004
| | Consolidated Statement of Changes in Shareholders’ Equity — Years ended December 31, 2005, 2004 and 2003 |
Consolidated Statement of Cash Flows — Years ended December 31, 2005, 2004 and 2003
Notes to Consolidated Financial Statements
(A)(2) FINANCIAL STATEMENT SCHEDULES
Certain schedules to the consolidated financial statements have been omitted if they were not required by Article 9 of Regulation S-X or if, under the related instructions, they were inapplicable, or the information was contained elsewhere herein.
(A)(3) EXHIBITS
A list of the exhibits filed or incorporated herein by reference is as follows:
| 2.1 | | | | Sale and Purchase Agreement between Deutsche Bank AG and State Street Corporation dated as of November 5, 2002, as amended by Amendment No. 1 thereto dated January 31, 2003, and by Amendment No. 2 thereto dated as of January 31, 2003 (filed as Exhibit 99.2 to Registrant’s Current Report on Form 8-K dated January 31, 2003, and incorporated herein by reference) |
| 3.1 | | | | Restated Articles of Organization, as amended (filed as Exhibit 3.1 to Registrant’s Quarterly Report on Form 10-Q for the quarter ended June 30, 2001 and incorporated herein by reference) |
| 3.2 | | | | By-laws, as amended (filed as Exhibit 3.1 to Registrant’s Annual Report on Form 10-K for the year ended December 31, 2004 and incorporated herein by reference) |
| 4.1 | | | | The description of the Registrant’s Common Stock is included in the Registrant’s Registration Statement on Forms 8-A, as filed on January 18, 1995 and March 7, 1995, as supplemented by the description of the Registrant’s Preferred Stock Purchase Rights attached to the Common Stock included in the Registrant’s Registration Statement on Forms 8-A (filed on January 18, 1995 and March 7, 1995 and as updated by Form 8-A/A filed on July 7, 1998, and incorporated herein by reference) |
| 4.2 | | | | Amended and Restated Rights Agreement dated as of June 18, 1998 between Registrant and Bank Boston N.A., as Rights Agent (filed as Exhibit 99.1 to Registrant’s Current Report on Form 8-K dated June 18, 1998 and incorporated herein by reference) |
| 4.3 | | | | Certificate of Designation, Preference and Rights (filed as Exhibit 3.1 to Registrant’s Annual Report on Form 10-K for the year ended December 31, 1991 and incorporated herein by reference) |
| 4.4 | | | | Indenture dated as of May 1, 1983 between Registrant and Morgan Guaranty Trust Company of New York, Trustee, relating to Registrant’s 7-3/4% Convertible Subordinated Debentures due 2008 (filed as Exhibit 4 to Registrant’s Registration Statement on Form S-3 (Commission File No. 2-83251) and incorporated herein by reference) |
112 State Street Corporation
| 4.5 | | | | Indenture dated as of August 2, 1993 between Registrant and The First National Bank of Boston, as trustee relating to Registrant’s long-term notes (filed as Exhibit 4 to Registrant’s Current Report on Form 8-K dated October 8, 1993 and incorporated herein by reference) |
| 4.6 | | | | Instrument of Resignation, Appointment, and Acceptance, dated as of February 14, 1996 among Registrant, The First National Bank of Boston (resigning trustee) and Fleet National Bank of Massachusetts (successor trustee) (filed as Exhibit 4.6 to Registrant’s Annual Report on Form 10-K for the year ended December 31, 1995 and incorporated herein by reference) |
| 4.7 | | | | Instrument of Resignation, Appointment and Acceptance dated as of June 26, 1997 among the Registrant, Fleet National Bank (resigning trustee) and First Trust National Association (now known as U.S. Bank National Association) (successor trustee) (filed as Exhibit 4.13 to Registrant’s Annual Report on Form 10-K for the year ended December 31, 1997 and incorporated herein by reference) |
| 4.8 | | | | Junior Subordinated Indenture dated as of December 15, 1996 between Registrant and Bank One Trust Company, N.A. (as successor in interest to The First National Bank of Chicago), as trustee (filed as Exhibit 1 to Registrant’s Current Report on Form 8-K dated February 27, 1997 and incorporated herein by reference) |
| 4.9 | | | | First Supplemental Indenture dated as of January 21, 2003 to the Junior Subordinated Indenture as of December 15, 1996 between Registrant and Bank One Trust Company, N.A., as trustee (filed as Exhibit 4.27 to Registrant’s Current Report on Form 8-K dated January 21, 2003 and incorporated herein by reference) |
| 4.10 | | | | Amended and Restated Trust Agreement dated as of December 15, 1996 relating to State Street Institutional Capital A (filed as Exhibit 2 to Registrant’s Current Report on Form 8-K dated February 27, 1997 and incorporated herein by reference) |
| 4.11 | | | | Capital Securities Guarantee Agreement dated as of December 15, 1996 between Registrant and Bank One Trust Company, N.A. (as successor in interest to The First National Bank of Chicago) (filed as Exhibit 3 to Registrant’s Current Report on Form 8-K dated February 27, 1997 and incorporated herein by reference) |
| 4.12 | | | | Amended and Restated Trust Agreement, dated March 11, 1997 relating to State Street Institutional Capital B (filed as Exhibit 2 to Registrant’s Current Report on Form 8-K dated April 17, 1997 and incorporated herein by reference) |
| 4.13 | | | | Capital Securities Guarantee Agreement dated March 11, 1997 between Registrant and Bank One Trust Company, N.A. (as successor in interest to The First National Bank of Chicago) (filed as Exhibit 3 to Registrant’s Current Report on Form 8-K dated April 17, 1997 and incorporated herein by reference) |
| 4.14 | | | | Indenture dated as of June 15, 2000 between Registrant and Bank One Trust Company, N.A., as trustee (filed as Exhibit 4.26 to Post-Effective Amendment No. 1 to Registrant’s Registration Statement on Form S-3 filed on June 20, 2000, Commission File No. 333-34516, and incorporated herein by reference) |
| 4.15 | | | | Certificate of Trust of State Street Capital Trust II, as filed with the Delaware Secretary of State on March 25, 1998 (filed as Exhibit 4.18 to Registrant’s Registration Statement on Form S-3 filed on April 1, 1998, Commission File No. 333-49143, and incorporated herein by reference) |
| 4.16 | | | | Certificate of Trust of State Street Capital Trust III, as filed with the Delaware Secretary of State on March 25, 1998 (filed as Exhibit 4.19 to Registrant’s Registration Statement on Form S-3 filed on April 1, 1998, Commission File No. 333-49143, and incorporated herein by reference) |
| 4.17 | | | | Certificate of Trust of State Street Capital Trust IV, as filed with the Delaware Secretary of State on March 31, 2000 (filed as Exhibit 4.19 to Registrant’s Registration Statement on Form S-3 filed on April 11, 2000, Commission File No. 333-34516, and incorporated herein by reference) |
State Street Corporation 113
| 4.18 | | | | Declaration of Trust of State Street Capital Trust II among Registrant, as Depositor, Bank One Trust Company, N.A. (as successor in interest to The First National Bank of Chicago), as Property Trustee, Bank One Delaware, Inc., as Delaware Trustee, and the Administrative Trustees named therein (filed as Exhibit 4.21 to Registrant’s Registration Statement on Form S-3 filed on April 1, 1998, Commission File No. 333-49143, and incorporated herein by reference) |
| 4.19 | | | | Declaration of Trust of State Street Capital Trust III among Registrant, as Depositor, Bank One Trust Company, N.A. (as successor in interest to The First National Bank of Chicago), as Property Trustee, Bank One Delaware, Inc., as Delaware Trustee, and the Administrative Trustees named therein (filed as Exhibit 4.22 to Registrant’s Registration Statement on Form S-3 filed on April 1, 1998, Commission File No. 333-49143, and incorporated herein by reference) |
| 4.20 | | | | Declaration of Trust of State Street Capital Trust IV among Registrant, as Depositor, Bank One Trust Company, N.A., as Property Trustee, Bank One Delaware, Inc., as Delaware Trustee, and the Administrative Trustees named therein (filed as Exhibit 4.22 to Registrant’s Registration Statement on Form S-3 filed on April 11, 2000, Commission File No. 333-34516, and incorporated herein by reference) |
| 4.21 | | | | Form of Amended and Restated Trust Agreement for each of State Street Capital Trust II, State Street Capital Trust III, and State Street Capital Trust IV among Registrant, as Depositor, Bank One Trust Company, N.A. (where applicable, as successor in interest to The First National Bank of Chicago), as Property Trustee, Bank One Delaware, Inc., as Delaware Trustee, and the Administrative Trustees named therein (filed as Exhibit 4.23 to Registrant’s Registration Statement on Form S-3 filed on April 11, 2000, Commission File No. 333-34516, and incorporated herein by reference) |
| 4.22 | | | | Form of Guarantee Agreement for each of State Street Capital Trust II, State Street Capital Trust III and State Street Capital Trust IV between Registrant, as guarantor, and Bank One Trust Company, N.A. (where applicable, as successor in interest to The First National Bank of Chicago), as trustee (filed as Exhibit 4.25 to Registrant’s Registration Statement on Form S-3 filed on April 11, 2000, Commission File No. 333-34516, and incorporated herein by reference) |
| | | | |
(Note: Registrant agrees to furnish to the Securities and Exchange Commission upon request a copy of any other instrument with respect to long-term debt of the Registrant and its subsidiaries. Such other instruments are not filed herewith since no such instrument relates to outstanding debt in an amount greater than 10% of the total assets of Registrant and its subsidiaries on a consolidated basis) |
| 10.1† | | | | Registrant’s Supplemental Executive Retirement Plan, together with individual benefit agreements (filed as Exhibit 10.1 to Registrant’s Annual Report on Form 10-K for the year ended December 31, 1991 and incorporated herein by reference) |
| 10.1A† | | | | Amendment No. 1 dated as of October 19, 1995, to Registrant’s Supplemental Executive Retirement Plan (filed as Exhibit 10.6A to Registrant’s Annual Report on Form 10-K for the year ended December 31, 1995 and incorporated herein by reference) |
| 10.2† | | | | Registrant’s 1994 Stock Option and Performance Unit Plan (filed as Exhibit 10.17 to Registrant’s Annual Report on Form 10-K for the year ended December 31, 1993 and incorporated herein by reference) |
| 10.2A† | | | | Amendment No. 1 dated as of October 19, 1995 to Registrant’s 1994 Stock Option and Performance Unit Plan (filed as Exhibit 10.13A to Registrant’s Annual Report on Form 10-K for the year ended December 31, 1995 and incorporated herein by reference) |
| 10.2B† | | | | Amendment No. 2 dated as of June 20, 1996 to Registrant’s 1994 Stock Option and Performance Unit Plan (filed as Exhibit 10.7B to Registrant’s Annual Report on Form 10-K for the year ended December 31, 1998 and incorporated herein by reference) |
114 State Street Corporation
| 10.2C† | | | | Amendment No. 3 dated as of June 28, 2000 to Registrant’s 1994 Stock Option and Performance Unit Plan, as amended (filed as Exhibit 10.1 to Registrant’s Quarterly Report on Form 10-Q for the quarter ended June 30, 2000 and incorporated herein by reference) |
| 10.3† | | | | Registrant’s Amended and Restated Supplemental Defined Benefit Pension Plan for Senior Executive Officers (filed as Exhibit 10.1 to Registrant’s Quarterly Report on Form 10-Q for the quarter ended March 3, 2004 and incorporated herein by reference) |
| 10.3A† | | | | Schedule B to Amended and Restated Supplemental Defined Benefit Pension Plan for Senior Executive Officers as applicable to J. Hooley |
| 10.4† | | | | State Street Global Advisors Incentive Plan for 1996 (filed as Exhibit 10.19 to Registrant’s Annual Report on Form 10-K for the year ended December 31, 1995 and incorporated herein by reference) |
| 10.5† | | | | Forms of Employment Agreement with Officers (Levels 1, 2, and 3) approved by the Board of Directors on September 1995 (filed as Exhibit 10.20 to Registrant’s Annual Report on Form 10-K for the year ended December 31, 1995 and incorporated herein by reference) |
| 10.6† | | | | State Street Global Advisors Equity Compensation Plan (filed as Exhibit 10 to Registrant’s Form 10-Q for the quarter ended September 30, 1996 and incorporated herein by reference) |
| 10.7† | | | | Registrant’s Senior Executive Annual Incentive Plan (filed as Exhibit 10.10 to Registrant’s Annual Report on Form 10-K for the year ended December 31, 2001 and incorporated herein by reference) |
| 10.8† | | | | Registrant’s Executive Compensation Trust Agreement dated December 6, 1996 (Rabbi Trust) (filed as Exhibit 10.18 to Registrant’s Annual Report on Form 10-K for the year ended December 31, 1996 and incorporated herein by reference) |
| 10.9† | | | | Registrant’s 1997 Equity Incentive Plan (filed as Exhibit 10.22 to Registrant’s Form 10-Q for the quarter ended June 30, 1997 and incorporated herein by reference) |
| 10.9A† | | | | Amendment No. 2 to Registrant’s 1997 Equity Incentive Plan (filed as Exhibit 10.17 to Registrant’s Annual Report on Form 10-K for the year ended December 31, 1997 and incorporated herein by reference) |
| 10.9B† | | | | Amendment No. 3 dated as of April 24, 2000 to Registrant’s 1997 Equity Incentive Plan, as amended (filed as Exhibit 10.1 to Registrant’s Quarterly Report on Form 10-Q for the quarter ended March 31, 2000 and incorporated herein by reference) |
| 10.9C† | | | | Amendment No. 4 dated as of June 28, 2000 to Registrant’s 1997 Equity Incentive Plan, as amended (filed as Exhibit 10.2 to Registrant’s Quarterly Report on Form 10-Q for the quarter ended June 30, 2000 and incorporated herein by reference) |
| 10.9D† | | | | Amendment No. 5 dated as of December 20, 2001 to Registrant’s 1997 Equity Incentive Plan, as amended (filed as Exhibit 12D to Registrant’s Annual Report on Form 10-K for the year ended December 31, 2001 and incorporated herein by reference) |
| 10.9E† | | | | Form of Performance Award agreement under the 1997 Equity Incentive Plan (filed as Exhibit 10.1 to Registrant’s Quarterly Report on Form 10-Q for the quarter ended September 30, 2004 and incorporated herein by reference) |
| 10.9F† | | | | Form of Performance Award deferral election agreement under the 1997 Equity Incentive Plan (filed as Exhibit 10.2 to Registrant’s Quarterly Report on Form 10-Q for the quarter ended September 30, 2004 and incorporated herein by reference) |
| 10.9G† | | | | Form of Non-Qualified Stock Option Award agreement under the 1997 Equity Incentive Plan (filed as Exhibit 10.3 to Registrant’s Quarterly Report on Form 10-Q for the quarter ended September 30, 2004 and incorporated herein by reference) |
State Street Corporation 115
| 10.9H† | | | | Form of Incentive Stock Option Award agreement under the 1997 Equity Incentive Plan (filed as Exhibit 10.4 to Registrant’s Quarterly Report on Form 10-Q for the quarter ended September 30, 2004 and incorporated herein by reference) |
| 10.9I† | | | | Form of Restrictive Stock Award agreement under the 1997 Equity Incentive Plan (filed as Exhibit 10.5 to Registrant’s Quarterly Report on Form 10-Q for the quarter ended September 30, 2004 and incorporated herein by reference) |
| 10.9J† | | | | Form of Deferred Stock Award Agreement under the 1997 Equity Incentive Plan (filed as Exhibit 10.6 to Registrant’s Quarterly Report on Form 10-Q for the quarter ended September 30, 2004 and incorporated herein by reference) |
| 10.9K† | | | | Form of Performance-Based Equity Award to SSgA employees under the 1997 Equity Incentive Plan (filed as Exhibit 10.7 to Registrant’s Quarterly Report on Form 10-Q for the quarter ended September 30, 2004 and incorporated herein by reference) |
| 10.9L† | | | | Form of Deferred Stock Award to Non-Employee Directors under the 1997 Equity Incentive Plan (filed as Exhibit 10.12L to Registrant’s Annual Report on Form 10-K for the year ended December 31, 2004 and incorporated herein by reference) |
| 10.10† | | | | Description of compensation arrangements for non-employee directors (filed as Exhibit 10.13G to Registrant’s Annual Report on Form 10-K for the year ended December 31, 2004 and incorporated herein by reference) |
| 10.11† | | | | Amended and Restated Deferred Compensation Plan for Directors of State Street Corporation (filed as Exhibit 10.1 to Registrant’s Quarterly Report on Form 10-Q for the quarter ended March 31, 1999 and incorporated herein by reference) |
| 10.12† | | | | Amended and Restated Deferred Compensation Plan for Directors of State Street Bank and Trust Company (filed as Exhibit 10.2 to Registrant’s Quarterly Report on Form 10-Q for the quarter ended March 31, 1999 and incorporated herein by reference) |
| 10.13† | | | | Registrant’s 401(k) Restoration and Voluntary Deferral Plan (filed as Exhibit 10 to Registrant’s Quarterly Report on Form 10-Q for the quarter ended June 30, 2000 and incorporated herein by reference) |
| 10.14† | | | | Registrant’s Savings-Related Stock Plan for United Kingdom employees (filed as Exhibit 99.1 to Registrant’s Registration Statement on Form S-8 filed on September 23, 2002, Commission File No. 333-100001, and incorporated herein by reference) |
| 10.15† | | | | Memorandum of Agreement with Nicholas A. Lopardo (filed as Exhibit 10.1 to Registrant’s Quarterly Report on Form 10-Q for the quarter ended September 30, 2001 and incorporated herein by reference) |
| 10.16† | | | | Memorandum of agreement of employment of Edward J. Resch, accepted October 16, 2002 (filed as Exhibit 10.23 to Registrant’s Annual Report on Form 10-K for the year ended December 31, 2002 and incorporated herein by reference) |
| 10.17† | | | | Memorandum of Agreement with Maureen Scannell Bateman supplemental to an Executive Voluntary Separation election (filed as Exhibit 10.1 to Registrant’s Quarterly Report on Form 10-Q for the quarter ended June 30, 2003 and incorporated herein by reference) |
| 10.18† | | | | Retirement Agreement with David A. Spina (filed as Exhibit 10.1 to Registrant’s Quarterly Report on Form 10-Q for the quarter ended June 30, 2004 and incorporated herein by reference) |
| 11.1 | | | | Computation of Earnings per Share (information appears in Note 22 of the “Notes to Consolidated Financial Statements” included under Part II, Item 8. |
| 12.1 | | | | Statement of ratios of earnings to fixed charges |
| 21.1 | | | | Subsidiaries of State Street Corporation |
| 23.1 | | | | Consent of Independent Registered Public Accounting Firm |
116 State Street Corporation
| 31.1 | | | | Rule 13a-14(a)/15d-14(a) Certification |
| 31.2 | | | | Rule 13a-14(a)/15d-14(a) Certification |
| 32 | | | | Section 1350 Certifications |
| † | | | | Denotes management contract or compensatory plan or arrangement |
State Street Corporation 117
SIGNATURES
Pursuant to the requirement of Section 13 or 15(d) of the Securities Exchange Act of 1934, the registrant has duly caused this report to be signed on its behalf by the undersigned, on February 16, 2006, thereunto duly authorized.
STATE STREET CORPORATION
| By | | /s/ EDWARD J. RESCH
EDWARD J. RESCH,
Executive Vice President and
Chief Financial Officer |
| By | | /s/ PAMELA D. GORMLEY
PAMELA D. GORMLEY,
Executive Vice President
and Corporate Controller |
Pursuant to the requirements of the Securities Exchange Act of 1934, this report has been signed below on February 16, 2006 by the following persons on behalf of the registrant and in the capacities indicated.
OFFICERS: | | | | | | |
| |
/s/ RONALD E. LOGUE
RONALD E. LOGUE,
Chairman and Chief Executive Officer;
Director | | | | /s/ EDWARD J. RESCH
EDWARD J. RESCH,
Executive Vice President and
Chief Financial Officer |
| |
| | | | | /s/ PAMELA D. GORMLEY
PAMELA D. GORMLEY,
Executive Vice President
and Corporate Controller |
DIRECTORS: | | | | |
/s/ TENLEY E. ALBRIGHT
TENLEY E. ALBRIGHT, M.D. | | | | /s/ KENNETT F. BURNES
KENNETT F. BURNES |
| |
/s/ TRUMAN S. CASNER
TRUMAN S. CASNER | | | | /s/ NADER F. DAREHSHORI
NADER F. DAREHSHORI |
| |
/s/ ARTHUR L. GOLDSTEIN
ARTHUR L. GOLDSTEIN | | | | /s/ DAVID P. GRUBER
DAVID P. GRUBER |
| |
/s/ LINDA A. HILL
LINDA A. HILL | | | | /s/ CHARLES R. LAMANTIA
CHARLES R. LAMANTIA |
| |
/s/ RONALD E. LOGUE
RONALD E. LOGUE | | | | /s/ RICHARD P. SERGEL
RICHARD P. SERGEL |
| |
/s/ RONALD L. SKATES
RONALD L. SKATES | | | | /s/ GREGORY L. SUMME
GREGORY L. SUMME |
| |
/s/ DIANA CHAPMAN WALSH
DIANA CHAPMAN WALSH | | | | /s/ ROBERT E. WEISSMAN
ROBERT E. WEISSMAN |
118 State Street Corporation
EXHIBIT INDEX
| 10.3A | | | | Schedule B to Amended and Restated Supplemental Defined Benefit Pension Plan for Senior Executive Officers as applicable to J. Hooley |
| 12.1 | | | | Statement of ratios of earnings to fixed charges |
| 21.1 | | | | Subsidiaries of State Street Corporation |
| 23.1 | | | | Consent of Independent Registered Public Accounting Firm |
| 31.1 | | | | Rule 13a-14(a)/15d-14(a) Certification |
| 31.2 | | | | Rule 13a-14(a)/15d-14(a) Certification |
| 32 | | | | Section 1350 Certifications |
State Street Corporation 119