Exhibit 99.2
Asset-Backed Commercial Paper As of December 31, 2008 January 20, 2009 State Street
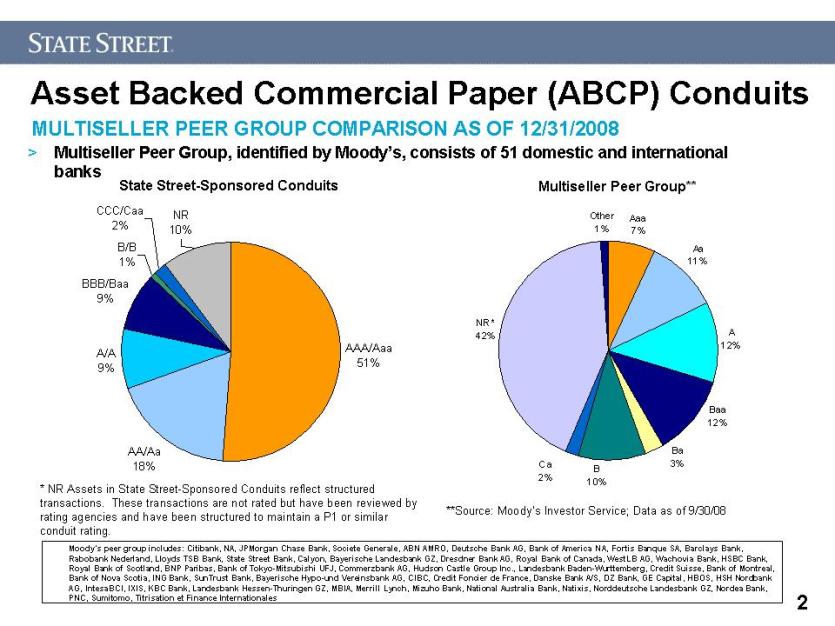
Asset Backed Commercial Paper (ABCP) Conduits Aaa 7% Aa 11% A 12% NR* 42% Other 1% Baa 12% Ba 3% B 10% Ca 2% AAA/Aaa 51% AA/Aa 18% A/A 9% BBB/Baa 9% B/B 1% CCC/ Caa 2% NR 10% State Street-Sponsored Conduits 2 Multiseller Peer Group** **Source: Moody’s Investor Service; Data as of 9/30/08 Multiseller Peer Group, identified by Moody’s, consists of 51 domestic and international banks * NR Assets in State Street-Sponsored Conduits reflect structured transactions. These transactions are not rated but have been reviewed by rating agencies and have been structured to maintain a P1 or similar conduit rating. Moody’s peer group includes: Citibank, NA, JPMorgan Chase Bank, Societe Generale, ABN AMRO, Deutsche Bank AG, Bank of America NA, Fortis Banque SA, Barclays Bank, Rabobank Nederland, Lloyds TSB Bank, State Street Bank, Calyon, Bayerische Landesbank GZ, Dresdner Bank AG, Royal Bank of Canada, WestLB AG, Wachovia Bank, HSBC Bank, Royal Bank of Scotland, BNP Paribas, Bank of Tokyo-Mitsubishi UFJ, Commerzbank AG, Hudson Castle Group Inc., Landesbank Baden-Wurttemberg, Credit Suisse, Bank of Montreal, Bank of Nova Scotia, ING Bank, SunTrust Bank, Bayerische Hypo-und Vereinsbank AG, CIBC, Credit Foncier de France, Danske Bank A/S, DZ Bank, GE Capital, HBOS, HSH Nordbank AG, IntesaBCI, IXIS, KBC Bank, Landesbank Hessen-Thuringen GZ, MBIA, Merrill Lynch, Mizuho Bank, National Australia Bank, Natixis, Norddeutsche Landesbank GZ, Nordea Bank, PNC, Sumitomo, Titrisation et Finance Internationales MULTISELLER PEER GROUP COMPARISON AS OF 12/31/2008 2
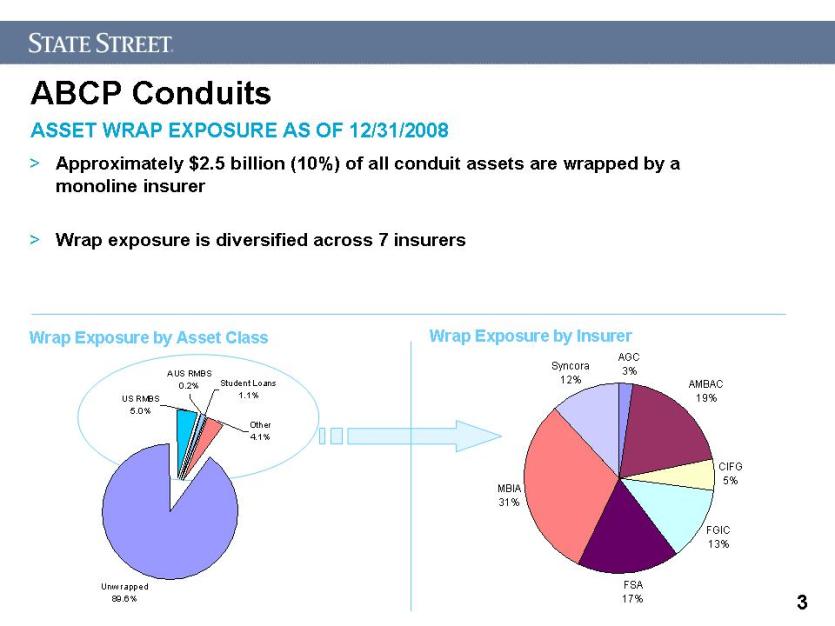
ABCP Conduits Approximately $2.5 billion (10%) of all conduit assets are wrapped by a monoline insurer Wrap exposure is diversified across 7 insurers Wrap Exposure by Asset Class Wrap Exposure by Insurer ASSET WRAP EXPOSURE AS OF 12/31/2008 AGC 3% CIFG 5% FGIC 13% FSA 17% MBIA 31% AMBAC 19% Syncora 12% AUS RMBS 0.2% Student Loans 1.1% US RMBS 5.0% Other 4.1% Unwrapped 89.6% 3
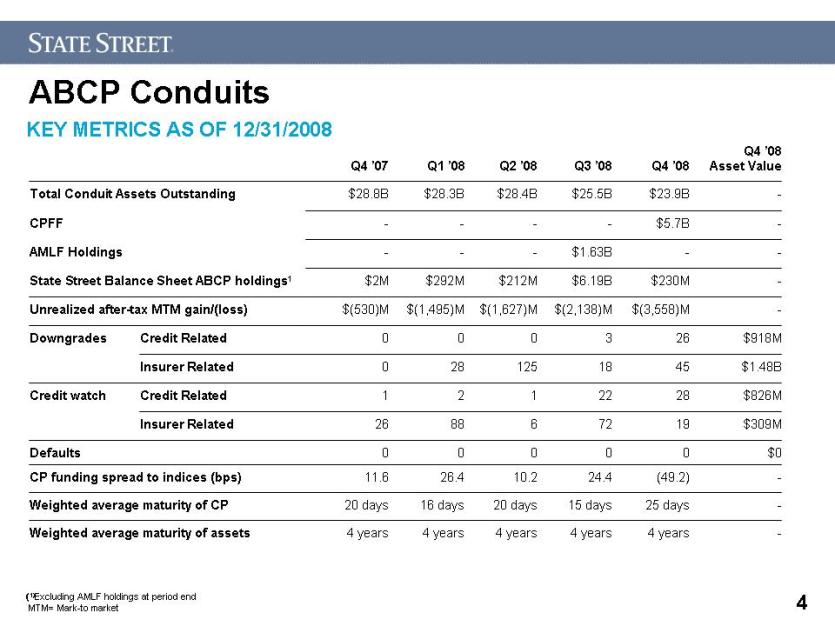
ABCP Conduits KEY METRICS AS OF 12/31/2008 (1)Excluding AMLF holdings at period end MTM= Mark-to market Q4 ’07 Q1 ’08 Q2 ’08 Q3 ’08 Q4 ’08 Q4 ’08 Asset Value Total Conduit Assets Outstanding $28.8B $28.3B $28.4B $25.5B $23.9B - CPFF - - - - $5.7B - AMLF Holdings - - - $1.63B - - State Street Balance Sheet ABCP holdings1 $2M $292M $212M $6.19B $230M - Unrealized after-tax MTM gain/(loss) $(530)M $(1,495)M $(1,627)M $(2,138)M $(3,558)M - Downgrades Credit Related 0 0 0 3 26 $918M Insurer Related 0 28 125 18 45 $1.48B Credit watch Credit Related 1 2 1 22 28 $826M Insurer Related 26 88 6 72 19 $309M Defaults 0 0 0 0 0 $0 CP funding spread to indices (bps) 11.6 26.4 10.2 24.4 (49.2) - Weighted average maturity of CP 20 days 16 days 20 days 15 days 25 days - Weighted average maturity of assets 4 years 4 years 4 years 4 years 4 years - 4
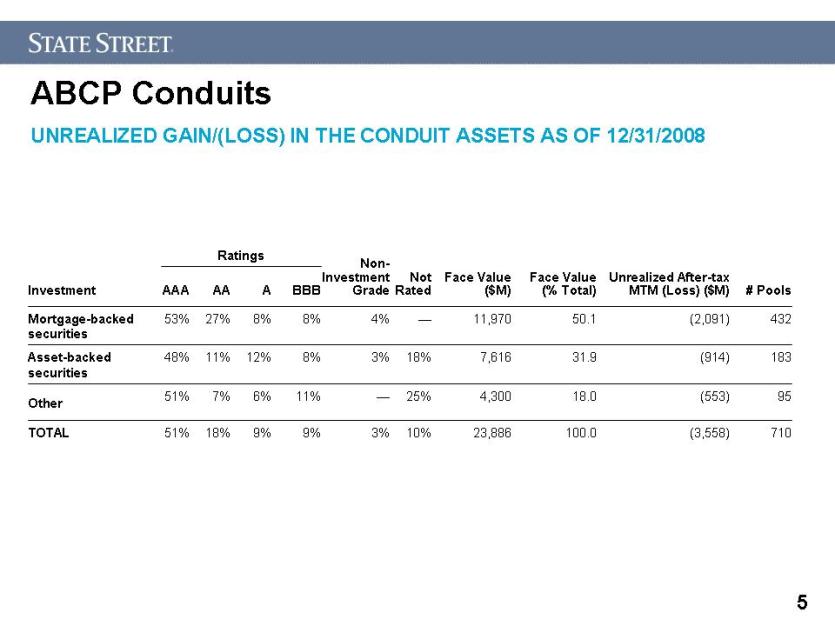
ABCP Conduits UNREALIZED GAIN/(LOSS) IN THE CONDUIT ASSETS AS OF 12/31/2008 Investment Ratings Non- Investment Grade Not Rated Face Value ($M) Face Value (% Total) Unrealized After-tax MTM (Loss) ($M) # Pools AAA AA A BBB Mortgage-backed securities 53% 27% 8% 8% 4% — 11,970 50.1 (2,091) 432 Asset-backed securities 48% 11% 12% 8% 3% 18% 7,616 31.9 (914) 183 Other 51% 7% 6% 11% — 25% 4,300 18.0 (553) 95 TOTAL 51% 18% 9% 9% 3% 10% 23,886 100.0 (3,558) 710 5
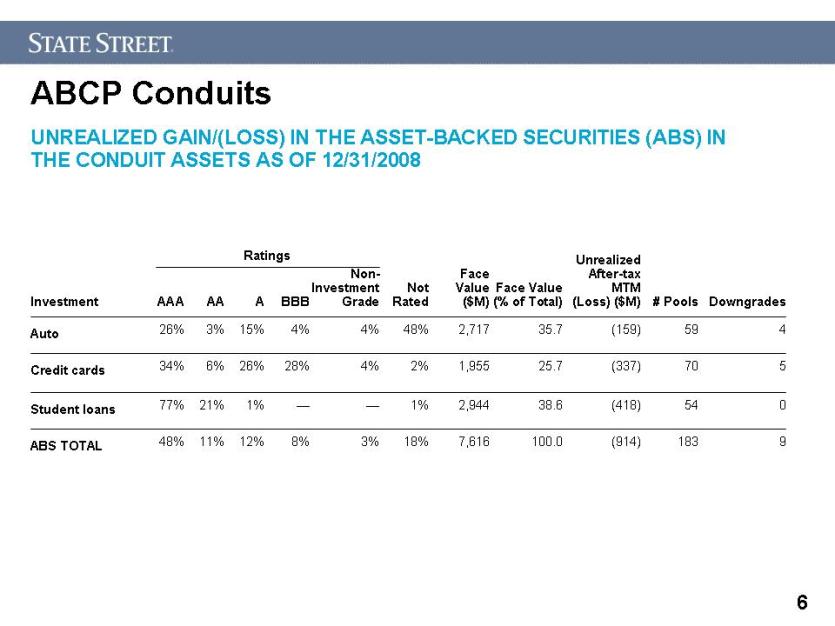
ABCP Conduits UNREALIZED GAIN/(LOSS) IN THE ASSET-BACKED SECURITIES (ABS) IN THE CONDUIT ASSETS AS OF 12/31/2008 Investment Ratings Not Rated Face Value ($M) Face Value (% of Total) Unrealized After-tax MTM (Loss) ($M) # Pools Downgrades AAA AA A BBB Non- Investment Grade Auto 26% 3% 15% 4% 4% 48% 2,717 35.7 (159) 59 4 Credit cards 34% 6% 26% 28% 4% 2% 1,955 25.7 (337) 70 5 Student loans 77% 21% 1% — — 1% 2,944 38.6 (418) 54 0 ABS TOTAL 48% 11% 12% 8% 3% 18% 7,616 100.0 (914) 183 9 6
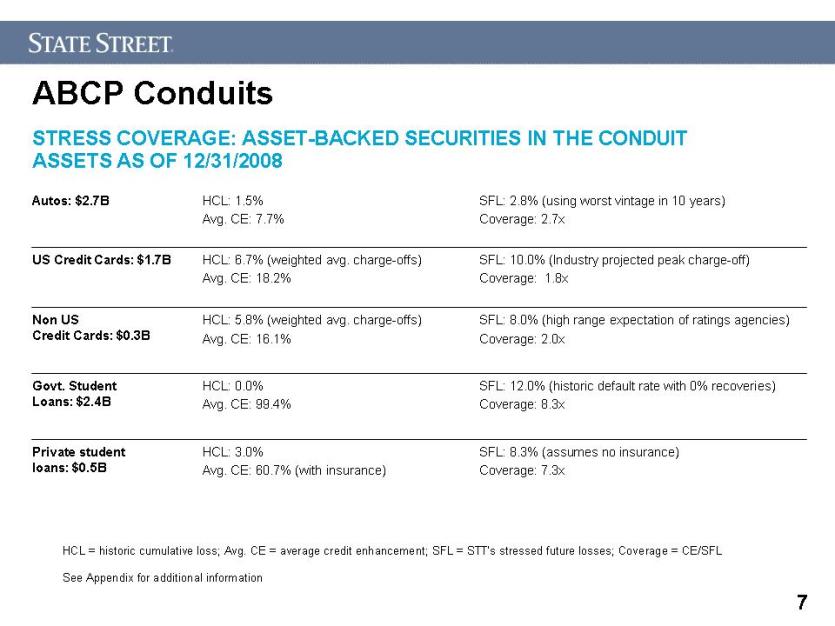
ABCP Conduits STRESS COVERAGE: ASSET-BACKED SECURITIES IN THE CONDUIT ASSETS AS OF 12/31/2008 HCL = historic cumulative loss; Avg. CE = average credit enhancement; SFL = STT’s stressed future losses; Coverage = CE/SFL See Appendix for additional information Autos: $2.7B HCL: 1.5% Avg. CE: 7.7% SFL: 2.8% (using worst vintage in 10 years) Coverage: 2.7x US Credit Cards: $1.7B HCL: 6.7% (weighted avg. charge-offs) Avg. CE: 18.2% SFL: 10.0% (Industry projected peak charge-off) Coverage: 1.8x Non US Credit Cards: $0.3B HCL: 5.8% (weighted avg. charge-offs) Avg. CE: 16.1% SFL: 8.0% (high range expectation of ratings agencies) Coverage: 2.0x Govt. Student Loans: $2.4B HCL: 0.0% Avg. CE: 99.4% SFL: 12.0% (historic default rate with 0% recoveries) Coverage: 8.3x Private student loans: $0.5B HCL: 3.0% Avg. CE: 60.7% (with insurance) SFL: 8.3% (assumes no insurance) Coverage: 7.3x 7
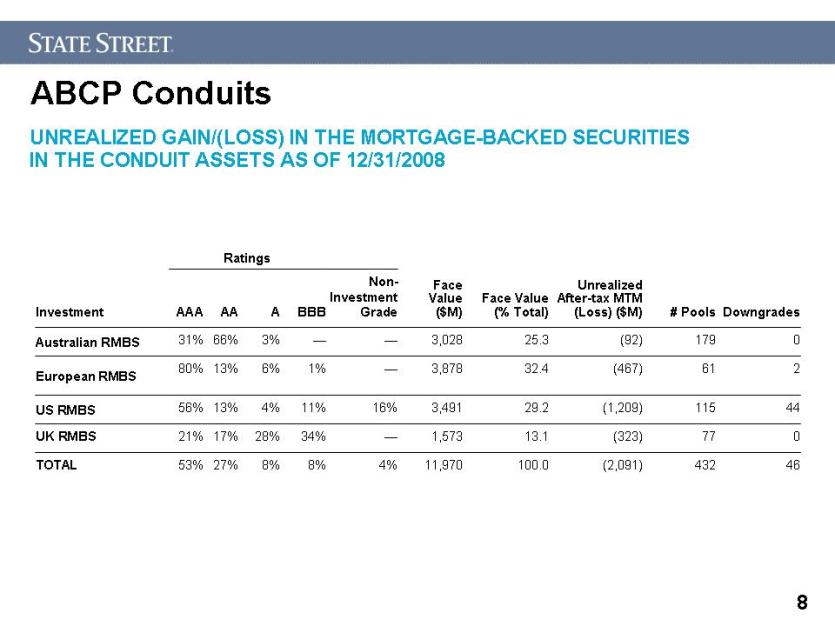
ABCP Conduits UNREALIZED GAIN/(LOSS) IN THE MORTGAGE-BACKED SECURITIES IN THE CONDUIT ASSETS AS OF 12/31/2008 Investment Ratings Face Value ($M) Face Value (% Total) Unrealized After-tax MTM (Loss) ($M) # Pools Downgrades AAA AA A BBB Non- Investment Grade Australian RMBS 31% 66% 3% — — 3,028 25.3 (92) 179 0 European RMBS 80% 13% 6% 1% — 3,878 32.4 (467) 61 2 US RMBS 56% 13% 4% 11% 16% 3,491 29.2 (1,209) 115 44 UK RMBS 21% 17% 28% 34% — 1,573 13.1 (323) 77 0 TOTAL 53% 27% 8% 8% 4% 11,970 100.0 (2,091) 432 46 8
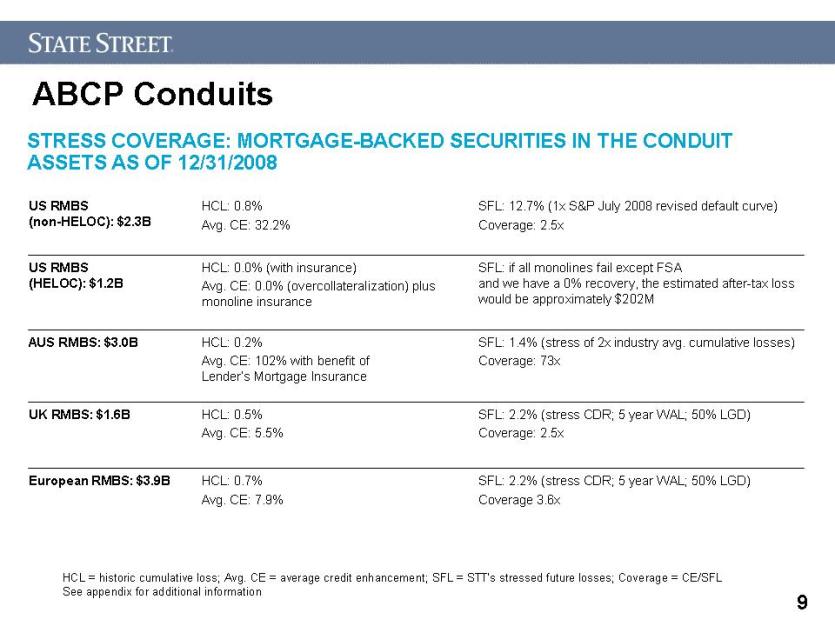
ABCP Conduits STRESS COVERAGE: MORTGAGE-BACKED SECURITIES IN THE CONDUIT ASSETS AS OF 12/31/2008 HCL = historic cumulative loss; Avg. CE = average credit enhancement; SFL = STT’s stressed future losses; Coverage = CE/SFL See appendix for additional information US RMBS (non-HELOC): $2.3B HCL: 0.8% Avg. CE: 32.2% SFL: 12.7% (1x S&P July 2008 revised default curve) Coverage: 2.5x US RMBS (HELOC): $1.2B HCL: 0.0% (with insurance) Avg. CE: 0.0% (overcollateralization) plus monoline insurance SFL: if all monolines fail except FSA and we have a 0% recovery, the estimated after-tax loss would be approximately $202M AUS RMBS: $3.0B HCL: 0.2% Avg. CE: 102% with benefit of Lender’s Mortgage Insurance SFL: 1.4% (stress of 2x industry avg. cumulative losses) Coverage: 73x UK RMBS: $1.6B HCL: 0.5% Avg. CE: 5.5% SFL: 2.2% (stress CDR; 5 year WAL; 50% LGD) Coverage: 2.5x European RMBS: $3.9B HCL: 0.7% Avg. CE: 7.9% SFL: 2.2% (stress CDR; 5 year WAL; 50% LGD) Coverage 3.6x 9
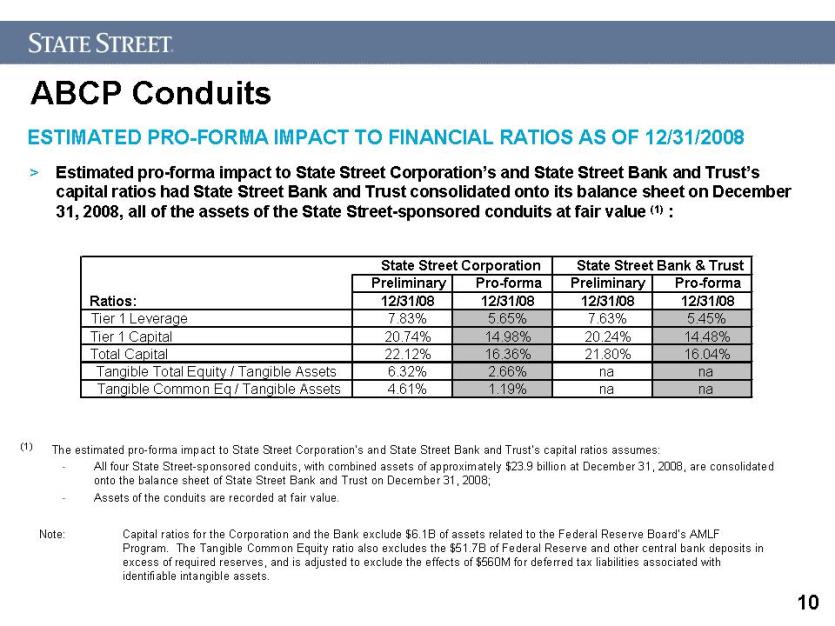
ABCP Conduits Estimated pro-forma impact to State Street Corporation’s and State Street Bank and Trust’s capital ratios had State Street Bank and Trust consolidated onto its balance sheet on December 31, 2008, all of the assets of the State Street-sponsored conduits at fair value (1) : (1) The estimated pro-forma impact to State Street Corporation’s and State Street Bank and Trust’s capital ratios assumes: All four State Street-sponsored conduits, with combined assets of approximately $23.9 billion at December 31, 2008, are consolidated onto the balance sheet of State Street Bank and Trust on December 31, 2008; Assets of the conduits are recorded at fair value. Note: Capital ratios for the Corporation and the Bank exclude $6.1B of assets related to the Federal Reserve Board’s AMLF Program. The Tangible Common Equity ratio also excludes the $51.7B of Federal Reserve and other central bank deposits in excess of required reserves, and is adjusted to exclude the effects of $560M for deferred tax liabilities associated with identifiable intangible assets. ESTIMATED PRO-FORMA IMPACT TO FINANCIAL RATIOS AS OF 12/31/2008 Preliminary Pro-forma Preliminary Pro-forma Ratios: 12/31/08 12/31/08 12/31/08 12/31/08 Tier 1 Leverage 7.83% 5.65% 7.63% 5.45% Tier 1 Capital 20.74% 14.98% 20.24% 14.48% Total Capital 22.12% 16.36% 21.80% 16.04% Tangible Total Equity / Tangible Assets 6.32% 2.66% na na Tangible Common Eq / Tangible Assets 4.61% 1.19% na na State Street Corporation State Street Bank & Trust 10
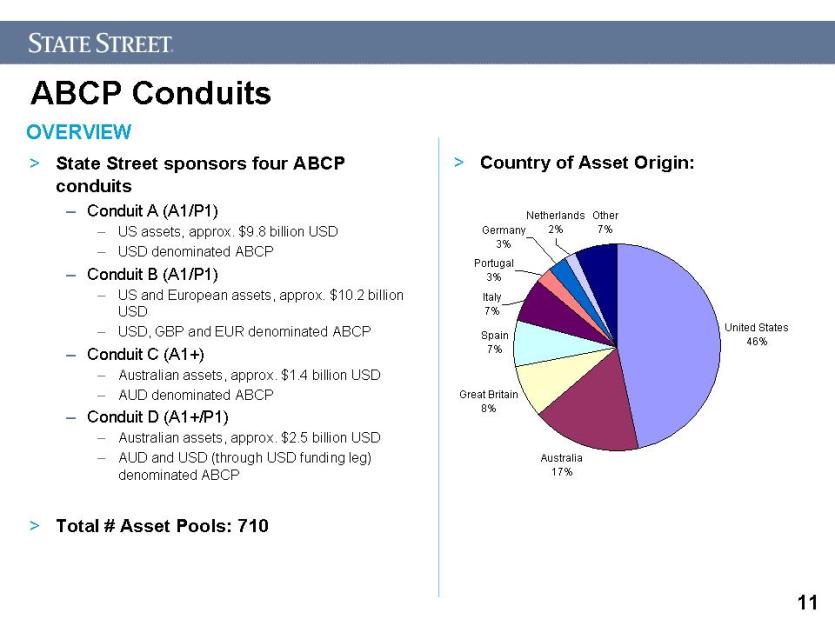
ABCP Conduits State Street sponsors four ABCP conduits Conduit A (A1/P1) US assets, approx. $9.8 billion USD USD denominated ABCP Conduit B (A1/P1) US and European assets, approx. $10.2 billion USD USD, GBP and EUR denominated ABCP Conduit C (A1+) Australian assets, approx. $1.4 billion USD AUD denominated ABCP Conduit D (A1+/P1) Australian assets, approx. $2.5 billion USD AUD and USD (through USD funding leg) denominated ABCP Total # Asset Pools: 710 Country of Asset Origin: OVERVIEW United States 46% Australia 17% Great Britain 8% Spain 7% Germany 3% Portugal 3% Italy 7% Netherlands 2% Other 7% 11
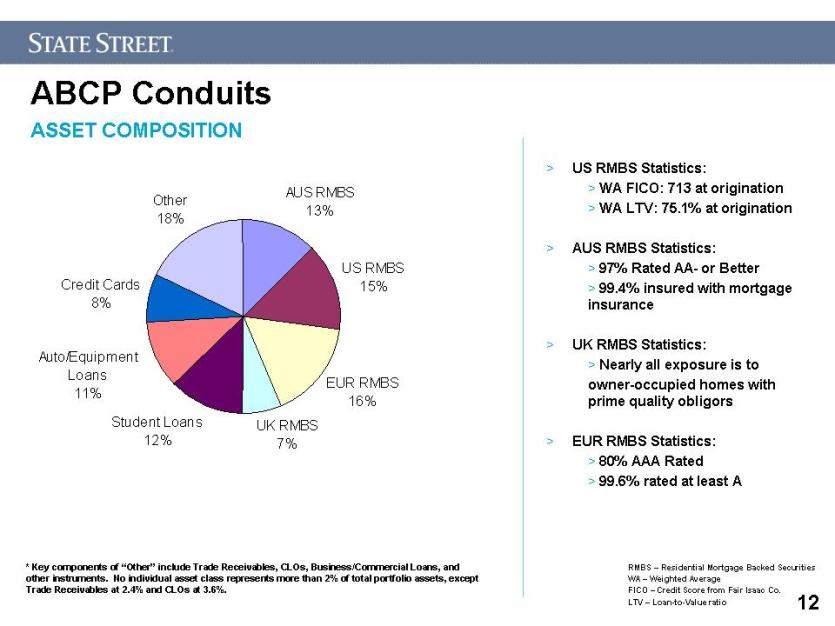
ABCP Conduits US RMBS Statistics: WA FICO: 713 at origination WA LTV: 75.1% at origination AUS RMBS Statistics: 97% Rated AA- or Better 99.4% insured with mortgage insurance UK RMBS Statistics: Nearly all exposure is to owner-occupied homes with prime quality obligors EUR RMBS Statistics: 80% AAA Rated 99.6% rated at least A RMBS – Residential Mortgage Backed Securities WA – Weighted Average FICO – Credit Score from Fair Isaac Co. LTV – Loan-to-Value ratio * Key components of “Other” include Trade Receivables, CLOs, Business/Commercial Loans, and other instruments. No individual asset class represents more than 2% of total portfolio assets, except Trade Receivables at 2.4% and CLOs at 3.6%. ASSET COMPOSITION AUS RMBS 13% US RMBS 15% EUR RMBS 16% UK RMBS 7% Student Loans 12% Credit Cards 8% Other 18% Auto/Equipment Loans 11% 12
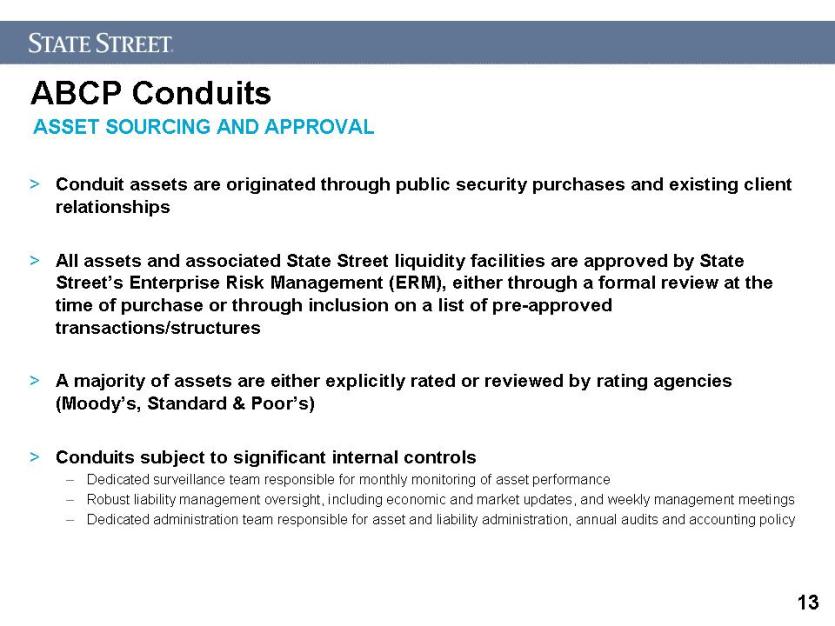
ABCP Conduits Conduit assets are originated through public security purchases and existing client relationships All assets and associated State Street liquidity facilities are approved by State Street’s Enterprise Risk Management (ERM), either through a formal review at the time of purchase or through inclusion on a list of pre-approved transactions/structures A majority of assets are either explicitly rated or reviewed by rating agencies (Moody’s, Standard & Poor’s) Conduits subject to significant internal controls Dedicated surveillance team responsible for monthly monitoring of asset performance Robust liability management oversight, including economic and market updates, and weekly management meetings Dedicated administration team responsible for asset and liability administration, annual audits and accounting policy ASSET SOURCING AND APPROVAL 13
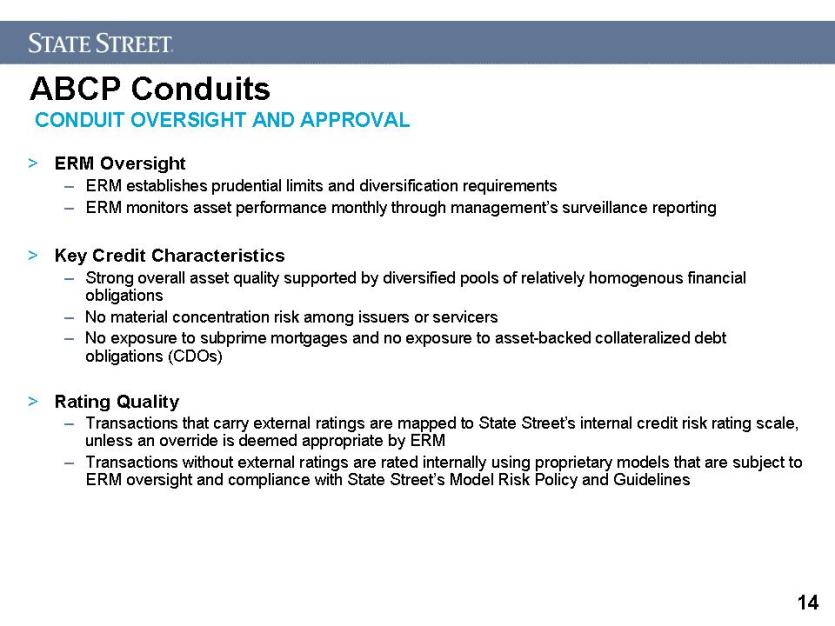
CONDUIT OVERSIGHT AND APPROVAL Body: ERM Oversight ERM establishes prudential limits and diversification requirements ERM monitors asset performance monthly through management’s surveillance reporting Key Credit Characteristics Strong overall asset quality supported by diversified pools of relatively homogenous financial obligations No material concentration risk among issuers or servicers No exposure to subprime mortgages and no exposure to asset-backed collateralized debt obligations (CDOs) Rating Quality Transactions that carry external ratings are mapped to State Street’s internal credit risk rating scale, unless an override is deemed appropriate by ERM Transactions without external ratings are rated internally using proprietary models that are subject to ERM oversight and compliance with State Street’s Model Risk Policy and Guidelines 14 ABCP Conduits
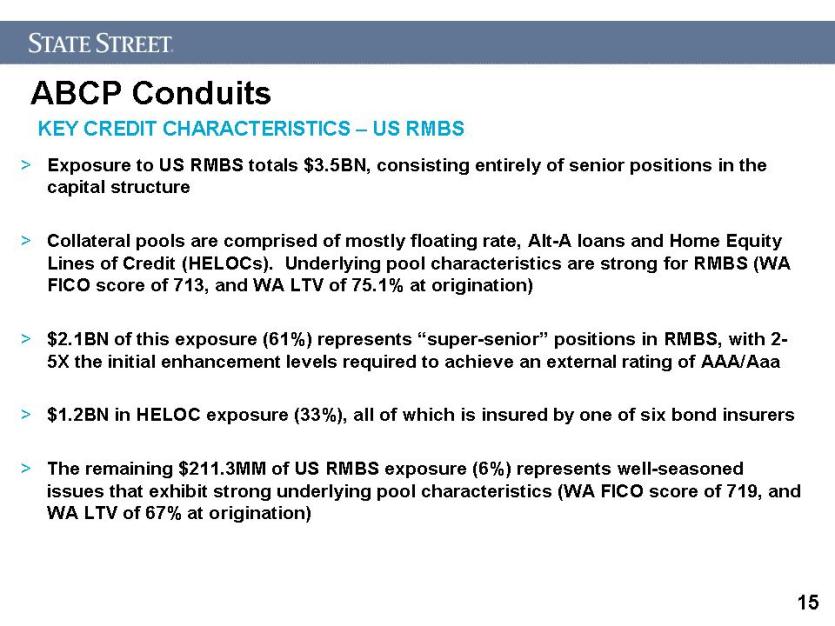
KEY CREDIT CHARACTERISTICS – US RMBS Exposure to US RMBS totals $3.5BN, consisting entirely of senior positions in the capital structure Collateral pools are comprised of mostly floating rate, Alt-A loans and Home Equity Lines of Credit (HELOCs). Underlying pool characteristics are strong for RMBS (WA FICO score of 713, and WA LTV of 75.1% at origination) $2.1BN of this exposure (61%) represents “super-senior” positions in RMBS, with 2-5X the initial enhancement levels required to achieve an external rating of AAA/Aaa $1.2BN in HELOC exposure (33%), all of which is insured by one of six bond insurers The remaining $211.3MM of US RMBS exposure (6%) represents well-seasoned issues that exhibit strong underlying pool characteristics (WA FICO score of 719, and WA LTV of 67% at origination) ABCP Conduits 15
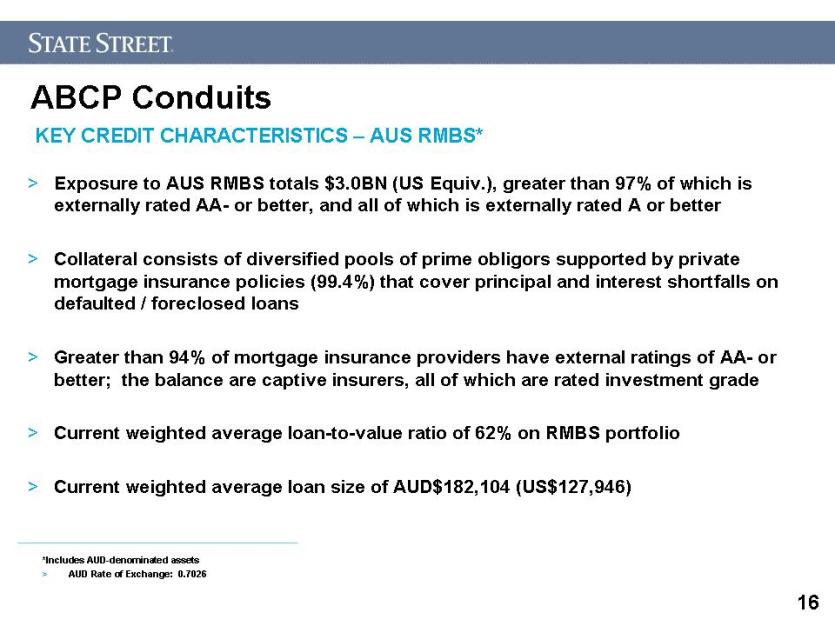
Exposure to AUS RMBS totals $3.0BN (US Equiv.), greater than 97% of which is externally rated AA- or better, and all of which is externally rated A or better Collateral consists of diversified pools of prime obligors supported by private mortgage insurance policies (99.4%) that cover principal and interest shortfalls on defaulted / foreclosed loans Greater than 94% of mortgage insurance providers have external ratings of AA- or better; the balance are captive insurers, all of which are rated investment grade Current weighted average loan-to-value ratio of 62% on RMBS portfolio Current weighted average loan size of AUD$182,104 (US$127,946) KEY CREDIT CHARACTERISTICS – AUS RMBS* *Includes AUD-denominated assets AUD Rate of Exchange: 0.7026 ABCP Conduits 16
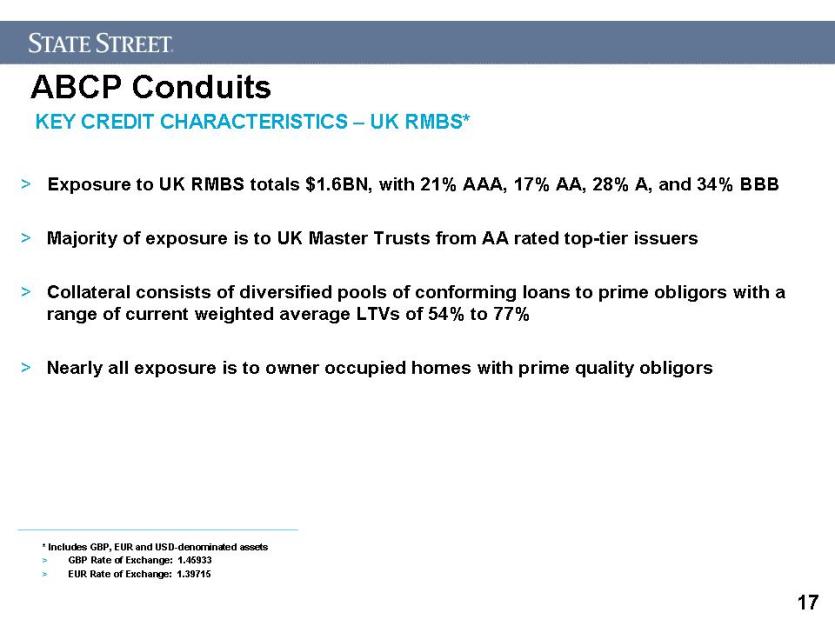
KEY CREDIT CHARACTERISTICS – UK RMBS* Exposure to UK RMBS totals $1.6BN, with 21% AAA, 17% AA, 28% A, and 34% BBB Majority of exposure is to UK Master Trusts from AA rated top-tier issuers Collateral consists of diversified pools of conforming loans to prime obligors with a range of current weighted average LTVs of 54% to 77% Nearly all exposure is to owner occupied homes with prime quality obligors * Includes GBP, EUR and USD-denominated assets GBP Rate of Exchange: 1.45933 EUR Rate of Exchange: 1.39715 ABCP Conduits 17
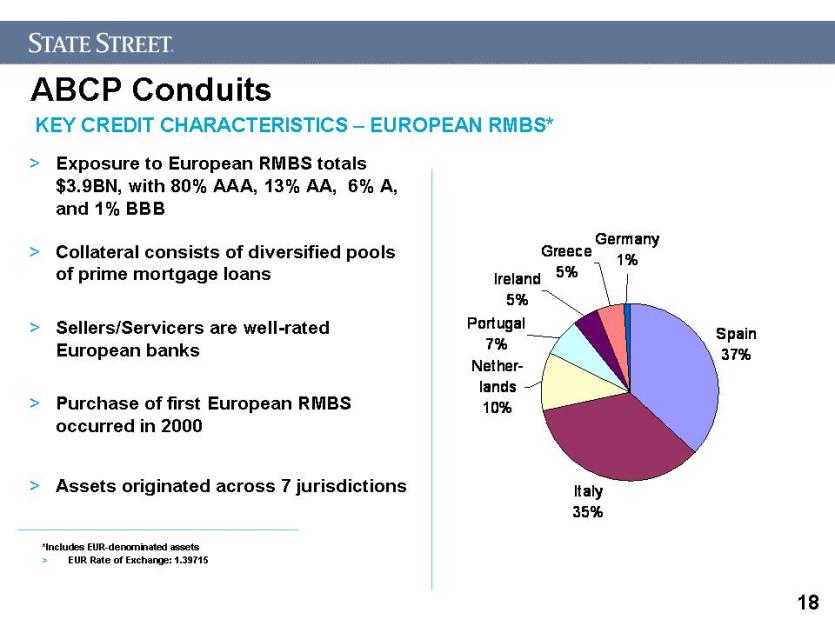
KEY CREDIT CHARACTERISTICS – EUROPEAN RMBS* Exposure to European RMBS totals $3.9BN, with 80% AAA, 13% AA, 6% A, and 1% BBB Collateral consists of diversified pools of prime mortgage loans Sellers/Servicers are well-rated European banks Purchase of first European RMBS occurred in 2000 Assets originated across 7 jurisdictions *Includes EUR-denominated assets EUR Rate of Exchange: 1.39715 ABCP Conduits Spain 37% Italy 35% Ireland 5% Portugal 7% Netherlands 10% Germany 1% Greece 5% 18
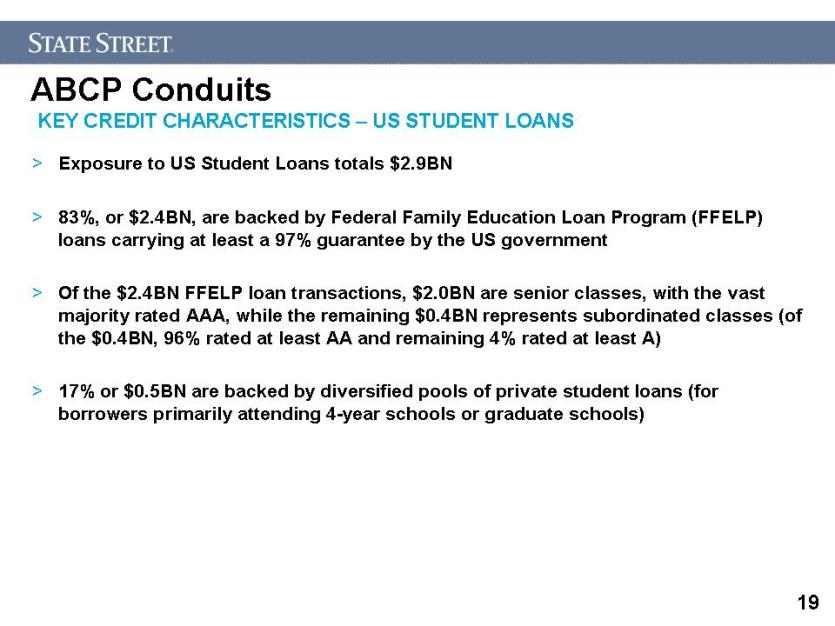
KEY CREDIT CHARACTERISTICS – US STUDENT LOANS Exposure to US Student Loans totals $2.9BN 83%, or $2.4BN, are backed by Federal Family Education Loan Program (FFELP) loans carrying at least a 97% guarantee by the US government Of the $2.4BN FFELP loan transactions, $2.0BN are senior classes, with the vast majority rated AAA, while the remaining $0.4BN represents subordinated classes (of the $0.4BN, 96% rated at least AA and remaining 4% rated at least A) 17% or $0.5BN are backed by diversified pools of private student loans (for borrowers primarily attending 4-year schools or graduate schools) ABCP Conduits 19
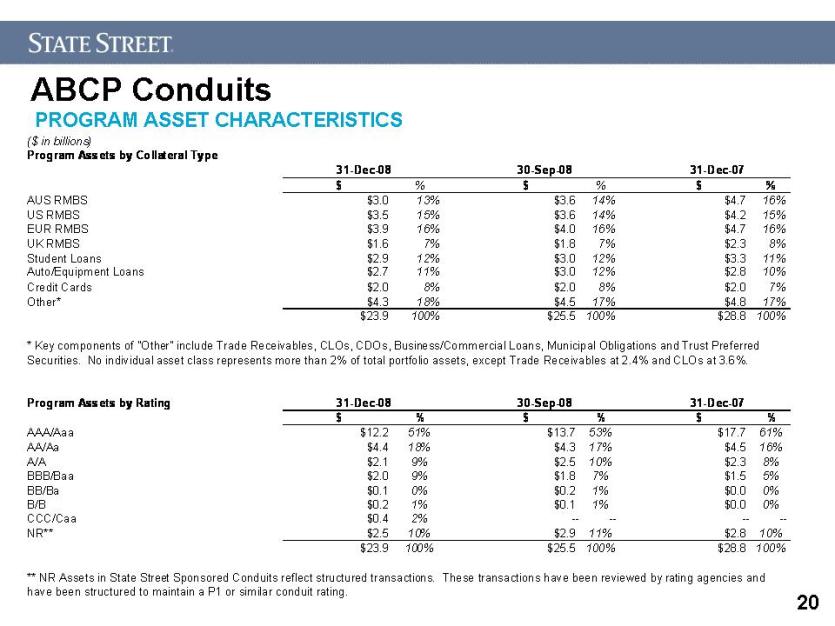
PROGRAM ASSET CHARACTERISTICS ABCP Conduits ($ in billions) Program Assets by Collateral Type $ % $ % $ % AUS RMBS $3.0 13% $3.6 14% $4.7 16% US RMBS $3.5 15% $3.6 14% $4.2 15% EUR RMBS $3.9 16% $4.0 16% $4.7 16% UK RMBS $1.6 7% $1.8 7% $2.3 8% Student Loans $2.9 12% $3.0 12% $3.3 11% Auto/Equipment Loans $2.7 11% $3.0 12% $2.8 10% Credit Cards $2.0 8% $2.0 8% $2.0 7% Other* $4.3 18% $4.5 17% $4.8 17% $23.9 100% $25.5 100% $28.8 100% Program Assets by Rating $ % $ % $ % AAA/Aaa $12.2 51% $13.7 53% $17.7 61% AA/Aa $4.4 18% $4.3 17% $4.5 16% A/A $2.1 9% $2.5 10% $2.3 8% BBB/Baa $2.0 9% $1.8 7% $1.5 5% BB/Ba $0.1 0% $0.2 1% $0.0 0% B/B $0.2 1% $0.1 1% $0.0 0% CCC/Caa $0.4 2% -- -- -- -- NR** $2.5 10% $2.9 11% $2.8 10% $23.9 100% $25.5 100% $28.8 100% ** NR Assets in State Street Sponsored Conduits reflect structured transactions. These transactions have been reviewed by rating agencies and have been structured to maintain a P1 or similar conduit rating. 31-Dec-08 30-Sep-08 31-Dec-07 * Key components of "Other" include Trade Receivables, CLOs, CDOs, Business/Commercial Loans, Municipal Obligations and Trust Preferred Securities. No individual asset class represents more than 2% of total portfolio assets, except Trade Receivables at 2.4% and CLOs at 3.6%. 20
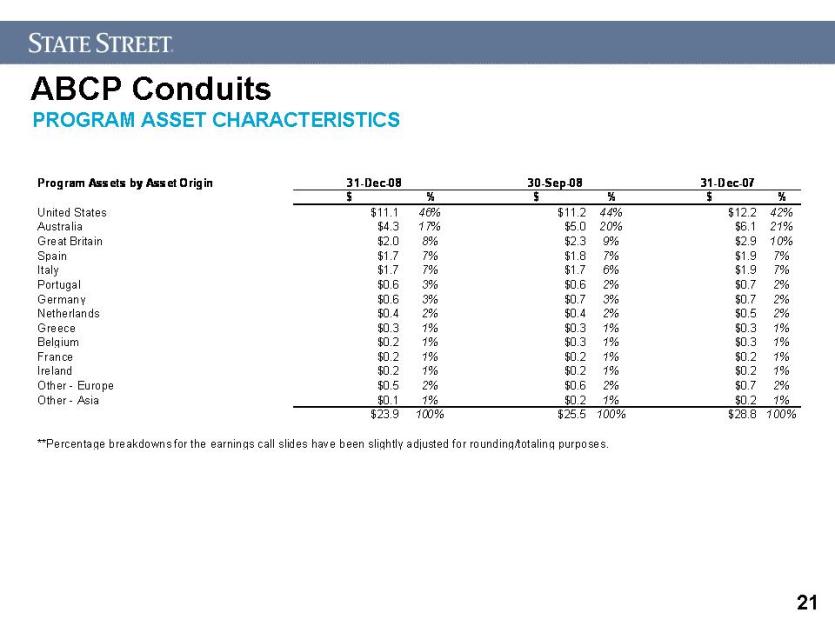
PROGRAM ASSET CHARACTERISTICS ABCP Conduits Program Assets by Asset Origin $ % $ % $ % United States $11.1 46% $11.2 44% $12.2 42% Australia $4.3 17% $5.0 20% $6.1 21% Great Britain $2.0 8% $2.3 9% $2.9 10% Spain $1.7 7% $1.8 7% $1.9 7% Italy $1.7 7% $1.7 6% $1.9 7% Portugal $0.6 3% $0.6 2% $0.7 2% Germany $0.6 3% $0.7 3% $0.7 2% Netherlands $0.4 2% $0.4 2% $0.5 2% Greece $0.3 1% $0.3 1% $0.3 1% Belgium $0.2 1% $0.3 1% $0.3 1% France $0.2 1% $0.2 1% $0.2 1% Ireland $0.2 1% $0.2 1% $0.2 1% Other - Europe $0.5 2% $0.6 2% $0.7 2% Other - Asia $0.1 1% $0.2 1% $0.2 1% $23.9 100% $25.5 100% $28.8 100% **Percentage breakdowns for the earnings call slides have been slightly adjusted for rounding/totaling purposes. 31-Dec-07 31-Dec-08 30-Sep-08 21
ABCP Conduits APPENDIX 22
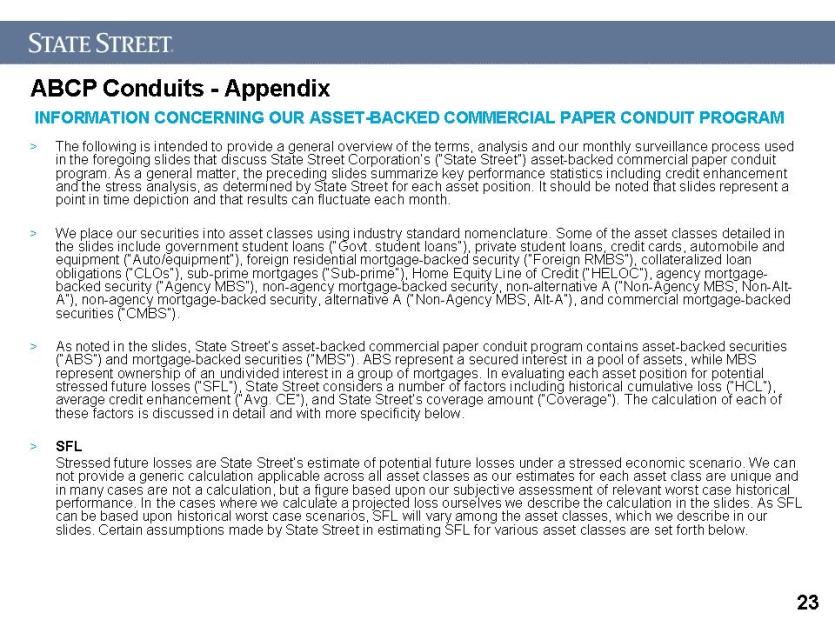
ABCP Conduits APPENDIX 22 Slide: 23 ABCP Conduits - Appendix The following is intended to provide a general overview of the terms, analysis and our monthly surveillance process used in the foregoing slides that discuss State Street Corporation’s (“State Street”) asset-backed commercial paper conduit program. As a general matter, the preceding slides summarize key performance statistics including credit enhancement and the stress analysis, as determined by State Street for each asset position. It should be noted that slides represent a point in time depiction and that results can fluctuate each month. We place our securities into asset classes using industry standard nomenclature. Some of the asset classes detailed in the slides include government student loans (“Govt. student loans”), private student loans, credit cards, automobile and equipment (“Auto/equipment”), foreign residential mortgage-backed security (“Foreign RMBS”), collateralized loan obligations (“CLOs”), sub-prime mortgages (“Sub-prime”), Home Equity Line of Credit (“HELOC”), agency mortgage-backed security (“Agency MBS”), non-agency mortgage-backed security, non-alternative A (“Non-Agency MBS, Non-Alt-A”), non-agency mortgage-backed security, alternative A (“Non-Agency MBS, Alt-A”), and commercial mortgage-backed securities (“CMBS”). As noted in the slides, State Street’s asset-backed commercial paper conduit program contains asset-backed securities (“ABS”) and mortgage-backed securities (“MBS”). ABS represent a secured interest in a pool of assets, while MBS represent ownership of an undivided interest in a group of mortgages. In evaluating each asset position for potential stressed future losses (“SFL”), State Street considers a number of factors including historical cumulative loss (“HCL”), average credit enhancement (“Avg. CE”), and State Street’s coverage amount (“Coverage”). The calculation of each of these factors is discussed in detail and with more specificity below. SFL Stressed future losses are State Street’s estimate of potential future losses under a stressed economic scenario. We can not provide a generic calculation applicable across all asset classes as our estimates for each asset class are unique and in many cases are not a calculation, but a figure based upon our subjective assessment of relevant worst case historical performance. In the cases where we calculate a projected loss ourselves we describe the calculation in the slides. As SFL can be based upon historical worst case scenarios, SFL will vary among the asset classes, which we describe in our slides. Certain assumptions made by State Street in estimating SFL for various asset classes are set forth below. INFORMATION CONCERNING OUR ASSET-BACKED COMMERCIAL PAPER CONDUIT PROGRAM 23
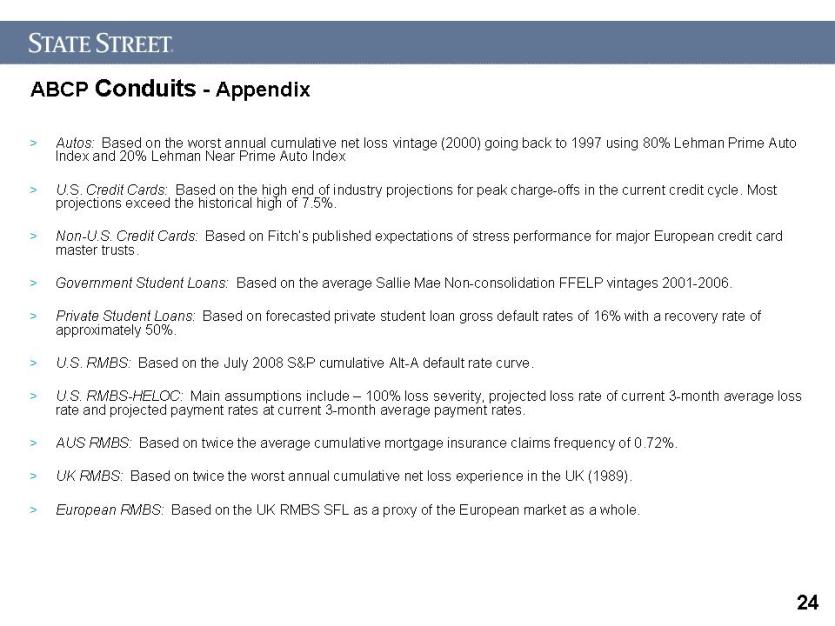
Autos: Based on the worst annual cumulative net loss vintage (2000) going back to 1997 using 80% Lehman Prime Auto Index and 20% Lehman Near Prime Auto Index U.S. Credit Cards: Based on the high end of industry projections for peak charge-offs in the current credit cycle. Most projections exceed the historical high of 7.5%. Non-U.S. Credit Cards: Based on Fitch’s published expectations of stress performance for major European credit card master trusts. Government Student Loans: Based on the average Sallie Mae Non-consolidation FFELP vintages 2001-2006. Private Student Loans: Based on forecasted private student loan gross default rates of 16% with a recovery rate of approximately 50%. U.S. RMBS: Based on the July 2008 S&P cumulative Alt-A default rate curve. U.S. RMBS-HELOC: Main assumptions include – 100% loss severity, projected loss rate of current 3-month average loss rate and projected payment rates at current 3-month average payment rates. AUS RMBS: Based on twice the average cumulative mortgage insurance claims frequency of 0.72%. UK RMBS: Based on twice the worst annual cumulative net loss experience in the UK (1989). European RMBS: Based on the UK RMBS SFL as a proxy of the European market as a whole. ABCP Conduits - Appendix 24
ABCP Conduits - Appendix HCL Historical cumulative loss is determined by State Street based upon data obtained from third party providers. Avg. CE Credit enhancement is determined by State Street based upon data obtained from third party providers. CE can include excess spread for the most recent year, over-collateralization, cash reserves, and subordination. Coverage Coverage is calculated by dividing CE by SFL, which results in the coverage multiple. Coverage is provided as a measure of excess enhancement above our projected future losses under a stressed economic scenario. As noted above and in the slides, in performing these calculations we collect and use information provided by third party providers. The information we used to create these slides included information from the latest surveillance reports that included data from servicer reports received during the most recent month. Third party sources use assumptions, judgments and estimates in determining data, and different third parties may provide different data. It should be noted that certain securities report on a quarterly vs. monthly basis. For those securities, the most recent available information was used. It should be noted that industry information, rather than portfolio experience was used in certain instances where industry information resulted in a more conservative approach. State Street does not independently verify the data obtained from third party providers that is used in determining and estimating SFL, HCL, Avg. CE and Coverage and the information is subject to the risk of inaccuracy. As noted above and in the slides, State Street’s estimates are based upon various subjective assumptions, and there is no assurance that these assumptions accurately predict maximum potential or likely future losses. 25