Exhibit 99.4
Capital Structure As of March 31, 2009 April 21, 2009
FORWARD-LOOKING STATEMENTS This presentation contains forward-looking statements as defined by United States securities laws, including statements about our goals and expectations regarding our business, financial condition, results of operations and strategies, the financial and market outlook, governmental and regulatory initiatives and developments, and the business environment. These statements are not guarantees of future performance, are inherently uncertain, are based on current assumptions that are difficult to predict and involve a number of risks and uncertainties. Therefore, actual outcomes and results may differ materially from what is expressed in those statements, and those statements should not be relied upon as representing our expectations or beliefs as of any date subsequent to the date of this presentation. Important factors that may affect future results and outcomes include: global financial market disruptions and the current worldwide economic recession, and monetary and other governmental actions designed to address such disruptions and recession in the U.S. and internationally; the possibility that changes in market conditions, regulatory activities or asset performance (including the financial condition of any insurer or guarantor, or the ratings, of any assets) or to accounting rules may require any off-balance sheet activities, including the unconsolidated asset-backed commercial paper conduits we administer, to be consolidated into our financial statements, requiring the recognition of associated losses; the financial strength of the counterparties with which we or our clients do business and with which we have investment or financial exposure; the liquidity of the U.S. and international securities markets, particularly the markets for fixed-income securities, and the liquidity requirements of our customers; the credit quality and credit agency ratings of the securities in our investment securities portfolio, a deterioration or downgrade of which could lead to other-than-temporary impairment of the respective securities and the recognition of an impairment loss; the maintenance of credit agency ratings for our debt obligations as well as the level of credibility of credit agency ratings; the possibility of our customers incurring substantial losses in investment pools where we act as agent, and the possibility of further general reductions in the valuation of assets; our ability to attract deposits and other low-cost, short-term funding; potential changes to the competitive environment, including changes due to the effects of consolidation, extensive and changing government regulation and perceptions of State Street as a suitable service provider or counterparty; the level and volatility of interest rates and the performance and volatility of securities, credit, currency and other markets in the U.S. and internationally; our ability to measure the fair value of securities in our investment securities portfolio and in the unconsolidated asset-backed commercial paper conduits we administer; the results of litigation and similar disputes and, in particular, the effect of current or potential litigation concerning SSgA’s active fixed-income strategies, and the enactment of legislation and changes in regulation and enforcement that impact us and our customers, as well as the effects of legal and regulatory proceedings; adverse publicity or other reputational harm; our ability to pursue acquisitions, strategic alliances and divestures, finance future business acquisitions and obtain regulatory approvals and consents for acquisitions; the performance and demand for the products and services we offer, including the level and timing of withdrawals from our collective investment products; our ability to continue to grow revenue, attract highly skilled people, control expenses and attract the capital necessary to achieve our business goals and comply with regulatory requirements; our ability to control operating risks, information technology systems risks and outsourcing risks, the possibility of errors in the quantitative models we use to manage our business and the possibility that our controls will fail or be circumvented; the potential for new products and services to impose additional costs on us and expose us to increased operational risk, and our ability to protect our intellectual property rights; our ability to obtain quality and timely services from third parties with which we contract; changes in accounting standards and practices, including changes in the interpretation of existing standards, that impact our consolidated financial statements; and changes in tax legislation and in the interpretation of existing tax laws by U.S. and non-U.S. tax authorities that impact the amount of taxes due. Other important factors that could cause actual results to differ materially from those indicated by any forward-looking statements are set forth in our 2008 Annual Report on Form 10-K and our subsequent SEC filings. We encourage investors to read our 10-K, particularly the section on Risk Factors, and our subsequent SEC filings for additional information with respect to any forward-looking statements and prior to making any investment decision. The forward-looking statements contained in this presentation speak only as of the date hereof, April 21, 2009, and we do not undertake efforts to revise those forward-looking statements to reflect events after this date.
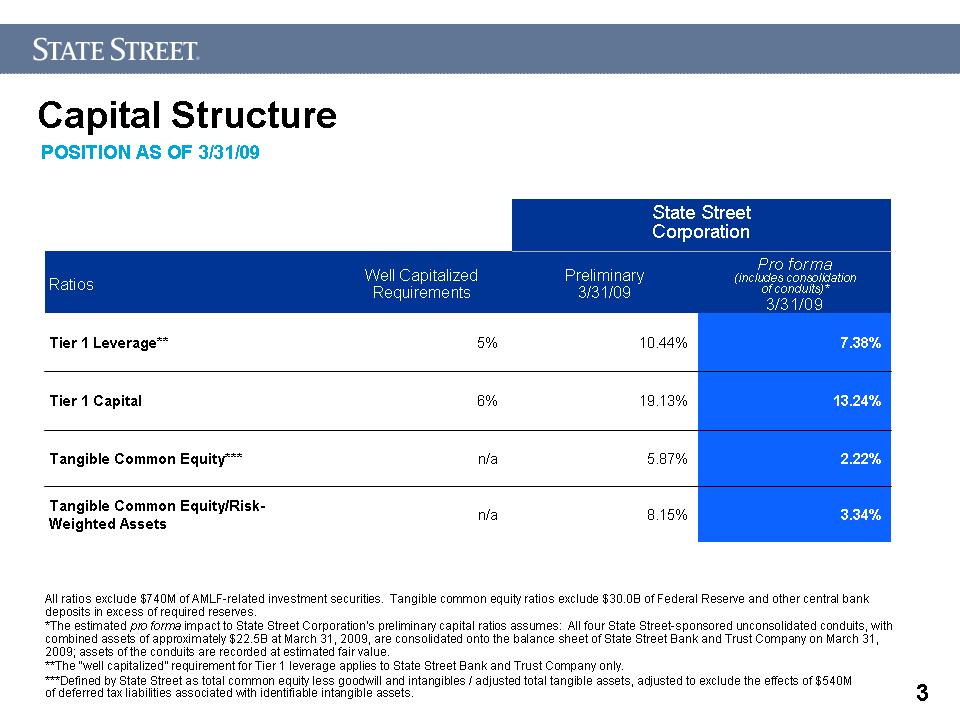
Capital Structure POSITION AS OF 3/31/09 All ratios exclude $740M of AMLF-related investment securities. Tangible common equity ratios exclude $30.0B of Federal Reserve and other central bank deposits in excess of required reserves. *The estimated pro forma impact to State Street Corporation’s preliminary capital ratios assumes: All four State Street-sponsored unconsolidated conduits, with combined assets of approximately $22.5B at March 31, 2009, are consolidated onto the balance sheet of State Street Bank and Trust Company on March 31, 2009; assets of the conduits are recorded at estimated fair value. **The “well capitalized” requirement for Tier 1 leverage applies to State Street Bank and Trust Company only. ***Defined by State Street as total common equity less goodwill and intangibles / adjusted total tangible assets, adjusted to exclude the effects of $540M of deferred tax liabilities associated with identifiable intangible assets. State Street Corporation Ratios Well Capitalized Requirements Preliminary 3/31/09 Pro forma (includes consolidation of conduits)* 3/31/09 Tier 1 Leverage** 5% 10.44% 7.38% Tier 1 Capital 6% 19.13% 13.24% Tangible Common Equity*** n/a 5.87% 2.22% Tangible Common Equity/Risk-Weighted Assets n/a 8.15% 3.34%
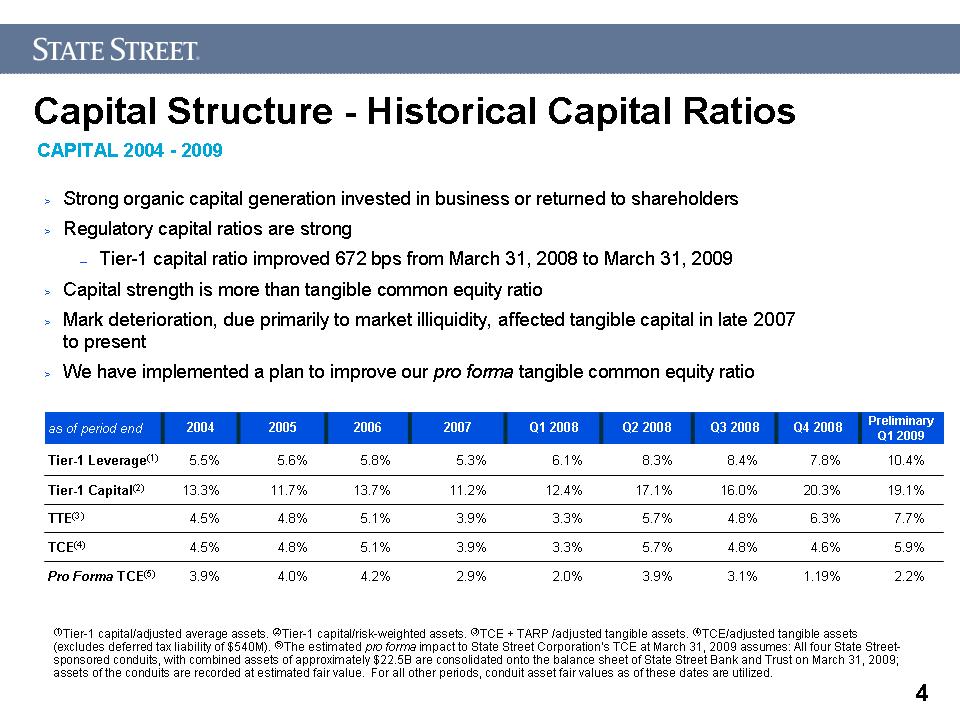
Capital Structure - Historical Capital Ratios (1)Tier-1 capital/adjusted average assets. (2)Tier-1 capital/risk-weighted assets. (3)TCE + TARP /adjusted tangible assets. (4)TCE/adjusted tangible assets (excludes deferred tax liability of $540M). (5)The estimated pro forma impact to State Street Corporation’s TCE at March 31, 2009 assumes: All four State Street-sponsored conduits, with combined assets of approximately $22.5B are consolidated onto the balance sheet of State Street Bank and Trust on March 31, 2009; assets of the conduits are recorded at estimated fair value. For all other periods, conduit asset fair values as of these dates are utilized. Strong organic capital generation invested in business or returned to shareholders Regulatory capital ratios are strong Tier-1 capital ratio improved 672 bps from March 31, 2008 to March 31, 2009 Capital strength is more than tangible common equity ratio Mark deterioration, due primarily to market illiquidity, affected tangible capital in late 2007 to present We have implemented a plan to improve our pro forma tangible common equity ratio CAPITAL 2004 - 2009 as of period end 2004 2005 2006 2007 Q1 2008 Q2 2008 Q3 2008 Q4 2008 Preliminary Q1 2009 Tier-1 Leverage(1) 5.5% 5.6% 5.8% 5.3% 6.1% 8.3% 8.4% 7.8% 10.4% Tier-1 Capital(2) 13.3% 11.7% 13.7% 11.2% 12.4% 17.1% 16.0% 20.3% 19.1% TTE(3) 4.5% 4.8% 5.1% 3.9% 3.3% 5.7% 4.8% 6.3% 7.7% TCE(4) 4.5% 4.8% 5.1% 3.9% 3.3% 5.7% 4.8% 4.6% 5.9% Pro Forma TCE(5) 3.9% 4.0% 4.2% 2.9% 2.0% 3.9% 3.1% 1.19% 2.2%
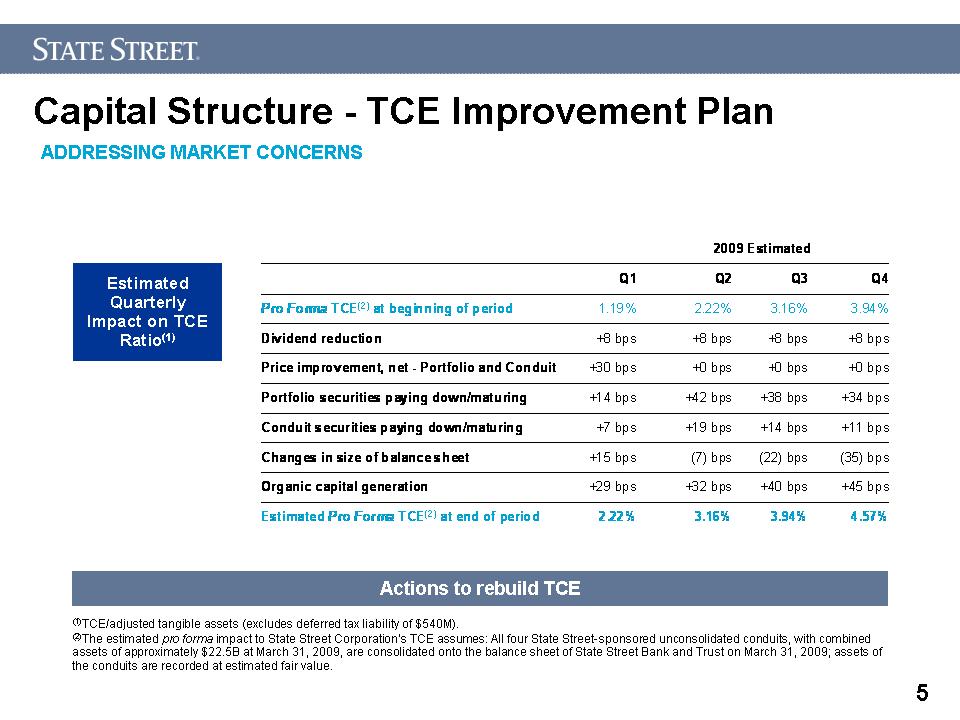
Capital Structure - TCE Improvement Plan (1)TCE/adjusted tangible assets (excludes deferred tax liability of $540M). (2)The estimated pro forma impact to State Street Corporation’s TCE assumes: All four State Street-sponsored unconsolidated conduits, with combined assets of approximately $22.5B at March 31, 2009, are consolidated onto the balance sheet of State Street Bank and Trust on March 31, 2009; assets of the conduits are recorded at estimated fair value. Actions to rebuild TCE Estimated Quarterly Impact on TCE Ratio(1) ADDRESSING MARKET CONCERNS
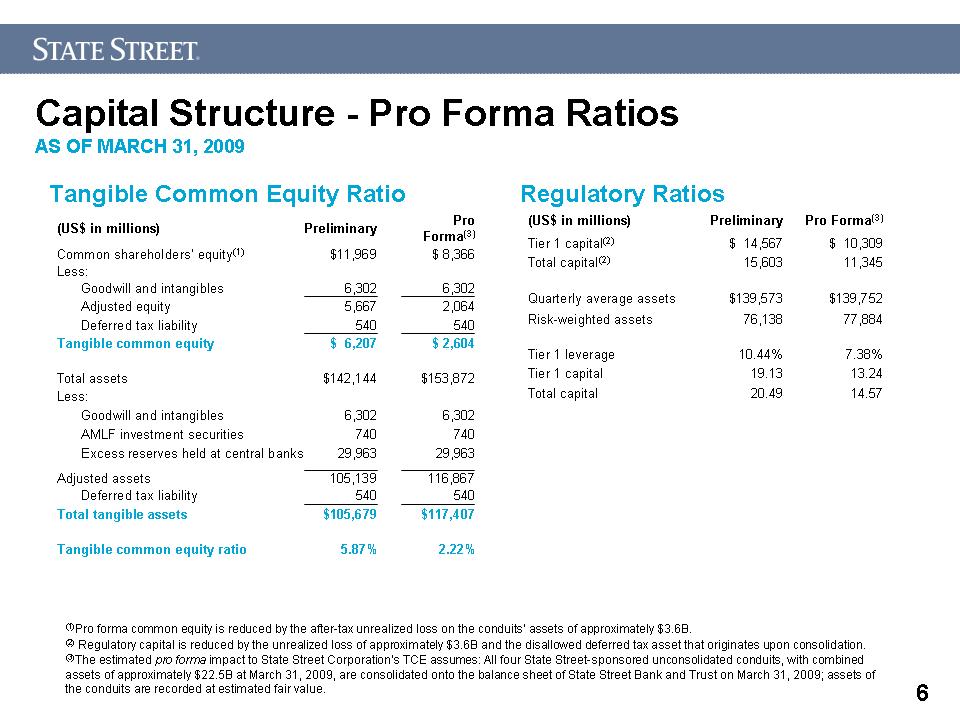
Capital Structure - Pro Forma Ratios AS OF MARCH 31, 2009 (1)Pro forma common equity is reduced by the after-tax unrealized loss on the conduits’ assets of approximately $3.6B. (2) Regulatory capital is reduced by the unrealized loss of approximately $3.6B and the disallowed deferred tax asset that originates upon consolidation. (3)The estimated pro forma impact to State Street Corporation’s TCE assumes: All four State Street-sponsored unconsolidated conduits, with combined assets of approximately $22.5B at March 31, 2009, are consolidated onto the balance sheet of State Street Bank and Trust on March 31, 2009; assets of the conduits are recorded at estimated fair value. Tangible Common Equity Ratio Regulatory Ratios (US$ in millions) Preliminary Pro Forma(3) Common shareholders’ equity(1) $11,969 $ 8,366 Less: Goodwill and intangibles 6,302 6,302 Adjusted equity 5,667 2,064 Deferred tax liability 540 540 Tangible common equity $ 6,207 $ 2,604 Total assets $142,144 $153,872 Less: Goodwill and intangibles 6,302 6,302 AMLF investment securities 740 740 Excess reserves held at central banks 29,963 29,963 Adjusted assets 105,139 116,867 Deferred tax liability 540 540 Total tangible assets $105,679 $117,407 Tangible common equity ratio 5.87% 2.22% (US$ in millions) Preliminary Pro Forma(3) Tier 1 capital(2) $ 14,567 $ 10,309 Total capital(2) 15,603 11,345 Quarterly average assets $139,573 $139,752 Risk-weighted assets 76,138 77,884 Tier 1 leverage 10.44% 7.38% Tier 1 capital 19.13 13.24 Total capital 20.49 14.57