
Third Quarter 2024 Earnings November 5, 2024 1
Safe Harbor Statement Forward-Looking Statements: This presentation contains forward-looking statements within the meaning of federal securities laws, including, among others, statements about our expectations, plans, strategies or prospects. We generally use the words “may,” “will,” “expect,” “believe,” “anticipate,” “plan,” “estimate,” “project,” “assume,” “guide,” “target,” “forecast,” “see,” “seek,” “can,” “should,” “could,” “would,” “intend,” “predict,” “potential,” “strategy,” “is confident that,” “future,” “opportunity,” “work toward,” and similar expressions to identify forward- looking statements. All statements other than statements of historical or current fact are, or may be deemed to be, forward-looking statements. Such statements are based upon the current beliefs, expectations and assumptions of management and are subject to significant risks, uncertainties and changes in circumstances that could cause actual results to differ materially from the forward-looking statements. Forward-looking statements speak only as of the date they are made, and we disclaim any intention or obligation to update or revise any forward-looking statements, whether as a result of new information, future events or otherwise. Readers of this presentation are cautioned not to rely on these forward-looking statements, since there can be no assurance that these forward-looking statements will prove to be accurate. This cautionary statement is applicable to all forward-looking statements contained in this presentation. The risks and uncertainties that may cause actual results to differ materially from Masimo’s current expectations are more fully described in Masimo’s reports filed with the U.S. Securities and Exchange Commission (SEC), including our most recent Form 10-K and Form 10-Q. Copies of these filings, as well as subsequent filings, are available online at www.sec.gov, www.masimo.com or upon request. Non-GAAP Financial Measures: The non-GAAP financial measures contained herein are a supplement to the corresponding financial measures prepared in accordance with U.S. GAAP. The non-GAAP financial measures presented exclude certain items that are more fully described in the Appendix. Management believes that adjustments for these items assist investors in making comparisons of period-to-period operating results. Furthermore, management also believes that these items are not indicative of the Company’s on-going core operating performance. These non-GAAP financial measures have certain limitations in that they do not reflect all of the costs associated with the operations of the Company’s business as determined in accordance with GAAP. Therefore, investors should consider non-GAAP financial measures in addition to, and not as a substitute for, or as superior to, measures of financial performance prepared in accordance with GAAP. The non-GAAP financial measures presented by the Company may be different from the non-GAAP financial measures used by other companies. The Company has presented the following non-GAAP financial measures to assist investors in understanding the Company’s core net operating results on an on-going basis: non-GAAP revenue (constant currency), pro-forma non-GAAP revenue (constant currency), pro-forma non-GAAP revenue growth (constant currency), non-GAAP gross profit/margin %, non-GAAP SG&A expense (prior definition and updated definition), non-GAAP R&D expense, non-GAAP litigation settlements and awards, non-GAAP impairment charge, non-GAAP operating expense % (prior definition and updated definition), non-GAAP operating profit/margin % (prior definition and updated definition), non-GAAP non-operating income (expense), non-GAAP provision for income taxes (prior definition and updated definition), non-GAAP net income (loss) (prior definition and updated definition), non-GAAP net income (loss) per share (prior definition and updated definition). These non-GAAP financial measures may also assist investors in making comparisons of the company’s core operating results with those of other companies. Management believes these non-GAAP financial measures are important in the evaluation of the Company’s performance and uses these measures to better understand and evaluate our business. For additional financial details, including GAAP to non-GAAP reconciliations, please visit the Investor Relations section of the Company’s website at www.investor.masimo.com to access Supplementary Financial Information. Forward-Looking Non-GAAP Financial Measures: This presentation also includes certain forward-looking non-GAAP financial measures. We calculate forward-looking non-GAAP financial measures based on internal forecasts that omit certain amounts that would be included in GAAP financial measures. For instance, we exclude the impact of certain charges related to acquisitions, integrations, divestitures and related costs; business transition and related costs; litigation related expenses and settlements; realized and unrealized gains or losses; tax related adjustments; and other adjustments. We have not provided quantitative reconciliations of these forward-looking non-GAAP financial measures to the most directly comparable forward-looking GAAP financial measures because the excluded items are not available on a prospective basis without unreasonable efforts. For example, the timing of certain transactions is difficult to predict because management's plans may change. In addition, the Company believes such reconciliations would imply a degree of precision and certainty that could be confusing to investors. It is probable that these forward-looking non-GAAP financial measures may be materially different from the corresponding GAAP financial measures. 2
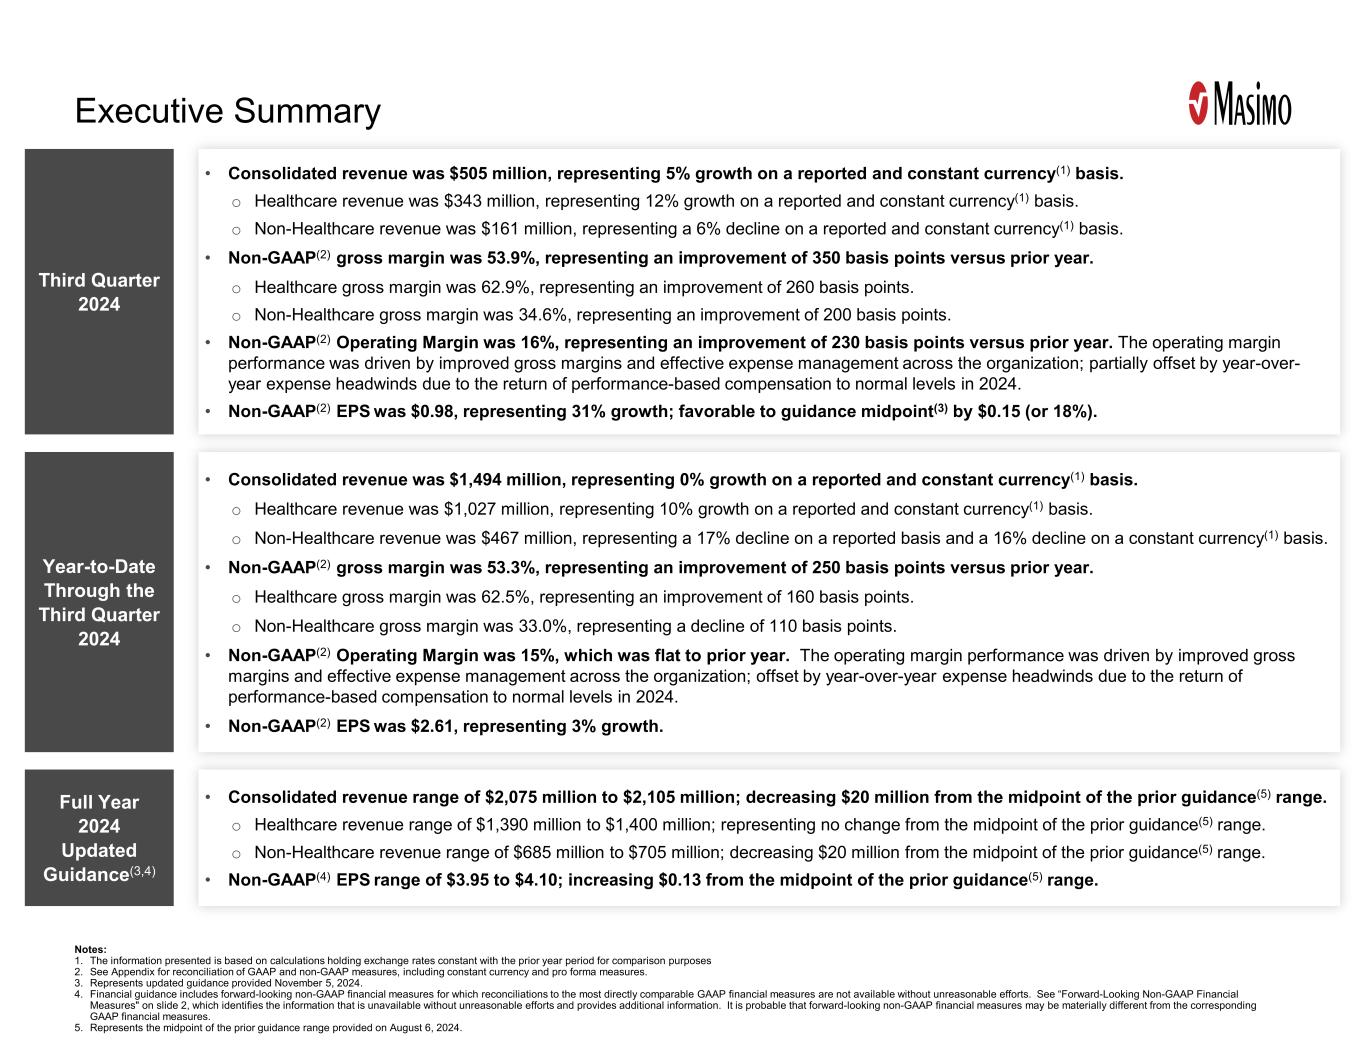
Notes: 1. The information presented is based on calculations holding exchange rates constant with the prior year period for comparison purposes 2. See Appendix for reconciliation of GAAP and non-GAAP measures, including constant currency and pro forma measures. 3. Represents updated guidance provided November 5, 2024. 4. Financial guidance includes forward-looking non-GAAP financial measures for which reconciliations to the most directly comparable GAAP financial measures are not available without unreasonable efforts. See “Forward-Looking Non-GAAP Financial Measures" on slide 2, which identifies the information that is unavailable without unreasonable efforts and provides additional information. It is probable that forward-looking non-GAAP financial measures may be materially different from the corresponding GAAP financial measures. 5. Represents the midpoint of the prior guidance range provided on August 6, 2024. Executive Summary Third Quarter 2024 • Consolidated revenue was $505 million, representing 5% growth on a reported and constant currency(1) basis. o Healthcare revenue was $343 million, representing 12% growth on a reported and constant currency(1) basis. o Non-Healthcare revenue was $161 million, representing a 6% decline on a reported and constant currency(1) basis. • Non-GAAP(2) gross margin was 53.9%, representing an improvement of 350 basis points versus prior year. o Healthcare gross margin was 62.9%, representing an improvement of 260 basis points. o Non-Healthcare gross margin was 34.6%, representing an improvement of 200 basis points. • Non-GAAP(2) Operating Margin was 16%, representing an improvement of 230 basis points versus prior year. The operating margin performance was driven by improved gross margins and effective expense management across the organization; partially offset by year-over- year expense headwinds due to the return of performance-based compensation to normal levels in 2024. • Non-GAAP(2) EPS was $0.98, representing 31% growth; favorable to guidance midpoint(3) by $0.15 (or 18%). Year-to-Date Through the Third Quarter 2024 • Consolidated revenue was $1,494 million, representing 0% growth on a reported and constant currency(1) basis. o Healthcare revenue was $1,027 million, representing 10% growth on a reported and constant currency(1) basis. o Non-Healthcare revenue was $467 million, representing a 17% decline on a reported basis and a 16% decline on a constant currency(1) basis. • Non-GAAP(2) gross margin was 53.3%, representing an improvement of 250 basis points versus prior year. o Healthcare gross margin was 62.5%, representing an improvement of 160 basis points. o Non-Healthcare gross margin was 33.0%, representing a decline of 110 basis points. • Non-GAAP(2) Operating Margin was 15%, which was flat to prior year. The operating margin performance was driven by improved gross margins and effective expense management across the organization; offset by year-over-year expense headwinds due to the return of performance-based compensation to normal levels in 2024. • Non-GAAP(2) EPS was $2.61, representing 3% growth. Full Year 2024 Updated Guidance(3,4) • Consolidated revenue range of $2,075 million to $2,105 million; decreasing $20 million from the midpoint of the prior guidance(5) range. o Healthcare revenue range of $1,390 million to $1,400 million; representing no change from the midpoint of the prior guidance(5) range. o Non-Healthcare revenue range of $685 million to $705 million; decreasing $20 million from the midpoint of the prior guidance(5) range. • Non-GAAP(4) EPS range of $3.95 to $4.10; increasing $0.13 from the midpoint of the prior guidance(5) range.
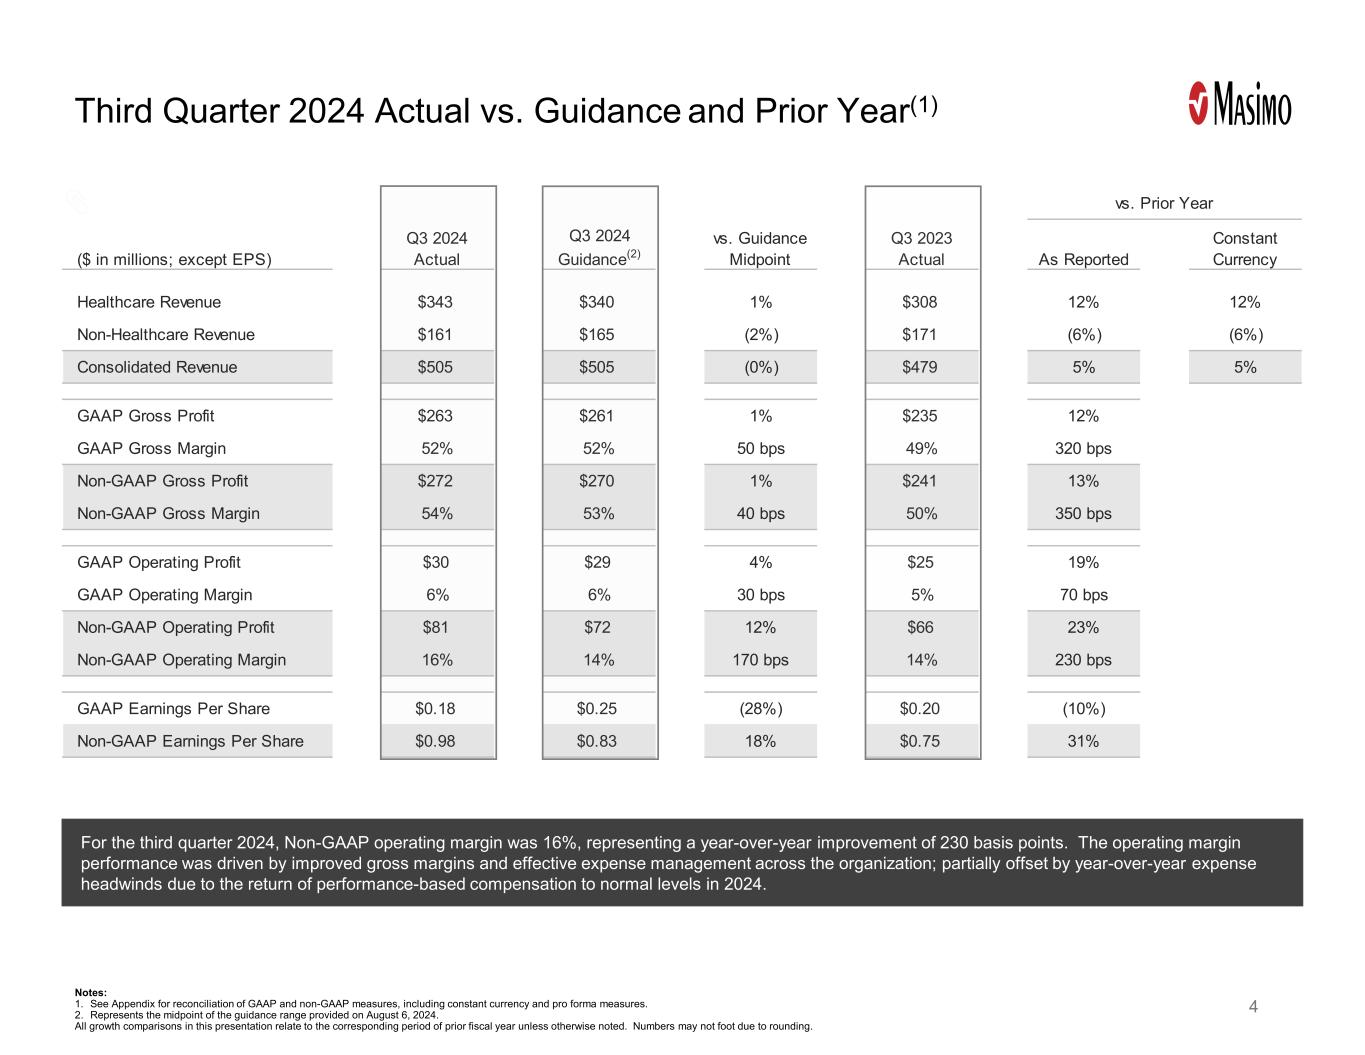
As Reported Constant Currency Healthcare Revenue $343 $340 1% $308 12% 12% Non-Healthcare Revenue $161 $165 (2%) $171 (6%) (6%) Consolidated Revenue $505 $505 (0%) $479 5% 5% GAAP Gross Profit $263 $261 1% $235 12% GAAP Gross Margin 52% 52% 50 bps 49% 320 bps Non-GAAP Gross Profit $272 $270 1% $241 13% Non-GAAP Gross Margin 54% 53% 40 bps 50% 350 bps GAAP Operating Profit $30 $29 4% $25 19% GAAP Operating Margin 6% 6% 30 bps 5% 70 bps Non-GAAP Operating Profit $81 $72 12% $66 23% Non-GAAP Operating Margin 16% 14% 170 bps 14% 230 bps GAAP Earnings Per Share $0.18 $0.25 (28%) $0.20 (10%) Non-GAAP Earnings Per Share $0.98 $0.83 18% $0.75 31% vs. Prior Year ($ in millions; except EPS) Q3 2024 Actual Q3 2023 Actual Q3 2024 Guidance(2) vs. Guidance Midpoint Third Quarter 2024 Actual vs. Guidance and Prior Year(1) For the third quarter 2024, Non-GAAP operating margin was 16%, representing a year-over-year improvement of 230 basis points. The operating margin performance was driven by improved gross margins and effective expense management across the organization; partially offset by year-over-year expense headwinds due to the return of performance-based compensation to normal levels in 2024. 4 Notes: 1. See Appendix for reconciliation of GAAP and non-GAAP measures, including constant currency and pro forma measures. 2. Represents the midpoint of the guidance range provided on August 6, 2024. All growth comparisons in this presentation relate to the corresponding period of prior fiscal year unless otherwise noted. Numbers may not foot due to rounding.

32.6% 34.6% 2023 2024 Financial Performance | Third Quarter 2024 vs. Prior Year(1) 60.3% 62.9% 2023 2024 Third Quarter Healthcare Gross Margin(2) % of Healthcare Revenue Third Quarter Non-Healthcare Gross Margin(2) % of Non-Healthcare Revenue Third Quarter Non-GAAP Earnings Per Share(2) $ per share $308 $343 2023 2024 Third Quarter Healthcare Revenue $MM $171 $161 2023 2024 Third Quarter Non-Healthcare Revenue $MM Third Quarter Consolidated Revenue $MM $479 $505 2023 2024 $0.75 $0.98 2023 2024 Notes: 1. The information presented is based on calculations holding exchange rates constant with the prior year period for comparison purposes. 2. See Appendix for reconciliation of GAAP and non-GAAP measures, including constant currency and pro forma measures.
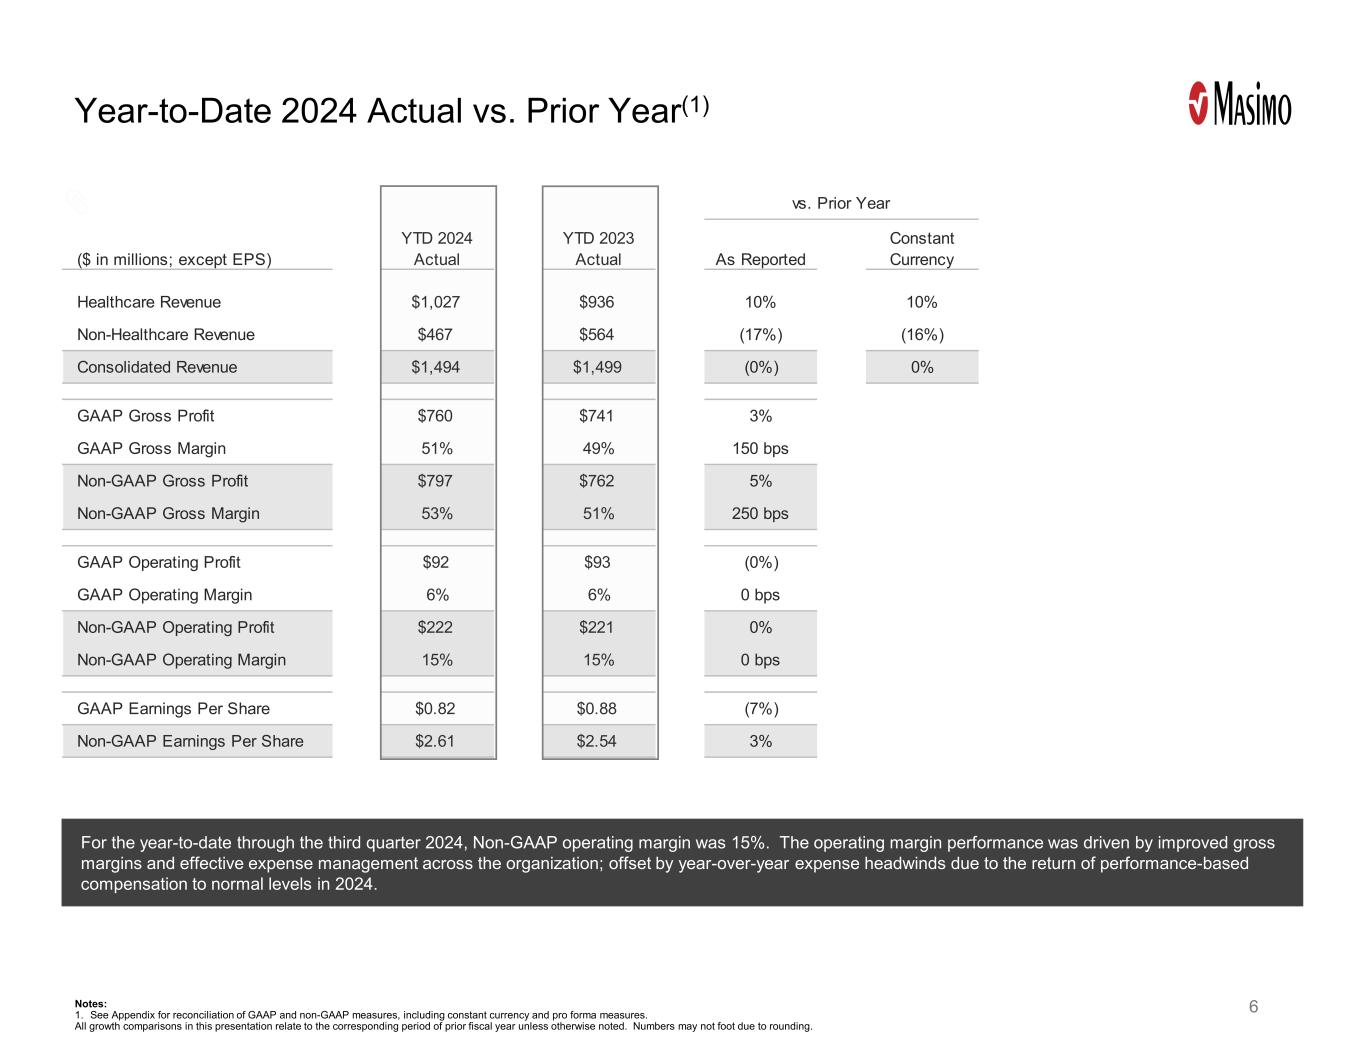
As Reported Constant Currency Healthcare Revenue $1,027 $936 10% 10% Non-Healthcare Revenue $467 $564 (17%) (16%) Consolidated Revenue $1,494 $1,499 (0%) 0% GAAP Gross Profit $760 $741 3% GAAP Gross Margin 51% 49% 150 bps Non-GAAP Gross Profit $797 $762 5% Non-GAAP Gross Margin 53% 51% 250 bps GAAP Operating Profit $92 $93 (0%) GAAP Operating Margin 6% 6% 0 bps Non-GAAP Operating Profit $222 $221 0% Non-GAAP Operating Margin 15% 15% 0 bps GAAP Earnings Per Share $0.82 $0.88 (7%) Non-GAAP Earnings Per Share $2.61 $2.54 3% vs. Prior Year ($ in millions; except EPS) YTD 2024 Actual YTD 2023 Actual Year-to-Date 2024 Actual vs. Prior Year(1) 6Notes: 1. See Appendix for reconciliation of GAAP and non-GAAP measures, including constant currency and pro forma measures. All growth comparisons in this presentation relate to the corresponding period of prior fiscal year unless otherwise noted. Numbers may not foot due to rounding. For the year-to-date through the third quarter 2024, Non-GAAP operating margin was 15%. The operating margin performance was driven by improved gross margins and effective expense management across the organization; offset by year-over-year expense headwinds due to the return of performance-based compensation to normal levels in 2024.
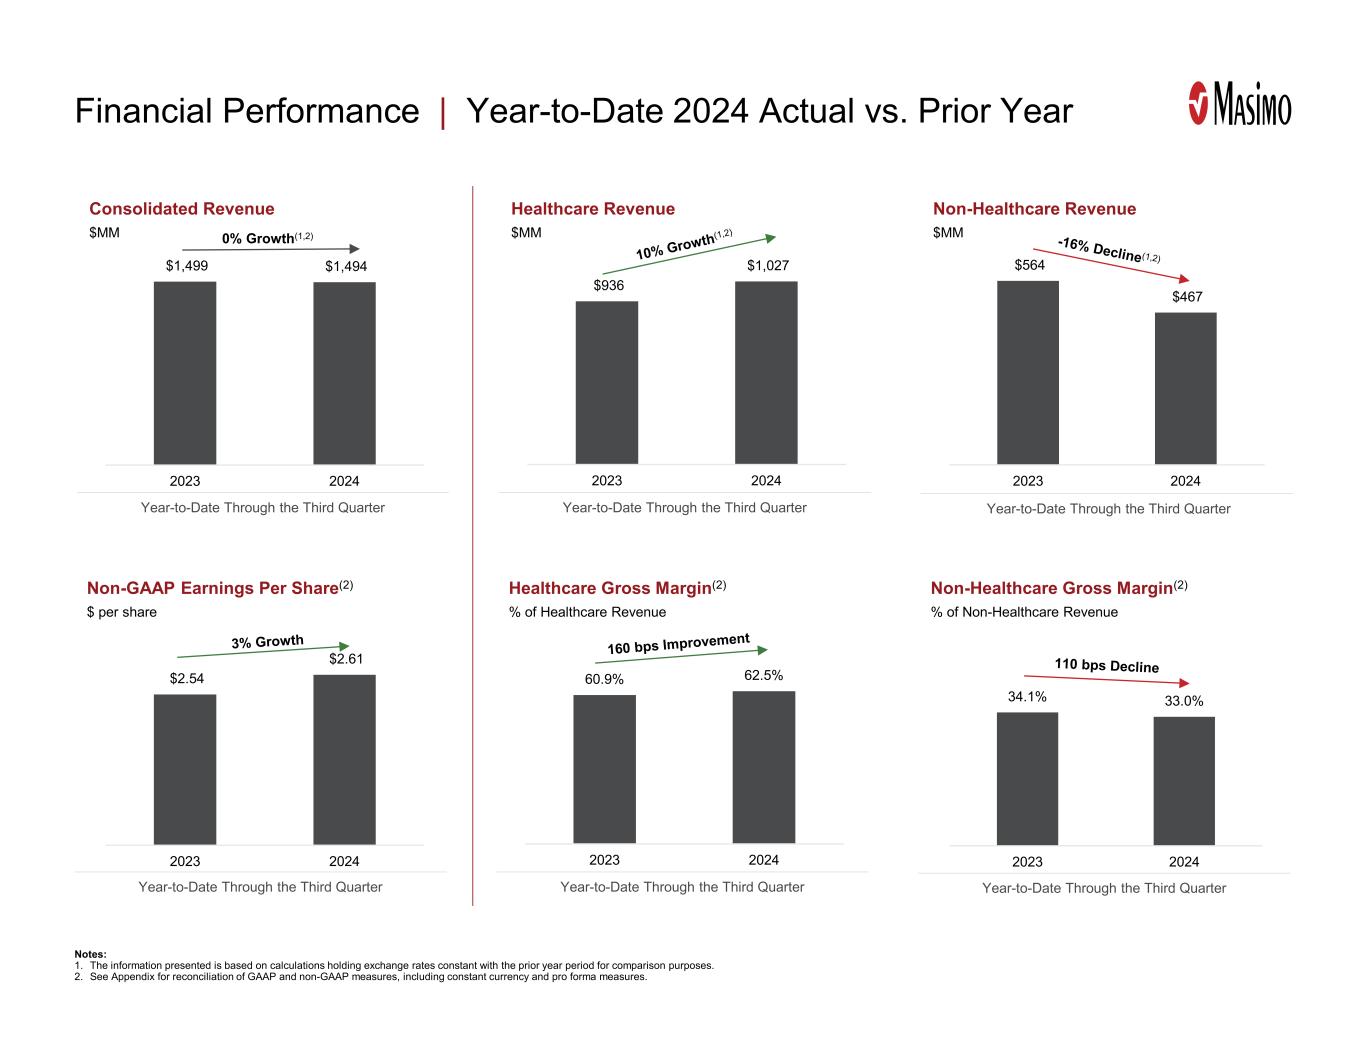
34.1% 33.0% 2023 2024 Financial Performance | Year-to-Date 2024 Actual vs. Prior Year 60.9% 62.5% 2023 2024 Year-to-Date Through the Third Quarter Healthcare Gross Margin(2) % of Healthcare Revenue Notes: 1. The information presented is based on calculations holding exchange rates constant with the prior year period for comparison purposes. 2. See Appendix for reconciliation of GAAP and non-GAAP measures, including constant currency and pro forma measures. Year-to-Date Through the Third Quarter Non-Healthcare Gross Margin(2) % of Non-Healthcare Revenue Year-to-Date Through the Third Quarter Non-GAAP Earnings Per Share(2) $ per share $936 $1,027 2023 2024 Year-to-Date Through the Third Quarter Healthcare Revenue $MM $564 $467 2023 2024 Year-to-Date Through the Third Quarter Non-Healthcare Revenue $MM Year-to-Date Through the Third Quarter Consolidated Revenue $MM $1,499 $1,494 2023 2024 0% Growth(1,2) $2.54 $2.61 2023 2024
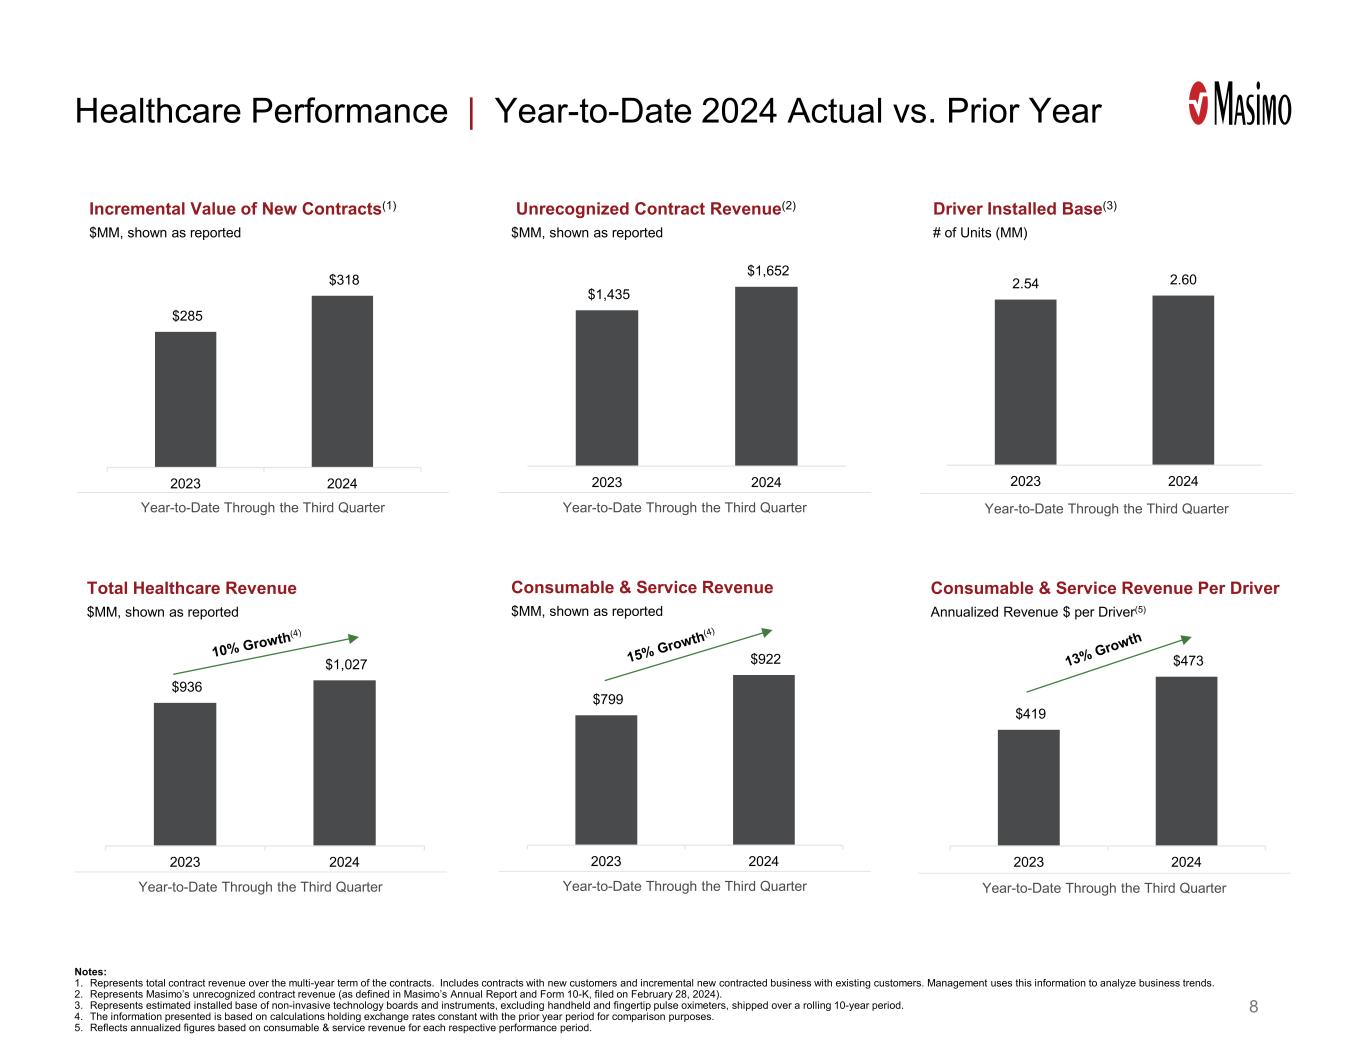
$1,435 $1,652 2023 2024 Healthcare Performance | Year-to-Date 2024 Actual vs. Prior Year Year-to-Date Through the Third Quarter Total Healthcare Revenue $MM, shown as reported Year-to-Date Through the Third Quarter Unrecognized Contract Revenue(2) $MM, shown as reported Year-to-Date Through the Third Quarter Driver Installed Base(3) # of Units (MM) Year-to-Date Through the Third Quarter Incremental Value of New Contracts(1) $MM, shown as reported Year-to-Date Through the Third Quarter Consumable & Service Revenue $MM, shown as reported Year-to-Date Through the Third Quarter Notes: 1. Represents total contract revenue over the multi-year term of the contracts. Includes contracts with new customers and incremental new contracted business with existing customers. Management uses this information to analyze business trends. 2. Represents Masimo’s unrecognized contract revenue (as defined in Masimo’s Annual Report and Form 10-K, filed on February 28, 2024). 3. Represents estimated installed base of non-invasive technology boards and instruments, excluding handheld and fingertip pulse oximeters, shipped over a rolling 10-year period. 4. The information presented is based on calculations holding exchange rates constant with the prior year period for comparison purposes. 5. Reflects annualized figures based on consumable & service revenue for each respective performance period. $936 $1,027 2023 2024 $799 $922 2023 2024 Consumable & Service Revenue Per Driver Annualized Revenue $ per Driver(5) $285 $318 2023 2024 $419 $473 2023 2024 2.54 2.60 2023 2024 8

2024 Financial Guidance | November 5, 2024(1) ($ in millions; except EPS) Low - High Low - High Healthcare Revenue $363 - $373 $1,390 - $1,400 Non-Healthcare Revenue $218 - $238 $685 - $705 Consolidated Revenue $581 - $611 $2,075 - $2,105 Healthcare Revenue Growth (Constant Currency)(2) 7% - 10% 9% - 10% Non-Healthcare Revenue Growth (Constant Currency)(2) 3% - 13% (11%) - (9%) Consolidated Revenue Growth (Constant Currency)(2) 5% - 11% 2% - 3% Non-GAAP Operating Profit $103 - $114 $325 - $336 Non-GAAP Operating Margin 18% - 19% 16% - 16% Non-GAAP Earnings Per Share $1.35 - $1.50 $3.95 - $4.10 Non-GAAP EPS Growth 8% - 20% 4% - 8% FY 2024 GuidanceQ4 2024 Guidance 9 Notes: 1. Financial guidance includes forward-looking non-GAAP financial measures for which reconciliations to the most directly comparable GAAP financial measures are not available without unreasonable efforts. See “Forward-Looking Non-GAAP Financial Measures" on slide 2, which identifies the information that is unavailable without unreasonable efforts and provides additional information. It is probable that forward-looking non-GAAP financial measures may be materially different from the corresponding GAAP financial measures. 2. The information presented is based on calculations holding exchange rates constant with the prior year period for comparison purposes. All growth comparisons in this presentation relate to the corresponding period of prior fiscal year unless otherwise noted. Numbers may not foot due to rounding.

Appendix GAAP to Non-GAAP Reconciliations 10
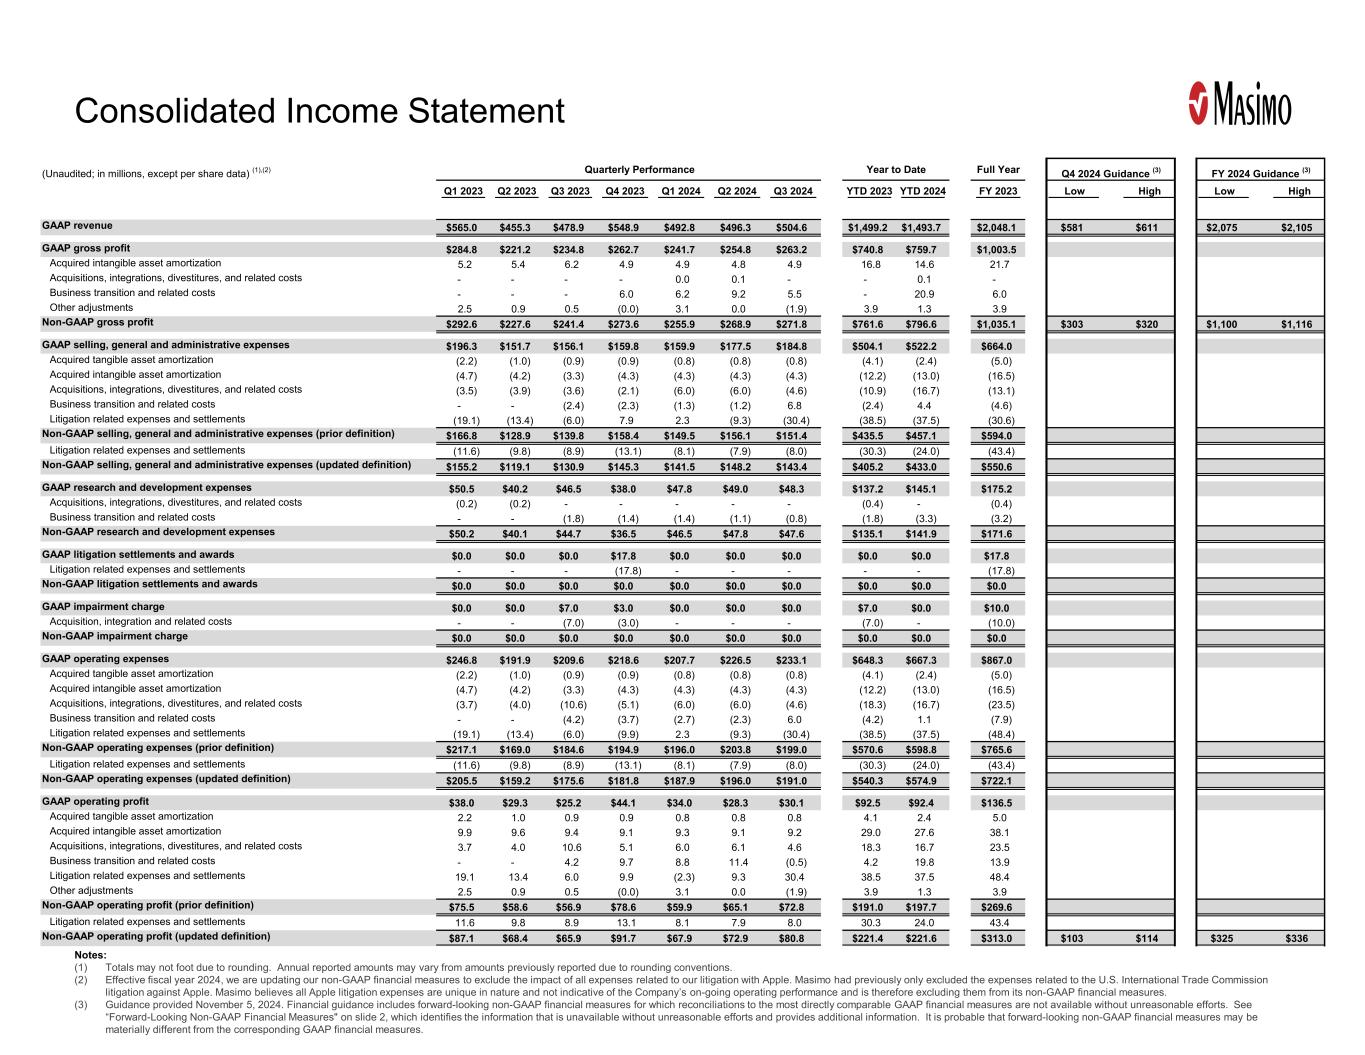
Consolidated Income Statement Notes: (1) Totals may not foot due to rounding. Annual reported amounts may vary from amounts previously reported due to rounding conventions. (2) Effective fiscal year 2024, we are updating our non-GAAP financial measures to exclude the impact of all expenses related to our litigation with Apple. Masimo had previously only excluded the expenses related to the U.S. International Trade Commission litigation against Apple. Masimo believes all Apple litigation expenses are unique in nature and not indicative of the Company’s on-going operating performance and is therefore excluding them from its non-GAAP financial measures. (3) Guidance provided November 5, 2024. Financial guidance includes forward-looking non-GAAP financial measures for which reconciliations to the most directly comparable GAAP financial measures are not available without unreasonable efforts. See “Forward-Looking Non-GAAP Financial Measures" on slide 2, which identifies the information that is unavailable without unreasonable efforts and provides additional information. It is probable that forward-looking non-GAAP financial measures may be materially different from the corresponding GAAP financial measures. (Unaudited; in millions, except per share data) (1),(2) Quarterly Performance Year to Date Full Year Q4 2024 Guidance (3) FY 2024 Guidance (3) Q1 2023 Q2 2023 Q3 2023 Q4 2023 Q1 2024 Q2 2024 Q3 2024 YTD 2023 YTD 2024 FY 2023 Low High Low High GAAP revenue $565.0 $455.3 $478.9 $548.9 $492.8 $496.3 $504.6 $1,499.2 $1,493.7 $2,048.1 $581 $611 $2,075 $2,105 GAAP gross profit $284.8 $221.2 $234.8 $262.7 $241.7 $254.8 $263.2 $740.8 $759.7 $1,003.5 Acquired intangible asset amortization 5.2 5.4 6.2 4.9 4.9 4.8 4.9 16.8 14.6 21.7 Acquisitions, integrations, divestitures, and related costs - - - - 0.0 0.1 - - 0.1 - Business transition and related costs - - - 6.0 6.2 9.2 5.5 - 20.9 6.0 Other adjustments 2.5 0.9 0.5 (0.0) 3.1 0.0 (1.9) 3.9 1.3 3.9 Non-GAAP gross profit $292.6 $227.6 $241.4 $273.6 $255.9 $268.9 $271.8 $761.6 $796.6 $1,035.1 $303 $320 $1,100 $1,116 GAAP selling, general and administrative expenses $196.3 $151.7 $156.1 $159.8 $159.9 $177.5 $184.8 $504.1 $522.2 $664.0 Acquired tangible asset amortization (2.2) (1.0) (0.9) (0.9) (0.8) (0.8) (0.8) (4.1) (2.4) (5.0) Acquired intangible asset amortization (4.7) (4.2) (3.3) (4.3) (4.3) (4.3) (4.3) (12.2) (13.0) (16.5) Acquisitions, integrations, divestitures, and related costs (3.5) (3.9) (3.6) (2.1) (6.0) (6.0) (4.6) (10.9) (16.7) (13.1) Business transition and related costs - - (2.4) (2.3) (1.3) (1.2) 6.8 (2.4) 4.4 (4.6) Litigation related expenses and settlements (19.1) (13.4) (6.0) 7.9 2.3 (9.3) (30.4) (38.5) (37.5) (30.6) Non-GAAP selling, general and administrative expenses (prior definition) $166.8 $128.9 $139.8 $158.4 $149.5 $156.1 $151.4 $435.5 $457.1 $594.0 Litigation related expenses and settlements (11.6) (9.8) (8.9) (13.1) (8.1) (7.9) (8.0) (30.3) (24.0) (43.4) Non-GAAP selling, general and administrative expenses (updated definition) $155.2 $119.1 $130.9 $145.3 $141.5 $148.2 $143.4 $405.2 $433.0 $550.6 GAAP research and development expenses $50.5 $40.2 $46.5 $38.0 $47.8 $49.0 $48.3 $137.2 $145.1 $175.2 Acquisitions, integrations, divestitures, and related costs (0.2) (0.2) - - - - - (0.4) - (0.4) Business transition and related costs - - (1.8) (1.4) (1.4) (1.1) (0.8) (1.8) (3.3) (3.2) Non-GAAP research and development expenses $50.2 $40.1 $44.7 $36.5 $46.5 $47.8 $47.6 $135.1 $141.9 $171.6 GAAP litigation settlements and awards $0.0 $0.0 $0.0 $17.8 $0.0 $0.0 $0.0 $0.0 $0.0 $17.8 Litigation related expenses and settlements - - - (17.8) - - - - - (17.8) Non-GAAP litigation settlements and awards $0.0 $0.0 $0.0 $0.0 $0.0 $0.0 $0.0 $0.0 $0.0 $0.0 GAAP impairment charge $0.0 $0.0 $7.0 $3.0 $0.0 $0.0 $0.0 $7.0 $0.0 $10.0 Acquisition, integration and related costs - - (7.0) (3.0) - - - (7.0) - (10.0) Non-GAAP impairment charge $0.0 $0.0 $0.0 $0.0 $0.0 $0.0 $0.0 $0.0 $0.0 $0.0 GAAP operating expenses $246.8 $191.9 $209.6 $218.6 $207.7 $226.5 $233.1 $648.3 $667.3 $867.0 Acquired tangible asset amortization (2.2) (1.0) (0.9) (0.9) (0.8) (0.8) (0.8) (4.1) (2.4) (5.0) Acquired intangible asset amortization (4.7) (4.2) (3.3) (4.3) (4.3) (4.3) (4.3) (12.2) (13.0) (16.5) Acquisitions, integrations, divestitures, and related costs (3.7) (4.0) (10.6) (5.1) (6.0) (6.0) (4.6) (18.3) (16.7) (23.5) Business transition and related costs - - (4.2) (3.7) (2.7) (2.3) 6.0 (4.2) 1.1 (7.9) Litigation related expenses and settlements (19.1) (13.4) (6.0) (9.9) 2.3 (9.3) (30.4) (38.5) (37.5) (48.4) Non-GAAP operating expenses (prior definition) $217.1 $169.0 $184.6 $194.9 $196.0 $203.8 $199.0 $570.6 $598.8 $765.6 Litigation related expenses and settlements (11.6) (9.8) (8.9) (13.1) (8.1) (7.9) (8.0) (30.3) (24.0) (43.4) Non-GAAP operating expenses (updated definition) $205.5 $159.2 $175.6 $181.8 $187.9 $196.0 $191.0 $540.3 $574.9 $722.1 GAAP operating profit $38.0 $29.3 $25.2 $44.1 $34.0 $28.3 $30.1 $92.5 $92.4 $136.5 Acquired tangible asset amortization 2.2 1.0 0.9 0.9 0.8 0.8 0.8 4.1 2.4 5.0 Acquired intangible asset amortization 9.9 9.6 9.4 9.1 9.3 9.1 9.2 29.0 27.6 38.1 Acquisitions, integrations, divestitures, and related costs 3.7 4.0 10.6 5.1 6.0 6.1 4.6 18.3 16.7 23.5 Business transition and related costs - - 4.2 9.7 8.8 11.4 (0.5) 4.2 19.8 13.9 Litigation related expenses and settlements 19.1 13.4 6.0 9.9 (2.3) 9.3 30.4 38.5 37.5 48.4 Other adjustments 2.5 0.9 0.5 (0.0) 3.1 0.0 (1.9) 3.9 1.3 3.9 Non-GAAP operating profit (prior definition) $75.5 $58.6 $56.9 $78.6 $59.9 $65.1 $72.8 $191.0 $197.7 $269.6 Litigation related expenses and settlements 11.6 9.8 8.9 13.1 8.1 7.9 8.0 30.3 24.0 43.4 Non-GAAP operating profit (updated definition) $87.1 $68.4 $65.9 $91.7 $67.9 $72.9 $80.8 $221.4 $221.6 $313.0 $103 $114 $325 $336

Consolidated Income Statement Notes: (1) Totals may not foot due to rounding. Annual reported amounts may vary from amounts previously reported due to rounding conventions. (2) Effective fiscal year 2024, we are updating our non-GAAP financial measures to exclude the impact of all expenses related to our litigation with Apple. Masimo had previously only excluded the expenses related to the U.S. International Trade Commission litigation against Apple. Masimo believes all Apple litigation expenses are unique in nature and not indicative of the Company’s on-going operating performance and is therefore excluding them from its non-GAAP financial measures. (3) Guidance provided November 5, 2024. Financial guidance includes forward-looking non-GAAP financial measures for which reconciliations to the most directly comparable GAAP financial measures are not available without unreasonable efforts. See “Forward-Looking Non-GAAP Financial Measures" on slide 2, which identifies the information that is unavailable without unreasonable efforts and provides additional information. It is probable that forward-looking non-GAAP financial measures may be materially different from the corresponding GAAP financial measures. (Unaudited; in millions, except per share data) (1),(2) Quarterly Performance Year to Date Full Year Q4 2024 Guidance (3) FY 2024 Guidance (3) Q1 2023 Q2 2023 Q3 2023 Q4 2023 Q1 2024 Q2 2024 Q3 2024 YTD 2023 YTD 2024 FY 2023 Low High Low High GAAP non-operating income (expense) ($11.8) ($4.5) ($11.2) ($20.9) ($9.1) ($8.4) ($18.5) ($27.5) ($36.0) ($48.4) Realized and unrealized gains or losses 0.7 (6.5) (1.0) 8.0 (2.1) (1.4) 9.2 (6.8) 5.8 1.1 Financing related adjustments 0.5 0.5 0.5 0.5 0.5 0.5 0.5 1.4 1.4 1.9 Non-GAAP non-operating income (expense) ($10.7) ($10.5) ($11.6) ($12.4) ($10.7) ($9.4) ($8.8) ($32.8) ($28.9) ($45.4) ($9) ($9) ($38) ($38) GAAP provision for income taxes $4.9 $9.1 $3.4 ($10.8) $6.0 $3.9 $1.8 $17.4 $11.7 $6.6 Tax impact of non-GAAP adjustments 10.0 4.8 8.0 12.0 6.1 9.2 13.8 22.8 29.0 34.8 Excess tax benefits from stock-based compensation 2.4 0.5 0.2 (0.2) 1.3 2.0 1.6 3.1 4.9 2.9 Tax related adjustments - - - 8.2 - - - - - 8.2 Non-GAAP provision for income taxes (prior definition) $17.4 $14.4 $11.5 $9.3 $13.4 $15.1 $17.2 $43.3 $45.7 $52.6 Tax impact of non-GAAP adjustments 2.7 2.3 2.1 3.1 1.9 1.9 1.9 7.2 5.7 10.3 Non-GAAP provision for income taxes (updated definition) $20.1 $16.7 $13.6 $12.4 $15.3 $16.9 $19.1 $50.5 $51.3 $62.9 $21 $23 $72 $74 GAAP net income $21.3 $15.7 $10.6 $34.0 $18.9 $16.0 $9.8 $47.6 $44.7 $81.5 Acquired tangible asset amortization 2.2 1.0 0.9 0.9 0.8 0.8 0.8 4.1 2.4 5.0 Acquired intangible asset amortization 9.9 9.6 9.4 9.1 9.3 9.1 9.2 29.0 27.6 38.1 Acquisitions, integrations, divestitures, and related costs 3.7 4.0 10.6 5.1 6.0 6.1 4.6 18.3 16.7 23.5 Business transition and related costs - - 4.2 9.7 8.8 11.4 (0.5) 4.2 19.8 13.9 Litigation related expenses and settlements 19.1 13.4 6.0 9.9 (2.3) 9.3 30.4 38.5 37.5 48.4 Other adjustments 2.5 0.9 0.5 (0.0) 3.1 0.0 (1.9) 3.9 1.3 3.9 Realized and unrealized gains or losses 0.7 (6.5) (1.0) 8.0 (2.1) (1.4) 9.2 (6.8) 5.8 1.2 Financing related adjustments 0.5 0.5 0.5 0.5 0.5 0.5 0.5 1.4 1.4 1.9 Tax impact of non-GAAP adjustments (10.0) (4.8) (8.0) (12.0) (6.1) (9.2) (13.8) (22.8) (29.0) (34.8) Excess tax benefits from stock-based compensation (2.4) (0.5) (0.2) 0.2 (1.3) (2.0) (1.6) (3.1) (4.9) (2.9) Tax related adjustments - - - (8.2) - - - - - (8.2) Non-GAAP net income (prior definition) $47.5 $33.7 $33.7 $56.9 $35.8 $40.6 $46.8 $114.8 $123.2 $171.6 Litigation related expenses and settlements 11.6 9.8 8.9 13.1 8.1 7.9 8.0 30.3 24.0 43.4 Tax impact of non-GAAP adjustments (2.7) (2.3) (2.1) (3.1) (1.9) (1.9) (1.9) (7.2) (5.7) (10.3) Non-GAAP net income (updated definition) $56.3 $41.2 $40.5 $66.9 $41.9 $46.6 $52.9 $138.0 $141.4 $204.8 $74 $82 $215 $223 GAAP net income per share $0.39 $0.29 $0.20 $0.63 $0.35 $0.29 $0.18 $0.88 $0.82 $1.51 Acquired tangible asset amortization 0.04 0.02 0.02 0.02 0.02 0.01 0.01 0.08 0.04 0.09 Acquired intangible asset amortization 0.18 0.18 0.18 0.17 0.17 0.17 0.17 0.54 0.51 0.70 Acquisitions, integrations, divestitures, and related costs 0.07 0.07 0.20 0.09 0.11 0.11 0.09 0.34 0.31 0.44 Business transition and related costs 0.00 0.00 0.08 0.18 0.16 0.21 (0.01) 0.08 0.36 0.26 Litigation related expenses and settlements 0.35 0.25 0.11 0.18 (0.04) 0.17 0.56 0.71 0.69 0.89 Other adjustments 0.05 0.02 0.01 (0.00) 0.06 0.00 (0.03) 0.07 0.02 0.07 Realized and unrealized gains or losses 0.01 (0.12) (0.02) 0.15 (0.04) (0.03) 0.17 (0.12) 0.11 0.02 Financing related adjustments 0.01 0.01 0.01 0.01 0.01 0.01 0.01 0.03 0.03 0.03 Tax impact of non-GAAP adjustments (0.18) (0.09) (0.15) (0.22) (0.11) (0.17) (0.25) (0.42) (0.53) (0.64) Excess tax benefits from stock-based compensation (0.04) (0.01) (0.00) 0.00 (0.02) (0.04) (0.03) (0.06) (0.09) (0.05) Tax related adjustments 0.00 0.00 0.00 (0.15) 0.00 0.00 0.00 0.00 0.00 (0.15) Non-GAAP net income per share (prior definition) $0.87 $0.62 $0.63 $1.06 $0.66 $0.75 $0.86 $2.11 $2.27 $3.17 Litigation related expenses and settlements 0.21 0.18 0.17 0.24 0.15 0.15 0.15 0.56 0.44 0.80 Tax impact of non-GAAP adjustments (0.05) (0.04) (0.04) (0.06) (0.04) (0.04) (0.04) (0.13) (0.11) (0.19) Non-GAAP net income per share (updated definition) $1.03 $0.76 $0.75 $1.25 $0.77 $0.86 $0.98 $2.54 $2.61 $3.79 $1.35 $1.50 $3.95 $4.10 Weighted average shares outstanding - Diluted 54.4 54.4 53.9 53.7 54.2 54.3 54.3 54.2 54.3 54.1 54.7 54.7 54.5 54.5
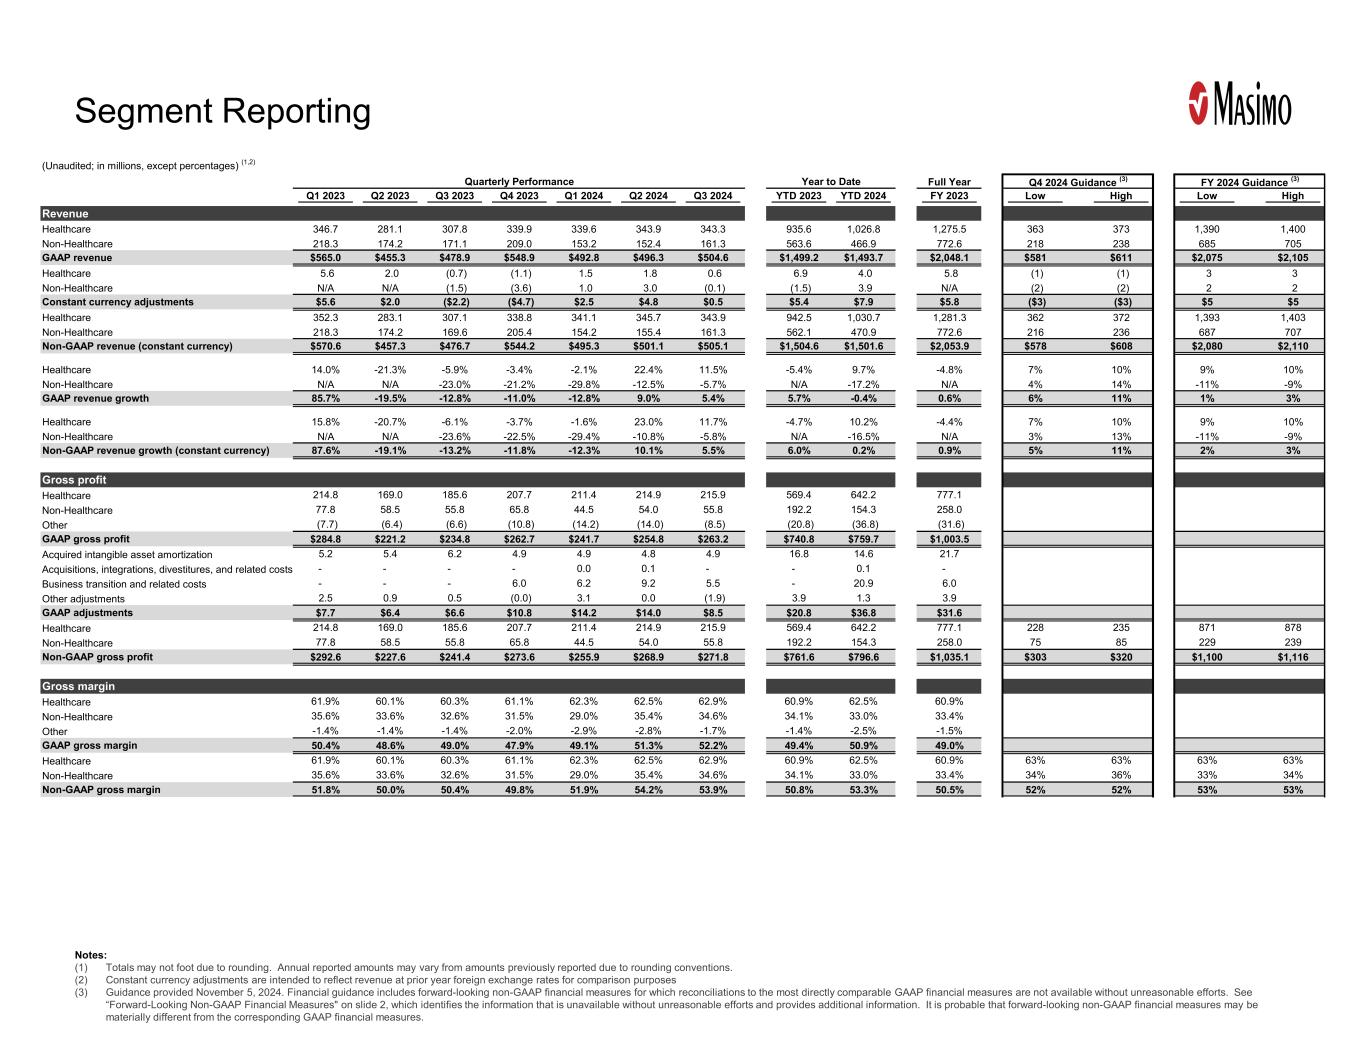
Segment Reporting Notes: (1) Totals may not foot due to rounding. Annual reported amounts may vary from amounts previously reported due to rounding conventions. (2) Constant currency adjustments are intended to reflect revenue at prior year foreign exchange rates for comparison purposes (3) Guidance provided November 5, 2024. Financial guidance includes forward-looking non-GAAP financial measures for which reconciliations to the most directly comparable GAAP financial measures are not available without unreasonable efforts. See “Forward-Looking Non-GAAP Financial Measures" on slide 2, which identifies the information that is unavailable without unreasonable efforts and provides additional information. It is probable that forward-looking non-GAAP financial measures may be materially different from the corresponding GAAP financial measures. (Unaudited; in millions, except percentages) (1,2) Quarterly Performance Year to Date Full Year Q4 2024 Guidance (3) FY 2024 Guidance (3) Q1 2023 Q2 2023 Q3 2023 Q4 2023 Q1 2024 Q2 2024 Q3 2024 YTD 2023 YTD 2024 FY 2023 Low High Low High Revenue Healthcare 346.7 281.1 307.8 339.9 339.6 343.9 343.3 ### 935.6 1,026.8 1,275.5 363 373 1,390 1,400 Non-Healthcare 218.3 174.2 171.1 209.0 153.2 152.4 161.3 563.6 466.9 772.6 218 238 685 705 GAAP revenue $565.0 $455.3 $478.9 $548.9 $492.8 $496.3 $504.6 $1,499.2 $1,493.7 $2,048.1 $581 $611 $2,075 $2,105 Healthcare 5.6 2.0 (0.7) (1.1) 1.5 1.8 0.6 6.9 4.0 5.8 (1) (1) 3 3 Non-Healthcare N/A N/A (1.5) (3.6) 1.0 3.0 (0.1) (1.5) 3.9 N/A (2) (2) 2 2 Constant currency adjustments $5.6 $2.0 ($2.2) ($4.7) $2.5 $4.8 $0.5 $5.4 $7.9 $5.8 ($3) ($3) $5 $5 Healthcare 352.3 283.1 307.1 338.8 341.1 345.7 343.9 942.5 1,030.7 1,281.3 362 372 1,393 1,403 Non-Healthcare 218.3 174.2 169.6 205.4 154.2 155.4 161.3 562.1 470.9 772.6 216 236 687 707 Non-GAAP revenue (constant currency) $570.6 $457.3 $476.7 $544.2 $495.3 $501.1 $505.1 $1,504.6 $1,501.6 $2,053.9 $578 $608 $2,080 $2,110 Healthcare 14.0% -21.3% -5.9% -3.4% -2.1% 22.4% 11.5% -5.4% 9.7% -4.8% 7% 10% 9% 10% Non-Healthcare N/A N/A -23.0% -21.2% -29.8% -12.5% -5.7% N/A -17.2% N/A 4% 14% -11% -9% GAAP revenue growth 85.7% -19.5% -12.8% -11.0% -12.8% 9.0% 5.4% 5.7% -0.4% 0.6% 6% 11% 1% 3% Healthcare 15.8% -20.7% -6.1% -3.7% -1.6% 23.0% 11.7% -4.7% 10.2% -4.4% 7% 10% 9% 10% Non-Healthcare N/A N/A -23.6% -22.5% -29.4% -10.8% -5.8% N/A -16.5% N/A 3% 13% -11% -9% Non-GAAP revenue growth (constant currency) 87.6% -19.1% -13.2% -11.8% -12.3% 10.1% 5.5% 6.0% 0.2% 0.9% 5% 11% 2% 3% Gross profit Healthcare 214.8 169.0 185.6 207.7 211.4 214.9 215.9 569.4 642.2 777.1 Non-Healthcare 77.8 58.5 55.8 65.8 44.5 54.0 55.8 192.2 154.3 258.0 Other (7.7) (6.4) (6.6) (10.8) (14.2) (14.0) (8.5) (20.8) (36.8) (31.6) GAAP gross profit $284.8 $221.2 $234.8 $262.7 $241.7 $254.8 $263.2 $740.8 $759.7 $1,003.5 Acquired intangible asset amortization 5.2 5.4 6.2 4.9 4.9 4.8 4.9 16.8 14.6 21.7 Acquisitions, integrations, divestitures, and related costs - - - - 0.0 0.1 - - 0.1 - Business transition and related costs - - - 6.0 6.2 9.2 5.5 - 20.9 6.0 Other adjustments 2.5 0.9 0.5 (0.0) 3.1 0.0 (1.9) 3.9 1.3 3.9 GAAP adjustments $7.7 $6.4 $6.6 $10.8 $14.2 $14.0 $8.5 $20.8 $36.8 $31.6 Healthcare 214.8 169.0 185.6 207.7 211.4 214.9 215.9 569.4 642.2 777.1 228 235 871 878 Non-Healthcare 77.8 58.5 55.8 65.8 44.5 54.0 55.8 192.2 154.3 258.0 75 85 229 239 Non-GAAP gross profit $292.6 $227.6 $241.4 $273.6 $255.9 $268.9 $271.8 $761.6 $796.6 $1,035.1 $303 $320 $1,100 $1,116 Gross margin Healthcare 61.9% 60.1% 60.3% 61.1% 62.3% 62.5% 62.9% 60.9% 62.5% 60.9% Non-Healthcare 35.6% 33.6% 32.6% 31.5% 29.0% 35.4% 34.6% 34.1% 33.0% 33.4% Other -1.4% -1.4% -1.4% -2.0% -2.9% -2.8% -1.7% -1.4% -2.5% -1.5% GAAP gross margin 50.4% 48.6% 49.0% 47.9% 49.1% 51.3% 52.2% 49.4% 50.9% 49.0% Healthcare 61.9% 60.1% 60.3% 61.1% 62.3% 62.5% 62.9% 60.9% 62.5% 60.9% 63% 63% 63% 63% Non-Healthcare 35.6% 33.6% 32.6% 31.5% 29.0% 35.4% 34.6% 34.1% 33.0% 33.4% 34% 36% 33% 34% Non-GAAP gross margin 51.8% 50.0% 50.4% 49.8% 51.9% 54.2% 53.9% 50.8% 53.3% 50.5% 52% 52% 53% 53%


